Advanced Public Transportation Systems - NET
218
v
-
Upload
khangminh22 -
Category
Documents
-
view
3 -
download
0
Transcript of Advanced Public Transportation Systems - NET

v

Advanced Public
Transportation Systems: The State of the Art
Update 2000
Prepared for: Federal Transit Administration
Office of Research, Demonstration and Innovation Office of Mobility Innovation
Advanced Public Transportation Systems Division 400 7th Street, SW
Washington, DC 20590
Prepared by: Research and Special Programs Administration Volpe National Transportation Systems Center
Office of System and Economic Assessment Operations Assessment Division 55 Broadway, Kendall Square Cambridge, MA 02142
vi

REPORT DOCUMENTATION PAGE
Form Approved OMB No. 0704-0188
Public reporting burden for this collection of information is estimated to average 1 hour per response, including the time for reviewing instructions, searching existing data sources, gathering and maintaining the data needed, and completing and reviewing the collection of information. Send comments regarding this burden estimate or any other aspect of this collection of information, including suggestions for reducing this burden, to Washington Headquarters Services, Directorate for Information Operations and Reports, 1215 Jefferson Davis Highway, Suite 1204, Arlington, VA 22202-4302, and to the Office of Management and Budget, Paperwork Reduction Project (0704-0188), Washington, DC 20503. 1. AGENCY USE ONLY (Leave blank) 2. REPORT DATE 3. REPORT TYPE AND DATES COVERED December 2000 Final Report August 1999-September 2000 4. TITLE AND SUBTITLE 5. FUNDING NUMBERS Advanced Public Transportation Systems: The State of the Art Update 2000 TT050/U0197 6. AUTHOR(S) Robert F. Casey, Lawrence N. Labell, Leisa Moniz, Jackson W. Royal, Michael Sheehan, Terry Sheehan, Alex Brown1, Malinda Foy1, Margaret Zirker1, Carol L. Schweiger2, Buck Marks2, Bruce Kaplan2, and Doug
Parker2 7. PERFORMING ORGANIZATION NAME(S) AND ADDRESS(ES) 8. PERFORMING ORGANIZATION U.S. Department of Transportation REPORT NUMBER
Research and Special Programs Administration John A. Volpe National Transportation Systems Center DOT-VNTSC-FTA-99-5 Cambridge, MA 02142-1093 9. SPONSORING/MONITORING AGENCY NAME(S) AND ADDRESS(ES) 10. SPONSORING/MONITORING U.S. Department of Transportation AGENCY REPORT NUMBER
Federal Transit Administration Office of Mobility Innovation, TRI-10 FTA-MA-26-7007-00-1 400 Seventh Street, SW Washington, DC 20590 11. SUPPLEMENTARY NOTES 1 EG&G, 2 Multisystems, Inc. 12a. DISTRIBUTION/AVAILABILITY STATEMENT 12b. DISTRIBUTION CODE This document is available to the public through the National Technical Information Service, Springfield, VA 22161 13. ABSTRACT (Maximum 200 words) I
This report documents work performed under FTA's Advanced Public Transportation Systems (APTS) Program, a program structured to undertake research and development of innovative applications of advanced navigation, communication, information, computer, and vehicle technologies that most benefit public transportation. This report is the latest in a series of State-of-the-Art reports, the last of which was published in January 1998. It contains the results of an investigation of the extent of adoption of advanced technology in the provision of public transportation service in North America. It focused on some of the most innovative or comprehensive implementations, categorized under five types of service/technologies: Fleet Management, Traveler Information, Electronic Fare Payment, Transportation Demand Management, and Intelligent Vehicle Initiative. The objective of this effort was to increase the industry's knowledge of successful applications of advanced technologies with the expectation that this will lead to their widespread adoption. 14. SUBJECT TERMS 15. NUMBER OF PAGES Intelligent Transportation Systems (ITS), Advanced Public 220 Transportation Systems (APTS), Advanced Technology Transit Applications, Automatic Vehicle Location, Transit Information 16. PRICE CODE Systems, Transit Communication Systems, Transit Control Systems, Transit Fleet Management, Traveler Information, Electronic Fare
Payment, Travel Demand Management, Intelligent Vehicle Initiative
vii
17. SECURITY 18. SECURITY 19. SECURITY 20. LIMITATION OF CLASSIFICATION CLASSIFICATION CLASSIFICATION ABSTRACT OF REPORT OF THIS PAGE OF ABSTRACT Unclassified
Unclassified Unclassified
NSN 7540-01-280-5500 Standard Form 298 (Rev. 2-89) Prescribed by ANSI Std. 239-18 298-102
PREFACE This report contains the results of a limited investigation of the extent of adoption of advanced
technology in the provision of public transportation service in North America. The objective of this
effort was to increase the industry’s knowledge of successful applications of advanced technologies
with the expectation that this will lead to their widespread adoption.
This research was conducted by the Volpe National Transportation Systems Center of the United
States Department of Transportation, Research and Special Programs Administration, and was
sponsored by Walter Kulyk, Director, Office of Mobility Innovation of the Federal Transit
Administration.
Appreciation goes to all of the researchers and professionals who supplied information for this report,
most of whom are listed as contacts in Appendix C. TABLE OF CONTENTS
Chapter Page
viii

1. Introduction 1-1 2. FLEET MANAGEMENT SYSTEMS ........................................................................................................ 2-1
2.1 AUTOMATIC VEHICLE LOCATION SYSTEMS ......................................................................... 2-2 2.2 TRANSIT OPERATIONS SOFTWARE ......................................................................................... 2-13
2.2.1 Operations Software for Fixed-Route Bus Operations ....................................................... 2-13 2.2.2 Operations Software for Rail ................................................................................................ 2-25 2.2.3 Operations Software for Paratransit .................................................................................... 2-27
2.3 COMMUNICATIONS SYSTEMS .................................................................................................... 2-35
2.3.1 Mobile Voice and Data Communications Systems for Bus Transit ................................... 2-39 2.3.2 Mobile Voice and Data Communications Systems for Rail Transit .................................. 2-46 2.3.3 Short Range and Other Communications ............................................................................ 2-51
2.4 GEOGRAPHIC INFORMATION SYSTEMS ................................................................................ 2-58 2.5 AUTOMATIC PASSENGER COUNTERS ..................................................................................... 2-65 2.6 TRAFFIC SIGNAL PRIORITY ....................................................................................................... 2-71 3. Traveler Information Systems 3-1 3.1 PRE-TRIP TRANSIT AND MULTIMODAL TRAVELER
INFORMATION SYSTEMS .................................................................................. 3-1 3.2 IN-TERMINAL/WAYSIDE TRANSIT INFORMATION SYSTEMS .......................................... 3-18 3.3 IN-VEHICLE TRANSIT INFORMATION SYSTEMS ................................................................. 3-26 4. ELECTRONIC PAYMENT SYSTEMS .................................................................................................... 4-1 5. TRANSPORTATION DEMAND MANAGEMENT ................................................................................ 5-1
5.1 DYNAMIC RIDESHARING ............................................................................................................... 5-2 5.2 AUTOMATED SERVICE COORDINATION .................................................................................. 5-9 5.3 TRANSPORTATION MANAGEMENT CENTERS ...................................................................... 5-18 6. TRANSIT INTELLIGENT VEHICLE INITIATIVE ............................................................................ 6-1 7. FTA-SPONSORED FIELD OPERATIONAL TESTS ............................................................................ 7-1
ix

UPDATE 2000
TABLE OF CONTENTS (Cont.) Chapter Page APPENDIX A. THE NATIONAL ITS ARCHITECTURE AND ITS
STANDARDS ........................................................................................... A-1
Appendix B. aPTS Mobile SHOWCASE........................................................................................................B-1 Appendix C. List of Contacts ..........................................................................................................................C-1 BIBLIOGRAPHY ........................................................................................................................................BIB-1
x

TABLE OF CONTENTS
LIST OF FIGURES Figure Page 1-1. National ITS Architecture Interconnect Diagram ............................................................................. 1-4 2-1. Fleet Management Technologies .......................................................................................................... 2-3 2-2. Schematic of an AVL System Used in a Transit Agency ................................................................... 2-4 2-3. Driver with MDT ................................................................................................................................... 2-5 2-4. Mobile Data Terminal ........................................................................................................................... 2-5 2-5. Dispatch Center ..................................................................................................................................... 2-5 2-6. AVL Dispatch Station ........................................................................................................................... 2-5 2-7. Location Technology for Operational AVL Systems in the U.S......................................................... 2-9 2-8. Aero Data Mobile Data Terminal ...................................................................................................... 2-19 2-9. TranStar Input Screen ........................................................................................................................ 2-20 2-10. TRIPS Directions ................................................................................................................................ 2-21 2-11. TRIPS Walking Access Map .............................................................................................................. 2-21 2-12. Lower Colorado River Association Tower ........................................................................................ 2-44 2-13. Variable Block Control Schematic .................................................................................................... 2-48 2-14. West Coast Express Operating Cab .................................................................................................. 2-50 2-15. Potential Site Locations for VMS’s, Monitors, and Kiosks ............................................................. 2-55 2-16. NYC CDPD Architecture ................................................................................................................... 2-56 2-17. Journey-to-Work Bus Trips Destined for White Plains ................................................................... 2-62 2-18. Transponder Tag on Bus .................................................................................................................... 2-72 2-19. Signal Priority Antenna on Pole ......................................................................................................... 2-72 2-20. Metro Transit Signal Priority System Design ................................................................................... 2-79 3-1. RideGuide Itinerary Results ................................................................................................................. 3-7 3-2. RideGuide “More Options” Screen ..................................................................................................... 3-8 3-3. BusView Main Page ............................................................................................................................ 3-11 3-4. BusView Progress Screen ................................................................................................................... 3-13 3-5. MyBus Web Page ................................................................................................................................ 3-13 3-6. Transportation Information Gathering and Distribution ............................................................... 3-15 3-7. SATIN Kiosk Screen ........................................................................................................................... 3-17 3-8. Customer Using TransitWatch .......................................................................................................... 3-26 3-9. Sample TransitWatch Screen from Northgate Transit Center ....................................................... 3-27 4-1. Example of a Smart Card...................................................................................................................... 4-3 4-2. Rider Using Smart Card for Fare Payment......................................................................................... 4-3 4-3. User Loading Value on Smart Card .................................................................................................... 4-5 5-1. East Bay Pick Up Points ....................................................................................................................... 5-4 5-2. Location of Potential Rideshare Matches ............................................................................................ 5-6 5-3. Seattle Smart Traveler Logo ................................................................................................................ 5-7 5-4. Omnilink Ridership Growth .............................................................................................................. 5-14 5-5. KC Metro Intranet Page – Thumbnail Images ................................................................................. 5-22 5-6. Phoenix Transit’s AZTech Workstation ............................................................................................ 5-23
xi

LIST OF FIGURES (Cont.) Figure Page
6-1. IVI Logo ................................................................................................................................................. 6-1 A-1. National ITS Architecture Interconnect Diagram A-5 B-1. APTS Mobile Showcase Trailer ...........................................................................................................B-1 B-2. APTS Mobile Showcase Exhibit Areas ................................................................................................B-3
LIST OF TABLES
Table Page
2-1. Synopsis of Location Technologies ....................................................................................................... 2-6 2-2. Traffic Signal Priority Installations and Tests ................................................................................... 2-74 4-1. Fare Media Advantages and Disadvantages ........................................................... 4-1 4-2. Financial Advantage of Electronic Fare Media ................................................................................... 4-2 5-1. Prior Commute Mode ............................................................................................................................ 5-4 7-1. FTA-Sponsored APTS Field Operational Tests ................................................................................... 7-2 A-1. ITS User Services and User Services Bundles.......................................................................................A-4 A-2. List of TCIP1 Standards.........................................................................................................................A-7 B-1. APTS Mobile Showcase Partners...........................................................................................................B-7 C-1. List of Contacts Alphabetically by Name ..............................................................................................C-1 C-2. List of Contacts Alphabetically by Location.........................................................................................C-5 LIST OF ACRONYMS ADART Autonomous Dial-A-Ride Transit AOS Advanced Operating System APC Automatic Passenger Counter APTS Advanced Public Transportation System ATC Automated Train Control ATIDS Automated Train Information Display System ATIMS Automated Travel Information Management System ATIS Advanced Traveler Information System AVI Automatic Vehicle Identification AVL Automatic Vehicle Location BDS Bus Dispatch System CAD Computer-Aided Dispatch CASM Computer-Aided Support Management CASR Computer-Aided Service Restoration CATM Computer-Assisted Transfer Management CBR Case-Based Reasoning CBTC Communications-Based Train Control CCTV Closed-Circuit Television CIS Customer Information Service CRADA Cooperative Research and Development Agreement DGPS Differential Global Positioning System
ix

DSRC Dedicated Short-Range Communications EDACS Enhanced Digital Access Communications System EDF Environmental Defense Fund ETA Estimated Time of Arrival ETD Estimated Time of Departure FCC Federal Communications Commission GIS Geographic Information System GPS Global Positioning System HOV High Occupancy Vehicle HTML HyperText Markup Language ISP Information Service Provider ITE Institute of Transportation Engineers ITS Intelligent Transportation Systems IVI Intelligent Vehicle Initiative LED Light-Emitting Dioxide MDT Mobile Data Terminal MMDI Metropolitan Model Deployment Initiative
x
LIST OF ACRONYMS (Cont.) MPO Metropolitan Planning Organization NPRM Notice of Proposed Rulemaking NTIA National Telecommunications and Information Administration PCS Personal Communication Systems PSWAC Public Safety Wireless Advisory Committee RCC Rail Control Center RCRS Roadway Closure and Restriction System RF Radio Frequency RFC Request For Comment RFP Request For Proposal SCADA Supervisory Control and Data Acquisition SDO Standards Development Organizations TAZ Transportation Analysis Zones TCIP Transit Communication Interface Profiles TCP Transfer Connection Protocol TMC Transportation Management Center TRIPS Transit Itinerary Planning System VCH Vehicle Control Head XML Extensible Markup Language
EXECUTIVE SUMMARY The Advanced Public Transportation Systems: State of the Art Update 2000 is the sixth in a series of
reports since 1991 that summarize the progress of implementing Advanced Public Transportation
Systems (APTS) technologies throughout the nation. The report documents the work performed
under Federal Transit Administration's (FTA) APTS Program, a program structured to undertake
research and development of innovative applications of advanced technologies that benefit public
transportation.
The objective of this report is to increase the public transportation industry's knowledge of successful
applications of advanced technologies. The report provides important information that can help
public and private sector decision-makers invest wisely in APTS technologies by answering the
following questions:
��What are APTS technologies? ��What is the state-of-the-art in APTS technology implementation? ��What are the challenges to implementation that transit agencies and organizations
encounter?
xi

��Who are the agencies and organizations that are successfully implementing and integrating APTS technologies as part of their systems?
With this information, public transportation decision-makers are informed about which APTS
technologies could best be applied to solve their transportation challenges and what they may expect
in their deployments.
What are APTS technologies? APTS technologies are a collection of technologies that increase the efficiency and safety of public
transportation systems and offer users greater access to information on system operations. The
implementation of APTS technologies is transforming the way public transportation systems operate,
and changing the nature of the transportation services that can be offered by public transportation
systems. The goal is to provide public transportation decision-makers more information to make
effective decisions on systems and operations and to increase travelers' convenience and ridership.
APTS technologies can be organized into five broad categories that describe the technologies'
relevance to transit applications. Each category is comprised of a variety of technology choices that
are available
to help transit agencies and organizations meet travelers' service needs while increasing safety and
efficiency. The five APTS technology categories are:
Transit Application APTS Technologies
Fleet Management Systems �� Automatic Vehicle Location Systems �� Transit Operations Software �� Communications Systems �� Geographic Information Systems �� Automatic Passenger Counters �� Traffic Signal Priority Systems
Traveler Information Systems
�� Pre-Trip Transit and Multimodal Traveler Information Systems
�� In-Terminal/Wayside Transit Information Systems �� In-Vehicle Transit Information Systems
Electronic Payment Systems
�� Smart Cards �� Fare Distribution Systems �� Clearinghouse
xii

EXECUTIVE SUMMARY
Transportation Demand Management
�� Dynamic Ridesharing �� Automated Service Coordination �� Transportation Management Centers
The Transit Intelligent Vehicle Initiative
�� Lane Change and Merge Collision Avoidance �� Forward Collision Avoidance �� Rear Impact Collision Mitigation �� Tight Maneuvering/ Precision Docking
��Fleet Management Systems aid in boosting the efficiency of transit systems, reducing operating
costs, and improving transit services through more precise adherence to schedules.1 Fleet
management systems do this by using technology to monitor the fleet's effectiveness in meeting
customer demand, identifying incidents, managing response, and restoring service more
effectively. More efficient planning, scheduling, and operations can also increase ridership as
customers are able to better depend on transit.
��Traveler Information Systems combine computer and communications technologies to provide
vehicle information to travelers at home, at work, on the roadside, or at bus and rail transit stations.
The information allows travelers to choose the most efficient and convenient modes of travel.
Travelers can access real-time schedules and congestion information through telephones, cable
television, variable message signs, kiosks, or personal computers. The result is more convenience
for routine or occasional travelers in using and choosing transit.
1 Implementation of the National Intelligent Transportation Systems Program: 1996 Report to Congress, p.96.
xiii

EXECUTIVE SUMMARY
��Electronic Payment Systems are installed to make fare payment more convenient for travelers and
revenue collection less costly for transit providers. These systems combine fare media, such as
magnetic stripe cards or smart cards, with electronic communications systems, data processing
computers, and data storage systems to more efficiently collect fares. Cards can be used for
regional travel on buses, subways, and rail. These systems can also be used to report real-time
travel demand for better planning and scheduling of services.2
��Transportation Demand Management refers to a set of techniques and programs employed by
transportation agencies and organizations to more effectively manage and utilize the capacity of the
existing infrastructure. The goal of demand management is to maximize the capacity of the current
transportation network in order to meet the increase in the demand for transportation services. The
techniques and programs utilize advanced technologies to monitor capacity and manage the system
in real time, as well as provide information and incentives for travelers to find alternative solutions
to traveling alone. An example is the use of High Occupancy Vehicle (HOV) lanes on freeways in
which cars with 2 or more passengers can drive. The objective of such a program is to encourage
carpooling on congested highways.
��The Transit Intelligent Vehicle Initiative (IVI) is a research and development effort that is
seeking to develop technologies that help prevent crashes. Advanced safety and information
systems are applied to help drivers operate transit vehicles more safely and effectively. The current
focus of Transit IVI is to test these technologies on buses and paratransit vehicles; rail vehicles will
be considered in the future. For buses, the FTA has identified the five most frequent crash types
2 ITS Joint Program Office, Intelligent Vehicle Initiative brochure, p. 1, 1998.
xiv

EXECUTIVE SUMMARY
(comprising approximately 87 percent of all crashes involving buses3). Based on this information,
Transit IVI technologies are being tested to reduce these types of crashes.
What is the state-of-the-art in APTS technology implementation? Since 1991 when the first State-of-the-Art report was published, implementation of APTS
technologies has continued to increase across the nation. A recent APTS benefits assessment report4
notes that there has been a significant increase in the deployment of APTS technologies within the
transit industry over the past five years. APTS implementations increased by over 70 percent, with
the largest increases seen in fleet management systems, electronic payment systems, and advanced
traveler information systems.5
Change is not only seen by the increase in APTS deployment. It can also be seen in the evolution of
many of these technologies. For instance, Automated Vehicle Location (AVL) systems have shifted
from using signpost and odometer technology to Global Positioning Systems (GPS). This allows for
easier technology installment. Rather than setting up signposts throughout designated areas, GPS
satellites provide a wider coverage through the use of receivers on transit vehicles.
Another change can be seen in how agencies are tailoring APTS technologies to meet their own local
needs. For example, the use of AVL systems requires additional communications capacity. How this
capacity is acquired differs depending on the physical infrastructure and local institutional
relationships. For instance, one agency may acquire telecommunications capacity by becoming a
partner in a wide area radio network, another agency may decide to buy it from another public
agency. In both cases, costs to obtain communications capacity are minimized by maximizing
already in-place capacity.
One of the most important changes in the past decade can be seen in the ability to integrate
technologies. Integration achieves a number of goals. First, it creates benefits greater than can be
realized by individual components operating independently, or in a "stove-pipe" fashion. For
instance, the combination of AVL systems with Automated Passenger Counters (APC) allows transit
3 Lenora Burke, Margaret Zirker, Intelligent Vehicle Initiative Needs Assessment, draft, Volpe National
Transportation Systems Center, U.S. Department of Transportation, 1999. 4 Dennis Goeddel, APTS Benefits Assessment, draft, Volpe National Transportation Systems Center, p. vii, May, 2000.
5 Ibid.
xv

EXECUTIVE SUMMARY
operators to more precisely monitor the demand for services. Second, integration allows for more
regional applications. For example, smart cards can be used on different transit agencies' buses,
subways, and rail in a regional area. Third, integration creates a more dynamic system for response to
problems in real
TIME. THROUGH THE INTEGRATION OF TECHNOLOGIES AND INSTITUTIONS, AN OPERATOR IN A MANAGEMENT CENTER CAN INSTANTANEOUSLY NOTICE A PROBLEM, SAY A BROKEN DOWN BUS, AND PUT IN MOTION A PLAN TO REPLACE THE BUS AND ACCOMMODATE THOSE RIDERS. What are the challenges to implementation that transit agencies and organizations encounter?
The challenges to implementation of APTS technologies are well-documented. They range from
technical to institutional difficulties. Rapid technological advances can cause equipment in use to
become outdated or obsolete and cause transit agency decision-makers to face more challenging
investment decisions. Therefore, knowing which APTS technology options are most beneficial
becomes paramount for procurement decisions. Institutional challenges, such as definition of roles on
a team, can result when several transit agencies cooperate on a regional project for the first time.
The FTA has developed tools to assist transportation decision-makers in understanding how to partner
with other agencies. Importantly, definitions of agency roles and responsibilities from a project's
beginning streamlines design and deployment activities. The National ITS Architecture and ITS
Standards were created to guide decisions makers in their implementations. The Architecture is a
framework that helps to achieve interoperability among the various transportation modes and ITS
Standards allow disparate components to function together as an overall system. A more detailed
definition of the National ITS Architecture and ITS Standards is presented in Appendix A.
To assist transportation decision-makers in learning about the latest technologies and their benefits,
the FTA has developed the APTS Mobile Showcase. The APTS Mobile Showcase is a 48-foot
expandable trailer equipped with APTS technologies and systems used at a bus stop, on a bus, and at
control and service support centers.
The APTS Mobile Showcase demonstrates technology applications and benefits to transit operations.
Additional information about the APTS Mobile Showcase can be found in Appendix B.
xvi

Who are the agencies and organizations that are successfully implementing and integrating APTS technologies as part of their systems?
Transit agencies and organizations around the nation are successfully installing APTS technologies.
It is estimated that over a ten year time period (2000-2009), the benefits of APTS technology
deployment could amount to between $3.4 billion and $8.4 billion, with the most likely estimate
projected to be $5.8 billion.6
While these numbers represent results at a national level, local agencies are seeing benefits in
operating efficiencies, safety, and cost reductions. The heart of this report is in the presentation of
Application Examples, where local transit agencies share their experiences of implementing APTS
technologies.
1. INTRODUCTION In 1991, the Federal Transit Administration (FTA) launched the Advanced Public Transportation
Systems (APTS) Program to coordinate all Federally-sponsored transit Intelligent Transportation
Systems (ITS) programs and initiatives. ITS is the application of computer and electronic
technologies to the transportation network to provide more efficient and effective solutions to current
transportation challenges. The goal of ITS is to offer significant improvements in safety,
productivity, accessibility, and mobility while establishing an intermodal surface transportation
system.
The National ITS Program
To reach these goals, the APTS Program works in cooperation with the National ITS Program,
administered by the U.S. Department of Transportation's ITS Joint Program Office. In so doing,
APTS technologies and projects are part of the National ITS Program's ITS Infrastructure, which is
comprised of four primary program areas:
�� Metropolitan ITS Infrastructure �� Rural ITS Infrastructure �� Intelligent Vehicle Initiative �� Commercial Vehicle Operations ITS Infrastructure
6 Ibid, p. viii. This amount is in discounted present value dollars.
2-17

APTS technologies are primarily used in the Metropolitan ITS Infrastructure for Fleet Management
Systems, Traveler Information Systems, Electronic Payment Systems, and Transportation Demand
Management. The Rural ITS Infrastructure is primarily comprised of APTS technologies applied to
paratransit vehicles, specifically Fleet Management Systems, Automatic Vehicle Location, Transit
Operations Software, and Geographic Information Systems. APTS on-board sensor technologies
such as lane change and merge collision avoidance are part of the Intelligent Vehicle Initiative. The
APTS Program does not have any applications relevant to Commercial Vehicle Operations ITS
Infrastructure.
APTS technologies will be briefly discussed in this chapter. More in-depth descriptions of these
technologies with examples of how they are being applied can be found in subsequent chapters of this
report. A discussion of the National ITS Architecture as a planning tool to integrate ITS projects, is
given at the end of this chapter. Finally, this chapter concludes with a summary of the report's
organization.
Metropolitan ITS Infrastructure Transit Management Systems efforts have focused on researching advances in vehicle tracking
technologies, facilitating multiple-agency regional fleet management, enhancing automated vehicle
diagnostics, and updating dispatching software algorithms. Efforts have also focused on archiving
data for reporting and planning purposes, streamlining passenger counting, and assisting with the
flexible routing of vehicles and timed-transfers.
Traveler Information Systems efforts have focused on the integration of traveler information systems
with Transit Management Systems and other operations-based systems. Anticipated technological
advances can improve the collection and dissemination of real-time information at bus stops and rail
stations via electronic signs. The integration of these systems can provide improved levels of transit
service information to the public.
Activities in Electronic Payment Systems continue to work towards the vision of cash-less payment
systems that may be used for any mode of transportation, as well as for other applications including
payment for telephone calls and retail purchasing. Integration with government benefits-transfer
systems is also being examined. Major activities include working with the industry to develop
2-18

integration guidelines and system specifications, as well as highly focused operational tests aimed at
solving specific integration issues.
Transportation Demand Management maximizes the capacity of the current transportation network to
meet the increased demand for transportation services. Advanced technologies are used to monitor
capacity and manage the system in real time, as well as provide incentives and information for
travelers to find alternative solutions to traveling alone.
Rural ITS Infrastructure Rural areas are diverse with unique local characteristics. This diversity is exhibited in the rural
transportation system's wide-range of motorists, road types, terrain, climates, jurisdictions, land use,
seasonal characteristics, and transit operators. This diversity translates into a wide variety of needs,
problems, and opportunities for improvement.
To meet these varied needs, the National Rural ITS Program initiated a series of tasks in November
1999. The objective of these tasks is to provide rural transit agencies and customers with information
about rural transit ITS activities, technologies, and their benefits. As well, the program will supply
guidance about coordination and shared use of an information infrastructure and create a strategic
plan for the integration of information technology systems between transportation and health and
human service agencies.
Research efforts have focused on improving rural mobility by coordinating dispatch with multiple
transportation agencies and fleet maintenance among different transit providers. Efforts have also
focused on enhancing communications, geocoding, and coordination of responses to weather-related
activities among various fleets (transit, highway maintenance, and emergency services).
Intelligent Vehicle Initiative
The Transit IVI Program provides a unique opportunity to improve the safety of transit operations
with the use of sensors on vehicles to avoid common crashes. The program is researching, testing,
deploying, and evaluating the following warning systems:
�� Lane Change and Merge Collision Avoidance �� Forward Collision Avoidance �� Rear Impact Collision Mitigation �� Tight Maneuvering/Precision Docking
2-19

All these warning systems alert the driver when another vehicle or obstacle is near the bus, so that the
driver can take preventative action to avoid a collision. These warning systems can be applied to
transit vehicles as well as passenger vehicles, emergency and enforcement vehicles, highway
maintenance vehicles and snowplows. These technologies can reduce costs by decreasing or avoiding
damage to the vehicles.
Research efforts in IVI have focused on developing performance guidelines, specifications, objective
test procedures, architectures and standards, and testing of the safety impact of the most promising
technical configurations. A major focus of the IVI program is to evaluate the benefits resulting from
these systems. These activities are accomplished through the combined efforts of the U.S.
Department of Transportation's modal administrations; the motor vehicle, trucking, and bus
industries; and state and local governments.
National ITS Architecture & ITS Standards
A key factor to tying the ITS Infrastructures and IVI together is the National ITS Architecture. The
National ITS Architecture is a framework that allows for a national interoperable system linking all
transportation modes. As a planning tool, it assists local and regional planners to consider all possible
ITS services and facilities as they develop their own ITS architectures.
The National ITS Architecture provides the framework for ITS systems integration by identifying
four categories of senders and receivers (travelers, centers, vehicles, and roadside) of information and
four categories of communications channels (wireless, wireline, vehicle to vehicle, and dedicated
short range). See Figure 1-1. The Architecture itself identifies the communications relationships
between ITS entities in detail. However, ITS Standards specify how data is transferred from one
category to another. Thus, ITS Standards help the transportation industry share technologies,
improve reliability, reduce the costs of maintaining a qualified and knowledgeable workforce, and
may reduce long-term costs.
2-20

Figure 1-1. National ITS Architecture Interconnect Diagram
The U.S. Department of Transportation recognizes that ITS standards are important and that they
should come from industry. Therefore, its role is to act as a catalyst and to participate in development
of standards that support the National ITS Architecture. This includes the development of
consistency guidance for the National ITS Architecture, as well as the refinement of the existing ITS
standards and other related efforts. The U.S. Department of Transportation strongly encourages and
fully supports consistency with the National ITS Architecture and accepted ITS Standards in all ITS
deployments.
Travelers
Remote TravelerSupport
Vehicle Roadway
Toll Collect ion
Parking Management
Commercia l Vehicle Check
Trans it
Commercial
Emergency
Vehicles
Roadside
Centers
Em
issi
on
s M
ana
gem
en
t
Tra
ffic
Man
age
me
nt
Em
erg
en
cy M
an
age
me
nt
Tra
nsi
t M
ana
gem
en
t
Tol
l Adm
inis
tra
tion
Fle
et
and
Fre
ight
Ma
nag
eme
nt
Co
mm
erci
al V
eh
Adm
in
Info
rmat
ion
Ser
vice
Pro
vid
er
Veh
icle
to
Veh
icle
Co
mm
unic
atio
ns
De
dica
ted
Sho
rt R
an
geC
om
mun
ica
tions
Pers onal In formationAccess
Wide Area Wire les sC ommunications
Pla
nn
ing
Wireline Communic ations
More information about the National ITS Architecture and ITS Standards is in Appendix A.
Report Organization
The APTS State of the Art, Update 2000 (Update ’00) summarizes the status of innovative APTS
deployments in the United States and Canada since Update '98. The report is divided into seven
chapters. Each chapter includes APTS deployments in the planning, implementation or operational
stage.
2-21

The report is organized as follows:
Chapter 1: Introduction.
Chapter 2: Fleet Management Systems. Chapter 3: Traveler Information Systems. Chapter 4: Electronic Payments Systems. Chapter 5: Transportation Demand Management. Chapter 6: Transit Intelligent Vehicle Initiative. Chapter 7: FTA-Sponsored Field Operational Tests.
Additional background information is included in three appendices:
�� Appendix A is a brief discussion about the National ITS Architecture and ITS Standards. �� Appendix B provides an overview of the APTS Mobile Showcase, a 48-foot expandable
exhibition trailer equipped with the latest APTS technologies and systems. �� Appendix C is list of individuals who provided input into this report.
2. FLEET MANAGEMENT SYSTEMS
Real-time management of bus and subway systems is now possible through the use of vehicle-based
fleet management systems. Advanced Public Transportation Systems (APTS) Fleet Management
systems present transit agencies with more effective tools for vehicle and fleet planning, scheduling,
operations, control of traffic signals, and monitoring of vehicle location. Managing fleets in real time
delivers benefits to the transit agencies, the riders, and the local community in the form of:
�� Increased ridership, as scheduling of vehicles is better aligned with demand; �� Decreased costs, congestion, and pollution, as ridership increases and fewer people drive
alone; �� Increased safety in transit service as technology connects the system more quickly to
emergency services; �� Provide a higher level of service to riders; and �� Reduce “bunching” of buses, a situation where one or more buses find themselves too closely
following one another.
The following APTS Fleet Management technologies are described in this chapter:
�� Section 2.1 Automatic Vehicle Location Systems — AVL systems are computer-based vehicle tracking systems that function by measuring the real-time position of each vehicle and relaying
2-22

the information back to a central location. They are used most frequently to identify the location coordinates of vehicles in order to better satisfy demand. They also serve to provide location coordinates to respond to emergency situations.
�� Section 2.2 Transit Operations Software — Data collected from vehicle-based fleet management systems is relayed to centralized computer systems and is made useful by the Transit Operations Software. This software helps the operator monitor the fleet’s effectiveness in meeting demand, identify incidents, manage response, and restore service more effectively. Section 2.2 is further divided into three sub-sections to describe how transit operations software is used for fixed route bus operations, rail operations, and paratransit operations. �� Section 2.3 Communications Systems — Communications systems pass voice and data
information (both raw and processed) between transit vehicles and transit agency dispatching centers. Transit communications systems are comprised mostly of wireless technologies and applications.
�� Section 2.4 Geographic Information Systems — Geographic Information Systems (GIS) are used for developing and displaying information to assist operators, dispatchers, and street supervisors to make on-the-spot decisions. A GIS is a special type of computerized database management system in which geographic databases are related to one another to allow an operator to immediately locate bus stops or subway stations or to determine the best route from one point to another when assisting transit passengers.
�� Section 2.5 Automatic Passenger Counters — Automatic Passenger Counters (APC) collect data on passenger boardings and alightings by time and location. APCs may contain mechanisms for delivering this information to the transit operations center for monitoring the level of demand in real time.
�� Section 2.6 Traffic Signal Priority Systems — Traffic Signal Priority is a technology by which a traffic signal may be held green (or made green earlier than scheduled) so that a vehicle may pass through the intersection more quickly. Applying this technology to buses allows for an increased number of people to pass through an intersection during a light cycle. It also helps with the management of bus routes that have short headways and helps to alleviate “bunching”— a situation where one or more buses find themselves too closely following one another.
These six APTS technologies aid transit operators in managing their fleets. When used in
combination, as illustrated in Figure 2-1, they form fleet management systems that help transit
agencies improve the efficiency and safety of transit service.
The following six sections discuss each technology in more detail. Each section provides:
�� A description of the technology;
2-23

�� A status report on the State-of-the-Art implementation around the nation; �� The challenges found in implementation; and �� Examples of how the technology is being applied at specific sites.
2.1 AUTOMATIC VEHICLE LOCATION SYSTEMS AVL systems have been used extensively by both the military and civilian organizations for a number
of years. Emergency police and fire services, commercial airlines, freight shippers, and transit
agencies are just a few of the organizations to use these systems to dispatch and control their fleets in
real time. Benefits to transit agencies include:
�� Improved dispatch and operational efficiency; �� Improved overall reliability of service; �� Quicker responses to disruptions in service, such as vehicle failure or unexpected congestion; �� Quicker response to threats of criminal activity (via silent alarm activation by the driver); and �� Extensive information provided at a lower cost for future planning purposes.
2-24

FLEET MANAGEMENT
Figure 2-1. Fleet Management Systems
Technology Description
An AVL system is a computer-based vehicle tracking system that includes a specific location
technology (or technologies) and a method of transmitting the data from the vehicle to a dispatch
center. The location technologies found on AVL systems are usually one of the following, but can
also be used in combination:
�� Global Positioning System (GPS); �� Signpost and Odometer interpolation, both active and passive; �� Ground-Based Radio, such as Loran C; and �� Dead Reckoning.
Table 2-1, located on pages 2-6 through 2-7, summarizes the various location technologies available,
their advantages, and their disadvantages. The choice of the location technology depends greatly on
the specifics of the agency, including where the AVL system is to be installed. Figure 2-2 presents an
example of the operation of an AVL system for a transit agency. In this example, the location
2-25

FLEET MANAGEMENT
technology is a Global Positioning System (GPS), with odometer interpolation when GPS signals are
not available.
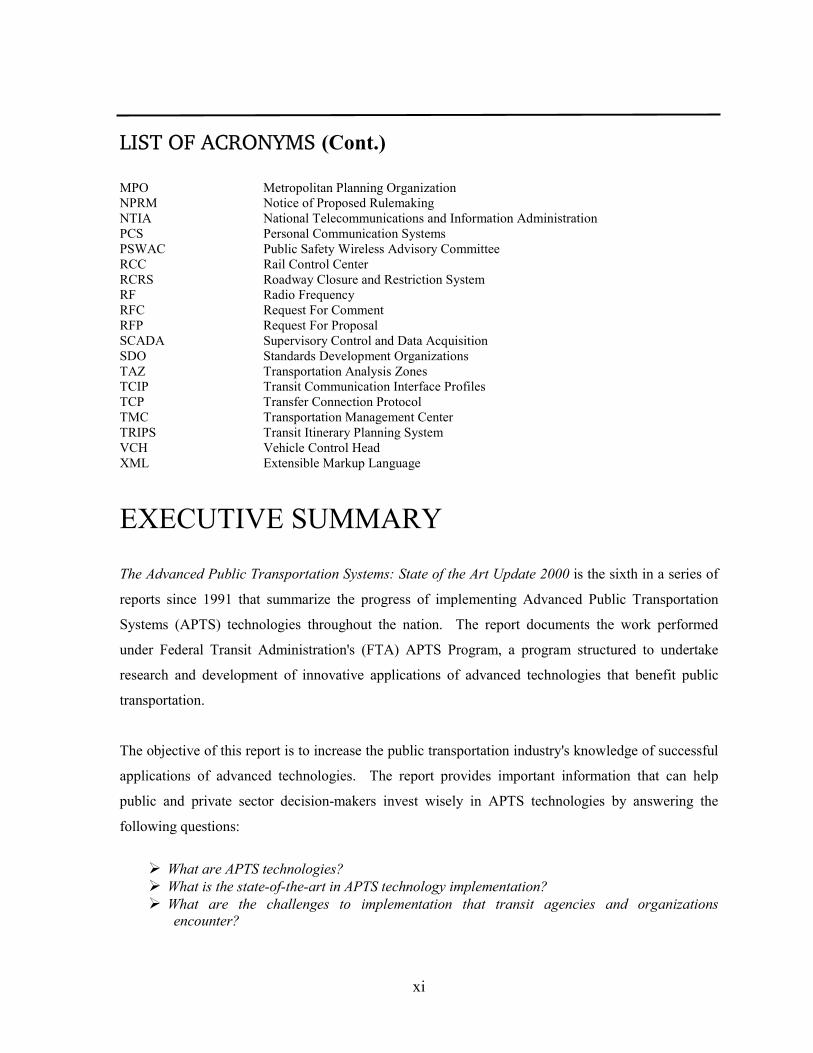
Figure 2-2. Schematic of an AVL System Used in a Transit Agency AVL systems normally come equipped with a mobile data terminal (MDT) for the driver to
communicate with dispatch, and to get direct feedback on on-time status (see Figure 2-3).8
In the case of paratransit, the mobile data terminal can give a driver his or her itinerary, including
updates, such as cancellations, and same-day booked trips. Figure 2-4 shows a close up of the MDT.
The dispatch center usually contains one or more staffed dispatch stations. Figure 2-5 shows a
dispatch center, and Figure 2-6 shows a staffed station. Each dispatcher usually has two screens, one
with a computerized map showing the current locations and status of all vehicles in service (covered
by the AVL), and one which can display a variety of information including communications with
other drivers.
8 Photographs in Figure 2-3 through 2-6 courtesy of Metropolitan Atlanta Rapid Transit Authority, Atlanta, Georgia.
2-26
FLEET MANAGEMENT
2-27
Figure 2-3. Driver with MDT Figure 2-4. Mobile Data Terminal
Figure 2-5. Dispatch Center Figure 2-6. AVL Dispatch Station

FLEET MANAGEMENT
Table 2-1. Synopsis of Location Technologies
Technology How it Operates Advantages Disadvantages
Signpost & Odometer — "active"
Signposts (beacons) are located at specific points along the route, each signpost transmitting a unique signal. Vehicle reads signals to determine location (Vehicle usually interpolate between signposts, using their own odometer readings). Vehicle sends location data to dispatch.
�� Proven, well-established technology.
�� Need signposts wherever AVL is to operate.
�� Not effective for vehicles off-route or paratransit
Signpost & Odometer — "passive"
Each vehicle transmits a unique signal to various signposts, located at specific points along the route (or signposts read transponders affixed to the vehicles). The signposts then transmit the vehicle's location to dispatch. How is odometer used in this instance
�� Proven, well-established technology.
�� Potentially reduces the number of dedicated radio frequencies required.
�� Need signposts wherever AVL is to operate.
�� Location only given when vehicle passes signpost.
�� Not effective for vehicles off-route or paratransit.
Global Positioning System (and Differential GPS)
A network of satellites in orbit transmits signals to the ground. Special receivers on each vehicle read the signals available to them and triangulate to determine location. If the agency expects there to be long periods between GPS readings, sometimes supplemented with odometer readings or even more extensive dead-reckoning.
�� Can be operated anywhere GPS signals can be received.
�� Does not require purchase, installation, or maintenance of wayside equipment.
�� Very accurate (especially differential GPS-DGPS).
�� Signals can be blocked by tall buildings, tree cover, tunnels, or overpasses.
2-28

FLEET MANAGEMENT
Table 2-1. Synopsis of Location Technologies (Cont.)
Technology How it Operates Advantages Disadvantages
Ground-Based Radio (e.g., Loran-C)
Network of radio towers on the ground transmits signals. Special receivers on each vehicle read the signals available to them and tri-angulate to determine location. Ground-based radio is sometimes supplemented with odometer readings for interpolations between signal receptions.
�� Can be operated anywhere signals can be received
�� Does not require purchase, installation, or maintenance of wayside equipment.
�� Can be blocked by hills and tall buildings
�� Incomplete coverage in U.S.
Dead-Reckoning
The vehicle uses its own odometer and a compass to measure its new position from its old (known) position. Dead-reckoning is often supplemented by “map-matching” - comparing expected position with a computerized map, and adjusting measured position if the vehicle is not on a road. Dead-reckoning is often supplemented with readings from another location technology, like signposts or GPS.
�� Requires no or significantly less purchase and maintenance of equipment if signposts are used as a supplement.
�� Not as accurate as other location technologies without supplements
2-29

FLEET MANAGEMENT
Status: State-of-the-Art
The number of operational systems and the total number of agencies operating, installing, or planning
AVL has increased many-fold since the first State-of-the-Art report was published in 1991. That
report identified only four agencies with operational AVL systems in the United States, and only nine
more installing or planning AVL systems.9 By 1999, 61 agencies operated AVL systems, and
another 93 were installing or planning such systems.10 In addition to the increase in number of implementations, there also has been a great shift in the
location technology used — away from signpost and odometer and towards GPS. Signpost and
odometer systems drop from more than 40 percent of the total in the early nineties to less than ten
percent in 1999. GPS/DGPS systems increase from 25-30 percent to about 70 percent over the same
period. Further, given the AVL systems available to those agencies now out to bid, it is likely that a
high percentage of the 22 percent “unknown/other” will become GPS/DGPS systems. Figure 2-7
shows the percentage of each type of location technology for all operational AVL systems. This trend
is even more remarkable as GPS wasn’t fully available until the early 1990s when all of the satellites
were placed into orbit.
Challenges to Implementation THERE ARE SEVERAL CHALLENGES TO THE PROCUREMENT OF AVL SYSTEMS. THE FIRST IS THEIR COST. SYSTEMS COSTS VARY SUBSTANTIALLY, WITH THE MEDIAN AROUND $8,000 PER VEHICLE. SECONDLY, THE CUSTOMIZATION OF SOFTWARE REQUIRED TO SUCCESSFULLY OPERATE THE AVL SYSTEM AT EACH LOCATION HAS BEEN A PROBLEM AND THE MAJOR CAUSE OF IMPLEMENTATION DELAYS. FINALLY, ACCEPTANCE OF AVL SYSTEMS BY BUS DRIVERS AND DISPATCHERS USED TO THE OLD MANNER OF OPERATIONS CAN BE DIFFICULT. MANY DRIVERS ARE HESITANT ABOUT A SYSTEM THAT CAN TRACK THEIR BUS’S EVERY MOVE.
9 Robert F. Casey, Lawrence N. Labell, Simon Prensky, and Carol L. Schweiger, Advanced Public
Transportation Systems - The State-of-the-Art, Volpe National Transportation Systems Center, U.S. DOT for the Federal Transit Administration, Report #DOT-VNTSC-UMTA-91-2, April 1991.
10 Robert F. Casey., Advanced Public Transportation Systems Deployment in the United States Update, Volpe National Transportation System Center, U.S. DOT for the Federal Transit Administration, Report #DOT-VNTSC-FTA-99-1, January 1999.
2-30

FLEET MANAGEMENT
0%
10%
20%
30%
40%
50%
60%
70%
80%
90%
100%
1991 1992 1994 1996 1997 1999
Year of Study(Source: 1991-1996 - State of the Art Reports; 1997, 1999 Deployment
Reports)
% of Systems
Other/Unknown
Ground-Based RadioDead-Reckoning(D)GPSSignpost & Odometer
Figure 2-7. Location Technology for Operational AVL Systems in the U.S.
Application Examples
The following are examples of AVL systems being implemented and used. (A larger report titled,
Advanced Public Transportation Systems Deployment in the United States11 contains a complete
survey of AVL systems in use nationally.)
�� Portland, Oregon’s DGPS AVL system. �� Essex County, New Jersey’s signpost and odometer AVL system. �� Chicago, Illinois’ AVL system. �� Baltimore, Maryland’s AVL system. �� Rochester, Pennsylvania’s upgrade from Loran-C AVL to a DGPS system.
Portland, Oregon The Tri-County Metropolitan Transportation District of Oregon (Tri-Met) issued final acceptance for
its DGPS AVL system in June 1998. The Bus Dispatch System (BDS), procured from Orbital,
includes units for Tri-Met’s fleet — about 650 fixed-route vehicles and about 150 paratransit vehicles
11 Robert F. Casey and Lawrence N. Labell, Advanced Public Transportation Systems Deployment in the
United States, Volpe National Transportation Systems Center, U.S. DOT for the Federal Transit Administration, Report #DOT-VNTSC-FTA-95-13, August 1996.
2-31

FLEET MANAGEMENT
— as well as equipment for dispatch. The AVL system did not require a new radio system. The BDS
system cost $5.7 million.
The AVL and APC systems generate data that is used to improve transit service. Information
collected includes the time a bus stops, the location and arrival time of the stop, passenger boardings
and alightings (if APC-equipped), lift usage (if any), departure time from the stop, and maximum
speed between stops. With this information, decision-makers can respond quickly to service
disruptions and assess overall service effectiveness.
As a result, Tri-Met has noted improvements in on-time performance, as well as reductions in
headway variability, schedule variability, and “excess customer wait time” due to late or early buses.
Tri-Met now orders each new bus equipped with AVL, APC, and J-1708 standard wiring. J-1708 is
the approved ITS communications standard for public transit vehicle area networks. This is a cost-
saving measure, since it is less expensive to install devices and wiring during manufacture than it is to
retrofit. Furthermore, the devices are more likely to fit better and work more closely in concert with
the vehicle if incorporated during construction.12
Essex County, New Jersey
New Jersey Transit’s (NJT) AVL system has been fully operational since early 1998. For $32
million, NJT purchased a signpost and odometer system and a statewide, 23-tower, radio system from
Motorola. Two thousand buses are AVL-equipped. The system operates fully on all 26 bus lines in
Essex County (Newark and the surrounding area). As there are only enough signposts to cover Essex
County (fewer than 100 are believed to be functional out of the original 600 due to wear and tear from
weather), full AVL is not possible throughout most of the state. However, since New Jersey has a
statewide radio system, a bus can communicate to dispatch from anywhere in the state, and thus, can
make use of its security alarm. Since it is now difficult to procure additional signposts as few vendors
make signpost systems anymore, NJT is investigating a GPS system that will cover the whole state.
NJT tracks vehicle movements in Essex County with AVL and uses the system for service
adjustments and headway maintenance. However, NJT reports 80 percent of the benefit comes from
having a statewide radio system for regular communications and emergency response.7
12 Ken Turner, Tri-County Metropolitan Transportation District of Oregon, Portland, Oregon. 7 Jim Kemp, New Jersey Transit, Newark, New Jersey.
2-32

FLEET MANAGEMENT
Chicago, Illinois
The Chicago Transit Authority’s (CTA) AVL system utilizes dead-reckoning, with DGPS correction.
Currently, AVL and Mobile Data Terminals (MDT) are installed on 1,210 of the agency’s 1,872
buses and the system provides emergency vehicle location and text messaging between the driver and
dispatch. Further capability is awaiting the installation of new radios on these buses.
By the end of 1999, an additional 254 buses were equipped with both AVL and new radios, and the
system software is expected to be fully installed by the Fall of 2000. The most time-consuming task
is the geo-coding of all CTA’s bus stops. This task requires driving a bus to each stop and carefully
measuring its position. CTA has about 12,900 bus stops, and the geo-coding of the first 1,000 stops
took three months.
Once the software installation, including geo-coding, is complete, the 254 buses will be used to prove
the concept of full AVL implementation. Upon completion, CTA will update the radios in the other
1,210 buses that now have AVL, giving CTA full AVL on 1,464 buses. The agency will outfit the
rest of the fleet with AVL as it replaces its buses. CTA has a contract with Nova for 150 new buses,
which will come equipped with J-1708 standard wiring for easy connection of the AVL equipment.
The AVL will include several functions. First, the system will have schedule adherence software,
with feedback indicating to the driver at each stop whether the person is on-time, late, or early.
Second, the system will have computer-aided service restoration (CASR), to be procured under a
separate bid. The CASR will automatically suggest to a dispatcher actions to remedy service
disruptions. Finally, if service adjustments are made, central control will be able to make appropriate
adjustments and notifications to passengers remotely and automatically. This includes changing the
bus’ destination sign and making an announcement to the passengers on the bus, telling them about
the change.8
Baltimore, Maryland
The Maryland Mass Transit Administration (MTA) has taken a phased approach to implementing its
AVL system. The MTA originally tested a 50-bus Loran-C AVL system. The agency has
subsequently purchased a DGPS system from Orbital along with a new radio system at an estimated
cost of $15,000 per bus including the radio and related base station equipment. Three hundred eighty
2-33

FLEET MANAGEMENT
of the agency’s 868-vehicle fleet are AVL-equipped. The agency plans to equip the rest of the fleet
by including AVL on all new vehicles it purchases. Sixty-five new AVL-equipped vehicles were due
in December 1999, at a cost of $8 million.
AVL data will be used in a real-time passenger information system that is under development.
Current plans are for pre-trip information to be available over the phone (and perhaps later, the
Internet) and for more limited en-route information at wayside electronic signs.
When the system is fully on-line, MTA expects service provision to be more efficient, by reducing
the number of buses needed, while maintaining the current level of service. Although these savings
aren’t expected until the fourth to sixth year of operation, MTA expects AVL to save $2-3 million per
year by purchasing, operating, and maintaining fewer vehicles. MTA also expects customers to
notice improved service reliability, which they hope will result in increased ridership.9
Rochester, Pennsylvania
The Beaver County Transit Authority (BCTA) has had an operational Motorola Loran-C AVL system
since the summer of 1991. The agency feels the system works well, but they are preparing to upgrade
to DGPS, since the agency feels that Loran-C may not be supported much longer. An RFP was to be
issued in October 1999, and BCTA hopes to have the system in operation by April 2000. All 20 of
the agency’s fixed route vehicles are to be AVL-equipped. If additional funding becomes available,
all 25 of the agency’s paratransit vehicles also will be AVL-equipped. The system will include a
silent alarm, MDTs, engine probes for automatic alert of impending engine problems, and dispatch
hardware and software. All new buses purchased by the agency will come with AVL and will be pre-
wired for ITS equipment according to the J-1708 standard.
BCTA expects several benefits from AVL. The system is expected to aid corrections to disruptions in
service more easily and more effectively than strictly manual correction. Increased accuracy may
mean increased utilization of public transportation as the service adjustment information is passed on
to the public. Initially, this information will be provided manually, but eventually, this will be
8 Ronald Baker, Chicago Transit Authority, Chicago, Illinois. 9 David Hill, Mass Transit Administration, Baltimore, Maryland.
2-34

FLEET MANAGEMENT
automated. The system also is expected to be very helpful in monitoring the contractors that operate
the service. Finally, AVL data will be used to investigate complaints made by the public.10
2.2 TRANSIT OPERATIONS SOFTWARE Transit Operations Software applications help transit agencies with route planning, “runcutting”,
driver scheduling, and vehicle assignments. Increasingly these software products are being integrated
with each other for additional benefits. When used in combination, these applications reduce
duplicate data input and allow for the cross-use of data that is generated by each application.
Computer-Aided Dispatching (CAD) combined with some form of AVL is the most popular form of
transit operations software. AVL/CAD gives transit properties the capability to monitor, supervise,
and control operations with real-time data in ways that were previously impossible. More agencies
are finding ways to use information from AVL/CAD software packages for other purposes such as
customer information, planning, and scheduling.
This section is further divided into the following sub-sections:
��
��
��
Section 2.2.1 Operations Software for Fixed Route Bus Operations Section 2.2.2 Operations Software for Rail Section 2.2.3 Operations Software for Paratransit
2.2.1 Operations Software for Fixed-Route Bus Operations Computer-Aided Dispatch (CAD) systems are currently the most visible software application in
fixed-route bus operations. Transit agencies use this software for bus service and operations
planning. Customers use it for itinerary planning and transfer connections. A number of transit
agencies and their vendors have implemented or are developing modules that will expand the
capabilities of vehicle location and dispatch systems to provide data for other agency functions.
10 David Strager, Beaver County Transit Authority, Rochester, Pennsylvania.
2-35

FLEET MANAGEMENT
Technology Description
CAD fixed route software falls into four primary categories, which are described in detail below:
�� Transfer connection protection software; �� Expert systems for service restoration; �� Itinerary planning systems; and �� Service planning applications.
Transfer Connection Protection
Transfer Connection Protection (TCP) software allows bus operators to inform on-board passengers
whether they will be able to make a transfer to a connecting bus given current schedule adherence.
The software reduces dispatchers’ workload because connection protection software relies on data
rather than voice communication. Therefore the dispatchers no longer have to be directly involved in
the transfer decision-making process and radio system capacity is freed up. Although connection
protection is still relatively new and the few real installations are for a single agency, the next logical
step appears to be inter-agency and inter-modal connection protection.
Expert Systems for Service Restoration
Expert systems are computer programs that process historical operating data and business rules to
assist decision-makers in addressing operating problems. While expert systems and related software
tools are already in use in other business environments, they are just beginning to be developed and
deployed in the transit industry. Expert systems for transit will use a variety of information sources to
resolve service disruptions including:
�� Dispatchers’ real-world knowledge of bus operations; �� Existing operating rules and procedures; �� A historical database of responses to service disruptions; and �� Real-time bus status information from an AVL/CAD system.
The need for expert systems is more pronounced in complex transit environments in dense urban
settings. This is because it is difficult to restore service with busy routes that can have bus-bunching
and overcrowding. These operating problems often impact scheduled connections with other transit
routes (interlining). When there are numerous variables involved in a service problem, a typical
dispatcher may not be able to solve it without additional support. An expert system would be able to
provide that necessary support.
2-36

FLEET MANAGEMENT
Itinerary Planning Systems
Itinerary planning systems are another trend in transit software development. The function of an
itinerary planning system is to determine the best way for a transit customer to travel from an origin
to a destination. Itinerary planning systems are indirectly linked to CAD systems because they
depend on the same static route schedule data.
The first automated itinerary planning systems ran on main-frame computers. Systems are now
designed to run on networked PC servers and workstations that integrate itinerary planning, GIS, and
off-the-shelf database software products. Access to many itinerary planning systems is available now
on the World Wide Web. These web applications have graphical user interfaces that allow customers
to plan trips and tailor individual preferences themselves. The graphical nature of the web and the
GIS software platforms used in itinerary planning software allow these systems to provide both text-
based directions and detailed maps. The maps may show an overall transit itinerary, directions for
making key transfers, and directions on how to access the transit system by walking from their origin.
Some of the new itinerary planning applications integrate the schedules of multiple transit agencies,
making the programming of such software extremely complex. Contributing to the complexity of
development is that different agencies often use different scheduling programs. Further, different
agencies change their schedules at different frequencies e.g., one agency may change its schedules
every three months, while another agency, every six months. The next phase in the development of
itinerary planning system appears to be the incorporation of real-time information from AVL/CAD
systems and incident reporting and management systems.
Service Planning Applications
Service planning applications are used to analyze the efficiency of fixed-route operations using data
from AVL/CAD systems. Service planning applications can perform the following functions:
�� Provide an average of running time between time points to determine which route segments are not performing to schedule, by how much, and why;
�� Calculate measures of headway and running time variability to determine where service and scheduling should be adjusted for efficiency and as a measure of customer service;
�� Develop new performance measures on an as-needed basis; and �� Map the analysis for visual evaluation based on geographical referencing.
A key feature of all CAD systems is their ability to manage communications in concert with MDTs,
with some processing and control functions distributed to the MDT. The capability to maximize
available radio frequency bandwidth is especially important considering that most transit agencies
2-37

FLEET MANAGEMENT
still face limited wireless capacity (this will be discussed further in Section 2.3, Communications
Systems).
Status: State-of-the-Art
Since Update ‘98, the use of transit operations software has focused on increasing service reliability,
improving customer service, improving safety, and increasing operational efficiency. To a large
degree, agencies reported to be deploying AVL/CAD systems in Update ‘98 are still learning how to
fully utilize these technologies and their capabilities. Agencies continue to use AVL/CAD to monitor
on-time status of buses and track their actual location. Exception reporting, programmed into
AVL/CAD systems, helps streamline this process. Dispatchers are able to more quickly spot
operating problems and initiate service restoration. However, limitations still exist in how effectively
dispatchers use these new sources of information. For example, even with good information, it is a
difficult task to institute some service restoration strategies that involve more than a few buses or
routes.
An important advance in CAD is the advent of fixed-route deviation software, which allows buses to
deviate up to 3/4 mile away from the standard route. This scheduling and dispatching application
schedules route-deviation service from pre-defined patterns to accommodate passenger requests.
How much a trip can deviate from its schedule is controlled by slack running time added at bus stops
and by a defined perimeter of the service area.
Future developments appear to focus on better use of AVL/CAD data in expert systems, itinerary
planning software, and other systems that can effectively use real-time or historical information about
operations.
Challenges to Implementation
The technical challenges related to software implementation include:
The data structures of an AVL/CAD server can be incompatible with that of the agency scheduling system. This makes it difficult to match the protocols and formats of the two systems, a necessary precursor for CAD software to use schedule data in its adherence calculations.
��
�� Some agencies’ schedule files do not contain certain pieces of information that are needed to integrate with CAD software. This can require an agency to provide additional data to allow the software to function correctly. The additional information may concern such data points
2-38

FLEET MANAGEMENT
as the schedule details of deadhead trips, pull-ins, pull-outs, layovers times, or layover points. ��
��
Vehicle location algorithms can be too sensitive. For example, a vehicle might be noted as off-route by merely pulling into a curbside bus bay to pick up passengers at a valid stop. Some agencies have experienced difficulties in determining schedule adherence anomalies at terminals that have different arrival and departure locations, and the ends or beginnings of routes.
Application Examples
The following are brief descriptions of fixed route bus operations software systems.
�� Chicago, Illinois’ transfer connection protection system. �� Santee Wateree, South Carolina’s “Service on Demand” rural transit system. �� Los Angeles, San Francisco, Denver, and New York/New Jersey/Connecticut
Metropolitan’s itinerary planning system. �� New York City’s decision support system. �� Ann Arbor, Michigan’s transfer connection protection software.
Chicago, Illinois In January 1999, the Regional Transportation Authority (RTA) began Phase I of a study to define
functional requirements and specifications for a transfer connection protection system for all Chicago
regional transit providers. Participating agencies include the Chicago Transit Authority (CTA-city
transit bus and rail), Pace (suburban transit bus), Metra (commuter rail), and the Illinois Department
of Transportation.
The CTA and Pace, are investigating transfer connection protection systems as components of their
transit management systems. The RTA would like to determine the feasibility of using these
developments as the foundation for creating inter-agency protection of transfer connections, including
the Metra commuter rail service. Not only is coordination among separate agencies a significant
challenge from technical, policy, and institutional perspectives, but the sheer number of potential
transfers sets this effort apart from systems at smaller transit agencies.11
The potential benefits of the RTA’s transfer connection protection project include reducing transfer
wait time for riders and improving the consistency of inter-carrier connections. The actual
11 Lawrence Wilson, Wilson Consulting, Grayslake, Illinois.
2-39

FLEET MANAGEMENT
implementation of transfer connection protection by RTA is contingent upon implementation of AVL
and necessary support systems at CTA, Pace and Metra.12
Santee Wateree, South Carolina
In and around the City of Sumter, South Carolina, the Santee Wateree Regional Transit Authority
(RTA) operates eight service routes. The RTA also operates a "Service on Demand" system, serving
Sumter, Lee, and Clarendon Counties. Approximately 90 transit vehicles provide services in this
predominantly rural setting.
Based on a novel software approach, the agency is customizing an AVL and mobile data
communication system. They have begun with a 10-vehicle pilot program with plans to expand if the
tests are successful. Using the services of AeroData Incorporated for system integration and ROM
Computer and Service for programming support, the system will use the Windows CE™ operating
platform on its mobile data terminals, representing a departure from the use of proprietary software
standard in other similar deployments.
Windows CE is a robust version of the Microsoft Windows computer operating system designed from
the ground up specifically for small computing devices such as palmtops, personal digital assistants,
and industrial control systems. CE is a real-time operating system, making it particularly suitable for
mobile data terminal tasks such as navigation, when a mobile computer must react to a constant flow
of new information without interruption.
Using CE will provide the potential to customize the RTA system both during start-up and after
installation because it can run software applications written in a variety of standard programming
languages. For example, the MDTs (Figure 2-8) may use commercial off-the-shelf navigation
software that can be modified using the Java programming language. Such an application would use
Java code to display the customer pick-up and drop-off locations and to make the map display scroll
across the screen as the position of the vehicle changes.
The CE platform will provide a seamless interface with the agency’s Windows NT local area
network. The CE platform also allows changes to be implemented using a wireless radio link, such as
12 Angela Johnson, Manager, Engineering and Technology, Regional Transportation Authority, Chicago,
Illinois.
2-40

FLEET MANAGEMENT
wireless Ethernet or other dedicated short-range communications link. Additional modules for
existing software or new applications can be added to the mobile data terminal in the same manner.
The relationship between the NT and CE operating systems will provide the ability to write software
that provides nearly direct access to the agency’s paratransit scheduling system. This design
Figure 2-8. Aero Data Mobile Data Terminal
flexibility means that the RTA will be able to easily add other functions such as barcode readers to
process customer I.D. cards, in-vehicle annunciators and signage, or APCs.
Based on Northeast Consultants computer processors, AeroData is building a custom, touch screen
MDT in a palm configuration designed to provide the necessary computing power, memory,
communications ports, and J-1708 vehicle area network standard compatibility to integrate the variety
of functions it is capable of handling.13
Los Angeles and San Francisco, California; Denver, Colorado; and the New York/New Jersey/Connecticut Metropolitan Area The Southern California Council of Governments (SCAG) developed and currently produces an
itinerary planning system called TranStar. The first installation was for the agency’s own service
2-41
13 Jeff King, Vice President Engineering, AeroData Incorporated, Livonia, Michigan.

FLEET MANAGEMENT
area.14 Since first being deployed, TranStar has been
installed in the San Francisco Bay area15 and a
version of the product is also being installed in Denver,
Colorado.
The latest deployment currently underway is a multi-
modal, multi-operator version for the New York/New
Jersey/Connecticut region’s Metropolitan Model
Deployment Initiative (MMDI) iTravel project called
the Transit Itinerary Planning System (TRIPS).
The basic TranStar software algorithm searches out
all itineraries that are possible from bus stop or rail
station locations within one-
quarter mile of the trip origin.16
The software then screens the resulting itineraries against
the criteria a customer has expressed in the input screen, as
listed below and shown in Figure 2-9. It then presents the customer with an itinerary that most
closely matches the indicated preferences (see Figure 2-10). The itinerary information includes both
text directions and maps of the itinerary, including walking access and transfer connections. For an
example of a Walking Access Map, see Figure 2-11.
Figure 2-9. TranStar Input Screen
For TRIPS, a customer’s travel criteria can include:
�� Origin and destination by address, intersection, or landmark; �� Day and time of travel, including desired arrival time; �� Special needs, such as wheelchair accessibility; �� Itinerary preferences, such as fastest itinerary, shortest walking access, or fewest
transfers; �� Mode selection, such as bus/rail, bus only, or rail only; and �� Maximum fare for peak, off-peak, or weekend travel.
14 Jim Sims, Director of Information Services, Southern California Council of Governments, Los Angeles,
California. 15The deployment is starting with BART and AC Transit with plans to expand to the entire Bay area. 16 Although this search parameter can be adjusted by the software operator depending on the density of the
transit network, it is transparent to and cannot be changed by the customer.
2-42

FLEET MANAGEMENT
Transit network data inputs for TRIPS include schedule data, a geographically-ordered list of bus stops
and rail stations, and a geographic database of the stops and stations.
Figure 2-10. TRIPS Directions
Figure 2-11. TRIPS Walking Access Map
2-43

FLEET MANAGEMENT
THE DEVELOPMENT OF SOFTWARE INTERFACES BETWEEN THE 60 PARTICIPATING CARRIERS AND THE TRANSTAR SOFTWARE HAS BEEN EXTENSIVE. SINCE THERE TYPICALLY IS NO STANDARDIZATION OF DATA FORMATS BETWEEN TRANSIT OPERATORS, THE TASK OF OBTAINING AND MAINTAINING COMPLETE AND ACCURATE TRANSIT DATA IN A MULTI-OPERATOR URBAN AREA LIKE NEW YORK/NEW JERSEY/CONNECTICUT IS A DIFFICULT UNDERTAKING. FOR EXAMPLE, ANY OPERATOR MAY GEOCODE BUS STOPS IN A MANNER SUCH THAT THE DATA CANNOT BE USED WITHOUT SOME PRE-PROCESSING.
Because TranStar is written in a proprietary format, the iTravel project team needed to build an
extensive front-end database to hold the formatted data for inputting to the itinerary planning
software. When completed, the TRIPS system will process, fuse, and calculate itineraries for over 60
different transit operators, comprising more than 1,000 different local bus, express bus, subway, and
commuter rail routes, and perhaps as many as 1 million landmarks.17
The approach in deploying TRIPS all at once for the entire region has proven to be a major challenge
in contrast to SCAG’s having built the Los Angeles and Bay Area systems over time. Since transit
schedule data can change daily, it is a huge task to keep a database the size of TRIPS up-to-date.
The TranStar itinerary planning algorithm will not directly incorporate real-time data into itineraries
for the TRIPS deployment. However, the system will identify real-time incident information and
inform customers if any leg of their itinerary might be affected. This will allow the user to recalculate
the itinerary to bypass the incident. Plans exist to incorporate other types of real-time data from the
TRANSCOM Regional Architecture in the future.18 19
New York, New York
As part of deploying its AVL system for buses, New York City Transit (NYCT) is working with
Orbital Sciences Corporation to develop a decision support system20 software module that will
17 Landmarks can include major locations pre-coded in the street file (city halls, libraries, etc), bus stops from
the stop list, and other landmarks frequently used by transit customers and transit customer service centers. These are added by the transit operators as needed.
18 Rob Bamford, TRANSCOM, Jersey City, New Jersey. 19 Ron Wolcott, Northeast Consultants, New York City, New York. 20 A decision support system is a computer program application that analyzes business data and presents it so
that users can make better informed decisions more easily. A decision support system may present information graphically and may include an expert system. Definition adapted from whatis?.com™ at http://www.whatis.com.
2-44

FLEET MANAGEMENT
enhance the service and control technologies provided by its Orbcad™ CAD software. The
computer-aided support management (CASM) system is intended to use AVL and related bus status
information to help dispatchers at NYCT’s Command Center address and resolve schedule adherence
and headway maintenance problems. Rather than focusing on the tardiness of individual buses, the
overall objective is to use the AVL system to maintain service regularity on a broader scale.
CASM is being designed to provide multiple service restoration strategies to the dispatchers, who can
choose the single strategy that makes the most sense given their experience. CASM will also be able
to help dispatchers implement the recommended actions. The software will determine what new data
or messages must be sent to the vehicles affected by the strategy. CASM will also work with the
CAD portion of the AVL system to update the vehicle tracking process so that a bus’s new location,
direction of travel, and schedule parameters will not produce erroneous schedule adherence or other
system events. Benefits of the system would include increased regularity of service and quicker
responses to service disruption.
Restoration plans can include single or multiple actions including inserting an extra bus into a
schedule, designating early route turnbacks, or instructing a bus to operate in skip stop mode. CASM
will consider resource constraints like vehicle availability and any managerial requirements that
might affect operations.
NYCT’s system is being designed to process information and develop restoration strategies using
case-based reasoning (CBR), a form of artificial intelligence. Software that uses CBR typically stores
previous problems, decisions, the rationale for those decisions, and whether a recommended action
failed or succeeded. When developing new plans, the system compares its historical database of this
information with the current situation. CBR systems are considered by some to be an advance over
strictly rule-based software applications because they integrate actual operational data into the
decision making process.21
21 Isaac Takyi, New York City Transit, Brooklyn, NY.
2-45

FLEET MANAGEMENT
Ann Arbor, Michigan
As reported in Update ‘98, the Ann Arbor Transportation Authority (AATA) has deployed an
Advanced Operating System that is based on Siemens’ TransitMaster AVL/CAD system.22 Among
a suite of advanced capabilities, the system includes computer-assisted transfer management (CATM;
also known as transfer “connection protection”), which can automatically process transfer requests
from on-board passengers. The objective is to inform passengers requesting transfers whether they
will be able to make a transfer and to inform the connecting bus to wait if needed.
The bus operator uses the vehicle’s MDT to input passenger transfer requests. The dispatch computer
processes these requests. Using a complex algorithm, the computer calculates whether a transfer is
possible given the schedule adherence of both the originating and connecting buses. If the transfer is
feasible, the originating bus driver is informed and notifies the requesting passenger. When the
originating bus is behind schedule and would miss a connecting bus that was running on time, the
CATM system is programmed to allow the connecting bus to wait approximately five minutes at the
transfer point, minus any time it is running behind schedule. In reality, the transfer algorithm is
considerably more complex because it takes into account other real-time operating parameters. The
five minute transfer window is a parameter that can be changed based on the agency’s experience
with the system. The process is transparent to dispatchers so it does not add to their workload.
The MDT display allows bus operators to see all transfer requests that they will encounter in the next
several minutes. This enables operators to let passengers know when the next bus is expected to
arrive at the transfer point if the desired transfer is not possible.
In addition to the primary objective of improving customer service, AATA has realized another
significant benefit. CATM has led to a large reduction in voice traffic on the agency’s radio system
since coordinating transfers used to involve sometimes lengthy voice communications between the
operators on both the originating and connecting buses and the dispatcher. AATA estimates that
CATM accounts for the majority of the estimated 70 percent reduction in voice traffic since the
advanced operating system was implemented.23
22 Siemens purchased Rockwell Corporation, the original manufacturer, in December 1999. 23 William Hiller, Ann Arbor Transportation Authority, Ann Arbor, Michigan.
2-46

FLEET MANAGEMENT
2.2.2 Operations Software for Rail
Rail operations software is based on CAD systems similar to those discussed in the fixed route bus
operations section.
Technology Description
Operations software for rail transit systems is usually built upon existing Supervisory Control and
Data Acquisition (SCADA) systems that monitor and manage the mechanical and electrical
subsystems of the line. Fiber optic cable is the preferred communications backbone, and many rail
operations that do not already have fiber are migrating to it.
SCADA systems are typically physically and/or functionally linked with other control systems such
as Automatic Train Control (ATC), Automatic Vehicle Identification (AVI), and some form of
automated train dispatching. Communications-based train control systems are also being developed,
especially for subway and light rail operations.
Status: State-of-the-Art
Since Update ‘98, one of the notable differences in CAD for rail operations is the use of highly
accurate GPS-based AVL data. This technology is not yet common in the passenger rail industry,
though bus deployments using this technology are relatively common.
ANOTHER IMPORTANT TECHNOLOGY NOW IN DEPLOYMENT IS COMMUNICATIONS-BASED TRAIN CONTROL (CBTC) SYSTEMS. WITH CBTC, INFORMATION IS PROCESSED BOTH ON-BOARD TRAINS AND BY WAYSIDE CONTROLLERS TO ESTABLISH VARIABLE BLOCK TRAIN CONTROL. VARIABLE BLOCK CONTROL USES PRECISE VEHICLE LOCATIONS, ROBUST COMMUNICATIONS, AND OPERATING PARAMETERS SUCH AS SPEED, TRACK CHARACTERISTICS, AND SAFE STOPPING DISTANCE TO CREATE VIRTUAL OR MOVING BLOCK CONTROL. BECAUSE OF THE RANGE OF INPUTS TO CBTC SOFTWARE SYSTEMS AND THE ABILITY OF THE SOFTWARE TO INCREASE THE EFFECTIVE CAPACITY OF FIXED RAIL LINES, CBTC SYSTEMS REPRESENT A SIGNIFICANT ADVANCE IN RAIL OPERATIONS.
ANOTHER ADVANCE OF NOTE IS THE DEVELOPMENT OF SOFTWARE SYSTEMS THAT PROVIDE REAL TIME, IN-TERMINAL TRAIN INFORMATION FOR RAIL PASSENGERS. THIS APPLICATION PROCESSES INFORMATION
2-47

FLEET MANAGEMENT
FROM THE TRAIN CONTROL AND MONITORING SYSTEM. AT PRESENT SUCH SOFTWARE IS MORE COMMONLY USED IN FREIGHT AND COMMERCIAL RAIL.
Challenges to Implementation
Advances in the operation of signal systems have lagged behind the integration of SCADA systems
with ATC and AVI systems, often limiting the capacity of rail systems. Thus, the advent and
increasing deployment of CBTC technology is an important step.
Application Example
The following is an example of rail operations software.
�� Newark, New Jersey’s software system, which provides real time, in-terminal train information for its commuter rail passengers.
Newark, New Jersey
New Jersey Transit Corporation is doing further development and testing on a software system to
provide real time, in-terminal train information for its commuter rail passengers. Called the
Automated Train Information Display System (ATIDS), the project design is unique because of its
integration with NJT’s train control systems and the complexity of information it processes. NJT has
hired Com-net Software Specialists of Dayton, Ohio to do the software development.24
As reported in Update ’98, the agency chose its Summit, New Jersey commuter rail station as a test
site because passengers have to navigate a complex set of travel choices at that station. The station
serves two separate NJT commuter rail lines leading to three major destinations in each direction with
combined headways of two to four minutes during peak periods. The station also serves Amtrak’s
Northeast Corridor trains. Thus, passengers are often faced with changing platforms quickly to
transfer.
When fully developed, ATIDS will process data from three sources to generate estimated train arrival
and departure times: NJT’s Centralized Train Control and Train Control Processor system; real-time
information from local track circuits; and manually-entered data from dispatchers or block
controllers.
24 Jim Kemp, op. cit.
2-48

FLEET MANAGEMENT
Phase 1 of the project has been completed and enhancements to the system necessary to test and
deploy a more robust version of ATIDS have been implemented. Programming of the Phase 1
recommendations for ATIDS enhancement is underway. NJT has budgeted $600,000 for software
development. A second round of pilot tests was to occur in December 1999 and plans are for pilot
deployment at the Summit station in early to mid-2000. Installation at the Summit station is expected
to cost around $200,000. Anticipated benefits of the system include: easier interaction between
dispatchers and the train control system; better tracking of train status; and improved customer
service and satisfaction from automated on-time information.
2.2.3 Operations Software for Paratransit
Paratransit operations are a significant component of the public transportation network. The
Americans with Disabilities Act, Welfare-to-Work initiatives along with other legislative mandates,
and an aging population who are becoming increasingly transit dependent, have caused paratransit
operators to consider scheduling and dispatching software for improved performance and increased
passenger-carrying capability.
Paratransit service is a dynamic rather than a static service. New subscription passengers are
continually being added to the systems, while the transportation needs of current passengers tend to
change over time. Therefore, trip routings and scheduling need to be analyzed on a regular basis to
maintain operating efficiency with changing trip demands. The customer expects quality service at a
reasonable cost, while, at the same time, the transit operator is expected to provide the most efficient
and effective method of scheduling and service delivery. Paratransit operations are also inherently
expensive. In 1997, the average fare per trip was $1.83 and the average cost per trip was $13.47, for a
subsidy of $11.64 per trip (86 percent). Computer-aided paratransit scheduling technology is one
way to address the needs of paratransit operators and their customers, while also addressing the innate
cost pressures experienced by agencies.
Technology Description
There are several high-end paratransit software and reporting systems that integrate applications.
Examples include fully automated capabilities such as passenger registration, automatic geocoding,
mapping, real-time and batch trip scheduling, and brokering for multiple carriers. These systems use
a GIS platform that assists in optimizing route planning, and can be combined with a GPS for AVL.
2-49

FLEET MANAGEMENT
Also MDTs can be installed to display dispatch messages (passenger pickup and drop-off addresses
and instructions), record and temporarily store certain types of information about each passenger
pickup and drop-off, and collect statistical and performance data on services provided. Software
programs can include billing, and accounting and reporting, while vendors may offer extensive
training, and extended technical assistance options that can include providing on-site staff and/or help
desks.
The typical software package price is under $10,000, and uses a generic base operating system
(DOS/Windows or UNIX) that is capable of handling only two or three software platforms. These
software packages cannot process trips in real time or provide detailed route optimization, but can
provide basic report writing such as more precise manifests and more detailed accounting
information.
Status: State-of-the-Art
Only a few agencies have installed the most sophisticated of the paratransit operations software
systems. Currently under development is a demand-responsive operations software system that will
virtually eliminate the role of the dispatcher in paratransit service. Known as autonomous dial-a-ride
transit, or ADART, it employs fully automated order-entry and dispatching systems that reside on
board the vehicles. The customer, then, is the only human involved in the entire process of requesting
a ride, assigning trips, scheduling arrivals, and routing the vehicle; no dispatcher is involved. The
computers on board the vehicles "talk" to each other, and "bid" for the incoming trip request based on
the vehicle's cost to serve it. The trip is assigned to the vehicle that is able to incorporate the trip most
efficiently. The driver simply follows the routing instructions from the computers. A system
prototype is under development25 and, by May 2001, a prototype with two vehicles communicating
with one another will be tested. If the testing provides positive results, a system is expected to be
operational and in actual revenue service by 2003.26
25 Robert F. Casey, Advanced Public Transportation Systems: The State-of-the-Art Update '98, Volpe National
Transportation Systems Center for the Federal Transit Administration, Report #DOT-VNTSC-FTA-97-9, January 1998.
26 Robert Casey and Robert Dial, Volpe National Transportation Systems Center.
2-50

FLEET MANAGEMENT
Challenges to Implementation Financial constraints faced by paratransit agencies are affecting their ability to purchase operations
software. This impacts paratransit software vendors’ ability to meet the paratransit agencies’ needs.
Paratransit software vendors are also constrained by the following market issues.
�� While there are over 5,000 paratransit operations in the United States, the market for paratransit software is very small. Mostly due to funding constraints, only about 100 software packages a year are currently being sold.
�� Most of the firms that develop and market paratransit software are small (usually under 20 employees), have limited financial resources, and tend to specialize in a particular core technology that does not have wide-ranging capabilities. The few larger firms in the business generally derive most of their net profits from other product lines.
�� Organizations that purchase paratransit software depend on most or all of their funding through public sector funding mechanisms, such as grants. Availability of these funds is highly unpredictable, and traditionally the culture of the industry has been to invest scarce funds in rolling stock, not technology.
All three issues combine to produce a paratransit software technology environment where there are no
industry-wide standards, architecture, expectations regarding the features and functions a system
should have, or the degree to which they should interface with other software or hardware. The
industry has taken notice of these issues, and a series of conferences have been held and expert papers
produced since the Update ‘98. Paratransit software vendors are now recognizing the need to recruit
staff who are not only technologically savvy, but have real world experience in paratransit operations
if they are going to deliver quality products.
On the other hand, not all transit operators have the needed sense of the expectations of what they
want out of a paratransit software system, especially in the initial conceptual design stage. Some
agencies have procured systems far in excess of their needs simply because they bought up to the
amount of available funding. There are several small rural agencies that have bought systems that
were more appropriate for larger urban systems. Some agencies have procured software packages
that did not perform as advertised and, in some cases, the parties are currently in litigation. Others
simply stopped using some or all components of a paratransit package because they became too
difficult to use. It is imperative that agencies hire and train staff that can write Requests for Proposals
that accurately convey what the operator wants at a price it can afford.
2-51

FLEET MANAGEMENT
Once the system is procured, it is equally imperative to have a strong and consistent commitment to
training, and to avoid turnover of difficult to replace technical staff. Agencies need to understand that
the introduction of software technology can increase worker stress and decrease job satisfaction.
Informing employees about how their roles will change and explaining the benefits of the changes
may alleviate employee discontent.
Application Examples
THE FOLLOWING ARE FIVE EXAMPLES OF PARATRANSIT SOFTWARE SYSTEMS IN USE OR BEING DEVELOPED. �� Honolulu, Hawaii’s advanced computerized reservation, scheduling, and dispatching system. �� Flagler, St. Johns, and Putnam Counties, Florida’s route optimization and real-time
scheduling software. �� Delaware County, Pennsylvania is scheduling and dispatching software. �� Prince William County, Virginia’s integrated real-time enhancement system. �� Corpus Christi, Texas’ automated demand responsive service.
Honolulu, Hawaii
THE HANDI-VAN PARATRANSIT SYSTEM, OPERATED BY OAHU TRANSIT SYSTEMS (OTS), IMPLEMENTED AN ADVANCED COMPUTERIZED RESERVATION, SCHEDULING, AND DISPATCHING SYSTEM IN MAY 1998. THE NEW SOFTWARE PROMISED GREATER EFFICIENCY IN VEHICLE USE AND IMPROVED SERVICE FOR OAHU’S 12,000 PLUS PARATRANSIT USERS. HOWEVER, DIFFICULTIES CONCERNING THE NEW SOFTWARE SURFACED IMMEDIATELY. THE NEW SOFTWARE REQUIRED ABOUT FIVE MINUTES TO BOOK A SINGLE RESERVATION, WHILE THE OLD SYSTEM TOOK ONLY ONE TO TWO MINUTES PER RESERVATION. THE ADDED BOOKING TIME, IN ADDITION TO TRIP CONFIRMATION INQUIRIES AND OTHER MISCELLANEOUS CALLS, FORCED CALLERS TO BE PLACED ON HOLD FOR EXCESSIVE PERIODS OF UP TO 45 MINUTES. THE SOFTWARE REQUIRES A CALLER’S RESERVATION DATA TO BE ENTERED IN A SEQUENCE, WHICH INCLUDES A SEARCH PERFORMED BY THE COMPUTER TO GEOCODE A GIVEN POINT-TO-POINT TRIP IN ORDER TO FIND AN AVAILABLE ROUTE AND VAN. THE TIME REQUIRED FOR BOOKING TRIPS IS EXPECTED TO DECREASE AS THE REGULAR TRIPS OF INDIVIDUAL PASSENGERS ARE STORED IN MEMORY.
In addition to working closely with the software vendor to streamline reservations, OTS hired
additional reservationists as the system developed. Presently, reservations are booked a day in
advance, which reserves a seat and places a desired pick-up time. However, the actual schedule is not
determined until the evening of the booking. If there is a deviation of the passenger-desired time to
2-52

FLEET MANAGEMENT
the computer generated pick-up time, an additional call is placed to the passenger to confirm the new
time. The vehicles are equipped with MDTs. It is anticipated that OTS will eventually implement
real-time scheduling.
The Handi-Van computer system is programmed to determine the shortest distance between points so
that vehicles are used more efficiently and so passengers will spend less time on the vehicles.
However, the initial geocodes did not factor the terrain or obstacles such as valleys or volcanoes when
calculating the shortest distance. This resulted in inaccurate pick-up and drop-off times. The
software vendor has added a feature that factors in these ‘barriers,’ and, after much testing, appears to
have adequately addressed this issue.
Over time, reservationists should reduce the time it takes to enter data as they become more adept at
using the software. The goal is to cut the time down to two to three minutes per reservation. The
Oahu paratransit user community has been very patient as OTS works out the ‘bugs’ that are inherent
with new system development and implementation. It is anticipated that by mid-2000, all
components of the system will be fully functional.27
Flagler, St. Johns, and Putnam Counties, Florida
Three rural Florida county social service providers are aggressively pursuing the incorporation of ITS
technology into their operations. Through a $200,000 grant awarded in October 1998, Flagler, St.
Johns and Putnam Counties have implemented paratransit software as part of a larger model inter-
county coordination project. This FTA demonstration project is administered through the Florida
Commission for the Transportation Disadvantaged. It is intended to show the cost savings and
efficiencies of the use of ITS technology in coordinating out-of-county human service trips,
encourage the use of ITS technology in other rural areas, promote intra-county coordination of
community-based services, and integrate small rural systems with nearby urban mass transit systems.
The project was fully operational in the three counties in October 1999.
Each county received approximately $60,000, which included some implementation administration
costs, hardware, a few GPS AVL units, and nine software licenses utilizing RouteLogic paratransit
software, installation, and training. The county coordinators have been working continually with the
27 Sarah Tajima, MIS Network Administrator, Oahu Transit Systems, Honolulu, Hawaii.
2-53

FLEET MANAGEMENT
RouteLogic software vendor to improve and tailor the system to the needs of their communities. The
software has been easy to use, as evidenced by its requiring only two weeks for initial system start-up.
At present, they are scheduling in real time, although batch scheduling is available. This has allowed
route optimization. Passengers are entered into the system using their Social Security number (or
default nine number code), which, after initial data input, automatically displays the passenger’s
home address and a history of origins and destinations. The system includes default Americans with
Disabilities Act categories; dispatch manifest listing by time, passenger, and route; billing
information; and report writing generation. Because these agencies have passengers who travel to
common destinations outside of their respective counties for specialized medical needs, the project’s
goal is to reduce the costs and increase the efficiency of vehicles used. A benefit of the geocoding
and passenger information is the ability to quickly locate mobility-impaired passengers who may need
to be evacuated quickly during an emergency (e.g. hurricane).28 This project has been expanded to
add two more counties, Marion and Alachua.
Delaware County, Pennsylvania
Since 1993, Community Transit of Delaware County Pennsylvania has been in the process of
integrating APTS technologies, including scheduling and dispatching software and MDTs that
provide a paperless manifest for paratransit drivers. This has provided a case study in “human
factors” integration, with drivers involved in every aspect of this major change in operations and
dispatch, and was accomplished in four phases.29 In Phase I, Community Transit determined which
drivers and runs would not be appropriate for the paperless manifest due to the categories of trips
carried. For instance, drivers who do medical trips (i.e. kidney dialysis, etc.) do not need to move to
the paperless manifest because these trips are already productive (because of the nature of the
passenger, these trips are predictable well in advance). After categorizing all drivers in terms of the
types of trips they do and their capabilities in terms of handling a paperless system, Community
Transit established driver groups that would use the paperless system and those that would not.
28 Steven E. Jones, Executive Director, Flagler County Council on Aging and Community Services, Inc., Palm
Coast, Florida. 29 A full treatment of this project is found in “Deployment of Technology for Paratransit: What are the Effects
on Employees?” by Carol L. Schweiger and Judith McGrane presented at the Fourth Annual World Congress on Intelligent Transport Systems, Berlin, Germany, October 21-24, 1997 and at the 16th National Conference on Accessible Transportation and Mobility, Phoenix, Arizona, March 2, 1999.
2-54

FLEET MANAGEMENT
Phase II involved a pilot test of the paperless manifest. Community Transit investigated and
addressed all problems brought to their attention by drivers using the MDTs. Community Transit also
paid attention to driver’s confidence, security, and comfort in using the MDTs to obtain their next
trip. This meant that the driver would not know the destination of the next trip until fairly close to the
time of the trip. Community Transit was very interested in this impact on driver performance,
perception of the job and the potential need for additional support from dispatch. Phase III was a
mentor program in which those who participated in Phase II became mentors to groups of 12 drivers.
Phase IV was an implementation of MDTs of one driver group at a time, until all appropriate driver
groups were using MDTs.
Drivers in the pilot program felt a great sense of accomplishment and increased job satisfaction
because the paperless manifest system was successful. Their increased job satisfaction was
demonstrated in drivers volunteering as mentors to their peers and assisting peers in making the
transition from paper manifests to MDTs. In addition, each driver gained a better understanding of
the need for accuracy and completeness in the information since they became aware of the many
processes dependent upon their work (such as scheduling, dispatching, billing, accounting, eligibility
verification, cash receipts, and reporting). In the case of the paperless manifest, the driver is the only
person that provides crucial trip information by creating the only audit trail for the trip information.
These strategies mitigated the negative or potentially stressful effects of technology on Community
Transit employees.30
Prince William County, Virginia
The Potomac Rappahannock Transportation Commission (PRTC) in Prince William County, Virginia
is operationally testing the Smart Flexroute Integrated Real-time Enhancement System (SaFIRES), as
part of the FTA APTS program. The goals for this route deviation system operational test are: to
improve on-street, operational and dispatching efficiencies; to enhance vehicle tracking and
communications capability; and to offer real-time reservation options. ITS technologies being
deployed include: GPS-based AVL; real-time call intake, scheduling, and dispatching software; and
communication enhancements.
30 Judith McGrane, Community Transit of Delaware County, Folsom, Pennsylvania.
2-55

FLEET MANAGEMENT
PRTC is currently implementing the Trapeze-FLEX automated scheduling and dispatching software
package, and anticipates having the system operational sometime in 2000. An important lesson
learned by PRTC managers is that the introduction of new ideas and technology created employee
stress, from the additional workload and job security fears. The reduction of this stress through an
effective employee education program has been found to be essential in successfully implementing
new systems at other agencies. Another lesson learned is that systems and technologies should be fully
tested prior to training employees on the new equipment. In the SaFIRES operational test, pieces of
technology were phased in throughout the project, requiring the employees to serve as a test group.
Training courses were provided too late and often proved to be redundant or ineffective. Frustration
and a lack of confidence in the new technologies caused a delay in employee willingness to accept the
changes as positive. Ensuring that employees are informed about technology changes and training
them on the new technologies in an effective manner are imperative to future success for agencies
contemplating technology upgrades.31
Corpus Christi, Texas
THE CORPUS CHRISTI REGIONAL TRANSPORTATION AUTHORITY (RTA) IS IN PHASE 2 OF A FOUR-PHASE PROJECT TO DEVELOP AN OPERATIONAL VERSION OF A “MORE-PASSENGERS-ON-FEWER-RIDES” DEMAND RESPONSIVE OR “DIAL-A-RIDE” TRANSPORTATION SERVICE, KNOWN AS AUTONOMOUS DIAL-A-RIDE TRANSIT (ADART). PHASE 1 PROVIDED THE FEASIBILITY ASSESSMENT THAT LED TO THE NEED FOR PHASE 2 DEVELOPMENT AND LIMITED TESTING OF PROTOTYPE SOFTWARE FOR THE ON-BOARD COMPUTERS. PHASE 3 WILL BE LIMITED TESTING OF THE COMPLETE SYSTEM IN THE FIELD, AND PHASE 4 WILL BE LIMITED TESTING OF THE SYSTEM IN REVENUE SERVICE. ALTHOUGH PHASE 2 EXPERIENCED A SIGNIFICANT DELAY DUE PRIMARILY TO NON-PERFORMANCE OF AN RTA PRIVATE SECTOR CONTRACTOR, PROGRESS HAS BEEN MADE IN TECHNICAL AREAS OF SYSTEMS DESIGN, ROUTING AND SCHEDULING OPTIMIZATION, AND THE COMPUTING PLATFORM. THE FOLLOWING IS A DETAILED DESCRIPTION OF THE ADART PROJECT INCLUDING SYSTEM DESIGN, FUNCTIONAL REQUIREMENTS, COMPUTER PLATFORM, AND SOFTWARE REQUIREMENTS.
System Design
An overall system design was completed for an ADART system that would operate without base-
station software. The system was composed of eight major subsystems:
31 Eric Marx, Potomac and Rappahannock Transportation Commission, Woodbridge, Virginia.
2-56

FLEET MANAGEMENT
�� Message queue, which receives and dispatches messages from and to; �� Trip auction, which attempts to assign the requested trip to a vehicle; �� Trip bid, which assesses the cost of accepting the trip; �� Route and schedule, which routes the vehicle and schedules stops; �� Vehicle itinerary, which provides the vehicle's next 20 stops; �� Vehicle position, which locates the vehicle's current location with respect to the street system; �� Road network, which provides street locations and minimum-time paths; and �� Driver console, which issues directives to the driver as well as accepting inputs.
Routing and Scheduling: Itinerary Optimization
A basic function of the on-board ADART software is the construction and maintenance of an optimal
itinerary for a vehicle. The vehicle's itinerary is a list of upcoming stops for the vehicle, where to
stop, and at what time. An optimal itinerary is a sequencing of these stops in a way that minimizes
the vehicle's on-road time – (driving and waiting), while arriving at stops within specified time
intervals.
An algorithm has been designed and programmed (in C language) to solve this problem. Besides
satisfying time-window constraints, the algorithm incorporates dynamic variations in travel time,
vehicle capacity constraints, and on- and off-duty schedules. It will continually optimize the
sequence of each vehicle's next 20 stops, which translates to 10 passengers, the expected capacity of
an ADART van. This algorithm has undergone exhaustive testing and is ready to serve as a platform
for Phase 3 activities.
Computing Platform
The QNX Software Inc. operating system has been installed and is operational. Tests have been run
on the routing of vehicles and their communication using the QNX inter-process communications
protocol. Based on this recent work, a crash work program is aimed at having two prototype vehicles
communicating intelligently with one another by May 2001.32
2.3 COMMUNICATIONS SYSTEMS
Effective and efficient operation of transit systems relies on a system comprised of a
telecommunications infrastructure and vehicle-based communications technologies. The system is
32 Robert Dial, Volpe National Transportation Systems Center, Cambridge, Massachusetts.
2-57

FLEET MANAGEMENT
used to transmit voice and data between vehicles and operations centers, and to transmit commands
between operators and technologies (e.g., signal preemption commands to traffic signal systems).
The two-way voice radio system used for fleet management and vehicle dispatching remains at the
heart of most transit operations. However, other communication technologies are becoming common;
for example, communications-based train control and short-range data links for traffic signal priority.
Deployment of APTS technologies is a key, contributing factor to communications capacity
constraints at transit agencies. The most notable impact comes from AVL systems because they
regularly transmit location and schedule status information to dispatch centers.
Technical and non-technical developments in the telecommunications industry are creating both
opportunities and challenges for transit agencies. Whereas decisions to deploy the previously
described APTS fleet management technologies are more primarily based on benefits and costs to the
transit agency and its fleet system, other factors external to the technologies themselves influence the
deployment of APTS communications systems and technologies. Four significant factors are:
�� The rapid technological advances in communications systems, most specifically the trend toward digital transmission;
�� The availability of radio spectrum/frequency; �� The Federal Communications Commission’s frequency refarming policy; and �� The availability and use of services supplied by private firms.
Before examining the various APTS communications systems available to transit agencies, these
external factors are discussed. Following this discussion, the specific APTS communications systems
and technologies are addressed.
Rapid Technological Advances
The widely reported trend toward digital voice and data communications, and away from analog,
continues in all parts of the telecommunications industry, especially in the mobile sector. Digital
wireless communications systems have been proven to extract more capacity from existing
bandwidth, including more efficient radio channel utilization through mixing of voice and data; to
create new services and provide increased functionality; to improve privacy and security; and to
reduce radio frequency interference.
2-58

FLEET MANAGEMENT
However, the advantages of digital technology have not resulted in widespread replacement of analog
radio systems commonly used in transit agencies. Often, transit agencies making major
communication system upgrades are retaining their analog technology albeit with more sophisticated
equipment that sometimes includes a digital messaging component. The Public Safety Wireless
Advisory Committee (PSWAC), in its 1996 final report to the Federal Communications Commission
(FCC) and the National Telecommunications and Information Administration (NTIA), suggested that
digital technology is essential for data transmission. However, this has not yet proven enough to
create wide-scale change in the transit industry.33 34
Advances in channel access/loading technologies, such as new modulation and encoding techniques,
digital and analog compression algorithms, multiplexing, and trunking are important developments
that apply to the entire mobile telecommunications industry. While many of these improvements
have focused on digital systems, some have also proven applicable to improving the capacity of
analog radio systems.
Cellular digital packet data (CDPD) has become an important data communications technology for
transit. It is used for transmitting data on cellular phone frequencies using bandwidth that is not used
by voice calls. Some of the reasons CDPD is so popular for wireless data transmission include:
(1) Relatively high data transfer rates (of up to 19.2 Kbps) can be supported by CDPD; (2) Internet Protocol multicast (one-to-many) service, meaning that a base station can broadcast a
message to many recipients simultaneously; and (3) Utilizes ‘unused’ space on existing cellular networks — CDPD is also cost-effective for
certain applications.
Spectrum/Frequency Issues
The availability of radio spectrum for use by transit agencies continues to be a significant issue.
Advances in signal processing and other technologies, which make more efficient use of existing
frequencies and make the use of ever higher radio frequencies feasible, have not proven to be a
sufficient expansion of the radio spectrum. The FCC’s reliance on allocating available spectrum
through competitive auctions makes it difficult for transit operators and other public agencies to 33 Final Report of the Public Safety Wireless Advisory Committee to the Federal Communications Commission, Public
Safety Wireless Advisory Committee, September 11, 1996, page 203. 34 According to the PSWAC, the FCC and NTIA established the PSWAC to evaluate the wireless communications needs of
federal, state, and local Public Safety agencies through the year 2010 and recommend possible solutions. The
2-59

FLEET MANAGEMENT
compete for available bandwidths.35 The lack of available spectrum is most severe in dense
metropolitan areas.
There are issues surrounding the use of higher frequencies. In the early 1990s, the FCC began to
aggressively open up markets for services in the 800 and 900 MHz bands. Although many continue
to successfully operate their lower band radio frequency systems,36 some transit agencies have moved
into these higher bands for apparently higher performance. The lower radio bands do have certain
characteristics that are not ideal in a crowded radio spectrum with increasing demand for data
transmission. However, systems based on these frequencies still work, and technology is improving
their performance. Most transit systems still use them.
An alternative to using dedicated spectrum for transit communications is to participate as a partner or
customer in a shared communications system with a public agency, a public safety user, or a
commercial customer. Some transit agencies are choosing this option. Another option is to operate
in one of the three unlicensed FCC bands (that do not require approval from the Government).
Frequency Refarming
The FCC’s June 1995 rules requiring frequency refarming could have a number of effects on transit
agencies even though the FCC’s rules are being implemented through equipment manufacturers (and
do not apply directly to radio frequency system operators).37 38 For example, transit agencies might
need to purchase technically more complex and potentially more expensive radio equipment.
Existing equipment could become obsolete more quickly if the aftermarket supply of parts and
service was mainly concerned with supporting more modern equipment and systems.
PSWAC included representatives from public safety agencies, public service providers, equipment manufacturers, commercial service providers, and the public at large.
35 For more information, see the Association of Public-Safety Communications Officials’ Web page at http://www.apcointl.org/.
36 The lower band generally include the former Industrial and Land Transportation Radio Services, Motor Carrier Radio Services, or Business Radio Services below 800 MHz. These services have been mostly redefined into the FCC’s Private Land Mobile Radio services and its various subcategories. However, Private Land Mobile Radio does provide for these services above 800 MHz.
37 Refarming applies to Private Land Mobile Radio bands below 800 MHz. 38 According to FCC PR Docket No. 92-235 (March 12, 1997), manufacturers need to demonstrate that their
equipment can broadcast within the specified channel widths at designated power levels by a series of milestone dates culminating in January 2005. This is called “type acceptance.”
2-60

FLEET MANAGEMENT
Thus far, however, the impact of refarming on the transit industry appears to be minor, although that
does not mean that future FCC actions might not have an impact. One solution being employed by
several transit agencies that could help protect them from refarming is to purchase software
programmable radio equipment when upgrading. Since a complete discussion of refarming and its
potential impact on transit is beyond the scope of this report, readers are referred to a study that
covered these issues in considerable detail.39
Utilization of Private Sector Services
The FCC’s Wireless Communications Bureau defines a variety of other communications technologies
that might be applicable to certain transit communications needs.40 These include:
�� Private land mobile radio categories in which many transit agencies already hold licenses; �� Several commercial land mobile categories in which users contract with private firms for
service; �� A variety of commercial paging services, including two-way and digital services; �� Personal communications services; �� Short-range communications; �� Infrared communications; and �� Subcarrier services.
MOST TRANSIT AGENCIES HAVE OPTED TO OWN THEIR OWN RADIO FREQUENCY LICENSES. A COMMON REASON IS THAT OWNERSHIP PROVIDES COMPLETE CONTROL OF THE LICENSED BANDWIDTH AND ITS USE. COMMERCIAL MOBILE RADIO SUPPLIERS DO PROVIDE SERVICE TO SOME TRANSIT AGENCIES. HOWEVER, THESE TYPES OF LEASED SERVICES HAVE NOT ATTRACTED MANY TRANSIT AGENCIES DUE TO THE UNCERTAINTY ABOUT CONTINUED AVAILABILITY OF CAPACITY GIVEN THAT CAPACITY IS SHARED WITH OTHERS. DETAILED APPLICATIONS OF COMMUNICATIONS SYSTEMS IN TRANSIT OPERATIONS ARE DISCUSSED IN THE FOLLOWING SECTIONS:
�� Section 2.3.1 Mobile Voice and Data Communications Systems for Bus Transit �� Section 2.3.2 Mobile Voice and Data Communications for Rail Transit �� Section 2.3.3 Short-Range and Other Communications
2.3.1 Mobile Voice and Data Communications Systems for Bus Transit
39 Impact of Radio Frequency Refarming on Transit Communications, TCRP Report 11, Arthur D. Little Inc.
for the Transportation Research Board, 1996. 40 See the FCC Wireless Communications Bureau’s Wireless Communications Services Web page at
http://www.fcc.gov/wtb/services.html.
2-61

FLEET MANAGEMENT
Often the deployment of an AVL system on a bus network results in the need for increased capacity
to the communications systems. Mobile voice and data communication systems for bus transit
include the use of analog, digital, and CDPD. These communication systems are used for routine
activities such as talking to dispatch, aligning transfers from one bus to another, or for emergency
situations such as bus breakdowns.
Technology Description
Mobile transit communications systems involve the broadcast of information over Radio Frequency
(RF) waves from a transmitter to receiver. The technology and methods used to perform this
function, which includes both voice and data transmissions, vary widely from traditional two-way
radios to personal communication system (PCS) devices.
Status: State-of-the-Art
As mentioned above in the description on Rapid Technological Advances, the widely reported trend
toward digital communications has not affected transit as much as expected. Therefore, since Update
’98, the state-of-the-art in public transit communications has not changed dramatically despite
advances in the overall telecommunications industry. In general, transit agencies have been able to
address their RF capacity needs by selectively using the latest generation in telecommunications
technology and services.
Agencies have upgraded their two-way voice systems to increase capacity, functionality, and/or
incorporate data transmission. In some cases, this has been done working with an existing frequency
allocation in a lower band (i.e. less than 800 MHz) and in other cases using the 800 and 900 MHz
bands.
Challenges to Implementation
As the telecommunications industry continues to grow and change rapidly in both the business and
the personal communications markets, the importance of robust telecommunications for transit
agencies increases as well. This fast-paced evolution makes it challenging for transit providers to
maintain, enhance, and plan for their wireless communication needs. Representing such a small share
of this multi-billion dollar per year industry, transit has not typically had a strong voice in its
direction. While many of the emerging services could benefit transit, it is unclear whether transit
agencies will take advantage of them.
2-62

FLEET MANAGEMENT
Application Examples The following are examples of mobile communications systems in bus operations.
�� Chicago, Illinois’ analog 450-470 MHz system. �� Portland, Oregon’s procurement of capacity from another agency. �� Austin, Texas’ state-of-the-art 900 MHz, wide area radio network. �� Phoenix, Arizona’s CDPD network.
Chicago, Illinois
THE CHICAGO TRANSIT AUTHORITY (CTA) IS UPGRADING ITS ORIGINAL 450-470 MHZ SYSTEM, DECIDING TO CONTINUE WITH ANALOG TECHNOLOGY. WHEN CTA PROCURED THE ORIGINAL SYSTEM, DIGITAL SYSTEMS WERE STILL MAINLY PROPRIETARY. CTA DETERMINED THAT ANALOG RADIOS WOULD BE EASIER TO SERVICE, ESPECIALLY CONSIDERING THE EXISTING ABILITIES OF CTA MAINTENANCE STAFF. CTA POSITIONED ITSELF FOR FLEXIBILITY BY CHOOSING NEW RADIOS CAPABLE OF COMMUNICATING ON EITHER 25 OR 12.5 KHZ CHANNELS. THIS FEATURE ENABLES THE AGENCY TO MIGRATE ITS FLEET GRADUALLY BY MAINTAINING THE FULL 25 KHZ CHANNELS UNTIL ALL OF THE NEW RADIOS ARE INSTALLED.
Portland, Oregon
While planning to upgrade the fixed facility infrastructure of its dispatch radio system, the Tri-County
Metropolitan Transportation District of Oregon (Tri-Met) developed a way of collecting new data
from its GPS-based AVL and CAD system to significantly enhance the computer propagation model
used by its communications consultant. The objective was to capture and use data related to
anomalies in radio system operation to accurately determine the precise location of dead spots in their
radio coverage area. The system is an example of using AVL data for purposes beyond day-to-day
operations.
The process works by enabling the AVL and CAD system to record an event when a mobile radio
loses contact for 90 seconds or more with the radio system’s dedicated data channel. This situation is
called “fallback.” Whenever fallback occurs, Tri-Met radios automatically move to a voice channel
and periodically check the data channel to determine if the signal has been reestablished. Once it has,
the radio returns to the data channel to wait for control instructions.
2-63

FLEET MANAGEMENT
To capture this data, Tri-Met had its AVL vendor, Orbital Sciences Corporation, install firmware in
its vehicle control head (VCH)41 that enables them to record two types of fallback events – when a
radio goes into fallback and when it comes out of fallback status. The VCH is the logical device to
handle this task because it manages a vehicle’s use of the radio system’s data and voice channels and
performs the necessary AVL and CAD calculations to complete the event record. The upgraded
VCHs now recognize and record the time and latitude/longitude coordinates of each fallback event.
The event logging process is the same as it is for any other programmed event, such as doors opening
or use of the wheelchair lift.
The agency downloads this data at the end of the day and creates an extensive database of both types
of fallback events over time. While filtering the data to ensure that only the type of fallback events
that could be used to pinpoint coverage gaps were included, Tri-Met discovered that its new
procedure also was an excellent radio maintenance troubleshooting tool.
First, since it could summarize the data by vehicle, Tri-Met filtered fallback event records for
individual vehicles exhibiting patterns that differed significantly from the general pattern for the
entire fleet. In doing so, it discovered a group of vehicles whose fallback patterns suggested
equipment problems. Upon inspecting these vehicles, various radio problems were discovered and
repaired, including anomalies such as insufficient antenna gain (strength), missing or broken
antennas, or radios in need of re-tuning.
The fallback records can also be sorted according to the antenna tower from which a vehicle was not
achieving sufficient signal strength for various periods of time. Although the agency has still not
resolved the problem, it was able to filter those records from the fallback event database so that they
would not lower the accuracy of locating the coverage gaps.
After eliminating all invalid fallback data, the agency mapped the rest of the data on a digital relief
base map. The resulting clusters of points or lines provided a clear picture of where coverage gaps
existed. Since the clusters were derived from many individual data points, an approximate magnitude
of each coverage gap could be determined based on the density of the cluster. Examining the
magnitude of each gap is critical since coverage gaps that have few bus trips per day may not be
41 “Vehicle control head” is synonymous with “mobile data terminal.”
2-64

FLEET MANAGEMENT
worth including as factors in the radio system upgrade. The maps not only confirmed some
anecdotally-reported coverage holes, but also located them more precisely. More importantly, the
process identified coverage gaps that were previously unreported or unknown.
Tri-Met’s radio consultant, Macro Corporation, used the data in the system upgrade design to
supplement the output of its propagation models. The firm reported that the mapped fallback
information demonstrated the actual coverage gaps as opposed to the propagation predictions the
computer model would produce. For Tri-Met, the fallback data was superior to the output of a
propagation model and much cheaper than performing costly field testing. 42 43
Austin, Texas
The Capitol Area Rural Transit System (CARTS) operates 15 fixed and 65 demand-response transit
vehicles to serve an area of over 7,500 square miles near Austin, Texas. After years of operating with
a radio system that did not adequately cover this large geographic service area, the agency recently
signed an agreement to use a state-of-the-art radio system installed by the Lower Colorado River
Association (LCRA).44 45
PRIOR TO 1996, CARTS CONTRACTED WITH UP TO SIX COMMERCIAL MOBILE RADIO SERVICE PROVIDERS TO CREATE A BROAD WIRELESS COMMUNICATIONS NETWORK. BESIDES BEING DIFFICULT TO MANAGE FROM AN INSTITUTIONAL PERSPECTIVE, THIS APPROACH FORCED CARTS TO MAINTAIN THREE SEPARATE RESERVATION, SCHEDULING, AND COMMUNICATIONS CENTERS THROUGHOUT ITS SERVICE AREA. ALTHOUGH THE SEPARATE COMMUNICATIONS SUBSYSTEMS COULD BE PATCHED TOGETHER TECHNOLOGICALLY TO PROVIDE VOICE TRANSMISSION ACROSS MOST OF THE AREA, THE SERVICE WAS UNRELIABLE AND HAD NUMEROUS COVERAGE GAPS. WITH UP TO 13 TRANSMISSION TOWERS INVOLVED, THE NETWORK WAS PRONE TO SERVICE DISRUPTIONS.
The LCRA system currently uses approximately 36 transmitter sites to provide a variety of
communications functions for its own 30,000 square mile service area, which overlays the CARTS’ 42 Ken Turner, Tri-County Metropolitan Transportation District of Oregon, Portland, Oregon. 43 Charles Ostrofe, Macro Corporation, San Francisco, California. 44 David Marsh, Executive Director, Capitol Area Rural Transit System, Austin, Texas.
2-65
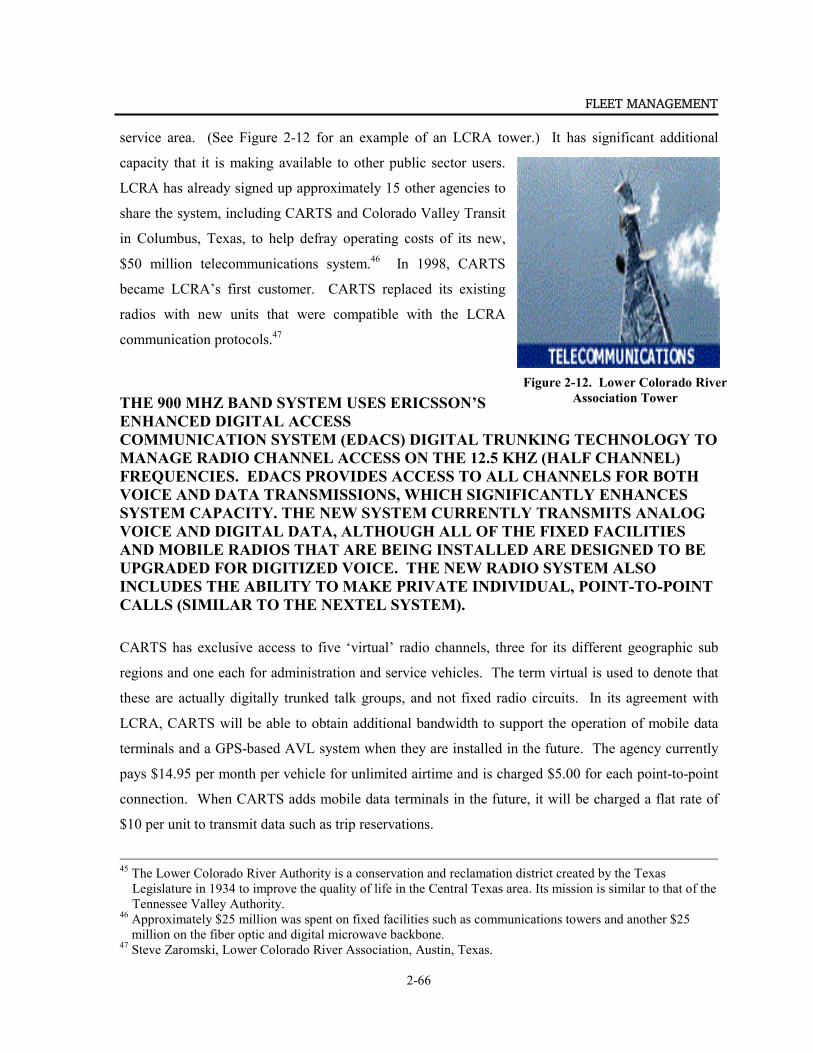
FLEET MANAGEMENT
service area. (See Figure 2-12 for an example of an LCRA tower.) It has significant additional
capacity that it is making available to other public sector users.
LCRA has already signed up approximately 15 other agencies to
share the system, including CARTS and Colorado Valley Transit
in Columbus, Texas, to help defray operating costs of its new,
$50 million telecommunications system.46 In 1998, CARTS
became LCRA’s first customer. CARTS replaced its existing
radios with new units that were compatible with the LCRA
communication protocols.47
THE 900 MHZ BAND SYSTEM USES ERICSSON’S ENHANCED DIGITAL ACCESS COMMUNICATION SYSTEM (EDACS) DIGITAL TRUNKING TECHNOLOGY TO MANAGE RADIO CHANNEL ACCESS ON THE 12.5 KHZ (HALF CHANNEL) FREQUENCIES. EDACS PROVIDES ACCESS TO ALL CHANNELS FOR BOTH VOICE AND DATA TRANSMISSIONS, WHICH SIGNIFICANTLY ENHANCES SYSTEM CAPACITY. THE NEW SYSTEM CURRENTLY TRANSMITS ANALOG VOICE AND DIGITAL DATA, ALTHOUGH ALL OF THE FIXED FACILITIES AND MOBILE RADIOS THAT ARE BEING INSTALLED ARE DESIGNED TO BE UPGRADED FOR DIGITIZED VOICE. THE NEW RADIO SYSTEM ALSO INCLUDES THE ABILITY TO MAKE PRIVATE INDIVIDUAL, POINT-TO-POINT CALLS (SIMILAR TO THE NEXTEL SYSTEM).
Figure 2-12. Lower Colorado River Association Tower
CARTS has exclusive access to five ‘virtual’ radio channels, three for its different geographic sub
regions and one each for administration and service vehicles. The term virtual is used to denote that
these are actually digitally trunked talk groups, and not fixed radio circuits. In its agreement with
LCRA, CARTS will be able to obtain additional bandwidth to support the operation of mobile data
terminals and a GPS-based AVL system when they are installed in the future. The agency currently
pays $14.95 per month per vehicle for unlimited airtime and is charged $5.00 for each point-to-point
connection. When CARTS adds mobile data terminals in the future, it will be charged a flat rate of
$10 per unit to transmit data such as trip reservations.
45 The Lower Colorado River Authority is a conservation and reclamation district created by the Texas
Legislature in 1934 to improve the quality of life in the Central Texas area. Its mission is similar to that of the Tennessee Valley Authority.
46 Approximately $25 million was spent on fixed facilities such as communications towers and another $25 million on the fiber optic and digital microwave backbone.
47 Steve Zaromski, Lower Colorado River Association, Austin, Texas.
2-66

FLEET MANAGEMENT
One benefit of the new system enables CARTS to combine all of its reservations, scheduling, and
communications functions into a single facility. Customer service and the marketability of CARTS
service have also improved by publishing a single, toll-free reservation line not feasible in the past.
The centralization of the scheduling and radio control is helping CARTS improve the efficiency of its
operations, since its automated scheduling software can now operate on one server instead of three.
Upgrades and modifications to the software and hardware are easier to perform and cost one-third of
previous amounts. The radio system also enables CARTS to plan for data communication between its
call center and vehicles with MDTs and to push forward its technology applications like web-based
reservations and AVL.
An additional benefit is being realized as more local governments join the LCRA Community Link
system. Having buses, police, emergency vehicles, and disaster control centers all linked together
under the control of one communications center could save lives and avert serious consequences in
emergency situations.48
Phoenix, Arizona
As part of the U.S. DOT’s Phoenix Metropolitan Model Deployment Initiative, the City of Phoenix is
implementing an AVL system on portions of its fixed route bus and paratransit fleets. When fully
deployed, this project will instrument 88 fixed route buses and 65 paratransit vans. The AVL system
uses a CDPD wireless communication link to transmit position data from vehicles to the dispatch
center, while voice communications are on a separate 450 MHz radio system. CDPD was needed to
provide the necessary bandwidth for the AVL system, which could not be handled by their existing
voice system.
Although a robust communication technology, CDPD was not Phoenix Transit’s first choice for this
purpose because of its cost. The agency would have preferred to use an 800 MHz channel (for which
it already held the FCC license) to transmit the AVL data. However, it was not able to get FCC
permission to relocate a broadcast tower, which was necessary to obtain the proper radio coverage
area. Phoenix Transit also looked at using a single frequency in the 150 MHz commercial land
mobile band owned by one of its subcontractors on the project. Although it appeared that this
48 David Marsh, op. cit.
2-67

FLEET MANAGEMENT
frequency would meet the required specifications, there were institutional issues regarding Phoenix
Transit’s future use of the channel.
Phoenix Transit’s AVL contractor, ADS, secured the services of Cellular One® to provide the CDPD
services. Both companies worked together to develop a data compression scheme that would help
minimize costs for Phoenix Transit. The agency currently pays $14.95 per vehicle per month for the
service. For this price, the agency is able to transmit an average of 350 kilobytes of data per vehicle.
This figure is expected to rise to about 500 kilobytes per month at a cost of $21 per vehicle.
The agency believes that CDPD will be too expensive as it expands the AVL system to its entire 450-
vehicle fleet. Therefore, Phoenix Transit is part of a regional ITS strategic plan that is designed to
obtain all ITS communications capacity needs. One scenario would incorporate Phoenix Transit’s
existing 450 MHz radio system into a more efficient and flexible multi-agency system.49
2.3.2 Mobile Voice and Data Communication Systems for Rail Transit
Mobile voice and data communication systems for rail transit include the use of analog, digital, and
CDPD. These communication systems are used for routine activities such as train monitoring and
control and for emergency situations such as train breakdowns.
Technology Description
Both wireline and wireless technologies are being used for rail transit communications. Wireline
Supervisory Control and Data Acquisition systems remain an important form of rail communications
networks; however, the recent applications of wireless technologies such as microwave and CDPD,
allow for applications such as variable block control. Variable block control permits shorter control
segments than fixed block signals, thus increasing the capacity of the rail system while improving
safety. The variable block tracking system involves installation of passive electronic radio frequency
transponders spaced approximately every 1,000 to 2,500 feet. These devices send a low power, high
frequency signal to tag readers/receivers installed on each train. The tag readers are networked with
the vehicle’s on-board computer, which processes the unique identification and known location of
each tag against a geocoded map of a particular track segment or line to calculate continuously the
train’s precise location on the tracks.
2-68

FLEET MANAGEMENT
Status: State-of-the-Art Although RF remains important in vehicle-to-dispatch communications for rail, several
agencies are using CDPD networks to transmit data such as standardized messages or vehicle
location information instead of using capacity on their RF voice systems. CDPD appears to be
an important wireless data communications solution for rail transit at this time.
Short-range communications are also being used for various purposes. Of particular interest are
dedicated short-range communications (DSRC) systems for communicating between rail vehicles and
wayside sensors for communications based train control (CBTC) and automatic vehicle identification
(AVI) systems. Microwave communications have been tested for use as the backbone for CBTC
systems, and fiber optic networks are becoming common as communications backbones as well.
Challenges to Implementation
THE CHALLENGES FACING RAIL TRANSIT OPERATORS IN IMPLEMENTING COMMUNICATIONS TECHNOLOGIES REVOLVE AROUND NEW APPLICATIONS OF EXISTING TECHNOLOGIES AND INTEGRATION WITH EXISTING ONES. FOR EXAMPLE, WHILE CDPD IS A WELL-ESTABLISHED COMMUNICATIONS MEDIUM, IT MAY SUFFER FROM COVERAGE GAPS WHEN USED ON COMMUTER RAIL SYSTEMS WHERE THE CELLULAR TELEPHONE NETWORK IS NOT SUFFICIENTLY DENSE. WHEN USED AS A SUPPLEMENT TO AN EXISTING RF SYSTEM, INTEGRATING THE TWO IS AN IMPORTANT CONCERN.
Application Examples
The following are examples of rail transit communications systems.
�� New York’s variable block train tracking technology. �� Vancouver, British Columbia, Canada’s CDPD communication system.
New York , New York
New York City Transit has completed testing and begun deployment of a number of systems
discussed in Update ’98. All are part of the Control Center Modernization Project and its Rail
Control Center (RCC). The system is being implemented to enhance the train monitoring and control
capabilities of the agency’s automated train supervision system through deployment of variable block
49 Mike Nevarez, Transit Operations Manager, Phoenix Transit, Phoenix, Arizona.
2-69

FLEET MANAGEMENT
train tracking technology (Figure 2-13). A key component of this project is microwave
communications technology, which is part of the communications-based train control system.
Variable block control requires a robust wireless communication link to send information between
trains and zone controllers. Because of the complexity of the information being exchanged, the
wireless communication system must be capable of transmitting a wide range of message sizes, from
short location reports to large database downloads. The system will also support sending limited text
messages from the rail control center to train operators. The CBTC wireless system will be interfaced
with the wireline system connecting zone controllers to each other and to the NYCT’s RCC.
Rail Control Center
Wayside
Carborne
* Located in relay room** Line circuits and data to adjacent interlockings*** Located only at 8th Avenue, East New York and Rockaway Parkway
CBTC-ATS
CBTC ZONECONTROLLER *
INTERLOCKING *
RemoteWorkstation ***MAINTAINER’S
PANEL *
DATA COMMUNICATIONS NETWORK
CARBORNECBTC
EQUIPMENT
ADDITIONALCBTC ZONE
CONTROLLERS
TRAIN OPERATORCONTROLS
TRAIN SUBSYSTEMS
** **
Figure 2-13. Variable Block Control Schematic
THE CBTC WIRELESS SYSTEM WILL EMPLOY A STANDARD PROTOCOL STRUCTURE CONSISTENT WITH OPEN ARCHITECTURE PRINCIPLES TO PROVIDE FUTURE EXPANSION FLEXIBILITY FOR THE AGENCY. IN
2-70

FLEET MANAGEMENT
PARTICULAR, NYCT IS REQUIRING VENDORS TO PROVIDE A COMMUNICATIONS ARCHITECTURE THAT WILL ALLOW THE AGENCY TO MIX DATA RADIO EQUIPMENT FROM DIFFERENT CONTRACTORS. THE SYSTEM WILL HAVE ENOUGH CAPACITY TO PROVIDE FOR ALL CBTC FUNCTIONS AND STILL MAINTAIN A 50 PERCENT RESERVE MARGIN TO ACCOMMODATE NON-CBTC APPLICATIONS. THE TECHNOLOGY USED FOR THE RADIO NETWORK WILL BE COMPATIBLE WITH THE RADIO PROPAGATION CHARACTERISTICS AND TIGHT TOLERANCES WITHIN NYCT TUNNELS.
NYCT is requiring the use of spread spectrum technology (typical for unlicensed FCC radio bands)
for security and interference purposes. The radio technology being deployed will be reprogrammable
so that it can use alternate encoding in case the original codes are compromised or interference from
other users in the selected radio band becomes a problem.
NYCT has identified three possible bands that the CBTC system can use. Each is in the FCC’s
unlicensed Industrial, Scientific and Medical service frequencies (for which rapid transit is eligible).
They include 902-928 MHz (UHF), 2400 -2483 MHz (UHF), and 5725-5850 MHz (Super High
Frequency). A recent article in Railway Age50 suggests that the competing vendors are all
considering the Kasten-Chase RailPath® wireless data network. This wireless networking technology
operates in the 2.4 GHz band. It uses a hybrid spread spectrum technology designed to resist
interference in this unlicensed band.51
Vancouver, British Columbia, Canada
West Coast Express (WCE), part of the newly created Greater Vancouver Transportation Authority,
has implemented a CDPD communication system to support the operation of its commuter train
service. CDPD provides the wireless communication link for West Coast Express’ AVL and tracking
system that monitors its 10 daily commuter trains traveling 40 miles between Mission and
Vancouver. West Coast Express originally examined leasing radio time from a local taxi company
that had capacity on a low frequency RF system, but decided to leave the communication
specification open in the Request for Proposals. CDPD was the data communications solution
50 William C. Vantuono, “CBTC: A Maturing Technology,” Railway Age, June 1999. 51 Geoff Hubbs, Director - New Technology Signals, New York City Transit, New York City, New York.
2-71

FLEET MANAGEMENT
proposed by the winning bidder. West Coast Express’ train operators use an existing radio system for
voice communication.52
A robust communication link like CDPD for train tracking was essential because West Coast Express
uses Canadian Pacific Railroad tracks. Canadian Pacific Railroad schedules as many as 60 freight
movements per day on the same right-of-way. Installed in 1998 by AVL International (AVLI), West
Coast Express' system represents the first time a commuter rail operation has incorporated AVL in
Canada. West Coast Express believed that using Canadian Pacific Railroad’s block signal technology
for train tracking would be insufficient given that some signal blocks are up to 6 miles in length.53
West Coast Express is partnering with AVLI, Canadian Pacific Railroad, Sierra Wireless (for the
CDPD modems), and British Columbia (BC) Tel Mobility (for provision of the CDPD network and
airtime). Unlike the NYCT CDPD system, West Coast Express trains (Figure 2-14) communicate
directly with the West Coast Express host computer via a base station CDPD modem (i.e., without
data being routed through a BC Tel Mobility central office). Although this would normally double
the communications costs, BC Tel is providing the base-to-vehicle airtime for a very reasonable flat
rate.
Figure 2-14. West Coast Express Operating Cab
52 Trish Webb, Public Relations Manager, West Coast Express, Vancouver, British Columbia, Canada. 53 Stephen Harmer, President, Allegro Integrated Systems, Vancouver, British Columbia, Canada.
2-72

FLEET MANAGEMENT
The communication system uses Sierra MP200 wireless cellular modems integrated with Trimble
GPS receivers to send GPS-based AVL data in real time over the CDPD network. Every 100 meters,
each train automatically reports its ID, latitude/longitude coordinates, velocity, and direction of travel
to the base station where schedule adherence is calculated. To integrate the GPS and CDPD signals,
AVLI created a computer application for the base station called CDPDLink. The software provides
the communications gateway to send GPS data across a CDPD network based on Internet
technology.54
START-UP COSTS SPECIFICALLY FOR THE CDPD SYSTEM WERE NOT AVAILABLE SINCE IT WAS PART OF THE LARGER TRAIN CONTROL PROJECT THAT COST $75,000 (CANADIAN). MONTHLY COMMUNICATIONS CHARGES FROM BC TEL MOBILITY ARE APPROXIMATELY $650 (CANADIAN). THIS INCLUDES AN AVERAGE OF 225 KILOBYTES OF DATA FOR EACH OF THE FIVE MOBILE CDPD RECEIVERS.
The CDPD system enables improved coordination with BC Transit’s other transit services because
the train terminates at BC Transit’s intermodal station in Vancouver. Information from the system is
used to inform passengers of arrival and departure times as well as coordinating transfers with other
transit modes. Safety is enhanced because the system automatically alerts West Coast Express
dispatchers when a train stops and provides the precise location so that the dispatcher can intervene
quickly and communicate with Canadian Pacific Railroad if necessary. Canadian Pacific Railroad is
considering using the West Coast Express system to help monitor operations to prevent operating
conflicts between the two railroads.55
2.3.3 Short-Range and Other Communications
Short-range communications is used for a myriad of transit operations. Communications systems,
such as microwave, CDPD, infared, sonic, radio frequency, and fiber optic lines, are excellent ways to
transfer data and voice communications where long-range wireless media are not suitable for one
reason or another.
54 Network uses the Transmission Control Protocol/Internet Protocol. 55 Trish Webb, op.cit.
2-73

FLEET MANAGEMENT
Technology Description
An example of short-range communications is traffic signal priority. For traffic signal priority,
emitters on buses send information via high energy infrared light emissions to receivers mounted on
traffic signals. The communication range between emitter and receiver is very flexible, from 50 feet
up to 2,500 feet. Because the system uses an infrared beam, separate ranges for each type of priority
vehicle can be set for each intersection approach. Other types of technologies such as short-range
radio frequency systems and sonic communications, are also being developed for this purpose.
For real-time bus status information, an agency can use a LAN to pass CDPD communications from
its server through a wide area digital network. As well, the installation of a fiber optic network can
dramatically increase the communications bandwidth for landline communication links of current and
future ITS deployments.
Status: State-of-the-Art
THE STATE-OF-THE-ART IN SHORT-RANGE COMMUNICATIONS INCLUDES INFRARED, SONIC, AND SHORT-RANGE, HIGH FREQUENCY COMMUNICATIONS MEDIA. ELECTRONIC RADIO FREQUENCY TAGS AND READERS, SIMILAR TO THOSE USED IN ELECTRONIC TOLL PAYMENT SYSTEMS, ARE ALREADY IN USE. INFRARED AND SHORT-RANGE RF SYSTEMS ARE USED BY BUS TRANSIT OPERATIONS TO PROBE ELECTRONIC FARE BOXES. THE FCC’S RECENT ALLOCATION OF THE 5850 TO 5925 MHZ BAND TO DEDICATED SHORT-RANGE COMMUNICATIONS (DSRC) FOR ITS MAY HAVE FUTURE BENEFIT FOR TRANSIT.
Challenges to Implementation
SHORT-RANGE TECHNOLOGIES MUST BE TAILORED TO THEIR INTENDED OPERATING ENVIRONMENTS. FOR EXAMPLE, INFRARED TECHNOLOGY MUST BE SHIELDED FROM SOURCES OF OPTICAL DISTORTION OR INTERFERENCE. MICROWAVE COMMUNICATIONS IN GENERAL CAN BE AFFECTED BY ENVIRONMENTAL INTERFERENCE SUCH AS RAIN AND SNOW. WHEN APPLIED TO TRAIN CONTROL, MICROWAVE MUST MAINTAIN HIGH LEVELS OF DATA SECURITY, RELIABILITY, AND DATA CAPACITY WHILE OPERATING IN DIFFICULT ENVIRONMENTS BOTH ABOVE GROUND AND WITHIN TUNNELS. OTHER SHORT-RANGE COMMUNICATION LINKS MAY BE SUSCEPTIBLE TO, AND MIGHT HAVE TO BE SHIELDED FROM ELECTROMAGNETIC INTERFERENCE.
2-74

FLEET MANAGEMENT
Application Examples The following are examples of short-range and other communications systems that are being
deployed or developed.
Portland, Oregon’s extensive traffic signal priority system. ��
��
��
New York, New York’s real-time CDPD-based information system at bus stops. Atlanta, Georgia’s enhanced fiber optic communications system.
Portland, Oregon
Tri-County Metropolitan Transportation District of Oregon is developing an extensive traffic signal
priority system in conjunction with the City of Portland. The City of Portland applied for and was
awarded an estimated $4 million in the TEA-21 High Priority Project category to deploy the system
on five major bus routes. With a 20 percent local match, the total project budget will be almost $5
million. The funding will help pay for the necessary mobile and fixed facility equipment needed to
deploy optical bus-to-signal communication.56
Tri-Met and the City conducted earlier tests of traffic signal priority technology. The concept of
communicating bus status information to traffic signals indirectly by passing it through Tri-Met’s
dispatch center to the City’s traffic signal control server was ruled unworkable because it involved too
many communications factors that could result in valid priority requests being denied because the
system would not be able to respond in time. This made direct bus-to-signal communication
essential.
The current project is designed to build on Tri-Met’s AVL system and the City’s signal control
system, which already uses 3M’s Opticom optical emitter/receiver system for providing signal
priority for fire vehicles. Some of the new funding will be used to install emitters on all of Tri-Met’s
775 fixed route buses; to revise the software on the fixed route mobile data terminals to activate the
emitter and send information at the right time to signals; to update the signal controller software to
include a robust priority algorithm; and to increase the number of intersections that have Opticom
receiver equipment.
The Opticom emitters on buses send information via high energy infrared light emissions to Opticom
receivers mounted on the traffic signals. The data carrying capacity of the infrared signal is not high,
but is sufficient to support this application even as other vehicle operating data are included in the
2-75

FLEET MANAGEMENT
priority algorithm. The emitters use the SAE J-1708 data bus standard and the SAE J-1587
communication protocol. Tri-Met believes this is the first time that the vehicle area network
standards of Transit Communication Interface Profiles (TCIP) have been applied in the field. The
result is having plug-and-play functionality between the Opticom emitter and the vehicle control unit.
Instrumented intersections will have separate receivers for each approach that serves a bus route. A
single receiver is capable of receiving and processing information from multiple lanes on a given
approach. Only one receiver is needed per approach because of the dispersed infrared emitter signal
described above.
Tri-Met began to install the Opticom infrared emitters on its fleet in late 1999. The City of Portland’s
installation of new receivers will begin in early 2000. Data from Tri-Met’s AVL/CAD system will be
used to determine transit benefits of the signal priority system once the project is operational.57 58
New York, New York
AS PART OF ITS AVL AND CUSTOMER INFORMATION SERVICE (CIS) PROJECT REPORTED IN UPDATE ’98, NEW YORK CITY TRANSIT IS FINALIZING THE DESIGN FOR PROVIDING REAL-TIME INFORMATION AT BUS STOPS. THE CIS WILL BE DEPLOYED AT KEY LOCATIONS ON THE M15, M57, AND M31 BUS ROUTES IN MANHATTAN (FIGURE 2-15). WHEN FULLY INSTALLED, THE SYSTEM WILL INCLUDE 10 CYBERCHROME FLAT SCREEN VIDEO MONITORS, 20 LIGHT-EMITTING DIODE (LED) DISPLAYS FROM TELECITE®, AND FOUR ‘SMART’ KIOSKS. THE VIDEO MONITORS ARE BEING USED AT SITES WHERE SIGNIFICANT TRANSFER ACTIVITY OCCURS BECAUSE THEY CAN DISPLAY MORE INFORMATION SIMULTANEOUSLY THAN THE LED DISPLAYS. THE INSTALLATION MAY ALSO INCLUDE AUDIO ANNOUNCEMENTS FOR VISUALLY-IMPAIRED PERSONS. THE COMMUNICATION LINK TO THESE DEVICES WILL BE VIA CELLULAR DIGITAL PACKET DATA. With the CDPD communication system (Figure 2-16), customer information messages will be
generated by the NYCT’s customer information server using real-time bus status data collected and
processed by the AVL/CAD system. Messages will be sent through a dedicated NYCT
communications server via the agency’s local area network and then to Bell Atlantic Mobile via a
high capacity data line. Bell Atlantic Mobile then sends the customer information messages to the
56 Bill Kloos, Signal System Manager, City of Portland, Portland, Oregon. 57 Bill Kloos, op. cit. 64 Ken Turner, op. cit.
2-76

FLEET MANAGEMENT
appropriate customer information sign(s) through a wireless CDPD modem installed on each unit.
The information is transmitted on Bell Atlantic Mobile’s regular digital cellular network.
Even though the components of the CIS are in fixed locations, NYCT decided to employ a wireless
rather than a wireline communication link. A large part of this decision was due to cost. Based on a
total of 30 information displays and the CDPD setup that NYCT has chosen, the start-up costs for the
wireline system were estimated to be $259,000 versus $11,000 for a wireless solution. A significant
part of this large difference in start-up costs was the high installation costs for a new phone line to
each CIS display.
West End Ave.
Amsterdam Ave.
10th Ave.
9th Ave.
8th Ave.
7th Ave.
6th Ave.
5th Ave.
Madison Ave.
Park Ave.
Lexington Ave.
3rd Ave.
2nd Ave.
1st Ave.
First St.
14th St.
23th St.
42nd St.
5 5th St.
57th St.
79th St.
86t h St
96th St.
116th St.
York Ave.
Worth St.
SouthFerryWater St. E. Broadway
Park Row
M31
M15
BroadwayKiosk
Video Monitor
VMS
M57
M31
6 7t h St .
Figure-1 Potential Site Locationsfor VMSs, Monitors and Kiosks
Updated June 1998
12
3
4
5
6
7
8
9
10
11
12
13
14
15
16
17
18
19 20
21 22
2324 25
26
27
2829 30
31
32
33 34
Figure 2-15. Potential Site Locations for VMS’s, Monitors, and Kiosks
2-77

FLEET MANAGEMENT
The wireline solution was estimated to have $15,000 in monthly charges compared to just over
$1,000 for the wireless system. The wireline solution is much more expensive because 30 leased
lines cost much more than a single high capacity line between NYCT’s communication server and
Bell Atlantic Mobile’s network, and there are relatively low airtime charges for each of the 30 display
units.
NYCT could have chosen to send information directly from its operation center to its CIS signs by
installing CDPD modems on its end and bypassing the Bell Atlantic center. The agency decided not
to take this approach because the data rate would have been much lower. Airtime costs, if figured on
a per kilobyte plan like Community Transit, would have doubled since NYCT would be charged for
each message sent over the airwaves versus over the single high capacity data line. 59
NYCT Comm. Tower
BAM R
ITS Server e
e
BA Frame
D NYCT Radio 130 Livingston Plaza
Printer Printer
ITS Equipment
Firewall
NYCT Network
Bay Network Router
Comm. System AVLC Server
NYCT Radio Transmission ENY CC
AVLC Equipment
2-78
FIEL
Transmission
AVL EquippedBus
outer
BAM CDPD
CDPD Modem
BAM Network
Relay
System Consol
System Consol
ITS Comm.System
Modem

FLEET MANAGEMENT
Atlanta, Georgia The Metropolitan At
communications syste
way by partnering wit
started in 1993, was t
agency with a suffici
installations.59
59 Rick Watts, Chief of C
Figure 2-16. NYC CDPD Architecture
lanta Rapid Transit Authority (MARTA) enhanced the operation of its
m through the installation of a fiber optic network along its entire rail right-of-
h private telecommunications firms. The goal of this project, which was first
o replace the aging copper cable communications backbone and provide the
ent quantity of communications bandwidth for both current and future ITS
2-79
ommunications, Metropolitan Atlanta Rapid Transit Authority, Atlanta, Georgia.

FLEET MANAGEMENT
MARTA negotiated and completed three separate contracts that resulted in its owning about 75 miles
of fiber optic cable. The first agreement, completed in 1996, called for MCI to pull fiber optic cable
through existing conduit. The installation included three inner ducts. Since only two inner ducts
were actually needed – one for MARTA’s cable and the other for MCI's – MARTA now has a spare.
It can serve as a back-up through which temporary cable can be pulled during an emergency; it can be
used to pull additional cable for the agency’s own use; or it can be leased to another company or
organization. The arrangement with MCI involved no exchange of money – the key factor in the
arrangement was that a conduit already existed.
The second phase, contracted to VYVX, extended the fiber optic backbone to all parts of MARTA’s
rail right-of-way and increased the capacity of the first phase system. This agreement was similar to
the MCI agreement. A key element of the second phase, completed in 1998, was the installation of
100 foot cable loops for future drops at all 36 train control rooms. This feature was planned
specifically to support phase 3 of the project.
Phase 3, contracted to MCI, involves installing the cable drops and splice cabinets inside each train
control room. Once completed, MARTA will be able to undertake phase 4, which will install the
synchronous optical network equipment needed to make final connections with its communications
and supervisory and control systems.
MARTA will benefit in many ways from this project. First, MARTA has obtained over $5 million in
equipment and services through its agreements. Second, all of its telephony systems will move to the
fiber network and allow ample capacity for growth. Finally, the agency will be able to move
communication for its supervisory and control system onto the network and integrate it with the train
control system.
MARTA now has the capacity to support many ITS systems, such as bandwidth-intensive closed-
circuit television for train operation and/or customer security. It is even considering using the fiber as
a wireline backbone for its rail radio communications system, affording the agency more flexibility in
future radio system design. The agency also has sufficient bandwidth available to consider leasing
2-80

FLEET MANAGEMENT
fiber capacity to help pay for its investment. One estimate suggests that MARTA can earn $1 million
per year with the network.60
2.4 GEOGRAPHIC INFORMATION SYSTEMS
Implementation of a Geographic Information System (GIS) provides an extremely powerful tool to
assist transit operators in developing the necessary data to make operations and investment decisions.
Data generated from GIS on “who needs to get from where to where, and when” is documented.
With this information, routes, schedules, fares, and infrastructure can be efficiently established and
timely modifications and adjustments made.
Technology Description
GIS provides a current, spatial, interactive visual representation of transit operations. It is a type of
computerized database management system in which geographic databases are related to one another
via a common set of location coordinates. This allows users to make queries and selections of
database records based on geographic proximity and attributes. It is most often used for:
�� Transportation planning and modeling; �� Demographic analysis; �� Route planning, analysis, and restructuring; �� Bus dispatch and scheduling; �� Bus stop and facility inventory; �� Ridership analysis; �� Automatic vehicle location and tracking; �� Fixed guideway facility management; �� Paratransit scheduling and routing; and �� Accident reporting and analysis.
For example, GIS can provide traveler information systems with origin to destination instructions.
Travelers enter information on where they are and where they want to go at a kiosk at a transit center
or on the Internet, and GIS will provide them the best route. GIS can also be used to do bus service
planning.
Another example of GIS capability was produced by the Geographics Lab, Moakley Center for
Technological Applications, Bridgewater State College. They developed a database for all bus
systems in the country, both inter- and intra-state, under a contract from the Federal Transit 60 ITS America APTS Quarterly, Winter 1999, page 2.
2-81
FLEET MANAGEMENT
Administration. This database contains routes, schedules, levels of service and service areas. The
service area data also includes information on paratransit services. The level of service data is listed
in terms of peak am, mid-day, and pm wait times. In addition to these databases two GIS
performance measures have been developed for the entire country. The first is a measure of the
population density within a 3/4 mile buffer around the routes and the second is a listing of all routes
that have a 15-minute, or less, wait time for a bus at mid-day, with the population served within 1/4
mile of the routes.61
Status: State-of-the-Art
There have been major GIS innovations in the areas of AVL equipment and integrated
communications. In both of these applications, the GIS provides the underlying display and analysis
tools for total transit integration. Whereas a basic GIS application provides significant improvement
in the ability to see and understand an entire fixed route transit system, the integration of AVL and
communications makes the system dynamic and a fully functional tool in planning, scheduling, and
dispatching.
In addition, GIS development has progressed from the “project” to the “enterprise” level. At the
project level, individual local or state governmental agencies developed their own GIS for their
specific needs. As other agencies became aware of GIS capabilities, they developed systems tailored
to fit their specific needs. The result was redundant systems that often could not even share data.
With the advent of enterprise-level GIS, separate agencies pool their needs and share their data in
order to develop an integrated comprehensive system that meets the needs of each agency, and
assures that each application is working from the same baseline data.
In sum, in the past couple of years, the use of GIS by Federal, state, and local governments has
become widespread throughout the country. Overall, the major advances in the application of GIS to
public transportation lies in the number of local and state agencies now using GIS (rather than in
61 Lawrence Harman, Director, Geographics Lab, Moakley Center for Technological Applications,
Bridgewater State College, Bridgewater, Massachusetts.
2-82

FLEET MANAGEMENT
particularly innovative designs), the trend toward enterprise level applications, and the number of
transit agencies working with state and local departments of human services to implement GIS into
planning for the welfare-to-work requirements.
Challenges to Implementation
It is certain that as computing and telecommunications power increases and precise spatial data
becomes more available, the use and influence of GIS in the management of public transportation
systems will increase. However, there are still some technical issues that are being addressed. For
instance, in the recent past, base maps had to be custom designed by the agency’s vendor and then
plotted with geo-coded references. This process could result in incorrect plotting and thus incorrect
geographical information. Presently, this difficulty has been lessened since agencies can buy already
designed and plotted databases.
Application Examples
One important example of GIS implementation is the recent changes in Federal welfare legislation in
response to the “Welfare-to-Work” program. Welfare agencies across the country, in cooperation
with public transportation authorities, have implemented GIS to analyze and schedule transportation
services between eligible participants and potential jobs.
The difficulty for social service organizations within a state and particularly in metropolitan areas is
matching jobs to job applicants. Traditionally, when job placement agencies get a job for one of their
applicants, the only criterion for assignment has been the suitability of the person to the job. With the
new laws, and the increase in resulting case loads, it has become incumbent on the agencies to
maximize the efficiency of the system by minimizing travel to the prospective job. The individual
getting off welfare will only be able to organize job and other activities in an adequate manner if
transportation to and from the job, perhaps along with intermediate stops at a day care center or a
grocery store, can be made as easy as reasonably possible.
The implementation of GIS to graphically represent the locations of jobs, welfare recipient
residences, day care centers, and transportation services provides a unique and powerful method for
streamlining and optimizing the entire welfare recipient job placement process.
Other examples of GIS include:
2-83

FLEET MANAGEMENT
�� New Jersey’s GIS analysis program. �� New York State’s GIS projects. �� Detroit, Michigan’s GIS software. �� Ann Arbor, Michigan’s Advanced Operating System with GIS. �� California’s integration of APC, MDT, and AVL subsystems into a Web-based
public information system.
New Jersey
New Jersey’s Department of Human Services (DHS) is using GIS analysis to help local communities
determine the most effective and efficient means of moving Work First New Jersey (WFNJ)
recipients to work. (The New Jersey approach represents the general approach taken by hundreds of
local and state organizations around the country to implement the new Federal welfare regulations.)
GIS analysis software plots data, such as the addresses of WFNJ recipients, child care providers,
work activity sites, employers with job openings, and public transit routes and schedules, on an
electronic map. A recent study by Rutgers University indicates that approximately 94 percent of all
WFNJ participants, 90 percent of DHS contracted training centers, 79 percent of licensed center-
based child care, 77 percent of registered family day care homes, and 85 percent of employers in the
study area are within a half mile of fixed route public transit.62
New York State
The New York State Department of Transportation (NYSDOT) administers a $1.4 billion State
Transit Operating Assistance annual program and a Transit Capital Program that provides 10 percent
matching funds to Federal monies for transit capital projects. Out of this sum, NYSDOT coordinates
the development of GIS applications for public transit throughout the state. The use of GIS began in
the early 1980s with a program to track traffic accident locations and has since expanded to cover
transportation applications including The Transit Market Research Data Package, bus route and stop
databases, Welfare-to-Work applications, Southern Tier Bus Network prototype, and GIS-Based
Schedule Data Maintenance. The basic GIS software for NYSDOT is ArcViewTM.
One of the specific GIS applications, the “Journey-to-Work Tool,” provides the user with a simple
means of determining travel patterns within or between specific locales. This tool can be extremely
helpful to transit operators and metropolitan planning organizations in evaluating travel patterns for
modification of existing transit routes or in developing new ones. Figure 2-17 shows an example of a
GIS representation of the number of bus trips from a particular locale to White Plains, New York.
2-84

FLEET MANAGEMENT
The data source is Census information by transportation analysis zone (TAZ) from the Census
Transportation Planning Package.
A SIGNIFICANT GIS-BASED PROJECT UNDER DEVELOPMENT IS CALLED “I-TRAVEL.” THIS PROJECT IS ONE OF A SERIES OF FEDERALLY FUNDED PROJECTS UNDER THE ITS PROGRAM WHICH PROVIDES MONIES FOR PUBLIC AND PRIVATE SECTOR PARTNERSHIPS TO DEMONSTRATE AND SHOWCASE MODEL DEPLOYMENTS OF FULLY INTEGRATED, METROPOLITAN-AREA INTELLIGENT TRANSPORTATION INFRASTRUCTURES. THE MODEL DEPLOYMENTS WILL SHOW THE BENEFITS OF INTEGRATED TRANSPORTATION MANAGEMENT SYSTEMS THAT FEATURE A STRONG REGIONAL, MULTIMODAL TRAVELER INFORMATION SERVICES COMPONENT.
Figure 2-17. Journey-to-Work Bus Trips Destined for White Plains
“I-Travel,” is a public Internet-based travel itinerary system that serves 27 counties and 50 transit
operators in the New York/Connecticut/New Jersey metropolitan area. When this system becomes
operational sometime next year, a public transit user will be able to enter any destination/origin
within the i-Travel service area into the Transit Itinerary Planning System and receive detailed travel
itinerary information.
2-85
62 http://www.esri.com/community

FLEET MANAGEMENT
2-86

FLEET MANAGEMENT
Utilizing the TRANSTAR63 itinerary planning system developed by the Southern California
Association of Governments, i-Travel enables the user to obtain timely geographically-referenced
information concerning the most efficient route of travel. The information may be based upon any
number of user-specified preferences such as minimizing travel time, transfers or changeovers, or
walking distance.
Implementation of such an extensive system required a substantial amount of data collection,
geocoding, processing and continuous maintenance (updating). To facilitate these activities, the
NYSDOT and Northeast Consultants (NEC), its lead contractor, developed an effective user friendly
GIS for transit operators to efficiently maintain and standardize these data utilizing editing tools
within an ArcViewTM and Microsoft AccessTM Database environment. The day-to-day maintenance
operations impetus necessitated standardization of data within the transit operator community; thus,
with the development of the Transit Communications Interface Profiles64 (TCIP) standard
documentation, the NEC-developed database utilizes only transit data based upon this standard
documentation. Each transit operator is then able to edit and correct schedule data with the user-
friendly GIS tools developed by NYSDOT.65
Detroit, Michigan
Recent high public demand for information concerning arrival times, routing, and scheduling of
accessible buses has persuaded the Detroit Department of Transportation (DDOT) to focus its
resources on further refinement of its Advanced Public Transportation System. The refocusing of
some APTS initiatives is being accomplished by employing more advanced software to deliver
information and service to its customers more efficiently.
63 The TRANSTAR system algorithm utilizes geo-referenced schedule data to generate optimum itineraries by
such preferences as shortest travel time, fewest transfers or minimal walking. Implementing this system has required collecting and geocoding diversely formatted data for 50 transit operators in the 27 county area. Data formats run the spectrum from hard copy public timetables, to DOS spreadsheets, to sophisticated scheduling and run-cutting software output.
64 TCIP is a suite of data interface standards for the transit industry. The TCIP Project is sponsored by the Institute of Transportation Engineers and funded by the U.S. Department of Transportation's Joint Program Office for ITS. Phase 1 was completed in 1999, and established a transit ITS data interface "Framework" and eight “Business Area Object Standards.” In Phase 2, the Project Team will build on the work of Phase 1 by developing the transaction sets, application profiles and guidebooks required to test and implement TCIP. (http://www.tcip.org)
65 Davis, Jim, William Telovsky, and Thomas Vaughan, Building Applications to Support the Effective Use of GIS, New York State Department of Transportation, 1999.
2-87

FLEET MANAGEMENT
First initiated in 1997, DDOT’s Automated Travel Information Management System (ATIMS) is a
tool for technical support, transit planning, and marketing operations. .Its goals are to develop
computer-based analysis tools for decision and project support, ranging from service reliability
analysis to evaluation of service changes. At the core of ATIMS’ mapping and analysis operations is
Caliper Corporation’s TransCadTM GIS software, which is used to compare actual arrival time versus
scheduled arrival time.
Future APTS plans include GPS-based AVL, mobile data terminals, automated passenger counters,
and in-vehicle annunciators. As these subsystems are implemented, they will be incorporated in the
GIS to provide information that can be related to particular locations on the various routes. These
devices will further DDOT’s knowledge of route and stop demand and ADA compliance
requirements, as well as serve as a data source for its paratransit operations.66
Ann Arbor, Michigan
The Ann Arbor Transportation Authority’s Advanced Operating System (AOS), uses GIS as a major
analysis and display platform for providing service for about 30 bus routes and paratransit operations
for Ann Arbor, Ypsilanti and surrounding areas. With initial funding from the U.S. Congress, the
AOS integrates communication, operation, and maintenance for a public transit system of more than
80 buses and maintains communications with area paratransit services. Each bus is equipped with a
radio, onboard computer, a graphical MDT, differential GPS equipment, a vehicle component
monitoring system, an automated passenger counter, an electronic fare collection system, and an
onboard en-route information system.
The system-wide bus network is represented on three basic GIS map databases. The major operating
system is run on a custom GIS (Mapmaster™) developed by Siemens. Additional mapping and
scheduling routines make use of TransCAD™, and a paratransit routine developed by Trapeze
Software Group. This extensive GIS capability provides the Operations Center with the ability to
evaluate the performance of the entire system in real time, to assess ridership patterns, and to make
adjustments based on traffic, special events, or bus breakdowns or accidents.67
66 April Lee, Transportation Planner, Southeast Michigan Council of Governments, Detroit, Michigan. 67 William Hiller, op. cit.
2-88

FLEET MANAGEMENT
California
GIS applications in public transit in the State of California represent an elaborate instance of
enterprise-level development. The California Smart Traveler program is being developed as a
statewide umbrella transit information, planning and operations system. Funding for this extensive
program is from the FHWA, FTA, and state sources. Its goal is to provide accurate, timely
information to the public on local, regional and state transportation services. When fully
implemented, the California Smart Traveler program will coordinate local, regional and statewide
traveler assistance programs in order to assure that commuters, travelers, or anyone wishing
information on traveling in California where these services exist, will have access to up-to-date
information in a common format. The system will integrate various forms of APC, MDT, and AVL
subsystems into a statewide, integrated Web-based public information system. The basic GIS used to
integrate these systems is ArcInfoTM, developed by ESRI Inc. In addition, custom GIS software has
been developed to assist in data integration. The current status of all transit properties can be
monitored and ridership trends can easily be evaluated. The system is designed so that as individual
transit system programs are developed or upgraded, a common set of underlying base databases will
be used. Through such enterprise applications, the public, state, and local transit agencies all will be
assured of using the same data for planning, analysis, and information processing.68 69
2.5 AUTOMATIC PASSENGER COUNTERS
As the name suggests, Automatic Passenger Counters (APC) are devices for counting passengers
automatically as they board and as they alight buses at each stop along a route. The benefits of APCs
come both in a reduced cost to collect ridership information and in an increase in the amount and
quality of the information gathered. APCs reduce or eliminate the need for manual checkers.
Further, by equipping 10 percent of the vehicles in the fleet, around 10 percent of the trips can be
sampled in a given year, a much greater number than any agency samples with manual checkers.
Also, the automatic equipment and is less likely to miscount passengers at busy stops.
68 http://www.urisa/abstracts/agencywidetransit.htm 69 Vickie Cobb, California Department of Transportation, Division of New Technology and Research,
Sacramento, California.
2-89

FLEET MANAGEMENT
APC systems have been in operation for about 20 years. APCs rely on location information to
maximize their benefits. The first systems came into use when AVL systems were rare, so nearly all
of the older systems needed their own location technology: probably either signpost and odometer, or
dead-reckoning. Since computer technology was far less advanced, all of the first systems used
removable media and manual downloading. These factors made the pioneering systems relatively
expensive (between $4,000 and $12,000 per vehicle) to buy, install, operate, and maintain, both
because of the need for some form of AVL, and because of the manual downloading required. The
older storage media and downloading techniques also were less reliable and more prone to data loss.
Technology Description
APCs typically use one of two counting technologies, either treadle mats or infrared beams. Treadle
mats, placed on the steps of the bus, register passengers as they step on a mat, and infrared beams
(mounted either horizontally or vertically), directed across the path of boarding and alighting
passengers, register riders when they break the beam. Typically, two mats or two beams are put in
succession, so that a boarding passenger triggers them in a different order than does an alighting one,
allowing the APC to distinguish between boardings and alightings. Other counting technologies are
being developed, such as those employing computer imaging.
An electronic record is created at each bus stop, typically including the following information: stop
location; date and time of bus stopping; time of doors opening and closing; number of passengers
boarding; and number of passengers alighting. These records are grouped by trip, and usually held in
storage on the vehicle for a time, until they are downloaded to a central facility for further processing
and use. Location typically is determined using one of the technologies described in Section 2.1 -
Automatic Vehicle Location Systems. Either the APC system is linked to an operational AVL system
employed by the same agency, or the APC system has its own location equipment, using one of the
technologies covered in Table 2-1.
The means of storing APC data on board the bus varies. Older APC installations tend to depend on
floppy disks or even cassette tapes. Newer systems make use of the cheaper, faster, and higher
capacity computer memory chips. Similarly, older APC installations might rely on physically
transferring the diskette or tape to transfer the data. Newer systems will either download the data
once a day via short-range microwave link when the vehicle comes back to the garage or in real time
over dedicated radio frequencies.
2-90

FLEET MANAGEMENT
Status: State-of-the-Art
An APC system procured now is frequently purchased as an add-on to an AVL system. Further, the
storage media used has more capacity than several years ago, and the downloading is automatic.
These factors can bring the cost of APCs down to around $1,000 - $1,200 per bus. Since only a
subset of the vehicles need to be equipped with APCs, it could cost as little as $15,000 to equip ten
percent of a 150-vehicle fleet, or less than the cost of one human counter for a single year, the
purchase of hand-held counters, and entering the manually collected data into a database. These
economics make APCs a very attractive option.
Challenges to Implementation
In the past, the cost of APC units was a deterrent to procurement and installation. With the cost now
in the neighborhood of $1,000 to $1,200 per bus if included in an AVL installation, this is less of an
obstacle. The cost of an APC without an AVL system will be more and may still be an impediment.
Some agencies may perceive that the accuracy of APCs is less than desired. Other agencies may not
feel they need APCs since registering fareboxes will give them ridership information. The vast
amounts of data APCs produce may exceed some agencies’ capabilities to use effectively. APCs
eliminate the need for manual checkers, but some agencies may not be able to eliminate these
positions or reassign the personnel to other duties.
Some of these impediments remain legitimate concerns. However, indications are that APCs are
more accurate than manual counts. Additionally, registering fareboxes will not provide boardings and
alightings by stop, information which some agencies use in their planning and scheduling of bus
routes.
Application Examples
The following are examples of APCs in use or under development.
�� Columbus, Ohio’s APC system. �� Atlanta, Georgia’s APCs on AVL-equipped buses. �� Portland, Oregon’s infrared beam APC system. �� Seattle, Washington’s new video-image counting technology. �� Baltimore, Maryland’s APC with DGPS AVL system. �� Newark, New Jersey’s APC procurement.
2-91
FLEET MANAGEMENT
Columbus, Ohio
The Central Ohio Transit Authority has had operational APCs since 1984, when it acquired 37 units,
enough to equip about 10 percent of their fleet, from Urban Transportation Associates for $171,000,
(about $4,600/bus). In 1996, COTA replaced the old tape drives with diskette drives in order to
improve reliability of data transfer and to increase data storage capacity. The agency was quite
pleased with the system, citing 95 percent accuracy of the counts, and the fact that no driver input was
required to make the system work.70
In July 1999, COTA awarded a contract to Orbital for a DGPS AVL system covering their entire fleet
(see Section 2.1). Part of the $6.3 million cost (for entire fleet AVL, APCs, and 800 MHz radio)
included 30 APCs, to be installed on fixed-route vehicles. The APCs will count passengers using
vertically pointed infrared beams mounted in the roof of the vehicle. The count data will be
transmitted to dispatch in real time, along with the AVL data and will be used for planning and to
improve schedules, as before. COTA expects installation to be complete in Spring of 2000 and final
acceptance by the end of 2000.
This upgrade represents a substantial improvement over the old system - which used signposts for
location, regular horizontal infrared beams for counting, and manual transfer of data on floppy disks.
It is anticipated that the new system will be much more robust and reliable.71
Atlanta, Georgia
As part of its integrated APTS bus management system (provided by Orbital Sciences Corporation72
and TRW at a cost of $20 million for the whole system), the Metropolitan Atlanta Rapid Transit
Authority has purchased and installed 74 APCs on AVL-equipped buses. MARTA also is in the
process of procuring another 40 APCs for their smaller (25-30 foot) buses. Data transmission was
originally in real time over the dedicated radio link used by the AVL. However, MARTA found that
this transmission method used 64 percent of the overall radio capacity. In an effort to save bandwidth
for more important uses, MARTA is investigating other ways of downloading the data, including via
diskette at the same time the data is retrieved from the registering farebox.
70 Robert F. Casey, et. al., Advanced Public Transportation Systems - The State-of-the-Art Update ’98, op. cit. 71 Kaled Shammout, Central Ohio Transit Authority. Columbus, Ohio. 72 Originally provided by Transportation Management Solutions, which was purchased by Orbital Sciences
Corporation.
2-92

FLEET MANAGEMENT
THE APC DATA ARE USED TO GENERATE A NUMBER OF REPORTS AND ANALYSES. THESE REPORTS ARE CONSIDERED VERY HELPFUL IN NOT ONLY MEASURING THE EFFICIENCY AND EFFECTIVENESS OF THE SERVICE, BUT ALSO FOR MAKING CHANGES TO THE SERVICE TO IMPROVE THESE MEASURES. MARTA FEELS THE DATA ARE 80 TO 85 PERCENT ACCURATE, MUCH BETTER THAN THE DATA THEY RECEIVED BEFORE APCS. HOWEVER, MARTA DOES NOT FEEL THAT APCS SHOULD REPLACE HUMAN CHECKERS, AND HAS NOT DECREASED THE NUMBER OF HUMAN CHECKERS THEY EMPLOY.
MARTA notes that APCs are the most difficult to maintain of the APTS technologies in the project.
Although the agency has 74 buses equipped with APCs, MARTA estimates that 60 of these are in
operation on any given day, and only about 40 of those are providing “good” data. Among the
biggest sources of maintenance issues are difficulties in data transfer and vibration from the bus,
especially in conjunction with loose connections. In spite of these maintenance problems, MARTA
claims to have used the AVL/APC data to make service changes that saved them $1.5 million in
operating expenses in a year.
MARTA staff feel that APCs can help them move from manual to automated processes of service
restoration and to move from reactive to advanced planning approaches to best use the data. They
stated that it is important to involve the users from the beginning, both so that the best system for the
job is purchased, and so that there is buy-in by the users. Finally, MARTA notes that there is a
learning curve regarding the data itself. It takes time to be able to distinguish relevant data from non-
relevant information.73
Portland, Oregon
The Tri-County Metropolitan Transportation District of Oregon acquired their old APCs from Red
Pine Instruments in 1982 for about $4,500 per bus. At that time, Tri-Met had no AVL, so the APCs
were a separate system. Position was calculated from the current time and a knowledge of the
schedule. As part of its Bus Dispatch System (see Section 2.1), Tri-Met now operates horizontal
infrared beam automatic passenger counters on about 55 percent of their buses and plans to raise that
total to 100 percent over time. This high percentage is not only due to the utility of the information
received, but also to the relatively low cost of existing technology (only about $1,000 per bus). 73 Evaluation of the Metropolitan Atlanta Rapid Transit Authority Intelligent Transportation System,
Multisystems, Inc., for the Volpe National Transportation Systems Center and Federal Transit Administration,
2-93

FLEET MANAGEMENT
APC data are stored on the bus in a PCMCIA card and transferred by physically removing the card.
The PCMCIA cards are programmed with the schedule and any special instructions necessary for that
time period for each bus. The uses and benefits of the APCs are heavily integrated with the AVL
system. Tri-Met is using the APC data, together with the AVL data, to adjust schedules and route
segment run times.74
Seattle, Washington
The King County Department of Transportation (Metro) has operated their APCs since 1980. The
original system was purchased from Pachena and London Mat at a cost of between $10,000 and
$12,000 per bus. Location was determined from a dedicated network of signposts, and counts were
determined by treadle mats. Metro implemented a full-scale signpost and odometer AVL system in
1993 and linked the APC system to the AVL system a few years later.
Currently, Metro is replacing all their APCs and increasing the overall number to 200, which will
bring the percentage of APC-equipped buses from 12 percent to 15 percent. The agency hopes that a
new video-imaging counting technology (with a mat-based technology for back-up) will be available
and affordable for this installation, scheduled to start around January 2000. The estimated cost per
bus for mats is $1,200, only about one-tenth of the price (not-adjusted-for-inflation) nearly 20 years
ago, and the agency hopes that video imaging will cost about the same amount.
Metro uses the APCs to collect very detailed ridership information at the system, route, trip, and stop
levels. They use the information for service planning and National Transit Database reporting. They
see great benefit in the detail of data they would not otherwise have, citing that each run with an APC
is equivalent to a ride check, but much more cost-effective.75
Baltimore, Maryland
As part of its DGPS AVL system (see Section 2.1), the Maryland Mass Transit Administration
(MTA) has operated APCs on 25 of its buses since 1997. The units were acquired from Urban
Transportation Associates, and count passengers using horizontal infrared beams. Data are
transmitted via radio link whenever an APC is at a garage, or whenever the on-board storage becomes
U.S. Department of Transportation DRAFT, October 15, 1999.
74 Ken Turner, op. cit. 75 Tom Friedman, King County Department of Transportation, Seattle, Washington.
2-94

FLEET MANAGEMENT
full. The data processing software has not yet been installed, but MTA is expecting it to be
operational soon. Once the software is running, MTA plans to use the APC data to help them provide
more efficient service and to ensure that the service they operate is most effectively serving the
demand. MTA plans to include 75 more APCs in the next procurement, if the funding is approved, in
order to have more than 10 percent of the fleet equipped.76
Newark, New Jersey
New Jersey Transit is in the initial stages of procuring APCs for 170 buses from Orbital as part of
their AVL system (see Section 2.1). The agency has experimented with three “pre-prototype” leased
units. The first two prototypes arrived by October 1999. These first units count passengers by
infrared beams, but NJT is looking at a number of technologies for the actual installation. Data
transmission is to be via wireless (short-range) download, when the bus reaches the garage. The
agency expects to go from these two prototypes to ten in one garage to the full 170 by September
2000. APCs will help NJT to generate a greater and more accurate data to help them better
understand ridership and fine-tune market research.77
2.6 TRAFFIC SIGNAL PRIORITY
Traffic signal priority is a strategy by which a particular set of vehicles is given preference at traffic
signals, either anytime they arrive at the intersection or only under certain conditions (e.g., on-time
status, amount of traffic at opposing approaches). Although a transit vehicle does not warrant the
same urgency as emergency vehicles, which always have priority, there are benefits to giving a bus
priority at a traffic signal under the right conditions. The overall goal should be maximizing the
number of people per hour through the intersection, rather than maximizing the number of vehicles.
Giving buses preference at traffic signals would help achieve that goal.
83.David Hill, Maryland Mass transit Administration, Baltimore, Maryland. 77 Jim Kemp, op. cit.
2-95

FLEET MANAGEMENT
Technology Description
To activate traffic signal priority for buses, a signal (via a sonic or optical pulse) is transmitted from
the bus to the traffic signal controller. Depending upon the phase the traffic signal is in, the controller
will either extend the current green phase or advance the timing of the next green phase. This allows
the bus to pass through the intersection with minimum delay.
Status: State-of-the-Art TRANSIT VEHICLES HAVE BEEN GIVEN PRIORITY AT TRAFFIC SIGNALS FOR A LONG TIME. IN THE EARLY SYSTEMS, THE BUS TRANSMITTED A REQUEST DIRECTLY TO THE TRAFFIC SIGNAL, AND PRIORITY WAS GIVEN. THE REQUEST WAS EITHER AUTOMATIC OR, IN SOME CASES, TOTALLY AT THE DISCRETION OF THE DRIVER. THERE WAS NO WAY TO CONTROL THE GRANTING OF PRIORITY, BASED ON TRANSIT CONCERNS SUCH AS THE VEHICLE’S ON-TIME STATUS OR ITS OCCUPANCY LEVEL, WITHOUT RELYING ON THE DRIVER. HOWEVER, IF INDUCTIVE LOOP DETECTORS (AVAILABLE SINCE THE MID-1960S) WERE PLACED AT THE INTERSECTION, THE GRANTING OF TRANSIT VEHICLE PRIORITY COULD BE MODIFIED IN RESPONSE TO TRAFFIC CONCERNS, SUCH AS THE NUMBER OF CARS WAITING AT THE OTHER APPROACHES.
Modern traffic signal priority systems take advantage of other APTS technologies, such as AVL and
CAD. With AVL and CAD, a vehicle’s on-time status is easily and quickly determined. Using
wireless communications, this request can be transmitted directly from vehicle to traffic signal, or
from vehicle to dispatch to traffic control to traffic signal (see Figure 2-18 and Figure 2-19).78
Further, if real-time APC data are used, then the request for priority also could be accepted or rejected
based on the number of passengers on the bus.
Figure 2-18. Transponder Tag on Bus
78 Bus Signal Priority Project – Draft Literature Survey Technical ty MTA – PB Farradyne Inc.
Memorandum, Los Angeles Coun Figure 2-19. Signal Priority Antenna on Pole
2-96

FLEET MANAGEMENT
Table 2-2 lists traffic signal priority applications, as gathered in an extensive literature survey by the
Los Angeles MTA and their contractor, PB Farradyne, Inc.79 The table shows that there have been a
number of tests of traffic signal priority over the last several years. It lists 24 installations in the
United States by 19 different transit operators, cities, counties, and state DOTs. However, many of
these tests are finished and have not led to regular operational systems.
Challenges to Implementation
THERE ARE CHALLENGES TO IMPLEMENTING TRAFFIC SIGNAL PRIORITY. TRAFFIC SIGNAL PRIORITY ALMOST ALWAYS REQUIRES COOPERATION BETWEEN THE TRANSIT AUTHORITY AND THE GOVERNMENTAL AGENCY IN CHARGE OF TRAFFIC. THIS MEANS COORDINATING TWO POTENTIALLY DIFFERENT PHILOSOPHIES, ONE OF WHICH MIGHT HOLD TO THE PRINCIPLE OF MAXIMIZING VEHICLE THROUGHPUT RATHER THAN PEOPLE THROUGHPUT. Another issue is whether or not to grant priority to an approaching bus. If a bus is running early, it
does not make sense to expedite its travel through the intersection. However, granting priority to
every approaching bus would shorten route travel times, thereby allowing the agency to change
schedules and perhaps, reduce the numbers of buses required to provide service. The challenge is to
achieve this reduced running time without seriously impacting the flow of other traffic.
Application Examples The following are brief descriptions of Traffic Signal Priority Systems.
�� Atlanta, Georgia’s Signal Priority Control System. �� Seattle, Washington’s Traffic Signal Priority System. �� Columbus, Ohio’s Traffic Signal Priority System. �� Portland, Oregon’s Traffic Signal Priority System. �� New Jersey’s “queue jumping” System.
79 This table is adapted from the table that is Appendix A of the report Signal Priority - Benefits for Transit,
King County Department of Transportation, Metro Transit Division, August 25, 1999.
2-97

Table 2-2. Traffic Signal Priority Installations and Tests
2-78
Agency Site/Project Name
Start End
Length (Mi)
# Buses
# Int.
System Type
Lessons Learned
Phoenix Transit, Phoenix, AZ
Advanced Bus Detection Project
1996 1997
6 10 6 Optical(Opticom)
Green extension and shortening of phases was used to provide priority. Opticom bus emitter requested priority constantly during test. Reduced red light delay by 16 percent but overall trip times were not reduced because buses dragged in order to maintain operating schedules. Impact on cross traffic was judged to be minimal. Net cost/benefit ratio positive.
LA DOT, Los Angeles, CA
Ventura Boulevard Pilot Project
1999 2000
200 36 RF(LoopCom)
On-time status to be determined from transit agency supplied schedule data. Priority algorithm will permit 10 percent green extension. Initial testing underway. Includes Transit Priority Manager (TPM) operational at ATSAC. TPM validates bus number against daily coach run assignments and makes determination when and how many priority green seconds to be provided.
Napa, CA 1993 18 Optical INFO
(Opticom)
Initial system required that bus operator activate request for priority. INFO system deployed system wide with decision to request priority based on bus schedule adherence.
Sonoma County, CA
Rohnert Park 1997 (on-going)
6 24 RF(Emtrac)
No published reports.
AC Transit & City of Union City, CA
1999 (on-going)
10 20 Optical(Opticom)
Opticom emitters to be used in conjunction with UTA on-bus DGPS/passenger counter systems. Project in the design phase; installation scheduled for August 1999. The project has been delayed due to contract-related issues.
Orlando, FL 1997 1998
5 Optical INFO
(Opticom)
System determines request based on schedule adherence. INFO system being used but not for signal priority at this time. Problem encountered with bus emitters activating emergency vehicle preemption.

FLEET MANAGEMENT
Table 2-2. Traffic Signal Priority Installations and Tests (Cont.)
2-75
Agency Site/Project Name
Start End
Length (Mi)
# Buses
# Int.
System Type
Lessons Learned
MARTA Atlanta, GA
(on-going)
25 17 Optical (Opticom)
Initial test conducted in Summer 1999. Test yielded time savings in both inbound (41.8 minutes to 28 minutes) and outbound directions (33.1 minutes to 27.5 minutes). More extensive test scheduled for Fall 1999, with a control period afterward.
Illinois DOT
Cermack Road Demonstration Project
1997 (on-
going)
2.5 75 15 RF (LoopCom)
Uses early green or green extension strategy. Check out loops provided at far side of intersection. Firmware modified. Running time was reduced by estimated one minute due to bus priority but overall reduction of 2-3 minutes as combined result of signal priority and traffic signal synchronization. Reported modest reduction in through automobile traffic delays and moderate increase in cross-street traffic delays.
Anne Arundel County, MD
1992 1992
12 14 Optical (Opticom)
Required that bus operator activate switch to request priority. An estimate of 10 minutes savings was reported on a 52 minute one way trip. Side street traffic was estimated to be delayed between 30 to 60 seconds under worst case scenarios.
Montgomery County, MD
Orbital Sciences AVL System
(on-going)
250 GPS (OrbTrac)
Under development. On-bus processor generates request for priority; traffic manager reviews scenario and grants/ denies priority request based on traffic conditions.
Metro Transit Minneapolis-St Paul, MN
Arcade Street Test
1993 1993
1 8 Optical (Opticom)
Measured average reduction of nine seconds in time spent waiting for red signal. Problem with emitter activating preemption in Ramsey County; project was discontinued.

FLEET MANAGEMENT
2-75
Metro Transit Minneapolis-St Paul, MN
Louisiana Street 1996 1997
Many 3 Optical (Opticom)
Investigated advance bus detection using Opticom system and providing priority for buses making left turns. No evaluation available.

FLEET MANAGEMENT
Table 2-2. Traffic Signal Priority Installations and Tests (Cont.)
2-75
Agency Site/Project Name
Start End
Length (Mi)
# Buses
# Int.
System Type Lessons Learned
Metro Transit Minneapolis-St Paul, MN
Lake Street Demonstration Project
(on-going)
123 20 Optical INFO
(Opticom)
Project delayed due to difficulties with bus emitters triggering emergency vehicle preemption at intersections; investigating INFO modifications so that emitters are only activated for Lake Street coach runs.
City of Charlotte, NC
1985 (on-
going)
6 (ex-press only)
14 Optical (Opticom)
Opticom priority system used on express buses, AM inbound and PM outbound. Signal phase skipping was not permitted. Reduced average travel time 4 minutes. Traffic controller processed requests for priority during peak periods only.
Hickory, NC 1999 6 100 Optical (Strobecom)
System installed as part of traffic signal system upgrade. All buses to be given priority. Using green extension control strategy. Evaluation not available.
Tri-Met Portland, OR
Powell Boulevard
2 75 4 RF (Am-Tech
& LoopCom)
Control strategies tested were early green/green extension, with one intersection having a queue jump. Both Amtech and LoopCom systems were tested on Powell Boulevard. Peak bus travel times decreased five percent for morning inbound and eight percent for afternoon outbound trips.
Tri-Met Portland, OR
NE Multinomah Street
1994 1995
0.75 75 9 Optical (Opticom)
Opticom emitters on buses used to provide priority request to traffic controller. Manual driver interface required to activate the system. Bus travel times decreased during the system test even with an increase in traffic volumes. Side street delay increased slightly. Bus operators were not consistent in activation of system.
Tri-Met Portland, OR
Orbital GPS system w/optical emitters
1999 (on-
going)
775 125 Optical/GPS
(OrbTrac)
Project is in the early installation phase. Using “smart bus” concept to activate optical emitter. Control strategies will be provided in new 2070 controllers.

FLEET MANAGEMENT
2-75
Tri-Met Portland, OR
(on-going)
775 125 Optical(Opticom)
Opticom emitters to be used in conjunction with Orbital on-bus DGPS/passenger counter systems. Project is in the early installation phase.
Table 2-2. Traffic Signal Priority Installations and Tests (Cont.)
Agency Site/Project Name
Start End
Length (Mi)
# Buses
# Int.
System Type Lessons Learned
MTA Houston, TX
1999 (on-
going)
1600 1347 Optical (Opticom)
Opticom emitters to be used in conjunction with smart-bus systems. The project is in early system design phase. 2070 controllers will be used.
Kitsap Transit Bremerton, WA
1993 40 8 init./ 43 full
Optical (INFO)
(Opticom)
Reported reduced bus travel times from five to 16 percent. System required extensive tuning and adjustments prior to testing. Impact on cross street traffic inconclusive.
King County Metro Seattle, WA
210 26 RF (Am-tech)
Preliminary evaluation results (AM peak only) of an undersaturated (LOS B) T-intersection indicate a reduction of bus stops by 50%. Average stopped delay for the bus priority approach was reduced by 57%. (7.7 to 3.3 seconds) Effects to side street and overall intersection delay were reported as insignificant. A system-wide evaluation will be conducted in Spring 2000 in an effort to obtain a comprehensive assessment of various traffic conditions.
Pierce Transit Tacoma, WA
3.1 15 11 Optical(Opticom & LoopCom)
Both Opticom and LoopCom systems tested. Reported travel time reduction up to 13 percent with six percent on the average. Encountered problem with buses activating emergency vehicle preemption systems outside of the test area. Formed an oversight committee to guide project. Prior to demonstration, all near side bus stops were

FLEET MANAGEMENT
relocated to far side locations. Toronto Transit Commission, Ontario, Canada
Mainline Traffic Signal Priority Study
1995 1995
10 210 RF (No-vax)
Round trip travel time reductions during the peak periods of from two percent to four percent were measured. Significant reductions in bus red signal delay times, from 32 to 40 percent, during peak periods were measured. Impact on cross street automobile traffic was mixed.
Source: Bus Signal Priority Project – Draft Literature Survey Technical Memorandum, Los Angeles County MTA – PB Farradyne Inc.
2-77

Atlanta, Georgia
In Summer 1999, the Metropolitan Atlanta Rapid Transit Authority tested its Signal Priority Control
System (SPCS) using 3M’s Opticom equipment. The test covered 25 buses on Route 15 as they
traveled Candler Road in Atlanta. The SPCS shortens the red time of a signal as the bus approaches
and allows the bus to proceed sooner. MARTA found that the average travel time inbound on the test
section (covering roughly the whole route) went from 41.8 minutes before the test to 28 minutes with
SPCS. The average travel time outbound went from 33.1 minutes to 27.5 minutes.80 MARTA ran a
more extensive test from September 27 - October 14, 1999, with another control period from October
14 - 28, 1999. The results are not yet available.
Seattle, Washington
The King County Department of Transportation has installed a traffic signal priority system on 210
buses that pass through five intersections on Ranier Avenue, South and 22 intersections on Aurora
Avenue, North. The system was procured from McCain Traffic Supply at a cost of $2.4 million, and
the acceptance test was to be completed in November 1999 on Ranier Avenue, and somewhat later,
on Aurora Avenue. Figure 2-20 shows the system design.81 A reader at the roadside identifies the
transponder tag on each bus and feeds the information to a processor, which decides whether or not to
grant priority (based on the bus’s on-time status and whether it meets the local traffic engineer’s
conditions for priority).
Metro hopes that the system will both reduce person minutes of delay and travel times for buses in
these corridors. The agency says it still has to examine which trips they want to prioritize. Early tests
of the system were encouraging, and Metro reports that the project is progressing well.82
Columbus, Ohio
The Central Ohio Transit Authority, in conjunction with Orbital, conducted two studies of traffic
signal priority in 1999. The agency categorizes the findings as “encouraging,” citing one of the
study’s findings that, in terms of calculated monetary values, the benefits to transit riders amounted to
nine times the dis-benefits to automobile riders who had to wait longer at the signals. COTA has
80 “Transit Signal Priority Shaves Time off Bus Route,” http://www.itsa.org/ 81 Signal Priority - Benefits for Transit, King County Department of Transportation. 82 Len Madsen, King County Metro, Seattle, Washington.
3-84

Bus Priority
Dial Up
Inpu
Local TrafficManagementCenter (TMC)
Local TrafficEngineers
Conditions forGranting Priority
Operating Data(on time
performance,passenger loads
Transit Interface Unit System
Dial Up
Tag Readers
Antennas
ABI Transponder
Traffic Signal SystemMaster
King CountyTSP CentralWorkstation
Dial UpInput
Remote TrafficAgency TSPWorkstation
KC MetroTransit
Schedules -Buses Eligible
for Priority
LocalLocal
Bus RouteData
Con
trolle
rC
abin
et
ControllerFirmware -
TSP Timings
Figure 2-20. Metro Transit Signal Priority System Design
been working closely for a year with the department that controls the signals to forge a good working
relationship.
COTA planned to release an RFP in October or November 1999 for a system covering about 32
intersections along their busiest route. About 80 buses will have signal priority request capability.
The system will be closely linked with the AVL they are now installing and testing (see Section 2.1).
The decision on whether or not to alter the signal timing would be based on the bus’s schedule
adherence. It is estimated that the cost to alter the traffic signal software is about $100,000. COTA
has been consulting with the fire and police departments about participating in the system. So far,
neither department has elected to participate.83
Portland, Oregon
3-85

The City of Portland has a Congressional Earmark of $4.5 million to implement a traffic signal
priority system. Most of the money is for the Fire Department, but $1.5 million has been given
(through FTA) to the Tri-County Metropolitan Transportation District of Oregon for an extensive
transit signal priority implementation. An Opticom light emitter will be installed on every one
(roughly 650) of the agency’s buses. Tri-Met’s Dispatch System (see Section 2.2.1) will control
requests for priority, and will only issue such a request if the bus is running sufficiently late.
Estimated capital cost of the on-board equipment is about $1,000 per bus and between $300-$400 per
bus for installation. Tri-Met expects all buses to be equipped by Spring 2000.
The City of Portland will need more time to equip the traffic signals, however, principally because the
Federal money for this part of the project is spread over the next several fiscal years. The City is
estimating about three years to equip about 200 (more than 200 if additional money is approved) of
their 900 signalized intersections. The intersections will be chosen both in consideration of the
location of Fire Stations and maximizing the benefits to transit. The test might eventually extend to
the Portland suburbs, if it is found that other traffic is not significantly delayed. Through traffic
signal priority, Tri-Met hopes to save buses while still providing the same level of service. An
analysis is planned.84
New Jersey
New Jersey Transit did a computer simulation of traffic signal priority, using Route 9 in Northern
New Jersey, where bus headways can be as small as 30 seconds. Unfortunately, in their simulation,
traffic signal priority actually made the buses operate more slowly, overall. Instead, NJT is pursuing
bus lanes, with “queue jumping,” where the bus lane (if occupied) gets a green light four seconds
before general traffic. According to the agency, the head start is sufficient to yield significant
benefits.85
3. TRAVELER INFORMATION SYSTEMS Advanced Public Transportation Systems (APTS) can provide travelers with more information in
more different ways than ever before. Transit information can be of a static nature such as route
83 Kaled Shammout, op. cit. 84 Ken Turner, op. cit. 85 Jim Kemp, op. cit.
3-86

maps, schedules, and fares, or dynamic information such as route delays and real-time arrival
estimates. Traffic data can include continuously updated freeway and arterial traffic flow conditions.
All data is integrated into an automated, cohesive traveler information database that can be accessed
by travelers through Web sites and kiosks as well as e-mail/pager alerts, television/radio broadcasts,
automated telephone systems, hand-held computing devices/mobile phones, and variable message
signs.
This chapter discusses traveler information systems in the following categories:
�� Section 3.1 Pre-Trip Transit and Multimodal Traveler Information Systems; �� Section 3.2 In-Terminal/Wayside Transit Information Systems; and �� Section 3.3 In-Vehicle Transit Information Systems.
For each type of traveler information system a description of the technology, its state of the art status,
challenges in implementing these technologies, and case studies are given.
3.1 Pre-Trip Transit and Multimodal Traveler Information Systems
Pre-trip traveler information systems help travelers make decisions about the choice of transportation
mode, route, and departure time before they begin their trip. There are four main types of pre-trip
information: General Service Information, Itinerary Planning, Real-Time Information, and
Multimodal Traveler Information.
Technology Description
With General Service Information, travelers can find route, schedule, and fare information by
phoning the transit center or by transit maps and schedules located on vehicles, by the wayside, or at
transit centers. This is the traditional form of traveler information.
In Itinerary Planning, transit users request an itinerary based on such variables as least travel time,
minimal walking distance, lowest cost, least number of transfers, modal preference (bus or rail), and
paratransit. Itineraries are given that can include walking directions from the origin to the transit
stop, from one stop to another en-route, and from the final transit stop to the final destination.
Real-Time Information is generated by AVL-equipped vehicles and can be accessed by travelers
through kiosks, Web sites, and interactive voice response (IVR) telephone systems. There are two
approaches to presenting transit users with real-time information. One is to display the actual
3-87

TRAVELER INFORMATION SYSTEMS
location of transit vehicles en-route. The second approach is to provide the estimated arrival time for
incoming vehicles at a selected stop or station. This requires supplementary software that uses the
current location of buses together with current traffic conditions to calculate the expected time of
arrival.
Multimodal Traveler Information Systems deliver traffic and transit information to the traveler.
These systems combine real-time and static data from one or more transit services. Agencies have
developed multimodal traveler information systems to promote transit and other commuting
alternatives such as carpooling in order to reduce the number of trips by automobile in regions not in
compliance with the air quality requirements of the Clean Air Act Amendments of 1990. Some
agencies have developed public-private partnerships to provide traffic services. Most of these
partnerships are in urban regions where transit controls a significant share of the commuter traveler
information market. As with freeway Intelligent Transportation Systems, the availability of quality
real-time information from the public sector drives the collaboration with the private sector in
distributing traveler information.
Status: State-of-the-Art Recent improvements to pre-trip transit and multimodal traveler information systems fall into three
general areas:
�� Interactive voice response telephone information; �� Kiosks; and �� The Internet.
Travelers can also access information via alphanumeric pagers. However, since these devices are not
frequently used by travelers, they are not discussed here.
Interactive voice response telephone information systems allow customers to call a single phone
number and navigate a menu for needed information. Previously, transit customer service operations
relied on agents to provide various types of information over the telephone. For many years,
automated telephone information systems assisted agents in answering routine questions. These new
systems eliminate the need for agent involvement in many information requests.
Kiosks are being deployed in some locations. Transportation agencies have placed kiosks at public
sites to provide transit information to travelers who might not be aware of transit alternatives. Public-
3-88

TRAVELER INFORMATION SYSTEMS
private partnerships are being formed to explore the commercial viability of kiosk networks.
Advertising on the exteriors of kiosks is one approach.
The Internet offers an alternative to kiosks for increasing public awareness of transit services and
providing transit information. There are several advantages to using the Internet for transit
information. The Internet provides a more suitable browsing environment for itinerary planning.
Second, the Internet is also a cost effective alternative to kiosks, which have high capital,
maintenance, and operating costs. Third, the Internet provides transit users with information 24 hours
a day, seven days a week. In contrast, some kiosks have restricted access, such as those located in
shopping areas. Additionally, there are normally only a few kiosks available in a transit service area
Challenges to Implementation
Interactive voice response systems do not always have good voice recognition. However, there have
been recent improvements in speech recognition technology. Another difficulty is that some systems
incorporate automated distribution features for information that would be too time-consuming to
provide over the telephone. In these cases, information can be sent via fax or e-mail.
The earliest kiosks did not communicate in real time and sometimes resulted in outdated information.
With the addition of networking and an increased use of Internet connectivity, kiosks are now
providing real-time information. Kiosks have been installed in various public locations, often far
away from other transit agency facilities. This can make it difficult to provide routine maintenance
and repairs due to system crashes, occasional vandalism, and the need for frequent cleaning.
Operational solutions include remote device monitoring tools and custom keyboards or touch screens.
Maintenance solutions include collaborative local support arrangements with host sites. There are
some concerns relating to the public perception of a private/public sector joint venture, along with
questions relating to advertising content.
The Internet is not always the most accessible means of providing transit information since many
people do not have access to the Internet.
In all these cases, displaying the real-time position of the vehicle en route or estimating the time of
vehicle arrival can be problematic. First, real-time estimates can be subject to revision. If the private
sector is the provider of the information, who is in charge of the accuracy of the data — the public or
3-89

TRAVELER INFORMATION SYSTEMS
private sector? Also, will the information be provided free? So far, many private sector traffic
information services that charge a fee have not attracted many customers. The accuracy of estimation
techniques and the need for ongoing calibration will be important issues as real-time information
becomes more widely distributed.
Application Examples
The following are examples of Pre-Trip Transit and Multimodal Traveler Information Systems.
�� Orange County California’s multi-phased and multi-faceted traveler information system. �� Washington, D.C.’s traveler information via fax and the web. �� Seattle, Washington’s multimodal transportation information system. �� Los Angeles, California’s public-private partnership to distribute traffic information. �� New York, New York’s traveler information kiosks.
Orange County, California The Orange County Transportation Authority (OCTA) is currently developing a multi-phased and
multi-faceted ATIS. The first phase of this system is called Travel Probe. Fixed-route buses,
equipped with GPS receivers, serve as information gathering devices for such transit-related data as
bus location, running time, and speed, in addition to roadway status information.
The project met some challenges in deployment. First, due to technological and monetary constraints,
the project was not deployed to the extent of its original scope. GPS units were installed on only 15
fixed-route buses, not the 43 referenced in Update ’98. Second, the technology used in the
deployment was originally designed for larger transportation systems with larger fleets. It was not
readily adaptable to a smaller and more flexible transit system, such as the OCTA operation. A
custom-designed OCTA-specific product rather than a generic mass-marketed product would have
worked considerably better for OCTA's purposes (and for those of smaller transportation systems).
Third, the technology did not perform as anticipated. OCTA expected that location data would be
provided in a continuous stream. Buses and freeways were to be continuously monitored by cameras
and other sensory equipment, and real-time data from these collection sources would then be
available for uninterrupted continuous dissemination. However, the installed system operated on an
exception rather than continuous basis. This was subsequently corrected. Fourth, data collected from
moving probes, such as GPS-equipped buses, was not compatible with data collected from stationary
and fixed-point probes, such as freeway monitoring cameras.
3-90

TRAVELER INFORMATION SYSTEMS
The second phase of OCTA's ATIS is TravelTIP. Traffic and transit information from four existing
regional advanced traffic management systems, other public agencies, Amtrak, Metrolink, and the
Los Angeles Metropolitan Transportation Authority (MTA) will be integrated with Travel Probe's
real-time data and disseminated through a multitude of telecommunications media including kiosks,
the Internet, cable television, telephone, radio, and pagers. Interactive kiosks will be deployed at key
transit locations, including Metrolink rail station and each of OCTA's transit centers.
The third phase of OCTA's ATIS is the Travel Advisory News Network (TANN). TANN is a
public/private enterprise that includes the Southern California Economic Partnership (SCEP) as the
information broker for the project, and Odetics, Inc. (now Iteris, Inc.) as the overall systems integrator
for the data collection sources and the private information service providers of TravelTips real-time
transit and traffic data. To date, the following service providers will be participating: Cue
Corporation, Etak, Fastline, Smart Route Systems, Metro Dynamics, and Road Director. Currently,
SCEP is in the process of identifying additional information service providers (ISP) to join the
project. In August 1999, the writing, development, and use of software interfaces between the ISPs,
TANN, and TravelTip was initiated. TANN and TravelTip were expected to be operational in 2000.
The consortium also helped to design the California statewide ATIS architecture as well as the
business plan for the statewide ATIS system. The SCEP is taking OCTA's ATIS system and applying
it statewide. Consequently, other ATIS systems around the state either will be identical to or
compatible with OCTA's ATIS system.86
Washington, D.C.
Building on the trip itinerary planning software used by customer service agents since 1979, the
Washington Metropolitan Area Transit Authority (WMATA) has recently enhanced their customer
service capabilities. Hewlett Packard originally implemented this software on a mainframe computer.
In 1989, Tidewater Consultants (now Mantech) developed a personal computer version of the
application, which was recently updated for the Windows environment. A related initiative currently
in operation is the TripFax service. Transit users can request information about a specific route by
entering its code number and a fax number.
86 Dean Delgado, Orange County Transportation Authority, Orange, California.
3-91

TRAVELER INFORMATION SYSTEMS
The Web site development firm, e.magination was selected to create a Web browser interface for the
trip itinerary system known as RideGuide. RideGuide went live on the WMATA Website87 in
September 1999 (see Figure 3-1 on the next page for results of an itinerary request). A Web interface
provides 24-hour access to schedule information, allowing transit users to research trip options at
their leisure and at varying levels of detail instead of contacting a WMATA customer service agent
by telephone.
RideGuide allows transit users to enter their origin and destination (including intersections or
landmarks closest to their origin and destination), date and time for the start of travel, and their
preferences to minimize walking, travel time or transfers. The web interface reduces uncertainty for
new users about how long the itinerary generation process will take by highlighting on the initial
screen that it is only a three-step process. An itinerary with alternatives is generated from published
timetables.
If the origin or destination is more than one-half mile from the nearest transit stop, an itinerary is not
provided. By using the More Options feature, the closest stops within a larger radius of the location
of interest are identified. Additional options on this screen allow the transit user to retrieve more
detailed information about these transit stops, including other routes that pass through these stops and
their arrival schedules, and to identify transit services suitable for the elderly and disabled within a
certain radius of the location (see Figure 3-288).
87 http://www.wmata.com
88 http://www.wmata.com
3-92

TRAVELER INFORMATION SYSTEMS
3-93
Figure 3-1. RideGuide Itinerary Results
During the first month of operation, RideGuide provided over 25,000 itineraries. WMATA expects to
roll out extended versions of RideGuide each quarter based on user feedback. Examples of
extensions under consideration include providing itineraries based on the requirements of elderly and
disabled transit users (currently available only in limited form through the More Options feature) and
allowing users to select bus-only or rail-only trips.
A REQUEST FOR AN ITINERARY MAP SLOWS DOWN THE RESPONSE TIME. WMATA IS EXPLORING SUCH OPTIONS AS HANDING THE PROCESSING FOR MAPS OVER TO A SEPARATE SERVER. LONG-TERM PLANS ARE TO INCORPORATE THIS TYPE OF VISUAL INTERACTIVE SCHEDULE INFORMATION DELIVERY INTO DIGITAL CABLE SERVICES FOR HOMES, HOTELS, AND WIRELESS DEVICE SERVICES. WMATA IS LOOKING AT THE FUTURE POTENTIAL FOR INCORPORATING REAL-TIME ARRIVAL ESTIMATES FROM AN AVL SYSTEM. IT IS EXPECTED THAT SUCH ESTIMATES WOULD, ALONG WITH PRE-TRIP SERVICES, BE OFFERED ONLY AS SUPPLEMENTARY INFORMATION AND ALWAYS WITH A DISCLAIMER THAT THE ESTIMATE IS SUBJECT TO CHANGE. MANY

TRAVELER INFORMATION SYSTEMS
Figure 3-2. RideGuide “More Options” Screen
of the information requests involve trip planning for a future time, in which case there would be no
real-time estimates.
WMATA is currently installing a new system of real-time information displays on rail platforms.
These displays will inform waiting transit passengers of general delays as well as the destination for
the incoming train and its expected arrival time. Eventually this information will also be made
available through WMATA's Web site. As hand-held computers with wireless communication access
and Internet access become more common, making this information available through the Internet
will become increasingly useful.
The call-in or Internet-based itinerary planning services do not cover the services of other transit
agencies. Other services, such as Amtrak’s, would most likely be provided through a hyperlink.
WMATA is expecting to develop relationships with multimodal traveler information initiatives such
3-94

TRAVELER INFORMATION SYSTEMS
as SmarTraveler, a member of Partners in Motion, the Washington, DC area traveler information
system.
Near the end of 1999, an integrated call center (including contracted paratransit operations)
incorporating computer-based call handling was to begin operation. During 2000, WMATA plans to
incorporate an Interactive Voice Response (IVR) system that will allow transit users to select options
using a telephone keypad. The goal is to reduce the call-handling load on customer service agents so
that they can focus on less routine customer information requests. Also during 2000, a voice interface
test is planned for an IVR system, offering transit users the option of acquiring information through a
voice interface. WMATA has been monitoring the emerging voice interface technology and feels it is
now capable of interpreting a significant share of the voices encountered. The agency feels that its
voice interpretation requirements are particularly demanding due to the large number of tourists and
foreign government personnel in the area. However, voice interpretation of foreign languages will
not be part of the initial test.89
Seattle, Washington There are three transit traveler information initiatives in the Seattle area:
�� BusView; �� MyBus; and �� Transit E-mail Notification
BusView
The King County Department of Transportation's BusView is an ATIS service, developed in part with
funds provided for Seattle's Smart Trek Metropolitan Model Deployment Initiative (MMDI), that
allows transit users to see on a map exactly where any bus on any route is currently located.
Smart Trek used a broad public-private partnership to build on and integrate the region's existing ITS
infrastructure. The project resulted in new and enhanced transportation data sources, established a
multimodal transportation information network, and significantly expanded regional multimodal
traveler information services. Besides BusView, Smart Trek created other ATIS services, including a
cable television traffic information program. It also provided $1.2 million for upgrades to King
County Metro's AVL/CAD system to improve the accuracy of bus location and schedule status data
for Metro's transit information systems. As an extension of the Seattle Wide-Area Information for
3-95

TRAVELER INFORMATION SYSTEMS
Travelers (SWIFT) project described in Update ’98, BusView provides transit users with real-time
bus location information through the Internet.90 This service became available to the public through
the Smart Trek Web page in mid-1998.
The software application supporting BusView geographically represents the location of over 1,200
Metro buses traveling on 226 routes throughout its 2,128 square mile service area (Figure 3-3).
BusView cost approximately $230,000 to develop. Bus location data is supplied by King County
Metro's sign post-based automatic vehicle location system.91
The Washington State Transportation Center (TRAC) developed the software algorithms to generate
accurate time and location data for Bus View displays. TRAC staff also created the Web interface for
BusView, based on an advanced Java software application. Java, a general purpose, object-oriented
programming-language, and is particularly well-suited for creating small, interactive programs on the
Web. Java programs can run on most computers since the program interface is included in industry-
standard Web browsers rather than on a computer's regular operating system such as Windows.92
Another benefit is that a Web page operator can be reasonably assured that a Java program will work
for its customers regardless of the computer system they use to access the Web.93 Also, Java
programs are immune from computer viruses since they only communicate with the Web browser
Java interface, not with a computer's operating system.
As indicated earlier, BusView displays the current location of a bus on a map. A transit user selects a
geographical area such as their home or workplace. If the default area does not meet their needs, the
user can easily scroll the map in any direction to display another area. They can also specify routes
they are not interested in and look at two areas simultaneously. Clicking an icon also allows them to
jump to the published timetable or to bring up a new bus progress screen.
89 Karen Lamb, Washington Metropolitan Area Transit Authority, Washington, D.C.
90 http://busview.its.washington.edu/busview_launch.html
91 Tom Friedman, op. cit.
92 For example, Netscape Communicator 4.5/Navigator 4.06 (or higher) or Microsoft Internet Explorer 4.01.
93 For example, a single Java program will run on a Windows-based PC, a Macintosh, of Unix workstations. With other programming languages, a version would have to be written for each type of computer the program was intended to run on. A Web page operator cannot know in advance what types of computers will be used to access its Web page.
3-96

TRAVELER INFORMATION SYSTEMS
The bus progress window is a linear representation of an entire bus route, showing buses for a single
direction of travel based on which direction the bus was moving when the user selected it in the main
Figure 3-3. BusView Main Page
window (see Figure 3-4). Arrows above the route indicate the location of time points in the published
bus schedule. Holding the cursor over an arrow icon shows the user either the time point's
intersection or name of a major landmark if the time point is a location, such as a shopping mall. Bus
icons below the route indicate the route number the bus is traveling and its location and the time its
position was last calculated. By simply clicking anywhere on the route in the bus progress window, a
user can add an alarm clock icon that will produce a visual and audible notification when the next bus
passes that particular point. This can provide an alert to the passenger that it is time to leave to catch
the bus.
3-97

TRAVELER INFORMATION SYSTEMS
3-98
Figure 3-4. BusView Progress Screen
Transit users can customize BusView based on their own travel preferences. The first time BusView
is used pre-loaded maps are displayed in the menu list of the main screen. If a user's Web browser
supports and accepts cookies,94 each time a new map is selected it is added to a list of maps stored in
the cookie file.
BusView is updated each second with selected data and each minute with all data for each bus. A user
can roughly determine time reliability for a bus by comparing the bus icon time to the window time.
The greater the disparity, the less reliable the current bus icon position.
The expected benefits of BusView include reduced wait time, reduced uncertainty about taking
transit, the ability to plan around transit delays, and increased transit usage.
94 A cookie is a message given to a Web browser by a Web server. The browser stores the message in a text file
called cookie.txt. The message is then sent back to the server each time the browser requests a page from the server. The main purpose of cookies is to identify users and possibly prepare customized Web pages for them. Definition from Webopedia, http://www.pcwebopaedia.com /

TRAVELER INFORMATION SYSTEMS
MyBus
MYBUS PROVIDES TRANSIT USERS WITH INFORMATION ON BUS ROUTE NUMBERS, TRIP DESTINATIONS, DEPARTING BUS BAY LOCATION, SCHEDULED DEPARTURE TIME, AND REAL-TIME DEPARTURE STATUS. MYBUS PROVIDES SIMILAR INFORMATION TO TRANSITWATCH (SEE SECTION 3.2) EXCEPT THAT IT IS A PRE-TRIP SERVICE ACCESSED USING THE WORLD WIDE WEB AND INCLUDES INFORMATION FOR MORE LOCATIONS (SEE FIGURE 3-5).95 MyBus development costs are included in the $500,000 TransitWatch budget and in the Smart Trek
MMDI. Three transit centers; Northgate, Bellevue, and Boeing Renton, provide MyBus information.
In addition, Smart Trek is planning to use information from five additional MyBus locations;
University of Washington HUB, University Way & NE 45th Street, the Kingsgate Park and Ride, the
Renton Transit Center, and SeaTac Airport, to install TransitWatch in the future.96
Transit E-mail Notification
IN NOVEMBER 1998, THE KING COUNTY DEPARTMENT OF TRANSPORTATION BEGAN OFFERING TRANSIT ALERT!, A FREE E-MAIL SERVICE TO ALERT SUBSCRIBERS ABOUT EMERGENCY CHANGES IN THEIR BUS ROUTES. THERE ARE CURRENTLY 3,200 SUBSCRIBERS. THE PRIMARY BENEFIT OF THE SERVICE IS THAT A SUBSCRIBER KNOWS WHERE TO CATCH THEIR BUS WHEN THE ROUTE HAS BEEN CHANGED TEMPORARILY. THE AGENCY ANTICIPATES THAT SUBSCRIBERS WILL RECEIVE BETWEEN ONE AND 10 NOTIFICATIONS A DAY AS OTHER INCIDENTS OR EVENTS AFFECTING TRANSIT ARE KEYED INTO THE SYSTEM.97 SUBSCRIBERS INITIATE THE E-MAIL NOTIFICATION USING A FORM ON KING COUNTY'S WEB PAGE. THERE ARE THREE ALERT LEVELS TO SELECT FROM: GENERAL ALERTS WITH NO ROUTE-SPECIFIC INFORMATION; LITE ALERTS FOR SPECIFIC BUS ROUTES; OR DETAILED ALERTS FOR SPECIFIC BUS ROUTES. KING COUNTY ALSO OFFERS A ROAD ALERT! E-MAIL NOTIFICATION SERVICE TO USE WITH TRANSIT ALERT! IN MAKING MORE EDUCATED TRANSPORTATION MODE CHOICES.98
95 http://www.its.washington.edu/mybus/
96 Tom Friedman, op. cit.
97 Tom Braman, King County Department of Transportation, Seattle, Washington.
98 http://www.metrokc.gov/go/alerts/transit/pubsubscribe.cfm
3-99

TRAVELER INFORMATION SYSTEMS
Figure 3-5. MyBus Web Page
Los Angeles, California There are several ITS integration initiatives being deployed in the southern California coastal region
corridor from Ventura County, just north of Los Angeles, down to the Mexican border. The goal of
these initiatives is to create a transportation infrastructure for the entire corridor linking existing and
emerging systems for traffic and transit information gathering and distribution. Information used by
the transportation agencies to manage operations will also be distributed to travelers. At first,
information will be regional in scope but as the regional systems throughout the corridor are
interconnected, any regional system would be able to provide information about the entire corridor.
INFORMATION WILL BE COLLECTED BY THE PUBLIC SECTOR THEN SOLD TO THE PRIVATE SECTOR INFORMATION SERVICE PROVIDERS FOR FREE DISTRIBUTION TO TRAVELERS VIA RADIO/TELEVISION REPORTS, AUTOMATED TELEPHONE INFORMATION SYSTEMS, KIOSKS AT PUBLIC LOCATIONS THROUGHOUT THE CORRIDOR, AND THE INTERNET.
The service will provide mobile devices such as cell phones and pagers with wireless Internet
connectivity to paid subscribers who will specify the types of information they want to receive.
Ongoing updates will be sent by wireless e-mail alert without any need for further subscriber action
3-100

TRAVELER INFORMATION SYSTEMS
(all messages are broadcast but individual devices only receive and display the messages for the
subscribed topics). See Figure 3-6 for an illustration of transportation information gathering and
distribution.99
By creating a multimodal-oriented traveler information system for Los Angeles and Ventura counties,
it is expected that the profile of transit information will be raised relative to current commercial
traveler information.
Figure 3-6. Transportation Information Gathering and Distribution
INDIVIDUAL PROJECTS FOR THE CORRIDOR SHOWCASE ARE CURRENTLY BEING IMPLEMENTED BY THE VENDOR TEAM OF ODETICS (NOW ITERIS) AND NET AND WILL BE COMPLETED DURING 2000 AND 2001. PROJECTS INCLUDE: �� Showcase Kernel: Creates the basis for regional information sharing and interoperability
between independent systems by defining an open systems profile. A standard data format will be used by each distributed system to communicate with the centralized data fusion consolidation process and provide data for distribution by the Internet Service Providers.
�� TravelTIP: Links four Orange County traffic management centers with real-time transit information and other traveler information such as weather (refer to the previous TravelTIP summary in this subsection ).
99 http://www.odetics-its.com
3-101

TRAVELER INFORMATION SYSTEMS
�� San Diego Regional Integration: Integrates a new transit management center and sports stadium traffic management center with existing transportation management centers in the region to create a multimodal system.
�� Los Angeles/Ventura Integrated Modal Shift Management System: Creates a multimodal-oriented traveler information system for Los Angeles and Ventura counties.
New York, New York TRANSCOM is jointly funded and operated by a consortium of highway and transit agencies
throughout the greater New York City region. The consortium provides a focal point for the
collection, fusion and distribution of real-time traveler information. Much of TRANSCOM’s early
efforts focused on creating a regional system architecture to provide all the participating agencies
with timely access to important information.
A recent TRANSCOM initiative is the Service Area Traveler Information Network (SATIN) project
(not part of the NY MMDI). To make traveler information more accessible to the general public, 20
information kiosks are being deployed in various public locations to provide conditions information
on traffic, roadway routing, service areas, transit schedules, weather, emergency services, tourism
information, and park and ride conditions (see Figure 3-7100). Real-time traffic information is
collected by TRANSCOM from the various operating agencies. Satin kiosks provide access to
information from all the transit agencies in the region relating to schedules, fares and reported delays.
Golden Screens Interactive Technologies are providing the kiosks and the information distribution
system.
The overall development cost for the initial 20-kiosk system is roughly $1.3 million, with the cost
divided between TRANSCOM and Golden Screens under a public-private partnership arrangement.
Golden Screens plans to access private sector financing to expand the kiosk network, using the initial
kiosks to demonstrate the economic viability based on advertising revenues. Information displayed
on the kiosk screen includes an advertising banner, a critical ingredient in to Golden Screen's business
case. Installation and one year of operations and maintenance support for each additional kiosk will
cost between $20,000 and $30,000. Site selection criteria includes pedestrian traffic of at least one
million persons per year.
100 From the Golden Screens Web site www.gsit.com
3-102

TRAVELER INFORMATION SYSTEMS
THE MOST USEFUL LOCATIONS FOR TRANSIT CUSTOMERS INCLUDE KIOSKS IN MAJOR BUS TERMINALS, SUCH AS THE BUS TERMINAL FOR THE GEORGE WASHINGTON BRIDGE AND AT THE PORT AUTHORITY BUS TERMINAL IN MANHATTAN. AS OF OCTOBER 1999, EIGHT OF THE INITIAL KIOSKS WERE INSTALLED; AND THE REST WERE SCHEDULED TO BE INSTALLED BY NOVEMBER 1999.
Figure 3-7. SATIN Kiosk Screen
A trip itinerary planning capability is in the process of being added. There is also interest in
presenting more detailed real-time transit information but the individual transit agencies must develop
the capabilities to provide such information to TRANSCOM.
Golden Screens is proposing to use the Internet for presenting transit information. Since the current
agreement with TRANSCOM does not include distribution of information beyond the kiosk
environment, Golden Screens is working with TRANSCOM on revising their agreement to support
the Internet approach.101 102
101 Tom Batz, TRANSCOM, Jersey City, New Jersey..
102 Glenn Gruber, Golden Screens, New York, New York.
3-103

TRAVELER INFORMATION SYSTEMS
3.2 IN-TERMINAL/WAYSIDE TRANSIT INFORMATION SYSTEMS
The desire for transit information does not end once the traveler is en route to his/her destination.
Many successful methods of providing transit information, such as posting up-to-date schedules in
stations and at stops, do not rely on advanced technology. However, waiting transit passengers
experience anxiety when there is a delay and there is no information about the expected duration of
the delay or no reassurance that the expected vehicle is still on its way. By providing estimated
arrival times at stops and stations to waiting passengers, anxiety about when or whether the vehicle
will arrive can be eliminated.
Technology Description
Agencies with AVL systems are able to provide real-time in-terminal or wayside transit information.
Several real-time traveler information systems are currently under consideration. In some cases the
system provides what could be considered both pre-trip and en-route information. There are several
communications devices that provide traveler information. The primary devices for in-terminal and
wayside systems are:
�� Video monitors; or �� Variable message signs.
These may be supplemented with audio announcements of the displayed information. In some cases,
the display may include service announcements or advertising. Real-time in-terminal and wayside
information systems require a communications link to a central computer system that provides the
information about upcoming arrivals. For systems that have a large number of stations and bus stops,
the need for a power and communications infrastructure at widely distributed locations is an
important economic issue.
Video Monitors
Video monitors are used often where a large amount of information needs to be displayed and where
flexibility in using graphics, fonts, and color is needed. Since the character height needs to be
relatively small, this approach is best suited to locations where transit users can stand relatively close
to the monitor. For example, a video monitor would be well-suited for a display at the entrance to a
station indicating which berth buses serving specific routes are located. A video monitor providing
real-time arrival updates would be less suited to a central display near a group of bus berths, since
3-104

TRAVELER INFORMATION SYSTEMS
transit users might be uncomfortable moving away from the berth and their place in line to get close
enough to read the display.
Variable Message Signs
Variable message signs are often used where a relatively small amount of information needs to be
displayed at a considerable distance from transit users, such as the centralized real-time display
described in the previous paragraph. These signs are also appropriate for environments that need a
device resistant to vandalism and the environment, such as on-street bus stops. The large character
heights typically used for longer-distance legibility tend to limit the number of characters that can be
displayed and such techniques as scrolling text and messages displayed in multiple phrases are often
used.
Status: State-of-the-Art
The current technologies — video monitors and variable messages signs — have been deployed with
success and agencies continue to plan for their use to distribute information to the traveler. Several
new technologies have emerged that can bring more detailed information more directly to the traveler.
These technologies also blur the distinction between pre-trip and en-route information. These
technologies are:
�� Cellular phones; �� Alphanumeric pagers; and �� Handheld computers.
With the increasing market penetration of cellular phones, transit users can more easily access
customer service agents or an automated telephone information system as they approach or wait at a
station or stop.
CONVENTIONAL PAGING SERVICES PROVIDE ONE-WAY COMMUNICATION WITH A CUSTOMER. THIS TECHNIQUE TENDS TO BE A MOBILE EXTENSION OF THE E-MAIL ALERT METHOD DESCRIBED UNDER PRE-TRIP TRANSIT INFORMATION IN SECTION 3.1. THE MAIN DIFFERENCE BETWEEN BROADCAST DISSEMINATION TECHNIQUES AND PAGING IS THAT A USER CAN CUSTOMIZE A SUBSCRIPTION AND RECEIVE ONLY THOSE MESSAGES RELEVANT TO THEIR TRAVEL PATTERNS. SOME OF THE NEWER PAGERS SUPPORT LIMITED TWO-WAY COMMUNICATIONS. THIS CREATES OPPORTUNITIES TO DISTRIBUTE ALERTS ON A CONDITIONAL BASIS, (I.E., A BRIEF ALERT WOULD BE DISTRIBUTED AND
3-105

TRAVELER INFORMATION SYSTEMS
THE USER COULD EITHER ACCEPT OR DECLINE THE FOLLOW-UP MESSAGE WITH MORE DETAILED INFORMATION).
Handheld computers, such as the Palm Pilot, are appearing increasingly with wireless
communications capability and Internet connectivity. In addition, a number of cellular phones now
incorporate handheld computer capabilities. The Web browsers for these devices have display
limitations compared to full-size personal computers, but Web servers are beginning to use
alternatives to conventional Hyper Text Markup Language (HTML), such as eXtensible Markup
Language (XML), that support flexibility in interpreting Web pages for presentation.
Challenges to Implementation
The challenge to implementing video monitors or variable message signs remains the issue of getting
information to the device. Wireline placement can be difficult and costly. Wireless transmission of
information has not yet proven to be consistent enough to handle larger amounts of data. With the
newer devices, the main challenge is the reluctance of customers to pay for traveler information via
cellular phones, pagers, or handheld computers when they can receive similar information for free via
the Internet, radio, or television. Nonetheless, private sector companies are devising ways to make
transportation information more “value added” than free information. An example is personalizing
information on a traveler’s commute and sending them signals when particular heavy congestion or
transit delays are occurring.
Application Examples
The following are examples of in-terminal/wayside transit information systems.
�� Miami, Florida’s TrainTrac train/bus operation tracking and passenger information system. �� Eastern Connecticut’s coordinated automated announcement system. �� New York, New York’s Talking Kiosk. �� San Francisco, California’s NextBus real-time bus arrival prediction system. �� San Francisco, California’s wayside traveler information system.
�� Seattle Washington’s traveler information system comprised of video monitors displaying route real-time departure status.
Miami, Florida
The Tri-County Commuter Rail Authority (Tri-Rail) operates 28 trips a day over a 72-mile corridor
from Palm Beach to Miami with 19 stations. Tri-Rail also operates shuttle buses for feeder service to
and from several stations. Since the trips are relatively infrequent (roughly one per hour in each
3-106

TRAVELER INFORMATION SYSTEMS
direction), many transit users arriving at the station already know the scheduled arrival time of the
train they are planning to take. The difficulty for Tri-Rail is that it operates on only a single track
shared with both Amtrak and freight services. Tri-Rail trains are sometimes shunted to a siding,
disrupting the scheduled arrival times. Although Tri-Rail is informed about which five to eight mile
long blocks (track operations control segments) are assigned to their trains, there is no way of
knowing the affected train location within that block or the current train speed.
Tri-Rail implemented the TrainTrac train/bus operation tracking and passenger information system
during 1997 to provide transit users with station arrival times. TrainTrac was developed by Geofocus
and provides on-train and in-bus computers using GPS receivers to monitor location and speed.
TrainTrac frequently sends this information to the central dispatch system using 900 MHz radio
frequency communications. TrainTrac uses the Environmental Systems Research Institute, Inc.
(ESRI) GIS platform to estimate station arrival times.
Transit users access this information before they arrive at the station by calling a toll free number.
Customer service agents use the GIS-based application to address questions. An Interactive Voice
Response system addresses the more routine questions about train or bus arrival time status.
Transit users at the station view train arrival information on electronic message boards (light emitting
diode displays with fully variable characters) installed on station platforms. Message boards display
scrolling text messages (with an accompanying multilingual audio version) indicating the estimated
arrival time for the next train, interspersed with public information.
Future plans include new distribution channels and a Web site version. There is also the potential for
distributing the message board displays through an alphanumeric pager service.103
Eastern Connecticut In conjunction with the Connecticut Department of Transportation and Amtrak, Rideworks and Total
Communications, Inc. have developed and deployed a coordinated automated announcement system
at every commuter rail station along the Shore Line East route. The system was developed to serve
transit user information needs at the Amtrak-operated unmanned stations. The previous approach for
103 Lauran Krugman, Tri-County Commuter Rail Authority, Miami, Florida.
3-107

TRAVELER INFORMATION SYSTEMS
Amtrak to relay information was by a telephone call to each station's public address system. This
process was cumbersome, affecting the quality and timeliness of other information being
disseminated.
Total Communications, Inc. developed software that coordinates information among Amtrak
personnel, station public address systems, and Shore Line East's Interactive Voice Response system.
When an incident is reported, Amtrak places a call to the IVR. The caller then follows a series of
voice prompts to select a pre-recorded announcement that best describes the incident. The selected
announcement explaining the delay, describing potential delayed schedules, or informing transit users
of alternate transportation, is then broadcast on the public address system(s) at the appropriate
stations(s) two minutes before the scheduled arrival time, at the scheduled arrival time, and then at
three minute intervals for nine minutes following the scheduled time of arrival.
In a survey conducted a year after the system was implemented, the transit user’s mean rating of the
quality of announcements increased by 18 percent over the old system. In addition, the percentage of
users who responded that the stations' announcements were above average rose by 23.5 percent.
Total Communications, Inc. is currently developing similar automated announcement systems for
Amtrak at its other unmanned rail stations in Connecticut. One issue to be addressed is that the
current system only can record incidents for one train. While this is not a problem on the Shore Line
East due to the long headways between trains, it could be a problem in a more active rail system
where service is more frequent.104
New York, New York
The Baruch College Computer Center for Visually Impaired Persons, working with the Metropolitan
Transit Authority’s (MTA) Long Island Rail Road (LIRR), recently installed a permanent Talking
Kiosk in the LIRR terminal adjacent to Penn Station's main corridor. The $50,000 project was funded
by the MTA and LIRR and is maintained by Baruch College and Touch Graphics, Inc.
The Talking Kiosk evolved from the 1997 Project Action-funded demonstration called the Talking
Directory Display System (TDDS). Initially, visually impaired persons were guided by an audible
104 Bob Levy, Rideworks, New Haven, Connecticut.
3-108

TRAVELER INFORMATION SYSTEMS
beacon and recorded voice directions to the kiosk in Penn Station. The beacon tone was changed
from a chime to a chirping noise to minimize irritation to both users and non-users. Improvements
were also made to the lighting and print size, in addition to the installation of a high contrast screen.
The tactile map of Penn Station and the standard telephone keypad remained the same. The kiosk
provided users with spatial information about the layout of Penn Station and the location of LIRR
trains and gates. In addition, the Talking Kiosk is now physically located in the back of one of the
LIRR ticket-vending machines (refer to Update ‘98).
Based on the usage tracking system, the kiosk is accessed every few minutes. The visually impaired
community and persons with low vision have high praise for the kiosk. Foreign tourists, clearly a
demographic group for which the kiosk was not planned, are among the highest percentage of kiosk
users, accessing it to navigate through Penn Station.
Baruch College and LIRR staff are planning to expand the number of kiosks both inside Penn Station
and at other LIRR facilities. There are also plans for transit users to access actual LIRR scheduling
and travel information. Funding for this expansion is currently being sought.105
San Francisco, California
In July 1999, the NextBus real-time bus arrival prediction system was tested on the San Francisco
Municipal Railway's 22-Fillmore route, one of Muni’s busiest and most complex lines. Several
vehicles on this line were equipped with GPS receivers and 10 bus shelters had VMS signs installed.
According to NextBus, results have been encouraging with the NextBus central processor recording
an average of 60 people per day using their Internet site to obtain information on the 22-Filmore
route. According to NextBus, this figure would be even higher if the route ran through more affluent
neighborhoods where more residents would be likely to own computers.
Positive feedback from this test resulted in Muni contracting with NextBus to install the system on
Muni's light-rail system. All the necessary vehicle and station equipment were to be installed by the
end of October 1999. This is the first non-tunnel related AVL/GPS system to be installed at Muni.
105 Karen Luxton-Gourgey, Director, Computer Center for Visually Impaired Persons, Baruch College, New
York City, New York.
3-109

TRAVELER INFORMATION SYSTEMS
NextBus technology is easily integrated into existing AVL/GPS systems. Schedules are predicted
based upon actual movement (running time) rather than deviations from a specific schedule. This
approach allows information relating to service modifications to be provided continually.
Many unforeseen factors, such as driver breaks and driver changes, were not built into the original
model tested. However, the running time approach takes these factors into account. In addition, the
flexibility of the NextBus software allows other factors existing in the Muni system to be
incorporated into the software.106
San Francisco, California
In September 1999, BART added real-time estimated time of arrival (ETA) to its station traveler
information system. Estimated time of arrival (ETA) data for each BART train, by line and
destination, is now displayed on the system's electronic train destination (ETD) signs using light
emitting diode (LED) technology. The ETD signs, purchased from Daktronic, are located at all 39
BART stations and are updated with new information at two-minute intervals. Response to the new
ETA displayed information has been overwhelmingly positive.
Deployment costs for new ETD signs were $300,000 for hardware and $100,000 for software. An
indoor platform sign cost $9,000, while an outdoor platform sign cost $14,000. BARTnet, BART's
existing internal fiber-optic network, is the key factor for this ATIS project. Fiber optic wires connect
the ETD signs to each station control room's local computer. This computer is also linked to the
tracks at each station as well as to BART's central train computer (managing BART's automatic train
control system). The real-time traveler information is recorded, updated, and disseminated using
BARTnet.
Once train doors close, arrival times are calculated for the station's next three or four trains. Train
location data is then integrated with speed, scheduling, and other vehicle information to predict future
arrivals at the station platform. This information is then displayed on the ETA signs at each
respective station. In addition, BARTnet can send specific information to selected stations and
organize messages and arrival times by stations and specific LED signs.
106 Jim Maresca, NextBus, Emeryville, California.
3-110

TRAVELER INFORMATION SYSTEMS
ETD signs can also broadcast train status, public information, emergency messages, and other data.
Advertisements are also beginning to appear on the signs to defray operating and capital costs.
Estimated revenue from one client is $100,000 annually.
To become fully compliant with the Americans with Disabilities Act, BART is also working on
incorporating audio ETA at each stop by providing digitized voice announcements of the updated
arrival times for each platform. Currently, BART is collaborating with Lucent Technologies on
converting the ETA information into digital audio sound. One challenge is the acoustics of each
station. Measures are being taken, both in slight modifications to existing station designs and in
audio technology, to ensure that audible announcements can be heard by all travelers.
BART recently installed new Daktronic Destination LED signs at 11 stations that had been using
either television monitors or LED signs that could only display single line messages. The new LED
signs can display several lines of scrollable information at once. BART's Systems Engineering
Department is proposing to install these new Daktronic signs in every station for a total cost of $12
million. This proposal had not been approved as of November 1999.107
Seattle, Washington TransitWatch is a traveler information system of video monitors displaying: route numbers; trip
destinations; departing bus bay location; scheduled departure time; and real-time departure status.
TransitWatch, like BusView (see Section 3.1), is an ATIS service implemented as part of Seattle's
Smart Trek Metropolitan Model Deployment Initiative. The service became operational in July 1998
and cost $500,000 to develop the software and purchase the necessary site computers, display
hardware, and communications equipment. Like BusView, TransitWatch obtains its raw bus location
data from the Metro signpost-based automatic vehicle location system.108 Figure 3-8 illustrates
TransitWatch.109
107 A.V. Seshadri, Manager of Systems Engineering, Bay Area Rapid Transit, Oakland, California.
108 Tom Friedman, op. cit.
109 Taken from http://www.smarttrek.org/html/transitwatch.html#
3-111

TRAVELER INFORMATION SYSTEMS
3-112
Video monitors, computers, and the necessary high-speed
communications infrastructure have been installed at the
Northgate, Bellevue, and Boeing Renton transit centers.
Figure 3-9 shows a sample screen from the Northgate
Transit Center.110 An additional five sites are planned.
Expected benefits to TransitWatch include promoting
increased transit use through the reduction of stress inherent
in transfers and service variability. When used in
conjunction with MyBus or BusView, transit users with
access to the Web will be able to time their arrival at the
transit centers and further reduce the travel time of their
transit trips.
3.3 IN-VEHICLE TRANSIT INFORMATION SYS
In-vehicle transit information systems provide useful en route
transit trips. As well, they comply with the Americans with Dis
that vehicle stops at all train stations and key bus stops be an
public address systems are most often an operator's responsibilit
relieve the vehicle operator of that responsibility by announci
points of interest automatically, based on the vehicle's location
some instances, this information is also provided to passengers
one or more locations in the bus. Although, primarily motivated
helpful for those unfamiliar with the route, when the bus is cro
outside the vehicle.
110 Taken from http://www.its.washington.edu/transitwatch/ngtc_applet.
Figure 3-8. Customer UsingTransitWatch
TEMS
information to travelers about their
abilities Act (ADA), which requires
nounced. These announcements on
y. Automated annunciation systems
ng stops, transfer possibilities, and
, route, and direction of travel. In
via variable message signs placed at
by support for the disabled, it is also
wded, and when it is difficult to see
gif

TRAVELER INFORMATION SYSTEMS
Figure 3-9. Sample TransitWatch Screen from Northgate Transit Center
3-113

Technology Description
Automated announcements are made via the bus public address system. Visual messages are
provided through VMS. Route specific software provides the information to be dispensed. The
precise information to be announced and displayed at a particular time is determined by the agency’s
AVL system.
Status: State-of-the-Art
Automated in-vehicle information has been installed by a few agencies. While these information
systems need AVL, not all agencies with AVL have included them. Of those that have, more have
installed annunciators than have installed VMS. However, incorporating advertising, as some
agencies are contemplating, could help to defray the cost of the in-vehicle systems.
Challenges to Implementation
The primary challenge to in-vehicle transit information systems is the cost. This has resulted in few
transit agencies deploying these systems.
Application Examples
The following are examples of in-vehicle transit information systems.
�� San Antonio, Texas’ integrated in-vehicle information systems. �� Washington, D.C.’s next stop annunciator system based on AVL and GPS receivers.
San Antonio, Texas
VIA Metropolitan Transit is in the process of equipping their entire fleet, including paratransit vans
and supervisory service and police vehicles, with an integrated in-vehicle information system by
Siemens. Each of the initial test fleet of 30 vehicles brought into service in October 1999 is equipped
with differential GPS receivers, and all fixed-route buses have audio/visual next-stop announcements.
The vendor has opted not to use the GPS data to automatically trigger the next stop announcements.
Instead, the annunciator system announcements are based on the odometer reading. If a bus detours,
the odometer accumulates additional mileage and the announcements are triggered too early. The
driver can suspend automatic announcements and instead make manual announcements over the
public address system.
4-1

Washington, D.C.
A smart bus plan is under development at WMATA. In addition to passenger information, this plan
is expected to include AVL, dispatch software, route/schedule adherence software, automated fare
collection, automatic passenger counting, surveillance cameras, and traffic signal priority. A
passenger information task force has been developing an Advanced Traveler Information System
vision that will help determine functional requirements for the overall smart bus approach. The smart
bus plan is currently being finalized and is part of a broad 10-year ITS plan to improve operations and
enhance transit user information.
WMATA’s approach for complying with ADA requirements is to acquire all new buses with voice
annunciator systems (Future bus orders could use equipment from different vendors).
WMATA has 302 buses in service using the GPS-linked voice annunciator system produced by
Clever Devices. An incoming order will provide an additional 230 buses with the voice annunciator
with an option for 200 more. WMATA is not planning to retrofit existing buses with annunciators
since retrofits for existing buses are considerably more expensive due to such the need for wiring
modifications.
Even though it incorporates GPS receivers, the next stop annunciator system was not specifically
designed to support future integration with other systems. To support AVL, it will be necessary to
integrate the controller for the annunciator system into an overall smart bus system and to route the
GPS location data over a mobile communications system.111
111 Julie Hershorn, Jack Requa and Rick Stevens, Washington Metropolitan Area Transit Authority,
Washington, D.C.
4-1

4. ELECTRONIC PAYMENT SYSTEMS119
Each type of fare payment, electronic or not, has its advantages and disadvantages. Comparison of
the advantages and disadvantages of magnetic stripe cards, smart cards, as well as other fare media
commonly used by transit agencies, is shown in Table 4-1.
Table 4-1. Fare Media Advantages and Disadvantages Advantages
Disadvantages
Cash and tokens: Simplest form of payment Most widely used
Cash and tokens:
Most expensive form of payment to process Highly susceptible to theft High exposure to fraud State-of-the-art cash and token collection equipment
is complex Paper passes and tickets:
Inexpensive to purchase stock Easily combined with other payment
technology, such as magnetic stripe and optical coating
Paper passes and tickets:
Susceptible to fraud Labor intensive Pre-printed stock needs to be treated like a currency
Magnetic stripe cards:
Proven technology Inexpensive media Can be combined with printing Support a high number of uses
Magnetic stripe cards: Require complex equipment Maintenance intensive Susceptible to accidental erasure Have a large variance in reliability More susceptible to fraud than smart cards
Smart cards: Secure data transfer No physical connection required for
contactless applications Larger memory capacity Can perform complex security validation
calculations (microprocessor card) High reliability High resistance to fraud
Smart cards: Cost - prohibits use for single ride
Transit operators continuously look for ways to lower the operational costs of their fare collection
systems. Operators are also interested in increasing revenue and customer convenience. With these
119 Some of the information provided in this Chapter has been developed for an on-going Federal Transit
Administration initiative to develop functional guidelines and technical specifications for integrating smart card technology into existing transit fare collection systems. These guidelines will be published in September 2000.
4-1

goals in mind, transit operators are capitalizing on the increased automation, security and data
capabilities offered by new fare and data technologies that can be integrated into existing fare
collection systems. These systems combine fare media, such as magnetic stripe cards or smart cards,
with electronic communications systems, data processing computers, and data storage systems to
more efficiently collect fares and may also increase revenue by increasing ridership (Table 4-2).
Table 4-2. Financial Advantage of Electronic Fare Media
Increased Revenue
Decreased Costs Shorter and more convenient fare payment processes may result in increased ridership. Integration with other modes or operators may enable more customer discounts and loyalty schemes resulting in increase ridership and revenue.
Use of electronic fare media decreases cash/coin handling:
�� cash/coin collected for fare payment (i.e., at fare box or fare gate) decreased or eliminated;
�� higher value ticket/fare sales transactions, resulting in fewer transactions.
Increased transaction data permits equitable distribution of shared revenues, and audit trail to protect against employee theft.
Automation of fare collection processes decreases labor costs.
Increased customer information permits optimization of fares, schedules, and transit services.
Use of products without mechanical/moving parts (e.g., ticket transports) increases equipment reliability, reducing maintenance.
Increased media security decreases fraud levels.
Today, fare collection systems are being updated from traditional cash, coin, token, and magnetically
based systems employing labor intensive processes and limited data collection capabilities, to
sophisticated smart card based systems. Smart cards have the potential to reduce costs through
increased automation while enhancing customer convenience. (See Figures 4-1 and 4-2 for examples
of a smart card and its use in fare payment.)
4-1

Figure 4-1. Example of a Smart Card
Figure 4-2. Rider Using Smart Card for Fare Payment
6-5

Transit operators are interested in the ability to offer innovative customer service provisions to their
riders. Such provisions can include card balance protection and autoload features. The audit trail
created by smart card systems provides the ability to track the value of each card in the system,
provided that each transaction is associated with a linked card serial number. This process permits
agencies to offer balance protection services to customers who register their cards. This protection
allows customers to receive the remaining value on their card if it is lost or stolen. Autoload
functions also allow customers to establish a link to a bank or credit card account that is automatically
billed for a preset value. Autoloads are performed during payment processes, and alleviate the
customers' need to use a load device.
Autoloads can be activated either at predetermined times in the week/month/year (pre-bill or post-
bill) or when the stored value on a customers card reaches a designated minimum level (post-bill
only). Anonymous accounts (non-registered accounts) cannot use this capability, as the customer’s
card must be associated with the customer’s bank or credit account. Balance protection services also
require a card to be registered, tying the card number to either the customer’s name or to a personal
identification number issued to the customer. Figure 4-3 demonstrates a customer loading value on to
a smart card.
THE FLEXIBILITY OFFERED BY THE USE OF SMART CARD SYSTEMS, PERMITS OPERATORS TO MORE EASILY IMPLEMENT CHANGES IN FARE POLICY BY UPLOADING FARE CHANGES AND MULTIPLE FARE STRUCTURES ELECTRONICALLY TO THE SYSTEM PAYMENT AND SALES DEVICES. ADDITIONALLY, THIS FLEXIBILITY ALLOWS OPERATORS TO PROMOTE DIFFERENT PRODUCTS AS WELL AS INCENTIVES AND LOYALTY DISCOUNTS (FOR INSTANCE, 12 RIDES FOR 11, FREE TRANSFERS) BASED UPON USAGE.
FOR TRANSACTION PROCESSING SYSTEMS, SMART CARDS OFFER A BENEFIT OVER MAGNETIC STRIPE TICKETS IN TERMS OF SECURITY, FLEXIBILITY AND DATA CAPACITY, BUT AT A HIGHER COST. MIGRATING FROM TRADITIONAL CASH, TICKET, TOKEN OR MAGNETICALLY BASED SYSTEMS TO A SMART CARD SYSTEM TYPICALLY REQUIRES OPERATORS TO REDESIGN SOME OF THEIR EXISTING FARE PAYMENT PROCESSES. SOME OF THE CHANGES MAY INCLUDE: AUTOMATING CERTAIN CLEARINGHOUSE AND SETTLEMENT FUNCTIONS TO A PRIVATE SECTOR PARTNER. THE OVERLAYING OF A NEW, MORE EXPENSIVE TECHNOLOGY ONTO AN EXISTING FARE SYSTEM WITHOUT MAKING ANY OF THESE
6-6

CHANGES MAY ADD COSTS THAT MAY BE DIFFICULT TO OFFSET WITH ANTICIPATED BENEFITS. THE MAJOR COST/BENEFITS WILL BE REALIZED BY TAKING THE OPPORTUNITY AFFORDED BY INTEGRATING THE ADVANCED TECHNOLOGY TO OPTIMIZE FARE PAYMENT AND COLLECTION PROCESSES.120
Figure 4-3. User Loading Value on Smart Card
Smart cards, which are much more difficult to counterfeit than paper, coin, or magnetic stripe tickets,
will help reduce incidents of fraud. Smart card security is achieved by combining the following three
basic elements:
�� Encryption: the transformation of data that is only readable through the use of a secret key; �� Authentication: the process of ensuring the message received is the message sent; and �� Non-repudiation: guarantees that the message sender cannot deny having sent it.
120 U.S. DOT/Volpe National Transportation Systems Center. National Transit Smart Card Guidelines,
Module 1, Regional Fare Integration, Booz-Allen & Hamilton, Inc., April 1999.
6-7

In addition to enhanced security, maintenance costs with a smart card system should be less. Current
magnetic stripe systems can require daily cleaning and maintenance to remove dust and other
particles from the turnstile and fare box readers. This maintenance process is labor intensive and
costly to the operator. The use of contactless smart cards decreases the number of mechanical and
moving parts required in the turnstiles, fareboxes and distribution devices. Additionally, eliminating
or reducing the use of other system components such as bill acceptors and coin recirculation units can
lessen the wear and tear on the supporting infrastructure, resulting in lower maintenance costs.
Technology Description
The main components of systems using smart card based technology are:
�� A fare payment system - the infrastructure used to receive value from the fare payment media and/or check the validity of the media for the current transit trip;
�� A fare distribution system - the infrastructure used for the distribution of the payment media, as well as the distribution of the value that is loaded onto the fare media; and
�� Clearinghouse and back office processing systems - infrastructure used to capture and process transaction data generated by the fare payment and distribution systems.
Within the last ten years, smart card developers and chip manufacturers have developed new card
technology and faster chips. Smart cards have different processing capabilities than traditional
payment systems. These capabilities include:
�� Memory only - simple memory cards store limited amounts of data in preprogrammed formats and offer little or no security;
�� Memory with security logic - security logic typically uses some form of access code (as large as 64 bytes) to secure card data, and;
�� Memory with microprocessor - microprocessor is capable of processing data, increased security, with the ability to implement cryptographic algorithms.
The following are non-exclusive examples of popular smart cards in use:
�� Contactless cards; �� Hybrid cards; �� Dual interface cards; and �� Multi-Application cards.
Contactless Cards Electronic payment systems employing smart card technology have two types of communication
interfaces. Contact cards require physical contact between the chip on the card and the corresponding
contact in the card reader. Contactless cards use radio frequency to communicate with the card reader
6-8

device and requires no contact between the card and reader, as demonstrated in Figure 4-2. The
reader activates the chip by electromagnetic signal as the card is passed by the reader. The card can
be passive or active. Passive cards are powered by radio frequency generated from the reader. An
active card is powered from a battery imbedded in the card.
Hybrid Cards Within the industry, the term “hybrid card” is used to define either a card that contains both smart
card and magnetic stripe elements or a card that contains two chips, one which communicates through
contact type interface and one which communicates through the contactless interface. Applications
using two different interfaces do not share operating systems or data. Since the two interfaces do not
communicate with each other, a terminal is required to move data from one interface to the other,
thereby limiting the flexibility and use of hybrid card technology.
Dual Interface Cards Dual interface card technology is sometimes referred to as “combi-card” technology and provides the
physical platform for multi-application card systems involving entities with different functional
requirements. For example, transit operators prefer contactless cards for fare payment transaction
speeds under 0.3 seconds. Financial institutions typically require a contact interface that provides the
capability to process complex encryption processes associated with financial applications. Dual
interface “combi-card” technology provides a single chip and the same memory that can be accessed
through both contact and contactless card interfaces.
Multi-Application Cards Multi-application systems can accommodate multiple fare types and fare structures including stored
value electronic purses, stored rides, time-based passes as well as discounts and loyalty schemes.
These capabilities allow for the development of multi-application card systems.
Status: State-of-the-Art
Transit operators in several U.S. cities are planning to replace their current fare collection systems
with smart card systems. A recent article in Card Technology Magazine stated, “By 2003, mass
6-9

transit riders worldwide will use more than 115 million chip cards to pay transit fares. This number is
up from last year’s estimate of 15.1 million.”121
Transit operators prefer contactless card technology to contact card technology because it allows
passengers to speed through turnstiles at rates of 30 to 60 per minute. Contactless technology also
provides added convenience by sparing cardholders the trouble of removing the cards from their
wallets. This added convenience in turn alleviates congestion at turnstiles and minimizes long
boarding queues.122
In addition to faster throughput, smart card systems can be designed to capture more detailed
transaction and revenue data than non smart card systems. The data can be used to evaluate route
planning, peak travel times, ridership statistics and profiles, effectiveness of the distribution network,
and enable more efficient revenue distribution among operators. Another incentive for integrating
smart card technology is that transit operators want to decrease expenditures on collecting revenue,
and lessen the associated security risks connected with collecting large amounts of cash and tokens.
Challenges to Implementation
Migrating from traditional payment systems (cash, ticket, token, or magnetically based systems) to a
smart card based system typically requires transit operators to redesign some of the existing fare
payment processes. For example, changes in some of the payment system components — readers,
turnstiles, fareboxes, and ticket vending machines — need to be done. This can be costly for transit
agencies depending on the amount of equipment to be installed. If a regional smart card that can
work on buses, subways, commuter trains, etc. is to be issued, several transportation agencies will
need to be involved. This can pose some challenges if the agencies have never cooperated before.
Also, to successfully achieve the benefits, many of the institutional aspects of the revenue collection
process must be integrated or at least coordinated. Combining card production, distribution, and
marketing of several agencies can be complex, but it can product significant cost savings.123
121 Balaban, Dan A. “Transit Smart Cards are Ready to Roll,” Card Technology Magazine, September 1999. 122 Ibid. 123 Multisystems, Inc., Dove Associates, Inc., Mundle & Associates, Inc., Potential of Multipurpose Fare
Media, Draft final report, TCRP, June 1997.
6-10

Before presenting examples of how different sites are implementing EPS, it is important to
understand that there are policy choices that need to be made at the outset of deployment. These
choices result in defining the type of EPS that will be deployed and how it will operate. Important
decisions include:
�� Fare Policies; �� Regional payment systems; �� Multi-application smart card environments; and �� Administrative service options.
These issues are defined in more detail in the textboxes on the following pages.
Application Examples
THE FOLLOWING SITES HAVE ELECTRONIC PAYMENT SYSTEMS IN USE. �� Greater Cleveland, Ohio’s Smart Card Demonstration Project. �� Washington, D.C.’s SmarTrip Demonstration Project. �� San Francisco, California’s TransLink Project. �� Seattle, Washington’s Regional Fare Coordination Project.
Greater Cleveland, Ohio
Greater Cleveland Regional Transit Authority’s Smart Card Demonstration Project in Ohio will
eventually involve 30,000 payment cards accepted on approximately 100 buses. The procurement
phase began in October 1999. It is expected to use a Mifare card and has the potential to affect
210,000 daily bus riders.
Washington, D.C.
WASHINGTON, D.C.’S SMARTRIP PROJECT BEGAN AS A DEMONSTRATION IN 1995 USING 2,000 CARDS FOR 21 BUSES AND 5 WMATA PARKING FACILITIES. THE PROJECT HAS GROWN TO INCLUDE A SYSTEM-WIDE PILOT IN 1998 THAT PROVIDED 1,500 CARDS FOR THE ENTIRE RAIL SYSTEM AND ALL WMATA-OPERATED PARKING FACILITIES. AS OF SEPTEMBER 1999, 30,000 CARDS WERE IN USE FOR RAIL AND BUS TRIPS.
SmarTrip uses a contactless card. By the end of 1999, about 40 percent of the system's fare gates (out
of 748 gates in total) were equipped to accept the SmarTrip card. SmarTrip has the potential to affect
users on three modes of transit:
The rail system experiences about 305,000 users; ��
��
��
The bus system has 235,000 users; and The paratransit system has about 1,000 users.
6-11

Fare Policies
Fare policies are driven by an agency's system goals. Once system goals are established, each agency should analyze its existing fare policies to determine how effective these policies work towards achieving the goals. Agencies should also recognize that the implementation of a more sophisticated payment technology might be accompanied with fare policy changes. Fare policy modifications will most likely be required when multiple agencies are involved. These modifications are usually a result of changes in service routes and the elimination of underused ticketing schemes. Beyond fare policy structure, integrating smart card technology into existing fare collectionsystems can require substantial changes of operational processes. Additional functions or servicesthat may be required to administer and support a smart card system may include:
�� Card procurement and issuance; �� Card and value distribution and card replacement; �� Financial settlement and reporting; �� Network management; �� Technical support and system maintenance; and �� Customer support.
Regional Payment Systems
A regional payment system can be defined as multiple operators, sometimes multiple modes(transit, ferry, light rail, parking, and toll) who employ and accept an interoperable paymentmechanism within the region. This type of system allows customers to travel throughout theregion in a “seamless” manner. At a minimum, the use of a common fare medium which storesexisting fare structures permits riders to load individual fare products (stored rides/passes) frommultiple operators onto a single card. Another benefit to integrating a common regional faremedium is the capability to allow riders to pay, from a single electronic purse, fares from multiple operators and possibly multiple modes. Implementing a regional electronic payment system program utilizing smart card technology is acomplex initiative involving a variety of technological considerations, partnership issues,institutional changes, legal considerations, as well as customer acceptance issues. The first step towards establishing a regional electronic payment system is to develop a consensus
among participating stakeholders of what the system will accomplish. Comprehensive, concise goals need to be agreed upon by all stakeholders. Operators must identify how theyare going to determine if the system is successful and what framework will drive the decisionmaking process; cost versus functionality. These goals will provide the baseline for evaluating and analyzing payment system elements.
6-12

Payme
��
��
��
��
Regionrequirinas wellfrom trequireapplicadevelop
A multbe prointegrastructuintegraagency
A mult“rentedapplicamay beapplica
If a sinAdditioclearinrevenumodel.
The adthe agequantif
blisesta
Regional Payment Systems (Cont'd) nt system elements will include:
Fare policies and procedures; Fare technology; Required services; and
Implementation priorities and strategy.
al electronic payment system programs already established in San Francisco and Seattle areg dual-interface cards. Dual interface cards can run contactless applications, such as transit,
as contact applications, including credit, debit, and stored value (used for phones and retail) he cards microprocessor. Dual interface card technology offers the enhanced securityd by the financial and retail establishments and the transaction speed required for transittions. Many industry experts believe dual interface card technology will facilitate thement of multi-application smart card programs.
Multi-Application Smart Card Environments i-application smart card environment supports more than one application on a card and can vided by different parties. For example, a transit multi-application card program can be ted through the use of a common funds pool across multiple applications, or can bered as completely separate (independent) applications on single cards. One of the benefits of ting a multi-application card program is the flexibility the program can offer th.
i-application smart card may be looked upon as “real estate” where space on the card can be ” to multiple entities that provide separate individual applications. In this model, eachtion owner becomes a merchant in a network of service providers. This type of structure characterized as a multi-function system ction in this model are cleared independently.
gle application is accepted by multiple entities the system moves to a more “open” platform.nally, if funds are stored in an electronic purse (e-purse) for multiple goods and services, the
g and revenue distribution processes must be modified to accommodate the dispersal ofe
vantages and disadvantages of participating in a multi-application card system are driven by ncy’s need to improve and augment existing revenue collection operations. In order toy the benefits of participating in a multi-application card system, a transit agency needs to h a baseline of existing fare collection costs, time, resource requirements and constraints.
to all merchants. The potential for merchant/acquirer fees can result from this type of
ontaining closed applications. Funds for each
e transit
6-13

6-14
Multi-Application Smart Card Environment (Cont'd) This baseline is then used as a means of comparison to evaluate any potential benefits that may be realized by integrating additional applications onto a transit fare card.* Administrative Service Options
The various administrative services required for system operation can be provided by the transit agency, by a system provider (private sector partner) under a turnkey solution, or through a third party contract(s).
Transit-operated system If the transit operator(s) decides to provide such functions, the operator(s) must have sufficientinternal resources, or add personnel and develop the necessary expertise to operate and maintainthe system. Resource needs may be analyzed for all participating regional transit operators as awhole. Agencies may take advantage of the resource capabilities provided by a specific operatorand/or may pool resources in a specific area to accomplish the required administrative functions.However, it may be difficult to identify an equitable or politically agreeable solution using such anapproach.
Turnkey Solution Agencies may desire to contract operations and maintenance services to the system provider usinga turnkey solution. This approach can substantially reduce agency risk by consolidating theresponsibility for system performance. This solution reduces contract administration requirementsby eliminating the management of multiple, independent contracts. The benefits of turnkey contracts can also include:
�� Consolidating overall system responsibility, substantially reducing the potential for conflict;
�� Less complex to manage; �� Schedule compression; and �� Consideration of product lifecycle. Third Party Solution
For some complex projects, it may be more cost effective and/or politically necessary to outsourcevarious functions and services. Multiple services can be provided by external organizations. Agencies should minimize the points of contact necessary to administer such contracts and requirethe provider to designate a program manager. It is also important that external organizations thatperform these services have offices located in the region. Typically a third party provider is paid by the transit agency through transaction-based fees and/or periodic payments established by the terms of a contract. This model leaves more flexibility to thecontractor; however, the transit agency may have less control over service features.
* U.S. DOT/Volpe National Trnsportation Systems Center, A National Transit Smart Card Guidelines, Module I, Regional Fare Integration, Booz-Allen & Hamilton, Inc., April 1999.

Lessons learned from the project include recognizing that advances in smart card fare collection
programs touch all parts of large organizations and that coordination and collaboration between
business units is important in the product development and deployment process. WMATA
specifically designed its SmarTrip system to provide the maximum flexibility to allow for future
development and expansion.
San Francisco, California San Francisco’s TransLink Project is in the demonstration phase. Phase I includes the issue of 20,000
cards that are expected to be operational in October 2000. Full use of approximately 750,000 cards is
expected in October 2001.
TransLink has the potential to affect 1.5 million transit users in the Bay Area that utilize multiple
modes including:
Buses; ��
��
��
��
��
��
��
��
Light rail vehicles; The BART metro system; Commuter rail; and Some ferries.
The plan is to eventually deploy 550 add-value machines and 4,000 proximity card readers, and to
have 400 point-of-sale locations, 50 operator pass sales offices, and 500 handheld card readers for
fare inspection. The current plan is to utilize the dual-interface card technology.
Seattle, Washington
Seattle’s Central Puget Sound Regional Fare Coordination Project’s contract was awarded in
February 2000. It is estimated that approximately 500,000 to 1 million commuters (out of 1.5
million) will use the planned dual-interface cards on buses, electric trolleys, commuter rail trains, and
ferry terminals at full deployment.
The project is currently in its procurement phase with the beta-test scheduled for mid-2001 and full
system deployment in early 2002. The scope of the project is based upon corporate and university
campus programs participating. Planned deployment includes:
2,300 card readers (fare transaction processors); 40 automatic re-value kiosks; and 22 customer service terminals.
6-15

The contractor will be responsible for providing additional card re-value methods under a 10-year
service contract.
Although still in its procurement phase, the project team has learned one lesson. They found that
customers do not recognize artificial service boundaries, and, therefore, customer service policies and
fare payment rationales need to be consistent.
5. TRANSPORTATION DEMAND MANAGEMENT
��
Transportation Demand Management (TDM) is a term applied to a broad range of strategies that are
intended to change traveler behavior for the purpose of reducing or reshaping use of the transportation
system. The paramount objective of TDM strategies is to reduce the amount of automobile travel on
the roadways by more efficiently utilizing existing transportation resources and infrastructure. TDM
strategies employ ITS technologies to:
�� Facilitate and increase the use of public transportation, including carpooling, vanpooling, walking, bicycling, and telecommuting;
�� Compress work weeks; �� Apply congestion pricing programs; and �� Manage parking and apply demand pricing.
TDM strategies frequently combine innovative approaches and advanced technologies in order to
create a more integrated approach to managing the various problems within a regional transportation
system.
Three TDM strategies that utilize ITS technologies are discussed in this chapter:
Section 5.1 Dynamic Ridesharing — Dynamic ridesharing (also called real-time ridesharing) is a form of carpooling that provides rides for single, one-way trips rather than for trips made on a regular basis. Dynamic ridesharing can be either a program organized and run by an official agency, or a system informally operated by participants. This latter setup is called “casual carpooling.” Although both types of dynamic ridesharing are discussed in this Section, the emphasis is on organized programs since only these use ITS technologies for matching riders with drivers.
6-16

Section 5.2 Automated Service Coordination — Automated service coordination can be defined as multiple transportation operators in a region that provide coordinated service with the assistance of APTS technologies. By coordinating the services of multiple transportation operators in a region, the connectivity of public transportation services can be greatly improved for persons who would have to travel on more than one transportation agency’s vehicles. This will produce the opportunity for attracting more trips to public transportation.
��
�� Section 5.3 Transportation Management Centers — “Transportation Management Center” (TMC) is a term that refers to a variety of state-of-the-art facilities in which transportation professionals can monitor, manage, or control transit and/or traffic operations. The use of ITS technologies and services allows for real-time management of public transit and/or traffic resources and capacity.
6-17

5.1 DYNAMIC RIDESHARING
Dynamic ridesharing can reduce the number of single occupant vehicle trips by providing an
opportunity for an individual who is unable or who prefers not to drive on a particular day or for a
particular trip to join with another person or persons making a trip in a car or vanpool. In organized
dynamic ridesharing programs, individuals submit requests for a ride to an operations center or
central database, either by telephone, e-mail, or direct input to a system residing on the Internet. A
request may be made for any destination or time of day, but matches are more likely to be found for
travel in peak periods and in principal commute directions. Requests for ridematches can be made
well in advance or close to the time when the ride is desired. A return trip would be a separate trip
request and could be matched with a different driver.
The database of trips that have been offered by registered drivers is searched by the ridematching
software to see if any match the approximate time and destination of the trip request. The requestor
normally provides a window of desired travel times to enhance the likelihood of finding a match.
Potential trip matches are presented to the requestor along with the contact information for those
offering these trips. This information is usually provided to the requestor by the same means as the
request is submitted. The person requesting the trip then must contact the potential trip provider(s) by
phone, e-mail or fax to make the arrangements for the ride.
Dynamic ridesharing benefits both drivers and passengers. Passengers benefit by having an
alternative when their usual mode is unavailable, and by possibly eliminating the need for an
additional car for occasional use. Dynamic ridesharing is particularly valuable when public
transportation is not an option. Drivers benefit by having someone to share the cost of the trip
(although this may not always happen) or to gain enough passengers to qualify for high occupancy
vehicle (HOV) lanes and reduce the travel time of their trip.
Technology Description
The ITS element in dynamic ridesharing is the automation of the trip request matching and
arrangement process, which allows trips to be arranged on short notice. This can be done by either
the traveler using the Internet or by a customer service representative at a transit agency call center.
The technology involved is rideshare software and possibly the Internet.
6-18

Status: State-of-the-Art
The FTA has funded several ridesharing activities. However, concerted efforts to develop organized
programs generally have either been terminated (Bellevue, Washington; Sacramento, California; and
Los Angeles, California) or never implemented (Ontario, California and Houston, Texas). These
were discussed in previous State-of-the-Art documents. Only the Seattle Smart Traveler remains in
existence, and only in a limited manner.
In contrast to the low utilization of organized dynamic ridesharing programs, casual carpooling has
received heavy utilization in two locations. Update ‘96 and Update ‘98 described the operations in
Oakland, California, where drivers pick up passengers by the roadside in order to use the HOV lane to
cross the San Francisco-Oakland Bay Bridge into San Francisco, and in Northern Virginia, where
drivers pick up passengers in order to use the HOV lanes on the Shirley Memorial Highway into and
out of the District of Columbia. Daily users at the two casual carpooling sites average in the
thousands. In 1993, RIDES for Bay Area Commuters estimated 8,000 daily casual carpoolers crossed
the Bay Bridge.
Casual carpooling in these two areas appears to be expanding and becoming more formal. The
Environmental Defense Fund (EDF) Web site (www.edf.org/carpool/carpool.html) hosts a map
showing the pick up points in the East Bay (Figure 5-1). The San Francisco Department of Parking
and Traffic has even set aside a block of Beale Street for drivers to pick up riders headed to the East
Bay on weekday afternoons. Signs at the Beale Street location indicate where to stand for various
East Bay destinations.
In spite of its popularity, there is controversy concerning casual carpooling’s benefits to the
transportation system in San Francisco. According to an analysis by RIDES for Bay Area
Commuters, casual carpooling takes riders from transit and adds to the number of cars on the road.
Table 5-1 shows the prior commute mode of drivers and passengers. As can be seen, casual
carpooling took 74 percent of casual carpool passengers and 33 percent of casual carpool drivers from
BART or AC Transit. Using the prior commute mode information and a count of 2,117 casual
carpools leaving from 12 East Bay locations, RIDES estimated that there would have been 455 fewer
cars on the road if casual carpooling did not exist.112
112 http://www.rides.org/lv2corner/lv3ccrpt/cc3survey6.html.
6-19

Figure 5-1. East Bay Pick Up Points
Table 5-1. Prior Commute Mode113
Passengers Drivers Combination
Drove Alone 9% 40% 20%
Drove With One Other 3% 7% 3%
BART 52% 25% 37%
AC Transit 22% 8% 13%
Formal Carpool (3+) 2% 3% 2%
Always Casual Carpooled 3% 5% 3%
Lived Elsewhere 6% 8% 12%
Other 4% 4% 9%
Challenges to Implementation
6-20
113 http://www.rides.org/lv2corner/lv3ccrpt/cc3survey7.html.

There are many potential reasons for low dynamic ridesharing. Possible reasons include a lack of
awareness of the programs, a deficiency in the number of driver participants and offered rides,
insufficient incentives to rideshare, a concern about sharing rides with strangers, the time factor to
receive a matchlist and contact possible trip providers, and, in many instances, the need to obtain a
match for a return trip. Some recent rideshare programs that have been installed on the Internet have
the capability to overcome the time delay factor in obtaining a matchlist, but many of the other
impediments described above remain.
Application Examples
The following examples document the attempts to establish dynamic ridesharing programs.
�� Redmond, Washington’s automated ridematching service. �� Seattle, Washington’s dynamic ridematching system.
�� Missoula, Montana’s ridesharing program.
Redmond, Washington
The Greater Redmond Transportation Management Association (GRTMA) has instituted an
automated ridematching service for carpools and vanpools on the Internet114 that can also be used by
individuals seeking a single ride. It is an employer and map-based system. Anyone in King,
Snohomish, Pierce, Kitsap, and Island counties can register for the program. Individuals register
themselves, providing an e-mail address, password, and their home address or a nearby intersection.
A map appears with the location indicated for verification by the registrant. The registrant’s trip
schedule then is entered and the user has the ability to indicate preferences such as whether they wish
to drive or ride, ride with smokers or non-smokers, or ride with employees of specific companies
(only for employees of TMA member companies). A map showing the requestor’s location and the
location of potential matches are displayed on the screen (Figure 5-2) together with their names and
methods of contacting them. E-mails can be automatically sent to any of the persons on the list.
Individuals can change their information at any time or remove themselves from the system if they
have found satisfactory ridesharing arrangements, moved, changed jobs, etc. Every three months, e-
mails are automatically sent to all registrants asking for their continued interest in participation. Non-
respondents are automatically removed along with those responding in the negative.
114 http://www.RIDEQUEST.com
6-21

The system was essentially designed by the end users (company employees) who indicated the
features they wanted in a rideshare program. A contract was signed with Puget Sound Systems Group
in November 1998 to develop the rideshare software. An early version of the system was tested in
April 1999. Map Objects is the geographic information system (GIS). The database is accessed by
SQL Server. Cost to date has been $278,000. SmartTrek, the U.S. DOT’s Model Deployment
Initiative in the Seattle area, provided $90,000. The remainder was secured through winning a
competition for oil rebate funds from the Washington State DOT. GRTMA owns the system and has
licensed Puget Sound Systems Group to sell the system to other agencies. It is anticipated that the
purchase price will be about $50,000 to $100,000.
Figure 5-2. Location of Potential Rideshare Matches
With the system residing on the Internet, the GRTMA has no involvement in day to day operations
and virtually no system maintenance is required. A GRTMA staff person spends a small amount of
time monitoring the Web site. The host computer (a PC server with a Windows NT operating
system) is located at City of Redmond offices. GRTMA gets a system-generated report on utilization
once a week. GRTMA is looking to add features such as bus schedules and fares.
The rideshare database currently contains about 1,200 registrants. There are no statistics available on
carpool formation yet. An employer survey on commuting is required annually by the State of
Washington. This survey, to be conducted in Spring 2000, will allow a comparison with the previous
6-22

year and provide information on the change in carpool and vanpool use. Initial indications are that
there is not much call for one-time rides.115
Seattle, Washington
The Seattle Smart Traveler (SST) was one component of a larger FHWA-funded ITS operational field
test (SmartTrek) in the Seattle area (see Figure 5-3 for the logo). As described in Update ‘98, the
SST was a dynamic ridematching system at the University of Washington. The World Wide Web
was the major method used to provide this real-time ridematching service. Users completed an
application form on the Web, offering or requesting trips for regular commuting trips, other regular
trips, or occasional trips. The system identified potential matches and automatically sent an e-mail
message with this information to the requestor. Final trip arrangements were usually made by e-mail.
Figure 5-3. Seattle Smart Traveler Logo
A demonstration of the SST can be found at http://sst.ivhs.washington.edu/sst. The 15-month SST
test was in operation through the Spring quarter of 1997. Funding for the SST demonstration was
provided by FHWA ($170,000) and Transportation Northwest ($35,000), the region’s University
Transportation Center.
Approximately 700 ridematches were requested during the 15-month test period. Of these, some 150
matches (21 percent) were generated. At least 41 individuals (six percent) actually established a
carpool for trips. It is likely that more than 41 dynamic ridesharing trips were taken, since there was
6-23
115 Donna Ambrose, Executive Director, Greater Redmond Transportation Management Association, Redmond,
Washington.

no requirement that actual trips be reported. The SST staff claims that the percent of persons that
shared single trip rides in the SST test is similar to the percent forming carpools in conventional
rideshare programs.116
Survey respondents provided generally positive comments concerning ease of use of the SST
ridematching process. Although some stated they would consider SST when their normal commute
mode was not available, most noted that they normally ask a friend for a ride.
University of Washington and SST staff identified some issues that may have limited the use of the
system. First, the project may have been implemented a little before the real boom in Internet use.
Second, the technology available at the time for developing the dynamic ridematching capabilities
was somewhat cumbersome. Third, the SST may have been viewed by some potential users as too
temporary or experimental. Fourth, other incentives may be needed to encourage greater ridesharing.
Finally, a significant limitation continues to be concerns about sharing rides with strangers.
Although the test ended in June 1997, the SST continues to operate even though no staff are assigned
to the project. Without staff support, the database is not updated or purged of former users.117
Missoula, Montana
The Missoula Ravalli Transportation Management Association (MRTMA) operates a ridesharing
program in a region 135 miles long by 90 miles wide, centered around Missoula. The MRTMA web
site is http://www.mrtma.org.
Because of the comparatively expensive cost of housing in Missoula, there are a large number of
fairly long distance commuting trips from rural areas for students at the University of Montana and
for employees of Missoula businesses. The MRTMA uses GeoMatch, a rideshare matching program
from Ecotek, for matching new applicants with existing carpools. MRTMA pays $600 for an annual
maintenance, technical support and software upgrade contract. MRTMA believes that the GeoMatch
software costs $5,000 now, but they paid significantly less for an early test version. The program
runs on personal computers using the Microsoft Access database software. Rideshare matches are
116 In the final report of the Seattle Smart Traveler program, the Texas Transportation Institute author cited a conventional
rideshare program in the Miami, Florida area which had a lower level of carpool formation. 117 Turnbull, Katherine, Assessment of the Seattle Smart Traveler, Texas Transportation Institute, November 1999.
6-24

normally requested and provided by telephone, although this process can be accomplished through
the mail or by fax. A matchlist usually takes about four minutes to generate.
The rideshare program, in operation since 1997, now has over 300 names in the carpool database,
more than double the number of two years ago. Close to 30 regular carpools and four vanpools have
been formed. MRTMA typically receives three to five rideshare request calls per week, one to two of
those are for one-time rides.118
5.2 AUTOMATED SERVICE COORDINATION
Automated Service Coordination is a “one-stop shopping” for travelers in a particular region. For
example, a traveler could find out information about the entire transit network (rail, bus, etc.) from
one place at one time. To provide such a service involves the cooperation of multiple transportation
providers in a region using advanced technologies to automate routine activities in transit operations.
Technology Description
Several ITS technologies are employed to facilitate automated service coordination. The most
prevalent technology applications are: central and remote scheduling and dispatching; automatic
vehicle location; advanced communications (particularly data communications); and automated fare
payment. For example, the coordinating agency may provide scheduling and dispatching services for
other local service providers using an automated scheduling system. Likewise, the coordinating
agency may outfit local service providers’ vehicles with AVL equipment in order to monitor all
vehicles within the region. Further, they may provide customers with an automated fare payment
device that can be used seamlessly on all regional service providers.
118 Noel Larrivee, Executive Director, Missoula Ravalli Transportation Management Association, Missoula,
Montana.
6-25

Status: State-of-the-Art There are two significant trends in automated service coordination program deployment. First, more
agencies are jointly procuring technologies in order to save resources. One example of this is the
Greater Attleboro-Taunton Regional Transit Authority, which is jointly purchasing mobile data
terminals with the Cape Cod Regional Transit Authority. Second, there is a growing trend toward
implementing service coordination with technology, rather than developing a coordinated service
without technology and adding it later. An example is the Lord Fairfax Planning District in Virginia,
which is developing a coordinated service with technology. The Virtual Transit Enterprise (VTE) in
South Carolina is another example of incorporating technology to facilitate information sharing and
service coordination. Both Virginia’s and South Carolina’s programs are described in more detail in
the application examples.
Challenges to Implementation
ITS TECHNOLOGIES HAVE THE POTENTIAL TO GREATLY IMPROVE THE COORDINATION OF TRANSIT SERVICES IN TERMS OF OPERATIONAL EFFICIENCY AND CUSTOMER SERVICE. HOWEVER, THERE ARE SEVERAL CHALLENGES TO THE IMPLEMENTATION OF ITS TO FACILITATE COORDINATION OF SERVICE. THE CHALLENGES ARE BOTH INSTITUTIONAL AND TECHNICAL.
There are two major institutional challenges. First, the issue of coordinating service has been
discussed vigorously over the past 25 years. There are many reasons why coordinating service
among public transit agencies and health and human service agencies is a challenge. These reasons
include the fact that a large number of these agencies are not highly-computerized, and since their
respective scheduling may be done by hand, it is difficult to coordinate service manually. The advent
of technology is just beginning to facilitate service integration and coordination. The procurement
aspect of coordination, where multiple agencies in a region coordinate to purchase the same ITS
equipment and software, can be very useful. Not only does this type of coordination reduce the per-
unit cost of ITS items (and thus the cost to transit agencies), but it ensures that agencies can share
information and potentially coordinate service much easier than if all involved agencies have different
equipment and software. Second, due to the typical size of agencies that wish to coordinate, they often do not have personnel
who have the technical expertise to procure and deploy ITS technologies. Or, if they do have the
technical expertise, they do not have the time to spend on these activities. This lack of time or
6-26

technical expertise can result in an ITS procurement or deployment taking longer to accomplish, or in
ITS not being considered at all.
There are two major technical challenges. First, while data collection and management is routine in
large transit agencies, it is often a challenge in smaller agencies that would be coordinating. This is
often due to minimal labor and computer resources that are necessary to collect and manage data.
Further, data used by automated tools (e.g., GIS) must be constantly updated and maintained, which
requires resources that smaller agencies do not often have. Considering that ITS technologies can
generate large quantities of data, this is an important issue.
Second, the automation of certain functions within a coordinating agencies may improve
operations and customer service, but the automation of certain customer service related
functions may actually confuse and alienate certain customers. For example, an automated
reservations system that requires the customer to use a touch-tone key pad to enter information
may be difficult for an elderly person or someone with specific disabilities to use.
Application Examples
The following five sites provide examples of how service coordination is being designed and
implemented.
�� Greater Attleboro-Taunton Region of Massachusetts’, human services ITS project. �� Northern Virginia’s, flexibility-routed service. �� Beaver County, Pennsylvania’s mobility manager. �� Lord Fairfax, Virginia’s development of coordinated human services transportation. �� South Carolina’s virtual transit enterprise.
Greater Attleboro-Taunton Region, Massachusetts
The Greater Attleboro-Taunton Regional Transit Authority (GATRA), in partnership with the
GeoGraphics Laboratory at Bridgewater State College in Bridgewater, Massachusetts, is currently in
the process of demonstrating a human services ITS project. GATRA is a regional transit authority
that purchases transportation services from private for-profit and private non-profit carriers.
The overall goal of this project is to use ITS to facilitate the coordination of human service
transportation with public transit. The objectives of the demonstration are to:
6-27

�� Automate the collection of trip and spatial data for GATRA’s Medical Transportation Brokerage for Massachusetts’ Division of Medical Assistance (DMA);
�� Promote the identification and utilization of the most cost-effective transportation services for DMA clients;
�� Support the coordination of human services transportation (particularly Medicaid transportation) with publicly-supported mass transportation services to the mutual benefit of both public partners; and
�� Support the safety of the Medicaid clients and their transportation providers.
This demonstration will be conducted in two phases: Phase 1, which involves the deployment of basic
ITS components for GATRA’s core service area (Attleboro, Taunton and other communities within
radio range of GATRA’s radio system), and Phase 2, which completes the deployment in the entire
region by adding more communications infrastructure to cover additional transportation services in
communities outside the core service area (Plymouth, Onset and Wareham).
This project started in June 1997 with $20,000 in FTA Section 9 funds to the Moakley Center’s
GeoGraphic’s Laboratory at Bridgewater State College to develop an APTS program for GATRA.
Funding for the subsequent demonstration activities (Phase 2) was still pending as of November
1999. GATRA has applied for $100,000 in state Medicaid funds for that portion of the project that
involves coordinating with contract taxis for Medicaid transportation.
Phase 1 (partially funded by the initial $20,000 grant) is underway. As of October 1999, the
following tasks had been completed: 1) the spatial analysis of GATRA transportation services,
including DMA’s medical transportation; 2) analysis of communications infrastructure for ITS
deployment; 3) design of computer infrastructure to support ITS; and 4) procurement of an advanced
paratransit scheduling system.
The spatial analysis of GATRA’s transportation services involved the use of a geographic information
system (GIS) to develop trip origin and destination matrices, to analyze the flow and volume of travel
between the origins and destinations, and to map the results of this analysis. The communications
infrastructure analysis determined that GATRA could use its own communications infrastructure to
lower the cost of ITS deployment for its transportation providers. This analysis also determined that
GATRA could also use other communications services (such as cellular digital packet data provided
by Bell Atlantic) for inter-city bus and/or taxi services that are outside GATRA’s area. GATRA has
examined the potential of utilizing a wide area network for its regional transportation providers.
6-28

Finally, GATRA is deploying an advanced, state-of-the-art paratransit scheduling and dispatching
system for both its paratransit and human service transportation brokerage services.
In October 1999, GATRA began the procurement of an AVL system, including mobile data terminals
for its fixed route and paratransit providers. These MDTs include the capability to accept magnetic
stripe cards for client identification and fare payment. After deployment in the transit vehicles, AVL
and MDTs will be added to taxis (of cooperating taxi companies) in GATRA’s service area.
The demonstration will use all the aforementioned technologies to provide Medicaid Transportation
on a multi-modal basis. Information on current client eligibility for transportation will be
downloaded by DMA to GATRA on a daily basis. Trip verification and billing information will be
available to DMA via an electronic data exchange on a weekly basis, including spatial information on
each trip.119
Northern Virginia
The Potomac and Rappanhannock Transportation Commission is providing flexibly-routed service
(called OmniLink Local Service) with 12 vehicles.
Implementation of the Smart Flexroute Integrated Real-time Enhancement System, which combines
the OmniLink service with APTS components, was begun in 1994 when OmniLink service began.
Installation of most of the APTS components was completed in October 1997. However, full
implementation of the APTS components of OmniLink has not yet been accomplished due to various
communication- and software-related challenges. Funding for this project included approximately
$1.2 million in Federal ITS funds from 1994 through 1997. Total project costs were over $3 million.
Even though the project has not been fully implemented, some success has been achieved. Ridership
has grown to 1,200 trips per day, as shown in Figure 5-4. Passengers per hour have increased to 10.0
per hour. The advanced reservation time has been reduced to two hours.
The communication challenges can be described as follows. In July 1997, a new radio system for
data communications was implemented at PRTC. In October 1998, the communication system
provider went out of business. PRTC quickly installed Nextel two-way digital radios in their larger
119 Lawrence Harman, op. cit.
6-29

buses (used for OmniRide Commuter Bus service). However, this system did not provide a solution
for the data exchange between dispatch and the smaller buses. Nextel then provided handheld radio
(which operated over the same system as used for the large buses) for voice communication between
0
200
400
600
800
1000
1200
FY95 FY96 FY97 FY98 FY99
Avg. Daily
Ridership
Figure 5-4. Omnilink Ridership Growth
smaller vehicles and dispatch. Currently, data communication between dispatch and the smaller
vehicles is not available using the Nextel handheld radios.
As of October 1999, a low-cost solution for data communication was being implemented. This
solution is the addition of PCMCIA cards to GMSI mobile data terminals, and the use of Bell South
service. This is not an integrated solution since there will be separate voice and data systems, and
will result in higher operating costs.120
Beaver County, Pennsylvania During 1999, the Beaver County Transit Authority (BCTA) in Rochester, Pennsylvania completed a
“revisioning” of their Mobility Manager concept to categorize activities and to identify short-term and
long-term initiatives. The revisioning resulted in updating the Mobility Manager Program’s
objectives as follows:
�� To use public/private partnerships to leverage funding for Mobility Manager activities and to facilitate the implementation of specific technologies (e.g., a regional smart card fare payment system);
�� To provide transportation services in addition to those fixed-route and paratransit services currently provided. These new services may include school transportation, short-term rental cars, and limousine service;
6-30
120 Eric Marx, op. cit.

�� To provide regional transportation information, including regional transit schedules; real-time arrival and departure information for regional transit services; information on transit connections and transfers; travel cost; travel time; travel directions; weather; traffic conditions; regional transit hours of operation; and locations of services such as accommodations, restaurants and automated teller machines. This information would be provided through various types of media, including touch-tone telephone; kiosks; Internet; cable television; highway advisory radio; BCTA service center; electronic signage at regional transit stops/stations; and personal communications devices;
�� To provide a one-stop shopping reservation service (analogous to a travel agent) for booking travel on BCTA, Port Authority of Allegheny County, and private transportation services; vanpools/carpools; and health/human service agency transportation services. Reservations services might also include reserving rental cars and making airline, AMTRAK and long-haul private bus reservations;
�� To provide non-transportation services, such as concierge services. These services might include having one’s automobile serviced after leaving it at BCTA’s new Expressway Travel Center (currently under construction); having groceries delivered upon return to one’s automobile at the end of the day; and having dry-cleaning brought to the cleaners and returned at the end of the day;
�� To accept payment for travel on any regional transportation service (part of the one-stop shopping reservation service mentioned above); and
�� To sell and distribute regional fare payment media and to provide facilities to recharge that media. This objective would also involve developing agreements with partners who accept the same payment media and with financial institutions.
Short-term projects (one to three years from now) to satisfy some of these objectives include
development of an automated, regional fare payment system and providing regional transportation
information. Longer term activities include the provision of a broader range of transportation services
and making reservations for local and regional travel and supplementary services.
The first technology that will be implemented in mid-2000 as part of the Mobility Manager Program
is a GPS-based AVL system. Beyond the AVL implementation, BCTA is considering the
deployment of the following technologies to meet the Mobility Manager objectives:
�� New voice and data communication system; �� Automated scheduling and dispatching software; �� Mobile data terminals; �� Automated fare payment; and �� Geographic information system.121
121 Mary Jo Morandini, General Manager, Beaver County Transit Authority, Rochester, Pennsylvania.
6-31

Lord Fairfax, Virginia In May 1997, the Lord Fairfax Planning District Commission in northern Virginia (encompassing
Frederick, Shenandoah, Warren, and Clarke Counties) initiated an ITS pre-deployment study to
identify the level of interest in, and potential support for, the development of coordinated human
services transportation in the District. This study led to the development of the Human Services
Transportation Public Mobility Program. The Program participants include the Committee for
Coordinated Human Services Transportation; Northwestern Community Services (the lead agency);
University of Virginia Center for Transportation Studies; and the George Mason University Institute
of Public Policy.
The purpose of the Program is to develop coordinated human service transportation in the Lord
Fairfax Planning District in two phases. In the first phase, the policy and technical issues associated
with providing a coordinated service will be fully explored. The technical component of this phase
will identify appropriate technologies to facilitate coordinated transportation, and will develop
functional requirements for associated software. These requirements will be used in the second phase
of the project, which will involve the technology procurement and the implementation of the
coordinated service. The project will be evaluated at the conclusion of Phase 2.
Phase 1, which is funded at approximately $200,000, includes five tasks:
�� Definition of goals and objectives; �� Definition of the problem; �� Geographic information system (GIS) analysis of structure; �� Development of implementation plan; and �� Development of functional requirements for support system.
The first task, which was underway as of October 1999, is to identify the goals and objectives of
providing coordinated transportation. The second task, which is also underway, is identifying current
transportation services in the area, the service needs that currently are not being met, and the existing
barriers to these services, among other important factors in developing coordinated transportation.
The third task will use the data collected in the second task to analyze the distribution of current
riders to determine modifications to existing services. The fourth task will develop a plan for
coordinating existing services, including recommendations on supporting this coordinated system
from an institutional and policy perspective. The final task will develop functional requirements for
6-32

software and hardware to perform routing, scheduling and dispatch for the coordinated system. These
requirements will be used to procure appropriate technologies in Phase 2.122
South Carolina The South Carolina Department of Transportation (SCDOT), in conjunction with SCRA®,123 initiated
the Virtual Transit Enterprise (VTE) project on March 31, 1999. VTE is being developed to “design,
develop, demonstrate and implement the capability to leverage funding and resources to enable the
public transportation providers within a given geographical region to remotely and cost-effectively
share information, data and software applications to accomplish their operational and business-related
activities in a more timely and accurate manner.”124 VTE will provide benefits to many groups in
South Carolina, including public transit customers, transit agencies and service providers, and local
economies that rely on individuals that are transit-dependent.
Smaller transit agencies and providers will have access to the same technologies as those used by
larger agencies. VTE is focusing on four technologies:
�� Information Sharing with External Entities - A structured method will be developed for selected Public Provider functions to interface with external entities (such as social service agencies, grantors, and private transportation providers) electronically, to benefit all 18 public transit providers in South Carolina.
�� Integrated Automated Fare Collection - Automated fare collection technology will be installed at one test site. Also, a shared passenger accounting system will be developed to benefit all 18 public transit providers and provide SCDOT with more timely ridership data.
�� Improved Grants/Contracts Making, Administration, Reporting, and Invoicing Processes - A mechanism will be developed to improve the Grant Making, Grants Administration, Reporting, and Invoicing processes conducted between SCDOT and the 18 public transit providers that receive SCDOT funding.
�� Scheduling and Dispatching Integration with AVL - Scheduling and dispatching software will be integrated with an AVL system at one test site. Further, standard procurement specifications will be developed that other transit providers can use to build their own scheduling and dispatching, and AVL systems.
VTE is being developed in three phases. Phase 1 is the requirements and design phase. Task 1 of
Phase 1 involved surveying all 18 public transit providers and two SCDOT departments, and is
complete. Task 2 of Phase 1, the requirements definition, was underway as of October 1999. Phase 1
is scheduled for completion in February 2000. Phase 2, which will involve system integration and
122 Mike Hite, Northwestern Community Services, Virginia. 123 SCRA® is a not-for-profit research and development corporation established in 1983 to develop high
technology programs for a variety of government, state, and local agencies.
6-33

initial implementation at test site(s) is scheduled to run 12 months, from March 1, 2000 to February
28, 2001. Phase 3, the full-scale implementation of the VTE in all 18 public transit providers in
South Carolina, is scheduled to run from March 1, 2001 to February 28, 2002.
VTE is expected to produce the following benefits to the public transit providers:
�� Support of transit-related initiatives, such as welfare-to-work; �� More timely and accurate planning and reporting; �� Minimization of computer implementation and cost through resource sharing; and �� Optimization of selected technology tools and applications through standardization.125 126
5.3 TRANSPORTATION MANAGEMENT CENTERS Transportation Management Centers (TMCs) help transit agencies improve transit service by
providing them with information on traffic conditions and incidents. This may allow transit vehicles
to bypass roadway blockages and thereby reduce running time delays. Knowing the traffic conditions
on streets traversed by transit vehicles can also help dispatchers select appropriate restoration
strategies when delays are anticipated to become excessive.
Technology Description
"Transportation Management Center" is a term that refers to a variety of different facilities. Known
also as Transportation Operations Centers, these facilities are designed to monitor, manage, or control
transit and/or traffic operations. All TMCs integrate a variety of APTS and/or ITS technologies and
services to more effectively manage public transit and traffic resources and capacity.
The key ITS technologies within TMCs are communications systems, surveillance and detection
systems, and management and control systems. These systems incorporate technologies such as:
�� Closed Circuit Television (CCTV) cameras and loop detectors to capture information on traffic conditions and incidents on highways and at major intersections;
�� AVL-equipped transit vehicles to act as traffic probes and provide valuable information on traffic flow to the TMC, especially on roadways not usually monitored by the TMC;
�� Traffic signal control systems which allow for emergency and transit pre-emption/priority as a means of improving safety, and regulating the flow of traffic, and better utilizing capacity; and
124 http://vte.scra.org/faq.html 125 Cathe Hanson, SCRA® North Charleston, South Carolina. 126 VTE Presentation presented at the Rural Advanced Technology and Transportation Systems 1999
International Conference, by David Jung, SCRA®, August 31, 1999, Flagstaff, Arizona.
6-34

�� Computer programs that use control algorithms for assessing responses to real-time congestion and system management needs.
Status: State-of-the-Art The three main developments in TMC operation since Update ’98 are as follows:
�� Limited coordination between transit and traffic personnel at TMCs that have transit and traffic operations co-located;
�� A trend away from co-located transit and traffic operations; and �� Development of regional transportation networks that facilitate ‘virtual’ TMCs.
Limited Coordination Between Transit and Traffic Personnel at TMCs Update ’98 reported on a number of TMCs, emphasizing transit and traffic facilities that are
physically co-located. Since that time, no other joint TMCs are known to have been deployed. The
primary focus of TMCs remains freeway management, with several involved in arterial management
such as traffic signal priority, but few with transit operations.127 Transit operations are usually
managed in separate transit dispatch and communications centers.
Trend Away from Co-Located Transit and Traffic Operations
While the value of co-location may seem important, it appears that this type of joint effort has not
evolved into seamless operation of these two related transportation functions. Co-location does not
necessarily result in shared operation and usually not in shared control. No study has quantified the
tangible value of being co-located. This Section suggests that face-to-face interaction between transit
and traffic personnel appears to be of minimal importance on a day-to-day basis, with the real value
occurring during major incidents.
The main advance in TMC operations is that transit and traffic coordinators have learned how to use
specific information from their peers in the other discipline for particular traffic or transit conditions
or incidents. This information is shared whether staff is located in the same facility or not.
Developments in the industry and technology have made the co-location approach less common and
perhaps less necessary.
127 Metropolitan Transportation Management Center Concepts of Operation: A Cross-Cutting Study.
6-35

Development of Regional Transportation Networks that Facilitate ‘Virtual’ Tmcs
The trend in shared TMCs is toward ‘virtual’ operation. By deploying high capacity regional
communications systems that connect the information resources of both transit and traffic operations
centers, professionals concerned with various travel modes can benefit from the APTS and/or ITS
systems the other is implementing. Because of its almost unlimited bandwidth (especially important
for high resolution video feeds from closed-circuit television (CCTV) cameras), fiber optic cable is
the preferred approach for data sharing when funds and right-of-way permit. Other relatively high
capacity wireline communication links, such as 56 kilobytes per second frame relay leased lines, are
also used when fiber optic is not feasible.
The TRANSCOM Regional Architecture described in Update ’98 is an excellent example of a
regional transportation information network. It connects a wide range of transportation and
transportation-related agencies. TRANSCOM provides the necessary connections and computing
resources to fuse and redistribute traffic and transit information. The Regional Architecture provides
a workstation at each participating agency, which allows staff to enter data and receive information
from their peers using a common user interface and information format. A popular component of the
Regional Architecture, the Interagency Regional Video Network, allows participating agencies to
share and receive CCTV images across the network.
The AZTech Metropolitan Model Deployment Initiative project (in the Phoenix area) discussed
below provides another good example of how regional transportation information networks can create
virtual TMCs. Phoenix Transit dispatchers with an AZTech workstation now have access to the same
traffic information as traffic operators at any of the region’s TMCs. The key to exploiting this newly
available resource is additional training from the AZTech project team for transit dispatchers so that
traffic conditions can be monitored as a routine rather than as a special task.
The ability to monitor CCTV camera feeds is a useful function that can be used by transit agencies
since CCTV access provides visual confirmation and clarification of situations in the field. Both
Phoenix Transit and King County Metro report that the video images are one of the most beneficial
components of their regional TMC structure. From the traffic management perspective, consideration
is being given to using AVL-equipped transit vehicles as traffic probes to enhance information on
traffic flow and conditions.
6-36

Challenges to Implementation
Transit Management Centers can be costly investments. Some transit agencies believe that those
funds can be better used in other APTS technologies since many TMC activities are currently
accomplished through dispatch centers. Other transit agencies believe that accessing information
from state highway management centers can be a cost-effective manner of receiving traffic
information.
Application Examples
The following are examples of TMCs in use.
�� Seattle, Washington’s SmartTrek. �� Phoenix, Arizona's Metropolitan Model Deployment Initiative (MMDI).
Seattle, Washington Supported in part with funding from the SmartTrek Metropolitan Model Deployment Initiative
(MMDI), the King County Department of Transportation, the Washington State Department of
Transportation (WSDOT), the University of Washington, and other organizations have been working
together to share traffic and transit operating data to enhance the operation of transportation service.
A fiber optic connection that allows KC Metro in King County to receive traffic information from the
WSDOT advanced traffic management system network has been completed. The data includes video
feeds from over 150 CCTV cameras (Figure 5-5 on the following page), incident information, travel
speeds, and other information on traffic conditions.
KC Metro has a dedicated computer running a specialized software application used to access and
display information from WSDOT on two large format video screens in its communications center.
This allows the information, whether CCTV images or a traffic flow map, to be viewed by all transit
dispatchers. Since the CCTV views are used most frequently by KC Metro dispatchers, a solution
was developed to provide access to other cameras simultaneously on individual dispatcher consoles.
Using King County’s intranet, KC Metro staff created an internal Web page containing graphical
links to over 20 of the most frequently used camera shots that are available from WSDOT over the
Internet. Now, if a transit dispatcher needs to consult a camera view that is not being displayed on the
monitor, he/she can easily access it through the intranet.
6-37

The SmartTrek project provided partial funding to upgrade the accuracy of KC Metro’s AVL data.
The agency provides its bus location information to the region’s ITS backbone where it is used for a
variety of purposes, including traveler information via the BusView and TransitWatch projects
described in the Advanced Traveler Information System Section of this report. KC Metro is also
cooperating with several area municipalities on implementing traffic signal priority projects that
would be controlled by those agencies’ TMCs.128 129
Figure 5-5. KC Metro Intranet Page - Thumbnail Images
128 Dan Overgaard, Senior Transit Planner, King County Department of Transportation, Metro Transit Division,
Seattle, Washington. 129 Peter Briglia, ITS Program Manager, Advanced Technology Branch, Washington State Department of
Transportation, Seattle, Washington.
6-38

Phoenix, Arizona
Although the AZTech MMDI has not resulted in a physically joined transit and traffic operations
center, it has created and extended the infrastructure to carry out many of the same functions of a joint
TMC. Through the AZTech traffic information server and the telecommunications backbone that
connects it with the various TMCs across the region, Phoenix Transit has access to traffic condition
information from around the Phoenix area. The agency has its own AZTech workstation in its bus
dispatch center (Figure 5-6) that it can use to monitor traffic conditions that might affect operations.
Its bus dispatch consoles can also be switched over to the AZTech system if necessary. Available
information includes traffic speed, incidents, and views from numerous cameras. Phoenix Transit is
using this information on a limited basis since it still needs training from the AZTech project team.
With such training, transit dispatchers will be capable of being more proactive in using traffic
information such as incidents and road closures to operate the bus system efficiently.
Figure 5-6. Phoenix Transit’s AZTech Workstation
The ongoing development of AZTech’s Roadway Closure and Restriction System (RCRS) will
enable increased coordination between traffic and transit managers. The RCRS is a wide area
network that links most of the region’s traffic operation centers and Phoenix Transit through high-
speed wireline communications. The system will increasingly provide detailed traffic data on arterial
streets on which public transit operates. The RCRS network will provide Phoenix Transit with more
CCTV camera images for use in monitoring specific incidents. It is also designed to distribute
information about incidents/accidents, road closures, lane restrictions, and road maintenance.130
6-39

6. INTELLIGENT VEHICLE INITIATIVE The Intelligent Vehicle Initiative (IVI) chapter is new to the State of the Art Update series of reports.
In 1997, U.S. DOT’s ITS Joint Program Office launched the IVI Program to research the ability of
technologies to help drivers operate their vehicles more safely and efficiently. IVI technologies
reduce the probability of motor vehicle accidents through the use of vehicle controls and driver
warnings. These systems help drivers process information, make better decisions, and operate their
vehicles more effectively.
The IVI program’s goal is to accelerate the development,
availability, and use of driver-assisted and driver-control
intervention systems. It is comprised of four vehicle platforms:
�� Light vehicles, in the form of passenger cars; �� Commercial vehicles such as trucks; �� Transit vehicles, including bus and rail vehicles; and �� Specialty vehicles such as snowplows or ambulances.
The individual platforms allow DOT to address the unique
problems posed by each.131 Additionally, coordinated
development and testing among the platforms will permit test
results sooner than if the IVI technologies were all tested on one
platform. This coordinated testing will shed light on how these
technologies can be applied across the platforms, thus leveraging funding and research. The story in
the textbox on the following page illustrates how IVI technologies tested and applied on a snow-plow
may have implications for transit vehicles.132
IVI
Figure 6-1. IVI Logo
In addition to technology development, the IVI Program emphasizes the development of industry-
wide architectures and standards, integrated system prototyping, and field test evaluations so the DOT
130 Mike Nevarez, Transit Operations Manager, Phoenix Transit, Phoenix, Arizona. 131 “Driving Safely Into the Future with Applied Technology,” U.S. DOT's IVI Program brochure, p.9. 132 Information on Minnesota's IVI Safeplow was provided by Craig Shankwitz, Program Manager of
Intelligent Vehicles at the Department of Mechanical Engineering, University of Minnesota, Minneapolis, Minnesota.
145 Lenora Burke and Margaret Zirker. Intelligent Vehicle Initiative Needs Assessment, Draft, Volpe National Transportation Systems Center, U.S. Department of Transportation, Cambridge, Massachusetts, 1999.
6-40

and industry participants can assess benefits, define performance requirements, and accelerate the
deployment of incremental driver-assistance products.
The time frame to accomplish development and testing of IVI technologies is within five years from
the inception of the program (near term — 2003) while implementation and transfer to market is
conservatively anticipated after five years (long term — after 2003).
FTA ranks safety as the number one priority goal as approximately eight billion annual passenger
trips rely on transit, thus making the transit IVI program a critical component of the FTA’s overall
agenda. A safer vehicle will minimize accident and incident rates, as well as their related costs. FTA
is responsible for the transit element of the IVI program and works closely with the ITS Joint
Program Office to define transit IVI research initiatives. The current focus of transit IVI is on bus
and paratransit vehicles; rail vehicles will be considered in the future.
The first and highest priority candidates for bus IVI applications are crash scenarios that present the
greatest severity and risk to human lives. Using safety as the guiding factor in deciding what IVI
technologies should be considered, the FTA commissioned a report, FTA IVI Needs Assessment,133
to determine these needs. The results from this research show that the five most frequent crash types
involving a bus in order are:
�� Lane changes and merges; �� Rear end collisions;
�� Intersection collisions; �� Backing up collisions; and �� Buses running into parked cars
Altogether, five crash categories comprise approximately 87 percent of crashes involving buses
within the United States between 1994 and 1996.134 Of these crashes, the most frequent type is lane
changes which (36 percent of all crashes); rear end collisions (22 percent); and intersection collisions
(18 percent). IVI technologies that address these crash types are the highest level priority for the FTA
IVI Program.
146 Ibid.
6-41

INTELLIGENT VEHICLE INITIATIVE
The Minnesota Guidtechnologies geareddeveloped for the SAavoidance. Then, di(HUD) were tested a �� Differential GPS
to the driver thro �� Magnetic Latera
boundaries, is deThe information
�� The head-up dis
roadway edges. �� Virtual Rumble
steering wheel to �� Forward-looking �� Rear radar activ
that may be hidd �� Side detectors, a
them. These technologies narrow (10') bus-onlsituations to maintaigetting stuck in the s Minnesota is lookinradar used presentlyhow to present inforintuitive on the head
Safer Travel Under Dangerous Conditions
estar's IVI Safeplow is a project that showcases several integrated IVI to improving travel in poor visibility conditions. Technologies were first
FETRUCK, which integrated autonomous vehicle guidance and collision fferential GPS guidance, radar collision avoidance, and a head-up display nd applied to the Safeplow in July 1999. The system works as follows:
is used to provide lateral guidance and driver assistance. Data are providedugh a heads-up display developed at the University of Minnesota.
l Warning and Guidance Tape, developed by 3-M, when installed along lanetected on board the plow to give the driver an indication of road position. is also displayed on the head-up display.
play projects an image of lane boundaries, helping the driver to detect Using radar tracking, it also indicates any obstacle locations on the display.
Strips, based on GPS feedback on the vehicle's lane position, cause the vibrate. This alerts the driver that s/he is leaving lane boundaries.
radar allows plow drivers to detect unseen obstacles.
ates high-intensity lights to alert travelers that they are approaching a plow en by snow.
ctivated when the turn signal is on, alert plow drivers of objects alongside
will be applied to Minnesota's Metro Transit's wide buses (9') that operate ony shoulders. The use of head-up display will assist drivers in bad weather n proper position on the shoulder to avoid collisions with guard rails or now.
g at collision avoidance — side avoidance in addition to the forward-looking — both for the bus on the shoulder and in general operation. A key issue is mation to the driver regarding side and rear collisions in a way that is as -up display.
6-42

INTELLIGENT VEHICLE INITIATIVE
6-43

The second level priority for transit IVI technologies are those that help reduce the accidents that
carry a medium range of risk and severity. They include other crash types such as running into
parked cars (9 percent) and backing up collisions (3 percent).135
Finally, the transit IVI platform provides an opportunity for evaluation of other types of technologies
that improve the efficiency of the fleet and provide even more levels of safety. For instance,
these technologies might include:
�� Tight maneuvering/precise docking. Tight maneuvering/precise docking technologies, using precision control and automated guidance technologies, allow the driver to handle the bus more effectively in close quarters (terminals and tunnels). It also permits safer boarding and alighting.
�� Precision control and automated guidance. �� Longitudinal and lateral vehicle control for driver assistance on transit buses.136 ��
��
Obstacle/pedestrian detection. Obstacle/pedestrian detection technologies will warn drivers of approaching activity in sufficient time to avoid an accident. Fully automated overnight maintenance. Automation of bus movements through the service areas in bus maintenance garages is another potential IVI application that is of interest to transit operators.
Technology Description
Four transit applications have been identified by the FTA as immediate areas for IVI investment.
These four focus particularly on the safety of the driver (and indirectly both passengers and
pedestrians) and the vehicle. Using systems that enable drivers to process information, make
better decisions, and operate vehicles more safely are the strong points of the following four
priorities.
�� Tight Maneuvering/Precise Docking - This application positions the bus very precisely relative to the curb or loading platform. The driver can maneuver the bus into the loading area and then turn it over to automation. Sensors continually determine the lateral distance to the curb, front and rear, and the longitudinal distance to the end of the bus loading area. The driver will be able to override the system at any time by operating brakes or steering, and will be expected to monitor the situation and take emergency action if necessary (for example, if a pedestrian steps in front of the bus). When the bus is properly docked, it will stop, open the doors and revert to manual control. Safer boarding and egress for the handicapped, the elderly and children, are important considerations in developing these systems.
135 Ibid. 136 “Intelligent Vehicle Initiative: Business Plan,” ITS Joint Program Office, November 1997.
7-44

�� Lane Change and Merge Collision Avoidance - These systems provide various levels of support for detecting and warning the driver of vehicles and objects in adjacent lanes (e.g., “blind spot” warning for early implementation). Later systems would introduce capabilities that will provide merge advice and/or warnings of vehicles in adjacent lanes whose position and relative velocity make the planned lane change unsafe. Those capabilities could include speed and steering control intervention for enhanced collision avoidance.
�� Forward Collision Avoidance - This feature senses the presence and speed of vehicles and objects in the vehicle’s lane of travel and will provide warnings and limited control of the vehicle speed (coasting or downshifting) to minimize risk of collisions with vehicles and objects in front of the equipped vehicle.
�� Rear Impact Collision Mitigation - The two basic concepts proposed for this application are the following: transit bus-based systems to warn following driver(s) of potential collision (e.g., visual warning display on rear of bus); and impact injury and damage mitigation.137
Status: State-of-the-Art There are few actual United States examples of currently operational IVI projects in transit. Most of
the current work focuses on designing performance specifications and testing technologies in
partnership with transit agencies, private corporations, and local universities. In 1997 in Houston,
Texas, the first operational test of IVI was done to test collision avoidance technologies and
demonstrate the effectiveness and safety of automated vehicles for transit. These test and
performance specifications projects are related in more detail in the Application Examples section
below.
Challenges to Implementation
In addition to research on the use of available technologies, there are some key non-technical issues
currently under study by other U.S. DOT-funded partnerships. The National Highway Traffic Safety
Administration (NHTSA) and Parsons Brinkerhoff are conducting a review of societal and
institutional factors for IVI. The transportation community has raised concerns over the impacts of
IVI services on society and potential barriers to deployment, including the general areas of product
liability and the institutional challenges of enhancing the roadway infrastructure to better support
intelligent vehicles. This study will seek to evaluate those deployment issues.138
A second project that has implications for IVI deployment is a benefits assessment of intelligent
vehicles that will be conducted at the Volpe National Transportation Systems Center in Cambridge, 137 Lenora Burke and Margaret Zirker, op. cit.
7-45

Massachusetts, sponsored by the NHTSA and the U.S. DOT/Research and Special Programs
Administration. This project will work on the development of proper methodologies and tools for
estimating the effectiveness and potential benefits of IVI systems.139
It is important that any “lessons learned” from these projects be made available to the transit industry
at large. As many previous high technology studies have indicated, the transit industry is reluctant to
incorporate untried, untested technologies into its basic fleet operation. The very relevant concerns
about cost and credibility require that transit be as informed as possible on all applications that might
be useful in their operations, while best utilizing taxpayer resources across the transportation field.
Application Examples
THE FOLLOWING ARE EXAMPLES OF TRANSIT IVI PROGRAMS THAT FOCUS ON DEFINING PERFORMANCE SPECIFICATIONS AND TESTING THE EFFECTIVENESS AND SAFETY OF TRANSIT IVI APPLICATIONS.
�� The Pennsylvania partnership to define performance specifications for Side Collision Warnings.
�� The San Mateo, California partnership to define performance specifications for a Frontal Collisions Warning System.
�� The Houston, Texas partnership to test and demonstrate the automated highway systems technologies for transit.
�� The operational test for Collision Avoidance Field Testing in Michigan. �� The Ann Arbor, Michigan partnership to define performance specifications for Rear
Collision Warning.
Pennsylvania Transit buses are a very safe form of transportation. The few collisions they do have are often
different from truck or car collisions. This transit IVI project focuses on preventing transit side
collisions with pedestrians and vehicles. Side collisions make up the highest percentage of transit
collisions, accounting for almost 40 percent140 of all transit accidents. Therefore, transit operators
have placed prevention of this type of accident as the issue that they would most like to see
investigated. Unfortunately, there have been few, if any, studies about the use of collision warning
systems in transit. In part, this is due to the difficulty of developing systems that will operate in city
driving conditions characterized by low speeds and high vehicle/pedestrian densities.
138 Ibid. 139 Ibid. 140 Accident statistic for Pittsburgh, reported by the Port Authority of Allegheny County, Pittsburgh,
Pennsylvania.
7-46

SIDE-LOOKING SENSORS DEVELOPED FOR HEAVY TRUCKS AND LIGHT VEHICLES HAVE BEEN APPLIED TO BUSES IN DEMONSTRATION PROJECTS. THREE PRIMARY CONCERNS EXIST WITH THESE SYSTEMS. FIRST, THEY ARE TUNED TO LOOK FOR VEHICLES AND OTHER LARGE OBJECTS, AND THEY MISS SMALLER OBJECTS SUCH AS CHILDREN. SECOND, THEY ARE DESIGNED TO COVER A FULL LANE WIDTH, SO THEY GENERATE NUISANCE ALARMS IN THE TIGHT QUARTERS OF BUS OPERATIONS. THIRD, IN ORDER TO COVER THE ENTIRE 40-FOOT LENGTH OF A BUS, EXISTING SYSTEMS REQUIRE UP TO 10 SENSORS PER SIDE, RAISING CONCERNS ABOUT INSTALLATION AND MAINTENANCE COSTS.
In the Pennsylvania study, the project team will carefully analyze available collision accident data to
determine the causal factors of these types of accidents as well as ascertain when intervention would
have been required to prevent them. Next, the team will develop specifications for technologies that
can reliably detect transit domain obstacles, including people, using only one or two sensors per side
of the bus. Finally, the team will test if these technologies can meet the specifications in typical
transit operating conditions and report on the anticipated benefit of widespread deployment. This
FTA-funded project has a two-year scope, with a budget of $950K and a 50 percent local cost
share.141 As part of the cost share, the Port Authority of Allegheny County is installing a side object
detection system from Collision Warning Systems on 100 vehicles operating out of their East Liberty
garage. As of July 2000, 20 buses were in operation. The system includes six sensors on each side of
the bus and a sensor on the back corners. The system detects objects and provides both an audible
and visual warning to the driver. The audible warning is only activated when the bus turn signals are
engaged. The Port Authority will be conducting an evaluation of the project and will issue a report on
the effectiveness of the system.
San Mateo, California
The goals of the frontal collision warning systems (defined as a bus colliding with a vehicle in front
of the bus) for this project are to: provide imminent crash warning; provide warnings for smoother
maneuvering; and provide warnings when the bus is too close to a forward vehicle.
SamTrans operates a fleet of 316 buses in one of the most congested areas in the country, which
includes the counties of San Mateo, Santa Clara, and San Francisco. A frontal collision warning
141 Chistoph Mertz, Carnegie Mellon University, Pittsburgh, Pennsylvania.
7-47

system using advanced sensing and computer technologies can increase safety by giving advanced
warning to the driver about potential hazards. Furthermore, information collected through sensors
can be recorded for the purpose of accident analysis and injury claim verification. This FTA-funded
project has a two-year scope, with a budget of $1,100K plus a 25 percent local cost share.
A Regional Advisory Committee has been formed for this project from select transit agencies within
the greater San Francisco Bay Area to facilitate communications among the transit community, and to
contribute to early development of a collision warning system market. These representatives will
assemble to review and provide input on the development of the collision warning system.142
Houston, Texas
The Metropolitan Transit Authority of Harris County (Metro) has taken the lead in the testing and
demonstration of automated highway systems in transit applications. In 1997, these applications were
demonstrated by the transit industry in the National Automated Highway System (AHS)
Demonstration '97 in San Diego, California.
The 1997 AHS Demonstration in San Diego had seven scenarios, designed to showcase different
technologies and different functions.
�� Platoons, with closely-spaced vehicles following buried magnets; �� Free agents, with cars and buses using vision and radar; �� Evolutionary - how this technology can be introduced incrementally for driver assistance; �� Control transition, using both vision and buried magnets; �� Alternative technology, using a radar-reflective strip for lateral control; �� Infrastructure diagnostic, checking the accuracy of the magnets; and �� Heavy trucking, using radars for smart cruise control and driver warning.
Metro, in concert with Carnegie Mellon University (CMU), built one of the seven demonstration
scenarios, the Free Agent Demonstration (FAD). Metro’s 40 foot, low floor buses were outfitted by
Carnegie Mellon with the hardware and software necessary for automated steering, braking, headway
maintenance and collision avoidance. Much of the underlying technology was new, built specifically
for the demonstration. The free agent demonstration involved two fully automated passenger cars,
one partially automated passenger car, and two fully automated New Flyer 40-foot transit buses. The
scenario demonstrated lane entry, speed and headway control, lane following, lane changing, obstacle
detection, and cooperative maneuvers.
7-48

The philosophy behind the free agent scenario was to surround the vehicles with sensors, putting all
the sensing and decision-making on-board the vehicle. When the vehicles encounter other automated
vehicles, they can communicate with them and drive close to each other. But they also can operate
autonomously, mixed in with conventional, manually driven vehicles.
For the demonstration runs, each vehicle followed a script, designed to showcase all the desired
functions. The script included turning obstacle detection on and off. Early tests showed that the radar
would pick up overpasses as obstacles, and incorrectly slow the vehicles until the roadway began to
dip down and the radar pattern fell below the level of the bridge. All runs in the demonstration
proceeded safely.
Metro has identified IVI technologies as having potential for future application to the region’s HOV
lane network as a cost-effective means of increasing vehicle throughput, reducing operational costs,
and improving passenger safety. These technologies would allow buses to automatically ride down a
Houston HOV lane before heading off to other destinations. Because the buses could be spaced close
together, the capacity of the HOV lane would be increased. Following Demo '97, Metro sponsored a
smaller, transit-focused demonstration in Houston. For four days in August 1997, passengers aboard
two automated Metro buses rode along a stretch of dedicated HOV lane. This proof of technical
feasibility demonstration featured full-scale, multi-vehicle demonstrations of automated highway
system technologies.
This project was designed as a demonstration to accommodate a specific need under the AHS
program; the proof of feasibility has implications for future development of the transit IVI
program.143
142 Brian Cronin, Federal Transit Administration, Washington, D.C. 143 Lenora Burke and Margaret Zirker, op. cit. 156“ITS International,” July/August 1999, pg.22.
7-49

Michigan
The partners in the first U.S. DOT IVI operational project on Collision Avoidance Field Testing have
announced a $35 million dollar field operation test (60 percent Federal share) of a rear-end collision
avoidance warning system. The test will evaluate performance, benefits and safety systems using
“real cars on real roads with real people.” It will create prototype crash-warning systems that caution
drivers about potential hazards ahead of them by means of audible tones and visual displays.
This is the first of the IVI operational tests to be announced and is expected to run for five years. The
first half of the five-year project will involve pre-development of prototype vehicles equipped with
crash avoidance technology. The second half will include field-testing of the prototypes and involve
more than 100 licensed drivers from Michigan. Drivers will be selected to use one of 10 vehicles,
each with the warning package and adaptive cruise control. The drivers will have unrestricted use of
the vehicle for at least two weeks. Data will be collected by on-board recording devices as well as in
post-test interviews and other means.
The research will be conducted at General Motor’s facilities in Warren, Michigan, along with Delphi
Delco facilities in Kokomo, Indiana, and Malibu, California. The University of Michigan
Transportation Research Institute will manage the field-testing and the Volpe Center in Cambridge,
Massachusetts will analyze the field data.144
Ann Arbor, Michigan Another of the most frequent accidents in transit bus operation is when a vehicle collides with a bus
from behind. The goal of the Performance Specifications for Rear Collision Mitigation research
program is to define corrective measures that will mitigate the consequences of these types of
collisions. The Ann Arbor Transit Authority, the lead agency, will provide their agency’s crash data
for analysis as part of the program in partnership with Veridian/ERIM International, the FTA, and the
University of California’s PATH Program.
In addressing the primary factors that cause rear collisions, one key issue is to develop a warning
system that can provide a longer time window for the drivers behind the bus to observe and react. If a
driver is given an effective warning signal and sufficient time to react, the frequency and the severity
7-50

of accidents can be lowered. Research, development, and deployment in the area of rear impact
mitigation can leverage existing sensor technologies and prior research completed for warning
systems in other domains. However, in order for the system to be truly successful, several unique
technical issues specific to rear impact mitigation must be understood and addressed. The most
significant of these are sensor requirements, warning criteria and false alarms, and warning modality.
REAR COLLISION WARNING IS A RELATIVELY UNEXPLORED AREA. BECAUSE THE HISTORICAL ACCIDENT DATA DO NOT NORMALLY CONTAIN DETAILED INFORMATION ON MAJOR CAUSES AND CIRCUMSTANCES OF BUS REAR-END COLLISIONS, IT IS NECESSARY TO COLLECT REAL WORLD DATA IN ORDER TO CHARACTERIZE THE BEHAVIORS OF DRIVERS BEHIND BUSES AS RELATED TO THE BUS MANEUVERS. MILESTONES WILL BE SET TO REVIEW THE COST-BENEFIT OF THE PROPOSED COUNTERMEASURES BASED ON THE PERIOD OF DATA COLLECTION. THE KNOWLEDGE GAINED THROUGH THE DATA COLLECTION AND ANALYSIS IN THE FIRST YEAR WILL BE USED TO FURTHER DEFINE THE SCOPE OF WORK FOR THE SYSTEM DEVELOPMENT AND TESTING IN THE SECOND YEAR. The final product of this work is the generation of performance specifications, including functional
level and component level specifications for rear-collision mitigation systems. The results from the
analysis of data acquired during the development of the system and the validation tests will be
summarized in the final report along with the performance specifications. This FTA-funded project
has a two-year scope, with a budget of $750K plus a 20 percent local cost share.145
7. FTA-SPONSORED FIELD OPERATIONAL TESTS
Testing in a real-world environment is essential for a complete and proper evaluation of any
technology, system, or innovation. It is only in this environment that the system will be subjected to
the challenges that it will experience in regular operation. As part of the APTS program, the FTA is
sponsoring several Field Operational Tests of various innovative technologies throughout the country.
These tests will include a full assessment of each promising technology with test results widely
disseminated. This will allow service providers interested in implementing APTS technologies and
innovations to benefit from the operational test information generated by others. It should reduce
145 Cronin, op. cit.
7-51

trial-and-error inefficiencies and may eliminate wasteful implementation of systems that are
inappropriate.
Operational Test Projects
The FTA-sponsored field operational tests listed in Table 7-1. Further details regarding many of the
projects, including status and findings-to-date, are given earlier in this report. More information also
is available from the contact persons listed in the Table.
7-52

FIELD OPERATIONAL TESTS
Table 7-1. FTA-Sponsored APTS Field Operational Tests146
Title FTA Contact Status Completion Date
Contact Agency // Location Contact Person
FLEET MANAGEMENT
North Florida Rural Transit ITS Charlene Wilder (202) 366-1077
Project Developmt
4/00 FL Comm. for the Transportation Disabled, Tallahassee, Florida
Mary Constiner (850) 921-9089
CTA Bus Service Mgmt. System (See also Traveler Information)
W. Raymond Keng (202) 366-6667
Imple- mentation
6/01 Chicago Transit Authority Chicago, Illinois
Tom Reynolds (312) 664-7200
Dallas Area Rapid Transit Personalized Public Transit
W. Raymond Keng (202) 366-6667
Project Developmt
8/01 Dallas Area Rapid Transit Dallas, Texas
Koorosh Olyai (214) 749-2866
Ann Arbor Smart Intermodal (See also Electronic Fare)
Sean Ricketson (202) 366-6678
Operation 2/98 Ann Arbor Transit Authority Ann Arbor, Michigan
William Hiller (313) 973-6500
TRAVELER INFORMATION
Miami Real-Time Passenger Information System
W. Raymond Keng (202) 366-6667
Project Developmt
4/01 Miami-Dade Transit Agency Miami, Florida
Isabel Padron (305) 375-4504
Cape Cod Advanced Intermodal Transportation System
Charlene Wilder (202) 366-1077
Project Developmt
6/99 Cape Cod Regional Transit Auth. Cape Cod, Massachusetts
Dennis Walsh
CTA Bus Service Mgmt. System (See also Fleet Management)
W. Raymond Keng (202) 366-6667
Imple- mentation
9/00 Chicago Transit Authority Chicago, Illinois
Tom Reynolds (312) 664-7200
Montgomery Co. Parking Info. System (see also TDM Tech.)
W. Raymond Keng (202) 366-6667
Project Developmt
2/02 Montgomery County DPW Montgomery County, Maryland
Emil Wolanin (240) 777-8788
7-2
Table 7-1. FTA-Sponsored APTS Field Operational Tests147 (Cont.)
146 Based on information provided by FTA, Office of Mobility Innovation.

FIELD OPERATIONAL TESTS
Title FTA Contact Status Completion Date
Contact Agency // Location Contact Person
TRAVELER INFORMATION
New York City Travel Information System
W. Raymond Keng (202) 366-6667
Project Developmt
5/02 New York City Transit New York, New York
Isaac Takyi (718) 694-3652
ELECTRONIC FARE PAYMENT
Delaware Smart DART Sean Ricketson (202) 366-6678
Under Review
12/99 Delaware DOT Wilmington, Delaware
Gene Donaldson
(302) 739-4301Ann Arbor Smart Intermodal (See also Fleet Management)
Sean Ricketson (202) 366-6678
Operation 2/98 Ann Arbor Transit Authority Ann Arbor, Michigan
William Hiller
(313) 973-6500Delaware County Ridetracking Sean Ricketson
(202) 366-6678 Operation 9/97 Community Transit
Delaware County, Pennsylvania Judith McGrane
(610) 532-2900 Northern Virginia Regional Fare System
Sean Ricketson (202) 366-6678
Project Developmt
9/98 Northern Virginia Transp. Comm. Northern Virginia
Heather Wallenstrom
(703) 524-3322
TDM TECHNOLOGIES
Montgomery Co. Parking Info. System (See also Traveler Info.)
W. Raymond Keng (202) 366-6667
Project Developmt.
2/02 Montgomery County DPW Montgomery County, Maryland
Emil Wolanin
(240) 777-8788
7-3
147 Based on information provided by FTA, Office of Mobility Innovation.

APPENDIX A THE NATIONAL ITS ARCHITECTURE AND ITS STANDARDS
The National ITS Architecture is a framework that allows for the development of interoperable
systems within and across transportation modes. It identifies needs for national standards for ITS
technologies to accommodate intercity travel and cross country goods movements, and to encourage
manufacturers to design ITS components that can function together as an overall system. As a
planning tool, the National ITS Architecture assists local and regional planners to consider all
possible ITS services and facilities as they develop their own ITS architectures to suit individual
needs.
This appendix provides a brief overview of the National ITS Architectures and related Transit ITS Standards. It describes: �� Section A.1 The National ITS Architecture; �� Section A.2 Transit ITS Standards; �� Section A.3 Transit Involvement in the National ITS Architecture and ITS Standards
Program; and 148 �� Section A.4 New Developments since Update ‘98.
A.1 National ITS Architecture The National ITS Architecture defines the functions performed by different ITS components and
ways in which they should be interconnected. It serves as guidance to develop systems and interfaces
to support identified user services. These user services are based upon needs and requirements as
identified when analyzing operational scenarios within the transportation environment.
In sum, the National ITS Architecture defines:
�� The System Functions associated with ITS User Services; �� The Physical Architecture which includes systems and subsystems within which such functions
reside; �� The Logical Architecture which includes the data interfaces and information flows between
physical subsystems; and �� The Communications Requirements associated with information flow.
148 Some information contained in this appendix on the National ITS System Architecture was summarized or
extracted from “ITS Architecture Executive Summary,” prepared by the Joint Architecture Team (Lockheed Martin and Rockwell International) for the U. S. DOT - Federal Highway Administration, January 1997.
A-55

A-56
What Is a System Archit
DEFINE HTHE BUILDINIS A DESCRIPTION OF HOW
�� Complete system operation; �� What each component does; and �� What information is exchanged among components.
In general, the more complicated a system is, the more benefit it derives from clearly identifying the complete “system,” defining component functions and eliminating redundancies, and defining interconnections between various components. Meeting the first objective assures that everyone agrees on the finished system operation and that no major functions are overlooked. The second objective is the embodiment of the “divide and conquer” methodology with the additional aspect of looking for opportunities for shared use of components. The third objective is a definition of which components need to communicate and what information is passed among components; this is necessary to allow the successful integration of components that could be developed by separate teams. A system architecture, however, is not the same as a system design. An architecture does not specify how each component accomplishes its respective task or an individual component’s “look and feel.” Instead, it is an organization of functions, not a specification of equipment. Nevertheless, it does have a strong influence on the design. For example, the architecture facilitates the development of standards that can flow directly from the specification of communication pathways. The resulting standards ensure equipment compatibility and inter-operation, resulting in larger, more competitive equipment markets and the accompanying reduction in component costs. The architecture also minimizes system costs by assuring that the system is sensibly deployed with a minimum of redundant equipment. A system architecture is also useful in helping agencies form a unified vision of ITS services. In regions that have already developed an ITS architecture, participants assert that the process of meeting with other agencies to discuss regional needs and cooperation was a key element of success. The organizational relationships forged during the architecture development process produced greater operating efficiency and a consensus vision of future ITS service.
ecture? MUCH LIKE ARCHITECTURAL DRAWINGS OF A NEW BUILDING OW INDIVIDUAL DESIGN FEATURES INTERACT TO CREATE
G’S GENERAL APPEARANCE, A SYSTEM ARCHITECTURE SYSTEM COMPONENTS INTERACT TO
ACHIEVE OVERALL SYSTEM GOALS. A SYSTEM ARCHITECTURE DEFINES:

These specific elements are defined in more detail below.
Thus, the National ITS Architecture provides a general framework for how ITS applications can be
interconnected so that agencies can share information with each other to enhance the safety and
efficiency of transportation system operations. Implementation details regarding the actual design
and deployment of ITS projects remain in state and local hands, including decisions regarding
institutional arrangements and specific technology acquisitions.
ITS User Services User services address a broad spectrum of functions including travel management, public
transportation operations, and emergency management. To date, 31 user services have been
identified and bundled into seven functional categories as shown in Table A-1.
In addition to existing or expanded ITS user services, the National ITS Architecture continues to
evolve and accommodate new user services to meet additional needs within the transportation
community. As an example, the 31st architecture user service, Archived Data User Service, was
officially incorporated into the National ITS Architecture in FY2000. This latest user service will
address the benefits of consistent storage of ITS generated information.
Physical Architecture
The physical architecture partitions the functions defined by the logical architecture into systems and
subsystems. The partitions are based on the functional similarity of the process specifications and the
location where the functions are being performed. Essentially, the physical architecture describes
how the functions group together. The ITS physical architecture (as depicted in Figure A-1) is
comprised of four systems (Traveler, Center, Roadside, and Vehicle) and 19 subsystems. Subsystems
are composed of equipment packages with specific functional attributes.
B-1

Table A-1. ITS User Services and User Service Bundles (as of November 1999) Bundle User Services
1. Travel and Transportation
Management �� Pre-trip Travel Information �� En-route Driver Information �� Route Guidance �� Ride Matching and Reservation �� Traveler Services Information �� Traffic Control �� Incident Management �� Travel Demand Management �� Emissions Testing and Mitigation �� Highway-Rail Intersection
2. Public Transportation Management
�� Public Transportation Management �� En-route Transit Information �� Personalized Public Transit � Public Travel Security
3. Electronic Payment Systems �� Electronic Payment Services 4. Commercial Vehicle Operation �� Commercial Vehicle Electronic Clearance
�� Automated Roadside Safety Inspection �� On-board Safety Monitoring �� Commercial Vehicle Administrative Processes �� Hazardous Material Incident Response �� Commercial Fleet Management
5. Emergency Management �� Emergency Notification and Personal Security �� Emergency Vehicle Management
6. Advanced Vehicle Safety Systems
�� Longitudinal Collision Avoidance �� Lateral Collision Avoidance �� Intersection Collision Avoidance �� Vision Enhancement for Crash Avoidance �� Safety Readiness �� Pre-crash Restraint Deployment �� Automated Vehicle Operation
7. Information Management �� Archived Data Function
B-2

Figure A-1. National ITS Architecture Interconnect Diagram
Travelers
Remote Travele rSupport
Veh icle Roadway
Toll Collect ion
Parking Management
Commercia l Vehicle Check
Trans it
Commercial
Emergency
Vehicles
Roadside
Centers
Em
issi
on
s M
ana
gem
en
t
Tra
ffic
Man
age
me
nt
Em
erg
en
cy M
an
age
me
nt
Tra
nsi
t M
ana
gem
en
t
Tol
l Adm
inis
tra
tion
Fle
et
and
Fre
ight
Ma
nag
eme
nt
Co
mm
erci
al V
eh
Adm
in
Info
rmat
ion
Ser
vice
Pro
vid
er
Veh
icle
to
Veh
icle
Co
mm
unic
atio
ns
De
dica
ted
Sho
rt R
an
geC
om
mun
ica
tions
Pers onal In formationAccess
Wide Area Wire les sC ommunications
Pla
nn
ing
Wireline Communic ations
Logical Architecture
The logical architecture presents a functional view of ITS services. The logical architecture defines
and describes what the functions or process specifications are that are required to perform ITS user
services, and the information or data flows that need to occur among these functions. It also identifies
system interfaces for connecting systems and components so that data can be provided where it is
needed. For example, data can be stored on several servers in a client-server system and thus
information flows must be charted to show the sequence of servers to be accessed to acquire the
requested data.
Communications Requirements for Information Flows
Communications requirements in the National ITS Architecture include wireless, wired line,
Dedicated Short-Range Communications (DSRC), and vehicle–to-vehicle communications.
Communications requirements refer to communications standards such as the Transit
Communications Interface Profiles.
B-3

A.2 TRANSIT ITS STANDARDS149
A fundamental ITS expectation is the ability to integrate and share information among various users
across institutional and jurisdictional boundaries. Open standards are the essential ingredients for
achieving the ITS interoperability and compatibility necessary to meet these expectations at regional
and national levels.
To help fast-track the creation of open ITS standards, the U.S. Department of Transportation (DOT)
has sponsored the accelerated development of approximately 100 ITS standards by existing
standards-setting organizations. These standards are being developed through the traditional
voluntary consensus process in Standards Development Organizations (SDO) such as the Institute for
Transportation Engineers (ITE), the Society of Automotive Engineers (SAE), and others. Over the
next several years, the U.S. DOT plans to adopt national ITS standards based on the results of these
efforts.
ITS Transit Standards Development
Several transit standards activities are actively underway. They include:
�� The Transit Communications Interface Profiles (TCIP); �� The Vehicle Area Network Standard (VAN); and �� Standards being adopted by International Standards Organization Technical
Committee 204 (ISO/TC204) Working Group 8 – Public Transport and Emergency Services.
Transit Communication Interface Profiles
The DOT has funded the development of several transit data interface standards. Collectively, these
standards are known as the Transit Communications Interface Profiles. TCIP is a standards
development effort designed to provide the interface structures that will allow separate transit system
components and organizations to exchange data. The goal of TCIP is to ensure that transit ITS
systems interact in a plug-and-play environment, particularly with regards to software for various
transit applications. In other words, TCIP will facilitate an environment where an agency may
procure interoperable software and hardware components from multiple vendors.
149 This section was taken from “Transit ITS Standards Activities” by Brian Cronin, Federal Transit
Administration, Washington, D.C.
B-4

In 1996, TCIP was launched and the Institute of Transportation Engineers (ITE) was selected to
develop the standards. In 1999, Phase 1 of TCIP (TCIP1) was completed with the help of over 800
volunteers. TCIP1 established a transit data interface framework and eight business area object
standards. A list of TCIP1 standards is contained in Table A-2.
Table A-2. List of TCIP1 Standards
Code Title
NTCIP 1400 Framework Document
NTCIP 1401 Standard on Common Public Transportation (CPT) Objects
NTCIP 1402 Standard on Incident Management (IM) Objects
NTCIP 1403 Standard on Passenger Information (PI) Objects
NTCIP 1404 Standard on Scheduling/Runcutting (SCH) Objects
NTCIP 1405 Standard on Spatial Representation (SP) Objects
NTCIP 1406 Standard on On-Board (OB) Objects
NTCIP 1407 Standard on Control Center (CC) Objects
NTCIP 1408 Fare Collection Business Area Standard
In March 2000, Phase 2 of TCIP (TCIP2) was launched. TCIP2 is sometimes referred to as the
“dialogues” phase of TCIP because it focuses on the details of information exchange (messages)
within and between transit applications of ITS. TCIP2 is paying particular attention to the issue of
messaging requirements for communications between different computing platforms since it is not
realistic to expect the entire transit industry to adopt a single standard platform. Therefore, the
project includes transit-specific profiles to existing applications and communications standards. The
goal of TCIP2 is to develop the transaction sets, application profiles, and implementation tools. A set
of guidebooks is also being developed to test and implement TCIP standards.
Vehicle Area Network Standard The Vehicle Area Network (VAN) standard for public transit vehicle area networks is based on the
Society of Automotive Engineers standard SAE J1708 (hardware and communications format) and
related standards, SAE J1587 (protocols), and SAE J1455 (environmental requirements).
Acceptance of the non-proprietary concept embodied by J1708 and its related standards has been
widespread. Transit agencies can assemble a system meeting their special needs and budgets by
B-5

selecting functions and performance requirements afforded by an open architecture marketplace. For
example, agencies can now specify and procure a given electronic device from multiple sources with
the expectation that these devices will be interchangeable and able to communicate with the rest of a
vehicle’s devices. Manufacturers now have the opportunity to market commodity building block
devices while competing on pure performance issues (speed, accuracy, power demands, etc.).
Furthermore, because of the modular nature of the device standards, additional device and functional
expansions could occur without discarding previous investments. Through standardization of
communication and hardware interfaces, the entire on-vehicle system becomes transparent to the
vehicle on which it is installed. This enables a single implementation solution to be transportable to
various types of transit vehicles.
International Standards Organization Technical Committee 204 Working Group 8 – Public
Transport and Emergency Services
The International Standards Organization has established Technical Committee 204, Transport
Information and Control Systems, composed of 13 active international working groups (WG), to
advance the adoption of international ITS standards. There are currently 19 participating countries
and 27 observing countries in ISO/TC204. The U.S. is the International Secretariat of ISO/TC204
and also convenes four of the WGs. ISO/TC204 Working Group 8, is chartered to develop ITS
standards in the areas of public transport and emergency services.
The U.S., in support of ISO/TC204 activities, established a parallel structure within the U.S. to
provide technical expertise in the development of U.S. input to the ISO/TC204 working groups. The
counterpart of ISO/TC204/WG8 is the U.S. Working Advisory Group (WAG) 8 for public transport
and emergency services, which is responsible for developing U.S. positions on international standards
and for initiation of international standards based on U.S. standards. The U.S. DOT Volpe National
Transportation Systems Center administers the U.S. WAG 8. WAG 8 has approximately 24 members
supporting three U.S. experts nominated by the WAG and confirmed by the American National
Standards Institute. WAG 8 membership includes representatives from U.S. industry, transit
authorities, academia, standards development organizations, transit associations, and government
agencies. The Transit Standards Consortium, which has active participation from all of these groups,
is a key component of the WAG.
Working Group 8 has advanced both the VAN standard and TCIP within the ISO. The Public
Transport Vehicle Area Network is a work item under active consideration by Technical Committee
B-6

204; based on the VAN SAE standards described above, it has been circulated through the nineteen
participating countries as a Committee Draft Standard and written comments have been received from
seven countries. TCIP, titled Public Transport Communication Interface Profiles within ISO, was
accepted by TC204 as a new work item at the November 1999 plenary meeting in Montreal; it is
likely to be circulated as a Committee Draft Standard in 2000. In the meantime, an effort to
harmonize the TCIP standard with the European data model, TRANSMODEL, has begun with the
participation of U.S. and European experts.
The SDOs continue to ballot standards and release them for use on transportation projects. The latest
incarnation of the VAN Standard, SAE J2496 (a cable and connector standard), was released earlier
this year. The TCIP framework and seven business area standards have been adopted as
recommended standards, and the SDOs are progressing on object definitions for phase II of TCIP.
Most significantly, the establishment of the Transit Standards Consortium, and the continuing
discussion in the ISO, highlight the depth of industry participation in what has clearly become a
grass-roots standards development process.
A.3 TRANSIT INVOLVEMENT IN THE NATIONAL ITS ARCHITECTURE AND ITS STANDARDS PROGRAMS
The FTA participated in the National ITS Architecture development process through an effort to
identify transit-specific requirements. In support of FTA, the U.S. DOT Volpe National
Transportation Systems Center and Sandia National Laboratories developed a set of information flow
charts that represent the logical information flows necessary to satisfy the needs of the APTS user
services. These flow charts along with a narrative description were provided to the architecture teams
as a basis for interaction with and validation within the transit community. The FTA has supported
outreach and educational activities to ensure that transit ITS projects are compatible with the
Architecture.
Outreach and Training
To help spread the word about TCIP and the other ITS standards, U.S. DOT has funded an extensive
ITS standards outreach and training program to promote awareness and usage. Several brochures,
fact sheets, and other outreach items are currently being developed.
B-7

Training Courses
A series of TCIP technical training courses are being developed by the Transit Standards Consortium.
The first three training courses are the following: "Transit Standards Procurement," "Incorporating
TCIP into Legacy Systems," and "Transit Vehicle Area Networks." The courses are in the early
development stage and scheduled for delivery in 2001.
The "Transit Standards Procurement" training course will focus on how to incorporate the TCIP and
SAE J1708 into the procurement process.
The "Incorporating TCIP into Legacy Systems" training course will provide information on how to
translate legacy databases and vendor products into TCIP formats. The training course will be based
on the TCIP guidebook.
The "Transit Vehicle Area Networks" training course will describe the benefits of investing in vehicle
area networks and purchasing standard-compliant equipment. The training course will be based on
existing material from SAE.
If additional information about FTA's Standards Program is needed, contact FTA's Brian P. Cronin at
[email protected] or http://www.fta.dot.gov/research/fleet/its/std.htm Additional information
regarding ITS standards is available on the U.S. DOT ITS Joint Program Office website at:
http://www.its.dot.gov/standard/standard.htm.
Reports
In addition, several reports have been written to assist the public transportation community to better
understand and use the National ITS Architecture report entitled“ITS Deployment Guidance for
Transit Systems,” has been developed by the U. S. DOT ITS Joint Program Office. Both the
Executive Edition and Technical Edition of this report are available from the APTS Division of the
Federal Transit Administration, 400 7th Street, SW, Washington, DC 20590.
The “ITS Deployment Guidance for Transit Systems” focuses on transit applications and provides
practical assistance based on real-life experiences with developing and implementing transit ITS
systems. The document includes: definitions of ITS and the National ITS Architecture; applications
of ITS using a systems engineering approach; alignment with the National ITS Architecture; and best
B-8

practices and lessons learned for developing and implementing ITS. The document is intended for
those performing the following functions within transit agencies: planning and development; project
definition; project approval; funds identification and allocation; design; project management;
procurement; and project implementation.
A.4 NEW DEVELOPMENTS SINCE UPDATE ‘98
With the unveiling of the National ITS Architecture and ratification of TEA-21 in 1996, the primary
focus of National ITS policy shifted from development of new technologies to deployment and
integration of existing technologies. Since Update ‘98, many of these pioneering deployments have
begun to realize the benefits of implementing an ITS architecture and there are now tangible case
studies150 to assist those considering or undertaking a regional architecture in their area. DOT’s focus
has also shifted toward ensuring that regional architectures are consistent with the National ITS
Architecture, through a combination of outreach to inform stakeholders of how they can achieve
consistency, and federal funding requirements that specify National Architecture-compatible design.
NPRM for National ITS Architecture Conformance
In May 2000, the FTA and FHWA issued a Notice of Proposed Rulemaking (NPRM) requiring that
all ITS projects conform to the National ITS Architecture and Standards. A Request for Comment
(RFC) was also issued so that the public could respond to the NPRM. The RFC covers architecture
and standards consistency at the transit projects level, while the joint NPRM covers ITS architecture
and standards consistency at the metropolitan planning organization (MPO) and state planning level.
These documents are available on the Internet at www.fta.dot.gov/library/legal/fr00toc.htm and
www.its.dot.gov/aconform/aconform.htm. The objectives for the FTA's National ITS Architecture
Policy for project development are to:151
�� Provide requirements for ITS project development for projects implemented wholly or partially with highway trust funds, including the Mass Transit Account;
�� Achieve system integration (e.g., seamless traveler information systems that electronically 150 One example of these resources is a series of seven ITS Architecture case studies examining pioneering
architectures that was recently released by the ITS Joint Program Office. Of particular interest to transit professionals are the cases examining Houston and the New York-New Jersey-Connecticut region. These cases are available from the ITS Joint Program Office, and on the Electronic Document Library (www.its.dot.gov).
151 This section was taken from “Ensuring Conformance with the National ITS Architecture” by Ronald Boenau, P.E., Chief of the Advanced Public Transportation Systems Division, Federal Transit Administration, Washington, D.C.
B-9

combines road and transit traveler information data from multiple transportation agencies in a region) for projects funded through the highway trust fund with all other projects contained in a regional ITS Integration Strategy;
�� Engage stakeholders such as state departments of transportation, transit agencies, public safety agencies and other transportation operating agencies;
�� Enable electronic information and data sharing among stakeholders; �� Facilitate future expansion capability of the transportation infrastructure; �� Foster interoperability; and �� Save design time through use of the National ITS Architecture.
To achieve these objectives, the FTA and FHWA propose that states and locales develop two policies
— a Regional ITS Architecture and an ITS Integration Strategy.
Regional ITS Architecture
A Regional ITS Architecture is what results when agencies apply the National ITS Architecture as a
guide to integrating ITS projects at a regional level. Whereas a Regional ITS Architecture should be
developed in cooperation with other ITS stakeholders within the area, it may be developed either
through an initial planning effort or incrementally as major ITS investments are initiated and updated
with later projects. Major ITS investments include projects that are multi-jurisdictional or multi-
modal, projects that affect regional integration of ITS systems, and projects which directly support
national interoperability. The ITS Regional Architecture should conform with the applicable local ITS
Integration Strategy developed under the transportation planning process.
ITS Integration Strategy
The FTA/FHWA joint NPRM also requires that local and state planners create an ITS Integration
Strategy for their region. The ITS Integration Strategy shall address how existing and future ITS
projects are to be integrated. The NPRM also calls for a formal interagency agreement among MPOs,
state DOTs, transit authorities, and other transportation agencies.
Both the Regional Architecture and Integration Strategy policies require the use of U.S. DOT-adopted
ITS standards and interoperability tests. Currently, ITS standards and interoperability tests are being
developed at an accelerated pace. The adoption of ITS standards will be the subject of separate future
rulemaking actions. Prior to final rulemaking, grantees are encouraged to use applicable standards,
such as TCIP, to the extent practical.
B-10

FTA proposes to issue a final policy after reviewing the comments and then modify FTA circulars as
appropriate. The proposed policy will contain documentation requirements on how a project
conforms to a local Regional ITS Architecture. If there is no applicable Regional ITS Architecture or
ITS Integration Strategy available in that area, FTA proposes to require that ITS projects conform to
the National ITS Architecture. There will be a two-year phase-in period for these requirements once
the final policy is published. Existing FTA oversight procedures will be used; grantees will self-
certify that they have met the National ITS Architecture consistency requirements.
To help grantees conform to these requirements, FTA has created a new FTA Architecture
Oversight/Technical Assistance Program. If the normal review process indicates a grantee is "at-risk"
for National ITS Architecture consistency, they become eligible to this program's assistance.
Transit agencies will benefit from the emphasis on regional integration emphasized in both the FTA
RFC and the joint FTA/FHWA NPRM. These policies will require local and state highway agencies
to more proactively coordinate ITS deployments with local transit authorities. These policies will
also put an increased emphasis on integrating ITS projects into the normal planning process.
For additional information about the National ITS Architecture, please contact Ronald E. Boenau at
[email protected] or Brian P. Cronin at [email protected].
APPENDIX B APTS MOBILE SHOWCASE152
LIKE AN INITIAL PUBLIC OFFERING ROADSHOW, THE FEDERAL TRANSIT ADMINISTRATION'S MOBILE SHOWCASE IS TRAVERSING THE NATION TO SPREAD THE WORD THAT INVESTMENTS IN ADVANCED PUBLIC TRANSPORTATION SYSTEMS (APTS) TECHNOLOGIES AND SYSTEMS CAN IMPROVE TRANSIT OPERATIONS AND PROVIDE A HIGHER LEVEL OF CUSTOMER SERVICE. SOUND TECHNOLOGICAL INVESTMENTS CAN ONLY BE MADE WHEN DECISION-MAKERS HAVE A SOLID UNDERSTANDING OF APTS TECHNOLOGIES AND SYSTEMS.
OFFERING A GREAT DEAL OF VERSATILITY, THE MOBILE SHOWCASE, A 48-FOOT EXPANDABLE TRAILER (FIGURE B-1), FUNCTIONS AS A RESEARCH
152 This appendix is adapted from an article “The APTS Mobile Showcase: Spreading the World about APTS Technologies
and Systems” written by W. Raymond Keng, General Engineer, Advanced Public Transportation Systems Division, Federal Transit Administration, Washington D.C.
B-11

LABORATORY, STANDARD TESTING FACILITY, AND BRIEFING ROOM ON WHEELS. THE MOBILE SHOWCASE IS THE MEANS TO EDUCATE TRANSIT BOARD MEMBERS, TRANSIT SENIOR EXECUTIVES, AND STATE AND LOCAL GOVERNMENT OFFICIALS.
Figure B- 1. APTS
Mobile Showcase
Trailer
For the first time,
decision- makers can
see the full capabilities
of APTS
technologies and systems working together. Side-by-side comparisons of available technologies and
systems are finally
B-12

UPDATE 2000
possible. The Mobile Showcase is also the means to research and evaluate systems integration issues.
The Transit Standards Consortium plans on using the showcase as a test bed for new products and
interoperability.
Interactive Learning Environment
TO ENHANCE THE LEARNING EXPERIENCE, OVER 35 APTS TECHNOLOGIES AND SYSTEMS ARE DISPLAYED IN AN INTERACTIVE, HANDS-ON ENVIRONMENT. VISITORS ARE ENCOURAGED TO SIT DOWN AND TRY OUT THE EQUIPMENT. APTS TECHNOLOGIES AND SYSTEMS ON DISPLAY ARE THE LATEST VERSION OF THE PRODUCTS ON THE MARKET. ONCE THE 48-FOOT TRAILER IS EXPANDED, A 16-FOOT WIDE ROOM IS FILLED WITH AN IMPRESSIVE TRANSIT BUS MODEL THAT DEMONSTRATES A WIDE RANGE OF IN-VEHICLE TECHNOLOGIES, TWO COMPUTER WORKSTATIONS THAT DEMONSTRATE A VARIETY OF SOFTWARE PACKAGES, AND A TECHNOLOGY WALL THAT SHOWCASES A WIDE RANGE OF TECHNOLOGIES AND SYSTEMS. APTS Technologies and Systems Demonstrated
The APTS technologies and systems aboard the trailer are displayed in five exhibit areas that are
focused around user perspectives (See Figure B-2):
�� At the Bus Stop; �� The Intelligent Bus; �� Control Center; �� Service Support Center; and �� Bus Technologies.
The Bus Stop Visitors can observe electronic transit arrival displays and destination signs in action. Simulated data
is used to demonstrate sign capabilities and functions.
The Intelligent Bus VISITORS ENTER THE BUS THROUGH A SIMULATED DOORWAY WHERE AN AUTOMATED PASSENGER COUNTER COUNTS EACH BOARDING. AFTER PAYING THEIR FARE, VISITORS CAN TAKE A SEAT OR STAND. ONCE ONBOARD, A BRIEF INTRODUCTORY VIDEO IS SHOWN THROUGH THE "FRONT WINDSHIELD" (TWO FORWARD-MOUNTED MONITORS). AFTER THE VIDEO, A FACILITATOR GIVES A BRIEF OVERVIEW OF THE IN-VEHICLE TECHNOLOGIES. THE MOST POPULAR PART OF THE TRANSIT
B-13

UPDATE 2000
BUS MODEL IS THE BUS DRIVER COCKPIT WHERE A VISITOR CAN SIT DOWN AND TRY OUT A VEHICLE LOGIC UNIT, SECURITY EQUIPMENT AND RADIO SYSTEM. .
B-14

MOBILE SHOWCASE
IN ONE OF THE PASSENGER SEATS, A WIRELESS ENTERTAINMENT/WORKSTATION, ANOTHER POPULAR ITEM, IS ON DISPLAY. VISITORS CAN WATCH MOVIES, CHECK THEIR E-MAIL AND SURF THE INTERNET.
Figure B-2. APTS Mobile Showcase Exhibit Areas
Control Center
A VIDEO OVERVIEW OF DISPATCHING AND RELATED TECHNOLOGIES IS SHOWN TO VISITORS. AFTER THE VIDEO, A FACILITATOR DEMONSTRATES A VARIETY OF COMPUTER-AIDED DISPATCH, VEHICLE TRACKING, GEOGRAPHICAL INFORMATION SYSTEM, AND INCIDENT REPORTING SOFTWARE ON A DUAL-MONITOR COMPUTER WORKSTATION. AFTERWARDS, VISITORS CAN TRY OUT THE SOFTWARE PACKAGES.
Service Support Center SIMILAR IN SETUP AS THE CONTROL CENTER, THE SERVICE SUPPORT CENTER ALLOWS VISITORS A BEHIND-THE-SCENES PERSPECTIVE IN PROVIDING TRANSIT SERVICE. VISITORS CAN TRY OUT A VARIETY OF PLANNING AND SCHEDULING SOFTWARE PACKAGES ON A COMPUTER WORKSTATION.
B-15

MOBILE SHOWCASE
Bus Technologies These technologies are mounted on a 45-foot wall and visitors can experiment with a smart
card reader, a traffic signal priority system, mobile terminal displays, collision avoidance
B-16

UPDATE 2000
systems, an in-vehicle navigation system, electronic bus destination signs, annunciators, and
other items.
Customized Tours and Training Workshops
Mobile Showcase facilitators lead the tours and highly regarded transit industry experts conduct a
variety of workshops. The Mobile Showcase typically spends 2-4 days at each site. Prior to a
scheduled visit, a showcase host can select from a menu of tours and training workshops that best
meets their needs. The menu includes the following items: 15-minute tour, 45-minute tour, one-hour
workshop, half-day workshop, and full-day workshop.
15-minute tour
Visitors get a brief overview about the APTS technologies and systems in each of the five exhibit
areas. Once the tour is complete, visitors are encouraged to explore and try out the technologies. The
target audience is transit board members, executives, managers and operators; government officials;
academia; media; and the general public.
45-minute tour
This is similar to the 15-minute tour except more time is spent in each of the five exhibit areas. If
desired, facilitators can spend more time focusing in a specific area or technology. The target
audience is the same as for the 15-minute tour.
One-hour workshop Visitors get a detailed briefing on a specific APTS technology or exhibit area. The target audience is
transit managers and operators; government officials; and academia.
Half-day workshop This is similar to the one-hour workshop except more in-depth technical knowledge about a specific
APTS technology or exhibit area is provided. The target audience is the same as for the one-hour
workshop.
B-17

MOBILE SHOWCASE
Full-day workshop This is similar to the half-day hour workshop except more in-depth technical knowledge about several
APTS technologies or exhibit areas is provided. The target audience is the same as for the other two
shorter workshops.
Public-Private Effort
The Mobile Showcase is the result of the FTA and transit industry working together. The FTA and
over 35 Mobile Showcase Partners have joined forces to show the transit industry and state and local
government officials the benefits of using APTS technologies and systems. The cost of the Mobile
Showcase is shared by the Federal government and the partners. The Federal government has
provided funding to launch the Mobile Showcase while over 35 partners have provided between $1M
to $2M in hardware, software and support. Current partners are listed in Table B-1 at the end of this
Appendix.
Vendors who have become Mobile Showcase Partners have entered into a Cooperative Research and
Development Agreement (CRADA) with the U. S. Department of Transportation. A CRADA is a
type of public-private partnership that allows the Federal government and a private company to share
the costs of research. The private sector partner gets the opportunity to demonstrate its goods and
gauge the degree of interoperability with other partners’ technologies. In turn, the partner agrees to
provide the funds, equipment and necessary support to carry out the research and development effort.
Safeguards protect proprietary vendor information, which makes for a truly open and collaborative
opportunity.
The collaborative nature of the Mobile Showcase is expected to bring about further benefits. Since
actual operating conditions will be simulated to the extent practicable, potential problems associated
with integrating hardware/software from different vendors can be identified and corrected prior to
real-world deployment by program partners. This will affect the policies and requirements for
deploying APTS technologies and systems, and establish transit industry standards for integrating
equipment, computer, and communication systems.
B-18

UPDATE 2000
On the Road Again AFTER A HIGHLY SUCCESSFUL UNVEILING AT THE 2000 AMERICAN PUBLIC TRANSPORTATION ASSOCIATION (APTA) BUS AND PARATRANSIT CONFERENCE IN HOUSTON, THE MOBILE SHOWCASE UNDERWENT FINAL REFURBISHMENT AND INTEGRATION AND REGULAR TOURING COMMENCED IN SEPTEMBER 2000. OVER THE NEXT TWO YEARS, THE MOBILE SHOWCASE IS SCHEDULED TO VISIT TRANSPORTATION CONFERENCES, TRANSIT AGENCIES, STATE AND LOCAL TRANSPORTATION AGENCIES, UNIVERSITIES, AND OTHER VENUES.
SINCE THE UNVEILING, HEIGHTENED INTEREST BY THE TRANSIT INDUSTRY HAS GUARANTEED A RAPIDLY BOOKED SCHEDULE. TO SCHEDULE A VISIT, CONTACT THE FTA'S APTS DIVISION AT (202)-366-4995 OR THE VOLPE CENTER'S MATTHEW RABKIN AT [email protected] OR (617) 494-2151. FOR ADDITIONAL INFORMATION, VISIT HTTP://WWW.FTA.DOT.GOV/RESEARCH/FLEET/ITS/MOBSHOW.HTM
B-19

MOBILE SHOWCASE
Table B-1. APTS Mobile Showcase Partners
Partners Supplied Technologies
3M Graphics Material for exterior graphics 3M Intelligent Transportation Systems
Traffic signal priority system
Booz-Allen and Hamilton Technical assistance in both design and integration of the wiring on the showcase
Collision Avoidance Systems Vehicle proximity detectors Dallas Area Rapid Transit Data for Innovative Transportation Concepts Dearborn Group Technology Hardware and software to allow computers to speak to Society
of Automotive Engineers (SAE) J1708 family of wiring standards
E.F. Johnson Digital radios Echovision Vehicle proximity detectors FAAC* Bus driver training simulation Gannett-Flemming, Inc. Data for Innovative Transportation Concepts demo Gemplus Smart card systems Idmicro* Bus stop passenger information systems Innovation Transportation Concepts
Traffic signal priority software demo
Kalatel Vehicle surveillance system Luminator In-vehicle signs Meister Electronics In-vehicle signs and audio announcement system Mentor Engineering Paratransit, in-vehicle computer and display software Microsoft Various software National Transit Institute Educational components NextBus Systems Bus stop, passenger information systems/signage NRoute Communications On board, individual passenger information systems Orbital Transportation Management Systems
Dispatch station software and in-vehicle driver display
Orion Bus front Positronic Industries SAE J1708 family cabling Raytheon Commercial Infrared Night vision system Red Pine Instruments Automated passenger counter RouteMatch Software Paratransit scheduling software SmartClic.com Smart card systems Siemens ILG Sign, driver display terminal Sunrise Systems In-vehicle signs Teleride* Technologies to be incorporated in the future* Trimble Navigation Global Positioning System, dead reckoning unit Twin Vision In-vehicle signs VDO North America Fleet management system, crash data recorder, in-vehicle
navigation system Virginia Tech Educational components *Future Contributor
B-20

APPENDIX C LIST OF CONTACTS
Table C-1. List of Contacts Alphabetically by Name Name, E-Mail
Agency Name, City, State
Phone Number, FAX Number
Jim Alves [email protected]
PULNiX America, Inc. Sunnyvale, California
(619) 523-9220
Donna Ambrose [email protected]
Greater Redmond Transportation Mgmt. Assn. Redmond, Washington
(425) 556-2401 (425) 556-4248
Tom Reynolds [email protected]
Chicago Transit Authority Chicago, Illinois
(312) 664-7200
Bob Bamford [email protected]
TRANSCOM Jersey City, New Jersey
(201) 963-4033 (201) 963-7488
Tom Batz TRANSCOM Jersey City, New Jersey
(201) 963-4033 (201) 963-7488
Tom Braman [email protected]
King County Department of Transportation Seattle, Washington
(206) 263-4662
Peter Briglia [email protected]
Washington State DOT Seattle, Washington
(206) 543-3331 (206) 685-0767
Glen Carlson Minnesota Department of Transportation Minneapolis, Minnesota
(612) 341-7500 (612) 341-7239
Vickie Cobb California DOT, Div. of New Tech. & Res. Sacramento, California
Brian Cronin [email protected]
Federal Transit Administration Washington, DC
(202) 366-8841
Sal D’Agostino [email protected]
Computer Recognition Systems, Inc. Cambridge, Massachusetts
(617) 491-7665 (617) 491-7753
Dean Delgado Orange County Transportation Authority Orange, California
(714) 560-5744 (714) 560-5794
Robert Dial Volpe National Transportation Systems Center Cambridge, Massachusetts
(617) 494-2660
Ed Dodge [email protected]
Computer Recognition Systems, Inc. Cambridge, Massachusetts
(617) 491-7665 (617) 491-7753
Tom Friedman [email protected]
King County Metro Seattle, Washington
(206) 684-1513 (206) 684-2059
Gary Gimmestead Georgia Tech Research Institute Atlanta, Georgia
(404) 894-3419
Glenn Gruber [email protected]
Golden Screens New York City, New York
(212) 983-5212 (212) 983-6736
Cathe Hansen [email protected]
SCRA North Charleston, South Carolina
(843) 760-3244 (843) 760-3250
Lawrence Harman [email protected]
Bridgewater State College Bridgewater, Massachusetts
(508) 279-6144 (508) 279-6121
C-1

UPDATE 2000
Table C-1. List of Contacts Alphabetically by Name (Cont.)
Name, E-Mail
Agency Name, City, State
Phone Number, FAX Number
Stephen Harmer [email protected]
Allegro Integrated Systems Vancouver, British Columbia CANADA
(604) 669-1604 (604) 669-1614
Julie Hershorn Washington Metropolitan Area Transit Auth. Washington, DC
(202) 962-1113
David Hill [email protected]
Maryland Mass Transit Administration Baltimore, Maryland
(410) 767-3316 (410) 333-4810
William Hiller [email protected]
Ann Arbor Transportation Authority Ann Arbor, Michigan
(734) 677-3944 (734) 973-6338
Mike Hite [email protected]
Northwestern Community Services Virginia
(540) 636-4250 (540) 636-7171
Geoff Hubbs [email protected]
New York City Transit New York City, New York
(212) 492-8495 (212) 492-8145
Angela Johnson [email protected]
Regional Transportation Authority Chicago, Illinois
(312) 917-0781 (312) 917-0846
Steven E. Jones Flagler County Council on Aging Palm Coast, Florida
(904) 437-7300
Jim Kemp [email protected]
New Jersey Transit Newark, New Jersey
(973) 491-7861 (973) 491-7837
Jeff King [email protected]
AeroData Incorporated Livonia, Michigan
(248) 471-1787 (248) 471-0279
Bill Kloos, [email protected]
City of Portland Portland, Oregon
(503) 823-5382 (503) 823-7682
Lauran Krugman Tri-County Commuter Rail Authority Miami, Florida
(954) 942-7245
Karen Lamb [email protected]
Washington Metropolitan Area Transit Authority Washington, DC
(301) 562-4690 (301) 562-4707
Noel Larrivee [email protected]
Missoula Ravalli Transportation Management Assn Missoula, Montana
(406) 523-4944 (406) 523-4944
April Lee Southeast Michigan Council of Governments Detroit, Michigan
Bob Levy [email protected]
Shore Line East Commuter Rail New Haven, Connecticut
(203) 777-7433 (203) 773-5014
Karen Luxton-Gourgey [email protected]
City University of NY – Baruch New York City, New York
(212) 802-2146 (212) 802-2103
Len Madsen [email protected]
King County Metro Seattle, Washington
(206) 684-1604 (206) 263-4958
Jim Maresca [email protected]
NextBus Information Systems Emeryville, California
(510) 652-9085 (510) 652-0349
C-2

CONTACTS
Table C-1. List of Contacts Alphabetically by Name (Cont.)
Name, E-Mail
Agency Name, City, State
Phone Number, FAX Number
David Marsh [email protected]
Capital Area Rural Transit System Austin, Texas
(512) 389-1011 (512) 478-1116
Eric Marx [email protected]
Potomac and Rappahonnack Transport. Comm. Woodbridge, Virginia
(703) 583-7782 (703) 583-1377
Judith McGrane [email protected]
Community Transit of Delaware County Folsom, Pennsylvania
(610) 490-3977 (610) 490-3992
Christoph Mertz [email protected]
Carnegie Mellon University Pittsburgh, Pennsylvania
(412) 268-3612 (412) 268-5571
Mary Jo Morandini [email protected]
Beaver County Transit Authority Rochester, Pennsylvania
(724) 728-4255 (724) 728-8333
Mike Nevarez [email protected]
City of Phoenix Public Transit Department Phoenix, Arizona
(602) 262-7242 (602) 495-2002
Charles Ostrofe Macro Corporation San Francisco, California
(415) 956-6118 (415) 956-3228
Dan Overgaard [email protected]
King County Metro Seattle, Washington
(206) 684-1415 (206) 684-2059
Jack Requa Washington Metropolitan Area Transit Auth. Washington, DC
(202) 962-1319
A.V. Seshadri [email protected]
Bay Area Rapid Transit District Oakland, California
(510) 464-6510
Kaled Shammout [email protected]
Central Ohio Transit Authority Columbus, OH
(614) 275-5837 (614) 275-5933
Craig Shankwitz [email protected]
University of Minnesota Minneapolis, Minnesota
(612) 625-0323
Jim Sims [email protected]
Southern California Association of Govts Los Angeles, California
(213) 236-1803
Rick Stevens Washington Metropolitan Area Transit Authority Washington, DC
(202) 962-1257
David Strager [email protected]
Beaver County Transit Authority Rochester, Pennsylvania
(724) 728-4255 (724) 728-8333
Sarah Tajima Oahu Transit Systems (TheBus) Honolulu, Hawaii
(808) 848-4519
Isaac Takyi New York City Transit Brooklyn, NY
(718) 694-3652 (718) 488-6468
Ken Turner [email protected]
Tri-County Metropolitan Transp. District of Oregon Portland, Oregon
(503) 962-4918 (503) 962-3088
C-3

UPDATE 2000
Table C-1. List of Contacts Alphabetically by Name (Cont.) Name, E-Mail
Agency Name, City, State
Phone Number, FAX Number
Ron Wolcott [email protected]
Northeast Consultants New York City, New York
(212) 465-5516 (212) 465-5442
Rick Watts [email protected]
Metropolitan Atlanta Rapid Transit Authority Atlanta, Georgia
(404) 870-3209 (404) 870-3224
Trish Webb [email protected]
West Coast Express Vancouver, British Columbia CANADA
(604) 488-8910 (604) 689-3896
Lawrence Wilson [email protected]
Wilson Consulting Grayslake, Illinois
(847) 543-8701 (847) 543-8703
Steve Zaromski [email protected]
Lower Colorado River Association Austin, Texas
C-4

CONTACTS
Table C-2. List of Contacts Alphabetically by Location Agency Name, City, State
Name, E-Mail
Phone Number, FAX Number
City of Phoenix Public Transit Department Phoenix, Arizona
Mike Nevarez [email protected]
(602) 262-7242 (602) 495-2002
NextBus Information Systems Emeryville, California
Jim Maresca [email protected]
(510) 652-9085 (510) 652-0349
Southern California Association of Govts Los Angeles, California
Jim Sims [email protected]
(213) 236-1803
Bay Area Rapid Transit District Oakland, California
A.V. Seshadri [email protected]
(510) 464-6510
Orange County Transportation Authority Orange, California
Dean Delgado (714) 560-5744 (714) 560-5794
California DOT, Div. of New Tech. & Res. Sacramento, California
Vickie Cobb
Macro Corporation San Francisco, California
Charles Ostrofe (415) 956-6118 (415) 956-3228
PULNiX America, Inc. Sunnyvale, California
Jim Alves [email protected]
(619) 523-9220
Shore Line East Commuter Rail New Haven, Connecticut
Bob Levy [email protected]
(203) 777-7433 (203) 773-5014
Federal Transit Administration Washington, DC
Brian Cronin [email protected]
(202) 366-
Washington Metropolitan Area Transit Authority Washington, DC
Julie Hershorn (202) 962-1113
Washington Metropolitan Area Transit Authority Washington, DC
Karen Lamb [email protected]
(301) 562-4690 (301) 562-4707
Washington Metropolitan Area Transit Authority Washington, DC
Jack Requa (202) 962-1319
Washington Metropolitan Area Transit Authority Washington, DC
Rick Stevens (202) 962-1257
Tri-County Commuter Rail Authority Miami, Florida
Lauran Krugman (954) 942-7245
Flagler County Council on Aging Palm Coast, Florida
Steven E. Jones (904) 437-7300
Georgia Tech Research Institute Atlanta, Georgia
Gary Gimmestead (404) 894-3419
Metropolitan Atlanta Rapid Transit Authority Atlanta, Georgia
Rick Watts [email protected]
(404) 870-3209 (404) 870-3224
Oahu Transit Systems (TheBus) Honolulu, Hawaii
Sarah Tajima (808) 848-4519
Chicago Transit Authority Chicago, Illinois
Ronald Baker [email protected]
(312) 432-8001 (312) 432-8010
Regional Transportation Authority Chicago, Illinois
Angela Johnson [email protected]
(312) 917-0781 (312) 917-0846
C-5

CONTACTS
Table C-2. List of Contacts Alphabetically by Location (Cont.) Agency Name, City, State
Name, E-Mail
Phone Number, FAX Number
Wilson Consulting Grayslake, Illinois
Lawrence Wilson [email protected]
(847) 543-8701 (847) 543-8703
Maryland Mass Transit Administration Baltimore, Maryland
David Hill [email protected]
(410) 767-3316 (410) 333-4810
Bridgewater State College Bridgewater, Massachusetts
Lawrence Harman [email protected]
(508) 279-6144 (508) 279-6121
Computer Recognition Systems, Inc. Cambridge, Massachusetts
Sal D’Agostino [email protected]
(617) 491-7665 (617) 491-7753
Computer Recognition Systems, Inc. Cambridge, Massachusetts
Ed Dodge [email protected]
(617) 491-7665 (617) 491-7753
Volpe National Transportation Systems Center Cambridge, Massachusetts
Robert Dial (617) 494-2660
Ann Arbor Transportation Authority Ann Arbor, Michigan
Bill Hiller [email protected]
(734) 677-3944 (734) 973-6338
Southeast Michigan Council of Governments Detroit, Michigan
April Lee
AeroData Incorporated Livonia, Michigan
Jeff King [email protected]
(248) 471-1787 (248) 471-0279
Minnesota DOT Minneapolis, Minnesota
Glen Carlson (612) 341-7500 (612) 341-7239
University of Minnesota Minneapolis, Minnesota
Craig Shankwitz [email protected]
(612) 625-0323
Missoula Ravalli Transportation Mgmt. Assn. Missoula, Montana
Noel Larrivee [email protected]
(406) 523-4944 (406) 523-4944
TRANSCOM Jersey City, New Jersey
Bob Bamford [email protected]
(201) 963-4033 (201) 963-7488
TRANSCOM Jersey City, New Jersey
Tom Batz (201) 963-4033 (201) 963-7488
New Jersey Transit Newark, New Jersey
Jim Kemp [email protected]
(973) 491-7861 (973) 491-7837
New York City Transit Brooklyn, New York
Isaac Takyi (718) 694-3652 (718) 488-6468
City University of NY – Baruch New York City, New York
Karen Luxton-Gourgey [email protected]
(212) 802-2146 (212) 802-2103
Golden Screens New York City, New York
Glenn Gruber [email protected]
(212) 983-5212 (212) 983-6736
New York City Transit New York City, New York
Geoff Hubbs [email protected]
(212) 492-8495 (212) 492-8145
Northeast Consultants New York City, New York
Ron Wolcott [email protected]
(212) 465-5516 (212) 465-5442
Central Ohio Transit Authority Columbus, Ohio
Kaled Shammout [email protected]
(614) 275-5837 (614) 275-5933
C-6

CONTACTS
Table C-2. List of Contacts Alphabetically by Location (Cont.)
Agency Name, City, State
Name, E-Mail
Phone Number, FAX Number
City of Portland Portland, Oregon
Bill Kloos [email protected]
(503) 823-5382 (503) 823-7682
Tri-County Metropolitan Transp. District of Oregon Portland, Oregon
Ken Turner [email protected]
(503) 962-4918 (503) 962-3088
Community Transit of Delaware County Folsom, Pennsylvania
Judith McGrane [email protected]
(610) 490-3977 (610) 490-3992
Carnegie Mellon University Pittsburgh, Pennsylvania
Christoph Mertz [email protected]
(412) 268-3612 (412) 268-5571
Beaver County Transit Authority Rochester, Pennsylvania
Mary Jo Morandini [email protected]
(724) 728-4255 (724) 728-8333
Beaver County Transit Authority Rochester, Pennsylvania
David Strager [email protected]
(724) 728-4255 (724) 728-8333
SCRA North Charleston, South Carolina
Cathe Hansen [email protected]
(843) 760-3244 (843) 760-3250
Capital Area Rural Transit System Austin, Texas
David Marsh [email protected]
(512) 389-1011 (512) 478-1116
Lower Colorado River Association Austin, Texas
Steve Zaromski [email protected]
(512) 473-3527
Northwestern Community Services Virginia
Mike Hite [email protected]
(540) 636-4250 (540) 636-7171
Potomac and Rappahonnack Transport. Comm. Woodbridge, Virginia
Eric Marx [email protected]
(703) 583-7782 (703) 583-1377
Greater Redmond Transportation Mgmt. Assn. Redmond, Washington
Donna Ambrose [email protected]
(425) 556-2401 (425) 556-4248
King County Department of Transportation Seattle, Washington
Tom Braman [email protected]
(206) 263-4662
King County Metro Seattle, Washington
Tom Friedman [email protected]
(206) 684-1513 (206) 684-2059
King County Metro Seattle, Washington
Len Madsen [email protected]
(206) 684-1604 (206) 263-4958
King County Metro Seattle, Washington
Dan Overgaard [email protected]
(206) 684-1415 (206) 684-2059
Washington State DOT Seattle, Washington
Peter Briglia [email protected]
(206) 543-3331 (206) 685-0767
Allegro Integrated Systems Vancouver, British Columbia CANADA
Stephen Harmer [email protected]
(604) 669-1604 (604) 669-1614
West Coast Express Vancouver, British Columbia CANADA
Trish Webb [email protected]
(604) 488-8910 (604) 689-3896
C-7

BIBLIOGRAPHY Reports: ITS Joint Program Office, Implementation of the National Intelligent Transportation Systems Program: 1996 Report to Congress, U.S. DOT Publication No. FHWA-JPO-97-026, September 1997. ITS Joint Program Office, Intelligent Vehicle Initiative, Brochure, U.S. DOT Publication No. FHWA-OP-99-034, 1998. Burke, Lenora and Margarate Zirker, Intelligent Vehicle Initiative Needs Assessment, draft, Volpe National Transportation System Center, U.S. DOT, 1999. Goeddel, Dennis, APTS Benefits Assessment, draft, Volpe National Transportation Systems Center, U.S. DOT, May 2000. Casey, Robert, Lawrence N. Labell, Simon Prensky, and Carol L. Schweiger, Advanced Public Transportation Systems – The State-of-the-Art, Volpe National Transportation Systems Center, U.S. DOT for the Federal Transit Administration, Report #DOT-VNTSC-UMTA-91-2, April 1991. Casey, Robert, Advanced Public Transportation Systems Deployment in the united States Update, Volpe National Transportation Systems Center, U.S. DOT for the Federal Transit Administration, Report #DOT-VNTSC-FTA-99-1, January 1999. Casey, Robert and Lawrence N. Labell, Advanced Public Transportation Systems Deployment in the United States, Volpe National Transportation Systems Center, U.S. DOT for the Federal Transit Administration, Report #DOT-VNTSC-FTA-95-13, August 1996. Casey, Robert, Advanced Public Transportation Systems: The State-of-the-Art Update ‘98, Volpe National Transportation Systems Center, U.S. DOT for the Federal Transit Administration, Report #DOT-VNTSC-UMTA-97-9, January 1999. Davis, Jim, William Telovsky, and Thomas Vaughn, Building Applications to Support the Effective Use of GIS, New York State Department of Transportation, 1999. Multisystems, Inc., Evaluation of the Metropolitan Atlanta Rapid Transit Authority Intelligent Transportation System, draft produced for the Volpe National Transportation Systems Center and Federal Transit Administration, U.S. Department of Transportation, October 15, 1999. King County Department of Transportation, Signal Priority — Benefits for Transit.
BIB-1

UPDATE 2000 Booz-Allen & Hamilton, Inc., A National Transit Smart Card Guidelines, Module 1: Regional Fare Integration, produced for the Volpe National Transportation Systems Center, April 1999. Multisystems, Inc., Dove Associates, Inc., and Mundle & Associates, Inc., Potential of Multipurpose Fare Media, draft final report, TCRP, June 1997. Turnbull, Katherine, Assessment of the Seattle Smart Traveler, Texas Transportation Institute, November 1999. Pavlidas, Ioannis, Peter Symosek, Vassilios Morellas, and Bernard Fritz of Honeywell Technology Center and Nikolaos Papanikolopoulos and Robert Sfarzo of University of Minnesota, Automatic Passenger Counting in the HOV Lane, final report, June 1999. ITS Joint Program Office, Driving Safely into the Future with Applied Technology, Brochure of the IVI Program, U.S. DOT Publication #FHWA-OP-99-034. ITS Joint Program Office, Intelligent Vehicle Initiative: Business Plan, U.S. DOT Publication #FHWA-JPO-98-007, November 1997. Articles and Papers: “Transit Signal Priority Shaves Time Off Bus Route,” ITS America news release, http://www.itsa.org. Balaban, Dan A., “Transit Smart Cards are Ready to Roll,” Card Technology Magazine, September 1999. Turner, Shawn, “Video Enforcement of HOV Lanes: Field Test Results for the I-30 HOV Lane in Dallas, Texas Transportation Institute,” Paper presented at the 78th Annual Meeting of the Transportation Research Board, Washington, D.C., January 1999. ITS International, July/August 1999, pg. 22.
ITS America APTS Quarterly, Winter 1999.
BIB-2

UPDATE 2000
Federal Transit Administration
Office of Research, Demonstration and Innovation
Office of Mobility Innovation
Advanced Public Transportation Systems Division
400 7th Street, SW
Room 9402, TRI-11
Washington, DC 20590
202.366.4995
http://www.fta.dot.gov
December 2000
FTA-MA-26-7007-00-1
DOT-VNTSC-FTA-99-5
This page left intentionally blank.
BIB-3