Adv Clin Exp Med. 2021;30(9) - Advances in Clinical and ...
120
Advances in Clinical and Experimental Medicine 2021, Vol. 30, No. 10 (October) Advances in Clinical and Experimental Medicine Impact Factor (IF) – 1.727 Ministry of Science and Higher Education – 40 pts Index Copernicus (ICV) – 166.39 pts 2021, Vol. 30, No. 10 (October) MONTHLY ISSN 1899-5276 (PRINT) ISSN 2451-2680 (ONLINE) www.advances.umw.edu.pl
-
Upload
khangminh22 -
Category
Documents
-
view
2 -
download
0
Transcript of Adv Clin Exp Med. 2021;30(9) - Advances in Clinical and ...

Advances in Clinical and Experimental M
edicine2021, Vol. 30, N
o. 10 (October)
Advances in Clinical and Experimental Medicine
Impact Factor (IF) – 1.727Ministry of Science and Higher Education – 40 ptsIndex Copernicus (ICV) – 166.39 pts
2021, Vol. 30, No. 10 (October)
MONTHLY ISSN 1899-5276 (PRINT) ISSN 2451-2680 (ONLINE) www.advances.umw.edu.pl

Advances in Clinical and Experimental M
edicine2021, Vol. 30, N
o. 10 (October)
Advances in Clinical and Experimental
Medicine

ISSN 1899-5276 (PRINT) ISSN 2451-2680 (ONLINE) www.advances.umw.edu.pl
Advances in Clinical and Experimental Medicine
MONTHLY 2021 Vol. 30, No. 10 (October)
Editor-in-ChiefProf. Donata Kurpas
Deputy EditorProf. Wojciech Kosmala
Managing EditorMarek Misiak
Advances in Clinical and Experimental Medicine (Adv Clin Exp Med) publishes high quality original articles, research-in-progress, research letters and systematic reviews and meta-analyses of recognized scientists that deal with all clinical and experimental medicine.
Section EditorsBasic SciencesDr. Anna LebedevaDr. Mateusz OlbromskiDr. Maciej SobczyńskiBiochemistryProf. Małgorzata Krzystek-Korpacka Clinical Anatomy, Legal Medicine,
Innovative TechnologiesProf. Rafael Boscolo-BertoDentistryProf. Marzena Dominiak Prof. Tomasz Gedrange Prof. Jamil Shibli
Scientific CommitteeProf. Sabine Bährer-Kohler Prof. Antonio Cano Prof. Breno Diniz Prof. Erwan Donal Prof. Chris Fox Prof. Naomi Hachiya Prof. Carol Holland Prof. Markku Kurkinen Prof. Christos Lionis
Statistical EditorsWojciech Bombała, MScKatarzyna Giniewicz, MSc Eng.Anna Kopszak, MScDr. Krzysztof Kujawa
Manuscript editingMarek Misiak, Jolanta Krzyżak
Prof. Raimundo Mateos Prof. Zbigniew W. Ras Prof. Jerzy W. Rozenblit Prof. Silvina Santana Prof. James Sharman Prof. Jamil ShibliProf. Michal Toborek Prof. László Vécsei Prof. Cristiana Vitale
DermatologyProf. Jacek Szepietowski Emergency Medicine, Innovative TechnologiesProf. Jacek Smereka Gynecology and ObstetricsProf. Olimpia Sipak-SzmigielHistology and EmbryologyProf. Marzenna Podhorska-Okołów Internal Medicine
AngiologyDr. Angelika ChachajCardiologyProf. Wojciech Kosmala Dr. Daniel Morris
Editorial Officeul. Marcinkowskiego 2–6 50-368 Wrocław, PolandTel.: +48 71 784 11 36 E-mail: [email protected]
PublisherWroclaw Medical UniversityWybrzeże L. Pasteura 1 50-367 Wrocław, Poland
© Copyright by Wroclaw Medical University, Wrocław 2021
Online edition is the original version of the journal

Editorial Policy Advances in Clinical and Experimental Medicine (Adv Clin Exp Med) is an independent multidisciplinary forum for exchange of scientific and clinical information, publishing original research and news encompassing all aspects of medicine, including molecular biology, biochemistry, genetics, biotechnology and other areas. During the review pro-cess, the Editorial Board conforms to the “Uniform Requirements for Manuscripts Submitted to Biomedical Journals: Writing and Editing for Biomedical Publication” approved by the International Committee of Medical Journal Editors (www.ICMJE.org/). The journal publishes (in English only) original papers and reviews. Short works considered origi-nal, novel and significant are given priority. Experimental studies must include a statement that the experimental protocol and informed consent procedure were in compliance with the Helsinki Convention and were approved by an ethics committee.
For all subscription-related queries please contact our Editorial Office: [email protected]
For more information visit the journal’s website: www.advances.umw.edu.pl
Pursuant to the ordinance No. 134/XV R/2017 of the Rector of Wroclaw Medical University (as of December 28, 2017) from January 1, 2018 authors are required to pay a fee amounting to 700 euros for each manuscript accepted for publication in the journal Advances in Clinical and Experimental Medicine.
Indexed in: MEDLINE, Science Citation Index Expanded, Journal Citation Reports/Science Edition, Scopus, EMBASE/Excerpta Medica, Ulrich’sTM International Periodicals Directory, Index Copernicus
Typographic design: Piotr Gil, Monika KolędaDTP: Wydawnictwo UMWCover: Monika KolędaPrinting and binding: Soft Vision Mariusz Rajski
EndocrinologyProf. Marek BolanowskiGastroenterologyAssoc. Prof. Katarzyna Neubauer HematologyProf. Dariusz Wołowiec Nephrology and TransplantologyAssoc. Prof. Dorota Kamińska Assoc. Prof. Krzysztof Letachowicz PulmonologyProf. Elżbieta Radzikowska
MicrobiologyProf. Marzenna Bartoszewicz Assoc. Prof. Adam Junka Molecular BiologyDr. Monika BieleckaProf. Jolanta Saczko Dr. Marta Sochocka NeurologyAssoc. Prof. Magdalena KoszewiczAssoc. Prof. Anna Pokryszko-Dragan Dr. Masaru Tanaka
OncologyDr. Marcin Jędryka Prof. Lucyna Kępka
Gynecological OncologyDr. Marcin Jędryka
OphthalmologyProf. Marta Misiuk-Hojło OrthopedicsProf. Paweł Reichert OtolaryngologyAssoc. Prof. Tomasz Zatoński Pediatrics
Pediatrics, Metabolic Pediatrics, Clinical Genetics, Neonatology, Rare DisordersProf. Robert Śmigiel Pediatric NephrologyProf. Katarzyna Kiliś-Pstrusińska Pediatric Oncology and HematologyAssoc. Prof. Marek Ussowicz
Pharmaceutical SciencesAssoc. Prof. Maria KepinskaProf. Adam Matkowski Pharmacoeconomics, RheumatologyDr. Sylwia Szafraniec-Buryło PsychiatryProf. Istvan BoksayProf. Jerzy Leszek Public HealthProf. Monika Sawhney Prof. Izabella Uchmanowicz Qualitative Studies, Quality of CareProf. Ludmiła Marcinowicz RehabilitationProf. Jakub Taradaj SurgeryAssoc. Prof. Mariusz Chabowski Prof. Renata Taboła Telemedicine, Geriatrics, MultimorbidityAssoc. Prof. Maria Magdalena
Bujnowska-Fedak

MONTHLY 2021, Vol. 30, No. 10 (October)
ISSN 1899-5276 (PRINT) ISSN 2451-2680 (ONLINE)
www.advances.umw.edu.pl
Advances in Clinical and Experimental Medicine
Contents
© Copyright by Wroclaw Medical University, Wrocław 2021
Editorials991 Erwan Donal, Vasileios Panis
Interaction between mitral valve apparatus and left ventricle. Functional mitral regurgitation: A brief state-of-the-art overview
Original papers999 Yuan Yuan, Jun Liu, Yongxin Zhou, Xufang Du, Qian Chen, Jiongying Zhou, Miao Hou
The relationship between monocyte-to-lymphocyte ratio and the risk of gastrointestinal system involvement in children with IgA vasculitis: A preliminary report
1007 Sebastian Podlewski, Natalia Gołębiowska, Maciej RadekEvaluation of changes in cervical sagittal balance and clinical parameters in patients undergoing two-level anterior cervical discectomy and fusion
1013 Zahide Betül Gündüz, Filiz Aktas, Husamettin Vatansev, Merve Solmaz, Ender ErdoğanEffects of amantadine and topiramate on neuronal damage in rats with experimental cerebral ischemia-reperfusion
1025 Nezahat Kurt, Özge Nur Türkeri, Bahadir Suleyman, Nuri BakanThe effect of taxifolin on high-dose-cisplatin-induced oxidative liver injury in rats
1031 Tao Wang, Huihe LuGanoderic acid A inhibits ox-LDL-induced THP-1-derived macrophage inflammation and lipid deposition via Notch1/PPARγ/CD36 signaling
1043 Guohua Cheng, Yarong Li, Zhaoyu Liu, Xiang SonglncRNA PSMA3-AS1 promotes the progression of non-small cell lung cancer through targeting miR-17-5p/PD-L1
1051 Rafał Olszewski, Paweł Ptaszyński, Iwona Cygankiewicz, Krzysztof KaczmarekImpedance fluctuation and steam pop occurrence during radiofrequency current ablation: An experimental in vitro model
1057 Anna Markowska, Anna Gryboś, Andrzej Marszałek, Wiesława Bednarek, Violetta Filas, Marian Gryboś, Janina Markowska, Radosław Mądry, Barbara Więckowska, Danuta Nowalińska, Monika SzarszewskaExpression of selected molecular factors in two types of endometrial cancer
Reviews1065 Jialing Liu, Ye Chen, Shihao Li, Zhihe Zhao, Zhihong Wu
Machine learning in orthodontics: Challenges and perspectives
1075 Mikołaj Błaziak, Szymon Urban, Maksym Jura, Wiktor KuliczkowskiFractional flow reserve-guided treatment in coronary artery disease: Clinical practice
Research letters1085 Vasyl Suvorov, Viktor Filipchuk, Vadym Mazevich, Leonid Suvorov
Simulation of pelvic osteotomies applied for DDH treatment in pediatric patients using piglet models
1091 Erkan Dalbaşı, Ömer Lütfi AkgülThe effectiveness of methotrexate and low-dose steroid therapy in the treatment of idiopathic granulomatous mastitis
1099 Joanna Adamiec-Mroczek27-gauge sutureless vitrectomy under topical anesthesia: A pilot study


Cite asDonal E, Panis V. Interaction between mitral valve apparatus and left ventricle. Functional mitral regurgitation: A brief state-of-the-art overview. Adv Clin Exp Med. 2021;30(10):991–997. doi:10.17219/acem/143324
DOI10.17219/acem/143324
Copyright© 2021 by Wroclaw Medical University This is an article distributed under the terms of theCreative Commons Attribution 3.0 Unported (CC BY 3.0)(https://creativecommons.org/licenses/by/3.0/)
Address for correspondenceErwan DonalE-mail: [email protected]
Funding sourcesNone declared
Conflict of interestNone declared
AcknowledgementsThe authors would like to gratefully acknowledge the contribution made by Professor Wojciech Kosmala.
Received on August 7, 2021Reviewed on September 12, 2021Accepted on October 25, 2021
Published online on October 27, 2021
AbstractIn this overview, we described the mitral valve anatomy, focusing on its anatomical and functional relation-ships with the left ventricle (LV), and how an impaired coordination between the two can lead to valvu-lar dysfunction with serious clinical consequences. In the 1st part of this overview, we sought to describe the anatomy of the mitral valve apparatus. In the 2nd part, we sought to analyze the interactions of the LV with the mitral valve, the possible etiologies that cause mitral regurgitation (MR), and therapeutic strate-gies that can be utilized nowadays in the effort to reinstate normal valvular function. The comprehension of these mechanisms makes it possible to implement appropriate therapeutic solutions in order to alleviate the burden of mitral valve disease.
Key words: treatment, anatomy, restriction, mitral regurgitation, atrial
Editorial
Interaction between mitral valve apparatus and left ventricle. Functional mitral regurgitation: A brief state-of-the-art overview
Erwan DonalA–F, Vasileios PanisA–F
Rennes University Hospital, University of Rennes, France
A – research concept and design; B – collection and/or assembly of data; C – data analysis and interpretation; D – writing the article; E – critical revision of the article; F – final approval of the article
Advances in Clinical and Experimental Medicine, ISSN 1899–5276 (print), ISSN 2451–2680 (online) Adv Clin Exp Med. 2021;30(10):991–997

E. Donal, V. Panis. Functional mitral regurgitation992
Introduction
The mitral valve has a dual role: to facilitate the flow from the left atrium (LA) to the left ventricle (LV) during dias-tole, and to interact with the LV and protect the LA from blood reflux during systole. The mitral valve is the last bar-rier between the low pressure system of the LA and pulmo-nary arteries, and the high pressure system of the LV and the aorta, which means that it withstands one of the great-est forces in terms of pressure difference in the human body.1 In the 1st part of this overview, we sought to de-scribe the anatomy of the mitral valve apparatus. In the 2nd part, we sought to analyze the interactions of the LV with the mitral valve, the possible etiologies that cause mitral regurgitation (MR), and therapeutic strategies that can be utilized nowadays in an effort to reinstate normal valvular function.
Mitral valve apparatus
The normal mitral valve is definitely one of the most complex anatomical structures as it consists of 6 main components: the mitral annulus (MA), the anterior (AL) and posterior (PL) leaflet, the chordae tendineae, the papil-lary muscles (PM), and the LV (Fig. 1). A precise tempo-ral and spatial motion of each of the components results in the unobstructed and unidirectional blood flow into the LV. Any abnormalities in this sequence of events can create a serious malfunction. Its clinical manifestations are described as mitral stenosis (MS) when there is obstruc-tion during diastole, MR when there is blood backflow during systole, or mixed valve disease when the 2 situa-tions combine.
Mitral annulus
The MA shape is described as a “saddleback” with a hy-perbolic paraboloid oval geometry. It lies in the intersec-tion between LA and LV, over the mitral leaflets. The MA has nerves and it supplies the mitral leaflets with blood vessels.1 The annular orifice area has normally 4–6 cm2. The anterior section, which is connected with aortomi-tral continuity, constitutes the atrial part of the saddle and is more stable during the cardiac circle. The poste-rior section includes the lowest part of the saddle, closer to the lateral and medial commissures, and it can move more freely.2 During diastole, the MA stays relatively un-changed, but during systole, the MA changes its shape: it deepens the saddle and shortens the anteroposterior diameter, resulting in an overall 25% reduction of the mi-tral valve area.3
Mitral leaflets
The most essential part of the valve are the mitral leaf-lets. The anterior mitral valve leaflet (AML) has a shape of a sail, is located anteriorly in close proximity to the non-coronary cusp (NC), and covers 2/3 of the perimeter of MA. The AML is larger, thicker and stronger than the PL, and although not anatomically separated, it is divided into 3 scallops: lateral A1, central A2 and medial A3. The pos-terior or mural leaflet has a crescentic shape, covers 2/3 of the MA and has 3 anatomically distinct scallops: lateral P1, central P2 and medial P3, opposed to the anterior coun-terparts. During systole, the leaflets approach, attach and form a single semilunar coaptation line. Their ends form the anterolateral and posteromedial commissure, respec-tively to the underlying PM.4,5 Nevertheless, the mitral leaf-lets are not composed of so-called “dead” tissue. In patho-logical situations with increased mechanical stress, there
Fig. 1. Basic anatomy of heart valves and chambers (mitral valve apparatus)

Adv Clin Exp Med. 2021;30(10):991–997 993
is a significant increase in both valve surface and thickness through the transdifferentiation from endothelial to mes-enchymal cells and increased collagen deposition.4,5
Papillary muscles and chordae tendineae
The subvalvular apparatus is composed of the 2 PM named after the concordant commissures, and the chordae tendineae. The base of the PM is attached to the apical 1/3 of the ventricle. The anterolateral PM is single-headed and has a dual blood supply. On the other hand, the postero-medial PM is usually double-headed and has a single blood supply, which makes it more susceptible to ischemia.6 From the tips of the PM, numerous chordae tendineae with various patterns arise and attach to the ventricular side of the mitral leaflets.7 There are 2 types of chords: a) the primary chords, which are thinner, less elastic and attached to the free edge of the leaflets; they protect the leaflets from inversion and flail into the atrium during systole; b) the secondary chords, which are thicker and more extensible; they are anchored to the anterior rough zone and the PL main body, as they stabilize the subval-vular geometry.7 The importance of PM anatomy is more apparent in patients with hypertrophic cardiomyopathy (HCM), where specific abnormalities such as PM hy-pertrophy, bifid mobility and anteroapical displacement of the anterolateral PM have been well described in both echocardiography and cardiovascular magnetic resonance imaging (CMR) studies. These variations can provoke an increased left ventricular outflow tract (LVOT) obstruc-tion with systolic anterior motion (SAM), while the shift-ing of the AML towards the septum makes the valve more susceptible to malcoaptation and regurgitation.8 Finally, in some cases of HCM, there is a direct attachment of PM head to AML without chords. It leads to a long mid-cavity narrowing with LVOT obstruction without SAM.7
Interaction with the left ventricle
The LV anatomy and function are quite important for the proper valve function. During the early systole, the PM base and tips move along the longitudinal con-traction towards the atrium, following the upward motion of the leaflets. At the same time, the MA contracts and folds along the intercommissural line, allowing the effec-tive early coaptation of the leaflets and saddle shape ac-centuation. In the midsystole and late systole, the closing forces created by the increased gradient between LV and LA promote the sealing of the valve, while the tethering forces transmitted by the LV-wall PM chords to the leaflets keep the coaptation point in the annular plane, prevent-ing prolapse or flail.9,10 Simultaneously, the PM contract and reduce their length, keeping both leaflets under direct tension and restrain, thus preventing systolic anterior mo-tion and obstruction of the LVOT. The properly timed activation of the LV and the simultaneous contraction of the PM ensure the homogenous movement of the sub-valvular mechanism, and the application of symmetrical tethering forces to the mitral leaflets throughout the sys-tolic period. Even mild alterations in this interplay among the main components of the mitral valve complex can un-balance the closing and tethering forces, creating a deficit in the coaptation line, with the occurrence of MR.
Mitral regurgitation classification
The original description of the mechanisms of MR based on the leaflet mobility was provided by Alain Carpentier (Fig. 2).11 More analytically, in type I MR, there is a nor-mal leaflet motion and the MR is the result of the annular dilation or perforation of the leaflet; typical causes include annular dilation with LA enlargement due to the chronic
Fig. 2. Carpentier classification of mitral regurgitation (MR)11

E. Donal, V. Panis. Functional mitral regurgitation994
atrial fibrillation for the former, and infectious endocar-ditis for the latter. In type II, there is an excessive leaflet motion, where MR is provoked by prolapse or ruptured chordae and classical etiologies include fibroelastic de-ficiency (FED) and myxomatous degeneration (Barlow’s disease).
In type III, there is a restricted leaflet motion, and more specifically, in type IIIa, there is a systolic and diastolic restriction caused by inflammation, rheumatoid valve dis-ease or carcinoid disease. In type IIIb, there is only systolic restriction due to the LV dilation, PM displacement and increased tethering forces applied on the mitral leaflets. From these categories, type I with annular dilation, type II with prolapse and type IIIb are more suitable subtypes for the newest transcutaneous therapies when the risk of sur-gical intervention is too high.12
Functional mitral regurgitation
Functional mitral regurgitation (FMR) occurs due to the LV dysfunction despite apparently normal leaflet anatomy and motion, and is very frequently a consequence of ischemic heart disease or dilated cardiomyopathy. This is the “classical” secondary MR that falls into IIIb category of Carpentier classification. Of note, the annulus is usually enlarged when the ventricle is sick, but it is believed that IIIb type, not I, is the predominant mechanism in this category.
Type IIIb MR is undoubtedly caused by LV remodel-ing and it is attributed to the global LV enlargement, in-creased LV sphericity, MA enlargement, and apical/pos-terior/posterolateral and upward displacement of PM.13 Moreover, there is an altered annular geometry with an in-creased anteroposterior diameter, loss of annular fold-ing and the absence of the saddle-shaped accentuation that is more obvious in early systole. Concerning the PM
in FMR, there is an increased tip to annulus distance, de-creased PM attenuation during midsystole, paradoxical relocation of the PML, and asymmetric descent towards the annulus. As a result, there is an increased tethering of the mitral leaflets, excessive tenting and apical displace-ment of the coaptation line, all of which lead to ineffective sealing of the mitral valve and MR (Fig. 3,4).13
Atrial functional mitral regurgitation
A different entity of functional MR with unique charac-teristics and pathophysiology, secondary to annular dila-tion due to the atrial enlargement, is referred to as atrial functional MR (AFMR).14 In the original description by Carpentier, type I MR (normal leaflet motion) included almost exclusively organic disease. Yet, in the current era, this can be completely reversed due to the exponen-tial increase in prevalence of atrial fibrillation, mainly in the older population. The AFMR occurs in the context of AF and/or heart failure (HF) with preserved ejection fraction (HFpEF), and its anatomic culprits are annular dilation, the absence of leaflet growth and impaired annu-lar dynamics. The annular dilation usually does not cause
Fig. 4. Main characteristics of Mitra-FR and COAPT studies. Note the dif-ferences in effective regurgitant orifice area (EROA) and left ventricle end-diastole volume (LVEDV) which led to the differentiation of proportionate from disproportionate functional mitral regurgitation (FMR)
Fig. 3. Schematic pathophysiology in type IIIb mitral regurgitation (MR) – four-chamber (4ch) view of left ventricle (LV) with the functional mitral regurgitation (FMR)
Adv Clin Exp Med. 2021;30(10):991–997 995
severe MR because of the intact nature of the subvalvular mechanism and its ability to counterbalance the coaptation deficit. However, as annular dilation progresses, the pro-tective mechanism may be lost. This can lead to severe functional MR, with no restriction or tethering of the leaf-lets.15 In patients with such condition, maintaining sinus rhythm may be of great value. Gertz et al. had shown that after a successful AF ablation and no recurrences of AF, there was a significant reduction in LA and MA sizes, and only 1/3 of patients had severe residual MR.16
Proportionate and disproportionate secondary mitral regurgitation
Macro- and microalterations in the LV–MV relation-ships became more obvious in the post hoc analysis of 2 important trials of the last decade – Multicentre Randomized Study of Percutaneous Mitral Valve Repair MitraClip Device in Patients With Severe Secondary Mi-tral Regurgitation (MITRA-FR) and Clinical Outcomes Assessment of the MitraClip Percutaneous Therapy for Extremely High Surgical Risk Patients (COAPT) – that evaluated transcatheter mitral valve replacement (TMVR) in functional MR and provided us with a new pathophysi-ological concept for understanding functional MR.17–20 In order to coalesce the contradictory results of the 2 trials, a new conceptual framework is proposed with 2 subtypes of FMR:
1. As “proportionate” is described the MR whose severity is predicted and explained by the LV dilation and symmet-rical tethering of MV leaflets mimicking the classical “sec-ondary MR”, and its prognosis is driven mainly by global LV dysfunction. Such population of patients was included in MITRA-FR trial, which showed no significant reduction in the risk of death or hospitalization from HF19,20;
2. As “disproportionate” is described the MR whose severity is far greater than anticipated, based on the LV
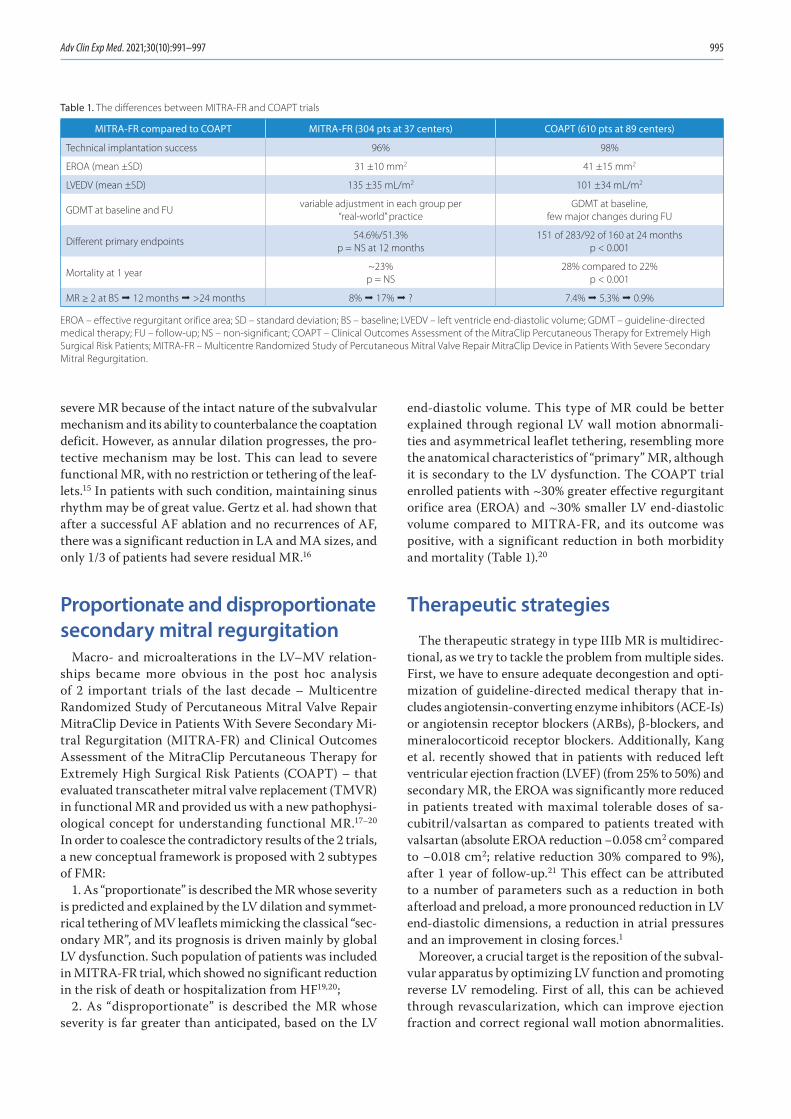
end-diastolic volume. This type of MR could be better explained through regional LV wall motion abnormali-ties and asymmetrical leaflet tethering, resembling more the anatomical characteristics of “primary” MR, although it is secondary to the LV dysfunction. The COAPT trial enrolled patients with ~30% greater effective regurgitant orifice area (EROA) and ~30% smaller LV end-diastolic volume compared to MITRA-FR, and its outcome was positive, with a significant reduction in both morbidity and mortality (Table 1).20
Therapeutic strategies
The therapeutic strategy in type IIIb MR is multidirec-tional, as we try to tackle the problem from multiple sides. First, we have to ensure adequate decongestion and opti-mization of guideline-directed medical therapy that in-cludes angiotensin-converting enzyme inhibitors (ACE-Is) or angiotensin receptor blockers (ARBs), β-blockers, and mineralocorticoid receptor blockers. Additionally, Kang et al. recently showed that in patients with reduced left ventricular ejection fraction (LVEF) (from 25% to 50%) and secondary MR, the EROA was significantly more reduced in patients treated with maximal tolerable doses of sa-cubitril/valsartan as compared to patients treated with valsartan (absolute EROA reduction −0.058 cm2 compared to −0.018 cm2; relative reduction 30% compared to 9%), after 1 year of follow-up.21 This effect can be attributed to a number of parameters such as a reduction in both afterload and preload, a more pronounced reduction in LV end-diastolic dimensions, a reduction in atrial pressures and an improvement in closing forces.1
Moreover, a crucial target is the reposition of the subval-vular apparatus by optimizing LV function and promoting reverse LV remodeling. First of all, this can be achieved through revascularization, which can improve ejection fraction and correct regional wall motion abnormalities.
Table 1. The differences between MITRA-FR and COAPT trials
MITRA-FR compared to COAPT MITRA-FR (304 pts at 37 centers) COAPT (610 pts at 89 centers)
Technical implantation success 96% 98%
EROA (mean ±SD) 31 ±10 mm2 41 ±15 mm2
LVEDV (mean ±SD) 135 ±35 mL/m2 101 ±34 mL/m2
GDMT at baseline and FUvariable adjustment in each group per
“real-world” practiceGDMT at baseline,
few major changes during FU
Different primary endpoints54.6%/51.3%
p = NS at 12 months151 of 283/92 of 160 at 24 months
p < 0.001
Mortality at 1 year~23%p = NS
28% compared to 22%p < 0.001
MR ≥ 2 at BS ° 12 months ° >24 months 8% ° 17% ° ? 7.4% ° 5.3% ° 0.9%
EROA – effective regurgitant orifice area; SD – standard deviation; BS – baseline; LVEDV – left ventricle end-diastolic volume; GDMT – guideline-directed medical therapy; FU – follow-up; NS – non-significant; COAPT – Clinical Outcomes Assessment of the MitraClip Percutaneous Therapy for Extremely High Surgical Risk Patients; MITRA-FR – Multicentre Randomized Study of Percutaneous Mitral Valve Repair MitraClip Device in Patients With Severe Secondary Mitral Regurgitation.

E. Donal, V. Panis. Functional mitral regurgitation996
Thus, the advanced screening of myocardial viability through high-quality imaging assessment (echocardio-gram (ECHO), positron emission tomography (PET) and CMR) could offer an additional “hidden” benefit. Secondly, in selected patients, using cardiac resynchronization therapy, we can improve LVEF, reduce LV volumes, syn-chronize PM motion, and – by restoring the equilibrium between closing and tethering forces – diminish the degree of MR.1,22
There are no studies, and therefore, no conclusive evidence, that mitral valve surgery with no option for revascularization provides any improvement in over-all survival.12 New guidelines state that secondary MR (severe symptomatic secondary FMR characterized by EROA ≥ 0.30 and regurgitant volume ≥45 mL) can be corrected, if the anatomy is suitable, by percutaneous edge-to-edge repair with a grade of recommendation IIa.22 The guidelines are restrictive to the COAPT-like patients, but they also provide the information about the required caution that needs to be taken in regard to the LVEF in MR patients. We should take into account global longitudi-nal strain and/or CMR evidence for fibrosis; these are the parameters reflecting the severity of the disease that might have an impact on the clinical outcome of the MR correction.
Therefore, the technique that should be considered is the transcatheter leaflet edge-to-edge approximation technique. This therapeutic intervention has been shown to be effective in improving symptoms and quality of life and reducing MR severity. Additionally, it may potentially offer survival benefit among patients with functional MR. The MitraClip™ (Abbott Laboratories, Menlo Park, USA) consists of a cobalt-chromium clip that has 2 arms and can effectively grasp and approximate the edges of oppos-ing leaflet segments.17,18 It was designed after the surgi-cal Alfieri technique and has gained the approval for use in primary type II MR and functional type I and IIIb MR. The PASCAL system (Edwards Lifesciences, Nyon, Swit-zerland) is using the same concept. Another type of trans-catheter interventions in MR patients is percutaneous mitral annuloplasty, using devices such as Cardioband (Edwards Lifesciences) or Carillon (Cardiac Dimensions, Kirkland, USA). An emerging option for less invasive treat-ment of MR is percutaneous mitral valve replacement. The Tendyne prosthesis (transapical) has been approved in Europe, but it does not yet have the level of recognition that the percutaneous edge-to-edge valve repair has.22
Conclusions
In this overview, we described the mitral valve anatomy, focusing on its anatomical and functional relationships with the LV, and how an impaired coordination between the two can lead to valvular dysfunction with serious clinical consequences. The mitral valve is a complex,
three-dimensional apparatus whose normal function de-pends on the equilibrium among different parts. The com-prehension of these mechanisms offers us the capacity to implement appropriate therapeutic solutions in order to alleviate the burden of mitral valve disease.
ORCID iDsErwan Donal https://orcid.org/0000-0002-9083-1582Vasileios Panis https://orcid.org/0000-0002-3296-7107
References1. Levine RA, Hagege AA, Judge DP, et al. Mitral valve disease: Morphol-
ogy and mechanisms. Nat Rev Cardiol. 2015;12(12):689–710. doi:10. 1038/nrcardio.2015.161
2. Sweeney J, Dutta T, Sharma M, et al. Variations in mitral valve leaf-let and scallop anatomy on 3-dimensional transesophageal echo-cardiography. J Am Soc Echocardiogr. 2021;S0894–7317(21)00598-8. doi:10.1016/j.echo.2021.07.010
3. Melillo E, Ancona F, Buzzatti N, Denti P, Agricola E. A challenging mitral valve anatomy for percutaneous repair with MitraClip: Cleft poste-rior leaflet. Eur Heart J Cardiovasc Imaging. 2019;20(12):1433–1434. doi:10.1093/ehjci/jez175
4. Marsit O, Clavel MA, Cote-Laroche C, et al. Attenuated mitral leaf-let enlargement contributes to functional mitral regurgitation after myocardial infarction. J Am Coll Cardiol. 2020;75(4):395–405. doi:10. 1016/j.jacc.2019.11.039
5. Dal-Bianco JP, Aikawa E, Bischoff J, et al. Myocardial infarction alters adaptation of the tethered mitral valve. J Am Coll Cardiol. 2016;67(3): 275–287. doi:10.1016/j.jacc.2015.10.092
6. Obadia JF, Casali C, Chassignolle JF, Janier M. Mitral subvalvular apparatus: Different functions of primary and secondary chordae. Circulation. 1997;96(9):3124–3128. doi:10.1161/01.cir.96.9.3124
7. Klues HG, Roberts WC, Maron BJ. Morphological determinants of echocardiographic patterns of mitral valve systolic anterior motion in obstructive hypertrophic cardiomyopathy. Circulation. 1993;87(5): 1570–1579. doi:10.1161/01.cir.87.5.1570
8. Levine RA, Vlahakes GJ, Lefebvre X, et al. Papillary muscle displace-ment causes systolic anterior motion of the mitral valve: Experimental validation and insights into the mechanism of subaortic obstruction. Circulation. 1995;91(4):1189–1195. doi:10.1161/01.cir.91.4.1189
9. Hung J, Otsuji Y, Handschumacher MD, Schwammenthal E, Levine RA. Mechanism of dynamic regurgitant orifice area variation in func-tional mitral regurgitation: Physiologic insights from the proximal flow convergence technique. J Am Coll Cardiol. 1999;33(2):538–545. doi:10.1016/s0735-1097(98)00570-1
10. Otsuji Y, Handschumacher MD, Schwammenthal E, et al. Insights from three-dimensional echocardiography into the mechanism of functional mitral regurgitation: Direct in vivo demonstration of altered leaflet tethering geometry. Circulation. 1997;96(6):1999–2008. doi:10.1161/01.cir.96.6.1999
11. Carpentier A. Cardiac valve surgery: The ’French correction’. J Thorac Cardiovasc Surg. 1983;86(3):323–337. PMID:6887954
12. Baumgartner H, Falk V, Bax JJ, et al. 2017 ESC/EACTS Guidelines for the management of valvular heart disease. Eur Heart J. 2017;38(36): 2739–2791. doi:10.1093/eurheartj/ehx391
13. He S, Fontaine AA, Schwammenthal E, Yoganathan AP, Levine RA. Integrated mechanism for functional mitral regurgitation. Leaflet restriction versus coapting force: In vitro studies. Circulation. 1997; 96(6):1826–1834. doi:10.1161/01.cir.96.6.1826
14. Deferm S, Bertrand PB, Verbrugge FH, et al. Atrial functional mitral regurgitation: JACC review topic of the week. J Am Coll Cardiol. 2019; 73(19):2465–2476. doi:10.1016/j.jacc.2019.02.061
15. Deferm S, Bertrand PB, Verhaert D, et al. Mitral annular dynamics in AF versus sinus rhythm: Novel insights into the mechanism of AFMR. JACC Cardiovasc Imaging. 2021;S1936–878X(21)00440-X. doi:10.1016/j. jcmg.2021.05.019
16. Gertz ZM, Raina A, Saghy L, et al. Evidence of atrial functional mitral regurgitation due to atrial fibrillation: Reversal with arrhythmia control. J Am Coll Cardiol. 2011;58(14):1474–1481. doi:10.1016/j.jacc. 2011.06.032

Adv Clin Exp Med. 2021;30(10):991–997 997
17. Obadia JF, Messika-Zeitoun D, Leurent G, et al. Percutaneous repair or medical treatment for secondary mitral regurgitation. N Engl J Med. 2018;379(24):2297–2306. doi:10.1056/NEJMoa1805374
18. Stone GW, Lindenfeld J, Abraham WT, et al. Transcatheter mitral-valve repair in patients with heart failure. N Engl J Med. 2018;379(24): 2307–2318. doi:10.1056/NEJMoa1806640
19. Packer M, Grayburn PA. New evidence supporting a novel concep-tual framework for distinguishing proportionate and disproportion-ate functional mitral regurgitation. JAMA Cardiol. 2020;5(4):469–475. doi:10.1001/jamacardio.2019.5971
20. Grayburn PA, Sannino A, Packer M. Proportionate and disproportionate functional mitral regurgitation: A new conceptual framework that rec-onciles the results of the MITRA-FR and COAPT trials. JACC Cardiovasc Imaging. 2019;12(2):353–362. doi:10.1016/j.jcmg.2018.11.006
21. Kang DH, Park SJ, Shin SH, et al. Angiotensin receptor neprilysin inhibitor for functional mitral regurgitation. Circulation. 2019;139(11): 1354–1365. doi:10.1161/CIRCULATIONAHA.118.037077
22. Donal E, Coisne A, Sade LE. Mitral regurgitation: Not a single disease with systematic and identic functional and haemodynamic conse-quences. Eur Heart J Cardiovasc Imaging. 2021;22(9):974–976. doi:10. 1093/ehjci/jeab136


Cite asYuan Y, Liu J, Zhou Y, et al. The relationship between monocyte-to-lymphocyte ratio and the risk of gastrointestinal system involvement in children with IgA vasculitis: A preliminary report. Adv Clin Exp Med. 2021;30(10):999–1005. doi:10.17219/acem/138906
DOI10.17219/acem/138906
Copyright© 2021 by Wroclaw Medical University This is an article distributed under the terms of theCreative Commons Attribution 3.0 Unported (CC BY 3.0)(https://creativecommons.org/licenses/by/3.0/)
Address for correspondenceMiao HouE-mail: [email protected]
Funding sourcesNone declared
Conflict of interestNone declared
Received on February 10, 2021Reviewed on May 5, 2021Accepted on June 14, 2021
Published online on September 6, 2021
AbstractBackground. Immunoglobulin A (IgA) vasculitis is the most common systemic vasculitis of childhood. It can affect the gastrointestinal system (GS) and the renal system.
Objectives. To evaluate the monocyte-to-lymphocyte ratio (MLR) and other hematological markers in pre-dicting GS and renal system complications of IgA vasculitis in children.
Materials and methods. One hundred and fifteen children with IgA vasculitis and 95 healthy children were included in this study. Demographic characteristics, organ involvement, and laboratory findings, including neutrophil, lymphocyte, monocyte and platelet (Plt) counts, red blood cell volume distribution width (RDW), platelet distribution width (PDW), mean platelet volumes (MPV), monocyte/platelet counts, neutrophil/lymphocyte ratio (NLR), and platelet/lymphocyte ratio (PLR), were evaluated.
Results. Among 115 children with IgA vasculitis, 34 (29.5%) cases had GS involvement, and renal involve-ment was observed in 12 children (10.4%). Neutrophil, monocyte and Plt count and MLR, NLR and PLR values were higher in the IgA vasculitis group than in control groups. Moreover, the neutrophil count and NLR and MLR levels were significantly higher in children with GS involvement than in those without GS involvement. Logistic regression analysis showed MLR was the sole risk factor for GS involvement among these parameters. Furthermore, a cut-off MLR value of 0.245 differentiated children with IgA vasculitis with GS involvement from those without GS involvement (area under the curve (AUC) 0.694, with a sensitivity of 52.9% and specificity of 77.8%).
Conclusions. An elevated MLR value could serve as a useful marker in predicting GS involvement in IgA vasculitis in children. Therefore, monitoring the blood MLR value may serve as an important novel indicator to pediatricians regarding the involvement of GS and disease severity of IgA vasculitis.
Key words: IgA vasculitis, neutrophil-to-lymphocyte ratio, gastrointestinal system involvement, monocyte-to-lymphocyte ratio, platelet-to-lymphocyte ratio
Original papers
The relationship between monocyte-to-lymphocyte ratio and the risk of gastrointestinal system involvement in children with IgA vasculitis: A preliminary report
Yuan Yuan1,A–F, Jun Liu1,A–F, Yongxin Zhou1,B,E,F, Xufang Du1,B,C,E,F, Qian Chen1,B,E,F, Jiongying Zhou1,C–F, Miao Hou2,A–F
1 Department of Pediatrics, Changshu No. 2 People’s Hospital, Jiangsu, China2 Department of Cardiology, Children’s Hospital of Soochow University, Suzhou, China
A – research concept and design; B – collection and/or assembly of data; C – data analysis and interpretation; D – writing the article; E – critical revision of the article; F – final approval of the article
Advances in Clinical and Experimental Medicine, ISSN 1899–5276 (print), ISSN 2451–2680 (online) Adv Clin Exp Med. 2021;30(10):999–1005

Y. Yuan et al. MLR and IgA vasculitis in children1000
Background
Immunoglobulin A (IgA) vasculitis is the most com-mon systemic vasculitis of childhood.1 The average annual incidence of this disease in children is about 20/100,000.2 Although the disease is most often characterized by a mild, self-limiting course with a good prognosis, it may present a progressive course and high recurrence in some cases.3 It not only affects the small vessels of the skin, but also the gastrointestinal and renal systems in some cases, in-cluding severe gastrointestinal bleeding and renal insuf-ficiency.4 Therefore, easily accessible and cost-effective laboratory parameters that can be used to predict the se-verity of the disease are needed.
Blood cell-derived parameters, including white blood cell (WBC) and its subtype cell counts (neutrophils, lymphocytes and monocytes), hemoglobin (Hb), red blood cell volume distribution width (RDW), platelet (Plt), platelet distribution width (PDW) and mean platelet volume (MPV), are com-monly used clinical indicators,5–7 which also have the advan-tage of simple retrieval from routine blood examination, with established detection methods and rapid results. Moreover, neutrophil-to-lymphocyte ratio (NLR) and platelet-to-lym-phocyte ratio (PLR) are new inflammatory indicators easily obtained from blood count. Recently, studies have shown that NLR and PLR are increased in a variety of other conditions, including cardiovascular disease,8 diabetes mellitus,9 im-mune system diseases,10 and cancer,11 and they can be used as novel inflammation parameters to predict the severity of these diseases. Similarly, NLR and PLR were reported to be associated with gastrointestinal bleeding among children with recent IgA vasculitis.12 Of note, monocyte-to-lympho-cyte ratio (MLR) was also suggested as a new inflammatory marker, and its clinical value has been investigated in patients with cancer,13 cirrhosis14 and retinopathy.15 However, few studies have investigated the relationship between MLR and severity of IgA vasculitis in children.
Objectives
We aimed to study the value of MLR and other blood cell-derived parameters, including neutrophil, lymphocyte, monocytes and Plt count, MPV, NLR and PLR in predict-ing the disease course, including gastrointestinal and renal involvement and recurrence in children with IgA vasculitis.
Materials and methods
Study design and participants
This study was conducted in full accordance with the Declaration of Helsinki and was approved by the Ethics
Committee of the Changshu No. 2 People’s Hospital (ap-proval No. 2020-KY-45).
This retrospective study included 115 children with IgA vasculitis who were admitted to the Department of Pedi-atrics, Changshu No. 2 People’s Hospital from January 1, 2016 to January 1, 2020. The IgA vasculitis was diagnosed according to the EULAR/PRINTO/PRES 2013 criteria.16,17 Ninety-five age and gender-matched healthy children were enrolled as the control group. Patients with other auto-immune diseases; severe heart, lung and endocrinal dis-eases; or those with fungal and tuberculosis infections were excluded.
Gastrointestinal system (GS) involvement was defined as the presence of abdominal pain, vomiting or gas-trointestinal hemorrhage.18 Renal involvement was de-fined as the presence of hematuria (>5 red blood cells per high-power microscopic field) and/or proteinuria (protein concentration in spot urine ≥30 mg/dL or spot urine protein/creatinine ratio >0.5 in children <2 years of age and >0.2 in children ≥2 years of age).19 The re-currence of IgA vasculitis was defined as a new flare of cutaneous lesions or other manifestations of vascu-litis in a patient at least 4 weeks after the initial IgA vasculitis diagnosis.3
Laboratory assessments
The venous blood sample was collected in the fast-ing state at the time of admission to the hospital (before the start of the treatment). Blood routine, urine routine and fecal occult blood tests were conducted by the Depart-ment of Clinical Laboratory of Changshu No. 2 People’s Hospital. The leukocyte count (neutrophil, monocyte and lymphocyte count), Plt count, RDW, Hb, PDW, C-reactive protein (CRP), and erythrocyte sedimentation rate (ESR) were recorded, and the NLR, MLR, and PLR were calculated.
Statistical analyses
All data were analyzed using the SPSS v. 19.0 soft-ware package (IBM Corp., Armonk, USA). The Shapiro–Wilk test was used to test the distribution of analyzed variables. Mean ± standard deviation (SD) were used to describe continuous data. To compare differences between 2 groups, independent t-tests for continuous variables with normal distribution were used. The per-centages were used to describe categorical data, which were analyzed with χ2 tests. Logistic regression analysis was performed for multivariate analysis. The receiver operating characteristic (ROC) curve analysis was con-ducted to evaluate the cutoff value of blood count param-eters. Results with p < 0.05 were considered statistically significant.

Adv Clin Exp Med. 2021;30(10):999–1005 1001
Results
Clinical characteristics and blood cell counts in the IgA vasculitis group and in healthy children
There were 56 (48.69%) boys and 59 (51.30%) girls with IgA vasculitis included in the study. Among the children with IgA vasculitis, 34 (29.56%) cases had GS involve-ment, and renal involvement was observed in 12 children (10.43%); only 3 cases (2.61%) had both GS and renal in-volvement. Additionally, 22 (19.13%) children had at least one recurrence of IgA vasculitis during follow-up.
The WBC, neutrophil, monocyte and Plt counts and MPV, NLR, MLR and PLR values were significantly higher in the IgA vasculitis group compared with control groups. However, there were no differences in lymphocyte count and Hb, RDW and PDW levels between the IgA vasculitis and control groups (Table 1).
Comparison of blood cell count parameters in children with IgA vasculitis with or without internal organ involvement
The neutrophil count and NLR and MLR levels were found to be significantly higher in children with GS in-volvement compared to those without GS involvement. However, there was no difference in WBC count, lym-phocyte count, monocyte count or Hb, Plt, RDW, PDW, MPV, PLR, CRP and ESR values between the 2 groups (Table 2).
The blood cell parameters were similar between children with and without renal involvement (Table 3). Additionally, there were no differences in hematological parameters between children with IgA vasculitis with or without re-currence groups, except for the PDW value (Table 4).
Multivariate analysis for children with IgA vasculitis with GS involvement
Independent variables of multivariate analysis were selected as the statistically significant variables between children with IgA vasculitis, with and without GS involve-ment. The results showed that MLR was an independent risk factor for IgA vasculitis combined with GS (p < 0.05, Table 5).
Diagnosis value of MLR in the differential of IgA vasculitis combined with GS involvement
The ROC curve analysis showed that the area under the curve for MLR diagnosis of IgA vasculitis combined with GS was 0.694, with a sensitivity of 52.9% and a speci-ficity of 77.8%, and the cutoff point was 0.245 (Fig. 1).
Discussion
The IgA vasculitis is an immune complex-mediated small vessel vasculitis with variable skin, gastrointesti-nal and renal involvement. In order to predict the risk of GS and kidney involvement in IgA vasculitis, several
Table 1. Comparison of clinical characteristics and blood cell-derived parameters between children with immunoglobulin A (IgA) vasculitis and healthy children
Variable IgA vasculitis(n = 115)
Control(n = 95) Test statistic p-value
Age [years] 8.29 ±2.59 8.57 ±1.58 −0.90† 0.3674
Gender (M/F) 56/59 50/45 0.32‡ 0.5702
WBC [109/L] 9.49 ±3.62 5.91 ±1.24 9.07† <0.0001
N [109/L] 6.08 ±3.25 2.93 ±0.97 8.97† <0.0001
M [109/L] 0.56 ±0.35 0.3 ±0.11 7.46† <0.0001
L [109/L] 2.73 ±1.32 2.52 ±0.54 1.57† 0.1189
Hb [g/L] 126.28 ±11.26 128.60 ±7.21 −1.71† 0.0879
Plt [109/L] 328.06 ±95.94 264.66 ±55.89 5.94† <0.0001
RDW 12.79 ±0.9 12.74 ±0.58 0.44† 0.6606
PDW 13.04 ±2.67 12.69 ±2.05 1.02† 0.3108
MPV 10.12 ±1.32 10.5 ±0.87 −2.37† 0.0186
NLR 2.83 ±2.41 1.21 ±0.47 7.05† <0.0001
MLR 0.22 ±0.14 0.12 ±0.05 7.31† <0.0001
PLR 147.09 ±84.18 110.47 ±34.49 4.34† <0.0001
Data are presented as mean ± standard deviation (SD). P-values were calculated using χ2 test for categorical variables and the independent t-test for continuous variables. † t-value; ‡ χ2-value; WBC – white blood cell count; N – neutrophil count; M – monocyte count; L – lymphocyte count; Hb – hemoglobin; Plt – platelet count; RDW – red blood cell volume distribution width; PDW – platelet distribution width; MPV – mean platelet volumes; NLR – neutrophil-to-lymphocyte ratio; PLR – platelet-to-lymphocyte ratio; MLR – monocyte-to-lymphocyte ratio.

Y. Yuan et al. MLR and IgA vasculitis in children1002
Table 2. Comparison of clinical characteristics and blood cell-derived parameters between immunoglobulin A (IgA) vasculitis children with gastrointestinal system (GS) involvement and without GS involvement
Variable GS involvement (+)(n = 34)
GS involvement (−)(n = 81) Test statistic p-value
Age [years] 8.38 ±2.81 8.25 ±2.52 0.25† 0.7997
Gender (M/F) 15/19 41/40 0.41‡ 0.5245
WBC [109/L] 10.37 ±4.55 9.12 ±3.1 1.70† 0.0914
N [109/L] 7.23 ±4.02 5.59 ±2.76 2.17† 0.0351
M [109/L] 0.66 ±0.47 0.51 ±0.28 1.77† 0.0837
L [109/L] 2.37 ±1.05 2.88 ±1.39 −1.94† 0.0554
Hb [g/L] 128.79 ±11.19 125.22 ±11.18 1.56† 0.1209
Plt [109/L] 318.38 ±103.35 332.12 ±93.02 −0.70† 0.4858
RDW 12.86 ±0.94 12.76 ±0.89 0.55† 0.5858
PDW 13.24 ±2.71 12.95 ±2.66 0.52† 0.6067
MPV 10.26 ±1.37 10.07 ±1.31 0.69† 0.4923
NLR 3.81 ±3.25 2.42 ±1.83 2.33† 0.0245
MLR 0.30 ±0.18 0.19 ±0.11 3.14† 0.0030
PLR 154.18 ±72.32 144.11 ±88.93 0.58† 0.5607
CRP 6.42 ±4.35 5.01 ±3.83 1.71† 0.0929
ESR 8.68 ±5.13 9.09 ±4.71 −0.42† 0.6791
Data are presented as mean ± standard deviation (SD). P-values were calculated using χ2 test for categorical variables and the independent t-test for continuous variables. † t-value; ‡ χ2-value; WBC – white blood cell count; N – neutrophil count; M – monocyte count; L – lymphocyte count; Hb – hemoglobin; Plt – platelet count; RDW – red blood cell volume distribution width; PDW – platelet distribution width; MPV – mean platelet volumes; NLR – neutrophil-to-lymphocyte ratio; PLR – platelet-to-lymphocyte ratio; MLR – monocyte-to-lymphocyte ratio; CRP – C-reactive protein; ESR – erythrocyte sedimentation rate.
Table 3. Comparison of clinical characteristics and blood cell-derived parameters between immunoglobulin A (IgA) vasculitis children with renal involvement and without renal involvement
Variable Renal involvement (+)(n = 12)
Renal involvement (−)(n = 103) Test statistic p-value
Age [years] 9.42 ±2.88 8.16 ±2.54 1.60† 0.1114
Gender (M/F) 5/7 51/52 0.27‡ 0.6067
WBC [109/L] 8.82 ±3.26 9.57 ±3.66 −0.68† 0.4980
N [109/L] 5.68 ±2.73 6.12 ±3.31 −0.44† 0.6602
M [109/L] 0.43 ±0.23 0.57 ±0.36 −1.38† 0.1691
L [109/L] 2.65 ±1.33 2.74 ±1.32 −0.22† 0.8241
Hb [g/L] 128.75 ±12.86 125.99 ±11.09 0.80† 0.4240
Plt [109/L] 323 ±87.14 328.65 ±97.28 −0.19† 0.8479
RDW 13.03 ±1.09 12.76 ±0.88 0.96† 0.3349
PDW 14.07 ±2.19 12.92 ±2.7 1.42† 0.1583
MPV 10.33 ±1.4 10.1 ±1.32 0.55† 0.5812
NLR 2.62 ±1.95 2.85 ±2.47 −0.31† 0.7550
MLR 0.2 ±0.14 0.23 ±0.14 −0.71† 0.4803
PLR 143.98 ±61.63 147.45 ±86.65 −0.13† 0.8929
CRP 4.63 ±3.86 5.51 ±4.09 −0.67† 0.4991
ESR 8.58 ±4.12 9.01 ±4.91 −0.29† 0.7732
Data are presented as mean ± standard deviation (SD). P-values were calculated using χ2 test for categorical variables and the independent t-test for continuous variables. † t-value; ‡ χ2-value; WBC – white blood cell count; N – neutrophil count; M – monocyte count; L – lymphocyte count; Hb – hemoglobin; Plt – platelet count; RDW – red blood cell volume distribution width; PDW – platelet distribution width; MPV – mean platelet volumes; NLR – neutrophil-to-lymphocyte ratio; PLR – platelet-to-lymphocyte ratio; MLR – monocyte-to-lymphocyte ratio; CRP – C-reactive protein; ESR – erythrocyte sedimentation rate.

Adv Clin Exp Med. 2021;30(10):999–1005 1003
inexpensive and practical biomarkers were investigated. The current study demonstrated that children with IgA vasculitis with GS involvement showed higher neutro-phil counts and MLR and NLR values. Moreover, elevated MLR was found to be a risk factor for GS involvement in children with IgA vasculitis, and ROC analysis indicated that MLR could be a predictive parameter of GS involve-ment in IgA vasculitis. To the best of our knowledge, this study is the first to comprehensively assess new blood cell-derived inflammatory biomarkers, especially MLR, in relation to GS involvement and disease course in IgA vasculitis in children.
In the current study, we found that the incidence of GS involvement in the current cohort is 29.56% (n = 34), and 10.43% (n = 12) for renal involvement. According to a cross-section study conducted in Turkey, clinical manifestations with gastrointestinal symptoms and re-nal involvement among children with IgA vasculitis ap-peared in, respectively, 56% and 29.8% of cases.20 Similarly,
Fig. 1. Receiver operating characteristic curves of the monocyte-to-lymphocyte ratio (MLR) for children with immunoglobulin A (IgA) vasculitis with gastrointestinal system involvement
1-specificity
sens
itivi
ty
MLR
reference line
50 1000
100
50
0
Table 5. Multivariate analysis for immunoglobulin A (IgA) vasculitis children combined with gastrointestinal system involvement
Parameter Coefficient SE Wald χ2 value df p-value OR95% CI
lower upper
N 0.03 0.09 0.11 1.00 0.73 1.03 0.86 1.23
MLR 4.49 1.96 5.22 1.00 0.02 89.06 1.89 4190.12
NLR 0.09 0.13 0.48 1.00 0.49 1.09 0.85 1.40
N – neutrophil count; NLR – neutrophil-to-lymphocyte ratio; MLR – monocyte-to-lymphocyte ratio; SE – standard error; OR – odds ratio; 95% CI – 95% confidence interval; df – degrees of freedom.
Table 4. Comparison of clinical characteristics and blood cell-derived parameters between immunoglobulin A (IgA) vasculitis children with recurrence and without recurrence
Variable Recurrence (+)(n = 22)
Recurrence (−)(n = 93) Test statistic p-value
Age [years] 8.05 ±2.64 8.34 ±2.59 −0.48† 0.6295
Gender (M/F) 12/10 47/46 0.11‡ 0.7352
WBC [109/L] 8.77 ±3.09 9.66 ±3.72 −1.04† 0.2995
N [109/L] 5.47 ±2.32 6.22 ±3.43 −0.97† 0.3351
M [109/L] 0.56 ±0.43 0.56 ±0.33 0.04† 0.9685
L [109/L] 2.6 ±1.12 2.76 ±1.36 −0.53† 0.5976
Hb [g/L] 126.55 ±15.35 126.22 ±10.16 0.12† 0.9021
Plt [109/L] 316.55 ±106.3 330.78 ±93.73 −0.62† 0.5336
RDW 12.7 ±0.71 12.81 ±0.94 −0.48† 0.6314
PDW 14.25 ±2.63 12.75 ±2.61 2.42† 0.0170
MPV 10.1 ±1.53 10.13 ±1.28 −0.08† 0.9382
NLR 2.54 ±1.72 2.9 ±2.55 −0.63† 0.5309
MLR 0.22 ±0.10 0.23 ±0.15 −0.29† 0.7749
PLR 141.38 ±69.41 148.44 ±87.58 −0.35† 0.7250
CRP 4.48 ±3.57 5.64 ±4.15 −1.18† 0.2397
ESR 9.55 ±5.53 8.83 ±4.66 0.63† 0.5324
Data are presented as mean ± standard deviation (SD). P-values were calculated using χ2 test for categorical variables and the independent t-test for continuous variables. † t-value; ‡ χ2-value; WBC – white blood cell count; N – neutrophil count; M – monocyte count; L – lymphocyte count; Hb – hemoglobin; Plt – platelet count; RDW – red blood cell volume distribution width; PDW – platelet distribution width; MPV – mean platelet volumes; NLR – neutrophil-to-lymphocyte ratio; PLR – platelet-to-lymphocyte ratio; MLR – monocyte-to-lymphocyte ratio; CRP – C-reactive protein; ESR – erythrocyte sedimentation rate.

Y. Yuan et al. MLR and IgA vasculitis in children1004
gastrointestinal symptoms and renal kidney involvement among the children with IgA vasculitis in Poland were found in, respectively, 64.8% and 22.5% of cases.25 In ad-dition, GS involvement was found to be 46.1% in Korea.12 However, according to a retrospective analysis conducted in China, the incidence of GS symptoms and kidney in-volvement was 28.78% and 13.33%, respectively, among children with IgA vasculitis, which is similar to our study and much lower than in other studies. We postulate the di-vergence of GS and kidney involvement may relate to racial and regional differences.
Blood cell count-derived inflammatory parameters, in-cluding NLR and PLR, are now recognized as novel bio-markers of chronic subclinical inflammation in diabetes mellitus,21 coronary artery disease8 and cancers.22 In this study, we demonstrated that the NLR but not PLR value was significantly increased in children with IgA vasculitis with GS involvement compared to those without GS involve-ment, which is consistent with the study by Karadağ et al.19 Furthermore, it was reported that elevated NLR and PLR may be relevant markers for predicting GS bleeding23 and renal organ involvement24,25 in children with IgA vasculi-tis. However, there was no relationship between NLR and PLR values and renal or GS involvement in the current study. This inconsistency may be due to different degrees of GS and kidney complication among the included partici-pants, which suggests the predictive value of NLR and PLR in children with IgA vasculitis may depend on the severity of the disease, and further extensive multicenter studies are needed to clarify this issue.
The MLR has been demonstrated as a novel hematologi-cal parameter in several medical fields. Recently, Suszek et al. demonstrated that MLR is an effective marker of sys-temic lupus erythematosus activity,26 and its value could also be used to identify disease activity of Takayasu ar-teritis27 and rheumatoid arthritis.28 Similarly, in the cur-rent study, MLR values were higher in children with IgA vasculitis with GS involvement than in those without GS involvement. Interestingly, MLR is the sole risk factor that predicted GS involvement in children with IgA vasculitis children. To our knowledge, this is the first study to reveal the predictive value of MLR in children with IgA vasculitis.
The elevated MLR level may result from increased mono-cyte counts or decreased lymphocyte counts. Monocytes are an essential source of pro-inflammatory mediators during various kinds of vasculitis.29–31 It was reported that mono-cytes were the predominant cell type infiltrating glomeruli in IgA nephritis,31 which indicates the monocyte count may reflect the development of IgA vasculitis. On the other hand, lymphocytes have been shown to play a broader role in modulating the inflammatory response at each phase of the vasculitis, and low lymphocyte count has been associ-ated with IgA vasculitis progression in rat and rabbit mod-els.32 Local activation of the immune system or inflamma-tion can increase lymphocyte apoptosis,33 resulting in lower lymphocyte counts. Therefore, higher monocyte counts
and/or lower lymphocyte counts may reflect an active role due to their immunomodulatory, pro-inflammatory effects on vasculitis. Thus, the MLR integrated with monocytes and lymphocytes provided a more reliable index to evaluate IgA vasculitis inflammation than either variable alone.
Limitations
This study has some limitations. Firstly, the sample size of this study is not large, and it is a single-center study. Secondly, the predictive value of MLR is probably more reliable than the commonly used laboratory inflammatory indicators CRP and ESR in evaluating GS involvement of IgA vasculitis in the current study; however, the predic-tive value of blood cell-derived inflammatory parameters cannot be compared with other inflammatory markers, including interleukin (IL)-6 and tumor necrosis factor alpha (TNF-α),34–36 due to the retrospective design and lack of related data. Another limitation was the lack of dy-namic changes in hematological parameters at IgA vascu-litis diagnosis and after long-term follow-up, which could provide more information about the relationships between these hematological parameter values and disease course.
Conclusions
This study showed that neutrophil count and NLR and MLR levels were found to be significantly higher in the children with IgA vasculitis with GS involvement, and elevated MLR was an independent risk factor in pre-dicting GS involvement in children with IgA vasculitis. Therefore, monitoring blood MLR values could provide an early indicator to clinicians regarding GS involvement and disease severity in children with IgA vasculitis.
ORCID iDsYuan Yuan https://orcid.org/0000-0002-0958-4757Jun Liu https://orcid.org/0000-0001-8148-9175Yongxin Zhou https://orcid.org/0000-0003-3119-9721Xufang Du https://orcid.org/0000-0002-9711-0198Qian Chen https://orcid.org/0000-0001-7780-0573Jiongying Zhou https://orcid.org/0000-0002-8651-3071Miao Hou https://orcid.org/0000-0002-9931-5146
References1. Dyga K, Szczepanska M. IgA vasculitis with nephritis in children.
Adv Clin Exp Med. 2020;29(4):513–519. doi:10.17219/acem/1125662. Leung A, Barankin B, Leong KF. Henoch–Schönlein purpura in chil-
dren: An updated review. Curr Pediatr Rev. 2020;16(4):265–276. doi:10.2174/1573396316666200508104708
3. Calvo-Rio V, Hernandez JL, Ortiz-Sanjuan F, et al. Relapses in patients with Henoch–Schönlein purpura: Analysis of 417 patients from a sin-gle center. Medicine (Baltimore). 2016;95(28):e4217. doi:10.1097/MD. 0000000000004217
4. Ozen S, Sag E. Childhood vasculitis. Rheumatology (Oxford). 2020; 59(Suppl 3):iii95–iii100. doi:10.1093/rheumatology/kez599
5. Cho JH, Cho HJ, Lee HY, et al. Neutrophil–lymphocyte ratio in patients with acute heart failure predicts in-hospital and long-term mortality. J Clin Med. 2020;9(2):557. doi:10.3390/jcm9020557

Adv Clin Exp Med. 2021;30(10):999–1005 1005
6. Masoumi M, Shadmanfar S, Davatchi F, et al. Correlation of clinical signs and symptoms of Behcet’s disease with mean platelet volume (MPV) and red cell distribution width (RDW). Orphanet J Rare Dis. 2020;15(1):297. doi:10.1186/s13023-020-01588-1
7. Li X, Shen J, Lu Z, et al. High neutrophil-to-lymphocyte ratio is asso-ciated with increased carotid artery intima-media thickness in type 2 diabetes. J Diabetes Investig. 2017;8(1):101–107. doi:10.1111/jdi.12541
8. Haybar H, Pezeshki S, Saki N. Evaluation of complete blood count parameters in cardiovascular diseases: An early indicator of prognosis? Exp Mol Pathol. 2019;110:104267. doi:10.1016/j.yexmp.2019.104267
9. Mertoglu C, Gunay M. Neutrophil–lymphocyte ratio and platelet–lymphocyte ratio as useful predictive markers of prediabetes and diabetes mellitus. Diabetes Metab Syndr. 2017;11(Suppl 1):S127–S131. doi:10.1016/j.dsx.2016.12.021
10. Paliogiannis P, Satta R, Deligia G, et al. Associations between the neu-trophil-to-lymphocyte and the platelet-to-lymphocyte ratios and the presence and severity of psoriasis: A systematic review and meta-analysis. Clin Exp Med. 2019;19(1):37–45. doi:10.1007/s10238-018-0538-x
11. Han D, Zhang J, Zhao J, et al. Platelet-to-lymphocyte ratio is an inde-pendent predictor of chemoradiotherapy-related esophageal fis-tula in esophageal cancer patients. Ann Transl Med. 2020;8(18):1163. doi:10.21037/atm-20-4053
12. Hong SH, Kim CJ, Yang EM. Neutrophil-to-lymphocyte ratio to predict gastrointestinal bleeding in Henoch–Schönlein purpura. Pediatr Int. 2018;60(9):791–795. doi:10.1111/ped.13652
13. Jakubowska K, Koda M, Grudzinska M, Kanczuga-Koda L, Famulski W. Monocyte-to-lymphocyte ratio as a prognostic factor in peripheral whole blood samples of colorectal cancer patients. World J Gastroenterol. 2020;26(31):4639–4655. doi:10.3748/wjg.v26.i31.4639
14. Li X, Wu J, Mao W. Evaluation of the neutrophil-to-lymphocyte ratio, monocyte-to-lymphocyte ratio, and red cell distribution width for the prediction of prognosis of patients with hepatitis B virus-related decompensated cirrhosis. J Clin Lab Anal. 2020;34(11):e23478. doi:10. 1002/jcla.23478
15. Hu YX, Xu XX, Shao Y, et al. The prognostic value of lymphocyte-to-monocyte ratio in retinopathy of prematurity. Int J Ophthalmol. 2017;10(11):1716–1721. doi:10.18240/ijo.2017.11.13
16. Jennette JC, Falk RJ, Bacon PA, et al. 2012 revised International Chapel Hill Consensus Conference Nomenclature of Vasculitides. Arthritis Rheum. 2013;65(1):1–11. doi:10.1002/art.37715
17. Ruperto N, Ozen S, Pistorio A et, al. EULAR/PRINTO/PRES criteria for Henoch–Schönlein purpura, childhood polyarteritis nodosa, child-hood Wegener granulomatosis and childhood Takayasu arteritis: Ankara 2008. Part I: Overall methodology and clinical characterisation. Ann Rheum Dis. 2010;69(5):790–797. doi:10.1136/ard.2009.116624
18. Paek EY, Yi DY, Kang B, Choe BH. Fecal calprotectin as a marker of gastro intestinal involvement in pediatric Henoch–Schönlein pur-pura patients: A retrospective analysis. BMC Pediatr. 2020;20(1):374. doi:10.1186/s12887-020-02263-x
19. Karadag SG, Cakmak F, Cil B, et al. The relevance of practical lab-oratory markers in predicting gastrointestinal and renal involve-ment in children with Henoch–Schönlein purpura. Postgrad Med. 2021;133(3):272–277. doi:10.1080/00325481.2020.1807161
20. Ekinci R, Balci S, Melek E, et al. Clinical manifestations and outcomes of 420 children with Henoch–Schönlein purpura from a single refer-ral center from Turkey: A three-year experience. Mod Rheumatol. 2020;30(6):1039–1046. doi:10.1080/14397595.2019.1687074
21. Demirtas L, Degirmenci H, Akbas EM, et al. Association of hema-tological indicies with diabetes, impaired glucose regulation and microvascular complications of diabetes. Int J Clin Exp Med. 2015;8(7): 11420–11427. PMID:26379958
22. de Jong MC, Mihai R, Khan S. Neutrophil-to-lymphocyte ratio (NLR) and platelet-to-lymphocyte ratio (PLR) as possible prognostic mark-ers for patients undergoing resection of adrenocortical carcinoma. World J Surg. 2020;45(3):754–764. doi:10.1007/s00268-020-05868-6
23. Gayret OB, Erol M, Tekin NH. The relationship of neutrophil–lympho-cyte ratio and platelet–lymphocyte ratio with gastrointestinal bleed-ing in Henoch–Schönlein purpura. Iran J Pediatr. 2016;26(5):e8191. doi:10.5812/ijp.8191
24. Ozdemir ZC, Cetin N, Kar YD, et al. Hemotologic indices for predict-ing internal organ involvement in Henoch–Schönlein purpura (IgA vasculitis). J Pediatr Hematol Oncol. 2020;42(1):e46–e49. doi:10.1097/MPH.0000000000001571
25. Jaszczura M, Gora A, Grzywna-Rozenek E, Barc-Czarnecka M, Machu-ra E. Analysis of neutrophil to lymphocyte ratio, platelet to lympho-cyte ratio and mean platelet volume to platelet count ratio in chil-dren with acute stage of immunoglobulin A vasculitis and assess-ment of their suitability for predicting the course of the disease. Rheumatol Int. 2019;39(5):869–878. doi:10.1007/s00296-019-04274-z
26. Suszek D, Gorak A, Majdan M. Differential approach to peripher-al blood cell ratios in patients with systemic lupus erythematosus and various manifestations. Rheumatol Int. 2020;40(10):1625–1629. doi:10.1007/s00296-020-04669-3
27. Seringec AN, Yildirim CG, Gogebakan H, Acipayam C. The C-reactive protein/albumin ratio and complete blood count parameters as indica-tors of disease activity in patients with Takayasu arteritis. Med Sci Monit. 2019;25:1401–1409. doi:10.12659/MSM.912495
28. Du J, Chen S, Shi J, et al. The association between the lymphocyte-mono-cyte ratio and disease activity in rheumatoid arthritis. Clin Rheumatol. 2017;36(12):2689–2695. doi:10.1007/s10067-017-3815-2
29. Matsumoto K, Suzuki K, Yoshimoto K, et al. Longitudinal immune cell monitoring identified CD14(++) CD16(+) intermediate monocyte as a marker of relapse in patients with ANCA-associated vasculitis. Arthritis Res Ther. 2020;22(1):145. doi:10.1186/s13075-020-02234-8
30. Verweij SL, Duivenvoorden R, Stiekema L, et al. CCR2 expression on circulating monocytes is associated with arterial wall inflamma-tion assessed by 18F-FDG PET/CT in patients at risk for cardiovascular disease. Cardiovasc Res. 2018;114(3):468–475. doi:10.1093/cvr/cvx224
31. Luo Y, Yang J, Zhang C, et al. Upregulation of miR-27a promotes monocyte-mediated inflammatory responses in Kawasaki disease by inhibiting function of B10 cells. J Leukoc Biol. 2020;107(1):133–144. doi:10.1002/JLB.5A0919-075RR
32. Li Y, Feng X, Huang L, et al. Hematologic and immunological char-acteristics of Henoch–Schönlein purpura in rat and rabbit models induced with ovalbumin based on type III hypersensitivity. Sci Rep. 2015;5:8862. doi:10.1038/srep08862
33. Ozaltin F, Besbas N, Uckan D, et al. The role of apoptosis in childhood Henoch–Schönlein purpura. Clin Rheumatol. 2003;22(4–5):265–267. doi:10.1007/s10067-003-0718-1
34. Chan H, Tang YL, Lv XH, et al. Risk factors associated with renal involve-ment in childhood Henoch–Schönlein purpura: A meta-analysis. PLoS One. 2016;11(11):e0167346. doi:10.1371/journal.pone.0167346
35. Sugiyama M, Wada Y, Kanazawa N, et al. A cross-sectional analysis of clinicopathologic similarities and differences between Henoch–Schönlein purpura nephritis and IgA nephropathy. PLOS One. 2020; 15(4):e0232194. doi:10.1371/journal.pone.0232194
36. Kuret T, Lakota K, Zigon P, et al. Insight into inflammatory cell and cytokine profiles in adult IgA vasculitis. Clin Rheumatol. 2019;38(2): 331–338. doi:10.1007/s10067-018-4234-8


Cite asPodlewski S, Gołębiowska N, Radek M. Evaluation of changes in cervical sagittal balance and clinical parameters in patients undergoing two-level anterior cervical discectomy and fusion. Adv Clin Exp Med. 2021;30(10):1007–1012. doi:10.17219/acem/137849
DOI10.17219/acem/137849
Copyright© 2021 by Wroclaw Medical University This is an article distributed under the terms of theCreative Commons Attribution 3.0 Unported (CC BY 3.0)(https://creativecommons.org/licenses/by/3.0/)
Address for correspondenceSebastian PodlewskiE-mail: [email protected]
Funding sourcesNone declared
Conflict of interestNone declared
Received on March 17, 2021Reviewed on April 27, 2021Accepted on May 19, 2021
Published online on September 22, 2021
AbstractBackground. Anterior cervical discectomy and fusion (ACDF) is an effective method in treating cervical sagittal imbalance and spine deformations.
Objectives. To assess whether changes of the Cobb angle, sagittal vertical axis (SVA) and T1 slope parameters affect the outcomes of a surgical treatment.
Materials and methods. A prospective study was performed in 30 patients qualified for surgical treatment for cervical degenerative disc disease. The ACDF was performed on 2 levels. Every patient underwent an X-ray examination before surgery and 3 months after the procedure. The following parameters were assessed: the T1 slope, the angle of cervical lordosis, the SVA distance, quality of life assessed using the Neck Disability Index (NDI), and perceived pain measurement assessed using the Visual Analogue Scale (VAS).
Results. The cervical lordosis angle significantly changed (p < 0.01) to an average of 11.52°. The SVA C2–C7 distance significantly decreased (p < 0.001) to an average of 21.06 mm. The value of the T1 slope angle did not change significantly before and after surgery (p = 0.706). After surgery, statistically significant improvement was achieved on the NDI scale for neck pain (p < 0.001) to an average of 9. The NDI score significantly decreased over time (p < 0.001), and this change was significantly related to the increased Cobb angle (p = 0.036).
Conclusions. The improvement in cervical lordosis C2–C7 can improve the outcomes of surgical treatment. Preoperative analysis of X-rays and sagittal balance parameters may be beneficial for treatment outcomes.
Key words: NDI, cervical discopathy, anterior cervical discectomy and fusion surgery, cervical sagittal balance
Original papers
Evaluation of changes in cervical sagittal balance and clinical parameters in patients undergoing two-level anterior cervical discectomy and fusion
Sebastian Podlewski1,A–D, Natalia Gołębiowska1,D,E, Maciej Radek2,E,F
1 Department of Neurosurgery and Spine Surgery, Regional Hospital, Kielce, Poland2 Department of Neurosurgery, Spine Surgery and Peripheral Nerves, University Clinical Hospital Military Medical Academy – Central Veterans Hospital, Łódź, Poland
A – research concept and design; B – collection and/or assembly of data; C – data analysis and interpretation; D – writing the article; E – critical revision of the article; F – final approval of the article
Advances in Clinical and Experimental Medicine, ISSN 1899–5276 (print), ISSN 2451–2680 (online) Adv Clin Exp Med. 2021;30(10):1007–1012

S. Podlewski, N. Gołębiowska, M. Radek. Changes in sagittal balance after ACDF1008
Background
Anterior cervical discectomy and fusion (ACDF), which was first described by Smith and Robinson, is considered one of the most effective surgical treatments for cervi-cal discopathy, as it provides safe access to disc spaces from the C3 to C7 levels.1 It is a very effective method for treating spinal canal stenosis, spinal cord and nerve root compression, and when correcting cervical spine deformities with improvement of alignment of the seg-ment in the sagittal projection.2 In Poland, the technique of the anterior approach to the cervical spine was first applied by Jan Haftek in 1967.
The ACDF is performed under general anesthesia with the patient lying in a supine position with their neck ex-tended. The appropriate level of the spine is determined with the use of the C-arm. A transverse incision is made on the anterolateral side of the neck and dissection of the muscles is performed. The discectomy and removal of osteophytes and ligaments is performed at the next step with the use of a microscope. To restore its height and stabilize the spine, a cage implant is placed into the inter-vertebral space under C-arm guidance.3,4
The anatomical structure of the vertebrae and the shape of the disc spaces ensure the positioning of the cervical spine in the lordosis position. To assess cervical lordosis, the cervical angle is measured (Cobb angle) as follows: lines are drawn along the upper endplate of the C2 vertebrae and the lower endplate of the C7 vertebrae and the angle between these 2 lines, where they intersect, is measured. The alternative way is to draw this line between the C1 and C7 vertebrae; however, the Cobb angle measured in this way is considered to be overestimated. The range of val-ues of the Cobb angle that are considered correct has not yet been established; however, values up to 40° ±9.7° are accepted as proper.5 Alterations in the angle of cervical lordosis can cause neck pain or even lead to disability.6
One of the parameters used to assess cervical sagittal balance is the sagittal vertical axis (SVA) value. The SVA is a clinically significant parameter showing the corre-lation with quality of life assessed by the health-related quality of life (HRQOL) index. Higher SVA values are as-sociated with greater pain and worse assessment of qual-ity of life.7 Kato et al. reported that a SVA value greater than 35 mm is associated with significant intensification of neck pain after surgery.8 The SVA is the horizontal distance between the posterior superior endplate of C7 and the vertical line from the center of the C2 vertebrae. The center of C2 is determined by the intersection of a line drawn from the base of the dens to the lower endplate of C2. The average SVA C2–C7 distance in healthy indi-viduals is up to 20 mm.9 The T1 slope is the angle between the upper endplate of the T1 vertebrae and a horizontal line. This parameter is equivalent to the pelvic incidence angle in pelvic parameters. It is possible to measure C7 slope as a substitute for T1 slope when it is impossible
to visualize T1 vertebrae on lateral X-ray, e.g., due to a high position of the shoulders.10 The T1 vertebrae is the con-nection between the mobile cervical spine and the much less mobile thoracic spine. It is a segment where thoracic kyphosis turns into cervical lordosis. The C2–C7 lordosis angle may increase with T1 slope.11 The results of previ-ous studies suggest that some values of T1 slope increase the risk of initiating degenerative changes. A T1 slope angle lower than 18.5° may be associated with a higher risk of de-veloping cervical myelopathy.12
Other radiological parameters that may be useful for as-sessing cranio-cervical balance are the chin-brow vertical axis (CBVA), cranial slope and cranial tilt. One limitation of these parameters is the necessity of radiographic ex-amination not only of the spine but also of the skull, which increases the patient’s exposure to X-rays.
Objectives
Our hypothesis is that increasing the cervical lordosis angle changes the other sagittal balance parameters (e.g., SVA, T1 slope). Changes in the aforementioned parameters may affect the outcomes of surgical treatment. The aim of this work is to assess whether changes of the Cobb angle, SVA value and T1 slope parameters affect the outcomes of surgical treatment. Our study is based on the assessment of lateral X-rays taken before surgery and 3 months post surgery in patients treated with ACDF on 2 levels.
Materials and methods
Patients
We recruited 60 patients with two- and one-level cervi-cal discopathy. In the present study, the group of patients that underwent two-level ACDF (n = 30) was assessed. The inclusion criteria were as follows: age above 18 years; symptomatic two-level cervical discopathy; and the pres-ence of at least 2 of the following symptoms of discopathy: pain in the cervical spine, radicular symptoms and neuro-logical deficits in the upper or lower limbs. Patients who had undergone surgery of the lumbar spine were excluded from this study. Patients for whom surgery would require the use of a front plate were also excluded because the use of a plate may affect the correction of the C2–C7 cervical lordosis angle. Bone fusion of the operated segments takes place at the angle of local lordosis of the operated seg-ment set by the implant. In order to avoid potential bias, this study excluded patients with previous cervical spine surgeries; implants manufactured by only 1 company were used and all patients wore the cervical collar for the same amount of time.
All patients were qualified for surgical treatment for cervical degenerative disc disease and the ACDF was

Adv Clin Exp Med. 2021;30(10):1007–1012 1009
performed on 2 levels. All patients were treated in the De-partment of Neurosurgery and Spine Surgery, Regional Hos-pital of Kielce, Poland, and were operated on by the same surgeon. Patients included in the study were operated be-tween February 2019 and January 2020. The follow-up period was 3 months and the last follow-up examinations took place in April 2020. Three patients were excluded due to failure to attend the follow-up examination.
Assessment of the sagittal balance parameters of the cervical spine
Measurement of sagittal balance was based on assess-ment of lateral projection of X-rays made in a relaxed standing position. The following angles were assessed: the T1 slope, the angle of cervical lordosis (the curvature of the lower cervical spine C2–C7) and the SVA value (the distance between the center of the C2 vertebrae and the posterior superior endplate of C7). Analysis of the ra-diographs and measurement of the sagittal balance param-eters were performed using Surgimap software (v. 2.2.15.5, OS X; www.surgimap.com). Each measurement was per-formed twice, and the average was taken in order to reduce measurement error. Surgimap software is characterized by a very high accuracy and low measurement error. Lafage et al. demonstrated excellent Surgimap software accuracy in their work where they assessed the parameters of lum-bar sagittal balance using the mean absolute difference from validated measurements for SVA value of 2.04 mm, and the mean difference between 2 rounds of measure-ment was <0.3 mm for SVA.13
Surgical technique and assessment of surgical outcomes
All patients underwent surgical nucleotomy performed on 2 levels. Cervical interbody 0–4° polyetheretherketone (PEEK) cages or cages with a screw locking mechanism were used during surgery. No plates were used. All pa-tients had an X-ray taken in a lateral projection while standing in a neutral position, providing visualization of the cervical spine with the T1 vertebral body. Qual-ity of life was assessed using the Neck Disability Index (NDI) test and perceived pain was assessed using the Vi-sual Analogue Scale (VAS).14 All examinations were per-formed before surgery and after 3 months of postsurgical observation.
The following tests for significance were used for statisti-cal analyses: Wilcoxon test (evaluation of data before and after surgery) and general estimating equations (GEE) with robust standard errors.
This study was approved by the Bioethics Committee at the Medical University of Lodz, Poland (approval No. RNN/221/19/ KE) on April 9, 2019. This research complied with the World Medical Association (WMA) Declaration of Helsinki.
Results
Patient demographics
The 30 patients included in this study (16 women and 14 men) were operated on using the two-level ACDF method. The distribution of patient age is presented in Fig. 1. Three patients (2 men and 1 woman) who did not report for follow-up examination were excluded from the postoperative evaluation.
The most common indication for surgical treatment was cervical discopathy with protrusion of the interver-tebral disc at 2 levels, with symptoms of radiculopathy and pain and no improvement after conservative treat-ment (19 patients). Motor dysfunction in the form of weak-ness of the upper extremities was found in 11 patients. The two-level ACDF surgery was most often performed on the C5–C7 levels (21 patients). No permanent postop-erative complications were found in the group of operated patients. The most common complication of treatment was dysphagia (5 patients), which resolved within 14 days after the procedure. Hoarseness occurred in 3 patients and it resolved before discharge from the Department.
Radiography: assessment of treatment results
Before the operation, the average cervical lordosis angle (C2–C7 Cobb angle) was 7.48° (Table 1), the T1 slope was 24.43° and the SVA distance was 28.36 mm. At three-month follow-up, the cervical lordosis angle changed significantly (p < 0.01) to an average of 11.52° (Table 1). The SVA C2–C7 distance significantly decreased (p < 0.001) to an average of 21.06 mm (Table 2). The value of the T1 slope angle did not change significantly before and after surgery (p = 0.706; however, there was an in-crease in the T1 slope angle with an increase in lordosis, and a decrease in its value was observed in patients whose lordosis angle decreased).
Fig. 1. Structure of the group according to age

S. Podlewski, N. Gołębiowska, M. Radek. Changes in sagittal balance after ACDF1010
Before surgery, the average NDI score was 28.71 and the average VAS score for neck pain was 7.30 (VAS score for limb pain was also 7.30). After surgery, statistically significant improvement was achieved on the NDI scale (p < 0.001) – the score increased to an average of 9 (Table 3). The VAS score for neck pain improved to an average of 2.59 (p < 0.001). The VAS score for limb pain also significantly improved (p < 0.001) to an average of 0.52.
The multivariate model with the C2–C7 Cobb angle as the dependent variable and the time factor as an inde-pendent variable (p = 0.002) showed a negative correlation
with SVA value (independent variable, p < 0.001) and a sig-nificant correlation with the slope increase in the Th1 angle (independent variable, p = 0.003), in patients undergoing two-level ACDF (Fig. 2).
In the multivariate analysis with NDI as the dependent variable, and the time factor, the Cobb angle C2–C7 and SVA as the independent variables, the following results were obtained (Fig. 3): NDI score decreased significantly over time (p < 0.001) and this change was significantly related to the increasing Cobb angle (p = 0.036), but not related to SVA changes (p = 0.554).
Using VAS score for pain in the upper limbs as the de-pendent variable, and the time factor, Cobb angle C2–C7 and SVA value as the independent variables, the following results were obtained: a statistically significant reduction in the intensity of pain over the time period of the study (p < 0.001), with no statistical relationship to changes in the Cobb angle (p = 0.660) or SVA value (p = 0.589).
Using VAS score for neck pain as the dependent variable, and the time factor, Cobb angle C2–C7 and SVA value as the inde-pendent variables, the following results were obtained: a sta-tistically significant reduction in the intensity of neck pain (p < 0.001), depending on the Cobb angle (p <0.001) and SVA value (p = 0.001) decreasing at the same time.
Fig. 3. Correlation of the severity of complaints according to the Neck Disability Index (NDI) with the C2–C7 lordosis angle after surgical treatment by two-level anterior cervical discectomy and fusion (ACDF)
Fig. 2. Correlation of the C2–C7 cervical lordosis angle with the Th1 inclination angle in the group of respondents in the area of the neck after surgery
Table 2. Sagittal vertical axis (SVA) values [mm] for all patients and patients separated by sex before and after surgery
Sex Research phaseStatistical parameter
M Me Q1–Q3 (IQR) SD SE 95% CI Min–Max
Womenbefore surgery 25.41 23.50 17.25–30.75 (13.50) 10.43 2.61 [19.86, 30.97] 13–50
post surgery 18.79 19 13.50–23 (9.50) 6.06 1.51 [15.56, 22.02] 10–28
Menbefore surgery 32.64 35 19–44 (25) 13.79 4.16 [23.37, 41.90] 12–52
post surgery 24.36 24 16–33 (17) 10.17 3.07 [17.53, 31.20] 10–40
Altogetherbefore surgery 28.36 28 18–39 (21) 12.21 2.35 [23.53, 33.18] 12–52
post surgery 21.06 20 14–28 (14) 8.29 1.60 [17.78, 24.34] 10–40
M – mean; Me – median; IQR – interquartile range; SD – standard deviation; SE – standard error; 95% CI – 95% confidence interval; Min–Max – minimum–maximum.
Table 1. Summary of the sagittal balance parameters before and after surgery (for multivariate analysis)
Parameter Before surgery(M)
Post surgery(M)
NDI score 28.71 9
VAS score for neck pain 7.30 2.59
Cobb angle C2–C7 7.48° 11.52°
SVA C2–C7 distance 28.36 mm 21.06 mm
T1 slope 24.43° 24.42°
M – mean; NDI – Neck Disability Index; VAS – Visual Analogue Scale; SVA – sagittal vertical axis.

Adv Clin Exp Med. 2021;30(10):1007–1012 1011
Discussion
The most important parameters associated with pain symptoms and the results of surgical treatment of cervical spine osteoarthritis include the T1 slope, SVA distance, and cervical lordosis angle (Cobb angle). These parameters are assessed in the lateral projection of X-ray examina-tions.15 It is also possible to assess sagittal balance param-eters based on computed tomography (CT) or magnetic resonance imaging (MRI) examination; however, its value may be limited due to the lying position during the exami-nation. Sagittal balance parameters are assessed in a re-laxed standing position, and a change of the body position during the test may affect the obtained results. The dis-advantage of the use of CT is the large dose of radiation that the patient is exposed to. However, CT examination can overcome some limitations of X-ray, i.e., anatomical interference of the shoulder contour.7
The analysis of changes in the values of the aforemen-tioned parameters and the determination of the sagittal balance allows the prognosis of surgical results. Research shows that the cervical lordosis angle and SVA value (SVA C2–C7) correlate with the severity of symptoms in the treatment of cervical myelopathy. Thus, they are considered indicators of the severity of symptoms.16 Vil-lavicencio et al. carried out work on lordotic implants and parallel interbody implants. In their research, they did not find any significant differences between the implants used in the correction of cervical lordosis. However, their results demonstrated a correlation between improvement of sagit-tal balance with improvement of the lordosis of the oper-ated segment and the degree of improvement in the clinical condition.17
The parameters of the sagittal balance of the cervical spine, similarly to the lumbar-pelvic parameters, show mutual dependencies. In this study, a statistically signifi-cant correlation was demonstrated between the cervical lordosis angle and the T1 slope (C7) and a negative correla-tion with the SVA value (SVA C2–C7). After nucleotomy with anterior stabilization (fusion) at 2 levels and 3 months of follow-up, both an increase in the C7 cervical lordosis angle and a shortening of the SVA distance were found.
Gills et al. analyzed sagittal parameters in patients after ACDF operations were performed on 1 and 2 levels. In their study, they used measurements of the C2–C7 lordosis an-gle, T1 slope, disc space height, operated segment lordosis angle, and SVA C2–C7 value. The follow-up observations were made 6 weeks and 1 year after the surgical treatment. In the group of patients operated on at 2 levels, a statisti-cally significant correlation between the lordosis angle and change in SVA C2–C7 value was observed. A similarly sig-nificant relationship was shown in the entire study group between the T1 slope and the SVA C2–C7.18
Changes in the sagittal balance correction value did not significantly affect perceived upper limb pain. The degree of decompression of the nerve roots is likely one of the most important factors in the reduction of nerve root symptoms. However, a significant relationship was observed between the reduction of symptoms assessed using the NDI ques-tionnaire and the change in the angle of cervical lordo-sis C2–C7. A similar relationship was found for the VAS score for neck pain. A statistically significant improvement in the VAS score was demonstrated in the case of changes in the angle of cervical lordosis (p < 0.001) and the SVA C2–C7 value (p = 0.001) after surgery.
Tang et al. evaluated 113 patients operated on using long segment posterior fixation in the course of cervical stenosis or myelopathy. In their methodology, they as-sessed the cervical lordosis angle C1–C2, C2–C7, SVA C2–C7, SVA C1–C7, and the line of the center of grav-ity of the head. They confirmed the positive correlation between the C2–C7 cervical lordosis angle and improve-ment in NDI values (r = 0.20, p = 0.036). When analyzing the relationship between the SVA (C2–C7) distance and NDI, NDI increased significantly, with a SVA value greater than 40 mm.7
Divi et al. analyzed the results of surgical procedures in pa-tients treated using anterior stabilization of the cervical spine covering 1–3 adjacent segments. A total of 249 patients after ACDF surgery were included in their study and followed up for over 1 year. One of the important parameters used in their methodology was the difference between the T1 slope and the cervical lordosis (CL) angle (parameter T1–CL). This parameter showed a statistically significant relationship with
Table 3. The neck disability index (NDI) for all patients and patients separated by sex before surgery
Sex Research phaseStatistical parameter
M Me Q1–Q3 (IQR) SD SE 95% CI Min–Max
Womenbefore surgery 32.94 33 27–39.50 (22.50) 8.58 2.15 [28.36, 37.51] 15–46
post surgery 9.62 8.50 4.50–12 (8.50) 7.57 1.89 [5.59, 13.66] 1–27
Menbefore surgery 22.54 24 17–28 (11) 6.64 2.00 [18.09, 27.00] 14–35
post surgery 8.09 7 1–11 (10) 8.44 2.55 [2.42, 13.76] 0–28
Altogetherbefore surgery 28.71 28 20–36 (16) 9.30 1.79 [25.02, 32.38] 14–46
post surgery 9.00 7 3–11 (8) 7.81 1.50 [5.91, 12.09] 0–28
M – mean; Me – median; IQR – interquartile range; SD – standard deviation; SE – standard error; 95% CI – 95% confidence interval; Min–Max – minimum–maximum.

S. Podlewski, N. Gołębiowska, M. Radek. Changes in sagittal balance after ACDF1012
the results of surgical treatment. Thus, the authors confirmed the correlation of the T1–CL value with perceived pain assess-ment using both, the VAS score for neck pain and the NDI score (p < 0.05). This relationship was even stronger when there was a deformity of the cervical spine before the start of treatment.19 The work of Iyer et al. showed that the sagittal balance parameters, i.e., the CL angle, T1 slope and T1–CL difference, were related to preoperative NDI score. Higher values of the CL angle (r = 0.277, p = 0.009) and higher values of the Th1 angle (r = −0.273, p = 0.011) correlated with lower patient scores on the NDI scale.20 Gum et al. assessed the an-gle of CL in 101 patients treated using the ACDF method over a two-year follow-up period. They also found that the pa-rameters were correlated with clinical results.21 The analysis carried out by the authors of the present study showed that obtaining a postoperative CL angle of at least 6° predicted improvement in NDI score by at least 8 points.
Limitations
There are a few limitations of this study. First, extension of the follow-up period would be beneficial for a deeper analysis of the study results. Second, including patients op-erated on at more levels in the study group would allow for a more complete assessment of changes in sagittal balance parameters. Additionally, including patients operated with the use of a plate would allow for comparison of the results and selection of the best method of surgical treatment.
Conclusions
Based on the results of this work, we conclude that improvement in cervical lordosis C2−C7 can improve surgical outcomes (in terms of NDI and VAS assessment of neck pain). However, the problem of cervical sagittal balance and its impact on treatment outcomes remains unresolved. There are only a few publications confirming the correlation of sagittal balance with the clinical status of patients after ACDF surgery. It is advisable to supple-ment the above conclusions with research in relation to long segment fixation (above 2 levels) and to extend the observation period.
ORCID iDsSebastian Podlewski https://orcid.org/0000-0003-3901-1885Natalia Gołębiowska https://orcid.org/0000-0002-6723-9003Maciej Radek https://orcid.org/0000-0003-3544-1482
References1. Smith GW, Robinson RA. The treatment of certain cervical-spine dis-
orders by anterior removal of the intervertebral disc and interbody fusion. J Bone Joint Surg Am. 1958;40-A(3):607–624. PMID:13539086
2. Shriver MF, Lewis DJ, Kshettry VR, Rosenbaum BP, Benzel EC, Mroz TE. Pseudoarthrosis rates in anterior cervical discectomy and fusion: A meta-analysis. Spine J. 2015;15(9):2016–2027. doi:10.1186/1471-2288-12-181
3. Bakhsheshian J, Mehta VA, Liu JC. Current diagnosis and management of cervical spondylotic myelopathy. Global Spine J. 2017;7(6):572–586. doi:10.1177/2192568217699208
4. Kang MS, Kim KJ, Bae JS, Jang IT. Treatment of two level artificial disc replacement for cervical spondylotic myelopathy. J Minim Invasive Spine Surg Tech. 2018;3(1):34–38. doi:10.21182/jmisst.2017.00269
5. Roussouly P, Nnadi C. Sagittal plane deformity: An overview of inter-pretation and management. Eur Spine J. 2010;19(11):1824–1836. doi:10. 1007/s00586-010-1476-9
6. McAviney J, Schulz D, Bock R, Harrison DE, Holland B. Determining the relationship between cervical lordosis and neck complaints. J Manipulative Physiol Ther. 2005;28(3):187–193. doi:10.1016/j.jmpt. 2005.02.015
7. Tang JA, Scheer JK, Smith JS, et al. The impact of standing regional cervical sagittal alignment on outcomes in posterior cervical fusion surgery. Neurosurgery. 2012;71(3):662–669;discussion 669. doi:10. 1227/NEU.0b013e31826100c9
8. Kato M, Namikawa T, Matsumura A, Konishi S, Nakamura H. Effect of cervical sagittal balance on laminoplasty in patients with cervi-cal myelopathy. Global Spine J. 2017;7(2):154–161. doi:10.1177/2192 568217694011
9. Iyer S, Lenke LG, Nemani VM, et al. Variations in sagittal alignment parameters based on age: A prospective study of asymptomatic vol-unteers using full-body radiographs. Spine (Phila Pa 1976). 2016;41(23): 1826–1836. doi:10.1097/brs.0000000000001642
10. Tamai K, Buser Z, Paholpak P, Sessumpun K, Nakamura H, Wang JC. Can C7 slope substitute the T1 slope? An analysis using cervical radio-graphs and kinematic MRIs. Spine (Phila Pa 1976). 2018;43(7):520–525. doi:10.1097/BRS.0000000000002371
11. Park JH, Cho CB, Song JH, Kim SW, Ha Y, Oh JK. T1 slope and cervi-cal sagittal alignment on cervical CT radiographs of asymptomatic persons. J Korean Neurosurg Soc. 2013;53(6):356–359. doi:10.3340/jkns.2013.53.6.356
12. Sun J, Zhao HW, Wang JJ, Xun L, Fu NX, Huang H. Diagnostic value of T1 slope in degenerative cervical spondylotic myelopathy. Med Sci Monit. 2018;24:791–796. doi:10.12659/msm.906417
13. Lafage R, Ferrero E, Henry JK, et al. Validation of a new computer-assisted tool to measure spino-pelvic parameters. Spine J. 2015;15(12): 2493–2502. doi:10.1016/j.spinee.2015.08.067
14. Misterska E, Jankowski R, Glowacki M. Cross-cultural adaptation of the Neck Disability Index and Copenhagen Neck Functional Disabil-ity Scale for patients with neck pain due to degenerative and dis-copathic disorders: Psychometric properties of the Polish versions. BMC Musculoskelet Disord. 2011;12(1):84. doi:10.1186/1471-2474-12-84
15. Ling FP, Chevillotte T, Leglise A, Thompson W, Bouthors C, Le Huec JC. Which parameters are relevant in sagittal balance analysis of the cer-vical spine? A literature review. Eur Spine J. 2018;27(Suppl 1):8–15. doi:10.1007/s00586-018-5462-y
16. Lin T, Wang Z, Chen G, Liu W. Is cervical sagittal balance related to the progression of patients with cervical spondylotic myelopathy? World Neurosurg. 2020;137:e52–e67. doi:10.1016/j.wneu.2019.12.148
17. Villavicencio AT, Babuska JM, Ashton A, et al. Prospective, ran-domized, double-blind clinical study evaluating the correlation of clinical outcomes and cervical sagittal alignment. Neurosurgery. 2011;68(5):1309–1316;discussion 1316. doi:10.1227/NEU.0b013e31820 b51f3
18. Gillis CC, Kaszuba MC, Traynelis VC. Cervical radiographic param-eters in 1- and 2-level anterior cervical discectomy and fusion. J Neurosurg Spine. 2016;25(4):421–429. doi:10.3171/2016.2.SPINE151056
19. Divi SN, Bronson WH, Canseco JA, et al. How do C2 tilt and C2 slope correlate with patient reported outcomes in patients after anterior cervical discectomy and fusion? Spine J. 2021;21(4):578–585. doi:10. 1016/j.spinee.2020.10.033
20. Iyer S, Nemani VM, Nguyen J, et al. Impact of cervical sagittal align-ment parameters on neck disability. Spine (Phila Pa 1976). 2016;41(5): 371–377. doi:10.1097/BRS.0000000000001221
21. Gum JL, Glassman SD, Douglas LR, Carreon LY. Correlation between cervical spine sagittal alignment and clinical outcome after anteri-or cervical discectomy and fusion. Am J Orthop (Belle Mead NJ). 2012; 41(6):E81–E84. PMID:22837996

Cite asGündüz ZB, Aktas F, Vatansev H, Solmaz M, Erdoğan E. Effects of amantadine and topiramate on neuronal damage in rats with experimental cerebral ischemia-reperfusion. Adv Clin Exp Med. 2021;30(10):1013–1023. doi:10.17219/acem/138327
DOI10.17219/acem/138327
Copyright© 2021 by Wroclaw Medical University This is an article distributed under the terms of theCreative Commons Attribution 3.0 Unported (CC BY 3.0)(https://creativecommons.org/licenses/by/3.0/)
Address for correspondenceZahide Betül GündüzE-mail: [email protected]
Funding sourcesThis study was funded by the Saglık Bilimleri University Research Projects Fund Committee (grant No. 2019/032-04/04/2019).
Conflict of interestNone declared
AcknowledgementsWe thank Prof. Dr. Yavuz Koksal for advice on statistical analyses.
Received on March 28, 2021Reviewed on May 17, 2021Accepted on May 31, 2021
Published online on September 9, 2021
AbstractBackground. Ischemia-reperfusion models are used to evaluate treatment options that may minimize cellular damage after ischemia.
Objectives. To investigate the effects of amantadine and topiramate on apoptosis and cellular oxidative damage.
Materials and methods. This experiment was performed using 30 male Wistar albino rats. The right internal carotid artery was identified and clamped with an aneurysm clip under general anesthesia, except for animals in the control group. After 10 min of occlusion, the aneurysm clip was removed, allowing re-perfusion. After reperfusion and a waiting period of 12 h, the test and control groups were intraperitoneally administered the following solutions: the sham group received 10 mg/kg of isotonic solution, the amanta-dine group received 20 mg/kg of amantadine, the topiramate group received 40 mg/kg of topiramate, and the amantadine-topiramate group received 20 mg/kg of amantadine and 40 mg/kg of topiramate. After 24 h, the rats were euthanized.
Results. Apoptosis was evaluated using the TUNEL method. Total antioxidant status (TAS), total oxidant status (TOS), total thiol, and ischemia-modified albumin (IMA) levels were measured in both brain tissue and serum samples. The rate of apoptosis in the sham and amantadine groups increased significantly compared to the control group and the non-ischemic counter hemisphere. In the amantadine-topiramate group, both serum TAS and tissue thiol levels decreased. Tissue TOS levels were significantly higher in the topiramate group compared to all other test groups. Tissue TAS levels were significantly higher in the amantadine group compared to all other test groups.
Conclusions. This experimental ischemia-reperfusion model revealed that topiramate reduces apoptosis in the early period after ischemia and that its combination with amantadine does not provide additional benefits against cell death. However, topiramate did not have an inhibitory effect on the oxidative stress biomarkers used in our study (TAS, TOS, IMA, and thiol). Studies that reveal the neuroprotective mechanism of action and long-term effects of topiramate are needed to complement this study.
Key words: topiramate, amantadine, apoptosis, oxidative stress, cerebral ischemia-reperfusion
Original papers
Effects of amantadine and topiramate on neuronal damage in rats with experimental cerebral ischemia-reperfusion
Zahide Betül Gündüz1,A–F, Filiz Aktas1,A, Husamettin Vatansev2,C, Merve Solmaz3,C, Ender Erdoğan3,B,C
1 Department of Neurology, Saglık Bilimleri University, Konya City Hospital, Turkey2 Department of Biochemistry, Faculty of Medicine, Selçuk University, Konya, Turkey3 Department of Histology and Embryology, Medical Faculty, Selçuk University, Konya, Turkey
A – research concept and design; B – collection and/or assembly of data; C – data analysis and interpretation; D – writing the article; E – critical revision of the article; F – final approval of the article
Advances in Clinical and Experimental Medicine, ISSN 1899–5276 (print), ISSN 2451–2680 (online) Adv Clin Exp Med. 2021;30(10):1013–1023

Z.B. Gündüz et al. Effects of amantadine and topiramate in rats1014
Background
Despite many positive developments in the diagnosis and treatment of cerebrovascular disease, it continues to be a significant cause of morbidity and mortality worldwide. Experimental stroke models are valuable because they can reveal important information about the biochemical and pathological changes that ischemia causes in cerebral tis-sue, and guide treatment options that act through these mechanisms.
Ischemia triggers apoptosis in cerebral tissue, leading to apoptotic cell death. This involves 2 pathways: the in-trinsic pathway, which is associated with mitochondrial release and caspase-3 stimulation of cytochrome c, and the extrinsic pathway, which leads to caspase-8 stimula-tion as a result of activation of cell surface death receptors. The developing ischemia destroys the cells that perform essential functions, such as oxygen transport, glucose production and maintenance of neuronal ionic gradients. Rapid depletion of energy after cerebral ischemia leads to loss of membrane potential and depolarization of nerves. The voltage-dependent Ca2+ channels are then activated, and stimulating amino acids are released into the extra-cellular space. It is thought that cytotoxic accumulation of intracellular Ca2+ then initiates a series of cytoplasmic and nuclear events, which primarily trigger the intrinsic apoptotic pathway.
Glutamate accumulates outside of cells during isch-emia, binding to and opening a group of cation channels on the cell surface. Previous ischemic stroke research has largely concentrated on these receptors. The binding of glu-tamate to these ionotropic N-methyl-d-aspartate (NMDA) and α-amino-3-hydroxy-5-methyl-4-isoxazolpropionic acid (AMPA) receptors promotes a further increase in Ca2+ input. Intracellular Ca2+ accumulation is a key step in cell death.
Reactive oxygen species (ROS) activity increases after ischemia and plays an important role in cell death in ce-rebral ischemia. Under physiological conditions, ROS, including superoxide anions (O2−), hydrogen peroxide (H2O2) and hydroxyl radicals (OH−), are produced at low levels and are crucial in signaling and metabolic pathways. The overproduction of ROS after ischemia, coupled with the inactivation of antioxidant enzymes and the consump-tion of antioxidants, leads to the failure of natural defense mechanisms in protecting neurons from oxidative dam-age. This increase in ROS is thought to cause destruction by directly affecting cellular proteins, lipids and DNA, or indirectly, by damaging normal cellular signaling and gene regulation. Although many of the key apoptotic pro-teins have been identified, understanding of the complex underlying mechanisms remains poor; thus, treatment of stroke patients by manipulating apoptotic pathways is an intensively studied subject.1
Based on the theory that NMDA receptor ion channels increase entry of Ca2+ into cells, memantine, an NMDA receptor blocker, was used in ischemia-reperfusion studies
and was shown to cause a decrease in apoptotic cell num-bers and oxidant levels. This result supports the hypothesis that memantine is neuroprotective.2
Amantadine is an NMDA receptor antagonist. It is com-monly used in antiparkinsonian treatment as a dopamine agonist, and there are clinical studies showing that it ac-celerates the rate of functional recovery in patients with post-traumatic consciousness disorders.3–5 Topiramate, another therapeutic agent, has a blocking effect on AMPA receptors, which increases intracellular Ca2+.6 In an ex-perimental spinal cord trauma model, topiramate acceler-ated recovery and was concluded to have a neuroprotec-tive effect.7 Although many factors contribute to neuronal damage in ischemia, the pathogenesis has not yet been fully elucidated. The idea that a single medical treatment will be sufficient for treating neuronal ischemic pathogenesis seems overly optimistic.
Objectives
We aimed to investigate the effects of topiramate and amantadine on cell death and oxidative damage in an isch-emic stroke model, with the prediction that combination therapy would increase the chance of success.
Materials and methods
Animals
A total of 30 male Wistar albino rats were used in this study, each weighing 450–500 g. Rats were housed in a con-trolled environment of 22°C with 12 h light and dark cycles. Standard laboratory rat food and water were provided. All animals received humane care in compliance with the Guide for the Care and Use of Laboratory Animals pub-lished by the Ethics Council of Selçuk University (Konya, Turkey). This study was performed at the Selçuk University Experimental Medicine Application and Research Center. The study protocol was approved by the Selçuk University Medical Faculty Ethics Committee (approval No. 2019/01-25/01/2019) and the study was funded by the Health Sci-ences University Research Projects Fund Committee (grant No. 2019/032-04/04/2019).
Ischemia-reperfusion model
Rats were randomly divided into 5 groups (6 rats per group): control (C) group, sham (S) group, amantadine (A) group, topiramate (T) group, and amantadine-topiramate (AT) group. General anesthesia was induced with intraper-itoneal ketamine (Ketalar 500 mg; Pfizer, New York, USA) at 50–75 mg/kg and 2% xylazine (Xylazinbo 2%; Bioveta, Katowice, Poland) at 5 mg/kg. Rats were kept in a supine position and their necks were shaved. Following a midline
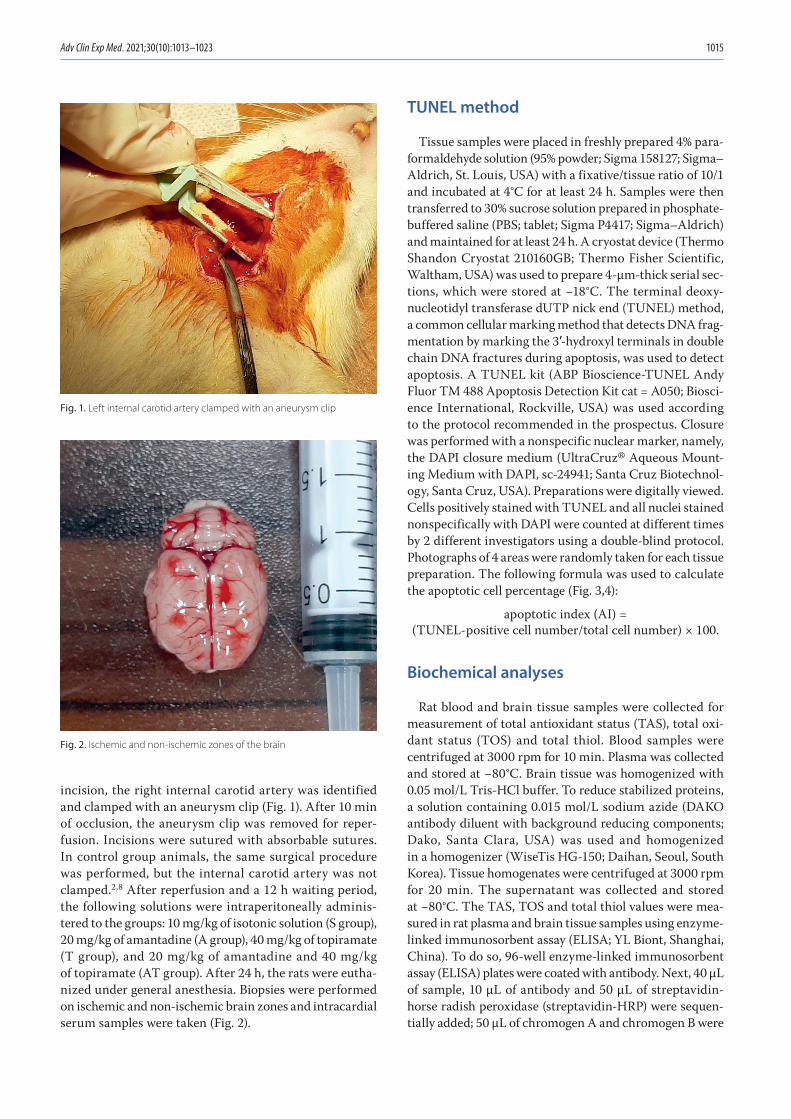
Adv Clin Exp Med. 2021;30(10):1013–1023 1015
incision, the right internal carotid artery was identified and clamped with an aneurysm clip (Fig. 1). After 10 min of occlusion, the aneurysm clip was removed for reper-fusion. Incisions were sutured with absorbable sutures. In control group animals, the same surgical procedure was performed, but the internal carotid artery was not clamped.2,8 After reperfusion and a 12 h waiting period, the following solutions were intraperitoneally adminis-tered to the groups: 10 mg/kg of isotonic solution (S group), 20 mg/kg of amantadine (A group), 40 mg/kg of topiramate (T group), and 20 mg/kg of amantadine and 40 mg/kg of topiramate (AT group). After 24 h, the rats were eutha-nized under general anesthesia. Biopsies were performed on ischemic and non-ischemic brain zones and intracardial serum samples were taken (Fig. 2).
TUNEL method
Tissue samples were placed in freshly prepared 4% para-formaldehyde solution (95% powder; Sigma 158127; Sigma–Aldrich, St. Louis, USA) with a fixative/tissue ratio of 10/1 and incubated at 4°C for at least 24 h. Samples were then transferred to 30% sucrose solution prepared in phosphate-buffered saline (PBS; tablet; Sigma P4417; Sigma–Aldrich) and maintained for at least 24 h. A cryostat device (Thermo Shandon Cryostat 210160GB; Thermo Fisher Scientific, Waltham, USA) was used to prepare 4-μm-thick serial sec-tions, which were stored at −18°C. The terminal deoxy-nucleotidyl transferase dUTP nick end (TUNEL) method, a common cellular marking method that detects DNA frag-mentation by marking the 3′-hydroxyl terminals in double chain DNA fractures during apoptosis, was used to detect apoptosis. A TUNEL kit (ABP Bioscience-TUNEL Andy Fluor TM 488 Apoptosis Detection Kit cat = A050; Biosci-ence International, Rockville, USA) was used according to the protocol recommended in the prospectus. Closure was performed with a nonspecific nuclear marker, namely, the DAPI closure medium (UltraCruz® Aqueous Mount-ing Medium with DAPI, sc-24941; Santa Cruz Biotechnol-ogy, Santa Cruz, USA). Preparations were digitally viewed. Cells positively stained with TUNEL and all nuclei stained nonspecifically with DAPI were counted at different times by 2 different investigators using a double-blind protocol. Photographs of 4 areas were randomly taken for each tissue preparation. The following formula was used to calculate the apoptotic cell percentage (Fig. 3,4):
apoptotic index (AI) = (TUNEL-positive cell number/total cell number) × 100.
Biochemical analyses
Rat blood and brain tissue samples were collected for measurement of total antioxidant status (TAS), total oxi-dant status (TOS) and total thiol. Blood samples were centrifuged at 3000 rpm for 10 min. Plasma was collected and stored at −80°C. Brain tissue was homogenized with 0.05 mol/L Tris-HCl buffer. To reduce stabilized proteins, a solution containing 0.015 mol/L sodium azide (DAKO antibody diluent with background reducing components; Dako, Santa Clara, USA) was used and homogenized in a homogenizer (WiseTis HG-150; Daihan, Seoul, South Korea). Tissue homogenates were centrifuged at 3000 rpm for 20 min. The supernatant was collected and stored at −80°C. The TAS, TOS and total thiol values were mea-sured in rat plasma and brain tissue samples using enzyme-linked immunosorbent assay (ELISA; YL Biont, Shanghai, China). To do so, 96-well enzyme-linked immunosorbent assay (ELISA) plates were coated with antibody. Next, 40 µL of sample, 10 µL of antibody and 50 µL of streptavidin-horse radish peroxidase (streptavidin-HRP) were sequen-tially added; 50 µL of chromogen A and chromogen B were
Fig. 1. Left internal carotid artery clamped with an aneurysm clip
Fig. 2. Ischemic and non-ischemic zones of the brain
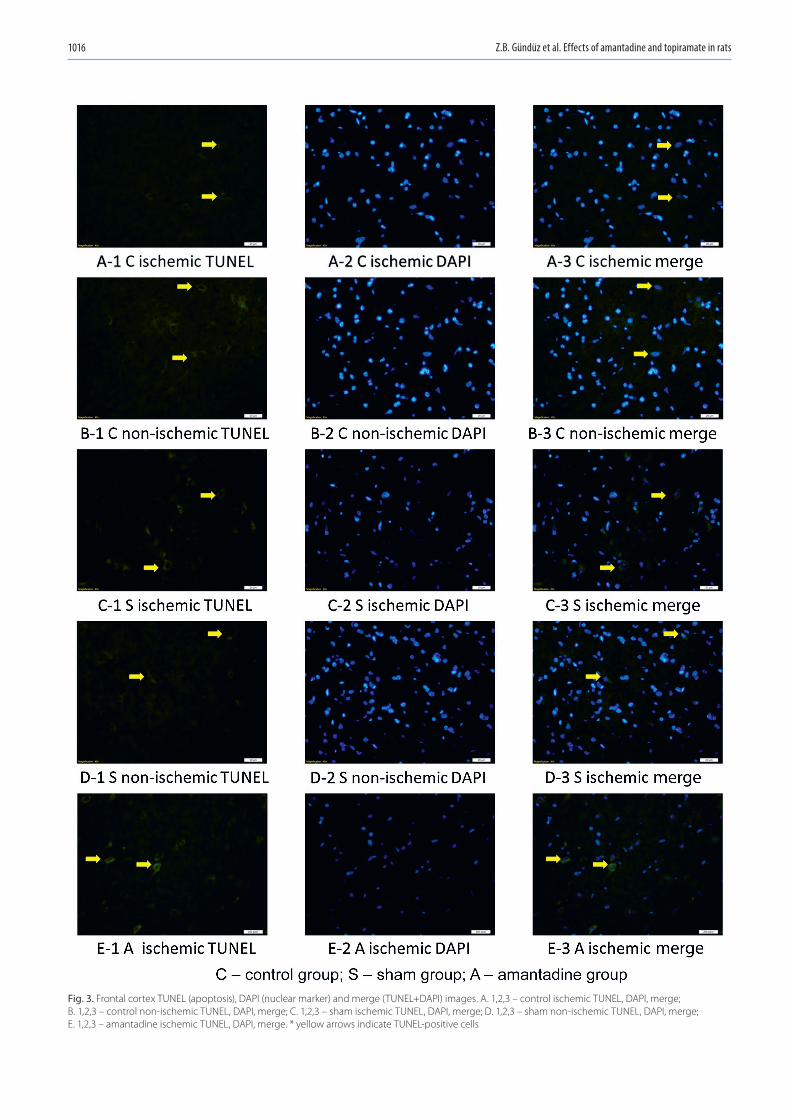
Z.B. Gündüz et al. Effects of amantadine and topiramate in rats1016
Fig. 3. Frontal cortex TUNEL (apoptosis), DAPI (nuclear marker) and merge (TUNEL+DAPI) images. A. 1,2,3 – control ischemic TUNEL, DAPI, merge; B. 1,2,3 – control non-ischemic TUNEL, DAPI, merge; C. 1,2,3 – sham ischemic TUNEL, DAPI, merge; D. 1,2,3 – sham non-ischemic TUNEL, DAPI, merge; E. 1,2,3 – amantadine ischemic TUNEL, DAPI, merge. * yellow arrows indicate TUNEL-positive cells

Adv Clin Exp Med. 2021;30(10):1013–1023 1017
Fig. 4. Frontal cortex TUNEL (apoptosis), DAPI (nuclear marker) and merge (TUNEL+DAPI) images. F. 1,2,3 – amantadine non-ischemic TUNEL, DAPI, merge; G. 1,2,3 – topiramate ischemic TUNEL, DAPI, merge; H. 1,2,3 – topiramate non-ischemic TUNEL, DAPI, merge; I. 1,2,3 – amantadine + topiramate ischemic TUNEL, DAPI, merge; J. 1,2,3 – amantadine + topiramate non-ischemic TUNEL, DAPI, merge. * yellow arrows indicate TUNEL-positive cells

Z.B. Gündüz et al. Effects of amantadine and topiramate in rats1018
added to the blank well. The ELISA plates were incubated in an incubator (Memmert, Schwabach, Germany) at 37°C for 60 min. The wash solution was diluted ×30 with distilled water. Each well was washed 5 times with 350 µL of wash so-lution. Next, 50 µL of chromogen A and chromogen B were added to each well. Plates were incubated for 10 min at 37°C to ensure coloration. To stop the reaction, 50 µL of stopping solution was added to each well. Absorbance was measured at 450 nm using an ELISA reader (Clariostar, Ortenberg, Germany). The linear regression equation of the standard curve was calculated according to the concentrations of the standards and their respective optical density (OD) values. Lastly, according to the OD value of the sample, the concentration was calculated.
The ischemia-modified albumin (IMA) level was mea-sured using another ELISA kit (Bioassay Technology Labo-ratory, Shanghai, China). For this assay, 50 µL of sample, 50 µL of standard and 50 µL of biotinylated antigen were sequentially added to 96-well ELISA plates previously coated with antibody and incubated for 30 min. The wash solution was diluted ×25 with distilled water. Each well was washed 5 times with 300 µL of wash solution. Next, 50 µL of avidin-HRP was added to the sample and stan-dard wells, and the plates were incubated for 30 min. Each well was again washed 5 times with 300 µL of wash solu-tion. Next, 50 µL of chromogen A and chromogen B were added to each well, and plates were incubated for 10 min at 37°C to ensure coloration. To stop the reaction, 50 µL of stopping solution was added to each well. Absorbance at 450 nm was measured using an ELISA reader. The linear regression equation of the standard curve was calculated according to the concentrations of the standards and their respective OD values. Lastly, according to the OD value of the sample, the concentration was calculated.
Statistical analyses
The maximum number of animals for each group was calculated to be 5, using the sample size resource equation method. Considering the possibility of loss of animals due to death or injury, 6 animals were included in each group (30 animals in total). SPSS v. 15 software (SPSS Inc., Chicago, USA) was used for all statistical analyses. Numerical data are
reported as the median (Me) value and the minimum and maximum (min–max) values. Since our data did not satisfy the assumptions for parametric tests, the Kruskal–Wallis test was used to compare all groups. When a statistically significant difference was detected with the Kruskal–Wal-lis test, pairwise comparisons were then performed using a Bonferroni-corrected Mann–Whitney U test. A value of p < 0.05 was considered statistically significant.
Results
Regarding the rate of apoptosis in the ischemic right hemispheres, there was no statistically significant differ-ence in the T and C groups. However, in the S and A groups, the rate was significantly higher than in the non-ischemic left hemisphere (p = 0.0090). Apoptotic cell counts showed no statistically significant difference between the isch-emic and non-ischemic samples from the T and AT groups (Table 1, Fig. 3,4). When comparing apoptosis in the isch-emic hemispheres of the groups, an increased rate of apop-tosis was found in the A and S groups compared with the C group (p = 0.0020). When the left hemispheres with-out ischemia were compared, it was found that the apop-totic cell count was not significantly different between the groups (Table 2).
The serum TAS level was significantly lower in the AT group compared to all the other groups. No significant differences were noted among other groups. The A group had the highest TAS value in the non-ischemic hemi-sphere samples, and this value was significantly differ-ent from those of the T, S and C groups. In addition, the value in the T group was significantly higher than that in the S group. The TAS values in the ischemic hemi-sphere samples were higher in all test groups compared to the C group, but only the value in the A group was significantly different (Table 3).
There were no significant differences in the serum and non-ischemic hemisphere TOS values in the test groups compared to the C group. The ischemic hemisphere TOS values were higher in all test groups compared to the C group, but only the T group showed a statisti-cally significant difference (Table 3).
Table 1. TUNEL method (apoptotic cell counts) in ischemic and non-ischemic group (in-group comparison; Mann–Whitney U test was used for pairwise comparison)
Groups nIschemiaMe value
(min–max)
Non-ischemiaMe value
(min–max)p-value
Group C 6 0.06 (0.04–0.13) 0.046 (0.037–0.063) 0.0760
Group S 6 0.18 (0.16–0.19) 0.073 (0.047–0.098) 0.0090
Group A 6 0.18 (0.17–0.22) 0.083 (0.05–0.129) 0.0090
Group T 6 0.16 (0.12–0.19) 0.07 (0.053–0.098) 0.4620
Group AT 6 0.13 (0.12–0.14) 0.076 (0.038–0.087) 0.8060
Me – median; C – control; S – sham; A – amantadine; T – topiramate; AT – amantadine-topiramate.

Adv Clin Exp Med. 2021;30(10):1013–1023 1019
Table 2. TUNEL method (apoptotic cell counts) in ischemic and non-ischemic group (intergroup comparison)
Parameters Groups N Me value(min–max) χ2 df p-value
Ischemic
group Cgroup Sgroup Agroup T
group AT
66666
0.06 (0.04–0.13)0.18 (0.16–0.19)0.18 (0.17–0.22)0.16 (0.12–0.19)0.13 (0.12–0.14)
16.992 4 0.0020
groups C and S, p = 0.0090 (adjusted p-value = 0.0900)groups C and A, p = 0.0090 (adjusted p-value = 0.0900)
Non-ischemic
group Cgroup Sgroup Agroup T
group AT
66666
0.046 (0.037–0.063)0.073 (0.047–0.098)0.083 (0.05–0.129)0.07 (0.053–0.098)
0.076 (0.038–0.087)
9.193 4 0.0560
The adjusted p-value is the p-value after the Bonferroni correction. Me – median; df – degrees of freedom; C – control; S – sham; A – amantadine; T – topiramate; AT – amantadine-topiramate.
Table 3. Comparison of serum and pathological tissue of total antioxidant status (TAS), total oxidant status (TOS), thiol, and ischemia-modified albumin (IMA) values of whole groups
Tests Groups NSerum Pathologic tissue
Me value(min–max) χ2 df p-value Me value
(min–max) χ2 df p-value
TAS 12.095 4 0.0172 14.821 4 0.0050
group C 6 8.04 (7.48–9.97) 7.6 (7.26–8.54)
group S 6 6.14 (5.77–15.29) 10.66 (7.26–12.51)
group A 6 8.57 (6.43–10.93) 11.16 (9.13–13.08)
group T 6 7.38 (6.53–9.67) 9.31 (8.54–10.34)
group AT 6 5.15 (3.97–5.29) 13.21 (11.32–14.13)
groups C and AT, p = 0.0140, adjusted p = 0.1400groups S and AT, p = 0.0140, adjusted p = 0.1400groups A and AT, p = 0.0140, adjusted p = 0.1400groups T and AT, p = 0.0140, adjusted p = 0.1400
groups C and A, p = 0.0090, adjusted p-value = 0.0900
TOS 5.073 4 0.2800 13.796 4 0.0080
group C 6 5.91 (5.59–6.68) 1.32 (1.26–5.63)
group S 6 8.52 (5.85–20.41) 4.67 (2.76–8.45)
group A 6 7.98 (1.23–11.57) 7.91 (5.36–9.32)
group T 6 6.84 (6.32–7.35) 9.11 (6.66–11.75)
group AT 6 6.77 (5.73–8.11) 7.6 (6.55–11.75)
groups C and T, p = 0.0090, adjusted p-value = 0.0900
Thiol 5.716 4 0.2210 10.700 4 0.0300
group C 6 4.39 (2.54–6.21) 18.38 (14.61–26.43)
group S 6 5.6 (2.55–11.07) 9.36 (4.34–18.07)
group A 6 8.51 (2.72–11.74) 4.92 (2.94–17.12)
group T 6 10.51 (3.15–28.96) 10.17 (7.36–21.54)
group AT 6 11.43 (6.75–16.71) 6.73 (4.62–9.81)
groups C and AT, p = 0.0140, adjusted p-value = 0.1400
IMA 4.281 4 0.3690 3.617 4 0.4600
group C 6 3.84 (2.32–14.51) 19.35 (14.81–39.58)
group S 6 10.39 (6.31–12.56) 30.65 (24.56–33.63)
group A 6 9.52 (2.75–11.19) 20.64 (16.37–28.62)
group T 6 7.56 (4.02–10.47) 21.98 (12.85–28.62)
group AT 6 4.05 (2.74–4.49) 20.01 (15.93–39.25)
The adjusted p-value is the p-value after the Bonferroni correction. Me – median value; df – degree of freedom; TAS – total antioxidant status; TOS – total oxidant status; IMA – ischemia-modified albumin; C – control; S – sham; A – amantadine; T – topiramate; AT – amantadine-topiramate.

Z.B. Gündüz et al. Effects of amantadine and topiramate in rats1020
There was no difference in serum total thiol values between groups. The A group had the lowest thiol value in the non-ischemic hemispheric tissue samples, but this level was only significantly different when compared to that in the T and S groups. All total thiol values in the ischemic hemisphere samples of the test groups were lower com-pared to that in the C group, but only the value in the AT group was significantly different (Table 3).
Regarding IMA levels, the C group had the lowest IMA level while the S group had the highest. The IMA values in the AT group were closest to those in the C group, but the difference was not statistically significant (Table 3).
Discussion
Cerebrovascular disease remains an important cause of morbidity and mortality worldwide. Many factors contribute to the etiology of cerebrovascular disease. Currently, the most effective treatments for stroke are control of correctable risk factors and prophylactic use of anti-aggregant/anticoagulant therapy. The probability of successful treatment is limited after ischemia devel-ops. Neurons that die within minutes in ischemic tissue and the penumbra, which is the recoverable area around these neurons, are defined as treatment targets. Recently, thrombolytic treatment and endovascular treatment op-tions have been developed to target the penumbra; they correct tissue perfusion in the hyperacute period and prevent tissue damage in the early period.9 These treat-ments ultimately aim to reduce mortality and morbidity. However, options for treating the ischemic nucleus, where cells rapidly die, have not yet been developed. To address this, the mechanisms of the pathophysiological events occurring in ischemic neurons must first be clearly un-derstood. Although previous studies suggest that apop-tosis is a key factor for damage (it develops in response to acute ischemic damage and is triggered by factors such as the overproduction of free radicals, Ca2+ overload and excitotoxicity), complete details of the processes leading to apoptosis remain unknown. Changes in cellular ho-meostasis can trigger necrosis or apoptosis; the choice of path usually depends on the cell type, cell age and its location in the brain. Apoptosis leads to degradation of DNA and cytoskeleton and nuclear proteins, crosslink-ing of proteins, formation of apoptotic bodies, expression of ligands for phagocytic cell receptors, and retention by phagocytic cells.9
Research focusing on the events that initiate apoptosis, namely ischemia triggering an increase in intracellular Ca2+, has recently gained momentum. Some neurotrans-mitters and neuromodulators are known to contribute to ischemic stroke damage and neuron death. Excit-atory amino acid receptor activation, Ca2+ overload, ni-tric oxide (NO), and oxidative stress are all well-known steps in the pathogenesis of ischemia. In a study testing
the hypothesis that an increase in gamma-aminobutyric acid (GABA) receptor activity may prevent NMDA recep-tor-mediated NO production and decrease brain damage, the results showed that both the GABA (A) receptor ago-nist muscimol and GABA (B) receptor agonist baclofen had neuroprotective effects. Neurons treated with a combina-tion of the 2 agonists were found to have reduced ischemia, suggesting that these agonists can significantly protect against neuronal death caused by reperfusion.10
An important factor determining the response of a cell to apoptotic mechanisms is the form of stress, which in-cludes hypoxia, energy deprivation, DNA damage, and in-flammation. The duration and intensity of stress also guide the response of a cell and adaptation to stress. A cell may survive stress and heal, or may die via apoptosis, necrosis or autophagy.11 In our study, an increase in apoptosis was observed in the non-ischemic hemisphere samples of all test groups compared to the C group. This finding suggests that ischemia can trigger apoptosis in the ischemic hemi-sphere and in the opposite hemisphere due to the stress it generates.
As predicted, the lowest amount of apoptosis in the isch-emic hemisphere was recorded in the C group. The AT group had an apoptosis value that was most similar to that of the C group, but only the S and A group values were significantly different from that of the C group. In our study, amantadine had no effect on apoptosis in the acute period after ischemia was induced.
Amantadine is a dopamine D2 receptor agonist. Since it is also an NMDA receptor antagonist, its effect on heal-ing after traumatic brain injury has been the subject of sev-eral studies. Although no serious adverse effects have been reported, some studies could not show a significant effect compared to a control group. Therefore, an experimental traumatic brain injury model was created in a previous study to test whether this inconsistency was the result of the evaluation criteria or the differences in the doses used: daily doses of 20 mg/kg and 40 mg/kg were adminis-tered intraperitoneally for 19 days. The study showed that amantadine improved motor and cognitive performance, emphasizing that amantadine showed efficacy in a dose-dependent manner.12
However, the mechanism of the neuroprotective effi-cacy of amantadine is still unclear. In rats, corticosterone-induced abnormal glutamatergic synaptic transmission in the hippocampal region has been observed to signifi-cantly improve when the release of spontaneous glutamate from presynaptic terminals is modulated and when oxi-dative stress is reduced by decreasing intracellular Ca2+ increases.13
In our study, amantadine was used in rats at a dose of 20 mg/kg/day in accordance with the literature, but its effectiveness on apoptosis could not be demonstrated. This may be due to the fact that its efficacy at the tissue level was assessed 24 h after acute ischemic injury. These results may indicate that amantadine has no effect on apoptosis

Adv Clin Exp Med. 2021;30(10):1013–1023 1021
in the acute period. Thus, studies of its longer-term use are warranted.
The anti-dyskinetic activity of amantadine in clinical Parkinson’s disease is well-known. A study of a Parkin-son’s disease animal model demonstrated that the com-bined use of amantadine and topiramate had synergistic effects on dyskinesia, without adverse motor effects.14 This report strongly influenced our study – we aimed to determine if amantadine and topiramate had the same synergistic effect in the ischemia-reperfusion model. Although the rate of apoptosis in ischemic tissue sam-ples increased significantly in the A group compared to the S group, it did not differ significantly in the T and AT groups compared to the C group. The apoptosis rate in the AT group, compared to the T group, was closer in value to that of the C group; however, the difference was not statistically significant. In future studies with more subjects, the issue of whether amantadine increases the antiapoptotic properties of topiramate should be fur-ther examined.
Although topiramate is less effective than memantine in hypoxic ischemic encephalopathy models in vivo and in vitro, it has been shown to decrease cerebral damage, es-pecially in combination with hypothermia.6 Recent studies that investigated the actions of topiramate on ventrolateral periaqueductal gray (vlPAG) glutamatergic transmission and aggressive behaviors in rats suggested that a single injection of topiramate systemically and dose-dependently inhibited elements of offensive aggressive behaviors.15 There are additional reports indicating that, in rats, topi-ramate (at 30 mg/kg/day) decreases hippocampal cell loss after hypoxia, prevents memory impairment and aggres-sion16 and reduces apoptosis in the hippocampus against hyperoxic damage (at 80 mg/kg/day).17
The dose range of topiramate reported in previous exper-imental studies is broad and often depends on the method of administration. For example, the efficacy of topiramate at a dose of 40–160 mg/kg/day in an inflammatory hyper-algesia model in rats18 was demonstrated, and at a dose of 40 mg/kg/day19 in studies on behavioral symptoms in rats. It has also been reported that hippocampal isch-emic neuronal damage almost eliminates all histological findings.20
In experimental studies, topiramate has been reported to effectively reduce intracranial pressure in rats, even at much lower doses (oral delivery of 6.25 mg/kg).21 Thus, it can be hypothesized that topiramate may pro-vide additional benefits in cerebral ischemia-reperfusion models, because one of the parameters that adversely af-fects the clinical condition after ischemia is the increase of edema in ischemic tissue.
In our study, we observed that topiramate, when admin-istered intraperitoneally at a dose of 40 mg/kg, signifi-cantly reduced apoptosis. In a study that examined patients with ischemic and hemorrhagic stroke, it was reported that the risk of seizures was higher after hemorrhagic
stroke and 10% of patients with stroke will develop sei-zures within a decade.22 However, there are currently no clear data supporting routine prophylactic antiepileptic use in stroke patients.23 When acute period antiepileptic drugs are selected for stroke patients, the positive effects of topiramate should be taken into consideration, namely, its ability to decrease intracranial pressure and apoptosis in ischemic tissue.
Post-stroke oxidative stress is thought to play a role in brain damage through the release of a significant amount of oxygen-free radicals. For example, the n-ter-minal of human serum albumin is unstable and more prone to deterioration during oxidative stress; a reduc-tion in binding capacity has been observed for transition metals, such as Cu and Co, and this form is called IMA. It has been reported that IMA levels increase in ischemic events, such as acute myocardial infarction and cerebro-vascular events.24 However, the increase in IMA is not tis-sue-specific and has been demonstrated to vary according to the duration of ischemia.25 Furthermore, IMA increases are not specific to ischemic events. The IMA levels have also been shown to increase in obstructive sleep apnea26 and during pregnancy, which is a physiological event.27 Notably, smokers showed no increase in IMA levels com-pared to a control group.28
In our study, there were no significant differences in IMA levels in the blood, ischemic tissue or non-ischemic tissue samples from the test groups compared to the C group or between test groups. A previous study reported IMA levels in 118 patients who had blood samples taken within 3 h of the onset of acute neurological deficits. These pa-tients were divided into 3 groups: cerebral ischemia; hem-orrhage and transient ischemic attack (TIA); or transient neurological deficit, which could not be clearly differenti-ated from epileptic seizure. In the first evaluation, no sig-nificant difference was observed between the groups with ischemia or hemorrhage, whereas both of these groups showed significant elevation compared to the group with temporary neurological deficits. These results suggest that the lack of change in IMA levels in our study were not due to the short duration of our ischemia-reperfusion model. In addition, the same study revealed that the IMA levels at 24 h in the ischemia group patients continued to be sig-nificantly different from those in the hemorrhagic group patients.29
Another indicator of oxidative stress is deterioration of the thiol–disulfide balance. In cerebrovascular events, this balance is disrupted. Total thiol and natural thiol levels have been reported to be significantly lower in pa-tients with cerebral venous sinus thrombosis (n = 38) than in healthy volunteers (n = 80).30 In experimental global and focal ischemia-reperfusion models, a decrease in thiol levels after ischemia has been reported.31
In the present study, no statistically significant difference was observed in blood total thiol levels between groups. In the ischemic tissue samples, the total thiol levels were

Z.B. Gündüz et al. Effects of amantadine and topiramate in rats1022
lower in all test groups than in the C group, but there was a statistically significant difference only in the AT group. This finding can be interpreted to mean that amantadine does not have a positive effect on oxidative stress, as evalu-ated using total thiol levels.
Furthermore, there was no significant difference in the serum TOS values in the test groups compared to the C group. In the tissue samples, the TOS value was lowest in the C group, as expected. Only the value in the T group was significantly different. It was also ob-served that topiramate had no positive effect on the TOS value and that amantadine and amantadine-topiramate combination therapy had no benefit over the isotonic group.
Regarding the serum TAS values, the only group that differed significantly from the C group was the AT group. A significant decrease in the serum TAS value was ob-served in this group. The lowest TAS value in the tissue samples was found in the C group. Although the value in the T group was most similar to that in the C group, the only significant difference was between the A and C groups. Thus, it was determined that amantadine did not have a positive effect on ischemia-induced TAS level and noted that the amantadine-topiramate com-bination did not have a significant effect compared to the S group.
As a result, we were unable to demonstrate a positive effect on the oxidative stress parameters with the isolated or combined use of these agents. This may have been due to the short length of exposure to ischemia or because oxidative stress was assessed after 24 h. Longer exposure to ischemia, use of different oxidative stress parameters, or evaluation of samples collected during the hyperacute or subacute periods may have different results. All of these issues are open to discussion.
Due to the increased rate of apoptosis after 10 min of ischemia, it may be stated that this short exposure to ischemia is sufficient for triggering cell death. How-ever, it may be necessary to explain the course of cell death in this acute period by mechanisms other than oxidative stress. Our study showed that administration of topira-mate, which had no significant effect on IMA, TAS, TOS, or total thiol levels, resulted in reduced apoptosis com-pared to the C group. In future studies, the positive ef-fects of topiramate on ischemia-induced neuronal damage should be evaluated using different biomarkers to investi-gate different mechanisms.
Limitations
Several limitations of our study should be noted. First of all, the duration of ischemia could be prolonged by lon-ger occlusion of the internal carotid artery. Secondly, the duration of administration of amantadine and topi-ramate could be extended. Either of these changes could affect the results.
Conclusions
Tissue damage in ischemic stroke cannot be fully ex-plained by hypoperfusion and acute cell death due to hy-poxia. The inflammatory response developed by ischemic tissue is also responsible for cell damage. Currently, the best known treatments are those that prevent ischemia. Throm-bolytic and endovascular treatment options, which have re-cently become widespread, have significantly reduced post-stroke morbidity and mortality rates. These treatments provide reperfusion at the tissue level and act by restoring the penumbra, but they cannot save neurons that die within minutes after ischemia. Clarifying the pathophysiologi-cal events that develop in the ischemic process will play an important role in the development of treatments aimed at reducing ischemic damage at the cell level. Our study shows that topiramate reduces apoptosis in the early post-ischemia period and that its combination with amantadine does not provide additional benefits for reducing cell death. Topiramate did not have an inhibitory effect on the oxi-dative stress biomarkers used in our study (TAS, TOS, IMA, and thiol). Studies that reveal the neuroprotective mechanism of action and long-term effects of topiramate are needed to complement the findings of this study.
ORCID iDsZahide Betül Gündüz https://orcid.org/0000-0002-6421-1857Filiz Aktas https://orcid.org/0000-0003-2973-916XHusamettin Vatansev https://orcid.org/0000-0002-0230-3414Merve Solmaz https://orcid.org/0000-0003-4144-4647Ender Erdoğan https://orcid.org/0000-0002-6220-9243
References1. Broughton BR, Reutens DC, Sobey CG. Apoptotic mechanisms after
cerebral ischemia. Stroke. 2009;40(5):331–339. doi:10.1161/STROKE AHA.108.531632
2. Ozdemir HH, Demir CF, Berilgen MS, et al. Protective effects of meman-tine induced by cerebral ischemia and reperfusion injury in rats. Turk J Neurol. 2013;19(3):85–89. doi:10.4274/Tnd.85866
3. Giacino JT, Whyte J, Bagiella E, et al. Placebo-controlled trial of aman-tadine for severe traumatic brain injury. N Engl J Med. 2012;366(9): 819–826. doi:10.1056/NEJMoa1102609
4. Farrell D, Bendo AA. Perioperative management of severe traumatic brain injury: What is new? Curr Anesthesiol Rep. 2018;8(3):279–289. doi:10.1007/s40140-018-0286-1
5. Sawyer E, Mauro LS, Ohlinger MJ. Amantadine enhancement of arousal and cognition after traumatic brain injury. Ann Pharmacother. 2008; 42(2):247–252. doi:10.1345/aph.1K284
6. Landucci E, Filippi L, Gerace E, Catarzi S, Guerrini R, Pellegrini- Giampietro DE. Neuroprotective effects of topiramate and meman-tine in combination with hypothermia in hypoxic-ischemic brain injury in vitro and in vivo. Neurosci Lett. 2018;668:103–107. doi:10.1016/j.neulet.2018.01.023
7. Narin F, Hanalioglu S, Ustun H, Kilinc K, Bilginer B. Topiramate as a neuroprotective agent in a rat model of spinal cord injury. Neural Regen Res. 2017;12(12):2071–2076. doi:10.4103/1673-5374.221164
8. Garcia JH. Experimental ischemic stroke: A review. Stroke. 1984;15(1): 5–14. doi:10.1161/01.str.15.1.5
9. Radak D, Katsiki N, Resanovic I, et al. Apoptosis and acute brain isch-emia in ischemic stroke. Curr Vasc Pharmacol. 2017;15(2):115–122. doi:10. 2174/1570161115666161104095522
10. Tuttolomondo A, Di Sciacca R, Di Raimondo D, et al. Neuron protection as a therapeutic target in acute ischemic stroke. Curr Top Med Chem. 2009;9(14):1317–1334. doi:10.2174/156802609789869646

Adv Clin Exp Med. 2021;30(10):1013–1023 1023
11. Milisav I, Poljšak B, Ribarič S. Reduced risk of apoptosis: Mecha-nisms of stress responses. Apoptosis. 2017;22(2):265–283. doi:10.1007/s10495-016-1317-3
12. Okigbo AA, Helkowski MS, Royes BJ, et al. Dose-dependent neu-rorestorative effects of amantadine after cortical impact injury. Neurosci Lett. 2019;694:69–73. doi:10.1016/j.neulet.2018.11.030
13. Xiao X, Zhang H, Wang H, Li Q, Zhang T. Neuroprotective effect of amantadine on corticosterone-induced abnormal glutamatergic syn-aptic transmission of CA3-CA1 pathway in rat’s hippocampal slices [Epub ahead of print]. Synapse. 2017;71(12):10. doi:10.1002/syn.22010
14. Kobylecki C, Hill MP, Crossman AR, Ravenscroft P. Synergistic anti-dyskinetic effects of topiramate and amantadine in animal models of Parkinson’s disease. Mov Disord. 2011;26(13):2354–2363. doi:10. 1002/mds.23867
15. Chou D. Topiramate inhibits offensive aggression through targeting ventrolateral periaqueductal gray. Neuropharmacology. 2020:181: 108361. doi:10.1016/j.neulet.2018.01.023
16. Mikati MA, Daderian R, Zeinieh M, Leonard AS, Azzam D, Kurdi R. Potential neuroprotective effects of continuous topiramate therapy in the developing brain. Epilepsy Behav. 2011;20(4):597–601. doi:10. 1016/j.yebeh.2010.12.011
17. Kurul SH, Yiş U, Kumral A, et al. Protective effects of topiramate against hyperoxic brain injury in the developing brain. Neuropediatrics. 2009;40(1):22–27. doi:10.1055/s-0029-1224101
18. Paranos SL, Tomić MA, Micov AM, Stepanović-Petrović R. The mecha-nisms of antihyperalgesic effect of topiramate in a rat model of inflam-matory hyperalgesia. Fundam Clin Pharmacol. 2013;27(3):319–328. doi:10.1111/j.1472-8206.2011.01018.x
19. Junqueira-Ayres DD, Asth L, Ayres AS, Lobão-Soares B, Soares- Rachetti VP, Gavioli EC. Topiramate reduces basal anxiety and relieves ethanol withdrawal-induced anxious behaviors in male rats. Exp Clin Psychopharmacol. 2017;25(2):105–113. doi:10.1037/pha0000118
20. Edmonds HL Jr, Jiang YD, Zhang PY, Shank R. Topiramate as a neu-roprotectant in a rat model of global ischemia-induced neurode-generation. Life Sci. 2001;69(19):2265–2277. doi:10.1016/s0024-3205 (01)01306-6
21. Scotton WJ, Botfield HF, Westgate CS, et al. Topiramate is more effec-tive than acetazolamide at lowering intracranial pressure. Cephalal-gia. 2019;39(2):209–218. doi:10.1177/0333102418776455
22. Merkler AE, Gialdini G, Lerario MP, et al. Population-based assess-ment of the long-term risk of seizures in survivors of stroke. Stroke. 2018;49(6):1319–1324. doi:10.1161/STROKEAHA.117.020178
23. Tanaka T, Ihara M. Post-stroke epilepsy. Neurochem Int. 2017;107:219–228. doi:10.1016/j.neuint.2017.02.002
24. Menon B, Ramalingam K, Krishna V. Study of ischemia-modified 24-albumin as a biomarker in acute ischaemic stroke. Ann Neurosci. 2018;25(4):187–190. doi:10.1159/000488188
25. Nayak AR, Kashyap RS, Kabra D, Purohit HJ, Taori GM, Daginawala HF. Prognostic significance of ischemia-modified albumin in acute isch-emic stroke patients: A preliminary study. Ann Neurosci. 2011;18(1):5–7. doi:10.5214/ans.0972.7531.1118103
26. Sunnetcioglu A, Asker S, Alp HH, Gunbatar H. Increased asymmetric dimethylarginine and ischemia-modified albumin levels in obstructive sleep apnea. Respir Care. 2016;61(8):1038–1043. doi:10.4187/respcare. 04472
27. Bahinipati J, Mohapatra PC. Ischemia-modified albumin as a marker of oxidative stress in normal pregnancy. J Clin Diagn Res. 2016;10(9): 15–17. doi:10.7860/JCDR/2016/21609.8454
28. Battal F, Tekin M, Aylanç H, et al. Serum ischemia-modified albumin levels in adolescent smokers. Int J Adolesc Med Health. 2016;30(1):1–5. doi:10.1515/ijamh-2015-0128
29. Abboud H, Labreuche J, Meseguer E, et al. Ischemia-modified albu-min in acute stroke. Cerebrovasc Dis. 2007;23(2–3):216–220. doi:10. 1159/000097644
30. Vural G, Gumusyayla S, Deniz O, Neselioglu S, Erel O. Thiol-disulfide homeostasis in cerebral venous sinus thrombosis. Clin Lab. 2018; 64(11):10–14. doi:10.7754/Clin.Lab.2018.180707
31. Ivanov AV, Alexandrin VV, Paltsyn AA, et al. Plasma low-molecular-weight thiol/disulphide homeostasis as an early indicator of global and focal cerebral ischaemia. Redox Rep. 2017;22(6):460–466. doi:10. 1080/13510002.2017.1311464


Cite asKurt N, Türkeri ÖN, Suleyman B, Bakan N. The effect of taxifolin on high-dose-cisplatin-induced oxidative liver injury in rats. Adv Clin Exp Med. 2021;30(10):1025–1030. doi:10.17219/acem/138318
DOI10.17219/acem/138318
Copyright© 2021 by Wroclaw Medical University This is an article distributed under the terms of theCreative Commons Attribution 3.0 Unported (CC BY 3.0)(https://creativecommons.org/licenses/by/3.0/)
Address for correspondenceNezahat KurtE-mail: [email protected]
Funding sourcesNone declared
Conflict of interestNone declared
Received on October 28, 2020Reviewed on March 22, 2021Accepted on May 31, 2021
Published online on August 24, 2021
AbstractBackground. Cisplatin is a non-specific platinum-based (derivative) chemotherapeutic agent that causes an increase in free radicals activity in the liver. Antioxidant activity of taxifolin has been demonstrated previ-ously, and it has been reported that taxifolin inhibits the hydroxyl, radical in experimental studies.
Objectives. No studies were found in the current literature examining the protective effect of taxifo-lin on cisplatin-induced oxidative liver damage. We aimed to determine the protective effect of taxifolin on cisplatin-induced hepatotoxicity in an experimental study.
Materials and methods. In total, 18 albino Wistar male rats were assigned into 3 groups: healthy controls (HC group), 5 mg/kg of cisplatin administered for 8 days (CIS group) and 50 mg/kg of taxifolin + 5 mg/kg of cisplatin administered for 8 days (TCG group). Malondialdehyde (MDA), total glutathione (tGSH), total oxidant (TOS), and total antioxidant (TAS) capacity levels were measured in the extracted liver tissue.
Results. Liver tissue MDA and TOS levels were significantly higher in the CIS group. In contrast, tGSH and TAS levels were significantly lower in the CIS group, administered cisplatin alone (p < 0.001), compared to other groups. In the TCG group, administered cisplatin + taxifolin, MDA and TOS levels were significantly lower, whereas tGSH and TAS levels were significantly higher than in the CIS group (p < 0.001).
Conclusions. These results suggest that taxifolin may be useful in preventing cisplatin-related liver injury.
Key words: cancer, hepatotoxicity, cisplatin, taxifolin, antioxidant
Original papers
The effect of taxifolin on high-dose-cisplatin-induced oxidative liver injury in rats
Nezahat Kurt1,A,C,D, Özge Nur Türkeri2,B, Bahadir Suleyman3,B,C, Nuri Bakan4,F
1 Department of Medical Biochemistry, Faculty of Medicine, Erzincan Binali Yıldırım University, Turkey2 Department of Nutrition and Dietetics, Faculty of Health Sciences, European University of Lefke, Cyprus3 Department of Pharmacology, Faculty of Medicine, Erzincan Binali Yıldırım University, Turkey4 Department of Medical Biochemistry, Faculty of Medicine, Atatürk University, Erzurum, Turkey
A – research concept and design; B – collection and/or assembly of data; C – data analysis and interpretation; D – writing the article; E – critical revision of the article; F – final approval of the article
Advances in Clinical and Experimental Medicine, ISSN 1899–5276 (print), ISSN 2451–2680 (online) Adv Clin Exp Med. 2021;30(10):1025–1030

N. Kurt et al. The antioxidant effect of taxifolin1026
Background
Cisplatin is a non-specific platinum-based (derivative) chemotherapeutic agent used to treat stomach, testis, ovar-ian, bladder, kidney, ureterovesical, head, and neck cancer.1 It has been reported to cause serious toxic effects in many organs and systems during treatment.2–4 The chemothera-peutic efficacy of cisplatin increases together with the dose. However, the increase in dose causes side effects such as nephrotoxicity, ototoxicity, neurotoxicity, hepatotoxicity, nausea, vomiting and, in 67% of patients, diarrhea, limiting its clinical use.5,6 Cisplatin also causes an increase in free radicals activity in the liver, leading to oxidative stress.7 Intravenously administered cisplatin (180–480 mg/m2) can also reach high concentrations in the liver, except in kidney and intestine, and may cause significant toxicity.8 There-fore, it has been reported that the most critical side effects are hepatotoxicity and nephrotoxicity.9 Hepatotoxicity manifests as an increase in serum transaminase (alanine aminotransferase (ALT) and aspartate aminotransferase (AST)) levels. Even the treatment dose used as a tumor sup-pressor has been shown to cause hepatotoxicity.10 Although the mechanism of injury of cisplatin is not well known, some evidence suggests that it is caused by oxidative stress, due to reactive oxygen species (ROS) activity.7 The oxida-tive stress induced by ROS causes a decrease in glutathione (GSH), which is an endogenous antioxidant.
Furthermore, ROS affect cell membrane lipid peroxida-tion and lead to occurrence of more toxic products such as malondialdehyde (MDA).11 This suggests that anti-oxidant therapy may help to prevent or reduce cisplatin-induced hepatotoxicity. Studies have shown that various antioxidants are protective against cisplatin hepatotoxic-ity.12 However, hepatotoxicity caused by cisplatin remains one of the crucial reasons for limiting its use at the desired dose. Therefore, several kinds of research to alleviate cispl-atin hepatotoxicity are being pursued. In our study, we in-vestigated whether taxifolin (3,3′,4′,5,7-pentahydroxiflava-none), a flavonoid contained in onions, milk thistle, French maritime bark, and Douglas fir bark, has a protective effect against the hepatotoxicity of cisplatin.13 Antioxidant activ-ity of taxifolin has been documented.14 In experimental studies, taxifolin has been reported to inhibit the hydroxyl radical (•OH), a ROS in the cell, and protects cellular DNA from oxidative damage by antioxidant activity.15 These data suggest that taxifolin will protect liver tissue against the oxidative damage caused by cisplatin.
Objectives
No data were found in literature reviews regarding the pro-tective effects of taxifolin on cisplatin-induced liver toxicity. Therefore, our study aimed to investigate, through biochemi-cal analysis, whether or not taxifolin has a protective effect on cisplatin-induced hepatotoxicity in rats.
Materials and methods
Study animals
Eighteen albino Wistar male rats (255–266 g) were ob-tained from Atatürk University Medical Experimental Ap-plication and Research Center (Erzurum, Turkey). Before the experiment, animals were housed and fed in the labora-tory for 1 week at normal room temperature (22°C). Ani-mal experiments were performed according to the National Guidelines for the Use and Care of Laboratory Animals and were approved by the local animal ethics committee of Atatürk University (approval No. 75296309-050.01.04-E.1800138920, May 4, 2018).
Experimental procedure
The experimental animals were divided into healthy control (HC) group, 5 mg/kg of cisplatin (CIS) group and 50 mg/kg of taxifolin + 5 mg/kg of cisplatin (TCG) group. In this ex-periment, 50 mg/kg of taxifolin (Evalar, Biysk, Russia) was administered to the rats in the TCG group (n = 6) via oral gavage. In the CIS (n = 6) and HC (n = 6) groups, distilled water as a solvent was administered orally. In the literature, the drugs investigated for action against the toxicity of cis-platin were generally administered to the experimental ani-mals 1 h before cisplatin.16 One hour after the administration of taxifolin and distilled water, a total of 4 doses of cisplatin (Ebewe-Liba, Istanbul, Turkey) were injected into animals from TCG and CIS groups at a dose of 5 mg/kg intraperito-neally (ip.) every 2 days.17 Taxifolin and distilled water were administered with the same method for 8 days once a day in the specified dose and volume. At the end of this period, the animals were sacrificed with high-dose (50 mg/kg) thio-pental (IE Ulagay, Istanbul, Turkey) anesthesia, and the liver tissues were removed. Malondialdehyde, tGSH, total oxidant status (TOS), and total antioxidant status (TAS) levels were measured in the extracted liver tissue. In addition, blood samples were collected from the lateral tail vein of non-anesthetized rats and centrifuged at 1500 × g for 10 min. Then, ALT and AST activity was measured in the serum.
Biochemical analyses
Before dissection, all tissues were rinsed with phosphate-buffered saline solution. The liver tissues were homogenized in ice-cold phosphate buffers (50 mM, pH 7.4) that were ap-propriate for the variable to be measured. The tissue homog-enates were centrifuged at 5000 rpm for 20 min at 4°C, and the supernatants were extracted to analyze MDA, tGSH, TAS, TOS, and protein concentration. The protein concen-tration of the supernatant was measured using the method described by Bradford. All tissue results were expressed by dividing by grams of protein.18 All spectrophotometric measurements were performed using a microplate reader (BioTek® Powerwave XS™; BioTek®, Winooski, USA).

Adv Clin Exp Med. 2021;30(10):1025–1030 1027
Malondialdehyde analysis
Malondialdehyde measurements were based on the method used by Ohkawa et al., involving spectrophotometrically measured absorbance of the pink-colored complex formed by thiobarbituric acid (TBA) and MDA. Briefly, 25 µL of tis-sue homogenate was added to a solution containing 25 µL of 80 g/L sodium dodecyl sulfate and 1 mL of mixture solution (20 g/L of acetic acid + 1.06 g 2-thiobarbiturate + 180 mL of distilled water). The mixture was incubated at 95°C for 1 h. Upon cooling, the mixture was centrifuged for 10 min at 4000 rpm. The absorbance of the supernatant was measured at 532 nm. The standard curve was obtained by using 1,1,3,3-tetramethoxypropane.19
Total glutathione (GSH) analysis
The amount of GSH in the total homogenate was measured with the method used by Sedlak et al.20 and Baker et al.,21 with some modifications. The principle of the method is that the color intensity of dark yellow 5-thio-2-nitrobenzoic acid (TNB). The TNB is released through the reduction of Ellman’s reagent (5,5 -dithiobis (2-nitrobenzoicacid) – DTNB) by free thiol groups, and is measured at a 412 nm wavelength (2 GSH + DTNB → G–S–S–G + 2 TNB, dark yellow color compound).
First, the deproteinization process was applied to all ho-mogenate samples to eliminate the reaction of protein sulf-hydryl groups with Ellman’s reagent. The tissue homog-enate was precipitated with 200 μL of 25% trichloroacetic acid, and the precipitate was removed after centrifugation at 2500 × g for 5 min at 4°C. The obtained supernatant was used to determine the GSH level. A total of 200 μL of measurement buffer (200 mmol/L of Tris-HCl buffer containing 0.2 mmol/L of ethylenediaminetetraacetic acid (EDTA) at pH 8.9), 100 μL of supernatant, 5 μL of DTNB (10 mmol/L in methanol), and 5 μL glutathione reduc-tase-NADPH mix (3.75 mL of 1 mM NADPH, and 80 µL of 625 U/L glutathione reductase) were added to the plate and incubated for 5 min at room temperature. The DTNB was used as a chromogen, and it formed a yellow-colored complex with sulfhydryl groups. The absorbance was mea-sured at 412 nm using a spectrophotometer mentioned above. The standard curve was obtained using reduced GSH. According to the GSH standard curve, the GSH levels of all tissues are calculated, and the results are ex-pressed as nmol GSH/mg protein.
Total antioxidant status (TAS) and total oxidative status (TOS) analyses
The TOS and TAS levels of tissue homogenates were determined using a novel automated measurement method and commercially available kits (Rel Assay Diagnostics, Gaziantep, Turkey), both developed by Erel.22,23 The TAS method is based on bleaching the characteristic color
of a more stable ABTS (2,2’-azino-bis (3-ethylbenzothi-azoline-6-sulfonic acid)) radical cation by antioxidants, and measurements are performed at 660 nm. The results are expressed as nmol Trolox equivalent/L. In the TOS method, the oxidants present in the sample oxidized the ferrous ion-o-dianisidine complex to ferric ion. The ox-idation reaction was enhanced by glycerol molecules, which are abundantly present in the reaction medium. The ferric ion produced a colored complex with xylenol orange in an acidic medium. The color intensity, which could be measured at 530 nm spectrophotometrically, was related to the total amount of oxidant molecules present in the sample. The results are expressed as nmol hydrogen peroxide (H2O2) equivalent/L.
ALT and AST analysis
Serum ALT and AST analysis were performed on a Roche Cobas 8000 autoanalyzer using the spectrophotometric method and kits from the same company (REF: 207649557-322, 20764949-322, respectively; Roche Diagnostics, Basel, Switzerland). The principle of both measurements is based on measuring the absorbance change of NADH at 340 nm.
Statistical analyses
Statistical analyses were performed using IBM SPSS soft-ware v. 21.0 (IBM Corp., Armonk, USA). The estimated power (1-beta) test value was calculated as 0.99 with the G-Power Program (https://www.psychologie.hhu.de/ar-beitsgruppen/allgemeine-psychologie-und-arbeitspsy-chologie/gpower). Numerical variables were expressed as a median (min–max). For the analysis of continuous variables, the Kruskal–Wallis test was performed. For be-tween 2 groups, Dunn‘s test (a post hoc comparison test) was performed. The minimum criterion for statistical sig-nificance was set at p < 0.05 for all comparisons.
Results
As shown in Table 1, serum ALT and AST activity were significantly higher in the CIS group compared with the HC and TCG groups (p < 0.001).
When mean MDA levels were compared, statistically significant differences were found between the study groups (p < 0.05). The amount of MDA in the TCG group was significantly decreased compared to the CIS group (p < 0.001), but no significant difference was found com-pared to the HC group (p > 0.05). When the mean tGSH levels were compared in the study groups, there was a sta-tistically significant difference among the groups (p < 0.05). In the TCG group, tGSH levels were significantly higher (p < 0.001) compared to the CIS and HC groups (Table 1).
There was a statistically significant difference among the groups in terms of TOS levels (p < 0.05). The levels

N. Kurt et al. The antioxidant effect of taxifolin1028
of TOS in the liver tissue of the TCG group were signifi-cantly lower compared to the CIS group (p < 0.001). There was no significant difference between the TCG and HC groups in terms of TOS level (p > 0.05). When the mean TAS levels were compared in the study groups, statistically significant differences were found (p < 0.05). The level of TAS in the liver tissue of the TCG group was significantly higher compared to the CIS group (p < 0.05) (Table 1). However, the difference between TAS levels in TCG and HC groups was insignificant (p > 0.05) (Table 1).
Discussion
In our study, the effect of taxifolin on cisplatin-induced oxidative liver injury in rats was investigated biochemi-cally. There are many studies showing cisplatin-induced liver damage.7,24 In our research, in parallel with the litera-ture, serum ALT and AST levels increased after exposure to high doses of cisplatin. These values decreased after ad-ministration of taxifolin. Our results showed that cisplatin caused an increase in MDA and TOS levels and a decrease of tGSH and TAS levels in animal liver tissue. Oxidant-antioxidant parameters are used to determine oxidative tissue damage25 and evaluate the biochemical toxicity of drugs.26 Increased MDA production in the CIS group suggests that lipid peroxidation is exacerbated in liver tis-sue cells in this group. The ROS lead to the peroxidation of lipids in the cell membrane and result in the secre-tion of more toxic products, such as MDA, from lipids.11 Malondialdehyde can cause damage in membrane proteins by inactivating receptors and membrane-bound enzymes in membranes, leading to cross-linking and polymerization of membrane components.27 The LPO reaction is either terminated by scavenging antioxidant reactions or contin-ues with auto-catalytic spreading reactions.28 Studies have suggested that ROS also play a role in the pathogenesis of the hepatotoxic effect of cisplatin.7 Niu et al. reported that the amount of MDA increased in cisplatin-associated
liver oxidative damage.29 In our study, high TOS values measured after cisplatin administration indicate cispla-tin-induced oxidative stress. The level of TOS was found to be increased in the CIS group, where MDA level was high. The TOS is used to determine the cumulative oxi-dative effects of various oxidants in biological systems.23 Studies have shown that cisplatin elevates TOS levels not only in the liver tissue but also in the kidney tissue.30 This is consistent with our experimental results showing that MDA and TOS levels in liver tissue were increased.
Again, in this study, it was observed that cisplatin de-creased the amount of tGSH in liver tissue compared to the TCG and the HC group. To prevent the harmful effects of ROS, living organisms develop several effective protection mechanisms both in the cell and in the cell membrane. These mechanisms act both by blocking rad-ical production and by eliminating the harmful effects of the radicals formed. Glutathione, a tripeptide consisting of L-glutamate, L-cysteine and glycine, is one of the most well-known antioxidants in living tissues. Glutathione reacts with H2O2 and organic peroxides by catalyzing the glutathione peroxidase enzyme, an enzyme contain-ing selenium in its active site, acting as an antioxidant and removing H2O2 from cells. Glutathione detoxifies hydro-gen peroxide or organic oxides chemically and protects the cells from ROS damage.31 In our study, the TAS level was measured to investigate the inhibitory effect of cispla-tin on antioxidant mechanisms. Our test results showed that there was a correlation between the decrease in tGSH and the TAS level. Niu et al. reported that cisplatin pro-duced oxidative stress by decreasing GSH and TAS levels in liver tissue.29
Taxifolin used against cisplatin-induced oxidative liver damage significantly inhibited an increase in MDA and TOS levels, and decreased tGSH and TAS levels. It has been documented in previous studies that taxifolin re-duced intracellular free radical levels, inhibited MDA and prevented the consumption of antioxidants.32 In another study, taxifolin was found to increase the effect of GSH.33
Table 1. The results of biochemical evaluations among groups
Variables
Groups
CISmedian (min–max)
(n = 6)
TCGmedian (min–max)
(n = 6)
HCmedian (min–max)
(n = 6)p-value
MDA [µmol/g protein] 8.65 (7.9–9.1)b,c 2.50 (2.2–3.7)a 3.05 (2.8–3.9)a 0.002
tGSH [nmol/g protein] 1.65 (1.4–2.1)b,c 4.85 (4.2–5.1)a 5.45 (5.1–5.7)a 0.001
TAS [nmol Trolox eq/mg protein] 5.45 (4.7–6.1)b,c 12.00 (10.0–16.0)a 14.50 (12.0–17.0)a 0.002
TOS [nmol H2O2 eq/mg protein] 18.00 (15.0–21.0)b,c 7.00 (6.1–8.0)a 6.25 (5.1–7.1)a 0.001
AST [IU/L] 200.06 (178.5–235.4)b,c 48.71 (38.1–56.3)a 40.43 (34.7–48.8)a 0.001
ALT [IU/L] 100.12 (89.2–116.8)b,c 38.07 (34.5–41.4)a 30.66 (23.6–34.5)a 0.001
HC – healthy control; CIS – 5 mg/kg cisplatin group; TCG – 50 mg/kg taxifolin + 5 mg/kg cisplatin group; MDA – malondialdehyde; tGSH – total glutathione; TAS – total antioxidant status; TOS – total oxidative status; ALT – alanine aminotransferase; AST – aspartate aminotransferase. a – statistically significantly different compared with CIS; b – statistically significantly different compared with TCG; c – statistically significantly different compared with HC.

Adv Clin Exp Med. 2021;30(10):1025–1030 1029
As noted above, taxifolin is a flavonoid.13 Previous studies have expressed that flavonoids demonstrate antioxidant activity by inhibiting lipid peroxidation and enzymatic reactions responsible for the formation of free radicals.34 In a recent study, it was suggested that taxifolin produces a hepatoprotective effect with antioxidant activity by in-hibiting the lipid peroxidation pathway.35 Viewed in total, data from the reviewed literature are in agreement with our experimental results.
Limitations
In our study, it was necessary to investigate the effect of taxifolin on pro-inflammatory cytokine levels, known to play a role in the pathogenesis of cisplatin toxicity, in or-der to clarify its protective effect against hepatotoxicity caused by cisplatin. In addition, histopathological findings should support all biochemical findings. The small number of animals in the groups could be considered as another limitation.
Conclusions
As a result, cisplatin caused oxidative damage in the liver tissue of animals. In the CIS group, the oxidant–antioxi-dant balance deteriorated against the oxidants. Taxifolin prevented the increase in oxidants and decreased antioxi-dants in the liver tissue injured due to cisplatin. Taxifolin prevented the change in favor of oxidants in the oxidant–antioxidant balance. These findings suggest that taxifolin could be a clinically beneficial agent for treating hepato-toxicity resulting from chemotherapy procedures.
ORCID iDsNezahat Kurt https://orcid.org/0000-0002-1685-5332Özge Nur Türkeri https://orcid.org/0000-0001-8791-5331Bahadir Suleyman https://orcid.org/0000-0001-5795-3177Nuri Bakan https://orcid.org/0000-0002-2139-7268
References1. Lebwohl D, Canetta R. Clinical development of platinum complexes in
cancer therapy: A historical perspective and an update. Eur J Cancer. 1998;34(10):1522–1534. doi:10.1016/s0959-8049(98)00224-x
2. Onk D, Mammadov R, Suleyman B, et al. The effect of thiamine and its metabolites on peripheral neuropathic pain induced by cisplatin in rats. Exp Anim. 2018;67(2):259–269. doi:10.1538/expanim.17-0090
3. Kuduban O, Kucur C, Sener E, Suleyman H, Akcay F. The role of thia-mine pyrophosphate in prevention of cisplatin ototoxicity in an ani-mal model. ScientificWorldJournal. 2013;2013:182694. doi:10.1155/ 2013/182694
4. Cao BB, Li D, Xing X, et al. Effect of cisplatin on the clock genes expres-sion in the liver, heart and kidney. Biochem Biophys Res Commun. 2018;501(2):593–597. doi:10.1016/j.bbrc.2018.05.056
5. Bodiga VL, Bodiga S, Surampudi S, et al. Effect of vitamin supple-mentation on cisplatin-induced intestinal epithelial cell apopto-sis in Wistar/NIN rats. Nutrition. 2012;28(5):572–580. doi:10.1016/j.nut.2011.09.007
6. Khan R, Khan AQ, Qamar W, et al. Chrysin abrogates cisplatin-induced oxidative stress, p53 expression, goblet cell disintegration and apop-totic responses in the jejunum of Wistar rats. Br J Nutr. 2012;108(9): 1574–1585. doi:10.1017/S0007114511007239
7. Liao Y, Lu X, Lu C, Li G, Jin Y, Tang H. Selection of agents for prevention of cisplatin induced hepatotoxicity. Pharmacol Res. 2008;57(2):125–131. doi:10.1016/j.phrs.2008.01.001
8. Tsang RY, Al-Fayea T, Au HJ. Cisplatin overdose: Toxicities and man-agement. Drug Saf. 2009;32(12):1109–1122. doi:10.2165/11316640-000000000-00000
9. Zheng XN, Wang XW, Li LY, et al. Pu-erh tea powder preventive effects on cisplatin-induced liver oxidative damage in Wistar rats. Asian Pac J Cancer Prev. 2014;15(17):7389–7394. doi:10.7314/apjcp. 2014.15.17.7389
10. Naqshbandi A, Khan W, Rizwan S, Khan F. Studies on the protective effect of flaxseed oil on cisplatin-induced hepatotoxicity. Hum Exp Toxicol. 2012;31(4):364–375. doi:10.1177/0960327111432502
11. Sun Y, Yang J, Wang LZ, Sun LR, Dong Q. Crocin attenuates cisplatin-induced liver injury in the mice. Hum Exp Toxicol. 2014;33(8):855–862. doi:10.1177/0960327113511475
12. Mohamadi Yarijani Z, Godini A, Madani SH, Najafi H. Reduction of cis-platin-induced renal and hepatic side effects in rat through anti-oxidative and anti-inflammatory properties of Malva sylvestris L. extract. Biomed Pharmacother. 2018;106:1767–1774. doi:10.1016/j.biopha.2018.07.115
13. Wang Q, Wang L, Li G, Ye B. A simple and sensitive method for deter-mination of taxifolin on palladium nanoparticles supported poly (diallyldimethylammonium chloride) functionalized graphene modi-fied electrode. Talanta. 2017;164:323–329. doi:10.1016/j.talanta.2016. 11.045
14. Topal F, Nar M, Gocer H, et al. Antioxidant activity of taxifolin: An activ-ity–structure relationship. J Enzyme Inhib Med Chem. 2016;31(4): 674–683. doi:10.3109/14756366.2015.1057723
15. Manigandan K, Jayaraj RL, Jagatheesh K, Elangovan N. Taxifolin mit-igates oxidative DNA damage in vitro and protects zebrafish (Danio rerio) embryos against cadmium toxicity. Environ Toxicol Pharmacol. 2015;39(3):1252–1261. doi:10.1016/j.etap.2015.04.021
16. Coskun R, Turan MI, Turan IS, Gulapolu M. The protective effect of thiamine pyrophosphate, but not thiamine, against cardiotoxicity induced with cisplatin in rats. Drug Chem Toxicol. 2014;37(3):290–294. doi:10.3109/01480545.2013.851688
17. Topal İ, Bilgin OA, Çimen KF, et al. The effect of rutin on cisplatin-induced oxidative cardiac damage in rats. Anatol J Cardiol. 2018;20(3): 136–142. doi:10.14744/AnatolJCardiol.2018.32708
18. Bradford MM. A rapid and sensitive method for the quantitation of microgram quantities of protein utilizing the principle of pro-tein-dye binding. Anal Biochem. 1976;7(72):248–254. doi:10.1006/abio.1976.9999
19. Ohkawa H, Ohishi N, Yagi K. Assay for lipid peroxides in animal tissues by thiobarbituric acid reaction. Anal Biochem. 1979;95(2):351–358. doi:10.1016/0003-2697(79)90738-3
20. Sedlak J, Lindsay RH. Estimation of total, protein-bound, and nonpro-tein sulfhydryl groups in tissue with Ellman’s reagent. Anal Biochem. 1968;25(1):192–205. doi:10.1016/0003-2697(68)90092-4
21. Baker MA, Cerniglia GJ, Zaman A. Microtiter plate assay for the mea-surement of glutathione and glutathione disulfide in large numbers of biological samples. Anal Biochem. 1990;190(2):360–365. doi:10. 1016/0003-2697(90)90208-q
22. Erel O. A novel automated method to measure total antioxidant response against potent free radical reactions. Clin Biochem. 2004; 37(2):112–119. doi:10.1016/j.clinbiochem.2003.10.014
23. Erel O. A new automated colorimetric method for measuring total oxidant status. Clin Biochem. 2005;38(12):1103–1111. doi:10.1016/j.clin-biochem.2005.08.008
24. Palipoch S, Punsawad C. Biochemical and histological study of rat liver and kidney injury induced by cisplatin. J Toxicol Pathol. 2013; 26(3):293–299. doi:10.1293/tox.26.293
25. Icel E, Uçak T, Agcayazi B, et al. Effects of pycnogenol on cisplatin-induced optic nerve injury: An experimental study. Cutan Ocul Toxicol. 2018;37(4):396–400. doi:10.1080/15569527.2018.1495224
26. Salman S, Kumbasar S, Gursan N, et al. Investigation of the rela-tionship of some antihypertensive drugs with oxidant/antioxidant parameters and DNA damage on rat uterus tissue. Int J Fertil Steril. 2011;5(2):96–103. PMID:24963366
27. Goulart M, Batoréu MC, Rodrigues AS, Laires A, Rueff J. Lipoperoxida-tion products and thiol antioxidants in chromium-exposed workers. Mutagenesis. 2005;20(5):311–315. doi:10.1093/mutage/gei043

N. Kurt et al. The antioxidant effect of taxifolin1030
28. Gutteridge JM. Lipid peroxidation and antioxidants as biomarkers of tissue damage. Clin Chem. 1995;41(12 Pt 2):1819–1828. PMID:7497639
29. Niu C, Ma M, Han X, Wang Z, Li H. Hyperin protects against cispla-tin-induced liver injury in mice. Acta Cir Bras. 2017;32(8):633–640. doi:10.1590/s0102-865020170080000005
30. Eren H, Aydin HR, Tumkaya L, et al. Whortleberry protects kidney against the cisplatin-induced nephrotoxicity: An experimental study. Ren Fail. 2018;40(1):466–474. doi:10.1080/0886022X.2018.1500292
31. Murray RK, Granner DK, Mayes PA, Rodwell VW. Harper’s Biochemistry. 25th ed. New York, USA: McGraw–Hill Press; 2000.
32. Sun X, Chen RC, Yang ZH, et al. Taxifolin prevents diabetic cardio-myopathy in vivo and in vitro by inhibition of oxidative stress and cell apoptosis. Food Chem Toxicol. 2014;63:221–232. doi:10.1016/j.fct.2013.11.013
33. Pereira RB, Sousa C, Costa A, Andrade PB, Valentao P. Glutathione and the antioxidant potential of binary mixtures with flavonoids: Syn-ergisms and antagonisms. Molecules. 2013;18(8):8858–8872. doi:10. 3390/molecules18088858
34. Cotelle N. Role of flavonoids in oxidative stress. Curr Top Med Chem. 2001;1(6):569–590. doi:10.2174/1568026013394750
35. Zhang Y, Jin Q, Li X, Jiang M, et al. Amelioration of alcoholic liver steatosis by dihydroquercetin through the modulation of AMPK-dependent lipogenesis mediated by P2X7R-NLRP3-inflammasome activation. J Agric Food Chem. 2018;66(19):4862–4871. doi:10.1021/acs.jafc.8b00944
Cite asWang T, Lu H. Ganoderic acid A inhibits ox-LDL-induced THP-1-derived macrophage inflammation and lipid deposition via Notch1/PPARγ/CD36 signaling. Adv Clin Exp Med. 2021;30(10):1031–1041. doi:10.17219/acem/137914
DOI10.17219/acem/137914
Copyright© 2021 by Wroclaw Medical University This is an article distributed under the terms of theCreative Commons Attribution 3.0 Unported (CC BY 3.0)(https://creativecommons.org/licenses/by/3.0/)
Address for correspondenceTao WangE-mail: [email protected]
Funding sourcesNone declared
Conflict of interestNone declared
Received on January 27, 2021Reviewed on April 5, 2021Accepted on May 20, 2021
Published online on July 30, 2021
AbstractBackground. Atherosclerosis (AS), a chronic inflammatory disease, is a major contributor to deaths worldwide. Ganoderic acid A (GAA) has been widely applied for various diseases due to its excellent anti-inflammatory properties.
Objectives. To investigate the underlying mechanism of GAA inhibition of inflammation and lipid deposition in human monocyte (THP-1) cells.
Materials and methods. The Cell Counting Kit-8 (CCK-8) assay was used to assess the potential effect of GAA on the viability of THP-1 cells. The release of inflammatory cytokines and oxidative stress was measured using enzyme-linked immunosorbent assay (ELISA) and the corresponding kit, respectively. The levels of lipid deposition and total cholesterol (TC) were also evaluated. Next, the scavenger receptors and proteins in Notch1/PPARγ/CD36 signaling were measured with western blot. As Notch1 was overexpressed in the THP-1 cells induced by oxidized low-density lipoprotein (ox-LDL), the above assays were performed again to confirm the underlying mechanism.
Results. Ganoderic acid A suppressed ox-LDL-induced inflammation and oxidative stress in THP-1 cells. At the same time, it inhibited the TC level and lipid deposition. The effects of GAA on alleviating inflammation, oxidative stress and lipid accumulation were relieved after the overexpression of Notch1 in the treated cells, and the effects of GAA on alleviating inflammation, oxidative stress and lipid accumulation were diminished. The PPARγ activator also weakened the effects of GAA on relieving inflammation, oxidative stress and lipid accumulation in ox-LDL-induced THP-1 cells.
Conclusions. Ganoderic acid A inhibits ox-LDL-induced macrophage inflammation and lipid deposition in THP-1 cells through Notch1/PPARγ/CD36 signaling, which may provide theoretical guidance for the clinical applications of GAA in AS treatment.
Key words: inflammation, Notch1, PPARγ, ganoderic acid A, lipid deposition
Original papers
Ganoderic acid A inhibits ox-LDL-induced THP-1-derived macrophage inflammation and lipid deposition via Notch1/PPARγ/CD36 signaling
Tao WangA–F, Huihe LuA–C,E,F
Department of Cardiology, Second Affiliated Hospital of Nantong University, China
A – research concept and design; B – collection and/or assembly of data; C – data analysis and interpretation; D – writing the article; E – critical revision of the article; F – final approval of the article
Advances in Clinical and Experimental Medicine, ISSN 1899–5276 (print), ISSN 2451–2680 (online) Adv Clin Exp Med. 2021;30(10):1031–1041

T. Wang, H. Lu. Ganoderic acid A reduces inflammation1032
Background
Atherosclerosis (AS), a chronic inflammatory disease, is a leading cause of death worldwide.1 The loading of cho-lesterol in macrophages of the artery walls contributes to lipid deposition, which is believed to induce the oc-currence and development of AS.2 Therefore, AS is con-sidered to have a close relationship with lipid deposition. Apart from lipid deposition and long-term inflammation, immune activation and the stimulation of inflammatory mediators are also AS characteristics. Therapies targeting anti-inflammatory agents are thought to be useful meth-ods for the treatment of AS, but investigation and stud-ies of agents that possess anti-inflammatory effects for the resolution of AS occurrence are limited. Thus, there is a desperate need to study and develop new agents fo-cusing on the inhibition of inflammation for the effective treatment of AS.
Ganoderma lucidum has been widely used in traditional Chinese medicine for the treatment of inflammatory dis-eases, cancers and immunological diseases.3 It has been applied for thousands of years due to its remarkable physi-ological and pharmacological activities. Ganoderic acid A (GAA) is one of the major triterpenoids in Ganoderma lucidum. Many experts have confirmed that GAA plays an important role in treating cancers because of its effi-cacy in preventing proliferation and enhancing apoptosis of multiple cancer cells.4,5 The anti-inflammatory and anti-oxidant roles of GAA cannot be neglected because rats injected with GAA have been shown to be protected from liver injury and lung injury induced by various factors.6,7 The latest findings show that GAA has great potential to in-hibit Notch1 protein expression, which is believed to en-hance the stability of peroxisome proliferator-activated receptor gamma (PPARγ) and increase the level of CD36 in human monocyte (THP-1)-derived macrophages stimu-lated by interleukin (IL)-4.8,9 Lipid deposition in macro-phage foam cells can contribute to the formation of plaques and exacerbate the development of AS. Inflammation is a critical risk factor for the occurrence of AS.10 Therefore, we speculated that GAA may alleviate the symptoms of AS by inhibiting inflammation and lipid deposition in THP-1-derived macrophages via the Notch1 signal.
A large quantity of low-density lipoprotein (LDL) is mod-ified to oxidized low-density lipoprotein (ox-LDL), which aggregates in the vascular internal wall and triggers ath-erosclerotic plaque development.11 Therefore, the present study used ox-LDL to induce an AS model.
Objectives
The present study aimed to investigate the effects of GAA on an in vitro AS model as well as its underlying mechanism, which may provide theoretical guidance for the clinical application of GAA in the treatment of AS.
Materials and methods
Cell culture and treatments
Human monocytes (THP-1) were purchased from the American Type Culture Collection (ATCC, Manassas, USA) and cultured in RPMI 1640 medium (Sigma–Aldrich, St. Louis, USA) containing 10% fetal bovine serum (FBS) and antibiotics (100 U/mL of penicillin A and streptomy-cin) at 37°C in a humidified atmosphere containing 5% CO2. A total of 1 × 10⁵ THP-1 cells were collected and cultivated with 100 nM phorbol-12-myristate13-acetate (PMA; Sigma–Aldrich) for 48 h to stimulate differentia-tion into macrophages. The harvested macrophages were subsequently cultured in serum-free medium containing ox-LDL (100 ng/mL; Sigma–Aldrich) for 24 h to induce foam cell formation. The GAA was purchased from YuanYe Biotechnology Co., Ltd (Shanghai, China). The cells were then treated with various concentrations of GAA (20 µm, 50 µm or 70 µm) or co-treated with a PPARγ activator. The transfection of THP-1 cells with the overexpression plasmid of Notch1 was performed using Lipofectamine 2000 (Invitrogen, Carlsbad, USA).
CCK-8
A total of 2 × 10⁴ cells were plated into 96-well plates. After the indicated treatment, the Cell Counting Kit-8 (CCK-8; Glpbio, Montclair, USA) reagent was mixed in the culture medium and added to the 96-well plates. These cells were then incubated for 1 h. Next, the absorbance of the cells was measured using a spectrophotometer (Thermo Fisher Scien-tific, Waltham, USA). The absorbance at 450 nm was mea-sured with a microplate reader (Thermo Fisher Scientific).
ELISA
The levels of tumor necrosis factor-α (TNF-α), IL-1β and IL-6 in the macrophages were evaluated using commer-cial enzyme-linked immunosorbent assay (ELISA) kits ac-cording to the manufacturer’s recommendations (Abcam, Cambridge, UK).
Western blot
Total proteins were extracted from TPC-1 cells with RIPA buffer (Beyotime, Shanghai, China) and the protein concentration was measured using the BCA Protein Assay Kit (Merck Millipore, Burlington, USA). Next, 40 µg of pro-tein in each group was separated using sodium dodecyl sulfate polyacrylamide gel electrophoresis (SDS-PAGE) and transferred to polyvinylidene fluoride (PVDF) membranes (Merck Millipore). The membranes were blocked with 5% skimmed milk. These blots were then incubated with diluted primary antibodies for the target proteins at 4°C overnight, and then secondary antibodies (Santa Cruz

Adv Clin Exp Med. 2021;30(10):1031–1041 1033
Biotechnology, Santa Cruz, USA) were added to the mem-branes and incubated. ImageJ software (National Insti-tutes of Health, Bethesda, USA) was used to determine the intensities. The expression of protein was normalized to GAPDH levels to correct for loading.
Detection of reactive oxygen species and malondialdehyde
The detection of reactive oxygen species (ROS) was con-ducted using a commercially available ROS kit (Jiancheng Bioengineering Institute, Shanghai, China), while the de-tection of malondialdehyde (MDA) was conducted using the corresponding MDA kit from Jiancheng Bioengineer-ing Institute (Nanjing, China) in line with the manufac-turer’s instructions.
Oil red O staining of macrophages
The treated macrophages were collected, fixed in 10% formaldehyde solution for 20 min, washed with phosphate-buffered saline (PBS) and stained using oil red O (Amresco, Solon, USA) solution (in 60% isopropanol) for 10 min. After-wards, the stained macrophages were counterstained with hematoxylin for 3 min. The lipid-stained areas of the slides and cross-sections were observed and photographed using an inverted microscope (Olympus Corp., Tokyo, Japan) at a ×200 magnification. With the application of Image-Pro Plus image analysis software v. 6.0 (Media Cybernetics Inc., Rockville, USA), the lipid droplet content was analyzed.
Measurement of total cholesterol
Total cholesterol (TC) levels were assayed using the Am-plex Red Cholesterol Assay Kit (Invitrogen) according to the manufacturer’s protocols.
RT-qPCR
Trizol reagent (Invitrogen) was used to separate the to-tal RNA from THP-1 cells according to the manufac-turer’s specifications. Before the real-time quantitative polymerase chain reaction (RT-qPCR) was performed for gene amplification using the SYBR Premix Ex TaqTM GC (TaKaRa, Tokyo, Japan) protocol on a 7900 real-time PCR system (Applied Biosystems, Foster City, USA), the complementary DNA (cDNA) was synthesized from quantified RNA with the use of a PrimeScript TM RT re-agent Kit. Relative gene expression was measured using the 2−ΔΔCt method. The ratio for the mRNA of interest was normalized to GAPDH. The primers used in this study are as follows: LOX-1 forward: 5’-TTGCCTGGGATTAG-TAGTGACC-3’. reverse: 5’- GCTTGCTCTTGTGTTAG-GAGGT-3; SR-A forward: 5’-GCAGTGGGATCACTTTCA-CAA-3’, reverse: 5’-AGCTGTCATTGAGCGAGCATC-3’; Notch1 forward 5’-GAGGCGTGGCAGACTATGC-3’:
reverse 5’-CTTGTACTCCGTCAGCGTGA-3’; PPARγ forward: 5’-GGGATCAGCTCCGTGGATCT-3’ reverse: 5’-TGCACTTTGGTACTCTTGAAGTT-3’; CD36 for-ward: 5’-GGCTGTGACCGGAACTGTG-3’, and reverse: 5’-AGGTCTCCAACTGGCATTAGAA-3’.
Statistical analyses
The results were analyzed using GraphPad Prism soft-ware v. 5.01 (GraphPad Software, San Diego, USA). All data are presented as the mean ± standard deviation (SD). One-way analysis of variance (ANOVA) was utilized to compare differences among multiple groups, followed by Tukey’s post hoc test for comparison between 2 groups. Value of p < 0.05 was considered to be statistically significant.
Results
GAA suppresses ox-LDL-induced inflammation and oxidative stress in THP-1 cells
To confirm the effects of GAA on THP-1 cells induced by ox-LDL, the toxicity of GAA to macrophages was first assessed. The THP-1 cells were treated with different con-centrations of GAA (10 µM, 20 µM, 50 µM, and 70 µM) for 24 h. The analysis showed that GAA had no toxic effect on macrophages (Fig. 1A). After 100 nM of PMA treat-ment of THP-1 cells for 48 h, THP-1 cells were induced to differentiate into macrophages. Next, the macrophages were subjected to ox-LDL stimulation for 24 h. As shown in Fig. 1B, inflammation was induced by ox-LDL through significant elevation of the levels of TNF-α, IL-1β, IL-6, and NF-κB p65 protein. However, GAA decreased their levels in a dose-dependent manner (Fig. 1C). The high expression of ROS and MDA triggered by ox-LDL was gradually inhibited by increasing the dose of GAA, dem-onstrating that the possible alteration of oxidative stress status induced by ox-LDL in THP-1 cells was alleviated by increasing the dose of GAA (Fig. 1D). Taken together, these findings show that GAA suppresses ox-LDL-induced inflammation and oxidative stress in THP-1 cells.
GAA suppresses lipid deposition in ox-LDL-induced THP-1 cells
Abnormal lipid metabolism is an important risk factor for the development of AS.12 Therefore, the level of lipid accumulation was measured with oil red O staining. Com-pared with the control group, ox-LDL-induced THP-1 cells exhibited markedly higher levels of lipid deposition, which were gradually relieved by GAA treatment (Fig. 2A). Mean-while, the TC level of THP-1 cells was markedly ele vated by ox-LDL. Nevertheless, as the dose of GAA increased, the TC level of THP-1 cells treated by ox-LDL decreased

T. Wang, H. Lu. Ganoderic acid A reduces inflammation1034
(Fig. 2B). The scavenger receptors that play an important part in lipid uptake have a close relationship with the patho-genesis of AS.13 Various scavenger receptors (SR) like SR class A (SR-A), SR class B (CD36) and lectin-like oxidized LDL 1 receptor (LOX-1) can recognize and bind to modi-fied LDL. The uptake of modified lipoproteins by these SRs makes great contributions to foam cell formation.14 There-fore, RT-qPCR and western blot were adopted to measure the expression of SR-A and CD36. The reduced expression of SR-A and CD36 in ox-LDL-induced THP-1 cells treated with GAA implied the inhibitory role of GAA in lipid uptake (Fig. 3A,B). Thus, the conclusion can be drawn that GAA suppresses lipid deposition in ox-LDL-induced THP-1 cells.
GAA suppresses expression of Notch1/PPARγ/CD36 signaling in ox-LDL-induced THP-1 cells
The effects of GAA on the expression of Notch1, PPARγ and CD36 in ox-LDL-induced THP-1 cells were measured. As seen in Fig. 4, compared with the con-trol group, the expression of Notch1, PPARγ and CD36 increased in the ox-LDL group. Notably, the levels of Notch1, PPARγ and CD36 in ox-LDL-induced THP-1 cells were reduced by GAA. Thus, GAA suppresses the expression of Notch1/PPARγ/CD36 in ox-LDL-in-duced THP-1 cells.
Fig. 1. The effect of GAA on the viability of THP-1 cells. A. The viability of THP-1 cells treated with GAA was assessed with the CCK-8 assay; B. The inflammatory cytokines in ox-LDL-induced THP-1 cells were detected with ELISA; C. The expression level of NF-kB p65 was measured with western blot; D. Oxidative stress-related factors were measured using the corresponding kits. Experimental data are presented as mean ±SD
*** p < 0.001 compared to ox-LDL (−), # p < 0.05, ## p < 0.01, ### p < 0.001 compared to ox-LDL (+), GAA [µM] (−). ox-LDL − oxidized low-density lipoprotein; ELISA − enzyme-linked immunosorbent assay; SD − standard deviation; CCK-8 − Cell Counting Kit-8; GAA − ganoderic acid A; THP-1 − human monocyte.

Adv Clin Exp Med. 2021;30(10):1031–1041 1035
GAA suppresses inflammation and oxidative stress in ox-LDL-induced THP-1 cells via Notch1/PPARγ/CD36 signaling
Next, the expression of Notch1 was increased to a rela-tively high level to allow detection of its downstream effectors
(Fig. 5A). The overexpression of Notch1 increased the ex-pression of PPARγ and CD36, indicating a positive relation-ship between Notch1 and its downstream effectors (Fig. 5B). Compared with ox-LDL-induced THP-1 cells with GAA treatment, the expression of inflammatory cytokines and NF-KB p65 was higher in ox-LDL-induced THP-1 cells with
Fig. 3. The expression of scavenger receptors was measured with qPCR and western blot. Experimental data are shown as mean ±SD
*** p < 0.001 compared to ox-LDL (−), ## p < 0.01, ### p < 0.001 compared to ox-LDL (+), GAA [µM] (−), #p < 0.05, ###p < 0.001 compared to ox-LDL (+), GAA [µM] (−). ox-LDL − oxidized low-density lipoprotein; SD − standard deviation; GAA − ganoderic acid A; THP-1 − human monocyte; qPCR − quantitative polymerase chain reaction.
Fig. 2. GAA suppresses lipid deposition in ox-LDL-induced THP-1 cells. A. The level of lipid deposition was detected with oil red O staining; B. The TC level was assayed using the Amplex Red Cholesterol Assay Kit. Values are expressed as mean ±SD
*** p < 0.001 compared to ox-LDL (−), # p < 0.05, ### p < 0.001 compared to ox-LDL (+), GAA [µM] (−); ox-LDL − oxidized low-density lipoprotein; TC − total cholesterol; SD − standard deviation; GAA − ganoderic acid A; THP-1 − human monocyte.

T. Wang, H. Lu. Ganoderic acid A reduces inflammation1036
combined GAA and the overexpression plasmid of Notch1 (Ov-Notch1) treatment (Fig. 6A,B). Similarly, pretreatment with troglitazone (10 µM), which is a PPARγ activator, in ox-LDL-induced THP-1 cells upon GAA challenge for 2 h led to an increased level of inflammatory cytokines. Treatment with Ov-Notch1 and PPARγ activator resulted in higher levels of ROS and MDA, respectively, in ox-LDL-induced THP-1 cells with GAA treatment (Fig. 6C). Therefore, GAA sup-presses inflammation and oxidative stress in ox-LDL-induced THP-1 cells via Notch1/PPARγ/CD36 signaling.
GAA inhibits lipid deposition in ox-LDL-induced THP-1 cells via Notch1/PPARγ/CD36 signaling
To further confirm the role of the Notch1/PPARγ/CD36 signal in lipid deposition in the AS model, the level of lipid accumulation was detected in ox-LDL-induced THP-1 cells with different treatments. As Fig. 7A shows, lipid accumu-lation reached the highest level in ox-LDL-induced THP-1 cells without any other treatment. The GAA greatly relieved lipid accumulation in ox-LDL-induced THP-1 cells. Fur-thermore, the addition of Ov-Notch1 or PPARγ activator promoted the formation of oil droplets. Notch signaling is recognized to regulate PPARγ protein stability in hu-man macrophages.15 In our study, the TC content, which
Fig. 4. GAA suppresses the expression of Notch1/PPARγ/CD36 in ox-LDL-induced THP-1 cells. A and B. Gene and protein expression in the Notch1/PPARγ/CD36 signaling pathway was assayed using qPCR and western blot, respectively. Experimental data are shown as mean ±SD
*** p < 0.001 compared to ox-LDL (−), #p < 0.05, ##p < 0.01, ###p < 0.001 compared to ox-LDL (+) + GAA [µM] (−). ox-LDL − oxidized low-density lipoprotein; SD − standard deviation; GAA − ganoderic acid A; THP-1 − human monocyte; qPCR − quantitative polymerase chain reaction.

Adv Clin Exp Med. 2021;30(10):1031–1041 1037
Fig. 5. Notch1 overexpression reversed the effects of GAA. GAA suppresses inflammation and oxidative stress in ox-LDL-induced THP-1 cells via Notch1/PPARγ/CD36 signaling pathway. A. The level of Notch1 was detected after it was overexpressed in THP-1 cells; B. Protein expression in the Notch1/PPARγ/CD36 signaling pathway was assayed using western blot. Values are expressed as mean ±SD
*** p < 0.001 compared to Ov-NC, ### p < 0.001 compared to ox-LDL (+) + GAA (−) + Ov-NC (−) + Ov-Notch1 (−), $$$ p < 0.001 compared to ox-LDL (+) + GAA (+) + Ov-NC (+) +Ov-Notch1 (−). ox-LDL − oxidized low-density lipoprotein; SD − standard deviation; GAA − ganoderic acid A; THP-1 − human monocyte.

T. Wang, H. Lu. Ganoderic acid A reduces inflammation1038
was reduced by GAA, increased by Notch1 overexpres-sion or PPARγ activator (Fig. 7B). The changes in the ex-pression levels of LOX-1 and SR-A demonstrate the same alteration as the abovementioned results (Fig. 8A,B). Therefore, the conclusion that GAA inhibits lipid deposi-tion in ox-LDL-induced THP-1 cells via Notch1/PPARγ/CD36 signaling can be drawn. However, Ov-Notch1 and PPARγ activator can partly reverse the suppressive effects of GAA on lipid deposition in ox-LDL-induced THP-1 cells.
Together, these results demonstrate that Notch1/PPARγ/CD36 signaling pathway is involved in the effects of GAA on lipid deposition.
Discussion
Macrophages play a critical role in innate immunity and diseases of high prevalence, including cancer, obesity
Fig. 6. GAA suppresses inflammation and oxidative stress in ox-LDL-induced THP-1 cells via Notch1/PPARγ/CD36 signaling pathway. A. The inflammatory cytokines in ox-LDL-induced THP-1 cells were detected with ELISA; B. The expression level of NF-kB p65 was measured using western blot; C. The oxidative stress-related factors were measured using the corresponding kits. Values are expressed as mean ±SD
*** p < 0.001 compared to Ov-NC, ### p < 0.001 compared to ox-LDL (+) + GAA (−) + Ov-NC (−) + Ov-Notch1 (−), $$$ p < 0.001 compared to ox-LDL (+) + GAA (+) + Ov-NC (+) + Ov-Notch1 (−). ox-LDL − oxidized low-density lipoprotein; SD − standard deviation; ELISA - enzyme-linked immunosorbent assay; GAA − ganoderic acid A; THP-1 − human monocyte; PPARγ − peroxisome proliferator-activated receptor gamma; NC − negative control.

Adv Clin Exp Med. 2021;30(10):1031–1041 1039
Fig. 7. GAA inhibits lipid deposition in ox-LDL-induced THP-1 cells via Notch1/PPARγ/CD36 signaling pathway. A. The level of lipid deposition was detected with oil red O staining; B. The TC level was assayed using the Amplex Red Cholesterol Assay Kit. Values are expressed as mean ±SD
*** p < 0.001 compared to Ov-NC, ###p < 0.001 compared to ox-LDL (+) + GAA (−) + Ov-NC (−) + Ov-Notch1 (−), $$$ p < 0.001 compared to ox-LDL (+) + GAA (+) + Ov-NC (+) + Ov-Notch1 (−). ox-LDL − oxidized low-density lipoprotein; TC − total cholesterol; SD − standard deviation; GAA − ganoderic acid A; THP-1 − human monocyte; PPARγ − peroxisome proliferator-activated receptor gamma; NC − negative control.
Fig. 8. GAA inhibits the expression of scavenger receptors in ox-LDL-induced THP-1 cells via Notch1/PPARγ/CD36 signaling pathway. The expression of scavenger receptors was measured with qPCR and western blot. Values are expressed as mean ±SD
*** p < 0.001 compared to Ov-NC, ###p < 0.001 compared to ox-LDL (+) + GAA (−) + Ov-NC (−) + Ov-Notch1 (−), $$$p < 0.001 compared to ox-LDL (+) + GAA (+) + Ov-NC (+) + Ov-Notch1 (−). ox-LDL − oxidized low-density lipoprotein; TC − total cholesterol; SD − standard deviation; GAA − ganoderic acid A; THP-1 − human monocyte; qPCR − quantitative polymerase chain reaction; PPARγ − peroxisome proliferator-activated receptor gamma; NC − negative control.

T. Wang, H. Lu. Ganoderic acid A reduces inflammation1040
and AS.16 When monocytes arrive at an injury site, they transform into macrophages, the activation of which can respond to signals in damaged tissues.17 Macrophages are thought to play a pathogenic role in the formation of ath-erosclerotic plaques. The roles of macrophages in AS are tied to its polarization. Polarized macrophages are divided into 2 phenotypes: M1 and M2.2 Activated M1 macro-phages can be induced by lipopolysaccharides (LPS), while M2 macrophages are activated after exposure to various cytokines, including IL-4, IL-13 and IL-10.
It was previously reported that pro-inflammatory fac-tors, including IL-1β, IL-6 and TNF-α, are critical con-tributors to the progression of AS. Thus, it is of great value to find novel targets for the suppression of inflam-mation related to AS lesions.3 Together with the decrease in the level of NF-KB p65, which is a transcription factor involved in the regulation of inflammation, the inhibition of these cytokines by GAA in THP-1 cells under ox-LDL conditions potently implies the role of GAA in blocking the inflammatory response.18 Consistent with our results, a previous report suggested that GAA caused decreased levels of IL-1β, IL-6 and TNF-α in mice with lung injury.7 Anti-oxidant therapy is considered an effective method for the prevention and treatment of AS because the inflam-matory changes triggering the occurrence of AS can be inhibited by suppressing oxidized lipoprotein and lipid formation and oxidative stress.19 Due to the remarkable effects of GAA on alleviating inflammation in multiple injuries and blocking the development of cancers, GAA was hypothesized to play a critical role in AS. We identified that GAA was able to suppress the release of inflammatory factors and oxidative stress in ox-LDL-induced THP-1 cells. Furthermore, lipid deposition induced by ox-LDL in THP-1 cells was relieved by GAA.
Notch signaling is a critical transcriptional factor in the regulation of differentiation and proliferation of stem cells.20 The Notch signaling pathway is involved in interactions among cells throughout the organs of the body in a large number of diseases. It is suggested that the cellular processes of monocytes and the modu-lation of macrophages are determined by this signaling pathway.21,22 In the present study, Notch signaling was induced by ox-LDL but inhibited by GAA. Furthermore, the overexpression of Notch1 relieved the inhibitory effect of GAA on the reduction of inflammatory factors and oxi-dative stress. PPARγ, a ligand-activated transcription factor that regulates fatty acid metabolism, plays a role in lipid deposition, cell differentiation and inflammation.23 It has been reported that ox-LDL can strongly activate PPARγ to regulate gene expression in macrophages.24 The expres-sion of PPARγ was markedly increased after ox-LDL was used to induce THP-1 cells, suggesting successful activa-tion of PPARγ by ox-LDL. The GAA treatment potently inhibited its expression, while the PPARγ activator, which activates the PPARγ signal, led to further inflammation and oxidative stress. Therefore, the mechanism by which
GAA alleviates inflammation and oxidative stress might be related to a PPARγ-dependent signal. Internalized ox-LDL supplies rich oxidized fatty acids that serve as li-gands to PPARγ, thereby inducing genes such as CD36.25 The role of CD36 in long-chain fatty acid uptake and oxi-dation has been deeply studied. The findings have shown that it participates in processes like apoptosis, inflam-mation and AS.26 CD36 has great potential in scavenging ox-LDL to protect intima from cholesterol deposits and atherosclerotic lesions.27 Knockout of CD36 is associated with enhanced symptoms in patients with atherosclerotic cardiovascular diseases.28 In this study, GAA inhibited the expression of Notch1, PPARγ and CD36 as well as lipid deposition. The expression of scavenger receptors could also be inhibited by GAA.
Limitations
There is still a lack of in vivo evidence to confirm the role and action mechanism of GAA in AS. Furthermore, how GAA affects Notch1/PPARγ/CD36 signaling requires deeper investigation.
Conclusions
Ganoderic acid A inhibits ox-LDL-induced THP-1-de-rived macrophage inflammation and lipid deposition via Notch1/PPARγ/CD36 signaling, which may provide theo-retical guidance for the clinical application of GAA in AS treatment.
The datasets used and/or analyzed in the current study are available from the corresponding author on reason-able request.
ORCID iDsTao Wang https://orcid.org/0000-0001-6355-392XHuihe Lu https://orcid.org/0000-0003-1474-8012
References1. Wang R, Nascimento BR, Neuenschwander FC. Atherosclerosis and
inflammation: Still a long way to go. Arq Bras Cardiol. 2020;114(4): 699–700. doi:10.36660/abc.20200219
2. Moore KJ, Tabas I. Macrophages in the pathogenesis of atheroscle-rosis. Cell. 2011;145(3):341–355. doi:10.1016/j.cell.2011.04.005
3. Liu P, Xu Y, Yan H, et al. Characterization of molecular signature of the roots of Paeonia lactiflora during growth. Chin J Nat Med. 2017; 15(10):785–793. doi:10.1016/S1875-5364(17)30110-3
4. Wang X, Sun D, Tai J, et al. Ganoderic acid A inhibits proliferation and invasion, and promotes apoptosis in human hepatocellular car-cinoma cells. Mol Med Rep. 2017;16(4):3894–3900. doi:10.3892/mmr. 2017.7048
5. Jiang J, Grieb B, Thyagarajan A, et al. Ganoderic acids suppress growth and invasive behavior of breast cancer cells by modulating AP-1 and NF-kappaB signaling. Int J Mol Med. 2008;21(5):577–584. PMID:18425349
6. Liu F, Shi K, Dong J, et al. Ganoderic acid A attenuates high-fat-diet-induced liver injury in rats by regulating the lipid oxidation and liver inflammation. Arch Pharm Res. 2020;43(7):744–754. doi:10.1007/s12272-020-01256-9

Adv Clin Exp Med. 2021;30(10):1031–1041 1041
7. Wan B, Li Y, Sun S, et al. Ganoderic acid A attenuates lipopolysaccha-ride-induced lung injury in mice. Biosci Rep. 2019;39(5):BSR20190301. doi:10.1042/BSR20190301
8. Gill BS, Navgeet, Kumar S. Antioxidant potential of ganoderic acid in Notch-1 protein in neuroblastoma. Mol Cell Biochem. 2019;456(1–2): 1–14. doi:10.1007/s11010-018-3485-7
9. Ernst IM, Wagner AE, Lipinski S, et al. Cellular uptake, stability, visu-alization by ‘Naturstoff reagent A’, and multidrug resistance pro-tein 1 gene-regulatory activity of cyanidin in human keratinocytes. Pharmacol Res. 2010;61(3):253–258. doi:10.1016/j.phrs.2009.10.006
10. Liu D, Wang X, Zhang M, et al. WISP1 alleviates lipid deposition in macrophages via the PPARgamma/CD36 pathway in the plaque for-mation of atherosclerosis. J Cell Mol Med. 2020;24(20):11729–11741. doi:10.1111/jcmm.15783
11. Chistiakov DA, Melnichenko AA, Grechko AV, et al. Potential of anti-inflammatory agents for treatment of atherosclerosis. Exp Mol Pathol. 2018;104(2):114–124. doi:10.1016/j.yexmp.2018.01.008
12. Tian M, Zhao J, Mi X, et al. Progress in research on effect of PM2.5 on occurrence and development of atherosclerosis. J Appl Toxicol. 2020;41(4). doi:10.1002/jat.4110
13. Moore KJ, Kunjathoor VV, Koehn SL, et al. Loss of receptor-media-ted lipid uptake via scavenger receptor A or CD36 pathways does not ameliorate atherosclerosis in hyperlipidemic mice. J Clin Invest. 2005;115(8):2192–2201. doi:10.1172/JCI24061
14. Kelley JL, Ozment TR, Li C, et al. Scavenger receptor-A (CD204): A two--edged sword in health and disease. Crit Rev Immunol. 2014;34(3): 241–261. doi:10.1615/critrevimmunol.2014010267
15. Sangphech N, Keawvilai P, Palaga T. Notch signaling increases PPARγ protein stability and enhances lipid uptake through AKT in IL-4-sti-mulated THP-1 and primary human macrophages. FEBS Open Bio. 2020;10(6):1082–1095. doi:10.1002/2211-5463.12858
16. Mahley RW. Cellular and molecular biology of lipoprotein metaboli-sm in atherosclerosis. Diabetes. 1981;30(Suppl 2):60–65. doi:10.2337/diab.30.2.s60
17. Brown BN, Ratner BD, Goodman SB, et al. Macrophage polarization: An opportunity for improved outcomes in biomaterials and regene-rative medicine. Biomaterials. 2012;33(15):3792–3802. doi:10.1016/j.biomaterials.2012.02.034
18. Berliner JA, Navab M, Fogelman AM, et al. Atherosclerosis: Basic mechanisms. Oxidation, inflammation, and genetics. Circulation. 1995;91(9):2488–2496. doi:10.1161/01.cir.91.9.2488
19. Witztum JL, Steinberg D. The oxidative modification hypothesis of atherosclerosis: Does it hold for humans? Trends Cardiovasc Med. 2001;11(3–4):93–102. doi:10.1016/s1050-1738(01)00111-6
20. Huang Y, Yang X, Wu Y, et al. Gamma-secretase inhibitor induces adipogenesis of adipose-derived stem cells by regulation of Notch and PPAR-gamma. Cell Prolif. 2010;43(2):147–156. doi:10.1111/j.1365-2184.2009.00661.x
21. Hu X, Chung AY, Wu I, et al. Integrated regulation of Toll-like recep-tor responses by Notch and interferon-gamma pathways. Immunity. 2008;29(5):691–703. doi:10.1016/j.immuni.2008.08.016
22. Jiang S, Da Y, Han S, et al. Notch ligand Delta-like1 enhances degra-nulation and cytokine production through a novel Notch/Dok-1/MAPKs pathway in vitro. Immunol Res. 2018;66(1):87–96. doi:10.1007/s12026-017-8977-0
23. Lee KJ, Kim HA, Kim PH, et al. Ox-LDL suppresses PMA-induced MMP-9 expression and activity through CD36-mediated activation of PPAR-gamma. Exp Mol Med. 2004;36(6):534–544. doi:10.1038/emm.2004.68
24. Nagy L, Tontonoz P, Alvarez JG, et al. Oxidized LDL regulates macroph-age gene expression through ligand activation of PPARgamma. Cell. 1998;93(2):229–240. doi:10.1016/s0092-8674(00)81574-3
25. Chawla A, Boisvert WA, Lee CH, et al. A PPAR gamma-LXR-ABCA1 path-way in macrophages is involved in cholesterol efflux and atheroge-nesis. Mol Cell. 2001;7(1):161–171. doi:10.1016/s1097-2765(01)00164-2
26. Febbraio M, Hajjar DP,Silverstein RL. CD36: A class B scavenger recep-tor involved in angiogenesis, atherosclerosis, inflammation, and lipid metabolism. J Clin Invest. 2001;108(6):785–791. doi:10.1172/JCI14006
27. Febbraio M, Podrez EA, Smith JD, et al. Targeted disruption of the class B scavenger receptor CD36 protects against atherosclero-tic lesion development in mice. J Clin Invest. 2000;105(8):1049–1056. doi:10.1172/JCI9259
28. Yuasa-Kawase M, Masuda D, Yamashita T, et al. Patients with CD36 deficiency are associated with enhanced atherosclerotic cardiovas-cular diseases. J Atheroscler Thromb. 2012;19(3):263–275. doi:10.5551/jat.10603


Cite asCheng G, Li Y, Liu Z, Song X. lncRNA PSMA3-AS1 promotes the progression of non-small cell lung cancer through targeting miR-17-5p/PD-L1. Adv Clin Exp Med. 2021;30(10):1043–1050. doi:10.17219/acem/138624
DOI10.17219/acem/138624
Copyright© 2021 by Wroclaw Medical University This is an article distributed under the terms of theCreative Commons Attribution 3.0 Unported (CC BY 3.0)(https://creativecommons.org/licenses/by/3.0/)
Address for correspondenceXiang SongE-mail: [email protected]
Funding sourcesNone declared
Conflict of interestNone declared
Received on December 7, 2020Reviewed on May 3, 2021Accepted on June 7, 2021
Published online on October 5, 2021
AbstractBackground. A growing number of studies have shown that long-chain non-coding RNA (lncRNA) plays an important role in the progression of non-small cell lung cancer (NSCLC).
Objectives. To explore the role and potential molecular mechanism of lncRNA PSMA3-AS1 in promoting the proliferation, migration and invasion of NSCLC.
Materials and methods. The expression of PSMA3-AS1, miR-17-5p and PD-L1 in a human bronchial epithelial cell line, BEAS-2B, and NSCLC cell lines, H226 and A549, were detected with quantitative real-time polymerase chain reaction (qRT-PCR) or western blot. The PSMA3-AS1 shRNA transfection was used to reduce the expression of PSMA3-AS1. Double fluorescent enzyme reporting was used to detect the relationship between PSMA3-AS1, miR-17-5p and PD-L1. Cell Counting Kit-8 (CCK-8), wound-healing and transwell assays, as well as western blot, were used to detect the expression of proliferation, migration, invasion, and epithelial–mesenchymal transition (EMT)-related proteins in lung cancer cells.
Results. The expression of PSMA3-AS1 in NSCLC cells was significantly higher than in human bronchial epithelial cells. The PSMA3-AS1 knockdown significantly reduced the proliferation, migration and invasion of lung cancer cells. In addition, double fluorescent enzyme results showed that PSMA3-AS1 could competi-tively bind miR-17-5p to PD-L1. The expression of miR-17-5p is low in lung cancer cells, while the expression of PD-L1 in them is high. Overexpression of PD-L1 reversed the inhibitory effect of PSMA3-AS1 knockdown on the proliferation, migration and invasion of lung cancer cells.
Conclusions. Generally speaking, PSMA3-AS1 is highly expressed in NSCLC. The PSMA3-AS1 can promote the proliferation, migration and invasion of NSCLC cells by regulating miR-17-5p/PD-L1.
Key words: non-small cell lung cancer, proliferation, miR-17-5p, invasion, lncRNA PSMA3-AS1
Original papers
lncRNA PSMA3-AS1 promotes the progression of non-small cell lung cancer through targeting miR-17-5p/PD-L1
Guohua ChengB–D, Yarong LiB, Zhaoyu LiuC, Xiang SongA,E,F
Department of Oncology, Second Hospital of Shanxi Medical University, Taiyuan, China
A – research concept and design; B – collection and/or assembly of data; C – data analysis and interpretation; D – writing the article; E – critical revision of the article; F – final approval of the article
Advances in Clinical and Experimental Medicine, ISSN 1899–5276 (print), ISSN 2451–2680 (online) Adv Clin Exp Med. 2021;30(10):1043–1050

G. Cheng et al. Role of PMSA3-AS1/miR-17-5p/PD-L1 in NSCLC1044
Background
Non-small cell lung cancer (NSCLC) is a common path-ological type of lung cancer, accounting for about 80% of all cases.1 At present, the cause of NSCLC is often not completely clear and, due to concealment of NSCLC di-agnoses by patients and atypical early clinical features, the early diagnosis rate of NSCLC is low and most patients have metastasis with poor overall prognosis.2 Therefore, further in-depth study of lung cancer is of great impor-tance for treating lung cancer and improving the prognosis of patients.
Long chain non-coding RNA (lncRNA) is a non-coding RNA with a length of more than 200 bp that does not encode a protein. It can regulate gene expression through complex molecular mechanisms at many cellular levels, but the specifics of the mechanisms are not clear.3 Recent studies have shown that lncRNA, as a regulatory factor, participates in almost all cellular processes and plays a role in promoting or inhibiting cancer.4,5 For example, high levels of expression of lncRNA PART1 was found to sig-nificantly accelerate the occurrence of NSCLC cancer.6 The lncRNA BRCAT54 overexpression promoted prolif-eration and migration, and activated apoptosis in NSCLC cells by binding RPS9.7 The lncRNA PSMA3-AS1 is located on chromosome 14 at position 14q23.1 and is overexpressed in esophageal cancer and glioma.8,9 However, the study of PSMA3-AS1 in NSCLC is currently less pressing.
MicroRNAs (miRNAs) are a type of endogenous non-coding RNA with 19–25 nucleotides. They affect cell proliferation, differentiation, migration, and apoptosis by inhibiting the mRNA level of their target gene.10 Mi-croRNA is widely reported to be abnormally expressed in NSCLC.11 Bioinformatic analysis showed that PSMA3-AS1 could target and bind miR-17-5p, and that the ex-pression level of miR-17-5p decreased significantly in lung cancer.12 Therefore, we speculate that PSMA3-AS1 can affect the progression of NSCLC by targeting miR-17-5p.
Objectives
This study aimed to primarily analyze whether PSMA3-AS1 targets miR-17-5p and affects biological processes in NSCLC cells, which could provide a new theoretical basis for clinical targeted therapy in NSCLC.
Materials and methods
Cell culture
BEAS-2B cells and NSCLC cell lines (H226 and A549, re-spectively; Shanghai Cell Bank of Chinese Academy of Sci-ences, Shanghai, China) were cultured in Dulbecco’s modi-fied Eagle’s medium (DMEM; Thermo Fisher Scientific,
Waltham, USA) containing 10% fetal bovine serum (FBS; Gibco, Waltham, USA), and subcultured in 5% CO2 and 37°C incubator. Follow-up experiments were carried out on the cells in the logarithmic phase.
Cell transfection
The shRNA targeting PSMA3-AS1 (sh-PSMA3-AS1), shRNA negative control (sh-NC), the PSMA3-AS1 over-expression plasmid (pcDNA-PSMA3-AS1), the negative control (pcDNA-NC), miR-17-5p mimic, mimic negative control (miR-NC), the PD-L1 overexpression plasmid (OE-PD-L1), and the negative control (OE-NC) were pro-vided from the GenePharma Co., Ltd (Shanghai, China). The Lipofectamine 2000 transfection reagent (Invitrogen, Waltham, USA) was used to transfect the above plasmids into A549 cells.
qRT-PCR analysis
Total RNA was extracted from cells and synthesized into the cDNA according to a first strand cDNA synthesis kit (Roche Diagnostics, Basel, Switzerland). Quantitative real-time polymerase chain reaction (qRT-PCR) was performed according to the SYBR Green Fast qPCR Mix protocol (Beyotime, Shanghai, China). The 2−ΔΔCt method was used to analyze the expression of PSMA3-AS1 and miR-17-5p.
CCK-8 assay
Cells were digested with trypsin and inoculated in 96-well plates at a density of 5 × 10⁵ cells/mL. Routine culture proceeded for 12 h. At the end of culture, Cell Counting Kit-8 (CCK-8) solution (10 μL; Beyotime) was added to each hole of the plates at 24 h, 48 h and 72 h. After 4 h of cul-ture, the absorbance of each hole at 450 nm was detected using an automatic enzyme labeling instrument (Thermo Fisher Scientific).
Wound-healing assay
Cells were inoculated in 12-well plates at a density of 5 × 10⁴ cells/mL. When the degree of cell fusion was more than 95%, a sterile 200-μL liquid transfer gun was used to cross the surface of the culture plate vertically. After 24 h of routine culture, the scratches were photo-graphed using an optical microscope (Eclipse 80i; Nikon Corp., Tokyo, Japan).
Transwell assay
Cells were inoculated in the upper chamber (Corning, Inc., Corning, USA) and smeared with Matrigel glue (Bec-ton Dickinson Biosciences, Franklin Lakes, USA) at a den-sity of 5 × 10⁵ cells/mL; the lower chamber contained 500 μL of DMEM complete medium. After 24 h of routine

Adv Clin Exp Med. 2021;30(10):1043–1050 1045
Fig.
1. P
SMA
3-A
S1 w
as u
preg
ulat
ed in
non
-sm
all c
ell l
ung
canc
er (N
SCLC
) cel
ls an
d kn
ockd
own
of P
SMA
3-A
S1 si
gnifi
cant
ly in
hibi
ted
the
prol
ifera
tion,
mig
ratio
n, in
vasio
n, a
nd e
pith
elia
l–m
esen
chym
al tr
ansit
ion
(EM
T)
proc
ess i
n A
549
cells
. A. T
he e
xpre
ssio
n of
PSM
A3-
AS1
in B
EAS-
2B c
ells
and
NSC
LC c
ell l
ines
(H22
6 an
d A
549)
was
det
ecte
d w
ith q
uant
itativ
e re
al-t
ime
poly
mer
ase
chai
n re
actio
n (q
RT-P
CR).
***p
< 0
.001
com
pare
d to
BEA
S-2B
; ### p
< 0
.001
com
pare
d to
H22
5; B
. The
effi
cien
cy o
f shR
NA
agai
nst P
SMA
3-A
S1 tr
ansf
ectio
n w
as d
eter
min
ed u
sing
qRT-
PCR;
C. T
he e
ffect
of P
SMA
3-A
S1 k
nock
dow
n on
the
prol
ifera
tion
of A
549
cells
was
an
alyz
ed w
ith C
ell C
ount
ing
Kit-
8 (C
CK-8
) ass
ay; D
and
E. T
he e
ffect
of P
SMA
3-A
S1 k
nock
dow
n on
the
mig
ratio
n an
d in
vasio
n of
A54
9 ce
lls w
as a
naly
zed
usin
g w
ound
-hea
ling
and
tran
swel
l ass
ays,
resp
ectiv
ely;
F.
The
effec
t of P
SMA
3-A
S1 k
nock
dow
n on
the
EMT-
rela
ted
prot
eins
of A
549
cells
was
ana
lyze
d w
ith w
este
rn b
lott
ing.
*p
< 0
.05,
**p
< 0
.01
and
***p
< 0
.001
com
pare
d to
con
trol
; # p <
0.0
5, ##
p <
0.0
1 an
d ##
# p <
0.0
01
com
pare
d to
sh-N
C

G. Cheng et al. Role of PMSA3-AS1/miR-17-5p/PD-L1 in NSCLC1046
culture, the cells were washed with phosphate-buffered saline (PBS) twice and fixed with paraformaldehyde for 20 min. Then, the uninvaded cells in the upper chamber were gently wiped with a cotton swab. After crystal violet staining for 5 min, the number of invaded cells in each group was observed and counted using a light microscope (Eclipse 80i; Nikon).
Western blot analysis
Total cellular proteins were extracted from RIPA cell ly-sate (Beyotime), and the concentration was determined us-ing BCA kit (Bio-Rad, Hercules, USA). The sodium dodecyl sulfate polyacrylamide gel electrophoresis (SDS-PAGE) gel electrophoresis was used to separate the proteins which were transferred to polyvinylidene difluoride (PVDF) mem-brane. Membranes were sealed with 5% skim milk at room temperature, incubated with 1:1000 primary antibodies E-cadherin (ab15148; Abcam, Cambridge, UK), N-cadherin (ab12221; Abcam), vimentin (ab45939; Abcam), matrix metalloproteinase (MMP)-2 (ab92536; Abcam), MMP-9 (ab137867; Abcam), and β-actin (ab8226; Abcam) at 4°C for overnight, and then incubated with 1:4000 second antibody anti-rabbit horseradish peroxidase (HRP)-conjugated IgG for another 2 h. The immune bands were visualized using enhanced electrochemiluminescence (ECL) photolumi-nescence solution (Wanleibio Co., Ltd., Shenyang, China).
Luciferase reporter assay
Wild-type (WT) and mutant (MUT) reporter plasmids were constructed based on the sequences of PSMA3-
AS1 3’-UTR and the PD-L1 3’-UTR. PSMA3-AS1-WT/Mut or PD-L1-WT/Mut were co-transfected into HEK293T cells with miR-NC and miR-17-5p mimic, respectively. The luciferase activity in the transfected cells was tested using the dual luciferase assay kit (KenReal, Shanghai, China) after 48 h.
Statistical analyses
Experimental data are presented as mean ± standard deviation (SD), and the statistical analyses were conducted using GraphPad Prism v. 8 software (GraphPad Software, San Diego, USA). The comparison of differences between 2 groups was carried out with Student’s t-test and be-tween multiple groups with one-way analysis of variance (ANOVA) followed by Tukey’s post hoc test. The differ-ences were statistically significant at p < 0.05.
Results
Knockdown of PSMA3-AS1 significantly inhibited the proliferation, migration, invasion, and EMT process in A549 cells
Compared with normal cells, PSMA3-AS1 was upregu-lated in NSCLC cells, with its highest level of expression in A549 cells (Fig. 1A). Therefore, A549 cells were used for the follow-up study. Subsequently, PSMA3-AS1 was found to be decreased in sh-PSMA3-AS1-1 and -2 groups and the expression of PSMA3-AS1 in the sh-PSMA3-AS1-1 group was the lowest (Fig. 1B). Knockdown of PSMA3-AS1
Fig. 2. PSMA3-AS1 negatively regulated the expression of miR-17-5p. A. The binding sites between PSMA3-AS1 and miR-17-5p were predicted using starBase (http://starbase.sysu.edu.cn/); B. The relationship between PSMA3-AS1 and miR-17-5p was determined with luciferase reporter assay. **p < 0.001 compared to miR-NC; C. The effect of PSMA3-AS1 knockdown on the expression of miR-17-5p was detected using quantitative real-time polymerase chain reaction (qRT-PCR). ***p < 0.001 compared to control; ###p < 0.001 compared to sh-NC; D. The expression of miR-17-5p in BEAS-2B cells and non-small cell lung cancer (NSCLC) cell lines (H226 and A549) was detected using qRT-PCR. ##p < 0.01 and ###p < 0.001 compared to BEAS-2B
WT – wild-type; MUT – mutant; NC – negative control.

Adv Clin Exp Med. 2021;30(10):1043–1050 1047
significantly inhibited the activity of A549 cells (Fig. 1C). As shown in Fig. 1D and E, knockdown of PSMA3-AS1 significantly suppressed migration and invasion of A549 cells. In addition, knockdown of PSMA3-AS1 significantly decreased the expression of MMP-2, MMP-9, vimentin, and N-cadherin, whereas it increased the expression of E-cadherin (Fig. 1F).
PSMA3-AS1 negatively regulated miR-17-5p expression
The miR-17-5p and PSMA3-AS1 binding sites were deter-mined (Fig. 2A). Relative luciferase activity in the PSMA3-AS1WT+miR-17-5p mimic group was significantly de-creased, but there was no change in the Mut group (Fig. 2B). miR-17-5p was downregulated in NSCLC cells and knockdown of PSMA3-AS1 significantly enhanced the expression level of miR-17-5p (Fig. 2C,D).
miR-17-5p negatively regulated the expression of PD-L1
The sites of miR-17-5p and PD-L1 binding are indicated in Fig. 3A. PD-L1 was highly expressed in NSCLC cells (Fig. 3B). Upregulation of miR-17-5p significantly reduced the expression of PD-L1 in A549 cells (Fig. 3C,D).
PSMA3-AS1 regulated the expression of PD-L1 competitively with miR-17-5p
Relative luciferase activity in the PD-L1 WT+ miR-17-5p mimic group was decreased, while it was increased in the PD-L1 WT+ miR-17-5p mimic+PCDNA-PSMA3-AS1 group; this indicated that PSMA3-AS1 and PD-L1 could bind to miR-17-5p competitively (Fig. 4A). Upregu-lation of PSMA3-AS1 significantly promoted the expres-sion of PD-L1, while miR-17-5p overexpression alleviated the enhanced PD-L1 expression caused by overexpression of PSMA3-AS1 (Fig. 4B,C).
PD-L1 reversed the inhibitory effect of PSMA3-AS1 on proliferation, invasion, migration, and the EMT process in A549 cells
The expression of PD-L1 was increased by transfection with pcDNA-PD-L1 into A549 cells (Fig. 5A). Upregula-tion of PD-L1 significantly reversed the inhibitory effect of PSMA3-AS1 knockdown on cell activity, migration and invasion (Fig. 5B–D). In addition, compared with the sh-PSMA3-AS1-1 group, upregulation of PD-L1 signifi-cantly promoted the expression of vimentin, N-cadherin, MMP-2, and MMP-9, whereas it decreased the expression of E-cadherin (Fig. 5E).
Fig. 3. miR-17-5p negatively regulated the expression of PD-L1. A. The binding sites between miR-17-5p and PD-L1 were predicted using TargetScan database (www.targetscan.org); B. The expression of PD-L1 in BEAS-2B cells and non-small cell lung cancer (NSCLC) cell lines (H226 and A549) was detected using quantitative real-time polymerase chain reaction (qRT-PCR). ***p < 0.001 compared to BEAS-2B; ###p < 0.001 compared to H225; C. The effect of miR-17-5p overexpression on the expression of PD-L1 was detected with western blotting; D. The effect of miR-17-5p overexpression on the expression of PD-L1 was detected using qRT-PCR. **p < 0.01 and ***p < 0.001 compared to control; ##p < 0.01 and ###p < 0.001 compared to miR-NC
NC – negative control.

G. Cheng et al. Role of PMSA3-AS1/miR-17-5p/PD-L1 in NSCLC1048
Discussion
The NSCLC is a common respiratory malignancy in adults and is highly susceptible to metastasis.13 There-fore, investigating the potential causes and pathogenesis of NSCLC is critical for improving the clinical curative effects of treatments in NSCLC patients.
Many studies have indicated that lncRNAs are involved in the development of NSCLC.14,15 Previous studies have shown that PSMA3-AS1 is highly expressed in the major-ity of tumors.8,9 Our results confirmed the high expression of PSMA3-AS1 in NSCLC cells. Knockdown of PSMA3-AS1 significantly inhibited the proliferation, migration and invasion of A549 cells. Therefore, upregulation of PSMA3-AS1 in NSCLC may play a role in promoting cancer, but its specific regulatory mechanism remains to be studied.
The lncRNAs not only participate in the activation of transcription and the regulation of the expression of surrounding protein-coding genes but are also relevant to many diseases.16,17 In addition, lncRNA could affect the role of relevant functional proteins through the ad-sorption of miRNA.18,19 For example, the lncRNA SNHG15 accelerates the progression of lung cancer cells by targeting miR-211-3p.20 The lncRNA PVT1-5 facilitates metastasis of lung cancer cells by suppressing the expression of miR-126.21 MiR-17-5p was selected as a target gene of PSMA3-AS1 by screening the starBase (http://starbase.sysu.edu.cn/) database. In thyroid cancer, miR-17-5p aggravates pro-liferation and invasiveness of thyroid cancer cells.22 In tri-ple-negative breast cancer (TNBC), miR-17-5p can suppress the occurrence of TNBC.23 In this study, miR-17-5p was
downregulated in NSCLC and miR-17-5p overexpression significantly reduced the facilitation effect of PSMA3-AS1 on the proliferation, migration and invasion of A549 cells.
For NSCLC treatment, PD-L1 inhibitors could effectively block T-cell proliferation and improve survival of NSCLC patients.24,25 Meanwhile, PD-L1 was highly expressed in the serum of patients with advanced lung cancer, sug-gesting that a high level of PD-L1 was correlated with a worse outcome.26 In the present study, we found that miR-17-5p could bind to PD-L1. PD-L1 was upregulated in NSCLC, and the effect of PSM3-AS1 downregulation on cancer progression could be reversed by the upregula-tion of PD-L1.
Limitations
In our study, we only carried out cellular experiments to investigate the role of PSMA3-AS1 in NSCLC progres-sion by targeting miR-17-5p/PD-L1. However, determining the effect of PSMA3-AS1 inhibition on NSCLC progres-sion in animal experiments and clinical scenarios, as well as the exact mechanism underlying the effect, requires further research.
Conclusions
PSMA3-AS1 was highly expressed in NSCLC. PSMA3-AS1 promoted the proliferation, migration and invasion of NSCLC through upregulation of PD-L1 by targeting miR-17-5p. However, the present study is based on cellular
Fig. 4. PSMA3-AS1 regulated the expression of PD-L1 through competition combined with miR-17-5p. A. The interaction among PSMA3-AS1, miR-17-5p and PD-L1 was detected using luciferase reporter assay. **p < 0.01 and ***p < 0.001 compared to miR-NC; B. Effect of miR-17-5p overexpression together with overexpression of PSMA3-AS1 on the expression of PD-L1 was detected with western blotting; C. Effect of miR-17-5p overexpression together with overexpression of PSMA3-AS1 on the expression of PD-L1 was detected using quantitative real-time polymerase chain reaction (qRT-PCR). **p < 0.01 and ***p < 0.001 compared to control; ##p < 0.01 and ###p < 0.001 compared to pcDNA-NC; $$p < 0.01 and $$$p < 0.001 compared to pcDNA-PSMA3-AS1+miR-NC
WT – wild-type; MUT – mutant; NC – negative control.

Adv Clin Exp Med. 2021;30(10):1043–1050 1049
experiments; thus, the detection of PSMA3-AS1 and miR-17-5p in NSCLC tissues and verification with animal exper-iments will be important to accomplish in future studies.
ORCID iDsGuohua Cheng https://orcid.org/0000-0001-9751-0792Yarong Li https://orcid.org/0000-0002-3572-002XZhaoyu Liu https://orcid.org/0000-0001-7104-1393Xiang Song https://orcid.org/0000-0003-2138-0463
References1. Cao M, Chen W. Epidemiology of lung cancer in China. Thorac Cancer.
2019;10(1):3–7. doi:10.1111/1759-7714.129162. Li M, Chen R, Ji B, et al. RAD52 variants influence NSCLC risk in the Chi-
nese population in a high altitude area. Ther Adv Respir Dis. 2020;14: 1753466620918192. doi:10.1177/1753466620918192
3. Feng C, Zhao Y, Li Y, Zhang T, Ma Y, Liu Y. LncRNA MALAT1 promotes lung cancer proliferation and gefitinib resistance by acting as a miR-200a sponge. Arch Bronconeumol. 2019;55(12):627–633. doi:10.1016/j.arbres.2019.03.026
4. Zhou Y, Shi H, Du Y, et al. lncRNA DLEU2 modulates cell proliferation and invasion of non-small cell lung cancer by regulating miR-30c-5p/SOX9 axis. Aging (Albany NY). 2019;11(18):7386–7401. doi:10.18632/aging.102226
5. Huang N, Guo W, Ren K, et al. LncRNA AFAP1-AS1 supresses miR-139-5p and promotes cell proliferation and chemotherapy resistance of non-small cell lung cancer by competitively upregulating RRM2. Front Oncol. 2019;9:1103. doi:10.3389/fonc.2019.01103
6. Chen Y, Zhou X, Huang C, et al. LncRNA PART1 promotes cell prolifera-tion and progression in non-small-cell lung cancer cells via sponging miR-17-5p. J Cell Biochem. 2021;122(3–4):315–325. doi:10.1002/jcb.29714
7. Yang W, Qian Y, Gao K, et al. LncRNA BRCAT54 inhibits the tumorigen-esis of non-small cell lung cancer by binding to RPS9 to transcription-ally regulate JAK-STAT and calcium pathway genes. Carcinogenesis. 2021;42(1):80–92. doi:10.1093/carcin/bgaa051
8. Qiu BQ, Lin XH, Ye XD, et al. Long non-coding RNA PSMA3-AS1 pro-motes malignant phenotypes of esophageal cancer by modulat-ing the miR-101/EZH2 axis as a ceRNA. Aging (Albany NY). 2020;12(2): 1843–1856. doi:10.18632/aging.102716
9. Zhou LL, Zhang M, Zhang YZ, Sun MF. Long non-coding RNA PSMA3-AS1 enhances cell proliferation, migration and invasion by regulating miR-302a-3p/RAB22A in glioma. Biosci Rep. 2020;40(9):BSR20191571. doi:10.1042/bsr20191571
Fig. 5. PD-L1 reversed the inhibitory effect of PSMA3-AS1 on proliferation, invasion, migration, and epithelial–mesenchymal transition (EMT) process in A549 cells. A. The efficiency of PD-L1 overexpression was examined using quantitative real-time polymerase chain reaction (qRT-PCR). ***p < 0.001 compared to control; ###p < 0.001 compared to OE-NC; B. Effect of PSM3-AS1 knockdown together with PD-L1 overexpression on the proliferation of A549 cells was analyzed using Cell Counting Kit-8 (CCK-8) assay; D and E. Effect of PSMA3-AS1 knockdown together with PD-L1 overexpression on the migration and invasion of A549 cells was analyzed using wound-healing and transwell assays, respectively; F. Effect of PSMA3-AS1 knockdown together with PD-L1 overexpression on the EMT-related proteins (E-cadherin, vimentin, N-cadherin, matrix metalloproteinase-2 (MMP-2), and MMP-9) of A549 cells was analyzed with western blotting. *p < 0.05, **p < 0.01 and ***p < 0.001 compared to sh-NC; #p < 0.05, ##p < 0.01 compared to sh-PSMA3-AS1-1
NC – negative control; sh – sham.

G. Cheng et al. Role of PMSA3-AS1/miR-17-5p/PD-L1 in NSCLC1050
10. Giallombardo M, Chacártegui Borrás J, Castiglia M, et al. Exosomal miRNA analysis in non-small cell lung cancer (NSCLC) patients’ plas-ma through qPCR: A feasible liquid biopsy tool. J Vis Exp. 2016;111: 53900. doi:10.3791/53900
11. Jin X, Guan Y, Zhang Z, Wang H. Microarray data analysis on gene and miRNA expression to identify biomarkers in non-small cell lung cancer. BMC Cancer. 2020;20(1):329. doi:10.1186/s12885-020-06829-x
12. Xu C, Zheng Y, Lian D, Ye S, Yang J, Zeng Z. Analysis of microRNA expression profile identifies novel biomarkers for non-small cell lung cancer. Tumori. 2015;101(1):104–110. doi:10.5301/tj.5000224
13. Duma N, Santana-Davila R, Molina JR. Non-small cell lung cancer: Epidemiology, screening, diagnosis, and treatment. Mayo Clin Proc. 2019;94(8):1623–1640. doi:10.1016/j.mayocp.2019.01.013
14. Yang H, Yang W, Dai W, Ma Y, Zhang G. LINC00667 promotes the pro-liferation, migration, and pathological angiogenesis in non-small cell lung cancer through stabilizing VEGFA by EIF4A3. Cell Biol Int. 2020;44(8):1671–1680. doi:10.1002/cbin.11361
15. Yan Z, Yang Q, Xue M, Wang S, Hong W, Gao X. YY1-induced lncRNA ZFPM2-AS1 facilitates cell proliferation and invasion in small cell lung cancer via upregulating of TRAF4. Cancer Cell Int. 2020;20:108. doi:10.1186/s12935-020-1157-7
16. Zhou S, Wang L, Yang Q, et al. Systematical analysis of lncRNA-mRNA competing endogenous RNA network in breast cancer subtypes. Breast Cancer Res Treat. 2018;169(2):267–275. doi:10.1007/s10549-018-4678-1
17. Zhao Y, Wang H, Wu C, et al. Construction and investigation of lncRNA-associated ceRNA regulatory network in papillary thyroid cancer. Oncol Rep. 2018;39(3):1197–1206. doi:10.3892/or.2018.6207
18. Ma L, Sun X, Kuai W, et al. LncRNA SOX2 overlapping transcript acts as a miRNA sponge to promote the proliferation and invasion of Ewing’s sarcoma. Am J Transl Res. 2019;11(6):3841–3849. PMID:31312393
19. D’Angelo D, Mussnich P, Sepe R, et al. RPSAP52 lncRNA is overex-pressed in pituitary tumors and promotes cell proliferation by act-ing as miRNA sponge for HMGA proteins. J Mol Med (Berl). 2019;97(7): 1019–1032. doi:10.1007/s00109-019-01789-7
20. Cui HX, Zhang MY, Liu K, Liu J, Zhang ZL, Fu L. LncRNA SNHG15 promotes proliferation and migration of lung cancer via targeting microRNA- 211-3p. Eur Rev Med Pharmacol Sci. 2018;22(20):6838–6844. doi:10. 26355/eurrev_201810_16152
21. Li H, Chen S, Liu J, et al. Long non-coding RNA PVT1-5 promotes cell proliferation by regulating miR-126/SLC7A5 axis in lung cancer. Biochem Biophys Res Commun. 2018;495(3):2350–2355. doi:10.1016/j.bbrc.2017.12.114
22. Shi YP, Liu GL, Li S, Liu XL. miR-17-5p knockdown inhibits prolifera-tion, autophagy and promotes apoptosis in thyroid cancer via tar-geting PTEN. Neoplasma. 2020;67(2):249–258. doi:10.4149/neo_2019_ 190110N29
23. Li J, Lai Y, Ma J, et al. miR-17-5p suppresses cell proliferation and inva-sion by targeting ETV1 in triple-negative breast cancer. BMC Cancer. 2017;17(1):745. doi:10.1186/s12885-017-3674-x
24. Bylicki O, Paleiron N, Rousseau-Bussac G, Chouaïd C. New PDL1 inhibitors for non-small cell lung cancer: Focus on pembrolizumab. Onco Targets Ther. 2018;11:4051–4064. doi:10.2147/ott.s154606
25. Dong H, Strome SE, Salomao DR, et al. Tumor-associated B7-H1 pro-motes T-cell apoptosis: A potential mechanism of immune evasion. Nat Med. 2002;8(8):793–800. doi:10.1038/nm730
26. Okuma Y, Hosomi Y, Nakahara Y, Watanabe K, Sagawa Y, Homma S. High plasma levels of soluble programmed cell death ligand 1 are prognostic for reduced survival in advanced lung cancer. Lung Cancer. 2017;104:1–6. doi:10.1016/j.lungcan.2016.11.023

Cite asOlszewski R, Ptaszyński P, Cygankiewicz I, Kaczmarek K. Impedance fluctuation and steam pop occurrence during radiofrequency current ablation: An experimental in vitro model. Adv Clin Exp Med. 2021;30(10):1051–1056. doi:10.17219/acem/136845
DOI10.17219/acem/136845
Copyright© 2021 by Wroclaw Medical University This is an article distributed under the terms of theCreative Commons Attribution 3.0 Unported (CC BY 3.0)(https://creativecommons.org/licenses/by/3.0/)
Address for correspondenceKrzysztof KaczmarekE-mail: [email protected]
Funding sourcesNone declared
Conflict of interestNone declared
Received on March 6, 2021Reviewed on May 11, 2021Accepted on May 12, 2021
Published online on October 5, 2021
AbstractBackground. The radiofrequency impedance measurement is one of the basic parameters monitored during ablation procedures. An abrupt rise in impedance is often observed corresponding to a steam pop. The exact correlation between the occurrence of steam pop and subsequent rise in impedance has not been experimentally described so far.
Objectives. To evaluate the relationship between steam pop occurrence and impedance fluctuations observed during radiofrequency ablation (RFA).
Materials and methods. Porcine heart tissue specimens were appropriately prepared and placed in an ex-perimental setup connected to electrophysiological equipment with 3D anatomical mapping facilities. The RFA lesions were performed in standardized conditions with the use of contact force measurement-enabled open irrigation ablation catheter (ThermoCool SmartTouch™, 3.5 mm tip, F-J curvature; Biosense Webster, Irvine, USA) in the power-control mode. The RFA delivery was stopped when the steam pop occurred. Time taken for the steam pop to occur and to the subsequent abrupt impedance rise was recorded, along with the im-pedance fluctuations during an application.
Results. In total, 25 experimental radiofrequency (RF) current deliveries ended up with steam pops, which occurred after 30–60 s. The time recorded from the beginning of the application up to the steam pop was shorter if increased power was applied (35 W compared to 30 W: 41.5 ±9.9 s compared to 49.9 ±8.2 s; p = 0.046). During all RF applications, impedance significantly but gradually decreased from 122.9 ±7.9 Ω to 87.5 ±3.6 Ω (p < 0.001) with a mean drop rate of 0.8 ±0.2 Ω/s. During all experiments, the abrupt and significant impedance increase (8.2 ±2.0 Ω, p < 0.001) was observed always after steam pop occurrence (207.4 ±155.9 ms).
Conclusions. During RF current delivery which ended up with steam pop, an abrupt impedance increase was always registered after the occurrence of this phenomenon. Therefore, the impedance rise observed during steam popping cannot be used for its prediction. The time to steam pop was shorter for applications with increased power but not with greater contact force.
Key words: impedance, radiofrequency ablation, tamponade, steam pop, ablation complication
Original papers
Impedance fluctuation and steam pop occurrence during radiofrequency current ablation: An experimental in vitro model
Rafał Olszewski1,A,B,D,F, Paweł Ptaszyński2,A–C,E,F, Iwona Cygankiewicz2,A,E,F, Krzysztof Kaczmarek2,A–C,E
1 Department of Cardiology, St. Adalbert’s Hospital, Gdańsk, Poland2 Department of Electrocardiology, Medical University of Lodz, Poland
A – research concept and design; B – collection and/or assembly of data; C – data analysis and interpretation; D – writing the article; E – critical revision of the article; F – final approval of the article
Advances in Clinical and Experimental Medicine, ISSN 1899–5276 (print), ISSN 2451–2680 (online) Adv Clin Exp Med. 2021;30(10):1051–1056

R. Olszewski et al. Impedance fluctuation and steam pop1052
Background
Radiofrequency catheter ablation (RFA) is currently the most common technique used for invasive treatment of a wide variety of arrhythmias. Despite growing under-standing of the biophysics of radiofrequency current (RFC) delivery, the procedure is still associated with some degree of risk, and steam pops are one of the most threatening complications.1–3
Radiofrequency ablation destroys myocardial tissue through thermal injury. Resistive heating occurs in a small zone adjacent to the catheter tip, while the surrounding myocardium is passively heated by conduction. Tissue temperatures above 50°C are necessary to produce ir-reversible coagulation necrosis. Steam pops result from excessive intramyocardial heating when the temperature exceeds 100°C. In such cases, steam is formed and trapped inside the myocardium. A violent tissue rupture occurs when the steam pressure destroys the structural integrity of the cardiac muscle.4,5 Steam pops can lead, in the worst cases, to uncontrolled cardiac perforation and the clini-cal sequelae of cardiac tamponade.6 Steam pop incidence complicating up to 1.5% of RFA procedures has already been a subject of several studies.7–18 Different parameters have been analyzed to predict the occurrence of steam explosions, including classical and novel tools.3,5,10,19–29 An abrupt impedance rise is one of the most widely de-scribed physical phenomena accompanying RFA compli-cated by steam popping.3,10,12
Objectives
As it has never been characterized precisely enough, the aim of our in vitro experiment was to evaluate the tim-ing of impedance fluctuations related to steam pop oc-currence to establish its predictive potential in such complications.
Materials and methods
Experimental setup
The experimental setup consisted of a transparent container with a sample-holder table and electrical con-nections necessary to use electrophysiological ablation catheters. Three hearts (weighing 310 g, 340 g and 320 g, respectively) excised by a local abattoir from healthy pigs (Sus scrofa) approx. 6 months of age were used (within 6 h from slaughtering) to prepare 3 separate cuboid sam-ples (dimensions: 70 mm wide, 80 mm long and 15 mm thick). The samples were immersed in saline (0.9% NaCl), which, to approximate physiologic conditions, was heated up to 37 ±2°C and diluted to generate an ablation circuit
impedance value within a range of 80–120 Ω. Electrical connections included indifferent RFA electrode located underneath the sample-holding table and connected to ra-diofrequency (RF) current generator (Stockert 70 RF™ Generator; Stockert GmbH, Freiburg im Brisgau, Ger-many), electroanatomic reference patches and a reference pad connected to the 3D electroanatomic environment (CARTO™; Biosense Webster Inc., Johnson and John-son Medical, NV/SA, Waterloo, Belgium). Contact force measurement-enabled open irrigation ablation catheter (ThermoCool SmartTouch™, 3.5 mm tip, F-J curvature; Biosense Webster, Inc., Johnson and Johnson Medical, NV/SA) was used to create ablation lesions. The catheter at-tachment enabled bidirectional movement of its distal part to achieve the planned target contact force value (Fig. 1). Steam pops were identified with a contact microphone (CM200™; Korg, Tokyo, Japan) placed in a saline solution close to the sample table, and connected to the electro-physiological recording system (EP Tracer™; Schwarzer Cardiotek GmbH, Heilbronn, Germany) in a bipolar con-figuration. Steam pop generated an acoustic wave, which was recorded using an immersed contact microphone and presented as a sharp electrogram by both electrophysi-ological and electroanatomical systems. The RealGraph™, module of the CARTO™ system, allowed simultaneous presentation of the RFA impedance curve and the spike corresponding to the moment of steam pop occurrence (Fig. 2).
Experimental protocol
Before lesion formation, an electroanatomical model of porcine heart tissue specimen was prepared. The RFA was performed in a power-control mode with 2 different energy settings: 30 W and 35 W. These 2 power settings were selected as they were the most commonly used power settings in our centers (35 W was applied for RF applica-tions in the ventricles, the right atrium and non-posterior wall application in the left atrium; 30 W was used in RF ap-plications in the posterior wall of the left atrium). To allow efficient RFC delivery, catheters were irrigated at a flow rate recommended by the manufacturer depending on the ab-lation power settings: 20 mL/min for the power of 30 W and 30 mL/min for 35 W. Two different contact force levels were maintained, i.e., 20 ±5 g and 30 ±5 g. Continuous measurements of power, impedance and contact force were recorded for each RF ablation. The RFC delivery duration was limited to the steam pop occurrence. The time from the beginning of energy application to the steam pop oc-currence, as well as the time to impedance fluctuations were recorded with the accuracy of 1 ms. Additionally, an impedance change was measured as the difference between the maximum impedance after the steam pop and the impedance just before this event. Having deter-mined the power value and the time of application, energy

Adv Clin Exp Med. 2021;30(10):1051–1056 1053
delivered to the tissue was calculated following a standard equation (energy [J] = power [W] × time [s]). The tempera-ture registered on the catheters just before steam pop was also recorded. After each steam pop occurrence, the abla-tion catheter was moved to another location where the new lesion was created.
As our study was purely experimental, without the par-ticipation of any humans nor any living organisms, the in-vestigators waived approval of a bioethical committee. For the same reasons, the Declaration of Helsinki was also not applicable to our research.
Statistical analyses
Statistical analyses were performed using Statistica soft-ware v. 13 (StatSoft Inc., Tulsa, USA). Continuous variables were tested for normality with the Shapiro–Wilk test and presented as mean ± standard deviation (SD) and median (interquartile range (IQR)). Categorical variables were given as numbers and percentages. When 2 groups were compared, either the Student’s test or the Mann–Whitney U test was used according to the data distribution. Values of p <0.05 were considered statistically significant.
Fig. 1. Experimental setup. A and B. Porcine heart tissue specimen attached to a sample-holding table; C and D. Wet-lab bathtub inside a cuboid cage equipped with electroanatomic reference patches

R. Olszewski et al. Impedance fluctuation and steam pop1054
Results
In total, 25 experimental RFC deliveries which ended up with steam pops were performed. All the investigated events occurred after approx. 30–60 s (Table 1). The time from the beginning of the application up to the steam pop record-ing was shorter if increased power value was set (35 W com-pared to 30 W: 41.5 ±9.9 s compared to 49.9 ±8.2 s; p = 0.046);
however, the amount of energy delivered was similar for both subgroups (35 W compared to 30 W: 1453.7 ±346.9 J compared to 1496.2 ±246.3 J; p = 0.7). There was no sig-nificant difference in the time to steam pop in applica-tions with distinct contact force (20 g compared to 30 g: 47.7 ±11.3 s compared to 44.3 ±7.5 s; p = 0.4). During all RFC applications, the impedance significantly decreased from 122.9 ±7.9 Ω to 87.5 ±3.6 Ω (p < 0.001), which means
Fig. 2. Sample of measurements performed during experimental radiofrequency ablation (RFA). Acoustic marker T – steam pop occurrence time (data from the contact microphone connected to the electrophysiological system); delta impedance – the impedance rise value; impedance rise T – impedance abrupt rise time; post-pop T – steam pop and impedance rise time difference
Table 1. Characteristics of radiofrequency (RF) current applications
Parameter Mean ±SD Median (IQR)
Impedance at baseline [Ω] 122.9 ±7.9 126.0 (116–130)
Impedance at the moment of steam pop [Ω] 87.5 ±3.6 88.0 (85.0–89.0)
Impedance baseline–steam pop [Ω] 35.4 ±6.8 –
Impedance baseline–steam pop [%] 28.6 ±4.1 27.8 (25.8–33.1)
Rate of an impedance decrease [Ω/s] 0.8 ±0.2 0.7 (0.6–0.8)
Impedance after steam pop [Ω] 8.2 ±2.0 7.8 (6.9–9.5)
Impedance after steam pop [%] 9.3 ±2.3 9.5 (7.8–10.7)
Time to steam pop [ms] 46,204 ±9760 46,687 (42,250–51,384)
Time to impedance increase [ms] 46,411 ±9793 46,904 (42,360–51,705)
Time from steam pop to impedance increase [ms] 207 ±1.6 160 (97–253)
Temperature prior to steam pop [°C] 33.5 ±1.9 34 (33–34)
Energy delivered until steam-pop [J] 1477.5 ±288.9 1508 (1279.6–1600.7)
∆ – difference; SD – standard deviation; IQR – interquartile range.

Adv Clin Exp Med. 2021;30(10):1051–1056 1055
a 28.6 ±4.1% reduction of the initial value. This impedance drop did not change significantly regardless of the change in ablation power (30 W compared to 35 W: 36.1 ±6.4 Ω compared to 34.5 ±7.6 Ω; p = 0.64) and the change in contact force values (20 g compared to 30 g: 35.4 ±6.8 Ω compared to 35.4 ±7.1 Ω; p = 1.0). The rate of impedance drop un-til steam pop amounted to 0.8 ±0.2 Ω/s and did not differ between the applications with lower and increased power (30 W: 0.8 ±0.2 Ω/s compared to 35 W: 0.9 ±0.3 Ω/s; p = 0.2), neither was it different when distinct contact forces were used (20 g: 0.8 ±0.2 Ω/s compared to 30 g: 0.8 ±0.3 Ω/s; p = 0.6). The other parameters did not differ between subgroups.
During all experiments, a significant and abrupt im-pedance increase (8.2 ±2.0 Ω, p < 0.001) was observed always after steam pop occurrence. The time difference between the steam pop and the rise in the impedance was insignificantly different between RFC applications with 35 W compared to 30 W (180.1 ±113.9 ms compared to 228.9 ±183.8 ms, p = 0.4) as well as those performed with distinct contact force (20 g: 243.9 ±187.7 ms compared to 30 g: 161.6 ±91.3 ms, p = 0.2). Analogously, the imped-ance rise was comparable in these subgroups (power 35 W: 8.7 ±4.0 Ω compared to 30 W: 7.7 ±2.0 Ω, p = 0.2; contact force 20 g: 7.6 ±2.1 Ω compared to 30 g: 8.9 ±1.8 Ω, p = 0.1). The temperature values recorded just before steam pop occurrence never exceeded 42°C, which proves that ir-rigation of the catheters was adequate. The results of this experiment are summarized in Table 1.
Discussion
Our study has identified, for the first time, that the abrupt rise in impedance does not precede steam pop but occurs shortly after. Additionally, we revealed that the time for the steam pop to occur was shorter when increased power values were applied, but it was not the case when a greater contact force was used.
Correct prediction of the possibility of a steam pop that can complicate RFA is clinically useful but challenging. Dur-ing RFC, the energy delivery impedance gradually decreases with tissue heating, and several studies have observed a sig-nificant impedance drop before the steam pops. A higher likelihood of steam pops was reported when impedance decreased by more than 15 Ω10,19,21; however, this correla-tion was too vague to either predict or detect steam pops.3,10 While the magnitude of impedance change during ablation is not a good predictor of steam pops, a rate of impedance drop for ablation lesion exceeding 1 Ω/s is seen as a strong independent predictor of their occurrence.20,21 However, in our study, the impedance drop rate of 0.8 Ω/s was regis-tered, and yet, in all the experiments, steam pops occurred. This could be accounted for by the difference in the ex-perimental conditions in our in vitro study compared to the in vivo environment. In one of our previous experi-ments, we reduced the rate of steam pops by using cardiac
tissue from porcine hearts just after slaughter (within less than 2 h) along with a high local fluid flow.30 Otherwise, the cardiac tissue might not have had enough potential for energy absorption due to the lack of myocardial perfusion.
An abrupt impedance rise was analyzed in the search for a variable that can predict the occurrence of a steam pop in RFA. In our experiment, all RFC applications were charac-terized with an impedance rise when steam pops occurred. The precise recording method revealed that the impedance increase did not start before, but shortly after a steam pop-related sound. A potential explanation of this phenomenon may be based on the previously described temperature dis-tribution in the ablated tissue.23,27,30 The highest temper-ature during RFA was recorded up to 3 mm underneath the tissue surface.5,23,31 Therefore, the phenomena related to overheating of deeper myocardium are not registered directly on the surface of the endocardium. The impedance rise probably results not only from transformed properties of the cardiac tissue which are provoked by its rupture but also from the catheter movement into an adjacent area. Consequently, the abrupt impedance rise during RFA can-not be used to predict steam pop occurrence. Furthermore, due to the delayed occurrence, any of its derivatives (imped-ance rise value, impedance rise ratio) cannot be of much use either.
Some authors point out that applications with increased power and greater contact force are connected to an in-creased probability of steam pops.10,13,21–25 Our experiments revealed that RFC delivery with the power increased by only 5 W (35 W compared to 30 W) resulted in a shorter time to steam pops. Such findings may indirectly suggest that in-creased power of RFC applications pose a greater risk of tis-sue overheating. Contrastingly, we found that the contact force was not related to the time of steam pops occurrence. Our outcomes are inconsistent with other available data21–25 – most probably due to the relatively minor difference in con-tact force applied in our experiments (20 g compared to 30 g).
Limitations
The main limitation of our study was the approximation of real-life intracardiac conditions as in vitro settings with the use of porcine cardiac tissue. However, this approach allowed us to control all investigated parameters with high precision.
Conclusions
During the delivery of a RF current delivery which ended up with steam pop, an abrupt impedance increase was registered always after the occurrence of this phenomenon. Therefore, the impedance rise observed during steam pop-ping cannot be used for its prediction. The time to steam pop was shorter for application with increased power but not when greater contact force was applied.

R. Olszewski et al. Impedance fluctuation and steam pop1056
ORCID iDsRafał Olszewski https://orcid.org/0000-0001-6506-7482Paweł Ptaszyński https://orcid.org/0000-0001-6084-7324Iwona Cygankiewicz https://orcid.org/0000-0003-3006-311XKrzysztof Kaczmarek https://orcid.org/0000-0003-1356-5249
References1. Wittkampf FHM, Nakagawa H. RF catheter ablation: Lessons on
lesions. Pacing Clin Electrophysiol. 2006;29(11):1285–1297. doi:10.1111/j. 1540-8159.2006.00533.x
2. Wittkampf FHM. When bubbles pop. Pacing Clin Electrophysiol. 2009; 32(7):831–832. doi:10.1111/j.1540-8159.2009.02396.x
3. Cooper JM, Sapp JL, Tedrow U, et al. Ablation with an internally irri-gated radiofrequency catheter: Learning how to avoid steam pops. Heart Rhythm. 2004;1(3):329–333. doi:10.1016/j.hrthm.2004.04.019
4. Fassini G, Conti S, Pontone G, Pepi M, Tondo C, Dello Russo A. Tissue char-acteristics and evolution after steam pop. J Interv Card Electrophysiol. 2015;43(3):313. doi:10.1007/s10840-015-9997-0
5. Thompson N, Lustgarten D, Mason B, et al. The relationship between surface temperature, tissue temperature, microbubble formation, and steam pops. Pacing Clin Electrophysiol. 2009;32(7):833–841. doi:10. 1111/j.1540-8159.2009.02397.x
6. Doppalapudi H, Yamada T, Kay GN. Complications during catheter abla-tion of atrial fibrillation: Identification and prevention. Heart Rhythm. 2009;6(12 Suppl):S18–S25. doi:10.1016/j.hrthm.2009.07.025
7. Chung FP, Chen SA. Avoiding steam explosions during catheter abla-tion: “Stopping before popping.” J Cardiovasc Electrophysiol. 2013; 24(12):1410–1411. doi:10.1111/jce.12233
8. Cappato R, Calkins H, Chen SA, et al. Worldwide survey on the meth-ods, efficacy, and safety of catheter ablation for human atrial fibril-lation. Circulation. 2005;111(9):1100–1105. doi:10.1161/01.CIR.000015 7153.30978.67
9. Tokuda M, Kojodjojo P, Epstein LM, et al. Outcomes of cardiac per-foration complicating catheter ablation of ventricular arrhythmias. Circ Arrhythm Electrophysiol. 2011;4(5):660–666. doi:10.1161/CIRCEP. 111.963413
10. Seiler J, Roberts-Thomson KC, Raymond JM, Vest J, Delacretaz E, Stevenson WG. Steam pops during irrigated radiofrequency ablation: Feasibility of impedance monitoring for prevention. Heart Rhythm. 2008;5(10):1411–1416. doi:10.1016/j.hrthm.2008.07.011
11. Cappato R, Calkins H, Chen SA, et al. Prevalence and causes of fatal outcome in catheter ablation of atrial fibrillation. J Am Coll Cardiol. 2009;53(19):1798–1803. doi:10.1016/j.jacc.2009.02.022
12. Haines DE, Verow AF. Observations on electrode-tissue interface tem-perature and effect on electrical impedance during radiofrequency ablation of ventricular myocardium. Circulation. 1990;82(3):1034–1038. doi:10.1161/01.cir.82.3.1034
13. Hsu LF, Jaïs P, Hocini M, et al. Incidence and prevention of cardiac tamponade complicating ablation for atrial fibrillation. Pacing Clin Electrophysiol. 2005;28(Suppl 1):S106–S109. doi:10.1111/j.1540-8159. 2005.00062.x
14. Vest JA, Seiler J, Stevenson WG. Clinical use of cooled radiofrequency ablation. J Cardiovasc Electrophysiol. 2008;19(7):769–773. doi:10.1111/j.1540-8167.2008.01193.x
15. Gaita F, Caponi D, Pianelli M, et al. Radiofrequency catheter abla-tion of atrial fibrillation: A cause of silent thromboembolism? Mag-netic resonance imaging assessment of cerebral thromboembo-lism in patients undergoing ablation of atrial fibrillation. Circulation. 2010;122(17):1667–1673. doi:10.1161/CIRCULATIONAHA.110.937953
16. Bunch TJ, Asirvatham SJ, Friedman PA, et al. Outcomes after car-diac perforation during radiofrequency ablation of the atrium. J Cardiovasc Electrophysiol. 2005;16(11):1172–1179. doi:10.1111/j.1540-8167.2005.50135.x
17. Jaïs P, Shah DC, Haïssaguerre M, et al. Efficacy and safety of septal and left-atrial linear ablation for atrial fibrillation. Am J Cardiol. 1999; 84(9A):139R–146R. doi:10.1016/s0002-9149(99)00714-6
18. Jaïs P, Hocini M, Hsu LF, et al. Technique and results of linear ablation at the mitral isthmus. Circulation. 2004;110(19):2996–3002. doi:10. 1161/01.CIR.0000146917.75041.58
19. Strickberger SA, Ravi S, Daoud E, Niebauer M, Man KC, Morady F. Rela-tion between impedance and temperature during radiofrequency ablation of accessory pathways. Am Heart J. 1995;130(5):1026–1030. doi:10.1016/0002-8703(95)90204-x
20. Koruth JS, Dukkipati S, Gangireddy S, et al. Occurrence of steam pops during irrigated RF ablation: Novel insights from microwave radio-metry. J Cardiovasc Electrophysiol. 2013;24(11):1271–1277. doi:10.1111/jce.12181
21. Nguyen DT, Zipse M, Borne RT, Zheng L, Tzou WS, Sauer WH. Use of tissue electric and ultrasound characteristics to predict and pre-vent steam-generated cavitation during high-power radiofrequency ablation. JACC Clin Electrophysiol. 2018;4(4):491–500. doi:10.1016/j.jacep.2017.10.003
22. Thiagalingam A, D’Avila A, Foley L, et al. Importance of catheter contact force during irrigated radiofrequency ablation: Evaluation in a porcine ex vivo model using a force-sensing catheter. J Cardiovasc Electrophysiol. 2010;21(7):806–811. doi:10.1111/j.1540-8167.2009.01693.x
23. Yokoyama K, Nakagawa H, Shah DC, et al. Novel contact force sensor incorporated in irrigated radiofrequency ablation catheter predicts lesion size and incidence of steam pop and thrombus. Circ Arrhythm Electrophysiol. 2008;1(5):354–362. doi:10.1161/CIRCEP.108.803650
24. Ikeda A, Nakagawa H, Lambert H, et al. Relationship between cath-eter contact force and radiofrequency lesion size and incidence of steam pop in the beating canine heart: Electrogram amplitude, impedance, and electrode temperature are poor predictors of elec-trode-tissue contact force and lesion size. Circ Arrhythm Electrophysiol. 2014;7(6):1174–1180. doi:10.1161/CIRCEP.113.001094
25. Nakagawa H, Jackman WM. The role of contact force in atrial fibrilla-tion ablation. J Atr Fibrillation. 2014;7(1):1027. doi:10.4022/jafib.1027
26. Chik WWB, Kosobrodov R, Bhaskaran A, et al. Acoustic signal emission monitoring as a novel method to predict steam pops during radiofre-quency ablation: Preliminary observations. J Cardiovasc Electrophysiol. 2015;26(4):440–447. doi:10.1111/jce.12598
27. Wright M, Harks E, Deladi S, et al. Visualizing intramyocardial steam for-mation with a radiofrequency ablation catheter incorporating near-field ultrasound. J Cardiovasc Electrophysiol. 2013;24(12):1403–1409. doi:10.1111/jce.12218
28. Kondo Y, Ueda M, Kobayashi Y. Visualizing induced silent steam pop with intracardiac echocardiography. Europace. 2017;19(7):1145. doi:10. 1093/europace/eux085
29. Wood MA, Shaffer KM, Ellenbogen AL, Ownby ED. Microbubbles dur-ing radiofrequency catheter ablation: Composition and formation. Heart Rhythm. 2005;2(4):397–403. doi:10.1016/j.hrthm.2004.12.026
30. Kaczmarek K, Cygankiewicz I, Strzelecki A, Wranicz JK, Ptaszyński P. In vitro evaluation of new Polish prototypes of 4-mm-tip and 8-mm-tip nonirrigated radiofrequency ablation catheters. Kardiol Pol. 2020; 78(11):1142–1147. doi:10.33963/KP.15605
31. Yokoyama K, Nakagawa H, Wittkampf FHM, Pitha JV, Lazzara R, Jack-man WM. Comparison of electrode cooling between internal and open irrigation in radiofrequency ablation lesion depth and inci-dence of thrombus and steam pop. Circulation. 2006;113(1):11–19. doi:10.1161/CIRCULATIONAHA.105.540062

Cite asMarkowska A, Gryboś A, Marszałek A, et al. Expression of selected molecular factors in two types of endometrial cancer. Adv Clin Exp Med. 2021;30(10):1057–1064. doi:10.17219/acem/137383
DOI10.17219/acem/137383
Copyright© 2021 by Wroclaw Medical University This is an article distributed under the terms of theCreative Commons Attribution 3.0 Unported (CC BY 3.0)(https://creativecommons.org/licenses/by/3.0/)
Address for correspondenceAnna GrybośE-mail: [email protected]
Funding sourcesNone declared
Conflict of interestNone declared
Received on June 29, 2020Reviewed on February 4, 2021Accepted on May 15, 2021
Published online on September 9, 2021
AbstractBackground. Endometrial cancers (EC) are a heterogeneous group of malignant neoplasms differing in etiology, clinical-pathological features and prognosis.
Objectives. To determine the differences between the expression of selected molecular factors and find connections between them in order to isolate possible biomarkers influencing treatment options.
Materials and methods. The investigated data involved archival histological preparations obtained from uterine EC samples taken from 137 patients, treated surgically between 2007 and 2014. The immunohisto-chemical Dako EnVisionTM Flex+ method was applied.
Results. The expression of ERβ, MLH1 and BRCA1 was lower in ECI than in ECII patients. The ERα expres-sion was higher in early Fédération internationale de gynécologie et d’obstétrique (FIGO) (IA) stages than in advanced (IB-IV) stages, while ERβ expression was significantly higher in advanced stages compared to stage IA and increased with grading. The BRCA1 expression also increased with grading. In both type I and type II EC patients, ERα expression correlated with MYH9 and BRCA1, while ERβ expression correlated with BAP expression. High expression of BRCA1 correlated with several proteins: BAP, MYH9 and FAK. High BAP expression also correlated with high MYH9 expression. A correlation in the expression of these proteins was also demonstrated in the group consisting only of patients with ECI. A significant correlation was found between BAP expression and MYH9 among patients diagnosed with ECI. In the ECII group, no correlation was found between the tested proteins.
Conclusions. The ECI and ECII patients differed in the studied molecular factors, mainly in terms of ER and BRCA1 expression. Changes in BRCA1 expression were linked to alterations in BAP expression, but were also associated with the proteins MYH9 and FAK.
Key words: MYH9, endometrial cancer, BAP, FAK
Original papers
Expression of selected molecular factors in two types of endometrial cancer
Anna Markowska1,A,C,D, Anna Gryboś2,B,E, Andrzej Marszałek3,C, Wiesława Bednarek4,B, Violetta Filas3,B,C, Marian Gryboś5,E, Janina Markowska6,E,F, Radosław Mądry6,B, Barbara Więckowska7,C, Danuta Nowalińska3,C, Monika Szarszewska6,C,E
1 Department of Perinatology and Gyneacology, Poznan University of Medical Sciences, Poland2 Department of Gyneacology and Obstetrics, Faculty of Health Science, Wroclaw Medical University, Poland3 Department of Tumour Pathology and Prophylaxis, Poznan University of Medical Sciences, Greater Poland Cancer Centre, Poland4 Chair and Clinic of Gynecological Oncology, Medical University of Lublin, Poland5 Department of Obstetrics, Faculty of Health Sciences, University of Opole, Poland6 Department of Gynecological Oncology, Poznan University of Medical Sciences, Poland7 Department of Computer Science and Statistics, Poznan University of Medical Sciences, Poland
A – research concept and design; B – collection and/or assembly of data; C – data analysis and interpretation; D – writing the article; E – critical revision of the article; F – final approval of the article
Advances in Clinical and Experimental Medicine, ISSN 1899–5276 (print), ISSN 2451–2680 (online) Adv Clin Exp Med. 2021;30(10):1057–1064

A. Markowska et al. Expression of selected molecular markers in EC1058
Background
According to global epidemiological statistics, endome-trial cancer (EC) is the 6th most common cancer in women. There were over 380,000 new cases of EC in 2018, repre-senting 4.4% of all female malignancies diagnosed that year. The age-standardized rate of EC per 100,000 women is the highest in Belarus, followed by the Samoan Islands (24.9 and 24.8, respectively). Poland ranks 12th in the in-cidence of EC.1 In the last 10 years, the incidence of EC has increased significantly in many geographical regions of the world, including Europe.2,3
Bokhman’s hypothesis has led to the identification of 2 basic types of EC: ECI and ECII. The ECI, which is characterized as endometrioid, is associated with a good prognosis and constitutes the large majority of patients, while ECII, which is non-endometrioid, occurs less fre-quently than ECI and has a more clinically aggressive course and poor prognosis.2,4
The molecular characteristics of ECI include mutations in the PTEN suppressor gene and β-catenin encoding CTNNB1 gene, as well as changes in PIK3CA signaling and in MMR genes (mismatch repair).2,5–7 The ECII is characterized by mutations in the TP53, HER-2 neu and BRCA genes.8,9
According to Setiawan et al., the risk factor profiles for both EC types are quite similar, suggesting that they share some common etiologic pathways.5 Long et al. studied 1170 cases of EC (including types I and II) and found that the germline MMR mutations typical of Lynch syndrome were present in 1.4% of ECI and 1.6% of ECII patients.10 Molecular changes in ECI and ECII were the reason for genomic analysis (TCGA), in which at least 4 EC subtypes were isolated.11
Epidemiological and genetic studies also indicate a rela-tionship between the development of endometrial serous cancer, ECII and BRCA 1/2 mutations.12,13 A relationship was also found between the BRCA1 suppressor and BAP1 (BRCA-associated protein-1), which has suppressor ef-fects. This link may affect the etiology of the pathogen-esis of BRCA-dependent cancers.14,15 The full spectrum of BAP1-dependent tumors is constantly updated, as new associations with other genes are discovered.16–18
Cytoplasmic tyrosine kinase, a product of the FAK (focal adhesion kinase) gene located at chromosome 8q24, partici-pates in processes facilitating the progression of malignant tumors, including EC.19 Deregulation of the biological func-tion of FAK is involved in cell migration, angiogenesis, cell growth, expression of anti-apoptotic proteins and, more prominently, in the invasion and metastasis of cancer.20,21 Upregulation of FAK is observed in both endometrial hyper-plasia and carcinoma.21,22 Tsai et al. suggested that the par-ticipation of FAK in the migration of EC cells is induced by estrogens.23
Further research is underway regarding ECI and ECII susceptibility to gene mutations and the isolation of bio-markers for early EC detection. So far, no relationship has
been described between MYH9 mutations and EC. How-ever, the results of studies on the expression of MYH9 pro-tein in ovarian and lung cancer indeed have shown clinical and prognostic value.24–26 Studies indicate that the MYH9 gene located at chromosome 22q12 may act as a suppressor gene in cancer. This gene codes for MYH9 (non-muscle myosin IIA), an actin-binding protein that is responsible for the normal structure of the cytoplasm and is involved in cell division, adhesion and motility, which is critical for cancer invasiveness and metastasis.27,28 Further research is ongoing to better understand the prognosis and pro-gression of these cancers and their relation to proteomic biomarkers and microRNAs.29,30
Objectives
This study aimed to determine differences between the expression of selected molecular factors in EC and to find potential relationships between them in order to iso-late possible biomarkers influencing treatment options.
Materials and methods
Samples
This article is based on a retrospective multicenter study of EC patients. The data consist of archival histological preparations from 137 patients with endometrial carcino-mas surgically treated between 2007 and 2014.
Of the 137 EC patients, 33 (24.1%) were diagnosed with stage IA, 36 (26.3%) with stage IB, 34 (24.8%) with stage II, 21 (15.3%) with stage III, and 13 (9.5%) with stage IV. Staging was performed according to Fédération internationale de gynécologie et d’obstétrique (FIGO) staging system (2009).
In the examined group, ECI was found in 106 patients (77.4%), while ECII was found in 31 (22.6%) patients. Among the patients diagnosed with type II EC, there were 18 patients with the serous type (13.4%), 11 patients with clear cell type (8.3%) and 2 patients with mucous tissue type (1.4%) (Table 1).
Well-differentiated endometrial cancer (histological grading G1) was diagnosed in 32 patients (23.4%), inter-mediate G2 type in 53 patients (38.7%) and poorly differ-entiated G3 type in 52 patients (37.9%) (Table 1).
The average age of all patients enrolled in the study was 65.8 years. The average age was 65.3 years (44–83 years) in patients with ECI and 67.5 years (34–83 years) in women with ECII (group difference in mean age p > 0.05; Table 1).
Immunohistochemistry
Tissue material was fixed in 10% buffered formalin at pH 7.4 and placed in a processor. The tissue was embed-ded in paraffin at 60°C using standard histopathological

Adv Clin Exp Med. 2021;30(10):1057–1064 1059
methods. The marked paraffin blocks were sliced us-ing a microtome into 4–5-μm thick sections. The sec-tions were then fixed to microscope slides and left for 1 h at 60°C. The Dako EnVisionTM FLEX + system (Dako, Santa Clara, USA) and the immunohistochemical method were used. High pH Target Retrieval Solution (Dako) was used as the buffer in the PT-link apparatus (Dako) at a tem-perature of 97°C for 20 min.
Antibodies
To test for the presence of antigens in the tissue, the fol-lowing antibodies were used: ERα (D-12, clone sc-8005; Santa Cruz Biotechnology, Santa Cruz, USA), ERβ1 (clone MSK042-05; Zytomed Systems, Berlin, Germany), BRCA1 (clone MS110; Abcam, Cambridge, UK), MLH1 (clone ES05; Leica Biosystems, Buffalo Grove, USA), and BAP1 (clone C-4; Abcam). Immunoperoxidase staining was per-formed on a Dako Autostainer Link 48 apparatus (Dako).
Polyclonal antibodies (Thermo Fisher Scientific, Waltham, USA) were used to determine MYH9 and FAK tumor markers. Sections were incubated with 1 antibody
for 20 min. In the case of the FAK antibody, the Dako rabbit linker was used for 15 min. Dako EnVisionTM FLEX/HRP was used with an incubation time of 20 min, and the sec-tions were then incubated with EnVisionTM FLEX DAB + Chromogen for 5 min. Immunoperoxidase staining was performed manually at room temperature. To assess the intensity of ER, MLH1, BRCA1, BAP, MYH9, and FAK protein staining, a four-point scale was used as follows:
0 no reaction;+ reaction of 1–50 immunopositive cells (nucleus
or cytoplasm);++ reaction of 50–75 immunopositive cells; and+++ reaction of 75–100 immunopositive cells.Staining was assessed in 10 fields of view. Preparations
exhibiting ++ or +++ staining were considered to represent a positive reaction.
Statistical analyses
Data are presented as numbers and their correspond-ing percentages n (%). The statistical analyses were based on Pearson’s χ2 test or Fisher’s exact test. Where sub-tables 2 × 2 or larger contingency were analyzed, the p-values were adjusted using Benjamini–Hochberg correction. The frequency of high protein expression in the analyzed groups is presented as the odds ratio (OR) and 95% confi-dence interval (95% CI). All tests were considered signifi-cant at p < 0.05. The statistical analysis was performed using PQStat v. 1.8.2 software (PQStat Software, Poznań, Poland).
Results
ERα, ERβ, MLH1, BRCA1, and BAF protein manifested nuclear reactions, whereas MYH9 and FAK presented cy-toplasmic immunohistochemical reactions (Fig. 1–3).
In EC cells, high protein expression of ERα was found in 37.2% of patients, ERβ in 25.6% of patients, MLH1 in 30.7% of patients, BRCA1 in 54.8% of patients, BAP in 63.5% of patients, MYH9 in 59.1% of patients, and FAK in only 3.7% of all patients.
The EC patients were divided into 2 groups based on the histopathological type: ECI (n = 106) and ECII (n = 31), which included patients with serous, clear cell and mucous carcinomas.
ERβ and MLH1 expression was lower in the subgroup of patients with ECI (22% compared to 44.3%, p = 0.021; OR = 2.71, 95% CI [1.14, 6.43]; 52.1% compared to 77.2%, p = 0.013; OR = 3.16, 95% CI [1.25, 8.01], respectively). In the case of BRCA1, positive expression of this protein was higher among ECII patients (ECI 24.5% compared to ECII 51.6%, p = 0.004; OR = 3.28, 95% CI [1.43, 7.54]). No statistically significant differences were found in ERα, BAP, MYH9, or FAK expression between the subgroups (all p > 0.05, Table 2).
Table 1. Clinicopathologic characteristics of studied patients with endometrial cancer
Clinical staging (FIGO) Number of patients
Adenocarcinoma endometrioides (n = 106)
IA 28
IB 32
II 24
III 13
IV 9
Adenocarcinoma serosum G3 (n = 18)
IA 4
IB 3
II 7
III 4
Adenocarcinoma clarocellulare G3 (n = 11)
IA 1
IB 1
II 2
III 4
IV 3
Adenocarcinoma mucinosum (n = 2)
II 1
IV 1
Histological grading (n = 137)
G1 32
G2 53
G3 52
FIGO – Fédération internationale de gynécologie et d’obstétrique (FIGO) staging system.
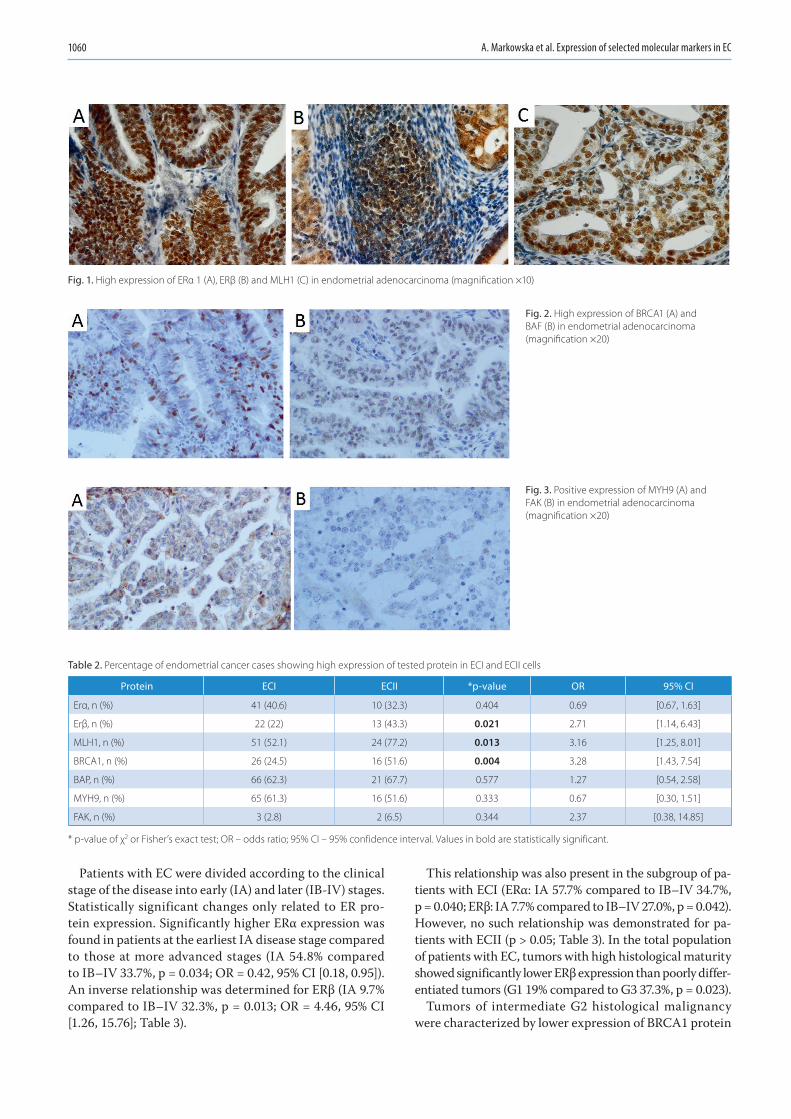
A. Markowska et al. Expression of selected molecular markers in EC1060
Patients with EC were divided according to the clinical stage of the disease into early (IA) and later (IB-IV) stages. Statistically significant changes only related to ER pro-tein expression. Significantly higher ERα expression was found in patients at the earliest IA disease stage compared to those at more advanced stages (IA 54.8% compared to IB–IV 33.7%, p = 0.034; OR = 0.42, 95% CI [0.18, 0.95]). An inverse relationship was determined for ERβ (IA 9.7% compared to IB–IV 32.3%, p = 0.013; OR = 4.46, 95% CI [1.26, 15.76]; Table 3).
This relationship was also present in the subgroup of pa-tients with ECI (ERα: IA 57.7% compared to IB–IV 34.7%, p = 0.040; ERβ: IA 7.7% compared to IB–IV 27.0%, p = 0.042). However, no such relationship was demonstrated for pa-tients with ECII (p > 0.05; Table 3). In the total population of patients with EC, tumors with high histological maturity showed significantly lower ERβ expression than poorly differ-entiated tumors (G1 19% compared to G3 37.3%, p = 0.023).
Tumors of intermediate G2 histological malignancy were characterized by lower expression of BRCA1 protein
Table 2. Percentage of endometrial cancer cases showing high expression of tested protein in ECI and ECII cells
Protein ECI ECII *p-value OR 95% CI
Erα, n (%) 41 (40.6) 10 (32.3) 0.404 0.69 [0.67, 1.63]
Erβ, n (%) 22 (22) 13 (43.3) 0.021 2.71 [1.14, 6.43]
MLH1, n (%) 51 (52.1) 24 (77.2) 0.013 3.16 [1.25, 8.01]
BRCA1, n (%) 26 (24.5) 16 (51.6) 0.004 3.28 [1.43, 7.54]
BAP, n (%) 66 (62.3) 21 (67.7) 0.577 1.27 [0.54, 2.58]
MYH9, n (%) 65 (61.3) 16 (51.6) 0.333 0.67 [0.30, 1.51]
FAK, n (%) 3 (2.8) 2 (6.5) 0.344 2.37 [0.38, 14.85]
* p-value of χ2 or Fisher’s exact test; OR – odds ratio; 95% CI – 95% confidence interval. Values in bold are statistically significant.
Fig. 1. High expression of ERα 1 (A), ERβ (B) and MLH1 (C) in endometrial adenocarcinoma (magnification ×10)
Fig. 3. Positive expression of MYH9 (A) and FAK (B) in endometrial adenocarcinoma (magnification ×20)
Fig. 2. High expression of BRCA1 (A) and BAF (B) in endometrial adenocarcinoma (magnification ×20)

Adv Clin Exp Med. 2021;30(10):1057–1064 1061
compared to G3 undifferentiated tumors (G2 20.8% com-pared to G3 44.2%, p = 0.030). In the examined group of patients, no relationship was found between the degree of ERα, MLH1, BAP, MYH9, and FAK expression and tu-mor histological grade (all p > 0.05; Table 4). Among all examined patients with EC, we observed that high expres-sion of ERα was associated with high expression of MYH9 protein (OR = 2.1, 95% CI [1.0, 4.5], p = 0.046) and with the presence of BRCA1 protein (OR = 2.1, 95% CI [1.0, 4.5], p = 0.047). High ERβ expression was associated with high BAP protein expression (OR = 3.37, 95% CI [1.28, 6.8], p = 0.007).
High BRCA1 expression was associated with high BAP protein expression (OR = 4.1, 95% CI [1.67, 10.2], p = 0.001), high MYH9 protein expression (OR = 3.6, 95% CI [1.55, 8.3], p = 0.002), and high FAK protein expression (OR = 28.01, 95% CI [1.5, 519.2], p = 0.002). High BAP expression was associated with high MYH9 protein expression (OR = 3.5, 95% CI 1.7– 7.3, p < 0.001).
Among patients with ECI, high ERβ expression was associated with high BAP expression (OR = 4.4, 95% CI [1.2, 16.1], p = 0.017) and high FAK expression (OR = 9.1, 95% CI [0.9, 414.5], p = 0.047). High BRCA1 expression was associated with high expression of MYH9 (OR = 6.9, 95% CI 1.9–25, p = 0.001), BAP (OR = 4.5, 95% CI [1.4, 4.3], p = 0.007) and FAK (OR = 24, 95% CI [1.2, 481.1],
p = 0.013). High BAP expression was associated with high MYH9 expression (OR = 3.6, 95% CI [1.6, 8.3], p = 0.002).
There was no association between expression of indi-vidual proteins among patients with ECII.
Discussion
Endometrial cancer is a molecularly heterogeneous ma-lignant neoplasm that can present with diverse morbidity, clinical-pathological features and clinical course.2,11,29,30 The majority of patients in this study (77.4%) were diag-nosed with ECI, while the remainder were diagnosed with ECII (22.6%).
The determined expression of ERα and ERβ values showed different relationships with the clinical-patho-logical features of EC. Their diverse roles in type I EC and type II EC have been indicated in numerous stud-ies.31,32 We found no differences in ERα expression between histological type (ECI compared to ECII) or histological grading of the cancer (G). However, the values of ERα ex-pression in our study differed significantly between stages according to the FIGO system. ERα expression was higher in stage IA FIGO compared to IB–IV (54.8% compared to 33.7%, Table 3). In a previous study, Backes et al. showed that advanced stage (according to FIGO) patients were
Table 3. Percentage of endometrial cancer cases showing high expression of the tested protein depending on the stage of cancer (IA compared to IB-IV, according to FIGO)
Protein FIGO IA FIGO IB-IV *p-value OR 95% CI
Erα, n (%) 17 (54.8) 34 (33.7) 0.034 0.42 [0.18, 0.95]
Erβ, n (%) 3 (9.7) 32 (32.3) 0.013 4.46 [1.26, 15.76]
MLH1, n (%) 15 (51.7) 60 (60.0) 0.911 1.05 [0.47, 2.32]
BRCA1, n (%) 10 (30.3) 32 (30.8) 0.959 1.02 [0.44, 2.39]
BAP, n (%) 21 (63.6) 66 (63.5) 0.985 0.99 [0.44, 2.23]
MYH9, n (%) 22 (66.7) 59 (56.7) 0.312 0.66 [0.29, 1.49]
FAK, n (%) 2 (6.1) 3 (2.9) 0.594 0.46 [0.07, 2.88]
*p-value of χ2 or Fisher’s exact test. OR – odds ratio; 95% CI – 95% confidence interval; FIGO – Fédération internationale de gynécologie et d’obstétrique (FIGO) staging system. Values in bold are statistically significant.
Table 4. The percentage of endometrial cancer cases showing high expression of a given protein depending on the grading (G1 compared to G2 compared to G3)
Protein G1 G2 G3 p-value*p-value G1 compared
to G2
*p-value G1 compared
to G3
*p-value G2 compared
to G3
Erα, n (%) 13 (44.8) 19 (37.3) 19 (36.5) 0.738 0.759 0.759 0.940
Erβ, n (%) 3 (10) 13 (26.5) 19 (37.3) 0.028 0.114 0.023 0.250
MLH1, n (%) 19 (65.5) 25 (51) 31 (60.8) 0.403 0.488 0.674 0.488
BRCA1, n (%) 8 (25) 11 (20.8) 23 (44.2) 0.024 0.649 0.114 0.030
BAP, n (%) 21 (65.6) 33 (62.3) 33 (63.5) 0.952 0.899 0.899 0.899
MYH9, n (%) 23 (71.9) 30 (56.6) 28 (53.8) 0.236 0.239 0.239 0.776
FAK, n (%) 0 (0) 0 (0) 5 (9.6) 0.017 1.000 0.227 0.081
*p-value of χ2 or Fisher’s exact test adjusted with Benjamini–Hochberg correction. OR – odds ratio. Values in bold are statistically significant.

A. Markowska et al. Expression of selected molecular markers in EC1062
characterized by ERα expression that was more frequently negative compared to patients at earlier stages.31 In their study, 88.6% of the patients in group I FIGO expressed ERα. Other authors have also described a reduction of ERα expression along with rising disease stage.34 According to Sho et al., ERα expression in ECII is associated with advanced cancer and worse prognosis.33
In our study, high ERα expression (higher in IA FIGO) was significantly correlated with high expression of MYH9 protein and the presence of BRCA1 protein. This may suggest that both the protein encoded by the suppressor MYH9 and the protein encoded by the suppressor BRCA1 perform their functions at early clinical stages.10,16,27
Although many studies have reported ERβ involvement in EC carcinogenesis, the data on the correlation of ERβ expression with disease stage and histological grading remain divergent.34,35 Our results showed significantly higher ERβ expression in type II EC (Table 2) compared to type I EC, as well as higher expression in advanced FIGO stages (Table 3) and in poorly differentiated cancers (G3 compared to G1) (Table 4). Thus, high ERβ expression may be related to aggressive cancers with worse prognosis. Similarly, in the study by Obata et al., high ERβ expression was correlated with an aggressive EC course, metastasis and/or recurrence.36
In our study, high ERβ expression was correlated with high BAP expression in the whole group of patients. In type I EC patients, we also showed a significant correlation with high BAP and FAK expression. The explanation for this correlation may be the association of ECII with BRCA mu-tations and the confirmed effect of BAP-1 on BRCA.9,15–17 In other studies, FAK activity was also reported to be in-creased in higher EC stages as well as in undifferentiated cancers, i.e., G3.22,37
One of the examined proteins in our study was MLH1, which is a product of a gene associated with Lynch syn-drome. Of the 2 most common mutations occurring in Lynch syndrome, we chose MLH1 because, according to Lynch and de la Chapelle, the MLH1 mutation occurred in 47% of patients with hereditary colorectal cancer com-pared to 19% of those with a mutation in MSH2.38 MLH1 expression was significantly lower in type I EC compared to type II EC patients, which may indicate that the MLH1 mutation is more common in ECI. We found no differ-ence in expression depending on the clinical stage of FIGO or grading. We also found no correlation between MLH1 expression and other proteins.
The relationship between BRCA1 mutations and ECII has been previously reported.9,12 In our study, BRCA1 ex-pression was significantly higher in ECII compared to ECI patients. This suggests that either our patients with ECII did not have the BRCA1 mutation or that we detected inac-tive proteins; the latter possibility would require further testing. We also found that BRCA1 expression was sig-nificantly increased in cancers at G3 compared to can-cers at G2, which could be an effect of including all ECII
patients in the G3 group, which is the typical histological grade for this type of cancer.7,9 A significant correlation be-tween the expression of BRCA1 and the expression of other proteins was strongly evident. BAP and MYH9 correlations were described in all of the study groups.
In the group of patients with type I EC in our study, there was not only a significant correlation between high expres-sion of BRCA1, MYH9 and BAP, but also with the expres-sion of FAK. As shown in a review by Silver and Livingston, BRCA1 interacts with many proteins by modifying their function.39 The correlation of BRCA1 expression with FAK expression may be of clinical significance. This is due to the fact that FAK expression is also associated with a more aggressive EC type, including undifferentiated G3 cancer.22,37
The BAP1 protein is a product of the suppressor BAP1 gene. It regulates key cell pathways like the cell cycle, transcription and signaling DNA damage and also partici-pates in inhibiting the growth of BRCA-dependent cancer cells.14,40 We did not find differences in BAP1 expression between ECI and ECII groups or between different stages or grading of cancer.
Regarding the other molecular factors, we noted a signif-icant correlation with BAP1 (ERβ and BRCA1). We found that high BAP expression significantly correlated with high MYH9 expression in the entire group of patients as well as in the subgroup of patients with ECI. According to Fu-kuda et al., there is a functional correlation between BAP and BRCA1 proteins.15 In our study, we showed a correla-tion between high expression of ERα, MYH9 and BRCA1. It can therefore be speculated that BAP interacts with many proteins using, among other features, its deubiqui-tinating ability.40
To the best of our knowledge, this paper is the first to study MYH9 expression in EC. The estimated expres-sion of MYH9 did not differ depending on EC type (I or II), stage or histological grading (G); for all the parameters mentioned, staining was intensive and exceeded 50% (Tables 2–4). However, we showed that high expression of ERα, BRCA1 and BAP correlates significantly with high MYH9 expression. Therefore, our research indi-cates a possible functional relationship between MYH9 and the BRCA1 and BAP suppressor genes, and an indirect relationship with estrogen receptors. These possibilities require further studies.
According to numerous studies, increased FAK expres-sion plays a negative role in EC; it is correlated to FIGO disease stage and shows an increase with decreasing his-tological maturity of cancer (e.g., a significant increase in G3).22,37
Limitations
In our study, FAK expression was low; this concerns both the FIGO stage and grading in the entire study group (ECI and ECII). In a study by Gabryel et al., FAK expression was evident in 89% of 134 EC cases.37 By contrast, in our

Adv Clin Exp Med. 2021;30(10):1057–1064 1063
study, FAK expression was positive in 3.7% of all patients, with highest perceptible expression in patients with G3 grading (9.6%). However, the correlation results showed that FAK expression is associated with BRCA1 expression, both in the entire study group and in individual EC types. In addition, in patients with type I EC, high ERβ expres-sion correlated significantly with FAK expression. Tsai et al. noted a relationship between FAK activity and ER activity in established EC cell lines, but they demonstrated an effect of ERα that we did not find in our study.23 Thus, the results of our research regarding the expression of FAK require more extensive study, as they dispute the results of other authors.22,23,37
Conclusions
Among patients with EC, increased expression of ERβ protein was found in patients with ECII, as well as in pa-tients with higher clinical stages and low histological ma-turity. The latter finding may be associated with a worse prognosis. Higher ERα protein expression was also evident in patients with FIGO IA, while higher MLH1 protein ex-pression was observed in ECI. The expression of BRCA1 protein was higher in patients with ECI and correlated with BAP, MYH9 and FAK expression. Our results showed high FAK protein expression in only 3.7% of EC cases – mainly in patients with low histopathological differentiation (G3). The clinical significance of these relationships and poten-tial applications for treatment require further study.
ORCID iDsAnna Markowska https://orcid.org/0000-0002-4078-6568Anna Gryboś https://orcid.org/0000-0002-7456-4373Andrzej Marszałek https://orcid.org/0000-0002-6055-9151Wiesława Bednarek https://orcid.org/0000-0001-8151-2697Violetta Filas https://orcid.org/0000-0003-2028-877XMarian Gryboś https://orcid.org/0000-0003-0216-8088Janina Markowska https://orcid.org/0000-0002-2893-8389Radosław Mądry https://orcid.org/0000-0003-0738-2788Barbara Więckowska https://orcid.org/0000-0002-1811-2583Danuta Nowalińska https://orcid.org/0000-0000-0000-0001Monika Szarszewska https://orcid.org/0000-0002-7101-1909
References1. Bray F, Ferlay J, Soerjomataram I, Siegel RL, Torre LA, Jemal A. Global
cancer statistics 2018: GLOBOCAN estimates of incidence and mor-tality worldwide for 36 cancers in 185 countries. CA Cancer J Clin. 2018;68(6):394–424. doi:10.3322/caac.21492
2. Colombo N, Creutzberg C, Amant F, et al; ESMO-ESGO-ESTRO Endo-metrial Consensus Conference Working Group. ESMO-ESGO-ESTRO Consensus Conference on Endometrial Cancer: Diagnosis, treatment and follow-up. Ann Oncol. 2016;27(1):16–41. doi:10.1093/annonc/mdv484
3. Lortet-Tieulent J, Ferlay J, Bray F, Jemal A. International patterns and trends in endometrial cancer incidence, 1978–2013. J Natl Cancer Inst. 2018;110(4):354–361. doi:10.1093/jnci/djx214
4. Bokhman JV. Two pathogenetic types of endometrial carcinoma. Gynecol Oncol. 1983;15(1):10–17. doi:10.1016/0090-8258(83)90111-7
5. Setiawan VW, Yang HP, Pike MC, et al. Type I and II endometrial cancers: Have they different risk factors? J Clin Oncol. 2013;31(20):2607–2618. doi:10.1200/JCO.2012.48.2596
6. Huang M, Djordjevic B, Yates MS, et al. Molecular pathogenesis of endometrial cancers in patients with Lynch syndrome. Cancer. 2013; 119(16):3027–3033. doi:10.1002/cncr.28152
7. Sagae S, Susumu N, Viswanathan AN, et al. Gynecologic Cancer Inter Group (GCIG) consensus review for uterine serous carcinoma. Int J Gynecol Cancer. 2014;24(9 Suppl 3):S83–S89. doi:10.1097/IGC. 0000000000000264
8. Felix AS, Yang HP, Bell DW, Sherman ME. Epidemiology of endome-trial carcinoma: Etiologic importance of hormonal and metabolic influences. Adv Exp Med Biol. 2017;943:3–46. doi:10.1007/978-3-319-43139-0_1
9. Bruchim I, Amichay K, Kidron D, et al. BRCA1/2 germline mutations in Jewish patients with uterine serous carcinoma. Int J Gynecol Cancer. 2010;20(7):1148–1153. doi:10.1111/IGC.0b013e3181ef622d
10. Long B, Lilyquist J, Weaver A, et al. Cancer susceptibility gene muta-tions in type I and II endometrial cancer. Gynecol Oncol. 2019;152(1): 20–25. doi:10.1016/j.ygyno.2018.10.019
11. Kandoth C, Schultz N, Cherniack AD, et al; Cancer Genome Atlas Research Network. Integrated genomic characterization of endome-trial carcinoma. Nature. 2013;497(7447):67–73. doi:10.1038/nature12113
12. Kadan Y, Raviv O, Segev Y, et al. Impact of BRCA mutations on out-comes among patients with serous endometrial cancer. Int J Gynaecol Obstet. 2018;142(1):91–96. doi:10.1002/ijgo.12486
13. Lavie O, Ben-Arie A, Segev Y, et al. BRCA germline mutations in women with uterine serous carcinoma: Still a debate. Int J Gynecol Cancer. 2010;20(9):1531–1534. doi:10.1111/IGC.0b013e3181cd242f
14. Jensen DE, Rauscher FJ III. BAP1, a candidate tumor suppressor pro-tein that interacts with BRCA1. Ann N Y Acad Sci. 1999;886:191–194. doi:10.1111/j.1749-6632.1999.tb09414.x
15. Fukuda T, Tsuruga T, Kuroda T, Nishikawa H, Ohta T. Functional link between BRCA1 and BAP1 through histone H2A, heterochromatin and DNA damage response. Curr Cancer Drug Targets. 2016;16:101–109. doi:10.2174/1568009615666151030102427
16. Jensen DE, Proctor M, Marquis ST, et al. BAP1: A novel ubiquitin hydro-lase which binds to the BRCA1 RING finger and enhances BRCA1-mediated cell growth suppression. Oncogene. 1998;16:1070–1112. doi:10.1038/sj.onc.1201861
17. Murali R, Wiesner T, Scolyer RA. Tumours associated with BAP1 mutations. Pathology. 2013;45(2):116–126. doi:10.1097/PAT.0b013e32835d0efb
18. Kolluri KK, Alifrangis C, Kumar N, et al. Loss of functional BAP1 aug-ments sensitivity to TRAIL in cancer cells. eLife. 2018;7:e30224. doi:10. 7554/eLife.30224
19. Schaller MD. Biochemical signals and biological responses elicited by the focal adhesion kinase. Biochim Biophys Acta. 2001;1540(1):1–21. doi:10.1016/s0167-4889(01)00123-9
20. Lv PC, Jiang AQ, Zhang WM, Zhu HL. FAK inhibitors in cancer: A pat-ent review. Expert Opin Ther Pat. 2018;28(2):139–145. doi:10.1080/ 13543776.2018.1414183
21. Alowayed N, Salker MS, Zeng N, Sing Y, Lang F. LEFTY2 controls migra-tion of human endometrial cancer cells via focal adhesion kinase activ-ity (FAK) and miRNA-200a. Cell Physiol Biochem. 2016;39(3):815–826. doi:10.1159/000447792
22. Chatzizacharias NA, Giaginis C, Gatzidou E, et al. Expression and clinical significance of FAK and Src proteins in human endometrial adenocarcinoma. Pathol Oncol Res. 2011;17(2):277–285. doi:10.1007/s12253-010-9310-6
23. Tsai CL, Wu HM, Lin CY, et al. Estradiol and tamoxifen induce cell migration through GPR30 and activation of focal adhesion kinase (FAK) in endometrial cancers with low or without nuclear estrogen receptor α (ERα). PLoS One. 2013;8(9):e72999. doi:10.1371/journal.pone.0072999
24. Liu L, Yi X, Yuan J, et al. MYH9 overexpression correlates with clini-copathoogical parameters and poor prognosis of epithelial ovarian cancer. Oncol Lett. 2019;18(2):1049–1056. doi:10.3892/ol.2019.10406
25. Katono K, Yuichi S, Jiang SX, et al. Prognostic significance of MYH9 expression in resected non-small cell lung cancer. PLoS One. 2015; 10(3):e0121460. doi:10.1371/journal.pone.0121460
26. Pecci A, Ma X, Savoia A, Adelstein RS. MYH9: Structure, functions and role of non-muscle myosin IIA in human disease. Gene. 2018;664: 152–167. doi:10.1016/j.gene.2018.04.048
27. Wang Y, Liu S, Zhang Y, Yang Y. Myosin heavy chain 9: Oncogene or tumor suppressor gene? Med Sci Monit. 2019;25:888–892. doi:10. 12659/MSM.912320

A. Markowska et al. Expression of selected molecular markers in EC1064
28. Njoku K, Chiasserini D, Whetton AD, Crosbie EJ. Proteomic biomark-ers for the detection of endometrial cancer. Cancers (Basel). 2019; 11(10):1572. doi:10.3390/cancers11101572
29. Cerretelii G, Ager A, Arends MJ, Frayling IM. Molecular pathology of Lynch syndrome. J Pathol. 2020;250(5):518–531. doi:10.1002/path.5422
30. Zhang L, Kwan SY, Wong KK, Soliman PT, Lu KH, Mok SC. Pathogen-esis and clinical management of uterine serous carcinoma. Cancers (Basel). 2020;12(3):E686. doi:10.3390/cancers12030686
31. Backes FJ, Walker CJ, Goodfellow PJ, et al. Estrogen receptor-alpha as a predictive biomarker in endometrioid endometrial cancer. Gynecol Oncol. 2016;141(2):312–317. doi:10.1016/j.ygyno.2016.03.006
32. Kreizman-Shefer H, Pricop J, Goldman S, Elmalah I, Shalev E. Distri-bution of estrogen and progesterone receptors isoforms in endo-metrial cancer. Diagn Pathol. 2014;9:77. doi:10.1186/1746-1596-9-77
33. Sho T, Hachisuga T, Nguyen TT, et al. Expression of estrogen receptor-α as a prognostic factor in patients with uterine serous carcinoma. Int J Gynecol Cancer. 2014;24(1):102–106. doi:10.1097/IGC.00000000 00000029
34. Hapangama DK, Kamal AM, Bulmer JN. Estrogen receptor β: The guardian of the endometrium. Hum Reprod Update. 2015;21(2): 174–193. doi:10.1093/humupd/dmu053
35. Chakravarty D, Srinivasan R, Ghosh S, Gopalan S, Rajwanshi A, Majumdar S. Estrogen receptor beta1 and the beta2/betacx isoforms in non-neo-plastic endometrium and in endometrioid carcinoma. Int J Gynecol Cancer. 2007;17(4):905–913. doi:10.1111/j.1525-1438.2006.00851.x
36. Obata T, Nakamura M, Mizumoto Y, et al. Dual expression of immu-noreactive estrogen receptor β and p53 is a potential predictor of regional lymph node metastasis and postoperative recurrence in endometrial endometrioid carcinoma. PLoS One. 2017;12(11): e0188641. doi:10.1371/journal.pone.0188641
37. Gabriel B, Hasenburg A, Waizenegger M, Orlowska-Volk M, Stickeler E, zur Hausen A. Expression of focal adhesion kinase in patients with endometrial cancer: A clinicopathologic study. Int J Gynecol Cancer. 2009;19(7):1221–1225. doi:10.1111/IGC.0b013e3181b33c61
38. Lynch HT, de la Chapelle A. Hereditary colorectal cancer. N Engl J Med. 2013;348(10):919–932. doi:10.1056/NEJMra012242
39. Silver DP, Livingston DM. Mechanisms of BRCA1 tumor suppression. Cancer Discov. 2012;2(8):679–684. doi:10.1158/2159-8290.CD-12-0221
40. Wang A, Papneja A, Hyrcza M, Habeeb A, Ghazarian D. Gene of the month: BAP1. J Clin Pathol. 2016;69(9):750–753. doi:10.1136/jclin-path-2016-203866

Cite asLiu J, Chen Y, Li S, Zhao Z, Wu Z. Machine learning in orthodontics: Challenges and perspectives. Adv Clin Exp Med. 2021;30(10):1065–1074. doi:10.17219/acem/138702
DOI10.17219/acem/138702
Copyright© 2021 by Wroclaw Medical University This is an article distributed under the terms of theCreative Commons Attribution 3.0 Unported (CC BY 3.0)(https://creativecommons.org/licenses/by/3.0/)
Address for correspondenceZhihong WuE-mail: [email protected]
Funding sourcesNone declared
Conflict of interestNone declared
AcknowledgementsWe acknowledge Dr. Wen Liao for his valuable suggestions.
*Jialing Liu and Ye Chen contributed equally to this work.
Received on March 26, 2021Reviewed on June 3, 2021Accepted on June 9, 2021
Published online on October 5, 2021
AbstractArtificial intelligence (AI) applications have significantly improved our everyday quality of life. The last decade has witnessed the emergence of up-and-coming applications in the field of dentistry. It is hopeful that AI, especially machine learning (ML), due to its powerful capacity for image processing and decision support systems, will find extensive application in orthodontics in the future. We performed a comprehensive lit-erature review of the latest studies on the application of ML in orthodontic procedures, including diagnosis, decision-making and treatment. Machine learning models have been found to perform similar to or with even higher accuracy than humans in landmark identification, skeletal classification, bone age prediction, and tooth segmentation. Meanwhile, compared to human experts, ML algorithms allow for high agreement and stability in orthodontic decision-making procedures and treatment effect evaluation. However, current research on ML raises important questions regarding its interpretability and dataset sample reliability. There-fore, more collaboration between orthodontic professionals and technicians is urged to achieve a positive symbiosis between AI and the clinic.
Key words: neural network, orthodontics, machine learning, artificial intelligence (AI), convolutional neural network (CNN)
Reviews
Machine learning in orthodontics: Challenges and perspectives
*Jialing Liu1,A–C, *Ye Chen1,A,B,D, Shihao Li3,B–D, Zhihe Zhao1,E, Zhihong Wu2,F
1 State Key Laboratory of Oral Diseases & National Clinical Research Center for Oral Diseases, Department of Orthodontics, West China Hospital of Stomatology, Sichuan University, Chengdu, China
2 College of Computer Science, Sichuan University, Chengdu, China3 National Key Laboratory of Fundamental Science on Synthetic Vision, College of Computer Science, Sichuan University, Chengdu, China
A – research concept and design; B – collection and/or assembly of data; C – data analysis and interpretation; D – writing the article; E – critical revision of the article; F – final approval of the article
Advances in Clinical and Experimental Medicine, ISSN 1899–5276 (print), ISSN 2451–2680 (online) Adv Clin Exp Med. 2021;30(10):1065–1074

J. Liu et al. Machine learning in orthodontics1066
Introduction
The goal of orthodontic treatment is to restore in-dividual normal occlusion and improve facial attrac-tiveness in patients with malocclusion. Malocclusion is a common disease with high prevalence (up to 56% in the world).1 The diagnosis of malocclusion is made with an accurate measurement of distance, planes and angles according to landmarks of soft and hard tissues using lateral cephalogram and cone-beam computed to-mography (CBCT). Due to high spatial resolution and multi-direction presentation, CBCT can provide more accurate craniometric outcomes than lateral cephalo-grams.2 However, the definitions of the anatomic land-marks differ among orthodontists, so the outcomes of landmark coordinates and geometrical parameters vary significantly in either method and depend largely on the orthodontists’ experience and the image quality. Moreover, the procedures of malocclusion diagnosis are time-consuming.
Treatment decision analysis plays a pivotal role in orthodontic procedures. For instance, orthodontists are often confronted with the choice between extrac-tion and non-extraction orthodontic treatment. Multiple factors including tooth health, arch width and smile esthetics need to be taken into consideration to achieve an optimal clinical effect.3 Additionally, due to higher risk, the choice of orthodontic-orthognathic combined treatment calls for caution, especially in patients with severe skeletal malocclusion and asymmetric jaw de-formity.4 Overall, orthodontic decision-making greatly influences the long-term prognosis, but, due to a lack of consensus on complicated cases, plans can vary among different orthodontists and even different cases treated by the same orthodontists. Thus, effective meth-ods are needed to help human experts improve their treatment planning and reduce the inter-physician vari-ability. Moreover, a standard therapy system could pro-vide clinical instructions for young doctors, particularly as the popularity of personalized orthodontics increases and the need for customized plans increases the com-plexity of treatment decisions.
With the development of computer-aided design/computer-aided manufacturing (CAD/CAM), thermo-formed tooth aligners have become a popular choice for adult patients with malocclusion.5 Tooth segmentation from intraoral scanning or CBCT is a pivotal step for computer-aided aligner design.6 Although some math-ematical methods, including region-based and feature curve-based segmentation, have been studied in tooth segmentation, the digital image results were not ideal, due to the distorted display of interdental and tooth-gingiva areas as well as curvature noises, which affect the manu-facturing accuracy.7 Therefore, tooth segmentation based on artificial intelligence (AI) has become a promising method to acquire high precision.
Objectives
Personalized orthodontic treatment poses challenges for orthodontists in diagnosis, decision-making and treat-ment. Fortunately, considerable increases in the perfor-mance of integrated circuits have allowed AI to contrib-ute substantially to handling images and decision-making due to developments in facial recognition and expert sys-tems. Thus far, AI has performed impressively in many applications in dentistry, especially in periodontology, prosthodontics and endodontics, and the research on AI-based orthodontic treatment is burgeoning.8 In this paper, we present current applications of AI in the field of ortho-dontics and we attempt to predict some future applications.
Artificial intelligence
The introduction of AI
At the beginning of the 1980s, a computer-aided tool called an “expert system” based on rules was strongly promoted by the Japanese government.9 However, due to an inefficient search and indefinite weight relation-ships between rules, the system could not meet the actual tasks. The emergence of machine learning (ML) solved the dilemma; it showed improved predictive performance by extracting internal connections among manually in-put features; such process is known as handcraft feature engineering.10 In the next stage of development, auto-matic feature engineering based on deep learning tech-nology could replace the process of manual extraction.11 As a branch of ML, deep learning relies on neural networks and it achieved the breakthrough of processing high-di-mensional structure data, such as images.
Artificial neural networks are based on a collection of connected units or nodes called artificial neurons, which can mimic the neurons in the biological brain. Each con-nection is like a synapse in a biological brain, which can transmit signals to neighboring neurons. The signal may propagate from input layer to output layer via several hid-den layers. Every layer consists of many neurons which are connected to the neurons of previous layers. The synapses represent weighted parameter (w) and constant (b) values. Deep learning refers to optimizing the weighted param-eters automatically by minimizing the errors between output and label input.12 The reduction of loss functions of mini-batch using gradient descent, called stochastic gradient descent (SGD), has been widely applied to train neural networks.13
As an evolution of deep learning, convolutional neural network (CNN) enhanced local feature extraction and reduced sensitivity to changes in the position and size of images. In CNN, the hidden layers were replaced by con-volutional layers, pooling layers and fully connected lay-ers.14 In convolutional layers, convolutional kernels with

Adv Clin Exp Med. 2021;30(10):1065–1074 1067
the entire depth of the input images are convoluted with the feature values of source pixels, and the calculated out-comes are projected to destined pixels.15 The kernels slide over the feature maps at certain places, and the parameters of each kernel could be shared within every layer.16 Pooling layers can narrow input volumes and decrease calcula-tion amounts. Common pooling functions include average pooling and max pooling. Fully connected layers are as-signed before output layers, and the neurons are connected with all the neurons of preceding layers.17
Four AI-driven tasks in dentistry
The 4 major AI-driven tasks in dentistry are classifica-tion, regression, detection, and segmentation. The most well-known task in the AI field is classification. This task means assigning objects or features to pre-specified cat-egories.18 Classification models have been widely studied in diagnosis of oral diseases, such as periodontitis and caries.10 The classification neural network will extract features in hidden layers and map optimal categories ac-cording to the likelihood in output layers.19 The common classification algorithms include naïve Bayesian, support vector machine (SVM), decision tree, and artificial neural network (ANN).20 Due to convolution and pooling, CNN can handle high-dimensional data such as high-resolution images.21 For instance, CNN has shown its potential in oral cancer pathologic diagnosis through its handling of shape, color and texture features of nuclei.22
In applications based on AI, the regression analysis is used to estimate the relationships between multiple variables and predict dependent variables based on inde-pendent variables.23 In dentistry, researchers transformed the procedure of predicting numerical results into a pro-cedure for determinations. For example, clinical decision support systems based on regression can estimate color change after tooth whitening.8 Additionally, regression methods can be integrated into ML models based on SVM and neural network. The accuracy of deep learning models in predicting oral cancer survival rates was significantly better than that of decision trees and Cox proportional hazards regression models.24
Segmentation and detection are similar tasks in AI, but segmentation mainly aims to define the contours of an ob-ject, whereas detection aims to define the position of ob-jects.25 Region-based CNN (R-CNN) is commonly utilized in object detection, and its pipelines include extracting region proposals, computing CNN features and classify-ing regions.26 The most recent algorithm mainly improves proposed region localization efficiency, such as You Only Look Once (YOLO).27 Moreover, it was discovered that a deep learning network based on YOLO was superior to oral surgeons in detecting odontogenic cysts in diagnos-tic function.28 Object segmentation required in dentistry is based on pixel-wise segmentation and categorizes each pixel in the region of interest (ROI). Fully convolutional
network (FCN) was designed to classify all the pixels using a forward propagation.29 In dentistry, delineation is a typi-cal segmentation task that has been applied in tumor diag-nosis and radiotherapy planning. The latest Mask R-CNN framework combines object detection and segmentation process, achieving tooth semantic segmentation.30 In Mask R-CNN, ROI align replaces ROI pooling to avoid misalign-ment, and adds FCN to segment objects in ROI.31
AI in orthodontics
Several reports have indicated that ML has the poten-tial to provide high-quality diagnosis and plan decision-making and treatment in the orthodontic field. Compared to traditional procedures, AI simplifies complex protocols, saves time and provides objective predictable outcomes. The 4 major AI-driven tasks can also be applied to orth-odontic treatment. Classification tasks are mainly applied to diagnose skeletal type and predict bone age. Regression tasks are applied to cope with clinical decision-making, such as whether or not to extract teeth. Automatic iden-tification of landmarks belongs to detection tasks, and the acquisition of tooth segmentation belongs to segmenta-tion tasks. This section reviews the current progress of ML in orthodontic diagnosis, decision-making, and treatment, and the specific roles in clinical procedures are vividly represented in Fig. 1.
AI-based malocclusion diagnosis
The automatic identification of landmarks
The AI-based diagnostic methods significantly reduce technical sensitivity and improve detection accuracy. The supervised learning model is commonly considered the optimal choice for developing an AI-based cephalo-metric system, in which training data consist of 2 parts: original images and labels. The original image is a lateral cephalogram or CBCT, and their corresponding labels are the desired X-Y coordinates of landmarks plotted by orthodontists.
Cheng et al. first applied a model based on random for-est to detect the odontoid of the epistropheus, which acts as a baseline of the midsagittal plane.32 Although the mean detection error of the model decreased to 3.15 mm, ran-dom forest needs to confine the clustered landmarks in the bounding box to avoid searching the whole images. Shahidi et al. utilized feature-based and voxel similarity-based image registration methods to detect 14 landmarks and obtained <3 mm mean absolute error (MAE) for 63.57% of landmarks.33 However, to achieve more accu-rate registration, severe skeletal deformity and fracture were excluded in the trials. Additionally, Montufar et al. used an active shape model combined with knowledge-based local landmark search to predict 18 landmarks and achieved a higher accuracy with an MAE of 2.51 mm.34

J. Liu et al. Machine learning in orthodontics1068
Nevertheless, these methods rely on significant prior knowledge and still require some manual processes. Fur-thermore, the methods mentioned above cannot apply to test all individuals due to image size, quality and ana-tomical variations. Moreover, the handcrafted feature-based ML methods depend on specific algorithm templates for different types of malocclusions.
Compared to traditional ML models, CNN-based mod-els became a desirable solution in actual clinical cases. Japanese scholars first applied the CNN model to identify 10 landmarks using 153 lateral cephalograms for model training. However, the precision was restricted by the lim-ited sample volume and measurement bias.35 Kunz et al. expanded the sample to 1792 different cephalograms for training plotted by 12 examiners who were verified by in-tra-rater and inter-rater reliability calibration.36 The MAE of 11 angles and distances calculated using these coor-dinates predicted by the CNN model demonstrated no statistically significant differences except for incisor in-clination. To improve detection efficiency, an advanced YOLO model, called YOLO v. 3, showed faster detection and higher accuracy in 1028 cephalograms with less than 0.9 mm in the MAE of coordinates when comparing to hu-man.37 Of note, the R-CNN model could detect soft tissue
landmarks to provide a reference for evaluating facial pro-files. Meanwhile, according to a sensitivity test, the ac-curacy of the cephalometric system was not hampered by image quality, gender, skeletal classification, or metal-lic artifacts. However, the detection of the closely-spaced points was a challenge for CNN-based cephalometric systems. The CBCT can provide higher detail resolution than lateral cephalograms. A geodesic map of mandibles was acquired through linear time distance transformation in CBCT.38 A CNN model could only locate the sparsely-spaced points in the geodesic maps and long short-term memory network framework was applied to capture closely spaced distributed landmarks.
Skeletal classification
Besides occlusion, the positions of the jaw relative to the cranium are also a valuable index in pre-orthodon-tic examination. Different types of skeletal malposition were categorized according to Angle classification. Based on ANB angle and Wits appraisal, the anteroposterior position relationship was classified into 3 types: class I (normal), class II (protrusion) and class III (retrusion). Traditional skeletal classification depends on the manual
Fig. 1. Schematic representation of the application of artificial intelligence (AI) in orthodontic diagnosis, decision-making and treatment

Adv Clin Exp Med. 2021;30(10):1065–1074 1069
calculation of linear and angular variables, using cranio-maxillary and mandible landmarks. However, mandible positions vary significantly due to occlusion and temporo-mandibular joint, which causes difficulties in skeletal clas-sification, while craniomaxillary landmarks are relatively stable. The SVM and ANN can predict mandible variables using craniomaxillary variables, and ANN showed higher correlation coefficients than SVM, especially for gnathion (Gn) and menton (Me) points. Remarkably, the indepen-dent variables for producing the best prediction outcomes using ANN came from the literature and from SVM selec-tion.39 Besides regression tasks, SVM also generates skel-etal classifications based on the automatically extracted craniomaxillary variables. Although the method achieved high sensitivity and precision in predicting class II and III, an unsatisfactory outcome was obtained for class I. This was partially attributed to the misclassification of the cases with marginal values. Better outcomes may be obtained by the combination of synthetic variables and literature variables.40
Compared to handcraft methods, CNN-based skeletal classification has demonstrated better classification per-formance in terms of accuracy, sensitivity and specificity.41 Instead of utilizing landmarks, the CNN-based method extracts features by first using the located ROI. The CNN-based method can also divide the vertical skeletal class into normal, hyper- and hypodivergent, in addition to the sagit-tal relationship. Due to superimposition, the classification precision needs further improvement using CBCT images. Moreover, Kim et al. found the CNN-based model with synchronized multi-channels produced ideal outcomes.42 Compared to the single-channel model, better classifi-cation performance was achieved by the ensemble and synchronized multi-channel algorithm. However, more influential factors, including race and the wide distribution of normal cases, need to be considered.
AI-based decision-making system
The prediction of bone age
The choice of proper treatment timing depends on bone age prediction based on cervical vertebrae maturity, which indicates the deviation extent from normal growth.43 The prediction methods of bone age depend on low edge concavities and trapezoid taper of vertebral bodies.44 The ML-based methods have shown >90% sensitivity, specificity and accuracy for vertical and sagittal skeletal maturation diagnosis.41 It has been demonstrated that the accuracy of classification models is superior to cluster-ing models in determining cervical vertebral maturation.45 Among a series of classifiers (software), the artificial neural network-based classifier acquired the highest weighted κ coefficient (0.926), whereas the lowest value was obtained by a naïve Bayes classifier (0.861).20,46 Though lacking ac-curacy, the discrimination between 2 adjacent stages is not
essential to clinical application because the bone devel-opment peak occurs between the 3rd and 4th periods.47 If the deviation of adjacent stages is neglected, the accuracy will reach 90.42% using the Bayes classifier.46
Besides cervical vertebral maturation, bone age can also be measured using the ossification centers of the proximal phalanx, metacarpal bone and distal radius when the pa-tients suffer from cervical vertebrae deformity. Gao et al. utilized U-Net to acquire mask images of hand bone, and VGGNet was used to perform image classification tasks.48 The background noise was removed with hand bone seg-mentation. Of note, the attention module was inserted into the VGGNet to focus on targeted regions and achieved an MAE of 9.997 months. Although the CNN model with attention modules increases accuracy and effectiveness, attention modules would increase complexity and decrease accuracy in the deeper neural networks, such as ResNet and DenseNet.49 Also, due to the additional radiated exposure, manual bone age radiography has been replaced by cer-vical vertebral maturation assessment using only lateral cephalograms. Therefore, a cervical vertebral maturation degree prediction system based on deep learning requires further research in order to be applied in orthodontic clini-cal treatment.50
The decision on the need for orthodontic treatment
Traditionally, the decision about whether a patient with malocclusion needs orthodontic treatment is evalu-ated based on the Index of Orthodontic Treatment Need (ITON) and Dental Aesthetic Index (DAI).51 The κ values between DAI and ITON in the range of 0.41–0.55 mean that a decision of a specialist is required.51 Tedious and complicated tasks can be replaced by decision-making support systems based on ML. Thanathornwong utilized a Bayesian network to look for underlying connections among 15 features of orthodontic patients and obtained conditional probability distributions.52 When users in-put the scores for every index, a probability value would be output, determining whether the patients need orth-odontic treatment. The results obtained using the semi-automatic system showed high consistency with 2 ortho-dontists. Nevertheless, manual interpretation of lateral cephalograms intraoral images may create measurement bias. Besides, the decision system should cover patients of a broader age range, especially the mixed dentition period. Estimating the size of the unerupted teeth plays a vital role in judging whether the patients need early in-tervention treatment during the mixed dentition period. The prediction primarily depends on Moyer’s regression and Tanaka and Johnston’s analysis, but the predicting outcomes are not accurate. Moghimi et al. utilized a hy-brid genetic algorithm, (GA)-ANN algorithm, to select ref-erence teeth and find the best mapping function to predict the unerupted teeth sizes.53 A higher proportion of pre-dicting error produced using the GA-ANN algorithm was

J. Liu et al. Machine learning in orthodontics1070
concentrated at 0 mm and 1 mm, which is acceptable for clinical needs. However, compared to traditional meth-ods used in the treatment of children regardless of dif-ferent regions and races, future research should improve the generalization capacity of decision systems through high-quality training datasets.
The decision on the need for advance extraction
The controversy over extraction and non-extraction orthodontic treatment remains unsolved. Currently, orth-odontic extraction treatment is applied in cases of dental protrusion and crowding and jaw dysplasia.54 Xie et al. described ANN-based decision-making models for deter-mining whether the extraction was necessary.55 Although ANN achieved a 100% success rate in training set using backpropagation, the test outcomes remained at only 80%. Jung et al. chose 1/3 of the training set as a validation set to avoid the overfitting phenomenon.56 The proposed method improved the success rate of ANN and achieved an agreement of 94% with an experienced orthodontist. Additionally, an ANN model consisting of 4 classifiers could not only diagnose the necessity of extraction but also choose proper extraction patterns based on 12 cepha-lometric variables. Although the accuracy was not ideal in terms of specific extraction positions, only 4 cases were unacceptable for clinical practice. Besides ANN, as one of the ensemble methods, random forest can also pre-vent overfitting, and random forest showed a lower er-ror rate than ANN regarding the need for extraction and the specific patterns.57 Moreover, bagging or boosting can decrease the error rate of the neural network to prevent overfitting. Interestingly, AI-based models discovered that the primary decisive factors for whether to extract teeth before orthodontic treatment are incompetent lips and lower incisor inclination, which can be used as clini-cal extraction instructions.55 However, AI models were used only to predict whether extractions are necessary based on cephalometric outcomes and other measure-ments. Medical imaging can provide more information than manual measurements and improve the accuracy of diagnosis. Thus, studies of AI-based decision-making models should aim to analyze imaging data. For example, Qin et al. proposed a deep learning method of combining fine-grained features from positron emission tomography (PET) with CT images to diagnose lung cancer noninva-sively.58 Based on this idea, orthodontists could develop deep learning models for more accurate diagnosis.
The decision on the need for orthognathic surgery
Due to the higher risk of orthognathic surgery, more comprehensive factors must be taken into consideration, including skeletal classification, facial asymmetry and a pa-tient’s chief complaints; all of the above issues bring chal-lenges to clinicians. Therefore, a variety of measurements
need to be adopted in the training set to make appropriate decisions. The commonly agreed standard for orthogna-thic surgery is skeletal class III and asymmetry. There-fore, Knoops et al. utilized an SVM model to diagnose whether patients needed orthognathic surgery using facial scanning images.59 Although the system achieved an ac-curacy of 95.4%, sample selection bias was used because of the fact that normal dentofacial individuals were cho-sen as non-surgery patients. Jeong et al. chose 822 facial photographs of patients with dentofacial dysmorphosis and/or malocclusion as training data and adopted 3 mea-surements: facial asymmetry, protrusion and retrusion.60 The CNN model could extract the profile feature from the front and side facial photographs, and subsequently divided the cases into surgery and non-surgery. To inte-grate more factors, Choi et al. incorporated more measures such as E-line and occlusal plane into ML models, but the feature values required manual input instead of au-tomatic image extraction.61 The ANN model provided high accuracy during the test stage without overfitting. Besides deciding whether to operate or not, the system can also predict the demand for tooth extraction for surgical patients using 4 classifiers. Obtaining right answers is not the purpose of AI-based models because excessive feature information increases the algorithm complexity and over-fitting risk. More importantly, the decision-making system can provide diverse clinical solutions for inexperienced orthodontists.
AI-based orthodontic treatment
The acquisition of tooth segmentation images
Template-based registration has been applied to segment target teeth contours, but the application of the method is limited by image intensity and anatomic similarity.62 Conversely, the level set method can handle the images with anatomic variation, low resolution and noise, but it performs poorly in delineating the edge contours, es-pecially in the interdental areas.63 Kim et al. removed the interdental area with masks and reconstructed the edge contours using Generative Adversarial Networks (GAN).64 Compared to separated scanning without inter-dental areas, the proposed method improved the precision to 0.004 mm. However, the size of the mask was inversely associated with the accuracy of the reconstruction, due to the masking of adjacent normal structures. Pose regres-sion was found to eliminate the overlapping areas by re-aligning the volume-of-interest regions.26 Moreover, it was discovered that for tooth segmentation, the pose-aware R-CNN model outperformed the Mask R-CNN model in accuracy and sensitivity.26,65 Due to redundant region proposals in R-CNN algorithms, similarity matrix and non-maximum suppression can both mine the region pro-posal network. Cui et al. found similarity matrix to show superiority to non-maximum suppression in segmentation

Adv Clin Exp Med. 2021;30(10):1065–1074 1071
accuracy.65 Additionally, tooth segmentation may often be interfered with by extreme gray values, such as metal artifacts. Chung et al. reported the cutout augmentation method to achieve metal artifacts segmentation.26 Addi-tionally, the edge map combined with original CBCT im-ages enhanced boundary information and caused accuracy improvement.65 With integrity of the spatial relation and shape features, Mask R-CNN was able to achieve tooth instance segmentation.65
The evaluation of treatment effect
Improving facial attractiveness is one of the main reasons for choosing orthodontic treatment. Therefore, it is impor-tant for orthodontists to provide patients with an objec-tive and esthetical assessment. Although attractiveness is based in cognitive psychology, ML can act as a useful tool to reflect professional and social esthetic apprecia-tion. The CNN model can simulate humans in grading the attractiveness of facial photographs utilizing facial detection and feature extraction. The outcomes produced by the CNN model were more closely aligned with ortho-dontists and oral surgeons than laypersons. Meanwhile, the variation resulted in fewer of the same targets. There-fore, these results reflected superior reliability of the CNN-based facial evaluation system. However, the CNN model could not explain the influence of each facial feature on fa-cial attractiveness.66 Zhao et al.utilized ML algorithms to predict facial attractiveness when considering different features, including facial shape, geometric features and triangle area features.67 Importantly, facial shape played a significant role in determining facial attractiveness. The treatment effect differed among different patients due to the treatment planning and individual conditions of a patient, including hairstyle and facial ratio. Moreover,
ML can help to evaluate the influence of plastic treatment on patients’ attractiveness. Currently, some scholars found that orthognathic surgery improved facial attractiveness and decreased estimated age by 1.2 years. Significant im-provement of facial attractiveness could be seen in patients with facial asymmetry and skeletal class II and III. Addi-tionally, lower jaw osteotomy could most clearly ameliorate facial attractiveness.68 What is important, facial esthetics are influenced by a variety of factors, so we need to reduce the influence of confounding factors such as skin, hairstyle and lighting conditions. Also, as training data, esthetic review bias needs further validation, so global standard-ized facial databases are recommended.
Limitations and perspectives
The rapid development of AI have contributed to its promising applications in dentistry. Accordingly, a vari-ety of AI-based products have been developed by several companies to assist dental clinical applications such as ra-diological diagnosis and decision-making, as summarized in Table 1. Due to the advantages of high-dimensional data mining, deep learning models have shown great potential in dentistry, especially in oral oncology. Recently, multi-feature concatenation method has been applied to diag-nose cervical lymph node metastasis, enhancing target de-tection efficiency.69 Additionally, deep convolutional GAN has become an effective solution to predict reconstructive jaw morphology before surgeries, which facilitates accurate 3D printing.70 Breakthroughs in other dental fields can shed light on the application of AI in orthodontics. Despite its potential, many challenges, such as data insufficiency, reproducibility crisis and overfitting need to be solved before AI is implemented into clinical practice.
Table 1. The companies and their representative products based on machine learning (ML) in dental field
Company Product Function Website Origin
Denti.AI Denti.AI dental disease detection https://www.denti.ai/ Toronto, Canada
VideaHealth VideaHealth dental disease detection https://www.videa.ai/ Boston, USA
Pearl Second Opinion dental disease detection https://www.hellopearl.com/ West Hollywood, USA
Dentem Dx Vision dental problem detection https://www.dentem.co/ Toronto, Canada
Medihome Medihome dental disease detection http://medihome.jp/ Tokyo, Japan
DeepCareDeepCare Dental
Landscapedental disease detection http://www.deepcare.com/ Beijing, China
ORCA Dental AI Cephxcephalometric analysis
teeth segmentationairway analysis
https://www.orca-ai.com/ Las Vegas, USA
CellmatiQ GmbHDentaliQ orthoDentaliQ opg
cephalometric analysisdental disease detection
https://cellmatiq.com/ Hamburg, Germany
Uceph Uceph cephalometric analysis http://www.uceph.com/ Chengdu, China
Zhibeicloud Zhibeicloudcephalometric analysis
bone age analysisfacial esthetic analysis
https://www.aortho360.com/ Chengdu, China

J. Liu et al. Machine learning in orthodontics1072
Data insufficiency
Compared to other medical fields, the high-quality data-sets for orthodontic research are limited. The discrepancies in training data make the comparison of different AI-based models questionable. Although supervised learning is cur-rently the optimal choice in malocclusion diagnosis, huge costs and labor required for target labeling create obstacles in creating standardized and high-quality datasets for orth-odontic studies, specifically. Additionally, data snooping bias usually occurs because training data are repeatedly applied in the test stage. Therefore, independent datas-ets for tests should be applied instead of cross-validation. To solve this problem, semi-supervised and weakly super-vised learning framework can be used in analyzing many original images, and show comparable accuracy and robust-ness in diagnosis with supervised learning.71 Moreover, transfer learning and few-shot learning could also become ideal alternatives to solve data insufficiency problems.41
Reproducibility crisis
An increasing number of scientists have realized the re-producibility crisis of AI, which means that many research results cannot be repeated when the same experiment is conducted by another team of scientists. The reasons for this phenomenon include algorithmic and metric knowledge deficiency, as well as misunderstanding. Ad-ditionally, many researchers neglect the sensitivity of re-sults to hyper-parameters, including study rate, iteration times and initialization strategy. There are some effec-tive solutions to improve the trustworthiness of AI. For instance, sensitivity tests need to be carried out when evaluating model performance. Furthermore, the im-provement of interpretability obtained through visual-izing the mechanisms of ML models could aid in solv-ing the dilemma. Of note, data cleaning method can be an effective alternative to prevent manual errors in label-ing and measurement from affecting the reproducibility of ML models.
Overfitting problem
Most feature engineering models are confronted with the overfitting problem, i.e., worse performance of the models in predicting unknown samples. Many reasons account for overfitting as, for example, data for testing and training are normally derived from a common internal dataset. Additionally, health data heterogeneity is a key factor. Several improvements can be made to pre-vent overfitting. Firstly, to improve the external general-ization capacities of ML models, greater and more diverse external clinical scenarios are required to validate the per-formance of the model. Meanwhile, choosing representa-tive datasets needs to be considered. Furthermore, several algorithms have been created to prevent overfitting, such
as early stopping, dropout and regularization penalty.72 Multimodal learning can integrate various types of in-formation, including records and images, and reach ideal performance when processing imbalanced data.73
The next step
Besides improving the experimental performance of ML, the question of how to apply AI to revolutionize traditional orthodontic procedures should be considered at present. First of all, due to the black-box feature of ML, enhanc-ing the visualization and establishing patients’ and doc-tors’ trust should be prioritized before clinical application of ML. Although the interpretability of ML still remains challenging, standardized clinical trials should be con-ducted, which can serve as strong medical evidence for guidance. During trial design, several methods are needed to control bias risk. For instance, it is essential to conduct inter-rater reliability calibration using consistency valida-tion. Additionally, the allocation schemes should be blind to reviewers to prevent subjective bias. Moreover, provid-ing context-specific empirical validation could also make it easier to audit bias and enhance trust of practitioners, instead of explaining inner workflows.
In the next few years, AI-based orthodontic systems could serve as an auxiliary tool for clinical procedures. The outcomes derived from ML models should be treated cautiously and used as a reference. Additionally, the AI-based models can simulate experts’ ways of thinking and provide the advice for orthodontists. Through ML models, acquisition of theories and practice experiences by young orthodontists could become easier and faster. In addition, with the help of nature language process, ML models could evaluate evidence quality by extracting information from published papers. The evidence evaluation system could relieve residents’ pressure in acquiring medical evidence.
The ethical problems in implementing ML in orthodon-tic procedures cannot be neglected. Firstly, it is the inher-ent right of subjects to know about the principles, functions and limitations of the ML models. Secondly, the doctor’s sense of responsibility should be emphasized when es-tablishing cooperation with patients. Thirdly, health data privacy should be redefined due to the prevalence of elec-tronic medical records. Lastly, the legal liability distribu-tion between doctors and ML models should be further improved.
Conclusions
With the advancement of AI in dentistry, high-quality disease diagnosis, decision-making and treatment can be achieved in the near future. However, there are many stud-ies relating to the image recognition, while decision sup-port systems have received little attention. Additionally, clinicians should view AI as a support for diagnosis and

Adv Clin Exp Med. 2021;30(10):1065–1074 1073
treatment, not as a threat. Moreover, clinicians need to be cautious about the prediction outcomes provided by AI models before the interpretability is fully clarified. Due to the growing emphasis on medical responsibility and ethical principles, legal recognition of AI is also a crucial issue. In the future, more clinical trials regarding the appli-cation of AI in orthodontics should be carried out to revo-lutionize traditional orthodontic treatment procedures.
ORCID iDsJialing Liu https://orcid.org/0000-0001-5554-0870Ye Chen https://orcid.org/0000-0002-7217-366XShihao Li https://orcid.org/0000-0002-6418-7818Zhihe Zhao https://orcid.org/0000-0003-2955-1706Zhihong Wu https://orcid.org/0000-0001-5712-2285
References1. Lombardo G, Vena F, Negri P, et al. Worldwide prevalence of maloc-
clusion in the different stages of dentition: A systematic review and meta-analysis. Eur J Paediatr Dent. 2020;21(2):115–122. doi:10.23804/ejpd.2020.21.02.05
2. Gribel BF, Gribel MN, Frazao DC, McNamara JA Jr, Manzi FR. Accuracy and reliability of craniometric measurements on lateral cephalom-etry and 3D measurements on CBCT scans. Angle Orthod. 2011;81(1): 26–35. doi:10.2319/032210-166.1
3. Konstantonis D, Vasileiou D, Papageorgiou SN, Eliades T. Soft tis-sue changes following extraction vs. nonextraction orthodontic fixed appliance treatment: A systematic review and meta-analysis. Eur J Oral Sci. 2018;126(3):167–179. doi:10.1111/eos.12409
4. da Pozzo F, Gibelli D, Beltramini GA, Dolci C, Gianni AB, Sforza C. The effect of orthognathic surgery on soft-tissue facial asymmetry: A longitudinal three-dimensional analysis. J Craniofac Surg. 2020; 31(6):1578–1582. doi:10.1097/SCS.0000000000006403
5. Papadimitriou A, Mousoulea S, Gkantidis N, Kloukos D. Clinical effec-tiveness of Invisalign(R) orthodontic treatment: A systematic review. Prog Orthod. 2018;19(1):37. doi:10.1186/s40510-018-0235-z
6. Gan Y, Xia Z, Xiong J, Li G, Zhao Q. Tooth and alveolar bone segmen-tation from dental computed tomography images. IEEE J Biomed Health Inform. 2018;22(1):196–204. doi:10.1109/JBHI.2017.2709406
7. Yuan T, Wang Y, Hou Z, Wang J. Tooth segmentation and gingival tissue deformation framework for 3D orthodontic treatment plan-ning and evaluating. Med Biol Eng Comput. 2020;58(10):2271–2290. doi:10.1007/s11517-020-02230-9
8. Machoy ME, Szyszka-Sommerfeld L, Vegh A, Gedrange T, Woźniak K. The ways of using machine learning in dentistry. Adv Clin Exp Med. 2020;29(3):375–384. doi:10.17219/acem/115083
9. Waldron T, Carr T, McMullen L, et al. Development of a program theory for shared decision-making: A realist synthesis. BMC Health Serv Res. 2020;20(1):59. doi:10.1186/s12913-019-4649-1
10. Schwendicke F, Samek W, Krois J. Artificial intelligence in dentistry: Chances and challenges. J Dent Res. 2020;99(7):769–774. doi:10.1177/ 0022034520915714
11. Chen D, Wang Z, Guo D, Orekhov V, Qu X. Review and prospect: Deep learning in nuclear magnetic resonance spectroscopy. Chemistry. 2020;26(46):10391–10401. doi:10.1002/chem.202000246
12. Yoon HJ, Kim S, Kim JH, et al. A lesion-based convolutional neural net-work improves endoscopic detection and depth prediction of early gastric cancer. J Clin Med. 2019;8(9):1310. doi:10.3390/jcm8091310
13. Wang L, Yang Y, Min R, Chakradhar S. Accelerating deep neural network training with inconsistent stochastic gradient descent. Neural Netw. 2017;93:219–229. doi:10.1016/j.neunet.2017.06.003
14. Hu X, Yi W, Jiang L, et al. Classification of metaphase chromosomes using deep convolutional neural network. J Comput Biol. 2019;26(5): 473–484. doi:10.1089/cmb.2018.0212
15. Luo X, Chi W, Deng M. Deepprune: Learning efficient and interpre-table convolutional networks through weight pruning for predict-ing DNA–protein binding. Front Genet. 2019;10:1145. doi:10.3389/fgene.2019.01145
16. Mellouli D, Hamdani TM, Sanchez-Medina JJ, Ben Ayed M, Alimi AM. Morphological convolutional neural network architecture for digit recognition. IEEE Trans Neural Netw Learn Syst. 2019;30(9):2876–2885. doi:10.1109/TNNLS.2018.2890334
17. Ilyas N, Shahzad A, Kim K. Convolutional-neural network-based image crowd counting: Review, categorization, analysis, and performance evaluation. Sensors (Basel). 2019;20(1):43. doi:10.3390/s20010043
18. Holder LB, Haque MM, Skinner MK. Machine learning for epigenetics and future medical applications. Epigenetics. 2017;12(7):505–514. doi:10.1080/15592294.2017.1329068
19. Zhang Y, Lin H, Yang Z, et al. Neural network-based approaches for biomedical relation classification: A review. J Biomed Inform. 2019;99: 103294. doi:10.1016/j.jbi.2019.103294
20. Amasya H, Yildirim D, Aydogan T, Kemaloglu N, Orhan K. Cervical ver-tebral maturation assessment on lateral cephalometric radiographs using artificial intelligence: Comparison of machine learning classifier models. Dentomaxillofac Radiol. 2020;49(5):20190441. doi:10.1259/dmfr.20190441
21. Wang EK, Xi L, Sun RP, et al. A new deep learning model for assisted diag-nosis on electrocardiogram. Math Biosci Eng. 2019;16(4):2481–2491. doi:10.3934/mbe.2019124
22. Das N, Hussain E, Mahanta LB. Automated classification of cells into multiple classes in epithelial tissue of oral squamous cell carcinoma using transfer learning and convolutional neural network. Neural Netw. 2020;128:47–60. doi:10.1016/j.neunet.2020.05.003
23. Kawahara A, Sato T, Hayashi K. Multivariate regression analysis to predict postoperative refractive astigmatism in cataract surgery. J Ophthalmol. 2020;2020:9842803. doi:10.1155/2020/9842803
24. Kim DW, Lee S, Kwon S, Nam W, Cha IH, Kim HJ. Deep learning-based survival prediction of oral cancer patients. Sci Rep. 2019;9(1):6994. doi:10.1038/s41598-019-43372-7
25. Rajan PG, Sundar C. Brain tumor detection and segmentation by intensity adjustment. J Med Syst. 2019;43(8):282. doi:10.1007/s10916-019-1368-4
26. Chung M, Lee M, Hong J, et al. Pose-aware instance segmentation framework from cone-beam CT images for tooth segmentation. Comput Biol Med. 2020;120:103720. doi:10.1016/j.compbiomed.2020. 103720
27. Liu JL, Li SH, Cai YM, et al. Automated radiographic evaluation of ade-noid hypertrophy based on VGG-Lite. J Dent Res. 2021;2021:220 345211009474. doi:10.1177/00220345211009474
28. Yang H, Jo E, Kim HJ, et al. Deep learning for automated detection of cyst and tumors of the jaw in panoramic radiographs. J Clin Med. 2020;9(6):1839. doi:10.3390/jcm9061839
29. Li H, Jiang G, Zhang J, et al. Fully convolutional network ensem-bles for white matter hyperintensities segmentation in MR images. Neuroimage. 2018;183:650–665. doi:10.1016/j.neuroimage.2018.07.005
30. Zhang L, Wu J, Fan Y, Gao H, Shao Y. An efficient building extrac-tion method from high spatial resolution remote sensing images based on improved mask R-CNN. Sensors (Basel). 2020;20(5):1465. doi:10.3390/s20051465
31. Zhang Y, Chu J, Leng L, Miao J. Mask-refined R-CNN: A network for refining object details in instance segmentation. Sensors (Basel). 2020;20(4):1010. doi:10.3390/s20041010
32. Cheng E, Chen J, Yang J, et al. Automatic dent-landmark detection in 3-D CBCT dental volumes. Annu Int Conf IEEE Eng Med Biol Soc. 2011;2011:6204–6207. doi:10.1109/IEMBS.2011.6091532
33. Shahidi S, Bahrampour E, Soltanimehr E, et al. The accuracy of a designed software for automated localization of craniofacial land-marks on CBCT images. BMC Med Imaging. 2014;14:32. doi:10.1186/ 1471-2342-14-32
34. Montufar J, Romero M, Scougall-Vilchis RJ. Hybrid approach for auto-matic cephalometric landmark annotation on cone-beam comput-ed tomography volumes. Am J Orthodont Dentofacial Orthop. 2018; 154(1):140–150. doi:10.1016/j.ajodo.2017.08.028
35. Nishimoto S, Sotsuka Y, Kawai K, Ishise H, Kakibuchi M. Personal com-puter-based cephalometric landmark detection with deep learn-ing, using cephalograms on the Internet. J Craniofacial Surg. 2019; 30(1):91–95. doi:10.1097/scs.0000000000004901
36. Kunz F, Stellzig-Eisenhauer A, Zeman F, Boldt J. Artificial intelligence in orthodontics. J Orofacial Orthoped. 2019;81(1):52–68. doi:10.1007/s00056-019-00203-8

J. Liu et al. Machine learning in orthodontics1074
37. Hwang HW, Park JH, Moon JH, et al. Automated identification of cephalometric landmarks. Part 2: Might it be better than human? Angle Orthod. 2020;90(1):69–76. doi:10.2319/022019-129.1
38. Torosdagli N, Liberton DK, Verma P, Sincan M, Lee JS, Bagci U. Deep geodesic learning for segmentation and anatomical landmarking. IEEE Trans Med Imaging. 2019;38(4):919–931. doi:10.1109/tmi.2018. 2875814
39. Nino-Sandoval TC, Guevara Perez SV, Gonzalez FA, Jaque RA, Infan-te-Contreras C. Use of automated learning techniques for predicting mandibular morphology in skeletal class I, II and III. Forensic Sci Int. 2017;281:187.e1–187.e7. doi:10.1016/j.forsciint.2017.10.004
40. Nino-Sandoval TC, Guevara Perez SV, Gonzalez FA, Jaque RA, Infan-te-Contreras C. An automatic method for skeletal patterns classifi-cation using craniomaxillary variables on a Colombian population. Forensic Sci Int. 2016;261:159.e1–e6. doi:10.1016/j.forsciint.2015.12.025
41. Yu HJ, Cho SR, Kim MJ, Kim WH, Kim JW, Choi J. Automated skeletal classification with lateral cephalometry based on artificial intelli-gence. J Dent Res. 2020;99(3):249–256. doi:10.1177/0022034520901715
42. Kim I, Misra D, Rodriguez L, et al. Malocclusion classification on 3D cone-beam CT craniofacial images using multi-channel deep learn-ing models. Annu Int Conf IEEE Eng Med Biol Soc. 2020;2020:1294–1298. doi:10.1109/EMBC44109.2020.9176672
43. Durka-Zajac M, Mitus-Kenig M, Derwich M, Marcinkowska-Mitus A, Loboda M. Radiological indicators of bone age assessment in cepha-lometric images: Review. Pol J Radiol. 2016;81:347–353. doi:10.12659/PJR.895921
44. McNamara JA Jr, Franchi L. The cervical vertebral maturation method: A user’s guide. Angle Orthod. 2018;88(2):133–143. doi:10.2319/111517-787.1
45. Sokic E, Tiro A, Sokic-Begovic E, Nakas E, Tiro A. Semi-automatic assessment of cervical vertebral maturation stages using cephalo-graph images and centroid-based clustering. Acta Stomatol Croat. 2012;46(4):280–290.
46. Baptista RS, Quaglio CL, Mourad LMEH, et al. A semi-automated method for bone age assessment using cervical vertebral matura-tion. Angle Orthod. 2012;82(4):658–662. doi:10.2319/070111-425.1
47. Gu Y, McNamara JA. Mandibular growth changes and cervical ver-tebral maturation: A cephalometric implant study. Angle Orthod. 2007;77(6):947–953. doi:10.2319/071006-284.1
48. Gao Y, Zhu T, Xu X. Bone age assessment based on deep convolution neural network incorporated with segmentation. Int J Comput Assist Radiol Surg. 2020;15(12):1951–1962. doi:10.1007/s11548-020-02266-0
49. Tajmir SH, Lee H, Shailam R, et al. Artificial intelligence-assisted inter-pretation of bone age radiographs improves accuracy and decreas-es variability. Skeletal Radiol. 2019;48(2):275–283. doi:10.1007/s00256-018-3033-2
50. Makaremi M, Lacaule C, Mohammad-Djafari A. Deep learning and artificial intelligence for the determination of the cervical vertebra maturation degree from lateral radiography. Entropy. 2019;21(12). doi:10.3390/e21121222
51. Vedovello SAS, Dos Santos PR, Mello de Carvalho AL, et al. Explor-ing the perception of orthodontic treatment need using the Den-tal Aesthetic Index and Index of Orthodontic Treatment Need. Am J Orthod Dentofacial Orthop. 2019;156(6):818–822. doi:10.1016/j.ajodo.2019.01.020
52. Thanathornwong B. Bayesian-based decision support system for assessing the needs for orthodontic treatment. Healthc Inform Res. 2018;24(1):22–28. doi:10.4258/hir.2018.24.1.22
53. Moghimi S, Talebi M, Parisay I. Design and implementation of a hybrid genetic algorithm and artificial neural network system for predict-ing the sizes of unerupted canines and premolars. Eur J Orthod. 2011; 34(4):480–486. doi:10.1093/ejo/cjr042
54. Soheilifar S, Soheilifar S, Ataei H, et al. Extraction versus non-extrac-tion orthodontic treatment: Soft tissue profile changes in borderline class I patients. Dent Med Probl. 2020;57(3):275–283. doi:10.17219/dmp/119102
55. Xie X, Wang L, Wang A. Artificial neural network modeling for deciding if extractions are necessary prior to orthodontic treatment. Angle Orthod. 2010;80(2):262–266. doi:10.2319/111608-588.1
56. Jung SK, Kim TW. New approach for the diagnosis of extractions with neural network machine learning. Am J Orthod Dentofacial Orthop. 2016;149(1):127–133. doi:10.1016/j.ajodo.2015.07.030
57. Suhail Y, Upadhyay M, Chhibber A, Kshitiz J. Machine learning for the diagnosis of orthodontic extractions: A computational anal-ysis using ensemble learning. Bioengineering (Basel). 2020;7(2):55. doi:10.3390/bioengineering7020055
58. Qin RX, Wang ZZ, Jiang LY, et al. Fine-grained lung cancer classifica-tion from PET and CT images based on multidimensional attention mechanism. Complexity. 2020;12:6153657. doi:10.1155/2020/6153657
59. Knoops PGM, Papaioannou A, Borghi A, et al. A machine learning framework for automated diagnosis and computer-assisted plan-ning in plastic and reconstructive surgery. Sci Rep. 2019;9(1):13597. doi:10.1038/s41598-019-49506-1
60. Jeong SH, Yun JP, Yeom HG, Lim HJ, Lee J, Kim BC. Deep learning based discrimination of soft tissue profiles requiring orthognathic surgery by facial photographs. Sci Rep. 2020;10(1):16235. doi:10.1038/s41598-020-73287-7
61. Choi HI, Jung SK, Baek SH, et al. Artificial intelligent model with neu-ral network machine learning for the diagnosis of orthognathic sur-gery. J Craniofac Surg. 2019;30(7):1986–1989. doi:10.1097/SCS.00000 00000005650
62. Barone S, Paoli A, Razionale AV. CT segmentation of dental shapes by anatomy-driven reformation imaging and B-spline modelling. Int J Numer Method Biomed Eng. 2016;32(6). doi:10.1002/cnm.2747
63. Gan Y, Xia Z, Xiong J, Zhao Q, Hu Y, Zhang J. Toward accurate tooth segmentation from computed tomography images using a hybrid level set model. Med Phys. 2014;42(1):14–27. doi:10.1118/1.4901521
64. Kim T, Cho Y, Kim D, Chang M, Kim YJ. Tooth segmentation of 3D scan data using generative adversarial networks. Appl Sci. 2020;10(2):490. doi:10.3390/app10020490
65. Cui Z, Li C, Wang W. ToothNet: Automatic tooth instance segmentation and identification from cone beam CT images. Paper presented at: 2019 IEEE/CVF Conference on Computer Vision and Pattern Rec-ognition (CVPR); June 15–20 2019; Long Beach, USA. doi:10.1109/CVPR.2019.00653
66. Patcas R, Timofte R, Volokitin A, et al. Facial attractiveness of cleft patients: A direct comparison between artificial-intelligence-based scoring and conventional rater groups. Eur J Orthod. 2019;41(4):428–433. doi:10.1093/ejo/cjz007
67. Zhao J, Zhang M, He C, Xie X, Li J. A novel facial attractiveness evalu-ation system based on face shape, facial structure features and skin. Cogn Neurodyn. 2020;14(5):643–656. doi:10.1007/s11571-020-09591-9
68. Patcas R, Bernini DAJ, Volokitin A, Agustsson E, Rothe R, Timofte R. Applying artificial intelligence to assess the impact of orthogna-thic treatment on facial attractiveness and estimated age. Int J Oral Maxillofac Surg. 2019;48(1):77–83. doi:10.1016/j.ijom.2018.07.010
69. Shih KH, Chiu CT, Lin JA, Bu YY. Real-time object detection with reduced region proposal network via multi-feature concatenation. IEEE Trans Neural Netw Learning Syst. 2020;31(6):2164–2173. doi:10.1109/TNNLS. 2019.2929059
70. Liang Y, Huan J, Li JD, Jiang C, Fang C, Liu Y. Use of artificial intel-ligence to recover mandibular morphology after disease. Sci Rep. 2020;10(1):16431. doi:10.1038/s41598-020-73394-5
71. Han CH, Kim M, Kwak JT. Semi-supervised learning for an improved diagnosis of COVID-19 in CT images. PLoS One. 2021;16(4):e0249450. doi:10.1371/journal.pone.0249450
72. Leite AF, Gerven AV, Willems H, et al. Artificial intelligence-driven novel tool for tooth detection and segmentation on panoramic radio-graphs. Clin Oral Investig. 2020;25(4):2257–2267. doi:10.1007/s00784- 020-03544-6
73. Dai L, Fang R, Li H, et al. Clinical report-guided retinal microaneurysm detection with multi-sieving deep learning. IEEE Trans Med Imaging. 2018;37(5):1149–1161. doi:10.1109/TMI.2018.2794988

Cite asBłaziak M, Urban S, Jura M, Kuliczkowski W. Fractional flow reserve-guided treatment in coronary artery disease: Clinical practice. Adv Clin Exp Med. 2021;30(10):1075–1084. doi:10.17219/acem/138862
DOI10.17219/acem/138862
Copyright© 2021 by Wroclaw Medical University This is an article distributed under the terms of theCreative Commons Attribution 3.0 Unported (CC BY 3.0)(https://creativecommons.org/licenses/by/3.0/)
Address for correspondenceMikołaj BłaziakE-mail: [email protected]
Funding sourcesNone declared
Conflict of interestNone declared
Received on April 22, 2021Reviewed on June 6, 2021Accepted on June 11, 2021
Published online on September 9, 2021
AbstractThe assessment of functional severity of moderate coronary stenoses is challenging. Coronary angiography remains the standard technique for diagnosis, although, due to its limitations, it is frequently insufficient to detect relevant myocardial ischemia. Fractional flow reserve (FFR) is defined as the ratio between the mean hyperemic coronary artery pressure distal to the lesion and mean pressure in the aorta. The FFR measurement is currently supported by guidelines to evaluate the hemodynamic significance of lesions. Proper identification of patients that have the potential to benefit from revascularization is crucial. Based on already published literature, we focus on the long-term follow-up of patients with FFR-driven treatment. We also provide a review of specific clinical cases such as borderline FFR values, comorbidities or lesions in anatomical risk locations, in which interpretation can be challenging during the physiological assessment. The aim of this paper is to provide an overview of the evidence of FFR implementation in daily clinical practice and determine issues that raise doubts.
Key words: revascularization, medical therapy, coronary artery disease (CAD), fractional flow reserve (FFR), grey zone
Reviews
Fractional flow reserve-guided treatment in coronary artery disease: Clinical practice
Mikołaj Błaziak1,D, Szymon Urban1,D, Maksym Jura1,D, Wiktor Kuliczkowski2,D
1 Student Scientific Organization, Department of Heart Diseases, Wroclaw Medical University, Poland2 Department of Heart Diseases, Wroclaw Medical University, Poland
A – research concept and design; B – collection and/or assembly of data; C – data analysis and interpretation; D – writing the article; E – critical revision of the article; F – final approval of the article
Advances in Clinical and Experimental Medicine, ISSN 1899–5276 (print), ISSN 2451–2680 (online) Adv Clin Exp Med. 2021;30(10):1075–1084
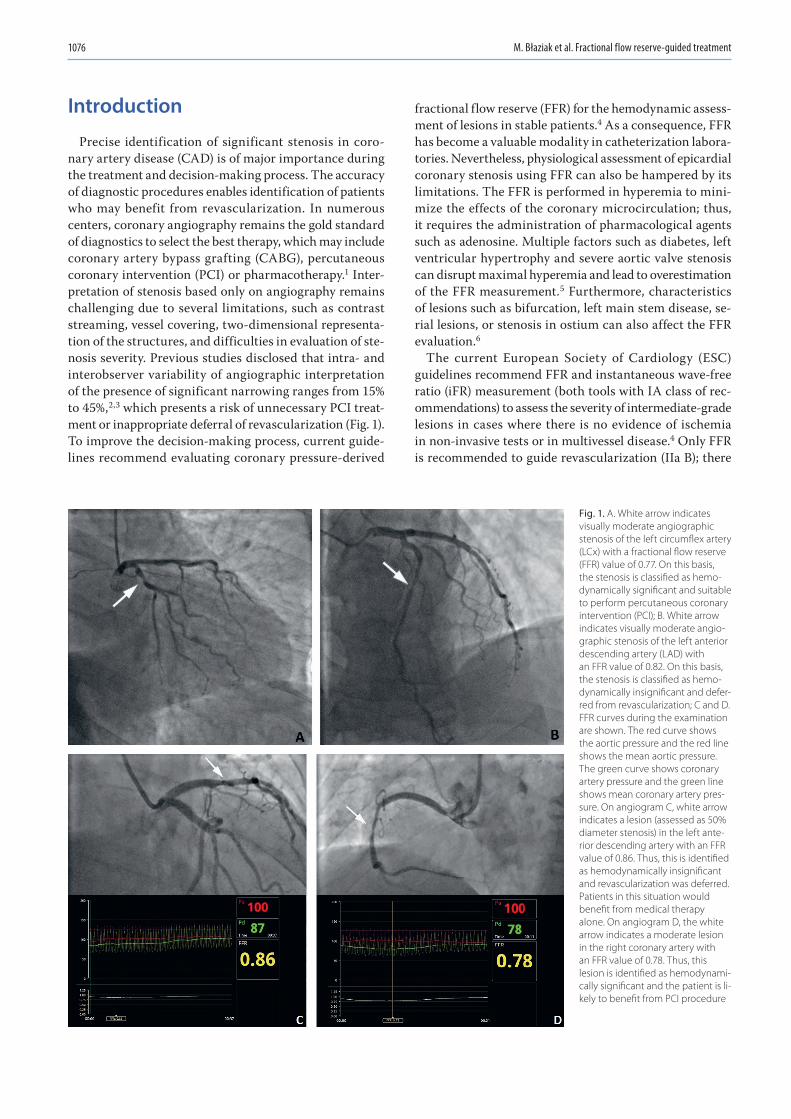
M. Błaziak et al. Fractional flow reserve-guided treatment1076
Introduction
Precise identification of significant stenosis in coro-nary artery disease (CAD) is of major importance during the treatment and decision-making process. The accuracy of diagnostic procedures enables identification of patients who may benefit from revascularization. In numerous centers, coronary angiography remains the gold standard of diagnostics to select the best therapy, which may include coronary artery bypass grafting (CABG), percutaneous coronary intervention (PCI) or pharmacotherapy.1 Inter-pretation of stenosis based only on angiography remains challenging due to several limitations, such as contrast streaming, vessel covering, two-dimensional representa-tion of the structures, and difficulties in evaluation of ste-nosis severity. Previous studies disclosed that intra- and interobserver variability of angiographic interpretation of the presence of significant narrowing ranges from 15% to 45%,2,3 which presents a risk of unnecessary PCI treat-ment or inappropriate deferral of revascularization (Fig. 1). To improve the decision-making process, current guide-lines recommend evaluating coronary pressure-derived
fractional flow reserve (FFR) for the hemodynamic assess-ment of lesions in stable patients.4 As a consequence, FFR has become a valuable modality in catheterization labora-tories. Nevertheless, physiological assessment of epicardial coronary stenosis using FFR can also be hampered by its limitations. The FFR is performed in hyperemia to mini-mize the effects of the coronary microcirculation; thus, it requires the administration of pharmacological agents such as adenosine. Multiple factors such as diabetes, left ventricular hypertrophy and severe aortic valve stenosis can disrupt maximal hyperemia and lead to overestimation of the FFR measurement.5 Furthermore, characteristics of lesions such as bifurcation, left main stem disease, se-rial lesions, or stenosis in ostium can also affect the FFR evaluation.6
The current European Society of Cardiology (ESC) guidelines recommend FFR and instantaneous wave-free ratio (iFR) measurement (both tools with IA class of rec-ommendations) to assess the severity of intermediate-grade lesions in cases where there is no evidence of ischemia in non-invasive tests or in multivessel disease.4 Only FFR is recommended to guide revascularization (IIa B); there
Fig. 1. A. White arrow indicates visually moderate angiographic stenosis of the left circumflex artery (LCx) with a fractional flow reserve (FFR) value of 0.77. On this basis, the stenosis is classified as hemo-dynamically significant and suitable to perform percutaneous coronary intervention (PCI); B. White arrow indicates visually moderate angio-graphic stenosis of the left anterior descending artery (LAD) with an FFR value of 0.82. On this basis, the stenosis is classified as hemo-dynamically insignificant and defer-red from revascularization; C and D. FFR curves during the examination are shown. The red curve shows the aortic pressure and the red line shows the mean aortic pressure. The green curve shows coronary artery pressure and the green line shows mean coronary artery pres-sure. On angiogram C, white arrow indicates a lesion (assessed as 50% diameter stenosis) in the left ante-rior descending artery with an FFR value of 0.86. Thus, this is identified as hemodynamically insignificant and revascularization was deferred. Patients in this situation would benefit from medical therapy alone. On angiogram D, the white arrow indicates a moderate lesion in the right coronary artery with an FFR value of 0.78. Thus, this lesion is identified as hemodynami-cally significant and the patient is li-kely to benefit from PCI procedure
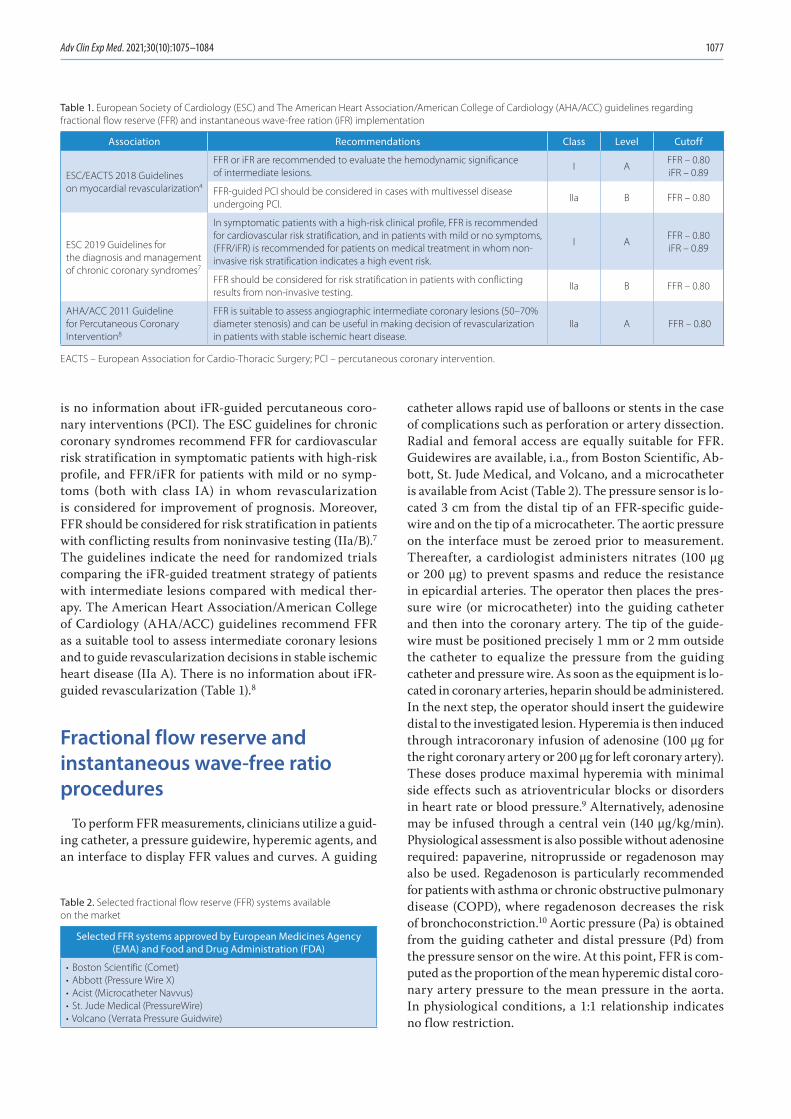
Adv Clin Exp Med. 2021;30(10):1075–1084 1077
is no information about iFR-guided percutaneous coro-nary interventions (PCI). The ESC guidelines for chronic coronary syndromes recommend FFR for cardiovascular risk stratification in symptomatic patients with high-risk profile, and FFR/iFR for patients with mild or no symp-toms (both with class IA) in whom revascularization is considered for improvement of prognosis. Moreover, FFR should be considered for risk stratification in patients with conflicting results from noninvasive testing (IIa/B).7 The guidelines indicate the need for randomized trials comparing the iFR-guided treatment strategy of patients with intermediate lesions compared with medical ther-apy. The American Heart Association/American College of Cardiology (AHA/ACC) guidelines recommend FFR as a suitable tool to assess intermediate coronary lesions and to guide revascularization decisions in stable ischemic heart disease (IIa A). There is no information about iFR-guided revascularization (Table 1).8
Fractional flow reserve and instantaneous wave-free ratio procedures
To perform FFR measurements, clinicians utilize a guid-ing catheter, a pressure guidewire, hyperemic agents, and an interface to display FFR values and curves. A guiding
catheter allows rapid use of balloons or stents in the case of complications such as perforation or artery dissection. Radial and femoral access are equally suitable for FFR. Guidewires are available, i.a., from Boston Scientific, Ab-bott, St. Jude Medical, and Volcano, and a microcatheter is available from Acist (Table 2). The pressure sensor is lo-cated 3 cm from the distal tip of an FFR-specific guide-wire and on the tip of a microcatheter. The aortic pressure on the interface must be zeroed prior to measurement. Thereafter, a cardiologist administers nitrates (100 μg or 200 μg) to prevent spasms and reduce the resistance in epicardial arteries. The operator then places the pres-sure wire (or microcatheter) into the guiding catheter and then into the coronary artery. The tip of the guide-wire must be positioned precisely 1 mm or 2 mm outside the catheter to equalize the pressure from the guiding catheter and pressure wire. As soon as the equipment is lo-cated in coronary arteries, heparin should be administered. In the next step, the operator should insert the guidewire distal to the investigated lesion. Hyperemia is then induced through intracoronary infusion of adenosine (100 µg for the right coronary artery or 200 µg for left coronary artery). These doses produce maximal hyperemia with minimal side effects such as atrioventricular blocks or disorders in heart rate or blood pressure.9 Alternatively, adenosine may be infused through a central vein (140 µg/kg/min). Physiological assessment is also possible without adenosine required: papaverine, nitroprusside or regadenoson may also be used. Regadenoson is particularly recommended for patients with asthma or chronic obstructive pulmonary disease (COPD), where regadenoson decreases the risk of bronchoconstriction.10 Aortic pressure (Pa) is obtained from the guiding catheter and distal pressure (Pd) from the pressure sensor on the wire. At this point, FFR is com-puted as the proportion of the mean hyperemic distal coro-nary artery pressure to the mean pressure in the aorta. In physiological conditions, a 1:1 relationship indicates no flow restriction.
Table 1. European Society of Cardiology (ESC) and The American Heart Association/American College of Cardiology (AHA/ACC) guidelines regarding fractional flow reserve (FFR) and instantaneous wave-free ration (iFR) implementation
Association Recommendations Class Level Cutoff
ESC/EACTS 2018 Guidelines on myocardial revascularization4
FFR or iFR are recommended to evaluate the hemodynamic significance of intermediate lesions.
I AFFR – 0.80iFR – 0.89
FFR-guided PCI should be considered in cases with multivessel disease undergoing PCI.
IIa B FFR – 0.80
ESC 2019 Guidelines for the diagnosis and management of chronic coronary syndromes7
In symptomatic patients with a high-risk clinical profile, FFR is recommended for cardiovascular risk stratification, and in patients with mild or no symptoms, (FFR/iFR) is recommended for patients on medical treatment in whom non-invasive risk stratification indicates a high event risk.
I AFFR – 0.80iFR – 0.89
FFR should be considered for risk stratification in patients with conflicting results from non-invasive testing.
IIa B FFR – 0.80
AHA/ACC 2011 Guideline for Percutaneous Coronary Intervention8
FFR is suitable to assess angiographic intermediate coronary lesions (50–70% diameter stenosis) and can be useful in making decision of revascularization in patients with stable ischemic heart disease.
IIa A FFR – 0.80
EACTS – European Association for Cardio-Thoracic Surgery; PCI – percutaneous coronary intervention.
Table 2. Selected fractional flow reserve (FFR) systems available on the market
Selected FFR systems approved by European Medicines Agency (EMA) and Food and Drug Administration (FDA)
• Boston Scientific (Comet)• Abbott (Pressure Wire X)• Acist (Microcatheter Navvus)• St. Jude Medical (PressureWire)• Volcano (Verrata Pressure Guidwire)

M. Błaziak et al. Fractional flow reserve-guided treatment1078
Instantaneous wave-free ratio (iFR) is assessed us-ing the same pressure wire and calculated as the ratio of distal coronary pressure to the aortic pressure (Pd/Pa) (Fig. 2). The primary difference between FFR and iFR is that iFR is performed during the isolated period of di-astole – the wave-free period – while microvascular re-sistance is low and stable and does not affect coronary flow.11 The ADVISE-in-practice study reported the cor-relation between an iFR threshold of 0.9 and FFR thresh-old of 0.8.12 Meta-analysis of 2 trials, Functional Lesion Assessment of Intermediate Stenosis to Guide Revas-cularisation (DEFINE-FLAIR) and The Instantaneous Wave-Free Ratio versus Fractional Flow Reserve in Pa-tients with Stable Angina Pectoris or Acute Coronary Syndrome (iFR-SWEDEHEART), reported that iFR-guided management was not inferior to FFR guidance in respect to death, myocardial infarction (MI) and un-planned revascularization.13
Objectives
The aim of the present article is to explore the clinical implementation, accuracy and limitations of FFR mea-surement. Based on already published literature, we focus on the long-term follow-up of patients with FFR-driven treatment. We also conduct an overview of specific clini-cal cases, where interpretation can be challenging during the physiological assessment, such as borderline FFR val-ues, comorbidity or lesions in anatomical risk locations. Our review is intended to improve understanding of the di-agnostic results and, in consequence, result in more suit-able treatment strategies.
Importance of fractional flow reserve measurement
There are 3 pivotal, randomized trials in the area of physi-ological assessment of coronary lesions severity: FAME 1,14 FAME 215 and DEFER.16 First of them revealed that, in com-parison with the standard angiography-guided treatment strategy, FFR-guided therapy is associated with better outcomes such as a significant reduction of death, MI and revascularization cases. Furthermore, the use of FFR re-duced the number of unnecessary stent implantations and the amount of contrast agents. The 2nd trial showed that revascularization in patients with FFR values ≤0.80 is su-perior to medical therapy alone. Over 5 years of follow-up, investigators did not observe significant differences in ad-verse cardiovascular effects between PCI-treated patients with FFR ≤ 0.80 and those with FFR > 0.80 treated with medical therapy only. The DEFER trial demonstrated that deferment of revascularization with an FFR cutoff >0.75 for patients with intermediate stenosis is safe and is still beneficial for functionally nonsignificant lesions after 15 years of follow-up. The results of a meta-analysis and systematic review of the randomized trials FAME 2,15 DAN-AMI-3-PRIMULTI17 and Compare-Acute18 were published in 2019.19 The goal of this study was to evaluate the effect of FFR guidance in PCI in comparison with medical therapy. The cohort consisted of patients suffering from stable CAD as well as those after acute coronary syndrome (ACS) who were hemodynamically stable, in whom non-infarct-related lesions were investigated. Cardiac death or MI constituted the primary endpoint. The authors concluded that planning revascularization based on FFR was superior to medical treatment, which was achieved primarily through a sta-tistically significant reduction in the incidence of MI. The trial, conducted by Völz et al., assessed the usefulness of FFR in patients with angina pectoris treated with PCI.20 It showed that, compared with angiography-guided PCI, FFR-guided PCI enhanced long-term outcomes because of lower rate of mortality, stent thrombosis and restenosis. Schampaert et al. investigated a cohort of 2217 patients with ACS and stable CAD, and reported that the treatment plan suggested by FFR diverged from the treatment plan indi-cated by standard angiography in 1/3 of patients.21 Among participants with ACS, 38% had a modified strategy, and among those with CAD, 32.6% had a modified strategy. The treatment plan based on FFR is associated with a reduc-tion of revascularization frequency. Interestingly, Tanaka et al. conducted a study to estimate how treatment plan adjustment based on FFR influences the medical cost.22 Data were adopted from CVIT-DEFER registry.23 After FFR measurement (with a cutoff of 0.80), 90.1% of patients who were initially assigned to PCI (based on coronary angiogra-phy) received medical therapy only. Management strategies guided by FFR allow decreasing medical cost due to the re-duction of unnecessary stent implantations despite the risk of revascularization in the deferred group.
Fig. 2. Both fractional flow reserve (FFR) and instantaneous wave-free ration (iFR) measurements are calculated using the following formula: Pd/Pa, where Pd is coronary pressure distal to the lesion and Pa is coronary pressure proximal to the lesion. The main difference between these methods is that the FFR is measured in maximal hyperemic coronary flow (which demands adenosine administration), whereas iFR is measured during isolated period of diastole – the wave-free period
FFR = iFR =distal coronary pressure
proximal coronary pressure
(during maximal hyperemia) (during wave-free period)
distal coronary pressureproximal coronary pressure

Adv Clin Exp Med. 2021;30(10):1075–1084 1079
FFR and iFR advantages and limitations
Specific features of lesions and clinical factors may af-fect the accuracy of FFR measurement and lead to false negative or false positive FFR values. The theory of FFR calculation is that the relationship between coronary flow and pressure is linear during maximum hyperemia. Fac-tors such as diabetic microangiopathy, former MI or left ventricular hypertrophy may result in microvascular im-pairment and, in consequence, reduce maximal hyperemia. If maximal hyperemia is not achieved, the pressure gradi-ent can be underestimated and lead to overestimated FFR values. Features of left ventricular hypertrophy (LVH), such as extravascular compression or high pressure in the left ventricle, can play a role in diminishing hyperemic flow.24 Another situation which can affect physiological assess-ment is a tandem lesion. In this case, FFR measurement can be underestimated because of the impact of serial lesions on each other. The proximal pressure to the 2nd lesion is af-fected by the 1st lesion and the other way around. The distal pressure to the 1st lesion can be skewed by the 2nd lesion. It seems that a pull-back FFR measurement is an accu-rate method to assess which stenosis should be treated first. Moreover, in this case, iFR pull-back measurement can probably provide a more reliable assessment because, in resting conditions, the interplay between both lesions can have minimal impact.25 The influence of downstream epicardial stenosis on the assessment of the hemodynamic significance of stenosis located in left stem was the matter of debate. However, only severe (FFR ≤ 0.50) and proxi-mally situated lesions can affect the FFR measurement in left main stem.26 Another situation in which FFR mea-surement can be uncertain is aortic stenosis, which is be-coming more common due to the aging of the popula-tion (and therefore, a higher rate of aortic stenosis) and increasing availability of transcatheter aortic valve im-plantation (TAVI). Functional assessment with adenosine infusion in patients with aortic stenosis was proven safe and well-tolerated.27 Aortic stenosis may impact the FFR value by inducing hypertrophy and decreasing vasodilation of the coronary circulation. In consequence, it may mask functionally significant coronary lesions. Pesarini et al.
reported that borderline lesions which are insignificant at baseline can become “truly” significant after TAVI.28
The advantages of FFR have been extensively studied and validated in many different clinical conditions such as multivessel disease, ACS, left main lesions, diffuse ath-erosclerosis, and bifurcations. The great number of studies allow for strong recommendations in current guidelines to support clinicians during treatment. The key advan-tage of FFR is its prognostic power. There is a continuous relationship between FFR values and clinical outcomes, which are modified by medical therapy or revasculariza-tion. Patients with lower FFR values obtain more benefits from revascularization.29 The iFR measurement is the al-ternative method of physiological assessment. Patients with contraindications to adenosine such as obstructive pulmonary disease or atrioventricular nodal blocks can benefit from this approach. The operator does not have to induce hyperemia, which reduces costs and procedural time. The FFR can be used to confirm borderline iFR val-ues. However, an important limitation of iFR is the small number of studies in different pathological and anatomical conditions. The iFR sensibility for hemodynamic variabil-ity (due to active autoregulation mechanisms in non-hyper-emic conditions) is a continual matter of debate and needs further research. The prognostic role of iFR in guiding myocardial revascularization also requires additional clari-fication (Table 3). Thus, all cases with specific features that could lead to artificially altered FFR and iFR values should be interpreted with great caution. All abovementioned sce-narios may demand a modified diagnostic approach in or-der to avoid misinterpretation of hemodynamic relevance.
Treatment strategy in borderline FFR values: the so-called “grey zone”
Appropriate management of patients with FFR values between 0.75 and 0.80 remains a subject of debate. A prior study suggested that FFR values in this grey zone are as-sociated with significant myocardial ischemia, although values in this range are observed in a limited number
Table 3. Advantages and disadvantages of fractional flow reserve (FFR) and instantaneous wave-free ration (iFR) methods
FFR and iFR comparison
FFR iFR
Advantages Disadvantages Advantages Disadvantages
• gold standard of invasive diagnostics
• extensively studied and validated• method of iFR borderline values
confirmation• FFR-guided PCI recommended
in guidelines• prognostic power
• necessity to achieve hyperemia• hypertrophy, aortic stenosis,
tandem lesions, microvascular impairment can affect measurement
• faster to proceed (no adenosine administration)
• cheaper to proceed (no adenosine administration)
• fewer patient-related side effects from adenosine
• still requires further explorations and validations
• can be vulnerable for hemodynamic variability
• need to investigate prognostic value

M. Błaziak et al. Fractional flow reserve-guided treatment1080
of patients.30,31 Johnson et al. demonstrated that benefi-cial FFR thresholds oscillate around the grey zone range.29 Several previous studies have reported conflicting results between revascularization and medical therapy for coro-nary stenosis in this population. The DEFER trial showed that medical therapy alone with FFR values ≥0.75 was as-sociated with promising outcomes16 even after 15 years of follow-up.32 However, the previous study reported that deferral of revascularization in that group is associated with higher target vessel failure mainly due to urgent re-vascularization.33 A systematic review and meta-analysis demonstrated a significant reduction of major adverse car-diovascular events (MACE) and target vessel revascular-ization (TVR) after revascularization but did not diminish endpoints, such as all-cause death, cardiac death or MI.34 Interestingly, both FAME trials found that all revascu-larized lesions with FFR ≤ 0.80 had favorable results.35,36 Furthermore, in their observational study, Adjedj et al. did not report a significant difference in MACE between deferred and medical therapy groups.37
Two recent studies evaluated which medical approaches are associated with improvements in long-term follow-up in the FFR grey zone. In a prospective, controlled trial, Hennigan et al. recruited 104 patients with angina with FFR values between 0.75 and 0.82 for intermediate le-sions and randomized half to optimal medical therapy (OMT) only and half to PCI with OMT.30 The primary endpoint was angina status, which was evaluated with the Seattle Angina Questionnaire (SAQ). The parameters were estimated in domains of quality of life, treatment satisfaction, physical limitation, angina stability, and an-gina frequency. The SAQ was initially completed after the index invasive procedure and again 3 and 12 months later. Additionally, participants underwent stress perfu-sion magnetic resonance imaging (MRI) at the same time, to evaluate the ischemia. At 3 months, the mean changes in the SAQ domains of angina frequency and quality of life were in favor of the PCI group. No significant dif-ferences were found regarding angina stability, physical limitation or treatment satisfaction. The MRI at base-line revealed that 11 patients with OMT and 6 patients with PCI had noticeable ischemia in the studied region, and there was no significant variation between groups. In the PCI subgroup, after 3 months, only 3 participants still presented ischemia in the target lesion area. Unfor-tunately, the authors did not report how many patients with OMT in that time revealed ischemia. The final SAQ obtained after 12 months suggested that PCI treatment is still superior to OMT, but it was no longer statistically significant. However, because of the lack of control group and openness of treatment strategy, a placebo effect may have impacted these findings.
Du et al. designed a study to identify beneficial FFR cutoff values for decision-making and risk assessment in patients with coronary stenosis.38 The study included 903 participants who were initially treated with PCI, after
which 1210 de novo lesions were detected and evaluated using FFR and further investigated. The mean clinical observation period lasted 21 months. The primary out-come was target lesion failure (TLF), which was defined as a composite of cardiac death, target lesion MI or target lesion revascularization (TLR). After measurement, 44% of participants underwent revascularization. Initially, all lesions were allocated to 4 FFR value categories: ≤0.75, 0.76–0.80, 0.81–0.85, and ≥0.86. Analysis revealed no differences in TLF frequency between performed and deferred revascularization for lesions in the groups with FFR > 0.80, whereas the incidence of TLF for deferred le-sions was higher than revascularized lesions in the groups with FFR < 0.80. Of note, in the grey zone, TLF rate in pa-tients with performed PCI amounted to 0%. Next, to ap-praise the 0.80 value as a proper cutoff for decision-making management, all lesions were assigned to 3 groups: a low FFR (≤0.80) defer (LFD) group and a high FFR (>0.80) de-fer (HFD) group, in whom lesions were untreated, and a low FFR (≤0.80) performed (LFR) group, in whom lesions were revascularized. The TLF rate was similar in the LFR and HFD groups, but noticeably lower than in the LFD group. In a further phase, deferred lesions were matched again in 4 FFR groups: ≤0.75, 0.76–0.80, 0.81–0.85, and ≥0.86, which showed a crucial increase in cumulative TLF events from the higher to the lower FFR categories. Lesions in both groups with FFR < 0.80 were associated with a poorer outcome. Moreover, it is hard to ignore the fact that, during the study, incompatibility between revascularization strategy and an FFR value of 0.80 was 17.4%. This especially concerned lesions with FFR values in the range of 0.76–0.80, in which management was de-termined by the physician. These outcomes reported that an FFR value of 0.80 is a beneficial and safe threshold for decision-making for revascularization. Revascularized le-sions with FFR values ≤0.80 (included in the grey zone) were associated with improved clinical outcomes (defer-ment of revascularization was associated with a four-fold increase in the TLF risk in that group), which is consistent with the results from the recent trial conducted by Hen-nigan et al.30 Among patients with grey zone FFR values, after PCI, no participant developed TLF, whilst 12 subjects with medical treatment developed TLF. Pharmacotherapy alone for those with FFR > 0.80 was identified as a suf-ficient and safe strategy.
A subsequent study based on the IRIS-FFR registry in-vestigated lesions with FFR values in the grey zone (0.75–0.80).39 Clinicians identified patients with a de novo na-tive coronary artery stenosis. The MACE was a primary endpoint. The mean follow-up duration was 2.9 years. Patients (n = 1334; 1 lesion per 1 patient) were divided into 2 groups: with deferred revascularization (683 subjects) and with performed PCI (651 subjects). Unfortunately, the authors did not inform about decision-making cri-teria (symptoms or lesion characteristics) used to assign the patients to perform or defer PCI. The MACE, overall

Adv Clin Exp Med. 2021;30(10):1075–1084 1081
mortality, incidence of death, and spontaneous MI event rate did not vary between the 2 groups (MACE appeared in 8.1% in the deferred group compared to 8.4% in the PCI group). Patients who underwent PCI had a significantly higher risk of target vessel infarction due to a higher likelihood of a periprocedural infarct. On the contrary, in the deferred group, an increase in TVR frequency was noted. The ACS, chronic renal failure and multi-vessel coronary artery disease were independent predictors of MACE in the PCI group, whereas left main or proxi-mal left anterior descending artery lesion and multi-ves-sel coronary artery disease were independent predictors of MACE in the deferred group. Of note, 3.7% of patients in the PCI group and 5.4% of patients in the deferred group experienced TVR. These results demonstrated that pa-tients with grey zone FFR values treated with PCI did not benefit. However, revascularization could be valuable for specific subgroups, such as those with medically refrac-tory angina.
Follow-up after deferred revascularization based on FFR in specific cases
Despite the number of studies concerning the role of FFR during the decision-making process, many clinical cases still require a careful approach. Proper patient recruitment can be challenging due to the lack of clinical evidence. A recent, multicenter study based on the J-CONFIRM reg-istry investigated outcomes of deferred revascularization (based on FFR measurement) in a group of 1263 patients in whom the large majority of lesions (84.6%) demonstrated FFR > 0.80.40 The primary endpoint was target vessel fail-ure (TVF), which consists of cardiac death, target vessel-related MI or clinically-driven TVR. The study revealed that, after 2 years of observation, TVF occurred in 5.5% of deferred lesions, which was mainly driven by a high rate of TVR. The results demonstrated that the FFR value, left main coronary artery (LMCA) lesion, moderately to se-verely calcified lesion, hemodialysis, and right coronary artery lesion were independent predictors of TVF. This and prior investigations have demonstrated a relationship between increasing rates of TVF and decreasing FFR val-ues. The association between TVF and FFR was observed in the proximal location of coronary stenosis but was not found in the distal segment. These findings also support the conclusion of the study conducted by Adjedj et al.,37 which showed that lower FFR values in the proximal area are associated with higher cardiac event risk and high-lighted the hemodynamic importance of stenosis in that region. Therefore, this paper supports the previous find-ings about the safety of revascularization deferral based on FFR and emphasizes that the aforementioned cases require a cautious approach.
The FACE study (Safety of FFR-guided Revascularisation Deferral in Anatomically Prognostic Disease) was per-formed to evaluate outcomes of patients with anatomical risk location lesions after deferment of revascularization.41 Clinicians recruited 292 patients with negative FFR (>0.80) and intermediate stenosis as follows: in the left main stem or in the proximal anterior descending artery or with 2 or 3 vessel disease and left ventricular ejection fraction (LVEF) less than 40% or these with lesions in a single re-maining patent coronary artery. The primary composite end-point MACE (consisting of death or acute MI) and unplanned TLR were recorded during 18 months of the fol-low-up. Over this observation time, MACE occurred in 11.6% of patients, death occurred in 3.8% (1.8% due to cardiovascular causes), and 6% required TVR. Event-free survival at follow-up was 88.5%. Chronic kidney disease and ostial stenosis were found as predictors of MACE, but only impaired renal function was revealed as a sig-nificant predictor of TLR. The FREAK registry reported a higher rate of false negative FFR values in patients with impaired renal function, which may explain the higher rate of endpoints in this group.42 With regard to ostial le-sions, the results are equivocal on the grounds of problems in the interpretation of FFR values in this setting. The pres-ence of the guiding catheter in the coronary ostium can generate artificial stenosis and lead to an overestimation of these lesions. The majority of subjects had proximal left anterior descending artery (LAD) lesions, and in this subgroup, the event rate of MACE was 8.3% and it was lower than the overall event rates. This outcome is in line with the previous study, which favors conservative treat-ment in LAD lesions with negative FFR.43 The results also demonstrated that MACE appeared more often in patients with LMCA disease (6.4% at 1 year and 30.3% at 2 years, mainly comprised of acute MI and TLR). Although these findings are crucial, the major limitation of this outcome is the relatively low statistical representation of the patients with lesions in the LMCA. The authors concluded that FFR-guided revascularization deferral in those settings is safe. However, it must be analyzed carefully, and in cer-tain cases, such as left main stem disease, ostial disease and renal dysfunction, isolated FFR measurement is probably insufficient for risk evaluation.
Sex-specific issues related to ischemic heart disease are a matter of current discussion regarding the appropriate-ness of diagnostic and therapeutic strategies for men and women. Sex differences include pathophysiology and clini-cal manifestations of CAD.44 Due to limited information on sex-based differences in long-term outcomes after FFR-guided revascularization deferral in patients with stable CAD, Hoshino et al. conducted a study based on 3 reg-istries.45 Each registry included patients undergoing FFR measurement in addition to coronary flow reserve (CFR) and microcirculatory resistance (IMR). Eight hundred seventy-nine participants with FFR > 0.75 who had been deferred from revascularization were observed for 5 years.

M. Błaziak et al. Fractional flow reserve-guided treatment1082
The patient-oriented composite outcome (POCO; com-posite of any death, any MI and any revascularization) was a primary endpoint. After 5 years of follow-up, POCO was noted in 83 patients (16 cardiac deaths, 14 MIs and 48 any revascularization) and the POCO rate in women compared to men was 4.8% compared to 11.1%. Women showed higher FFR values than men for non-obstructive lesions, and women have a significantly lower risk of POCO. Further-more, in comparison with previous records46,47 where car-diac events were reported in about 10% of women after PCI, the present study revealed that POCO was reported in only 4.9% of women in deferred arms throughout the time of ob-servation. Interestingly, CFR, but not FFR, was a significant predictor of POCO. The CFR values were significantly lower in women. Furthermore, no significant difference in IMR was found between women and men. Analysis displayed that age, diabetes mellitus in men and multivessel disease in women were significant predictors of POCO. This study showed also that there is no variation in cumulative rates of POCO between sexes at the first 3 years of follow-up, which supports the previous results from the FAME study,48 but the rates of POCO were higher for men than for women following the 4th year of the observation period. However, the better prognosis in favor of women can be explained by the smaller number of LAD lesions and the fact that, in this study, no difference in microvascular responsiveness to hyperemic induction between sexes was shown, whereas women have more tendency to suffer from microvascu-lar angina.49 The fact that there are noticeable variations in FFR values between sexes in similar angiographic le-sions highlights the significance of physiological assessment of CAD, especially in women, who have a lower probability to develop obstructive epicardial disease as compared with men. The authors suggest that their data indicate the pos-sible necessity of a sex-specific diagnostic approach which considers the pathophysiological differences with sex-dif-ferentiated FFR cutoff points.
Using the large, multicenter PRIME-FFR registry (n = 1983), clinicians evaluated the utility of FFR among patients with diabetes (in comparison with those without diabetes) and described the rate of changes in treatment strategy after FFR evaluation. The rate of revasculariza-tion deferral and MACE incidence at 1 year follow-up was also assessed.50 Preliminarily, all participants underwent coronary angiography, which was the basis for determining the primary treatment strategy. Afterward, FFR assess-ment was conducted. Reclassification was recognized when the treatment strategy (pharmacotherapy/PCI/CABG) af-ter FFR measurement was different than the initial one. In this study, patients with diabetes reported lower FFR values than those without diabetes, which is in line with former papers.51,52 Changes in the treatment approach oc-curred more frequently in the group with diabetes (41.2%), but were still similar to that in the group without diabe-tes (37.5%); however, diabetes was associated with more common reclassification from medical therapy to PCI
or CABG. One year of observation disclosed that, in pa-tients with diabetes, the rate of MACE between reclas-sified and non-reclassified groups was similar. Likewise, the rate of MACE after revascularization deferment (based on FFR) between those with and without diabetes was comparable. The exploration indicates that FFR-guided treatment (with 0.80 thresholds) in patients with diabetes improves prognosis. Moreover, revascularization deferral for those patients is safe, despite higher diabetes-related atherosclerotic burden.
Conclusions and future directions
In summary, FFR measurement in patients with stable CAD is a safe and valuable modality to assess the hemody-namic relevance of coronary stenoses. Thus, greater adop-tion of FFR evaluation can identify patients who benefit from PCI and avoid periprocedural complications of un-necessary revascularization. However, this invasive tool is not free from limitations, and particular lesions features can lead to FFR over- or underestimation. Further studies are needed to investigate lesions with anatomical risk loca-tion due to prognostic value, such as left main stem disease or ostial stenosis. Consequently, there is a need to specify clinical factors which can be associated with adverse car-diac events. Further evaluation is required for patients with treatment strategy reclassification after FFR measure-ment. Long-term observation of patients with angiographic high-grade stenoses which were deferred from revascu-larization is also needed. Another issue that seems to be valuable during treatment is post-PCI evaluation of FFR. It is not uncommon that, after successful PCI, the treated artery does not achieve satisfactory FFR values. The FFR measurement after revascularization seems to have prog-nostic significance for MACE. Further studies are needed to evaluate the role of post-PCI FFR and to verify cutoff values for post-procedural FFR. In patients with grey zone FFR values, decision-making is always challenging. Several studies indicated that there is no relevant treatment for all patients with grey zone FFR. Every case judgment should take into account comorbidity, the character of symptoms, lesion complexity, the feasibility of safe stenting, results of non-invasive tests, and patient preference. Factors such as lesions located in the proximal LAD or in the left main stem, refractory angina, or focal gradient favor revascular-ization, whereas distal lesions, mild symptoms and diffuse gradient suggest conservative treatment. Therefore, there is still room for observational studies and especially for randomized trials to elucidate the most suitable therapeu-tic plan in this subset of patients.
ORCID iDsMikołaj Błaziak https://orcid.org/0000-0001-8207-1723Szymon Urban https://orcid.org/0000-0002-5547-150XMaksym Jura https://orcid.org/0000-0003-4316-8623Wiktor Kuliczkowski https://orcid.org/0000-0001-6284-0820

Adv Clin Exp Med. 2021;30(10):1075–1084 1083
References1. Scanlon PJ, Faxon DP, Audet AM, et al. ACC/AHA Guidelines for cor-
onary angiography: Executive summary and recommendations. Circulation. 1999;99(17):2345–2357. doi:10.1161/01.cir.99.17.2345
2. Leape LL, Park RE, Bashore TM, Harrison JK, Davidson CJ, Brook RH. Effect of variability in the interpretation of coronary angiograms on the appropriateness of use of coronary revascularization pro-cedures. Am Heart J. 2000;139(1 Pt 1):106–113. doi:10.1016/S0002-8703(00)90316-8
3. Pijls NHJ, De Bruyne B. Coronary pressure measurement and fractional flow reserve. Heart. 1998;80(6):539–542. doi:10.1136/hrt.80.6.539
4. Neumann FJ, Sousa-Uva M, Ahlsson A, et al. 2018 ESC/EACTS Guide-lines on myocardial revascularization. Eur Heart J. 2019;40(2):87–165. doi:10.1093/eurheartj/ehy394
5. Botas J. Assessment and therapeutic guideline of intermediate coronary lesions on the catheterization laboratory [in Spanish]. Rev Esp Cardiol. 2003;56(12):1218–1230. doi:10.1016/S0300-8932(03)77041-9
6. Lau JK, Yong ASC. Use of fractional flow reserve in different anatom-ical subsets. Coron Artery Dis. 2015;26(Suppl 1):e2–e7. doi:10.1097/MCA.0000000000000203
7. Neumann FJ, Sechtem U, Banning AP, et al. 2019 ESC Guidelines for the diagnosis and management of chronic coronary syndromes. Eur Heart J. 2020;41(3):407–477. doi:10.1093/eurheartj/ehz425
8. Levine GN, Bates ER, Blankenship JC, et al. 2011 ACCF/AHA/SCAI Guidelines for percutaneous coronary intervention. J Am Coll Cardiol. 2011;58(24):e44–e122. doi:10.1016/j.jacc.2011.08.007
9. Adjedj J, Toth GG, Johnson NP, et al. Intracoronary adenosine: Dose-response relationship with hyperemia. JACC Cardiovasc Interv. 2015; 8(11):1422–1430. doi:10.1016/j.jcin.2015.04.028
10. Prenner BM, Bukofzer S, Behm S, Feaheny K, McNutt BE. A random-ized, double-blind, placebo-controlled study assessing the safety and tolerability of regadenoson in subjects with asthma or chronic obstructive pulmonary disease. J Nucl Cardiol. 2012;19(4):681–692. doi:10.1007/s12350-012-9547-4
11. Götberg M, Christiansen EH, Gudmundsdottir IJ, et al. Instantaneous wave-free ratio versus fractional flow reserve to guide PCI. N Engl J Med. 2017;376(19):1813–1823. doi:10.1056/nejmoa1616540
12. Petraco R, Al-Lamee R, Gotberg M, et al. Real-time use of instanta-neous wave-free ratio: Results of the ADVISE in-practice. An inter-national, multicenter evaluation of instantaneous wave-free ratio in clinical practice. Am Heart J. 2014;168(5):739–748. doi:10.1016/j.ahj.2014.06.022
13. McClure JD. Meta-analysis of death and myocardial infarction in the DEFINE-FLAIR and iFR-SWEDEHEART trials. Circulation. 2017; 136(24):2389–2391. doi:10.1161/CIRCULATIONAHA.117.030430
14. Tonino PAL, De Bruyne B, Pijls NH, et al; FAME Study Investigators: Fractional flow reserve versus angiography for guiding percuta-neous coronary intervention. N Engl J Med. 2009;360(3):213–224. doi:10.1056/NEJMoa0807611
15. Xaplanteris P, Fournier S, Pijls NHJ, et al. Five-year outcomes with PCI guided by fractional flow reserve. N Engl J Med. 2018;379(3):250–259. doi:10.1056/nejmoa1803538
16. Pijls NHJ, van Schaardenburgh P, Manoharan G, et al. Percutaneous coronary intervention of functionally nonsignificant stenosis: 5-year follow-up of the DEFER study. J Am Coll Cardiol. 2007;49(21):2105–2111. doi:10.1016/j.jacc.2007.01.087
17. Engstrøm T, Kelbæk H, Helqvist S, et al. Complete revascularisa-tion versus treatment of the culprit lesion only in patients with ST-segment elevation myocardial infarction and multivessel disease (DANAMI-3 – PRIMULTI): An open-label, randomised controlled trial. Lancet. 2015;386(9994):665–671. doi:10.1016/S0140-6736(15)60648-1
18. Smits PC, Abdel-Wahab M, Neumann FJ, et al; Compare-Acute Inves-tigators. Fractional flow reserve-guided multivessel angioplas-ty in myocardial infarction. N Engl J Med. 2017;376(13):1234–1244. doi:10.1056/NEJMoa1701067
19. Zimmermann FM, Omerovic E, Fournier S, et al. Fractional flow reserve-guided percutaneous coronary intervention vs. medical therapy for patients with stable coronary lesions: Meta-analysis of individual patient data. Eur Heart J. 2019;40(2):180–186. doi:10.1093/eurheartj/ehy812
20. Völz S, Dworeck C, Redfors B, et al. Survival of patients with angina pectoris undergoing percutaneous coronary intervention with intra-coronary pressure wire guidance. J Am Coll Cardiol. 2020;75(22):2785–2799. doi:10.1016/j.jacc.2020.04.018
21. Schampaert E, Kumar G, Achenbach S, et al. A global registry of fraction-al flow reserve (FFR)-guided management during routine care: Study design, baseline characteristics and outcomes of invasive management. Catheter Cardiovasc Interv. 2020;96(4):E423–E431. doi:10.1002/ccd.28827
22. Tanaka N, Kohsaka S, Murata T, et al. Treatment strategy modifi-cation and its implication on the medical cost of fractional flow reserve-guided percutaneous coronary intervention in Japan. J Car-diol. 2019;73(1):38–44. doi:10.1016/j.jjcc.2018.05.018
23. Tanaka N, Nakamura M, Akasaka T, et al. One-year outcome of frac-tional flow reserve-based coronary intervention in Japanese daily practice: CVIT-DEFER registry. Circ J. 2017;81(9):1301–1306. doi:10.1253/circj.CJ-16-1213
24. Sabbah M, Nepper-Christensen L, Lønborg J, et al. Fractional flow reserve-guided PCI in patients with and without left ventricular hypertrophy: A DANAMI-3-PRIMULTI substudy. EuroIntervention. 2021;16(7):584–590. doi:10.4244/eij-d-19-00577
25. Piek JJ, Van De Hoef TP. Pre-angioplasty instantaneous wave-free ratio pullback and virtual revascularization: The pressure wire as a crys-tal ball. JACC Cardiovasc Interv. 2014;7(12):1397–1399. doi:10.1016/j.jcin.2014.07.010
26. Yong ASC, Daniels D, de Bruyne B, et al. Fractional flow reserve assess-ment of left main stenosis in the presence of downstream coro-nary stenoses. Circ Cardiovasc Interv. 2013;6(2):161–165. doi:10.1161/ CIRCINTERVENTIONS.112.000104
27. Stanojevic D, Gunasekaran P, Tadros P, et al. Intravenous adenosine infusion is safe and well-tolerated during coronary fractional flow reserve assessment in elderly patients with severe aortic stenosis. J Invasive Cardiol. 2016;28(9):357–361. PMID:27315577
28. Pesarini G, Scarsini R, Zivelonghi C, et al. Functional assessment of coronary artery disease in patients undergoing transcatheter aor-tic valve implantation: Influence of pressure overload on the eval-uation of lesions severity. Circ Cardiovasc Interv. 2016;9(11):1–10. doi:10.1161/CIRCINTERVENTIONS.116.004088
29. Johnson NP, Tóth GG, Lai D, et al. Prognostic value of fractional flow reserve: Linking physiologic severity to clinical outcomes. J Am Coll Cardiol. 2014;64(16):1641–1654. doi:10.1016/j.jacc.2014.07.973
30. Hennigan B, Berry C, Collison D, et al. Percutaneous coronary inter-vention versus medical therapy in patients with angina and grey-zone fractional flow reserve values: A randomised clinical trial. Heart. 2020;106(10):758–764. doi:10.1136/heartjnl-2019-316075
31. Kulecki K, Bech J, de Winter H, van Crombrugge P. Prior myocardial infarction. Circulation. 2001;104(2):157–162. doi:10.1161/01.cir.104.2.157
32. Zimmermann FM, Ferrara A, Johnson NP, et al. Deferral vs. perfor-mance of percutaneous coronary intervention of functionally non-significant coronary stenosis: 15-year follow-up of the DEFER trial. Eur Heart J. 2015;36(45):3182–3188. doi:10.1093/eurheartj/ehv452
33. Shiono Y, Kubo T, Tanaka A, et al. Long-term outcome after deferral of revascularization in patients with intermediate coronary steno-sis and gray-zone fractional flow reserve. Circ J. 2014;79(1):91–95. doi:10.1253/circj.CJ-14-0671
34. Du Y, Liu Y, Cai G, et al. Deferral versus performance of revascular-ization for coronary stenosis with grey zone fractional flow reserve values: A systematic review and meta-analysis. Angiology. 2020;71(1): 48–55. doi:10.1177/0003319719863174
35. Tonino PAL, Fearon WF, De Bruyne B, et al. Angiographic versus func-tional severity of coronary artery stenoses in the FAME study: Frac-tional flow reserve versus angiography in multivessel evaluation. J Am Coll Cardiol. 2010;55(25):2816–2821. doi:10.1016/j.jacc.2009.11.096
36. De Bruyne B, Pijls NHJ, Kalesan B, et al. Fractional flow reserve-guided PCI versus medical therapy in stable coronary disease. N Engl J Med. 2012;367(11):991–1001. doi:10.1056/nejmoa1205361
37. Adjedj J, De Bruyne B, Floré V, et al. Significance of intermediate val-ues of fractional flow reserve in patients with coronary artery dis-ease. Circulation. 2016;133(5):502–508. doi:10.1161/CIRCULATIONAHA. 115.018747
38. Du Y, Yang B, Zhang J, Liu W. Optimal revascularization threshold of fractional flow reserve and its effect on outcomes: Perspectives from a high-volume center in China. Angiology. 2019;70(5):423–430. doi:10.1177/0003319718806394
39. Kang DY, Ahn JM, Lee CH, et al. Deferred vs. performed revasculariza-tion for coronary stenosis with grey-zone fractional flow reserve val-ues: Data from the IRIS-FFR registry. Eur Heart J. 2018;39(18):1610–1619. doi:10.1093/eurheartj/ehy079

M. Błaziak et al. Fractional flow reserve-guided treatment1084
40. Kuramitsu S, Matsuo H, Shinozaki T, et al. Two-year outcomes after deferral of revascularization based on fractional flow reserve: The J-CONFIRM Registry. Circ Cardiovasc Interv. 2020;13(1):e008355. doi:10.1161/CIRCINTERVENTIONS.119.008355
41. Barbero U, D’Ascenzo F, Campo G, et al. Safety of FFR-guided revascu-larisation deferral in Anatomically prognostiC diseasE (FACE: CARDIO-GROUP V STUDY): A prospective multicentre study. Int J Cardiol. 2018;270(2017):107–112. doi:10.1016/j.ijcard.2018.06.013
42. Tebaldi M, Biscaglia S, Fineschi M, et al. Fractional flow reserve eval-uation and chronic kidney disease: Analysis from a multicenter Ital-ian registry (the FREAK Study). Catheter Cardiovasc Interv. 2016;88(4): 555–562. doi:10.1002/ccd.26364
43. Muller O, Mangiacapra F, Ntalianis A, et al. Long-term follow-up after fractional flow reserve-guided treatment strategy in patients with an isolated proximal left anterior descending coronary artery stenosis. JACC Cardiovasc Interv. 2011;4(11):1175–1182. doi:10.1016/j.jcin.2011.09.007
44. Bairey Merz CN, Shaw LJ, Reis SE, et al. Insights from the NHLBI-sponsored Women’s Ischemia Syndrome Evaluation (WISE) study. Part II: Gender differences in presentation, diagnosis, and outcome with regard to gender-based pathophysiology of atherosclerosis and macro vascular and microvascular cor. J Am Coll Cardiol. 2006; 47(3 Suppl):S21–S29. doi:10.1016/j.jacc.2004.12.084
45. Hoshino M, Hamaya R, Kanaji Y, et al. Sex differences in long-term outcomes in patients with deferred revascularization following frac-tional flow reserve assessment: International Collaboration Reg-istry of Comprehensive Physiologic Evaluation. J Am Heart Assoc. 2020;9(4):e014458. doi:10.1161/JAHA.119.014458
46. Solinas E, Nikolsky E, Lansky AJ, et al. Gender-specific outcomes after sirolimus-eluting stent implantation. J Am Coll Cardiol. 2007;50(22): 2111–2116. doi:10.1016/j.jacc.2007.06.056
47. Abbott JD, Vlachos HA, Selzer F, et al. Gender-based outcomes in per-cutaneous coronary intervention with drug-eluting stents (from the National Heart, Lung, and Blood Institute Dynamic Registry). Am J Cardiol. 2007;99(5):626–631. doi:10.1016/j.amjcard.2006.09.109
48. Kim HS, Tonino PAL, De Bruyne B, et al. The impact of sex differenc-es on fractional flow reserve-guided percutaneous coronary inter-vention: A FAME (Fractional Flow Reserve Versus Angiography for Multivessel Evaluation) substudy. JACC Cardiovasc Interv. 2012;5(10): 1037–1042. doi:10.1016/j.jcin.2012.06.016
49. Konst RE, Meeder JG, Wittekoek ME, et al. Ischaemia with no obstruc-tive coronary arteries. Neth Heart J. 2020;28(Suppl 1):66–72. doi:10. 1007/s12471-020-01451-9
50. Van Belle E, Cosenza A, Baptista SB, et al. Usefulness of routine frac-tional flow reserve for clinical management of coronary artery dis-ease in patients with diabetes. JAMA Cardiol. 2020;5(3):272–281. doi:10. 1001/jamacardio.2019.5097
51. Domínguez-Franco AJ, Jiménez-Navarro MF, Muñoz-García AJ, Alonso- Briales JH, Hernández-García JM, de Galván ET. Long-term prognosis in diabetic patients in whom revascularization is deferred following fractional flow reserve assessment. Rev Española Cardiol (English Ed). 2008;61(4):352–359. doi:10.1016/s1885-5857(08)60144-9
52. Gargiulo G, Stabile E, Ferrone M, et al. Diabetes does not impact the diagnostic performance of contrast-based fractional flow reserve: Insights from the CONTRAST study. Cardiovasc Diabetol. 2017;16(1):1–8. doi:10.1186/s12933-016-0494-2
Cite asSuvorov V, Filipchuk V, Mazevich V, Suvorov L. Simulation of pelvic osteotomies applied for DDH treatment in pediatric patients using piglet models. Adv Clin Exp Med. 2021;30(10):1085–1090. doi:10.17219/acem/140548
DOI10.17219/acem/140548
Copyright© 2021 by Wroclaw Medical University This is an article distributed under the terms of theCreative Commons Attribution 3.0 Unported (CC BY 3.0)(https://creativecommons.org/licenses/by/3.0/)
Address for correspondenceVasyl SuvorovE-mail: [email protected]
Funding sourcesNone declared
Conflict of interestNone declared
Received on May 5, 2021Reviewed on June 20, 2021Accepted on July 27, 2021
Published online on September 22, 2021
AbstractBackground. Developmental dysplasia of the hip (DDH) is a common hip joint pathology seen in the pediatric orthopedist’s practice. Pelvic osteotomies are the reliable surgical option for DDH treatment in walking patients, and 3 osteotomies (Salter, Dega and Pemberton) are widely used in patients under 6 years of age. Plastic changes in hinge points occur during iliac fragment movement, after the performed osteotomy. The loca-tions of these points are described in the literature, but some debate still exists about their true positions.
Objectives. To reveal hinge point locations during a simulation of pelvic osteotomies on biological models.
Materials and methods. Eighteen piglet pelvis complexes were obtained and separated according to their age. Pelvic osteotomies were simulated, and bone changes were assessed on computed tomography (CT) scans after the performed surgeries.
Results. No bone changes were found after Salter osteotomy in younger piglets, while contralateral pubic bone metaphyseal fractures were found in older animals. After Pemberton osteotomy, greenstick fractures in iliac and pubic bones metaphyses in the triradiate cartilage area were revealed in younger and older piglets. After Dega osteotomy, a posterior medial cortical layer fracture of the uncut iliac bone in the greater sciatic notch was found in all piglets. In older piglets, an additional hinge point was detected in the ipsilateral pubic bone metaphysis.
Conclusions. It was found that the age of the piglets has an impact on hinge point number and location, and this may be explained by an age-related decrease in pelvic bone and cartilage plasticity. The results of this study may help surgeons to decrease the number of preventable complications during pelvic osteotomies.
Key words: developmental dysplasia of the hip, pelvic osteotomy, hinge point, piglet model
Research letters
Simulation of pelvic osteotomies applied for DDH treatment in pediatric patients using piglet models
Vasyl Suvorov1,A–D, Viktor Filipchuk1,C,E,F, Vadym Mazevich2,B,C,E, Leonid Suvorov3,A–C
1 Department of Joint Diseases in Children and Adolescents, The Institute of Traumatology and Orthopedics of the NAMS Ukraine, Kyiv, Ukraine2 Department of Functional Diagnostics with Radiology Group, The Institute of Traumatology and Orthopedics of the NAMS Ukraine, Kyiv, Ukraine3 Surgical Department, Bolgrad Central District Hospital, Ukraine
A – research concept and design; B – collection and/or assembly of data; C – data analysis and interpretation; D – writing the article; E – critical revision of the article; F – final approval of the article
Advances in Clinical and Experimental Medicine, ISSN 1899–5276 (print), ISSN 2451–2680 (online) Adv Clin Exp Med. 2021;30(10):1085–1090

V. Suvorov et al. Pelvic osteotomies simulation – piglet models1086
Background
Developmental dysplasia of the hip (DDH) is one of the most common pathologies seen in the pediatric or-thopedist’s practice and the second most common after transient synovitis.1,2 Untreated DDH can cause hip sub-luxation and dislocation, hip instability, limp gait, walk-ing delay, leg shortening, pain, and the restriction of hip movement. It also leads to early-onset hip arthritis, and about 50% of patients under 50 need a hip replacement due to the presence of residual acetabular dysplasia.3 Therefore, the timely and effective treatment of DDH is important.
In younger patients, DDH is successfully managed with nonsurgical methods, including abduction braces, closed reduction and casting.4 In patients who have started walk-ing, surgical treatment is more effective.5 When com-paring different types of surgeries (isolated open reduc-tion, proximal femoral osteotomies, pelvic osteotomies, or single-stage surgery), the best results may be achieved after pelvic osteotomies or single-stage surgeries.6 Thus, the importance of pelvic osteotomies in terms of DDH surgical treatment is evident. Three pelvic osteotomies (Salter, Dega and Pemberton) are widely used for DDH treatment in pediatric patients under 6 years of age, and these surgeries allow for further development of the ac-etabulum. These procedures can be divided into complete (Salter) and incomplete (Dega and Pemberton) osteoto-mies of the iliac bone.7
Acetabular deformity correction during pelvic osteoto-mies occurs due to the acetabular reorientation after iliac bone fragment movement. Plastic changes in the hinge points take place during iliac fragment movement. The lo-cations of hinge points are described in literature and include the symphysis pubis cartilage during Salter os-teotomy, a posterior-medial cortical layer of the uncut iliac bone in the greater sciatic notch region during Dega osteotomy, and the triradiate cartilage during Pemberton osteotomy.8–11 The location of the hinge points reflects bio-mechanical changes that occur during pelvic osteotomy. Thus, it is important for a surgeon to know the true hinge point locations in terms of the surgical technique, preoper-ative planning and prevention of complications. However, there are no biomechanical or clinical studies to confirm the true hinge point locations during the abovementioned pelvic osteotomies.
Moreover, there is some debate about hinge point lo-cations. Regarding the Salter pelvic osteotomy, the sym-physis pubis cartilage has been suggested as a hinge poin. However, later studies have revealed that greenstick fractures take place in the long bone metaphysis during the loading of a shaft epiphysis connection.12 If pelvic bones are treated as long bones with areas of primary and secondary ossification,13 the pubis bone metaphyses are more likely the hinge points. The Dega osteotomy is also a subject for discussion in terms of the number and lo-cation of hinge points. While it has been suggested that
the posterior medial cortical layer of the uncut iliac bone in the greater sciatic notch is a hinge point, others have de-scribed the presence of additional hinge points.8 Regarding the Pemberton osteotomy, the hinge point is considered to be located inside the triradiate cartilage, but the tri-radiate cartilage has 3 limbs and there is no clarification as to which limb is overloaded.9–11
As an independent factor, the patient’s age may have an impact on hinge point numbers and locations. Hypo-thetically, younger patients may have a lower density of pel-vic bones and cartilages, and greater plasticity of these tissues. This may lead to different biomechanical changes during pelvis osteotomies, and to different outcomes in younger and older patients (as described earlier).14
The true hinge point locations during pelvic osteotomies may be evaluated with different types of pelvic models.15–17 Among animals, the ideal non-rodent candidate for medical experiments is the pig.18 In this study, piglet models were used. The advantages of the piglet models for pelvic oste-otomy simulation are the similarity to human anatomy and physiology, and the relatively large size of the pelvic organs.19
Objectives
The aim of this study was to assess the true hinge point locations during 3 pelvic osteotomies applied in pediat-ric patients for DDH treatment, and to reveal the impact of the patient’s age on hinge point number and location.
Materials and methods
The evaluation of the hinge point locations during dif-ferent pelvic osteotomies was performed using piglet pelvic complex models. The permission of the institutional ethics committee was obtained for pelvic complex model analysis and surgical simulation using these models (approval No. 2 of April 5, 2021). All piglets died from natural causes, no interventions were performed on live animals, and they were not slaughtered for the sake of this experiment.
The pelvic complexes consisted of pelvic bones, lumbar vertebrae, hip joints, proximal parts of the femoral bones, and surrounding soft tissues. All pelvic complexes were free of trauma or other injuries to the pelvis girdles or hip joints. All piglets included in this study were Landrace breeds. After death, the pelvic complexes were extracted for further examination.
The correlation between children’s and piglets’ chron-ological ages was calculated according to data available in the literature. It is known that sexual maturity in pigs occurs at 5–6 months,20 the closure of growth plates oc-curs at 20 months, and the age of 3–4 months in pigs is equivalent to 6–7 years of age in humans.21 For these reasons, the piglets chosen for this study were younger than 3 months (which is equivalent to a six-year-old human

Adv Clin Exp Med. 2021;30(10):1085–1090 1087
– the period of the most active acetabular development when the abovementioned pelvic osteotomies are widely used).22 We selected 18 pelvic complexes for further in-vestigation, with 6 complexes intended for each pelvic os-teotomy procedure (Salter, Dega and Pemberton). Among the 6 pelvic complexes utilized in each procedure, 3 com-plexes were obtained from piglets younger than 1 month and 3 from 2–2.5-month-old piglets. This was done to sim-ulate surgeries in younger and older patients.
The pelvic complexes were frozen at –20°C from the mo-ment of obtaining until the day before the surgery. On that day, the pelvic complexes were slowly thawed at room tem-perature. It is known that 1 freeze-thaw cycle does not affect the biological and plastic properties of bones and cartilages,23–26 so the surgery simulation on thawed pelvic complexes was similar to those performed on live piglets. The Salter, Dega and Pemberton pelvic osteotomies were performed on these complexes, according to the original descriptions of these surgeries.8,26,27
Bone changes after the performed osteotomies were assessed using computed tomography (CT) scans (per-formed with a Philips Brilliance 16 CT scanner (Philips, Amsterdam, the Netherlands)). For better visualization, the slice thickness was set at 0.5 mm for younger pig-lets (up to 1 month of age) and 0.8 mm for older animals (2–2.5-month-old). The assessment of bone changes was
performed taking into account the concept of metaphyseal lesions during shaft epiphysis load application, according to the theory presented by Thompson et al.12 It is known that all pelvic bones during their development have pri-mary and secondary ossification centers and cartilages between them, which are equated to the metaphyses and epiphyses in long bones.13
Medixant RadiAnt DICOM Viewer software, v. 2020.1 (https://www.radiantviewer.com, accessed March 9, 2020) was used to evaluate the CT scans. The localization of bone changes was determined based on the consensus of the authors.
Results
After the performed pelvic osteotomies and the analysis of bone changes, several changes were detected on CT scans, according to the piglet’s age and performed surgery (Table 1).
No bone changes were found after Salter pelvic oste-otomy in three-week-old piglets. However, there was a me-taphyseal contralateral pubic bone fracture in the sym-physis pubis region in piglets aged 4 weeks and older (Fig. 1). Extrapolating these data to humans, we can assume that the hinge point in younger patients will be located
Table 1. Bone changes after performed pelvic osteotomies according to the piglet’s age and performed surgery
No. Piglet’s age Pelvic osteotomy Bone changes
1 3 weeks Salter none
2 3 weeks Salter none
3 4 weeks Salter contralateral pubic bone metaphysis in the symphysis pubis region
4 2 months Salter contralateral pubic bone metaphysis in the symphysis pubis region
5 2 months Salter contralateral pubic bone metaphysis in the symphysis pubis region
6 2.5 months Salter contralateral pubic bone metaphysis in the symphysis pubis region
7 3 weeks Pemberton1) uncut iliac bone metaphysis in the triradiate cartilage region (between iliac and pubic bones)
2) medial cortical layer of the uncut iliac bone
8 3 weeks Pemberton1) uncut iliac bone metaphysis in the triradiate cartilage region (between iliac and pubic bones)
2) pubic bone metaphysis in triradiate cartilage region
9 3 weeks Pemberton uncut iliac bone metaphysis in the triradiate cartilage region (between iliac and pubic bones)
10 2 months Pemberton1) uncut iliac bone metaphysis in the triradiate cartilage region (between iliac and pubic bones)
2) pubic bone metaphysis in triradiate cartilage region
11 2 months Pemberton pubic bone metaphysis in triradiate cartilage region
12 2 months Pemberton1) uncut iliac bone metaphysis in the triradiate cartilage region (between iliac and pubic bones)
2) pubic bone metaphysis in triradiate cartilage region
13 3 weeks Dega posterior medial cortical layer of the uncut iliac bone in the greater sciatic notch region
14 3 weeks Dega posterior medial cortical layer of the uncut iliac bone in the greater sciatic notch region
15 4 weeks Dega posterior medial cortical layer of the uncut iliac bone in the greater sciatic notch region
16 2 months Dega posterior medial cortical layer of the uncut iliac bone in the greater sciatic notch region
17 2 months Dega1) posterior medial cortical layer of the uncut iliac bone in the greater sciatic notch region
2) ipsilateral pubic bone metaphysis in the symphysis pubis region
18 2 months Dega1) posterior medial cortical layer of the uncut iliac bone in the greater sciatic notch region
2) ipsilateral pubic bone metaphysis in the symphysis pubis region

V. Suvorov et al. Pelvic osteotomies simulation – piglet models1088
in the symphysis pubis cartilage, which is considered to be the “classic” hinge point described earlier. However, in older patients, this hinge point is likely to be located in the contralateral pubic bone metaphysis. This may be explained by the decrease in cartilage tissue amount in the pelvis and by the increase of pelvic bone and carti-lage density with the patient’s age (which leads to transfer-ring the load from the cartilaginous part of the symphysis pubis to the contralateral pubic bone metaphysis).
After Pemberton osteotomy, a greenstick metaphyseal fracture of an uncut iliac bone in the triradiate cartilage
region (between iliac and pubic bones) was detected in all three-week-old piglets. In 1 piglet, a greenstick fracture was found in the medial cortical layer of the uncut iliac bone. In another piglet, a pubic bone metaphyseal frac-ture was found in the triradiate cartilage region (be-tween the iliac and pubic bones). In two-month-old piglet models, a greenstick metaphyseal fracture of an uncut iliac bone was detected in the triradiate cartilage region (between iliac and pubic bones) and, in 2 piglet mod-els, a pubic bone metaphyseal fracture in the triradiate cartilage area (between the iliac and pubic bones) was found (Fig. 2).
A fracture in the posterior medial cortical layer of the un-cut iliac bone in the greater sciatic notch region was found in all piglets after the Dega osteotomy. In 2 two-month-old piglets, there was an ipsilateral pubic bone metaphyseal fracture (Fig. 3). The presence of an additional hinge point in elderly patients may be explained by an age-related in-crease in pelvic bone and cartilage density, which requires an additional hinge point for acetabular deformity correc-tion during iliac fragment movement.
Discussion
DDH is the second most common hip disorder in chil-dren, after transient synovitis. Nonsurgical treatment of DDH is effective in non-walking patients, but in older individuals (those who have started walking), surgical treatment is preferable. Among all of the methods for sur-gical treatment, pelvic osteotomies are considered to be the best choice. There are 3 widely used pelvic osteotomies for DDH treatment in patients under 6 years of age – Salter, Dega and Pemberton (which involve complete or incom-plete cutting of the iliac bone). Acetabular deformity cor-rection occurs due to acetabular reorientation after iliac fragment movement, and plastic changes in hinge points are observed during these changes. The hypothetical loca-tions of these points have been described in the literature,
Fig. 2. Bone changes after Pemberton osteotomy. Bone changes in three-week-old piglets. A. Fracture in the uncut iliac bone medial cortical layer; B. Fracture of the iliac bone uncut part in the triradiate cartilage region; C. Pubic bone metaphyseal fracture in the triradiate cartilage region. Bone changes in two-month-old piglets; D. Fracture of the iliac bone uncut part in the triradiate cartilage region; E. Pubic bone metaphyseal fracture in the triradiate cartilage region
Fig. 1. Bone changes after Salter osteotomy. Сontralateral pubic bone metaphyseal fracture in four-week (A) and two-month (B) old piglets

Adv Clin Exp Med. 2021;30(10):1085–1090 1089
but are still debated.8–9,12 It is essential to know the true hinge point locations for surgeons to be able to improve preoperative planning and avoid complications.
In this study, it was found that Salter pelvic osteotomy did not lead to any bone changes in younger piglets, but, in older animals, the contralateral pubic bone metaphyseal fractures were found. This confirms the Thompson’s et al. hypothesis regarding metaphyseal changes during load application at the epiphysis–diaphysis border.12 However, in older individuals, the hinge point will likely be located in the contralateral pubic bone metaphysis, in the symphy-sis pubis region. This finding has not been described pre-viously and it puts the conventional location of the hinge point into question. Also, due to the location of the hinge point in the contralateral hemipelvis, simultaneous bilat-eral application of this technique, or in combination with other pelvic osteotomies, is impossible in older patients due to the presence of pelvic ring violation, contradictory to previous data.28–30
After the Pemberton osteotomy, a greenstick metaphy-seal fracture of an uncut iliac bone in the triradiate car-tilage region was found in all pelvic models. The fact that the Pemberton osteotomy leads to a pubic bone metaphy-seal fracture in the triradiate cartilage region indicates an overload of the triradiate cartilage limb between the il-iac and pubic bones, which was not described previously. Also, this observation indicates possible triradiate cartilage damage during this surgical technique, and this damage may lead to further acetabular development disturbance, as described by others.31,32 Therefore, the Pemberton pelvic osteotomy should be used with caution, especially in pa-tients under 6 years of age (during the period of active acetabular development).22
The hinge point location after Dega osteotomy was found in the posterior medial cortical layer of the uncut iliac bone in the greater sciatic notch region. This confirms the conventional concept described by the author of this
technique. Thus, the acetabular deformity should be care-fully corrected during this technique to avoid unnecessary fracture of the intact part of the iliac bone. In older piglets, an additional hinge point was found in the ipsilateral pubic bone metaphysis in the symphysis pubis region, which confirms the data of Czubak et al. regarding the presence of 2 hinge points in this technique.8 This observation in-dicates that simultaneous bilateral Dega osteotomy, or the combination of this procedure with other pelvic osteoto-mies is impossible in older patients, due to the presence of pelvic ring violation.
Limitations
For surgery simulation and bone changes assessment, piglet pelvic complexes were used instead of human ones. Thus, the postsurgical results may not be the same as in humans. In addition, the bone changes in this study were assessed using healthy pelvis models rather than ones with DDH. No cartilage changes were assessed after the simulated surgeries. Therefore, the conclusions about triradiate cartilage overload were drawn indirectly. Also, a small number of pelvises was included in this investiga-tion and future studies should be planned with a larger number of cases.
Conclusions
The surgeon must know the true hinge point locations and their number during different pelvic osteotomies ap-plied for DDH treatment in pediatric patients. The cur-rent data indicate that the patient’s age may have an im-pact on hinge point locations and number. The results of the current work may help pediatric surgeons to im-prove surgical planning and avoid some preventable complications.
Fig. 3. Bone changes after Dega osteotomy. Fracture in the posterior medial cortical layer of the uncut iliac bone in the greater sciatic notch in three-week (A) and two-month old (B,C) piglets; B. Ipsilateral pubic bone metaphyseal fracture in a two-month-old piglet

V. Suvorov et al. Pelvic osteotomies simulation – piglet models1090
ORCID iDsVasyl Suvorov https://orcid.org/0000-0002-0862-7997Viktor Filipchuk https://orcid.org/0000-0002-9727-9532Vadym Mazevich https://orcid.org/0000-0002-3617-5043Leonid Suvorov https://orcid.org/0000-0002-8744-1751
References1. Storer SK, Skaggs DL. Developmental dysplasia of the hip. Am Fam
Physician. 2006;74(8):1310–1316. PMID:170874242. Neville DNW, Zuckerbraun N. Pediatric nontraumatic hip pathology.
Clin Pediatr Emerg Med. 2016;17(1):13–28. doi:10.1016/j.cpem.2016.01.0053. Clohisy JC, Dobson MA, Robison JF, et al. Radiographic structural
abnormalities associated with premature, natural hip-joint failure. J Bone Joint Surg Am. 2011;93(Suppl 2):3–9. doi:10.2106/JBJS.J.01734
4. Cooper AP, Doddabasappa SN, Mulpuri K. Evidence-based manage-ment of developmental dysplasia of the hip. Orthop Clin North Am. 2014;45(3):341–354. doi:10.1016/j.ocl.2014.03.005
5. Chen Q, Deng Y, Fang B. Outcome of one-stage surgical treatment of developmental dysplasia of the hip in children from 1.5 to 6 years old: A retrospective study. Acta Orthop Belg. 2015;81(3):375–383. PMID: 26435230
6. Kothari A, Grammatopoulos G, Hopewell S, Theologis T. How does bony surgery affect results of anterior open reduction in walking-age children with developmental hip dysplasia? Clin Orthop Relat Res. 2016;474(5):1199–1208. doi:10.1007/s11999-015-4598-x
7. Sales de Gauzy J. Pelvic reorientation osteotomies and acetabulo-plasties in children: Surgical technique. Orthop Traumatol Surg Res. 2010;96(7):793–799. doi:10.1016/j.otsr.2010.07.004
8. Czubak J, Kowalik K, Kawalec A, Kwiatkowska M. Dega pelvic osteoto-my: Indications, results and complications. J Child Orthop. 2018;12(4): 342–348. doi:10.1302/1863-2548.12.180091
9. Ezirmik N, Yildiz K. A biomechanical comparison between Salter innominate osteotomy and Pemberton pericapsular osteotomy. Eurasian J Med. 2012;44(1):40–42. doi:10.5152/eajm.2012.08
10. Ertürk C, Altay MA, Işikan UE. A radiological comparison of Salter and Pemberton osteotomies to improve acetabular deformations in developmental dysplasia of the hip. J Pediatr Orthop B. 2013;22(6): 527–532. doi:10.1097/BPB.0b013e32836337cd
11. Chunho C, Wang TM, Kuo KN. Pelvic osteotomies for developmental dysplasia of the hip. In: Spasovski D, ed. Developmental Diseases of the hip. IntechOpen; 2017. https://www.intechopen.com/chapters/ 54481. Accessed August 5, 2021.
12. Thompson A, Bertocci G, Kaczor K, Smalley C, Pierce MC. Biomechan-ical investigation of the classic metaphyseal lesion using an imma-ture porcine model. AJR Am J Roentgenol. 2015;204(5):W503–W509. doi:10.2214/AJR.14.13267
13. Verbruggen SW, Nowlan NC. Ontogeny of the human pelvis. Anat Rec (Hoboken). 2017;300(4):643–652. doi:10.1002/ar.23541
14. El-Sayed M, Ahmed T, Fathy S, Zyton H. The effect of Dega acetabu-loplasty and Salter innominate osteotomy on acetabular remodeling monitored by the acetabular index in walking DDH patients between 2 and 6 years of age: Short- to middle-term follow-up. J Child Orthop. 2012;6(6):471–477. doi:10.1007/s11832-012-0451-x
15. Ike H, Inaba Y, Kobayashi N, et al. Effects of rotational acetabular osteotomy on the mechanical stress within the hip joint in patients with developmental dysplasia of the hip: A subject-specific finite ele-ment analysis. Bone Joint J. 2015;97-B(4):492–497. doi:10.1302/0301-620X.97B4.33736
16. Yassir W, Mahar A, Aminian A, Newton P, Wenger D. A comparison of the fixation stability of multiple screw constructs for two types of pelvic osteotomies. J Pediatr Orthop. 2005;25(1):14–17. doi:10.1097/ 00004694-200501000-00005
17. Fukushima K, Takahira N, Uchiyama K, Moriya M, Takaso M. Pre-oper-ative simulation of periacetabular osteotomy via a three-dimen-sional model constructed from salt. SICOT J. 2017;3:14. doi:10.1051/sicotj/2016051
18. Bassols A, Costa C, Eckersall PD, Osada J, Sabrià J, Tibau J. The pig as an animal model for human pathologies: A proteomics perspective. Proteomics Clin Appl. 2014;8(9–10):715–731. doi:10.1002/prca.201300099
19. Marchant-Forde JN, Herskin MS. Pigs as laboratory animals. In: Špinka, Camerlink I, eds. Advances in Pig Welfare. Cambridge, UK: Woodhead Publishing; 2018:445–475. doi:10.1016/b978-0-08-101012-9.00015-0
20. Reiland S. Growth and skeletal development of the pig. Acta Radiol Suppl. 1978;358:15–22. PMID:233594
21. Tohyama S, Kobayashi E. Age-appropriateness of porcine models used for cell transplantation. Cell Transplant. 2019;28(2):224–228. doi:10.1177/0963689718817477
22. Novais EN, Pan Z, Autruong PT, Meyers ML, Chang FM. Normal per-centile reference curves and correlation of acetabular index and ace-tabular depth ratio in children. J Pediatr Orthop. 2018;38(3):163–169. doi:10.1097/BPO.0000000000000791
23. Shaw JM, Hunter SA, Gayton JC, Boivin GP, Prayson MJ. Repeated freeze-thaw cycles do not alter the biomechanical properties of fib-ular allograft bone. Clin Orthop Relat Res. 2012;470(3):937–943. doi:10. 1007/s11999-011-2033-5
24. Changoor A, Fereydoonzad L, Yaroshinsky A, Buschmann MD. Effects of refrigeration and freezing on the electromechanical and biomechani-cal properties of articular cartilage. J Biomech Eng. 2010;132(6):064502. Erratum in: J Biomech Eng. 2011;133(4):047001. doi:10.1115/1.4000991
25. Szarko M, Muldrew K, Bertram JE. Freeze-thaw treatment effects on the dynamic mechanical properties of articular cartilage. BMC Musculo skelet Disord. 2010;11:231. doi:10.1186/1471-2474-11-231
26. Shannon CE, Kelley SP. The Salter innominate osteotomy. In: Hamdy RC, Saran N, eds. Pediatric Pelvic and Proximal Femoral Osteotomies. New York, USA: Springer International Publishing; 2018:29–35. doi:10. 1007/978-3-319-78033-7_3
27. Kuo KN, Wang TM. Pemberton osteotomy (anterolateral acetabulo-plasty). In: Hamdy RC, Saran N, eds. Pediatric Pelvic and Proximal Fem-oral Osteotomies. New York, USA: Springer International Publishing; 2018:111–119. doi:10.1007/978-3-319-78033-7_12
28. Agus H, Bozoglan M, Kalenderer Ö, Kazımoğlu C, Onvural B, Akan İ. How are outcomes affected by performing a one-stage combined procedure simultaneously in bilateral developmental hip dysplasia? Int Orthop. 2014;38(6):1219–1224. doi:10.1007/s00264-014-2330-1
29. Ezirmik N, Yildiz K. Advantages of single-stage surgical treatment with salter innominate osteotomy and Pemberton pericapsular oste-otomy for developmental dysplasia of both hips. J Int Med Res. 2012; 40(2):748–755. doi:10.1177/147323001204000240
30. Li L, Yang X, Song B, Jiang J, Yang L, Tang X. Biomechanical investi-gation of pelvic stability in developmental dysplasia of the hip: Uni-lateral salter osteotomy versus one-stage bilateral salter osteotomy. J Orthop Surg Res. 2020;15(1):169. doi:10.1186/s13018-020-01683-w
31. Plaster RL, Schoenecker PL, Capelli AM. Premature closure of the tri-radiate cartilage: A potential complication of pericapsular acetabulo-plasty. J Pediatr Orthop. 1991;11(5):676–678. PMID:1918360
32. Leet AI, Mackenzie WG, Szoke G, Harcke HT. Injury to the growth plate after Pemberton osteotomy. J Bone Joint Surg Am. 1999;81(2):169–176. doi:10.2106/00004623-199902000-00004

Cite asDalbaşı E, Akgül Ö. The effectiveness of methotrexate and low-dose steroid therapy in the treatment of idiopathic granulomatous mastitis. Adv Clin Exp Med. 2021;30(10):1091–1097. doi:10.17219/acem/140842
DOI10.17219/acem/140842
Copyright© 2021 by Wroclaw Medical University This is an article distributed under the terms of theCreative Commons Attribution 3.0 Unported (CC BY 3.0)(https://creativecommons.org/licenses/by/3.0/)
Address for correspondenceErkan DalbaşıE-mail: [email protected]
Funding sourcesNone declared
Conflict of interestNone declared
Received on April 15, 2021Reviewed on July 26, 2021Accepted on August 4, 2021
Published online on September 9, 2021
AbstractBackground. Idiopathic granulomatous mastitis (IGM) is a rare, chronic, benign, inflammatory breast disease of unknown cause. Patients usually present with a single breast mass, hyperemia, discharge, skin disorders, and fever. Radiological and clinical findings can mimic carcinoma and infection.
Objectives. To examine the treatment of IGM with methotrexate (MTX) + low-dose steroid, and present the results and follow-up data from our center.
Materials and methods. Sixty-two patients, diagnosed with IGM in our center between January 2009 and December 2017 were included in this study. Patients diagnosed with granulomatous mastitis histopathologi-cally underwent testing with anamnesis, physical examination and imaging methods to exclude other diseases that cause granulomatous reactions. Patients with a history of malignancy, chronic infectious diseases such as hepatitis B and pregnant women were excluded from this study. Data collected from 62 patients were reviewed retrospectively for this study.
Results. The mean patient age was 36.58 ±5.83 years (range: 28–54 years). Lesions were present in the right breast in 30 (48.38%) patients, the left breast in 26 (41.94%) patients and both breasts in 6 (9.68%) patients. Methotrexate was administered orally at a dose of 15 mg/week and methylprednisolone at a dose of 8 mg/day. The mean clinical and radiological remission periods of these patients were 10.14 ±1.21 months (range: 3–14 months). All patients attended regular follow-up appointments. The recovery rate of patients during follow-up was determined to be 93.71%.
Conclusions. Methotrexate + low-dose steroid therapy is successful in the treatment of IGM. Prospective, large case series and/or multi-center studies are needed to develop an IGM treatment algorithm.
Key words: autoimmune disease, methotrexate, low-dose steroid, granulomatous mastitis
Research letters
The effectiveness of methotrexate and low-dose steroid therapy in the treatment of idiopathic granulomatous mastitis
Erkan Dalbaşı1,A–F, Ömer Lütfi Akgül2,A–F
1 Memorial Hospital, Department of General Surgery, Diyarbakır, Turkey2 Genesis Hospital, Department of General Surgery, Diyarbakır, Turkey
A – research concept and design; B – collection and/or assembly of data; C – data analysis and interpretation; D – writing the article; E – critical revision of the article; F – final approval of the article
Advances in Clinical and Experimental Medicine, ISSN 1899–5276 (print), ISSN 2451–2680 (online) Adv Clin Exp Med. 2021;30(10):1091–1097

E. Dalbaşı, Ö. Akgül, Idiopathic granulomatous mastitis1092
Background
Idiopathic granulomatous mastitis (IGM) is a rare, chronic, benign, inflammatory breast disease of unknown cause.1 It is an idiopathic mastitis that mostly affects young and middle-aged women. Although there is no clear in-formation about its incidence, there are publications stat-ing it to be around 0.37%. Its prevalence is approx. 2.4 per 100,000.2 Patients usually present with a single breast mass, hyperemia, discharge, skin disorders, and fever. Radiologi-cal and clinical findings can mimic carcinoma and infec-tion.3 A definitive diagnosis is made with histopathologic examination. Fine needle aspiration, tru-cut biopsy, or in-cisional or excisional biopsies can be performed for tissue evaluation. Although chronic inflammation, microabscess and fat necrosis can be seen in tissue biopsies, the presence of non-caseous epithelioid and multinucleated giant cell granulomas within the breast lobules are histopathological findings for IGM.4 Even though the pathogenesis of IGM is not known, it is thought to be an autoimmune response to extravasated secretions from the lobules.5 The coexis-tence of other autoimmune diseases such as erythema nodo-sum and arthritis in IGM patients, and their responsiveness to immunosuppressive drugs support this view.6,7 Systemic diseases that cause granulomatous lesions such as myco-bacteria, fungal infections, sarcoidosis, Wegener granu-lomatous, and polyarteritis nodosa should be excluded.8 Currently, there are no established treatment algorithms for IGM. Treatment options include antibiotics, immuno-suppressive agents, glucocorticoids, and surgical procedures used alone or in combination.9
Objectives
Methotrexate (MTX) reversibly inhibits dihydrofolate reductase, preventing the conversion of folic acid to tetra-hydrofolic acid. The inhibition of tetrahydrofolate results in the cessation of adenine-guanine synthesis and sup-presses cell proliferation through the inhibition of protein synthesis.10 Methotrexate treatment remission rates are around 60–90% and recurrence rates are lower than those of surgical and steroid therapy.11 This study aims to examine the treatment results of MTX + low-dose steroid and follow-up data in patients diagnosed with IGM in General Surgery Department of Memorial Hospital (Diyarbakır, Turkey).
Materials and methods
Patient follow-up
Sixty-two female patients diagnosed with IGM in our center between January 2009 and December 2017 were included in the study. The mean age of participants was 36.58 ±5.83 years (range: 28–54 years). Patients diagnosed
with granulomatous mastitis histopathologically under-went testing with anamnesis, physical examination and imaging methods to exclude other diseases that cause gran-ulomatous reactions. Patients with a history of malignancy, chronic infectious diseases such as hepatitis B and pregnant women were excluded from the study. Data collected from 62 patients were reviewed retrospectively for this study. The study protocol was approved by the ethics committees at Memorial Hospital (Diyarbakır, Turkey) in agreement with the Declaration of Helsinki of 1975. All participants provided voluntary informed consent prior to the initiation of the study. The demographic data of the patients, presence of comorbidities, symptoms on hospital admission, labora-tory tests, radiological imaging, microbiological culture results, MTX and methylprednisolone doses and durations, surgical history, and the presence of recurrence were re-corded. The possibility of malignancy was excluded using radiological and pathological examination. Tru-cut biopsy was performed for pathological examination and abscesses present in patients were aspirated, and the contents were
Fig. 1. Hematoxylin and eosin (H&E) staining of idiopathic granulomatous mastitis (IGM)
Fig. 2. CD68 immunohistochemical staining of idiopathic granulomatous mastitis (IGM)

Adv Clin Exp Med. 2021;30(10):1091–1097 1093
sent for microbiological culture. The CD68 was used for immunostaining. A microscopic image of IGM with he-matoxylin and eosin (H&E) staining is shown in Fig. 1 and CD68 immunostaining in Fig. 2. Cultures were performed to rule out bacterial infections, tuberculosis and fungal infections. Symptoms before and after the treatment as well as laboratory results were compared. Radiological imaging with bilateral breast axillary ultrasonography (USG) and breast magnetic resonance imaging (MRI) were performed in all patients. An MRI image of IGM is shown in Fig. 3. Patients’ responses to treatment were evaluated using USG.
After the diagnosis of IGM, oral treatment with 8 mg/day of methylprednisolone and 15 mg/week of MTX started.
Subcutaneous MTX treatment was started in patients who could not tolerate or did not respond to oral MTX and the dose was increased to 25 mg/week. Calcium, vitamin D, folic acid, and a proton pump inhibitor were admin-istered to protect against the side effects of steroids and MTX. The patients were followed up every 3 weeks with systemic examination, complete blood count, and liver and kidney function tests. The treatment period of patients after remission was planned as 24 months.
Erythrocyte sedimentation rate (ESR), C-reactive protein (CRP) and white blood cell (WBC) count were measured before starting treatment. In addition, clinical findings such as mass size and pain severity were compared before and after the remission.
In our study, remission was defined as the regression of inflammatory changes in the breast, closure of fistulas, healing of existing skin lesions, and regression of USG findings. Recurrence of symptoms during or after treat-ment was deemed to be a relapse. Photographs of a pa-tient’s breasts at the time of diagnosis (Fig. 4) and after the treatment (Fig. 5) are shown.
Fig. 5. Healed skin fistula of idiopathic granulomatous mastitis (IGM)Fig. 4. First application image of idiopathic granulomatous mastitis (IGM)
Fig. 3. Magnetic resonance image (MRI) of idiopathic granulomatous mastitis (IGM)

E. Dalbaşı, Ö. Akgül, Idiopathic granulomatous mastitis1094
Immunohistochemical staining
Heat-induced antigen retrieval was performed using a microwave oven (700 W’; Bosch, Gerlingen, Germany) for 3 min at 90°C. The heating process was performed with a citrate buffer (pH 6) solution for proteolysis. Sections were washed in phosphate-buffered saline (PBS) (3 × 5 min) and incubated with hydrogen peroxide (K-40677109; Merck, Darmstadt, Germany) for 15 min. Other sections were washed in PBS (3 × 5 min) and blocked with Ultra V Block (lot # PHL150128; Thermo Fisher Scientific, Waltham, USA) for 8 min. After draining, CD68 Monoclonal Antibod-ies (KP1), (cat # MA5-13324, 1:100–1:200; Thermo Fisher Scientific) were applied directly to the sections, which were then incubated, left overnight at 4°C, then washed in PBS (3 × 5 min) and incubated with Biotinylated Secondary Antibody (lot # PHL150128; Thermo Fisher Scientific) for 20 min. After washing with PBS, Streptavidin Peroxidase (lot # PHL150128; Thermo Fisher Scientific) was applied to the sections for 15 min. The sections were again washed in PBS (3 × 5 min) and DAB (lot # HD36221, Thermo Fisher Scientific) was applied to the sections for up to 10 min. The sections were counterstained in Harris’s Hematoxylin for 45 s. Then, they were dehydrated in a graded series of alcohols and cleared in xylene. Slides were mounted with Entellan and examined under a light microscope (Carl Zeiss AG, Jena, Germany).
Statistical analyses
Statistical analyses were performed using the IBM SPSS v. 22.0 (IBM Corp., Armonk, USA) software. Results are presented as mean ±standard deviation. Statistical dif-ferences before and after treatment were evaluated using a paired t-test. A χ2 test was used to ensure homogeneity of variances in the group. A value of p < 0.05 was consid-ered significant.
Results
During follow-up of patients, chest radiographs and liver and kidney function tests were normal. Growth occurred in microbiological cultures in 23 (37.09%) patients. Staphy-lococcus aureus was identified in 9 patients, Streptococcus in 7 patients, and Corynebacterium in 7 patients. Despite the appropriate antibiotic therapy for 10 days, based on cul-ture antibiogram results, the patient’s symptoms did not regress.
Histopathological findings
The diagnosis of IGM was confirmed with histopathol-ogy. In histopathological examination, epithelioid his-tiocytes, giant cells, fibroblasts, and reactive ductal cells were detected with standard H&E staining. Nucleolus
prominence, cell nucleus growth and hyperchromasia seen in epithelioid cells can suggest malignancy. In ad-dition, the cohesive nature of the cells can be confused with other proliferative lesions. Therefore, the diagnosis was supported by the presence of immunopositive stain-ing of epithelioid cells, Langerhans-type giant cells, and histiocytic cells with CD68 markers.
Clinical findings
Lesions were present in the right breast in 30 (48.38%) patients, in the left breast in 26 (41.94%) patients and in both breasts in 6 (9.68%) patients. Lesions were located in the up-per quadrants in 38 (61.29%) patients while 21 (33.87%) patients had lesions in the lower quadrants. Widespread in-volvement was present in 3 (4.83%) patients. The difference in terms of right and left breast involvement was statistically significant (p < 0.001). All patients experienced pain, breast mass and hyperemia in the affected area. Erythema nodo-sum and arthralgia were associated with IGM in 7 (11.29%) and 4 (6.45%) patients, respectively. No patients had a diag-nosis of concomitant chronic disease. Axillary lymphade-nopathy was seen in 26 (41.93%) patients. Post-treatment lymphadenopathy was seen in 4 (6.45%) patients. Fistulas and purulent discharges were observed in 15 (24.19%) pa-tients, and ulceration of the breast skin in 9 (14.51%). After treatment, all fistulas and ulcers healed. Five (8.06%) pa-tients developed nipple collapse prior to treatment. After the treatment, the nipple remained collapsed despite disease recovery in 1 (1.61%) of these patients. Three (4.83%) patients were nulliparous. None of the patients were pregnant or lac-tating at the time of diagnosis. Twenty (32.25%) patients were using oral contraceptives. The body mass index (BMI) of 38 (61.29%) patients was over 30 kg/cm2. Thirty-one (50%) patients were active smokers. The demographic information and clinical findings are summarized in Table 1.
Methotrexate was administered orally at a dose of 15 mg/week and methylprednisolone at 8 mg/day. In 5 (8.06%)
Table 1. Demographic and clinical characteristics
Variable Value
Age [years] 36.58 ±5.83
Mass location, n (%) right breastleft breastbilateral
30 (48.38)26 (41.94)
6 (9.68)
Clinical findings, n (%)erytema nodosumarthralgiafistulaulcerationnipple collapseaxillary lymphadenopathy
7 (11.29)4 (6.45)
15 (24.19)9 (14.51)5 (8.06)
26 (41.93)
Smoker, n (%) 31 (50)
Follow-up duration [months] 24 ±3.6
Oral contraceptives, n (%) 20 (32.25)

Adv Clin Exp Med. 2021;30(10):1091–1097 1095
patients who could not tolerate oral MTX, the same dose was administered subcutaneously and steroids were con-tinued. Clinical improvement was observed in 47 (75.80%) patients within the first 3 months. The mean clinical and radiological remission periods of the patients were 10.14 ±1.21 months (range: 3–14 months). Due to the lack of clinical improvement in 15 (24.19%) patients within the first 3 months, the MTX dose was gradually increased to 25 mg/week and subcutaneous administration was initiated. Additionally, the dose of methylprednisolone was increased to 12 mg/day. In 10 of those 15 patients, remission was achieved after the increase in the dosage of the treatment medications. Surgery was performed in 5 patients who failed to achieve remission. A segmen-tal mastectomy was performed to excise the entire cav-ity. After surgery, MTX and methylprednisolone treat-ment was begun at the initial dose, and remission was achieved in all patients. The mean ESR of the patients before treatment was 48.25 ±23.84 mm/h and decreased to 14.34 ±10.82 mm/h after treatment. The mean CRP value was 32.34 ±24.23 mg/L before treatment. After treatment, the CRP value dropped to 4.68 ±3.5 mg/L. The WBC was 18.64 ±5.30 1000/μL before treatment and 6.41 ±2.14 1000/μL after treatment. The mean size of the ra-diological mass measured 42.32 ±4.21 mm at the time of the 1st application and 8.65 ±4.56 mm after treatment. Comparisons of these differences were made using the val-ues at 6 months post-treatment. All findings were statisti-cally significant (p < 0.001). Changes in the clinical and laboratory data of patients at the 1st admission and after treatment are summarized in Table 2. None of the patients discontinued the medications due to side effects. After achieving remission, all patients continued their treatment and regular follow-ups. The mean duration of treatment was 14 ±1.25 months (range: 6–24 months). No relapses were observed in any of the patients during the treatment period. Recurrence was observed in a total of 7 (11.29%) patients – 2 patients within the first 3 months, 3 patients within 6 months and 2 patients within a year after the cessa-tion of treatment. One of the recurrences occurred in a pa-tient who underwent surgery. All patients attended regular followed up appointments. The mean follow-up time was 24 ±3.6 months (range: 18–36 months). The recovery rate of patients during follow-up was determined to be 93.71%.
Discussion
Idiopathic granulomatous mastitis is a rare, benign breast disease of unknown etiology.12 Despite IGM being a disease that seriously affects young women, there has been no standard treatment protocol or remission criteria developed. Factors that lead to increased intraductal secre-tions such as lactation, prolactinoma, medications, obesity, and smoking are implicated in the etiology.13,14 Drainage or surgical resection alone has not been sufficient to cure the disease without the medical treatment.15,16 Idiopathic granulomatous mastitis can show similar clinical find-ings to breast cancer, such as breast skin deterioration and nipple collapse. In addition, culture and histopathologic testing should be performed to rule out other systemic diseases that can cause granulomatous lesions. Therefore, a biopsy was performed for tissue culture and histopatho-logical evaluation in all patients of our study.17
Radiological imaging alone is insufficient to confirm the diagnosis of IGM. However, USG and MRI can provide important information on IGM. Numerous combined, ir-regular, hypoechoic areas on USG indicate the formation of abscesses. In addition, USG can evaluate the axillary lymph nodes for involvement. Parenchymal disorder and heterogeneous lesions with hyperintense signals on MRI images suggest IGM.18 In this study, bilateral breast-axil-lary USG and breast MRI were performed in all patients at the time of diagnosis, and USG was performed to access lesions during follow-up appointments. Although the diag-nosis of IGM is confirmed using histopathology, there is no consensus on its treatment. Surgical treatment, antibiotics, steroids, MTX, and immunosuppressive drugs such as aza-thioprine are options in the treatment of IGM.19 Successful results have been achieved with the use of long-term and high-dose steroid therapy. However, the significant side ef-fects such as diabetes, obesity and Cushing’s disease expe-rienced with high-dose steroid treatment make this option less desirable. However, the recurrence rate is unacceptably high in low-dose steroid therapy. Studies have reported successful results with MTX monotherapy or concomi-tant low-dose steroid therapy in attempts to avoid these side effects.20 Surgical treatment without medication has a high recurrence and it has been abandoned in the treat-ment of IGM.21
Table 2. Pre- and post-treatment laboratory and clinical findings
Parameters Pre-treatment Post-treatment p-value t-test
ESR [mm/h] 48.25 ±23.84 14.34 ±10.82 <0.001* 2.099
CRP [mg/L] 32.34 ±24.23 4.68 ±3.5 <0.001* 1.890
WBC [1000/µL] 18.64 ±5.30 6.41 ±2.14 <0.001* 2.142
Mass size [mm] 42.32 ±4.21 8.65 ±4.56 <0.001* 2.121
Lymphadenopathy, n (%) 15 (24.19) 4 (6.45) <0.001* 2.018
Nipple collapse, n (%) 5 (8.06) 1 (1.61) <0.001* 1.910
ESR – erythrocyte sedimentation rate; CRP – C-reactive protein; WBC – white blood cell count; *paired t-test.

E. Dalbaşı, Ö. Akgül, Idiopathic granulomatous mastitis1096
The MTX dosage has been started at 10–15 mg/week and increased to 20–25 mg, according to clinical response. This treatment regimen was continued for an average du-ration of 13–15 months (1–30 months) and resulted in 94% recovery and 75% remission in patients at the end of 15 months. These recovery and remission rates are in line with the rates seen in our study.22
Kehribar et al.23 treated 33 IGM patients with low-dose steroids and 7.5–15 mg/week of MTX. The complete remis-sion rate achieved was 87.8%, and no relapse occurred dur-ing the follow-up. In this study, steroid treatment was used for 6–8 weeks, and then monotherapy with MTX was con-tinued. The remission rates found are similar to our find-ings, but MTX and low-dose steroids were used together for the entire treatment period in our study. It has been reported in studies that MTX reduces IGM recurrence, prevents side effects by decreasing the dose of steroids, and prolongs the remission period without medication. These findings are consistent with those found in our study.1,24,25
There are studies showing that lactation is the main fac-tor that causes IGM, and that recurrent pregnancy and breastfeeding lead to relapse.1,2,14 In accordance with our findings, 95.17% of the patients conceived and breastfed at least once. There are studies indicating that oral contra-ceptive drugs are a risk factor for IGM by increasing intra-ductal secretion. Oltean et al.26 showed that chronic mas-titis and oral contraceptive drug use are related. The rate of oral contraceptive use in our study was 32.25%, which is consistent with the literature. There are studies showing smoking and obesity to be controllable causes of IGM.13,26 Uysal et al. stated that smoking was also effective on IGM on relapse. Recurrence was more common in smokers with IGM.2 There is not enough evidence in the literature to prove that obesity causes IGM.2,27 On the other hand, in our study, the BMI of 38 (61.29%) patients was over 30.
A study by Tekgöz et al.13 was instrumental in determin-ing the treatment protocol with MTX. It involved 41 pa-tients with IGM. Clinical improvement was observed in all patients within the 1st month of treatment. A remission rate of almost 80% was achieved. Methotrexate was switched to azathioprine in 4 of the 5 patients who developed recur-rence, and in 1 patient who could not tolerate MTX, and all of these patients achieved remission. The patients included in this study did not use any medications other than MTX and steroids. The remission rates achieved in this study are also consistent with our findings.
There are not enough data in the literature to draw de-finitive conclusions about the role of bacteria in the etiol-ogy of IGM. The antibiotic treatment administered based on the culture antibiogram results did not affect remis-sion rates. In many instances, microorganisms identified in cultures are highly likely the results of contamination.28
In a study by Ringsted et al.,29 the results of various treat-ment methods were evaluated in 28 patients with IGM. Re-mission without recurrence was achieved in 80% of patients treated with MTX, 66% of patients treated with surgery and
steroids, and 42% of patients treated with steroids alone. In this study, arthralgia was seen in 14% of patients and erythema nodosum in 18%. According to the current litera-ture, the remission rate of IGM patients treated with MTX is around 90% on average. While the remission rates are similar to our findings, the incidence of additional findings such as arthralgia were higher.
Limitations
The main limitation of our study is its retrospective na-ture. Multi-center, prospective studies are needed to dem-onstrate the efficacy of MTX + low-dose steroid in the treat-ment of IGM.
Conclusions
Idiopathic granulomatous mastitis is a rare benign breast disease with unknown etiology or treatment algorithm. Immunosuppressive drugs have been used in its treatment. Although the data are limited, effective results have been obtained with MTX in the treatment of IGM, whether used alone or in combination with steroids. As seen in our study, MTX + low-dose steroid therapy are successful in the treatment of IGM. However, prospective large case series and multi-center studies are needed to definitively determine an IGM treatment algorithm.
ORCID iDsErkan Dalbaşı https://orcid.org/0000-0002-4652-1747Ömer Lütfi Akgül https://orcid.org/0000-0002-7858-454X
References1. Sheybani F, Sarvghad M, Naderi H, Gharib M. Treatment for and clin-
ical characteristics of granulomatous mastitis. Obstet Gynecol. 2015; 125(4):801–807. doi:10.1097/AOG.0000000000000734
2. Uysal E, Soran A, Sezgin E; Granulomatous Mastitis Study Group. Factors related to recurrence of idiopathic granulomatous mastitis: What do we learn from a multicenter study? ANZ J Surg. 2018;88(6): 635–639. doi:10.1111/ans.14115
3. Seo HR, Na KY, Yim HE, et al. Differential diagnosis in idiopathic gran-ulomatous mastitis and tuberculous mastitis. J Breast Cancer. 2012; 15(1):111–118. doi:10.4048/jbc.2012.15.1.111
4. Helal TE, Shash LS, Saad El-Din SA, Saber SM. Idiopathic granuloma-tous mastitis: Cytologic and histologic study of 65 Egyptian patients. Acta Cytol. 2016;60(5):438–444. doi:10.1159/000448800
5. Patel RA, Strickland P, Sankara IR, Pinkston G, Many W Jr, Rodriguez M. Idiopathic granulomatous mastitis: Case reports and review of liter-ature. J Gen Intern Med. 2010;25(3):270–273. doi:10.1007/s11606-009-1207-2
6. Wong SCY, Poon RWS, Chen JHK, et al. Corynebacterium kroppenst-edtii is an emerging cause of mastitis especially in patients with psy-chiatric illness on antipsychotic medication. Open Forum Infect Dis. 2017;4(2):ofx096. doi:10.1093/ofid/ofx096
7. Alibi S, Ferjani A, Gaillot O, Marzouk M, Courcol R, Boukadida J. Iden-tification of clinically relevant Corynebacterium strains by Api Coryne, MALDI-TOF-mass spectrometry and molecular approaches. Pathol Biol (Paris). 2015;63(4–5):153–157. doi:10.1016/j.patbio.2015.07.007
8. Shah KK, Pritt BS, Alexander MP. Histopathologic review of granulo-matous inflammation. J Clin Tuberc Other Mycobact Dis. 2017;7:1–12. doi:10.1016/j.jctube.2017.02.001

Adv Clin Exp Med. 2021;30(10):1091–1097 1097
9. Barreto DS, Sedgwick EL, Nagi CS, Benveniste AP. Granulomatous mas-titis: Etiology, imaging, pathology, treatment, and clinical findings. Breast Cancer Res Treat. 2018;171(3):527–534. doi:10.1007/s10549-018-4870-3
10. Strober BE, Menon K. Folate supplementation during methotrexate therapy for patients with psoriasis. J Am Acad Dermatol. 2005;53(4): 652–659. doi:10.1016/j.jaad.2005.06.036
11. Azlina AF, Ariza Z, Arni T, Hisham AN. Chronic granulomatous mas-titis: Diagnostic and therapeutic considerations. World J Surg. 2003; 27(5):515–518. doi:10.1007/s00268-003-6806-1
12. Oran EŞ, Gürdal SÖ, Yankol Y, et al. Management of idiopathic gran-ulomatous mastitis diagnosed by core biopsy: A retrospective mul-ticenter study. Breast J. 2013;19(4):411–418. doi:10.1111/tbj.12123
13. Tekgöz E, Çolak S, Çinar M, Yilmaz S. Treatment of idiopathic gran-ulomatous mastitis and factors related with disease recurrence. Turk J Med Sci. 2020;50(5):1380–1386. doi:10.3906/sag-2003-93
14. Taylor GB, Paviour SD, Musaad S, Jones WO, Holland DJ. A clinicopath-ological review of 34 cases of inflammatory breast disease showing an association between corynebacteria infection and granuloma-tous mastitis. Pathology. 2003;35(2):109–119. PMID:12745457
15. Pandey TS, Mackinnon JC, Bressler L, Millar A, Marcus EE, Ganschow PS. Idiopathic granulomatous mastitis: A prospective study of 49 women and treatment outcomes with steroid therapy. Breast J. 2014;20(3): 258–266. doi:10.1111/tbj.12263
16. Aghajanzadeh M, Hassanzadeh R, Alizadeh Sefat S, et al. Granulo-matous mastitis: Presentations, diagnosis, treatment and outcome in 206 patient from the north of Iran. Breast. 2015;24(4):456–460. doi:10.1016/j.breast.2015.04.003
17. Ergin AB, Cristofanilli M, Daw H, Tahan G, Gong Y. Recurrent granulo-matous mastitis mimicking inflammatory breast cancer. BMJ Case Rep. 2011;2011:bcr0720103156. doi:10.1136/bcr.07.2010.3156
18. Gautier N, Lalonde L, Tran-Thanh D, et al. Chronic granulomatous mastitis: Imaging, pathology and management. Eur J Radiol. 2013; 82(4):e165–e175. doi:10.1016/j.ejrad.2012.11.010
19. Akbulut S, Arikanoglu Z, Senol A, et al. Is methotrexate an acceptable treatment in the management of idiopathic granulomatous mastitis? Arch Gynecol Obstet. 2011;284(5):1189–1195. doi:10.1007/s00404-010-1825-2
20. Hovanessian Larsen LJ, Peyvandi B, Klipfel N, Grant E, Iyengar G. Granulomatous lobular mastitis: Imaging, diagnosis, and treatment. AJR Am J Roentgenol. 2009;193(2):574–581. doi:10.2214/AJR.08.1528
21. Skandarajah A, Marley L. Idiopathic granulomatous mastitis: A medi-cal or surgical disease of the breast? ANZ J Surg. 2015;85(12):979–982. doi:10.1111/ans.12929
22. Postolova A, Troxell ML, Wapnir IL, Genovese MC. Methotrexate in the treatment of idiopathic granulomatous mastitis. J Rheumatol. 2020;47(6):924–927. doi:10.3899/jrheum.181205
23. Kehribar DY, Duran TI, Polat AK, Ozgen M. Effectiveness of metho-trexate in idiopathic granulomatous mastitis treatment. Am J Med Sci. 2020;360(5):560–565. doi:10.1016/j.amjms.2020.05.029
24. Kim J, Tymms KE, Buckingham JM. Methotrexate in the management of granulomatous mastitis. ANZ J Surg. 2003;73(4):247–249. doi:10. 1046/j.1445-1433.2002.02564.x
25. Raj N, Macmillan RD, Ellis IO, Deighton CM. Rheumatologists and breasts: Immunosuppressive therapy for granulomatous mastitis. Rheumatology (Oxford). 2004;43(8):1055–1056. doi:10.1093/rheuma tology/keh246
26. Oltean HN, Soliman AS, Omar OS, et al. Risk factors for chronic masti-tis in Morocco and Egypt. Int J Inflam. 2013;2013:184921. doi:10.1155/ 2013/184921
27. Al-Khaffaf B, Knox F, Bundred NJ. Idiopathic granulomatous masti-tis: A 25-year experience. J Am Coll Surg. 2008;206(2):269–273. doi:10. 1016/j.jamcollsurg.2007.07.041
28. Dobinson HC, Anderson TP, Chambers ST, Doogue MP, Seaward L, Werno AM. Antimicrobial treatment options for granulomatous mas-titis caused by corynebacterium species. J Clin Microbiol. 2015;53(9): 2895–2899. doi:10.1128/JCM.00760-15
29. Ringsted S, Friedman M. A rheumatologic approach to granuloma-tous mastitis: A case series and review of the literature. Int J Rheum Dis. 2021;24(4):526–532. doi:10.1111/1756-185X.14065


Cite asAdamiec-Mroczek J. 27-gauge sutureless vitrectomy under topical anesthesia: A pilot study. Adv Clin Exp Med. 2021;30(10):1099–1103. doi:10.17219/acem/142353
DOI10.17219/acem/142353
Copyright© 2021 by Wroclaw Medical University This is an article distributed under the terms of theCreative Commons Attribution 3.0 Unported (CC BY 3.0)(https://creativecommons.org/licenses/by/3.0/)
Address for correspondenceJoanna Adamiec-MroczekE-mail: [email protected]
Funding sourcesNone declared
Conflict of interestNone declared
Received on March 29, 2021Reviewed on May 17, 2021Accepted on September 17, 2021
Published online on October 5, 2021
AbstractBackground. The implementation of the 27-gauge (G) sutureless vitrectomy technique is associated with a marked shortening of surgery time, faster healing of scleral and conjunctival wounds, less severe conjunctival scarring, limited postoperative corneal astigmatism, and marked improvement in the postoperative comfort of patients. The traditional methods of anesthesia for vitrectomy surgery are quite varied and each has its own potential for complications.
Objectives. To assess the feasibility and safety of 27G pars plana vitrectomy (PPV) performed under local topical anesthesia for diabetic maculopathy, asteroid hyalosis and vitreomacular traction syndrome associ-ated with high myopia.
Materials and methods. Three carefully selected patients with various vitreoretinal disorders underwent primary 27G PPV performed by a single surgeon under local topical anesthesia. Patients were analyzed in regard to best corrected visual acuity, intraocular pressure, intraoperative/postoperative complications, intraoperative/postoperative pain, and surgery time.
Results. All patients showed postoperative improvement in visual acuity. No decrease in intraocular pressure below 10 mm Hg was documented on postoperative day 1. Furthermore, no postoperative complications were recorded during the six-month follow-up, and evident improvement in the anatomical status was confirmed using ophthalmic coherence tomography in all cases.
Conclusions. Our findings support that 27G PPV performed solely under local topical anesthesia is safe and effective for treating selected vitreoretinal disorders.
Key words: 27-gauge, pars plana vitrectomy, maculopathy, high myopia, local topical anesthesia
Research letters
27-gauge sutureless vitrectomy under topical anesthesia: A pilot study
Joanna Adamiec-MroczekA–F
Department of Ophthalmology, Wroclaw Medical University, Poland
A – research concept and design; B – collection and/or assembly of data; C – data analysis and interpretation; D – writing the article; E – critical revision of the article; F – final approval of the article
Advances in Clinical and Experimental Medicine, ISSN 1899–5276 (print), ISSN 2451–2680 (online) Adv Clin Exp Med. 2021;30(10):1099–1103

J. Adamiec-Mroczek. Vitrectomy under topical anesthesia1100
Background
The implementation of the sutureless vitrectomy tech-nique has revolutionized the work of vitreoretinal sur-geons in the last 5 years. The 23- and 25-gauge (G) pars plana vitrectomies (PPV) are performed with increasing frequency and have a well-established position in modern ophthalmology.1 Pars plana vitrectomies are associated with a marked shortening of surgical time, faster healing of scleral and conjunctival wounds, less severe conjunc-tival scarring, limited postoperative corneal astigmatism, marked improvement in postoperative comfort of patients and, in some cases, earlier postoperative visual recovery than after traditional 20G PPV.1
All of these advantages of novel vitreoretinal tech-niques result from the intraoperative formation of self-sealing scleral incisions; due to their presence, no sutures need to be placed on the sclerectomy and conjunctival wounds. However, the lack of suture placement on 0.6 mm (23G) or 0.5 mm (25G) wounds can quite frequently lead to complications such as hypotony, choroidal detach-ment and increased risk of exogenous endophthalmitis.2,3 The risk of these complications seems reduced in cases in which a 27G vitrectomy system is used and the diameter of the wounds equals 0.4 mm.
In 2010, Oshima et al. presented a 27G instrument system successfully used in their center for transcon-junctival fluid–air and fluid–fluid exchange.4 The limi-tations of the system – namely the insufficient illumina-tion of the globe and poor performance of the stripper resulting from its small diameter, as well as the excessive flexibility of the instruments – were the main obstacles to the popularization of the 27G vitrectomy. However, the manufacturers of modern vitrectomy systems have managed to eliminate most of these flaws.5
Objectives
In view of the markedly shorter duration of 27G PPV compared to 20G vitrectomy, we decided to conduct a pilot study of 27G PPV under topical anesthesia in a carefully selected group of patients. We chose this model of anes-thesia because it is safe and eliminates the postoperative discomfort associated with periocular anesthesia.
Materials and methods
All patients provided written informed consent prior to their inclusion in this study.
The 27G PPV involved 3 phakic globes of patients with diabetic maculopathy resulting from proliferative diabetic retinopathy (n = 1), asteroid hyalosis (n = 1) and vitreo-macular traction syndrome associated with high myopia (n = 1). All patients were free from degenerative disorders
of the spine and hips, dementia, asthma, chronic bronchi-tis, and deafness. Patients’ ability to cooperate with the sur-geon performing PPV was verified by means of ophthal-moscopy and ophthalmic coherence tomography (OCT) during qualification for the procedure. All patients were informed that they would experience a sensation of touch and that the movements of the operated globe would be retained throughout the surgery.
After achieving maximal mydriasis with 1% tropicamide and 5% phenylephrine, all patients received topical anes-thesia with 5 drops of proxymetacaine hydrochloride (eye drops: 5 mg/mL, administered into the conjunctival sac at 10 min intervals, followed by a single intraconjunctival application of lignocaine gel (lignocainum 20 mg/mL)). Ten minutes after anesthesia, the surgical field (protective apparatus of the eye and periorbital skin) was disinfected with 5% povidone iodine.
A 27G sutureless vitrectomy system (DORC, Zuidland, the Netherlands) was used to perform 3 typical direct transconjunctival sclerectomies located 3.5 mm from the corneal limbus in the lower temporal, upper tempo-ral and upper nasal quadrants, respectively, in 3 patients. The use of vented gas-forced infusion during the proce-dure guaranteed excellent control of the intraoperative intraocular pressure (IOP).2 Patients with vitreomacular traction syndrome and diabetic maculopathy were sub-jected to internal limiting membrane peeling with reusable microforceps. Adjuvant panretinal photocoagulation with 27G curved stepped laser probes was performed in the fe-male patient with proliferative diabetic retinopathy, along with fluid-air exchange due to diabetic maculopathy. The final stage of 27G PPV comprised detailed examina-tion of the peripheral retina up to the ora serrata for any potential iatrogenic intraoperative retinal injuries (iatro-genic holes, choroidal detachment, retinal detachment/retinoschisis, etc.); no such pathologies were identified.
Subsequently, the trocars were removed. None of the pa-tients required placement of conjunctival and scleral su-tures. Ofloxacin drops were routinely administered into the conjunctival sac along with hydrocortisone acetate and oxytetracycline hydrochloride.
The surgery time was 35 min for vitreomacular trac-tion syndrome, 15 min for asteroid hyalosis and 25 min for the removal of epiretinal membrane. The severity of intraoperative and postoperative pain was determined using the ten grade Visual Analogue Scale (VAS), with 0 corresponding to a lack of pain and 10 corresponding to the most severe, unbearable pain. The severity of pain was assessed 4 times: immediately after PPV as well as 2 h, 4 h and 6 h after the surgery.
Results
The clinical characteristics of the patients are presented in Table 1. No patients required additional (periocular,

Adv Clin Exp Med. 2021;30(10):1099–1103 1101
subconjunctival or systemic) analgesia, either intra- or postoperatively (2 h, 4 h and 6 h after the surgery). In all cases, the severity of pain corresponded to grade 0 (i.e., lack of pain and discomfort).
All patients showed postoperative improvement in vi-sual acuity (Table 2). No decrease in IOP below 10 mm Hg was documented on postoperative day 1. Furthermore, no postoperative complications were recorded during the six-month follow-up, and evident improvement of the an-atomical status was confirmed using OCT in all cases (Fig. 1).
Discussion
The implementation of sutureless transconjunctival vit-rectomy reflects the advances in vitreoretinal surgery over the last 20 years. However, after initial euphoria, a number of papers pointing out the technical weaknesses of early PPV systems were published. Due to their many flaws (e.g., poor performance of the stripper, too low efficiency of infusion, excessive flexibility), the initially utilized 25G instruments were replaced by 23G devices. The latter were considered the “gold standard” as they enabled suture-less procedures while eliminating all the flaws inherent
Table 2. Preoperative and postoperative intraocular pressure (IOP) with best corrected visual acuities (BCVA) at 1 week and 6 months after surgery
Patient BCVA preoperatively(Snellen chart)
BCVA at 1 week post surgery
(Snellen chart)
BCVA at 6 months post surgery
(Snellen chart)Preoperative IOP Postoperative
IOP (day 1)
RA FC 1 m FC 1,5 m FC 3 m 18.0 mm Hg 15.0 mm Hg
SM 0.3 0.5 0.6 17.0 mm Hg 19.0 mm Hg
GJ 0.1 0.2 0.3 15.0 mm Hg 10.0 mm Hg
FC – finger counting.
Table 1. Patient characteristics
Patient Condition Age Gender Procedure Pain score
RAproliferative diabetic retinopathy OU
status post panretinal photocoagulation OU28 F
PPV + ILM peeling + endolaser
0
SMvitreous opacities OU
pseudophakia OUglaucoma OU
82 F PPV 0
GJvitreomacular traction syndrome OS
high myopia OS53 F PPV + ILM peeling 0
OU – both eyes; OS – left eye; PPV – pars plana vitrectomy; ILM – inner limiting membrane.
Fig. 1. A. Preoperative optical coherence tomography (OCT) scan showing vitreomacular traction (in a patient with high myopia) (left). Postoperative OCT revealing complete release of traction with reduction in central foveal thickness (right); B. Preoperative OCT scan in a patient with vitreoretinal traction syndrome (left). Postoperative OCT with complete release of traction (right)

J. Adamiec-Mroczek. Vitrectomy under topical anesthesia1102
to 25G microinstruments. However, in 2007, Oshima et al. introduced a novel 27G endoillumination system.6 Shortly thereafter, Sakaguchi et al. reported their experiences with 27G nonvitrectomizing vitreous surgery in a patient with epiretinal membrane.7
The paucity of papers documenting the application of these least invasive vitrectomy systems reflects the per-sisting opinions of vitreoretinal surgeons about the limited usefulness of 27G microinstruments. After familiarizing ourselves with the experiences of other authors,8–10 we de-cided to conduct 27G procedures in a carefully selected cohort of patients at our center. We present the technical possibilities of conducting PPV using the instruments with such small diameters. Our patients required relatively small surgical interventions: internal limiting membrane peeling, removal of the epiretinal membrane, and local vitreoretinal tractions or vitreous body with floaters and intravitreal hemorrhage. The procedure resulted in satisfactory ana-tomical outcomes and improved visual acuity in all cases. None of the patients required placing sutures on conjuncti-val and scleral wounds; furthermore, we did not record any cases of postoperative hypotony. Finally, no reoperations with microinstruments larger than 27G were required.
The relatively poor performance of vitrectomy and in-fusion systems represents the most significant challenge during 27G PPV. Oshima et al. documented the techni-cal parameters of a 27G device, which are characterized by a slightly lower flow cut (62%) and aspiration rates (80%) than a 25G vitrectomy system.6 However, the duty cycle of the cutter turned out to be better than in the case of larger instruments, and vented gas-forced infusion at 30 mm Hg enabled the maintenance of optimal intra-operative IOP. The technical possibilities of the abovemen-tioned system (aspiration, infusion and striper efficiencies) and characteristics of individual microinstruments guar-anteed fast and flawless outcomes of all planned intraoper-ative manipulations (including the access to the peripheral part of the eye).
None of our patients who qualified for 27G PPV re-quired any complicated intraoperative manipulation, and the lack of conjunctival and scleral suture placement was reflected by a marked shortening of the surgical time. Therefore, we decided to perform the procedure solely under local topical anesthesia, augmented with lignocaine gel. Similar experiences with 25G vitrectomy under lo-cal anesthesia were previously reported by Raju et al.11 The use of topical anesthesia, combined with infiltration anesthesia in the areas of planned sclerectomies, turned out to be sufficient for a complete elimination of pain, both during the surgeries and postoperatively. Chakraborty et al. used a similar protocol of anesthesia for successful repair of ruptured globes.12 It should be noted that the use of local anesthesia does not represent a novel approach to PPV. As early as 1999, Yepez et al. reported successful use of sedation and local anesthesia for 20G PPV. How-ever, the patients of that study reported mild (grade 2)
pain, especially during cauterization of the scleral vessels, sclerectomy, and placement of scleral and conjunctival su-tures.13 The use of modern sutureless vitrectomy systems seems to considerably limit the extent of scleral trauma (due to the protection of scleral ports with cannulas), and markedly attenuates or even completely eliminates pain. The minimal size of the ports is another advan-tage of the 27G systems used in our patients. It mark-edly limited the extent of scleral trauma compared with other available microinstruments. In addition, the lack of cauterization of the scleral vascular bed and completely sutureless nature of the procedure markedly attenuated the pain experienced by the patients. The use of topical anesthesia and intraconjunctival administration of ligno-caine gel seem to be optimal choices in terms of patient comfort. A protocol for anesthesia allowing a completely painless procedure is vital from the patient’s perspective. Due to retained eye movements during the procedure, a proper qualification of patients remains a crucial deter-minant of a successful surgery.
Limitations
The limitations of this study include the relatively small sample of patients. Further studies with larger samples and more comprehensive evaluations are warranted.
Conclusions
Our findings suggest that the 27G PPV system is a safe and effective treatment for various vitreoretinal diseases. Even though 27G surgery is not widely performed at pres-ent, it may soon become a standard of management for patients who require the so-called simple vitreoretinal procedures due to its unquestioned advantages, minimal ocular trauma and possibility of topical anesthesia.
ORCID iDsJoanna Adamiec-Mroczek https://orcid.org/0000-0002-6804-358X
References1. Pollack JS, Sabherwal N. Small gauge vitrectomy: Operative tech-
niques. Curr Opin Ophthalmol. 2019;30(3):159–164. doi:10.1097/ICU.00 00000000000568
2. Khanduja S, Kakkar A, Majumdar S, Vohra R, Garg S. Small gauge vit-rectomy: Recent update. Oman J Ophthalmol. 2013;6(1):3–11. doi:10. 4103/0974-620X.111893
3. Shields RA, Ludwig CA, Powers MA, Tran EMT, Smith SJ, Moshfeghi DM. Postoperative adverse events, interventions, and the utility of rou-tine follow-up after 23-, 25-, and 27-gauge pars plana vitrectomy. Asia Pac J Ophthalmol (Phila). 2019;8(1):36–42. doi:10.22608/APO. 2018398
4. Oshima Y, Wakabayashi T, Sato T, Ohji M, Tano Y. A 27-gauge instru-ment system for transconjunctival sutureless microincision vitrec-tomy surgery. Ophthalmology. 2010;117(1):93–102.e2. doi:10.1016/j.ophtha.2009.06.043
5. Lin X, Apple D, Hu J, Tewari A. Advancements of vitreoretinal surgi-cal machines. Curr Opin Ophthalmol. 2017;28(3):242–245. doi:10.1097/ICU.0000000000000369

Adv Clin Exp Med. 2021;30(10):1099–1103 1103
6. Oshima Y, Awh CC, Tano Y. Self-retaining 27-gauge transconjuncti-val chandelier endoillumination for panoramic viewing during vit-reous surgery. Am J Ophthalmol. 2007;143(1):166–167. doi:10.1016/j.ajo.2006.07.051
7. Sakaguchi H, Oshima Y, Tano Y. 27-gauge transconjunctival nonvitrec-tomizing vitreous surgery for epiretinal membrane removal. Retina. 2007;27(8):1131–1132. doi:10.1097/IAE.0b013e31805931c0
8. Mori R, Naruse S, Shimada H. Comparative study of 27-gauge and 25-gauge vitrectomy performed as day surgery. Int Ophthalmol. 2018;38(4):1575–1582. doi:10.1007/s10792-017-0625-0
9. Li J, Liu SM, Dong WT, et al. Outcomes of transconjunctival suture-less 27-gauge vitrectomy for vitreoretinal diseases. Int J Ophthalmol. 2018;11(3):408–415. doi:10.18240/ijo.2018.03.10
10. Masri I, Steel DH. Outcomes of 27 gauge microincision vitrectomy surgery for posterior segment disease. Am J Ophthalmol. 2016;164: 147–148. doi:10.1016/j.ajo.2016.01.012
11. Raju B, Raju NS, Raju AS. 25 gauge vitrectomy under topical anes-thesia: A pilot study. Indian J Ophthalmol. 2006;54(3):185–188. doi:10. 4103/0301-4738.27070
12. Chakraborty A, Bandyopadhyay SK, Mukhopadhyay S. Regional anaes-thesia for surgical repair in selected open globe injuries in adults. Saudi J Ophthalmol. 2013;27(1):37–40. doi:10.1016/j.sjopt.2011.12.002
13. Yepez J, Cedeño de Yepez J, Arevalo JF. Topical anesthesia in pos-terior vitrectomy. Retina. 2000;20(1):41–45. doi:10.1097/00006982-200001000-00008