
Aditya Heritage - Environmental Clearance
62
Aditya Heritage M/s. SRI ADITYA HOMES PVT. LTD., SURVEY NOS. 250, 251, 252 /P, 253 & 255, Ward No. 9, Block No. 4, T.S NO.19, QUALLA MOHAMMAD NAGAR, GOLCONDA MANDAL, HYDERABAD 1. FORM I 2. FORM I A Submitted By M/s Sri Aditya Homes Pvt. Ltd., Aditya House, D.No 8-2-332/8/A, Road No.3, Banjara Hills, Hyderabad -500 034. Studies & Documentation by M/s Team Labs and Consultants (An ISO Certified Organization) B-115 -117 & 509, Annapurna Block, Aditya Enclave, Ameerpet, Hyderabad- 500 038 Phone: 91-040-23748555/616 Fax : 91-040-23748666 e-mail: [email protected] SUBMITTED TO STATE LEVEL ENVIRONMENT IMPACT ASSESSMENT AUTHORITY TELANGANA GOVERNMENT OF INDIA
-
Upload
khangminh22 -
Category
Documents
-
view
3 -
download
0
Transcript of Aditya Heritage - Environmental Clearance
Aditya HeritageM/s. SRI ADITYA HOMES PVT. LTD.,
SURVEY NOS. 250, 251, 252 /P, 253 & 255,Ward No. 9, Block No. 4, T.S NO.19,
QUALLA MOHAMMAD NAGAR,GOLCONDA MANDAL, HYDERABAD
1. FORM I
2. FORM I A
Submitted ByM/s Sri Aditya Homes Pvt. Ltd.,Aditya House, D.No 8-2-332/8/A,Road No.3, Banjara Hills,Hyderabad -500 034.
Studies & Documentation byM/s Team Labs and Consultants(An ISO Certified Organization)B-115 -117 & 509, Annapurna Block,Aditya Enclave, Ameerpet,Hyderabad- 500 038Phone: 91-040-23748555/616Fax : 91-040-23748666e-mail: [email protected]
SUBMITTED TOSTATE LEVEL ENVIRONMENT IMPACT ASSESSMENT AUTHORITY
TELANGANAGOVERNMENT OF INDIA
FI - 1
APPENDIX I
(See paragraph – 6)FORM 1S.No Item Details
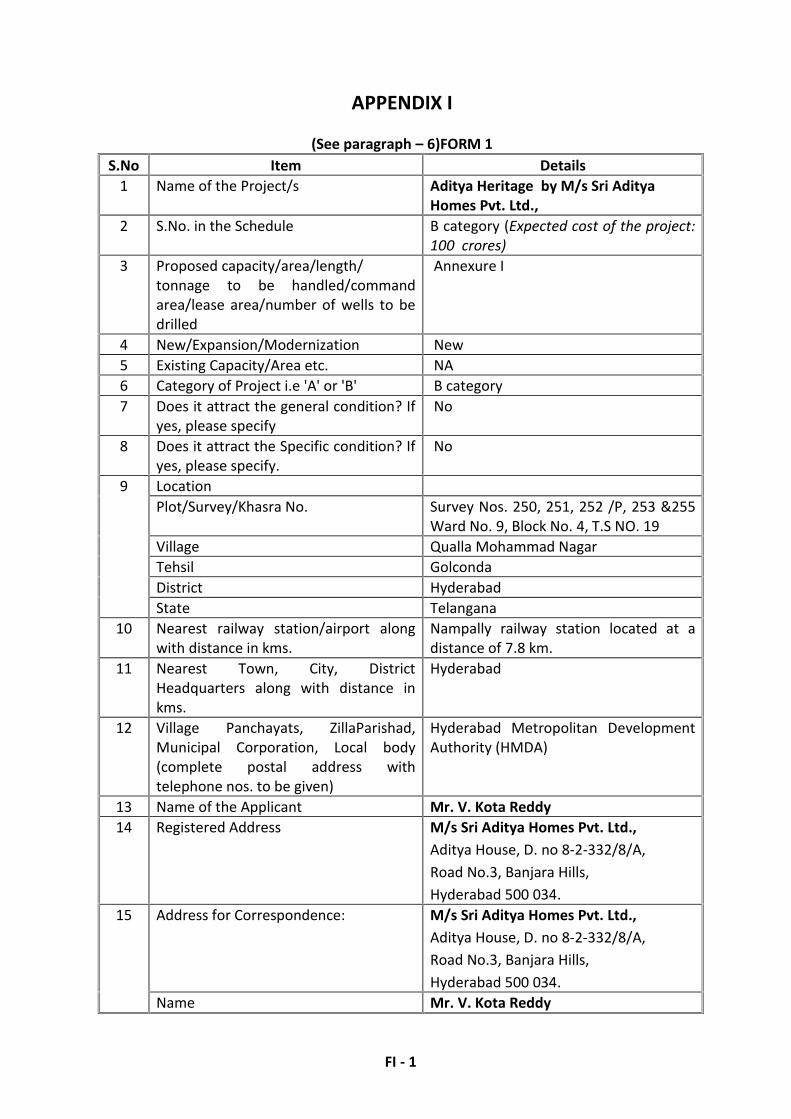
1 Name of the Project/s Aditya Heritage by M/s Sri AdityaHomes Pvt. Ltd.,
2 S.No. in the Schedule B category (Expected cost of the project:100 crores)
3 Proposed capacity/area/length/tonnage to be handled/commandarea/lease area/number of wells to bedrilled
Annexure I
4 New/Expansion/Modernization New5 Existing Capacity/Area etc. NA6 Category of Project i.e 'A' or 'B' B category7 Does it attract the general condition? If
yes, please specifyNo
8 Does it attract the Specific condition? Ifyes, please specify.
No
9 LocationPlot/Survey/Khasra No. Survey Nos. 250, 251, 252 /P, 253 &255
Ward No. 9, Block No. 4, T.S NO. 19Village Qualla Mohammad NagarTehsil GolcondaDistrict HyderabadState Telangana
10 Nearest railway station/airport alongwith distance in kms.
Nampally railway station located at adistance of 7.8 km.
11 Nearest Town, City, DistrictHeadquarters along with distance inkms.
Hyderabad
12 Village Panchayats, ZillaParishad,Municipal Corporation, Local body(complete postal address withtelephone nos. to be given)
Hyderabad Metropolitan DevelopmentAuthority (HMDA)
13 Name of the Applicant Mr. V. Kota Reddy14 Registered Address M/s Sri Aditya Homes Pvt. Ltd.,
Aditya House, D. no 8-2-332/8/A,Road No.3, Banjara Hills,Hyderabad 500 034.
15 Address for Correspondence: M/s Sri Aditya Homes Pvt. Ltd.,Aditya House, D. no 8-2-332/8/A,Road No.3, Banjara Hills,Hyderabad 500 034.
Name Mr. V. Kota Reddy

FI - 2
S.No Item DetailsDesignation(Owner/Partner/CEO) Managing DirectorAddress M/s Sri Aditya Homes Pvt. Ltd.,
Aditya House, D. no 8-2-332/8/A,Road No.3, Banjara Hills,Hyderabad 500 034.
Pin CodeE-mail [email protected] Number 23558673 / 74 / 80Fax No.
16 Details of alternative Sites examined, ifany. Location of these sites should beshown on a topo sheet.
Village-District-StateNA
17 Interlinked Projects No18 Whether separate application of
interlinked project has beensubmitted?
19 If yes, date of submission20 If no, reason21 Whether the proposal involves
approval/clearance under: if yes,details of the same and their status tobe given.(a) The Forest (Conservation) Act,1980? (b) The Wildlife(Protection) Act, 1972 ? (c) TheC.R.Z Notification, 1991 ?
No
22 Whether there is any GovernmentOrder/Policy relevant/relating to thesite?
No
23 Forest land involved (hectares) No24 Whether there is any location pending
against the project and /or land inwhich the project is propose to be setup?(a) Name of the Court(b) Case No(c) Orders/directions of the Court, ifany and its relevance with theproposed project.
No
FI - 3
(II) Activity
1. Construction, operation or decommissioning of the Project involving actions, which willcause physical changes in the locality (topography, land use, changes in water bodies, etc.)
S.No. Information/Checklist confirmation Yes/No
Details thereof (withapproximate quantities /rates,wherever possible) with sourceof information data
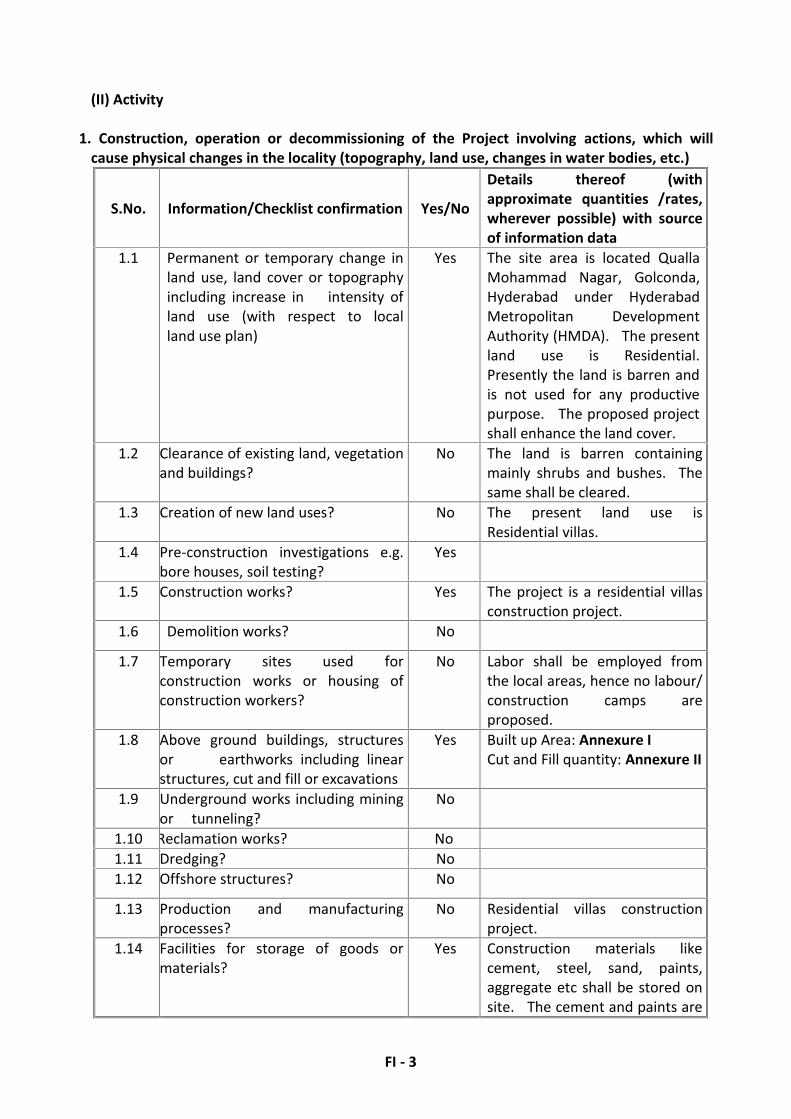
1.1 Permanent or temporary change inland use, land cover or topographyincluding increase in intensity ofland use (with respect to localland use plan)
Yes The site area is located QuallaMohammad Nagar, Golconda,Hyderabad under HyderabadMetropolitan DevelopmentAuthority (HMDA). The presentland use is Residential.Presently the land is barren andis not used for any productivepurpose. The proposed projectshall enhance the land cover.
1.2 Clearance of existing land, vegetationand buildings?
No The land is barren containingmainly shrubs and bushes. Thesame shall be cleared.
1.3 Creation of new land uses? No The present land use isResidential villas.
1.4 Pre-construction investigations e.g.bore houses, soil testing?
Yes
1.5 Construction works? Yes The project is a residential villasconstruction project.
1.6 Demolition works? No
1.7 Temporary sites used forconstruction works or housing ofconstruction workers?
No Labor shall be employed fromthe local areas, hence no labour/construction camps areproposed.
1.8 Above ground buildings, structuresor earthworks including linearstructures, cut and fill or excavations
Yes Built up Area: Annexure ICut and Fill quantity: Annexure II
1.9 Underground works including miningor tunneling?
No
1.10 Reclamation works? No1.11 Dredging? No1.12 Offshore structures? No
1.13 Production and manufacturingprocesses?
No Residential villas constructionproject.
1.14 Facilities for storage of goods ormaterials?
Yes Construction materials likecement, steel, sand, paints,aggregate etc shall be stored onsite. The cement and paints are

FI - 4
S.No. Information/Checklist confirmation Yes/No
Details thereof (withapproximate quantities /rates,wherever possible) with sourceof information datastored indoor, while theremaining is stored out doors.
1.15 Facilities for treatment or disposal ofsolid waste or liquid effluents?
Yes The wastewater shall be treatedand reused for flushing and onland irrigation purpose. Theexcess treated water if any shallbe let out into Municipal sewerlines. The water balance, waterrecycling quantities and thedesign details of sewagetreatment plant are presented inAnnexure –III. The garbage shallbe collected and the collectedgarbage shall be sentsegregation point located withinthe site and then sent toMunicipal solid wastemanagement facility. Thegarbage management plan isenclosed in Annexure – IV.
1.16 Facilities for long term housing ofoperational workers?
Yes Required labour shall be drawnfrom neighboring areas/villages.
1.17 New road, rail or sea traffic duringconstruction or operation?
No
1.18 New road, rail, air waterborne orother transport infrastructureincluding new or altered routes andstations, ports, airports etc?
No
1.19 Closure or diversion of existingtransport routes or infrastructureleading to changes in trafficmovements?
No
1.20 New or diverted transmission linesor pipelines?
No
1.21 Impoundment, damming, culverting,realignment or other changes to thehydrology of watercourses oraquifers?
No The local hydrology shall beconsidered while designing thestorm water drains.
1.22 Stream crossings? No
FI - 5
S.No. Information/Checklist confirmation Yes/No
Details thereof (withapproximate quantities /rates,wherever possible) with sourceof information data
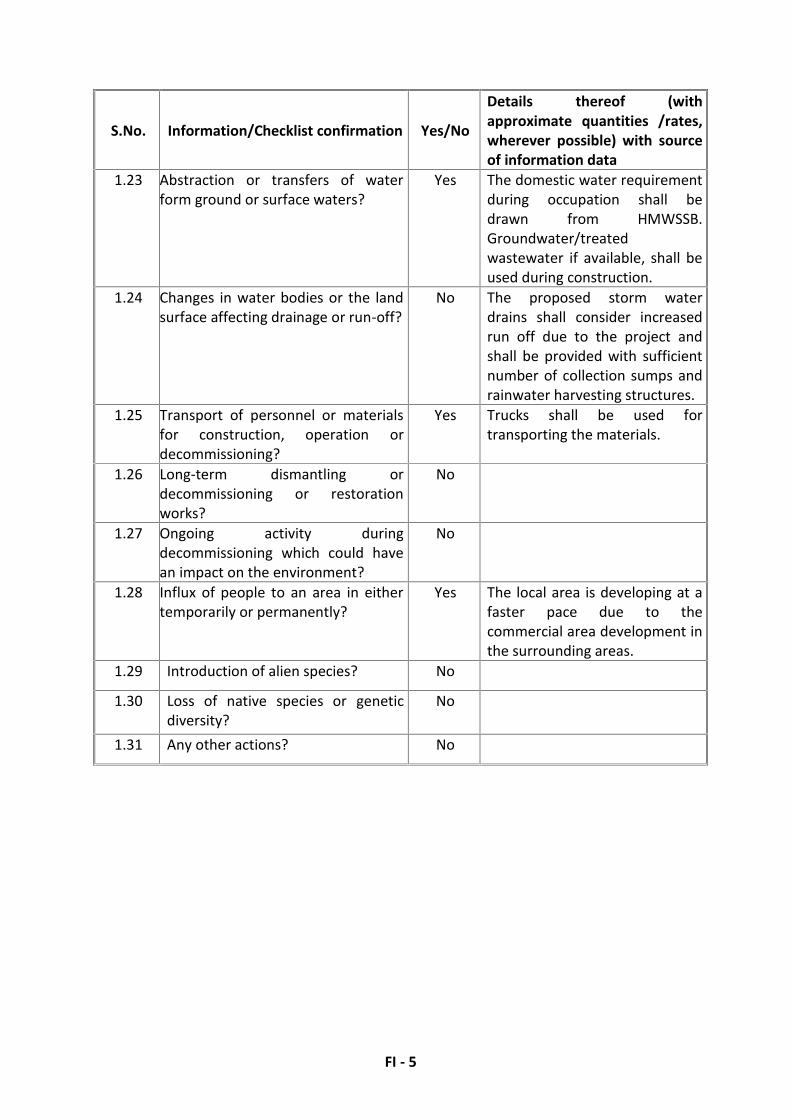
1.23 Abstraction or transfers of waterform ground or surface waters?
Yes The domestic water requirementduring occupation shall bedrawn from HMWSSB.Groundwater/treatedwastewater if available, shall beused during construction.
1.24 Changes in water bodies or the landsurface affecting drainage or run-off?
No The proposed storm waterdrains shall consider increasedrun off due to the project andshall be provided with sufficientnumber of collection sumps andrainwater harvesting structures.
1.25 Transport of personnel or materialsfor construction, operation ordecommissioning?
Yes Trucks shall be used fortransporting the materials.
1.26 Long-term dismantling ordecommissioning or restorationworks?
No
1.27 Ongoing activity duringdecommissioning which could havean impact on the environment?
No
1.28 Influx of people to an area in eithertemporarily or permanently?
Yes The local area is developing at afaster pace due to thecommercial area development inthe surrounding areas.
1.29 Introduction of alien species? No
1.30 Loss of native species or geneticdiversity?
No
1.31 Any other actions? No

FI - 6
2. Use of Natural resources for construction or operation of the Project (such as land, water,materials or energy, especially any resources which are non-renewable or in short supply):
S.No. Information/checklist confirmation Yes/No
Details thereof (withapproximate quantities /rates,wherever possible) with sourceof information data
2.1 Land especially undeveloped oragricultural land (ha)
Yes Undeveloped land of 5.83 ha
2.2 Water (expected source &competing users) unit: KLD
Yes HMWSSB, Water requirementduring occupation is 43.5 KLD.During construction the waterrequirement is 30 KLD. Theavailability of water forHyderabad city are presented inAnnexure - V
2.3 Minerals (MT) No2.4 Construction material – stone,
aggregates, sand / soil (expectedsource – MT)
Yes Annexure – VI: Lead distances ofconstruction materials. Annexure– VII: Quantity of constructionmaterial requirement.
2.5 Forests and timber (source – MT) Yes Local authorized Suppliers2.6 Energy including electricity and fuels
(source, competing users) Unit: fuel(MT), energy (MW)
Yes DG sets and constructionequipment shall be used duringconstruction, which shall usemainly HSD as fuel. The energyrequirement during occupation ispresented in Annexure – VIII.320 kVA X 2 nos of DG sets shallbe used during occupation in theevent of power shut down byTRANSCO to provide power forlifts, street lighting, commonlighting and sewage treatmentplants.
2.7 Any other natural resources (useappropriate standard units)
No

FI - 7
3. Use, storage, transport, handling or production of substances or materials, which couldbe harmful to human health or the environment or raise concerns about actual or perceivedrisks to human health.
S.No. Information/Checklistconfirmation Yes/No
Details thereof (withapproximate quantities/rates,wherever possible) with sourceof information data
3.1 Use of substances or materials,which are hazardous (as per MSIHCrules) to human health or theenvironment (flora, fauna, andwater supplies)
No Hazardous materials used are;HSD, Paints etc.
3.2 Changes in occurrence of disease oraffect disease vectors (e.g. insect orwater borne diseases)
No
3.3 Affect the welfare of people e.g. bychanging living conditions?
Yes The project shall provide housingfacility for 53 families.
3.4 Vulnerable groups of people whocould be affected by the project e.g.hospital patients, children, theelderly etc.,
No
3.5 Any other causes No
FI - 8
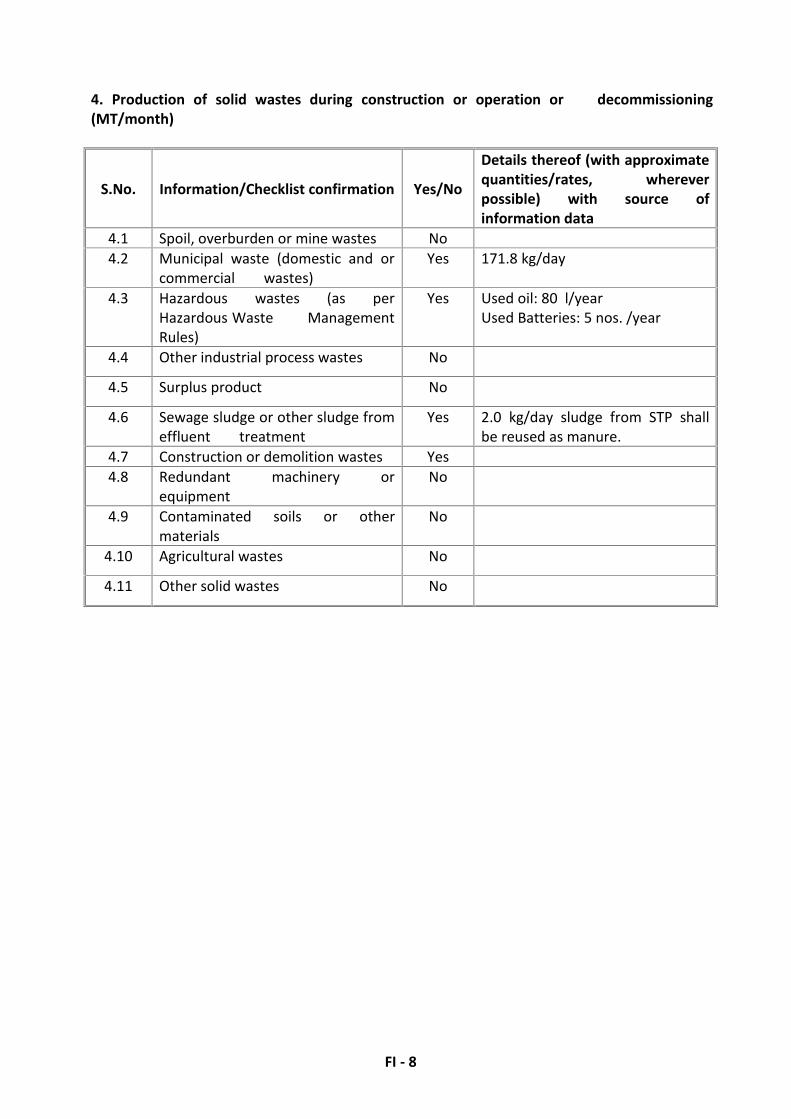
4. Production of solid wastes during construction or operation or decommissioning(MT/month)
S.No. Information/Checklist confirmation Yes/No
Details thereof (with approximatequantities/rates, whereverpossible) with source ofinformation data
4.1 Spoil, overburden or mine wastes No4.2 Municipal waste (domestic and or
commercial wastes)Yes 171.8 kg/day
4.3 Hazardous wastes (as perHazardous Waste ManagementRules)
Yes Used oil: 80 l/yearUsed Batteries: 5 nos. /year
4.4 Other industrial process wastes No
4.5 Surplus product No
4.6 Sewage sludge or other sludge fromeffluent treatment
Yes 2.0 kg/day sludge from STP shallbe reused as manure.
4.7 Construction or demolition wastes Yes4.8 Redundant machinery or
equipmentNo
4.9 Contaminated soils or othermaterials
No
4.10 Agricultural wastes No
4.11 Other solid wastes No

FI - 9
5. Release of pollutants or any hazardous, toxic or noxious substances to air (Kg/hr)
S.No. Information/Checklistconfirmation Yes/No
Details thereof (with approximatequantities/rates, whereverpossible) with source ofinformation data
5.1 Emissions from combustion offossil fuels from stationary ormobile sources
Yes Emissions from DG sets, operatedonly during load shut down byTRANSCO. Emissions quantitiesare presented in Annexure – IX.
5.2 Emissions from productionprocesses
No Cooking and vehicular transportare the other sources of emission.
5.3 Emissions from materials handlingincluding storage or transport
No
5.4 Emissions from constructionactivities including plant andequipment
Yes Construction equipment and DGsets which mainly use HSD, as fuelshall generate emissions.
5.5 Dust or odours from handling ofmaterials including constructionmaterials, sewage and waste
No
5.6 Emissions from incineration ofwaste
No
5.7 Emissions from burning of wastein open air (e.g. slash materials,construction debris)
No
5.8 Emissions from any other sources No
FI - 10
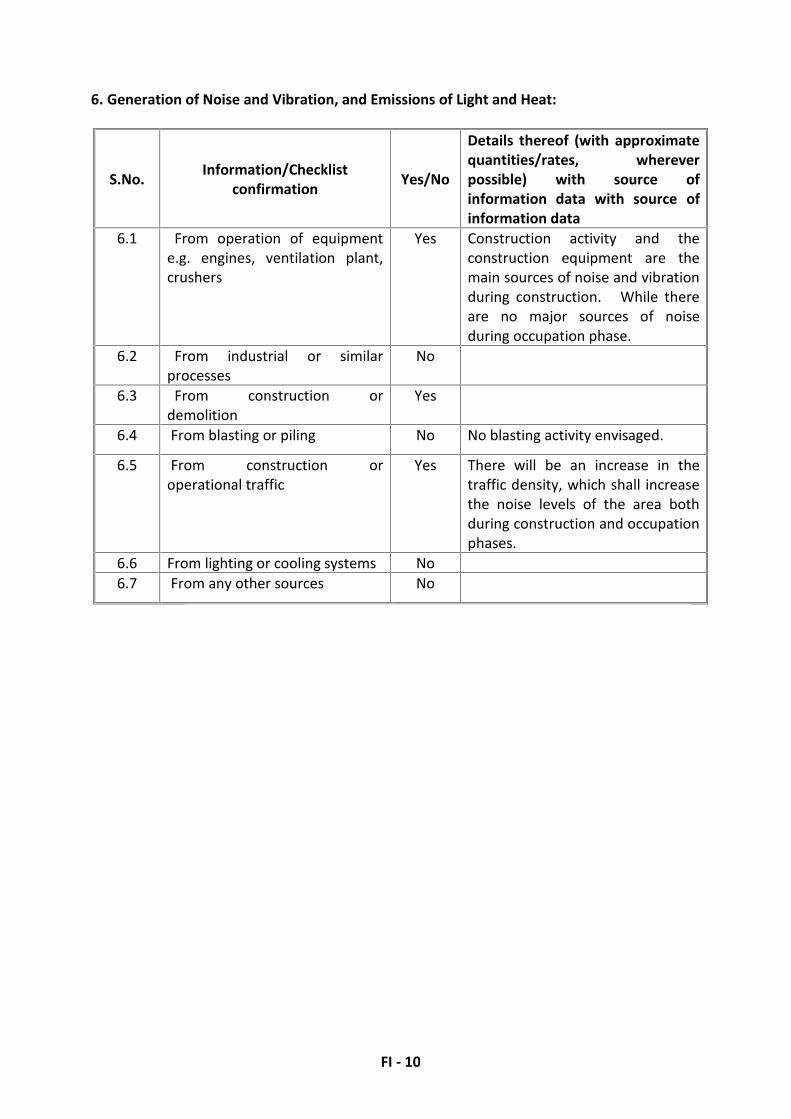
6. Generation of Noise and Vibration, and Emissions of Light and Heat:
S.No. Information/Checklistconfirmation Yes/No
Details thereof (with approximatequantities/rates, whereverpossible) with source ofinformation data with source ofinformation data
6.1 From operation of equipmente.g. engines, ventilation plant,crushers
Yes Construction activity and theconstruction equipment are themain sources of noise and vibrationduring construction. While thereare no major sources of noiseduring occupation phase.
6.2 From industrial or similarprocesses
No
6.3 From construction ordemolition
Yes
6.4 From blasting or piling No No blasting activity envisaged.
6.5 From construction oroperational traffic
Yes There will be an increase in thetraffic density, which shall increasethe noise levels of the area bothduring construction and occupationphases.
6.6 From lighting or cooling systems No6.7 From any other sources No

FI - 11
7. Risks of contamination of land or water from releases of pollutants into the ground orinto sewers, surface waters, groundwater, coastal waters or the sea:
S.No. Information/Checklistconfirmation Yes/No
Details thereof (with approximatequantities/rates, whereverpossible) with source ofinformation data
7.1 From handling, storage, use orspillage of hazardous materials
No Used batteries and waste oil shallbe stored separately and shall notlead to contamination of landduring normal operation.
7.2 From discharge of sewage orother effluents to water or theland (expected mode and place ofdischarge)
No The sewage shall be treated toachieve the standards prescribed byMoE&F during operation phase.While the discharges fromtemporary toilets duringconstruction shall be sent to septictank followed by municipal sewerlines.
7.3 By deposition of pollutantsemitted to air into the land or intowater
No The project shall not emitsubstantial quantities of pollutantsto have an impact on the air quality.
7.4 From any other sources No
7.5 Is there a risk of long term buildup of pollutants in theenvironment from thesesources?
No
FI - 12
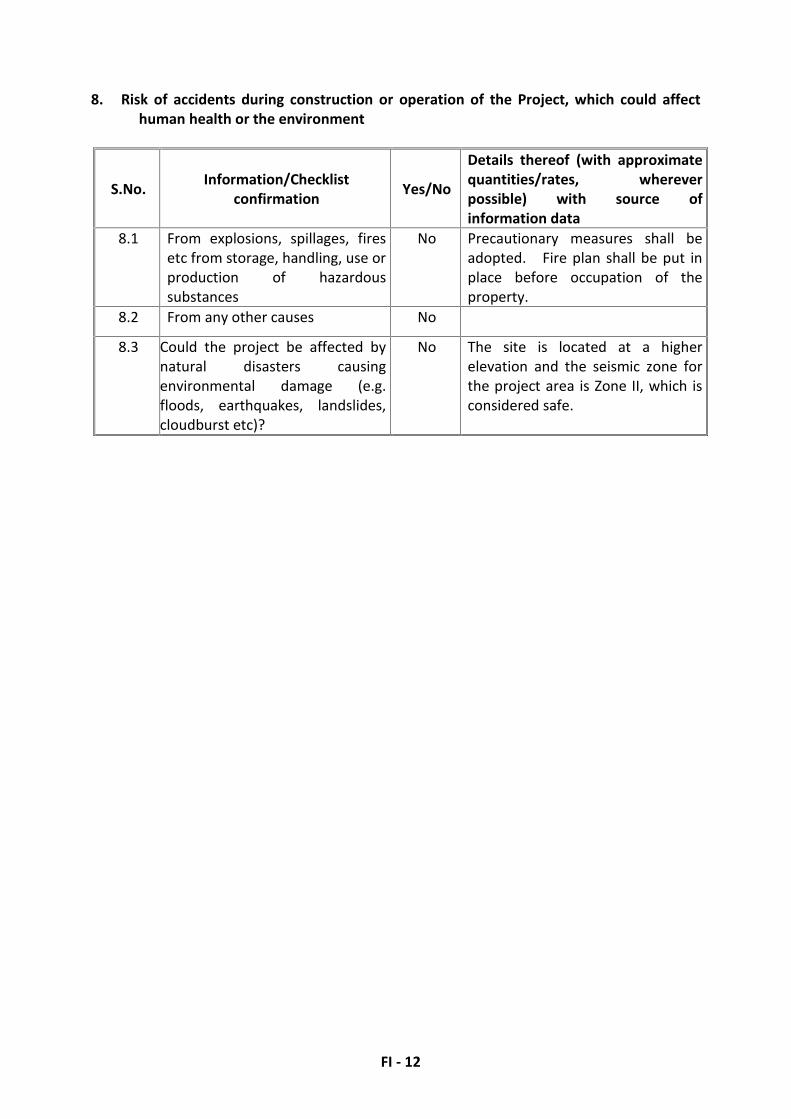
8. Risk of accidents during construction or operation of the Project, which could affecthuman health or the environment
S.No. Information/Checklistconfirmation Yes/No
Details thereof (with approximatequantities/rates, whereverpossible) with source ofinformation data
8.1 From explosions, spillages, firesetc from storage, handling, use orproduction of hazardoussubstances
No Precautionary measures shall beadopted. Fire plan shall be put inplace before occupation of theproperty.
8.2 From any other causes No
8.3 Could the project be affected bynatural disasters causingenvironmental damage (e.g.floods, earthquakes, landslides,cloudburst etc)?
No The site is located at a higherelevation and the seismic zone forthe project area is Zone II, which isconsidered safe.

FI - 13
9. Factors which should be considered (such as consequential development) which couldlead to environmental effects or the potential for cumulative impacts with other existingor planned activities in the locality
S. No. Information/Checklistconfirmation Yes/No
Details thereof (withapproximate quantities/rates,wherever possible) with sourceof information data
9.1 Lead to development ofsupporting.
Lities, ancillary development ordevelopmentStimulated by the project whichcould have impact on theenvironment e.g.:
• Supporting infrastructure (roads,power supply, waste or wastewater treatment, etc.)
• Housing development
• Extractive industries
• Supply industries
• Other
Yes
Yes
Yes
No
No
No
The area is presently developinginto a prime residential andcommercial locality in view of thethrust given by Government ofTelangana for the development ofIT and ITES services.
9.2 Lead to after-use of the site, whichcould have an impact on theenvironment
No
9.3 Set a precedent for laterdevelopments
Yes The surrounding areas shalldevelop as residential/Commercial areas.
9.4 Have cumulative effects due toproximity to other existing orplanned projects with similareffects
No
FI - 14
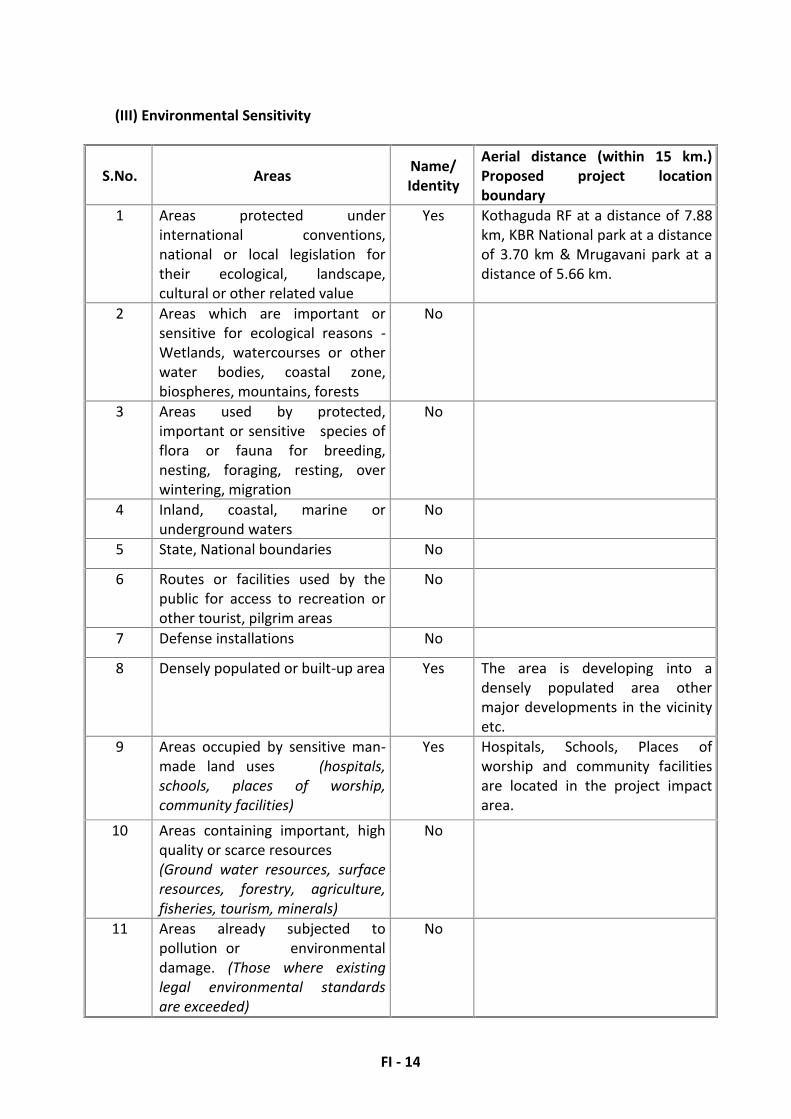
(III) Environmental Sensitivity
S.No. Areas Name/Identity
Aerial distance (within 15 km.)Proposed project locationboundary
1 Areas protected underinternational conventions,national or local legislation fortheir ecological, landscape,cultural or other related value
Yes Kothaguda RF at a distance of 7.88km, KBR National park at a distanceof 3.70 km & Mrugavani park at adistance of 5.66 km.
2 Areas which are important orsensitive for ecological reasons -Wetlands, watercourses or otherwater bodies, coastal zone,biospheres, mountains, forests
No
3 Areas used by protected,important or sensitive species offlora or fauna for breeding,nesting, foraging, resting, overwintering, migration
No
4 Inland, coastal, marine orunderground waters
No
5 State, National boundaries No
6 Routes or facilities used by thepublic for access to recreation orother tourist, pilgrim areas
No
7 Defense installations No
8 Densely populated or built-up area Yes The area is developing into adensely populated area othermajor developments in the vicinityetc.
9 Areas occupied by sensitive man-made land uses (hospitals,schools, places of worship,community facilities)
Yes Hospitals, Schools, Places ofworship and community facilitiesare located in the project impactarea.
10 Areas containing important, highquality or scarce resources(Ground water resources, surfaceresources, forestry, agriculture,fisheries, tourism, minerals)
No
11 Areas already subjected topollution or environmentaldamage. (Those where existinglegal environmental standardsare exceeded)
No

FI - 15
S.No. Areas Name/Identity
Aerial distance (within 15 km.)Proposed project locationboundary
12 Areas susceptible to naturalhazard which could cause theproject to present environmentalproblems (Earthquakes,subsidence, landslides, erosion,flooding or extreme or adverseclimatic conditions)
No
FI - 16
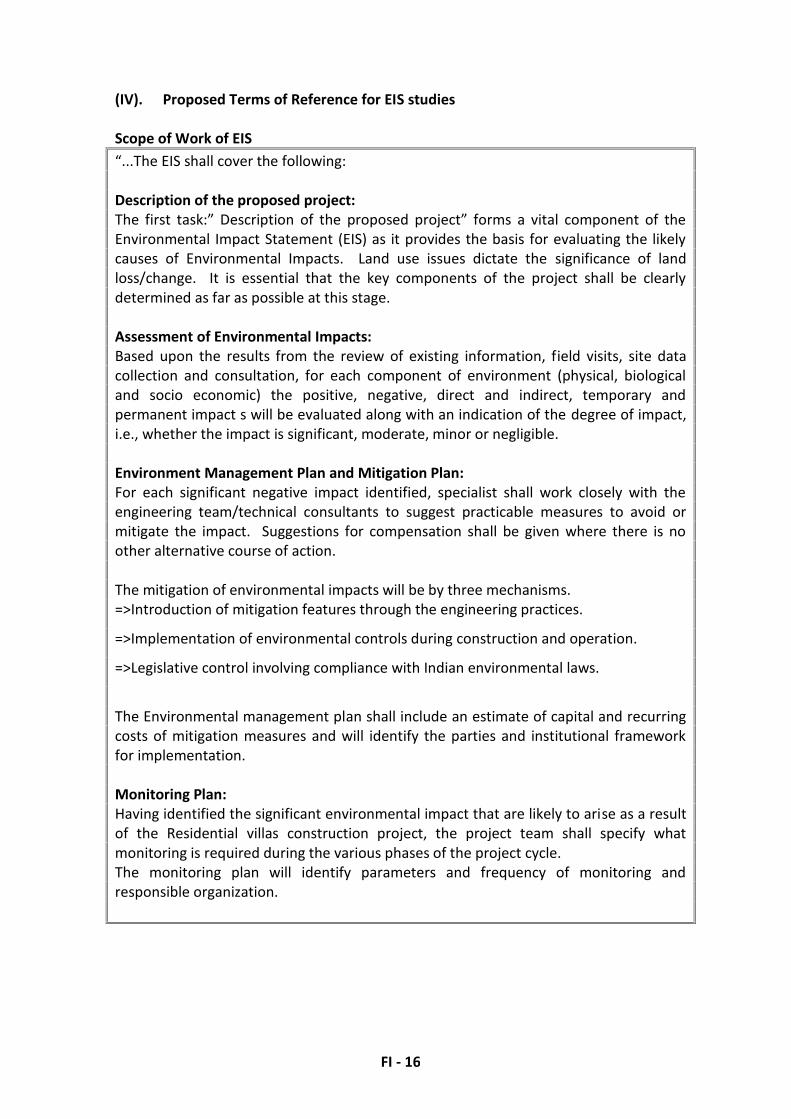
(IV). Proposed Terms of Reference for EIS studies
Scope of Work of EIS“...The EIS shall cover the following:
Description of the proposed project:The first task:” Description of the proposed project” forms a vital component of theEnvironmental Impact Statement (EIS) as it provides the basis for evaluating the likelycauses of Environmental Impacts. Land use issues dictate the significance of landloss/change. It is essential that the key components of the project shall be clearlydetermined as far as possible at this stage.
Assessment of Environmental Impacts:Based upon the results from the review of existing information, field visits, site datacollection and consultation, for each component of environment (physical, biologicaland socio economic) the positive, negative, direct and indirect, temporary andpermanent impact s will be evaluated along with an indication of the degree of impact,i.e., whether the impact is significant, moderate, minor or negligible.
Environment Management Plan and Mitigation Plan:For each significant negative impact identified, specialist shall work closely with theengineering team/technical consultants to suggest practicable measures to avoid ormitigate the impact. Suggestions for compensation shall be given where there is noother alternative course of action.
The mitigation of environmental impacts will be by three mechanisms.=>Introduction of mitigation features through the engineering practices.
=>Implementation of environmental controls during construction and operation.
=>Legislative control involving compliance with Indian environmental laws.
The Environmental management plan shall include an estimate of capital and recurringcosts of mitigation measures and will identify the parties and institutional frameworkfor implementation.
Monitoring Plan:Having identified the significant environmental impact that are likely to arise as a resultof the Residential villas construction project, the project team shall specify whatmonitoring is required during the various phases of the project cycle.The monitoring plan will identify parameters and frequency of monitoring andresponsible organization.
FI - 17

A - 1
ANNEXURE-I
Built Up Area Statement
Land Use No. of Floor No. of Units Total Site Area(m2)
Total Built uparea (m2)
Villas G + 2 53 12827.0 27474.6Amenities G + 1 628.4 1392.9Green area 22138.4Road area 13221.9Open area 7980.7Utility Area 901.6Net plot Area 57697.9Road widening area 570.7Total Site Area 53 58268.7 28867.5

A - 2
ANNEXURE-II
Earth Work Quantities
S.No. Area Qty. of fill (m3) Qty. of cut (m3) Surplus fill(m3) Surplus cut (m3)
1 Site area 11654 11654 ---- ----
A - 3
ANNEXURE-III
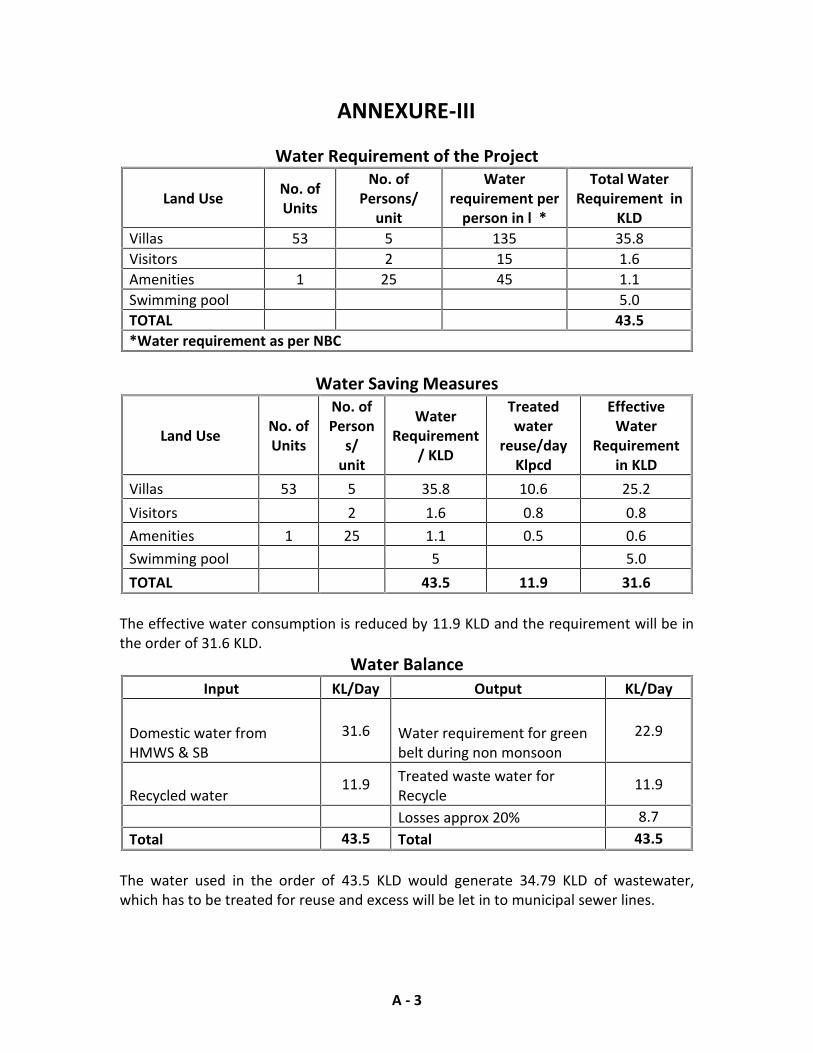
Water Requirement of the Project
Land Use No. ofUnits
No. ofPersons/
unit
Waterrequirement per
person in l *
Total WaterRequirement in
KLDVillas 53 5 135 35.8Visitors 2 15 1.6Amenities 1 25 45 1.1Swimming pool 5.0TOTAL 43.5*Water requirement as per NBC
Water Saving Measures
Land Use No. ofUnits
No. ofPerson
s/unit
WaterRequirement
/ KLD
Treatedwater
reuse/dayKlpcd
EffectiveWater
Requirementin KLD
Villas 53 5 35.8 10.6 25.2Visitors 2 1.6 0.8 0.8Amenities 1 25 1.1 0.5 0.6Swimming pool 5 5.0TOTAL 43.5 11.9 31.6
The effective water consumption is reduced by 11.9 KLD and the requirement will be inthe order of 31.6 KLD.
Water BalanceInput KL/Day Output KL/Day
Domestic water fromHMWS & SB
31.6 Water requirement for greenbelt during non monsoon
22.9
Recycled water11.9 Treated waste water for
Recycle11.9
Losses approx 20% 8.7Total 43.5 Total 43.5
The water used in the order of 43.5 KLD would generate 34.79 KLD of wastewater,which has to be treated for reuse and excess will be let in to municipal sewer lines.
A - 4
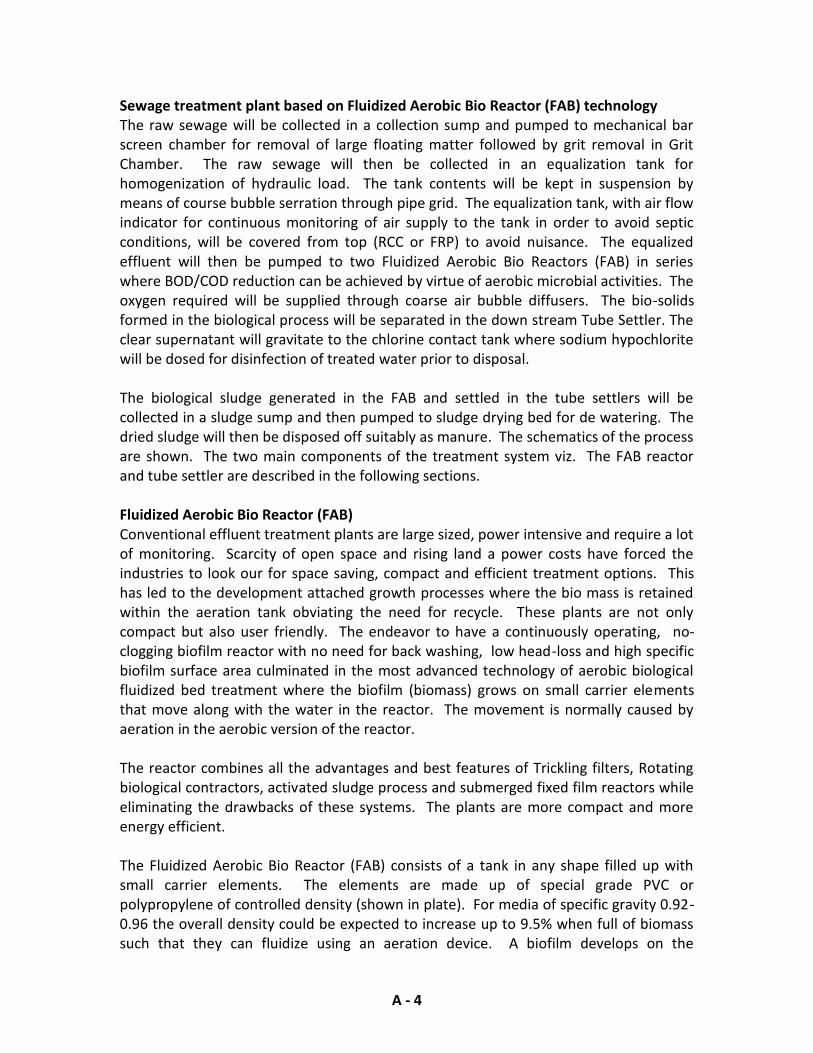
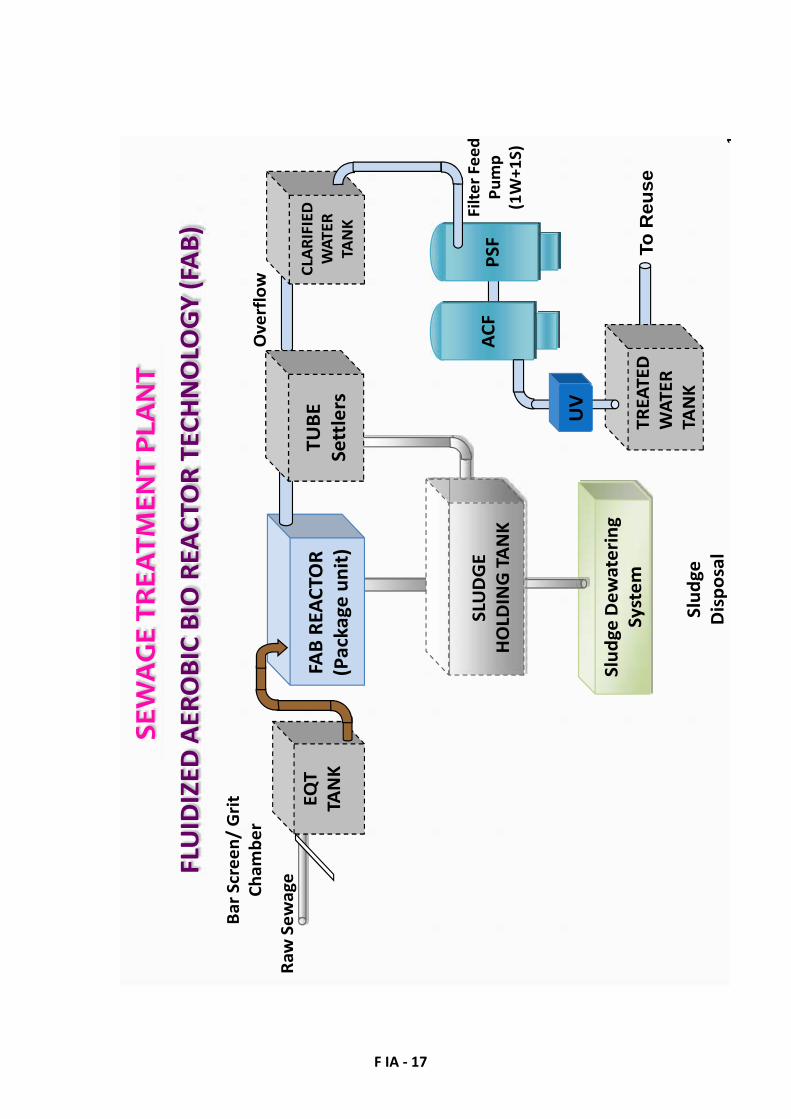
Sewage treatment plant based on Fluidized Aerobic Bio Reactor (FAB) technologyThe raw sewage will be collected in a collection sump and pumped to mechanical barscreen chamber for removal of large floating matter followed by grit removal in GritChamber. The raw sewage will then be collected in an equalization tank forhomogenization of hydraulic load. The tank contents will be kept in suspension bymeans of course bubble serration through pipe grid. The equalization tank, with air flowindicator for continuous monitoring of air supply to the tank in order to avoid septicconditions, will be covered from top (RCC or FRP) to avoid nuisance. The equalizedeffluent will then be pumped to two Fluidized Aerobic Bio Reactors (FAB) in serieswhere BOD/COD reduction can be achieved by virtue of aerobic microbial activities. Theoxygen required will be supplied through coarse air bubble diffusers. The bio-solidsformed in the biological process will be separated in the down stream Tube Settler. Theclear supernatant will gravitate to the chlorine contact tank where sodium hypochloritewill be dosed for disinfection of treated water prior to disposal.
The biological sludge generated in the FAB and settled in the tube settlers will becollected in a sludge sump and then pumped to sludge drying bed for de watering. Thedried sludge will then be disposed off suitably as manure. The schematics of the processare shown. The two main components of the treatment system viz. The FAB reactorand tube settler are described in the following sections.
Fluidized Aerobic Bio Reactor (FAB)Conventional effluent treatment plants are large sized, power intensive and require a lotof monitoring. Scarcity of open space and rising land a power costs have forced theindustries to look our for space saving, compact and efficient treatment options. Thishas led to the development attached growth processes where the bio mass is retainedwithin the aeration tank obviating the need for recycle. These plants are not onlycompact but also user friendly. The endeavor to have a continuously operating, no-clogging biofilm reactor with no need for back washing, low head-loss and high specificbiofilm surface area culminated in the most advanced technology of aerobic biologicalfluidized bed treatment where the biofilm (biomass) grows on small carrier elementsthat move along with the water in the reactor. The movement is normally caused byaeration in the aerobic version of the reactor.
The reactor combines all the advantages and best features of Trickling filters, Rotatingbiological contractors, activated sludge process and submerged fixed film reactors whileeliminating the drawbacks of these systems. The plants are more compact and moreenergy efficient.
The Fluidized Aerobic Bio Reactor (FAB) consists of a tank in any shape filled up withsmall carrier elements. The elements are made up of special grade PVC orpolypropylene of controlled density (shown in plate). For media of specific gravity 0.92-0.96 the overall density could be expected to increase up to 9.5% when full of biomasssuch that they can fluidize using an aeration device. A biofilm develops on the

A - 5
elements, which move along the effluent in the reactor. The movement within thereactor is generated by providing aeration with the help of diffusers placed at thebottom of the reactor. Then thin biofilm on the elements enables the bacteria to actupon the biodegradable matter in the effluent and reduce the BOD/COD content in thepresence of oxygen available from the air that is used for fluidization.
Characteristics of Waste waterParameter Quantity in mg/l
PH 6 – 7Total Suspended Solids 400 – 600BOD 200 – 300COD 450 – 500
Design of the unitBasic dataFlow : 34 KLDCapacity : 40 m3
Peak factor : 3.5Peak flow Q peak : 140 m3/dayInfluent BOD : 200 mg/litInfluent Suspended Solids : 200 mg/litInfluent COD : 350 mg/litEffluent BOD : 30 mg/litEffluent COD : 200 mg/litEffluent Suspended Solids : 100 mg/lit
1. Bar Screen Chamber
Average flow :0.00046 m3/sec
Peak factor : 3.5Peak flow : 0.0016 m3/secVelocity at peak flow : 0.75 m/SecEffective area of screen RequiredAt average flow : 0.0015 m2
At Peak flow : 0.0021 m2
Provide Effective area of screen : 0.0021 m2
Considering the bar of dia. 10 mm(w) and clear spacing of 20 mm (b)Overall area required : 0.0032 m2
Considering screen depth as : 0.006 m Consider 0.5 mNumber of clear spacing : 0.1Number of bars : 1 Consider 3 Nos.Hence Provide 3 barsProvide a screen of 0.5 m X 0.5 m at an inclination of sin 600. In a screen channel of onemeter (1 m) length.

A - 6
2. Grit Chamber :The flow from the bar screen chamber is let into the Grit Chamber of minimum 2 hourscapacity. This tank is provided to even out the flow variation, and to provide a continuousfeed into the secondary biological treatment units.Peak flow Q : 0.0016 m3/secProviding a flow through velocity of 0.30 m/secCross sectional area of Channel : 0.005 m2
Surface area of channel : 0.12 m2
Assuming depth d : 0.2 mWidth of channel : 0.02 m (say 0.1m)Length of channel : 4. 0 m (say 4.0 m)Provide two channels each of 0.1 m wide and 4.0 m long with depth of waste water 0.2 m.
3. Equalization tank:The flow from the bar screen chamber is let into the equalization tank of minimum 2hourscapacity. This tank is provided to even out the flow variation, and to provide a continuousfeed into the secondary biological treatment units.Average flow : 1.6 m3/hrPeak factor : 3.5Peak flow : 5.8 m3/hrHydraulic retention tank = 2 hrs at Peak flowHence required volume of the tank : 11.66 m3
Provide tank of : 11.66 m3 CapacityAssuming depth : 3 mArea : 3.8 m2
Assuming length to width ratio (1:1) ; l=blength of the tank : 1.9 mwidth of the tank : 1.9 mAir required for agitation : 0.01 m3/ m2 minTotal air required : 11.66 m3/hrAir blower required : 20 m3/hr @ 3.8 mwcEffluent transfer pump : 1.6 m3/hr @ 8 mwc
4. Fluidized Aerobic Bio Reactor (FAB):The polypropylene media have been provided with a specific surface area of 350 – 520 m2
/m3. This allows micro-organisms to get attached and biomass concentration can beincreased to four folds as compared to Activated Sludge Process. This enables to considerhigher Organic loading rates.
The micro-organisms attached to media are kept in a fluid state thereby maintaining theCSTR (continuous Stirrer tank reactor) regime as well as two tanks are provided in seriesmaking the plug – flow system. This will enhance the efficiencies and have the merits ofboth CSTR and plug-flow regimes.

A - 7
Organic loading rate : 3.2 kg BOD/ m3 dOrganic load : 8 kg/dayVolume of the tank : 2.5 m3
Assume the depth : 3 mNo. of tanks in series : 1Size of the tank : 1.3 m dia. x 3.0 SWDSpecific gravity of media : 0.92 to 0.96Specific surface area of media : 350 – 520 m2 /m3
Media filling : 30 – 50 % of tank volumeOxygen required : 2 kg / kg BODOxygen in air : 23%Specific gravity of air @ 30 deg. : 1.65Aeration : Coarse bubbleOxygen transfer efficiency : 12%Air required : 20 m3/hrAir blower required : 50 m3/hr @ 6.5 m wc
5.Tube settlerSurface loading rate : 20 m2 /m3 dSurface area required : 2 m2
Tank size : 3.0 m x 6.0 m x 2.7 m SWD With 55deg. hopper bottom
Tube Modules : 3.0m x 6.0 m x 0.6 m ht.Tube inclination : 60 deg.Settling area for 60 deg slope : 11 m2 /m3
Cross sectional area of tubes : 120 mm x 44 mm HexagonalHydraulic radius : 1/61 cm (1.5 cm)Shape factor : 0.6 – 0.7 for media settleable solids
6. Pre Filtration tankThe flow from the each individual settling tank i.e., the supernatant liquid is let into therespective Pre-Filtration Tank, which has a minimum 1.5 hours holding capacity. This tankis provided to hold the treated effluent and give an even flow to the pressure sand filter.Average flow : 1.6 m3/hrPeak factor : 2 m3/hrPeak flow : 3.3 m3/hrProvide min 1.5 hours holding capacity.Hence required volume of the tank : 5 m3
7. Pressure Sand Filter:Vertical down flow type with graded/sand bed under drain plate with polysterene strains.Flow : 40 m3/dayRate of filtration assumed as : 10 m3/m2/hrRequirement of treated water for usage in 20 hrs : 2 m3/hr

A - 8
Dia. of filter of 1 nos. : 504 mmProvide pressure sand filter of 550 mm dia. and 800 mm HOS with sand as media layer,under drain pipe, laterals face piping etc for each stream.
8. Activated Carbon Filter:Vertical down flow type with graded/sand bed under drain plate with polysterene strains.Flow : 40 m3/dayRate of filtration assumed as : 10 m3/m2/hrRequirement of treated water for usage in 20 hrs : 2 m3/hrDia of filter of 1 nos. : 504 mmProvide Activated Carbon filter of 550 mm dia with granular Activated carbon as mediaand 800 mm HOS with sand as media layer, under drain pipe, laterals face piping etc foreach stream.
9.Final Treated Water Holding TankIt is always preferred to provide one final holding tank of minimum one day holdingcapacity, so that the treated effluents can be stored and used back for gardening or othertertiary purposes.Capacity: 40 m3
10. Sludge Filter Press:The biomass in the aeration tank stabilizes BOD in wastewater by consuming the organicmatter in the wastewater. The metabolic activity results in growth of the biomasspopulation in the Fluidized Aerobic Bio Reactor (FAB). Sludge holding tank has beenprovided with filter press for dewatering sludge. The filtrate drains off through the media,which is again let into equalization tank.The dewatered sludge is collected in trays, which can be used as manure in the garden.No. of plates : 24Size of plates : 600 mm X 600 mmPlate moc (material of construction) : PP (poly propline)Type of operation : HydraulicPower pack capacity : 2 HPThe biomass in the aeration tank stabilizes BOD in wastewater by consuming the organicmatter in the wastewater. The metabolic activity results in growth of the biomasspopulation in the Fluidized Aerobic Bio Reactor (FAB).
Sludge holding tank has been provided with filter press for dewatering sludge. The filtratedrains off through the media, which is again let into equalization tank.
The dewatered sludge is collected in trays, which can be used as manure in the garden.
A - 9
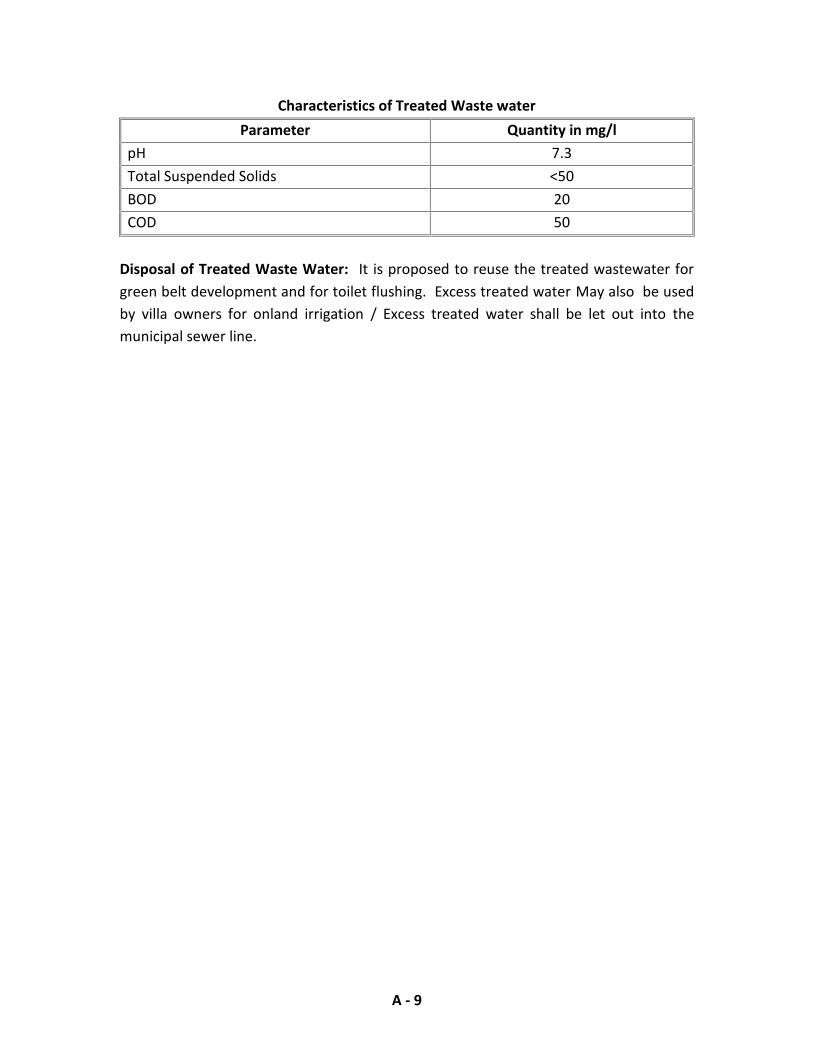
Characteristics of Treated Waste waterParameter Quantity in mg/l
pH 7.3Total Suspended Solids <50BOD 20COD 50
Disposal of Treated Waste Water: It is proposed to reuse the treated wastewater forgreen belt development and for toilet flushing. Excess treated water May also be usedby villa owners for onland irrigation / Excess treated water shall be let out into themunicipal sewer line.

A - 10
SEW
AG
E TR
EATM
ENT
PLA
NT
FLU
IDIZ
ED A
ERO
BIC
BIO
REA
CTO
R TE
CHN
OLO
GY
(FAB
)
Slud
geD
ewat
erin
gSy
stem
EQT
TAN
K
PSF
ACF
BarS
cree
n/ G
ritCh
ambe
r
Raw
Sew
age
Ove
rflo
w
Filte
r Fee
dPu
mp
(1W
+1S)
Slud
geD
ispo
sal
SLU
DG
EH
OLD
ING
TAN
K
CLAR
IFIE
DW
ATER
TAN
K
FAB
REAC
TOR
(Pac
kage
uni
t)
TREA
TED
WAT
ERTA
NK
To R
euse
TUBE
Sett
lers
18
UV
A - 11
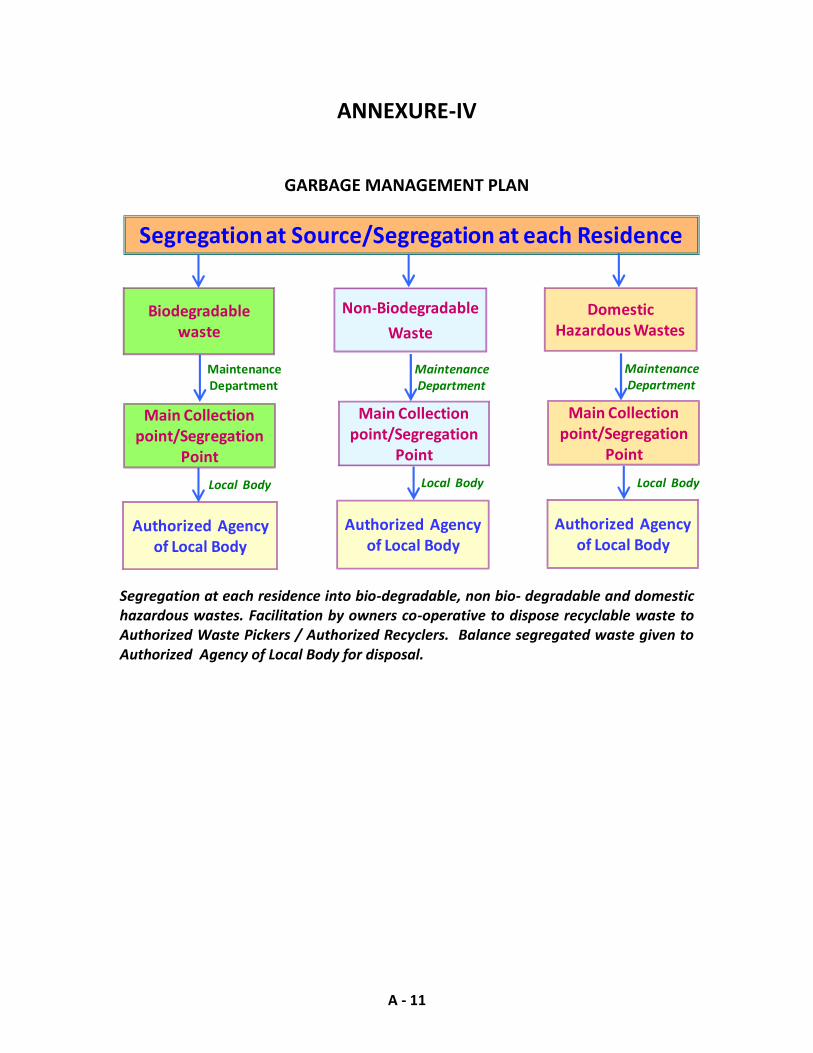
ANNEXURE-IV
GARBAGE MANAGEMENT PLAN
Segregation at each residence into bio-degradable, non bio- degradable and domestichazardous wastes. Facilitation by owners co-operative to dispose recyclable waste toAuthorized Waste Pickers / Authorized Recyclers. Balance segregated waste given toAuthorized Agency of Local Body for disposal.
MaintenanceDepartment
MaintenanceDepartment
Biodegradablewaste
Non-BiodegradableWaste
Authorized Agencyof Local Body
Authorized Agencyof Local Body
Main Collectionpoint/Segregation
Point
Main Collectionpoint/Segregation
PointLocal Body
Segregation at Source/Segregation at each Residence
MaintenanceDepartment
DomesticHazardous Wastes
Authorized Agencyof Local Body
Main Collectionpoint/Segregation
PointLocal Body Local Body
A - 12
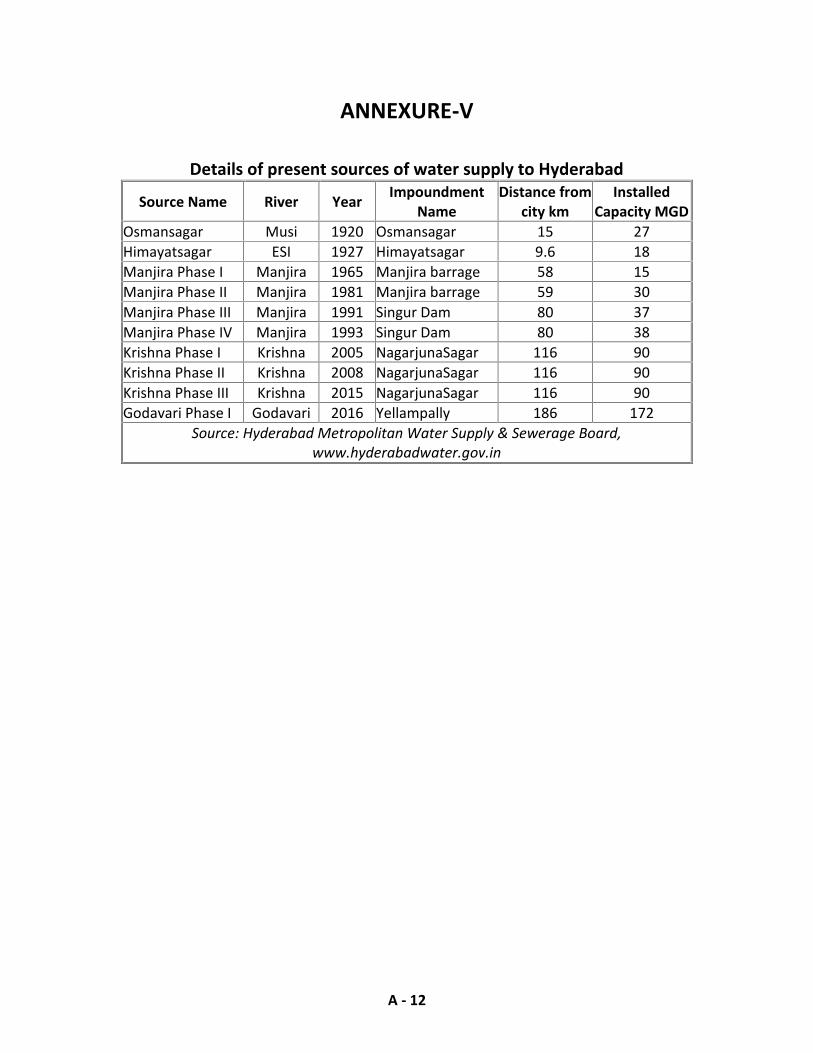
ANNEXURE-V
Details of present sources of water supply to Hyderabad
Source Name River Year ImpoundmentName
Distance fromcity km
InstalledCapacity MGD
Osmansagar Musi 1920 Osmansagar 15 27Himayatsagar ESI 1927 Himayatsagar 9.6 18Manjira Phase I Manjira 1965 Manjira barrage 58 15Manjira Phase II Manjira 1981 Manjira barrage 59 30Manjira Phase III Manjira 1991 Singur Dam 80 37Manjira Phase IV Manjira 1993 Singur Dam 80 38Krishna Phase I Krishna 2005 NagarjunaSagar 116 90Krishna Phase II Krishna 2008 NagarjunaSagar 116 90Krishna Phase III Krishna 2015 NagarjunaSagar 116 90Godavari Phase I Godavari 2016 Yellampally 186 172
Source: Hyderabad Metropolitan Water Supply & Sewerage Board,www.hyderabadwater.gov.in
A - 13
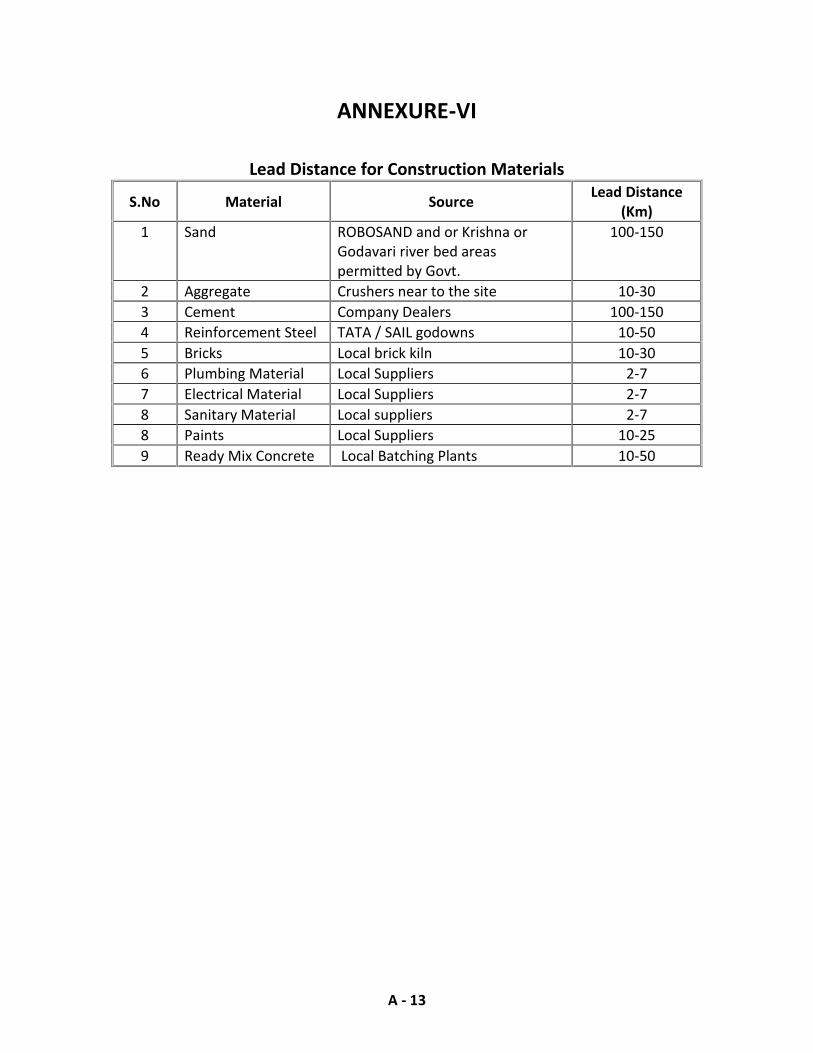
ANNEXURE-VI
Lead Distance for Construction Materials
S.No Material Source Lead Distance(Km)
1 Sand ROBOSAND and or Krishna orGodavari river bed areaspermitted by Govt.
100-150
2 Aggregate Crushers near to the site 10-303 Cement Company Dealers 100-1504 Reinforcement Steel TATA / SAIL godowns 10-505 Bricks Local brick kiln 10-306 Plumbing Material Local Suppliers 2-77 Electrical Material Local Suppliers 2-78 Sanitary Material Local suppliers 2-78 Paints Local Suppliers 10-259 Ready Mix Concrete Local Batching Plants 10-50
A - 14
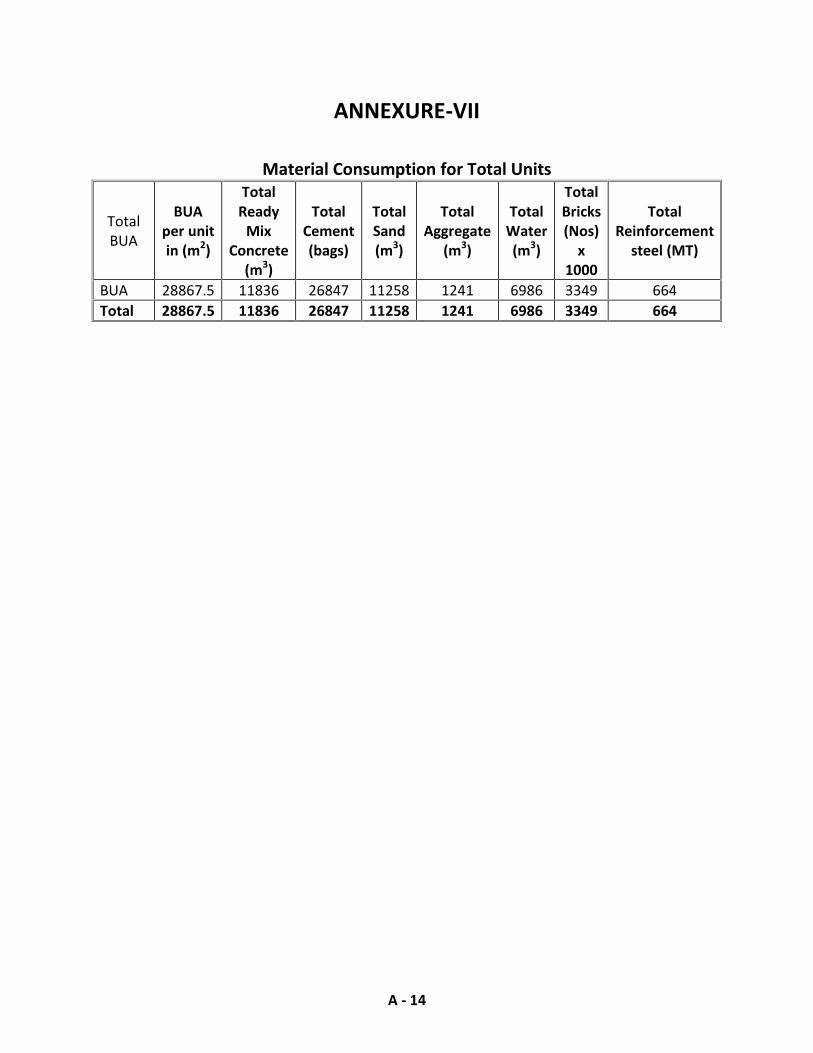
ANNEXURE-VII
Material Consumption for Total Units
TotalBUA
BUAper unitin (m2)
TotalReady
MixConcrete
(m3)
TotalCement(bags)
TotalSand(m3)
TotalAggregate
(m3)
TotalWater(m3)
TotalBricks(Nos)
x1000
TotalReinforcement
steel (MT)
BUA 28867.5 11836 26847 11258 1241 6986 3349 664Total 28867.5 11836 26847 11258 1241 6986 3349 664
A - 15
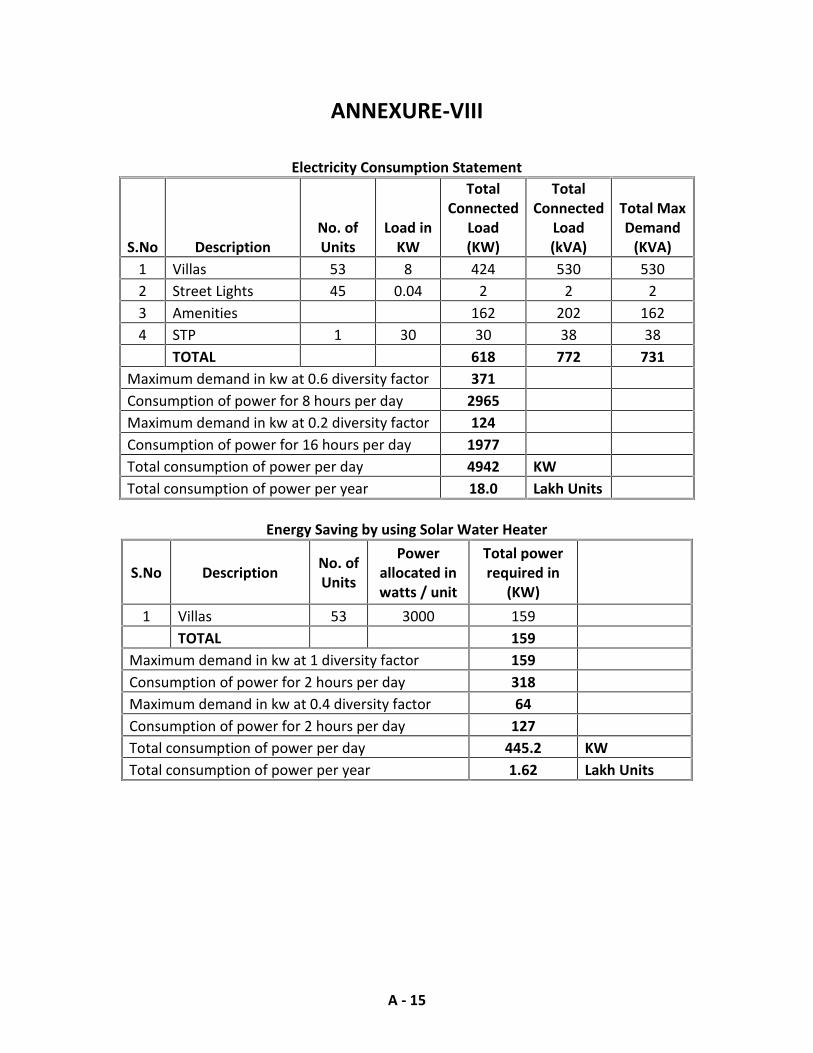
ANNEXURE-VIII
Electricity Consumption Statement
S.No DescriptionNo. ofUnits
Load inKW
TotalConnected
Load(KW)
TotalConnected
Load(kVA)
Total MaxDemand
(KVA)1 Villas 53 8 424 530 5302 Street Lights 45 0.04 2 2 23 Amenities 162 202 1624 STP 1 30 30 38 38
TOTAL 618 772 731Maximum demand in kw at 0.6 diversity factor 371Consumption of power for 8 hours per day 2965Maximum demand in kw at 0.2 diversity factor 124Consumption of power for 16 hours per day 1977Total consumption of power per day 4942 KWTotal consumption of power per year 18.0 Lakh Units
Energy Saving by using Solar Water Heater
S.No Description No. ofUnits
Powerallocated inwatts / unit
Total powerrequired in
(KW)1 Villas 53 3000 159
TOTAL 159Maximum demand in kw at 1 diversity factor 159Consumption of power for 2 hours per day 318Maximum demand in kw at 0.4 diversity factor 64Consumption of power for 2 hours per day 127Total consumption of power per day 445.2 KWTotal consumption of power per year 1.62 Lakh Units

A - 16
Energy Saving by using Solar Street Lights
S.No Description No. ofUnits
Powerallocated inwatts / unit
Total powerrequired in
(KW)1 Street lights 25 40 1
TOTAL 1Maximum demand in kw at 0.6 diversity factor 0.6Consumption of power for 8 hours per day 5Maximum demand in kw at full load 1Consumption of power for 4 hours per day 4Total consumption of power per day 8.8 KWTotal consumption of power per year 0.03 Lakh Unitssaving with Solar Heater and Street Lighting 1.66 Lakh Units
Electrical Power savings using CFL for lighting
S.No Description Area inm2
Powerallocated inwatts / unit
Total powerrequired in
(KW)1 Residential 27475 6 1652 Common & Utilities 1393 1.5 2
TOTAL 167Maximum demand in kw at 0.9 diversity factor 150Consumption of power for 12 hours per day 1803Total consumption of power per day 1802.9 KWTotal consumption of power per year 6.58 Lakh UnitsSavings in power using CFL 1.97 Lakh Units
Savings in Electrical Power Consumption – SUMMARY
S.No Description WithCFL/LED
With SolarHeater and
StreetLighting
TotalConsumption
lakh unitsTotal Saving
1 Savings in lakhkwh units 1.97 1.66
18.03.63
2 Savings inpercentage (%) 10.94 9.19 20.1
A - 17
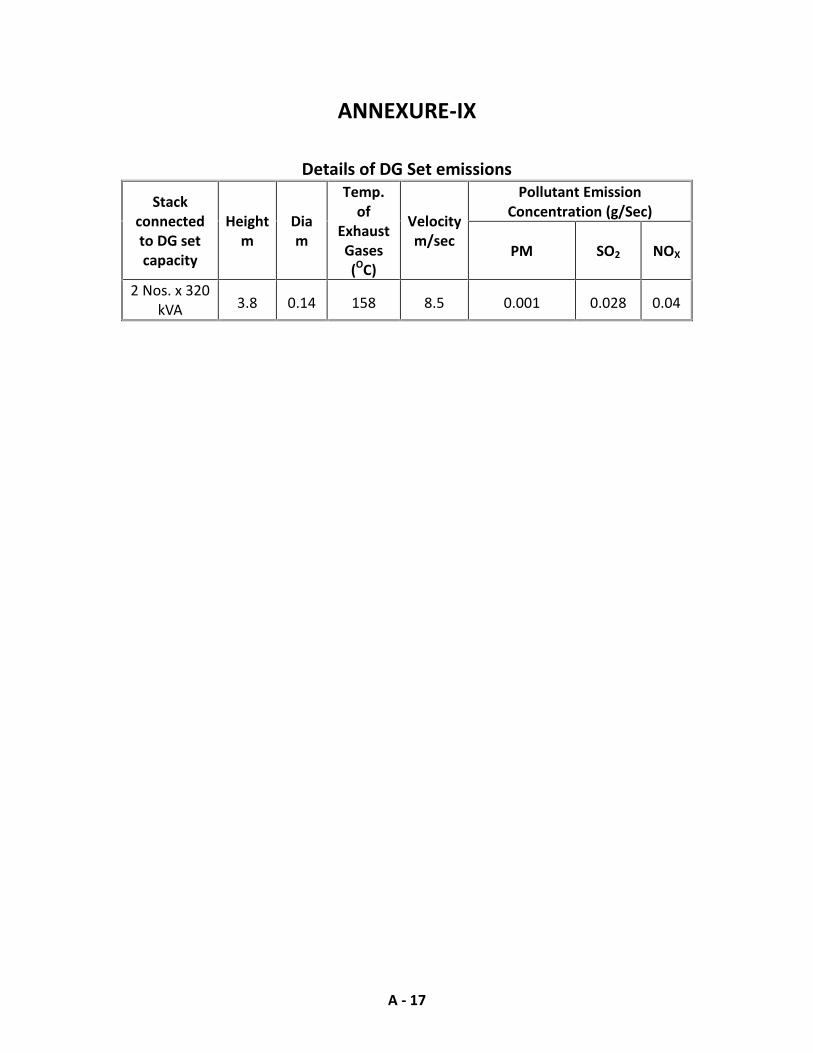
ANNEXURE-IX
Details of DG Set emissions
Stackconnectedto DG setcapacity
Heightm
Diam
Temp.of
ExhaustGases(OC)
Velocitym/sec
Pollutant EmissionConcentration (g/Sec)
PM SO2 NOX
2 Nos. x 320kVA 3.8 0.14 158 8.5 0.001 0.028 0.04
F IA - 1
APPENDIX II(See paragraph 6)
FORM-1 A (only for construction projects listed under item 8 of the Schedule)
CHECK LIST OF ENVIRONMENTAL IMPACTS
(Project proponents are required to provide full information and wherever necessaryattach explanatory notes with the Form and submit along with proposed environmentalmanagement plan & monitoring programmer)
1. LAND ENVIRONMENT
(Attach panoramic view of the project site and the vicinity): Location Plan enclosed.
1.1. Will the existing land use get significantly altered from the project that is notconsistent with the surroundings? (Proposed land use must conform to the approvedMaster Plan / Development Plan of the area. Change of land use if any and the statutoryapproval from the competent authority are submitted). Attach Maps of (i) site location,(ii) surrounding features of the proposed site (within 500 meters).The site area is a classified residential zone of GHMC/HMDA. The location plan is enclosed.
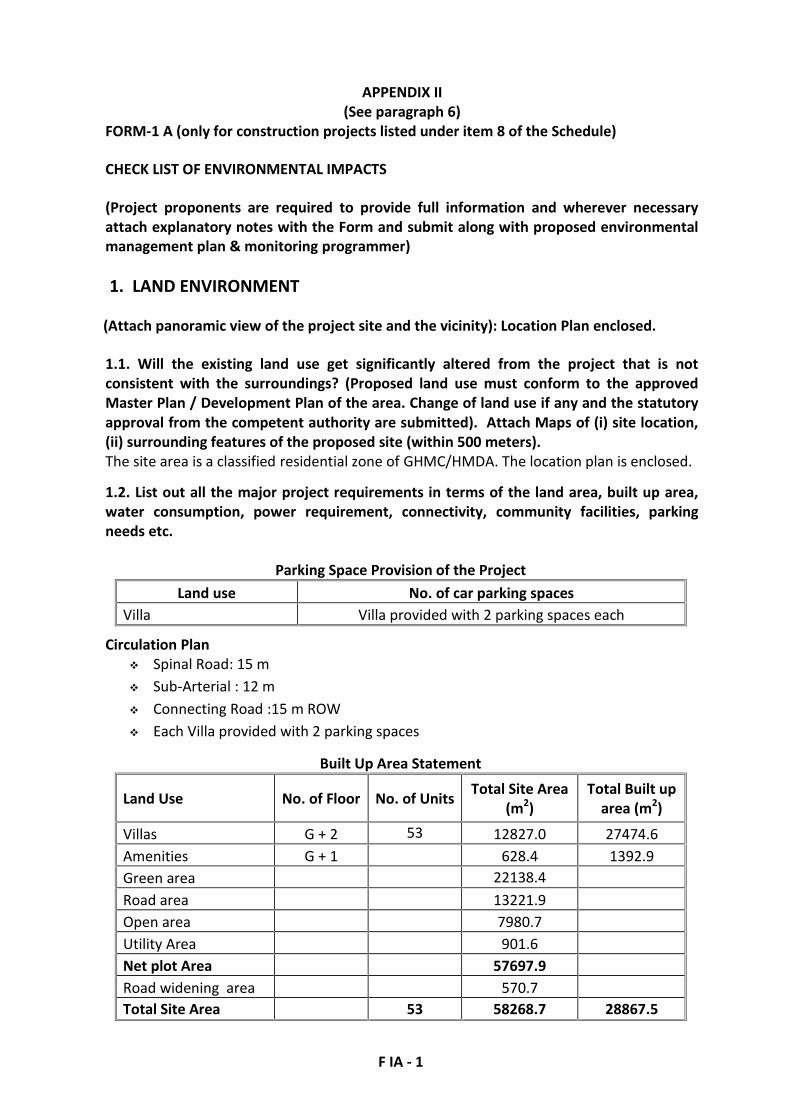
1.2. List out all the major project requirements in terms of the land area, built up area,water consumption, power requirement, connectivity, community facilities, parkingneeds etc.
Parking Space Provision of the ProjectLand use No. of car parking spaces
Villa Villa provided with 2 parking spaces each
Circulation Plan Spinal Road: 15 m Sub-Arterial : 12 m Connecting Road :15 m ROW Each Villa provided with 2 parking spaces
Built Up Area Statement
Land Use No. of Floor No. of Units Total Site Area(m2)
Total Built uparea (m2)
Villas G + 2 53 12827.0 27474.6Amenities G + 1 628.4 1392.9Green area 22138.4Road area 13221.9Open area 7980.7Utility Area 901.6Net plot Area 57697.9Road widening area 570.7Total Site Area 53 58268.7 28867.5
F IA - 2
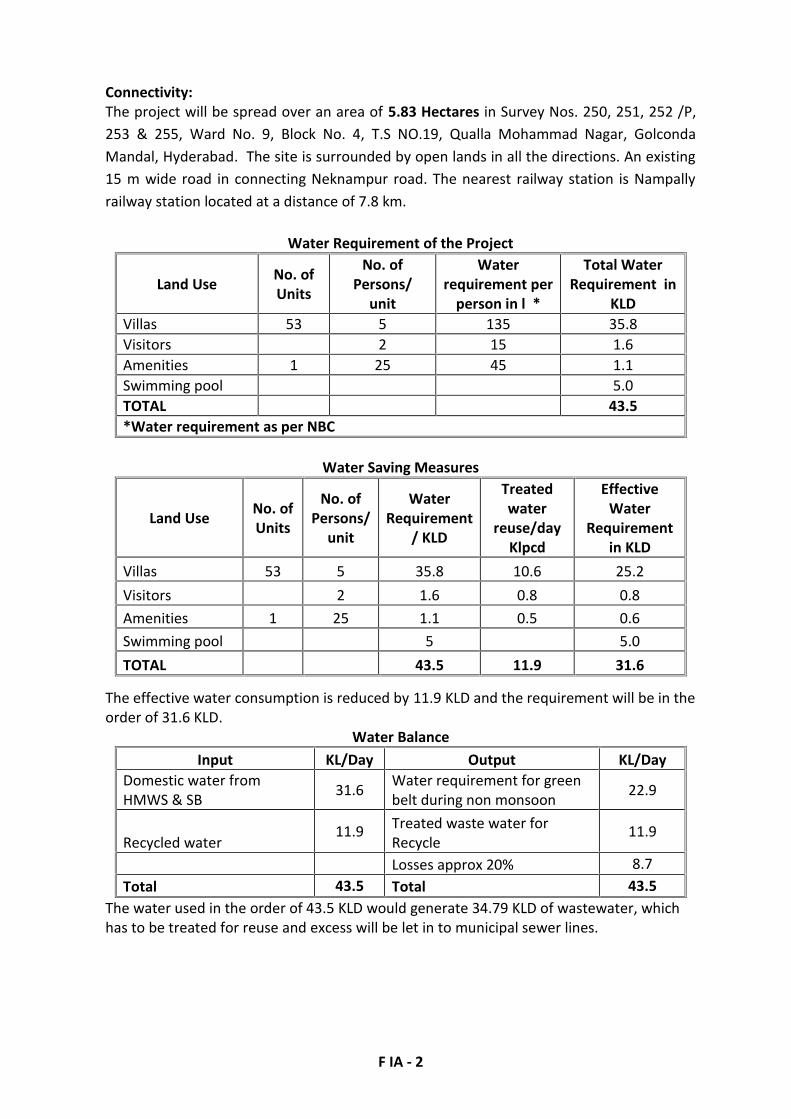
Connectivity:The project will be spread over an area of 5.83 Hectares in Survey Nos. 250, 251, 252 /P,253 & 255, Ward No. 9, Block No. 4, T.S NO.19, Qualla Mohammad Nagar, GolcondaMandal, Hyderabad. The site is surrounded by open lands in all the directions. An existing15 m wide road in connecting Neknampur road. The nearest railway station is Nampallyrailway station located at a distance of 7.8 km.
Water Requirement of the Project
Land Use No. ofUnits
No. ofPersons/
unit
Waterrequirement per
person in l *
Total WaterRequirement in
KLDVillas 53 5 135 35.8Visitors 2 15 1.6Amenities 1 25 45 1.1Swimming pool 5.0TOTAL 43.5*Water requirement as per NBC
Water Saving Measures
Land Use No. ofUnits
No. ofPersons/
unit
WaterRequirement
/ KLD
Treatedwater
reuse/dayKlpcd
EffectiveWater
Requirementin KLD
Villas 53 5 35.8 10.6 25.2Visitors 2 1.6 0.8 0.8Amenities 1 25 1.1 0.5 0.6Swimming pool 5 5.0TOTAL 43.5 11.9 31.6
The effective water consumption is reduced by 11.9 KLD and the requirement will be in theorder of 31.6 KLD.
Water BalanceInput KL/Day Output KL/Day
Domestic water fromHMWS & SB 31.6 Water requirement for green
belt during non monsoon 22.9
Recycled water11.9 Treated waste water for
Recycle11.9
Losses approx 20% 8.7Total 43.5 Total 43.5
The water used in the order of 43.5 KLD would generate 34.79 KLD of wastewater, whichhas to be treated for reuse and excess will be let in to municipal sewer lines.
F IA - 3
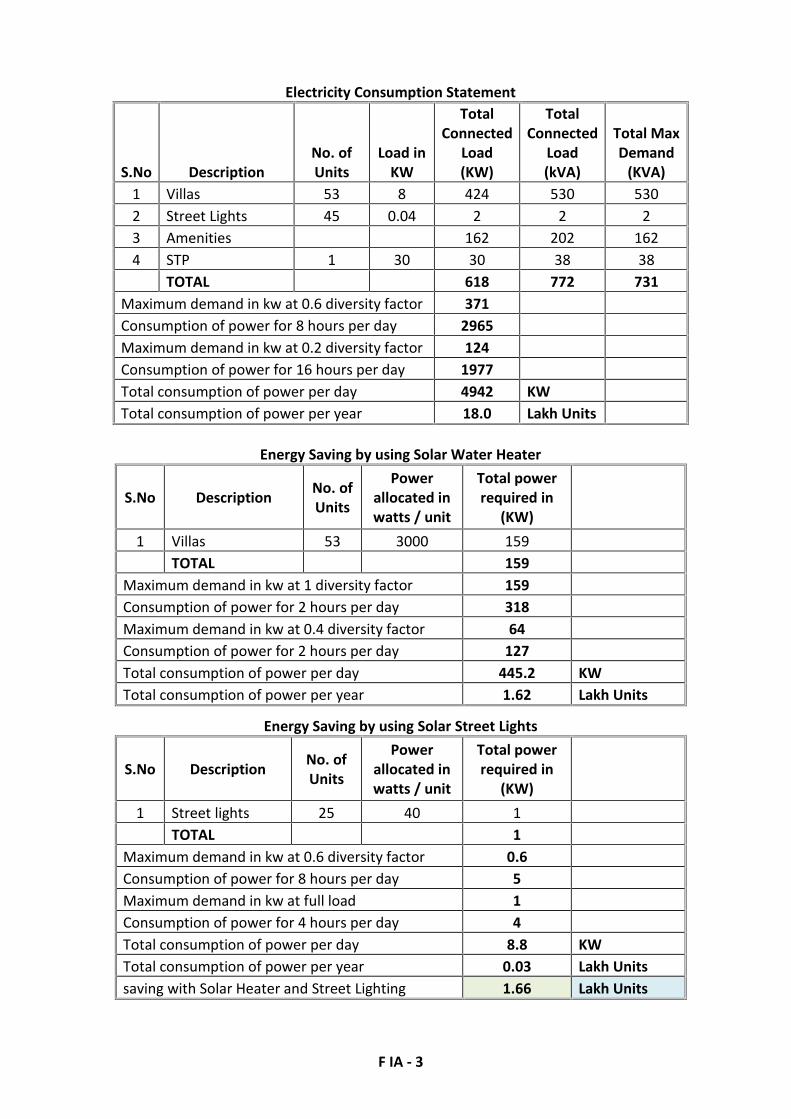
Electricity Consumption Statement
S.No DescriptionNo. ofUnits
Load inKW
TotalConnected
Load(KW)
TotalConnected
Load(kVA)
Total MaxDemand
(KVA)1 Villas 53 8 424 530 5302 Street Lights 45 0.04 2 2 23 Amenities 162 202 1624 STP 1 30 30 38 38
TOTAL 618 772 731Maximum demand in kw at 0.6 diversity factor 371Consumption of power for 8 hours per day 2965Maximum demand in kw at 0.2 diversity factor 124Consumption of power for 16 hours per day 1977Total consumption of power per day 4942 KWTotal consumption of power per year 18.0 Lakh Units
Energy Saving by using Solar Water Heater
S.No Description No. ofUnits
Powerallocated inwatts / unit
Total powerrequired in
(KW)1 Villas 53 3000 159
TOTAL 159Maximum demand in kw at 1 diversity factor 159Consumption of power for 2 hours per day 318Maximum demand in kw at 0.4 diversity factor 64Consumption of power for 2 hours per day 127Total consumption of power per day 445.2 KWTotal consumption of power per year 1.62 Lakh Units
Energy Saving by using Solar Street Lights
S.No Description No. ofUnits
Powerallocated inwatts / unit
Total powerrequired in
(KW)1 Street lights 25 40 1
TOTAL 1Maximum demand in kw at 0.6 diversity factor 0.6Consumption of power for 8 hours per day 5Maximum demand in kw at full load 1Consumption of power for 4 hours per day 4Total consumption of power per day 8.8 KWTotal consumption of power per year 0.03 Lakh Unitssaving with Solar Heater and Street Lighting 1.66 Lakh Units
F IA - 4
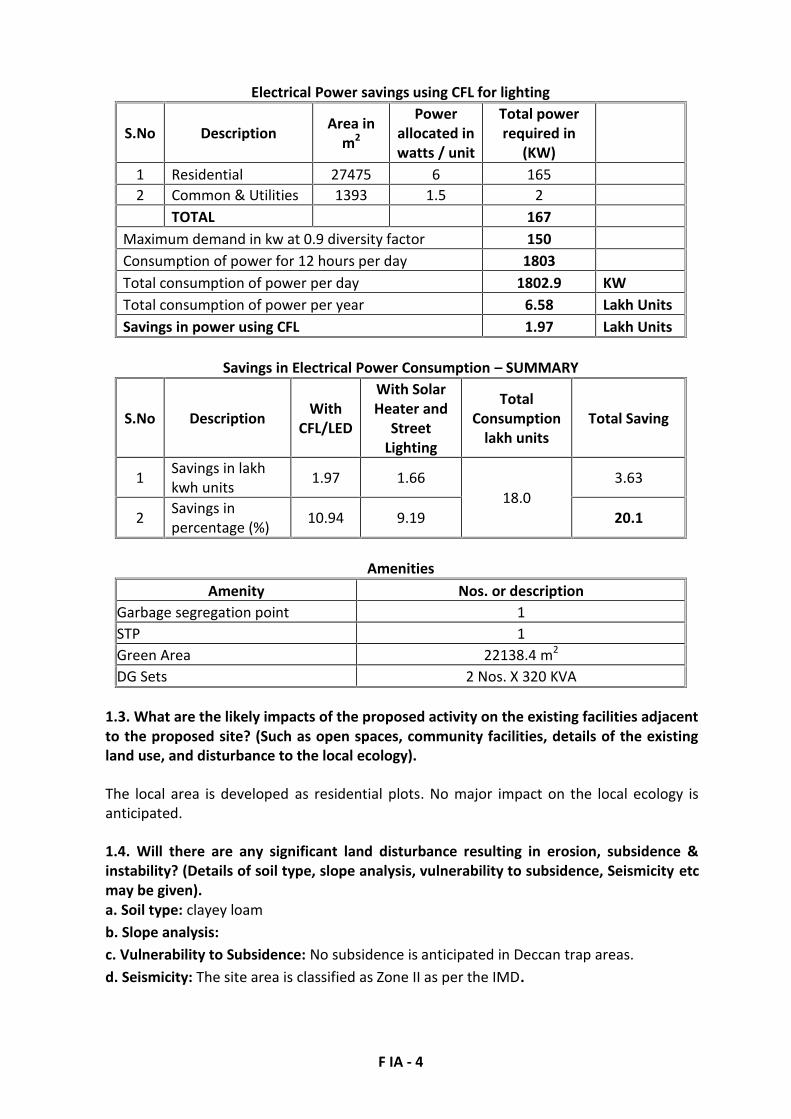
Electrical Power savings using CFL for lighting
S.No Description Area inm2
Powerallocated inwatts / unit
Total powerrequired in
(KW)1 Residential 27475 6 1652 Common & Utilities 1393 1.5 2
TOTAL 167Maximum demand in kw at 0.9 diversity factor 150Consumption of power for 12 hours per day 1803Total consumption of power per day 1802.9 KWTotal consumption of power per year 6.58 Lakh UnitsSavings in power using CFL 1.97 Lakh Units
Savings in Electrical Power Consumption – SUMMARY
S.No Description WithCFL/LED
With SolarHeater and
StreetLighting
TotalConsumption
lakh unitsTotal Saving
1 Savings in lakhkwh units 1.97 1.66
18.03.63
2 Savings inpercentage (%) 10.94 9.19 20.1
AmenitiesAmenity Nos. or description
Garbage segregation point 1STP 1Green Area 22138.4 m2
DG Sets 2 Nos. X 320 KVA
1.3. What are the likely impacts of the proposed activity on the existing facilities adjacentto the proposed site? (Such as open spaces, community facilities, details of the existingland use, and disturbance to the local ecology).
The local area is developed as residential plots. No major impact on the local ecology isanticipated.
1.4. Will there are any significant land disturbance resulting in erosion, subsidence &instability? (Details of soil type, slope analysis, vulnerability to subsidence, Seismicity etcmay be given).a. Soil type: clayey loamb. Slope analysis:c. Vulnerability to Subsidence: No subsidence is anticipated in Deccan trap areas.d. Seismicity: The site area is classified as Zone II as per the IMD.

F IA - 5
1.5. Will the proposal involve alteration of natural drainage systems? (Give details on acontour map showing the natural drainage near the proposed project site)
a. No, The site area is 58268.7 m2 and does form part of drainage system.
1.6. What are the quantities of earthwork involved in the construction activity cutting,filling, reclamation etc. (Give details of the quantities of earthwork involved, transport offill materials from outside the site etc.)
Earth Work Quantities
S.No. Area Qty. of fill (m3) Qty. of cut (m3) Surplus fill(m3) Surplus cut (m3)
1 Site area 11654 11654 ---- ----
1.7 Give details regarding water supply, waste handling etc during the constructionperiod.
The water requirement during construction shall be drawn from treated sewage fromtreatment plants from other occupied areas, surrounding the project. Constructiondebris like cement, sand, RCC, Aggregate, steel etc. are the waste generation duringconstruction and these waste materials are used for road development.
1.8. Will the low lying areas & wetlands get altered? (Provide details of how low lyingand wetlands are getting modified from the proposed activity)
-NO-
1.9. Whether construction debris & waste during construction cause health hazard? (Givequantities of various types of wastes generated during construction including theconstruction labour and the means of disposal).
Construction DebrisThe construction debris consists of various types of materials. The construction debris willbe in both hazardous and non-hazardous categories. The hazardous debris consists emptycontainers of adhesives, thinners, paints, and petroleum products. These empty containerswill be sold to authorize recycling agencies. The non hazardous wastes contain recyclabledebris like iron and other metal, glass, plastics, cartons of paper, wood etc. These wasteswill be sent for reuse/recycle. The waste percentage will be in the order of 2%.Construction debris containing bricks, demolished RCC will be used for land filling in theplace of subgrade.

F IA - 6
2. WATER ENVIRONMENT
2.1. Give the total quantity of water requirement for the proposed project with thebreakup of requirements for various uses. How will the water requirement met? Statethe sources & quantities and furnish a water balance statement.
Water Requirement of the Project
Land Use No. ofUnits
No. ofPersons/
unit
Waterrequirement per
person in l *
Total WaterRequirement in
KLDVillas 53 5 135 35.8Visitors 2 15 1.6Amenities 1 25 45 1.1Swimming pool 5.0TOTAL 43.5*Water requirement as per NBC
Water Saving Measures
Land Use No. ofUnits
No. ofPersons/
unit
WaterRequirement
/ KLD
Treatedwater
reuse/dayKlpcd
EffectiveWater
Requirementin KLD
Villas 53 5 35.8 10.6 25.2Visitors 2 1.6 0.8 0.8Amenities 1 25 1.1 0.5 0.6Swimming pool 5 5.0TOTAL 43.5 11.9 31.6
The effective water consumption is reduced by 11.9 KLD and the requirement will be in theorder of 31.6 KLD.
Water BalanceInput KL/Day Output KL/Day
Domestic water fromHMWS & SB
31.6 Water requirement for greenbelt during non monsoon
22.9
Recycled water11.9 Treated waste water for
Recycle11.9
Losses approx 20% 8.7Total 43.5 Total 43.5
The water used in the order of 43.5 KLD would generate 34.79 KLD of wastewater, whichhas to be treated for reuse and excess will be let in to municipal sewer lines.
It is proposed to draw domestic water from the Hyderabad Metropolitan Water Supplyand Sewerage Board (HMWSSB), which have been encouraging the bulk consumers. Thewater shortage if any during summer season will be drawn from ground water sources.The water requirement of the project during occupation stage is in the order of 34.79 KLD.
F IA - 7
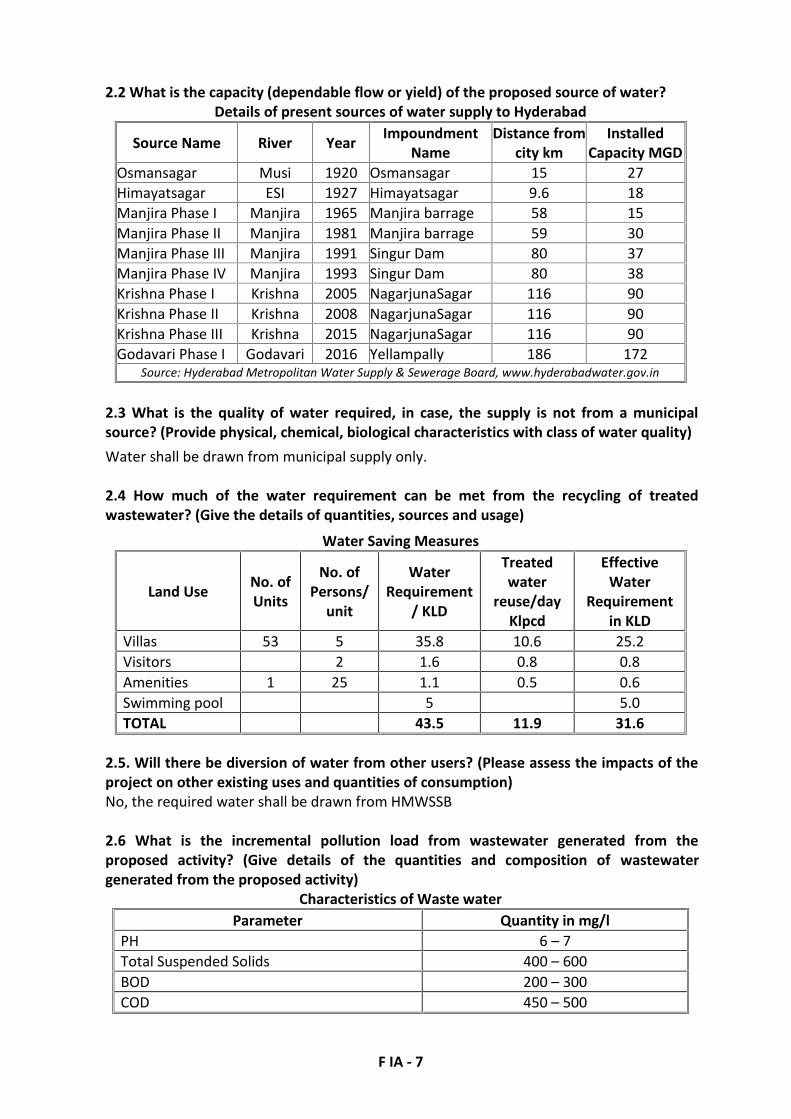
2.2 What is the capacity (dependable flow or yield) of the proposed source of water?Details of present sources of water supply to Hyderabad
Source Name River Year ImpoundmentName
Distance fromcity km
InstalledCapacity MGD
Osmansagar Musi 1920 Osmansagar 15 27Himayatsagar ESI 1927 Himayatsagar 9.6 18Manjira Phase I Manjira 1965 Manjira barrage 58 15Manjira Phase II Manjira 1981 Manjira barrage 59 30Manjira Phase III Manjira 1991 Singur Dam 80 37Manjira Phase IV Manjira 1993 Singur Dam 80 38Krishna Phase I Krishna 2005 NagarjunaSagar 116 90Krishna Phase II Krishna 2008 NagarjunaSagar 116 90Krishna Phase III Krishna 2015 NagarjunaSagar 116 90Godavari Phase I Godavari 2016 Yellampally 186 172
Source: Hyderabad Metropolitan Water Supply & Sewerage Board, www.hyderabadwater.gov.in
2.3 What is the quality of water required, in case, the supply is not from a municipalsource? (Provide physical, chemical, biological characteristics with class of water quality)Water shall be drawn from municipal supply only.
2.4 How much of the water requirement can be met from the recycling of treatedwastewater? (Give the details of quantities, sources and usage)
Water Saving Measures
Land Use No. ofUnits
No. ofPersons/
unit
WaterRequirement
/ KLD
Treatedwater
reuse/dayKlpcd
EffectiveWater
Requirementin KLD
Villas 53 5 35.8 10.6 25.2Visitors 2 1.6 0.8 0.8Amenities 1 25 1.1 0.5 0.6Swimming pool 5 5.0TOTAL 43.5 11.9 31.6
2.5. Will there be diversion of water from other users? (Please assess the impacts of theproject on other existing uses and quantities of consumption)No, the required water shall be drawn from HMWSSB
2.6 What is the incremental pollution load from wastewater generated from theproposed activity? (Give details of the quantities and composition of wastewatergenerated from the proposed activity)
Characteristics of Waste waterParameter Quantity in mg/l
PH 6 – 7Total Suspended Solids 400 – 600BOD 200 – 300COD 450 – 500
F IA - 8
The sewage shall be treated and reused for flushing and on land irrigation. The treatedsewage shall meet the standards for disposal into surface water bodies, and hence thereshall not be any major additional load on the sewer lines, and may facilitate dilution of thesewage. The quantity of sewage expected is in the order of 34.79 KL/day.
2.7. Give details of the water requirements met from water harvesting? Furnish details ofthe facilities created.
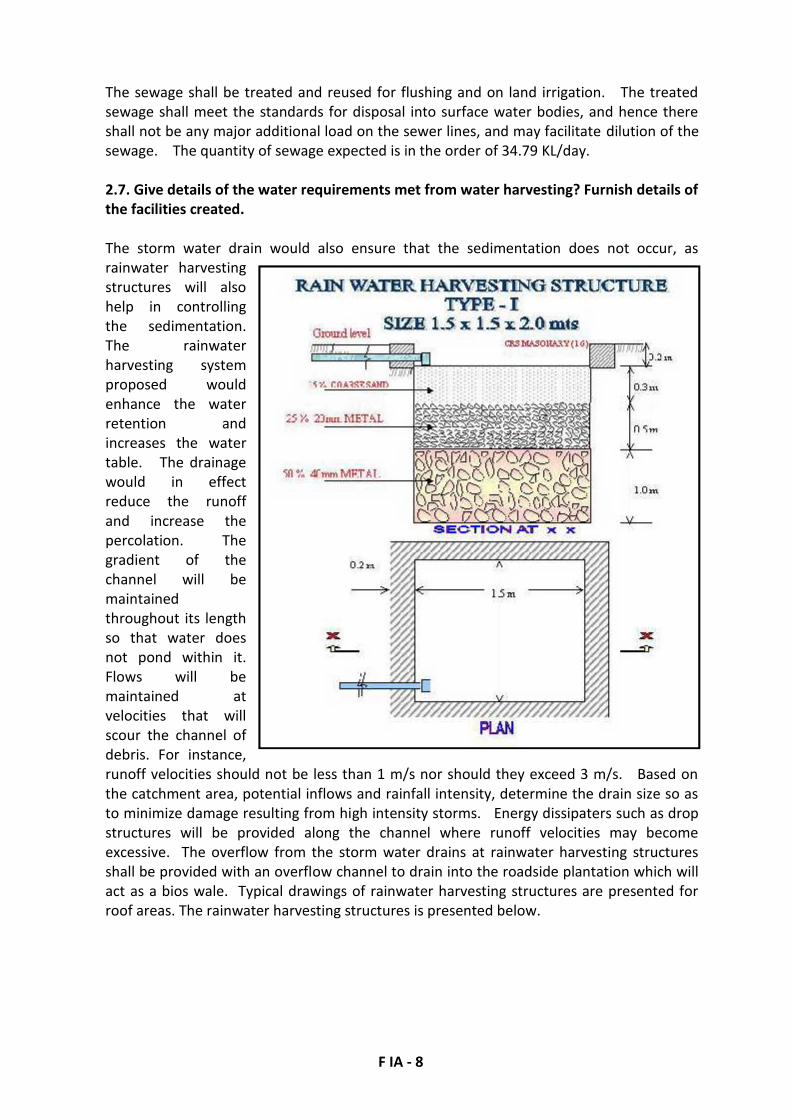
The storm water drain would also ensure that the sedimentation does not occur, asrainwater harvestingstructures will alsohelp in controllingthe sedimentation.The rainwaterharvesting systemproposed wouldenhance the waterretention andincreases the watertable. The drainagewould in effectreduce the runoffand increase thepercolation. Thegradient of thechannel will bemaintainedthroughout its lengthso that water doesnot pond within it.Flows will bemaintained atvelocities that willscour the channel ofdebris. For instance,runoff velocities should not be less than 1 m/s nor should they exceed 3 m/s. Based onthe catchment area, potential inflows and rainfall intensity, determine the drain size so asto minimize damage resulting from high intensity storms. Energy dissipaters such as dropstructures will be provided along the channel where runoff velocities may becomeexcessive. The overflow from the storm water drains at rainwater harvesting structuresshall be provided with an overflow channel to drain into the roadside plantation which willact as a bios wale. Typical drawings of rainwater harvesting structures are presented forroof areas. The rainwater harvesting structures is presented below.

F IA - 9
2.8. What would be the impact of the land use changes occurring due to the proposedproject on the runoff characteristics (quantitative as well as qualitative) of the area in thepost construction phase on a long term basis? Would it aggravate the problems offlooding or water logging in any way?The impact of housing project on physiography is a function of the terrain of the area. It ismost drastically altered in case of hilly terrain or where extensive cut-and-fill operationsare involved. The project area has a rocky terrain and the design stage deliberations haveensured that the major contours are not disturbed. However the physiography impact willbe significant and non-reversible, as the contours of the area will be disturbed. The cutand fill operations may cause air pollution, clogging of drains and solid waste for disposal.The design stage has optimized the cut and fill operations and the excess cut material isminimum and the same shall be reused for the construction purposes.The project will have a positive impact on the soils and soil quality as housing project willhave landscaping and the soils will be protected due to conservation.
During the occupation stage, compaction will not occur, and the compaction if any will berestricted to road ROW. And the road ROW compaction cannot be said to be an impact ofthe operation stage as the pavement itself is a function of compacted base and sub base.
During the occupation stage, soil pollution due to garbage dumping at unauthorizedlocations may have temporary negative impact leading contamination of soil. Theaccidental spills or leaks are also a low probability incident.
The other major impact will be due to the increased run off and may have negative impacton the receiving body if the same is not properly managed. Impacts due to surface runoffinclude increased soil erosion and local flooding or water logging. Hence the project will bedesigned with adequate storm water drains and cross drainage structures. The housingactivity will be provided with a Sewage treatment plant to treat the domestic wastewaterand necessary infrastructure will be provided for the safe disposal of domestic wastes toprotect the water bodies.
2.9. What are the impacts of the proposal on the ground water? (Will there be tapping ofground water; give the details of ground water table, recharging capacity, and approvalsobtained from competent authority, if any)Ground water shall be used as a secondary source during non-availability of water fromHMWSSB. The ground water table is at a depth of 10m to 15m
2.10. What precautions/measures are taken to prevent the run-off from constructionactivities polluting land & aquifers? (Give details of quantities and the measures taken toavoid the adverse impacts)Construction activity is taken up only during non-monsoon season. There are no majordrains in the site. All material dumps shall be located away from the natural drains.Storm water drains shall be constructed before the construction of the buildings.
2.11. How is the storm water from within the site managed?(State the provisions madeto avoid flooding of the area, details of the drainage facilities provided along with a sitelayout indication contour levels)Storm water drains will be provided all over the site to meet the expected increase in therunoff during rainy seasons due to the impervious nature of the roads and other paved
F IA - 10
areas. It is proposed to maintain the levels as much as possible before letting storm waterinto side drains of main road.
Based on the catchment area, potential inflows and rainfall intensity, determine the drainsize so as to minimize damage resulting from high intensity storms. Energy dissipaterssuch as drop structures will be provided along the channel where runoff velocities maybecome excessive. The overflow from the storm water drains at rainwater harvestingstructures shall be provided with an overflow channel to drain into the roadside plantation,which will act as a bioswale.
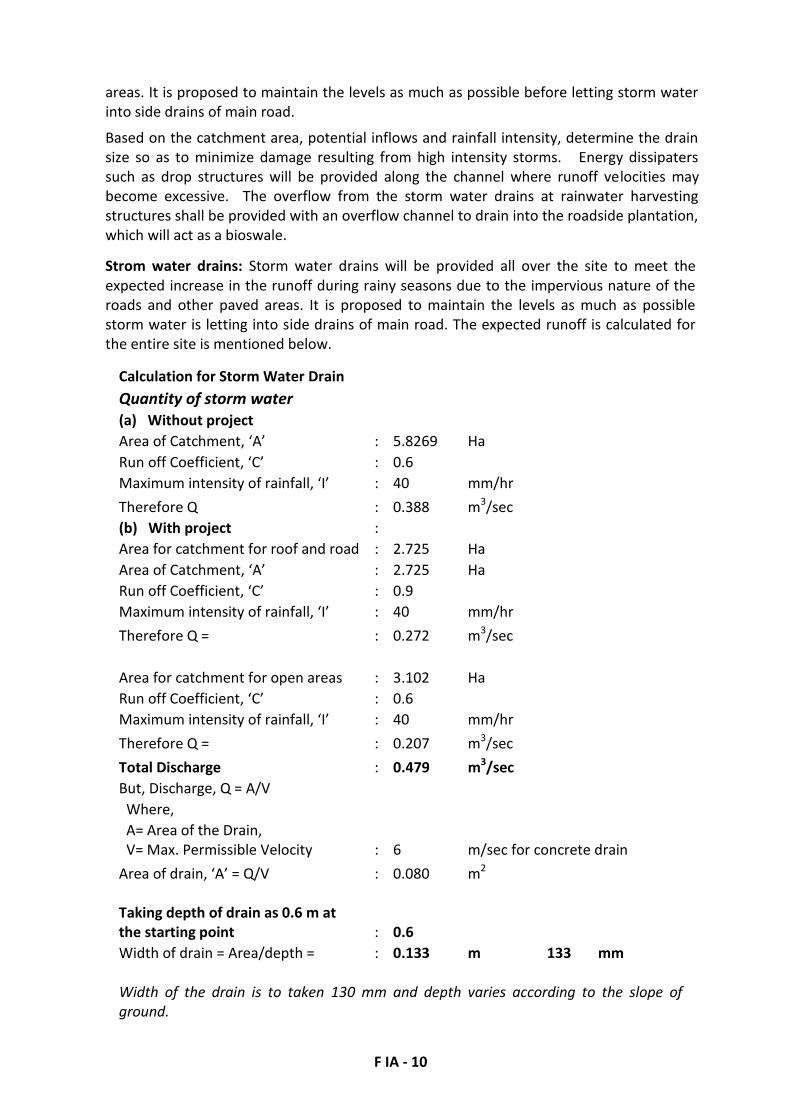
Strom water drains: Storm water drains will be provided all over the site to meet theexpected increase in the runoff during rainy seasons due to the impervious nature of theroads and other paved areas. It is proposed to maintain the levels as much as possiblestorm water is letting into side drains of main road. The expected runoff is calculated forthe entire site is mentioned below.
Calculation for Storm Water DrainQuantity of storm water(a) Without projectArea of Catchment, ‘A’ : 5.8269 HaRun off Coefficient, ‘C’ : 0.6Maximum intensity of rainfall, ‘I’ : 40 mm/hrTherefore Q : 0.388 m3/sec(b) With project :Area for catchment for roof and road : 2.725 HaArea of Catchment, ‘A’ : 2.725 HaRun off Coefficient, ‘C’ : 0.9Maximum intensity of rainfall, ‘I’ : 40 mm/hrTherefore Q = : 0.272 m3/sec
Area for catchment for open areas : 3.102 HaRun off Coefficient, ‘C’ : 0.6Maximum intensity of rainfall, ‘I’ : 40 mm/hrTherefore Q = : 0.207 m3/secTotal Discharge : 0.479 m3/secBut, Discharge, Q = A/V
Where,A= Area of the Drain,V= Max. Permissible Velocity : 6 m/sec for concrete drain
Area of drain, ‘A’ = Q/V : 0.080 m2
Taking depth of drain as 0.6 m atthe starting point : 0.6Width of drain = Area/depth = : 0.133 m 133 mm
Width of the drain is to taken 130 mm and depth varies according to the slope ofground.
F IA - 11
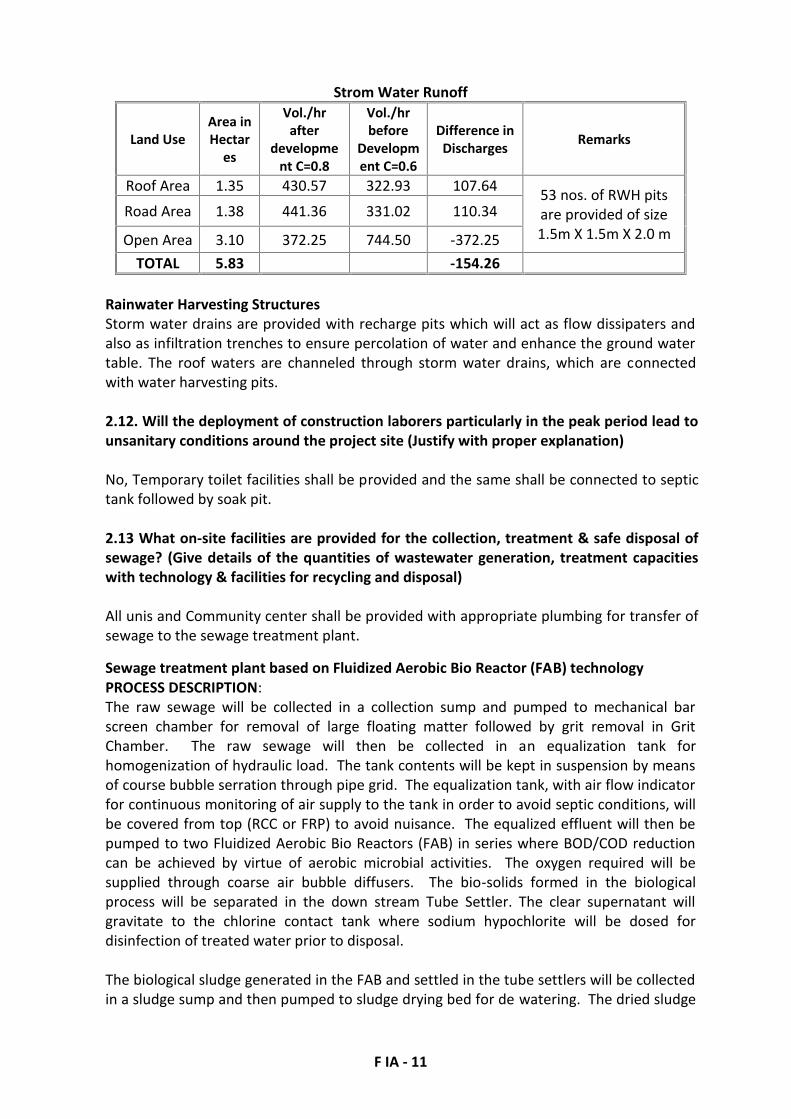
Strom Water Runoff
Land UseArea inHectar
es
Vol./hrafter
development C=0.8
Vol./hrbefore
Development C=0.6
Difference inDischarges Remarks
Roof Area 1.35 430.57 322.93 107.64 53 nos. of RWH pitsare provided of size1.5m X 1.5m X 2.0 m
Road Area 1.38 441.36 331.02 110.34
Open Area 3.10 372.25 744.50 -372.25TOTAL 5.83 -154.26
Rainwater Harvesting StructuresStorm water drains are provided with recharge pits which will act as flow dissipaters andalso as infiltration trenches to ensure percolation of water and enhance the ground watertable. The roof waters are channeled through storm water drains, which are connectedwith water harvesting pits.
2.12. Will the deployment of construction laborers particularly in the peak period lead tounsanitary conditions around the project site (Justify with proper explanation)
No, Temporary toilet facilities shall be provided and the same shall be connected to septictank followed by soak pit.
2.13 What on-site facilities are provided for the collection, treatment & safe disposal ofsewage? (Give details of the quantities of wastewater generation, treatment capacitieswith technology & facilities for recycling and disposal)
All unis and Community center shall be provided with appropriate plumbing for transfer ofsewage to the sewage treatment plant.
Sewage treatment plant based on Fluidized Aerobic Bio Reactor (FAB) technologyPROCESS DESCRIPTION:The raw sewage will be collected in a collection sump and pumped to mechanical barscreen chamber for removal of large floating matter followed by grit removal in GritChamber. The raw sewage will then be collected in an equalization tank forhomogenization of hydraulic load. The tank contents will be kept in suspension by meansof course bubble serration through pipe grid. The equalization tank, with air flow indicatorfor continuous monitoring of air supply to the tank in order to avoid septic conditions, willbe covered from top (RCC or FRP) to avoid nuisance. The equalized effluent will then bepumped to two Fluidized Aerobic Bio Reactors (FAB) in series where BOD/COD reductioncan be achieved by virtue of aerobic microbial activities. The oxygen required will besupplied through coarse air bubble diffusers. The bio-solids formed in the biologicalprocess will be separated in the down stream Tube Settler. The clear supernatant willgravitate to the chlorine contact tank where sodium hypochlorite will be dosed fordisinfection of treated water prior to disposal.
The biological sludge generated in the FAB and settled in the tube settlers will be collectedin a sludge sump and then pumped to sludge drying bed for de watering. The dried sludge
F IA - 12
will then be disposed off suitably as manure. The schematics of the process are shown.The two main components of the treatment system viz. The FAB reactor and tube settlerare described in the following sections.
Fluidized Aerobic Bio Reactor (FAB)Conventional effluent treatment plants are large sized, power intensive and require a lotof monitoring. Scarcity of open space and rising land a power costs have forced theindustries to look our for space saving, compact and efficient treatment options. This hasled to the development attached growth processes where the bio mass is retained withinthe aeration tank obviating the need for recycle. These plants are not only compact butalso user friendly. The endeavor to have a continuously operating, no-clogging biofilmreactor with no need for back washing, low head-loss and high specific biofilm surfacearea culminated in the most advanced technology of aerobic biological fluidized bedtreatment where the biofilm (biomass) grows on small carrier elements that move alongwith the water in the reactor. The movement is normally caused by aeration in the aerobicversion of the reactor.
The reactor combines all the advantages and best features of Trickling filters, Rotatingbiological contractors, activated sludge process and submerged fixed film reactors whileeliminating the drawbacks of these systems. The plants are more compact and moreenergy efficient.
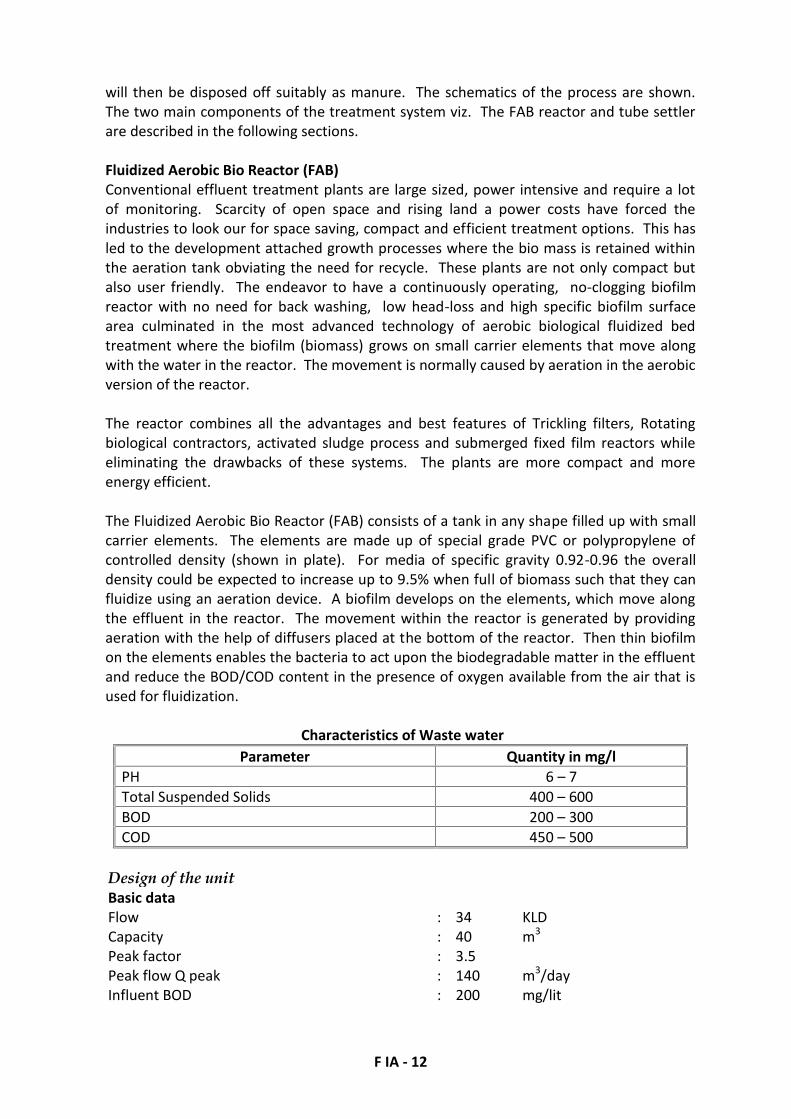
The Fluidized Aerobic Bio Reactor (FAB) consists of a tank in any shape filled up with smallcarrier elements. The elements are made up of special grade PVC or polypropylene ofcontrolled density (shown in plate). For media of specific gravity 0.92-0.96 the overalldensity could be expected to increase up to 9.5% when full of biomass such that they canfluidize using an aeration device. A biofilm develops on the elements, which move alongthe effluent in the reactor. The movement within the reactor is generated by providingaeration with the help of diffusers placed at the bottom of the reactor. Then thin biofilmon the elements enables the bacteria to act upon the biodegradable matter in the effluentand reduce the BOD/COD content in the presence of oxygen available from the air that isused for fluidization.
Characteristics of Waste waterParameter Quantity in mg/l
PH 6 – 7Total Suspended Solids 400 – 600BOD 200 – 300COD 450 – 500
Design of the unitBasic dataFlow : 34 KLDCapacity : 40 m3
Peak factor : 3.5Peak flow Q peak : 140 m3/dayInfluent BOD : 200 mg/lit
F IA - 13
Influent Suspended Solids : 200 mg/litInfluent COD : 350 mg/litEffluent BOD : 30 mg/litEffluent COD : 200 mg/litEffluent Suspended Solids : 100 mg/lit
1. Bar Screen Chamber
Average flow :0.00046 m3/sec
Peak factor : 3.5Peak flow : 0.0016 m3/secVelocity at peak flow : 0.75 m/SecEffective area of screen RequiredAt average flow : 0.0015 m2
At Peak flow : 0.0021 m2
Provide Effective area of screen : 0.0021 m2
Considering the bar of dia. 10 mm(w) and clear spacing of 20 mm (b)Overall area required : 0.0032 m2
Considering screen depth as : 0.006 m Consider 0.5 mNumber of clear spacing : 0.1Number of bars : 1 Consider 3 Nos.Hence Provide 3 barsProvide a screen of 0.5 m X 0.5 m at an inclination of sin 600. In a screen channel of onemeter (1 m) length.
2. Grit Chamber :The flow from the bar screen chamber is let into the Grit Chamber of minimum 2 hourscapacity. This tank is provided to even out the flow variation, and to provide a continuousfeed into the secondary biological treatment units.Peak flow Q : 0.0016 m3/secProviding a flow through velocity of 0.30 m/secCross sectional area of Channel : 0.005 m2
Surface area of channel : 0.12 m2
Assuming depth d : 0.2 mWidth of channel : 0.02 m (say 0.1m)Length of channel : 4. 0 m (say 4.0 m)Provide two channels each of 0.1 m wide and 4.0 m long with depth of waste water 0.2 m.
3. Equalization tank:The flow from the bar screen chamber is let into the equalization tank of minimum 2hourscapacity. This tank is provided to even out the flow variation, and to provide a continuousfeed into the secondary biological treatment units.Average flow : 1.6 m3/hrPeak factor : 3.5Peak flow : 5.8 m3/hrHydraulic retention tank = 2 hrs at Peak flowHence required volume of the tank : 11.66 m3
Provide tank of : 11.66 m3 Capacity
F IA - 14
Assuming depth : 3 mArea : 3.8 m2
Assuming length to width ratio (1:1) ; l=blength of the tank : 1.9 mwidth of the tank : 1.9 mAir required for agitation : 0.01 m3/ m2 minTotal air required : 11.66 m3/hrAir blower required : 20 m3/hr @ 3.8 mwcEffluent transfer pump : 1.6 m3/hr @ 8 mwc
4. Fluidized Aerobic Bio Reactor (FAB):The polypropylene media have been provided with a specific surface area of 350 – 520 m2
/m3. This allows micro-organisms to get attached and biomass concentration can beincreased to four folds as compared to Activated Sludge Process. This enables to considerhigher Organic loading rates.
The micro-organisms attached to media are kept in a fluid state thereby maintaining theCSTR (continuous Stirrer tank reactor) regime as well as two tanks are provided in seriesmaking the plug – flow system. This will enhance the efficiencies and have the merits ofboth CSTR and plug-flow regimes.Organic loading rate : 3.2 kg BOD/ m3 dOrganic load : 8 kg/dayVolume of the tank : 2.5 m3
Assume the depth : 3 mNo. of tanks in series : 1Size of the tank : 1.3 m dia. x 3.0 SWDSpecific gravity of media : 0.92 to 0.96Specific surface area of media : 350 – 520 m2 /m3
Media filling : 30 – 50 % of tank volumeOxygen required : 2 kg / kg BODOxygen in air : 23%Specific gravity of air @ 30 deg. : 1.65Aeration : Coarse bubbleOxygen transfer efficiency : 12%Air required : 20 m3/hrAir blower required : 50 m3/hr @ 6.5 m wc
5.Tube settlerSurface loading rate : 20 m2 /m3 dSurface area required : 2 m2
Tank size : 3.0 m x 6.0 m x 2.7 m SWD With 55deg. hopper bottom
Tube Modules : 3.0m x 6.0 m x 0.6 m ht.Tube inclination : 60 deg.Settling area for 60 deg slope : 11 m2 /m3
Cross sectional area of tubes : 120 mm x 44 mm HexagonalHydraulic radius : 1/61 cm (1.5 cm)Shape factor : 0.6 – 0.7 for media settleable solids
F IA - 15
6. Pre Filtration tankThe flow from the each individual settling tank i.e., the supernatant liquid is let into therespective Pre-Filtration Tank, which has a minimum 1.5 hours holding capacity. This tankis provided to hold the treated effluent and give an even flow to the pressure sand filter.Average flow : 1.6 m3/hrPeak factor : 2 m3/hrPeak flow : 3.3 m3/hrProvide min 1.5 hours holding capacity.Hence required volume of the tank : 5 m3
7. Pressure Sand Filter:Vertical down flow type with graded/sand bed under drain plate with polysterene strains.Flow : 40 m3/dayRate of filtration assumed as : 10 m3/m2/hrRequirement of treated water for usage in 20 hrs : 2 m3/hrDia. of filter of 1 nos. : 504 mmProvide pressure sand filter of 550 mm dia. and 800 mm HOS with sand as media layer,under drain pipe, laterals face piping etc for each stream.
8. Activated Carbon Filter:Vertical down flow type with graded/sand bed under drain plate with polysterene strains.Flow : 40 m3/dayRate of filtration assumed as : 10 m3/m2/hrRequirement of treated water for usage in 20 hrs : 2 m3/hrDia of filter of 1 nos. : 504 mmProvide Activated Carbon filter of 550 mm dia with granular Activated carbon as mediaand 800 mm HOS with sand as media layer, under drain pipe, laterals face piping etc foreach stream.
9.Final Treated Water Holding TankIt is always preferred to provide one final holding tank of minimum one day holdingcapacity, so that the treated effluents can be stored and used back for gardening or othertertiary purposes.Capacity: 40 m3
10. Sludge Filter Press:The biomass in the aeration tank stabilizes BOD in wastewater by consuming the organicmatter in the wastewater. The metabolic activity results in growth of the biomasspopulation in the Fluidized Aerobic Bio Reactor (FAB). Sludge holding tank has beenprovided with filter press for dewatering sludge. The filtrate drains off through the media,which is again let into equalization tank.The dewatered sludge is collected in trays, which can be used as manure in the garden.No. of plates : 24Size of plates : 600 mm X 600 mmPlate moc (material of construction) : PP (poly propline)Type of operation : HydraulicPower pack capacity : 2 HP

F IA - 16
The biomass in the aeration tank stabilizes BOD in wastewater by consuming the organicmatter in the wastewater. The metabolic activity results in growth of the biomasspopulation in the Fluidized Aerobic Bio Reactor (FAB).
Sludge holding tank has been provided with filter press for dewatering sludge. The filtratedrains off through the media, which is again let into equalization tank.
The dewatered sludge is collected in trays, which can be used as manure in the garden.
Characteristics of Treated Waste waterParameter Quantity in mg/l
pH 7.3Total Suspended Solids <50BOD 20COD 50
Disposal of Treated Waste Water: It is proposed to reuse the treated wastewater forgreen belt development and for toilet flushing. Excess treated water May also be used byvilla owners for onland irrigation / Excess treated water shall be let out into the municipalsewer line.
F IA - 17
SEW
AG
E TR
EATM
ENT
PLA
NT
FLU
IDIZ
ED A
ERO
BIC
BIO
REA
CTO
R TE
CHN
OLO
GY
(FAB
)
Slud
geD
ewat
erin
gSy
stem
EQT
TAN
K
PSF
ACF
BarS
cree
n/ G
ritCh
ambe
r
Raw
Sew
age
Ove
rflo
w
Filte
r Fee
dPu
mp
(1W
+1S)
Slud
geD
ispo
sal
SLU
DG
EH
OLD
ING
TAN
K
CLAR
IFIE
DW
ATER
TAN
K
FAB
REAC
TOR
(Pac
kage
uni
t)
TREA
TED
WAT
ERTA
NK
To R
euse
TUBE
Sett
lers
18
UV
F IA - 18
2.14. Give details of dual plumbing system if treated waste used is used for flushing oftoilets or any other use
Dual plumbing system is used in apartments for toilet flushing. Separate tank is providedto store the treated water, the tank shall be 1 foot below the over head tank. Separatepipe system is provided to pump the treated water for flushing. All the treated waterpipelines shall be colored blue.
3. VEGETATION
3.1. Is there any threat of the project to the biodiversity? (Give a description of the localecosystem with its unique features, if any)The local area biodiversity is denudated due to increased urbanization. Kothaguda RF at adistance of 7.88 km, KBR National park at a distance of 3.7 km & Mrugavani park at adistance of 5.66 km.
4. FAUNA
4.1. Is there likely to be any displacement of fauna- both terrestrial and aquatic orcreation of barriers for their movement? Provide the details.
-NO-
4.2. Any direct or indirect impacts on the avifauna of the area? Provide details.
-No major impact envisaged. However the proposed plantaion shall help in providingnesting space for the avifauna.
4.3. Prescribe measures such as corridors, fish ladders etc to mitigate adverse impacts onfauna.
-NA-
5. AIR ENVIRONMENT
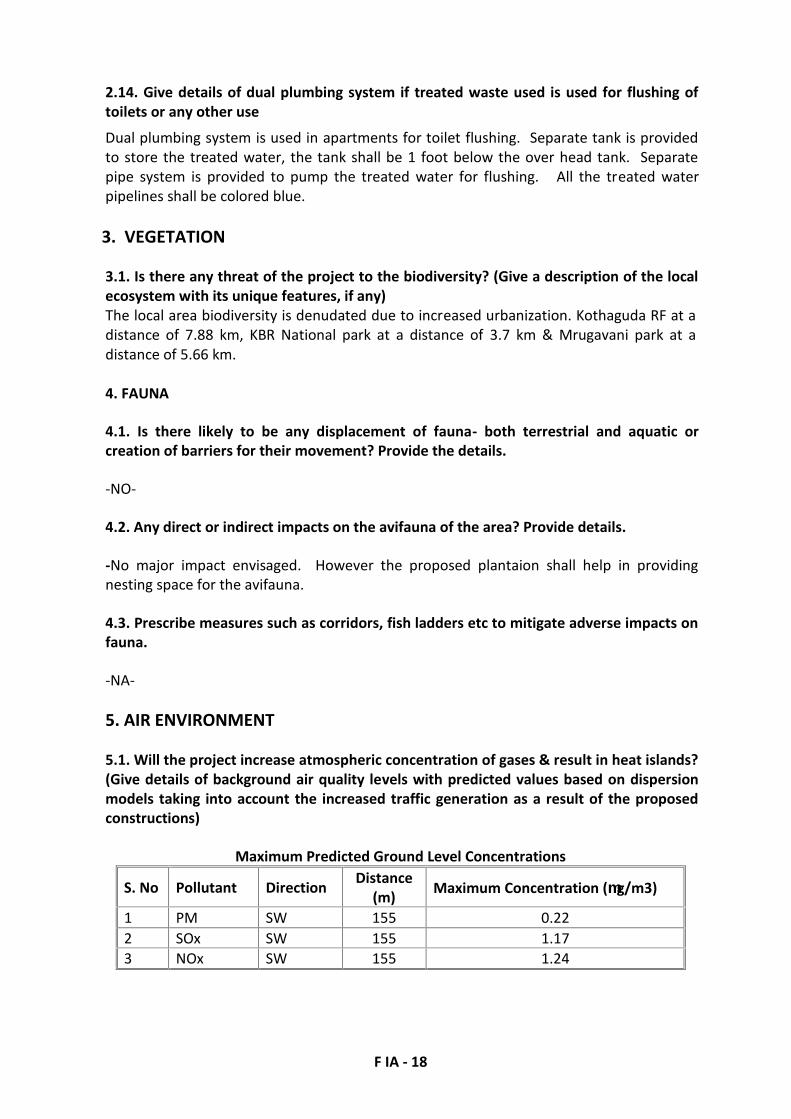
5.1. Will the project increase atmospheric concentration of gases & result in heat islands?(Give details of background air quality levels with predicted values based on dispersionmodels taking into account the increased traffic generation as a result of the proposedconstructions)
Maximum Predicted Ground Level Concentrations
S. No Pollutant Direction Distance(m) Maximum Concentration (g/m3)
1 PM SW 155 0.222 SOx SW 155 1.173 NOx SW 155 1.24
F IA - 19
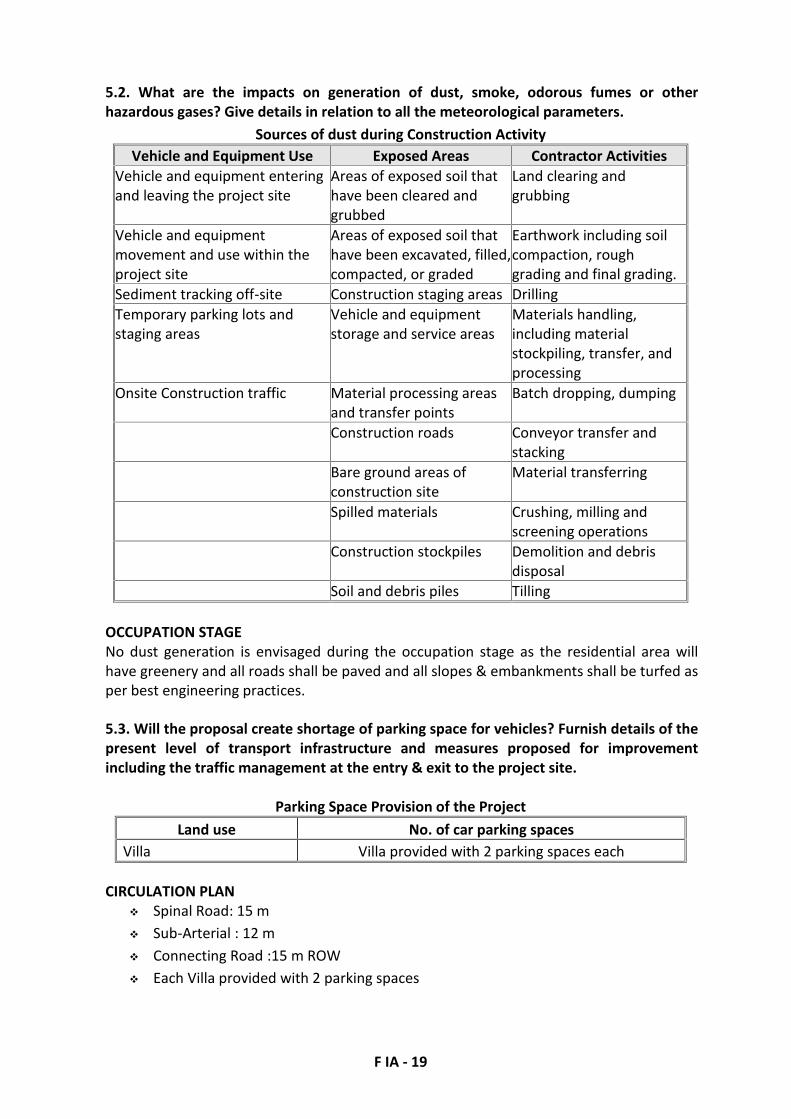
5.2. What are the impacts on generation of dust, smoke, odorous fumes or otherhazardous gases? Give details in relation to all the meteorological parameters.
Sources of dust during Construction ActivityVehicle and Equipment Use Exposed Areas Contractor Activities
Vehicle and equipment enteringand leaving the project site
Areas of exposed soil thathave been cleared andgrubbed
Land clearing andgrubbing
Vehicle and equipmentmovement and use within theproject site
Areas of exposed soil thathave been excavated, filled,compacted, or graded
Earthwork including soilcompaction, roughgrading and final grading.
Sediment tracking off-site Construction staging areas DrillingTemporary parking lots andstaging areas
Vehicle and equipmentstorage and service areas
Materials handling,including materialstockpiling, transfer, andprocessing
Onsite Construction traffic Material processing areasand transfer points
Batch dropping, dumping
Construction roads Conveyor transfer andstacking
Bare ground areas ofconstruction site
Material transferring
Spilled materials Crushing, milling andscreening operations
Construction stockpiles Demolition and debrisdisposal
Soil and debris piles Tilling
OCCUPATION STAGENo dust generation is envisaged during the occupation stage as the residential area willhave greenery and all roads shall be paved and all slopes & embankments shall be turfed asper best engineering practices.
5.3. Will the proposal create shortage of parking space for vehicles? Furnish details of thepresent level of transport infrastructure and measures proposed for improvementincluding the traffic management at the entry & exit to the project site.
Parking Space Provision of the ProjectLand use No. of car parking spaces
Villa Villa provided with 2 parking spaces each
CIRCULATION PLAN Spinal Road: 15 m Sub-Arterial : 12 m Connecting Road :15 m ROW Each Villa provided with 2 parking spaces
F IA - 20
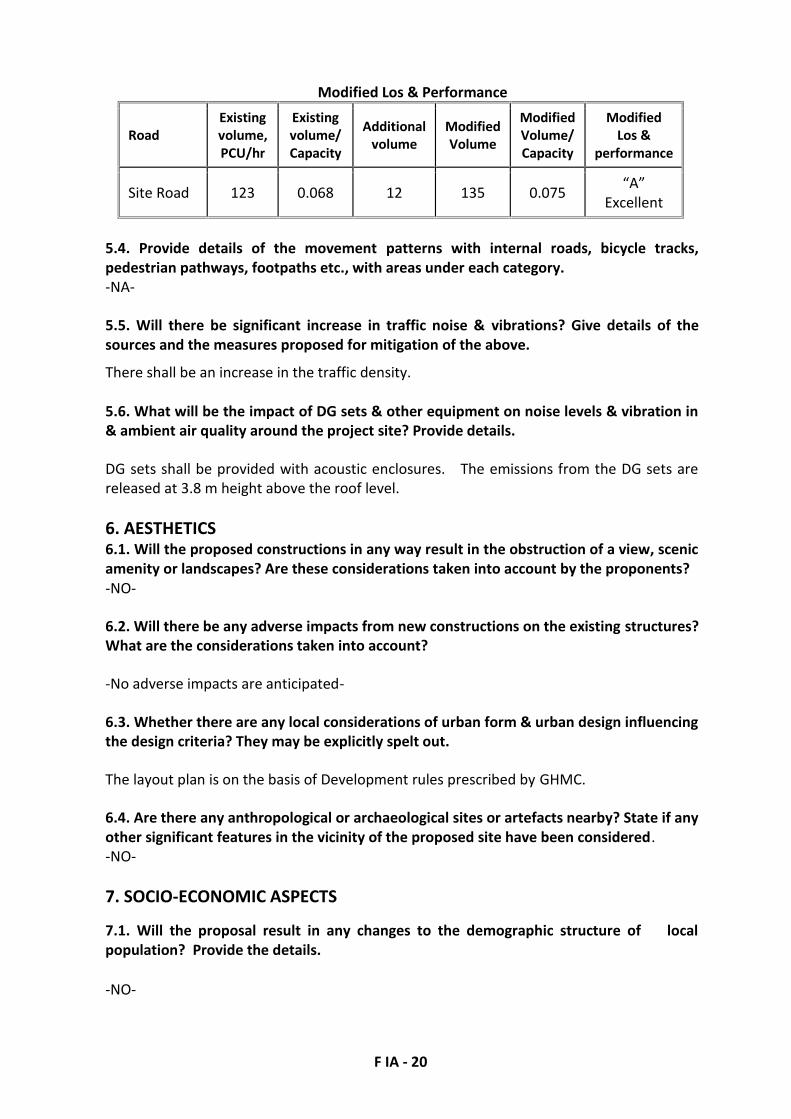
Modified Los & Performance
RoadExistingvolume,PCU/hr
Existingvolume/Capacity
Additionalvolume
ModifiedVolume
ModifiedVolume/Capacity
ModifiedLos &
performance
Site Road 123 0.068 12 135 0.075 “A”Excellent
5.4. Provide details of the movement patterns with internal roads, bicycle tracks,pedestrian pathways, footpaths etc., with areas under each category.-NA-
5.5. Will there be significant increase in traffic noise & vibrations? Give details of thesources and the measures proposed for mitigation of the above.
There shall be an increase in the traffic density.
5.6. What will be the impact of DG sets & other equipment on noise levels & vibration in& ambient air quality around the project site? Provide details.
DG sets shall be provided with acoustic enclosures. The emissions from the DG sets arereleased at 3.8 m height above the roof level.
6. AESTHETICS6.1. Will the proposed constructions in any way result in the obstruction of a view, scenicamenity or landscapes? Are these considerations taken into account by the proponents?-NO-
6.2. Will there be any adverse impacts from new constructions on the existing structures?What are the considerations taken into account?
-No adverse impacts are anticipated-
6.3. Whether there are any local considerations of urban form & urban design influencingthe design criteria? They may be explicitly spelt out.
The layout plan is on the basis of Development rules prescribed by GHMC.
6.4. Are there any anthropological or archaeological sites or artefacts nearby? State if anyother significant features in the vicinity of the proposed site have been considered.-NO-
7. SOCIO-ECONOMIC ASPECTS
7.1. Will the proposal result in any changes to the demographic structure of localpopulation? Provide the details.
-NO-

F IA - 21
7.2 Give details of the existing social infrastructure around the proposed project.
School: 1.5 km from site
Bus Stops: 0.7 km from site
Railway station: 7.8 Km from site
Temples/church/mosque: a number of them within 5 km radius of the site.
7.3. Will the project cause adverse effects on local communities, disturbance to sacredsites or other cultural values? What are the safeguards proposed?
-NO-
8. BUILDING MATERIALS
8.1. May involve the use of building materials with high-embodied energy. Are theconstruction materials produced with energy efficient processes? (Give details of energyconservation measures in the selection of building materials and their energy efficiency)
Material Consumption for Total Units of Housing.
BUAper unitin (m2)
TotalReady
MixConcrete
(m3)
TotalCement(bags)
TotalSand(m3)
TotalAggregate(m3)
TotalWater(m3)
TotalBricks(Nos)
x1000
TotalReinfo
rcementsteel(MT)
BUA 28867.5 11836 26847 11258 1241 6986 3349 664Total 28867.5 11836 26847 11258 1241 6986 3349 664
8.2. Transport and handling of materials during construction may result in pollution,noise & public nuisance. What measures are taken to minimize the impacts?
All materials shall be transported during non peak hours. Sand and aggregate are coveredduring transportation. Noise generating construction activity shall not be taken up duringnight times, adjacent to the residential area.
8.3. Are recycled materials used in roads and structures? State the extent of savingsachieved?
Yes

F IA - 22
8.4. Give details of the methods of collection, segregation & disposal of the garbagegenerated during the operation phases of the project.
GARBAGE MANAGEMENT PLAN
Segregation at source into bio-degradable, non bio- degradable and domestic hazardouswastes. Facilitation by owners co-operative to dispose recyclable waste to AuthorizedWaste Pickers / Authorized Recyclers. Balance segregated waste given to AuthorizedAgency of Local Body for disposal.
9. ENERGY CONSERVATION9.1. Give details of the power requirements, source of supply, backup source etc. What isthe energy consumption assumed per square foot of built-up area? How have you triedto minimize energy consumption?
Electricity Consumption Statement
S.No DescriptionNo. ofUnits
Load inKW
TotalConnected
Load(KW)
TotalConnected
Load(kVA)
Total MaxDemand
(KVA)1 Villas 53 8 424 530 5302 Street Lights 45 0.04 2 2 23 Amenities 162 202 1624 STP 1 30 30 38 38
TOTAL 618 772 731Maximum demand in kw at 0.6 diversity factor 371Consumption of power for 8 hours per day 2965Maximum demand in kw at 0.2 diversity factor 124Consumption of power for 16 hours per day 1977Total consumption of power per day 4942 KWTotal consumption of power per year 18.0 Lakh Units
MaintenanceDepartment
MaintenanceDepartment
Biodegradablewaste
Non-BiodegradableWaste
Authorized Agencyof Local Body
Authorized Agencyof Local Body
Main Collectionpoint/Segregation
Point
Main Collectionpoint/Segregation
PointLocal Body
Segregation at Source/Segregation at each Residence
MaintenanceDepartment
DomesticHazardous Wastes
Authorized Agencyof Local Body
Main Collectionpoint/Segregation
PointLocal Body Local Body
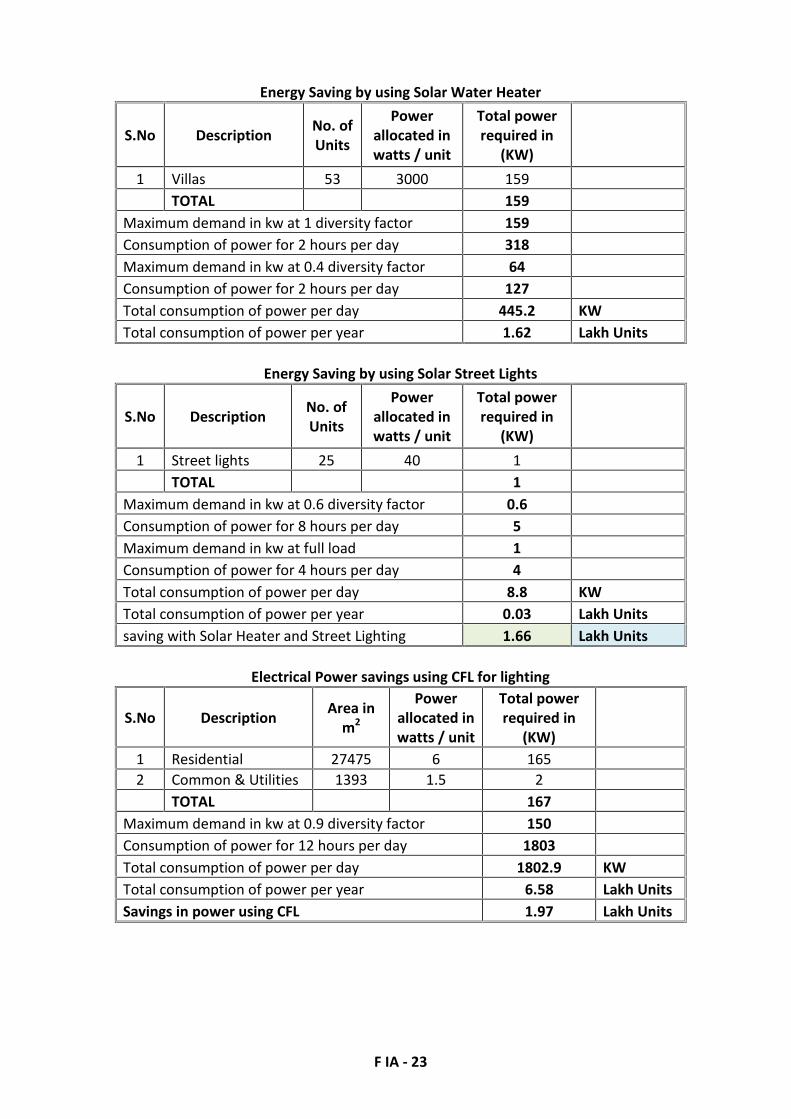
F IA - 23
Energy Saving by using Solar Water Heater
S.No Description No. ofUnits
Powerallocated inwatts / unit
Total powerrequired in
(KW)1 Villas 53 3000 159
TOTAL 159Maximum demand in kw at 1 diversity factor 159Consumption of power for 2 hours per day 318Maximum demand in kw at 0.4 diversity factor 64Consumption of power for 2 hours per day 127Total consumption of power per day 445.2 KWTotal consumption of power per year 1.62 Lakh Units
Energy Saving by using Solar Street Lights
S.No Description No. ofUnits
Powerallocated inwatts / unit
Total powerrequired in
(KW)1 Street lights 25 40 1
TOTAL 1Maximum demand in kw at 0.6 diversity factor 0.6Consumption of power for 8 hours per day 5Maximum demand in kw at full load 1Consumption of power for 4 hours per day 4Total consumption of power per day 8.8 KWTotal consumption of power per year 0.03 Lakh Unitssaving with Solar Heater and Street Lighting 1.66 Lakh Units
Electrical Power savings using CFL for lighting
S.No Description Area inm2
Powerallocated inwatts / unit
Total powerrequired in
(KW)1 Residential 27475 6 1652 Common & Utilities 1393 1.5 2
TOTAL 167Maximum demand in kw at 0.9 diversity factor 150Consumption of power for 12 hours per day 1803Total consumption of power per day 1802.9 KWTotal consumption of power per year 6.58 Lakh UnitsSavings in power using CFL 1.97 Lakh Units

F IA - 24
Savings in Electrical Power Consumption – SUMMARY
S.No Description WithCFL/LED
With SolarHeater and
StreetLighting
TotalConsumption
lakh unitsTotal Saving
1 Savings in lakhkwh units 1.97 1.66
18.03.63
2 Savings inpercentage (%) 10.94 9.19 20.1
9.2. What type of, and capacity of, power back-up to you plan to provide?
Details of DG Set emissionsStack
connectedto DG setcapacity
Heightm
Diam
Temp. ofExhaustGases(OC)
Velocitym/sec
Pollutant EmissionConcentration (g/Sec)
PM SO2 NOX
2 Nos. x 320kVA 3.8 0.14 158 8.5 0.001 0.028 0.04
9.3. What are the characteristics of the glass you plan to use? Provide specifications of itscharacteristics related to both short wave and long wave radiation?The façade is not made of glass, and the glass requirement is only for windows. The glasscharacteristics are presented as follows;
Characteristics of Glass utilized.Nomal Anti-firing type
Seethrough(SE) Non-seethrough(NS) SE NS
Nominal thickness 6 8 10 6 10 9.8 9.8
StructureOut glass FL3 FL4 FL5 G3 G5 PWN 6.8 GWN 6.8vacuum 0.2 0.2 0.2 0.2 0.2 0.2 0.2In glass Low-E 3 Low-E 4 Low-E 5 Low-E 3 Low-E 3 Low-E 3 Low-E 3
VisibleTL(%) 75.5 74.6 73.8 75.5 73.8 72.4 72.4RL(%) 15.9 15.8 15.6 15.9 15.6 16.8 16.8
SolarTS(%) 62.6 60.1 57.8 62.6 57.8 56.9 56.9RS(%) 14.1 13.6 13.2 14.1 13.2 14.2 14.2AS(%) 23.3 26.3 29.0 23.3 29.0 28.9 28.9
Solar heat gain 0.76 0.74 0.72 0.69 0.66 0.69 0.63Thermal
insulation(W/m2K)
(kcal/m2hrC)1.5 1.5 1.5 1.5 1.5 1.5 1.51.3 1.3 1.3 1.3 1.3 1.3 1.3
Sound reduction(JIS grade) 30 30 30 30 30 35 35
Maximum size(mm)Minimum size(mm)
2,400 x 1,350350 x 200
1,800 x1,200350 x 200
L M350 x 200
F IA - 25
9.4. What passive solar architectural features are being used in the building? Illustratethe applications made in the proposed project.
The width to height ratio between the villa units is around 1:1.5 which is achievedas per the development control rules.
All window openings is provided with chajjas depth as specified by the designstandards (around 300mm)
9.5. Does the layout of streets & buildings maximize the potential for solar energydevices? Have you considered the use of street lighting, emergency lighting and solar hotwater systems for use in the building complex? Substantiate with details.
Solar power shall be used for the community center for both water heating and lightingrequirement.
9.6. Is shading effectively used to reduce cooling/heating loads? What principles havebeen used to maximize the shading of Walls on the East and the West and the Roof?How much energy saving has been effected?
Yes, the apartment blocks are aligned north and south to maximize the shading.
9.7. Do the structures use energy-efficient space conditioning, lighting and mechanicalsystems? Provide technical details. Provide details of the transformers and motorefficiencies, lighting intensity and air-conditioning load assumptions? Are you using CFCand HCFC free chillers? Provide specifications.
Building Materials The building materials chosen for the landed and apartment units are as per the
recommendations of the climatic standards. To achieve the maximum energy value, a balance between the availability of
building materials locally and skilled labourers is achieved. Burnt brickwork with fly ash for the walling and plastering reduces the thermal
penetration by 20-30%.
Colour of Facades The colour choice for the buildings uses a maximum of white surface (nearly 84%).
This increases the solar reflectivity factor. Emittance factor for white surfaces is around 90% compared to coloured surface
(20-60%) 16% of wall area uses earthen colours and this space has longer thermal storage in
the walls. This creates a comfortable temperature at nights due to the thicker wallsdesigned.
Heat Absorbance of the brick used for building is around 50%. The roof of the units (if not covered with terrace garden) is painted white to have a
maximum reflectivity. The R-factor (resistance factor) for the roof with brickbats and white painted is
nearly 40% more as compared to the recommended standards.
F IA - 26
9.8. What are the likely effects of the building activity in altering the microclimates?Provide a self-assessment on the likely impacts of the proposed construction on creationof heat island & inversion effects?Green RoofsGreen roofs are an attractive roofing option that can reduce urban heat islands byproviding shade and through evapotranspiration, the release of water from plants to thesurrounding air. The benefits of green roofs include:
Reduce sewage system loads by assimilating large amounts of rainwater. Absorb air pollution, collect airborne particulates, and store carbon. Protect underlying roof material by eliminating exposure to the sun's ultraviolet
(UV) radiation and extreme daily temperature fluctuations. Serve as living environments that provide habitats for birds and other small
animals. Offer an attractive alternative to traditional roofs, addressing growing concerns
about urban quality of life. Reduce noise transfer from the outdoors. Insulate a building from extreme temperatures, mainly by keeping the building
interior cool in the summer.
9.9. What are the thermal characteristics of the building envelope? (a) Roof; (b) Externalwalls; and (c) Fenestration? Give details of the material used and the U-values or the R-values of the individual components.NA
9.10. What precautions & safety measures are proposed against fire hazards? Furnishdetails of emergency plans.NA
9.11. If you are using glass as wall material provides details and specifications includingemissivity and thermal characteristics.-No-
9.12. What is the rate of air infiltration into the building? Provide details of how you aremitigating the effects of infiltration.4 A changes = 4.
9.13. To what extent the non-conventional energy technologies are utilized in the overallenergy consumption? Provide details of the renewable energy technologies used.-Nil-
10. ENVIRONMENT MANAGEMENT PLANThe Environment Management Plan would consist of all mitigation measures for eachitem wise activity to be undertaken during the construction, operation and the entire lifecycle to minimize adverse environmental impacts as a result of the activities of theproject. It would also delineate the environmental monitoring plan for compliance ofvarious environmental regulations. It will state the steps to be taken in case ofemergency such as accidents at the site including fire.
Furnished in EIS/EMP report.
Aditya HeritageM/s. SRI ADITYA HOMES PVT. LTD.,
SURVEY NOS. 250, 251, 252 /P, 253 & 255,Ward No. 9, Block No. 4, T.S NO.19,
QUALLA MOHAMMAD NAGAR,GOLCONDA MANDAL, HYDERABAD
Studies and Documentation by:Team Labs and Consultants(An ISO Certified Organization)B-115 -117 & 509, Annapurna Block,Aditya Enclave, Ameerpet,Hyderabad- 500 038Phone: 91-040-23748555/23748616Fax : 91-040-23748666e-mail: [email protected]