Addressing Market Access Challenges Arising from Stringent MRL- based SPS Standards
32
Agricultural Exports from India: Addressing Challenges Arising from Stringent MRL- based Standards 21 st and 22 nd May 2015 Published in the Volume of STANDARDS CONCLAVE 2015 (Chapter 7) Role of Standards in International Trade: Challenges, Opportunities and Issues Dr. Murali Kallummal, Associate Professor Centre for WTO Studies Ms. Hari Maya Gurung, Research Fellow Centre for WTO Studies
Transcript of Addressing Market Access Challenges Arising from Stringent MRL- based SPS Standards

Agricultural Exports from India: Addressing Challenges Arising
from Stringent MRL- based Standards
21st and 22
nd May 2015
Published in the Volume of
STANDARDS CONCLAVE 2015
(Chapter 7)
Role of Standards in International Trade: Challenges,
Opportunities and Issues
Dr. Murali Kallummal, Associate Professor
Centre for WTO Studies
Ms. Hari Maya Gurung, Research Fellow
Centre for WTO Studies
1
Addressing Challenges Arising from Stringent MRL-
based Standards1
1. Introduction
The Agreement on Sanitary and Phytosanitary measure (SPS Agreement) reaffirms the right
of WTO Members to adopt or enforce measures necessary to protect human, animal or plant
life. It mandates that these regulations should be applied only to the extent necessary to
protect human, animal or plant life, or health. Further, these standards or regulations should
not arbitrarily or unjustifiably discriminate between countries where identical or similar
conditions prevail. SPS measures which conform to international standards are presumed to
be consistent with WTO obligations. The SPS Agreement mentions three relevant
international organisations - Codex Alimentarius Commission (Codex), International Office
of Epizootics and International Plant Protection Convention. The SPS Agreement encourages
Members to use international standards, guidelines and recommendations where they exist.
Members may adopt SPS measures that result in higher levels of protection, or introduce
measures related to health concerns for which international standards do not exist, provided
there is scientific justification or a thorough and scientific risk assessment validates the claim
for a stringent regulation. Since the use of these measures may have a negative impact on
market access, the WTO makes it mandatory for all Members to notify such SPS
regulations/standards to the WTO Secretariat. The SPS Agreement also established a
Committee on Sanitary and Phytosanitary Measures to provide a forum for consultations
about food safety or animal and plant health measures that affect trade, and to carry out the
functions necessary for ensure the implementation of the SPS Agreement.
An analysis of SPS measures notified to the SPS Committee indicates that there is an
increasing trend towards WTO members implementing measures that depart from
international standards. In case the measures are more stringent than international standards,
it would be important to assess whether the measures are backed with sufficient scientific
evidence or based on scientific risk assessment. In particular, if such stringent measures are
implemented on products of India's export interest, there might be a case for a deeper
examination of the measures to confirm their WTO-consistency. In this background, this
paper compares the maximum residue limit (MRL) standards implemented by Australia,
Canada, Japan and the USA with the corresponding limits specified by Codex to identify
1 The authors would like to express their gratitude to Prof. Abhijit Das for all the support by way of
suggestions provided for the completion of this study.

1
measures that are more stringent than international standards. It is apprehended that these
measures might be constraining India's agriculture exports.
The paper is divided into three sections: section 2 provides a detailed profile of SPS
Measures; section 3 analyses the standards MRLs in respect of certain agriculture products
and identifies the standards that are more stringent than Codex; section 4 provides some
suggestions on the steps that could be considered by the government to address the issue. In
this paper we have used data from various sources like the Centre for WTO Studies database
on SPS measure, WITS online COMTRADE database, MRL online database of US, FAS.
2. Growing Domination of SPS Measures that do not Conform
to International Standards
Declining tariffs, but increasing NTM notifications
Various studies have observed that while the non-tariff measures (NTMs) are increasing,
applied tariffs have been slowly and steadily decreasing, especially since the formation
of WTO in 1995.2 The average tariffs have been coming down for developing and LDCs
at much faster pace than for the developed countries. While it is relatively simple task
to make an assessment of the impact on trade of tariffs, on the other hand making a
similar assessment of non-tariff measures is rather difficult. This arises from the fact
that unlike tariffs, NTMs are not quantifiable, as most often these are qualitative in
nature (for example like, labelling, quality related technical specifications, level of
contaminations in PPM, etc).
The impact of NTMs can be measured from the exporters’ point of view as cost of
compliance with these qualitative measures. Further, the cost of compliance can vary as
there is divergence in the level of technological capabilities, skill-set and development
across the sectors, firms and more broadly countries. This makes the task of assessing
the impact of SPS measures even more difficult.
In this context, the Centre for WTO Studies (CWS) has collated and created databases of
notification of non-tariff measures such as SPS and TBT that are being implemented by
countries, based on the Members’ submission to the WTO Secretariat as mandated
under the SPS and TBT Agreements. There are nearly 16.4 thousand SPS notifications
from January 1995 to 2014, in terms of product coverage roughly 1.4 lakh products at
2 In the period before 1995 this process of tariff reduction was limited to the largely developed countries with
occasional bilateral deals with limited set of developing countries.
1
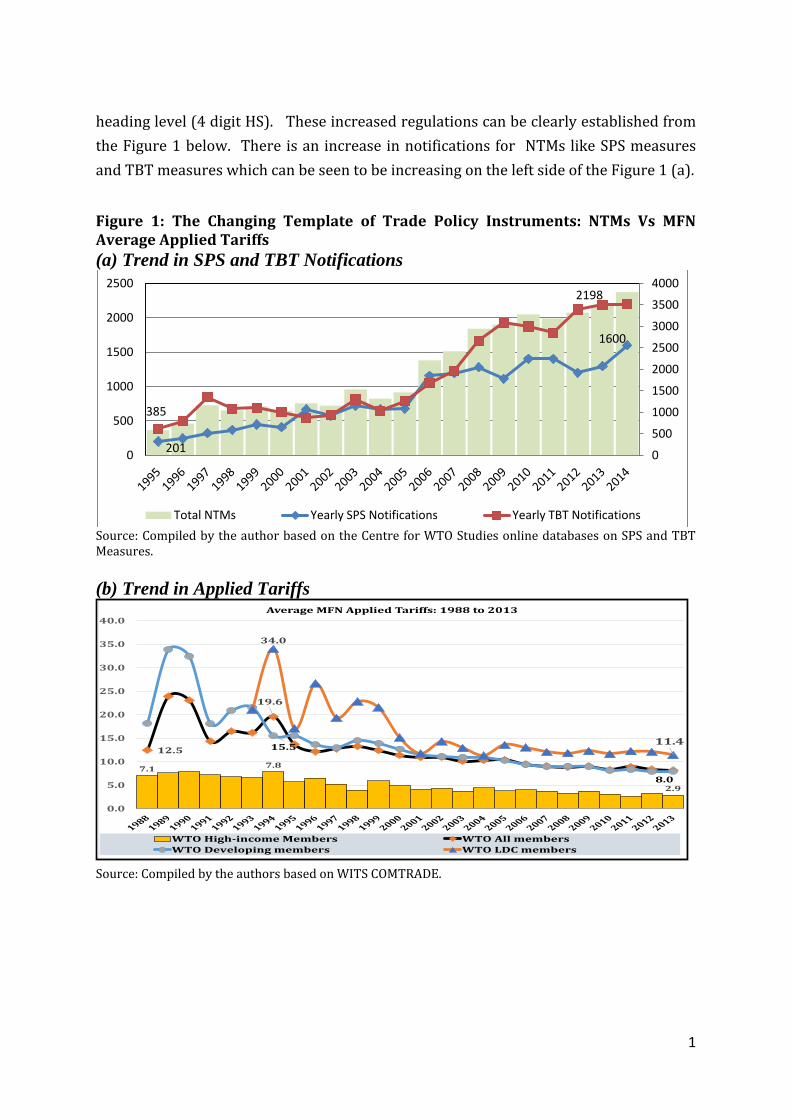
heading level (4 digit HS). These increased regulations can be clearly established from
the Figure 1 below. There is an increase in notifications for NTMs like SPS measures
and TBT measures which can be seen to be increasing on the left side of the Figure 1 (a).
Figure 1: The Changing Template of Trade Policy Instruments: NTMs Vs MFN Average Applied Tariffs
(a) Trend in SPS and TBT Notifications
Source: Compiled by the author based on the Centre for WTO Studies online databases on SPS and TBT Measures.
(b) Trend in Applied Tariffs
Source: Compiled by the authors based on WITS COMTRADE.
201
1600
385
2198
0
500
1000
1500
2000
2500
3000
3500
4000
0
500
1000
1500
2000
2500
Total NTMs Yearly SPS Notifications Yearly TBT Notifications
7.1 7.8
2.9
12.5
19.6
15.5
8.0
34.0
11.4
0.0
5.0
10.0
15.0
20.0
25.0
30.0
35.0
40.0Average MFN Applied Tariffs: 1988 to 2013
WTO High-income Members WTO All members
WTO Developing members WTO LDC members

1
The average applied MFN rates3 in the high-income members was 7.1 percent in 1988
only to increase at 7.8 percent just after the WTO came to existence, see Figure 1 (b).
However, it decreased thereafter by 3 percent in 2013. On the other hand both the
developing countries and least developed countries (LDCs) showed a decrease of 8
percentage points and 23 percentage points during the two years, although from a
relatively higher initial base. Therefore, we can observe sharp reductions in tariff rates
in the case of developing and the LDCs creating relatively low tariff regimes.
Figure 2 clearly indicates that in 9.5 percent of the total notifications have trade
linkages (HS codes) indicated by the members out of total 16.4 thousand SPS
notifications made during 1995 to 2013. The remaining notifications do not contain the
HS codes. This has been rectified by the Centre for WTO Studies4 web portal which
provides the likely trade links for all the notifications from 1995 onwards. This would
enhance the understanding of increased NTMs notifications since 1995 and its overall
impact on trade.
Figure 2: Actual Trade Coverage’s (HS codes) SPS and TBT Notifications under the WTO
SPS Notifications
• 9.5 % of the total notificationcontains information on theactual HS codes.
TBT Notifications
• 15 % of the total notificationcontains information on theactual HS codes.
Source: Compiled by the author based on CWS Web portal on SPS and TBT databases.
Top 20 countries in terms of number of SPS notifications during January 1995 to December
2014 are listed in Table 1. Additionally the table also lists India at 44th
rank. The total
3 Note that much of agricultural products were protected in the developed countries with the repent use
of specific tariff rates (non-ad-valorem tariffs) this was as a direct outcome of the 100 percent tariffication procedure agreed in the Uruguay Round, See the discussions in Kallummal, 2015.
4 Visit the web Sites of Centre for WTO Studies, IIFT <http://wtocentre.iift.ac.in/> and the following web
links for SPS Measures <http://cc.iift.ac.in/sps/index.asp> and for TBT measures
http://cc.iift.ac.in/tbt/index.asp.

1
39,445 notifications are almost divided into half between SPS notifications with 16,954
numbers (43%) and TBT notifications with 22,491 numbers with 57% shares.
Table 1: SPS measures notifications (January 1995 to December 2014)
Ranking Countries SPS
Notifications
Share of
SPS (%)
TBT
Notifications
Shares of
TBT (%)
Total
SPS and
TBT
Notificati
ons
Avg.
MFN
Tariff
(%)
1 United States 3402 62 2128 38 5530 3.4
2 Brazil 1359 54 1164 46 2523 13.5
3 Canada 1509 64 856 36 2365 4.2
4 China 782 39 1213 61 1995 9.9
5 European Union 824 42 1144 58 1968 5.5
6 South Korea 556 44 703 56 1259 13.3
7 Japan 406 36 730 64 1136 4.9
8 Mexico 365 33 727 67 1092 7.9
9 Chile 589 57 447 43 1036 6.0
10 Israel 12 1 967 99 979 4.6
11 Colombia 420 44 531 56 951 8.8
12 Saudi Arabia 144 16 783 84 927 4.8
13 Thailand 295 33 602 67 897 11.4
14 Ecuador 174 19 722 81 896 10.1
15 The SCT of TPKM 544 69 245 31 789 6.0
16 New Zealand 623 84 123 16 746 2.0
17 Peru 635 90 71 10 706 3.4
18 Netherlands 75 11 631 89 706 5.5
19 Argentina 215 31 485 69 700 13.4
20 Philippines 401 62 250 38 651 6.3
44 India 112 51 106 49 218 13.5
Total Notifications (1995 to 2014) 16954 43 22491 57 39445 7.25*
Note * average MFN applied tariff rates (excluding India’s) based on WTO Tariff profile of 2014, See web
source http://stat.wto.org/TariffProfile/.
Source: Centre for WTO Studies, web databases on SPS and TBT databases at web address
http://wtocentre.iift.ac.in/ last accessed on 08-05-2015
The highest total NTMs notifications was of United States in both the SPS measures and TBT
measures with 3,402 and 2,128 notification respectively and thereby accounting for the
highest number of notifications 5,530. USA had a share of 14 percent in the total notifications
for the complete period from 1995 to 2014. The other four countries with the highest number
of notifications were Brazil with 2,523 notifications followed by Canada with 2,365
notifications. At fourth rank was China which joined the WTO in the month of 1st January,
2002 had 1,995 notifications and at the fifth place was the European Union with 1,968
notifications. However, India was at 44th
place as shown in the Table with 218 notifications
and the US NTM notifications was 26 times more than Indian NTM notifications.
This clearly reflects highly skewed trends in India’s MFN applied tariffs rates and the number
of NTMs with both suggesting a very low values unlike the other countries with low MFN
applied tariff rate having a higher number of NTM notifications. The increase in NTM
notifications suggests that these are perhaps being used as trade policy instruments by these
WTO members in order to regulate imports. This phenomenon could be argued as
protectionism by some members, while others could view the same as protection of human
and animal life or health.

1
Notifications of SPS Measures indicate increasing trends towards measures that do not
conform to international standards
Unlike tariffs, the non-tariff measures can be result in virtual denial of the product entry into
the market - if the product does not confer to the regulatory standards or technical
specifications. In the case of high tariffs the exporting country can aspire to get some market
access in the importing country if it is price competitive. However, in the case of SPS / TBT
measures applied by the importing country, there could be a spectrum of scenarios ranging
from the partial denial of imports to complete rejection of consignments at the border. There
is no certainty for the exporter, if there exist information asymmetry on notifications which
deviate from harmonised international standards.
The Centre for WTO Studies databases provide 100 percent coverage on all the SPS
measures notified to the WTO by all Members. This assists in tracking the trend in SPS
notifications.
The Case of SPS Notifications- Trends During 1995 to 2014
Annual SPS notifications increased from 201 in 1995 to 1,600 notification in 2014 with a
growth rate of 9.8 percent. Figure 3 shows two phases in the SPS Measures notified to the
WTO. The first phase is from 1995 to 2006 and the second phase from 2007 to 2014. In the
first phase it was observed that the number of annual notifications of developed and
developing countries were similar.
Figure 3: SPS Notifications- Trends of Developed and Developing Countries
Source: Compiled by the authors based on the Centre for WTO Studies web databases on SPS notifications
201
1,600
1,011
599 589
0
200
400
600
800
1000
1200
1400
1600
0
200
400
600
800
1000
1200
Total SPS Measures (sec.axis) Developing Countries Developed Countries

1
Figure 4: SPS Notifications- Trends in Terms of International Standards and Deviation
from International Measures
Source: Compiled by the authors based on the Centre for WTO Studies web databases on SPS notifications
However, in the second phase there was a clear domination by the developing countries out-
notifying the developed countries. Further, as shown in Figure 4, there is an increasing trend
in notifying measures that do not conform to international standards.
The total SPS notifications are classified into three categories based on the stringency and
nature of application of these measures: i.e. international measures5; measures that deviate
from International measures6; and regional measures
7, see Figure 5. Composition of
distribution across the three measures will impact trade between countries significantly either
by increasing the cost of compliance or by increased rejections of products.
At the macro level the trends in the SPS notifications suggest some clear trends in terms of
the movements in international measures which increased its share from 31 percent to 47
percents with the increase of 16 percentage points. While the national measures seem to have
decreased from 65 percent share in the first phase to 52 percent in the second phase
suggesting a decrease of 13 percentage points. Therefore, with the increase in notification
and participation by developing countries, we can observe a slight shift in composition
towards more and more international standards.
5 These are as per the SPS agreement of three sisters being the CODEX alimentarius (food with stated
function of ensuring safe and good food for everyone, everywhere), international plant protection convention
(IPPC- aims to secure coordinated, effective action to prevent and to control the introduction and spread of
pests of plants and plant products) and world organisation for animal health (OIE - an intergovernmental
organisation responsible for improving animal health worldwide). 6 Any deviation from the international measures or if there is no existing standard at the international level are
stated to be a national measures. 7 The standards and regulations adopted at the regional levels (EU and MERCUSOR) these could the different
from international measures and more like national measures.
1600
0
500
1000
1500
0
200
400
600
800
1000
Grand Total International Measures
Deviation from International Measures Regional Measures

1
Figure 5: Changing Composition of SPS Notifications
Source: Compiled by the authors based on the Centre for WTO Studies web databases on SPS notifications
The dominance of national measures in the SPS measures (agricultural products) is expressed
in the form of differences in the growth rates of international and national measures
notifications. On the one hand, the international measures was seen to be showing a
decreasing trends in growth rates from 27.5 percent during the first phase to 19.2 percent in
the second phase. The growth rates of notification with national measures increased from 9.8
percent in the first phase to 15.2 percent in the second phase. This suggests that although
there could be some respite in terms of increased notification and participation by developing
countries in terms of increased notification of national measures, but the notification with
national measures will continue to stay for a long time in the context of SPS measures.8
These SPS measures are basically domestic regulations and these would continue to increase
in numbers will have increased as the MFN applied tariffs are brought further downward.
3. Prevalence of Stringent MRL-based Standards
An important category of SPS measures that deviate from international standards relate to
regulations based on the maximum residual limits (MRLs) of contaminants like pesticides,
fungicides, herbicides, veterinary drugs and other chemical residuals. Table 2 analyses these
MRL levels for a total of 7600 cases of pesticides, fungicides, herbicides, veterinary drugs
and other chemical residuals present in 23 agricultural products exported by India. The
information is obtained from FAS online database of US Department of Agriculture.
8 Kallummal Murali 2013 (a)
0
10
20
30
40
50
60
70
International Measures Deviation from International Measures
Regional Measures
31
65
4
47 52
1
First Phase (1995 to 2006) Second Phase (2007 to 2014)

1
Table 2: MRL-based Standards on India's Agriculture exports in 9 countries
S. N
o.
Cro
ps
Co
de
x
Au
stra
lia
Ch
ina
Jap
an
Ko
rea
Ma
lay
sia
Ne
w
Ze
ala
nd
Sin
ga
po
re
Th
ail
an
d
Vie
tna
m
1 Cashew Nut 37 28 11 75 81 38 10 39 38 40 2 Chickpeas-Dry 24 58 11 94 93 25 24 29 24 25 3 Coconut 10 12 4 30 27 13 3 12 11 10 4 Coffee Bean-Green 5 9 20 33 8 3 7 6 6 5 Corn-Grain 50 80 43 120 101 54 31 54 50 54 6 Cucumber 62 56 47 101 100 67 60 65 64 65 7 Grape-Table 71 96 35 115 117 71 80 75 73 73 8 Guar-Dry 7 52 1 9 Guava 1 13 6 30 36 6 7 3 1 1
10 Mustard Seed Indian (Brown)
4 2 1 29 31 4 4 8 4 7
11 Onion-Bulb 38 37 15 77 80 40 38 45 39 40 12 Peanut 35 41 22 87 88 39 14 39 40 40 13 Pepper-Non-Bell 52 48 34 113 105 62 62 63 56 67 14 Rice-Grain 28 46 15 65 28 22 33 31 33 15 Sesame Seed 7 15 2 24 40 7 6 11 7 7 16 Soybean 50 62 42 112 103 55 32 56 55 51 17 Spearmint-Oil 1 2 18 Sugar Cane 12 28 14 46 12 16 7 15 15 12 19 Tea Leaves 7 11 6 25 11 8 8 7 6 7 20 Turmeric-Root 1 19 62 67 1 1 1 3 2 21 Wheat-Grain 55 88 48 103 92 55 44 59 55 56 22 Cattle Meat* 25 32 29 50 40 30 21 22 25 23 Milk* 24 24 24 24 24 24 24 24 24
Total 598 813 409 1389 1346 651 504 621 624 645
Note * = Veterinary Drugs
Source: Compiled by the Author based on FAS database on MRLs. http://www.fas.usda.gov/
Information in Table 2 clearly establishes that the in some countries and for certain products,
number of MRL standards are higher in number as compared to Codex- based MRL
standards. This provides the background for exploring this issue in further detail to identify
MRL standards that are more stringent than what has been mandated by Codex. Our analysis
proceeds in three steps. First, in respect of each product, we identify the pesticides, fungicides
etc. in which the MRL is more stringent than the Codex standard. Second, from within the
stringent MRLs, we identify the number of standards that are at least ten times more stringent
than the Codex standards. Finally, for each product as a whole we calculate the extent to
which all MRLs are more stringent than the Codex standards.
4. Six Country Analysis of MRL- based Standards
This sub-section analyses the maximum residual limits (MRLs) in prominent markets like:
United States, Australia, Japan, Canada, European Union and New Zealand and compares the
1
limits with those mandated by Codex. Therefore, there exist two MRL-based standards, the
first one is Codex MRL-based standard which is internationally agreed between all the
membership9 and the second is SPS standards which deviate from these internationally
agreed measures and these are national MRL-based standards. If the deviations are towards
more stringent MRL standards, generally represented as lower parts per million (PPM), then
this would call for analysing whether the measures are backed by sufficient scientific
evidence or based on an appropriate risk assessment. We carry-out a detailed analysis of
those which are more stringent than Codex standards and in particular focus our attention on
deviations that are at least 10 times more stringent than the Codex MRL standards. These
measures may be onerous on the exporting country like India. Of course, these stringent
measures may be permitted under the SPS Agreement, if they are backed by sufficient
scientific evidence or based on an appropriate risk assessment.
MRL-based Standards in Japan
Agricultural products exported by India are analysed for MRL-based SPS measures imposed
by Japan which could be used as a basis for refusal of export consignments. Since the
refusals are necessarily behind the border measure and therefore these are not captured in the
trade statistics. A sample of 23 agricultural products of export interest for India was
examined for identifying instances where the MRL is more stringent than the Codex standard
for the pesticides, fungicides, herbicides and veterinary drugs. Japan would be justified in the
application of such a measure, if it was compatible with the SPS Agreement of the WTO.
The SPS Agreement permits any SPS measure to deviate from the international standard only
if there is a scientific justification. In the absence of scientific evidence it requires a detailed
risk assessment procedure to be carried-out before the application of a more stringent level of
tolerance of MRLs.10
Table 3 below provides a summary of MRL based standards on 16
agricultural products of export interest of India.
Japan maintains a higher MRL-based standard of fungicides, herbicides, pesticides and
veterinary drugs on 16 products out of the 23 products analysed in this paper. The products
include- cattle meat, chickpea, coconut, coffee bean (green), corn grain, cucumber, grape
(table), milk, cashew nut, onion bulb, peanut, pepper (non-bell), rice, soybean seed, Tea
leaves and wheat, grains. There are 1,242 MRL-based standards applied by Japan on 16
products exported by India. Out of the 1,242 MRL-based standards we can clearly establish
that in the case of 140 Japan’s MRL-based standards were more stringent than Codex.
9 The membership of Codex is 185 Member Countries and 1 Member Organisation (EU) and 230 Codex
Observers which consists of 52 Intergovernmental Organisations (IGOs) 162 non-governmental
organisations (NGOs,) 16 belonging to the United Nations. 10 In order to determination of the acceptable daily intake (ADI) quantities of pesticides, fungicides, herbicides,
other contaminants and the veterinary drugs.

1
Table 3: Japan’s MRL-based Stringent Restrictions on India’s Agricultural products
Sl. N. India's Export products Total Pesticides Analysed for
MRL-based Standards
No. of Pesticides/veterinary
Drugs with MRL more
stringent than CODEX
1 Cattle Meat 84 35
2 Milk 140 33
3 Rice 84 17
4 Wheat, grain 98 10
5 Chickpea 34 8
6 Corn Grain 113 7
7 Peanut 84 6
8 Soybean, seed 107 6
9 Pepper, non-bell 109 4
10 Grape, table 69 3
11 Onion, bulb 68 3
12 Cucumber 95 2
13 Nut, cashew 69 2
14 Tea, leaves 67 2
15 Coconut 8 1
16 Coffee bean, green 13 1
Total MRLs Counts 1242 140
Source: Compiled by the authors based on MRL database of the FAS online from http://www.fas.usda.gov/
We can observe from the Table 4 that Japan protected four agricultural products like rice,
cattle meat, wheat grains and milk the most. Japan maintains very stringent MRL-based
standards in 37 pesticides, fungicides, herbicides and veterinary drugs. In respect of these
products the MRLs are at least ten times more stringent than the Codex standards.
Table 4: Japan’s MRL-based Standards (10 times Stringent)
Agricultural products Count of number of MRL based standards that are at least
10 times more stringent than Codex Standards
Milk 13
Cattle Meat 10
Chickpea 5
Rice 3
Pepper, non-bell 2
Wheat, grain 2
Soybean, seed 1
Tea, leaves 1
Total Count of National MRLs
having more than 10 times higher
Stringency
37
Source: Compiled by the authors based on MRL database of the FAS online.
It is observed from the Table 5 that Japan’s MRL-based standard was on an average 10 times
more stringent than that of the Codex MRL-based standards. The ratios ranged from the
highest average of 22 times in the case of rice to lowest average 1.4 times in the case of
coffee-bean. We analysed the top four products with average ratios of more than 10 times as
shown in Table 5, for a detailed analysis of for individual pesticides fungicides, herbicides.

1
Table 5: Japan’s Very Stringent MRL-based Standards
Agricultural Products Average level Stringency (MRL of Japan as a factor of
the Codex Standard)
Rice 22.17
Pepper, non-bell 12.13
Chickpea 11.17
Cattle Meat 10.71
Milk 9.81
Tea, leaves 7.42
Wheat, grain 4.40
Soybean, seed 4.05
Coconut 3.50
Nut, cashew 3.42
Corn Grain 2.89
Grape, table 2.83
Cucumber 2.25
Onion, bulb 2.23
Peanut 1.70
Coffee bean, green 1.43
Avg. MRL Stringency 9.70
Note: Stringency of MRL-based standards of Japan is calculated dividing the CODEX MRL (numerator) by
Japan’s MRL (denominator).
Source: Compiled by the authors based on MRL database of the FAS online.
It was found that rice is the most protected in terms of average ratio of stringent MRL-based
standard of 22 times over the Codex MRL-based standard level. The pesticides, fungicides,
herbicides and other contaminants regulated were lambda cyhalothrin (150 times); Alpha-
cypermethrin (20 times); cypermethrin (20 time); spinetoram (20 times); zeta-cypermethrin
(20 times); deltamethrin (16.7 times); novaluron (14.3 times); fipronil (12.5 times); beta-
cyfluthrin (10 times) and cyfluthrin 10 times when compared to that of Codex MRL-based
standard.
In case of pepper Japan had an average of 12 times higher MRL-based protection when
compared to the Codex MRLs. The MRL-based standards for individual pesticides which
were restricted were: Ametoctradin (30 times); Novaluron (14 times); Ethephon (2.5 times)
and Buprofezin with more than 2 times stringency when compared to that of Codex MRL-
based standard.
The third highest average protection was in chickpeas which recorded an average of 11 times
more stringent MRL than the Codex based standards. The MRL-based standards for
individual pesticides, fungicides and herbicides were: bifenazate (23.3 times); spinosad (15
times); alpha-cypermethrin (14 times); zeta-cypermethrin (14 times); paraquat dichloride (10
times); azoxystrobin (6 times); chlorothalonil (5 times) and flubendiamide with more than 2
times stringency when compared to that of Codex MRL-based standard.

1
In cattle meat MRL-based standard recorded an average of nearly 11 times more stringency
when compared with Codex MRL-based standards. Close to 35 pesticides were recorded for
stringent MRL-based standards out this those with above 10 times was recorded in the case of
10 individual veterinary drugs/pesticides. These were lambda cyhalothrin (150 times); alpha-
cypermethrin (20 times); cypermethrin (20 times); spinetoram (20 times); zeta-cypermethrin
(20 times); deltamethrin (16.7 times); novaluron (14.3 times); fipronil (12.5 times); beta-
cyfluthrin (10 times) and cyfluthrin with more than 10 times stringency when compared to
that of Codex MRL-based standard.
The last product is milk although it has lower average level of stringency of nearly 10 times
than Codex MRL-based standards. This product was one of the most protected products
among all the products analysed for Japan in terms of MRL-based stringency. Thirteen
individual pesticides, fungicides and herbicides and veterinary drugs had more than 10 times
the Codex MRL-based standards. These were pesticides and veterinary drugs like
flubendiamide (50 times); diphenylamine (25 times); diphenylamine (25 times); endosulfan
(25 times); fluxapyroxad (25 times); boscalid (20 times); indoxacarb (20 times); novaluron
(17.5 times); bifenthrin (15 times) alpha-cypermethrin (10 times); cypermethrin (10 times);
spinetoram (10 times) and zeta-cypermethrin with more 10.0 times stringency when
compared to that of Codex MRL-based standard.
MRL-based Standards in the United States
In the case of United States, India is faced with higher MRL-standards in all 23 agricultural
products it exports like: cattle meat; chickpea (dry); coconut; coffee bean (green); corn
(grain); cucumber; grape (table); milk; mustard seed (black); mustard seed ( field); mustard
seed (Indian brown); mustard seed (white/yellow); nut (cashew); onion (bulb); peanut; pepper
(non-bell); rice (grain); sesame (seed); soybean; sugar cane; tea (leaves); turmeric (root) and
wheat (grain). In some of the individual pesticides and veterinary drugs belonging to these
products we can observe the US MRL-based standards are higher than the Codex MRL-based
standards which have been listed in the Table 6.
Table 6: USA’s MRL-based Stringent Restrictions
Sl. N. India's Export products Total Pesticides Analysed
for MRL-based Standards
No. of Pesticides/veterinary
Drugs with MRL more
stringent than CODEX
1 Grape, table 136 23 2 Wheat, grain 130 21 3 Soybean 139 16 4 Cucumber 121 15 5 Peanut 109 12 6 Pepper, non-bell 97 12 7 Rice, grain 84 11

1
8 Chickpea, dry 118 9 9 Corn, grain 151 9
10 Turmeric, root 54 8 11 Onion, bulb 97 7 12 Cattle Meat 43 5 13 Milk 18 5 14 Nut, cashew 101 5 15 Coconut 40 3 16 Mustard seed, black 42 3 17 Mustard seed, field 42 3 18 Mustard seed, Indian (brown) 42 3 19 Mustard seed, white/yellow 42 3 20 Tea, leaves 32 3 21 Sesame, seed 54 2 22 Sugar cane 67 2 23 Coffee bean, green 42 1
Total Pesticides 1,801 181 Source: Compiled by the authors based on MRL database of the FAS online from http://www.fas.usda.gov/
USA maintains higher MRL-based standards on fungicides, herbicides, pesticides and
veterinary drugs on all 23 products analysed. There are 1,801 different MRL-based standards
applied by US on 23 products which are exported by India. Out of the 1,801 MRL-based
standards we can clearly establish that in the case of 181 MRL-based standards were more
stringent than Codex MRL-based standards.
The United States maintains very stringent MRL-based standards of more than 10 times in 38
individual pesticides fungicides, herbicides. It can be observed that in commodities like
Wheat with a count of 5 pesticides having stringency of more than 10 times, followed by
three other products - grapes, pepper and tea had individual pesticides more than 10 times
higher stringency when compared to the Codex standards.
Table 7: US MRL-based Standards (10 times Stringent)
Agricultural products Count of 10 times more stringent MRL-Based
Standards
Wheat, grain 5.0
Grape, table 3.0
Pepper, non-bell 3.0
Tea, leaves 3.0
Chickpea, dry 2.0
Mustard seed, black 2.0
Mustard seed, field 2.0
Mustard seed, Indian (brown) 2.0
Mustard seed, white/yellow 2.0
Rice, grain 2.0
Sesame, seed 2.0
Soybean 2.0
Turmeric, root 2.0
Corn, grain 1.0
Cucumber 1.0
Milk 1.0
Nut, cashew 1.0
Onion, bulb 1.0
1
Peanut 1.0
Total Count of National MRLs having more than 10 times
higher Stringency 38.0
Source: Compiled by the authors based on MRL database of the FAS online.
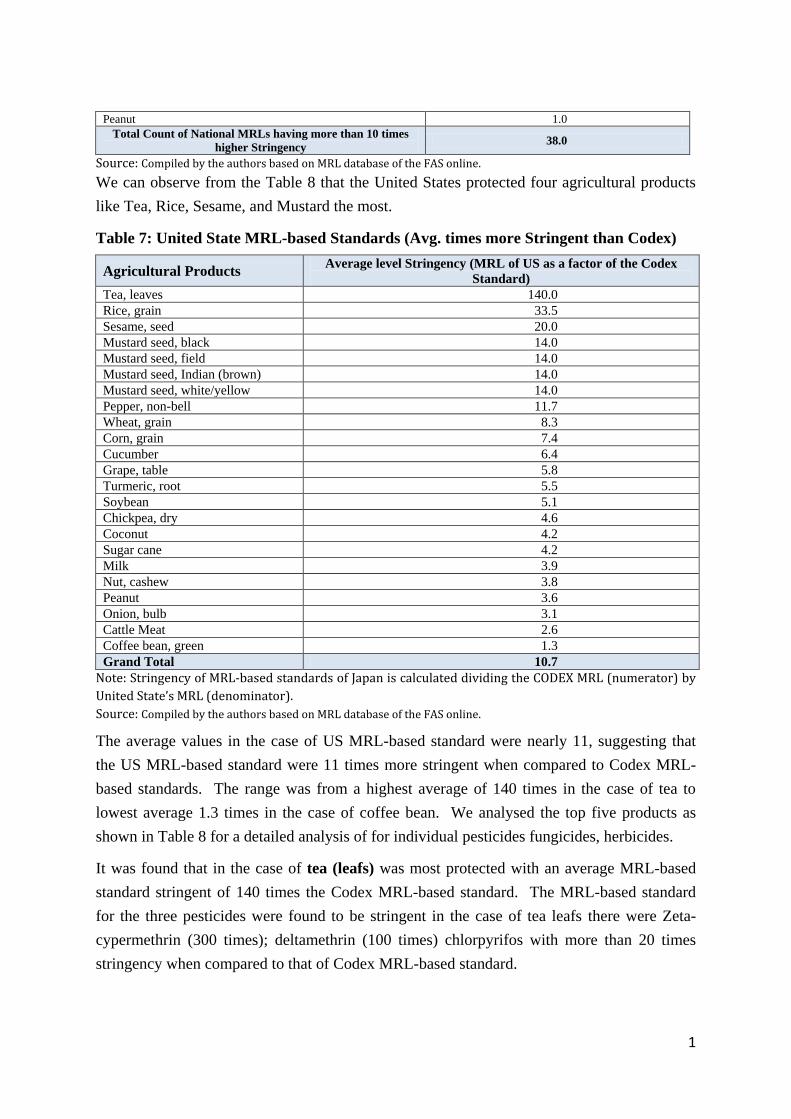
We can observe from the Table 8 that the United States protected four agricultural products
like Tea, Rice, Sesame, and Mustard the most.
Table 7: United State MRL-based Standards (Avg. times more Stringent than Codex)
Agricultural Products Average level Stringency (MRL of US as a factor of the Codex
Standard) Tea, leaves 140.0
Rice, grain 33.5
Sesame, seed 20.0
Mustard seed, black 14.0
Mustard seed, field 14.0
Mustard seed, Indian (brown) 14.0
Mustard seed, white/yellow 14.0
Pepper, non-bell 11.7
Wheat, grain 8.3
Corn, grain 7.4
Cucumber 6.4
Grape, table 5.8
Turmeric, root 5.5
Soybean 5.1
Chickpea, dry 4.6
Coconut 4.2
Sugar cane 4.2
Milk 3.9
Nut, cashew 3.8
Peanut 3.6
Onion, bulb 3.1
Cattle Meat 2.6
Coffee bean, green 1.3
Grand Total 10.7
Note: Stringency of MRL-based standards of Japan is calculated dividing the CODEX MRL (numerator) by
United State’s MRL (denominator).
Source: Compiled by the authors based on MRL database of the FAS online.
The average values in the case of US MRL-based standard were nearly 11, suggesting that
the US MRL-based standard were 11 times more stringent when compared to Codex MRL-
based standards. The range was from a highest average of 140 times in the case of tea to
lowest average 1.3 times in the case of coffee bean. We analysed the top five products as
shown in Table 8 for a detailed analysis of for individual pesticides fungicides, herbicides.
It was found that in the case of tea (leafs) was most protected with an average MRL-based
standard stringent of 140 times the Codex MRL-based standard. The MRL-based standard
for the three pesticides were found to be stringent in the case of tea leafs there were Zeta-
cypermethrin (300 times); deltamethrin (100 times) chlorpyrifos with more than 20 times
stringency when compared to that of Codex MRL-based standard.
1
In case of rice the United States standards were nearly 36 times that of the Codex MRL-
based protection. The MRL-based standards for individual pesticides which were restricted
were: glyphosate (300 times); clothianidin (50 times); chlorpyrifos (5 times);
chlorantraniliprole (2.67 times); fludioxonil (2.5 times); deltamethrin (2 times); piperonyl
butoxide (1.5 times); trifloxystrobin (1.43 times); alpha-cypermethrin (1.33 times); Zeta-
cypermethrin (1.33 times) and sulfuryl fluoride with more than 1.25 times stringency when
compared to that of Codex MRL-based standard.
The third highest protected in terms of average number of times was sesame seeds which
recorded an average of 20 times higher than Codex MRL-based standard. The MRL-based
standards for two pesticides, fungicides and herbicides were 20 times more stringent when
compared to that of Codex MRL-based Standard in gamma cyhalothrin and lambda
cyhalothrin.
The fourth product is mustard Seeds which recorded an average of nearly 14 times
stringency when compared to Codex MRL-based standards. Three different products
varieties of Mustard were traced for the purpose of analysis these were mustard seed, black,
mustard seed, field, mustard seed, Indian (brown) and mustard seed, white/yellow. However,
for the purposes of this paper we have captured MRL-based standards only of the mustard
seed Indian (brown). The individual US MRL-based standards for individual pesticides,
fungicides and herbicides suggest the gamma cyhalothrin (20 times); lambda cyhalothrin (20
times) and zeta-cypermethrin with more than 2 times higher standards in comparison to
Codex MRL-based standards.
The last product is Pepper which recorded an average of nearly 12 times stringency in the
case of the United States MRL-based standards compared to Codex MRL-based standard.
The individual pesticides which were restricted in terms of MRL-based standards were:
fenhexamid (100 times); Alpha-Cypermethrin (10 times); zeta-cypermethrin (10 times);
Buprofezin (5 times); diflubenzuron (3 times); thiamethoxam (2.8 times); sulfoxaflor (2.14
times); fludioxonil (2 times); gamma cyhalothrin (1.5 times); lambda cyhalothrin (1.5 times);
cyprodinil (1.33 times) and flubendiamide more than 1.2 times stringent when compared to
that of Codex MRL-based standard.
MRL-based Standards in Australia
Australia is maintaining higher MRL-based standards on food products imported into the
country. Stringent measures were identified based on a comparison of Australia’s MRL-
based standard to that of Codex MRL-based standard. Out of 23 agricultural products taken
up for analysis, we have found MRL-based stringent barriers in 19 products which are the
exports interest of India. The nineteen products were: wheat-grain, grape-table, pepper-non-

1
bell, corn-grain, soybean, rice-grain, onion-bulb, cucumber, cattle meat, peanut, sugar cane,
cashew nut, chickpeas-dry, coconut, sesame seed, coffee Bean-green, milk, tea leaves
and mustard seed, Indian (brown).
Table 8: Australia MRL-based Stringent Restrictions
Sl.
N. India's Export products
Total Pesticides analysed for
MRL-based Standards
No. Stringent Pesticides/
veterinary Drugs
1 Wheat-Grain 88 24
2 Grape-Table 96 22
3 Pepper-Non-Bell 48 12
4 Corn-Grain 80 11
5 Soybean 62 11
6 Rice-Grain 46 10
7 Onion-Bulb 37 9
8 Cucumber 56 8
9 Cattle Meat 32 7
10 Peanut 41 7
11 Sugar Cane 28 6
12 Cashew Nut 28 5
13 Chickpeas-Dry 58 5
14 Coconut 12 3
15 Sesame Seed 15 3
16 Coffee Bean-Green 9 2
17 Milk 17 2
18 Tea Leaves 11 2
19 Mustard Seed, Indian (Brown) 2 1
Australia’s total MRL Based Standards 766 150
Source: Compiled by the authors based on MRL database of the FAS online from http://www.fas.usda.gov/
A total of 766 individual MRL-based standards are applied by Australia on 19 products
exported by India. Out of the 766 MRL-based standards we can clearly establish that 150
MRL-based standards were more stringent than Codex in the Australia. We can observe
from the Table 10 that the Australia protected six agricultural products like wheat grains,
soybean, rice, chickpea, onion, pepper and sugarcane the most protected in terms of the
presence more than 10 times pesticides/veterinary drugs. When compared to the Codex MRL
Standards, Australia can be seen to maintain very stringent MRL-based standards in 41
individual pesticides fungicides, herbicides (with above 10 times stringency) in 14 different
products of India’s export interest.
Table 9: Australia MRL-based Standards (10 times Stringent)
Agricultural products Count of More 10 times Stringent MRL-Based Standards Wheat-Grain 13
Soybean 5
Rice-Grain 4
Chickpeas-Dry 3
Onion-Bulb 3
Pepper-Non-Bell 3
Sugar Cane 3
Cattle Meat 1
Corn-Grain 1
Grape-Table 1

1
Mustard Seed, Indian (Brown) 1
Peanut 1
Sesame Seed 1
Tea Leaves 1
Grand Total 41.00
Source: Compiled by the authors based on MRL database of the FAS online.
Table 10: Australia’s MRL-based Standards- (Avg. times more Stringent than Codex)
Agricultural Products Average level Stringency (MRL of Australia as a factor of the Codex Standard)
Rice-Grain 56.15
Tea Leaves 19.00
Sugar Cane 15.69
Soybean 14.73
Wheat-Grain 10.59
Mustard Seed, Indian (Brown) 10.00
Chickpeas-Dry 8.49
Onion-Bulb 7.63
Sesame Seed 6.67
Coconut 5.67
Coffee Bean-Green 5.00
Pepper-Non-Bell 4.97
Cashew Nut 4.20
Cucumber 3.94
Corn-Grain 3.73
Cattle Meat 3.57
Peanut 3.26
Grape-Table 2.90
Milk 2.00
Grand Total 10.31
Note: Stringency of MRL-based standards of Japan is calculated dividing the CODEX MRL (numerator) by
Australia’s MRL (denominator).
Source: Compiled by the authors based on MRL database of the FAS online.
The average value of the Australian MRL-based standard which can be observed at nearly
10.3 times, suggests that the Australian MRL-based standard were nearly 10 times more
stringent than the Codex MRL-based standards. These ranged from the highest average of 56
times in the case of tea to the lowest average 2 times in the case of coffee bean. We
identified top five products from Table 10 for a detailed analysis for individual MRL of
pesticides fungicides, herbicides and veterinary drugs. These were the rice-grain with a
stringency average of 56 times followed by tea leaves with 19 times, sugar cane with 16
times, soybean with 15 times, wheat-grain with 11 times and mustard seed, Indian (brown)
times stringent standard in comparison to Codex MRL-based standard.
It was found that rice grain is protected by having an average Australian MRL-based
standard at nearly 56 times of the Codex MRL-based standard. However, the individual
stringent MRL-based standards for each of the pesticides, fungicides and herbicides were
found to be very high in the case of glyphosate (300 times); gamma cyhalothrin (100 times);
lambda cyhalothrin (100 times); chlorantraniliprole (40 times); glufosinate-ammonium (9
times); chlorpyrifos (5 times); alpha-cypermethrin (2 times); zeta-cypermethrin (2 times);

1
fipronil (2 times) and piperonyl butoxide more than 1.5 times stringent standard in
comparison to Codex MRL-based standard.
In case of tea leaves Australia had nearly 19 times higher stringency in term of average of
MRL-based protection in comparison the Codex MRL-based standards. The MRL-based
standards for individual pesticides, fungicides and herbicides were found to be more stringent
than Codex in the case of zeta-cypermethrin by 30 times and dicofol by 8 times.
The third highest protection in terms of average number of times is the case of sugarcane
which recorded an average of nearly 16 times higher MRL-based standards for Australia.
The individual MRL-based standards for pesticides, fungicides and herbicides were found to
be stringent in Chlorantraniliprole by 50 times followed by Zeta-Cypermethrin (20 times),
Dicamba (10 times), Glyphosate (6.7 times), Aldicarb (5 times), and Trinexapac-ethyl more
than 2.5 times stringent standard in comparison to Codex MRL-based standard.
The fourth product is soybean which recorded an average of nearly 15 times stringency in
Australia’s MRL-based standard in comparison to the Codex MRL-based standard. In this
products the individual MRL-based standards for pesticides, fungicides and herbicides
suggests that the clethodim with 100 times was followed by bifenthrin (15 times);
deltamethrin (10 times); saflufenacil (10 times); chlorpyrifos (10 times); boscalid (6 times);
Indoxacarb (2.5 times); gamma cyhalothrin (2.5 times); lambda cyhalothrin (2.5 times);
glyphosate (2 times); tebuconazole with more than 1.5 times stringent standard in comparison
to Codex MRL-based standard.
The fifth product wheat recorded an average of nearly 11 times stringency in the case of the
Australian MRL-based standards compared to Codex MRL-based standard. The 24
individual pesticides which were restrictive in terms of MRL-based standards ranged from
pesticides like the Dicamba with 40 times to Malathion with 1.25 times compared to the
Codex MRL-based Standard. The other 10 individual pesticides which were restrictive in
terms of MRL-based standards were Bifenthrin (25 times); Methomyl, (20 times);
Pyraclostrobin (20 times); Sulfoxaflor (20 times); Triadimenol (20 times); .Trinexapac-ethyl
(10 times); Alpha-Cypermethrin (10 times); Zeta-Cypermethrin (10 times); 2,4-D (10 times);
Azoxystrobin (10 times); MCPA (10 times) and Fenbuconazole with 10 times higher
standards in comparison to Codex MRL-based standards.
MRL-based Standards in Canada
Canada has been maintaining stringent MRL-based standards on 21 agricultural products
exported from India. The twenty one products were: cattle meat (pesticide), grape table, milk
(pesticides), wheat, cucumber, onion bulb, pepper (non-bell), corn grain, peanut, soybean,
rice, cattle meat (for some veterinary drugs), dry guar seeds, chickpea, spearmint (raw and

1
dry), milk (for some veterinary drugs), mustard seed (oilseed), nut-cashew, turmeric root,
mustard seed (spice), and sesame seed.
Table 11: Canada’s MRL-based Stringent Restrictions
Sl. N. India's Export products Total Pesticides analysed for
MRL-based Standards
No. Stringent Pesticides/
veterinary Drugs
1 Cattle Meat (Pesticide) 78 24
2 Grape Table 78 21
3 Milk (Pesticides) 78 14
4 Wheat 72 11
5 Cucumber 70 10
6 Onion Bulb 53 10
7 Pepper (Non-Bell) 69 8
8 Corn Grain 83 8
9 Peanut 35 8
10 Soybean 73 8
11 Rice 24 5
12 Cattle Meat (Veterinary Drugs) 39 4
13 Dry Guar Seeds 27 4
14 Chickpea 45 3
15 Spearmint 12 3
16 Milk (Veterinary Drugs) 17 2
17 Mustard Seed (Oilseed) 33 2
18 Nut-Cashew 35 2
19 Turmeric Root 33 2
20 Mustard Seed (Spice) 11 1
21 Sesame Seed 12 1
Total MRL-based Standards 977 151
Source: Compiled by the authors based on MRL database of the FAS online from http://www.fas.usda.gov/
Out of 23 agricultural products we have taken up for analysis Canada maintains a higher
MRL-based standards on fungicides, herbicides, pesticides and veterinary drugs on 21 export
interest agricultural products for India. Out of the total of 977 individual Canadian MRL-
based standards we can clearly establish that 151 MRL-based standards were more stringent
than Codex MRL-based standards.
We can observe based on Tables 13 and 14, Canada protected three agricultural products -
Cattle meat, Dry Guar and Soybean. These were the most protected in terms of the presence
of pesticides with more than 10 times stringency over the Codex MRL standards. It is further
established that Canada maintains very stringent MRL-based standards in 9 of the 21
products.
Table 13 shows the count of MRLs that are at least 10 times more stringent than the Codex
MRL-based standards in a particular product.
Table 12: Canadian MRL-based Standards (10 times Stringent)
Products Concentration Count of Stringency Value Above 10 times
Cattle Meat (Pesticides/Veterinary Drugs) 11
Dry Guar Seeds 2
Soybean 2
Corn Grain 1
Grape Table 1

1
Onion Bulb 1
Peanut 1
Spearmint 1
Wheat 1
Grand Total 21
Source: Compiled by the authors based on MRL database of the FAS online.
Table 13: Canada’s MRL-based Standards- (Avg. times more Stringent than Codex)
Agricultural Products Average level Stringency (MRL of Canada as a factor of the Codex
Standard)
Wheat 12.5
Cattle Meat (Pesticides/Veterinary Drugs) 11.6
Dry Guar Seeds 8.3
Corn Grain 7.2
Soybean 7.1
Spearmint 4.7
Grape Table 4.4
Peanut 4.2
Milk (Pesticides/Veterinary Drugs) 3.0
Nut Cashew 2.8
Onion Bulb 2.8
Pepper (Non-Bell) 2.3
Rice 2.3
Turmeric Root 2.3
Cucumber 2.2
Mustard Seed (Oilseed) 2.0
Mustard Seed (Spice) 2.0
Sesame Seed 2.0
Cattle Meat (Veterinary Drugs) 1.8
Milk (Veterinary Drugs) 1.8
Chickpea 1.4
Grand Total 5.7
Note: Stringency of MRL-based standards of Japan is calculated dividing the CODEX MRL-based standard
(numerator) by Canada’s MRL-based standard (denominator).
Source: Compiled by the authors based on MRL database of the FAS online.
The average value of Canadian MRL-based standard was 5.7 times, suggesting that Canada
had an MRL-based standard were nearly 6 times more stringent when compared with the
Codex MRL-based standards. These ranged from a high average of 12 times in the case of
wheat to a low average 1.4 times in the case of chickpea. We analysed the top three products
as shown in Table 14 for a detailed analysis for individual pesticides fungicides, herbicides.
These were wheat with an average of 12.5 times followed by cattle meat with nearly 12 times
and dry gaur with 8 times more stringent than the Codex MRL based Standard.
It was found that wheat grain is the most protected with an average of 12 times more
stringent measure over the codex MRL-based standards. The MRL-based standards for
individual pesticides, fungicides and herbicides were found to be stringent in the case of
pesticides like diquat dibromide with over 100 times followed by azoxystrobin (6.7 times);
MCPA (6.7 times); glyphosate (6 times) triadimenol (4 times); trifloxystrobin (4 times);
aminopyralid (2.5 times); fludioxonil (2.5 times); thiamethoxam (2.5 times); piperonyl

1
butoxide (1.5 times) and malathion 1.3 times higher standards in comparison to Codex MRL-
based standards.
In the second product cattle meat, Canada had nearly 12 times higher average MRL-based
protection compared to the Codex MRL-based standards. The MRL-based standards in the
case of individual pesticides, fungicides and herbicides which were found to be more
stringent were piperonyl butoxide with more than 50 times followed by novaluron (25
times); deltamethrin (25 times); cypermethrin (20 times); zeta-cypermethrin (20 times);
chlorantraniliprole (20 times); fluxapyroxad (20 times); lambda cyhalothrin (15 times);
spinosad (15 times); permethrin (10 times) and fluopyram with more than 10 times higher
standards in comparison to Codex MRL-based standards.
The third and last product with high protection in terms of average nearly 8 times is dry guar
when compared with Codex MRL-based standard. The MRL-based standards for individual
pesticides, fungicides and herbicides were found to be stringent for azoxystrobin with over 15
times followed by spinosad (15 times); lambda cyhalothrin (2 times) and boscalid with more
than 1.2 times higher standards in comparison to Codex MRL-based standards.
MRL-based Standards in European Union (EU)
Agricultural products exported by India are analysed for MRL-based SPS measures imposed
by European Union (EU) which could be used as a basis for refusal of export consignments.
Since the refusals are necessarily behind the border measure and therefore these are not
captured in the trade statistics. A sample of 23 agricultural products of export interest for
India was examined for identifying instances where the MRL is more stringent than the
Codex standard for the pesticides, fungicides, herbicides and veterinary drugs. EU would be
justified in the application of such a measure, if it was compatible with the SPS Agreement of
the WTO. The SPS Agreement permits any SPS measure to deviate from the international
standard only if there is a scientific justification. In the absence of scientific evidence it
requires a detailed risk assessment procedure to be carried-out before the application of a
more stringent level of tolerance of MRLs.11
Table 14 below provides a summary of MRL
based standards on 21 agricultural products of export interest of India.
EU maintains a higher MRL-based standard of fungicides, herbicides, pesticides and
veterinary drugs on 21 products out of the 23 products analysed in this paper. The products
include- cattle meat, chickpea, coffee bean (green), corn grain, cucumber, grape (table), guar
seed, milk, mustard seed (oilseed), cashew nut, onion bulb, peanut, pepper (non-bell), rice,
sesame seed, soybean seed, sugar cane, tea leaves and wheat, grains. There are 1,492 MRL-
11 In order to determination of the acceptable daily intake (ADI) quantities of pesticides, fungicides, herbicides,
other contaminants and the veterinary drugs.

1
based standards applied by EU on 21 products exported by India. Out of the 1,492 MRL-
based standards we can clearly establish that in the case of 164 EU’s MRL-based standards
were more stringent than Codex.
Table 14: European Union’s MRL-based Stringent Restrictions on India’s Agricultural
products
Sl. N. India's Export products Total Pesticides Analysed for
MRL-based Standards
No. of
Pesticides/veterinary
Drugs with MRL more
stringent than CODEX
1. Cattle meat (Pesticide) 128 26
2. Cattle meat (Veterinary Drugs) 35 11
3. Chickpea 108 5
4. Coffee bean green 19 3
5. Corn grain 112 7
6. Cucumber 100 14
7. Grape, table 111 16
8. Guar, seed 9 6
9. Milk (Pesticide) 131 9
10. Milk (Veterinary Drugs) 19 2
11. Mustard seed (oilseed) 30 1
12. Nut cashew 76 5
13. Onion bulb 74 5
14. Peanut 87 5
15. Pepper, non-bell 108 17
16. Rice 58 5
17. Sesame seed 27 1
18. Soybean seed 109 11
19. Sugar cane 41 3
20. Tea leaves 10 1
21. Wheat, grain 100 11
Total MRLs Counts 1492 164
Source: Compiled by the authors based on MRL database of the FAS online from http://www.fas.usda.gov/
We can observe from the Table 4 that EU protected four agricultural products like grape
(table), cattle meat (pesticide), cucumber and soybean seed the most. EU maintains very
stringent MRL-based standards in 55 pesticides, fungicides, herbicides and veterinary drugs,
from a total of 85 pesticides, fungicides, herbicides and veterinary drugs analysed. In respect
of these products the MRLs are at least ten times more stringent than the Codex standards.
Table 15: European Union’s MRL-based Standards (10 times Stringent)
Agricultural products Count of number of MRL based standards that are at
least 10 times more stringent than Codex Standards
Grape, table 10
Cattle meat (Pesticide) 9
Cucumber 6
Soybean, seed 5
Guar, seed 4

1
Pepper, non-bell 4
Chickpea 3
Wheat, grain 3
Onion bulb 2
Rice 2
Sugar cane 2
Corn grain 1
Milk (Pesticide) 1
Milk (Veterinary Drugs) 1
Nut cashew 1
Peanut 1
Total Count of National MRLs having
more than 10 times higher Stringency
55
Source: Compiled by the authors based on MRL database of the FAS online.
It is observed from the Table 5 that EU’s MRL-based standard was on an average 36 times
more stringent than that of the Codex MRL-based standards. The ratios ranged from the
highest average of 195 times in the case of grape (table) to lowest average 1.5 times in the
case of coffee-bean. We analysed the top three products with average ratios of more than 36
times as shown in Table 5, for a detailed analysis of individual pesticides fungicides,
herbicides.
Table 16: European Union’s Very Stringent MRL-based Standards
Agricultural Products Average level Stringency (MRL of EU as a factor of the Codex
Standard)
Grape, table 195.25
Rice 112.07
Soybean 41.83
Cucumber 29.54
Sugar cane 25.00
Chickpea 24.80
Onion bulb 22.00
Wheat, grain 16.19
Pepper, non-bell 16.13
Guar 13.17
Nut cashew 13.10
Cattle meat (Pesticide) 10.04
Corn grain 8.13
Milk (Veterinary Drugs) 6.00
Peanut 4.65
Milk (Pesticide) 3.85
Cattle meat (Veterinary Drugs) 2.10
Mustard seed (oilseed) 2.00

1
Sesame seed 2.00
Tea leaves 2.00
Coffee bean green 1.50
Avg. MRL Stringency 35.89
Note: Stringency of MRL-based standards of EU is calculated dividing the CODEX MRL (numerator) by
EU’s MRL (denominator).
Source: Compiled by the authors based on MRL database of the FAS online.
It was found that grape (table) is the most protected in terms of average ratio of stringent
MRL-based standard of 195 times over the Codex MRL-based standard level. Close to 16
pesticides were recorded for stringent MRL-based standards out of this those with above 10
times was recorded in the case of 10 individual pesticides, fungicides, herbicides and other
contaminants. These were Captan (1250 times); Dicloran (700 times); Fenpropathrin (500
times); Malathion (250 times); Phosmet (200 times); Clofentezine (100 times); Ziram (50
times); Thiophanate-methyl (30 times); Methomyl (15 times); Tebuconazole with 12 times
when compared to that of Codex MRL-based standard.
In case of rice EU had an average of 112 times higher MRL-based protection when compared
to the Codex MRLs. The MRL-based standards for individual pesticides which were
restricted were: Glyphosate (300 times); Trifloxystrobin (250 times); Fludioxonil (5 times);
Iprodione (3 times) and Fipronil 2 times when compared to that of Codex MRL-based
standard.
The third highest average protection was in soybean which recorded an average of 42 times
more stringent MRL than the Codex based standards. The MRL-based standards for
individual pesticides, fungicides and herbicides were: Dicamba (200 times); Chlorothalonil
(100 times); Flubendiamide (100 times); Paraquat dichloride (25 times); Deltamethrin (20
times); Carbaryl (4 times); Bifenthrin (3 times); Saflufenacil (3 times); Chlorpyrifos (2
times); Thiophanate-methyl (1.6 times) and Diquat dibromide with more than 1.5 times
stringency when compared to that of Codex MRL-based standard.
MRL-based Standards in New Zealand
When examined for stringent MRLs of pesticides and veterinary drugs, unlike others New
Zealand is following Codex MRL standards in almost the entire selected sample of 23
agricultural products of export interest for India. Only in the case of cattle meat, New
Zealand is following stringency on the use of veterinary drugs with the average stringency of
1.82 times when compared to that of Codex MRL-based standard. It was following 2 times
stringent MRL standard for these veterinary drugs: Chlortetracycline, Eprinomectin,
Fenbendazole, Oxfendazole, Oxytetracycline, Pirlimycin, and Tetracycline; and was
following 1.5 times stringent MRL for Dihydrostreptomycin and Streptomycin respectively.

1
Table 17: New Zealand's Stringency of Veterinary Drugs in Cattle Meat
Veterinary Drugs Codex New Zealand Stringency- number of times over
Codex MRL Standard
Chlortetracycline 0.20 0.10 2.00
Eprinomectin 0.10 0.05 2.00
Fenbendazole 0.10 0.05 2.00
Oxfendazole 0.10 0.05 2.00
Oxytetracycline 0.20 0.10 2.00
Pirlimycin 0.10 0.05 2.00
Tetracycline 0.20 0.10 2.00
Dihydrostreptomycin 0.60 0.50 1.20
Streptomycin 0.60 0.50 1.20
Average MRL stringency 0.24 0.17 1.82
Source: Compiled by the authors based on MRL database of the FAS online from http://www.fas.usda.gov/
New zeal followed the Codex MRL-based standard for the other products.
5. Challenges for Checking for WTO Compatibility12
The difference between protection and protectionism is very thin and tricky. There is a need
to check for WTO compatibility (of an action and to establish it) and it is still one of the
biggest challenge faced by specifically exporting developing country. The complete process
of checking WTO compatibility requires three sets of information, which are dynamic and
legalistic in nature.
The following steps have to be followed for an effective solution to the issue of export
refusal:
Step 1: Getting the notification/alert/information on the refusal parameter in MRLs
terms from the importing country (market), this is critical for comparing the
same with information collected from the WTO submission of the importing
country for checking similarity of contents;
Step 2: Checking for importing country (market) notification to the WTO for
analysing the product and pesticides coverage, this can be tricky for some
notifications as most often the notification to the WTO are without HS codes;
Step 3: Compare the two set of documents: i) the WTO notification of the importing
country (market) and analysing for objectives for the application of MRL-
based standard; and ii) the check for export refusal documents for the
12
This section was development later and therefore is not available in the published report titled “Standards
Conclave 2015”.

1
objectives for MRL-based refusal as mentioned and verification of the match
with the WTO document. Prima facie the mismatch between the two sets of
documents can be termed as protectionism. However, it could be violative of
other provisions of the SPS and TBT Agreements also.
We have to be alert regarding while being an exporting country; the whole production
process should be following good manufacturing and good agricultural practices to avoid the
refusal of exports. There is a need to check the WTO compatibility of any new MRL-based
restriction that is introduced on a product. This process is particularly challenging because
the WTO notifications most often do not have the relevant trade linkage (HS codes) as
indicated in the paper.
Therefore, there is a need to keep a close account of the following developments:
1. To get involved in the process by analysing any new MRL-based standard (NTMs),
particularly the SPS measures, which are being introduced in the recent times and
years? These MRL-based measures would have to be mapped with the existing
internationally harmonised standards, in order to establish whether the new measure is
a deviation from international measures. There is also a need to keep watch over
notifications by the importing country (market). The same cannot be attempted for all
trading partners, but at least for the prominent trading partners.
2. Counter intelligence and surveillance of the domestic sales within the importing
country becomes another integral part of this whole exercise. We need to develop
mechanisms and put system in place to carried-out studies which would make an
assessment of all the domestically sold goods confer with the (MRL-based) SPS
measures directive or the basis of refusal. This process is to check for national
treatment (NT) and most favoured nation (MFN) principles are being adhered by the
importing country as directed by the SPS agreement. Especially, if there are records
on the refusals of imports, these would have to be mapped with the results that are
obtained by the process of surveillance of domestic sales. Checking and testing for
nearly all the products in importing country’s (market) will become a primary concern
for any exporter or exporting country.
3. These would have to be done through the analysis at the laboratory or manual
checking. In case of import refusals these would have to be carried-out keeping the
information of the refusal intact. This will become important for exporter to make an

1
assessment on the violation of WTO principles like “national treatment” and “most
favoured nation”.
4. In case of the first three points mentioned above there is a particular need to carry out
at the sectoral level. Some of these efforts need to be addressed at sectoral level as
the problems are unique and have sectoral impact and also because the need for
inspection of these measures/regulations for “compatibility” requires a sectoral
treatment. Further, there is an urgent need for checking the stringency of SPS
measures in terms of maximum residual limits (MRLs), based on risk assessment
approach, most often these measures are adopted largely by the developed countries at
regular intervals.
5. MRL-based measures once adopted by an importing country should be tracked for
continuity of the same so that they are not relaxed in the future WTO notifications.
As such MRL-based standards can be used for short-term disruption in the
competitiveness.
6. Conclusions and Way Forward
The difference between protection and protectionism is very thin and tricky. WTO members
have the right to take measures to protect human, animal and plant life or health. However,
the measures have to conform to international standards. If the measures deviate from
international standards, these must be backed by sufficient scientific evidence or be based on
appropriate risk assessment. Our study clearly establishes that in a large number of
agriculture products of export interest to India the MRL standards are significantly more
stringent than the Codex international standards.
With 36 time more stringent MRL-based SPS standards, the EU maintains a very high
standards in fungicides, herbicides, pesticides and veterinary drugs and these were applied on
21 products out of 23 products - compared to the Codex MRL standard. The The EU
maintains very stringent MRL-based standards in 55 pesticides, fungicides, herbicides and
veterinary drugs, from a total of 85 pesticides, fungicides, herbicides and veterinary drugs.
EU’s MRL-based standard was on an average 36 times more stringent than that of the Codex
MRL-based standards. The countries which followed EU were United States of America
with nearly 11 times more stringent measures which was closely followed by Australia and
Japan with 10.3 and 9.7 times more stringent standards. While Canada maintained a
relatively lower average stringency of 5.7 times, New Zealand had the lowest average of 1.8
times more stringent standards when to the Codex MRL levels. New Zealand is following
1
Codex MRL standards in most of the selected sample of 23 agricultural products of export
interest for India. Only in the case of cattle meat, New Zealand is following stringency on the
use of veterinary drugs with the average stringency of 1.82 times when compared to that of
Codex MRL-based standard.
These measures could be impeding India's exports. Following steps are suggested to take our
analysis to a logical end:
a) While our study has been based on information available in FAS online of the US
Department of Agriculture, it is important to obtain confirmation about existence of
standards that are more stringent than Codex standards from the countries concerned.
b) In case it is confirmed by the countries that they maintain MRL-based standards that
are more stringent than Codex, these countries should be requested to provide
adequate scientific justification or the appropriate risk assessment. If this evidence is
not forthcoming, then in the first instance India could consider taking up this issue
bilaterally. If the issue is not successfully resolved, India could consider raising it at
the SPS Committee and if need be resort to the Dispute Settlement Mechanism.
c) India should also seek to obtain confirmation that the stringent MRL standards are
being applied uniformly and consistently to domestic producers and not exclusively to
imports.
***

1
Selected References
Ante, Jhon M and Pingali, Prabhu L., 1994, “Pesticides, productivity, and farmer health: A Philippines Case
Study”, American Journal of Agricultural Economics, Vol.76, No.3, pp.418 – 430.
Babili, M., 2009, “Ad Valorem equivalent in the WTO”, Working Paper No. 43, National Agricultural Policy
Centre, Ministry of Agriculture and Agrarian Reforms, Damascus.
Crissman, Charles C., Cole, Donald C. and Carpio Fernando, 1994, “Pesticide use and farm worker health in
ecuadorian potato production”, American Journal of Agricultural Economics, Vol.76, No.3,
pp.593 – 597.
Das, K., 2008, “Addressing SPS challenges in India”, 1 September, Available at http://ssrn.com/.
Dasgupta, S., C. Meisner and N. Mamingi, 2005, “Pesticide Traders’ Perception of health risks: Evidence from
Bangladesh”, World Bank Policy Research Working Paper No. 3777, Washington, D.C.
Dhar, B. and M. Kallummal, 2007, “Taming non-tariff barriers: can WTO find a solution?” Studies on Trade
and Investment, No. 61, pp.131-180, United Nations Economic and Social Commission for
Asia and the Pacific, Bangkok.
Disdier A.C., Fontagne L. and M. Mimouni, 2007, “The impact of regulation on agricultural trade: Evidence
from SPS and TBT Agreements”, CEPII Working Paper, No. 2007-04. Centre d’Etudes
Prospectives et d’Informations Internationales, Paris.
Dung, N.H and T.T.T. Dung, 2003, “Economic and health consequence of pesticides use in paddy production in
the Mekong delta, Vietnam”, EEPSEA Research Reports 39,
http://203.116.43.77/publications/research1/ACF124.html.
Fontagne, L., Mimouni, M. and J. M. Pasteels, 2005, “Estimating the impact of environmental SPS and TBT on
international trade”, Integration and Trade Journal, Vol.28, No.19, pp.7-37.
Grossman, G. M. and A. B. Krueger, 1995, “Economic growth and the environment”, The Quarterly Journal of
Economics, vol.110, No.2; pp.353-377.
Jaiswal, A. K., 2003, “WTO agreement on SPS: strategic implications”, Economic and Political Weekly, 8
November, pp. 4737-4742.
Kallummal M., 2015a, “Imbalance in Doha Round and Agricultural Trade: Prospects for Market Access for
Developing Countries”, Agrarian South: Journal of Political Economy, vol 4, no.1, pp 85-125.
Kallummal M., 2015b, “Hindrances Caused by Rising NTMs to Potential Gains in Market Access: The case of
India-APEC Trade”, Edited by Observer Research Foundation. (forthcoming).
Kallummal M., 2015c, “Market Access in Goods Trade under the ASEAN-India FTA: NTMs Gaining
Prominence”, Chapter 7, in the edited book by the RIS Rutledge publishers (forthcoming).
Kallummal M and Hari Maya Gurng, 2014, “India’s Agricultural Exports and United States Sanitary and other
Regulatory Measures: Special Focus on Exports in Spices and Vegetable Products from
Maharashtra and Gujarat”, Presented at International Conference on Indian Agriculture
Sector under Trade Liberalisation and WTO: Issues and Challenges, Session 6: Agriculture
and Indian Economy, December 11 -12, 2014, New Delhi
Kallummal M., 2013a, SPS Measures and Market Access Implications for Agricultural Trade WTO's Systemic
Issues and Changing Scale of Technology, LAP Lambert Academic Publishing, ISBN-
13:978-3-659-40808-3,ISBN-10: 3659408085.
Kallummal M., 2013b, “Imbalance in Doha round market access outcomes in trade in agriculture and allied
sectors”, Working Paper 5, New Delhi, March.
Kallummal M., Gupta, Aditi and V. Poornima, 2012, “Agricultural trade from South-Asia and the impact of SPS
measures: a case study European Rapid Alert System for Food and Feed (RASFF)”, paper to
be presented at the international conference on Public Policy and Governance, Indian
Institute of Science, Bangalore, 6-7 September.
Kallummal M., V. Poornima and P. Prabhakar, 2011, “An analysis of India and EU trade in the chemical sector:
testing for the evidence on Pollution Haven Hypothesis”, Draft report (mimeograph), Centre
for WTO Studies, Indian Institute of Foreign Trade, New Delhi.
Kallummal M., V. Poornima and R. Shajpal, 2011, “The Impact of sanitary and phytosanitary measures on
India’s agricultural exports”, Draft report (mimeograph), Centre for WTO Studies, Indian
Institute of Foreign Trade, New Delhi.
Kallummal M. and H. M. Gurung, 2010a, “Sanitary and phytosanitary measures and analysis of systemic issues:
Trends based on the online database of CWS – 1995 to 2010”, India, WTO and Trade Issues
Bi-monthly Newsletter, Vol.1, No.15.
Kallummal M., 2010b,“How the technology for detection has changed in terms of NTMs measurement scales in
the case of SPS standards: The select eight cases from QUAD countries”, draft report
1
(mimeograph) submitted to Department of Commerce and Industry, Centre for WTO
Studies, Indian Institute of Foreign Trade, New Delhi.
Korinek, J., M. Melatos and M. Rau, 2008, “A review of methods for quantifying the trade effects of standards
in the agri-food sector”, OECD Trade Policy Working Paper, No.79. Paris. Available at
http://dx.doi.org/10.1787/235833787115
Lehmann, B. and S. Karrer, 2004, “Food safety”, Third Annual Meeting on Agriculture and
Globalization,October 7, 2004, pp.1-32.
Lesser, C., 2007, “Do bilateral and regional approaches for reducing technical barriers to trade converge towards
the multilateral trading system?” OECD Trade Policy Working Paper No. 58, Paris.
Liu Lan and Yue Chengyan, 2009, “NTBs to trade caused by SPS measures and customs procedures with
product quality changes”, Journal of Agricultural and Resource Economics, Vol.34, No.1,
pp.196-212.
Mani, M., 1996, “Environmental tariffs on polluting imports: An empirical study”, Environmental and Resource
Economics, Vol.7, pp. 391-411.
Mehta, R., J. George and M. Saqib, 2002, “Addressing sanitary and phytosanitary agreement: A case study of
select processed food products in India”, RIS Discussion Paper No. 39. Research and
Information System for Developing Countries, New Delhi.
OECD, 2003, “The impact of regulations on agro-food trade: the technical barriers to trade (TBT) and sanitary
and phytosanitary measures (SPS) agreements”, Vol. 2003, No. 27, pp. 1-153, Paris, France.
Pingali, Prabhu L., Marquez, Cynthia B., and Palis, Florencia G., 1994, “Pesticides and Philippine rice farmer
health: a medical and economic analysis”, American Journal of Agricultural Economics,
Vol.76, No.3, pp.587 – 592.
Ratna, S. R., S. K. Sharma, M. Kallummal and A. Biswas, 2010, “Agriculture under WTO regime: cross-
country analysis of select issues”, Discussion Paper No. 5, Centre for WTO Studies, Indian
Institute of Foreign Trade, New Delhi.
Robison, D. H., 1988, “Industrial pollution abatement: The impact on the balance of trade”, Canadian Journal
of Economics, Vol. 21; pp.702-706.
Shafaeddin, M., 2009, “The cost of compliance with sanitary and phytosanitary measures in low-income
countries: A strategy for reorganization of the supply chain”, Third World Network,
Available at www.twnside.org.sg.
Swann, G. P., 2010, “International standards and trade: A review of the empirical literature”, OECD Trade
Policy Working Paper, No. 97, Paris, Available at http://dx.doi.org/10.1787/5kmdbg9xktwg-
en.
Tobey, J. A., 1990, “The effects of domestic environmental policies on patterns of world trade: An empirical
test”, Kyklos, Vol.43, No. 2, pp.191-209.
United Nations Conference on Trade and Development (UNCTAD), 2010, “Non-tariff measures: evidence from
selected developing countries and future research agenda”, Developing Countries in
International Trade Studies, Geneva.
Vaillant, M., 2011, “How to encourage the network trade rules interconnections? An application to the case of
non-tariff barriers”, Trade and Development Symposium Perspectives on the Multilateral
Trading System: A Collection of Short Essays, International Centre for Trade and
Sustainable Development, Geneva.
WTO, 2008a, Committee on Sanitary and Phytosanitary Measures, G/SPS/7/Rev.3, 20 June 2008, Geneva.
———, 2008b, Committee on Sanitary and Phytosanitary Measures, “Major decisions and documents”, summer
2008, Geneva
———, 1995, “The legal text: The results of Uruguay Round of multilateral trade negotiations”, Agreement on
Sanitary and Phytosanitary Measures, Geneva.