Yeast gene CMR1/YDL156W is consistently co-expressed with genes participating in DNA-metabolic...
10
rsif.royalsocietypublishing.org Research Cite this article: Abu-Jamous B, Fa R, Roberts DJ, Nandi AK. 2013 Yeast gene CMR1/ YDL156W is consistently co-expressed with genes participating in DNA-metabolic processes in a variety of stringent clustering experiments. J R Soc Interface 10: 20120990. http://dx.doi.org/10.1098/rsif.2012.0990 Received: 30 November 2012 Accepted: 2 January 2013 Subject Areas: bioinformatics, computational biology Keywords: CMR1/YDL156W, G1/S transition, DNA replication, DNA repair, binarization of consensus partition matrix Author for correspondence: Asoke K. Nandi e-mail: [email protected] Electronic supplementary material is available at http://dx.doi.org/10.1098/rsif.2012.0990 or via http://rsif.royalsocietypublishing.org. Yeast gene CMR1/YDL156W is consistently co-expressed with genes participating in DNA-metabolic processes in a variety of stringent clustering experiments Basel Abu-Jamous 1 , Rui Fa 1 , David J. Roberts 2,3 and Asoke K. Nandi 1,4 1 Department of Electrical Engineering and Electronics, University of Liverpool, Brownlow Hill, Liverpool L69 3GJ, UK 2 National Health Service Blood and Transplant, Oxford, UK 3 University of Oxford, John Radcliffe Hospital, Oxford OX3 9UB, UK 4 Department of Mathematical Information Technology, University of Jyva ¨skyla ¨, Jyva ¨skyla ¨, Finland The binarization of consensus partition matrices (Bi-CoPaM) method has, among its unique features, the ability to perform ensemble clustering over the same set of genes from multiple microarray datasets by using various clus- tering methods in order to generate tunable tight clusters. Therefore, we have used the Bi-CoPaM method to the most synchronized 500 cell-cycle-regulated yeast genes from different microarray datasets to produce four tight, specific and exclusive clusters of co-expressed genes. We found 19 genes formed the tightest of the four clusters and this included the gene CMR1/YDL156W, which was an uncharacterized gene at the time of our investigations. Two very recent proteomic and biochemical studies have independently revealed many facets of CMR1 protein, although the precise functions of the protein remain to be elucidated. Our computational results complement these biologi- cal results and add more evidence to their recent findings of CMR1 as potentially participating in many of the DNA-metabolism processes such as replication, repair and transcription. Interestingly, our results demonstrate the close co-expressions of CMR1 and the replication protein A (RPA), the cohesion complex and the DNA polymerases a, d and 1, as well as suggest functional relationships between CMR1 and the respective proteins. In addition, the analy- sis provides further substantial evidence that the expression of the CMR1 gene could be regulated by the MBF complex. In summary, the application of a novel analytic technique in large biological datasets has provided supporting evi- dence for a gene of previously unknown function, further hypotheses to test, and a more general demonstration of the value of sophisticated methods to explore new large datasets now so readily generated in biological experiments. 1. Introduction The rate of data generation in biology has been much faster than that of devel- opments in data analysis and integration [1]. The volume of the generated data have reached a level that cannot be readily interpreted without some form(s) of preprocessing by computational methods to produce comprehensible sum- maries or to highlight small useful subsets of data in order to formulate new hypotheses to target future research. Although the complete exploration and interpretation of this large amount of raw data has become an increasingly chal- lenging issue, raw data generation has not stopped; indeed, the rate of accumulation of data is accelerating. Gene clustering is one of many classes of in silico computational methods that have been applied to high-throughput datasets for their analysis. Gene clustering based on the genetic expression profiles measured by microarrays aims to group the given set of genes in a set of clusters such that those & 2013 The Authors. Published by the Royal Society under the terms of the Creative Commons Attribution License http://creativecommons.org/licenses/by/3.0/, which permits unrestricted use, provided the original author and source are credited.
Transcript of Yeast gene CMR1/YDL156W is consistently co-expressed with genes participating in DNA-metabolic...

rsif.royalsocietypublishing.org
ResearchCite this article: Abu-Jamous B, Fa R, Roberts
DJ, Nandi AK. 2013 Yeast gene CMR1/
YDL156W is consistently co-expressed with
genes participating in DNA-metabolic processes
in a variety of stringent clustering experiments.
J R Soc Interface 10: 20120990.
http://dx.doi.org/10.1098/rsif.2012.0990
Received: 30 November 2012
Accepted: 2 January 2013
Subject Areas:bioinformatics, computational biology
Keywords:CMR1/YDL156W, G1/S transition, DNA
replication, DNA repair, binarization of
consensus partition matrix
Author for correspondence:Asoke K. Nandi
e-mail: [email protected]
Electronic supplementary material is available
at http://dx.doi.org/10.1098/rsif.2012.0990 or
via http://rsif.royalsocietypublishing.org.
& 2013 The Authors. Published by the Royal Society under the terms of the Creative Commons AttributionLicense http://creativecommons.org/licenses/by/3.0/, which permits unrestricted use, provided the originalauthor and source are credited.
Yeast gene CMR1/YDL156W is consistentlyco-expressed with genes participating inDNA-metabolic processes in a variety ofstringent clustering experiments
Basel Abu-Jamous1, Rui Fa1, David J. Roberts2,3 and Asoke K. Nandi1,4
1Department of Electrical Engineering and Electronics, University of Liverpool, Brownlow Hill,Liverpool L69 3GJ, UK2National Health Service Blood and Transplant, Oxford, UK3University of Oxford, John Radcliffe Hospital, Oxford OX3 9UB, UK4Department of Mathematical Information Technology, University of Jyvaskyla, Jyvaskyla, Finland
The binarization of consensus partition matrices (Bi-CoPaM) method has,
among its unique features, the ability to perform ensemble clustering over
the same set of genes from multiple microarray datasets by using various clus-
tering methods in order to generate tunable tight clusters. Therefore, we have
used the Bi-CoPaM method to the most synchronized 500 cell-cycle-regulated
yeast genes from different microarray datasets to produce four tight, specific
and exclusive clusters of co-expressed genes. We found 19 genes formed the
tightest of the four clusters and this included the gene CMR1/YDL156W,
which was an uncharacterized gene at the time of our investigations. Two
very recent proteomic and biochemical studies have independently revealed
many facets of CMR1 protein, although the precise functions of the protein
remain to be elucidated. Our computational results complement these biologi-
cal results and add more evidence to their recent findings of CMR1 as
potentially participating in many of the DNA-metabolism processes such as
replication, repair and transcription. Interestingly, our results demonstrate the
close co-expressions of CMR1 and the replication protein A (RPA), the cohesion
complex and the DNA polymerases a, d and 1, as well as suggest functional
relationships between CMR1 and the respective proteins. In addition, the analy-
sis provides further substantial evidence that the expression of the CMR1 gene
could be regulated by the MBF complex. In summary, the application of a novel
analytic technique in large biological datasets has provided supporting evi-
dence for a gene of previously unknown function, further hypotheses to test,
and a more general demonstration of the value of sophisticated methods to
explore new large datasets now so readily generated in biological experiments.
1. IntroductionThe rate of data generation in biology has been much faster than that of devel-
opments in data analysis and integration [1]. The volume of the generated data
have reached a level that cannot be readily interpreted without some form(s) of
preprocessing by computational methods to produce comprehensible sum-
maries or to highlight small useful subsets of data in order to formulate new
hypotheses to target future research. Although the complete exploration and
interpretation of this large amount of raw data has become an increasingly chal-
lenging issue, raw data generation has not stopped; indeed, the rate of
accumulation of data is accelerating.
Gene clustering is one of many classes of in silico computational methods
that have been applied to high-throughput datasets for their analysis. Gene
clustering based on the genetic expression profiles measured by microarrays
aims to group the given set of genes in a set of clusters such that those

rsif.royalsocietypublishing.orgJR
SocInterface10:20120990
2
genes that belong to one cluster are relatively more co-expressed with each other, while not so co-expressed with
the genes that are assigned to the other clusters. Many studies
achieved this by using different clustering methods such as
k-means [2], hierarchical clustering (HC) [3], self-organizing
maps (SOMs) [4], self-organizing oscillator networks
(SOONs) [5] and others.
Because different clustering methods generate different
clustering results, ensemble clustering methods have been
proposed to scrutinize the results of many individual cluster-
ing experiments over the same set of genes in order to
produce one consensus result. Some of these ensemble clus-
tering methods are relabelling and voting [6], co-association
matrix-based methods [7], hypergraph-based methods [8]
and others.
A new paradigm of clustering has been proposed recently
through a new ensemble clustering method called binarizationof consensus partition matrix (Bi-CoPaM) that relaxes conven-
tional clustering constraints and allows any gene to be
assigned exclusively to one cluster, assigned simultaneously
to multiple clusters or unassigned from all the clusters
[9,10]. This method can be tuned to generate clusters with
different levels of tightness ranging from very tight clusters,
while leaving most of the genes unassigned, to very wide
and overlapping clusters passing through conventional
complementary clusters. The aim of this new paradigm of
clustering is to be able not only to restructure the raw biologi-
cal data into a set of well-defined clusters, but also, in the case
of generating tighter clusters, to shrink the size of these clus-
ters to more comprehensible levels appropriate to the specific
requirements of research.
One of the genes that have been extensively considered in
our Bi-CoPaM analysis is the newly characterized yeast gene
CMR1/YDL156W. Our experiment had begun before the
availability of the newly revealed information about this
gene in three recent studies that have investigated this gene
[11–13]. Choi et al. [11] used biochemical methods to find
that the CMR1 gene’s product binds the DNA and may be
involved in DNA-damage responses. Gilmore et al. [12]
used integrative bioinformatics, quantitative proteomics and
biochemical approaches to conclude that CMR1 is a
member of the core histone network and is highly associated
with the four histones as well as with many of the other
proteins within the network. Sufficient evidence was also
found to associate CMR1 with many cellular processes such
as chromatin remodelling, transcription and DNA repair/
replication [12]. Even more recently, Tkach et al. [13] have
thoroughly investigated the genetic and physical interactions
between CMR1 and DNA repair genes that are localized in
nuclear foci to characterize a previously unknown DNA
response pathway.
In this study, we aim to highlight the most tightly co-
expressed cell-cycle genes by applying the Bi-CoPaM
method over a set of cell-cycle genes from two relatively
recent yeast microarray datasets that have a high sampling
rate [14]. Moreover, we investigate the tightest of the gener-
ated clusters while putting more focus on the CMR1 gene
and its relation with the rest of the genes in the clusters.
We also aim to compare our in silico gene-expression-based
clusters with other CMR1-containing subsets of genes
recently obtained by biochemical approaches in order to gen-
erate testable hypotheses for the CMR1 gene and other genes
of previously unknown or poorly known function.
2. Datasets and experimental proceduresWe apply the novel ensemble clustering method Bi-CoPaM[9,10] over the 500 most periodic cell-cycle-regulated genes in
budding yeast from two different microarray datasets. The
aim was to exploit the benefits provided by the new paradigm
of clustering proposed through the Bi-CoPaM method to derive
four tight clusters of highly co-expressed genes to generate
hypotheses for further functional or genomic research.
The considered datasets are described in §2.1, a descrip-
tion of the Bi-CoPaM method is presented in §2.2 and the
set-up of the Bi-CoPaM experiment over the datasets is
described in §2.3.
2.1. DatasetsTwo microarray datasets were generated for the yeast
Saccharomyces cerevisiae genome using the a-30 and a-38 syn-
chronization techniques, respectively [14]. Each experiment
captures the profiles for the genes over 2 h that cover two
complete cell cycles. The number of time samples in each is
25 with 5 min intervals between consecutive samples.
These two datasets as well as three older datasets synchro-
nized by alpha [15], cdc-15 [15] and cdc-28 [16] were combined
in Pramila et al. [14] and used to order the genes according to
their periodicity in the cell cycle. The average time of peak
expression for the 1000 most periodic genes was calculated
in that same study as a percentage of the time progress in
the cell cycle, i.e. peaking at 0 per cent means peaking at the
M/G1 transition point, peaking at 50 per cent means peaking
in the middle of the cell cycle and peaking at 99 per cent means
peaking at the very end of the M phase.
The subset of genes that we consider in this study includes
the most periodic 500 genes of these 1000 genes. We consider
their profiles from both the a-30 and a-38 microarray datasets
provided in Pramila et al. [14]. Electronic supplementary
material, S1 lists the names of these 500 genes, their peaking
times as percentages of the cell cycle that has been provided
by Pramila et al. [14], and their normalized log-ratio expression
profiles from both datasets a-30 and a-38.
2.2. Binarization of consensus partition matrixClustering methods have been increasingly applied over
microarray datasets in gene discovery research. However,
most of the traditional clustering methods apply the con-
straint that each gene must be exclusively included in one
and only one cluster in the results. In many gene studies, it
would be useful to develop different formats of the clustering
results by obtaining either tight clusters with a few genes
while leaving many genes unassigned to any cluster, or
obtaining wide clusters that overlap or allowing single
genes to be simultaneously included in multiple clusters.
The Bi-CoPaM method described in Abu-Jamous et al. [9]
relaxes conventional clustering constraints by allowing
these forms of clusters to be obtained.
The Bi-CoPaM method has four main steps illustrated in
figure 1 and described in the following sections.
2.2.1. Partitions generationDifferent clustering results are obtained when different clus-
tering methods are applied over the same set of genes
either by using the same method with different parameters
or the same stochastic method and parameters over different
partition1
partition2
partition3
partitionR
clusteringmethod 1
clusteringmethod 2
clusteringmethod C
microarraydataset 1
set ofgenes
microarraydataset L
individual partitionsgeneration
relabellingand
CoPaMgeneration
fuzzyCoPaM
binarizationtechnique
binarization
consensusbinary
partition
Figure 1. Flow chart summarizes the procedure followed by the Bi-CoPaM method. The first step is the generation of individual partitions by different clusteringmethods and based on multiple microarray datasets. These partitions are then relabelled and combined to produce a single fuzzy consensus partition matrix(CoPaM), which is then binarized to produce the final consensus binary partition [9,10]. (Online version in colour.)
rsif.royalsocietypublishing.orgJR
SocInterface10:20120990
3
runs. Moreover, if the same method and parameters are used
to cluster the same set of genes from different microarray
datasets, then different results are obtained [9,17].
The first step of Bi-CoPaM is to produce R clustering
results (partitions) by adopting R different clustering set-
ups that vary in the adopted method, parameters and/or
microarray dataset. These R partitions are represented by
the partition matrices fU1, . . . ,URg, where each partition
matrix has K rows representing the K clusters and M columns
representing the M genes. The element uri;j represents the
membership of the jth gene in the ith cluster based on the
rth partition.
2.2.2. RelabellingBecause clustering is unsupervised, the ith cluster of one of
the generated partitions does not necessarily correspond to
the ith cluster of any other partition. The relabelling step
aims to rearrange the clusters of the generated partitions,
i.e. the rows of the partition matrices, such that they are
aligned. After relabelling, the ith cluster of any partition
will correspond to the ith cluster of each one of the other par-
titions. The problem of rearranging the rows of a partition
matrix U to be aligned with a reference partition matrix
U ref is tackled by a min–max approach as follows [9,10]:
(1) A dissimilarity matrix SK�K is constructed such that its
element si,j represents the dissimilarity between the ithcluster (row) of the partition U and the jth cluster (row)
of the reference partition U ref.
(2) The minimum of each column in S is calculated.
(3) The maximum of these minima is located, then the clus-
ters from U and U ref that represent this maximum of
minima are matched.
(4) The row and the column in which that maximum of
minima has been found are removed from S.
(5) Repeat the steps 2 to 4 until all clusters from both
partitions are matched and the matrix S is empty.
The relabelled version of the partition matrix U is therefore
denoted as U, and the relabelling function is represented by
U ¼ RelabelðU;UrefÞ.
2.2.3. CoPaM generationThe relabelled partitions are scrutinized to generate a single
fuzzy CoPaM that assigns each gene a different fuzzy mem-
bership value in each of the clusters based on the times in
which this gene was included in the corresponding cluster
in different individual clustering results. The membership
values for any gene follow the constraints of fuzzy logic in
that they can have any value between 0 (does not belong at
all) to 1 (definitely belongs). The summation of the mem-
bership values of any gene in all of the clusters must be
unity [9,18].
To generate the CoPaM, we define an intermediate
CoPaM partition matrix U int that initially represents the
first partition U1. The rest of the R partitions are then fused
within this intermediate partition matrix one by one. In
each step, the next partition matrix to be fused into U int is
relabelled by considering this U int as its relabelling reference.
After all of the R partitions are fused, the final U int represents
the CoPaM U*. Let the intermediate partition matrix after
fusing k partitions be U int(k), then the mathematical formu-
lation of this algorithm is
(1) U int(1) ¼ U1.
(2) For k ¼ 2 to R(a) U
k ¼ RelabelðUk;Uintðk�1ÞÞ(b) UintðkÞ ¼ 1
k Uk þ k�1
k Uintðk�1Þ
(3) U* ¼ Uint(R).
This final CoPaM U* is then passed to the final step,
which is binarization.
2.2.4. BinarizationConventionally, the CoPaM is binarized; so that each gene
is exclusively assigned to a single cluster and unassigned
from all of the other clusters. Instead, Bi-CoPaM has
the novelty in the binarization step that allows any gene to
be either assigned exclusively to one cluster, or assigned
simultaneously to multiple clusters, or unassigned from all
of the clusters.
Six tunable binarization techniques have been proposed
in the Bi-CoPaM method that can be used to generate tunable
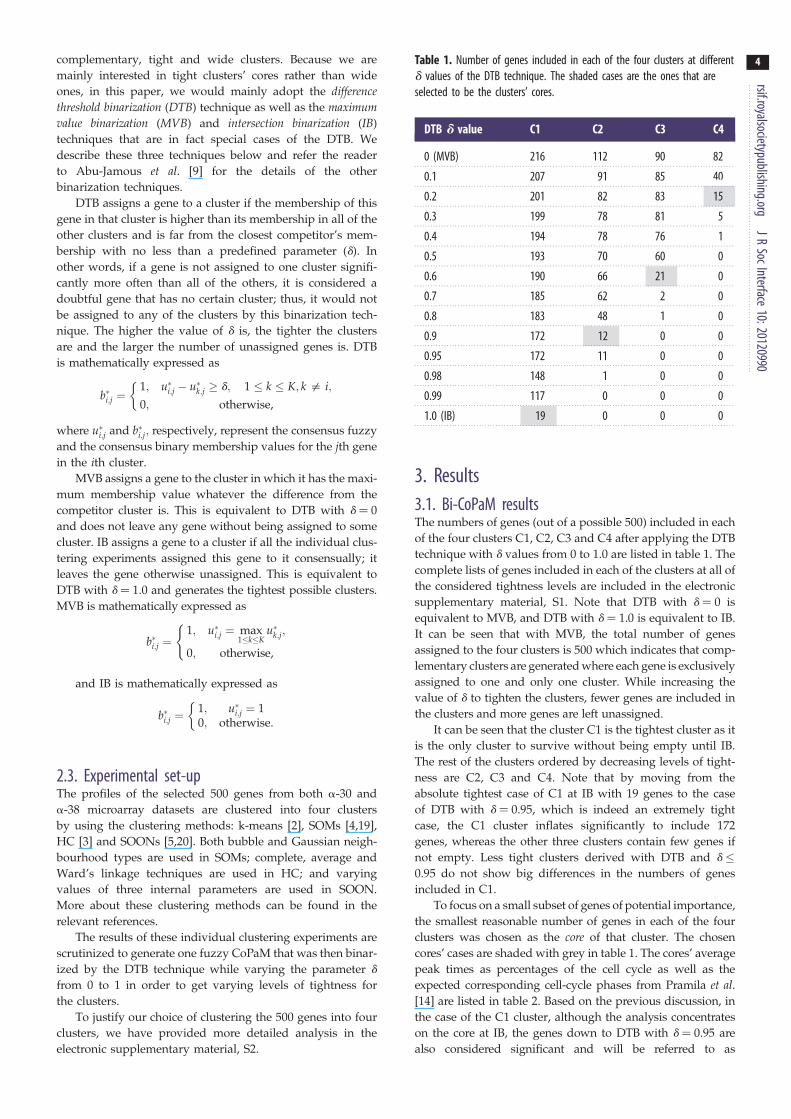
Table 1. Number of genes included in each of the four clusters at differentd values of the DTB technique. The shaded cases are the ones that areselected to be the clusters’ cores.
DTB d value C1 C2 C3 C4
0 (MVB) 216 112 90 82
0.1 207 91 85 40
0.2 201 82 83 15
0.3 199 78 81 5
0.4 194 78 76 1
0.5 193 70 60 0
0.6 190 66 21 0
0.7 185 62 2 0
0.8 183 48 1 0
0.9 172 12 0 0
0.95 172 11 0 0
0.98 148 1 0 0
0.99 117 0 0 0
1.0 (IB) 19 0 0 0
rsif.royalsocietypublishing.orgJR
SocInterface10:20120990
4
complementary, tight and wide clusters. Because we aremainly interested in tight clusters’ cores rather than wide
ones, in this paper, we would mainly adopt the differencethreshold binarization (DTB) technique as well as the maximumvalue binarization (MVB) and intersection binarization (IB)
techniques that are in fact special cases of the DTB. We
describe these three techniques below and refer the reader
to Abu-Jamous et al. [9] for the details of the other
binarization techniques.
DTB assigns a gene to a cluster if the membership of this
gene in that cluster is higher than its membership in all of the
other clusters and is far from the closest competitor’s mem-
bership with no less than a predefined parameter (d). In
other words, if a gene is not assigned to one cluster signifi-
cantly more often than all of the others, it is considered a
doubtful gene that has no certain cluster; thus, it would not
be assigned to any of the clusters by this binarization tech-
nique. The higher the value of d is, the tighter the clusters
are and the larger the number of unassigned genes is. DTB
is mathematically expressed as
b�i;j ¼1; u�i;j � u�k;j � d; 1 � k � K; k = i;
0; otherwise,
�
where u�i;j and b�i;j; respectively, represent the consensus fuzzy
and the consensus binary membership values for the jth gene
in the ith cluster.
MVB assigns a gene to the cluster in which it has the maxi-
mum membership value whatever the difference from the
competitor cluster is. This is equivalent to DTB with d ¼ 0
and does not leave any gene without being assigned to some
cluster. IB assigns a gene to a cluster if all the individual clus-
tering experiments assigned this gene to it consensually; it
leaves the gene otherwise unassigned. This is equivalent to
DTB with d ¼ 1.0 and generates the tightest possible clusters.
MVB is mathematically expressed as
b�i;j ¼1; u�i;j ¼ max
1�k�Ku�k;j;
0; otherwise,
(
and IB is mathematically expressed as
b�i;j ¼1; u�i;j ¼ 10; otherwise.
�
2.3. Experimental set-upThe profiles of the selected 500 genes from both a-30 and
a-38 microarray datasets are clustered into four clusters
by using the clustering methods: k-means [2], SOMs [4,19],
HC [3] and SOONs [5,20]. Both bubble and Gaussian neigh-
bourhood types are used in SOMs; complete, average and
Ward’s linkage techniques are used in HC; and varying
values of three internal parameters are used in SOON.
More about these clustering methods can be found in the
relevant references.
The results of these individual clustering experiments are
scrutinized to generate one fuzzy CoPaM that was then binar-
ized by the DTB technique while varying the parameter d
from 0 to 1 in order to get varying levels of tightness for
the clusters.
To justify our choice of clustering the 500 genes into four
clusters, we have provided more detailed analysis in the
electronic supplementary material, S2.
3. Results3.1. Bi-CoPaM resultsThe numbers of genes (out of a possible 500) included in each
of the four clusters C1, C2, C3 and C4 after applying the DTB
technique with d values from 0 to 1.0 are listed in table 1. The
complete lists of genes included in each of the clusters at all of
the considered tightness levels are included in the electronic
supplementary material, S1. Note that DTB with d ¼ 0 is
equivalent to MVB, and DTB with d ¼ 1.0 is equivalent to IB.
It can be seen that with MVB, the total number of genes
assigned to the four clusters is 500 which indicates that comp-
lementary clusters are generated where each gene is exclusively
assigned to one and only one cluster. While increasing the
value of d to tighten the clusters, fewer genes are included in
the clusters and more genes are left unassigned.
It can be seen that the cluster C1 is the tightest cluster as it
is the only cluster to survive without being empty until IB.
The rest of the clusters ordered by decreasing levels of tight-
ness are C2, C3 and C4. Note that by moving from the
absolute tightest case of C1 at IB with 19 genes to the case
of DTB with d ¼ 0.95, which is indeed an extremely tight
case, the C1 cluster inflates significantly to include 172
genes, whereas the other three clusters contain few genes if
not empty. Less tight clusters derived with DTB and d �0.95 do not show big differences in the numbers of genes
included in C1.
To focus on a small subset of genes of potential importance,
the smallest reasonable number of genes in each of the four
clusters was chosen as the core of that cluster. The chosen
cores’ cases are shaded with grey in table 1. The cores’ average
peak times as percentages of the cell cycle as well as the
expected corresponding cell-cycle phases from Pramila et al.[14] are listed in table 2. Based on the previous discussion, in
the case of the C1 cluster, although the analysis concentrates
on the core at IB, the genes down to DTB with d ¼ 0.95 are
also considered significant and will be referred to as

Table 2. For each of the four clusters’ cores, the first to the fourth rows, respectively, show the average peak time as a percentage of the cell cycle, itsstandard deviation (s.d.), minimum (min.) and maximum (max.) values. The last row shows the estimated cell-cycle phase for each core based on its averagepeaking time.
cluster C1 (%) C2 (%) C3 (%) C4 (%)
average peak time for core genes 20 66 97 46
s.d. 3.2 3.3 4.9 6.7
min. 14 62 88a 40
max. 27 75 6a 67
expected cell-cycle phase late G1/S G2 M/early G1 S/G2aThese percentage values are cyclic, i.e. after 99%, the cycle goes back to 0%. So the earliest peak in C3 is at 88% of the cycleand the latest is at 6% of the next cycle.
Table 3. The names of the genes included in each of the four clusters’ cores. For each of these clusters, the title row shows the cluster’s label, the binarizationconfiguration under which it has been chosen and the number of genes included in it.
C1 core at IB (DTB withd 5 1.0) (19 genes)
C2 core at DTB withd 5 0.9 (12 genes)
C3 core at DTB withd 5 0.6 (21 genes)
C4 core at DTB withd 5 0.2 (15 genes)
AXL2 SLK19 BUD20 ASH1 PIG1 ABF1 YGL101W
CDC45 SMC1 CDC5 CHS1 PIL1 CSN9 YJL118W
CHR1 SMC3 CLB1 FAR1 PRY1 FLR1 YLR455W
CMR1 SPC42 CLB2 HSP150 PST1 GDA1
EXO1 URH1 FET3 HXT2 ROD1 GDT1
MSH2 YDL163W FRK1 LSP1 SED1 MBP1
POL2 YJR030C PMP3 MCM2 TEC1 MSB1
POL3 SCW4 MCM3 YLR194C NDD1
RAD27 SHE2 MCM4 YNL134C SSA1
RFA2 SML1 MCM5 STU2
RNR1 SRC1 MCM7 TOF2
RTT107 SWI5 NIS1 VID22
rsif.royalsocietypublishing.orgJR
SocInterface10:20120990
5
appropriate, see electronic supplementary material, S2 for
more detail about the profiles of the genes included in C1 at
these less tight levels. Revealing the difference in the precision
of assignment for these four clusters as well as the ability of
choosing different clusters’ cores by tuning the level of strict-
ness for different clusters are potentially useful outcomes of
using the Bi-CoPaM method.
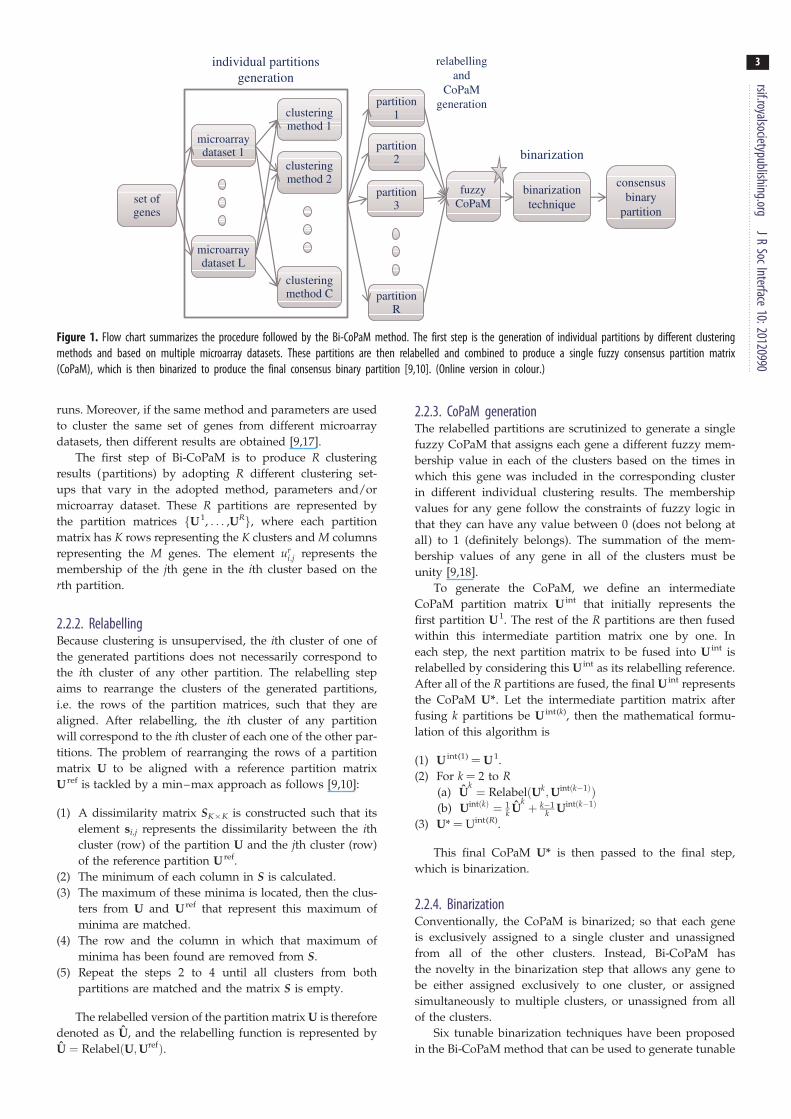
The full lists of the genes in these four cores are listed in
table 3, and the profiles for the genes in these core clusters
from both a-38 and a-30 datasets are plotted in figures 2 and
3, respectively. Note that in the lists of genes, if any yeast ORF
has not been characterized previously, and thus does not have
a gene name, the ORF name is used instead.
From figures 2 and 3, many observations can be made.
First, the a-30 and the a-38 datasets have very close profiles
except for some outlier values; this allows us to use either
set for most of the remaining discussions. Second, the profiles
of expression over time for the genes that are within each
cluster’s core clearly show the usefulness of the Bi-CoPaM
approach in obtaining tighter and more specific clusters.
Third, although all of these clusters’ cores are tight, the clus-
ter C1 is clearly the tightest, as shown by the d value at which
this core was obtained compared with the others (table 1).
Finally, each set of genes in the four clusters’ cores shows
periodic peaking at a different stage of the cell cycle, which
demonstrates clustering has derived sets of genes with
distinct properties (table 2).
3.2. Gene ontologies analysisWe have performed gene ontologies (GOs) analysis for the
genes included in the C1 cluster by using the GO Slim tool
[21]. We have used this tool to search for biological processes,
functions and components GO terms that are enriched in
C1 at DTB with all of the values of d reported in table 1.
Full results lists of this GO Slim analysis for processes, func-
tions and components have been provided in the electronic
supplementary material, S3, S4, and S5, respectively.
4. Analysis and discussionOur study is based on the computational analysis of high-
throughput data from different experiments by using the
Bi-CoPaM method, rather than by pure biological or bio-
chemical experiments. It highlights important subsets of
genes and has led to a set of proposed hypotheses. We
hypothesize that CMR1 has a biological relationship with
the replication factor A (RPA) complex, DNA polymerases

−2
0
2
(a)
(c)
(b)
(d)
expr
essi
on
0 50 100time (min)
0 50 100time (min)
−2
0
2
expr
essi
on
Figure 2. The expression profiles for the genes in the clusters’ cores from thea-30 dataset. (a) C1 – 19 genes, (b) C2 – 12 genes, (c) C3 – 21 genes and(d) C4 – 15 genes. (Online version in colour.)
−2
0
2
expr
essi
on
0 50 100
−2
0
2
time (min)0 50 100
time (min)
expr
essi
on
(a)
(c)
(b)
(d)
Figure 3. The expression profiles for the genes in the clusters’ cores from thea-38 dataset. (a) C1 – 19, (b) C2 – 12 genes, (c) C3 – 21 genes and(d) C4 – 15 genes. (Online version in colour.)
(a) core histones-associating genes
(c) CMR1-associating genes
(b) tight cluster of co-expressed genes
H2A
RET1
RPC37
PSH1
YKU70 YKU80YTA7 RIM1 RFA3
CMR1
RAD27
EXO1
POL2
POL3
CRH1
RTT107
AXL2
RNR1
URH1
MSH2
SMC1
CDC45
SLK19
SPC42
YDL163W
YJR030C
RFA2
H2B H3 H4
RPO31 RPC17
RPC82RPC40
CSE4 ABF2 CKA2
TIF3
DEM1
SUB2
SMC3
Figure 4. Venn diagram illustrating relations between the subsets of genesfound by using quantitative proteomics to extend the core histone networkand the subset of genes found by tight gene clustering based on geneexpression profiles. The subset (a) represents the 25 genes found to beassociated with the four core histones [12], the subset (b) represents theseven genes out of those 25 found to be associating with CMR1 [12] andthe subset (c) represents the 19 co-expressed genes found in the tightestcluster of genes by using the Bi-CoPaM method in our study.
rsif.royalsocietypublishing.orgJR
SocInterface10:20120990
6
a, d and 1 as well as the cohesion complex. Also our study
provides support for some previously unconfirmed, or not
fully understood, hypotheses such that the CMR1 gene is a
potential target for the MBF transcription complex [22], that
it has a role at the G1/S transition within the cell cycle [12],
and that it has a role in DNA repair and some other DNA-
related processes such as synthesis and transcription
[11–13]. We also provide a set of novel clusters of genes
with tunable co-expression levels that can serve as a resource
for further focused gene discovery studies.
In reference [12], a quantitative proteomics approach was
adopted to extend the protein network of core histones (H2A,
H2B, H3 and H4) in the budding yeast S. cerevisiae and ident-
ified CMR1 as a member in this network. Some 556 proteins
were found binding to one or more histones, whereas only 25
proteins of these were found binding to the four core histones.
The 25 proteins include the four histones (H2A, H2B, H3 and
H4), two units of the RPA complex (RFA2 and RFA3), two
units of the Ku complex (YKU70 and YKU 80), many units
of the RNA polymerase complex (RET1, RPO31, RPC17,
RPC37, RPC40 and RPC82), many single-unit proteins
(RIM1, YTA7, PSH1, CSE4, ABF2, CKA2, TIF3, DEM1, SUB2
and SMC3) and the previously uncharacterized pro-
tein YDL156W/CMR1. Then, associations with the CMR1
protein were investigated, and it was found that many proteins
showed stable association with YDL156W, including the six
proteins RIM1, RFA2, RFA3, YTA7, YKU70 and YKU80
which are within the 25 proteins found binding to all of the
four core histones [12].
In our Bi-CoPaM gene expression analysis, CMR1 has
been found in a small subset of 19 tightly co-expressed
genes; figure 4 illustrates the relation between the core his-
tone genes subset and our co-expressed genes subset. It can
be seen that three of the 19 co-expressed genes, CMR1,
RFA2 and SMC3, in Bi-CoPaM are found to be associated
with all the four core histones. Moreover, RFA2 not only
associates with the four histones, it associates with CMR1
itself and is co-expressed with it. Thus, Bi-CoPaM provides
stronger evidence for the relation between CMR1 and RFA2
in the cellular processes.
It is worth mentioning that in our results the histones them-
selves have been found in the cluster C4 at DTB with d ¼ 0.2
and not in the cluster C1 which includes CMR1 (see electronic
supplementary material, S1). This is because the transcription
of histones occurs in the S phase in order to synthesize the
chromosomes of the forthcoming daughter cells [14,23]; recall
from table 2 that the C4 cluster peaks at the S/G2 phase.
Despite that, histone proteins exist within the nucleus, packa-
ging the DNA molecules, at all of the stages of the cell cycle.
Thus, although the CMR1 gene has not been found co-
expressed with the histones themselves, it has been found
co-expressed with many genes whose products interact with
the histones.
We will now focus our analysis and discussion around the
genes within the very tight novel cluster of genes obtained at
the strictest binarization technique, IB. When needed, we

rsif.royalsocietypublishing.orgJR
SocInterface10:20120990
7
shall refer to some of the genes included in the C1 cluster atjust below the tightest binarization levels such as DTB with d
values of 0.99, 0.98 and 0.95. The full gene membership lists
for the four clusters at all of the cases listed in table 1 are pro-
vided in the electronic supplementary material, S1. They can
serve as an important resource for further yeast gene
discovery studies.
4.1. Replication factor ARFA2 is part of the heterotrimeric RPA complex that also
includes RFA1 and RFA3 proteins. RPA participates in
many of the DNA-metabolism pathways such as DNA repli-
cation, recombination, repair and transcription [24]. In
addition to Gilmore et al.’s [12] findings, Tkach et al. [13]
also reported genetic and/or physical interactions between
the CMR1 gene and all of the three components of the RPA
complex. Interestingly, in our results at DTB with d ¼ 0.99,
RFA1 is included within the cluster C1, whereas RFA3, to
its slightly noisier profile, can be found in C1 by going
back to complementary clusters at MVB. Thus, the three com-
ponents of the RPA complex are seen to be clustered with
CMR1 from the Bi-CoPaM co-expression point of view,
adding stronger evidence to the findings of Gilmore and
Tkach and their co-workers [12,13].
Furthermore, it was shown by Longhese et al. [24] that
RPA interacts with both DNA polymerase a-primase com-
plex and DNA polymerase d complex. Bi-CoPaM finds that
most of this complex’s components are co-expressed with
the RPA components as well as the CMR1 gene at very
tight levels of the cluster C1. The significance of co-expression
of DNA polymerases, CMR1 and related genes, and protein
complexes is provided in §4.2.
4.2. DNA polymerases and the mini-chromosomemaintenance complex (MCM2 – 7)
DNA polymerases catalyse DNA replication and repair.
A striking level of co-expression among these complexes’
genes is clear in our Bi-CoPaM results. All of the units com-
posing DNA polymerase d complex (POL3, POL31 and
POL32), three of the four units composing DNA polymerase
a complex (POL1, POL12 and PRI2), and two of the five units
composing DNA polymerase 1 complex (POL2 and DPB2)
are found in the C1 cluster’s core at the very strict level of
tightness of DTB with d ¼ 0.98. Most of these genes also
appear at d ¼ 0.99 and two of them (POL2 and POL3)
appear at the absolute strictest case of IB. In fact, those
units of DNA polymerase complexes that have not been
included in C1 at these extreme levels of tightness are not pre-
sent in the 500 genes considered in this study, indicating the
100 per cent clustering accuracy of Bi-CoPaM for the known
components of the DNA polymerase complexes.
Moreover, the proliferating cell nuclear antigen PCNA/
POL30, which functions as a sliding clamp for the DNA poly-
merase d, is found in the cluster C1 at the very tight level of
DTB with d ¼ 0.95. In Huttner & Ulrich [25], it was shown
that the RPA complex is required for the ubiquitylation of
PCNA at the replication fork. Again, Bi-CoPaM finds that
all of these co-operating genes are tightly co-expressed.
It was shown that POL2, the catalytic unit of the DNA
polymerase 1, interacts extensively with MRC1 at the G1/S
checkpoint and during the S phase for DNA replication
and in response to DNA damage on the leading strand
[26]. Lou et al. [26] have also shown that MRC1 and POL2
co-immunoprecipitate and associate with CDC45, GINS and
the MCMs. They then provided a model for the functional
interaction between these proteins on the leading DNA
strand during both normal DNA replication and replication
stress. Interestingly, POL2 and CDC45 appear within C1 clus-
ter at the tightest case of IB (figure 4), MRC1 and other genes
associated with it as components of the replication check-
point complex such as CSM3 and TOF1 [27] appear in C1
at the very tight case of DTB with d ¼ 0.99, whereas GINS
is not one of the 500 genes included in this study.
The MCMs have a different story; Lou and co-workers
proposed a parallel model at the lagging DNA strand
during replication in which the six MCM units, MCM2,
MCM3, MCM4, MCM5, MCM6 and MCM7, are loaded in
late M phase and early G1 phase onto chromatin to form
the ring-shaped heterohexamer complex MCM2–7 [26,28].
Then, the DNA polymerase a is loaded onto the chromatin
and recruited to the MCM2–7 complex by MCM10, CTF4
and CDC45 [29].
The notable aspect of our results in relation to previous
observations is that CDC45, most of the units in the DNA poly-
merase a complex, and CTF4 are found within the very tight
cluster C1 at DTB with d ¼ 0.99 (except for MCM10 which is
not one of the 500 genes considered in this study). More inter-
estingly, the six MCM units within the MCM2–7 complex are
all included in the same co-expressing comparatively tight
cluster C3 at DTB with d ¼ 0.5 with five of them also included
in the even tighter core case at d ¼ 0.6 (figure 4).
The genes in the cluster C3 show peak expression at the
late M phase and the early G1 phase (table 2). The obser-
vations drawn from the two models at the leading and the
lagging DNA strands during the replication checkpoint
[26], in addition to the clear phase shift between the MCMs
in the cluster C3 and the replication checkpoint genes in the
cluster C1 shown in our tight co-expression clustering results,
would indicate that the MCMs are co-regulated with the
replication checkpoint genes, not only at the lagging strand
but at the leading strand as well.
4.3. Yeast cohesion complexThe protein SMC3, which was found previously [12] to be
associated with the four histones, is found within the tightest
case of the cluster C1 in our study (figure 4). SMC3 associates
with SMC1 to make a heterodimer that associates with MCD1
and IRR1 to compose the yeast cohesion complex, which is
required for sister chromatid cohesion [30,31]. Interestingly,
SMC1 and SMC3 are found in the tightest case of C1 at IB
(figure 4), whereas MCD1 and IRR1 are found as well at
DTB with d ¼ 0.99. Bi-CoPaM proposes that these genes are
not only physically associated but also tightly co-expressed.
4.4. CMR1 as a potential target for the Mlu1 cell-cyclebox binding factor complex
Many genes that are expressed at the G1/S transition have
the Mlu1 cell-cycle box (MCB) element in their promoters
[15,32,33], which is the target for the MCB binding factor
(MBF) complex for transcription [22].
McIntosh [34] provided a list of 31 budding yeast genes
that are regulated (or potentially regulated) by the MBF
(b)
(c)
0.30 0.60 0.95 0.98 0.99 1.000
0.05
0.10
0.15
0.20
0.25
0.30
0.35
0.40
0.45
0.50
(a)
DTB d value
frac
tion
of C
1DNA repair
DNA recombination
DNA replication
mitotic cell cycle
meiotic cell cycle
chromosome segregation
biological processunknown
0
0.1
0.2
0.3
frac
tion
of C
1
DNA binding
molecular function unknown
0 0.30 0.60 0.95 0.98 0.99 1.00
0.2
0.4
0.6
0.8
DTB d valuefr
actio
n of
C1
nucleus
chromosome
cytoplasm
cellular component unknown
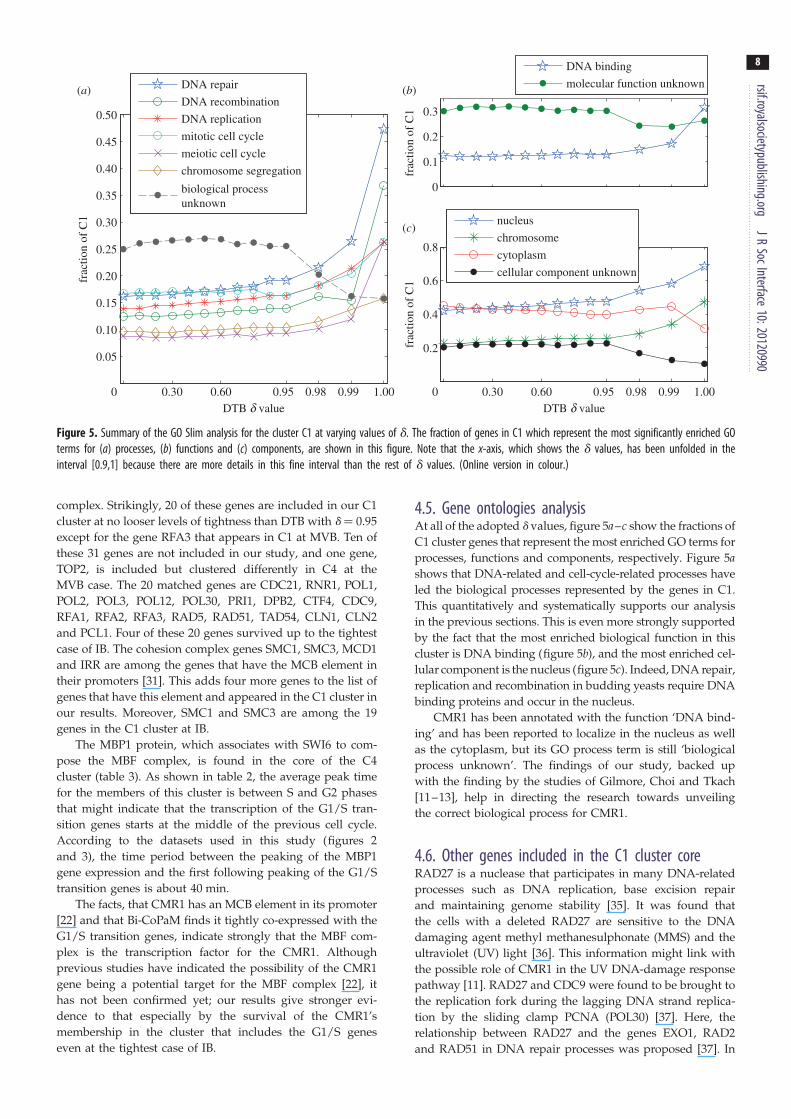
Figure 5. Summary of the GO Slim analysis for the cluster C1 at varying values of d. The fraction of genes in C1 which represent the most significantly enriched GOterms for (a) processes, (b) functions and (c) components, are shown in this figure. Note that the x-axis, which shows the d values, has been unfolded in theinterval [0.9,1] because there are more details in this fine interval than the rest of d values. (Online version in colour.)
rsif.royalsocietypublishing.orgJR
SocInterface10:20120990
8
complex. Strikingly, 20 of these genes are included in our C1
cluster at no looser levels of tightness than DTB with d ¼ 0.95
except for the gene RFA3 that appears in C1 at MVB. Ten of
these 31 genes are not included in our study, and one gene,
TOP2, is included but clustered differently in C4 at the
MVB case. The 20 matched genes are CDC21, RNR1, POL1,
POL2, POL3, POL12, POL30, PRI1, DPB2, CTF4, CDC9,
RFA1, RFA2, RFA3, RAD5, RAD51, TAD54, CLN1, CLN2
and PCL1. Four of these 20 genes survived up to the tightest
case of IB. The cohesion complex genes SMC1, SMC3, MCD1
and IRR are among the genes that have the MCB element in
their promoters [31]. This adds four more genes to the list of
genes that have this element and appeared in the C1 cluster in
our results. Moreover, SMC1 and SMC3 are among the 19
genes in the C1 cluster at IB.
The MBP1 protein, which associates with SWI6 to com-
pose the MBF complex, is found in the core of the C4
cluster (table 3). As shown in table 2, the average peak time
for the members of this cluster is between S and G2 phases
that might indicate that the transcription of the G1/S tran-
sition genes starts at the middle of the previous cell cycle.
According to the datasets used in this study (figures 2
and 3), the time period between the peaking of the MBP1
gene expression and the first following peaking of the G1/S
transition genes is about 40 min.
The facts, that CMR1 has an MCB element in its promoter
[22] and that Bi-CoPaM finds it tightly co-expressed with the
G1/S transition genes, indicate strongly that the MBF com-
plex is the transcription factor for the CMR1. Although
previous studies have indicated the possibility of the CMR1
gene being a potential target for the MBF complex [22], it
has not been confirmed yet; our results give stronger evi-
dence to that especially by the survival of the CMR1’s
membership in the cluster that includes the G1/S genes
even at the tightest case of IB.
4.5. Gene ontologies analysisAt all of the adopted d values, figure 5a–c show the fractions of
C1 cluster genes that represent the most enriched GO terms for
processes, functions and components, respectively. Figure 5ashows that DNA-related and cell-cycle-related processes have
led the biological processes represented by the genes in C1.
This quantitatively and systematically supports our analysis
in the previous sections. This is even more strongly supported
by the fact that the most enriched biological function in this
cluster is DNA binding (figure 5b), and the most enriched cel-
lular component is the nucleus (figure 5c). Indeed, DNA repair,
replication and recombination in budding yeasts require DNA
binding proteins and occur in the nucleus.
CMR1 has been annotated with the function ‘DNA bind-
ing’ and has been reported to localize in the nucleus as well
as the cytoplasm, but its GO process term is still ‘biological
process unknown’. The findings of our study, backed up
with the finding by the studies of Gilmore, Choi and Tkach
[11–13], help in directing the research towards unveiling
the correct biological process for CMR1.
4.6. Other genes included in the C1 cluster coreRAD27 is a nuclease that participates in many DNA-related
processes such as DNA replication, base excision repair
and maintaining genome stability [35]. It was found that
the cells with a deleted RAD27 are sensitive to the DNA
damaging agent methyl methanesulphonate (MMS) and the
ultraviolet (UV) light [36]. This information might link with
the possible role of CMR1 in the UV DNA-damage response
pathway [11]. RAD27 and CDC9 were found to be brought to
the replication fork during the lagging DNA strand replica-
tion by the sliding clamp PCNA (POL30) [37]. Here, the
relationship between RAD27 and the genes EXO1, RAD2
and RAD51 in DNA repair processes was proposed [37]. In

rsif.royalsocietypublishing.orgJR
SocInterface10:20120990
9
our results, RAD27 and EXO1 are found within the tightestC1 cluster at IB, whereas PCNA (POL30), CDC9 and
RAD51 are found in the same cluster at DTB with d ¼ 0.99.
Another gene included in the tightest cluster C1 at IB is
MSH2 that forms a heterodimer with MSH6 to repair base-
pair mismatches in DNA [38]. This gene MSH6 is also
found in C1 at DTB with d ¼ 0.99.
An epistatic miniarray map has been constructed that
shows quantitative measurements of the genetic interactions
between 743 budding yeast genes from different chromosome
biology pathways [2]. By clustering a subset of this array
that have the DNA replication and repair genes based on
their patterns of mutual genetic interactions (not genetic
expressions), the genes RTT101, RTT107, MMS1, MMS22,
RTT109 and ASF1 formed a small cluster which was investi-
gated further [2]. It was found that RTT109 and ASF1
participate in the histone H3 K56 acetylation pathway at the
transmission to the S phase. This was significant because
the 25 gene products found to be associated with the four his-
tones (figure 4) do not include any of these genes [12].
Nonetheless, in our tightly co-expressing clusters, the genes
RTT107, RTT109 and ASF1 are found in the tight cluster C1
at DTB with d ¼ 0.98 (RTT107 was found at IB; figure 4).
We also note that the gene YRF1 is repeated seven times
in the budding yeast genome and all of them appear in C1 at
the very tight level of DTB with d ¼ 0.98.
4.7. Summary and conclusionsThe new paradigm of clustering realized by the Bi-CoPaM
method possesses the unique ability to perform tightness-
tunable ensemble clustering, and it has been adopted to
generate a small subset of tightly co-expressed genes. This
subset and another subset generated by Gilmore et al. [12]
are two different but overlapping small CMR1-including sub-
sets of genes involved in DNA-related cellular processes such
as DNA replication, repair and transcription. This comp-
lements the quantitative proteomics approach described by
Gilmore et al. [12] extending the core histone network. The
common factor for the genes in the subset provided in
Gilmore et al. [12] is the association with the four histones,
whereas the common factor for the genes in our results is
highly synchronous co-expressions through the cell cycle.
The notable observation in both subsets is the existence of
strongly functionally related genes that are often components
of the same protein complex or the same pathway. The three
components of the replication protein A (RPA); RFA1, RFA2
and RFA3 seem to be the closest to the newly characterized
gene CMR1 in that RFA2 appeared in both sets of results associ-
ating with the four histones, associating with CMR1 and co-
expressed with it, and that RFA1 and RFA3 appeared in the
same subset of CMR1 in either results. Gilmore and co-workers
[15] explored the relationship between CMR1 and the RNA
polymerase complex III. Although they noticed the possibility
that CMR1 would participate in the DNA repair at the G1/S
checkpoint, they did not investigate this further. Our results
suggest such a relationship may be functionally significant.
We propose that CMR1 may have a functional relationship
not only with DNA polymerases but also with the cohesion
complex. Most of the components of the DNA polymerases a,
d and 1 are found to be tightly co-expressed with CMR1
and suggests a possible role of CMR1 in DNA replication and
repair. SMC3, a core component of the cohesion complex, is
found in Bi-CoPaM results and by Gilmore et al. [12] was associ-
ated with CMR1, whereas the other components of the complex
were associated with CMR1 in our analysis. The strong associ-
ation of CMR1 with the known targets of the MBF complex
even in the extreme tightest cases clearly suggests the hypoth-
esis that CMR1 expression is controlled by MBF complex and
can be tested in future experimental work.
Taken together, our results have highlighted important
subsets of genes based on the computational analysis of
high-throughput data from different experiments instead of
pure biological or biochemical experiments. They not only
add stronger evidence for the main findings of the study of
Gilmore et al. [12], but they also strongly highlight areas of
less previous attention about the function of the CMR1
gene. CMR1 has been postulated to have functions in DNA
processing. We have shown its expression through the cell
cycle would support a relation between CMR1 with the
RPA complex, DNA polymerases and the cohesion complex
in addition to its role at the G1/S transition.
Finally, we also provide novel co-expressing genes clus-
ters with tunable tightness levels. The evidence for the
validity of these clusters’ tight cores comes from genes that
are strongly related by being in the same complex or path-
way. These novel clusters can serve as an important
resource for further focused gene discovery studies.
The project (ref. no. NIHR-RP-PG-0310-1004-AN) is supported byNational Institute for Health Research (NIHR), UK. We thank Pro-fessor Steve Oliver and Dr Duygu Dikicioglu from the CambridgeSystems Biology Centre and the Department of Biochemistry at theUniversity of Cambridge (Cambridge, UK) for fruitful discussions.
References
1. Palsson B, Zengler K. 2010 The challenges ofintegrating multi-omic data sets. Nat. Chem. Biol. 6,787 – 789. (doi:10.1038/nchembio.462)
2. Pena JM, Lozano JA, Larranaga P. 1999 An empiricalcomparison of four initialization methods for the K-Means algorithm. Pattern Recognit. Lett. 20, 1027 –1040. (doi:10.1016/S0167-8655(99)00069-0)
3. Eisen MB, Spellman PT, Brown PO, Botstein D. 1998Cluster analysis and display of genome-wideexpression patterns. Proc. Natl Acad. Sci. USA 95,14 863 – 14 868. (doi:10.1073/pnas.95.25.14863)
4. Kohonen TE. 1997 Self-organizing maps. New York,NY: Springer.
5. Salem SA, Jack LB, Nandi AK. 2008 Investigation ofself-organizing oscillator networks for use inclustering microarray data. IEEE Trans. Nanobiosci. 7,65 – 79. (doi:10.1109/TNB.2008.2000151)
6. Ayad HG, Kamel MS. 2010 On voting-basedconsensus of cluster ensembles. Pattern Recogn. 43,1943 – 1953. (doi:10.1016/j.patcog.2009.11.012)
7. Fred A, Jain AK. 2002 Data clustering using evidenceaccumulation. Proc. 16th Int. Conf. Pattern Recognit.4, 276 – 280.
8. Strehl A, Ghosh J. 2002 Cluster ensembles: aknowledge reuse framework for combining multiplepartitions. J. Mach. Learn. Res. 3, 583 – 617.
9. Abu-Jamous B, Fa R, Nandi AK, Roberts DJ. 2012Binarization of consensus partition matrix forensemble clustering. In Proc. 20th EuropeanSignal Processing Conf. (EUSIPCO-2012),Bucharest, Romania, 27 – 31 August 2012,pp. 2193 – 2197.
10. Abu-Jamous B, Fa R, Roberts RJ, Nandi AK. 2012Comprehensive analysis of multiple microarraydatasets by binarization of consensus partitionmatrix. In 2012 IEEE Int. Workshop on MachineLearning for Signal Processing (MLSP 2012),Santander, Spain, 23 – 26 September 2012.(doi:10.1109/MLSP.2012.6349787)
rsif.royalsocietypublishing.orgJR
SocInterface10:20120990
10
11. Choi DH, Kwon SH, Kim JH. 2012 Saccharomycescerevisiae Cmr1 protein preferentially binds to UV-damaged DNA in vitro. J. Microbiol. 50, 112 – 118.(doi:10.1007/s12275-012-1597-4)12. Gilmore JM, Sardiu ME, Venkatesh S, Stutzman B,Peak A, Seidel CW, Workman JL, Florens L,Washburn MP. 2012 Characterization of a highlyconserved histone related protein, Ydl156w, and itsfunctional associations using quantitative proteomicanalyses. Mol. Cellular Proteomics 11, M111.011544.(doi:10.1074/mcp.M111.011544)
13. Tkach JM et al. 2012 Dissecting DNA damageresponse pathways by analysing protein localizationand abundance changes during DNA replicationstress. Nat. Cell Biol. 14, 966 – 976. (doi:10.1038/ncb2549)
14. Pramila T, Wu W, Miles S, Noble WS, Breeden LL.2006 The Forkhead transcription factor Hcm1regulates chromosome segregation genes and fillsthe S-phase gap in the transcriptional circuitry ofthe cell cycle. Genes Dev. 20, 2266 – 2278. (doi:10.1101/gad.1450606)
15. Spellman PT, Sherlock G, Zhang MQ, Iyer VR, AndersK, Eisen MB, Brown PO, Botstein D, Futcher B. 1998Comprehensive identification of cell cycle-regulatedgenes of the yeast Saccharomyces cerevisiae bymicroarray hybridization. Mol. Biol. Cell 9,3273 – 3297.
16. Cho RJ et al. 1998 A genome-wide transcriptionalanalysis of the mitotic cell cycle. Mol. Cell 2, 65 –73. (doi:10.1016/S1097-2765(00)80114-8)
17. Vega-Pons S, Ruiz-Shulcloper J. 2011 A survey ofclustering ensemble algorithms. Int. J. PatternRecognit. Artif. Intell. 25, 337 – 372. (doi:10.1142/S0218001411008683)
18. Dimitriadou E, Weingessel A, Hornik K. 2002 Acombination scheme for fuzzy clustering.Int. J. Pattern Recognit. Artif. Intell. 16, 901 – 912.(doi:10.1142/S0218001402002052)
19. Xiao X, Dow ER, Eberhart R, Miled ZB, Oppelt RJ.2003 Gene clustering using self-organizing mapsand particle swarm optimization. In IEEE Paralleland Distributed Processing Symp. Proc., Indianapolis,USA, 22 – 26 April 2003, pp. 154 – 163. (doi:10.1109/IPDPS.2003.1213290).
20. Rhouma MBH, Frigui H. 2001 Self-organization ofpulse-coupled oscillators with application toclustering. IEEE Trans. Pattern Anal. Mach. Intell. 23,1 – 16. (doi:10.1109/34.908968)
21. SGD. 2012 GO Slim Mapper. (accessed 2012November) See http://www.yeastgenome.org/cgi-bin/GO/goSlim-Mapper.pl.
22. Brohee S, Janky R, Abdel-Sater F, Vanderstocken G,Andre B, Helden JV. 2011 Unraveling networks ofco-regulated genes on the sole basis of genomesequences. Nucleic Acids Res. 39, 6340 – 6358.(doi:10.1093/nar/gkr264)
23. Fernandez MA, Rueda C, Peddada SD. 2012Identification of a core set of signature cell cyclegenes whose relative order of time to peakexpression is conserved across species. NucleicAcids Res. 40, 2823 – 2832. (doi:10.1093/nar/gkr1077)
24. Longhese MP, Plevani P, Lucchini G. 1994Replication factor A is required in vivo for DNAreplication, repair, and recombination. Mol. Cell.Biol. 14, 7884 – 7890.
25. Huttner D, Ulrich HD. 2008 Cooperation ofreplication protein A with the ubiquitin ligaseRad18 in DNA damage bypass. Cell Cycle 7,3629 – 3633. (doi:10.4161/cc.7.23.7166)
26. Lou H, Komata M, Katou Y, Guan Z, Reis CC, BuddM, Shirahige K, Campbell JL. 2008 Mrc1 andDNA polymerase epsilon function together inlinking DNA replication and the S phase checkpoint.Mol. Cell 32, 106 – 117. (doi:10.1016/j.molcel.2008.08.020)
27. Collins SR et al. 2007 Functional dissectionof protein complexes involved in yeastchromosome biology using a genetic interactionmap. Nature 446, 806 – 810. (doi:10.1038/nature05649)
28. Kawasaki Y, Kim HD, Kojima A, Seki T, Sugino A.2006 Reconstitution of Saccharomyces cerevisiaeprereplicative complex assembly in vitro. Genes Cells11, 745 – 756. (doi:10.1111/j.1365-2443.2006.00975.x)
29. Zhu W, Ukomadu C, Jha S, Senga T, Dhar SK,Wohlschlegel JA, Nutt LK, Kornbluth S, Dutta A.2007 Mcm10 and And-1/CTF4 recruit DNA
polymerase a to chromatin for initiation of DNAreplication. Genes Dev. 21, 2288 – 2299. (doi:10.1101/gad.1585607)
30. Strunnikov AV, Jessberger R. 1999 Structuralmaintenance of chromosomes (SMC) proteins:conserved molecular properties for multiplebiological functions. Eur. J. Biochem. 263, 6 – 13.(doi:10.1046/j.1432-1327.1999.00509.x)
31. Jones S, Sgouros J. 2001 The cohesin complex:sequence homologies, interaction networks andshared motifs. Genome Biol. 2, 0009 – 00012.(doi:10.1186/gb-2001-2-3-research0009)
32. Koch C, Moll T, Neuberg M, Ahorn H, Nasmyth K.1993 A role for the transcription factors Mbpland Swi4 in progression from G1 to S phase.Science 261, 1551 – 1557. (doi:10.1126/science.8372350)
33. Bahler J. 2005 Cell-cycle control of gene expressionin budding and fission yeast. Annu. Rev. Genet. 39,69 – 94. (doi:10.1146/annurev.genet.39.110304.095808)
34. McIntosh EM. 1993 MCB elements and theregulation of DNA replication genes in yeast.Curr. Genet. 24, 185 – 192. (doi:10.1007/BF00351790)
35. Liu Y, Kao HI, Bambara RA. 2004 Flap endonuclease1: a central component of DNA metabolism. Annu.Rev. Biochem. 73, 589 – 615. (doi:10.1146/annurev.biochem.73.012803.092453)
36. Reagan MS, Pittenger C, Siede W, Friedberg EC. 1995Characterization of a mutant strain of Saccharomycescerevisiae with a deletion of the RAD27 gene, astructural homolog of the RAD2 nucleotide excisionrepair gene. J. Bacteriol. 177, 364 – 371.
37. Karanja KK, Livingston DM. 2009 C-terminal flapendonuclease (rad27) mutations: lethal interactionswith a DNA ligase I mutation (cdc9-p) andsuppression by proliferating cell nuclear antigen(POL30) in Saccharomyces cerevisiae. Genetics 183,63 – 78. (doi:10.1534/genetics.109.103937)
38. Bowers J, Sokolsky T, Quach T, Alani E. 1999 Amutation in the MSH6 subunit of the Saccharomycescerevisiae MSH2 – MSH6 complex disrupts mismatchrecognition. J. Biol. Chem. 274, 16 115 – 16 125.(doi:10.1074/jbc.274.23.16115)