An Evaluation of Switzerland becoming a Participating State of ...
Upload
independentCategory
view
1download
0
obesity
reviews
doi: 10.1111/j.1467-789X.2006.00263.x
© 2007 The AuthorsJournal compilation © 2007 The International Association for the Study of Obesity.
obesity
reviews
8
, 263–276
263
Blackwell Publishing LtdOxford, UKOBRobesity reviews1467-7881© 2006 The Authors; Journal compilation © 2006 The International Association for the Study of Obesity
2006
8
263276
Review Article
The CODA meta-analysis project S. Duval et al.
Address for correspondence: S Duval, Division
of Epidemiology and Community Health,
School of Public Health, University of
Minnesota, 1300 South Second St., Suite 300,
Minneapolis, MN 55454-1015, USA. E-mail:
*See Appendix.
The Collaborative Study of Obesity and Diabetes in Adults (CODA) project: meta-analysis design and description of participating studies
S. Duval, G. Vazquez, W. L. Baker and D. R. Jacobs Jr for the CODA Study Group*
Division of Epidemiology and Community
Health, School of Public Health, University of
Minnesota, Minneapolis, MN, USA
Received 15 November 2005; revised 20
February 2006; accepted 21 February 2006
Summary
The Collaborative Study of Obesity and Diabetes in Adults (CODA) project wasformed to establish an international database of studies of abdominal obesity andtype 2 diabetes mellitus (T2DM), and to provide analyses of these associationsusing individual participant data (IPD) meta-analytic techniques. The collabora-tion involves obtaining raw data from existing studies. The main objectives of thecollaboration are to assess which simple anthropometric indices most closelypredict the risk of T2DM in adults, and to investigate ethnicity and other factorsthat potentially modify that prediction. A second task related to primary preven-tion of diabetes subsequently evolved, the CODA-2 project, and is concerned withpopulation-based methods to identify people most likely to benefit from diabetesinterventions. This article describes the meta-analysis design and the studiesinvolved. The collaboration currently has 37 studies enrolled, providing data on260 000 participants. The proposed IPD meta-analyses will help resolve severaloutstanding issues in diabetes.
Keywords:
Diabetes, meta-analysis, obesity.
Introduction
In 1999, the US Centers for Disease Control and Prevention(CDC) organized a workshop to examine the use of standardcategories of body mass index (BMI) and waist circumfer-ence (WC) as indicators of health risk in adults (1). TheBMI and WC categories came from evidence-based obesityguidelines issued separately by the US National Institutesof Health (2), The World Health Organization (3), and theScottish Intercollegiate Guidelines Network (4). The datapresented confirmed that the BMI categories and the WCcategories were both able to identify risk for type 2 diabetesmellitus (T2DM) in a variety of populations worldwide.Despite such confirmation, which adds to a growing bodyof evidence in the medical literature, a major issue thatemerged from the workshop was that the value of thesetwo anthropometric indices as health indicators might differ
from each other and might vary depending on the popula-tion and the health condition examined. Given the relativesimplicity of measuring these two anthropometric indicesand their potential value as indicators of health risk inindividuals and populations, participants of the workshoprecommended that these issues be explored further.
In direct response to this workshop, the CollaborativeStudy of Obesity and Diabetes in Adults (CODA) project,a consortium of existing studies contributing raw data formeta-analysis, was established. This report describes theCODA project, giving general background informationabout the studies participating, with specific focus on thechallenges involved in establishing the collaborative effort,and on the methods implemented to ensure success.
The purposes of this paper are to document several prac-tical issues pertaining to assembling the meta-analytic data-base and to describe CODA and its database.
obesity
reviews (2007)
8
, 263–276
264
The CODA meta-analysis project
S. Duval
et al.
obesity
reviews
© 2007 The AuthorsJournal compilation © 2007 The International Association for the Study of Obesity.
obesity
reviews
8
, 263–276
Objectives of CODA
The objectives of the collaboration are: (i) to assess whichsimple anthropometric indices (WC, BMI, waist-to-hipratio [WHR]) most closely predict the risk of T2DM inadults; (ii) to investigate ethnicity and other factors thatpotentially modify that prediction; (iii) to determine thresh-olds for diabetes for the anthropometric measures, whichmay vary across populations; and (iv) to determine if theassociation of these anthropometric indices with cardiovas-cular disease morbidity and mortality are exacerbated bytheir association with T2DM.
After the inception of the CODA project, several relatedquestions were added to the scope of the project, and willbe referred to as the CODA-2 project. The CODA-2 objec-tives are related to primary prevention of diabetes andrevolve around population-based methods to identify peo-ple most likely to benefit from interventions. These are: (i)to determine whether it is possible to predict several dia-betes-related risk states (impaired fasting glucose [IFG] andimpaired glucose tolerance [IGT], collectively referred to asimpaired glucose metabolism [IGM], undiagnosed diabe-tes, and diabetes incidence) using non-invasive or mini-mally invasive methods; and (ii) should the screening toolsdiffer by ethnicity?
This question regarding screening has led to a new col-laboration between the CODA group and the DETECT-2group (5), who have goals similar to those of CODA-2.Rather than pursue similar questions independently in theUnited States and Denmark, the two groups are workingtogether to bring the most useful information to the diabe-tes community by incorporating additional studies as veri-fication for findings in either study group.
Methods
Identification of relevant studies
Several strategies were employed to establish the collabo-rative study. Among them were a literature search, screen-ing of abstracts of major international diabetesconferences, personal communication with experts in thefield, collaborators and colleagues, and collaboration withCDC and other international groups.
In the case of the literature search and screening ofabstracts to identify relevant studies, we developed a pro-tocol that focused on prospective studies and cross-sec-tional studies with the ability to discern newly diagnosedcases, and where abdominal obesity had been measured asa risk factor for diabetes. The collaborative approachincluded working together with experts in the field andinternational agencies such as WHO MONICA, and thecollaborative groups DECODE (6,7), and DECODA (6,8).This second approach was intended to increase identifica-
tion of studies as well as to increase successful recruitmentof studies. Incorporation of new studies identified after theinitial collaboration is ongoing as we develop new researchquestions.
Inclusion criteria
To be eligible for inclusion in either CODA or CODA-2,studies had to meet the following criteria: (i) prospectivestudies with T2DM as an outcome, or cross-sectional stud-ies able to determine newly diagnosed cases of IGT orT2DM; and (ii) at least one measure of obesity, with par-ticular emphasis on WC.
Outcomes
Incident diabetes was the principal outcome for the pro-spective studies. We collected time to event/date of event,diagnostic criteria and instrument used for diagnosis. Inaddition, we requested glucose measurements at follow-upwhere possible. For cross-sectional studies and at baselinefor prospective studies, we requested fasting glucose mea-surements, 2-h Oral Glucose Tolerance Test (OGTT), anddetails on those with known diabetes, based on either self-report or medications to distinguish between newly diag-nosed and known diabetes at baseline. In addition todiabetes, cause-specific mortality (International Classifica-tion of Diseases [ICD]-9 or ICD-10 codes) was requestedfor prospective studies.
Baseline covariates
Anthropometric variables were the initial focus of theCODA project. We collected information on weight,height, waist and hip, where available. In addition toanthropometric variables, we collected demographic infor-mation including ethnicity/race, metabolic measurementsand other established risk factors (9–13). Included vari-ables are WC (cm), body weight (kg), height (m), BMI(kg m
−
2
), hip circumference (cm), WHR, fasting glucose(mmol L
−
1
), 2-h OGTT (mmol L
−
1
), fasting total cho-lesterol (mmol L
−
1
), high-density lipoprotein (HDL)-cholesterol (mmol L
−
1
), triglycerides (mmol L
−
1
), fastinginsulin (uu mL
−
1
), 2-h insulin (uu mL
−
1
), diastolic and sys-tolic blood pressure (mmHg), consumption of alcohol, edu-cational attainment, smoking status, menopausal status,use of hormone replacement therapy, use of blood pressuremedication, history of hypertension, gestational diabetes,and first degree family history of diabetes.
Establishing the collaborative group
Initial communication from the CODA steering commit-tee (see Appendix) was by a letter of invitation, along
obesity
reviews
The CODA meta-analysis project
S. Duval
et al.
265
© 2007 The AuthorsJournal compilation © 2007 The International Association for the Study of Obesity.
obesity
reviews
8
, 263–276
with a request for input into the collaborative effort, toworkshop delegates (1). Much interest was generated atthis stage, leading to a list of study names and principalinvestigators. Those studies were sent a questionnaire toverify eligibility, and permission forms were obtainedfrom each study to become part of CODA. For studiesthat were eligible and willing to join the collaboration, wesent a data request form with a suggested data-codingscheme, allowing flexibility in the format to ensure conve-nience to collaborators. Also at this stage, a full protocoland other supporting documentation were sent to all col-laborators.
Data acquisition, collection and checking
Study collaborators were asked to supply raw data as out-lined by the data request form. We implemented a flexibledata transfer method that included File Transfer Protocolto a secure site, email, or CD of any machine-readablemedium and in any format convenient to the collaborator.Once the original data file was received from the partici-pating study, data were transferred to SAS version 8, andthe original data were archived for backup purposes.
The original data were examined for completeness andconsistency using the following protocol: summary statis-tics for all variables were sent back to collaborators toverify categories, units of measurements, and protocol. Inaddition, we were able to verify consistency of data withinindividuals, highlight potential outliers, and identify miss-ing data. Any data queries were discussed and resolveddirectly with the responsible collaborator.
Harmonization
Implicit in the process of implementing a meta-analysis atthe level of the individual is the task of acquiring individ-ual-level data from a representative selection of existingstudies. Most often the studies identified for the meta-analysis will have data generated for similar but non-identical purposes, and with similar but non-identicalmethods. Obtaining a variable from the original sourcesthat is identical in meaning and structure across the studies
is ideal. When this is not possible an attempt must be madeto derive from an existing variable, or variables, a newvariable that is comparable across the studies.
We use the term ‘harmonize’ to refer to the process thatincludes thinking about the comparability of variablesacross studies, and then defining and deriving the codingscheme of a new variable that is as close as possible to theconceptual target and yet is still true to each study’s specificdata. Consideration is given to study design, variable-specific data collection protocols, units of measurement,response categories and variable names. Harmonizationalways involves compromises and is often, but not always,possible to achieve.
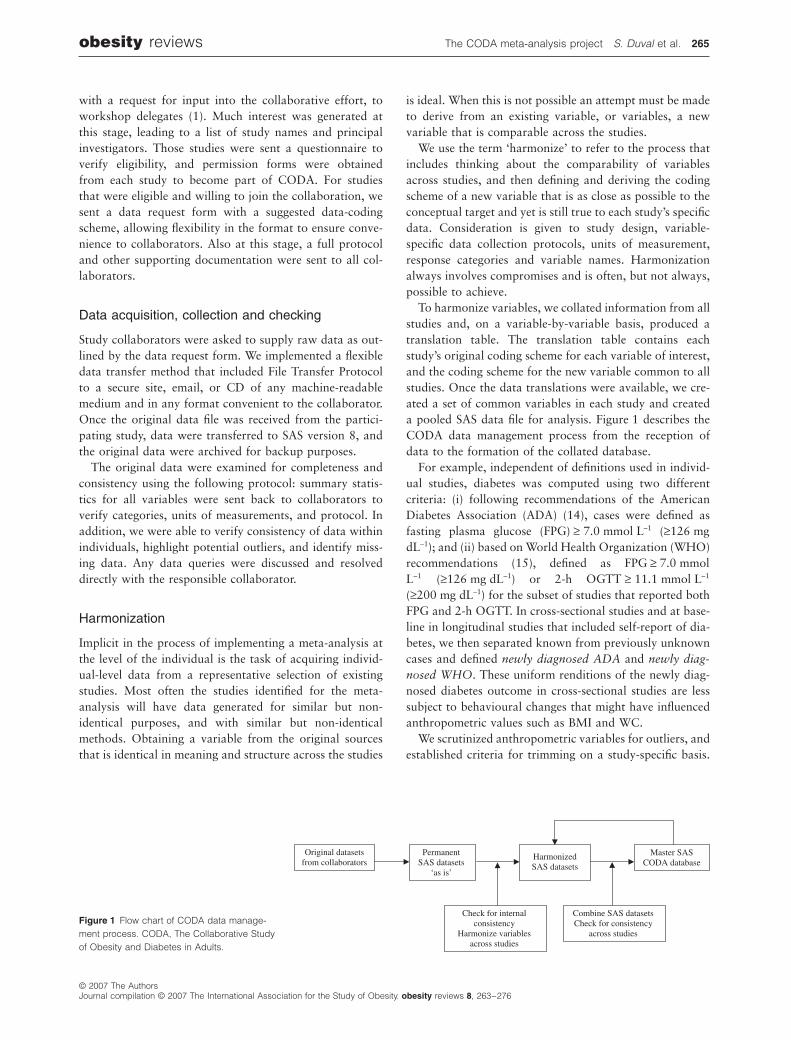
To harmonize variables, we collated information from allstudies and, on a variable-by-variable basis, produced atranslation table. The translation table contains eachstudy’s original coding scheme for each variable of interest,and the coding scheme for the new variable common to allstudies. Once the data translations were available, we cre-ated a set of common variables in each study and createda pooled SAS data file for analysis. Figure 1 describes theCODA data management process from the reception ofdata to the formation of the collated database.
For example, independent of definitions used in individ-ual studies, diabetes was computed using two differentcriteria: (i) following recommendations of the AmericanDiabetes Association (ADA) (14), cases were defined asfasting plasma glucose (FPG)
≥
7.0 mmol L
−
1
(
≥
126 mgdL
−
1
); and (ii) based on World Health Organization (WHO)recommendations (15), defined as FPG
≥
7.0 mmolL
−
1
(
≥
126 mg dL
−
1
) or 2-h OGTT
≥
11.1 mmol L
−
1
(
≥
200 mg dL
−
1
) for the subset of studies that reported bothFPG and 2-h OGTT. In cross-sectional studies and at base-line in longitudinal studies that included self-report of dia-betes, we then separated known from previously unknowncases and defined
newly diagnosed ADA
and
newly diag-nosed WHO
. These uniform renditions of the newly diag-nosed diabetes outcome in cross-sectional studies are lesssubject to behavioural changes that might have influencedanthropometric values such as BMI and WC.
We scrutinized anthropometric variables for outliers, andestablished criteria for trimming on a study-specific basis.
Figure 1
Flow chart of CODA data manage-ment process. CODA, The Collaborative Study of Obesity and Diabetes in Adults.
Original datasets from collaborators
Permanent SAS datasets
‘as is’
Harmonized SAS datasets
Master SAS CODA database
Check for internal consistency
Harmonize variables across studies
Combine SAS datasets Check for consistency
across studies
266
The CODA meta-analysis project
S. Duval
et al.
obesity
reviews
© 2007 The AuthorsJournal compilation © 2007 The International Association for the Study of Obesity.
obesity
reviews
8
, 263–276
Typically, anthropometric values were considered to be out-liers if they were more than 3.5 standard deviations fromthe mean, and consequently trimmed prior to analysis. Insubsequent analyses, we will use similar strategies for trim-ming outliers from continuous variables in the database.We obtained information from each study as to the site ofboth waist and hip measurement; WC was subsequentlyclassified into four categories, according to measurementsite (16). In cases where there was ambiguity, we contactedthe collaborator directly for clarification and agreementwith our coding.
Data confidentiality
Data received from each investigator remain the property ofthe original study group. Any data supplied are held securelyand treated as confidential. This study is based on anony-mized datasets already collected; therefore ethical consider-ations are those pertaining to secondary data analysis.
Statistical analysis
Any meta-analysis gains power at the expense of broaden-ing of definitions, as discussed under harmonization,above. Among advantages of an individual participant data(IPD) meta-analysis are that it allows more accurate time-to-event analysis, covariate adjustment, and subgroup anal-ysis, than does a literature-based meta-analysis; it can alsoinclude unpublished findings (17–19). It is also possible toperform an assessment of heterogeneity between studiesand subgroups (e.g. age group, gender, and race/ethnicity),often at both the pooled within study and between studylevels (17,20,21). In addition, sensitivity analysis takingaccount of factors including completeness of follow-up,methods of assessing outcomes, periods of follow-up, andthe use of repeated measurements of risk factors can beperformed to determine the robustness of the findings andthe appropriateness of analysis based on pooled datasets.
Analysis is based on two different strategies. The first isto calculate summary statistics for each study and combineresults using a standard meta-analytic approach. Randomeffects models, which take heterogeneity between studiesinto account, will be the main analytic technique (22,23).In addition, heterogeneity due to study-level populationcharacteristics and study design features will be analysedusing meta-regression methods (24). The second is to per-form a ‘pooled’ analysis, using hierarchical regression mod-els, with the study being incorporated as either a fixed orrandom effect and with adjustment for other individual-level covariates where indicated (17,20,21). The hierarchi-cal regression, or multilevel model, can be written as a two-level model with participants corresponding to level oneunits and studies to level two units, as described in Higgins
et al
. (18).
Project management
Study co-ordination and statistical analyses are performedin the Division of Epidemiology and Community Health inthe School of Public Health at the University of Minnesota.Collaborating investigators are welcomed to proposeprojects and to spend time at the University of Minnesotadoing data analysis.
Publication policy
The results of the study will be published in scientific peer-reviewed journals after the analyses are completed andpresented to all of the collaborators. Collaborators aregiven sufficient time for a full review of the results. Theprimary publications will be in the name of the collabora-tive group rather than individual authors.
Writing for these primary publications is by a writingcommittee from the research staff working at the analysiscentre, and those collaborators who have expressed interestin particular analyses. All participating studies and investi-gators contributing to this project will be listed at the endof each publication along with the members of the writingcommittee. The member of the group leading the analysisand writing effort will be designated as the correspondingauthor in the publication. Contributors have the right towithdraw their data from a given paper without giving areason, for example, if issues concerning local publicationcannot be reconciled. If multiple papers arise from thismeta-analysis, contributors may decline participation on apaper-by-paper basis.
Results
Collaboration characteristics
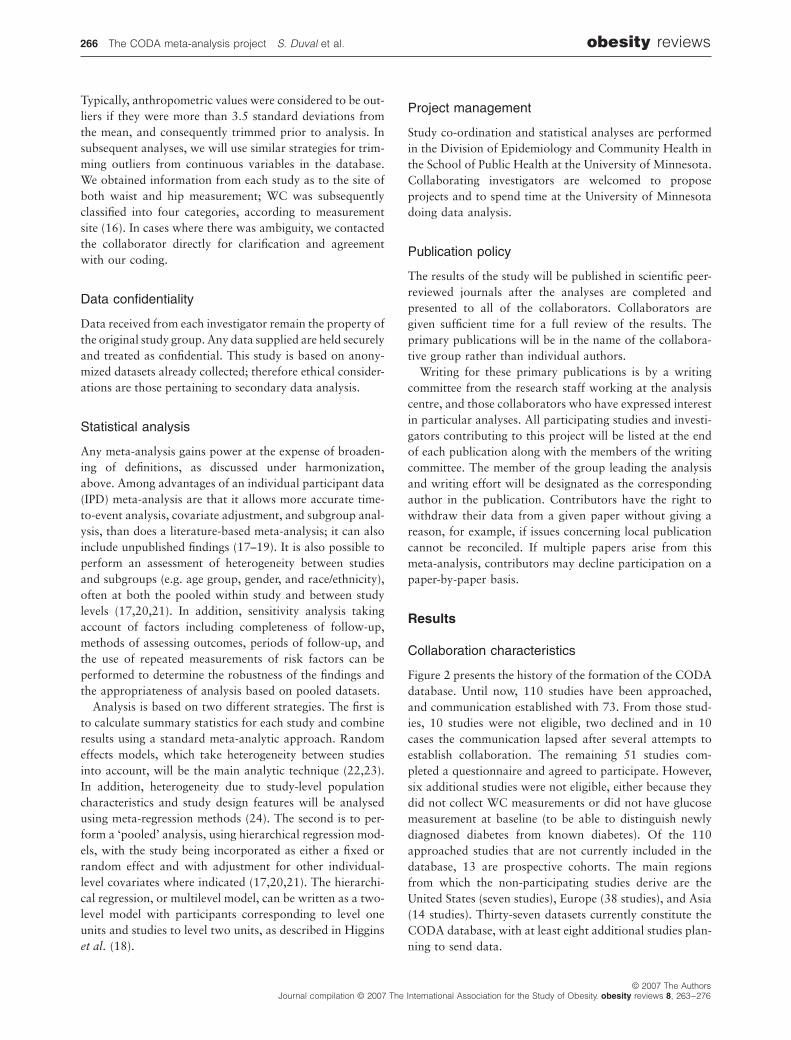
Figure 2 presents the history of the formation of the CODAdatabase. Until now, 110 studies have been approached,and communication established with 73. From those stud-ies, 10 studies were not eligible, two declined and in 10cases the communication lapsed after several attempts toestablish collaboration. The remaining 51 studies com-pleted a questionnaire and agreed to participate. However,six additional studies were not eligible, either because theydid not collect WC measurements or did not have glucosemeasurement at baseline (to be able to distinguish newlydiagnosed diabetes from known diabetes). Of the 110approached studies that are not currently included in thedatabase, 13 are prospective cohorts. The main regionsfrom which the non-participating studies derive are theUnited States (seven studies), Europe (38 studies), and Asia(14 studies). Thirty-seven datasets currently constitute theCODA database, with at least eight additional studies plan-ning to send data.
obesity
reviews
The CODA meta-analysis project
S. Duval
et al.
267
© 2007 The AuthorsJournal compilation © 2007 The International Association for the Study of Obesity.
obesity
reviews
8
, 263–276
Characteristics of the studies
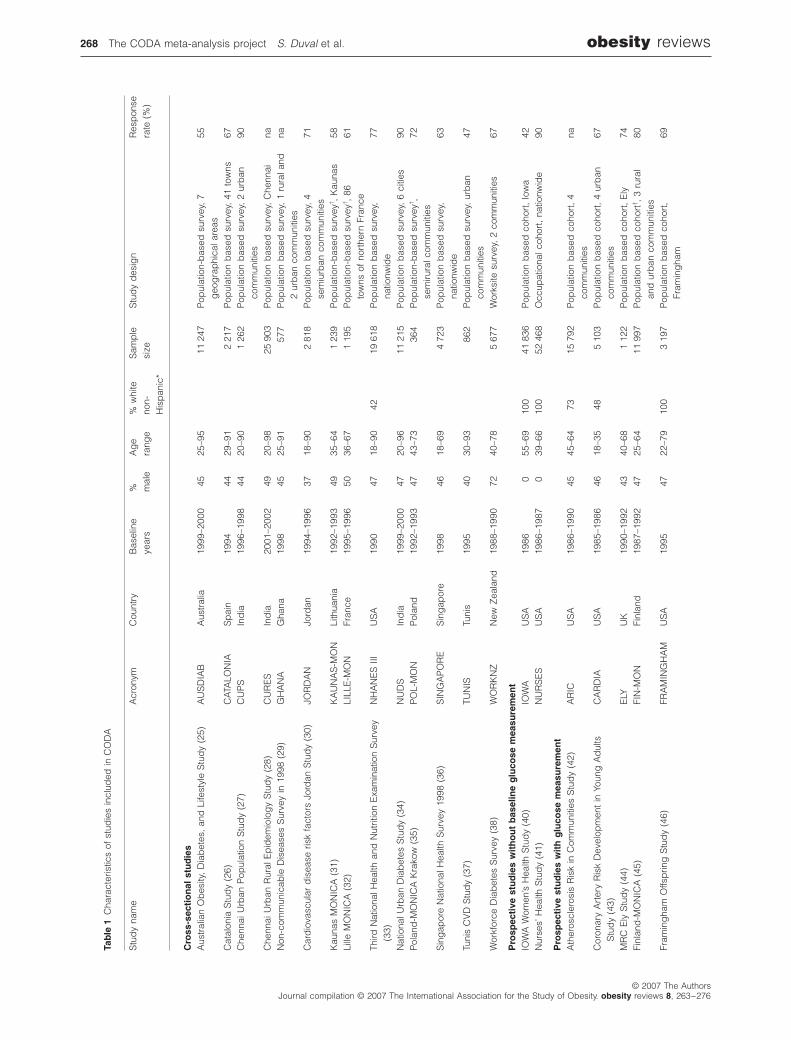
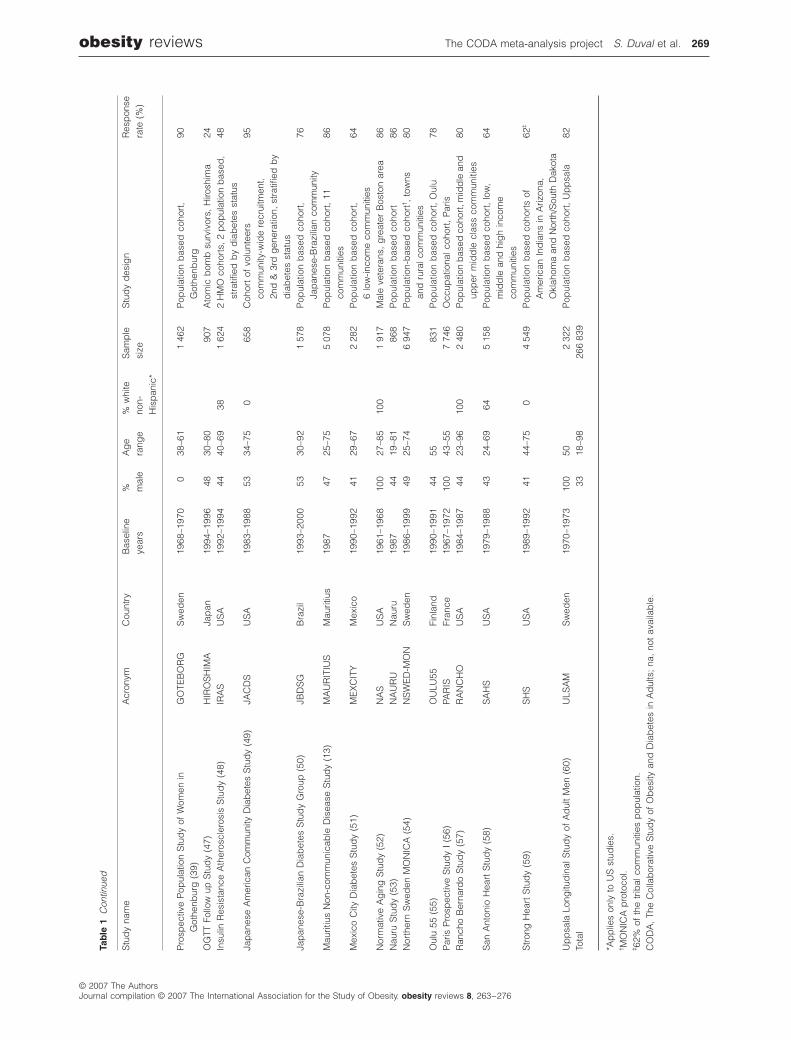
Table 1 provides a detailed description of the study levelcharacteristics. Collectively, these 37 studies involve atotal of more than 260 000 participants. Twenty-threestudies are prospective (62%) and 14 are cross-sectional.Prevalence analysis of diabetes and IGT can be performedin 35 of the studies that provided glucose measurements(64% of the sample). Studies are from 20 countries, mostof the participants being from the United States (58%),India (14%) and Europe (14%). Most studies are basedon population-based surveys that consisted of probabilis-tic samples of a geographical area. Several studies usedstratified random sampling, and, e.g. IRAS and JACDS,stratified on glucose status. We also have three occupa-tional studies, one study including an HMO cohort, and acohort of US veterans. The proportion of males is 33%and the ages of participants at baseline ranges from 18 to98 years.
Outcomes
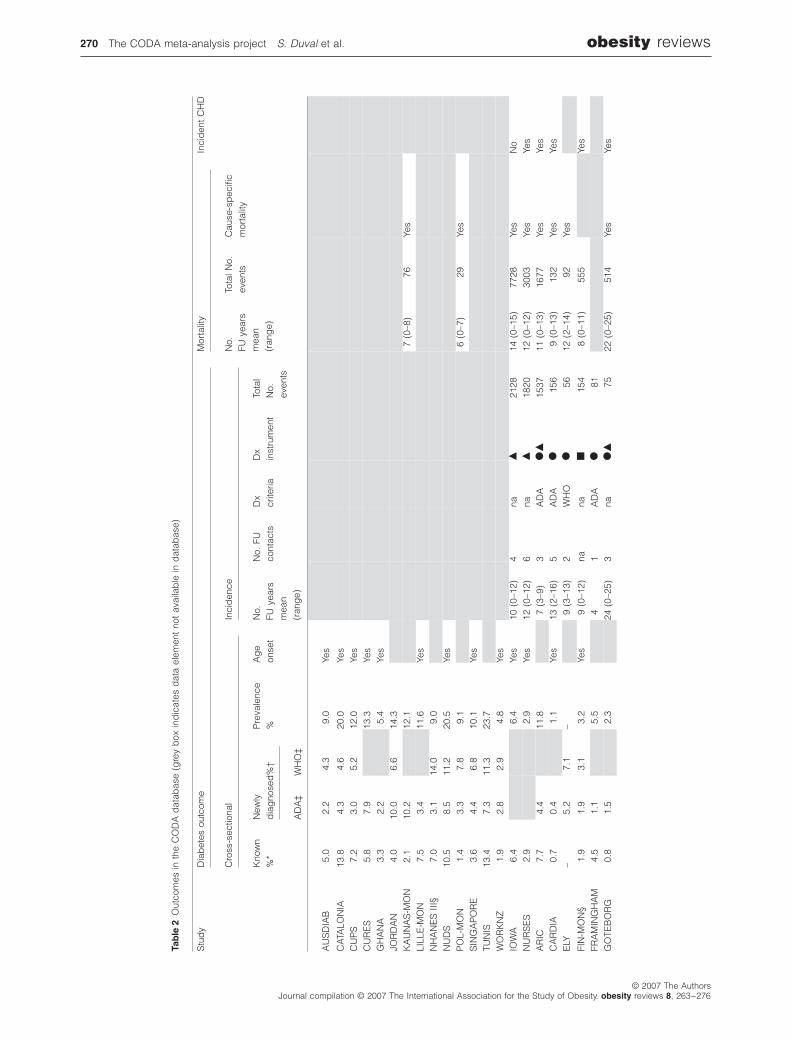
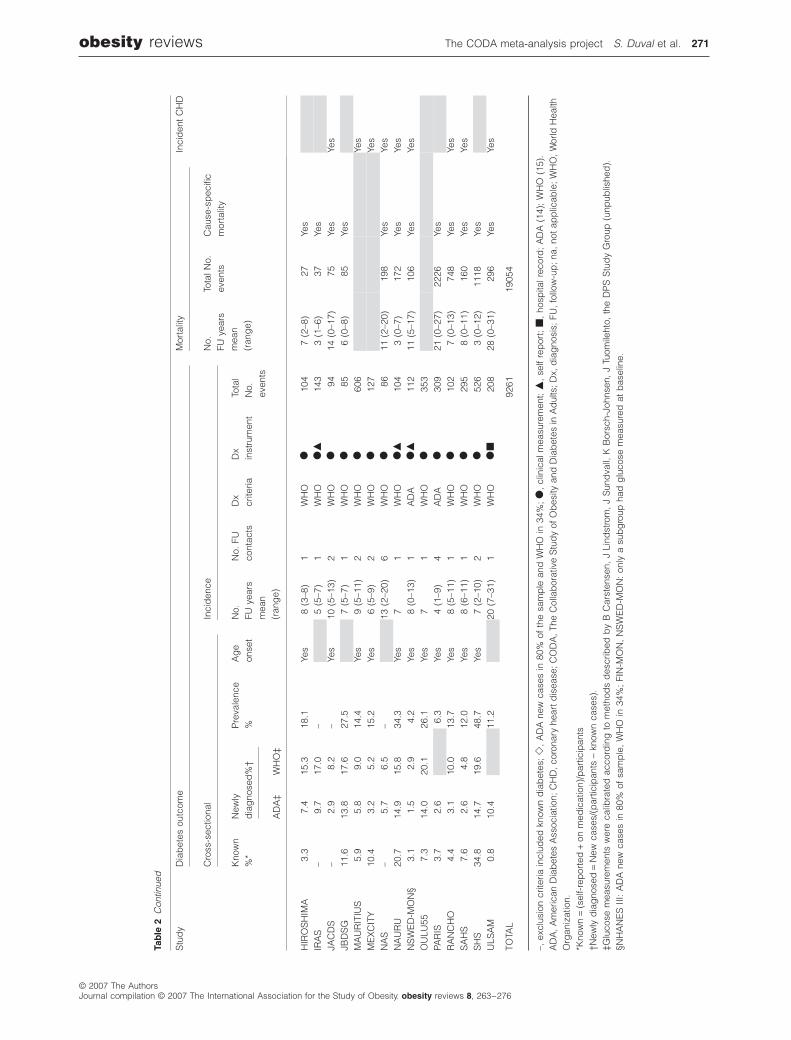
Table 2 provides study level characteristics for CODA out-comes. Collectively, follow-up information is available formore than 150 000 participants, with a mean duration offollow-up of 9.9 years and a total follow-up of almost1 500 000 person-years, with more than 9000 incidentcases of diabetes and nearly 19 000 deaths. Fifteen studiesused only blood measurements, two studies used self-reportand one study medication records only. In addition, fivestudies used a combination of self-report, blood measure-ments and medical records.
Newly diagnosed diabetes was available for 35 studiesbased on ADA criteria and for 25 based on WHO criteria.Known diabetes could not be calculated in four studiesbecause the studies excluded subjects based on known
diabetes or because it was associated with the samplingscheme (e.g. IRAS). Prevalent cases of diabetes were calcu-lated from the sum of known and newly diagnosed cases.Prevalence of newly diagnosed diabetes was calculated asthe ratio of the newly diagnosed cases to those at risk,excluding the known cases. In addition, prevalence couldnot be computed for studies when known diabetes statuswas unavailable.
Baseline covariates
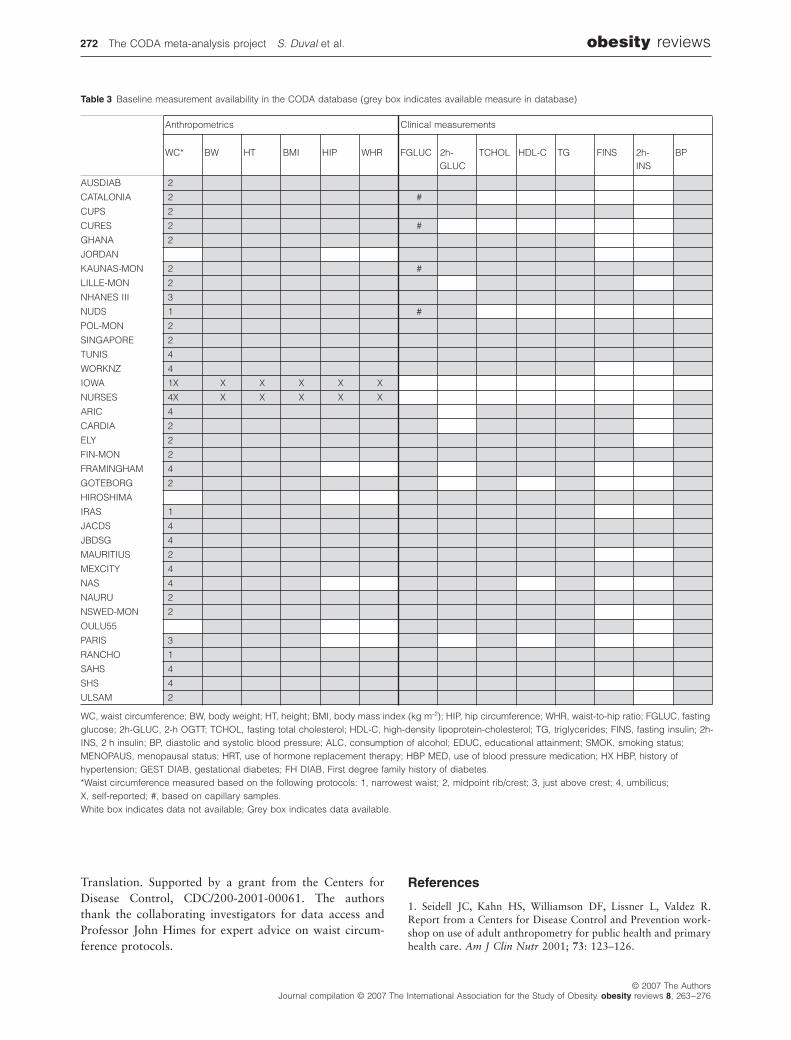
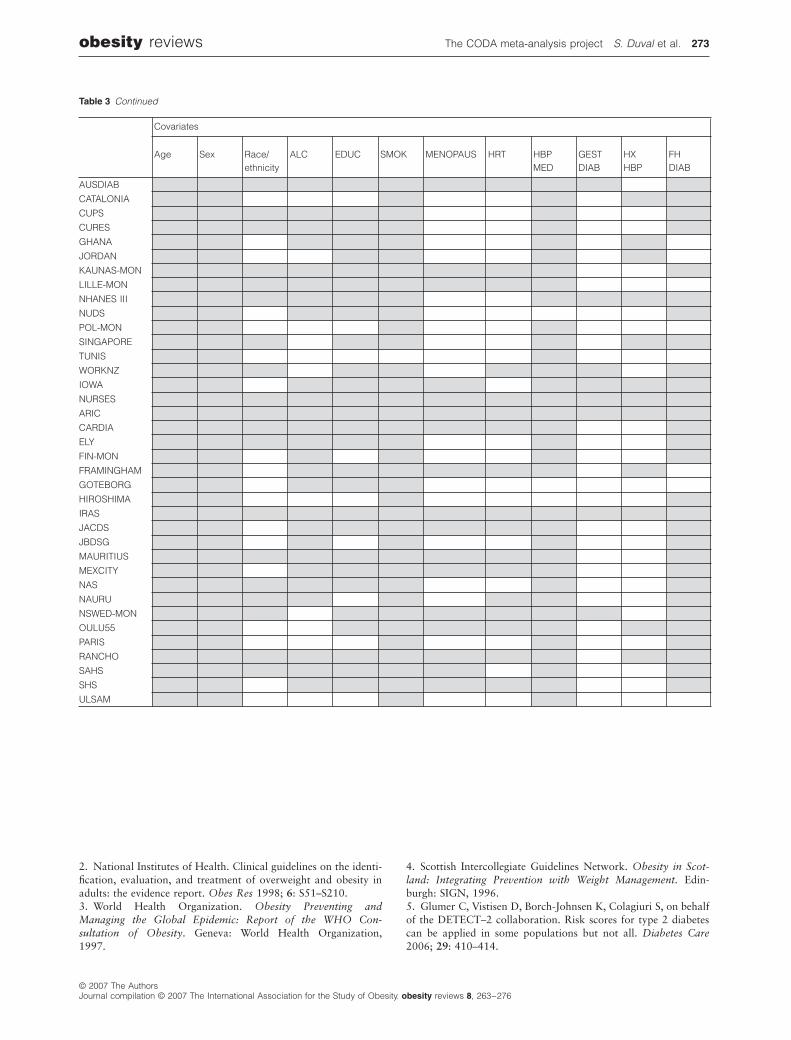
We collected baseline information on anthropometrics,demographics, metabolic risk factors, ethnicity/race andother risk factors. Table 3 presents availability of baselinevariables. Waist circumference was available in 34 andWHR in 32 of the studies. All anthropometrics were mea-sured at clinic visits, except for IOWA and NURSES.
Limitations
The IPD design does have some limitations. Not all relevantstudies have chosen to participate; this ‘study wide non-participation’ might result in ‘collaboration bias’, a termwe use in a somewhat analogous way to that of publicationbias in literature-based meta-analysis. However, there is noreason to believe that lack of participation is correlatedwith effect size, but is rather more likely linked with prag-matic issues, such as not enough monetary reward, lack ofinterest, or no time for such activities in an academic envi-ronment. On balance, we feel that the rewards from thisdesign outweigh these potential problems.
Conclusions
We have described CODA, a meta-analysis project includ-ing a collaborative group of diabetes studies and investiga-tors, and the CODA database. The substantive rationalefor the first set of analyses has been determined, and inves-tigators representing many parts of the world have com-mitted their time and knowledge to the combined effort.We have the large majority of cohort studies with a verylarge number of participants.
The proposed IPD meta-analyses from the CODA groupwill help resolve several outstanding questions in diabetesepidemiology.
Conflict of interest statement
No conflict of interest was declared.
Acknowledgements
The CODA Project is supported by the US Centers forDisease Control and Prevention, Division of Diabetes
Figure 2
Flow chart of CODA collaboration. CODA, The Collaborative Study of Obesity and Diabetes in Adults.
37
73
110
34
8
Collaboration invitation
Noresponse
Communication established
Not eligible
Declined
Not eligible
Datasets received
Failedcommunication
Completedquestionnaire
10
51
Pending response
Additional CODA-2
CODA-13
10
6
2
37
268
The CODA meta-analysis project
S. Duval
et al.
obesity
reviews
© 2007 The AuthorsJournal compilation © 2007 The International Association for the Study of Obesity.
obesity
reviews
8
, 263–276
Tab
le 1
Cha
ract
eris
tics
of s
tud
ies
incl
uded
in C
OD
A
Stu
dy
nam
eA
cron
ymC
ount
ryB
asel
ine
year
s%
m
ale
Ag
e ra
nge
% w
hite
non-
His
pan
ic*
Sam
ple
si
zeS
tud
y d
esig
nR
esp
onse
rate
(%
)
Cro
ss-s
ecti
on
al s
tud
ies
Aus
tral
ian
Ob
esity
, D
iab
etes
, an
d L
ifest
yle
Stu
dy
(25)
AU
SD
IAB
Aus
tral
ia19
99–2
000
4525
–95
11 2
47P
opul
atio
n-b
ased
sur
vey,
7g
eog
rap
hica
l are
as55
Cat
alon
ia S
tud
y (2
6)C
ATA
LON
IAS
pai
n19
9444
29–9
12
217
Pop
ulat
ion
bas
ed s
urve
y, 4
1 to
wns
67C
henn
ai U
rban
Pop
ulat
ion
Stu
dy
(27)
CU
PS
Ind
ia19
96–1
998
4420
–90
1 26
2P
opul
atio
n b
ased
sur
vey,
2 u
rban
com
mun
ities
90
Che
nnai
Urb
an R
ural
Ep
idem
iolo
gy
Stu
dy
(28)
CU
RE
SIn
dia
2001
–200
249
20–9
825
903
Pop
ulat
ion
bas
ed s
urve
y, C
henn
aina
Non
-com
mun
icab
le D
isea
ses
Sur
vey
in 1
998
(29)
GH
AN
AG
hana
1998
4525
–91
577
Pop
ulat
ion
bas
ed s
urve
y, 1
rur
al a
nd2
urb
an c
omm
uniti
esna
Car
dio
vasc
ular
dis
ease
ris
k fa
ctor
s Jo
rdan
Stu
dy
(30)
JOR
DA
NJo
rdan
1994
–199
637
18–9
02
818
Pop
ulat
ion
bas
ed s
urve
y, 4
sem
iurb
an c
omm
uniti
es71
Kau
nas
MO
NIC
A (
31)
KA
UN
AS
-MO
NLi
thua
nia
1992
–199
349
35–6
41
239
Pop
ulat
ion-
bas
ed s
urve
y
†
, K
auna
s58
Lille
MO
NIC
A (
32)
LILL
E-M
ON
Fran
ce19
95–1
996
5036
–67
1 19
5P
opul
atio
n-b
ased
sur
vey
†
, 86
tow
ns o
f no
rthe
rn F
ranc
e61
Third
Nat
iona
l Hea
lth a
nd N
utrit
ion
Exa
min
atio
n S
urve
y(3
3)N
HA
NE
S I
IIU
SA
1990
4718
–90
4219
618
Pop
ulat
ion
bas
ed s
urve
y,na
tionw
ide
77
Nat
iona
l Urb
an D
iab
etes
Stu
dy
(34)
NU
DS
Ind
ia19
99–2
000
4720
–96
11 2
15P
opul
atio
n b
ased
sur
vey,
6 c
ities
90P
olan
d-M
ON
ICA
Kra
kow
(35
)P
OL-
MO
NP
olan
d19
92–1
993
4743
–73
364
Pop
ulat
ion-
bas
ed s
urve
y
†
,se
miru
ral c
omm
uniti
es72
Sin
gap
ore
Nat
iona
l Hea
lth S
urve
y 19
98 (
36)
SIN
GA
PO
RE
Sin
gap
ore
1998
4618
–69
4 72
3P
opul
atio
n b
ased
sur
vey,
natio
nwid
e63
Tuni
s C
VD
Stu
dy
(37)
TUN
ISTu
nis
1995
4030
–93
862
Pop
ulat
ion
bas
ed s
urve
y, u
rban
com
mun
ities
47
Wor
kfor
ce D
iab
etes
Sur
vey
(38)
WO
RK
NZ
New
Zea
land
1988
–199
072
40–7
85
677
Wor
ksite
sur
vey,
2 c
omm
uniti
es67
Pro
spec
tive
stu
die
s w
ith
ou
t b
asel
ine
glu
cose
mea
sure
men
t
IOW
A W
omen
’s H
ealth
Stu
dy
(40)
IOW
AU
SA
1986
055
–69
100
41 8
36P
opul
atio
n b
ased
coh
ort,
Iow
a42
Nur
ses’
Hea
lth S
tud
y (4
1)N
UR
SE
SU
SA
1986
–198
70
39–6
610
052
468
Occ
upat
iona
l coh
ort,
natio
nwid
e90
Pro
spec
tive
stu
die
s w
ith
glu
cose
mea
sure
men
t
Ath
eros
cler
osis
Ris
k in
Com
mun
ities
Stu
dy
(42)
AR
ICU
SA
1986
–199
045
45–6
473
15 7
92P
opul
atio
n b
ased
coh
ort,
4co
mm
uniti
esna
Cor
onar
y A
rter
y R
isk
Dev
elop
men
t in
You
ng A
dul
tsS
tud
y (4
3)C
AR
DIA
US
A19
85–1
986
4618
–35
485
103
Pop
ulat
ion
bas
ed c
ohor
t, 4
urb
anco
mm
uniti
es67
MR
C E
ly S
tud
y (4
4)E
LYU
K19
90–1
992
4340
–68
1 12
2P
opul
atio
n b
ased
coh
ort,
Ely
74Fi
nlan
d-M
ON
ICA
(45
)FI
N-M
ON
Finl
and
1987
–199
247
25–6
411
997
Pop
ulat
ion
bas
ed c
ohor
t
†
, 3
rura
lan
d u
rban
com
mun
ities
80
Fram
ing
ham
Offs
prin
g S
tud
y (4
6)FR
AM
ING
HA
MU
SA
1995
4722
–79
100
3 19
7P
opul
atio
n b
ased
coh
ort,
Fram
ing
ham
69
*Ap
plie
s on
ly t
o U
S s
tud
ies.
†
MO
NIC
A p
roto
col.
‡
62%
of
the
trib
al c
omm
uniti
es p
opul
atio
n.C
OD
A,
The
Col
lab
orat
ive
Stu
dy
of O
bes
ity a
nd D
iab
etes
in A
dul
ts;
na,
not
avai
lab
le.
obesity
reviews
The CODA meta-analysis project
S. Duval
et al.
269
© 2007 The AuthorsJournal compilation © 2007 The International Association for the Study of Obesity.
obesity
reviews
8
, 263–276
Pro
spec
tive
Pop
ulat
ion
Stu
dy
of W
omen
inG
othe
nbur
g (
39)
GO
TEB
OR
GS
wed
en19
68–1
970
038
–61
1 46
2P
opul
atio
n b
ased
coh
ort,
Got
henb
urg
90
OG
TT F
ollo
w u
p S
tud
y (4
7)H
IRO
SH
IMA
Jap
an19
94–1
996
4830
–80
907
Ato
mic
bom
b s
urvi
vors
, H
irosh
ima
24In
sulin
Res
ista
nce
Ath
eros
cler
osis
Stu
dy
(48)
IRA
SU
SA
1992
–199
444
40–6
938
1 62
42
HM
O c
ohor
ts, 2
pop
ulat
ion
bas
ed,
stra
tified
by
dia
bet
es s
tatu
s48
Jap
anes
e A
mer
ican
Com
mun
ity D
iab
etes
Stu
dy
(49)
JAC
DS
US
A19
83–1
988
5334
–75
0 6
58C
ohor
t of
vol
unte
ers
com
mun
ity-w
ide
recr
uitm
ent,
2nd
& 3
rd g
ener
atio
n, s
trat
ified
by
dia
bet
es s
tatu
s
95
Jap
anes
e-B
razi
lian
Dia
bet
es S
tud
y G
roup
(50
)JB
DS
GB
razi
l19
93–2
000
5330
–92
1 57
8P
opul
atio
n b
ased
coh
ort,
Jap
anes
e-B
razi
lian
com
mun
ity76
Mau
ritiu
s N
on-c
omm
unic
able
Dis
ease
Stu
dy
(13)
MA
UR
ITIU
SM
aurit
ius
1987
4725
–75
5 07
8P
opul
atio
n b
ased
coh
ort,
11co
mm
uniti
es86
Mex
ico
City
Dia
bet
es S
tud
y (5
1)M
EX
CIT
YM
exic
o19
90–1
992
4129
–67
2 28
2P
opul
atio
n b
ased
coh
ort,
6 lo
w-in
com
e co
mm
uniti
es64
Nor
mat
ive
Ag
ing
Stu
dy
(52)
NA
SU
SA
1961
–196
810
027
–85
100
1 91
7M
ale
vete
rans
, g
reat
er B
osto
n ar
ea86
Nau
ru S
tud
y (5
3)N
AU
RU
Nau
ru19
8744
19–8
1 8
68P
opul
atio
n b
ased
coh
ort
86N
orth
ern
Sw
eden
MO
NIC
A (
54)
NS
WE
D-M
ON
Sw
eden
1986
–199
949
25–7
46
947
Pop
ulat
ion-
bas
ed c
ohor
t
†
, to
wns
and
rur
al c
omm
uniti
es80
Oul
u 55
(55
)O
ULU
55Fi
nlan
d19
90–1
991
4455
831
Pop
ulat
ion
bas
ed c
ohor
t, O
ulu
78P
aris
Pro
spec
tive
Stu
dy
I (5
6)PA
RIS
Fran
ce19
67–1
972
100
43–5
57
746
Occ
upat
iona
l coh
ort,
Par
isR
anch
o B
erna
rdo
Stu
dy
(57)
RA
NC
HO
US
A19
84–1
987
4423
–96
100
2 48
0P
opul
atio
n b
ased
coh
ort,
mid
dle
and
up
per
mid
dle
cla
ss c
omm
uniti
es80
San
Ant
onio
Hea
rt S
tud
y (5
8)S
AH
SU
SA
1979
–198
843
24–6
964
5 15
8P
opul
atio
n b
ased
coh
ort,
low
,m
idd
le a
nd h
igh
inco
me
com
mun
ities
64
Stro
ng H
eart
Stu
dy
(59)
SH
SU
SA
1989
–199
241
44–7
50
4 54
9P
opul
atio
n b
ased
coh
orts
of
Am
eric
an I
ndia
ns in
Ariz
ona,
O
klah
oma
and
Nor
th/S
outh
Dak
ota
62
‡
Up
psa
la L
ong
itud
inal
Stu
dy
of A
dul
t M
en (
60)
ULS
AM
Sw
eden
1970
–197
310
050
2 32
2P
opul
atio
n b
ased
coh
ort,
Up
psa
la82
Tota
l33
18–9
826
6 83
9
Stu
dy
nam
eA
cron
ymC
ount
ryB
asel
ine
year
s%
m
ale
Ag
e ra
nge
% w
hite
non-
His
pan
ic*
Sam
ple
si
zeS
tud
y d
esig
nR
esp
onse
rate
(%
)
*Ap
plie
s on
ly t
o U
S s
tud
ies.
†
MO
NIC
A p
roto
col.
‡
62%
of
the
trib
al c
omm
uniti
es p
opul
atio
n.C
OD
A,
The
Col
lab
orat
ive
Stu
dy
of O
bes
ity a
nd D
iab
etes
in A
dul
ts;
na,
not
avai
lab
le.
Tab
le 1
Con
tinue
d
270
The CODA meta-analysis project
S. Duval
et al.
obesity
reviews
© 2007 The AuthorsJournal compilation © 2007 The International Association for the Study of Obesity.
obesity
reviews
8
, 263–276
Tab
le 2
Out
com
es in
the
CO
DA
dat
abas
e (g
rey
box
ind
icat
es d
ata
elem
ent
not
avai
lab
le in
dat
abas
e)
Stu
dy
Dia
bet
es o
utco
me
Mor
talit
yIn
cid
ent
CH
D
Cro
ss-s
ectio
nal
Inci
den
ceN
o.FU
yea
rsm
ean
(ran
ge)
Tota
l No.
even
tsC
ause
-sp
ecifi
c m
orta
lity
Kno
wn
%*
New
lyd
iag
nose
d%
†P
reva
lenc
e%
Ag
eon
set
No.
FU y
ears
mea
n(r
ang
e)
No.
FU
cont
acts
Dx
crite
riaD
xin
stru
men
tTo
tal
No.
even
ts
AD
A‡
WH
O‡
AU
SD
IAB
5.0
2.2
4.3
9.0
Yes
CAT
ALO
NIA
13.8
4.3
4.6
20.0
Yes
CU
PS
7.2
3.0
5.2
12.0
Yes
CU
RE
S5.
87.
913
.3Ye
sG
HA
NA
3.3
2.2
5.4
Yes
JOR
DA
N4.
010
.06.
614
.3K
AU
NA
S-M
ON
2.1
10.2
12.1
7 (0
–8)
76Ye
sLI
LLE
-MO
N7.
53.
411
.6Ye
sN
HA
NE
S I
II§7.
03.
114
.09.
0N
UD
S10
.58.
511
.220
.5Ye
sP
OL-
MO
N1.
43.
37.
89.
16
(0–7
)29
Yes
SIN
GA
PO
RE
3.6
4.4
6.8
10.1
Yes
TUN
IS13
.47.
311
.323
.7W
OR
KN
Z1.
92.
82.
94.
8Ye
sIO
WA
6.4
6.4
Yes
10 (
0–12
)4
na
�
2128
14 (
0–15
)77
28Ye
sN
oN
UR
SE
S2.
92.
9Ye
s12
(0–
12)
6na
�
1820
12 (
0–12
)30
03Ye
sYe
sA
RIC
7.7
4.4
11.8
7 (3
–9)
3A
DA
��
1537
11 (
0–13
)16
77Ye
sYe
sC
AR
DIA
0.7
0.4
1.1
Yes
13 (
2–16
)5
AD
A
�
156
9 (0
–13)
132
Yes
Yes
ELY
–5.
27.
1–
9 (3
–13)
2W
HO
�
5612
(2–
14)
92Ye
s
FIN
-MO
N§
1.9
1.9
3.1
3.2
Yes
9 (0
–12)
nana
�
154
8 (0
–11)
555
Yes
FRA
MIN
GH
AM
4.5
1.1
5.5
41
AD
A
�
81G
OTE
BO
RG
0.8
1.5
2.3
24 (
0–25
)3
na
��
7522
(0–
25)
514
Yes
Yes
–, e
xclu
sion
crit
eria
incl
uded
kno
wn
dia
bet
es;
�
, A
DA
new
cas
es in
80%
of
the
sam
ple
and
WH
O in
34%
;
�
, cl
inic
al m
easu
rem
ent;
�
, se
lf re
por
t;
�
, ho
spita
l rec
ord
; A
DA
(14
); W
HO
(15
).A
DA
, Am
eric
an D
iab
etes
Ass
ocia
tion;
CH
D, c
oron
ary
hear
t dis
ease
; CO
DA
, The
Col
lab
orat
ive
Stu
dy
of O
bes
ity a
nd D
iab
etes
in A
dul
ts; D
x, d
iag
nosi
s; F
U, f
ollo
w-u
p; n
a, n
ot a
pp
licab
le; W
HO
, Wor
ld H
ealth
O
rgan
izat
ion.
*Kno
wn
=
(se
lf-re
por
ted
+ on
med
icat
ion)
/par
ticip
ants
†New
ly d
iag
nose
d =
New
cas
es/(
par
ticip
ants
− k
now
n ca
ses)
.‡G
luco
se m
easu
rem
ents
wer
e ca
libra
ted
acc
ord
ing
to
met
hod
s d
escr
ibed
by
B C
arst
ense
n, J
Lin
dst
rom
, J
Sun
dva
ll, K
Bor
sch-
John
sen,
J T
uom
ileht
o, t
he D
PS
Stu
dy
Gro
up (
unp
ublis
hed
).§N
HA
NE
S I
II: A
DA
new
cas
es in
80%
of
sam
ple
, W
HO
in 3
4%;
FIN
-MO
N,
NS
WE
D-M
ON
: on
ly a
sub
gro
up h
ad g
luco
se m
easu
red
at
bas
elin
e.
obesity reviews The CODA meta-analysis project S. Duval et al. 271
© 2007 The AuthorsJournal compilation © 2007 The International Association for the Study of Obesity. obesity reviews 8, 263–276
HIR
OS
HIM
A3.
37.
415
.318
.1Ye
s8
(3–8
)1
WH
O�
104
7 (2
–8)
27Ye
sIR
AS
–9.
717
.0–
5 (5
–7)
1W
HO
��
143
3 (1
–6)
37Ye
sJA
CD
S–
2.9
8.2
–Ye
s10
(5–
13)
2W
HO
�94
14 (
0–17
)75
Yes
Yes
JBD
SG
11.6
13.8
17.6
27.5
7 (5
–7)
1W
HO
�85
6 (0
–8)
85Ye
sM
AU
RIT
IUS
5.9
5.8
9.0
14.4
Yes
9 (5
–11)
2W
HO
�60
6Ye
sM
EX
CIT
Y10
.43.
25.
215
.2Ye
s6
(5–9
)2
WH
O�
127
Yes
NA
S–
5.7
6.5
–13
(2–
20)
6W
HO
�86
11 (
2–20
)19
8Ye
sYe
sN
AU
RU
20.7
14.9
15.8
34.3
Yes
71
WH
O�
�10
43
(0–7
)17
2Ye
sYe
sN
SW
ED
-MO
N§
3.1
1.5
2.9
4.2
Yes
8 (0
–13)
1A
DA
��
112
11 (
5–17
)10
6Ye
sYe
sO
ULU
557.
314
.020
.126
.1Ye
s7
1W
HO
�35
3PA
RIS
3.7
2.6
6.3
Yes
4 (1
–9)
4A
DA
�30
921
(0–
27)
2226
Yes
RA
NC
HO
4.4
3.1
10.0
13.7
Yes
8 (5
–11)
1W
HO
�10
27
(0–1
3)74
8Ye
sYe
sS
AH
S7.
62.
64.
812
.0Ye
s8
(6–1
1)1
WH
O�
295
8 (0
–11)
160
Yes
Yes
SH
S34
.814
.719
.648
.7Ye
s7
(2–1
0)2
WH
O�
526
3 (0
–12)
1118
Yes
ULS
AM
0.8
10.4
11.2
20 (
7–31
)1
WH
O�
�20
828
(0–
31)
296
Yes
Yes
TOTA
L92
6119
054
Stu
dy
Dia
bet
es o
utco
me
Mor
talit
yIn
cid
ent
CH
D
Cro
ss-s
ectio
nal
Inci
den
ceN
o.FU
yea
rsm
ean
(ran
ge)
Tota
l No.
even
tsC
ause
-sp
ecifi
c m
orta
lity
Kno
wn
%*
New
lyd
iag
nose
d%
†P
reva
lenc
e%
Ag
eon
set
No.
FU y
ears
mea
n(r
ang
e)
No.
FU
cont
acts
Dx
crite
riaD
xin
stru
men
tTo
tal
No.
even
ts
AD
A‡
WH
O‡
–, e
xclu
sion
crit
eria
incl
uded
kno
wn
dia
bet
es; �
, A
DA
new
cas
es in
80%
of
the
sam
ple
and
WH
O in
34%
; �,
clin
ical
mea
sure
men
t; �
, se
lf re
por
t; �
, ho
spita
l rec
ord
; A
DA
(14
); W
HO
(15
).A
DA
, Am
eric
an D
iab
etes
Ass
ocia
tion;
CH
D, c
oron
ary
hear
t dis
ease
; CO
DA
, The
Col
lab
orat
ive
Stu
dy
of O
bes
ity a
nd D
iab
etes
in A
dul
ts; D
x, d
iag
nosi
s; F
U, f
ollo
w-u
p; n
a, n
ot a
pp
licab
le; W
HO
, Wor
ld H
ealth
O
rgan
izat
ion.
*Kno
wn
= (s
elf-
rep
orte
d +
on
med
icat
ion)
/par
ticip
ants
†New
ly d
iag
nose
d =
New
cas
es/(
par
ticip
ants
− k
now
n ca
ses)
.‡G
luco
se m
easu
rem
ents
wer
e ca
libra
ted
acc
ord
ing
to
met
hod
s d
escr
ibed
by
B C
arst
ense
n, J
Lin
dst
rom
, J
Sun
dva
ll, K
Bor
sch-
John
sen,
J T
uom
ileht
o, t
he D
PS
Stu
dy
Gro
up (
unp
ublis
hed
).§N
HA
NE
S I
II: A
DA
new
cas
es in
80%
of
sam
ple
, W
HO
in 3
4%;
FIN
-MO
N,
NS
WE
D-M
ON
: on
ly a
sub
gro
up h
ad g
luco
se m
easu
red
at
bas
elin
e.
Tab
le 2
Con
tinue
d
272 The CODA meta-analysis project S. Duval et al. obesity reviews
© 2007 The AuthorsJournal compilation © 2007 The International Association for the Study of Obesity. obesity reviews 8, 263–276
Translation. Supported by a grant from the Centers forDisease Control, CDC/200-2001-00061. The authorsthank the collaborating investigators for data access andProfessor John Himes for expert advice on waist circum-ference protocols.
References
1. Seidell JC, Kahn HS, Williamson DF, Lissner L, Valdez R.Report from a Centers for Disease Control and Prevention work-shop on use of adult anthropometry for public health and primaryhealth care. Am J Clin Nutr 2001; 73: 123–126.
Table 3 Baseline measurement availability in the CODA database (grey box indicates available measure in database)
Anthropometrics Clinical measurements
WC* BW HT BMI HIP WHR FGLUC 2h-GLUC
TCHOL HDL-C TG FINS 2h-INS
BP
AUSDIAB 2
CATALONIA 2 #
CUPS 2
CURES 2 #
GHANA 2
JORDAN
KAUNAS-MON 2 #
LILLE-MON 2
NHANES III 3
NUDS 1 #
POL-MON 2
SINGAPORE 2
TUNIS 4
WORKNZ 4
IOWA 1X X X X X X
NURSES 4X X X X X X
ARIC 4
CARDIA 2
ELY 2
FIN-MON 2
FRAMINGHAM 4
GOTEBORG 2
HIROSHIMA
IRAS 1
JACDS 4
JBDSG 4
MAURITIUS 2
MEXCITY 4
NAS 4
NAURU 2
NSWED-MON 2
OULU55
PARIS 3
RANCHO 1
SAHS 4
SHS 4
ULSAM 2
WC, waist circumference; BW, body weight; HT, height; BMI, body mass index (kg m−2); HIP, hip circumference; WHR, waist-to-hip ratio; FGLUC, fasting glucose; 2h-GLUC, 2-h OGTT; TCHOL, fasting total cholesterol; HDL-C, high-density lipoprotein-cholesterol; TG, triglycerides; FINS, fasting insulin; 2h-INS, 2 h insulin; BP, diastolic and systolic blood pressure; ALC, consumption of alcohol; EDUC, educational attainment; SMOK, smoking status; MENOPAUS, menopausal status; HRT, use of hormone replacement therapy; HBP MED, use of blood pressure medication; HX HBP, history of hypertension; GEST DIAB, gestational diabetes; FH DIAB, First degree family history of diabetes.*Waist circumference measured based on the following protocols: 1, narrowest waist; 2, midpoint rib/crest; 3, just above crest; 4, umbilicus; X, self-reported; #, based on capillary samples.White box indicates data not available; Grey box indicates data available.
obesity reviews The CODA meta-analysis project S. Duval et al. 273
© 2007 The AuthorsJournal compilation © 2007 The International Association for the Study of Obesity. obesity reviews 8, 263–276
2. National Institutes of Health. Clinical guidelines on the identi-fication, evaluation, and treatment of overweight and obesity inadults: the evidence report. Obes Res 1998; 6: S51–S210.3. World Health Organization. Obesity Preventing andManaging the Global Epidemic: Report of the WHO Con-sultation of Obesity. Geneva: World Health Organization,1997.
4. Scottish Intercollegiate Guidelines Network. Obesity in Scot-land: Integrating Prevention with Weight Management. Edin-burgh: SIGN, 1996.5. Glumer C, Vistisen D, Borch-Johnsen K, Colagiuri S, on behalfof the DETECT–2 collaboration. Risk scores for type 2 diabetescan be applied in some populations but not all. Diabetes Care2006; 29: 410–414.
Covariates
Age Sex Race/ethnicity
ALC EDUC SMOK MENOPAUS HRT HBP MED
GEST DIAB
HX HBP
FH DIAB
AUSDIAB
CATALONIA
CUPS
CURES
GHANA
JORDAN
KAUNAS-MON
LILLE-MON
NHANES III
NUDS
POL-MON
SINGAPORE
TUNIS
WORKNZ
IOWA
NURSES
ARIC
CARDIA
ELY
FIN-MON
FRAMINGHAM
GOTEBORG
HIROSHIMA
IRAS
JACDS
JBDSG
MAURITIUS
MEXCITY
NAS
NAURU
NSWED-MON
OULU55
PARIS
RANCHO
SAHS
SHS
ULSAM
Table 3 Continued
274 The CODA meta-analysis project S. Duval et al. obesity reviews
© 2007 The AuthorsJournal compilation © 2007 The International Association for the Study of Obesity. obesity reviews 8, 263–276
6. Nakagami T, Qiao Q, Carstensen B, Nhr-Hansen C, Hu G,Tuomilehto J, Balkau B, Borch-Johnsen K, The DECODE-DECODA Study Group: Age, body mass index and Type 2 diabe-tes associations modified by ethnicity. Diabetologia 2003; 46:1063–1070.7. DECODE Study Group. Age- and sex-specific prevalences ofdiabetes and impaired glucose regulation in 13 European cohorts.Diabetes Care 2003; 26: 61–69.8. The DECODA Study Group. Age- and sex-specific prevalencesof diabetes and impaired glucose regulation in 11 Asian cohorts.Diabetes Care 2003; 26: 1770–1780.9. Young TK, Harris SB. Risk of clinical diabetes in a NorthernNative Canadian cohort. Arctic Med Res 1994; 53: 64–70.10. Edelstein SL, Knowler WC, Bain RP, Andres R, Barrett-Connor EL, Dowse GK, Haffner SM, Pettitt DJ, Sorkin JD, MullerDC, Collins VR, Hamman RF. Predictors of progression fromimpaired glucose tolerance to NIDDM: an analysis of six prospec-tive studies. Diabetes 1997; 46: 701–710.11. Chen KT, Chen CJ, Gregg EW, Imperatore G, Narayan KMV.Impaired fasting glucose and risk of diabetes in Taiwan: follow-up over 3 years. Diabetes Res Clin Pract 2003; 60: 177–182.12. Shin CS, Yoo KY, Lee HK, Paik HY, Koh C-S, Park YS, KimYI, Yang BG, Shin YS. Risk factors for the development ofNIDDM in Yonchon County, Korea. Diabetes Care 1997; 20:1842–1846.13. Boyko EJ, Chitson P, de Courten M, Tuomilehto J, ZimmetPZ, Alberti KGMM. Features of the metabolic syndrome predicthigher risk of diabetes and impaired glucose tolerance. A pro-spective study of Mauritius. Diabetes Care 2000; 23: 1242–1248.14. Expert Committee on the Diagnosis and Classification of Dia-betes Mellitus. Follow-up report on the diagnosis of diabetes mel-litus. Diabetes Care 2003; 26: 3160–3167.15. World Health Organization. Definition, diagnosis and classi-fication of diabetes mellitus and its complications. I. Diagnosis andclassification of diabetes mellitus. Geneva: World Health Organi-zation, 1999.16. Wang J, Thornton JC, Bari S, Williamson B, Gallagher D,Heymsfield SB, Horlick M, Kotler D, Laferrere B, Mayer L, Pi-Sunyer FX, Pierson RN Jr. Comparisons of waist circumferencesmeasured at 4 sites. Am J Clin Nutr 2003; 77: 379–384.17. Bennett DA. Review of analytical methods for prospectivecohort studies using time to event data: single studies and impli-cations for meta-analysis. Stat Methods Med Res 2003; 12: 297–319.18. Higgins JPT, Whitehead A, Turner RM, Omar RZ, Thomp-son SG. Meta-analysis of continuous outcome data from individ-ual patients. Stat Med 2001; 20: 2219–2241.19. Whitehead A, Omar RZ, Higgins JPT, Savaluny E, TurnerRM, Thompson SG. Meta-analysis of ordinal outcomes usingindividual patient data. Stat Med 2001; 20: 2243–2260.20. Simmonds MC, Higgins JP, Stewart LA, Tierney JF, ClarkeMJ, Thompson SG. Meta-analysis of individual patient data fromrandomized trials: a review of methods used in practice. Clin Trials2005; 2: 209–217.21. Thompson SG, Turner RM, Warn DE. Multilevel models formeta-analysis, and their application to absolute risk differences.Stat Methods Med Res 2001; 10: 375–392.22. DerSimonian R, Laird N. Meta-analysis in clinical trials. Con-trol Clin Trials 1986; 7: 177–188.23. Normand S.L.T. Meta-analysis. formulating, evaluating com-bining and reporting. Stat Med 1999; 18: 321–359.24. Thompson SG, Higgins JP. How should meta-regression anal-yses be undertaken and interpreted? Stat Med 1998; 21: 1559–1573.
25. Dunstan DW, Zimmet PZ, Welborn TA, Cameron AJ, ShawJ, de Courten M, Jolley D, McCarty DJ, AusDiab Steering Com-mittee. The Australian Diabetes, Obesity and Lifestyle Study (Aus-Diab) – methods and response rates. Diabetes Res Clin Pract 2002;57: 119–129.26. Castell C, Tresserras R, Serra J, Goday A, Lloveras G, SallerasL. Prevalence of diabetes in Catalonia (Spain): an oral glucosetolerance test-based population study. Diabetes Res Clin Pract1999; 43: 33–40.27. Mohan V, Shanthirani S, Deepa R, Premalatha G, Sastry NG,Saroja R. Intra-urban differences in the prevaence of the metabolicsyndrome in southern India – the Chennai Urban Population Study(CUPS No. 4). Diabetic Medicine 2001; 18: 280–287.28. Deepa M, Pradeepa R, Rema M, Mohan A, Deepa R, Shan-thirani S, Mohan V. The Chennai Urban Rural EpidemiologyStudy (CURES) – study design and methodology (urban compo-nent) (CURES-I). J Assoc Physicians India 2003; 51: 863–870.29. Amoah AGB. Undiagnosed diabetes and impaired glucoseregulation in adult Ghanaians using the ADA and WHO diagnos-tic criteria. Acta Diabetol 2002; 39: 7–13.30. Ajlouni K, Jaddou H, Batieha A. Diabetes and impaired glu-cose tolerance in Jordan: prevalence and associated risk factors. JIntern Med 1998; 244: 317–323.31. Domarkiene S, Tamosiunas A, Reklaitiene R, Sidlauskiene D.Trends in main cardiovascular risk factors among middle-agedKaunas population between 1983 and 2002. Medicina (Kaunas)2003; 39: 1193–1199.32. Cottel D, Dallongeville J, Wagner A, Ruidavets JB, ArveilerD, Ferrieres J, Bingham A, Marecaux N, Ducimetiere P, AmouyelP. The North-East-South gradient of coronary heart disease mor-tality and case fatality rates in France is consistent with a similargradient in risk factor clusters. European Journal of Epidemiology2000; 16: 317–322.33. Okosun IS. Racial differences in rates of Type 2 diabetes inAmerican women: how much is due to differences in overall adi-posity? Ethn Health 2001; 6: 27–34.34. Ramachandran A, Snehalatha C, Kapur A, Vijay V, MohanV, Das AK, Rao PV, Yajnik CS, Prasanna KM, Nair JD, for theDiabetes Epidemiology Study Group in India (DESI). High preva-lence of diabetes and impaired glucose tolerance in India: nationalurban diabetes survey. Diabetologia 2001; 44: 1094–1101.35. Dennis BH, Pajak A, Pardo B, Davis CE, Williams OD,Piotrowski W. Weight gain and its correlates in Poland between1983 and 1993. Int J Obes Relat Metab Disord 2000; 24: 1507–1513.36. Cutter J, Tan BY, Chew SK. Levels of cardiovascular diseaserisk factors in Singapore following a national intervention pro-gramme. Bull World Health Organ 2001; 79: 908–915.37. Chihaoui M, Kanoun F, Ben Rehaiem B, Ben Brahim S, FtouhiB, Mekaouar A, Fekih M, Mbazaa A, Zouari B, Ben Khalifa F.Predictive risk factors for deterioration from normoglycemic stateto type 2 diabetes mellitus or impaired glucose tolerance in aTunisian urban population. Diabetes Metab 2001; 27: 487–495.38. Scragg R, Baker J, Metcalf P, Dryson E. Prevalence of diabetesmellitus and impaired glucose tolerance in a New Zealand multi-racial workforce. N Z Med J 1991; 104: 395–397.39. Bjorkelund C, Bondyr-Carlsson D, Lapidus L, Lissner L,Mansson J, Skoog I, Bengtsson C. Sleep disturbances in midlifeunrelated to 32-year diabetes incidence. The prospective popula-tion study of women in Gothenburg. Diabetes Care 2005; 28:2739–2744.40. Folsom AR, Kushi LH, Anderson KE, Mink PJ, Olson JE,Hong C-P. Associations of general and abdominal obesity withmultiple outcomes in older women. The Iowa Women’s HealthStudy. Arch Intern Med 2000; 160: 2117–2128.
obesity reviews The CODA meta-analysis project S. Duval et al. 275
© 2007 The AuthorsJournal compilation © 2007 The International Association for the Study of Obesity. obesity reviews 8, 263–276
41. Carey VJ, Walters EE, Colditz GA, Solomon CG, Willett WC,Rosner BA, Speizer FE, Manson JE. Body fat distribution and riskof non-insulin-dependent diabetes mellitus in women. The Nurse’sHealth Study. Am J Epidemiol 1997; 145: 614–619.42. ARIC investigators. The Atherosclerosis Risk in Communities(ARIC) Study: design and objectives. Am J Epidemiol 1989; 129:687–702.43. Friedman GD, Cutter GR, Donahue RP, Hughes GH, HulleySB, Jacobs DR, Liu K, Savage PJ. CARDIA: study design, recruit-ment, and some characteristics of the examined subjects. J ClinEpidemiol 1988; 41: 1105–1116.44. Williams DR, Wareham NJ, Brown DC, Byrne CD, ClarkPM, Cox BD, Cox LJ, Day NE, Hales CN, Palmer CR. Undiag-nosed glucose intolerance in the community: the Isle of Ely Dia-betes Project. Diabet Med 1995; 12: 30–35.45. Tuomilehto J, Marti B, Kartovaara L, Korhonen HJ, PietinenP. Body fat distribution, serum lipoproteins and blood pressure inmiddle-aged Finnish men and women. Rev Epidemiol Sante Pub-lique 1990; 38: 507–515.46. Meigs JB, Wilson PWF, Nathan DM, D’Agostino RB Sr,Williams K, Haffner SM. Prevalence and characteristics of themetabolic syndrome in the San Antonio Heart and FraminghamOffspring Studies. Diabetes 2003; 52: 2160–2167.47. Ito C, Maeda R, Ishida S, Harada H, Inoue N, Sasaki H.Importance of OGTT for diagnosing diabetes mellitus based onprevalence and incidence of retinopathy. Diabetes Res Clin Pract2000; 49: 181–186.48. Wagenknecht LE, Mayer EJ, Rewers M, Haffner S, Selby J,Borok GM, Henkin L, Howard G, Savage PJ, Saad MF. TheInsulin Resistance Atherosclerosis Study (IRAS). Objectives,design, and recruitment results. Ann Epidemiol 1995; 5: 464–472.49. Boyko EJ, Leonetti DL, Bergstrom RW, Newell-Morris L,Fujimoto WY. Low insulin secretion and high fasting insulin andC-peptide levels predict increased visceral adiposity. 5-year follow-up among initially nondiabetic Japanese–American men. Diabetes1996; 45: 1010–1015.50. Gimeno SG, Ferreira SR, Franco LJ, Iunes M. Comparison ofglucose tolerance categories according to World Health Organiza-tion and American Diabetes Association diagnostic criteria in apopulation-based study in Brazil. The Japanese-Brazilian DiabetesStudy Group. Diabetes Care 1998; 21: 1889–1892.
51. Haffner SM, Gonzalez C, Mykkanen L, Stern MP.Total immunoreactive proinsulin, immunoreactive insulin andspecific insulin in relation to conversion to NIDDM: theMexico City Diabetes Study. Diabetologia 1997; 40: 830–837.52. Cassano PA, Rosner B, Vokonas PS, Weiss ST. Obesity andbody fat distribution in relation to the incidence of non-insulin-dependent diabetes mellitus. A prospective cohort study of men inthe Normative Aging Study. Am J Epidemiol 1992; 136: 1474–1486.53. Dowse GK, Zimmet PZ, Finch CF, Collins VR. Decline inincidence of epidemic glucose intolerance in Nauruans: implica-tions for the ‘thrifty genotype’. Am J Epidemiol 1991; 133: 1093–1104.54. Eliasson M, Asplund K, Nasic S, Rodu B. Influence of smok-ing and snus on the prevalence and incidence of type 2 diabetesamongst men: the northern Sweden MONICA study. J Intern Med2004; 256: 101–110.55. Rajala U, Laakso M, Qiao Q, Keinanen-Kiukaanniemi S.Prevalence of retinopathy in people with diabetes, impaired glu-cose tolerance, and normal glucose tolerance. Diabetes Care 1998;21: 1664–1669.56. Balkau B, Forhan A, Eschwege E. Two hour plasma glucoseis not unequivocally predictive for early death in men withimpaired fasting glucose: more results from the Paris ProspectiveStudy. Diabetologia 2002; 45: 1224–1230.57. Wedick NM, Mayer-Davis EJ, Wingard DL, Addy CL, Bar-rett-Connor E. Insulin resistance precedes weight loss in adultswithout diabetes: The Rancho Bernardo Study. Am J Epidemiol2001; 153: 1198–1205.58. Haffner SM, Hazuda HP, Mitchell BD, Patterson JK, SternMP. Increased incidence of type II diabetes mellitus in MexicanAmericans. Diabetes Care 1991; 14: 102–108.59. Lee ET, Welty TK, Fabsitz R, Cowan LD, Le N-A, Oopik AJ,Cucchiara AJ, Savage PJ, Howard BV. The Strong Heart Study. Astudy of cardiovascular disease in American Indians: design andmethods. Am J Epidemiol 1990; 132: 1141–1155.60. Zethelius B, Byberg L, Hales CN, Lithell H, Berne C. Proin-sulin is an independent predictor of coronary heart disease: reportfrom a 27-year follow-up study. Circulation 2002; 105: 2153–2158.
Appendix
CODA study groupSteering committee: Sue Duval (PI), David R. Jacobs Jr (co-investigator), Karri Silventoinen (co-investigator/projectmanager), Jaakko Tuomilehto (co-investigator), MichaelStern (co-investigator), Rodolfo Valdez (co-investigator/CDC project officer).Data analyses and management: Sue Duval (PI), Karri Sil-ventoinen (project manager), Gabriela Vazquez (statisti-cian), David R. Jacobs Jr (co-investigator), William L.Baker (programmer), Amit Mahipal (research assistant),Khadeeja Pruett (research assistant).
Official study names, acronyms, and collaborators fromeach study in CODAAustralian Obesity, Diabetes, and Lifestyle Study (AUS-DIAB): J Shaw;
Atherosclerosis Risk in Communities (ARIC) Study: JStevens;Coronary Artery Risk Development in Young Adults(CARDIA) Study: P Schreiner, D. Jacobs;Catalonia Study (CATALONIA): C Castell;Chennai Urban Population Study (CUPS): V Mohan;Chennai Urban Rural Epidemiology Study (CURES): VMohan;MRC Ely Study (ELY): N Wareham;Finland-MONICA (FIN-MON): J Tuomilehto;Framingham Offspring Study (FRAMINGHAM): P Wilson;Non-communicable Diseases Survey in 1998 (GHANA): AAmoah;Prospective Population Study of Women in Gothenburg(GOTEBORG): L Lissner;
276 The CODA meta-analysis project S. Duval et al. obesity reviews
© 2007 The AuthorsJournal compilation © 2007 The International Association for the Study of Obesity. obesity reviews 8, 263–276
OGTT Follow up Study (HIROSHIMA): C Ito;Iowa Women’s Health Study (IOWA): A Folsom;Insulin Resistance Atherosclerosis Study (IRAS): LWagenknecht;Japanese American Community Diabetes Study (JACDS):E Boyko;Japanese-Brazilian Diabetes Study Group (JBDSG): S RFerreira, LJ Franco;Cardiovascular disease risk factors Jordan Study (JOR-DAN): A Batieha;Kaunas MONICA (KAUNAS-MON): S Domarkiene, ATamosiunas;Lille MONICA (LILLE-MON): P Amouyel, JDallongeville;Mauritius Non-communicable Disease Study (MAURI-TIUS): J Shaw;Mexico City Diabetes Study (MEXCITY): M Stern, CGonzalez;Normative Aging Study (NAS): P Cassano;
Nauru Study (NAURU): J Shaw;Third National Health and Nutrition Examination Survey(NHANES III): Public use dataset;Northern Sweden MONICA (NSWED-MON): M Eliasson;National Urban Diabetes Study (NUDS): A Ramachan-dran;Nurses’ Health Study (NURSES): GA Colditz, D Feskanich;Oulu 55 (OULU55): S Keinanen-Kiukaanniemi;Paris Prospective Study I (PARIS): MA Charles;POL-MONICA Krakow (POL-MON): A Pajak;Rancho Bernardo Study (RANCHO): E Barrett-Connor;San Antonio Heart Study (SAHS): M Stern;Strong Heart Study (SHS): BV Howard;Singapore National Health Survey 1998 (SINGAPORE): JCutter, CW Fong, SK Chew;Tunis CVD Study (TUNIS): F Harzallah;Uppsala Longitudinal Study of Adult Men (ULSAM): BZethelius;Workforce Diabetes Survey (WORKNZ): R Scragg
Copyright © 2022 FDOKUMEN