
Addition of Missing Loops and Domains to Protein Models by X-Ray Solution Scattering
13
Addition of Missing Loops and Domains to Protein Models by X-Ray Solution Scattering Maxim V. Petoukhov,* † Nigel A. J. Eady, ‡ Katherine A. Brown, ‡ and Dmitri I. Svergun* § *European Molecular Biology Laboratory, Hamburg Outstation, D-22603 Hamburg, Germany; † Physics Department, Moscow State University, 117234 Moscow, Russia; ‡ Department of Biological Sciences, Centre for Molecular Microbiology and Infection, Imperial College of Science, Technology and Medicine, London SW7 2AY, United Kingdom; and § Institute of Crystallography, Russian Academy of Sciences, 117333 Moscow, Russia ABSTRACT Inherent flexibility and conformational heterogeneity in proteins can often result in the absence of loops and even entire domains in structures determined by x-ray crystallographic or NMR methods. X-ray solution scattering offers the possibility of obtaining complementary information regarding the structures of these disordered protein regions. Methods are presented for adding missing loops or domains by fixing a known structure and building the unknown regions to fit the experimental scattering data obtained from the entire particle. Simulated annealing was used to minimize a scoring function containing the discrepancy between the experimental and calculated patterns and the relevant penalty terms. In low- resolution models where interface location between known and unknown parts is not available, a gas of dummy residues represents the missing domain. In high-resolution models where the interface is known, loops or domains are represented as interconnected chains (or ensembles of residues with spring forces between the C atoms), attached to known position(s) in the available structure. Native-like folds of missing fragments can be obtained by imposing residue-specific constraints. After validation in simulated examples, the methods have been applied to add missing loops or domains to several proteins where partial structures were available. INTRODUCTION Protein function is related not only to the three-dimensional arrangement of polypeptide chains but also to their intrinsic mobility. Techniques such as x-ray crystallography and NMR can yield high-resolution information regarding the positions of individual atomic groups within a macromole- cule, but flexible or disordered regions may appear to be absent. Such regions may be of significant functional im- portance and can include, for example, a loop in an enzyme active site, a receptor-binding motif, or an antigenic epitope. In large multi-domain proteins, inherent flexibility between domains can prevent successful crystallization, and in these cases crystallographic or NMR data may be limited to studies of individual domains produced by genetic or pro- teolytic methods. However, it is apparent that complemen- tary approaches are required to analyze the structure of intact multi-domain proteins and assemblies, especially in view of recent initiatives aimed at large-scale expression and purification of proteins for subsequent structure deter- mination (e.g., Edwards et al., 2000). One such approach is small-angle x-ray scattering (SAXS) (Feigin and Svergun, 1987). This technique can yield structural information about macromolecules in solu- tion with proteins from as small as 6 kDa (e.g., Sayers et al., 1999) to large macromolecular complexes such as the ribo- some (Svergun and Nierhaus, 2000). SAXS patterns result from an average of the scattering from the entire ensemble of randomly oriented particles in the sample, and this lowers the resolution of the method. Nevertheless, in contrast to x-ray crystallographic analysis where flexible regions of a structure may result in poorly interpretable electron density, solution scattering patterns are sensitive to these disordered regions, yielding information about their average conforma- tion. The SAXS method can thus provide (at low resolution) information complementary to that of crystallography and NMR. Solution scattering also permits one to construct models of multi-domain proteins and macromolecular com- plexes from high-resolution structures of individual do- mains or subunits. Rigid body modeling, successfully used by different groups (Ashton et al., 1997; Krueger et al., 1997; Svergun et al., 1997, 1998a, 2000), is an effective way to characterize complex structures. The methods to compute solution scattering patterns accurately from atomic models and rapidly evaluate scattering from complex par- ticles are now well established (Svergun, 1994, 1995, 1998b). These methods coupled with three-dimensional dis- play and manipulation programs allow interactive or auto- mated searches of positional parameters to fit the experi- mental scattering from the complex (Konarev et al., 2001; Kozin and Svergun, 2000). In cases where the portions of a macromolecule or com- plex lack a three-dimensional structure description, alterna- tive methods are required (beyond rigid-body refinement) to generate a model. For example, the known part of the structure (either high- or low-resolution model) can be fixed, and missing portions, such as the disordered loops or domains, can be then be modeled to fit the experimental scattering data obtained from the intact particle. In the present paper, a recently proposed dummy-residues model Submitted June 7, 2002, and accepted for publication July 17, 2002. Address reprint requests to Dr. Dmitri Svergun, EMBL c/o DESY, Not- kestrasse 85, D-22603 Hamburg, Germany. Tel.: 49-40-89902-125; Fax: 49-40-89902-149; E-mail: [email protected]. © 2002 by the Biophysical Society 0006-3495/02/12/3113/13 $2.00 3113 Biophysical Journal Volume 83 December 2002 3113–3125
Transcript of Addition of Missing Loops and Domains to Protein Models by X-Ray Solution Scattering
Addition of Missing Loops and Domains to Protein Models by X-RaySolution Scattering
Maxim V. Petoukhov,*† Nigel A. J. Eady,‡ Katherine A. Brown,‡ and Dmitri I. Svergun*§
*European Molecular Biology Laboratory, Hamburg Outstation, D-22603 Hamburg, Germany; †Physics Department, Moscow StateUniversity, 117234 Moscow, Russia; ‡Department of Biological Sciences, Centre for Molecular Microbiology and Infection, ImperialCollege of Science, Technology and Medicine, London SW7 2AY, United Kingdom; and §Institute of Crystallography, Russian Academyof Sciences, 117333 Moscow, Russia
ABSTRACT Inherent flexibility and conformational heterogeneity in proteins can often result in the absence of loops andeven entire domains in structures determined by x-ray crystallographic or NMR methods. X-ray solution scattering offers thepossibility of obtaining complementary information regarding the structures of these disordered protein regions. Methods arepresented for adding missing loops or domains by fixing a known structure and building the unknown regions to fit theexperimental scattering data obtained from the entire particle. Simulated annealing was used to minimize a scoring functioncontaining the discrepancy between the experimental and calculated patterns and the relevant penalty terms. In low-resolution models where interface location between known and unknown parts is not available, a gas of dummy residuesrepresents the missing domain. In high-resolution models where the interface is known, loops or domains are represented asinterconnected chains (or ensembles of residues with spring forces between the C� atoms), attached to known position(s) inthe available structure. Native-like folds of missing fragments can be obtained by imposing residue-specific constraints. Aftervalidation in simulated examples, the methods have been applied to add missing loops or domains to several proteins wherepartial structures were available.
INTRODUCTION
Protein function is related not only to the three-dimensionalarrangement of polypeptide chains but also to their intrinsicmobility. Techniques such as x-ray crystallography andNMR can yield high-resolution information regarding thepositions of individual atomic groups within a macromole-cule, but flexible or disordered regions may appear to beabsent. Such regions may be of significant functional im-portance and can include, for example, a loop in an enzymeactive site, a receptor-binding motif, or an antigenic epitope.In large multi-domain proteins, inherent flexibility betweendomains can prevent successful crystallization, and in thesecases crystallographic or NMR data may be limited tostudies of individual domains produced by genetic or pro-teolytic methods. However, it is apparent that complemen-tary approaches are required to analyze the structure ofintact multi-domain proteins and assemblies, especially inview of recent initiatives aimed at large-scale expressionand purification of proteins for subsequent structure deter-mination (e.g., Edwards et al., 2000).
One such approach is small-angle x-ray scattering(SAXS) (Feigin and Svergun, 1987). This technique canyield structural information about macromolecules in solu-tion with proteins from as small as 6 kDa (e.g., Sayers et al.,1999) to large macromolecular complexes such as the ribo-some (Svergun and Nierhaus, 2000). SAXS patterns result
from an average of the scattering from the entire ensembleof randomly oriented particles in the sample, and this lowersthe resolution of the method. Nevertheless, in contrast tox-ray crystallographic analysis where flexible regions of astructure may result in poorly interpretable electron density,solution scattering patterns are sensitive to these disorderedregions, yielding information about their average conforma-tion. The SAXS method can thus provide (at low resolution)information complementary to that of crystallography andNMR. Solution scattering also permits one to constructmodels of multi-domain proteins and macromolecular com-plexes from high-resolution structures of individual do-mains or subunits. Rigid body modeling, successfully usedby different groups (Ashton et al., 1997; Krueger et al.,1997; Svergun et al., 1997, 1998a, 2000), is an effectiveway to characterize complex structures. The methods tocompute solution scattering patterns accurately from atomicmodels and rapidly evaluate scattering from complex par-ticles are now well established (Svergun, 1994, 1995,1998b). These methods coupled with three-dimensional dis-play and manipulation programs allow interactive or auto-mated searches of positional parameters to fit the experi-mental scattering from the complex (Konarev et al., 2001;Kozin and Svergun, 2000).
In cases where the portions of a macromolecule or com-plex lack a three-dimensional structure description, alterna-tive methods are required (beyond rigid-body refinement) togenerate a model. For example, the known part of thestructure (either high- or low-resolution model) can befixed, and missing portions, such as the disordered loops ordomains, can be then be modeled to fit the experimentalscattering data obtained from the intact particle. In thepresent paper, a recently proposed dummy-residues model
Submitted June 7, 2002, and accepted for publication July 17, 2002.
Address reprint requests to Dr. Dmitri Svergun, EMBL c/o DESY, Not-kestrasse 85, D-22603 Hamburg, Germany. Tel.: 49-40-89902-125; Fax:49-40-89902-149; E-mail: [email protected].
© 2002 by the Biophysical Society
0006-3495/02/12/3113/13 $2.00
3113Biophysical Journal Volume 83 December 2002 3113–3125

(Svergun et al., 2001a) is further developed to construct thealgorithms for complementing high- and low-resolution par-tial models of protein structures. Simulated annealing isused to minimize a scoring function containing the discrep-ancy between the experimental and calculated patterns andrelevant penalty terms. Where applicable, information aboutthe primary and secondary structure is used to restrain themodel and to provide native-like conformations of the miss-ing structural fragments.
After validation in simulated examples, the potential ofthis approach has been explored using three model systems.These methods have first been applied to develop modelsfor small contiguous loops (�30–35 residues), which areabsent in the crystal structures of a Drosophila motor pro-tein (Kozielski et al., 1999) and the R2 protein of Esche-richia coli ribonucleotide reductase (Logan et al., 1996).Second, reconstruction of an entire missing domain hasbeen attempted using experimentally observed scatteringdata from a fusion protein. This fusion consists of Schisto-soma japonicum glutathione S-transferase (GST) and E. colidihydrofolate reductase (DHFR). Although a few examplesexist of crystal structures of GST fused with relatively smallfusion fragments (Lim et al., 1994; Ware et al., 1999; Zhanget al., 1998), proteins of interest are often isolated byproteolytic digestion of the linker region (Nagai andThogersen, 1984) before structural analysis. Therefore, littleis known about the conformation of the linker region or thestructure of a globular protein fused to GST. Using SAXSand the reconstruction methods, new information regardingdomain and linker orientations in this popular fusion systemis presented. In combination, analysis of these model sys-tems provides an insight into the possible scope of thesereconstruction techniques, from small loops to multi-do-main assemblies.
MATERIALS AND METHODS
Dummy-residues approach
The scattering intensity I(s) from a dilute monodispersed solution ofmacromolecules is an isotropic function depending on the modulus of thescattering vector s � (s, �), where � is the solid angle in reciprocal space,s � (4�/�)sin�, � is the wavelength, and 2� is the scattering angle. Thex-ray scattering intensity is proportional to the scattering from a singleparticle averaged over all orientations and can be expressed as:
I�s� � ��Aa�s� � �sAs�s� � �bAb�s��2��, (1)
where Aa(s), As(s), and Ab(s) are, respectively, the scattering amplitudesfrom the particle in vacuo, from the excluded volume, and from thehydration shell. The electron density of the bulk solvent, �s, may differfrom that of the hydration shell, �b, yielding a nonzero contrast for the shell�b � �b � �s (Svergun et al., 1995).
In the method (Svergun et al., 2001a), the protein structure is repre-sented by an ensemble of dummy residues (DRs) centered at the positionsof virtual C� atoms. A simulated annealing (SA) procedure (Kirkpatrick etal., 1983) is used to find DR positions by fitting the experimental data andsimultaneously providing a chain-compatible structure. This is achieved byminimizing a scoring function E(r) � 2 �iPi(r) where 2 is the
discrepancy between the experimental and calculated scattering patternsand the penalties Pi(r) restrain the solution to ensure a chain-compatiblearrangement of the DRs. The weights �i are selected in such a way that thetotal penalty �iPi(r) yields a significant contribution (�10–50%) to E(r)at the end of the minimization. It has been demonstrated that the DRrepresentation adequately represents solution scattering patterns up to aresolution of 0.5 nm and that the method allows an ab initio restoration ofdomain structures of proteins (Svergun et al., 2001a). In the present paper,the DR approach is extended to build missing domains or loops around aknown part of the protein structure. Depending on the information avail-able, four models are considered, differing by the representation of themissing portion of the structure and by the set of constraints.
Computation of the scattering intensity
The scattering intensity Imod(s) from a protein model consisting of N DRspositioned at ri is calculated as described (Svergun et al., 2001a) usingDebye’s formula (Debye, 1915):
Imod�s� � �i�1
K �j�1
K
gi�s�gj�s�sin srij
srij, (2)
where K � N M and M is the number of dummy solvent atoms in thehydration shell of the particle, gi(s) is the form factor of ith residue orsolvent atom, and rij � �ri � rj� is the distance between the ith and jth point.To generate the hydration shell of thickness �r � 0.3 nm, the most distantresidue is found along each direction of a quasi-uniform angular grid ofM � N vectors, and a solvent atom with the form factor gi(s) � (4�ri
2/M)�r�b is placed 0.5 nm outside the protein. Following previouslypublished methods (Svergun et al., 1995, 1998b), the contrast of thehydration shell is taken to be 30 e/nm3. Solvent-corrected sphericallyaveraged scattering intensities from the amino acid residues are weightedaccording to their abundance in proteins, yielding an average residue formfactor �g(s)� (Fig. 1 a). The DR-form factor gi(s) � �g(s)� is taken whenusing models that do not account for the primary structure of the protein.To account for the internal residue structure, a correction factor �c(s)� isintroduced. More than 100 proteins with known structures were taken fromthe Protein Data Bank (PDB) (Bernstein et al., 1977), and the scatteringintensities of the full-atom representations of Ifull(s) were computed by theprogram CRYSOL (Svergun et al., 1995) where the average ratio �c(s)� ��Ifull(s)/Imod(s)� is evaluated over the ensemble (Fig. 1 b). As demonstratedin Svergun et al. (2001a), the function �c(s)� Imod(s) yields an adequaterepresentation of the scattering pattern of a protein up to a resolution of0.5 nm.
For the DR models accounting for the primary structure, form factors ofthe individual residues (Fig. 1 a) are computed by averaging the formfactors of different conformations in the PDB files. The correction factorcalculated as described above for the case of DRs is presented in Fig. 1 b.Simulations performed on proteins with known structures demonstrated,not unexpectedly, that the use of individual residues yields an even betteraccuracy than the dummy residues.
The discrepancy 2 between the calculated curve and experimental dataIexp(s) measured at n points sj, j � 1, . . . n is computed as:
2 �1
n � 1 �j�1
n ���c�s��Imod�sj� � Iexp�sj�
��sj��2
, (3)
where �(sj) are the experimental errors and � is an overall scalingcoefficient.
Simulated annealing protocol
For all the models described here, SA (Kirkpatrick et al., 1983) is used forglobal minimization of the scoring function. The main aim of this method
3114 Petoukhov et al.
Biophysical Journal 83(6) 3113–3125

is to perform random modifications of the system (i.e., of the currentresidue arrangement) by always moving to configurations that decrease thescoring function E(r) but to also occasionally move to configurations thatincrease E(r). The probability of accepting the latter moves decreases in thecourse of the minimization (the system is cooled). At the beginning, thetemperature is high and the changes are almost random, whereas at the enda configuration with (nearly) minimum E(r) is reached. The algorithm isimplemented in its faster simulated quenching (Ingber, 1993; Press et al.,1992) version as follows. 1) The known part of the structure is loaded andmoved to the origin and remains fixed during minimization. The rest of thestructure is then generated depending on the model used. A value of thegoal function E(r) is computed and a high starting temperature T0 isselected. 2) A random modification (move from r to r ) of the system isperformed (specific ways of generation and modification of the system areconsidered below). 3) Positions of the solvent atoms accounting for theborder solvent layer are updated if necessary and a difference �E �E(r ) � E(r) is computed. If �E � 0, the move is accepted; if �E 0, themove is accepted with a probability exp(��E/T). 4) Steps 2 and 3 arerepeated a sufficient number of times NT to equilibrate the system, and thetemperature is lowered (T � �T, � � 1) afterwards. The system is cooleduntil no improvement in E(r) is observed.
Types of dummy-residue models
Free dummy-residues model
This model is an extension of the original DR model (Svergun et al.,2001a) and can be used when the location of the interface between theknown and missing portions of the structure is unknown. This usually takesplace when a low-resolution model represents the known portion, although
high-resolution models can also be used. The known part of the structureis fixed and the unknown part is represented as a gas of free DRs within asearch volume (the latter is a sphere with a diameter equal to the maximumsize Dmax of the entire particle). The numbers of residues in the fixed andvariable parts (N0 and ND, respectively) are assumed to be available apriori, whereas the value of Dmax can be determined from the solutionscattering pattern of the particle. The scoring function is:
E�r� � RF2 � �dstPdst � �con1 Pcon
1 � �con2 Pcon
2 � �gyrPgyr
RF2 � �n � 1�2��j�1
n �Iexp�sj�
��sj��2��1
(4)
Here and below, a normalized R-factor RF will enter the scoring functioninstead of the discrepancy to facilitate the choice of the SA parameters andthe penalty weights.
The first penalty ensuring a protein-like distribution of the nearestneighbors in the model has the form introduced in Svergun et al. (2001a):
Pdst � �k
�W�Rk��Nmod�Rk� � �N�Rk����2, (5)
where �N(Rk)� is a histogram of the average number of C� atoms in a0.1-nm-thick spherical shell surrounding a given C� atom as a function ofthe shell radius for 0 � Rk � 1 nm observed for real proteins. Nmod(Rk) issuch a histogram for the model, and the weights W(Rk) are inverselyproportional to the variations of �N(Rk)� (Fig. 2 a). The summation in Eq.
FIGURE 1 (a) Form factors of the 20 amino acid residues (� � �) and anaverage form factor (——); (b) Average correction factor �c(s)� for theintensity computation using individual (— — —) and dummy residues(——).
FIGURE 2 Histograms of the average distributions of nearest neighbors(a) and of the C�-C�-C� bond angles (b) in a polypeptide chain.
Missing Domains in Proteins 3115
Biophysical Journal 83(6) 3113–3125
5 is performed over the DRs in the variable portion of the model.The second penalty requires the model to be interconnected so that each
residue has at least one neighbor at a distance of 0.38 nm:
Pcon � ln�N/Nl�, (6)
where Nl is the length of the longest interconnected fragment of the model.This penalty is applied twice: once for the entire structure and separatelyfor the variable part.
The third penalty restrains the space occupied by the variable partwhose radius of gyration Rg can approximately be estimated as Rg
est
� 3�3 ND. The penalty has the form:
Pgyr � ��Rgmod � Rg
est�/Rgest�2, (7)
where Rgmod is the radius of gyration of the variable portion.
Initially, the missing DRs are randomly positioned inside the searchvolume but outside the fixed portion of the model. A single SA stepinvolves relocation of a randomly selected residue to a point at a distanceof 0.38 nm from another randomly selected residue in the variableportion. The penalties force the variable portion to condense to acompact chain-compatible model, and the procedure (implemented inthe program CREDO) is best suited for generating low-resolutionmodels of missing domains without using information about primaryand secondary structures.
Dummy-residues model with spring forcesbetween neighbors
This approach builds chains of DRs attached to given point(s) or residue(s)in the known part of the structure. In contrast to the previous model, it isexplicitly required that the ith DR be separated by 0.38 nm from the (i 1)th one. The scoring function is:
E�r� � RF2 � �dstPdst � �sprPspr � �gyrPgyr, (8)
where Pdst and Pgyr are the same penalties as in Eq. 7, but instead of thedisconnectivity penalty (Pcon), spring potentials Pspr between the neigh-boring DRs are used:
Pspr�r� �1
NDmax2 �
i�1
N�1
��r�i � 1� � r�i�� � 0.38�2 (9)
The first (and, if appropriate, the last) DR(s) in the variable part arerequired to contact the interface point(s) between the known and variableparts of the structure. The initial approximation of the variable part israndomly generated inside a sphere with radius of gyration Rg
est � 3�3 ND.centered at the interface point (or between the two interface points). TheSA step involves moving a randomly selected residue to an arbitrary pointat a distance of 0.38 nm from one of two adjacent residues. The variablepart converges to a quasi-C� chain attached to the given point(s) in theknown structure. This algorithm (program CHADD) is useful for addingmissing loops or terminal portions to high-resolution models but can alsobe used for missing domain restoration.
Individual-residues model with spring forcesbetween neighbors
This model is similar to the previous one but accounts for the primarystructure of the protein. Not only is the scattering intensity computed usingthe individual form factors, but also residue-specific information is formu-lated as additional penalties to further restrain the solution and to generate
native-like folds of the missing loop/domain. The scoring function has theform:
E�r� � RF2 � �dstPdst � �sprPspr � �hydPhyd � �burPbur
� �engPeng � �volPvol � �angPang � �dihPdih, (10)
where the penalties Pdst and Pspr are as discussed above and the additionalterms contain the residue-specific information.
The two penalties accounting for the hydrophobicity of the residues arefrom Huang et al. (1995):
Phyd � �1
n �j
�Hj � Cjhj/Nj� (11)
Pbur � �1
n �j
Bj (12)
The sums (Eqs. 11 and 12) run over the hydrophobic residues in the entiremodel. The penalty of Eq. 11 promotes contacts between the hydrophobicresidues. Here, n is the total number of hydrophobic residues; Cj and Hj arethe numbers of all contacts and nonhydrophilic contacts of the jth residue,respectively (contacting distance is assumed to be 0.73 nm); and Nj and hj
are the total number and the number of nonhydrophilic residues, respec-tively, except for the (j � 1)th, jth, and (j 1)th residues. The penalty ofEq. 12 forces the hydrophobic residues to be buried in the interior of theprotein. Here, Bj is the number of all neighbors of jth residue except forthe(j � 2)th, (j � 1)th, (j 1)th, and (j 2)th residues (the neighboringdistance equals 1 nm).
The penalty Peng uses knowledge-based potentials to minimize theempirical free energy of the model. The interaction potentials betweenresidues in proteins can be computed from the analysis of the PDBstructures (Miyazawa and Jernigan, 1999; Sippl, 1990; Thomas and Dill,1996). The total energy of the model is calculated as the sum over allinter-residue contacts, and the penalty has the form:
Peng �1
N �i
�j�i�1
Uij, (13)
where the summation is performed over the residues separated by less than0.73 nm and the potentials Uij are tabulated in Miyazawa and Jernigan(1999) and (Thomas and Dill, 1996).
In keeping with the low resolution of the solution scattering data, theDR model describes the C� backbone only, and the excluded volumeeffects between the backbone atoms due to the penalties Pdst and Pspr donot account for the side chains. To compensate for this, pseudo-C� atomsrepresenting the side chains are introduced following the lolly-loop model(Aszodi et al., 1995). The direction of the ith C�-C� vector depends on thepositions of the (i � 1)th, ith, and (i 1)th C� atoms. The C�-C� distanceand the van der Waals radius r�i of the pseudo-C� atom depend on the typeof the ith residue. The additional excluded volume effect is taken intoaccount by minimizing the averaged cross-volume of all spheres represent-ing the C� (van der Waals radius r� � 0.19 nm) and pseudo-C� atoms:
Pvol �1
V �i�
j�Vij
�� � 0.5Vij���, (14)
where V is the total excluded volume of the protein, and Vij�� and Vij
�� arethe cross-volumes of the C� or C� atom belonging to ith residue with theC� atom belonging to jth residue, respectively.
The two other penalties impose restrictions on the distribution of bondand dihedral angles of the model chain. It is well known (Irbaeck et al.,1997; Levitt, 1976) that the C�-C�-C� bond angles in a protein backbonehave a specific distribution. Fig. 2 b presents a histogram of the distributionof C�-C�-C� angles �F(�k)� averaged over more than 100 protein structures
3116 Petoukhov et al.
Biophysical Journal 83(6) 3113–3125

deposited in the PDB. Similar to the neighbors penalty, Pdst (Eq. 5), thebond angle penalty is computed as:
Pang � �k� �Fmod��k� � �F��k���
0.1 max��F��k��, 0.02��2
, (15)
where Fmod(�k) is the histogram of the current model (bin step equals 5°).Fig. 3 displays a histogram of the distribution of C�-C�-C�-C� dihedral
angles versus C�-C�-C� angles (quasi-Ramachandran plot) computed byaveraging the distributions for the above PDB models. Following Kleywegt(1997), the histogram can be split into four areas: core (index � 1),additionally allowed (2), generously allowed (3), and disallowed (4). Aplausible model should display bond angles and dihedrals concentrated inthe core and additionally allowed regions. Each pair of C�-C�-C�-C�
dihedral angles versus C�-C�-C� bond angles in the model is attributed toa cell in the quasi-Ramachandran plot, and the sum:
Pdih �1
N �i�2
N�2
�index�i� � 1�2, (16)
gives the penalty for improper dihedrals.The generation and modification of the model during SA are the same
as in the previous section. The algorithm, implemented in the programGLOOPY, allows native-like configurations to be attributed to the missingloops or domains.
Folding of a model chain composed of individual residues
The most straightforward protein model consisting of C� atoms is aninterconnected polypeptide chain. This model does not require a connec-tivity constraint, and the secondary structure elements, if known, can beeasily introduced. The chain model is less flexible than the gas of residues,and this increases the chances of being trapped in an incorrect conforma-tion during minimization. As indicated in Svergun et al. (2001a), attempts
at ab initio fitting of x-ray solution scattering data starting from a random-walk C� chain led to a manifold of native-like models with different foldtopologies. The chain model is, however, very useful as a means ofrestoring the conformation of shorter fragments such as missing loops.
The missing loop(s) are attached to the appropriate residue(s) in theknown part of the structure, initially as random-walk chain(s) with a stepof 0.38 nm between joints. If a specific portion of the loop is known toform an �-helix or �-sheet (e.g., from secondary structure prediction), anidealized secondary structure template of the appropriate length is inserted.The scoring function is the same as in Eq. 10 but without the springpotentials Pspr. Two types of moves, local and global, are used to modifythe variable part of the model maintaining the distances between theadjacent residues and preserving the secondary structure. In both cases, aresidue is selected at random among those not belonging to the secondarystructure elements. A local move involves random rotation of a residuearound the axis drawn through its two neighbors. For a global move, madeafter each ND local moves, the second residue in the variable domain isselected, which does not belong to the secondary structure elements. Thepart of the chain between the selected residues is rotated by an arbitraryangle around the axis drawn through these two residues.
The algorithm, implemented in the program CHARGE, is aimed atrestoring the conformation of the missing loop(s) and is most useful ifinformation about their secondary structure is available.
Materials
Oligonucleotides were synthesized by Sigma-Genosys (Pampisford, UK).Media reagents were from Merck (Lutterworth, UK). Isopropyl �-D-thio-galactoside was from Genesys (London, UK). Taq polymerase chain reac-tion (PCR) Ready-To-Go beads, precast native and SDS polyacrylamidegels, protein molecular weight standards, Coomassie Brilliant Blue, gluta-thione Sepharose 4B, and Factor Xa were from Amersham PharmaciaBiotech (St. Alban’s, UK). DNA molecular weight standards were fromGibco BRL (Paisley, UK). DNA Qiaquick gel extraction and Miniprep kitswere from Qiagen (Crawley, UK). Restriction enzymes and T4 DNA ligasewere from New England Biolabs (Hitchin, UK). Protein Microcon, Cen-tricon, and Centriprep devices were from Millipore (Watford, UK). Brad-ford assay reagent and disposable plastic columns were from Biorad(Hemel Hempstead, UK). All other chemicals were from Sigma-Aldrich(Poole, UK).
Construction of plasmid
Plasmid pGEX-DHFR is a pGEX-5X-1 derivative (Amersham). The plas-mid encodes Schistosoma japonicum GST, a 10-residue C-terminal linkerpeptide (containing a protease cleavage site) and the Escherichia colifolA-encoded DHFR. The folA gene was PCR amplified from a genomicDNA preparation of E. coli K-12 cells using primer 1 (5 -GAGTGGATC-CCTATCAGTCTGATTGCGGCG-3 ), which contains a BamHI restric-tion site upstream of the second codon (ATC), and primer 2 (5 -CTATCTCGAGTTACCGCCGCTCCAGAAT-3 ), which incorporates aunique XhoI restriction site downstream of the TAA stop codon. One cycleof 96°C for 5 min followed by 35 cycles of 96°C for 1 min, 50°C for 1 min,and 72°C or 1.5 min, linked to a final cycle of 72°C for 10 min,generated a 500-bp PCR fragment encoding the E. coli K-12 folA gene.This fragment was gel purified, digested with BamHI and XhoI, andligated into the BamHI-XhoI restriction sites of the pGEX-5X-1 vectorto produce plasmid pGEX-DHFR. Initial clones were obtained byheat-shock transformation into E. coli strain BL21-CODONPLUS(DE3)-RIL. The presence of the folA gene was confirmed by restriction digestionof the transformed construct and by DNA sequencing with an ABI/Perkin-Elmer 377 Automated Sequencer (Perkin-Elmer Applied Biosystems, Nor-walk, CT) using the dideoxy method with BigDye Terminator ReadyReaction Kits (Perkin-Elmer).
FIGURE 3 Distribution of the C� backbone angles and dihedrals. Thecore area is shown in black, the additionally allowed regions in dark gray,the generously allowed in light gray, and the disallowed region in white.Sampling rates of the bond angles and of the dihedrals equal 5° and 10°,respectively.
Missing Domains in Proteins 3117
Biophysical Journal 83(6) 3113–3125

Protein purification
GST and GST-DHFR proteins were purified as follows. One liter of 2XYT(1.6% (w/v) tryptone, 1.0% (w/v) yeast extract, and 0.5% (w/v) NaCl indistilled water) containing 100 �g/ml ampicillin was inoculated with 10 mlof an overnight culture of E. coli BL21-CODONPLUS(DE3)-RIL trans-formed with pGEX-DHFR. Cells were grown at 37°C with shaking until acell density corresponding to an OD600 of 0.6 was reached. Isopropyl�-D-thiogalactoside was then added to a final concentration of 1 mM, andgrowth was allowed to continue for another 4 h. Centrifugation of theculture at 8000 � g for 20 min yielded a cell pellet that was resuspendedin PBS (0.01 M KH2PO4/K2HPO4 buffer, 0.0027 M KCl, 0.137 M NaCl,pH 7.4; Sigma-Aldrich). Cells were lysed by sonication with three 30-sbursts at full power, and insoluble material was removed by centrifugationat 12,000 � g for 45 min.
Six milliliters of 50% (w/v) glutathione Sepharose 4B (Amersham) inPBS was added to the cell lysate supernatant (typically, 15 ml), which wasthen incubated at 4°C for 1.5 h with rotation. The material was transferredinto a plastic column (Biorad) and washed seven times with 10 ml of PBS.GST, produced from pGEX-5X-1, was eluted by resuspending the gluta-thione Sepharose in 5 ml of 10 mM glutathione in 50 mM Tris-HCl, pH8.0, and collecting the flow through from the column after incubation for10 min at room temperature. This was repeated twice more to retrieve allthe GST protein. GST-DHFR, produced from pGEX-DHFR, was elutedintact from the glutathione Sepharose as above for GST. Alternatively,cleavage of the linker between DHFR and GST was attempted by resus-pending the glutathione Sepharose in 6 ml of PBS and incubating with 200�l of 100 �g/ml Factor Xa (Amersham) at 4°C for 24 h with rotation.Protein cleaved from the bound GST was initially collected as flow-through from the column. Subsequent washing of the column with 6 ml ofPBS retrieved any additional protein. Proteins eluted from the column withglutathione and those cleaved with Factor Xa were analyzed by SDS andnative polyacrylamide gel electrophoresis.
Sample preparation
All GST proteins were buffer exchanged into PBS using HiTrap Desaltcolumns (Amersham). Pooled samples of GST-DHFR were concentrated inCentriprep and Centricon YM-30 concentrators (Millipore) whereas pooledGST samples required Centriprep and Centricon YM-10 concentrators(Millipore). Protein concentrations were determined by Bradford assay(Biorad). For R2, SAXS measurements were performed at 2.5, 5, 10, and20 mg/ml; GST measurements were performed at 3, 6, 7.8, and 24 mg/ml;GST-DHFR measurements were performed at 3.7, 5.4, 8.1, and 14.4mg/ml; nonclaret disjunctional (ncd) measurements were as described(Svergun et al., 2001b).
Scattering experiments, data processing,and analysis
The experimental x-ray scattering data from protein solutions were col-lected following standard procedures using the X33 camera (Boulin et al.,1986, 1988; Koch and Bordas, 1983) of the European Molecular BiologyLaboratory on the storage ring DORIS III of the Deutsches ElektronenSynchrotron with multiwire proportional chambers with delay line readout(Gabriel and Dauvergne, 1982). The data processing (normalization, buffersubtraction, etc.) involved statistical error propagation using the programSAPOKO (D. I. Svergun and M. H. J. Koch, unpublished data). Thescattering patterns from R2, GST and GST-DHFR were recorded at sam-ple-detector distances of 3.2 m and 1.4 m, and the wavelength � � 0.15.The scattering patterns recorded at the two sample-detector distances weremerged to yield the final composite curves to cover the range of momen-tum transfer 0.1 nm�1 � s � 5.2 nm�1. Additional details of the experi-mental procedures and the ncd data collection are described elsewhere
(Svergun et al., 2001b). The value of Dmax was determined from thescattering patterns using the orthogonal expansion program ORTOGNOM(Svergun, 1993). The x-ray scattering patterns for simulated examples andthose from the incomplete atomic models of proteins were computed fromthe structures taken from the PDB using the program CRYSOL (Svergunet al., 1995). The models without a one-to-one residue correspondencewere superimposed using the program SUPCOMB (Kozin and Svergun,2001), and those with such correspondence were computed with the algo-rithm (Kabsch, 1978).
RESULTS AND DISCUSSION
Computer programs and testing
The programs CREDO, CHADD, GLOOPY, and CHARGEall run on IBM PC-compatible machines under Windows9x/NT/2000/XP and Linux as well as on major Unix plat-forms. To reduce the time required for computations, themodel scattering intensity and the penalties are not recom-puted after each modification of the structure but ratherupdated as previously described (Svergun et al., 2001a). Allthe programs are able to take into account particle symmetryby generating symmetry mates for the residues in the asym-metric unit (point groups P2 to P6 and P222 to P62 aresupported). The programs were tested on simulated exam-ples to adjust the parameters of the SA procedures. Thevalues T0 � 10�3, NT � 5000�ND and � � 0.9 were foundto ensure convergence. The default values of the penaltyweights for different algorithms are summarized in Table 1.
Method validation using simulated examples
To validate reconstruction procedures, a simulated fusionprotein was constructed using the crystallographic coordi-nates of hen egg-white lysozyme (129 residues, PDB file6lyz) (Diamond, 1974) as the N-terminal domain, withbovine pancreas trypsin inhibitor (BPTI; 58 residues, PDBentry 4pti) (Marquart et al., 1983) fused to the C-terminus ofthe former protein (Fig. 4, a and b). The theoretical scat-tering curve of the fusion protein was computed usingCRYSOL (Fig. 5, curve 1) and was then used to reconstructthe structure of the BPTI domain assuming that the ly-sozyme structure is known. The program CREDO was usedto fit DR models to the simulated data yielding a reasonablerepresentation of the overall shape of the BPTI. However, insome cases the BPTI domain was not oriented next to theC-terminus of lysozyme as in the original simulated fusionprotein (see typical example in Fig. 4 a). This is not sur-prising given that information about the interface betweenthe proteins is missing in the CREDO reconstruction. It isinteresting to note that even though the location of theinterface is incorrect, the overall low-resolution structure ofthe restored models after appropriate rotation and transla-tion agrees well with that of the simulated fusion protein(Fig. 4 a). To improve relative domain orientation, we usedthe program CHADD, which explicitly uses information
3118 Petoukhov et al.
Biophysical Journal 83(6) 3113–3125
about the location of the interface. In the example presentedhere, the C-terminus of lysozyme was identified as thefusion point. The shapes of the resulting added domainsobtained in independent runs of CHADD were consistentwith the crystal structure of BPTI, although their positionsvaried by 0.3–0.5 nm. Fig. 4 b presents an averaged resultof 10 independent runs, which predicts the correct positionand shape of the BPTI domain fairly well.
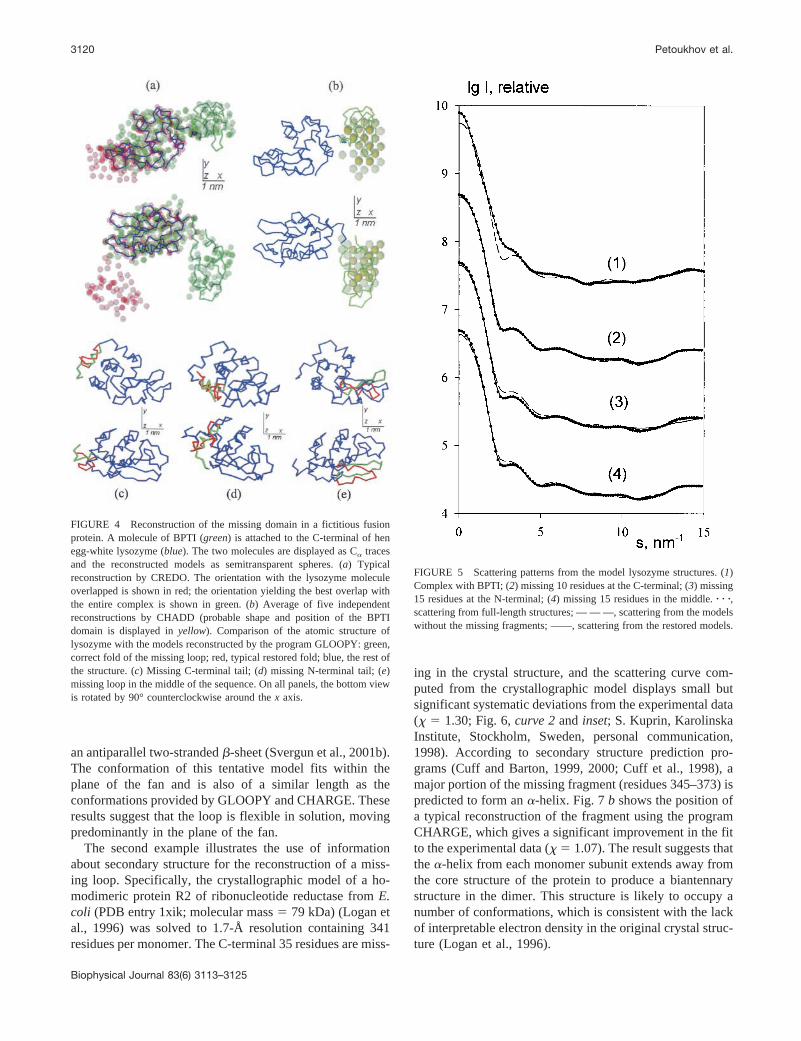
To validate the loop reconstruction procedures, severallysozyme models were made containing deletions in thefollowing regions: 1) residues 120–129 located at the C-terminus, 2) residues 1–15 containing an �-helix located atthe N-terminus, and 3) residues 40–55 containing a �-sheetlocated on the surface of the structure. First, the theoreticalscattering pattern of the intact protein was calculated usingCRYSOL. Using this scattering pattern and the coordinatesof each deletion model, missing loop regions were recon-structed using the program GLOOPY. In all cases, theoret-ical scattering curves of the reconstructed proteins, obtainedafter addition of the missing loop regions, gave good fits tothe simulated scattering pattern of the intact protein (Fig. 5,curves 2–4). When compared with C� coordinates of thecrystal structure of lysozyme, typical restored models (Fig.4, c–e) have an overall RMSD equal to 0.17, 0.24, and 0.25nm for deletions 1, 2, and 3, respectively. For comparison,generation of the missing fragments as random-walk self-avoiding chains yields the average RMSD values of 0.37,0.53, and 0.51, respectively. Use of the program CHARGEfor deletion 2 forces residues 5–15 to form an �-helix, thusfurther reducing the RMSD (to �0.15–0.2 nm; results notshown).
Conformational mobility in small loops/domains
The failure to observe structural elements in electron den-sity maps arising from protein crystal structures is often dueto conformational mobility or heterogeneity. The applica-tion of reconstruction methods offers the possibility ofconstructing a model for the missing loops or domains bothin terms of their structure and their position in three-dimen-sional space. Two examples are presented below that illus-trate these concepts.
In the first example, a truncated form of the Drosophilamotor protein ncd was studied using SAXS (Svergun et al.,2001b). The native ncd protein is 700 residues in length. Aconstruct named MC6 was made that expresses the C-terminal 368 residues (M333-K700) of ncd. This constructappears to be monomeric in solution as it lacks an N-terminal coiled-coil region (residues 196–347) that wouldotherwise mediate dimerization. Using crystallographic co-ordinates of a ncd variant (PDB entry 1cz7) (Kozielski etal., 1999), a partial three-dimensional model of MC6 wasproduced (Svergun et al., 2001b). This model lacked the 33C-terminal residues absent in the crystal structure. Thescattering curve computed from the MC6 model fails to fitthe scattering pattern of the protein in solution (Fig. 6, curve1; � 1.98). Addition of the missing loop using theprograms GLOOPY and CHARGE in these studies signif-icantly improved the fit ( � 0.89). The loop conformationsyielded by the programs in different independent recon-structions are similar to each other, suggesting a fan-likemanifold of orientations (Fig. 7 a). In an earlier study usingtrial secondary structure motifs, this region was modeled as
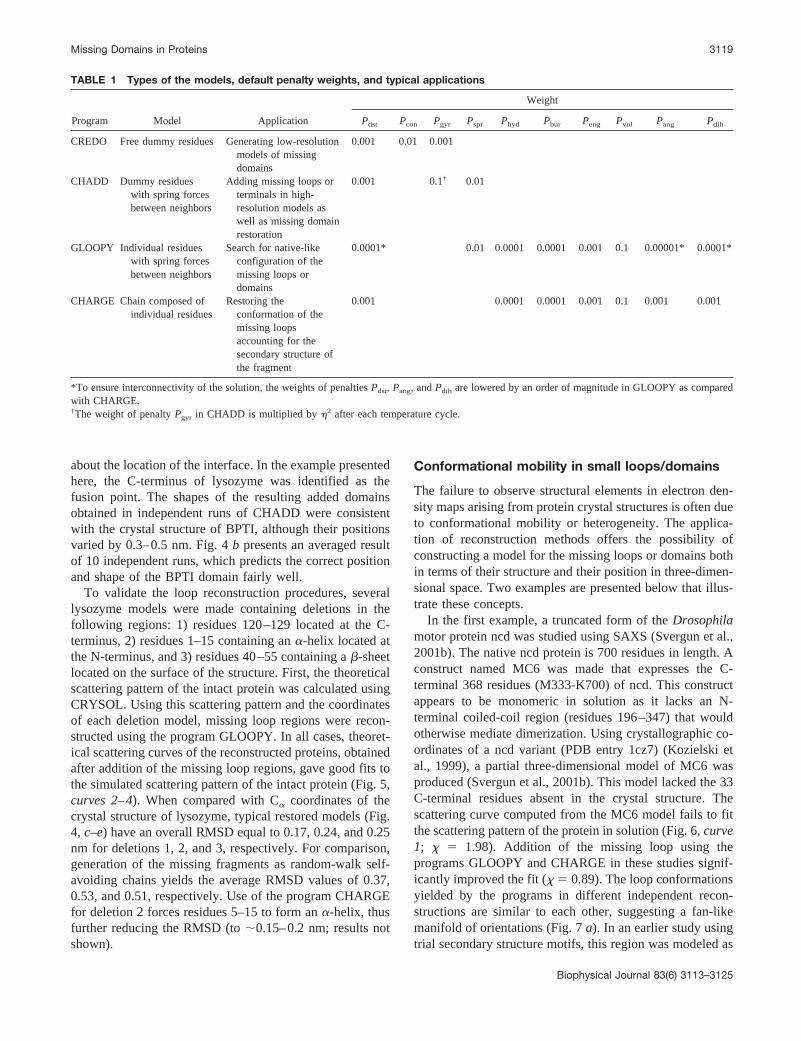
TABLE 1 Types of the models, default penalty weights, and typical applications
Program Model Application
Weight
Pdst Pcon Pgyr Pspr Phyd Pbur Peng Pvol Pang Pdih
CREDO Free dummy residues Generating low-resolutionmodels of missingdomains
0.001 0.01 0.001
CHADD Dummy residueswith spring forcesbetween neighbors
Adding missing loops orterminals in high-resolution models aswell as missing domainrestoration
0.001 0.1† 0.01
GLOOPY Individual residueswith spring forcesbetween neighbors
Search for native-likeconfiguration of themissing loops ordomains
0.0001* 0.01 0.0001 0.0001 0.001 0.1 0.00001* 0.0001*
CHARGE Chain composed ofindividual residues
Restoring theconformation of themissing loopsaccounting for thesecondary structure ofthe fragment
0.001 0.0001 0.0001 0.001 0.1 0.001 0.001
*To ensure interconnectivity of the solution, the weights of penalties Pdst, Pang, and Pdih are lowered by an order of magnitude in GLOOPY as comparedwith CHARGE.†The weight of penalty Pgyr in CHADD is multiplied by �2 after each temperature cycle.
Missing Domains in Proteins 3119
Biophysical Journal 83(6) 3113–3125
an antiparallel two-stranded �-sheet (Svergun et al., 2001b).The conformation of this tentative model fits within theplane of the fan and is also of a similar length as theconformations provided by GLOOPY and CHARGE. Theseresults suggest that the loop is flexible in solution, movingpredominantly in the plane of the fan.
The second example illustrates the use of informationabout secondary structure for the reconstruction of a miss-ing loop. Specifically, the crystallographic model of a ho-modimeric protein R2 of ribonucleotide reductase from E.coli (PDB entry 1xik; molecular mass � 79 kDa) (Logan etal., 1996) was solved to 1.7-Å resolution containing 341residues per monomer. The C-terminal 35 residues are miss-
ing in the crystal structure, and the scattering curve com-puted from the crystallographic model displays small butsignificant systematic deviations from the experimental data( � 1.30; Fig. 6, curve 2 and inset; S. Kuprin, KarolinskaInstitute, Stockholm, Sweden, personal communication,1998). According to secondary structure prediction pro-grams (Cuff and Barton, 1999, 2000; Cuff et al., 1998), amajor portion of the missing fragment (residues 345–373) ispredicted to form an �-helix. Fig. 7 b shows the position ofa typical reconstruction of the fragment using the programCHARGE, which gives a significant improvement in the fitto the experimental data ( � 1.07). The result suggests thatthe �-helix from each monomer subunit extends away fromthe core structure of the protein to produce a biantennarystructure in the dimer. This structure is likely to occupy anumber of conformations, which is consistent with the lackof interpretable electron density in the original crystal struc-ture (Logan et al., 1996).
FIGURE 4 Reconstruction of the missing domain in a fictitious fusionprotein. A molecule of BPTI (green) is attached to the C-terminal of henegg-white lysozyme (blue). The two molecules are displayed as C� tracesand the reconstructed models as semitransparent spheres. (a) Typicalreconstruction by CREDO. The orientation with the lysozyme moleculeoverlapped is shown in red; the orientation yielding the best overlap withthe entire complex is shown in green. (b) Average of five independentreconstructions by CHADD (probable shape and position of the BPTIdomain is displayed in yellow). Comparison of the atomic structure oflysozyme with the models reconstructed by the program GLOOPY: green,correct fold of the missing loop; red, typical restored fold; blue, the rest ofthe structure. (c) Missing C-terminal tail; (d) missing N-terminal tail; (e)missing loop in the middle of the sequence. On all panels, the bottom viewis rotated by 90° counterclockwise around the x axis.
FIGURE 5 Scattering patterns from the model lysozyme structures. (1)Complex with BPTI; (2) missing 10 residues at the C-terminal; (3) missing15 residues at the N-terminal; (4) missing 15 residues in the middle. � � �,scattering from full-length structures; — — —, scattering from the modelswithout the missing fragments; ——, scattering from the restored models.
3120 Petoukhov et al.
Biophysical Journal 83(6) 3113–3125
GST-fusion protein domains
The pGEX series of vectors (Amersham) (Smith and John-son, 1988) are designed to enable inducible, high-levelintracellular expression of genes as fusions with the Schis-tosoma japonicum GST, a 26-kDa protein forming ho-modimers in solution. Crystal structures are available forGSTs from a number of sources (Ji et al., 1992; Parker et al.,1990), including recombinant S. japonicum GST purifiedfrom pGEX-3X (Amersham) (McTigue et al., 1995). Thisrecombinant S. japonicum GST contains an extra 13 resi-dues at the C-terminus compared with the native S. japoni-cum GST, but this linker peptide is absent in the PDB entry
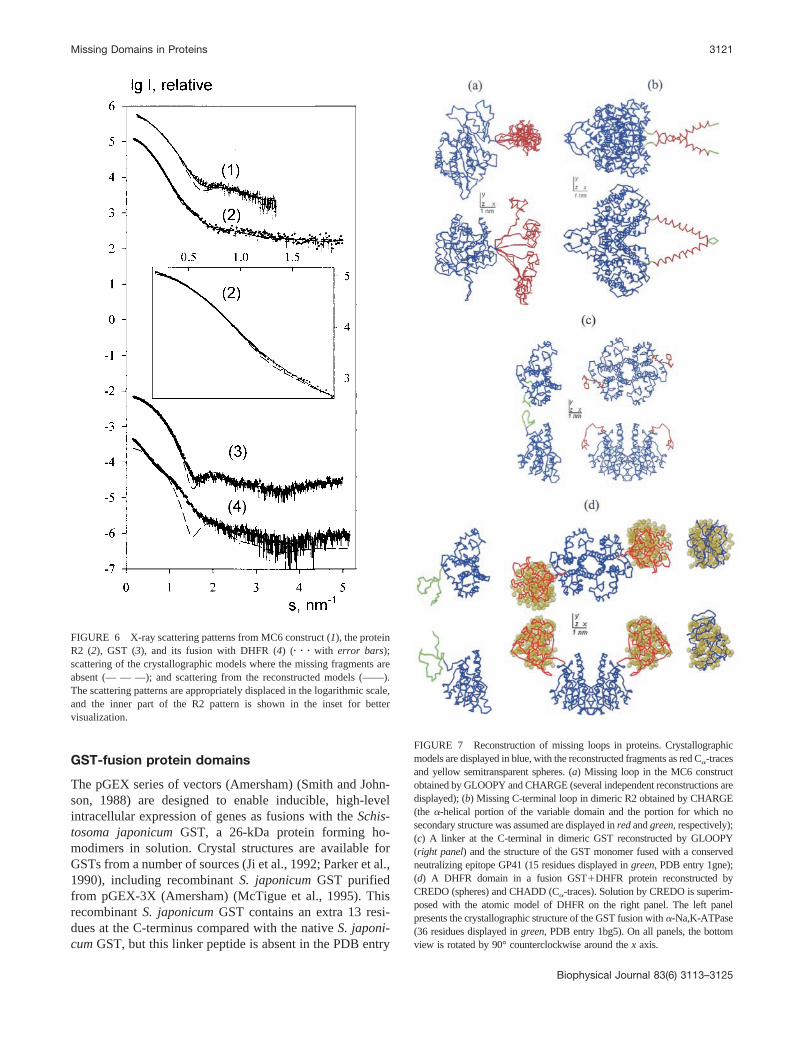
FIGURE 6 X-ray scattering patterns from MC6 construct (1), the proteinR2 (2), GST (3), and its fusion with DHFR (4) (� � � with error bars);scattering of the crystallographic models where the missing fragments areabsent (— — —); and scattering from the reconstructed models (——).The scattering patterns are appropriately displaced in the logarithmic scale,and the inner part of the R2 pattern is shown in the inset for bettervisualization.
FIGURE 7 Reconstruction of missing loops in proteins. Crystallographicmodels are displayed in blue, with the reconstructed fragments as red C�-tracesand yellow semitransparent spheres. (a) Missing loop in the MC6 constructobtained by GLOOPY and CHARGE (several independent reconstructions aredisplayed); (b) Missing C-terminal loop in dimeric R2 obtained by CHARGE(the �-helical portion of the variable domain and the portion for which nosecondary structure was assumed are displayed in red and green, respectively);(c) A linker at the C-terminal in dimeric GST reconstructed by GLOOPY(right panel) and the structure of the GST monomer fused with a conservedneutralizing epitope GP41 (15 residues displayed in green, PDB entry 1gne);(d) A DHFR domain in a fusion GSTDHFR protein reconstructed byCREDO (spheres) and CHADD (C�-traces). Solution by CREDO is superim-posed with the atomic model of DHFR on the right panel. The left panelpresents the crystallographic structure of the GST fusion with �-Na,K-ATPase(36 residues displayed in green, PDB entry 1bg5). On all panels, the bottomview is rotated by 90° counterclockwise around the x axis.
Missing Domains in Proteins 3121
Biophysical Journal 83(6) 3113–3125
(1gta) (McTigue et al., 1995). GST was expressed andpurified for SAXS data collection and analysis from similarplasmid in the pGEX series, pGEX-5X-1 (Amersham).Compared with the native S. japonicum GST, this GST hasan extra 22 residues at the C-terminus. The x-ray solutionscattering pattern from the latter protein is presented in Fig.6. The scattering curve computed from a homodimer builtfrom the crystallographic structure of GST lacking the C-terminal residues yields a poor fit to the experimental data(Fig. 6, curve 3; � 1.30). GLOOPY was used to model themissing linker, assuming P2 symmetry for the entire struc-ture. Several independent runs produced similar extendedconformations of the modeled linker (a typical result ispresented in Fig. 7 c). The theoretical scattering of the GSTcrystal structure combined with this modeled linker gave asignificant improvement in the fit to the experimental datawith � 0.81.
SAXS analysis was also performed on a GST fusionprotein. The folA gene, encoding dihydrofolate reductasefrom E. coli K-12 was cloned into the same vector, pGEX-5X-1, from which GST was expressed. This enabled pro-duction of a fusion protein, GST-DHFR, consisting of the218 residues of the S. japonicum GST followed by a 10-residue linker containing the Factor Xa cleavage site and158 residues of E. coli K-12 DHFR. Fig. 6 (curve 4) showsthe experimental scattering pattern of GST-DHFR. Modelsof the dimeric fusion protein were built using the programsCREDO and CHADD by fixing the structure of dimericGST and then adding the linker and the DHFR domain as avariable part and assuming P2 symmetry for the entirecomplex. Both programs gave good fits to the experimentaldata with � 1.02 (Fig. 6, curve 4). The shape and positionof the missing domain for each model reconstructed by thetwo methods were consistent with each other and also withthe crystallographic model of DHFR (PDB entry 1ra9)(Sawaya and Kraut, 1997), as illustrated in Fig. 7 d. It wouldappear from comparison of the linker regions of GST andGST-DHFR that the configuration of the linker is differentin each case (cf. Fig. 7 c). Attempts to cleave the linkerregion of GST-DHFR using Factor Xa were unsuccessful,even when the wt % was increased above 1% and theincubation time was �16 h. Even in the presence of 0.05%SDS, the percentage of protein cleaved was minimal. Re-sistance to proteolytic cleavage may well be due to a morecompact conformation of the linker region in GST-DHFRand/or steric hindrance causing the Factor Xa cleavage siteto be inaccessible. Although there are no crystal structuresin the PDB of proteins �40 residues fused to GST, com-parison of the structures of two GST fusions (Fig. 8, a andb), PDB entries 1gne (Lim et al., 1994) and 1bg5 (Zhang etal., 1998), with the model of GST-DHFR shows that thereappears to be a similar orientation of GST and its fusionpartner in all three cases.
CONCLUSION
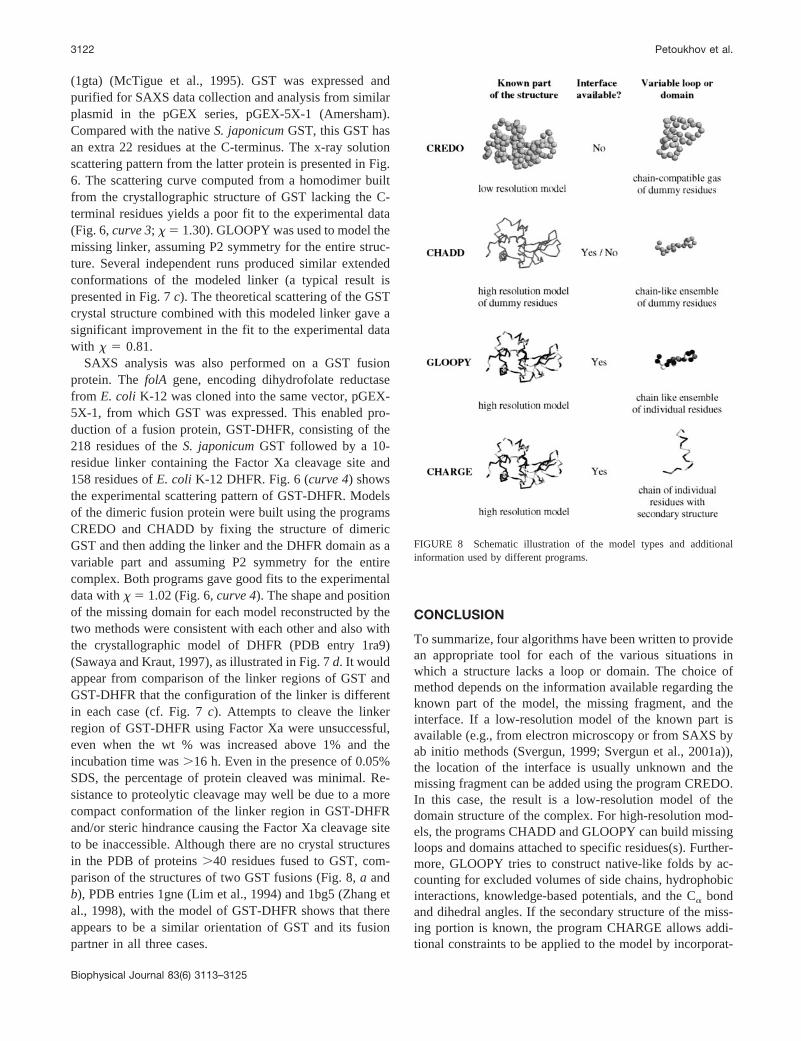
To summarize, four algorithms have been written to providean appropriate tool for each of the various situations inwhich a structure lacks a loop or domain. The choice ofmethod depends on the information available regarding theknown part of the model, the missing fragment, and theinterface. If a low-resolution model of the known part isavailable (e.g., from electron microscopy or from SAXS byab initio methods (Svergun, 1999; Svergun et al., 2001a)),the location of the interface is usually unknown and themissing fragment can be added using the program CREDO.In this case, the result is a low-resolution model of thedomain structure of the complex. For high-resolution mod-els, the programs CHADD and GLOOPY can build missingloops and domains attached to specific residues(s). Further-more, GLOOPY tries to construct native-like folds by ac-counting for excluded volumes of side chains, hydrophobicinteractions, knowledge-based potentials, and the C� bondand dihedral angles. If the secondary structure of the miss-ing portion is known, the program CHARGE allows addi-tional constraints to be applied to the model by incorporat-
FIGURE 8 Schematic illustration of the model types and additionalinformation used by different programs.
3122 Petoukhov et al.
Biophysical Journal 83(6) 3113–3125

ing �-helices and/or �-sheets in the variable fragment. Asthe model of an interconnected C� chain used by CHARGEis less flexible than a free gas of residues implemented inthe other programs, CHARGE is better suited to reconstructmissing loops rather than missing domains. The main fea-tures and possible applications of the four algorithms aresummarized in Table 1 and Fig. 8.
Even though the programs CHADD, GLOOPY, andCHARGE yield the missing fragments in the form of foldedC� chains, these should be considered as approximate mod-els only. Solution scattering, being a low-resolution method,does not provide an exact fold but rather a probable con-figuration of the volume occupied by the missing portion. Inall of the above algorithms, scattering from the model iscomputed using Eqs. 1–3, which do not explicitly takeaveraging over possible different conformations of flexibleloops or terminal fragments into account. Such an averagewould not significantly influence the results given the lowresolution of the scattering data but would take much longercomputation times. The methods are trying to obtain asingle equivalent conformation of the missing domain, andit is also useful to analyze the results of several independentSA runs to generate averaged probability maps. This anal-ysis allows refinement of the shape and position of missingdomains (see Fig. 4, a and b) and better visualization ofregions occupied by the missing loops (Fig. 7 a). Whenusing CHARGE, care must be taken not to restrict the modeltoo much based on secondary structure predictions (whichgenerally are no better than 70% accurate). In the aboveexample for R2, all major techniques predicted an �-helixwith high probability, which made it possible to use a longhelical fragment for constructing the model in Fig. 7 b.
Missing loop residues can be added to known high-resolution structures using homology modeling (Mendelsonand Morris, 1997; Perera et al., 2000). In general, thereliability of structures produced using homology modelingis high for short loops but decreases as the length of thefragment to be added is increased. Using solution scattering,the situation is precisely the opposite: the larger the missingfragment, the more significant its contribution to the entirescattering pattern, and the missing residues can be modeledmore reliably. In practical terms, one can expect the meth-ods presented here to be useful for missing fragments con-sisting of �5–10% of the entire structure (20–40 residuesfor a 50-kDa protein) and higher. For shorter loops, homol-ogy modeling may be sufficient; however, solution scatter-ing data can be used as an additional restraint (in particular,for rigid body refinement of the orientation of the fragmentto be added) and can also be used for validation of the finalmodel (see, e.g., Zheng and Doniach, 2002). Moreover, itshould be stressed that the methods presented are not lim-ited to amending crystallographic models with disorderedloops but are also applicable to the addition of missingdomains to low-resolution models and to fusion proteins,especially when no crystals are available.
In the model systems presented here, experimental SAXSdata has allowed the reconstruction of both missing loopsand domains, providing a structural description of disor-dered regions. The reconstructions are based on the exper-imental data of �1.2-nm resolution, but the actual resolu-tion of the models may be higher because of the additionalinformation used. In particular, histogram and angular pen-alties (Figs. 2 and 3) ensure adequate behavior of the modelscattering curves at higher momentum transfers. In the caseof the Drosophila motor and R2 ribonuclease reductaseproteins, modeling predicts extended structures from thesurface of the globular core. Such structures could indeedshow large flexibility in solution, which may explain whythe regions could not be modeled from the crystallographicelectron density maps. Modeling studies of GST expressedfrom the pGEX system give a description of the linkerregion, which was not visible in the original crystal structure(McTigue et al., 1995). The model of GST-DHFR alsoprovides a visualization of how such fusions appear insolution. In particular, the linker region appears to ade-quately separate both globular domains, suggesting thatGST does not, per se, directly influence folding of itspartner in protein-protein interactions. In addition, themodel shows how the fused protein (i.e., DHFR) can oc-clude the linker, resulting in resistance to protease digestionin this case. Taken together, these examples demonstratehow such reconstruction methods using SAXS data have thepotential to add missing fragments to available high- orlow-resolution protein models. Indeed, as three-dimensionalstructural information from larger multi-protein complexesemerges, the true potential of these techniques may berealized for modeling both domains and interfaces respon-sible for macromolecular assembly where inherent flexibil-ity and conformational heterogeneity limit high-resolutionvisualization. Modeling using the protein structure repre-sentation as an ensemble of residues could also becomeuseful for the interpretation of low-resolution crystallo-graphic maps (Guo et al., 1999).
The executable codes of the programs CREDO, CHADD,GLOOPY, and CHARGE are available as Wintel �-releasesfrom the EMBL-Hamburg website (http://www.embl-ham-burg.de/ExternalInfo/Research/Sax). The executables forLinux and major UNIX platforms can be obtained from theauthors upon request.
We are indebted to M. H. J. Koch for stimulating discussions and help withthe x-ray data collection and to F. Kozielski and S. Kuprin for providingthe experimental data on MC6 and R2.
The work was supported by the International Association for the Promotionof Cooperation with Scientists from the Independent States of the FormerSoviet Union, grants 00–243 and YSF 00–50, the U.K. Biotechnology andBiological Sciences Research Council (studentship to N.A.J.E.) and theEuropean Community Access to Research Infrastructure Action of theImproving Human Potential Program to the EMBL Hamburg Outstation,contract HPRI-CT-1999–00017.
Missing Domains in Proteins 3123
Biophysical Journal 83(6) 3113–3125
REFERENCES
Ashton, A. W., M. K. Boehm, J. R. Gallimore, M. B. Pepys, and S. J.Perkins. 1997. Pentameric and decameric structures in solution of serumamyloid P component by X-ray and neutron scattering and molecularmodelling analyses. J. Mol. Biol. 272:408–422.
Aszodi, A., M. J. Gradwell, and W. R. Taylor. 1995. Global fold determi-nation from a small number of distance restraints. J. Mol. Biol. 251:308–326.
Bernstein, F. C., T. F. Koetzle, G. J. B. Williams, E. F. Meyer, Jr., M. D.Brice, J. R. Rodgers, O. Kennard, T. Shimanouchi, and M. Tasumi.1977. The Protein Data Bank: a computer-based archival file for mac-romolecular structures. J. Mol. Biol. 112:535–542.
Boulin, C. J., R. Kempf, A. Gabriel, and M. H. J. Koch. 1988. Dataacquisition systems for linear and area X-ray detectors using delay linereadout. Nuclear Instrum. Methods A. 269:312–320.
Boulin, C., R. Kempf, M. H. J. Koch, and S. M. McLaughlin. 1986. Dataappraisal, evaluation and display for synchrotron radiation experiments:hardware and software. Nuclear Instrum. Methods A. 249:399–407.
Cuff, J. A., and G. J. Barton. 1999. Evaluation and improvement ofmultiple sequence methods for protein secondary structure prediction.Proteins. 34:508–519.
Cuff, J. A., and G. J. Barton. 2000. Application of multiple sequencealignment profiles to improve protein secondary structure prediction.Proteins. 40:502–511.
Cuff, J. A., M. E. Clamp, A. S. Siddiqui, M. Finlay, and G. J. Barton. 1998.JPred: a consensus secondary structure prediction server. Bioinformat-ics. 14:892–893.
Debye, P. 1915. Zerstreuung von Roentgenstrahlen. Ann. Phys. 46:809–823.
Diamond, R. 1974. Real-space refinement of the structure of hen egg-whitelysozyme. J. Mol. Biol. 82:371–391.
Edwards, A. M., C. H. Arrowsmith, D. Christendat, A. Dharamsi, J. D.Friesen, J. F. Greenblatt, and M. Vedadi. 2000. Protein production:feeding the crystallographers and NMR spectroscopists. Nat. Struct.Biol. 7:970–972.
Feigin, L. A., and D. I. Svergun. 1987. Structure Analysis by Small-AngleX-Ray and Neutron Scattering. Plenum Press, New York.
Gabriel, A., and F. Dauvergne. 1982. The localization method used atEMBL. Nuclear Instrum. Methods. 201:223–224.
Guo, D. Y., R. H. Blessing, D. A. Langs, and G. D. Smith. 1999. On‘globbicity’ of low-resolution protein structures. Acta Crystallogr. D.55:230–237.
Huang, E. S., S. Subbiah, and M. Levitt. 1995. Recognizing native folds bythe arrangement of hydrophobic and polar residues. J. Mol. Biol. 252:709–720.
Ingber, L. 1993. Simulated annealing: practice versus theory. Math. Com-put. Model. 18:29–57.
Irbaeck, A., C. Peterson, F. Potthast, and O. Sommelius. 1997. Localinteractions and protein foldig: a three-dimensional off-latice approach.J. Chem. Phys. 107:273–282.
Ji, X., P. Zhang, R. N. Armstrong, and G. L. Gilliland. 1992. The three-dimensional structure of a glutathione S-transferase from the mu geneclass: structural analysis of the binary complex of isoenzyme 3–3 andglutathione at 2.2-A resolution. Biochemistry. 31:10169–10184.
Kabsch, W. A. 1978. A discussion of the solution for the best rotation torelate two sets of vectors. Acta Crystallogr. A. 34:827–828.
Kirkpatrick, S., C. D. Gelatt, Jr., and M. P. Vecci. 1983. Optimization bysimulated annealing. Science. 220:671–680.
Kleywegt, G. J. 1997. Validation of protein models from C� coordinatesalone. J. Mol. Biol. 273:371–376.
Koch, M. H. J., and J. Bordas. 1983. X-ray diffraction and scattering ondisordered systems using synchrotron radiation. Nuclear Instrum. Meth-ods. 208:461–469.
Konarev, P. V., M. V. Petoukhov, and D. I. Svergun. 2001. MASSHA: agraphic system for rigid body modelling of macromolecular complexesagainst solution scattering data. J. Appl. Crystallogr. 34:527–532.
Kozielski, F., S. De Bonis, W. P. Burmeister, C. Cohen-Addad, and R. H.Wade. 1999. The crystal structure of the minus-end-directed microtubulemotor protein ncd reveals variable dimer conformations. Struct. FoldDes. 7:1407–1416.
Kozin, M. B., and D. I. Svergun. 2000. A software system for automatedand interactive rigid body modeling of solution scattering data. J. Appl.Crystallogr. 33:775–777.
Kozin, M. B., and D. I. Svergun. 2001. Automated matching of high- andlow-resolution structural models. J. Appl. Crystallogr. 34:33–41.
Krueger, J. K., G. A. Olah, S. E. Rokop, G. Zhi, J. T. Stull, and J.Trewhella. 1997. Structures of calmodulin and a functional myosin lightchain kinase in the activated complex: a neutron scattering study. Bio-chemistry. 36:6017–6023.
Levitt, M. 1976. A simplified representation of protein conformations forrapid simulation of protein folding. J. Mol. Biol. 104:59–107.
Lim, K., J. X. Ho, K. Keeling, G. L. Gilliland, X. Ji, F. Ruker, and D. C.Carter. 1994. Three-dimensional structure of Schistosoma japonicumglutathione S-transferase fused with a six-amino acid conserved neutral-izing epitope of gp41 from HIV. Protein Sci. 3:2233–2244.
Logan, D. T., X. D. Su, A. Aberg, K. Regnstrom, J. Hajdu, H. Eklund, andP. Nordlund. 1996. Crystal structure of reduced protein R2 of ribonu-cleotide reductase: the structural basis for oxygen activation at adinuclear iron site. Structure. 4:1053–1064.
Marquart, M., J. Walter, J. Deisenhofer, W. Bode, and R. Huber. 1983. Thegeometry of the reactive site and of the peptide groups in trypsin,trypsinogen and its complex with inhibitors. Acta Crystallogr. B. 39:480–490.
McTigue, M. A., D. R. Williams, and J. A. Tainer. 1995. Crystal structuresof a schistosomal drug and vaccine target: glutathione S-transferase fromSchistosoma japonica and its complex with the leading antischistosomaldrug praziquantel. J. Mol. Biol. 246:21–27.
Mendelson, R., and E. P. Morris. 1997. The structure of the acto-myosinsubfragment 1 complex: results of searches using data from electronmicroscopy and x-ray crystallography. Proc. Natl. Acad. Sci. U.S.A.94:8533–8538.
Miyazawa, S., and R. L. Jernigan. 1999. Self-consistent estimation ofinter-residue protein contact energies based on an equilibrium mixtureapproximation of residues. Proteins Struct. Funct. Genet. 34:49–68.
Nagai, K., and H. C. Thogersen. 1984. Generation of �-globin by se-quence-specific proteolysis of a hybrid protein produced in Escherichiacoli. Nature. 309:810–812.
Parker, M. W., M. Lo Bello, and G. Federici. 1990. Crystallization ofglutathione S-transferase from human placenta. J. Mol. Biol. 213:221–222.
Perera, L., C. Foley, T. A. Darden, D. Stafford, T. Mather, C. T. Esmon,and L. G. Pedersen. 2000. Modeling zymogen protein C. Biophys. J.79:2925–2943.
Press, W. H., S. A. Teukolsky, W. T. Wetterling, and B. P. Flannery. 1992.Numerical Recipes. University Press, Cambridge, UK.
Sawaya, M. R., and J. Kraut. 1997. Loop and subdomain movements in themechanism of Escherichia coli dihydrofolate reductase: crystallographicevidence. Biochemistry. 36:586–603.
Sayers, Z., P. Brouillon, D. I. Svergun, P. Zielenkiewicz, and M. H. J.Koch. 1999. Biochemical and structural characterization of recombinantcopper-metallothionein from Saccharomyces cerevisiae. Eur. J. Bio-chem. 262:858–865.
Sippl, M. J. 1990. Calculation of conformational ensembles from potentialsof mean force: an approach to the knowledge-based prediction of localstructures in globular proteins. J. Mol. Biol. 213:859–883.
Smith, D. B., and K. S. Johnson. 1988. Single-step purification of polypep-tides expressed in Escherichia coli as fusions with glutathione S-transferase. Gene. 67:31–40.
Svergun, D. I. 1993. A direct indirect method of small-angle scattering datatreatment. J. Appl. Crystallogr. 26:258–267.
Svergun, D. I. 1994. Solution scattering from biopolymers: advancedcontrast variation data analysis. Acta Crystallogr. A. 50:391–402.
3124 Petoukhov et al.
Biophysical Journal 83(6) 3113–3125

Svergun, D. I. 1999. Restoring low-resolution structure of biological mac-romolecules from solution scattering using simulated annealing. Bio-phys. J. 76:2879–2886.
Svergun, D. I., I. Aldag, T. Sieck, K. Altendorf, M. H. J. Koch, D. J. Kane,M. B. Kozin, and G. Grueber. 1998a. A model of the quaternarystructure of the Escherichia coli F1 ATPase from x-ray solution scat-tering and evidence for structural changes in the delta subunit duringATP hydrolysis. Biophys. J. 75:2212–2219.
Svergun, D. I., C. Barberato, and M. H. J. Koch. 1995. CRYSOL: aprogram to evaluate x-ray solution scattering of biological macromole-cules from atomic coordinates. J. Appl. Crystallogr. 28:768–773.
Svergun, D. I., C. Barberato, M. H. J. Koch, L. Fetler, and P. Vachette.1997. Large differences are observed between the crystal and solutionquaternary structures of allosteric aspartate transcarbamylase in the Rstate. Proteins. 27:110–117.
Svergun, D. I., and K. H. Nierhaus. 2000. A map of protein-rRNA distri-bution in the 70 S Escherichia coli ribosome. J. Biol. Chem. 275:14432–14439.
Svergun, D. I., M. V. Petoukhov, and M. H. J. Koch. 2001a. Determination ofdomain structure of proteins from x-ray solution scattering. Biophys. J.80:2946–2953.
Svergun, D. I., M. V. Petoukhov, M. H. J. Koch, and S. Koenig. 2000.
Crystal versus solution structures of thiamine diphosphate-dependentenzymes. J. Biol. Chem. 275:297–302.
Svergun, D. I., S. Richard, M. H. J. Koch, Z. Sayers, S. Kuprin, and G.Zaccai. 1998b. Protein hydration in solution: experimental observationby x-ray and neutron scattering. Proc. Natl. Acad. Sci. U.S.A. 95:2267–2272.
Svergun, D. I., G. Zaccai, M. Malfois, R. H. Wade, M. H. J. Koch, and F.Kozielski. 2001b. Conformation of the Drosophila motor protein non-claret disjunctional in solution from x-ray and neutron scattering. J. Biol.Chem. 276:24826–24832.
Thomas, P. D., and K. A. Dill. 1996. An iterative method for extractingenergy-like quantities from protein structures. Proc. Natl. Acad. Sci.U.S.A. 93:11628–11633.
Ware, S., J. P. Donahue, J. Hawiger, and W. F. Anderson. 1999. Structureof the fibrinogen �-chain integrin binding and factor XIIIa cross-linkingsites obtained through carrier protein driven crystallization. Protein Sci.8:2663–2671.
Zhang, Z., P. Devarajan, A. L. Dorfman, and J. S. Morrow. 1998. Structureof the ankyrin-binding domain of �-Na,K-ATPase. J. Biol. Chem. 273:18681–18684.
Zheng, W., and S. Doniach. 2002. Protein structure prediction constrainedby solution x-ray scattering data and structural homology identification.J. Mol. Biol. 316:173–187.
Missing Domains in Proteins 3125
Biophysical Journal 83(6) 3113–3125