adapting the new queen elisabeth ii hospital for future climates
79
TECHNOLOGY STRATEGY BOARD: DESIGN FOR FUTURE CLIMATE: ADAPTING BUILDINGS ADAPTING THE NEW QUEEN ELISABETH II HOSPITAL FOR FUTURE CLIMATES FINAL REPORT NOVEMBER 2011 – JULY 2013 PENOYRE & PRASAD LLP ARCHITECTS & OXFORD BROOKES UNIVERSITY LOW CARBON BUILDING GROUP
-
Upload
khangminh22 -
Category
Documents
-
view
2 -
download
0
Transcript of adapting the new queen elisabeth ii hospital for future climates

TECHNOLOGY STRATEGY BOARD: DESIGN FOR FUTURE
CLIMATE: ADAPTING BUILDINGS
ADAPTING THE NEW QUEEN ELISABETH II HOSPITAL FOR FUTURE CLIMATES FINAL REPORT
NOVEMBER 2011 – JULY 2013 PENOYRE & PRASAD LLP ARCHITECTS & OXFORD BROOKES UNIVERSITY LOW CARBON BUILDING GROUP

Adapting Queen Elizabeth II Hospital for Future Climate Final Report - August 2013
Page 2 of 80
TABLE OF CONTENTS
PROJECT DETAILS: 4
LIST OF ABBREVIATIONS 5
EXECUTIVE SUMMARY 6
SECTION 1: BUILDING PROFILE 8 SECTION 1A: BUILDING DESCRIPTION 8 SECTION 1B:THE WIDER DEVELOPMENT 11
SECTION 2 CLIMATE CHANGE RISKS 12 SECTION 2A: ASSESSMENT OF CLIMATE CHANGE RISKS FOR THE NEW QEII HOSPITAL 12 SECTION 2B IDENTIFICATION OF THE CLIMATE SCENARIOS AND CLIMATE DATA 18 SECTION 2C: OTHER FEATURES SIGNIFICANT TO THE ADAPTATION STRATEGY 21
SECTION 3: ADAPTATION STRATEGY 22 SECTION 3A: THE ADAPTION STRATEGY 22 SECTION 3B: TIMESCALES FOR RECOMMENDATIONS 44 SECTION 3C: COST BENEFIT ANALYSIS & RISK MITIGATION OF IMPLEMENTING THESE MEASURES 45 SECTION 3D: DETAILS OF WHICH RECOMMENDATIONS ARE BEING IMPLEMENTED ON THIS BUILDING AND ANY BARRIERS TO IMPLEMENTATION 57
SECTION 4: LEARNING FROM THE WORK 60 SECTION 4A: SUMMARY OF OUR APPROACH TO THE ADAPTATION DESIGN WORK 60 SECTION 4B: WHO WAS INVOLVED IN THE WORK 62 SECTION 4C: HOW THE INITIAL PROJECT PLAN CHANGED 63 SECTION 4D: RESOURCES AND TOOLS 64 SECTION 4E: EVALUATING OUR APPROACH 66 SECTION 4F: DECISION MAKING PROCESSES BY THE CLIENT AND THE BEST WAYS TO INFLUENCE THEM 68
SECTION 5 EXTENDING ADAPTATIONS TO OTHER BUILDINGS 70 SECTION 5A: APPLICATION TO OTHER BUILDING PROJECTS 70 SECTION 5B: THE LIMITATIONS OF APPLYING THIS STRATEGY TO OTHER BUILDINGS 71 SECTION 5C: UK BUILDINGS SUITABLE FOR SIMILAR RECOMMENDATIONS 73 SECTION 5D: RESOURCES, TOOLS AND MATERIALS FOR FUTURE ADAPTATION WORK 75 SECTION 5E: PROVIDING FURTHER ADAPTATION SERVICES 76
APPENDICES 77
REFERENCES 80

Adapting Queen Elizabeth II Hospital for Future Climate Final Report - August 2013
Page 4 of 80
PROJECT DETAILS:
TSB DESIGN FOR FUTURE CLIMATE: THE NEW QUEEN ELISABETH II LOCAL GENERAL HOSPITAL NOVEMBER 2011 – JULY 2013 PENOYRE & PRASAD LLP ARCHITECTS & OXFORD BROOKES UNIVERSITY LOW CARBON BUILDING GROUP
WITH BUILDING SERVICES DESIGN CONSULTING ENGINEERS & TROPUS AND SPICER COST MANAGEMENT FUNDED BY THE TECHNOLOGY STRATEGY BOARD: DESIGN FOR FUTURE CLIMATE

Adapting Queen Elizabeth II Hospital for Future Climate Final Report - August 2013
Page 5 of 80
LIST OF ABBREVIATIONS
BREEAM Building Research Establishment’s Environmental Assessment Method CO2 Carbon Dioxide CoP Coefficient of Performance CIBSE The Chartered Institution of Building Services Engineers DEFRA The Department for Environment, Food and Rural Affairs D4FC Design for Future Climate DSY Design Summer Year GHG Greenhouse Gas HTM Health Technical Memorandum IPCC Intergovernmental Panel on Climate Change kWh kilowatt-hours ppm parts per million QE Queen Elizabeth RH relative humidity TRY Test Reference Year UKCP09 UK Climate Projections 2009

Adapting Queen Elizabeth II Hospital for Future Climate Final Report - August 2013
Page 6 of 80
EXECUTIVE SUMMARY This report describes the development of a climate change adaptation strategy for the New Queen Elizabeth II, an 8000 square metre general hospital in Hertfordshire. The building will bring together new and existing services in a purpose built facility on the site of an existing hospital in Welwyn Garden City. The New QEII is a major component of a wider estate and service reorganisation strategy by East and North Hertfordshire NHS. The building has been designed to achieve a BREEAM ‘Excellent’ rating and therefore already includes some features to mitigate the effects of climate change. Led by Penoyre and Prasad Architects and funded by the Technology Strategy Board, this Design 4 Future Climate project has been developed though collaboration Oxford Brookes University Low Carbon Building Group as well as with the design team, the client, East and North Hertfordshire NHS, and their delivery partners Assemble Community Partnerships. Key outcomes of the project are as follows:
o A methodology has been developed for assessing building design and identifying appropriate climate change adaptation o The knowledge base for the costs and benefits of climate change adaptation has been extended o The challenges of adapting buildings within a limited construction budget and timetable have been better understood
A significant feature of this project is that the design was already at RIBA Stage D when the D4FC programme was joined. We therefore had to take into account the fact that a number of adaptation measures had already been incorporated, though without systematic assessment. These had to be brought into the picture with a robust way of assessing them in terms of efficacy and cost and other factors. In place of a SWOT analysis as envisaged by the TSB guidance we implemented an alternative workshop based way of analysing both the already included and potential additional measures by a process of grading as described in this report. The adaptation strategy was developed in line with the protocols developed for the D4FC programme as follows:
o The climate change risk to the building was analysed o Desktop thermal and energy building simulations were run to inform the adaptation choices o Possible adaptation measures were appraised and graded according to suitability for inclusion through discussion at workshops o Suitable adaptation measures were assessed for capital benefit, calculating both capital cost and energy costs o Measures were selected for uptake through discussion at a final workshop
The risk posed to the building by the projected future climate was assessed under three categories: thermal comfort, construction and water. Thermal comfort was considered to be a particularly high risk. This was interrogated using dynamic building simulation and overheating benchmarks, which indicated overheating was likely to be an issue during the lifetime of the building. Thermal adaptation measures that were likely to reduce overheating were assessed using the same dynamic building simulation tool.

Adapting Queen Elizabeth II Hospital for Future Climate Final Report - August 2013
Page 7 of 80
The project team considered this data alongside a list of adaptation opportunities put forward by The Technology Strategy and additional measures proposed by the design team. Possible adaptations were discussed in terms of practicality and effectiveness, and the collective knowledge of the team was then used to grade adaptation measures according to their suitability for inclusion in the project. Measures that had been graded as suitable for inclusion were then analysed for cost benefit. As the New QE2 was commissioned with a sustainable agenda many measures relating to these opportunities had already been developed as part of the project. The project team considered these measures offered valuable research material and chose to assess their cost benefit as part of the report. This approach mitigated the risk of adaptations not being taken up, which was considered to be high as the project had been already been contracted and the budget was fixed. The cost benefit of adaptation measures was assessed over a period of 25 years, as this will be the term of the initial lease to the NHS. Building simulation was used to assess energy savings. Cost benefit information was then discussed during a client workshop and measures to be taken up were agreed. A focus on cost neutral and “already included” measures created a positive atmosphere where the team’s recommendations were well received. It was agreed that the following additional measures not already incorporated in the design would be integrated into the building:
o Low water use fittings o Energy efficient street lights with zoned control o Soft Landing process o Post occupancy evaluation
The methodology for climate change risk assessment and selection of adaptation measures developed through this research project could be applied to other building projects, and the cost benefit analysis could help designers and clients to identify cost effective adaptation measures. The model for client engagement and risk mitigation has also proved very successful and could be applied to buildings with similar contractual arrangements.

Adapting Queen Elizabeth II Hospital for Future Climate Final Report - August 2013
Page 8 of 80
SECTION 1: BUILDING PROFILE SECTION 1A: BUILDING DESCRIPTION
THE NEW QUEEN ELIZABETH II HOSPITAL The New QEII Hospital will be an 8000 square metre hospital on the site of the existing QEII hospital in Welwyn Garden City. It will bring together new and existing services in a purpose built facility. The New QEII project is part of a wider estate and service reorganisation strategy by NHS Hertfordshire and is a major component of this process. The New QEII will accommodate outpatient services, a local accident and emergency service, a pharmacy, a large diagnostic imaging department including MRI, CT, X-Ray and ultrasound imaging. The largest element of the new facility will be the outpatients department encompassing many of the existing services on site. Other services to be provided at The New QEII include: Children’s services, Therapies, the Vicki Adkins Breast Clinic and a Day Treatment suite. The following drawings & images describing the building and site are included in Appendix 1
o CGI Image of QEII Approach o CGI Image of QEII Courtyard o Drawing 435-G-201 QEII Ground Floor Plan o Drawing 435-G-202 QEII 1st Floor Plan o Drawing 435-G-203 QEII 2nd Floor Plan o Drawing 435-G-204 QEII 3rd Floor Plan o Drawing 435-G-205 QEII Roof Plan o Drawing 435-G-301 North East & South East Elevations o Drawing 435-G-302 North West & South West Elevations o Drawing 435-G-303 North West & South West Sections o Drawing 435-G-304 North East & South East Sections o Drawing 457-SC-004 Masterplan
Map of the Location of the QEII Hospital Site
Adapting Queen Elizabeth II Hospital for Future Climate Final Report - August 2013
Page 9 of 80
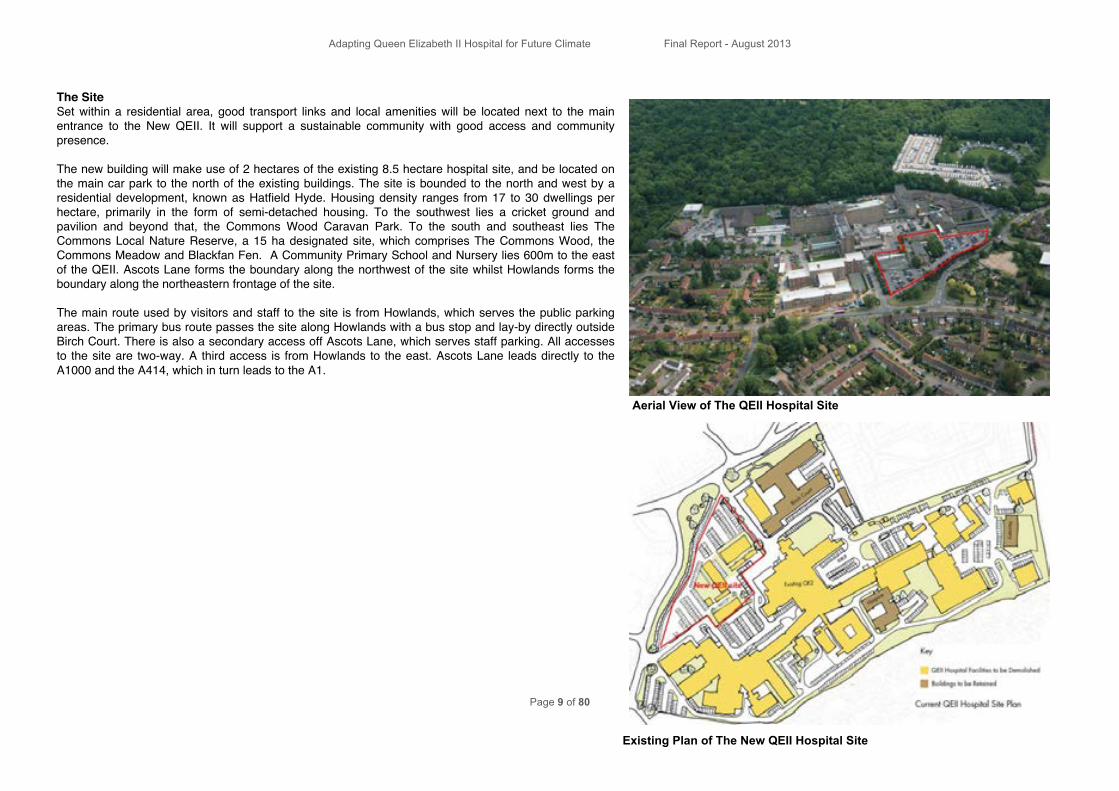
The Site Set within a residential area, good transport links and local amenities will be located next to the main entrance to the New QEII. It will support a sustainable community with good access and community presence. The new building will make use of 2 hectares of the existing 8.5 hectare hospital site, and be located on the main car park to the north of the existing buildings. The site is bounded to the north and west by a residential development, known as Hatfield Hyde. Housing density ranges from 17 to 30 dwellings per hectare, primarily in the form of semi-detached housing. To the southwest lies a cricket ground and pavilion and beyond that, the Commons Wood Caravan Park. To the south and southeast lies The Commons Local Nature Reserve, a 15 ha designated site, which comprises The Commons Wood, the Commons Meadow and Blackfan Fen. A Community Primary School and Nursery lies 600m to the east of the QEII. Ascots Lane forms the boundary along the northwest of the site whilst Howlands forms the boundary along the northeastern frontage of the site. The main route used by visitors and staff to the site is from Howlands, which serves the public parking areas. The primary bus route passes the site along Howlands with a bus stop and lay-by directly outside Birch Court. There is also a secondary access off Ascots Lane, which serves staff parking. All accesses to the site are two-way. A third access is from Howlands to the east. Ascots Lane leads directly to the A1000 and the A414, which in turn leads to the A1.
Aerial View of The QEII Hospital Site
Existing Plan of The New QEII Hospital Site

Adapting Queen Elizabeth II Hospital for Future Climate Final Report - August 2013
Page 10 of 80
The Building The Hospital will be a new four-storey healthcare facility with a gross floor area of 8,323 square metres. It will be made up of three “L” shaped clinical wings arranged around a central soft-landscaped courtyard to maximise daylight and natural ventilation. Green roofs on 2 storey wings connect visually with the courtyards and, in combination with permeable paving, minimize rainwater run-off. A generous, covered entrance plaza with drop-off facilities will lead to the main entrance with central reception, café, pharmacy and a range of retail, information and community support facilities. The triple height main entrance space will be light and open, connecting the external spaces of the plaza and the landscaped central courtyard. Department receptions and sub-waiting zones will be arranged around the courtyard and internal open voids, linking these spaces visually for good interconnectivity. The building has been designed and pre-assessed to achieve a BREEAM ‘Excellent’ rating, and some features that mitigate the effects of climate change are already present. The New QEII Hospital, Welwyn Garden City
The New QEII Hospital Ground Floor Plan

Adapting Queen Elizabeth II Hospital for Future Climate Final Report - August 2013
Page 11 of 80
SECTION 1B:THE WIDER DEVELOPMENT
The QEII hospital project is part of a wider reorganisation of NHS services in the area. The current hospital will be incrementally decommissioned with most of the outpatient and other services relocated to the New QEII Hospital on the site and the rest relocated to the Lister Hospital, 13 miles away in Stevenage. A largely residential re-development master plan for the whole site has been progressed in parallel with the New QEII. This was created in order to fulfill a planning condition, which ensures that there is a robust and sustainable development strategy for the whole site. The Masterplan shows several existing buildings that are to be retained: 1 Birch Court (2008): Key worker
apartments. A brick built four and six storey H-shaped block.
2 Isabel Hospice (1990): A 16 bed hospice that houses a team of community nurse specialists.
3 Beech Tree Day Nursery: A nursery for children aged 0-5.
The area within the immediate vicinity of the site is shown as a mix of residential use with some recreational and public open space. It is highly likely that the land will be sold for independent residential development. The New QEII Masterplan

Adapting Queen Elizabeth II Hospital for Future Climate Final Report - August 2013
Page 12 of 80
SECTION 2 CLIMATE CHANGE RISKS SECTION 2A: ASSESSMENT OF CLIMATE CHANGE RISKS FOR THE NEW QEII HOSPITAL
Oxford Brooks University have produced a technical report covering the climate change risks, which is included in Appendix 2: The New QEII_P&P_Climate Changes Hazards and Impacts Report_1. The findings are discussed below. Climate Change In The UK The impacts of climate change are already observable in many places around the world and further change is unavoidable. According to the Intergovernmental Panel on Climate Change, it would take a united world 40 years to reduce emissions sufficiently and to begin a downward trajectory of CO2 concentrations in the atmosphere resulting in a best estimate of 2°C global average surface warming by the end of the century (IPCC 2007). Other calculations indicate a far higher temperature rise The UKCP09 provides publicly accessible climate change data free of charge to raise awareness and improve communication about climate change and to assist in UK adaptation. UKCP09 is the fifth generation of information based on methodology from the Met Office and reflects the most recent, best insight into how the climate system works and how it might change in the future with built-in logical uncertainties. UKCP09 presents data as a result of three different possible future climate change scenario levels: low, medium and high greenhouse gas emissions up to 2099. Based on evidence, the UKCP09 provides a range of possible outcomes defined regionally across the UK with varying probabilities linked to each outcome (UKCP09, 2010a; Jenkins et al., 2009). ``` The key findings of the UKCP09 are represented as a grid of 25km x 25km squares covering 16 administrative regions of the UK. Individually defined probabilistic climate projections are available for each 25km x 25km grid square. Using the background data of the UKCP09 projections, the Weather Generator is used to spatially downscale the 25km data to 5km and to temporally downscale the monthly data to daily or hourly data. Additionally, river basins and marine regions have been aggregated but will not be directly relevant to this study (Jenkins et al., 2009). Map of UK administrative regions 25km2 grid covering the UK (Jenkins et al., 2009)

Adapting Queen Elizabeth II Hospital for Future Climate Final Report - August 2013
Page 13 of 80
Climate parameters are the physical measurements of weather variables that define a climate. The following weather variables have impacts on building performance: 1 Temperature change 2 Precipitation change 3 Solar radiation 4 Cloud cover 5 Humidity 6 Wind speed 7 Changes of climatic variable for QEII hospital site
Carbon emissions have the greatest impact on temperature and precipitation. Other climate parameters, cloud cover and relative humidity for example, tend to be less affected by the variation in emissions scenarios. The preliminary analysis results of future climate conditions at the QEII site indicate that:
o Overall summer mean temperature increases are projected to be higher than winter mean temperature increases.
o The mean summer maximum temperature is likely to increase by 1-2°C every 30 years, with high carbon emissions.
o The mean summer maximum temperature is very unlikely to increase by more than 2-3°C every 30 years, with high carbon emissions.
o Throughout the century, annual mean precipitation is likely to show little to no change. Summer mean precipitation decrease and winter mean precipitation increase will be almost equal.
o Annual cloud cover and relative humidity are likely to decrease. There is likely to be little or no change in winter cloud cover and relative humidity. The decrease will be in summer cloud cover and relative humidity.
o Annual solar radiation is likely to increase. There is likely to be little or no change in winter solar radiation. The increase will be in summer solar radiation. Summer solar radiation is likely to increase by 1-2 W/m2 every 30 years.
2080’s Welwyn Garden City Summer Conditions

Adapting Queen Elizabeth II Hospital for Future Climate Final Report - August 2013
Page 14 of 80
Local Environmental Features Local features can either ameliorate or exacerbate the impact of climate change on a locality. Features that can affect this impact include:
o Proximity to the coast o Elevation o Surrounding topography o Urban density o Trees and green space coverage
A site’s exposure to floods, for example, is dependent on these local conditions, and is exacerbated by climate change. The adjacent table categorises the local environmental features of the site that could positively or negatively affect the impacts of climate change hazards. It shows that the local environmental features are unlikely significantly affect climate change, although the development of the rest of the QEII site needs to be undertaken with care to avoid creating an urban heat island effect. It is also possible that prior to redevelopment the hard surfaces and limited greenery of the existing buildings may cause some heat retention. This is described below. 1Urban cover refers to built-up areas, e.g. asphalt, concrete and buildings.
Local Environmental Features
QE II hospital Hazard relevance
Latitude 51° 46’ 59’’ N Northern Europe will experience increased temperature & solar intensity change, together with increased winter rainfall
Proximity to coast 50 miles to coast Coasts are subject to sea level rise, coastal erosion, and changes in the frequency and intensity of storms. Oceans may also become more acidic, with significant effects on marine life
Urban cover1 4/6 storey building to the NE. 2 storey residential to the N&W. Landscaped courtyard & hedge gardens. Green roof. Grass verges and hedges locally. Wooded area to the south.
Hard surfaces and limited green cover can lead to the “urban heat island effect”. Hard urban materials retain heat and transpiration cooling is limited where there is little vegetation
Elevation (Edina, 2011)
75m above sea level (low elevation)
Higher elevations may show higher temperature increases and greater precipitation increase
Fluvial flood risk (EA, 2012)
No flood risk Flooding will be exacerbated by climate change
Water stress (EA, 2012)
Low Increased difference between summer and winter rainfall may exacerbate summertime water shortages
Wind driven rain potential (Graves and Phillipson, 2000)
Less than 33 litres/m2/spell (low). Conditions do not exacerbate wind, but no significant protection
Wind driven rain is likely to increase to 33 to 56.5 litres/m2/spell (low to moderate) result of climate change.
Local Environmental Features for the QEII Hospital Site
Adapting Queen Elizabeth II Hospital for Future Climate Final Report - August 2013
Page 15 of 80
Building Use The use of a building can make it more vulnerable to the impacts of climate change. The QEII hospital is a health care facility. The building will accommodate a wide age range of hospital staff and infirm outpatients. Pre-existing medical conditions such as neurological diseases and illness increase the vulnerability of individuals to environmental exposure. According to a study of heat-related and cold-related deaths in England and Wales, people in nursing homes were most vulnerable to the dangers of hot and cold weather. Many heat-related deaths are caused by heat and pollution exacerbating existing illness (Hajat, Kovats and Lachowycz, 2007). There are certain factors that predispose people with health problems to heightened vulnerability during a heat wave:
o Certain medications: Medications can affect renal function, the body’s ability to sweat, thermoregulation or electrolyte balance. (DH, 2010) o Inability to adapt behaviour to keep cool: Having a disability or being confined to a bed make this group less able to adapt to warmer environment. (DH, 2010) o Age: A study in Santiago showed that 67% of heat related deaths was from the age group 65+ (Bell et al., 2008)
High temperature and heat wave are potential risks to the building occupants. The Met Office defines the heat wave as when maximum daily temperature is greater than 28°C and minimum daily temperature is greater than 15°C for a minimum of three consecutive days. For QEII hospital site, there is relatively high chance of a heat wave occurring in July and August in the 2080s. Increased temperatures represent a high risk to the hospital. The design needs to ensure that the building will not overheat.

Adapting Queen Elizabeth II Hospital for Future Climate Final Report - August 2013
Page 16 of 80
Building Characteristics Building characteristics can exacerbate and ameliorate the impacts of climate change. These characteristics include:
o Building height o Building orientation o Surface material o Street width o Surrounding building types o Density
The New QEII building is 2 to 4 storeys high, with higher parts facing south east. This should provide some shading to the courtyard and building, ameliorating the effects of increased solar radiation. The building will be clad in hard materials that might contribute to an urban heat island effect. Green roofs, a permeable, planted courtyard, and trees to the car park will mitigate this. Streets are wide, with tree and hedge planting. This will help reduce the urban heat island effect. The effect on wind speeds is hard to establish but wind is considered a low risk for the project. The immediate surroundings consist of low to medium density residential areas. There are some high-rise buildings, which could contribute to an urban island effect. These will be largely demolished as part of the site redevelopment. Care should be taken to ensure the new development contains sufficient planting and permeable surfaces.
Vulnerability Exposure Hazard & Mitigation Local Environmental Features
Existing surrounding site: • Hard surfaces • Limited green cover. • High-rise buildings
Planned redevelopment:
• Lower density residential buildings
• Increased green space • SUDS
The existing surrounding site may contribute to urban heat island effect. Care should be taken to ensure that the redevelopment remedies this.
Building Use Health Facility Patients of the health facility are likely to be ill, infirm, or taking medication. These factors will make them particularly vulnerable to higher temperatures. The building should be designed to avoid overheating.
Building Characteristics
• 2-4 Storeys • Wide spaces surrounding
building • Ceramic, render, and
timber to elevations • Aluminum and biodiverse
green roofs • High building elements
facing SE • Impermeable car park &
pedestrian access • Permeable courtyard • Building overhangs create
shading • Trees to car park
Hard surfaces to the building elevation, car park, and pedestrian access may contribute to an urban heat island effect. This should be mitigated by the permeable planted courtyard, green roofs, and tree planting to car park.

Adapting Queen Elizabeth II Hospital for Future Climate Final Report - August 2013
Page 17 of 80
The Local Climate Impacts Profile The Local Climate Impacts Profile (LCLIP) is a tool created by UKCIP (previously UK Climate Impacts Programme). LCLIP is a simple tool designed to help organisations to assess their exposure to weather and climate. It uses current weather phenomena, hazards and impacts to highlight a locality’s vulnerability to severe future weather events and understand their consequences for local communities, authority assets, infrastructure and capacity to deliver services. The intention of a LCLIP is to focus on the impact rather than weather events themselves and it’s objective is to be a starting point for understanding the future. (UKCIP, 2009). A preliminary LCLIP was completed for Hertfordshire County Council in January 2009 reviewing media records and Emergency Planning Unit records in past 10 years about extreme weather events and their implications for the city. Hertfordshire County Council identified 68 extreme weather events over the past 10 years. These were split into four categories:
o Flooding (31 events): Flood events have been the most prevalent weather event reported within Hertfordshire over the last 10 years;
o Storms and high winds (17 events): Storms and high wind have damaged and disrupted to the county’s highway network,
o Heat waves and high temperatures (7 events): Heat waves occurred in 2003 and 2006. High temperatures have damaged the county’s highway network
o Snow, ice and cold temperatures (13 events): snow, ice and floods, have damaged and disrupted the county’s highway network
Snow, ice and cold weather events have the potential to have significant impacts within Hertfordshire. Although the results of climate models point to increasing average winter temperatures, this does not rule out major snow and cold weather events in the future. According to the records of extreme weather events for Hertfordshire County Council, the damage from extreme events mainly happened on transportation network and infrastructure. Although the River Lea and tributaries border the current QEII hospital site, the Environment Agency Flood Risk Map 2013 shows the area to have less than a 0.1 per cent (1 in 1000) chance of flooding occurring each year. Therefore there is no meaningful current flood risk in the site (EA, 2012).
Surroundings of the QEII Hospital Site

Adapting Queen Elizabeth II Hospital for Future Climate Final Report - August 2013
Page 18 of 80
SECTION 2B IDENTIFICATION OF THE CLIMATE SCENARIOS AND CLIMATE DATA
We have compared CIBSE and PROMETHEUS weather data in our simulation. CIBSE provides 20 yearly data sets of hourly weather data for 14 UK locations. They also provide “Test Reference Year” (TRY) data, which represents a typical year for simulations. PROMETHEUS provides specific weather projections for any UK location over seven time periods in the next century. PROMETHEUS Weather Data In order to provide a more detailed impact assessment we have undertaken spatial and temporal downscaling of the UKCP09 data to increase the spatial resolution of the projections. This is done via the Weather Generator which allows researchers to apply micro-climatic and more detailed regional information to the UKCP09 data for more meaningful analysis. The selection of suitable PROMETHEUS weather data for the building simulation was based on four factors: o Location: The QEII Hospital project is located at 51.783N, 0.188W. The UKCP09 5km by 5km grid
(5300215) covers the development area.
o Time periods: UKCP09 provides projections for seven 30 year time periods. Three time periods have been selected to represent short, medium and long term climate conditions. New buildings constructed today typically require building services replacement every 15-20 years (short term). They would have minor refurbishment after 35-45 years (medium term), and major refurbishments would occur after 60 100 years (long term).
o Carbon emission scenarios: UKCP09 offers climate projections based on three carbon emission scenarios; low, medium and high. The high carbon emission scenario has been selected, as building adaptations would still be effective under the medium or low emission scenarios. Care has been taken to ensure adaptations would not result in negative impacts under lower emissions scenarios.
o Risk percentiles: UKCP09 offers climate projections based on a probabilistic approach. Temperature change by a future time is described as having, for example, a 10% probability of being less than 2.3°C and a 90% probability of being less than 3.6°C. This can also be described as a 90% probability of being more than 2.3ºC and a 10% probability being more than 3.6ºC. The 50% weather data has been selected to conduct simulations as this represents the most likely temperature change.
UKCP09 5km grid for QEII Hospital
Climate Time Scale Diagram
Adapting Queen Elizabeth II Hospital for Future Climate Final Report - August 2013
Page 19 of 80
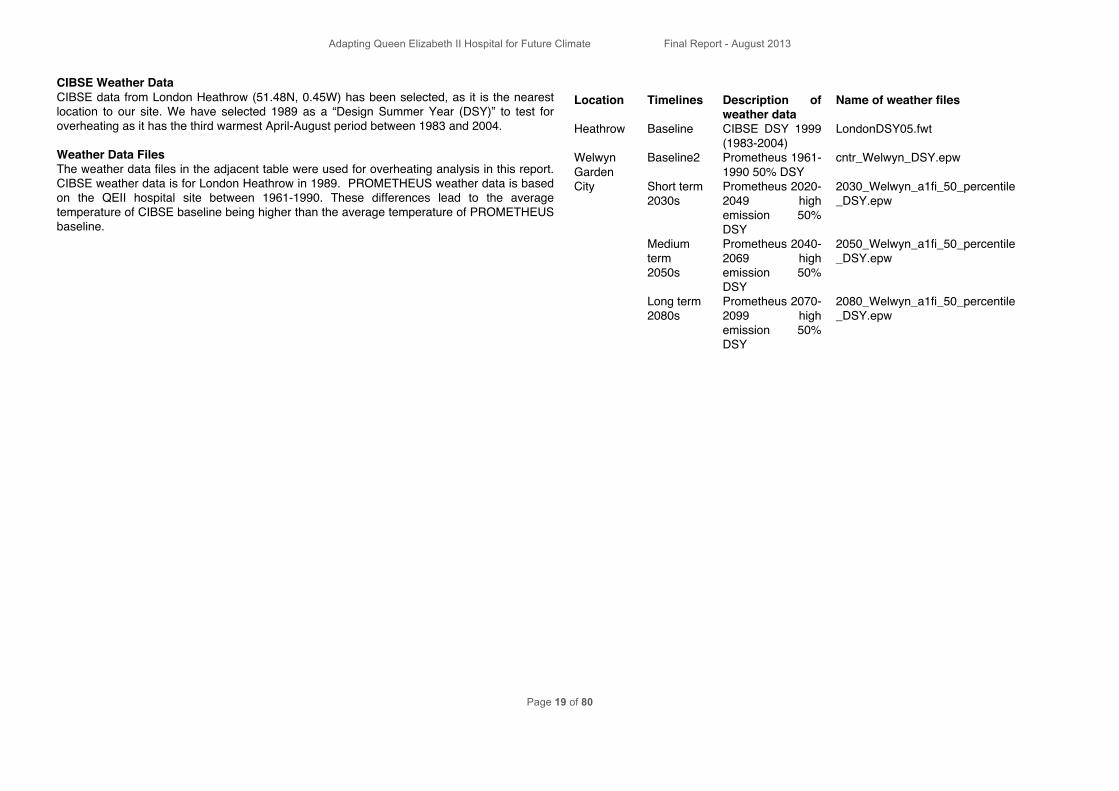
CIBSE Weather Data CIBSE data from London Heathrow (51.48N, 0.45W) has been selected, as it is the nearest location to our site. We have selected 1989 as a “Design Summer Year (DSY)” to test for overheating as it has the third warmest April-August period between 1983 and 2004. Weather Data Files The weather data files in the adjacent table were used for overheating analysis in this report. CIBSE weather data is for London Heathrow in 1989. PROMETHEUS weather data is based on the QEII hospital site between 1961-1990. These differences lead to the average temperature of CIBSE baseline being higher than the average temperature of PROMETHEUS baseline.
Location Timelines Description of weather data
Name of weather files
Heathrow Baseline CIBSE DSY 1999 (1983-2004)
LondonDSY05.fwt
Baseline2 Prometheus 1961-1990 50% DSY
cntr_Welwyn_DSY.epw
Short term 2030s
Prometheus 2020-2049 high emission 50% DSY
2030_Welwyn_a1fi_50_percentile_DSY.epw
Medium term 2050s
Prometheus 2040-2069 high emission 50% DSY
2050_Welwyn_a1fi_50_percentile_DSY.epw
Welwyn Garden City
Long term 2080s
Prometheus 2070-2099 high emission 50% DSY
2080_Welwyn_a1fi_50_percentile_DSY.epw

Adapting Queen Elizabeth II Hospital for Future Climate Final Report - August 2013
Page 20 of 80
Weather Projections for the QEII Site A brief comparison of all weather data was made to show the average temperature increase during April-September period from the baseline to the 2080s. The April-September average temperature increase is 4.65 ⁰C from the Prometheus baseline to the 2080s. The number of hours when external temperatures are predicted to be over 25, 26, 27 and 28⁰C during April-September is illustrated the adjacent chart. These assessments indicate that a warming climate will occur in the latter part of this century. As Prometheus baseline temperatures are significantly lower than CIBSE baseline the number of hours of temperatures greater than 25⁰C in the 2030s is slightly below the CIBSE baseline, and the Apr-Sept average temperature in the 2030s is slightly below CIBSE baselines’ average temperatures.
267!
46!
246!
357!
590!
179!
21!
169!257!
478!
107!13!
114!175!
368!
63!2!
59!119!
270!
0!
100!
200!
300!
400!
500!
600!
700!
CIBSE baseline! Prometheus baseline 50%!
Prometheus 2030s H 50%!
Prometheus 2050s H 50%!
Prometheus 2080s H 50%!
Number of Hours of High Temperatures April-Sept!
Number of hours over 25 ⁰C! Number of hours over 26 ⁰C!Number of hours over 27 ⁰C! Number of hours over 28 ⁰ C!
Num
ber of hou
rs
15.85!
13.89!
15.79!
16.79!
18.54!
13.00!
14.00!
15.00!
16.00!
17.00!
18.00!
19.00!
CIBSE baseline! Prometheus baseline!
2030s! 2050s! 2080s!
Comparison of Average Temperatures April-Sept!
⁰C
Adapting Queen Elizabeth II Hospital for Future Climate Final Report - August 2013
Page 21 of 80
SECTION 2C: OTHER FEATURES SIGNIFICANT TO THE ADAPTATION STRATEGY
There are some other features that impact on the adaptation strategy development. They are:
o Budgetary and Contract Limitations: Led us to focus on cost-neutral and "already included" measures. o Lease Term: As the building will be on 25-year lease contract the cost assessment is based on a 25-year period. o Ventilation Strategies: These are limited by specific healthcare ventilation requirements.

Adapting Queen Elizabeth II Hospital for Future Climate Final Report - August 2013
Page 22 of 80
SECTION 3: ADAPTATION STRATEGY SECTION 3A: THE ADAPTATION STRATEGY
METHODOLOGY Following the guidance provided by the Design for Future Climate report (Gething 2012), this report investigates the climate change impacts for the built environment under three categories:
o Comfort and energy o Construction o Water
Technical investigations are summarized in a report produced by Oxford Brookes and included in Appendix 3: The New QEII_P&P_Climate Change Adaptation Report _1
The previous section identified future climate changes for the site of Queen Elizabeth (QE) II Hospital project:
o 2.7°C increase in the annual maximum temperature by the 2030s rising to 4.1 °C by the 2050s and 6.5°C by the 2080s
o 2.1°C increase in the summer mean and minimum temperature by the 2030s o 3.2°C increase in the summer mean and minimum temperature by the by the 2050s o 5.1°C increase in the summer mean and minimum temperature by the by the 2080s
The following methodology was employed to develop adaptation measures:
o Understand the changing climate o Identify climate change risks for QEII hospital
o Undertake desktop research and simulate adaptation measures dynamic thermal simulation
(from projects and D4fC programme):
1. 11 individual adaptation measures were modeled in Model IT and ApacheSim using Integrated Environmental Solution’s Virtual Environment (IES).
2. This dynamic thermal simulation showed the overheating implication of each adaptation measure using future weather years, and helped to inform our thinking as to which adaptation measures best minimised overheating risk now and in the future

Adapting Queen Elizabeth II Hospital for Future Climate Final Report - August 2013
Page 23 of 80
o Select suitable adaptation measures:
• A project team workshop was held to review findings, discuss the list of design opportunities put forward by The Technology Strategy Board (ref Bill Gething “Design for Future
Climate, an adaptation agenda for the built environment” 2010), and to propose additional adaptation measures for consideration.
• A stakeholder workshop with the client was held to grade the list of design opportunities put forward by TSB and additional measures proposed by the design team, based on results from environmental modeling, project specific risk analysis, collective wisdom and practical implementation. These opportunities were then developed into a graded list of possible adaptation measures. Gradings were: 1. Measures already included in the design 2. Measures that should be considered for inclusion in the design 3. Measures that could be retrofitted in the future but implication worth considering for present design to avoid compromising this possibility 4. Measures that could be retrofitted in the future but need no action at present 5. Measures not suitable for inclusion The graded checklist is included in Appendix 3: The New QEII_P&P_Checklist of Adaptation Measures_1
o Assess the energy savings related to adaptation measures:
• Energy savings related to adaptation measure being considered for inclusion were modeled or estimated to calculate the cost benefits. • Energy savings were calculated for measures that were included in the designed building
o Develop the selected adaptation measures and assess the possible cost benefit o Agree uptake of adaptation measures by the client
o A stakeholder workshop was held with the client to discuss cost benefit and agree which measures could be implemented now or in the future
o Implement adaptations

Adapting Queen Elizabeth II Hospital for Future Climate Final Report - August 2013
Page 24 of 80
COMFORT
Overheating has been identified as a high risk issue for The New QEII Hospital building. The adaptation measures for comfort mentioned in Design for Future Climate report (Gething 2010) were considered and adaptation measures that were suitable for The New QEII hospital were selected. These measures were then simulated by adjusting the IES model of the existing building. Results from the simulations informed our choice of adaptation measures for development. A detailed description of the modeling process and results is included overheating analysis section of this report. This table sets out the adaptation measures considered, highlighting those selected for modeling.
Design opportunity (adaptation measure) Adapted element Overheating 24aximizi in IES Keeping cool for internal spaces
1.1 Interstitial blinds Window Not applicable at this stage of QEII Hospital project 1.2 Internal blinds or curtain Window IES model case 1 1.3 External fixed shades Window IES model case 2
1 Shading – building form
1.4 External adjustable shading Window IES model case 3 2.1 Double glazing Window Considered in the base model 2.2 Triple glazing Window IES model case 4
2 Glass technologies
2.1 Windows filming Window IES model case 5, 6 3 Green roofs/transpiration cooling 3.1 Green roof Roof Not implementable in IES VE 4 Shading – planting 4 Deciduous planting on south façade Façade Not implementable in IES VE 5 Reflective materials 5 Reflective coatings on external walls and roof Wall/roof IES model case 7, 8 6 Conflict between 24aximizing daylight and
overheating 6 Adjust window size Window Not applicable at this stage of QEII Hospital project
7 Secure and bug free night ventilation 7 Secure and bug free night ventilation Window Considered in the base model 8.1 Acoustic HVAC system Not implementable in IES VE 8.2 Air purifier HVAC system Not implementable in IES VE
8 Interrelationship with noise & air pollution
8.3 Mechanical ventilation HVAC system IES model case 9-11 9 Interrelationship with ceiling height 9 Adjust ceiling height Wall Not applicable at this stage of QEII Hospital project
10.1 Apply concrete floor Floor Considered in the base model 10.2 Apply concrete internal wall Wall Considered in the base model
10 Role of thermal mass in significantly warmer climate
10.3 Apply heavy weight external wall Wall Considered in the base model 11 11.1 Apply concrete staircase and fireplace Internal space Applied already Enhancing thermal mass in lightweight construction
11.2 Install phase change material Wall Could implement in IES VE by using air-conditioned cavity, however its accuracy is not guaranteed
12 Energy efficient/ renewable powered cooling systems 12 Heat Recovery Ventilation (operation in summer, when outdoor T> indoor T) HVAC system Not effective at current climate, may be implemented at
future 13 Groundwater cooling 13 Groundwater cooling Space nearby Not applicable for overheating modelling 14 Enhanced control systems – peak lopping 14 Enhanced control systems – peak lopping HVAC system Not applicable for overheating modelling 15 Maximum temperature legislation 15 Change building regulation Building regulation Apply adaptive thermal comfort limit

Adapting Queen Elizabeth II Hospital for Future Climate Final Report - August 2013
Page 25 of 80
Keeping cool for spaces around buildings 16 Built form - building to building shading 16 building to building shading Planning Not applicable at this stage of QEII Hospital project 17 Access to external space -overheating relief 17 Access to external space Planning Not implementable in IES VE 18 Shade from planting 18 Listed above Listed above 19 Manufactured shading 19 Listed above Listed above 20 Interrelationship with renewables 20 Listed above Listed above 21 Shading parking/ transport infrastructure 21 Shading parking/ transport infrastructure Planning Need review overheating metric for transportation 22 Role of water - landscape/ swimming pools 22 Role of water - landscape/ swimming pools Landscape Not implementable in IES VE

Adapting Queen Elizabeth II Hospital for Future Climate Final Report - August 2013
Page 26 of 80
CONSTRUCTION
Wind load Four resources were used to review wind speed projections:
o The regional climate model output on which UKCP09 was partly based. o The Penman-Monteith equation as used by COPSE and PROMETHEUS projects o The BRE wind load calculation tool was developed by BRE o Roofconsult 2012 wind load calculator based on the method in British Standard (BS 6399-2:1997)
Wind driven rain By the 2080s, mean winter precipitation is likely to increase 30.7%, and summer precipitation is very likely to decrease 26.3%. The current approximate wind driven rain for the project site is low: less than 33 Litres/m2 per spell, as discussed in the Climate Change Risk section of this report. The building has been robustly designed to cope with severe weather events. The existing detailing is considered to be adequate in view of the project risk. The following measures are already included in the design:
Adaptation Element
Measures for Adapting to impacts from Climatic change that the adaptation is responding to
Climate change hazard Climatic change impact
Recessed window and door reveals
Structural stability Winter precipitation increase and wind change
Fabric damage
Render finishes
Structural stability Winter precipitation increase and wind change
Fabric damage
Projecting sills with drips
Structural stability Winter precipitation increase and wind change
Fabric damage
Greater laps and fixings to roof and cladding fixings
Structural stability Winter precipitation increase and wind change
Fabric damage
Construction element
Avoidance of fully filled cavities Structural stability Winter precipitation increase and wind change
Fabric damage
Basic Wind Speed Map 1997 (Gething 2010)

Adapting Queen Elizabeth II Hospital for Future Climate Final Report - August 2013
Page 27 of 80
WATER
The risk for water stress for The New QEII Hospital was considered low. However, the team felt that the aspiration to reduce water use, mitigating the effects of climate change and reducing water costs was worth pursing. The team considered the following:
o Low Water Use Fittings o Greywater Reuse o Rainwater Catchment
Low water use fittings Low water use fittings are already specified to the WC’s and kitchens in the QEII Hospital project. This could be extended to clinical rooms, subject to infection control approval. Greywater Reuse Greywater is wastewater generated from wash hand basins, showers and baths, which can be recycled on-site for uses such as WC flushing, landscape irrigation is water. This is an effective way of reducing the water usage, but the client is not prepared to accept the potential risk of infection.
Rainwater catchment system A rainwater catchment system collects and reuses rainwater within the building and grounds. At an earlier design stage, a rainwater catchment system was proposed to supply the WC’s within The New QE2, but was omitted due to concerns over sanitary ware staining. The project team recommend an alternative system be considered which supplies water only to irrigate the courtyard
Adapting Queen Elizabeth II Hospital for Future Climate Final Report - August 2013
Page 28 of 80
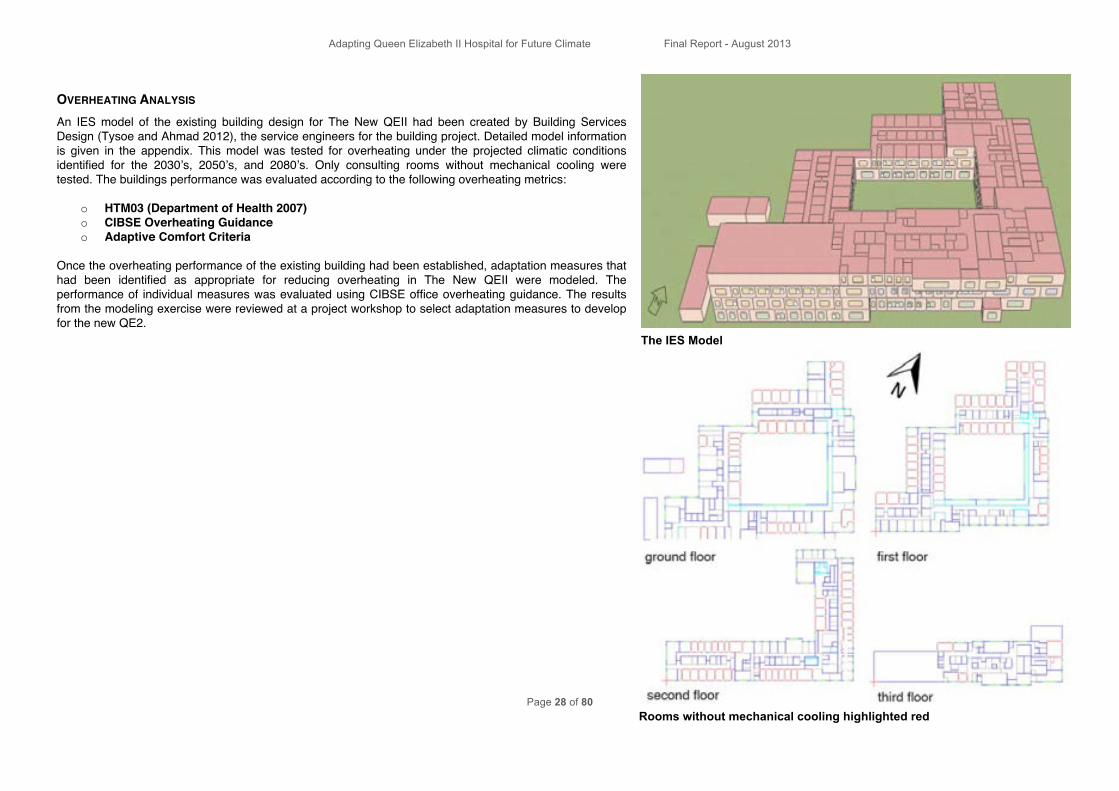
OVERHEATING ANALYSIS An IES model of the existing building design for The New QEII had been created by Building Services Design (Tysoe and Ahmad 2012), the service engineers for the building project. Detailed model information is given in the appendix. This model was tested for overheating under the projected climatic conditions identified for the 2030’s, 2050’s, and 2080’s. Only consulting rooms without mechanical cooling were tested. The buildings performance was evaluated according to the following overheating metrics:
o HTM03 (Department of Health 2007) o CIBSE Overheating Guidance o Adaptive Comfort Criteria
Once the overheating performance of the existing building had been established, adaptation measures that had been identified as appropriate for reducing overheating in The New QEII were modeled. The performance of individual measures was evaluated using CIBSE office overheating guidance. The results from the modeling exercise were reviewed at a project workshop to select adaptation measures to develop for the new QE2.
Rooms without mechanical cooling highlighted red
The IES Model

Adapting Queen Elizabeth II Hospital for Future Climate Final Report - August 2013
Page 29 of 80
Three overheating metrics were used to evaluate overheating risks of the existing building design. They are summarized in following table.
Source Assessment metric Criterion Applicability HTM03 (Department of Health 2007) Number of hours over dry bulb temperature
of 28 ⁰C No more than 50 occupied hours All spaces
CIBSE Guide A (CIBSE 2006) Percentage of hours over dry operative temperature of 28 ⁰C
No more than 1% of occupied hours Offices (Consulting rooms)
BS EN 15251 (British Standards Institution 2007)
Number of hours over category I adaptive comfort upper limit
No more than 5% (or 3%) of occupied hours during a year
Naturally ventilated spaces with operable windows
HTM03 (Department of Health 2007) Engineering Health Technical Memoranda (HTMs) give comprehensive advice and guidance on the design of specialized building and engineering technology used in the delivery of healthcare. HTM03 stipulates the following limitation to high temperatures: “Calculations and thermal modeling should be undertaken to ensure that, during the summertime, internal temperatures in patient areas do not exceed 28⁰C (dry bulb) for more than 50 hours per year”. The New QEII has been designed to comply with this guidance when tested using current weather data. CIBSE Overheating Guidance The CIBSE benchmark of overheating for office areas is 1% of annual occupied hours over operative temperature of 28°C. It is a simple definition of overheating and widely used by practitioners. Adaptive Comfort Criteria Recent standards (European Standard BS EN 152511) and guidance (CIBSE2, ASHRAE3) advise that comfort temperatures vary through the year as people adapt to changes in outside temperatures. According to this criteria comfortable temperatures are based on outside temperatures during the preceding few days. We have based our assessment on the level of thermal expectation recommended for very sensitive occupants such with as unwell or elderly persons. Adaptive comfort limits are calculated from current temperatures. The guidance recommends that these limits not be exceeded for more than 5% or 3% of occupied hours a day, a week, a month and a year. In this report, a higher than stipulated temperature for 5% of occupied hours during a year were used as overheating criteria.

Adapting Queen Elizabeth II Hospital for Future Climate Final Report - August 2013
Page 30 of 80
Comparison of Overheating Metrics The adjacent table illustrates the upper limits of adaptive thermal comfort zone of for the current and the projected 2080s’ climate. The adaptive comfort limit is always lower than the 28 ⁰C, therefore the adaptive comfort criteria for this location are more demanding than the CIBSE guidance and the HTM03 guidance. Performance of the Existing Building The following tables give overheating results for the original building design, according to the three metrics described above. The results support the appraisal of BS EN 15251 adaptive thermal comfort limit as being the strictest benchmark for overheating, as this method for assessment results in more incidences of overheating in all three time periods. . The table is highlighted red when the building exceeds the CIBSE overheating benchmark (when more that 1% of occupied hours are over 28⁰C). The modeling shows that according to all benchmarks, the building will be subject to significant overheating by the 2080’s and some adaptation will be required to reduce this overheating.

Adapting Queen Elizabeth II Hospital for Future Climate Final Report - August 2013
Page 31 of 80
Percentage of occupied hours over dry bulb temperature of 28 ⁰C Threshold of 2.13% (50 of 2349 occupied hours)
Percentage of occupied hours over operative temperature of 28 ⁰C Threshold of 1%
Percentage of occupied hours over adaptive comfort limits Threshold of 5%
Zone
CIBSE baseline
P baseline 50%
P 2030s H 50%
P 2050s H 50%
P 2080s H 50%
CIBSE baseline
P baseline 50%
P 2030s H 50%
P 2050s H 50%
P 2080s H 50%
CIBSE baseline
P baseline 50%
P 2030s H 50%
P 2050s H 50%
P 2080s H 50%
0-ADMIN 1.2% 0.0% 0.9% 2.6% 6.1% 1.1% 0.0% 0.4% 2.2% 6.0% 4.0% 15.9% 7.5% 7.9% 13.0%
0-ADMIN MRI 0.0% 0.0% 0.0% 0.1% 0.4% 0.0% 0.0% 0.0% 0.0% 0.2% 1.7% 18.6% 4.4% 4.1% 7.3%
0-EXAM 1 0.6% 0.0% 0.0% 0.8% 3.3% 0.4% 0.0% 0.0% 0.5% 2.3% 1.9% 16.0% 5.1% 5.2% 9.0%
0-EXAM 2 0.5% 0.0% 0.0% 0.6% 2.3% 0.3% 0.0% 0.0% 0.2% 1.8% 2.0% 17.1% 4.5% 4.3% 7.8%
0-EXAM 3 0.5% 0.0% 0.0% 0.5% 2.3% 0.3% 0.0% 0.0% 0.1% 1.7% 1.9% 16.6% 4.4% 4.0% 7.3%
0-EXAM 4 0.5% 0.0% 0.0% 0.5% 2.4% 0.4% 0.0% 0.0% 0.1% 1.8% 1.7% 15.2% 4.5% 4.3% 7.8%
0-FAITH 0.9% 0.0% 0.2% 2.0% 5.2% 0.7% 0.0% 0.1% 1.4% 4.4% 3.7% 21.9% 8.4% 7.8% 13.2%
0-HOTDESKS 0.6% 0.0% 0.0% 0.8% 3.2% 0.4% 0.0% 0.0% 0.5% 2.4% 1.7% 10.2% 4.0% 4.5% 8.4%
0-INTRVW 1 0.6% 0.0% 0.1% 0.9% 3.2% 0.5% 0.0% 0.0% 0.5% 2.5% 2.4% 17.8% 4.9% 5.4% 9.3%
0-INTRVW 2 0.6% 0.0% 0.1% 1.2% 3.7% 0.5% 0.0% 0.0% 0.6% 2.4% 3.1% 26.3% 8.6% 7.5% 11.4%
0-OFFICE 1.4% 0.0% 1.5% 3.1% 6.9% 1.3% 0.0% 1.3% 2.9% 6.8% 4.7% 16.5% 9.5% 9.3% 14.6%
0-PALS 0.6% 0.0% 0.0% 1.0% 3.4% 0.4% 0.0% 0.0% 0.5% 2.2% 2.8% 24.0% 7.2% 6.4% 10.8%
0-POLICE 0.9% 0.0% 0.3% 2.1% 5.3% 0.8% 0.0% 0.1% 1.8% 4.8% 4.7% 31.1% 16.3% 14.2% 16.2%
0-SINGLERM 0.6% 0.0% 0.0% 0.8% 3.1% 0.4% 0.0% 0.0% 0.5% 2.3% 1.6% 7.5% 3.0% 4.0% 8.0%
0-TRIAGE 1 0.7% 0.0% 0.0% 0.8% 3.3% 0.5% 0.0% 0.0% 0.5% 2.6% 1.6% 6.6% 2.6% 3.5% 7.9%
0-TRIAGE 2 0.7% 0.0% 0.0% 1.0% 3.3% 0.5% 0.0% 0.0% 0.6% 2.6% 1.7% 10.1% 3.7% 4.0% 8.0%
0-TRIAGE 3 0.7% 0.0% 0.0% 0.9% 3.2% 0.5% 0.0% 0.0% 0.4% 2.3% 1.7% 10.0% 3.6% 4.0% 7.7%
0-TRIAGE 4 0.5% 0.0% 0.0% 0.4% 2.0% 0.3% 0.0% 0.0% 0.2% 1.4% 1.4% 9.7% 2.9% 3.2% 6.4%
0-TRIAGE 5 1.3% 0.0% 0.8% 2.8% 6.9% 1.1% 0.0% 0.2% 2.3% 6.5% 4.1% 12.4% 7.3% 8.1% 13.5%
0-TRIAGE 6 1.4% 0.0% 0.8% 2.7% 6.6% 1.1% 0.0% 0.3% 2.3% 6.3% 4.0% 13.4% 7.1% 7.6% 12.9%
0-TRIAGE 7 1.3% 0.0% 0.8% 2.8% 6.8% 1.1% 0.0% 0.3% 2.3% 6.4% 4.0% 12.5% 7.2% 8.0% 13.4%
0-TRIAGE 9 1.2% 0.0% 0.9% 2.8% 7.1% 1.1% 0.0% 0.3% 2.3% 6.7% 4.0% 11.2% 7.4% 8.1% 13.7%

Adapting Queen Elizabeth II Hospital for Future Climate Final Report - August 2013
Page 32 of 80
Percentage of occupied hours over dry bulb temperature of 28 ⁰C Threshold of 2.13% (50 of 2349 occupied hours)
Percentage of occupied hours over operative temperature of 28 ⁰C Threshold of 1%
Percentage of occupied hours over adaptive comfort limits Threshold of 5% Zone
CIBSE baseline
P baseline 50%
P 2030s H 50%
P 2050s H 50%
P 2080s H 50%
CIBSE baseline
P baseline 50%
P 2030s H 50%
P 2050s H 50%
P 2080s H 50%
CIBSE baseline
P baseline 50%
P 2030s H 50%
P 2050s H 50%
P 2080s H 50%
0-WAIT 2 0.5% 0.0% 0.0% 0.4% 2.3% 0.4% 0.0% 0.0% 0.1% 1.5% 1.4% 14.6% 3.4% 3.4% 7.3%
0-WC SR 0.0% 0.0% 0.0% 0.0% 0.0% 0.0% 0.0% 0.0% 0.0% 0.0% 0.1% 0.0% 0.0% 0.5% 2.7%
1-ADMIN 2 1.0% 0.0% 0.2% 1.4% 4.8% 0.8% 0.0% 0.1% 0.9% 3.7% 2.4% 12.9% 5.4% 6.0% 10.0%
1-ADMINRET 0.7% 0.0% 0.2% 1.4% 4.2% 0.4% 0.0% 0.0% 0.6% 2.5% 2.9% 7.8% 4.9% 6.3% 9.7%
1-C BASE 1 0.5% 0.0% 0.1% 1.2% 3.8% 0.3% 0.0% 0.0% 0.7% 2.5% 1.7% 13.5% 5.4% 5.4% 8.7%
1-C BASE 2 1.4% 0.0% 1.2% 3.0% 7.6% 1.3% 0.0% 0.5% 2.5% 7.4% 4.8% 15.6% 8.3% 8.8% 14.6%
1-C EXAM 1 0.9% 0.0% 0.7% 2.1% 5.6% 0.6% 0.0% 0.3% 1.7% 4.6% 3.0% 15.4% 6.9% 7.2% 11.7%
1-C EXAM 10 1.1% 0.0% 1.0% 2.9% 6.9% 1.0% 0.0% 0.2% 2.2% 6.3% 4.3% 16.4% 8.3% 8.9% 14.3%
1-C EXAM 11 0.9% 0.0% 0.2% 1.2% 4.1% 0.6% 0.0% 0.0% 0.6% 2.7% 2.0% 10.5% 5.0% 5.9% 9.3%
1-C EXAM 12 0.9% 0.0% 0.2% 1.1% 4.1% 0.6% 0.0% 0.0% 0.6% 2.9% 2.1% 11.5% 4.9% 5.4% 9.1%
1-C EXAM 13 0.7% 0.0% 0.0% 0.8% 3.2% 0.5% 0.0% 0.0% 0.3% 2.2% 1.6% 11.7% 3.7% 4.0% 8.1%
1-C EXAM 14 0.6% 0.0% 0.0% 0.8% 3.6% 0.5% 0.0% 0.0% 0.4% 2.3% 1.5% 10.6% 3.6% 4.0% 8.3%
1-C EXAM 15 0.7% 0.0% 0.0% 1.0% 3.7% 0.5% 0.0% 0.0% 0.6% 2.6% 1.8% 11.5% 4.3% 4.6% 8.4%
1-C EXAM 16 0.6% 0.0% 0.0% 0.8% 3.0% 0.4% 0.0% 0.0% 0.3% 2.0% 1.7% 11.5% 3.9% 4.1% 7.7%
1-C EXAM 17 0.4% 0.0% 0.0% 0.3% 2.0% 0.2% 0.0% 0.0% 0.0% 1.2% 1.2% 11.5% 3.4% 3.5% 6.7%
1-C EXAM 19 1.0% 0.0% 1.1% 2.4% 6.0% 0.7% 0.0% 0.6% 2.0% 5.2% 3.6% 16.7% 8.2% 8.1% 13.1%
1-C EXAM 2 1.0% 0.0% 0.9% 2.4% 6.0% 0.7% 0.0% 0.5% 2.0% 5.4% 3.4% 15.5% 7.4% 7.6% 12.5%
1-C EXAM 20 1.3% 0.0% 1.2% 2.6% 6.6% 0.9% 0.0% 0.8% 2.2% 6.0% 3.6% 14.2% 7.3% 7.7% 12.9%
1-C EXAM 21 1.0% 0.0% 0.2% 1.5% 5.1% 0.9% 0.0% 0.1% 1.2% 4.4% 2.5% 7.2% 4.2% 5.7% 10.6%
1-C EXAM 22 1.1% 0.0% 0.3% 2.0% 5.6% 1.0% 0.0% 0.1% 1.3% 4.6% 3.0% 11.8% 5.2% 6.4% 10.9%
1-C EXAM 3 0.7% 0.0% 0.5% 2.0% 5.2% 0.6% 0.0% 0.1% 1.2% 4.0% 2.9% 15.2% 6.6% 6.5% 11.3%
1-C EXAM 4 0.6% 0.0% 0.4% 1.7% 4.7% 0.5% 0.0% 0.1% 1.1% 3.6% 2.7% 14.7% 6.0% 6.1% 10.5%
1-C EXAM 5 0.6% 0.0% 0.3% 1.5% 4.3% 0.5% 0.0% 0.1% 1.0% 3.2% 2.4% 14.4% 5.7% 5.9% 10.0%

Adapting Queen Elizabeth II Hospital for Future Climate Final Report - August 2013
Page 33 of 80
Percentage of occupied hours over dry bulb temperature of 28 ⁰C Threshold of 2.13% (50 of 2349 occupied hours)
Percentage of occupied hours over operative temperature of 28 ⁰C Threshold of 1%
Percentage of occupied hours over adaptive comfort limits Threshold of 5% Zone
CIBSE baseline
P baseline 50%
P 2030s H 50%
P 2050s H 50%
P 2080s H 50%
CIBSE baseline
P baseline 50%
P 2030s H 50%
P 2050s H 50%
P 2080s H 50%
CIBSE baseline
P baseline 50%
P 2030s H 50%
P 2050s H 50%
P 2080s H 50%
1-C EXAM 6 1.4% 0.0% 1.0% 2.9% 7.0% 1.3% 0.0% 0.3% 2.3% 6.5% 4.6% 16.0% 7.7% 8.5% 14.0%
1-C EXAM 7 1.1% 0.0% 0.4% 2.3% 6.0% 0.8% 0.0% 0.2% 1.9% 5.6% 3.5% 15.7% 7.2% 7.7% 13.1%
1-C EXAM 9 1.0% 0.0% 0.3% 2.2% 6.1% 0.7% 0.0% 0.2% 1.9% 5.5% 3.2% 15.3% 7.1% 7.6% 13.0%
1-ECHO 0.7% 0.0% 0.0% 1.1% 3.9% 0.6% 0.0% 0.0% 0.6% 2.9% 1.7% 7.7% 3.2% 3.9% 8.4%
1-HOLTER 0.7% 0.0% 0.0% 0.9% 3.3% 0.5% 0.0% 0.0% 0.4% 2.2% 1.6% 15.7% 4.4% 4.3% 8.8%
1-HOTDESK 1 0.9% 0.0% 0.3% 1.7% 4.9% 0.6% 0.0% 0.1% 0.9% 3.2% 3.0% 7.3% 5.1% 6.5% 10.2%
1-HOTDESK 2 0.7% 0.0% 0.1% 1.1% 4.2% 0.5% 0.0% 0.0% 0.6% 2.9% 1.7% 10.7% 4.2% 4.9% 9.0%
1-INTERV 1 1.1% 0.0% 0.3% 1.9% 4.9% 0.9% 0.0% 0.1% 1.2% 3.9% 3.3% 22.8% 7.9% 7.7% 11.5%
1-PRE ASS 1 0.5% 0.0% 0.0% 0.6% 2.8% 0.3% 0.0% 0.0% 0.3% 1.8% 2.0% 16.9% 5.1% 5.2% 8.5%
1-PRE ASS 2 0.6% 0.0% 0.1% 0.8% 3.2% 0.4% 0.0% 0.0% 0.3% 2.1% 2.1% 16.9% 5.2% 5.2% 8.7%
1-PRE ASS 3 0.8% 0.0% 0.1% 1.6% 4.6% 0.5% 0.0% 0.0% 0.9% 3.6% 2.5% 16.4% 5.8% 6.3% 10.2%
1-RECEPTN 0.8% 0.0% 0.2% 1.5% 4.4% 0.6% 0.0% 0.1% 0.8% 3.3% 2.9% 23.4% 8.5% 8.0% 11.5%
2-ADMIN 1 1.4% 0.0% 0.8% 2.4% 5.8% 1.0% 0.0% 0.3% 1.9% 4.7% 4.3% 22.7% 8.3% 8.6% 12.6%
2-ADMIN 2 1.3% 0.0% 0.9% 2.6% 6.0% 0.9% 0.0% 0.2% 1.9% 5.0% 4.8% 25.2% 11.6% 9.5% 14.6%
2-ADMIN 3 1.5% 0.0% 1.7% 3.1% 6.9% 1.3% 0.0% 1.2% 2.6% 6.7% 4.8% 20.2% 9.8% 9.6% 14.7%
2-C EXAM 01 1.5% 0.0% 1.4% 3.2% 7.7% 1.3% 0.0% 0.8% 2.9% 7.7% 6.5% 20.3% 11.4% 10.7% 17.2%
2-C EXAM 02 1.3% 0.0% 1.2% 2.9% 7.1% 1.0% 0.0% 0.3% 2.4% 6.4% 5.6% 19.8% 9.7% 9.4% 15.4%
2-C EXAM 03 1.4% 0.0% 1.2% 3.0% 7.2% 1.2% 0.0% 0.4% 2.5% 6.8% 5.9% 19.8% 9.8% 9.6% 15.9%
2-C EXAM 05 1.8% 0.0% 1.6% 3.4% 8.4% 1.7% 0.0% 1.2% 3.4% 8.5% 7.2% 20.4% 11.5% 11.2% 18.1%
2-C EXAM 06 2.0% 0.0% 1.8% 3.9% 9.1% 1.7% 0.0% 1.4% 3.7% 9.6% 8.0% 20.7% 12.7% 12.7% 19.5%
2-C EXAM 07 1.1% 0.0% 0.3% 2.1% 5.8% 0.9% 0.0% 0.2% 1.4% 4.8% 3.1% 11.7% 5.4% 6.6% 11.1%
2-C EXAM 08 1.1% 0.0% 0.3% 2.0% 5.7% 1.0% 0.0% 0.1% 1.3% 4.7% 2.9% 10.9% 5.2% 6.4% 11.0%

Adapting Queen Elizabeth II Hospital for Future Climate Final Report - August 2013
Page 34 of 80
Percentage of occupied hours over dry bulb temperature of 28 ⁰C Threshold of 2.13% (50 of 2349 occupied hours)
Percentage of occupied hours over operative temperature of 28 ⁰C Threshold of 1%
Percentage of occupied hours over adaptive comfort limits Threshold of 5%
Zone
CIBSE baseline
P baseline 50%
P 2030s H 50%
P 2050s H 50%
P 2080s H 50%
CIBSE baseline
P baseline 50%
P 2030s H 50%
P 2050s H 50%
P 2080s H 50%
CIBSE baseline
P baseline 50%
P 2030s H 50%
P 2050s H 50%
P 2080s H 50%
2-C EXAM 09 1.7% 0.0% 1.1% 2.9% 7.2% 1.5% 0.0% 0.7% 2.6% 7.2% 4.9% 8.0% 6.6% 8.6% 13.7%
2-C EXAM 10 1.4% 0.0% 0.9% 2.5% 6.6% 1.3% 0.0% 0.3% 2.0% 6.2% 4.0% 9.8% 5.9% 7.4% 12.4%
2-C EXAM 11 1.1% 0.0% 0.4% 2.2% 6.3% 1.0% 0.0% 0.2% 1.4% 5.1% 3.1% 10.0% 5.6% 6.8% 11.7%
2-C EXAM 12 1.1% 0.0% 0.2% 1.8% 5.4% 0.9% 0.0% 0.1% 1.1% 4.4% 2.6% 10.7% 5.2% 6.3% 10.7%
2-COUNSEL 1 0.6% 0.0% 0.0% 0.8% 3.2% 0.4% 0.0% 0.0% 0.3% 2.0% 2.3% 17.3% 5.3% 5.4% 9.0%
2-COUNSEL 2 0.6% 0.0% 0.0% 0.7% 3.1% 0.4% 0.0% 0.0% 0.3% 1.8% 2.4% 18.4% 5.3% 5.4% 9.1%
2-COUNSEL 3 0.7% 0.0% 0.1% 1.1% 4.0% 0.5% 0.0% 0.0% 0.6% 2.8% 2.6% 18.4% 5.9% 6.0% 10.1%
2-COUNSEL 4 0.8% 0.0% 0.1% 1.4% 4.3% 0.6% 0.0% 0.0% 0.7% 3.2% 2.6% 18.7% 5.9% 6.2% 10.3%
2-CUB 1 1.0% 0.0% 0.4% 2.4% 5.9% 0.8% 0.0% 0.1% 1.8% 5.1% 4.0% 23.7% 9.7% 8.8% 14.2%
2-CUB 2 0.9% 0.0% 0.2% 2.0% 5.2% 0.6% 0.0% 0.1% 1.5% 4.3% 3.6% 23.9% 8.6% 8.1% 12.9%
2-CUB 3 0.5% 0.0% 0.0% 0.9% 3.4% 0.3% 0.0% 0.0% 0.4% 1.9% 2.7% 23.1% 6.5% 5.9% 10.3%
2-CUB 4 0.4% 0.0% 0.0% 0.6% 2.6% 0.3% 0.0% 0.0% 0.3% 1.4% 2.5% 23.0% 5.8% 5.4% 9.6%
2-CUB 5 0.4% 0.0% 0.0% 0.6% 2.6% 0.3% 0.0% 0.0% 0.3% 1.4% 2.5% 23.0% 5.8% 5.4% 9.5%
2-CUB 6 0.5% 0.0% 0.0% 0.8% 2.9% 0.3% 0.0% 0.0% 0.3% 1.6% 2.6% 22.9% 6.2% 5.7% 10.1%
2-INFO 1.4% 0.0% 1.6% 3.2% 7.3% 1.1% 0.0% 1.2% 2.8% 7.2% 4.6% 14.4% 9.0% 9.0% 14.9%
2-INTERVW 1 0.9% 0.0% 0.2% 1.5% 4.4% 0.6% 0.0% 0.1% 0.9% 3.2% 3.0% 23.3% 7.4% 7.2% 11.0%
2-INTERVW 2 0.8% 0.0% 0.1% 1.1% 4.0% 0.5% 0.0% 0.0% 0.5% 2.8% 2.7% 17.7% 5.9% 6.3% 9.7%
2-INTERVW 3 1.1% 0.0% 0.3% 1.9% 4.9% 0.8% 0.0% 0.1% 1.2% 4.0% 3.0% 17.6% 6.3% 6.8% 11.0%
3-ADMIN 0.8% 0.0% 0.2% 1.4% 4.3% 0.6% 0.0% 0.0% 0.7% 3.1% 2.6% 20.3% 6.5% 6.4% 10.4%
3-HOTDESK 1 1.9% 0.0% 1.6% 3.5% 8.3% 1.6% 0.0% 1.3% 3.2% 8.6% 7.2% 25.8% 14.2% 13.0% 19.1%
3-STAFF 1.4% 0.0% 1.1% 2.7% 6.6% 1.0% 0.0% 0.3% 1.9% 6.0% 4.2% 11.2% 7.0% 8.3% 13.3%
Adapting Queen Elizabeth II Hospital for Future Climate Final Report - August 2013
Page 35 of 80
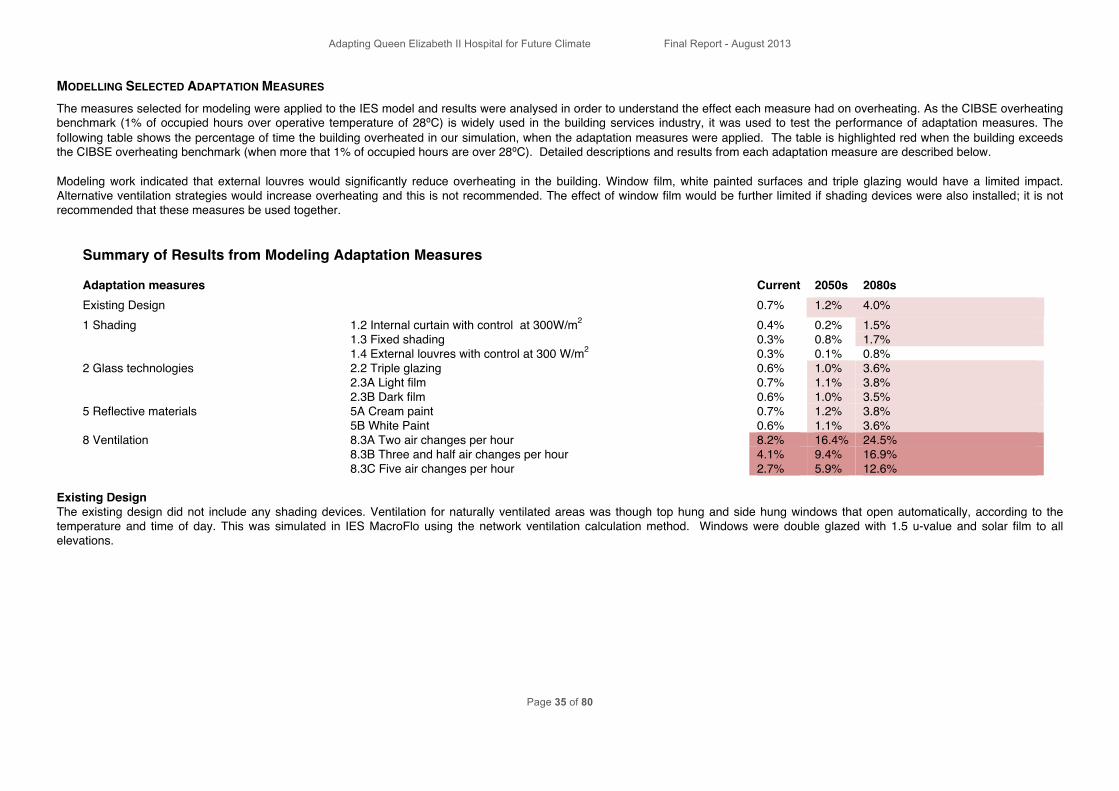
MODELLING SELECTED ADAPTATION MEASURES The measures selected for modeling were applied to the IES model and results were analysed in order to understand the effect each measure had on overheating. As the CIBSE overheating benchmark (1% of occupied hours over operative temperature of 28⁰C) is widely used in the building services industry, it was used to test the performance of adaptation measures. The following table shows the percentage of time the building overheated in our simulation, when the adaptation measures were applied. The table is highlighted red when the building exceeds the CIBSE overheating benchmark (when more that 1% of occupied hours are over 28⁰C). Detailed descriptions and results from each adaptation measure are described below. Modeling work indicated that external louvres would significantly reduce overheating in the building. Window film, white painted surfaces and triple glazing would have a limited impact. Alternative ventilation strategies would increase overheating and this is not recommended. The effect of window film would be further limited if shading devices were also installed; it is not recommended that these measures be used together.
Summary of Results from Modeling Adaptation Measures Adaptation measures Current 2050s 2080s Existing Design 0.7% 1.2% 4.0%
1.2 Internal curtain with control at 300W/m2 0.4% 0.2% 1.5% 1.3 Fixed shading 0.3% 0.8% 1.7%
1 Shading
1.4 External louvres with control at 300 W/m2 0.3% 0.1% 0.8% 2.2 Triple glazing 0.6% 1.0% 3.6% 2.3A Light film 0.7% 1.1% 3.8%
2 Glass technologies
2.3B Dark film 0.6% 1.0% 3.5% 5A Cream paint 0.7% 1.2% 3.8% 5 Reflective materials 5B White Paint 0.6% 1.1% 3.6% 8.3A Two air changes per hour 8.2% 16.4% 24.5% 8.3B Three and half air changes per hour 4.1% 9.4% 16.9%
8 Ventilation
8.3C Five air changes per hour 2.7% 5.9% 12.6% Existing Design The existing design did not include any shading devices. Ventilation for naturally ventilated areas was though top hung and side hung windows that open automatically, according to the temperature and time of day. This was simulated in IES MacroFlo using the network ventilation calculation method. Windows were double glazed with 1.5 u-value and solar film to all elevations.

Adapting Queen Elizabeth II Hospital for Future Climate Final Report - August 2013
Page 36 of 80
1.0 Shading
1.2 Internal curtains that close when the light intensity is greater that 300 W/m2: This shading strategy assumes that building occupants draw curtains closed when the incident radiation is higher than 300 W/m2. 1.3 External louvres that close when the light intensity is greater than 300 W/m2: This shading strategy assumes that external louvres could block all direct incident radiation. Vertical louvres are most effective for southwest facing windows and horizontal louvres for southeast facing windows.. 1.4 Fixed shading panels that shading panels block all direct sunlight 10:00-17:00 during 1st May to 30th September.
2.0 Glass Technologies
2.1 Triple glazed windows 2.2 Light reflective window film that allows 48% of light through, applied to triple glazed windows. 2.3 Dark reflective window film that allows 18% of light through, applied to triple glazed windows.
Shading Strategies Shading strategies Implementations in IES Base model No shading device External louvre with control at 300 W/m2
Set louvre as external shading devices Incident radiation to lower device: 300 W/m2 Incident radiation to raise device: 300 W/m2
Internal curtain with control at 300W/m2
Set curtains as internal shading devices Incident radiation to lower device: 300 W/m2 Incident radiation to raise device: 300 W/m2
Fixed shading panels Set local shade as external shading devices Southeast facing windows: Window width 1.7m, window height 1.8m, overhang projection 2.1m, overhang offset 0.1m, left fin projection 1.43m, left fin offset 0.1m, right fin projection 2.1m, right fin offset 0.1m Southwest facing windows: Window width 1.7m, window height 1.8m, overhang projection 2.6m, overhang offset 0.1m, left fin projection 2.6m, left fin offset 0.1m,
Glass Technologies Settings Base
model Triple glazing
Light film Dark film
Glazing type Double Triple Triple with light film
Triple with dark film
G-value (BS EN 410) 0.4068 0.3651 0.3850 0.3634 Inside surface emissivity 0.900 0.900 0.74 0.7 Visible light normal transmittance 0.65 0.65 0.312 (48%) 0.117 (18%) Transmittance of internal layer 0.78 0.78 0.312 (40%) 0.094 (12%) Outside/inside reflectance 0.07 0.07 0.022 (31%) 0.039 (55%) U-value (W/m2K, including frame) 1.5006 1.2332 1.5006 1.5006 Frame 10% metal frame

Adapting Queen Elizabeth II Hospital for Future Climate Final Report - August 2013
Page 37 of 80
5.0 Reflective Materials
5.1 White paint to the roof and the external walls 5.2 Cream paint to the roof and the external walls
8.0 Ventilation
8.3A 2 air changes per hour provided by exhaust fans or windows opening. 8.3B 3.5 air changes per hour provided by exhaust fans or windows opening. 8.3C 5 air changes per hour provided by exhaust fans or windows opening.
Reflective Materials Settings Base model White paint Cream paint Outside surface emissivity 0.9 0.9 0.87 Outside surface solar absorptance 0.7 for external wall
0.5 for roof 0.2 0.4
Ventilation Strategies Ventilation strategies
Implementations in IES
Original building design
Set windows opening type in MarcoFlo as follows, Opening category: side hung Opening Category: 95% Max Angle Open: 90o (side hung) Crack Flow Coefficient: 0.15 Degree of Opening: On when indoor air temperature >19⁰C and > external air temperature during 8:00am-18:30 Off during 18:30-8:00am Opening category: top hung Opening Category: 95% Max Angle Open: 30o (top hung) Crack Flow Coefficient: 0.15 Degree of Opening: On when indoor air temperature >19⁰C and > external air temperature during 8:00am-24:00 On when indoor air temperature >17⁰C during 0:00-8:00am
2 air changes per hour
Set auxiliary ventilation rate as 2 ACH, and set its profile as BSD7to19
3.5 air changes per hour
Set auxiliary ventilation rate as 3.5 ACH, and set its profile as BSD7to19
5 air changes per hour
Set auxiliary ventilation rate as 5 ACH , and set its profile as BSD7to19

Adapting Queen Elizabeth II Hospital for Future Climate Final Report - August 2013
Page 38 of 80
Energy Performance of the Building and Adaptations The overall energy performance of the existing design for the building at each chosen time period has been tested. This adds to our understanding of how the building as a whole will respond to climate change. In order to conduct a cost benefit analysis, the energy implications of all the adaptation measures tested in the previous section have been tested. In addition, adaptation measures are already included in the building design have been compared to a notional building which does not include climate change adaptations. This is to allow clients and designers to understand the cost benefit of each adaptation measure. Reducing electricity consumption for the system is also one of the key targets for the building adaptations, so this assessment will inform the selection of the most effective measures. The IES energy model of QEII hospital is almost the same as the model for overheating analysis. The only difference is that the energy model uses Test Reference Year (TRY) data as it represents the most ‘typical’ weather conditions. The weather data files used for simulation are listed in the adjacent table Detailed energy consumption simulation results for the existing building design are listed in the adjacent pie chart. The makeup of system electricity consumption is illustrated in the bar chart below. Gas is only used for providing domestic hot water in the QEII hospital IES model, this gas and any electricity consumption for equipment and lights will not change due to climate and adaptation measures. Therefore the following section only considers the change in electricity consumption by space heating, chillers and system fans/pumps.
Weather Data Files for Energy Simulation Location Timelines Description of weather
data Name of weather files
Heathrow Baseline CIBSE TRY 1999 (1983-2004)
LondonTRY05.fwt
Medium term 2050s
Prometheus 2040-2069 high emission 50% TRY
2050_Welwyn_a1fi_50_percentile_TRY.epw
Welwyn Garden City Long term
2080s Prometheus 2070-2099 high emission 50% TRY
2080_Welwyn_a1fi_50_percentile_TRY.epw
Total gas (by DHW only)
30.3 6%
Electricity by equip 131.8 28%
Electricity by lights 155.3 33%
Electricity by system 154.3 33%
Total electricity 94%
Total annual energy consump1on (471.7 MWh) exclusive of PV

Adapting Queen Elizabeth II Hospital for Future Climate Final Report - August 2013
Page 39 of 80
Energy Performance of the Whole Building The general trend for the electricity consumption of the existing building design (base model) is shown in the adjacent table, which indicates the consumption slightly reduces with time. The energy consumption in the 2080s is less than current consumption. This is due to reduced requirement for space heating in the future, and an increase in electricity generated by the buildings 170 square m of photovoltaic cells, resulting from increased solar radiation.
Energy implications of adaption measures for overheating The energy implications of adaption measures to reduce overheating are illustrated in the adjacent bar chart. These implications can be summarized as follows:
o Triple glazing reduces energy consumption under current climatic conditions. This is because it reduces heat loss in the winter.
o Triple glazing will increase energy consumption in a warmer future climate. o Measures that reduce overheating tend to heating energy consumption in winter which results in increased total
annual energy consumption Energy implications of measures that have been included in the base model The existing building design includes the following climate change adaptation measures:
o Good insulation: Lower U-values than required by Building Regulations are used in the existing building design.
o Solar control glazing with low U-values: Windows will have a U-value of 1.3 W/m2K The U-value required by Building Regulations minimum model is 2.2 W/m2K.
o Exposed thermal mass: The existing building design exposes sections of the 250mm structural slab to form part of the consulting room ceilings.
o Night time purge ventilation. Top hung windows are designed to open at night time when indoor temperature is higher than 17⁰C
o Trees planted for shading We have tested the energy implication of these measures against a notional standard, Building Regulations compliant building. Results are described below.
2015 2050s 2080s 0
10
20
30
40 PV generated electricity (MWh)
Electricity consumption of space heating & ventilation

Adapting Queen Elizabeth II Hospital for Future Climate Final Report - August 2013
Page 40 of 80
Good Insulation The designed U values for the building fabric, together with Building Regulations minimum requirements are listed in the adjacent table. Our simulation compared buildings with the two sets of values. Results are shown in chart below, and indicate that improving U-value of building fabrics could significantly reduce heating energy consumption at current climate; however its positive energy impact will be reduced in 2080s due to the warmer climate. Glazing with low U-values: Windows will have a U-value of 1.3 W/m2K The U-value required by Building Regulations minimum model is 2.2 W/m2K. Our simulation compared buildings with windows with these two U-values The results indicate that improving the U-value of windows significantly reduces heating energy consumption under current climatic conditions. This effect will be reduced by warmer future temperatures.
U-value (W/m2K) Designed Values (Base Model)
Building Regulations minimum
External walls 0.2 0.35 Roof 0.15 0.25 Floor 0.2 0.25
System Energy Consumption for Different Fabrics
System Energy Consumption for Different Glazing
Adapting Queen Elizabeth II Hospital for Future Climate Final Report - August 2013
Page 41 of 80
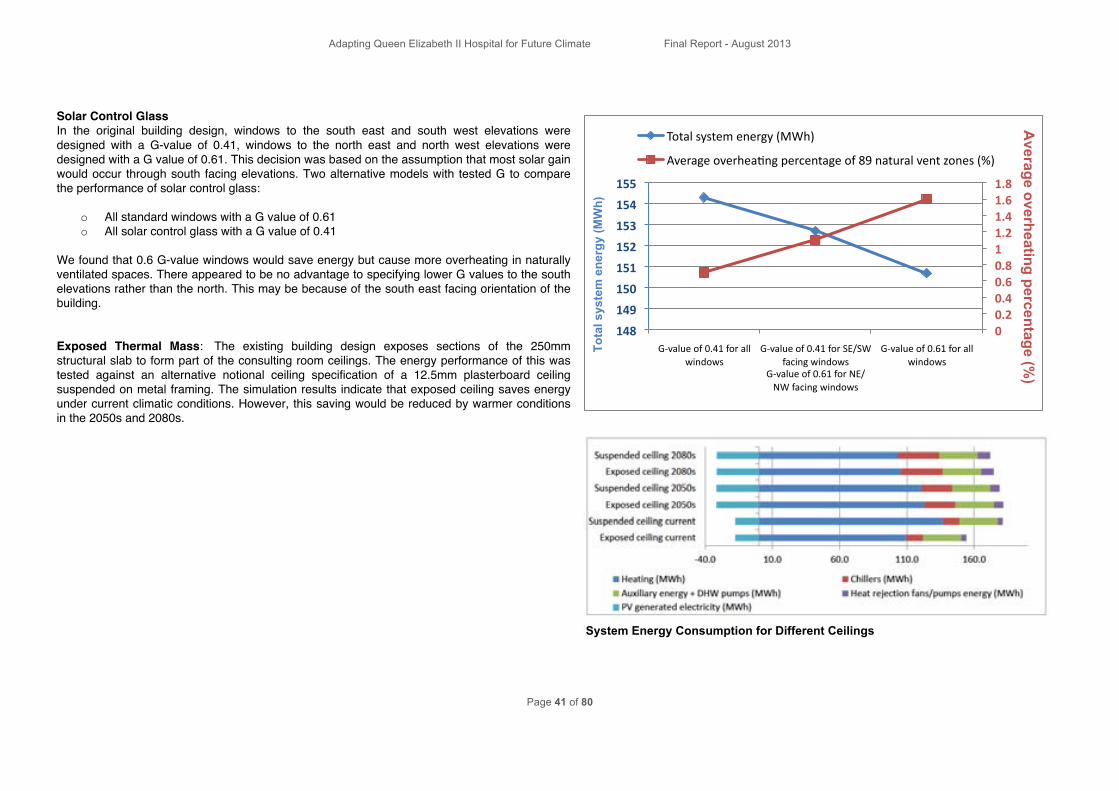
Solar Control Glass In the original building design, windows to the south east and south west elevations were designed with a G-value of 0.41, windows to the north east and north west elevations were designed with a G value of 0.61. This decision was based on the assumption that most solar gain would occur through south facing elevations. Two alternative models with tested G to compare the performance of solar control glass:
o All standard windows with a G value of 0.61 o All solar control glass with a G value of 0.41
We found that 0.6 G-value windows would save energy but cause more overheating in naturally ventilated spaces. There appeared to be no advantage to specifying lower G values to the south elevations rather than the north. This may be because of the south east facing orientation of the building. Exposed Thermal Mass: The existing building design exposes sections of the 250mm structural slab to form part of the consulting room ceilings. The energy performance of this was tested against an alternative notional ceiling specification of a 12.5mm plasterboard ceiling suspended on metal framing. The simulation results indicate that exposed ceiling saves energy under current climatic conditions. However, this saving would be reduced by warmer conditions in the 2050s and 2080s.
0 0.2 0.4 0.6 0.8 1 1.2 1.4 1.6 1.8
148
149
150
151
152
153
154
155
G-‐value of 0.41 for all windows
G-‐value of 0.41 for SE/SW facing windows
G-‐value of 0.61 for NE/NW facing windows
G-‐value of 0.61 for all windows
Total system energy (MWh)
Average overheaSng percentage of 89 natural vent zones (%)
Tota
l sys
tem
ene
rgy
(MW
h)
Average overheating percentage (%
)
System Energy Consumption for Different Ceilings

Adapting Queen Elizabeth II Hospital for Future Climate Final Report - August 2013
Page 42 of 80
Night Time Purge Ventilation. Top hung windows are designed to open at night time when the indoor temperature is higher than 17⁰C. An alternative model without night time ventilation was tested. This showed that night time ventilation would reduce cooling energy consumption under current and future climatic conditions Tree Shading The tree plan is shown below. To simplify the energy model, only newly planted trees near the south edge of the building were considered in the model. The modeling results of trees show that trees have positive impact on reducing cooling load, but they increase heating load in other seasons. The total impact is minimal.
The New QEII Proposed Tree Plan Energy Model of Tree Shading Openable Vents for Night Time Ventilation
Cooling Energy Consumption for Different Ventilation Strategies

Adapting Queen Elizabeth II Hospital for Future Climate Final Report - August 2013
Page 43 of 80
SUMMARY OF ENERGY IMPLICATIONS FOR INCLUDED ADAPTATION
MEASURES The energy implications of the adaption measures included in the existing design (base model), under current climatic conditions, are illustrated in the adjacent chart. Better insulation and night time ventilation will save energy. The embedded energy savings in the current building design are:
o 38.2 MWh by improving U-value roof and floor to 0.2 W/m2K and improving U-value external wall to 0.15 W/m2K
o 37.8 MWh by using windows with U-value of 1.3 W/m2K o 27.1 MWh by using exposed ceiling o 24.1 MWh by night time ventilation
The use of solar control glass will increase energy consumption. Windows with lower G-values reduce overheating but increase energy consumption.

Adapting Queen Elizabeth II Hospital for Future Climate Final Report - August 2013
Page 44 of 80
SECTION 3B: TIMESCALES FOR RECOMMENDATIONS
Our approach to timescale for implementing adaptation measures was very simple. The project team considered there were three options for when adaptations could be implemented:
o Adaptations could be implemented now, as part of the construction programme o Enabling measures could be implemented now, with adaptations implemented when required in the future o Adaptations could be implemented at a future date when climate change makes the adaptation necessary, ideally as part of a replacement or renewal works
The team reviewed the list of design opportunities put forward by The Technology Strategy Board (ref Bill Gething “Design for Future Climate, an adaptation agenda for the built environment” 2010), along with additional opportunities proposed by the design team at project team and stakeholder workshops on 30th Oct 2012. A significant feature of this project is that the design was advanced when the D4FC programme was joined. We therefore had to take into account the fact that a number of adaptation measures had already been incorporated, though without systematic assessment. These had to be brought into the picture with a robust way of assessing them in terms of efficacy and cost and other factors. In place of a SWOT analysis as envisaged by the TSB guidance we implemented an alternative workshop based way of analysing both the already included and potential additional measures by the process of grading. We assessed the climate change risks, overheating and energy implication of each adaptation opportunity and collectively graded them against the following criteria:
o Measures already included in the design o Measures that should be considered for inclusion in the design o Measures that could be retrofitted in the future with enabling measures that should be considered for inclusion now o Measures that could be retrofitted in the future but which need no action at present o Measures not suitable for inclusion
The graded checklist from the workshops held on 3oth Oct 2012 is included in Appendix 3: The New QEII_P&P_Checklist of Adaptation Measures_1. These gradings were reviewed again, in the light of the cost benefit analysis during the workshop held on 19th July 2013 when the team identified which adaption measures would be taken up. Measures graded 1 & 2 would be implemented now. Measures graded 3 would be implemented in future, with enabling work undertaken now. Measures graded 4 would be implemented in the future. The final graded checklist is included in Section 3C: Cost Benefit Analysis. These measures are discussed in more detail in section 3C, and the timescale for implementing each agreed measure is set out clearly in section 3D.
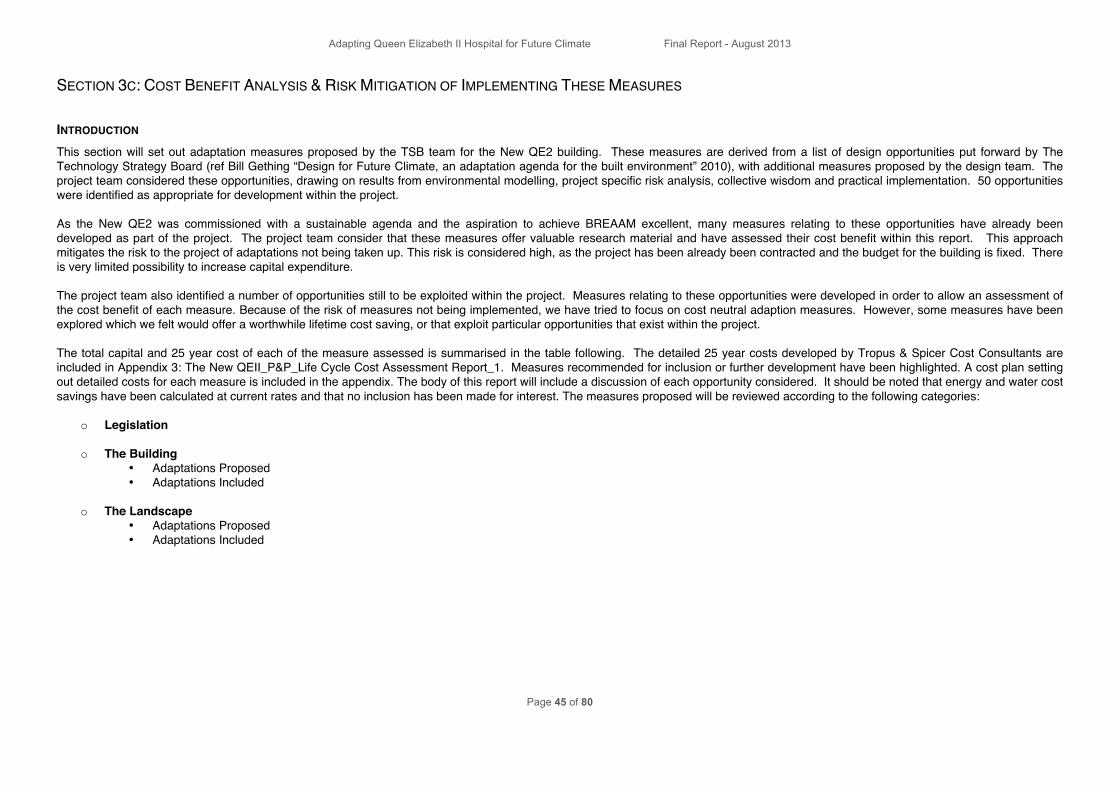
Adapting Queen Elizabeth II Hospital for Future Climate Final Report - August 2013
Page 45 of 80
SECTION 3C: COST BENEFIT ANALYSIS & RISK MITIGATION OF IMPLEMENTING THESE MEASURES
INTRODUCTION This section will set out adaptation measures proposed by the TSB team for the New QE2 building. These measures are derived from a list of design opportunities put forward by The Technology Strategy Board (ref Bill Gething “Design for Future Climate, an adaptation agenda for the built environment” 2010), with additional measures proposed by the design team. The project team considered these opportunities, drawing on results from environmental modelling, project specific risk analysis, collective wisdom and practical implementation. 50 opportunities were identified as appropriate for development within the project. As the New QE2 was commissioned with a sustainable agenda and the aspiration to achieve BREAAM excellent, many measures relating to these opportunities have already been developed as part of the project. The project team consider that these measures offer valuable research material and have assessed their cost benefit within this report. This approach mitigates the risk to the project of adaptations not being taken up. This risk is considered high, as the project has been already been contracted and the budget for the building is fixed. There is very limited possibility to increase capital expenditure. The project team also identified a number of opportunities still to be exploited within the project. Measures relating to these opportunities were developed in order to allow an assessment of the cost benefit of each measure. Because of the risk of measures not being implemented, we have tried to focus on cost neutral adaption measures. However, some measures have been explored which we felt would offer a worthwhile lifetime cost saving, or that exploit particular opportunities that exist within the project. The total capital and 25 year cost of each of the measure assessed is summarised in the table following. The detailed 25 year costs developed by Tropus & Spicer Cost Consultants are included in Appendix 3: The New QEII_P&P_Life Cycle Cost Assessment Report_1. Measures recommended for inclusion or further development have been highlighted. A cost plan setting out detailed costs for each measure is included in the appendix. The body of this report will include a discussion of each opportunity considered. It should be noted that energy and water cost savings have been calculated at current rates and that no inclusion has been made for interest. The measures proposed will be reviewed according to the following categories:
o Legislation
o The Building • Adaptations Proposed • Adaptations Included
o The Landscape
• Adaptations Proposed • Adaptations Included

Adapting Queen Elizabeth II Hospital for Future Climate Final Report - August 2013
Page 46 of 80
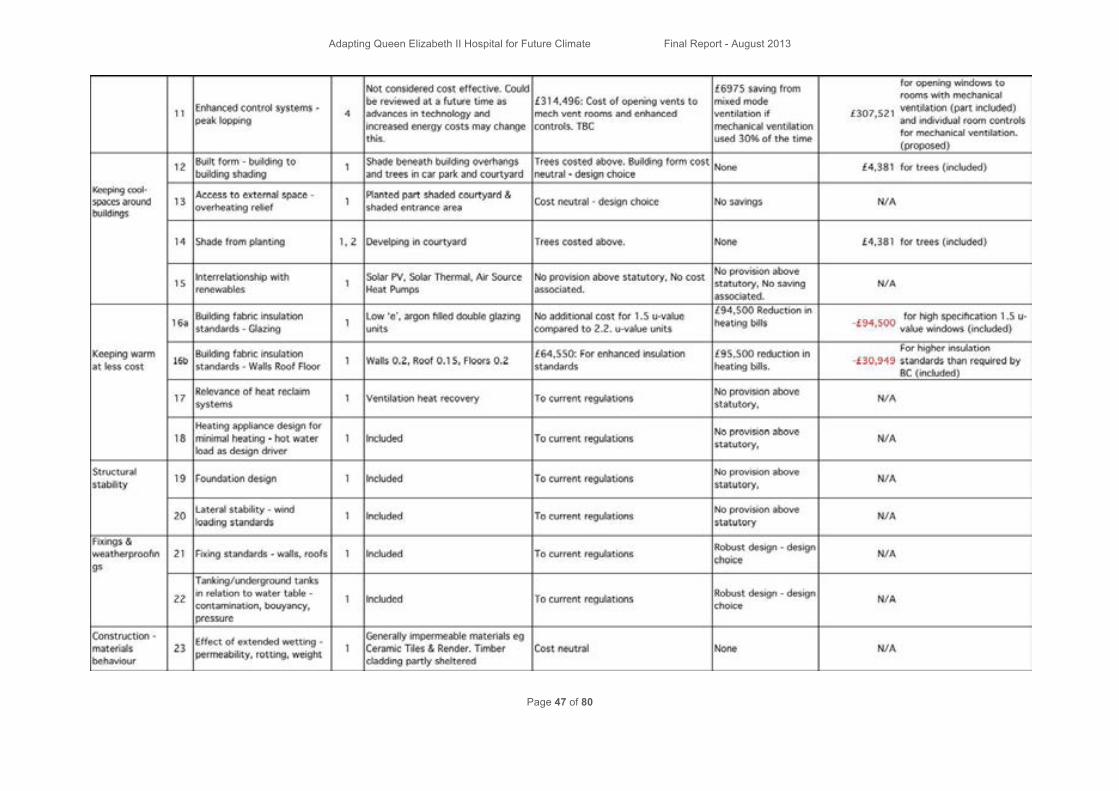
Adapting Queen Elizabeth II Hospital for Future Climate Final Report - August 2013
Page 47 of 80

Adapting Queen Elizabeth II Hospital for Future Climate Final Report - August 2013
Page 48 of 80

Adapting Queen Elizabeth II Hospital for Future Climate Final Report - August 2013
Page 49 of 80

Adapting Queen Elizabeth II Hospital for Future Climate Final Report - August 2013
Page 50 of 80
POTENTIAL ADAPTATION MEASURES OVERRIDDEN BY LEGISLATION A number of the opportunities identified in TSB’s list related to building elements that, in the a building such as The New QEII, are covered by legislation or regulation. In these cases we have not assessed the cost of conforming. As these elements are subject to statute we felt there would be little benefit in interrogating the costs. In the following instances we have conformed to regulation and thus ensured the building is robust enough to withstand the effects of climate change over its 60-year design life: Item 10: Maximum Temperature Legislation: The building’s ventilation system has been designed and tested to ensure that it is in compliance with “HTM Guide 03-01: Specialised Ventilation for Healthcare premises” which states that, during the summer time, internal temperatures in patient areas should not exceed 28℃ (dry bulb) for more than 50 hours per year. Item 15: Interrelationship with Renewable Energy: PV’s, Solar Thermal, and Air Source Heat Pumps have been included in order to meet the planning requirement that 10% of energy used is provided from renewable sources. Item 17: Ventilation Heat Recovery System: Ventilation heat recovery has been provided. This is in compliance with Building Regulation Requirements. Item 18: Heating Design for Minimal Heating – Hot Water Load as Design Driver: The hot water system design is based on the minimum requirement of the building. This is in compliance with Building Regulation requirements. Item 19: Foundation Design: Foundation design is in compliance with Building Regulation requirement, and as such is considered robust enough to cope with climate change events over the 60 year design life. Item 20: Lateral Stability, Wind loading standards: Wind loadings are designed in accordance with BS 6399 which the project team considers to be sufficient in view of the risks associated with this site Item 21: Fixing Standards: Material fixings are designed with robust detailing in compliance with Building Regulation requirements. Detailing is considered to be robust enough to cope with climate change events over the 60-year design life. Item 22: Tanking & Underground Tanks: Designed in Compliance with Building Regulation requirements. Ground water changes are not considered a significant design risk. Item 27: Drain Design: Designed in accordance with “Planning Policy Statement 25: Development and Flood Risk (PPS25): the proposed development should not cause flooding at the site or elsewhere within the catchment for rainfall events up to a 1 in 100 year return period critical duration storm with a 20% increase in the peak rainfall intensity for climate change consideration” Item 30: Flood avoidance, Environmental Agency Guidance: A flood risk assessment has been undertaken which identifies no flood risk for the site.

Adapting Queen Elizabeth II Hospital for Future Climate Final Report - August 2013
Page 51 of 80
ADAPTATION MEASURES INCLUDED: THE BUILDING Item 2: Glass Technologies: The building has been designed with solar control glass to the SE and SW elevations. Our modelling has shown that this helps to reduce overheating by blocking solar gain. We have analysed the energy and overheating impact of including solar control glass to the all elevations, SE and SW elevations, and of not including any. The results are shown in the graphs below. More solar glass results in less overheating and higher energy use.
Our cost analysis indicated that the capital cost of using solar control glass will be £26,482. Solar control glass will also generate an increased energy cost of £5000 over 25 years, which would be due to increased heating bills with reduced solar gain in the winter. This suggests that fixed louvres or tree planting might be a more energy efficient method of shading, as these measures allow more solar gain during the winter than the summer. Fixed louvres, however, would require substantially higher capital investment that would be unlikely to be recovered in energy costs over a 25 year period. Tree planting for shading has been included where possible. Item 3: Green Roofs/Transpiration Cooling: The building has been designed with flat roofs finished with a bio diverse green roof. This will help to reduce overheating through transpiration cooling and to insulate the building during winter. It will also provide important habitats for biodiversity and reduce the speed at which rainwater runs off buildings, reducing flood risk. It is not possible to quantify any energy saving associated with transpiration cooling, however, the roof should contribute both to reduced energy use and increased user comfort. Our cost analysis indicates that the green roof as specified cost an additional £8,785, over a standard gravel finish Item 5: Reflective Materials: Our overheating analysis suggests that reflective and light coloured external materials help to reduce overheating by reducing solar gain. This informed our design process, resulting in a building with glazed ceramic tile and render forming the majority of the external cladding. Both of these materials have strong reflective properties and therefore help to reduce overheating during the summer. There is no capital cost associated with this measure, as it is a factor of architectural specification and design choice. There is negligible energy cost associated with it as any reduction in energy use by the ventilation system in summer is offset by an increase in heating energy use during the winter, when solar gain would otherwise helps to warm the building.
2050's Current Climate 2080's
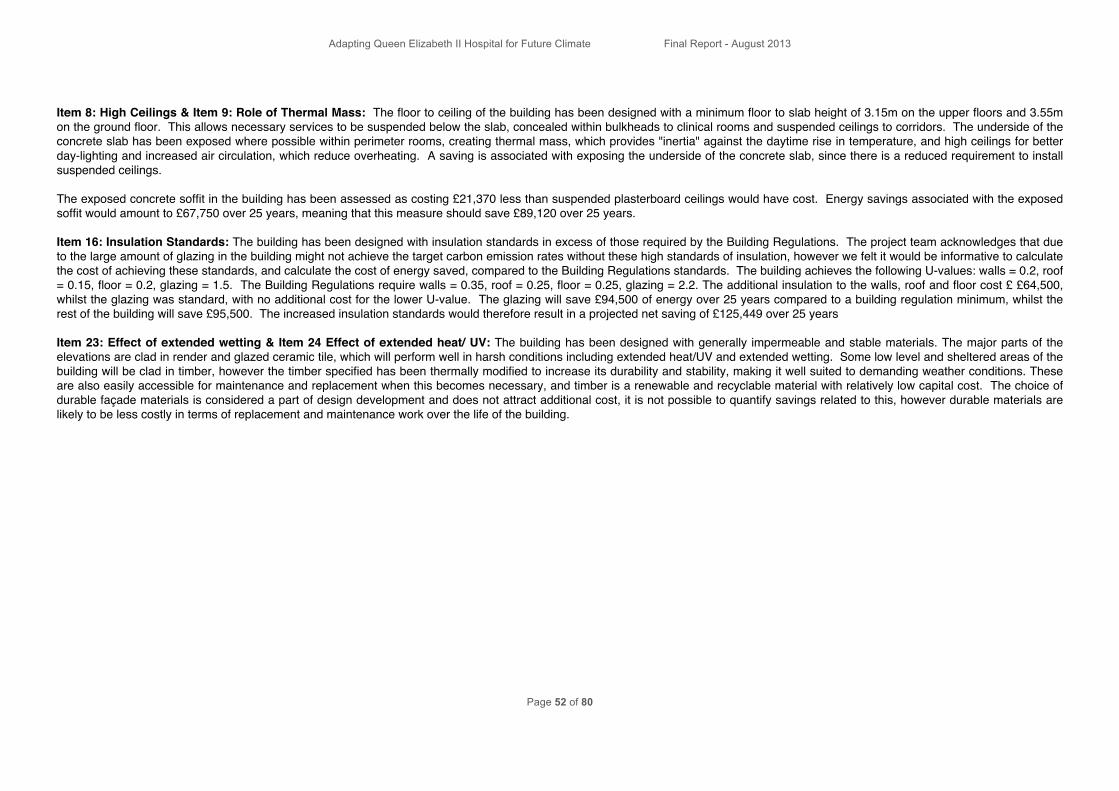
Adapting Queen Elizabeth II Hospital for Future Climate Final Report - August 2013
Page 52 of 80
Item 8: High Ceilings & Item 9: Role of Thermal Mass: The floor to ceiling of the building has been designed with a minimum floor to slab height of 3.15m on the upper floors and 3.55m on the ground floor. This allows necessary services to be suspended below the slab, concealed within bulkheads to clinical rooms and suspended ceilings to corridors. The underside of the concrete slab has been exposed where possible within perimeter rooms, creating thermal mass, which provides "inertia" against the daytime rise in temperature, and high ceilings for better day-lighting and increased air circulation, which reduce overheating. A saving is associated with exposing the underside of the concrete slab, since there is a reduced requirement to install suspended ceilings. The exposed concrete soffit in the building has been assessed as costing £21,370 less than suspended plasterboard ceilings would have cost. Energy savings associated with the exposed soffit would amount to £67,750 over 25 years, meaning that this measure should save £89,120 over 25 years. Item 16: Insulation Standards: The building has been designed with insulation standards in excess of those required by the Building Regulations. The project team acknowledges that due to the large amount of glazing in the building might not achieve the target carbon emission rates without these high standards of insulation, however we felt it would be informative to calculate the cost of achieving these standards, and calculate the cost of energy saved, compared to the Building Regulations standards. The building achieves the following U-values: walls = 0.2, roof = 0.15, floor = 0.2, glazing = 1.5. The Building Regulations require walls = 0.35, roof = 0.25, floor = 0.25, glazing = 2.2. The additional insulation to the walls, roof and floor cost £ £64,500, whilst the glazing was standard, with no additional cost for the lower U-value. The glazing will save £94,500 of energy over 25 years compared to a building regulation minimum, whilst the rest of the building will save £95,500. The increased insulation standards would therefore result in a projected net saving of £125,449 over 25 years Item 23: Effect of extended wetting & Item 24 Effect of extended heat/ UV: The building has been designed with generally impermeable and stable materials. The major parts of the elevations are clad in render and glazed ceramic tile, which will perform well in harsh conditions including extended heat/UV and extended wetting. Some low level and sheltered areas of the building will be clad in timber, however the timber specified has been thermally modified to increase its durability and stability, making it well suited to demanding weather conditions. These are also easily accessible for maintenance and replacement when this becomes necessary, and timber is a renewable and recyclable material with relatively low capital cost. The choice of durable façade materials is considered a part of design development and does not attract additional cost, it is not possible to quantify savings related to this, however durable materials are likely to be less costly in terms of replacement and maintenance work over the life of the building.

Adapting Queen Elizabeth II Hospital for Future Climate Final Report - August 2013
Page 53 of 80
ADAPTATION MEASURES INCLUDED: THE LANDSCAPE The design of the building includes an accessible internal courtyard and a pedestrianised entrance area with cycle rack, protected pedestrian paths, and external seating. The internal courtyard is planted with trees and shrubs and porous materials are being used for hard surfaces. The trees have been assessed as costing the project £5,417 and the pedestrian access, seating, paths and cycle stands as costing £70,370. The landscaping to the external courtyard saves £6,896 when compared to basic asphalt Item 6: Use of Trees for Shading: Use of trees for shading mitigates the conflict between reducing overheating and maximising daylight: The landscape design includes for deciduous trees both to the pedestrianised entrance areas, car park, and central courtyard. These trees provide shading both to external spaces and to the building façade during winter, but drop their leaves in winter allowing the building to make use both solar gain and additional daylight. Item 12: Built Form Building to Building Shading & Item 13: Access to External Space & Item 14: Shade from Planting: The accessible pedestrianised entrance and courtyard are part shaded by building overhangs creating sheltered spaces, and by planted trees. Seating is provided below overhangs and under trees, as well as in sunny areas. People are able to exit from the building to cooler, planted external areas with shaded seating areas. This will help people feel comfortable during warmer future summers. Item 33: Role of Planting and Paving in Modifying Microclimate and Heat Island Effect & Item 38: Increase vegetation if soil has good infiltration qualities Transpiration from the plants and porous surfaces in the courtyard will have a cooling effect on the building and reduce the “Heat Island Effect” associated with building Item 39: Plant heat, drought and pollution resistant plants & Item 40: Species (willows, poplars, and oaks) which should not be specified and they cause low level ozone production under high temperatures & Item 41: Minimise non-porous garden surfaces: P&P has been liaising with the landscape designer to ensure best advantage is taken of shaded areas and tree planting, and to explore the possibility of replacing any impermeable surfaces with permeable. We have also been discussing the specification of trees to suggest that drought resistant, non-ozone producing plants be specified. If the client considers this a desirable measure any alternative planting and hard landscaping specifications will be proposed to the client as part of the ongoing design review of the courtyard. Item 45: Remodel Streets to Encourage Walking Cycling and Public Transport: The pedestrianised entrance area, cycle racks, seating and planting will encourage patients and family to travel to the hospital on foot, by bicycle, or on public transport, which reduces energy use thereby helping to mitigate climate change. Item 28: Sustainable Urban Drainage System: The building design includes sustainable drainage in the form of a surface water attenuation tank with petrol interceptor. SUDS reduce the peaks and troughs of rainwater supply to rivers and streams, decreasing the likelihood of flooding and drought. We have assessed the SUDS system as costing the project £50,700. Item 32: Limitations on Water Features: Limiting water features reduces insect nuisance and water use, mitigating water shortage. The building has been designed without water features, as there was concern that they might pose a health risk on a hospital site. This is an architectural design decision and has no cost impact.

Adapting Queen Elizabeth II Hospital for Future Climate Final Report - August 2013
Page 54 of 80
ADDITIONAL ADAPTATIONS CONSIDERED: THE BUILDING Item 1: Manufactured Shading: Our overheating analysis suggests that by 2080 the building will be subject to significant overheating, and that fixed external louvres would be the most efficient method of shading the building from summer sun. External louvres have the advantage that they can be angled to allow the lower winter sun to penetrate the building, allowing it to benefit from solar gain, reduced heating costs and increased daylighting. In the summer they block the higher summer sun, creating a cooler summer environment. It might therefore prove desirable to fit louvres to the building some time in the mid-century. With this in mind we have considered what would be required to modify the current building design to enable external louvres to be easily retrofitted. This would involve fitting steel flitch plates to the sides of the windows before installation, to which the louvres could later be fixed. Adding flitch plates to the windows has been assessed as attracting an additional cost in the region of £55,000. However, the windows have a design life of between 30-50 years, and the initial building lease will be up for review in 25 years, with the building changing ownership at that point. Advances in shading technology may also take place during this time; therefore the client is likely to decide that expenditure to enable future external shading is not desirable at this point. Item 7: Secure and Bug Free Night Ventilation: The building has been designed with secure opening vents for night time purge ventilation. This helps to reduce overheating by letting cool air into the building at night, cooling the thermal mass of the building, which provides "inertia" against the daytime rise in temperature. However, some building areas will be open 24 hours, and in these areas night time lighting may attract bugs through the opening vents. This may lead to vents being closed at night. In view this happening the team has considered the cost of installing insect mesh to the opening vents in these areas. The cost of this has been assessed as £1854, with an associated £1500 reduction in energy bills over 25 years. The measure would lead to a net cost of £356 and reduced overheating. Details and specifications of the insect mesh are included in Appendix 3: The New QEII_P&P_Drawing 498-A-634-06-Vent Panel in Terracotta Cladding; The New QEII_P&P_Drawing 498-A-634-07-Vent Panel in Render_A & The New QEII_P&P_Specification 498-06B-L Windows/Doors/Stairs_1. Item 11: Peak Lopping (Mixed Mode Ventilation): The New QE2 Hospital is part naturally ventilated, with mechanical ventilation provided to rooms without the possibility of opening windows and those that require a particularly high number of air changes for clinical reasons. Some of these rooms have been provided with opening windows for night-time purge ventilation and for future flexibility. Mechanically ventilated rooms do not have the controls required to turn off the ventilation individually, or according to user preference. As these rooms may be used flexibly, if mechanically ventilated rooms with an external wall are provided both with individual ventilation controls and opening windows, they could be ventilated naturally when appropriate. We were advised that the cost of supplying and installing the additional ventilation dampers and control systems to accommodate this would cost around £1350 per room. When the cost of opening vents in place of fixed vents is added to this the additional cost of accommodating the peak lopping would be £292,240. If rooms with mixed mode ventilation were naturally ventilated 30% of the time this would lead to a saving of £6975 over 25 years. The mixed mode ventilation would have a net cost of £285,260 to the project over 25 years, which would not be cost effective. Item 25: Low water use fittings: In order to meet BREEAM requirements, water saving fitting have been specified to WC’s and kitchen areas. Water saving fittings have not been specified to clinical areas as these are subject to dispensation from the BREEAM requirements. We assessed the cost to the project of providing water saving fittings to the WC’s and kitchen areas, and any additional cost attached to changing to water saving fittings in the clinical areas. We also calculated the likely 25 year savings in water bills generated by the water saving fittings. The water saving fittings currently specified (to WC’s and kitchens) attract no additional cost to the project, and create water savings worth £12,456.72 over 25 years. Our assessment suggests that changing to water saving fittings in clinical areas could save the project £26,030 in capital costs and £1626 of water savings, a net saving of £27,656. Water saving fittings mitigates water shortages caused by hotter, drier, summers. The cost information is supported by the following information included in Appendix 3: The New QEII_P&P_Armitage Shanks Sanitaryware NBS Specification_1; The New QEII_P&P_Armitage Shanks Sanitaryware Quote_1 & The New QEII_P&P_Sensorflow 21 DataSheet_1.
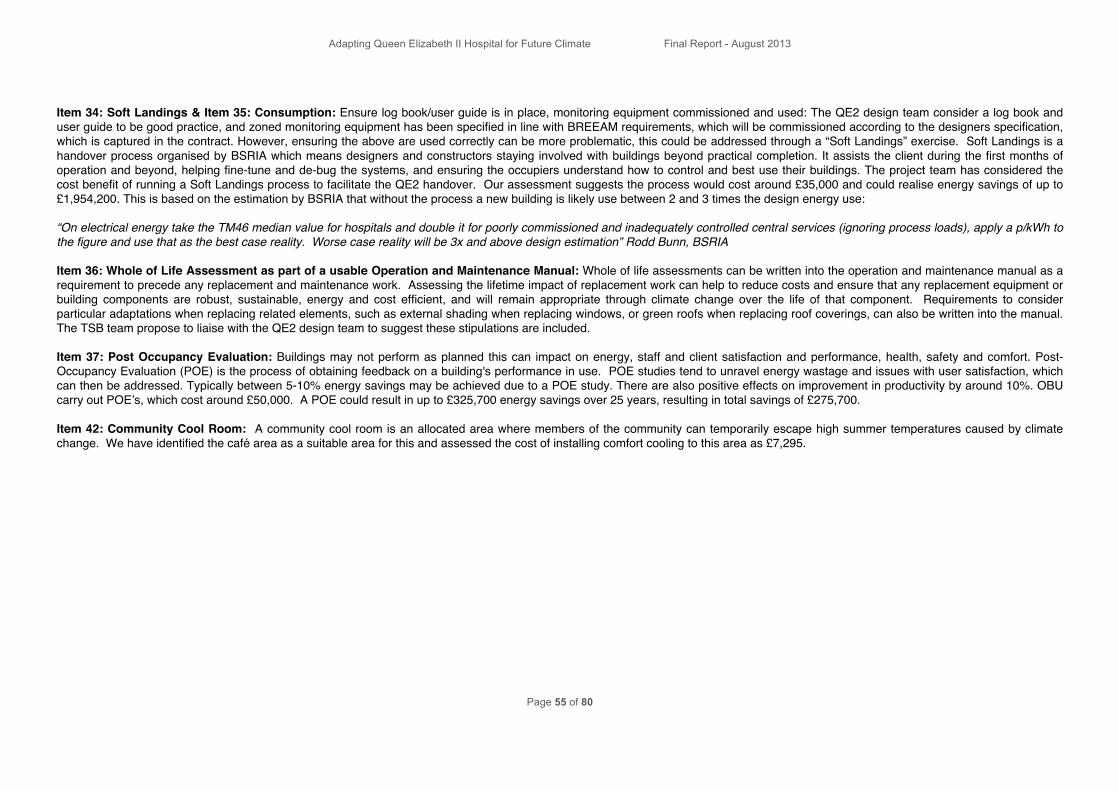
Adapting Queen Elizabeth II Hospital for Future Climate Final Report - August 2013
Page 55 of 80
Item 34: Soft Landings & Item 35: Consumption: Ensure log book/user guide is in place, monitoring equipment commissioned and used: The QE2 design team consider a log book and user guide to be good practice, and zoned monitoring equipment has been specified in line with BREEAM requirements, which will be commissioned according to the designers specification, which is captured in the contract. However, ensuring the above are used correctly can be more problematic, this could be addressed through a “Soft Landings” exercise. Soft Landings is a handover process organised by BSRIA which means designers and constructors staying involved with buildings beyond practical completion. It assists the client during the first months of operation and beyond, helping fine-tune and de-bug the systems, and ensuring the occupiers understand how to control and best use their buildings. The project team has considered the cost benefit of running a Soft Landings process to facilitate the QE2 handover. Our assessment suggests the process would cost around £35,000 and could realise energy savings of up to £1,954,200. This is based on the estimation by BSRIA that without the process a new building is likely use between 2 and 3 times the design energy use: “On electrical energy take the TM46 median value for hospitals and double it for poorly commissioned and inadequately controlled central services (ignoring process loads), apply a p/kWh to the figure and use that as the best case reality. Worse case reality will be 3x and above design estimation” Rodd Bunn, BSRIA Item 36: Whole of Life Assessment as part of a usable Operation and Maintenance Manual: Whole of life assessments can be written into the operation and maintenance manual as a requirement to precede any replacement and maintenance work. Assessing the lifetime impact of replacement work can help to reduce costs and ensure that any replacement equipment or building components are robust, sustainable, energy and cost efficient, and will remain appropriate through climate change over the life of that component. Requirements to consider particular adaptations when replacing related elements, such as external shading when replacing windows, or green roofs when replacing roof coverings, can also be written into the manual. The TSB team propose to liaise with the QE2 design team to suggest these stipulations are included. Item 37: Post Occupancy Evaluation: Buildings may not perform as planned this can impact on energy, staff and client satisfaction and performance, health, safety and comfort. Post-Occupancy Evaluation (POE) is the process of obtaining feedback on a building's performance in use. POE studies tend to unravel energy wastage and issues with user satisfaction, which can then be addressed. Typically between 5-10% energy savings may be achieved due to a POE study. There are also positive effects on improvement in productivity by around 10%. OBU carry out POE’s, which cost around £50,000. A POE could result in up to £325,700 energy savings over 25 years, resulting in total savings of £275,700. Item 42: Community Cool Room: A community cool room is an allocated area where members of the community can temporarily escape high summer temperatures caused by climate change. We have identified the café area as a suitable area for this and assessed the cost of installing comfort cooling to this area as £7,295.

Adapting Queen Elizabeth II Hospital for Future Climate Final Report - August 2013
Page 56 of 80
ADAPTATIONS MEASURES CONSIDERED: THE LANDSCAPE Item 26: Rainwater harvesting & Item 31 Irrigation Techniques: Rainwater harvesting also mitigates water shortages, and can allow irrigation to continue through national water shortages. This means that planting with higher transpiration rates can be used, which has a greater cooling effect on external spaces around buildings and reduces the urban heat island effect. The New QE2 was initially designed with a rainwater harvesting system serving all WC’s. This was omitted due to concerns over staining of sanitary ware. The omission of this system saved the project £49.570 in capital costs. It would have been likely to generate water savings of £33,936 over 25 years, resulting in a net cost of £15,634 over 25 years. The project team also investigated the cost of installing an alternative system, which would harvest the rainwater only for irrigation purposes. Our cost assessment suggests an irrigation-only system would cost £43,503. The irrigation system would be designed as a “leaky pipe” drip feed system with buried pipes to supply water below ground. This type of system uses 30-50% less water than sprinkler based systems, where water is wasted through evaporation. It would allow for a more densely planted, lush courtyard, which would create transpiration cooling in the external areas of the building. The value of cooling and environmental effect cannot however be assessed, and water savings would be unlikely as without the irrigation it is likely that the courtyard would be designed to need very little irrigation.
OTHER DESIRABLE MEASURES CONSIDERED The following measures were suggested by the design team for consideration. These measures should properly be considered mitigation, as they reduce the carbon emissions of the building, but do not improve the performance of the building under future climatic conditions. The team felt it appropriate to recommend measures that reduced carbon emissions and therefore the effect of emissions on the climate, if they proved financially viable. Item 44a: Switch Off Street Lights for Periods of the Night: The New QE2 will operate a 24 hour local A&E. As a result both staff and patient car parks will be in use 24 hours a day. However, usage will be substantially lower than during the centre’s daytime operating hours. The project team have investigated the possibility of only lighting the patient car park outside of daytime operating hours. This would reduce energy use, mitigating climate change, and also reduce light pollution. However, it would involve a review of the car parking strategy, as staff would need to park in the patient car park at night, or use a small section adjacent to the patient car park, which would remain lit. This might make the strategy impractical in this case. Our assessment suggest that only lighting the patient car park outside of daytime operating hours would attract an additional cost of £1855, for creating an additional lighting zone. The strategy could save £32,000 in energy bills over 25 years, resulting in a net saving of 30,145 over 25 years.
Item 44b: Use More Energy Efficient Lights: External lights are currently specified with Metal Halide and Fluorescent bulbs. LED lights can be somewhat more expensive but the light they provide is directional, reducing light spillage into the environment. This reduces light pollution and saves energy. LED bulb also only need to be replaced after an average of 25 years, compared to an average of every 5 years for Metal Halide and Fluorescent. This can lead to a substantial saving over the life of the building. The project team has reviewed the cost and energy savings related to a change to LED external lights. Our analysis suggests that a change to LED’s would attract an increase in capital cost of £4485. They would generate a saving in replacement bulbs of £6719.80, and an energy saving of £53,000 over 25 years. The net saving related to LED’s would be £55,235. An LED lighting layout & quote supporting the cost information in included in Appendix 3: The New QEII_P&P_Advanced LEDs Relux Hospital Car Park Lighting Report_1 & The New QEII_P&P_Advanced LEDs QEII Hospital Car Park Lighting Quote_1

Adapting Queen Elizabeth II Hospital for Future Climate Final Report - August 2013
Page 57 of 80
SECTION 3D: DETAILS OF WHICH RECOMMENDATIONS ARE BEING IMPLEMENTED ON THIS BUILDING AND ANY BARRIERS TO IMPLEMENTATION
ADAPTATIONS INCLUDED IN THE DESIGN The following measures, described above, have already been integrated into the building design: Measures required by legislation
o Item 10: Maximum Temperature Legislation: Compliance with “HTM Guide 03-01: Specialised Ventilation for Healthcare premises” o Item 15: Interrelationship with Renewable Energy: PV’s, Solar Thermal, and Air Source Heat Pumps Included o Item 17: Ventilation Heat Recovery System: Ventilation heat recovery has been provided. o Item 18: Heating Design for Minimal Heating – Hot Water Load as Design Driver: The hot water system design is based on the minimum requirement of the building. o Item 19: Foundation Design: Foundation design is robust enough to cope with climate change events over the 60 year design life. o Item 20: Lateral Stability, Wind loading standards: Wind loadings are designed in accordance with BS 6399 o Item 21: Fixing Standards: Material fixings are designed with robust detailing. o Item 22: Tanking & Underground Tanks: Designed in Compliance with Building Regulation requirements. o Item 27: Drain Design: Designed in accordance with “Planning Policy Statement 25: Development and Flood Risk (PPS25) o Item 30: Flood avoidance, Environmental Agency Guidance: A flood risk assessment has been undertaken which identifies no flood risk for the site.
Measures as part of a Sustainable Design
o Item 2: Glass Technologies: Solar control glazing to SE and SW elevations o Item 3: Green Roofs/Transpiration Cooling: Bio-diverse green roof to flat roofs o Item 5: Reflective Materials: Glazed ceramic tile and white render to majority of the elevations o Item 6: Use of Trees for Shading: Deciduous trees shading the building mitigate the conflict between reducing overheating and maximising daylight. o Item 8: High Ceilings: High ceilings within perimeter rooms o Item 9: Role of Thermal Mass: Exposed concrete soffit within perimeter rooms o Item 12: Built Form, Building to Building Shading: Overhangs to entrance and courtyard o Item 13: Access to External Space: Pedestrianised entrance area and accessible courtyard o Item 14: Shade from Planting: Seating and pedestrian paths are shaded by overhangs and under trees, o Item 16: Insulation Standards: U values in excess of building regulations minimums. The New QE2: walls = 0.2, roof = 0.15, floor = 0.2, glazing = 1.5. Building Regulations: 0.35,
roof = 0.25, floor = 0.25, glazing = 2.2. o Item 23: Effect of extended wetting & Item 24 Effect of extended heat/ UV: Durable materials specified, glazed ceramic tile and white render to majority of the elevations. Durable,
heat-treated timber to accessible sheltered areas. o Item 28: Sustainable Urban Drainage System: The building design includes a surface water attenuation tank with petrol interceptor. o Item 32: Limitations on Water Features: The building has been designed without water features o Item 35: Consumption: Ensure log book/user guide is in place, monitoring equipment commissioned and used: a log book , user guide, and zoned monitoring equipment
have been specified in line with BREEAM requirements o Item 45: Remodel Streets to Encourage Walking Cycling and Public Transport: Pedestrianised entrance area, cycle racks, seating and planting

Adapting Queen Elizabeth II Hospital for Future Climate Final Report - August 2013
Page 58 of 80
ADAPTATIONS TO BE DEVELOPED IN THE DESIGN The following measures are under development as part of the buildings sustainable aspiration. Modification of these items need not impact on capital cost and they are recommended for review in light of D4FC findings to ensure opportunities are fully exploited. These items have been listed within the contract as “reviewable design data” so it is within the clients remit to request any changes that can be accommodated within the existing budget.
o Item 33: Role of Planting and Paving in Modifying Microclimate and Heat Island Effect: Planting and permeable surfaces to be maximised in courtyard o Item 38: Increase vegetation if soil has good infiltration qualities: Native planting to be increased to hedge gardens o Item 39: Plant heat, drought and pollution resistant plants: Planting specification to be to be reviewed for drought resistance. o Item 40: Species (willows, poplars, and oaks) which should not be specified and they cause low level ozone production under high temperatures: Planting specification to
be reviewed for ozone creating plants o Item 41: Minimise non-porous garden surfaces: Permeable surfaces to be maximised in courtyard and garden areas
Measures Recommended for Implementation Now The following measures have been found to be effective and offer cost benefit over 25 years. They are recommended for integration into the project at this time. Any barriers to implementation are described below.
o Item 7: Secure and Bug Free Night Ventilation: The building has been designed with secure opening vents for night time purge ventilation. However, some building areas will be open 24 hours, and in these areas bugs may cause problems. Insect mesh to these areas could be installed at minimal cost, which would be recovered through energy cost savings over 25 years. Installation of mesh is recommended in order to ensure the building operates as designed. This item has been listed within the contract as “reviewable design data” so it is within the clients remit to request the required changes. The client believes that the small cost involved in this modification can be met.
o Item 25: Low water use fittings: Changing to water saving fittings in clinical areas could save the project £26,000 in capital costs and £1626 of water savings, a net saving of £27,656. This adaptation would be effective, save capital cost and create lifetime energy savings, and is therefore recommended for integration. The change will need to be reviewed by the NHS infection control officer to ensure fittings remain compliant with requirements. This item has been listed within the contract as “reviewable design data” so it is within the clients remit to request the required changes. If the capital cost savings described above can be realised then cost will not be an issue.
o Item 34: Soft Landings: A “Soft Landings” exercise would be likely to save a substantial amount money, energy, and water, and increase user satisfaction, though user education and systems “debugging”. The client has advised that they have their own, similar, handover process but it is recommended that this process be reviewed to ensure it covers all elements, which would be addressed by Soft Landings. It is hoped that any modifications to the existing handover process do not attract additional cost.
o Item 36: Whole of Life Assessment as part of a usable Operation and Maintenance Manual: Whole of life assessments written into the operation and maintenance manual as a requirement to precede any replacement and maintenance work would be cost neutral and would be likely to create lifetime cost savings and increase the buildings’ future resilience to climate change. It is recommended that this requirement be added to the O & M manual.
o Item 37: Post Occupancy Evaluation: ACP, the developer client, is obliged to carry out a Post-Occupancy energy assessment. It is recommended that this be extended into a full Post-Occupancy Evaluation. Ideally this would be an independent review and the engagement of a University partner would be considered to bring credibility and academic rigour. No funds are currently available for this but the Client is keen to investigate options. OBU carry out POE’s, which cost around £50,000. A POE could result in up to £325,700 energy savings over 25 years, resulting in total savings of £275,700.
o Item 44: Switch Off Street Lights for Periods of the Night or Use More Energy Efficient Lights: Only lighting the part of the car park outside of daytime operating hours would reduce energy use and light pollution. This would attract minimal capital cost increase and generate a substantial saving in energy bills over 25 years. The client would need to review the management strategy to ensure that this was operationally feasible. A change to lower energy LED lights would involve minimal increased capital costs and generate substantial savings, with no operational impact. These measures are recommended for implementation. This item is listed as “reviewable design data” so it is within the clients remit to request changes. A capital cost increase of up to £5000 might need to be met. However it is hoped that this cost might be reduced.

Adapting Queen Elizabeth II Hospital for Future Climate Final Report - August 2013
Page 59 of 80
MEASURES RECOMMENDED FOR FUTURE REVIEW The following measures are not currently required and integration at this time would offer no cost benefit. They are recommended for future review.
o Item 1: Manufactured Shading: Our overheating analysis suggests that by 2080 the building will require some additional external shading. Modifying the windows at this point, in order to enable louvres to be fixed in the future is unlikely to be cost effective and may also limit future shading options. As the windows have a design life of 30-50 years It is recommended that shading options be reviewed at such time that window replacement work is undertaken.
o Item 42: Community Cool Room: A community cool room is unnecessary at this point, but may become desirable in the future. Currently the café has been allocated as a suitable area but the use of this space may change over time, as may the building use. It is unlikely that retrofitting local comfort cooling would be significantly more expensive that fitting it now, and advances in technology may allow for more efficient or less expensive cooling. It is therefore recommended that providing a community cool room be reviewed after 25 years, should the building remain as a community facility.

Adapting Queen Elizabeth II Hospital for Future Climate Final Report - August 2013
Page 60 of 80
SECTION 4: LEARNING FROM THE WORK SECTION 4A: SUMMARY OF OUR APPROACH TO THE ADAPTATION DESIGN WORK
Our approach to developing an adaptation strategy for the buildings was as follows:
o Assess the Specific Climate Change Risk For The Building & Users: Identify the risks and exposure of the building to the projected future climate, by evaluating the impact of future climatic condition on the building, taking into account the following:
UK Climate Change Projections Local Environmental Features Specific to the Site User Vulnerabilities The New QEII Building Characteristics Vulnerability of the Locality to Climate Change Impacts
The Oxford Institute for Sustainable Development has developed a methodology for climate change risk analysis based on UKCP09 Weather Generator, which described in more detail in Appendix 2.
o Identify the Climate Change Scenarios for which we will design adaptations
o Undertake Desktop Analysis of the list of design opportunities put forward by The Technology Strategy Board (Bill Gething “Design for Future Climate, an adaptation agenda for
the built environment” 2010). Propose additional adaptation measures if appropriate. Review opportunities and adaptations according to the following categories
Comfort and energy Construction Water
o Undertake Overheating Analyses: of the following:
The Existing Design for the Building Appropriate Adaptations which can be Simulated

Adapting Queen Elizabeth II Hospital for Future Climate Final Report - August 2013
Page 61 of 80
o Review Adaptation Opportunities and Select Suitable Adaptation Measures for Development: Review the following possible adaptation opportunities at project team and stakeholder workshops. Agree with the client which opportunities will be developed for costing.
List of design opportunities put forward by The Technology Strategy Board (ref Bill Gething “Design for Future Climate, an adaptation agenda for the built
environment” 2010) Additional opportunities proposed by the design team
As the design was already advanced, a methodology was adopted to evaluate measures already incorporated in the design as well as future recommendations. This is describe in detail earlier in this report
o Assess the Cost Benefit of Selected Adaptation Measures: Develop adaptation measures to enable the following budget costs to be established:
Additional capital cost for including the selected measure 25 year energy and water costs or savings associated with the measure
o Agree Uptake of Recommended Adaptations: Discuss cost benefit findings at a stakeholder workshop attended by the clients and relevant parties, to explore take-up of
recommendations. Agree which measures will be taken up.
o Disseminate Design Information: Disseminate information on selected adaptations to the design team to allow these adaptations to be progressed as part of the built project.
o Reporting And Dissemination: Issue the final TSB report to the client, together with a brief summary of key findings. Identify appropriate conferences and events will for dissemination of this report and findings. Explore opportunities to involve the client and the contractor in this process.

Adapting Queen Elizabeth II Hospital for Future Climate Final Report - August 2013
Page 62 of 80
SECTION 4B: WHO WAS INVOLVED IN THE WORK
The Project team comprised of Penoyre & Prasad, Oxford Institute for Sustainable Development, Tropus & Spicer Quantity Surveyors, Building Services Design Service Engineers, and URS Scott Wilson Structural Engineers. P&P, T&S, BSD & URS formed the core design team for the New QEII building. All the consultants had in-depth knowledge of the existing design strategies for the building. They were in a strong position to capture and provide case study data, to advise on the extent to which the current designs may be able to accommodate climate change adaptation, and act on the adaptation strategy recommendations where implemented. OISD, T&S, BSD, and URS were appointed as sub-contractors to Penoyre & Prasad.
o Penoyre & Prasad (P&P): the architect and lead designer for the new QEII hospital. P&P was the lead partner on the TSB D4FC work, responsible for overall project management. Since their ground-breaking, low-energy educational visitors centre in Dagenham in 1995, Penoyre &Prasad has been at the forefront in creating low energy, low environmental impact buildings that have been seen as exemplars for the construction industry. As RIBA President 2007–2009, Sunand Prasad was responsible for a number of initiatives to up skill the profession, lobby and advise government on low carbon design, and was voted 26th in the Independent’s top 100 environmentalists list. He continues to represent the profession internationally on the issue of climate change and is on the Mayor of London's Design Panel to advise the Mayor on carbon reduction in the capital. Penoyre &Prasad’s thorough understanding of the evolving design for the New QEII will enable them to identify opportunities to innovate and adapt, and to guide the design process in parallel with the adaption strategy to maximise effectiveness.
o Oxford Institute for Sustainable Development (OISD) at Oxford Brookes University: experts in climate change impact modeling, risk assessment and adaptation. OISD were lead consultant for climate change risk assessment, options appraisal and modeling. P&P and OISD have an existing relationship working together on strategic sustainability projects, including the Technology Strategy Board’s “Retrofit for the Future” and “Building Performance Evaluation Competition” projects. The Oxford Institute for Sustainable Development (OISD) at Oxford Brookes University is the largest academic research institute in the UK dedicated to research on sustainable development in the built environment. The Low Carbon Building (LCB) group at OISD holds world-leading expertise in carbon counting and climate change adaptation of buildings and cities. Professor Rajat Gupta, Director of LCB group is the Principal Investigator from OISD for this project.
o Tropus and Spicer (T&S): Quantity surveyors T&S are experienced cost consultants with a strong commitment to developing sustainable communities and environmental solutions. Their on-going objective is to contribute to the project team effort to address the wider effects of global climatic change and support a better client understanding of the issues from the building economics perspective. As the authors of the current cost plan for QEII they are ideally placed to continue this work in producing advice on valuations and costs for the adaptation plan report.
o Building Services Design (BSD): Service engineers and BREEAM assessors
BSD has extensive experience in sustainability and renewable technologies, and a wide skill base including computer modelling and BREEAM assessments. Their work helps clients to identify, design and implement 'lean clean and green solutions'. Their track record in sustainable design has won them many of their major projects in recent years, including several associated with the 2012 Olympic Games.
o URS Scott Wilson Ltd: Structural engineers
URS are part of a global Environmental and Engineering firm providing multidisciplinary services to the Public and Private Sector, for some of the most innovative buildings around the UK. Sustainable design and construction is at the forefront of their work. They work closely with the design team, advising where structure can make a major contribution to a holistic sustainable solution, reducing energy need and CO2 emissions by the use of the structure as thermal mass and considering minimising embedded energy.

Adapting Queen Elizabeth II Hospital for Future Climate Final Report - August 2013
Page 63 of 80
SECTION 4C: HOW THE INITIAL PROJECT PLAN CHANGED
The TSB D4FC for The New QEII project has evolved considerably since its inception:
o The completion date has been extended o The SWOT analysis of TSB’s suggested adaptation measures was replaced with a workshop based grading method o Adaptation measures already included in the designed project were assessed o We focused on cost neutral adaptation measures o Additional modeling work has been undertaken o The cost benefit analysis was much more involved than expected o Minimal construction detailing was necessary
The initial plan was to finish the project in April 2013. The building project was delayed through repeated revisions to the brief, value engineering, and an extended Financial Close process (the process of agreeing the construction contract). This led to revisions to our approach to the work and additional modeling work being undertaken. Subcontractor performance on the TSB work was impacted both directly, as their work become more complex and indirectly, as their resources were redirected towards the financial close effort. As a result the deadline for the final report was extended to August 2013. A cost limit was agreed for The New QEII at the completion of Stage 1 (Prior to Stage D), before the TSB project was joined. Brief revisions, and subsequent value engineering meant that there was very limited possibility to incorporate adaptation measures that would require capital expenditure. Two mitigation strategies were developed over the course of the project: First, adaptation measures already included in the designed project were assessed, and second, cost neutral adaptation measures were developed for recommendation. As the project had been designed with a sustainable agenda and the target of achieving BREEAM “Excellent”, a number of adaptation measures had already been incorporated, though without systematic assessment. These had to be brought into the picture with a robust way of assessing them in terms of efficacy and cost and other factors. In place of a SWOT analysis as envisaged by the TSB guidance we implemented an alternative workshop based way of analysing both the already included and potential additional measures by a process of grading measures, through discussion with relevant designers and stakeholders. The method is described in detail earlier in this report. Assessing the 25 year cost of adaptation measures included in the project proved to be a complex and testing exercise. It involved extensive engagement with the quantity surveyor, who was unfamiliar with the concept and the method for this assessment. P&P’s resources were directed away from detailing adaptation measures, which proved not to be necessary, and into establishing what would be costed and how, producing specifications, obtaining lighting layouts, and identifying elements and areas that had been adapted. In order to complete the 25 year costing an assessment of energy and water savings was needed. This meant that the IES model needed to be adapted to represent a notional building that did not include these adaptations, to provide a basis for comparison. OBU also produced additional energy consumption figures, which fed into the cost benefit analysis. The whole process took around 4 months to complete, much longer than anticipated. The focus on cost neutral adaptation measures proved to be an effective strategy. When combined with the workshop based approach to adaptation selection and assessment of the benefits of adaptation measures already included, as described above, it led to a high level of uptake of our recommendations. Because energy, water, and replacement costs were factored into cost assessment recommended measures also tended to be sustainable measures. It also meant that recommended adaptations generally took the form of adjusted management strategies, specifications, layouts, and equipment zoning. These changes do not require the construction design development and detailing that we had envisaged. Some detailing was undertaken for the mesh to night time vents but even this was not vital to the adaptation costing and selection process which was the main focus of our work. External shading might have required construction detailing but our modeling work proved that this would not be necessary or cost effective during the 25 year term of the building’s lease. Enabling methods would also be expensive and likely to prove to be abortive by the time the shading was required. As a result much less drawing work was required than expected.

Adapting Queen Elizabeth II Hospital for Future Climate Final Report - August 2013
Page 64 of 80
SECTION 4D: RESOURCES AND TOOLS
This project used the following resources and tools. All resources and tools used in this project are carefully selected based on our knowledge; therefore they are recommended for other projects. The strengths and limitations of these resources and tools are listed below. Engagement and Assessment Tools Stakeholder Workshops Workshops were used throughout the project to introduce the work, discuss findings and recommendations, and agree uptake. They were very successful tools that resulted in increased client engagement and knowledge sharing. Adaptation Grading Methodology A grading methodology was used to assess adaptation opportunities according to their suitability for inclusion in The New QEII hospital building. This was found to be a simple, effective, and replicable assessment tool. 25 Year Cost Assessment We used a 25 year cost assessment process to establish the financial viablilty of adaptations. This proved to be a clear and effective way of expressing financial value, but was resource intensive to produce. Overheating Guidance CIBSE Overheating Guidance The CIBSE benchmark of overheating for offices is 1% annual occupied hours over operative temperature of 28°C. It is a simple definition of overheating and widely used by practitioners. BS EN 15251 Overheating Guidance The adaptive comfort limits mentioned in BS EN 15251 standard are based on a daily running mean outdoor temperature. HTM03 Overheating Guidance Health Technical Memorandum 03-01 – ‘Specialised ventilation in healthcare premises’ Part A (Department of Health 2007) which deals with the design and installation of ventilation systems for healthcare buildings recommends that internal dry bulb temperatures in patient areas should not exceed 28oC for more than 50 hours per year. Climate and weather data UKCP09 The UK Climate Projections (UKCP09) gives climate information for the UK up to the end of this century. Projections of future changes to our climate are provided, based on simulations from climate models. The purpose of providing information on the possible future climate is to help those needing to plan how they will adapt to help society and the natural environment to cope with a changing climate. UKCP09 Weather Generator UKCP09 Weather Generator is a downscaling tool that can be used to generate statistically plausible daily and hourly time series. These time series comprise a set of climate variables at a 5 km2 resolution that are consistent with the underlying 25 km2 resolution climate projections.. This tool can be time consuming to use when generating hourly and daily data. Does not support batch processing.

Adapting Queen Elizabeth II Hospital for Future Climate Final Report - August 2013
Page 65 of 80
UKCP09 Threshold Detector The UKCP09 Threshold Detector is a post-processing tool that can be applied to the output from the Weather Generator. It allows users to define their own basic weather events made up of simple conditions such as temperatures or daily rainfall totals greater/lower than a certain threshold. The Threshold Detector could count the number of occurrences of the prescribed event. It also produces a set of summary statistics across all the runs. PROMETHEUS weather data PROMETHEUS weather data is created at Centre for Energy and the Environment, University of Exeter under EPSRC funding. The weather data is in EPW format which is already for use for most of building simulation tools. DView DView is free software developed by US National Renewable Energy Laboratory. The epw weather files could simply be loaded for visualizing hourly, monthly values and cumulative distribution of hourly values. Graphic comparisons of different weather data are also can be made in this tool. MATLAB MATLAB is a powerful numerical computing programming language developed by MathWorks. A function was created by the author to quickly calculate adaptive thermal comfort limits based on external weather data. MATLAB also helps post-processing numerical outputs from thermal modelling software. Programming experience is needed to use this tool. Thermal modeling tools IES ApacheSim IES is market leading environmental building modelling software. Detailed building level climate change impact analysis is being undertaken through building thermal simulation modelling in IES ApacheSim. IES ApacheSim was selected partly due to the wide international usage by both research and practice communities, and partly due to the extensive historical testing and verification (Gough and Rees 2004). IES VE does not support batch post-processing of simulation results Ecotect Autodesk Ecotect is an environmental analysis tool for architects. Powerful shading design component was employed for optimizing external shading device.
Adapting Queen Elizabeth II Hospital for Future Climate Final Report - August 2013
Page 66 of 80
SECTION 4E: EVALUATING OUR APPROACH
Climate Change Risk Assessment Our climate change risk assessment was based on UKCP09 Weather Data and IES modeling. These tools provided thorough and detailed data for temperature and precipitation predictions. However, they were not capable of providing this level of data for risks relating to wind and flooding. Empirical data was used for these elements. As overheating is one of the biggest problems relating to climate change, and the risk of flooding and high winds at the QEII site was considered low, this did not pose a particular problem. However, for buildings where wind and flooding pose a higher risk more detailed projection and evaluation tools would be beneficial. We considered three overheating metrics in our risk assessments and analysis, which provided a good overview, but was quite complex. If the government and professional bodies are to introduce a requirement for designers and developers to undertake future climate overheating risk analyses for new buildings then there is a need for consistent overheating metrics. This involves agreeing on an appropriate overheating risk criterion and using a standardized calculation method for assessing risk and future climate data. The metrics may differ for building typologies and occupant categories but should have a common approach. Building Performance Modeling: Building performance modeling tools are limited in their scope. As a result we were only able to use this tool to assess building adaptations that related to overheating. Other measures, such as transpiration cooling from the green roof and external planting, SUDS and permeable surfaces, rainwater irrigation, and the performance of building materials and construction detailing under future climatic conditions could not be assessed. Modeling offers accurate and comprehensive outputs, but these are dependant on detailed information being input. As our model was built at an early stage, some of the construction detail, including external materials and ventilation strategy, was not fully resolved default settings were included. This led to some of the work having to be revisited at a later stage. It might be advantageous to use a simpler tool to make early stage assessments. The IES model is also very slow when running different scenarios. If the designer wishes to optimize an adaption they must make a guess at the optimal settings and rerun the simulation until they arrive at the best result. We found that time and resource limitations meant that researchers and service engineers could be unwilling to engage in an optimization process, or to rerun the simulations to investigate issues raised through our research. In these instances use of the modeling tool was found to reduce creative and intelligent engagement with the problem. Risk mitigation and Client Engagement The New QEII project had been already been contracted and the budget was fixed when adaptations were selected, therefore the risk of adaptations not being taken up was considered high. We followed two strategies to mitigate this:
o Adaptation measures already included in the design were reviewed for cost benefit, energy savings, and effectiveness o Focus on cost neutral adaptation measures
The New QE2 was commissioned with a sustainable agenda and many adaptation measures were included as part of the design. Evaluating these measures added to the climate change knowledge base. However it was also particularly successful in terms of client engagement, as we were able to illustrate the advantages in terms of sustainability and energy cost savings over time. Reviewing these successful strategies set a positive tone to the workshop, leading to greater engagement. However, obtaining a cost benefit analysis for adaptations already included in the design proved to be a difficult and time consuming experience. The task was unfamiliar to the quantity surveyor and very high levels of co-ordination, and guidance were required. It was also necessary to undertake additional modeling work to obtain energy saving data. We had considerably under estimated the length and cost of this process.

Adapting Queen Elizabeth II Hospital for Future Climate Final Report - August 2013
Page 67 of 80
Our recommendations were focused on cost neutral adaptation measures, which led to high levels of uptake by the client. This also led to decisions being driven by the cost benefit analysis. Adaptation measures which required capital expenditure and could not demonstrate energy saving were unlikely to be taken up. Energy savings might not be evident either because the tools were not available to assess energy saving or because they did not save energy or water. Focusing on cost neutral measures may lead to those measures that improve thermal comfort without providing energy savings being overlooked. There is a need to develop a methodology to quantify the health benefits of adaptation measures. Workshop Based Adaptation Analysis and Grading Our method for adaptation selection was developed from the SWOT analysis as suggested by the TSB guidance. We had to take into account the fact that a number of adaptation measures had already been incorporated, though without systematic assessment. These were brought into the picture through a robust, workshop based way of way of analysing both the already included and potential additional measures by a process of grading as described in this report. This method was very successful in drawing together the results of IES building modeling, empirical knowledge, and practical implementation. It also led to a high level of client engagement, which contributed positively to uptake of adaptation measures and added depth to our understanding of the contractual and political issues. Potential adaptation measures and opportunities were based on a list provided by TSB Board (Bill Gething “Design for Future Climate, an adaptation agenda for the built environment” 2010), which was augmented with additional suggestions from the project team. However, a number of the measures that were identified as suitable for inclusion and which subsequently proved cost effective might better be be described as climate change mitigation measures. The following proposed measures (together with a number of I”ncluded” measures) reduce the building’s energy and water use but do not specifically adapt its performance under a changed climate:
o Item 25: Low water use fittings: Changing to water saving fittings in clinical areas. o Item 44: Switch Off Street Lights for Periods of the Night or Use More Energy Efficient Lights: Only light part of the car park outside of daytime operating hours & change to
lower energy LED lights
Naturally ventilated versus mechanically ventilated buildings Our analysis of shading adaptations showed that while they reduced overheating they also increased winter heating costs, and this effect continued until 2080. This raises interesting questions about the effect of shading on mechanically cooled buildings, and on the relative sustainability of naturally ventilated spaces compared to mechanically ventilated spaces. It may be that highly insulated, well-sealed buildings with carefully sized glazed areas and mechanical cooling would use less energy than shaded, naturally ventilated buildings under future climatic conditions. This would be because they were able to make better use of winter solar gain. Further research into this would be of interest, as would an assessment of user comfort in these buildings.

Adapting Queen Elizabeth II Hospital for Future Climate Final Report - August 2013
Page 68 of 80
SECTION 4F: DECISION MAKING PROCESSES BY THE CLIENT AND THE BEST WAYS TO INFLUENCE THEM
The New QE2 is a building contracted under the Local Initiatives Finance Trust procurement system. The building was subject to considerable value engineering to ensure it met the maximum cost limit of £22 million. TSB recommendations were introduced well into the design process, and after documents had been completed for Financial Close, the process which lets the contract to the contractor. This meant that budgets were fixed at the time we were making our adaptation recommendations, and much of the building design was no longer under the control of the Client. This affected decision-making processes by limiting the extent to which the building design could be modified, and severely reducing any opportunity to increase capital expenditure. We attempted to mitigate this problem by concentrating on cost neutral adaptations and reviewing adaptations that had already been included in the building design. Our findings and recommendations were discussed with the client through three key workshops:
o Start up workshop: The TSB project and the research approach were introduced. Attended by the developer: Assemble Community Partnerships o Design opportunities workshop: The list of design opportunities put forward by The Technology Strategy Board (ref Bill Gething “Design for Future Climate, an adaptation agenda
for the built environment” 2010) was reviewed, along with additional measures proposed by the design team. Opportunities appropriate for development and cost assessment were identified, drawing on results from environmental modeling, project specific risk analysis, collective wisdom and practical implementation. Attended by the developer: Assemble Community Partnerships.
o Cost benefit workshop: Opportunities identified in the previous workshop were reviewed in the context of the Cost Benefit Analysis. Measures to be integrated into the design or reviewed at a future time were agreed through discussion with the client. Attended by the developer: Assemble Community Partnerships and end user: Hertfordshire NHS
We found our mitigation measures and workshop based approach to client engagement to be very successful. As a result of our focus on developing low cost and cost neutral measures, adaptations that were recommended had relatively low capital cost and generated considerable savings over time. This made them appealing to the client who was then happy to try to incorporate them. Evaluating measures already included in the building was particularly successful in terms of client engagement, as we were able to illustrate the advantages in terms of sustainability and energy cost savings over time. Reviewing these successful strategies set a positive tone to the workshop, leading to greater engagement. We were successful in making recommendations that the client was interested in pursuing. If we were to do the same project again we would hope to resolve adaptation recommendations earlier, to allow them to be more easily integrated into the design. In an ideal world recommendations would be made before construction documentation was completed.

Adapting Queen Elizabeth II Hospital for Future Climate Final Report - August 2013
Page 69 of 80
The contract for the construction work included a number of items that were identified as “reviewable design data (RDD)”. The adaptations that the client hoped to adopt all related to items listed as RDD. It was therefore agreed that the following changes would be incorporated as part of design reviews arranged in respect of the RDD items:
o Item 7: Secure and Bug Free Night Ventilation: Specify insect mesh to AOV’s in 24 hour areas. Details and specifications of the insect mesh are included in Appendix 3: The New QEII_P&P_Drawing 498-A-634-06-Vent Panel in Terracotta Cladding; The New QEII_P&P_Drawing 498-A-634-07-Vent Panel in Render_A & The New QEII_P&P_Specification 498-06B-L Windows/Doors/Stairs_1.
o Item 25: Low water use fittings: Change to water saving fittings in clinical areas. An LED lighting layout & quote supporting the cost information in included in Appendix 3: The New QEII_P&P_Advanced LEDs Relux Hospital Car Park Lighting Report_1 & The New QEII_P&P_Advanced LEDs QEII Hospital Car Park Lighting Quote_1
Additionally, we agreed to review the courtyard design, also an RDD item, to ensure that the following adaptations, which formed part of the original design aspiration, were incorporated as far as possible within the budget:
o Item 33: Role of Planting and Paving in Modifying Microclimate and Heat Island Effect: Planting and permeable surfaces to be maximised in courtyard o Item 38: Increase vegetation if soil has good infiltration qualities: Native planting to be increased to hedge gardens o Item 39: Plant heat, drought and pollution resistant plants: Planting specification to be to be reviewed for drought resistance. o Item 40: Species (willows, poplars, and oaks) which should not be specified and they cause low level ozone production under high temperatures: Planting specification
to be reviewed for ozone creating plants o Item 41: Minimise non-porous garden surfaces: Permeable surfaces to be maximised in courtyard and garden areas
The following items are management issues and our findings will be issued to Assemble Community Partnerships, the LIFT Co., developer and landlord for integration and review in respect of their management strategy. The handover process and possible POE offer opportunities to evaluate the effectiveness of adaptations:
o Item 34: Soft Landings: Review existing handover process to ensure it covers all elements that would be addressed by Soft Landings. o Item 36: Whole of Life Assessment as part of a usable Operation and Maintenance Manual: Include the requirement for whole of life assessments in the operation and
maintenance manual. o Item 37: Post Occupancy Evaluation: ACP will look into options for extending the required Post-Occupancy energy assessment into a full Post-Occupancy Evaluation. OBU and
P&P will inform the client should any external funding become available for this type of study.
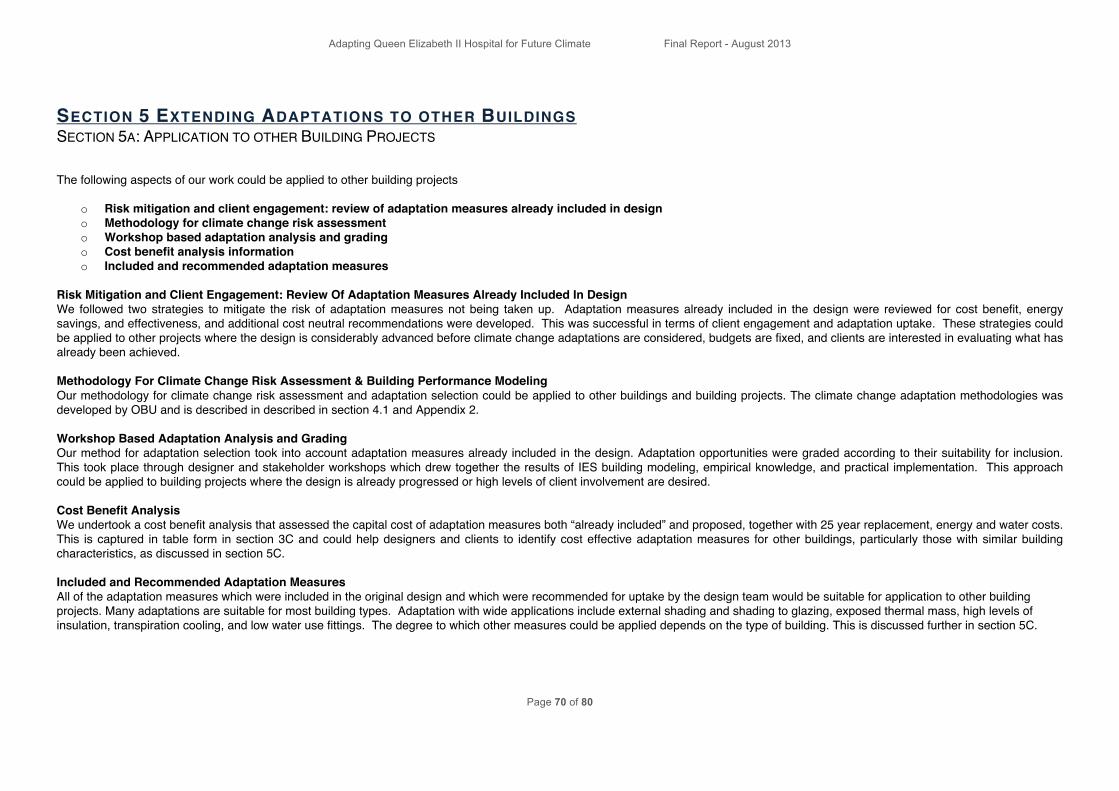
Adapting Queen Elizabeth II Hospital for Future Climate Final Report - August 2013
Page 70 of 80
SECTION 5 EXTENDING ADAPTATIONS TO OTHER BUILDINGS SECTION 5A: APPLICATION TO OTHER BUILDING PROJECTS
The following aspects of our work could be applied to other building projects
o Risk mitigation and client engagement: review of adaptation measures already included in design o Methodology for climate change risk assessment o Workshop based adaptation analysis and grading o Cost benefit analysis information o Included and recommended adaptation measures
Risk Mitigation and Client Engagement: Review Of Adaptation Measures Already Included In Design We followed two strategies to mitigate the risk of adaptation measures not being taken up. Adaptation measures already included in the design were reviewed for cost benefit, energy savings, and effectiveness, and additional cost neutral recommendations were developed. This was successful in terms of client engagement and adaptation uptake. These strategies could be applied to other projects where the design is considerably advanced before climate change adaptations are considered, budgets are fixed, and clients are interested in evaluating what has already been achieved. Methodology For Climate Change Risk Assessment & Building Performance Modeling Our methodology for climate change risk assessment and adaptation selection could be applied to other buildings and building projects. The climate change adaptation methodologies was developed by OBU and is described in described in section 4.1 and Appendix 2. Workshop Based Adaptation Analysis and Grading Our method for adaptation selection took into account adaptation measures already included in the design. Adaptation opportunities were graded according to their suitability for inclusion. This took place through designer and stakeholder workshops which drew together the results of IES building modeling, empirical knowledge, and practical implementation. This approach could be applied to building projects where the design is already progressed or high levels of client involvement are desired. Cost Benefit Analysis We undertook a cost benefit analysis that assessed the capital cost of adaptation measures both “already included” and proposed, together with 25 year replacement, energy and water costs. This is captured in table form in section 3C and could help designers and clients to identify cost effective adaptation measures for other buildings, particularly those with similar building characteristics, as discussed in section 5C. Included and Recommended Adaptation Measures All of the adaptation measures which were included in the original design and which were recommended for uptake by the design team would be suitable for application to other building projects. Many adaptations are suitable for most building types. Adaptation with wide applications include external shading and shading to glazing, exposed thermal mass, high levels of insulation, transpiration cooling, and low water use fittings. The degree to which other measures could be applied depends on the type of building. This is discussed further in section 5C.

Adapting Queen Elizabeth II Hospital for Future Climate Final Report - August 2013
Page 71 of 80
SECTION 5B: THE LIMITATIONS OF APPLYING THIS STRATEGY TO OTHER BUILDINGS
The limitations of applying this strategy to other buildings can be considered under two headings:
o Limitations of the selection strategy o Limitations of the adopted and recommended adaptation measures
Limitations of the selection strategy Although the risk analysis and adaptation selection strategy is fairly robust, and could be applied to many buildings, as described in section 5a, there are also some limitations: Risk mitigation and client engagement: review of adaptation measures already included in design Buildings at a very early stage of design or those that have not been designed with a sustainable agenda may not benefit from an assessment of adaptation measures already included in the design Methodology for climate change risk assessment & building performance modeling The climate change risk analysis is limited in its ability to assess the effects of wind, particularly those exacerbated by altitude or local conditions. This must be based on empirical data. The analysis may therefore not be robust in assessing buildings high risk from wind damage, such high buildings or buildings in urban areas that create “wind tunnels”. It is similarly limited in its ability to assess the local effects of rainwater run off and erosion. The building performance modeling tools used in this work are limited in their scope. Some adaptation measures cannot be assessed, such as:
o Transpiration cooling from the green roof and external planting o The effect of SUDS and permeable surfaces on rainwater run-off and transpiration cooling o The benefits of irrigation o The performance of building materials and construction detailing under future climatic conditions
To quantify the benefit of these measures, experiential data and new modeling methods are required. The modeling tools are also limited in their ability to deal with mechanical ventilation, comfort cooling, and mixed modes of ventilation. These tools also require a highly resolved building form with construction details before analysis can take place. Because of this they may not be suitable for buildings at an early stage of design. They are consuming to run and require repeated simulations and creative input from the user to attempt optimization of measures. This can be expensive and may not be appropriate where there are limited consultant fees available for adaptation development. Workshop based adaptation analysis and grading The workshop-based analysis is a robust approach but might not be necessary for small, simple buildings, where simple recommendations from the designers may be more appropriate. It might also prove unsuitable for very large and complex or multiple building projects where the meeting might become too large and unmanageable. For these projects it might be better to select “case studies” – small areas or buildings from the project that can be assessed to provide a strategy for the larger project. Cost benefit analysis The cost benefit analysis for this project is based on a 25-year period, because this building is on a 25-year lease contract. For other buildings, suitable assessment periods should be chosen based on the building usage.

Adapting Queen Elizabeth II Hospital for Future Climate Final Report - August 2013
Page 72 of 80
Limitations of Recommended Measures Our recommendations are based on a largely naturally ventilated building. The adaptations included or recommended may not be effective in a mechanically ventilated building. Our analysis of shading adaptations showed that while they reduced overheating they also increased winter heating costs, and this effect continued until 2080. It is unlikely that they would be cost or energy efficient in a mechanically ventilated building. Our research does not offer insight into the effect of including thermal mass in a mechanically ventilated building. Our adaptations that make use of transpiration cooling and shading from trees might not be appropriate in a built up urban site. Remodeling streets for pedestrians, and providing accessible external, shaded space would be difficult on those sites. More innovative solutions, such as climbing planting and folding shutters, and shaded entrance areas, might need to be considered. Night time ventilation for cooling would require further consideration if it was to be used in residential buildings or wards, as night time temperatures might be too low. Building management and operation adaptations are also unlikely to be suitable for residential applications. Low water use may not be appropriate for laboratory and clinical areas that have restrictions on sanitary fittings
Adapting Queen Elizabeth II Hospital for Future Climate Final Report - August 2013
Page 73 of 80
SECTION 5C: UK BUILDINGS SUITABLE FOR SIMILAR RECOMMENDATIONS
The New QEII Hospital is a public healthcare building. It has the following characteristics that relate to other building types:
o Procurement through public private partnership or PFI o Vulnerable users particularly sensitive to excessive heat o Public building used by the community o Large car park and external lighting o Provides 24 hour services o External landscaping
Building types that have these characteristics may benefit from reviewing the recommendations for The New QEII. Public Buildings Public buildings, and buildings which are used by the community would benefit particularly from considering introducing a Community Cool Room in the future. It may be worth designers of these buildings considering secure ventilation for safety and cooling. Public buildings and community buildings may be procured through PFI (discussed below) and include the following:
o Schools o Libraries o Leisure Centres o Healthcare Buildings o Museums o Shopping Centres
Procurement through PPP or PFI Buildings procured the PPP or PFI may benefit from the approach taken towards selecting adaptation for integration into the design. These type of buildings often have tight budgets and complicated contractual structures. They would benefit from introducing the requirement for adaptation into the brief early, or concentrating on cost neutral adaptation measures. They would also benefit from following the consultation based workshop approach to adaptation selection, as this increased client involvement and created a positive environment within which to agree uptake of recommended measures. In addition, managerial adaptations are well suited to these buildings: Soft Landings, Post Occupancy Evaluation, and Whole Life Assessments as Part of the Operation and Management Manual. The buildings listed above, together with the following, are amoung those procured through PFI/PPP
o Police Stations o Council Buildings o Embassies o Royal Forces Buildings o Prisons
Adapting Queen Elizabeth II Hospital for Future Climate Final Report - August 2013
Page 74 of 80
Vulnerable Users Buildings with vulnerable users will need to pay particular attention to avoiding overheating at future dates. They may consider secure ventilation to achieve this, which was part of the original design for The New QEII. Other cooling measures that may be particularly suitable for buildings with vulnerable users include green roofs and planting for transpiration cooling, exposed thermal mass, and shading to glazing and external spaces. The following building types have vulnerable users:
o Hospitals o Primary Healthcare Buildings o Sheltered/Extra Care Housing o Mental Health Buildings o Hospices
Buildings with Large Car Parks/External Lighting Zoned control of street lights and energy efficient street lights are appropriate for building projects with large car parks. This is particularly pertinent if the building has a 24 hour use. The following buildings are likely to have large car parks:
o Airports o Hospitals o Shopping Centres o Supermarkets
24 Hour Services Buildings that provide 24 hour services may benefit from reviewing the adaptation secure night time ventilation (including mesh to prevent insects from being attracted to the building). Buildings with 24 hour uses include:
o Police Stations o Airports o Hospitals o Fire Stations
External Landscaping Many building types have external landscaped areas. Buildings with these external areas would benefit from reviewing our approach to external shaded space, transpiration cooling, shading from trees, drought resistant planting and pedestrian and cycle areas. Buildings that may have external landscaped space include:
o Schools o Residential Buildings o Hospitals
All Building Types Many adaptations are suitable for most building types. These include external shading and shading to glazing, high levels of insulation, exposed thermal mass, and transpiration cooling, and low water use fittings.

Adapting Queen Elizabeth II Hospital for Future Climate Final Report - August 2013
Page 75 of 80
SECTION 5D: RESOURCES, TOOLS AND MATERIALS FOR FUTURE ADAPTATION WORK
In order to assess and develop suitable adaptations for The New QEII Hospital, the following resources tools and materials were developed. These will be useful for designers and researchers undertaking future adaptation work: Cost Benefit Checklist P&P have produced a cost benefit checklist of adaptation measures. This could help designers and clients quickly understand the benefit of various adaptation measures. Assessment Methodology for Overheating Adaptations This project has allowed us to develop an approach for designing adaptations to reduce future overheating in buildings:
• Review suitable adaptation measures for the project drawing from current literature such as those mentioned in Design for Future Climate report (Gething 2010); • Build a detailed room level energy model in a dynamic building thermal simulation package • Review overheating metrics and select an appropriate metric • Test the performance of individual adaptation measures for reducing overheating under current and projected 2030s, 2050s and 2080s’ climatic conditions • Discuss the overheating results with relevant stakeholders. Review these against a standardised list of design opportunities and, drawing on results from environmental modeling,
project specific risk analysis, collective wisdom and practical implementation, grade each measure against the following criteria: i. Measures already included in the design ii. Measures that should be considered for inclusion in the design iii. Measures that could be retrofitted in the future but implication worth considering for present design to avoid compromising this possibility iv. Measures that could be retrofitted in the future but need no action at present v. Measures not suitable for inclusion
• Develop adaptation measures in order to allow them to be costed and analysed for energy use • Investigate the energy implication of measures • Conduct cost benefit analysis of measures • Discuss the cost benefit analysis results with clients and identify measures to be taken up
Matlab A function was developed in Matlab to calculate adaptive thermal comfort limits based on external weather data. Publications and Reports The following documents and papers have been produced for a “Design for Future Climate” workshop, which is planned to present the learning outcomes of the D4fC projects conducted by Oxford Brookes University:
o Gupta, R. & Du, H. (2013) Adapting the design of hospital buildings against a warming climate, Building Simulation 2013: 13th International conference of International Building Performance Simulation Association, 25-28 August 2013, France.
o Gupta, R., Du, H. & Gregg, M. (2012) Overheating modelling and climate change adaptation for Queen Elizabeth II Hospital. TSB Design for future climate: Adapting buildings programme. Submitted to Penoyre and Prasad LLP, London in August 2012.
o Gupta, R. & Du, H. (2012) Climate changes hazards and impacts: Queen Elizabeth II Hospital. TSB Design for future climate: Adapting buildings programme. Submitted to Penoyre and Prasad LLP, London, May 2012

Adapting Queen Elizabeth II Hospital for Future Climate Final Report - August 2013
Page 76 of 80
SECTION 5E: PROVIDING FURTHER ADAPTATION SERVICES
This adaptation design project has been undertaken in consultation with the client, East and North Hertfordshire NHS, and their delivery partners Assemble Community Partnerships. Both have expressed an interest in extending the adaptation work to include an evaluation of the effectiveness of the measures in practice. This could be achieved by conducting a building performance evaluation, which would cost approximately £50,000. No funds are currently in place to support this and these would need to be found in order to further the work.

Adapting Queen Elizabeth II Hospital for Future Climate Final Report - August 2013
Page 77 of 80
APPENDIX 1 DRAWINGS AND IMAGES AS FOLLOWS:
The New QEII_P&P_Appendix 1 CGI Image of QEII Approach_1 The New QEII_P&P_Appendix 1 CGI Image of QEII Courtyard_1 The New QEII_P&P_Appendix 1 Drawing 435-G-201 QEII GF Plan_H The New QEII_P&P_Appendix 1 Drawing 435-G-202 QEII 1F Plan_I The New QEII_P&P_Appendix 1 Drawing 435-G-203 QEII 2F Plan_H The New QEII_P&P_Appendix 1 Drawing 435-G-204 QEII 3F Plan_I The New QEII_P&P_Appendix 1 Drawing 435-G-205 QEII RF Plan_D The New QEII_P&P_Appendix 1 Drawing 435-G-301 NE SE Elevations_E The New QEII_P&P_Appendix 1 Drawing 435-G-302 NW SW Elevations_E The New QEII_P&P_Appendix 1 Drawing 435-G-303 NW SW Sections_F The New QEII_P&P_Appendix 1 Drawing 435-G-304 NE SE Sections_F The New QEII_P&P_Appendix 1 Drawing 457-SC-004 Masterplan_G
APPENDIX 2 RELEVANT SUBSETS OF UKCP09 DATA
o The New QEII_P&P_Appendix 2 Climate Changes Hazards and Impacts Report_1
APPENDIX 3 DOCUMENTS AS FOLLOWS:
o The New QEII_P&P_Appendix 3 Climate Change Adaptation Report _1 o The New QEII_P&P_Appendix 3 Checklist of Adaptation Measures_1 o The New QEII_P&P_Appendix 3 Life Cycle Cost Assessment Report_1 o The New QEII_P&P_Appendix 3 Advanced LEDs Relux Hospital Car Park Lighting Report_1 o The New QEII_P&P_Appendix 3 Advanced LEDs QEII Hospital Car Park Lighting Quote_1 o The New QEII_P&P_Appendix 3 Armitage Shanks Sanitaryware NBS Specification_1 o The New QEII_P&P_Appendix 3 Armitage Shanks Sanitaryware Quote_1 o The New QEII_P&P_Appendix 3 Sensorflow 21 DataSheet_1 o The New QEII_P&P_Appendix 3 Drawing 498-A-634-06-Vent Panel in Terracotta Cladding_A o The New QEII_P&P_Appendix 3 Drawing 498-A-634-07-Vent Panel in Render_A o The New QEII_P&P_Appendix 3 Specification 498-06B-L Windows/Doors/Stairs_1

Adapting Queen Elizabeth II Hospital for Future Climate Final Report - August 2013
Page 78 of 80
APPENDIX 4: TEAM CV’S PENOYRE & PRASAD ARCHITECTS
PENOYRE & PRASAD ARCHITECTS Since their ground-breaking, low-energy educational visitors centre in Dagenham in 1995, Penoyre &Prasad has been at the forefront in creating low energy, low environmental impact buildings that have been seen as exemplars for the construction industry. As RIBA President 2007–2009, Sunand Prasad was responsible for a number of initiatives to up skill the profession, lobby and advise government on low carbon design, and was voted 26th in the Independent’s top 100 environmentalists list. He continues to represent the profession internationally on the issue of climate change and is on the Mayor of London's Design Panel to advise the Mayor on carbon reduction in the capital. Penoyre &Prasad’s thorough understanding of the evolving design for the New QEII will enable them to identify opportunities to innovate and adapt, and to guide the design process in parallel with the adaption strategy to maximise effectiveness.
SUNAND PRASAD: SENIOR PARTNER: MA (CANTAB); AA DIP PHD (RCA); PPRIBA; FRSA; HONFRIAS; ARB Sunand is at the forefront of UK Healthcare development creating patient centred, evidence based environments of high clinical functionality. He has published writings and puts his knowledge into practice, for example through the transformation of the Northern Ireland estate. As co-founder of Penoyre & Prasad in 1988, Sunand has played a central role in the design, procurement and delivery of the practice’s 300 plus projects, which have won more than 80 design awards. He is instrumental in guiding the overall design philosophy of the practice and the strategic design development of individual projects. At the core of Sunand’s architectural practice is a passionate belief in collaboration, and the need for expert knowledge to be catalysed by the everyday experience of users, in order to create truly successful environments and long term value. Sunand was President of the Royal Institute of British Architects (RIBA) from 2007 to 2009. As a leading figure in architecture and construction, he continues to hold a number of key positions related to policy development and design quality, including membership of the Green Construction Board set up to coordinate Government and Industry action to promote green growth and transform UK Construction for a low carbon future.
Kirsty Yaldron: BA(HONS); MA (HONS) ARCHITECTURE & INTERIORS; ARB Kirsty joined Penoyre & Prasad in 2004. As a senior architect she led design work on The new QEII Hospital, undertaking extensive client consultation and stakeholder liaison. She has specialist experience of Healthcare Architecture including building design, adjacency and healthcare space planning, detail construction work and interior design. Her experience extends from conception to completion and covers a number of LIFT Schemes, Treatment and Care Centres in Belfast procured through Performance Related Partnering, and our latest Sir Ludwig Guttmann Health & Wellbeing Centre, built for the 2012 Olympics. Kirsty trained at Manchester School of Architecture from 1996 until 1999, and has an MA in Architecture from the Royal College of Art, London. She previously worked for other leading architectural practices including Allies and Morrison and Feilden Clegg Bradley.
Adapting Queen Elizabeth II Hospital for Future Climate Final Report - August 2013
Page 79 of 80
LOW CARBON BUILDING GROUP, OXFORD INSTITUTE FOR SUSTAINABLE DEVELOPMENT, OXFORD BROOKES UNIVERSITY
THE OXFORD INSTITUTE FOR SUSTAINABLE DEVELOPMENT (OISD) OISD at Oxford Brookes University is the largest academic research institute in the UK dedicated to research on sustainable development in the built environment. The Low Carbon Building (LCB) research group at OISD holds world-leading expertise in carbon counting and climate change adaptation of buildings and cities. Professor Rajat Gupta, Director of OISD and LCB group is the Principal Investigator (lead) on this project from OISD. Professor Gupta is supported by Dr Hu Du (Lecturer in Architecture and Climate Change) and Matt Gregg (Research Associate in Architecture and Climate Change).
PROFESSOR RAJAT GUPTA BARCH MSC PHD FRSA Rajat Gupta is Professor of Sustainable Architecture and Climate Change, Director of the Oxford Institute for Sustainable Development (OISD) and leader of the OISD: Low Carbon Building Group at Oxford Brookes University. He is recipient of the inaugural 2006 RIBA President’s award for outstanding research related to DECoRuM carbon counting model for neighbourhoods and communities. Professor Gupta is engaged in teaching, research and knowledge exchange activities focussing on carbon counting and global common carbon metrics, building performance evaluation, post occupancy feedback, low carbon communities and climate change adaptation of buildings. As Principal Investigator, he has won close to £4.5 million in research grants from ESRC, EPSRC, UK Government, World Bank, UNEP, UNFCCC, RIBA, RICS and British Council. Recently Prof Gupta co-led a 3-year EPSRC (Engineering and Physical Sciences Research Council) funded project (Suburban Neighbourhood Adaptation for a Changing Climate = SNACC) on adapting UK homes, suburbs and neighbourhoods for a changing climate (case study cities are Oxford, Bristol and Stockport). Previously Prof Gupta was part of the core team which developed a report on 'Adaptation Strategies for new Growth Areas', funded by the Department for Environment, Food and Rural Affairs (DEFRA). In May 2010, Prof Gupta was invited by DEFRA to participate in an expert researcher workshop on defining the scope and vision of DEFRA’s forthcoming ‘Adapting to climate change built environment’ project. Prof Gupta has published widely in this area. He is a Visiting Fellow in Arizona State University, USA, and Faculty Associate in the Smith School of Enterprise and Environment, University of Oxford.
DR HU DU BENG PGDIP PHD Dr Hu Du is a Lecturer in Architecture and Energy Simulation, based in the Low Carbon Building Group of the School of Architecture. He is working on a range of cutting-edge research projects with leading industry partners on climate change adaptation of buildings, building performance evaluation of innovative low carbon refurbishments. Previously Dr Du worked on the 3-year EPSRC funded COPSE (COincident Probabilistic climate change weather data for a Sustainable built Environment) project, wherein he developed a simple calculation method for predicting the distribution of future cooling design loads, and a tool in Matlab to generate future weather files. He is interested in building adaptation in a changing climate, lighting environment modelling, dynamic thermal modelling, CFD modelling, urban scale modelling, building optimization and statistical analysis of large databases. Matt Gregg BArch MSc LEED AP Matt Gregg is a Research Fellow in Architecture and Climate Change, based in the Low Carbon Building Group (LCBG) of Oxford Institute for Sustainable Development at Oxford Brookes University. Matt is currently involved in a number of climate change adaptation projects including the 3-year EPSRC-funded Suburban Neighbourhood Adaptation for a Changing Climate (SNACC) and five TSB funded Design for Future Climate projects. In 2009, Matt graduated with a MSc Sustainable Building: Performance and Design from Oxford Brookes University. Prior to joining Oxford Brookes in 2010, Matt worked over three years in an architecture practice in Tennessee after getting his BArch degree at the University of Tennessee.

Adapting Queen Elizabeth II Hospital for Future Climate Final Report - August 2013
Page 80 of 80
REFERENCES
o Allen, R. G., et al., 1998. Crop evapotranspiration - Guidelines for computing crop water requirements - FAO Irrigation and drainage paper 56. Food and Agricultural Organization of the United Nations.
o British Standards Institution, 2007. BS EN 15251:2007 Indoor environmental input parameters for design and assessment of energy performance of buildings addressing indoor air quality, thermal environment, lighting and acoustics. London: British Standards Institute.
o CIBSE, 2006. CIBSE Guide A: Environmental Design. London: Chartered Institution of Building Services Engineers.
o Department of Health, 2007. Heating and ventilation systems – Health Technical Memorandum 03-01: Specialised ventilation for healthcare premises – Part A. Norwich: The
Stationery Office.
o Gething, B., 2010. Design for future climate - Opportunities for adaptation in the built environment [online] [online]. Available from: http://www.innovateuk.org/ourstrategy/innovationplatforms/lowimpactbuilding/design-for-future-climate-report-.ashx [Accessed 2012 4 May].
o Gething, B., 2012. Design for Future Climate Report:Opportunities for adaptation in the built environment. London: Technology Strategy Board.
o Gough, M. and Rees, C., 2004. Tests performed on ApacheSim in accordance with ANSI/ASHRAE Standard 140-2001. Glasgow: IES Ltd.
o IPCC, 2007. Climate Change 2007: Synthesis Report - An Assessment of the Intergovernmental Panel on Climate Change. Geneva.
o Murphy, J., et al. 2009. UK Climate Projections science report: Climate change projections.
o Penoyre&Prasad, 2011a. 435-SC-001: GROUND FLOOR PLAN: New Queen Elizabeth II Hospital.
o Penoyre&Prasad, 2011b. New QEII Hospital: Addendum to Design and Access Statement.
o PURLFROST Ltd, 2012. Window Films - Silver Reflective Film [online]. Available from: http://www.purlsol.com/products_bymeter_list.php?catid=92 [Accessed 8 Jun 2012].
o Roofconsult, 2012. Wind load Calculations to BS 6399:Part 2:1997 [online]. Available from: http://www.roofconsult.co.uk/calculations/wind/main.asp [Accessed 21 June 2012].
o The Barton Willmore Planning LLP, 2011. Planning Support Statement Redevelopment of the QEII Site, Howlands, Welwyn Garden City Ref:18221.P1d.PSS.PF.doc.
o Tysoe, B. and Ahmad, Z., 2012. Email communication with Rajat Gupta on 4 Jan. Welwyn Garden City Hospital IES file. Building Services Design.
o Watkins, R., Levermore, G. and Parkinson, J. 2011. Constructing a future weather file for use in building simulation using UKCP09 projections. Building Services Engineering
Research and Technology, 32(3), 293-299.