Adapting CAHPS® for an American Indian Population
18
Journal of Health Care for the Poor and Underserved 20 (2009): 695–712. PART I: ORIGINAL PAPER Adapting CAHPS® for an American Indian Population Beverly Weidmer-Ocampo, MA Patrick Johansson, MD, MPH Debbie Dalpoas, BS David Wharton, MPH, RN Charles Darby, MA Ron D. Hays, PhD Abstract: Objective. Develop a culturally appropriate, reliable, and valid survey that can be used by the Choctaw Nation Health Services (CNHS) to compare patients’ health care experiences across CNHS clinics, and to support quality improvement efforts. Methods. We worked with CNHS staff to adapt the CAHPS Clinician and Group Survey for this purpose. We conducted cognitive interviews and a field-test to evaluate the survey. Results. Cognitive testing yielded a survey that covered issues relevant to CNHS patients. Field testing yielded 696 surveys, (58% response rate). Analyses provided support for internal consistency of multi-item scales. Correlations among scales indicate the scales were related to one another but not redundant. Discussion. e CAHPS American Indian Survey is useful for assessing perceptions of care at the clinic level and across different clinics. e close partnership with CNHS helped yield a survey that is scientifically sound, reflects how services are organized and delivered locally, and meets CNHS information needs. Key words: CAHPS American Indian Survey, American Indian Health, community-based participatory research, American Indians. T he Consumer Assessment of Healthcare Providers and Systems (CAHPS®) program is a public-private initiative to develop surveys to collect information on patient experiences with care. e CAHPS program is funded and administered by the U.S. Agency for Healthcare Research and Quality (AHRQ), working with a consortium of public and private organizations. e primary goal of the CAHPS program is to BEVERLY WEIDMER is a Survey Director at the RAND Corporation, where she can be reached at 1776 Main Street, PO Box 2138, Santa Monica, CA 90407-2138. PATRICK JOHANSSON is an Assistant Research Professor at George Washington University School of Public Health and Health Sci- ences. DEBBIE DALPOAS is Chief of Quality/Risk and a Compliance Officer at the Choctaw Nation Health Care Center in Talihina, OK. DAVID WHARTON is a Preventive Health Informaticist with the Choctaw Nation Health Care Center. CHARLES DARBY was a Social Science Administrator with the Agency for Healthcare Research and Quality in Rockville, MD. He died in March 2009. RON HAYS is a Professor of Medicine in the UCLA Department of Medicine/Division of General Internal Medicine & Health Services Research.
Transcript of Adapting CAHPS® for an American Indian Population
Journal of Health Care for the Poor and Underserved 20 (2009): 695–712.
Part i: Original PaPer
adapting CaHPS® for an american indian Population
Beverly Weidmer-Ocampo, MAPatrick Johansson, MD, MPH
Debbie Dalpoas, BSDavid Wharton, MPH, RN
Charles Darby, MARon D. Hays, PhD
Abstract: Objective. Develop a culturally appropriate, reliable, and valid survey that can be used by the Choctaw Nation Health Services (CNHS) to compare patients’ health care experiences across CNHS clinics, and to support quality improvement efforts. Methods. We worked with CNHS staff to adapt the CAHPS Clinician and Group Survey for this purpose. We conducted cognitive interviews and a field-test to evaluate the survey. results. Cognitive testing yielded a survey that covered issues relevant to CNHS patients. Field testing yielded 696 surveys, (58% response rate). Analyses provided support for internal consistency of multi-item scales. Correlations among scales indicate the scales were related to one another but not redundant. Discussion. The CAHPS American Indian Survey is useful for assessing perceptions of care at the clinic level and across different clinics. The close partnership with CNHS helped yield a survey that is scientifically sound, reflects how services are organized and delivered locally, and meets CNHS information needs.
Key words: CAHPS American Indian Survey, American Indian Health, community-based participatory research, American Indians.
The Consumer Assessment of Healthcare Providers and Systems (CAHPS®) program is a public-private initiative to develop surveys to collect information on patient
experiences with care. The CAHPS program is funded and administered by the U.S. Agency for Healthcare Research and Quality (AHRQ), working with a consortium of public and private organizations. The primary goal of the CAHPS program is to
Beverly Weidmer is a Survey Director at the RAND Corporation, where she can be reached at 1776 Main Street, PO Box 2138, Santa Monica, CA 90407-2138. Patrick Johansson is an Assistant Research Professor at George Washington University School of Public Health and Health Sci-ences. deBBie dalPoas is Chief of Quality/Risk and a Compliance Officer at the Choctaw Nation Health Care Center in Talihina, OK. david Wharton is a Preventive Health Informaticist with the Choctaw Nation Health Care Center. charles darBy was a Social Science Administrator with the Agency for Healthcare Research and Quality in Rockville, MD. He died in March 2009. ron hays is a Professor of Medicine in the UCLA Department of Medicine/Division of General Internal Medicine & Health Services Research.
696 Adapting CAHPS® for an American Indian population
develop standardized surveys of patients’ experiences with ambulatory and facility-level care.1
Users of CAHPS survey data include patients and consumers, quality monitors and regulators, purchasers, health care organizations, and providers. These individuals and organizations use CAHPS data to help with health care choices, inform their purchasing or contracting decisions, and improve quality of care. All CAHPS products, resources, and services are in the public domain. When the CAHPS program started in 1995, its primary focus was on developing a survey that could be used to collect consumer experience of care with their health plan. The focus of CAHPS subsequently grew to include developing surveys and reporting tools across a range of health care providers and services. Presently, CAHPS facility care surveys assess the experiences of health care consumers in hospitals, hemodialysis centers, and nursing homes. Ambulatory care surveys from CAHPS assess the experiences of consumers with health plans, managed care organizations, dental plans, physician groups, and physicians.2
There are no other CAHPS surveys designed specifically for ethnic or linguistic minority populations. However, CAHPS surveys are translated into Spanish and in some cases several other languages (the CAHPS® Hospital Survey, for example, is available in English, Spanish, Vietnamese, Russian, and Chinese). The CAHPS surveys follow a set of guiding design principles including the use of both reports and ratings of the care experience, input from patients and other stakeholders in the design and testing of the survey, and rigorous testing.
One of CAHPS’s guiding principles has been to design surveys that can be admin-istered to consumers with all types of health insurance coverage, including Medicaid, Medicare, and commercial insurance, and across the full range of delivery systems. All new survey products are developed with an eye towards making them useful for various types of consumers, particularly vulnerable populations. American Indians are one such population. According to the U.S. Census conducted in 2000, 26% of American Indians were living in poverty compared with 12% of the total population in the United States. American Indians also have significantly poorer health outcomes than their non-Hispanic White counterparts, poorer access to quality health care, and higher prevalence rates for certain diseases such as diabetes, heart disease, HIV/AIDS, stroke, and certain types of cancer.3
The Indian Health Service (IHS), an agency within the Dept. of Health and Human Services, is responsible for providing federal health services to some American Indians and Alaska Natives.4,5 The IHS has expressed an interest in developing a CAHPS survey that could be used to assess patient experience of care across different American Indian tribes. In late 2003, the Choctaw Nation Health Services (CNHS) Program approached AHRQ to explore the possibility of developing a survey to collect patient experience of care data that could be used to evaluate care received by patients at different CNHS clinics. As a result, AHRQ and the CAHPS consortium (under the leadership of the RAND Corporation) agreed to work with CNHS to develop a CAHPS American Indian Survey. These partners recognized the work as an opportunity to develop a survey that could be used to measure patient experience of care for a vulnerable and tradition-ally under-served and not well-studied population, while at the same time laying the groundwork for developing a survey that could eventually be used by IHS to measure
697Weidmer-Ocampo, Johansson, Dalpoas, Wharton, Darby, and Hays
quality of care across various IHS programs serving different tribes in different parts of the country.
The Choctaw people were relocated from Alabama and Mississippi in 1820, and the tribe was given the entire southeast quadrant of what was to become Oklahoma. The Choctaws are one of the so-called “Five Civilized Tribes,” designated as such because settlers perceived their systems of government, education, and law enforcement as advanced (the other tribes are the Cherokee, Chickasaw, Creek, and Seminole).6 Since February 1, 1985, all health care facilities on Choctaw Nation land have been managed by the Choctaw Nation under the auspices of P.L. 93-638, the Indian Self-Determination Act.7
The Choctaw Nation of Oklahoma is also the first in the U.S. to build a tribally-owned hospital with tribal funding. The Choctaw Nation Health Care Center, located in Talihina, Oklahoma, is a 145,000 square-foot health facility with 37 hospital beds for inpatient care and 52 exam rooms. The hospital provides state-of-the-art equipment and furnishings and serves as the hub of the CNHS health care program. In addition to the hospital, the CNHS program manages five comprehensive health centers—Broken Bow Clinic at Broken Bow, Hugo Clinic at Hugo, McAlester Clinic at McAlester, Rubin White Clinic at Poteau, and the Stigler Clinic at Stigler. It also manages the Choctaw Nation Diabetes Wellness Center at Talihina. All the CNHS clinics are accredited by The Joint Commission (a nationally recognized, independent, not-for-profit organiza-tion that evaluates and accredits health care organizations and programs), and hold deemed status from the Dept. of Health and Human Services, Centers for Medicare/Medicaid Services (CMS). All told, CNHS provides health care to an estimated 47,849 Native Americans in 11 counties in southeastern Oklahoma and averages approximately 200,000 outpatient visits per year.8
In working with CNHS, AHRQ and the CAHPS consortium followed the U.S. Dept. of Health and Human Services Policy on Consultation with American Indians.9 In the past, research efforts undertaken in Native American communities have in many cases replicated paternalistic colonial and federal policies that have disaffected American Indian communities.4,5 Consequently, these interventions have often led to distrust of research and have marginalized communities to non-decision-making tasks.
In developing a model for this project, we reviewed literature on working with American Indian, low-income, and vulnerable populations10–14 and tried to identify and learn from studies that had established successful collaborations with American Indian communities.15–20 The AHRQ and the CAHPS consortium sought to establish a government–public–private partnership with the CNHS, through a community-based participatory research model in which all partners were equal. In addition to repre-sentation from the AHRQ and RAND, the research team included CNHS staff, one of whom was an enrolled member of the Choctaw Nation of Oklahoma. Using Fisher and Ball’s Tribal Participatory Research Model21–22 and the Turning Point Policy Principles for Advancing Collaborative Activity Among and Between Tribal Communities and Surrounding Jurisdictions,23 the research team sought full involvement of the CNHS in the design of the survey by meeting with CNHS staff in person and visiting CNHS facilities to understand better how the health care system was organized. We sought approval for the study through the Choctaw Nation institutional review board (IRB)
698 Adapting CAHPS® for an American Indian population
and Tribal Council, and discussed issues related to data ownership, data dissemination, and publication of data and survey results at the beginning of the study with designated CNHS staff. We also consulted with CNHS staff in the development of the survey instrument in an effort to make the survey CNHS need-specific and to ensure that the survey reflected the way health care is organized and delivered by CNHS. For example, CNHS staff, doctors, and nurses identified specific content areas they wanted included in the survey, reviewed the draft instrument, and identified changes to be made to specific item-wording to reflect language used by their patient population. In addition, we scheduled monthly conference calls between AHRQ, RAND, and CNHS in order to keep all parties abreast on the progress of the project; consulted with CNHS on the design of the study as it progressed (e.g., jointly developing the recruitment and data collection protocol for both the cognitive interviews and the field test, selecting sites for the cognitive interviews, outlining a sampling plan for the field test, and resolving any issues as they came up). Finally, we scheduled project meetings and activities to avoid major Choctaw Nation events, celebrations, and holidays.
The CAHPS American Indian Survey was thus developed as a true collaborative effort between CAHPS investigators and CNHS. The survey that was developed reflects the contributions of all partners in this community-based participatory research study. The survey is culturally appropriate, reflects how health care services are organized and delivered locally, and meets CNHS’ specific information needs. The objectives of this study were to develop a survey to assess perceptions of care at CNHS clinics in the last 12 months, assist with CNHS quality improvement efforts, and provide input into the development of a CAHPS American Indian Survey.
The project kick-off meeting was held in February 2004 between CAHPS team members from RAND and AHRQ and the CNHS staff at the CNHS Talihina clinic. The purpose of this meeting was to exchange information, to identify and prioritize concrete objectives for the study, to get background information on how the CNHS are organized and how health care is delivered through the outpatient clinics, and to review prior CNHS experiences in conducting patient surveys. Preliminary survey develop-ment work included a review of survey instruments that CNHS had used in the past and a review of the CAHPS Ambulatory Care Survey and the CAHPS Clinician and Group Survey. Staff of CAHPS and CNHS worked to identify domains of interest and specific measures that CNHS was interested in including in the survey. Measures were adapted to reflect how health services are organized and delivered and survey items were reworded to include terms or phrases familiar to the CNHS patient population.
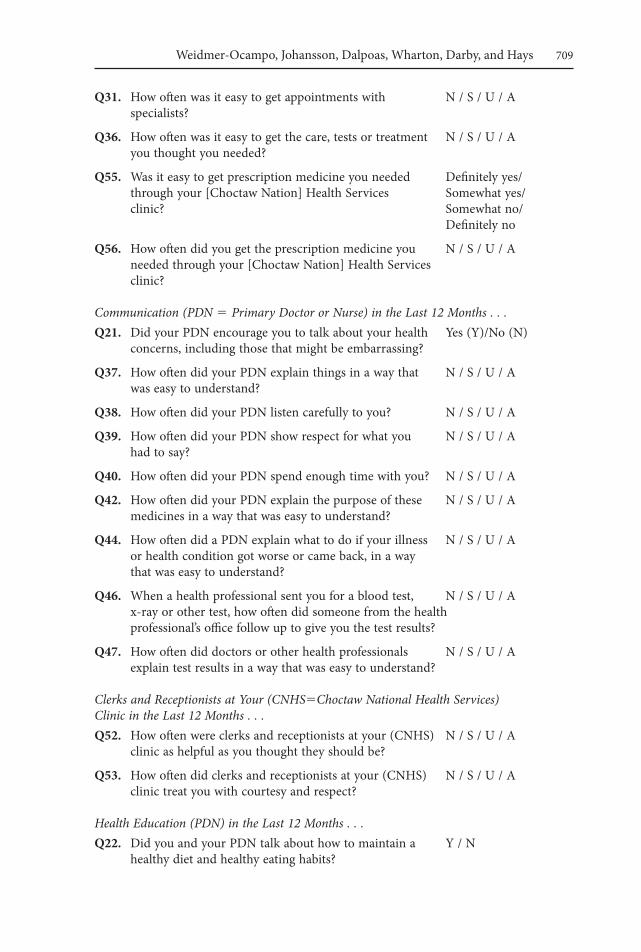
The draft instrument was based largely on the CAHPS Clinician and Group Survey, and is written using simple language. The survey consists of 65 questions, including two global ratings (primary care provider and clinic) and 15 specific domains: 1) Getting Care Quickly, 2) After Hours Care, 3) Wait Time, 4) Getting Needed Care, 5) Provider Communication, 6) Communication About Prescription Medications, 7) Communi-cation About Symptoms, 8) Communication About Test Results, 9) Coordination of Care Among Providers, 10) Shared Decision Making, 11) Office Staff Courtesy, 12) Prescriptions, 13) Information, 14) Health Education, and 15) Discrimination. The Appendix provides the Survey Core Measures. Although items on perceived discrimi-nation have not traditionally been included as part of CAHPS surveys, we felt it was

699Weidmer-Ocampo, Johansson, Dalpoas, Wharton, Darby, and Hays
an important domain to include for this survey in particular, given the findings from the California Health Interview Survey (CHIS) that showed that American Indians reported the highest prevalence of perceived discrimination in the health care setting and other studies that have found that Native Americans were less likely to trust health care providers, clinics, and hospitals than non-Hispanic Whites.24,25 The discrimination questions included in this survey were adapted from the Commonwealth Fund’s 2001 Survey on Disparities in Quality of Health Care.26
Methods
Cognitive interviews. The RAND CAHPS team members conducted 20 in-person cognitive interviews with people recruited from three CNHS outpatient clinics. In recent years, cognitive interviewing has become a widely accepted approach in the field of survey research to evaluate survey questionnaires critically. Cognitive interviewing allows the developer of the survey tool to study the manner in which subjects understand, mentally process, and respond to survey items and to use this information to modify and refine the survey questionnaire.27,28 This approach to evaluating questionnaires was adopted by the CAHPS Consortium early on and has been used to evaluate the English version and most of the Spanish versions of every CAHPS survey instrument that has been developed to date.29–31 The CNHS institutional review board (IRB), the RAND Human Subjects Protection Committee (HSPC #H0088-02-01), and the Choctaw Nation Tribal Council and Chief reviewed and approved the cognitive interview plan. Staff at CNHS conducted patient recruitment. Researchers from RAND conducted in-person interviews with respondents using a scripted protocol that followed a modified concur-rent, verbal probing method for cognitive interviewing. In this approach, respondents are encouraged, but not required to verbalize what they are thinking as they respond to the survey items.32 Interviewers asked respondents to complete the survey themselves and to think out loud as they completed the survey. When necessary, interviewers used scripted probes to assess understanding of draft survey items, to assess understanding of key concepts, and to identify terms, items, or response options.28
With few exceptions, the cognitive interviews indicated that the survey covered issues that resonated with the CNHS patient population. Respondents generally had little difficulty in understanding survey items; however, findings from the cognitive interviews as well as feedback from CNHS staff led us to modify the survey to reflect how services were structured in specific clinics and better to reflect terminology used by CNHS patients. For example, primary care providers at some CNHS clinics include both doctors and nurse practitioners therefore we modified the survey to ask about the patient’s doctor or nurse. In addition, we substituted the term health professional for the term health provider as the former is more widely used and recognized by CNHS patients. Finally, we modified the survey to provide CNHS with clinic-specific infor-mation by including three questions that provide information on the clinic or clinics visited by the survey respondent in the last 12 months, the clinic visited most often, and the clinic visited most often for specialist care.
Field test. The RAND CAHPS team conducted a field test of the revised survey instrument in June through August, 2005. The CNHS IRB (IRB #04-00025), the
700 Adapting CAHPS® for an American Indian population
RAND HSPC (HSPC #H0088-02-01) and the Choctaw Nation Tribal Council and Chief approved the field test, data collection, and analysis plan. The field test survey included 81 questions assessing a variety of aspects of care and background informa-tion (health, having a chronic condition, age, gender, educational attainment, race, and language spoken at home). The sample file for the field test was drawn by CNHS according to specifications agreed upon by RAND, AHRQ, and CNHS. Two hundred and forty adults (18 years old or older) with at least one outpatient visit in the prior eight months were randomly selected from each of the five CNHS outpatient clinics (1,200 in total). Approximately half were men and half were women.
We field-tested the survey only in English. According to the Census 2000 Special Report on American Indians and Alaskan Natives, most American Indians speak only English at home and the CNHS staff confirmed this finding. Of those who completed the survey, only 2% reported that they spoke Choctaw or another language at home. Although CAHPS surveys are typically available for both telephone and mail survey administration, we opted to field-test the survey via mail only as this is the data col-lection approach that is most likely to be used by CNHS in the future. Respondents were mailed an advance notification letter signed by the Choctaw Nation Chief. Approximately one week after we mailed the advance notification letter, the survey was mailed with a cover letter from RAND. The cover letter provided basic information about the purpose of the survey, the confidentiality of the information provided, how the data would be used, and the $10 respondent payment for completing the survey. Two weeks after the survey was mailed, respondents received a reminder letter asking them to complete and return it. Two weeks after the mailing of the reminder letter, we mailed non-respondents a second copy of the survey with another reminder letter. We mailed respondents who completed and returned the survey a thank you-letter with a $10 Wal-Mart gift card.
Analyses were conducted to examine survey response rates and reliability and valid-ity of responses including item distribution (including ceiling and floor effects), item missing data, internal consistency reliability of the composites, reliability of global rating items and composites at the clinic level, and correlations of composites with global rating items.
results
We obtained a total of 696 returned surveys (one partial), for a raw response rate of 58%. Response rates by clinic ranged between 41% and 84% (McAlester 5 41%; Broken Bow 5 45%; Hugo 5 52%; Poteau 5 52%; and Talihina 5 84%). Respondents to the survey reported the clinic they visited most often in the last 12 months to get care for themselves: Talihina (n5202), Hugo (n5125), Poteau (n5124), Broken Bow (n5109), McAlester (n599), and another clinic (n514).
Item-missing-data rates tended to be low, with most items having missing-data rates of 1% or less. The exception was the global rating of the primary doctor or nurse (Q29 in Appendix), which had the most missing data (8%). One reason for the high rate of missing data for this question is that a significant number of respondents (~2%)
701Weidmer-Ocampo, Johansson, Dalpoas, Wharton, Darby, and Hays
reported that they do not have a primary doctor or nurse and therefore this question did not apply.
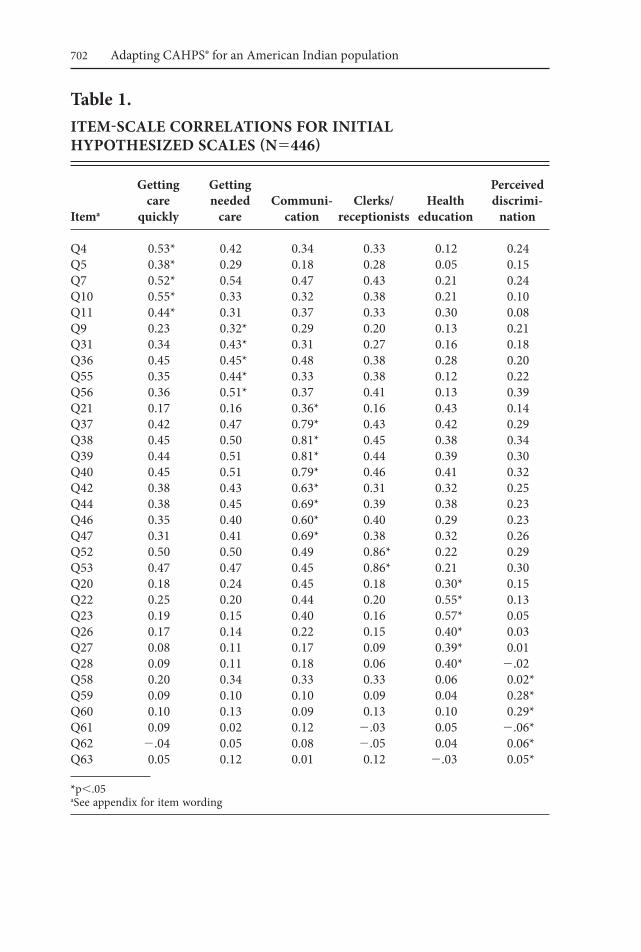
Based on the content of the items, we hypothesized seven multi-item scales: Get-ting Care Quickly (five items), Getting Needed Care (five items), Communication with Providers (nine items), Shared Decision Making (two items), Courtesy/Respect and Helpfulness of Clerks and Receptionists (two items), Health Education (six items), and Perceived Discrimination (six items). We also included a single question on coordination of care. Item-scale correlations for six of the seven scales are given in Table 1 below. (One of the multi-item scales, shared decision making, is not included because only 247 people reported having more than one choice for their health care and were eligible to answer the two shared decision making questions. The alpha reliability estimate for this two-item shared decision-making scale was 0.63.)
The discrimination items did not coalesce into a homogeneous scale (item-scale correlations tended to be low).* Therefore, we looked at the correlations among these items to see if any correlated highly with one another and found two items that did (Q59: Did you feel that a health professional you saw judged you unfairly or treated you with disrespect because of your tribal affiliation? Q60: Did you feel that a health profes-sional you saw judged you unfairly or treated you with disrespect because of your blood quantum level**?) Hence, we estimated a second item-scale correlation matrix using these two items as a discrimination scale. In addition, we removed Q20 (Did your primary doctor or nurse give you the help you needed to make changes in your habits or lifestyle to prevent illness?) from the health education scale because it correlated only 0.30 with that scale and more highly (r50.45) with the communication scale.
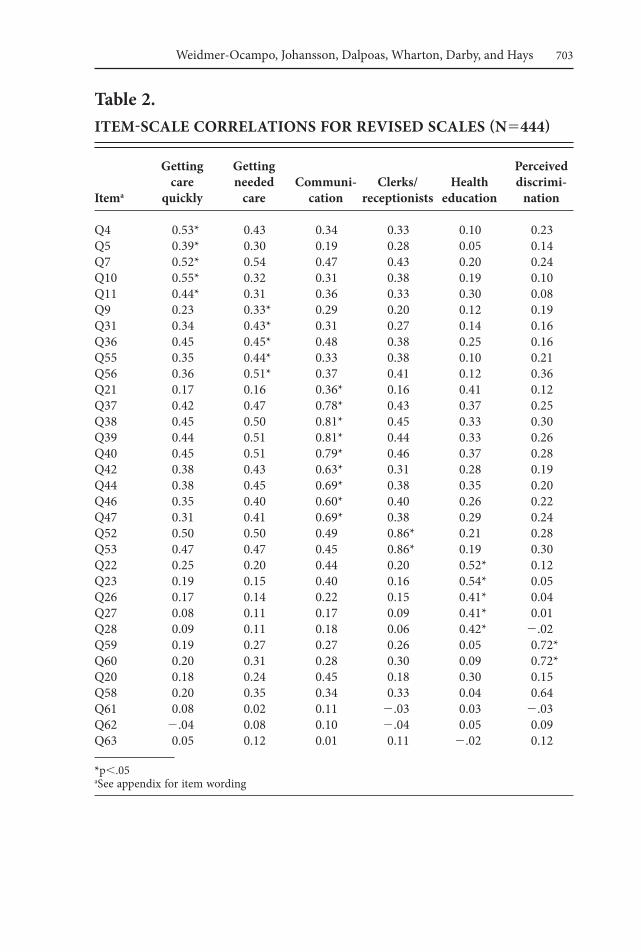
The revised item-scale correlation matrix is provided as Table 2. This matrix shows that Q7 (Not counting the times you needed care right away, how often did you get an appointment for your health care [at a Choctaw Nation Health Services] clinic as soon as you thought you needed it?) correlated as highly with the getting needed care scale as it did with getting care quickly. Q36 (How often was it easy to get the care, tests or treatment you thought you needed?) correlated as highly with getting care quickly and communication as it did with its hypothesized getting needed care scale. Aside from these anomalies, the items tended to correlate most highly with the scale they were intended to represent.
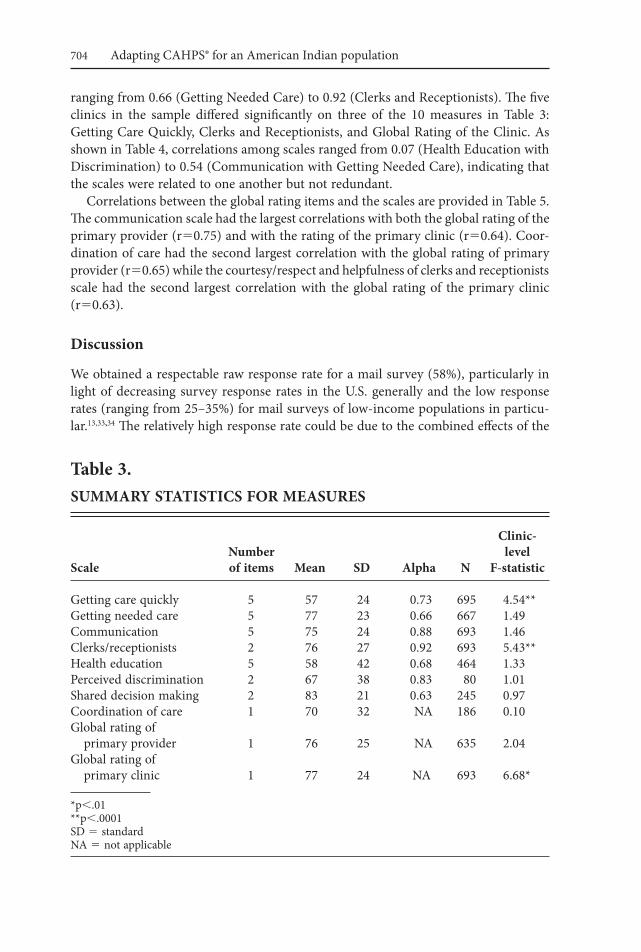
The internal consistency reliability estimates for the scales are given in Table 3. The reliability estimates in this sample tended to be of acceptable magnitude, with alphas
* We also ran analyses after recoding questions 59–63 to “no” answers if question 58 was a “no” (skip-ping people to Q64). This recoding preserved information about perceived discrimination for people who said they never felt judged unfairly or treated with disrespect by a health professional in the last 12 months. However, it induced more internal consistency among items 59–63 than would otherwise be the case and should therefore be considered an upwardly-biased estimate of reliability. Item-scale correlations increased but these correlations were still only large for Q59 and Q60. The item-scale correlations were 0.26 (Q62), 0.25 (Q63), and 0.06 (Q61) for the other three items.** Blood quantum level refers to the level of tribal blood required for membership in some American Indian Tribes.
702 Adapting CAHPS® for an American Indian population
table 1.iteM-SCale COrrelatiOnS FOr initial HyPOtHeSizeD SCaleS (n5446)
getting getting Perceived care needed Communi- Clerks/ Health discrimi- itema quickly care cation receptionists education nation
Q4 0.53* 0.42 0.34 0.33 0.12 0.24Q5 0.38* 0.29 0.18 0.28 0.05 0.15Q7 0.52* 0.54 0.47 0.43 0.21 0.24Q10 0.55* 0.33 0.32 0.38 0.21 0.10Q11 0.44* 0.31 0.37 0.33 0.30 0.08Q9 0.23 0.32* 0.29 0.20 0.13 0.21Q31 0.34 0.43* 0.31 0.27 0.16 0.18Q36 0.45 0.45* 0.48 0.38 0.28 0.20Q55 0.35 0.44* 0.33 0.38 0.12 0.22Q56 0.36 0.51* 0.37 0.41 0.13 0.39Q21 0.17 0.16 0.36* 0.16 0.43 0.14Q37 0.42 0.47 0.79* 0.43 0.42 0.29Q38 0.45 0.50 0.81* 0.45 0.38 0.34Q39 0.44 0.51 0.81* 0.44 0.39 0.30Q40 0.45 0.51 0.79* 0.46 0.41 0.32Q42 0.38 0.43 0.63* 0.31 0.32 0.25Q44 0.38 0.45 0.69* 0.39 0.38 0.23Q46 0.35 0.40 0.60* 0.40 0.29 0.23Q47 0.31 0.41 0.69* 0.38 0.32 0.26Q52 0.50 0.50 0.49 0.86* 0.22 0.29Q53 0.47 0.47 0.45 0.86* 0.21 0.30Q20 0.18 0.24 0.45 0.18 0.30* 0.15Q22 0.25 0.20 0.44 0.20 0.55* 0.13Q23 0.19 0.15 0.40 0.16 0.57* 0.05Q26 0.17 0.14 0.22 0.15 0.40* 0.03Q27 0.08 0.11 0.17 0.09 0.39* 0.01Q28 0.09 0.11 0.18 0.06 0.40* 2.02Q58 0.20 0.34 0.33 0.33 0.06 0.02*Q59 0.09 0.10 0.10 0.09 0.04 0.28*Q60 0.10 0.13 0.09 0.13 0.10 0.29*Q61 0.09 0.02 0.12 2.03 0.05 2.06*Q62 2.04 0.05 0.08 2.05 0.04 0.06*Q63 0.05 0.12 0.01 0.12 2.03 0.05*
*p,.05aSee appendix for item wording
703Weidmer-Ocampo, Johansson, Dalpoas, Wharton, Darby, and Hays
table 2.iteM-SCale COrrelatiOnS FOr reviSeD SCaleS (n5444)
getting getting Perceived care needed Communi- Clerks/ Health discrimi- itema quickly care cation receptionists education nation
Q4 0.53* 0.43 0.34 0.33 0.10 0.23 Q5 0.39* 0.30 0.19 0.28 0.05 0.14 Q7 0.52* 0.54 0.47 0.43 0.20 0.24 Q10 0.55* 0.32 0.31 0.38 0.19 0.10 Q11 0.44* 0.31 0.36 0.33 0.30 0.08 Q9 0.23 0.33* 0.29 0.20 0.12 0.19 Q31 0.34 0.43* 0.31 0.27 0.14 0.16 Q36 0.45 0.45* 0.48 0.38 0.25 0.16 Q55 0.35 0.44* 0.33 0.38 0.10 0.21 Q56 0.36 0.51* 0.37 0.41 0.12 0.36 Q21 0.17 0.16 0.36* 0.16 0.41 0.12 Q37 0.42 0.47 0.78* 0.43 0.37 0.25 Q38 0.45 0.50 0.81* 0.45 0.33 0.30 Q39 0.44 0.51 0.81* 0.44 0.33 0.26 Q40 0.45 0.51 0.79* 0.46 0.37 0.28 Q42 0.38 0.43 0.63* 0.31 0.28 0.19 Q44 0.38 0.45 0.69* 0.38 0.35 0.20 Q46 0.35 0.40 0.60* 0.40 0.26 0.22 Q47 0.31 0.41 0.69* 0.38 0.29 0.24 Q52 0.50 0.50 0.49 0.86* 0.21 0.28 Q53 0.47 0.47 0.45 0.86* 0.19 0.30 Q22 0.25 0.20 0.44 0.20 0.52* 0.12 Q23 0.19 0.15 0.40 0.16 0.54* 0.05 Q26 0.17 0.14 0.22 0.15 0.41* 0.04 Q27 0.08 0.11 0.17 0.09 0.41* 0.01 Q28 0.09 0.11 0.18 0.06 0.42* 2.02 Q59 0.19 0.27 0.27 0.26 0.05 0.72* Q60 0.20 0.31 0.28 0.30 0.09 0.72* Q20 0.18 0.24 0.45 0.18 0.30 0.15 Q58 0.20 0.35 0.34 0.33 0.04 0.64 Q61 0.08 0.02 0.11 2.03 0.03 2.03 Q62 2.04 0.08 0.10 2.04 0.05 0.09 Q63 0.05 0.12 0.01 0.11 2.02 0.12
*p,.05aSee appendix for item wording
704 Adapting CAHPS® for an American Indian population
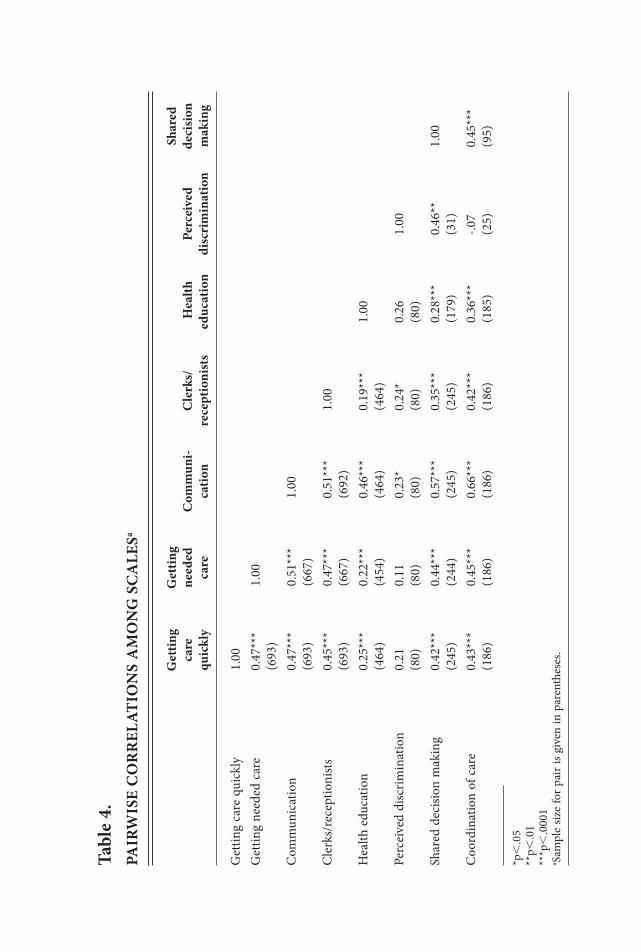
ranging from 0.66 (Getting Needed Care) to 0.92 (Clerks and Receptionists). The five clinics in the sample differed significantly on three of the 10 measures in Table 3: Getting Care Quickly, Clerks and Receptionists, and Global Rating of the Clinic. As shown in Table 4, correlations among scales ranged from 0.07 (Health Education with Discrimination) to 0.54 (Communication with Getting Needed Care), indicating that the scales were related to one another but not redundant.
Correlations between the global rating items and the scales are provided in Table 5. The communication scale had the largest correlations with both the global rating of the primary provider (r50.75) and with the rating of the primary clinic (r50.64). Coor-dination of care had the second largest correlation with the global rating of primary provider (r50.65) while the courtesy/respect and helpfulness of clerks and receptionists scale had the second largest correlation with the global rating of the primary clinic (r50.63).
Discussion
We obtained a respectable raw response rate for a mail survey (58%), particularly in light of decreasing survey response rates in the U.S. generally and the low response rates (ranging from 25–35%) for mail surveys of low-income populations in particu-lar.13,33,34 The relatively high response rate could be due to the combined effects of the
table 3. SuMMary StatiStiCS FOr MeaSureS
Clinic- number level Scale of items Mean SD alpha n F-statistic
Getting care quickly 5 57 24 0.73 695 4.54**Getting needed care 5 77 23 0.66 667 1.49Communication 5 75 24 0.88 693 1.46Clerks/receptionists 2 76 27 0.92 693 5.43**Health education 5 58 42 0.68 464 1.33Perceived discrimination 2 67 38 0.83 80 1.01Shared decision making 2 83 21 0.63 245 0.97Coordination of care 1 70 32 NA 186 0.10Global rating of primary provider 1 76 25 NA 635 2.04Global rating of primary clinic 1 77 24 NA 693 6.68*
*p,.01**p,.0001SD 5 standardNA 5 not applicable
tabl
e 4.
Pa
irw
iSe
CO
rr
elat
iOn
S a
MO
ng
SC
ale
Sa
g
ettin
g g
ettin
g
Sh
ared
care
ne
eded
C
omm
uni-
Cle
rks/
H
ealth
Pe
rcei
ved
deci
sion
quic
kly
care
ca
tion
rece
ptio
nist
s ed
ucat
ion
disc
rim
inat
ion
mak
ing
Get
ting
care
qui
ckly
1
.00
Get
ting
need
ed c
are
0.4
7***
1.
00
(693
)C
omm
unic
atio
n 0
.47*
**
0.51
***
1.00
(6
93)
(667
)C
lerk
s/re
cept
ioni
sts
0.4
5***
0.
47**
* 0.
51**
* 1.
00
(693
) (6
67)
(692
)H
ealth
edu
catio
n 0
.25*
**
0.22
***
0.46
***
0.19
***
1.00
(4
64)
(454
) (4
64)
(464
)Pe
rcei
ved
disc
rimin
atio
n 0
.21
0.11
0.
23*
0.24
* 0.
26
1.00
(8
0)
(80)
(8
0)
(80)
(8
0)Sh
ared
dec
ision
mak
ing
0.4
2***
0.
44**
* 0.
57**
* 0.
35**
* 0.
28**
* 0.
46**
1.
00
(245
) (2
44)
(245
) (2
45)
(179
) (3
1)C
oord
inat
ion
of c
are
0.4
3***
0.
45**
* 0.
66**
* 0.
42**
* 0.
36**
* -.0
7 0.
45**
*
(186
) (1
86)
(186
) (1
86)
(185
) (2
5)
(95)
*p,
.05
**p,
.01
***p
,.0
001
a Sam
ple
size
for p
air i
s giv
en in
par
enth
eses
.

706 Adapting CAHPS® for an American Indian population
table 5.PairwiSe COrrelatiOnS between SCaleS anD glObal rating iteMSa
global rating of
Primary provider Primary clinic
Getting care quickly 0.47** 0.54** (635) (693)Getting needed care 0.45** 0.54** (612) (665)Communication 0.75** 0.64** (635) (691)Clerks/receptionists 0.41** 0.63** (635) (691)Health education 0.43** 0.32** (462) (464)Perceived discrimination 0.00 0.23* (74) (80)Shared decision making 0.43** 0.45** (228) (245)Coordination of care 0.65** 0.54** (185) (186)
*p,.05**p,.0001aSample size for pair is given in parentheses.
$10 dollar incentive, good contact information provided by CNHS (less than 2% of addresses in the sample were undeliverable), the advance notification letter from the Choctaw Nation Chief, and a survey that was easy to fill out and elicited information that resonated with respondents. We also experienced low item-missing-data rates (1% or less for most items). Overall, the results indicate that it is feasible to collect detailed patient experience of care information from a mostly low-income, mostly rural population through a mail survey. Prior work with CAHPS surveys has tended to find equivalence between mail and telephone modes of data collection.35
Analyses conducted provided support for internal consistency of multi-item scales (Getting Care Quickly, Getting Needed Care, Communication, Clerks and Reception-ists, Health Education, Perceived Discrimination). Correlations among scales indicated that they were related to one another but not redundant. The communication scale was the most strongly related of all scales to global ratings of the primary care provider and the primary clinic.

707Weidmer-Ocampo, Johansson, Dalpoas, Wharton, Darby, and Hays
The study was successful in developing a survey tool that provides patient experi-ence of care data that can be used for quality improvement efforts designed to improve patient care. The study was successful in providing preliminary information about patient experience of care at CNHS facilities and identifying opportunities for qual-ity improvement. In particular, our CNHS collaborators were pleased that the survey was able to provide information at the clinic level that is actionable for the purposes of quality improvement, and that allows them to compare patient experience of care across clinics. The information from the survey allows CNHS to target quality improve-ment efforts not only in specific areas (e.g., access to care), but to prioritize quality improvement efforts in the clinics that need it most. In addition, the information from the survey allows them to identify the highest performing clinic in order to identify best practices that can be adopted or implemented in other clinics.
The tribal/federal/private partnership between CNHS, AHRQ, and the RAND Corporation represents a successful model for collaboration and community-based participatory research with an American Indian tribe. The CAHPS American Indian Survey reflects the contributions of all partners in this community-based participa-tory research study, and provided CNHS access to a publicly available survey that met their specific information needs. The survey was culturally appropriate and reflected how health care services were organized and delivered locally. The CAHPS American Indian Survey is a useful tool in assessing perceptions of care at the clinic level and in comparing patients’ experiences across different clinics. The survey that resulted from the work described here has become a member of the CAHPS family of surveys. Like other CAHPS surveys, the CAHPS American Indian Survey is publicly available, reflects input from stakeholders (including patients), and includes ratings as well as reports of patient experience that are more specific, actionable, understandable, and more objective than simple patient satisfaction ratings alone. The survey could be used by other American Indian tribes and by the Indian Health Service to collect patient experience of care data to make valid comparison across facilities or health care set-tings and to collect benchmarking data. This information could be useful in identifying areas for quality improvement designed to improve the delivery of patient care, and for public reporting.
limitations. While the cognitive interview and field test results suggest that the CAHPS American Indian Survey demonstrates a high level of reliability and measures its intended domains well, the field-testing was limited to a mail survey of adults receiving care at CNHS clinics only. Future work is needed to evaluate other modes of data collection (e.g., telephone interviews). In addition, although the survey covers issues that have been shown to resonate with a broad range of consumers and can be administered to consumers with all types of health insurance coverage, including Medicaid, Medicare, and commercial insurance, the survey was adapted to reflect how CNHS facilities are organized and how they deliver care. Thus, the current version of the survey may be most useful in assessing patient experience of care at CNHS facili-ties. Furthermore, the findings may not be generalizable to other American Indian communities or to American Indians living in non-tribal areas given the heterogeneity that exists among tribes and the differences that exist between American Indians that live in tribal areas and those that don’t.3

708 Adapting CAHPS® for an American Indian population
Future directions. Further testing of the CAHPS American Indian Survey should be conducted to assess whether the survey works in other American Indian health care settings and with other American Indian communities. In addition, future work could include a field test that included more than one tribal grouping and utilized both mail and telephone modes of data collection. Field testing with more than one tribe could provide insight into whether the survey can be used to compare patient experience of care across tribal groupings while combining modes would almost certainly increase response rates and allow comparisons by mode of data collection.
acknowledgments
Preparation of this manuscript was supported through cooperative agreements from the Agency for Healthcare Research and Quality and the Center for Medicare and Medicaid Services (U18 HS09204 and U18 HS016980). The authors thank Chief Gregory E. Pyle, Assistant Chief Gary Batton, the Choctaw Nation Tribal Council and Choctaw Nation Health Service for their advice, collaboration, and support of this study.
appendix—CaHPS american indian Survey Core Scales
Survey scales and items response format
Access: Getting Care Quickly in the Last 12 Months . . .Q4. When you called or went to a [Choctaw Nation Health Never (N)/
Services] clinic to get an appointment for care you Sometimes (S)/ needed right away, how often did you get an Usually (U)/Always (A) appointment as soon as you thought you needed it?
Q5. When you called or went to a [Choctaw Nation Health Same day/1 day/ Services] clinic to get an appointment for care you 2–3 days/4–7 days/ needed right away, how long did you usually have to 8–14 days/15 days wait between trying to get an appointment and actually or longer seeing a doctor or other health professional?
Q7. Not counting the times you needed care right away, N / S / U / A how often did you get an appointment for your health care [at a Choctaw Nation Health Services] clinic as soon as you thought you needed it?
Q11. After you checked in for your appointment at a Definitely yes/ [Choctaw Nation Health Services] clinic, were you Somewhat yes/ kept informed about how long you would need to wait Somewhat no/ for the person you went to see? Definitely no
Access: Getting Needed Care in the Last 12 Months . . .Q9. When you called a [Choctaw Nation] Health Services N / S / U / A
clinic after regular office hours, how often did you get the medical help or advice you needed?
709Weidmer-Ocampo, Johansson, Dalpoas, Wharton, Darby, and Hays
Q31. How often was it easy to get appointments with N / S / U / A specialists?
Q36. How often was it easy to get the care, tests or treatment N / S / U / A you thought you needed?
Q55. Was it easy to get prescription medicine you needed Definitely yes/ through your [Choctaw Nation] Health Services Somewhat yes/ clinic? Somewhat no/ Definitely no
Q56. How often did you get the prescription medicine you N / S / U / A needed through your [Choctaw Nation] Health Services clinic?
Communication (PDN 5 Primary Doctor or Nurse) in the Last 12 Months . . .Q21. Did your PDN encourage you to talk about your health Yes (Y)/No (N)
concerns, including those that might be embarrassing?
Q37. How often did your PDN explain things in a way that N / S / U / A was easy to understand?
Q38. How often did your PDN listen carefully to you? N / S / U / A
Q39. How often did your PDN show respect for what you N / S / U / A had to say?
Q40. How often did your PDN spend enough time with you? N / S / U / A
Q42. How often did your PDN explain the purpose of these N / S / U / A medicines in a way that was easy to understand?
Q44. How often did a PDN explain what to do if your illness N / S / U / A or health condition got worse or came back, in a way that was easy to understand?
Q46. When a health professional sent you for a blood test, N / S / U / A x-ray or other test, how often did someone from the health professional’s office follow up to give you the test results?
Q47. How often did doctors or other health professionals N / S / U / A explain test results in a way that was easy to understand?
Clerks and Receptionists at Your (CNHS5Choctaw National Health Services) Clinic in the Last 12 Months . . .Q52. How often were clerks and receptionists at your (CNHS) N / S / U / A
clinic as helpful as you thought they should be?
Q53. How often did clerks and receptionists at your (CNHS) N / S / U / A clinic treat you with courtesy and respect?
Health Education (PDN) in the Last 12 Months . . .Q22. Did you and your PDN talk about how to maintain a Y / N
healthy diet and healthy eating habits?
710 Adapting CAHPS® for an American Indian population
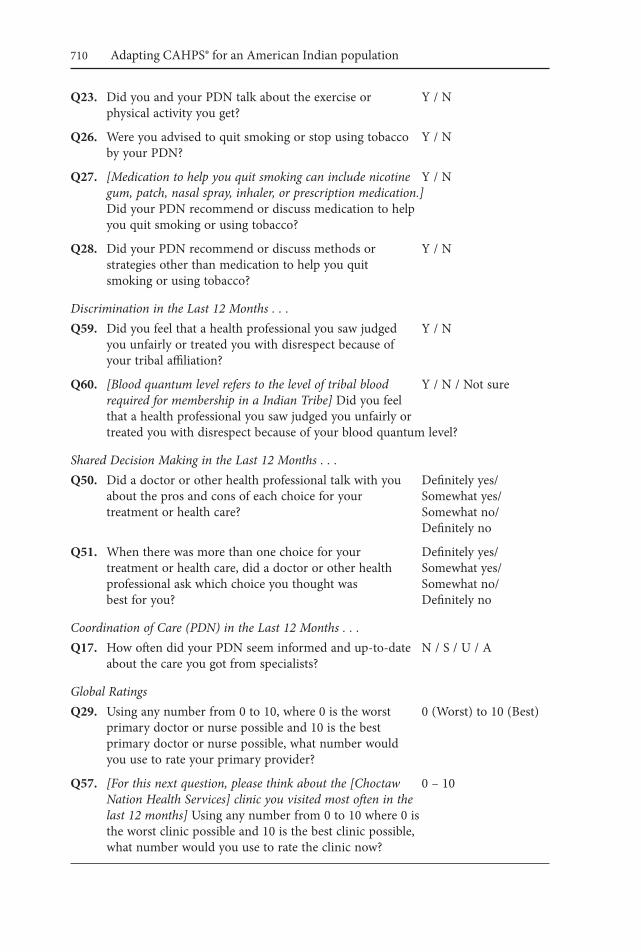
Q23. Did you and your PDN talk about the exercise or Y / N physical activity you get?
Q26. Were you advised to quit smoking or stop using tobacco Y / N by your PDN?
Q27. [Medication to help you quit smoking can include nicotine Y / N gum, patch, nasal spray, inhaler, or prescription medication.] Did your PDN recommend or discuss medication to help you quit smoking or using tobacco?
Q28. Did your PDN recommend or discuss methods or Y / N strategies other than medication to help you quit smoking or using tobacco?
Discrimination in the Last 12 Months . . .Q59. Did you feel that a health professional you saw judged Y / N
you unfairly or treated you with disrespect because of your tribal affiliation?
Q60. [Blood quantum level refers to the level of tribal blood Y / N / Not sure required for membership in a Indian Tribe] Did you feel that a health professional you saw judged you unfairly or treated you with disrespect because of your blood quantum level?
Shared Decision Making in the Last 12 Months . . .Q50. Did a doctor or other health professional talk with you Definitely yes/
about the pros and cons of each choice for your Somewhat yes/ treatment or health care? Somewhat no/ Definitely no
Q51. When there was more than one choice for your Definitely yes/ treatment or health care, did a doctor or other health Somewhat yes/ professional ask which choice you thought was Somewhat no/ best for you? Definitely no
Coordination of Care (PDN) in the Last 12 Months . . .Q17. How often did your PDN seem informed and up-to-date N / S / U / A
about the care you got from specialists?
Global Ratings Q29. Using any number from 0 to 10, where 0 is the worst 0 (Worst) to 10 (Best)
primary doctor or nurse possible and 10 is the best primary doctor or nurse possible, what number would you use to rate your primary provider?
Q57. [For this next question, please think about the [Choctaw 0 – 10 Nation Health Services] clinic you visited most often in the last 12 months] Using any number from 0 to 10 where 0 is the worst clinic possible and 10 is the best clinic possible, what number would you use to rate the clinic now?
711Weidmer-Ocampo, Johansson, Dalpoas, Wharton, Darby, and Hays
notes 1. Darby C, Hays RD, Kletke P. Development and evaluation of the CAHPS hospital
survey. Health Serv Res. 2005 Dec;40(6 Pt 2):1973–6. 2. Agency for Health Care Research and Quality (AHRQ). CAHPS fact sheet. Rockville,
MD: AHRQ, 2002. Available at: http://www.ahrq.gov/qual/cahpfact.htm. 3. Ogunwole S. We the people: American Indians and Alaska natives in the United
States. Census 2000 Special Reports. Washington, DC: U.S. Census Bureau, 2006. 4. Kunitz SJ. The history and politics of U.S. health care policy for American Indians
and Alaskan Natives. Am J Public Health. 1996 Oct;86(10):1464–73. 5. Joe JR. The delivery of health care to American Indians: history, policies, and pros-
pects. In: Green DE, Tonnesen V, eds. American Indians: social justice and public policy. Chicago, IL: University of Wisconsin Press, 1991; 49–79.
6. Foreman G. The five civilized tribes: Cherokee, Chickasaw, Choctaw, Creek, Seminole. Norman, OK: University of Oklahoma Press, 1934.
7. United States Congress House Committee on Resources. Cherokee, Choctaw, and Chickasaw Nations Claims Settlement Act: report. Washington, DC: U.S. Government Printing Office, 2002.
8. Choctaw Nation Health Services Authority. Choctaw Nation Health Services Authority website. Talihina, OK: Choctaw Nation Health Services Authority, 2008. Available at: http://www.choctawnationhealth.com.
9. U.S. Department of Health and Human Services. HHS Tribal Consultation Policy. Washington DC: DHHS, 2000. Available at: http://www.ihs.gov/AdminMngr Resources/Regulations/deptpolicy.asp.
10. Noe TD, Manson SP, Croy C, et al. The influence of community-based participatory research principles on the likelihood of participation in health research in American Indian communities. Ethn Dis. 2007 Winter;17(1Suppl1):S6–14.
11. Letiecq BL, Bailey SJ. Evaluating from the outside: conducting cross-cultural evaluation research on an American Indian reservation. Eval Rev. 2004 Aug;28(4):342–57.
12. Foster CH. What nurses should know when working in Aboriginal communities. Can Nurse. 2006 Apr;102(4):28–31.
13. Fredrisckshon, DD, Jones TL, Molgaard CA, et al. Optimal design features for surveying low income populations. J Health Care Poor Underserved. 2005 Nov;16(4):677–90.
14. McCabe M, Morgan F, Curley H, et al. The informed consent process in a cross-cultural setting: is the process achieving the intended result? Ethn Dis. 2005 Spring; 15(2):300–4.
15. Christopher S, McCormick A, Smith A, et al. Development of an interviewer training manual for a cervical health project on the Apsaalooke Reservation. Health Promot Pract. 2005 Oct;6(4):414–22.
16. Gone JP. Research reservations: response and responsibility in an American Indian community. Am J Community Psychol. 2006 Jun;37(3–4):333–40.
17. LaRowe TL, Wubben DP, Cronin KA, et al. Development of a culturally appropri-ate, home-based nutrition and physical activity curriculum for Wisconsin American Indian families. Prev Chronic Dis. 2007 Oct;4(4):A109. Epub 2007 Sep 15.
18. Quigley D. A review of improved ethical practices in environmental and public health research: case examples from native communities. Health Educ Behav. 2006 Apr; 33(2):130–47.
19. Richmond LS, Peterson DJ, Betts SC. The evolution of an evaluation: a case study using
712 Adapting CAHPS® for an American Indian population
the tribal participatory research model. Health Promot Pract. 2008 Oct;9(4):368–77. Epub 2006 Jun 27.
20. Satter DE, Veiga-Ermert A, Burhansstipanov L, et al. Communicating respectfully with American Indian and Alaska natives: lessons from the California Health Interview Survey. J Cancer Educ. 2005 Spring;20(1):49–51.
21. Fisher PA, Ball TJ. The Indian Family Wellness project: an application of the tribal participatory research model. Prev Sci. 2002 Sep;3(3):235–40.
22. Fisher PA, Ball TJ. Tribal participatory research: mechanisms of a collaborative model. Am J Community Psychol. 2003 Dec;32(3–4):207–16.
23. Minkler M, Wallerstein N, eds. Community based participatory research for health. San Francisco, CA: Jossey-Bass, 2003.
24. Johansson P, Jacobsen C, Buchwald D. Perceived discrimination in health care among American Indian/Alaska natives. Ethn Dis. 2006;16(4):766–71.
25. Guadagnolo BA, Cina K, Helbig P, et al. Medical mistrust and less satisfaction with health care among Native Americans presenting for cancer treatment. J Health Care Poor Underserved. 2009 Feb;20(1):210–26.
26. McIntosh M. Survey on disparities in quality of health care. New York: The Com-monwealth Fund, 2001.
27. Hughes KA. Comparing pretesting methods: cognitive interviews, respondent debrief-ing, and behavior coding. Washington, DC: U.S. Census Bureau, 2003.
28. Willis G. Cognitive interviewing: a tool for improving questionnaire design. Thousand Oaks, CA: Sage Publications, 2004.
29. Harris-Kojetin LD, Fowler FJ Jr, Brown JA, et al. The use of cognitive testing to develop and evaluate CAHPS 1.0 core survey items. Consumer Assessment of Health Plans Study. Med Care. 1999 Mar;37(3 Suppl):MS10–21.
30. Levine RE, Fowler FJ Jr, Brown JA. Role of cognitive testing in the development of the CAHPS Hospital Survey. Health Serv Res. 2005 Dec;40(6 Pt 2):2037–56.
31. Weech-Maldonado R, Weidmer B, Morales L, et al. Cross-cultural adaptation of sur-vey instruments: the CAHPS experience. In: Cynamon ML, Kulka RA, eds. Seventh Conference on Health Survey Research Methods. Hyattsville, MD: U.S. Department of Health and Human Services, 2001; 83–90.
32. Willis G. Cognitive interviewing and questionnaire design: a training manual. Hyatts-ville, MD: National Center for Health Statistics, 1994.
33. Smith TW. Trends in non-response rates. Int Journal of Public Opinion Research. 1995;7(2):157–71.
34. Atrostic BK, Bates N, Burt G, et al. Nonresponse in U.S. government household surveys: consistent measures, recent trends, and new insights. Journal of Official Statistics. 2001;17(2):208–26.
35. Hepner KA, Brown JA, Hays RD. Comparison of mail and telephone in assessing patient experiences in receiving care from medical group practices. Eval Health Prof. 2005 Dec;28(4):377–89.