
Adaptation to climate change in coastal area and drought-prone Barind area of Bangladesh
63
LIVELIHOOD ADAPTATION TO CLIMATE CHANGE IN COASTAL AREA OF KHULNA AND DROUGHT PRONE HIGH BARIND TRACT (LACC-II, BARI-FAO program)
Transcript of Adaptation to climate change in coastal area and drought-prone Barind area of Bangladesh

LIVELIHOOD ADAPTATION TO CLIMATE
CHANGE IN COASTAL AREA OF KHULNA
AND DROUGHT PRONE HIGH BARIND
TRACT (LACC-II, BARI-FAO program)


What is Adaptation to Climate Change?
Adapting to climate change means taking
action to reduce the adverse consequences
or to take advantage of any opportunities
that may arise.
What is Adaptive capacity?
The ability of a system to adjust its
characteristics or behavior in order to expand
its coping range under existing climatic
variability or future climatic conditions.

Dying big river: Jamuna and Padma

Denuded Hill
and
Rampant
forest cutting


Laudove,
Dakope,
Khulna for
Saline/coa
stal area
Nachole &
Shapahar,
Rajshahi
Region (for
drought
area)

Communicating with mainland
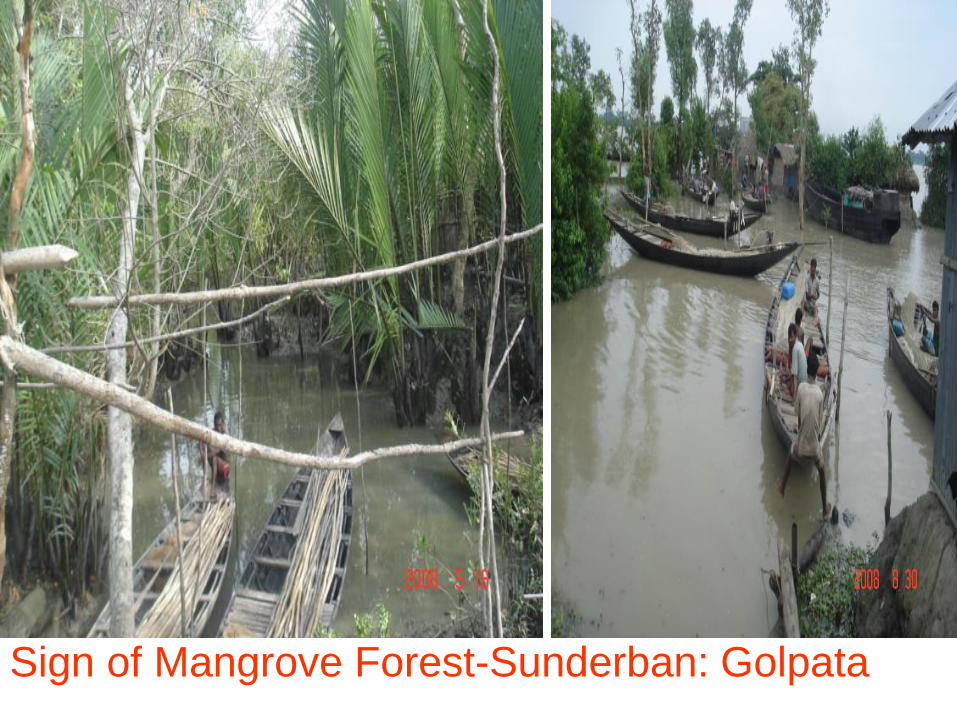
Sign of Mangrove Forest-Sunderban: Golpata

Sunderban

Only few Km Embankment cum HBB Road

0.5%
15.9%
21%21%
8%
0
20
40
60
80
100
120
140
160
Khulna Bagerhat Satkhira Patuakhali Noakhali
Coastal areas
Sa
lt a
ffe
cte
d a
re
a (0
00
h
a)
1973
2000

Salinity in Patch

Both drought and salinity


Table: relative tolerance of some plants to salinity
Tolerant(8-
12dS/m)
M.tolerant(6-8
dS/m)
M.Sensitive(4-6
dS/m)
Sensitive(0-4
dS/m)
Barley,grain Barley,forage Broad bean Bean
Cotton Beet,garden/red Cabbage Blackberry
Date Cowpea Cauliflower/brocolli/
Knlkhol
Carrot
Salt grass Clover,berseem Clover, strawberry Lemon/mango
Rosemary/jujube Fig/coconut/guava Maize Onion
Sugar beet Oats/pineapple Cowpea/watermelon
/muskmelon/radish
Orange
Triticale Orchard grass Cucumber/papaya Pineapple,guava?
Sorghum Lettuce/spinach Rose
Soybean Pea Strawberry
Wheat Peanut/garlic Mungbean
Dhiancha Potato
B. Napus Rice,paddy
Soybean Tomato

Saline
tolerant
crop

Homestead gardening adaptation with saline tolerant vegetable

jvD‡Wve g‡Wj (Lyjbvi jeYv³ GjvKvi Rb¨)
Abycwi‡ek
km¨web¨vm
iwe Lwid-1 Lwid-2
Db¥y³ RvqMv
†eW-1 IjKwc wMgvKjgx wMgvKjgx
†eW-2 exU ‡Xuom ‡Xuom+ jvjkvK
†eW-3 cvjskvK cyuBkvK cyuBkvK
†eW-4 U‡g‡Uv WvUv WvUv
N‡ii Pvjv
Pvjv-1 evwi jvD-2/¯’vbxq jvD PvjKzgov PvjKzgov
Pvjv-2 wgwó Kzgov PvjKzgov PvjKzgov
gvPv (euv‡ki ˆZwi)
gvPv-1 evwi jvD-2/¯’vbxq jvD PvjKzgov ay›`yj
gvPv-2 evwi mxg-2/¯’vbxq mxg Kijv wPwPsMv

Qvqvhy³ ¯’vb
web¨vm-1 ‡gŠjfx KPz ‡gŠjfx KPz ‡gŠjfx KPz
web¨vm-2 _vbKzwb/†n‡jÂv _vbKzwb/†n‡jÂv _vbKzwb/†n‡jÂv
mu¨vZ‡mu‡Z Rwg cvwbKPz cvwbKPz cvwbKPz
Mv‡Qi Dci mv‡ne Avjy/ ˆP mv‡ne Avjy/ ˆP mv‡ne Avjy/ ˆP
evoxi mxgvbv ¯’vbxq Kjv/mvRbv/ †bwcqvi Nvm
¯’vbxq Kjv/mvRbv/ †bwcqvi Nvm
¯’vbxq Kjv/mvRbv/ †bwcqvi Nvm
evoxi mxgvbvi †eov evwi wkg-2/¯’vbxq wkg eiewU ay›`j
emZevwoi Lvwj RvqMvq (jeYv³Zv mwnòz dj †ivcY): Q‡d`v, Avg,
bvwi‡Kj, †jey, Av‡cj/ evDK~j, Avgov, wP‡e LvIqvi AvL|

Saline tolerant Spinach, Knolkhol, Beet & Tomato
were selected
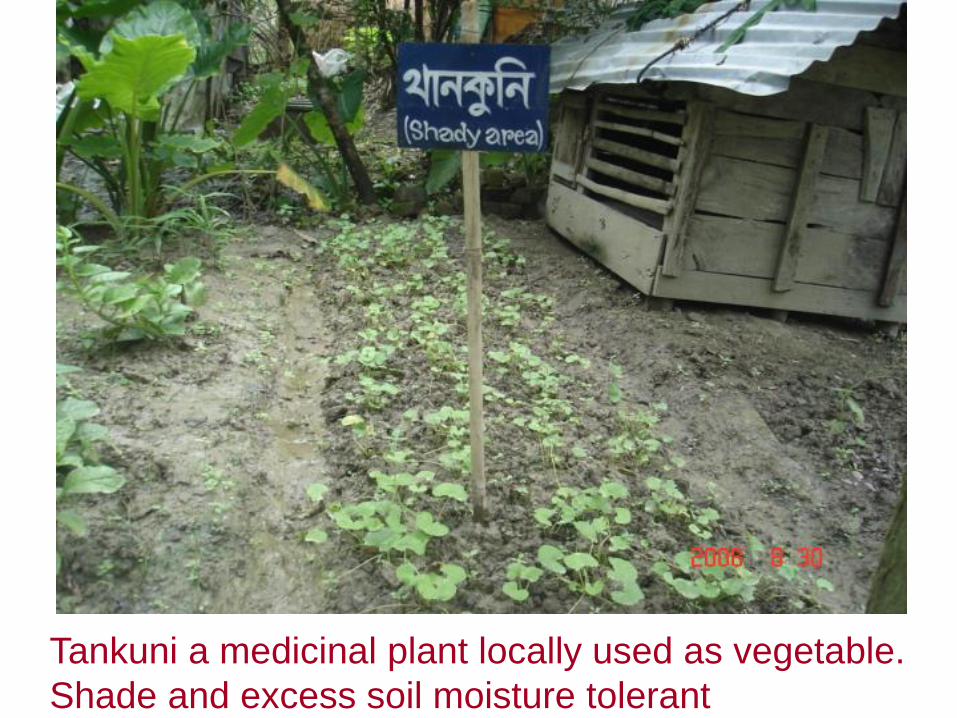
Tankuni a medicinal plant locally used as vegetable.
Shade and excess soil moisture tolerant

Table 1. Average production and disposal pattern of rabi and
kharif season (240 days) vegetable per homestead at
Laudove MLT site,Dakope, Khulna during Jul.2008- Feb.09
Season
Total
product
ion
in240
days
(kg)
Total
own
consump
tion (kg)
Own*
consump
tion
(g/head/d
ay)
Free
distribu
tion
(kg)
Sold
(kg)
Total
cash
incom
e (Tk)
Kharif 40 27 45.66 7 6 37
Rabi 120 55 92.00 22 43 405
All season
total
160 83(52) 68.83 29(18) 49(3
0)
443
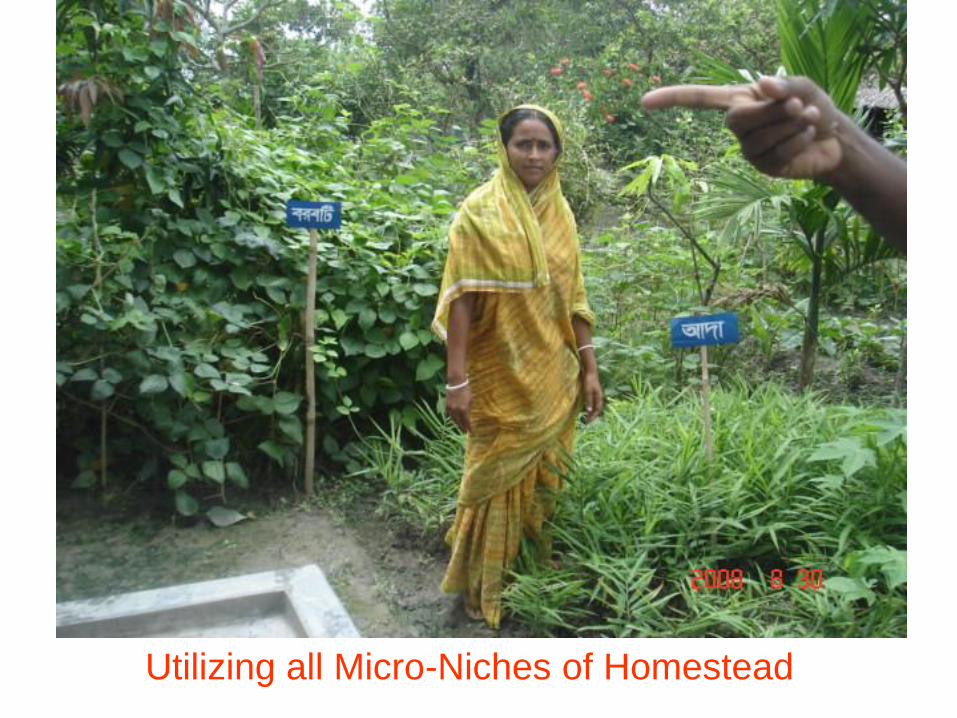
Utilizing all Micro-Niches of Homestead

0
20
40
60
80
100
g/h
ea
d/d
ay
Kharif rabi Mean
Vegetable consumption (g/h/day), before and
after intervention at Laudove, Khulna
Before
Intervention
After
Intervention

Fig. Work done by male and female in homestead gardening,
Laudove, Khulna, 2008-09
0
10
20
30
40
50
60
70
80
90
L.prep
aration
Sow
ing
Irrig
a
Intercul.
Harve
st
Marke
t
% o
f w
ork
Male %
Female %
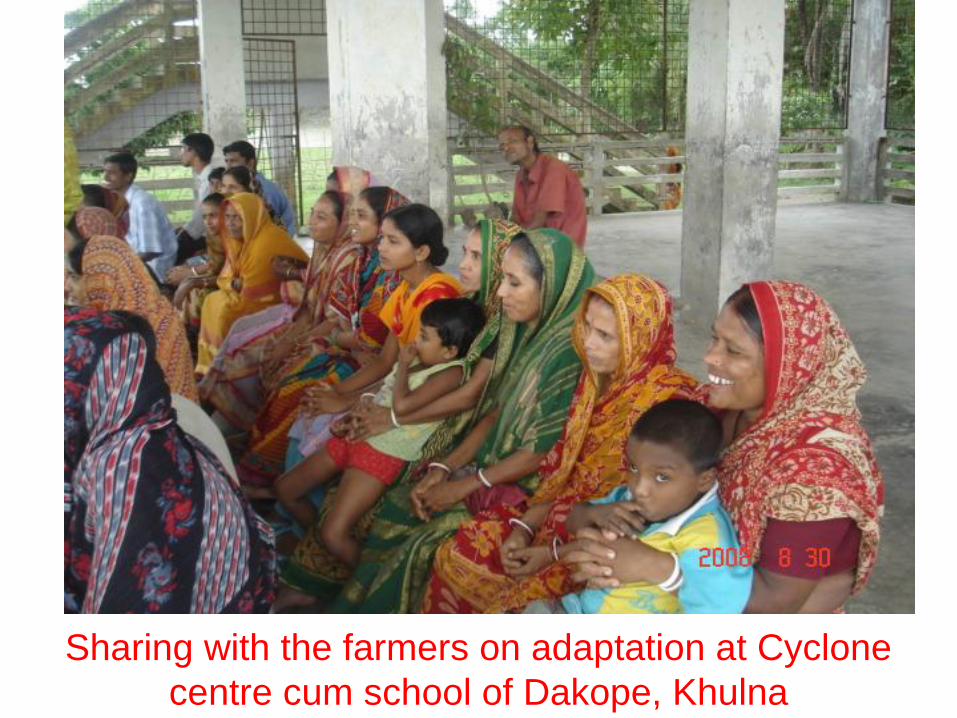
Sharing with the farmers on adaptation at Cyclone
centre cum school of Dakope, Khulna


Spill over effect of homestead vegetable
gardening by landless fisherman’s wife


Yield
traditional
BR23: 3 t/ha
Harvested:
Dec 7
Yield BINA 4: 3.8
t/ha
Harvested: Early
Nov

0
500
1000
1500
2000
2500
Cowpea Wheat Watermelon Sweet gourd
Yield(kg/bigha
Gross
margin(Tk/Bigha)

Problem is excess soil moisture (BARI
cowpea 1) for filed crop


Prospective crop for Coastal belt

Kuni/Mini pond is
important for small
scale irrigation in
saline area


Fig 1. Relationship between salinity and rainfall during June, 2008 to
March, 2009, at Laudove, Dakope, Khulna
0
1
2
3
4
5
6
7
8
9
June
.08
July.08
Aug
.08
Sep
t.08
Oct.08
Nov
.08
Dec
.08
Jan.09
Feb
.09
Mar
.09
Sa
lin
ity
(dS
/m)
0
50
100
150
200
250
300
350
400
To
tal ra
infa
ll(m
m)
Salinity(dS/m)
Rainfall(mm)


Mostly fallow land after T.aman
rice in deeper areas of HBT

In Search of water

Boro rice requires 3-5 t water/kg rice
Boro rice (rabi season) cultivation even in top
part of elevation of Barind, requiring large
quantity of underground water

Table 26. Twelve years (1998- May 2009) monthly rainfall (mm)
of Rajshahi, Bangladesh
Year Jan Feb Mar Apr May Jun Jul Aug Sep Oct Nov Dec Total
1998 12 5 51 33 129 92 436 276 280 208 33 0 1555
1999 5 8 25 9 144 348 347 310 502 155 108 0 1961
2000 4 7 27 136 200 244 117 191 642 85 0 0 1653
2001 0 4 9 13 214 324 337 211 97 185 1 0 1395
2002 11 1 21 111 195 223 316 240 281 49 11 0 1459
2003 2 19 64 44 84 280 238 131 262 293 0 8 1425
2004 10 0 0 63 85 503 305 217 361 152 0 0 1696
2005 13 1 101 34 106 92 493 147 115 268 0 0 1370
2006 0 0 7.4 37.2 191.2 189 120.4 217.8 304 35.2 10.4 0 1112.6*
2007 0
26.
6 59.4 54 125.6 309.6 325 235.7 306.9 75.4 0.6 0 1518.8
2008 25 0.6 0.4 22.4 131.6 256.9 221.5 245.5 127.5 127 0 0 1158.4*
2009 1 7 27.9 0 - - - - - - - - -
Mean
6.9
2
6.6
0
32.7
6
46.3
8
145.9
5
260.1
4
295.9
9
220.1
8
298.0
4
148.4
2
14.9
1
0.7
3
1482.1
6
SD
(±)
7.5
7
8.2
6
30.5
4
40.6
8 46.97
116.9
9
116.5
3 51.69
163.9
8 85.24
32.4
6
2.4
1 240.05

Table: Five years (2005 - May 2009)
average temperature (0C) of
Rajshahi
Month
2005 2006 2007 2008 2009
Min Max Min Max Min Max Min Max Min Max
January 9.4 26.4 6.5 29 6.2 18.3 11.09 23.74 12.35 24.49
February 8.9 33.2 12.8 35.4 10.6 30.5 11.96 25.59 12.56 29.45
March 15.2 36 13.7 39.6 11.9 37.5 20.12 33.03 17.96 33.39
April 18.9 38.6 20 38.8 18.5 39 23.07 36.33 23.89 37.44 May 19.4 39.8 21 39 20.9 39.2 24.25 35.43 - -
June 24 42.4 22.5 36.8 25.59 33.77 25.71 32.64 - -
July 24 34 25.2 36.4 26.05 32.45 25.98 31.95 - -
August 24.2 35.5 25.2 35.8 26.56 33.17 26.37 32.77 - -
September 23.4 36.2 24 35.5 26.06 32.85 25.84 32.24 - -
October 19 33 21.7 34.6 23.29 31.9 22.56 31.79 - -
November 14 31.4 10.4 31.5 18.45 29.75 16.55 29.59 - -
December 10.2 27.8 9.7 27.4 11.54 25.42 15.04 25.01 - -
Mean 17.55 34.53 17.73 34.98 18.80 31.98 20.71 30.84 - -


Table. Average production and disposal pattern of
homestead vegetable of 10 farmers Barind area, Rajshahi,
July 2008- February 2009
Locati
on
Total
producti
on in
240
days
(kg)
Total
own
consumpt
ion (kg)
Own
consumpt
ion
(g/head/d
ay)
Free
distribut
ion (kg)
Sold
(kg)
Total
cash
incom
e
(Taka)
Nachol
e 83 66 55.00 14.73 2.27 23/-
Shapa
har 137 87 72.71 18.74 31.00 310/-
Mean 110 76.63(70) 63.85
16.73(15
)
16.63(1
5)
166.50
/-

0
10
20
30
40
50
60
70
80g
/head
/day
Before intervention After Intervention
Fig. Comparative vegetable consumption per
head/day (g) , before and after intervention
Nachole
Shapahar
Mean

Fresh vegetable collection from home garden
and cooking for healthy dish

Fig. Work distribution in homestead vegetable
between male and female, HBT, 2008-09
0
10
20
30
40
50
60
70
80
90
100
L. p
repa
See
ding
Inte
rcult
Har
vest
Mar
ket
% w
ork
dis
trib
uti
on
Male
Female

Timely wheat plantation has prospect,
requires small amount of water for
irrigation

Reduced chickpea growth-low pH
and low organic matter

Fig. Comparative economic benefits of different
dry land crops,Nachole, HBT, 2008-09
0
500
1000
1500
2000
2500
3000
3500
Chickpea
Chickpea+Barley
Wheat
Tk/B
ig
ha
0
0.5
1
1.5
2
2.5
3
3.5
4
BC
R
Gross
margin(Tk/Big
ha)
Fig. Coparative economic return from from different
crops, Shapahar, HBT, 2008-09
0
200400
600800
1000
12001400
16001800
2000
Chickpea
Chickpea+Linseed
Wheat
Tk/B
ig
ha
0
0.5
1
1.5
2
2.5
3
BC
R
Gross margin(Tk/Bigha)
BCR

Rainfed but good
growth due to deep
root and prolific root
system of both
chickpea and barley.
Up to 105 cm deep
root in Barind soil

Moringa a drought
tolerant , widely
Adapted, highly
nutritious and medicinal
plant –leaves are more
valuable than pod

Bamboo Bush management: - A
Scarce resource of Barind


Provided Technical Back-up to DAE (LACC-II
project) for BARI mandated crops/technology

Adaptation to Climate
Change for children