
ActiveReports 6 User Guide - Documents Free Download PDF
452
ActiveReports 6 User Guide ActiveReports 6 User Guide |
-
Upload
khangminh22 -
Category
Documents
-
view
3 -
download
0
Transcript of ActiveReports 6 User Guide - Documents Free Download PDF

ActiveReports 6 User Guide
ActiveReports 6 User Guide |
Table of Contents
ActiveReports User Guide 1
Introducing ActiveReports 6 2
What's New 3-8
ActiveReports Editions 9-10
GrapeCity Copyright Notice 11
ActiveReports License Agreement 12-13
Installation 14
Requirements 15
Installed Files 16-17
Installation Troubleshooting 18
Service Packs and Hot Fixes 19
ActiveReports for .NET 2.0 Side-by-Side Installation 20
License Your ActiveReports 21-23
Upgrading Reports 24
Changes from Previous Versions 25
Upgrading from Previous Versions 26-28
Migrating from ActiveReports 2 29
Converting MS Access Reports 30
Getting Started 31
Adding ActiveReports Controls 32
Adding an ActiveReport to a Project 33
ActiveReports Templates 34
ActiveReports Designer 35
Design View 36
Report Explorer 37-39
ActiveReports Toolbox Controls 40-41
Text Input for TextBox and Label Controls 42-43
Cross Section Controls 44
Toolbar 45
Designer Tabs 46
Snap Lines 47
ActiveReports 6 User Guide |
DataSource Icon 48
Properties Window 49
Viewing Reports 50
Windows Form Viewer Hot Keys And Shortcuts 51
ActiveReports and the Web 52
Getting Started with the Web Viewer (Pro Edition) 53-55
Flash Viewer Options 56-57
Flash Viewer Hot Keys and Shortcuts 58
Concepts 59-60
Report Structure 61-62
Report and Page Settings 63-64
KeepTogether Options 65
Date, Time, and Number Formatting 66
Parameters 67-68
Layout Files 69
Scripting 70
Export Filters 71
HTML 72-73
PDF 74-75
Digital Signatures (Pro Edition) 76-77
RTF 78
Text 79
TIFF 80
Excel 81
Charts 82
Chart Elements 83-84
Chart Series 85-86
Chart and Series-Specific Properties 87-93
Chart Wizard 94
Chart Types 95
Common Charts 96-101
3D Charts 102-110
ActiveReports 6 User Guide |

XY Charts 111-113
Financial Charts 114-120
Chart Appearance 121
Chart Effects 122-124
Chart Control Items 125-131
Chart Axes and Walls 132-135
Chart Data 136-140
RichText 141-142
Grouping Data 143
Multiple Groupings 144-145
Subreports 146
Report Events 147-148
Section Events 149
Sequence of Events 150-151
Unbound Reporting 152-154
Optimizing ActiveReports 155-156
CacheToDisk and Resource Storage 157
Section 508 Compliance 158-161
Localization 162
Designer Control (Pro Edition) 163
How To 164-165
Work with Data 166
Bind Reports to a Data Source 167-170
Group Data 171
Modify Data Sources at Run Time 172-173
Work with Fields 174
Add Field Expressions 175-176
Create Summary Fields 177
Create Calculated Fields 178
Create Common Reports 179
Create Top N Reports 180
Create Summary Reports 181
Create Green Bar Reports 182-183
ActiveReports 6 User Guide |
Change Ruler Measurements 184-185
Display Page Numbers and Report Dates 186
Format BarCodes 187-190
Add Hyperlinks 191-193
Add Annotations 194-196
Export Reports 197
Create a Digital Signature for a PDF Export 198-201
Print Multiple Copies, Duplex, and Landscape 202-204
Conditionally Show or Hide Details 205-206
Use External Style Sheets 207-209
Add Bookmarks 210-212
Insert or Add Pages 213-215
Create Charts 216-218
Access the Chart Wizard and Data Source 219-220
Load a File into a RichText Control 221-223
Use Custom Controls on Reports (TreeView) 224-225
Create Report Templates (Inheritance) 226-227
Add Parameters 228-231
Embed Subreports in a Report 232
Pass Parameters to a Subreport 233-234
Save and Load Report Files (RDF) 235-236
Save and Load Report Layout Files (RPX) 237-238
Add Code to Layouts Using Script 239-243
Provide No-Touch Printing in the WebViewer (Pro Edition) 244
Add Designer ToolStrips (Pro Edition) 245-246
Add Report Links to Web Forms (Pro Edition) 247
Customize, Localize and Deploy 248
Customize the Viewer Control 249-250
Localize the Viewer Control 251
Cultures 252-255
Localize Active Reports Resources 256
Deploy Windows Applications 257-258
ActiveReports 6 User Guide |
Deploy Web Applications (Std Edition) 259
Localize the End User Report Designer 260
Deploy the End User Report Designer (Pro Edition) 261
Customize the FlashViewer Toolbar (Pro Edition) 262-265
Localize the Flash Viewer 266
Deploy Web Applications (Pro Edition) 267-268
Customize End User Designer Help (Pro Edition) 269-270
Deploy End User Designer Help (Pro Edition) 271
Configure HTTPHandlers (Pro Edition) 272-273
Configure Handler Mappings in IIS 7.0 274-275
Samples and Walkthroughs 276
Samples 277-278
NEW Flash Web Viewer Sample 279-280
NEW Cross Section Control Sample 281-283
NEW Style Sheets Sample 284-285
Annual Report Sample 286-287
Bound Data Sample 288-289
Category Selection Sample 290-291
Charting Sample 292-293
Cross Tab Report Sample 294-295
Custom Preview Sample 296-297
Hyperlinks and Drill Down Sample 298-299
Rdf Viewer Sample 300
SubReports Sample 301-302
Walkthroughs 303
Basic Data Bound Reports 304-305
Basic XML-Based Reports (RPX) 306-309
Address Labels 310-312
Columnar Reports 313-314
Overlaying Reports (Letterhead) 315-318
Chart Walkthroughs 319
Bar Chart 320-322
3D Pie Chart 323-325
ActiveReports 6 User Guide |

Financial Chart 326-329
Unbound Chart 330-333
Basic Spreadsheet with SpreadBuilder 334-336
Group On Unbound Fields 337-341
Subreport Walkthroughs 342
Subreports with Run-Time Data Sources 343-346
Nested Subreports 347-351
Subreports with XML Data 352-354
Hyperlinks for Simulated Drill-Down Reporting 355-362
Mail Merge with RichText 363-367
Run Time or Ad Hoc Reporting 368
Run Time Layouts 369-377
Run Time Data Sources 378-380
Web Walkthroughs (Standard Edition) 381
Custom Web Exporting (Std Edition) 382-385
Custom HTML Outputter 386-391
Web Services 392
DataSet Web Service 393-394
DataSet Windows Application 395-396
Document Web Service 397-399
Document Windows Application 400-401
Layout Files with Embedded Script 402
Script for Simple Reports 403-406
Script for Subreports 407-412
Creating a Basic End User Report Designer (Pro Edition) 413-418
Web Viewer (Pro Edition) 419-421
Flash Viewer 422-423
Troubleshooting 424-429
Export Troubleshooting 430-433
ActiveReports 6 User Guide |
ActiveReports 6 is a fully integrated Visual Studio component which combines the features of the Visual Studio .NET programming languages with user-friendly controls to provide a powerful report designer.
In This Documentation
Introducing ActiveReports 6Find out what's new in ActiveReports 6, learn which features are freed from the evaluation banner with the Standard and Professional Edition licenses, and find copyright and license information.
InstallationView requirements for installation of ActiveReports 6, learn what files are installed and how to verify your installation, and find installation troubleshooting tips.
License Your ActiveReportsThis topic walks you through how to license your machine and how to add licensing to any projects created during your evaluation.
Upgrading ReportsUse this section to guide you through the upgrade path from previous ActiveReports versions, and to learn to convert Microsoft Access reports to ActiveReports.
Getting StartedThis section serves as a guide to help you to get started, with topics on adding controls to Visual Studio, adding reports to projects, and understanding the designer interface. You will also find topics on the report viewer and on using ActiveReports on the Web.
ConceptsThis section explains important concepts to help you to understand what to expect from ActiveReports and how it works.
How ToHere you will find topics that guide you through specific tasks that you may want to perform with ActiveReports.
Samples and WalkthroughsFind out how to use various features of ActiveReports using included sample projects and step-by-step guides to create new projects.
TroubleshootingBrowse frequently asked questions, learn how to resolve some common issues with ActiveReports, and find information on technical support options.
ActiveReports User Guide
ActiveReports 6 User Guide | 1

ActiveReports leverages the latest technologies including XML, scripting and CSS along with open architecture to provide you with a fully-integrated and user-friendly report designer. This version now supports Visual Studio 2008, as well as Visual Studio 2005.
This section contains information about:
What's NewLearn about the new features in ActiveReports 6.
ActiveReports EditionsFind out which features are freed from the evaluation banner with the Standard and Professional Edition licenses.
GrapeCity Copyright NoticeExplains GrapeCity copyright information.
ActiveReports License AgreementUnderstand the terms of the ActiveReports License Agreement and Limited Warranty.
Introducing ActiveReports 6
ActiveReports 6 User Guide | 2
ActiveReports 6 contains many new features that enhance the reporting capabilities already praised by developers in previous versions of ActiveReports.
New Flash Viewer
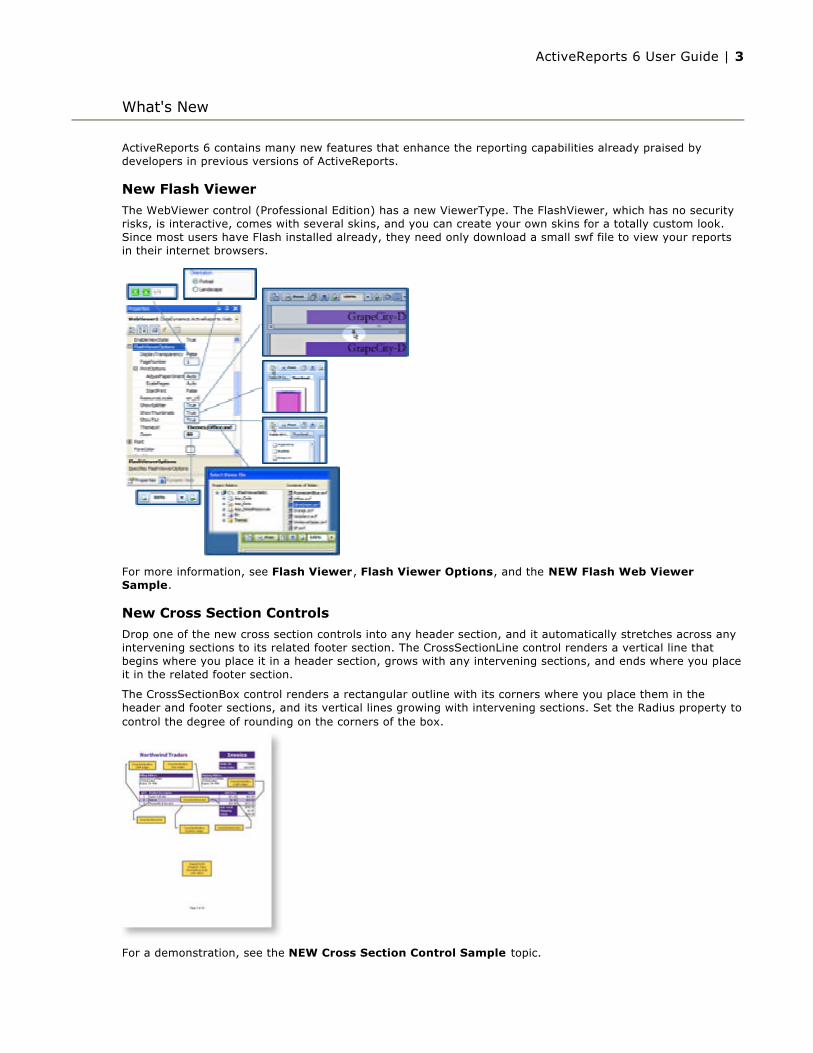
The WebViewer control (Professional Edition) has a new ViewerType. The FlashViewer, which has no security risks, is interactive, comes with several skins, and you can create your own skins for a totally custom look. Since most users have Flash installed already, they need only download a small swf file to view your reports in their internet browsers.
For more information, see Flash Viewer, Flash Viewer Options, and the NEW Flash Web Viewer Sample.
New Cross Section Controls
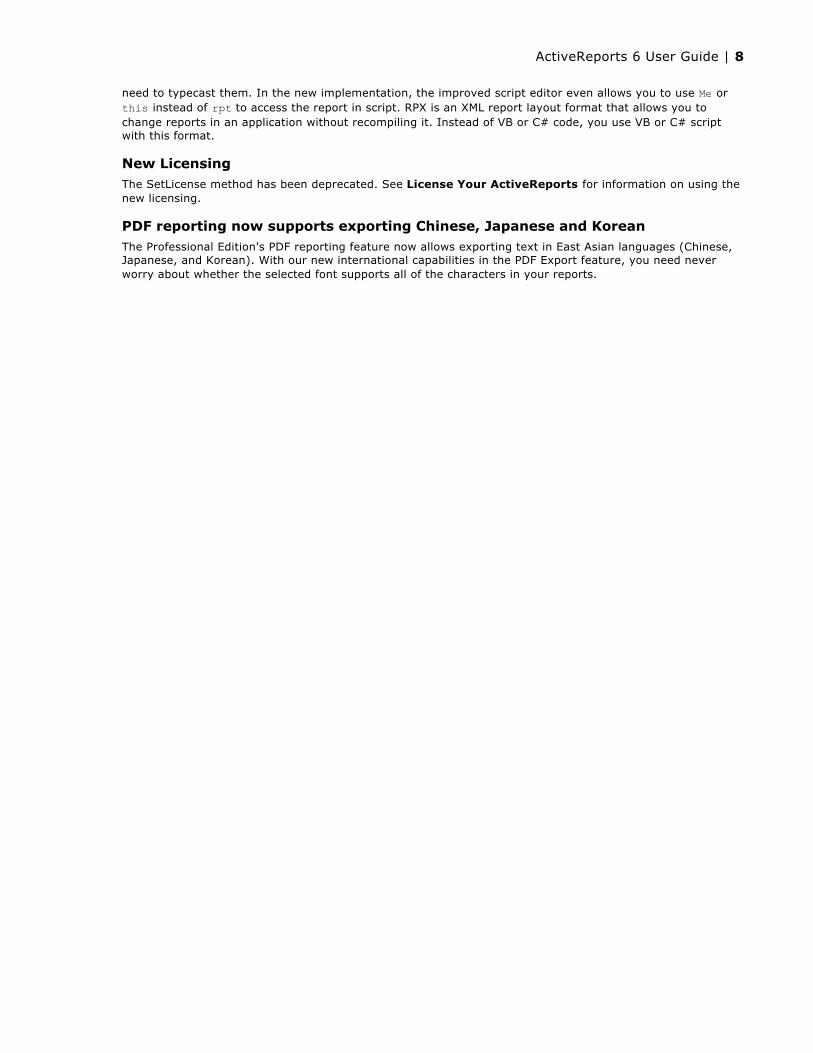
Drop one of the new cross section controls into any header section, and it automatically stretches across any intervening sections to its related footer section. The CrossSectionLine control renders a vertical line that begins where you place it in a header section, grows with any intervening sections, and ends where you place it in the related footer section.
The CrossSectionBox control renders a rectangular outline with its corners where you place them in the header and footer sections, and its vertical lines growing with intervening sections. Set the Radius property to control the degree of rounding on the corners of the box.
For a demonstration, see the NEW Cross Section Control Sample topic.
What's New
ActiveReports 6 User Guide | 3

New SnapLinesSnapLines let you glide controls freely around your report instead of snapping to a grid, and display blue horizontal and vertical alignment lines and slowed dragging when your control comes into alignment with other controls or section edges. Visual placement of controls has never been easier.
See Snap Lines for more information.
New Detail RepeatToFill PropertyThe Detail section has a new RepeatToFill property that allows your green bar or other formatting to fill the page even if your data doesn't. For the simplest example, if you have a report with a PageHeader, Detail, and PageFooter section, and the detail section has a background color set, the background color on the last page would normally end with the data, and then the PageFooter section would render at the bottom of that page, leaving a white gap between the two sections. With the RepeatToFill property set to True however, the last page of the report would have the background color extending down to just above the PageFooter, leaving no white space.
For a demonstration, see the NEW Cross Section Control Sample topic.
New Professional Edition Digital Signature and TimeStamp Features on the PDF ExportThe new Signature feature includes sixteen properties such as Certificate to prove that you created the document, and CertificationLevel to control users' access to your documents. And if you need to prove that data such as contracts or medical records existed before a certain point, set the new TimeStamp property on your PDF exports. To use the feature, provide the URL of a trusted third party acting as a time stamping authority (TSA). The digital signature and time stamp are concatenated with a one-way hash calculated from the report data.
New Support for External Style SheetsWith the addition of several options on the Report Settings window in the Styles page, you can now save the styles you set on report sections into external XML style sheets. Once saved, you can link these external style sheets to other reports for an easy way to keep related reports consistent.
Note: The RepeatToFill property cannot be used if the PageBreak or SubReport control is used in the Detail section, or if the NewPage or NewColumn property is set to any value other than None.
ActiveReports 6 User Guide | 4

See the NEW Style Sheets Sample and the Use External Style Sheets topic for more information.
New ToolStrips
The End User Designer no longer relies on clunky old toolbars or CommandBarManager. It has all been replaced with the Visual Studio ToolStrip component. See the refurbished EndUserDesigner Sample for a demonstration, or see the Add Designer ToolStrips topic for more information.
New Annotation Images
The Viewer now allows users to add images as annotations. To use it, drop down the Annotations list, drag the new Image annotation onto the report, right-click the image and choose Properties. In the Annotation's Properties window that appears, you can set the Background Image property to any image.
New TextJustify PropertyText justification in TextBox and Label controls now also supports single character justification. When you set the Alignment property to Justify, the new TextJustify property extends your justification options to include Auto (default), Distribute and DistributeAllLines.
ActiveReports 6 User Guide | 5

New Padding on TextBoxesThe TextBox control now has a Padding property, with five settings at design time: All, Left, Top, Right, and Bottom. More settings, like Vertical and Horizontal, are available in code. The All property has a default value of -1, which means that all of the Padding values are not equal. Change this value to 10, and a space ten pixels wide is left around the text on all sides. The Left, Top, Right, and Bottom properties are 0, 0, 0, 0 by default.
New Direct Text Input for TextBox, Label, and CheckBox Controls
Double-click inside the control or select it and press the F2 key to edit text directly in the control instead of using the Properties window. If you do use the Properties window, the Text property now supports multi-line text input.
New Barcode SymbologiesWith the addition of the six new barcode symbologies, developers are freed from the need to find a separate
Note: The Justify alignment option is not supported in edit mode for the TextBox and Label controls.
For more information, see Text Input for TextBox and Label Controls.
ActiveReports 6 User Guide | 6

barcode component. This not only saves money, but also time, as the Barcode control is already integrated into ActiveReports.
New barcode symbologies include the following:
Reduced Space Symbology (RSS) encodes Composite Component (CC) extended EAN and UPC information in less space. Here are the six variations included, and their usages:
RSS14 14-digit EAN.UCC item identification for use with omnidirectional point-of-sale scanners.
RSS14Truncated 14-digit EAN.UCC item identification plus Indicator digits for use on small items, not for point-of-sale scanners.
RSS14Stacked (pictured above) Same as RSS14Truncated, but stacked in two rows when RSS14Truncated is too wide.
RSS14StackedOmnidirectional Same as RSS14, but stacked in two rows when RSS14 is too wide.
RSSExpanded 14-digit EAN.UCC item identification plus AI element strings (expiration date, weight, etc.) for use with omnidirectional point-of-sale scanners.
RSSExpandedStacked Same as RSSExpanded, but stacked in two rows when RSSExpanded is too wide.
New Redistributable Help Project for the End User Designer
Now Professional Edition licensees have access to an Innovasys HelpStudio 3 (http://www.innovasys.com/products/hs3/overview.aspx) User Guide project. If you have HelpStudio 3, you can customize it to create your own CHM or PDF file. If you have Adobe Acrobat, you can also customize the ActiveReports6EUD.pdf file. Or you can distribute the included ActiveReports6EUD.chm or ActiveReports6EUD.pdf file along with your Designer application.
For more information, see Customize End User Designer Help or Deploy End User Designer Help.
The RPX Format Is BackRPX, the Report XML format that was available prior to ActiveReports for .NET 3, is back, and it is better than ever. We now offer design-time support for the format, and you can access controls directly in script with no
ActiveReports 6 User Guide | 7
need to typecast them. In the new implementation, the improved script editor even allows you to use Me or this instead of rpt to access the report in script. RPX is an XML report layout format that allows you to change reports in an application without recompiling it. Instead of VB or C# code, you use VB or C# script with this format.
New LicensingThe SetLicense method has been deprecated. See License Your ActiveReports for information on using the new licensing.
PDF reporting now supports exporting Chinese, Japanese and KoreanThe Professional Edition's PDF reporting feature now allows exporting text in East Asian languages (Chinese, Japanese, and Korean). With our new international capabilities in the PDF Export feature, you need never worry about whether the selected font supports all of the characters in your reports.
ActiveReports 6 User Guide | 8
ActiveReports 6 is an enhancement of the popular ActiveReports engine and report viewer. It includes the same power and flexibility of ActiveReports and the same integration with the Visual Studio® .NET 2005 Environment, and adds several new features including integration with the Visual Studio .NET 2008 Environment.
Available in two editions, ActiveReports 6 delivers outstanding reporting capabilities. Drop down the sections below to see the features packed with each edition of ActiveReports.
Standard Edition Features
Designer
Full integration with the .NET environment
Familiar user interface
NEW SnapLines to help you visually align controls
C# and VB.NET support
The ability to compile reports into the application for speed and security or to keep them separate for ease of updating
Designer hosting of .NET and user controls
Report Controls
ReportInfo
Label
Line
PageBreak
OleObject
Subreport
Shape
Picture
RichTextBox with HTML tag support
ChartControl with separate data source
Textbox
Barcode with standard styles plus NEW RSS and UPC styles
Checkbox
NEW CrossSectionBox extends from a header section to the related footer section
NEW CrossSectionLine extends from a header section to the related footer section
Reporting Engine Managed code
Binding to ADO.NET, XML, iList, and custom data sources
NEW Document DLL as a separate assembly
All of the features of previous versions of ActiveReports
Report Viewer Managed C# code
Very small deployment assembly, suitable for use on the Internet
Table of Contents and Bookmarks
Thumbnail View
ActiveReports Editions
ActiveReports 6 User Guide | 9
HyperLinking
Tabbed Viewing
Annotations
Export Filters
ActiveReports includes export filters to generate output into Rich Text Format (RTF) for word-processing, Portable Document Format (PDF) for printing, Microsoft® Excel® worksheets, HTML and DHTML for publishing your reports to the internet, TIFF for optical archiving and faxing, and delimited text for spreadsheets and databases.
Professional Edition Features
ActiveReports 6 Professional Edition includes all of the features of the Standard Edition and supports the following additional features:
End-User Report Designer
The control is a run-time designer that may be distributed royalty-free. It allows the ActiveReports designer to be hosted in an application and provides end-user report editing capabilities. The control's methods and properties provide easy access for saving and loading report layouts, monitoring and controlling the design environment, and customizing the look and feel to the needs of end users.
ASP.NET Integration
The Web server control provides convenience for running and exporting reports in ASP.NET.
HTTP Handler extensions allow report files (RPX) or compiled assemblies containing reports to be dropped on the server and hyperlinked.
Web Viewer Control The Web Viewer control allows quick viewing of ActiveReports on the web as well as printing capability
with the AcrobatReader ViewerType enumeration.
NEW Flash ViewerType enumeration supports multiple browsers and allows you to avoid asking users to install an ActiveX control.
HTTP Handlers The RPX HTTPHandler allows the developer to hyperlink ActiveReports on a web page to return HTML
format or PDF format reports for viewing and/or printing.
The Compiled Report HTTPHandler allows the developer to hyperlink ActiveReports compiled in an assembly on a web page to return HTML format or PDF format reports for viewing and/or printing.
PdfSignature and TimeStamp Features
The PdfSignature class allows you to provide PDF document digital signatures and certification.
The PdfStamp class allows you to draw the digital signatures and certification onto the documents.
The TimeStamp class allows you to add a TSA (Time Stamping Authority) stamp to your digital signatures.
ActiveReports 6 User Guide | 10

Information in this document, including URL and other Internet Web site references, is subject to change without notice. Unless otherwise noted, the example companies, organizations, products, domain names, e-mail addresses, logos, people, places and events depicted herein are fictitious, and no association with any real company, organization, product, domain name, e-mail address, logo, person, place or event is intended or should be inferred. Complying with all applicable copyright laws is the responsibility of the user. No part of this document may be reproduced, stored in or introduced into a retrieval system, or transmitted in any form or by any means (electronic, mechanical, photo copying, recording, or otherwise), or for any purpose, without the express written permission of GrapeCity, inc.
The ActiveReports License Agreement constitutes written permission for Professional Edition licensees to copy documentation content for distribution with their end user designer applications so long as GrapeCity is given credit within the distributed documentation.
ActiveReports and the ActiveReports logo are registered trademarks of GrapeCity, inc.
All other trademarks are the property of their respective owners.
GrapeCity Copyright Notice
ActiveReports 6 User Guide | 11

License Agreement and Limited Warranty
Please read carefully before installing this software package. Your installation of the package indicates your acceptance of the terms and conditions of this license agreement. Contact GrapeCity if you have any questions about this license.
The Product (libraries and object code) is proprietary to GrapeCity, inc. and is protected by Federal Copyright Law. GrapeCity retains the title to and ownership of the Product. You are licensed to use this Product on the following terms and conditions:
LICENSE:
The Product is licensed per software application developer (“developer”). Licensee is defined as the person or entity that pays consideration for the license to use the Product. GrapeCity, inc. hereby grants the Licensee a nonexclusive License authorizing one, and only one, developer at a time to use the Product for development purposes. The Licensee is also permitted to distribute applications containing the files designated below on a royalty-free basis. The use of this License does not create any kind of partnership or joint ownership interest in the Licensee’s proprietary applications. Please contact GrapeCity, inc. if you require additional Licenses. Licensee may incorporate the sample code into Licensee’s applications. Use of this product by more than one developer at a time terminates, without notification, this License and the right to use the Product.
LICENSEE MAY NOT:
Distribute, rent, sub-license or otherwise make available to others the software or documentation or copies thereof, except as expressly permitted in this License without prior written consent from GrapeCity, inc. In the case of an authorized transfer, the transferee must agree to be bound by the terms and conditions of this License Agreement.
RESTRICTIONS:
Licensee may use the Product in Licensee's business application for sale or distribution as long as:
1. The application that Licensee produces and/or distributes is NOT a software development application that is sold primarily to software developers or system integrators or a development environment of any kind. Please contact GrapeCity, inc. for special commercial licensing provisions in these circumstances.
2. The software serial number and Licensee must be registered with GrapeCity, inc. in order to receive support or distribution rights.
3. Licensee may not remove any proprietary notices, labels, or trademarks on the Product or documentation.
4. Licensee may copy documentation content for distribution with their end user designer application so long as GrapeCity, inc. is given credit within the distributed documentation.
5. Licensee may not modify, de-compile, disassemble, reverse engineer or translate the Product or any component thereof.
FILES THAT MAY BE DISTRIBUTED WITH YOUR APPLICATION:
Standard Edition License:ActiveReports6.dll, ActiveReports.Document.dll, ActiveReports.Chart.dll, ActiveReports.Viewer6.dll, ActiveReports.Interop.dll, ActiveReports.Interop64.dll, ActiveReports.XlsExport.dll, ActiveReports.HtmlExport.dll, ActiveReports.PdfExport.dll, ActiveReports.RtfExport.dll, ActiveReports.TextExport.dll, ActiveReports.TiffExport.dll
Professional Edition License:ActiveReports.Design6.dll, ActiveReports.FlashViewer.swf, ActiveReports.FlashViewer.Resources.swf, any *.swf file from the Themes folder, and ActiveReports.Web.dll, in addition to the Standard Edition files.
Also, AR6DesignerGuide.pdf (http://downloads.datadynamics.com/AR6DesignerGuide.pdf), AR6DesignerGuide.chm, or any output from the ActiveReports6EUD.hsp file available as a zipped file (http://downloads.datadynamics.com/ActiveReports6_UserGuide.zip) on the Web site may be distributed as documentation for your licensed End User Designer application so long as GrapeCity is given credit within the distributed documentation.
US GOVERNMENT RESTRICTED RIGHTS:
ActiveReports License Agreement
ActiveReports 6 User Guide | 12
Use, duplication or disclosure by the United States Government is subject to restrictions as set forth under DFARS 252.227-7013 or in FARS 52.227-19 Commercial Computer Software - Restricted Rights.
TERM:
Licensee may terminate its License and this Agreement at any time by destroying all copies of the Product and Product Documentation. This License and this Agreement will also terminate automatically if Licensee fails to comply with any term or condition in this Agreement.
LIMITED WARRANTY
This Product and Product documentation are licensed "as is" without any warranty as to their performance, merchantability or fitness for any particular purpose. Licensee assumes the entire risk as to the quality and performance of the Product. GrapeCity, inc. warrants that the media on which the Program is furnished will be free from any defects in materials. Exclusive remedy in the event of a defect is expressly limited to the replacement of media. In no event shall GrapeCity, inc. or anyone else who has been involved in the creation, development, production, or delivery of the Product be liable for any direct, incidental or consequential damages, such as, but not limited to, loss of anticipated profits, benefits, use, or data resulting from the use of this software, or arising out of any breach of warranty.
GOVERNING LAW; VENUE
This Agreement shall be governed by, and construed in accordance with, the laws of the State of Washington and the United States, and any action brought in connection with this Agreement shall be brought only in the state or federal courts sitting in Seattle, Washington. In any such action, you submit to the personal jurisdiction of such courts and waive any objections to venue in such courts. If any action is brought by either party to this Agreement against the other party regarding the subject matter hereof, the prevailing party shall be entitled to recover, in addition to any other relief granted, reasonable and actual attorney fees and expenses of litigation. Application of the U.N. Convention of Contracts for the International Sale of Goods is expressly excluded. The original version of this Agreement is the English language version. Any discrepancy or conflicts between the English version and the versions in any other language will be resolved with reference to and interpreting the English version, which will control.
ActiveReports 6 User Guide | 13

This section will help you to understand the installation process.
This section contains information about:
RequirementsLearn about the hardware and software required to run ActiveReports 6.
Installed FilesFind out what files are installed with ActiveReports 6, and where to locate them.
Installation TroubleshootingGet help with installation issues.
Service Packs and Hot FixesLearn about our interim product releases.
Installation
Tip: At the end of the installation process, you can open the Readme.hta file by leaving the Review release notes check box selected. After installation, you can locate it in the Introductionfolder of the root ActiveReports 6 installation folder. Double-click to open and view the file.
ActiveReports 6 User Guide | 14

To install and use ActiveReports 6, you need compatible hardware and software.
Hardware requirements (minimum) Processor: Pentium® II-class processor 450 MHz (Pentium® III 600 MHz recommended)
RAM: 200 MB
Hard drive space: 50 MB available
Software requirements Operating System: Windows® 2000, Windows® XP, Windows® NT 4.0, or Windows ™ Vista
Microsoft® .NET Framework Version: 2.0 or higher
Microsoft Visual Studio: 2005 or 2008.
For Web deployment: IIS 5.1 or 6.0 and ASP.NET (version to match the .NET Framework version)
Requirements
Note: The Express Editions of Visual Studio 2005 do not work with ActiveReports, as they do not support packages.
ActiveReports 6 User Guide | 15
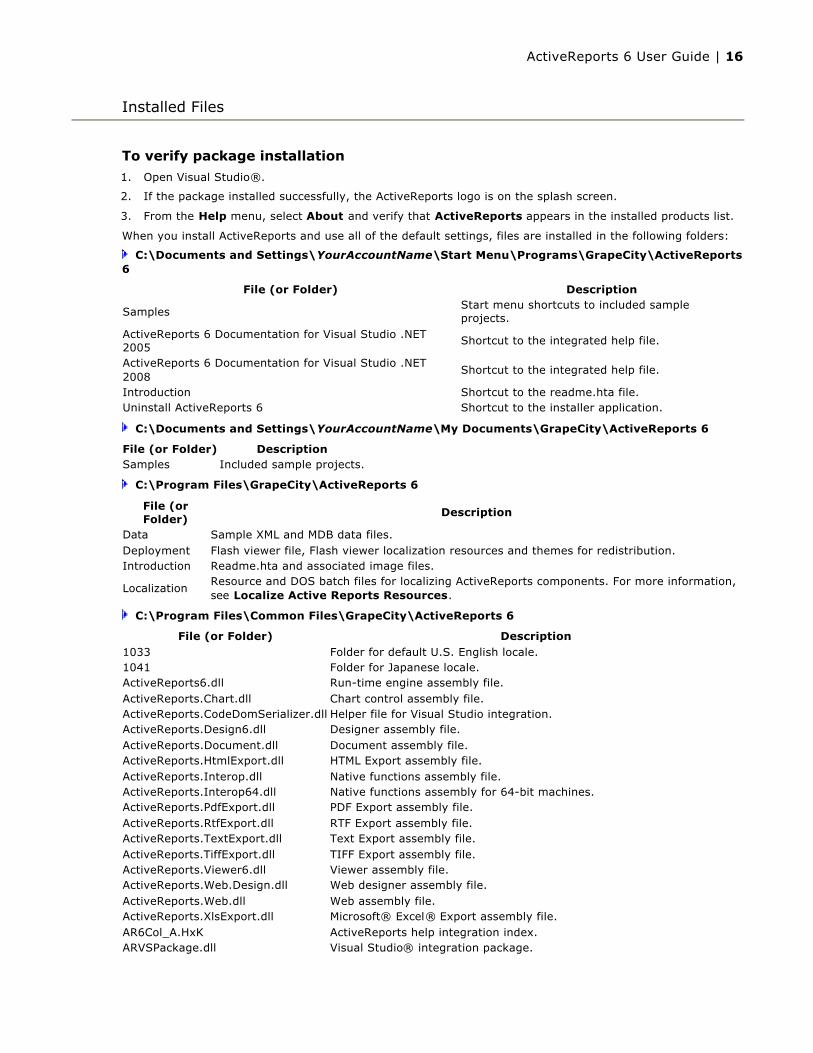
To verify package installation
1. Open Visual Studio®.
2. If the package installed successfully, the ActiveReports logo is on the splash screen.
3. From the Help menu, select About and verify that ActiveReports appears in the installed products list.
When you install ActiveReports and use all of the default settings, files are installed in the following folders:
C:\Documents and Settings\YourAccountName\Start Menu\Programs\GrapeCity\ActiveReports 6
C:\Documents and Settings\YourAccountName\My Documents\GrapeCity\ActiveReports 6
C:\Program Files\GrapeCity\ActiveReports 6
C:\Program Files\Common Files\GrapeCity\ActiveReports 6
Installed Files
File (or Folder) Description
SamplesStart menu shortcuts to included sample projects.
ActiveReports 6 Documentation for Visual Studio .NET 2005
Shortcut to the integrated help file.
ActiveReports 6 Documentation for Visual Studio .NET 2008
Shortcut to the integrated help file.
Introduction Shortcut to the readme.hta file.Uninstall ActiveReports 6 Shortcut to the installer application.
File (or Folder) DescriptionSamples Included sample projects.
File (or Folder)
Description
Data Sample XML and MDB data files.Deployment Flash viewer file, Flash viewer localization resources and themes for redistribution.Introduction Readme.hta and associated image files.
LocalizationResource and DOS batch files for localizing ActiveReports components. For more information, see Localize Active Reports Resources.
File (or Folder) Description1033 Folder for default U.S. English locale.1041 Folder for Japanese locale.ActiveReports6.dll Run-time engine assembly file.ActiveReports.Chart.dll Chart control assembly file.ActiveReports.CodeDomSerializer.dll Helper file for Visual Studio integration.ActiveReports.Design6.dll Designer assembly file.ActiveReports.Document.dll Document assembly file.ActiveReports.HtmlExport.dll HTML Export assembly file.ActiveReports.Interop.dll Native functions assembly file.ActiveReports.Interop64.dll Native functions assembly for 64-bit machines.ActiveReports.PdfExport.dll PDF Export assembly file.ActiveReports.RtfExport.dll RTF Export assembly file.ActiveReports.TextExport.dll Text Export assembly file.ActiveReports.TiffExport.dll TIFF Export assembly file.ActiveReports.Viewer6.dll Viewer assembly file.ActiveReports.Web.Design.dll Web designer assembly file.ActiveReports.Web.dll Web assembly file.ActiveReports.XlsExport.dll Microsoft® Excel® Export assembly file.AR6Col_A.HxK ActiveReports help integration index.ARVSPackage.dll Visual Studio® integration package.
ActiveReports 6 User Guide | 16

COL_*.* (14 files) ActiveReports help integration collection.ddAR6.HxS ActiveReports 6 Help File.
H2Reg*.* (3 files)Files used to register the ActiveReports help collection with the combined help collection of Visual Studio.
riched20.dllVersion 4.0 of the Microsoft® RichEdit control, used to support rtf tables in edit mode of the ActiveReports RichTextBox control.
ActiveReports 6 User Guide | 17
Symptoms: Other users cannot access or use ActiveReports on my machine.
Cause: The installation for ActiveReports 6 gives you the option to install the program for everyone or the current user. If it is installed only for the current user, other users cannot access it or use it.
Solution: Reinstall ActiveReports and select Everyone.
Symptoms: I just installed ActiveReports 6. Why can't I see the help files?
Cause: If the installation was run while Visual Studio® was open, the help files cannot be integrated.
Solution: Close Visual Studio and reopen it.
Symptoms: When I run the ActiveReports Setup, I get the message "The installer was interrupted before GrapeCity ActiveReports 6 could be installed. You need to restart the installer to try again."
Cause: You do not have permissions to install on the machine, or to the folder containing the setup files.
Solution: Verify that the system account for the local machine has permissions to the folder containing the setup and log in as Administrator on the machine.
Installation Troubleshooting
ActiveReports 6 User Guide | 18

We are always improving our products, and from time to time we release Service Packs or Hot Fixes on our Web site. These are always free of charge.
Hot Fixes
These are interim releases that have fixes for specific issues found either internally or reported by users. Hot Fixes are tested, but not as rigorously as Service Packs. We recommend that you install a Hot Fix only if you are affected by an issue that is fixed in it and cannot wait for a Service Pack.
Service Packs
These are interim releases that include all fixes incorporated in the Hot Fixes up to that point in time, plus we add a few minor features to each one. Service Packs undergo the same rigorous testing as product releases.
To install a Hot Fix or Service Pack1. Close Visual Studio and any Visual Studio help files you may have open.
2. Download and run the ActiveReports6.exe file.
3. The installer detects the previous version, and asks permission to uninstall it. Click OK.
4. When it finishes uninstalling, select the options to install the new build as usual. (The installer automatically brings forward your licensing information, so you are not prompted for it again.)
5. Open Visual Studio, and in the toolbox, right-click and select Choose Items.
6. In the Choose Toolbox Items dialog that appears, in the Filter box, enter DataDynamics. The list displays only DataDynamics components.
7. Drag the right edge of the Assembly Name column so that you can see the build number.
8. Clear the checkbox next to any component using an old assembly, and select the checkbox for the component in the new assembly.
9. Click OK . The new versions of the components are added to the toolbox.
To update a WebViewer project after installing a Hot Fix or Service Pack
1. In the Web.config file, update the version number in the following HTTP Handler code.
********** ActiveReports HttpHandler Configuration **********--> <add verb="*" path="*.rpx" type="DataDynamics.ActiveReports.Web.Handlers.RpxHandler, ActiveReports.Web, Version=6.0.1661.0, Culture=neutral, PublicKeyToken=cc4967777c49a3ff"/> <add verb="*" path="*.ActiveReport" type="DataDynamics.ActiveReports.Web.Handlers.CompiledReportHandler, ActiveReports.Web, Version=6.0.1661.0, Culture=neutral, PublicKeyToken=cc4967777c49a3ff"/> <add verb="*" path="*.ArCacheItem" type="DataDynamics.ActiveReports.Web.Handlers.WebCacheAccessHandler, ActiveReports.Web, Version=6.0.1661.0, Culture=neutral, PublicKeyToken=cc4967777c49a3ff"/></httpHandlers>
2. Open the ASPX page and look in the Source view for a line that looks similar to the following and update the version number:
<%@ Register TagPrefix="ActiveReportsWeb" Namespace="DataDynamics.ActiveReports.Web" Assembly="ActiveReports.Web, Version=6.0.1661.0, Culture=neutral, PublicKeyToken=cc4967777c49a3ff" %>
3. Save and rebuild your project.
Service Packs and Hot Fixes
ActiveReports 6 User Guide | 19

ActiveReports 6 does not support a side-by-side installation with ActiveReports for .NET 2.0, therefore we do not recommend to install both products on a single machine.
If you decide to have both products installed on a single machine, you will encounter the following compatibility issues:
1. The Add New Item dialog may create the ActiveReports 6 xml-based report template instead of the ActiveReports for .NET 2.0 report template after ActiveReports 6 has been installed.
2. ActiveReports 6 xml-based reports may be opened in the Active Reports for .NET 2.0 report designer after ActiveReports for .NET 2.0 has been installed on top of ActiveReports 6.
ActiveReports for .NET 2.0 Side-by-Side Installation
ActiveReports 6 User Guide | 20

License your ActiveReports during installation, or from Add or Remove Programs if you already have a trial version installed.
When you install a service pack or hot fix on top of a previous version of ActiveReports 6, the Customer Registration screen is not shown during installation. If your previous version was not licensed and you wish to license it now, follow the steps described in To license a trial version of ActiveReports without reinstalling below.
To license a machine for ActiveReports during installation
1. Near the end of the installation, the Customer Registration screen requests the following information:
User Name: Enter your name or company name here. You can use any characters in this field except the semicolon.
Email: Enter your e-mail address in this field.
Serial: Enter the serial number exactly as you received it from GrapeCity, including any dashes or capital letters.
2. Click the Next button and then the Finish button to complete the installation. The Licensing result message box informs you that licensing was successful.
License Your ActiveReports
Caution: When installing on a Vista machine, do not just double-click the exe to install ActiveReports. This will not license the machine. On Windows Vista, you must instead right-click the exe and select Run as Administrator even if you are already the administrator on your machine.
ActiveReports 6 User Guide | 21

3. The machine is now licensed, and no nag screens or evaluation banners appear when you use the product or create new solutions with it.
To license a trial version of ActiveReports without reinstalling
1. From the Start menu, open the Control Panel.
2. Select Add or Remove Programs.
3. From the list of currently installed programs, select ActiveReports 6.
4. Click the Change button.
5. Select License ActiveReports 6 and click the Next button.
6. The Customer Registration screen requests the following information:
User Name: Enter your name or company name here. You can use any characters in this field except the semicolon.
Email: Enter your e-mail address in this field.
Serial: Enter the serial number exactly as you received it from GrapeCity, including any dashes or capital letters.
If you have already created any Visual Studio projects using ActiveReports components, see the appropriate section on licensing Windows or Web applications below.
To check an existing ActiveReports Windows application for licensing
Caution: If the application containing ActiveReports is not an executable, licensing must be embedded in the calling application, or root level executable, to take effect.
ActiveReports 6 User Guide | 22
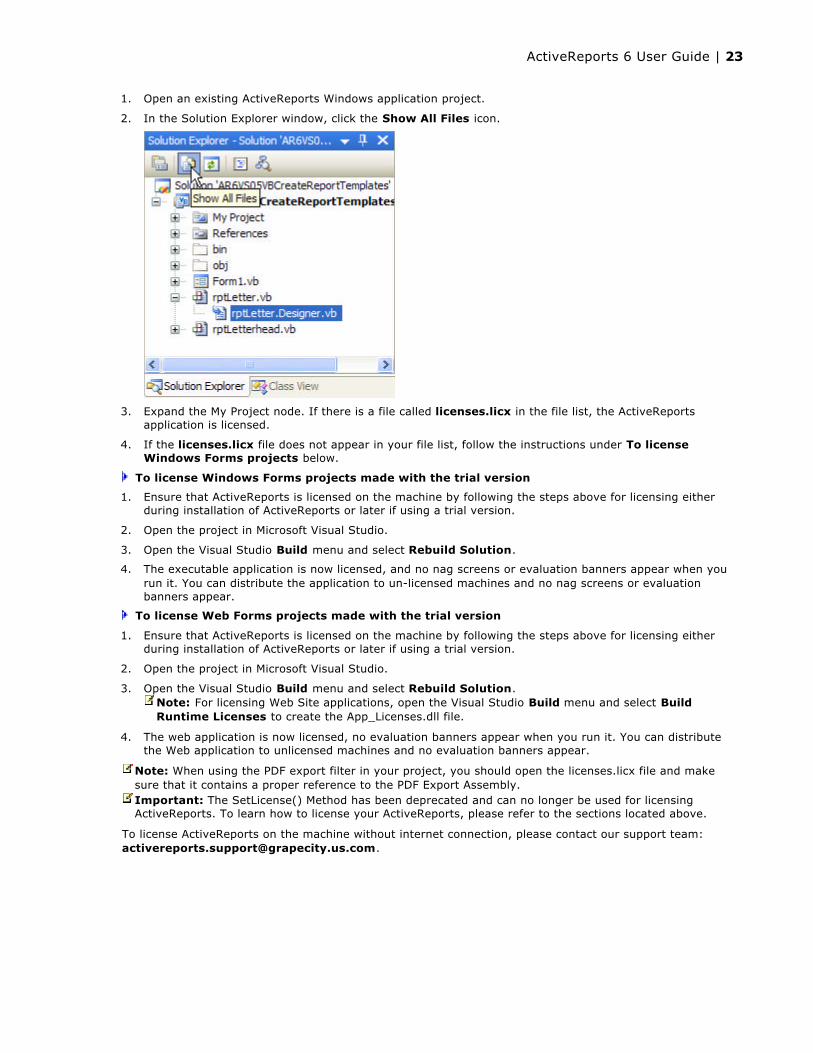
1. Open an existing ActiveReports Windows application project.
2. In the Solution Explorer window, click the Show All Files icon.
3. Expand the My Project node. If there is a file called licenses.licx in the file list, the ActiveReports application is licensed.
4. If the licenses.licx file does not appear in your file list, follow the instructions under To license Windows Forms projects below.
To license Windows Forms projects made with the trial version
1. Ensure that ActiveReports is licensed on the machine by following the steps above for licensing either during installation of ActiveReports or later if using a trial version.
2. Open the project in Microsoft Visual Studio.
3. Open the Visual Studio Build menu and select Rebuild Solution.
4. The executable application is now licensed, and no nag screens or evaluation banners appear when you run it. You can distribute the application to un-licensed machines and no nag screens or evaluation banners appear.
To license Web Forms projects made with the trial version
1. Ensure that ActiveReports is licensed on the machine by following the steps above for licensing either during installation of ActiveReports or later if using a trial version.
2. Open the project in Microsoft Visual Studio.
3. Open the Visual Studio Build menu and select Rebuild Solution.
4. The web application is now licensed, no evaluation banners appear when you run it. You can distribute the Web application to unlicensed machines and no evaluation banners appear.
To license ActiveReports on the machine without internet connection, please contact our support team: [email protected].
Note: For licensing Web Site applications, open the Visual Studio Build menu and select Build Runtime Licenses to create the App_Licenses.dll file.
Note: When using the PDF export filter in your project, you should open the licenses.licx file and make sure that it contains a proper reference to the PDF Export Assembly.Important: The SetLicense() Method has been deprecated and can no longer be used for licensing ActiveReports. To learn how to license your ActiveReports, please refer to the sections located above.
ActiveReports 6 User Guide | 23

ActiveReports allows you to upgrade your reports from other versions of ActiveReports and other reporting programs.
This section contains information about:
Changes from Previous VersionsFind out about changes in ActiveReports 6 that may break your old ActiveReports for .NET 1.0, 2.0, or 3.0 projects.
Upgrading Reports from Previous Versions of ActiveReportsFind out how to upgrade reports created with ActiveReports for .NET 1.0, 2.0, or 3.0 to ActiveReports 6.
Migrating from ActiveReports 2Find out how to upgrade reports created with ActiveReports 2.0 (COM version) to ActiveReports 6.
Converting Microsoft® Access® ReportsFind out about converting Microsoft® Access® reports to ActiveReports.
Upgrading Reports
ActiveReports 6 User Guide | 24

There are a few breaking changes introduced in ActiveReports 6 to keep in mind when upgrading your existing ActiveReports for .NET 3.0 or 2.0 projects:
The BaseClass name has been changed.
ARN3: DataDynamics.ActiveReports.ActiveReport3
AR6: DataDynamics.ActiveReports.ActiveReport
The ActiveReports 6 Report Converter converts and updates previous versions of ActiveReports to ActiveReports 6 format. Save back-ups of your reports before running it.
The SetLicense method for run-time reporting and end user designer licensing has been marked as obsolete and raises a compile error. We have updated our licensing models and we sincerely hope to provide an easy and seamless licensing and deployment experience with this release. See License Your ActiveReports (ms-help://dd.ActiveReports6.1033/ddAR6/arHOWLicensingActiveReports.html) for more information.
The Report.Show method has been removed. This removes the viewer dependency for a leaner package. Instead, you can use the Preview tab at design time or the Viewer control at run time.
Changes from Previous Versions
Note: We recommend that you check the Active Reports for NET 2.0 or Active Reports for NET 3.0 project before running the ActiveReports 6.0 Report Converter and make sure that the project has valid ActiveReports references.
ActiveReports 6 User Guide | 25

Upgrading from an ActiveReports for .NET 3.0 project
You can upgrade an ActiveReports for .NET 3.0 project by using the converter utility(see the section Upgrading from an ActiveReports for .NET 1.0 or 2.0 project located below), or by opening it in Visual Studio, replacing the old references with the new versions (adding the new Document reference) and correcting two errors in the code.
To update the project references
1. Open the Visual Studio project that contains the reports that you want to upgrade.
2. In the Solution Explorer, click the Show All Files button.
3. Expand the References folder, and make note of which ActiveReports references you use in your project.
4. Right-click each of the ActiveReports3 references, and select Remove.
5. Right-click the References folder and select Add Reference.
6. In the Add Reference window that appears, select Version 6.x.xxx.x of the ActiveReports references.
7. Click the OK button to add the references and close the window. Many errors appear in the Visual Studio Error List window.
To correct the errors
1. If the Visual Studio Error List window is not showing, drop down the View menu and select Error List.
2. In the Error List window, double-click the warning that states that ActiveReports3 could not be defined.
3. In the report code, ActiveReports3 is highlighted. Change ActiveReport3 to ActiveReport. This resolves most of the errors in the list.
4. In the Error List window, double-click the warning that states that ActiveReports3.FetchEventArgscould not be defined.
5. In the report code, change ActiveReport3 to ActiveReport.
6. Close and reopen the design view of the report.
Upgrading from an ActiveReports for .NET 1.0 or 2.0 projectTo run the converter utility for old RPX files
Because ActiveReports 6 writes its report layout files in C# or Visual Basic for .NET, reports that were built with ActiveReports for .NET 1.0 and ActiveReports for .NET 2.0 as RPX files need to be converted to run in the new environment. ActiveReports 6 includes a converter that makes this an easy process.
Upgrading from Previous Versions
Note: You also need to add the new GrapeCity ActiveReports Document reference to the project, as some of the code has moved.
ActiveReports 6 User Guide | 26
The naming convention for controls changed as of version 3. Previously (in versions 1 and 2) controls could be similarly named by using a different case, as in "Test" and "test," but ActiveReports 6 (and 3) require control names to be unique. When you load an RPX that has two controls with the same names but different cases, the report does not load and an error occurs. In order to avoid this, give each control a unique name and update the names in the code-behind.
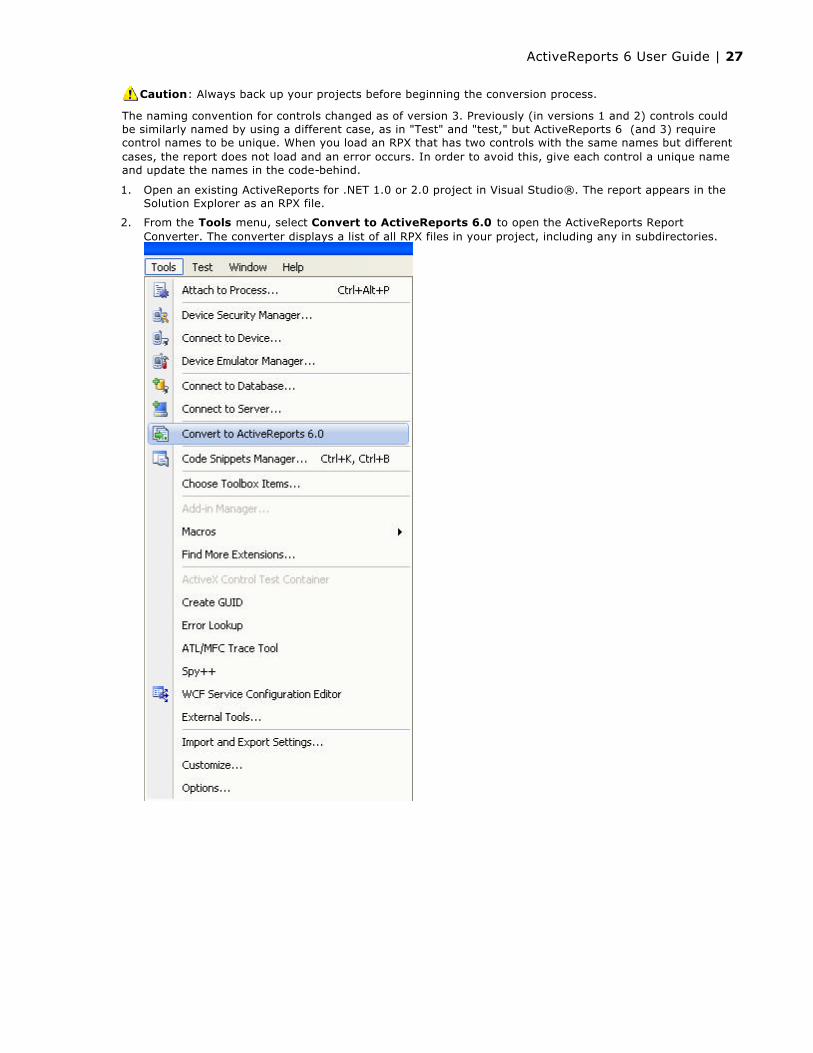
1. Open an existing ActiveReports for .NET 1.0 or 2.0 project in Visual Studio®. The report appears in the Solution Explorer as an RPX file.
2. From the Tools menu, select Convert to ActiveReports 6.0 to open the ActiveReports Report Converter. The converter displays a list of all RPX files in your project, including any in subdirectories.
Caution: Always back up your projects before beginning the conversion process.
ActiveReports 6 User Guide | 27
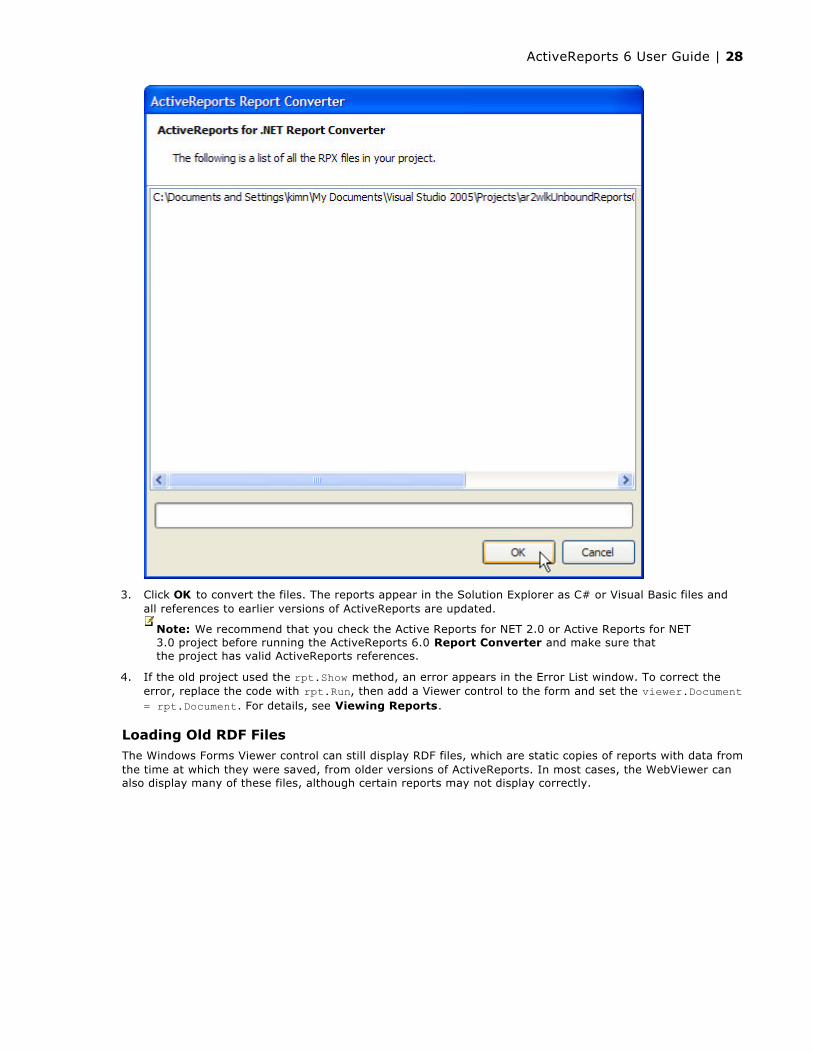
3. Click OK to convert the files. The reports appear in the Solution Explorer as C# or Visual Basic files and all references to earlier versions of ActiveReports are updated.
4. If the old project used the rpt.Show method, an error appears in the Error List window. To correct the error, replace the code with rpt.Run, then add a Viewer control to the form and set the viewer.Document = rpt.Document. For details, see Viewing Reports.
Loading Old RDF FilesThe Windows Forms Viewer control can still display RDF files, which are static copies of reports with data from the time at which they were saved, from older versions of ActiveReports. In most cases, the WebViewer can also display many of these files, although certain reports may not display correctly.
Note: We recommend that you check the Active Reports for NET 2.0 or Active Reports for NET 3.0 project before running the ActiveReports 6.0 Report Converter and make sure that the project has valid ActiveReports references.
ActiveReports 6 User Guide | 28

ActiveReports 6 can use existing ActiveReports 2.0 (COM) report layout files (RPX) after some modifications to the scripting code. ActiveReports 2.0 designer files (DSR/DSX) must be saved as RPX files in the ActiveReports 2.0 Designer before they can be imported into ActiveReports. Since ActiveReports does not import any Visual Basic® or scripting code into .NET, the code will need to be rewritten using the appropriate language in the new .NET environment.
Migrating from ActiveReports 2
ActiveReports 6 User Guide | 29

You can convert Microsoft® Access® reports into ActiveReports format by running the ActiveReports Microsoft Access Import Wizard. Due to differences between products, the extent to which your reports are converted depends on your specific report layout. However, since GrapeCity provides source code, you can modify the resulting ActiveReport to achieve the results you desire.
To convert a Microsoft® Access® report into an ActiveReport1. Open a project in Visual Studio®.
2. From the Project menu, select Add New Item.
3. Select ActiveReports 6 Access Import Wizard from the Templates pane and click the Add button.
4. In the ActiveReports Microsoft Access Import Wizard that appears, click the ellipsis button button to browse for the Access Database that contains the report or reports you want to convert and click the Open button..
5. If you receive a security warning, click Open to proceed.
6. Select the reports from the database that you want to import and click Next.
7. Click Finish to begin the conversion process.
8. Click Open to proceed through any security warnings.
9. Click Finish when the conversion process has finished. The converted reports appear in the Solution Explorer.
Converting MS Access Reports
ActiveReports 6 User Guide | 30

Quickly begin using ActiveReports by reviewing some of the most commonly used features.
This section contains information about:
Adding ActiveReports ControlsLearn how to add ActiveReports controls to the toolbox in Visual Studio.
Adding an ActiveReport to a ProjectLearn how to add an ActiveReport to a Visual Studio project.
ActiveReports DesignerLearn what each of the tools and UI items on the report designer can help you to accomplish.
Viewing ReportsLearn how to preview a report at design time as well as how to use the Flash Viewer to view a report at run time.
ActiveReports and the Web Learn about using ActiveReports on the internet.
Getting Started
ActiveReports 6 User Guide | 31

You can add an ActiveReport to a project without adding anything to the Visual Studio toolbox, but in order to use the Viewer control, any of the exports, the Designer and related controls, or the WebViewer control, you must first add them to your toolbox.
To add the controls1. Right-click the Visual Studio toolbox tab where you want to add ActiveReports controls and select Choose
Items.
2. In the Choose Toolbox Items window that appears, in the Filter textbox, enter DataDynamics.ActiveReports.
3. Select the check boxes next to any of the controls that you want to add to your toolbox:
Designer
HtmlExport
PdfExport
ReportExplorer
RtfExport
TextExport
TiffExport
Toolbox
Viewer
WebViewer
XlsExport
4. Click OK to add the controls to the selected toolbox.
Adding ActiveReports Controls
Tip: Include the dot at the end of DataDynamics.ActiveReports. to eliminate the controls you use on the reports themselves and display only the controls that you can use with Windows Forms or Web Forms.
ActiveReports 6 User Guide | 32

To add an ActiveReport to a project1. From the Visual Studio Project menu, select Add New Item.
2. Select ActiveReports 6 (code-based) File or ActiveReports 6 (xml-based) File and name your new report.
3. Click Add to add the report to your project and open it in design view.
Adding an ActiveReport to a Project
ActiveReports 6 User Guide | 33
To create a report, an end-user must select a template containing the report layout. In ActiveReports 6, there are two types of such templates – the XML-based report template , ActiveReports 6 (xml-based) File, and the code-based report template, ActiveReports 6 (code-based) File. It is possible to use both types of report templates within one project.
A report layout based on the code-based template is saved as a C# or Visual Basic for .NET file, whereas a report layout based on the xml-based template is saved as an RPX file.
The RPX file is an XML-formatted file which contains the layout information and any scripts added to the report. RPX files with scripting allow to change and modify distributed reports without recompiling the project. They also make it possible to use a database of report file names to set up a collection of reports to run. You can use an RPX file using scripting as a stand-alone file in a web project.
To convert a code-based report layout to RPX
1. From the Report menu, select Save Layout.
2. In the Save dialog that appears, enter a name for the report, i.e. rptScript.rpx, and click the Save button.
3. In a Visual Studio project, select an xml-based report template (ActiveReports 6 (xml-based) File in Project>Add New Item).
4. Click on File > Open > File...
5. Select the RPX report layout from the appropriate location.
6. Click Open to load the report layout.
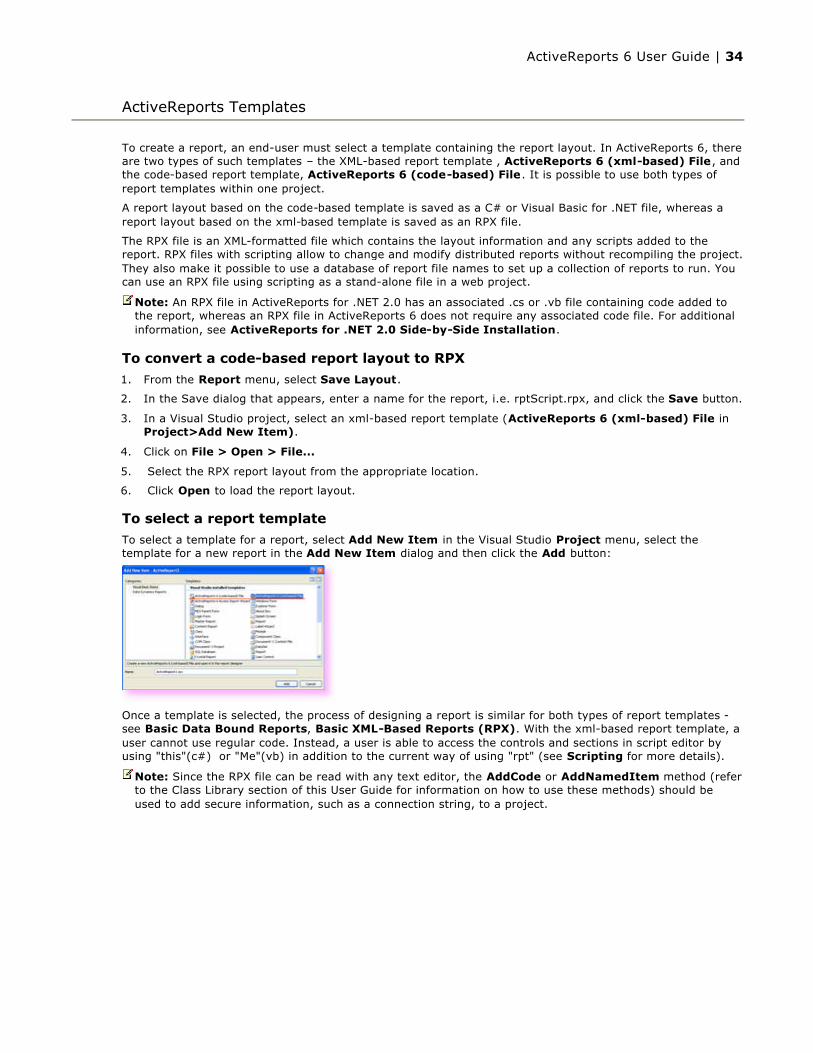
To select a report template
To select a template for a report, select Add New Item in the Visual Studio Project menu, select the template for a new report in the Add New Item dialog and then click the Add button:
Once a template is selected, the process of designing a report is similar for both types of report templates -see Basic Data Bound Reports, Basic XML-Based Reports (RPX). With the xml-based report template, a user cannot use regular code. Instead, a user is able to access the controls and sections in script editor by using "this"(c#) or "Me"(vb) in addition to the current way of using "rpt" (see Scripting for more details).
ActiveReports Templates
Note: An RPX file in ActiveReports for .NET 2.0 has an associated .cs or .vb file containing code added to the report, whereas an RPX file in ActiveReports 6 does not require any associated code file. For additional information, see ActiveReports for .NET 2.0 Side-by-Side Installation.
Note: Since the RPX file can be read with any text editor, the AddCode or AddNamedItem method (refer to the Class Library section of this User Guide for information on how to use these methods) should be used to add secure information, such as a connection string, to a project.
ActiveReports 6 User Guide | 34

With its various tools and properties, ActiveReports 6 offers great flexibility in constructing report projects.
Click one of the red-outlined areas to view a topic with more information on that section.
ActiveReports Designer
ActiveReports 6 User Guide | 35

When you first add an ActiveReport to a Visual Studio project, the design view of the report displays by default. To reopen one that you have closed, double-click the report in the Solution Explorer. Select any section or the report itself to view available properties in the Properties window. (Click in the grey area below the report to select the report.)
Use the ruler to determine how your report will look on paper. If you drag the right edge of the report, or drop controls near the right edge, you can see by the ruler how much the PrintWidth of the report has grown. Keep in mind that you have to add the right and left margin widths to the PrintWidth to determine whether your report will fit on the selected paper size.
By default, a report has three sections: a page header, a detail section, and a page footer. Drag controls from the toolbox onto these sections to display your data. Right-click the report and select Insert to add other types of header and footer section pairs. For more information, see Report Structure, Section Events and Grouping Data.
In walkthroughs and how-to topics, you may be told to double-click the grey area below the report to create the ReportStart event. You can also click in this area to select the report.
The preview tab allows you to check out your report without running the project and displaying it in the Viewer control.
The script tab is where you can add VB.NET or C# script for use with RPX portable layout files. For more information, see Layout Files.
Use section grab handles to drag a section's height up or down.
Click the data source icon to open the Report Data Source window, from which you can bind your report to any OLE DB, SQL, or XML data source. For more information, see DataSource Icon.
Click a section collapse icon to close a section that you have finished working on so you don't accidentally move or change any of your controls.
Design View
ActiveReports 6 User Guide | 36

In ActiveReports, the Report Explorer gives you a visual overview of the elements that make up the report in the form of a tree view with nodes for:
The Report
Each of its sections
Each section's controls
Fields
Bound
Calculated
Parameters
Report Settings
In the Report Explorer, you can remove individual controls, add parameters and calculated fields, drag bound data fields onto the report as textbox controls, and change report settings. You can also select a section, control, or the report itself to display in the Properties window, where you can modify its properties.
If you do not see the Report Explorer in Visual Studio:
1. Right-click the Visual Studio toolbar and select ActiveReports 6 to display the designer toolbar.
2. On the designer toolbar, click the View Report Explorer button.
Or from the View menu, select Other Windows, then Report Explorer.
When you open the Report Explorer in Visual Studio, it appears every time you create a new Windows Application. You can close it any time.
The Report Explorer lays out all of the elements contained in your report in one place.
The following demonstrates how you can quickly modify a report using the Report Explorer.
To bind data fields to textbox controls
Report Explorer
ActiveReports 6 User Guide | 37
1. In the Report Explorer, select the data field you want to bind to a textbox control.
2. Drag the field onto the design surface of the report. A textbox control is created and bound to the field. The textbox is selected in the Properties window, and the DataField and Name properties reflect the name of the field. For example, if you dragged a field named EmployeeID, the DataField property of the textbox is set to EmployeeID and the textbox is named txtEmployeeID1.
To modify control or section properties1. In the Report Explorer, select the control or section you want to modify. The Properties window displays
all available properties for the item.
2. In the Properties window, set properties as you like.
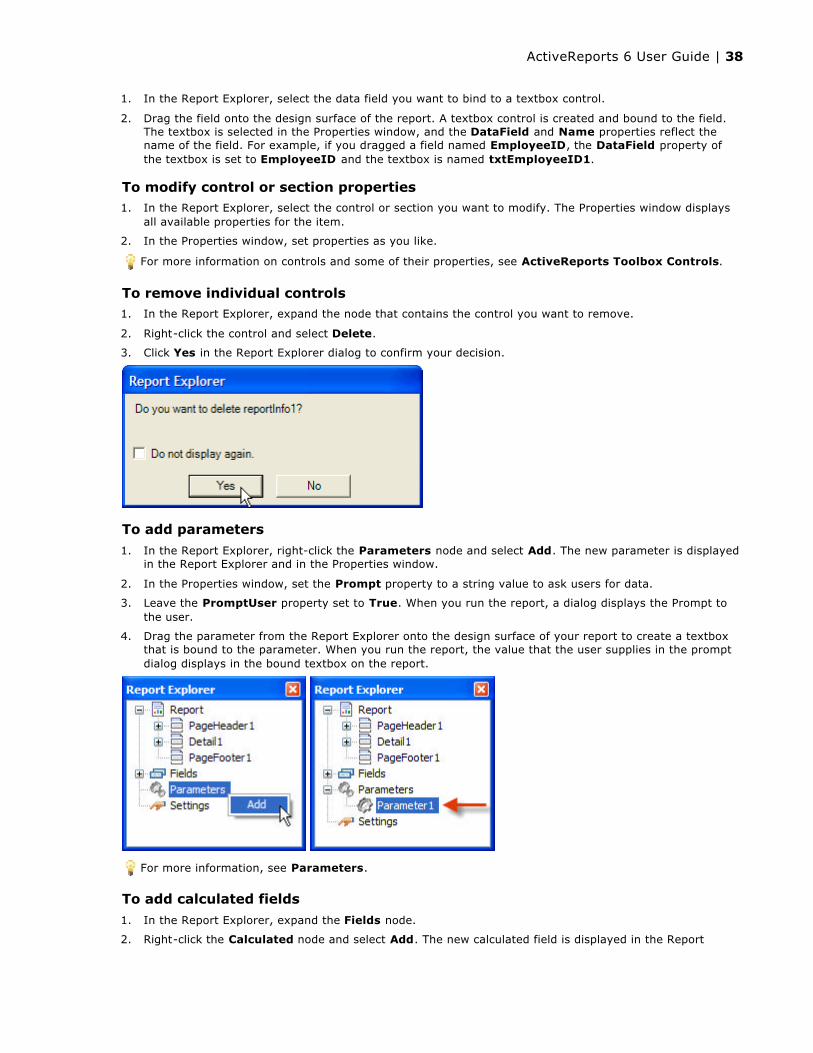
To remove individual controls1. In the Report Explorer, expand the node that contains the control you want to remove.
2. Right-click the control and select Delete.
3. Click Yes in the Report Explorer dialog to confirm your decision.
To add parameters
1. In the Report Explorer, right-click the Parameters node and select Add. The new parameter is displayed in the Report Explorer and in the Properties window.
2. In the Properties window, set the Prompt property to a string value to ask users for data.
3. Leave the PromptUser property set to True. When you run the report, a dialog displays the Prompt to the user.
4. Drag the parameter from the Report Explorer onto the design surface of your report to create a textbox that is bound to the parameter. When you run the report, the value that the user supplies in the prompt dialog displays in the bound textbox on the report.
To add calculated fields
1. In the Report Explorer, expand the Fields node.
2. Right-click the Calculated node and select Add. The new calculated field is displayed in the Report
For more information on controls and some of their properties, see ActiveReports Toolbox Controls.
For more information, see Parameters.
ActiveReports 6 User Guide | 38

Explorer and in the Properties window.
3. In the Properties window, set the Formula property to a calculation, for example: = unitprice * 1.07
4. Drag the field from the Report Explorer onto the design surface of your report to create a textbox that is bound to the field.
To change report settings1. In the Report Explorer, right-click the Settings node and select Show to open the Report Settings dialog.
2. Make changes to properties on the Page Setup, Printer Settings, Styles, and Global Settings tabs.
3. Click OK to save the changes.
For more information, see Create Calculated Fields.
For more information, see Report and Page Settings.
ActiveReports 6 User Guide | 39

When you are in design view of an ActiveReport, the Visual Studio toolbox automatically displays the ActiveReports controls that you can drag onto your report.
ActiveReports Toolbox Controls
Tip: If you do not see the Visual Studio toolbox, from the View menu, select Toolbox.
Control Description (Important properties are in bold.)
PointerSelected by default, the pointer allows you to select, move, and resize controls, and resize sections. After you drop or draw a control onto your report, the pointer is automatically selected.
ReportInfoA text box with preset FormatString options, the report info control allows you to quickly display page numbers, page counts, and report dates.
For more information, see Display Page Numbers and Report Dates.
LabelThe label allows you to display static text to describe the data you display in text boxes. Use the Text property to set the label text. Set the Angle property to 900 for vertical text.
Now supports direct text input.
LineUse the line to visually separate or call out areas of your report. You can drag it to the size and location you want, or use the X1, X2, Y1, and Y2 properties. The AnchorBottomproperty lets the line grow along with the section.
PageBreakUse the page break to have the report stop inside a section and resume printing on a new page. You may also wish to use the PageBreakBefore or PageBreakAfter properties available on the sections themselves.
You can add an OLE object, bound to a database or unbound, directly to your report. When you drop or draw the control onto your report, the Insert Object dialog allows you to create
ActiveReports 6 User Guide | 40

OleObjecta new object, or select an existing file.
When you deploy reports that use the OleObject, you must also deploy the ActiveReports.Interop.dll, or for 64-bit machines, the ActiveReports.Interop64.dll.
SubReportUse the subreport control as a placeholder for data from a separate report. Use code to connect the separate report to the subreport control.
For more information, see Embed Subreports in a Report.
ShapeThe shape control has a Style property that allows you to select whether to render an ellipse, a rectangle, or a rounded rectangle.
PictureThe Image property of the picture control allows you to select any image file to display. Use the PictureAlignment and SizeMode properties to control cropping and alignment.
RichTextBox
You can use different formats on adjacent text in the rich text box control, merge data in it, or load an HTML or RTF file into it. Or double-click inside the control to enter text directly into it.
For more information, see Load a File into a RichText Control or Mail Merge with RichText.
ChartControlThe chart control offers you more than 30 chart types and access to properties controlling every aspect of a chart's appearance.
For more information, see Create Charts.
TextBox
The text box is the basis of reporting. You can bind it to data using the DataFieldproperty, or set it at run time. It is the control that forms when you drag a field onto a report from the Report Explorer. You can use the Summary properties to create summary fields. You can also set the new Padding property to add space between text and the edge of the control.
For more information, see Create Summary Fields. Now supports direct text input.
Barcode
Select from over 30 barcode Styles, including the latest postal codes. You can bind it to data using the DataField property, and use the Text and CaptionPosition properties to add a caption.
For more information, see Format BarCodes.
CheckBoxYou can set the Checked property of the check box in code or bind it to a Boolean database value. Provide static text in the Text property.
CrossSectionBoxDrag the cross section box onto a header section and it spans any intervening sections to end in the related footer section. Set the Radius property to round the edges of the box.
See Cross Section Controls for more information.
CrossSectionLine
Drag the cross section line onto a header section and it spans any intervening sections to end in the related footer section. This line control is strictly vertical. If you want a horizontal or diagonal line, use the Line control, which does not span sections.
See Cross Section Controls for more information.
ActiveReports 6 User Guide | 41

When working with the TextBox, CheckBox, and Label controls, you can enter or format the text by double-clicking directly in the control area on the report design surface. You can still enter text in the Properties window and in code.
The text in the control is formatted in edit mode by means of the ActiveReports toolbar, or by modifying properties in the Properties window. The formatting commands are applied to the entire text in the selected control.
It is also possible to use key commands when working with a textbox or label control in edit mode.
Text Input for TextBox and Label Controls
Note: Text formatting changes in the Properties window are immediately applied to the text in the selected control, and changes made by means of the toolbar are immediately reflected in the Properties window.
Note: The Justify alignment option is not supported in edit mode for the TextBox and Label controls. To apply this alignment option, a user should exit edit mode, select the TextBox or Label control by clicking on it and then set the alignment to Justify in the Toolbar or in the Properties window.
If the TextBox or Label control with the Justify alignment is put into edit mode, the alignment value automatically changes to the default one - Left. However, after exiting edit mode, the alignment value of the TextBox or Label control automatically changes back to Justify.
Key Combination ActionEnter New line.Shift + Enter New line.
ActiveReports 6 User Guide | 42

In the End User Designer, you can disable this feature using the EditModeEntering and EditModeExitevents.
Ctrl + Enter New line.Alt + Enter Saves modifications and exits the edit mode.Esc Cancels modifications and exits the edit mode.
ActiveReports 6 User Guide | 43

ActiveReports includes two new cross section controls that you can drop into any header or footer section. The controls automatically span any intervening sections to end in the related footer or header section.
CrossSectionLine
The CrossSectionLine control is a vertical line that begins in the GroupHeader and ends in the corresponding section footer. At run time, the line stretches across the detail section. You can control the appearance of the line with properties such as:
LineColor allows you to select a color for the line.
LineStyle allows you to select from various styles of dashes, dots, or solid.
LineWeight allows you to set the width of the line in pixels.
CrossSectionBox
The CrossSectionBox control draws a rectangle that begins in a section header and ends in the corresponding section footer. You can control the appearance of the rectangle with the properties above, plus:
Radius allows you to set a value in pixels to round the corners of the box, where 0 is a rectangle and 200 is a circle.
Cross Section Controls
Note: If you try to drop a cross-section control into a section other than a header or footer, the mouse pointer changes to Unavailable, and you cannot drop the control.
ActiveReports 6 User Guide | 44

You can rearrange buttons and menu options, as well as hide, display, dock or float the ActiveReports toolbar in Visual Studio.
To access the toolbars shortcut menu
Right-click anywhere in the toolbar area.
The shortcut menu allows you to show or hide toolbars by selecting the toolbar name from the menu. In addition, you can customize the toolbars or create a new toolbar from the customize option on the menu.
The ActiveReports toolbar is made up of the following components:
Report Explorer Shows or hides the report explorer tree and the fields list.
Style Sheets Sets the style sheet for a control.
Font Sets the typeface of the selected text in the RichText control, or all text in any other control.
Size Sets the font size of the selected text in the RichText control, or all text in any other control.
View Grid Indicates whether the grid display is on or off. If the grid is on, snap lines are turned off.
Reorder Groups Opens the Group Order dialog, where you can drag and drop groups to rearrange them. Enabled when you have multiple groups.
Zoom Out Reduces the magnification level of the design surface.
Zoom In Increases the magnification level of the design surface.
Zoom Sets the magnification level of the design surface between 100 and 800%.
Bold Sets or removes text emphasis. Applies to selected text in the RichText control, or all text in any other control.
Italic Sets or removes text slant. Applies to selected text in the RichText control, or all text in any other control.
Underline Sets or removes text underlining. Applies to selected text in the RichText control, or all text in any other control.
Align Left Aligns the text left in the control area.
Align Center Centers the text in the control area.
Align Right Aligns the text right in the control area.
Justify Fully justifies the text in the control area.
Bullets Adds bullets to selected text in the RichText control area.
Decrease Indent Decreases the indent of selected text in the RichText control area.
Increase Indent Increases the indent of selected text in the RichText control area.
Toolbar
ActiveReports 6 User Guide | 45
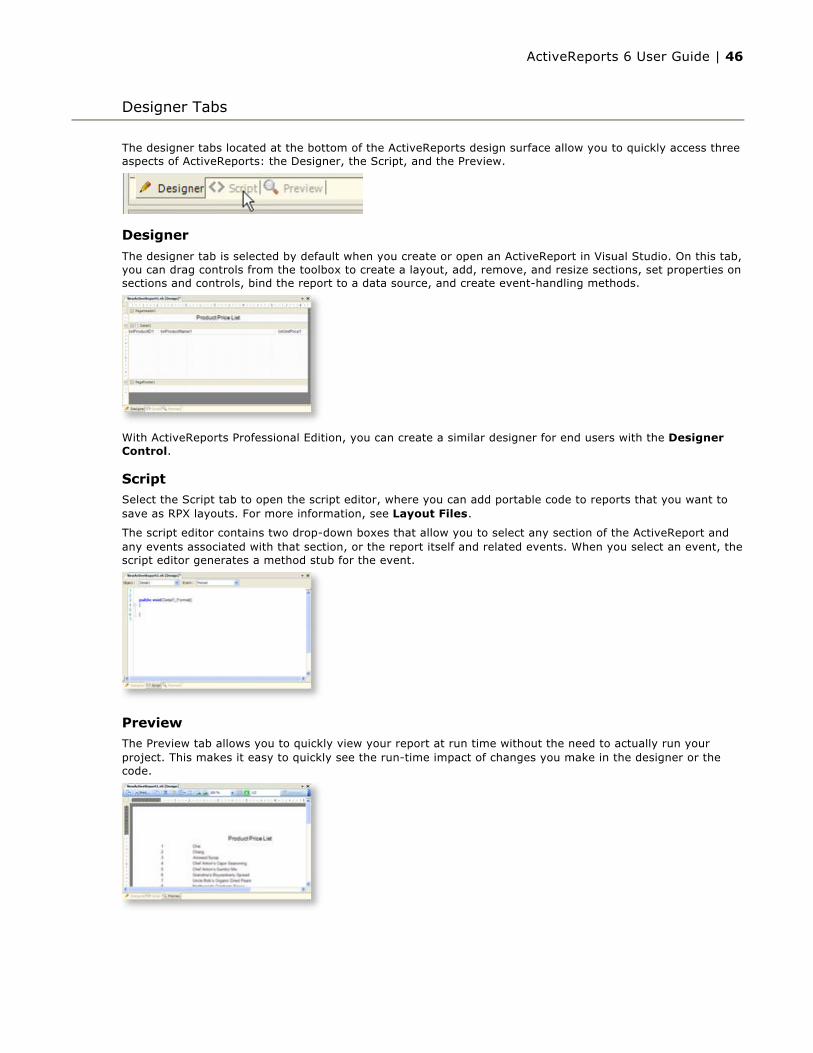
The designer tabs located at the bottom of the ActiveReports design surface allow you to quickly access three aspects of ActiveReports: the Designer, the Script, and the Preview.
Designer
The designer tab is selected by default when you create or open an ActiveReport in Visual Studio. On this tab, you can drag controls from the toolbox to create a layout, add, remove, and resize sections, set properties on sections and controls, bind the report to a data source, and create event-handling methods.
With ActiveReports Professional Edition, you can create a similar designer for end users with the Designer Control.
ScriptSelect the Script tab to open the script editor, where you can add portable code to reports that you want to save as RPX layouts. For more information, see Layout Files.
The script editor contains two drop-down boxes that allow you to select any section of the ActiveReport and any events associated with that section, or the report itself and related events. When you select an event, the script editor generates a method stub for the event.
PreviewThe Preview tab allows you to quickly view your report at run time without the need to actually run your project. This makes it easy to quickly see the run-time impact of changes you make in the designer or the code.
Designer Tabs
ActiveReports 6 User Guide | 46
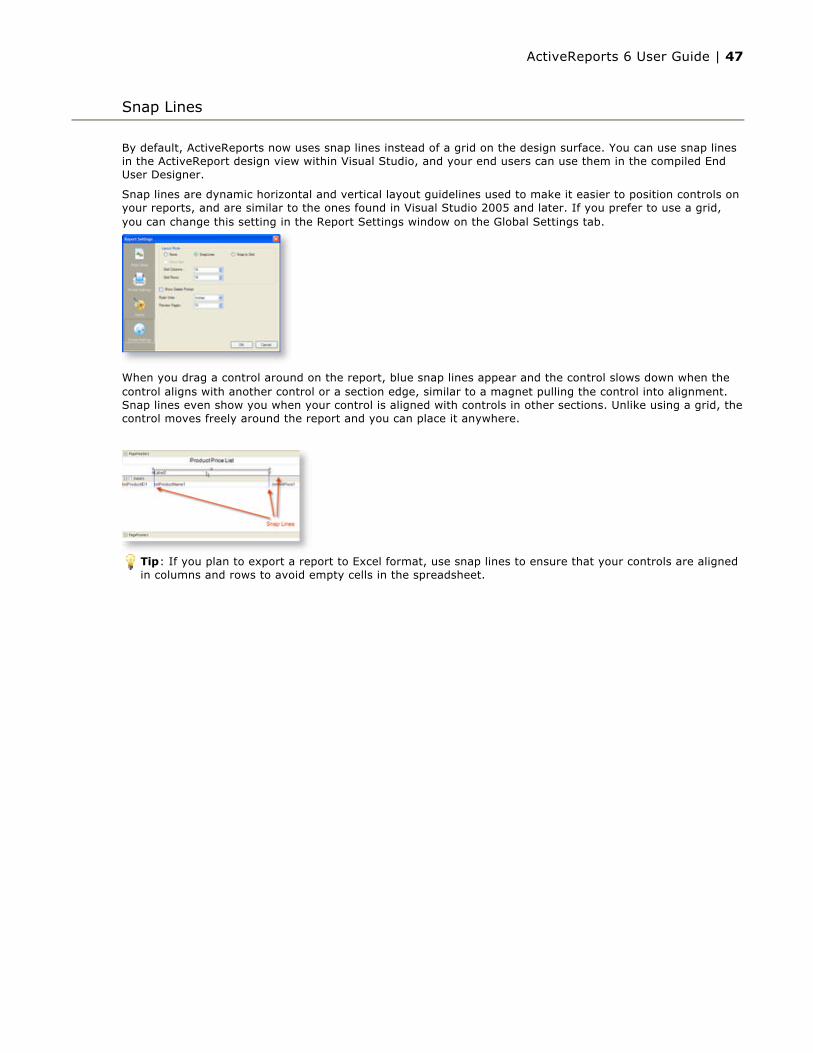
By default, ActiveReports now uses snap lines instead of a grid on the design surface. You can use snap lines in the ActiveReport design view within Visual Studio, and your end users can use them in the compiled End User Designer.
Snap lines are dynamic horizontal and vertical layout guidelines used to make it easier to position controls on your reports, and are similar to the ones found in Visual Studio 2005 and later. If you prefer to use a grid, you can change this setting in the Report Settings window on the Global Settings tab.
When you drag a control around on the report, blue snap lines appear and the control slows down when the control aligns with another control or a section edge, similar to a magnet pulling the control into alignment. Snap lines even show you when your control is aligned with controls in other sections. Unlike using a grid, the control moves freely around the report and you can place it anywhere.
Snap Lines
Tip: If you plan to export a report to Excel format, use snap lines to ensure that your controls are aligned in columns and rows to avoid empty cells in the spreadsheet.
ActiveReports 6 User Guide | 47

Use the DataSource icon to bind your report to a data source at design time.
When you click the icon, the Report Data Source window appears. You can connect the report to OLE DB, SQL, or XML data, and supply a query to retrieve the data you want. You can also add parameters to the report by using parameter syntax in the SQL query. For more information, see Add Parameters.
Select the OLE DB, SQL, or XML tab to see the options you have for each type of data source. For more information, see Bind Reports to a Data Source.
DataSource Icon
ActiveReports 6 User Guide | 48

The Visual Studio Properties window is an important tool when you are designing an ActiveReports layout. Select any control, section, or the report itself to gain access to its properties in the Properties window.
Select a property to reveal a description in the bottom section of the window. Just above the description is a commands section that contains verbs, links to windows that give you access to further properties for the item. Only the chart control and the report itself have associated verbs.
If you cannot see the Description or Command section, right-click anywhere on the Properties window and ensure that both are selected, or try resizing the sections.
For more information on some of the important properties for ActiveReports controls, see ActiveReports Toolbox Controls.
Properties Window
ActiveReports 6 User Guide | 49
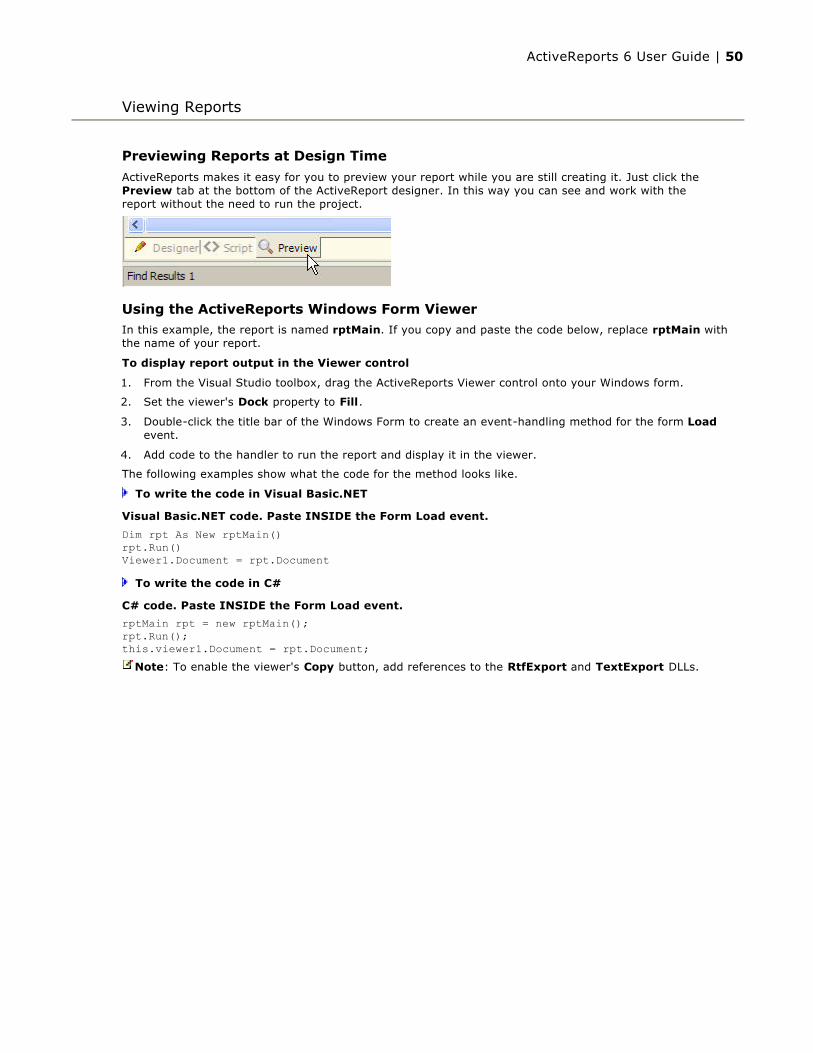
Previewing Reports at Design Time
ActiveReports makes it easy for you to preview your report while you are still creating it. Just click the Preview tab at the bottom of the ActiveReport designer. In this way you can see and work with the report without the need to run the project.
Using the ActiveReports Windows Form ViewerIn this example, the report is named rptMain. If you copy and paste the code below, replace rptMain with the name of your report.
To display report output in the Viewer control
1. From the Visual Studio toolbox, drag the ActiveReports Viewer control onto your Windows form.
2. Set the viewer's Dock property to Fill.
3. Double-click the title bar of the Windows Form to create an event-handling method for the form Loadevent.
4. Add code to the handler to run the report and display it in the viewer.
The following examples show what the code for the method looks like.
To write the code in Visual Basic.NET
To write the code in C#
Viewing Reports
Visual Basic.NET code. Paste INSIDE the Form Load event.
Dim rpt As New rptMain()rpt.Run()Viewer1.Document = rpt.Document
C# code. Paste INSIDE the Form Load event.
rptMain rpt = new rptMain();rpt.Run();this.viewer1.Document = rpt.Document;
Note: To enable the viewer's Copy button, add references to the RtfExport and TextExport DLLs.
ActiveReports 6 User Guide | 50

The following shortcuts are available on the Windows Form viewer:
Windows Form Viewer Hot Keys And Shortcuts
Keyboard Shortcut ActionCtrl + F Shows the find dialog.Ctrl + P Shows the print dialog.Esc Closes the find or print dialogs.Page Down Moves to the next page.Page Up Moves to the previous page.Ctrl + T Shows or hides the table of contents.Ctrl + Home Moves to the first page.Ctrl + End Moves to the last page.Ctrl + Right Navigates forward.Ctrl + Left Navigates backward.Ctrl + - Zooms out.Ctrl + + Zooms in.Left, Right, Up, Down Moves the visible area of the page in the corresponding direction.Ctrl + 0 (zero) Sets the zoom level to 100%.Ctrl + rotate mouse wheel Changes the zoom level up or down.Ctrl + M Turns on the Continuous scroll mode.Ctrl + S Turns off the Continuous scroll mode.
ActiveReports 6 User Guide | 51
Professional Edition
The ActiveReports Professional Edition license entitles you to use the WebViewer, which allows you to quickly display reports in any of four viewer types: HtmlViewer, RawHtml, AcrobatReader, or the new FlashViewer.
Before using the WebViewer, you must first configure the HTTPHandlers.
Getting Started with the Web Viewer (Pro Edition)
Flash Viewer Options
Flash Viewer Hot Keys and Shortcuts
Standard EditionThe Standard Edition license does not have a Web viewer, but you can export reports for use on the Web or use Web Services to distribute documents or data sources. For more information, see Web Walkthroughs (Standard Edition).
ActiveReports and the Web
ActiveReports 6 User Guide | 52

The WebViewer control allows you to quickly display reports in Web applications, and now includes a FlashViewer option. You must purchase the Professional Edition license in order to use the WebViewer control; the FlashViewer can be used in both Standard and Pro Editions. If you have the Standard Edition license, see Web Walkthroughs (Standard Edition).
To use the WebViewer control, you must first add it to the Visual Studio toolbox. See Adding ActiveReports Controls for more information.
You must also configure HTTP Handlers on your server so that IIS knows how to associate ActiveReports files in the browser.
Once you have the control in your toolbar, you can add it to the Design view of an ASPX page in a Web application, and set its ReportName property to the name of an ActiveReport within your solution.
For more control of the output, the WebViewer offers many properties, some of which only apply when you select a specific ViewerType. Drop down the table below for more information on each of the properties.
WebViewer Control Properties
Getting Started with the Web Viewer (Pro Edition)
Important: If you elect to use the FlashViewer ViewerType, you must copy the ActiveRepors.FlashViewer.swf file into your project folder. This file is located in:
C:\Program Files\GrapeCity\ActiveReports 6\Deployment
Property Name Description
New FlashViewerOptions
These options apply only when you select the FlashViewer ViewerType.
PageNumber Allows you to specify the page to display initially.
PrintOptions Allows you to specify how the viewer handles page orientation and scaling.
ResourceLocale Allows you to specify the culture for localization. Separate multiple values with commas.
ShowSplitter Allows you to specify whether to display the splitter, which allows the user to compare report pages in the viewer.
ShowThumbnails Allows you to specify whether to display a pane with thumbnail views of pages.
ShowToc Allows you to specify whether to display the table of contents pane.
StartPrint Allows you to specify whether to print the report after loading for no-touch printing. If you set the WebViewer's Height and Width properties to 0, you can have the report print without displaying it.
ThemeUrl Allows you to specify the relative URL of a skin to use on the FlashViewer. The following skins are included:
FluorescentBlue.swf
Office.swf
OliveGreen.swf
Orange.swf
VistaAero.swf
WindowsClassic.swf
XP.swf
Zoom Allows you to specify the zoom level, between 10% and 800%, at which to display the report.
BookmarkStyle Allows you to specify whether to use HTML bookmarks.
CharacterSet Allows you to select from 15 character sets to use for the report.
ActiveReports 6 User Guide | 53

HtmlExportOptions
These options apply only when you select the HtmlViewer ViewerType.
CreateFramesetPage Allows you to specify whether to use Frameset or Body tags in the generated HTML report.
IncludeHtmlHeader Allows you to specify whether to include a header section in the generated HTML report.
IncludePageMargins Allows you to specify whether to keep page margins with reports in the generated HTML.
MultiPage
OutputType Allows you to specify whether to use DHTML or HTML for the output.
RemoveVerticalSpace Allows you to specify whether to keep white space, for example, space at the end of a page not filled with data before a page break.
Title Allows you to specify the text to display in the title bar of the Web browser.
MaxReportRunTime
The maximum number of seconds that a request for a report's output waits for the report to finish executing. The default value is 10 seconds. If a report takes longer to run than the value of this property, the control makes subsequent requests at 5 second intervals for the report to see when it is finished executing.
PdfExportOptions
These options apply only when you select the AcrobatReader ViewerType.
Application Allows you to set the value to display in the Application field in the Document Properties dialog of the Acrobat Reader.
Author Allows you to set the value to display in the Author field in the Document Properties dialog of the Acrobat Reader.
CenterWindow Allows you to specify whether to position the document's window in the center of the screen in the initial view when the document is opened in the Acrobat Reader.
ConvertMetaToPng Allows you to specify whether to convert meta files (WMF or EMF) into PNG files in the PDF.
DisplayMode Allows you to specify how to display the document: in outlines, thumbnails, full screen, or none to use the Acrobat Reader's default display mode.
DisplayTitle Allows you to specify whether to display the document title from the Title property.
Encrypt Allows you to specify whether to encrypt the document.
ExportBookmarks Allows you to specify whether to create PDF bookmarks from any bookmarks that may be in the report.
FitWindow Allows you to specify whether to resize the document's window to fit the size of the first displayed page.
HideMenuBar Allows you to specify whether to hide the viewer application's menu bar when the document is active.
HideToolbar Allows you to specify whether to hide the viewer application's tool bars when the document is active.
HideWindowUI Allows you to specify whether to hide user interface elements in the document’s window (such as scroll bars and navigation controls), leaving only the document’s contents displayed.
ImageQuality Allows you to specify whether to render image metafiles (WMF or EMF) in the document at lowest, medium, or highest quality.
ImageResolution Allows you to specify the image resolution for metafiles (WMF or EMF).
Typical values are 75-2400 dpi. 75 dpi at low resolution would be used to save space, 150 dpi is used for normal screen viewing and 300 dpi and higher is used for print quality.
Keywords Allows you to set the value to display in the Keywords field in the Document Properties dialog of the Acrobat Reader. These are
ActiveReports 6 User Guide | 54
For more information on properties inherited from the system, see the Class Library and Visual Studio help.
used in document searches.
NeverEmbedFonts Allows you to specify a semicolon-delimited string of values indicating which fonts are not embedded in the PDF document. Not embedding any of the fonts used in your documents can reduce the PDF file size dramatically if you use many fonts.
OwnerPassword Allows you to specify the password to enter in the reader to permit full access to the document regardless of the specified user permissions.
Permissions Allows you to specify the user permissions for the document. You can combine Permissions by using commas between values.
Subject Allows you to specify the value to display in the Subject field in the Document Properties dialog of the Acrobat Reader.
Title Allows you to specify a title to display when the DisplayTitle property is set to True.
Use128Bit Allows you to specify whether to use 128 bit encryption with full permissions capability. Set to True to enable the AllowFillIn, AllowAccessibleReaders, and AllowAssembly permissions to function. Set to False to use 40 bit encryption with limited permissions.
UserPassword Allows you to specify the password to enter to allow a user to open the document in the reader. If this value is left empty, the user is not prompted for a password, but is restricted by the specified permissions.
Version Allows you to specify whether to use Pdf11 (v1.1), Pdf12 (v1.2), or Pdf13 (v1.3 or Acrobat 4.0).
ReportName
This new property replaces the old Report property. The new property is a string instead of an ActiveReport object, and specifies the report to display in the viewer.
SkinID Inherited from System.Web.UI.WebControls.WebControl
SlidingExpirationIntervalThe interval in seconds between the time the report was last retrieved and the time the report is removed from the ASP.NET WebCache.
ViewerType
HtmlViewer Provides a scrollable view of a single page of the report at a time. Downloads only HTML and javascript to the client browser. Not recommended for printable output.
RawHtml Shows all pages in the report document as one continuous HTML page. Provides a static view of the entire report document, and generally printable output, although under some circumstances pagination is not preserved.
AcrobatReader Returns output as a PDF document viewable in Acrobat Reader.
Client requirements: Adobe Acrobat Reader.
FlashViewer Provides an interactive viewing experience and no-touch printing using the widely-adopted Flash Player.
Client Requirements: Adobe Flash Player.
ActiveReports 6 User Guide | 55
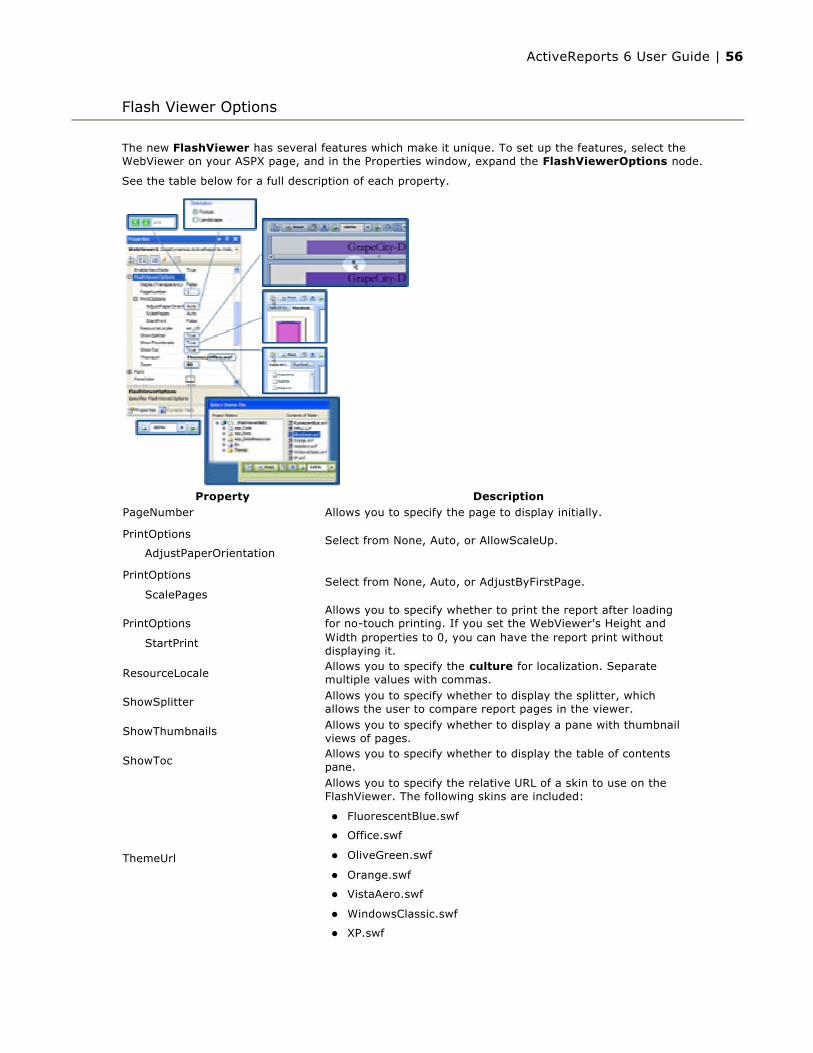
The new FlashViewer has several features which make it unique. To set up the features, select the WebViewer on your ASPX page, and in the Properties window, expand the FlashViewerOptions node.
See the table below for a full description of each property.
Flash Viewer Options
Property DescriptionPageNumber Allows you to specify the page to display initially.
PrintOptions
AdjustPaperOrientationSelect from None, Auto, or AllowScaleUp.
PrintOptions
ScalePagesSelect from None, Auto, or AdjustByFirstPage.
PrintOptions
StartPrint
Allows you to specify whether to print the report after loading for no-touch printing. If you set the WebViewer's Height and Width properties to 0, you can have the report print without displaying it.
ResourceLocaleAllows you to specify the culture for localization. Separate multiple values with commas.
ShowSplitter Allows you to specify whether to display the splitter, which allows the user to compare report pages in the viewer.
ShowThumbnails Allows you to specify whether to display a pane with thumbnail views of pages.
ShowTocAllows you to specify whether to display the table of contents pane.
ThemeUrl
Allows you to specify the relative URL of a skin to use on the FlashViewer. The following skins are included:
FluorescentBlue.swf
Office.swf
OliveGreen.swf
Orange.swf
VistaAero.swf
WindowsClassic.swf
XP.swf
ActiveReports 6 User Guide | 56

WindowModeAllows you to specify such display options as transparency, layering, and positioning of the FlashViewer in the browser.
Select from Window, Opaque and Transparent.
ZoomAllows you to specify the zoom level, between 10% and 800%, at which to display the report.
ActiveReports 6 User Guide | 57

The following shortcuts are available on the Flash viewer:
Flash Viewer Hot Keys and Shortcuts
Keyboard Shortcut ActionCtrl + F Shows the find dialog.F3 Finds the next search result.Esc Closes the find dialog.Page Down Moves to the next page.Page Up Moves to the previous page.Ctrl + P Shows the print dialog.Ctrl + T Shows the table of contents.Ctrl + Home Moves to the first page.Ctrl + End Moves to the last page.Ctrl + Right Navigates forward.Ctrl + Left Navigates backward.Ctrl + - Zooms out.Ctrl + + Zooms in.Left, Right, Up, Down Moves the visible area of the page in the corresponding direction.Home, End Moves to the start or end of the current page.Ctrl + 0 (zero) Sets the zoom level to 100%.Ctrl + rotate mouse wheel Changes the zoom level up or down.Ctrl + M Shows multiple pages.Ctrl + S Shows a single page.
Note: As with any Flash Web application, when the FlashViewer has focus, browser keyboard shortcuts do not work. The user must click outside of the FlashViewer to return focus to the browser. Likewise, if the browser has focus, the user must click inside the FlashViewer in order to use the viewer's keyboard shortcuts.
ActiveReports 6 User Guide | 58
This section introduces you to the basic structure and concepts behind ActiveReports 6 to enable you to efficiently create reports.
This section contains information about:
Report StructureActiveReports are arranged in bands similar to those found in Access reports. This topic describes each type of section and how it may be used.
Report and Page SettingsFind out how to access printer setup, page settings, styles, and global report settings at design time or run time.
KeepTogether OptionsThere are several ways that you can work with ActiveReports to keep section data together. Learn about all of them here.
Date, Time, and Number FormattingLearn about built-in and customizable formatting for date, time, currency, and other numeric values.
ParametersActiveReports allows you to specify parameters for simple reports and subreports, in SQL statements, or at run time. This topic explains the various methods.
Layout FilesReport layouts can be saved to different file formats. Find out which one is best for you.
ScriptingIn order to save custom code along with an rpx report layout file, you must use scripts. Here you will find a number of important concepts about scripting.
Export FiltersActiveReports export filters can do a lot, but each format has inherent limitations. This topic explains them so that you can avoid the frustration of trying to do the impossible.
Charts The ActiveReports chart control allows you to create many types of charts, including XY and financial charts. In this section, you can find information on each of these chart types, as well as on different ways to add data, and on customizing the appearance of charts.
RichTextLearn how the RichText control works, and which HTML tags are supported.
Grouping DataFind out how grouping works in ActiveReports, and what special options help you to control groupings.
Multiple GroupingsLearn about nesting groups, and how to manage multiple groups.
SubreportsFind out when and how to use subreports.
Report EventsLearn about the intelligent, multi-threaded, single-pass processing used in ActiveReports.
Section EventsEach section in an ActiveReport has three events. Learn what you can and cannot do within these events.
Sequence of EventsSometimes the order in which report events fire can affect the way in which your reports run. This topic helps you to understand what determines the sequence in which they fire.
Unbound ReportingLearn which events you can use to set up unbound reporting, and copy some code samples to get started quickly.
Optimizing ActiveReportsIf you run very large reports, there are several ways that you can make them run more quickly and use less memory.
Concepts
ActiveReports 6 User Guide | 59

CacheToDisk and Resource StorageIf you run very large reports, and are considering whether to use CacheToDisk to use less memory, here is insight into what goes on behind the scenes to help you with your decision.
Section 508 ComplianceLearn about accessibility support in ActiveReports components.
LocalizationFind out how you can localize the viewer control and other ActiveReports controls.
Designer Control (Pro Edition) The designer control allows you to offer your end users the features you enjoy with ActiveReports, customized to your specifications.
ActiveReports 6 User Guide | 60

ActiveReports are based on banded sections. By default, an ActiveReport has three sections: a PageHeader, a Detail section, and a PageFooter. You can right-click on the report and select Insert, then select the type of section pair you would like to add: ReportHeader and Footer, or GroupHeader and Footer. Except for the Detail section, sections always come in pairs.
A report section contains a group of controls that are processed and printed at the same time as a single unit. All sections except the detail section come in pairs, above and below the detail section. You can hide any section that you are not using by setting the Visible property of the section to False. ActiveReports defines the following section types:
Report Header
A report can have one report header section that prints at the beginning of the report. This section generally is used to print a report title, a summary table, a chart or any information that only needs to appear once at the report's start. This section has a NewPage property that you can use to cause the report to break to a new page after it renders.
Page Header
A report can have one page header section that prints at the top of each page. Unless the page contains a report header section, the page header is the first section that prints on the page. The page header section is used to print column headers, page numbers, a page title, or any information that needs to appear at the top of each page in the report.
GroupHeaderA report can consist of single or nested groups, with each group having its own header and footer sections. The header section is inserted and printed immediately before the detail section. For more information on grouping, see Grouping Data.
The GroupHeader section is the only section type on which you can drop the new CrossSectionBox and CrossSectionLine controls, which then span any intervening sections to the corresponding GroupFooter section.
For Columnar Reports, you can have the GroupHeader section follow the ColumnLayout or not, use ColumnGroupKeepTogether, and select whether to start a NewColumn before or after a group.
You can also specify whether to print a NewPage before or after the section, and have the section print on every page until the group details complete with the RepeatStyle property. The UnderlayNext property allows you to show group header information inside the group details, so long as you keep the BackColor property of the Detail section set to Transparent.
Detail
A report has one detail section. The detail section is the body of the report and one instance of the section is created for each record in the report. You can set the CanShrink property to True to eliminate white space after controls, and you can set up Columnar Reports using ColumnCount, ColumnDirection, ColumnSpacing and NewColumn properties.
The KeepTogether property attempts to keep the section together on a single page, and the new RepeatToFill property allows you to fill each page with the same number of formatted rows, regardless of whether there is enough data to fill them. This is especially useful for reports such as invoices in which you want consistent formatting like lines or green bars or back colors to fill each page down to the Footer section at the bottom.
GroupFooter
A report can consist of single or nested groups, with each group having its own header and footer sections. The header section is inserted and printed immediately before the detail section. The footer section is inserted and printed immediately after the detail section.
Page Footer
Report Structure
Note: The RepeatToFill property cannot be used if the PageBreak or SubReport control is used in the Detail section, or if the NewPage or NewColumn property is set to any value other than None.
ActiveReports 6 User Guide | 61

A report can have one page footer section that prints at the bottom of each page. It is used to print page totals, page numbers, or any other information that needs to appear at the bottom of each page.
Report FooterA report can have one report footer section that prints at the end of the report. Use this section to print a summary of the report, grand totals, or any information that needs to print once at the report's end.
ActiveReports 6 User Guide | 62

The Report Settings Dialog
With ActiveReports, you can modify facets of your report, such as the page setup, printer settings, styles, and global settings at design time, as well as at run time. To make changes at design time, access the Report Settings dialog by selecting Report, then Settings from the toolbar menu.
Alternatively, you can right-click the Settings node in the Report Explorer and select Show.
Page Setup
On the Page Setup page, you can make changes to the report margins (left, right, top, and bottom), specify a gutter, and select the Mirror margins option.
By setting a gutter and selecting Mirror margins, you can easily set up reports for publishing purposes. When you select Mirror margins, the inner margins in the report are set for opposite pages to be the same width and the outside margins for opposite pages to be the same width. Specifying a gutter gives extra space between the edge of the page and the margins. This allows reports to be bound.
Printer Settings
On the Printer Settings page, you can make changes to the printer paper size and orientation. You can set a custom paper size by dropping down the Paper Size list and selecting Custom Size. Once you select this
Report and Page Settings
ActiveReports 6 User Guide | 63

option, the Width and Height fields are enabled.
The Printer Settings dialog also lets the user choose the type of collation to use, whether or not the report should be printed in duplex, and the location of the paper source.
StylesOn the Styles page, you can change the appearance of text associated with controls, either by creating a new style sheet, or by modifying and applying an existing style. See Use External Style Sheets for more information.
Global SettingsOn the Global Settings page, you can change the design layout of your report. You can use SnapLines, show or hide the grid, set the controls to align to the grid, have a warning appear when you try to delete a parameter or calculated field from the Report Explorer, set the number of columns or rows on the grid, and change the ruler units to inches or centimeters.
Also, you can set the number of Pages that display in the Preview tab of the ActiveReports Designer. The minimum value is 1 and the maximum value is 10000. By default, the Preview tab displays 10 pages. This is generally enough to allow you to see all of your report sections without taking the time to generate the entire report.
ActiveReports 6 User Guide | 64

ActiveReports provides several KeepTogether options for your reports so that you can keep sections together when you print them.
KeepTogether is available on the following sections:
GroupHeader
Detail
GroupFooter
ReportFooter
The GroupHeader section has two additional keep together options:
GroupKeepTogether
ColumnGroupKeepTogether
KeepTogether
The KeepTogether property, when set to True, attempts to print the section on a single page with no page breaks. If the section is too large for the current page and too large to fit fully on the next page, the KeepTogether property is ignored.
Setting the property to False allows the section to split across two or more pages.
GroupKeepTogetherThe GroupKeepTogether property, which can be set on a group header section, has three enumerated values:
None is the default setting. The group header does not attempt to stay with its related sections, so the group block is allowed to split across pages.
FirstDetail keeps the group header and at least the first detail together on the same page to prevent widowed group header sections. If there is no room on the current page for the first detail, the group header moves to the next page along with the detail.
All attempts to keep the section, related details, and group footer as a single block on the same page. If the group block does not fit on a single page, the property is ignored.
For more information on grouping, see the Grouping Data topic.
ColumnGroupKeepTogetherThe ColumnGroupKeepTogether property only takes effect when the GroupHeader's GroupKeepTogether property is set to All, and the Detail section's Columns property is set to a value greater than 1. When set to true, it keeps newspaper-style column layouts in both the Detail and Group sections together. It attempts to prevent a group block from splitting across columns. If a group cannot fit in the current column, it tries the next. If the group is too large for a single column, the property is ignored.
Setting the property to False allows the group block to split across two or more columns. For more information on columnar reports, see the Columnar Reports walkthrough.
KeepTogether Options
ActiveReports 6 User Guide | 65

ActiveReports allows you to set formatting strings for date, time, currency, and other numeric values using the OutputFormat property on the TextBox control. The OutputFormat dialog also allows you to select international currency values and select from various built-in string expressions. In addition to the built-in string expressions, you may use any .NET standard formatting strings. You can find information about these strings (Numerics (http://msdn2.microsoft.com/en-us/library/dwhawy9k(vs.71).aspx) and Date/Time (http://msdn2.microsoft.com/en-us/library/az4se3k1(vs.71).aspx) formats) on MSDN.
The OutputFormat property allows four sections delimited by a semicolon. Each section contains the format specifications for a different type of number:
The first section provides the format for positive numbers.
The second section provides the format for negative numbers.
The third section provides the format for Zero values.
The fourth section provides the format for Null or System.DBNull values.
For example: $#,#00.00; ($#,#00.00); $0.00; #
Times:
hh:mm tt = 09:00 AM
HH:mm = 21:00 (twenty-four hour clock)
HH = hours in 24 hour clock
hh = hours in 12 hour clock
mm = minutes
ss = seconds
tt = AM or PM
Dates: dddd, MMMM d, yyyy = Saturday, December 25, 2004
dd/MM/yyyy = 25/12/2004
d or dd = day in number format
ddd = day in short string format (for example, Sat for Saturday)
dddd = day in string format (for example, Saturday)
MM = month in number format
MMM = month in short string format (for example, Dec for December)
MMMM = month in string format (for example, December)
y or yy = year in two digit format (for example, 04 for 2004)
yyyy or yyyy = year in four digit format (for example, 2004)
Currency and numbers: $0.00 = $6.25
$#,#00.00 = $06.25
0 = digit or zero
# = digit or nothing
% = percent-multiplies the string expression by 100
Date, Time, and Number Formatting
Note: The ReportInfo control has many preformatted options for RunDateTime and Page Numbers. For more information, see ActiveReports Toolbox Controls.
ActiveReports 6 User Guide | 66
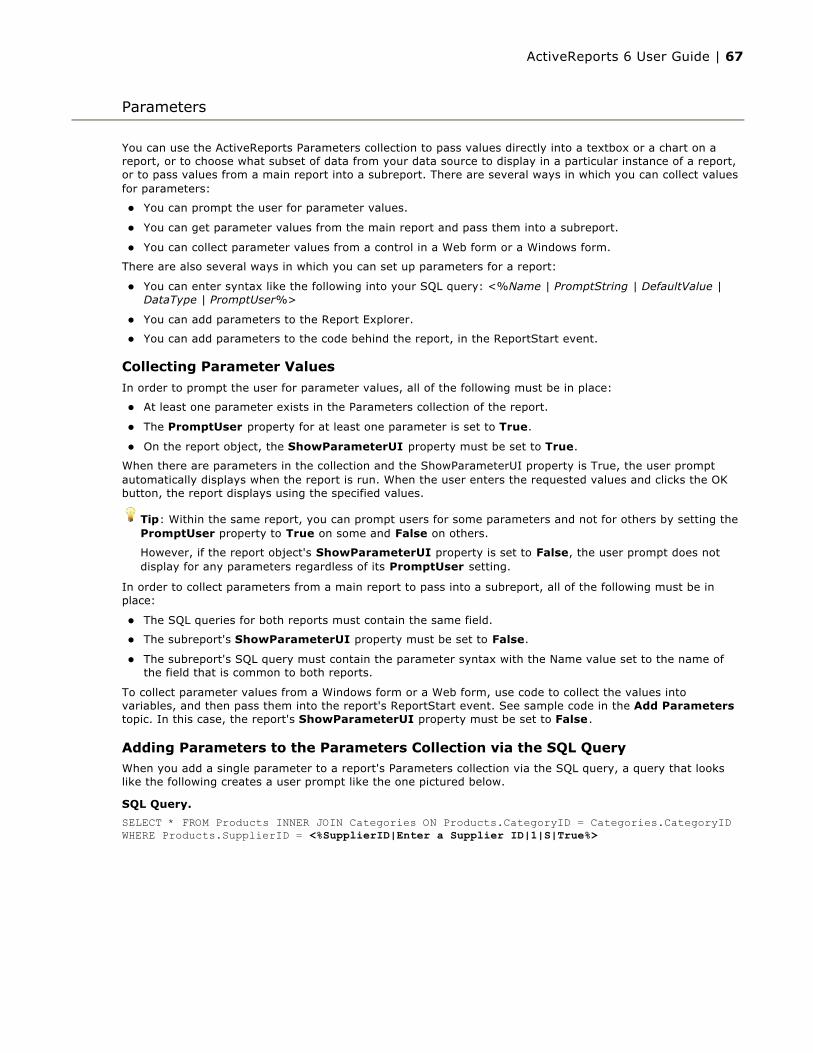
You can use the ActiveReports Parameters collection to pass values directly into a textbox or a chart on a report, or to choose what subset of data from your data source to display in a particular instance of a report, or to pass values from a main report into a subreport. There are several ways in which you can collect values for parameters:
You can prompt the user for parameter values.
You can get parameter values from the main report and pass them into a subreport.
You can collect parameter values from a control in a Web form or a Windows form.
There are also several ways in which you can set up parameters for a report:
You can enter syntax like the following into your SQL query: <%Name | PromptString | DefaultValue | DataType | PromptUser%>
You can add parameters to the Report Explorer.
You can add parameters to the code behind the report, in the ReportStart event.
Collecting Parameter Values
In order to prompt the user for parameter values, all of the following must be in place:
At least one parameter exists in the Parameters collection of the report.
The PromptUser property for at least one parameter is set to True.
On the report object, the ShowParameterUI property must be set to True.
When there are parameters in the collection and the ShowParameterUI property is True, the user prompt automatically displays when the report is run. When the user enters the requested values and clicks the OK button, the report displays using the specified values.
In order to collect parameters from a main report to pass into a subreport, all of the following must be in place:
The SQL queries for both reports must contain the same field.
The subreport's ShowParameterUI property must be set to False.
The subreport's SQL query must contain the parameter syntax with the Name value set to the name of the field that is common to both reports.
To collect parameter values from a Windows form or a Web form, use code to collect the values into variables, and then pass them into the report's ReportStart event. See sample code in the Add Parameterstopic. In this case, the report's ShowParameterUI property must be set to False.
Adding Parameters to the Parameters Collection via the SQL QueryWhen you add a single parameter to a report's Parameters collection via the SQL query, a query that looks like the following creates a user prompt like the one pictured below.
Parameters
Tip: Within the same report, you can prompt users for some parameters and not for others by setting the PromptUser property to True on some and False on others.
However, if the report object's ShowParameterUI property is set to False, the user prompt does not display for any parameters regardless of its PromptUser setting.
SQL Query.
SELECT * FROM Products INNER JOIN Categories ON Products.CategoryID = Categories.CategoryID WHERE Products.SupplierID = <%SupplierID|Enter a Supplier ID|1|S|True%>
ActiveReports 6 User Guide | 67

There are five values in the parameter syntax, separated by the pipe character: |
Only the first value (Name) is required, but if you do not specify the third value (DefaultValue), the field list is not populated at design time. You can provide only the Name value and no pipes, or if you wish to provide some, but not all of the values, simply provide pipes with no space between them for the missing values. For example, <%ProductID||||False%>
Name This is the unique name of the parameter, and corresponds to the Key property in parameters entered via code.
PromptString This string is displayed in the user prompt to let the user know what sort of value to enter.
DefaultValue Providing a default value to use for the parameter allows ActiveReports to populate the bound fields list while you are designing your report, enabling you to drag fields onto the report. It also populates the user prompt so that the user can simply click the OK button to accept the default value.
Type This value, which defaults to S for string, tells ActiveReports what type of data the parameter represents. It also dictates the type of control used in the user prompt. The type can be one of three values.
S (string) provides a textbox into which the user can enter the string.
D (date) provides a drop-down calendar control from which the user can select a date.
B (Boolean) provides a checkbox which the user can select or clear.
PromptUser This Boolean allows you to tell ActiveReports whether to prompt the user for a value. This can be set to True for some parameters and False for others. If you set the report's ShowParameterUIproperty to False, users are not prompted for any parameters, regardless of the PromptUser value set for any parameter in the report.
For a date parameter, you can use a SQL query like the following to allow users to select a beginning and ending date.
Note: Depending on your data source, you may need to put apostrophes (single quotes) or quotation marks around the parameter syntax for string values.
For example, '<%MyStringParameter%>'
Also, if you provide a default value for a string parameter that is enclosed in apostrophes or quotation marks, ActiveReports sends the apostrophes or quotation marks along with the string to SQL.
For example, <%MyStringParameter||"DefaultValue"|S|False%>
Note: Depending on your data source, you may need to put number signs around the parameter syntax.
For example, #<%MyDateParameter%>#
Note: If you provide a default value of True or False, or 0 or 1 for a Boolean parameter, ActiveReports sends it to SQL in that format.
SQL Query.
SELECT * FROM Orders INNER JOIN [Order Details] ON Orders.OrderID = [Order Details].OrderID WHERE OrderDate BETWEEN #<%StartDate|Start date|1/1/1994|D|True%># AND #<%EndDate|End date|12/31/1994|D|True%>#
ActiveReports 6 User Guide | 68
Report layouts in ActiveReports are automatically saved as C# or Visual Basic for .NET files within the project in which they are created. Each report is composed of three files:
rptYourReportName.vb or .cs
rptYourReportName.Designer.vb or .cs
rptYourReportName.resx
In this way, layout information models the behavior of Windows Forms in the .NET framework.
However, you can also save report layouts as stand-alone Report XML (RPX) files. RPX files are the same report layouts used in previous editions of ActiveReports for .NET. This makes ActiveReports 6 truly backward compatible. Older layout files can easily be brought into the newest applications while new layout files can be saved to an older format.
When you save a layout that contains a dataset, the data adapter and data connection are saved, but the dataset itself is lost. When you load the saved layout into another report, you must generate the dataset again.
The RPX format cannot contain Visual Basic.NET or C# code. In order to port logic along with the layout, you can add VB.NET or C# script in the Script view of the report.
For more information on using script with a layout file, see Scripting.
Layout Files
ActiveReports 6 User Guide | 69
ActiveReports allows you to use VB.NET or C# script to port your custom logic to report layouts. This permits layouts saved to report XML (RPX) files to serve as stand-alone reports. By including scripting before you save the report layout as an RPX file, you can later load, run, and display the report directly to the viewer control without using the designer. In conjunction with RPX files, scripting allows you to update distributed reports without recompiling your project.
ActiveReports loads RPX files, including any scripting, in the InitializeComponent() method.
You can add C# or VB.NET code to the script editor at design time or by using the rpt.Script property at run time. The script is then saved to the RPX file along with layout information.
To access the script editor, click the script tab below the report design surface.
Since the RPX file can be read with any text editor, use the AddCode or AddNamedItem method to add secure information such as a connection string.
Tips for Using Script Keep the report class public. If the report class is private, the script cannot recognize the items in your
report. The report class is public by default.
Set the Modifiers property of any control referenced in script to Public. If the control's Modifiersproperty is not set to Public, the control cannot be referenced in script and an error occurs when the report is run. The Modifiers property has a default value of Private, so you must set this property in the designer.
Use "this" (as in C# code-behind) or "Me" (as in VB code-behind) to reference the report. Using "rpt" to reference the report is also possible but it is recommended to use the "this" and "Me" keywords.
Use error handling. When working with script, use error handling around the .Run() call. When errors are raised, the returned error points to the section of script causing the error.
Scripting
Note: The ActiveReports script editor supports IntelliSense that helps the writing of code by making the access to the language elements fast and easy.
ActiveReports 6 User Guide | 70

ActiveReports provides custom components for exporting reports into six formats. Each export format has special features, however, not all formats support all of the features that you can use in your reports. Here are the unique usage possibilities of each format, along with any limitations inherent in each.
HTML
RTF
Text
TIFF
Excel
For information on using these export filters, see the Export Reports or Custom Web Exporting (Std Edition) topics.
Export Filters
ActiveReports 6 User Guide | 71
HTML, or hypertext markup language, is a format that opens in a Web browser. The HTML export filter has a number of useful properties that allow you to control your output. You can set the properties either in code using the export object, or by selecting the object in the component tray below the form and using the Properties window.
Table of HTML Export Properties
More information on output types
By default, the report is exported as DynamicHtml (DHTML), with cascading style sheets (CSS). Using the OutputType property, you can change the output to LegacyHtml (HTML). Neither of the output types creates a report that looks exactly like the one you display in the viewer because of differences in the formats. See below for the usage of each type, and controls to avoid in each.
DynamicHtml (DHTML)
Usage:
Create Web reports with Cascading Style Sheets (CSS)
Open in Web browsers
Does not support:
Diagonal line control
CrossSectionBox control
HTML
Property Valid Values Description
BookmarkStyle Html (default) or NoneSet to Html to generate a page of bookmarks from the bookmarks in the report. If the report has no bookmarks, this setting is ignored.
CharacterSet
Big5, EucJp, HzGb2312, Ibm850, Iso2022Jp, Iso2022Kr, Iso8859_1, Iso8859_2, Iso8859_5, Iso8859_6, Koi8r, Ksc5601, ShiftJis, UnicodeUtf16, UnicodeUtf8 (default)
Select the IANA character set that you want to use in the meta tag in the header section of the HTML output. This property only takes effect if the IncludeHtmlHeader property is set to True.
CreateFramesetPage True or False (default)
Set to True to generate a set of frames that display a page of bookmarks (if available) in the left frame and the report document in the right frame. The HTML output uses the specified filename with the extension .frame.html.
IncludeHtmlHeader True (default) or False
Set to False if you want to embed the HTML output in another HTML document. Otherwise, the HTML output includes the usual HTML, HEAD, and BODY elements.
IncludePageMargins True or False (default)Set to True to include the report's margins in the HTML output.
MultiPage True or False (default)Set to True to create a separate HTML page for each page of the report. Otherwise, the HTML output is a single page.
OutputTypeDynamicHtml (default) or LegacyHtml
Set to LegacyHtml to use tables for positioning and avoid the use of cascading style sheets (CSS). Otherwise, positioning of controls is handled in the CSS.
RemoveVerticalSpace True or False (default)
Set to True if the OutputType property is set to LegacyHtml and you plan to print the output from a browser. This removes white space from the report to help improve pagination. Otherwise, vertical white space is kept intact.
Title Any StringEnter the text to use in the header section's title. This is displayed in the title bar of the browser.
ActiveReports 6 User Guide | 72
Control borders
Shapes (other than filled rectangles)
LegacyHtml (HTML)
Usage:
Create archival reports
Open in Web browsers
Does not support:
Line control
Control borders
Shapes (other than filled rectangles)
CrossSectionBox and CrossSectionLine controls
Overlapping controls
ActiveReports 6 User Guide | 73
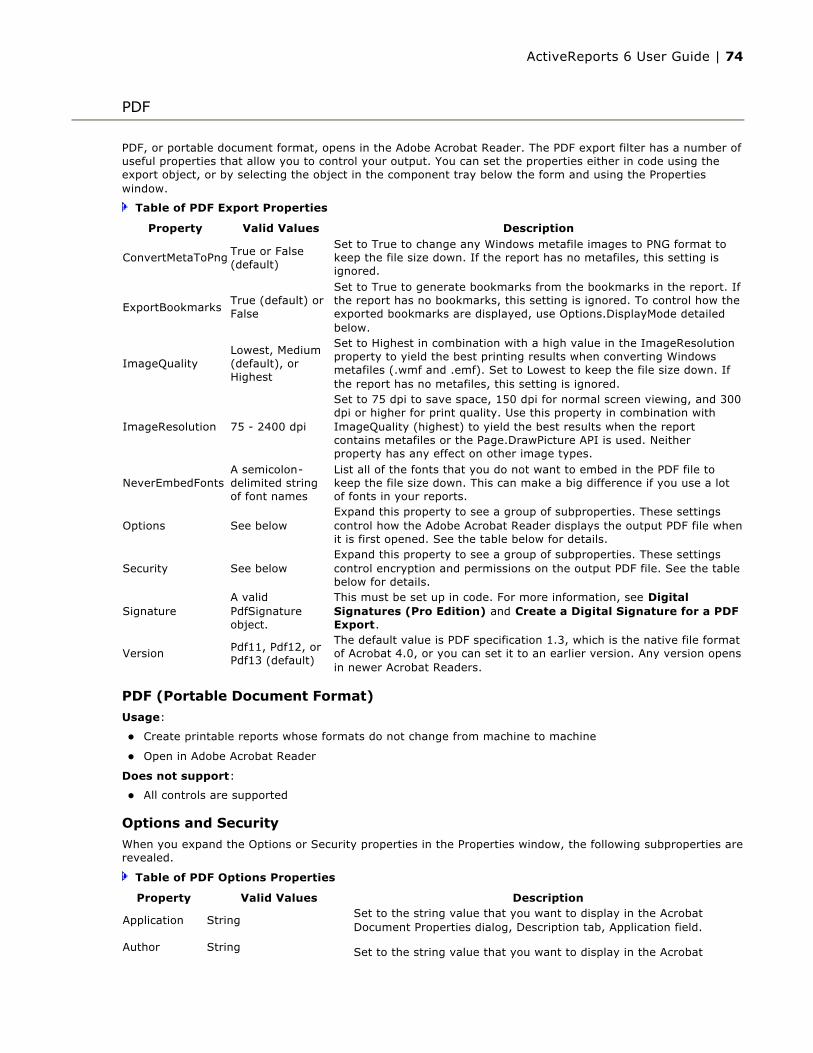
PDF, or portable document format, opens in the Adobe Acrobat Reader. The PDF export filter has a number of useful properties that allow you to control your output. You can set the properties either in code using the export object, or by selecting the object in the component tray below the form and using the Properties window.
Table of PDF Export Properties
PDF (Portable Document Format)
Usage:
Create printable reports whose formats do not change from machine to machine
Open in Adobe Acrobat Reader
Does not support:
All controls are supported
Options and Security
When you expand the Options or Security properties in the Properties window, the following subproperties are revealed.
Table of PDF Options Properties
Property Valid Values Description
ConvertMetaToPng True or False (default)
Set to True to change any Windows metafile images to PNG format to keep the file size down. If the report has no metafiles, this setting is ignored.
ExportBookmarksTrue (default) or False
Set to True to generate bookmarks from the bookmarks in the report. If the report has no bookmarks, this setting is ignored. To control how the exported bookmarks are displayed, use Options.DisplayMode detailed below.
ImageQualityLowest, Medium (default), or Highest
Set to Highest in combination with a high value in the ImageResolution property to yield the best printing results when converting Windows metafiles (.wmf and .emf). Set to Lowest to keep the file size down. If the report has no metafiles, this setting is ignored.
ImageResolution 75 - 2400 dpi
Set to 75 dpi to save space, 150 dpi for normal screen viewing, and 300 dpi or higher for print quality. Use this property in combination with ImageQuality (highest) to yield the best results when the report contains metafiles or the Page.DrawPicture API is used. Neither property has any effect on other image types.
NeverEmbedFontsA semicolon-delimited string of font names
List all of the fonts that you do not want to embed in the PDF file to keep the file size down. This can make a big difference if you use a lot of fonts in your reports.
Options See belowExpand this property to see a group of subproperties. These settings control how the Adobe Acrobat Reader displays the output PDF file when it is first opened. See the table below for details.
Security See belowExpand this property to see a group of subproperties. These settings control encryption and permissions on the output PDF file. See the table below for details.
SignatureA valid PdfSignature object.
This must be set up in code. For more information, see Digital Signatures (Pro Edition) and Create a Digital Signature for a PDF Export.
Version Pdf11, Pdf12, or Pdf13 (default)
The default value is PDF specification 1.3, which is the native file format of Acrobat 4.0, or you can set it to an earlier version. Any version opens in newer Acrobat Readers.
Property Valid Values Description
Application StringSet to the string value that you want to display in the Acrobat Document Properties dialog, Description tab, Application field.
Author String Set to the string value that you want to display in the Acrobat
ActiveReports 6 User Guide | 74
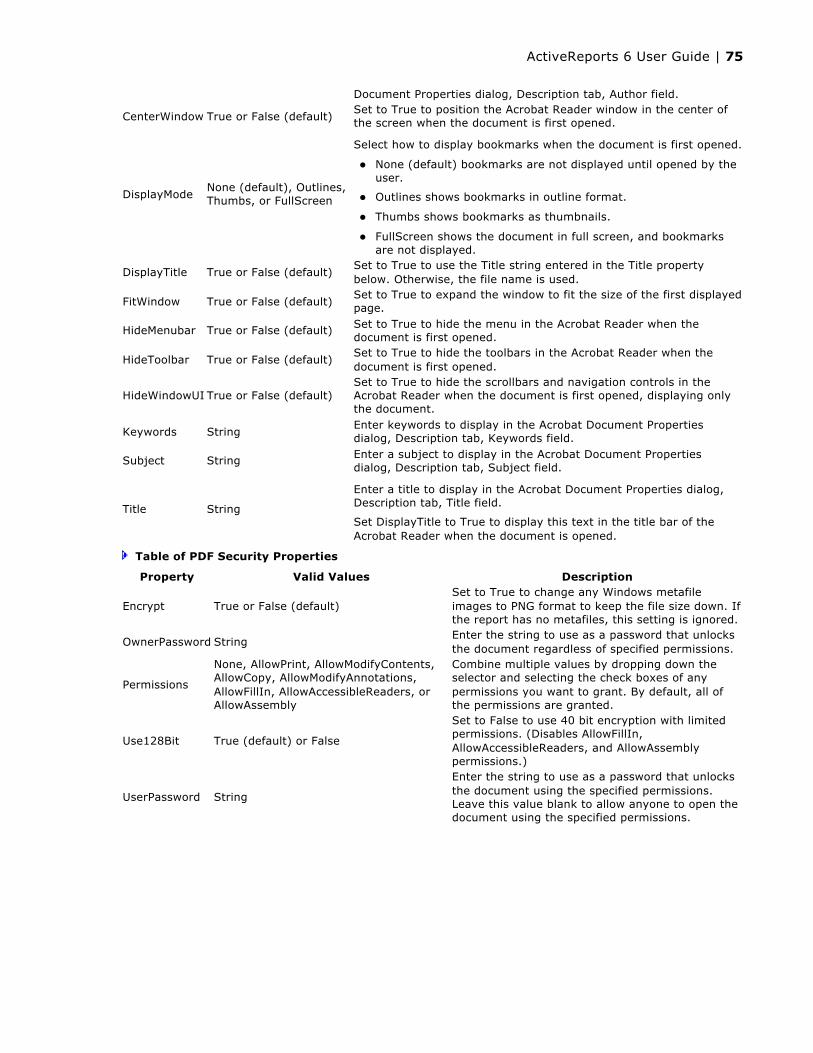
Table of PDF Security Properties
Document Properties dialog, Description tab, Author field.
CenterWindow True or False (default)Set to True to position the Acrobat Reader window in the center of the screen when the document is first opened.
DisplayModeNone (default), Outlines, Thumbs, or FullScreen
Select how to display bookmarks when the document is first opened.
None (default) bookmarks are not displayed until opened by the user.
Outlines shows bookmarks in outline format.
Thumbs shows bookmarks as thumbnails.
FullScreen shows the document in full screen, and bookmarks are not displayed.
DisplayTitle True or False (default)Set to True to use the Title string entered in the Title property below. Otherwise, the file name is used.
FitWindow True or False (default)Set to True to expand the window to fit the size of the first displayed page.
HideMenubar True or False (default) Set to True to hide the menu in the Acrobat Reader when the document is first opened.
HideToolbar True or False (default)Set to True to hide the toolbars in the Acrobat Reader when the document is first opened.
HideWindowUI True or False (default)Set to True to hide the scrollbars and navigation controls in the Acrobat Reader when the document is first opened, displaying only the document.
Keywords StringEnter keywords to display in the Acrobat Document Properties dialog, Description tab, Keywords field.
Subject String Enter a subject to display in the Acrobat Document Properties dialog, Description tab, Subject field.
Title String
Enter a title to display in the Acrobat Document Properties dialog, Description tab, Title field.
Set DisplayTitle to True to display this text in the title bar of the Acrobat Reader when the document is opened.
Property Valid Values Description
Encrypt True or False (default)Set to True to change any Windows metafile images to PNG format to keep the file size down. If the report has no metafiles, this setting is ignored.
OwnerPassword StringEnter the string to use as a password that unlocks the document regardless of specified permissions.
Permissions
None, AllowPrint, AllowModifyContents, AllowCopy, AllowModifyAnnotations, AllowFillIn, AllowAccessibleReaders, or AllowAssembly
Combine multiple values by dropping down the selector and selecting the check boxes of any permissions you want to grant. By default, all of the permissions are granted.
Use128Bit True (default) or False
Set to False to use 40 bit encryption with limited permissions. (Disables AllowFillIn, AllowAccessibleReaders, and AllowAssembly permissions.)
UserPassword String
Enter the string to use as a password that unlocks the document using the specified permissions. Leave this value blank to allow anyone to open the document using the specified permissions.
ActiveReports 6 User Guide | 75
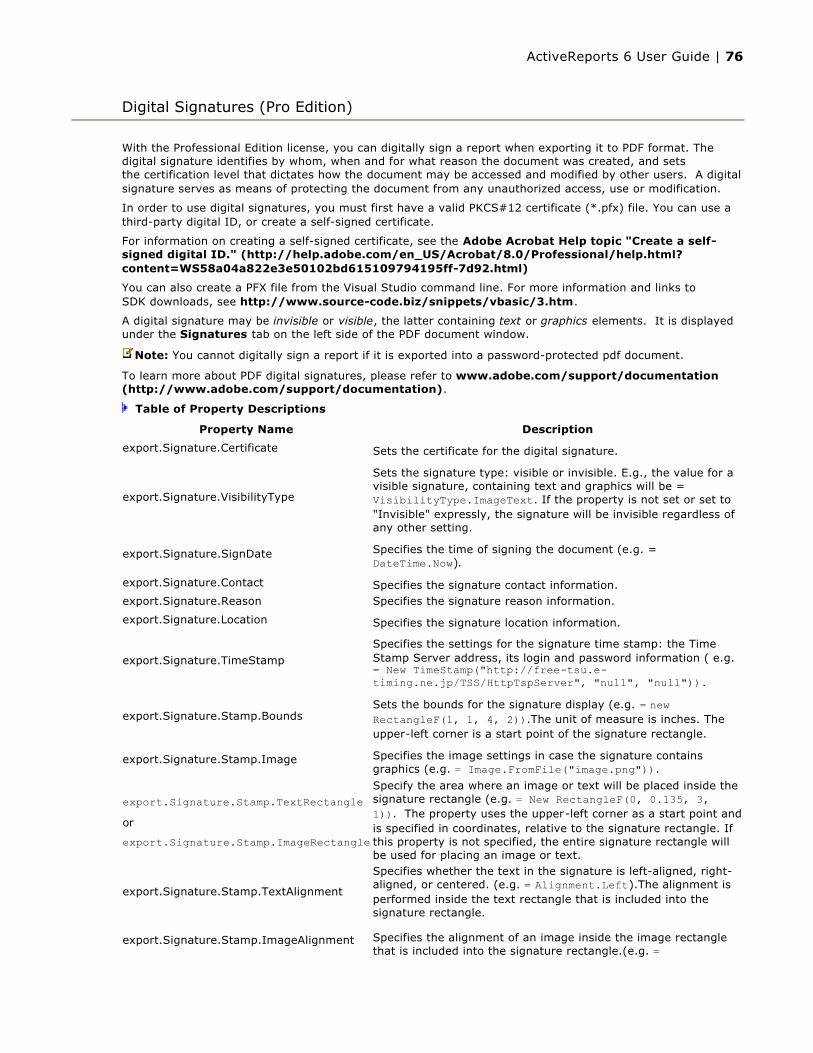
With the Professional Edition license, you can digitally sign a report when exporting it to PDF format. The digital signature identifies by whom, when and for what reason the document was created, and sets the certification level that dictates how the document may be accessed and modified by other users. A digital signature serves as means of protecting the document from any unauthorized access, use or modification.
In order to use digital signatures, you must first have a valid PKCS#12 certificate (*.pfx) file. You can use a third-party digital ID, or create a self-signed certificate.
For information on creating a self-signed certificate, see the Adobe Acrobat Help topic "Create a self-signed digital ID." (http://help.adobe.com/en_US/Acrobat/8.0/Professional/help.html?content=WS58a04a822e3e50102bd615109794195ff-7d92.html)
You can also create a PFX file from the Visual Studio command line. For more information and links to SDK downloads, see http://www.source-code.biz/snippets/vbasic/3.htm.
A digital signature may be invisible or visible, the latter containing text or graphics elements. It is displayed under the Signatures tab on the left side of the PDF document window.
To learn more about PDF digital signatures, please refer to www.adobe.com/support/documentation (http://www.adobe.com/support/documentation).
Table of Property Descriptions
Digital Signatures (Pro Edition)
Note: You cannot digitally sign a report if it is exported into a password-protected pdf document.
Property Name Description
export.Signature.Certificate Sets the certificate for the digital signature.
export.Signature.VisibilityType
Sets the signature type: visible or invisible. E.g., the value for a visible signature, containing text and graphics will be = VisibilityType.ImageText. If the property is not set or set to "Invisible" expressly, the signature will be invisible regardless of any other setting.
export.Signature.SignDate Specifies the time of signing the document (e.g. = DateTime.Now).
export.Signature.Contact Specifies the signature contact information.export.Signature.Reason Specifies the signature reason information.
export.Signature.Location Specifies the signature location information.
export.Signature.TimeStamp
Specifies the settings for the signature time stamp: the Time Stamp Server address, its login and password information ( e.g. = New TimeStamp("http://free-tsu.e-timing.ne.jp/TSS/HttpTspServer", "null", "null")).
export.Signature.Stamp.BoundsSets the bounds for the signature display (e.g. = new RectangleF(1, 1, 4, 2)).The unit of measure is inches. The upper-left corner is a start point of the signature rectangle.
export.Signature.Stamp.Image Specifies the image settings in case the signature contains graphics (e.g. = Image.FromFile("image.png")).
export.Signature.Stamp.TextRectangleor
export.Signature.Stamp.ImageRectangle
Specify the area where an image or text will be placed inside the signature rectangle (e.g. = New RectangleF(0, 0.135, 3, 1)). The property uses the upper-left corner as a start point and is specified in coordinates, relative to the signature rectangle. If this property is not specified, the entire signature rectangle will be used for placing an image or text.
export.Signature.Stamp.TextAlignment
Specifies whether the text in the signature is left-aligned, right-aligned, or centered. (e.g. = Alignment.Left).The alignment is performed inside the text rectangle that is included into the signature rectangle.
export.Signature.Stamp.ImageAlignment Specifies the alignment of an image inside the image rectangle that is included into the signature rectangle.(e.g. =
ActiveReports 6 User Guide | 76

Alignment.Right).
export.Signature.Stamp.Font Specifies the signature stamp font (e.g. = new Font("Arial", 10, FontStyle.Italic)).
export.Signature.Stamp.TextColor Specifies the stamp text color ( e.g. = Color.AliceBlue).
export.Signature.CertificationLevelSets the level of other users’ access to the document (e.g. = CertificationLevel.FormFilling).
Note: Be careful when changing fonts of exports using localization. If a selected font does not support the language, then the localized labels are not shown in the signature.
ActiveReports 6 User Guide | 77
RTF, or RichText format, opens in Microsoft Word, and is native to WordPad. This export does not render reports exactly as they appear in the Viewer due to inherent differences in the formats.
The RTF export filter has one property, EnableShapes, that allows you to control your output. You can set the property either in code using the export object, or by selecting the object in the component tray below the form and using the Properties window.
Usage:
Create word-processing files
Open in Word or WordPad
Does not support:
Section Backcolors
Overlapping controls
Angled text
Only supported when EnableShapes property is True:
Full justification
Line control
Control Backcolors
Shapes
Control borders
RTF
If you set the EnableShapes property to True, the resulting RTF file displays correctly only in Web Layout View in Microsoft Word.
ActiveReports 6 User Guide | 78

Plain Text is a format that opens in Notepad or Microsoft Excel depending on the file extension you use in the filePath parameter of the Export method. Use the extension .txt for files to open in Notepad, or use .csv for comma separated value files to open in Excel. The Text export filter has a number of useful properties that allow you to control your output. You can set the properties either in code using the export object, or by selecting the object in the component tray below the form and using the Properties window.
Table of Text Export Properties
Text
Usage:
Create plain text files
Create comma (or other character) delimited text files
Feed raw data to spreadsheets or databases
Open in Notepad or Excel (comma delimited)
Does not support anything but plain fields and labels:
Supports plain text only with no formatting other than simple delimiters
Supports encoding for foreign language support
Text
Property Valid Values Description
Encoding
System.Text.ASCIIEncoding (default), System.Text.UnicodeEncoding, System.Text.UTF7Encoding, or System.Text.UTF8Encoding
This property can only be set in code. Enter an enumerated system encoding value to use for character encoding.
PageDelimiter StringEnter a character or sequence of characters to mark the end of each page.
SuppressEmptyLines True (default) or FalseSet to False if you want to keep empty lines in the exported text file. Otherwise, white space is removed.
TextDelimiter String
Enter a character or sequence of characters to mark the end of each text field. This is mainly for use with CSV files that you open in Excel.
ActiveReports 6 User Guide | 79
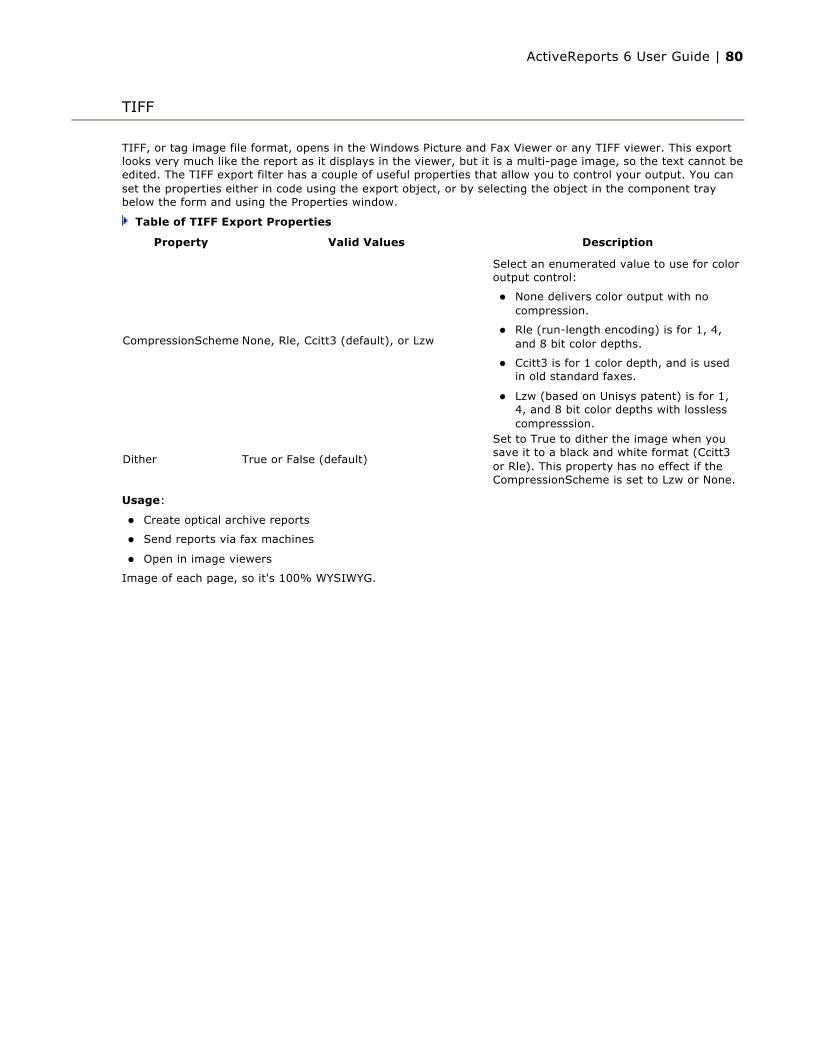
TIFF, or tag image file format, opens in the Windows Picture and Fax Viewer or any TIFF viewer. This export looks very much like the report as it displays in the viewer, but it is a multi-page image, so the text cannot be edited. The TIFF export filter has a couple of useful properties that allow you to control your output. You can set the properties either in code using the export object, or by selecting the object in the component tray below the form and using the Properties window.
Table of TIFF Export Properties
Usage:
Create optical archive reports
Send reports via fax machines
Open in image viewers
Image of each page, so it's 100% WYSIWYG.
TIFF
Property Valid Values Description
CompressionScheme None, Rle, Ccitt3 (default), or Lzw
Select an enumerated value to use for color output control:
None delivers color output with no compression.
Rle (run-length encoding) is for 1, 4, and 8 bit color depths.
Ccitt3 is for 1 color depth, and is used in old standard faxes.
Lzw (based on Unisys patent) is for 1, 4, and 8 bit color depths with lossless compresssion.
Dither True or False (default)
Set to True to dither the image when you save it to a black and white format (Ccitt3 or Rle). This property has no effect if the CompressionScheme is set to Lzw or None.
ActiveReports 6 User Guide | 80
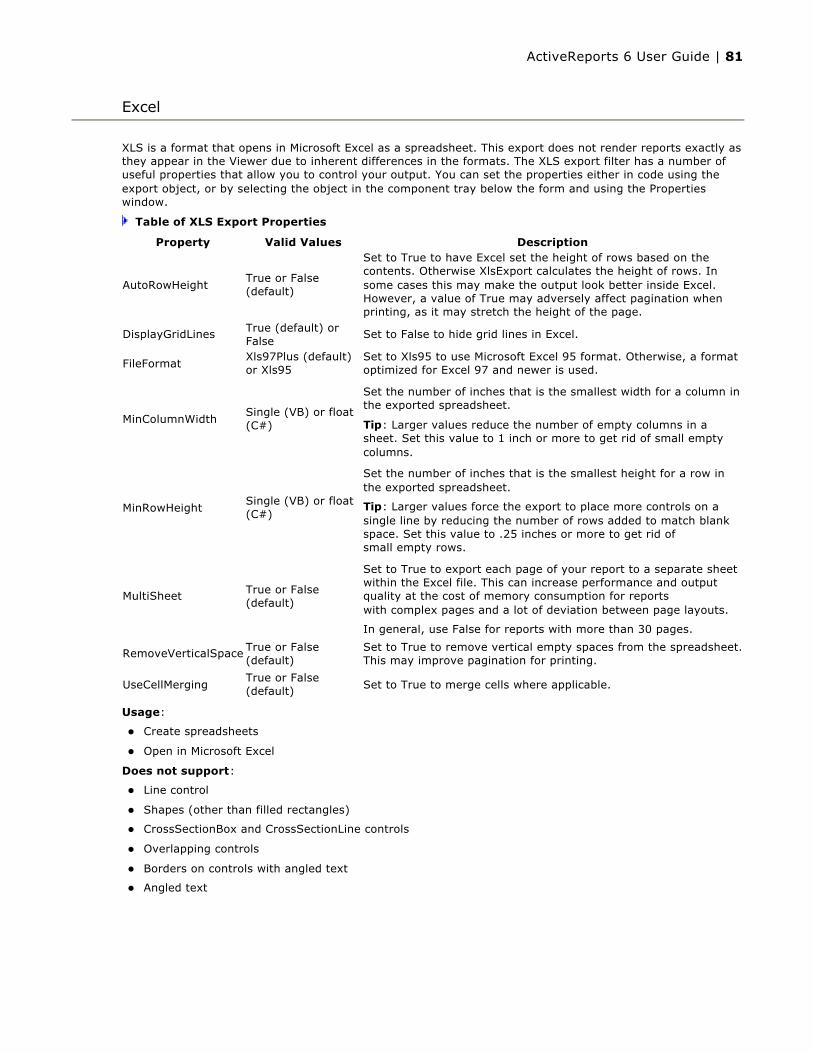
XLS is a format that opens in Microsoft Excel as a spreadsheet. This export does not render reports exactly as they appear in the Viewer due to inherent differences in the formats. The XLS export filter has a number of useful properties that allow you to control your output. You can set the properties either in code using the export object, or by selecting the object in the component tray below the form and using the Properties window.
Table of XLS Export Properties
Usage:
Create spreadsheets
Open in Microsoft Excel
Does not support:
Line control
Shapes (other than filled rectangles)
CrossSectionBox and CrossSectionLine controls
Overlapping controls
Borders on controls with angled text
Angled text
Excel
Property Valid Values Description
AutoRowHeightTrue or False (default)
Set to True to have Excel set the height of rows based on the contents. Otherwise XlsExport calculates the height of rows. In some cases this may make the output look better inside Excel. However, a value of True may adversely affect pagination when printing, as it may stretch the height of the page.
DisplayGridLines True (default) or False
Set to False to hide grid lines in Excel.
FileFormatXls97Plus (default) or Xls95
Set to Xls95 to use Microsoft Excel 95 format. Otherwise, a format optimized for Excel 97 and newer is used.
MinColumnWidthSingle (VB) or float (C#)
Set the number of inches that is the smallest width for a column in the exported spreadsheet.
Tip: Larger values reduce the number of empty columns in a sheet. Set this value to 1 inch or more to get rid of small empty columns.
MinRowHeightSingle (VB) or float (C#)
Set the number of inches that is the smallest height for a row in the exported spreadsheet.
Tip: Larger values force the export to place more controls on a single line by reducing the number of rows added to match blank space. Set this value to .25 inches or more to get rid of small empty rows.
MultiSheet True or False (default)
Set to True to export each page of your report to a separate sheet within the Excel file. This can increase performance and output quality at the cost of memory consumption for reports with complex pages and a lot of deviation between page layouts.
In general, use False for reports with more than 30 pages.
RemoveVerticalSpace True or False (default)
Set to True to remove vertical empty spaces from the spreadsheet. This may improve pagination for printing.
UseCellMergingTrue or False (default) Set to True to merge cells where applicable.
ActiveReports 6 User Guide | 81

Follow the links below for information about concepts essential to the use of the Chart control.
Chart ElementsSee an overview of the different pieces that make up an ActiveReports Chart.
Chart SeriesExplains what a series is and how it comprises the data that is seen on a chart.
Chart- and Series-Specific PropertiesLearn which series properties apply to each of the Chart Types.
Chart WizardShows how to access the Chart Wizard.
Chart TypesShows examples of Common Charts, 3D Charts, XY Charts, and Financial Charts.
Chart AppearanceCovers Chart Effects, Chart Control Items, and Chart Axes and Walls.
Chart DataDiscusses ways of connecting a chart to data.
Charts
ActiveReports 6 User Guide | 82
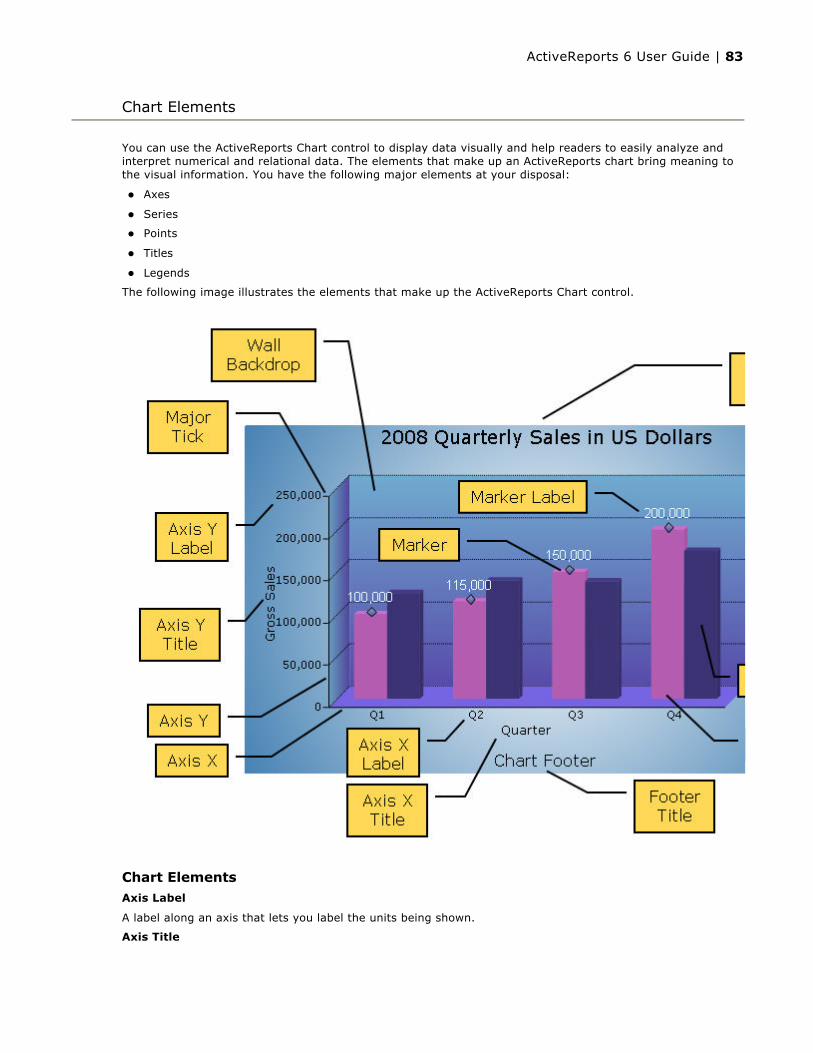
You can use the ActiveReports Chart control to display data visually and help readers to easily analyze and interpret numerical and relational data. The elements that make up an ActiveReports chart bring meaning to the visual information. You have the following major elements at your disposal:
Axes
Series
Points
Titles
Legends
The following image illustrates the elements that make up the ActiveReports Chart control.
Chart ElementsAxis Label
A label along an axis that lets you label the units being shown.
Axis Title
Chart Elements
ActiveReports 6 User Guide | 83
The axis title allows you to provide a title for the information being shown on the axis.
Chart Backdrop
The chart backdrop is the background for the whole chart that is created. You can create your own backdrop using the different styles and colors available or you can use an image as a backdrop for your chart.
Chart Title
The chart title serves as the title for the chart control.
Footer Title
The footer title allows you to add a secondar title for the chart control along the bottom.
Grid Line
Grid lines can occur on horizontal and vertical axes and normally correlate to the major or minor tick marks for the axes.
Legend
The legend serves as a key to the specific colors or patterns being used to show series values in the chart.
Marker
The marker is used to annotate a specific plotted point in a data series.
Marker Label
The marker label allows you to display the value of a specific plotted point in a data series.
Major Tick
Major tick marks can occur on horizontal and vertical axes and normally correlate to the major gridlines for the axes.
Minor Tick
Minor tick marks can occur on horizontal and vertical axes and normally correlate to the minor gridlines for the axes.
Series
The series is a related group of data values that are plotted on the chart. Each plotted point is a data point that reflects the specific values charted. Most charts, such as the above bar chart, can contain more than one series, while others, such as a pie chart, can contain only one.
Wall Backdrop
The wall is the back section of the chart on which data is plotted.
ActiveReports 6 User Guide | 84
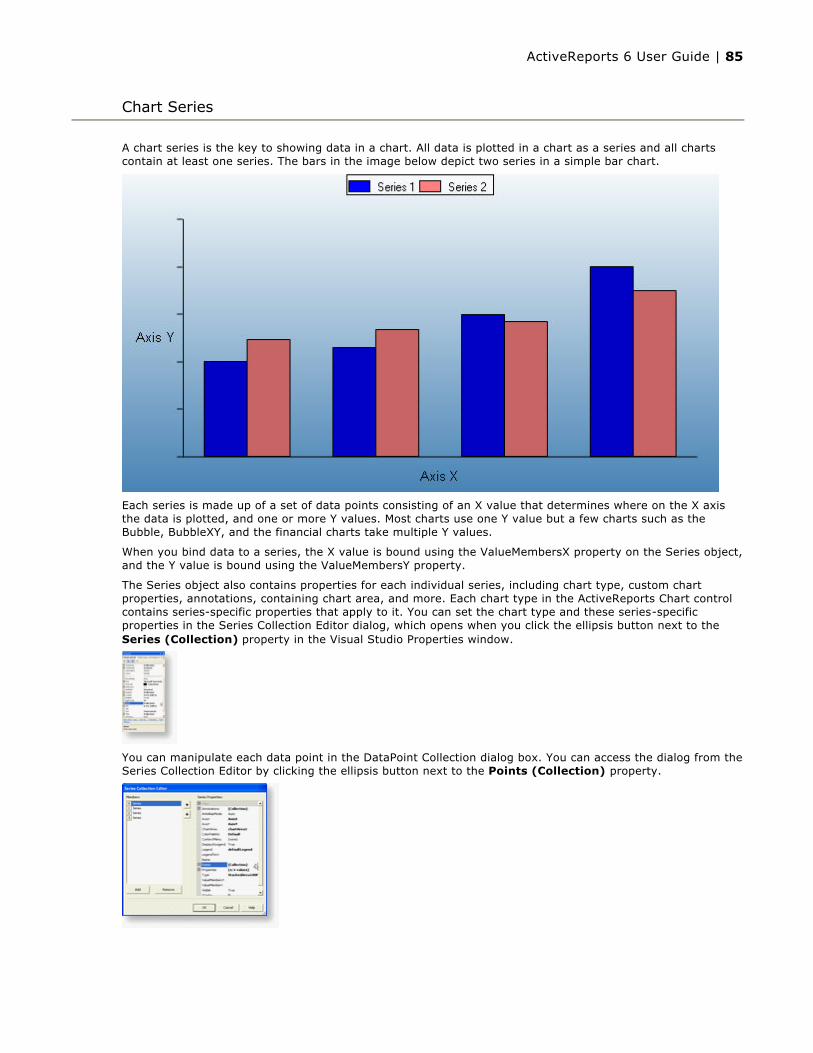
A chart series is the key to showing data in a chart. All data is plotted in a chart as a series and all charts contain at least one series. The bars in the image below depict two series in a simple bar chart.
Each series is made up of a set of data points consisting of an X value that determines where on the X axis the data is plotted, and one or more Y values. Most charts use one Y value but a few charts such as the Bubble, BubbleXY, and the financial charts take multiple Y values.
When you bind data to a series, the X value is bound using the ValueMembersX property on the Series object, and the Y value is bound using the ValueMembersY property.
The Series object also contains properties for each individual series, including chart type, custom chart properties, annotations, containing chart area, and more. Each chart type in the ActiveReports Chart control contains series-specific properties that apply to it. You can set the chart type and these series-specific properties in the Series Collection Editor dialog, which opens when you click the ellipsis button next to the Series (Collection) property in the Visual Studio Properties window.
You can manipulate each data point in the DataPoint Collection dialog box. You can access the dialog from the Series Collection Editor by clicking the ellipsis button next to the Points (Collection) property.
Chart Series
ActiveReports 6 User Guide | 85

When you set a property on the Series object, it is applied to all data point objects in the series unless a different value for the property is set on a specific data point. In that case, the data point property setting overrides the series property setting for that particular data point. Note that for charts bound to a data source, you do not have access to the DataPoint collection in the dialog.
If you specify the value for any of the custom properties, this value is not cleared when you change the ChartType. Although this will show properties that do not apply to certain ChartTypes, it has the advantage of keeping your settings in case you accidentally change the ChartType.
Setting chart and series-specific properties at run time
To set custom properties for a chart on the series programmatically, reference the series by name or index and use the string Properties attribute name you wish to set.
The following code samples set the shape for bubbles on a bubble chart to diamond.
To write the code in Visual Basic.NET
To write the code in C#
To set custom properties for a chart on the data points object programmatically, reference the series by name or index, reference the data point by index, and use the string Properties attribute name you wish to set.
The following code samples set the explode factor on a doughnut chart for the second point in the series.
To write the code in Visual Basic.NET
To write the code in C#
Visual Basic.NET code. Paste INSIDE the section Format event.
Me.ChartControl1.Series(0).Properties("Shape") = Chart.MarkerStyle.Diamond
C# code. Paste INSIDE the section Format event.
this.chartControl1.Series[0].Properties["Shape"] = DataDynamics.ActiveReports.Chart.MarkerStyle.Diamond;
Visual Basic.NET code. Paste INSIDE the section Format event.
Me.ChartControl1.Series(0).Points(1).Properties("ExplodeFactor") = 0.5F
C# code. Paste INSIDE the section Format event.
this.chartControl1.Series[0].Points[1].Properties["ExplodeFactor"] = .5f;
ActiveReports 6 User Guide | 86
Each chart type in the ActiveReports Chart control contains specific properties that apply to it. You can set the chart type and the correlating series-specific properties in the Series Collection Editor dialog via the Series (Collection) property in the Properties Window of Visual Studio and in the DataPoint Collection dialog box via the Points (Collection) property in the Series dialog.
Chart Standard Properties
Backdrop: Gets or sets the backdrop information for the series. Does not apply to Bezier, Line, LineXY, Line3D, PlotXY, or Scatter charts.
BorderLine: Gets or sets the line information used to draw the border of the series. Does not apply to Bezier, Line, LineXY, PlotXY, or Scatter charts.
Line: Gets or sets the line information for the series. Only applies to Bezier, Line, and LineXY charts.
Marker: Gets or sets the ToolTip settings for the series.
ToolTip: Gets or sets the ToolTip information for the series.
Charts and Custom Properties
Area (none)
Area3D
Custom Properties
LineBackdrop Gets or sets the backdrop information for the 3D line.
Thickness Gets or sets the thickness of the 3D line.
Width Gets or sets the width of the 3D line.
Bar2D
Custom Property
Gap Gets or sets the space between the bars of each X axis value.
Bar3D
Custom Properties
BarTopPercent Gets or sets the percentage of the top of the bar that is shown for Cone or Custom BarTypes.
BarType Gets or sets the type of bars that are displayed. Values are Bar, Cylinder, Cone, Pyramid, and Custom.
Gap Gets or sets the space between the bars of each X axis value.
PointBarDepth Gets or sets the thickness of the 3D bar.
RotationAngle Gets or sets the starting horizontal angle for custom 3D bar shapes. Can only be used with the Custom BarType.
VertexNumber Gets or sets the number of vertices for the data point, used to create custom 3D bar shapes. Can only be used with the Custom BarType. Bars must contain 3 or more vertices.
Bezier
Custom Property
Tension Gets or sets the tension of the curved lines. Values must be less than or equal to 1. Default is null.
Bezier3D
Custom Property
Tension Gets or sets the tension of the curved lines. Values must be less than or equal to 1. Default is null.
Width Gets or sets the width of the 3D line.
Bubble
Chart and Series-Specific Properties
ActiveReports 6 User Guide | 87
Custom Properties
MaxSizeFactor Gets or sets the maximum size of the bubble radius. Values must be less than or equal to 1. Default is .25.
MaxValue Gets or sets the bubble size that is used as the maximum.
MinValue Gets or sets the bubble size that is used as the minimum.
Shape Gets or sets the shape of the bubbles. Uses or returns a valid MarkerStyle enumeration value.
Candle
Custom Properties
BodyDownswingBackdrop Gets or sets the backdrop information used to fill the downswing rectangle.
BodyUpswingBackdrop Gets or sets the backdrop information used to fill the upswing rectangle.
BodyWidth Gets or sets the width of the rectangle used to show upswing or downswing.
Wickline Gets or sets the line information for the wick line.
ClusteredBar
Custom Properties
BarTopPercent Gets or sets the percentage of the top of the bar that is shown for Cone or Custom BarTypes.
BarType Gets or sets the type of bars that are displayed. Values are Bar, Cylinder, Cone, Pyramid, and Custom.
Gap Gets or sets the space between the bars of each X axis value.
RotationAngle Gets or sets the starting horizontal angle for custom 3D bar shapes. Can only be used with the Custom BarType.
VertexNumber Gets or sets the number of vertices for the data point, used to create custom 3D bar shapes. Can only be used with the Custom BarType. Bars must contain 3 or more vertices.
Doughnut
Custom Properties
Clockwise Gets or sets a value indicating whether to display the data in clockwise order. By default, the data is displayed counterclockwise beginning at 12 o'clock.
ExplodeFactor Gets or sets the amount of separation between data point values. The value must be less than or equal to 1. To explode one section of the doughnut chart, set ExplodeFactor on the data point instead of on the series.
HoleSize Gets or sets the inner radius of the chart. If set to 0, the chart looks like a pie chart. The value must be less than or equal to 1.
OutsideLabels Gets or sets a value indicating whether the data point labels appear outside the chart.
Radius Gets or sets the size of the doughnut within the chart area.
StartAngle Gets or sets the horizontal start angle for the series.
Doughnut3D
Custom Properties
Clockwise Gets or sets a value indicating whether to display the data in clockwise order. By default, the data is displayed counterclockwise beginning at 12 o'clock.
ExplodeFactor Gets or sets the amount of separation between data point values. The value must be less than or equal to 1. To explode one section of the doughnut chart, set ExplodeFactor on the data point instead of on the series.
HoleSize Gets or sets the inner radius of the chart. If set to 0, the chart looks like a pie chart. The value must be less than or equal to 1.
OutsideLabels Gets or sets a value indicating whether the data point labels appear outside the chart.
Radius Gets or sets the size of the doughnut within the chart area.
StartAngle Gets or sets the horizontal start angle for the series data points.
Funnel
ActiveReports 6 User Guide | 88

Custom Properties
CalloutLine Gets or sets the style for a line connecting the marker label to its corresponding funnel section. The default value is a black one-point line.
FunnelStyle Gets or sets the Y value for the series points to the width or height of the funnel. The default value is YIsHeight.
MinPointHeight Gets or sets the minimum height allowed for a data point in the funnel chart. The height is measured in relative coordinates.
NeckHeight Gets or sets the neck height for the funnel chart. This property can only be used with the FunnelStyle property set to YIsHeight. The default value is 5.
NeckWidth Gets or sets the neck width for the funnel chart. This property can only be used with the FunnelStyle property set to YIsHeight. The default value is 5.
OutsideLabels Gets or sets a value indicating whether the labels are placed outside of the funnel chart. The default value is True.
OutsideLabelsPlacement Gets or sets a value indicating whether the data point labels appear on the left or right side of the funnel. This property can only be used with the OutsideLabels property set to True.
PointGapPct Gets or sets the amount of space between the data points of the funnel chart. The PointGapPct is measured in relative coordinates. The default value is 0, and valid values range from 0 to 100.
Funnel3D
Custom Properties
BaseStyle Gets or sets a circular or square base drawing style for the 3D funnel chart. This property only takes effect if the Projection property is set to Orthogonal.
CalloutLine Gets or sets the style for a line connecting the marker label to its corresponding funnel section. The default value is a black one-point line.
FunnelStyle Gets or sets the Y value for the series points to the width or height of the funnel. The default value is YIsHeight.
MinPointHeight Gets or sets the minimum height allowed for a data point in the funnel chart. The height is measured in relative coordinates.
NeckHeight Gets or sets the neck height for the funnel chart. This property can only be used with the FunnelStyle property set to YIsHeight. The default value is 5.
NeckWidth Gets or sets the neck width for the funnel chart. This property can only be used with the FunnelStyle property set to YIsHeight. The default value is 5.
OutsideLabels Gets or sets a value indicating whether the labels are placed outside of the funnel chart. The default value is True.
OutsideLabelsPlacement Gets or sets a value indicating whether the data point labels appear on the left or right side of the funnel. This property can only be used with the OutsideLabels property set to True.
PointGapPct Gets or sets the amount of space between the data points of the funnel chart. The PointGapPct is measured in relative coordinates. The default value is 0, and valid values range from 0 to 100.
RotationAngle Gets or sets the left-to-right rotation angle of the funnel. The valid values range from -180 to 180 degrees. This property is only effective with the Projection property set to Orthogonal and the BaseStyle property set to SquareBase.
Gantt
Custom Property
Gap Gets or sets the space between the bars of each X axis value.
Gantt3D
Custom Property
BarTopPercent Gets or sets the percentage of the top of the bar that is shown for Cone or Custom BarTypes.
BarType Gets or sets the type of bars that are displayed. Values are Bar, Cylinder, Cone, Pyramid, and Custom.
ActiveReports 6 User Guide | 89
Gap Gets or sets the space between the bars of each X axis value.
PointBarDepth Gets or sets the thickness of the 3D bar.
RotationAngle Gets or sets the starting horizontal angle for custom 3D bar shapes. Can only be used with the Custom BarType.
VertexNumber Gets or sets the number of vertices for the data point, used to create custom 3D bar shapes. Can only be used with the Custom BarType. Bars must contain 3 or more vertices.
HiLo
Custom Property
HiLoLine Gets or sets the line information for the hi-lo line.
HiLoOpenClose
Custom Properties
CloseLine Gets or sets the line information for the close line.
HiLoLine Gets or sets the line information for the hi-lo line.
OpenLine Gets or sets the line information for the open line.
TickLen Gets or sets the length of the tick for the open and close lines.
HorizontalBar
Custom Property
Gap Gets or sets the space between the bars of each X axis value.
HorizontalBar3D
Custom Properties
BarTopPercent Gets or sets the percentage of the top of the bar that is shown for Cone or Custom BarTypes.
BarType Gets or sets the type of bars that are displayed. Values are Bar, Cylinder, Cone, Pyramid, and Custom.
Gap Gets or sets the space between the bars of each X axis value.
PointBarDepth Gets or sets the thickness of the 3D bar.
RotationAngle Gets or sets the starting horizontal angle for custom 3D bar shapes. Can only be used with the Custom BarType.
VertexNumber Gets or sets the number of vertices for the data point, used to create custom 3D bar shapes. Can only be used with the Custom BarType. Bars must contain 3 or more vertices.
Kagi
Custom Properties
DownswingLine Gets or sets the style and color settings to use for a Kagi line which charts a price decrease.
ReversalAmount Gets or sets the amount that a price must shift in order for the Kagi line to change direction.
UpswingLine Gets or sets the style and color settings to use for a Kagi line which charts a price increase.
Kagi3D
Custom Properties
BodyDownswingBackdrop Gets or sets the style and color settings for the three-dimensional side view of downswing Kagi lines. This property is only effective when the Width property is set to a value higher than 25.
BodyUpswingBackdrop Gets or sets the style and color settings for the three-dimensional side view of upswing Kagi lines. This property is only effective when the Width property is set to a value higher than 25.
DownswingLine Gets or sets the style and color settings to use for a Kagi line which charts a price decrease.
ReversalAmount Gets or sets the amount that a price must shift in order for the Kagi line to change direction.
ActiveReports 6 User Guide | 90

UpswingLine Gets or sets the style and color settings to use for a Kagi line which charts a price increase.
Width Gets or sets the width of the three-dimensional side view of the Kagi lines.This property must be set higher than its default value of 1 in order to display body downswing and upswing backdrops.
Line
Custom Property
LineJoin Gets or sets the type of join to draw when two lines connect. Valid values include Miter, Bevel, Round, and MiterClipped.
Line3D
Custom Properties
LineBackdrop Gets or sets the backdrop information for the 3D line.
Thickness Gets or sets the thickness of the 3D line.
Width Gets or sets the width of the 3D line.
Point and Figure
Custom Properties
BoxSize Gets or sets the amount a price must change in order to create another X or O.
DownswingLine Gets or sets the style and color settings for the downswing Os.
ReversalAmount Gets or sets the amount that a price must shift in order for a new column to be added.
UpswingLine Gets or sets the style and color settings for the upswing Xs.
Pyramid
Custom Properties
CalloutLine Gets or sets the style for a line connecting the marker label to its corresponding pyramid section. The default value is a black one-point line.
MinPointHeight Gets or sets the minimum height allowed for a data point in the pyramid chart. The height is measured in relative coordinates.
OutsideLabels Gets or sets a value indicating whether the labels are placed outside of the pyramid chart. The default value is True.
OutsideLabelsPlacement Gets or sets a value indicating whether the data point labels appear on the left or right side of the pyramid. This property can only be used with the OutsideLabels property set to True.
PointGapPct Gets or sets the amount of space between the data points of the pyramid chart. The PointGapPct is measured in relative coordinates. The default value is 0, and valid values range from 0 to 100.
Pyramid3D
Custom Properties
BaseStyle Gets or sets a circular or square base drawing style for the 3D pyramid chart. This property only takes effect with the Projection property set to Orthogonal.
CalloutLine Gets or sets the style for a line connecting the marker label to its corresponding pyramid section. The default value is a black one-point line.
MinPointHeight Gets or sets the minimum height allowed for a data point in the pyramid chart. The height is measured in relative coordinates.
OutsideLabels Gets or sets a value indicating whether the labels are placed outside of the pyramid chart. The default value is True.
OutsideLabelsPlacement Gets or sets a value indicating whether the data point labels appear on the left or right side of the pyramid. This property can only be used with the OutsideLabels property set to True.
PointGapPct Gets or sets the amount of space between the data points of the pyramid chart. The PointGapPct is measured in relative coordinates. The default value is 0, and valid values range from 0 to 100.
RotationAngle Gets or sets the left-to-right rotation angle of the pyramid. The valid values range from -180 to 180 degrees. This property is only effective with the Projection property set to Orthogonal and the
ActiveReports 6 User Guide | 91

BaseStyle property set to SquareBase.
Renko
Custom Properties
BodyDownswingBackdrop Gets or sets the style and color settings for the downswing bricks.
BodyUpswingBackdrop Gets or sets the style and color settings for the upswing bricks.
BoxSize Gets or sets the amount a price must change in order to create another brick.
Renko3D
Custom Properties
BodyDownswingBackdrop Gets or sets the style and color settings for the downswing bricks.
BodyUpswingBackdrop Gets or sets the style and color settings for the upswing bricks.
BoxSize Gets or sets the amount a price must change in order to create another brick.
Scatter (none)
StackedArea (none)
StackedArea3D
Custom Property
Width Gets or sets the width of the 3D area.
StackedBar
Custom Property
Gap Gets or sets the space between the bars of each X axis value.
StackedBar3D
Custom Properties
BarTopPercent Gets or sets the percentage of the top of the bar that is shown for Cone or Custom BarTypes.
BarType Gets or sets the type of bars that are displayed. Values are Bar, Cylinder, Cone, Pyramid, and Custom.
Gap Gets or sets the space between the bars of each X axis value.
VertexNumber Gets or sets the number of vertices for the data point, used to create custom 3D bar shapes. Can only be used with the Custom BarType. Bars must contain 3 or more vertices.
StackedArea100Pct (none)
StackedArea3D100Pct
Custom Property
Width Gets or sets the width of the 3D area.
StackedBar100Pct
Custom Property
Gap Gets or sets the space between the bars of each X axis value.
StackedBar3D100Pct
Custom Properties
BarTopPercent Gets or sets the percentage of the top of the bar that is shown for Cone or Custom BarTypes.
BarType Gets or sets the type of bars that are displayed. Values are Bar, Cylinder, Cone, Pyramid, and Custom.
Gap Gets or sets the space between the bars of each X axis value.
VertexNumber Gets or sets the number of vertices for the data point, used to create custom 3D bar shapes. Can only be used with the Custom BarType. Bars must contain 3 or more vertices.
Three Line Break
Custom Properties
ActiveReports 6 User Guide | 92

BodyDownswingBackdrop Gets or sets the style and color settings for the downswing boxes.
BodyUpswingBackdrop Gets or sets the style and color settings for the upswing boxes.
NewLineBreak Gets or sets the number of previous boxes/lines that must be compared before a new box/line is drawn. The default value is 3.
Three Line Break3D
Custom Properties
BodyDownswingBackdrop Gets or sets the style and color settings for the downswing boxes.
BodyUpswingBackdrop Gets or sets the style and color settings for the upswing boxes.
NewLineBreak Gets or sets the number of previous boxes/lines that must be compared before a new box/line is drawn. The default value is 3.
ActiveReports 6 User Guide | 93

The chart control features an easy-to-use wizard. The chart wizard automatically runs when you first add a chart control to a report. If you prefer not to have the wizard run automatically, clear the Auto Run Wizard checkbox at the bottom of the wizard.
You can also access the wizard through the Wizard verb that appears below the Properties window when the chart is selected on the report.
If the verb does not appear in the Properties window, see Access the Chart Wizard and Data Source.
Chart Wizard
ActiveReports 6 User Guide | 94
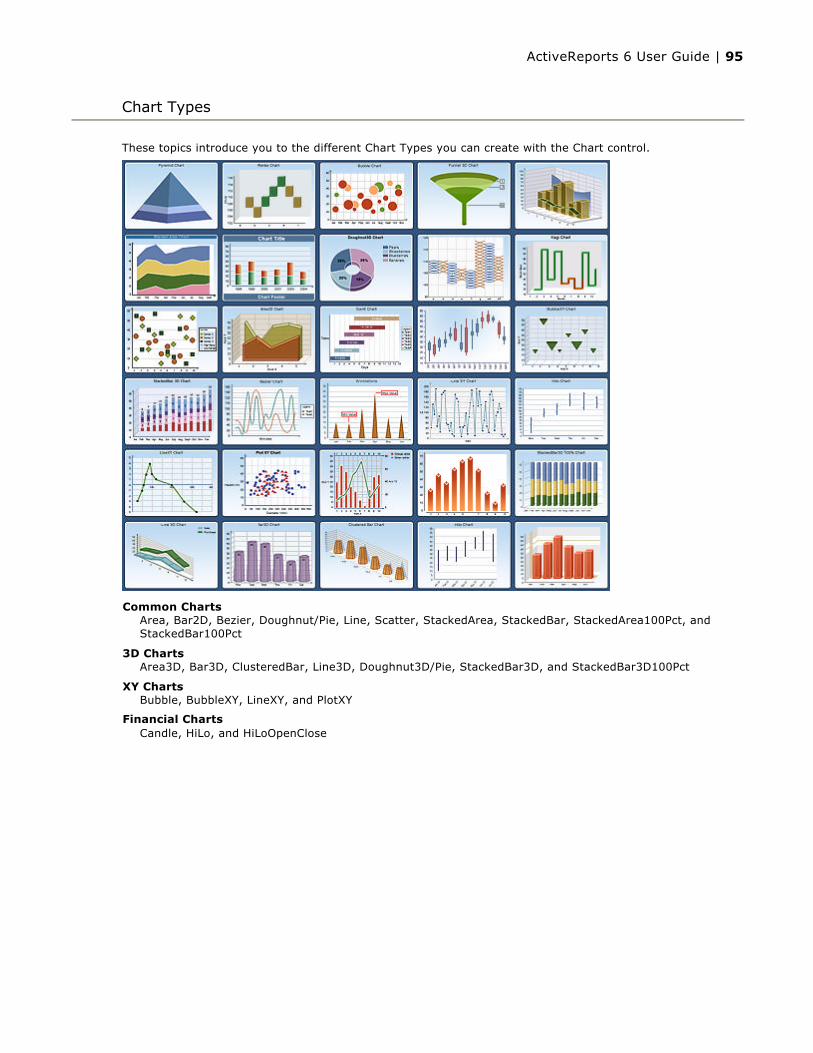
These topics introduce you to the different Chart Types you can create with the Chart control.
Common ChartsArea, Bar2D, Bezier, Doughnut/Pie, Line, Scatter, StackedArea, StackedBar, StackedArea100Pct, and StackedBar100Pct
3D ChartsArea3D, Bar3D, ClusteredBar, Line3D, Doughnut3D/Pie, StackedBar3D, and StackedBar3D100Pct
XY ChartsBubble, BubbleXY, LineXY, and PlotXY
Financial ChartsCandle, HiLo, and HiLoOpenClose
Chart Types
ActiveReports 6 User Guide | 95

The ActiveReports Chart control can draw a number of 2D chart types:
Area, Bar 2D, Bezier
Doughnut and Pie, Gantt
Horizontal Bar, Line
Scatter, Stacked Area, Stacked Area 100 Percent
Stacked Bar, Stacked Bar 100 Percent
See below for details on each of the common chart types.
Area ChartUse an area chart to compare trends over a period of time or across categories.
Chart Information
Bar 2D ChartUse a bar chart to compare values of items across categories.
Chart Information
Below is an example of how to set the custom chart properties at run time for a bar chart.
To write the code in Visual Basic.NET
To write the code in C#
Common Charts
Chart InformationNumber of Y values per data point 1
Number of Series 1 or moreMarker Support Series or Data Point
Custom Properties None
Chart Information Number of Y values per data point 1
Number of Series 1 or moreMarker Support Series or Data Point
Custom PropertiesGap gets or sets the space between the bars of eachX axis value
Visual Basic.NET code. Paste INSIDE the section Format event.
Me.ChartControl1.Series(0).Properties("Gap") = 50.0F
ActiveReports 6 User Guide | 96

Bezier Chart
Use a Bezier or spline chart to compare trends over a period of time or across categories. It is a line chart that plots curves through the data points in a series.
Chart Information
Doughnut ChartA doughnut chart shows how the percentage of each data item contributes to the total.
Chart Information
In order to show each section of the pie in a different color, the Background property for each data point must be set. Below is an example of how to set custom chart properties at run time for a doughnut chart.
To write the code in Visual Basic.NET
To write the code in C#
C# code. Paste INSIDE the section Format event.
this.chartControl1.Series[0].Properties["Gap"] = 50f;
Chart Information Number of Y values per data point 1
Number of Series 1 or moreMarker Support Series or Data Point
Custom Properties None
Chart Information Number of Y values per
data point1
Number of Series 1Marker Support Series or Data Point
Custom Properties
ExplodeFactor gets or sets the amount of separation between data point values.HoleSize gets or sets the inner radius of the chart.OutsideLabels gets or sets a value indicating whether the data point labels appear outside the chart.StartAngle gets or sets the horizontal start angle for the series.
Visual Basic.NET code. Paste INSIDE the section Format event.
Me.ChartControl1.Series(0).Properties("ExplodeFactor") = 0.0FMe.ChartControl1.Series(0).Properties("HoleSize") = 0.25FMe.ChartControl1.Series(0).Properties("OutsideLabels") = FalseMe.ChartControl1.Series(0).Properties("StartAngle") = 0.0F
C# code. Paste INSIDE the section Format event.
this.chartControl1.Series[0].Properties["ExplodeFactor"] = 0f;
ActiveReports 6 User Guide | 97
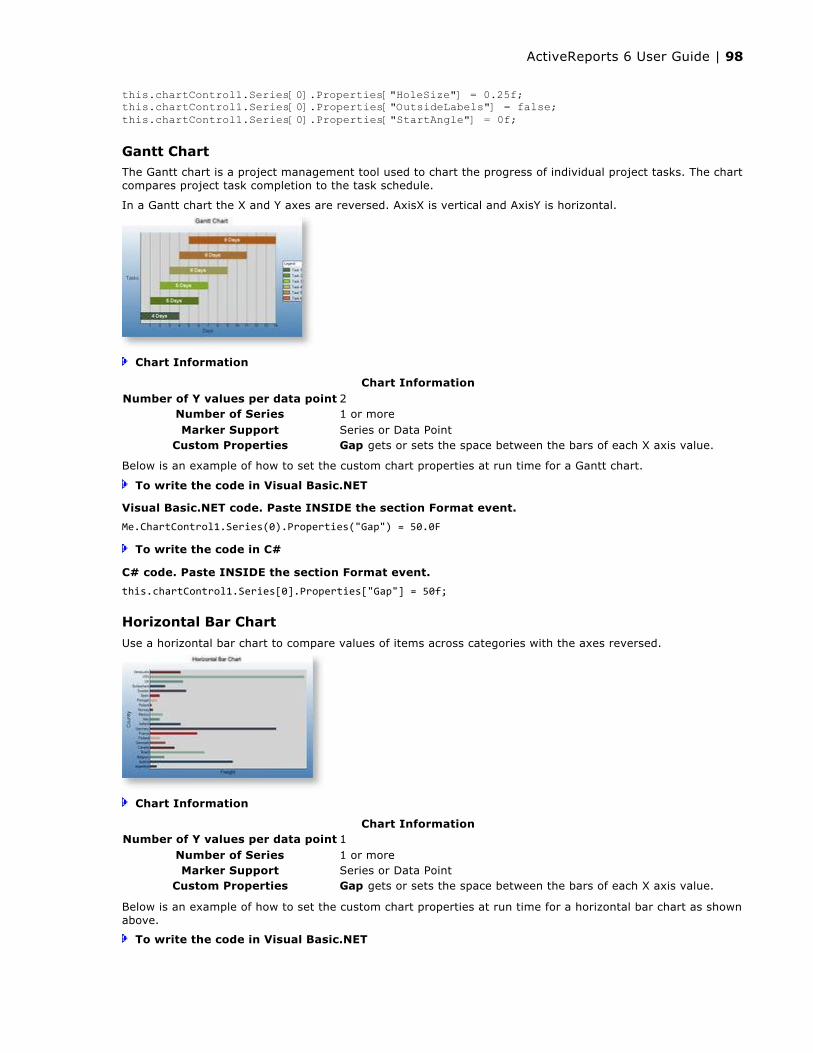
Gantt ChartThe Gantt chart is a project management tool used to chart the progress of individual project tasks. The chart compares project task completion to the task schedule.
In a Gantt chart the X and Y axes are reversed. AxisX is vertical and AxisY is horizontal.
Chart Information
Below is an example of how to set the custom chart properties at run time for a Gantt chart.
To write the code in Visual Basic.NET
To write the code in C#
Horizontal Bar Chart
Use a horizontal bar chart to compare values of items across categories with the axes reversed.
Chart Information
Below is an example of how to set the custom chart properties at run time for a horizontal bar chart as shown above.
To write the code in Visual Basic.NET
this.chartControl1.Series[0].Properties["HoleSize"] = 0.25f;this.chartControl1.Series[0].Properties["OutsideLabels"] = false;this.chartControl1.Series[0].Properties["StartAngle"] = 0f;
Chart Information Number of Y values per data point 2
Number of Series 1 or moreMarker Support Series or Data Point
Custom Properties Gap gets or sets the space between the bars of each X axis value.
Visual Basic.NET code. Paste INSIDE the section Format event.
Me.ChartControl1.Series(0).Properties("Gap") = 50.0F
C# code. Paste INSIDE the section Format event.
this.chartControl1.Series[0].Properties["Gap"] = 50f;
Chart Information Number of Y values per data point 1
Number of Series 1 or moreMarker Support Series or Data Point
Custom Properties Gap gets or sets the space between the bars of each X axis value.
ActiveReports 6 User Guide | 98

To write the code in C#
Line ChartUse a line chart to compare trends over a period of time or across categories.
Chart Information
Scatter Chart
Use a scatter chart to compare values across categories.
Chart Information
Stacked Area ChartA stacked area chart is an area chart with two or more data series stacked one on top of the other. Use this chart to show how each value contributes to a total.
Chart Information
Visual Basic.NET code. Paste INSIDE the section Format event.
Me.ChartControl1.Series(0).Properties("Gap") = 65.0F
C# code. Paste INSIDE the section Format event.
this.chartControl1.Series[0].Properties["Gap"] = 65f;
Chart Information Number of Y values per data point 1
Number of Series 1 or moreMarker Support Series or Data Point
Custom Properties None
Chart Information Number of Y values per data point 1
Number of Series 1 or moreMarker Support Series or Data Point
Custom Properties None
ActiveReports 6 User Guide | 99
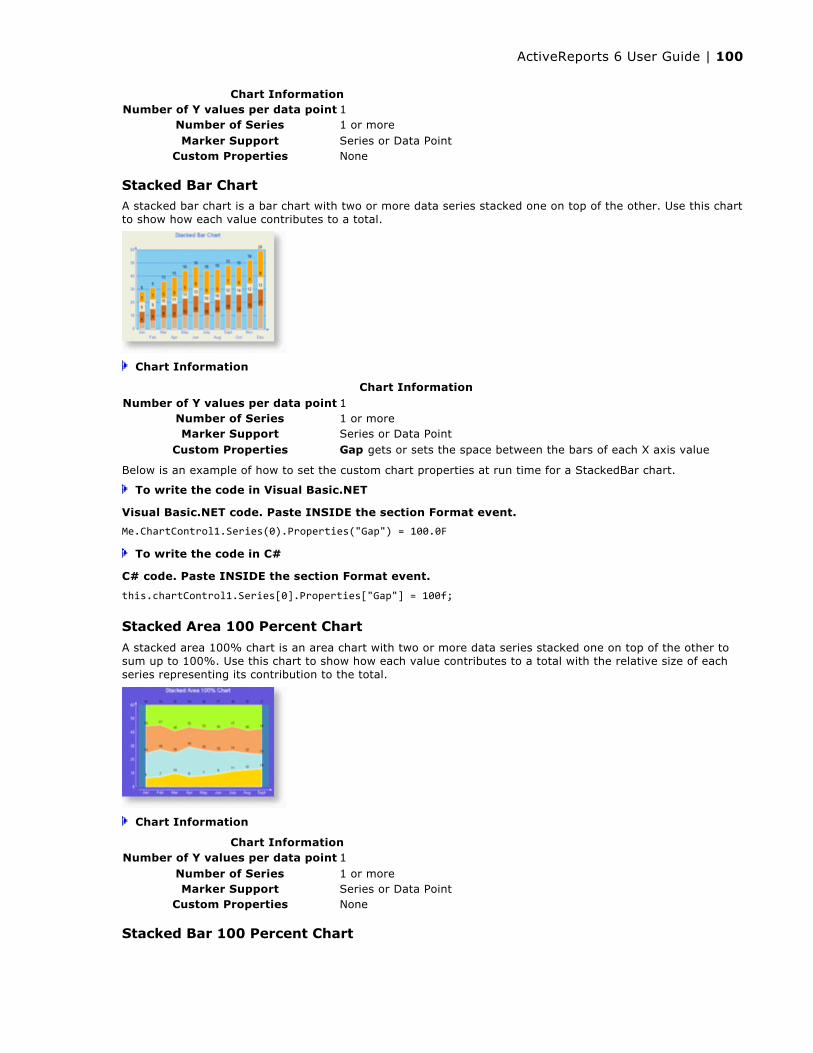
Stacked Bar ChartA stacked bar chart is a bar chart with two or more data series stacked one on top of the other. Use this chart to show how each value contributes to a total.
Chart Information
Below is an example of how to set the custom chart properties at run time for a StackedBar chart.
To write the code in Visual Basic.NET
To write the code in C#
Stacked Area 100 Percent Chart
A stacked area 100% chart is an area chart with two or more data series stacked one on top of the other to sum up to 100%. Use this chart to show how each value contributes to a total with the relative size of each series representing its contribution to the total.
Chart Information
Stacked Bar 100 Percent Chart
Chart Information Number of Y values per data point 1
Number of Series 1 or moreMarker Support Series or Data Point
Custom Properties None
Chart Information Number of Y values per data point 1
Number of Series 1 or moreMarker Support Series or Data Point
Custom Properties Gap gets or sets the space between the bars of each X axis value
Visual Basic.NET code. Paste INSIDE the section Format event.
Me.ChartControl1.Series(0).Properties("Gap") = 100.0F
C# code. Paste INSIDE the section Format event.
this.chartControl1.Series[0].Properties["Gap"] = 100f;
Chart Information Number of Y values per data point 1
Number of Series 1 or moreMarker Support Series or Data Point
Custom Properties None
ActiveReports 6 User Guide | 100

A StackedBar100Pct chart is a bar chart with two or more data series stacked one on top of the other to sum up to 100%. Use this chart to show how each value contributes to a total with the relative size of each series representing its contribution to the total.
Chart Information
Below is an example of how to set the custom chart properties at run time for a StackedBar100Pct chart.
To write the code in Visual Basic.NET
To write the code in C#
Chart Information Number of Y values per data point 1
Number of Series 1 or moreMarker Support Series or Data Point
Custom Properties Gap gets or sets the space between the bars of each X axis value
Visual Basic.NET code. Paste INSIDE the section Format event.
Me.ChartControl1.Series(0).Properties("Gap") = 100.0F
C# code. Paste INSIDE the section Format event.
this.chartControl1.Series[0].Properties["Gap"] = 100f;
ActiveReports 6 User Guide | 101

The ActiveReports Chart control can draw a number of 3D chart types:
Area 3D, Bar 3D, Clustered Bar
Doughnut 3D, Funnel 3D, Pyramid 3D
Horizontal Bar 3D, Line 3D
Stacked Bar 3D, Stacked Bar 3D 100 Percent
See below for details on each of the 3D chart types.
Area 3D Chart
Use a 3D area chart to compare trends in two or more data series over a period of time or in specific categories, so that data can be viewed side by side.
Chart Information
Below is an example of how to set the custom chart properties at run time for a 3D area chart as shown for the first series in the image above.
To write the code in Visual Basic.NET
To write the code in C#
Bar 3D Chart
Use a 3D bar chart to compare values of items across categories, allowing the data to be viewed conveniently in a 3D format.
3D Charts
Note: To see a chart in three dimensions, set the ProjectionType to Orthogonal. The ProjectionType is found in the ChartArea Collection dialog in the Projection section.
Chart Information Number of Y values per data point 1
Number of Series 1 or moreMarker Support Series or Data Point
Custom PropertiesLineBackdrop gets or sets the backdrop information for the 3D line.Thickness gets or sets the thickness of the 3D line.Width gets or sets the width of the 3D line.
Visual Basic.NET code. Paste ABOVE the report class.
Imports DataDynamics.ActiveReports.Chart.Graphics
Visual Basic.NET code. Paste INSIDE the section Format event.
Me.ChartControl1.Series(0).Properties("LineBackdrop") = New Chart.Graphics.Backdrop(Color.Red, CType(150, Byte))Me.ChartControl1.Series(0).Properties("Thickness") = 5.0FMe.ChartControl1.Series(0).Properties("Width") = 30.0F
C# code. Paste ABOVE the report class.
using DataDynamics.ActiveReports.Chart.Graphics
C# code. Paste INSIDE the section Format event.
this.chartControl1.Series[0].Properties["LineBackdrop"] = new Chart.Graphics.Backdrop(Color.Red, ((System.Byte)(150)));this.chartControl1.Series[0].Properties["Thickness"] = 5f;this.chartControl1.Series[0].Properties["Width"] = 30f;
ActiveReports 6 User Guide | 102

Chart Information
Below is an example of how to set the custom chart properties at run time for a 3D bar chart as shown above.
To write the code in Visual Basic.NET
To write the code in C#
3D Clustered Bar ChartUse a 3D clustered bar chart to compare values of items across categories, allowing the data to be viewed conveniently in a 3D format.
Chart Information
Chart Information Number of Y values
per data point1
Number of Series 1 or moreMarker Support Series or Data Point
Custom Properties
BarTopPercent gets or sets the percentage of the top of the bar that is shown for Cone or Custom BarTypes.BarType gets or sets the type of bars that is displayed.Gap gets or sets the space between the bars of each X axis value.RotationAngle gets or sets the starting horizontal angle for custom 3D bar shapes. Can only be used with the Custom BarType.VertexNumber gets or sets the number of vertices for the data point, used to create custom 3D bar shapes. Can only be used with the Custom BarType. Bars must contain 3 or more vertices.
Visual Basic.NET code. Paste INSIDE the section Format event.
Me.ChartControl1.Series(0).Properties("BarTopPercent") = 80.0FMe.ChartControl1.Series(0).Properties("BarType") = BarType.CustomMe.ChartControl1.Series(0).Properties("Gap") = 65.0FMe.ChartControl1.Series(0).Properties("RotationAngle") = 0.0FMe.ChartControl1.Series(0).Properties("VertexNumber") = 6
C# code. Paste INSIDE the section Format event.
this.chartControl1.Series[0].Properties["BarTopPercent"] = 80f;this.chartControl1.Series[0].Properties["BarType"] = BarType.Custom;this.chartControl1.Series[0].Properties["Gap"] = 65f;this.chartControl1.Series[0].Properties["RotationAngle"] = 0f;this.chartControl1.Series[0].Properties["VertexNumber"] = 6;
Chart Information Number of Y values
per data point1
Number of Series 1 or more
ActiveReports 6 User Guide | 103

Below is an example of how to set the custom chart properties at run time for a 3D clustered bar chart as shown above.
To write the code in Visual Basic.NET
To write the code in C#
Doughnut 3D ChartA 3D doughnut chart shows how the percentage of each data item contributes to a total percentage, allowing the data to be viewed in a 3D format.
Chart Information
Marker Support Series or Data Point
Custom Properties
BarTopPercent gets or sets the percentage of the top of the bar that is shown for Cone or Custom BarTypes.BarType gets or sets the type of bars that are displayed.Gap gets or sets the space between the bars of each X axis value.RotationAngle gets or sets the starting horizontal angle for custom 3D bar shapes. Can only be used with the Custom BarType.VertexNumber gets or sets the number of vertices for the data point, used to create custom 3D bar shapes. Can only be used with the Custom BarType. Bars must contain 3 or more vertices.
Visual Basic.NET code. Paste ABOVE the report class.
Imports DataDynamics.ActiveReports.Chart
Visual Basic.NET code. Paste INSIDE the section Format event.
' set the custom properties for series 1Me.ChartControl1.Series(0).Properties("BarTopPercent") = 50.0FMe.ChartControl1.Series(0).Properties("BarType") = BarType.CustomMe.ChartControl1.Series(0).Properties("Gap") = 300.0FMe.ChartControl1.Series(0).Properties("RotationAngle") = 0.0FMe.ChartControl1.Series(0).Properties("VertexNumber") = 6
' set the custom properties for series 2Me.ChartControl1.Series(1).Properties("BarTopPercent") = 20.0FMe.ChartControl1.Series(1).Properties("BarType") = BarType.CustomMe.ChartControl1.Series(1).Properties("Gap") = 300.0FMe.ChartControl1.Series(1).Properties("RotationAngle") = 90.0FMe.ChartControl1.Series(1).Properties("VertexNumber") = 3
C# code. Paste ABOVE the report class.
using DataDynamics.ActiveReports.Chart;
C# code. Paste INSIDE the section Format event.
// set the custom properties for series 1this.chartControl1.Series[0].Properties["BarTopPercent"] = 50f;this.chartControl1.Series[0].Properties["BarType"] = BarType.Custom;this.chartControl1.Series[0].Properties["Gap"] = 300f;this.chartControl1.Series[0].Properties["RotationAngle"] = 0f;this.chartControl1.Series[0].Properties["VertexNumber"] = 6;
// set the custom properties for series 2this.chartControl1.Series[1].Properties["BarTopPercent"] = 20f;this.chartControl1.Series[1].Properties["BarType"] = BarType.Custom;this.chartControl1.Series[1].Properties["Gap"] = 300f;this.chartControl1.Series[1].Properties["RotationAngle"] = 90f;this.chartControl1.Series[1].Properties["VertexNumber"] = 3;
ActiveReports 6 User Guide | 104
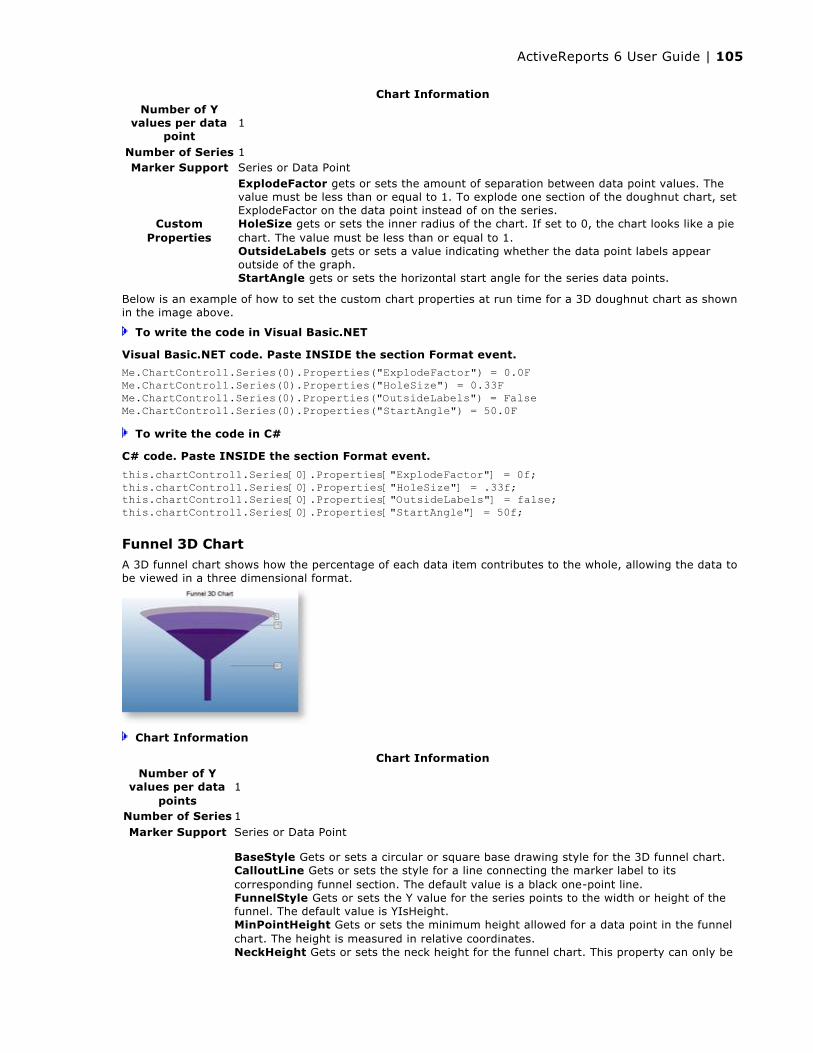
Below is an example of how to set the custom chart properties at run time for a 3D doughnut chart as shown in the image above.
To write the code in Visual Basic.NET
To write the code in C#
Funnel 3D ChartA 3D funnel chart shows how the percentage of each data item contributes to the whole, allowing the data to be viewed in a three dimensional format.
Chart Information
Chart Information Number of Y
values per data point
1
Number of Series 1Marker Support Series or Data Point
Custom Properties
ExplodeFactor gets or sets the amount of separation between data point values. The value must be less than or equal to 1. To explode one section of the doughnut chart, set ExplodeFactor on the data point instead of on the series.HoleSize gets or sets the inner radius of the chart. If set to 0, the chart looks like a pie chart. The value must be less than or equal to 1.OutsideLabels gets or sets a value indicating whether the data point labels appear outside of the graph.StartAngle gets or sets the horizontal start angle for the series data points.
Visual Basic.NET code. Paste INSIDE the section Format event.
Me.ChartControl1.Series(0).Properties("ExplodeFactor") = 0.0FMe.ChartControl1.Series(0).Properties("HoleSize") = 0.33FMe.ChartControl1.Series(0).Properties("OutsideLabels") = FalseMe.ChartControl1.Series(0).Properties("StartAngle") = 50.0F
C# code. Paste INSIDE the section Format event.
this.chartControl1.Series[0].Properties["ExplodeFactor"] = 0f;this.chartControl1.Series[0].Properties["HoleSize"] = .33f;this.chartControl1.Series[0].Properties["OutsideLabels"] = false;this.chartControl1.Series[0].Properties["StartAngle"] = 50f;
Chart Information Number of Y
values per data points
1
Number of Series 1Marker Support Series or Data Point
BaseStyle Gets or sets a circular or square base drawing style for the 3D funnel chart.CalloutLine Gets or sets the style for a line connecting the marker label to its corresponding funnel section. The default value is a black one-point line.FunnelStyle Gets or sets the Y value for the series points to the width or height of the funnel. The default value is YIsHeight.MinPointHeight Gets or sets the minimum height allowed for a data point in the funnel chart. The height is measured in relative coordinates.NeckHeight Gets or sets the neck height for the funnel chart. This property can only be
ActiveReports 6 User Guide | 105

Below is an example of how to set the custom chart properties at run time for a 3D funnel chart.
To write the code in Visual Basic.NET
To write the code in Visual Basic.NET
Horizontal Bar 3D ChartUse a horizontal 3D bar chart to compare values of items across categories, allowing the data to be viewed conveniently in a 3D format with the axes reversed.
Custom Properties
used with the FunnelStyle property set to YIsHeight. The default value is 5.NeckWidth Gets or sets the neck width for the funnel chart. This property can only be used with the FunnelStyle property set to YIsHeight. The default value is 5.OutsideLabels Gets or sets a value indicating whether the labels are placed outside of the funnel chart. The default value is True.OutsideLabelsPlacement Gets or sets a value indicating whether the data point labels appear on the left or right side of the funnel. This property can only be used with the OutsideLabels property set to True.PointGapPct Gets or sets the amount of space between the data points of the funnel chart. The PointGapPct is measured in relative coordinates. The default value is 0, and valid values range from 0 to 100.RotationAngle Gets or sets the left-to-right rotation angle of the funnel. The valid values range from -180 to 180 degrees. This property is only effective with the Projection property set to Orthogonal and the BaseStyle property set to SquareBase.
Visual Basic.NET code. Paste ABOVE the report class.
Imports DataDynamics.ActiveReports.ChartImports DataDynamics.ActiveReports.Chart.GraphicsVisual Basic.NET code. Paste INSIDE the section Format event.
With Me.ChartControl1.Series(0) .Properties("BaseStyle") = BaseStyle.SquareBase .Properties("CalloutLine") = New Line(Color.Black, 2, LineStyle.Dot) .Properties("FunnelStyle") = FunnelStyle.YIsWidth .Properties("MinPointHeight") = 10.0F .Properties("NeckWidth") = 20.0F .Properties("NeckHeight") = 5.0F .Properties("OutsideLabels") = True .Properties("OutsideLabelsPlacement") = LabelsPlacement.Right .Properties("PointGapPct") = 3.0F .Properties("RotationAngle") = 3.0FEnd With
C# code. Paste ABOVE the report class.
using DataDynamics.ActiveReports.Chart;using DataDynamics.ActiveReports.Chart.Graphics;C# code. Paste INSIDE the section Format event.
this.chartControl1.Series[0].Properties["BaseStyle"] = BaseStyle.SquareBase;this.chartControl1.Series[0].Properties["CalloutLine"] = new Line(Color.Black, 2, LineStyle.Dot);this.chartControl1.Series[0].Properties["FunnelStyle"] = FunnelStyle.YIsWidth;this.chartControl1.Series[0].Properties["MinPointHeight"] = 10f;this.chartControl1.Series[0].Properties["NeckWidth"] = 20f;this.chartControl1.Series[0].Properties["NeckHeight"] = 5f;this.chartControl1.Series[0].Properties["OutsideLabels"] = true;this.chartControl1.Series[0].Properties["OutsideLabelsPlacement"] = LabelsPlacement.Right; this.chartControl1.Series[0].Properties["PointGapPct"] = 3f;this.chartControl1.Series[0].Properties["RotationAngle"] = 3f;
ActiveReports 6 User Guide | 106
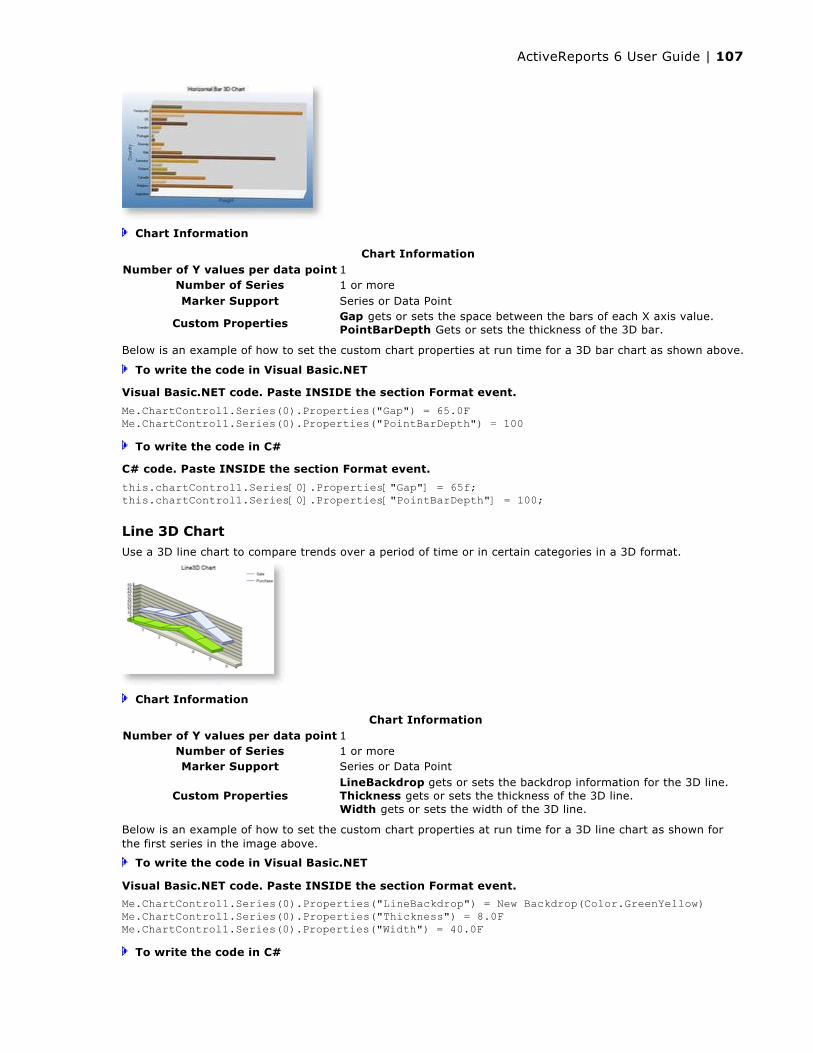
Chart Information
Below is an example of how to set the custom chart properties at run time for a 3D bar chart as shown above.
To write the code in Visual Basic.NET
To write the code in C#
Line 3D ChartUse a 3D line chart to compare trends over a period of time or in certain categories in a 3D format.
Chart Information
Below is an example of how to set the custom chart properties at run time for a 3D line chart as shown for the first series in the image above.
To write the code in Visual Basic.NET
To write the code in C#
Chart Information Number of Y values per data point 1
Number of Series 1 or moreMarker Support Series or Data Point
Custom PropertiesGap gets or sets the space between the bars of each X axis value.PointBarDepth Gets or sets the thickness of the 3D bar.
Visual Basic.NET code. Paste INSIDE the section Format event.
Me.ChartControl1.Series(0).Properties("Gap") = 65.0FMe.ChartControl1.Series(0).Properties("PointBarDepth") = 100
C# code. Paste INSIDE the section Format event.
this.chartControl1.Series[0].Properties["Gap"] = 65f;this.chartControl1.Series[0].Properties["PointBarDepth"] = 100;
Chart Information Number of Y values per data point 1
Number of Series 1 or moreMarker Support Series or Data Point
Custom PropertiesLineBackdrop gets or sets the backdrop information for the 3D line.Thickness gets or sets the thickness of the 3D line.Width gets or sets the width of the 3D line.
Visual Basic.NET code. Paste INSIDE the section Format event.
Me.ChartControl1.Series(0).Properties("LineBackdrop") = New Backdrop(Color.GreenYellow)Me.ChartControl1.Series(0).Properties("Thickness") = 8.0FMe.ChartControl1.Series(0).Properties("Width") = 40.0F
ActiveReports 6 User Guide | 107

Pyramid 3D Chart
A 3D Pyramid chart shows how the percentage of each data item contributes to the whole, allowing the data to be viewed in a three dimensional format.
Chart Information
Below is an example of how to set the custom chart properties at run time for a Pyramid chart.
To write the code in Visual Basic.NET
To write the code in C#
C# code. Paste INSIDE the section Format event.
this.chartControl1.Series[0].Properties["LineBackdrop"] = new Backdrop(Color.GreenYellow);this.chartControl1.Series[0].Properties["Thickness"] = 8f;this.chartControl1.Series[0].Properties["Width"] = 40f;
Chart Information Number of Y
values per data point
1
Number of Series
1
Marker Support Series or Data Points
Custom Properties
BaseStyle Gets or sets a circular or square base drawing style for the 3D pyramid chart.CalloutLine Gets or sets the style for a line connecting the marker label to its corresponding pyramid section. The default value is a black one-point line.MinPointHeight Gets or sets the minimum height allowed for a data point in the pyramid chart. The height is measured in relative coordinates.OutsideLabels Gets or sets a value indicating whether the labels are placed outside of the pyramid chart. The default value is True.OutsideLabelsPlacement Gets or sets a value indicating whether the data point labels appear on the left or right side of the pyramid. This property can only be used with the OutsideLabels property set to True.PointGapPct Gets or sets the amount of space between the data points of the pyramid chart. The PointGapPct is measured in relative coordinates. The default value is 0, and valid values range from 0 to 100.RotationAngle Gets or sets the left-to-right rotation angle of the pyramid. The valid values range from -180 to 180 degrees. This property is only effective with the Projection property set to Orthogonal and the BaseStyle property set to SquareBase.
Visual Basic.NET code. Paste ABOVE the report class.
Imports DataDynamics.ActiveReports.ChartImports DataDynamics.ActiveReports.Chart.GraphicsVisual Basic.NET code. Paste INSIDE the section Format event.
With Me.ChartControl1.Series(0) .Properties("BaseStyle") = BaseStyle.SquareBase .Properties("MinPointHeight") = 10.0F .Properties("OutsideLabels") = True .Properties("OutsideLabelsPlacement") = LabelsPlacement.Right .Properties("PointGapPct") = 3.0F .Properties("RotationAngle") = 3.0FEnd With
C# code. Paste ABOVE the report class.
ActiveReports 6 User Guide | 108

Stacked Bar 3D ChartUse a 3D bar graph to compare values of items across categories, allowing the data to be viewed conveniently in a 3D format. A stacked bar graph is a bar graph with two or more data series stacked on top of each other. Use this graph to show how each value contributes to a total.
Chart Information
Below is an example of how to set the custom chart properties at run time for a StackedBar3D chart.
To write the code in Visual Basic.NET
To write the code in C#
Stacked Bar 3D 100 Percent Chart
A StackedBar3D100Pct chart is a bar chart with two or more data series stacked one on top the other three dimensionally to sum up to 100%. Use this chart to show how each value contributes to a total with the relative size of each series representing its contribution to the total.
Chart Information
using DataDynamics.ActiveReports.Chart;using DataDynamics.ActiveReports.Chart.Graphics;C# code. Paste INSIDE the section Format event.
this.chartControl1.Series[0].Properties["BaseStyle"] = BaseStyle.SquareBase;this.chartControl1.Series[0].Properties["MinPointHeight"] = 10f;this.chartControl1.Series[0].Properties["OutsideLabels"] = true;this.chartControl1.Series[0].Properties["OutsideLabelsPlacement"] = LabelsPlacement.Right; this.chartControl1.Series[0].Properties["PointGapPct"] = 3f;this.chartControl1.Series[0].Properties["RotationAngle"] = 3f;
Chart Information Number of Y values per data point 1
Number of Series 1 or moreMarker Support Series or Data Point
Custom Properties Gap gets or sets the space between the bars of each X axis value
Visual Basic.NET code. Paste INSIDE the section Format event.
Me.ChartControl1.Series(0).Properties("Gap") = 100.0F
C# code. Paste INSIDE the section Format event.
this.chartControl1.Series[0].Properties["Gap"] = 100f;
Chart Information Number of Y values per data point 1
Number of Series 1 or more
ActiveReports 6 User Guide | 109
Below is an example of how to set the custom chart properties at run time for a StackedBar3D100Pct chart.
To write the code in Visual Basic.NET
To write the code in C#
Marker Support Series or Data PointCustom Properties Gap gets or sets the space between the bars of each X axis value
Visual Basic.NET code. Paste INSIDE the section Format event.
Me.ChartControl1.Series(0).Properties("Gap") = 100.0F
C# code. Paste INSIDE the section Format event.
this.chartControl1.Series[0].Properties["Gap"] = 100f;
ActiveReports 6 User Guide | 110
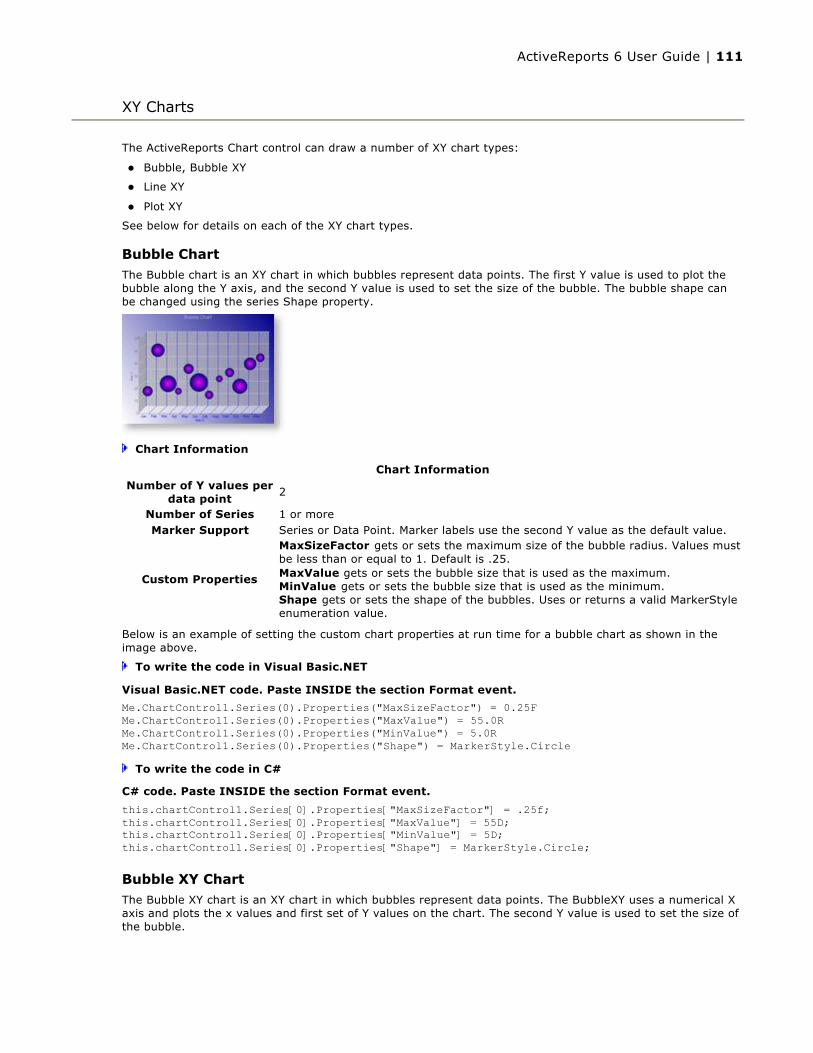
The ActiveReports Chart control can draw a number of XY chart types:
Bubble, Bubble XY
Line XY
Plot XY
See below for details on each of the XY chart types.
Bubble ChartThe Bubble chart is an XY chart in which bubbles represent data points. The first Y value is used to plot the bubble along the Y axis, and the second Y value is used to set the size of the bubble. The bubble shape can be changed using the series Shape property.
Chart Information
Below is an example of setting the custom chart properties at run time for a bubble chart as shown in the image above.
To write the code in Visual Basic.NET
To write the code in C#
Bubble XY ChartThe Bubble XY chart is an XY chart in which bubbles represent data points. The BubbleXY uses a numerical X axis and plots the x values and first set of Y values on the chart. The second Y value is used to set the size of the bubble.
XY Charts
Chart Information Number of Y values per
data point2
Number of Series 1 or moreMarker Support Series or Data Point. Marker labels use the second Y value as the default value.
Custom Properties
MaxSizeFactor gets or sets the maximum size of the bubble radius. Values must be less than or equal to 1. Default is .25.MaxValue gets or sets the bubble size that is used as the maximum.MinValue gets or sets the bubble size that is used as the minimum.Shape gets or sets the shape of the bubbles. Uses or returns a valid MarkerStyle enumeration value.
Visual Basic.NET code. Paste INSIDE the section Format event.
Me.ChartControl1.Series(0).Properties("MaxSizeFactor") = 0.25FMe.ChartControl1.Series(0).Properties("MaxValue") = 55.0RMe.ChartControl1.Series(0).Properties("MinValue") = 5.0RMe.ChartControl1.Series(0).Properties("Shape") = MarkerStyle.Circle
C# code. Paste INSIDE the section Format event.
this.chartControl1.Series[0].Properties["MaxSizeFactor"] = .25f;this.chartControl1.Series[0].Properties["MaxValue"] = 55D;this.chartControl1.Series[0].Properties["MinValue"] = 5D;this.chartControl1.Series[0].Properties["Shape"] = MarkerStyle.Circle;
ActiveReports 6 User Guide | 111

Chart Information
Below is an example of setting the custom chart properties at run time for a bubble XY chart as shown in the image above.
To write the code in Visual Basic.NET
To write the code in C#
Line XY Chart
A line XY chart plots points on the X and Y axes as one series and uses a line to connect points to each other.
Chart Information
Plot XY ChartA plot XY chart shows the relationships between numeric values in two or more series sets of XY values.
Chart Information Number of Y values per
data point2
Number of Series 1 or moreMarker Support Series or Data Point. Marker labels use the second Y value as the default value.
Custom Properties
MaxSizeFactor gets or sets the maximum size of the bubble radius. Values must be less than or equal to 1. Default is .25.MaxValue gets or sets the bubble size that is used as the maximum.MinValue gets or sets the bubble size that is used as the minimum.Shape gets or sets the shape of the bubbles. Uses or returns a valid MarkerStyle enumeration value.
Visual Basic.NET code. Paste INSIDE the section Format event.
Me.ChartControl1.Series(0).Properties("MaxSizeFactor") = 0.25FMe.ChartControl1.Series(0).Properties("MaxValue") = 50.0RMe.ChartControl1.Series(0).Properties("MinValue") = 0.0RMe.ChartControl1.Series(0).Properties("Shape") = MarkerStyle.InvTriangle
C# code. Paste INSIDE the section Format event.
this.chartControl1.Series[0].Properties["MaxSizeFactor"] = .25f;this.chartControl1.Series[0].Properties["MinValue"] = 0D;this.chartControl1.Series[0].Properties["MaxValue"] = 50D;this.chartControl1.Series[0].Properties["Shape"] = MarkerStyle.InvTriangle;
Chart Information Number of Y values per data point 1
Number of Series 1 or moreMarker Support Series or Data Point
Custom Properties None
ActiveReports 6 User Guide | 112
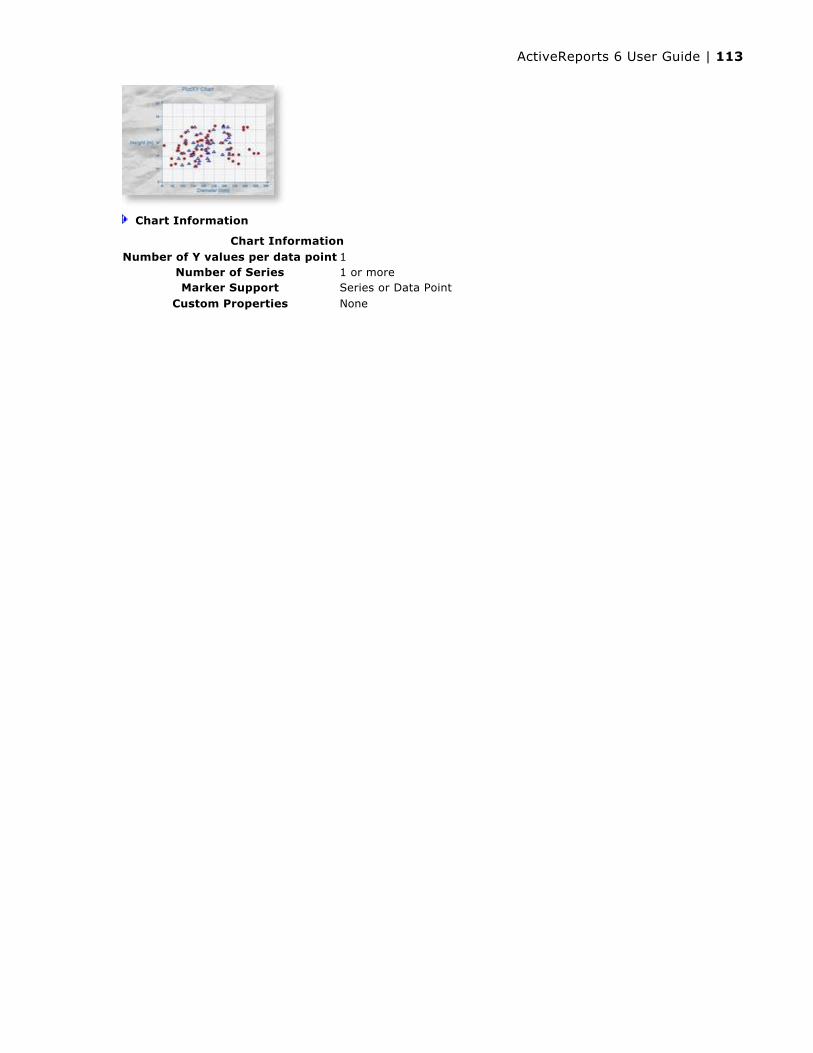
Chart Information
Chart Information Number of Y values per data point 1
Number of Series 1 or moreMarker Support Series or Data Point
Custom Properties None
ActiveReports 6 User Guide | 113

The ActiveReports Chart control can draw a number of financial chart types:
Candle, High Low, High Low Open Close
Kagi, Renko
Point and Figure, Three Line Break
See below for details on each of the financial chart types.
Candle ChartA candle chart displays stock information using High, Low, Open and Close values. The size of the wick line is determined by the High and Low values, while the size of the bar is determined by the Open and Close values. The bar is displayed using different colors, depending on whether the price of the stock has gone up or down.
Chart Information
Below is an example of how to set the custom chart properties at run time for a candle chart as shown in the image above.
To write the code in Visual Basic.NET
To write the code in C#
Financial Charts
Chart Information Number of Y values
per data point4 (The first value is the high figure, the second is the low figure, the third is the opening figure, and the fourth is the closing figure.)
Number of Series 1 or moreMarker Support Series or Data Point. Marker labels use the first Y value as the default value.
Custom Properties
BodyDownswingBackdrop gets or sets the backdrop information used to fill the rectangle for data points in which the closing figure is lower than the opening figure.BodyUpswingBackdrop gets or sets the backdrop information used to fill the rectangle for data points in which the closing figure is higher than the opening figure.BodyWidth gets or sets the width of the rectangle used to show upswing or downswing.WickLine gets or sets the line information for the wick line.
Visual Basic.NET code. Paste ABOVE the report class.
Imports DataDynamics.ActiveReports.Chart.Graphics
Visual Basic.NET code. Paste INSIDE the section Format event.
With Me.ChartControl1.Series(0) .Properties("BodyDownswingBackdrop") = New Chart.Graphics.Backdrop(Color.FromArgb(255, 192, 255)) .Properties("BodyUpswingBackdrop") = New Chart.Graphics.Backdrop(Color.FromArgb(192, 192, 255)) .Properties("WickLine") = New Chart.Graphics.Line(Color.Indigo) .Properties("BodyWidth") = 7.0FEnd With
C# code. Paste ABOVE the report class.
Using DataDynamics.ActiveReports.Chart.Graphics
ActiveReports 6 User Guide | 114
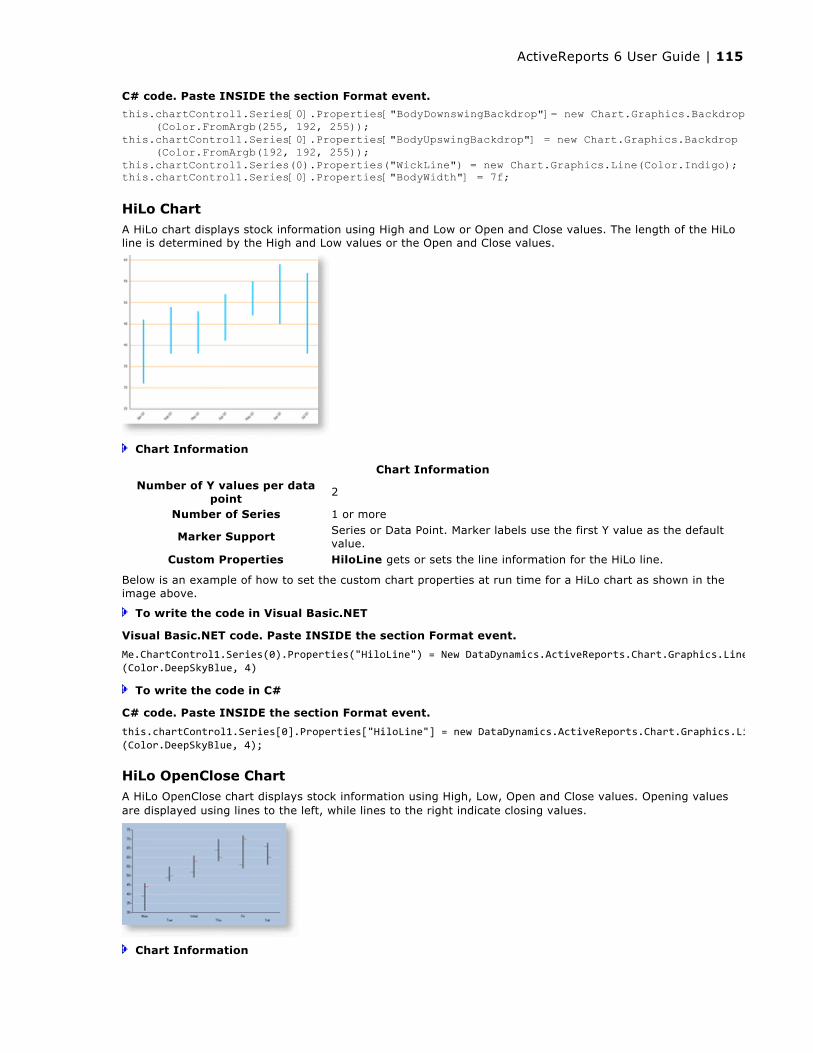
HiLo ChartA HiLo chart displays stock information using High and Low or Open and Close values. The length of the HiLo line is determined by the High and Low values or the Open and Close values.
Chart Information
Below is an example of how to set the custom chart properties at run time for a HiLo chart as shown in the image above.
To write the code in Visual Basic.NET
To write the code in C#
HiLo OpenClose ChartA HiLo OpenClose chart displays stock information using High, Low, Open and Close values. Opening values are displayed using lines to the left, while lines to the right indicate closing values.
Chart Information
C# code. Paste INSIDE the section Format event.
this.chartControl1.Series[0].Properties["BodyDownswingBackdrop"]= new Chart.Graphics.Backdrop (Color.FromArgb(255, 192, 255));this.chartControl1.Series[0].Properties["BodyUpswingBackdrop"] = new Chart.Graphics.Backdrop (Color.FromArgb(192, 192, 255));this.chartControl1.Series(0).Properties("WickLine") = new Chart.Graphics.Line(Color.Indigo);this.chartControl1.Series[0].Properties["BodyWidth"] = 7f;
Chart Information Number of Y values per data
point2
Number of Series 1 or more
Marker Support Series or Data Point. Marker labels use the first Y value as the default value.
Custom Properties HiloLine gets or sets the line information for the HiLo line.
Visual Basic.NET code. Paste INSIDE the section Format event.
Me.ChartControl1.Series(0).Properties("HiloLine") = New DataDynamics.ActiveReports.Chart.Graphics.Line(Color.DeepSkyBlue, 4)
C# code. Paste INSIDE the section Format event.
this.chartControl1.Series[0].Properties["HiloLine"] = new DataDynamics.ActiveReports.Chart.Graphics.Line(Color.DeepSkyBlue, 4);
ActiveReports 6 User Guide | 115

Below is an example of how to set the custom chart properties at run time for a HiLoOpenClose chart as shown in the image above.
To write the code in Visual Basic.NET
To write the code in C#
Kagi Chart
A Kagi chart displays supply and demand trends using a sequence of linked vertical lines. The thickness and direction of the lines vary depending on the price movement. If closing prices go in the direction of the previous Kagi line, then that Kagi line is extended. However, if the closing price reverses by the preset reversal amount, a new Kagi line is charted in the next column in the opposite direction. Thin lines indicate that the price breaks the previous low (supply) while thick lines indicate that the price breaks the previous high (demand).
Chart Information
Chart Information Number of Y values per data
point 4
Number of Series 1 or more
Marker SupportSeries or Data Point. Marker labels use the first Y value as the default value.
Custom Properties
HiloLine gets or sets the line information for the HiLo line.CloseLine gets or sets the line information for the close line.OpenLine gets or sets the line information for the open line.TickLen gets or sets the length of the tick for the open and close lines.
Visual Basic.NET code. Paste ABOVE the report class.
Imports DataDynamics.ActiveReports.Chart.Graphics
Visual Basic.NET code. Paste INSIDE the section Format event.
With Me.ChartControl1.Series(0) .Properties("OpenLine") = New Chart.Graphics.Line(Color.Green) .Properties("CloseLine") = New Chart.Graphics.Line(Color.Red) .Properties("HiloLine") = New Chart.Graphics.Line(Color.Black, 2) .Properties("TickLen") = 10.0FEnd With
C# code. Paste ABOVE the report class.
using DataDynamics.ActiveReports.Chart.Graphics;
C# code. Paste INSIDE the section Format event.
this.chartControl1.Series[0].Properties["OpenLine"] = new Chart.Graphics.Line(Color.Green);this.chartControl1.Series[0].Properties["CloseLine"] = new Chart.Graphics.Line(Color.Red);this.chartControl1.Series[0].Properties["HiloLine"] = new Chart.Graphics.Line(Color.Black, 2);this.chartControl1.Series[0].Properties["TickLen"] = 10f;
Chart Information Number of Y
values per data point
1
Number of Series 1
Marker Support Series or Data Points
ActiveReports 6 User Guide | 116
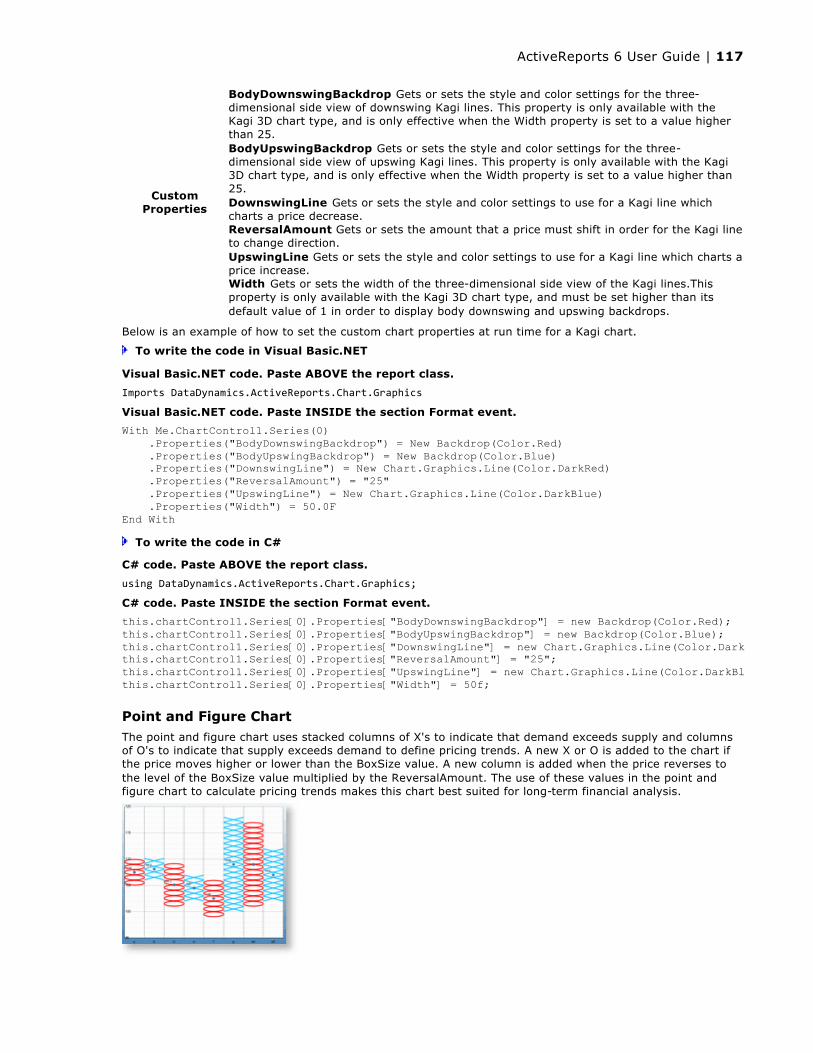
Below is an example of how to set the custom chart properties at run time for a Kagi chart.
To write the code in Visual Basic.NET
To write the code in C#
Point and Figure ChartThe point and figure chart uses stacked columns of X's to indicate that demand exceeds supply and columns of O's to indicate that supply exceeds demand to define pricing trends. A new X or O is added to the chart if the price moves higher or lower than the BoxSize value. A new column is added when the price reverses to the level of the BoxSize value multiplied by the ReversalAmount. The use of these values in the point and figure chart to calculate pricing trends makes this chart best suited for long-term financial analysis.
Custom Properties
BodyDownswingBackdrop Gets or sets the style and color settings for the three-dimensional side view of downswing Kagi lines. This property is only available with the Kagi 3D chart type, and is only effective when the Width property is set to a value higher than 25.BodyUpswingBackdrop Gets or sets the style and color settings for the three-dimensional side view of upswing Kagi lines. This property is only available with the Kagi 3D chart type, and is only effective when the Width property is set to a value higher than 25.DownswingLine Gets or sets the style and color settings to use for a Kagi line which charts a price decrease.ReversalAmount Gets or sets the amount that a price must shift in order for the Kagi line to change direction.UpswingLine Gets or sets the style and color settings to use for a Kagi line which charts a price increase.Width Gets or sets the width of the three-dimensional side view of the Kagi lines.This property is only available with the Kagi 3D chart type, and must be set higher than its default value of 1 in order to display body downswing and upswing backdrops.
Visual Basic.NET code. Paste ABOVE the report class.
Imports DataDynamics.ActiveReports.Chart.Graphics
Visual Basic.NET code. Paste INSIDE the section Format event.
With Me.ChartControl1.Series(0) .Properties("BodyDownswingBackdrop") = New Backdrop(Color.Red) .Properties("BodyUpswingBackdrop") = New Backdrop(Color.Blue) .Properties("DownswingLine") = New Chart.Graphics.Line(Color.DarkRed) .Properties("ReversalAmount") = "25" .Properties("UpswingLine") = New Chart.Graphics.Line(Color.DarkBlue) .Properties("Width") = 50.0FEnd With
C# code. Paste ABOVE the report class.
using DataDynamics.ActiveReports.Chart.Graphics;
C# code. Paste INSIDE the section Format event.
this.chartControl1.Series[0].Properties["BodyDownswingBackdrop"] = new Backdrop(Color.Red);this.chartControl1.Series[0].Properties["BodyUpswingBackdrop"] = new Backdrop(Color.Blue);this.chartControl1.Series[0].Properties["DownswingLine"] = new Chart.Graphics.Line(Color.DarkRed);this.chartControl1.Series[0].Properties["ReversalAmount"] = "25"; this.chartControl1.Series[0].Properties["UpswingLine"] = new Chart.Graphics.Line(Color.DarkBlue);this.chartControl1.Series[0].Properties["Width"] = 50f;
ActiveReports 6 User Guide | 117

Chart Information
Below is an example of how to set the custom chart properties at run time for a Point and Figure chart.
To write the code in Visual Basic.NET
To write the code in C#
Renko ChartThe Renko chart uses bricks of uniform size to chart price movement. When a price moves to a greater or lesser value than the preset BoxSize value required to draw a new brick, a new brick is drawn in the succeeding column. The change in box color and direction signifies a trend reversal.
Chart Information
Chart Information Number of Y values per
data point 2
Number of Series 1Marker Support Series or Data Points
Custom Properties
BoxSize Gets or sets the amount a price must change in order to create another X or O.DownswingLine Gets or sets the style and color settings for the downswing O's.ReversalAmount Gets or sets the amount that a price must shift in order for a new column to be added.UpswingLine Gets or sets the style and color settings for the upswing X's.
Visual Basic.NET code. Paste ABOVE the report class.
Imports DataDynamics.ActiveReports.Chart.Graphics
Visual Basic.NET code. Paste INSIDE the section Format event.
With Me.ChartControl1.Series(0) .Properties("DownswingLine") = New Chart.Graphics.Line(Color.Red) .Properties("UpswingLine") = New Chart.Graphics.Line(Color.Blue) .Properties("BoxSize") = 3.0FEnd With
C# code. Paste ABOVE the report class.
using DataDynamics.ActiveReports.Chart.Graphics;
C# code. Paste INSIDE the section Format event.
this.chartControl1.Series[0].Properties["DownswingLine"] = new Chart.Graphics.Line(Color.Red);this.chartControl1.Series[0].Properties["UpswingLine"] = new Chart.Graphics.Line(Color.Blue);this.chartControl1.Series[0].Properties["BoxSize"] = 3f;
Chart Information Number of Y values per
data point2
Number of Series 1Marker Support Series or Data Points
Custom PropertiesBodyDownswingBackdrop Gets or sets the style and color settings for the downswing bricks.BodyUpswingBackdrop Gets or sets the style and color settings for the
ActiveReports 6 User Guide | 118

Below is an example of how to set the custom chart properties at run time for a Renko chart.
To write the code in Visual Basic.NET
To write the code in C#
Three Line Break ChartA Three Line Break chart uses vertical boxes or lines to illustrate price changes of an asset or market. Movements are depicted with box colors and styles; movements that continue the trend of the previous box paint similarly while movements that trend oppositely are indicated with a different color and/or style. The opposite trend is only drawn if its value exceeds the extreme value of the previous three boxes or lines. The below Three Line Break depicts upward pricing movement with black boxes and downward pricing movement with red boxes.
Chart Information
Below is an example of how to set the custom chart properties at run time for a Three Line Break chart.
To write the code in Visual Basic.NET
upswing bricks.BoxSize Gets or sets the amount a price must change in order to create another brick.
Visual Basic.NET code. Paste ABOVE the report class.
Imports DataDynamics.ActiveReports.Chart.Graphics
Visual Basic.NET code. Paste INSIDE the section Format event.
With Me.ChartControl1.Series(0) .Properties("BodyDownswingBackdrop") = New Backdrop(Color.BlueViolet) .Properties("BodyUpswingBackdrop") = New Backdrop(Color.Navy) .Properties("BoxSize") = 3.0FEnd With
C# code. Paste ABOVE the report class.
using DataDynamics.ActiveReports.Chart.Graphics;
C# code. Paste INSIDE the section Format event.
this.chartControl1.Series[0].Properties["BodyDownswingBackdrop"] = new Backdrop(Color.BlueViolet);this.chartControl1.Series[0].Properties["BodyUpswingBackdrop"] = new Backdrop(Color.Navy);this.chartControl1.Series[0].Properties["BoxSize"] = 3f;
Chart Information Number of Y values
per data point1
Number of Series 1Marker Support Series or Data Points
Chart-Specific Properties
BodyDownswingBackdrop Gets or sets the style and color settings for the downswing boxes.BodyUpswingBackdrop Gets or sets the style and color settings for the upswing boxes.NewLineBreak Gets or sets the number of previous boxes/lines that must be compared before a new box/line is drawn. The default value is 3.
Visual Basic.NET code. Paste ABOVE the report class.
ActiveReports 6 User Guide | 119

To write the code in C#
Imports DataDynamics.ActiveReports.Chart.Graphics
Visual Basic.NET code. Paste INSIDE the section Format event.
With Me.ChartControl1.Series(0) .Properties("BodyDownswingBackdrop") = New Backdrop(Color.Red) .Properties("BodyUpswingBackdrop") = New Backdrop(Color.Black) .Properties("NewLineBreak") = 3End With
C# code. Paste ABOVE the report class.
using DataDynamics.ActiveReports.Chart.Graphics;
C# code. Paste INSIDE the section Format event.
this.chartControl1.Series[0].Properties["BodyDownswingBackdrop"] = new Backdrop(Color.Red);this.chartControl1.Series[0].Properties["BodyUpswingBackdrop"] = new Backdrop(Color.Black);this.chartControl1.Series[0].Properties["NewLineBreak"] = 3;
ActiveReports 6 User Guide | 120
These topics introduce you to some basic information about manipulating the appearance of Charts.
Chart EffectsLearn about the visual effects possible with the Chart control.
Chart Control ItemsLearn about Chart control items that can be used to customize your chart.
Chart Axes and WallsLearn some basic information about Chart axes and walls.
Chart Appearance
ActiveReports 6 User Guide | 121
Colors
In the Chart control, colors can be used in different ways to enhance the chart's appearance, distinguish different series, point out or draw attention to data information such as averages, and more.
Color Palettes
The Chart control includes several pre-defined color palettes that can be used to automatically set the colors for data values in a series. The pre-defined palettes are as follows:
Cascade (default) A cascade of eight cool colors ranging from deep teal down through pale orchid.
Confetti A sprinkling of bright and pastel colors.
Iceberg A range of the soft blues and greys found in an iceberg.
Springtime The colors of spring, in deep green, two vivid colors and five pastels.
None All data is drawn using the same teal color.
These enumerated values are accessed through the Series class with code like the following.
1. In design view of the report, double-click the section where you placed your chart. This creates a Format event handling method for the section.
2. Add code to the handler to set the color palette for the series.
To write the code in Visual Basic.NET
To write the code in C#
Gradients
Gradients can be used in object backdrops to enhance the visual appearance of various chart items. Gradients can be used in the following chart sections:
Chart backdrop
Chart area backdrops
Wall backdrops
Title backdrops
Legend backdrops
Legend item backdrops (for custom legend items)
WallRange backdrops
Series backdrops
Data point backdrops
Marker backdrops
Marker label backdrops
Annotation TextBar backdrops
You can set gradients for a backdrop at run time by creating a BackdropItem, setting its Style property to Gradient, setting the GradientType, and setting the two colors to use for the gradient as shown in the following example.
1. In design view of the report, double-click the section where you placed your chart. This creates a Format event handling method for the section.
2. Add code to the handler to set gradients for the backdrop.
Chart Effects
Visual Basic.NET code. Paste INSIDE the section Format event.
Me.ChartControl1.Series(0).ColorPalette = DataDynamics.ActiveReports.Chart.ColorPalette.Iceburg
C# code. Paste INSIDE the section Format event.
this.chartControl1.Series[0].ColorPalette = DataDynamics.ActiveReports.Chart.ColorPalette.Iceburg;
ActiveReports 6 User Guide | 122

To write the code in Visual Basic.NET
To write the code in C#
3D EffectsUsing the projection and viewpoint settings, you can display your 3D chart at any angle to provide the desired view or call attention to a specific chart section.
Projection
Determine the projection for a 3D chart using three factors: the Z depth ratio, the projection type, and the projection DX and DY values.
ZDepth ratio The Z depth ratio is the level of depth the Z axis has in the chart. Values range from 0 (for a 2D chart) to 1.0.
ProjectionType The type of projection used for the chart. In order to show charts three dimensionally, the ProjectionType in the ChartArea Collection editor must be set to Orthogonal. To access this dialog box, click the ellipsis button next to the ChartAreas (Collection) property in the Properties Window.
ProjectionDX The origin position of the Z axis in relation to the X axis. This property is valid only when the ProjectionType is Orthogonal.
ProjectionDY The origin position of the Z axis in relation to the Y axis. This property is valid only when the ProjectionType is Orthogonal.
HorizontalRotation The HorizontalRotation property allows you to set the degree (-90° to 90°) of horizontal rotation from which the chart is seen.
VerticalRotation The VerticalRotation property allows you to set the degree (-90° to 90°) of vertical rotation from which the chart is seen.
Alpha Blending
The Backdrop class in the Chart control has an Alpha property which employs GDI+, and is used to set the transparency level of each object's backdrop. GDI+ uses 32 bits overall and 8 bits per alpha, red, green, and blue channels respectively to indicate the transparency and color of an object. Like a color channel's levels of color, the alpha channel represents 256 levels of transparency.
The default value of the Alpha property is 255, which represents a fully opaque color. For a fully transparent color, set this value to 0. To blend the color of the object's backdrop with the background color, use a setting between 0 and 255.
Visual Basic.NET code. Paste ABOVE the report class.
Imports DataDynamics.ActiveReports.Chart.Graphics
Visual Basic.NET code. Paste INSIDE the section Format event.
Dim bItem As New Chart.BackdropItem(GradientType.Vertical, Color.Purple, Color.White)Me.ChartControl1.Backdrop = bItem
C# code. Paste ABOVE the report class.
using DataDynamics.ActiveReports.Chart.Graphics
C# code. Paste INSIDE the section Format event.
DataDynamics.ActiveReports.Chart.BackdropItem bItem = new DataDynamics.ActiveReports. Chart.BackdropItem(GradientType.Vertical, Color.Purple, Color.White);this.chartControl1.Backdrop = bItem;
ActiveReports 6 User Guide | 123

In the Chart control, you can use the Color.FromArgb method to set the alpha and color levels for a particular chart element. The following example shows how you can use the method to set the alpha and color values for the chart backdrop.
1. In design view of the report, double-click the section where you placed your chart. This creates a Format event handling method for the section.
2. Add code to the handler to set the transparency of the chart objects.
To write the code in Visual Basic.NET
To write the code in C#
Changing the alpha level of a chart element reveals other items that are beneath the object. Because you can set the alpha level for any chart element that supports color, you can create custom effects for any chart. For example, you can use alpha blending to combine background images with a semi-transparent chart backdrop to create a watermark look.
LightingThe Chart control allows you to completely customize lighting options for 3D charts.
Directional Light Ratio
Using the DirectionalLightRatio property, you can control the directional or ambient intensity ratio.
Light Type
By setting the Type property to one of the enumerated LightType values, you can control the type of lighting used in the chart. The settings are as follows:
Ambient An ambient light source is used. It is equal to DirectionalLightRatio = 0.
InfiniteDirectional An infinite directional light source (like the sun) is used.
FiniteDirectional A point light source is used.
Light Source
You can also set the Source property to a Point3d object, which controls the location of the light source.
Visual Basic.NET code. Paste INSIDE the section Format event.
Me.ChartControl1.Backdrop = New DataDynamics.ActiveReports.Chart.BackdropItem(Color.FromArgb(100, 0, 11, 220))
C# code. Paste INSIDE the section Format event.
this.chartControl1.Backdrop = new DataDynamics.ActiveReports.Chart.BackdropItem(Color.FromArgb(100, 0, 11, 220));
ActiveReports 6 User Guide | 124
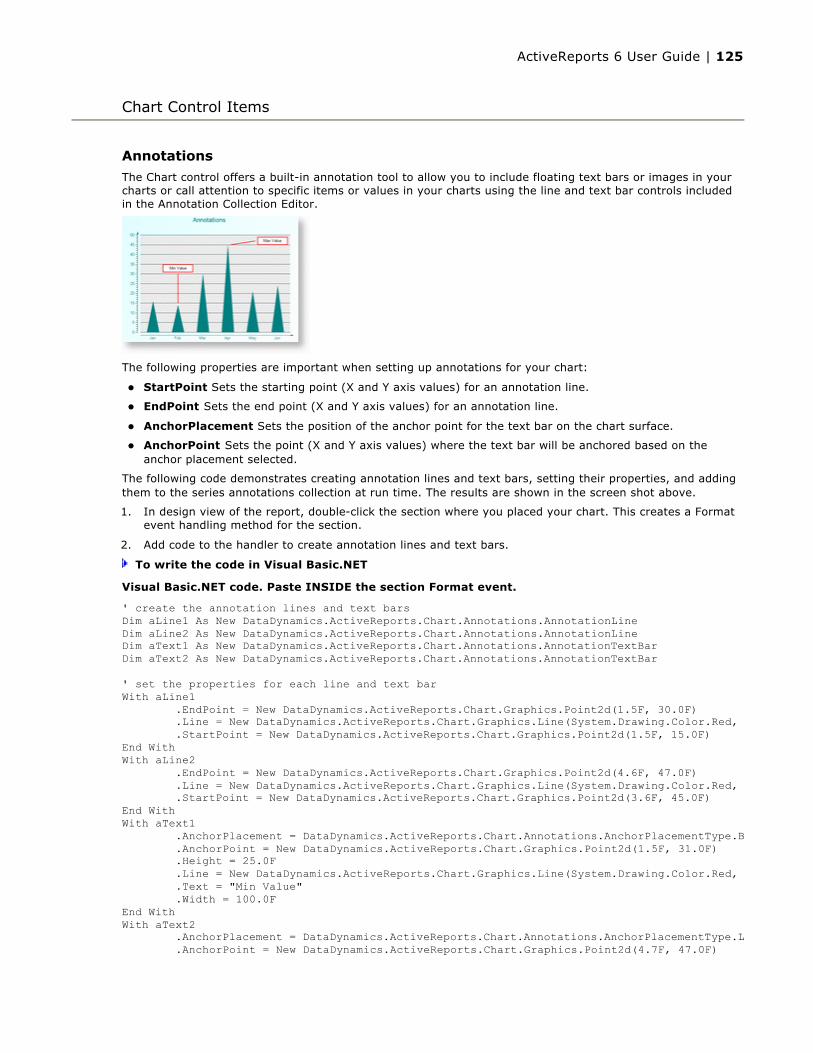
Annotations
The Chart control offers a built-in annotation tool to allow you to include floating text bars or images in your charts or call attention to specific items or values in your charts using the line and text bar controls included in the Annotation Collection Editor.
The following properties are important when setting up annotations for your chart:
StartPoint Sets the starting point (X and Y axis values) for an annotation line.
EndPoint Sets the end point (X and Y axis values) for an annotation line.
AnchorPlacement Sets the position of the anchor point for the text bar on the chart surface.
AnchorPoint Sets the point (X and Y axis values) where the text bar will be anchored based on the anchor placement selected.
The following code demonstrates creating annotation lines and text bars, setting their properties, and adding them to the series annotations collection at run time. The results are shown in the screen shot above.
1. In design view of the report, double-click the section where you placed your chart. This creates a Format event handling method for the section.
2. Add code to the handler to create annotation lines and text bars.
To write the code in Visual Basic.NET
Chart Control Items
Visual Basic.NET code. Paste INSIDE the section Format event.
' create the annotation lines and text barsDim aLine1 As New DataDynamics.ActiveReports.Chart.Annotations.AnnotationLineDim aLine2 As New DataDynamics.ActiveReports.Chart.Annotations.AnnotationLineDim aText1 As New DataDynamics.ActiveReports.Chart.Annotations.AnnotationTextBarDim aText2 As New DataDynamics.ActiveReports.Chart.Annotations.AnnotationTextBar
' set the properties for each line and text barWith aLine1 .EndPoint = New DataDynamics.ActiveReports.Chart.Graphics.Point2d(1.5F, 30.0F) .Line = New DataDynamics.ActiveReports.Chart.Graphics.Line(System.Drawing.Color.Red, 2) .StartPoint = New DataDynamics.ActiveReports.Chart.Graphics.Point2d(1.5F, 15.0F)End WithWith aLine2 .EndPoint = New DataDynamics.ActiveReports.Chart.Graphics.Point2d(4.6F, 47.0F) .Line = New DataDynamics.ActiveReports.Chart.Graphics.Line(System.Drawing.Color.Red, 2) .StartPoint = New DataDynamics.ActiveReports.Chart.Graphics.Point2d(3.6F, 45.0F)End WithWith aText1 .AnchorPlacement = DataDynamics.ActiveReports.Chart.Annotations.AnchorPlacementType.Bottom .AnchorPoint = New DataDynamics.ActiveReports.Chart.Graphics.Point2d(1.5F, 31.0F) .Height = 25.0F .Line = New DataDynamics.ActiveReports.Chart.Graphics.Line(System.Drawing.Color.Red, 2) .Text = "Min Value" .Width = 100.0FEnd WithWith aText2 .AnchorPlacement = DataDynamics.ActiveReports.Chart.Annotations.AnchorPlacementType.Left .AnchorPoint = New DataDynamics.ActiveReports.Chart.Graphics.Point2d(4.7F, 47.0F)
ActiveReports 6 User Guide | 125

To write the code in C#
Titles and FootersThe Chart control allows you to add custom titles to your charts. The Titles collection is accessible from the Chart object. With the ability to add as many titles as needed, dock them to any side of a chart area, change all of the font properties, add borders and shadows, make the background look the way you want it, and change the location of the text, you can easily make your titles look the way you want them to look.
The following code demonstrates creating header and footer titles, setting their properties, and adding them to the titles collection at run time.
1. In design view of the report, double-click the section where you placed your chart. This creates a Format event handling method for the section.
2. Add code to the handler to create header and footer titles.
To write the code in Visual Basic.NET
.Height = 25.0F .Line = New DataDynamics.ActiveReports.Chart.Graphics.Line(System.Drawing.Color.Red, 2) .Text = "Max Value" .Width = 100.0FEnd With
' add the annotation lines and text bars to the annotations collection for the seriesMe.ChartControl1.Series(0).Annotations.AddRange(New DataDynamics.ActiveReports.Chart.Annotations.Annotation() {aLine1, aLine2, aText1, aText2})
C# code. Paste INSIDE the section Format event.
// create the annotation lines and text barsDataDynamics.ActiveReports.Chart.Annotations.AnnotationLine aLine1 = new DataDynamics.SharpGraph.Windows.Annotations.AnnotationLine();DataDynamics.ActiveReports.Chart.Annotations.AnnotationLine aLine2 = new DataDynamics.SharpGraph.Windows.Annotations.AnnotationLine();DataDynamics.ActiveReports.Chart.Annotations.AnnotationTextBar aText1 = new DataDynamics.SharpGraph.Windows.Annotations.AnnotationTextBar();DataDynamics.ActiveReports.Chart.Annotations.AnnotationTextBar aText2 = new DataDynamics.SharpGraph.Windows.Annotations.AnnotationTextBar();
// set the properties for each line and text baraLine1.EndPoint = new DataDynamics.ActiveReports.Chart.Graphics.Point2d(1.5F, 30F);aLine1.Line = new DataDynamics.ActiveReports.Chart.Graphics.Line(System.Drawing.Color.Red, 2);aLine1.StartPoint = new DataDynamics.ActiveReports.Chart.Graphics.Point2d(1.5F, 15F);aLine2.EndPoint = new DataDynamics.ActiveReports.Chart.Graphics.Point2d(4.6F, 47F);aLine2.Line = new DataDynamics.ActiveReports.Chart.Graphics.Line(System.Drawing.Color.Red, 2);aLine2.StartPoint = new DataDynamics.ActiveReports.Chart.Graphics.Point2d(3.6F, 45F);aText1.AnchorPlacement = DataDynamics.ActiveReports.Chart.Annotations.AnchorPlacementType.Bottom;aText1.AnchorPoint = new DataDynamics.ActiveReports.Chart.Graphics.Point2d(1.5F, 31F);aText1.Height = 25F;aText1.Line = new DataDynamics.ActiveReports.Chart.Graphics.Line(System.Drawing.Color.Red, 2);aText1.Text = "Min Value";aText1.Width = 100F;aText2.AnchorPlacement = DataDynamics.ActiveReports.Chart.Annotations.AnchorPlacementType.Left;aText2.AnchorPoint = new DataDynamics.ActiveReports.Chart.Graphics.Point2d(4.7F, 47F);aText2.Height = 25F;aText2.Line = new DataDynamics.ActiveReports.Chart.Graphics.Line(System.Drawing.Color.Red, 2);aText2.Text = "Max Value";aText2.Width = 100F;
// add the annotation lines and text bars to the annotations collection for the seriesthis.chartControl1.Series[0].Annotations.AddRange(new DataDynamics.ActiveReports.Chart.Annotations.Annotation[] {aLine1, aLine2, aText1, aText2});
Visual Basic.NET code. Paste INSIDE the section Format event.
' create the header and footer titlesDim tHeader As New DataDynamics.ActiveReports.Chart.Title
ActiveReports 6 User Guide | 126

To write the code in C#
Legends
The Chart control automatically creates a legend item for each series added to a chart at design time and sets the Legend property for each series by default. However, the legend's Visible property must be set to True for the legend to show with the chart. The text for each default legend entry is taken from the Name property on the series.
Dim tFooter As New DataDynamics.ActiveReports.Chart.Title
' set the properties for the headertHeader.Alignment = Chart.Alignment.CentertHeader.Backdrop = New DataDynamics.ActiveReports.Chart.Graphics.Backdrop(System.Drawing.Color.Thistle)tHeader.Border = New DataDynamics.ActiveReports.Chart.Border(New DataDynamics.ActiveReports.Chart.Graphics.Line(System.Drawing.Color.DimGray), 3)tHeader.DockArea = Me.ChartControl1.ChartAreas(0)tHeader.Docking = Chart.DockType.ToptHeader.Font = New DataDynamics.ActiveReports.Chart.FontInfo(System.Drawing.Color.White, New System.Drawing.Font("Arial", 25.0F))tHeader.Text = "Chart Title"tHeader.Visible = True
' set the properties for the footertFooter.Alignment = Chart.Alignment.CentertFooter.Backdrop = New DataDynamics.ActiveReports.Chart.Graphics.Backdrop(System.Drawing.Color.Thistle)tFooter.Border = New DataDynamics.ActiveReports.Chart.Border(New DataDynamics.ActiveReports.Chart.Graphics.Line(System.Drawing.Color.Indigo), 0, System.Drawing.Color.Black)tFooter.DockArea = Me.ChartControl1.ChartAreas(0)tFooter.Docking = Chart.DockType.BottomtFooter.Font = New DataDynamics.ActiveReports.Chart.FontInfo(System.Drawing.Color.DimGray, New System.Drawing.Font("Arial", 12.0F, System.Drawing.FontStyle.Bold))tFooter.Text = "Chart Footer"tFooter.Visible = True
' add the header and footer titles to the titles collectionMe.ChartControl1.Titles.AddRange(New DataDynamics.ActiveReports.Chart.Title() {tHeader, tFooter})
C# code. Paste INSIDE the section Format event.
// create the header and footer titlesDataDynamics.ActiveReports.Chart.Title tHeader = new DataDynamics.ActiveReports.Chart.Title();DataDynamics.ActiveReports.Chart.Title tFooter = new DataDynamics.ActiveReports.Chart.Title();
// set the properties for the headertHeader.Alignment = Chart.Alignment.Center;tHeader.Backdrop = new DataDynamics.ActiveReports.Chart.Graphics.Backdrop(System.Drawing.Color.Thistle);tHeader.Border = new DataDynamics.ActiveReports.Chart.Border(new DataDynamics.ActiveReports.Chart.Graphics.Line(System.Drawing.Color.DimGray), 3);tHeader.DockArea = this.ChartControl1.ChartAreas[0];tHeader.Docking = Chart.DockType.Top;tHeader.Font = new DataDynamics.ActiveReports.Chart.FontInfo(System.Drawing.Color.White, new System.Drawing.Font("Arial", 25F));tHeader.Text = "Chart Title";tHeader.Visible = true;
// set the properties for the footertFooter.Alignment = Chart.Alignment.Center;tFooter.Backdrop = new DataDynamics.ActiveReports.Chart.Graphics.Backdrop(System.Drawing.Color.Thistle);tFooter.Border = new DataDynamics.ActiveReports.Chart.Border(new DataDynamics.ActiveReports.Chart.Graphics.Line(System.Drawing.Color.Indigo), 0, System.Drawing.Color.Black);tFooter.DockArea = this.ChartControl1.ChartAreas[0];tFooter.Docking = Chart.DockType.Bottom;tFooter.Font = new DataDynamics.ActiveReports.Chart.FontInfo(System.Drawing.Color.DimGray, new System.Drawing.Font("Arial", 12F, System.Drawing.FontStyle.Bold));tFooter.Text = "Chart Footer";tFooter.Visible = true;
// add the header and footer titles to the titles collectionthis.chartControl1.Titles.AddRange(new DataDynamics.ActiveReports.Chart.Title[] {tHeader,tFooter});
ActiveReports 6 User Guide | 127

The following code demonstrates how to create a legend at run time, add it to the legends collection for the Chart object and set the legend property of the series to the new legend, resulting in the legend shown above.
Note: Each Series to be shown in the Legend must have a Name. If the Name property is not set, the Series does not show up in the Legend.
1. In design view of the report, double-click the section where you placed your chart. This creates a Format event handling method for the section.
2. Add code to the handler to create a legend.
To write the code in Visual Basic.NET
To write the code in C#
Visual Basic.NET code. Paste INSIDE the section Format event.
' create the legend and title for the legendDim legend1 As New DataDynamics.ActiveReports.Chart.LegendDim lHeader As New DataDynamics.ActiveReports.Chart.Title' set the properties for the legend titlelHeader.Backdrop = New DataDynamics.ActiveReports.Chart.Graphics.Backdrop(Chart.Graphics.BackdropStyle.Transparent, Color.White, Color.White, Chart.Graphics.GradientType.Vertical, Drawing2D.HatchStyle.DottedGrid, Nothing, Chart.Graphics.PicturePutStyle.Stretched)lHeader.Border = New DataDynamics.ActiveReports.Chart.Border(New Chart.Graphics.Line(Color.White, 2, Chart.Graphics.LineStyle.None), 0, Color.Black)lHeader.Font = New DataDynamics.ActiveReports.Chart.FontInfo(Color.White, New System.Drawing.Font("Arial", 10.0F, FontStyle.Bold))lHeader.Text = "Series:"' set the properties for the legend and add it to the legends collectionlegend1.Alignment = DataDynamics.ActiveReports.Chart.Alignment.TopRightlegend1.Backdrop = New DataDynamics.ActiveReports.Chart.BackdropItem(Chart.Graphics.BackdropStyle.Transparent, Color.Gray, Color.White, Chart.Graphics.GradientType.Vertical, Drawing2D.HatchStyle.DottedGrid, Nothing, Chart.Graphics.PicturePutStyle.Stretched)legend1.Border = New DataDynamics.ActiveReports.Chart.Border(New Chart.Graphics.Line(Color.Navy, 2), 0, Color.Black)legend1.DockArea = Me.ChartControl1.ChartAreas(0)legend1.LabelsFont = New DataDynamics.ActiveReports.Chart.FontInfo(Color.White, New System .Drawing.Font("Arial", 9.0F))legend1.Header = lHeaderlegend1.MarginX = 5legend1.MarginY = 5Me.ChartControl1.Legends.Add(legend1)' set the legend property of the series to the legend you createdMe.ChartControl1.Series(0).Legend = legend1Me.ChartControl1.Series(1).Legend = legend1Me.ChartControl1.Series(2).Legend = legend1
C# code. Paste INSIDE the section Format event.
// create the legend and title for the legendDataDynamics.ActiveReports.Chart.Legend legend1 = new DataDynamics.ActiveReports.Chart.Legend();DataDynamics.ActiveReports.Chart.Title lHeader = new DataDynamics.ActiveReports.Chart.Title();// set the properties for the legend titlelHeader.Backdrop = new DataDynamics.ActiveReports.Chart.Graphics.Backdrop(Chart.Graphics.BackdropStyle.Transparent, Color.White, Color.White, Chart.Graphics.GradientType.Vertical, System.Drawing.Drawing2D.HatchStyle.DottedGrid, null, Chart.Graphics.PicturePutStyle.Stretched);lHeader.Border = new DataDynamics.ActiveReports.Chart.Border(new Chart.Graphics.Line(Color.White, 2, Chart.Graphics.LineStyle.None), 0, Color.Black);lHeader.Font = new DataDynamics.ActiveReports.Chart.FontInfo(Color.White, new Font("Arial", 10F, FontStyle.Bold)); lHeader.Text = "Series:";// set the properties for the legend and add it to the legends collectionlegend1.Alignment = DataDynamics.ActiveReports.Chart.Alignment.TopRight;legend1.Backdrop = new DataDynamics.ActiveReports.Chart.BackdropItem(Chart.Graphics.BackdropStyle.Transparent, Color.Gray, Color.White, Chart.Graphics.GradientType.Vertical, System.Drawing.Drawing2D.HatchStyle.DottedGrid, null, Chart.Graphics.PicturePutStyle.Stretched);legend1.Border = new DataDynamics.ActiveReports.Chart.Border(new Chart.Graphics.Line(Color.Navy, 2), 0, Color.Black);legend1.DockArea = this.sharpGraph1.ChartAreas[0];legend1.LabelsFont = new DataDynamics.ActiveReports.Chart.FontInfo(Color.White, new Font("Arial", 9F));legend1.Header = lHeader;legend1.MarginX = 5;legend1.MarginY = 5;
ActiveReports 6 User Guide | 128
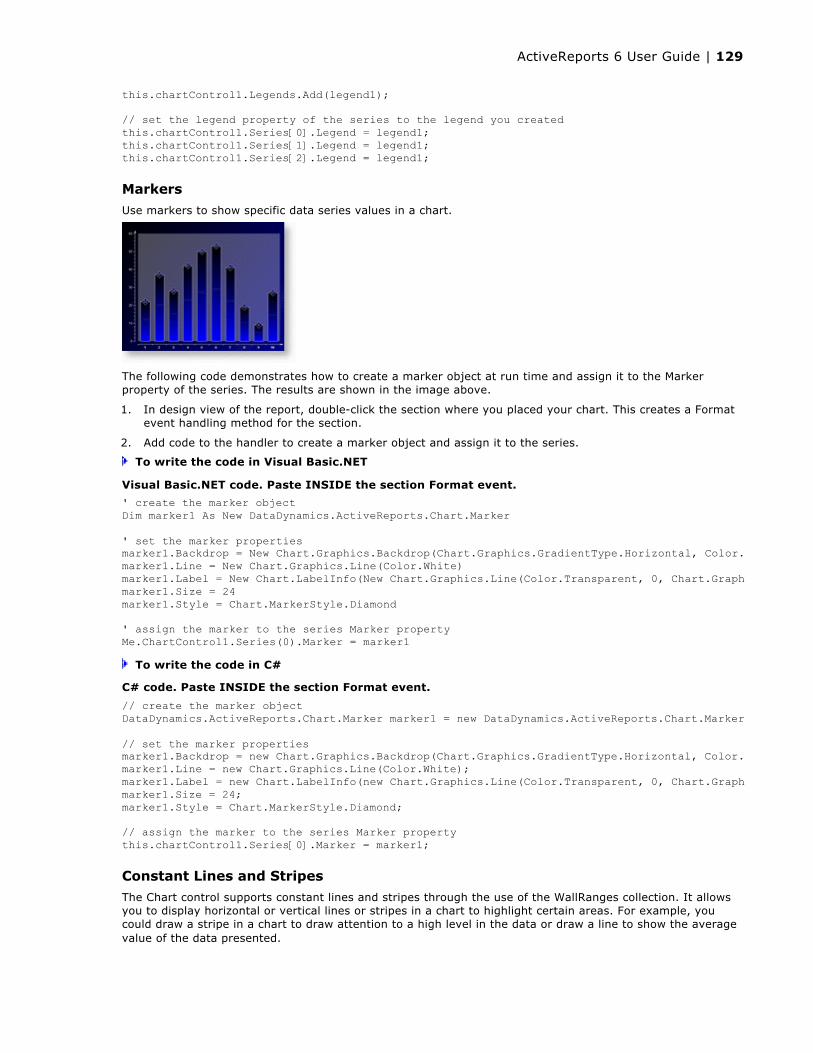
Markers
Use markers to show specific data series values in a chart.
The following code demonstrates how to create a marker object at run time and assign it to the Marker property of the series. The results are shown in the image above.
1. In design view of the report, double-click the section where you placed your chart. This creates a Format event handling method for the section.
2. Add code to the handler to create a marker object and assign it to the series.
To write the code in Visual Basic.NET
To write the code in C#
Constant Lines and Stripes
The Chart control supports constant lines and stripes through the use of the WallRanges collection. It allows you to display horizontal or vertical lines or stripes in a chart to highlight certain areas. For example, you could draw a stripe in a chart to draw attention to a high level in the data or draw a line to show the average value of the data presented.
this.chartControl1.Legends.Add(legend1); // set the legend property of the series to the legend you createdthis.chartControl1.Series[0].Legend = legend1;this.chartControl1.Series[1].Legend = legend1;this.chartControl1.Series[2].Legend = legend1;
Visual Basic.NET code. Paste INSIDE the section Format event.
' create the marker objectDim marker1 As New DataDynamics.ActiveReports.Chart.Marker
' set the marker propertiesmarker1.Backdrop = New Chart.Graphics.Backdrop(Chart.Graphics.GradientType.Horizontal, Color.Navy, Color.Black)marker1.Line = New Chart.Graphics.Line(Color.White)marker1.Label = New Chart.LabelInfo(New Chart.Graphics.Line(Color.Transparent, 0, Chart.Graphics.LineStyle.None), New Chart.Graphics.Backdrop(Chart.Graphics.BackdropStyle.Transparent, Color.White, Color.White, Chart.Graphics.GradientType.Vertical, System.Drawing.Drawing2D.HatchStyle.DottedGrid, Nothing, Chart.Graphics.PicturePutStyle.Stretched), New Chart.FontInfo(Color.White, New Font("Arial", 8.0F)), "{Value}", Chart.Alignment.Center)marker1.Size = 24marker1.Style = Chart.MarkerStyle.Diamond
' assign the marker to the series Marker propertyMe.ChartControl1.Series(0).Marker = marker1
C# code. Paste INSIDE the section Format event.
// create the marker objectDataDynamics.ActiveReports.Chart.Marker marker1 = new DataDynamics.ActiveReports.Chart.Marker();
// set the marker propertiesmarker1.Backdrop = new Chart.Graphics.Backdrop(Chart.Graphics.GradientType.Horizontal, Color.Navy, Color.Black);marker1.Line = new Chart.Graphics.Line(Color.White);marker1.Label = new Chart.LabelInfo(new Chart.Graphics.Line(Color.Transparent, 0, Chart.Graphics.LineStyle.None), new Chart.Graphics.Backdrop(Chart.Graphics.BackdropStyle.Transparent, Color.White, Color.White, Chart.Graphics.GradientType.Vertical, System.Drawing.Drawing2D.HatchStyle.DottedGrid, null, Chart.Graphics.PicturePutStyle.Stretched), new Chart.FontInfo(Color.White, new Font("Arial", 8F)), "{Value}", Chart.Alignment.Center);marker1.Size = 24;marker1.Style = Chart.MarkerStyle.Diamond;
// assign the marker to the series Marker propertythis.chartControl1.Series[0].Marker = marker1;
ActiveReports 6 User Guide | 129
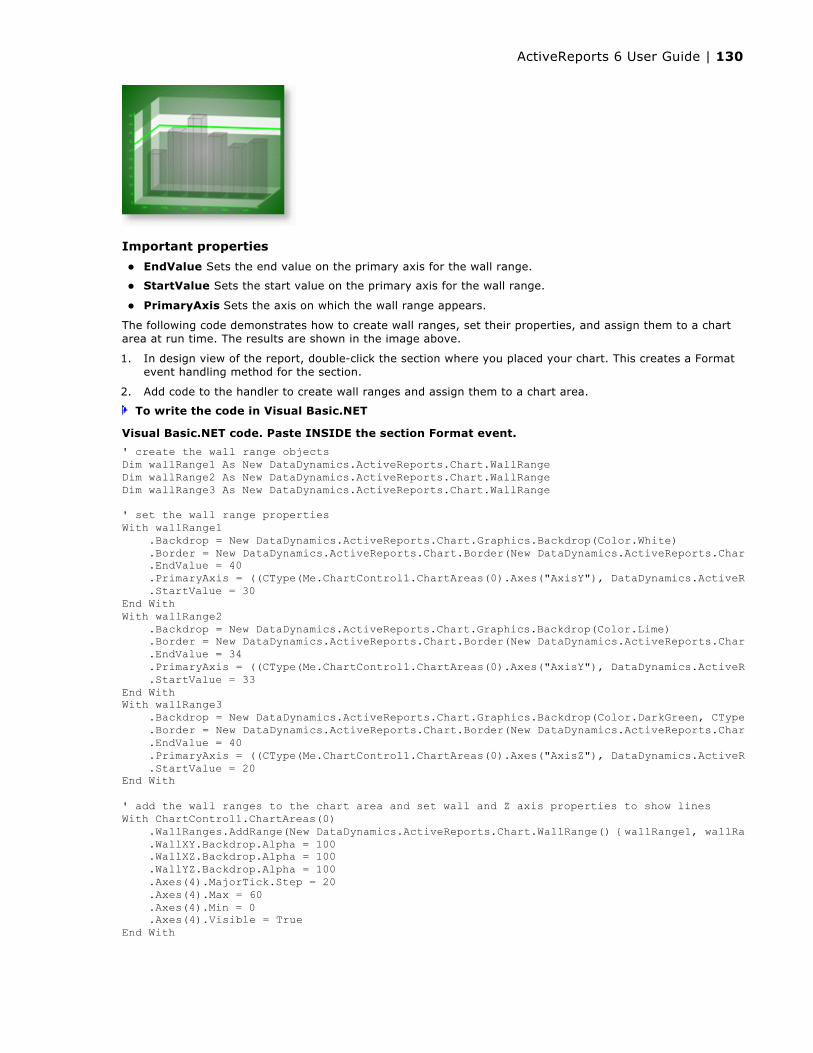
Important properties
EndValue Sets the end value on the primary axis for the wall range.
StartValue Sets the start value on the primary axis for the wall range.
PrimaryAxis Sets the axis on which the wall range appears.
The following code demonstrates how to create wall ranges, set their properties, and assign them to a chart area at run time. The results are shown in the image above.
1. In design view of the report, double-click the section where you placed your chart. This creates a Format event handling method for the section.
2. Add code to the handler to create wall ranges and assign them to a chart area.
To write the code in Visual Basic.NET
Visual Basic.NET code. Paste INSIDE the section Format event.
' create the wall range objectsDim wallRange1 As New DataDynamics.ActiveReports.Chart.WallRangeDim wallRange2 As New DataDynamics.ActiveReports.Chart.WallRangeDim wallRange3 As New DataDynamics.ActiveReports.Chart.WallRange
' set the wall range propertiesWith wallRange1 .Backdrop = New DataDynamics.ActiveReports.Chart.Graphics.Backdrop(Color.White) .Border = New DataDynamics.ActiveReports.Chart.Border(New DataDynamics.ActiveReports.Chart.Graphics.Line(Color.Transparent, 0, DataDynamics.ActiveReports.Chart.Graphics.LineStyle.None), 0, Color.Black) .EndValue = 40 .PrimaryAxis = ((CType(Me.ChartControl1.ChartAreas(0).Axes("AxisY"), DataDynamics.ActiveReports.Chart.Axis))) .StartValue = 30End WithWith wallRange2 .Backdrop = New DataDynamics.ActiveReports.Chart.Graphics.Backdrop(Color.Lime) .Border = New DataDynamics.ActiveReports.Chart.Border(New DataDynamics.ActiveReports.Chart.Graphics.Line(Color.Transparent, 0, DataDynamics.ActiveReports.Chart.Graphics.LineStyle.None), 0, Color.Black) .EndValue = 34 .PrimaryAxis = ((CType(Me.ChartControl1.ChartAreas(0).Axes("AxisY"), DataDynamics.ActiveReports.Chart.Axis))) .StartValue = 33End WithWith wallRange3 .Backdrop = New DataDynamics.ActiveReports.Chart.Graphics.Backdrop(Color.DarkGreen, CType(150, Byte)) .Border = New DataDynamics.ActiveReports.Chart.Border(New DataDynamics.ActiveReports.Chart.Graphics.Line(Color.Transparent, 0, DataDynamics.ActiveReports.Chart.Graphics.LineStyle.None), 0, Color.Black) .EndValue = 40 .PrimaryAxis = ((CType(Me.ChartControl1.ChartAreas(0).Axes("AxisZ"), DataDynamics.ActiveReports.Chart.Axis))) .StartValue = 20End With
' add the wall ranges to the chart area and set wall and Z axis properties to show linesWith ChartControl1.ChartAreas(0) .WallRanges.AddRange(New DataDynamics.ActiveReports.Chart.WallRange() {wallRange1, wallRange2, wallRange3}) .WallXY.Backdrop.Alpha = 100 .WallXZ.Backdrop.Alpha = 100 .WallYZ.Backdrop.Alpha = 100 .Axes(4).MajorTick.Step = 20 .Axes(4).Max = 60 .Axes(4).Min = 0 .Axes(4).Visible = TrueEnd With
ActiveReports 6 User Guide | 130
To write the code in C#
C# code. Paste INSIDE the section Format event.
// create the wall range objectsDataDynamics.ActiveReports.Chart.WallRange wallRange1 = new DataDynamics.ActiveReports.Chart.WallRange();DataDynamics.ActiveReports.Chart.WallRange wallRange2 = new DataDynamics.ActiveReports.Chart.WallRange();DataDynamics.ActiveReports.Chart.WallRange wallRange3 = new DataDynamics.ActiveReports.Chart.WallRange();
// set the wall range propertieswallRange1.Backdrop = new DataDynamics.ActiveReports.Chart.Graphics.Backdrop(System.Drawing.Color.White);wallRange1.Border = new DataDynamics.ActiveReports.Chart.Border(new DataDynamics.ActiveReports.Chart.Graphics.Line(System.Drawing.Color.Transparent, 0, DataDynamics.ActiveReports.Chart.Graphics.LineStyle.None), 0, System.Drawing.Color.Black);wallRange1.EndValue = 40;wallRange1.PrimaryAxis = (DataDynamics.ActiveReports.Chart.Axis)this.ChartControl1.ChartAreas[0].Axes["AxisY"];wallRange1.StartValue = 30;wallRange2.Backdrop = new DataDynamics.ActiveReports.Chart.Graphics.Backdrop(System.Drawing.Color.Lime);wallRange2.Border = new DataDynamics.ActiveReports.Chart.Border(new DataDynamics.ActiveReports.Chart.Graphics.Line(System.Drawing.Color.Transparent, 0, DataDynamics.ActiveReports.Chart.Graphics.LineStyle.None), 0, System.Drawing.Color.Black);wallRange2.EndValue = 34;wallRange2.PrimaryAxis = (DataDynamics.ActiveReports.Chart.Axis)this.ChartControl1.ChartAreas[0].Axes["AxisY"];wallRange2.StartValue = 33;wallRange3.Backdrop = new DataDynamics.ActiveReports.Chart.Graphics.Backdrop(System.Drawing.Color.DarkGreen);wallRange3.Border = new DataDynamics.ActiveReports.Chart.Border(new DataDynamics.ActiveReports.Chart.Graphics.Line(System.Drawing.Color.Transparent, 0, DataDynamics.ActiveReports.Chart.Graphics.LineStyle.None), 0, System.Drawing.Color.Black);wallRange3.EndValue = 40;wallRange3.PrimaryAxis = (DataDynamics.ActiveReports.Chart.Axis)this.ChartControl1.ChartAreas[0].Axes["AxisZ"];wallRange3.StartValue = 20;
// add the wall ranges to the chart area and set wall and Z axis properties to show linesthis.chartControl1.ChartAreas[0].WallRanges.AddRange(new DataDynamics.ActiveReports.Chart.WallRange[] {wallRange1,wallRange2,wallRange3});this.chartControl1.ChartAreas[0].WallXY.Backdrop.Alpha = 100;this.chartControl1.ChartAreas[0].WallXZ.Backdrop.Alpha = 100;this.chartControl1.ChartAreas[0].WallYZ.Backdrop.Alpha = 100;this.chartControl1.ChartAreas[0].Axes[4].MajorTick.Step = 20;this.chartControl1.ChartAreas[0].Axes[4].Max = 60;this.chartControl1.ChartAreas[0].Axes[4].Min = 0;this.chartControl1.ChartAreas[0].Axes[4].Visible = true;
ActiveReports 6 User Guide | 131
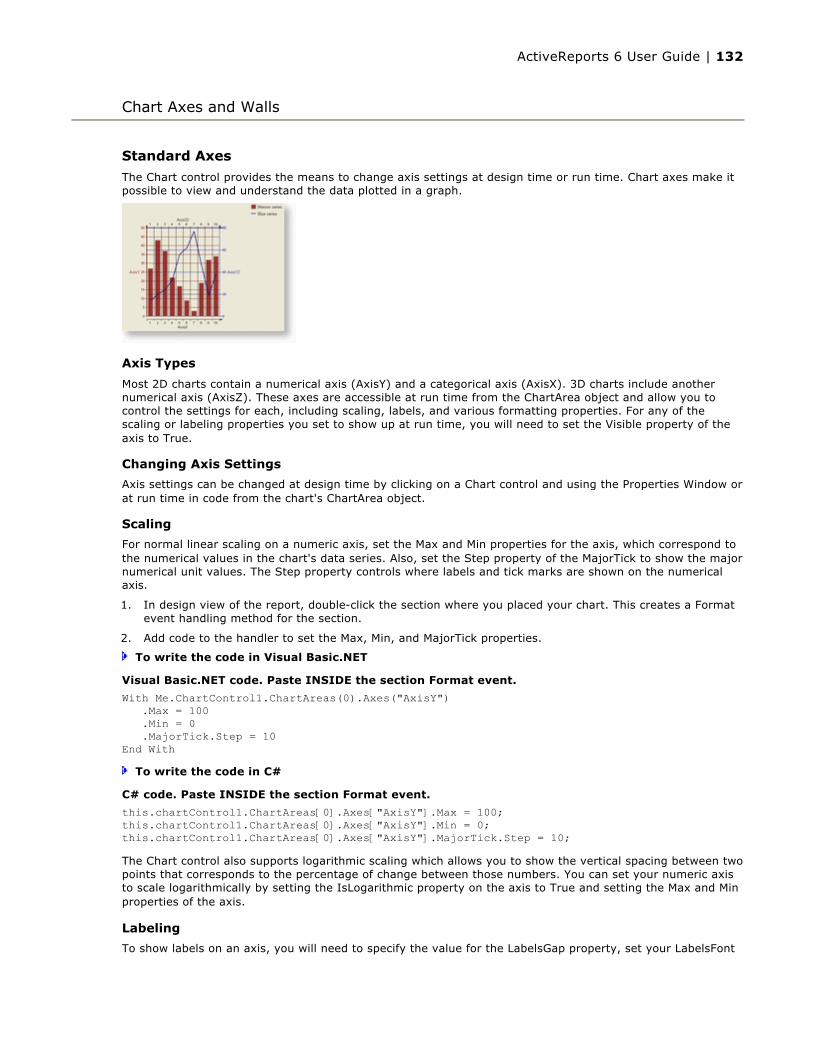
Standard Axes
The Chart control provides the means to change axis settings at design time or run time. Chart axes make it possible to view and understand the data plotted in a graph.
Axis Types
Most 2D charts contain a numerical axis (AxisY) and a categorical axis (AxisX). 3D charts include another numerical axis (AxisZ). These axes are accessible at run time from the ChartArea object and allow you to control the settings for each, including scaling, labels, and various formatting properties. For any of the scaling or labeling properties you set to show up at run time, you will need to set the Visible property of the axis to True.
Changing Axis Settings
Axis settings can be changed at design time by clicking on a Chart control and using the Properties Window or at run time in code from the chart's ChartArea object.
Scaling
For normal linear scaling on a numeric axis, set the Max and Min properties for the axis, which correspond to the numerical values in the chart's data series. Also, set the Step property of the MajorTick to show the major numerical unit values. The Step property controls where labels and tick marks are shown on the numerical axis.
1. In design view of the report, double-click the section where you placed your chart. This creates a Format event handling method for the section.
2. Add code to the handler to set the Max, Min, and MajorTick properties.
To write the code in Visual Basic.NET
To write the code in C#
The Chart control also supports logarithmic scaling which allows you to show the vertical spacing between two points that corresponds to the percentage of change between those numbers. You can set your numeric axis to scale logarithmically by setting the IsLogarithmic property on the axis to True and setting the Max and Min properties of the axis.
Labeling
To show labels on an axis, you will need to specify the value for the LabelsGap property, set your LabelsFont
Chart Axes and Walls
Visual Basic.NET code. Paste INSIDE the section Format event.
With Me.ChartControl1.ChartAreas(0).Axes("AxisY") .Max = 100 .Min = 0 .MajorTick.Step = 10End With
C# code. Paste INSIDE the section Format event.
this.chartControl1.ChartAreas[0].Axes["AxisY"].Max = 100;this.chartControl1.ChartAreas[0].Axes["AxisY"].Min = 0;this.chartControl1.ChartAreas[0].Axes["AxisY"].MajorTick.Step = 10;
ActiveReports 6 User Guide | 132

properties, and set LabelsVisible to True. These properties can be set in the AxisBase Collection editor, which is accessed at design time by clicking the ellipsis button next to the ChartAreas (Collection) property, then the Axes (Collection) property of the ChartArea.
Tip: Labels render first, and then the chart fills in the remaining area, so be sure to make the chart large enough if you use angled labels.
You can specify strings to be used for the labels instead of numerical values on an axis by using the Labels collection property at design time or assigning a string array to the Labels property at run time. You can also specify whether you want your axis labels to appear on the outside or inside of the axis line using the LabelsInside property. By default, labels appear outside the axis line.
Secondary Axes
By default, a Chart object includes secondary X and Y axes (AxisX2 and AxisY2). At design time or run time, you can specify a secondary axis to plot data against by setting all of the appropriate properties for AxisX2 or AxisY2, including the Visible property.
If you want to use two axes to show the same data as it appears on two different scales, you can set the primary axis to show the actual data value scale, for example, and set the secondary axis to show a logarithmic scale.
1. In design view of the report, double-click the section where you placed your chart. This creates a Format event handling method for the section.
2. Add code to the handler to create a primary axis with actual data, and a secondary axis with a logarithmic scale.
To write the code in Visual Basic.NET
To write the code in C#
Custom Axes
The Chart control supports the creation of additional custom axes through the use of the chart's CustomAxes collection. Once a custom axis has been added to the collection, in addition to setting the normal axis properties, you will need to set the following properties:
Parent - The Parent property allows you to choose the primary or secondary axis on which your custom axis resides.
Visual Basic.NET code. Paste INSIDE the section Format event.
' set properties for AxisY (primary axis)With Me.ChartControl1.ChartAreas(0).Axes("AxisY") .Max = 25 .Min = 0 .MajorTick.Step = 5End With
' set properties for AxisY2 (secondary Y axis)With Me.ChartControl1.ChartAreas(0).Axes("AxisY2") .Max = 1000 .Min = 0 .MajorTick.Step = 200 ' set the scaling for the secondary axis to logarithmic .AxisType = DataDynamics.ActiveReports.Chart.AxisType.Logarithmic.Visible = TrueEnd With
C# code. Paste INSIDE the section Format event.
// set properties for AxisY (primary axis)this.chartControl1.ChartAreas[0].Axes["AxisY"].Max = 25;this.chartControl1.ChartAreas[0].Axes["AxisY"].Min = 0;this.chartControl1.ChartAreas[0].Axes["AxisY"].MajorTick.Step = 5;
// set properties for AxisY2 (secondary Y axis)this.chartControl1.ChartAreas[0].Axes["AxisY2"].Max = 1000;this.chartControl1.ChartAreas[0].Axes["AxisY2"].Min = 0;this.chartControl1.ChartAreas[0].Axes["AxisY2"].MajorTick.Step = 200;// set the axis type for the secondary axis to logarithmicthis.chartControl1.ChartAreas[0].Axes["AxisY2"].AxisType = DataDynamics.ActiveReports.Chart.AxisType.Logarithmic;this.chartControl1.ChartAreas[0].Axes["AxisY2"].Visible = true;
ActiveReports 6 User Guide | 133
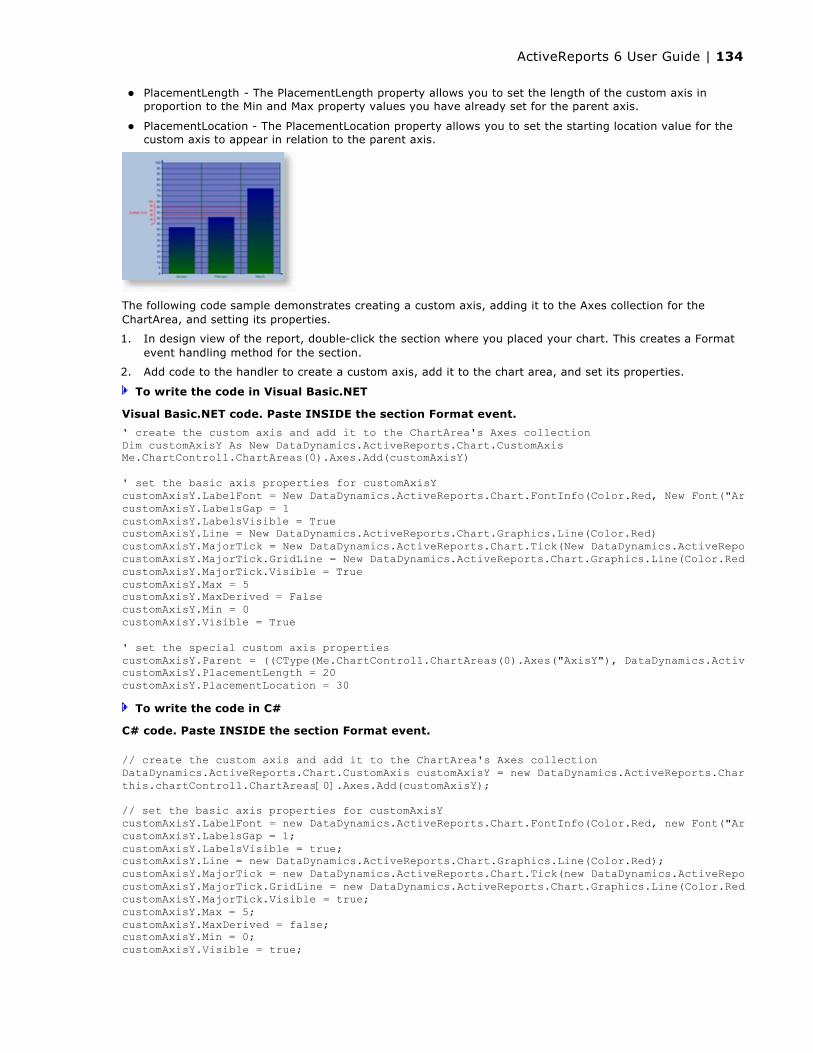
PlacementLength - The PlacementLength property allows you to set the length of the custom axis in proportion to the Min and Max property values you have already set for the parent axis.
PlacementLocation - The PlacementLocation property allows you to set the starting location value for the custom axis to appear in relation to the parent axis.
The following code sample demonstrates creating a custom axis, adding it to the Axes collection for the ChartArea, and setting its properties.
1. In design view of the report, double-click the section where you placed your chart. This creates a Format event handling method for the section.
2. Add code to the handler to create a custom axis, add it to the chart area, and set its properties.
To write the code in Visual Basic.NET
To write the code in C#
Visual Basic.NET code. Paste INSIDE the section Format event.
' create the custom axis and add it to the ChartArea's Axes collectionDim customAxisY As New DataDynamics.ActiveReports.Chart.CustomAxisMe.ChartControl1.ChartAreas(0).Axes.Add(customAxisY)
' set the basic axis properties for customAxisYcustomAxisY.LabelFont = New DataDynamics.ActiveReports.Chart.FontInfo(Color.Red, New Font("Arial", 7.0!))customAxisY.LabelsGap = 1customAxisY.LabelsVisible = TruecustomAxisY.Line = New DataDynamics.ActiveReports.Chart.Graphics.Line(Color.Red)customAxisY.MajorTick = New DataDynamics.ActiveReports.Chart.Tick(New DataDynamics.ActiveReports.Chart.Graphics.Line(Color.Red, 1), New DataDynamics.ActiveReports.Chart.Graphics.Line(Color.Red, 1), 1, 2.0F, True)customAxisY.MajorTick.GridLine = New DataDynamics.ActiveReports.Chart.Graphics.Line(Color.Red, 1, LineStyle.Solid)customAxisY.MajorTick.Visible = TruecustomAxisY.Max = 5customAxisY.MaxDerived = FalsecustomAxisY.Min = 0customAxisY.Visible = True
' set the special custom axis propertiescustomAxisY.Parent = ((CType(Me.ChartControl1.ChartAreas(0).Axes("AxisY"), DataDynamics.ActiveReports.Chart.Axis)))customAxisY.PlacementLength = 20customAxisY.PlacementLocation = 30
C# code. Paste INSIDE the section Format event.
// create the custom axis and add it to the ChartArea's Axes collectionDataDynamics.ActiveReports.Chart.CustomAxis customAxisY = new DataDynamics.ActiveReports.Chart.CustomAxis();this.chartControl1.ChartAreas[0].Axes.Add(customAxisY);
// set the basic axis properties for customAxisYcustomAxisY.LabelFont = new DataDynamics.ActiveReports.Chart.FontInfo(Color.Red, new Font("Arial", 7F, FontStyle.Regular, GraphicsUnit.Point, ((System.Byte)(0))));customAxisY.LabelsGap = 1;customAxisY.LabelsVisible = true;customAxisY.Line = new DataDynamics.ActiveReports.Chart.Graphics.Line(Color.Red);customAxisY.MajorTick = new DataDynamics.ActiveReports.Chart.Tick(new DataDynamics.ActiveReports.Chart.Graphics.Line(Color.Red, 1), new DataDynamics.ActiveReports.Chart.Graphics.Line(Color.Red, 1), 1, 2F, true);customAxisY.MajorTick.GridLine = new DataDynamics.ActiveReports.Chart.Graphics.Line(Color.Red, 1, LineStyle.Solid);customAxisY.MajorTick.Visible = true;customAxisY.Max = 5;customAxisY.MaxDerived = false;customAxisY.Min = 0;customAxisY.Visible = true;
ActiveReports 6 User Guide | 134

Gridlines and Tick Marks
Gridlines and tick marks are generally used to help increase the readability of a chart.
Types
There are two kinds of gridlines and tick marks in the Chart control: major and minor. The properties for the major gridlines and tick marks are set on the MajorTick object of the particular axis and the properties for minor gridlines and ticks are set on the MinorTick object of the axis. The location for any labels shown for the axis are determined by the Step property of the MajorTick object.
Step and TickLength
For either the MajorTick or MinorTick objects, you can define where the tick marks and gridlines will appear by setting the Step property. The TickLength property allows you to set how far outside of the axis line the tick mark will extend.
Visible
To make any defined major or minor tick marks to show up at design time or run time, the Visible property of the MajorTick or MinorTick object must be set to True. To show major or minor gridlines at design time or run time, the Visible property of the WallXY object as well as that of the MajorTick or MinorTick object must be set to True.
// set the special custom axis propertiescustomAxisY.Parent = (DataDynamics.ActiveReports.Chart.Axis)this.ChartControl1.ChartAreas[0].Axes["AxisY"];customAxisY.PlacementLength = 20;customAxisY.PlacementLocation = 30;
ActiveReports 6 User Guide | 135
Bound Data
The Chart control has its own data source which is distinct from the report data source. To access the chart's data source, click the Data Source verb which appears below the Properties window when the chart is selected on the report. If the Data Source verb does not appear, see Access the Chart Wizard and Data Source for help.
Unbound DataThe Chart control allows you to set the data source for a chart control, series, or data points collection at run time.
Any of the following objects can be used as data sources:
Dataset
Dataset Column
Data Table
SqlCommand/OleDbCommand
SqlDataAdapter/OleDbDataAdapter
Array
XML data
Below are some examples of binding to different data sources at run time.
Dataset
The Chart control's DataSource property can be set to a dataset at run time. The following code demonstrates how to set up a dataset, set the DataSource property to the dataset, create a series, and set the ValueMembersY property to the dataset expression at run time.
1. In design view of the report, double-click the section where you placed your chart. This creates a Format event handling method for the section.
2. Add code to the handler to create a data source and bind a series to a dataset expression.
To write the code in Visual Basic.NET
To write the code in C#
Chart Data
Visual Basic.NET code. Paste INSIDE the section Format event.
' create the seriesDim s As New DataDynamics.ActiveReports.Chart.SeriesDim m_cnnString As String = "Provider=Microsoft.Jet.OLEDB.4.0;Data Source=C:/Northwind.mdb; Persist Security Info=False"Dim m_cnn As New System.Data.OleDb.OleDbConnection(m_cnnString)Dim oDBAdapter As System.Data.OleDb.OleDbDataAdapter
' create the datasetDim oDS As DataSetoDBAdapter = New System.Data.OleDb.OleDbDataAdapter("SELECT ShipCountry, SUM(Freight) AS Expr1 FROM Orders GROUP BY ShipCountry", m_cnnString)oDS = New DataSetoDBAdapter.Fill(oDS, "Expr1")
' set the DataSource and ValueMembersY propertiesMe.ChartControl1.DataSource = oDSs.ValueMembersY = "Expr1"
Me.ChartControl1.Series.Add(s)
C# code. Paste INSIDE the section Format event.
// create the seriesDataDynamics.ActiveReports.Chart.Series s = new DataDynamics.ActiveReports.Chart.Series();string m_cnnString = "Provider=Microsoft.Jet.OLEDB.4.0;Data Source=C:/Northwind.mdb;Persist Security Info=False"; System.Data.OleDb.OleDbConnection m_cnn = new System.Data.OleDb.OleDbConnection(m_cnnString);
ActiveReports 6 User Guide | 136

Dataset Column
In the Chart control, the ValueMembersX and ValueMembersY properties of a series can be set to a dataset column. The following code demonstrates how to create a series, set up a dataset, set the DataSource property to the dataset, and set the ValueMembersY and ValueMembersX properties to dataset columns at run time.
1. In design view of the report, double-click the section where you placed your chart. This creates a Format event handling method for the section.
2. Add code to the handler to create a data source and bind a series to dataset columns.
To write the code in Visual Basic.NET
To write the code in C#
Data Command
System.Data.OleDb.OleDbDataAdapter oDBAdapter;
// create the datasetSystem.Data.DataSet oDS;oDBAdapter = new System.Data.OleDb.OleDbDataAdapter("SELECT ShipCountry, SUM(Freight) AS Expr1 FROM Orders GROUP BY ShipCountry", m_cnnString);oDS = new System.Data.DataSet();oDBAdapter.Fill(oDS, "Expr1");
// set the DataSource and ValueMembersY propertiesthis.chartControl1.DataSource = oDS;s.ValueMembersY = "Expr1";
this.chartControl1.Series.Add(s);
Visual Basic.NET code. Paste INSIDE the section Format event.
' create the seriesDim s As New DataDynamics.ActiveReports.Chart.SeriesDim m_cnnString As String = "Provider=Microsoft.Jet.OLEDB.4.0;Data Source=C:/Northwind.mdb; Persist Security Info=False"Dim m_cnn As New System.Data.OleDb.OleDbConnection(m_cnnString)Dim oDBAdapter As System.Data.OleDb.OleDbDataAdapter
' create the datasetDim oDS As DataSetoDBAdapter = New System.Data.OleDb.OleDbDataAdapter("SELECT * from Orders WHERE OrderDate < #08/17/1994#", m_cnnString)oDS = New DataSetoDBAdapter.Fill(oDS, "Orders")
' set the DataSource, ValueMembersY, and ValueMembersX propertiesMe.ChartControl1.DataSource = oDSMe.ChartControl1.Series.Add(s)Me.ChartControl1.Series(0).ValueMembersY = oDS.Tables("Orders").Columns(7).ColumnNameMe.ChartControl1.Series(0).ValueMemberX = oDS.Tables("Orders").Columns(8).ColumnName
C# code. Paste INSIDE the section Format event.
// create the seriesDataDynamics.ActiveReports.Chart.Series s = new DataDynamics.ActiveReports.Chart.Series();string m_cnnString = "Provider=Microsoft.Jet.OLEDB.4.0;Data Source=C:/Northwind.mdb;Persist Security Info=False"; System.Data.OleDb.OleDbConnection m_cnn = new System.Data.OleDb.OleDbConnection(m_cnnString); System.Data.OleDb.OleDbDataAdapter oDBAdapter;
// create the datasetSystem.Data.DataSet oDS;oDBAdapter = new System.Data.OleDb.OleDbDataAdapter("SELECT * from Orders WHERE OrderDate < #08/17/1994#", m_cnnString);oDS = new System.Data.DataSet();oDBAdapter.Fill(oDS, "Orders");
// set the DataSource, ValueMembersY, and ValueMembersX propertiesthis.chartControl1.DataSource = oDS;this.chartControl1.Series.Add(s);this.chartControl1.Series[0].ValueMembersY = oDS.Tables["Orders"].Columns[7].ColumnName;this.chartControl1.Series[0].ValueMemberX = oDS.Tables["Orders"].Columns[8].ColumnName;
ActiveReports 6 User Guide | 137
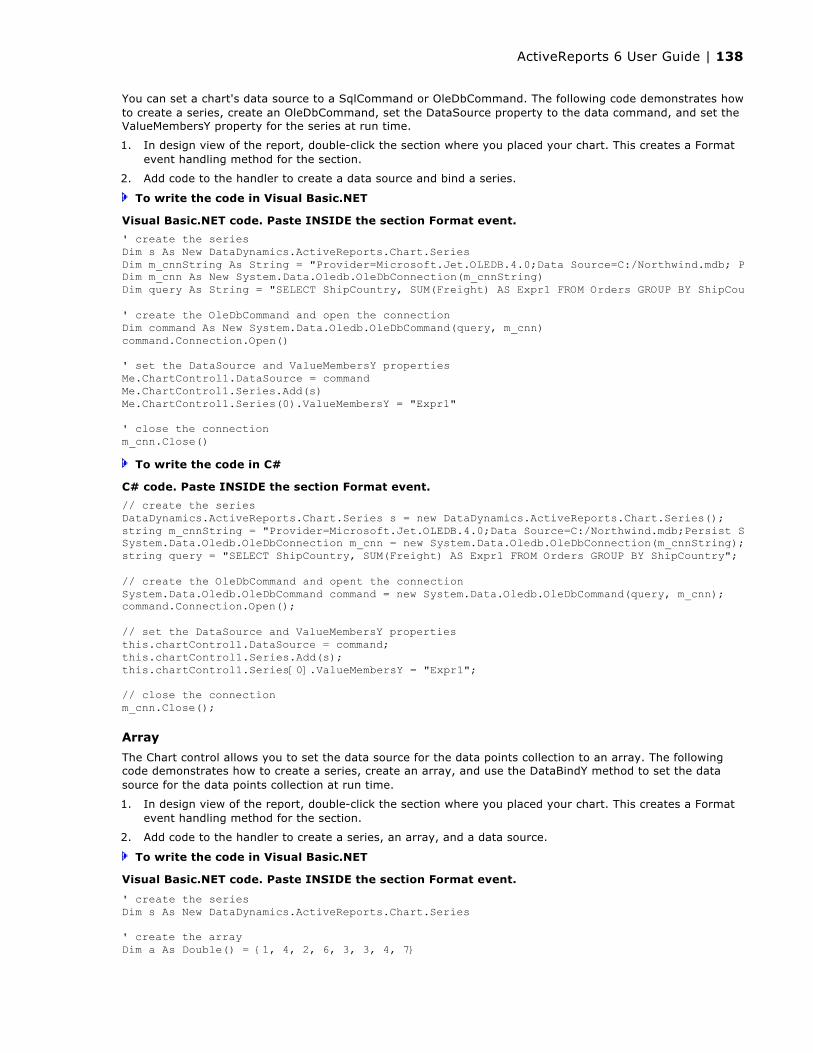
You can set a chart's data source to a SqlCommand or OleDbCommand. The following code demonstrates how to create a series, create an OleDbCommand, set the DataSource property to the data command, and set the ValueMembersY property for the series at run time.
1. In design view of the report, double-click the section where you placed your chart. This creates a Format event handling method for the section.
2. Add code to the handler to create a data source and bind a series.
To write the code in Visual Basic.NET
To write the code in C#
Array
The Chart control allows you to set the data source for the data points collection to an array. The following code demonstrates how to create a series, create an array, and use the DataBindY method to set the data source for the data points collection at run time.
1. In design view of the report, double-click the section where you placed your chart. This creates a Format event handling method for the section.
2. Add code to the handler to create a series, an array, and a data source.
To write the code in Visual Basic.NET
Visual Basic.NET code. Paste INSIDE the section Format event.
' create the seriesDim s As New DataDynamics.ActiveReports.Chart.SeriesDim m_cnnString As String = "Provider=Microsoft.Jet.OLEDB.4.0;Data Source=C:/Northwind.mdb; Persist Security Info=False"Dim m_cnn As New System.Data.Oledb.OleDbConnection(m_cnnString)Dim query As String = "SELECT ShipCountry, SUM(Freight) AS Expr1 FROM Orders GROUP BY ShipCountry"
' create the OleDbCommand and open the connectionDim command As New System.Data.Oledb.OleDbCommand(query, m_cnn)command.Connection.Open()
' set the DataSource and ValueMembersY propertiesMe.ChartControl1.DataSource = commandMe.ChartControl1.Series.Add(s)Me.ChartControl1.Series(0).ValueMembersY = "Expr1"
' close the connectionm_cnn.Close()
C# code. Paste INSIDE the section Format event.
// create the seriesDataDynamics.ActiveReports.Chart.Series s = new DataDynamics.ActiveReports.Chart.Series();string m_cnnString = "Provider=Microsoft.Jet.OLEDB.4.0;Data Source=C:/Northwind.mdb;Persist Security Info=False"; System.Data.Oledb.OleDbConnection m_cnn = new System.Data.Oledb.OleDbConnection(m_cnnString); string query = "SELECT ShipCountry, SUM(Freight) AS Expr1 FROM Orders GROUP BY ShipCountry";
// create the OleDbCommand and opent the connectionSystem.Data.Oledb.OleDbCommand command = new System.Data.Oledb.OleDbCommand(query, m_cnn);command.Connection.Open();
// set the DataSource and ValueMembersY propertiesthis.chartControl1.DataSource = command;this.chartControl1.Series.Add(s);this.chartControl1.Series[0].ValueMembersY = "Expr1";
// close the connection m_cnn.Close();
Visual Basic.NET code. Paste INSIDE the section Format event.
' create the seriesDim s As New DataDynamics.ActiveReports.Chart.Series
' create the arrayDim a As Double() = {1, 4, 2, 6, 3, 3, 4, 7}
ActiveReports 6 User Guide | 138

To write the code in C#
Calculated Series
You can easily create a calculated series based on the values of one or more series by setting the ValueMembersY property of a series to a formula. To reference a series in the formula, use the name of the series. The following code demonstrates how to create two series, one bound to a data array and the other bound to a formula based on the Y values of the first series.
1. In design view of the report, double-click the section where you placed your chart. This creates a Format event handling method for the section.
2. Add code to the handler to create a data bound series and a calculated series.
To write the code in Visual Basic.NET
To write the code in C#
Sequence Series
Set a sequence series by specifying the minimum value, maximum value, and step for the series. The following code shows how to set the ValueMembersY property at run time to create a sequence series.
1. In design view of the report, double-click the section where you placed your chart. This creates a Format event handling method for the section.
2. Add code to the handler to add a series to the chart and set its members.
To write the code in Visual Basic.NET
' set the data source for the data points collectionMe.ChartControl1.Series.Add(s)Me.ChartControl1.Series(0).Points.DataBindY(a)
C# code. Paste INSIDE the section Format event.
// create the seriesDataDynamics.ActiveReports.Chart.Series s = new DataDynamics.ActiveReports.Chart.Series();
// create the arraydouble [] a = {1,4,2,6,3,3,4,7};
// set the data source for the data points collectionthis.chartControl1.Series.Add(s);this.chartControl1.Series[0].Points.DataBindY(a);
Visual Basic.NET code. Paste INSIDE the FetchData event.
Dim s As New DataDynamics.ActiveReports.Chart.SeriesDim cS As New DataDynamics.ActiveReports.Chart.SeriesDim a As Double() = {1, 4, 2, 6, 3, 3, 4, 7}
Me.ChartControl1.Series.AddRange(New DataDynamics.ActiveReports.Chart.Series() {s, cS})Me.ChartControl1.Series(0).Points.DataBindY(a)Me.ChartControl1.Series(0).Name = "Series1"Me.ChartControl1.Series(1).ValueMembersY = "Series1.Y[0]+10"
C# code. Paste INSIDE the FetchData event.
DataDynamics.ActiveReports.Chart.Series s = new DataDynamics.ActiveReports.Chart.Series();DataDynamics.ActiveReports.Chart.Series cS = new DataDynamics.ActiveReports.Chart.Series();double [] a = { 1,4,2,6,3,3,4,7};
this.chartControl1.Series.AddRange(new DataDynamics.ActiveReports.Chart.Series[] {s, cS});this.chartControl1.Series[0].Name = "Series1";this.chartControl1.Series[0].Points.DataBindY(a);this.chartControl1.Series[1].ValueMembersY = "Series1.Y[0]+10";
Visual Basic.NET code. Paste INSIDE the section Format event.
Dim s As New DataDynamics.ActiveReports.Chart.SeriesMe.ChartControl1.Series.Add(s)Me.ChartControl1.Series(0).ValueMembersY = "sequence(12,48,4)"
ActiveReports 6 User Guide | 139

To write the code in C#
XML Data
The Chart control allows you to set the data source to an XML document. The following code demonstrates how to create a series and to set the ValueMembersY and ValueMemberX properties at run time.
1. In design view of the report, double-click the section where you placed your chart. This creates a Format event handling method for the section.
2. Add code to the handler to add a series to the chart and set its members.
To write the code in Visual Basic.NET
To write the code in C#
C# code. Paste INSIDE the section Format event.
DataDynamics.ActiveReports.Chart.Series s = new DataDynamics.ActiveReports.Chart.Series();this.chartControl1.Series.Add(s);this.chartControl1.Series[0].ValueMembersY = "sequence(12,48,4)";
Visual Basic.NET code. Paste INSIDE the section Format event.
' create the seriesDim s As New DataDynamics.ActiveReports.Chart.Series()Dim xmlDS As New DataDynamics.ActiveReports.DataSources.XMLDataSource("c:/customer.xml", "//CUSTOMER")
' set the DataSource, ValueMembersY and ValueMemberX propertiesMe.ChartControl1.DataSource = xmlDSMe.ChartControl1.Series.Add(s)Me.ChartControl1.Series(0).ValueMembersY = "xpath:ORDER/ITEM/PRICE"Me.ChartControl1.Series(0).ValueMemberX = "xpath:ORDER/ITEM/AUTHOR"
C# code. Paste INSIDE the section Format event.
// create the seriesDataDynamics.ActiveReports.Chart.Series s = new DataDynamics.ActiveReports.Chart.Series();DataDynamics.ActiveReports.DataSources.XMLDataSource xmlDS = new XMLDataSource("c:/customer.xml","//CUSTOMER");
// set the DataSource, ValueMembersY and ValueMemberX propertiesthis.chartControl1.DataSource = xmlDS;this.chartControl1.Series.Add(s);this.chartControl1.Series[0].ValueMembersY = "xpath:ORDER/ITEM/PRICE";this.chartControl1.Series[0].ValueMemberX = "xpath:ORDER/ITEM/AUTHOR";
ActiveReports 6 User Guide | 140

The RichText control gives you an enormous amount of control over the appearance of text in the report. Unlike the TextBox control which applies formatting to the entire contents of the control, the RichText control allows you to apply selective formatting to various areas of text within the control.
For example, the Find method allows you to find specific words or characters in the control, while the various selection properties allow you to select text and change its formatting in a dozen ways.
You can set the control's text directly using the Text, Html, or RTF properties, or you can load it from a plain text, RTF or HTML file or stream using the Load method.
Use the InsertField and ReplaceField methods for field merging reports, such as the mail merge report demonstrated in the Mail Merge with RichText walkthrough. The RichTextBox now automatically binds inserted fields to the report's fields collection, so you only need to use InsertField and ReplaceField for special cases such as conditional values or system dates.
The following is a list of all of the HTML tags that can be used with the RichText control. Unsupported tags are ignored. Please note that W3C conventions are strictly observed.
Supported HTML Tags
The style attribute of <FONT>, <P>, and <TABLE> supports the following properties:
Supported Style Attribute Properties
RichText
Tip: In order to show special characters in an html file loaded into the control, use the character entity reference (for example, è for è or & for &).
Note: If you have trouble loading a file at design time, be sure that you are not in edit mode. You are in edit mode if your cursor appears inside the control.
Tag Description Attributes<B> Bold none<I> Italic none<P> Paragraph align, style<STRONG> Strong (looks like bold) none<BIG> Big none<SMALL> Small none<PRE> Preformatted none<FONT> Font face, size, color, style (see notes for style attributes)<BODY> The body tag background, text, leftmargin<H1> -<H6>
Heading levels one through six
none
<BR> Line break none
<EM>Emphasized (looks like Italics)
none
<U> Underlined none<IMG> Image align, height, src, width<SUP> Superscript none<SUB> Subscript none<CENTER> Center alignment none<TABLE> Table align, border, cellpadding, cellspacing, height, style, width<TR> Table row align<TH> Table head none<TD> Table datum align, border, colspan, rowspan, width
<LI> List itemnone (nested levels automatically use disc, then circle, then square bullets)
<OL> Ordered list type<UL> Unordered list type, value<STRIKE> Strike through none
border-bottom border-top-width margin-top
ActiveReports 6 User Guide | 141

border-bottom-width
border-color
border-left
border-left-width
border-right
border-right-width
border-style
border-top
border-width
font-family
font-size
height
line-height
margin-bottom
margin-left
margin-right
padding-bottom
padding-left
padding-right
padding-top
table-layout
text-align
text-indent
width
ActiveReports 6 User Guide | 142
When you add a pair of group header and group footer sections to a report, the new sections appear immediately above and below the detail section.
Set group header section's DataField property to the field on which you want to group the report. For best results, in the SQL query, order the data by the grouping field.
When you run the report, it renders the group header, followed by all related instances of the detail section, and then the group footer. It renders a new group header section for each instance of the grouping field.
Controls in the group header render once for each instance of the group, so this is a good place for column header labels to describe the data in the detail fields.
Group options
With the group header selected in the Properties window, there are a number of properties that allow you to control group header behavior.
For more information on columnar reporting, see Columnar Reports. For more information on KeepTogether options, see KeepTogether Options.
Grouping Data
Note: You cannot add a header section without a corresponding footer section. If you try to do so in code, the results are highly unstable.
You can, however, hide one of the sections. To hide a section, set its Visible property to False, or set its Height property to 0.
Property DescriptionColumnGroupKeepTogether If possible, keeps grouped items together in a single column.
ColumnLayout If True, lays out the group header with the same number of columns as the detail section.
DataField Sets the field on which to group the report.GroupKeepTogether If possible, keeps grouped items together on a single page.KeepTogether If possible, keeps the section together on a single page.NewColumn Tells the group to begin a new column before or after the group field changes.NewPage Tells the group to begin a new page before or after the group field changes.
RepeatStyleAllows you to have the group header render on each page or column for long groups.
UnderlayNext
If True, renders the group header as a layer underneath the following section. This is useful if you want to render a group header control in the same row as data in a nested group header or in the detail section. Take care to leave the BackColor property set to Transparent in the following section, or the group header is hidden.
ActiveReports 6 User Guide | 143

You can nest group header and footer pairs and group each on a different field.
See the image below for the order in which report sections appear on the report. GroupHeader1 in the image was added first and appears above the other two group headers, while GroupFooter1, its partner, appears below the other two group footers.
When you run a report with multiple groupings like the one above, the sections print in an order like the following:
1. ReportHeader1 prints once and does not repeat.
2. PageHeader1 prints once at the top of each page.
3. GroupHeader1 prints once for the first value its DataField returns.
4. GroupHeader2 prints once for the first value its DataField returns within the context of GroupHeader1's DataField value.
5. GroupHeader3 prints once for the first value its DataField returns within the context of GroupHeader2's DataField value.
6. Detail1 prints once for each record that falls within the context of GroupHeader3's DataField value.
7. GroupFooter3 prints once at the end of the records that fall within the context of GroupHeader3's DataField value.
8. GroupHeader3 may print again, if more values return within the context of GroupHeader2's DataField value.
9. Each time GroupHeader3 prints again, it is followed by Detail1 (once for each related record) and GroupFooter3.
10. GroupFooter2 prints once after GroupFooter3.
11. GroupHeader2 may print again, if more values return within the context of GroupHeader1's DataField value.
12. Each time GroupHeader2 prints again, it is followed by Detail1 (once for each related record) and GroupFooter2.
13. GroupFooter1 prints once after GroupFooter2.
14. GroupHeader1 prints once for the second value its DataField returns, followed by GroupHeader2, and so on in a pattern similar to the one above.
15. PageFooter1 prints once at the bottom of each page. (Its position within groupings varies.)
16. ReportFooter1 prints once at the end of the report.
You can add up to 32 groupings in one report. With many groupings, you might find the need to rearrange the order of your groups. If your report has more than one group and you right-click the report surface, you
Multiple Groupings
Important: As with any group header and footer pair, group your data on the fields that you specify in the DataField property of the group header, but in the order of your groups. For example:
SELECT * FROM Customers ORDER BY GroupHeader1DataField, GroupHeader2DataField, GroupHeader3DataField
ActiveReports 6 User Guide | 144
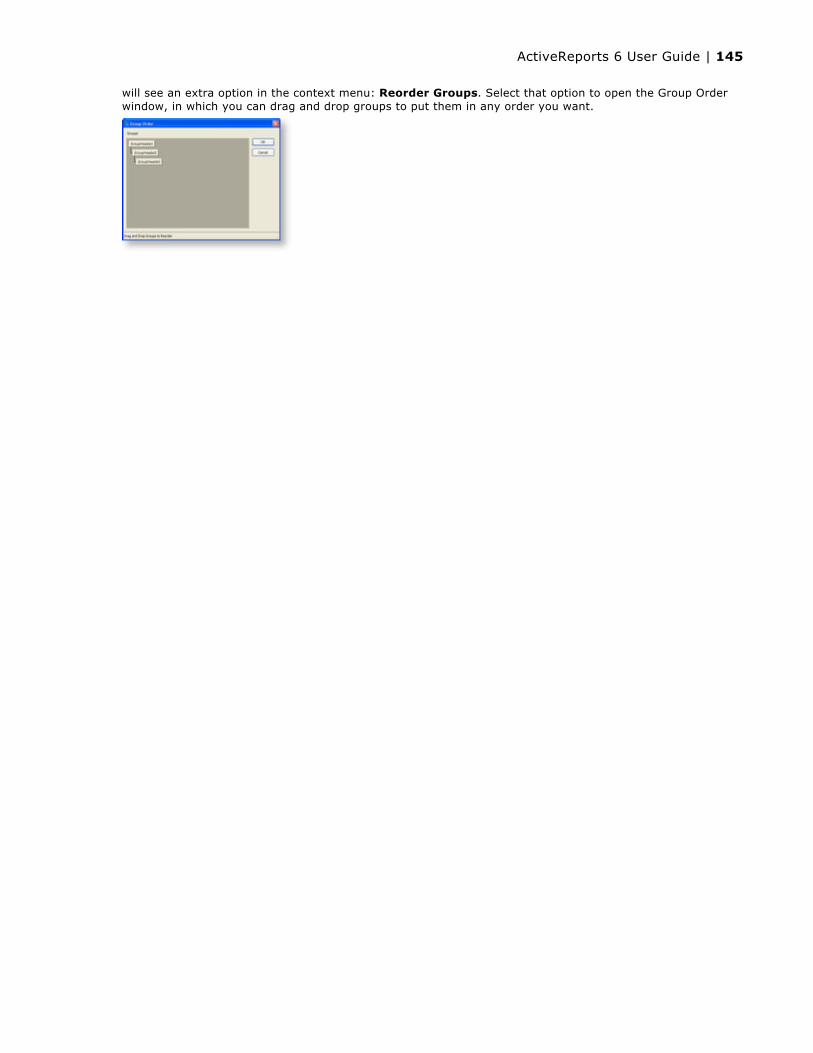
will see an extra option in the context menu: Reorder Groups. Select that option to open the Group Order window, in which you can drag and drop groups to put them in any order you want.
ActiveReports 6 User Guide | 145
In ActiveReports, you can embed a report in another report using the Subreport control. Once you place the Subreport control on a report, you attach a report object to it in code. You can pass parameters to the subreport from the main report, ensuring that data related to the main report displays in each instance of the subreport.
Since they render inside the main report, subreports are disconnected from any concept of a printed page. For this reason, page-dependent features are not supported for use in subreports. Keep any such logic in the main report. Page-related concepts that are not supported in subreports include:
Page numbers
Page header and footer sections (delete these sections to save processing time)
KeepTogether properties
GroupKeepTogether properties
NewPage properties
Because of the high overhead of running a second report and embedding it in the first, it is generally best to instead use grouping wherever possible. If grouping cannot accommodate your particular report, use subreports. Some uses of subreports include:
Repeating groups
Relational data
Multiple data sources
Multiple detail sections
As a best practice, create an instance of the report for your Subreport control in the ReportStart event of the main report, and then dispose of it in the ReportEnd event. In this way, you are creating only one subreport instance when you run the main report.
If you instantiate the subreport in a section Format event, it creates a new instance of the subreport each time the section processes. This consumes a lot of memory and processing time, especially in a report that processes a large amount of data.
Subreports
ActiveReports 6 User Guide | 146

Events that are Raised Only Once
The following events are all of the events that are raised only once during a report's processing. These events are raised at the beginning and at the end of the report processing cycle.
ReportStart
This event is raised before the DataInitialize event. Use this event to initialize any objects or variables needed while running a report. Also use this event to set any Subreport control objects to a new instance of the report assigned to the Subreport control. Do not add items dynamically to a report once this event has finished.
DataInitialize
This event is raised after ReportStart. Use it to add custom fields to the report's Fields collection. Custom fields can be added to a bound report (one that uses a Data Control to connect and retrieve records) or an unbound report (one that does not depend on a data control to get its records). In a bound report the dataset is opened and the dataset fields are added to the custom fields collection, then the DataInitialize event is raised so new custom fields can be added. The DataInitialize event can also be used to make adjustments to the DataSource or to set up database connectivity.
ReportEnd
This event is raised after the report finishes processing. Use this event to close or free any objects that you were using while running a report in unbound mode, or to display information or messages to the end user. This event can also be used to export reports.
Events that are Raised Multiple Times
The following ActiveReports events are raised multiple times during a report's processing.
FetchData
This event is raised every time a new record is processed. The FetchData has an EOF parameter indicating whether the FetchData event should be raised. This parameter is not the same as the Recordset's EOF property and is defaulted to True. When working with bound reports (reports using a DataControl), the EOF parameter is automatically set by the report; however, when working with unbound reports this parameter needs to be controlled manually.
Use the FetchData event with unbound reports to set the values of custom fields that were added in the DataInitialize event or with bound reports to perform special functions, such as combining fields together or performing calculations. The FetchData event should not have any references to controls on the report.
If you need to use a value from a Dataset with a control in the Detail section, set a variable in the FetchData event and use the variable in the section's Format event to set the value for the control. Please note that this method of setting a variable in the FetchData event and using it to set a control's value is only supported in the Detail_Format event.
Also use the FetchData event to increment counters when working with arrays or collections.
PageStart
This event fires before a page is rendered. Use this event to initialize any variables needed for each page when running an unbound report.
PageEnd
This event is raised after each page in the report is rendered. Use this event to update any variables needed for each page when running an unbound report.
When Bound and Unbound Data Values are Set
1. The Fields collection is populated from the dataset that is bound to the report after the DataInitialize event is raised. (In an unbound report, the Fields collection values are not set to anything at this point.)
2. The FetchData event is raised, giving the user a chance to modify the Fields collection.
Report Events
ActiveReports 6 User Guide | 147

3. Any fields that are bound have the values transferred over.
4. The Format event is raised.
ActiveReports 6 User Guide | 148

In a report, regardless of the type or content of the various sections, there are three events for each section: Format, BeforePrint and AfterPrint.
Because there are many possible report designs, the event-raising sequence is dynamic in order to accommodate individual report demands. The only guaranteed sequence is that a section's Format event is raised before the BeforePrint event, which in turn occurs before the AfterPrint event but not necessarily all together. Reports should not be designed to rely on these events being raised in immediate succession.
Format eventActiveReports raises this event after the data is loaded and bound to the controls contained in a section, but before the section is rendered to a page.
The Format event is the only event in which you can change the section's height. Use this section to set or change the properties of any controls or the section itself.
Also use the Format event to pass information, such as an SQL String, to a Subreport.
If the CanGrow or CanShrink property is True for the section or any control within the section, all of the growing and shrinking takes place in the Format event. Because of this, you cannot obtain information about a control or section's height in this event.
Because a section's height is unknown until the Format event finishes, it is possible for a section's Format event to be raised while the report is on a page to which the section is not rendered. For example, the Detail Format event is raised but the section is too large to fit on the page. This causes the PageFooter events and the PageEnd event to be raised on the current page, and the PageStart, any other Header events, and possibly the FetchData event to be raised before the section is rendered to the canvas on the next page.
BeforePrint eventActiveReports raises this event before the section is rendered to the page.
The growing and shrinking of the section and its controls have already taken place. Therefore, you can use this event to get an accurate height of the section and its controls. You can modify values and resize controls in the BeforePrint event, but you cannot modify the height of the section itself.
Also use this event to do page-specific formatting since the report knows which page the section will be rendered to when this event is raised. Once this event has finished, the section cannot be changed in any way because the section is rendered to the canvas immediately after this event.
AfterPrint eventActiveReports raises this event after the section is rendered to the page.
Although AfterPrint was an important event prior to ActiveReports Version 1 Service Pack 3, it is rarely used in any of the newer builds of ActiveReports. This event is still useful, however, if you want to draw on the page after text has already been rendered to it.
Section Events
Important: Never reference the report's Fields collection in these section events. Only reference the Fields collection in the DataInitialize and FetchData events.
ActiveReports 6 User Guide | 149

Intelligent, multi-threaded, single-pass processing enables ActiveReports to surpass other reports in processing and output generation speed. ActiveReports processes and renders each page as soon as the page is ready. If a page has unknown data elements or its layout is not final, it places the page in cache until the data is available.
Summary fields and KeepTogether constraints are two reasons why a page might not render immediately. The summary field is not complete until all the data needed for calculation is read from the data source. When a summary field such as a grand total is placed ahead of its completion level, such as in the report header, the report header and all following sections are delayed until all of the data is read.
There are eleven report events in the code behind an ActiveReport, or seven in an ActiveReport script.
Because there are so many ways in which you can customize your reports, not all reports execute in the same way. However, when you run a report, this is generally what happens:
1. ActiveReports raises the ReportStart event. The report validates any changes made to the report structure in ReportStart. In some cases, data source properties raise the DataInitialize event.
2. Printer settings are applied. If none are specified, the local machine's default printer settings are used.
3. If the DataInitialize event was not already raised, ActiveReports raises it and opens the data source.
4. If the data source contains parameters with unset values and the ShowParameterUI property is set to True, ActiveReports displays a parameters dialog to request values from the user.
5. Closing the dialog raises the ParameterUIClosed event. If the report is a subreport that requires parameters, ActiveReports binds the subreport parameters to any fields in the parent report.
6. ActiveReports raises the FetchData event.
7. If there is no data, the NoData event is raised.
8. The PageStart event raises, and then raises again after each PageEnd event until the final page.
9. Group sections are bound and sections begin rendering on pages.
10. ActiveReports raises Section Events to process sections in (roughly) the following order:
Report header
Page header
Group header
Detail
Group footer
Page footer
Report footer
11. After each event, ActiveReports checks the Cancel flag to ensure that it should continue.
12. Other events may raise, depending on the report logic.
13. The PageEnd event raises after each page becomes full, and the PageStart raises if the report has not finished.
Sequence of Events
ActiveReports 6 User Guide | 150

14. Finally, ActiveReports raises the ReportEnd event.
ActiveReports 6 User Guide | 151

ActiveReports allows you to bind reports to any type of data source, including arrays. You can create a report without setting its data source, then load the data into the control at run time. Use the ReportStart event to set up your data source, the ReportEnd event to close it, the DataInitialize event to create your fields collection, and the FetchData event to populate it.
Use the ReportStart event to connect the report to a data source1. Double-click in the gray area below the report to create an event-handling method for the ReportStart
event.
2. Add code to the handler to:
Set the database path (place this code above the ReportStart event)
Set the data source connection string
Set the data source SQL query
Open the connection to create the DataReader
The following examples show what the code for the method looks like.
Add using or Imports statements for System.Data and System.Data.OleDb.
To create a GetDatabasePath method in Visual Basic.NET
To create a GetDatabasePath method in C#
Unbound Reporting
Visual Basic.NET code. Paste JUST ABOVE the ReportStart event.
Private Function getDatabasePath() As String Dim regKey As Microsoft.Win32.RegistryKey regKey = Microsoft.Win32.Registry.LocalMachine regKey = regKey.CreateSubKey _ ("SOFTWARE\\GrapeCity\\ActiveReports 6\\SampleDB") getDatabasePath = CType(regKey.GetValue(""), String)End Function
Private conn As OleDbConnectionPrivate reader As OleDbDataReaderPrivate cmd As OleDbCommandVisual Basic.NET code. Paste INSIDE the ReportStart event.
Private Sub rptYourReportName_ReportStart(ByVal sender As Object, ByVal e As System.EventArgs) _ Handles MyBase.ReportStart Dim dbPath As String = getDatabasePath() Dim connString As String = "Provider=Microsoft.Jet.OLEDB.4.0;Data Source= " + dbPath + "\\NWIND.mdb" conn = New OleDbConnection(connString) cmd = New OleDbCommand("SELECT * FROM categories INNER JOIN products ON _ categories.categoryid = products.categoryid ORDER BY products.categoryid, products.productid", conn) conn.Open() reader = cmd.ExecuteReader()End Sub
C# code. Paste JUST ABOVE the ReportStart event.
private string getDatabasePath(){ Microsoft.Win32.RegistryKey regKey = Microsoft.Win32.Registry.LocalMachine; regKey = regKey.CreateSubKey("SOFTWARE\\GrapeCity\\ActiveReports 6\\SampleDB"); return ((string)(regKey.GetValue(""))); } private static OleDbConnection conn;private static OleDbDataReader reader;C# code. Paste INSIDE the ReportStart event.
string dbPath = getDatabasePath();string connString = "Provider=Microsoft.Jet.OLEDB.4.0;Data Source= " + dbPath + "\\NWIND.mdb";
ActiveReports 6 User Guide | 152

Use the ReportEnd event to close the data connection
The following examples show what the code for the method looks like.
To write the code in Visual Basic.NET
1. Right-click in any section of the design window of the report and select View Code.
2. At the top left of the code view, click the drop-down arrow and select (rptYourReportName Events).
3. At the top right of the code window, click the drop-down arrow and select ReportEnd. This creates an event-handling method for the report's ReportEnd event.
4. Add code to the handler to close the data connection
To write the code in C#
1. Click in the gray area below the report to select it.
2. Click the events icon in the Properties window to display available events for the report.
3. Double-click ReportEnd. This creates an event-handling method for the report's ReportEnd event.
4. Add code to the handler to close the data connection
Use the DataInitialize event to add fieldsThe following examples show what the code for the method looks like.
To write the code in Visual Basic.NET
1. Right-click in any section of the design view of the report and select View Code.
2. At the top left of the code view, click the drop-down arrow and select (rptYourReportName Events).
3. At the top right of the code window, click the drop-down arrow and select DataInitialize. This creates an event-handling method for the report's DataInitialize event.
4. Add code to the handler to add fields to the report's fields collection.
To write the code in C#
1. Click in the gray area below the report to select it.
2. In the Properties window, click the events icon to display available events for the report.
3. Double-click DataInitialize. This creates an event-handling method for the report's DataInitialize event.
4. Add code to the handler to add fields to the report's fields collection.
conn = new OleDbConnection(connString);OleDbCommand cmd = new OleDbCommand("SELECT * FROM categories INNER JOIN products ON categories.categoryid = products.categoryid ORDER BY products.categoryid, products.productid", conn); conn.Open();reader = cmd.ExecuteReader();
Visual Basic.NET code. Paste INSIDE the ReportEnd event.
reader.Close()conn.Close()
C# code. Paste INSIDE the ReportEnd event.
reader.Close();conn.Close();
Visual Basic.NET code. Paste INSIDE the DataInitialize event.
Fields.Add("CategoryName")Fields.Add("ProductName")Fields.Add("UnitsInStock")Fields.Add("Description")
C# code. Paste INSIDE the DataInitialize event.
Fields.Add("CategoryName");Fields.Add("ProductName");Fields.Add("UnitsInStock");Fields.Add("Description");
ActiveReports 6 User Guide | 153

Use the FetchData event to populate fieldsReference the Fields collection only in the DataInitialize and FetchData events.
The following examples show what the code for the method looks like.
To write the code in Visual Basic.NET
1. Right-click in any section of the design window of the report, and select View Code to display the code view for the report.
2. At the top left of the code view, click the drop-down arrow and select (rptYourReportName Events).
3. At the top right of the code window, click the drop-down arrow and select FetchData. This creates an event-handling method for the report's FetchData event.
4. Add code to the handler to retrieve information to populate the report fields.
To write the code in C#
1. Click in the gray area below the report to select it.
2. In the Properties window, click the events icon to display available events for the report.
3. Double-click FetchData. This creates an event-handling method for the report's FetchData event.
4. Add code to the handler to retrieve information to populate the report fields.
Visual Basic.NET code. Paste INSIDE the FetchData event.
Try reader.Read() Me.Fields("CategoryName").Value = reader("CategoryName") Me.Fields("ProductName").Value = reader("ProductName") Me.Fields("UnitsInStock").Value = reader("UnitsInStock") Me.Fields("Description").Value = reader("Description") eArgs.EOF = FalseCatch ex As Exception eArgs.EOF = TrueEnd Try
C# code. Paste INSIDE the FetchData event.
try{ reader.Read(); Fields["CategoryName"].Value = reader["CategoryName"].ToString(); Fields["ProductName"].Value = reader["ProductName"].ToString(); Fields["UnitsInStock"].Value = reader["UnitsInStock"].ToString(); Fields["Description"].Value = reader["Description"].ToString(); eArgs.EOF = false;}catch{ eArgs.EOF = true;}
ActiveReports 6 User Guide | 154

Optimization can be crucial for large reports (i.e. over 100 pages). Here is some information which will help you to achieve the best possible results for such reports. To optimize ActiveReports for the web, please refer to the memory considerations section.
Memory Considerations
Images Limit the use of large images when exporting to RTF and TIFF formats. Note that even one image uses a lot of memory if it's repeated on every page of a very long report exported to TIFF or RTF. If you are not exporting, or if you are exporting to Excel, PDF, or HTML, repeated images are stored only once to save memory, but the comparison necessary to detect duplicate images slows the processing time for the report.
Subreports Limit the use of subreports in repeating sections because each subreport instance consumes memory. For example, consider that a subreport in the Detail section of a report in which the Detail section is repeated 2,000 times will have 2,000 instances of the subreport. Nested subreports will compound the number of instances. If you need to use subreports in repeating sections, instantiate them in the ReportStart event instead of the Format event of the repeating section so that they will be instantiated only once and use less memory.
CacheToDisk Set the CacheToDisk property of the Document object to True. Although it will slow down the processing time, this will cause the document to be cached to disk instead of loading the whole report in memory. The PDF export will also detect this setting and use the cached report to export. Please note that only the PDF export is affected by the CacheToDisk Property; other exports may run out of memory with very large reports. Also note that CacheToDisk uses IsolatedStorage to store a page’s canvasItems to disk. To use CacheToDisk you must have IsolatedStorageFilePermission.
Summaries Placing summaries (primarily page count and report totals) in header sections will have an adverse effect on memory as well as rendering speed with large reports using the CacheToDisk property. Since the rendering of the header is delayed until ActiveReports determines the total or page count of the following sections, CacheToDisk is unable to perform any optimization. The greater the number of affected sections, the longer rendering is delayed and the less optimization CacheToDisk will offer. Therefore, a group total in a group header section does not affect performance and memory as much as a report total in the report header.
Releasing Reports To properly release a report instance from memory, take these steps in the following order:
1. Call the Dispose() method of the Document object
2. Call the Dispose() method of the Report object
3. Set the Report object to null
The following code uses the above steps to release a report.
To write the code in Visual Basic.NET
To write the code in C#
Speed Considerations
Images An image repeated on every page of a very long report is stored only once to improve memory, but the comparison necessary to detect duplicate images slows performance. This is not only the case with the report document itself, but also with the Excel, PDF, and HTML exports as they perform their own comparisons.
Optimizing ActiveReports
Visual Basic.NET code.
rpt.Document.Dispose()rpt.Dispose()rpt = Nothing
C# code.
rpt.Document.Dispose();rpt.Dispose();rpt = null;
ActiveReports 6 User Guide | 155
Summaries Placing summaries (primarily page count and report totals) in header sections will slow report processing. ActiveReports must determine the total or page count of the following sections before it can render the header section. The greater the number of affected sections, the longer rendering is delayed. Therefore, a group total in a group header section does not affect performance and memory as much as a report total in the report header.
CacheToDisk Be sure that the CacheToDisk property of the Document object is not set to True. Setting it to True increases the amount of time the report takes to load, and should only be used with very large reports that use a lot of memory. If this is used with smaller reports of less than 100 pages, it may actually cause more memory to be used.
Stored Procedures Using stored procedures instead of SELECT statements speeds up the processing time of a report, as it reduces the number of records handled by ActiveReports. Using SELECT * statements is not recommended unless you are actually using all of the data returned by such a statement. Consult your database administrator for other ways to speed up data retrieval, such as indexing tables.
ActiveReports 6 User Guide | 156
There are several internal settings to consider when you use the CacheToDisk property of the ActiveReports Document object.
The CacheToDisk property tells ActiveReports whether to move report resources to IsolatedStorage instead of holding it in memory. With this property set to False, all memory is used to store resources. Otherwise, if CacheToDisk is set to True, the memory consumption is limited to 100 mb. When this value is exceeded, ActiveReports caches the resources in IsolatedStorage or at another specified location - see the CacheToDiskLocation property.
To avoid using IsolatedStorage, you can specify a folder in the CacheToDiskLocation property. For an example of the code used to turn on CacheToDisk and specify a folder, see the CacheToDiskLocation property in the Class Library section of this documentation.
CacheToDisk and Resource Storage
Note: You must have IsolatedStorageFilePermission in order to use this property. Use of CacheToDisk slows processing time.
Note: The cache capacity size is 3 GB.
ActiveReports 6 User Guide | 157
Section 508 requires that when Federal agencies develop, procure, maintain, or use electronic and information technology, Federal employees with disabilities have access to and use of information and data that is comparable to the access and use by Federal employees without disabilities, unless an undue burden would be imposed on the agency. Section 508 also requires that individuals with disabilities seeking information or services from a Federal agency have access to and use of information and data that is comparable to that provided to the general public, unless an undue burden would be imposed on the agency.
Accessibility Summary:
All major features of ActiveReports software are accessible via keyboard navigation.
DISCLAIMER:GRAPECITY MAKES NO WARRANTIES, EXPRESS OR IMPLIED, IN THIS DOCUMENT. The following information reflects the general accessibility features of GrapeCity software components as related to the Section 508 standards. If you find that the information is not accurate, or if you have specific accessibility needs that our products do not meet, please contact us and we will attempt to rectify the problem, although we cannot guarantee that we will be able to do so in every case.
ActiveReports Viewer and End User Designer controls
Section 1194.21 Software applications and operating systems
Section 508 Compliance
Criteria Status Remarks
(a) When software is designed to run on a system that has a keyboard, product functions shall be executable from a keyboard where the function itself or the result of performing a function can be discerned textually.
Supported
Each of the toolboxes, toolbox items, toolbars, buttons, menu items, and context menus is executable from a keyboard, and the functions performed by each can be discerned textually. Hyperlinks supported within the control can also provide textual cues provided by the developer.
(b) Applications shall not disrupt or disable activated features of other products that are identified as accessibility features, where those features are developed and documented according to industry standards. Applications also shall not disrupt or disable activated features of any operating system that are identified as accessibility features where the application programming interface for those accessibility features has been documented by the manufacturer of the operating system and is available to the product developer.
SupportedThe controls do not disrupt or disable industry standard accessibility features of other products.
(c) A well-defined on-screen indication of the current focus shall be provided that moves among interactive interface elements as the input focus changes. The focus shall be programmatically exposed so that Assistive Technology can track focus and focus changes.
Supported
Focus on interface elements is programmatically exposed so that Assistive Technology can track focus and focus changes.
(d) Sufficient information about a user interface element including the identity, operation and state of the element shall be available to Assistive Technology. When an image represents a program element, the information conveyed by the image must also be available in text.
Supported
Each of the user interface elements provides Assistive Technology with information about its identity, operation, and state. Any images representing a user interface element also provide a textual conveyance of the information.
(e) When bitmap images are used to identify controls, status indicators, or other programmatic elements, the meaning assigned to those images shall be consistent throughout an application's performance.
Supported
Any images used to identify a programmatic element have a consistent meaning throughout the controls.
(f) Textual information shall be provided through operating system functions for displaying text. The minimum information that shall be made available is text content,
SupportedTextual information about all viewer elements includes text content, caret location, and any text attributes (i.e.
ActiveReports 6 User Guide | 158
Web Viewer control (Professional Edition)Section 1194.22 Web-based Internet information and applications
text input caret location, and text attributes. bold, italic, size, color, etc.).
(g) Applications shall not override user selected contrast and color selections and other individual display attributes.
SupportedThe controls do not, by default, override local settings for contrast and color or other display attributes.
(h) When animation is displayed, the information shall be displayable in at least one non-animated presentation mode at the option of the user.
Not Applicable
There are no animated elements in the controls, so a non-animated presentation mode is not necessary.
(i) Color coding shall not be used as the only means of conveying information, indicating an action, prompting a response, or distinguishing a visual element.
Supported
Any interface element that uses color to indicate an action, prompt a response, or distinguish a visual element also provides a textual cue.
(j) When a product permits a user to adjust color and contrast settings, a variety of color selections capable of producing a range of contrast levels shall be provided.
Supported
By default, no color or contrast settings are available to the user unless the developer adds them; therefore it is the responsibility of the developer to provide the user with a variety of color selections, if applicable, so that they can produce a range of contrast levels.
(k) Software shall not use flashing or blinking text, objects, or other elements having a flash or blink frequency greater than 2 Hz and lower than 55 Hz.
Supported The controls do not use flashing or blinking text or objects.
(l) When electronic forms are used, the form shall allow people using Assistive Technology to access the information, field elements, and functionality required for completion and submission of the form, including all directions and cues.
Supported
Any form-type dialogs or windows associated with the controls provide Assistive Technology with access to information on all directions, cues, field elements, and functionality required for completion.
Criteria Status Remarks(a) A text equivalent for every non-text element shall be provided (e.g., via "alt", "longdesc", or in element content). Supported
Each non-text element has a text equivalent.
(b) Equivalent alternatives for any multimedia presentation shall be synchronized with the presentation.
Not Applicable
There is no multimedia presentation associated with the software.
(c) Web pages shall be designed so that all information conveyed with color is also available without color, for example from context or markup.
Not Applicable
By default, no information is conveyed with color.
(d) Documents shall be organized so they are readable without requiring an associated style sheet.
Supported
ActiveReports provides a text export, so that any generated reports can be issued as plain text.
(e) Redundant text links shall be provided for each active region of a server-side image map.
Not Applicable
There are no server-side image maps associated with the software.
(f) Client-side image maps shall be provided instead of server-side image maps except where the regions cannot be defined with an available geometric shape.
Not Applicable
There are no client-side image maps associated with the software.
(g) Row and column headers shall be identified for data tables.Not Applicable
By default, there are no data tables associated with the software.
(h) Markup shall be used to associate data cells and header cells for data tables that have two or more logical levels of row or column headers.
Not Applicable
By default, there are no data tables associated with the software.
(i) Frames shall be titled with text that facilitates frame identification and navigation.
Not Applicable
By default, the software does not use frames.
(j) Pages shall be designed to avoid causing the screen to flicker with a frequency greater than 2 Hz and lower than 55 Hz. Supported The software does not cause
the screen to flicker outside
ActiveReports 6 User Guide | 159
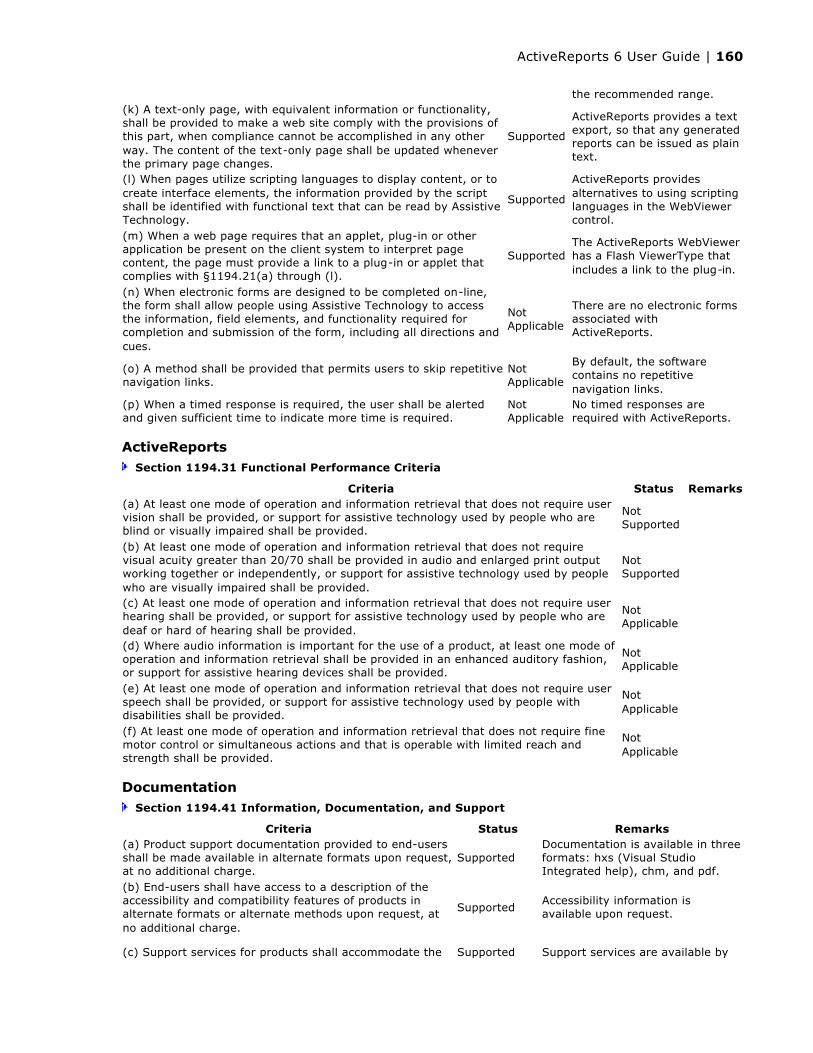
ActiveReportsSection 1194.31 Functional Performance Criteria
DocumentationSection 1194.41 Information, Documentation, and Support
the recommended range.(k) A text-only page, with equivalent information or functionality, shall be provided to make a web site comply with the provisions of this part, when compliance cannot be accomplished in any other way. The content of the text-only page shall be updated whenever the primary page changes.
Supported
ActiveReports provides a text export, so that any generated reports can be issued as plain text.
(l) When pages utilize scripting languages to display content, or to create interface elements, the information provided by the script shall be identified with functional text that can be read by Assistive Technology.
Supported
ActiveReports provides alternatives to using scripting languages in the WebViewer control.
(m) When a web page requires that an applet, plug-in or other application be present on the client system to interpret page content, the page must provide a link to a plug-in or applet that complies with §1194.21(a) through (l).
SupportedThe ActiveReports WebViewer has a Flash ViewerType that includes a link to the plug-in.
(n) When electronic forms are designed to be completed on-line, the form shall allow people using Assistive Technology to access the information, field elements, and functionality required for completion and submission of the form, including all directions and cues.
Not Applicable
There are no electronic forms associated with ActiveReports.
(o) A method shall be provided that permits users to skip repetitive navigation links.
Not Applicable
By default, the software contains no repetitive navigation links.
(p) When a timed response is required, the user shall be alerted and given sufficient time to indicate more time is required.
Not Applicable
No timed responses are required with ActiveReports.
Criteria Status Remarks(a) At least one mode of operation and information retrieval that does not require user vision shall be provided, or support for assistive technology used by people who are blind or visually impaired shall be provided.
Not Supported
(b) At least one mode of operation and information retrieval that does not require visual acuity greater than 20/70 shall be provided in audio and enlarged print output working together or independently, or support for assistive technology used by people who are visually impaired shall be provided.
Not Supported
(c) At least one mode of operation and information retrieval that does not require user hearing shall be provided, or support for assistive technology used by people who are deaf or hard of hearing shall be provided.
Not Applicable
(d) Where audio information is important for the use of a product, at least one mode of operation and information retrieval shall be provided in an enhanced auditory fashion, or support for assistive hearing devices shall be provided.
Not Applicable
(e) At least one mode of operation and information retrieval that does not require user speech shall be provided, or support for assistive technology used by people with disabilities shall be provided.
Not Applicable
(f) At least one mode of operation and information retrieval that does not require fine motor control or simultaneous actions and that is operable with limited reach and strength shall be provided.
Not Applicable
Criteria Status Remarks(a) Product support documentation provided to end-users shall be made available in alternate formats upon request, at no additional charge.
SupportedDocumentation is available in three formats: hxs (Visual Studio Integrated help), chm, and pdf.
(b) End-users shall have access to a description of the accessibility and compatibility features of products in alternate formats or alternate methods upon request, at no additional charge.
SupportedAccessibility information is available upon request.
(c) Support services for products shall accommodate the Supported Support services are available by
ActiveReports 6 User Guide | 160

communication needs of end-users with disabilities. with Exceptions
telephone and by email and forum.
ActiveReports 6 User Guide | 161
ActiveReports uses the Hub and Spoke model for localizing resources. The hub is the main executing assembly, for example, the Viewer Control, ActiveReports.Viewer6.dll.
The spokes are the satellite DLLs that contain localized resources for the application, for example, ActiveReports.Viewer6.resources.dll.
The Localization folder, C:\Program Files\GrapeCity\ActiveReports 6\Localization, contains everything you need to localize all of your ActiveReports components.
Within that folder, each component of ActiveReports that you can localize, 14 in all, has two files:
*.bat Set the culture to which you want to localize.
*.zip Change the strings in the resource files (*.resx) it contains.
There is one application in the folder: NameCompleter.exe When you run your bat file after changing it to your culture, it runs this application to create a SatelliteAssembly folder with a language subfolder containing the localized ActiveReports.AssemblyName.resources.dll file.
Place the culture subdirectories containing the satellite assemblies in the folder that contains your main executing assembly.
When the main executing assembly needs a resource, it uses a ResourceManager object to load the required resource. The ResourceManager uses the thread's CurrentUICulture property.
The common language runtime sets the CurrentUICulture property or you can set it in code to force a certain UI Culture to test whether your satellite DLL is loading properly. The ResourceManager class uses the CurrentUICulture Property to locate subdirectories that contain a satellite DLL for the current culture. If no subdirectory exists, the ResourceManager uses the resource that is embedded in the assembly. US English is the default culture for ActiveReports.
Localization
Note: If you want to put your localization in the Global Assembly Cache (GAC), you must first send the localized ActiveReports.AssemblyName.resources.dll file to GrapeCity (mailto:[email protected]?subject=Need to have localized resource dll signed.) and get it signed. Then you can drag the language subfolder with the signed dll file into C:\WINDOWS\ASSEMBLY.
For more detailed information about how the Framework locates satellite DLLs, please refer to the help system in Visual Studio® or the book Developing International Software, 2nd edition by MS Press that contains information on localizing applications using the .NET Framework.
ActiveReports 6 User Guide | 162

With the Professional Edition of ActiveReports, you can host the ActiveReports Designer control in your application and provide your end users with report editing capabilities. The control's methods and properties allow you to save and load report layouts, monitor and control the design environment, and customize the look and feel.
In addition to the Designer control, ActiveReports offers a CreateToolStrips method to help you add default toolbars to the designer and add and remove individual tool bars and commands. This gives your designer a finished look and allows you to quickly create a functioning report designer application.
See the Add Designer ToolStrips topic for more information.
Designer Control (Pro Edition)
ActiveReports 6 User Guide | 163

See step-by-step instructions for performing common tasks using ActiveReports.
This section contains information about how to:
Work with DataLearn to bind reports to data, group data, and modify data sources at run time.
Work with FieldsLearn how to add field expressions and to create summary fields and calculated fields.
Create Common ReportsLearn how to create top N, summary, and green bar reports.
Change Ruler MeasurementsLearn how to change the units associated with the ruler from standard to metric.
Display Page Numbers and Report DatesLearn how to quickly add Page N of M and report dates and times to your reports.
Format BarCodes Learn to format the many barcode styles included with the BarCode control.
Add HyperlinksLearn how hyperlinks can be used in ActiveReports.
Add AnnotationsLearn how to add text, shapes, arrows, and lines to your reports as temporary or persistent annotations.
Export ReportsLearn to export reports to each of the supported formats.
Print Multiple Copies, Duplex, and LandscapeLearn to use the Printer Settings tab of the Report Settings window.
Conditionally Show or Hide DetailsLearn to prevent rendering of the detail section for data that meets certain conditions.
Use External Style SheetsLearn to use custom styles, save them externally, and use them in other reports.
Add BookmarksLearn how to use bookmarks in ActiveReports.
Insert or Add PagesLearn how to add or insert specified pages from one report into another.
Create Charts Learn to create charts using the Chart control.
Load a File into a RichText Control Learn to load an HTML or RTF file into the RichText control.
Use Custom Controls on Reports (TreeView) Learn to access custom or third-party controls in ActiveReports code.
Create Report Templates (Inheritance) Learn how to use Inheritance to create report templates.
Add Parameters Learn to pass parameters into reports in several ways.
Embed Subreports in a Report Learn to use the Subreport control.
Pass Parameters to a Subreport Learn to pass parameters from a parent report to a subreport.
Save and Load Report Files (RDF) Learn how to save and load reports as RDF files at run time.
Save and Load Report Layout Files (RPX) Learn how to save and load reports as RPX-based report layouts at run time.
How To
ActiveReports 6 User Guide | 164

Add Code to Layouts Using Script Learn the specifics of using the scripting capabilities of ActiveReports for .NET in your applications.
Provide No-Touch Printing in the WebViewer (Pro Edition) Learn how to set up no-touch printing with the new FlashViewer.
Add Designer ToolStrips Learn how to add the designer control's ToolStrips to a ToolStripContainer.
Configure HTTPHandlers (Pro Edition) Learn to configure HttpHandlers in IIS so that you can use them to display ActiveReports on the Web.
Add Report Links to Web Forms (Pro Edition) Learn to display ActiveReports from hyperlinks that include parameter values or specify output formats.
Customize, Localize and DeployLearn to localize the components of ActiveReports, and how to deploy your applications.
ActiveReports 6 User Guide | 165

See step-by-step instructions for performing common tasks using ActiveReports.
This section contains information about how to:
Bind Reports to a Data SourceLearn how to bind reports to various data sources, datasets, and data views.
Group DataLearn how to use the GroupHeader section to group data in a report.
Modify Data Sources at Run Time Learn to use code to modify a report's data source.
Work with Data
ActiveReports 6 User Guide | 166

Add data at design time using the Report Explorer.
To add Calculated Fields
1. In the Report Explorer, expand the Fields node.
2. Right-click the Calculated node and select Add.
3. With the field selected in the Properties window, enter a Formula for the calculation (for example, UnitPrice * Discount).
4. Drag the calculated field onto the design surface of the report to create a bound textbox.
To add Parameters
1. In the Report Explorer, right-click the Parameters node and select Add.
2. With the parameter selected in the Properties window, enter a DefaultValue for the parameter.
3. Select whether to PromptUser for a parameter value, and if so, supply a string for the Prompt.
Bind a report to a data source using the data source icon in the detail section band which opens the Report Data Source window. There are four tabs on the window for the four most commonly used data sources:
To use the OLE DB data source
1. Click the gray report DataSource icon on the Detail section band to open the Report Data Source dialog.
2. On the OLE DB tab, next to Connection String, click the Build button.
3. In the Data Link Properties window that appears, select Microsoft Jet 4.0 OLE DB Provider and click the Next button.
4. Click the ellipsis (...) button to browse to your database or the sample Northwind database. Click Openonce you have selected the appropriate access path.
5. Click OK to close the window and fill in the Connection String field.
6. In the Query field, enter a SQL query to select the data that you want.
7. Click OK to save the data source and return to the report design surface.
To use the SQL data source
1. Click the gray report DataSource icon on the Detail section band to open the Report Data Source dialog.
2. On the SQL tab, next to Connection String, click the Build button.
3. In the Data Link Properties window that appears, select Microsoft OLE DB Provider for SQL Serverand click the Next button.
4. Under 1. Select or enter a server name, drop down the box and select your server.
5. Under 2. Enter information to log on to the server, set up your log on information.
6. Under 3. you can select a database on the server or attach a database file.
7. Click OK to close the window and fill in the Connection String field.
Bind Reports to a Data Source
Note: Do not use an equals sign (=) at the beginning of the formula as you would in the DataFieldproperty of a textbox.
ActiveReports 6 User Guide | 167
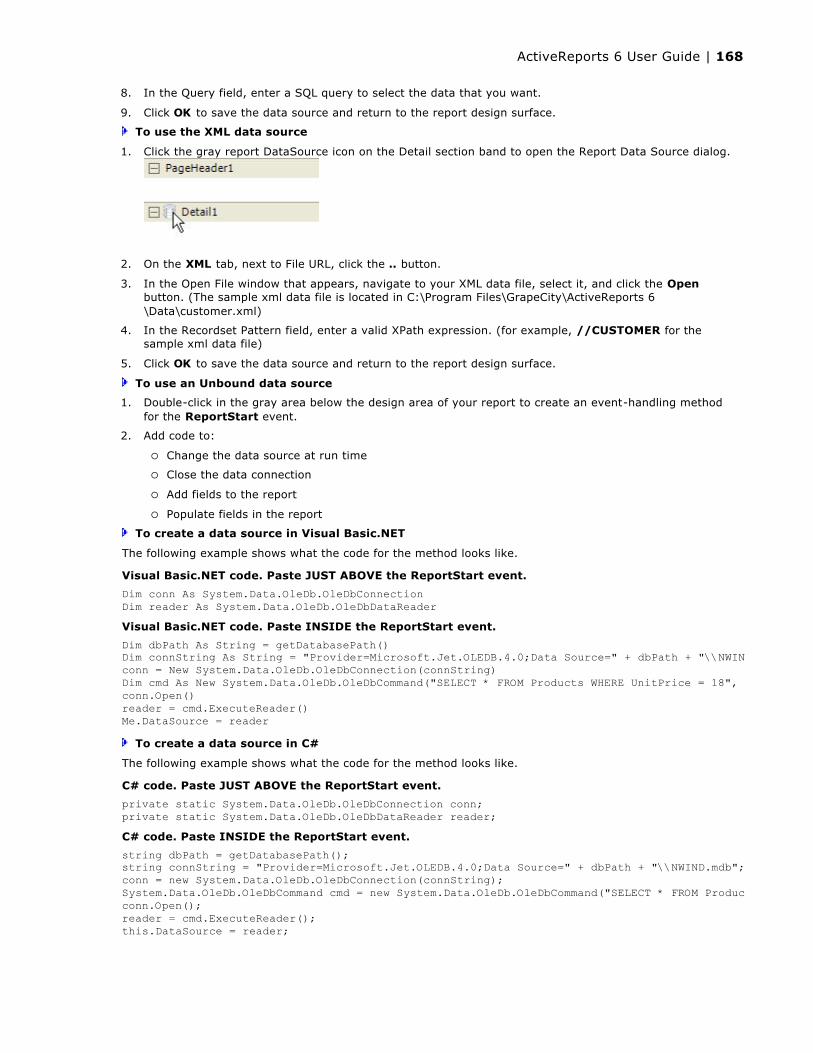
8. In the Query field, enter a SQL query to select the data that you want.
9. Click OK to save the data source and return to the report design surface.
To use the XML data source
1. Click the gray report DataSource icon on the Detail section band to open the Report Data Source dialog.
2. On the XML tab, next to File URL, click the .. button.
3. In the Open File window that appears, navigate to your XML data file, select it, and click the Openbutton. (The sample xml data file is located in C:\Program Files\GrapeCity\ActiveReports 6\Data\customer.xml)
4. In the Recordset Pattern field, enter a valid XPath expression. (for example, //CUSTOMER for the sample xml data file)
5. Click OK to save the data source and return to the report design surface.
To use an Unbound data source
1. Double-click in the gray area below the design area of your report to create an event-handling method for the ReportStart event.
2. Add code to:
Change the data source at run time
Close the data connection
Add fields to the report
Populate fields in the report
To create a data source in Visual Basic.NET
The following example shows what the code for the method looks like.
To create a data source in C#
The following example shows what the code for the method looks like.
Visual Basic.NET code. Paste JUST ABOVE the ReportStart event.
Dim conn As System.Data.OleDb.OleDbConnectionDim reader As System.Data.OleDb.OleDbDataReaderVisual Basic.NET code. Paste INSIDE the ReportStart event.
Dim dbPath As String = getDatabasePath()Dim connString As String = "Provider=Microsoft.Jet.OLEDB.4.0;Data Source=" + dbPath + "\\NWIND.mdb"conn = New System.Data.OleDb.OleDbConnection(connString) Dim cmd As New System.Data.OleDb.OleDbCommand("SELECT * FROM Products WHERE UnitPrice = 18", conn)conn.Open()reader = cmd.ExecuteReader()Me.DataSource = reader
C# code. Paste JUST ABOVE the ReportStart event.
private static System.Data.OleDb.OleDbConnection conn;private static System.Data.OleDb.OleDbDataReader reader;C# code. Paste INSIDE the ReportStart event.
string dbPath = getDatabasePath();string connString = "Provider=Microsoft.Jet.OLEDB.4.0;Data Source=" + dbPath + "\\NWIND.mdb";conn = new System.Data.OleDb.OleDbConnection(connString);System.Data.OleDb.OleDbCommand cmd = new System.Data.OleDb.OleDbCommand("SELECT * FROM Products WHERE UnitPrice = 18", conn);conn.Open();reader = cmd.ExecuteReader();this.DataSource = reader;
ActiveReports 6 User Guide | 168

To close the data connection in Visual Basic
1. In design view of rptModifyDS, drop down the field at the top left of the code view and select (rptModifyDS Events).
2. Drop down the field at the top right of the code view and select ReportEnd. This creates an event-handling method for ReportEnd event.
3. Add code to the handler to close the data connection.
The following example shows what the code for the method looks like.
To close the data connection in C#
1. Click in the gray area below rptModifyDS to select the report.
2. Click the events icon in the Properties Window to display available events for the report.
3. Double-click ReportEnd. This creates an event-handling method for the ReportEnd event.
4. Add code to the handler to close the data connection.
The following example shows what the code for the method looks like.
To add fields in Visual Basic
1. Right-click in any section of the design surface of the report, and select View Code to display the code view for the report.
2. At the top left of the code view of the report, click the drop-down arrow and select (YourReportName Events).
3. At the top right of the code window, click the drop-down arrow and select DataInitialize. This creates an event-handling method for the report's DataInitialize event.
4. Add code to the handler to add fields to the report's Fields collection.
The following example shows what the code for the method looks like.
To add fields in C#
1. Click in the gray area below the report to select it.
2. Click the events icon in the Properties Window to display available events for the report.
3. Double-click DataInitialize. This creates an event-handling method for the report's DataInitialize event.
4. Add code to the handler to add fields to the report's Fields collection.
The following example shows what the code for the method looks like.
Visual Basic.NET code. Paste INSIDE the ReportEnd event.
reader.Close()conn.Close()
C# code. Paste INSIDE the ReportEnd event.
reader.Close();conn.Close();
Warning: Do not access the Fields collection outside the DataInitialize and FetchData events. Accessing the Fields collection outside of these events is not supported, and has unpredictable results.
Visual Basic.NET code. Paste INSIDE the DataInitialize event.
Fields.Add("CategoryID") Fields.Add("CategoryName") Fields.Add("ProductName") Fields.Add("UnitsInStock") Fields.Add("Description") Fields.Add("TotalLabel")
C# code. Paste INSIDE the DataInitialize event.
Fields.Add("CategoryID");Fields.Add("CategoryName");Fields.Add("ProductName");Fields.Add("UnitsInStock");Fields.Add("Description");
ActiveReports 6 User Guide | 169
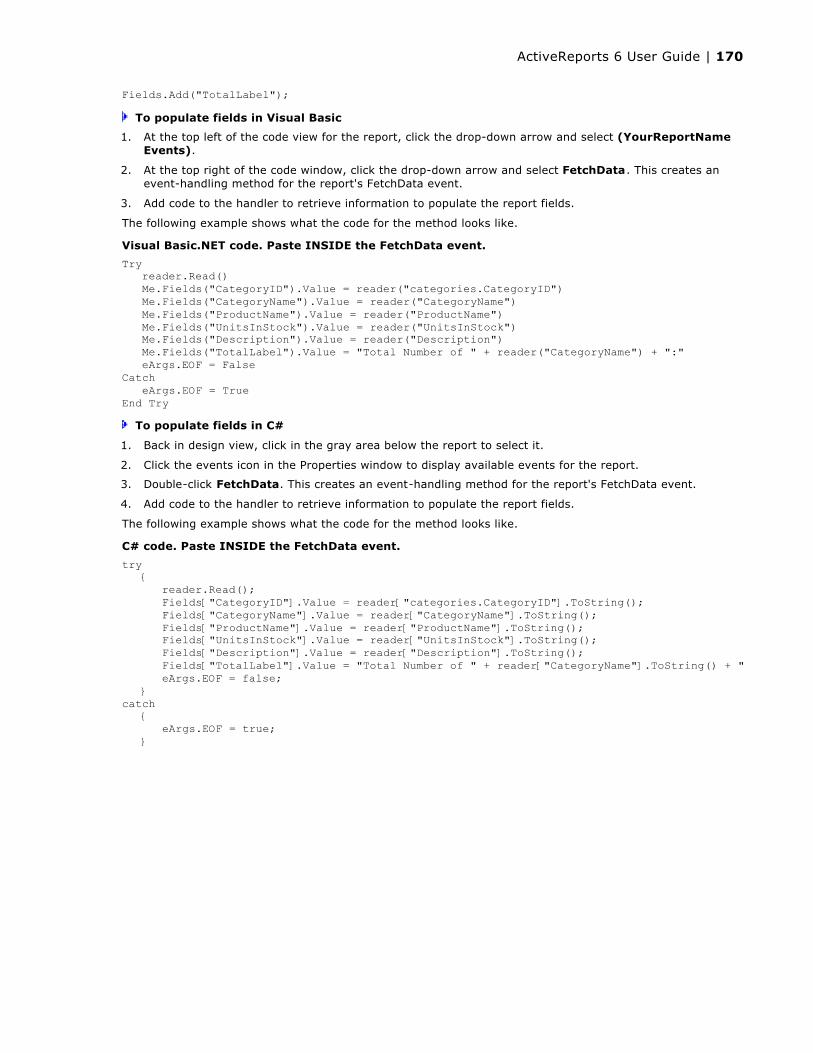
To populate fields in Visual Basic
1. At the top left of the code view for the report, click the drop-down arrow and select (YourReportName Events).
2. At the top right of the code window, click the drop-down arrow and select FetchData. This creates an event-handling method for the report's FetchData event.
3. Add code to the handler to retrieve information to populate the report fields.
The following example shows what the code for the method looks like.
To populate fields in C#
1. Back in design view, click in the gray area below the report to select it.
2. Click the events icon in the Properties window to display available events for the report.
3. Double-click FetchData. This creates an event-handling method for the report's FetchData event.
4. Add code to the handler to retrieve information to populate the report fields.
The following example shows what the code for the method looks like.
Fields.Add("TotalLabel");
Visual Basic.NET code. Paste INSIDE the FetchData event.
Try reader.Read() Me.Fields("CategoryID").Value = reader("categories.CategoryID") Me.Fields("CategoryName").Value = reader("CategoryName") Me.Fields("ProductName").Value = reader("ProductName") Me.Fields("UnitsInStock").Value = reader("UnitsInStock") Me.Fields("Description").Value = reader("Description") Me.Fields("TotalLabel").Value = "Total Number of " + reader("CategoryName") + ":" eArgs.EOF = FalseCatch eArgs.EOF = TrueEnd Try
C# code. Paste INSIDE the FetchData event.
try { reader.Read(); Fields["CategoryID"].Value = reader["categories.CategoryID"].ToString(); Fields["CategoryName"].Value = reader["CategoryName"].ToString(); Fields["ProductName"].Value = reader["ProductName"].ToString(); Fields["UnitsInStock"].Value = reader["UnitsInStock"].ToString(); Fields["Description"].Value = reader["Description"].ToString(); Fields["TotalLabel"].Value = "Total Number of " + reader["CategoryName"].ToString() + ":"; eArgs.EOF = false; }catch { eArgs.EOF = true; }
ActiveReports 6 User Guide | 170
To group a report on a field
1. Right-click the design surface of a report and select Insert, then Group Header/Footer to add a group header and group footer section.
2. With the group header selected in the Properties window, drop down the DataField property and select the field on which to group the report.
To group a report on a field expression1. Right-click the design surface of a report and select Insert, then Group Header/Footer to add a group
header and group footer section.
2. Enter a field expression in the DataField property, for example, =City + Country (For more information on field expressions, see the Add Field Expressions topic.)
Group Data
ActiveReports 6 User Guide | 171
ActiveReports allows you to modify your data source at run time. Below is sample code that you can use to connect a report to the Nwind.mdb sample database at run time.
To find the database path
1. Right-click in any section of the design window of the report, and select View Code to display the code view for the report.
2. Add code to the report to get the sample database path from the registry.
To write the code in Visual Basic
The following example shows what the code for the function looks like.
This creates a function for getDatabasePath.
To write the code in C#
This creates a function for getDatabasePath.
To change the data source at run time1. Double-click in the gray area below the report to create an event-handling method for the ReportStart
event.
2. Add code to the handler to change the data source at run time.
To write the code in Visual Basic.NET
The following example shows what the code for the method looks like.
Modify Data Sources at Run Time
Visual Basic.NET code. Paste JUST BELOW the Imports DataDynamics.ActiveReports statements at the top of the code view.
Imports System Imports Microsoft.Win32Visual Basic.NET code. Paste INSIDE the report class and hit ENTER.
Private Function getDatabasePath() As String
Visual Basic.NET code. Paste INSIDE the getDatabasePath function.
Dim regKey As RegistryKeyregKey = Registry.LocalMachineregKey = regKey.CreateSubKey("SOFTWARE\\GrapeCity\\ActiveReports 6\\SampleDB")getDatabasePath = CType(regKey.GetValue(""), String)
C# code. Paste JUST BELOW the using DataDynamics.ActiveReports; statements at the top of the code view.
using Microsoft.Win32;using System;C# code. Paste INSIDE the report class and hit ENTER.
private string getDatabasePath()
C# code. Paste INSIDE the getDatabasePath function.
RegistryKey regKey = Registry.LocalMachine;regKey = regKey.CreateSubKey("SOFTWARE\\GrapeCity\\ActiveReports 6\\SampleDB");return ((string)(regKey.GetValue("")));
Visual Basic.NET code. Paste JUST ABOVE the ReportStart event.
Dim conn As System.Data.OleDb.OleDbConnectionDim reader As System.Data.OleDb.OleDbDataReaderVisual Basic.NET code. Paste INSIDE the ReportStart event.
Dim dbPath As String = getDatabasePath()Dim connString As String = "Provider=Microsoft.Jet.OLEDB.4.0;Data Source=" + dbPath + "\\NWIND.mdb"conn = New System.Data.OleDb.OleDbConnection(connString)
ActiveReports 6 User Guide | 172

To write the code in C#
The following example shows what the code for the method looks like.
To close the data connectionTo write the code in Visual Basic
1. In design view of rptModifyDS, drop down the field at the top left of the code view and select (rptYourReport Events).
2. Drop down the field at the top right of the code view and select ReportEnd. This creates an event-handling method for ReportEnd event.
3. Add code to the handler to close the data connection.
The following example shows what the code for the method looks like.
To write the code in C#
1. Click in the gray area below rptModifyDS to select the report.
2. Click the events icon in the Properties Window to display available events for the report.
3. Double-click ReportEnd. This creates an event-handling method for the ReportEnd event.
4. Add code to the handler to close the data connection.
The following example shows what the code for the method looks like.
Dim cmd As New System.Data.OleDb.OleDbCommand("SELECT * FROM Products WHERE UnitPrice = 18", conn)conn.Open()reader = cmd.ExecuteReader()Me.DataSource = reader
C# code. Paste JUST ABOVE the ReportStart event.
private static System.Data.OleDb.OleDbConnection conn;private static System.Data.OleDb.OleDbDataReader reader;C# code. Paste INSIDE the ReportStart event.
string dbPath = getDatabasePath();string connString = "Provider=Microsoft.Jet.OLEDB.4.0;Data Source=" + dbPath + "\\NWIND.mdb";conn = new System.Data.OleDb.OleDbConnection(connString);System.Data.OleDb.OleDbCommand cmd = new System.Data.OleDb.OleDbCommand("SELECT * FROM Products WHERE UnitPrice = 18", conn);conn.Open();reader = cmd.ExecuteReader();this.DataSource = reader;
Visual Basic.NET code. Paste INSIDE the ReportEnd event.
reader.Close()conn.Close()
C# code. Paste INSIDE the ReportEnd event.
reader.Close();conn.Close();
ActiveReports 6 User Guide | 173

See step-by-step instructions for using properties to manipulate fields.
This section contains information about how to:
Add Field ExpressionsLearn how to add field expressions to a text box data field.
Create Summary FieldsLearn how to create subtotal and grand total fields.
Create Calculated FieldsLearn how to add field expressions to a text box data field.
Work with Fields
ActiveReports 6 User Guide | 174

In ActiveReports, C# expressions can be used in the DataField property to specify textbox output in a report, such as date/time, mathematical calculations or conditional values. All field expressions used in the DataField property begin with the equals sign (=).
Using Field Expressions
To use a mathematical expression
Change the DataField property for the text box to the mathematical calculation desired.
Examples: =UnitPrice+5
=Quantity-5
=Quantity*UnitPrice
=UnitPrice/QuantityPerUnit
To use a substring
Change the DataField property for the text box to the substring needed. If setting up grouping, change the GroupHeader's DataField property to the same substring.
Example: =ProductName.Substring(0, 1)
To use date/time
Change the DataField property for the text box to the following.
Example: =System.DateTime.Now.ToString()
To create a conditional value
Change the DataField property for the text box to the conditional statement desired.
Example: =(UnitsInStock > 0)?"In Stock":"Backorder"
To concatenate fields
Change the DataField property for the text box to the following.
Add Field Expressions
ActiveReports 6 User Guide | 175
Examples: ="There are " + UnitsInStock + " units of " + ProductName + " in stock."
=TitleOfCourtesy + " " + FirstName + " " + LastName
To round a calculation
Change the DataField Property for the text box to the following.
Example: =(double)System.Math.Round(UnitPrice*UnitsOnOrder,2)
To use modular division
Change the DataField Property for the text box to the following to get the remainder (2 in this case).
Example: =22%(5)
To replace a null value
Change the DataField Property for the text box to the following to replace nulls with your own value.
=(Region == System.DBNull.Value) ? "No region specified" : Region
Note: ActiveReports automatically handles null values, replacing them with an empty string.
ActiveReports 6 User Guide | 176
In ActiveReports, summary fields can be added to any section to calculate totals, counts, averages and other aggregations. The summary field's placement dictates when the section containing the field, and sections after it, will be printed. A section with a summary field will be delayed until all the calculations are completed. This allows summary fields to be placed ahead of the corresponding detail.
Summary fields are calculated according to the textbox's Summary properties. A summary textbox is updated with each new detail record. When a field is placed ahead of the Detail section (i.e. in the ReportHeader, PageHeader or GroupHeader sections), the Detail section is formatted with each record and the summary field is updated. When all records for the summary level are read, the header section is printed followed by the delayed sections.
To add a group summary field
1. Right-click the design surface of the report and select Insert, then Group Header/Footer to add a group header and group footer section to the report.
2. With the group header selected in the Properties window, change the DataField property to the field on which to group the report.
3. Drag a field that you want to summarize onto the group footer section and set its properties as follows:
SummaryType = SubTotal
SummaryRunning = Group
SummaryGroup = YourGroupHeaderName
To add a report summary field1. Right-click the design surface of the report and select Insert, then Report Header/Footer to add
a report header and group footer section to the report.
2. Drag a field that you want to summarize onto the report footer section and set its properties as follows:
SummaryType = GrandTotal
SummaryRunning = All
Distinct summarization can be used in a situation when the field's value repeats in several detail records and the summary function needs to include a single value from all repeating values. To do this, you would need to set the DistinctField property of the summary field to the appropriate value and set the SummaryFuncproperty to the appropriate distinct summary function (for example, DSum for distinct summary or DCount for distinct count).
Create Summary Fields
Note: The SummaryRunning property is only set when the SummaryType is GrandTotal or SubTotal, otherwise it is set to None.
ActiveReports 6 User Guide | 177
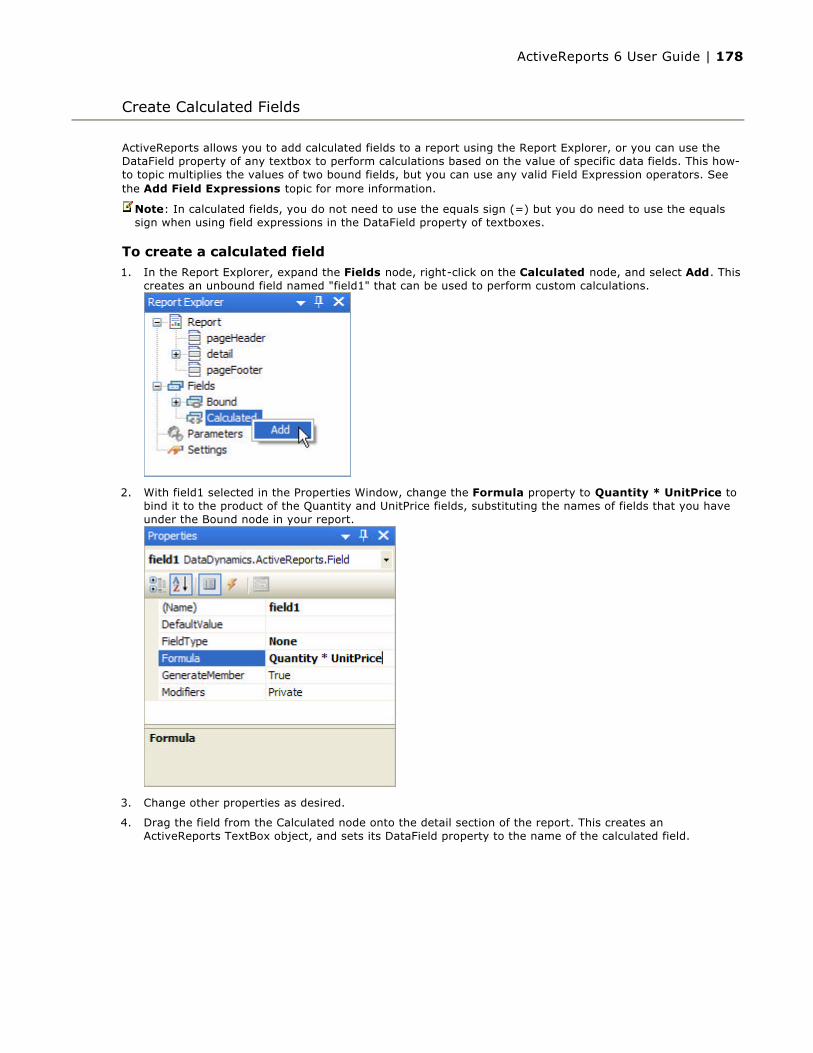
ActiveReports allows you to add calculated fields to a report using the Report Explorer, or you can use the DataField property of any textbox to perform calculations based on the value of specific data fields. This how-to topic multiplies the values of two bound fields, but you can use any valid Field Expression operators. See the Add Field Expressions topic for more information.
To create a calculated field1. In the Report Explorer, expand the Fields node, right-click on the Calculated node, and select Add. This
creates an unbound field named "field1" that can be used to perform custom calculations.
2. With field1 selected in the Properties Window, change the Formula property to Quantity * UnitPrice to bind it to the product of the Quantity and UnitPrice fields, substituting the names of fields that you have under the Bound node in your report.
3. Change other properties as desired.
4. Drag the field from the Calculated node onto the detail section of the report. This creates an ActiveReports TextBox object, and sets its DataField property to the name of the calculated field.
Create Calculated Fields
Note: In calculated fields, you do not need to use the equals sign (=) but you do need to use the equals sign when using field expressions in the DataField property of textboxes.
ActiveReports 6 User Guide | 178
See step-by-step instructions for creating commonly used reports with ActiveReports.
This section contains information about how to:
Create Top N ReportsLearn to get top 10 data from an Access database and display the data in fields.
Create Summary ReportsLearn to display summary data while hiding detail.
Create Green Bar ReportsLearn to alternate background colors on the detail section.
Create Common Reports
ActiveReports 6 User Guide | 179
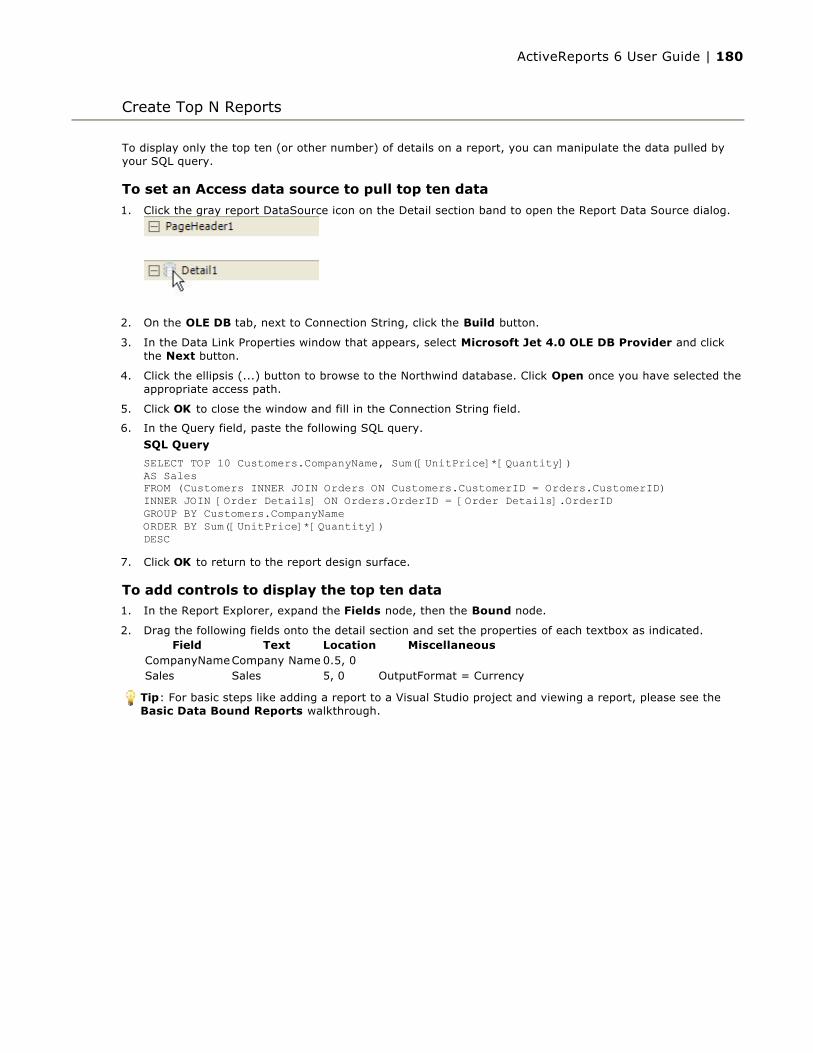
To display only the top ten (or other number) of details on a report, you can manipulate the data pulled by your SQL query.
To set an Access data source to pull top ten data
1. Click the gray report DataSource icon on the Detail section band to open the Report Data Source dialog.
2. On the OLE DB tab, next to Connection String, click the Build button.
3. In the Data Link Properties window that appears, select Microsoft Jet 4.0 OLE DB Provider and click the Next button.
4. Click the ellipsis (...) button to browse to the Northwind database. Click Open once you have selected the appropriate access path.
5. Click OK to close the window and fill in the Connection String field.
6. In the Query field, paste the following SQL query.
7. Click OK to return to the report design surface.
To add controls to display the top ten data1. In the Report Explorer, expand the Fields node, then the Bound node.
2. Drag the following fields onto the detail section and set the properties of each textbox as indicated.
Create Top N Reports
SQL Query
SELECT TOP 10 Customers.CompanyName, Sum([UnitPrice]*[Quantity]) AS Sales FROM (Customers INNER JOIN Orders ON Customers.CustomerID = Orders.CustomerID) INNER JOIN [Order Details] ON Orders.OrderID = [Order Details].OrderID GROUP BY Customers.CompanyName ORDER BY Sum([UnitPrice]*[Quantity]) DESC
Field Text Location MiscellaneousCompanyNameCompany Name 0.5, 0 Sales Sales 5, 0 OutputFormat = Currency
Tip: For basic steps like adding a report to a Visual Studio project and viewing a report, please see the Basic Data Bound Reports walkthrough.
ActiveReports 6 User Guide | 180
To show only summary data in a report, set the Detail section's Visible property to False or set its Height to 0. The Detail section still processes, but only the the summary fields in the GroupHeader and Footer sections are displayed.
To create a summary report1. With the Detail section selected in the Properties window, set the Visible property to False.
2. Right-click the design surface of a report and select Insert, then Group Header/Footer to add a group header and group footer section.
3. With the group header selected in the Properties window, drop down the DataField property and select the field on which to group the report.
4. Add a TextBox control to the GroupFooter section, and set its properties as follows:
DataField: the field that you want to summarize
SummaryGroup: the name of the GroupHeader section
SummaryRunning: Group
SummaryType: SubTotal
To display a grand total at the end of the report1. Right-click the design surface of a report and select Insert, then Report Header/Footer to add a report
header and report footer section.
2. Add a TextBox control to the ReportFooter section, and set its properties as follows:
DataField: the field that you want to summarize
SummaryRunning: All
SummaryType: GrandTotal
Create Summary Reports
ActiveReports 6 User Guide | 181

Green bar printouts can be created by alternating the shading or background color of the report's Detail section in the Format event.
To add code to alternate colors in the detail section1. Double-click the detail section of the report to create an event-handling method for the Detail Format
event.
2. Add code to the handler to alternate background colors.
The following example shows what the code for the method looks like.
To write the code in Visual Basic.NET
To write the code in C#
Create Green Bar Reports
Visual Basic.NET code. Paste JUST ABOVE the Detail Format event.
Dim color As Boolean
Visual Basic.NET code. Paste INSIDE the Detail Format event.
If color = True Then Me.Detail1.BackColor = System.Drawing.Color.DarkSeaGreen color = FalseElse Me.Detail1.BackColor = System.Drawing.Color.Transparent color = TrueEnd If
ActiveReports 6 User Guide | 182

C# code. Paste JUST ABOVE the Detail Format event.
bool color;
C# code. Paste INSIDE the Detail Format event.
if(color){ this.detail.BackColor = System.Drawing.Color.DarkSeaGreen; color = false;}else{ this.detail.BackColor = System.Drawing.Color.Transparent; color = true;}
ActiveReports 6 User Guide | 183
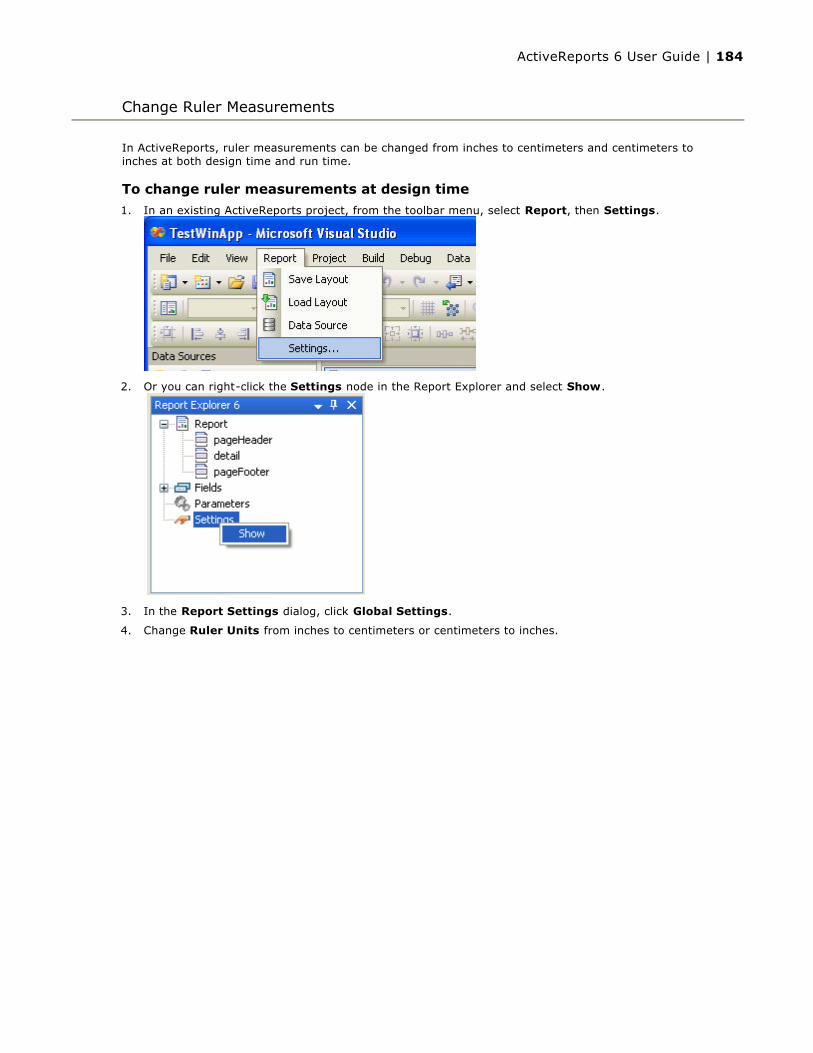
In ActiveReports, ruler measurements can be changed from inches to centimeters and centimeters to inches at both design time and run time.
To change ruler measurements at design time
1. In an existing ActiveReports project, from the toolbar menu, select Report, then Settings.
2. Or you can right-click the Settings node in the Report Explorer and select Show.
3. In the Report Settings dialog, click Global Settings.
4. Change Ruler Units from inches to centimeters or centimeters to inches.
Change Ruler Measurements
ActiveReports 6 User Guide | 184

To call a measurement conversion at run timeCall the CmToInch method or InchToCm method whenever needed. For example, if you were working in centimeters and needed to convert a label's position measurements from centimeters to inches at run time, you would use the following code.
To write the code in Visual Basic.NET
To write the code in C#
Visual Basic.NET code. Paste INSIDE the Format event.
Me.lblMyLabel.Left = ActiveReport.CmToInch(2)Me.lblMyLabel.Top = ActiveReport.CmToInch(2)
C# code. Paste INSIDE the Format event.
this.lblMyLabel.Left = ActiveReport.CmToInch(2);this.lblMyLabel.Top = ActiveReport.CmToInch(2);
ActiveReports 6 User Guide | 185
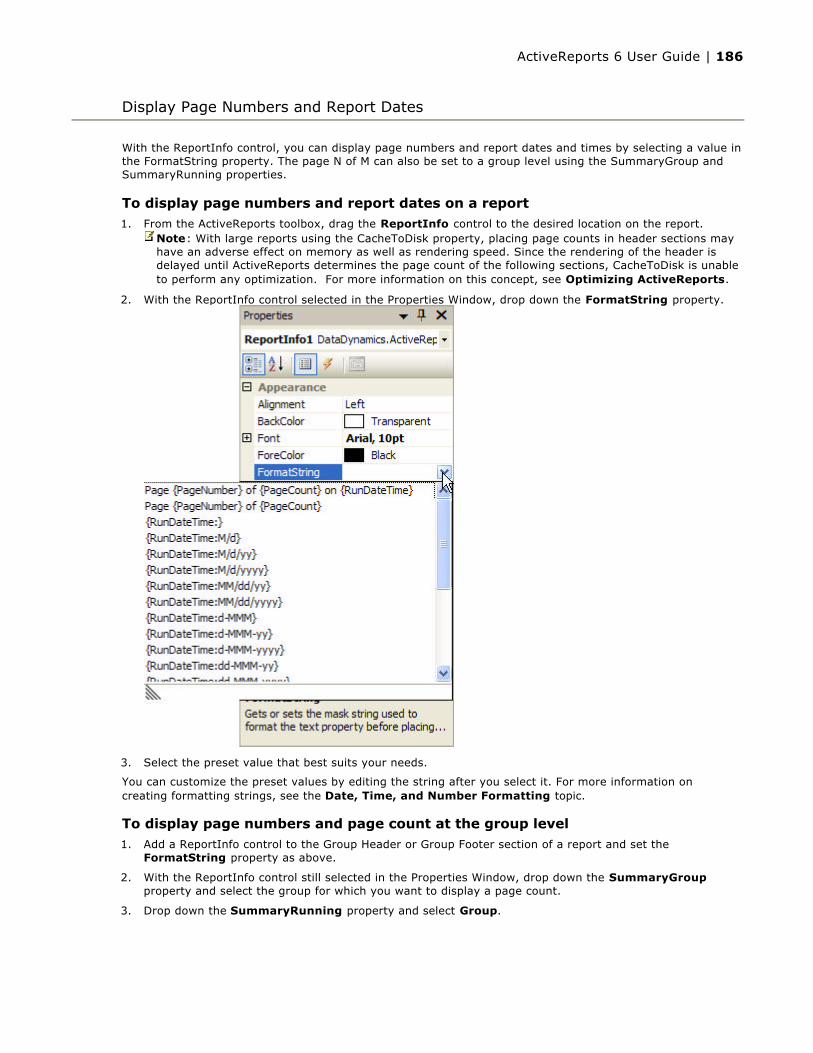
With the ReportInfo control, you can display page numbers and report dates and times by selecting a value in the FormatString property. The page N of M can also be set to a group level using the SummaryGroup and SummaryRunning properties.
To display page numbers and report dates on a report1. From the ActiveReports toolbox, drag the ReportInfo control to the desired location on the report.
2. With the ReportInfo control selected in the Properties Window, drop down the FormatString property.
3. Select the preset value that best suits your needs.
You can customize the preset values by editing the string after you select it. For more information on creating formatting strings, see the Date, Time, and Number Formatting topic.
To display page numbers and page count at the group level1. Add a ReportInfo control to the Group Header or Group Footer section of a report and set the
FormatString property as above.
2. With the ReportInfo control still selected in the Properties Window, drop down the SummaryGroupproperty and select the group for which you want to display a page count.
3. Drop down the SummaryRunning property and select Group.
Display Page Numbers and Report Dates
Note: With large reports using the CacheToDisk property, placing page counts in header sections may have an adverse effect on memory as well as rendering speed. Since the rendering of the header is delayed until ActiveReports determines the page count of the following sections, CacheToDisk is unable to perform any optimization. For more information on this concept, see Optimizing ActiveReports.
ActiveReports 6 User Guide | 186

The ActiveReports BarCode control offers all of the following barcode styles:
Barcode styles and descriptions
Format BarCodes
BarCodeStyle Description
Ansi39ANSI 3 of 9 (Code 39) uses upper case, numbers, - , * $ / + %. This is the default barcode style.
Ansi39x ANSI Extended 3 of 9 (Extended Code 39) uses the complete ASCII character set.
Code_2_of_5 Code 2 of 5 uses only numbers.Code25intlv Interleaved 2 of 5 uses only numbers.Code25mat Code 25 Matrix is a two-dimensional version of the linear Code 2 of 5 barcode.Code39 Code 39 uses numbers, % * $ /. , - +, and upper case.Code39x Extended Code 39 uses the complete ASCII character set.Code_128_A Code 128 A uses control characters, numbers, punctuation, and upper case.Code_128_B Code 128 B uses punctuation, numbers, upper case and lower case.Code_128_C Code 128 C uses only numbers.
Code_128auto Code 128 Auto uses the complete ASCII character set. Automatically selects between Code 128 A, B and C to give the smallest barcode.
Code_93 Code 93 uses uppercase, % $ * / , + -, and numbers.Code93x Extended Code 93 uses the complete ASCII character set.MSI MSI Code uses only numbers.PostNet PostNet uses only numbers with a check digit.Codabar Codabar uses A B C D + - : , / and numbers.EAN_8 EAN-8 uses only numbers (7 numbers and a check digit).
EAN_13
EAN-13 uses only numbers (12 numbers and a check digit). If there are only 12 numbers in the string, it calculates a checksum and adds it to the thirteenth position. If there are 13, it validates the checksum and throws an error if it is incorrect.
UPC_A UPC-A uses only numbers (11 numbers and a check digit).
UPC_E0
UPC-E0 uses only numbers. Used for zero-compression UPC symbols. For the Caption property, you may enter either a six-digit UPC-E code or a complete 11-digit (includes code type, which must be zero) UPC-A code. If an 11-digit code is entered, the Barcode control will convert it to a six-digit UPC-E code, if possible. If it is not possible to convert from the 11-digit code to the six-digit code, nothing is displayed.
UPC_E1UPC-E1 uses only numbers. Used typically for shelf labeling in the retail environment. The length of the input string for U.P.C. E1 is six numeric characters.
RM4SCC Royal Mail RM4SCC uses only letters and numbers (with a check digit). This is the barcode used by the Royal Mail in the United Kingdom.
UCCEAN128UCC/EAN –128 uses the complete ASCII character Set. This is a special version of Code 128 used in HIBC applications.
QRCodeQRCode is a 2D symbology that is capable of handling numeric, alphanumeric and byte data as well as Japanese kanji and kana characters. This symbology can encode up to 7,366 characters.
Code49Code 49 is a 2D high-density stacked barcode containing two to eight rows of eight characters each. Each row has a start code and a stop code. Encodes the complete ASCII character set.
JapanesePostal
This is the barcode used by the Japanese Postal system. Encodes alpha and numeric characters consisting of 18 digits including a 7-digit postal code number, optionally followed by block and house number information. The data to be encoded can include hyphens.
Pdf417
Pdf417 is a popular high-density 2-dimensional symbology that encodes up to 1108 bytes of information. This barcode consists of a stacked set of smaller barcodes. Encodes the full ASCII character set. It has ten error correction levels and three data compaction modes: Text, Byte, and Numeric. This
ActiveReports 6 User Guide | 187
* The RSS and QRCode styles have fixed height-to-width ratios. When you resize the width, the height is automatically calculated.
The following properties help you to customize the exact barcode you need for your application:
Barcode properties and descriptions
symbology can encode up to 1,850 alphanumeric characters or 2,710 numeric characters.
EAN128FNC1
EAN-128 is an alphanumeric one-dimensional representation of Application Identifier (AI) data for marking containers in the shipping industry.
This type of bar code contains the following sections:
Leading quiet zone (blank area)
Code 128 start character
A allows standard alphanumeric plus control and special characters
B allows standard alphanumeric plus lower case alpha and special characters
C allows a set of 100 digit pairs from 00 to 99
FNC (function) 1 character which allows scanners to identify this as an EAN-128 barcode
Data (AI plus data field)
Symbol check character (Start code value plus product of each character position plus value of each character divided by 103. The checksum is the remainder value.)
Stop character
Trailing quiet zone (blank area)
The AI in the Data section sets the type of the data to follow (i.e. ID, dates, quantity, measurements, etc.). There is a specific data structure for each type of data. This AI is what distinguishes the EAN-128 code from Code 128.
Multiple AIs (along with their data) can be combined into a single bar code.
EAN128FNC1 is a UCC/EAN-128 (EAN128) type barcode that allows you to insert FNC1 character at any place and adjust the bar size, etc., which is not available in UCC/EAN-128.
To insert FNC1 character, set “\n” for C#, or “vbLf” for VB to Text property at runtime.
RSS14RSS14 is a 14-digit Reduced Space Symbology that uses EAN.UCC item identification for point-of-sale omnidirectional scanning.
RSS14TruncatedRSS14Truncated uses the EAN.UCC information as in the RSS14, but also includes Indicator digits of zero or one for use on small items not scanned at the point of sale.
RSS14Stacked RSS14Stacked uses the EAN.UCC information with Indicator digits as in the RSS14Truncated, but stacked in two rows for a smaller width.
RSS14StackedOmnidirectionalRSS14StackedOmnidirectional uses the EAN.UCC information with omnidirectional scanning as in the RSS14, but stacked in two rows for a smaller width.
RSSExpandedRSSExpanded uses the EAN.UCC information as in the RSS14, but also adds AI elements such as weight and best-before dates.
RSSExpandedStackedRSSExpandedStacked uses the EAN.UCC information with AI elements as in the RSSExpanded, but stacked in two rows for a smaller width.
Property Description
Alignment The horizontal alignment of the caption in the control. Select from Near, Center, or Far. See CaptionPosition for vertical alignment.
AutoSize When set to True, the barcode automatically stretches to fit the control.BackColor Select a background fill color for the barcode.
BarWidth Set the width, in inches, of the barcode's narrow bars. Setting the width to 0 expands the barcode to fit the control. The width ratio is 1 to 0.012 inches. So setting the BarWidth to
ActiveReports 6 User Guide | 188
2 will have a value of 0.024 inches, while a value of 10 yields a bar width of 0.12 inches for the narrowest bars.
CaptionPositionThe vertical alignment of the caption in the control. Select from None, Above, or Below. See Alignment for horizontal alignment. None is selected by default, and no caption is displayed.
CheckSumEnabledSome barcode styles require a checksum and some have an optional checksum. CheckSumEnabled has no effect if the style already requires a check digit or if the style does not offer a checksum option.
Code128
Code128 has three settings that work in conjunction: Dpi, BarAdjust, and ModuleSize. This property only applies to the barcode style EANFNC1. You can improve the readability of the barcode by setting all three properties.
Dpi sets the printer resolution. Specify the resolution of the printer as dots per inch to create an optimized barcode image with the specified Dpi value.
BarAdjust sets the adjustment size by dot units, which affects the size of the module and not the entire barcode.
ModuleSize sets the horizontal size of the barcode module.
Code49
Code49 Options include Grouping and Group. If Grouping is set to True, any value not expressed by a single barcode is expressed by splitting it into several barcodes, and the Group property may be set to a number between 0 and 8. The default values are False and 0, respectively. When the Group property is set to 2, the grouped barcode's second symbol is created. When invalid group numbers are set, the BarCodeDataException is thrown.
DirectionSpecify the print direction of the barcode symbol. Select from LeftToRight (the default value), RightToLeft, TopToBottom, or BottomToTop.
Font Set the font for the caption. Only takes effect if you set the CaptionPosition property to a value other than None.
ForeColor Select a color for the barcode and caption.
PDF417
PDF417 Options only apply to the barcode style PDF417.
Column sets column numbers for the barcode. Values for this property range from 1 to 30. The default value is -1 which automatically determines row numbers.
ErrorLevel sets the error correction level for the barcode. Values range between 0 and 8. The error correction capability increases as the value increases. With each increase in the ErrorLevel value, the size of the barcode increases. The default value is -1 for automatic configuration.
Row sets row numbers for the barcode. Values range between 3 and 90. The default value is -1 which automatically determine row numbers.
Type sets the barcode type to Normal or Simple. Simple is the compact type in which the right indicator is neither displayed nor printed.
QRCode
QRCode Options only apply to the barcode style QRCode.
Connection allows any value which cannot be expressed by a single barcode to split into several barcodes. This property is used in conjunction with the ConnectionNumber property.
ConnectionNumber Use this property with the Connection property to set the number of barcodes it can split into. Values between 0 and 15 are valid. An invalid number raises the BarCodeData Exception.
ErrorLevel values are L (7% restorable), M (15% restorable), Q (25% restorable), and H (30% restorable). The higher the percentage, the larger the barcode becomes.
Mask is used to balance brightness and offers 8 patterns in the QRCodeMask enumeration. The default value is Auto, which sets the masking pattern automatically, and is recommended for most uses.
Mask000 (i+j) mod 2 = 0
Mask001 i mod 2 = 0
Mask010 j mod 3 = 0
Mask011 (i+j) mod 3 = 0
Mask100 (( i div 2)+(j div 3)) mod 2 = 0
ActiveReports 6 User Guide | 189
Mask101 (ij) mod 2 + (ij) mod 3 = 0
Mask110 ((ij) mod 2 +(ij) mod 3) mod 2 = 0
Mask111 ((ij)mod 3 + (i+j) mod 2) mod 2 = 0
Model sets Model1, the original model, or Model2, the extended model.
Version indicates the size of the barcode. As the value increases, the barcode's size increases, enabling more information to be stored. Specify any value between 1 and 14 when the Model property is set to Model1 and 1 to 40 for Model2. The default value is -1, which automatically determines the version most suited to the value.
RowCount Sets the number of stacked rows in the barcode.
Style Sets the symbology used to render the barcode. See the table above for details about each style.
TextSets the value to print as a barcode symbol and caption. ActiveReports fills this value from the bound data field if the control is bound to the data source.
ActiveReports 6 User Guide | 190
Using the Hyperlink property available on the following ActiveReports controls, you can add hyperlinks that connect to a Web page, open an e-mail, or jump to a bookmark.
Label
TextBox
Picture
OleObject
To link to a Web page1. Click the control to select it.
2. In the Properties window, set the HyperLink property to any valid URL.
To link to an e-mail address1. Click the control to select it.
2. In the Properties window, set the HyperLink property to mailto: and any valid e-mail address.
To parse the URL out of a database field for a hyperlink1. Double-click the section where the control is located. This creates an event-handling method for the
section's Format event.
2. Add code to the Format event to
Parse the URL out of the HomePage field
Assign it to the HyperLink property of txtHomePage
Remove the URL markers from the text displayed in txtHomePage
The following example shows what the code for the method looks like.
To write the code in Visual Basic.NET
To write the code in C#
To create a hyperlink that jumps to a bookmark1. Double-click the section where the control is located. This creates an event-handling method for the
section's Format event.
Add Hyperlinks
Visual Basic.NET code. Paste INSIDE the Format event.
Dim iStart As IntegerDim sHTML As StringIf txtHomePage.Text <> "" Then iStart = InStr(1, txtHomePage.Text, "#", CompareMethod.Text) sHTML = Right(txtHomePage.Text, (Len(txtHomePage.Text) - iStart)) sHTML = Replace(sHTML, "#", "", 1, -1, CompareMethod.Text) txtHomePage.HyperLink = sHTML txtHomePage.Text = Replace(txtHomePage.Text, "#", "", 1, -1, CompareMethod.Text)End If
C# code. Paste INSIDE the Format event.
int iStart;string sHTML;if (txtHomePage.Text != "") { iStart = txtHomePage.Text.IndexOf("#",0); sHTML = txtHomePage.Text.Substring(iStart, txtHomePage.Text.Length - iStart); sHTML = sHTML.Replace("#", ""); txtHomePage.HyperLink = sHTML; txtHomePage.Text = txtHomePage.Text.Replace("#", ""); }
ActiveReports 6 User Guide | 191

2. Add code to the Format event to
Parse the URL out of the HomePage field
Assign it to the HyperLink property of txtHomePage
Remove the URL markers from the text displayed in txtHomePage
The following example shows what the code for the method looks like.
To write the code in Visual Basic.NET
To write the code in C#
To display the page number of the bookmark in the table of contents
To write the code in Visual Basic
1. At the top left of the code view for the report, click the drop-down arrow and select (YourReportName Events).
2. At the top right of the code window, click the drop-down arrow and select FetchData. This creates an event-handling method for the report's FetchData event.
3. Add code to the handler to retrieve information to populate the report fields.
The following example shows what the code for the method looks like.
To write the code in C#
1. Back in design view, click in the gray area below the report to select it.
2. Click the events icon in the Properties window to display available events for the report.
3. Double-click FetchData. This creates an event-handling method for the report's FetchData event.
4. Add code to the handler to retrieve information to populate the report fields.
The following example shows what the code for the method looks like.
Visual Basic.NET code. Paste JUST ABOVE the Format event.
Public pBM As New BookmarksCollection()Dim iEntry As IntegerVisual Basic.NET code. Paste INSIDE the Format event.
Me.Detail1.AddBookmark(Me.txtCompanyName.Text)Me.txtEntry.HyperLink = "toc://" + pBM(iEntry - 1).LabelMe.txtEntry.Text = pBM(iEntry - 1).Label Me.txtPage.Text = pBM(iEntry - 1).PageNumber
C# code. Paste JUST ABOVE the Format event.
public BookmarksCollection pBM = new BookmarksCollection();int iEntry;C# code. Paste INSIDE the Format event.
this.detail.AddBookmark(this.txtCompanyName.Text);this.txtEntry.HyperLink = "toc://" + pBM[iEntry - 1].Label;this.txtEntry.Text = pBM[iEntry - 1].Label;this.txtPage.Text = pBM[iEntry - 1].PageNumber.ToString();
Visual Basic.NET code. Paste INSIDE the FetchData event.
If iEntry > pBM.Count - 1 Then eArgs.EOF = TrueElse eArgs.EOF = False iEntry += 1End If
C# code. Paste INSIDE the FetchData event.
if (iEntry > pBM.Count - 1){ eArgs.EOF = true;}else{
ActiveReports 6 User Guide | 192

eArgs.EOF = false; iEntry += 1;}
ActiveReports 6 User Guide | 193

You or your users can add notes, special instructions, even images, directly to the ActiveReport, making team collaboration, feedback, and support an easier task. Annotations are added in two ways: via the viewer's toolbar, or in code.
Annotations added via the viewer's toolbar are temporary. They reside on the Page object in which they are placed, and are destroyed when the report closes. In order to save annotations you must save the report data and accompanying annotations to RDF format.
Each annotation type allows you to change the colors, transparency, border, font, and alignment, plus other properties specific to the type of annotation. Available annotations include:
AnnotationText A rectangular box in which you can enter text.
AnnotationCircle A circle without text. You can change the shape to an oval.
AnnotationRectangle A rectangular box without text.
AnnotationArrow A 2D arrow in which you can enter text. You can change the arrow direction.
AnnotationBalloon A balloon caption in which you can enter text. You can point the balloon's tail in any direction.
AnnotationLine A line with text above or below it. You can add arrow caps to one or both ends and select different dash styles.
AnnotationImage A rectangle with a background image and text. You can select an image and its position, and place text on the image.
To add annotations using the viewer1. Load a report into the viewer and click the Annotations button on the toolbar.
2. Click the annotation you want to add and drag it onto the report.
3. Drag the corners to resize the annotation as needed, or drag the center to relocate it.
To change the properties of an annotation in the viewer1. Right-click the annotation and select Properties.
2. In the Annotation Properties window that appears, add text, change the alignment, set colors, and use any other special properties to make the annotation appear the way you want it.
To save annotationsYou can save annotations along with report data into an RDF file. The following example shows how to add a Save Annotated Report button to the viewer.
1. From the Visual Studio toolbox, drag a Button control onto the viewer.
2. Set the Text property of the button to Save Annotated Report.
Add Annotations
ActiveReports 6 User Guide | 194

3. Double-click the button. This creates an event-handling method for the button Click event.
4. Add code to the click handler to save the document to an RDF file.
To write the code in Visual Basic.NET
To write the code in C#
To add annotations in code
The following example shows how to add annotations at run time and save the report data and annotations to an RDF file.
1. Double-click the title bar of the form in which you host the viewer. This creates an event-handling method for the form Load event.
2. Add code to the handler to run the report, add annotations, display the report in the viewer, and save it into an RDF file.
To write the code in Visual Basic.NET
To write the code in C#
Tip: See Save and Load Report Files (RDF) for more information on loading the saved RDF file into the viewer.
Visual Basic.NET code. Paste INSIDE the button Click event.
Me.Viewer1.Document.Save("C:\\UserAnnotations.rdf")
C# code. Paste INSIDE the button Click event.
this.viewer1.Document.Save("C:\\UserAnnotations.rdf");
Visual Basic.NET code. Paste ABOVE the class.
Imports DataDynamics.ActiveReports.Document.Annotations
Visual Basic.NET code. Paste INSIDE the Form Load event.
Dim rpt As New NewActiveReport1 'Run the report first rpt.Run()
'Assign the viewer Me.Viewer1.Document = rpt.Document
'Create an annotation and assign property values Dim circle As New AnnotationCircle circle.Color = System.Drawing.Color.GreenYellow circle.Border.Color = System.Drawing.Color.Chartreuse
'Add the annotation circle.Attach(1,1) 'screen location Me.Viewer1.Document.Pages(0).Annotations.Add(circle)
'Set the size properties. The annotation must be added to the page first. circle.Height = 0.25 circle.Width = 0.50
'Save annotations with the report in an RDF file rpt.Document.Save("C:\\AnnotatedReport.rdf")
C# code. Paste ABOVE the class.
using DataDynamics.ActiveReports.Document.Annotations;
C# code. Paste INSIDE the Form Load event.
NewActiveReport1 rpt = new NewActiveReport1(); //Run the report first rpt.Run(); //Assign the viewer this.viewer1.Document = rpt.Document;
ActiveReports 6 User Guide | 195
//Create an annotation and assign property values AnnotationCircle circle = new AnnotationCircle(); circle.Color = System.Drawing.Color.GreenYellow; circle.Border.Color = System.Drawing.Color.Chartreuse; //Add the annotation circle.Attach(1,1); //screen location this.viewer1.Document.Pages[0].Annotations.Add(circle);
//Set the size properties. The annotation must be added to the page first. circle.Height = 0.25f; circle.Width = 0.50f;
//Save annotations with the report in an RDF file rpt.Document.Save("C:\\AnnotatedReport.rdf");
ActiveReports 6 User Guide | 196

To export your reports to the various formats that ActiveReports supports, you must first add the export controls to your Visual Studio toolbox. For more information, see the Adding ActiveReports Controls topic. Here are the export formats that are included with ActiveReports:
HTML For displaying in Web browsers or e-mail.
PDF For preserving formatting on different computers.
RTF For preserving some formatting, but allowing reports to be opened with Word or WordPad.
Text For transmitting raw data, with little or no formatting.
TIFF For transmitting faxes.
XLS For spreadsheets.
To export a report1. From the Visual Studio toolbox, drag the export filter that you want to use onto your Windows form. The
control appears in the component tray below the form.
2. Double-click in the title bar of the form to create an event-handling method for the form Load event.
3. Add code to the event to run the report and export it.
The following examples show what the code for the method looks like for each of the export types.
To write the code in Visual Basic.NET
To write the code in C#
Export Reports
Visual Basic.NET code. Paste INSIDE the Form Load event.
Dim rpt As New NewActiveReport1()rpt.Run()Me.HtmlExport1.Export(rpt.Document, Application.StartupPath + "\\HTMLExpt.html")Me.PdfExport1.Export(rpt.Document, Application.StartupPath + "\\PDFExpt.pdf")Me.RtfExport1.Export(rpt.Document, Application.StartupPath + "\\RTFExpt.rtf")Me.TextExport1.Export(rpt.Document, Application.StartupPath + "\\TextExpt.txt")Me.TiffExport1.Export(rpt.Document, Application.StartupPath + "\\TIFFExpt.tiff")Me.XlsExport1.Export(rpt.Document, Application.StartupPath + "\\XLSExpt.xls")
C# code. Paste INSIDE the Form Load event.
NewActiveReport1 rpt = new NewActiveReport1(); rpt.Run();this.htmlExport1.Export(rpt.Document, Application.StartupPath + "\\HTMLExpt.html"); this.pdfExport1.Export(rpt.Document, Application.StartupPath + "\\PDFExpt.pdf");this.rtfExport1.Export(rpt.Document, Application.StartupPath + "\\RTFExpt.rtf"); this.textExport1.Export(rpt.Document, Application.StartupPath + "\\TextExpt.txt");this.tiffExport1.Export(rpt.Document, Application.StartupPath + "\\TIFFExpt.tiff"); this.xlsExport1.Export(rpt.Document, Application.StartupPath + "\\XLSExpt.xls");
ActiveReports 6 User Guide | 197

This feature is for use with the Professional Edition license only. An evaluation message is rendered when used with the Standard Edition license.
The following code samples assume that you have a report variable rpt, and that you have dragged the PDFExport object onto your form.
To add an invisible signatureThe following example shows what the code for adding an invisible signature looks like. Replace the path and filename and password of the Certificate with your certificate information.
To write the code in Visual Basic.NET
To write the code in C#
To add a visible signature with the time stamp
Create a Digital Signature for a PDF Export
Important: In order to create a digital signature, you must first have a valid PKCS#12 certificate (*.pfx) file.
To use the code below, change the path and file name to point to your PFX, and change "password" to the password for your PFX file. You can use a third-party digital ID, or create a self-signed certificate.
For information on creating a self-signed certificate, see the Adobe Acrobat Help topic "Create a self-signed digital ID." (http://help.adobe.com/en_US/Acrobat/8.0/Professional/help.html?content=WS58a04a822e3e50102bd615109794195ff-7d92.html)
You can also create a PFX file from the Visual Studio command line. For more information and links to SDK downloads, see http://www.source-code.biz/snippets/vbasic/3.htm .
Visual Basic.NET code. Paste INSIDE the Form Load event.
Me.PdfExport1.Signature.VisibilityType = DataDynamics.ActiveReports.Export.Pdf.Signing.VisibilityType.Invisible' Set certificate & password.Me.PdfExport1.Signature.Certificate = New Security.Cryptography.X509Certificates.X509Certificate2(Application.StartupPath & "\..\..\certificate.pfx", "password")
' Signature items. Me.PdfExport1.Signature.Reason = New DataDynamics.ActiveReports.Export.Pdf.Signing.SignatureField(Me.PdfExport1.Signature.Location = New DataDynamics.ActiveReports.Export.Pdf.Signing.SignatureField(
Me.PdfExport1.Export(rpt.Document, Application.StartupPath & "\..\..\VisibilityType_Invisible.pdf")
C# code. Paste INSIDE the Form Load event.
String path = Path.Combine(Application.StartupPath, "\..\..\certificate.pfx");
String output = “output.pdf”;// Set certificate & password.this.pdfExport1.Signature.Certificate = new System.Security.Cryptography.X509Certificates.X509Certificate2(path, "password");
// Signature items.this.pdfExport1.Signature.Reason = new DataDynamics.ActiveReports.Export.Pdf.Signing.SignatureField <this.pdfExport1.Signature.Location = new DataDynamics.ActiveReports.Export.Pdf.Signing.SignatureField <
this.pdfExport1.Export(rpt.Document, output);
ActiveReports 6 User Guide | 198
The following example shows what the code for adding a visible signature with the time stamp looks like. Replace the path and filename and password of the Certificate with your certificate information, and replace the time stamping authority (TSA) URL with that of your TSA.
To write the code in Visual Basic.NET
To write the code in C#
To add a visible signature with text and graphics elementsThe following example shows what the code for adding a visible signature with text and graphics looks like. Replace the path and filename and password of the Certificate with your certificate information.
To write the code in Visual Basic.NET
Note: You must purchase a volume-based registration at an actual TSA for your applications.
Visual Basic.NET code. Paste INSIDE the Form Load event.
' Text signature.Me.PdfExport1.Signature.VisibilityType = DataDynamics.ActiveReports.Export.Pdf.Signing.VisibilityType.TextMe.PdfExport1.Signature.Stamp.Bounds = New RectangleF(1, 1, 4, 2)Me.PdfExport1.Signature.Stamp.TextAlignment = DataDynamics.ActiveReports.Export.Pdf.Signing.Alignment.Left
' Set certificate & password.Me.PdfExport1.Signature.Certificate = New Security.Cryptography.X509Certificates.X509Certificate2(Application.StartupPath & "\..\..\certificate.pfx", "password")
' Signature items.Me.PdfExport1.Signature.SignDate = New DataDynamics.ActiveReports.Export.Pdf.Signing.SignatureField(Of Date)(System.DateTime.Now(), True)Me.PdfExport1.Signature.Contact = New DataDynamics.ActiveReports.Export.Pdf.Signing.SignatureField(Of String)("[email protected]", True)Me.PdfExport1.Signature.Reason = New DataDynamics.ActiveReports.Export.Pdf.Signing.SignatureField(Of String)("I agree.", True)Me.PdfExport1.Signature.Location = New DataDynamics.ActiveReports.Export.Pdf.Signing.SignatureField(Of String)("Japan", True)
' Time stamp.Me.PdfExport1.Signature.TimeStamp = New DataDynamics.ActiveReports.Export.Pdf.Signing.TimeStamp("Me.PdfExport1.Export(rpt.Document, Application.StartupPath & "\..\..\TimeStamped.pdf")
C# code. Paste INSIDE the Form Load event.
// Text signature.this.pdfExport1.Signature.VisibilityType = DataDynamics.ActiveReports.Export.Pdf.Signing.VisibilityType.Text;this.pdfExport1.Signature.Stamp.Bounds = new RectangleF(1, 2, 5, 2);this.pdfExport1.Signature.Stamp.TextAlignment = DataDynamics.ActiveReports.Export.Pdf.Signing.Alignment.Left;
// Set certificate & password.this.pdfExport1.Signature.Certificate = new System.Security.Cryptography.X509Certificates.X509Certificate2(Application.StartupPath & "\..\..\certificate.pfx", "password");
// Signature items.this.pdfExport1.Signature.SignDate = new DataDynamics.ActiveReports.Export.Pdf.Signing.SignatureField<System.DateTime>(System.DateTime.Now, true);this.pdfExport1.Signature.Contact = new DataDynamics.ActiveReports.Export.Pdf.Signing.SignatureField<String>("[email protected]", true);this.pdfExport1.Signature.Reason = new DataDynamics.ActiveReports.Export.Pdf.Signing.SignatureField<String>("I agree.", true);this.pdfExport1.Signature.Location = new DataDynamics.ActiveReports.Export.Pdf.Signing.SignatureField<String>("Japan", true);
// Time stamp.this.pdfExport1.Signature.TimeStamp = new DataDynamics.ActiveReports.Export.Pdf.Signing.TimeStamp("
this.pdfExport1.Export(rpt.Document, Application.StartupPath & "\..\..\TimeStamped.pdf");
Visual Basic.NET code. Paste INSIDE the Form Load event.
' ImageText signature.Me.PdfExport1.Signature.VisibilityType = DataDynamics.ActiveReports.Export.Pdf.Signing.VisibilityType.ImageText
' Bounds (Container of Text & Image).Me.PdfExport1.Signature.Stamp.Bounds = New RectangleF(2, 1, 5, 1)
' Text area.Me.PdfExport1.Signature.Stamp.TextAlignment = DataDynamics.ActiveReports.Export.Pdf.Signing.Alignment.LeftMe.PdfExport1.Signature.Stamp.Font = New Font(System.Drawing.FontFamily.GenericSansSerif, 8, FontStyle.Regular)' Note: Specify (x, y) in relative coordinate from Bounds top-left.Me.PdfExport1.Signature.Stamp.TextRectangle = New RectangleF(2, 0, 3, 1)
ActiveReports 6 User Guide | 199

To write the code in C#
To add a visible signature with graphics
The following example shows what the code for adding a visible signature with graphics looks like. Replace the path and filename and password of the Certificate with your certificate information.
To write the code in Visual Basic.NET
' Image area.Me.PdfExport1.Signature.Stamp.Image = Image.FromFile(Application.StartupPath & "\..\..\image\stamp.bmp")Me.PdfExport1.Signature.Stamp.ImageAlignment = DataDynamics.ActiveReports.Export.Pdf.Signing.Alignment.Center' Note: Specify (x, y) in relative coordinate from Bounds top-left.Me.PdfExport1.Signature.Stamp.ImageRectangle = New RectangleF(0, 0, 2, 1)
' Set certificate & password.Me.PdfExport1.Signature.Certificate = New Security.Cryptography.X509Certificates.X509Certificate2(Application.StartupPath & "\..\..\certificate.pfx", "password")
' Signature items.Me.PdfExport1.Signature.SignDate = New DataDynamics.ActiveReports.Export.Pdf.Signing.SignatureField(Me.PdfExport1.Signature.Contact = New DataDynamics.ActiveReports.Export.Pdf.Signing.SignatureField(Me.PdfExport1.Signature.Reason = New DataDynamics.ActiveReports.Export.Pdf.Signing.SignatureField(Me.PdfExport1.Signature.Location = New DataDynamics.ActiveReports.Export.Pdf.Signing.SignatureField(
Me.PdfExport1.Export(rpt.Document, Application.StartupPath & "\..\..\TextAndGraphics.pdf")
C# code. Paste INSIDE the Form Load event.
// ImageText signature.this.pdfExport1.Signature.VisibilityType = DataDynamics.ActiveReports.Export.Pdf.Signing.VisibilityType.ImageText;
// Bounds (Container of Text & Image).this.pdfExport1.Signature.Stamp.Bounds = new RectangleF(2, 1, 5, 1);
// Text area.this.pdfExport1.Signature.Stamp.TextAlignment = DataDynamics.ActiveReports.Export.Pdf.Signing.Alignment.Left;this.pdfExport1.Signature.Stamp.Font = new Font("Comic Sans MS", 8, FontStyle.Regular);// Note: Specify (x, y) in relative coordinate from Bounds top-left.this.pdfExport1.Signature.Stamp.TextRectangle = new RectangleF(2, 0, 3, 1);
// Image area.this.pdfExport1.Signature.Stamp.Image = Image.FromFile("stamp.bmp");this.pdfExport1.Signature.Stamp.ImageAlignment = DataDynamics.ActiveReports.Export.Pdf.Signing.Alignment.Center;// Note: Specify (x, y) in relative coordinate from Bounds top-left.this.pdfExport1.Signature.Stamp.ImageRectangle = new RectangleF(0, 0, 2, 1);
// Set certificate & password.this.pdfExport1.Signature.Certificate = new System.Security.Cryptography.X509Certificates.X509Certificate2("c:\\certificate.pfx", "password");
//Signature items.this.pdfExport1.Signature.SignDate = new DataDynamics.ActiveReports.Export.Pdf.Signing.SignatureField<this.pdfExport1.Signature.Contact = new DataDynamics.ActiveReports.Export.Pdf.Signing.SignatureField<stthis.pdfExport1.Signature.Reason = new DataDynamics.ActiveReports.Export.Pdf.Signing.SignatureField<this.pdfExport1.Signature.Location = new DataDynamics.ActiveReports.Export.Pdf.Signing.SignatureField<
this.pdfExport1.Export(rpt.Document, "c:\\TextAndGraphics.pdf");
Visual Basic.NET code. Paste INSIDE the Form Load event.
' Image signature.Me.PdfExport1.Signature.VisibilityType = DataDynamics.ActiveReports.Export.Pdf.Signing.VisibilityType.ImageMe.PdfExport1.Signature.Stamp.Image = Image.FromFile(Application.StartupPath & "\..\..\image\stamp.bmp")Me.PdfExport1.Signature.Stamp.Bounds = New RectangleF(1, 2, 4, 1)Me.PdfExport1.Signature.Stamp.ImageAlignment = DataDynamics.ActiveReports.Export.Pdf.Signing.Alignment.Left
' Set certificate & password.Me.PdfExport1.Signature.Certificate = New Security.Cryptography.X509Certificates.X509Certificate2(Application.StartupPath & "\..\..\certificate.pfx", "password")
Me.PdfExport1.Export(rpt.Document, Application.StartupPath & "\..\..\VisibilityType_Image.pdf")
ActiveReports 6 User Guide | 200
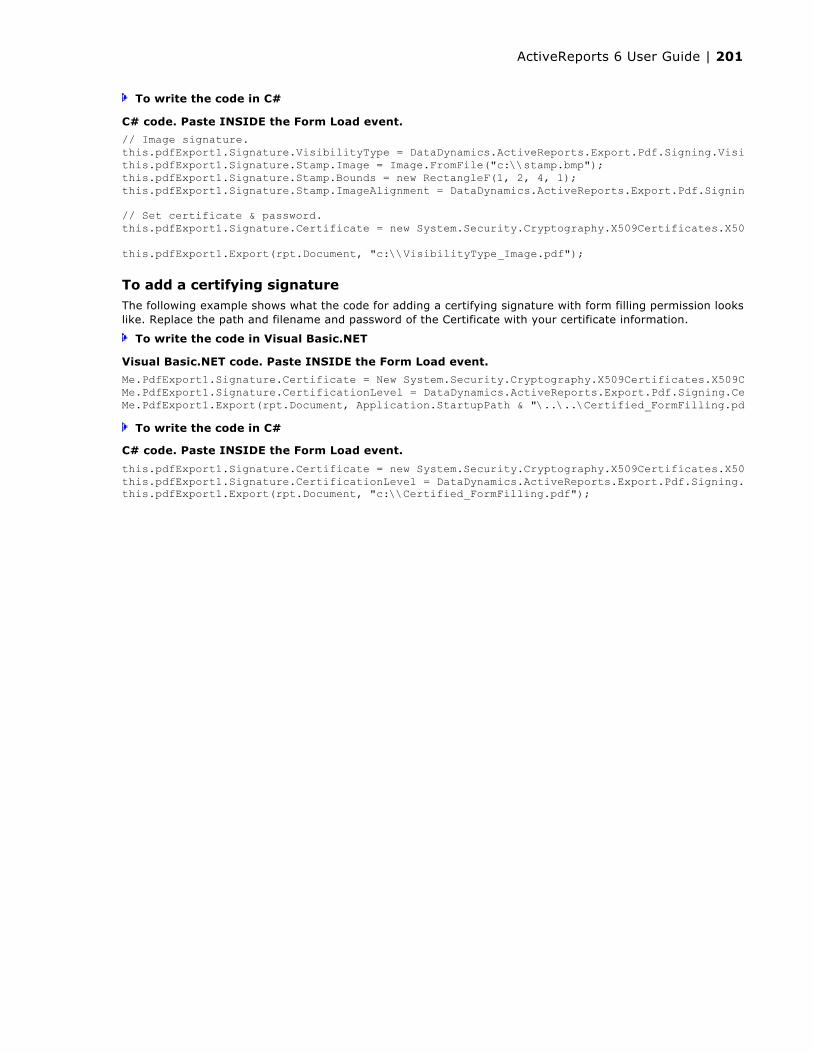
To write the code in C#
To add a certifying signatureThe following example shows what the code for adding a certifying signature with form filling permission looks like. Replace the path and filename and password of the Certificate with your certificate information.
To write the code in Visual Basic.NET
To write the code in C#
C# code. Paste INSIDE the Form Load event.
// Image signature.this.pdfExport1.Signature.VisibilityType = DataDynamics.ActiveReports.Export.Pdf.Signing.VisibilityType.Image;this.pdfExport1.Signature.Stamp.Image = Image.FromFile("c:\\stamp.bmp");this.pdfExport1.Signature.Stamp.Bounds = new RectangleF(1, 2, 4, 1);this.pdfExport1.Signature.Stamp.ImageAlignment = DataDynamics.ActiveReports.Export.Pdf.Signing.Alignment.Left;
// Set certificate & password.this.pdfExport1.Signature.Certificate = new System.Security.Cryptography.X509Certificates.X509Certificate2("c:\\certificate.pfx", "password");
this.pdfExport1.Export(rpt.Document, "c:\\VisibilityType_Image.pdf");
Visual Basic.NET code. Paste INSIDE the Form Load event.
Me.PdfExport1.Signature.Certificate = New System.Security.Cryptography.X509Certificates.X509Certificate2(Application.StartupPath & "\..\..\certificate.pfx", "password")Me.PdfExport1.Signature.CertificationLevel = DataDynamics.ActiveReports.Export.Pdf.Signing.CertificationLevel.FormFillingMe.PdfExport1.Export(rpt.Document, Application.StartupPath & "\..\..\Certified_FormFilling.pdf")
C# code. Paste INSIDE the Form Load event.
this.pdfExport1.Signature.Certificate = new System.Security.Cryptography.X509Certificates.X509Certificate2("c:\\certificate.pfx", "password");this.pdfExport1.Signature.CertificationLevel = DataDynamics.ActiveReports.Export.Pdf.Signing.CertificationLevel.FormFilling;this.pdfExport1.Export(rpt.Document, "c:\\Certified_FormFilling.pdf");
ActiveReports 6 User Guide | 201

With ActiveReports, printer settings can be modified at design time and at run time.
Multiple CopiesTo set multiple copies in the print dialog
1. With a report displayed in the viewer, click Print.
2. In the Print dialog that appears, next to Number of copies, select the number of copies that you want to print.
To use code to set multiple copies
1. Double-click in the gray section below the report to create an event-handling method for the report's ReportStart event.
2. Add code to the handler to set multiple copies of the report for printing.
The following example shows what the code for the method looks like for printing five copies.
To write the code in Visual Basic.NET
To write the code in C#
Printer Settings
At design time, you can set paper size, orientation, collation, duplexing or paper source on the Printer Settings tab of the Report Settings window.
To open the Report Settings window
1. Open an ActiveReport.
2. Click on any section of the report to select it so that the Report menu appears.
3. Drop down the Report menu and select Settings.
Print Multiple Copies, Duplex, and Landscape
Visual Basic.NET code. Paste INSIDE the ReportStart event.
Me.Document.Printer.PrinterSettings.Copies = 5
Visual Basic.NET code. Paste INSIDE the ReportEnd event.
Me.Document.Print(false, false)
C# code. Paste INSIDE the ReportStart event.
this.Document.Printer.PrinterSettings.Copies = 5;
C# code. Paste INSIDE the ReportEnd event.
this.Document.Print(false, false);
ActiveReports 6 User Guide | 202

4. Click Printer Settings to open the printer settings tab.
DuplexTo set duplexing in Printer Settings
1. Open the Report Settings window and select Printer Settings .
2. Next to Duplex, select one of the following options:
Printer Default: The report uses the default setting on the selected printer.
Simplex: Turns off duplex printing.
Horizontal: Prints horizontally on both sides of the paper.
Vertical: Prints vertically on both sides of the paper.
3. Click OK to return to the report.
OrientationTo change page orientation in Printer Settings
1. Open the Report Settings window and select Printer Settings .
ActiveReports 6 User Guide | 203
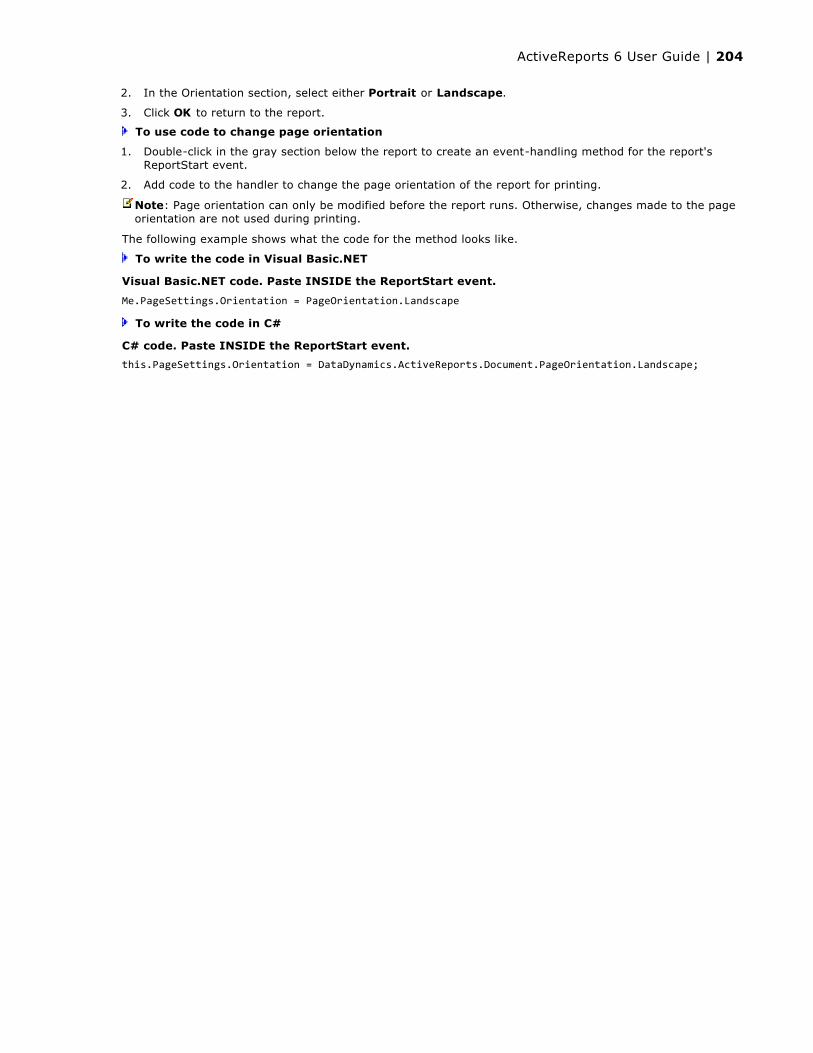
2. In the Orientation section, select either Portrait or Landscape.
3. Click OK to return to the report.
To use code to change page orientation
1. Double-click in the gray section below the report to create an event-handling method for the report's ReportStart event.
2. Add code to the handler to change the page orientation of the report for printing.
The following example shows what the code for the method looks like.
To write the code in Visual Basic.NET
To write the code in C#
Note: Page orientation can only be modified before the report runs. Otherwise, changes made to the page orientation are not used during printing.
Visual Basic.NET code. Paste INSIDE the ReportStart event.
Me.PageSettings.Orientation = PageOrientation.Landscape
C# code. Paste INSIDE the ReportStart event.
this.PageSettings.Orientation = DataDynamics.ActiveReports.Document.PageOrientation.Landscape;
ActiveReports 6 User Guide | 204

You can use conditions in the Format event to control when the report's Detail section is shown.
To add code to hide the detail section
1. Double-click the detail section of the report to create an event-handling method for the Detail Format event.
2. Add code to the handler to hide the detail section if the product is discontinued.
The following example shows what the code for the method looks like. This code assumes that your report has the following fields:
txtReorderLevel (numeric)
txtDiscontinued (Boolean)
To write the code in Visual Basic.NET
Conditionally Show or Hide Details
Visual Basic.NET code. Paste INSIDE the Detail Format event.
If Me.txtReorderLevel.Value = 0 And Me.txtDiscontinued.Value = False Then Me.Detail1.Visible = True Me.txtDiscontinued.Text = "" Me.txtReorderLevel.Text = "Need to Reorder" Me.txtReorderLevel.ForeColor = System.Drawing.Color.DarkRedElse Me.Detail.Visible = FalseEnd If
ActiveReports 6 User Guide | 205
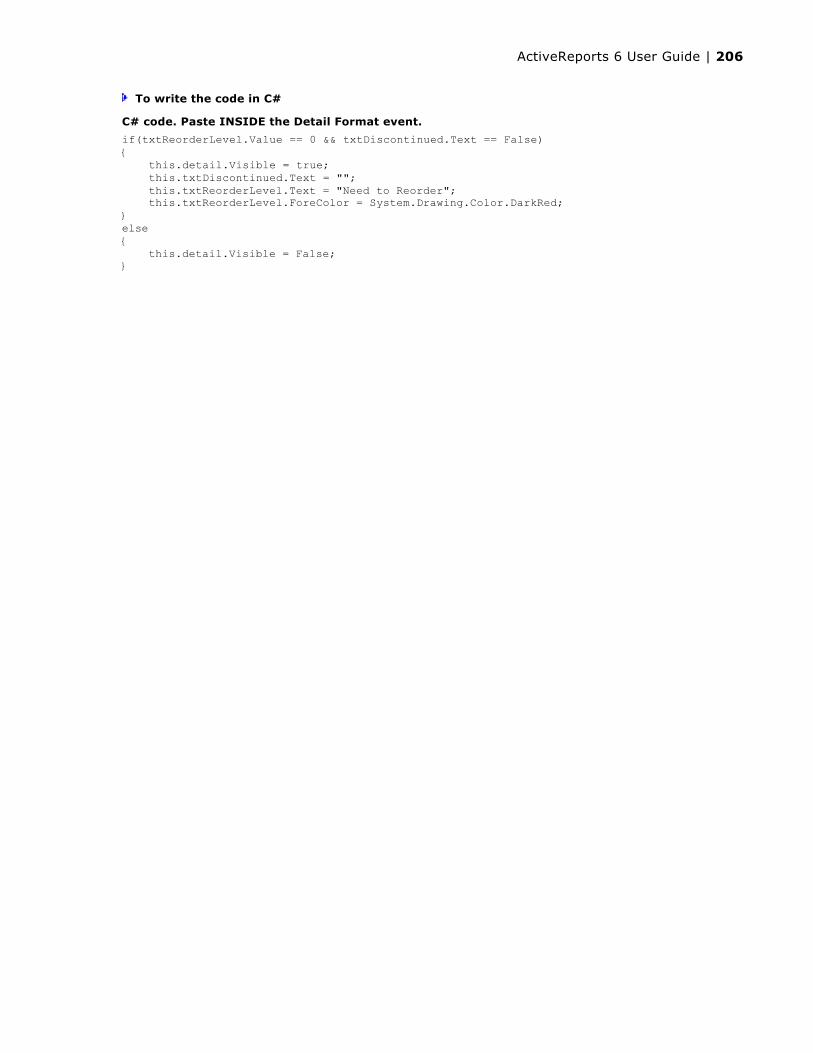
To write the code in C#
C# code. Paste INSIDE the Detail Format event.
if(txtReorderLevel.Value == 0 && txtDiscontinued.Text == False){ this.detail.Visible = true; this.txtDiscontinued.Text = ""; this.txtReorderLevel.Text = "Need to Reorder"; this.txtReorderLevel.ForeColor = System.Drawing.Color.DarkRed;}else{ this.detail.Visible = False;}
ActiveReports 6 User Guide | 206

You can set custom style values using the Report Settings window, and then apply the styles to controls using the ClassName property in the Properties Window. If you want to apply these same styles to controls in other reports without setting them up each time, you can export them to XML files of type *.reportstyle which you can then select in the Report Settings window. Reports using external style sheets have these styles applied before the report is run.
To save an external style sheet
1. With an ActiveReport open and selected in Visual Studio, drop down the Report menu and select Settings.
2. In the Report Settings window that appears, click the Styles button to view the style settings.
3. By default, ActiveReports has six predefined styles: Normal, Heading1, Heading2, Heading3, DetailRecord, and ReportTitle. Click each of these styles in the list to modify them using the fields to the right, or click the New button to create a new style.
4. To save your styles to an external XML *.reportstyle file, click the Export styles to file button.
5. In the Save As dialog that appears, navigate to the location in which you want to save the style sheet, provide a name for the file, and click the Save button.
6. Back on the Report Settings window, click the OK button to close the window and save the styles in the current report.
To import an external style sheet at design time
1. With an ActiveReport open and selected in Visual Studio, drop down the Report menu and select Settings.
2. In the Report Settings window that appears, click the Styles icon to view the style settings.
3. Click the Import styles from file button. A message box warns that current styles will be deleted. Click Yes to continue.
4. In the Open dialog that appears, navigate to the *.reportstyle file that you want to use and click the Open button.
To apply an external style sheet at run time
To make a style sheet available at run time, double-click the grey area of the report to create an event-handling method for the ReportStart event of the report. Add code inside the handler to make the style style sheet available to the report.
Use External Style Sheets
ActiveReports 6 User Guide | 207

The following examples show what the code for the method looks like.
To apply styles to controls at design time
You can apply styles to four types of ActiveReports controls: CheckBox, Label, TextBox, and ReportInfo.
1. Select the control to which you want to apply the style.
2. In the ActiveReports toolbar, drop down the Styles combo box and select the style.
3. Or in the Properties Window, drop down the ClassName field and select the style to apply.
4. When you run the report, ActiveReports applies the default style values for the selected style, or the style values contained in the specified external style sheet.
To apply styles to controls at run time
You can apply styles to four types of ActiveReports controls: CheckBox, Label, TextBox, and ReportInfo.
To apply a style at run time, double-click the section of the report containing the control to create an event-handling method for the Format event of the section. Add code inside the handler to apply the style to the control.
Visual Basic.NET code. Paste INSIDE the ReportStart event.
Me.LoadStyles("C:\My.reportstyle")
C# code. Paste INSIDE the ReportStart event.
this.LoadStyles("C:\My.reportstyle");
ActiveReports 6 User Guide | 208

The following examples show what the code for the method looks like.
Visual Basic.NET code. Paste INSIDE the Format event.
Me.TextBox1.ClassName = "Heading1"
C# code. Paste INSIDE the Format event.
this.textBox1.ClassName = "Heading1";
ActiveReports 6 User Guide | 209

ActiveReports can display bookmarks and nested bookmarks in the viewer's table of contents for fields, groups, subreports. You can also add special bookmarks at run time.
To set up basic bookmarks
This code uses the same controls used in the Basic Data Bound Reports walkthrough
1. Double-click on the detail section of the report. This creates an event-handling method for the report's Detail Format event.
2. Add code to the handler to set up bookmarks.
The following example shows what the code for the method looks like.
To write the code in Visual Basic.NET
To write the code in C#
To set up leveled or nested bookmarksThis code uses fields from the Group On Unbound Fields walkthrough.
1. Double-click on the detail section of the report. This creates an event-handling method for the report's Detail Format event.
2. Add code to the handler to set up bookmarks.
The following example shows what the code to set up leveled or nested Bookmarks looks like.
To write the code in Visual Basic.NET
To write the code in C#
To nest grandchild bookmarks and use bookmarks in grouping1. Double-click in the Detail section of the report. This creates an event-handling method for the report's
Detail_Format event.
2. Add code to the handler to set up a bookmark for each city and nest city bookmarks within each country, and company bookmarks in each city.
The following example shows what the code for the detail section looks like.
To write the code in Visual Basic.NET
To write the code in C#
Add Bookmarks
Visual Basic.NET code. Paste INSIDE the Detail Format event.
Me.Detail1.AddBookmark(txtProductName1.text)
C# code. Paste INSIDE the Detail Format event.
detail.AddBookmark(txtProductName1.Text);
Visual Basic.NET code. Paste INSIDE the Detail Format event.
Me.Detail1.AddBookmark(txtCategoryName.Text + "\" + txtProductName.Text)
C# code. Paste INSIDE the Detail Format event.
detail.AddBookmark(txtCategoryName.Text + "\\" + txtProductName.Text);
Visual Basic.NET code. Paste INSIDE the Detail Format event.
Me.Detail1.AddBookmark(txtCountry1.Text + "\" + txtCity1.Text + "\" + txtCompanyName1.Text)
C# code. Paste INSIDE the Detail Format event.
this.detail.AddBookmark(txtCountry1.Text + "\\" + txtCity1.Text + "\\" + txtCompanyName1.Text);
ActiveReports 6 User Guide | 210

1. Double-click in the Group Header section of the report. This creates an event-handling method for the report's Group Header Format event.
2. Add code to the handler to set up a bookmark for each instance of the country group.
The following example shows what the code for the group header looks like.
To write the code in Visual Basic.NET
To write the code in C#
To combine parent report and subreport bookmarksThis code uses the same controls as those found in the Subreports with Run-Time Data Sourceswalkthrough.
1. Double-click in the Detail section of the main report to create an event-handling method for the report's Detail Format event.
2. Add code to the handler to create a bookmark for each instance of the CategoryName field in the main report.
The following example shows what the code for the method looks like for the main report.
To write the code in Visual Basic.NET
To write the code in C#
1. Double-click in the Detail section of the subreport to create an event-handling method for the report's Detail Format event.
2. Add code to the handler to create a bookmark for each instance of the CategoryName field in the subreport.
The following example shows what the code for the method looks like for the subreport.
To write the code in Visual Basic.NET
To write the code in C#
To preview the report and Bookmarks Collection in the designer
1. Click the Preview tab at the bottom of the designer.
2. Click the Table of Contents icon to view the Bookmarks collection.
Visual Basic.NET code. Paste INSIDE the Group Header Format event.
Me.GroupHeader1.AddBookmark(txtCountry1.Text)
C# code. Paste INSIDE the Group Header Format event.
this.groupHeader1.AddBookmark(txtCountry1.Text);
Visual Basic.NET code. Paste INSIDE the Detail Format event of the main report.
Me.Detail1.AddBookmark(txtCategoryName1.Text)
C# code. Paste INSIDE the Detail Format event of the main report.
detail1.AddBookmark(txtEmployeeID1.Text);
Visual Basic.NET code. Paste INSIDE the Detail Format event of the subreport.
Me.Detail1.AddBookmark(CType(Me.ParentReport.Sections("Detail1").Controls("txtCategoryName1"), TextBox).Text + "\" + Me.txtProductName.Text)
C# code. Paste INSIDE the Detail Format event of the subreport.
this.detail1.AddBookmark(((TextBox)(this.ParentReport.Sections["ghEmployees"].Controls["txtEmployeeID1"])).Text + "\\" + this.txtCompanyName1.Text);
ActiveReports 6 User Guide | 211

To view a report's bookmarks in the viewer
1. Add the ActiveReports viewer control to your Windows form.
2. Add code to display the report document in the viewer. See Viewing Reports for help.
3. Press F5 to run the report.
4. Click the Table of Contents icon to view the Bookmarks collection.
To add special bookmarks at run timeTo create and add special bookmarks to the bookmarks collection at run time, add the bookmarks to the report document's pages collection.
To write the code in Visual Basic.NET
1. In design view of the report, drop down the field at the top left of the code view and select (rptYourReportName Events).
2. Drop down the field at the top right of the code view and select ReportEnd. This creates an event-handling method for ReportEnd event.
3. Add code to the handler to add a bookmark.
The following example shows what the code for the method looks like.
To write the code in C#
1. Click in the gray area below the report to select it.
2. Click the events icon in the Properties Window to display available events for the report.
3. Double-click ReportEnd. This creates an event-handling method for the ReportEnd event.
4. Add code to the handler to add a bookmark.
The following example shows what the code for the method looks like.
Caution: Keep in mind that the pages collection does not exist until after the report runs, so use this code in the ReportEnd event or in form code after the report has run.
Visual Basic.NET code. Paste INSIDE the ReportEnd event.
Me.Document.Pages(0).AddBookmark("New Bookmark", 1)
C# code. Paste INSIDE the ReportEnd event.
this.Document.Pages[0].AddBookmark("New Bookmark", 1);
ActiveReports 6 User Guide | 212

ActiveReports allows you to run multiple reports and combine their PagesCollections, or specified portions of them, into a single report. The document containing the merged reports can be saved to an RDF file or exported.
To add pages from one report to anotherThe Add method of the ActiveReports Document Pages Collection takes one parameter: value. The valueparameter references a report document page. To add an entire report, use code like that in the example below to iterate through the entire pages collection of a report and append it to the first report.
1. Add the ActiveReports viewer control to the Windows Form. For more information, see the Adding ActiveReports Controls topic.
2. Double-click the title bar of the Windows Form to create an event-handling method for the form's Load event.
3. Add code to the handler to add rptTwo to rptOne
The following example shows what the code for the Add() method looks like.
To write the code in Visual Basic.NET
To write the code in C#
To add a range of pages from one report to anotherThe AddRange method has two overloads, each with one parameter. The first overload takes an array of page objects, while the second takes a pages collection. Use the second overload to add an entire report's pages collection. Us the first (as in the example below) to append only specified pages from the second report onto the first.
1. Add the ActiveReports viewer control to the Windows Form.
2. Double-click the title bar of the Windows Form to create an event-handling method for the form's Load event.
3. Add code to the handler to use the AddRange() method to add rptTwo to rptOne
The following example shows what the code for the AddRange() method looks like.
To write the code in Visual Basic.NET
Insert or Add Pages
Visual Basic.NET code. Paste JUST ABOVE the Form Load event.
Dim i As Integer
Visual Basic.NET code. Paste INSIDE the Form Load event.
Dim rpt As New rptOne()rpt.Run()Viewer1.Document = rpt.DocumentDim rpt2 As New rptTwo()rpt2.Run()For i = 0 To rpt2.Document.Pages.Count - 1 rpt.Document.Pages.Add(rpt2.Document.Pages(i))Next
C# code. Paste JUST ABOVE the Form Load event.
int i;
C# code. Paste INSIDE the Form Load event.
rptOne rpt1 = new rptOne();rpt1.Run();Viewer1.Document = rpt.DocumentrptTwo rpt2 = new rptTwo();rpt2.Run();for(i = 0; i < rpt2.Document.Pages.Count; i++){ rpt1.Document.Pages.Add(rpt2.Document.Pages[i]);}
ActiveReports 6 User Guide | 213

To write the code in C#
To insert pages from one report into anotherThe Insert method takes two parameters, an index, which dictates where in the main report the pages are inserted, and value, the report page to insert.
1. Add the ActiveReports viewer control to the Windows Form.
2. Double-click the title bar of the Windows Form to create an event-handling method for the form's Load event.
3. Add code to the handler to insert a second report at the beginning of the first
The following example shows what the code for the Insert method looks like.
To write the code in Visual Basic.NET
To write the code in C#
To add code to insert a page into a specified report location
The InsertNew method takes one parameter, index, which specifies the page after which you want to insert a new blank page.
1. Double-click the title bar of the Windows Form to create an event-handling method for the form's Load event.
2. Add code to the handler to insert a page into a specific report location.
The following example shows what the code for the InsertNew() method looks like.
To write the code in Visual Basic.NET
Visual Basic.NET code. Paste INSIDE the Form Load event.
Dim rpt As New rptOne()rpt.Run()Dim rpt2 As New rptTwo()rpt2.Run()rpt.Document.Pages.AddRange(rpt2.Document.Pages(2-7))Viewer1.Document = rpt.Document
C# code. Paste INSIDE the Form Load event.
rptOne rpt1 = new rptOne();rpt1.Run();rptTwo rpt2 = new rptTwo(); rpt2.Run();rpt1.Document.Pages.AddRange(rpt2.Document.Pages[2-7]);viewer1.Document = rpt1.Document;
Visual Basic.NET code. Paste INSIDE the Form Load event.
Dim rpt As New rptInsertPage()Viewer1.Document = rpt.Documentrpt.Run()Dim rpt2 As New rptCoverPage()rpt2.Run()rpt.Document.Pages.Insert(1, rpt2.Document.Pages(0))
C# code. Paste INSIDE the Form Load event.
rptInsertPage rpt = new rptInsertPage();viewer1.Document = rpt.Document;rpt.Run();rptCoverPage rpt2 = new rptCoverPage();rpt2.Run();rpt.Document.Pages.Insert(1, rpt2.Document.Pages[0]);
Visual Basic.NET code. Paste INSIDE the Form Load event.
Dim rpt As New rptInsertPage()rpt.Run()rpt.Document.Pages.InsertNew(3)Viewer1.Document = rpt.Document
ActiveReports 6 User Guide | 214

To write the code in C#
C# code. Paste INSIDE the Form Load event.
rptInsertPage rpt = new rptInsertPage();rpt.Run();rpt.Document.Pages.InsertNew(3);viewer1.Document = rpt.Document;
ActiveReports 6 User Guide | 215
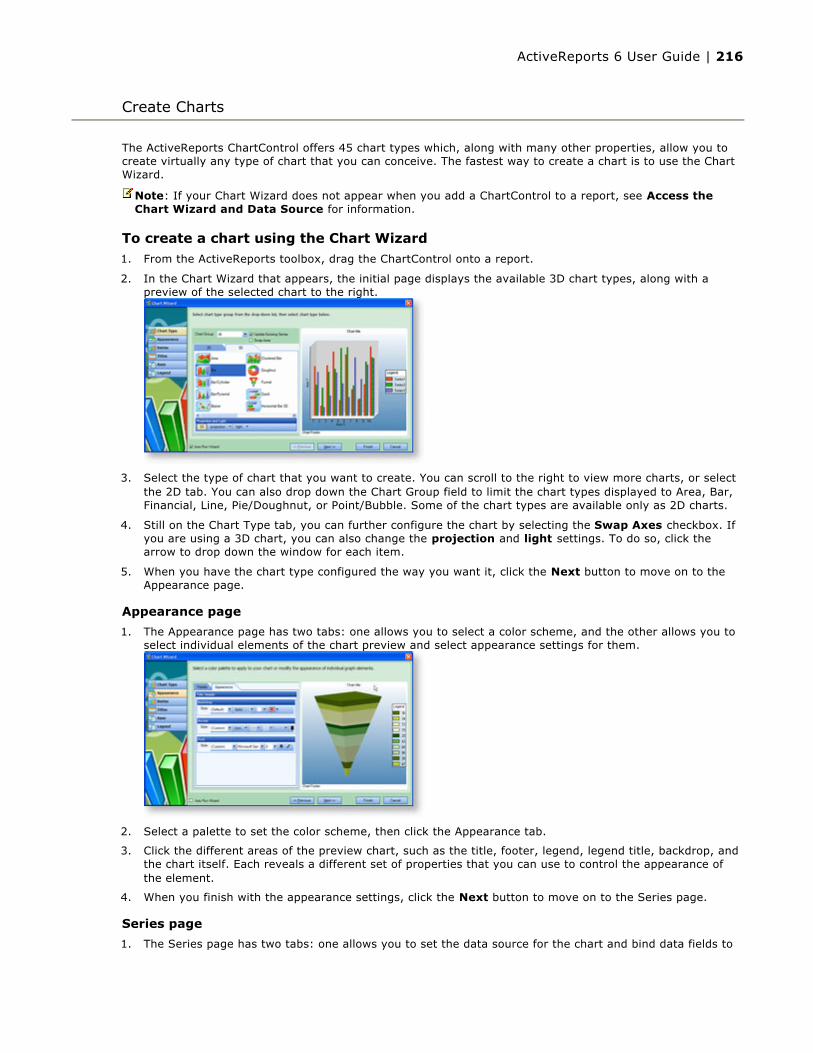
The ActiveReports ChartControl offers 45 chart types which, along with many other properties, allow you to create virtually any type of chart that you can conceive. The fastest way to create a chart is to use the Chart Wizard.
To create a chart using the Chart Wizard1. From the ActiveReports toolbox, drag the ChartControl onto a report.
2. In the Chart Wizard that appears, the initial page displays the available 3D chart types, along with a preview of the selected chart to the right.
3. Select the type of chart that you want to create. You can scroll to the right to view more charts, or select the 2D tab. You can also drop down the Chart Group field to limit the chart types displayed to Area, Bar, Financial, Line, Pie/Doughnut, or Point/Bubble. Some of the chart types are available only as 2D charts.
4. Still on the Chart Type tab, you can further configure the chart by selecting the Swap Axes checkbox. If you are using a 3D chart, you can also change the projection and light settings. To do so, click the arrow to drop down the window for each item.
5. When you have the chart type configured the way you want it, click the Next button to move on to the Appearance page.
Appearance page
1. The Appearance page has two tabs: one allows you to select a color scheme, and the other allows you to select individual elements of the chart preview and select appearance settings for them.
2. Select a palette to set the color scheme, then click the Appearance tab.
3. Click the different areas of the preview chart, such as the title, footer, legend, legend title, backdrop, and the chart itself. Each reveals a different set of properties that you can use to control the appearance of the element.
4. When you finish with the appearance settings, click the Next button to move on to the Series page.
Series page
1. The Series page has two tabs: one allows you to set the data source for the chart and bind data fields to
Create Charts
Note: If your Chart Wizard does not appear when you add a ChartControl to a report, see Access the Chart Wizard and Data Source for information.
ActiveReports 6 User Guide | 216
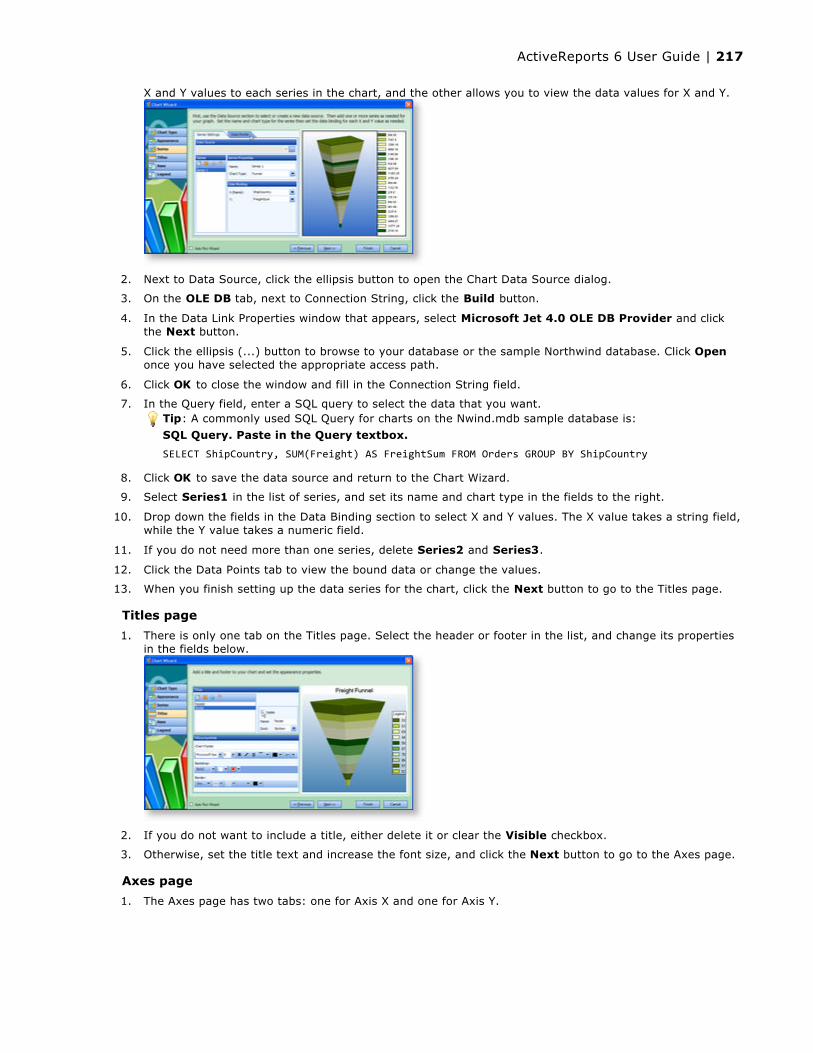
X and Y values to each series in the chart, and the other allows you to view the data values for X and Y.
2. Next to Data Source, click the ellipsis button to open the Chart Data Source dialog.
3. On the OLE DB tab, next to Connection String, click the Build button.
4. In the Data Link Properties window that appears, select Microsoft Jet 4.0 OLE DB Provider and click the Next button.
5. Click the ellipsis (...) button to browse to your database or the sample Northwind database. Click Openonce you have selected the appropriate access path.
6. Click OK to close the window and fill in the Connection String field.
7. In the Query field, enter a SQL query to select the data that you want.
8. Click OK to save the data source and return to the Chart Wizard.
9. Select Series1 in the list of series, and set its name and chart type in the fields to the right.
10. Drop down the fields in the Data Binding section to select X and Y values. The X value takes a string field, while the Y value takes a numeric field.
11. If you do not need more than one series, delete Series2 and Series3.
12. Click the Data Points tab to view the bound data or change the values.
13. When you finish setting up the data series for the chart, click the Next button to go to the Titles page.
Titles page
1. There is only one tab on the Titles page. Select the header or footer in the list, and change its properties in the fields below.
2. If you do not want to include a title, either delete it or clear the Visible checkbox.
3. Otherwise, set the title text and increase the font size, and click the Next button to go to the Axes page.
Axes page
1. The Axes page has two tabs: one for Axis X and one for Axis Y.
Tip: A commonly used SQL Query for charts on the Nwind.mdb sample database is:
SQL Query. Paste in the Query textbox.
SELECT ShipCountry, SUM(Freight) AS FreightSum FROM Orders GROUP BY ShipCountry
ActiveReports 6 User Guide | 217
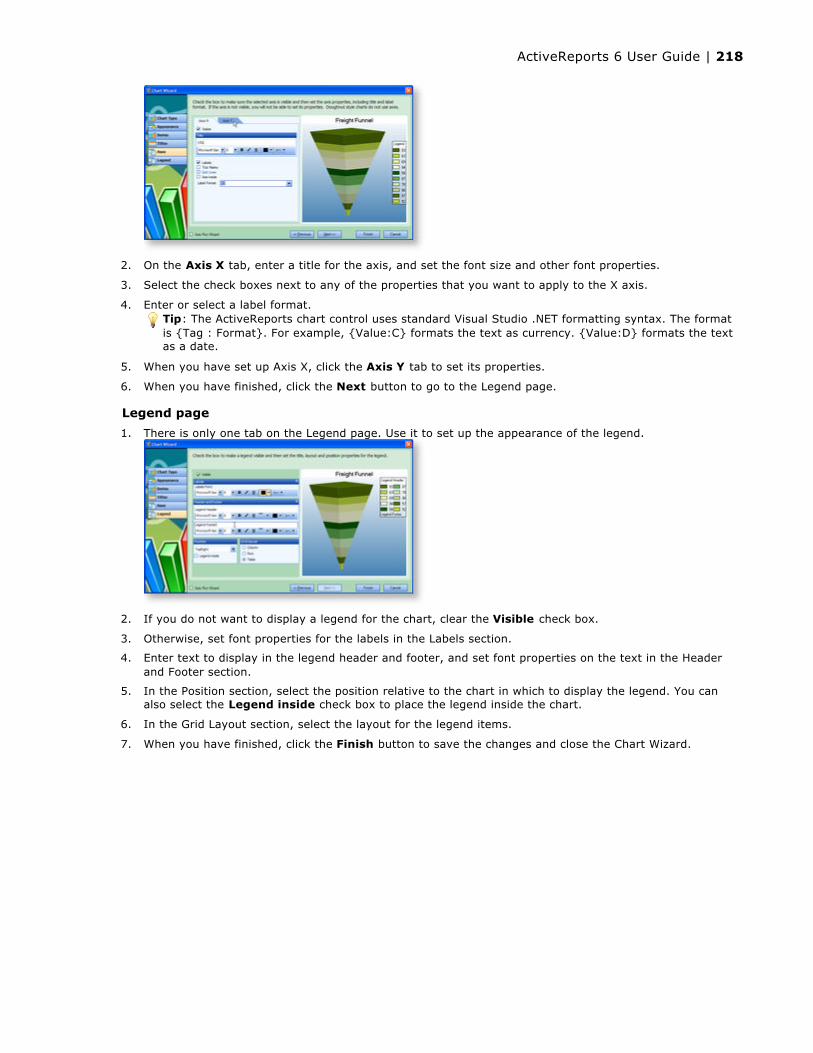
2. On the Axis X tab, enter a title for the axis, and set the font size and other font properties.
3. Select the check boxes next to any of the properties that you want to apply to the X axis.
4. Enter or select a label format.
5. When you have set up Axis X, click the Axis Y tab to set its properties.
6. When you have finished, click the Next button to go to the Legend page.
Legend page
1. There is only one tab on the Legend page. Use it to set up the appearance of the legend.
2. If you do not want to display a legend for the chart, clear the Visible check box.
3. Otherwise, set font properties for the labels in the Labels section.
4. Enter text to display in the legend header and footer, and set font properties on the text in the Header and Footer section.
5. In the Position section, select the position relative to the chart in which to display the legend. You can also select the Legend inside check box to place the legend inside the chart.
6. In the Grid Layout section, select the layout for the legend items.
7. When you have finished, click the Finish button to save the changes and close the Chart Wizard.
Tip: The ActiveReports chart control uses standard Visual Studio .NET formatting syntax. The format is {Tag : Format}. For example, {Value:C} formats the text as currency. {Value:D} formats the text as a date.
ActiveReports 6 User Guide | 218

You can open the chart wizard, chart data source, and other chart-related functions by clicking verbs in the Properties window.
To access verbs in the Properties window if they are not displayed by default
1. Right-click anywhere in the Properties window.
2. Select Commands so that it becomes checked.
3. The verbs display at the bottom of the Properties window. You may need to resize the verb area in order to see all six of them.
Here is a table describing each of the six verbs.
Access the Chart Wizard and Data Source
Verb Usage Window
Clear ChartClears all data, including default data, from the chart. Click the OK button to clear the chart, or click Cancel.
Load...
Loads a chart previously saved to XML format. In the Open window that appears, navigate to the XML file, select it, and click the Openbutton to load the saved chart into the current chart control.
Save As...
Saves all data from a chart into XML format. In the Save As window that appears, navigate to the directory in which you want to save the XML file, enter a File Name, and click the Save button to save the current chart's settings to XML format.
Saved charts can be loaded into chart controls on other reports.
ActiveReports 6 User Guide | 219

Customize...Opens the Chart Designer window, where you can change settings on the chart areas, titles, series, legends, and appearance of the chart.
Wizard... Opens the Chart Wizard, which takes you through the basic steps of creating a chart.
Data Source...
Opens the Chart Data Source window, from which you can connect the chart to any data source.
ActiveReports 6 User Guide | 220

You can load an RTF file or an HTML file into the ActiveReports RichText control at run time.
To write an RTF file to load into a RichText control
1. Open WordPad, and paste the following formatted text and table into it.
Paste into an RTF File
Customer List by CountryArgentina Rancho grande Océano Atlántico Ltda. Cactus Comidas para llevar
Austria Piccolo und mehr Ernst Handel
Belgium Suprêmes délices Maison Dewey
Brazil Familia Arquibaldo Wellington Improtadora Que Delícia Tradição Hipermercados Ricardo Adocicados Hanari Carnes Queen Cozinha Comércio Mineiro Gourmet Lanchonetes
2. Save the file as sample.rtf in the debug directory in the bin folder of your project.
To load the RTF file into the RichText control
1. Double-click the detail section of the report to create an event-handling method for the Detail Format event.
Load a File into a RichText Control
Caution: Do not attempt to load a file into a RichTextBox in a section that repeats. After the first iteration of the section, the RTF or HTML file is in use by that first iteration and returns "file in use" errors when the section is processed again.
Month SalesOctober $4,872November$8,517December $9,623
ActiveReports 6 User Guide | 221
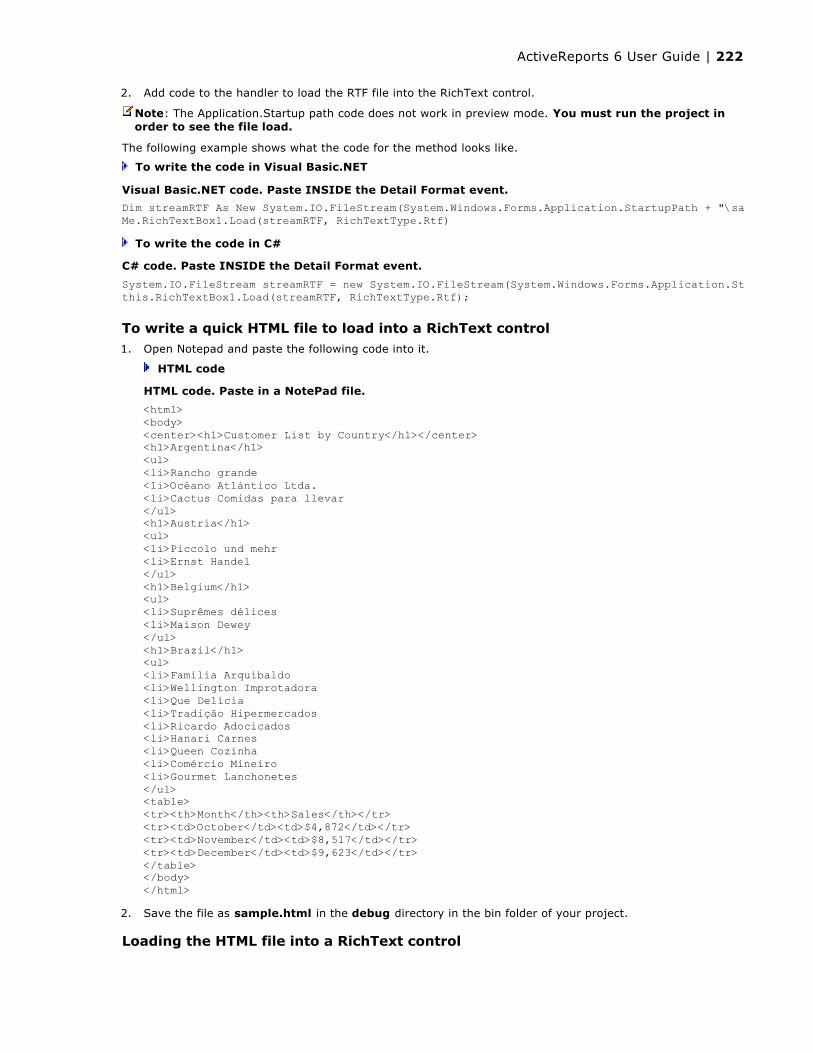
2. Add code to the handler to load the RTF file into the RichText control.
The following example shows what the code for the method looks like.
To write the code in Visual Basic.NET
To write the code in C#
To write a quick HTML file to load into a RichText control1. Open Notepad and paste the following code into it.
HTML code
2. Save the file as sample.html in the debug directory in the bin folder of your project.
Loading the HTML file into a RichText control
Note: The Application.Startup path code does not work in preview mode. You must run the project in order to see the file load.
Visual Basic.NET code. Paste INSIDE the Detail Format event.
Dim streamRTF As New System.IO.FileStream(System.Windows.Forms.Application.StartupPath + "\sample.rtf", System.IO.FileMode.Open)Me.RichTextBox1.Load(streamRTF, RichTextType.Rtf)
C# code. Paste INSIDE the Detail Format event.
System.IO.FileStream streamRTF = new System.IO.FileStream(System.Windows.Forms.Application.StartupPath + "\\sample.rtf", System.IO.FileMode.Open);this.RichTextBox1.Load(streamRTF, RichTextType.Rtf);
HTML code. Paste in a NotePad file.
<html><body><center><h1>Customer List by Country</h1></center><h1>Argentina</h1><ul><li>Rancho grande<li>Océano Atlántico Ltda.<li>Cactus Comidas para llevar</ul><h1>Austria</h1><ul><li>Piccolo und mehr<li>Ernst Handel</ul><h1>Belgium</h1><ul><li>Suprêmes délices<li>Maison Dewey</ul><h1>Brazil</h1><ul><li>Familia Arquibaldo<li>Wellington Improtadora<li>Que Delícia<li>Tradição Hipermercados<li>Ricardo Adocicados<li>Hanari Carnes<li>Queen Cozinha<li>Comércio Mineiro<li>Gourmet Lanchonetes</ul><table><tr><th>Month</th><th>Sales</th></tr><tr><td>October</td><td>$4,872</td></tr><tr><td>November</td><td>$8,517</td></tr><tr><td>December</td><td>$9,623</td></tr></table></body></html>
ActiveReports 6 User Guide | 222

1. Double-click the detail section of the report to create an event-handling method for the Detail Format event.
2. Add code to the handler to load the HTML file into the RichText control.
The following example shows what the code for the method looks like.
To write the code in Visual Basic.NET
To write the code in C#
Note: The Application.Startup path code does not work in preview mode. You must run the project in order to see the file load.
Visual Basic.NET code. Paste INSIDE the Detail Format event.
Dim streamHTML As New System.IO.FileStream(System.Windows.Forms.Application.StartupPath + "\sample.HTML", System.IO.FileMode.Open)Me.RichTextBox1.Load(streamHTML, RichTextType.Html)
C# code. Paste INSIDE the Detail Format event.
System.IO.FileStream streamHTML = new System.IO.FileStream(System.Windows.Forms.Application.StartupPath + "\\sample.html", System.IO.FileMode.Open);this.RextTextBox1.Load(streamHTML, RichTextType.Html);
ActiveReports 6 User Guide | 223

ActiveReports allows you to drop a third party control onto a report where it is recognized as a custom control. You can access its properties using type casting. In this case, we use hidden textboxes to populate a Visual Studio TreeView control.
To add the TreeView control to a report1. From the Visual Studio toolbox Common Controls tab, drag the TreeView control onto the detail section
of a report.
2. Notice that in the Properties window, the control is called CustomControl1.
To add data and hidden textboxes to the report1. Connect the report to the sample nwind.mdb. (For help with this, see the Bind Reports to a Data
Source topic.)
2. In the Query field, enter the following SQL query
3. From the Report Explorer, drag the following fields onto the detail section of the report:
ShipCountry
ShipCity
CustomerID
EmployeeID
4. Select all four textboxes, and in the Properties window, change the Visible property to False.
To create a function to add nodes to the TreeView control1. Right-click the report and select View Code.
2. Add a function to the report to add nodes to the TreeView.
The following examples show what the code for the function looks like.
To write the code in Visual Basic.NET
To write the code in C#
To access the TreeView control properties in code and assign data
1. Back in the design view of the report, double-click the detail section to create an event-handling method for the Detail Format event.
2. Add code to the handler to access the TreeView properties and assign data from the hidden textboxes.
The following example shows what the code for the method looks like.
Use Custom Controls on Reports (TreeView)
SQL Query
SELECT * FROM Orders ORDER BY ShipCountry, ShipCity, CustomerID, EmployeeID
Visual Basic.NET code. Paste INSIDE the report class.
Private Function AddNodeToTreeView(ByVal colNodes As TreeNodeCollection, ByVal sText As String) As TreeNode Dim objTreeNode As TreeNode objTreeNode = New TreeNode(sText) colNodes.Add(objTreeNode) Return objTreeNodeEnd Function
C# code. Paste INSIDE the report class.
private TreeNode AddNodeToTreeView(TreeNodeCollection colNodes, string sText) { TreeNode objTreeNode; objTreeNode = new TreeNode(sText); colNodes.Add(objTreeNode); return objTreeNode; }
ActiveReports 6 User Guide | 224

To write the code in Visual Basic.NET
To write the code in C#
Visual Basic.NET code. Paste INSIDE the Detail Format event.
'type cast the custom control as a TreeViewctlTreeView = CType(Me.CustomControl1.Control, TreeView)
'create a tree nodeDim objCountryTreeNode As TreeNode'assign the text from a hidden textbox to the nodeobjCountryTreeNode = AddNodeToTreeView(ctlTreeView.Nodes, Me.txtShipCountry1.Text)'add a second-level nodeAddNodeToTreeView(objCountryTreeNode.Nodes, Me.txtShipCity1.Text)'expand the top-level node so the second-level node is in viewobjCountryTreeNode.Expand()
'create a second top-level nodeDim objCustomerTreeNode As TreeNodeobjCustomerTreeNode = AddNodeToTreeView(ctlTreeView.Nodes, Me.txtCustomerID1.Text)AddNodeToTreeView(objCustomerTreeNode.Nodes, Me.txtEmployeeID1.Text)objCustomerTreeNode.Expand()
C# code. Paste INSIDE the Detail Format event.
//type cast the custom control as a TreeView ctlTreeView = (TreeView)this.CustomControl1.Control; //create a tree node TreeNode objCountryTreeNode; //assign the text from a hidden textbox to the node objCountryTreeNode = AddNodeToTreeView(ctlTreeView.Nodes, this.txtShipCountry1.Text); //add a second-level node AddNodeToTreeView(objCountryTreeNode.Nodes, this.txtShipCity1.Text); //expand the top-level node so the second-level node is in view objCountryTreeNode.Expand();
//create a second top-level node TreeNode objCustomerTreeNode; objCustomerTreeNode = AddNodeToTreeView(ctlTreeView.Nodes, this.txtCustomerID1.Text); AddNodeToTreeView(objCustomerTreeNode.Nodes, this.txtEmployeeID1.Text); objCustomerTreeNode.Expand();
ActiveReports 6 User Guide | 225

You can create a base report class as a template from which other reports can inherit. This is useful when many of your reports share common features, such as identical page headers and footers. Instead of recreating the look every time, create template headers and footers once and use inheritance to apply them to your other reports.
In ActiveReports, you can use inheritance at both design time and run time. A simple example of how you can use this functionality is a company letterhead template.
To create a company letterhead template at design time1. Add an ActiveReport to your Visual Studio project and name the file rptLetterhead. This is the base
report class.
2. Drag the following controls from the ActiveReports toolbox to the indicated section of rptLetterhead and set the properties as indicated. Reports do not inherit from the detail section, so do not add controls to it.
Controls for rptLetterhead
3. Click in the grey area below the report to select it, and in the Properties window, set the MasterReportproperty to True.
4. The detail section of the report is disabled. When you create reports that inherit from this class, they will provide the detail section.
5. Add a second ActiveReport to your project and name the file rptLetter. This report will inherit its PageHeader and PageFooter sections from rptLetterhead.
6. In the Solution Explorer tool strip, click the Show All Files button.
7. Expand the rptLetter node and double-click to open the rptLetter.Designer file.
Create Report Templates (Inheritance)
Control Section Location Size MiscellaneousPicture PageHeader 0, 0 in 2.1, 0.6 in Image = (select an image)
Label PageHeader 0.75, 0.625 in 1.2, 0.19 in Text = Control Yourself!FontStyle = Bold
Label PageFooter 0, 0 in 6.5, 0.19 in
Text = http://www.datadynamics.comHyperLink = http://www.datadynamics.comFontStyle = BoldAlignment = Center
Important: Do not set the MasterReport property to True until you have finished making changes to the report. Setting this property to True triggers major changes in the designer file for the report.
ActiveReports 6 User Guide | 226
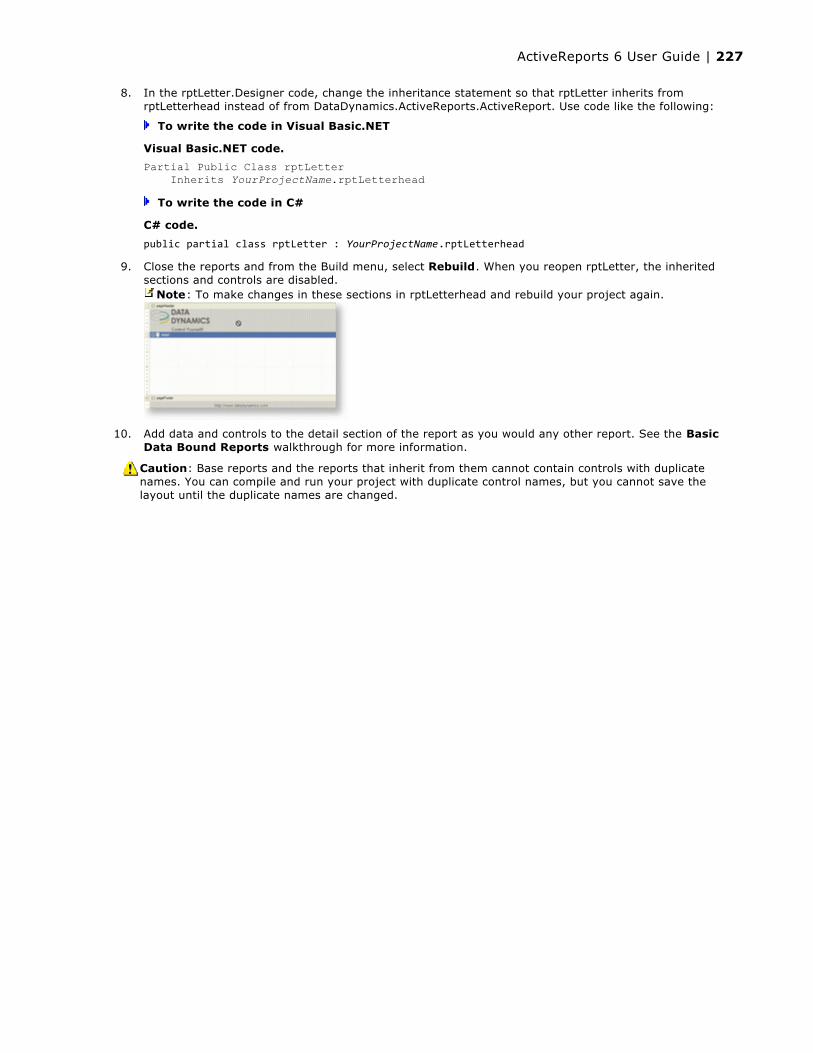
8. In the rptLetter.Designer code, change the inheritance statement so that rptLetter inherits from rptLetterhead instead of from DataDynamics.ActiveReports.ActiveReport. Use code like the following:
To write the code in Visual Basic.NET
To write the code in C#
9. Close the reports and from the Build menu, select Rebuild. When you reopen rptLetter, the inherited sections and controls are disabled.
10. Add data and controls to the detail section of the report as you would any other report. See the Basic Data Bound Reports walkthrough for more information.
Visual Basic.NET code.
Partial Public Class rptLetter Inherits YourProjectName.rptLetterhead
C# code.
public partial class rptLetter : YourProjectName.rptLetterhead
Note: To make changes in these sections in rptLetterhead and rebuild your project again.
Caution: Base reports and the reports that inherit from them cannot contain controls with duplicate names. You can compile and run your project with duplicate control names, but you cannot save the layout until the duplicate names are changed.
ActiveReports 6 User Guide | 227

There are several ways to use parameters in ActiveReports
Report Explorer ParametersTo add parameters using the Report Explorer
1. Right-click the Parameters node in the Report Explorer and select Add. This adds a child to the Parameters node.
2. Once you add a parameter to the Report Explorer, you can set it up in the Properties window.
3. You can pass the parameter to a field on the report, or access it programmatically.
SQL Query Parameters
To add parameters to a SQL query
You can allow users to filter the amount of information exposed in a report through the use of parameters. When you add SQL parameters to a report, ActiveReports displays an Enter Report Parameters dialog where the user can enter the values to pull from the database.
1. Click the gray report DataSource icon on the Detail section band to open the Report Data Source dialog.
2. On the OLE DB tab, next to Connection String, click the Build button.
3. In the Data Link Properties window that appears, select Microsoft Jet 4.0 OLE DB Provider and click the Next button.
4. Click the ellipsis (...) button to browse to your database or the sample Northwind database. Click Openonce you have selected the appropriate access path.
5. Click OK to close the window and fill in the Connection String field.
6. In the Query field, enter a SQL query like the one below, which contains parameter syntax that ActiveReports uses to generate the following dialog.
7. Click OK to save the data source and return to the report design surface.
The SQL query above causes ActiveReports to display the following dialog to the user. The user can accept these or input other values to select report data.
Add Parameters
SQL Query. Paste in the Report Data Source window's Query box.
SELECT * FROM Products INNER JOIN Categories ON Products.CategoryID = Categories.CategoryID WHERE Products.SupplierID = <%SupplierID|Enter Supplier ID|1000%> AND OrderDate = #<%OrderDate|Order date|1/1/2001|D%>#AND Discount = <%Discount|Is this checked?|true|B%>
ActiveReports 6 User Guide | 228

To understand how this works, see SQL Query Parameters.
SQL Query Parameter SyntaxSQL Query Parameters Syntax
The SQL query above contains three parameters:
<%SupplierID|Enter Supplier ID|1000%>
<%OrderDate|Order date|1/1/2001|D%>
<%Discount|Is this checked?|true|B%>
Each of these parameters follow the syntactical pattern <%FieldName | PromptString | DefaultValue | Type | PromptUser%>
FieldNameThe name of the field you wish to request (e.g. SupplierID or OrderDate). This is the only part of the syntax which is required, so you can use <%FieldName%> if you do not wish to use the other values.
PromptStringAn optional string value which sets the text that appears in the dialog next to the control (e.g. "Enter Supplier ID: ").
DefaultValueSets a default value for the parameter. For example, if you have a date parameter, you can set the DefaultValue for the field to the current date so users can just hit ENTER unless they want to generate a report based on a new date. If you do not supply this value, the Report Explorer is not populated with bound fields at design time.
TypeIndicates the type of data requested. The possible values S for string, D for date, and B for Boolean. If you do not provide a value, string is assumed. A string type provides a textbox for input, a date type provides a calendar drop-down control for input, and a Boolean type provides a check box for input.
PromptUser Sets whether to prompt the user for a value. The value can be set to True for some parameters and Falsefor others. If you set the report's ShowParameterUI property to False, users are not prompted for any parameters, regardless of the PromptUser value set for any parameter in the report.
Stored Procedures
You can use stored procedures with parameters in ActiveReports. The SQL query has the stored procedure call and placeholders for the parameters: CustOrderHist <%ID | Enter Customer ID | AFLKI%>.
ActiveReports replaces the parameter with what the user types into the dialog to create a query like this: CustOrderHist 'AFLKI'.
Note: Although FieldName is the only required parameter, if you do not specify a DefaultValue for each parameter, the Report Explorer is not populated with bound fields at design time.
Tip: For Strings, if you specify a default value that is enclosed in apostrophes or quotation marks, ActiveReports sends the same marks to SQL. For Boolean parameters, if you specify true/false for the DefaultValue it generates true/false for SQL output. If you specify 0,1, it generates 0 or 1. For date values, enclose the parameter syntax in pound signs, for example, #<%Date%>#
ActiveReports 6 User Guide | 229
Run-time ParametersYou can add, edit, and delete parameters at run time. The following code demonstrates how to add a parameter and display its value in an ActiveReports textbox control.
To add parameters at run time in Visual Basic.NET
1. Double-click in the gray area below the report to create an event-handling method for the ReportStartevent.
2. Add code to the handler to change the data source at run time.
To add parameters at run time in C#
1. Double-click in the gray area below the report to create an event-handling method for the ReportStartevent.
2. Add code to the handler to change the data source at run time.
Parameters with Subreports
To use parameters with subreports
Add a parameter to the datasource of the subreport as above, either in the sql statement or in code, and ensure that the parameter value exists in the parent report's data. the parameter is passed automatically. The only other consideration is that you need to set the ShowParameterUI property of the subreport to False to prevent the subreport from requesting the parameter value from the user.
You can use parameters with subreports to connect the subreport to the parent report. If you set a parameter for the field that links the parent report to the child subreport, the parent report passes the information to the child through the parameters. Keep the following in mind when working with subreports and parameters:
Set the subreport's ShowParametersUI property to False.
Set the subreport's SQL query to use the parameter syntax = <%fieldname%>.
Both report queries must contain the same field (so the main report must have a categoryID field and the subreport also must have a categoryID field.
Parameters in ChartsTo set a parameter in a chart data source
1. With the chart control highlighted, click the Data Source verb below the Properties Window to open the Chart DataSource dialog. If you do not see the verb, see the Access the Chart Wizard and Data Source topic for more information.
Visual Basic.NET code. Paste INSIDE the ReportStart event.
Dim myParam1 As New Parameter()myParam1.Key = "myParam1"myParam1.Type = Parameter.DataType.StringmyParam1.PromptUser = True 'set to False if you do not want input from usermyParam1.Prompt = "Enter last name:"myParam1.DefaultValue = "This is myParam1 default value"Me.Parameters.Add(myParam1) 'Set textbox text equal to the value of the parameterMe.txtParam1.Text = Me.Parameters("myParam").Value
C# code. Paste INSIDE the ReportStart event.
Parameter myParam1 = new Parameter();myParam1.Key = "myParam1";myParam1.Type = Parameter.DataType.String;myParam1.PromptUser = true; //set to false if you do not want input from usermyParam1.Prompt = "Enter last name:";this.Parameters.Add(myParam1); //Set textbox text equal to the value of the parameterthis.txtParam1.Text = this.Parameters["myParam"].Value;
Caution: If you don't set the same ORDER in both SQL queries, that of the report and that of the chart, the chart data is not ordered.
ActiveReports 6 User Guide | 230

2. On the OLE DB tab, next to Connection String, click the Build button.
3. In the Data Link Properties window that appears, select Microsoft Jet 4.0 OLE DB Provider and click the Next button.
4. Click the ellipsis button to browse to the NorthWind database. Click Open once you have selected the file.
5. Click OK to close the window and fill in the Connection String field.
6. In the Query field, enter a SQL query to select the data that you want.
7. Click OK to save the data source and return to the report design surface.
SQL Query. Paste in the Query field.
SELECT * FROM Products WHERE CategoryID = <%CategoryID||1%> ORDER BY ProductName
Note: To see the chart draw at design time when using parameters, provide a default value. Otherwise, you must run the project and display the report in the viewer in order to see the chart.
ActiveReports 6 User Guide | 231

To embed a subreport into a parent report, you add two reports to a Visual Studio project, and from the ActiveReports toolbox, drag the SubReport control onto one of the reports. You can then add code to create an instance of the child report, and to display it in the SubReport control.
To add code to create an instance of the child report
To write the code in Visual Basic
1. At the top left of the code view for the parent report, click the drop-down arrow and select (rptYourParentReportName Events).
2. At the top right of the code window, click the drop-down arrow and select ReportStart. This creates an event-handling method for the report's ReportStart event.
3. Add code to the handler to create a new instance of the child report.
The following example shows what the code for the method looks like.
To write the code in C#
1. Click in the gray area below the parent report to select it.
2. Click the events icon in the Properties Window to display available events for the report.
3. Double-click ReportStart. This creates an event-handling method for the report's ReportStart event.
4. Add code to the handler to create a new instance of the child report.
The following example shows what the code for the method looks like.
To add code to display the child report in a subreport control on a parent report1. Double-click in the detail section of the design surface of the parent report to create a detail_Format
event.
2. Add code to the handler to display a report in the subreport control.
To write the code in Visual Basic
The following example shows what the code for the method looks like.
To write the code in C#
The following example shows what the code for the method looks like.
Embed Subreports in a Report
Warning: Do not create a new instance of the subreport in the Format event. Doing so creates a new subreport each time the section Format code is run, which uses a lot of memory.
Visual Basic.NET code. Paste JUST ABOVE the ReportStart event.
Dim rpt As rptYourChildReportNameVisual Basic.NET code. Paste INSIDE the ReportStart event.
rpt = New rptYourChildReportName()
C# code. Paste JUST ABOVE the ReportStart event.
rptCustomers rpt = rptYourChildReportName();C# code. Paste INSIDE the ReportStart event.
rpt = new rptYourChildReportName();
Visual Basic.NET code. Paste INSIDE the Format event.
Me.SubReport1.Report = rpt
C# code. Paste INSIDE the Format event.
this.subReport1.Report = rpt;
ActiveReports 6 User Guide | 232
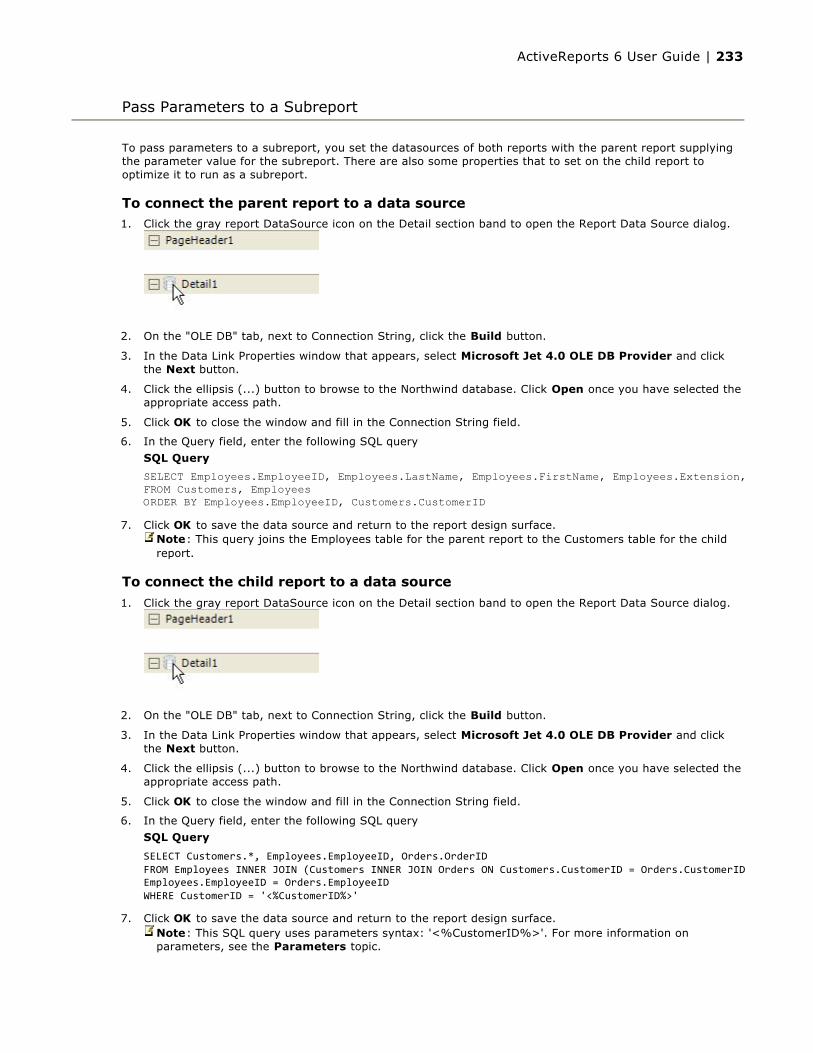
To pass parameters to a subreport, you set the datasources of both reports with the parent report supplying the parameter value for the subreport. There are also some properties that to set on the child report to optimize it to run as a subreport.
To connect the parent report to a data source1. Click the gray report DataSource icon on the Detail section band to open the Report Data Source dialog.
2. On the "OLE DB" tab, next to Connection String, click the Build button.
3. In the Data Link Properties window that appears, select Microsoft Jet 4.0 OLE DB Provider and click the Next button.
4. Click the ellipsis (...) button to browse to the Northwind database. Click Open once you have selected the appropriate access path.
5. Click OK to close the window and fill in the Connection String field.
6. In the Query field, enter the following SQL query
7. Click OK to save the data source and return to the report design surface.
To connect the child report to a data source
1. Click the gray report DataSource icon on the Detail section band to open the Report Data Source dialog.
2. On the "OLE DB" tab, next to Connection String, click the Build button.
3. In the Data Link Properties window that appears, select Microsoft Jet 4.0 OLE DB Provider and click the Next button.
4. Click the ellipsis (...) button to browse to the Northwind database. Click Open once you have selected the appropriate access path.
5. Click OK to close the window and fill in the Connection String field.
6. In the Query field, enter the following SQL query
7. Click OK to save the data source and return to the report design surface.
Pass Parameters to a Subreport
SQL Query
SELECT Employees.EmployeeID, Employees.LastName, Employees.FirstName, Employees.Extension, Customers.CustomerIDFROM Customers, EmployeesORDER BY Employees.EmployeeID, Customers.CustomerID
Note: This query joins the Employees table for the parent report to the Customers table for the child report.
SQL Query
SELECT Customers.*, Employees.EmployeeID, Orders.OrderIDFROM Employees INNER JOIN (Customers INNER JOIN Orders ON Customers.CustomerID = Orders.CustomerID) ON Employees.EmployeeID = Orders.EmployeeIDWHERE CustomerID = '<%CustomerID%>'
Note: This SQL query uses parameters syntax: '<%CustomerID%>'. For more information on parameters, see the Parameters topic.
ActiveReports 6 User Guide | 233

To set up the child report to be used in the subreport control1. Click in the gray area below the child report to select the report.
2. In the Properties Window, change the ShowParametersUI property to False. This prevents the subreport from requesting parameter values from the user.
3. Right-click the PageHeader or PageFooter section and select Delete. Subreports do not render these sections, so deleting them saves processing time.
To display the child report in the subreport control on the parent report, see the Embed Subreports in a Report topic.
ActiveReports 6 User Guide | 234

ActiveReports allows reports to be saved into their own standard format called an RDF file (Report Document Format). In this format, the data is static. The saved report displays the data that is retrieved when you run the report. Once a report has been saved to an RDF file, it can be loaded into the viewer control.
To save a report as a static RDF file1. Double-click the title bar of the Windows Form to create a Form Load event.
2. Add the following code to run and save the report.
To save the report to RDF format in Visual Basic.NET
To save the report to RDF format in C#
To load a saved RDF file into the ActiveReports viewerThe Windows Form Viewer can display RDF files made with any version of ActiveReports, including COM versions. The FlashViewer viewer type of the WebViewer (Professional Edition) may be able to display RDF files made with previous versions, but this is not guaranteed for every RDF.
1. Double-click the title bar of the Windows Form to create a Form Load event.
2. Add the following code to load the saved report.
To load an RDF file in Visual Basic.NET
To load an RDF file in C#
To save or load report files to a memory stream1. Double-click the title bar of the Windows Form to create an event-handling method for the Form_Load
event.
2. Add code to the handler to save the report to a memory stream and load the memory stream into the ActiveReports viewer.
The following examples show what the code for the method looks like.
To write the code in Visual Basic.NET
To write the code in C#
Save and Load Report Files (RDF)
Visual Basic.NET code. Paste INSIDE the Form load event.
Dim rpt As New rptYourReportName()rpt.Run()rpt.Document.Save(Application.StartupPath + "\\NewRDF.RDF")
C# code. Paste INSIDE the Form load event.
ActiveReport1 rpt = new ActiveReport1();rpt.Run();rpt.Document.Save(Application.StartupPath + \\NewRDF.RDF);
Visual Basic.NET code. Paste INSIDE the Form load event.
Viewer1.Document.Load(Application.StartupPath + \\NewRDF.RDF)
C# code. Paste INSIDE the Form load event.
viewer1.Document.Load(Application.StartupPath + \\NewRDF.RDF);
Visual Basic.NET code. Paste INSIDE the Form Load event.
Dim strm As New System.IO.MemoryStream()Dim rpt As New rptMemoryStream()rpt.Run()rpt.Document.Save(strm)Dim theBytes(strm.Length) As Bytestrm.Read(theBytes, 0, Int(strm.Length))strm.Position = 0Viewer1.Document.Load(strm)
ActiveReports 6 User Guide | 235

C# code. Paste INSIDE the Form Load event.
System.IO.MemoryStream strm = new System.IO.MemoryStream();rptMemoryStream rpt = new rptMemoryStream();rpt.Run();rpt.Document.Save(strm);byte[] theBytes = new byte[strm.Length];strm.Read(theBytes, 0, (int)strm.Length);strm.Position =0;viewer1.Document.Load(strm);
ActiveReports 6 User Guide | 236
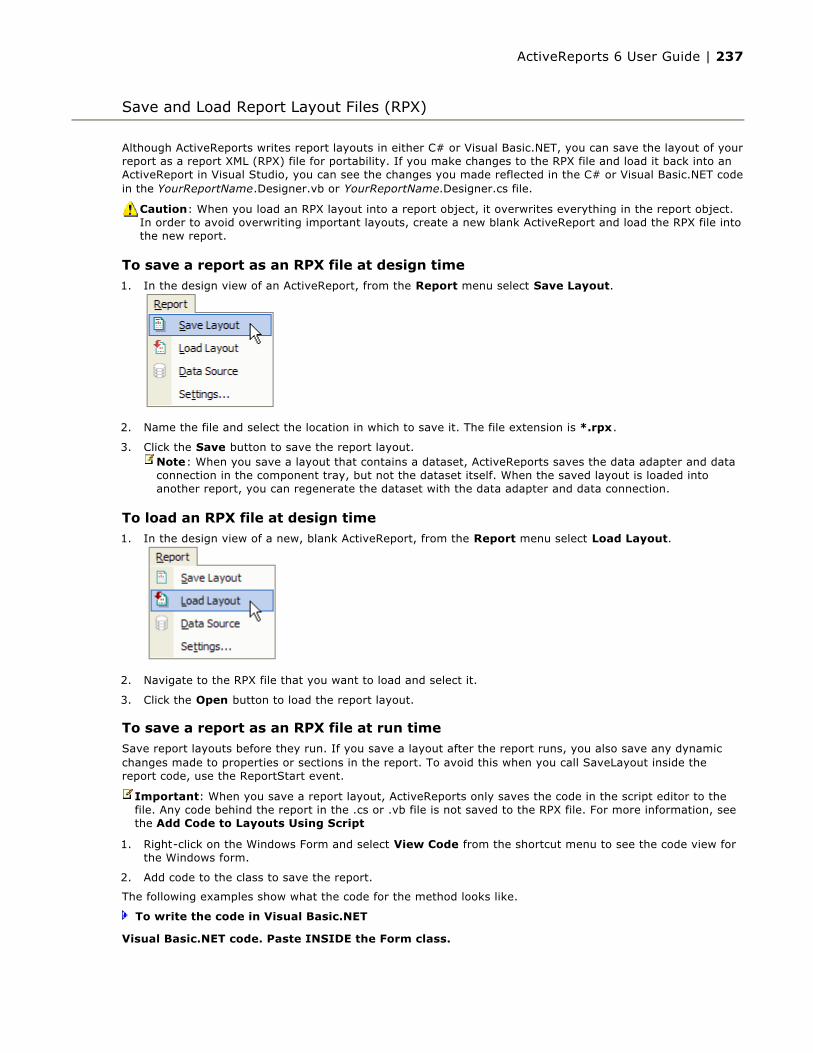
Although ActiveReports writes report layouts in either C# or Visual Basic.NET, you can save the layout of your report as a report XML (RPX) file for portability. If you make changes to the RPX file and load it back into an ActiveReport in Visual Studio, you can see the changes you made reflected in the C# or Visual Basic.NET code in the YourReportName.Designer.vb or YourReportName.Designer.cs file.
To save a report as an RPX file at design time1. In the design view of an ActiveReport, from the Report menu select Save Layout.
2. Name the file and select the location in which to save it. The file extension is *.rpx.
3. Click the Save button to save the report layout.
To load an RPX file at design time1. In the design view of a new, blank ActiveReport, from the Report menu select Load Layout.
2. Navigate to the RPX file that you want to load and select it.
3. Click the Open button to load the report layout.
To save a report as an RPX file at run timeSave report layouts before they run. If you save a layout after the report runs, you also save any dynamic changes made to properties or sections in the report. To avoid this when you call SaveLayout inside the report code, use the ReportStart event.
1. Right-click on the Windows Form and select View Code from the shortcut menu to see the code view for the Windows form.
2. Add code to the class to save the report.
The following examples show what the code for the method looks like.
To write the code in Visual Basic.NET
Save and Load Report Layout Files (RPX)
Caution: When you load an RPX layout into a report object, it overwrites everything in the report object. In order to avoid overwriting important layouts, create a new blank ActiveReport and load the RPX file into the new report.
Note: When you save a layout that contains a dataset, ActiveReports saves the data adapter and data connection in the component tray, but not the dataset itself. When the saved layout is loaded into another report, you can regenerate the dataset with the data adapter and data connection.
Important: When you save a report layout, ActiveReports only saves the code in the script editor to the file. Any code behind the report in the .cs or .vb file is not saved to the RPX file. For more information, see the Add Code to Layouts Using Script
Visual Basic.NET code. Paste INSIDE the Form class.
ActiveReports 6 User Guide | 237

To write the code in C#
To load a saved RPX file into the ActiveReports viewer1. Right-click on the Windows Form to see the code view for the Windows form.
2. Add the following code to the form class to load a report.
The following examples show what the code for the method looks like.
To write the code in Visual Basic.NET
To write the code in C#
Private Sub SaveRPX() Dim rpt As New DataDynamics.ActiveReports.ActiveReport() rpt.Run() rpt.SaveLayout("C:\NewRPX.RPX")End Sub
C# code. Paste INSIDE the Form class.
private void SaveRPX(){ DataDynamics.ActiveReports.ActiveReport rpt = new DataDynamics.ActiveReports.ActiveReport(); rpt.Run(); rpt.SaveLayout(@"C:\NewRPX.RPX");}
Note: The SaveLayout method uses utf-16 encoding when you save to a stream, and utf-8 encoding when you save to a file.
Visual Basic.NET code. Paste INSIDE the Form class.
Dim rpt As New DataDynamics.ActiveReports.ActiveReport()Private Sub LoadRPX() rpt.LoadLayout("C:\NewRPX.RPX") Viewer1.Document = rpt.Document rpt.Run()End Sub
C# code. Paste INSIDE the Form class.
private void LoadRPX(){ DataDynamics.ActiveReports.ActiveReport rpt = new DataDynamics.ActiveReports.ActiveReport(); rpt.LoadLayout(@"C:\NewRPX.rpx"); viewer1.Document = rpt.Document; rpt.Run();}
ActiveReports 6 User Guide | 238
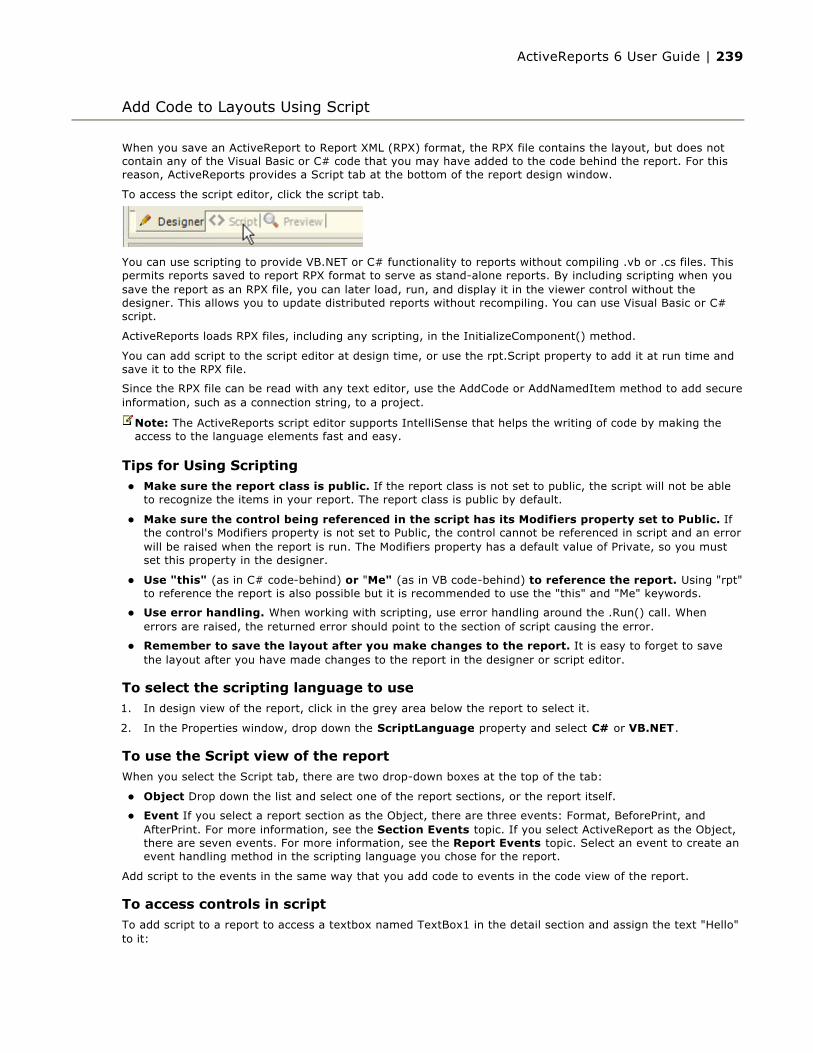
When you save an ActiveReport to Report XML (RPX) format, the RPX file contains the layout, but does not contain any of the Visual Basic or C# code that you may have added to the code behind the report. For this reason, ActiveReports provides a Script tab at the bottom of the report design window.
To access the script editor, click the script tab.
You can use scripting to provide VB.NET or C# functionality to reports without compiling .vb or .cs files. This permits reports saved to report RPX format to serve as stand-alone reports. By including scripting when you save the report as an RPX file, you can later load, run, and display it in the viewer control without the designer. This allows you to update distributed reports without recompiling. You can use Visual Basic or C# script.
ActiveReports loads RPX files, including any scripting, in the InitializeComponent() method.
You can add script to the script editor at design time, or use the rpt.Script property to add it at run time and save it to the RPX file.
Since the RPX file can be read with any text editor, use the AddCode or AddNamedItem method to add secure information, such as a connection string, to a project.
Tips for Using Scripting Make sure the report class is public. If the report class is not set to public, the script will not be able
to recognize the items in your report. The report class is public by default.
Make sure the control being referenced in the script has its Modifiers property set to Public. If the control's Modifiers property is not set to Public, the control cannot be referenced in script and an error will be raised when the report is run. The Modifiers property has a default value of Private, so you must set this property in the designer.
Use "this" (as in C# code-behind) or "Me" (as in VB code-behind) to reference the report. Using "rpt" to reference the report is also possible but it is recommended to use the "this" and "Me" keywords.
Use error handling. When working with scripting, use error handling around the .Run() call. When errors are raised, the returned error should point to the section of script causing the error.
Remember to save the layout after you make changes to the report. It is easy to forget to save the layout after you have made changes to the report in the designer or script editor.
To select the scripting language to use1. In design view of the report, click in the grey area below the report to select it.
2. In the Properties window, drop down the ScriptLanguage property and select C# or VB.NET.
To use the Script view of the reportWhen you select the Script tab, there are two drop-down boxes at the top of the tab:
Object Drop down the list and select one of the report sections, or the report itself.
Event If you select a report section as the Object, there are three events: Format, BeforePrint, and AfterPrint. For more information, see the Section Events topic. If you select ActiveReport as the Object, there are seven events. For more information, see the Report Events topic. Select an event to create an event handling method in the scripting language you chose for the report.
Add script to the events in the same way that you add code to events in the code view of the report.
To access controls in scriptTo add script to a report to access a textbox named TextBox1 in the detail section and assign the text "Hello" to it:
Add Code to Layouts Using Script
Note: The ActiveReports script editor supports IntelliSense that helps the writing of code by making the access to the language elements fast and easy.
ActiveReports 6 User Guide | 239

1. On the script tab of the report, drop down the Object list and select Detail1 . This populates the Event drop-down list with section events.
2. Drop down the Event list and select Format. This creates script stubs for the event.
To access a textbox in the detail section in VB.NET script
To access a textbox in the detail section in C# script
To give a script access to functions in a class in your projectUse the AddNamedItem method to allow the script to access functions in a class file within your project. This allows you to keep secure information such as a database connection string or a SQL query string in the code instead of in the RPX file.
1. Add a class to your project named clsMyItem .
2. Add a public function to your class using code like the following:
To create a public function in Visual Basic.NET
To create a public function in C#
3. On the script tab of the report, in the Object drop-down list, ActiveReport is selected by default. Drop down the Event list and select ReportStart. This creates script stubs for the event.
4. Add script to the event to access the class:
To access the class in VB.NET script
To access the class in C# script
5. Drop down the Object list and select Detail1. This populates the Event drop-down list with section events.
6. Drop down the Event list and select Format. This creates script stubs for the event.
7. Add script to the event to typecast a control on the report and populate it using the named item.
Note: Use the examples with the "this" and "Me" keywords, as they are recommended rather than the ones with "rpt".
Visual Basic.NET script. On the Script tab of the report, paste INSIDE the Detail Format event.
Me.TextBox1.Text = "Hello"
Visual Basic.NET script. On the Script tab of the report, paste INSIDE the Detail Format event.
CType(rpt.Sections("Detail1").Controls("TextBox1"), TextBox).Text = "Hello"
C# script. On the Script tab of the report, paste INSIDE the Detail Format event.
this.TextBox1.Text = "Hello";
C# script. On the Script tab of the report, paste INSIDE the Detail Format event.
((TextBox)rpt.Sections["detail1"].Controls["TextBox1"]).Text = "Hello";
Visual Basic.NET code. Paste INSIDE the new class.
Public Function getMyItem() As String getMyItem = "Hello" End Function
C# code. Paste INSIDE the new class.
public string getMyItem() { return "Hello"; }
VB.NET script. Paste before or in the ReportStart event.
rpt.AddNamedItem("myItem", new clsMyItem())
C# script. Paste before or in the ReportStart event.
rpt.AddNamedItem("myItem", new clsMyItem());
Note: Use the examples with the "this" and "Me" keywords, as they are recommended rather
ActiveReports 6 User Guide | 240

To typecast the control in VB.NET script
To typecast the control in C# script
To access namespacesUse the AddScriptReference method to gain access to .NET or other namespaces. This is only necessary if you need a reference, such as System.Data.dll, that is not initialized in the project before the script runs.
To access a namespace in Visual Basic.NET
To access a namespace in C#
To add code to a report's script from a Windows Form
Use the AddCode method to inject code into the script.
The AddCode method allows you to add actual code segments to the script at run time. This is useful for allowing secure information, such as a database connection string or SQL query string, to be used inside the script without saving it into the RPX file.
To add code in Visual Basic.NET
To add code in C#
than the ones with "rpt".
VB.NET script. Paste INSIDE the Detail Format event.
Me.textBox1.Text = myItem.getMyItem()
VB.NET script. Paste INSIDE the Detail Format event.
CType(rpt.Sections("Detail1").Controls("TextBox1"), TextBox).Text = myItem.getMyItem()
C# script. Paste INSIDE the Detail Format event.
this.textBox1.Text = myItem.getMyItem();
C# script. Paste INSIDE the Detail Format event.
((TextBox)rpt.Sections["detail1"].Controls["TextBox1"]).Text = myItem.getMyItem()
Visual Basic.NET code. Paste INSIDE the Form code.
Private Sub runReport() Dim rpt as new ActiveReport1() rpt.AddScriptReference("System.Data.dll") rpt.Run() Me.Viewer1.Document = rpt.Document End Sub
C# code. Paste INSIDE the Form code.
private void runReport() { ActiveReport1 rpt = new ActiveReport1(); rpt.AddScriptReference("System.Data.dll"); rpt.Run(); this.viewer1.Document = rpt.Document; }
Visual Basic.NET code. Paste INSIDE the report class.
Public Function addThisCode() As String Dim sCode As String = "Public Function ShowACMessage() As String" + Environment.NewLine + "ShowACMessage = ""my Added Code""" + Environment.NewLine + "End Function" addThisCode = sCode End Function VB.NET script. Paste INSIDE the ReportStart event.
rpt.AddCode(addThisCode)
C# code. Paste INSIDE the report class.
public string addThisCode()
ActiveReports 6 User Guide | 241
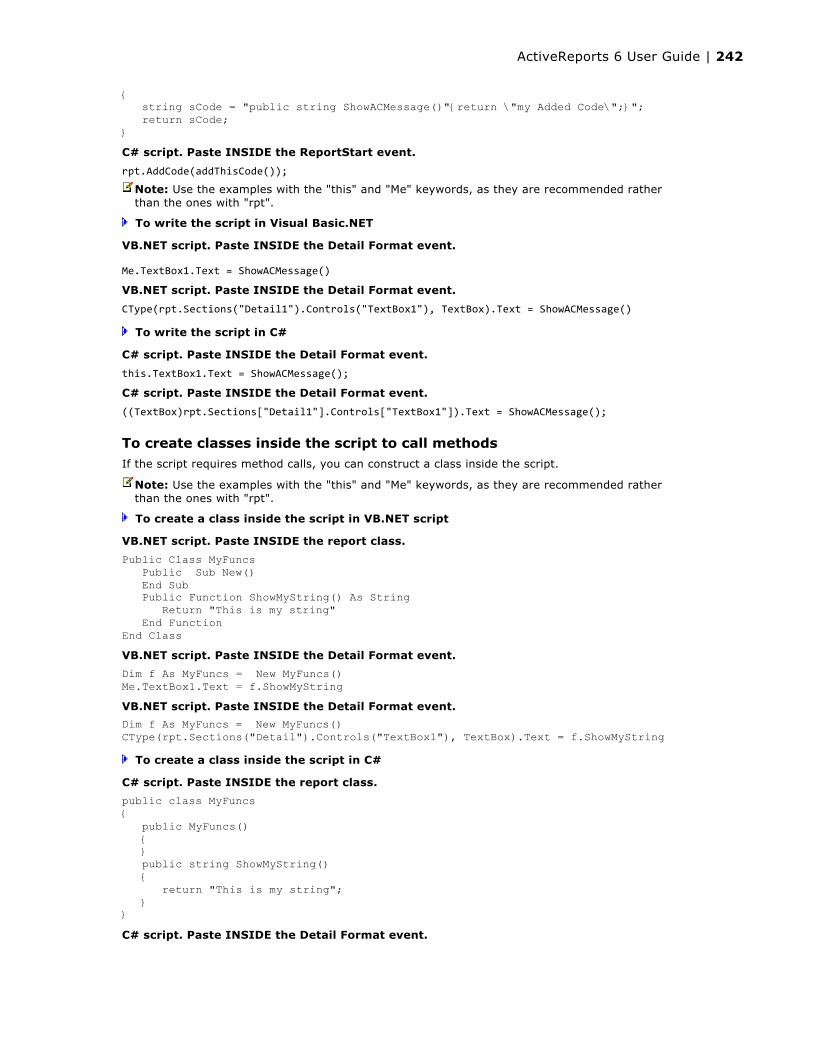
To write the script in Visual Basic.NET
To write the script in C#
To create classes inside the script to call methodsIf the script requires method calls, you can construct a class inside the script.
To create a class inside the script in VB.NET script
To create a class inside the script in C#
{ string sCode = "public string ShowACMessage()"{return \"my Added Code\";}"; return sCode; } C# script. Paste INSIDE the ReportStart event.
rpt.AddCode(addThisCode());
Note: Use the examples with the "this" and "Me" keywords, as they are recommended rather than the ones with "rpt".
VB.NET script. Paste INSIDE the Detail Format event.
Me.TextBox1.Text = ShowACMessage()
VB.NET script. Paste INSIDE the Detail Format event.
CType(rpt.Sections("Detail1").Controls("TextBox1"), TextBox).Text = ShowACMessage()
C# script. Paste INSIDE the Detail Format event.
this.TextBox1.Text = ShowACMessage();
C# script. Paste INSIDE the Detail Format event.
((TextBox)rpt.Sections["Detail1"].Controls["TextBox1"]).Text = ShowACMessage();
Note: Use the examples with the "this" and "Me" keywords, as they are recommended rather than the ones with "rpt".
VB.NET script. Paste INSIDE the report class.
Public Class MyFuncs Public Sub New() End Sub Public Function ShowMyString() As String Return "This is my string" End FunctionEnd ClassVB.NET script. Paste INSIDE the Detail Format event.
Dim f As MyFuncs = New MyFuncs()Me.TextBox1.Text = f.ShowMyStringVB.NET script. Paste INSIDE the Detail Format event.
Dim f As MyFuncs = New MyFuncs() CType(rpt.Sections("Detail").Controls("TextBox1"), TextBox).Text = f.ShowMyString
C# script. Paste INSIDE the report class.
public class MyFuncs{ public MyFuncs() { } public string ShowMyString() { return "This is my string"; }}C# script. Paste INSIDE the Detail Format event.
ActiveReports 6 User Guide | 242

MyFuncs f = new MyFuncs();this.TextBox1.Text = f.ShowMyString();C# script. Paste INSIDE the Detail Format event.
MyFuncs f = new MyFuncs();((TextBox)rpt.Sections["Detail1"].Controls["TextBox1"]).Text = f.ShowMyString();
ActiveReports 6 User Guide | 243

Professional Edition licensees can provide no-touch printing using the new FlashViewer ViewerType of the WebViewer control.
To provide no-touch printing
1. From the Visual Studio toolbox, drag the WebViewer control onto your ASPX page. (See Adding ActiveReports Controls for help if you have not yet added the control to your toolbox.)
2. Add an ActiveReport to the project.
3. Back on the ASPX page, click to select the WebViewer, and in the Properties window, make the following changes:
1. Set the ReportName property to the name of your report.
2. Set the ViewerType property to FlashViewer.
3. Expand the FlashViewerOptions and PrintOptions nodes, and set the StartPrint property to True.
4. If you do not want to display the report to the user, set the Height and Width properties to 0.
4. Copy the ActiveRepors.FlashViewer.swf file into your project folder. This file is located in:
C:\Program Files\GrapeCity\ActiveReports 6\Deployment.
5. Run the project to see the report print with no user interaction.
Provide No-Touch Printing in the WebViewer (Pro Edition)
ActiveReports 6 User Guide | 244

The Designer control has built-in methods to add its menus and toolbars to a Visual Studio ToolStripContainer in your end user designer project.
To add Designer ToolStrips
Prior to following these steps, add an ActiveReports Designer control and a Visual Studio ToolStripContainer to your form.
1. Double-click the designer control on the form to create the Designer Load event.
2. Add code like the following to the event:
To write the code in Visual Basic.NET
To write the code in C#
3. See the table below for the run-time results of adding each tool strip.
ToolStrips at Run Time
Add Designer ToolStrips (Pro Edition)
If you need help adding the Designer control to your Visual Studio toolbox, see Adding ActiveReports Controls.
Visual Basic.NET code. Paste INSIDE the Load event.
Dim menuStrip As ToolStrip = Me.Designer1.CreateToolStrips(DataDynamics.ActiveReports.Design.DesignerToolStrips.Menu)(0) Dim editStrip As ToolStrip = Me.Designer1.CreateToolStrips(DataDynamics.ActiveReports.Design.DesignerToolStrips.Edit)(0) Dim formatStrip As ToolStrip = Me.Designer1.CreateToolStrips(DataDynamics.ActiveReports.Design.DesignerToolStrips.Format)(0) Dim layoutStrip As ToolStrip = Me.Designer1.CreateToolStrips(DataDynamics.ActiveReports.Design.DesignerToolStrips.Layout)(0) Dim reportStrip As ToolStrip = Me.Designer1.CreateToolStrips(DataDynamics.ActiveReports.Design.DesignerToolStrips.Report)(0) Dim undoStrip As ToolStrip = Me.Designer1.CreateToolStrips(DataDynamics.ActiveReports.Design.DesignerToolStrips.Undo)(0) Dim zoomStrip As ToolStrip = Me.Designer1.CreateToolStrips(DataDynamics.ActiveReports.Design.DesignerToolStrips.Zoom)(0) Me.ToolStripContainer1.TopToolStripPanel.Join(menuStrip, 0) Me.ToolStripContainer1.TopToolStripPanel.Join(editStrip, 1) Me.ToolStripContainer1.TopToolStripPanel.Join(formatStrip, 2) Me.ToolStripContainer1.TopToolStripPanel.Join(layoutStrip, 3) Me.ToolStripContainer1.TopToolStripPanel.Join(reportStrip, 4) Me.ToolStripContainer1.TopToolStripPanel.Join(undoStrip, 5) Me.ToolStripContainer1.TopToolStripPanel.Join(zoomStrip, 6)
C# code. Paste INSIDE the Load event.
ToolStrip menuStrip = this.designer1.CreateToolStrips(DataDynamics.ActiveReports.Design.DesignerToolStrips.Menu)[0]; ToolStrip editStrip = this.designer1.CreateToolStrips(DataDynamics.ActiveReports.Design.DesignerToolStrips.Edit)[0]; ToolStrip formatStrip = this.designer1.CreateToolStrips(DataDynamics.ActiveReports.Design.DesignerToolStrips.Format)[0]; ToolStrip layoutStrip = this.designer1.CreateToolStrips(DataDynamics.ActiveReports.Design.DesignerToolStrips.Layout)[0]; ToolStrip reportStrip = this.designer1.CreateToolStrips(DataDynamics.ActiveReports.Design.DesignerToolStrips.Report)[0]; ToolStrip undoStrip = this.designer1.CreateToolStrips(DataDynamics.ActiveReports.Design.DesignerToolStrips.Undo)[0]; ToolStrip zoomStrip = this.designer1.CreateToolStrips(DataDynamics.ActiveReports.Design.DesignerToolStrips.Zoom)[0]; this.toolStripContainer1.TopToolStripPanel.Join(menuStrip, 0); this.toolStripContainer1.TopToolStripPanel.Join(editStrip, 1); this.toolStripContainer1.TopToolStripPanel.Join(formatStrip, 2); this.toolStripContainer1.TopToolStripPanel.Join(layoutStrip, 3); this.toolStripContainer1.TopToolStripPanel.Join(reportStrip, 4); this.toolStripContainer1.TopToolStripPanel.Join(undoStrip, 5); this.toolStripContainer1.TopToolStripPanel.Join(zoomStrip, 6);
ToolStrip Name
Run-Time
Menu
ActiveReports 6 User Guide | 245

The File menu includes these commands: New, Open, Save, and Export.
The Edit menu includes these commands: Undo, Redo, Cut, Copy, Paste, Delete, and Select All.
Edit
The Edit tool strip includes these tools: Cut, Copy, Paste, and Delete.
FormatThe Format tool strip includes these tools: Font Name, Font Size, Bold, Italic, Underline, Fore Color, Back Color, Align Left, Align Center, Align Right, Align Justify, Indent, and Outdent.
LayoutThe Layout tool strip includes these tools: Align to Grid, Align Lefts, Align Centers, Align Rights, Align Tops, Align Middles, Align Bottoms, Bring to Front, and Send to Back.
Report
The Report tool strip includes these tools: New, Open, and Save.
Undo
The Undo tool strip includes these tools: Undo and Redo.
Zoom
The Zoom tool strip includes these tools: Zoom Out, Zoom In, Zoom %, and Actual Size.
ActiveReports 6 User Guide | 246

To add hyperlinks to reports, you must first configure the ActiveReports HttpHandlers and save your report layouts to report XML (RPX) format.
For more information, see Configure HTTPHandlers (Pro Edition) and Save and Load Report Layout Files (RPX).
To enable the HTTPHandlers
1. In the Solution Explorer, double-click the Web.config file.
2. In the XML view, add the following code to the Web.config file.
HttpHandler Configuration XML
3. Update the Version and PublicKeyToken values to reflect the current version of ActiveReports installed on your machine.
To add a link to a Web Form that opens a report in PDF format1. In the HTML view of the Web Form (*.aspx), add a hyperlink like the following.
Hyperlink HTML
2. Press F5 to run the program.
3. Click the link on the web form to view the report PDF.
To add a link that passes a parameter to a report and opens it in HTML formatIn order to pass a parameter to a report, you must first Add Parameters to the report. In this case, we are using a report with a Country parameter.
1. In the HTML view of the Web Form, add a hyperlink like the following.
Hyperlink HTML
2. Press F5 to run the program.
3. Click the link on the web form to show the report in its default HTML format.
Add Report Links to Web Forms (Pro Edition)
XML code. Paste in the XML view of the Web.config file inside the system.web section.
<httpHandlers> <!-- ********** ActiveReports HttpHandler Configuration ********** --> <add verb="*" path="*.rpx" type="DataDynamics.ActiveReports.Web.Handlers.RpxHandler, ActiveReports.Web, <add verb="*" path="*.ActiveReport" type="DataDynamics.ActiveReports.Web.Handlers.CompiledReportHandler, ActiveReports.Web, <add verb="*" path="*.ArCacheItem" type="DataDynamics.ActiveReports.Web.Handlers.WebCacheAccessHandler, ActiveReports.Web, </httpHandlers>
Tip: You can find the Version and PublicKeyToken values in the Global Assembly Cache (GAC), C:\WINDOWS\ASSEMBLY.
HTML code. Paste in the HTML view of the Web Form.
<a href="rptYourReportName.rpx?OutputFormat=pdf">Open the report in PDF format.</a>
Caution: Set your report's ShowParameterUI property to False to prevent the server from hanging while it tries to show the parameter dialog box.
Tip: Remember to save your report layout to RPX format again after you make any changes.
HTML code. Paste in the HTML view of the Web Form.
<a href="rptYourReportName.rpx?Country=USA">Customer Phone List for USA</a>
ActiveReports 6 User Guide | 247
ActiveReports uses an English locale by default, and includes localization resources for Japanese and Russian locales. You can also localize all of the components into any language you need. GrapeCity may, from time to time and on the agreement of users who localize components, include additional locales with future hot fixes and service packs. If you are willing to share your localized resources with other users, please inform technical support staff so that they can pass on your resource files to development.
There are several ways to deploy your ActiveReports applications. See the topics listed below for more information on localizing and deploying your applications.
This section contains information about how to:
Customize the Viewer Control Learn how to customize the viewer control in a report.
Localize the Viewer Control Learn how to localize settings for the ActiveReports Viewer control.
Localize Active Reports Resources Learn to localize ActiveReports dialogs.
Deploy Windows Applications Learn to deploy ActiveReports Windows applications.
Deploy Web Applications (Std Edition) Learn to deploy Web applications with the Standard Edition of ActiveReports.
Localize the End User Report Designer Learn to localize all of the strings in the End User Report Designer.
Deploy the End User Report Designer (Pro Edition) Learn how to properly deploy the End User Report Designer (Professional Edition).
Localize the Flash Viewer Learn to localize the FlashViewer in the WebViewer (Professional Edition).
Customize the FlashViewer Toolbar (Pro Edition) Learn to add, remove, and rearrange buttons in the FlashViewer toolbar.
Deploy Web Applications (Pro Edition) Learn to deploy Web applications with the WebViewer.
Customize End User Designer Help (Pro Edition) Learn what third-party tools you need to customize the help project for your designer application.
Deploy End User Designer Help (Pro Edition) Learn to deploy the help file for your designer application.
Customize, Localize and Deploy
ActiveReports 6 User Guide | 248

ActiveReports includes a control to view report output in custom preview forms. The viewer allows developers to modify the toolbars or add custom menu commands to the preview form.
To create a basic preview form
1. Open a new Windows Forms project in Visual Studio and size the form according to your needs.
2. From the Visual Studio toolbox, drag the Viewer control onto the form. If you have not added the viewer to the toolbox, see Adding ActiveReports Controls for more information.
3. In the Properties window, set the Dock property to Fill.
4. From the Project menu, select Add New Item .
5. Select ActiveReports 6 File and click the Add button.
6. Double-click in the title bar of the form to create a Form Load event.
7. Add the following code to run the report and display the resulting document in the viewer.
To write the code in Visual Basic.NET
To write the code in C#
8. Press F5 to run the project.
To use split windows on the viewer control1. With the project running, click the splitter control and drag downward.
2. When the viewer is split into two sections, report layouts can be examined and report pages can be compared easily.
To add a custom print button to the viewer control
1. Add a second Windows Form to the project created above and name it frmPrintDlg.
2. Add a label to frmPrintDlg and change the Text property to This is the custom print dialog.
3. Add a button to frmPrintDlg and change the Text property to OK.
4. Back on the viewer form, double-click the title bar of the form to create a Form Load event.
5. Add the following code to the Form Load event to remove the default print button and add your own.
To write the code in Visual Basic.NET
Customize the Viewer Control
Visual Basic.NET code. Paste INSIDE the Form Load event.
Dim rpt as new NewActiveReport1rpt.Run()Viewer1.Document = rpt.Document
C# code. Paste INSIDE the Form Load event.
ActiveReport1 rpt = new ActiveReport1();rpt.Run();viewer1.Document = rpt.Document;
Visual Basic.NET code. Paste INSIDE the Form Load event.
' Remove the default print button
ActiveReports 6 User Guide | 249
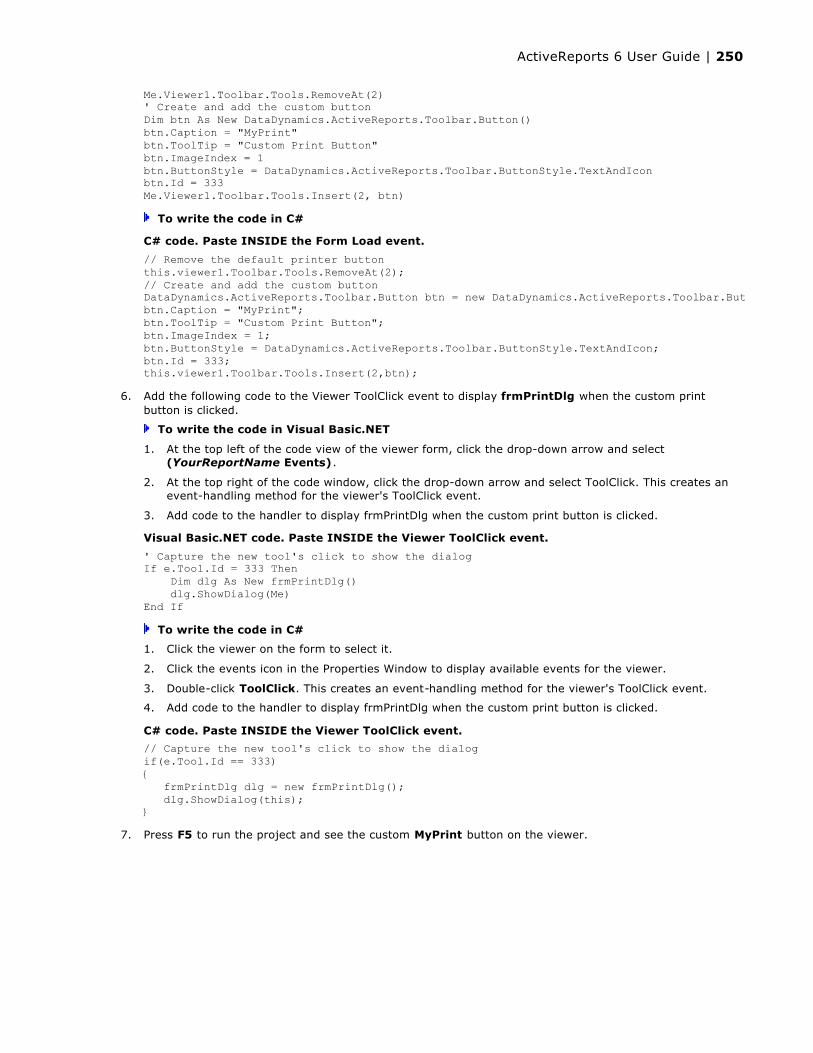
To write the code in C#
6. Add the following code to the Viewer ToolClick event to display frmPrintDlg when the custom print button is clicked.
To write the code in Visual Basic.NET
1. At the top left of the code view of the viewer form, click the drop-down arrow and select (YourReportName Events).
2. At the top right of the code window, click the drop-down arrow and select ToolClick. This creates an event-handling method for the viewer's ToolClick event.
3. Add code to the handler to display frmPrintDlg when the custom print button is clicked.
To write the code in C#
1. Click the viewer on the form to select it.
2. Click the events icon in the Properties Window to display available events for the viewer.
3. Double-click ToolClick. This creates an event-handling method for the viewer's ToolClick event.
4. Add code to the handler to display frmPrintDlg when the custom print button is clicked.
7. Press F5 to run the project and see the custom MyPrint button on the viewer.
Me.Viewer1.Toolbar.Tools.RemoveAt(2)' Create and add the custom buttonDim btn As New DataDynamics.ActiveReports.Toolbar.Button()btn.Caption = "MyPrint"btn.ToolTip = "Custom Print Button"btn.ImageIndex = 1btn.ButtonStyle = DataDynamics.ActiveReports.Toolbar.ButtonStyle.TextAndIconbtn.Id = 333Me.Viewer1.Toolbar.Tools.Insert(2, btn)
C# code. Paste INSIDE the Form Load event.
// Remove the default printer buttonthis.viewer1.Toolbar.Tools.RemoveAt(2);// Create and add the custom buttonDataDynamics.ActiveReports.Toolbar.Button btn = new DataDynamics.ActiveReports.Toolbar.Button();btn.Caption = "MyPrint";btn.ToolTip = "Custom Print Button";btn.ImageIndex = 1;btn.ButtonStyle = DataDynamics.ActiveReports.Toolbar.ButtonStyle.TextAndIcon;btn.Id = 333;this.viewer1.Toolbar.Tools.Insert(2,btn);
Visual Basic.NET code. Paste INSIDE the Viewer ToolClick event.
' Capture the new tool's click to show the dialogIf e.Tool.Id = 333 Then Dim dlg As New frmPrintDlg() dlg.ShowDialog(Me)End If
C# code. Paste INSIDE the Viewer ToolClick event.
// Capture the new tool's click to show the dialogif(e.Tool.Id == 333){ frmPrintDlg dlg = new frmPrintDlg(); dlg.ShowDialog(this);}
ActiveReports 6 User Guide | 250

To localize the viewer control
1. In Windows Explorer, navigate to C:\Program Files\GrapeCity\ActiveReports 6\Localization.
2. Edit the Viewer.bat file:
1. Right-click the Viewer.bat file and select Edit.
2. Change the culture in the line set Culture="en-Us" to the culture you want to use. For your convenience, here is a list of predefined .NET Cultures.
3. Ensure that the ProgamFilesDDPath is correct.
4. Save and close the Viewer.bat file.
3. Change strings in the resource files:
1. Double-click the Viewer.zip file to open it.
2. Extract all of the files to C:\Program Files\GrapeCity\ActiveReports 6\Localization. A Viewersubfolder is created.
3. In the new Viewer folder's Res subfolder, open each of the three *.resx files and change the strings as needed.
4. If you want to change any of the images, rename your localized images to the names of the ones in the Res\Resources subfolder and replace them with your localized images.
4. Back in the main Localization folder, double-click the Viewer.bat file to run it. The NameCompleter.exe application runs, and creates:
A SatelliteAssembly folder inside the Viewer folder.
A language subfolder with the same name as the culture you set in the Viewer.bat file inside the SatelliteAssemby folder.
A localized ActiveReports.Viewer6.resources.dll file inside the language subfolder.
5. Copy the language subfolder and paste it into the bin folder of your application.
To test your localized application on a machine that does not share the culture of the localized dll1. Add the following code in the form's constructor just before the InitializeComponent method is called.
2. Replace the "ja" in the example code with the culture specified in the Viewer.bat file.
To write the code in Visual Basic.NET
To write the code in C#
Localize the Viewer Control
Caution: Do not change the ProjectName, dllName, msDir, or BaseNamespace.
Note: If you want to put your localization in the Global Assembly Cache (GAC), you must first send the localized ActiveReports.Viewer6.resources.dll file to GrapeCity (mailto:[email protected]?subject=Need to have localized resource dll signed.)and get it signed. Then you can drag the language subfolder with the signed dll file into C:\WINDOWS\ASSEMBLY.
Visual Basic.NET code. Paste INSIDE the the form's constructor just before the InitializeComponent method.
System.Threading.Thread.CurrentThread.CurrentUICulture = New System.Globalization.CultureInfo("ja")
C# code. Paste INSIDE the form's constructor just before the InitializeComponent method.
System.Threading.Thread.CurrentThread.CurrentUICulture = new System.Globalization.CultureInfo("ja");
ActiveReports 6 User Guide | 251

For your convenience, here is a list of predefined System.Globalization cultures. (Source: MSDN (http://msdn.microsoft.com/en-us/library/system.globalization.cultureinfo.aspx).) For ActiveReports localization purposes, use the Culture/Language Name value in the first column.
Cultures
Culture/Language Name Culture Identifier Culture"" (empty string) 0x007F Invariant cultureaf 0x0036 Afrikaansaf-ZA 0x0436 Afrikaans (South Africa)sq 0x001C Albaniansq-AL 0x041C Albanian (Albania)ar 0x0001 Arabicar-DZ 0x1401 Arabic (Algeria)ar-BH 0x3C01 Arabic (Bahrain)ar-EG 0x0C01 Arabic (Egypt)ar-IQ 0x0801 Arabic (Iraq)ar-JO 0x2C01 Arabic (Jordan)ar-KW 0x3401 Arabic (Kuwait)ar-LB 0x3001 Arabic (Lebanon)ar-LY 0x1001 Arabic (Libya)ar-MA 0x1801 Arabic (Morocco)ar-OM 0x2001 Arabic (Oman)ar-QA 0x4001 Arabic (Qatar)ar-SA 0x0401 Arabic (Saudi Arabia)ar-SY 0x2801 Arabic (Syria)ar-TN 0x1C01 Arabic (Tunisia)ar-AE 0x3801 Arabic (U.A.E.)ar-YE 0x2401 Arabic (Yemen)hy 0x002B Armenianhy-AM 0x042B Armenian (Armenia)az 0x002C Azeriaz-Cyrl-AZ 0x082C Azeri (Azerbaijan, Cyrillic)az-Latn-AZ 0x042C Azeri (Azerbaijan, Latin)eu 0x002D Basqueeu-ES 0x042D Basque (Basque)be 0x0023 Belarusianbe-BY 0x0423 Belarusian (Belarus)bg 0x0002 Bulgarianbg-BG 0x0402 Bulgarian (Bulgaria)ca 0x0003 Catalanca-ES 0x0403 Catalan (Catalan)zh-HK 0x0C04 Chinese (Hong Kong SAR, PRC)zh-MO 0x1404 Chinese (Macao SAR)zh-CN 0x0804 Chinese (PRC)zh-Hans 0x0004 Chinese (Simplified)zh-SG 0x1004 Chinese (Singapore)zh-TW 0x0404 Chinese (Taiwan)zh-Hant 0x7C04 Chinese (Traditional)hr 0x001A Croatianhr-HR 0x041A Croatian (Croatia)cs 0x0005 Czechcs-CZ 0x0405 Czech (Czech Republic)da 0x0006 Danishda-DK 0x0406 Danish (Denmark)
ActiveReports 6 User Guide | 252
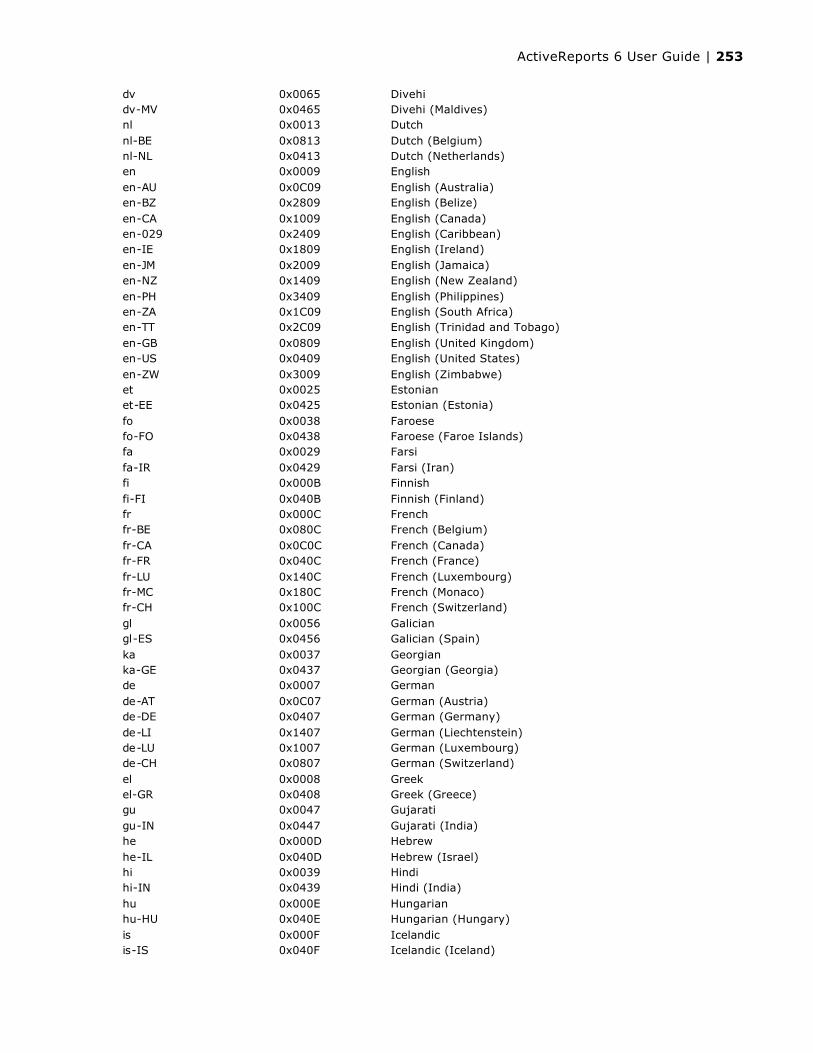
dv 0x0065 Divehidv-MV 0x0465 Divehi (Maldives)nl 0x0013 Dutchnl-BE 0x0813 Dutch (Belgium)nl-NL 0x0413 Dutch (Netherlands)en 0x0009 Englishen-AU 0x0C09 English (Australia)en-BZ 0x2809 English (Belize)en-CA 0x1009 English (Canada)en-029 0x2409 English (Caribbean)en-IE 0x1809 English (Ireland)en-JM 0x2009 English (Jamaica)en-NZ 0x1409 English (New Zealand)en-PH 0x3409 English (Philippines)en-ZA 0x1C09 English (South Africa)en-TT 0x2C09 English (Trinidad and Tobago)en-GB 0x0809 English (United Kingdom)en-US 0x0409 English (United States)en-ZW 0x3009 English (Zimbabwe)et 0x0025 Estonianet-EE 0x0425 Estonian (Estonia)fo 0x0038 Faroesefo-FO 0x0438 Faroese (Faroe Islands)fa 0x0029 Farsifa-IR 0x0429 Farsi (Iran)fi 0x000B Finnishfi-FI 0x040B Finnish (Finland)fr 0x000C Frenchfr-BE 0x080C French (Belgium)fr-CA 0x0C0C French (Canada)fr-FR 0x040C French (France)fr-LU 0x140C French (Luxembourg)fr-MC 0x180C French (Monaco)fr-CH 0x100C French (Switzerland)gl 0x0056 Galiciangl-ES 0x0456 Galician (Spain)ka 0x0037 Georgianka-GE 0x0437 Georgian (Georgia)de 0x0007 Germande-AT 0x0C07 German (Austria)de-DE 0x0407 German (Germany)de-LI 0x1407 German (Liechtenstein)de-LU 0x1007 German (Luxembourg)de-CH 0x0807 German (Switzerland)el 0x0008 Greekel-GR 0x0408 Greek (Greece)gu 0x0047 Gujaratigu-IN 0x0447 Gujarati (India)he 0x000D Hebrewhe-IL 0x040D Hebrew (Israel)hi 0x0039 Hindihi-IN 0x0439 Hindi (India)hu 0x000E Hungarianhu-HU 0x040E Hungarian (Hungary)is 0x000F Icelandicis-IS 0x040F Icelandic (Iceland)
ActiveReports 6 User Guide | 253
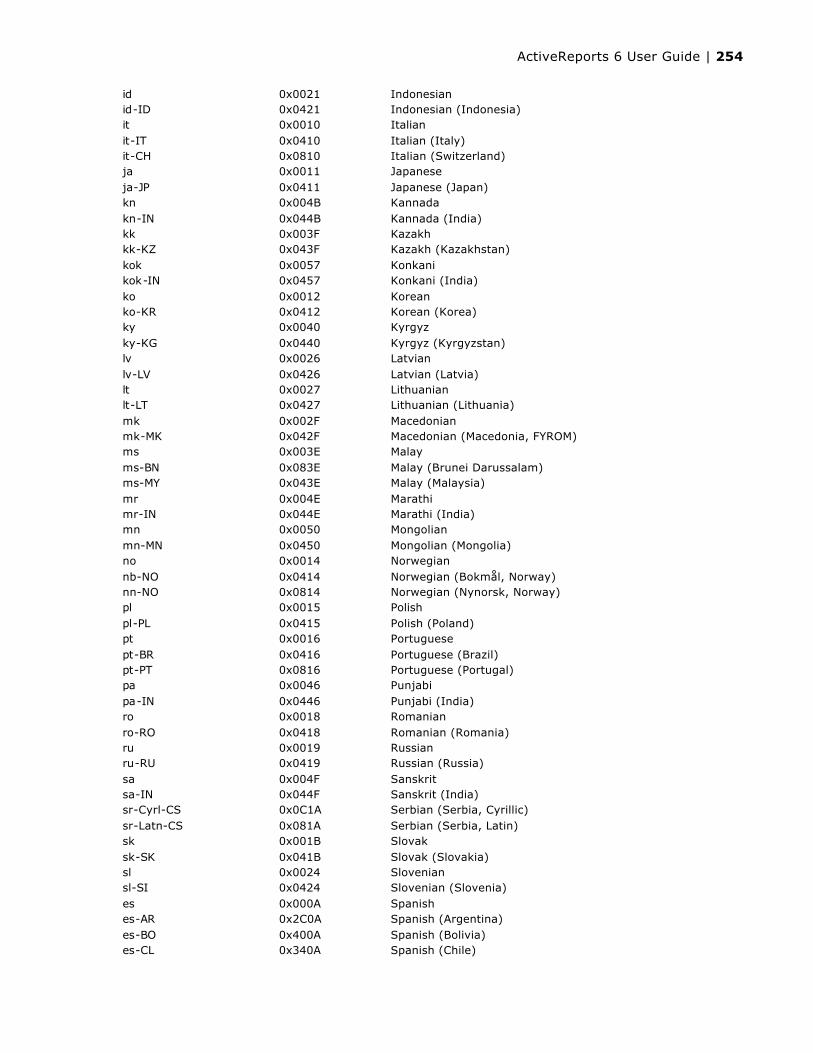
id 0x0021 Indonesianid-ID 0x0421 Indonesian (Indonesia)it 0x0010 Italianit-IT 0x0410 Italian (Italy)it-CH 0x0810 Italian (Switzerland)ja 0x0011 Japaneseja-JP 0x0411 Japanese (Japan)kn 0x004B Kannadakn-IN 0x044B Kannada (India)kk 0x003F Kazakhkk-KZ 0x043F Kazakh (Kazakhstan)kok 0x0057 Konkanikok-IN 0x0457 Konkani (India)ko 0x0012 Koreanko-KR 0x0412 Korean (Korea)ky 0x0040 Kyrgyzky-KG 0x0440 Kyrgyz (Kyrgyzstan)lv 0x0026 Latvianlv-LV 0x0426 Latvian (Latvia)lt 0x0027 Lithuanianlt-LT 0x0427 Lithuanian (Lithuania)mk 0x002F Macedonianmk-MK 0x042F Macedonian (Macedonia, FYROM)ms 0x003E Malayms-BN 0x083E Malay (Brunei Darussalam)ms-MY 0x043E Malay (Malaysia)mr 0x004E Marathimr-IN 0x044E Marathi (India)mn 0x0050 Mongolianmn-MN 0x0450 Mongolian (Mongolia)no 0x0014 Norwegiannb-NO 0x0414 Norwegian (Bokmål, Norway)nn-NO 0x0814 Norwegian (Nynorsk, Norway)pl 0x0015 Polishpl-PL 0x0415 Polish (Poland)pt 0x0016 Portuguesept-BR 0x0416 Portuguese (Brazil)pt-PT 0x0816 Portuguese (Portugal)pa 0x0046 Punjabipa-IN 0x0446 Punjabi (India)ro 0x0018 Romanianro-RO 0x0418 Romanian (Romania)ru 0x0019 Russianru-RU 0x0419 Russian (Russia)sa 0x004F Sanskritsa-IN 0x044F Sanskrit (India)sr-Cyrl-CS 0x0C1A Serbian (Serbia, Cyrillic)sr-Latn-CS 0x081A Serbian (Serbia, Latin)sk 0x001B Slovaksk-SK 0x041B Slovak (Slovakia)sl 0x0024 Sloveniansl-SI 0x0424 Slovenian (Slovenia)es 0x000A Spanishes-AR 0x2C0A Spanish (Argentina)es-BO 0x400A Spanish (Bolivia)es-CL 0x340A Spanish (Chile)
ActiveReports 6 User Guide | 254
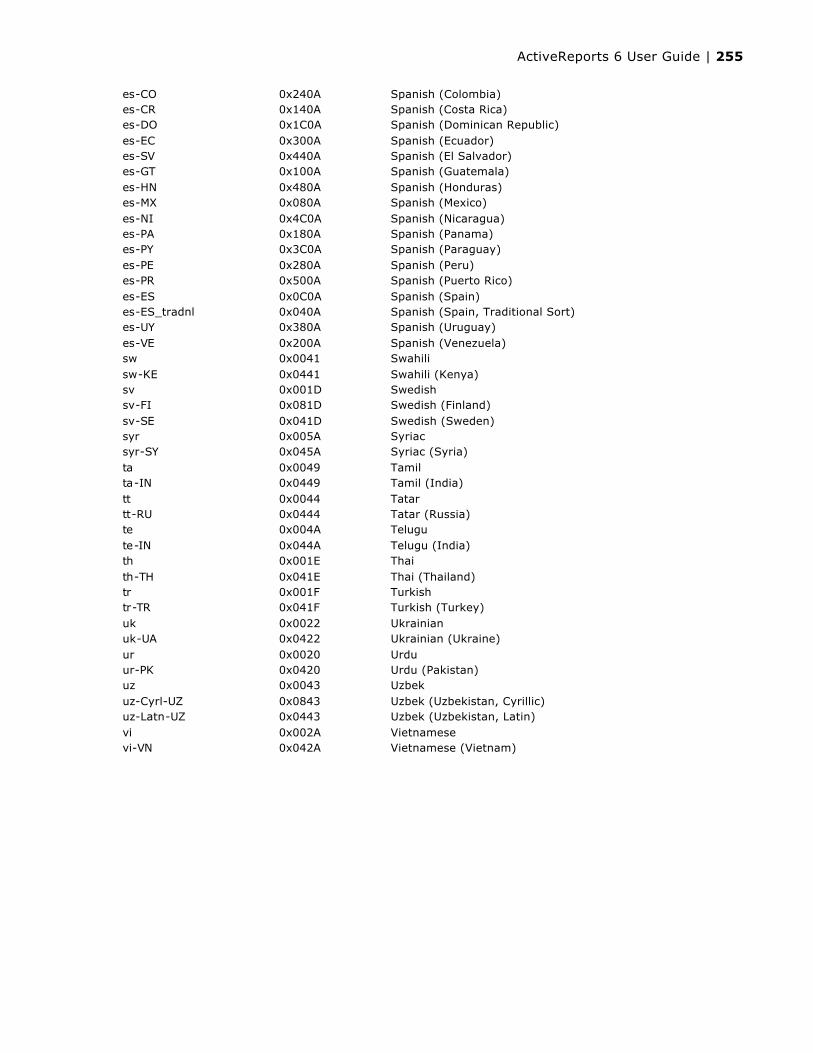
es-CO 0x240A Spanish (Colombia)es-CR 0x140A Spanish (Costa Rica)es-DO 0x1C0A Spanish (Dominican Republic)es-EC 0x300A Spanish (Ecuador)es-SV 0x440A Spanish (El Salvador)es-GT 0x100A Spanish (Guatemala)es-HN 0x480A Spanish (Honduras)es-MX 0x080A Spanish (Mexico)es-NI 0x4C0A Spanish (Nicaragua)es-PA 0x180A Spanish (Panama)es-PY 0x3C0A Spanish (Paraguay)es-PE 0x280A Spanish (Peru)es-PR 0x500A Spanish (Puerto Rico)es-ES 0x0C0A Spanish (Spain)es-ES_tradnl 0x040A Spanish (Spain, Traditional Sort)es-UY 0x380A Spanish (Uruguay)es-VE 0x200A Spanish (Venezuela)sw 0x0041 Swahilisw-KE 0x0441 Swahili (Kenya)sv 0x001D Swedishsv-FI 0x081D Swedish (Finland)sv-SE 0x041D Swedish (Sweden)syr 0x005A Syriacsyr-SY 0x045A Syriac (Syria)ta 0x0049 Tamilta-IN 0x0449 Tamil (India)tt 0x0044 Tatartt-RU 0x0444 Tatar (Russia)te 0x004A Telugute-IN 0x044A Telugu (India)th 0x001E Thaith-TH 0x041E Thai (Thailand)tr 0x001F Turkishtr-TR 0x041F Turkish (Turkey)uk 0x0022 Ukrainianuk-UA 0x0422 Ukrainian (Ukraine)ur 0x0020 Urduur-PK 0x0420 Urdu (Pakistan)uz 0x0043 Uzbekuz-Cyrl-UZ 0x0843 Uzbek (Uzbekistan, Cyrillic)uz-Latn-UZ 0x0443 Uzbek (Uzbekistan, Latin)vi 0x002A Vietnamesevi-VN 0x042A Vietnamese (Vietnam)
ActiveReports 6 User Guide | 255

To localize ActiveReports Resources
1. In Windows Explorer, navigate to C:\Program Files\GrapeCity\ActiveReports 6\Localization.
2. Edit the *.bat files of any assemblies that you want to localize:
1. Right-click the *.bat file and select Edit.
2. Change the culture in the line set Culture="en-Us" to the culture that you want to use. For your convenience, here is a list of predefined .NET Cultures.
3. Ensure that the ProgamFilesDDPath is correct.
4. Save and close the *.bat file.
3. Change strings in the resource files:
1. Double-click the *.zip file of the assembly that you want to localize to open it.
2. Extract all of the files to C:\Program Files\GrapeCity\ActiveReports 6\Localization. A subfolder with the same name as the zip file is created.
3. In the new folder's Res subfolder, open each of the *.resx files and change the strings as needed.
4. If you want to change any of the images, rename your localized images to the names of the ones in the Res\Resources subfolder and replace them with your localized images.
4. Back in the main Localization folder, double-click the *.bat file to run it. The NameCompleter.exe application runs, and creates:
A SatelliteAssembly folder inside the new folder.
A language subfolder with the same name as the culture you set in the *.bat file inside the SatelliteAssemby folder.
A localized ActiveReports.AssemblyName.resources.dll file inside the language subfolder.
5. Copy the language subfolder and paste it into the bin folder of your application.
To test your localized application on a machine that does not share the culture of the localized dll
1. Add the following code in the form's constructor just before the InitializeComponent method is called.
2. Replace the "ja" in the example code with the culture specified in the *.bat file.
To write the code in Visual Basic.NET
To write the code in C#
Localize Active Reports Resources
Caution: Do not change the ProjectName, dllName, msDir, or BaseNamespace.
Note: If you want to put your localization in the Global Assembly Cache (GAC), you must first send the localized ActiveReports.AssemblyName.resources.dll file to GrapeCity (mailto:[email protected]?subject=Need to have localized resource dll signed.)and get it signed. Then you can drag the language subfolder with the signed dll file into C:\WINDOWS\ASSEMBLY.
Visual Basic.NET code. Paste INSIDE the the form's constructor just before the InitializeComponent method.
System.Threading.Thread.CurrentThread.CurrentUICulture = New System.Globalization.CultureInfo("ja")
C# code. Paste INSIDE the form's constructor just before the InitializeComponent method.
System.Threading.Thread.CurrentThread.CurrentUICulture = new System.Globalization.CultureInfo("ja");
ActiveReports 6 User Guide | 256

To create an installer project
1. Open an existing ActiveReports project or create a new one.
2. From the Visual Studio Build menu, select Build YourActiveReportsProjectName to build your report project.
3. From the File menu, select Add, then New Project to open the Add New Project dialog.
4. In the Add New Project dialog under Project Types, expand the Other Project Types node and select Setup and Deployment.
5. Under Templates, select Setup Project, rename the file and click OK.
6. In Solution Explorer, select the Installer project. In the Properties window, select the ProductNameproperty and enter the name of your file.
The ProductName property determines the name that is displayed for the application in folder names and in the Add/Remove Programs dialog box.
To add the ActiveReports application to the installer
1. Select the Installer project in the Solution Explorer. If the File System Editor does not open, drop down the View menu and select Editor, then File System.
2. In the File System Editor, select the Application Folder.
3. From the Visual Studio Action menu, select Add, then Project Output.
4. In the Add Project Output Group dialog that appears, choose your ActiveReports project name from the drop-down list.
5. In the list, select Primary Output and click OK. This adds all of the existing assembly dependencies to your project.
6. If you want to add other ActiveReports DLLs to the installer (e.g. if you use OleObjects on reports, you need to include the Interop.dll or Interop64.dll for 64-bit machines), in the Solution Explorer, right-click
Deploy Windows Applications
ActiveReports 6 User Guide | 257

the installer project name, select Add, then Assembly.
7. In the Select Component dialog that appears, select any components that you want to add and click the OK button.
8. From the Visual Studio Build menu, select Build YourInstallerProjectName to build your Installer project.
To deploy the installer application1. Select the Installer project in the Solution Explorer.
2. From the Visual Studio Project menu, click Install.
3. The Installer application runs and installs the project on your computer. The distributable exe and msi setup files appear in your installer project Debug folder.
Note: If you would rather use the ActiveReports .msm file, please contact [email protected] .
ActiveReports 6 User Guide | 258

Follow this guide to deploy ActiveReports Standard Edition Web projects to your Web server. For Web projects using the Professional Edition WebViewer, see Deploy Web Applications (Pro Edition).
To deploy your ActiveReports Web projects, you must have access to the Microsoft .NET Framework version 2.0 or higher and the coordinating version of ASP.NET. You must also have access to Internet Information Services version 5.1 or 6.0, and you need administrative access to the server. For examples of how to create ActiveReports Web projects, see the walkthroughs linked at the bottom of this topic.
To add referenced DLLs to your project
1. In the Visual Studio Solution Explorer, if the References node is not showing, click the Show All Filesbutton.
2. Expand the References node, and select one of the ActiveReports references.
3. In the Properties window, change the CopyLocal property to True. The corresponding DLL is stored in the Bin folder of your project.
4. Set the CopyLocal property to True for each ActiveReports reference used in your project.
To install prerequisites on the server
Follow Microsoft's instructions to install each of the following on your Web server:
1. The Microsoft .NET Framework version 2.0 or higher
2. Internet Information Services (IIS) version 5.1 or 6.0
3. ASP.NET version 2.0 or higher (must be the same version as the Framework)
To copy your project to the server
1. Copy the entire directory containing your project to the server.
2. If your project is in a virtual directory on your local machine (i.e. C:\Inetpub\wwwroot\YourProject), you must set up a virtual directory in IIS on the server as well.
To set permissions on the server
Depending on your project, you may need to set permissions to allow ActiveReports access to data or folders.
Some examples of required permissions on the server
If you are saving files (i.e. PDF or RDF) to a folder on Windows XP or 2000 machines, the ASPNET user ID needs Write access to that folder.
Windows 2003 is user configurable, so use the name assigned to the ASPNET user instead.
If your application reads anything from any folder, assign Read access to it.
If your reports run on any networked data source (i.e. SQL, Access, etc.) assign Read access to it.
If you use CacheToDisk, assign IsolatedStorageFilePermission to it.
Deploy Web Applications (Std Edition)
ActiveReports 6 User Guide | 259
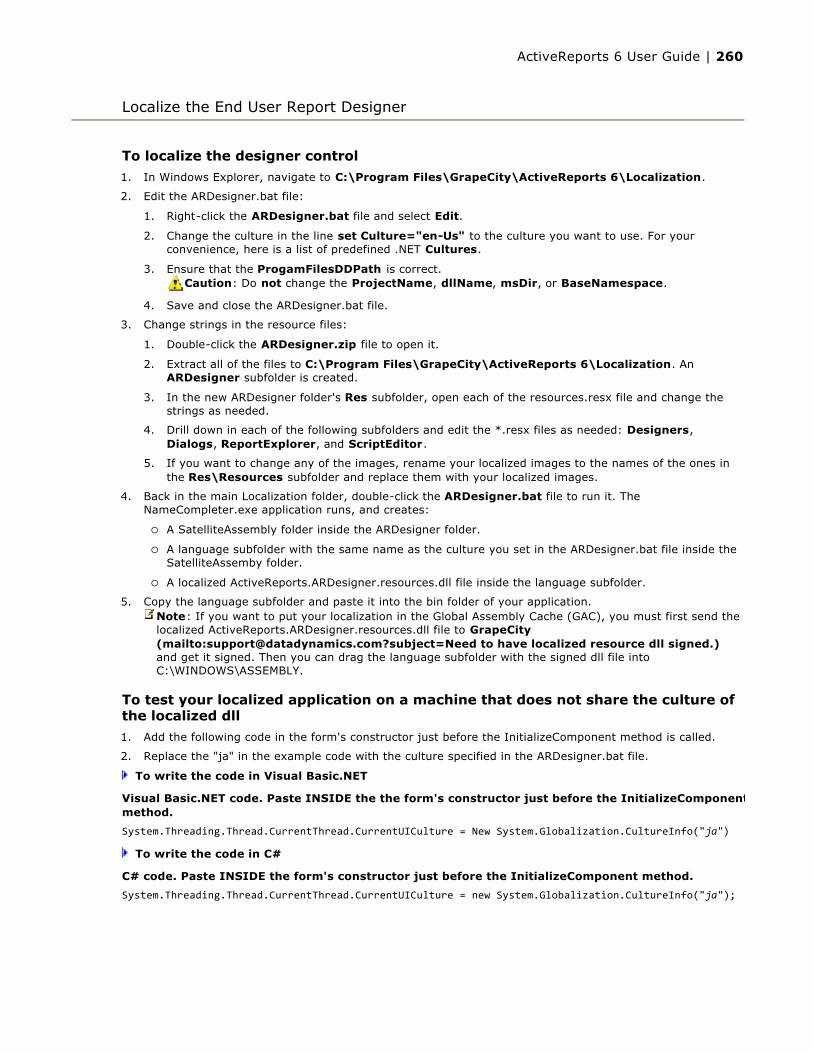
To localize the designer control
1. In Windows Explorer, navigate to C:\Program Files\GrapeCity\ActiveReports 6\Localization.
2. Edit the ARDesigner.bat file:
1. Right-click the ARDesigner.bat file and select Edit.
2. Change the culture in the line set Culture="en-Us" to the culture you want to use. For your convenience, here is a list of predefined .NET Cultures.
3. Ensure that the ProgamFilesDDPath is correct.
4. Save and close the ARDesigner.bat file.
3. Change strings in the resource files:
1. Double-click the ARDesigner.zip file to open it.
2. Extract all of the files to C:\Program Files\GrapeCity\ActiveReports 6\Localization. An ARDesigner subfolder is created.
3. In the new ARDesigner folder's Res subfolder, open each of the resources.resx file and change the strings as needed.
4. Drill down in each of the following subfolders and edit the *.resx files as needed: Designers, Dialogs, ReportExplorer, and ScriptEditor.
5. If you want to change any of the images, rename your localized images to the names of the ones in the Res\Resources subfolder and replace them with your localized images.
4. Back in the main Localization folder, double-click the ARDesigner.bat file to run it. The NameCompleter.exe application runs, and creates:
A SatelliteAssembly folder inside the ARDesigner folder.
A language subfolder with the same name as the culture you set in the ARDesigner.bat file inside the SatelliteAssemby folder.
A localized ActiveReports.ARDesigner.resources.dll file inside the language subfolder.
5. Copy the language subfolder and paste it into the bin folder of your application.
To test your localized application on a machine that does not share the culture of the localized dll
1. Add the following code in the form's constructor just before the InitializeComponent method is called.
2. Replace the "ja" in the example code with the culture specified in the ARDesigner.bat file.
To write the code in Visual Basic.NET
To write the code in C#
Localize the End User Report Designer
Caution: Do not change the ProjectName, dllName, msDir, or BaseNamespace.
Note: If you want to put your localization in the Global Assembly Cache (GAC), you must first send the localized ActiveReports.ARDesigner.resources.dll file to GrapeCity (mailto:[email protected]?subject=Need to have localized resource dll signed.)and get it signed. Then you can drag the language subfolder with the signed dll file into C:\WINDOWS\ASSEMBLY.
Visual Basic.NET code. Paste INSIDE the the form's constructor just before the InitializeComponent method.
System.Threading.Thread.CurrentThread.CurrentUICulture = New System.Globalization.CultureInfo("ja")
C# code. Paste INSIDE the form's constructor just before the InitializeComponent method.
System.Threading.Thread.CurrentThread.CurrentUICulture = new System.Globalization.CultureInfo("ja");
ActiveReports 6 User Guide | 260
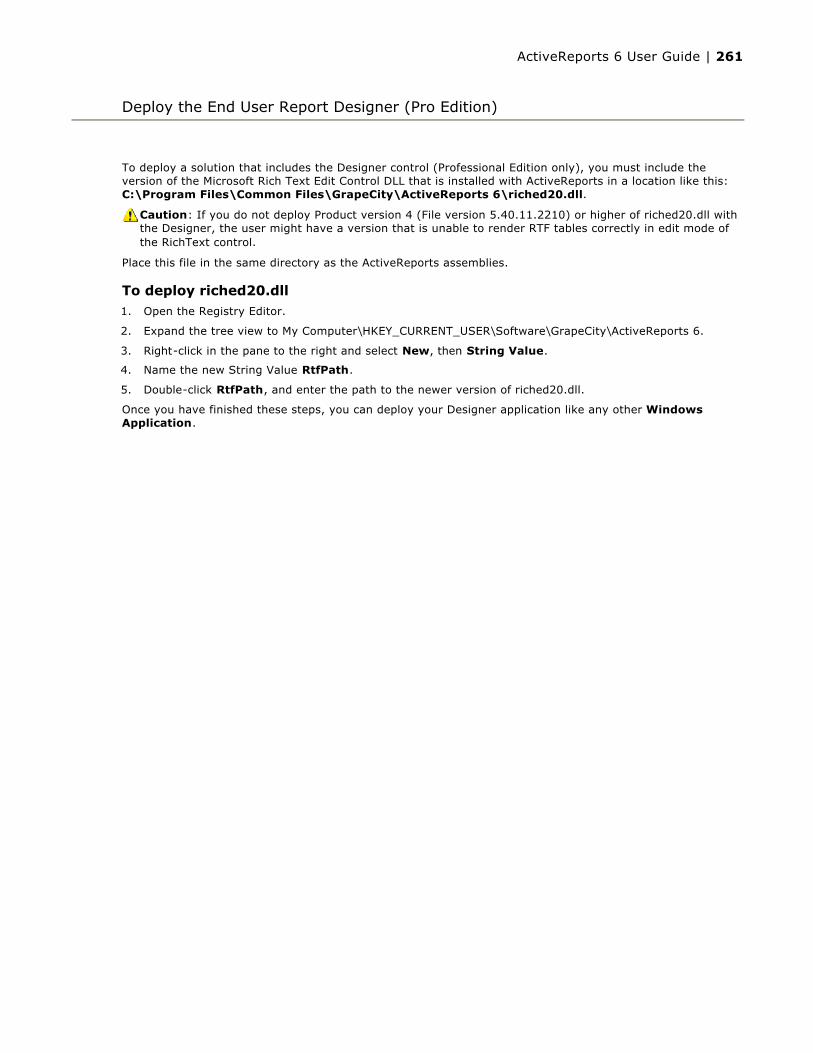
To deploy a solution that includes the Designer control (Professional Edition only), you must include the version of the Microsoft Rich Text Edit Control DLL that is installed with ActiveReports in a location like this: C:\Program Files\Common Files\GrapeCity\ActiveReports 6\riched20.dll.
Place this file in the same directory as the ActiveReports assemblies.
To deploy riched20.dll1. Open the Registry Editor.
2. Expand the tree view to My Computer\HKEY_CURRENT_USER\Software\GrapeCity\ActiveReports 6.
3. Right-click in the pane to the right and select New, then String Value.
4. Name the new String Value RtfPath.
5. Double-click RtfPath, and enter the path to the newer version of riched20.dll.
Once you have finished these steps, you can deploy your Designer application like any other Windows Application.
Deploy the End User Report Designer (Pro Edition)
Caution: If you do not deploy Product version 4 (File version 5.40.11.2210) or higher of riched20.dll with the Designer, the user might have a version that is unable to render RTF tables correctly in edit mode of the RichText control.
ActiveReports 6 User Guide | 261
When you select the FlashViewer ViewerType of the WebViewer (Professional Edition license), the FlashViewer toolbar is very similar to the Viewer control's toolbar. You can show or hide it, reorder buttons, remove buttons, add custom buttons, or create a custom toolbar. Use the Web.Controls namespace to create custom buttons or a custom toolbar that you can specify in the WebViewer's FlashViewerToolbar property.
Hide the Toolbar
Reorder Buttons
Remove a Button
Create a Custom Button
Create a Custom Toolbar
The buttons that are available in the toolbar by default are:
TOCButton
PrintButton
PageRangeButton
SearchButton
ZoomOutButton
ZoomBox
ZoomInButton
SinglePageViewButton
MultiPageBox
ContinuousViewButton
PreviousPageButton
NextPageButton
CurPageTextArea
BackwardButton
ForwardButton
To hide the toolbar
1. In the Visual Studio Solution Explorer, right-click the ASPX file that contains your WebViewer and select View Designer.
2. In the design view of your web form, double-click the WebViewer. This creates an event handling method for the Page Load event and takes you to the code view of the page.
3. Use code like the following to hide the toolbar:
To write the code in Visual Basic.NET
To write the code in C#
To rearrange buttons in the toolbar1. In the Visual Studio Solution Explorer, right-click the ASPX file that contains your WebViewer and select
View Designer.
Customize the FlashViewer Toolbar (Pro Edition)
Note: If the ViewerType property of your WebViewer control is not set to FlashViewer, this code is ignored.
Visual Basic.NET code. Paste INSIDE the Page Load event.
WebViewer.FlashViewerToolBar.Visible = False
C# code. Paste INSIDE the Page Load event.
WebViewer1.FlashViewerToolBar.Visible = false;
ActiveReports 6 User Guide | 262
2. In the design view of your web form, double-click the page. This creates an event handling method for the Page Load event and takes you to the code view of the page.
3. Use code like the following to create a button and insert it at the beginning of the toolbar:
To write the code in Visual Basic.NET
To write the code in C#
To remove a button from the toolbar1. In the Visual Studio Solution Explorer, right-click the ASPX file that contains your WebViewer and select
View Designer.
2. In the design view of your web form, double-click the WebViewer. This creates an event handling method for the Page Load event and takes you to the code view of the page.
3. Use code like the following to remove a button from the toolbar:
To write the code in Visual Basic.NET
To write the code in C#
To create a custom button and add it to the toolbar
1. In the Visual Studio Solution Explorer, right-click the ASPX file that contains your WebViewer and select View Designer.
2. In the design view of your web form, double-click the WebViewer. This creates an event handling method for the Page Load event and takes you to the code view of the page.
3. Use code like the following to create a button and insert it at the beginning of the toolbar:
To write the code in Visual Basic.NET
Visual Basic.NET code. Paste INSIDE the Page Load event.
'Get an existing tool from the toolbar. (If you prefer, you can specify the index of the tool.)Dim tool As DataDynamics.ActiveReports.Web.Controls.ToolBase = WebViewer1.FlashViewerToolBar.Tools("PageRangeButton")'Remove the tool from the toolbar.WebViewer1.FlashViewerToolBar.Tools.Remove(tool)'Add the tool in a different position.WebViewer1.FlashViewerToolBar.Tools.Insert(0, tool)
C# code. Paste INSIDE the Page Load event.
//Get an existing tool from the toolbar. (If you prefer, you can specify the index of the tool.)ToolBase tool = WebViewer1.FlashViewerToolBar.Tools[ToolsCollection.ToolCommands.PageRangeButton];//Remove the tool from the toolbar.WebViewer1.FlashViewerToolBar.Tools.Remove(tool);//Add the tool in a different position.WebViewer1.FlashViewerToolBar.Tools.Insert(8, tool);
Visual Basic.NET code. Paste INSIDE the Page Load event.
'Get an existing tool from the toolbar. (If you prefer, you can specify the index of the tool.)Dim tool As DataDynamics.ActiveReports.Web.Controls.ToolBase = WebViewer1.FlashViewerToolBar.Tools("PageRangeButton")'Remove the tool from the toolbar.WebViewer1.FlashViewerToolBar.Tools.Remove(tool)
C# code. Paste INSIDE the Page Load event.
//Get an existing tool from the toolbar. (If you prefer, you can specify the index of the tool.)ToolBase tool = WebViewer1.FlashViewerToolBar.Tools[ToolsCollection.ToolCommands.PageRangeButton];//Remove the tool from the toolbar.WebViewer1.FlashViewerToolBar.Tools.Remove(tool);
Tip: The ToolsCollection class in the Web.Controls namespace has the standard System.Collections.ObjectModel.Collection methods available, so if you want to just add the button to the end of the toolbar, you can use the Add method instead.
Visual Basic.NET code. Paste INSIDE the Page Load event.
Dim customButton As ToolButton = Tool.CreateButton("CustomButton")customButton.Caption = "Visit Us!"customButton.ToolTip = "Click here to visit datadynamics.com"
ActiveReports 6 User Guide | 263

To write the code in C#
To create a custom toolbar and add it to the viewer1. In the Visual Studio Solution Explorer, right-click the ASPX file that contains your WebViewer and select
View Designer.
2. In the design view of your web form, double-click the WebViewer. This creates an event handling method for the Page Load event and takes you to the code view of the page.
3. Use code like the following to create a custom toolbar and add it to the viewer:
To write the code in Visual Basic.NET
To write the code in C#
customButton.ClickNavigateTo = "http://www.datadynamics.com"'Insert the button at the specified index, in this case 20 'to put it in the second-to-last place, between Backward and Forward. 'Set the index parameter to 0 to put it in the left-most position.WebViewer.FlashViewerToolBar.Tools.Insert(20, customButton)
C# code. Paste INSIDE the Page Load event.
ToolButton customButton = Tool.CreateButton("CustomButton");customButton.Caption = "Visit Us!";customButton.ToolTip = "Click here to visit datadynamics.com";customButton.ClickNavigateTo = "http://www.datadynamics.com";//Insert the button at the specified index, in this case, 20 //to put it in the second-to-last place, between Backward and Forward. //Set the index parameter to 0 to put it in the left-most position.WebViewer.FlashViewerToolBar.Tools.Insert(20, customButton);
Visual Basic.NET code. Paste INSIDE the Page Load event.
'Get the collection of buttons and separators used in the toolbarDim collection As DataDynamics.ActiveReports.Web.Controls.ToolsCollection = WebViewer1.FlashViewerToolBar.Tools'Remove all buttons and separatorscollection.Clear()'Add pre-defined buttonscollection.Add(DataDynamics.ActiveReports.Web.Controls.Tool.Create(DataDynamics.ActiveReports.Web.Controls.ToolsCollection.ToolCommands.ZoomOutButton))collection.Add(DataDynamics.ActiveReports.Web.Controls.Tool.Create(DataDynamics.ActiveReports.Web.Controls.ToolsCollection.ToolCommands.ZoomBox))collection.Add(DataDynamics.ActiveReports.Web.Controls.Tool.Create(DataDynamics.ActiveReports.Web.Controls.ToolsCollection.ToolCommands.ZoomInButton))'Add separatorcollection.Add(DataDynamics.ActiveReports.Web.Controls.Tool.CreateSeparator())'Add pre-defined buttoncollection.Add(DataDynamics.ActiveReports.Web.Controls.Tool.Create(DataDynamics.ActiveReports.Web.Controls.ToolsCollection.ToolCommands.SearchButton))'Add separatorcollection.Add(DataDynamics.ActiveReports.Web.Controls.Tool.CreateSeparator())'Add custom buttonscollection.Add(DataDynamics.ActiveReports.Web.Controls.Tool.CreateButton("btn1"))collection.Add(DataDynamics.ActiveReports.Web.Controls.Tool.CreateButton("btn2"))
C# code. Paste INSIDE the Page Load event.
//Get the collection of buttons and separators used in the toolbar DataDynamics.ActiveReports.Web.Controls.ToolsCollection collection = WebViewer1.FlashViewerToolBar.Tools; //Remove all buttons and separators collection.Clear(); //Add pre-defined buttons collection.Add(DataDynamics.ActiveReports.Web.Controls.Tool.Create(DataDynamics.ActiveReports.Web.Controls.ToolsCollection.ToolCommands.ZoomOutButton)); collection.Add(DataDynamics.ActiveReports.Web.Controls.Tool.Create(DataDynamics.ActiveReports.Web.Controls.ToolsCollection.ToolCommands.ZoomBox)); collection.Add(DataDynamics.ActiveReports.Web.Controls.Tool.Create(DataDynamics.ActiveReports.Web.Controls.ToolsCollection.ToolCommands.ZoomInButton)); //Add separator collection.Add(DataDynamics.ActiveReports.Web.Controls.Tool.CreateSeparator()); //Add pre-defined button collection.Add(DataDynamics.ActiveReports.Web.Controls.Tool.Create(DataDynamics.ActiveReports.Web.Controls.ToolsCollection.ToolCommands.SearchButton)); //Add separator collection.Add(DataDynamics.ActiveReports.Web.Controls.Tool.CreateSeparator()); //Add custom buttons collection.Add(DataDynamics.ActiveReports.Web.Controls.Tool.CreateButton("btn1")); collection.Add(DataDynamics.ActiveReports.Web.Controls.Tool.CreateButton("btn2"));
ActiveReports 6 User Guide | 264

In the Class Library (on-line documentation) portion of the documentation, you can see all of the available properties and methods in the Web assembly's Controls namespace.
ActiveReports 6 User Guide | 265
The FlashViewer, one of the ViewerTypes of the WebViewer control, is localized separately from other ActiveReports resources. You can redistribute the Flash localization resources separately from the application so that you need not recompile the ActiveReports.FlashViewer.swf file.
The default locale is en_US, U.S. English, but the included ActiveReports.FlashViewer.Resources.swf also contains strings localized for ru_RU, Russian, and ja_JP, Japanese.
To localize the FlashViewer for Russian or Japanese
1. Copy the ActiveReports.FlashViewer.Resources.swf from C:\Program Files\GrapeCity\ActiveReports 6\Deployment into your project folder that contains the ASPX file with the WebViewer.
2. With focus on the WebViewer control, in the Visual Studio Properties window, expand the FlashViewerOptions node.
3. In the ResourceLocale property, drop down the list of values and select ja_JP or ru_RU.
4. Run the project to see the localized FlashViewer.
To create custom localizations1. In the C:\Program Files\GrapeCity\ActiveReports 6\Localization folder, open the
FlashViewer.zip file.
2. Using Notepad, open the Resources.properties file and localize the strings.
3. Email the localized FlashViewer.zip file to [email protected] to have it compiled in the ActiveReports.FlashViewer.Resources.swf file.
4. When you receive the new ActiveReports.FlashViewer.Resources.swf file, place it in your project folder.
5. Open the project in Visual Studio, select the WebViewer, and in the Properties window, expand the FlashViewerOptions node.
6. Set the ResourceLocale property to the new culture.
Localize the Flash Viewer
Note: If you are willing to share your new localization with other customers, let support know so that the updated ActiveReports.FlashViewer.Resources.swf file can be included in future builds of the product.
ActiveReports 6 User Guide | 266
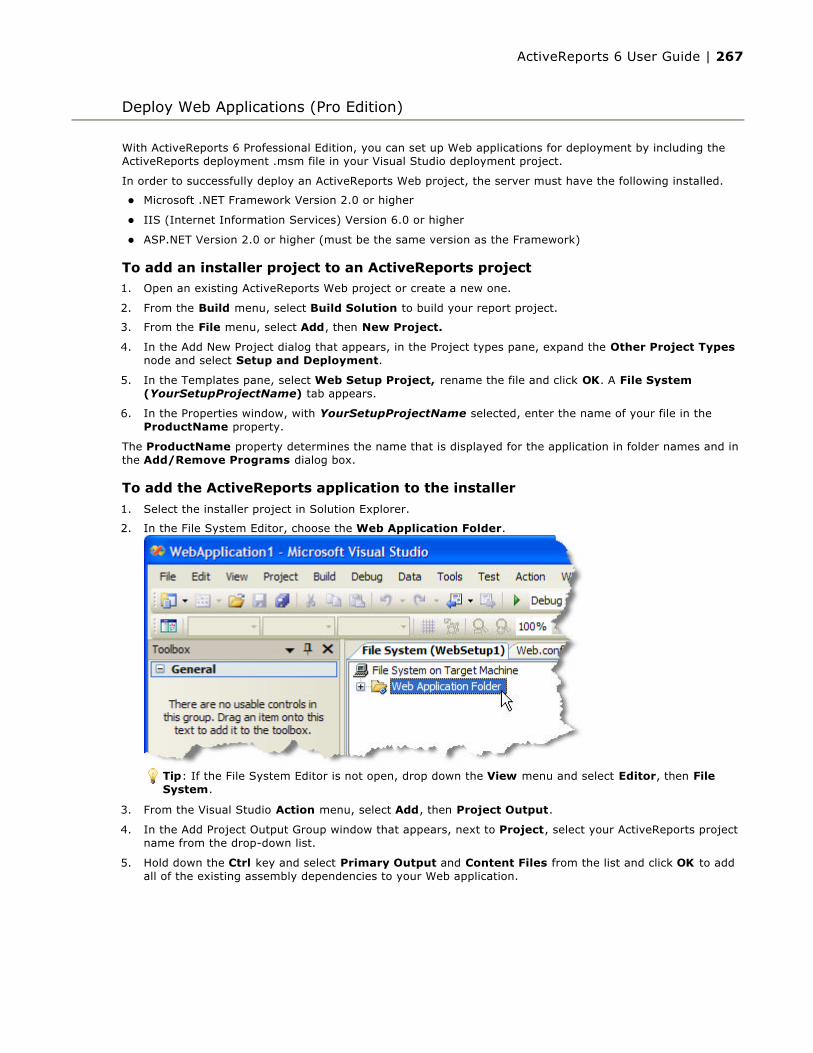
With ActiveReports 6 Professional Edition, you can set up Web applications for deployment by including the ActiveReports deployment .msm file in your Visual Studio deployment project.
In order to successfully deploy an ActiveReports Web project, the server must have the following installed.
Microsoft .NET Framework Version 2.0 or higher
IIS (Internet Information Services) Version 6.0 or higher
ASP.NET Version 2.0 or higher (must be the same version as the Framework)
To add an installer project to an ActiveReports project1. Open an existing ActiveReports Web project or create a new one.
2. From the Build menu, select Build Solution to build your report project.
3. From the File menu, select Add, then New Project.
4. In the Add New Project dialog that appears, in the Project types pane, expand the Other Project Typesnode and select Setup and Deployment.
5. In the Templates pane, select Web Setup Project, rename the file and click OK. A File System (YourSetupProjectName) tab appears.
6. In the Properties window, with YourSetupProjectName selected, enter the name of your file in the ProductName property.
The ProductName property determines the name that is displayed for the application in folder names and in the Add/Remove Programs dialog box.
To add the ActiveReports application to the installer
1. Select the installer project in Solution Explorer.
2. In the File System Editor, choose the Web Application Folder.
3. From the Visual Studio Action menu, select Add, then Project Output.
4. In the Add Project Output Group window that appears, next to Project, select your ActiveReports project name from the drop-down list.
5. Hold down the Ctrl key and select Primary Output and Content Files from the list and click OK to add all of the existing assembly dependencies to your Web application.
Deploy Web Applications (Pro Edition)
Tip: If the File System Editor is not open, drop down the View menu and select Editor, then File System.
ActiveReports 6 User Guide | 267
6. On the Build menu, select Build YourInstallerProjectName to build your installer project.
To deploy the installer application to a Web server1. In Solution Explorer, select the installer project.
2. From the Project menu, select Install and follow the wizard's steps to install it.
3. To access the Web application that was deployed, start Internet Explorer and enter the URL: http://localhost:nnnn where nnnn is the port number.
Note: If you prefer to use the ActiveReports .msm file, please contact [email protected].
Important: If you are using the WebViewer control or HttpHandlers in your application, you must also Configure HTTPHandlers (Pro Edition).
If you are using the FlashViewer ViewerType of the WebViewer control, you must add the ActiveReports.FlashViewer.swf file to your IIS root folder. You can find the file in the C:\Program Files\GrapeCity\ActiveReports 6\Deployment folder.
If you are using a localized version of the FlashViewer, you also need to add the ActiveReports.FlashViewer.Resources.swf file. For more information, see Localize the Flash Viewer.
ActiveReports 6 User Guide | 268

A scaled-down version of this user guide project is now available for download.
http://downloads.datadynamics.com/ActiveReports6_UserGuide.zip
You can use Innovasys HelpStudio 3 (http://www.innovasys.com/products/hs3/overview.aspx) to customize the help to your application, or you can use Adobe Acrobat to customize the included PDF build of the user guide. If you want to distribute the included CHM or PDF file as is for a quick solution, see Deploy End User Designer Help (Pro Edition).
To customize the PDF file (requires Adobe Acrobat (http://www.adobe.com/products/acrobat/))1. Download the file at: http://downloads.datadynamics.com/ActiveReports6_UserGuide.zip
2. Open the zip file, and extract the AR6Designer.pdf file.
3. Make any required changes in the file, and save it.
4. Deploy it along with your application.
To customize the CHM file (requires Innovasys HelpStudio 3 (http://www.innovasys.com/products/hs3/overview.aspx))For more detailed help on using HelpStudio, see the HelpStudio help file. These steps are just enough to get you started.
1. Download the file at: http://downloads.datadynamics.com/ActiveReports6_UserGuide.zip
2. Open the zip file, and extract the contents. The main folder that the project extracts to is AR6EUD.
3. In the AR6EUD folder, double-click the ActiveReports6EUD.hsp file to open the project in HelpStudio.
4. In the table of contents for the help project, you will notice that some of the topics have a purple flag to the left of the topic name. These topics require editing (mainly converting code samples to script) and are not included in the help file output unless you clear the build flags from them.
1. To clear the build flag from a topic, right-click the topic in the table of contents and select Topic Properties.
2. In the Topic Properties dialog, under the Build Flags node, clear the check box next to In Progress.
3. Click the OK button to close the dialog and save the change.
5. Double-click any topic in the table of contents to open it for editing. You will also notice that content in some of the overview topics is highlighted with the purple In Progress build flag.
1. To clear the build flag from content, select the content and in the toolbar, drop down the Build Flagslist.
2. Select Remove Build Flag. The selected content no longer appears highlighted in purple, and will be included in the help file output.
6. If you want to find and replace specific text within the entire project, for example "ActiveReports" or "GrapeCity," from the Tools menu, select Project Find and Replace.
1. Enter the text you want to find in the Find What field, and the text you want to replace it with in the Replace With field.
2. Click the Find in Project button or hit Enter on your keyboard. The list of topics containing the search terms appears.
3. Double-click any item in the list to open the topic for editing. The find dialog appears and the search term is highlighted in the topic.
7. If you add or remove any topics and you are providing context-sensitive help, you need to regenerate the ActiveReports6.h file.
1. From the Tools menu, select Create .h Help Context ID File.
2. In the Create .h File dialog that appears, click the Browse button.
3. In the Browse dialog that appears, select the ActiveReports6.h file and click OK .
4. Select the check box to Assign Help Context IDs to any Topics without IDs already assigned.
Customize End User Designer Help (Pro Edition)
ActiveReports 6 User Guide | 269
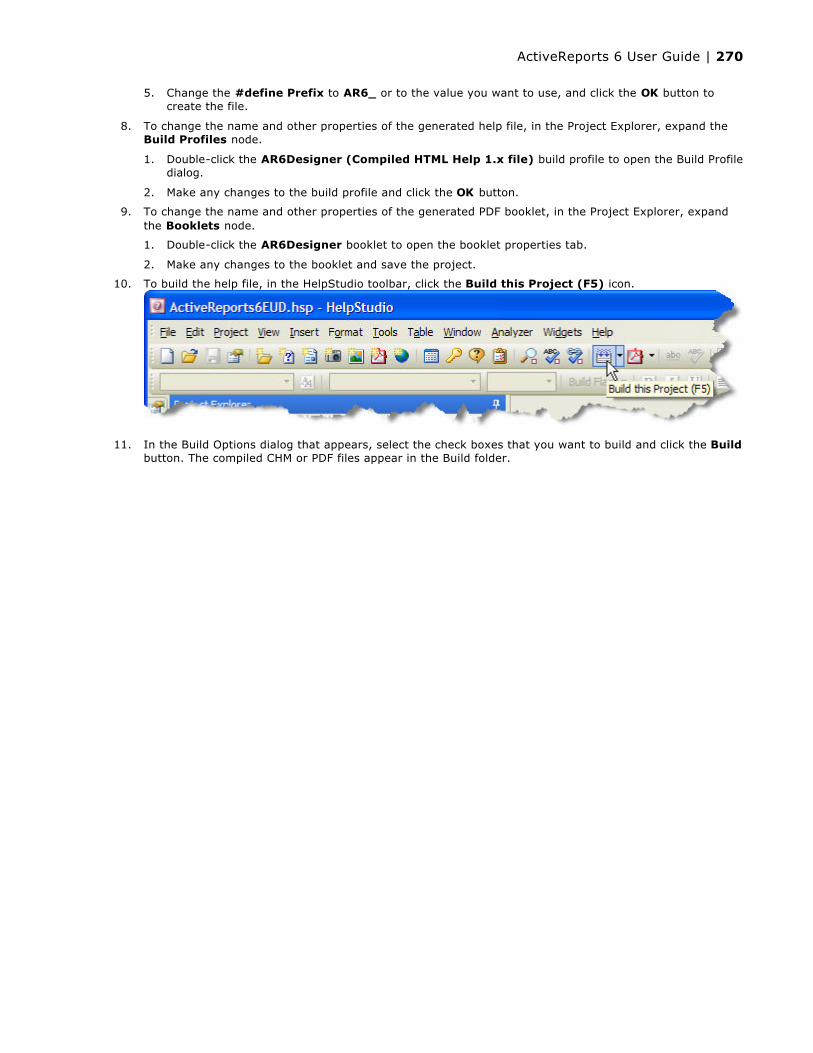
5. Change the #define Prefix to AR6_ or to the value you want to use, and click the OK button to create the file.
8. To change the name and other properties of the generated help file, in the Project Explorer, expand the Build Profiles node.
1. Double-click the AR6Designer (Compiled HTML Help 1.x file) build profile to open the Build Profile dialog.
2. Make any changes to the build profile and click the OK button.
9. To change the name and other properties of the generated PDF booklet, in the Project Explorer, expand the Booklets node.
1. Double-click the AR6Designer booklet to open the booklet properties tab.
2. Make any changes to the booklet and save the project.
10. To build the help file, in the HelpStudio toolbar, click the Build this Project (F5) icon.
11. In the Build Options dialog that appears, select the check boxes that you want to build and click the Buildbutton. The compiled CHM or PDF files appear in the Build folder.
ActiveReports 6 User Guide | 270
A scaled-down version of this user guide project is now available for download.
http://downloads.datadynamics.com/ActiveReports6_UserGuide.zip
The PDF version of the file is also available.
http://downloads.datadynamics.com/AR6DesignerGuide.pdf
You can use Innovasys HelpStudio 3 (http://www.innovasys.com/products/hs3/overview.aspx) to customize the help to your application, or you can use Adobe Acrobat (http://www.adobe.com/products/acrobat/) to customize the included PDF build of the user guide. Or you can distribute the included CHM or PDF file as is for a quick solution. For information on customizing the user guide, see Customize End User Designer Help (Pro Edition).
To deploy end user designer help1. Download the file at: http://downloads.datadynamics.com/ActiveReports6_UserGuide.zip
2. Open the zip file. In it you will find all of the help project files, as well as the AR6Designer.pdf and ActiveReports6.chm deliverables and the ActiveReports6.h file.
3. The ActiveReports6.h file contains context IDs mapped to all of the topics in the user guide. You can use this to provide context-sensitive help for your users.
1. If you want to provide context-sensitive help, open ActiveReports6.h in notepad.
2. Find the topic names that you want to associate with your application contexts and enter a context ID from the .h file into your application UI element's Help Context ID property for each topic.
3. Build your application. When you run the application and give focus to one of the UI elements for which you specified a Help Context ID, clicking the F1 key opens the associated help topic.
4. Include the ActiveReports6.chm and ActiveReports6.h files in your deployment folder along with your executable.
5. You can put the AR6Designer.pdf file in any folder for deployment.
Deploy End User Designer Help (Pro Edition)
ActiveReports 6 User Guide | 271

Manually Configuring Web Samples
In order to use ActiveReports HTTPHandlers on the Web with ASP.NET, you must first configure the machine to use the handlers. Please note that HttpHandlers are only enabled if you purchased the Professional Edition.
For information on how to configure ActiveReports handler mappings in IIS 7.0, see the section Configure Handler Mappings in IIS 7.0 of this Guide.
To configure the report layout (RPX) handler1. In the Control Panel, open Administrative Tools, then Internet Information Services.
2. In the Internet Information Services window that appears, expand the tree view in the left pane until you see the the Web site that you need to configure. Right-click the Web site and select Properties.
3. On the Directory tab of the YourWebSite Properties dialog that appears, click the Configuration button.
4. In the Application Configuration dialog that appears, select the list item with .aspx in the Extension column and click the Edit button.
5. In the Executable field, select and copy all of the text, and click Cancel to return to the Application Configuration dialog.
6. Click the Add button to add a new Application Mapping.
7. In the Add/Edit Application Extension Mapping window that appears, paste the value from the .aspx extension into the Executable field.
8. In the Extension field, enter .rpx.
9. Click the OK button to add the mapping and return to the Application Configuration dialog.
To configure the compiled report handler1. In the Application Configuration dialog, click the Add button to add a new Application Mapping.
2. In the Executable field, paste the value copied from .aspx above.
Configure HTTPHandlers (Pro Edition)
Note: If your machine does not have the ASP.NET server components installed, the .aspx handler does not appear in the Application Mappings list.
ActiveReports 6 User Guide | 272

3. In the Extension field, enter .ActiveReport.
4. Clear the Check that file exists check box.
5. Click the OK button to add the mapping and return to the Application Configuration dialog.
To configure the WebCacheAccessHandler
1. In the Application Configuration dialog, click the Add button to add a new Application Mapping.
2. In the Executable field, paste the value copied from .aspx above.
3. In the Extension field, enter .ArCacheItem.
4. Clear the Check that file exists check box.
5. Click the OK button to add the mapping and return to the Application Configuration dialog.
6. Click OK on the remaining open dialogs to exit the IIS Administrative tool.
See the topic Add Report Links to Web Forms (Pro Edition) for information on enabling the handlers in a Web Form.
ActiveReports 6 User Guide | 273

Follow these steps to configure the ActiveReports handler mappings in IIS 7.0 for running ActiveReports Web Applications on your machine.
2. In the Control Panel, open Administrative Tools, then Internet Information Services Manager.
3. In the Internet Information Services window that appears, expand the tree view in the left pane until you see the Web application you need to configure.
4. Select the node for your application. The Features View pane is displayed.
5. Double-click Handler Mappings in the Features View pane.
6. On the Actions pane, click Add Script Map...
The Add Script Map window is displayed.
7. In the displayed Add Script Map window, enter the following information:
Request path:*.ActiveReportExecutable: C:\Windows\Microsoft.NET\Framework\v2.0.50727\aspnet_isapi.dllName: ActiveReport Script Mapping
8. Click the Request Restrictions… button and make sure the "Invoke handler only if request is mapped to:" check box is not selected.
9. Click OK to close the Add Script Map window.
10. Repeat steps 5-8 to add another script mapping.
Enter the following information for the second script mapping (see the step 6 above):
Request path:*.ArCacheItemExecutable: C:\Windows\Microsoft.NET\Framework\v2.0.50727\aspnet_isapi.dllName: ActiveReport Cache Item Script Mapping
11. Repeat steps 5-8 to add the last required script mapping.
Enter the following information for the third script mapping (see the step 6 above):
Request path:*.rpxExecutable: C:\Windows\Microsoft.NET\Framework\v2.0.50727\aspnet_isapi.dllName: ActiveReport RPX Script Mapping
12. To ensure that your Web Application is running in the Classic .NET Application Pool, go to the Internet Information Services Manager and select your Web Application in the Connections panel.
13. In the Actions pane, click Basic Settings.... The Edit Application window will appear.
Configure Handler Mappings in IIS 7.0
ActiveReports 6 User Guide | 274

14. In the Edit Application window, click the "Select..." button.
15. In the drop-down box, select Classic .NET AppPool, then click OK.
16. Click OK in the Edit Application window to accept the changes.
ActiveReports 6 User Guide | 275

To understand some of the more complex tasks you can accomplish using ActiveReports, you can open included sample projects, or you can follow walkthroughs, step-by-step tutorials that walk you through every step required to create a specific type of report.
This section contains:
SamplesBrowse brief descriptions of included samples, and follow links that open sample projects in Visual Studio.
WalkthroughsLook through tutorials that teach you all of the steps involved in creating various types of ActiveReports projects, from the basic report through more complex unbound reports and Web options.
Samples and Walkthroughs
ActiveReports 6 User Guide | 276
Your ActiveReports 6 installation includes the following samples, with four versions of each. There is a C# and a Visual Basic.NET version for Visual Studio versions 2005 and 2008.
Click a sample name below to drop down a description of the sample. A more complete description of the samples are available in a *README.html file within the sample folder, and comments are sprinkled throughout the sample code.
Annual Report
Demonstrates how to use subreports and nested subreports, how to modify data source properties at run time, how to use parameters in the chart control, how to create alternate row highlighting and how to use the page break control. See the Annual Report Sample topic for more information.
Bound Data
Demonstrates binding to ADO.NET Data objects. See the Bound Data Sample topic for more information.
Calculated Fields
Demonstrates using an unbound data field to perform a calculation which can then be aggregated. See the Calculated Fields Sample (on-line documentation) for more information.
Category Selection
Demonstrates using the ad hoc report filter by modifying the report's SQL query at run time. See the Category Selection Sample topic for more information.
Charting
Demonstrates the use of the Chart control in both bound and unbound modes. See the Charting Sample topic for more information.
NEW! Cross Section Controls
Demonstrates the use of the new cross section lines and boxes. See the NEW Cross Section Control Sample topic for more information.
Cross Tab Report
Demonstrates using unbound data, conditional highlighting and distributing data across columns to create a cross-tab view and data aggregation. See the Cross Tab Report Sample topic for more information.
Custom Preview
Demonstrates using viewer control customization, export filters, rich edit control and mail-merge, parameters in the chart control, and grouping. See the Custom Preview Sample topic for more information.
Data Field Expressions
Demonstrates the use of expressions in the DataField properties of controls. See the Data Field Expressions Sample (on-line documentation) topic for more information.
Hyperlinks and Drill Down
Demonstrates using hyperlinks and the viewer hyperlink event to simulate drill-down from one report to another. See the Hyperlinks and Drill Down Sample topic for more information.
IList Binding
Demonstrates how to bind reports to objects.
Print Multiple Pages per Sheet
Demonstrates how to print multiple pages of a report on a single sheet of paper.
RDF Viewer
Demonstrates customizing the WinForms viewer control toolbar, loading Report Document Files (RDF) and using the export filters. See the Rdf Viewer Sample topic for more information.
Standard Edition Web Sample
Demonstrates using Standard Edition in ASP.NET. It shows how to use custom exporting without the Pro Edition server controls or RPX handlers as well as running reports on the server, exporting output to HTML or PDF streams and pushing content to the client. The sample also demonstrates using the Flash viewer to view report output on the client machine.
Samples
ActiveReports 6 User Guide | 277

NEW! Style Sheets
Demonstrates the use of style sheets to create consistent styles across different reports. See the NEW Style Sheets Sample topic for more information.
Subreports
Shows the proper use of Reports with SubReports to minimize memory usage. See the SubReports Sample topic for more information.
Unbound Data
Demonstrates retrieving data from an array and from a text file in unbound mode.
XML
Demonstrates the XML data source and using it to run multi-level reports with and without using subreports.
Professional Edition
NEW! Flash Web Viewer
Demonstrates customization possibilities with the new FlashViewer, including localization, themes, and a custom button. See the NEW Flash Web Viewer Sample for more information.
End User Designer
Demonstrates a custom end-user report designer that can be integrated in your applications to allow users to modify report layouts.
Toolbox Class Library
This is the project that creates the toolbox used in the End User Designer sample.
Professional Edition Web Sample
The ASP.NET Web Samples demonstrate the use of Professional Edition ASP.NET features, including HTTP Handlers, Report Caching, and the Server Viewer Control in both Visual Studio 2005 and 2008.
Note: The ASP.NET user machine must have ASP.NET write access before you run the sample or an exception is thrown during execution.
ActiveReports 6 User Guide | 278

The Flash Web Viewer sample includes the following files to showcase the capabilities of the new FlashViewer ViewerType option in the Professional Edition WebViewer control. In the Solution Explorer, double-click a file to open it.
Run the project to explore the features.
ViewReport.aspx
This file contains the WebViewer control. It opens to the Source view, so click Design at the bottom to see the WebViewer.
Click the WebViewer control at the top of the page to select it.
In the Properties window, notice that the ViewerType property is set to FlashViewer, and the Height and Width properties are set to 100%. (This ensures that the viewer resizes to fill the browser window.) The ReportName property is not set, as the ReportName value is passed to it in code.
Expand the FlashViewerOptions node to see properties specifically related to this ViewerType. The ResourceLocale and ThemeUrl values are passed to the viewer in code, as are the ShowSplitter, ShowThumbnails, and ShowToc values.
Right-click on the design surface of ViewReport.aspx and select View Code. In the C# or VB code page that
NEW Flash Web Viewer Sample
ActiveReports 6 User Guide | 279

appears, you can see the code used in the Page_Load event to pass the user input values into the WebViewer properties.
Two of the user input values are not included in the Properties window: ShowToolbar and InsertButton. The code demonstrates how to access the FlashViewerToolBar.Visible property, and how to create a custom button using the FlashViewerToolBar.Tools.Add method.
Default.aspx
This file contains controls to collect user input, and a button to send the collected values to the WebViewer and open it. Right-click the file and select View Code to see the code used to populate the Themes drop-down list and to redirect to the ViewReport form.
Reports folder
The Reports folder contains the two reports that you can select in the Select Report drop-down list. For detailed information on the Invoice report, see the NEW Cross Section Control Sample.
ActiveReports.FlashViewer.Resources.swf
The Resources file contains the three included locales that you can select in the Select Language drop-down list. For detailed information on Localization, see the Localize the Flash Viewer topic.
ActiveReports.FlashViewer.swf
The FlashViewer file contains the FlashViewer object, and must be copied into every FlashViewer project. Your original copy is stored in C:\Program Files\GrapeCity\ActiveReports 6\Deployment.
ActiveReports 6 User Guide | 280
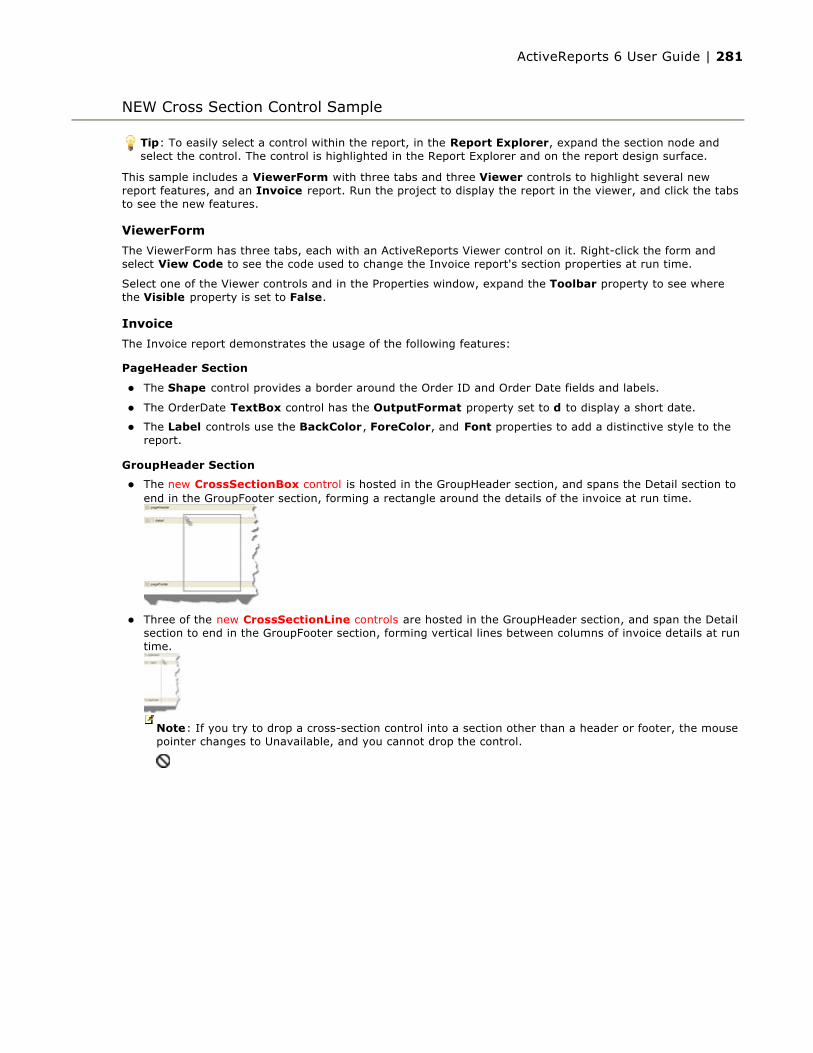
This sample includes a ViewerForm with three tabs and three Viewer controls to highlight several new report features, and an Invoice report. Run the project to display the report in the viewer, and click the tabs to see the new features.
ViewerForm
The ViewerForm has three tabs, each with an ActiveReports Viewer control on it. Right-click the form and select View Code to see the code used to change the Invoice report's section properties at run time.
Select one of the Viewer controls and in the Properties window, expand the Toolbar property to see where the Visible property is set to False.
Invoice
The Invoice report demonstrates the usage of the following features:
PageHeader Section
The Shape control provides a border around the Order ID and Order Date fields and labels.
The OrderDate TextBox control has the OutputFormat property set to d to display a short date.
The Label controls use the BackColor, ForeColor, and Font properties to add a distinctive style to the report.
GroupHeader Section
The new CrossSectionBox control is hosted in the GroupHeader section, and spans the Detail section to end in the GroupFooter section, forming a rectangle around the details of the invoice at run time.
Three of the new CrossSectionLine controls are hosted in the GroupHeader section, and span the Detail section to end in the GroupFooter section, forming vertical lines between columns of invoice details at run time.
NEW Cross Section Control Sample
Tip: To easily select a control within the report, in the Report Explorer, expand the section node and select the control. The control is highlighted in the Report Explorer and on the report design surface.
Note: If you try to drop a cross-section control into a section other than a header or footer, the mouse pointer changes to Unavailable, and you cannot drop the control.
ActiveReports 6 User Guide | 281
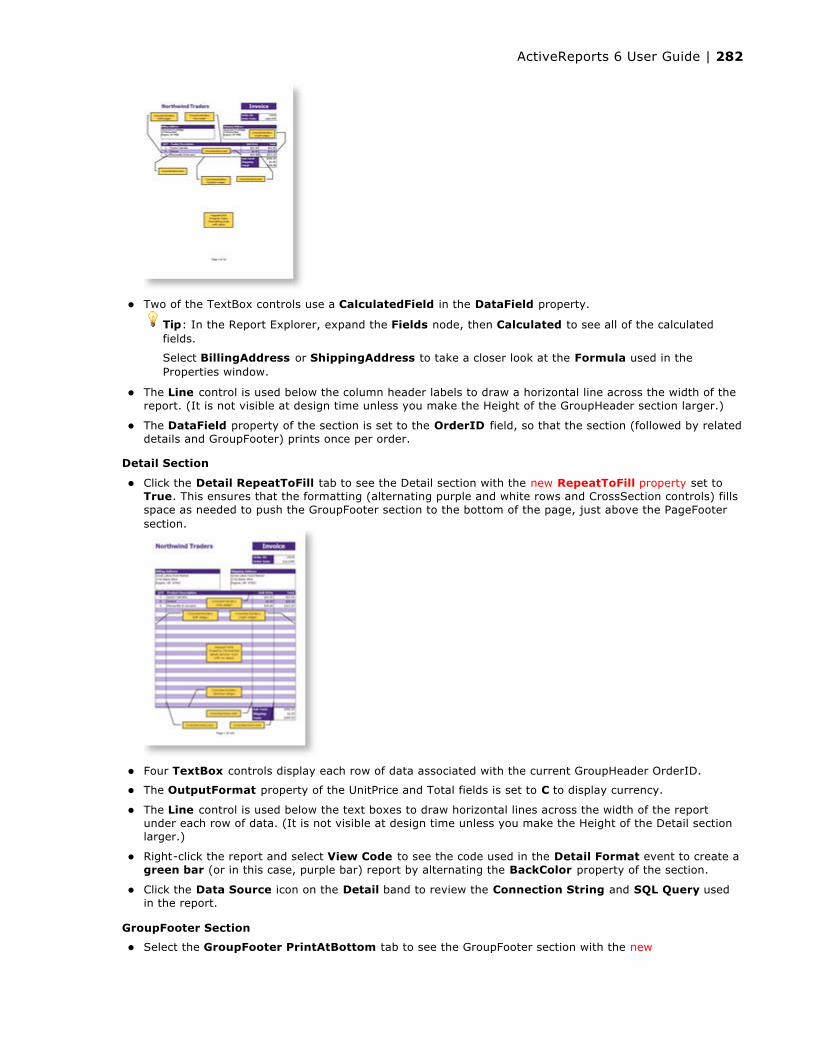
Two of the TextBox controls use a CalculatedField in the DataField property.
The Line control is used below the column header labels to draw a horizontal line across the width of the report. (It is not visible at design time unless you make the Height of the GroupHeader section larger.)
The DataField property of the section is set to the OrderID field, so that the section (followed by related details and GroupFooter) prints once per order.
Detail Section
Click the Detail RepeatToFill tab to see the Detail section with the new RepeatToFill property set to True. This ensures that the formatting (alternating purple and white rows and CrossSection controls) fills space as needed to push the GroupFooter section to the bottom of the page, just above the PageFooter section.
Four TextBox controls display each row of data associated with the current GroupHeader OrderID.
The OutputFormat property of the UnitPrice and Total fields is set to C to display currency.
The Line control is used below the text boxes to draw horizontal lines across the width of the report under each row of data. (It is not visible at design time unless you make the Height of the Detail section larger.)
Right-click the report and select View Code to see the code used in the Detail Format event to create a green bar (or in this case, purple bar) report by alternating the BackColor property of the section.
Click the Data Source icon on the Detail band to review the Connection String and SQL Query used in the report.
GroupFooter Section
Select the GroupFooter PrintAtBottom tab to see the GroupFooter section with the new
Tip: In the Report Explorer, expand the Fields node, then Calculated to see all of the calculated fields.
Select BillingAddress or ShippingAddress to take a closer look at the Formula used in the Properties window.
ActiveReports 6 User Guide | 282
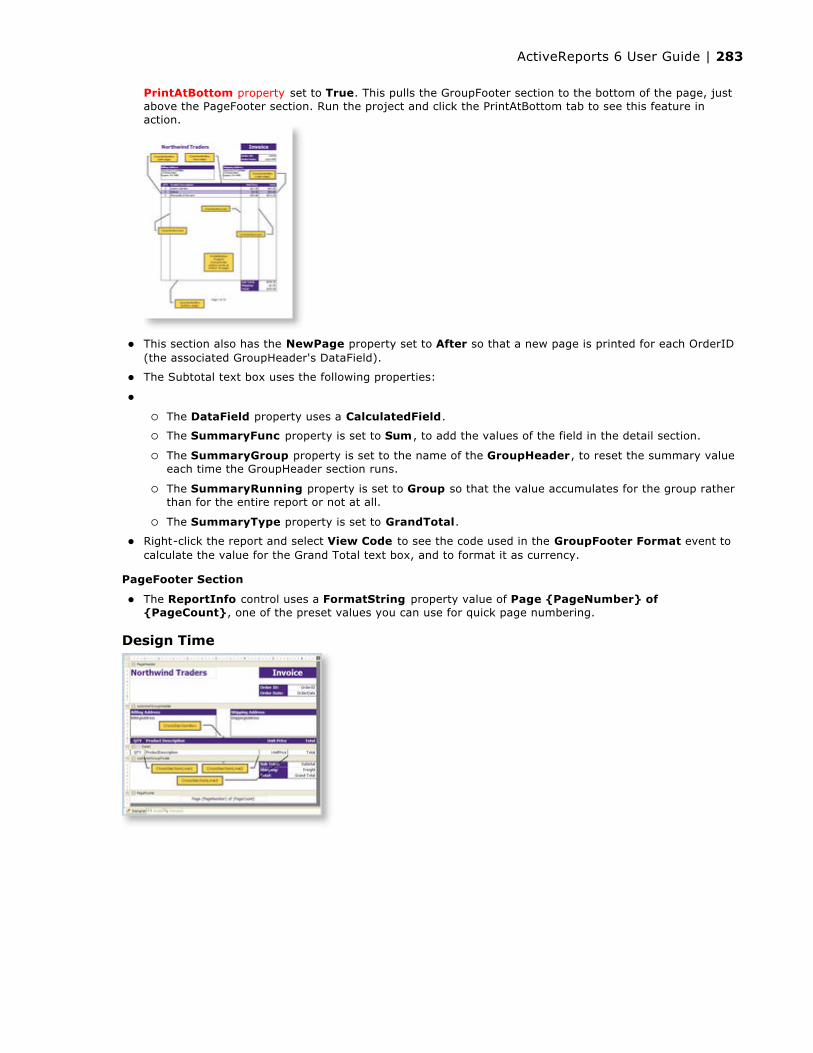
PrintAtBottom property set to True. This pulls the GroupFooter section to the bottom of the page, just above the PageFooter section. Run the project and click the PrintAtBottom tab to see this feature in action.
This section also has the NewPage property set to After so that a new page is printed for each OrderID (the associated GroupHeader's DataField).
The Subtotal text box uses the following properties:
The DataField property uses a CalculatedField.
The SummaryFunc property is set to Sum , to add the values of the field in the detail section.
The SummaryGroup property is set to the name of the GroupHeader, to reset the summary value each time the GroupHeader section runs.
The SummaryRunning property is set to Group so that the value accumulates for the group rather than for the entire report or not at all.
The SummaryType property is set to GrandTotal.
Right-click the report and select View Code to see the code used in the GroupFooter Format event to calculate the value for the Grand Total text box, and to format it as currency.
PageFooter Section
The ReportInfo control uses a FormatString property value of Page {PageNumber} of {PageCount}, one of the preset values you can use for quick page numbering.
Design Time
ActiveReports 6 User Guide | 283
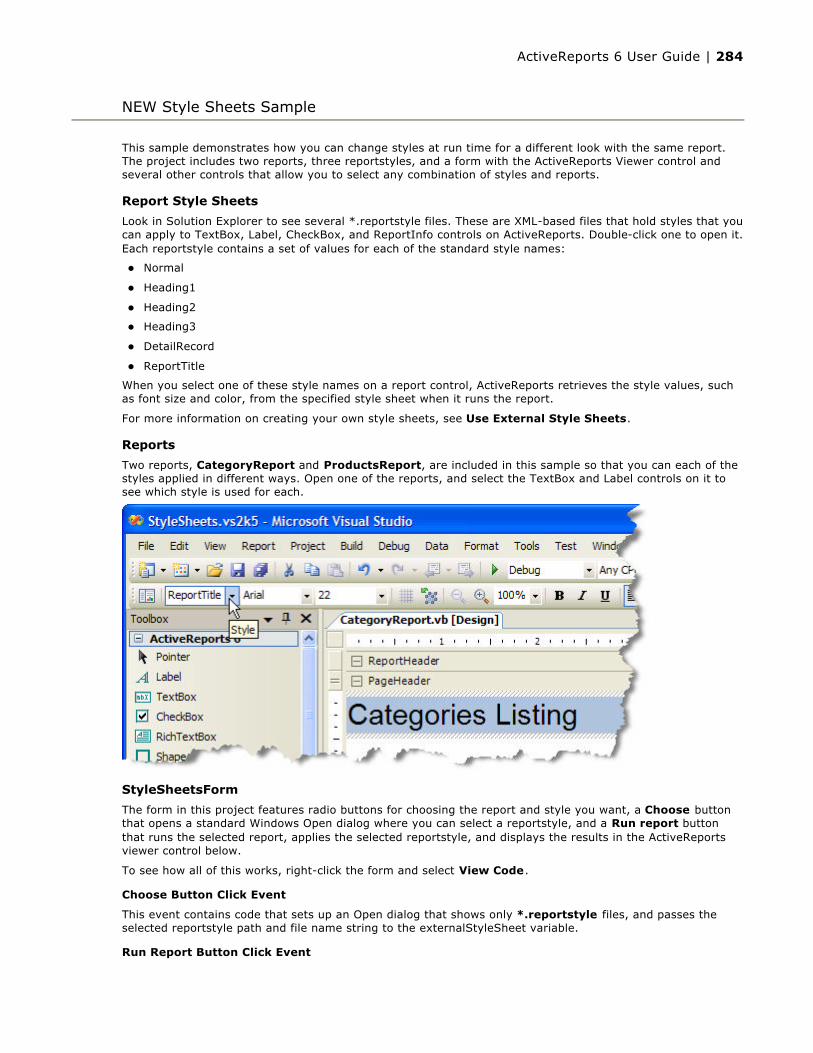
This sample demonstrates how you can change styles at run time for a different look with the same report. The project includes two reports, three reportstyles, and a form with the ActiveReports Viewer control and several other controls that allow you to select any combination of styles and reports.
Report Style Sheets
Look in Solution Explorer to see several *.reportstyle files. These are XML-based files that hold styles that you can apply to TextBox, Label, CheckBox, and ReportInfo controls on ActiveReports. Double-click one to open it. Each reportstyle contains a set of values for each of the standard style names:
Normal
Heading1
Heading2
Heading3
DetailRecord
ReportTitle
When you select one of these style names on a report control, ActiveReports retrieves the style values, such as font size and color, from the specified style sheet when it runs the report.
For more information on creating your own style sheets, see Use External Style Sheets.
Reports
Two reports, CategoryReport and ProductsReport, are included in this sample so that you can each of the styles applied in different ways. Open one of the reports, and select the TextBox and Label controls on it to see which style is used for each.
StyleSheetsForm
The form in this project features radio buttons for choosing the report and style you want, a Choose button that opens a standard Windows Open dialog where you can select a reportstyle, and a Run report button that runs the selected report, applies the selected reportstyle, and displays the results in the ActiveReports viewer control below.
To see how all of this works, right-click the form and select View Code.
Choose Button Click Event
This event contains code that sets up an Open dialog that shows only *.reportstyle files, and passes the selected reportstyle path and file name string to the externalStyleSheet variable.
Run Report Button Click Event
NEW Style Sheets Sample
ActiveReports 6 User Guide | 284

This event contains code that creates an empty ActiveReport object, assigns the selected report to it, and assigns a path and file name string to the styleSheet variable. It then assigns the style sheet to the report using the LoadStyles(styleSheet) method, runs the report, and displays it in the viewer.
ActiveReports 6 User Guide | 285
The Annual Report sample demonstrates the use of subreports, section properties, and the Chart control. See a description of each file below.
AnnualReport
This is the main ActiveReport for the project.
ReportHeader Section
This report features a two-page ReportHeader section that uses a PageBreak control to separate the two pages, and breaks to the second page by setting the ReportHeader section's NewPage property to After. This report shows how you can use the BackColor and ForeColor properties of labels to create a distinctive look for your reports.
The ReportHeader section also has a SubReport control that links to the ProductSalesByCategory report in the code behind the report, in the ReportStart event.
The yellow background in the right half of the ReportHeader below the page break is achieved by using the Shape control and setting its BackColor property. The image to the left is a Picture control.
Detail Section
The Detail section contains two SubReport controls that link in the code behind the report to the Top10Customers and Top10Products reports. In most reports, the Detail section would run multiple times. In this report, the Detail section has only labels, and no bound textboxes, so it will only run once. Therefore, the Top10 reports can be assigned to the SubReport control in the ReportStart event where it is initialized.
Notice that the ReportFooter section has its Height property set to 0. This is because, except for the Detail section, all sections come in pairs. In order to use the ReportHeader section, you must also have a ReportFooter section. If you do not want to use it, you can set its Height to 0.
GetDBPath
This is a helper class that finds the installation path of ActiveReports, and extrapolates the path of the sample NorthWind database that is included in the installation. It returns a connection string that is used by all of the ActiveReports samples that use the NorthWind database.
ProductSalesByCategory
This is the ActiveReport that is assigned to the SubReport control in the ReportHeader section of the Annual Report.
Notice also that the PrintWidth property of this report is only 2.677 inches. This is so that it fits easily within the SubReport control on the Annual Report.
This report uses the GroupHeader section to display labels for the data fields that fill the Detail section. The fields in the Detail section repeat once for each row of data in the database.
Right-click in the grey area around the report and select View Code to see the code that sets the data source for the report, and sets the background color to yellow on every second row of data.
StartupForm
This form contains the ActiveReports Viewer control. The Dock property of the viewer is set to Fill so that it resizes automatically with the form at run time. Right-click and select View Code to see the code that displays the AnnualReport when the form loads.
Annual Report Sample
Best practice: It is a best practice to initialize reports in the ReportStart event rather than a section Format event so that a new report is not initialized every time the section runs.
If the SubReport control were in a section that prints multiple times, you would need to assign the report in the section Format event while still initializing in the ReportStart event. See the SubReports sample for more information.
Best practice: Notice that this report has had its ReportHeader/Footer and PageHeader/Footer sections removed. That is a best practice for reports to be used as subreports. These sections are not printed within the SubReport control, so removing the sections saves on processing.
ActiveReports 6 User Guide | 286
Top10Customers and Top10Products
The Top10Customers and Top10Products reports use only two sections, GroupHeader and Detail. The PrintWidth property of each report is set to 3.135 inches so that it fits into the subreport control on the Annual Report.
The GroupHeader section of each report is filled with a Chart control. Click the chart to see its properties in the Properties window. At the bottom of the Properties window, click the Data Source verb to open the Chart Data Source dialog. In the Query box, you can see the SQL query that selects the top 10. For more information on creating charts, see Chart Walkthroughs.
The Detail section of each report has two bound TextBoxes and a Label control. Right-click and select View Code to see the code that sets the data source for the report, passes data to the Chart control, alternates the background color of the detail section, and sets the Text property of the label.
ActiveReports 6 User Guide | 287

The Bound Data sample demonstrates the use of seven different data binding techniques. The sample Invoice report demonstrates the use of grouping and of summary functions.
MainForm
The MainForm uses the ActiveReports Viewer control in the bottom section of the form, and a panel docked to the top contains seven tabs, each with a different data binding technique. Click to select a tab, and then double-click the button on the tab to jump to the button's Click event in the code.
Bind to DataSet
Bind to DataReader
Bind to DataView
Bind to DataTable
Bind to SQL Server
Bind to OleDb
Bind to XML
Above the Data Binding Code region is the Drop Down Population Code region that is used to populate the combo boxes on the DataView and SQL Server tabs. The XML tab also features a button that generates a DataSet and saves it as an XML data file.
Run the project and click to select a tab, then click the buttons to check the functionality of each type of data binding as it processes the data, passes it to the report, and displays it in the viewer below.
Invoice
The Invoice report uses three GroupHeader sections, the Detail section and a GroupFooter section to display data, and adds a label in the PageFooter section.
ghOrderHeader
The DataField property of this section is set to OrderID. This setting, in conjunction with data ordered by the OrderID field, causes the report to print all of the information for one order ID value, including all of the related details and footers, before moving on to the next order ID. For more information on grouping, see Grouping Data.
This section contains a Picture control, a number of Label controls, and two bound TextBox controls. The TextBoxes are bound using the DataField property in the Properties window, and the date is formatted using the OutputFormat property.
ghOrderID
The DataField property of this section is also set to OrderID. This allows subtotal summary functions in the related GFOrderID section to calculate properly.
This section contains a number of labels and bound text boxes, as well as two Line controls.
ghTableHeader
This section contains only labels for the data to follow in the Detail section.
Detail
This section contains bound TextBox controls. These render once for each row of data found in the current OrderID before the report moves on to the GroupFooter sections.
GFOrderID
The NewPage property of this section is set to After. This causes the report to break to a new page and generate a new invoice after this section prints its subtotals.
This section contains several labels and several text boxes. Two of the TextBox controls use the following properties to summarize the detail data: SummaryFunc, SummaryGroup, and SummaryType. For more
Bound Data Sample
Note: Except for the Detail section, all sections come in header and footer pairs. Unused counterparts to the sections in use have their Height properties set to 0 and their Visible properties set to False.
ActiveReports 6 User Guide | 288
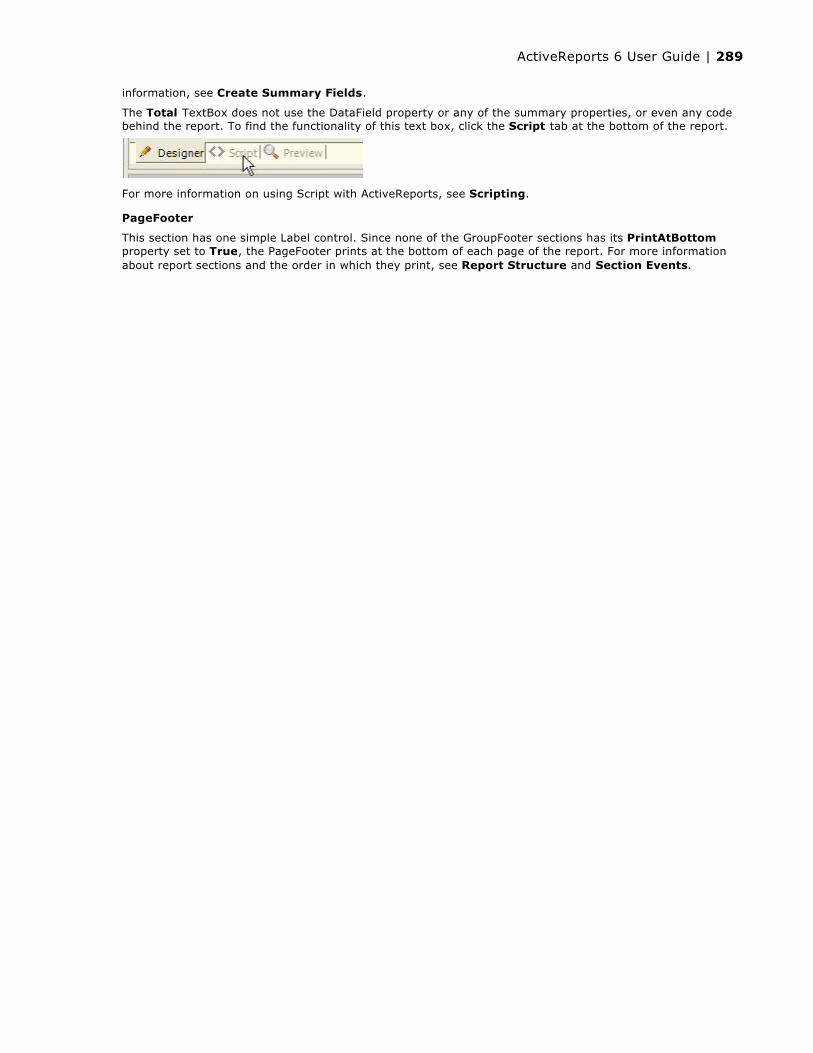
information, see Create Summary Fields.
The Total TextBox does not use the DataField property or any of the summary properties, or even any code behind the report. To find the functionality of this text box, click the Script tab at the bottom of the report.
For more information on using Script with ActiveReports, see Scripting.
PageFooter
This section has one simple Label control. Since none of the GroupFooter sections has its PrintAtBottomproperty set to True, the PageFooter prints at the bottom of each page of the report. For more information about report sections and the order in which they print, see Report Structure and Section Events.
ActiveReports 6 User Guide | 289

This sample shows you how to pass a SQL string into a report at run time. It consists of a CategoryProducts report and a CategorySelectForm.
CategorySelectForm
The ActiveReports Viewer control fills most of the form, and a combo box at the top allows the user to select which data to send to the viewer.
Right-click the form and select View Code to see how this is done.
The getCategories code populates the combo box.
The runCategoryReport code runs the report with a SQL string with the CategoryName passed in by the combo box selection.
The SelectIndexChanged event calls runCategoryReport and passes it the CategoryName.
CategoryProducts Report
This report lists products in the selected category, and summarizes the number of products. Here are the features used in each section:
ReportHeader
This section cannot be deleted, because the related ReportFooter section is used. When this is the case, the best practice is to set the unused section's Height property to 0.
PageHeader
This section uses a Label control with a large Font size and its BackColor property set to LightSteelBlue for the report title.
The TextBox control, txtCategory, has its DataField property set to CategoryName.
Two Line controls and two more Label controls create the column headers for the report.
Detail
This section contains two bound TextBox controls to display each product in the selected category along with its price.
Although the form passes data to the report at run time, the report's data source is set for design time use. It is easier at design time to drag bound fields onto the report from the Report Explorer than it is to create them and set their properties. The data source also allows you to preview the report while you are designing it.
Click the DataSource Icon on the Detail band to view the data source.
PageFooter
This section uses the ReportInfo control to display Page N of M. In the Properties window, you can select a way to display the page number and run date in the FormatString property.
ReportFooter
This section contains a Label control and a bound TextBox. The TextBox uses the SummaryType of GrandTotal to display the total number of products in the selected category.
Category Selection Sample
ActiveReports 6 User Guide | 290

ActiveReports 6 User Guide | 291
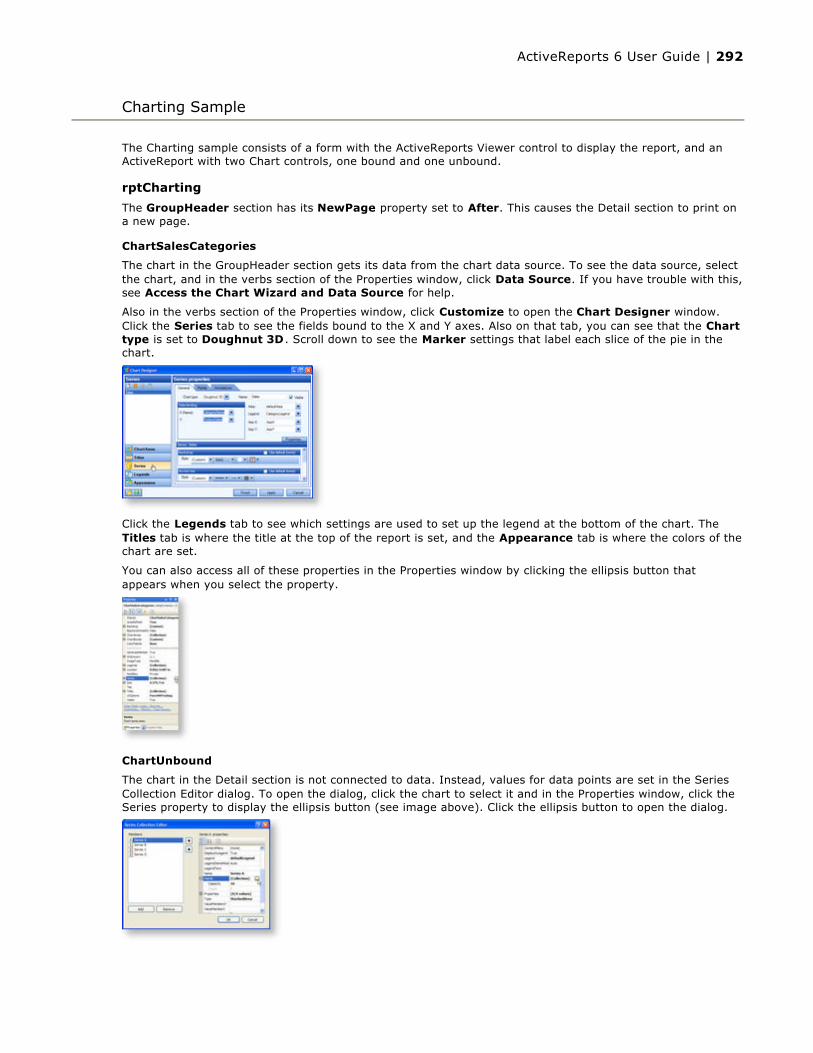
The Charting sample consists of a form with the ActiveReports Viewer control to display the report, and an ActiveReport with two Chart controls, one bound and one unbound.
rptCharting
The GroupHeader section has its NewPage property set to After. This causes the Detail section to print on a new page.
ChartSalesCategories
The chart in the GroupHeader section gets its data from the chart data source. To see the data source, select the chart, and in the verbs section of the Properties window, click Data Source. If you have trouble with this, see Access the Chart Wizard and Data Source for help.
Also in the verbs section of the Properties window, click Customize to open the Chart Designer window. Click the Series tab to see the fields bound to the X and Y axes. Also on that tab, you can see that the Chart type is set to Doughnut 3D . Scroll down to see the Marker settings that label each slice of the pie in the chart.
Click the Legends tab to see which settings are used to set up the legend at the bottom of the chart. The Titles tab is where the title at the top of the report is set, and the Appearance tab is where the colors of the chart are set.
You can also access all of these properties in the Properties window by clicking the ellipsis button that appears when you select the property.
ChartUnbound
The chart in the Detail section is not connected to data. Instead, values for data points are set in the Series Collection Editor dialog. To open the dialog, click the chart to select it and in the Properties window, click the Series property to display the ellipsis button (see image above). Click the ellipsis button to open the dialog.
Charting Sample
ActiveReports 6 User Guide | 292

Here you can see the four series in the chart, A through D. Scroll down in the properties for one of the series, and you can see that the chart Type (in this case, StackedArea) can be set for each series. Select the Pointsproperty. Click the ellipsis button that appears next to it to open the DataPoint Collection Editor dialog where the Y value for each data point is entered.
Close both dialogs to return to the chart, and in the Properties window, expand the Backdrop property to see the settings used to create the gradient blue backdrop for the chart. Click the ellipsis button next to the Titles property to find where the header and footer titles are set.
For more information on creating charts, see the Create Charts topic and the Chart Walkthroughs section.
ViewerForm
The ViewerForm contains the ActiveReports Viewer control, with its Dock property set to Fill. This enables the viewer to automatically resize along with the form. Right-click the form and select View Code to see the three lines of code used to run the report and display it in the viewer.
ActiveReports 6 User Guide | 293
The Cross Tab Report Sample consists of a StartForm with an ActiveReports Viewer control and a ProductWeeklySales report.
StartForm
The Viewer control has its Dock property set to Fill. This ensures that the viewer resizes along with the form at run time. Right-click the form and select View Code to see the code used to run the report and display it in the viewer.
ProductWeeklySales
This report features a number of accumulated values using summary function property settings and calculated in the code behind the report.
ReportHeader
This section of the report features static controls including Labels, a Picture, a Line, and a Shape control with its BackColor property set to yellow. The report header prints only once, on the first page of the report, so it is a good place for a title, company information, and a logo.
PageHeader
The page header section also contains static Label controls that print at the top of each page and serve as column headers for the group header sections.
ghCategory
This group header section has its DataField property set to CategoryName. This setting, along with data sorted by the same field, produces a report grouped by category. The section contains one bound TextBox control to display the category name at the beginning of each group. The section's UnderlayNext property is set to True so that the category prints to the left of the top line of data instead of above it.
ghProduct
Although this group header contains no controls and is hidden using the Height and Visible properties, it still performs two important functions. First, its DataField property is set to ProductName, sorting the data inside each category by product, and second, its related group footer section displays the bulk of the data for the report.
Detail
The detail section of this report is hidden using the Height and Visible properties, but it does contain four bound fields whose values are used in the code behind the report.
Code
ReportStart Event
Right-click the report and select View Code to see how this report, which does not have its data source set using the data source icon on the Detail band, gets its data. Private variables are created to hold values, and are set initially within the ReportStart event.
DataInitialize Event
The data source is set in the DataInitialize event, and then unbound fields are added to the report's Fieldscollection. For more information on unbound reporting, see Unbound Reporting.
FetchData Event
The FetchData event, which runs once for each row in your dataset, is where most of this report's logic is set. See the comments in the code to understand how data is calculated and passed to the report's Fieldscollection.
Detail Format Event
In the Detail Format event, the value from the hidden txtDetProduct text box is collected and passed to the _sProductName variable.
For more information on section events, see Section Events.
Cross Tab Report Sample
ActiveReports 6 User Guide | 294
gfCategory Format Event
In the gfCategory Format event for the outer group footer section, the Value for the txtCatPQTDChangetext box is calculated by subtracting the prior year's quarter-to-date sales figure from the current quarter-to-date sales figure.
The BackColor of the txtCatPQTDChange text box is set to Red if the value is negative.
gfProduct Format Event
In the gfProduct Format event for the inner group footer section, the product name collected from the Detail Format event is passed to the txtProduct text box. The Value for the txtPQTDChange text box is calculated by subtracting the prior year's quarter-to-date sales figure from the current quarter-to-date sales figure.
The BackColor of the txtPQTDChange text box is set to Red if the value is negative.
gfProduct
This group footer section displays the bulk of the data for the report in TextBox controls that have values passed in code, or are bound to fields from the report's Fields collection (see FetchData and DataInitialize events in the code) using the DataField property. The total units and sales for each product is summarized using the following properties:
SummaryFunc: Sum (the default value) adds values rather than counting or averaging them.
SummaryGroup: ghProduct summarizes the values that fall within the current product group.
SummaryRunning: None (the default value) ensures that this value is reset each time the product group changes.
SummaryType: SubTotal summarizes the current group rather than a page or report total.
gfCategory
This group footer section displays totals of the gfProduct data in TextBox controls that have values passed in code, or are bound to fields from the report's Fields collection (see FetchData and DataInitialize events in the code) using the DataField property. The total units and sales for each category is summarized using the following properties:
SummaryFunc: Sum (the default value) adds values rather than counting or averaging them.
SummaryGroup: ghCategory summarizes the values that fall within the current category group.
SummaryRunning: None (the default value) ensures that this value is reset each time the category group changes.
SummaryType: SubTotal summarizes the current group rather than a page or report total.
PageFooter
This section is not used, so it is hidden using the Height and Visible properties. Otherwise, it would print at the bottom of each page. The section cannot be deleted, because its related PageHeader section is in use.
ReportFooter
This section is not used, so it is hidden using the Height and Visible properties. Otherwise, it would print once at the end of the report. The section cannot be deleted, because its related ReportHeader section is in use.
ActiveReports 6 User Guide | 295
The Custom Preview sample consists of a parent CustomPreviewForm with menus, a child PreviewForm with an ActiveReports Viewer control, an ExportForm with a PropertyGrid, a Reports folder with six reports, and a Resources folder with six icons.
CustomPreviewForm
The CustomPreviewForm has its IsMdiContainer property set to True. This ensures that when a user opens a child PreviewForm, it is contained within the parent CustomPreviewForm.
This form has a menu bar, mnuMain, with three menus: File, Reports, and Window. The MergeTypeproperty of the File menu is set to MergeItems so that the menu items from any child PreviewForms are added to it. The form also has two dialogs: dlgOpenFile, and dlgPrint.
Right-click the form and select View Code to see how reports selected from the Reports menu are run and passed to the PreviewForm using the ShowReport code.
PreviewForm
The PreviewForm has the ActiveReports Viewer control with it Dock property set to Fill so that the viewer resizes with the form at run time. The form also has a File menu with its MergeType set to MergeItems so that when a report is open, the File menu on the CustomPreviewForm displays the Export, Save, and PrinterSetup menu items. The form also has one dialog: dlgPrint.
Right-click the form and select View Code to see how, in the PreviewForm Load event, two custom buttons are added to the toolbar. The ToolClick event of the viewer calls the SaveDocument and ExportDocument functions for the new buttons. The menu item click events call the same functions for the related menu items.
The SaveDocument function opens the dialog dlgSave, while the ExportDocument opens a new ExportForm.
ExportForm
The Export Report Document form opens from the ExportDocument function on the PreviewForm. The form features an Export Format combo box, cboExportFormat, that populates the PropertyGrid control below based on the selected item. The export types are added to cboExportFormat via the Items (collection)property.
Right-click the form and select View Code to see how, in the cboExportFormat SelectedIndexChangedevent, the property grid control's SelectedObject is set to the selected export. This ensures that only the properties related to each export type show in the grid.
See the btnOK Click event for the code that exports the report to the selected file name and format, and the btnSaveFile Click event for the code that opens the Save dialog.
Resources Folder
This folder holds the icons used in adding tools to the toolbar.
Reports Folder
Most of the reports in the Reports folder are documented in more detail elsewhere. Here, they are used mainly to show the Viewer and Export features.
Catalog is documented below.
CustomerLabels is explained in the Address Labels walkthrough.
EmployeeProfiles is explained in detail in the code behind the report. (Right-click and select View Code.)
EmployeeSales is explained in the Bar Chart walkthrough.
Invoice is in the Bound Data Sample.
Letter is explained in the Mail Merge with RichText walkthrough.
Catalog Report
The Catalog report uses the PageBreak control and the NewPage property to create a cover at the beginning and an order form at the end of the catalog. It uses grouping to list products by category.
Custom Preview Sample
ActiveReports 6 User Guide | 296

ReportHeader
In the top of the ReportHeader section, the Picture, Line, and Label controls are used to create a static cover page for the catalog. The PageBreak control allows a second page of static labels to be set up in the same section, and setting the section's NewPage property to After ensures that the report breaks to a new page before rendering the next section. The ReportHeader section prints once per report.
PageHeader
This section is not in use, so the Height property is set to 0. This section cannot be deleted because its related PageFooter section is in use.
ghCategoryName
This GroupHeader section has its DataField property set to CategoryName. This, along with sorting the data by the same field, ensures that all of the details for one category are printed before the report moves on to the next category. Also, the section's GroupKeepTogether property is set to All. This causes ActiveReports to attempt to print the group header, related details, and the group footer together all on one page.
The controls in this section include two bound TextBox controls and a bound Picture control, along with a row of labels to serve as column headers for the Detail section to follow.
Detail
Click the gray report DataSource icon on the Detail section band to open the Report Data Source dialog, where you can see the Connection String and SQL Query that provide data for the bound fields.
The Detail section has four bound TextBox controls. Select one of them and you can see in the Properties window the field that it is bound to in the DataField property. The UnitPrice text box also uses the OutputFormat to display the data in currency format. This section prints once for each row of data.
gfCategoryName
This section is used only to render a horizontal Line control after each category grouping is completed.
PageFooter
This section is used to display the page number at the bottom of each page.
ReportFooter
This section has the NewPage property set to Before to ensure that it begins at the top of a new page.
Label, Shape, and Line controls are used to create the static order form layout in this page-long report section that prints once at the end of the report.
ActiveReports 6 User Guide | 297

This sample consists of three reports and a ViewerForm. The reports use the Hyperlink event of the viewer to pass a value from the Hyperlink property of a TextBox control to a Parameter value in a more detailed report.
ViewerForm
This form contains only an ActiveReports Viewer control with its Dock property set to Fill. This ensures that the viewer resizes along with the form at run time.
Right-click the form and select View Code to see the code that allows multiple ViewerForms to display, and see the Form Load event for the code that loads the main report into the viewer.
See the Viewer Hyperlink event for the code that collects a string value from the Hyperlink property of the clicked TextBox on the main report and passes it into the customerID Parameter of the report DrillDown1, or collects a numeric value and passes it to the orderID Parameter of the report DrillDown2. This code then runs the report with the parameter value and displays it in another instance of the ViewerForm.
DrillDownMain Report
The main report that is loaded in the ViewerForm by default uses the PageHeader and Detail sections.
PageHeader Section
This section contains three Label controls to serve as column headers for the details, and a CrossSectionBox control. For more information, see Cross Section Controls.
Detail Section
The Detail section has its BackColor property set to Thistle, and its RepeatToFill property set to True. This ensures that the background color reaches all the way to the bottom of the page when there is not enough data to fill it.
Click the gray report DataSource icon on the Detail section band to open the Report Data Source dialog, where you can see the Connection String and SQL Query that provide data for the bound fields.
The Detail section has three bound TextBox controls that display a list of customer information. Select CustomerID and you will see that the HyperLink property is not set in the Properties window. To see the code that assigns the data from the TextBox to its HyperLink property, right-click the report and select View Code.
The HyperLink property is set in the Detail BeforePrint event. For more information, see Section Events.
PageFooter Section
This section is not in use, so it is hidden by setting the Visible property to False. This section cannot be deleted, because its related PageHeader section is in use.
DrillDown1 Report
This report looks similar to the DrillDownMain report, but the main difference is that it has a CustomerID parameter in its SQL Query.
GroupHeader Section
Since this report only displays order information for the CustomerID from the clicked hyperlink, the PageHeader section could have been used, but this report uses the GroupHeader section. To make this section print at the top of each page, its RepeatStyle property is set to OnPage.
Like in the previous report, this section contains three Label controls to serve as column headers for the details, and a CrossSectionBox control.
Hyperlinks and Drill Down Sample
Note: This hyperlink does not work in Preview mode, because it relies on code in the ViewerForm to pass the value to DrillDown1 report's parameter.
ActiveReports 6 User Guide | 298
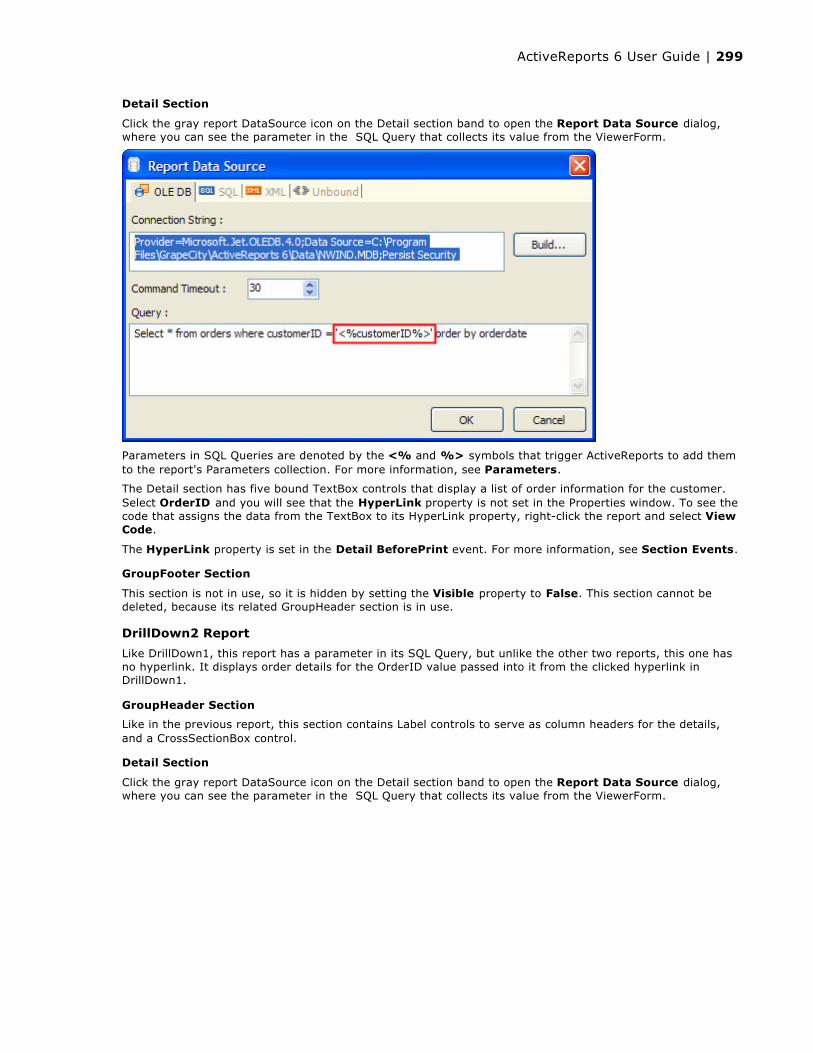
Detail Section
Click the gray report DataSource icon on the Detail section band to open the Report Data Source dialog, where you can see the parameter in the SQL Query that collects its value from the ViewerForm.
Parameters in SQL Queries are denoted by the <% and %> symbols that trigger ActiveReports to add them to the report's Parameters collection. For more information, see Parameters.
The Detail section has five bound TextBox controls that display a list of order information for the customer. Select OrderID and you will see that the HyperLink property is not set in the Properties window. To see the code that assigns the data from the TextBox to its HyperLink property, right-click the report and select View Code.
The HyperLink property is set in the Detail BeforePrint event. For more information, see Section Events.
GroupFooter Section
This section is not in use, so it is hidden by setting the Visible property to False. This section cannot be deleted, because its related GroupHeader section is in use.
DrillDown2 Report
Like DrillDown1, this report has a parameter in its SQL Query, but unlike the other two reports, this one has no hyperlink. It displays order details for the OrderID value passed into it from the clicked hyperlink in DrillDown1.
GroupHeader Section
Like in the previous report, this section contains Label controls to serve as column headers for the details, and a CrossSectionBox control.
Detail Section
Click the gray report DataSource icon on the Detail section band to open the Report Data Source dialog, where you can see the parameter in the SQL Query that collects its value from the ViewerForm.
ActiveReports 6 User Guide | 299
The RDF Viewer sample consists of an RdfViewerForm with an ActiveReports Viewer control, and an ExportForm with a Property Grid. The sample also contains an RDFs folder of saved reports.
RdfViewerForm
This form contains an ActiveReports Viewer control with its Dock property set to Fill. This ensures that the viewer resizes along with the form at run time.
It also contains a MenuStrip and an OpenFile dialog. To see the code for each of these, right-click the form and select View Code.
Code
The GetReportDoc property gets the Document object from the viewer. The ExportForm uses this property to export report documents.
The OpenToolStripMenuItem Click event filters to show only RDF files and opens the Open File dialog to the RDFs folder. The dlgOpenFile FileOK function loads the selected RDF file into the viewer.
The ExportToolStripMenuItem Click event opens a new ExportForm. Each of the other menu item click events performs its function in a straightforward manner.
For more information on the Viewer control, see Viewing Reports.
ExportForm
This form contains a combo box to collect the user-selected export format, a property grid to display properties for the selected format, and an OK button to export the report to the selected format. It also contains a Save dialog. Right-click the form and select View Code to see how this is done.
Code
The overloaded Show method allows the ExportForm to be called as a child object of the RdfViewerForm.
The Export Format combo box SelectIndexChanged event sets the exportComponent variable and the pgOptions property grid's SelectedObject to the selected export type.
The exportComponent variable is picked up in the OK button Click event, and then the report Document is pulled from the viewer and exported to the selected format.
RDFs Folder
An RDF file is a static copy of a report saved to the native Report Document Format. This can be loaded into the viewer without running it or accessing data. For more information, see Save and Load Report Files (RDF).
The following five reports are included in this sample:
Catalog.rdf
Customer Labels.rdf
Employee Profiles.rdf
Employee Sales.rdf
Invoice.rdf
Letter.rdf
Rdf Viewer Sample
ActiveReports 6 User Guide | 300
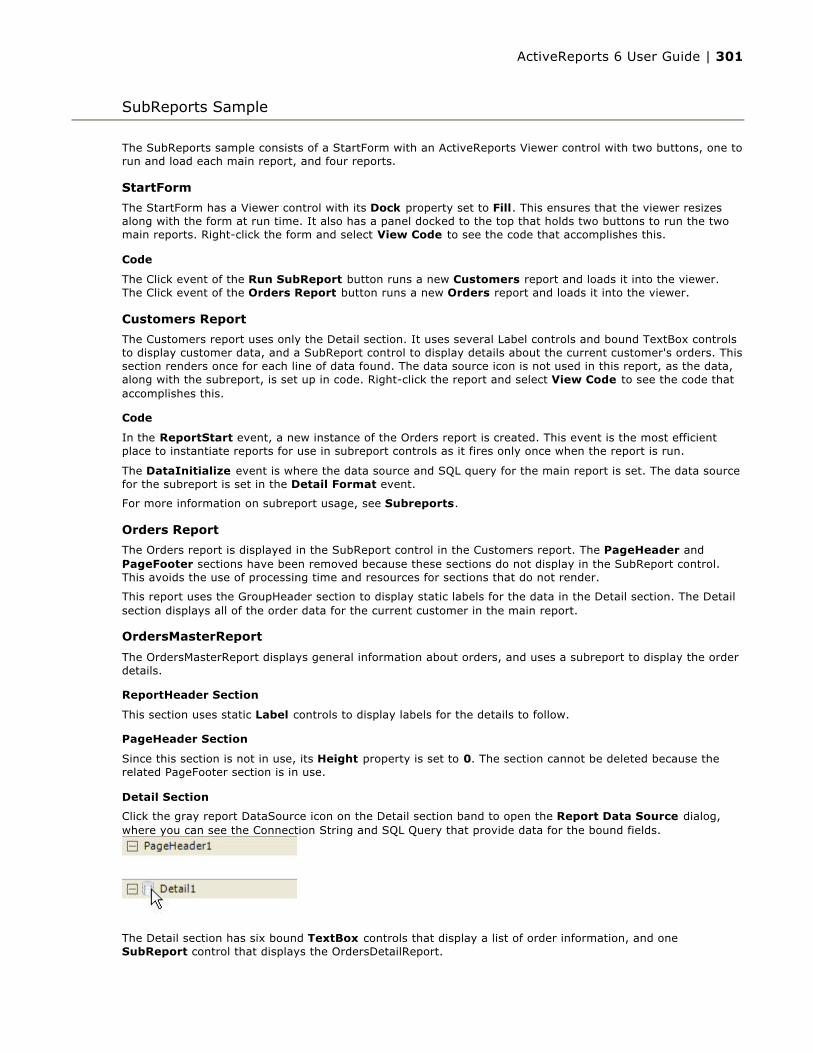
The SubReports sample consists of a StartForm with an ActiveReports Viewer control with two buttons, one to run and load each main report, and four reports.
StartForm
The StartForm has a Viewer control with its Dock property set to Fill. This ensures that the viewer resizes along with the form at run time. It also has a panel docked to the top that holds two buttons to run the two main reports. Right-click the form and select View Code to see the code that accomplishes this.
Code
The Click event of the Run SubReport button runs a new Customers report and loads it into the viewer. The Click event of the Orders Report button runs a new Orders report and loads it into the viewer.
Customers Report
The Customers report uses only the Detail section. It uses several Label controls and bound TextBox controls to display customer data, and a SubReport control to display details about the current customer's orders. This section renders once for each line of data found. The data source icon is not used in this report, as the data, along with the subreport, is set up in code. Right-click the report and select View Code to see the code that accomplishes this.
Code
In the ReportStart event, a new instance of the Orders report is created. This event is the most efficient place to instantiate reports for use in subreport controls as it fires only once when the report is run.
The DataInitialize event is where the data source and SQL query for the main report is set. The data source for the subreport is set in the Detail Format event.
For more information on subreport usage, see Subreports.
Orders Report
The Orders report is displayed in the SubReport control in the Customers report. The PageHeader and PageFooter sections have been removed because these sections do not display in the SubReport control. This avoids the use of processing time and resources for sections that do not render.
This report uses the GroupHeader section to display static labels for the data in the Detail section. The Detail section displays all of the order data for the current customer in the main report.
OrdersMasterReport
The OrdersMasterReport displays general information about orders, and uses a subreport to display the order details.
ReportHeader Section
This section uses static Label controls to display labels for the details to follow.
PageHeader Section
Since this section is not in use, its Height property is set to 0. The section cannot be deleted because the related PageFooter section is in use.
Detail Section
Click the gray report DataSource icon on the Detail section band to open the Report Data Source dialog, where you can see the Connection String and SQL Query that provide data for the bound fields.
The Detail section has six bound TextBox controls that display a list of order information, and one SubReport control that displays the OrdersDetailReport.
SubReports Sample
ActiveReports 6 User Guide | 301

PageFooter Section
This section, which renders once per page, uses the ReportInfo control to display page n of m at the bottom of each page.
ReportFooter Section
This section is not used, but cannot be deleted because the related ReportHeader section is in use.
Code
The report for the SubReport control, OrdersDetailReport, is instantiated and assigned to the SubReport control in the ReportStart event.
OrdersDetailReport
This report has static Label controls in the ReportHeader section, and bound TextBoxes in the Detail section.
Click the gray report DataSource icon on the Detail section band to open the Report Data Source dialog, where you can see the Connection String and SQL Query that provide data for the bound fields.
ActiveReports 6 User Guide | 302
The Walkthroughs section of the User Guide provides you with step-by-step tutorials that you can follow as you create projects in Visual Studio. The walkthroughs progress from basic through advanced for Standard and Professional Editions of ActiveReports.
Standard Edition WalkthroughsBasic Data Bound Reports
Address Labels
Columnar Reports
Overlaying Reports (Letterhead)
Chart Walkthroughs
Basic Spreadsheet with SpreadBuilder
Group On Unbound Fields
Subreport Walkthroughs
Hyperlinks for Simulated Drill-Down Reporting
Mail Merge with RichText
Run Time or Ad Hoc Reporting
Web Walkthroughs (Standard Edition)
Layout Files with Embedded Script
Professional Edition WalkthroughsCreating a Basic End User Report Designer (Pro Edition)
Web Viewer (Pro Edition)
Flash Viewer
Walkthroughs
ActiveReports 6 User Guide | 303

In ActiveReports, the simplest reporting style is a tabular listing of fields from a data source.
This walkthrough illustrates the basics of setting up bound reports by introducing the ideas of using the DataSource icon and dragging fields from the Report Explorer onto the report.
The walkthrough is split up into the following activities:
Creating a new Visual Studio project
Adding an ActiveReport to the Visual Studio project
Connecting the data source to a database
Adding controls to the report
Viewing the report
To complete the walkthrough, you must have access to the Northwind database. A copy is located at C:\Program Files\GrapeCity\ActiveReports 6\Data\NWIND.MDB.
When you have finished this walkthrough, you will have a report that looks similar to the following.
To create a new Visual Studio project1. Open Visual Studio.
2. From the File menu, select New > Project.
3. In the New Project dialog, select the project type in the Project Types section and then select Windows Application in the Templates section.
4. Change the name of your project and click OK .
To add an ActiveReport to the Visual Studio project
1. From the Project menu, select Add New Item .
2. Select ActiveReports 6 (code-based) File and rename the file rptBound.
3. Click Add.
Basic Data Bound Reports
ActiveReports 6 User Guide | 304

To connect the report to a database1. Click the gray report DataSource icon on the Detail section band to open the Report Data Source dialog.
2. On the OLE DB tab, next to Connection String, click the Build button.
3. In the Data Link Properties window that appears, select Microsoft Jet 4.0 OLE DB Provider and click the Next button.
4. Click the ellipsis (...) button to browse to the Northwind database. Click Open once you have selected the appropriate access path.
5. Click OK to close the window and fill in the Connection String field.
6. In the Query field, enter the following SQL query
7. Click OK to save the data source and return to the report design surface.
To add controls to the report1. In the Report Explorer, expand the Fields node, then the Bound node. Drag the following fields onto
the detail section and set the properties of each textbox as indicated.
2. Click just below the fields to select the Detail section, and in the Properties Window, set the CanShrinkproperty to True to eliminate white space in the rendered report.
To view the report
You can quickly view your report at design time by clicking the Preview tab at the bottom of the designer.
1. Drag the ActiveReports viewer control from the Visual Studio toolbox onto the Windows Form and set its Dock property to Fill.
2. Double click the title bar of the form to create a Form_Load event, and add the code needed to run the report and display it in the viewer.
3. To enable the viewer's copy button, add references to the RtfExport and TextExport dlls.
4. Run the project to display the report in the viewer.
SQL Query
SELECT * FROM Products
Field Text Location SizeProductName Product Name 0, 0 2.3, 0.2QuantityPerUnit Quantity 2.4, 0 1.5, 0.2UnitsInStock Stock 4, 0 1, 0.2
Run the report and display it in the viewer using Visual Basic.NET
Dim rpt As New rptBoundrpt.Run()Me.Viewer1.Document = rpt.DocumentRun the report and display it in the viewer using C#
rptBound rpt = new rptBound();rpt.Run();this.viewer1.Document = rpt.Document;
ActiveReports 6 User Guide | 305

ActiveReports 6 allows you to create reports with embedded script and save them to the XML-based RPX file format. By embedding script in reports saved as RPX files, you can later load, run, and display reports directly in the viewer control without rebuilding the application. This walkthrough illustrates how to create a simple report, using the XML-based report template.
This walkthrough is split into the following activities:
Adding controls to a report to display data
Adding scripting to supply data for the controls
Loading an xml-based report from resources
To complete the walkthrough, you must have access to the Northwind database. A copy is located at C:\Program Files\GrapeCity\ActiveReports 6\Data\NWIND.mdb.
When you have finished this walkthrough, you will have a report that looks similar to the following.
To add controls to the report1. Add an ActiveReports 6 (xml-based) File to a Visual Basic project and name it rptScript.
2. In the Solution Explorer click the rptScript.rpx item and set the Build Action property to Embedded Resource.
3. Add the following controls to the Detail section:
Detail section fields
4. Click just below the fields to select the Detail section, and in the Properties Window, set the CanShrinkproperty to True to eliminate white space in the rendered report.
To add scripting to the report to supply data for the controls1. Click the Script tab located at the bottom edge of the report designer to access the scripting editor.
Basic XML-Based Reports (RPX)
Tip: For basic steps like adding a report to a Visual Studio project and viewing a report, please see the Basic Data Bound Reports walkthrough.
Note: If you are working on the 64-bit Operating System, the target platform of the project should be set to "x86". In this case, a copy of the Northwind database is located at C:\Program Files (x86)\GrapeCity\ActiveReports 6\Data\NWIND.mdb.
Control Name DataField Location SizeTextBox txtProductName ProductName 0, 0 in 2.3, 0.2 inTextBox txtQuantityPerUnit QuantityPerUnit 2.4, 0 in 1.5, 0.2 inTextBox txtUnitsInStock UnitsInStock 4, 0 in 1, 0.2 in
ActiveReports 6 User Guide | 306

2. Add the scripting code.
The following example shows what the scripting code looks like.
To write the code in Visual Basic.NET
To write the code in C#
Warning: Do not access the Fields collection outside the DataInitialize and FetchData events. Accessing the Fields collection outside of these events is not supported, and has unpredictable results.
Visual Basic.NET code. Paste in the script editor window.
Private Shared m_reader As System.Data.OleDb.OleDbDataReaderPrivate Shared m_cnn As System.Data.OleDb.OleDbConnection
Public Sub ActiveReport_ReportStart() 'Set up a data connection for the report Dim connString As String = "Provider=Microsoft.Jet.OLEDB.4.0;Data Source=C:\Program Files\GrapeCity\ActiveReports 6\Data\NWIND.mdb" Dim sqlString As String = "SELECT * FROM products" m_cnn = new System.Data.OleDb.OleDbConnection(connString) Dim m_Cmd As System.Data.OleDb.OleDbCommand = new System.Data.OleDb.OleDbCommand(sqlString, m_cnn) If m_cnn.State = System.Data.ConnectionState.Closed Then m_cnn.Open End If m_reader = m_Cmd.ExecuteReaderEnd Sub
Public Sub ActiveReport_DataInitialize() 'Add data fields to the report rpt.Fields.Add("ProductName") rpt.Fields.Add("QuantityPerUnit") rpt.Fields.Add("UnitsInStock")End Sub
Public Function ActiveReport_FetchData(ByVal eof As Boolean) As Boolean Try eof = False m_reader.Read 'Populated the fields with data from the data reader rpt.Fields("ProductName").Value = m_reader("ProductName") rpt.Fields("QuantityPerUnit").Value = m_reader("QuantityPerUnit") rpt.Fields("UnitsInStock").Value = m_reader("UnitsInStock")Catch Ex as Exception 'If the end of the data file has been reached, tell the FetchData function eof = True End Try Return eofEnd Function
Public Sub ActiveReport_ReportEnd() 'Close the data reader and connection m_reader.Close m_cnn.CloseEnd Sub
C# code. Paste in the script editor window.
private static System.Data.OleDb.OleDbDataReader m_reader;private static System.Data.OleDb.OleDbConnection m_cnn;
public void ActiveReport_ReportStart(){ //Set up a data connection for the report string m_cnnString = @"Provider=Microsoft.Jet.OLEDB.4.0;Data Source=C:\Program Files\GrapeCity\ActiveReports 6\Data\NWIND.mdb"; string sqlString = "SELECT * FROM products";
ActiveReports 6 User Guide | 307
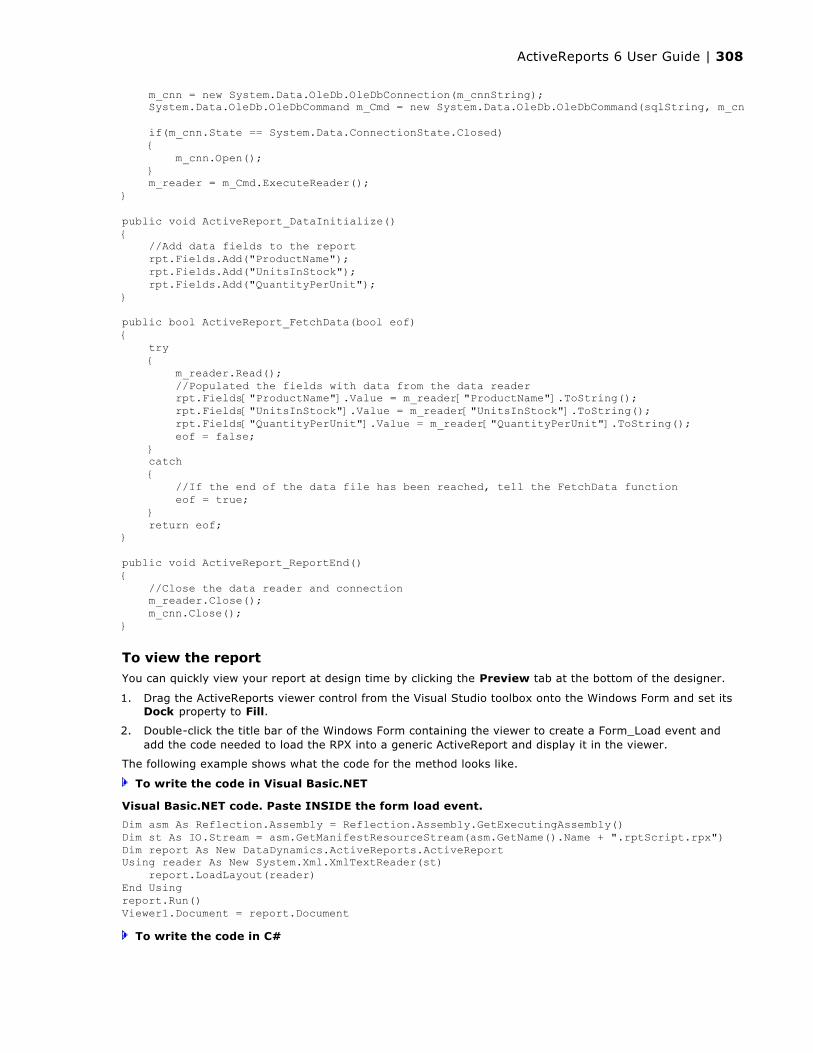
To view the reportYou can quickly view your report at design time by clicking the Preview tab at the bottom of the designer.
1. Drag the ActiveReports viewer control from the Visual Studio toolbox onto the Windows Form and set its Dock property to Fill.
2. Double-click the title bar of the Windows Form containing the viewer to create a Form_Load event and add the code needed to load the RPX into a generic ActiveReport and display it in the viewer.
The following example shows what the code for the method looks like.
To write the code in Visual Basic.NET
To write the code in C#
m_cnn = new System.Data.OleDb.OleDbConnection(m_cnnString); System.Data.OleDb.OleDbCommand m_Cmd = new System.Data.OleDb.OleDbCommand(sqlString, m_cnn);
if(m_cnn.State == System.Data.ConnectionState.Closed) { m_cnn.Open(); } m_reader = m_Cmd.ExecuteReader();}
public void ActiveReport_DataInitialize(){ //Add data fields to the report rpt.Fields.Add("ProductName"); rpt.Fields.Add("UnitsInStock"); rpt.Fields.Add("QuantityPerUnit");}
public bool ActiveReport_FetchData(bool eof){ try { m_reader.Read(); //Populated the fields with data from the data reader rpt.Fields["ProductName"].Value = m_reader["ProductName"].ToString(); rpt.Fields["UnitsInStock"].Value = m_reader["UnitsInStock"].ToString(); rpt.Fields["QuantityPerUnit"].Value = m_reader["QuantityPerUnit"].ToString(); eof = false; } catch { //If the end of the data file has been reached, tell the FetchData function eof = true; } return eof;}
public void ActiveReport_ReportEnd(){ //Close the data reader and connection m_reader.Close(); m_cnn.Close();}
Visual Basic.NET code. Paste INSIDE the form load event.
Dim asm As Reflection.Assembly = Reflection.Assembly.GetExecutingAssembly()Dim st As IO.Stream = asm.GetManifestResourceStream(asm.GetName().Name + ".rptScript.rpx")Dim report As New DataDynamics.ActiveReports.ActiveReportUsing reader As New System.Xml.XmlTextReader(st) report.LoadLayout(reader)End Usingreport.Run()Viewer1.Document = report.Document
ActiveReports 6 User Guide | 308

C# code. Paste INSIDE the form load event.
System.Reflection.Assembly asm = System.Reflection.Assembly.GetExecutingAssembly();System.IO.Stream st = asm.GetManifestResourceStream(asm.GetName().Name + ".rptScript.rpx");DataDynamics.ActiveReports.ActiveReport report = new DataDynamics.ActiveReports.ActiveReport();using (System.Xml.XmlTextReader reader = new System.Xml.XmlTextReader(st)){ report.LoadLayout(reader);}report.Run();Viewer1.Document = report.Document;
ActiveReports 6 User Guide | 309
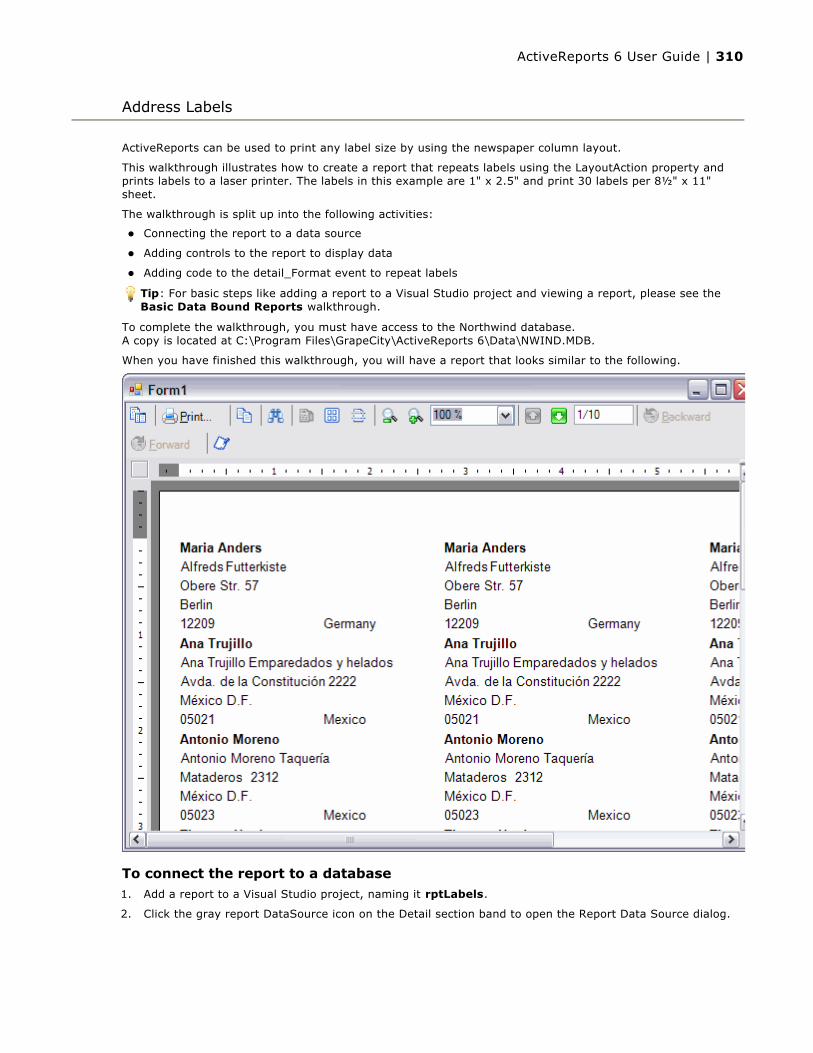
ActiveReports can be used to print any label size by using the newspaper column layout.
This walkthrough illustrates how to create a report that repeats labels using the LayoutAction property and prints labels to a laser printer. The labels in this example are 1" x 2.5" and print 30 labels per 8½" x 11" sheet.
The walkthrough is split up into the following activities:
Connecting the report to a data source
Adding controls to the report to display data
Adding code to the detail_Format event to repeat labels
To complete the walkthrough, you must have access to the Northwind database.A copy is located at C:\Program Files\GrapeCity\ActiveReports 6\Data\NWIND.MDB.
When you have finished this walkthrough, you will have a report that looks similar to the following.
To connect the report to a database1. Add a report to a Visual Studio project, naming it rptLabels.
2. Click the gray report DataSource icon on the Detail section band to open the Report Data Source dialog.
Address Labels
Tip: For basic steps like adding a report to a Visual Studio project and viewing a report, please see the Basic Data Bound Reports walkthrough.
ActiveReports 6 User Guide | 310
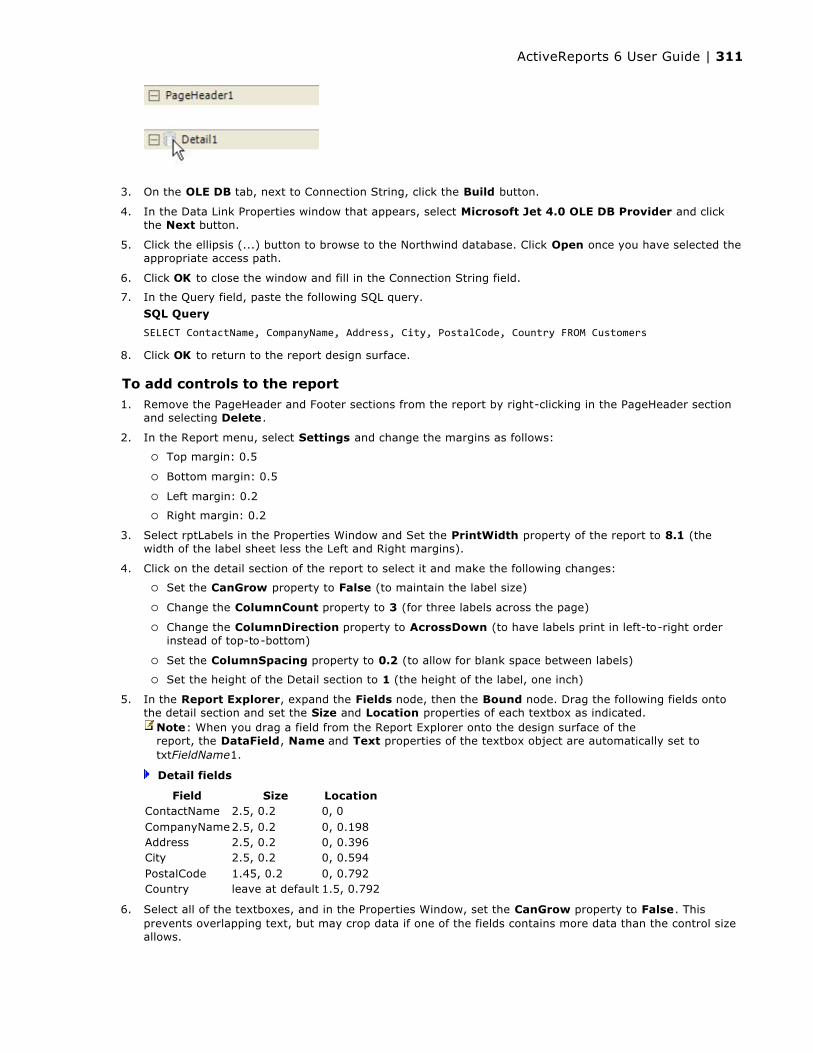
3. On the OLE DB tab, next to Connection String, click the Build button.
4. In the Data Link Properties window that appears, select Microsoft Jet 4.0 OLE DB Provider and click the Next button.
5. Click the ellipsis (...) button to browse to the Northwind database. Click Open once you have selected the appropriate access path.
6. Click OK to close the window and fill in the Connection String field.
7. In the Query field, paste the following SQL query.
8. Click OK to return to the report design surface.
To add controls to the report1. Remove the PageHeader and Footer sections from the report by right-clicking in the PageHeader section
and selecting Delete.
2. In the Report menu, select Settings and change the margins as follows:
Top margin: 0.5
Bottom margin: 0.5
Left margin: 0.2
Right margin: 0.2
3. Select rptLabels in the Properties Window and Set the PrintWidth property of the report to 8.1 (the width of the label sheet less the Left and Right margins).
4. Click on the detail section of the report to select it and make the following changes:
Set the CanGrow property to False (to maintain the label size)
Change the ColumnCount property to 3 (for three labels across the page)
Change the ColumnDirection property to AcrossDown (to have labels print in left-to-right order instead of top-to-bottom)
Set the ColumnSpacing property to 0.2 (to allow for blank space between labels)
Set the height of the Detail section to 1 (the height of the label, one inch)
5. In the Report Explorer, expand the Fields node, then the Bound node. Drag the following fields onto the detail section and set the Size and Location properties of each textbox as indicated.
Detail fields
6. Select all of the textboxes, and in the Properties Window, set the CanGrow property to False. This prevents overlapping text, but may crop data if one of the fields contains more data than the control size allows.
SQL Query
SELECT ContactName, CompanyName, Address, City, PostalCode, Country FROM Customers
Note: When you drag a field from the Report Explorer onto the design surface of the report, the DataField, Name and Text properties of the textbox object are automatically set to txtFieldName1.
Field Size LocationContactName 2.5, 0.2 0, 0CompanyName2.5, 0.2 0, 0.198Address 2.5, 0.2 0, 0.396City 2.5, 0.2 0, 0.594PostalCode 1.45, 0.2 0, 0.792Country leave at default 1.5, 0.792
ActiveReports 6 User Guide | 311

If you preview the report at this point, one copy of each label appears on the page.
To add code to the detail_Format event to repeat labels
1. Double-click in the detail section to create a detail_Format event.
2. Add the following code to the event to repeat each label across all three columns.
To write the code in Visual Basic.NET
To write the code in C#
Visual Basic.NET code. Paste INSIDE the Format event.
'print each label three timesStatic counter As Integercounter = counter + 1If counter <= 2 Then Me.LayoutAction = 3Else Me.LayoutAction = 7 counter = 0End If
C# code. Paste JUST ABOVE the Format event.
int counter=0; C# code. Paste INSIDE the Format event.
//print each label three timescounter = counter + 1; if (counter <= 2) { this.LayoutAction = LayoutAction.MoveLayout|LayoutAction.PrintSection; } else { this.LayoutAction = LayoutAction.MoveLayout|LayoutAction.NextRecord|LayoutAction.PrintSection; counter = 0; }
ActiveReports 6 User Guide | 312

ActiveReports supports newspaper column layouts in both the Detail and Group sections. You can render the columns either horizontally or vertically in the section with options to break the column on the Group section (i.e. start a new column on the change of a group). There is also a Boolean ColumnGroupKeepTogether property on the GroupHeader. When set to True, the ColumnGroupKeepTogether property attempts to prevent a group from splitting across columns. If a group cannot fit in the current column, it tries the next. If the group is too large for a single column, the property is ignored.
This walkthrough illustrates how to create a simple report using columns, and is split up into the following activities:
Connecting the report to a data source
Adding controls to the report to display data
To complete the walkthrough, you must have access to the Northwind database.A copy is located at C:\Program Files\GrapeCity\ActiveReports 6\Data\NWIND.MDB.
When you have finished this walkthrough, you will have a report that looks similar to the following.
To connect the report to a database1. Add a report to a Visual Studio project, naming it rptColumnar.
2. Click the gray report DataSource icon on the Detail section band to open the Report Data Source dialog.
3. On the OLE DB tab, next to Connection String, click the Build button.
4. In the Data Link Properties window that appears, select Microsoft Jet 4.0 OLE DB Provider and click the Next button.
5. Click the ellipsis (...) button to browse to the Northwind database. Click Open once you have selected the appropriate access path.
Columnar Reports
Note: The ColumnGroupKeepTogether property is only implemented when the GroupHeader's GroupKeepTogether property is set to All.
Tip: For basic steps like adding a report to a Visual Studio project and viewing a report, please see the Basic Data Bound Reports walkthrough.
ActiveReports 6 User Guide | 313
6. Click OK to close the window and fill in the Connection String field.
7. In the Query field, enter the following SQL query
8. Click OK to save the data source and return to the report design surface.
To add controls to the report1. Add a GroupHeader/Footer section to rptColumnar by right-clicking on the design surface of the report
and selecting Insert, then Group Header/Footer.
2. Select the group header and, in the Properties Window, make the following changes:
Change the Name property to ghCountry .
Change the BackColor property to Gold.
Change the DataField property to Country.
Change the ColumnGroupKeepTogether property to True to attempt to prevent groups from splitting across columns.
Change the GroupKeepTogether property to All to enable the ColumnGroupKeepTogether property.
3. Select the group footer, and change its BackColor property to Goldenrod.
4. Drag the Country field from the Report Explorer into the GroupHeader section, and set its properties as indicated:
5. Select the PageHeader section and change its BackColor property to Linen.
6. Drag a Label control from the ActiveReports toolbox into the PageHeader section, and set its properties as indicated:
7. Select the Detail section, and make the following changes in the Properties Window:
Change the CanShrink property to True to eliminate white space after each name.
Change the ColumnCount property to 2 to split the detail section into two columns.
8. Drag the following fields from the Report Explorer into the Detail section and set their properties as indicated:
SQL Query
SELECT Country, CompanyName, ContactName, Phone FROM Customers ORDER BY Country
Alignment Font Location SizeCenter Arial, 12pt, style=Bold 0, 0 3.25, 0.2 in
Alignment Font Text Location SizeCenter Arial, 14pt Customer Telephone List by Country0, 0 6.5, 0.25 in
Field Font Location SizeCompanyNameArial, 8pt 0, 0 in 1.15, 0.2 inContactName Arial, 8pt 1.16, 0 in 1.15, 0.2 inPhone Arial, 8pt 2.3, 0 in 0.95, 0.2 in
ActiveReports 6 User Guide | 314
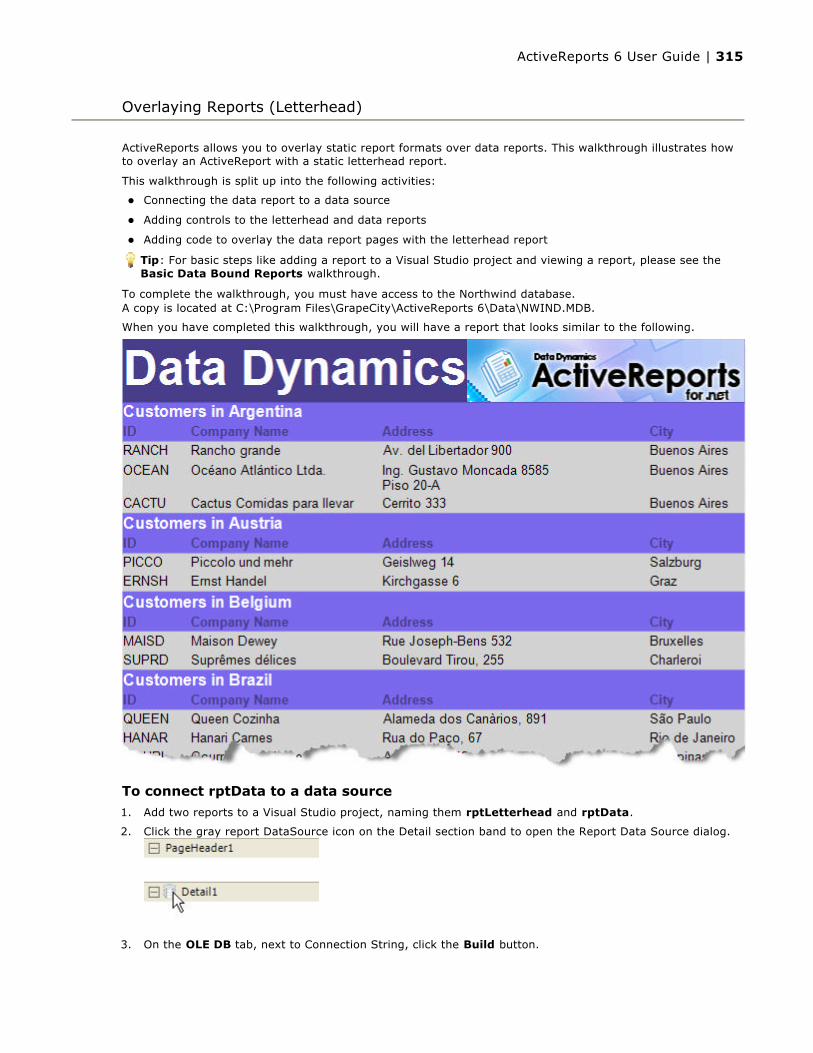
ActiveReports allows you to overlay static report formats over data reports. This walkthrough illustrates how to overlay an ActiveReport with a static letterhead report.
This walkthrough is split up into the following activities:
Connecting the data report to a data source
Adding controls to the letterhead and data reports
Adding code to overlay the data report pages with the letterhead report
To complete the walkthrough, you must have access to the Northwind database.A copy is located at C:\Program Files\GrapeCity\ActiveReports 6\Data\NWIND.MDB.
When you have completed this walkthrough, you will have a report that looks similar to the following.
To connect rptData to a data source
1. Add two reports to a Visual Studio project, naming them rptLetterhead and rptData.
2. Click the gray report DataSource icon on the Detail section band to open the Report Data Source dialog.
3. On the OLE DB tab, next to Connection String, click the Build button.
Overlaying Reports (Letterhead)
Tip: For basic steps like adding a report to a Visual Studio project and viewing a report, please see the Basic Data Bound Reports walkthrough.
ActiveReports 6 User Guide | 315
4. In the Data Link Properties window that appears, select Microsoft Jet 4.0 OLE DB Provider and click the Next button.
5. Click the ellipsis (...) button to browse to the Northwind database. Click Open once you have selected the appropriate access path.
6. Click OK to close the window and fill in the Connection String field.
7. In the Query field, enter the following SQL query
8. Click OK to save the data source and return to the report design surface.
To add controls to rptData1. Select the PageHeader section, and in the Properties Window, set the Height property to 0.65. (This
will match the height of the page header in the template.)
2. Right-click the report and select Insert > GroupHeader/Footer to add group header and group footer sections.
3. Make the following changes to the group header:
Change the Name property to ghCustomers
Change the BackColor property to MediumSlateBlue
Change the CanShrink property to True
Change the DataField property to Country
Change the GroupKeepTogether property to FirstDetail
Change the KeepTogether property to True
4. Add the following controls to ghCustomers with properties set as indicated:
Group header labels
5. Make the following changes to the detail section:
Change the BackColor property to LightGray
Change the CanShrink property to True
6. In the Report Explorer, expand the Fields node, then the Bound node. Drag the following fields onto the detail section and set the properties of each textbox as indicated.
Detail fields
7. Change the group footer's Height property to 0.
To add static controls to rptLetterhead1. Make the following changes to the page header:
SQL Query
SELECT * FROM Customers ORDER BY Country
Control Miscellaneous Text (or DataField) Size Location
TextBoxBoldForeColor = WhiteFont Size = 12
="Customers in " + Country(DataField) 2, 0.2 in 0, 0 in
LabelBoldForeColor = DarkSlateBlue
ID 0.6, 0.198 in 0, 0.2 in
LabelBoldForeColor = DarkSlateBlue Company Name 1.1, 0.198 in 0.7, 0.2 in
Label BoldForeColor = DarkSlateBlue
Address 1, 0.198 in 2.7, 0.2 in
LabelBoldForeColor = DarkSlateBlue
City 1, 0.198 in 5.5, 0.2 in
Field Size LocationCustomerID 0.6, 0.2 in 0, 0 inCompanyName2, 0.2 in 0.7, 0 inAddress 2.8, 0.2 in 2.7, 0 inCity 1, 0.2 in 5.5, 0 in
ActiveReports 6 User Guide | 316

Change the BackColor property to DarkSlateBlue
Change the Height property to 0.65
2. Add the following controls to the page header with properties set as indicated:
Page header labels
3. Make the following changes to the page footer:
Change the BackColor property to DarkSlateBlue
4. Add a label with the following properties to the page footer:
Page footer label
Adding code to overlay the data report pages with the letterhead report
To write the code in Visual Basic.NET
Add the ActiveReports viewer control to the Windows Form. Then, double-click the top of the Windows Form to create an event-handling method for the form's Load event. Add code to the handler to:
Set the viewer to display the rptData report document
Overlay rptLetterhead on rptData
The following example shows what the code for the method looks like.
To write the code in C#
Add the ActiveReports viewer control to the Windows Form. Then, double-click the top of the Windows Form to create an event-handling method for the form's Load event. Add code to the handler to:
Set the viewer to display the rptData report document
Overlay rptLetterhead on rptData
The following example shows what the code for the method looks like.
Control Miscellaneous Size Location
Label
Size = 36Style = BoldForeColor = WhiteText = GrapeCity
3.7, 0.65 in 0, 0 in
PicturePictureAlignment = TopLeftImage (click ellipsis, navigate to C:\Program Files\GrapeCity\ActiveReports 6\Introduction and select itopimage1.gif)
2.9, 0.65 in
3.6, 0 in
Miscellaneous ForeColor Text Size LocationAlignment = CenterStyle = Bold
White(614) 895-3142, http://www.datadynamics.com (http://www.datadynamics.com/), [email protected]
6.5, 0.2 in
0, 0 in
Visual Basic.NET code. Paste INSIDE the Form Load event.
Dim rpt As New rptData() rpt.Run() Viewer1.Document = rpt.Document Dim rpt2 As New rptLetterhead() rpt2.Run() Dim i As Integer For i = 0 To rpt.Document.Pages.Count - 1 rpt.Document.Pages(i).Overlay(rpt2.Document.Pages(0)) Next
C# code. Paste INSIDE the Form Load event.
rptData rpt = new rptData(); rpt.Run(); viewer1.Document = rpt.Document; rptLetterhead rpt2 = new rptLetterhead(); rpt2.Run(); for(int i = 0; i < rpt.Document.Pages.Count; i++) { rpt.Document.Pages[i].Overlay(rpt2.Document.Pages[0]);
ActiveReports 6 User Guide | 317

}
ActiveReports 6 User Guide | 318

Charts add quick visual impact to your reports, and allow data to be readily grasped even by casual readers. With a built-in chart control, ActiveReports makes it easy to provide premium reporting without the need to purchase extra tools.
Bar Chart Describes how to create a bar chart which compares items across categories.
3D Pie ChartDescribes how to create a three dimensional pie chart which shows how the percentage of each data item contributes to a total percentage.
Financial ChartDescribes how to create a financial chart which lets you plot high, low, opening, and closing prices.
Simple Unbound ChartDescribes how to create a simple unbound chart.
Chart Walkthroughs
ActiveReports 6 User Guide | 319
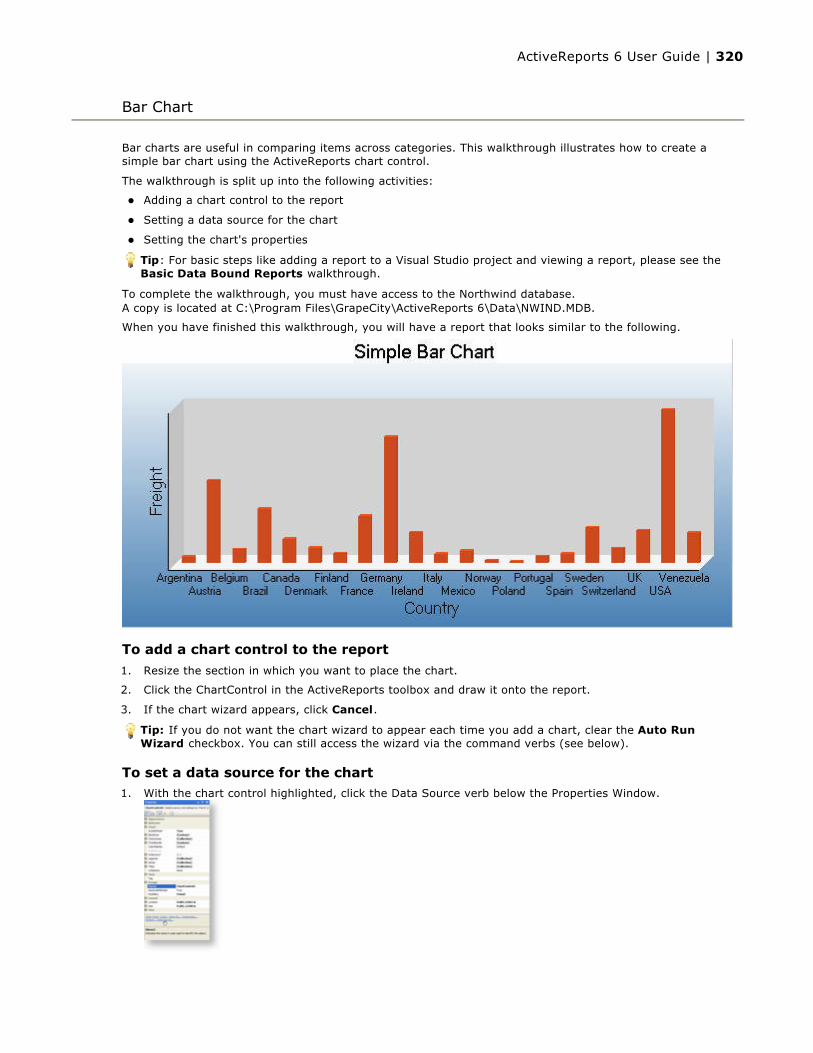
Bar charts are useful in comparing items across categories. This walkthrough illustrates how to create a simple bar chart using the ActiveReports chart control.
The walkthrough is split up into the following activities:
Adding a chart control to the report
Setting a data source for the chart
Setting the chart's properties
To complete the walkthrough, you must have access to the Northwind database.A copy is located at C:\Program Files\GrapeCity\ActiveReports 6\Data\NWIND.MDB.
When you have finished this walkthrough, you will have a report that looks similar to the following.
To add a chart control to the report
1. Resize the section in which you want to place the chart.
2. Click the ChartControl in the ActiveReports toolbox and draw it onto the report.
3. If the chart wizard appears, click Cancel.
To set a data source for the chart1. With the chart control highlighted, click the Data Source verb below the Properties Window.
Bar Chart
Tip: For basic steps like adding a report to a Visual Studio project and viewing a report, please see the Basic Data Bound Reports walkthrough.
Tip: If you do not want the chart wizard to appear each time you add a chart, clear the Auto Run Wizard checkbox. You can still access the wizard via the command verbs (see below).
ActiveReports 6 User Guide | 320

2. In the Chart DataSource dialog box that appears, click the Build button.
3. In the Data Link Properties window, select Microsoft Jet 4.0 OLE DB Provider and click the Nextbutton.
4. Click the ellipsis button (...) to browse to the Northwind database. Click Open once you have selected the file.
5. Click the OK button to close the window and fill in the Connection String.
6. In the Query field, enter the following SQL query
7. Click OK to save the data source and return to the report design surface.
To set the chart's properties
1. With the chart control highlighted, click the Customize verb below the Properties Window to open the Chart Designer window.
2. In the ChartAreas view which displays by default, click the Axes bar to expand it.
3. Click Axis X, and on the Common tab in the pane to the right, type Country in the Title textbox and increase the font size to 12.
4. Choose the Labels tab in the Axis Properties pane on the right, and select the Staggered Labels option to avoid overlapping labels.
5. Click Axis Y on the left, and on the Common tab in the pane to the right, type Freight in the Titletextbox and increase the font size to 12.
6. Click the Titles bar on the left to expand it and display Title Properties in the pane to the right. In the list of titles, header is selected by default.
7. Type Simple Bar Chart in the Caption textbox, and increase the font size to 14.
Tip: If the verb is not visible, right-click an empty space in the Properties Window and select Commands to display verbs.
SQL Query
SELECT ShipCountry, SUM(Freight) AS FreightSum FROM Orders GROUP BY ShipCountry
ActiveReports 6 User Guide | 321

8. Select the footer in the list of titles to the left, and delete it.
9. Click the Series bar on the left to expand it and display Series Properties in the pane to the right. Series1 is selected by default.
10. In the Data Binding box, set X (Name) to ShipCountry, and set Y to FreightSum.
11. Delete Series2 and Series3.
12. Click the Legend bar on the left to expand it and display Legend Properties in the pane to the right. defaultLegend is selected by default.
13. Clear the Visible checkbox at the top of the Common tab to hide the legend.
14. Click the Finish button to exit the Chart Designer.
ActiveReports 6 User Guide | 322

Pie charts are useful in showing how the percentage of each data item contributes to the total. This walkthrough illustrates how to create a three dimensional pie chart.
The walkthrough is split up into the following activities:
Adding a chart control to the report
Adding a series and data points to the chart
Setting the chart's properties
When you have finished this walkthrough, you will have a chart that looks similar to the following.
To add a chart control to the report1. Resize the section in which you want to place the chart.
2. Click the ChartControl icon in the ActiveReports toolbox and draw it onto the report.
3. If the chart wizard appears, click Cancel.
To add a series and data points to the chart1. With the chart control selected, click the Series (Collection) property in the Properties Window, then
click the ellipsis button (...) that appears.
2. In the Series Collection Editor window that appears, Series1 is selected by default.
3D Pie Chart
Tip: For basic steps like adding a report to a Visual Studio project and viewing a report, please see the Basic Data Bound Reports walkthrough.
Tip: If you do not want the chart wizard to appear each time you add a chart, clear the Auto Run Wizard checkbox. You can still access the wizard via the command verbs (see below).
ActiveReports 6 User Guide | 323
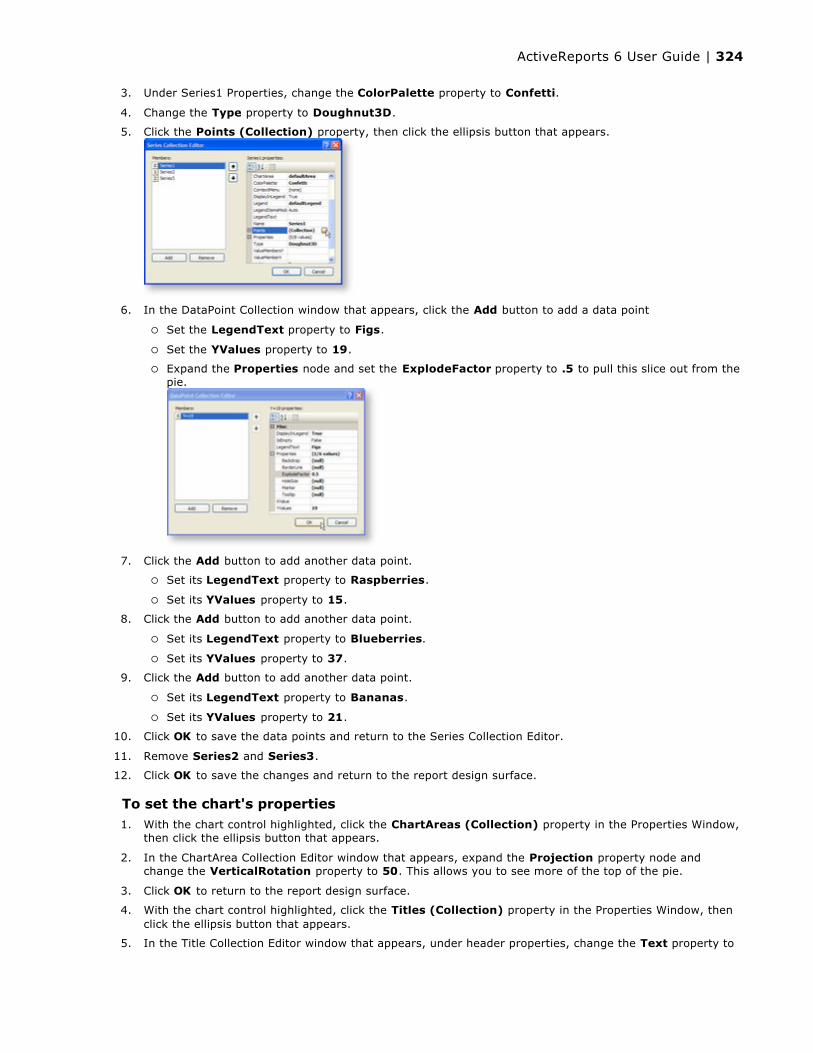
3. Under Series1 Properties, change the ColorPalette property to Confetti.
4. Change the Type property to Doughnut3D.
5. Click the Points (Collection) property, then click the ellipsis button that appears.
6. In the DataPoint Collection window that appears, click the Add button to add a data point
Set the LegendText property to Figs.
Set the YValues property to 19.
Expand the Properties node and set the ExplodeFactor property to .5 to pull this slice out from the pie.
7. Click the Add button to add another data point.
Set its LegendText property to Raspberries.
Set its YValues property to 15.
8. Click the Add button to add another data point.
Set its LegendText property to Blueberries.
Set its YValues property to 37.
9. Click the Add button to add another data point.
Set its LegendText property to Bananas.
Set its YValues property to 21.
10. Click OK to save the data points and return to the Series Collection Editor.
11. Remove Series2 and Series3.
12. Click OK to save the changes and return to the report design surface.
To set the chart's properties1. With the chart control highlighted, click the ChartAreas (Collection) property in the Properties Window,
then click the ellipsis button that appears.
2. In the ChartArea Collection Editor window that appears, expand the Projection property node and change the VerticalRotation property to 50. This allows you to see more of the top of the pie.
3. Click OK to return to the report design surface.
4. With the chart control highlighted, click the Titles (Collection) property in the Properties Window, then click the ellipsis button that appears.
5. In the Title Collection Editor window that appears, under header properties, change the Text property to
ActiveReports 6 User Guide | 324

3D Pie Chart.
6. Expand the Font property node and set the Size to 14 to make your title stand out more.
7. Remove the footer title.
8. Click OK to return to the report design surface.
ActiveReports 6 User Guide | 325
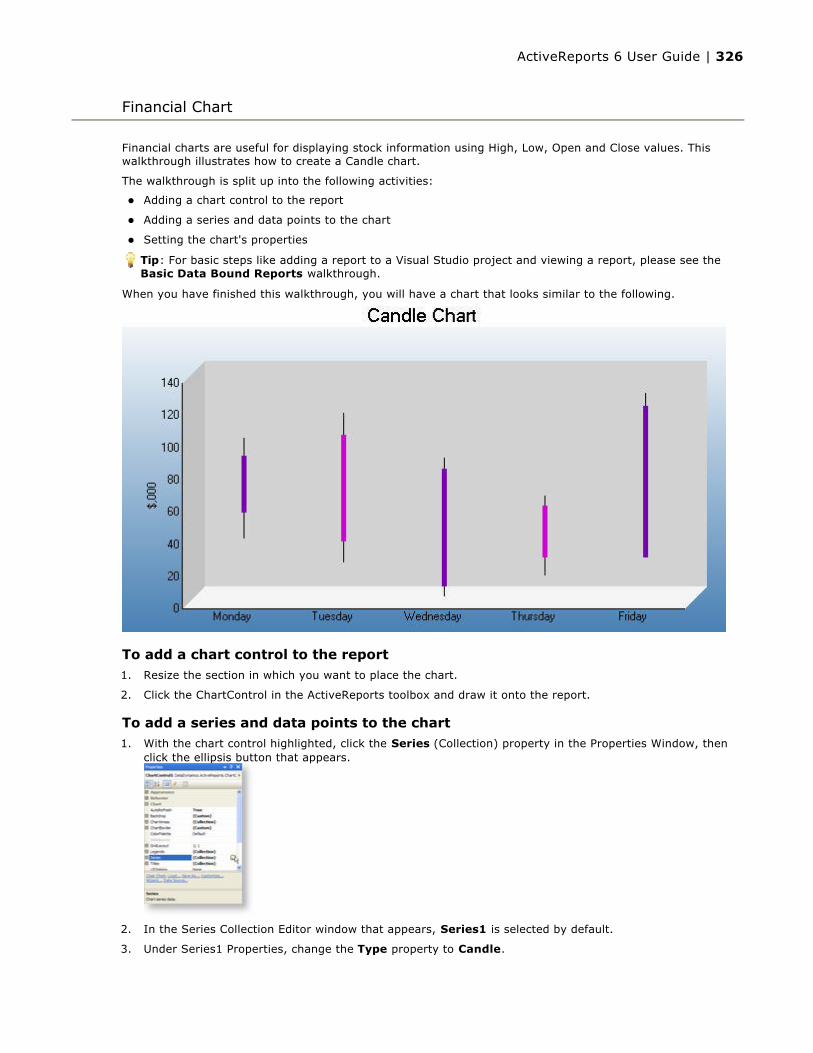
Financial charts are useful for displaying stock information using High, Low, Open and Close values. This walkthrough illustrates how to create a Candle chart.
The walkthrough is split up into the following activities:
Adding a chart control to the report
Adding a series and data points to the chart
Setting the chart's properties
When you have finished this walkthrough, you will have a chart that looks similar to the following.
To add a chart control to the report1. Resize the section in which you want to place the chart.
2. Click the ChartControl in the ActiveReports toolbox and draw it onto the report.
To add a series and data points to the chart1. With the chart control highlighted, click the Series (Collection) property in the Properties Window, then
click the ellipsis button that appears.
2. In the Series Collection Editor window that appears, Series1 is selected by default.
3. Under Series1 Properties, change the Type property to Candle.
Financial Chart
Tip: For basic steps like adding a report to a Visual Studio project and viewing a report, please see the Basic Data Bound Reports walkthrough.
ActiveReports 6 User Guide | 326
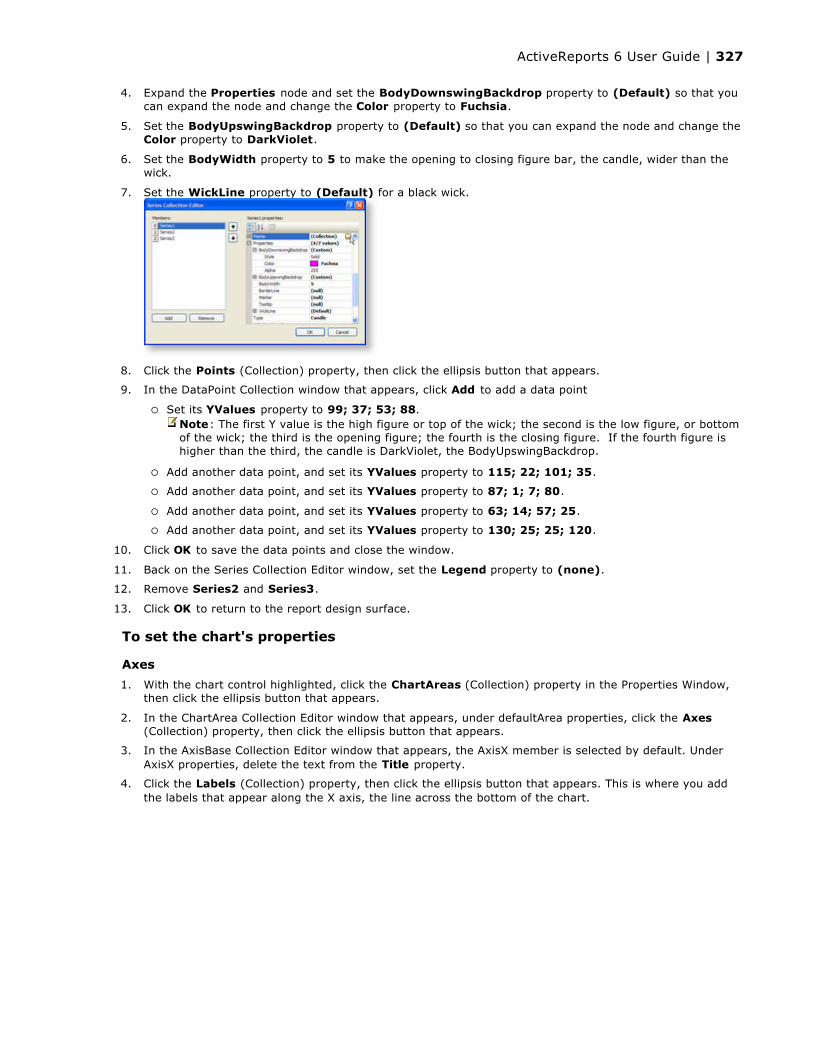
4. Expand the Properties node and set the BodyDownswingBackdrop property to (Default) so that you can expand the node and change the Color property to Fuchsia.
5. Set the BodyUpswingBackdrop property to (Default) so that you can expand the node and change the Color property to DarkViolet.
6. Set the BodyWidth property to 5 to make the opening to closing figure bar, the candle, wider than the wick.
7. Set the WickLine property to (Default) for a black wick.
8. Click the Points (Collection) property, then click the ellipsis button that appears.
9. In the DataPoint Collection window that appears, click Add to add a data point
Set its YValues property to 99; 37; 53; 88.
Add another data point, and set its YValues property to 115; 22; 101; 35.
Add another data point, and set its YValues property to 87; 1; 7; 80.
Add another data point, and set its YValues property to 63; 14; 57; 25.
Add another data point, and set its YValues property to 130; 25; 25; 120.
10. Click OK to save the data points and close the window.
11. Back on the Series Collection Editor window, set the Legend property to (none).
12. Remove Series2 and Series3.
13. Click OK to return to the report design surface.
To set the chart's properties
Axes
1. With the chart control highlighted, click the ChartAreas (Collection) property in the Properties Window, then click the ellipsis button that appears.
2. In the ChartArea Collection Editor window that appears, under defaultArea properties, click the Axes(Collection) property, then click the ellipsis button that appears.
3. In the AxisBase Collection Editor window that appears, the AxisX member is selected by default. Under AxisX properties, delete the text from the Title property.
4. Click the Labels (Collection) property, then click the ellipsis button that appears. This is where you add the labels that appear along the X axis, the line across the bottom of the chart.
Note: The first Y value is the high figure or top of the wick; the second is the low figure, or bottom of the wick; the third is the opening figure; the fourth is the closing figure. If the fourth figure is higher than the third, the candle is DarkViolet, the BodyUpswingBackdrop.
ActiveReports 6 User Guide | 327
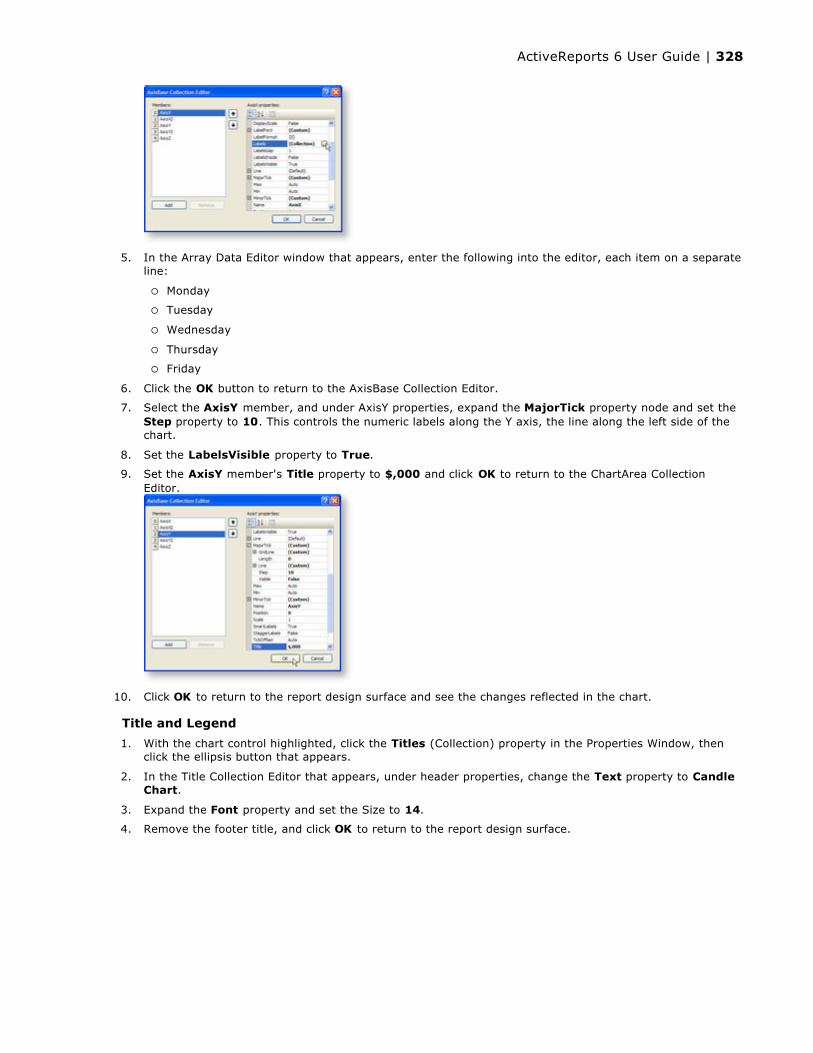
5. In the Array Data Editor window that appears, enter the following into the editor, each item on a separate line:
Monday
Tuesday
Wednesday
Thursday
Friday
6. Click the OK button to return to the AxisBase Collection Editor.
7. Select the AxisY member, and under AxisY properties, expand the MajorTick property node and set the Step property to 10. This controls the numeric labels along the Y axis, the line along the left side of the chart.
8. Set the LabelsVisible property to True.
9. Set the AxisY member's Title property to $,000 and click OK to return to the ChartArea Collection Editor.
10. Click OK to return to the report design surface and see the changes reflected in the chart.
Title and Legend
1. With the chart control highlighted, click the Titles (Collection) property in the Properties Window, then click the ellipsis button that appears.
2. In the Title Collection Editor that appears, under header properties, change the Text property to Candle Chart.
3. Expand the Font property and set the Size to 14.
4. Remove the footer title, and click OK to return to the report design surface.
ActiveReports 6 User Guide | 328

5. With the Chart control highlighted, click the Legends (Collection) property in the Properties Window, then click the ellipsis button that appears.
6. In the Legend Collection Editor window that appears, set the Visible property to False, and click OK to return to the report design surface and see the completed chart.
ActiveReports 6 User Guide | 329
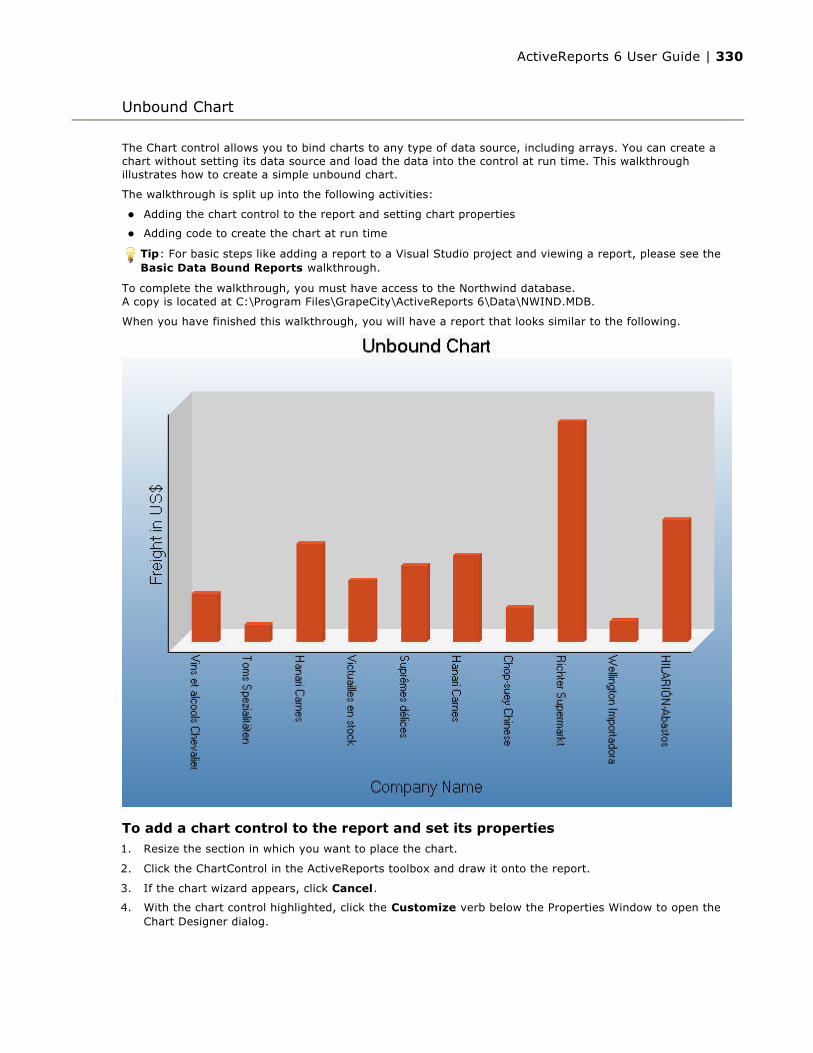
The Chart control allows you to bind charts to any type of data source, including arrays. You can create a chart without setting its data source and load the data into the control at run time. This walkthrough illustrates how to create a simple unbound chart.
The walkthrough is split up into the following activities:
Adding the chart control to the report and setting chart properties
Adding code to create the chart at run time
To complete the walkthrough, you must have access to the Northwind database.A copy is located at C:\Program Files\GrapeCity\ActiveReports 6\Data\NWIND.MDB.
When you have finished this walkthrough, you will have a report that looks similar to the following.
To add a chart control to the report and set its properties1. Resize the section in which you want to place the chart.
2. Click the ChartControl in the ActiveReports toolbox and draw it onto the report.
3. If the chart wizard appears, click Cancel.
4. With the chart control highlighted, click the Customize verb below the Properties Window to open the Chart Designer dialog.
Unbound Chart
Tip: For basic steps like adding a report to a Visual Studio project and viewing a report, please see the Basic Data Bound Reports walkthrough.
ActiveReports 6 User Guide | 330
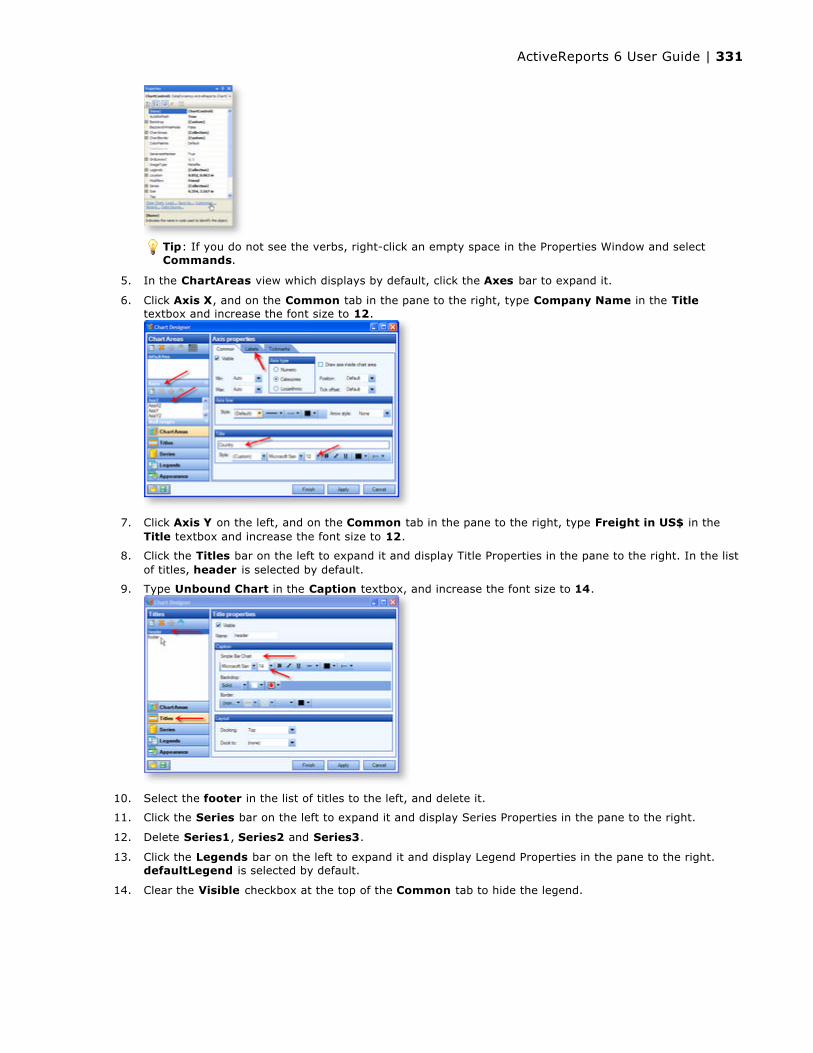
5. In the ChartAreas view which displays by default, click the Axes bar to expand it.
6. Click Axis X, and on the Common tab in the pane to the right, type Company Name in the Titletextbox and increase the font size to 12.
7. Click Axis Y on the left, and on the Common tab in the pane to the right, type Freight in US$ in the Title textbox and increase the font size to 12.
8. Click the Titles bar on the left to expand it and display Title Properties in the pane to the right. In the list of titles, header is selected by default.
9. Type Unbound Chart in the Caption textbox, and increase the font size to 14.
10. Select the footer in the list of titles to the left, and delete it.
11. Click the Series bar on the left to expand it and display Series Properties in the pane to the right.
12. Delete Series1, Series2 and Series3.
13. Click the Legends bar on the left to expand it and display Legend Properties in the pane to the right. defaultLegend is selected by default.
14. Clear the Visible checkbox at the top of the Common tab to hide the legend.
Tip: If you do not see the verbs, right-click an empty space in the Properties Window and select Commands.
ActiveReports 6 User Guide | 331

15. Click the Finish button to exit the Chart Designer.
Back on the design surface of the report, the chart appears empty except for the legends and title.
To write the code to create a chart at run time chart in Visual Basic or C#Double-click in the gray area below rptUnbound. This creates an event-handling method for rptUnboundChart's ReportStart event. Add code to the handler to:
Set the database path
Create the series
Create the dataset
Set the chart properties
Angle the labels to avoid overlap
The following examples show what the code for the methods look like in Visual Basic.NET and C#.
Important: Place this code above the ReportStart event.
Visual Basic.NET code. Paste JUST ABOVE the ReportStart event.
'Set the database path Private Function getDatabasePath() As String Dim regKey As Microsoft.Win32.RegistryKey regKey = Microsoft.Win32.Registry.LocalMachine regKey = regKey.CreateSubKey("SOFTWARE\\GrapeCity\\ActiveReports 6\\SampleDB") getDatabasePath = CType(regKey.GetValue(""), String) End FunctionVisual Basic.NET code. Paste INSIDE the ReportStart event.
'create the series Dim series As New DataDynamics.ActiveReports.Chart.Series series.Type = Chart.ChartType.Bar3D 'connection string and data adapter Dim dbPath As String = getDatabasePath() Dim connString As String = "Provider=Microsoft.Jet.OLEDB.4.0;Data Source= " + dbPath + "\\NWIND.mdb" Dim da As New System.Data.OleDb.OleDbDataAdapter("SELECT * from Orders WHERE OrderDate < #08/17/1994#", connString)
'create the dataset Dim ds As New DataSet da.Fill(ds, "Orders")
'set chart properties Me.ChartControl1.DataSource = ds Me.ChartControl1.Series.Add(series) Me.ChartControl1.Series(0).ValueMembersY = ds.Tables("Orders").Columns(7).ColumnName Me.ChartControl1.Series(0).ValueMemberX = ds.Tables("Orders").Columns(8).ColumnName
'angle the labels to avoid overlapping Me.ChartControl1.ChartAreas(0).Axes(0).LabelFont.Angle = 90C# code. Paste JUST ABOVE the ReportStart event.
ActiveReports 6 User Guide | 332
//Set the database path private string getDatabasePath() { Microsoft.Win32.RegistryKey regKey = Microsoft.Win32.Registry.LocalMachine; regKey = regKey.CreateSubKey("SOFTWARE\\GrapeCity\\ActiveReports 6\\SampleDB"); return ((string)(regKey.GetValue(""))); }C# code. Paste INSIDE the ReportStart event.
//create the series DataDynamics.ActiveReports.Chart.Series series = new DataDynamics.ActiveReports.Chart.Series(); series.Type = DataDynamics.ActiveReports.Chart.ChartType.Bar3D; //connection string and data adapter string dbPath = getDatabasePath(); string connString = "Provider=Microsoft.Jet.OLEDB.4.0;Data Source= " + dbPath + "\\NWIND.mdb"; System.Data.OleDb.OleDbDataAdapter da = new System.Data.OleDb.OleDbDataAdapter ("SELECT * from Orders WHERE OrderDate < #08/17/1994#", connString);
// create the dataset System.Data.DataSet ds = new System.Data.DataSet(); da.Fill(ds, "Orders");
// set chart properties this.chartControl1.DataSource = ds; this.chartControl1.Series.Add(series); this.chartControl1.Series[0].ValueMembersY = ds.Tables["Orders"].Columns[7].ColumnName; this.chartControl1.Series[0].ValueMemberX = ds.Tables["Orders"].Columns[8].ColumnName; // angle the labels to avoid overlapping this.chartControl1.ChartAreas[0].Axes[0].LabelFont.Angle = 90;
ActiveReports 6 User Guide | 333
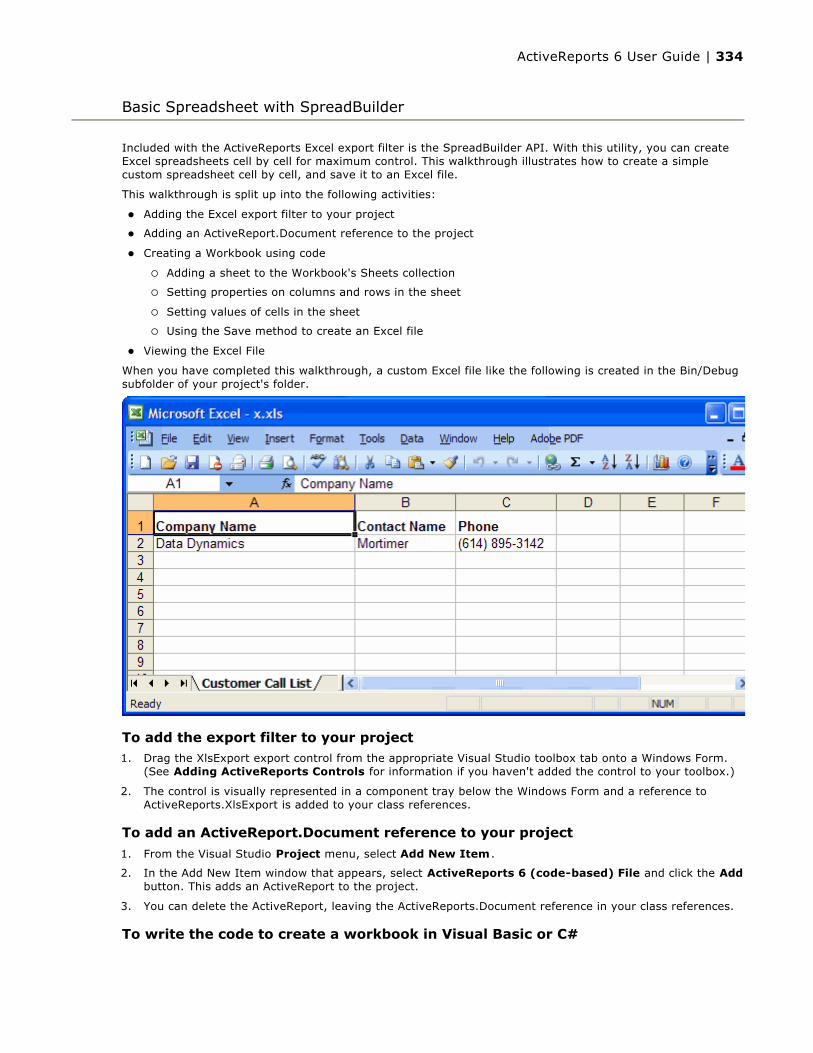
Included with the ActiveReports Excel export filter is the SpreadBuilder API. With this utility, you can create Excel spreadsheets cell by cell for maximum control. This walkthrough illustrates how to create a simple custom spreadsheet cell by cell, and save it to an Excel file.
This walkthrough is split up into the following activities:
Adding the Excel export filter to your project
Adding an ActiveReport.Document reference to the project
Creating a Workbook using code
Adding a sheet to the Workbook's Sheets collection
Setting properties on columns and rows in the sheet
Setting values of cells in the sheet
Using the Save method to create an Excel file
Viewing the Excel File
When you have completed this walkthrough, a custom Excel file like the following is created in the Bin/Debug subfolder of your project's folder.
To add the export filter to your project1. Drag the XlsExport export control from the appropriate Visual Studio toolbox tab onto a Windows Form.
(See Adding ActiveReports Controls for information if you haven't added the control to your toolbox.)
2. The control is visually represented in a component tray below the Windows Form and a reference to ActiveReports.XlsExport is added to your class references.
To add an ActiveReport.Document reference to your project
1. From the Visual Studio Project menu, select Add New Item .
2. In the Add New Item window that appears, select ActiveReports 6 (code-based) File and click the Addbutton. This adds an ActiveReport to the project.
3. You can delete the ActiveReport, leaving the ActiveReports.Document reference in your class references.
To write the code to create a workbook in Visual Basic or C#
Basic Spreadsheet with SpreadBuilder
ActiveReports 6 User Guide | 334

Double-click the title bar of the Windows Form to create an event-handling method for the Form_Load event. Add code to the handler to:
Create a Workbook, and add a sheet to the Workbook's Sheets collection
Set properties on columns and rows in the sheet
Set values of cells in the sheet
Use the Save method to create an Excel file
The following example shows what the code for the method looks like.
To write the code in Visual Basic.NET
To write the code in C#
Visual Basic.NET code. Paste inside the form Load event.
'Dimension a Workbook and add a sheet to its Sheets collection Dim sb As New DataDynamics.SpreadBuilder.Workbook() sb.Sheets.AddNew() 'Set up properties and values for columns, rows, and cells as desired With sb.Sheets(0) .Name = "Customer Call List" 'sets the name of the sheet .Columns(0).Width = 2 * 1440 'sets the width of the 1st column .Columns(1).Width = 1440 .Columns(2).Width = 1440 .Rows(0).Height = 1440 / 4 'Header row .Cell(0, 0).SetValue("Company Name") .Cell(0, 0).FontBold = True .Cell(0, 1).SetValue("Contact Name") .Cell(0, 1).FontBold = True .Cell(0, 2).SetValue("Phone") .Cell(0, 2).FontBold = True 'First row of data .Cell(1, 0).SetValue("GrapeCity") .Cell(1, 1).SetValue("Mortimer") .Cell(1, 2).SetValue("(425) 880-2601") End With 'Save the Workbook to an Excel file sb.Save(Application.StartupPath & "\x.xls") MessageBox.Show("Your Spreadsheet has been saved to " & Application.StartupPath & "\x.xls")
C# code. Paste inside the form Load event.
//Dimension a Workbook and add a sheet to its Sheets collection DataDynamics.SpreadBuilder.Workbook sb = new DataDynamics.SpreadBuilder.Workbook(); sb.Sheets.AddNew(); //Set up properties and values for columns, rows and cells as desired sb.Sheets[0].Name = "Customer Call List"; sb.Sheets[0].Columns(0).Width = 2 * 1440; sb.Sheets[0].Columns(1).Width = 1440; sb.Sheets[0].Columns(2).Width = 1440; sb.Sheets[0].Rows(0).Height = 1440/4; //Header row sb.Sheets[0].Cell(0,0).SetValue("Company Name"); sb.Sheets[0].Cell(0,0).FontBold = true; sb.Sheets[0].Cell(0,1).SetValue("Contact Name"); sb.Sheets[0].Cell(0,1).FontBold = true; sb.Sheets[0].Cell(0,2).SetValue("Phone"); sb.Sheets[0].Cell(0,2).FontBold = true; //First row of data sb.Sheets[0].Cell(1,0).SetValue("GrapeCity");
ActiveReports 6 User Guide | 335

To view the Excel File
1. Press F5 to run the project. A message box informs you of the exact location of the exported x.xls file.
2. Navigate to the Bin/Debug subfolder of your project's folder and open the XLS file.
sb.Sheets[0].Cell(1,1).SetValue("Mortimer"); sb.Sheets[0].Cell(1,2).SetValue("(425) 880-2601"); //Save the Workbook to an Excel file sb.Save (Application.StartupPath + @"\x.xls"); MessageBox.Show("Your Spreadsheet has been saved to " + Application.StartupPath + @"\x.xls");
ActiveReports 6 User Guide | 336
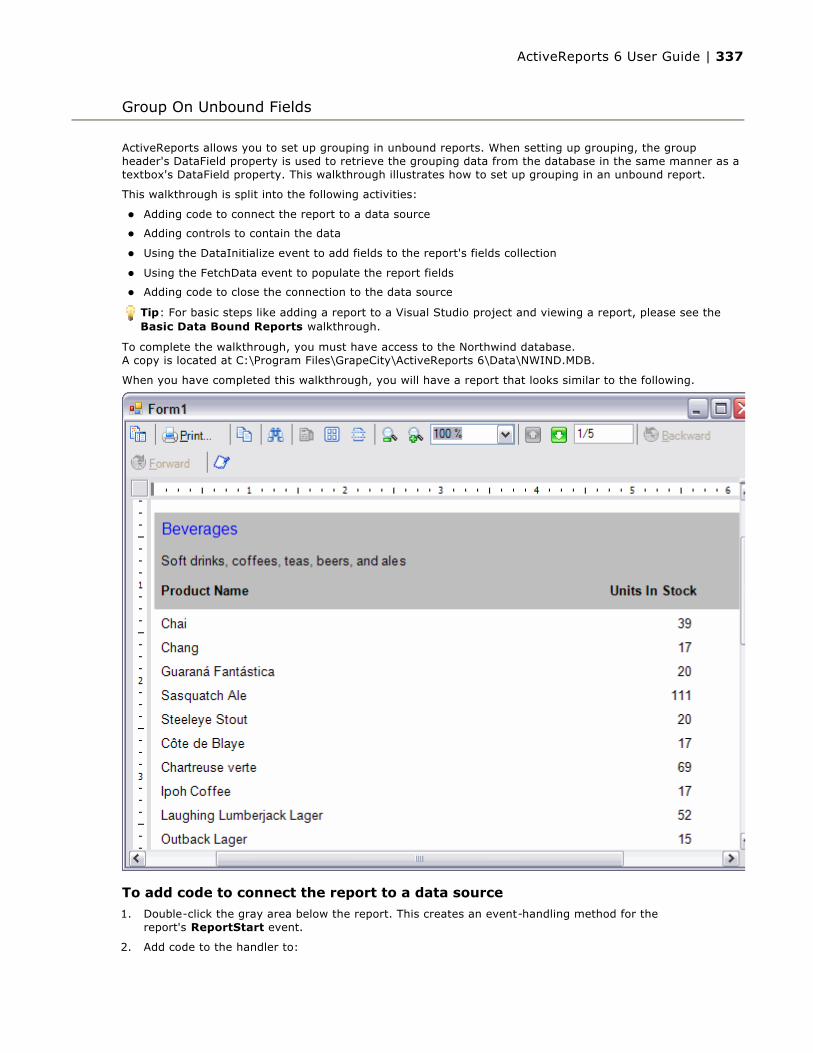
ActiveReports allows you to set up grouping in unbound reports. When setting up grouping, the group header's DataField property is used to retrieve the grouping data from the database in the same manner as a textbox's DataField property. This walkthrough illustrates how to set up grouping in an unbound report.
This walkthrough is split into the following activities:
Adding code to connect the report to a data source
Adding controls to contain the data
Using the DataInitialize event to add fields to the report's fields collection
Using the FetchData event to populate the report fields
Adding code to close the connection to the data source
To complete the walkthrough, you must have access to the Northwind database.A copy is located at C:\Program Files\GrapeCity\ActiveReports 6\Data\NWIND.MDB.
When you have completed this walkthrough, you will have a report that looks similar to the following.
To add code to connect the report to a data source
1. Double-click the gray area below the report. This creates an event-handling method for the report's ReportStart event.
2. Add code to the handler to:
Group On Unbound Fields
Tip: For basic steps like adding a report to a Visual Studio project and viewing a report, please see the Basic Data Bound Reports walkthrough.
ActiveReports 6 User Guide | 337

Set the data source connection string
Set the data source SQL query
Open the connection and retrieve the data with the data reader
The following examples show what the code for the method looks like in Visual Basic.NET and C#.
To write the code in Visual Basic.NET
To write the code in C#
To add controls to the report to contain data1. Back on the design surface of the report, right-click and select Insert, then Group Header/Footer to
add group header and footer sections.
2. Select the group header and make the following changes in the Properties Window.
Name: ghCategories
BackColor: Silver
CanShrink: True
DataField: CategoryID
GroupKeepTogether: All
KeepTogether: True
3. Select the group footer, and in the Properties Window, change the Name property to gfCategories.
4. Select the detail section, and in the Properties Window, change the CanShrink property to True.
5. Add the following controls to the GroupHeader section (drag the bottom edge of the section down to display all of the controls):
GroupHeader controls
Visual Basic.NET code. Paste JUST ABOVE the ReportStart event.
Dim connection As System.Data.OleDb.OleDbConnectionDim reader As System.Data.OleDb.OleDbDataReader Visual Basic.NET code. Paste INSIDE the ReportStart event.
'Create the data connection and change the data source path as necessary Dim connectionString As String connectionString = "Provider=Microsoft.Jet.OLEDB.4.0;Data Source=C:\Program Files\GrapeCity\ActiveReports 6\Data\NWIND.MDB" connection = New System.Data.OleDb.OleDbConnection(connectionString) connection.Open() Dim sqlString As String sqlString = "SELECT * FROM categories INNER JOIN products ON categories.categoryid= products.categoryid ORDER BY categories.CategoryID" Dim command As New System.Data.OleDb.OleDbCommand(sqlString, connection) 'Retrieve data reader = command.ExecuteReader()
C# code. Paste JUST ABOVE the ReportStart event.
private System.Data.OleDb.OleDbConnection connection;private System.Data.OleDb.OleDbDataReader reader;C# code. Paste INSIDE the ReportStart event.
//Create the data connection and change the data source path as necessarystring connectionString = @"Provider=Microsoft.Jet.OLEDB.4.0;Data Source=C:\Program Files\GrapeCity\ActiveReports 6\Data\NWIND.MDB";connection=new System.Data.OleDb.OleDbConnection(connectionString);connection.Open();
string sqlString = "SELECT * FROM categories INNER JOIN products ON categories.categoryid = products.categoryid ORDER BY categories.CategoryID";System.Data.OleDb.OleDbCommand command = new System.Data.OleDb.OleDbCommand(sqlString, connection);
//Retrieve datareader = command.ExecuteReader();
Control DataField Name Text Miscellaneous Location
ActiveReports 6 User Guide | 338

6. Add the following controls to the Detail section:
Detail controls
7. Add the following controls to the GroupFooter section:
GroupFooter controls
To add fields using the DataInitialize event
To write the code in Visual Basic
1. Right-click in any section of the design surface of the report, and select View Code to display the code view for the report.
2. At the top left of the code view of the report, click the drop-down arrow and select (YourReportName Events).
3. At the top right of the code window, click the drop-down arrow and select DataInitialize. This creates an event-handling method for the report's DataInitialize event.
4. Add code to the handler to add fields to the report's Fields collection.
The following example shows what the code for the method looks like.
To write the code in C#
1. Click in the gray area below the report to select it.
2. Click the events icon in the Properties Window to display available events for the report.
3. Double-click DataInitialize. This creates an event-handling method for the report's DataInitialize event.
4. Add code to the handler to add fields to the report's Fields collection.
The following example shows what the code for the method looks like.
TextBoxCategoryName txtCategoryName Category NameForeColor = BlueBackColor = SilverFont size = 12
0, 0 in
TextBoxDescription txtDescription Description Size = 6, 0.198 0, 0.3 inLabel lblProductName Product Name Bold 0, 0.6 in
Label lblUnitsInStock Units In StockBoldAlignment = Right 4.4, 0.6 in
Control DataField Name Miscellaneous Text LocationTextBoxProductName txtProductName Size = 4, 0.198 in Product Name 0, 0 inTextBoxUnitsInStock txtUnitsInStock Alignment = Right Units In Stock4.4, 0 in
Control Miscellaneous Name Text Miscellaneous Location
Label lblTotalLabel Total Number of Beverages
Size = 1.8, 0.198 in 2, 0 in
TextBoxDataField = ProductNameAlignment = Right
txtTotalItems Total Items
SummaryType = SubTotalSummaryFunc = CountSummaryRunning = GroupSummaryGroup = ghCategories
4.4, 0
Line Line1 LineWeight = 3
X1 = 1.88 X2 = 6.44Y1 = 0Y2 = 0
Warning: Do not access the Fields collection outside the DataInitialize and FetchData events. Accessing the Fields collection outside of these events is not supported, and has unpredictable results.
Visual Basic.NET code. Paste INSIDE the DataInitialize event.
Fields.Add("CategoryID") Fields.Add("CategoryName") Fields.Add("ProductName") Fields.Add("UnitsInStock") Fields.Add("Description") Fields.Add("TotalLabel")
ActiveReports 6 User Guide | 339
To populate the fields using the FetchData eventTo write the code in Visual Basic
1. At the top left of the code view for the report, click the drop-down arrow and select (YourReportNameEvents).
2. At the top right of the code window, click the drop-down arrow and select FetchData. This creates an event-handling method for the report's FetchData event.
3. Add code to the handler to retrieve information to populate the report fields.
The following example shows what the code for the method looks like.
To write the code in C#
1. Back in design view, click in the gray area below the report to select it.
2. Click the events icon in the Properties window to display available events for the report.
3. Double-click FetchData. This creates an event-handling method for the report's FetchData event.
4. Add code to the handler to retrieve information to populate the report fields.
The following example shows what the code for the method looks like.
Adding code to close the connection to the data sourceTo write the code in Visual Basic
1. At the top left of the code view for the report, click the drop-down arrow and select (YourReportNameEvents).
C# code. Paste INSIDE the DataInitialize event.
Fields.Add("CategoryID");Fields.Add("CategoryName");Fields.Add("ProductName");Fields.Add("UnitsInStock");Fields.Add("Description");Fields.Add("TotalLabel");
Visual Basic.NET code. Paste INSIDE the FetchData event.
Try reader.Read() Me.Fields("CategoryID").Value = reader("categories.CategoryID") Me.Fields("CategoryName").Value = reader("CategoryName") Me.Fields("ProductName").Value = reader("ProductName") Me.Fields("UnitsInStock").Value = reader("UnitsInStock") Me.Fields("Description").Value = reader("Description") Me.Fields("TotalLabel").Value = "Total Number of " + reader("CategoryName") + ":" eArgs.EOF = FalseCatch eArgs.EOF = TrueEnd Try
C# code. Paste INSIDE the FetchData event.
try { reader.Read(); Fields["CategoryID"].Value = reader["categories.CategoryID"].ToString(); Fields["CategoryName"].Value = reader["CategoryName"].ToString(); Fields["ProductName"].Value = reader["ProductName"].ToString(); Fields["UnitsInStock"].Value = reader["UnitsInStock"].ToString(); Fields["Description"].Value = reader["Description"].ToString(); Fields["TotalLabel"].Value = "Total Number of " + reader["CategoryName"].ToString() + ":"; eArgs.EOF = false; }catch { eArgs.EOF = true; }
ActiveReports 6 User Guide | 340

2. At the top right of the code window, click the drop-down arrow and select ReportEnd. This creates an event-handling method for the report's ReportEnd event.
3. Add code to the handler to close the connection.
To write the code in C#
1. Back in design view, click in the gray area below the report to select it.
2. Click the events icon in the Properties window to display available events for the report.
3. Double-click ReportEnd. This creates an event-handling method for the report's ReportEnd event.
4. Add code to the handler to close the connection.
The following example shows what the code for the method looks like.
Visual Basic.NET code. Paste INSIDE the ReportEnd event.
reader.Close() connection.Close()
C# code. Paste INSIDE the ReportEnd event.
reader.Close();connection.Close();
ActiveReports 6 User Guide | 341

Follow step-by-step tutorials as you create Visual Studio projects using the ActiveReports subreport control. You can use the subreport control to embed a report within another report. Subreports are executed each time the parent section (i.e. the section in which the Subreport control is placed) is printed. Some ways to use subreports include:
Repeating a group of relational data (for example, a list of orders in the main report, with ordered items in the subreport)
Using multiple data sources within a report
Creating multiple detail sections within a report
This section contains information about how to:
Subreports with Run-Time Data SourcesLearn how to embed a subreport in a main report, passing the data source from the main report to the subreport at run time.
Nested SubreportsLearn how to nest subreports to display main, child, and grandchild levels in a report.
Subreports with XML DataLearn how to use XML data with subreports.
Subreport Walkthroughs
ActiveReports 6 User Guide | 342

ActiveReports allows reports to contain any number of child reports using the Subreport control. Child reports, or subreports, are executed each time the parent section (i.e. the section in which the Subreport control is placed) is processed. This walkthrough illustrates how to modify the subreport record source from the data in the parent report to retrieve the correct information.
This walkthrough is split up into the following activities:
Adding a main report and a subreport to a Visual Studio project
Connecting the main report to a data source
Adding controls to the main report to display data and contain the subreport
Adding controls to the subreport to display data
Adding code to save the current record's CategoryID for use in the subreport's SQL query
Adding code to create an instance of the subreport
Adding code to assign a data source for the subreport
To complete the walkthrough, you must have access to the Northwind database.A copy is located at C:\Program Files\GrapeCity\ActiveReports 6\Data\NWIND.MDB.
When you have finished this walkthrough, you will have a report that looks similar to the following.
Subreports with Run-Time Data Sources
ActiveReports 6 User Guide | 343

To add a main report and a subreport to a Visual Studio project1. Open a new project in Visual Studio.
2. From the Project menu, select Add New Item .
3. Select ActiveReports 6 (code-based) File and rename the file rptMain.
4. Click Open .
5. Add a second report named rptSub.
To connect the main report to a data source1. Click the gray report DataSource icon on the Detail section band of rptMain to open the Report Data
Source dialog.
ActiveReports 6 User Guide | 344
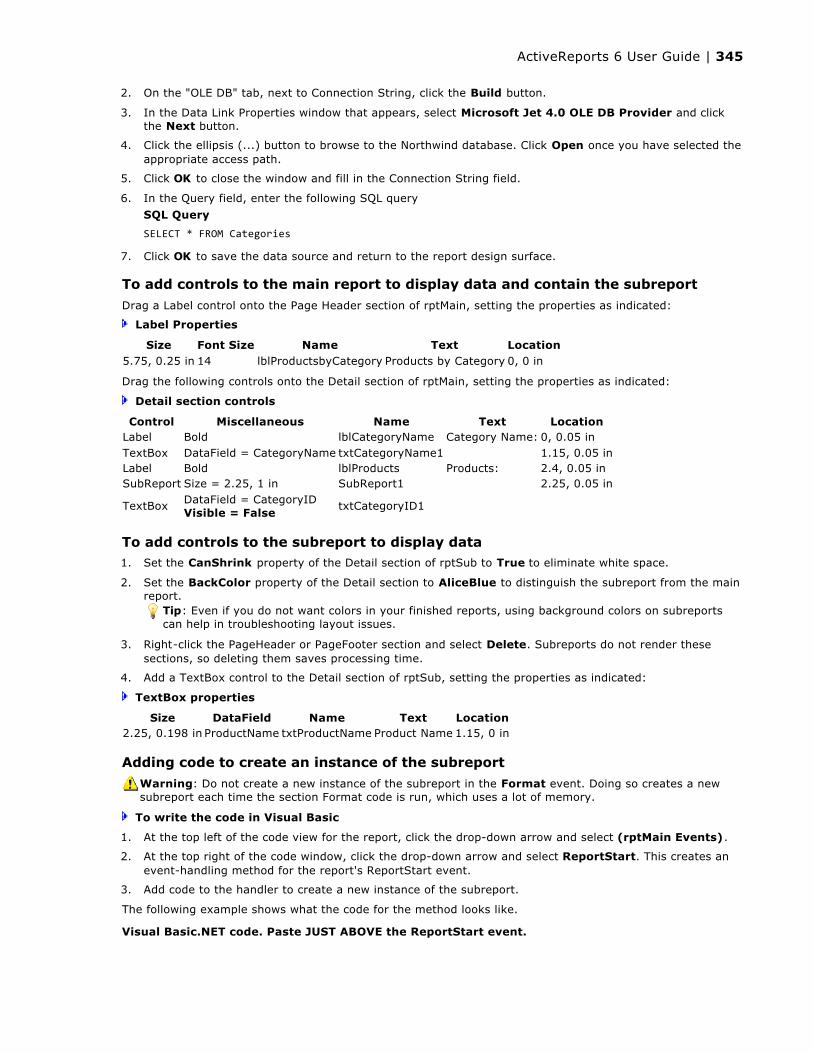
2. On the "OLE DB" tab, next to Connection String, click the Build button.
3. In the Data Link Properties window that appears, select Microsoft Jet 4.0 OLE DB Provider and click the Next button.
4. Click the ellipsis (...) button to browse to the Northwind database. Click Open once you have selected the appropriate access path.
5. Click OK to close the window and fill in the Connection String field.
6. In the Query field, enter the following SQL query
7. Click OK to save the data source and return to the report design surface.
To add controls to the main report to display data and contain the subreport
Drag a Label control onto the Page Header section of rptMain, setting the properties as indicated:
Label Properties
Drag the following controls onto the Detail section of rptMain, setting the properties as indicated:
Detail section controls
To add controls to the subreport to display data1. Set the CanShrink property of the Detail section of rptSub to True to eliminate white space.
2. Set the BackColor property of the Detail section to AliceBlue to distinguish the subreport from the main report.
3. Right-click the PageHeader or PageFooter section and select Delete. Subreports do not render these sections, so deleting them saves processing time.
4. Add a TextBox control to the Detail section of rptSub, setting the properties as indicated:
TextBox properties
Adding code to create an instance of the subreport
To write the code in Visual Basic
1. At the top left of the code view for the report, click the drop-down arrow and select (rptMain Events).
2. At the top right of the code window, click the drop-down arrow and select ReportStart. This creates an event-handling method for the report's ReportStart event.
3. Add code to the handler to create a new instance of the subreport.
The following example shows what the code for the method looks like.
SQL Query
SELECT * FROM Categories
Size Font Size Name Text Location5.75, 0.25 in 14 lblProductsbyCategory Products by Category 0, 0 in
Control Miscellaneous Name Text LocationLabel Bold lblCategoryName Category Name: 0, 0.05 inTextBox DataField = CategoryName txtCategoryName1 1.15, 0.05 inLabel Bold lblProducts Products: 2.4, 0.05 inSubReport Size = 2.25, 1 in SubReport1 2.25, 0.05 in
TextBox DataField = CategoryIDVisible = False
txtCategoryID1
Tip: Even if you do not want colors in your finished reports, using background colors on subreports can help in troubleshooting layout issues.
Size DataField Name Text Location2.25, 0.198 in ProductName txtProductName Product Name 1.15, 0 in
Warning: Do not create a new instance of the subreport in the Format event. Doing so creates a new subreport each time the section Format code is run, which uses a lot of memory.
Visual Basic.NET code. Paste JUST ABOVE the ReportStart event.
ActiveReports 6 User Guide | 345
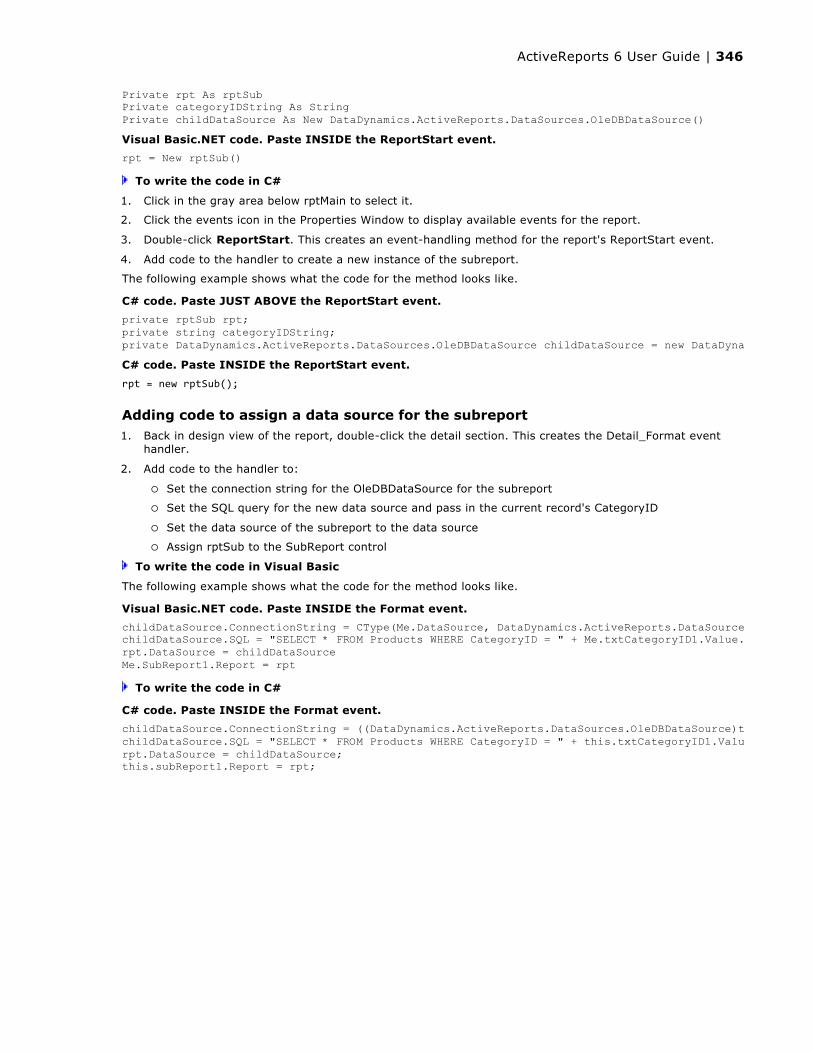
To write the code in C#
1. Click in the gray area below rptMain to select it.
2. Click the events icon in the Properties Window to display available events for the report.
3. Double-click ReportStart. This creates an event-handling method for the report's ReportStart event.
4. Add code to the handler to create a new instance of the subreport.
The following example shows what the code for the method looks like.
Adding code to assign a data source for the subreport1. Back in design view of the report, double-click the detail section. This creates the Detail_Format event
handler.
2. Add code to the handler to:
Set the connection string for the OleDBDataSource for the subreport
Set the SQL query for the new data source and pass in the current record's CategoryID
Set the data source of the subreport to the data source
Assign rptSub to the SubReport control
To write the code in Visual Basic
The following example shows what the code for the method looks like.
To write the code in C#
Private rpt As rptSubPrivate categoryIDString As StringPrivate childDataSource As New DataDynamics.ActiveReports.DataSources.OleDBDataSource()Visual Basic.NET code. Paste INSIDE the ReportStart event.
rpt = New rptSub()
C# code. Paste JUST ABOVE the ReportStart event.
private rptSub rpt;private string categoryIDString;private DataDynamics.ActiveReports.DataSources.OleDBDataSource childDataSource = new DataDynamics.ActiveReports.DataSources.OleDBDataSource();C# code. Paste INSIDE the ReportStart event.
rpt = new rptSub();
Visual Basic.NET code. Paste INSIDE the Format event.
childDataSource.ConnectionString = CType(Me.DataSource, DataDynamics.ActiveReports.DataSources.OleDBDataSource).ConnectionStringchildDataSource.SQL = "SELECT * FROM Products WHERE CategoryID = " + Me.txtCategoryID1.Value.ToStringrpt.DataSource = childDataSourceMe.SubReport1.Report = rpt
C# code. Paste INSIDE the Format event.
childDataSource.ConnectionString = ((DataDynamics.ActiveReports.DataSources.OleDBDataSource)this.DataSource).ConnectionString;childDataSource.SQL = "SELECT * FROM Products WHERE CategoryID = " + this.txtCategoryID1.Value.ToString();rpt.DataSource = childDataSource;this.subReport1.Report = rpt;
ActiveReports 6 User Guide | 346

When setting up embedded subreports in ActiveReports, the principles are the same as when setting up simple subreports but are applied to the child-grandchild reports. This walkthrough illustrates how to set up embedded subreports.
This walkthrough is split up into the following activities:
Creating parent, child, and grandparent reports
Connecting each report to a data source
Adding controls to each report to display the data
Adding code to display reports in the subreport controls
To complete the walkthrough, you must have access to the Northwind database.A copy is located at C:\Program Files\GrapeCity\ActiveReports 6\Data\NWIND.MDB.
When you have finished this walkthrough, you will have a report that looks similar to the following.
To create parent, child, and grandchild reports
1. Open a new project in Visual Studio.
2. From the Project menu, select Add New Item .
3. Select ActiveReports 6 (code-based) File and rename the file rptEmployees.
4. Click Open .
5. Repeat for rptCustomers and rptOrders.
To connect the parent report, rptEmployees, to a data source
1. Click the gray report DataSource icon on the Detail section band to open the Report Data Source dialog.
Nested Subreports
Tip: For basic steps like viewing a report, please see the Basic Data Bound Reports walkthrough.
ActiveReports 6 User Guide | 347
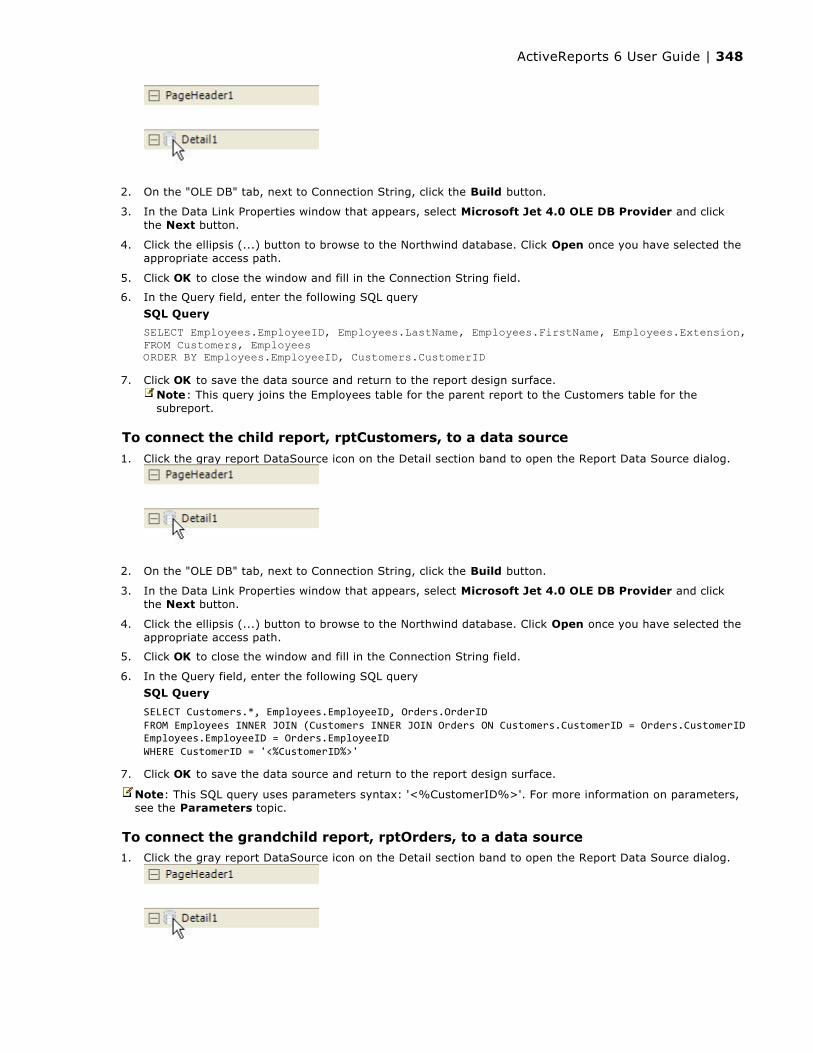
2. On the "OLE DB" tab, next to Connection String, click the Build button.
3. In the Data Link Properties window that appears, select Microsoft Jet 4.0 OLE DB Provider and click the Next button.
4. Click the ellipsis (...) button to browse to the Northwind database. Click Open once you have selected the appropriate access path.
5. Click OK to close the window and fill in the Connection String field.
6. In the Query field, enter the following SQL query
7. Click OK to save the data source and return to the report design surface.
To connect the child report, rptCustomers, to a data source
1. Click the gray report DataSource icon on the Detail section band to open the Report Data Source dialog.
2. On the "OLE DB" tab, next to Connection String, click the Build button.
3. In the Data Link Properties window that appears, select Microsoft Jet 4.0 OLE DB Provider and click the Next button.
4. Click the ellipsis (...) button to browse to the Northwind database. Click Open once you have selected the appropriate access path.
5. Click OK to close the window and fill in the Connection String field.
6. In the Query field, enter the following SQL query
7. Click OK to save the data source and return to the report design surface.
To connect the grandchild report, rptOrders, to a data source1. Click the gray report DataSource icon on the Detail section band to open the Report Data Source dialog.
SQL Query
SELECT Employees.EmployeeID, Employees.LastName, Employees.FirstName, Employees.Extension, Customers.CustomerIDFROM Customers, EmployeesORDER BY Employees.EmployeeID, Customers.CustomerID
Note: This query joins the Employees table for the parent report to the Customers table for the subreport.
SQL Query
SELECT Customers.*, Employees.EmployeeID, Orders.OrderIDFROM Employees INNER JOIN (Customers INNER JOIN Orders ON Customers.CustomerID = Orders.CustomerID) ON Employees.EmployeeID = Orders.EmployeeIDWHERE CustomerID = '<%CustomerID%>'
Note: This SQL query uses parameters syntax: '<%CustomerID%>'. For more information on parameters, see the Parameters topic.
ActiveReports 6 User Guide | 348

2. On the "OLE DB" tab, next to Connection String, click the Build button.
3. In the Data Link Properties window that appears, select Microsoft Jet 4.0 OLE DB Provider and click the Next button.
4. Click the ellipsis (...) button to browse to the Northwind database. Click Open once you have selected the appropriate access path.
5. Click OK to close the window and fill in the Connection String field.
6. In the Query field, enter the following SQL query
7. Click OK to save the data source and return to the report design surface.
To add controls to the parent report, rptEmployees, to display data
1. Right-click on the design surface of rptEmployees and select Insert, then Group Header/Footer to add a group header and a group footer section to the report.
2. With the group header selected in the Properties Window, make the following changes:
Name: ghEmployees
DataField: EmployeeID
Height: 0.6
3. Set the Height property of the page header section to 0.3 .
4. Set the CanShrink property of the Detail section to True to eliminate white space.
5. In the Report Explorer, expand the Fields node, then the Bound node. Drag the following fields onto the group header section and set the properties of each textbox as indicated.
Group header fields
6. Drag the following controls from the ActiveReports Toolbox onto the indicated section of rptEmployees, setting the properties as indicated.
Other controls
To add controls to the child report, rptCustomers, to display dataSince the subreport control in the parent report that displays this report is 5.4 inches wide, none of the controls on this report extend beyond 5.4 inches. If you need a visual reminder, you can resize the child report by dragging the right edge inward or by changing the PrintWidth property.
1. Click in the gray area below rptCustomers to select the report.
2. In the Properties Window, change the ShowParametersUI property to False. This prevents the subreport from requesting parameter values from the user.
3. Select the Detail section and set the CanShrink property to True to eliminate white space.
4. Set the BackColor property of the Detail section to AliceBlue to distinguish the subreport from the main
SQL Query
SELECT * FROM Orders WHERE EmployeeID = <%EmployeeID%>
DataField Name Location SizeEmployeeID txtEmployeeID1 0, 0.3 in 1, 0.2 inLastName txtLastName1 1.05, 0.3 in 1.35, 0.2 inFirstName txtFirstName1 2.5, 0.3 in 1.3, 0.2 inExtension txtExtension1 3.85, 0.3 in 1, 0.2 in
Control Section Name Text Miscellaneous Location Size
Label PageHeader label1Customer Orders by Employee
Font size = 14Alignment = Center
0, 0 in 6.5, 0.25 in
Label GroupHeader label2 Employee ID Bold 0, 0 in 1, 0.198 inLabel GroupHeader label3 Last Name Bold 1.05, 0 in 1, 0.198 inLabel GroupHeader label4 First Name Bold 2.5, 0 in 1, 0.198 inLabel GroupHeader label5 Extension Bold 3.85, 0 in 1, 0.198 inSubreport Detail subReport1 1.05, 0 in 5.4, 1 in
ActiveReports 6 User Guide | 349
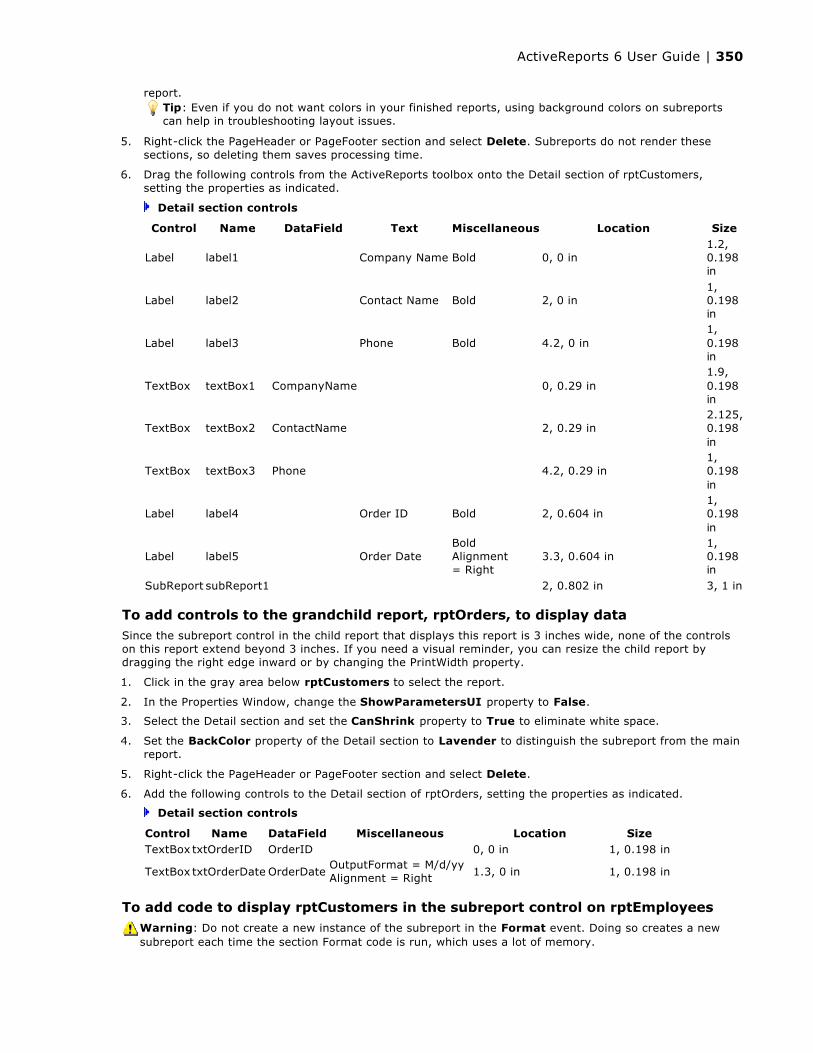
report.
5. Right-click the PageHeader or PageFooter section and select Delete. Subreports do not render these sections, so deleting them saves processing time.
6. Drag the following controls from the ActiveReports toolbox onto the Detail section of rptCustomers, setting the properties as indicated.
Detail section controls
To add controls to the grandchild report, rptOrders, to display dataSince the subreport control in the child report that displays this report is 3 inches wide, none of the controls on this report extend beyond 3 inches. If you need a visual reminder, you can resize the child report by dragging the right edge inward or by changing the PrintWidth property.
1. Click in the gray area below rptCustomers to select the report.
2. In the Properties Window, change the ShowParametersUI property to False.
3. Select the Detail section and set the CanShrink property to True to eliminate white space.
4. Set the BackColor property of the Detail section to Lavender to distinguish the subreport from the main report.
5. Right-click the PageHeader or PageFooter section and select Delete.
6. Add the following controls to the Detail section of rptOrders, setting the properties as indicated.
Detail section controls
To add code to display rptCustomers in the subreport control on rptEmployees
Tip: Even if you do not want colors in your finished reports, using background colors on subreports can help in troubleshooting layout issues.
Control Name DataField Text Miscellaneous Location Size
Label label1 Company Name Bold 0, 0 in1.2, 0.198 in
Label label2 Contact Name Bold 2, 0 in1, 0.198 in
Label label3 Phone Bold 4.2, 0 in1, 0.198 in
TextBox textBox1 CompanyName 0, 0.29 in1.9, 0.198 in
TextBox textBox2 ContactName 2, 0.29 in2.125, 0.198 in
TextBox textBox3 Phone 4.2, 0.29 in1, 0.198 in
Label label4 Order ID Bold 2, 0.604 in1, 0.198 in
Label label5 Order DateBoldAlignment = Right
3.3, 0.604 in1, 0.198 in
SubReport subReport1 2, 0.802 in 3, 1 in
Control Name DataField Miscellaneous Location SizeTextBox txtOrderID OrderID 0, 0 in 1, 0.198 in
TextBox txtOrderDate OrderDateOutputFormat = M/d/yyAlignment = Right 1.3, 0 in 1, 0.198 in
Warning: Do not create a new instance of the subreport in the Format event. Doing so creates a new subreport each time the section Format code is run, which uses a lot of memory.
ActiveReports 6 User Guide | 350
To write the code in Visual Basic
1. At the top left of the code view for the report, click the drop-down arrow and select (rptEmployees Events).
2. At the top right of the code window, click the drop-down arrow and select ReportStart. This creates an event-handling method for the report's ReportStart event.
3. Add code to the handler to create a new instance of the subreport.
The following example shows what the code for the method looks like.
To write the code in C#
1. Click in the gray area below rptEmployees to select it.
2. Click the events icon in the Properties Window to display available events for the report.
3. Double-click ReportStart. This creates an event-handling method for the report's ReportStart event.
4. Add code to the handler to create a new instance of the subreport.
The following example shows what the code for the method looks like.
To add code to display rptOrders in the subreport control on rptCustomersTo write the code in Visual Basic
1. At the top left of the code view for the report, click the drop-down arrow and select (rptCustomers Events).
2. At the top right of the code window, click the drop-down arrow and select ReportStart. This creates an event-handling method for the report's ReportStart event.
3. Add code to the handler to create a new instance of the subreport.
The following example shows what the code for the method looks like.
To write the code in C#
1. Click in the gray area below rptCustomers to select it.
2. Click the events icon in the Properties Window to display available events for the report.
3. Double-click ReportStart. This creates an event-handling method for the report's ReportStart event.
4. Add code to the handler to create a new instance of the subreport.
The following example shows what the code for the method looks like.
Visual Basic.NET code. Paste INSIDE the ReportStart event.
Me.subReport1.Report = New rptCustomers()
C# code. Paste INSIDE the ReportStart event.
this.subReport1.Report = new rptCustomers();
Visual Basic.NET code. Paste INSIDE the ReportStart event.
Me.SubReport1.Report = New rptOrders()
C# code. Paste INSIDE the ReportStart event.
this.subReport1.Report = new rptOrders();
ActiveReports 6 User Guide | 351
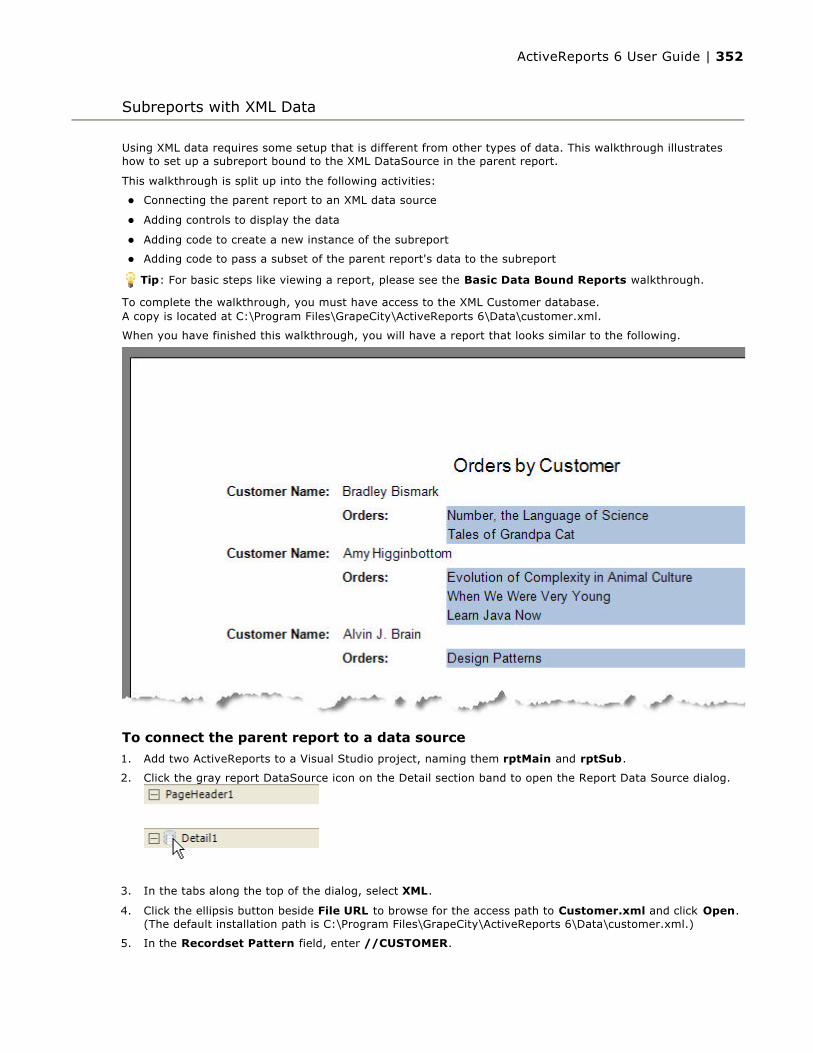
Using XML data requires some setup that is different from other types of data. This walkthrough illustrates how to set up a subreport bound to the XML DataSource in the parent report.
This walkthrough is split up into the following activities:
Connecting the parent report to an XML data source
Adding controls to display the data
Adding code to create a new instance of the subreport
Adding code to pass a subset of the parent report's data to the subreport
To complete the walkthrough, you must have access to the XML Customer database.A copy is located at C:\Program Files\GrapeCity\ActiveReports 6\Data\customer.xml.
When you have finished this walkthrough, you will have a report that looks similar to the following.
To connect the parent report to a data source
1. Add two ActiveReports to a Visual Studio project, naming them rptMain and rptSub.
2. Click the gray report DataSource icon on the Detail section band to open the Report Data Source dialog.
3. In the tabs along the top of the dialog, select XML.
4. Click the ellipsis button beside File URL to browse for the access path to Customer.xml and click Open. (The default installation path is C:\Program Files\GrapeCity\ActiveReports 6\Data\customer.xml.)
5. In the Recordset Pattern field, enter //CUSTOMER.
Subreports with XML Data
Tip: For basic steps like viewing a report, please see the Basic Data Bound Reports walkthrough.
ActiveReports 6 User Guide | 352
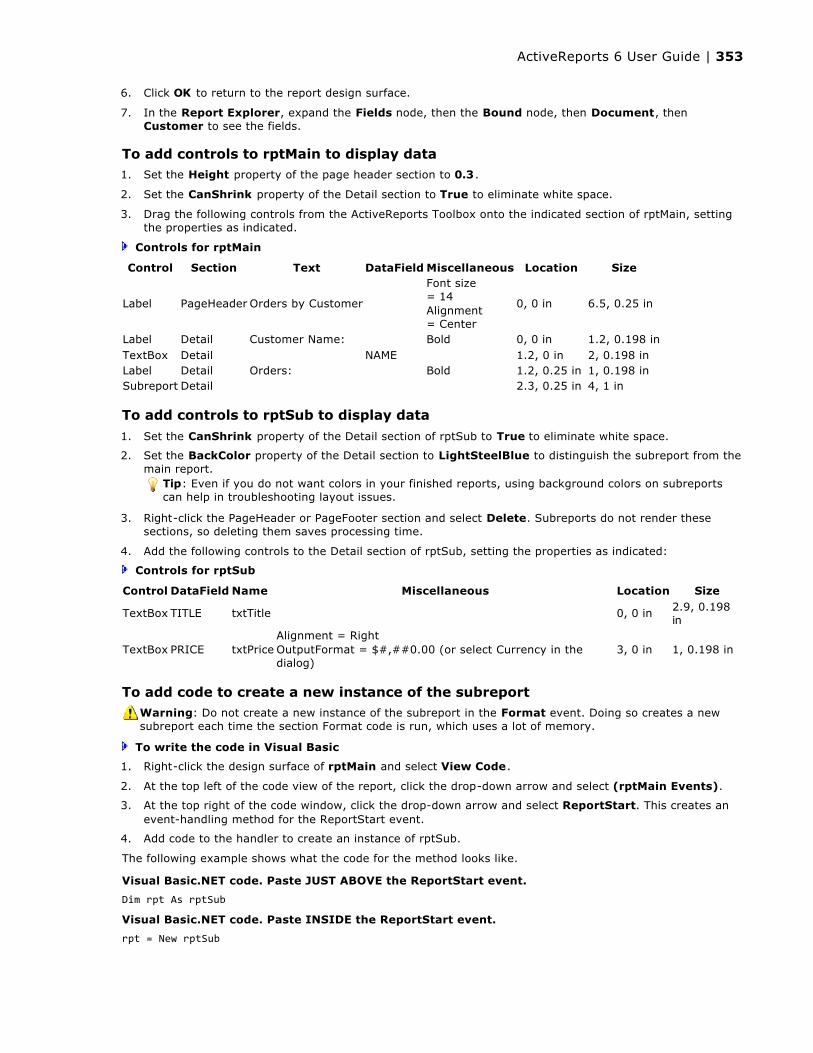
6. Click OK to return to the report design surface.
7. In the Report Explorer, expand the Fields node, then the Bound node, then Document, then Customer to see the fields.
To add controls to rptMain to display data1. Set the Height property of the page header section to 0.3 .
2. Set the CanShrink property of the Detail section to True to eliminate white space.
3. Drag the following controls from the ActiveReports Toolbox onto the indicated section of rptMain, setting the properties as indicated.
Controls for rptMain
To add controls to rptSub to display data
1. Set the CanShrink property of the Detail section of rptSub to True to eliminate white space.
2. Set the BackColor property of the Detail section to LightSteelBlue to distinguish the subreport from the main report.
3. Right-click the PageHeader or PageFooter section and select Delete. Subreports do not render these sections, so deleting them saves processing time.
4. Add the following controls to the Detail section of rptSub, setting the properties as indicated:
Controls for rptSub
To add code to create a new instance of the subreport
To write the code in Visual Basic
1. Right-click the design surface of rptMain and select View Code.
2. At the top left of the code view of the report, click the drop-down arrow and select (rptMain Events).
3. At the top right of the code window, click the drop-down arrow and select ReportStart. This creates an event-handling method for the ReportStart event.
4. Add code to the handler to create an instance of rptSub.
The following example shows what the code for the method looks like.
Control Section Text DataField Miscellaneous Location Size
Label PageHeader Orders by Customer
Font size = 14Alignment = Center
0, 0 in 6.5, 0.25 in
Label Detail Customer Name: Bold 0, 0 in 1.2, 0.198 inTextBox Detail NAME 1.2, 0 in 2, 0.198 inLabel Detail Orders: Bold 1.2, 0.25 in 1, 0.198 inSubreport Detail 2.3, 0.25 in 4, 1 in
Tip: Even if you do not want colors in your finished reports, using background colors on subreports can help in troubleshooting layout issues.
Control DataField Name Miscellaneous Location Size
TextBox TITLE txtTitle 0, 0 in 2.9, 0.198 in
TextBox PRICE txtPriceAlignment = RightOutputFormat = $#,##0.00 (or select Currency in the dialog)
3, 0 in 1, 0.198 in
Warning: Do not create a new instance of the subreport in the Format event. Doing so creates a new subreport each time the section Format code is run, which uses a lot of memory.
Visual Basic.NET code. Paste JUST ABOVE the ReportStart event.
Dim rpt As rptSub
Visual Basic.NET code. Paste INSIDE the ReportStart event.
rpt = New rptSub
ActiveReports 6 User Guide | 353
To write the code in C#
1. Click in the gray area below rptMain to select it.
2. Click the events icon in the Properties Window to display available events for the report.
3. Double-click ReportStart. This creates an event-handling method for the report's ReportStart event.
4. Add code to the handler to create a new instance of rptSub.
The following example shows what the code for the method looks like.
To add code to pass a subset of the parent report's data to the subreport1. Double-click in the detail section of the design surface of rptMain to create a detail_Format event.
2. Add code to the handler to:
Create a new DataDynamics XMLDataSource
Type cast the new data source as rptMain's data source and set the NodeList to the "ORDER/ITEM" field
Display rptSub in the subreport control
Pass the new data source to the subreport
To write the code in Visual Basic
The following example shows what the code for the method looks like.
To write the code in C#
The following example shows what the code for the method looks like.
C# code. Paste JUST ABOVE the ReportStart event.
private rptSub rpt;
C# code. Paste INSIDE the ReportStart event.
rpt = new rptSub();
Visual Basic.NET code. Paste INSIDE the Format event.
Dim xmlDS As New DataDynamics.ActiveReports.DataSources.XMLDataSource xmlDS.NodeList = CType(CType(Me.DataSource, DataDynamics.ActiveReports.DataSources.XMLDataSource).Field("ORDER/ITEM", True), System.Xml.XmlNodeList) rpt.DataSource = xmlDS Me.SubReport1.Report = rpt
C# code. Paste INSIDE the Format event.
DataDynamics.ActiveReports.DataSources.XMLDataSource xmlDS = new DataDynamics.ActiveReports.DataSources.XMLDataSource(); xmlDS.NodeList = (System.Xml.XmlNodeList)((DataDynamics.ActiveReports.DataSources.XMLDataSource) this.DataSource).Field("ORDER/ITEM", true); rpt.DataSource = xmlDS; this.SubReport1.Report = rpt;
ActiveReports 6 User Guide | 354
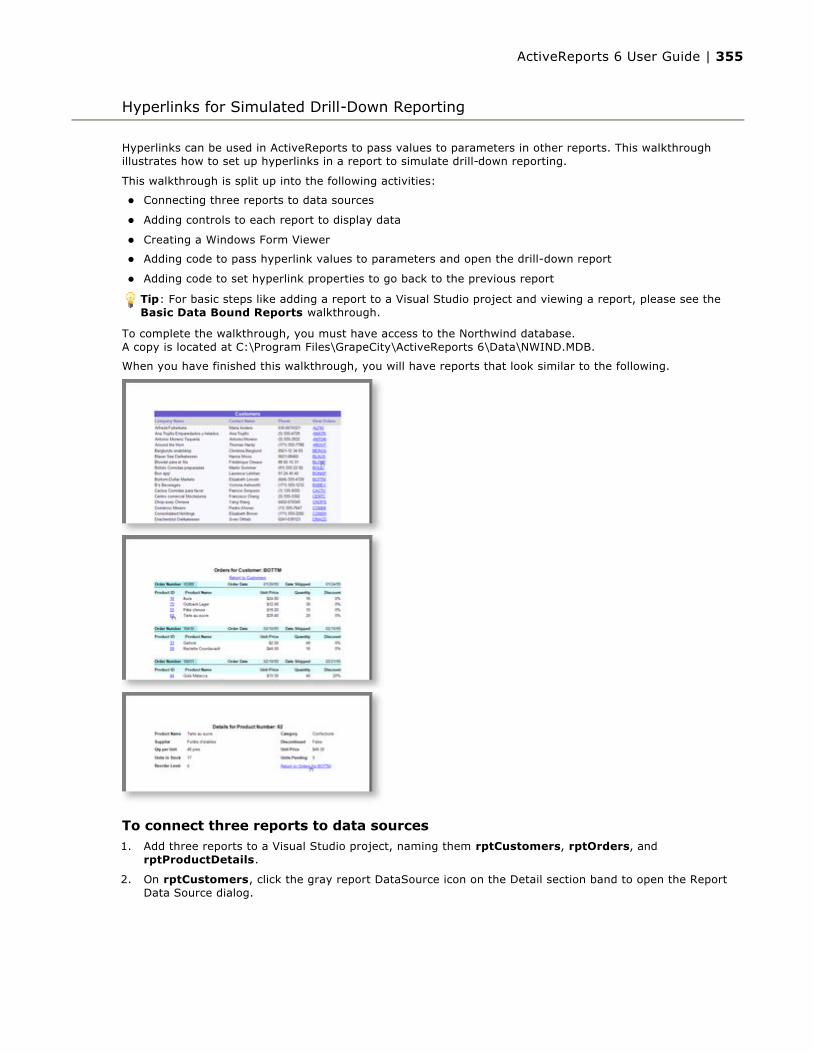
Hyperlinks can be used in ActiveReports to pass values to parameters in other reports. This walkthrough illustrates how to set up hyperlinks in a report to simulate drill-down reporting.
This walkthrough is split up into the following activities:
Connecting three reports to data sources
Adding controls to each report to display data
Creating a Windows Form Viewer
Adding code to pass hyperlink values to parameters and open the drill-down report
Adding code to set hyperlink properties to go back to the previous report
To complete the walkthrough, you must have access to the Northwind database.A copy is located at C:\Program Files\GrapeCity\ActiveReports 6\Data\NWIND.MDB.
When you have finished this walkthrough, you will have reports that look similar to the following.
To connect three reports to data sources1. Add three reports to a Visual Studio project, naming them rptCustomers, rptOrders, and
rptProductDetails.
2. On rptCustomers, click the gray report DataSource icon on the Detail section band to open the Report Data Source dialog.
Hyperlinks for Simulated Drill-Down Reporting
Tip: For basic steps like adding a report to a Visual Studio project and viewing a report, please see the Basic Data Bound Reports walkthrough.
ActiveReports 6 User Guide | 355
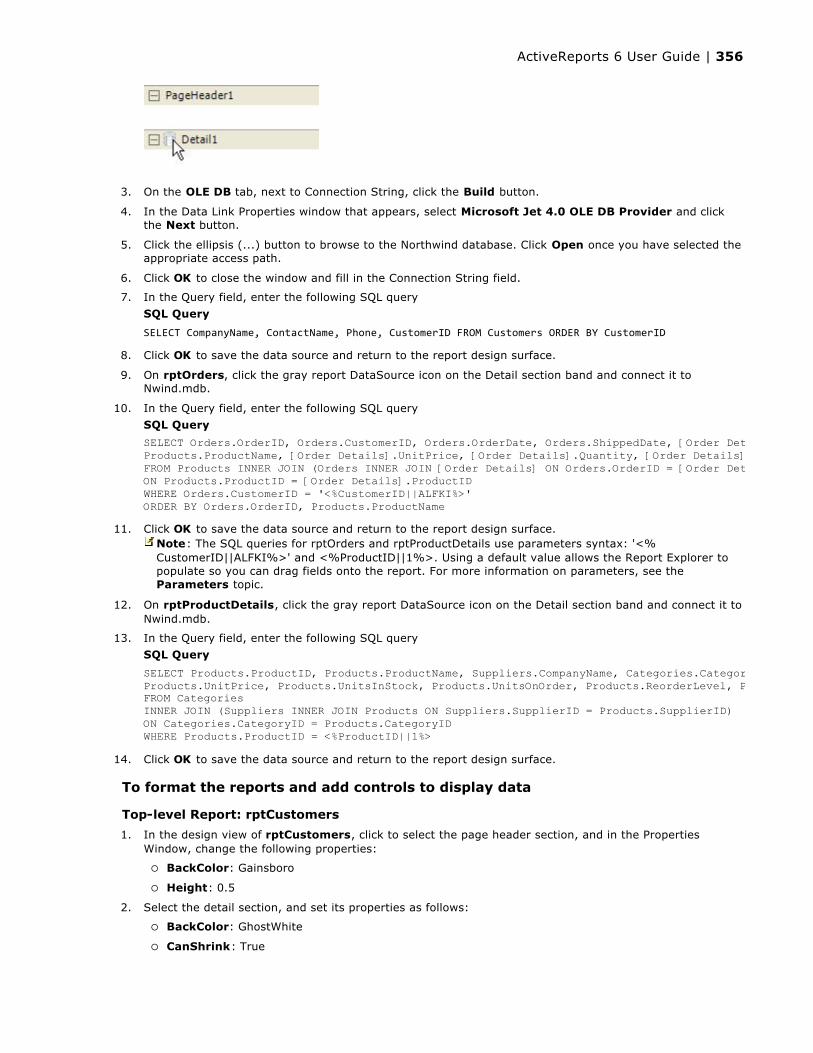
3. On the OLE DB tab, next to Connection String, click the Build button.
4. In the Data Link Properties window that appears, select Microsoft Jet 4.0 OLE DB Provider and click the Next button.
5. Click the ellipsis (...) button to browse to the Northwind database. Click Open once you have selected the appropriate access path.
6. Click OK to close the window and fill in the Connection String field.
7. In the Query field, enter the following SQL query
8. Click OK to save the data source and return to the report design surface.
9. On rptOrders, click the gray report DataSource icon on the Detail section band and connect it to Nwind.mdb.
10. In the Query field, enter the following SQL query
11. Click OK to save the data source and return to the report design surface.
12. On rptProductDetails, click the gray report DataSource icon on the Detail section band and connect it to Nwind.mdb.
13. In the Query field, enter the following SQL query
14. Click OK to save the data source and return to the report design surface.
To format the reports and add controls to display data
Top-level Report: rptCustomers
1. In the design view of rptCustomers, click to select the page header section, and in the Properties Window, change the following properties:
BackColor: Gainsboro
Height: 0.5
2. Select the detail section, and set its properties as follows:
BackColor: GhostWhite
CanShrink: True
SQL Query
SELECT CompanyName, ContactName, Phone, CustomerID FROM Customers ORDER BY CustomerID
SQL Query
SELECT Orders.OrderID, Orders.CustomerID, Orders.OrderDate, Orders.ShippedDate, [Order Details].ProductID, Products.ProductName, [Order Details].UnitPrice, [Order Details].Quantity, [Order Details].DiscountFROM Products INNER JOIN (Orders INNER JOIN [Order Details] ON Orders.OrderID = [Order Details].OrderID) ON Products.ProductID = [Order Details].ProductIDWHERE Orders.CustomerID = '<%CustomerID||ALFKI%>'ORDER BY Orders.OrderID, Products.ProductName
Note: The SQL queries for rptOrders and rptProductDetails use parameters syntax: '<%CustomerID||ALFKI%>' and <%ProductID||1%>. Using a default value allows the Report Explorer to populate so you can drag fields onto the report. For more information on parameters, see the Parameters topic.
SQL Query
SELECT Products.ProductID, Products.ProductName, Suppliers.CompanyName, Categories.CategoryName, Products.QuantityPerUnit, Products.UnitPrice, Products.UnitsInStock, Products.UnitsOnOrder, Products.ReorderLevel, Products.DiscontinuedFROM Categories INNER JOIN (Suppliers INNER JOIN Products ON Suppliers.SupplierID = Products.SupplierID) ON Categories.CategoryID = Products.CategoryIDWHERE Products.ProductID = <%ProductID||1%>
ActiveReports 6 User Guide | 356
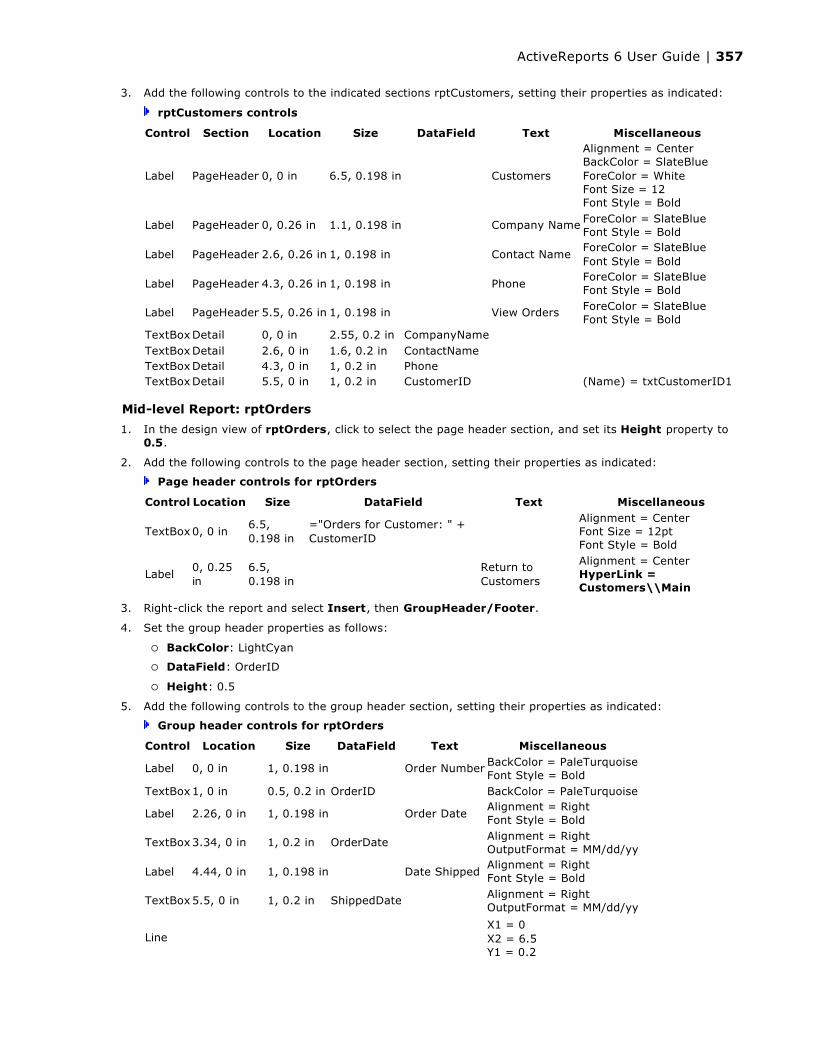
3. Add the following controls to the indicated sections rptCustomers, setting their properties as indicated:
rptCustomers controls
Mid-level Report: rptOrders
1. In the design view of rptOrders, click to select the page header section, and set its Height property to 0.5.
2. Add the following controls to the page header section, setting their properties as indicated:
Page header controls for rptOrders
3. Right-click the report and select Insert, then GroupHeader/Footer.
4. Set the group header properties as follows:
BackColor: LightCyan
DataField: OrderID
Height: 0.5
5. Add the following controls to the group header section, setting their properties as indicated:
Group header controls for rptOrders
Control Section Location Size DataField Text Miscellaneous
Label PageHeader 0, 0 in 6.5, 0.198 in Customers
Alignment = CenterBackColor = SlateBlueForeColor = WhiteFont Size = 12Font Style = Bold
Label PageHeader 0, 0.26 in 1.1, 0.198 in Company Name ForeColor = SlateBlueFont Style = Bold
Label PageHeader 2.6, 0.26 in 1, 0.198 in Contact NameForeColor = SlateBlueFont Style = Bold
Label PageHeader 4.3, 0.26 in 1, 0.198 in PhoneForeColor = SlateBlueFont Style = Bold
Label PageHeader 5.5, 0.26 in 1, 0.198 in View Orders ForeColor = SlateBlueFont Style = Bold
TextBoxDetail 0, 0 in 2.55, 0.2 in CompanyNameTextBoxDetail 2.6, 0 in 1.6, 0.2 in ContactNameTextBoxDetail 4.3, 0 in 1, 0.2 in PhoneTextBoxDetail 5.5, 0 in 1, 0.2 in CustomerID (Name) = txtCustomerID1
Control Location Size DataField Text Miscellaneous
TextBox0, 0 in6.5, 0.198 in
="Orders for Customer: " + CustomerID
Alignment = CenterFont Size = 12ptFont Style = Bold
Label0, 0.25 in
6.5, 0.198 in
Return to Customers
Alignment = CenterHyperLink = Customers\\Main
Control Location Size DataField Text Miscellaneous
Label 0, 0 in 1, 0.198 in Order Number BackColor = PaleTurquoiseFont Style = Bold
TextBox1, 0 in 0.5, 0.2 in OrderID BackColor = PaleTurquoise
Label 2.26, 0 in 1, 0.198 in Order DateAlignment = RightFont Style = Bold
TextBox3.34, 0 in 1, 0.2 in OrderDate Alignment = RightOutputFormat = MM/dd/yy
Label 4.44, 0 in 1, 0.198 in Date ShippedAlignment = RightFont Style = Bold
TextBox5.5, 0 in 1, 0.2 in ShippedDate Alignment = RightOutputFormat = MM/dd/yy
LineX1 = 0X2 = 6.5Y1 = 0.2
ActiveReports 6 User Guide | 357
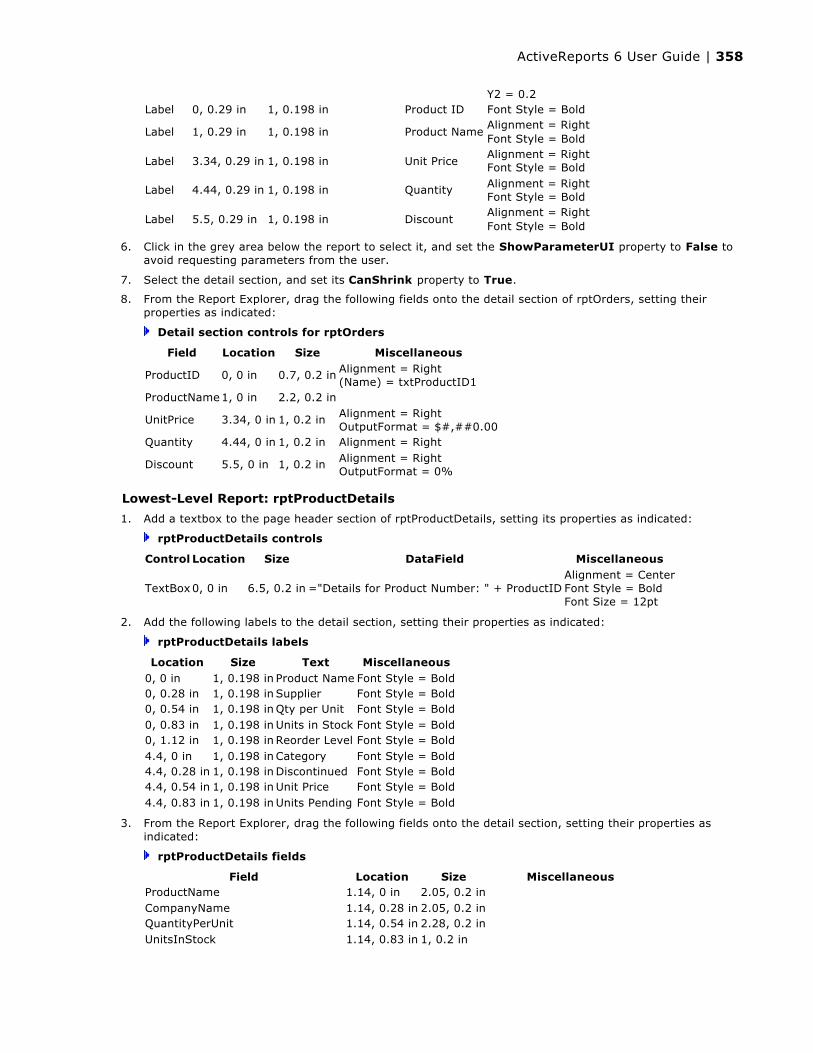
6. Click in the grey area below the report to select it, and set the ShowParameterUI property to False to avoid requesting parameters from the user.
7. Select the detail section, and set its CanShrink property to True.
8. From the Report Explorer, drag the following fields onto the detail section of rptOrders, setting their properties as indicated:
Detail section controls for rptOrders
Lowest-Level Report: rptProductDetails
1. Add a textbox to the page header section of rptProductDetails, setting its properties as indicated:
rptProductDetails controls
2. Add the following labels to the detail section, setting their properties as indicated:
rptProductDetails labels
3. From the Report Explorer, drag the following fields onto the detail section, setting their properties as indicated:
rptProductDetails fields
Y2 = 0.2Label 0, 0.29 in 1, 0.198 in Product ID Font Style = Bold
Label 1, 0.29 in 1, 0.198 in Product NameAlignment = RightFont Style = Bold
Label 3.34, 0.29 in 1, 0.198 in Unit PriceAlignment = RightFont Style = Bold
Label 4.44, 0.29 in 1, 0.198 in Quantity Alignment = RightFont Style = Bold
Label 5.5, 0.29 in 1, 0.198 in DiscountAlignment = RightFont Style = Bold
Field Location Size Miscellaneous
ProductID 0, 0 in 0.7, 0.2 in Alignment = Right(Name) = txtProductID1
ProductName1, 0 in 2.2, 0.2 in
UnitPrice 3.34, 0 in 1, 0.2 in Alignment = RightOutputFormat = $#,##0.00
Quantity 4.44, 0 in 1, 0.2 in Alignment = Right
Discount 5.5, 0 in 1, 0.2 in Alignment = RightOutputFormat = 0%
Control Location Size DataField Miscellaneous
TextBox0, 0 in 6.5, 0.2 in ="Details for Product Number: " + ProductIDAlignment = CenterFont Style = BoldFont Size = 12pt
Location Size Text Miscellaneous0, 0 in 1, 0.198 in Product Name Font Style = Bold0, 0.28 in 1, 0.198 in Supplier Font Style = Bold0, 0.54 in 1, 0.198 in Qty per Unit Font Style = Bold0, 0.83 in 1, 0.198 in Units in Stock Font Style = Bold0, 1.12 in 1, 0.198 in Reorder Level Font Style = Bold4.4, 0 in 1, 0.198 in Category Font Style = Bold4.4, 0.28 in 1, 0.198 in Discontinued Font Style = Bold4.4, 0.54 in 1, 0.198 in Unit Price Font Style = Bold4.4, 0.83 in 1, 0.198 in Units Pending Font Style = Bold
Field Location Size MiscellaneousProductName 1.14, 0 in 2.05, 0.2 inCompanyName 1.14, 0.28 in 2.05, 0.2 inQuantityPerUnit 1.14, 0.54 in 2.28, 0.2 inUnitsInStock 1.14, 0.83 in 1, 0.2 in
ActiveReports 6 User Guide | 358
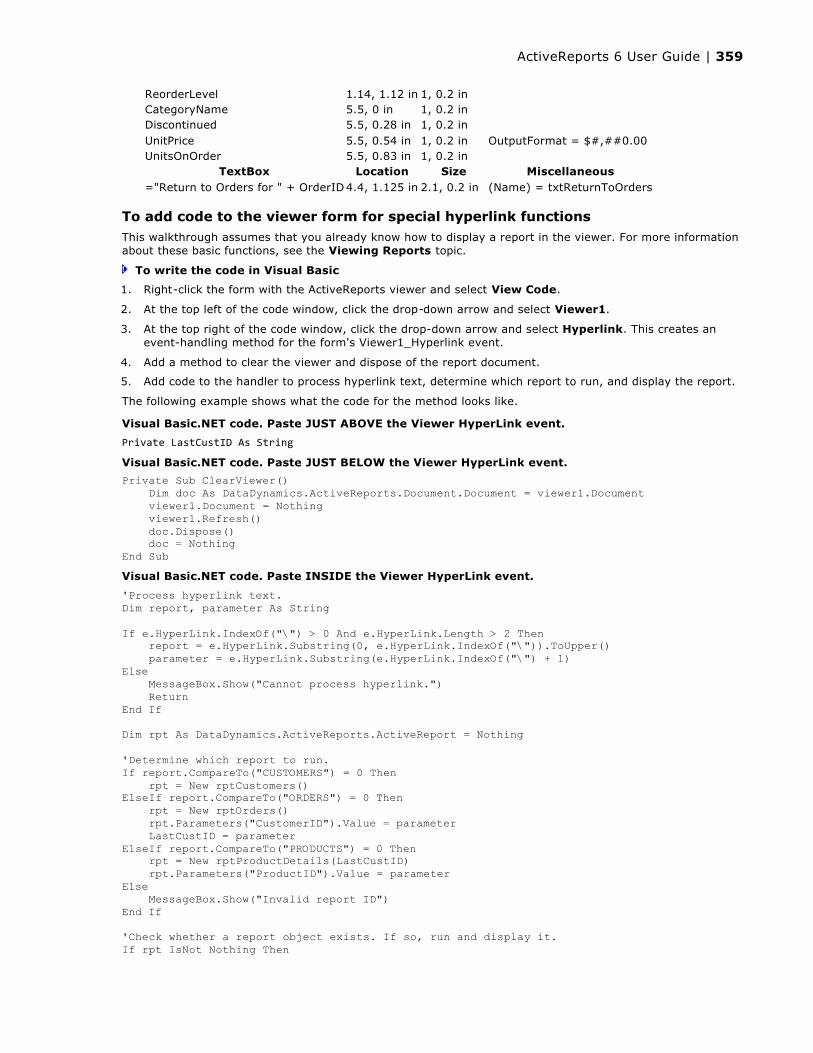
To add code to the viewer form for special hyperlink functionsThis walkthrough assumes that you already know how to display a report in the viewer. For more information about these basic functions, see the Viewing Reports topic.
To write the code in Visual Basic
1. Right-click the form with the ActiveReports viewer and select View Code.
2. At the top left of the code window, click the drop-down arrow and select Viewer1.
3. At the top right of the code window, click the drop-down arrow and select Hyperlink. This creates an event-handling method for the form's Viewer1_Hyperlink event.
4. Add a method to clear the viewer and dispose of the report document.
5. Add code to the handler to process hyperlink text, determine which report to run, and display the report.
The following example shows what the code for the method looks like.
ReorderLevel 1.14, 1.12 in 1, 0.2 inCategoryName 5.5, 0 in 1, 0.2 inDiscontinued 5.5, 0.28 in 1, 0.2 inUnitPrice 5.5, 0.54 in 1, 0.2 in OutputFormat = $#,##0.00UnitsOnOrder 5.5, 0.83 in 1, 0.2 in
TextBox Location Size Miscellaneous="Return to Orders for " + OrderID4.4, 1.125 in 2.1, 0.2 in (Name) = txtReturnToOrders
Visual Basic.NET code. Paste JUST ABOVE the Viewer HyperLink event.
Private LastCustID As String
Visual Basic.NET code. Paste JUST BELOW the Viewer HyperLink event.
Private Sub ClearViewer() Dim doc As DataDynamics.ActiveReports.Document.Document = viewer1.Document viewer1.Document = Nothing viewer1.Refresh() doc.Dispose() doc = Nothing End SubVisual Basic.NET code. Paste INSIDE the Viewer HyperLink event.
'Process hyperlink text.Dim report, parameter As String
If e.HyperLink.IndexOf("\") > 0 And e.HyperLink.Length > 2 Then report = e.HyperLink.Substring(0, e.HyperLink.IndexOf("\")).ToUpper() parameter = e.HyperLink.Substring(e.HyperLink.IndexOf("\") + 1)Else MessageBox.Show("Cannot process hyperlink.") ReturnEnd If
Dim rpt As DataDynamics.ActiveReports.ActiveReport = Nothing
'Determine which report to run.If report.CompareTo("CUSTOMERS") = 0 Then rpt = New rptCustomers()ElseIf report.CompareTo("ORDERS") = 0 Then rpt = New rptOrders() rpt.Parameters("CustomerID").Value = parameter LastCustID = parameterElseIf report.CompareTo("PRODUCTS") = 0 Then rpt = New rptProductDetails(LastCustID) rpt.Parameters("ProductID").Value = parameterElse MessageBox.Show("Invalid report ID")End If
'Check whether a report object exists. If so, run and display it.If rpt IsNot Nothing Then
ActiveReports 6 User Guide | 359

To write the code in C#
1. Click the Viewer to select the it.
2. Click the events icon in the Properties Window to display available events for the viewer.
3. Double-click Hyperlink. This creates an event-handling method for the form's viewer1_Hyperlink event.
4. Add a method to clear the viewer and dispose of the report document.
5. Add code to the handler to process hyperlink text, determine which report to run, and display the report.
The following example shows what the code for the method looks like.
ClearViewer() rpt.ShowParameterUI = False Viewer1.Document = rpt.Document rpt.Run() rpt.Dispose() rpt = NothingEnd If
C# code. Paste JUST ABOVE the viewer HyperLink event.
private string LastCustID;
C# code. Paste JUST BELOW the viewer HyperLink event.
private void ClearViewer(){ DataDynamics.ActiveReports.Document.Document doc = viewer1.Document;
viewer1.Document = null; viewer1.Refresh();
doc.Dispose(); doc = null;}C# code. Paste INSIDE the viewer HyperLink event.
//Process hyperlink text.string report, parameter;
if (e.HyperLink.IndexOf('\\') > 0 && e.HyperLink.Length > 2){ report = e.HyperLink.Substring(0, e.HyperLink.IndexOf('\\')).ToUpper(); parameter = e.HyperLink.Substring(e.HyperLink.IndexOf('\\') + 1);}else{ MessageBox.Show("Cannot process hyperlink."); return;}
DataDynamics.ActiveReports.ActiveReport rpt = null;
//Determine which report to run.if (report.CompareTo("CUSTOMERS") == 0){ rpt = new rptCustomers();}else if (report.CompareTo("ORDERS") == 0){ rpt = new rptOrders(); rpt.Parameters["CustomerID"].Value = parameter; LastCustID = parameter;}else if (report.CompareTo("PRODUCTS") == 0){ rpt = new rptProductDetails(LastCustID); rpt.Parameters["ProductID"].Value = parameter;}else
ActiveReports 6 User Guide | 360

To add code to set the drill-down hyperlink in rptCustomers1. Double-click in the detail section to create a detail_Format event.
2. Add code to the event to set the hyperlink of the Customer ID textbox to call the viewer code that passes the parameter to rptOrders.
To write the code in Visual Basic.NET
To write the code in C#
To add code to set the drill-down hyperlink in rptOrders1. Double-click in the detail section to create a detail_Format event.
2. Add code to the event to set the hyperlink of the Product ID textbox to call the viewer code that passes the parameter to rptProductDetails.
To write the code in Visual Basic.NET
To write the code in C#
To add code to create a parameter to hold the previous report for rptProductDetails1. Right-click the report and select View Code.
2. Add code to create a parameter for the previous report.
To write the code in Visual Basic.NET
To write the code in C#
{ MessageBox.Show("Invalid report ID");}
//Check whether a report object exists. If so, run and display it.if (rpt != null){ ClearViewer(); rpt.ShowParameterUI = false; viewer1.Document = rpt.Document; rpt.Run(); rpt.Dispose(); rpt = null;}
Visual Basic.NET code. Paste INSIDE the Format event.
txtCustomerID1.HyperLink = "Orders\" + txtCustomerID1.Text
C# code. Paste INSIDE the Format event.
txtCustomerID1.HyperLink = "Orders\\" + txtCustomerID1.Text;
Visual Basic.NET code. Paste INSIDE the Format event.
txtProductID1.HyperLink = "Products\" + txtProductID1.Text
C# code. Paste INSIDE the Format event.
txtProductID1.HyperLink = "Products\\" + txtProductID1.Text;
Visual Basic.NET code. Paste JUST BELOW the Public Class rptProductDetails line.
'The prevRptParam member is used to track the parameter for 'returning to the orders report for the correct customer Private prevRptParam As StringPublic Sub New(ByVal previousRptParameter As String) InitializeComponent() prevRptParam = previousRptParameterEnd Sub
C# code. Paste JUST BELOW the public partial class rptProductDetails() line.
ActiveReports 6 User Guide | 361
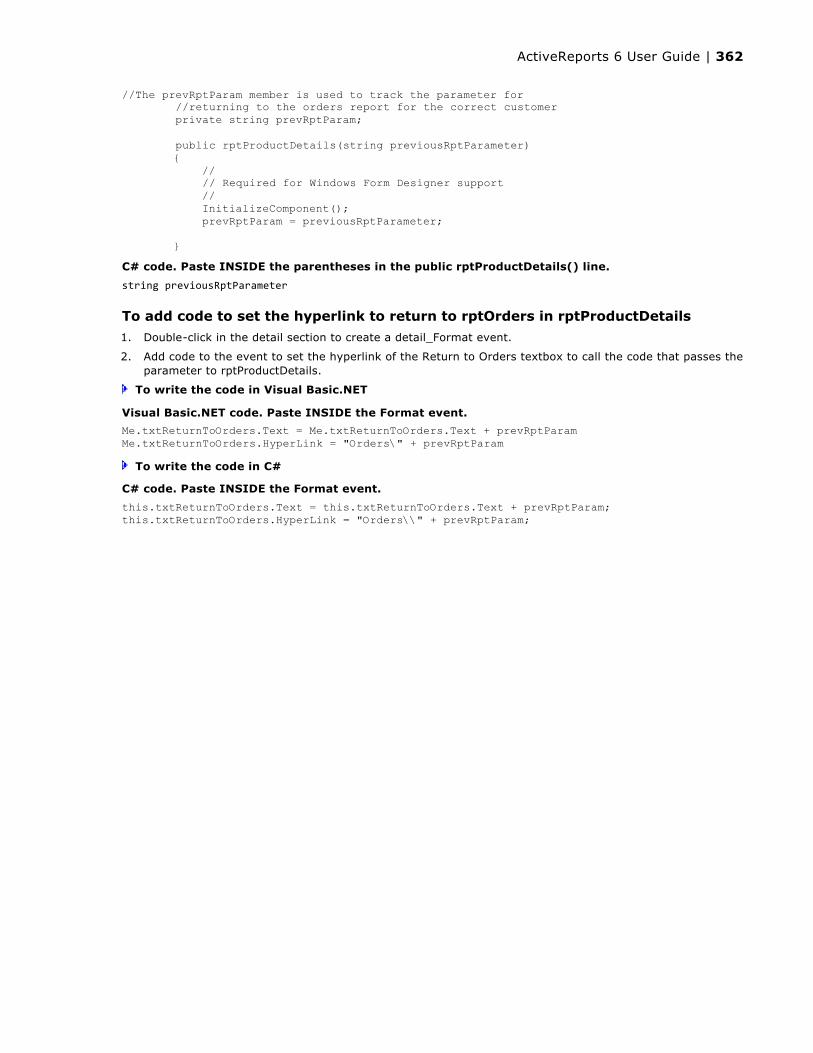
To add code to set the hyperlink to return to rptOrders in rptProductDetails
1. Double-click in the detail section to create a detail_Format event.
2. Add code to the event to set the hyperlink of the Return to Orders textbox to call the code that passes the parameter to rptProductDetails.
To write the code in Visual Basic.NET
To write the code in C#
//The prevRptParam member is used to track the parameter for //returning to the orders report for the correct customer private string prevRptParam;
public rptProductDetails(string previousRptParameter) { // // Required for Windows Form Designer support // InitializeComponent(); prevRptParam = previousRptParameter;
}C# code. Paste INSIDE the parentheses in the public rptProductDetails() line.
string previousRptParameter
Visual Basic.NET code. Paste INSIDE the Format event.
Me.txtReturnToOrders.Text = Me.txtReturnToOrders.Text + prevRptParamMe.txtReturnToOrders.HyperLink = "Orders\" + prevRptParam
C# code. Paste INSIDE the Format event.
this.txtReturnToOrders.Text = this.txtReturnToOrders.Text + prevRptParam;this.txtReturnToOrders.HyperLink = "Orders\\" + prevRptParam;
ActiveReports 6 User Guide | 362
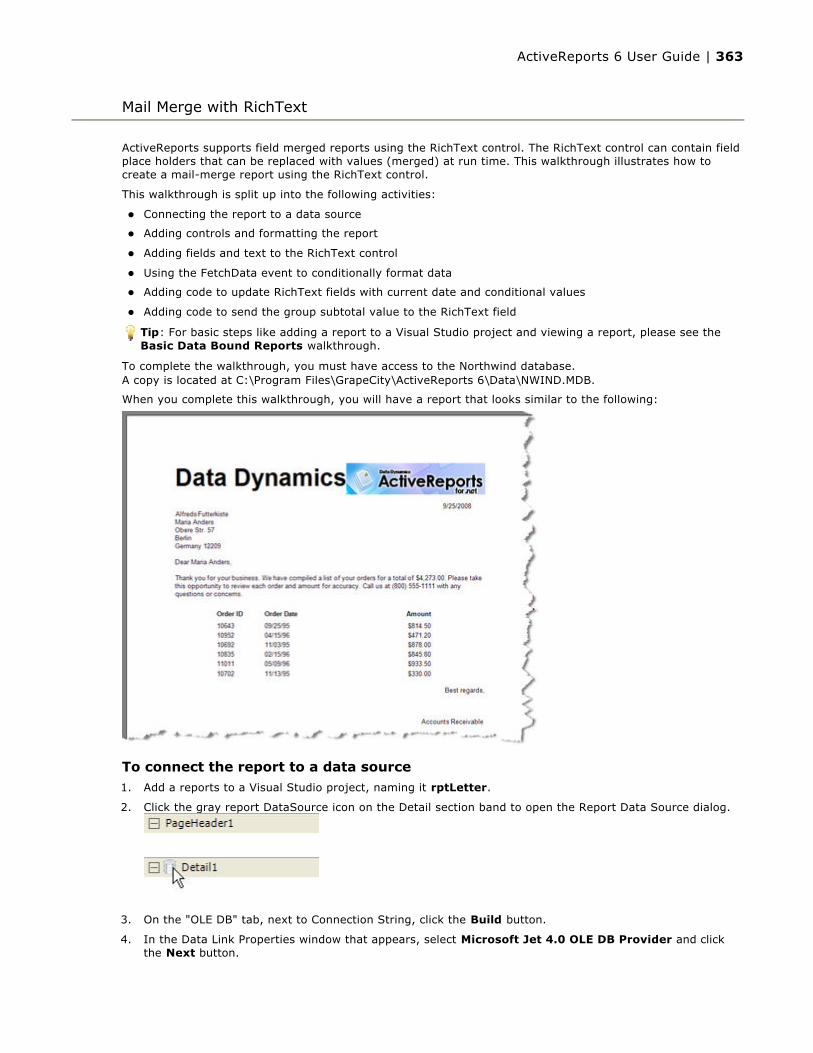
ActiveReports supports field merged reports using the RichText control. The RichText control can contain field place holders that can be replaced with values (merged) at run time. This walkthrough illustrates how to create a mail-merge report using the RichText control.
This walkthrough is split up into the following activities:
Connecting the report to a data source
Adding controls and formatting the report
Adding fields and text to the RichText control
Using the FetchData event to conditionally format data
Adding code to update RichText fields with current date and conditional values
Adding code to send the group subtotal value to the RichText field
To complete the walkthrough, you must have access to the Northwind database.A copy is located at C:\Program Files\GrapeCity\ActiveReports 6\Data\NWIND.MDB.
When you complete this walkthrough, you will have a report that looks similar to the following:
To connect the report to a data source1. Add a reports to a Visual Studio project, naming it rptLetter.
2. Click the gray report DataSource icon on the Detail section band to open the Report Data Source dialog.
3. On the "OLE DB" tab, next to Connection String, click the Build button.
4. In the Data Link Properties window that appears, select Microsoft Jet 4.0 OLE DB Provider and click the Next button.
Mail Merge with RichText
Tip: For basic steps like adding a report to a Visual Studio project and viewing a report, please see the Basic Data Bound Reports walkthrough.
ActiveReports 6 User Guide | 363

5. Click the ellipsis (...) button to browse to the Northwind database. Click Open once you have selected the appropriate access path.
6. Click OK to close the window and fill in the Connection String field.
7. In the Query field, enter the following SQL query
8. Click OK to save the data source and return to the report design surface.
To add controls and format the report1. Right-click the design surface of the report and select Insert, then Group Header/Footer to add group
header and group footer sections.
2. In the Properties Window, make the following changes to the group header section:
DataField: CustomerID (This sets a new group for each customer.)
Height: 2.5
KeepTogether: True
3. Make the following changes to the group footer section:
Height: 1.1
KeepTogether: True
NewPage: After (This ensures that a new page begins after each customer's letter has finished rendering.)
4. Make the following changes to the detail section:
CanShrink: True
5. Make the following changes to the page header section:
Height: 0.8
6. Add the following controls to the PageHeader section and set the properties as indicated.
Page header controls
7. In the Report Explorer, expand the Fields node, then the Bound node. Drag the SubTotal field onto the group header section, add the following controls from the ActiveReports toolbox, and set the properties as indicated.
Group header controls
1, 0.2 in
SQL Query
SELECT Customers.CustomerID, Customers.CompanyName, Customers.ContactName, Customers.Address, Customers.City, Customers.Region, Customers.Country, Customers.PostalCode, Orders.OrderID, Orders.OrderDate, [Order Subtotals].SubtotalFROM Customers INNER JOIN ([Order Subtotals] INNER JOIN Orders ON [Order Subtotals].OrderID = Orders.OrderID) ON Customers.CustomerID = Orders.CustomerID
Control Miscellaneous Size Location
LabelFont Size = 36Style = BoldText = GrapeCity
3.7, 0.65 in
0, 0 in
PicturePictureAlignment = TopLeftImage (click ellipsis, navigate to C:\Program Files\GrapeCity\ActiveReports 6\Introduction and select itopimage1.gif)
2.9, 0.65 in
3.6, 0 in
Control DataField Size Text (Name) Miscellaneous Location
Textbox SubTotal 1, 0.2 in txtSubtotal1(Name)
OutputFormat = CurrencyVisible = FalseSummaryType = SubTotalSummaryGroup = GroupHeader1
5, 0 in
RichText 6.5, 2.1 in AutoReplaceFields = True 0, 0 inLabel 1, 0.198 in Order ID Bold 0.875, 2.25 inLabel 1, 0.198 in Order Date Bold 1.875, 2.25 in
Label 1, 0.198 in AmountBoldAlignment = Right 4.375, 2.25 in
ActiveReports 6 User Guide | 364
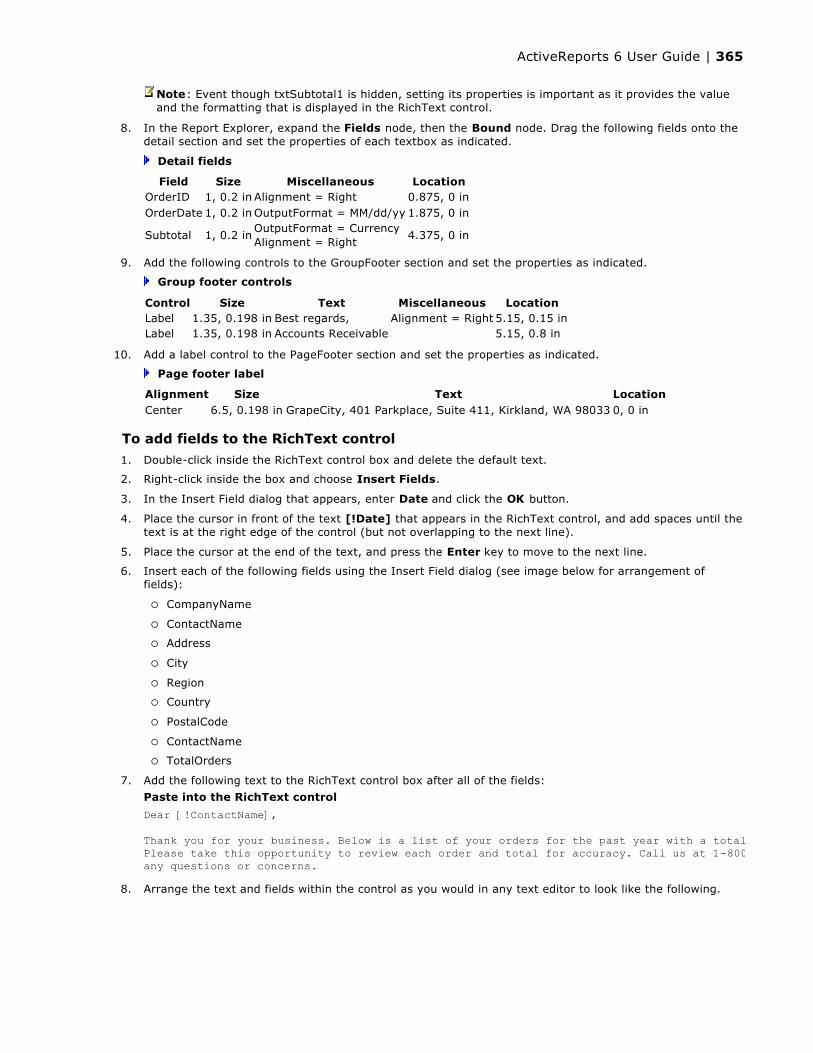
8. In the Report Explorer, expand the Fields node, then the Bound node. Drag the following fields onto the detail section and set the properties of each textbox as indicated.
Detail fields
9. Add the following controls to the GroupFooter section and set the properties as indicated.
Group footer controls
10. Add a label control to the PageFooter section and set the properties as indicated.
Page footer label
To add fields to the RichText control
1. Double-click inside the RichText control box and delete the default text.
2. Right-click inside the box and choose Insert Fields.
3. In the Insert Field dialog that appears, enter Date and click the OK button.
4. Place the cursor in front of the text [!Date] that appears in the RichText control, and add spaces until the text is at the right edge of the control (but not overlapping to the next line).
5. Place the cursor at the end of the text, and press the Enter key to move to the next line.
6. Insert each of the following fields using the Insert Field dialog (see image below for arrangement of fields):
CompanyName
ContactName
Address
City
Region
Country
PostalCode
ContactName
TotalOrders
7. Add the following text to the RichText control box after all of the fields:
8. Arrange the text and fields within the control as you would in any text editor to look like the following.
Note: Event though txtSubtotal1 is hidden, setting its properties is important as it provides the value and the formatting that is displayed in the RichText control.
Field Size Miscellaneous LocationOrderID 1, 0.2 in Alignment = Right 0.875, 0 inOrderDate 1, 0.2 in OutputFormat = MM/dd/yy 1.875, 0 in
Subtotal 1, 0.2 inOutputFormat = CurrencyAlignment = Right
4.375, 0 in
Control Size Text Miscellaneous LocationLabel 1.35, 0.198 in Best regards, Alignment = Right 5.15, 0.15 inLabel 1.35, 0.198 in Accounts Receivable 5.15, 0.8 in
Alignment Size Text LocationCenter 6.5, 0.198 in GrapeCity, 401 Parkplace, Suite 411, Kirkland, WA 98033 0, 0 in
Paste into the RichText control
Dear [!ContactName], Thank you for your business. Below is a list of your orders for the past year with a total of [!SubTotal]. Please take this opportunity to review each order and total for accuracy. Call us at 1-800any questions or concerns.
ActiveReports 6 User Guide | 365

To use the FetchData event to conditionally format data
To write the code in Visual Basic
1. At the top left of the code view for the report, click the drop-down arrow and select (rptLetter Events).
2. At the top right of the code window, click the drop-down arrow and select FetchData. This creates an event-handling method for the report's FetchData event.
3. Add code to the handler to add a comma and a space if there is a Region value for the customer's address.
The following example shows what the code for the method looks like.
To write the code in C#
1. Back in design view, click in the gray area below the report to select it.
2. Click the events icon in the Properties window to display available events for the report.
3. Double-click FetchData. This creates an event-handling method for the report's FetchData event.
4. Add code to the handler to add a comma and a space if there is a Region value for the customer's address.
The following example shows what the code for the method looks like.
To add code to update RichText fields with the current date and conditional values1. Double-click in the group header section of the report to create an event-handling method for the group
header's Format event.
2. Add code to the handler to:
Replace the Date field in the RichText control with the current system date
Replace the Region field with the conditional value created in the FetchData event
To write the code in Visual Basic.NET
Visual Basic.NET code. Paste JUST ABOVE the FetchData event.
Dim region As StringVisual Basic.NET code. Paste INSIDE the FetchData event.
'If there is no region for the customer, display nothing If Fields("Region").Value Is System.DBNull.Value Then region = "" Else 'If there is a region, add a comma and a space region = ", " + Fields("Region").Value End If
C# code. Paste JUST ABOVE the FetchData event.
string region;C# code. Paste INSIDE the FetchData event.
if(Fields["Region"].Value is System.DBNull) region = ""; else region = ", " + Fields["Region"].Value.ToString();
Visual Basic.NET code. Paste INSIDE the Group Header Format event.
ActiveReports 6 User Guide | 366

To write the code in C#
To add code to send the group subtotal value to the RichText field1. Right-click in any section of the design window of rptLetter, and click on View Code to display the code
view for the report.
2. At the top left of the code view for rptLetter, click the drop-down arrow and select GroupHeader1.
3. At the top right of the code window, click the drop-down arrow and select BeforePrint. This creates an event-handling method for rptLetter's GroupHeader1_BeforePrint event.
4. Add code to the handler to replace the value of the Subtotal field in the RichText control with the value of the hidden textbox in the group header.
To write the code in Visual Basic.NET
To write the code in C#
'Use the current date in the letterMe.RichTextBox1.ReplaceField("Date", System.DateTime.Today.Date)'Use the value returned by the FetchData eventMe.RichTextBox1.ReplaceField("Region", region)
C# code. Paste INSIDE the Group Header Format event.
//Use the current date in the letterthis.RichTextBox1.ReplaceField("Region", region);//Use the value returned by the FetchData eventthis.RichTextBox1.ReplaceField("Date", System.DateTime.Today.Date.ToString());
Note: We use the BeforePrint event instead of the Format event to get the final value of the subtotal field just prior to printing. For more information on section event usage, see the Section Events topic.
Visual Basic.NET code. Paste INSIDE the Group Header BeforePrint event.
'Use the value from the hidden group subtotal fieldMe.RichTextBox1.ReplaceField("SubTotal", Me.txtSubtotal1.Text)
C# code. Paste INSIDE the Group Header BeforePrint event.
//Use the value from the hidden group subtotal fieldthis.RichTextBox1.ReplaceField("SubTotal", this.txtSubtotal1.Text);
ActiveReports 6 User Guide | 367

ActiveReports allows objects, controls and the data source to be completely accessible at run time. These properties can be modified to provide a dynamic view of your report.
Run Time LayoutsDescribes how to create and modify report layouts dynamically.
Run Time Data SourcesDescribes how to change the report data source at run time using the ReportStart event.
Run Time or Ad Hoc Reporting
ActiveReports 6 User Guide | 368

ActiveReports objects and controls are completely accessible at run time. You can modify the properties of any of the report sections or controls to produce a dynamic report. The section Format event allows you to modify the properties of the section and its controls, including height, visibility, and other visual properties. The Format event is the only event in which you can modify the printable area of a section. Once this event has run, any changes to the section's height are not reflected in the report output. This walkthrough illustrates how to create a report layout at run time based on user input.
This walkthrough is split up into the following activities:
Connecting the report to a data source
Adding controls to the Windows Form to display fields and a viewer
Generating a dataset for the Windows Form
Adding code to create the report layout
Adding code to fill the check list with fields and to launch the report
Adding code to alternate colors in the detail section
Adding code to the ReportStart event to call the report layout code
Adding code to the button's Click event to collect the selected values and launch the report
Adding code to to enable the button when fields are selected
Adding code to the Form_Load event to call the fill check list code
To complete the walkthrough, you must have access to the Northwind database.A copy is located at C:\Program Files\GrapeCity\ActiveReports 6\Data\NWIND.MDB.
When you have completed this walkthrough, you will have an application that looks similar to the following.
Run Time Layouts
Note: Add controls dynamically in the ReportStart event. Otherwise, results may be unpredictable. For more information on events, see the Sequence of Events topic.
Tip: For basic steps like adding a report to a Visual Studio project and viewing a report, please see the Basic Data Bound Reports walkthrough.
ActiveReports 6 User Guide | 369

To connect the report to a data source
1. Add an ActiveReport 6 File to a Visual Studio project, and rename the file rptRunTime.
2. Click the gray report DataSource icon in the Detail section to open the report DataSource dialog.
3. On the OLE DB tab, click the Build button.
4. Select Microsoft Jet 4.0 OLE DB Provider and click Next.
5. Click the ellipsis button to browse for the access path to the Northwind database. Click Open once you have selected the appropriate access path.
6. Click OK to continue.
7. In the Query field, paste the following SQL query.
8. Click OK to return to the report design surface.
To add controls to the form1. Resize the Windows form so that it is large enough to accommodate a number of controls.
2. From the Visual Studio toolbox, drag the following controls onto the form and set the properties as indicated.
Form controls
SQL Query
SELECT * FROM Products
Control Location Dock Property Name TextPanel Windows Form Left Panel1
ActiveReports 6 User Guide | 370

To generate a dataset for the form1. From the Project menu, select Add New Item .
2. Select DataSet, rename the file NWINDDataSet.xsd and click the Add button.
3. In the DataSet Designer that appears, click the Server Explorer link.
4. In the Server Explorer, expand the node for your local copy of the Northwind database, then the Tablesnode, and drag the Products table onto the DataSet designer.
5. In the design view of your Windows form, expand the Data section of the Visual Studio Toolbox and double-click DataSet to open the Add Dataset dialog.
6. Under Typed dataset, select YourProjectName.NWINDDataSet and click OK to make the dataset available to your Windows form. NwindDataSet1 appears in the tray below the form.
To add code to create the report layout
1. Right-click on rptRunTime and select View Code.
2. Add code within the class declaration of the report to:
Create an array of fields
Create an option for whether to use groups
Set properties on the report sections
Add textboxes and labels to the report based on the array of fields
Handle exceptions
To write the code in Visual Basic.NET
The following example shows what the code for the method looks like.
Label Panel1 Top lblSelectFields Select Fields for Your ReportChecked ListBox Panel1 Fill clbFieldsButton Panel1 Bottom btnGenRep Generate ReportCheckBox Panel1 Bottom chkGroup Group By Category IDViewer Windows Form Fill Viewer1
Tip: If you do not see a copy of the Northwind database, click the Connect to Database icon and follow the prompts.
Visual Basic.NET code. Paste INSIDE the class declaration of the report.
Private m_arrayFields As ArrayListPrivate m_useGroups As Boolean'Create an array to hold the fields selected by the userPublic WriteOnly Property FieldsList() As ArrayList Set(ByVal Value As ArrayList) m_arrayFields = Value End SetEnd Property'Create a property to hold the user's grouping choicePublic WriteOnly Property UseGroups() As Boolean Set(ByVal Value As Boolean) m_useGroups = False m_useGroups = Value End SetEnd PropertyPrivate m_defaultHeight As Single = 0.2FPrivate m_defaultWidth As Single = 4.0FPrivate m_currentY As Single = 0.0F'Set up report formatting and add fields based on user choicesPrivate Sub constructReport() Try Me.Detail1.CanGrow = True
ActiveReports 6 User Guide | 371

To write the code in C#
The following example shows what the code for the method looks like.
Me.Detail1.CanShrink = True Me.Detail1.KeepTogether = True If m_useGroups = True Then 'If the user wants grouping, add a group header and footer and set the grouping field Me.Sections.InsertGroupHF() CType(Me.Sections("GroupHeader1"), GroupHeader).DataField = "CategoryID" Me.Sections("GroupHeader1").BackColor = System.Drawing.Color.Gray Me.Sections("GroupHeader1").CanGrow = True Me.Sections("GroupHeader1").CanShrink = True CType(Me.Sections("GroupHeader1"), GroupHeader).RepeatStyle = RepeatStyle.OnPageIncludeNoDetail 'Add a textbox to display the group's category ID Dim txt As New TextBox txt.DataField = "CategoryID" txt.Location = New System.Drawing.PointF(0.0F, 0) txt.Width = 2.0F txt.Height = 0.3F txt.Style = "font-weight: bold; font-size: 16pt" Me.Sections("GroupHeader1").Controls.Add(txt) End If Dim i As Integer For i = 0 To m_arrayFields.Count - 1 'For all fields selected by the user (except CategoryID) create a label and a textbox If m_arrayFields(i).ToString <> "CategoryID" Then Dim lbl As New Label 'Set the label to display the name of the selected field lbl.Text = m_arrayFields(i) + ":" 'Set the location of each label '(m_currentY gets the height of each control added on each iteration) lbl.Location() = New System.Drawing.PointF(0.0F, m_currentY) lbl.Width = 0.9F lbl.Height = m_defaultHeight Me.Detail1.Controls.Add(lbl) Dim txt As New TextBox 'Set the textbox to display data txt.DataField = m_arrayFields(i) 'Set the location of the textbox txt.Location = New System.Drawing.PointF(1.0F, m_currentY) txt.Width = m_defaultWidth txt.Height = m_defaultHeight Me.Detail1.Controls.Add(txt) 'Set the textbox to use currency formatting if the field is UnitPrice If m_arrayFields(i) = "UnitPrice" Then txt.OutputFormat = "$#.00" End If 'Increment the vertical location by adding the height of the added controls m_currentY = m_currentY + m_defaultHeight End If Next Catch ex As Exception System.Windows.Forms.MessageBox.Show("Error in Report-constructReport: " + ex.Message, "Project Error", System.Windows.Forms.MessageBoxButtons.OK, System.Windows.Forms.MessageBoxIcon.Error) End TryEnd Sub
C# code. Paste INSIDE the class declaration of the report.
private ArrayList m_arrayFields;//Create an array to hold the fields selected by the userpublic ArrayList FieldsList{ set{m_arrayFields = value;}}private bool m_useGroups = false;//Create a property to hold the user's grouping choicepublic bool UseGroups{
ActiveReports 6 User Guide | 372
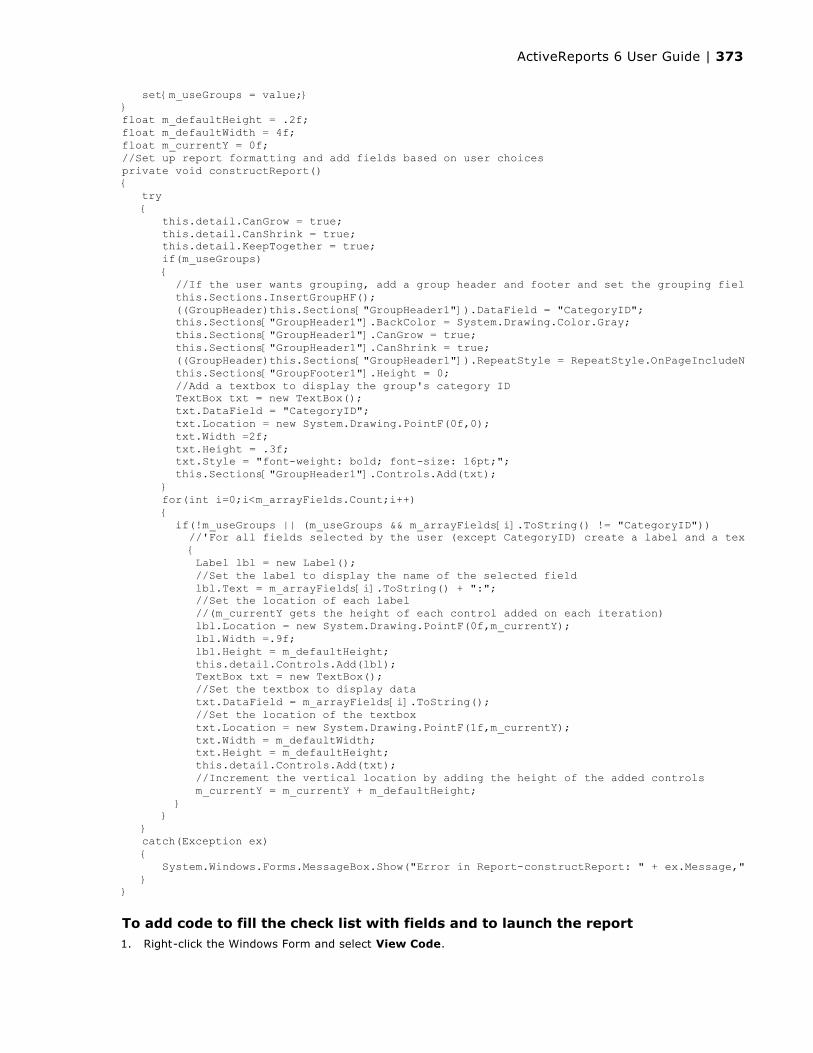
To add code to fill the check list with fields and to launch the report1. Right-click the Windows Form and select View Code.
set{m_useGroups = value;}}float m_defaultHeight = .2f;float m_defaultWidth = 4f;float m_currentY = 0f;//Set up report formatting and add fields based on user choicesprivate void constructReport(){ try { this.detail.CanGrow = true; this.detail.CanShrink = true; this.detail.KeepTogether = true; if(m_useGroups) { //If the user wants grouping, add a group header and footer and set the grouping field this.Sections.InsertGroupHF(); ((GroupHeader)this.Sections["GroupHeader1"]).DataField = "CategoryID"; this.Sections["GroupHeader1"].BackColor = System.Drawing.Color.Gray; this.Sections["GroupHeader1"].CanGrow = true; this.Sections["GroupHeader1"].CanShrink = true; ((GroupHeader)this.Sections["GroupHeader1"]).RepeatStyle = RepeatStyle.OnPageIncludeNoDetail; this.Sections["GroupFooter1"].Height = 0; //Add a textbox to display the group's category ID TextBox txt = new TextBox(); txt.DataField = "CategoryID"; txt.Location = new System.Drawing.PointF(0f,0); txt.Width =2f; txt.Height = .3f; txt.Style = "font-weight: bold; font-size: 16pt;"; this.Sections["GroupHeader1"].Controls.Add(txt); } for(int i=0;i<m_arrayFields.Count;i++) { if(!m_useGroups || (m_useGroups && m_arrayFields[i].ToString() != "CategoryID")) //'For all fields selected by the user (except CategoryID) create a label and a textbox { Label lbl = new Label(); //Set the label to display the name of the selected field lbl.Text = m_arrayFields[i].ToString() + ":"; //Set the location of each label //(m_currentY gets the height of each control added on each iteration) lbl.Location = new System.Drawing.PointF(0f,m_currentY); lbl.Width =.9f; lbl.Height = m_defaultHeight; this.detail.Controls.Add(lbl); TextBox txt = new TextBox(); //Set the textbox to display data txt.DataField = m_arrayFields[i].ToString(); //Set the location of the textbox txt.Location = new System.Drawing.PointF(1f,m_currentY); txt.Width = m_defaultWidth; txt.Height = m_defaultHeight; this.detail.Controls.Add(txt); //Increment the vertical location by adding the height of the added controls m_currentY = m_currentY + m_defaultHeight; } } } catch(Exception ex) { System.Windows.Forms.MessageBox.Show("Error in Report-constructReport: " + ex.Message,"Project Error",System.Windows.Forms.MessageBoxButtons.OK,System.Windows.Forms.MessageBoxIcon.Error); }}
ActiveReports 6 User Guide | 373

2. Add code within the class declaration of the form to:
Fill the check list with fields
Launch the report
To write the code in Visual Basic.NET
The following example shows what the code for the method looks like.
To write the code in C#
The following example shows what the code for the method looks like.
Adding code to alternate colors in the detail section1. Double-click in the detail section of rptRunTime. This creates an event-handling method for rptRunTime's
Visual Basic.NET code. Paste INSIDE the class declaration of the form.
Dim i As IntegerDim c As IntegerDim m_arrayField As New ArrayList()Private Sub fillCheckBox() For i = 0 To Me.NwindDataSet1.Tables.Count - 1 For c = 0 To Me.NwindDataSet1.Tables(i).Columns.Count - 1 Me.clbFields.Items.Add(Me.NwindDataSet1.Tables(i).Columns(c).ColumnName) Next NextEnd SubPrivate Sub launchReport() Dim rpt As New rptRunTime() Try rpt.FieldsList = m_arrayField rpt.UseGroups = chkGroup.Checked rpt.DataSource = Me.NwindDataSet1.Products.TableName Viewer1.Document = rpt.Document rpt.Run() Catch ex As Exception System.Windows.Forms.MessageBox.Show(Me, "Error in launchReport: " + ex.Message, "Project Error", MessageBoxButtons.OK, MessageBoxIcon.Error) End TryEnd Sub
C# code. Paste INSIDE the class declaration of the form.
ArrayList m_arrayField = new ArrayList();private void fillCheckBox(){ for(int i = 0; i < this.dataSet11.Tables.Count; i++) { for(int c = 0; c < this.dataSet11.Tables[i].Columns.Count; c++) { this.clbFields.Items.Add(this.dataSet11.Tables[i].Columns[c].ColumnName); } }}private void launchReport(){ try { rptRunTime rpt = new rptRunTime(); rpt.FieldsList = m_arrayField; rpt.UseGroups = chkGroup.Checked; rpt.DataSource = this.dataSet11.Products.TableName; this.viewer1.Document = rpt.Document; rpt.Run(); } catch(Exception ex) { MessageBox.Show(this,"Error in launchReport: " + ex.Message,"Project Error",MessageBoxButtons.OK,MessageBoxIcon.Error); }}
ActiveReports 6 User Guide | 374
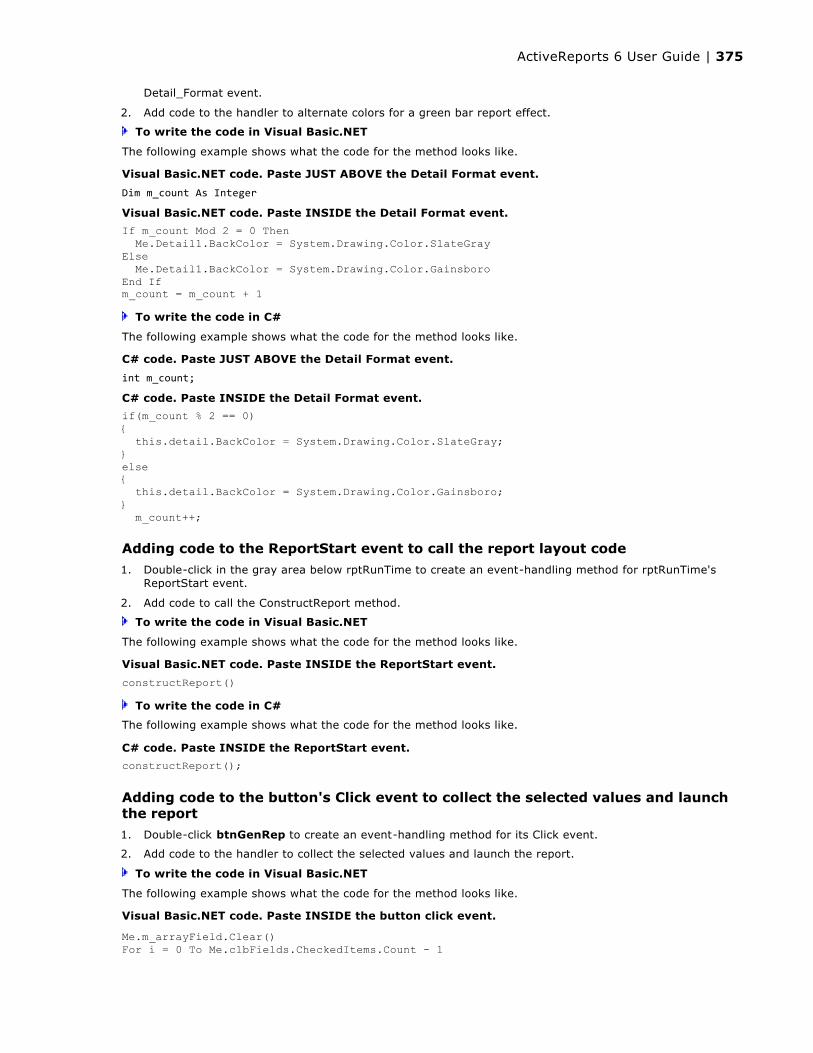
Detail_Format event.
2. Add code to the handler to alternate colors for a green bar report effect.
To write the code in Visual Basic.NET
The following example shows what the code for the method looks like.
To write the code in C#
The following example shows what the code for the method looks like.
Adding code to the ReportStart event to call the report layout code
1. Double-click in the gray area below rptRunTime to create an event-handling method for rptRunTime's ReportStart event.
2. Add code to call the ConstructReport method.
To write the code in Visual Basic.NET
The following example shows what the code for the method looks like.
To write the code in C#
The following example shows what the code for the method looks like.
Adding code to the button's Click event to collect the selected values and launch the report
1. Double-click btnGenRep to create an event-handling method for its Click event.
2. Add code to the handler to collect the selected values and launch the report.
To write the code in Visual Basic.NET
The following example shows what the code for the method looks like.
Visual Basic.NET code. Paste JUST ABOVE the Detail Format event.
Dim m_count As Integer
Visual Basic.NET code. Paste INSIDE the Detail Format event.
If m_count Mod 2 = 0 Then Me.Detail1.BackColor = System.Drawing.Color.SlateGrayElse Me.Detail1.BackColor = System.Drawing.Color.GainsboroEnd Ifm_count = m_count + 1
C# code. Paste JUST ABOVE the Detail Format event.
int m_count;
C# code. Paste INSIDE the Detail Format event.
if(m_count % 2 == 0){ this.detail.BackColor = System.Drawing.Color.SlateGray;}else{ this.detail.BackColor = System.Drawing.Color.Gainsboro;} m_count++;
Visual Basic.NET code. Paste INSIDE the ReportStart event.
constructReport()
C# code. Paste INSIDE the ReportStart event.
constructReport();
Visual Basic.NET code. Paste INSIDE the button click event.
Me.m_arrayField.Clear()For i = 0 To Me.clbFields.CheckedItems.Count - 1
ActiveReports 6 User Guide | 375

To write the code in C#
The following example shows what the code for the method looks like.
Adding code to enable the button when fields are selected
To write the code in Visual Basic.NET
1. At the top left of the code view for the form, click the drop-down arrow and select clbFields.
2. At the top right of the code window, click the drop-down arrow and select SelectedIndexChanged. This creates an event-handling method for the clbFields_SelectedIndexChanged event.
3. Add code to the handler to enable the button when fields are selected.
The following example shows what the code for the method looks like.
To write the code in C#
1. On the form, click clbFields to select it.
2. Click on the events icon in the Properties Window to display available events and double-click SelectedIndexChanged. This creates an event-handling method for the clbFields_SelectedIndexChanged event.
3. Add code to the handler to enable the button when fields are selected.
The following example shows what the code for the method looks like.
Adding code to the Form_Load event to call the fill check list code1. Double-click the title bar of the form. This creates an event-handling method for the Windows Form_Load
event.
2. Add code to the handler to call the fillCheckBox() method to populate clbFields with field values and to handle exceptions.
To write the code in Visual Basic.NET
The following example shows what the code for the method looks like.
m_arrayField.Add(Me.clbFields.CheckedItems(i).ToString)NextlaunchReport()
C# code. Paste INSIDE the button click event.
this.m_arrayField.Clear();for(int i = 0; i < this.clbFields.CheckedItems.Count; i++){ m_arrayField.Add(this.clbFields.CheckedItems[i].ToString());}launchReport();
Visual Basic.NET code. Paste INSIDE the SelectedIndexChanged event.
If Me.clbFields.CheckedItems.Count < 0 Then Me.btnGenRep.Enabled = FalseElse Me.btnGenRep.Enabled = TrueEnd If
C# code. Paste INSIDE the SelectedIndexChanged event.
if(this.clbFields.CheckedItems.Count>0){ this.btnGenRep.Enabled = true;}else{ this.btnGenRep.Enabled = false;}
Visual Basic.NET code. Paste INSIDE the Form Load event.
Try
ActiveReports 6 User Guide | 376

To write the code in C#
The following example shows what the code for the method looks like.
fillCheckBox()Catch ex As Exception System.Windows.Forms.MessageBox.Show(Me, "Error in Form1_Load: " + ex.Message, "Project Error", MessageBoxButtons.OK, MessageBoxIcon.Error)End Try
C# code. Paste INSIDE the Form Load event.
try{ fillCheckBox();}catch(Exception ex){ MessageBox.Show(this,"Error in Form1_Load: " + ex.Message,"Project Error", + MessageBoxButtons.OK,MessageBoxIcon.Error);}
ActiveReports 6 User Guide | 377

ActiveReports allows you to change the data source of a report at run time. This walkthrough illustrates how to find the location of the sample database file on the user's computer and connect the report to it at run time.
This walkthrough is split up into the following activities:
Connecting the report to a design time data source
Adding controls to the report to display data
Adding code to find the database path
Adding code to change the data source at run time
Adding code to close the data connection
To complete the walkthrough, you must have access to the Northwind database.A copy is located at C:\Program Files\GrapeCity\ActiveReports 6\Data\NWIND.MDB.
To connect the report to a design time data source
1. Add an ActiveReport 6 (code-based) File to a Visual Studio project, and rename the file rptModifyDS.
2. Click the gray report DataSource icon in the Detail section to open the report DataSource dialog.
3. On the OLE DB tab, click the Build button.
4. Select Microsoft Jet 4.0 OLE DB Provider and click Next.
5. Click the ellipsis button to browse for the access path to the Northwind database. Click Open once you have selected the appropriate access path.
6. Click OK to continue.
7. In the Query field, paste the following SQL query.
8. Click OK to return to the report design surface.
To add controls to the report
1. Click the detail section to select it, and in the Properties Window, set the CanShrink property to True.
2. In the Report Explorer, expand the Fields node, then the Bound node.
3. Drag the following fields onto the detail section of the report and set the properties of each textbox as indicated.
Detail section fields
To find the database path1. Right-click in any section of the design window of rptModifyDS, and select View Code to display the
code view for the report.
2. Add code to the report to get the sample database path from the registry.
Run Time Data Sources
Tip: For basic steps like adding a report to a Visual Studio project and viewing a report, please see the Basic Data Bound Reports walkthrough.
Tip: Even if you will change the data source at run time, setting a design time data source allows you to drag fields onto the report from the Report Explorer.
SQL Query
SELECT * FROM Products
Field Size Location MiscellaneousProductID 0.5, 0.2 in 0, 0 inProductName 2.8, 0.2 in 0.6, 0 inUnitsInStock 0.5, 0.2 in 3.5, 0 in Alignment = RightUnitsOnOrder 0.5, 0.2 in 4.1, 0 in Alignment = Right
UnitPrice 0.9, 0.2 in 4.7, 0 inOutputFormat = CurrencyAlignment = Right
ActiveReports 6 User Guide | 378

To write the code in Visual Basic
The following example shows what the code for the function looks like.
This creates a function for getDatabasePath.
To write the code in C#
This creates a function for getDatabasePath.
To change the data source at run time1. Double-click in the gray area below rptModifyDS to create an event-handling method for the
ReportStart event.
2. Add code to the handler to change the data source at run time.
To write the code in Visual Basic.NET
The following example shows what the code for the method looks like.
To write the code in C#
The following example shows what the code for the method looks like.
Visual Basic.NET code. Paste JUST BELOW the Imports DataDynamics.ActiveReports statements at the top of the code view.
Imports System Imports Microsoft.Win32Visual Basic.NET code. Paste INSIDE the report class and hit ENTER.
Private Function getDatabasePath() As String
Visual Basic.NET code. Paste INSIDE the getDatabasePath function.
Dim regKey As RegistryKeyregKey = Registry.LocalMachineregKey = regKey.CreateSubKey("SOFTWARE\\GrapeCity\\ActiveReports 6\\SampleDB")getDatabasePath = CType(regKey.GetValue(""), String)
C# code. Paste JUST BELOW the using DataDynamics.ActiveReports; statements at the top of the code view.
using Microsoft.Win32;using System;C# code. Paste INSIDE the report class and hit ENTER.
private string getDatabasePath()
C# code. Paste INSIDE the getDatabasePath function.
RegistryKey regKey = Registry.LocalMachine;regKey = regKey.CreateSubKey("SOFTWARE\\GrapeCity\\ActiveReports 6\\SampleDB");return ((string)(regKey.GetValue("")));
Visual Basic.NET code. Paste JUST ABOVE the ReportStart event.
Dim conn As System.Data.OleDb.OleDbConnectionDim reader As System.Data.OleDb.OleDbDataReaderVisual Basic.NET code. Paste INSIDE the ReportStart event.
Dim dbPath As String = getDatabasePath()Dim connString As String = "Provider=Microsoft.Jet.OLEDB.4.0;Data Source=" + dbPath + "\\NWIND.mdb"conn = New System.Data.OleDb.OleDbConnection(connString) Dim cmd As New System.Data.OleDb.OleDbCommand("SELECT * FROM Products WHERE UnitPrice = 18", conn)conn.Open()reader = cmd.ExecuteReader()Me.DataSource = reader
C# code. Paste JUST ABOVE the ReportStart event.
private static System.Data.OleDb.OleDbConnection conn;private static System.Data.OleDb.OleDbDataReader reader;
ActiveReports 6 User Guide | 379

To close the data connectionTo write the code in Visual Basic
1. In design view of rptModifyDS, drop down the field at the top left of the code view and select (rptModifyDS Events).
2. Drop down the field at the top right of the code view and select ReportEnd. This creates an event-handling method for ReportEnd event.
3. Add code to the handler to close the data connection.
The following example shows what the code for the method looks like.
To write the code in C#
1. Click in the gray area below rptModifyDS to select the report.
2. Click the events icon in the Properties Window to display available events for the report.
3. Double-click ReportEnd. This creates an event-handling method for the ReportEnd event.
4. Add code to the handler to close the data connection.
The following example shows what the code for the method looks like.
C# code. Paste INSIDE the ReportStart event.
string dbPath = getDatabasePath();string connString = "Provider=Microsoft.Jet.OLEDB.4.0;Data Source=" + dbPath + "\\NWIND.mdb";conn = new System.Data.OleDb.OleDbConnection(connString);System.Data.OleDb.OleDbCommand cmd = new System.Data.OleDb.OleDbCommand("SELECT * FROM Products WHERE UnitPrice = 18", conn);conn.Open();reader = cmd.ExecuteReader();this.DataSource = reader;
Visual Basic.NET code. Paste INSIDE the ReportEnd event.
reader.Close()conn.Close()
C# code. Paste INSIDE the ReportEnd event.
reader.Close();conn.Close();
ActiveReports 6 User Guide | 380

Follow step-by-step tutorials as you create Visual Studio ASP.NET projects using ActiveReports. You can use the export controls to export and stream reports to a browser.
This section contains information about how to:
Custom Web Exporting (Std Edition)Learn how to export reports to a memory stream and display the exports in a Web browser.
Custom HTML OutputterLearn how to create a custom HTML outputter class and export reports to it.
Web ServicesLearn how to create data or document Web services, and consume them in Windows applications.
Web Walkthroughs (Standard Edition)
ActiveReports 6 User Guide | 381
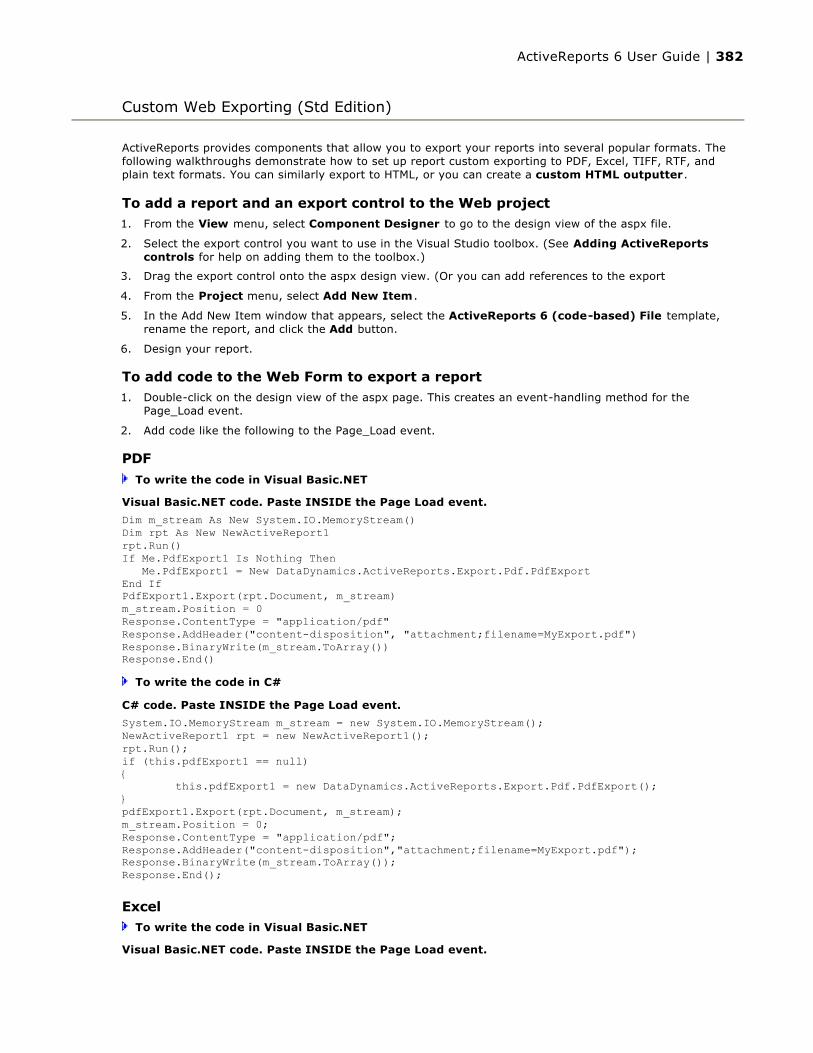
ActiveReports provides components that allow you to export your reports into several popular formats. The following walkthroughs demonstrate how to set up report custom exporting to PDF, Excel, TIFF, RTF, and plain text formats. You can similarly export to HTML, or you can create a custom HTML outputter.
To add a report and an export control to the Web project1. From the View menu, select Component Designer to go to the design view of the aspx file.
2. Select the export control you want to use in the Visual Studio toolbox. (See Adding ActiveReports controls for help on adding them to the toolbox.)
3. Drag the export control onto the aspx design view. (Or you can add references to the export
4. From the Project menu, select Add New Item .
5. In the Add New Item window that appears, select the ActiveReports 6 (code-based) File template, rename the report, and click the Add button.
6. Design your report.
To add code to the Web Form to export a report1. Double-click on the design view of the aspx page. This creates an event-handling method for the
Page_Load event.
2. Add code like the following to the Page_Load event.
To write the code in Visual Basic.NET
To write the code in C#
ExcelTo write the code in Visual Basic.NET
Custom Web Exporting (Std Edition)
Visual Basic.NET code. Paste INSIDE the Page Load event.
Dim m_stream As New System.IO.MemoryStream()Dim rpt As New NewActiveReport1rpt.Run()If Me.PdfExport1 Is Nothing Then Me.PdfExport1 = New DataDynamics.ActiveReports.Export.Pdf.PdfExportEnd IfPdfExport1.Export(rpt.Document, m_stream)m_stream.Position = 0Response.ContentType = "application/pdf"Response.AddHeader("content-disposition", "attachment;filename=MyExport.pdf")Response.BinaryWrite(m_stream.ToArray())Response.End()
C# code. Paste INSIDE the Page Load event.
System.IO.MemoryStream m_stream = new System.IO.MemoryStream();NewActiveReport1 rpt = new NewActiveReport1();rpt.Run();if (this.pdfExport1 == null){ this.pdfExport1 = new DataDynamics.ActiveReports.Export.Pdf.PdfExport();}pdfExport1.Export(rpt.Document, m_stream);m_stream.Position = 0;Response.ContentType = "application/pdf";Response.AddHeader("content-disposition","attachment;filename=MyExport.pdf");Response.BinaryWrite(m_stream.ToArray());Response.End();
Visual Basic.NET code. Paste INSIDE the Page Load event.
ActiveReports 6 User Guide | 382

To write the code in C#
TIFF
To write the code in Visual Basic.NET
To write the code in C#
Dim m_stream As New System.IO.MemoryStream()Dim rpt As New NewActiveReport1()rpt.Run()If Me.XlsExport1 Is Nothing Then Me.XlsExport1 = New DataDynamics.ActiveReports.Export.Xls.XlsExportEnd IfXlsExport1.MinColumnWidth = 0.5XlsExport1.Export(rpt.Document, m_stream)m_stream.Position = 0Response.ContentType = "application/vnd.ms-excel"Response.AddHeader("content-disposition", "inline; filename=MyExport.xls")Response.BinaryWrite(m_stream.ToArray())Response.End()
C# code. Paste INSIDE the Page Load event.
System.IO.MemoryStream m_stream = new System.IO.MemoryStream();NewActiveReport1 rpt = new NewActiveReport1();rpt.Run();if (this.xlsExport1 == null){ this.xlsExport1 = new DataDynamics.ActiveReports.Export.Xls.XlsExport();}xlsExport1.MinColumnWidth = 0.5;xlsExport1.Export(rpt.Document, m_stream);m_stream.Position = 0;Response.ContentType = "application/vnd.ms-excel";Response.AddHeader("content-disposition","inline; filename=MyExport.xls");Response.BinaryWrite(m_stream.ToArray());Response.End();
Visual Basic.NET code. Paste INSIDE the Page Load event.
Dim m_stream As New System.IO.MemoryStream()Dim rpt As New NewActiveReport1()rpt.Run()If Me.TiffExport1 Is Nothing Then Me.TiffExport1 = New DataDynamics.ActiveReports.Export.Tiff.TiffExportEnd IfMe.TiffExport1.CompressionScheme = DataDynamics.ActiveReports.Export.Tiff.CompressionScheme.NoneMe.TiffExport1.Export(rpt.Document, m_stream)m_stream.Position = 0Response.ContentType = "image/tiff"Response.AddHeader("content-disposition", "inline; filename=MyExport.tiff")Response.BinaryWrite(m_stream.ToArray())Response.End()
C# code. Paste INSIDE the Page Load event.
System.IO.MemoryStream m_stream = new System.IO.MemoryStream();NewActiveReport1 rpt = new NewActiveReport1();rpt.Run();if (this.tiffExport1 == null){ this.tiffExport1 = new DataDynamics.ActiveReports.Export.Tiff.TiffExport(); } tiffExport1.CompressionScheme = DataDynamics.ActiveReports.Export.Tiff.CompressionScheme.None;tiffExport1.Export(rpt.Document, m_stream);m_stream.Position = 0;Response.ContentType = "image/tiff";Response.AddHeader("content-disposition","inline; filename=MyExport.tiff");Response.BinaryWrite(m_stream.ToArray());Response.End();
ActiveReports 6 User Guide | 383

RTFTo write the code in Visual Basic.NET
To write the code in C#
Plain Text
To write the code in Visual Basic.NET
To write the code in C#
Visual Basic.NET code. Paste INSIDE the Page Load event.
Dim m_stream As New System.IO.MemoryStream()Dim rpt As New NewActiveReport1()rpt.Run()If Me.RtfExport1 Is Nothing Then Me.RtfExport1 = New DataDynamics.ActiveReports.Export.Rtf.RtfExportEnd IfRtfExport1.Export(rpt.Document, m_stream)m_stream.Position = 0Response.ContentType = "application/msword"Response.AddHeader("content-disposition", "inline; filename=MyExport.rtf")Response.BinaryWrite(m_stream.ToArray())Response.End()
C# code. Paste INSIDE the Page Load event.
System.IO.MemoryStream m_stream = new System.IO.MemoryStream();NewActiveReport1 rpt = new NewActiveReport1();rpt.Run();if (this.rtfExport1 == null) { this.rtfExport1 = new DataDynamics.ActiveReports.Export.Rtf.RtfExport(); }rtfExport1.Export(rpt.Document, m_stream);m_stream.Position = 0;Response.ContentType = "application/msword";Response.AddHeader("content-disposition","inline; filename=MyExport.rtf");Response.BinaryWrite(m_stream.ToArray());Response.End();
Visual Basic.NET code. Paste INSIDE the Page Load event.
Dim m_stream As New System.IO.MemoryStream()Dim rpt As New NewActiveReport1()rpt.Run()If Me.TextExport1 Is Nothing Then Me.TextExport1 = New DataDynamics.ActiveReports.Export.Text.TextExportEnd IfTextExport1.Export(rpt.Document, m_stream)m_stream.Position = 0Response.ContentType = "text/plain"Response.BinaryWrite(m_stream.ToArray())Response.End()
C# code. Paste INSIDE the Page Load event.
System.IO.MemoryStream m_stream = new System.IO.MemoryStream();NewActiveReport1 rpt = new NewActiveReport1();rpt.Run();if (this.textExport1 == null) { this.textExport1 = new DataDynamics.ActiveReports.Export.Text.TextExport(); }textExport1.Export(rpt.Document, m_stream);m_stream.Position = 0;Response.ContentType = "text/plain";Response.BinaryWrite(m_stream.ToArray());Response.End();
ActiveReports 6 User Guide | 384

To view the results in your Web browser, run the project.
ActiveReports 6 User Guide | 385
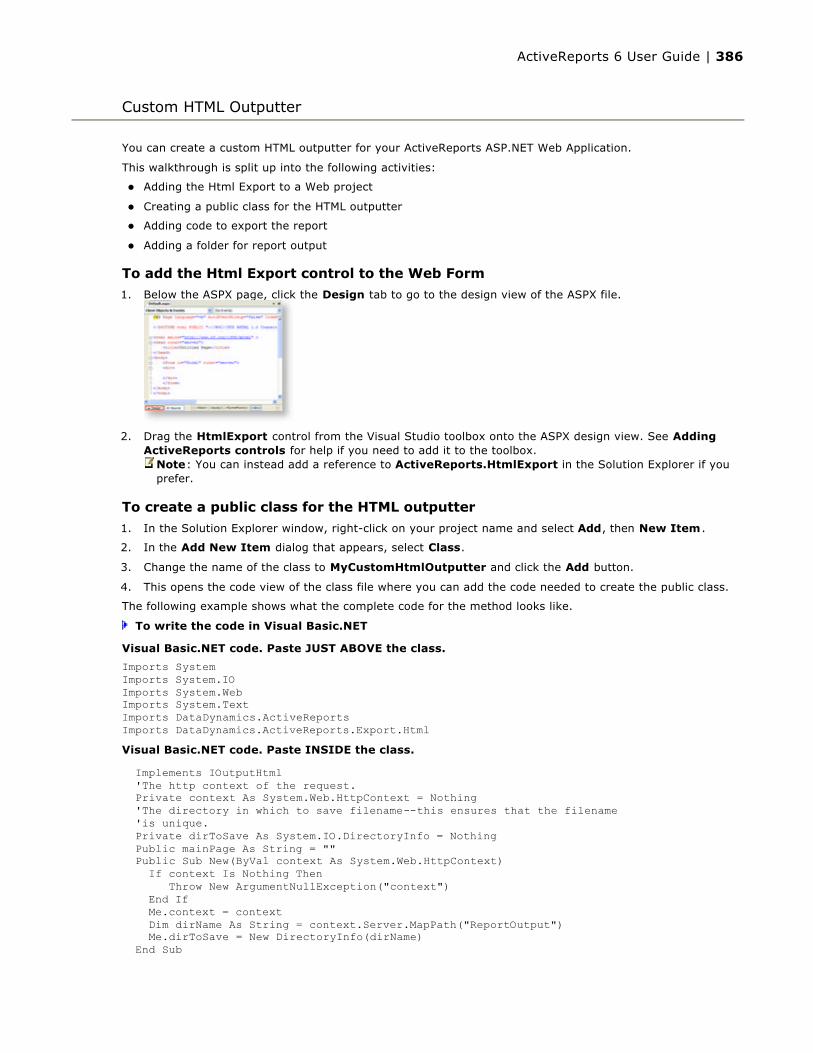
You can create a custom HTML outputter for your ActiveReports ASP.NET Web Application.
This walkthrough is split up into the following activities:
Adding the Html Export to a Web project
Creating a public class for the HTML outputter
Adding code to export the report
Adding a folder for report output
To add the Html Export control to the Web Form
1. Below the ASPX page, click the Design tab to go to the design view of the ASPX file.
2. Drag the HtmlExport control from the Visual Studio toolbox onto the ASPX design view. See Adding ActiveReports controls for help if you need to add it to the toolbox.
To create a public class for the HTML outputter
1. In the Solution Explorer window, right-click on your project name and select Add, then New Item .
2. In the Add New Item dialog that appears, select Class.
3. Change the name of the class to MyCustomHtmlOutputter and click the Add button.
4. This opens the code view of the class file where you can add the code needed to create the public class.
The following example shows what the complete code for the method looks like.
To write the code in Visual Basic.NET
Custom HTML Outputter
Note: You can instead add a reference to ActiveReports.HtmlExport in the Solution Explorer if you prefer.
Visual Basic.NET code. Paste JUST ABOVE the class.
Imports System Imports System.IO Imports System.Web Imports System.TextImports DataDynamics.ActiveReports Imports DataDynamics.ActiveReports.Export.HtmlVisual Basic.NET code. Paste INSIDE the class.
Implements IOutputHtml 'The http context of the request. Private context As System.Web.HttpContext = Nothing 'The directory in which to save filename--this ensures that the filename 'is unique. Private dirToSave As System.IO.DirectoryInfo = Nothing Public mainPage As String = "" Public Sub New(ByVal context As System.Web.HttpContext) If context Is Nothing Then Throw New ArgumentNullException("context") End If Me.context = context Dim dirName As String = context.Server.MapPath("ReportOutput") Me.dirToSave = New DirectoryInfo(dirName) End Sub
ActiveReports 6 User Guide | 386
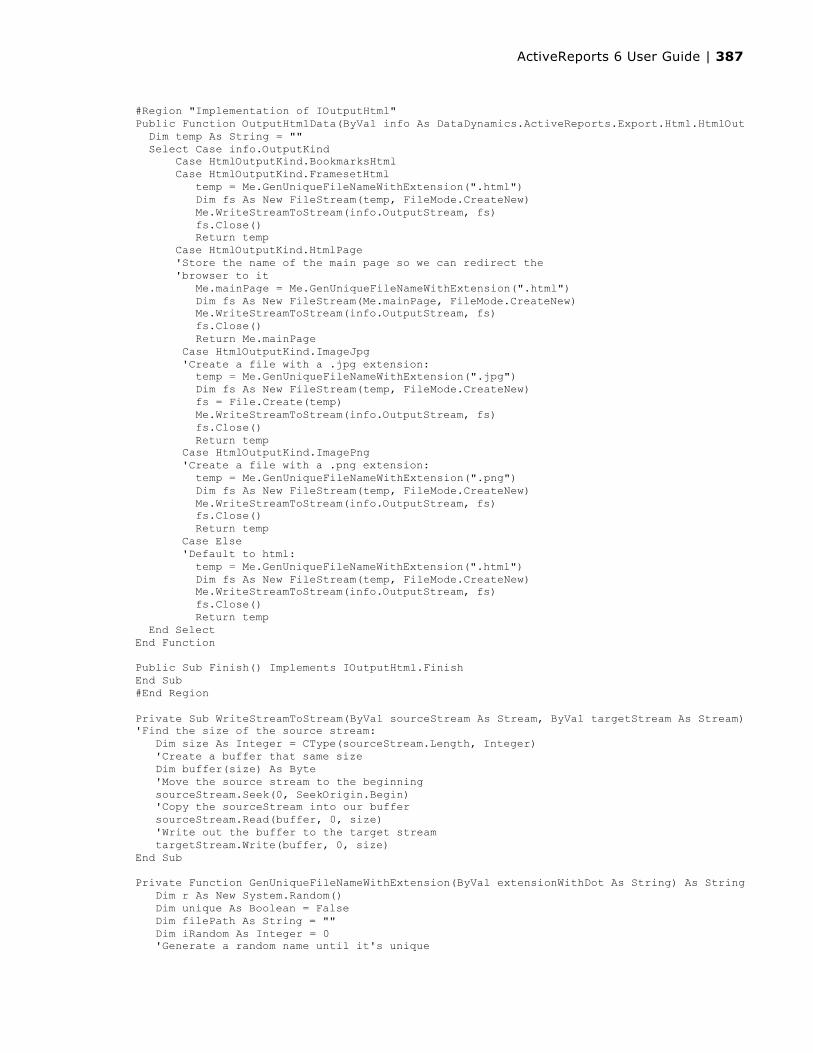
#Region "Implementation of IOutputHtml" Public Function OutputHtmlData(ByVal info As DataDynamics.ActiveReports.Export.Html.HtmlOutputInfoArgs) As String Implements IOutputHtml.OutputHtmlData Dim temp As String = "" Select Case info.OutputKind Case HtmlOutputKind.BookmarksHtml Case HtmlOutputKind.FramesetHtml temp = Me.GenUniqueFileNameWithExtension(".html") Dim fs As New FileStream(temp, FileMode.CreateNew) Me.WriteStreamToStream(info.OutputStream, fs) fs.Close() Return temp Case HtmlOutputKind.HtmlPage 'Store the name of the main page so we can redirect the 'browser to it Me.mainPage = Me.GenUniqueFileNameWithExtension(".html") Dim fs As New FileStream(Me.mainPage, FileMode.CreateNew) Me.WriteStreamToStream(info.OutputStream, fs) fs.Close() Return Me.mainPage Case HtmlOutputKind.ImageJpg 'Create a file with a .jpg extension: temp = Me.GenUniqueFileNameWithExtension(".jpg") Dim fs As New FileStream(temp, FileMode.CreateNew) fs = File.Create(temp) Me.WriteStreamToStream(info.OutputStream, fs) fs.Close() Return temp Case HtmlOutputKind.ImagePng 'Create a file with a .png extension: temp = Me.GenUniqueFileNameWithExtension(".png") Dim fs As New FileStream(temp, FileMode.CreateNew) Me.WriteStreamToStream(info.OutputStream, fs) fs.Close() Return temp Case Else 'Default to html: temp = Me.GenUniqueFileNameWithExtension(".html") Dim fs As New FileStream(temp, FileMode.CreateNew) Me.WriteStreamToStream(info.OutputStream, fs) fs.Close() Return temp End Select End Function Public Sub Finish() Implements IOutputHtml.Finish End Sub #End Region Private Sub WriteStreamToStream(ByVal sourceStream As Stream, ByVal targetStream As Stream) 'Find the size of the source stream: Dim size As Integer = CType(sourceStream.Length, Integer) 'Create a buffer that same size Dim buffer(size) As Byte 'Move the source stream to the beginning sourceStream.Seek(0, SeekOrigin.Begin) 'Copy the sourceStream into our buffer sourceStream.Read(buffer, 0, size) 'Write out the buffer to the target stream targetStream.Write(buffer, 0, size) End Sub Private Function GenUniqueFileNameWithExtension(ByVal extensionWithDot As String) As String Dim r As New System.Random() Dim unique As Boolean = False Dim filePath As String = "" Dim iRandom As Integer = 0 'Generate a random name until it's unique
ActiveReports 6 User Guide | 387

To write the code in C#
While Not unique iRandom = r.Next() 'Buld the full filename Dim sb = New StringBuilder() sb.Append(Me.dirToSave.FullName) sb.Append(Path.DirectorySeparatorChar) sb.Append(iRandom.ToString()) sb.Append(extensionWithDot) filePath = sb.ToString() If File.Exists(filePath) = False Then unique = True Else unique = False End If End While Return filePath End Function
C# code. Paste JUST ABOVE the class.
using System; using System.IO; using System.Web; using System.Text; using DataDynamics.ActiveReports; using DataDynamics.ActiveReports.Export.Html;C# code. Paste INSIDE the class.
//The http context of the request private System.Web.HttpContext context = null; //The directory in which to save filename--this ensures that the filename //is unique. private System.IO.DirectoryInfo dirToSave = null; public string mainPage = ""; public MyCustomHtmlOutputter(System.Web.HttpContext context) { if(context == null) { throw new ArgumentNullException("context"); this.context = context; string dirName = context.Server.MapPath("ReportOutput"); this.dirToSave = new DirectoryInfo(dirName); } } #region Implementation of IOutputHtmlpublic string OutputHtmlData(DataDynamics.ActiveReports.Export.Html.HtmlOutputInfoArgs info){ string temp = ""; switch(info.OutputKind) { case HtmlOutputKind.BookmarksHtml: case HtmlOutputKind.FramesetHtml: { temp = this.GenUniqueFileNameWithExtension(".html"); FileStream fs = File.Create(temp); this.WriteStreamToStream(info.OutputStream, fs); fs.Close(); return temp; } case HtmlOutputKind.HtmlPage: { //Store the name of the main page so we can //redirect the browser to it this.mainPage = this.GenUniqueFileNameWithExtension(".html"); FileStream fs = File.Create(this.mainPage);
ActiveReports 6 User Guide | 388
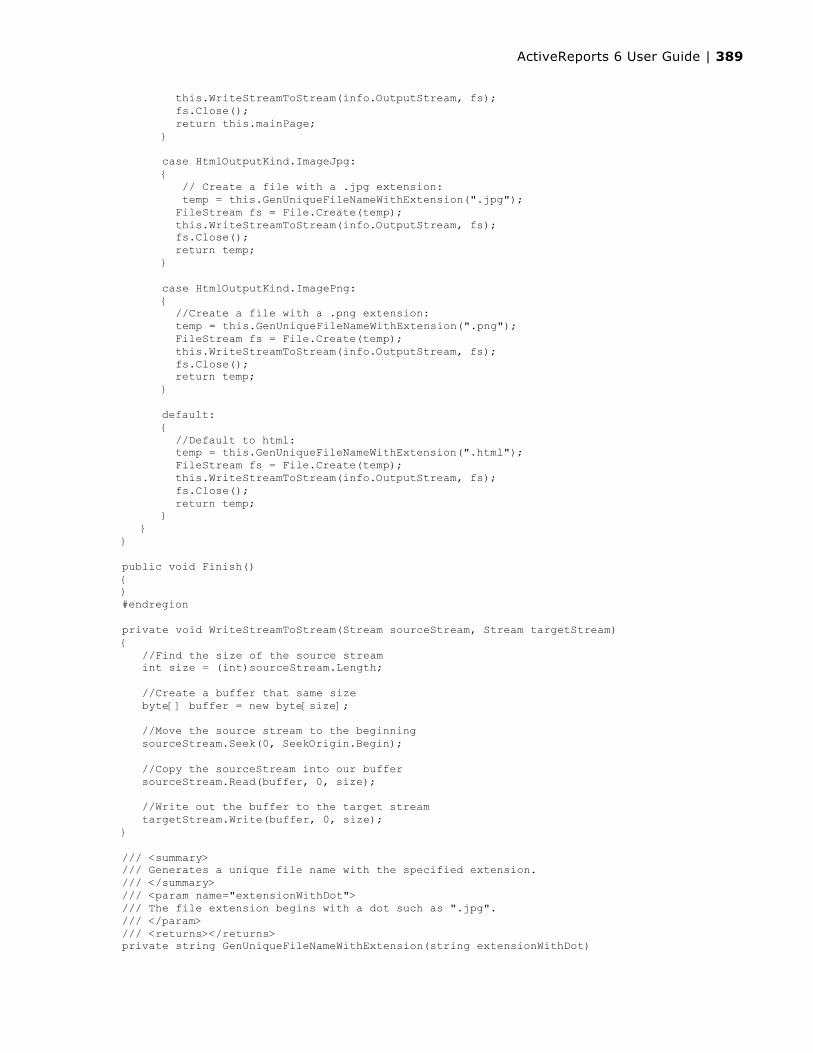
this.WriteStreamToStream(info.OutputStream, fs); fs.Close(); return this.mainPage; } case HtmlOutputKind.ImageJpg: { // Create a file with a .jpg extension: temp = this.GenUniqueFileNameWithExtension(".jpg"); FileStream fs = File.Create(temp); this.WriteStreamToStream(info.OutputStream, fs); fs.Close(); return temp; } case HtmlOutputKind.ImagePng: { //Create a file with a .png extension: temp = this.GenUniqueFileNameWithExtension(".png"); FileStream fs = File.Create(temp); this.WriteStreamToStream(info.OutputStream, fs); fs.Close(); return temp; } default: { //Default to html: temp = this.GenUniqueFileNameWithExtension(".html"); FileStream fs = File.Create(temp); this.WriteStreamToStream(info.OutputStream, fs); fs.Close(); return temp; } }} public void Finish(){}#endregion private void WriteStreamToStream(Stream sourceStream, Stream targetStream){ //Find the size of the source stream int size = (int)sourceStream.Length; //Create a buffer that same size byte[] buffer = new byte[size]; //Move the source stream to the beginning sourceStream.Seek(0, SeekOrigin.Begin); //Copy the sourceStream into our buffer sourceStream.Read(buffer, 0, size); //Write out the buffer to the target stream targetStream.Write(buffer, 0, size);} /// <summary>/// Generates a unique file name with the specified extension./// </summary>/// <param name="extensionWithDot">/// The file extension begins with a dot such as ".jpg"./// </param>/// <returns></returns>private string GenUniqueFileNameWithExtension(string extensionWithDot)
ActiveReports 6 User Guide | 389

To add code to the Web Form to export to HTML1. Add an ActiveReport to the project, and name it rptCustHTML.
2. Double-click on the design view of the ASPX. This creates an event-handling method for the Web Form's Page Load event.
3. Add the following code to the Page Load event.
The following example shows what the code for the method looks like.
To write the code in Visual Basic.NET
To write the code in C#
{ System.Random r = new Random(); bool unique = false; string filePath = ""; int iRandom = 0; //Generate a random name until it's unique while(!unique) { iRandom = r.Next(); //Buld the full filename System.Text.StringBuilder sb = new System.Text.StringBuilder(); sb.Append(this.dirToSave.FullName); sb.Append(Path.DirectorySeparatorChar); sb.Append(iRandom.ToString()); sb.Append(extensionWithDot); filePath = sb.ToString(); unique = !File.Exists(filePath); } return filePath; }
Visual Basic.NET code. Paste INSIDE the Page Load event.
Dim rpt As New rptCustHTML() Try rpt.Run(False) Catch eRunReport As Exception 'If the report fails to run, report the error to the user Response.Clear() Response.Write("<h1>Error running report:</h1>") Response.Write(eRunReport.ToString()) Return End Try 'Buffer this page's output until the report output is ready. Response.Buffer = True 'Clear any part of this page that might have already been buffered for output. Response.ClearContent() 'Clear any headers that might have already been buffered (such as the content type 'for an HTML page) Response.ClearHeaders() 'Tell the browser and the "network" that the resulting data of this page should be 'cached since this could be a dynamic report that changes upon each request. Response.Cache.SetCacheability(HttpCacheability.NoCache) 'Tell the browser this is an Html document so it will use an appropriate viewer. Response.ContentType = "text/HTML" 'Create the Html export object Dim HtmlExport1 As New DataDynamics.ActiveReports.Export.Html.HtmlExport() Dim outputter As New MyCustomHtmlOutputter(Me.Context) HtmlExport1.Export(rpt.Document, outputter, "") Response.Redirect("ReportOutput" + "/" + System.IO.Path.GetFileName(outputter.mainPage))
ActiveReports 6 User Guide | 390
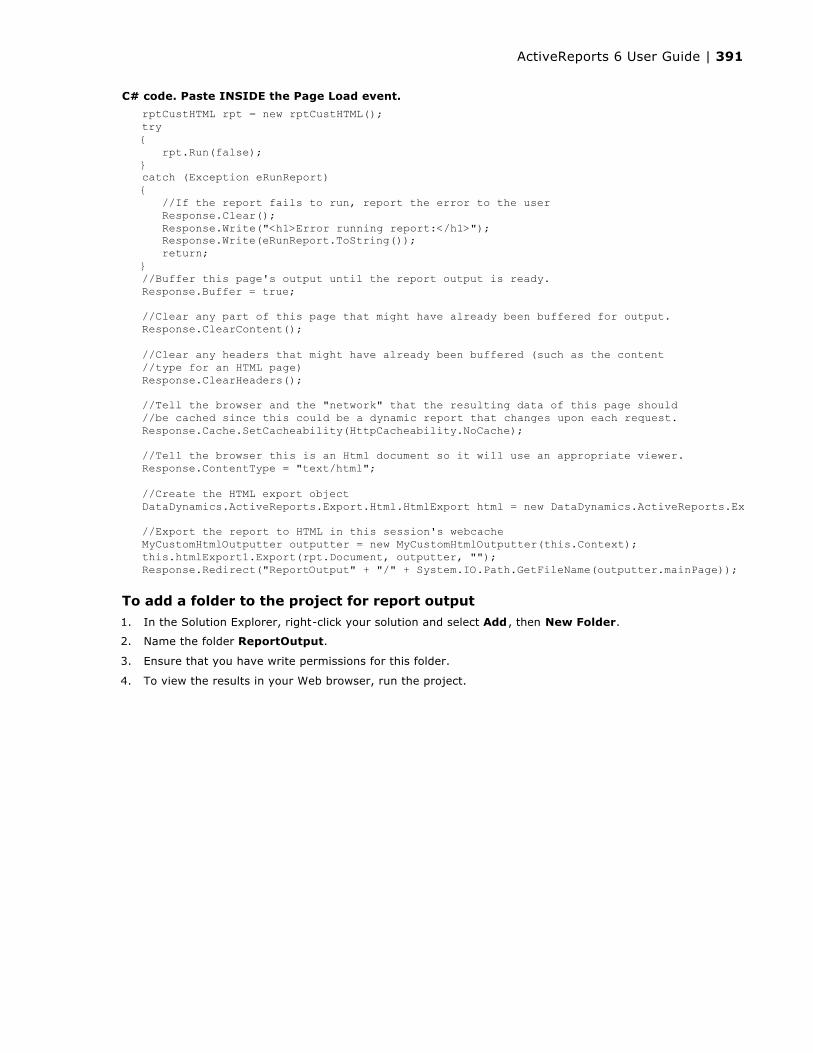
To add a folder to the project for report output
1. In the Solution Explorer, right-click your solution and select Add , then New Folder.
2. Name the folder ReportOutput.
3. Ensure that you have write permissions for this folder.
4. To view the results in your Web browser, run the project.
C# code. Paste INSIDE the Page Load event.
rptCustHTML rpt = new rptCustHTML(); try { rpt.Run(false); } catch (Exception eRunReport) { //If the report fails to run, report the error to the user Response.Clear(); Response.Write("<h1>Error running report:</h1>"); Response.Write(eRunReport.ToString()); return; } //Buffer this page's output until the report output is ready. Response.Buffer = true; //Clear any part of this page that might have already been buffered for output. Response.ClearContent();
//Clear any headers that might have already been buffered (such as the content //type for an HTML page) Response.ClearHeaders(); //Tell the browser and the "network" that the resulting data of this page should //be cached since this could be a dynamic report that changes upon each request. Response.Cache.SetCacheability(HttpCacheability.NoCache); //Tell the browser this is an Html document so it will use an appropriate viewer. Response.ContentType = "text/html"; //Create the HTML export object DataDynamics.ActiveReports.Export.Html.HtmlExport html = new DataDynamics.ActiveReports.Export.Html.HtmlExport(); //Export the report to HTML in this session's webcache MyCustomHtmlOutputter outputter = new MyCustomHtmlOutputter(this.Context); this.htmlExport1.Export(rpt.Document, outputter, ""); Response.Redirect("ReportOutput" + "/" + System.IO.Path.GetFileName(outputter.mainPage));
ActiveReports 6 User Guide | 391

ActiveReports provides support for web services to be used to return a dataset as a data source for a report or to return an ActiveReport document to show in a Windows Forms viewer. The following walkthroughs show how to create a simple web service for each scenario and how to create a Windows client application for each web service.
DataSet Web ServiceDescribes how to set up a simple web service that returns a dataset.
DataSet Windows ApplicationDescribes how to set up a Windows client application for the dataset Web Service.
Document Web ServiceDescribes how to set up a simple web service that returns an ActiveReports document.
Document Windows ApplicationDescribes how to set up a Windows client application for the ActiveReports Document Web Service.
Web Services
Important: In order to consume Web services in your Windows applications, you must set permissions to allow the ASP.NET user to consume the services. Ask your server administrator for help with this.
ActiveReports 6 User Guide | 392

With ASP.NET, you can set up a Web Service that returns a dataset to use for an ActiveReport. This walkthrough illustrates how to create one.
This walkthrough is split up into the following activities:
Creating an ASP.NET Web Service project
Adding code to create the Web method
Testing the Web service
Publishing the Web service
Creating a virtual directory in IIS
To complete the walkthrough, you must have access to the Northwind database.A copy is located at C:\Program Files\GrapeCity\ActiveReports 6\Data\NWIND.MDB.
To create an ASP.NET Web Service project1. From the File menu, select New, then Web Site.
2. In the New Web Site dialog that appears, select ASP.NET Web Service.
3. Change the name of the project.
4. Click OK to open the new project in Visual Studio.
To create the Web Method
In the App_Code/Service.asmx file that displays by default, replace the existing <WebMethod()> _ and HelloWorld function with code like the following.
To write the code in Visual Basic.NET
To write the code in C#
To test the Web Service1. Press F5 to run the project.
2. If the Debugging Not Enabled dialog appears, select the option that enables debugging and click OK to continue.
3. In the list of supported operations, click the GetProduct link. (The description string from the code above appears below the link.)
DataSet Web Service
Visual Basic.NET code. Paste OVER the existing WebMethod.
Private connString As String<WebMethod(Description:="Returns a DataSet containing all Products")> _Public Function GetProduct() As Data.DataSet connString = "Provider=Microsoft.Jet.OLEDB.4.0;Data Source=C:\Program Files\GrapeCity\ActiveReports 6\Data\nwind.mdb" Dim adapter As New Data.OleDb.OleDbDataAdapter("select * from products", connString) Dim ds As New Data.DataSet() adapter.Fill(ds, "Products") Return dsEnd Function
C# code. Paste OVER the existing WebMethod.
private static string connString = "Provider=Microsoft.Jet.OLEDB.4.0;C:\Program Files\GrapeCity\ActiveReports 6\Data\nwind.mdb";[WebMethod(Description="Returns a DataSet containing all Products")]public Data.DataSet GetProduct(){ Data.OleDb.OleDbDataAdapter adapter; Data.DataSet ds; adapter = new Data.OleDb.OleDbDataAdapter("select * from products", connString); ds = new Data.DataSet(); adapter.Fill(ds, "Products"); return ds;}
ActiveReports 6 User Guide | 393

4. Click the Invoke button to test the Web Service operation.
5. If the test is successful, a valid XML schema of the Northwind products table displays in a new browser window.
6. Copy the URL from the browser for use in the Web Reference of your DataSet Windows Application.
To publish the Web Service1. In the Solution Explorer, right-click the project name and select Publish Web Site.
2. In the Publish Web Site window that appears, click the OK button.
3. This makes the Web Service available for consumption by other projects in a folder under the main folder called PrecompiledWeb.
To create a virtual directory in Internet Information Services1. In Windows Explorer, navigate to the folder containing your Web service folder.
2. Right-click the folder and select Sharing and Security.
3. On the Web Sharing tab, select the Share this folder radio button.
4. Click the OK button to save the setting and close the window.
For information on consuming the DataSet Web Service in an ActiveReport, see DataSet Windows Application.
Important: In order to consume Web services in your Windows applications, you must set permissions to allow the ASP.NET user to consume the services. Ask your server administrator for help with this.
ActiveReports 6 User Guide | 394
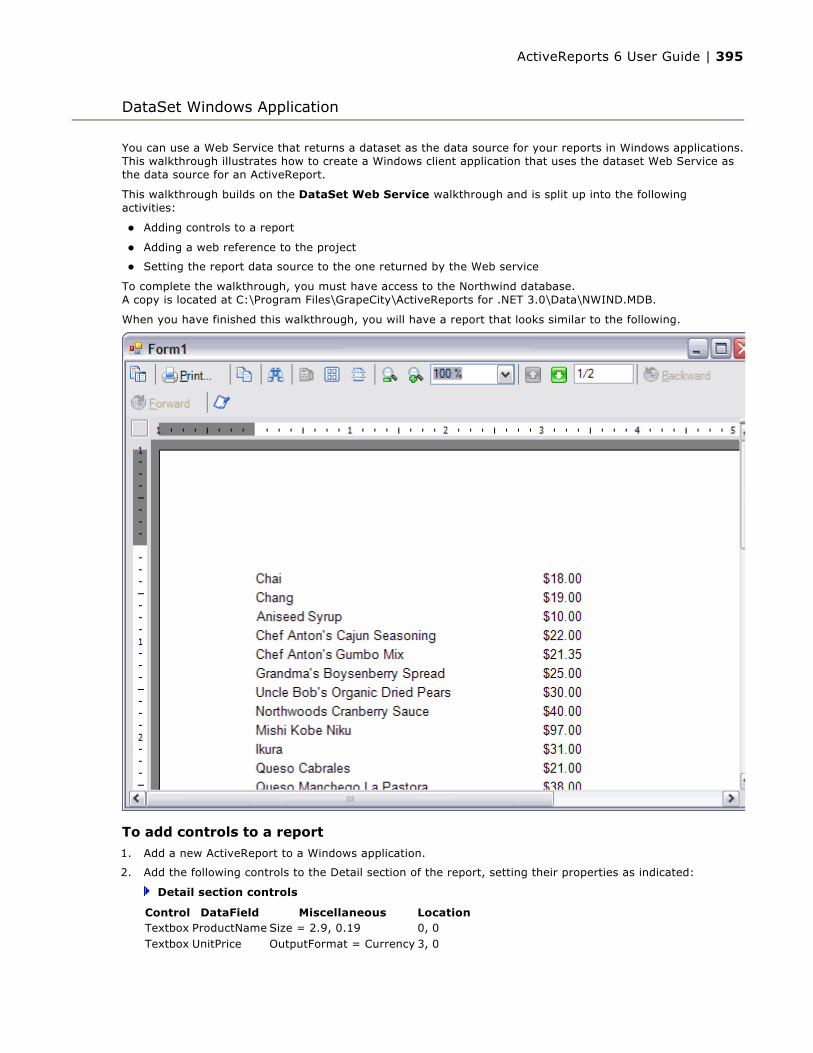
You can use a Web Service that returns a dataset as the data source for your reports in Windows applications. This walkthrough illustrates how to create a Windows client application that uses the dataset Web Service as the data source for an ActiveReport.
This walkthrough builds on the DataSet Web Service walkthrough and is split up into the following activities:
Adding controls to a report
Adding a web reference to the project
Setting the report data source to the one returned by the Web service
To complete the walkthrough, you must have access to the Northwind database.A copy is located at C:\Program Files\GrapeCity\ActiveReports for .NET 3.0\Data\NWIND.MDB.
When you have finished this walkthrough, you will have a report that looks similar to the following.
To add controls to a report
1. Add a new ActiveReport to a Windows application.
2. Add the following controls to the Detail section of the report, setting their properties as indicated:
Detail section controls
DataSet Windows Application
Control DataField Miscellaneous LocationTextbox ProductName Size = 2.9, 0.19 0, 0Textbox UnitPrice OutputFormat = Currency 3, 0
ActiveReports 6 User Guide | 395

3. Set the CanShrink property of the Detail section to True.
To add a web reference to the project1. From the Project menu, select Add Web Reference.
2. In the Add Web Reference window that appears, click the Web services on the local machine link.
3. Click the link to the virtual directory you created in the previous walkthrough. You can get the address by running the project from the previous walkthrough and copying the url from the address in the browser. (It will look something like http://localhost:####/DataSetWS/Service.asmx where #### is the port number.)
4. Click the Go button, and then click the Add Reference button when the Web Service is recognized.
To set the report data source to the one returned by the Web service
1. Double-click the gray area below the report. This creates an event-handling method for the ReportStart event.
2. Add code to the handler to use the web service dataset in the report.
The following example shows what the code for the method looks like.
To write the code in Visual Basic.NET
To write the code in C#
Visual Basic.NET code. Paste INSIDE the ReportStart event.
Dim ws As New localhost.ServiceDim ds As New DataSet()ds = ws.GetProduct()Me.DataSource = dsMe.DataMember = "Products"
C# code. Paste INSIDE the ReportStart event.
localhost.DataSetWS ws = new localhost.Service;DataSet ds = ws.GetProduct(); this.DataSource = ds;this.DataMember = "Products";
ActiveReports 6 User Guide | 396

With ASP.NET and ActiveReports, you can set up a Web Service that returns a report document which can be shown in a report viewer control.
This walkthrough illustrates how to create a Web Service that returns the contents of an ActiveReport as a byte array.
This walkthrough is split up into the following activities:
Creating an ASP.NET Web Service project
Adding a report and connecting it to data
Adding controls to the report
Adding code to create the Web Method
Testing the Web Service
Publishing the Web Service
To complete the walkthrough, you must have access to the Northwind database.A copy is located at C:\Program Files\GrapeCity\ActiveReports 6\Data\NWIND.MDB.
You must also add a reference in your project to the System.Data.OleDb namespace.
When you have completed this walkthrough, you will have a Web Service that returns the contents of an ActiveReport as a byte array.
To create an ASP.NET Web Service project1. From the Visual Studio File menu, select New, then Web Site.
2. In the Templates window of the New Web Site dialog, select ASP.NET Web Service.
3. Change the name of the project from WebSite1 to ARDocumentWS .
4. Click OK to open the new project in Visual Studio.
To add a report and connect it to data
1. From the Website menu, select Add New Item.
2. Select ActiveReports 6 (code-based) File, rename it rptProducts, and click the Add button.
3. In the message box that appears, click the Yes button to place the report inside the App_Code folder. Instead of the design view, the code view of the report opens.
4. To go to the design view of the report, in the Solution Explorer, right-click rptProducts and select View Designer.
5. Click the gray report DataSource icon on the Detail section band to open the Report Data Source dialog.
6. On the OLE DB tab, next to Connection String, click the Build button.
7. In the Data Link Properties window that appears, select Microsoft Jet 4.0 OLE DB Provider and click the Next button.
8. Click the ellipsis (...) button to browse to the Northwind database. Click Open once you have selected the appropriate access path.
9. Click OK to close the window and fill in the Connection String field.
10. In the Query field, enter the following SQL query
Document Web Service
SQL Query
SELECT * FROM Products INNER JOIN Categories ON Products.CategoryID = Categories.CategoryID ORDER BY CategoryName
ActiveReports 6 User Guide | 397

11. Click OK to save the data source and return to the report design surface.
To add controls to the report1. Right-click on the design surface of the report and select Insert, then Group Header/Footer to add a
group header and group footer section.
2. Click to select the group header section, and in the Properties window, make the following changes:
Change the Name property to ghCategories
Change the DataField property to CategoryName
Change the BackColor property to LightGray
3. In the Report Explorer, expand the Fields node, then the Bound node.
4. Drag the following field onto ghCategories and set the properties as indicated.
Field for ghCategories
5. Add a second GroupHeader/Footer section to the report to contain labels.
6. Make the following changes to the new group header:
Change the Name property to ghProducts
Change the BackColor property to WhiteSmoke
7. Add labels with the following properties to ghProducts:
Labels for ghProducts
8. Set the CanShrink property of the detail section to True.
9. From the Report Explorer, drag the following fields onto the detail section and set the properties as indicated.
Controls for the detail section
To write the code to create the Web Method1. On the Service.vb or Service.cs tab is the code view of the Service.asmx file.
2. Replace the existing WebMethod and HelloWorld function with the following code.
To write the code in Visual Basic.NET
To write the code in C#
Field Size Location Miscellaneous
CategoryName6.5, 0.2 in 0, 0 in Font size = 14ForeColor = DarkGreen
Name Text LocationlblProductName Product Name 0, 0 inlblUnitPrice Unit Price 2.4, 0 inlblUnitsInStock Units in Stock 4, 0 inlblUnitsOnOrder Units on Order 5.5, 0 in
Field Text Miscellaneous LocationProductName Product Name Size = 2.25, 0.2 in 0, 0 in
UnitPrice Unit Price OutputFormat = CurrencyAlignment = Right
2.4, 0 in
UnitsInStock Units In Stock Alignment = Right 4, 0 inUnitsOnOrder Units On Order Alignment = Right 5.5, 0
Visual Basic.NET code. REPLACE the existing WebMethod and function with this code.
<WebMethod( _ Description:="Returns a products report grouped by category")> _Public Function GetProductsReport() As Byte() Dim rpt As New rptProducts() rpt.Run() Return rpt.Document.ContentEnd Function
ActiveReports 6 User Guide | 398

To test the Web Service1. Press F5 to run the project. The Service page appears in your browser.
2. In the list of supported operations at the top, click GetProductsReport.
3. Click the Invoke button to test the Web Service operation.
4. If the test is successful, you will see the binary version of the contents of rptProducts.
To publish the Web Service1. In the Solution Explorer, right-click the project name and select Publish Web Site.
2. Click the OK button. The Web Service is now available for consumption by other projects.
To create a virtual directory in Internet Information Services
1. In Windows Explorer, navigate to the folder containing your Web service folder.
2. Right-click the folder and select Sharing and Security.
3. On the Web Sharing tab, select the Share this folder radio button.
4. Click the OK button to save the setting and close the window.
For information on consuming the Document Web Service in a viewer, see Document Windows Application.
C# code. REPLACE the existing WebMethod and function with this code.
[WebMethod(Description="Returns a products report grouped by category")]public Byte[] GetProductsReport(){ rptProducts rpt = new rptProducts(); rpt.Run(); return rpt.Document.Content;}
Important: In order to consume Web services in your Windows applications, you must set permissions to allow the ASP.NET user to consume the services. Ask your server administrator for help with this.
ActiveReports 6 User Guide | 399

In ActiveReports 6, you can use a Web Service that returns the content of an ActiveReport to show in the Windows Forms viewer control.
This walkthrough illustrates how to create a Windows client application that returns the content of an ActiveReport in the Windows Forms viewer.
This walkthrough builds on the Document Web Service walkthrough and is split up into the following activities:
Creating a Visual Studio project
Adding the ActiveReports Windows Forms viewer control to the form
Adding a web reference to the project
Displaying the content returned by the Document Web Service in the viewer
Running the project
To complete the walkthrough, you must have access to the Northwind database.A copy is located at C:\Program Files\GrapeCity\ActiveReports 6\Data\NWIND.MDB.
When you have finished this walkthrough, you will have a report that looks similar to the following.
To create a Visual Studio project
1. From the File menu, select New, then Project.
2. In the Templates section of the New Project dialog, select Windows Application.
3. Change the name of the application to ARDocumentClient.
Document Windows Application
ActiveReports 6 User Guide | 400
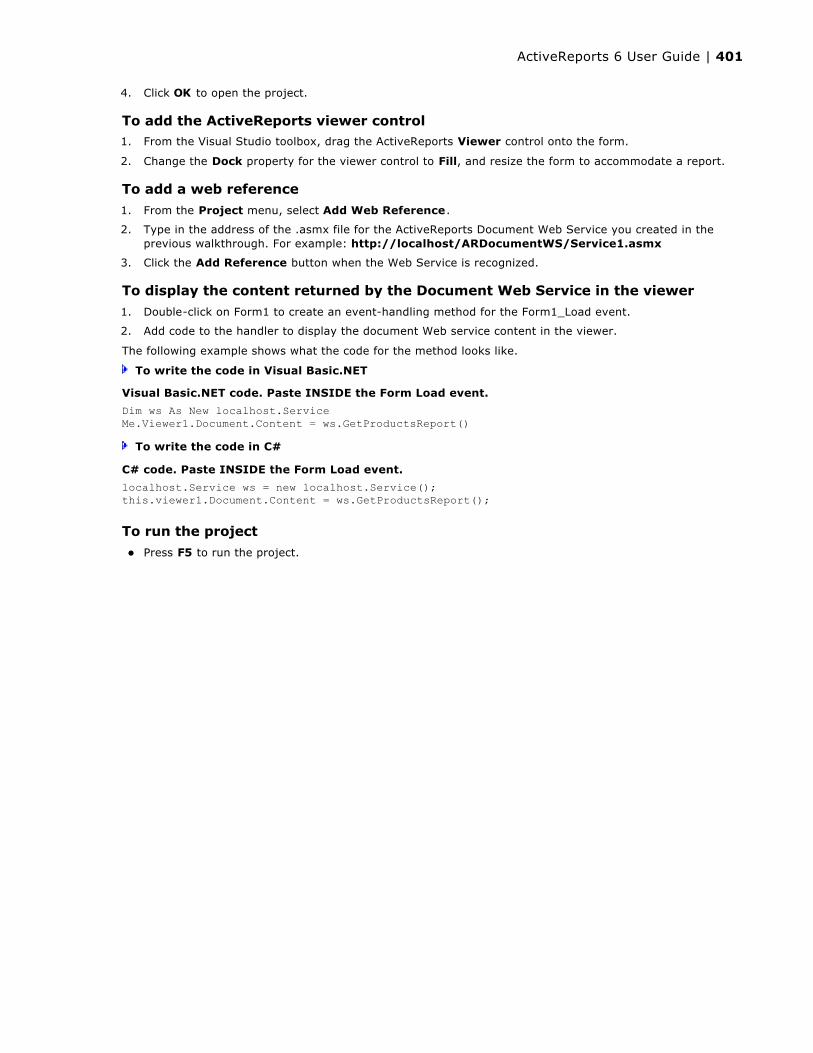
4. Click OK to open the project.
To add the ActiveReports viewer control1. From the Visual Studio toolbox, drag the ActiveReports Viewer control onto the form.
2. Change the Dock property for the viewer control to Fill, and resize the form to accommodate a report.
To add a web reference
1. From the Project menu, select Add Web Reference.
2. Type in the address of the .asmx file for the ActiveReports Document Web Service you created in the previous walkthrough. For example: http://localhost/ARDocumentWS/Service1.asmx
3. Click the Add Reference button when the Web Service is recognized.
To display the content returned by the Document Web Service in the viewer
1. Double-click on Form1 to create an event-handling method for the Form1_Load event.
2. Add code to the handler to display the document Web service content in the viewer.
The following example shows what the code for the method looks like.
To write the code in Visual Basic.NET
To write the code in C#
To run the project
Press F5 to run the project.
Visual Basic.NET code. Paste INSIDE the Form Load event.
Dim ws As New localhost.ServiceMe.Viewer1.Document.Content = ws.GetProductsReport()
C# code. Paste INSIDE the Form Load event.
localhost.Service ws = new localhost.Service();this.viewer1.Document.Content = ws.GetProductsReport();
ActiveReports 6 User Guide | 401
ActiveReports allows you to embed script in reports so that code becomes portable when you save a report layout to XML-based RPX format. This characteristic allows the options of stand-alone reporting and web reporting without the need to distribute related .vb or .cs files. By embedding script when the report is saved as an RPX file, it can later by loaded, run and displayed directly to the viewer control without using the designer. Script can also be used in conjunction with RPX files to allow distributed reports to be updated without recompiling the Visual Studio project.
Script for Simple ReportsDescribes how to embed script in a simple stand-alone report.
Script for SubreportsDescribes how to embed script to pass a parameter to a subreport.
Layout Files with Embedded Script
ActiveReports 6 User Guide | 402
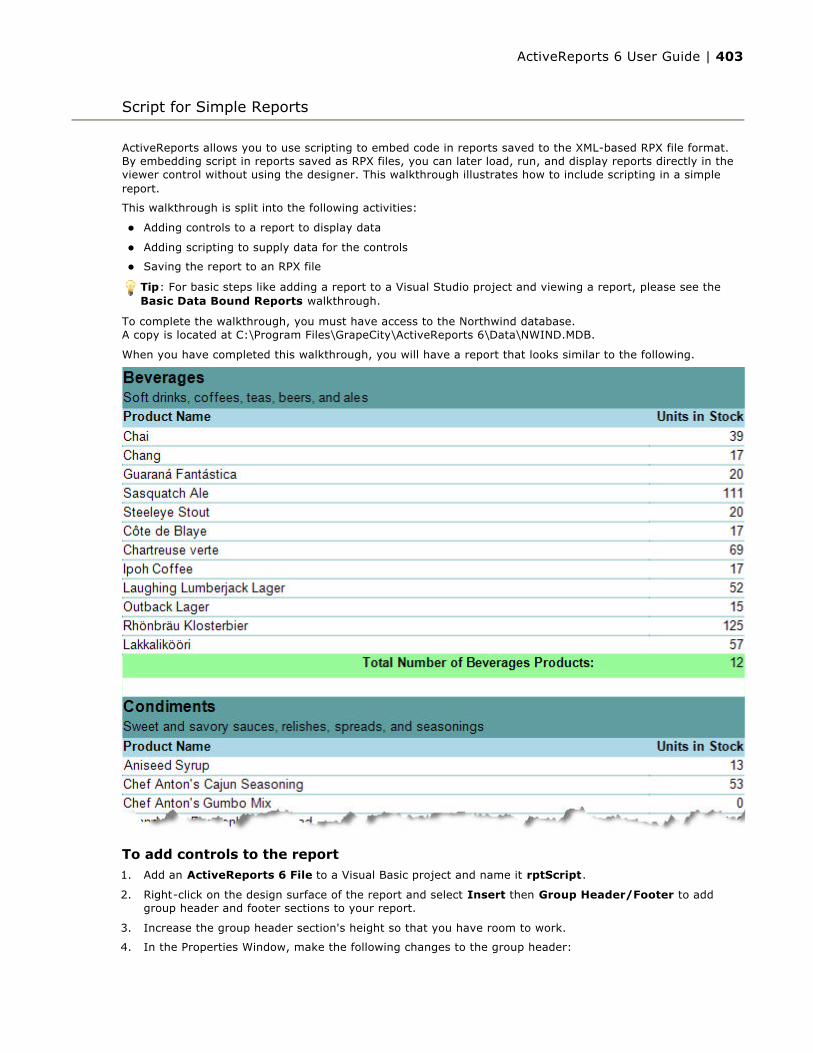
ActiveReports allows you to use scripting to embed code in reports saved to the XML-based RPX file format. By embedding script in reports saved as RPX files, you can later load, run, and display reports directly in the viewer control without using the designer. This walkthrough illustrates how to include scripting in a simple report.
This walkthrough is split into the following activities:
Adding controls to a report to display data
Adding scripting to supply data for the controls
Saving the report to an RPX file
To complete the walkthrough, you must have access to the Northwind database.A copy is located at C:\Program Files\GrapeCity\ActiveReports 6\Data\NWIND.MDB.
When you have completed this walkthrough, you will have a report that looks similar to the following.
To add controls to the report1. Add an ActiveReports 6 File to a Visual Basic project and name it rptScript.
2. Right-click on the design surface of the report and select Insert then Group Header/Footer to add group header and footer sections to your report.
3. Increase the group header section's height so that you have room to work.
4. In the Properties Window, make the following changes to the group header:
Script for Simple Reports
Tip: For basic steps like adding a report to a Visual Studio project and viewing a report, please see the Basic Data Bound Reports walkthrough.
ActiveReports 6 User Guide | 403

BackColor: LightBlue
CanShrink: True
DataField: CategoryID
GroupKeepTogether: All
KeepTogether: True
5. Add the following controls to the GroupHeader section and set the properties as indicated.
Group header controls
6. In the Report Explorer, expand the Fields node, then the Bound node, and drag the following fields onto the detail section, setting the properties as indicated.
Detail section fields
7. Set the CanShrink property of the detail section to True.
8. Select both of the text boxes in the detail section, right-click and select Format Border.
Select dark cyan in the color combo box
Select the solid line in the Line Styles pane
Click the bottom edge in the Preview pane
Click the OK button to add a solid cyan line to the bottom edge of the text boxes.
9. Increase the group footer section's height so that you have room to work.
10. Make the following changes to the group footer:
BackColor: PaleGreen
CanShrink: True
11. Add the following controls to the GroupFooter section, setting the properties as indicated.
Group footer controls
To add scripting to the report to supply data for the controls
1. Click in the grey area below the report to select it, and in the Properties Window, change the ScriptLanguage property for the report to the scripting language you want to use. The default setting is C#.
2. Click the Script tab located at the bottom edge of the report designer to access the scripting editor.
Control DataField Text Location Size Miscellaneous
TextBoxCategoryName 0, 0 in 6.5, 0.2 inBackColor = CadetBlueFont Style = BoldFont Size = 12
TextBoxDescription 0, 0.2 in 6.5, 0.2 in BackColor = CadetBlueLabel Product Name 0, 0.4 in 1, 0.2 in Font Style = Bold
Label Units in Stock 5.5, 0.4 in 1, 0.2 inFont Style = BoldAlignment = Right
DataField Location Size AlignmentProductName0, 0 in 5.5, 0.198 inUnitsInStock 5.5, 0 in 1, 0.198 in Right
Control DataField Size Miscellaneous LocationTextBoxTotalLabel 3, 0.198 in Font Style = Bold 2.5, 0
TextBoxProductName txtTotalItems
SummaryType = SubtotalSummaryFunc = CountSummaryRunning = GroupSummaryGroup = GroupHeader1Alignment = Right
5.5, 0
Label 6.5, 0.198 inBackColor = White (creates white space after the subtotal)Delete default text from Text property
0, 0.25
ActiveReports 6 User Guide | 404
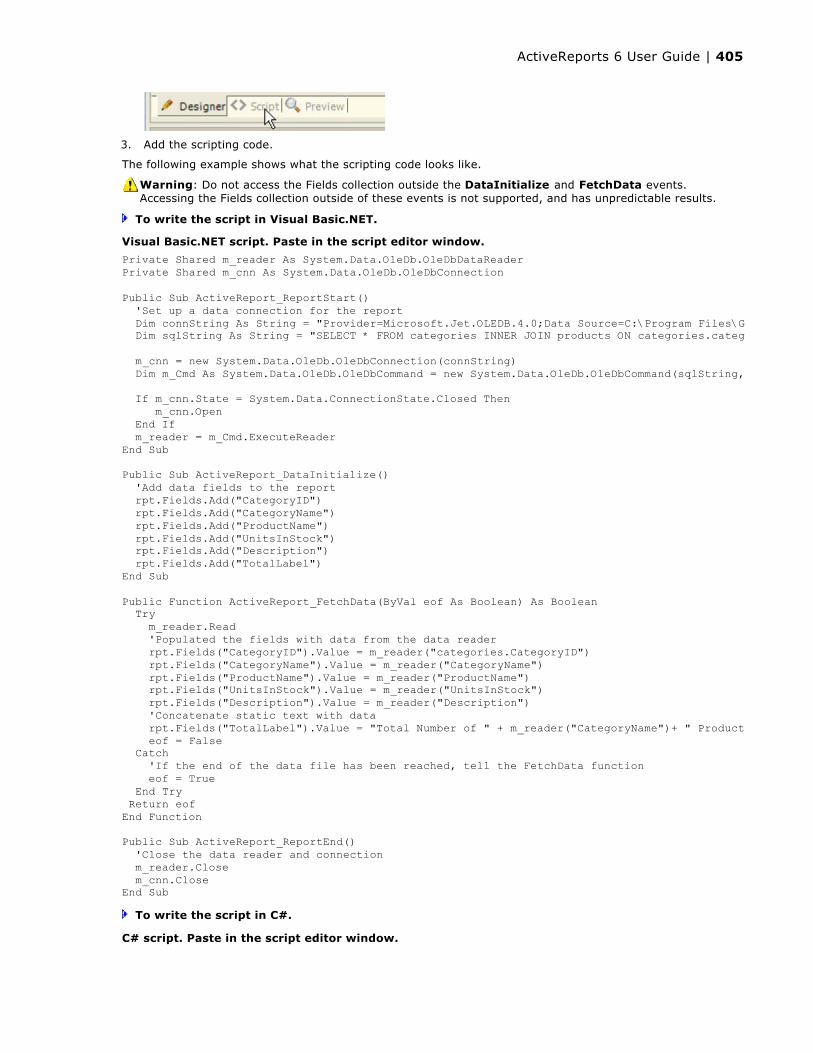
3. Add the scripting code.
The following example shows what the scripting code looks like.
To write the script in Visual Basic.NET.
To write the script in C#.
Warning: Do not access the Fields collection outside the DataInitialize and FetchData events. Accessing the Fields collection outside of these events is not supported, and has unpredictable results.
Visual Basic.NET script. Paste in the script editor window.
Private Shared m_reader As System.Data.OleDb.OleDbDataReaderPrivate Shared m_cnn As System.Data.OleDb.OleDbConnection
Public Sub ActiveReport_ReportStart() 'Set up a data connection for the report Dim connString As String = "Provider=Microsoft.Jet.OLEDB.4.0;Data Source=C:\Program Files\GrapeCity\ActiveReports 6\Data\NWIND.mdb" Dim sqlString As String = "SELECT * FROM categories INNER JOIN products ON categories.categoryid = products.categoryid ORDER BY products.categoryid, products.productid" m_cnn = new System.Data.OleDb.OleDbConnection(connString) Dim m_Cmd As System.Data.OleDb.OleDbCommand = new System.Data.OleDb.OleDbCommand(sqlString, m_cnn) If m_cnn.State = System.Data.ConnectionState.Closed Then m_cnn.Open End If m_reader = m_Cmd.ExecuteReaderEnd Sub
Public Sub ActiveReport_DataInitialize() 'Add data fields to the report rpt.Fields.Add("CategoryID") rpt.Fields.Add("CategoryName") rpt.Fields.Add("ProductName") rpt.Fields.Add("UnitsInStock") rpt.Fields.Add("Description") rpt.Fields.Add("TotalLabel")End Sub
Public Function ActiveReport_FetchData(ByVal eof As Boolean) As Boolean Try m_reader.Read 'Populated the fields with data from the data reader rpt.Fields("CategoryID").Value = m_reader("categories.CategoryID") rpt.Fields("CategoryName").Value = m_reader("CategoryName") rpt.Fields("ProductName").Value = m_reader("ProductName") rpt.Fields("UnitsInStock").Value = m_reader("UnitsInStock") rpt.Fields("Description").Value = m_reader("Description") 'Concatenate static text with data rpt.Fields("TotalLabel").Value = "Total Number of " + m_reader("CategoryName")+ " Products:" eof = False Catch 'If the end of the data file has been reached, tell the FetchData function eof = True End Try Return eofEnd Function
Public Sub ActiveReport_ReportEnd() 'Close the data reader and connection m_reader.Close m_cnn.CloseEnd Sub
C# script. Paste in the script editor window.
ActiveReports 6 User Guide | 405

To save the report to an XML-based RPX file1. From the Report menu, select Save Layout.
2. In the Save dialog that appears, enter a name for the report, i.e. rptScript.rpx, and click the Savebutton.
//C#private static System.Data.OleDb.OleDbDataReader m_reader;private static System.Data.OleDb.OleDbConnection m_cnn;
public void ActiveReport_ReportStart(){ //Set up a data connection for the report string m_cnnString = @"Provider=Microsoft.Jet.OLEDB.4.0;Data Source=C:\Program Files\GrapeCity\ActiveReports 6\Data\NWIND.mdb"; string sqlString = "SELECT * FROM categories INNER JOIN products ON categories.categoryid = products.categoryid ORDER BY products.categoryid, products.productid"; m_cnn = new System.Data.OleDb.OleDbConnection(m_cnnString); System.Data.OleDb.OleDbCommand m_Cmd = new System.Data.OleDb.OleDbCommand(sqlString,m_cnn); if(m_cnn.State == System.Data.ConnectionState.Closed) { m_cnn.Open(); } m_reader = m_Cmd.ExecuteReader();}
public void ActiveReport_DataInitialize(){ //Add data fields to the report rpt.Fields.Add("CategoryID"); rpt.Fields.Add("CategoryName"); rpt.Fields.Add("ProductName"); rpt.Fields.Add("UnitsInStock"); rpt.Fields.Add("Description"); rpt.Fields.Add("TotalLabel");}
public bool ActiveReport_FetchData(bool eof){ try { m_reader.Read(); //Populated the fields with data from the data reader rpt.Fields["CategoryID"].Value = m_reader["categories.CategoryID"].ToString(); rpt.Fields["CategoryName"].Value = m_reader["CategoryName"].ToString(); rpt.Fields["ProductName"].Value = m_reader["ProductName"].ToString(); rpt.Fields["UnitsInStock"].Value = m_reader["UnitsInStock"].ToString(); rpt.Fields["Description"].Value = m_reader["Description"].ToString(); //Concatenate static text with data rpt.Fields["TotalLabel"].Value = "Total Number of " + m_reader["CategoryName"].ToString() + " Products:"; eof = false; } catch { //If the end of the data file has been reached, tell the FetchData function eof = true; } return eof;}
public void ActiveReport_ReportEnd(){ //Close the data reader and connection m_reader.Close(); m_cnn.Close();}
ActiveReports 6 User Guide | 406

ActiveReports allows you to use scripting to permit reports saved to an XML file to contain code. By including scripting when reports are saved into XML, the reports later can be loaded, run, and displayed directly to the viewer control without needing to use the designer.
This walkthrough illustrates how to use scripting when creating a subreport.
This walkthrough is split up into the following activities:
Temporarily connecting the main report to a data source
Connecting the subreport to a data source
Adding controls to each report to display data
Saving the rptSub layout to RPX format
Adding the scripting code for rptMain
Saving the rptMain layout to RPX format
Loading a saved RPX into the viewer
To complete the walkthrough, you must have access to the Northwind database.A copy is located at C:\Program Files\GrapeCity\ActiveReports 6\Data\NWIND.MDB.
When you have finished this walkthrough, you will have a report that looks similar to the following.
To temporarily connect the main report to a data source1. Add an ActiveReports 6 File to a Visual Studio project and rename it rptMain.
2. Click the gray report DataSource icon on the Detail section band to open the Report Data Source dialog.
Script for Subreports
Tip: For basic steps like adding a report to a Visual Studio project and viewing a report, please see the Basic Data Bound Reports walkthrough.
Note: The following steps are just for convenience so that the fields list in the Report Explorer can be populated at design time.
ActiveReports 6 User Guide | 407

3. On the OLE DB tab, next to Connection String, click the Build button.
4. In the Data Link Properties window that appears, select Microsoft Jet 4.0 OLE DB Provider and click the Next button.
5. Click the ellipsis (...) button to browse to the Northwind database. Click Open once you have selected the appropriate access path.
6. Click OK to close the window and fill in the Connection String field.
7. In the Query field, enter the following SQL query.
8. Click OK to save the data source and return to the report design surface.
To temporarily connect the subreport to a data source1. Add a second ActiveReports 6 File to the project and rename it rptSub.
2. Right-click the PageHeader or PageFooter section and select Delete. Subreports do not render these sections, so deleting them saves processing time.
3. Click in the grey area below the report to select it, and in the Properties Window, change the report's ShowParameterUI property to False. This prevents the subreport from requesting a parameter from the user.
4. Click the gray report DataSource icon on the Detail section band to open the Report Data Source dialog.
5. Click the Build button.
6. In the Data Link Properties window that appears, select Microsoft Jet 4.0 OLE DB Provider and click the Next button.
7. Click the ellipsis button to browse to the NorthWind database. Click Open once you have selected the appropriate access path.
8. Click OK to close the window and fill in the Connection String field.
9. In the Query field, enter the following SQL query.
10. Click OK to return to the report design surface.
To add controls to rptMain to display data1. Right-click on the design surface of rptMain and select Insert then Group Header/Footer to add group
header and footer sections to the report.
2. In the Properties Window, make the following changes to the group header:
Name: ghCompanies
BackColor: LemonChiffon
CanShrink: True
DataField: CompanyName
GroupKeepTogether: All
KeepTogether: True
3. In the Report Explorer, expand the Fields node, then the Bound node. Drag the following field onto
SQL Query
SELECT * FROM Orders INNER JOIN Customers ON Orders.CustomerID = Customers.CustomerID ORDER BY CompanyName, OrderDate
Note: The following steps are just for convenience so that the fields list in the Report Explorer can be populated at design time.
SQL Query
Select * from [order details] inner join products on [order details].productid = products.productid
ActiveReports 6 User Guide | 408
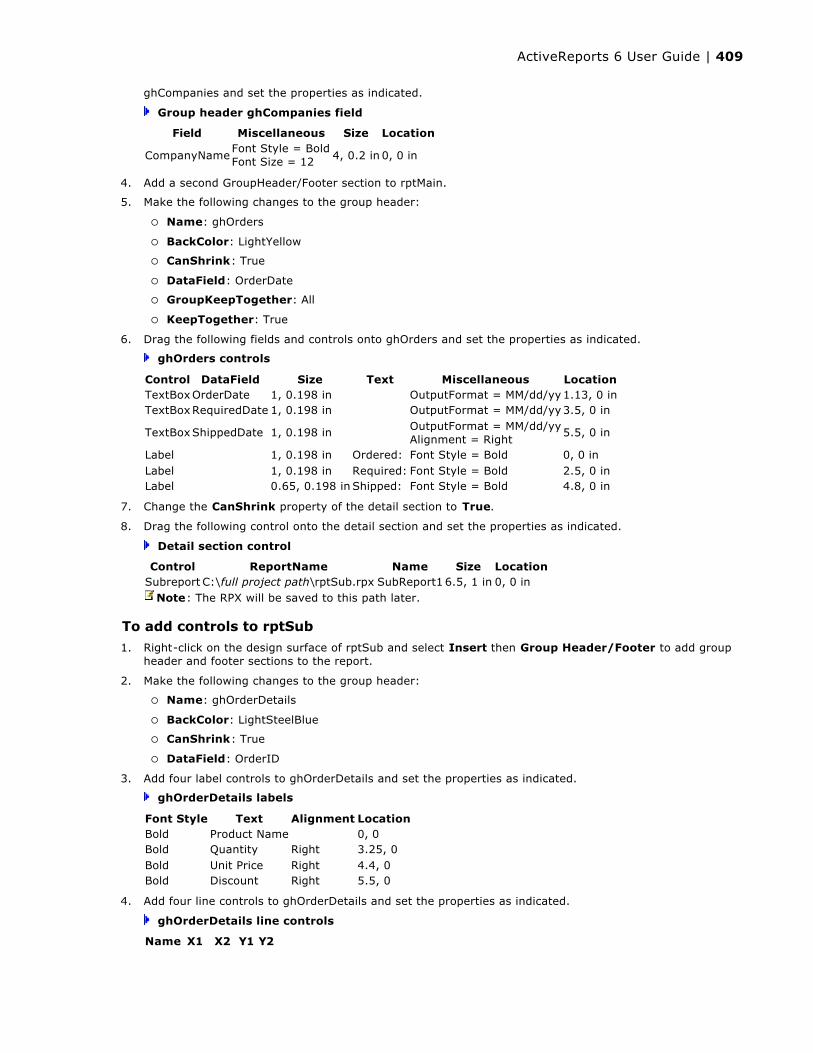
ghCompanies and set the properties as indicated.
Group header ghCompanies field
4. Add a second GroupHeader/Footer section to rptMain.
5. Make the following changes to the group header:
Name: ghOrders
BackColor: LightYellow
CanShrink: True
DataField: OrderDate
GroupKeepTogether: All
KeepTogether: True
6. Drag the following fields and controls onto ghOrders and set the properties as indicated.
ghOrders controls
7. Change the CanShrink property of the detail section to True.
8. Drag the following control onto the detail section and set the properties as indicated.
Detail section control
To add controls to rptSub
1. Right-click on the design surface of rptSub and select Insert then Group Header/Footer to add group header and footer sections to the report.
2. Make the following changes to the group header:
Name: ghOrderDetails
BackColor: LightSteelBlue
CanShrink: True
DataField: OrderID
3. Add four label controls to ghOrderDetails and set the properties as indicated.
ghOrderDetails labels
4. Add four line controls to ghOrderDetails and set the properties as indicated.
ghOrderDetails line controls
Field Miscellaneous Size Location
CompanyNameFont Style = BoldFont Size = 12 4, 0.2 in 0, 0 in
Control DataField Size Text Miscellaneous LocationTextBoxOrderDate 1, 0.198 in OutputFormat = MM/dd/yy1.13, 0 inTextBoxRequiredDate 1, 0.198 in OutputFormat = MM/dd/yy3.5, 0 in
TextBoxShippedDate 1, 0.198 in OutputFormat = MM/dd/yyAlignment = Right
5.5, 0 in
Label 1, 0.198 in Ordered: Font Style = Bold 0, 0 inLabel 1, 0.198 in Required: Font Style = Bold 2.5, 0 inLabel 0.65, 0.198 in Shipped: Font Style = Bold 4.8, 0 in
Control ReportName Name Size LocationSubreport C:\full project path\rptSub.rpx SubReport1 6.5, 1 in 0, 0 in
Note: The RPX will be saved to this path later.
Font Style Text Alignment LocationBold Product Name 0, 0Bold Quantity Right 3.25, 0Bold Unit Price Right 4.4, 0Bold Discount Right 5.5, 0
Name X1 X2 Y1 Y2
ActiveReports 6 User Guide | 409
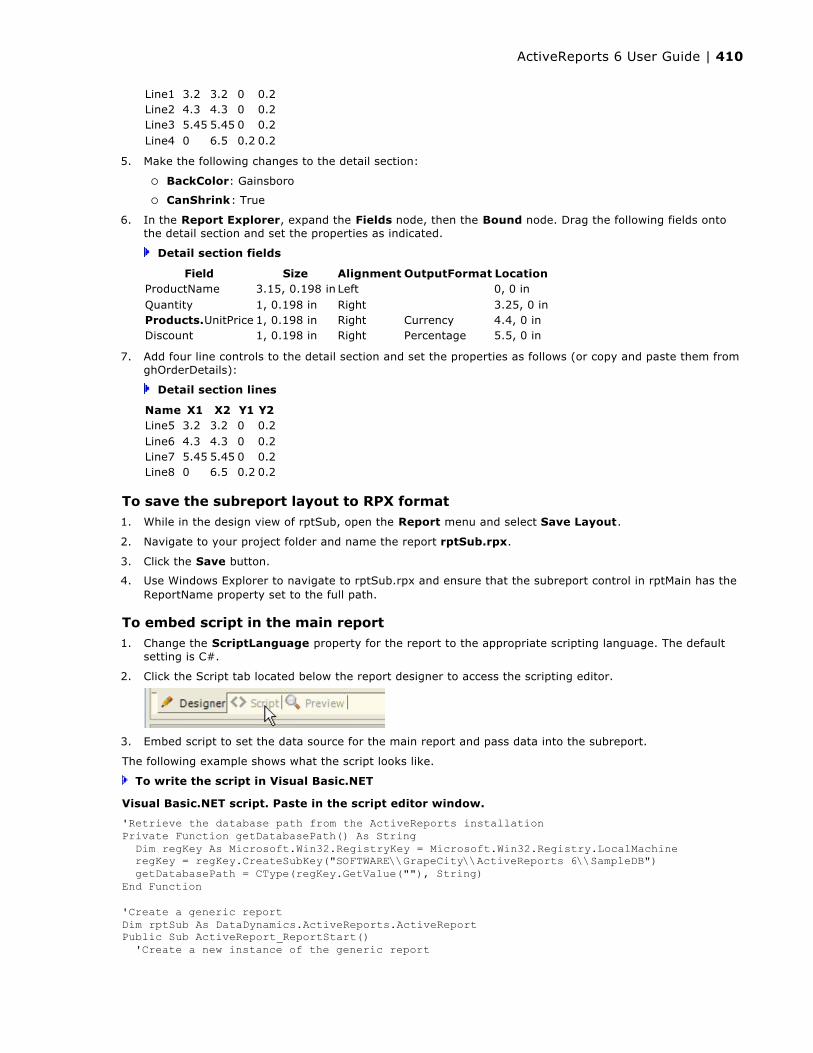
5. Make the following changes to the detail section:
BackColor: Gainsboro
CanShrink: True
6. In the Report Explorer, expand the Fields node, then the Bound node. Drag the following fields onto the detail section and set the properties as indicated.
Detail section fields
7. Add four line controls to the detail section and set the properties as follows (or copy and paste them from ghOrderDetails):
Detail section lines
To save the subreport layout to RPX format1. While in the design view of rptSub, open the Report menu and select Save Layout.
2. Navigate to your project folder and name the report rptSub.rpx.
3. Click the Save button.
4. Use Windows Explorer to navigate to rptSub.rpx and ensure that the subreport control in rptMain has the ReportName property set to the full path.
To embed script in the main report1. Change the ScriptLanguage property for the report to the appropriate scripting language. The default
setting is C#.
2. Click the Script tab located below the report designer to access the scripting editor.
3. Embed script to set the data source for the main report and pass data into the subreport.
The following example shows what the script looks like.
To write the script in Visual Basic.NET
Line1 3.2 3.2 0 0.2Line2 4.3 4.3 0 0.2Line3 5.45 5.45 0 0.2Line4 0 6.5 0.2 0.2
Field Size Alignment OutputFormat LocationProductName 3.15, 0.198 in Left 0, 0 inQuantity 1, 0.198 in Right 3.25, 0 inProducts.UnitPrice 1, 0.198 in Right Currency 4.4, 0 inDiscount 1, 0.198 in Right Percentage 5.5, 0 in
Name X1 X2 Y1 Y2Line5 3.2 3.2 0 0.2Line6 4.3 4.3 0 0.2Line7 5.45 5.45 0 0.2Line8 0 6.5 0.2 0.2
Visual Basic.NET script. Paste in the script editor window.
'Retrieve the database path from the ActiveReports installationPrivate Function getDatabasePath() As String Dim regKey As Microsoft.Win32.RegistryKey = Microsoft.Win32.Registry.LocalMachine regKey = regKey.CreateSubKey("SOFTWARE\\GrapeCity\\ActiveReports 6\\SampleDB") getDatabasePath = CType(regKey.GetValue(""), String)End Function
'Create a generic reportDim rptSub As DataDynamics.ActiveReports.ActiveReportPublic Sub ActiveReport_ReportStart() 'Create a new instance of the generic report
ActiveReports 6 User Guide | 410

To write the script in C#
To save the main report to an XML-based RPX file
rptSub = new DataDynamics.ActiveReports.ActiveReport() 'Load the rpx file into the generic report rptSub.LoadLayout(CType(rpt.Sections("Detail1").Controls("SubReport1"), DataDynamics.ActiveReports.SubReport).ReportName) 'Connect data to the main report Dim dbPath As String = getDatabasePath() Dim connString As String = "Provider=Microsoft.Jet.OLEDB.4.0;Data Source= " + dbPath + "\\NWIND.mdb" Dim sqlString As String = "Select * from orders inner join customers on orders.customerid = customers.customerid order by CompanyName,OrderDate" Dim ds As new DataDynamics.ActiveReports.DataSources.OleDBDataSource() ds.ConnectionString = connString ds.SQL = sqlString rpt.DataSource = dsEnd Sub
Public Sub Detail1_Format() Dim rptSubCtl As DataDynamics.ActiveReports.SubReport = CType(rpt.Sections("Detail1").Controls("SubReport1"), DataDynamics.ActiveReports.SubReport) Dim childDataSource As New DataDynamics.ActiveReports.DataSources.OleDBDataSource() childDataSource.ConnectionString = CType(rpt.DataSource, DataDynamics.ActiveReports.DataSources.OleDBDataSource).ConnectionString 'Set a parameter in the SQL query childDataSource.SQL = "Select * from [order details] inner join products on [order details].productid = products.productid where [order details].orderid = >%OrderID%<" 'Pass the data to the subreport rptSub.DataSource = childDataSource 'Display rptSub in the subreport control rptSubCtl.Report = rptSubEnd Sub
C# code. Paste in the script editor window.
//Retrieve the database path from the ActiveReports installation private string getDatabasePath(){ Microsoft.Win32.RegistryKey regKey = Microsoft.Win32.Registry.LocalMachine; regKey = regKey.CreateSubKey("SOFTWARE\\GrapeCity\\ActiveReports 6\\SampleDB"); return ((string)(regKey.GetValue(""))); }
//'Create a generic reportDataDynamics.ActiveReports.ActiveReport rptSub = DataDynamics.ActiveReports.ActiveReport();public void ActiveReport_ReportStart(){ //Create a new instance of the generic report rpt = new DataDynamics.ActiveReports.ActiveReport(); //Load the rpx file into the generic report rptSub.LoadLayout(((DataDynamics.ActiveReports.SubReport)rpt.Sections["detail"].Controls["subReport1"]).ReportName); //Connect data to the main report string dbPath = getDatabasePath(); string connString = "Provider=Microsoft.Jet.OLEDB.4.0;Data Source= " + dbPath + "\\NWIND.mdb"; string sqlString = "Select * from orders inner join customers on orders.customerid = customers.customerid order by CompanyName,OrderDate"; DataDynamics.ActiveReports.DataSources.OleDBDataSource ds = new DataDynamics.ActiveReports.DataSources.OleDBDataSource(); ds.ConnectionString = connString; ds.SQL = sqlString; rpt.DataSource = ds;}
public void detail_Format() { DataDynamics.ActiveReports.SubReport rptSubCtl = ((DataDynamics.ActiveReports.SubReport) rpt.Sections["detail"].Controls["subReport1"]); DataDynamics.ActiveReports.DataSources.OleDBDataSource childDataSource = new DataDynamics.ActiveReports.DataSources.OleDBDataSource(); childDataSource.ConnectionString = ((DataDynamics.ActiveReports.DataSources.OleDBDataSource)rpt.DataSource).ConnectionString; //Set a parameter in the SQL query childDataSource.SQL = "Select * from [order details] inner join products on [order details].productid = products.productid where [order details].orderid = <%OrderID%>"; //Pass the data to the subreport rptSub.DataSource = childDataSource; //Display rptSub in the subreport control rptSubCtl.Report = rptSub; }
ActiveReports 6 User Guide | 411
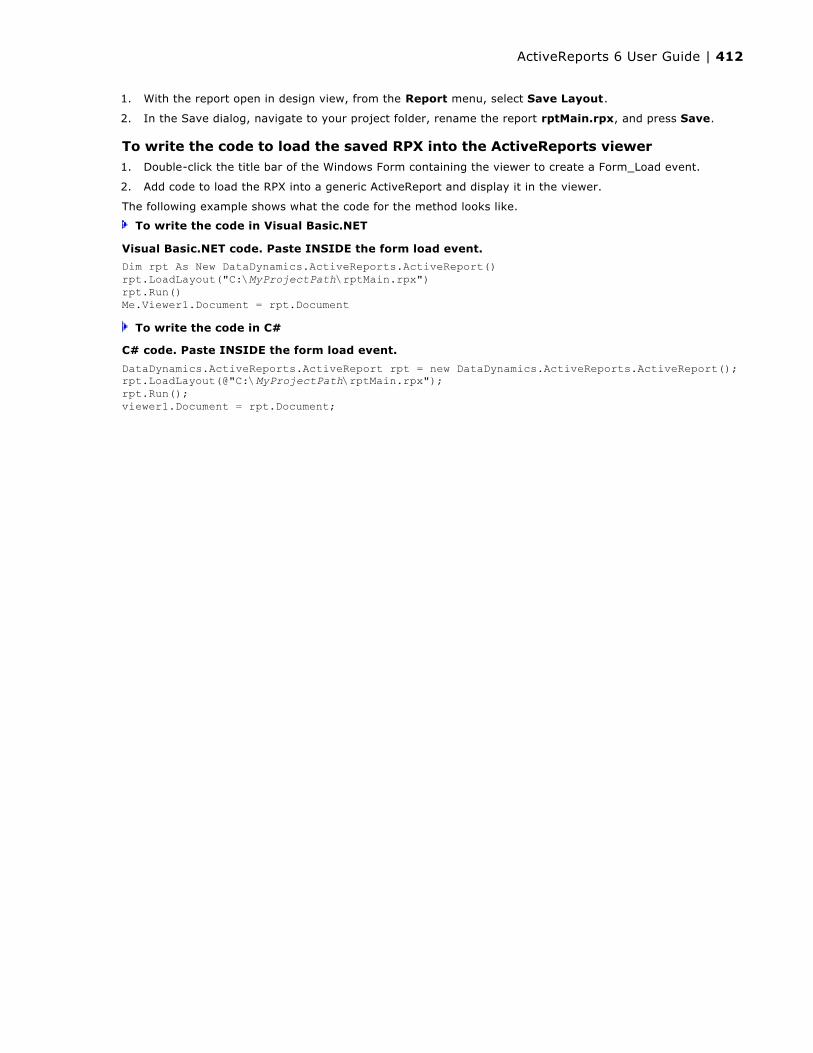
1. With the report open in design view, from the Report menu, select Save Layout.
2. In the Save dialog, navigate to your project folder, rename the report rptMain.rpx, and press Save.
To write the code to load the saved RPX into the ActiveReports viewer1. Double-click the title bar of the Windows Form containing the viewer to create a Form_Load event.
2. Add code to load the RPX into a generic ActiveReport and display it in the viewer.
The following example shows what the code for the method looks like.
To write the code in Visual Basic.NET
To write the code in C#
Visual Basic.NET code. Paste INSIDE the form load event.
Dim rpt As New DataDynamics.ActiveReports.ActiveReport()rpt.LoadLayout("C:\MyProjectPath\rptMain.rpx")rpt.Run()Me.Viewer1.Document = rpt.Document
C# code. Paste INSIDE the form load event.
DataDynamics.ActiveReports.ActiveReport rpt = new DataDynamics.ActiveReports.ActiveReport();rpt.LoadLayout(@"C:\MyProjectPath\rptMain.rpx");rpt.Run(); viewer1.Document = rpt.Document;
ActiveReports 6 User Guide | 412
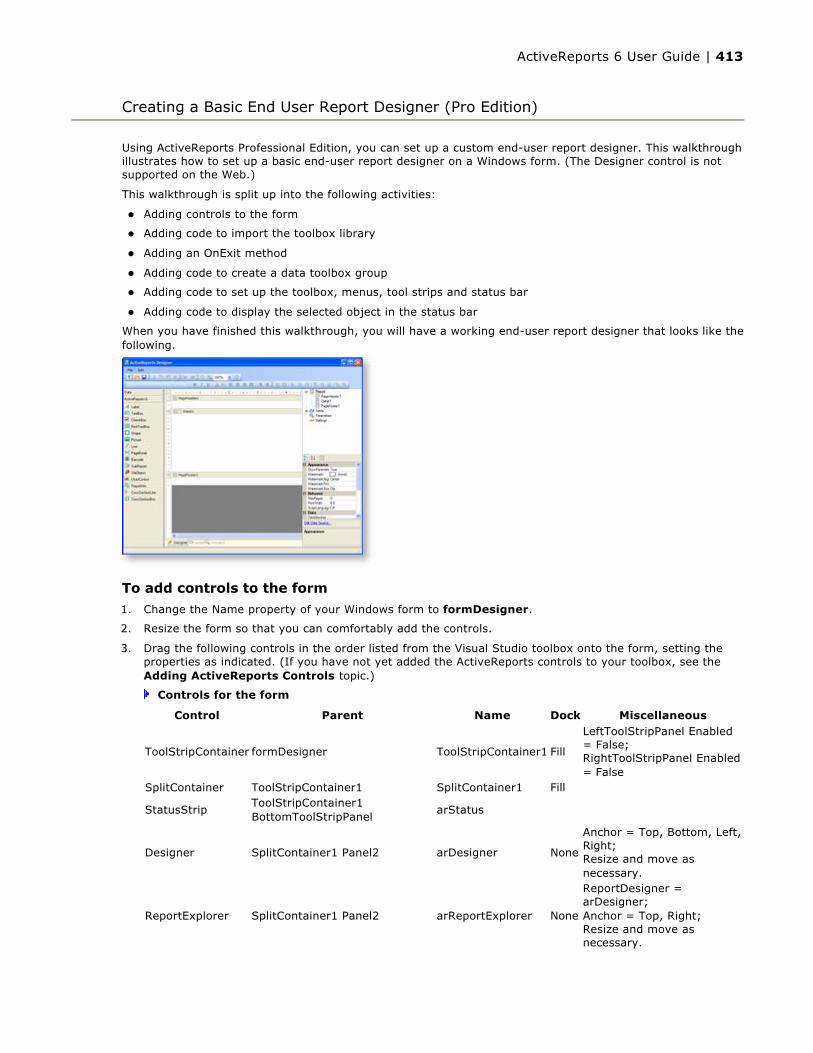
Using ActiveReports Professional Edition, you can set up a custom end-user report designer. This walkthrough illustrates how to set up a basic end-user report designer on a Windows form. (The Designer control is not supported on the Web.)
This walkthrough is split up into the following activities:
Adding controls to the form
Adding code to import the toolbox library
Adding an OnExit method
Adding code to create a data toolbox group
Adding code to set up the toolbox, menus, tool strips and status bar
Adding code to display the selected object in the status bar
When you have finished this walkthrough, you will have a working end-user report designer that looks like the following.
To add controls to the form
1. Change the Name property of your Windows form to formDesigner.
2. Resize the form so that you can comfortably add the controls.
3. Drag the following controls in the order listed from the Visual Studio toolbox onto the form, setting the properties as indicated. (If you have not yet added the ActiveReports controls to your toolbox, see the Adding ActiveReports Controls topic.)
Controls for the form
Creating a Basic End User Report Designer (Pro Edition)
Control Parent Name Dock Miscellaneous
ToolStripContainer formDesigner ToolStripContainer1 Fill
LeftToolStripPanel Enabled = False;RightToolStripPanel Enabled = False
SplitContainer ToolStripContainer1 SplitContainer1 Fill
StatusStripToolStripContainer1 BottomToolStripPanel
arStatus
Designer SplitContainer1 Panel2 arDesigner None
Anchor = Top, Bottom, Left, Right;Resize and move as necessary.
ReportExplorer SplitContainer1 Panel2 arReportExplorer None
ReportDesigner = arDesigner;Anchor = Top, Right;Resize and move as necessary.
ActiveReports 6 User Guide | 413
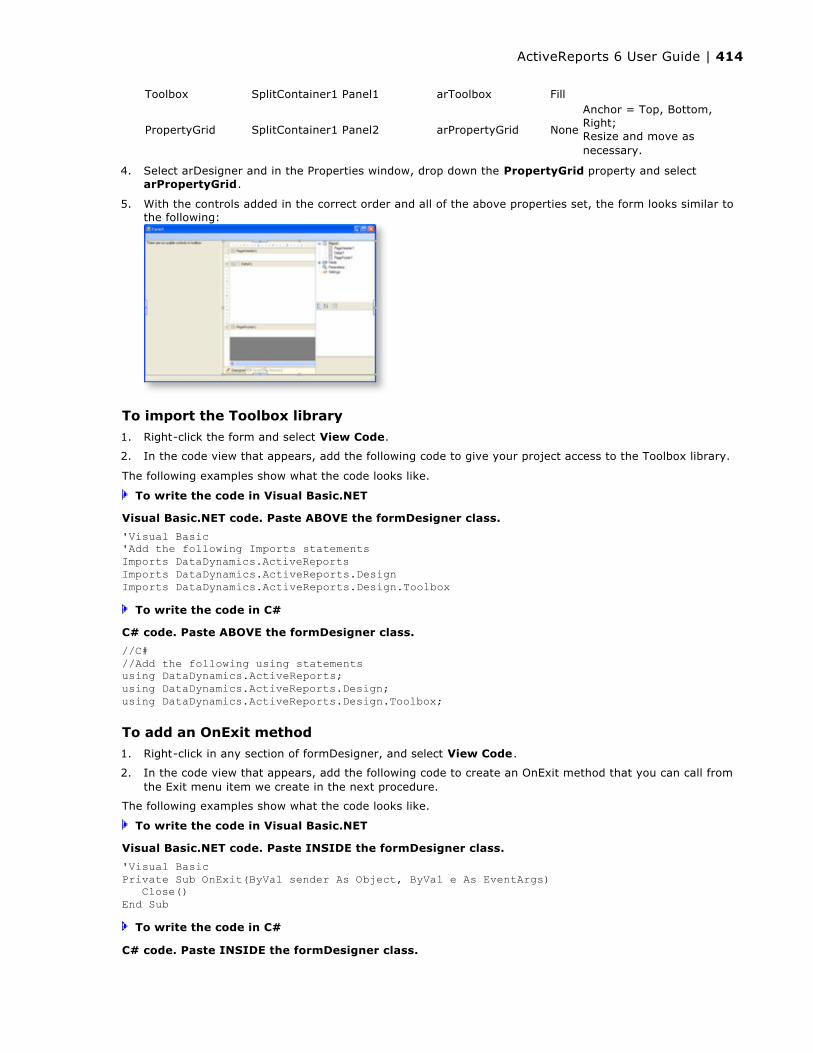
4. Select arDesigner and in the Properties window, drop down the PropertyGrid property and select arPropertyGrid.
5. With the controls added in the correct order and all of the above properties set, the form looks similar to the following:
To import the Toolbox library
1. Right-click the form and select View Code.
2. In the code view that appears, add the following code to give your project access to the Toolbox library.
The following examples show what the code looks like.
To write the code in Visual Basic.NET
To write the code in C#
To add an OnExit method
1. Right-click in any section of formDesigner, and select View Code.
2. In the code view that appears, add the following code to create an OnExit method that you can call from the Exit menu item we create in the next procedure.
The following examples show what the code looks like.
To write the code in Visual Basic.NET
To write the code in C#
Toolbox SplitContainer1 Panel1 arToolbox Fill
PropertyGrid SplitContainer1 Panel2 arPropertyGrid None
Anchor = Top, Bottom, Right;Resize and move as necessary.
Visual Basic.NET code. Paste ABOVE the formDesigner class.
'Visual Basic'Add the following Imports statementsImports DataDynamics.ActiveReportsImports DataDynamics.ActiveReports.DesignImports DataDynamics.ActiveReports.Design.Toolbox
C# code. Paste ABOVE the formDesigner class.
//C#//Add the following using statements using DataDynamics.ActiveReports;using DataDynamics.ActiveReports.Design;using DataDynamics.ActiveReports.Design.Toolbox;
Visual Basic.NET code. Paste INSIDE the formDesigner class.
'Visual BasicPrivate Sub OnExit(ByVal sender As Object, ByVal e As EventArgs) Close()End Sub
C# code. Paste INSIDE the formDesigner class.
ActiveReports 6 User Guide | 414

To create a data toolbox group
1. Add the following code right after the OnExit method to create a data group on the toolbox.
2. This code creates a LoadTools method that you can call in the designerForm Load event to load the new toolbox group into the toolbox.
The following examples show what the code looks like.
To write the code in Visual Basic.NET
To write the code in C#
To set up the designer's toolbox, menus, toolstrips and status bar
1. In the Design view of the form, double-click the title bar of formDesigner. This creates an event-handling method for the formDesigner Load event.
2. Add code to the handler to:
Set up the toolbox
Set up the menu and tool strips
Add an Exit command to the menu
Set up the status bar
The following examples show what the code for the method looks like.
To write the code in Visual Basic.NET
//C#private void OnExit(object sender, EventArgs e){ Close();}
Visual Basic.NET code. Paste INSIDE the formDesigner class.
Private Sub LoadTools(ByVal arToolbox As DataDynamics.ActiveReports.Design.Toolbox.Toolbox) 'Add Data Providers Me.arToolbox.AddToolboxItem(New System.Drawing.Design.ToolboxItem(GetType(System.Data.DataSet)), "Data") Me.arToolbox.AddToolboxItem(New System.Drawing.Design.ToolboxItem(GetType(System.Data.DataView)), "Data") Me.arToolbox.AddToolboxItem(New System.Drawing.Design.ToolboxItem(GetType(System.Data.OleDb.OleDbConnection)), "Data") Me.arToolbox.AddToolboxItem(New System.Drawing.Design.ToolboxItem(GetType(System.Data.OleDb.OleDbDataAdapter)), "Data") Me.arToolbox.AddToolboxItem(New System.Drawing.Design.ToolboxItem(GetType(System.Data.Odbc.OdbcConnection)), "Data") Me.arToolbox.AddToolboxItem(New System.Drawing.Design.ToolboxItem(GetType(System.Data.Odbc.OdbcDataAdapter)), "Data") Me.arToolbox.AddToolboxItem(New System.Drawing.Design.ToolboxItem(GetType(System.Data.SqlClient.SqlConnection)), "Data") Me.arToolbox.AddToolboxItem(New System.Drawing.Design.ToolboxItem(GetType(System.Data.SqlClient.SqlDataAdapter)), "Data")End Sub
C# code. Paste INSIDE the formDesigner class.
private void LoadTools(DataDynamics.ActiveReports.Design.Toolbox.Toolbox arToolbox){ //Add Data Providers this.arToolbox.AddToolboxItem(new System.Drawing.Design.ToolboxItem(typeof(System.Data.DataSet)), "Data"); this.arToolbox.AddToolboxItem(new System.Drawing.Design.ToolboxItem(typeof(System.Data.DataView)), "Data"); this.arToolbox.AddToolboxItem(new System.Drawing.Design.ToolboxItem(typeof(System.Data.OleDb.OleDbConnection)), "Data"); this.arToolbox.AddToolboxItem(new System.Drawing.Design.ToolboxItem(typeof(System.Data.OleDb.OleDbDataAdapter)), "Data"); this.arToolbox.AddToolboxItem(new System.Drawing.Design.ToolboxItem(typeof(System.Data.Odbc.OdbcConnection)), "Data"); this.arToolbox.AddToolboxItem(new System.Drawing.Design.ToolboxItem(typeof(System.Data.Odbc.OdbcDataAdapter)), "Data"); this.arToolbox.AddToolboxItem(new System.Drawing.Design.ToolboxItem(typeof(System.Data.SqlClient.SqlConnection)), "Data"); this.arToolbox.AddToolboxItem(new System.Drawing.Design.ToolboxItem(typeof(System.Data.SqlClient.SqlDataAdapter)), "Data");}
Visual Basic.NET code. Paste INSIDE the formDesigner Load event.
'Note: Assigning the ToolBox to the designer before calling NewReport' automatically adds the default controls to the toolbox in a group called' "ActiveReports 6"LoadTools(arToolbox)arDesigner.Toolbox = arToolbox
ActiveReports 6 User Guide | 415
To write the code in C#
To display the selected object in the status barThe following examples show what the code to display objects in the status bar looks like.
To write the code in Visual Basic.NET
1. Right-click in any section of formDesigner, and select View Code to display the code view for the Windows Form.
2. At the top left of the code view for formDesigner, click the drop-down arrow and select arDesigner.
3. At the top right of the code window, click the drop-down arrow and select SelectionChanged. This creates an event-handling method for the arDesigner SelectionChanged event.
' Add Menu and ToolStrips to FormDim menuStrip As ToolStrip = arDesigner.CreateToolStrips(DesignerToolStrips.Menu)(0)Dim fileMenu As ToolStripDropDownItem = CType(menuStrip.Items(0), ToolStripDropDownItem)
' Add an Exit command to the File menufileMenu.DropDownItems.Add(New ToolStripMenuItem("Exit", DataDynamics.ActiveReports.Design.Images.Delete, AddressOf OnExit))
Dim panel As ToolStripPanel = toolStripContainer1.TopToolStripPanelpanel.Join(menuStrip, 0)panel.Join(arDesigner.CreateToolStrips(DesignerToolStrips.Zoom)(0), 1)panel.Join(arDesigner.CreateToolStrips(DesignerToolStrips.Undo)(0), 1)panel.Join(arDesigner.CreateToolStrips(DesignerToolStrips.Edit)(0), 1)panel.Join(arDesigner.CreateToolStrips(DesignerToolStrips.Report)(0), 1)
panel.Join(arDesigner.CreateToolStrips(DesignerToolStrips.Layout)(0), 2)panel.Join(arDesigner.CreateToolStrips(DesignerToolStrips.Format)(0), 2)
'Set up the Status BarDim tsLabel1 As ToolStripStatusLabel = New ToolStripStatusLabel()tsLabel1.Spring = TruetsLabel1.BorderStyle = Border3DStyle.SunkenarStatus.Items.Add(tsLabel1)
C# code. Paste INSIDE the formDesigner Load event.
//C#//Note: Assigning the ToolBox to the designer before calling NewReport// automatically adds the default controls to the toolbox in a group called// "ActiveReports 6"LoadTools(arToolbox);arDesigner.Toolbox = arToolbox;
// Add Menu and CommandBar to FormToolStrip menuStrip = arDesigner.CreateToolStrips(DesignerToolStrips.Menu)[0];
ToolStripDropDownItem fileMenu = (ToolStripDropDownItem)menuStrip.Items[0];
// Add an Exit command to the File menufileMenu.DropDownItems.Add(new ToolStripMenuItem("Exit", DataDynamics.ActiveReports.Design.Images.Delete, OnExit));
ToolStripPanel panel = toolStripContainer1.TopToolStripPanel;panel.Join(menuStrip, 0); panel.Join(arDesigner.CreateToolStrips(DesignerToolStrips.Zoom)[0], 1);panel.Join(arDesigner.CreateToolStrips(DesignerToolStrips.Undo)[0], 1);panel.Join(arDesigner.CreateToolStrips(DesignerToolStrips.Edit)[0], 1);panel.Join(arDesigner.CreateToolStrips(DesignerToolStrips.Report)[0], 1);
panel.Join(arDesigner.CreateToolStrips(DesignerToolStrips.Layout)[0], 2);panel.Join(arDesigner.CreateToolStrips(DesignerToolStrips.Format)[0], 2);
//Set up the Status BarToolStripStatusLabel tsLabel1 = new ToolStripStatusLabel();tsLabel1.Spring = true;tsLabel1.BorderStyle = Border3DStyle.Sunken;arStatus.Items.Add(tsLabel1);
ActiveReports 6 User Guide | 416

The following example shows what the code for the method looks like.
To write the code in C#
1. Click in the designer control on formDesigner to select arDesigner.
2. Click on the events icon in the Properties window to display available events for the control.
3. Double-click SelectionChanged. This creates an event-handling method for the arDesigner_SelectionChanged event.
Visual Basic.NET code. Paste INSIDE the SelectionChanged event.
'Display the current selection in the designer's status barDim curSelection As String = ""Dim selectionEnum As IEnumerator = NothingIf Not (arDesigner.Selection Is Nothing) Then selectionEnum = arDesigner.Selection.GetEnumerator()End IfWhile Not (selectionEnum Is Nothing) AndAlso selectionEnum.MoveNext() If TypeOf selectionEnum.Current Is Section Then curSelection = curSelection + (CType(selectionEnum.Current, Section)).Name + ", " End If If TypeOf selectionEnum.Current Is ARControl Then curSelection = curSelection + (CType(selectionEnum.Current, ARControl)).Name + ", " End If If TypeOf selectionEnum.Current Is Field Then curSelection = curSelection + (CType(selectionEnum.Current, Field)).Name + ", " End If If TypeOf selectionEnum.Current Is Parameter Then curSelection = curSelection + (CType(selectionEnum.Current, Parameter)).Key + ", " End If If TypeOf selectionEnum.Current Is ActiveReport Then curSelection = curSelection + (CType(selectionEnum.Current, ActiveReport)).Document.Name + ", " End IfEnd WhileIf Me.arStatus.Created AndAlso Not (Me.arStatus.Items(0) Is Nothing) Then If Not (curSelection = "") Then Me.arStatus.Items(0).Text = "Current Selection: " + curSelection.Substring(0, curSelection.Length Else Me.arStatus.Items(0).Text = "No Selection" End IfEnd If
C# code. Paste INSIDE the SelectionChanged event.
//C#//This will display the current selection in the designer's status barstring curSelection = "";System.Collections.IEnumerator selectionEnum = null;if(arDesigner.Selection != null) selectionEnum = arDesigner.Selection.GetEnumerator();while(selectionEnum != null && selectionEnum.MoveNext()){ if(selectionEnum.Current is Section) curSelection = curSelection + (selectionEnum.Current as Section).Name + ", "; if(selectionEnum.Current is ARControl) curSelection = curSelection + (selectionEnum.Current as ARControl).Name + ", "; if(selectionEnum.Current is Field) curSelection = curSelection + (selectionEnum.Current as Field).Name + ", "; if(selectionEnum.Current is Parameter) curSelection = curSelection + (selectionEnum.Current as Parameter).Key + ", "; if(selectionEnum.Current is ActiveReport) curSelection = curSelection + (selectionEnum.Current as ActiveReport).Document.Name + ", ";}if(this.arStatus.Created && this.arStatus.Items[0] != null){ if(curSelection != "") this.arStatus.Items[0].Text = "Current Selection: " + curSelection.Substring(0, curSelection.Length else this.arStatus.Items[0].Text = "No Selection";
ActiveReports 6 User Guide | 417

}
ActiveReports 6 User Guide | 418

The ActiveReports WebViewer control allows you to easily publish reports to the web for viewing in the browser. The client machine does not require ActiveReports or ASP.NET to be installed. If you use the PDF viewer type, the client machine requires the Adobe Acrobat Reader, and if you use the Flash viewer type, the client machine requires the Adobe Flash Player.
The WebViewer also takes advantage of a report queueing technology to ensure the reports are executed and output efficiently. To use the WebViewer you will select an ActiveReport using the Report property of the WebViewer in the property list and set the ViewerType property to the viewer of your choice. Alternatively, you can set the Report property programmatically to a new instance of an ActiveReport class.
This walkthrough is split up into the following activities:
Creating an ASP.NET Web application using ActiveReports
Connecting the report to a data source
Setting up a report
Adding the ActiveReports WebViewer control to the Web Form
To complete the walkthrough, you must have access to the Northwind database.A copy is located at C:\Program Files\GrapeCity\ActiveReports 6\Data\NWIND.MDB.
You must also have access to Internet Information Services either from your computer or from the server to Configure the HTTPHandlers.
When you have completed this walkthrough, you will have a report that looks similar to the following.
Web Viewer (Pro Edition)
Caution: The WebViewer does not support the use of Ole Objects.
ActiveReports 6 User Guide | 419

To create an ASP.NET Web application with ActiveReports1. From the Visual Studio File menu, select New, then Project.
2. In the New Project dialog that appears, select ASP.NET Web Application.
3. Rename the project and click the OK button.
4. From the Project menu, select Add New Item .
5. Select ActiveReports 6 (code-based) File, rename it, and click Add.
To connect the report to a data source1. Click the gray report DataSource icon on the Detail section band to open the Report Data Source dialog.
2. On the "OLE DB" tab, next to Connection String, click the Build button.
3. In the Data Link Properties window that appears, select Microsoft Jet 4.0 OLE DB Provider and click the Next button.
4. Click the ellipsis (...) button to browse to the Northwind database. Click Open once you have selected the appropriate access path.
5. Click OK to close the window and fill in the Connection String field.
6. In the Query field, enter the following SQL query
7. Click OK to save the data source and return to the report design surface.
To set up the report1. Right-click the design surface of the report and choose Insert, then GroupHeader/Footer to add a
group header and footer section.
2. Make the following changes to the group header:
Change the BackColor property to PaleVioletRed.
Change the DataField property to CategoryID.
Change the GroupKeepTogether property to FirstDetail.
Change the KeepTogether property to True.
3. Add the following controls to the GroupHeader section:
Group header controls
4. In the Report Explorer, expand the Fields node, then the Bound node.
5. Select the detail section, and in the Properties window, make the following changes:
Change the CanShrink property to True.
Change the BackColor property to LightGray.
6. Drag the following fields onto the detail section and set the properties of each textbox as indicated.
Detail section fields
SQL Query
SELECT * FROM Products ORDER BY CategoryID, ProductName
Control Size Text LocationLabel 1, 0.198 in Product Name 0, 0Label 1.1, 0.198 in Quantity Per Unit 2.5, 0Label 1, 0.198 in In Stock 4.4, 0Label 1, 0.198 in Unit Price 5.5, 0
ActiveReports 6 User Guide | 420

To add the ActiveReports WebViewer control to the ASPX1. On the Default.aspx page, click the Design tab at the bottom.
2. From the Toolbox, drag the WebViewer control onto the page.
3. Drag the bottom right corner of the control to enlarge the viewer.
4. In the Properties window, drop down the ReportName property and select your report.
5. Drop down the ViewerType property, and select from the following:
HtmlViewer (default) displays the report in an HTML version of the report viewer, with page navigation and a Find function.
RawHtml displays the report as one long HTML page with no viewer interface.
AcrobatReader displays the report in the Adobe Reader. (The user must have the Adobe Reader installed.)
FlashViewer displays the report in a Flash version of the report viewer.
6. Run the project to display the report in the selected viewer.
Field Size Location OutputFormatProductName 1.8, 0.2 in 0, 0 NAQuantityPerUnit 1.8, 0.2 in 2.5, 0 NAUnitsInStock 1, 0.2 in 4.4, 0 NAUnitPrice 1, 0.2 in 5.5, 0 Currency
If you get a Could not load file or assembly... message, an old version of ActiveReports was installed when the WebViewer was last added to the toolbox. To add the latest version of the control, right-click the toolbox and select Choose Items. In the Choose Toolbox Items dialog, clear the WebViewer check box and select the WebViewer check box with the highest version number in the Assembly Name column.
Important: To use the Flash Viewer, copy the ActiveRepors.FlashViewer.swf file into your project folder. This file is located in:
C:\Program Files\GrapeCity\ActiveReports 6\Deployment
ActiveReports 6 User Guide | 421
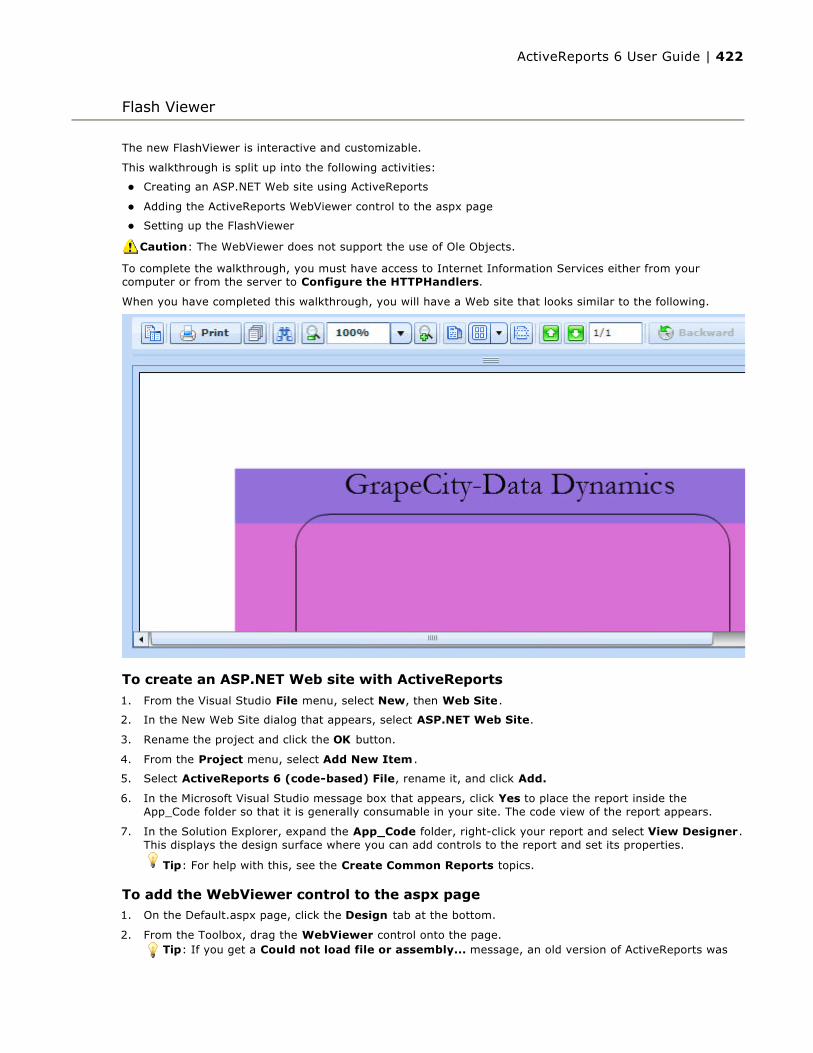
The new FlashViewer is interactive and customizable.
This walkthrough is split up into the following activities:
Creating an ASP.NET Web site using ActiveReports
Adding the ActiveReports WebViewer control to the aspx page
Setting up the FlashViewer
To complete the walkthrough, you must have access to Internet Information Services either from your computer or from the server to Configure the HTTPHandlers.
When you have completed this walkthrough, you will have a Web site that looks similar to the following.
To create an ASP.NET Web site with ActiveReports
1. From the Visual Studio File menu, select New, then Web Site.
2. In the New Web Site dialog that appears, select ASP.NET Web Site.
3. Rename the project and click the OK button.
4. From the Project menu, select Add New Item .
5. Select ActiveReports 6 (code-based) File, rename it, and click Add.
6. In the Microsoft Visual Studio message box that appears, click Yes to place the report inside the App_Code folder so that it is generally consumable in your site. The code view of the report appears.
7. In the Solution Explorer, expand the App_Code folder, right-click your report and select View Designer. This displays the design surface where you can add controls to the report and set its properties.
To add the WebViewer control to the aspx page1. On the Default.aspx page, click the Design tab at the bottom.
2. From the Toolbox, drag the WebViewer control onto the page.
Flash Viewer
Caution: The WebViewer does not support the use of Ole Objects.
Tip: For help with this, see the Create Common Reports topics.
Tip: If you get a Could not load file or assembly... message, an old version of ActiveReports was
ActiveReports 6 User Guide | 422

3. Drag the bottom right corner of the control to enlarge the viewer to at least 740 px wide to avoid horizontal scrollbars at run time.
4. In the Properties window, drop down the ReportName property and select your report.
5. Drop down the ViewerType property, and select FlashViewer.
To set up the FlashViewer1. In Windows Explorer, navigate to C:\Program Files\GrapeCity\ActiveReports 6\Deployment.
2. In the Deployment folder, copy the ActiveReports.FlashViewer.swf file and the Themes folder.
3. Paste the swf file and Themes folder into your main project folder.
4. Back in Visual Studio, in the Solution Explorer, click the Refresh button to see the swf file and Themes folder.
5. Click the WebViewer so that it is selected in the Properties window.
6. Expand the FlashViewerOptions property node, and click the ThemeUrl property to show the ellipsis button.
7. Click the ellipsis button to open the Select theme file dialog.
8. In the Project folders pane to the left, select the Themes folder. The included themes display in the Contents of folder pane to the right.
9. Select a theme and click OK .
10. Run the project to view the results.
installed when the WebViewer was last added to the toolbox. To add the latest version of the control, right-click the toolbox and select Choose Items. In the Choose Toolbox Items dialog, clear the old WebViewer check box and select the WebViewer check box with the highest version number.
The ActiveReports.FlashViewer.Resources.swf file is only used for localization.
ActiveReports 6 User Guide | 423
If you run into an issue while using ActiveReports, you will probably find the solution within this section. Click any short description below to drop down the symptoms, cause, and solution. Or click a link to another section of the troubleshooting guide.
General TroubleshootingCopy icon missing from the viewer
Symptoms: The copy icon is not showing in the viewer.
Cause: The ActiveReports RTF and Text export filters are not referenced in the project. The viewer has intentionally been designed not to require the export filters so no extra files are required in distribution.
Solution:
1. In the Solution Explorer, right click References and choose Add Reference.
2. Select GrapeCity ActiveReports Rich Text Format (RTF) Export Component and GrapeCity ActiveReports Text Export Component and click OK.
Errors after installing a new build
Symptoms: When you open a project created with a previous build of ActiveReports after installing a new build, there are errors related to being unable to find the previous build.
Cause: Visual Studio has a property on references called Specific Version. If this property is set to True, the project looks for the specific version that you had installed when you created the report, and throws errors when it cannot find it.
Solution: For each of the ActiveReports references in the Solution Explorer, select the reference and change the Specific Version property to False in the Properties Window.
Blank pages printed between pages or red line in the viewer
Symptoms: Blank pages are printed between pages of the report.
Cause: This problem occurs when the PrintWidth plus the left and right margins exceeds the paper width. For example, if the paper size were set to A4, the PrintWidth plus the left and right margins should not exceed 8.27"; otherwise blank pages will be printed. At run time, ActiveReports marks a page overflow by displaying a red line in the viewer at the position in which the breach has occurred.
Solution: The PrintWidth can be adjusted in the report designer using either the property grid or by dragging the right edge of the report. Page margins, height, and width can be adjusted either through the print properties dialog box in the Report menu under Settings. or programmatically in the Report_Start event.
Copying reports results in stacked controls
Symptoms: A report file copied into a new project has all of its controls piled up at location 0, 0.
Cause: The report has become disconnected from its resource file. When you set a report"s Localizable property to True, the Size and Location properties of the report"s controls are moved to the associated *.resx file, so if you copy or move the report, you must move the *.resx file along with it.
Solution: When you copy a report"s *.vb or *.cs file from one project"s App_Code folder into the App_Code folder of a new project, you need to also copy its *.resx file from the original project"s App_GlobalResources folder into the new project"s App_GlobalResources folder.
Export Troubleshooting (Separate topic)
Parameters TroubleshootingError message appears in Fields list
Symptoms: An error message is displayed in the Fields list in the Report Explorer instead of the fields.
Cause: This is an expected error if no default value is given. If the field is a data type other than text, memo, or date/time in Access, the report will run normally.
Solution: To display the fields in the Fields list in the Report Explorer, supply a default value for the parameter in the Properties Window, or in the SQL query as below:
Troubleshooting
ActiveReports 6 User Guide | 424

<%Name | PromptString | DefaultValue | DataType | PromptUser%>
Only the Name parameter is required. To use some, but not all, of the optional parameters, use all of the separator characters but with no text between one and the next for unused parameters. For example:
<%Name | | DefaultValue | |%>
An unhandled exception of type "System.Data..." occurs when the report is run
Symptoms: When the report is run, an exception like the following occurs: "An unhandled exception of type "System.Data.OleDb.OleDbException" occurred in system.data.dll"
Cause: If the field is a text, memo, or date/time data type in Access, the parameter syntax requires single quotes for text or memo fields, or pound signs for date/time fields. Please note that for different data sources, these requirements may differ.
Solution: To avoid the exception when the report is run against an Access database, use pound signs for date/time values, or single quotes for string values in your SQL query, for example:
#<%InvoiceDate | Choose invoice date: | 11/2/04 | D | True%>#
or
"<%Country | Country: | Germany | S | True%>"
User is prompted for parameters for subreports even though they are supplied by the main report
Symptoms: The parameter user interface pops up at run time asking for a value even though the main report is supplying the parameter values for the subreports.
Cause: The default value of the ShowParameterUI property of the report is True.
Solution: Set the ShowParameterUI property of the report to False. This can be done in the property grid or in code in the ReportStart event.
Print TroubleshootingThe printing thread dies before the report finishes printing
Symptoms: The printing thread dies before the report is printed.
Cause: If printing is done in a separate thread and the application is shut down right after the print call, the separate thread dies before the report is printed.
Solution: Set the usePrintingThread parameter of the Print() method to False to keep the printing on the same thread.
//C#private void rptPrint_ReportEnd(object sender, System.EventArgs eArgs){ this.Document.Print(false, false, false); }
"Visual Basic Private Sub rptPrint_ReportEnd(ByVal sender As Object, ByVal e As System.EventArgs) Handles MyBase.ReportEnd Me.Document.Print(False, False, False)End Sub
The viewer shows the report on the wrong paper size
Symptoms: In the viewer, the report renders to a different paper size than the one specified.
Cause: ActiveReports polls the printer driver assigned to the report to check for clipping, margins, and paper sizes supported by the printer. If the paper size specified for the report is not supported by the printer, ActiveReports uses the printer's default paper size to render the report.
Solution: If the report is to be printed, the printer assigned to the report must support the paper size and
ActiveReports 6 User Guide | 425

margins. Please note that any changes to the print settings in code must be made in or before the ReportStart event. To use custom paper sizes not supported by the driver, set the PrinterName to an empty string to use the ActiveReports virtual print driver. This does not allow printing, but is recommended for reports that are only exported or viewed. This prevents Activereports from making a call to the default printer driver. Use the following code in the ReportStart event, or just before .Run is called.
//C#this.Document.Printer.PrinterName = "";
"Visual Basic Me.Document.Printer.PrinterName = ""
The PaperHeight and PaperWidth properties, which take a float value defined in inches, have no effect unless you set the PaperKind property to Custom. Here is some sample code which can be placed in the ReportStart event, or just before .Run.
//C#this.PageSettings.PaperKind = Drawing.Printing.PaperKind.Custom;this.PageSettings.PaperHeight = 2;//sets the height to two inchesthis.PageSettings.PaperWidth = 4;//sets the width to four inches
"Visual Basic Me.PageSettings.PaperKind = Drawing.Printing.PaperKind.CustomMe.PageSettings.PaperHeight = 2'sets the height to two inchesMe.PageSettings.PaperWidth = 4'sets the width to four inches
Custom paper sizes do not work
Symptoms: Custom paper sizes do not work.
Cause: You can create more than one custom paper size, so setting only the PaperKind property is not enough to create a custom paper size.
Solution: In addition to setting the PaperKind property to Custom, you must also set the PaperNameproperty to a unique string.
Blank pages are printed between report pages
Symptoms: Blank pages are printed between pages of the report.
Cause: This problem occurs when the PrintWidth plus the left and right margins exceeds the paper width. For example, if the paper size were set to A4, the PrintWidth plus the left and right margins should not exceed 8.27"; otherwise blank pages are printed. At run time, ActiveReports marks a page overflow by displaying a red line in the viewer at the position in which the breach has occurred.
Solution: Adjust the PrintWidth in the report designer using either the property grid or by dragging the right edge of the report. Page margins, height, and width can be adjusted either through the print properties dialog box in the Report menu under Settings, or programmatically in the Report_Start event.
Memory TroubleshootingSymptoms: ActiveReports is consuming too much memory and the CPU usage is at 100%.
The CPU usage always goes to 100% when using ActiveReports.
Cause: There are several reasons why too much memory may be consumed:
The report is not being disposed of properly
Cause: The report is not being disposed of properly. The incorrect syntax is as follows.
//C#rpt.Dispose();rpt=null;
'Visual Basic.NET
ActiveReports 6 User Guide | 426
rpt.Dispose()rpt=Nothing
Solution: The correct syntax for disposing of a report is as follows.
//C#rpt.Document.Dispose();rpt.Dispose();rpt=null;
'Visual Basic.NETrpt.Document.Dispose()rpt.Dispose()rpt=Nothing
Machine.Config MemoryLimit setting is insufficient
Cause: Large reports in an ASP.NET application can easily use up the 60% of memory allocated to the ASP.NET worker process by default, which produces an error. In Machine.Config, MemoryLimit specifies the maximum allowed memory size, as a percentage of total system memory, that the worker process can consume before ASP.NET launches a new process and reassigns existing requests.
Solution: Set the CacheToDisk property of the document to True.
This caches the report to disk instead of holding it in memory. This setting is also detected by the PDF Export, which follows suit, but any other exports still consume memory. Although it is not advised, the ASP.NET worker process memory allocation can also be changed in your Machine.Config file, which is located in a path like: C:\WINDOWS\Microsoft.NET\Framework\v1.1.4322\CONFIG\. Search the Machine.Config file for memoryLimit which is located in the processModel.
Report never finishes processing
Cause: In some cases, very large reports can consume so much memory that the report never finishes processing. Some of the things that can cause this include:
1. Many non-repeating images, or a high resolution repeating image
2. Instantiating a new instance of a subreport each time the format event of a section fires
3. Using a lot of subreports instead of grouping with joins in the SQL query
4. Pulling in all of the data when only a few fields are needed (e.g. Select * from db instead of Select First, Last, Address from db)
Solution: In cases where the report is too large to run any other way, the CacheToDisk property may be set to True. This property should only be used when there is no other way to run the report to completion. Before resorting to this method, please see the Optimizing ActiveReports topic.
Task manager indicates the current "working set" of the process
Cause: If inflated memory usage is seen in the Task Manager it is not necessarily in use by the code. Task manager indicates the current "working set" of the process and, upon request, other processes can gain access to that memory. It is managed by the Operating System.
Solution: For an example of some working set behavior anomalies (which are considered normal), create a WinForms application and run it. Look in Task Manager at the working set for that process (it should be several megabytes), then minimize and maximize the form and notice that the working set reclaims to <1MB. Obviously, the code was not using all that memory even though Task Manager showed that it was allocated to that process. Similarly, you'll see ASP.NET and other managed service processes continue to gradually grow their working set even though the managed code in that process is not using all of it. To see whether this is the case, try using the two lines of code below in a button Click event after running the project.
System.Diagnostics.Process pc = System.Diagnostics.Process.GetCurrentProcess();pc.MaxWorkingSet = pc.MinWorkingSet;
If that reclaims the memory then the Operating System trimmed the working set down to the minimum amount necessary and this indicates that the extra memory was not actually in use.
Note: According to Microsoft it is not necessary to call GC.Collect and it should be avoided. However, if calling GC.Collect reduces the memory leak, then this indicates that it is not a leak after all. A leak in
ActiveReports 6 User Guide | 427
WebViewer Troubleshooting
The WebViewer will not print without displaying the report
Symptoms: The WebViewer will not automatically print a report without displaying it.
Cause: Only the new FlashViewer ViewerType of the WebViewer offers this functionality.
Solution:
1. Set the ViewerType property to FlashViewer.
2. Expand the FlashViewerOptions property, and expand the PrintOptions subproperty.
3. Under the PrintOptions subproperty, set the StartPrint property to True.
The report is not getting updated with new data, or the page number stays the same
Symptoms: The WebViewer stays on the page number last viewed in the previous report when a user selects a new report or refreshes the current report, or new data does not display on refresh.
Cause: If the control is loaded in response to a client postback, the Report property does not run the specified report. Instead it uses a previously cached copy of the report's Document in the WebCache service to supply speedy responses to clients.
Solution: To force the client to use a new instance, call the ClearCachedReport method before setting the Report property.
The report in the HTML viewer type does not look exactly like the other viewer types
Symptoms: The report in the HTML viewer type does not look exactly like the other viewer types.
Cause: The HTML format is not WYSIWYG. It does not support the following items:
Line control
Control borders
Shapes (other than filled rects)
CrossSectionBox and CrossSectionLine controls
Overlapping controls
Solution: Try to avoid using the above items in reports which are shown in HTML format.
The icons are missing on my WebViewer control
Symptoms: The icons are missing on my WebViewer control.
Cause: The httpHandlers in the Web.config file are missing or referencing the wrong version.
Solution: Ensure that the following HTTP Handler code is in the Web.config file and that the version is current.
********** ActiveReports HttpHandler Configuration ********** --> <add verb="*" path="*.rpx" type="DataDynamics.ActiveReports.Web.Handlers.RpxHandler, ActiveReports.Web, Version=6.0.0.5280, Culture=neutral, PublicKeyToken=cc4967777c49a3ff"/> <add verb="*" path="*.ActiveReport" type="DataDynamics.ActiveReports.Web.Handlers.CompiledReportHandler, ActiveReports.Web, Version=6.0.0.5280, Culture=neutral, PublicKeyToken=cc4967777c49a3ff"/> <add verb="*" path="*.ArCacheItem" type="DataDynamics.ActiveReports.Web.Handlers.WebCacheAccessHandler, ActiveReports.Web, Version=6.0.0.5280, Culture=neutral, PublicKeyToken=cc4967777c49a3ff"/> </httpHandlers>
"Error Creating Control - Webviewer"
Symptoms: "Error Creating Control - Webviewer" appears on the WebForm in place of the WebViewer control.
Cause: There is a version conflict within the project.
Solution:
1. Open the ASPX page and look in the Source view for a line that looks similar to the following and remove it:
<%@ Register TagPrefix="ActiveReportsWeb" Namespace="DataDynamics.ActiveReports.Web" Assembly="ActiveReports.Web, Version=6.0.0.5280, Culture=neutral, PublicKeyToken=cc4967777c49a3ff" %>
managed code is caused by holding a reference to an object indefinitely. If ActiveReports is holding a reference to an object, then the object cannot be collected by the garbage collector.
ActiveReports 6 User Guide | 428
2. Right-click the ASPX page and select View Code. In the code view that appears, remove the following line from the Web Form Designer Generated Code:
Protected WithEvents WebViewer1 As DataDynamics.ActiveReports.Web.WebViewer
3. In the Solution Explorer, under References, right click and Remove the ActiveReports.Web reference.
4. Delete the control from the WebForm.
5. Add the WebViewer back to the WebForm.
6. Open the Web.config file in the solution, and scroll down to the httpHandlers tag near the bottom. There are three add verb tags on that line which indicate the Version. Update the version number.
Blank reports with the AcrobatReader viewer type on the production web server
Symptoms: In the WebViewer, reports render correctly with the HTML ViewerType but they show up blank with the AcrobatReader ViewerType on the production web server.
Cause: .ArCacheItem is not set up in your IIS extension mappings.
Solution:
1. From the Start menu, choose Control Panel, then Administrative Tools, then Internet Information Services.
2. Right-click your Default Web Site and choose Properties.
3. On the Home Directory tab, click the Configuration button.
4. On the Mapping tab, check the Extension column to see whether .ArCacheItem appears. If not, click Add.
5. In the Add/Edit Application Extension Mapping dialog that appears, click Browse and navigate to (Windows)\Microsoft.NET\Framework\v2.0.50727 or v3.0 or v3.5.
6. In the Open dialog, change Files of type to Dynamic Link libraries (*.dll).
7. Select aspnet_isapi.dll and click Open .
8. In the Extension textbox type .ArCacheItem.
9. Click the Limit to radio button and type GET,HEAD,POST,DEBUG.
10. Ensure that the Script engine check box is selected and the Check that file exists check box is cleared.
11. Click OK .
ActiveReports 6 User Guide | 429

If you run into an issue while using ActiveReports exports, you will probably find the solution within this section. Click any short description below to drop down the symptoms, cause, and solution.
General Export Troubleshooting
Specified cast not valid exception
Symptoms: The "Specified Cast Is Not Valid" exception fires.
Cause: There is a mix of old and new dlls in the references.
Solution:
1. Remove all ActiveReports 6 references from the project.
2. Add the ActiveReports 6 references necessary to your project, making sure to use only references to assemblies from the latest build installed on your machine.
Excel Export Troubleshooting
Extra columns in exported spreadsheet
Symptoms: Extra columns are showing up in the Excel export.
Cause: Controls don't have the same Top and Height properties. When the Excel export runs, it divides the report into rows and columns based on the borders of the controls, much like a grid. Controls that are not aligned across the report cause the Excel export to produce more columns to accommodate them.
Solution: Use the new SnapLines feature to help align the controls. To remedy the situation, set as many controls with the same Left property values and the same Top property values as you can, aligning them as if they were in a grid. This reduces the number of columns exported. Also, setting the RemoveVerticalSpace or UseCellMerging property to True, or setting the MinColumnWidth property equal to the width of the narrowest cell may help.
Extremely long reports do not export
Symptoms: Extremely long reports do not export to Excel.
Cause: The maximum number of rows which can be exported to MS Excel version 8.0 or higher is 65,536, while older versions of Excel (4.0, 5.0 and 7.0) had a limit of 16,384 rows.
Here are other specifications for Excel version 9.0 which may affect your export:
Maximum worksheet size: 65,536 rows by 256 columns
Maximum column width: 255 characters
Maximum row height: 409 points
Maximum length of cell contents (text): 32,767 characters. Only 1,024 display in a cell; all 32,767 display in the formula bar.
Solution: Use the Export(document,filePath,pageRange) or Export(document,outputStream,pageRange) method to export ranges of pages into separate Excel documents.
Export fails sporadically in memory stream
Symptoms: When using a memory stream, the Excel export sporadically fails.
Cause: Internet Explorer requires a "content-disposition" header in the response.
Solution: Use code like the following before creating the export.
The export does not look like the original
Symptoms: The exported Excel file does not look exactly like the original report.
Cause: The Excel export is not WYSIWYG. It does not support the following items:
Line control
Export Troubleshooting
Paste this code
Response.ContentType = "application/x-msexcel";Response.AddHeader("content-disposition","attachment; filename=MyXLS.XLS");Response.AddHeader("content-disposition","inline;filename=MyXLS.xls");
ActiveReports 6 User Guide | 430
Borders on controls with angled text
Shapes (other than filled rects)
Overlapping controls
Solution: Try to avoid using the above items in reports which will be exported to Excel.
HTML Export TroubleshootingInvalid syntax error
Symptoms: Internet Explorer displays "Invalid syntax error" on the title bar, "The page cannot be displayed" in the body and the URL is prepended with mhtml: in the address bar.
Cause: This is caused by Microsoft Hotfix Q330994 (http://support.microsoft.com/default.aspx?kbid=330994). Microsoft addressed an Outlook security flaw that used the MHT extension and broke the streaming HTML functionality.
Solution: Append the mht extension to the file when you link to it. For example,
SortSample.aspx?RunReport=true
Would be changed to the following.
SortSample.aspx?RunReport=true f=temp.mht
The export does not look like the original
Symptoms: The exported HTML file does not look exactly like the original report.
Cause: The HTML export is not WYSIWYG. It does not support the following items:
Line control
Control borders
Shapes (other than filled rects)
Overlapping controls
Solution: Try to avoid using the above items in reports which will be exported to HTML.
PDF Export Troubleshooting
Barcodes do not scan and margins expand
Symptoms: Barcodes in printed PDF exports do not scan and the page margins appear larger than the ones in the original report.
Cause: The Adobe Acrobat reader has a default setting in the Print dialog which tells it to scale down large pages. The reader views ActiveReports margins as part of the document, and renders them inside the new margins it creates. This is normally not noticeable unless barcodes are used or the PDF printout is held up next to a printout of the original report.
Solution:
For Acrobat 6, 7, or 8, change the following options in the Print dialog under Page Handling:
1. Set Page Scaling to None.
2. Clear Auto-Rotate and Center.
For Acrobat 5, clear the following options in the Print dialog:
1. Shrink oversized pages to paper size
2. Expand small pages to paper size
3. Auto-rotate and center pages
The WebViewer shows blank PDF reports
Symptoms: In the WebViewer, reports render correctly with the HTML viewer type but they show up blank with the AcrobatReader viewer type on the production Web server.
ActiveReports 6 User Guide | 431
Cause: .ArCacheItem is not set up in your IIS extension mappings. Visual Studio now has the built-in Cassini Web server, so this problem does not show up during testing. However, this still needs to be set up for production.
Solution:
1. On the production Web server, from the Start menu, choose All Programs, Administrative Tools, Internet Information Services.
2. Right-click your Default Web Site and choose Properties.
3. On the Home Directory tab, click the Configuration button.
4. On the Mapping tab, check the Extension column to see whether .ArCacheItem appears there.
5. If .ArCacheItem does not appear click the Add button.
6. Browse to C:\WINDOWS\Microsoft.NET\Framework\v2.x.xxxx or C:\WINNT\Microsoft.NET\Framework\v2.x.xxxx (or v3.x.xxxx).
7. Change Files of type: to Dynamic Link libraries (*.dll).
8. Choose the aspnet_isapi.dll and click Open.
9. In the Extension textbox type ".ArCacheItem".
10. Click the Limit to: radio button and type "GET,HEAD,POST,DEBUG".
11. Make sure that the "Script engine" checkbox is checked and the "Check that file exists" checkbox is not checked.
12. Click OK.
RTF Export TroubleshootingThe export does not look like the original
Symptoms: The exported RTF file does not look exactly like the original report.
Cause: The RTF export is not WYSIWYG, and is based on WordPad rather than Word, so there are some limitations. The following items are not supported in the RTF export.
Line controls
Backcolor
Shape controls
Overlapping controls
Control borders (except for borders on the RichTextBox control, which are supported)
Angled text
Solution: Try to avoid using the above items in reports which will be exported to RTF.
Text Export Troubleshooting
The export does not look like the original
Symptoms: The exported text file does not look exactly like the original report.
Cause: The text export is not WYSIWYG. It is limited to plain, unformatted text, or plain text with encoding for foreign language support.
Solution: Only use the Text export when the output can be plain text with no formatting.
TIFF Export Troubleshooting
The export is completely black
Symptoms: Reports exported to TIFF format with the RLE or CCITT3 compression scheme are rendering black.
Cause: The sections in the reports have a BackColor and are not dithered.
Solution: Set the Dither property for the export object to True, or set the BackColor property of each section to Transparent.
The export has extra white space at the bottom of the page
ActiveReports 6 User Guide | 432

Symptoms: Some reports are exported to TIFF with extra white space at the bottom of the page.
Cause: The default value for CompressionScheme is CCITT3. According to CCITT3 standards, the page size is 1728 x 2376 pixels and the resolution is 200 x 196 DPI, as required by some fax machines. If the page is smaller than this standard, then it is scaled up to CCITT3 standards, which can cause extra white space at the bottom.
Solution: To get an accurate page size, set the CompressionScheme to CompressionScheme.Rle (Run length encoding).
ActiveReports 6 User Guide | 433
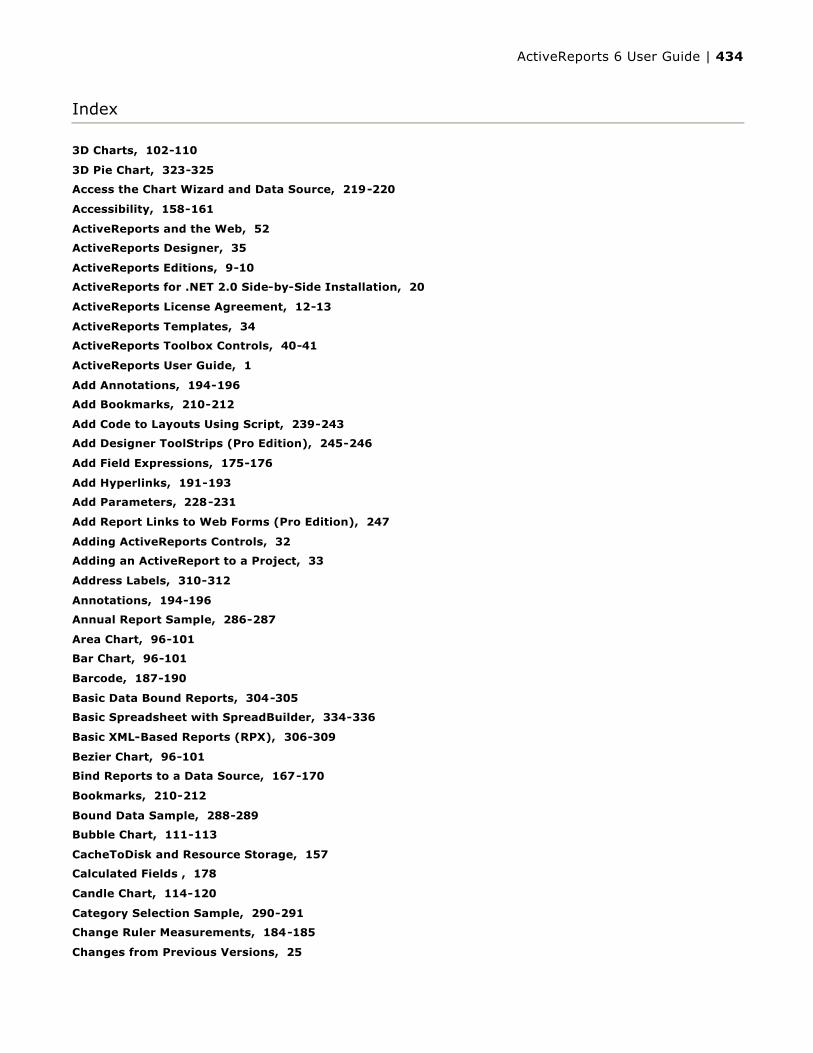
3D Charts, 102-110
3D Pie Chart, 323-325
Access the Chart Wizard and Data Source, 219-220
Accessibility, 158-161
ActiveReports and the Web, 52
ActiveReports Designer, 35
ActiveReports Editions, 9-10
ActiveReports for .NET 2.0 Side-by-Side Installation, 20
ActiveReports License Agreement, 12-13
ActiveReports Templates, 34
ActiveReports Toolbox Controls, 40-41
ActiveReports User Guide, 1
Add Annotations, 194-196
Add Bookmarks, 210-212
Add Code to Layouts Using Script, 239-243
Add Designer ToolStrips (Pro Edition), 245-246
Add Field Expressions, 175-176
Add Hyperlinks, 191-193
Add Parameters, 228-231
Add Report Links to Web Forms (Pro Edition), 247
Adding ActiveReports Controls, 32
Adding an ActiveReport to a Project, 33
Address Labels, 310-312
Annotations, 194-196
Annual Report Sample, 286-287
Area Chart, 96-101
Bar Chart, 96-101
Barcode, 187-190
Basic Data Bound Reports, 304-305
Basic Spreadsheet with SpreadBuilder, 334-336
Basic XML-Based Reports (RPX), 306-309
Bezier Chart, 96-101
Bind Reports to a Data Source, 167-170
Bookmarks, 210-212
Bound Data Sample, 288-289
Bubble Chart, 111-113
CacheToDisk and Resource Storage, 157
Calculated Fields , 178
Candle Chart, 114-120
Category Selection Sample, 290-291
Change Ruler Measurements, 184-185
Changes from Previous Versions, 25
Index
ActiveReports 6 User Guide | 434
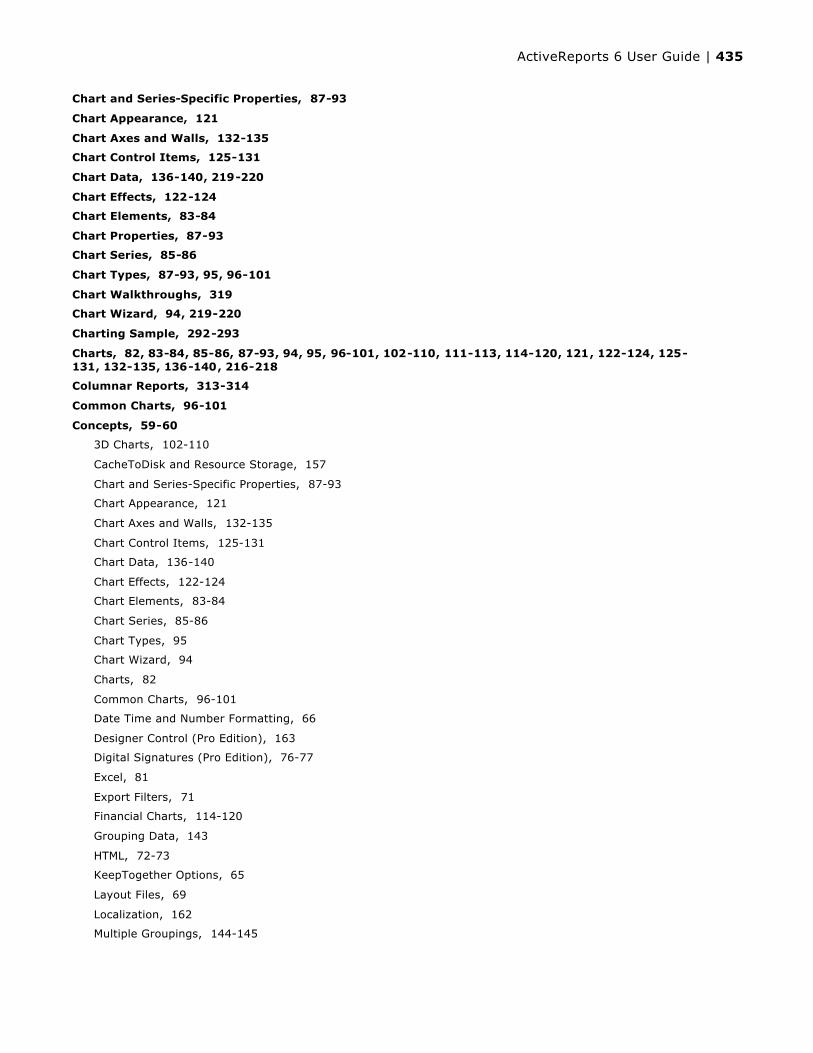
Chart and Series-Specific Properties, 87-93
Chart Appearance, 121
Chart Axes and Walls, 132-135
Chart Control Items, 125-131
Chart Data, 136-140, 219-220
Chart Effects, 122-124
Chart Elements, 83-84
Chart Properties, 87-93
Chart Series, 85-86
Chart Types, 87-93, 95, 96-101
Chart Walkthroughs, 319
Chart Wizard, 94, 219-220
Charting Sample, 292-293
Charts, 82, 83-84, 85-86, 87-93, 94, 95, 96-101, 102-110, 111-113, 114-120, 121, 122-124, 125-131, 132-135, 136-140, 216-218
Columnar Reports, 313-314
Common Charts, 96-101
Concepts, 59-60
3D Charts, 102-110
CacheToDisk and Resource Storage, 157
Chart and Series-Specific Properties, 87-93
Chart Appearance, 121
Chart Axes and Walls, 132-135
Chart Control Items, 125-131
Chart Data, 136-140
Chart Effects, 122-124
Chart Elements, 83-84
Chart Series, 85-86
Chart Types, 95
Chart Wizard, 94
Charts, 82
Common Charts, 96-101
Date Time and Number Formatting, 66
Designer Control (Pro Edition), 163
Digital Signatures (Pro Edition), 76-77
Excel, 81
Export Filters, 71
Financial Charts, 114-120
Grouping Data, 143
HTML, 72-73
KeepTogether Options, 65
Layout Files, 69
Localization, 162
Multiple Groupings, 144-145
ActiveReports 6 User Guide | 435

Optimizing ActiveReports, 155-156
Parameters, 67-68
PDF, 74-75
Report and Page Settings, 63-64
Report Events, 147-148
Report Structure, 61-62
RichText, 141-142
RTF, 78
Scripting, 70
Section 508 Compliance, 158-161
Section Events, 149
Sequence of Events, 150-151
Subreports, 146
Text, 79
TIFF, 80
Unbound Reporting, 152-154
XY Charts, 111-113
Condition, 205-206
Conditionally Show or Hide Details, 205-206
Configure Handler Mappings in IIS 7.0, 274-275
Configure HTTPHandlers (Pro Edition), 272-273
Converting MS Access Reports, 30
Copy, 424-429
Create a Digital Signature for a PDF Export, 198-201
Create Calculated Fields, 178
Create Charts, 216-218
Create Common Reports, 179
Create Green Bar Reports, 182-183
Create Report Templates (Inheritance), 226-227
Create Summary Fields, 177
Create Summary Reports, 181
Create Top N Reports, 180
Creating a Basic End User Report Designer (Pro Edition), 413-418
Cross Section Controls, 44
Cross Tab Report Sample, 294-295
CrossSection, 44
Cultures, 252-255
Custom Controls, 224-225
Custom HTML Outputter, 386-391
Custom Preview Sample, 296-297
Custom Web Exporting (Std Edition), 382-385
Customize End User Designer Help (Pro Edition), 269-270
Customize the FlashViewer Toolbar (Pro Edition), 262-265
Customize the Viewer Control, 249-250
ActiveReports 6 User Guide | 436

Customize, Localize and Deploy, 248
Data, 166
DataDynamics.ActiveReports.ActiveReport, 35
DataDynamics.ActiveReports.Barcode, 187-190
DataDynamics.ActiveReports.ChartControl, 216-218
DataDynamics.ActiveReports.CheckBox, 40-41
DataDynamics.ActiveReports.CrossSectionBox, 40-41
DataDynamics.ActiveReports.CrossSectionLine, 40-41
DataDynamics.ActiveReports.Design.Designer, 413-418
DataDynamics.ActiveReports.Design.ReportExplorer, 413-418
DataDynamics.ActiveReports.Design.Toolbox.Toolbox, 413-418
DataDynamics.ActiveReports.Detail, 61-62
DataDynamics.ActiveReports.Export.Html.HtmlExport, 197
DataDynamics.ActiveReports.Export.Pdf.PdfExport, 197
DataDynamics.ActiveReports.Export.Rtf.RtfExport, 197
DataDynamics.ActiveReports.Export.Text.TextExport, 197
DataDynamics.ActiveReports.Export.Tiff.TiffExport, 197
DataDynamics.ActiveReports.Export.Xls.XlsExport, 197
DataDynamics.ActiveReports.GroupFooter, 143
DataDynamics.ActiveReports.GroupHeader, 143
DataDynamics.ActiveReports.Label, 40-41
DataDynamics.ActiveReports.Line, 40-41
DataDynamics.ActiveReports.OleObject, 40-41
DataDynamics.ActiveReports.PageBreak, 40-41
DataDynamics.ActiveReports.PageFooter, 61-62
DataDynamics.ActiveReports.PageHeader, 61-62
DataDynamics.ActiveReports.Parameter, 67-68
DataDynamics.ActiveReports.Picture, 40-41
DataDynamics.ActiveReports.ReportFooter, 61-62
DataDynamics.ActiveReports.ReportHeader, 61-62
DataDynamics.ActiveReports.ReportInfo, 40-41
DataDynamics.ActiveReports.RichTextBox, 141-142
DataDynamics.ActiveReports.Shape, 40-41
DataDynamics.ActiveReports.SubReport, 146
DataDynamics.ActiveReports.TextBox, 40-41
DataDynamics.ActiveReports.Viewer.Viewer, 50
DataSet Web Service, 393-394
DataSet Windows Application, 395-396
DataSource, 48
DataSource Icon, 48
Date, Time, and Number Formatting, 66
Deploy, 257-258, 259, 261, 267-268
Deploy End User Designer Help (Pro Edition), 271
Deploy the End User Report Designer (Pro Edition), 261
ActiveReports 6 User Guide | 437

Deploy Web Applications (Pro Edition), 267-268
Deploy Web Applications (Std Edition), 259
Deploy Windows Applications, 257-258
Design View, 36
Designer, 46
Designer Control (Pro Edition), 163
Designer Tabs, 46
Designer_DataDynamics.ActiveReports.Design.ReportDesigner, 35
Digital Signature, 198-201
Digital Signatures (Pro Edition), 76-77
Display Page Numbers and Report Dates, 186
Document Web Service, 397-399
Document Windows Application, 400-401
Doughnut Chart, 96-101
Duplex, 202-204
Embed Subreports in a Report, 232
End User Designer, 269-270, 271
End User Report Designer, 260, 261
Events, 147-148, 149, 150-151, 152-154
Excel, 71
Export, 430-433
Export Filters, 71
Export Reports, 197
Export Troubleshooting, 430-433
Exports, 71, 197
Field Expressions, 175-176
Financial Chart, 326-329
Financial Charts, 114-120
Flash Viewer, 266
Flash Viewer Hot Keys and Shortcuts, 58
Flash Viewer Options, 56-57
FlashViewer, 56-57, 58
Format BarCodes, 187-190
Formatting, 66
Gantt Chart, 96-101
Getting Started, 31
ActiveReports and the Web, 52
ActiveReports Designer, 35
ActiveReports Templates, 34
ActiveReports Toolbox Controls, 40-41
Adding ActiveReports Controls, 32
Adding an ActiveReport to a Project, 33
Changes from Previous Versions, 25
Cross Section Controls, 44
ActiveReports 6 User Guide | 438

DataSource Icon, 48
Design View, 36
Designer Tabs, 46
Flash Viewer Hot Keys and Shortcuts, 58
Flash Viewer Options, 56-57
Getting Started with the Web Viewer (Pro Edition), 53-55
Migrating from ActiveReports 2, 29
Properties Window, 49
Report Explorer, 37-39
Snap Lines, 47
Text Input for TextBox and Label Controls, 42-43
Toolbar, 45
Viewing Reports, 50
Windows Form Viewer Hot Keys And Shortcuts, 51
Getting Started with the Web Viewer (Pro Edition), 53-55
GrapeCity Copyright Notice, 11
Green Bar, 182-183
Group Data, 171
Group On Unbound Fields, 337-341
Grouping, 143, 144-145, 171
Grouping Data, 143
GroupKeepTogether, 65
High Low Chart, 114-120
High Low Open Close Chart, 114-120
Horizontal Bar Chart, 96-101
How To, 164-165
Access the Chart Wizard and Data Source, 219-220
Add Annotations, 194-196
Add Bookmarks, 210-212
Add Code to Layouts Using Script, 239-243
Add Designer ToolStrips (Pro Edition), 245-246
Add Field Expressions, 175-176
Add Hyperlinks, 191-193
Add Parameters, 228-231
Add Report Links to Web Forms (Pro Edition), 247
Bind Reports to a Data Source, 167-170
Change Ruler Measurements, 184-185
Conditionally Show or Hide Details, 205-206
Configure Handler Mappings in IIS 7.0, 274-275
Configure HTTPHandlers (Pro Edition), 272-273
Create a Digital Signature for a PDF Export, 198-201
Create Calculated Fields, 178
Create Charts, 216-218
Create Common Reports, 179
ActiveReports 6 User Guide | 439
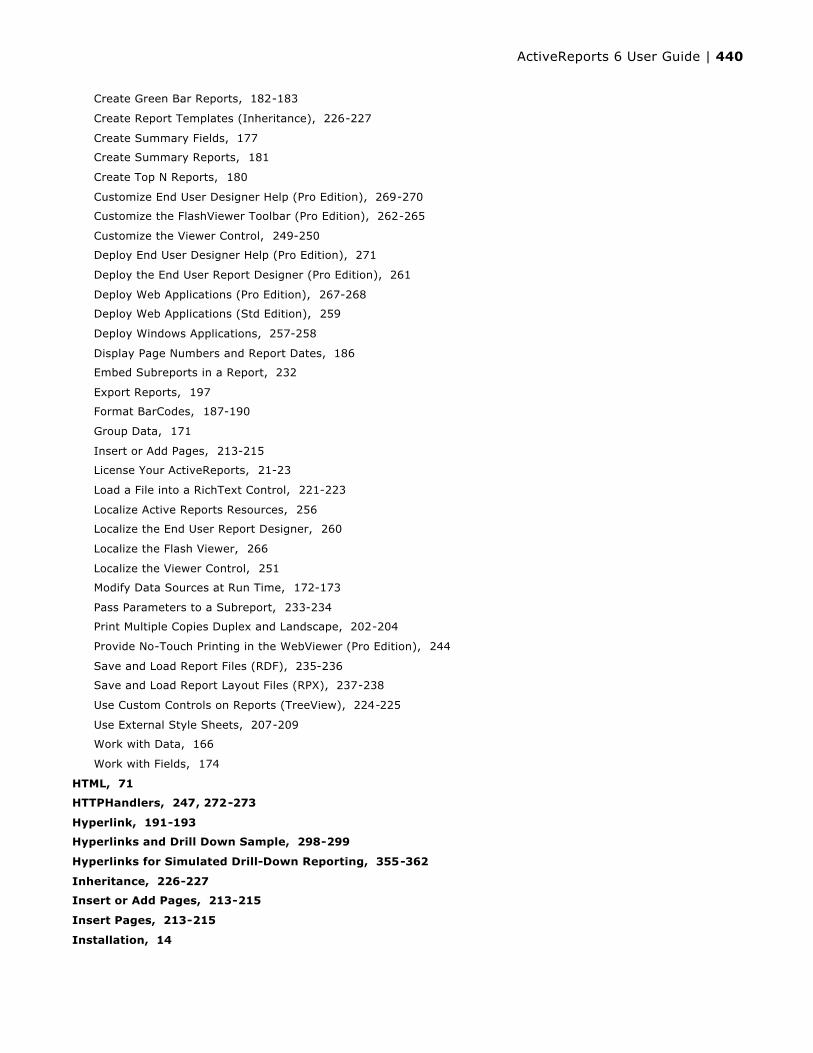
Create Green Bar Reports, 182-183
Create Report Templates (Inheritance), 226-227
Create Summary Fields, 177
Create Summary Reports, 181
Create Top N Reports, 180
Customize End User Designer Help (Pro Edition), 269-270
Customize the FlashViewer Toolbar (Pro Edition), 262-265
Customize the Viewer Control, 249-250
Deploy End User Designer Help (Pro Edition), 271
Deploy the End User Report Designer (Pro Edition), 261
Deploy Web Applications (Pro Edition), 267-268
Deploy Web Applications (Std Edition), 259
Deploy Windows Applications, 257-258
Display Page Numbers and Report Dates, 186
Embed Subreports in a Report, 232
Export Reports, 197
Format BarCodes, 187-190
Group Data, 171
Insert or Add Pages, 213-215
License Your ActiveReports, 21-23
Load a File into a RichText Control, 221-223
Localize Active Reports Resources, 256
Localize the End User Report Designer, 260
Localize the Flash Viewer, 266
Localize the Viewer Control, 251
Modify Data Sources at Run Time, 172-173
Pass Parameters to a Subreport, 233-234
Print Multiple Copies Duplex and Landscape, 202-204
Provide No-Touch Printing in the WebViewer (Pro Edition), 244
Save and Load Report Files (RDF), 235-236
Save and Load Report Layout Files (RPX), 237-238
Use Custom Controls on Reports (TreeView), 224-225
Use External Style Sheets, 207-209
Work with Data, 166
Work with Fields, 174
HTML, 71
HTTPHandlers, 247, 272-273
Hyperlink, 191-193
Hyperlinks and Drill Down Sample, 298-299
Hyperlinks for Simulated Drill-Down Reporting, 355-362
Inheritance, 226-227
Insert or Add Pages, 213-215
Insert Pages, 213-215
Installation, 14
ActiveReports 6 User Guide | 440

Installation Troubleshooting, 18
Installed Files, 16-17
Installer, 257-258, 267-268
Introducing ActiveReports 6, 2
Kagi Chart, 114-120
KeepTogether, 65
KeepTogether Options, 65
Label, 42-43
Layout Files, 69, 237-238, 239-243
Layout Files with Embedded Script, 402
License, 21-23
License Your ActiveReports, 21-23
Line Chart, 96-101, 111-113
Load a File into a RichText Control, 221-223
Localization, 162
Localize, 162, 251, 252-255, 256, 260, 266
Localize Active Reports Resources, 256
Localize the End User Report Designer, 260
Localize the Flash Viewer, 266
Localize the Viewer Control, 251
Mail Merge with RichText, 363-367
Memory, 155-156, 157, 424-429
Migrating from ActiveReports 2, 29
Modify Data Sources at Run Time, 172-173
Multiple Groupings, 144-145
Nested Subreports, 347-351
NEW Cross Section Control Sample, 281-283
NEW Flash Web Viewer Sample, 279-280
NEW Style Sheets Sample, 284-285
Optimizing ActiveReports, 155-156
Orientation, 202-204
Overlaying Reports (Letterhead), 315-318
Page Numbers, 186
Page Setup, 63-64
Parameters, 67-68, 228-231, 233-234, 424-429
Pass Parameters to a Subreport, 233-234
PDF, 71, 198-201
Pie Chart, 96-101
Plot Chart, 111-113
Point and Figure Chart, 114-120
Preview, 46, 50
Print Multiple Copies, Duplex, and Landscape, 202-204
Printer Settings, 63-64
Printing, 202-204, 424-429
ActiveReports 6 User Guide | 441

Properties, 49
Properties Window, 49
Provide No-Touch Printing in the WebViewer (Pro Edition), 244
RDF, 235-236
Rdf Viewer Sample, 300
Related Sections
ActiveReports User Guide, 1
Concepts, 59-60
Customize Localize and Deploy, 248
Getting Started, 31
How To, 164-165
Installation, 14
Introducing ActiveReports 6, 2
Layout Files with Embedded Script, 402
Samples and Walkthroughs, 276
Subreport Walkthroughs, 342
Troubleshooting, 424-429
Upgrading Reports, 24
Walkthroughs, 303
Web Walkthroughs (Standard Edition), 381
Renko Chart, 114-120
Report and Page Settings, 63-64
Report Date, 186
Report Events, 147-148
Report Explorer, 37-39
Report Structure, 61-62
ReportInfo, 186
Requirements, 15
RichText, 141-142, 221-223
RPX, 237-238
RTF, 71, 141-142
Ruler, 184-185
Run Time Data Sources, 378-380
Run Time Layouts, 369-377
Run Time or Ad Hoc Reporting, 368
Sample ReadMe Files
Annual Report Sample, 286-287
Bound Data Sample, 288-289
Category Selection Sample, 290-291
Charting Sample, 292-293
Cross Tab Report Sample, 294-295
Custom Preview Sample, 296-297
Hyperlinks and Drill Down Sample, 298-299
NEW Cross Section Control Sample, 281-283
ActiveReports 6 User Guide | 442

NEW Flash Web Viewer Sample, 279-280
NEW Style Sheets Sample, 284-285
Rdf Viewer Sample, 300
SubReports Sample, 301-302
Samples, 277-278
Samples and Walkthroughs, 276
Save and Load Report Files (RDF), 235-236
Save and Load Report Layout Files (RPX), 237-238
Scatter Chart, 96-101
Script, 46, 239-243
Script for Simple Reports, 403-406
Script for Subreports, 407-412
Scripting, 70
Scripts, 70
Section 508 Compliance, 158-161
Section Events, 149
Sections, 61-62, 149
Sequence of Events, 150-151
Service Packs and Hot Fixes, 19
Settings, 63-64
Snap Lines, 47
SnapLines, 47
Speed, 155-156
Stacked Area Chart, 96-101
Stacked Bar Chart, 96-101
Style Sheets, 63-64, 207-209
Subreport Walkthroughs, 342
Subreports, 146, 232, 233-234
SubReports Sample, 301-302
Subreports with Run-Time Data Sources, 343-346
Subreports with XML Data, 352-354
Summary, 177, 181
Templates, 226-227
Text, 71
Text Input for TextBox and Label Controls, 42-43
TextBox, 42-43
Three Line Break Chart, 114-120
TIFF, 71
Toolbar, 45
Toolbox, 40-41
Top N, 180
Troubleshooting, 424-429, 430-433
Export Troubleshooting, 430-433
Unbound Chart, 330-333
ActiveReports 6 User Guide | 443
Unbound Reporting, 152-154
Upgrading from Previous Versions, 26-28
Upgrading Reports, 24
Use Custom Controls on Reports (TreeView), 224-225
Use External Style Sheets, 207-209
Viewer, 50, 249-250, 251
Viewing Reports, 50
Walkthroughs, 303
3D Pie Chart, 323-325
Address Labels, 310-312
Bar Chart, 320-322
Basic Data Bound Reports, 304-305
Basic Spreadsheet with SpreadBuilder, 334-336
Basic XML-Based Reports (RPX), 306-309
Chart Walkthroughs, 319
Columnar Reports, 313-314
Creating a Basic End User Report Designer (Pro Edition), 413-418
Custom HTML Outputter, 386-391
Custom Web Exporting (Std Edition), 382-385
DataSet Web Service, 393-394
DataSet Windows Application, 395-396
Document Web Service, 397-399
Document Windows Application, 400-401
Financial Chart, 326-329
Flash Viewer, 422-423
Group On Unbound Fields, 337-341
Hyperlinks for Simulated Drill-Down Reporting, 355-362
Mail Merge with RichText, 363-367
Nested Subreports, 347-351
Overlaying Reports (Letterhead), 315-318
Run Time Data Sources, 378-380
Run Time Layouts, 369-377
Run Time or Ad Hoc Reporting, 368
Script for Simple Reports, 403-406
Script for Subreports, 407-412
Subreports with Run-Time Data Sources, 343-346
Subreports with XML Data, 352-354
Unbound Chart, 330-333
Web Services, 392
Web Viewer (Pro Edition), 419-421
Web, 52, 247, 259, 267-268, 272-273
Web Services, 392
Web Viewer (Pro Edition), 419-421
Web Walkthroughs (Standard Edition), 381
ActiveReports 6 User Guide | 444

WebViewer, 53-55, 56-57, 244, 424-429
What's New, 3-8
Windows Form Viewer Hot Keys And Shortcuts, 51
Work with Data, 166
Work with Fields, 174
XY Charts, 111-113
ActiveReports 6 User Guide | 445