Reliability in endoscopic diagnosis of portal hypertensive gastropathy
Upload
independentCategory
view
1download
0
Journal of the American Society of Nephrology 443
Active Kallikrein Response to Changes in Sodium-ChlorideIntake in Essential Hypertensive Patients1Claudio Fern,2 Cesare Bellini, Antonio Carbomagno, Giovambattista Desideri, and Anna Santucci
C. Fern, C. Bellini, A. Carlomagno, G. Desideri, Univer-
sily of Rome “La Sapienza,” Institute of I Clinica Med-ca, Andrea Cesalpino Foundation, Rome, Italy
A. Santucci, Universily of L’Aquila, Department of In-
ternal Medicine and Public Health, L’Aquila, Italy
(J, Am. Soc. Nephrol. 199#{243};7:443-453)
ABSTRACT
1To evaluate the behavior of active kallikrein excre-
tion in salt-sensitive and salt-resistant hypertensive pa-tients during changes in sodium-chloride (NaCI) in-take, 61 male, nonobese, nondlabetic outpatientsaffected by uncomplicated essential hypertensionwere given a diet that contained 140 mmol NaCI perday for 2 wk. Patients then received either a low- (20mmol NaCI/day) or a high- (320 mmol NaCI/day)sodium diet for 2 wk, according to a randomized,double-blind, cross-over protocol. Hypertensive pa-
tients were classified as salt sensitive when their dia-stolic blood pressure rose by at least 10 mm Hg afterthe high-sodium diet, and decreased by at least 10mm Hg after the low-sodium diet, considering as
baseline blood pressure values those that were takenat the end of the 140 mmol NaCI/day Intake period.
The remaining patients were classified as salt resistantor, when diastolic blood pressure increased by 10mm Hg or more after low-sodium intake, as counter-
regulating. Twenty-three patients were therefore clas-sified as salt sensitive, 28 as salt resistant, and 10 as
counterregulating. The baseline active kallikrein ex-cretion was significantly lower (P < 0.0001) in salt-
sensitive (0.62 ± 0.31 U/24 h) patients than in salt-resistant (1.39 ± 0.44 U/24 h) and counterregulatingpatients (1 .27 ± 0.38 U/24 h). Surprisingly, the kallikreinresponse to changes in sodium intake was similar inall subgroups, although enzyme excretion was al-ways at the lowest level in salt-sensitive hypertensivepatients. This buffer group also showed the highestplasma atrial natriuretic peptide levels (28.2 ± 8.5fmol/mL, P < 0.0001 versus salt-resistant and counter-regulating patients), and the greatest peptide incre-
ment with sodium load (P < 0.0001 versus salt-resistant
1 ReceIved November 29, 1994. Accepted September 15, 1995.
2 correspondence to Dr. c. Fern, Instituto dl I clinical Medica. Universita La
saplenza. Viale del Policlinico, 155, 00161 Rome, Italy.
1046.6673/0703-0443$03.00/0Journal of the AmerIcan Society of Nephrologycopyright C 1996 by the American Society of Nephrology
and counterregulating patients). Counterregulatingpatients showed the steepest increase in plasma re-
nm activity (from 0.24 ± 0.18 to 0.83 ± 0.21 ng/L per s,P < 0.001) and decrease of plasma atrial natriuretic
peptide (from 26.1 ± 6.3 to 6.8 ± 3.1 fmol/mL, P <
0.001) when switched from a high to a low-sodium
intake. In conclusion, salt-sensitive hypertensive pa-tients excrete less active kallikrein than do salt-resis-
tant and counterregulating patients, but maintain a
normal enzyme response to changes in dietary so-
dium intake. The exaggerated response of atrial na-
triuretic peptide to high-sodium intake that was ob-served in the same patients could be compensating
for an impaired renal capability to excrete a sodiumload.
Key Words: Sodium. hypertension. renin. atrial natriuretic
peptides, kidney
S alt sensitivity is defined as a significant rise In
blood pressure when individuals switch from alow- to a high-sodium (NaCl) intake and/or vice versa( 1-6). The frequency of salt sensitivity is stronglyinfluenced by age (2-4,7-9), body weight (2,3,8-13),
race (2,3,8,9, 14-16), gender (6, 17), and family history
of hypertension (2-4,18).
In middle-aged Caucasian populations, approxi-mately 50% of hypertensive patients can be included
within the salt-sensitive subgroup (1-3,5,6,17,19). In
the remaining patients, blood pressure does not
change or may even increase during bow-sodium In-
take ( 1-3,20-22), making the potential efficacy of
health care programs that are directed toward Indis-
criminate sodium restriction debatable (2,3,21-26).
As a consequence, a number of studies attempted to
define genetic (8,27), familial (8), racial (8,9,14-16),
sexual (6, 1 7), ethnic ( 1 6), environmental (28), renal
(14,29,30), endocrine (19,27,31-33), and cell-mem-
brane (34-36) characteristics related to salt sensltlv-
ity, and to indicate one or more parameters that would
be able to predict the individual blood-pressure re-
sponse to sodium.In this regard, the work of B#{246}nner et a!. with nor-
motensive patients (37,38) and our group’s work with
hypertensive patients (39) have recently suggested
that a bow-kalbikrein excretion might determine the
salt sensitivity of blood pressure. In particular, we
demonstrated that a reduced kallikrein excretion at
baseline was present in 84% of salt-sensitive and 22%
of salt-resistant patients (39). Therefore, we suggested
an inability of the kidney to modulate kalbikrein pro-
duction during changes in sodium intake as the cause
for sodium retention and the consequent bbood-pres-
sure rise (39).

I STUDY PROTOCOL I
- ..NORMAL LOW
#{182}‘Blood pressure and hormonal evaluation
Kallikrein and Salt Sensitivity
444 Volume 7 - Number 3 ‘ 1996
Although fascinating, this theory was merely spec-
ulative, because we did not evaluate the kalllkrein
response to changes in dietary sodium intake (39).
Furthermore, we excluded from the study the so-
called “counterregulating hypertensives,” i.e. , thosepatients whose blood-pressure levels increase with
sodium restriction (and/or decrease with sodium
load) (20-22,39-44). This fact limited the pathoge-
netic as well as therapeutic implications of our find-
ings . Indeed, counterregulating hypertensive patients
are those patients who could report a potential incre-
ment of cardiovascular risk after severe sodium re-
striction (3,20-22).
Herewith we present a randomized double-blind
cross-over study that alms to Investigate the behavior of
urinary active kallikrein during changes in dietary sod-
um-chboride intake in a barge number of nonobese,nondiabetic hypertensive men, classified according to
individual blood-pressure response to changes in so-
dium intake as salt-sensitive, salt-resistant or counter-
regulating hypertensive patients. In this study, we also
analyzed the relationship between kalllkrein and other
sodium-rebated hormonal changes. Because reproduc-
Ibifity Is a crucial point in salt-sensitivity evaluation
(3,6, 18,45), and the entire existence of salt sensitivity
has been attributed to artifacts and / or casual variations
of blood pressure (2,6,45), we also tested the reproduc-
ibility of our procedure 6 months after the end of the
study.
PATIENTS AND METHODS
Patients
The study was approved by the Ethics Committee of the
Andrea Cesalpino Foundation and stated in 79 never-treated outpatients who had a body mass index > 1 9 and <
27 kg/m2. Patients were between the ages of 30 to 55 yr(mean, 47.8 ± 6.3 yr), and were affected by uncomplicatedessential hypertension. All patients were white Caucasians.Because the menstrual cycle strongly Influences the behav-ior of several of the hormones that are Involved in renalsodium handling (46), and because urine collection for kal-
hlkreln and electrolyte determinations Is not feasible In men-struating women, only male patients were recruited.
In all patients, diastolic blood pressure (DBP) was requiredto be >95 mm Hg and < 1 1 4 mm Hg at three consecutivevisits performed at 1 -wk intervals before definitive enroll-
ment in the study (Figure 1 ). Serum creatinine concentrationwas < 100 �tmol/L: proteinurla was absent, microalbumin-uria was <20 �.tg/mIn on two consecutive 24-h urine collec-tions, ‘ � ‘ I-OrthoIodohyppurate scintirenographies were nor-
mal. All patients had a normal glucose tolerance, asevaluated by oral glucose tolerance tests (75 g D-glucose),and had no cardiovascular alterations as evaluated on thebasis of clinical and ultrasound studies. The secondaryforms of hypertension were excluded by clinical and labora-tory assessments.
At the first of the three screening visits, patients answered
standard questions concerning family history of hyperten-sion, according to a previously described methodology(39,47). In brief, family information was first obtained byeach patient and then confirmed by the family physician and,when possible, by other patient’s relatives (wife, brethren,
I MU�kS 2W((KS I 2(EKS I 2W�K3 I a UEKS I
I PHASE 1 I PHASE 2 IFigure 1 . Schematic representing the study protocol. Re-cruited patients were followed-up for 4 wk, during which theenrollment criteria were evaluated. Then, after the definitiveenrollment, patients followed a normal sodium diet (140mmol NaCI/day) for 2 wk to obtain the same baselineconditions. After baseline blood and urine samplings, pa-tients were randomized to one of two different sequences: 32patients followed the high-sodium diet (320 mmol/day),then the normal-sodium diet, and ended with the low-sodium diet (20 mmol/day); 33 patients followed the oppo-site sequence (LOW-NORMAL-HIGH). Blood-pressure mea-surements for the salt sensitivity assessment and blood andurine samplings for hormonal assays were repeated at theend of each diet period.
children, etc.). A positive family history was defined as the
presence of at least one first-degree relative who was affected
by essential hypertension. To avoid bias, the family historyinformation was collected by a separate group of researchers,who were unaware of the study purpose and results.
During the recruitment period, all patients were on aconstant sodium Intake ( 140 mmol NaC1 per day). Eachpatient received a scheme ofa diet prepared by our dietitians,and containing approximately 1 g/kg protein, 2.5 g/kg car-bohydrates, 0.7 g/kg fat, 35 mmol calcium, 20 mmol NaCl,and 70 mmol potassium per day. A total amount of 120 mmol
NaC1 was added to the diet by means of six capsules per day
(each capsule containing 20 mmol of NaC1), to be takenorally. Each patient was given oral and written instructionsand detailed information on the way to cook their meals
without added salt. To simulate as closely as possible theabsorption of salt with food, according to the Italian habit,patients were advised to take three capsules at lunch andthree at dinner.
The total number of calories remained identical during theentire study period and was calculated on the basis ofindividual needs. All patients were advised to drink 1 .5 L
water/day. Adherence to the diet was assessed by 24-h urinecollections on the last two consecutive days of each week.Participants were instructed by our medical staff on how to
collect the 24-h urine sample. Sodium-chloride excretionwas required to be between 100 mmol/24 h and 140
mmol/24 h. On these same occasions, potassium and cal-cium excretions were also measured. In particular, urinarypotassium was required to be between 50 and 70 mmol/24 hto allow patients’ continued participation in the study.

Fern et al
Journal of the American Society of Nephrology 445
Of the Initial cohort of 79 patIents, 14 dId not enter thesalt-sensitivity assessment phase because of noncompliance
with the diet (N = 7), DBP <95 mm Hg (N = 4), or > 1 14 mmHg (N = 1 ) requirements, and because of hack of return tofollow-up visits (N = 2). Therefore, only 65 patients were
definitively enrolled in the following phase of the study.Salt-Sensitivity Assessment Phase. At the end of the
recruitment phase, blood samples for plasma renin activity(PRA), aldosterone (PAC), atrIaj natriuretic peptide (ANP),
and digoxin-like substance (DLS) levels were taken after 1 hat rest in a supine position. Two consecutive 24-h urinecollections were requested from each patient, to determinethe urinary active kallikreln excretion. After blood and urinesamples were taken, patients were assigned in a randomdouble-blind manner to a high- (320 mmoh NaC1 per day for2 wk) or a low- (20 mmol NaCl per day for 2 wk) sodiumintake (Figure 1). Thirty-two patients received first the highand then the low-sodium diet. The remaining patients (N =
33) followed the reverse order. To have a similar baseline dietbefore switching to low or high-sodium intake, a period of 2wk on a diet that contained 140 mmol NaCl per day wasInterposed during the cross-over phase (Figure 1).
Individual sodium Intake was obtained by changing theNaC1 content of the capsules. During the high-sodium intakeperiod, each capsule contained 50 mmol NaC1. During thelow-sodium Intake period, each capsule contained a placebo(dextrose). Throughout the study, potassium intake re-malned unvarled (70 mmol potassium per day).
During the evaluation of salt sensitivity, compliance wasalso controlled by measuring 24-h sodium excretion levels.Patients were considered compliant when their 24-h sodiumexcretion level was >270 mmol and <40 mmol In all urinecollections obtained during the high- and low-sodium Intakeperiods, respectively. Urinary potassium levels were requiredto be between 50 mmol/24 h and 70 mmol/24 h. Fouradditional patients were noncomphiant, all during the high-sodium diet period. and the salt-sensitivity assessmentphase was therefore successfully completed In 6 1 patients.
Patient ClassificationPatients were classified as salt sensitive when a change of
10 mm Hg or more of DBP occurred after each period of eitherlow- or high-sodium intake (i.e. , blood pressure decreasesduring the low-sodium intake period. and increases duringthe ingh-sodlum intake period) (39). Changes in blood pres-sure were evaluated with baseline blood pressure consideredto be the measurement taken at the end of the 140-mmolNaC1 diet. In contrast to our previous report (39), patients
who had an Increase in blood pressure with sodium restric-tion were not excluded from the study, and were admitted toa third group of patients, I.e. , “counterregulators.”
ReproducibilityThe assessment of reproducibility of the above procedure
was scheduled for 32 patients, who were randomly chosenamong those patients who initially participated in the study.In all cases, patients were recalled after 6 months from thelast visit of the salt-sensitivity assessment phase. The repro-duciblilty evaluation was not feasible In six patients (four forloss at follow-up, two for compliance problems during the
changes in sodium Intake), although it was successfullyperformed in the remaining ones (N = 26).
Blood Pressure and Laboratory EvaluationsThroughout the study, blood-pressure levels were mea-
sured on the last two days of each week in the Outpatient
Unit of the Institute of I Clinica Medica, after 15 mm In a
seated position in an air-conditioned room (22 to 24#{176}C),by a
standard Riva-Rocci sphygmomanometer (Zenith. Rome, It-aly) and a stethoscope placed over the brachial artery. As
recommended for nonobese adults (48), a normal-size cuffwas used to encircle the nondominant arm, which was
supported comfortably at heart level. Systolic blood pressure(SBP) was taken at Korotkoffs Phase I, and DBP was taken atKorotkoffs Phase V (48). The first measurement of blood
pressure and heart rate was excluded, and the average of thefollowing three measurements, taken at 3-mm intervals, wasconsidered. Blood pressure was always taken by the sameresearchers, who were unaware of the study purpose, design,and results.
After blood-pressure measurement, patients rested com-fortably In bed for 1 h. Blood samples for PRA, PAC, ANP,
DLS, serum Na� and K� were then withdrawn from anantecubital vein. Plasma samples were Immediately stored at
-80#{176}C.All of the assays were performed no later than 8 daysafter storage. Plasma ANP was assayed as described else-where (47). In short, ANP was extracted from plasma byAmprep c-18 columns (Amersham, Amersham, Bucking-hamshire, U.K.) activated with 4 mL methanol and 12 mLdistified water. Each column was loaded with 2.5 mL acidi-fled plasma. The eluate was collected In 1 mL ethanol, driedunder vacuum, reconstituted in 1 mL neutral phosphatebuffer, and then measured by a commercially available hu-man-ANP (99-126) RIA kit (Peninsula Laboratories, Bel-mont, CA). Synthetic human-ANP (99-126) was used as astandard. Mean recovery for ANP in this study was 80%:interassay and intra-assay variations were less than 10%.
PRA and PAC were assayed by commercially available RIAkits (Sorin Biomedica S.p.A., Vercehli, Italy). Plasma DLS wasmeasured by the method of Balzan et al. (49) with slightmodifications. In brief, plasma samples were purified asfollows: Amprep c- 1 8 columns (Amersham) were activatedwith 5 mL methanol and 20 mL distilled water. Each columnwas loaded with 2.5 mL plasma, washed with 20 mL distilledwater, and then eluted with 2 mL methanol. The eluates offour 2.5-mL aliquots of plasma were collected, dried undervacuum, and reconstituted in 1 mL ofa buffer solution (NaCl130 mmol/L, sucrose 20 mmol/L, glucose 10 mmol/L, Tris-HC1 10 mmol/L, pH 7.4). For DLS radiolmmunoassay, asolid-phase system was used (Diagnostic Products Corpora-tion, Los Angeles, CA). Digoxin (Wellcome, Pomezia, Italy)was used as a standard. The other laboratory measurementswere performed by standard laboratory methods.
The 24-h urinary excretion level of active kalhikrein wasmeasured on fresh urine samples by hydrolysis of the chro-mogenic trypeptide substrate H-D-V-L-R-pNA (S-2266;Kabivitrum, MOlndal, Sweden) according to the method ofAmundsen et al. (50).
Statistical Analyses
The statistical evaluation was performed by a PC OlivettiM-380XP1 (Olivetti, Ivrea, Italy). The statistical softwareSPSS (SPSS Inc., Chicago, IL) was used. To evaluate intra-group statistical significances. we used the paired t test andanalysis of variance for repeated measures. To establish thedifferences among groups, we used unpaired t test and
one-way analysis of variance followed by post hoc analysis
(Bonferroni’s test). Linear regression and correlation wereused to evaluate the relationship between two variables.Descriptive parameters were analyzed by the chi-squared
method.
Kallikrein and Salt Sensitivity
446 Volume 7 ‘ Number 3 ‘ 1996
The results of each statistical test were considered signil-icant when the associated probability value (P) was <0.05.Unless otherwise stated, data are given as mean ± SD.
RESULTS
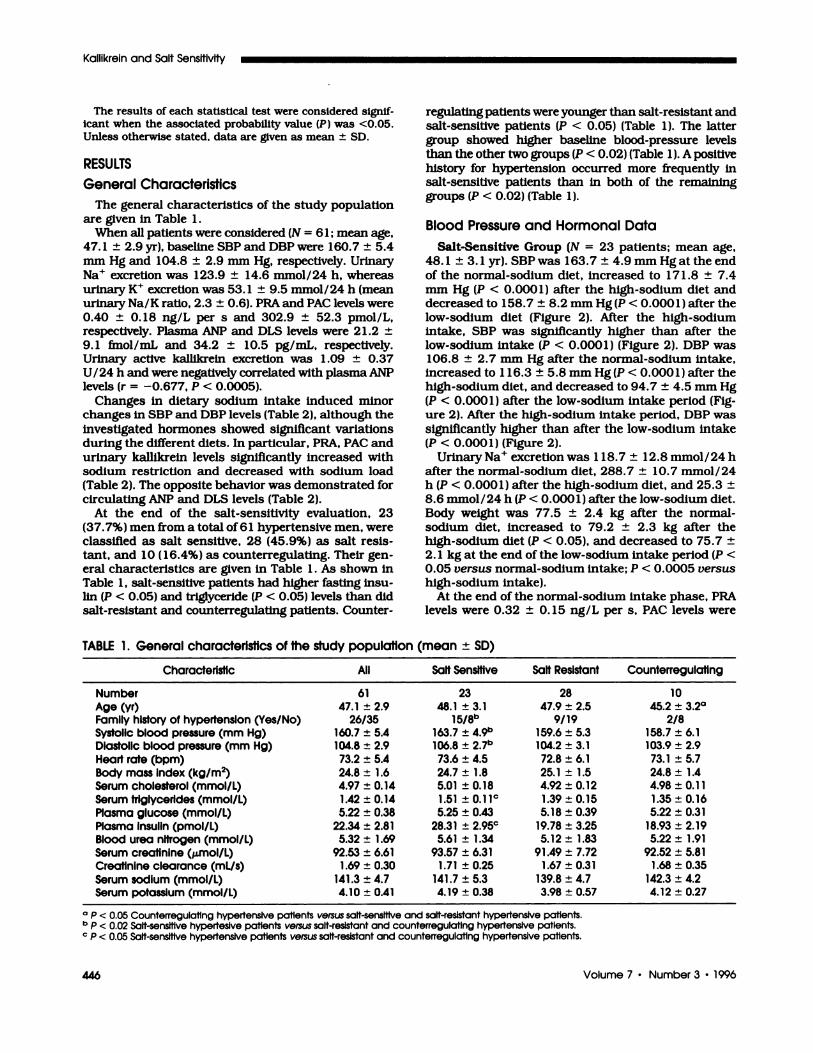
General Characteristics
The general characteristics of the study population
are given in Table 1.
When all patients were considered (N = 6 1 ; mean age,
47. 1 ± 2.9 yr), baseline SBP and DBP were 160.7 ± 5.4
mm Hg and 104.8 ± 2.9 mm Hg, respectively. Urinary
Na� excretion was 123.9 ± 14.6 mmob/24 h, whereas
urinary K� excretion was 53. 1 ± 9.5 mmol/24 h (mean
urinary Na/K ratio, 2.3 ± 0.6). PRA and PAC bevels were
0.40 ± 0.18 ng/L per s and 302.9 ± 52.3 pmob/L,
respectively. Plasma ANP and DLS levels were 2 1 .2 ±
9. 1 fmol/mL and 34.2 ± 10.5 pg/mL, respectively.
Urinary active kallikrein excretion was 1 .09 ± 0.37
U/24 h and were negatively correlated with plasma ANP
levels (r = -0.677, P < 0.0005).
Changes in dietary sodium intake induced minor
changes in SBP and DBP bevels (Table 2), although the
investigated hormones showed significant variationsduring the different diets. In particular, PRA, PAC and
urinary kabhlkrein levels significantly increased with
sodium restriction and decreased with sodium load
(Table 2). The opposite behavior was demonstrated for
circulating ANP and DLS bevels (Table 2).
At the end of the salt-sensitivity evaluation, 23
(37.7%) men from a total of6l hypertensive men, were
classified as salt sensitive, 28 (45.9%) as salt resis-
tant, and 10 ( 16.4%) as counterregulating. Their gen-
eral characteristics are given in Table 1 . As shown in
Table 1 , salt-sensitive patients had higher fasting insu-
bin (P < 0.05) and triglyceride (P < 0.05) levels than did
salt-resistant and counterregulating patients. Counter-
regulating patients were younger than salt-resistant and
salt-sensitive patients (P < 0.05) (Table 1). The batter
group showed higher baseline blood-pressure levels
than the other two groups (P < 0.02) (Table 1). A positive
history for hypertension occurred more frequently in
salt-sensitive patients than in both of the remaining
groups (P < 0.02) (Table 1).
Blood Pressure and Hormonal Data
Salt-Sensitive Group (N = 23 patients; mean age,
48. 1 ± 3. 1 yr). SBP was 163.7 ± 4.9 mm Hg at the end
of the normal-sodium diet, increased to 1 7 1 .8 ± 7.4
mm Hg (P < 0.0001) after the high-sodium diet and
decreased to 158.7 ± 8.2 mm Hg(P < 0.0001) after the
low-sodium diet (Figure 2). After the high-sodium
intake, SBP was significantly higher than after the
low-sodium intake (P < 0.000 1) (Figure 2). DBP was106.8 ± 2.7 mm Hg after the normal-sodium intake,
increased to 1 16.3 ± 5.8 mm Hg(P < 0.0001) after the
high-sodium diet, and decreased to 94.7 ± 4.5 mm Hg
(P < 0.000 1) after the bow-sodium intake period (Fig-ure 2). After the high-sodium intake period, DBP was
significantly higher than after the bow-sodium intake(P < 0.0001) (Figure 2).
Urinary Na� excretion was 1 18.7 ± 12.8 mmol/24 h
after the normal-sodium diet, 288.7 ± 10.7 mmol/24
h (P < 0.0001) after the high-sodium diet, and 25.3 ±
8.6 mmol/24 h (P < 0.0001) after the low-sodium diet.
Body weight was 77.5 ± 2.4 kg after the normal-sodium diet, increased to 79.2 ± 2.3 kg after thehigh-sodium diet (P < 0.05), and decreased to 75.7 ±
2. 1 kg at the end of the low-sodium intake period (P <
0.05 versus normal-sodium intake; P < 0.0005 versushigh-sodium intake).
At the end of the normal-sodium intake phase. PRA
bevels were 0.32 ± 0. 15 ng/L per s, PAC levels were
TABLE 1 . General characteristics of the study population (mean ± SD)
Characteristic All Salt Sensitive Salt Resistant Counterregulating
Number 61 23 28 10Age (yr) 47.1 ± 2.9 48.1 ± 3.1 47.9 ± 2.5 45.2 ± 3.2aFamily history of hypertension (Yes/No) 26/35 15/8b 9/19 2/8Systolic blood pressure (mm Hg) 160.7 ± 5.4 163.7 ± 4�9b 159.6 ± 5.3 158.7 ± 6.1Diastolic blood pressure (mm Hg) 104.8 ± 2.9 106.8 ± 2#{149}7b 104.2 ± 3.1 103.9 ± 2.9Heart rate (bpm) 73.2 ± 5.4 73.6 ± 4.5 72.8 ± 6.1 73.1 ± 5.7
Body mass Index (kg/m2) 24.8 ± 1.6 24.7 ± 1.8 25. 1 ± 1 .5 24.8 ± 1.4Serum cholesterol (mmol/L) 4.97 ± 0.14 5.01 ± 0.18 4.92 ± 0.12 4.98 ± 0.11Serum triglycerides (mmol/L) 1.42 ± 0.14 1.51 ± 0.1 1C 1.39 ± 0.15 1.35 ± 0.16Plasma glucose (mmol/L) 5.22 ± 0.38 5.25 ± 0.43 5.18 ± 0.39 5.22 ± 0.31
Plasma Insulin (pmol/L) 22.34 ± 2.81 28.31 ± 2,95c 19.78 ± 3.25 18.93 ± 2.19Blood urea nitrogen (mmol/L) 5.32 ± 1.69 5.61 ± 1.34 5.12 ± 1.83 5.22 ± 1.91Serum creatinine (�mol/L) 92.53 ± 6.61 93.57 ± 6.31 91.49 ± 7.72 92.52 ± 5.81
Creatinine clearance (mL/s) 1.69 ± 0.30 1.71 ± 0.25 1.67 ± 0.31 1.68 ± 0.35Serum sodium (mmol/L) 141.3 ± 4.7 141.7 ± 5.3 139.8 ± 4.7 142.3 ± 4.2Serum potassium (mmol/L) 4.10 ± 0.41 4.19 ± 0.38 3.98 ± 0.57 4.12 ± 0.27
a p < 0.05 Counterregulating hypertensive patients versus salt-sensitive and salt-resistant hypertensive patients.b p < 0.02 Salt-sensitIve hypertesive patients versus salt-resistant and counterregulating hypertensive patients.C p < 0.05 Salt-sensitive hypertensive patients versus salt-resistant and counterregulating hypertensive patients.

El-ip<O.O2
UEl
***
w 180
�(I,(I) -
w� -�17O..01
a -_J
� 160LI_Ja -
� 150:
120U�� -
Cl)
� 110_Q_
o� -
0=0� ,� 100�
LI-J0
� 90�
C
o-1p<O.000ILi
p<O.000l
Li**
Figure 2. Blood-pressure changes during normal (140 mmol/day), low (20 mmol/day) and high-sodium diets (320 mmol/day) in salt-sensitive (N = 23; open squares), salt-resistant(N = 28: filled squares), and counterregulating hypertensivepatients (N = 10; dIagonal-tIlled squares). Standard devia-tions were omiffed for clarity. � � < 0.0001 versus normal-sodium diet, � P < 0.0001 versus high-sodium diet, � = P <
0.01 versus normal and versus high-sodium diet. Intergroupsignificant differences are given on the lines in the figure.
278.3 ± 75.2 pmob/L, ANP levels were 28.2 ± 8.5
fmob/mL, and DLS levels were 45.2 ± 12.3 pg/mL.
Urinary active kalbikrein excretion resulted of 0.62 ±
Fern et al
Journal of the American Society of Nephrology 447
TABLE 2. Primary clinical and endocrine changes after different sodium intake periods in a group of 61hypertensive patients (mean ± SD)#{176}
, .
CharacterIsticNormal NaCI
.
dietLow NaCI diet
.
High NaCI diet
Weight (kg) 76.8 ± 4.5 75.6 ± 33b 78.2 ± 4.1Systolic blood pressure (mm Hg) 160.7 ± 5.4 161.3 ± 85b 168.7 ± 8.9cDiastolic blood pressure (mm Hg) 104.8 ± 2�9b 104.2 ± 56b 107.7 ± 6.1Heart rate (bpm) 73.2 ± 5.1 73.5 ± 4.9 73.3 ± 4.9Plasma renin activity (ng/L per 5) 0.40 ± 0. 18 0.62 ± 0.22c d 0.26 ± 0. 15C
Plasma aldosterone (pmol/L) 302.9 ± 52.3 360.3 ± �55C. d 239.8 ± 73,6cPlasma ANP (fmol/mL) 21.2 ± 9.2 12.3 ± 49c,d 29.3 ± 7.2cPlasma DLS (pg/mL) 34.2 ± 10.5 26.3 ± 8.7c d 42.7 ± 16.6�Urinary active kallikreln (U/24 h) 1 .09 ± 0.37 1.40 ± 0.35c d 0.79 ± 0.22cUrinary Na� excretion (mmol/24 h) 123.9 ± 14.6 26.9 ± 6.3c d 291 .4 ± 8.7cUrinary K� excretion (mmol/24 h) 53.1 ± 9.5 56.7 ± 8.9 52.3 ± 74C
a During the normal-sodium diet. patients assumed 140 mmol NaCI per day; during the low-sodium diet. patients assumed 20 mmol NaCI per day;and during the high-sodium diet. patients assumed 320 mmol NaCI per day. ANP. atrial natriuretic peptide; DLS. digoxin-like substance.b p < 0.05 versus high-sodium diet period.C p < o.ooo5 versus normal-sodium diet period.d p < 0.0005 versus high-sodium diet period.
0
r-�p<O.0001
j�O.OO4 L�1p<O.000I
o.�i I I _______NORMAL LOW HIGH
0.31 U/24 h. The urinary excretion ofactive kalllkreinand plasma ANP bevels were inversely correlated (r =-0.615, P < 0.002). Hormonal parameter changesthat occurred with sodium restriction and sodium
load are given in Figure 3.Salt-Resistant Group (N = 28 patients; mean age,
47.9 ± 2.5 yr). With regard to blood pressure, SBPafter the normal-sodium intake was 159.6 ± 5.3 mmHg and did not change after both the high- ( 162.3 ±
9.4 mm Hg, not significant ENS]) and the low-sodium
diets (159.6 ± 9.7 mm Hg, NS) (Figure 2). DBP was104.2 ± 3. 1 mm Hg after the normal-sodium intakeand was not significantly influenced by sodium intakevariations ( 105. 1 ± 5.3 mm Hg INS] at the end of thehigh-sodium diet and 103.8 ± 5.8 mm Hg ENS] at theend of the low-sodium intake) (Figure 2). Body weightwas 76. 1 ± 3.8 kg after the normal-sodium diet, 77.2± 3.5 kg after the high-sodium diet (NS), and 75.2 ±
2.8 kg after the bow-sodium diet (NS).
The urinary Na� excretion level was 1 25.9 ± 13.7
mmol/24h after the normal-sodium diet, increased to
296. 1 ± 12.5 mmob/24 h after the high-sodium diet (P< 0.005), and decreased to 28.5 ± 7.7 mmol/24 h
NaCI DIET after the bow-sodium diet (P < 0.005). After the nor-mal-sodlum intake period, PRA bevels were 0.4 1 ±
0. 19 ng/L per s, PAC bevels were 308.9 ± 88.7 pmol/L,and ANP levels were 18.6 ± 9.3 fmol/mL. Plasma DLSbevels were 30. 1 ± 8.9 pg/mL. The urinary activekalbikrein excretion bevel was 1 .39 ± 0.44 U/24 h. The
hormonal parameter changes induced by differentsodium diets are given in Figure 3.
Counterregulating Group (N = 10 patients; meanage, 45.2 ± 3.2 yr). The behavior of these patientsmimicked that of the salt-resistant patients. Interest-ingby, these patients showed the greatest rise In PRA
after the low-sodium diet (Figure 3). Indeed, the meanpercentage increment of PRA bevebs was 72.9% Inthese patients, whereas It was 25% in salt-sensitive (P
- 0.9‘�1c�0.84
‘�o.i�1� O.&1
� 0.4
�0.st�0.3� 0.2a�oI
400
I1��#{176}‘�340
�32O
�3OO
�28O
� 260
�240
22001
#{149}.
0
uu
�
‘
NORMAL
u:1�-u:.
L�
�p<o_O�I
F,:.
�“II�
<�
L0
I
LOW
I:
I0
�HIGH NaC1
.�
-
��
�
�
��DIET
40
�201�m
a
80
��#{176}I-I
<40J
I�
203.
01
Irolp.CO.000S
I
huu
o
�lp<0.000I
Ii�
NORMAL
r0#{149}�
u:.Lu:.
,
ri-1!�#{176}#{176}#{176}
1LOW
u[Osp<o-o�’
us
Olp<O.0001
.1u-�u�
�-�-HIGH Nd1 DIET
:I]
p<o.oom�<#{176}r’#{231}j�i0 �<o.ooo#{244}J
NORMAL LOW 11611 NoCI DIET
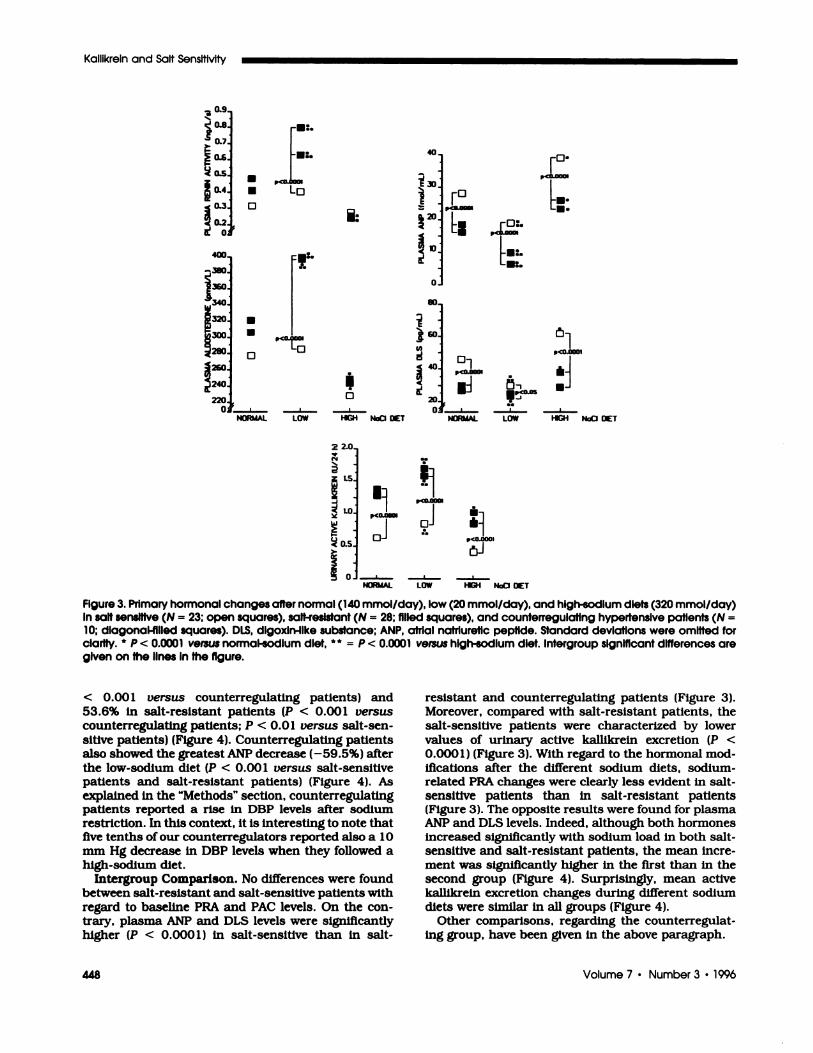
FIgure 3. Primary hormonal changes after normal (140 mmol/day), low (20 mmol/day), and high-sodium diets (320 mmol/day)In salt sensItive (N = 23; open squares), salt-resistant (N = 28; filled squares), and counterregulatlng hypertensive patients (N =
10; dlagonal-fllled squares). DLS, dlgoxln-Ilke substance: ANP, atrial natrluretic peptide. Standard deviations were omitted forclarity. * � < � versus normal-sodIum diet, ** = p < 0.0001 versus high-sodium diet. Intergroup significant dIfferences aregIven on the lInes In the figure.
448 Volume 7 ‘ Number 3 ‘ 1996
Kallikrein and Salt Sensitivity
2 2.0.
(%4
�- -
� 1.5.
� -
� 1�0i< 0.5_>.
�� 0�
< 0.00 1 versus counterregulating patients) and53.6% in salt-resistant patients (P < 0.001 versus
counterregubating patients; P < 0.0 1 versus salt-sen-
sitive patients) (Figure 4). Counterregubating patientsalso showed the greatest ANP decrease (-59.5%) afterthe bow-sodium diet (P < 0.00 1 versus salt-sensitivepatients and salt-resistant patients) (Figure 4). Asexplained in the “Methods” section, counterregubatingpatients reported a rise in DBP levels after sodiumrestriction. In this context, it is interesting to note thatfive tenths of our counterregubators reported also a 10
mm Hg decrease in DBP levels when they followed ahigh-sodium diet.
Intergroup Comparison. No differences were foundbetween salt-resistant and salt-sensitive patients with
regard to baseline PRA and PAC bevels. On the con-trary, plasma ANP and DLS levels were significanflyhigher (P < 0.000 1 ) in salt-sensitive than in salt-
resistant and counterregulating patients (Figure 3).Moreover, compared with salt-resistant patients, thesalt-sensitive patients were characterized by bowervalues of urinary active kallikrein excretion (P <
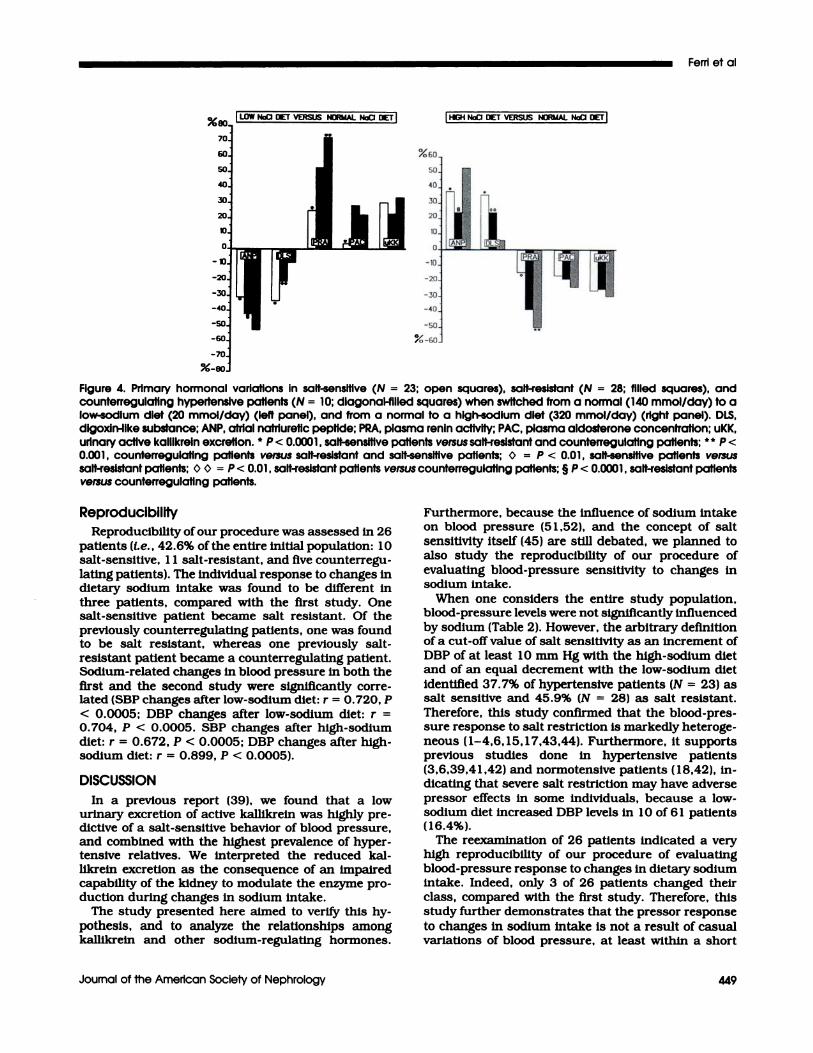
0.000 1) (Figure 3). With regard to the hormonal mod-ifications after the different sodium diets, sodium-related PRA changes were clearly less evident in salt-sensitive patients than in salt-resistant patients(Figure 3). The opposite results were found for plasmaANP and DLS bevels. Indeed, although both hormonesincreased significantly with sodium load in both salt-sensitive and salt-resistant patients, the mean incre-ment was significantly higher in the first than in thesecond group (Figure 4). Surprisingly, mean activekalblkreln excretion changes during different sodium
diets were similar in all groups (Figure 4).Other comparisons, regarding the counterregulat-
ing group, have been given in the above paragraph.
Fern et al
Journal of the American Society of Nephrology 449
IHIGH NoCI DIET VERSUSNORMAL NadI DIET
Figure 4. Primary hormonal variations in salt-sensitive (N = 23: open squares), salt-resistant (N = 28; filled squares), andcounterregulating hypertensive patients (N = 10; dIagonal-filled squares) when switched from a normal (140 mmol/day) to alow-sodium diet (20 mmol/day) (left panel), and from a normal to a high-sodium diet (320 mmol/day) (right panel). DLS,dlgoxln-ilke substance; ANP, atrial nafriuretic peptide; PRA, plasma renin activity; PAC, plasma aldosterone concentration; uKK,urinary active kalllkrein excretion. � � < 0.0001 , salt-sensitive patients versus salt-resistant and counterregulating patients: � P <
0.001 , counterregulatlng patients versus salt-resistant and salt-sensitive patients; � = P < 0.01 , salt-sensitive patients versussalt-resistant patients; 0 � = P < 0.01 , salt-resistant patients versus counterregulating patients; § P < 0.0001 , salt-resistant patientsversus counterregulatlng patients.
ReproducibilityReproducibility ofour procedure was assessed in 26
patients (i.e. , 42.6% ofthe entire initial population: 10salt-sensitive, 1 1 salt-resistant, and five counterregu-
bating patients). The individual response to changes indietary sodium intake was found to be different inthree patients, compared with the first study. Onesalt-sensitive patient became salt resistant. Of thepreviously counterregubating patients, one was foundto be salt resistant, whereas one previously salt-resistant patient became a counterregulating patient.Sodium-related changes in blood pressure in both thefirst and the second study were significanfly corre-bated (SBP changes after low-sodium diet: r = 0.720, P
< 0.0005; DBP changes after bow-sodium diet: r =0.704, P < 0.0005. SBP changes after high-sodium
diet: r = 0.672, P < 0.0005; DBP changes after high-sodium diet: r = 0.899, P < 0.0005).
DISCUSSION
In a previous report (39), we found that a lowurinary excretion of active kalbikrein was highly pre-dictive of a salt-sensitive behavior of blood pressure,and combined with the highest prevalence of hyper-tensive relatives. We interpreted the reduced kal-likrein excretion as the consequence of an impairedcapability of the kidney to modulate the enzyme pro-
duction during changes in sodium intake.The study presented here aimed to verify this hy-
pothesis, and to analyze the relationships amongkaffikrein and other sodium-regulating hormones.
Furthermore, because the Influence of sodium intake
on blood pressure (5 1 ,52), and the concept of saltsensitivity itself (45) are still debated, we planned to
also study the reproducibility of our procedure of
evaluating blood-pressure sensitivity to changes insodium intake.
When one considers the entire study population,blood-pressure levels were not significantly Influencedby sodium (Table 2). However, the arbitrary definition
of a cut-off value of salt sensitivity as an increment ofDBP of at beast 10 mm Hg with the high-sodium dietand of an equal decrement with the low-sodium dietIdentified 37.7% of hypertensive patients (N = 23) assalt sensitive and 45.9% (N = 28) as salt resistant.
Therefore, this study confirmed that the bbood-pres-sure response to salt restriction is markedly heteroge-neous ( 1-4,6, 15, 1 7,43,44). Furthermore, It supportsprevious studies done in hypertensive patients(3,6,39,41 ,42) and normotensive patients (18,42), in-dicating that severe salt restriction may have adversepressor effects in some individuals, because a low-
sodium diet increased DBP levels In 1 0 of 6 1 patients(16.4%).
The reexamination of 26 patients indicated a veryhigh reproducibility of our procedure of evaluatingblood-pressure response to changes in dietary sodiumintake. Indeed, only 3 of 26 patients changed theirclass, compared with the first study. Therefore, this
study further demonstrates that the pressor responseto changes in sodium intake is not a result of casualvariations of blood pressure, at beast within a short

Kallikrein and Salt Sensitivity
450 Volume 7 - Number 3 ‘ 1996
period of time. Furthermore, only one patient changedfrom the salt-sensitive to the salt-resistant class,
whereas the remaining two patients switched from the
salt-resistant to the counterregubating group (N = 1)
or vice versa (N = 1 ), thus confirming the inefficacy of
dietary sodium restriction in their management. Anexcellent study by Overback et a!. ( 18), in complete
agreement with our findings, demonstrated in normo-tensive patients that the blood-pressure response to
changes in dietary sodium intake, as assessed by a
protocol similar to the current one, was highly repro-
ducible In more than 90% of the subjects. Indeed,reexamination of 3 1 normotensive patients revealed
different blood-pressure responses to changes in so-dium Intake only in three subjects (18).
On the other hand, patient selection allowed us toexclude any confounding factors rebated to bodyweight (10-12), disturbances of the carbohydrate me-tabohism ( 1 3), and age (3, 1 5, 1 7). With regard to theinfluence of sex, salt sensitivity has been reported tobe more (53) or less marked (54) in women than inmen, although Weinberger et a!. (3) were not able toobserve any difference at all. However, because sev-eral of the hormones that are involved in sodiumhomeostasis are strongly influenced by the menstrualcycle (46), and because urine collection is not possibleIn menstruating women, we decided to select onlyhypertensive men for our study.
Another problem we tried to bypass with the current
protocol Is rebated to the sequence. Indeed, the use ofthe same order in the diet sequence may result in anorder effect, limiting the efficacy of the study (3,5,6).Furthermore, each diet must be followed for a periodof time that is long enough to achieve sodium balance(55,56), and must be identical for all patients (6,57).Therefore, we designed a study in which a short periodof “normal” (I.e. , intermediate) sodium intake pre-ceded the randomization to a 2-wk period on either ahigh- or low-sodium intake. The use of capsules con-taming different amounts of sodium allowed us tomaintain the study in absolute double-blind condi-
tlons, whereas repeated measurements of 24-h un-
nary sodium excretion levels assured the perfect ad-herence to each diet.
With regard to the results obtained, we confirmedthat a low active kalblkrein excretion level during anintermediate sodium intake is linked with salt sensi-
tivity of blood pressure. This association does notImply a causal relationship between kallikreln excre-tion and salt sensitivity. Similarly. It must be empha-sized that it does not prove that an impaired kal-blkreln-kinin system function determines the salt
sensitivity of blood pressure. According to this proto-
cob, we failed to demonstrate an altered kalbikreinresponse to changes in dietary sodium intake In salt-sensitive patients. Indeed, although bow active kal-hikrein excretion levels always resulted, sodium-re-bated changes in urinary excretion were similar in thesalt-sensitive patients, compared with both salt-resis-
tant and counterregulating patients.
This kalbikrein behavior is in complete agreement
with recent findings obtained in normotensive pa-
tients (37,38), demonstrating identical decreases inkailikrein excretion after a high-sodium diet in sub-
jects with either a bow or a high-enzyme excretion bevelat baseline. Interestingly, normotensive patients who
had a bow kallikreln excretion were markedly salt
sensitive, whereas the remaining subjects were salt
resistant (37,38). On the other hand, we have recentlydemonstrated a marked salt sensitivity of blood pres-sure in the presence of a normal kalbikrein response to
changes In dietary sodium chloride Intake in low-
renin hypertensive patients with a reduced kalbikreinexcretion (36).
In this context, experimental studies have already
demonstrated that kalbikrein production is regulatedby potassium rather than by sodium intake (58). In
humans, Berry et at. (59) were abbe to classify 80% of
an Utah population into groups with a high or bow-
kallikrein genotype. In particular, a bow-kablikreinexcretion bevel was combined with the highest preva-bence of hypertensive relatives, segregating as a Men-debian recessive trait (59). Enzyme excretion was de-pendent on a major gene with strong environmentalmodulation by dietary potassium In heterozygotic but
not in homozygotic subjects (60). Therefore, a reducedkallikrein excretion bevel, as webb as an increased
prevalence of familial hypertension. resulted from thepatients’ being homozygous for the bow-kalbikrein gene
or from being heterozygous and having a bow potas-
slum intake (60). In agreement with this concept, twin
studies showed that urinary potassium more than
urinary sodium correlated with urinary kalllkrein andblood-pressure levels (6 1 ). Moreover. dietary potas-sium supplementation significantly increased kal-
bikreln excretion, and reduced blood-pressure levels in
essential hypertensive patients (62). In the study pre-
sented here, potassium intake did not change duringthe assessment of salt sensitivity. As a consequence,the bow kallikrein excretion we found in salt-sensitivehypertensive patients as well as the normality of theenzyme response to changes in sodium intake should
simply reflect the casual allebic distribution and theconsequent presence of both homozygotic and het-erozygotic subjects for the bow-kallikrein gene. Never-theless, a genetic influence on kalblkrein excretiondoes not imply a causal role for kalbikrein in determin-ing a progressive sensitization of susceptible individ-
uals to an “inappropriate” sodium intake. Further-
more, we cannot exclude that the observed kalllknelnbehavior has been influenced by other factors, such asRBF (63). Indeed, unfortunately, we have not mea-sured this parameter in our patients.
With regard to the other fmdings of this study, mean
PRA levels were lower in salt-sensitive than in salt-
resistant patients. Furthermore, PRA bevels increased
slightly with bow sodium intake, confirming previous
data that showed a marked salt sensitivity of bloodpressure in patients who have a PRA unresponsive to

Fern et al
Journal of the American Society of Nephrology 451
low sodium intake ( 19,3 1 ,33,43,64-66), furosemideadministration (3), and upright posture (47,65).
Counterregubating hypertensive patients showed amarked overstimulation of the renin system after so-
dium restriction. Even more interestingly, the samepatients showed the most evident reduction of plasmaANP with the bow-sodium diet. Because ANP caninhibit renin release in man (67,68), It seems intnigu-ing to speculate that a marked decrease of ANT mayhave favored PRA overstimubation. This latter phe-nomenon could be the primary contributor to theparadoxical behavior of blood pressure that wasshown by counterregulating patients.
In agreement with previous findings ( 18,65,69), theANP increment after the high-sodium diet was morepronounced in salt-sensitive than in salt-resistanthypertensive patients. In this regard, some previousreports (65,70,71) have also demonstrated that theANP response to sodium load is a function of the reninstatus, being more evident in hypertensive patientswith a low renin activity than in those with a highrenin activity. Therefore, because atnial secretion ofANP is primarily a result of volume expansion
(70,72,73), we think our data support the hypothesisby Overback et a!. ( 18), who suggested that an tin-paired ability of the kidney to excrete a sodium loadmight induce a compensatory increase in ANP releasefrom the atnlal myocytes. In a similar way, differencesin extracelbular fluid volume between salt-resistant
and salt-sensitive patients may easily explain theinverse relationship between the kalhikrein and ANPconcentrations that exist in salt-sensitive hyperten-
sive patients, as well as their tendency to displaysuppressed PRA bevels.
In keeping with this interpretation, ANP behaviorwas paralleled by that of plasma DLS. Indeed, on anormal sodium-intake diet, plasma DLS bevels werehigher in salt-sensitive than in salt-resistant patients.Moreover, the increase of this substance with thehigh-sodium diet was particularly evident in the firstgroup, supporting the hypothesis that an impairedability to modulate a sodium load may induce thesecretion of an endogenous substance(s) cross-react-ing with digoxin antibodies (74,75). This finding couldbe particularly interesting because of the suggestednatriuretic action of this substance(s) (47,76). How-
ever, the effective robe of DLS as a natniuretic agent isnot undisputed (76). Therefore, we can state thatsalt-sensitive patients showed the highest sodium-rebated increment of a circulating substance(s) cross-reacting with digoxin antibodies. On the contrary. anyspeculative hypothesis that is based on the renalactions of DLS seems absolutely arbitrary.
Another interesting finding of this study Is rebated to
the higher triglyceride and fasting insulin levels wefound in salt-sensitive patients, compared with salt-resistant and counterregulating patients. In this con-text, Williams et at. (77) have already suggested that
punctiform mutations may explain the segregating sin-gle-gene effects for low urinary kalllkrein excretion, high
sensitivity to environmental “hypertensinogenic” agents,
and fasting hyperinsulinemla and hyperdyslipldemla.
According to this hypothesis, Sharma et a!. (78) have
recently described a hyperinsubinemic response to oral
glucose load in salt-sensitive normotensive patients.Furthermore, we have recently described (65,7 1 ) thepresence offasting hypeninsulinemia in a patient subsetdefined as “non-modulators” because of abnormal an-
giotensin H-mediated controb of PAC release and therenal blood supply. abnormal sodium handling, andsalt-sensitive hypertension (19,31,33).
In conclusion, we presented herewith a randomized.double-blind, cross-over study that confirmed a marked
salt sensitivity of blood pressure in hypertensive pa-
tients who have a reduced excretion of active kalllkrein.Compared with salt-resistant hypertensive patients,salt-sensitive hypertensive patients excreted less activekabllkrein when they ingested either 20 mmol, 140mmol, or 320 mmol NaCl per day. However, the kal-likrein response to different sodium diets was similar inboth groups, suggesting that the enzyme production Isreduced, although its sodium-related regulation Is nor-mal in patients who have a deleterious blood pressuresensitivity to high-sodium intake.
Sodium restriction induced a marked increase ofblood pressure in 10 of 6 1 patients ( 1 6.4%). A blood-pressure increment after sodium restriction waslinked with an overstimubation of the renin system
and suppression of ANP release, suggesting that bothof these hormonal changes may have determined theadverse pressor effects.
Finally, we confirmed that salt sensitivity Is not a
result of casual variations of blood pressure, becauseIdentical pressor responses to changes in dietary so-dium intake were found in 23 of 26 patients whoreceived again both the low and the high-sodium diets6 months after the end of the first study.
REFERENCES1 . Campese VM: Salt sensitivity in hypertension. Renal and
cardiovascular Implications . Hypertension (Dallas)1994:23:531-550.
2. Muntzel M, Dr#{252}ekeT: A comprehensive review ofthe saltand blood pressure relationship. Am J Hypertens 1992:5:51-542.
3. Weinberger MH, Miller JZ, Luft FC, Grim CE, FinebergNS: Definitions and characteristics of sodium sensitivityand blood pressure resistance. Hypertension (Dallas)1986:8lSuppl 111:11 127-Il 134.
4. Luft FC, Weinberger MH, Grim CE, Fineberg NS, MillerJZ: Sodium sensitivity In normotensive human subjects.Ann Intern Med 1983:98:758-762.
5. Dustan HP, Kirk KA: Corcoran Lecture: The case for oragainst salt in hypertension. Hypertension (Dallas) 1989;13:696-705.
6. Sullivan JM: Salt sensitivity: Definition, conception,methodology. and long-term issues. Hypertension (Dal-las) 1991;l7lSuppl 11:161-168.
7. Weinberger MH, Fineberg NS: Sodium and volume sen-sitivity of blood pressure: Age and pressure change overtime. Hypertension (Dallas) 199 1 ; 18:67-71.
8. WillIams RR, Hasstedt SJ, Hunt SC, et at.: Genetic traitsrelated to hypertension and electrolyte metabolism. Hy-pertenslon (Dallas) 199 1 ; 1 7lSuppl 11:169-173.
9. Williams PR, Hopkins PN. Salt, hypertension and ge-netic environmental interactions. In: Sing CF. Skolnick

Kallikrein and Salt Sensitivity
452 Volume 7 ‘ Number 3 ‘ 1996
M. Eds. The Genetic Analysis of Common Diseases. NewYork: Alan R. Liss; 1979:183-194.
10. Rocchinl AP, Key J. Bondie D, et at.: The effect of weightloss on the sensitivity of blood pressure to sodium inobese adolescents. N Engl J Med 1989:321:580-585.
1 1 . Cooper R, Van Horn L, Liu K, et at.: A randomized trialon the effect ofdecreased dietary sodium intake on bloodpressure In adolescents. J Hypertens 1984:2:321-366.
12. Prineas RJ: Clinical interaction of salt and weightchange on blood pressure level. Hypertension (Dallas)1991: l7lSuppl 11:1143-1149.
13. Tuck ML: Role of salt in the control of blood pressure inobesity and diabetes mellitus. Hypertension (Dallas)199l;l7ESuppl 11:1135-1142.
1 4. Campese VM, Parise M, Kombian F, Bigazzi R: Abnor-mal renal hemodynamics in black salt-sensitive patientswith hypertension. Hypertension (Dallas) 1991 ; 18:805-812.
15. Luft FC. Miller JZ, Grim CE, et at.: Salt sensitivity andresistance of blood pressure: Age and race as factors inphysiological responses. Hypertension (Dallas) 1991:1 7lSuppl 11:1 102-I 108.
16. Flack JM, Ensrud KE, Mascioli S, et aL: Racial andethnic modifiers of the salt-blood pressure response.Hypertension (Dallas) 199 1 : 1 7lSuppl II:! 1 15-I 121.
1 7. Grobbee DE: Methodology of sodium sensitivity assess-ment. The example ofage and sex. Hypertension (Dallas)1991:l7lSuppl 11:1109-Il 14.
18. Overlack A, Ruppert M, Kolloch R, et aL: Divergenthemodynamic and hormonal responses to varying saltIntake in normotensive subjects. Hypertension (Dallas)1993;22:331-338.
19. Williams GH, Hollenberg NK: Non-modulating hyper-tension a subset of sodium sensitive hypertension. Hy-pertension (Dallas) 1991 : 17(Suppl 11:18 1-185.
20. Weder AB, Egan BM: Potential deleterious Impact ofdietary salt restriction on cardiovascular risk. KilnWochenschr 199 1 :69lSuppl XXVI:545-S50.
2 1 . Morgan T, Nowson C: The role of sodium restriction inthe management of hypertension. Can J Physiol Phar-macol 1986:64:786-792.
22. Laragh JH, Pecker MS: Dietary sodium and essentialhypertension: Some myths, hopes, and truths. Ann In-tern Med 1983;98:735-743.
23. Simpson FA: Salt and hypertension: A skeptical reviewof the evidence. Clin Sci 1979:57lSuppl 5l:S463-S480.
24. Heagerty AM: Salt restriction, a sceptic’s viewpoint. KilnWochenschr 199 1 :69ESuppl 251:526-529.
25. Luft PC: Can that which is unsavory be eaten withoutsalt ? Am J Hypertens 1992;5:S43S-S44.
26. de Wardener HE, Kaplan NM: On the assertion that amoderate restriction of sodium intake may have adversehealth effects. Am J Hypertens 1993;9:810-8l4.
27. Welnberger Ml!. Miller JZ, Fineberg NS, Luft PC, GrimCE, Christian JC: Association of haptogbobin with so-dium sensitivity and resistance of blood pressure. Hy-pertension (Dallas) 1987:10:443-446.
28. Hamet P, Mongeau E, Lambert J, et at.: Interactionsamong calcium, sodium and alcohol intake as determi-nants of blood pressure. Hypertension (Dallas) 1991:l7lSuppl 11:1150-1154.
29. Turner ST. Reilly SL: Renal sodium excretion in sons ofhypertensive parents. Hypertension (Dallas) l993;22:323-330.
30. Fern C, Bellini C, Piccoli A, et at.: Enhanced bloodpressure response to cyclooxygenase inhibition In salt-sensitive human essential hypertension. Hypertension(Dallas) 1993:21:875-881.
3 1 . Williams GH, Hollenberg NK: Are non-modulating pa-tients with essential hypertension a distinct subgroup?Am J Med l985:79(3C):3-9.
32. Gill JR, Grossman E, Goldstein DS: High urinary dopaand low urinary dopamine-to-dopa ratio in salt-sensitivehypertension. Hypertension (Dallas) 1991:18:614-621.
33. Williams GH, Dluhy RG, Lifton RP, et at.: Non-modulation as an intermediate phenotype in essentialhypertension. Hypertension (Dallas) 1992:20:788-796.
34. Hasstedt SJ, Wu IL, Ash 1(0, Kuida H, Wiffiams RR:
Hypertension and sodium-lithium countertransport InUtah pedigrees: Evidence for major locus inheritance.Am J Hum Genet 1988:43:14-22.
35. Weder AB: Membrane sodium transport and salt sensi-tivity of blood pressure. Hypertension (Dallas) 1991:l7ESuppl 11:174-180.
36. Cacciafesta M, Fern C, Carlomagno A, et aL: Erythro-cyte Na-K-Cl cotransport activity In low renin essentialhypertensive patients. A 23Na nuclear magnetic reso-nance study. Am J Hypertens 1994:7: 15 1-158.
37. B#{246}nner G, Thieven B, Rutten H, Krone W: Renal kal-llkrein determines salt sensitivity of blood pressure lAb-stracti. Circulation 1992;84:1543A.
38. B#{246}nner G. Thieven B, Rutten H, Chrosch R, Krone W:Renal kalllkrein is a determinant of salt sensitivity.J Hypertens 1993: 1 llSuppl 51:S2 10-52 1 1.
39. Fern C, Bellini C, Carbomagno A, Perrone A, Santucci A:Urinary kalllkreln and salt sensitivity In essential hyper-tensive males. Kidney mt 1994:46:780-788.
40. Alderman MH, Lamport B: Moderate sodium restriction:Do the benefits justify the hazards ? Am J Hypertensl990;3:499-504.
4 1 . Longworth DL, Drayer JIM, Weber MA, Laragh JH:Divergent blood pressure responses during short-termsodium restriction in hypertension. Chin Pharmacol &Ther 1980:27:544-546.
42. Egan BM, Weder AB, Petrin J, Hoffman RG: Neurohu-moral and metabolic effects of short-term dietary NaClrestriction in men: relationship to salt-sensitivity status.Am J Hypertens 1991:4:416-421.
43. Sullivan JM, Ratts TE: Sodium sensitivity in humansubjects: Hemodynamic and hormonal correlates. Hy-pertension (Dallas) 1988:11:717-723.
44. Takeshita A, Imaizumi T, Ashihara T, Nakamura M:Characteristics of responses to salt loading and depriva-tion in hypertensive subjects. Circ Res l982;5 1:457-464.
45. Watt CGM: Does salt sensitivity exist? Klin Wochenschr199l;69lSuppl XXVI:S30-S35.
46. Sealey JE, Cholst J. Glorioso N, et at.: Sequentialchanges in plasma lutelnizlng hormone and plasmaprorenin during the menstrual cycle. J Clin Endocrinol& Metab 1987:63:1-5.
47. Musca A, Cammarella I, Fern C, et aL : Natriuretichormones In young hypertensives and in young normo-tensives with or without a family history of hypertension.Am J Hypertens 1992:5:592-599.
48. The Guidelines Subcommittee of the WHO/ISH MildHypertension Liaison Committee: 1993 guidelines forthe management of mild hypertension. Memorandumfrom a World Health Organization/International Societyof Hypertension Meeting. Hypertension (Dallas) 1993;22:393-403.
49, Baizan S. Ghione S. Clerico A. Montali U: Correlationbetween endogenous digoxin-like Immunoreactivity and3H-ouabain displacement on erythrocyte membranes inextracts of human plasma. Clin Blochem 1986; 19:311-314.
50. Amundsen E, Putter J. Friberger P. Knos M, LarsbrotenM, Claeson G: Methods for the determination of glandu-lar kallikrein by means of a chromogenic tripeptidesubstrate. Adv Exp Med 1979; 102A:83-95.
5 1 . Swales JD: Salt saga continued. Salt has only smallimportance in hypertension. Br Med J 1988;297:307-308.
52. Swales JD. Dietary sodium restriction in hypertension.In: Laragh JH, Brenner BM, Eds. Hypertension, Patho-Physiology, Diagnosis and Management. New York:Raven Press; 1990:201 1-20 19.
53. Elliot P. Dyer A, Stamler R: The INTERSALT study:Results from 24 hour sodium and potassium. by age andsex. J Hum Hypertens 1989;3:323-330.
54. Khaw KT, Barret-Connor E: The association betweenblood pressure. age and dietary sodium and potassium:a population study. Circulation 1988;77:53-6l.
55. Simpson FO: Sodium intake, body sodium and sodiumexcretion. Lancet 1988:2:25-29.
56. Wedler B, Brier MA, Wiersbitzky M. et at.: Sodium
Fern et al
Journal of the American Society of Nephrology 453
kinetics in salt sensitive and salt resistant normotensiveand hypertensive subjects. J Hypertens 1992; 10:663-669.
57. Dustan HP, Kirk KA: Relationship of sodium balance toarterial pressure in black hypertensive patients, Am JMed Sd 1988:295:378-383.
58. Vio CP, Loyola 5, Velarde V: Localization of componentsof the kallikrein-klnin system In the kidney: Relation torenal function. State of the Art lecture. Hypertension(Dallas) 1992; l9ISuppl 111:1110-1116.
59. Berry TD, Hasstedt SJ, Hunt SC, et at.: A gene for highurinary kallikrein may protect against hypertension inUtah kindreds. Hypertension (Dallas) 1989; 13:3-8.
60. Hunt SC, Hasstedt SJ, Wu LL, Williams RR: A geneenvironment Interaction between Inferred kalllkrein gen-otype and potassium. Hypertension (Dallas) 1993:22:16 1-168.
6 1 . Hunt SC, Wu LL, Slattery ML, Meikle AW. Williams RR:Environmental determinants of urinary kalllkrein excre-tion. Am J Hypertens 1993:6:226-233.
62. Valdes GG, Vio CP, Montero J, Avendano R: Potassiumsupplementation lowers blood pressure and Increasesurinary kallikreIn in essential hypertenslves. J HumHypertens 1991:5:91-96.
63. Levy SB, Liley JJ. Frigon RP. Stone RA: Urinary kal-blkreln and plasma renin activity as determinant of renalblood flow. The Influence of race and dietary sodiumintake. J Clin Invest 1977:60:129-138.
64. Thurston H, Bing RF. Pohi JRF, Swales JD: Reninsubgroups in essential hypertension: an analysis andcritique. J Med (Westbury) 1978:47:325-327.
65. Leonetti Luparini R, Fern C, Santucci A, Balsano F:Atrial natniuretic peptide in non-modulating essentialhypertension. Hypertension (Dallas) 1993:21:803-809.
66. Fujita T, Henry WL, Batter PC, Lake CR, Delea CS:Factors influencing blood pressure in salt-sensitive pa-tients with hypertension. Am J Med 1980:69:334-344.
67. Atlas SA, Laragh JH. Atrial natriuretic factor and itsinvolvement In hypertensive disorders. In: Laragh JH,Brenner BM, Eds. Hypertension. Pathophysiology. Dia -
nosis and Management. New York: Raven Press; 199861-883.
68. Atlas SA, Volpe M. Sosa RE, Laragh JH. Camargo MJF,Maack T: Effects of atrial natriuretic factor infusion onblood pressure and the renin-angiotensln-aldosteronesystem. Fed Proc 1986:45:2 1 1�-2 121.
69. Kohno M, Yasunari M, Murakawa K, Kanayama Y, Mat-suira T, Takeda T: Effects of high-sodium and low-sodium Intake on circulating atrial natriuretic peptldesin salt-sensitive patients with systemic hypertension.Am J Cardiol 1987:59:1212-12 13.
70. Matsubara H, Umeda Y, Yamane Y, Nishikawa M, Tan-iguci T, Inada M: Role ofatrial natniuretic polypeptide forexaggerated natriuresis In essential hypertension. Am JCardiol 1987:60:708-714.
71 . Fern C, Bellini C, Baldoncini R, et al.: Abnormal atrialnatriuretic peptide and renal responses to saline Infu-sian in non-modulating essential hypertensive patients.Circulation 1994:90:2859-2869.
72. Lang RE, Thoelken H, Ganten D, Luft FC, Ruskoaho H,Unger TH: Atrial natniuretic factor is a circulating hor-mone, stimulated by sodium loading. Nature 1985:3 14:264-266.
73. Sagnella GA, Markandu ND, Shore AC, MacGregor GAEffects of changes In dietary sodium intake and salineinfusion on immunoreactive atnial natniuretic peptide inhuman plasma. Lancet 1985:2:1208-1210.
74. Klingmuller D, Weller E, Kramer HJ: Digoxin-llke natri-uretic activity in the urine of salt-loaded healthy sub-jects. Kiln Wochenschr 1982:60:1249-1253.
75. Gault MH, Vasdev SC, Longerich LL. et at.: Plasmadigitialis-like factor(s) increase with salt loading [Letter).N Engl J Med 1983:309:1459-1460.
76. Buckalew VM, Haddy FJ. Circulating natriuretic factorin hypertension. In: Laragh JH. Brenner BM, Eds. Hy-pertension. Pathophysiology. Diagnosis and Manage-ment. New York: Raven Press; 1990:939-954.
77. Williams PR, Hunt SC, Hopkins PN, et aL: Genetic basisof familial dyslipidemla and hypertension: 15-year re-sults from Utah. Am J Hypertens 1993;6:S319S-S327.
78. Sharma AM, Ruland K, Spies K, Distler A: Salt sensitiv-ity in young normotensive subjects is associated with ahypeninsulinemic response to oral glucose. J Hypertens1 99 1 ;9:329-335.
Copyright © 2022 FDOKUMEN