Preliminary Assessment of Chloride Concentrations, Loads ...
Upload
khangminh22Category
view
4download
0
Synthesis and Characterization of Polyacrylamide and Poly(acrylamide-co-
diallyldimethylammonium chloride) via Free-Radical and RAFT Polymerization
by
Hannah Welch
A thesis presented to the Honors College of Middle Tennessee State
University in partial fulfillment of the requirements for graduation from
the University Honors College
Term Spring 2021
Thesis Committee:
Dr. Dwight Patterson
Dr. Kevin Bicker, Second Reader
Dr. Gregory Van Patten, Thesis Committee Chair

Synthesis and Characterization of Polyacrylamide and Poly(acrylamide-co-
diallyldimethylammonium chloride) via Free-Radical and RAFT Polymerization
by
Hannah Welch
APPROVED:
______________________________________
Dr. Dwight Patterson, Thesis Director
Professor, Department of Chemistry
______________________________________
Dr. Gregory Van Patten, Thesis Committee Chair
Chair, Department of Chemistry

iii
ACKNOWLEDGEMENTS
I owe much appreciation and respect to my thesis advisor, Dr. Dwight Patterson,
for guiding me through this research project. He provided an infinite supply of
knowledge and encouragement along the way, and I admire his continuous passion for
polymers. I would also like to thank my momma for the support and steady optimism,
and the love of science pursuits that I inherited from her. Finally, I want to thank Robbie
Mahaffey for keeping me laughing and sharing in the triumphs and defeats, the epic highs
and lows of scientific research with me. A special shoutout to Donut Country and the
local Starbucks for never failing to provide sustenance, energy, and hope throughout this
project.

iv
ABSTRACT
First synthesized decades ago, arylamide-based polymers have blossomed into
one of the most important polymers in the modern-day era. The uses of polyacrylamides
are plentiful and varied, from their main application in waste-water treatment to paper
making processes. The water solubility and large molecular weights of these polymers
make them extremely useful for coagulation methods as well. Acrylamide itself reacts
easily with a wide array of polyelectrolytes, expanding the function possibilities even
more. Free-radical synthesis has been a vital mode of creation in previous years, but in
more recent times, new and improved synthesis methods have been discovered. RAFT
polymerization in particular is well-known for its ease of use and for its ability to
maximize polymer content control. This research focuses on the synthesis and
characterization of these acrylamide-based polymers with an intent to deepen an
understanding of their polymeric properties. To do this, compounds were synthesized
using acrylamide and diallyldimethylammonium chloride. Both free-radical and RAFT
polymerization methods were used as well. The products were characterized using
nuclear magnetic resonance, Fourier transform infrared spectroscopy, and dilute-solution
viscosity tests. Thermal properties were obtained using thermogravimetric analysis and
differential scanning calorimetry. The hypothesized product structures were proven
correct with analysis methods. RAFT and free-radical synthesis were compared, but more
in-depth research is required to isolate the differences in molecular compositions.

v
TABLE OF CONTENTS
LIST OF TABLES…………………………………………………………………..…...vii
LIST OF FIGURES……………………………………………………………..………viii
CHAPTER I: INTRODUCTION………………………………………………………….1
A. Background………………………………………………………………………..1
B. Polymerization Syntheses………………………………………………………....2
1. Free Radical Polymerization…………………………………………………..3
2. RAFT Synthesis……………………………………………………………….7
C. Purpose of this Study………………………………………………………….....11
CHAPTER II: MATERIALS AND METHODS………………………………………...13
A. General Experiment Details……………………………………………………...13
B. Synthesis………………………………………………………………………...14
1. Free-Radical Synthesis of Polyacrylamide…………………………………..14
2. Free Radical Synthesis of Poly(acrylamide-co-diallyldimethylammonium-
chloride)………………………………………………………………...……16
3. RAFT Synthesis of Polyacrylamide through Microwave Synthesis…………18
C. Analysis Methods………………………………………………………………...22
1. Thermogravimetric Analysis………………………………………………...22
2. DSC Analysis………………………………………………………………...22
3. Fourier Transform Infrared (FTIR) Spectroscopy…………………………...22
4. NMR Analysis……………………………………………………………….23
5. Dilute Solution Viscosity Analysis…………………………………………..23

vi
CHAPTER III: RESULTS AND DISCUSSIONS………………………………………25
A. FTIR……………………………………………………………………………...25
B. NMR……………………………………………………………………………..34
C. Thermogravimetric Analysis…………………………………………………….45
D. Differential Scanning Calorimetry……………………………………………….48
E. Dilute Solution Viscosity………………………………………………………...51
CHAPTER IV: CONCLUSIONS………………………………………………………..54
REFERENCES…………………………………………………………………………..55
APPENDIX………………………………………………………………………………58
A. NMR Spectroscopy Data……………………………………..………………….58
B. Thermal Analysis Data………………………………..…………………………62
C. FTIR Analysis Data…………………………………..………………………….63

vii
LIST OF TABLES
TABLE PAGE
1. Compositions of A-Series polyacrylamide samples, showing grams of initiator and
acrylamide, with product yield, theoretical yield, and percent yield…………...…15
2. Compositions of E-Series samples, showing grams of initiator and co-monomers,
with product yield, theoretical yield, and percent yield………………………….17
3. Compositions of G-Series polyacrylamide samples, showing grams of RAFT agent,
initiator, and acrylamide, with product yield, theoretical yield, and percent yield..19
4. Viscosity tests solution concentrations and time measurements of A5 sample…...24
5. Viscosity tests solution concentrations and calculations based off time
measurements of sample A5…………………………………………………...…24
6. Peak Assignments for A3, E8, and G4 samples with corresponding functional
groups………………………………………………………………………….…33
7. 1H NMR Peak Assignments of Samples A8, E4, and G4……………………...…34
8. Comparison of Tacticities between 13C NMR Samples A8 and G4………………45
9. Degradation Onsets of Series A, E, and G………………………………………..45
10. Tg, Tm, and Heat of Fusion for Series A, E, and G………………………………...48
11. Intrinsic Viscosities and Molecular weights of A Series………………………….53

viii
LIST OF FIGURES
FIGURE PAGE
1. Process of acrylamide-based polymer interacting with a particle suspension to form
large flocs……………………….…………………………………………………2
2. Examples of diverse ways in which copolymers can be manipulated using
controlled/living polymerizations…………………...…………………………….3
3. General mechanism of initiator radicalizing in response to heat……………….…..4
4. Molecular structure of 4,4′-Azobis(4-cyanopentanoic acid)……………………....4
5. Molecular structure of 4,4′-Azobis(4-cyanopentanoic acid) radical……….………5
6. a. Molecular structure of acrylamide monomer……………………………………………5
b. Molecular structure of polyacrylamide………………………………………………….5
7. Example of propagation of acrylamide monomers into a chain polymer…………………..6
8. a. Molecular structure of diallyldimethylammonium chloride…………………………….7
b. Molecular structure of co-polymer poly(acrylamide-co diallyldimethylammonium
chloride……………………………………………………………………………………7
9. A comparison of the chain lengths of tradition free-radical polymerization and RAFT
polymerization…………………………………………………………………………….8
10. Flow chart of causalities of a suitable RAFT agent and a well-defined polymer…………...9
11. Structure of RAFT agent 2-cyano-2-propyl benzodithioate……………………………….9
12. Mechanism of RAFT polymerization with legend………………………………………11
13. Energy and Temperature plots of G-Series Microwave synthesis………………...20
14. Parameters of microwave synthesis polymerization for G Series……….………..21
15. FTIR overlay plots of A Series…………………………………………………………..26
16. FTIR overlay plots of E Series…………………………………………………………...27

ix
17. FTIR overlay plots of G Series…………………………………………………………..28
18. FTIR stack plots of A Series, E Series and G Series …………………………………...29
19. : FTIR stack plots of A Series, E Series, and G Series.(2380-3850cm-1)…………...…...30
20. FTIR stack plots of A Series, E Series, and G Series (550-1900cm-1)………………………....31
21. FTIR plots Sample A3 specific peak assignments……………………………………….32
22. 13C NMR (D2O) Sample A8……………………………………………………………...35
23. . 1H NMR (D2O) Sample A8……………………………………………………………..36
24. . 13C NMR (D2O) Sample E4……………………………………………………………..37
25. 1H NMR (D2O) Sample E4……………………………………………………………….38
26. 13C NMR (D2O) Sample G4………………………………………………………………39
27. . 1H NMR (D2O) Sample G4……………………………………………………………...40
28. Zoomed-In 13C NMR (D2O) Sample A8…………………………………………………43
29. Zoomed-In 13C NMR (D2O) Sample G4…………………………………………………44
30. Overlay Plot of TGA thermogram for A Series…………………………………………..47
31. Overlay Plot of DSC thermogram for A, E and G Series………………………………….50
32. Legend for Huggins and Kraemer Plot for calculating Intrinsic Viscosity………..51
33. Huggins/Kraemer overlay graphs of Sample A9…………………………………51
34. Huggins/Kraemer overlay graphs of Sample E4………………….………………52
35. Huggins/Kraemer overlay graphs of Sample G4…………………………………52

1
CHAPTER I: INTRODUCTION
A. Background
Water-soluble polymers have been the objects of intrigue and subsequent research for
many years due to their vast array of uses. The last couple decades have seen an
explosion in uses for acrylamide-based polymers particularly.1-3 Acrylamide is an
advantageous monomer because it can be modified in different ways to create linear co-
polymers with an array of cationic, anionic, and non-ionic monomers, each with different
functionalities. The extremely high molecular weight of polymers also has a variety of
applications. Because of this, acrylamides and their polymer derivatives are used in
waste-water treatment as flocculants, in petroleum industries, paper-making industries,
and agricultural settings.4 In fact, the market for polyacrylamide has become so expansive
in recent years that it is expected to hit a value of $6.68 billion by the year 2023.4
A cationic monomer commonly paired with acrylamide is diallyldimethylammonium
chloride, or DADMAC. DADMAC was first discovered to be profitable in the 1940s,
when initially diallydimethylammonium bromide was synthesized and radically
cyclopolymerized to form a polymer, then converted to its chloride form5. Because of its
cationic nature, it was highly soluble in water.6 Diallyldimethylammonium chloride has
more recently been paired with acrylamide monomers in the 1980s to create a high
molecular weight polymer used mainly for flocculation.7,8 This polymer is called
Poly(acrylamide-co-diallyldimethylammonium chloride). Polymeric flocculants are most
sought after because they require smaller doses, cost cheaper, and settle impurities out of
2
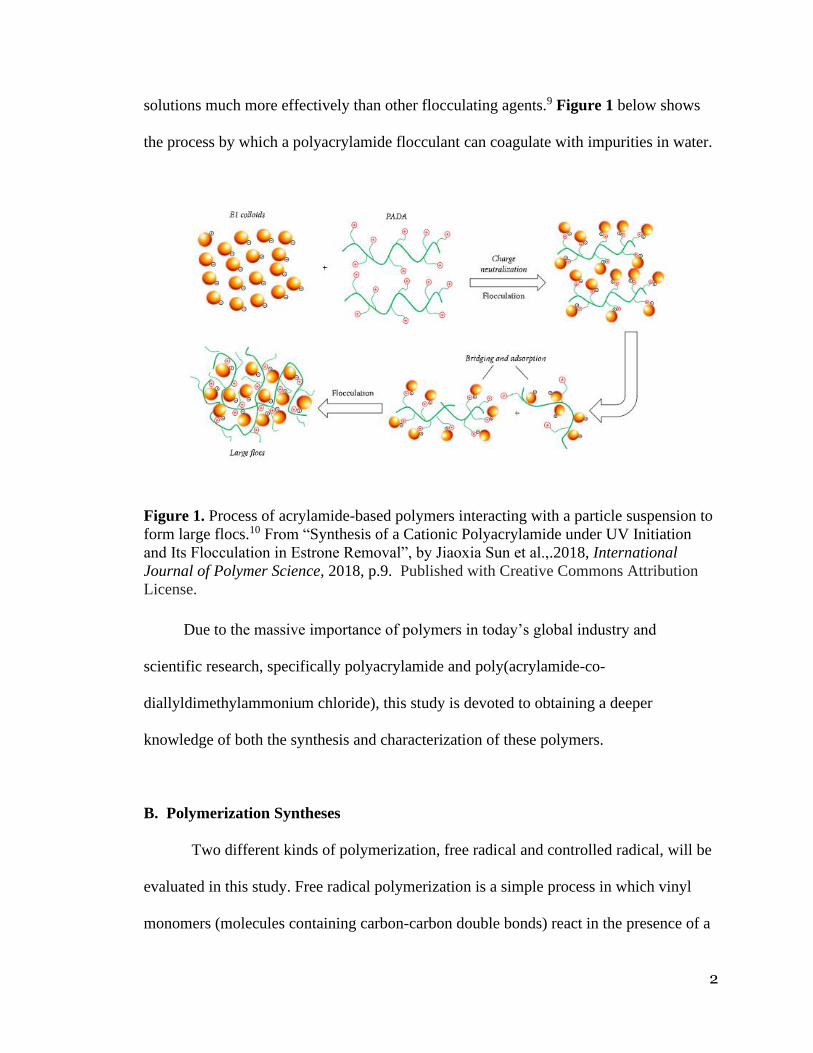
solutions much more effectively than other flocculating agents.9 Figure 1 below shows
the process by which a polyacrylamide flocculant can coagulate with impurities in water.
Figure 1. Process of acrylamide-based polymers interacting with a particle suspension to
form large flocs.10 From “Synthesis of a Cationic Polyacrylamide under UV Initiation
and Its Flocculation in Estrone Removal”, by Jiaoxia Sun et al.,.2018, International
Journal of Polymer Science, 2018, p.9. Published with Creative Commons Attribution
License.
Due to the massive importance of polymers in today’s global industry and
scientific research, specifically polyacrylamide and poly(acrylamide-co-
diallyldimethylammonium chloride), this study is devoted to obtaining a deeper
knowledge of both the synthesis and characterization of these polymers.
B. Polymerization Syntheses
Two different kinds of polymerization, free radical and controlled radical, will be
evaluated in this study. Free radical polymerization is a simple process in which vinyl
monomers (molecules containing carbon-carbon double bonds) react in the presence of a

3
catalyst and are polymerized randomly in a solution.11 The monomer levels and
uniformity of the polymer chain cannot be controlled. However, newer methods have
been developed that make it possible to control the polymerization process so that
monomer layout can be sculpted as desired, and the resulting polymer molecules are
uniform. This is known as CRP, controlled radical polymerization.12 Various techniques
such as stable free radical mediated polymerization, atom transfer radical polymerization
(ATRP), and reversible addition-fragmentation chain transfer (RAFT) are all subtypes of
controlled radical polymerization.13 Figure 2. illustrates these benefits.
Figure 2. Examples of diverse ways in which copolymers can be manipulated using
controlled/living polymerizations.14 From Features of Controlled "Living" Radical
polymerizations - Matyjaszewski polymer group - Carnegie Mellon University.
https://www.cmu.edu/maty/crp/features.html. Copyright 2001 by Carnegie Mellon.
Reprinted with permission.
1. Free Radical Polymerization
Free radical polymerization is a specific type of chain-growth polymerization,
which is the process of creating a chain of molecules through a reactive intermediate.

4
There are several reactions possible, such as radical polymerization, cationic
polymerization, and anionic polymerization. The reactions depend on what initiators are
used and what monomers. In this study, an acid, 4,4′-Azobis(4-cyanovaleric acid), or
4,4′-Azobis(4-cyanopentanoic acid), is used as a radical initiator. According to literature,
4,4′-Azobis(4-cyanovaleric acid) is commonly used in heterogenous and homogenous
free-radical polymerizations involving polyvinyl chlorides, polyacrylonitriles, and
polyvinyl alcohols.15 To start the polymerization process, the initiator reacts in the
presence of heat to form radicals, which then interact with the in situ monomers. The
mechanism of the radical formation is shown below in Figure 3.
Figure 3. General mechanism of initiator radicalizing in response to heat.
In the presence of heat, the N-R bonds break, creating two radical groups and a
triple bond between the nitrogen atoms. Those radical groups then react with a monomer
to form a reactive monomer end group, which can lead to chain propagation. The
structure of 4,4′-Azobis(4-cyanopentanoic acid) is shown in Figure 4.

5
Figure 4. Molecular structure of 4,4′-Azobis(4-cyanopentanoic acid).
The sites of bond breakage are in between the two nitrogens and their adjacent
carbons. and nitrogen-3 and carbon-4, as labelled in Figure 6, leaving a triple bond
between N-2 and N-3, and two radical R groups. The resulting radical R group is shown
in Figure 5.
Figure 5. Molecular structure of 4,4′-Azobis(4-cyanopentanoic acid) radical.
When mixed in a solution with acrylamide, the initiator sets off an extensive
reaction. The structure of acrylamide is shown in Figure 6.a, and Figure 6.b shows the
molecular structure of acrylamide once it has been exposed to a radical and chain-linked
with other monomers.
a. b.
Figure 6.a. Molecular structure of acrylamide monomer.
Figure 6.b. Molecular structure of polyacrylamide.

6
When the acrylamide molecule is exposed to a radicalized initiator, the radical
attacks the double bond between the alpha and beta carbons attaching onto the beta
carbon. The alpha carbon is now left with an extra electron, becoming a radical itself. The
new radical attacks another acrylamide monomer, elongating until, ideally, there are no
more acrylamide monomers left in the solution. This process is shown in Figure 7.
Figure 7. Example of propagation of acrylamide monomers into a chain polymer.16
This study involves the free-radical synthesis of both polyacrylamide and
poly(acrylamide-co-diallyldimethylammonium chloride). The formation of
polyacrylamide was previously discussed; a simple homo-polymer chain elongation. The
free-radical polymerization of a heteropolymer involving two or more types of monomer,
such as acrylamide and DADMAC, is a very similar process. Figure 8.a shows the
molecular structure of DADMAC and Figure 8.b portrays the molecular structure of
poly(acrylamide-co-diallyldimethylammonium chloride.

7
a. b.
Figure 8.a. Molecular structure of diallyldimethylammonium chloride.
Figure 8.b. Molecular structure of co-polymer poly(acrylamide-co
diallyldimethylammonium chloride.
Co-polymerization DADMAC includes begins with an initiation step, with a radical
attacking a C=C bond and opening it. Cyclization then occurs as the remaining C=C is
broken open, which leaves an open radical waiting to react with another monomer. The
result is a polymer with a backbone of cyclic units and extremely hydrophilic charged
quaternary ammonium groups on each monomer.17 This makes for a strong
polyelectrolyte with a high molecular weight.18 However, because the reaction is a free-
radical polymerization, there is little control over the distribution or amount of the
DADMAC interspersed throughout the acrylamide monomers.
2. RAFT Synthesis
The next synthesis performed was a form of controlled radical polymerization
known as RAFT, or Reversible Addition-Fragmentation chain-Transfer. RAFT
polymerization is useful for better control of molecular weight and low molecular weight
distribution in comparison to free-radical polymerizations.19 A visual of this is provided
in Figure 9.

8
Figure 9. A comparison of the chain lengths of tradition free-radical polymerization and
RAFT polymerization.22 From Concepts and tools for raft polymerization.
https://www.sigmaaldrich.com/technical-documents/articles/crp-guide/concepts-and-
tools-for-raft-polymerization.html. Copyright Sigma-Aldrich, Inc. Reprinted with
permission.
RAFT was first discovered in 1998 by Tam. P.Le, Graeme Moad, Ezio Rizzardo,
and San H. Thang.20 It can be used to polymerize a large variety of monomers, such as
(meth)acrylates, acrylonitriles, and (meth)acrylamides.21 Laboratory synthesis
procedures for this form of polymerization are similar to free radical polymerization
synthesis. The difference lies in adding a thiocarbonylthio compound into the reaction,
which is known as a chain-transfer agent, or a RAFT agent. RAFT agents must be chosen
carefully to properly react with the chosen monomers. For example, cyanomethyl
diphenylcarbamodithioate is most suited for vinyl acetates and vinyl benzoates. The
necessity for a compatible agent lies in the reaction kinetics of the polymerization, as
well as the agent solubility.22 A characteristic of a good raft agent is that its C=S bond is
more reactive to radicals than the alkene of the co-monomers, which is dependent upon
the Z- and R- groups of the RAFT agent.23 This is supported by the flow chart in Figure
10. A RAFT agent must have a reactive C=S bond, an R group that is both a good leaving

9
group and can reinitiate polymerization, and a Z group that influences the reaction
kinetics of radical addition and fragmentation.
Figure 10. Flow chart of causalities of a suitable RAFT agent and a well-defined
polymer.22 From Concepts and tools for raft polymerization.
https://www.sigmaaldrich.com/technical-documents/articles/crp-guide/concepts-and-
tools-for-raft-polymerization.html. Copyright Sigma-Aldrich, Inc. Reprinted with
permission.
The RAFT agent used in this study is 2-cyano-2-propyl benzodithioate, which is
compatible with (meth)acrylate and (meth)acrylamide monomers.22 The structure of 2-
cyano-2-propyl benzodithioate is shown in Figure 11.
Figure 11. Structure of RAFT agent 2-cyano-2-propyl benzodithioate.
With an appropriate RAFT agent determined, the synthesis proceeds. This kind of
CRP is dependent on an equilibrium between active and dormant chains.23 A source of
radicals is needed, which is provided by a radical initiator. In this study, the same radical

10
initiator is used for both CRP and free-living polymerization, which is 4,4′-Azobis(4-
cyanopentanoic acid. The process begins with initiator radical activation through thermal
decomposition, kicking off a small chain growth with the monomers. The RAFT agent
then binds to the chain; its thiocarbonylthio group inhibiting the chain radicals and
creating a new intermediate radical. This implements an equilibrium between the active
and dormant chains in the solution. 24 The new intermediate will then fragment into an
original radical species that reinitiates chain growth. 24 If the RAFT agent was chosen
carefully, the forward reaction (creating an original group) will dominate, and the leaving
group R• will be kicked off instead of the polymeric species. That R• leaving group then
reacts with another monomer, in the process of re-initiation. Through this inhibit/initiate
reversible system, the reaction reaches an equilibrium. The rate of addition/fragmentation
should exceed the rate of propagation, resulting in chains that have similar DPs (degree
of polymerization), which ultimately results in uniform polymers.25 Termination occurs
when two radicals react to form a dead polymer.26 This entire process is portrayed in
Figure 12. along with a legend explaining the symbol meanings.

11
Figure 12. Mechanism of RAFT polymerization with legend.
C. Purpose of this Study
The primary goal of this work will be to further understand the complex processes
of free-radical and RAFT polymerization through synthesis and characterization of
polymer products. A homopolymer and a co-polymer will be created via free-radical
polymerization using the monomer acrylamide (AM), and acrylamide and DADMAC,
respectively. A homopolymer synthesized through controlled radical polymerization with
acrylamide will also be created. The reaction will be carried out in aqueous solution, as it
Raft Polymerization Mechanism Legend
Symbol Definition
I ֺ˙ Initiator Radical
M Monomers
Pn˙ 1st
Propagating Radical
R˙ New Radical formed from intermediate radical
Pm˙ New (2nd) Propagating Radical

12
is the most common and cheapest method. The resulting polymeric products will be
studied using a variety of polymer characterization techniques, such as FTIR, NMR,
TGA, DSC, and dilute-solution viscosity analysis. Through these analyses, the structure,
molecular weight, and various properties will be assigned to the polymeric products.

13
CHAPTER II: MATERIALS AND METHODS
This chapter provides in-depth descriptions of the synthesis procedures and
materials used. First, free-radical polymerization of homopolymer polyacrylamide will be
discussed. Free-radical polymerization of heteropolymer acrylamide-
diallyldimethylammonium chloride will then be described. Finally, the process of
controlled polymerization synthesis of both homogenous and PAM-co-DADMAC
copolymers will be discussed.
A. General Experiment Details
All solvents, reagents, and labware used were commercially available, without
any purification or further processing. NMR data were attained using a 500 MHz FT-
NMR model ECA-500 JEOL(Peabody, MA), bought by MTSU Chemistry Department.
To dry the samples, the Isotemp Vacuum Oven Model 281A, (Fisher Scientific) was
used. Thermal analysis was carried out using Differential Scanning Calorimetry
instrument, model DSC Q2000, and Thermogravimetric Analysis instrument, model TGA
Q500. Infrared data was obtained using the iS50 FTIR w/ ATR (Thermo Scientific)
instrument. A Koehler Kinematic Viscosity Bath was used to measure the dilute -solution
viscosity and behavior of the resulting polymeric systems.

14
B. Synthesis
1. Free-Radical Synthesis of Polyacrylamide
Twelve samples, known as Series A, was the first series to be synthesized. First, a
1 M solution of acrylamide was created by adding dry, powdered acrylamide (7.105 g,
0.1 mol) to 100 mL of DI H2O This was degassed for O2 by passing argon gas for 15
minutes by inserting a pipette emitting gas into the solution and slowly stirring. It was
kept in an air tight container, sealed with PM-992 Parafilm at 8℃. The initiator, 4,4′-
Azobis(4-cyanopentanoic acid)(≥91.5%), was then measured out into twelve 20 mL
cylinder vials. A1-A3 contained ~0.0280 g, 0.1 mmol of initiator, A4-A6 (~0.0560 g, 0.2
mmol), A7-A9 (~0.0840 g, 0.3 mmol) and A10-A12 (~0.1121 g, 0.4 mmol). Ten
milliliters of the acrylamide solution were then pipetted into each vial, and solutions were
purged for five minutes each with nitrogen gas. Vials were then placed on a Fine Vortex
FINEPCR vibrator, stirring the mixtures for thirty seconds. However, as the solutions
were being mixed, and indeed, as soon as the initiator came into contact with the solution,
they started to polymerize, forming an opaque, jelly-like substance before they could be
exposed to heat, which was troubling to say the least, as acrylamide is not supposed to
polymerize at room temperature. The samples were then processed for analysis. This
involved removing the polymerized gel from vials and placing into twelve 250 mL
beakers with 200 mL of DI H2O. These were covered in parafilm and placed on 50 ℃
heating plate with stir bars for ~48 hours. When fully dissolved, beakers were removed
from heat and placed into fridge for cooling. Precipitation methods were used to extract
the pure product from the solution of DI H2O. Chilled liquid methanol (500 mL, ≥99.6%)

15
was poured separately into twelve 800 mL beakers to use as an anti-solvent. The polymer
solution was then poured slowly into the methanol, while stirring vigorously with a glass
rod to coagulate the precipitating polymers. Using methanol as a solvent proved to be
only partly successful, as the solution became murky, and it was obvious only a fraction
of the polymer was precipitating out of solution. The beakers were then placed in the
fridge for a further 24 hours to gather more precipitation. After filtration, the samples
were placed in glass petri dishes and dried in the vacuum oven for 38 hours at 50 ℃.
Once samples were dried, they were stored and then analyzed. The sample products were
very firm pellets of material, neither flexible nor brittle. They were an opaque white in
color. Table 1 shows the polymer compositions of Series A.
Table 1. Compositions of A-Series polyacrylamide samples, showing grams of initiator
and acrylamide, with product yield, theoretical yield, and percent yield.
Series B-D were then devoted to figuring out why the Series A solution polymerized
immediately. Through this investigation it was eventually ascertained that a smaller
amount of initiator was required. While Series A used ~ 0.0280-0.1120 grams of initiator
(1% - 4% molar ratio of initiator to acrylamide), Series E-G used a substantially less
amount. Series E had a 0.1% - 0.5% molar ratio and Series G contained a 0.5% molar
Samples
A1-A12:
4,4'-Azo-bis (4-cyano-
valeric acid) (g):
Acrylamide
(g):
Product
(g):
Theoretical Yield
(g):Percent Yield (%)
A1 0.0281 0.7108 0.592 0.7389 80.1
A2 0.0280 0.7108 0.466 0.7388 63.1
A3 0.0280 0.7108 0.711 0.7388 96.2
A4 0.0560 0.7108 0.595 0.7668 77.6
A5 0.0561 0.7108 0.625 0.7669 81.5
A6 0.0561 0.7108 0.723 0.7669 94.3
A7 0.0838 0.7108 0.792 0.7946 99.7
A8 0.0840 0.7108 0.512 0.7948 64.4
A9 0.0838 0.7108 0.783 0.7946 98.5
A10 0.1120 0.7108 0.789 0.8228 95.9
A11 0.1121 0.7108 0.491 0.8229 59.7
A12 0.1120 0.7108 0.777 0.8228 94.4

16
ratio of initiator to AM. Theoretically, larger amounts of initiator should not trigger a
polymerization reaction. Without an exposure to heat, the initiator should not radicalize.
Further research is required to pinpoint the cause of immediate polymerization.
2. Free Radical Synthesis of Poly(acrylamide-co-diallyldimethylammonium
chloride)
Upon discovering the issue with the initiator, the E series was created, adding
another monomer into the mix. The added monomer was diallylmethylammonium
chloride (≥97.0%, (AT)), or DADMAC. There were 8 samples, 1E-8E, with varying
levels of both DADMAC and initiator. 1E-2E were composed of ~0.0028 g initiator,
0.0808 g (0.5 mmol) DADMAC; 3E-4E (~0.0140 g initiator, 0.161 g (1 mmol)
DADMAC; 5E-6E (~0.0140 g initiator, 0.0808 g (0.5 mmol) DADMAC; 7E-8E (~0.0028
g initiator, 0.161 g (1 mmol) DADMAC. The samples were prepared in a comparable
way to the A series. The anhydrous monomers were measured out and added to 10 mL of
1 M acrylamide solution, then stirred for 15 min with magnetic stir bars, until solutions
were clear and colorless. The solutions were then purged with nitrogen for 5 minutes
each, wrapped securely with foil (six layers), and placed on a 70 ℃ warming pad for 2
hours until polymerization. With the lower amount of initiator, the samples did not
polymerize until exposed to heat, as expected from literature.27 The precipitation process
used in A series was repeated as well, using 200 mL of DI H2O and 50 ℃ to dissolve the
eight separate polymer samples, which were cooled and then precipitated using methanol.
The precipitations did not yield the desired results, even when stirring most vigorously
and pouring slowly. The amount of solute that came out was very little, even when

17
beakers were left for a week to settle out. It was also hoped the methanol would
evaporate, leaving the polymers behind. After seven days, roughly 100 mL of
polymer/methanol solution was left. It was hypothesized that the solvent may not be the
most efficient, and using acetone was then approached. The remaining amount of the
solutions, which were foggy and had much unprecipitated polymer, were poured into
separate beakers containing 600 mL of acetone. White, stringy solid material
immediately precipitated, proving acetone to be a much more effective anti-solvent. The
precipitate was then filtered out, placed in petri dishes, and dried in vacuum oven in the
same way as A series, then stored for further evaluation. Immediately, it was apparent
that the E series was much more brittle than A series, indicating straight away the
compositions were different. Table 2 below shows the compositions of samples E1-E8.
Table 2. Compositions of E-Series samples, showing grams of initiator and co-
monomers, with product yield, theoretical yield, and percent yield.
Samples
E1-E8:
4,4'-Azo-bis
(4-cyano-
valeric acid)
Acrylamide
(g):
Diallyldimethyl-
ammonium
chloride (g):
Product
(g):
Theoretical
Yield (g):
Percent
Yield (%)
E1 0.0025 0.7108 0.0803 0.592 0.7936 74.6
E2 0.0024 0.7108 0.0811 0.466 0.7943 58.7
E3 0.0143 0.7108 0.1619 0.711 0.8870 80.2
E4 0.0142 0.7108 0.1621 0.595 0.8871 67.1
E5 0.0139 0.7108 0.0806 0.625 0.8053 77.6
E6 0.0141 0.7108 0.0811 0.723 0.8060 89.7
E7 0.0030 0.7108 0.1619 0.792 0.8757 90.4
E8 0.0024 0.7108 0.1610 0.512 0.8742 58.6

18
3. RAFT Synthesis of Polyacrylamide through Microwave Synthesis
The preparation of polyacrylamide through RAFT synthesis involved reacting a
RAFT agent 2-Cyano-2-propyl benzodithioate with initiator 4,4'-Azo-bis (4-cyano-
valeric acid) and a solution of acrylamide. The new series was labelled as the G Series
and will be referred to the G se232ries from here on. The F Series involved a calculation
error in the amount of grams of RAFT agent used, so further analysis and
characterization was not acquired. The G Series procedure started with calculating the
correct raft agent to initiator molar ratio. According to literature, several of the most
effective ratios are [RAFT]/[I] = 1.67, 3.33, and 6.67, respectively.22 From series E, it
was determined that 0.0140 grams of 4,4'-Azo-bis (4-cyano-valeric acid) provided the
most consistent and highest yielding products, leading to that amount being used for each
sample in the G series, and from that the RAFT agent amount was calculated. The
anhydrous reagents were measured and mixed with 3 mL of 1 M acrylamide solution in a
4 mL screw-cap glass vial. The vials were purged with argon gas for 5 minutes each, then
placed on 30 ℃ and stirred with a magnetic stir bar until the reagents were evenly
distributed, roughly 15 minutes. The samples were then placed in the microwave to
polymerize. Upon removal, the samples appeared only slightly viscous and pink in color,
due to the RAFT agent. Precipitation of the samples involved slowly pouring the contents
into a 50 mL beaker containing ~40 mL of acetone while stirring with a spatula. White
polymers immediately formed, but there were still traces of polymer residues left in the
acetone. The samples were centrifuged at 4000 rpm for 30 minutes to gather the
polymers, which were then dried in the vacuum oven at 50 ℃ for 72 hours. The samples
were then stored in petri glass dishes for further analysis. The G-series products turned

19
out to be very brittle, much like the E-series samples. They also were slightly pink in
color, due to the strong pink color of the RAFT agent. Table 3 shows the compositions
of G series samples.
Table 3. Compositions of G-Series polyacrylamide samples, showing grams of RAFT
agent, initiator, and acrylamide, with product yield, theoretical yield, and percent yield.
Microwave Synthesis
A plot showing the temperature graphed against time with power and pressure
constraints of the microwave synthesis for G-Series are shown in Figure 13 below.
Figure 14 illustrates the specifics of the parameters in the microwave-assisted synthesis.
Samples
G1-G6
2-Cyano-2-propyl
benzodithioate (g):
Acrylamide
(g):
4,4'-AZO-bis-(4-cyano-
valeric acid) (g):
Product
(g):Theoretical
Yield (g):
Percent
Yield (%)
1G 0.0056 0.2132 0.0041 0.1778 0.2229 80
2G 0.0054 0.2132 0.0044 0.1370 0.2230 61
3G 0.0113 0.2132 0.0042 0.1224 0.2287 54
4G 0.0111 0.2132 0.0043 0.1034 0.2286 45
5G 0.0226 0.2132 0.0043 0.1751 0.2401 73
6G 0.0224 0.2132 0.0043 0.1095 0.2399 46

20
Figure 13. Energy and Temperature plots of G-Series Microwave synthesis.

21
Figure 14. Parameters of microwave synthesis polymerization for G Series.

22
C. Analysis Methods
1. Thermogravimetric Analysis
Samples from the A, E and G series were analyzed by thermogravimetric analysis
using a TA Q500. The samples were cut or ground into a rough powder, then
approximately 0.010g, (5-15 mg) of the samples were weighed out and placed on
platinum pans. They were then heated to 1000 ℃ at a rate of 10 ℃/min under nitrogen
gas.
2. DSC Analysis
TA Instrument DSC Q2000 was used to analyze the sample using differential
scanning calorimetry. The samples were weighed out between 2 and 3 mg on an
analytical balance, then crimped into T-Zero Low Mass hematic aluminum pans. The
sample and reference pans were heated at a rate of 10 ℃/min to 170 ℃ under a nitrogen
purge.
3. Fourier Transform Infrared (FTIR) Spectroscopy
Samples were prepared for FTIR analysis by crushing to a fine powder with a
ceramic mortar and pestle. The molecules were fine enough to have acceptable surface
contact on the ATR. Scan parameters included 64 scans, 4.00 cm-1 resolution, and
automatic atmospheric suppression. iS50 ATR sample compartment, DTGS ATR
detector, XT-KBr beam-splitter, and IR source were used. Background samples were

23
collected before each run, and the final spectra were processed with both baseline
correction and ATR correction.
4. NMR Analysis
To characterize using NMR, the samples were dissolved in D2O. The concentration
of sample in D2O solution varied through the different series. Series A NMR solution
initially had a 5% weight ratio, but that was much too viscous too properly place in NMR
tubes, so it was reduced to 1% weight ratio. Series E samples were prepared using a 1%
weight ratio. G Series samples were also prepared at a 1% weight ratio, however, the
noise to signal ratio was too high to properly evaluate the spectra, so a 3% weight ratio
sample was prepared, which had better signal-to-noise ratio of the peaks. 1H and 13C
spectra were obtained on a JEOL ECA 500 MHz spectrometer using automated methods.
13C NMR spectra required 16,384 scans for analysis. 1H NMR spectra required 64 scans.
5. Dilute Solution Viscosity Analysis
A Koehler Kinematic Viscosity Bath was used to measure the dilute solution
viscosity of each sample. The process of viscosity analysis started with dissolving enough
sample in a 25 mL volumetric flask to make a 0.1 g/dL concentration. According to
literature, an ideal concentration would have been 1 g/dL.28 However, the 1 g/dL solution
proved to be much too viscous to flow through the viscometer. 0.4 g/dL solutions were
also attempted, but those were too viscous as well. Individually, twelve milliliters of the
sample solutions were pipetted into the viscometer, then sat for 10 minutes to equilibrate.
Afterwards, three runs of the pure 0.1 g/dL solution were timed. Two milliliters of DI

24
H2O were then added with mixing to the solution, which sat for 5 minutes to equilibrate.
The process repeated until 10 mL of DI H2O were added. Table 4 and Table 5 below
show an example of the viscosity measurements and calculations.
Table 4. Viscosity tests solution concentrations and time measurements of A5 sample.
Table 5. Viscosity tests solution concentrations and calculations based off time
measurements of sample A5.
Concentration
(g/dL):
Average T (s): Relative Viscosity
(ηr = t/t0)
Specific Viscosity
(ηsp= (t-t0)/t0)
Reduced Viscosity
( ηred = ηsp/C)
Inherent Viscosity
(ηinh=ln ηr/c)
0.100 178.93 1.80 0.80 8.05 2.89
0.086 164.05 1.65 0.65 7.61 2.96
0.075 153.92 1.55 0.55 7.37 3.03
0.067 145.34 1.47 0.47 6.95 3.09
0.060 139.04 1.40 0.40 6.71 3.15
0.054 134.28 1.35 0.35 6.56 3.22
t0 (sec) = 99.15
Run: Time (s): Concentration
(g/dL):
1 178.81 12ml
2 178.95 0.100
3 179.02
1 163.97 +2 ml H2O
2 164.15 0.086
3 164.03
1 154.73 +4 ml H2O
2 153.44 0.075
3 153.58
1 145.26 +6 ml H2O
2 145.39 0.067
3 145.37
1 139.09 +8 ml H2O
2 138.99 0.060
3 139.03
1 134.27 +10 ml H2O
2 134.40 0.054
3 134.18

25
CHAPTER III: RESULTS AND DISCUSSION
Two different products were synthesized using free-radical polymerization,
polyacrylamide and poly(acrylamide-co-diallyldimethylammonium chloride). One
product was formed using reversible addition-fragmentation chain transfer
polymerization (RAFT) through microwave-assisted synthesis, which was
polyacrylamide. The products were then characterized through several methods. These
included nuclear magnetic resonance (NMR), Fourier transform infrared spectroscopy
(FTIR), and dilute-solution viscometer tests. Thermogravimetric analysis (TGA) and
differential scanning calorimetry (DSC) were used to evaluate the thermal properties of
the compounds.
A. FTIR
Figures 15-17 show FTIR overlay spectra from the samples created in A Series, E
Series, and G Series. Figure 18 shows a stack plot of a sample from each of the three
series for comparison. The following two figures, Figures 19 and 20, show zoomed-in
stack plots of the three series in regions (550-1900 cm-1) and (2380-3850 cm-1) for a
closer inspection. Finally, Figures 21 specific peak assignments for Series A. The
specific peak assignments for Series E and G can be found in the Appendix. Table 6
provides the peak assignments as well as the corresponding functional groups.

26
Fig
ure
15:
FT
IR o
ver
lay
plo
ts o
f A
Ser
ies

27
Fig
ure
16:
FT
IR o
ver
lay
plo
ts o
f E
Ser
ies

28
Fig
ure
17
: F
TIR
over
lay
plo
ts o
f G
Ser
ies.

29
Fig
ure
18
: F
TIR
sta
ck p
lots
of
A S
erie
s, E
Ser
ies,
and G
Ser
ies.

30
\
Fig
ure
19:
FT
IR s
tack
plo
ts o
f A
Ser
ies,
E S
erie
s, a
nd G
Ser
ies.
(2380
-3850
cm-1
)

31
Fig
ure
20:
FT
IR s
tack
plo
ts o
f A
Ser
ies,
E S
erie
s, a
nd G
Ser
ies.
(550
-1900cm
-1)

32
Fig
ure
21:
FT
IR p
lots
Sam
ple
A3 s
pec
ific
pea
k a
ssig
nm
ents

33
Table 6. Peak Assignments for A3, E8, and G4 samples with corresponding functional
groups.
The IR spectra support the hypothesized Series A and G polyacrylamide structures.
The broad peaks in the 3000-3400 cm-1 are linked to N-H bonds in the amide of the
molecule. Primary asymmetric amide stretching peaks are seen around 3337 cm-1, and
primary amide symmetric stretching is seen around 3190 cm-1. Interestingly, this peak has
a significantly higher value in the A series than the E and G series. Secondary amide
stretching shows up around 3300-3250 cm-1 in all the series. The C-H interactions are
evident in the 2800-2900 cm-1 range, while C=O interactions show up quite clearly in the
1600-1650 cm-1 range. There are a few peaks near the fingerprint region that may be CH2
scissoring. The peaks around 1450 cm-1 and 1410 cm-1 in the E series are from the lack of
-CH in -N(CH) symmetrical bending vibration absorption peak, and an N-CH stretching
vibration peak, respectively. These show that a DADMAC monomer is present.
1451.60 cm−1 is the absence of –CH3 in –N+(CH3)3 symmetrical bending vibration
absorption peak, while 1414.54 cm−1 is N–CH3 stretching vibration peak, thus illustrating
the existence of DADMAC monomer.29 Another telling sign that the E series contained
DADMAC was the lack of peak at around 2900 cm−1, which matches acrylamide-
DADMAC polymer IR in previous literature.30
Series A: (cm-1) Series E:(cm-1) Series G:(cm-1) Group
3337.72 3336.86 3337.76 primary amide asymmetric stretching band NH2
3300-3250 3300-3250 3300-3250 secondary amide N-H stretching
3197.3 3186.57 3189.45 primary amide NH2 symmetric stretching
3100-3060 3100-3060 3100-3060 secondary amide II overtone
2921.29 2929.5 2924.24 symmetrical CH2 stretch, chain
2851.03 x 2853.12 asymmetrical C-H stretching
1648.11 1648.27 1650.44 primary amide C=O stretching
1604.4 1606.54 1606.69 Secondary amide C=O stretching
1450.87,1405.40 1449.37,1413.02 1449.95,1413.58 CH2 scissor

34
B. NMR
The 13C and 1H spectra for Series A, E, and G are shown in Figures 24-29. Zoomed-
in spectra are available in the Appendix for closer analysis.
The 1H NMR of all three series is comparable to spectra from previous literature, proving
that the hypothesized products were correctly synthesized.29,30 Specific peak assignments
for 1H NMR are given to molecules pictured on Figures 25,27, and 29. 13C NMR is
portrayed in Figures 24,26, and 28. Table 7 illustrates the peak integrals, relative shifts,
and corresponding structures of the 1H NMR spectra.
Table 7. 1H NMR Peak Assignments of Samples A8, E4, and G4.

35
Fig
ure
22.
13C
NM
R (
D2O
) S
ample
A8
abundance
chem
ical
shif
t (p
pm
)

36
Fig
ure
23.
1H
NM
R (
D2O
) S
ample
A8
a
b
b
a
abundance
chem
ical
shif
t (p
pm
)

37
Fig
ure
24.
13C
NM
R (
D2O
) S
ample
E4
abundance
chem
ical
shif
t (p
pm
)

38
Fig
ure
25.
1H
NM
R (
D2O
) S
ample
E4
a
b
c a
a
b
b
e
d
c c
d
e
f
f f
abundance
chem
ical
shif
t (p
pm
)

39
Fig
ure
26.
13C
NM
R (
D2O
) S
ample
G4
abundance
chem
ical
shif
t (p
pm
)

40
Fig
ure
27.
1H
NM
R (
D2O
) S
ample
G4
a
b
b
a
abundance
chem
ical
shif
t (p
pm
)

41
1H NMR was primarily used to confirm the structures of the product samples. The
spectra for Samples A8 and G4 clearly showed the hydrogens of a polyacrylamide. The
H-atom bonded to the tertiary carbon in the amide had a peak shift of approximately 2.1
ppm, and the H-atom on the secondary carbon atom had an approximate peak shift of 1.5
ppm in both spectra. The solvent, D2O, was depicted at 4.6 ppm. The NH2 hydrogen
peaks usually do not appear because heteroatoms such as N-H can exchange rapidly with
the solvent, even more so if it is D2O. However, the little blips at 6.5-8 ppm on the A8 1H
NMR spectra are due to the amide hydrogens. Notably, the main difference in the Series
A and Series G 1H NMR spectra seems to lie in the integration values. For Sample A8,
the ratio of C-H hydrogens to C-H2 hydrogens is 2:3, but for Sample G4 it is 7:1.
Integration values represent the relative amount of hydrogens present in the same
chemical environment. The discrepancy between the spectra of the free-radical
polymerization, A8, and the controlled-radical polymerization, G4, could be due to
contrasting molecular structures created in the two syntheses. The 1H NMR spectra for
Sample E4 was consistent with the molecular composition of poly(acrylamide-co-
diallyldimethylammonium chloride). Peaks at 3.60, 3.10, and 2.50 ppm show CH2
hydrogens,CH3 hydrogens, and CH hydrogens in the DADMAC co-monomer,
respectively. Peaks at 2.00 ppm and 1.50 ppm are caused by the acrylamide co-monomers
(also seen in A8 and G4 spectra). The 13C NMR spectra obtained was not as useful in
determining distinctions between the series. The noise-to-signal ratio was too large to
differentiate between some of the smaller peaks, inhibiting confident specific peak
assignments. Unfortunately, even 16,384 scans and ~13-hour runs were not adequate in
lessening the spectra noise. The problem lay in how viscous the samples were when a

42
higher concentration was used. The samples proved to be too viscous to transfer to NMR
tubes unless at a relatively low concentration. Solutions to this hinderance may include
adding a relaxing agent to speed up the run times, or using even more scans per sample.
However, we were able to compare the tacticities between the A series and G series.
Specifically, the effects the two syntheses, free-radical and controlled-radical
polymerization, had on the stereochemistry of the molecules were studied. Free-radical
synthesis usually creates amorphous, atactic polymers.The mm, mr, and rr triad
sequences represent isotactic, atactic, and syndiotactic parts of the polymer chains,
respectively. Controlled-radical synthesis may result in slightly more uniform tacticities.
The peak integrals of the β-carbon (methylene) were compared, which would appear in
between ~ 34 - 36.6 ppm of the 13C NMR spectra. A closer look at this region in the 13C
NMR spectra of Samples A8 and G4 are shown in Figures 28 and 29. A comparison of
the integral values is shown in Table 8. The peak at around 30 ppm could be due to
RAFT agent present in the mixture.

43
Fig
ure
28. Z
oom
ed-I
n 1
3C
NM
R (
D2O
) S
ample
A8
abundance
chem
ical
shif
t (p
pm
)

44
Fig
ure
29. Z
oom
ed-I
n 1
3C
NM
R (
D2O
) S
ample
G4
abundance
chem
ical
shif
t (p
pm
)

45
Table 8. Comparison of Tacticities between 13C NMR Samples A8 and G4.
C. Thermogravimetric Analysis
Figure 30 portrays an overlay plot of the thermal decomposition of four A-series
samples. Table 9 contains the onset of degradations of A, E, and G series. TGA overlay
plots of E series and G series can be found in the Appendix. Samples in the individual
series were chosen based on the amount of initiator they had, choosing samples with the
lowest and highest amount of initiator to see if it would affect the molecular
decomposition.
Table 9. Degradation Onsets of Series A, E, and G.
Methylene Carbon: mm/mr/rr Percentage mm/mr/rr
A8 3/5/1 33/56/11
G4 2/6/1 22/67/11
Sample
1st onset of
degradation
(℃)
2nd onset of
degradation
(℃)
3rd onset of
degradation
(℃)
A2 198.35 265.75 396.88
A12 186.44 262.58 403.79
E2 263.14 358.52 x
E4 221.18 263.25 406.51
G2 173.96 254.48 394.24
G6 177.05 247.89 390.83

46
Thermogravimetric analysis of the samples shows some interesting trends in the
polymer samples. Thermogravimetric analysis tracks the weight percentage of the sample
at continuously increasing temperatures. Through these measurements, it can be
determined at what temperatures molecules break down, and how much weight they lose
as a result. Series A and Series G samples had lower temperatures at their firs onset of
degradation; samples A2 and A12 had temperatures between 180-190℃ while samples
G2 and G6 had temperatures in the 170-180℃ range. In contrast, E2 and E4 had
temperatures above 200℃. The same trend in temperatures occurs at the 2nd and 3rd
onsets of degradation. The maximum rate of decomposition occurs at the third onset of
degradation, around 390-410℃ for all series. Plot lines were graphically offset to allow
for better analysis. Of the samples, E Series seems to be the most thermally stable.
Thermal stability depends on the amount of heat required to break the compound. The
stronger the bonds between the atoms are, the more heat will be required to break them.

47
Fig
ure
30.
Over
lay P
lot
of
TG
A t
her
mogra
m f
or
A S
erie
s.

48
D. Differential Scanning Calorimetry
Table 10 shows the glass transition temperature, the melting points, and the heat of
fusion related to the melting points for Series A-G. Figure 31 is an overlay plot of the
DSC runs.
Table 10. Tg, Tm, and Heat of Fusion for Series A, E, and G.
Differential Scanning Calorimetry is used to examine the conditions in which
materials change states of matter. For this analysis, two pans are heated equivalently. One
is a reference pan and the other holds the sample. The process of changing from one state
to another can quickly change the rate of heat a sample absorbs. As a result, when
comparing the temperature differences to a steadily heating reference pan, points of glass
transitions and melting temperatures can be determined. In most of the samples, it was
clear there were two glass-transition points (all except for A2 and A12). A glass
transition point occurs when an amorphous sample changes from a “glassy”, hard, brittle
solid into a more viscous state. Melting points occur when distinct forms of material
change from the solid to liquid phase. If a sample has several melting points, it could
mean there were several types of crystalline structures in the sample, breaking bonds at
Sample1st Tg
(℃)
2nd Tg
(℃)
1st
M.P.(℃)
Heat of
Fusion 1st
M.P. (J/g)
2nd
M.P.(℃)
Heat of
Fusion 2nd
M.P.
3rd
M.P.(℃)
Heat of
Fusion
3rd M.P.
A2 76.73 x 159.41 4.906 164.02 14.070 x x
A12 68.86 132.68 132.68 0.248 155.30 2.697 160.18 42.70
E2 66.20 x 115.21 77.120 x x x x
E4 65.10 130.87 147.86 2.330 153.79 1.024 x x
G2 57.43 114.39 144.64 6.113 152.27 7.989 x x
G6 48.15 94.33 143.72 3.979 147.37 1.186 166.44 2.18

49
different temperatures. This is apparent in most of the samples as well. The peak
temperature used for the series, 170℃, was obtained from the averages of the first onsets
of degradation in thermogravimetric analysis. Going to a peak temperature higher than
170℃ may be useful to see if there are any more melting points. The drop-offs in the
graphs at the very end could be either complete degradation or possibly another melting
point. It is interesting to note that branched polymers show lower Tg and melting points
than linear polymers. According to this theory, G Series would have more branching in
the polymer chains. Series A would have the least amount of branching, as it has the
highest glass transition temperatures and melting points.

50
Fig
ure
31. O
ver
lay P
lot
of
DS
C t
her
mogra
m f
or
A,
E a
nd
G S
erie
s.

51
E. Dilute Solution Viscosity
Tables 4 and 5 (created from the viscosity tests), were used to graph Huggins and
Kraemer plots. The y-intercept of the two plots gives the intrinsic viscosity, which can be
used to determine the molecular weight. Shown in Figure 33 is an example of a
Huggins/Kraemer plot for sample A9. A legend for all proceeding viscosity test graphs is
shown in Figure 32.
Figure 32. Legend for Huggins and Kraemer Plot for calculating Intrinsic Viscosity
Figure 33. Huggins/Kraemer overlay graphs of Sample A9.
Huggins Plot- Blue Sphere Data Points Kraemer Plot- Orange Sphere Data Points Linear (Huggins Plot)- Dotted Blue Line Linear (Kraemer Plot)-Dotted Orange Line

52
Although the y-intercepts of the two plots are relatively similar throughout the A series,
the graphs were not as precise for the E and G series. Plots for E4 and G4 are shown
below in Figures 34 and 35.
Figure 34. Huggins/Kraemer overlay graphs of Sample E4.
Figure 35. Huggins/Kraemer overlay graphs of Sample G4.
The Kraemer and Huggins plots in the remaining samples do not share a common y-
axis. As a result the intrinsic viscosity could not be identified, and the molecular weight
for these samples could not be determined. It is hypothesized that using a 0.01 g/dL
solution may have introduced errors due to being at such a low concentration.

53
Unfortunately, at higher concentrations the solution was too viscous, so further
examination is required to find the exact useful concentration. The calculated molecular
weights of the A series are shown in the following Table 11. The equation ([η] = kM α),
which was obtained from previous literature, is key to determining the molecular weight.
Values for k and α for polyacrylamide in water are 4.75x10⁻³ and 0.80, respectively.30
Table 11. Intrinsic Viscosities and Molecular weights of A Series.
SampleIntrinsic Viscosity
(η) (mL/g)
Molecular Weight
(g/mol)
A3 4.46 5202.60
A5 4.17 4780.30
A9 3.61 3988.85
A10 3.50 3843.14

54
CHAPTER IV: CONCLUSIONS
For this research project, three different acrylamide-based polymers were created:
polyacrylamide and poly(acrylamide-co-diallyldimethylammonium chloride) via free-
radical synthesis (A and E Series), and polyacrylamide via reversible addition-
fragmentation chain transfer synthesis (G Series). Series A consisted of a tough pellet-
like white material, while Series E was a much more brittle product and easy to crush into
a powder. Series G was slightly more brittle than Series A, with a pink hue due to the
RAFT agent present. Differences in structure were shown in 1H NMR and FTIR spectra,
with distinct differences between the polyacrylamide and poly(acrylamide-co-
diallyldimethylammonium chloride) samples, and subtler differences between the free-
radical and RAFT synthesized polyacrylamides. Thermal analysis of the samples
included thermogravimetric analysis and differential scanning calorimetry to show the
differences in onset degradations, glass transitions, and melting point temperatures of the
samples. Dilute-solution viscosity tests were used to determine the molecular weights of
Series A samples but could not be used to properly determine the remaining series’
molecular weights. Future work would include obtaining 13C NMR spectra with better
noise-to-signal ratios and dilute-solution viscosity tests that could accurately provide
intrinsic viscosities. This could be done by determining effective solution concentrations
that are not highly viscous. A change in solvents could possibly be useful as well. Further
in-depth investigation into the differences of polymer structure and molecular weights
between free-radical and RAFT synthesis should also be completed. This could include
adding another monomer and creating a co-monomer series via RAFT synthesis.

55
REFERENCES:
1. Murugan, R., Mohan, S., & Bigotto, A. (1998). FTIR and Polarised Raman
Spectra of Acrylamide and Polyacrylamide. Journal of the Korean Physical
Society, 32(1).
2. Abdollahi, M., Ziaee, F., Alamdari, P., & Koolivand, H. (2013). A comprehensive
study on the kinetics of aqueous free-radical homo- and copolymerization of
acrylamide and diallyldimethylammonium chloride by online 1h-nmr
spectroscopy. Journal of Polymer Research, 20(10). doi:10.1007/s10965-013-
0239-9
3. Price, J. T., Gao, W., & Fatehi, P. (2018). Lignin-g-poly(acrylamide)-g-
poly(diallyldimethyl- ammonium chloride): Synthesis, characterization and
applications. ChemistryOpen, 7(8), 645-658. doi:10.1002/open.2018001054. Research, T. (2018, June 29). Polyacrylamide market for water Treatment, oil &
Gas, paper and other applications - global industry Analysis, SIZE, Share, growth, trends
and FORECAST, 2015 - 2023: Transparency market research. Retrieved April 27, 2021,
from https://www.prnewswire.com/news-releases/polyacrylamide-market-for-water-
treatment-oil--gas-paper-and-other-applications---global-industry-analysis-size-share-
growth-trends-and-forecast-2015---2023-transparency-market-research-570502131.html
5. Lin, Y., Pledger, H., Jr., & Butler, G. B. (1988). Synthesis and Characterization of
Poly(diallyldimethylammonium chloride-g-acrylamide). J. Macromol. SCI.-
CHEM, A25(8).
6. Lee, C. S., Robinson, J., & Chong, M. F. (2014). A review on application of
flocculants in wastewater treatment. Process Safety and Environmental
Protection, 92(6), 489-508. doi:10.1016/j.psep.2014.04.010
7. Zhang, Y. J., & Jia, X. (2016). Synthesis of ultra high molecular weight
poly(dimethyldiallyl ammonium chloride). Russian Journal of Applied Chemistry,
89(2), 315-323. doi:10.1134/s10704272160020233
8. Oladoja, N. A. (2016). Advances in the quest for substitute for synthetic organic
polyelectrolytes as coagulant aid in water and wastewater treatment operations.
Sustainable Chemistry and Pharmacy, 3, (47-58). doi:10.1016/j.scp.2016.04.001
9. Rahman, M., Rana, M., Nasreen, Z., Hossain, M. M., & Sharmin, A. (2018).
Treatment of Reactive Dye Containing Textile Wastewater using Microwave
ASSISTED Synthesized Poly(Diallyldimethylammonium Chloride). Journal of
Bangladesh Academy of Sciences, 41(2), 165-174. doi:10.3329/jbas.v41i2.35495
10. Sun, J., Ma, X., Li, X., Fan, J., Chen, Q., Liu, X., & Pan, J. (2018). Synthesis of a
cationic polyacrylamide under uv initiation and its flocculation in estrone
removal. International Journal of Polymer Science, 2018, 1-11.
doi:10.1155/2018/8230965
11. Free radical vinyl polymerization. (n.d.). Retrieved April 11, 2021, from
https://pslc.ws/macrog/radical.htm
12. Matyjaszewski, K. (2009). Controlled/living radical polymerization: Progress in
ATRP. Washington, DC: American Chemical Society.
13. Matyjaszewski, K. (2000). Controlled/living radical polymerization: Progress in
ATRP, NMP, and RAFT. Washington, D.C.: American Chemical Society.

56
14. University, C. Features of Controlled "Living" Radical polymerizations -
Matyjaszewski polymer group - Carnegie Mellon University. Retrieved April 27,
2021, from https://www.cmu.edu/maty/crp/features.html
15. Fishersci.com. Retrieved April 11, 2021, from
https://www.fishersci.com/shop/products/4-4-azobis-4-cyanovaleric-acid-98-cont-
ca-18-water/AAH5961114 16. Craciun, G., Ighigeanu, D., Manaila, E., & Stelescu, M. Synthesis and
characterization Of Poly(Acrylamide-Co-Acrylic Acid) Flocculant obtained by
electron Beam irradiation. Retrieved April 27, 2021, from
http://www.scielo.br/scielo.php?script=sci_arttext&pid=S1516-
14392015000500984
17. G.B. Butler, Cyclopolymerization and Cyclocopolymerization, Marcel Dekker,
New York, 1992
18. H. Dautzenberg, W. Jaeger, J. Kotz, B. Philipp, C. Seidel, D. Stscherbina,
Polyelectrolytes-Formation, Characterization, Macromol. Sci. Chem. A21 (1984)
593. Application, Carl Hanser Verlag, Munich,1994
19. Chen, F., Dai, D., Yang, J., Fei, Z., & Zhong, M. (2013). Controlled synthesis OF
Polyelectrolytes By 4-Cyanopentanoic ACID DITHIOBENZOATE Mediated raft
polymerization. Journal of Macromolecular Science, Part A, 50(9), 1002-1006.
doi:10.1080/10601325.2013.814329
20. T.P. Le, G. Moad, E. Rizzardo, S.H. Thang , Int. Pat. WO9801478 (1998)
21. Polymer properties database. (n.d.). Retrieved April 11, 2021, from
https://polymerdatabase.com/polymer%20chemistry/RAFT.html
22. Concepts and tools for raft polymerization. (n.d.). Retrieved April 11, 2021, from
https://www.sigmaaldrich.com/technical-documents/articles/crp-guide/concepts-
and-tools-for-raft-polymerization.html
23. S. Perrier, Macromolecules, 50, 19, 7433 - 7447 (2017)
24. Perrier, S. (2017). 50Th anniversary perspective: Raft polymerization—a user
guide. Macromolecules, 50(19), 7433-7447. doi:10.1021/acs.macromol.7b00767
25. Rizzardo, E., Moad, G., & Thang, S. H. (2009). Reversible addition-
fragmentation chain transfer polymerization. Encyclopedia of Polymer Science
and Technology. doi:10.1002/0471440264.pst564
26. Cowie, J.M.G; Valeria Arrighi (2008). Polymers: Chemistry and Physics of
Modern Materials (3rd ed.). CRC Press. ISBN 978-0-8493-9813-1.
27. Braun, D. (2009). Origins and development of initiation of free radical
polymerization processes. International Journal of Polymer Science, 2009, 1-10.
doi:10.1155/2009/893234
28. Collins, E. A., Bares, J., & Billmeyer, F. W. (1973). Experiments in polymer
science. New York: John Wiley & Sons.
29. Al-Sabagh, A., Kandile, N., El-Ghazawy, R., Noor El-Din, M., & El-sharaky, E.
(2013). Synthesis and characterization of high molecular weight hydrophobically
modified polyacrylamide nanolatexes using novel nonionic polymerizable
surfactants. Egyptian Journal of Petroleum, 22(4), 531-538.
doi:10.1016/j.ejpe.2013.11.007

57
30. Yang, K., Chen, J., Fu, Q., Dun, X., & Yao, C. (2020). Preparation of novel
amphoteric polyacrylamide and its synergistic retention with cationic polymers.
E-Polymers, 20(1), 162-170. doi:10.1515/epoly-2020-0026

58
APPENDIX A: NMR Spectroscopy Data
1. Polyacrylamide: Sample A8 13C NMR Zoomed-In
2. Polyacrylamide: Sample A8 13C NMR Zoomed-In
3. Polyacrylamide: Sample A8
abu
nd
ance
ab
und
ance
chemical shift (ppm)
chemical shift (ppm)

59
1H NMR Zoomed-In
4. Poly(acrylamide-co-diallyldimethylammonium chloride): Sample E4 13C NMR Zoomed-In
5. Poly(acrylamide-co-diallyldimethylammonium chloride): Sample E4
abu
nd
ance
ab
und
ance
chemical shift (ppm)
chemical shift (ppm)

60
13C NMR Zoomed-In
6. Poly(acrylamide-co-diallyldimethylammonium chloride): Sample E41H NMR Zoomed-In
7. Polyacrylamide: Sample G4
abu
nd
ance
ab
und
ance
chemical shift (ppm)
chemical shift (ppm)

61
13C NMR Zoomed-IN
abu
nd
ance
chemical shift (ppm)

62
APPENDIX B: Thermal Analysis Data
1. TGA Overlay plot of Samples E4 and E6
2. TGA Overlay plot of Samples G2 and G4

63
APPENDIX C: FTIR Analysis Data
1. FTIR plots specific peak assignments: Sample E8
2. FTIR plots specific peak assignments: Sample G4
Copyright © 2022 FDOKUMEN