Prediction model of chloride diffusion in concrete ... - engrXiv
18
Prediction model of chloride diffusion in concrete considering the coupling effects of coarse aggregate and steel reinforcement exposed to marine tidal environment Yuanzhan Wang a , Xiaolong Gong a,⇑ , Linjian Wu b a State Key Laboratory of Hydraulic Engineering Simulation and Safety and Collaborative Innovation Center for Advanced Ship and Deep-Sea Exploration, Tianjin University, 135 Yaguan Road, Jinnan District, Tianjin 300072, People’s Republic of China b National Engineering Research Center for Inland Waterway Regulation, School of River and Ocean Engineering, Chongqing Jiaotong University, 66 Xuefu Road, Nan’an District, Chongqing 400074, People’s Republic of China highlights An in-door test for chloride diffusion under a real-time tidal cycle is carried out. Coupling effects of coarse aggregate (CA) and rebar on chloride diffusion is studied. Prediction model of chloride diffusion considering the CA and rebar is proposed. article info Article history: Received 14 November 2018 Received in revised form 18 April 2019 Accepted 25 April 2019 Available online 4 May 2019 Keywords: Reinforced concrete Chloride Coarse aggregate and steel reinforcement Coupling effects Prediction model abstract Chloride-induced corrosion of steel reinforcement is one of the significant factors for the durability of the reinforced concrete structures exposed to marine environments. Reinforced concrete is a multiphase composite material composed of mortar, coarse aggregate, and rebar. The coarse aggregate and rebar can both affect the chloride diffusion characteristics of concrete. Nevertheless, the current researches related to the effects of the aforementioned two impact factors on chloride diffusion in concrete either considered the coarse aggregate only, or taken into account the steel bar separately. The coupling effects of coarse aggregate and steel reinforcement on chloride transport in concrete required to be further explored and discussed. In this paper, an in-door physical experiment for chloride diffusion in plain and reinforced concrete specimens exposed to marine tidal environment was carried out. The specimens were cast using different volume fractions of coarse aggregate and diameters of steel reinforcement. The chloride concentrations for experimental specimens were measured at various exposure times, and these measurements were adopted to further investigate the common influences of coarse aggregate volume fraction and blocking effect of rebar on chloride diffusion in concrete. Using the impact factors of coarse aggregate volume fraction f(v), the direct and indirect blocking effect coefficients of rebar a(v), b r (U/c) to improve the analytical solution of Fick’s second law, a prediction model of chloride diffusion in concrete considering the coupling effects of coarse aggregate and steel reinforcement was proposed. The accuracy of this proposed prediction model was validated by comparing the chloride concentrations evaluated by the prediction model with the experimental measurements. The findings are expected to be useful in realistically predicting the durability of reinforced concrete structures. Ó 2019 Elsevier Ltd. All rights reserved. 1. Introduction Chloride ions ingress in concrete is one of the most significant factors for reinforced concrete structures when exposed to marine environment, and this can cause the steel reinforcement corrosion, ultimately, shorten the durability and serviceability of reinforced concrete structures [1]. Therefore, it is essential to explore the transport behaviors of chloride ions in concrete covers and develop the useful chloride diffusion model in realistically predicting the durability of concrete structures [2]. Reinforced concrete is a multiphase composite material com- posed of mortar, coarse aggregate, and steel bar [3]. The coarse https://doi.org/10.1016/j.conbuildmat.2019.04.221 0950-0618/Ó 2019 Elsevier Ltd. All rights reserved. ⇑ Corresponding author. E-mail addresses: [email protected] (Y. Wang), [email protected] (X. Gong). Construction and Building Materials 216 (2019) 40–57 Contents lists available at ScienceDirect Construction and Building Materials journal homepage: www.elsevier.com/locate/conbuildmat
-
Upload
khangminh22 -
Category
Documents
-
view
1 -
download
0
Transcript of Prediction model of chloride diffusion in concrete ... - engrXiv

Construction and Building Materials 216 (2019) 40–57
Contents lists available at ScienceDirect
Construction and Building Materials
journal homepage: www.elsevier .com/locate /conbui ldmat
Prediction model of chloride diffusion in concrete considering thecoupling effects of coarse aggregate and steel reinforcement exposed tomarine tidal environment
https://doi.org/10.1016/j.conbuildmat.2019.04.2210950-0618/� 2019 Elsevier Ltd. All rights reserved.
⇑ Corresponding author.E-mail addresses: [email protected] (Y. Wang), [email protected]
(X. Gong).
Yuanzhan Wang a, Xiaolong Gong a,⇑, Linjian Wu b
a State Key Laboratory of Hydraulic Engineering Simulation and Safety and Collaborative Innovation Center for Advanced Ship and Deep-Sea Exploration, Tianjin University,135 Yaguan Road, Jinnan District, Tianjin 300072, People’s Republic of ChinabNational Engineering Research Center for Inland Waterway Regulation, School of River and Ocean Engineering, Chongqing Jiaotong University, 66 Xuefu Road, Nan’an District,Chongqing 400074, People’s Republic of China
h i g h l i g h t s
� An in-door test for chloride diffusion under a real-time tidal cycle is carried out.� Coupling effects of coarse aggregate (CA) and rebar on chloride diffusion is studied.� Prediction model of chloride diffusion considering the CA and rebar is proposed.
a r t i c l e i n f o
Article history:Received 14 November 2018Received in revised form 18 April 2019Accepted 25 April 2019Available online 4 May 2019
Keywords:Reinforced concreteChlorideCoarse aggregate and steel reinforcementCoupling effectsPrediction model
a b s t r a c t
Chloride-induced corrosion of steel reinforcement is one of the significant factors for the durability of thereinforced concrete structures exposed to marine environments. Reinforced concrete is a multiphasecomposite material composed of mortar, coarse aggregate, and rebar. The coarse aggregate and rebarcan both affect the chloride diffusion characteristics of concrete. Nevertheless, the current researchesrelated to the effects of the aforementioned two impact factors on chloride diffusion in concrete eitherconsidered the coarse aggregate only, or taken into account the steel bar separately. The coupling effectsof coarse aggregate and steel reinforcement on chloride transport in concrete required to be furtherexplored and discussed. In this paper, an in-door physical experiment for chloride diffusion in plainand reinforced concrete specimens exposed to marine tidal environment was carried out. The specimenswere cast using different volume fractions of coarse aggregate and diameters of steel reinforcement. Thechloride concentrations for experimental specimens were measured at various exposure times, and thesemeasurements were adopted to further investigate the common influences of coarse aggregate volumefraction and blocking effect of rebar on chloride diffusion in concrete. Using the impact factors of coarseaggregate volume fraction f(v), the direct and indirect blocking effect coefficients of rebar a(v), br(U/c) toimprove the analytical solution of Fick’s second law, a prediction model of chloride diffusion in concreteconsidering the coupling effects of coarse aggregate and steel reinforcement was proposed. The accuracyof this proposed prediction model was validated by comparing the chloride concentrations evaluated bythe prediction model with the experimental measurements. The findings are expected to be useful inrealistically predicting the durability of reinforced concrete structures.
� 2019 Elsevier Ltd. All rights reserved.
1. Introduction
Chloride ions ingress in concrete is one of the most significantfactors for reinforced concrete structures when exposed to marine
environment, and this can cause the steel reinforcement corrosion,ultimately, shorten the durability and serviceability of reinforcedconcrete structures [1]. Therefore, it is essential to explore thetransport behaviors of chloride ions in concrete covers and developthe useful chloride diffusion model in realistically predicting thedurability of concrete structures [2].
Reinforced concrete is a multiphase composite material com-posed of mortar, coarse aggregate, and steel bar [3]. The coarse

Y. Wang et al. / Construction and Building Materials 216 (2019) 40–57 41
aggregate is regarded as one of the vital components of concreteand they can significantly affect the chloride diffusion characteris-tics in concrete [4]. Some of the efforts devoted to study the effectsof coarse aggregate on chloride migration in concrete. Yang andCho [5] used the non-steady accelerate chloride migration test(ACMT) to inquire into the effect of lateral surface area of the reg-ular cylindrical coarse aggregate on chloride diffusion coefficient ofconcrete specimens, and the chloride diffusion coefficients of inter-facial transition zone (ITZ) were indirectly obtained. Yang [6] con-firmed the volume fraction of coarse aggregate has significantinfluence on chloride diffusion coefficient through the ACMT. Shahet al. [7] proposed that the essential effects of coarse aggregate onchloride diffusion coefficient for concrete included dilution, tortu-osity, and ITZ effects. Abyaneh et al. [8] developed a three-dimensional meso-scopic numerical model of concrete to investi-gate the effects of w/c; degree of hydration; volume fraction, size,shape and orientation of aggregate; width and percolation of ITZ onchloride diffusion coefficient for concrete using the finite elementmethod (FEM). Li et al. [9] built three-dimensional concretenumerical model by Monte Carlo method and used the FEM toinvestigate the effects of shape, grading and volume fraction ofaggregates; the thickness and permeability of ITZ on the effectivepermeability of chloride in concrete models. Wang et al. [10] pro-posed a time-and-depth-dependent chloride diffusion coefficientmodel (T-D model) for concrete considering the influences ofcoarse aggregate volume fraction (CAVF) and maximum size ofaggregate (MSA). The T-D model can elaborate the variation char-acteristics for chloride diffusion coefficient of concrete with expo-sure time and diffusion depth varying. Wang et al. [11]investigated the effects of the heterogeneity of concrete materials(consistent with the influence of coarse aggregate) on long-termchloride diffusion in concrete using the meso-scopic FEM, and anempirical model for predicting long-term chloride profiles in con-crete considering the various volume fractions of coarse aggregatewas elaborated. Wang et al. [12] explored the effects of volumefraction and maximum size of natural coarse aggregate on chlorideprofiles and diffusion characteristics for concrete under drying-wetting cycles. A time-dependent model of surface chloride con-centration and a multifactor model of chloride diffusion coefficientfor concrete considering the exposure time, volume fraction andmaximum size of natural coarse aggregate were developed.
Moreover, the blocking effects of steel reinforcement on chlo-ride ions transport in reinforced concrete cannot be neglected aswell. Actually, the accumulation phenomenon of chloride ions atthe apex of rebar was reported by Hansen and Saouma [13] in1999. Kranc and Sagues [14] pointed out that the blocking effectof rebar can enhance the chloride concentrations at the apex ofsteel reinforcement by numerical analysis, and they proposed theattenuation coefficient for chloride concentration due to the steelbar existence to explore the earlier initiation time of steel corro-sion. Oh and Jang [15] used the FEM to estimate the chloride trans-port behaviors in reinforced concrete. They concluded that thelarger diameter of rebar can result in greater accumulation of chlo-ride concentrations at the apex of steel bar, as well as the initiationtime of steel corrosion can shorten about 30–40% due to the rein-forcement existence. The aforementioned literatures presented aconvinced argument for the chloride accumulation at the apex ofsteel bar and a serious worry about the overestimating the servicelife of reinforced concrete structures, whereas few physical exper-iments for this problem were carried out. In this context, Wanget al. [16] tested the chloride concentrations at the apex of steelbar embedded in reinforced concrete members under the experi-mental drying-wetting cycles. The authors found the phenomenonof chloride accumulation in front of rebar, as well as the largerdiameter of steel bars would result in greater chloride measure-ments. The direct and indirect blocking effects of the steel rein-
forcement were defined to reasonably describe the physicalobstruction and the chloride diffusion coefficient variation due tothe existence of cylindrical bar with various diameters.
Despite of all these laudable achievements during the previousinvestigations, however, the existing researches related to theeffects of the coarse aggregate and steel reinforcement on chloridediffusion either considered the coarse aggregate volume fraction(or coarse aggregate content) only [5–12,17], or taken into accountthe blocking effect of steel bar separately [13–16]. The couplingeffects of coarse aggregate and steel reinforcement on chloride dif-fusion in concrete required to be deeply researched and explored.In this paper, an in-door physical experiment for chloride diffusionin plain and reinforced concrete specimens exposed to marine tidalenvironment was carried out, and the specimens were cast usingdifferent volume fractions of coarse aggregate and diameters ofsteel reinforcement. The chloride concentrations for experimentalspecimens were measured at various exposure times, and theywere used to investigate the common influence of volume fractionof coarse aggregate and blocking effect of rebar on chloride diffu-sion in concrete. Using the impact factors of coarse aggregate vol-ume fraction, the direct and indirect blocking effect coefficients ofsteel bar to improve the analytical solution of Fick’s second law, aprediction model of chloride diffusion in concrete considering thecoupling effects of coarse aggregate and steel reinforcement wasproposed. The accuracy of this proposed prediction model was val-idated through comparing the chloride concentrations evaluatedby the prediction model with the experimental measurements.
2. Experimental studies
2.1. Materials and mixture proportions
During the experiment, the Ordinary Portland cement (P.O.42.5) with the density of 3100 kg/m3, which was produced by Tian-jin Cement Plant, was used as the cementitious material for differ-ent experimental specimens. River sand with continuous grading,which can be considered as no initial chloride ions, was used asthe fine aggregate, as well as the apparent density and finenessmodulus for sand were 2610 kg/m3 and 2.7, respectively. Naturalcrushed limestone with continuous grading was used as the coarseaggregate, in which its nominal size range and apparent densitywere 5–20 mm and 2690 kg/m3. Distilled water was utilized dur-ing the process of experimental specimens casting, curing, andtesting in order to avoid the interference of additional chloride ionswithin the raw materials on the final experimental measurements.
To explore the coupling effects of coarse aggregate volume frac-tions and diameters of steel bar on chloride diffusion characteris-tics of concrete, the mixture proportions for concrete specimens(100 � 100 � 400 mm3) were designed by the standard [18]. Thevolume fractions of coarse aggregate v = 0, 0.2, 0.3, 0.4, and 0.5,and the details of mix proportions were listed in Table 1. The con-crete can be generally simplified as a heterogeneous compositematerial consisting of three-phases, namely, cement paste, aggre-gate, and the interfacial transition zone (ITZ) at the meso-scale per-spective [8]. In fact, the mortar can be also treated as a compositematerial consisting of cement paste, fine aggregate, and ITZ. How-ever, the mortar is generally considered as a homogeneous chloridetransport medium in concrete because of the smaller sizes of gelpores, capillary pores, and fine aggregates than those of coarseaggregate [19]. Therefore, the effect of aggregate on chloride diffu-sion in concrete is significantly attributed to the coarse aggregate.For this paper’s study, the influence of fine aggregate on chloridediffusivity can be reasonably neglected. The hot-rolled plain roundsteel bars (HPB300) with diameters of U = 0, 8, 12, 16, and 20 mmwere used and embedded in experimental specimens. The detail

Table 1Mixtures details for concrete specimens with various volume fractions of coarse aggregate.
w/c Cement (kg/m3) Water (kg/m3) Fine aggregate (kg/m3) Coarse aggregate (kg/m3) volume fraction of coarse aggregate, v
0.54 345 639 1173 0 0277 512 932 538 0.2242 448 816 807 0.3208 384 699 1076 0.4173 320 583 1345 0.5
42 Y. Wang et al. / Construction and Building Materials 216 (2019) 40–57
information of the steel bar properties were provided in Table 2.The experimental specimens with U = 0 mm means there is nosteel bar installed in concrete, and these types were named asthe plain concrete specimens. Also, the others with U– 0 mmwere called as the reinforced concrete specimens. To sum up, dur-ing this paper’s experiment, the numbers of coarse aggregate vol-ume fractions and steel bar diameters are both 5, namely, thetotal experimental groups are equal to 25, as exhibited in Table 3.
2.2. Casting, curing and preparation for specimens
Plain and reinforced concrete specimens, all measuring100 � 100 � 400 mm3 sizes and considering the concrete cover of20 mm for reinforced concrete, were cast in plastic molds, subse-quently, compacted on a vibrating table. After casting for 24 h kepttemperature of 20 ± 3 �C and over 90% relative humidity, experi-mental specimens were demoded and moved to water saturatedwith Ca(OH)2 at 20 ± 3 �C for 28 days curing. Then, all the speci-mens were sealed on the five sides using epoxy polyurethanebased coating to expose only one side (100 � 400 mm2) to makesure chloride ions would diffuse only in one-dimension.
For this paper’s study, the slump values (Sv) of three mixtureproportions of concrete with v = 0.3, 0.4, and 0.5 were measuredto evaluate the effect of coarse aggregate on the workability andrheological properties of fresh concrete. They were determined asSv(v = 0.3) = 131 mm, Sv(v = 0.4) = 123 mm, and Sv(v = 0.5)= 115 mm per the procedure of GB 50164-2011 [20]. An increasein design volume fraction of coarse aggregate from v = 0.3 to 0.5resulted in a lower slump, and the slump values decreased from131 to 115 mm, representing a 13.9 % reduction, when the coarseaggregate volume fraction was increased from 0.3 to 0.5. This isdue to lower cement paste content in concrete mixes, providingless lubrication for the coarse aggregates and reduced workability.In addition, the compressive strength results of 28 days (fc) for theaforementioned three uniform mixture proportions of concrete aretested based on three specimens and their average results arefc(v = 0.3) = 38.3 MPa, fc(v = 0.4) = 46.4 MPa and fc(v = 0.5)= 53.2 MPa. The 28 days compressive strength increased with thevolume fraction of coarse aggregate increasing. This indicated that
Table 2Properties of steel bar.
Type Eigenvalue dr (mm) dr(m) (mm) Weigh
HPB300 Max 8 8.24 0.41612 12.18 0.91916 16.32 1.61320 20.24 2.574
Min 8 7.92 0.38512 11.86 0.84116 15.76 1.52620 19.82 2.430
Average 8 8.08 0.40112 12.02 0.88016 16.04 1.57020 20.03 2.502
dr and dr(m) denote the theoretical diameter and the measured diameter of rebar; Rel andare the fracture elongation and the elongation at maximum load, respectively.
the increased coarse aggregate volume fractions led to compressivestrength of concrete improvement, which is consistent with thereality.
2.3. Exposure environment
To simulate the marine environment in diurnal tidal zone, theartificial marine tidal environment automatic simulation device,which developed by the research team of Harbour EngineeringStructure Laboratory in Tianjin University, is used to realisticallysimulate the real-time tidal cycles. This device contained a seriesof components including the test tank, storage tank (water levelindicator), flow rate control system (flow meter, water pump,and solenoid value, etc.), air-blast system, temperature control sys-tem, humidity control system, spray system (sprayer, sprinkler),operating system, etc., which connected with each others basedon the programmable logic controller (PLC), shown in Fig. 1. Com-paring to the totally wet and totally dry conditions in traditionalwetting-drying cycles [10,12,16,17], this device can automatically,effectively and realistically simulate the real-time rising and ebbtide cycling simulation during the long-term test periods, whichis more approximated to the true circumstance. Some significantcontrolling parameters, for instance the number of tidal cycles,the high- and low-water level values, the temperature and relativehumidity in test tank, etc., can be set through the parameters inputinterface of operating system, and the automatic simulation devicewould complete the requested action by receiving the commandfrom the programs compiled into the PLC controller. This devicecan not only control the water level to go up and down graduallyin marine tidal zone but also adjust the temperature, relativehumidity, and other ocean environmental impact factors, whichrealized the test automation and greatly improved the experimen-tal efficiency. 3.5% sodium chloride solution was configured andused as the seawater, and all experimental specimens were verti-cally placed on a corrosion-resistant table (200 mm high) locatedin test box of this device for chloride ions diffusion. In terms ofthe geometric sizes of the specimens, the high and low tidal levelswere set as 600 ± 20 mm and 200 ± 20 mm respectively. The tidalcycle period was 24 hours (one day), including 12 hours for rising
t (kg/m) Rel (MPa) Rm (MPa) A (%) Agt (%)
390 515 39.5 22.5
335 460 31.5 16
362.5 487.5 35.5 19.3
Rm mean the yield strength and the tensile strength of rebar, respectively; A and Agt

Table 3Codes of plain and reinforced concrete specimens.
Code Diameters of rebar, U (mm)
0 8 12 16 20
Volume fractions of coarse aggregate, v 0 U0-0 U8-0 U12-0 U16-0 U20-00.2 U0-0.2 U8-0.2 U12-0.2 U16-0.2 U20-0.20.3 U0-0.3 U8-0.3 U12-0.3 U16-0.3 U20-0.30.4 U0-0.4 U8-0.4 U12-0.4 U16-0.4 U20-0.40.5 U0-0.5 U8-0.5 U12-0.5 U16-0.5 U20-0.5
Fig. 1. Artificial marine environment automatic simulation device.
Y. Wang et al. / Construction and Building Materials 216 (2019) 40–57 43
tide and other 12 hours for ebb tide. The exposure times for exper-imental specimens of U = 0 mm (no rebar existence) were 30, 70,100, 140, and 180 consecutive days, as well as for the specimensof U = 8, 12, 16, and 20 mm were 100, 140, and 180 consecutivedays, respectively.
2.4. Samples and testing
The real-time tidal cycles can significantly affect the chlorideions distributions along the elevation direction of concrete struc-tures. According to an in-site test for a certain wharf concretestructure, the tested chloride concentration results decreased withthe structural elevation increasing, and the most unfavorable chlo-ride concentrations were distributed at the areas about 1/4–1/2elevation from the bottom of the structure (the midway down ofthe wharf structure) [21]. On the basis of the aforementioned sum-mary, after each required chloride exposure time completed, therelated experimental specimens were taken out of the device’s testbox and were averagely divided into four parts numbered ①–④from the bottom to the top, and the part ② was used as the repre-sentative to drill the concrete powders, as shown in Fig. 2. To makesure the test accuracy, the concrete cubes of part ② were againdivided into two parts (see in Fig. 2), and the powders for thetwo parts in any of the same holes were respectively drilled andobtained. The chloride concentrations were measured using thetwo powders which obtained in same sample holes, and the aver-age values of the two were treated as the final chloride ion resultsin this hole position. In addition, all the powders obtained weredried for 2 h in the drying box (105 ± 5 �C) after being sievedthrough the sieve with a 0.63 mm aperture, subsequently, theywere separately tested to determine the water-soluble chlorideconcentration (free chloride) at each depth by the standard [22].
3. Results analysis and model establishment
3.1. Tested results
(1) Chloride profiles in plain concrete specimens (U = 0 mm)
For the plain concrete specimens (denotes the diameter of steelbarU = 0 mm), the tested chloride profiles against diffusion depthsin concrete specimens with various volume fractions of coarseaggregate at different exposure times are exhibited in Fig. 3. Thefree chloride concentration results shown in Fig. 3 and the follow-ing figures for this paper’s study are all presented as a percentageof the concrete mass (%). The chloride concentrations in concretespecimens with various coarse aggregate volume fractions, asexpected, increase with the exposed time increasing, whereasdecrease with the diffusion depth increasing. These variationtrends for chloride profiles are consistence with the resultsreported in literatures [5,11,12,16,17].
(2) Chloride concentration distributions in reinforced concretespecimens (U – 0 mm)
The chloride concentration distributions within the reinforcedconcrete specimens with different diameters of U = 8, 12, 16, and20 mm are all measured during the experiment procedure. A rep-resentative, in which the volume fraction of coarse aggregate,diameter of rebar and exposure time are v = 0.2, U = 12 mm andt = 180 d respectively, is used to exhibit the tested chloride concen-tration isolines, as shown in Fig. 4. The data involved in Fig. 3 pre-sent the chloride concentration values located on various isolines.Fig. 4 illustrates that the phenomenon of chloride accumulation isoccurred at the apex of rebar, and the impact region is about 3–5 mm from the apex of rebar to the exposure surface of reinforcedconcrete specimen. Moreover, the chloride concentrations aretended to be consistence in a same diffusion depth (sample holesin an uniform x coordinate with various y coordinates) with thedistance from the apex of rebar increasing. Thus, it means thatthe steel reinforcement embedded in concrete can significantlyaffect the chloride ion concentration distributions around therebar.
3.2. Prediction model of chloride profiles considering the effect ofcoarse aggregate
When the reinforced concrete structures are exposed to themarine aggressive environments, the chloride ions can ingress in

Fig. 2. Specimens processed and sample holes distribution for (a) plain concrete; (b) reinforced concrete (units: mm).
44 Y. Wang et al. / Construction and Building Materials 216 (2019) 40–57
concrete through multiple mechanisms, such as diffusion, convec-tion, adsorption, permeation and surface deposit of airborne salts.However, among these reasons, the main transport mechanism forchloride ions in concrete is diffusion [23,24], which can be mod-eled using Fick’s second law of diffusion:
@C@t
¼ @C@x
D � @C@x
� �ð1Þ
where C denotes chloride concentration (%); D means chloride dif-fusion coefficient of concrete (m2/s); t is exposure time (s); xdenotes the diffusion depth (m). According to a large number ofinvestigations, the boundary condition of C = Cs (for x = 0, t � 0)and the chloride diffusion coefficient D should be both consideredas time-dependent parameters resulting in Cs = Cs(t) and D = D(t)[25], where Cs means the surface chloride concentration (%). Formu-las of Cs(t) can be expressed as linear, square-root, power, exponent,and logarithmic functions [11]. Also, the time-dependency of chlo-ride diffusion coefficient D(t) is more appropriately modeled basedon a power function proposed by Thomas and Bamforth [26] asfollows:
DðtÞ ¼ D28t28t
� �m
ð2Þ
where D(t) means the chloride diffusion coefficient at the exposuretime t (m2/s); D28 denotes the chloride diffusion coefficient at theexposure time t = 28 d (m2/s), and D28 can be also defined as the ref-erence chloride diffusion coefficient; m is the aging factor. Substi-tuting the Eq. (2) and Cs = Cs(t) into Eq. (1) and considering theactual initial condition C = C0 (for x > 0, t = 0) (where C0 denotesthe initial chloride concentration of concrete before exposure tothe marine environment (%)), the solution of Eq. (1) considering
the time-dependency of the chloride diffusion coefficient and thesurface chloride concentration is determined as:
Cðx; tÞ ¼ CsðtÞ 1� erf x2
ffiffiffiffiffiffiffiffiffiffiDaðtÞ�t
p� �� �
DaðtÞ ¼ D281�m
t28t
� �m
8><>: ð3Þ
where Da denotes the apparent chloride diffusion coefficient (m2/s).Da is also a time-dependent parameter, Da = Da(t) [27–30], and theexpression form of Da(t) can be based on the references [31,32];erf(�) is the error function. The significant parameters Cs(t), Da(t),D28 and m within Eq. (3) can be determined by fitting the experi-mental measurements using a non-linear regression analysis basedon the method of least squares fit.
(1) Surface chloride concentration Cs(t)
The surface chloride concentrations Cs for different plain con-crete specimens with v = 0, 0.2, 0.3, 0.4 and 0.5 at various exposuretimes are determined by fitting the Fick’s second law of diffusion tothe corresponding tested chloride profiles (see in Fig. 3) usingregression analysis. Fig. 5 plots the values of surface chloride con-centration with various volume fractions of coarse aggregate at dif-ferent exposure times. Also, this figure depicts that the surfacechloride concentration scatters increase with the exposure timeincreasing, validating the time-dependency of surface chlorideconcentration. Moreover, although the surface chloride concentra-tions at each time exhibit random fluctuation with coarse aggre-gate volume fraction varying, the little differences between thescatters and their average values are shown in Fig. 5. Thus, it isappropriate to consider that the surface chloride concentrationsare independent of volume fraction of coarse aggregate, namely,

Fig. 3. Chloride profiles for concrete specimens with various volume factions of coarse aggregate: (a) v = 0; (b) v = 0.2; (c) v = 0.3; (d) v = 0.4; (e) v = 0.5.
Y. Wang et al. / Construction and Building Materials 216 (2019) 40–57 45
there is no specific relation between surface chloride concentrationand coarse aggregate. Fitted formula of surface chloride concentra-tion against the exposure time, Cs(t), can be reasonably quantifiedas logarithmic functions [33] for this paper’s Cs scatters, and the fit-ted curve and expression are hence expressed in Eq. (4) and shownin Fig. 5, respectively.
Cs tð Þ ¼ 0:6009 � ln tð Þ � 1:6192; t � 30 d ð4Þ
(2) Apparent chloride diffusion coefficient Da, reference chloridediffusion coefficient D28 and aging factor m
The apparent chloride diffusion coefficients Da for differentplain concrete specimens with v = 0, 0.2, 0.3, 0.4, and 0.5 at variousexposure times can be simultaneously confirmed by fitting theFick’s second law of diffusion to the corresponding tested chlorideprofiles (see in Fig. 3) using regression analysis. Fig. 6 illustrates
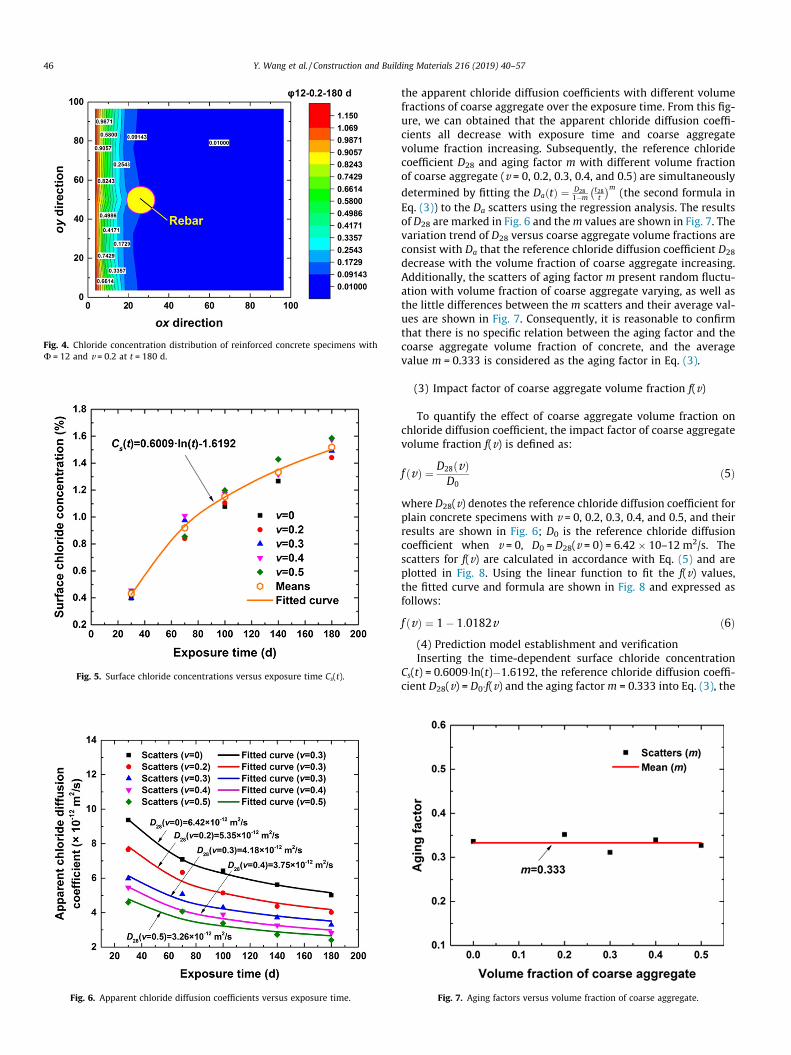
Fig. 4. Chloride concentration distribution of reinforced concrete specimens withU = 12 and v = 0.2 at t = 180 d.
Fig. 5. Surface chloride concentrations versus exposure time Cs(t).
Fig. 6. Apparent chloride diffusion coefficients versus exposure time.
46 Y. Wang et al. / Construction and Building Materials 216 (2019) 40–57
the apparent chloride diffusion coefficients with different volumefractions of coarse aggregate over the exposure time. From this fig-ure, we can obtained that the apparent chloride diffusion coeffi-cients all decrease with exposure time and coarse aggregatevolume fraction increasing. Subsequently, the reference chloridecoefficient D28 and aging factor m with different volume fractionof coarse aggregate (v = 0, 0.2, 0.3, 0.4, and 0.5) are simultaneously
determined by fitting the DaðtÞ ¼ D281�m
t28t
� �m(the second formula in
Eq. (3)) to the Da scatters using the regression analysis. The resultsof D28 are marked in Fig. 6 and them values are shown in Fig. 7. Thevariation trend of D28 versus coarse aggregate volume fractions areconsist with Da that the reference chloride diffusion coefficient D28
decrease with the volume fraction of coarse aggregate increasing.Additionally, the scatters of aging factor m present random fluctu-ation with volume fraction of coarse aggregate varying, as well asthe little differences between the m scatters and their average val-ues are shown in Fig. 7. Consequently, it is reasonable to confirmthat there is no specific relation between the aging factor and thecoarse aggregate volume fraction of concrete, and the averagevalue m = 0.333 is considered as the aging factor in Eq. (3).
(3) Impact factor of coarse aggregate volume fraction f(v)
To quantify the effect of coarse aggregate volume fraction onchloride diffusion coefficient, the impact factor of coarse aggregatevolume fraction f(v) is defined as:
f vð Þ ¼ D28 vð ÞD0
ð5Þ
where D28(v) denotes the reference chloride diffusion coefficient forplain concrete specimens with v = 0, 0.2, 0.3, 0.4, and 0.5, and theirresults are shown in Fig. 6; D0 is the reference chloride diffusioncoefficient when v = 0, D0 = D28(v = 0) = 6.42 � 10–12 m2/s. Thescatters for f(v) are calculated in accordance with Eq. (5) and areplotted in Fig. 8. Using the linear function to fit the f(v) values,the fitted curve and formula are shown in Fig. 8 and expressed asfollows:
f ðvÞ ¼ 1� 1:0182v ð6Þ(4) Prediction model establishment and verificationInserting the time-dependent surface chloride concentration
Cs(t) = 0.6009�ln(t)�1.6192, the reference chloride diffusion coeffi-cient D28(v) = D0�f(v) and the aging factorm = 0.333 into Eq. (3), the
Fig. 7. Aging factors versus volume fraction of coarse aggregate.

Fig. 8. Impact factors of coarse aggregate volume fraction f(v) and its fitted curve.
Y. Wang et al. / Construction and Building Materials 216 (2019) 40–57 47
prediction model of chloride profiles considering the effect ofcoarse aggregate volume fraction is established as:
C x; t;vð Þ ¼ Cs tð Þ � 1� erf x
2
ffiffiffiffiffiffiffiffiffiffiffiffiffiffiffiffiffiffiffiffiffiD28ðvÞ1�m
t28t
� �mt
q0@
1A
24
35
Cs tð Þ ¼ 0:6009 � lnðtÞ � 1:6192D28ðvÞ ¼ f ðvÞ � D0; f ðvÞ ¼ 1� 1:0182 � vD0 ¼ 6:42� 10�12m2=s; m ¼ 0:333
8>>>>>>>><>>>>>>>>:
ð7Þ
the prediction model of Eq. (7) proposed by this paper can beused to rapidly, high-efficiently and conveniently determine thechloride diffusion concentration profiles in concrete specimenswith different volume fractions of coarse aggregate at arbitraryexposure time or depth. The variables including diffusion depthsx, exposure times t, and the volume fractions of coarse aggregatev, which are consistent with the experimental study, for examplex = 3.5, 8, 14, 18.5 mm; t = 30, 70, 100, 140, and 180 d; v = 0, 0.2,0.3, 0.4, 0.5, are inserted in Eq. (7). Subsequently, the correspond-ing chloride concentration results can be calculated in terms ofEq. (7) and applied to compare with the experimental chloridemeasurements in Fig. 3, as shown in Fig. 9. Fig. 9 depicts the trendvariations of chloride concentrations in different plain concretespecimens against the depths and exposure times. The chlorideconcentrations, no matter the experimental results or the pre-dicted values by Eq. (7), both decrease as the diffusion depthincreases, whereas increase with the exposure times increasing.This is consistent with the actual situation. The magnitudes ofthe chloride concentrations evaluated by prediction model Eq. (7)are in good agreement with those from the experiments. Moreover,the chloride results for various plain concrete specimens predictedbased on the model Eq. (7) against the experimental measure-ments are plotted in Fig. 10. The chloride concentration data inFig. 10 all come from Fig. 9. The experimental chloride concentra-tion results of concrete with different volume fractions of coarseaggregate (scatters in Fig. 9) are treated as the abscissa in Fig. 10,and the chloride results determined by the prediction model Eq.(7) (curves in Fig. 9) are regarded as the ordinate in Fig. 10.Fig. 10 can intuitively show and analyze the relative errorsbetween the predicted chloride concentrations by Eq. (7) and thechloride results tested by experiment, and this method can referto references [31,34]. This figure shows that almost all of the chlo-ride concentrations estimated by prediction model Eq. (7) are
located within a ±15% error margin, validating the accuracy andreliability of the prediction model for plain concrete specimensdeveloped in this paper. Additionally, the chloride diffusion coeffi-cients from the experiment and the predicted model Eq. (7) arealso listed in Table 4. The chloride diffusion coefficients deter-mined by Eq. (7) show good correlation with those of experiment,and the relative errors between the both chloride diffusion coeffi-cients are almost within a ±10% margin, further validating theaccuracy and reliability of the prediction model proposed by thispaper. In sum, the prediction model of chloride diffusion in con-crete considering the effect of coarse aggregate volume fraction(Eq. (7)) can accurately predict the chloride concentration profilesand diffusion characteristics for plain concrete.
3.3. Prediction model of chloride concentration considering thecoupling effects of coarse aggregate and steel reinforcement
To further explore the effect of steel reinforcement with differ-ent diameters on chloride diffusion concentration in concrete withvarious coarse aggregate volume fractions, the tested chloride con-centrations at the apex of rebar (coordinate x = 18.5 mm andy = 0 mm shown in Fig. 2) for the reinforced concrete specimens,which included the diameters of rebar U = 0, 8, 12, 16, 20 mm;the volume fractions of coarse aggregate v = 0, 0.2, 0.4; and theexperimental exposure times t = 100, 140, 180 d, are all plottedin Fig. 11. In this figure, we can observe that the chloride concen-trations at the apex of rebar with U = 8, 12, 16, 20 mm are allgreater than those ofU = 0 mmwhen the volume fraction of coarseaggregate is constant, and the difference of chloride concentrationsbetween the rebar diameter U = 8, 12, 16, 20 mm and U = 0 mmincreases with the diameter increasing. Subsequently, the chlorideresults at the apex of rebar with U = 8, 12, 16, 20 mm against thevalues forU = 0 mm are drawn in Fig. 12. Figs. 11 and 12 both indi-cate that the blocking effect of steel bar existence can significantenhance the chloride concentrations at the surface of rebar, andthe chloride ion concentrations at the apex of rebar are approxi-mate to maximum three times than those of no rebar. To sumup, it is necessary to deeply explore and further quantify the block-ing effect of steel reinforcement on chloride diffusion concentra-tion in concrete with different volume fractions of coarseaggregate, especially, at the place of rebar apex.
Wang et al. [16] reported that the blocking effect of rebar exis-tence on chloride concentration distribution in concrete is dividedinto two part, i.e. indirect blocking effect and direct blocking effect.The followings will respectively elaborate the influence of indirectand direct blocking effects on chloride concentration at the apex ofrebar.
(1) Determination for coarse aggregate content in front of thesteel bar
The steel reinforcement embedded in concrete can alter themesoscopic structure of concrete adjacent to the rebar, i.e. updatethe coarse aggregate content and distribution within a certain areaaround the steel reinforcement, thereby, affect the chloride diffu-sion coefficient at this area in front of the rebar. This physical phe-nomenon is defined as the indirect blocking effect of steel bar[35,36].
The three reinforced concrete specimens withU = 16 mm at theexposure time of 100, 140, and 180 d are treated as the represen-tatives, and the part③ and④ of the three samples (shown in Fig. 2(b)) are further divided into two parts along the axle wire of rebar,as exhibited in Fig. 13(a). Subsequently, the particle image instru-ment and its corresponding devices is adopted to scan the sectionsof reinforced concrete (S1, S2 marked in Fig. 13(a)), and then, toquantify the coarse aggregate contents and distribution in front

Fig. 9. Comparison of the chloride profiles of concrete specimens between the experiment and prediction model Eq. (7): (a) v = 0; (b) v = 0.2; (c) v = 0.3; (d) v = 0.4; (e) v = 0.5.
48 Y. Wang et al. / Construction and Building Materials 216 (2019) 40–57
of the rebar. The device mainly consists of three components,including the particle image instrument, main controller and com-puter, as shown in Fig. 14. The test implementation procedures areexpressed as follows:
1) The high resolution images for the sections of reinforcedconcrete samples require to be obtained using the scanningfunction of the particle image instrument, and an instance isshown in Fig. 13(b).
2) The real and high resolution images for reinforced concretesamples need to be further processed in black and white,as shown in Fig. 13(c).
3) The concrete cover within the black and white images areevenly divided into 1 mm/layer, and the area fractions ofcoarse aggregate in each area (1 � 100 mm2 rectangle), i.e.the percentage of the white region (denotes coarse aggre-gate) accounting for the 1 � 100 mm2 rectangle exhibitedin Fig. 13(c), are determined respectively.

Fig. 10. Comparison of the chloride concentrations by the prediction model Eq. (7)versus those of experiment in concrete specimens with different volume fractionsof coarse aggregate.
Y. Wang et al. / Construction and Building Materials 216 (2019) 40–57 49
The area fractions of coarse aggregate Arc in different dividedareas (1 � 100 mm2 rectangle) along the front of steel bar(U = 16 mm) for reinforced concrete sections with their originalcoarse aggregate volume fractions v = 0.2, 0.3, 0.4, and 0.5 arerespectively determined during the aforementioned procedures.The results are shown in Fig. 13(d). Fig. 13(d) depicts that the areafractions of coarse aggregate Arc at the adjacent region of steel barshow lower than their corresponding original coarse aggregate vol-ume fractions, i.e. Arc < v, and the area fractions of coarse aggregateArc initially increase and then tend to stable with the distance alongthe front of rebar increasing. The increased Arc is included inapproximately 4 mm width region along the apex of rebar,whereas the values of Arc tend to constant when the distanceexceeds 4 mm. Consequently, it is reasonable to consider that theinfluence area of steel reinforcement (U = 16 mm) on coarse aggre-gate distribution around the steel bar is about 4 � 100 mm2 inclose proximity to the rebar, and this result is very similar to theconclusion reported in literature [35]. Subsequently, the particleimage instrument is again used to measure the total area fractionsof coarse aggregate Arc(t)(v) in the rectangle of 4 � 100 mm2 next tothe steel bar (U = 16 mm) for different reinforced concrete sec-tions. The original coarse aggregate volume fractions of these sec-tions are equal to v = 0.2, 0.3, 0.4, and 0.5, as shown in Fig. 13(e).Notice that the value of Arc(t) with each volume fraction of coarseaggregate v is determined by the average values of three reinforcedconcrete samples’ measurements, and the three samples are corre-sponding with the exposure times of 100, 140, and 180 d.
To compare the Arc(t)(v) with the total area fraction of coarseaggregate at the consistent influence region of steel reinforcementfor their corresponding plain concrete sections (no rebar,
Table 4Chloride diffusion coefficient from the experimental result and the predicted model.
vt
0 0.2 0.3
ER PM RE ER PM RE ER P
30 9.37 9.41 0.33 7.65 7.83 2.36 5.98 670 7.08 7.07 �0.11 6.33 5.82 �8.18 5.08 4100 6.42 6.27 �2.32 5.13 5.13 �0.07 4.30 4140 5.62 5.60 �0.38 4.36 4.56 4.43 3.71 3180 5.01 5.15 2.75 4.02 4.17 3.91 3.30 3
ER: Experimental Result, unit: �10�12 m2/s; PM: Prediction Model, unit: �10�12 m2/s; R
U = 0 mm), the particle image instrument is re-applied to test thetotal area fractions of coarse aggregate Apc(v) in the same4 � 100 mm2 rectangle of plain concrete samples during the imple-mentation procedures of Fig. 15.
Drawing the whole measured Arc(t) and Apc scatters and theircorresponding average values against the volume fractions ofcoarse aggregate in Fig. 16, and we can observe that:
1) The tested Arc(t) and Apc scatters, in which are correspondingto the diameter of steel bar U = 16 mm and U = 0 mm (norebar), respectively, have little differences with each otheron the precondition of a consistent volume fraction of coarseaggregate. Moreover, the relative errors between the scattersand their average values are all within ±15% range. Accord-ingly, it’s appropriate to consider that the average valuesof Arc(t) and Apc at each coarse aggregate volume fractioncan be as the representative during the following analysis.
2) The average values of Arc(t) are all lower than the originalvolume fractions of coarse aggregate v within reinforcedconcrete specimens (see in Fig. 16(a)), validating that therebar existence can decrease the content of coarse aggregatein a certain region around the steel reinforcement, and then,increase the chloride diffusion coefficient in this region,thus, enhance the chloride ion concentration at the surfaceof rebar. This indicates the essential mechanism for the indi-rect blocking effect of steel bar.
3) The tested average values of Apc are approximately equal tothe original volume fractions of coarse aggregate v for rein-forced concrete specimens, as shown in Fig. 16(b) (theabscissa in Fig. 16(b) denotes the actual volume fractionsof coarse aggregate v, and the ordinate means the testedApc values). For the aforementioned phenomenon, Zhenget al. [37] numerically simulate the distribution of aggregateparticles at a concrete element considering the effect offormwork walls. The simulation results show that the vol-ume fraction of average aggregate initially increased andthen asymptotically trended to a certain value as the depthfrom the surface to the inside of concrete element increas-ing. Moreover, the stable aggregate volume fraction valuesare approach to the area fraction of aggregate [38,39]. Dur-ing this paper’s scanning experiment, the conclusion is inaccord with the references [37,38,39]. Accordingly, for thispaper’s study, it can be reasonable to consider Apc = v.
(2) Indirect blocking effect coefficient of rebar a
To quantify the influence of indirect blocking effect of rebar onchloride diffusion coefficient at the apex of steel bar, the indirectblocking effect coefficient of rebar a considering the volume frac-tion of coarse aggregate v is hence defined as:
aðvÞ ¼ D28ðArcðtÞÞD28ðApcÞ ¼ D28ðArcðtÞÞ
D28ðvÞ ¼ D0 � f ðArcðtÞÞD0 � f ðvÞ
¼ 1� 1:0182 � ArcðtÞ1� 1:0182 � v ð8Þ
0.4 0.5
M RE ER PM RE ER PM RE
.14 2.65 5.46 5.50 0.65 4.59 4.78 4.20
.71 �7.17 4.08 4.12 1.02 4.06 3.63 �10.75
.22 �1.96 3.89 3.65 �6.17 3.39 3.23 �4.81
.80 2.31 3.26 3.26 �0.17 2.72 2.89 6.11
.51 6.46 2.82 2.99 5.96 2.41 2.66 10.36
E: Relative Error, %.

Fig. 11. Comparison of the experimental chloride concentrations at the apex ofrebar: (a) v = 0; (b) v = 0.2; (c) v = 0.4.
Fig. 12. Comparison of the experimental chloride concentrations at the apex ofrebar (U– 0) versus those of U = 0.
50 Y. Wang et al. / Construction and Building Materials 216 (2019) 40–57
where D28(Arc(t)) is the reference chloride diffusion coefficient con-sidering the indirect blocking effect of rebar (m2/s), and D28(Arc(t))= D0�f(Arc(t)) by means of Eq. (5); D28(Apc) denotes the referencechloride diffusion coefficient of plain concrete (no rebar) (m2/s),i.e. D28(Apc) = D28(v). For this paper’s study, the steel bar, whichembedded in concrete, would affect the content and distributionof coarse aggregate around the reinforcement; as a result, alter
the chloride diffusion coefficient at this front area of rebar. Accord-ingly, the indirect blocking effect coefficient of rebar in Eq. (8) isdefined based on the relationship of chloride diffusion coefficientin front of steel reinforcement between the rebar presences and dis-appear, and the indirect blocking effect coefficient is used to quan-tify the effect of coarse aggregate content variation within the frontarea of rebar on chloride diffusion coefficient at this area in Eq. (8).
Substituting the tested average values of Arc(t) and Apc (or v)into Eq. (8), the scatters of indirect blocking effect coefficient ofrebar with various volume fractions of coarse aggregate are calcu-lated, and these results are fitted by the linear function, as shownin Fig. 17. Ultimately, the empirical formula of indirect blockingeffect coefficient of rebar (U = 16 mm) considering the volumefraction of coarse aggregate a(v) is obtained using the regressionanalysis and expressed as:
aðvÞ ¼ 1þ 0:9416 � m ð9Þ
(3) Prediction model of chloride concentration at the apex ofrebar (U = 16 mm) considering the volume fraction of coarseaggregate and indirect blocking effect of rebar
Uniting the Eqs. (8) and (9), the expression of D28(Arc(t)) can bedetermined as:
D28ðArcðtÞÞ ¼ aðvÞ � D28ðvÞ ¼ 1 þ 0:9416 � vð Þ � D28ðvÞ ð10ÞSubstituting the D28(Arc(t)) = a(v)�D28(v) into Eq. (7) to replace
the original parameter D28(v), the prediction model of chlorideconcentration at the apex of steel bar (U = 16 mm) consideringthe volume fraction of coarse aggregate and indirect blocking effectof rebar is subsequently established as:
C x; t;vð Þ ¼ Cs tð Þ � 1� erf x
2
ffiffiffiffiffiffiffiffiffiffiffiffiffiffiffiffiffiffiffiffiffiffiffiffiffiffiaðvÞ�D28ðvÞ
1�mt28t
� �mt
q0@
1A
24
35
Cs tð Þ ¼ 0:6009 � lnðtÞ � 1:6192
aðvÞ ¼ 1þ 0:9416 � vD28ðvÞ ¼ f ðvÞ � D28ðv ¼ 0Þ; f ðvÞ ¼ 1� 1:0182 � vD28ðv ¼ 0Þ ¼ 6:423� 10�12m2=s; m ¼ 0:333
8>>>>>>>>>>>>><>>>>>>>>>>>>>:
ð11Þ

Fig. 13. Experimental procedure for determining the area fraction of coarse aggregate at the apex of rebar (U = 16 mm).
Fig. 14. Experimental device for quantifying the indirect blocking effect of rebar: (a) particle image instrument; (b) main controller; (c) computer.
Y. Wang et al. / Construction and Building Materials 216 (2019) 40–57 51
Using the prediction model Eq. (11) to estimate the chlorideconcentrations at the apex of rebar with various volume fractionsof coarse aggregate at the exposure times of 100, 140, and 180 d,the chloride results at the apex of steel bar evaluated by Eq. (11)are compared with those of experiment, as exhibited in Fig. 18.Fig. 18 illustrates the predicted chloride concentrations by modelEq. (11) are all lower than the experimental measurements, and
this variation can be more significantly observed in Fig. 19. It isbecause that the prediction model of Eq. (11) only take accountof the influences of coarse aggregate volume fraction and indirectblocking effect of steel reinforcement, whereas the direct blockingeffect of steel bar is not considered in Eq. (11). Accordingly, thechloride concentrations predicted by Eq. (11) (curves in Fig. 18)are not matched with the experimental results (scatters in

Fig. 15. Experimental procedure for determining the area fraction of coarse aggregate at the consistent influence region of steel reinforcement in plain concrete specimens.
Fig. 16. Tested area fractions of coarse aggregate (4 � 100 mm2 rectangle) in (a)reinforced concrete and (b) plain concrete samples.
Fig. 17. Fitted curve of indirect blocking effect coefficient of rebar (U = 16 mm)considering the volume fraction of coarse aggregate.
Fig. 18. Comparison of the chloride results at the apex of rebar (U = 16 mm):chloride concentrations with various volume fractions of coarse aggregate versusexposure time.
52 Y. Wang et al. / Construction and Building Materials 216 (2019) 40–57
Fig. 18). To more accurately predict the chloride concentrations atthe apex of steel reinforcement, the influence of direct blockingeffect of rebar on chloride diffusion in concrete requires to be fur-ther considered.
(4) Direct blocking effect coefficient of rebar b
Comparing to the irregular shape and random distribution ofcoarse aggregates, the steel reinforcement can be assumed as akind of special cylindrical aggregate with relatively fixed position

Fig. 19. Comparison of the chloride results at the apex of rebar (U = 16 mm):predicted chloride concentrations considering the indirect blocking effect of rebarversus the experimental measurements.
Fig. 20. Direct blocking coefficient of rebar in reinforced concrete specimens.
Fig. 21. Comparison of the chloride results at the apex of rebar (U = 16 mm):chloride concentrations with various volume fractions of coarse aggregate versusexposure time.
Y. Wang et al. / Construction and Building Materials 216 (2019) 40–57 53
embedded in concrete. The transportation of chloride irons can bepostulated to bypass instead of piercing through the steel bar dueto the higher hardness and density of steel bar than mortar.Accordingly, the steel bar can be treated as a physical obstructionto directly block chloride ions transport in concrete resulting in thechloride concentrations accumulation at the apex of rebar, and thisphenomenon is considered as the direct blocking effect of rebar[26]. On the basis of this mechanism, the ratio between the exper-imental chloride concentrations at the apex of rebar and the calcu-lated chloride results by prediction model of Eq. (11) is used todefine the direct blocking effect coefficient of rebar to furtherquantify the influence of direct blocking effect of reinforcementon chloride diffusion behaviors. The direct blocking effect coeffi-cient of rebar (U = 16 mm as an instance) b is hence expressed as:
bðv; tÞ ¼ Ceðc; t;v ;U16Þ=Cmðc; t; v;U16Þ ð12Þ
where Ce(c,t,v,U16) denotes the experimental chloride concentra-tions at the apex of rebar (U = 16 mm) (%), as shown in Fig. 18 (scat-ters); Cm(c,t,v,U16) is the predicted chloride results considering theindirect blocking effect of rebar (estimated by Eq. (11)) (%), asshown in Fig. 18 (continuous lines); c is the thickness of concretecover (mm), and other parameters are the same to above.
The direct blocking effect coefficient of rebar (U = 16 mm) b(v,t) can be determined by substituting the values of Ce(c,t,v,U16)and Cm(c,t,v,U16) within Fig. 18 into Eq. (12), and the b(v, t) resultsare shown in Fig. 20. Fig. 20 depicts that the direct blocking effectcoefficients of rebar b are independent of coarse aggregate volumefraction and exposure time, consequently, the average value of b,i.e. b = 1.1026, is obtained and treated as the representative toquantify the direct blocking effect of rebar.
The chloride concentrations at the apex of rebar considering thevolume fraction of coarse aggregate, indirect and direct blockingeffects of rebar (U = 16 mm) can be quantified by the equivalentrelationship of C(c,t,v,U16) = b�Cm(c,t,v,U16) in terms of Eq. (12).Thus, the prediction model of chloride concentration at the apexof steel bar (U = 16 mm) considering the volume fraction of coarseaggregate, indirect and direct blocking effects of rebar is estab-lished by inserting the direct blocking effect coefficient b into Eq.(11) and hence expressed as follows:
C x; t; v;U16ð Þ ¼ b � Cs tð Þ � 1� erf x
2
ffiffiffiffiffiffiffiffiffiffiffiffiffiffiffiffiffiffiffiffiffiffiffiffiffiffiaðvÞ�D28ðvÞ
1�mt28t
� �mt
q0@
1A
24
35
b ¼ 1:1026Cs tð Þ ¼ 0:6009 � lnðtÞ � 1:6192aðvÞ ¼ 1þ 0:9416 � vD28ðvÞ ¼ f ðvÞ � D28ðv ¼ 0Þ; f ðvÞ ¼ 1� 1:0182 � vD28ðv ¼ 0Þ ¼ 6:423� 10�12m2=s; m ¼ 0:333
8>>>>>>>>>>>>><>>>>>>>>>>>>>:
ð13Þ
Fig. 21 exhibits the comparison between the chloride concen-trations at the apex of rebar (U = 16 mm) predicted by Eq. (13)and the experimental results for reinforced concrete with variousvolume fractions of coarse aggregate at different exposure times.The magnitudes of the chloride concentrations at the apex of rebarevaluated by the prediction model Eq. (13) are in good agreementwith those from the experiments. Also, the chloride concentrationsevaluated by Eq. (13) versus those of experiment are plotted in

Fig. 23. Means of normalized chloride concentrations at the apex of rebar inreinforced concrete specimens versus rebar diameter and the fitted curve ofCn(U/c).
54 Y. Wang et al. / Construction and Building Materials 216 (2019) 40–57
Fig. 22. This drawn shows that most of the scatters fall approxi-mately on the equality line and within a ±5% relative error margin,validating the accuracy and reasonability of the prediction modelof Eq. (13) developed in this paper.
(5) Improved direct blocking effect coefficient of rebar br(U/c)The aforementioned conclusions are all derived and determined
on the precondition of the steel bar diameterU = 16 mm. However,the experimental chloride concentrations at the apex of rebarincrease with the diameter of steel barU increasing. To more wide-spread application of this paper’s proposed prediction model con-sidering the effects of coarse aggregate and steel reinforcement,the tested chloride concentrations at the apex of rebar for rein-forced concrete specimens with the diameter of rebar U = 16 mmand various volume fractions of coarse aggregate are treated asthe base values to improve the direct blocking effect coefficientof rebar, and then, to quantify and determine the direct blockingeffect coefficient of rebar with different diameters. To sum up,the normalized chloride concentrations at the apex of rebar Cn
are defined and expressed as:
Cnðc; t;v ;UÞ ¼ Ceðc; t;v;UÞ=Ceðc; t;v ;U16Þ ð14Þ
where Ce(c,t,v,U) is the tested values of chloride concentration atthe apex of rebar for different reinforced concrete specimens, inwhich includes the diameters of steel bar U = 8, 12, 16, 20 mmand the volume fractions of coarse aggregate v = 0, 0.2, 0.3, 0.4,and 0.5; The other parameters are consistent to above. Substitutingthe corresponding experimental chloride concentrations at the apexof rebar into Eq. (14), the normalized chloride concentrations at theapex of rebar for reinforced concrete specimens with various vol-ume fractions of coarse aggregate against the diameters of steelreinforcement are calculated and shown in Fig. 23.
Fig. 23 illustrates that the relative errors between the scatters ofnormalized chloride concentrations at the apex of rebar, Cn(c,t,v,U),and their average values are almost within ±5% range when thediameter of rebar is constant. Consequently, it’s appropriate toconsider that the values of Cn are independent of coarse aggregatevolume fraction and exposure time. Accordingly, the average val-ues of Cn at each diameter are used as the representatives, andthe linear function is applied to fit the relationship between theCn and the normalized rebar diameter U/c, as shown in Fig. 23(where c means the thickness of concrete cover). Finally, the
Fig. 22. Comparison of the chloride results at the apex of rebar (U = 16 mm):predicted chloride concentrations considering the direct and indirect blockingeffects of rebar versus the experimental measurements.
improved direct blocking effect of rebar is hence expressed asfollows:
brUc
� �¼ b � Cn
Uc
� �¼ 0:5933 � U
c
� �þ 0:5253 ð15Þ
(6) Prediction model of chloride concentration at the apex ofrebar considering the coupling effects of coarse aggregate and steelreinforcement
Using the improved direct blocking effect coefficient br(U/c)expressed in Eq. (15) to replace the original b within Eq. (13), theprediction model of chloride concentration at the apex of rebarconsidering the coupling effects of coarse aggregate and steel rein-forcement is ultimately established and expressed as:
C x; t;v ;Uð Þ ¼ brUc
� � � Cs tð Þ � 1� erf x
2
ffiffiffiffiffiffiffiffiffiffiffiffiffiffiffiffiffiffiffiffiffiffiffiffiffiffiaðvÞ�D28 ðvÞ
1�mt28t
� �mt
q0@
1A
24
35
brUc
� � ¼ 0:5933 � Uc
� �þ 0:5253Cs tð Þ ¼ 0:6009 � lnðtÞ � 1:6192
aðvÞ ¼ 1þ 0:9416 � vD28ðvÞ ¼ f ðvÞ � D28ðv ¼ 0Þ; f ðvÞ ¼ 1� 1:0182 � vD28ðv ¼ 0Þ ¼ 6:423� 10�12m2=s; m ¼ 0:333
8>>>>>>>>>>>>><>>>>>>>>>>>>>:
ð16Þ
Similarly, the chloride concentrations at the apex of rebar testedby experiment are compared with the results estimated by the pro-posed prediction model Eq. (16), as shown in Fig. 24. Fig. 24 exhi-bits that the magnitudes of the chloride concentrations at the apexof rebar evaluated by prediction model Eq. (16) are in good agree-ment with those from the experiments. Moreover, the chlorideresults for various reinforced concrete specimens predicted bymeans of the model Eq. (16) against the experimental measure-ments are plotted in Fig. 25. This figure shows that almost all ofthe chloride concentrations at the apex of rebar estimated by theprediction model Eq. (16) are located within a ±15% error margin,validating the accuracy and reliability of the prediction modelsfor reinforced concrete specimens proposed in this paper. To sumup, the prediction model of chloride concentration at the apex ofrebar considering the coupling effects of coarse aggregate and steelreinforcement (Eq. (16)) can accurately predict the chloride con-

Fig. 24. Comparison of the chloride concentrations at the apex of rebar in reinforced concrete between experiment and prediction model of Eq. (12): (a) v = 0; (b) v = 0.2; (c)v = 0.3; (d) v = 0.4; (e) v = 0.5.
Y. Wang et al. / Construction and Building Materials 216 (2019) 40–57 55
centrations at the apex of rebar with different coarse aggregatevolume fractions and diameters of steel bar at arbitrary exposuretimes.
4. Conclusions
For this paper’s study, an in-door physical experiment for chlo-ride diffusion in plain and reinforced concrete specimens exposedto marine tidal environment was carried out. The specimens werecast using different volume fractions of coarse aggregate anddiameters of steel reinforcement. The chloride concentrations for
experimental specimens were measured at various exposure times,and they were adopted to further investigate the common influ-ences of coarse aggregate volume fraction and blocking effect ofrebar on chloride diffusion in concrete. Finally, a prediction modelof chloride diffusion in concrete considering the coupling effects ofcoarse aggregate and steel reinforcement was proposed. The fol-lowing significant conclusions are showed as:
(1) An in-door experiment for chloride diffusion in plain con-crete specimens with different volume fractions of coarseaggregate exposed to marine tidal zone was carried out,

Fig. 25. Comparison of the chloride concentrations at the apex of rebar by theprediction model of Eq. (12) versus those of experiment in reinforced concretespecimens.
56 Y. Wang et al. / Construction and Building Materials 216 (2019) 40–57
and the chloride profiles at various exposure times weretested. The variations for surface chloride concentrationand apparent chloride diffusion coefficient versus exposuretime are obtained by fitting the Fick’s second law of diffusionto the experimental chloride profiles using the regressionanalysis. The conclusions indicated that the surface chlorideconcentration is independent of coarse aggregate effects,nevertheless, the apparent chloride diffusion coefficientsdecreased with the exposure time increasing.
(2) The impact factor of coarse aggregate volume fraction f(v)was proposed to quantify the effect of coarse aggregate onchloride diffusion coefficient. The f(v) was adopted toimprove the chloride diffusion coefficient within the analyt-ical solution of Fick’s second law. A prediction model of chlo-ride diffusion profiles in concrete considering the effect ofcoarse aggregate volume fraction was established and theaccuracy of this model was validated using the experimentalchloride results.
(3) An in-door physical experiment for chloride diffusion inreinforced concrete specimens exposed to marine tidal envi-ronment was carried out. The specimens were cast usingvarious volume fractions of coarse aggregate and diametersof steel reinforcement. The chloride concentrations forexperimental specimens at different positions and exposuretimes were tested. According to the experimental measure-ments, it can be found that the chloride concentrations atthe apex of rebar were greater than those of other positions,which indicated that the blocking effect of steel bar can sig-nificant enhance the chloride concentrations at the surfaceof rebar. The steel reinforcement embedded in concretecan alter the meso-scopic structure of concrete adjacent tothe rebar, i.e. update (decrease) the coarse aggregate contentand distribution within a region of 4 � 100 mm2 rectangle infront of the steel reinforcement, thereby, affect (increase)the chloride diffusion coefficient at this area of rebar, whichmeant the indirect blocking effects of rebar. Moreover, thesteel bar was regarded as a physical obstruction to blockchloride ions diffusion in concrete resulting in the chlorideconcentrations accumulation at the apex of rebar, whichdenoted the direct blocking effect of rebar.
(4) The indirect and direct blocking effect coefficients a(v),br(U/c) were proposed to quantify the influence of blockingeffect of steel reinforcement on chloride concentrations at
the apex of rebar. Substituting the a(v) and br(U/c) in theprediction model of chloride diffusion in concrete consider-ing the volume fraction of coarse aggregate, an improvedprediction model of chloride concentration at the apex ofrebar considering the coupling effects of coarse aggregateand steel reinforcement was established. The accuracy andreasonability for this paper’s proposed prediction modelwere validated using the experimental measurements.
Conflicts of interest
None.
Acknowledgments
The authors would like to appreciate the insightful and con-structive comments of two anonymous reviewers. This researchwas supported by the National Key Research and DevelopmentProgram of China (2016YFC0802204, 2016YFC0802201), theNational Natural Science Foundation of China (51679166), theNational Natural Science Fund for Innovative Research GroupsScience Foundation (51321065), and the Construction Scienceand Technology Project of the Ministry of Transport of the People’sRepublic of China (2014328224040).
References
[1] A. Costa, J. Appleton, Case studies of concrete deterioration in a marineenvironment in Portuga, Cement. Concrete. Comp. 24 (1) (2002) 169–179.
[2] Y.D. Yan, W.L. Jin, J. Chen, Experiments of chloride ingression in flexuralreinforced concrete beams, Adv. Struct. Eng. 15 (2) (2012) 277–286.
[3] S.L. Amey, D.A. Johnson, M.A. Miltenberger, Predicting the service life ofconcrete marine structures: an environmental methodology, ACI. Struct. J. 95(2) (1998) 205–214.
[4] F.H. Wittmann, Structure of concrete with respect to crack formation, FractureMech-anics of Concrete, Elsevier, London/New York, 1983, pp. 43–74.
[5] C.C. Yang, S.W. Cho, Approximate migration coefficient of percolatedinterfacial transition zone by using the accelerated chloride migration test,Cem. Concr. Res. 35 (2) (2005) 344–350.
[6] C.C. Yang, Effect of the percolated interfacial transition zone on the chloridemigration coefficient of cement-based materials, Mater. Chem. Phys. 91 (2)(2005) 538–544.
[7] S.P. Shah, High Performance Concrete: Past, present and future, Proc., Int.Symp. on High Performance Concrete: Workability, Strength and Durability. C.K. Leung, Y. Z. Li, and J. T. Ding, eds., Vol. 1, Hong Kong Univ. of Science andTechnology, Hong Kong. (2000) 3–29.
[8] S.D. Abyaneh, H.S. Wong, N.R. Buenfeld, Modelling the diffusivity of mortar andconcrete using a three-dimensional mesostructure with several aggregateshapes, Comput. Mater. Sci. 78 (1) (2013) 63–73.
[9] X.X. Li, Y. Xu, S. Chen, Computational homogenization of effective permeabilityin three-phase mesoscale concrete, Constr. Build. Mater. 121 (2016) 100–111.
[10] Y.Z. Wang, C.X. Liu, Y.C. Wang, Q.M. Li, H. Liu, Time-and-depth-dependentmodel of chloride diffusion coefficient for concrete members considering theeffect of coarse aggregate, J. Mater. Civ. Eng. 30 (3) (2018). 04017302 (1-12).10.1061/(ASCE)MT.1943-5533.0002161.
[11] Y.Z. Wang, L.J. Wu, Y.C. Wang, Q.M. Li, Z. Xiao, Prediction model of long-termchloride diffusion into plain concrete considering the effect of theheterogeneity of materials exposed to marine tidal zone, Constr. Build.Mater. 159 (2018) 297–315.
[12] Y.Z. Wang, L.J. Wu, Y.C. Wang, C.X. Liu, Q.M. Li, Effects of coarse aggregates on
[13] Corrosion Propagation of Carbon Steel Rebars in High Performance Concrete, Francisco J Presuel-Moreno, Rolando Bencosme, Kazi Hoque, Manzural Nazim, Amirkhosro Kazemi, Fujian Tang, 2018/11
[14] Corrosion Prevention of Bridge Tendons using Flexible Filler Materials, Francisco J Presuel-Moreno, Carlos Castaneda, Ingrid Santillan, Amirkhosro Kazemi, Fujian Tang, 2018/11
[15] Chloride Diffusivity and Resistivity of Cured and Mature Binary/Ternary Concrete. Francisco J Presuel-Moreno, Sanjoy Barman, Farhad Raof, Amirkhosro Kazemi, 2019/2.

Y. Wang et al. / Construction and Building Materials 216 (2019) 40–57 57
[18] JTJ 202-2011: 2011. Specifications for concrete construction of port andwaterway engineering. Ministry of transport of the people’s republic of China,Beijing, 2011 (in Chinese).
[19] L.Y. Li, J. Xia, S.S. Lin, A multi-phase model for predicting the effective diffusioncoefficient of chlorides in concrete, Constr. Build. Mater. 26 (1) (2012) 295–301.
[20] GB 50164-2011:2011. Standard for quality control of concrete. Ministry ofHousing and Urban-Rural Development of the people’s republic of China,Beijing, 2011 (in Chinese).
[21] C. Xu, W.L. Jin, Z.Y. Li, A new test method to simulate chloride penetration intoconcrete in tidal zone, The Ocean Eng. 29 (4) (2011) 51–59 (in Chinese).
[22] JTJ 270-98: 1998. Testing code of concrete for port and waterway engineering.Ministry of transport of the people’s republic of China, Beijing, 1998 (inChinese).
[23] F.H. Xiang, Study on the Transport Mechanism of Chloride ions in Concrete,Central South University, Changsha, HN, China, 2011 (in Chinese).
[24] L. Pang, Q. Li, Service life prediction of RC structures in marine environmentusing long term chloride ingress data: comparison between exposure trialsand real structure surveys, Constr. Build. Mater. 113 (2016) 979–987.
[25] M. Collepardi, A. Marcialis, R. Turriziani, Penetration of chloride ions intocement paste and concrete, J. Am. Ceram. Soc. 10 (55) (1972) 534–535.
[26] M.D.A. Thomas, P.B. Bamforth, Modelling chloride diffusion in concrete effectof fly ash and slag, Cement. Concrete. Res. 29 (4) (1999) 487–495.
[27] L.J. Wu, W. Li, X.N. Yu, Time-dependent chloride penetration in concrete inmarine environments, Constr. Build. Mater. 167 (2017) 406–413.
[28] Z.Q. Jin, X. Zhao, T.J. Zhao, J.Q. Li, Chloride ions transportation behavior andbinding capacity of concrete exposed to different marine corrosion zones,Constr. Build. Mater. 177 (2018) 170–183.
[29] J.Q. Wu, P.P.N. Faye, W.M. Zhang, B. Diao, Chloride diffusivity and service lifeprediction of RC columns with sustained load under chloride environment,Constr. Build. Mater. 158 (2018) 97–107.
[30] J.Z. Zhang, J. Zhao, Y.R. Zhang, Y.H. Gao, Y.Y. Zheng, Instantaneous chloridediffusion coefficient and its time dependency of concrete exposed to a marinetidal environment, Constr. Build. Mater. 167 (2018) 225–234.
[31] A. Petcherdchoo, Time dependent models of apparent diffusion coefficient andsurface chloride for chloride transport in fly ash concrete, Constr. Build. Mater.38 (1) (2013) 497–507.
[32] L. Tang, J. Gulikers, On the mathematics of time-dependent apparent chloridediffusion coefficient in concrete, Cement. Concrete. Res. 37 (2007) 589–595.
[33] H. Song, C. Lee, K.Y. Ann, Factors influencing chloride transport in concretestructures exposed to marine environments, Cement. Concrete. Comp. 30 (2)(2008) 113–121.
[34] A. Farahani, H. Taghaddos, M. Shekarchi, Prediction of long-term chloridediffusion in silica fume concrete in a marine environment, Cement. Concrete.Comp. 59 (2015) 10–17.
[35] H. Yu, R.J. Himiob, W.H. Hartt, Effects of reinforcement and coarse aggregateson chloride ingress into concrete and time-to-corrosion: Part 1—SpatialChloride Distribution and Implications, Corrosion. 63 (9) (2007) 843–849.
[36] H. Yu, R.J. Himiob, W.H. Hartt, Effects of reinforcement and coarse aggregateson chloride ingress into concrete and time-to-corrosion: Part 2—SpatialDistribution of Coarse Aggregates, Corrosion. 63 (10) (2007) 924–931.
[37] J.J. Zheng, C.Q. Li, L.Y. Zhao, Simulation of two-dimensional aggregatedistribution with wall effect, ASCE-J. Mater. Civil. Eng. 15 (5) (2003) 506–510.
[38] W.X. Xu, H.S. Chen, Influences of shapes and sizes of aggregates on wall effectof concrete, J. Chin. Ceram. Soc. 39 (9) (2011) 1498–1504 (in Chinese).
[39] W.X. Xu, H.S. Chen, Influence of size distribution of multiscale ellipticalaggregates on wall effect of concrete, J. Southeast Univ. (Natural ScienceEdition). 41 (5) (2011) 1048–1053 (in Chinese).