Challenges of high-brightness laser systems: a photon odyssey
Upload
independentCategory
view
2download
0
Mon. Not. R. Astron. Soc. 418, 789–800 (2011) doi:10.1111/j.1365-2966.2011.19530.x
Active galactic nucleus activity and black hole masses in low surfacebrightness galaxies
S. Ramya,1� T. P. Prabhu1� and M. Das1,2�1Indian Institute of Astrophysics, Koramangala, Bangalore 560 034, India2Birla Institute of Technology and Science - Pilani, Hyderabad Campus, Jawahar Nagar, Shameerpet Mandal, Hyderabad 500078, India
Accepted 2011 July 28. Received 2011 July 26; in original form 2010 June 2
ABSTRACTWe present medium resolution optical spectroscopy of a sample of nine low surface brightness(LSB) galaxies. For those that show clear signatures of active galactic nucleus (AGN) emission,we have disentangled the AGN component from stellar light and any Fe I and Fe II contribution.We have decomposed the Hα line into narrow and broad components and determined thevelocities of the broad components; typical values lie between 900 and 2500 km s−1. Of thegalaxies in our study, UGC 6614, UGC 1922, UGC 6968 and LSBC F568−6 (Malin 2) showclear signatures of AGN activity. We have calculated the approximate black hole (BH) massesfor these galaxies from the Hα line emission using the virial approximation. The BH massesare ∼3 × 10⁵ M� for three galaxies and lie in the intermediate-mass BHs domain rather thanthe supermassive range. UGC 6614 harbours a BH of mass 3.8 × 10⁶ M�; it also showsan interesting feature bluewards of Hα and Hβ implying outflow of gas or a one-sided jetstreaming towards us. We have also measured the bulge stellar velocity dispersions using theCa II triplet lines and plotted these galaxies on the M–σ plot. We find that all the three galaxiesUGC 6614, UGC 6968 and F568−6 lie below the M–σ relation for nearby galaxies. Thus, wefind that although the bulges of LSB galaxies may be well evolved, their nuclear BH massesare lower than those found in bright galaxies and lie offset from the M–σ correlation.
Key words: galaxies: active – galaxies: bulges – galaxies: general – galaxies: nuclei.
1 IN T RO D U C T I O N
Low surface brightness (LSB) galaxies are an extreme class oflate-type spiral galaxies (Impey & Bothun 1997). They are poorin star formation (O’Neil et al. 2004; Boissier et al. 2008), havelow metallicities (McGaugh 1994) and low dust masses (Hinz et al.2007; Rahman et al. 2007). However, they are gas rich (H I) andtheir H I discs are far more extended than their diffuse stellar discs(O’Neil et al. 2004). Their discs have weak spiral arms and their barperturbations are not as prominent as those seen in bright galaxies.This low level of disc activity can be attributed to the presence ofdark matter haloes (de Blok et al. 2001) that tend to prevent theformation of disc instabilities (Mihos, McGaugh & de Blok 1997;Mayer & Wadsley 2004; Galaz et al. 2011). Surveys show thatalthough LSB galaxies are common in our local Universe they arepreferentially found in low-density environments (Rosenbaum et al.2009) and can have widely varying morphologies; starting from thepopulous dwarf LSB galaxies (Schombert, McGaugh & Eder 2001)
�E-mail: [email protected] (SR); [email protected] (TPP); [email protected] (MD)
to the giant LSB (GLSB) galaxies, of which Malin 1 is a goodexample (Pickering et al. 1997).
Although a lot of work has been done towards understand-ing the stellar and gas content of LSB galaxies, not much isknown about their nuclear activity or central black hole (BH)masses. A significant fraction of GLSB galaxies have activegalactic nuclei (AGN) that are often associated with massivebulges (Schombert 1998; Impey, Burkholder & Sprayberry 2001).The AGN may be radio-bright (Das et al. 2009a) and visibleat X-ray wavelengths as well (Das et al. 2009b; Naik et al.2010). It is now well established that the BH masses in galax-ies are correlated with their bulge velocity dispersions (M–σ )and bulge luminosities (M–L) (Ferrarese & Merritt 2000; Geb-hardt et al. 2000) which suggests that BH formation, galaxy evolu-tion and AGN activity are all interlinked (Merloni & Heinz 2008;Somerville et al. 2008; Schawinski et al. 2010). However, the M–σ
and M–L relations show less scatter when only ellipticals and early-type galaxies are included (Graham 2008a,b; Hu 2008; Gultekinet al. 2009). Late-type spirals introduce more scatter in the cor-relations which create the need for newer calibrations of M−σ
and M−L (Graham et al. 2011) as better estimates of BH massesat the low mass end are available. This may be due to a largerintrinsic scatter in the BH masses of late-type spirals or simply
C© 2011 The AuthorsMonthly Notices of the Royal Astronomical Society C© 2011 RAS
at Indian Institute of Astrophysics on A
ugust 22, 2014http://m
nras.oxfordjournals.org/D
ownloaded from

790 S. Ramya, T. P. Prabhu and M. Das
measurement uncertainties since late-type spirals, in general, havesmaller bulges. They also show weaker AGN activity comparedto the earlier type galaxies (Ho 2008). Alternatively, in a studyby Beifiori et al. (2009) involving Hubble Space Telescope (HST)observations of 105 nearby galaxies spanning a wide range of Hub-ble types from ellipticals to late-type spirals, the estimated BHmasses’ upper limits appear to lie closer to the expected BH massesin the most massive elliptical galaxies with values of σ above220 km s−1 than for galaxies with σ in the range 90–220 km s−1,which appears to be consistent with a co-evolution of supermassiveBHs (SMBHs) and galaxies driven by dry mergers.
It is not clear where LSB galaxies lie on the M–σ plot. Theirbulge velocity and disc rotation speeds suggest that they lie belowthe M–σ correlation for bright galaxies (Pizzella et al. 2005). X-raystudies also suggest that GLSB galaxies do not lie on the radio–X-ray correlation (Das et al. 2009b) and their BH masses maybe quite low (Naik et al. 2010). In this paper, we use detailedoptical spectroscopy to determine the position of a sample of LSBgalaxies on the M–σ diagram. We observed the nuclear spectra ofseveral bulge-dominated LSB galaxies; for galaxies that showedAGN emission, we estimated both the BH masses and also thebulge velocity dispersion. In the following sections, we presentour observations, the results and discuss the implications of ourfindings.
2 SAMPLE SELECTION
Our sample consists of nine large, bulge-dominated LSB galaxiesfrom Schombert & Bothun (1987), of which eight have been ob-served further by Schombert (1998). The basic parameters of thegalaxies are listed in Table 1. The LSB galaxies in the Schombertsample were all H I rich, giant, spiral galaxies that were derivedfrom the uppasala general catalogue (UGC) catalogue; they havesystemic velocities that are less than 15 000 km s−1. We chose a sub-set of eight nearby galaxies from that sample that had vsys ≤ 10 000km s−1 and appear to be bulge-dominated galaxies with LSB discs.The last galaxy in our list, F568−6 (or Malin 2), has been observedby Sprayberry et al. (1995) and is also bulge-dominated. The prop-erties of individual galaxies are summarized below.UGC 1378. This galaxy has a prominent bulge and a diffuse stellardisc. It is classified as an LSB galaxy with an active nucleus bySchombert (1998). The bulge shows diffuse X-ray emission, possi-bly associated with an old stellar population (Das et al. 2009b).UGC 1922. The galaxy has a featureless disk and a bright bulge thatalso shows diffuse X-ray emission. It is classified as an LSB galaxywith an active nucleus by Schombert (1998). UGC 1922 is also one
of the few LSB galaxies that have a significant concentration ofmolecular gas (O’Neil & Schinnerer 2003).UGC 3968. Not much is known about this LSB galaxy except thatit has a prominent bulge with a faint disc. The Two Micron All SkySurvey image reveals a bar associated with the bulge and two faintspiral arms. It is also classified as an LSB galaxy by Schombert(1998), but it is not clear whether the galaxy has an AGN.UGC 4219. Not much is known about this GLSB galaxy either.According to Schombert (1998), the galaxy has a large bulge andan AGN. The LSB disc shows faint spiral arms.UGC 6614. This is a well-studied GLSB galaxy (de Blok, van derHulst & Bothun 1995a). It is close to face-on in morphology and hasa large bulge surrounded by a ring-like feature (Hinz et al. 2007;Rahman et al. 2007). The disc has faint but tightly wound spiralarms (Pickering et al. 1997). The bulge hosts an AGN that is brightat optical (Schombert 1998), radio (Das et al. 2006) and X-ray (Naiket al. 2010) wavelengths.UGC 6754. This galaxy has an LSB disc (Schombert & Bothun1987) and a prominent bulge but does not appear to have an AGN(Schombert 1998). The disc has flocculent spiral arms and onlypatchy star formation (Amram et al. 1994).UGC 6968. Not much is known about this galaxy, but it is describedas an LSB galaxy having a prominent bulge and an AGN (Schombert1998). There are two faint spiral arms extending out into the disc.UGC 7357. This galaxy has an LSB disc (MacArthur, Courteau &Holtzman 2003) and a bright bulge, but does not appear to have anAGN (Schombert 1998). The disc is fairly featureless.F568−6 (Malin 2). This is also a relatively well-studied GLSBgalaxy. It has an LSB disc (Schombert & Bothun 1987), prominentbulge and an AGN (Schombert 1998). Like UGC 1922, it is one ofthe rare LSB galaxies that have a significant mass of molecular gas(Das, Boone & Viallefond 2010).
3 O B S E RVAT I O N S A N D DATA R E D U C T I O N
3.1 HCT data
The LSB galaxies were observed using the 2-m Himalayan ChandraTelescope (HCT) at the Indian Astronomical Observatory (IAO),Hanle, which is remotely controlled from the Centre for Researchand Education in Science and Technology (CREST), Indian Instituteof Astrophysics (IIA), Bangalore. The spectra were obtained using a11 arcmin × 1.92 arcsec slit (#167l) in combination with a grism #7(blue region) and grism #8 (red region) which cover the wavelengthranges of 3700–7200 and 5500–9000 Å with dispersions of 1.46and 1.26 Å pixel−1, respectively. The spectral resolution is around
Table 1. The sample of LSB galaxies.
Galaxy Other Galaxy Velocitya Distanceb Galaxy Galaxy Galaxy Absolutename type (km s−1) (Mpc) coordinates (J2000) inclination size (arcmin) magnitude (MH)
UGC 1378 PGC 007247 (R)SB(rs)a 2935 43 01h56m19.s2 + 73◦16′58′′ 68.◦6 3.4 −24.01UGC 1922c PGC 009373 S 10 894 151 02h27m45.s8 + 28◦12′33′′ 29.◦6 2.1 −25.25UGC 3968 PGC 021636 SB(r)c 6780 94 07h42m45.s2 + 66◦15′30′′ 37.◦8 1.4 −23.55UGC 4219 PGC 022766 SA(rs)b 12 433 170 08h06m42.s8 + 39◦05′25′′ 44.◦7 1.1 −24.37UGC 6614 PGC 036122 (R)SA(r)a 6352 86 11h39m14.s9 + 17◦08′37′′ 29.◦9 1.7 −23.70UGC 6754d PGC 036740 SA(rs)b 7025 96 11h46m47.s2 + 20◦40′32′′ 29.◦1 3.0 −24.74UGC 6968 PGC 037704 S 8232 113 11h58m44.s6 + 28◦17′22′′ 44.◦7 2.8 −24.04UGC 7357 PGC 039640 SAB(s)c 6682 91 12h19m13.s4 + 22◦25′54′′ 48◦ 1.6 −22.17
F568−6 Malin 2 Sd/ 13 830 189 10h39m52.s5 + 20◦50′49′′ 38◦ 1.5 −25.50
aHeliocentric velocities from NED; bGalactocentric distances from NED assuming H0 = 73 km s−1 Mpc−1; c = IC 226; d = NGC 3883.
C© 2011 The Authors, MNRAS 418, 789–800Monthly Notices of the Royal Astronomical Society C© 2011 RAS
at Indian Institute of Astrophysics on A
ugust 22, 2014http://m
nras.oxfordjournals.org/D
ownloaded from
AGN activity and black hole masses in LSB galaxies 791
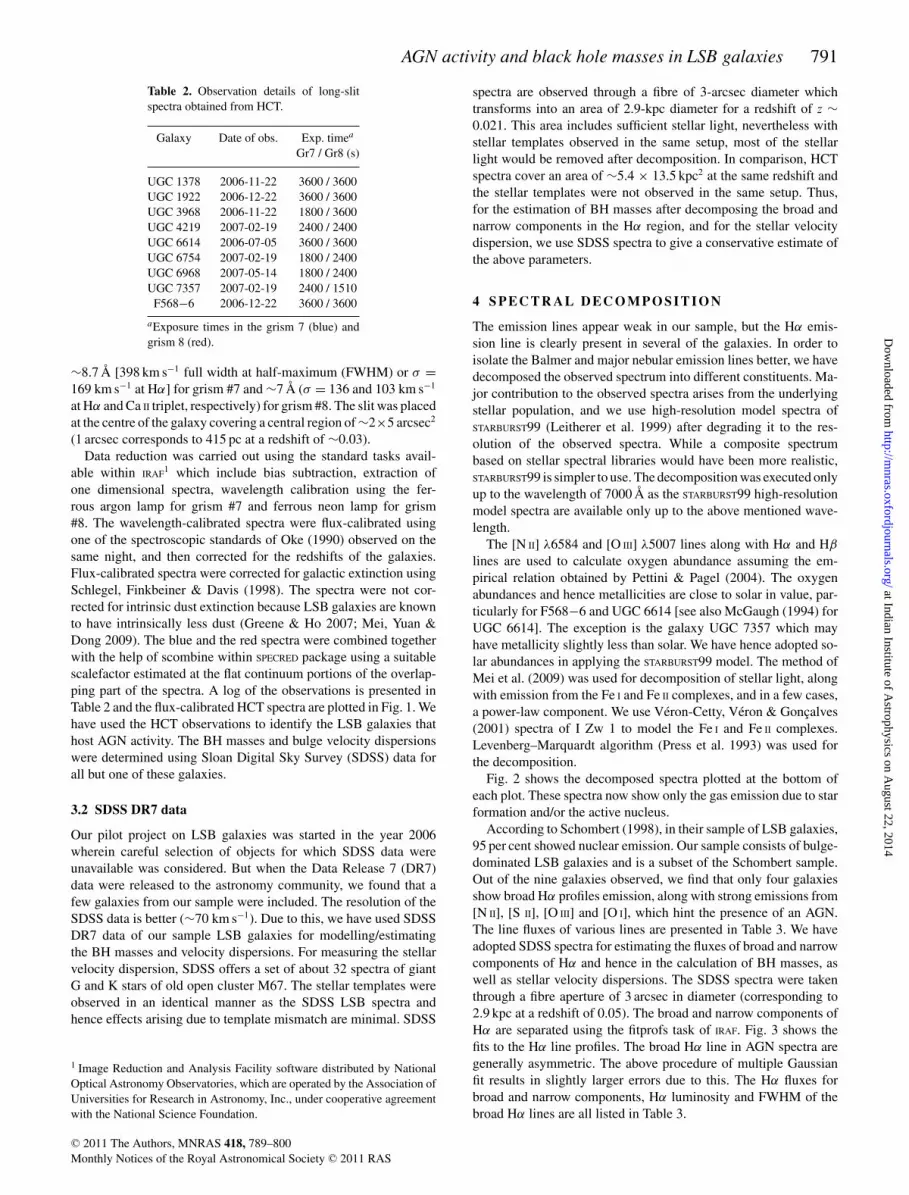
Table 2. Observation details of long-slitspectra obtained from HCT.
Galaxy Date of obs. Exp. timea
Gr7 / Gr8 (s)
UGC 1378 2006-11-22 3600 / 3600UGC 1922 2006-12-22 3600 / 3600UGC 3968 2006-11-22 1800 / 3600UGC 4219 2007-02-19 2400 / 2400UGC 6614 2006-07-05 3600 / 3600UGC 6754 2007-02-19 1800 / 2400UGC 6968 2007-05-14 1800 / 2400UGC 7357 2007-02-19 2400 / 1510
F568−6 2006-12-22 3600 / 3600
aExposure times in the grism 7 (blue) andgrism 8 (red).
∼8.7 Å [398 km s−1 full width at half-maximum (FWHM) or σ =169 km s−1 at Hα] for grism #7 and ∼7 Å (σ = 136 and 103 km s−1
at Hα and Ca II triplet, respectively) for grism #8. The slit was placedat the centre of the galaxy covering a central region of ∼2×5 arcsec2
(1 arcsec corresponds to 415 pc at a redshift of ∼0.03).Data reduction was carried out using the standard tasks avail-
able within IRAF1 which include bias subtraction, extraction ofone dimensional spectra, wavelength calibration using the fer-rous argon lamp for grism #7 and ferrous neon lamp for grism#8. The wavelength-calibrated spectra were flux-calibrated usingone of the spectroscopic standards of Oke (1990) observed on thesame night, and then corrected for the redshifts of the galaxies.Flux-calibrated spectra were corrected for galactic extinction usingSchlegel, Finkbeiner & Davis (1998). The spectra were not cor-rected for intrinsic dust extinction because LSB galaxies are knownto have intrinsically less dust (Greene & Ho 2007; Mei, Yuan &Dong 2009). The blue and the red spectra were combined togetherwith the help of scombine within SPECRED package using a suitablescalefactor estimated at the flat continuum portions of the overlap-ping part of the spectra. A log of the observations is presented inTable 2 and the flux-calibrated HCT spectra are plotted in Fig. 1. Wehave used the HCT observations to identify the LSB galaxies thathost AGN activity. The BH masses and bulge velocity dispersionswere determined using Sloan Digital Sky Survey (SDSS) data forall but one of these galaxies.
3.2 SDSS DR7 data
Our pilot project on LSB galaxies was started in the year 2006wherein careful selection of objects for which SDSS data wereunavailable was considered. But when the Data Release 7 (DR7)data were released to the astronomy community, we found that afew galaxies from our sample were included. The resolution of theSDSS data is better (∼70 km s−1). Due to this, we have used SDSSDR7 data of our sample LSB galaxies for modelling/estimatingthe BH masses and velocity dispersions. For measuring the stellarvelocity dispersion, SDSS offers a set of about 32 spectra of giantG and K stars of old open cluster M67. The stellar templates wereobserved in an identical manner as the SDSS LSB spectra andhence effects arising due to template mismatch are minimal. SDSS
1 Image Reduction and Analysis Facility software distributed by NationalOptical Astronomy Observatories, which are operated by the Association ofUniversities for Research in Astronomy, Inc., under cooperative agreementwith the National Science Foundation.
spectra are observed through a fibre of 3-arcsec diameter whichtransforms into an area of 2.9-kpc diameter for a redshift of z ∼0.021. This area includes sufficient stellar light, nevertheless withstellar templates observed in the same setup, most of the stellarlight would be removed after decomposition. In comparison, HCTspectra cover an area of ∼5.4 × 13.5 kpc2 at the same redshift andthe stellar templates were not observed in the same setup. Thus,for the estimation of BH masses after decomposing the broad andnarrow components in the Hα region, and for the stellar velocitydispersion, we use SDSS spectra to give a conservative estimate ofthe above parameters.
4 SPECTRAL D ECOMPOSI TI ON
The emission lines appear weak in our sample, but the Hα emis-sion line is clearly present in several of the galaxies. In order toisolate the Balmer and major nebular emission lines better, we havedecomposed the observed spectrum into different constituents. Ma-jor contribution to the observed spectra arises from the underlyingstellar population, and we use high-resolution model spectra ofSTARBURST99 (Leitherer et al. 1999) after degrading it to the res-olution of the observed spectra. While a composite spectrumbased on stellar spectral libraries would have been more realistic,STARBURST99 is simpler to use. The decomposition was executed onlyup to the wavelength of 7000 Å as the STARBURST99 high-resolutionmodel spectra are available only up to the above mentioned wave-length.
The [N II] λ6584 and [O III] λ5007 lines along with Hα and Hβ
lines are used to calculate oxygen abundance assuming the em-pirical relation obtained by Pettini & Pagel (2004). The oxygenabundances and hence metallicities are close to solar in value, par-ticularly for F568−6 and UGC 6614 [see also McGaugh (1994) forUGC 6614]. The exception is the galaxy UGC 7357 which mayhave metallicity slightly less than solar. We have hence adopted so-lar abundances in applying the STARBURST99 model. The method ofMei et al. (2009) was used for decomposition of stellar light, alongwith emission from the Fe I and Fe II complexes, and in a few cases,a power-law component. We use Veron-Cetty, Veron & Goncalves(2001) spectra of I Zw 1 to model the Fe I and Fe II complexes.Levenberg–Marquardt algorithm (Press et al. 1993) was used forthe decomposition.
Fig. 2 shows the decomposed spectra plotted at the bottom ofeach plot. These spectra now show only the gas emission due to starformation and/or the active nucleus.
According to Schombert (1998), in their sample of LSB galaxies,95 per cent showed nuclear emission. Our sample consists of bulge-dominated LSB galaxies and is a subset of the Schombert sample.Out of the nine galaxies observed, we find that only four galaxiesshow broad Hα profiles emission, along with strong emissions from[N II], [S II], [O III] and [O I], which hint the presence of an AGN.The line fluxes of various lines are presented in Table 3. We haveadopted SDSS spectra for estimating the fluxes of broad and narrowcomponents of Hα and hence in the calculation of BH masses, aswell as stellar velocity dispersions. The SDSS spectra were takenthrough a fibre aperture of 3 arcsec in diameter (corresponding to2.9 kpc at a redshift of 0.05). The broad and narrow components ofHα are separated using the fitprofs task of IRAF. Fig. 3 shows thefits to the Hα line profiles. The broad Hα line in AGN spectra aregenerally asymmetric. The above procedure of multiple Gaussianfit results in slightly larger errors due to this. The Hα fluxes forbroad and narrow components, Hα luminosity and FWHM of thebroad Hα lines are all listed in Table 3.
C© 2011 The Authors, MNRAS 418, 789–800Monthly Notices of the Royal Astronomical Society C© 2011 RAS
at Indian Institute of Astrophysics on A
ugust 22, 2014http://m
nras.oxfordjournals.org/D
ownloaded from

792 S. Ramya, T. P. Prabhu and M. Das
Figure 1. Spectra of the LSBs observed from HCT using the blue (#7) and red (#8) grisms and combined together using the scombine task of IRAF. The x-axisrepresents the rest-frame wavelength. The spectra are arbitrarily displaced for clear viewing.
We have adopted the penalized-pixel fitting (pPxF) algorithm ofCappellari & Emsellem (2004) for recovering the stellar velocitydispersion. pPxF is Gauss–Hermite parametrization (Gerhard 1993;van der Marel & Franx 1993) that works in the pixel space. The
reason is that in pixel space it is easy to mask gas emission linesor bad pixels from the fit and the continuum matching can be di-rectly taken into account (Cappellari & Emsellem 2004). Also, theestimation of measurement errors are simplified. pPxF creates an
C© 2011 The Authors, MNRAS 418, 789–800Monthly Notices of the Royal Astronomical Society C© 2011 RAS
at Indian Institute of Astrophysics on A
ugust 22, 2014http://m
nras.oxfordjournals.org/D
ownloaded from

AGN activity and black hole masses in LSB galaxies 793
Figure 2. (a) Plots show observed HCT spectra on the top, with best-fitting Gyr model showing the age of the underlying stellar population as a dashed line.Fe I and Fe II template spectra taken from Veron-Cetty et al. (2001) are plotted as dot–dashed line. Dotted lines seen in UGC 1378, UGC 3968 and UGC 4219are power-law continuum following Mei et al. (2009). The bottom spectra drawn as thick solid lines show the subtracted spectrum. The x-axis represents therest-frame wavelength. (b) UGC 6614 and UGC 6968 are best fitted using only the stellar spectra from STARBURST99, while the spectra of UGC 7357 andF568−6 require additional power-law continuum shown as dotted lines in these plots.
C© 2011 The Authors, MNRAS 418, 789–800Monthly Notices of the Royal Astronomical Society C© 2011 RAS
at Indian Institute of Astrophysics on A
ugust 22, 2014http://m
nras.oxfordjournals.org/D
ownloaded from

794 S. Ramya, T. P. Prabhu and M. Das
Table 3. Fluxes of emission lines in the units of 10−15 erg cm−2 s−1 obtained from HCT spectra.a
Galaxy [O II] Hβ [O III] [O I] Hαb [N II] [S II]3727 Å 4861 Å 5007 Å 6300 Å 6563narrow 6548 Å 6584 Å 6717 Å 6731 Å
UGC 1378 – – 5.75 ± 0.54 – 5.30 ± 0.81 – 8.20 ± 0.87 5.30 ± 1.56 4.74 ± 1.25(9.41 ± 0.84) (10.12 ± 1.19) (10.16 ± 0.98) (13.07 ± 3.12) (12.72 ± 3.03)
UGC 1922 31.01 ± 0.07 4.35 ± 0.67 3.32 ± 0.56 2.21 ± 0.73 –c 3.77 ± 0.69 8.29 ± 0.59 5.20 ± 1.36 3.56 ± 0.89(9.60 ± 0.23) (9.47 ± 1.08) (8.44 ± 1.23) (9.82 ± 3.06) – (15.58 ± 1.88) (18.72 ± 3.08) (11.67 ± 2.60) (9.93 ± 2.95)
UGC 3968 – 2.08 ± 0.13 – – 3.50 ± 0.51 1.81 ± 0.52 2.75 ± 0.35 0.91 ± 0.40 1.45 ± 0.59– (8.76 ± 0.71) – – (10.41 ± 0.92) (14.73 ± 3.01) (9.47 ± 0.91) (8.02 ± 2.75) (13.31 ± 4.58)
UGC 4219 – 1.10 ± 0.25 – – 4.45 ± 0.50 0.58 ± 0.35 1.08 ± 0.39 0.69 ± 0.45 0.46 ± 0.38– (10.03 ± 2.59) – – (11.75 ± 0.86) (8.91 ± 5.37) (10.30 ± 3.76) (11.37 ± 9.13) (10.64 ± 10.57)
UGC 6614 7.89 ± 0.09 2.56 ± 0.35 5.12 ± 0.31 3.78 ± 0.86 –c 1.69 ± 0.55 5.58 ± 0.40 5.46 ± 0.36d
– (10.52 ± 1.80) (12.41 ± 0.94) (13.93 ± 2.88) (15.63 ± 0.98) (16.78 ± 3.91) (15.63 ± 0.98) (18.55 ± 2.13)UGC 6754 – – 0.59 ± 0.38 – 1.41 ± 0.83 – 0.18 ± 0.42 0.54 ± 0.33 0.76 ± 0.56
– – (8.59 ± 6.63) – (5.54 ± 8.57) – (5.83 ± 4.84) (7.34 ± 4.46) (11.15 ± 8.04)UGC 6968 – 4.52 ± 0.62 3.49 ± 0.43 1.14 ± 0.41 –c 0.40 ± 0.53 2.10 ± 0.53 1.49 ± 0.61 2.14 ± 1.09
– (15.80 ± 2.58) (12.25 ± 1.83) (7.45 ± 3.57) – – – (6.78 ± 2.60) (15.06 ± 7.56)UGC 7357 – 2.03 ± 0.08 0.45 ± 0.08 – 4.60 ± 0.06 1.16 ± 0.09 2.57 ± 0.07 2.31 ± 0.16 1.83 ± 0.13
– (8.51 ± 0.25) (3.95 ± 0.48) – (8.21 ± 0.16) (10.37 ± 0.78) (9.85 ± 0.36) (10.25 ± 0.36) (11.12 ± 0.79)F568−6 – 1.66 ± 0.26 1.55 ± 0.31 0.49 ± 0.39 –c – 2.34 ± 1.99 0.79 ± 0.61 0.54 ± 0.39
– (12.57 ± 2.23) (10.17 ± 1.56) (9.65 ± 2.33) – – (15.31 ± 1.31) (11.56 ± 7.78) (9.77 ± 7.51)
aThe values quoted inside the brackets for each of the galaxies are FWHM of each of the lines whose fluxes are given above.bHα fluxes for the objects which do not host AGN.cBroad Hα line is detected and hence separation of broad and narrow lines is done. These are deblended and given in the Table 4.dThe telluric line λ6870 Å exactly coincided with the [S II] emission. After the telluric line correction, the lines could not be resolved and hence could not bedeblended. Total [S II] flux is given here.
algorithm, wherein, initial guesses for V (redshift, z) and σ are pro-vided. The model spectra are convolved with a broadening functionusing initial σ values. χ 2 is calculated for each data set. The resid-uals or χ 2 for each of the data points is perturbed and fed into anon-linear least squares optimization routine, in this case, MonteCarlo optimization. The whole procedure is iterated to obtain V , σ
and Gauss–Hermite polynomials. The estimation of Gauss–Hermitepolynomials becomes a problem if the observed velocity dispersionis of order 2 pixels or σ < 140 km s−1 (1 pixel = 70 km s−1 for SDSSdata). A detailed explanation of the procedure can be obtained fromCappellari & Emsellem (2004).
With the availability of libraries with high spectral resolutionstellar and galaxy spectra, templates can be carefully matched withthe observed galaxy spectra. The 32 G and K giant stars of old opencluster M67 observed with the SDSS are used as stellar templates.Empirically, early K giants consistently provide the closest matchto both the Mg I b and Ca II triplet regions of many AGN samples.Here, we have tried to measure the stellar velocity dispersion byfitting the Ca II triplet lines for these galaxies, UGC 6614, UGC6968 and F568−6. According to Greene & Ho (2007), the optimalspectral region for measuring σ depends on the Eddington ratio,continuum level of the AGN and redshift of interest which suggeststhat for z < 0.05, Ca II triplet is the region of choice for Eddingtonratio ≤0.5 for the most reliable measurement of σ . The pPxF codewas applied to only Ca II triplet region to estimate σ . Fig. 4 displaysthe fits to the data; fitting error of ∼10 per cent is estimated fromthe residuals.
5 AGN AC TIVITY AND BLACK HOLE MAS SES
5.1 Emission line diagnostic diagram
It is interesting to investigate the positions occupied by these LSBgalaxies in the Baldwin–Phillips–Terlevich (BPT) diagnostic di-agram [first given by Baldwin, Phillips & Terlevich (1981) andimproved further by Veilleux & Osterbrock (1987) – see Kewley
et al. (2001, 2006) and references therein]. Fig. 5 shows the diagnos-tic diagrams plotted for [O III]/Hβ versus [N II]/Hα, [S II]/Hα and[O I]/Hα, respectively. Also plotted in these diagrams are the de-marcation lines between starbursts, Seyferts and LINERs obtainedfrom Kewley et al. (2001, 2006) and Kauffmann et al. (2003). Fromthe plots, four galaxies appear strong candidates for AGN, showingLINER-like activity. Of these, the galaxies F568−6 and UGC 6614also show a high value of [O III]/Hβ ∼1.5 when compared to othergalaxies in the sample and could be Seyfert-like. It may be notedthat the [O III]/Hβ ratio for low-mass AGNs selected from SDSS is1.9 for one kind of sample (Greene & Ho 2007). The width of thebroad Hα lines observed in these galaxies is below ∼2000 km s−1,indicating that they both belong to the class of narrow-line Seyfert 1galaxies (NLS1s).
5.2 Stellar velocity dispersion σ∗
The stellar velocity dispersion σ ∗ is measured using the Ca II tripletlines adopting the pPxF code of Cappellari & Emsellem (2004).We could detect the Ca II triplet lines at 8542 and 8662 Å in someof our galaxies such as UGC 6614 and F568−6. However, dueto template mismatch, we could not estimate σ ∗ using the HCTspectra. Hence, we used the SDSS spectra for measuring σ ∗. Thespectral resolution of SDSS spectra are about 4 Å, which amountsto a velocity width of about 140 km s−1 and σ = 70 km s−1. Thederived values for UGC 6614, UGC 6968 and LSBC F568−6 are inthe range 150–210 km s−1. The SDSS spectrum is not available forthe galaxy UGC 1922 and hence we could not estimate the stellarvelocity dispersion for this galaxy. We estimate σ ∗ ∼ 157, ∼196 and∼209 km s−1 for UGC 6614, UGC 6968 and F568−6, respectively,using SDSS spectra. These values are shown in Table 4. Fig. 4shows the fits to the observed data obtained using the pPxF code.
There is some discussion in the literature on the need to reducethe observed stellar velocity dispersions to a uniform system, sincethe observed values are averaged over the slit or aperture size whichwill translate into different sizes on the face of the galaxy with
C© 2011 The Authors, MNRAS 418, 789–800Monthly Notices of the Royal Astronomical Society C© 2011 RAS
at Indian Institute of Astrophysics on A
ugust 22, 2014http://m
nras.oxfordjournals.org/D
ownloaded from

AGN activity and black hole masses in LSB galaxies 795
Figure 3. (a) Fits to the broad and narrow emission line components for thegalaxies F568−6 and UGC 1922 from SDSS. The points show the observedspectra after decomposition. The dotted lines show the individual Gaussianfits to the lines and the solid line shows the combined fits for the region. Thespectra used for estimating BH mass in F568−6 is the SDSS spectra, whilefor UGC 1922 we have used HCT spectra as SDSS data for this galaxy areunavailable. (b) Using SDSS spectra for the two galaxies UGC 6614 andUGC 6968.
respect to the bulge scalelength. Jorgensen, Franx & Kjaergaard(1995) transform the values to the equivalent of an aperture ofradius re/8, where re is the effective bulge radius. The effective bulgeradius is about 4.2 arcsec for UGC 6968 as calculated by Gavazziet al. (2000) using near-IR H-band image of the galaxy. ThoughMcGaugh (1994) has attempted only to fit the disc, the bulge isvisible in their surface brightness profile plots for the galaxies UGC6614 and F568−6. de Blok, van der Hulst & Bothun (1995b) havealso obtained the surface brightness profile for UGC 6614 but fit
Figure 4. The thin red line fits to the observed SDSS spectra using thepPxF code. The thick black line represents the observed spectra, the red lineis the best-fitting SDSS template for the Ca II triplet region to estimate thevelocity dispersion σ ∗ for the three galaxies namely (from top to bottom)UGC 6614, UGC 6968 and F568−6. Measured σ ∗ is 157, 196 and 209km s−1, respectively, for the three galaxies. Green dots show the residues ofthe fit.
only the disc. The effective bulge radius re for the galaxies UGC1922, UGC 6614 and F568−6 are not available in the literature. Onthe other hand, as pointed out by Ferrarese & Merritt (2000), theapplied corrections for the velocity dispersion σ ∗ are very small, themaximum correction being <5 per cent. Greene & Ho (2005) and
C© 2011 The Authors, MNRAS 418, 789–800Monthly Notices of the Royal Astronomical Society C© 2011 RAS
at Indian Institute of Astrophysics on A
ugust 22, 2014http://m
nras.oxfordjournals.org/D
ownloaded from

796 S. Ramya, T. P. Prabhu and M. Das
Figure 5. Diagnostic diagrams for the sample of LSB galaxies, observed from HCT. The dashed line in the leftmost figure, log([O III]/Hβ) versus log([N II]/Hα),is the starburst–Seyfert demarcation taken from Kauffmann et al. (2003). The dotted line is the extreme starburst line of Kewley et al. (2001). The solid linesshowing the demarcation in log([O III]/Hβ) versus log([S II]/Hα) and log([O III]/Hβ) versus log([O I]/Hα) are taken from Kewley et al. (2001). The straight linedrawn in the centre and right plots is the Seyfert–LINER demarcation line taken from Kewley et al. (2006). The [O I] emission was clearly detected only infour of the galaxies UGC 1922, UGC 6614, UGC 6968 and F568−6. These galaxies definitely host near-Seyfert kind of nuclei. UGC 7357 and UGC 4219clearly fall in the starburst regime, and the galaxy UGC 3968 might be hosting a starburst–AGN composite nucleus as seen from the diagnostic diagrams.
Table 4. Hα flux for narrow and broad components in erg cm−2 s−1, luminosity of broad Hα line, FWHM of thebroad Hα line, σ ∗ calculated using Ca II triplet lines from SDSS spectra for three galaxies UGC 6614, UGC 6968and F568−6. Due to unavailability of SDSS data for UGC 1922, HCT spectra are used for estimation of BH mass.
Galaxy Hαa LHα FWHMb σ ∗ MBH
Broad Narrow (×1040 erg s−1) (km s−1) (km s−1) (×106 M�)
UGC 1922 8.13 ± 1.50 4.79 ± 1.93 2.21 ± 0.410 855.7 ± 140.7 – 0.39+0.18−0.15
UGC 6614 32.77 ± 3.62 5.11 ± 0.71 2.91 ± 0.020 2456.5 ± 167.3 157.3 ± 13.1 3.89+1.21−1.04
UGC 6968 3.54 ± 1.68 1.83 ± 0.69 0.54 ± 0.001 1244.7 ± 742.8 195.8 ± 16.4 0.45+0.81−0.38
F568−6 2.01 ± 0.84 0.93 ± 0.40 0.85 ± 0.020 899.6 ± 372.4 209.1 ± 18.0 0.29+0.32−0.20
aHα fluxes of the broad and narrow components in units of 10−15 erg cm−2 s−1.bFWHM of the broad line of Hα.
Pizzella et al. (2004) find that radial dependence of σ ∗ is flat withless than 7 per cent correction for early-type galaxies. Followingthese arguments, we have not applied any correction based on re toσ ∗, the spectra are extracted from a region of 2 × 5 arcsec2.
5.3 The mass of central black hole (MBH)
The BH masses are calculated using the equation given in Greene& Ho (2007), using Hα luminosity and FWHM. The masses are∼0.3 × 10⁶ M� for the galaxies UGC 1922, UGC 6968 andF568−6, and lie on the lower mass tail of the low-mass BH sampleof Greene & Ho (2007) which has a median mass of 1.3 × 10⁶ M�.UGC 6614 has a slightly higher BH mass of 3.8 × 10⁶ M�. Theaverage Lbol/LEdd ratio calculated for their sample is about 0.4 andsuggests that their sources are radiating at high fraction of Eddingtonlimit (Greene & Ho 2007). We find the values of 0.18, 0.023, 0.046and 0.106 for UGC 1922, UGC 6614, UGC 6968 and F568−6,respectively. While these are lower compared to the median forthe sample of Greene & Ho (2007), they are within their observedrange.
We could identify clear signature for AGN in four out of nineobjects in our sample which agrees with the high (50 per cent) oc-currence of AGN found by Schombert (1998) in LBGs.
5.4 Interesting case of UGC 6614
The emission line spectra of UGC 6614 obtained after the decom-position of stellar light shows an interesting feature. A bump isnoticed bluewards of the Hα emission from the galaxy. This bluebump is noticeable in the observed flux-calibrated spectra beforespectral decomposition but is clearly seen after the decomposition.The blue bump is the excess emission at Hα which could be arisingfrom ionized gas travelling at speeds ∼3600 km s−1 towards us,centred at 3920 km s−1. The blue bump is also noticed bluewards ofHβ and the velocities with which the gas streaming out towards us∼3600 km s−1 (median value of Hα and Hβ) centred at 3360 km s−1
from Hβ, similar to Hα. This emission at Hα and Hβ wavelengthsoverlap, indicating the feature to be real as shown in Fig. 6. Das et al.(2009a) detected a compact core and a one-sided radio jet in UGC6614 from 610-MHz map. An extended feature is also indicated ina low-resolution Very Large Array map at 1420 MHz (Das et al.2009a). The blueshifted ionized gas emission could indicate a jet orhotspot along the line of sight. Similar asymmetric blue bumps of the[O III] lines were detected from a bunch of type 1/type 2 Seyfertsfrom SDSS DR2 sample by Greene & Ho (2005). These wingsindicate radial motions in the narrow-line region, associated withan outflow. The outflowing components are principally responsible
C© 2011 The Authors, MNRAS 418, 789–800Monthly Notices of the Royal Astronomical Society C© 2011 RAS
at Indian Institute of Astrophysics on A
ugust 22, 2014http://m
nras.oxfordjournals.org/D
ownloaded from

AGN activity and black hole masses in LSB galaxies 797
Figure 6. Line fits for the region around Hα and Hβ for the galaxy UGC6614. The x-axis is in terms of velocities. A blue bump is clearly noticeablearound Hα and Hβ which is centred at −3600 ± 300 km s−1 and moving ata velocity of ∼3600 km s−1 towards us.
for imparting supervirial motions to the gas and originate from amore compact region closer to the centre (Greene & Ho 2005).
5.5 The MBH–σ∗ plot
The Ca II triplet linewidths and masses of BHs for the three galaxiesin our sample are shown in the MBH–σ∗ plot in Fig. 7. Also plottedin the figure are the linear regression lines given by Tremaine et al.(2002), Ferrarese & Ford (2005) and Gultekin et al. (2009) (dotted,dashed and solid lines, respectively) for MBH against σ ∗. The low-mass AGNs hosted within LSB galaxies occupy the region justbelow the lowest mass BH of Circinus galaxy from the sampleof Gultekin et al. (2009), well below the extrapolations of high-mass BHs. On the other hand, three AGNs in LSBs observed byMei et al. (2009) in the BH mass range of 2.8–20 × 106 M� liecloser to the Tremaine et al. (2002) relation, though systematicallylower. It would be of interest to study more LSB galaxies and low-luminosity AGN of Greene & Ho (2007) for a better understandingof faint luminosity end of MBH–σ∗ relation.
6 D ISCUSSION
6.1 Intermediate-mass BH (IMBH) in GLSB galaxies
One of the main results of our spectroscopic study is the detectionof broad Hα emission in GLSBs and the subsequent estimation ofnuclear BH masses from SDSS spectra in bulge-dominated GLSBgalaxies. The AGNs fall in Seyfert–LINER region in the diagnosticdiagram (Fig. 5).
We obtained masses ∼3 × 10⁵ M� for three GLSB galaxies inour sample, which fall in the IMBH range rather than the SMBHrange. A higher BH mass is estimated for UGC 6614 which is∼3.8 × 10⁶ M� and a similar estimate was given earlier by Daset al. (2009b) based on a low-resolution optical spectrum from
Figure 7. M–σ plot for the LSBs. Points represent the MBH and velocitydispersion of the three LSBs UGC 6968, UGC 6614 and F568−6. Thesolid line is the MBH–σ ∗ relation taken from Ferrarese & Merritt (2000),the dashed line is from Tremaine et al. (2002) and dotted line is takenfrom Gultekin et al. (2009). The MBH and σ ∗ are estimated from the SDSSspectra.
Sprayberry et al. (1995). Another estimate of ∼1.2 × 10⁵ M� wasderived later from AGN X-ray variability studies by Naik et al.(2010), which is lower than the present estimate. It must be borne inmind that these estimates are fairly approximate as they are basedon the assumption that the gas in the broad-line region in the AGNis in virial equilibrium (Kaspi et al. 2000).
IMBHs are fairly rare in the galactic nuclei and have been de-tected mainly in late-type spirals (Filippenko & Ho 2003; Greene& Ho 2004; Satyapal et al. 2007), nearby galaxies (Seth et al. 2010)or dwarf galaxies (Barth et al. 2004). They are difficult to detect dy-namically at large distances; hence AGN activity is one of the mainmethods through which we detect them. The presence of IMBHsin GLSB galaxies is surprising as their bulges are well developed;in fact, a SMBH would be far more typical for these bulges. Thissuggests that the lack of disc evolution in these extreme late-typegalaxies has affected the evolution of their nuclear BHs. Galacticdisc activity contributes to the growth of SMBHs through gas inflow,star formation and mass accumulation in the nuclei of spiral galax-ies as observed in bulge-dominated, star-forming early-type spirals.Large-scale disc instabilities such as bars and spiral arms exertgravitational torques that funnel gas into galaxy centres leading tonuclear star formation and the build-up of central mass concentra-tions (e.g. Friedli & Benz 1993). This can result in the growth ofnuclear BHs and bulges in galaxies (Kormendy & Kennicutt 2004).This process of disc evolution leading to the growth of central massconcentrations in galaxies is prevented from happening or sloweddown when there is a dominant dark matter halo (Ostriker &Peebles 1973). Thus, the lack of disc evolution and relatively lowmass of the BH may share the same origin – which is the presenceof a dominant dark halo in the galaxy.
C© 2011 The Authors, MNRAS 418, 789–800Monthly Notices of the Royal Astronomical Society C© 2011 RAS
at Indian Institute of Astrophysics on A
ugust 22, 2014http://m
nras.oxfordjournals.org/D
ownloaded from
798 S. Ramya, T. P. Prabhu and M. Das
6.2 Constraining the M–σ relation for extreme late-typegalaxies
In the past 10 years, the M–σ and M–L relations have become es-tablished benchmarks for galaxy and BH evolution theories. Ourpresent work affects these correlations in two ways: first, it helpsconstrain the low-mass end of the M–σ correlation, and secondly, ithelps constrain the scatter in the plot (Gultekin et al. 2010). Graham(2008a,b) found that the scatter is actually due to systematic offsetsfor different types of galaxies while Hu (2008) found such offsetsbetween galaxies with pseudo-bulge in contrast to classical bulge.The low-mass end of the M–σ relation is populated by late-typegalaxies or dwarf galaxies; many are often outliers in the plot. Ourpresent work shows that extreme late-type galaxies are also fairlyoffset from the main M–σ line (Fig. 7). It also suggests that dwarfgalaxies and extreme late-type galaxies have different evolutionarypaths compared to early-type galaxies and the more massive ellip-ticals at the high SMBH end of the M–σ relation. Models of galaxyevolution thus need to incorporate late-type systems such as GLSBgalaxies in their overall picture.
The late-type spirals also increase the scatter in the correlationwhich is tighter when only ellipticals and early-type spirals are in-cluded (Tremaine et al. 2002; Beifiori et al. 2009). Many theoreticalstudies have been undertaken to explain the M–σ correlation andpredict the high-mass end of the plot (Natarajan & Treister 2009).Dalla Bonta et al. (2009) carried out HST observations of threebrightest cluster galaxies (BCGs) and estimated masses of SMBHsto be ∼109 M� present in these BCGs. While for one galaxy, SMBHmass correlates well in the M–σ and M–L plot at the high-mass end,the other two galaxies show inconsistencies with the two relations.The sample is small to derive any conclusions, but hints that therecould be scatter in the SMBH scaling relations at the high-massend as well (Dalla Bonta et al. 2009). One may also note here thatBatcheldor (2010) suggests that the SMBH M-σ relation is actuallyan upper limit.
However, the low-mass end does not appear to have a clear cut-off according to most models (Volonteri & Natarajan 2009). In fact,we could be missing observationally a large fraction of the lowermass BHs in the centres of galaxies. Thus, there is an increase in thescatter at the low-mass end of the correlation. This scatter could bedue to measurement errors or could be intrinsic to the BH evolutionprocesses in the galaxies themselves (Volonteri 2007). A few of theNLS1 galaxies observed (Grupe & Mathur 2004; Mathur & Grupe2005) lie below the M-σ line for normal galaxies similar to ourLSBs.
One of the processes for BH evolution could be BH growth byaccretion in well-formed bulges, probably after a major merger,which increases the mass of BH, naturally moving closer to the M-σ for normal galaxies (Grupe & Mathur 2004). Our present study isthus important for understanding the overall trends in the low-massend of the BH mass spectrum.
6.3 AGN evolution in late-type galaxies
Studies have shown that the space density of high-luminosity AGNspeaks at redshift of z ∼ 2; this is also the redshift at which themost massive SMBHs were formed in galaxies (Cowie et al. 2003;Hasinger, Miyaji & Schmidt 2005). However, in the local universe,the most rapidly growing BHs appear to be those in the lower massrange of 106–107 M� (Goulding et al. 2010). Also, studies of nearbygalaxies show that it is the most massive BHs in late-type galaxiesthat are growing at the present epoch (Schawinski et al. 2010). The
GLSB galaxies in our sample fall into the latter category as theyhave large bulges; though they have lower BH masses, they appearto be accreting and hence luminous in the optical domain.
6.4 Decoupled bulge–disc evolution in GLSB galaxies
As suggested by Das et al. (2009b), the bulges of GLSB galaxiesappear to be very evolved compared to their discs. In general, bulgesform in two ways: one is through repeated galaxy mergers or accre-tion events that lead to the formation of a central spheroidal massdistribution (Springel, Di Matteo & Hernquist 2005). The second isthrough secular evolutionary processes where disc instabilities leadto bars, spiral arms, gas infall and the evolution of a discy pseudo-bulge (Kormendy & Kennicutt 2004). These processes result in discstar formation and enhanced disc structure, both of which are notobserved in most GLSB galaxies; instead their discs are metal-poorand often fairly featureless. Therefore, the bulges in GLSB galaxiesprobably formed in a different way; one possibility is that galaxymergers resulted in spheroidal bulges and then the discs were rebuiltfrom accreted gas (Springel & Hernquist 2005). Such an evolution-ary scenario would lead to a bulge that is relatively decoupled fromits disc or its central BH.
6.5 BHs in halo-dominated galaxies
Although the correlation of BH mass and galaxy properties is nowwell established, it is still not clear exactly what regulates BHgrowth (see e.g. Booth & Schaye 2010, and references therein).Mass accretion close to the BH, bulge mass and the mass of thedark matter halo are some of the factors important for regulating BHgrowth in galaxies. It is not clear which factor is the most importantor whether all the processes play a role. Several theoretical studieshave explored how the potential of the dark halo may regulate bulgeevolution and BH growth (Silk & Rees 1998; Xu, Wu & Zhao2007; Booth & Schaye 2010) and there are observational studiesthat indicate a correlation between the dark halo and BH mass(Ferrarese 2002; Baes et al. 2003; Pizzella et al. 2005). On the otherhand, some studies show that nuclear BH masses do not correlatewith the dark matter haloes of galaxies and dark matter gravity is notdirectly responsible for BH growth (Ho 2007; Kormendy & Bender2011). Such studies suggest that SMBHs co-evolve with classicalbulges or ellipticals only. GLSB galaxies are halo-dominated andoften bulge-dominated as well. Hence, they are ideal systems tostudy the dark halo–BH relation and this should be investigated infuture studies.
7 C O N C L U S I O N
(i) The paper presents spectroscopic observations of the nuclearregions of nine LSB galaxies observed in the wavelength range3700–9000 Å. The stellar light has been subtracted from the nuclearspectra to obtain only gas emission spectra. Broad Hα lines alongwith strong [NII], [SII] and [OI] lines are detected in four galaxiesnamely UGC 1922, UGC 6614, UGC 6968 and F568−6, confirmingthe presence of AGN activity in these LSB galaxies. SDSS spectraof three galaxies namely UGC 6614, UGC 6968 and F568−6 areused to estimate the BH masses and stellar velocity dispersion asthe resolution of the SDSS spectra is good enough (∼70 km s−1) togive a conservative estimate on the above parameters.
(ii) The BPT AGN diagnostic diagram was created using theemission line ratios. It is clearly seen that the above four galaxies
C© 2011 The Authors, MNRAS 418, 789–800Monthly Notices of the Royal Astronomical Society C© 2011 RAS
at Indian Institute of Astrophysics on A
ugust 22, 2014http://m
nras.oxfordjournals.org/D
ownloaded from

AGN activity and black hole masses in LSB galaxies 799
lie in the AGN regime and more closely in the Seyfert regime. UGC3968 might also host a starburst–AGN composite nucleus.
(iii) The broad Hα linewidths (900–2500 km s−1) and luminosi-ties (1039 erg s−1) are used to deduce the nuclear BH masses in theaforementioned galaxies; the masses for three galaxies are ∼3 ×10⁵ M� and for UGC 6614 the BH mass is estimated to be about3.8 × 106 M�. The masses suggest that the nuclei of LSB galax-ies have IMBHs rather than the SMBHs found in the centres ofbrighter galaxies. UGC 6614 also shows an interesting feature of ablueshifted bump of Hα emission which can be attributed to outflowof gas travelling at speeds of 3600 km s−1 towards us. The blue bumpfeature is detected in the Hβ region as well. There could be moresuch AGN in the sample that may be identified through other meanssuch as the reverberation technique with improved sensitivity.
(iv) The stellar velocity dispersion, σ ∗ is measured for the threegalaxies, UGC 6614, UGC 6968 and F568−6; the values lie between150 and 210 km s−1. The three low-mass BHs lie below the standardline in the M–σ ∗ plot and lower than the ones studied by Mei et al.(2009).
AC K N OW L E D G M E N T S
We would like to thank the anonymous referee for suggestions andclarifications which enhanced the quality of the paper immensely.We thank Dr J. E. Greene for providing the SDSS templates and IDL
fitting routine, Dr Monica Valluri for suggestions, fruitful discus-sions and for introduction to pPxF algorithm, and Dr T. Sivarani forhelp and discussions for the pPxF fitting routines.
We thank the staff of IAO and CREST for their help during theobservations.
This research has made use of the NASA/IPAC ExtragalacticDatabase (NED) which is operated by the Jet Propulsion Laboratory,California Institute of Technology, under contract with the NationalAeronautics and Space Administration.
The SDSS is managed by the Astrophysical Research Consor-tium (ARC) for the Participating Institutions. The ParticipatingInstitutions are the University of Chicago, Fermilab, the Insti-tute for Advanced Study, the Japan Participation Group, the JohnsHopkins University, Los Alamos National Laboratory, the Max-Planck-Institute for Astronomy (MPIA), the Max-Planck-Institutefor Astrophysics (MPA), New Mexico State University, PrincetonUniversity, the United States Naval Observatory and the Universityof Washington.
SR would like to thank the University Grants Commission (UGC)for their UGC-CSIR NET fellowship given by the Government ofIndia.
RE FERENCES
Amram P., Marcelin M., Balkowski C., Cayatte V., Sullivan W. T., III, LeCoarer E., 1994, A&AS, 103, 5
Baes M., Buyle P., Hau G. K. T., Dejonghe H., 2003, MNRAS, 341, L44Baldwin J. A., Phillips M. M., Terlevich R., 1981, PASP, 93, 5Barth A. J., Ho L. C., Rutledge R. E., Sargent W. L. W., 2004, ApJ, 607, 90Batcheldor D., 2010, ApJ, 711, L108Beifiori A., Sarzi M., Corsini E. M., Dalla Bonta E., Pizzella A., Coccato
L., Bertola F., 2009, ApJ, 692, 856Boissier S. et al., 2008, ApJ, 681, 244Booth C. M., Schaye J., 2010, MNRAS, 405, L1Cappellari M., Emsellem E., 2004, PASP, 116, 138Cowie L. L., Barger A. J., Bautz M. W., Brandt W. N., Garmire G. P., 2003,
ApJ, 584, L57Dalla Bonta E., Ferrarese L., Corsini E. M., Miralda Escude J., Coccato L.,
Sarzi M., Pizzella A., Beifiori A., 2009, ApJ, 690, 537
Das M., O’Neil K., Vogel S. N., McGaugh S., 2006, ApJ, 651,853
Das M., Kantharia N. G., Vogel S. N., McGaugh S. S., 2009a, in SaikiaD. J., Green D. A., Gupta Y., Venturi T., eds, ASP Conf. Ser. Vol. 407,The Low-Frequency Radio Universe. Astron. Soc. Pac., San Francisco,p. 167
Das M., Reynolds C. S., Vogel S. N., McGaugh S. S., Kantharia N. G.,2009b, ApJ, 693, 1300
Das M., Boone F., Viallefond F., 2010, A&A, 523, A63de Blok W. J. G., van der Hulst J. M., Bothun G. D., 1995a, MNRAS, 274,
235de Blok W. J. G., van der Hulst J. M., Bothun G. D., 1995b, MNRAS, 274,
235de Blok W. J. G., McGaugh S. S., Bosma A., Rubin V. C., 2001, ApJ, 552,
L23Ferrarese L., 2002, ApJ, 578, 90Ferrarese L., Ford H., 2005, Space Sci. Rev., 116, 523Ferrarese L., Merritt D., 2000, ApJ, 539, L9Filippenko A. V., Ho L. C., 2003, ApJ, 588, L13Friedli D., Benz W., 1993, A&A, 268, 65Galaz G., Herrera-Camus R., Garcia-Lambas D., Padilla N., 2011, ApJ, 728,
74Gavazzi G., Franzetti P., Scodeggio M., Boselli A., Pierini D., 2000, A&A,
361, 863Gebhardt K. et al., 2000, ApJ, 539, L13Gerhard O. E., 1993, MNRAS, 265, 213Goulding A. D., Alexander D. M., Lehmer B. D., Mullaney J. R., 2010,
MNRAS, 406, 597Graham A. W., 2008a, ApJ, 680, 143Graham A. W., 2008b, Publ. Astron. Soc. Australia, 25, 167Graham A. W., Onken C. A., Athanassoula E., Combes F., 2011, MNRAS,
412, 2211Greene J. E., Ho L. C., 2004, ApJ, 610, 722Greene J. E., Ho L. C., 2005, ApJ, 627, 721Greene J. E., Ho L. C., 2007, ApJ, 670, 92Grupe D., Mathur S., 2004, ApJ, 606, L41Gultekin K. et al., 2009, ApJ, 698, 198Gultekin K., Cackett E. M., Miller J. M., Di Matteo T., Markoff S., Richstone
D. O., 2010, BAAS, 41, 440Hasinger G., Miyaji T., Schmidt M., 2005, A&A, 441, 417Hinz J. L., Rieke M. J., Rieke G. H., Willmer C. N. A., Misselt K., Engel-
bracht C. W., Blaylock M., Pickering T. E., 2007, ApJ, 663, 895Ho L. C., 2007, ApJ, 668, 94Ho L. C., 2008, ARA&A, 46, 475Hu J., 2008, MNRAS, 386, 2242Impey C., Bothun G., 1997, ARA&A, 35, 267Impey C., Burkholder V., Sprayberry D., 2001, AJ, 122, 2341Jorgensen I., Franx M., Kjaergaard P., 1995, MNRAS, 276, 1341Kaspi S., Smith P. S., Netzer H., Maoz D., Jannuzi B. T., Giveon U., 2000,
ApJ, 533, 631Kauffmann G. et al., 2003, MNRAS, 346, 1055Kewley L. J., Dopita M. A., Sutherland R. S., Heisler C. A., Trevena J.,
2001, ApJ, 556, 121Kewley L. J., Groves B., Kauffmann G., Heckman T., 2006, MNRAS, 372,
961Kormendy J., Bender R., 2011, Nat, 469, 377Kormendy J., Kennicutt R. C., Jr, 2004, ARA&A, 42, 603Leitherer C. et al., 1999, ApJS, 123, 3MacArthur L. A., Courteau S., Holtzman J. A., 2003, ApJ, 582, 689McGaugh S. S., 1994, ApJ, 426, 135Mathur S., Grupe D., 2005, ApJ, 633, 688Mayer L., Wadsley J., 2004, MNRAS, 347, 277Mei L., Yuan W., Dong X., 2009, Res. Astron. Astrophys., 9, 269Merloni A., Heinz S., 2008, MNRAS, 388, 1011Mihos J. C., McGaugh S. S., de Blok W. J. G., 1997, ApJ, 477, L79Naik S., Das M., Jain C., Paul B., 2010, MNRAS, 404, 2056Natarajan P., Treister E., 2009, MNRAS, 393, 838O’Neil K., Schinnerer E., 2003, ApJ, 588, L81
C© 2011 The Authors, MNRAS 418, 789–800Monthly Notices of the Royal Astronomical Society C© 2011 RAS
at Indian Institute of Astrophysics on A
ugust 22, 2014http://m
nras.oxfordjournals.org/D
ownloaded from

800 S. Ramya, T. P. Prabhu and M. Das
O’Neil K., Bothun G., van Driel W., Monnier Ragaigne D., 2004, A&A,428, 823
Oke J. B., 1990, AJ, 99, 1621Ostriker J. P., Peebles P. J. E., 1973, ApJ, 186, 467Pettini M., Pagel B. E. J., 2004, MNRAS, 348, L59Pickering T. E., Impey C. D., van Gorkom J. H., Bothun G. D., 1997, AJ,
114, 1858Pizzella A., Corsini E. M., Vega Beltran J. C., Bertola F., 2004, A&A, 424,
447Pizzella A., Corsini E. M., Dalla Bonta E., Sarzi M., Coccato L., Bertola F.,
2005, ApJ, 631, 785Press W. H., Teukolsky S. A., Vetterling W. T., Flannery B. P., Lloyd C.,
Rees P., 1993, The Obser., 113, 214Rahman N., Howell J. H., Helou G., Mazzarella J. M., Buckalew B., 2007,
ApJ, 663, 908Rosenbaum S. D., Krusch E., Bomans D. J., Dettmar R., 2009, A&A, 504,
807Satyapal S., Vega D., Heckman T., O’Halloran B., Dudik R., 2007, ApJ,
663, L9Schawinski K., Dowlin N., Thomas D., Urry C. M., Edmondson E., 2010,
ApJ, 714, L108
Schlegel D. J., Finkbeiner D. P., Davis M., 1998, ApJ, 500, 525Schombert J., 1998, AJ, 116, 1650Schombert J. M., Bothun G. D., 1987, AJ, 93, 60Schombert J. M., McGaugh S. S., Eder J. A., 2001, AJ, 121, 2420Seth A. C. et al., 2010, ApJ, 714, 713Silk J., Rees M. J., 1998, A&A, 331, L1Somerville R. S., Hopkins P. F., Cox T. J., Robertson B. E., Hernquist L.,
2008, MNRAS, 391, 481Sprayberry D., Impey C. D., Bothun G. D., Irwin M. J., 1995, AJ, 109, 558Springel V., Hernquist L., 2005, ApJ, 622, L9Springel V., Di Matteo T., Hernquist L., 2005, MNRAS, 361, 776Tremaine S. et al., 2002, ApJ, 574, 740van der Marel R. P., Franx M., 1993, ApJ, 407, 525Veilleux S., Osterbrock D. E., 1987, ApJS, 63, 295Veron-Cetty M., Veron P., Goncalves A. C., 2001, A&A, 372, 730Volonteri M., 2007, ApJ, 663, L5Volonteri M., Natarajan P., 2009, MNRAS, 400, 1911Xu B., Wu X., Zhao H., 2007, ApJ, 664, 198
This paper has been typeset from a TEX/LATEX file prepared by the author.
C© 2011 The Authors, MNRAS 418, 789–800Monthly Notices of the Royal Astronomical Society C© 2011 RAS
at Indian Institute of Astrophysics on A
ugust 22, 2014http://m
nras.oxfordjournals.org/D
ownloaded from
Copyright © 2022 FDOKUMEN