Effects of mineral trioxide aggregate, calcium hydroxide ...
Active Dimer of Epratuzumab Provides Insight intothe Complex Nature of an Antibody Aggregate
RICHARD L. REMMELE, JR.,1 WILLIAM J. CALLAHAN,1 SAMPATHKUMAR KRISHNAN,1 LINDA ZHOU,1
PAVEL V. BONDARENKO,1 ANDREW C. NICHOLS,2 GERD R. KLEEMANN,1 GARY D. PIPES,1 SUNGAE PARK,1
SZILAN FODOR,1 EVA KRAS,1 DAVID N. BREMS1
1Amgen Inc., One Amgen Center Drive, Thousand Oaks, CA 91320-1799
2Abgenix, 6701 Kaiser Dr., Fremont, CA 94555
Received 19 April 2005; revised 2 September 2005; accepted 14 September 2005
Published online in Wiley InterScience (www.interscience.wiley.com). DOI 10.1002/jps.20515
ABSTRACT: Understanding the intermolecular products of antibodies as a consequenceof host-cell expression, aging, and heat-stress can be insightful especially when itinvolves the development of a stable biopharmaceutical product. The dimerized form ofEpratuzumab (an IgG1 antibody)with amolecularmass of�300kDa (twice themonomerantibody molecular weight of�150 kDa) was examined to gain a better perspective of itsproperties pertaining to structure and activity. The nascent dimerwas shown to partiallydissociate upon incubation at 308C and 378C, exhibit no discernable alteration ofstructure (i.e., secondary or tertiary structure based on CD and 2nd derivative UVspectroscopy), have �70% covalent forms (based upon CE-SDS results) and manifesttwofold higher activity relative to the active monomer form (on a weight basis the dimerandmonomer have equal activity). Interestingly, these properties were not attributed toa single dimer species, but rather to a more complex dimer assembly. The Epratuzumabdimer was digested with papain to reveal three uniquely dimerized aggregates. Therelative molar distribution of Fab:Fab, Fc:Fc, and Fab:Fc was found to be 4:3:8, respec-tively. The data suggest that all three predominantly covalent dimer adducts are capableof full activity, shedding light on their complex nature and showing that their targetspecificity was unaltered. ESI-MS data indicated the presence of remnant levels of non-covalent dimers for all three dimerized forms. Material aged at 378C exhibited a similarpapain digest molar distribution of the three dimerized forms, except with enhancedchemical heterogeneity and an increase in covalent forms to�84%. � 2005Wiley-Liss, Inc.
and the American Pharmacists Association J Pharm Sci 95:126–145, 2006
Keywords: adduct; glycoprotein; physical stability; preformulation; protein aggrega-tion; protein formulation; protein structure; solvation; structure-activity relationship
INTRODUCTION
Over the past 50 years, there has been a wealthof knowledge acquired regarding different pro-tein systems that aggregate,1–4 yet little informa-tion has been gathered concerning details of theintermolecular complex forms that are the pro-ducts of such reaction pathways. Most of theeffort has focused on kinetic and thermody-namic models that generalize the progressionand mechanism leading toward higher orderprotein aggregates.1–7 Aggregation is a primary
126 JOURNAL OF PHARMACEUTICAL SCIENCES, VOL. 95, NO. 1, JANUARY 2006
Abbreviations: MRE, mean residue elipticity; mAb, mono-clonal antibody; ESI, electrospray ionization; TOF, time offlight; TFA, triflouroacetic acid; PBS, phosphate bufferedsaline solution; SEC, size exclusion chromatography; CD,circular dichroism; IAM, iodoacetamide; CE-SDS, capillaryelectrophoresis-sodium dodecyl sulfate analysis; MS, massspectrometry; MW, molecular weight.
Correspondence to: Richard L. Remmele, Jr. (Telephone:805-447-5534; Fax: 805-375-5794;E-mail: [email protected])
Journal of Pharmaceutical Sciences, Vol. 95, 126–145 (2006)� 2005 Wiley-Liss, Inc. and the American Pharmacists Association
degradation pathway for proteins like the amyloidsthat are implicated in the cause of Alzheimer’sand Huntington’s diseases,8,9 or protein thera-peutics that treat disease, like hormones (i.e.,insulin, hGh), growth factors (i.e., transforminggrowth factor-beta, G-CSF), cytokines (i.e., inter-leukins), antivirals (i.e., interferons), and anti-bodies.10–14 Aggregation can become a majorissue when formulating proteins that requirehigh concentrations to achieve therapeutic effi-cacy. Hence, protein systems have tendencies toassociate or aggregate into multiple forms of theirrespective monomer units. Some with deleteriousconsequences that include decreased activity,solubility, and increased immunogenicity,15–17
while others retain activity as dimerized units oftheir monomer building blocks.18,19 The dimer-ized form of a protein is perhaps the simplestelement of protein aggregation.
Monoclonal antibody aggregation poses a com-plex problem when the nature of the intermole-cular forms is affected differently by the type ofstress involved. During process development,monoclonal antibodies can experience pH, tem-perature, and pressure events that can lead toaggregation. Given the complex issues surround-ing antibody aggregates, there is interest inunderstanding this phenomenon as it pertains totherapeutic influence (i.e., efficacy), biochemistry,and stabilization.
Activity requires variable domain regions to bestructurally accessible to bind their specific sub-strates.20–25 Antibody dimers tend to make up thepredominant species of antibody aggregates.26 Itwould be of interest to know how dimerizationmight affect such substrate-binding interactions(with antigens, receptors, etc.). Dimers frompooledplasmasareknown to form cyclic complexesof idotypic-anti-idiotypic associations.26,27 Amongthe four human isotypes, IgG3 have been reportedas more prone to form dimers than IgG4>IgG1> IgG2 classes.
28
The nature of the dimer can offer insights aboutthe properties that mark product quality andshelf-life (since it is considered a degradationproduct). Yet, there is little information aboutantibody dimers as it pertains to intermoleculardomain interactions and their covalent nature.Attention to understanding antibody dimers interms of their structure, types of complexes theyform, and the corresponding therapeutic conse-quences is therefore of great value.
A curious characteristic of some antibodydimers subjected to temperature-stress is that
they partially dissociate into monomers uponincubationat elevated temperatures.For example,rhuMAb VEGF tends to dissociate in this mannerconcomitant with rise in temperature that ischaracteristic of reversible noncovalent interac-tions.29 Heat-mediated dissociation has beenascribed to monomer-dimer equilibria and canconfound the interpretation of accelerated stabi-lity data since it can obscure the aggregationtrends and their relationship to low temperature.Observations in the literature have suggested thatmonomer-dimer equilibria primarily involveinter-domain interactions of Fab-localized bindingsites (i.e., variable regions).26,29 Even studies ofantibody fragments, like those of refolded mono-mer single-chain variable fragments (scFv), havefound that dimers and multimers followed the lawof mass-action at 48C, but dissociated back tomonomer when heated to 208C with a half-life ofapproximately 8 days.30 Collectively, the studiessuggest that equilibria-driven reactions tend to belocalized to the Fab domains with very slowdissociation kinetics that increase with tempera-ture. Such temperature-mediated dissociationproperties of antibodies may be more commonthan previously thought,29 for it applies to adimerized form of a monoclonal antibody knownas Epratuzumab.
Epratuzumab is a recombinant antihuman-CD22 monoclonal antibody for the treatment ofnonHodgkins lymphoma.31 Epratuzumab is aglycoprotein with an N-linked glycan on the CH2
domain of an IgG1 Fc. This study will elucidate thenature of the nascent dimerized entity and as aconsequence of temperature-induced stress.Furthermore, reference to the dimer in thiscontext will refer to two intact monomers (wherea monomer is defined as the mass of two lightchains and two heavy chains covalently attachedvia two inter-heavy chain disulfide bonds in the Fchinge region) with an apparent molecular mass of�300kDa.Thisworkwill focus on the covalent andnoncovalent nature of the Epratuzumab dimer(before and after temperature-induced stress), thetype and proportion of complex forms, and domaininteractions that define them.
MATERIALS AND METHODS
Materials and Solutions
Epratuzimab was recombinantly derived (mye-loma-cell expressed) and purified as a drugproduct in PBS (40 mM sodium phosphate, pH
ACTIVE COMPLEX EPRATUZUMAB DIMER AGGREGATE 127
JOURNAL OF PHARMACEUTICAL SCIENCES, VOL. 95, NO. 1, JANUARY 2006
7.4, and 140 mM NaCl) obtained from Amgen,Inc., Thousand Oaks, CA. Protein concentrationsreported were measured at 280 nm and calculatedbased on an absorptivity of 1.4 mL/mg � cm. Thepapain used in the digest experiments wasimmobilized enzyme attached to beaded agarose(#P-4406, lyophilized powder stabilized withlactose, Sigma, St. Louis, MO).
The papain ‘‘digest’’ buffer solution consisted of10 mM Tris (#4102-01, J.T. Baker, Phillipsburg,NJ), pH 8, 20 mM NaCl (#7713, Mallinckrodt, St.Louis, MO), 15 mM cysteine (#C7755, Sigma), and2 mM EDTA (#ED2SS, Sigma). A ‘‘quench’’ solu-tion contained 20 mM sodium phosphate (forsource see SEC buffers below), pH 5.45 and 5%sorbitol (#423126250R,Roquette,Corp., LesTrem,France) and was used to stop the papain digestreaction. All chemicals used were reagent grade orbetter.
A 250 mM iodoacetamide (IAM) alkylatingreagent solution for nonreduced CE-SDS experi-ments was prepared by weighing 46 mg of highpurity IAM (#I-1149: 5 g quantity, Sigma) andtransferring it into a clean microvial prior toadding 1 mL of deionized water and capping thevial tightly followed by thoroughmixing. The IAMalkylation reagent was freshly prepared andstable for approximately 24 h at room tempera-ture.
Two mobile phases were required for rp-HPLCconsisting of an aqueous phase, ‘‘solution A’’ andorganic phase, ‘‘solution B.’’ Solution A waspreparedbyaddingTFA (#28904, PierceScientific,Rockford, IL) to HPLC grade water (#NP365-20,Burdick&Jackson, Muskegon, MI) to achieve adesignated volume (i.e., 1 L or 2 L) and finalconcentration of 0.1% TFA (v/v). Solution B wascomposed of 70% isopropyl alcohol (#NP323-20,Burdick&Jackson), 20% acetonitrile (#NP015-20,Burdick&Jackson), 9.9% water, and 0.1% TFA.
Size-exclusion chromatography reagents con-sisted of ethanol (200 proof, Aaper, Shelbyville,KY), NaCl, and sodium phosphate (monobasicmonohydrate, #7868; dibasic dihydrate, #7771;Mallinckrodt).
Isolation of Dimer
The nascent (purified drug product, unheated)protein material was stored refrigerated (2–88C)and subjected to SEC to separate and collect thedimer formed as a result of product manufactur-ing. Multiple 50 mL (10–15 mg/mL Epratuzumab)injections of monomer containing �1% dimer
were carried out using a TSKgel SWXL G3000column (300� 7.8 mm with 5 mm particles;TOSOH Bioscience #08541) and 0.8 mL/min flowrate. Dimer molecular weight (MW) was con-firmed using light scattering32,33 and collectedusing an Agilent 100 series fraction collectoronline with an Agilent series 1100 HPLC system.The dimer fraction constituted approximately1%–2 % of the main peak and therefore, requiredsufficient pools to produce a little over 1 mL ofdimer at a concentration of about 1 mg/mL. Thecollected pools were stored in the elution bufferconsisting of 0.1M sodium phosphate (pH 7), 0.5MNaCl, and 5% ethanol at 2–88C.
To investigate the influence of prolonged heat-ing, a portion of Epratuzumab was aged byincubating at 378C over 5 months in PBS. Thedimer from this sample was subsequently isolatedand analyzed in the same way described above.
Observed Dimer Dissociation Rate Constant
A portion of the isolated dimer (at approximately0.1 mg/mL) was evaluated to kinetically discernthe dissociation rate at 48C, 308C, and 378C in theSEC elution buffer. Assessment of the proportionof dimer and monomer forms as a function of timewas determined from SEC data in the same wayreported by Moore et al.29 Assuming pseudo first-order reaction kinetics, the observed dissociationrate constant (kobs) was computed from a plot ofdimer concentration (M) as a function of time (h)and approximated by a fit with the equation
½D�t ¼ ½D�oe�kobst ð1Þ
where [D]t is the amount of dimer at time t, and[D]o represents the starting concentration ofdimer. By rearranging Eq. 1 and taking thenatural log of both sides of the equation it ispossible to derive an expression for kobs
kobs ¼ ln½D�o=½D�t� �
tð2Þ
An Arrhenius plot was later constructed byplotting ln kobs as a function of 1/T.
Second Derivative UV Spectral Analysis
To determine the structural differences betweenthe Epratuzumab monomer and dimer forms, UV-visible absorbance scans (from 190 to 600 nm) ofeach species from a single SEC run were obtainedusing a HP1090 liquid chromatography systemwith a diode array detector.34 The data were then
128 REMMELE ET AL.
JOURNAL OF PHARMACEUTICAL SCIENCES, VOL. 95, NO. 1, JANUARY 2006
processed using BOMEM-Grams software. Thedata were interpolated and the second-derivativespectrum of each species was calculated using aSavitzky–Golay function. The second-derivativeUV spectra of 1 mg/mL N-acetyl tyrosinamide(#A6626, Sigma) and 1 mg/mL N-acetyl trypto-phanamide (#A6501, Sigma) were examined inthe elution buffer for comparison purposes.
Near- and Far-UV CD Analysis
An Aviv Circular Dichroism Spectrometer (Model62ADS, Lakewood, NJ) was used for determiningthe near-UV and far-UV CD structure of Epratu-zumab.
Near-UV CD spectral scans were obtained ofnative (monomer) and isolated dimer that weredialyzed into the quench solution. After dialysis,the protein concentration was adjusted with thequench solution to achieve approximately 0.5 mg/mL. A 1-cm pathlength quartz cuvette was used toexamine the Epratuzumab monomer, dimer, andbuffer samples at a controlled temperature of4� 0.28C in a peltier cell holder. Scans wereperformed using a 1-nm slit-width, from 350 to250 nm at 0.5 nm intervals and with a scan rate of4 s/nm. Ten scans were collected and averaged foreach sample. In each case, the resulting monomerand dimer spectra were compared after subtrac-tion of the buffer signal (obtained under identicalscan rate conditions used for analyzing the proteinsamples).
The far-UV CD spectra were also obtained formonomer (native), dimer, and Epratuzumab lessone Fab that were prepared in the quench solutionby dialysis prior to spectral analysis. The adjustedconcentrations of monomer, dimer, and partialantibody (less one Fab) were 0.17, 0.31, and0.36 mg/mL, respectively. Scans were measuredfrom 250 to 175 nm, using a slit-width of 1 nm, at0.5nm intervals in a0.1-cmpathlengthquartz cell.The scan rate and number of scans collected wereidentical to the conditions listed for the near-UVCD analysis. Temperature was controlled at4� 0.28C as noted above.
Activity
A cell-based bioassay for determining the potencyof Epratuzumab was used to examine the activityof the monomer, dimer, and partial antibodysamples. Exposure of the Ramos B-lymphomacell-line to Epratuzumab leads to apoptosis in24 h, followed by a decrease in viable cells in 72 h.
The decrease in viable cell content over time wasmeasured using an Alamar Blue fluorescentreagent. Different concentrations of Epratuzu-mab were immobilized on 96-well immuno-plateswith the subsequent addition of a fixed amount ofanti-IgM and Ramos cells at 2500 cells per well.The sample plate was incubated for 64 h at 378Cfollowed by the addition of 20 mL Alamar Blue andfurther incubation for 6 additional hours at 378Cprior to fluorescence measurement using a fluor-escence plate reader (CytoFluor II, AppliedBiosystems, Foster City, CA). The Alamar Bluefluorescence emission intensity was measured at595 nm (excitation at 535 nm) and was propor-tional to the number of viable cells and inverselyproportional to the concentration of biologicallyactive Epratuzumab. Activity was expressed as apercent using the following formula:
%Relative potency ¼ sample activity
standard activity
� �� 100
where the sample activity was compared to theactivity expected for the total monomeric protein(or standard) expressed as a percent. The relativepotencies of samples measured using this methodhave been found to be comparable with thoseobtained by a cell-based CD22 binding assay. Theaccuracy of the measurement is greater than 90%and intermediate precision (CV) has been about10%. Specificity of the bioassay was demonstratedby showing a lack of response to other mAbproducts (Rituximab, anti-IFNg, and anti-IL-1R1).
Nonreduced CE-SDS
Approximately 100 mg of either the monomer ordimer isolate was placed into a 0.5 mL micro-centrifuge tube. The 100 mg of sample in eithercase was desalted by centrifugation in a Centricon(10 K MWCO) using an Eppendorf centrifuge(Model 5417R) to a volume of approximately 5 mL.To each, the final volume was further adjusted to95 mL with the sample buffer (Beckman CE-SDSsample buffer consisting of 100 mM Tris-HCl,pH 9.0 with 1% SDS). To this, 2 mL of 10 kDa inter-nal standard (P/N A10308, Beckman Coulter,Fullerton, CA) and 5 mL of the alklyation reagentwere added. The total contents were then cappedtightly and mixed thoroughly followed by centri-fugation at 300g (where g is the unit of gravita-tional acceleration) for 1 min. The samplemixtures were then heated in a water bath at
ACTIVE COMPLEX EPRATUZUMAB DIMER AGGREGATE 129
JOURNAL OF PHARMACEUTICAL SCIENCES, VOL. 95, NO. 1, JANUARY 2006
708C for 10 min in a closed microvial. Afterheating, the vials were cooled to room tempera-ture in a water bath for at least 3 min beforetransfer to 200 mL PCR vials (P/N 144649,Beckman Coulter). Approximately 100 mL ofthe sample was transferred into each PCR vialand placed in microvial holders (P/N 970657,BeckmanCoulter). Themicrovialswere subsequen-tly placed in the sample rack of the instrument.
A Beckman CE PA800 capillary electrophoresisinstrument equipped with a PDA detector, fixedwavelength monitoring at 220 nm, and a 50 mm�30.2 cm (20.2 cm effective length) uncoated fusedsilica capillary was used for the analysis. A gelbuffer was used to fill the capillary as specified bythe ‘‘Beckman IgG heterogeneity assay kit’’ (P/NA10308). The kit consisted of gel buffer (0.2% SDS,pH 8), 0.1N NaOH (rinse solution), and 0.1N HCl(rinse solution). The procedure involved rinsingthe capillary in forward wash mode with the 0.1NNaOH solution for 3 min at 70 psi followed byanother forward wash with 0.1N HCl for 1 min at70 psi. Finally, the capillary column was rinsed(forward wash mode) with deionized water for1 min at 70 psi. After this treatment, the capillarywasfilled (forwardmode)with gel buffer for 10minat 70 psi followed by a water dip. At this point thesample was injected electro-kinetically for 20 s at�5 kV followed by water dip (water dips werecarried out before and after sample injections).Samples were separated at�15 kV for 30min. Theexperiment was carried out with the temperatureof the capillary maintained at 258C and appliedpressure of 20 psi to both inlet and outlet.
Papain Digest
Approximtely 0.5 mL of isolated dimer product(�1 mg/mL protein concentration) was buffer-exchanged into the papain digest solution usingMillipore (UFV4BGC00) 10 K NMWL membrane4-mL capacity centrifuge filter and tube assembly.Particular care was taken to perform the centri-fuge step at refrigerated conditions in a BeckmanAllegra 6R centrifuge for approximately 30 min at3100 rpm. In between preparation steps, thesample was kept on ice as much as possible tokeep the temperature within the range of refri-gerated conditions in order to minimize conver-sion to themonomer form. Three buffer exchangeswere sufficient to complete the exchange, followedby reconstitution to approximately the originalstarting volume (�0.5 mL) with the digest solu-tion. The sample was then added to an Agilent
glass sample vial (Part # 5182-0546) containingpreviously weighed, �7 mg of lyophilized papain.The contents were then sealed using an Agilentsnap-cap with red rubber septa (Part # 5182-0550). The entire contents of the vial were thenrotated in a rotisserie manner to insure propermixing and to aid the digestion process at 308C ina hybridization oven (Red Roller II; HoeferScientific Instruments, San Francisco, CA) for�3.5 h to complete the digest. At this point, thesample was either placed on ice or refrigeratedbefore proceeding. Following this treatment, thesample contents were transferred to an Eppen-dorf vial and the immobilized papain beads weresedimented in a benchtop Eppendorf centrifuge(model 5417 C) at 10,400 rpm. The supernatatant,containing the digested protein, was placed in aMillipore 10 K NMWL Membrane 4-mL capacitycentrifuge filter and tube assembly and buffer-exchanged three times into the quench solutionprior to SEC analysis.
N-Terminal Sequence Analysis
The sample (containing approximately 3 mg ofprotein) was diluted 1:1 with 0.1% TFA solutionand loaded onto an Applied Biosystems ProsorbTM
PVDF (polyvinylidene fluoride) membrane. Themembrane was loaded onto the reaction chamberof an Applied Biosystems 494 Procise sequencerwith 140C syringe pump and a Perkin Elmerseries 200 detector. The generic ‘‘pulsed-liquid’’method was used for 15 residue cycles. Thismethod followed the Edman degradation proce-dure to characterize the isolated, dimerized,papain-digested fragments.
SEC/rp-HPLC/MS Analysis
Two-dimensional chromatography employing sizeexclusion in one dimension and reversed-phaseHPLC in the other, was performed on a normalflow Agilent HP1100 binary pump coupled withan Agilent 1100 Capillary HPLC system. Thelater was connected on-line to a Micromass Q-TOF Micro mass spectrometer through an elec-trospray ionization (ESI) atmosphere-vacuuminterface. Size exclusion chromatography wascarried out isocratically using a Toso Haas TSK‘‘Super’’ SWXL G-3000, 300� 4.6 mm column(with 4 mm particle size), and an eluent of 50 mMsodium phosphate (pH 7), 250 mM NaCl, and5% ethanol. A flow rate of 150 ml/min wasmaintained with a normal flow HP1100 binary
130 REMMELE ET AL.
JOURNAL OF PHARMACEUTICAL SCIENCES, VOL. 95, NO. 1, JANUARY 2006
pump. An injection volume of 30 mL (dimerconcentration¼ 0.4 mg/mL) was used, corre-sponding to an injection load of 12 mg to achievean appropriate signal of the dimerized fragmentsin the mass spectrometer. When the papain-digested dimerized fragments were eluted fromthe SEC column (between 18.7 and 20.7 min inthe experiment), the flowwas diverted from wasteto the reversed-phase column using a Rheodynesix-port two-position valve. After the peakwas collected on the reversed-phase column, thevalve was switched back to the starting position,and the reversed-phase gradient commenced.Reversed-phase separation was performed usingan Applied BioSciences POROS 10/R1 150�2.0 mm column (maintained at 508C) and usinga binary gradient consisting of solutions A and Bwith a flow rate of 200 ml/min. Within the first5 min after gradient commencement, the percen-tage of solution B went from 0% to 30%, then theramp rate was slowed down to 1% ‘‘B’’ per minutefor the next 40 min to elute the papain-digesteddimerized fraction for analysis by MS. Thecolumn was then cleaned by raising the percent-age of solution B to 100% for 5 min and re-equilibrating with 100% solution A during theSEC portion of the next run. Protein recovery offthe rp-HPLC column was approximately 97%.
The ESI-Q-TOF mass spectrometer was set torun in positive ionmode with a capillary voltage of3400 V, sample cone voltage of 80 V, m/z range of800–5500, and mass resolution of 5000. Theinstrument was tuned and calibrated using multi-ply charged ions of trypsinogen. Thedeconvolutionof ESI mass spectra was performed using aMaxEnt1 algorithm, which is a part of the
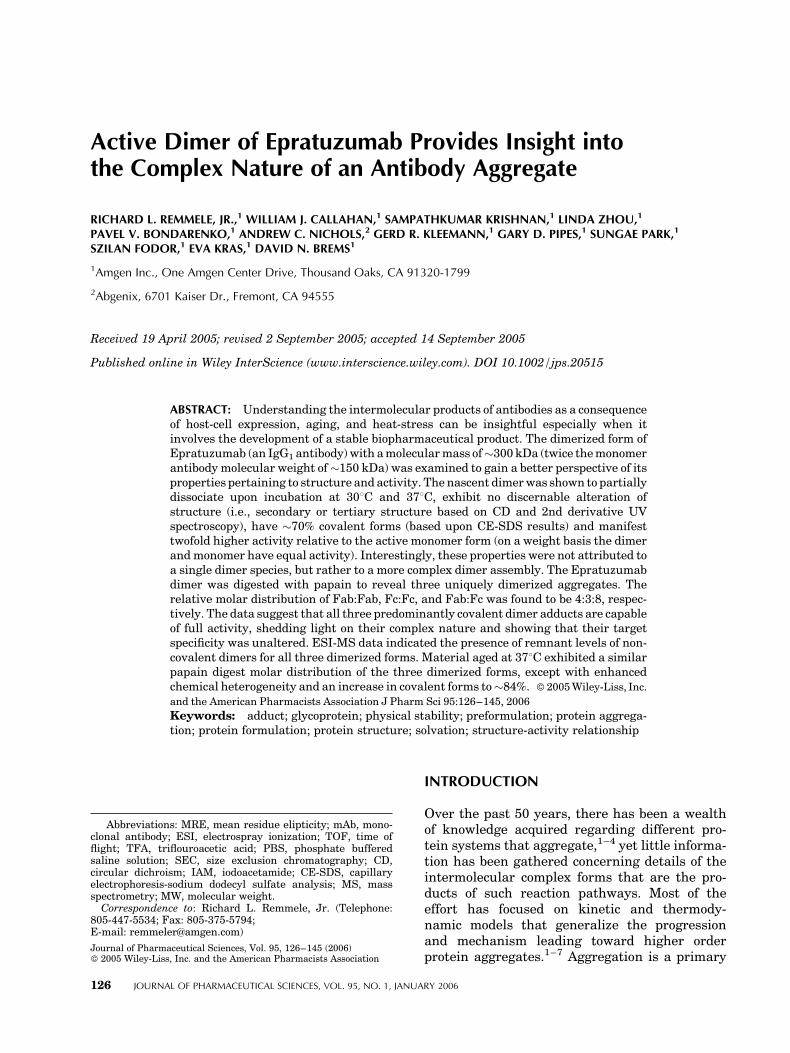
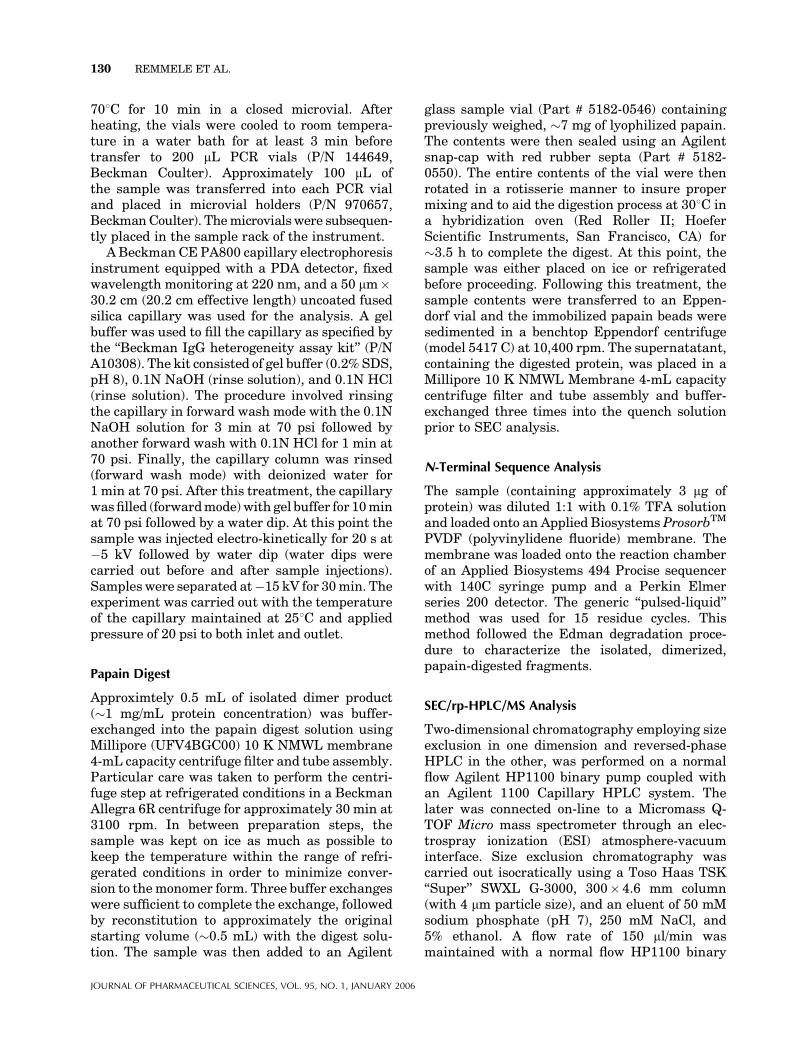
MassLynx software from Micromass. A summaryof the approach used may be found in the diagramof Figure 1.
RESULTS
Biophysical Characterization of the IsolatedEpratuzumab Dimer
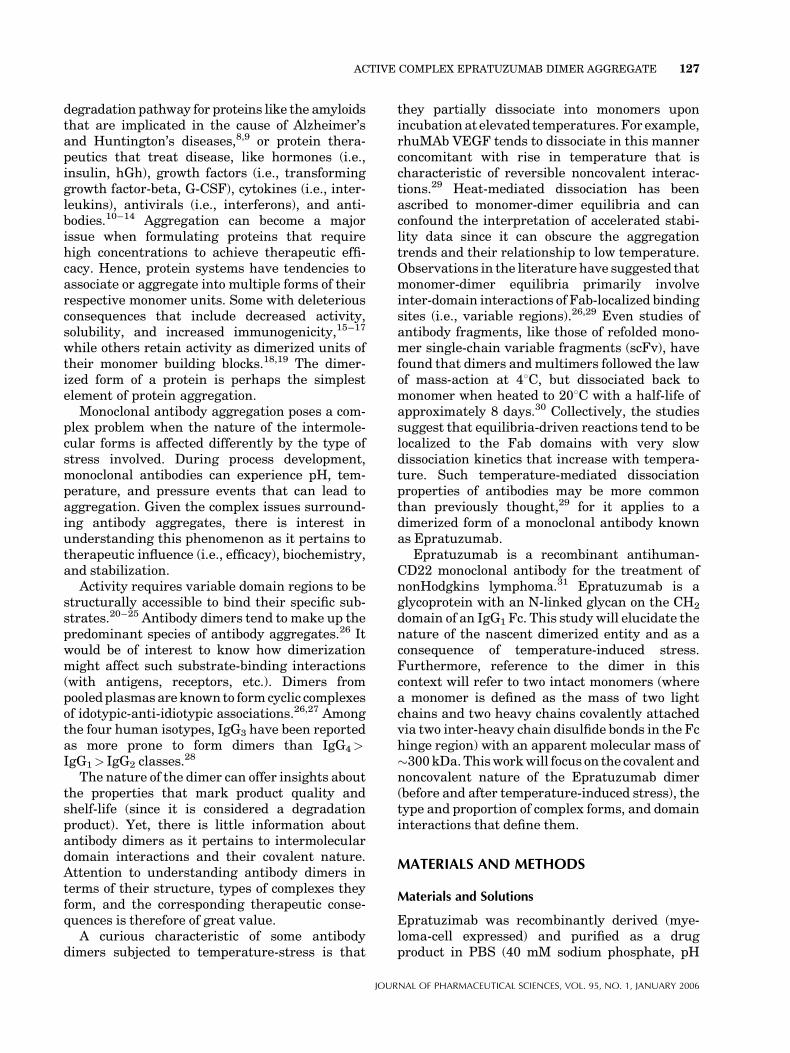
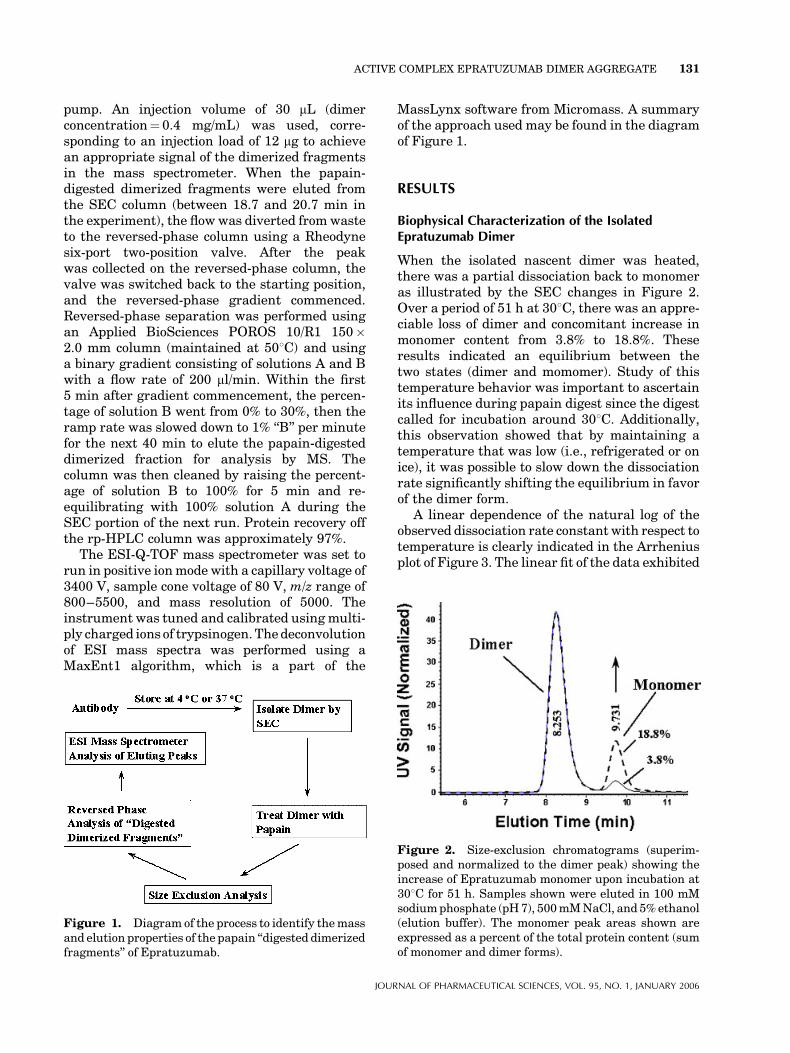
When the isolated nascent dimer was heated,there was a partial dissociation back to monomeras illustrated by the SEC changes in Figure 2.Over a period of 51 h at 308C, there was an appre-ciable loss of dimer and concomitant increase inmonomer content from 3.8% to 18.8%. Theseresults indicated an equilibrium between thetwo states (dimer and momomer). Study of thistemperature behavior was important to ascertainits influence during papain digest since the digestcalled for incubation around 308C. Additionally,this observation showed that by maintaining atemperature that was low (i.e., refrigerated or onice), it was possible to slow down the dissociationrate significantly shifting the equilibrium in favorof the dimer form.
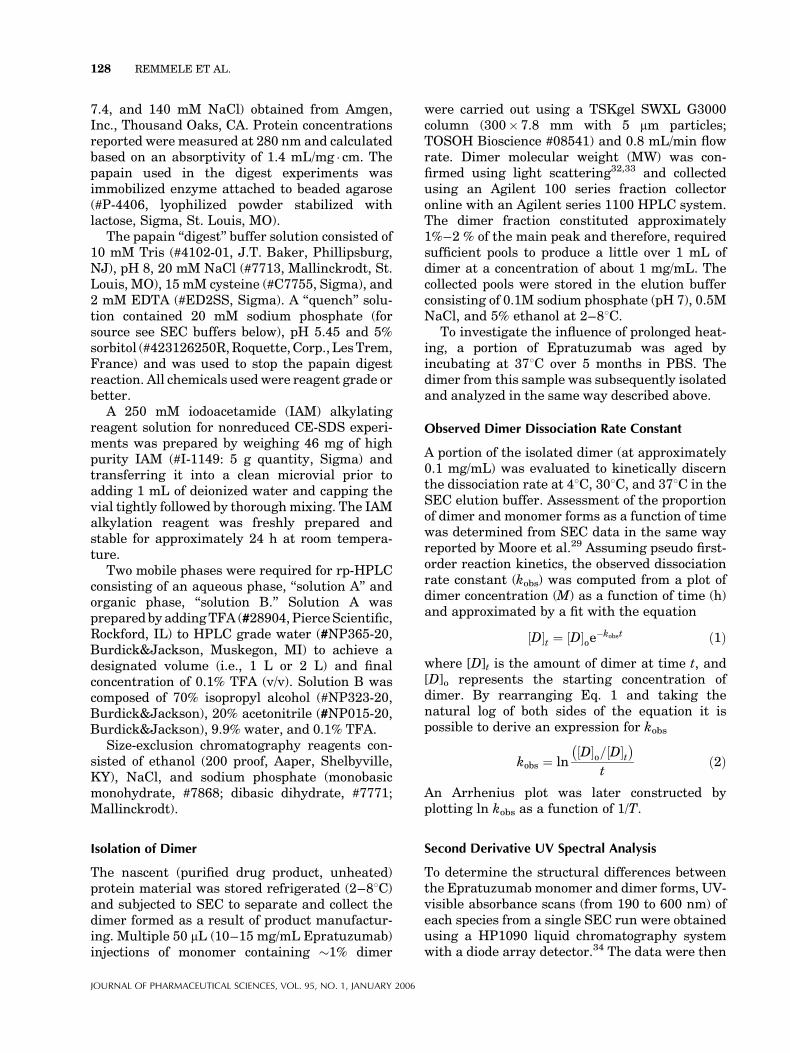
A linear dependence of the natural log of theobserved dissociation rate constant with respect totemperature is clearly indicated in the Arrheniusplot of Figure 3. The linear fit of the data exhibited
Figure 1. Diagram of the process to identify themassand elution properties of the papain ‘‘digested dimerizedfragments’’ of Epratuzumab.
Figure 2. Size-exclusion chromatograms (superim-posed and normalized to the dimer peak) showing theincrease of Epratuzumab monomer upon incubation at308C for 51 h. Samples shown were eluted in 100 mMsodiumphosphate (pH7), 500mMNaCl, and 5%ethanol(elution buffer). The monomer peak areas shown areexpressed as a percent of the total protein content (sumof monomer and dimer forms).
ACTIVE COMPLEX EPRATUZUMAB DIMER AGGREGATE 131
JOURNAL OF PHARMACEUTICAL SCIENCES, VOL. 95, NO. 1, JANUARY 2006
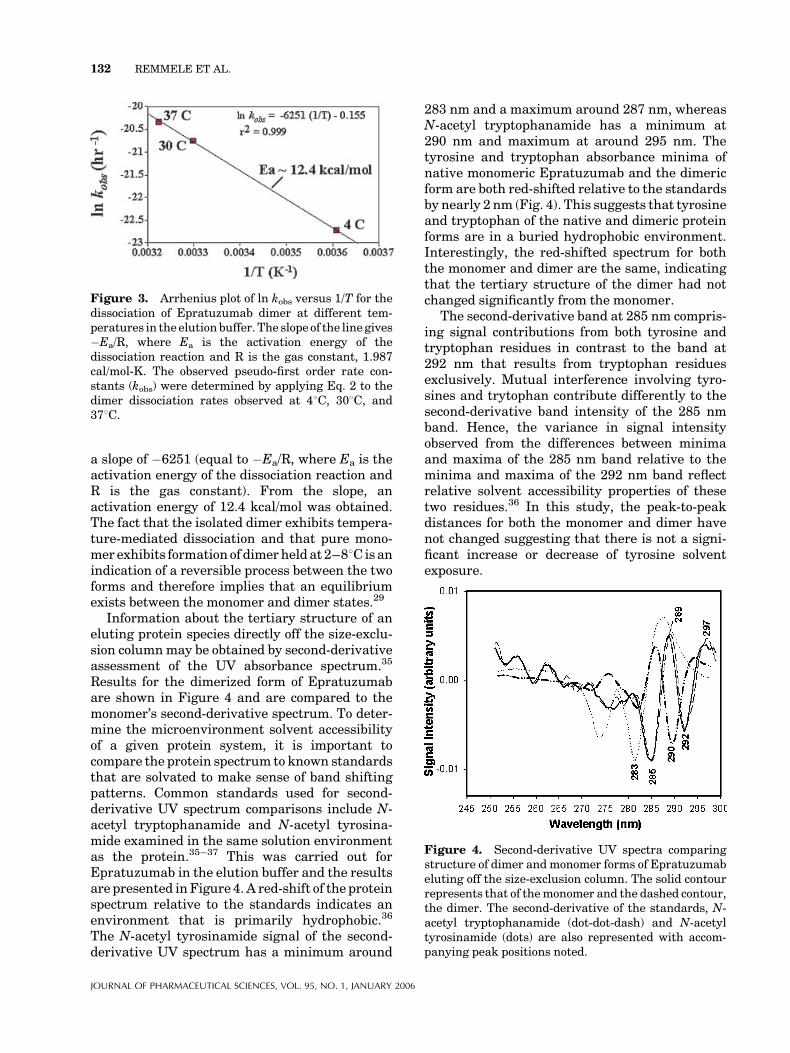
a slope of �6251 (equal to �Ea/R, where Ea is theactivation energy of the dissociation reaction andR is the gas constant). From the slope, anactivation energy of 12.4 kcal/mol was obtained.The fact that the isolated dimer exhibits tempera-ture-mediated dissociation and that pure mono-mer exhibits formation of dimerheld at 2–88C isanindication of a reversible process between the twoforms and therefore implies that an equilibriumexists between the monomer and dimer states.29
Information about the tertiary structure of aneluting protein species directly off the size-exclu-sion columnmay be obtained by second-derivativeassessment of the UV absorbance spectrum.35
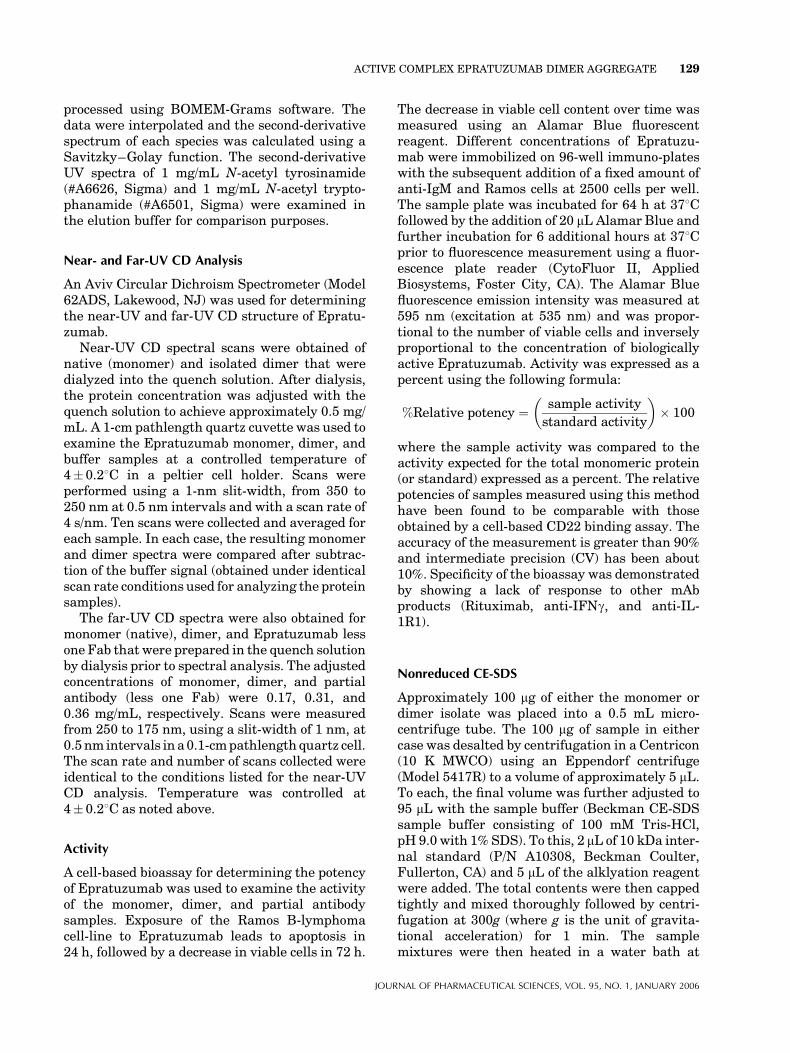
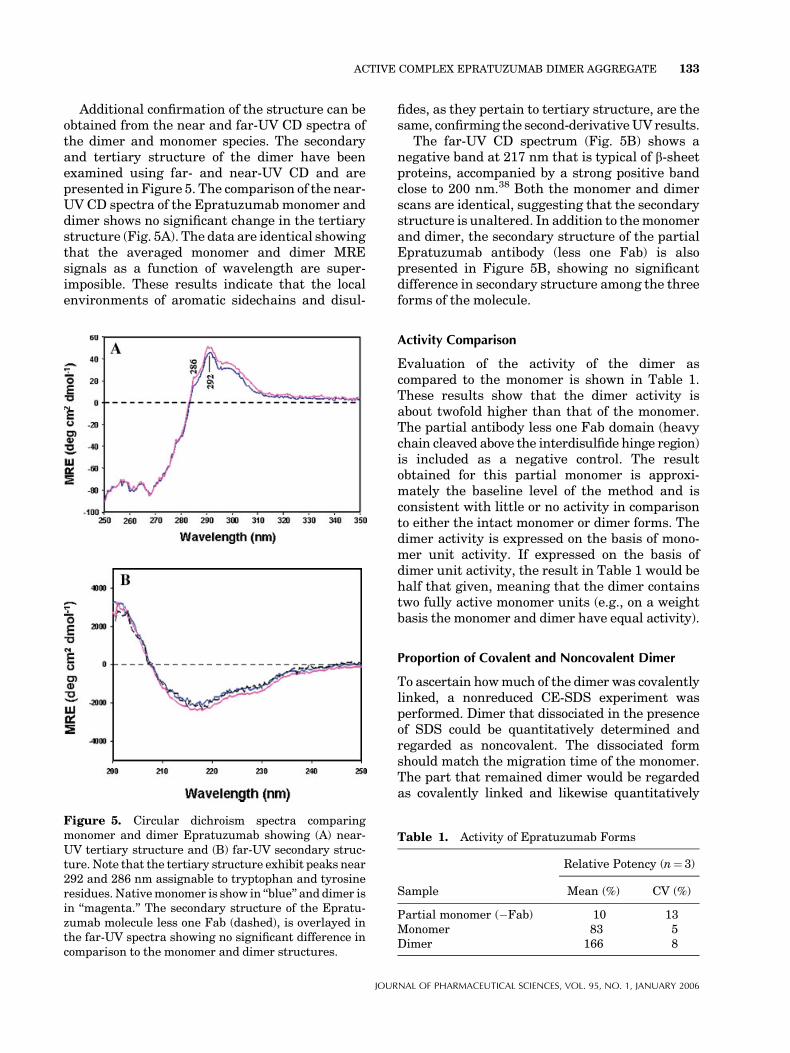
Results for the dimerized form of Epratuzumabare shown in Figure 4 and are compared to themonomer’s second-derivative spectrum. To deter-mine the microenvironment solvent accessibilityof a given protein system, it is important tocompare the protein spectrum to known standardsthat are solvated to make sense of band shiftingpatterns. Common standards used for second-derivative UV spectrum comparisons include N-acetyl tryptophanamide and N-acetyl tyrosina-mide examined in the same solution environmentas the protein.35–37 This was carried out forEpratuzumab in the elution buffer and the resultsare presented inFigure 4. A red-shift of the proteinspectrum relative to the standards indicates anenvironment that is primarily hydrophobic.36
The N-acetyl tyrosinamide signal of the second-derivative UV spectrum has a minimum around
283 nm and a maximum around 287 nm, whereasN-acetyl tryptophanamide has a minimum at290 nm and maximum at around 295 nm. Thetyrosine and tryptophan absorbance minima ofnative monomeric Epratuzumab and the dimericform are both red-shifted relative to the standardsby nearly 2 nm (Fig. 4). This suggests that tyrosineand tryptophan of the native and dimeric proteinforms are in a buried hydrophobic environment.Interestingly, the red-shifted spectrum for boththe monomer and dimer are the same, indicatingthat the tertiary structure of the dimer had notchanged significantly from the monomer.
The second-derivative band at 285 nm compris-ing signal contributions from both tyrosine andtryptophan residues in contrast to the band at292 nm that results from tryptophan residuesexclusively. Mutual interference involving tyro-sines and trytophan contribute differently to thesecond-derivative band intensity of the 285 nmband. Hence, the variance in signal intensityobserved from the differences between minimaand maxima of the 285 nm band relative to theminima and maxima of the 292 nm band reflectrelative solvent accessibility properties of thesetwo residues.36 In this study, the peak-to-peakdistances for both the monomer and dimer havenot changed suggesting that there is not a signi-ficant increase or decrease of tyrosine solventexposure.
Figure 3. Arrhenius plot of ln kobs versus 1/T for thedissociation of Epratuzumab dimer at different tem-peratures in the elutionbuffer. The slope of the line gives�Ea/R, where Ea is the activation energy of thedissociation reaction and R is the gas constant, 1.987cal/mol-K. The observed pseudo-first order rate con-stants (kobs) were determined by applying Eq. 2 to thedimer dissociation rates observed at 48C, 308C, and378C.
Figure 4. Second-derivative UV spectra comparingstructure of dimer and monomer forms of Epratuzumabeluting off the size-exclusion column. The solid contourrepresents that of themonomer and the dashed contour,the dimer. The second-derivative of the standards, N-acetyl tryptophanamide (dot-dot-dash) and N-acetyltyrosinamide (dots) are also represented with accom-panying peak positions noted.
132 REMMELE ET AL.
JOURNAL OF PHARMACEUTICAL SCIENCES, VOL. 95, NO. 1, JANUARY 2006
Additional confirmation of the structure can beobtained from the near and far-UV CD spectra ofthe dimer and monomer species. The secondaryand tertiary structure of the dimer have beenexamined using far- and near-UV CD and arepresented in Figure 5. The comparison of the near-UV CD spectra of the Epratuzumab monomer anddimer shows no significant change in the tertiarystructure (Fig. 5A). The data are identical showingthat the averaged monomer and dimer MREsignals as a function of wavelength are super-imposible. These results indicate that the localenvironments of aromatic sidechains and disul-
fides, as they pertain to tertiary structure, are thesame, confirming the second-derivativeUV results.
The far-UV CD spectrum (Fig. 5B) shows anegative band at 217 nm that is typical of b-sheetproteins, accompanied by a strong positive bandclose to 200 nm.38 Both the monomer and dimerscans are identical, suggesting that the secondarystructure is unaltered. In addition to themonomerand dimer, the secondary structure of the partialEpratuzumab antibody (less one Fab) is alsopresented in Figure 5B, showing no significantdifference in secondary structure among the threeforms of the molecule.
Activity Comparison
Evaluation of the activity of the dimer ascompared to the monomer is shown in Table 1.These results show that the dimer activity isabout twofold higher than that of the monomer.The partial antibody less one Fab domain (heavychain cleaved above the interdisulfide hinge region)is included as a negative control. The resultobtained for this partial monomer is approxi-mately the baseline level of the method and isconsistent with little or no activity in comparisonto either the intact monomer or dimer forms. Thedimer activity is expressed on the basis of mono-mer unit activity. If expressed on the basis ofdimer unit activity, the result in Table 1 would behalf that given, meaning that the dimer containstwo fully active monomer units (e.g., on a weightbasis the monomer and dimer have equal activity).
Proportion of Covalent and Noncovalent Dimer
To ascertain howmuch of the dimer was covalentlylinked, a nonreduced CE-SDS experiment wasperformed. Dimer that dissociated in the presenceof SDS could be quantitatively determined andregarded as noncovalent. The dissociated formshould match the migration time of the monomer.The part that remained dimer would be regardedas covalently linked and likewise quantitatively
Figure 5. Circular dichroism spectra comparingmonomer and dimer Epratuzumab showing (A) near-UV tertiary structure and (B) far-UV secondary struc-ture. Note that the tertiary structure exhibit peaks near292 and 286 nm assignable to tryptophan and tyrosineresidues. Nativemonomer is show in ‘‘blue’’ and dimer isin ‘‘magenta.’’ The secondary structure of the Epratu-zumab molecule less one Fab (dashed), is overlayed inthe far-UV spectra showing no significant difference incomparison to the monomer and dimer structures.
Table 1. Activity of Epratuzumab Forms
Sample
Relative Potency (n¼ 3)
Mean (%) CV (%)
Partial monomer (�Fab) 10 13Monomer 83 5Dimer 166 8
ACTIVE COMPLEX EPRATUZUMAB DIMER AGGREGATE 133
JOURNAL OF PHARMACEUTICAL SCIENCES, VOL. 95, NO. 1, JANUARY 2006
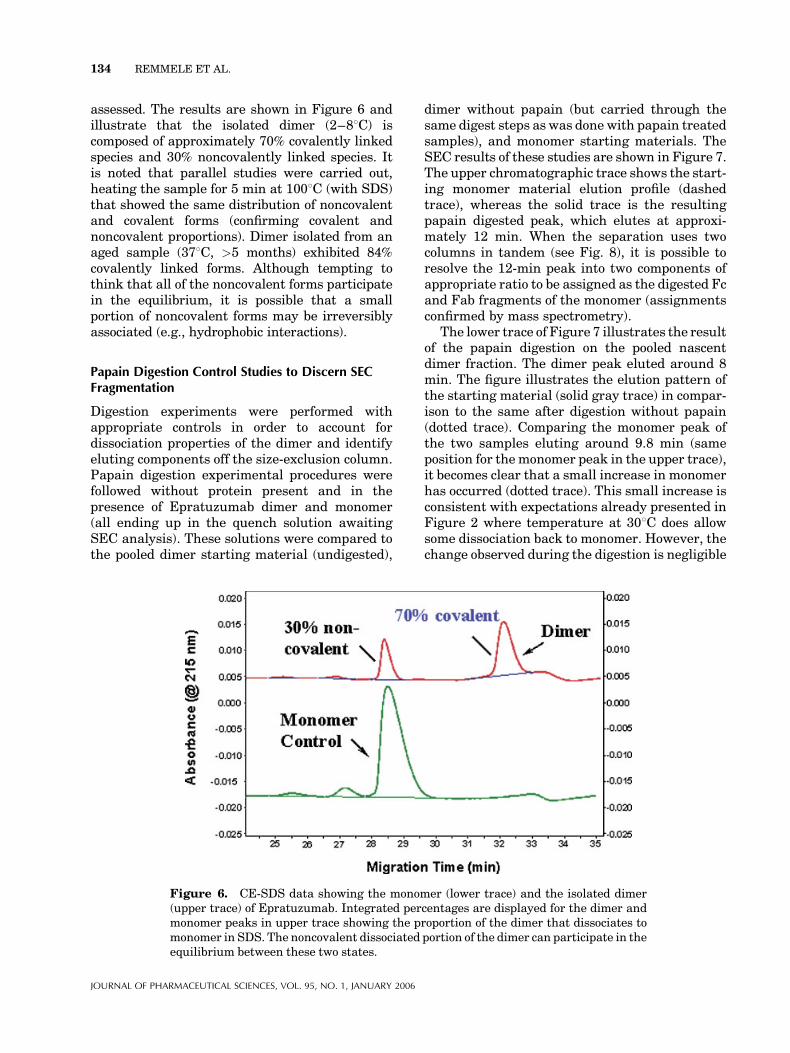
assessed. The results are shown in Figure 6 andillustrate that the isolated dimer (2–88C) iscomposed of approximately 70% covalently linkedspecies and 30% noncovalently linked species. Itis noted that parallel studies were carried out,heating the sample for 5 min at 1008C (with SDS)that showed the same distribution of noncovalentand covalent forms (confirming covalent andnoncovalent proportions). Dimer isolated from anaged sample (378C, >5 months) exhibited 84%covalently linked forms. Although tempting tothink that all of the noncovalent forms participatein the equilibrium, it is possible that a smallportion of noncovalent forms may be irreversiblyassociated (e.g., hydrophobic interactions).
Papain Digestion Control Studies to Discern SECFragmentation
Digestion experiments were performed withappropriate controls in order to account fordissociation properties of the dimer and identifyeluting components off the size-exclusion column.Papain digestion experimental procedures werefollowed without protein present and in thepresence of Epratuzumab dimer and monomer(all ending up in the quench solution awaitingSEC analysis). These solutions were compared tothe pooled dimer starting material (undigested),
dimer without papain (but carried through thesame digest steps as was done with papain treatedsamples), and monomer starting materials. TheSEC results of these studies are shown in Figure 7.The upper chromatographic trace shows the start-ing monomer material elution profile (dashedtrace), whereas the solid trace is the resultingpapain digested peak, which elutes at approxi-mately 12 min. When the separation uses twocolumns in tandem (see Fig. 8), it is possible toresolve the 12-min peak into two components ofappropriate ratio to be assigned as the digested Fcand Fab fragments of the monomer (assignmentsconfirmed by mass spectrometry).
The lower trace of Figure 7 illustrates the resultof the papain digestion on the pooled nascentdimer fraction. The dimer peak eluted around 8min. The figure illustrates the elution pattern ofthe starting material (solid gray trace) in compar-ison to the same after digestion without papain(dotted trace). Comparing the monomer peak ofthe two samples eluting around 9.8 min (sameposition for the monomer peak in the upper trace),it becomes clear that a small increase in monomerhas occurred (dotted trace). This small increase isconsistent with expectations already presented inFigure 2 where temperature at 308C does allowsome dissociation back to monomer. However, thechange observed during the digestion is negligible
Figure 6. CE-SDS data showing the monomer (lower trace) and the isolated dimer(upper trace) of Epratuzumab. Integrated percentages are displayed for the dimer andmonomer peaks in upper trace showing the proportion of the dimer that dissociates tomonomer in SDS. The noncovalent dissociated portion of the dimer can participate in theequilibrium between these two states.
134 REMMELE ET AL.
JOURNAL OF PHARMACEUTICAL SCIENCES, VOL. 95, NO. 1, JANUARY 2006
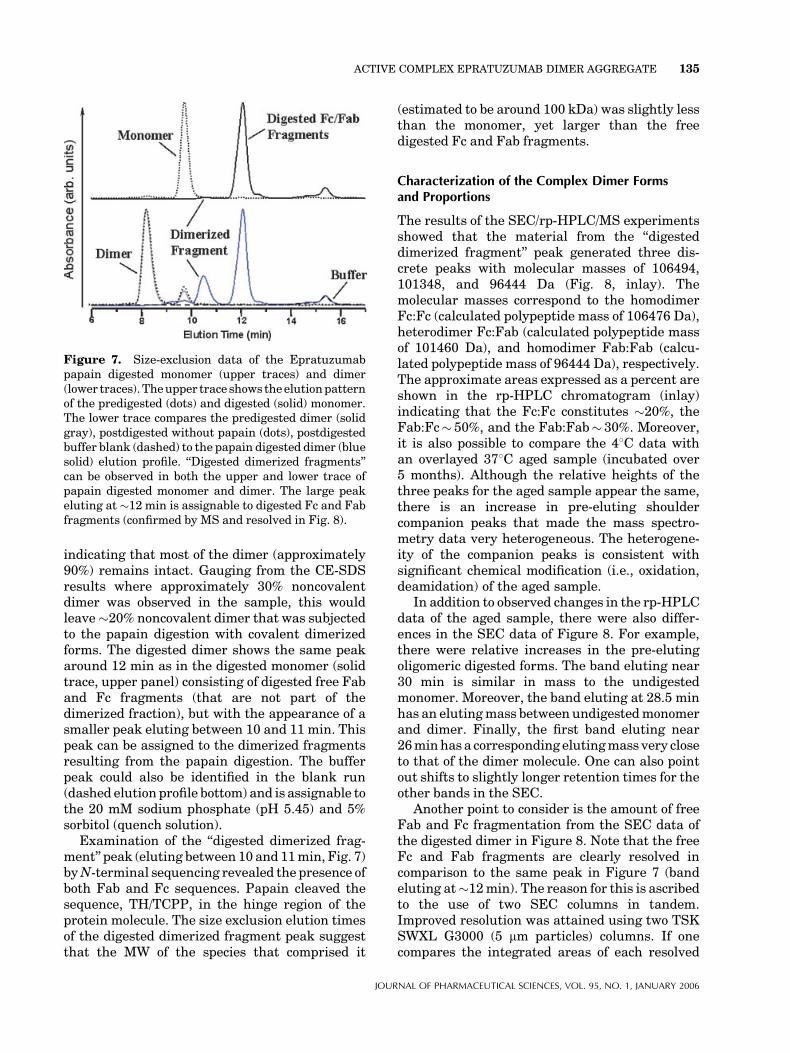
indicating that most of the dimer (approximately90%) remains intact. Gauging from the CE-SDSresults where approximately 30% noncovalentdimer was observed in the sample, this wouldleave�20% noncovalent dimer that was subjectedto the papain digestion with covalent dimerizedforms. The digested dimer shows the same peakaround 12 min as in the digested monomer (solidtrace, upper panel) consisting of digested free Faband Fc fragments (that are not part of thedimerized fraction), but with the appearance of asmaller peak eluting between 10 and 11 min. Thispeak can be assigned to the dimerized fragmentsresulting from the papain digestion. The bufferpeak could also be identified in the blank run(dashed elution profile bottom) and is assignable tothe 20 mM sodium phosphate (pH 5.45) and 5%sorbitol (quench solution).
Examination of the ‘‘digested dimerized frag-ment’’ peak (eluting between 10 and 11min, Fig. 7)byN-terminal sequencing revealed the presence ofboth Fab and Fc sequences. Papain cleaved thesequence, TH/TCPP, in the hinge region of theprotein molecule. The size exclusion elution timesof the digested dimerized fragment peak suggestthat the MW of the species that comprised it
(estimated to be around 100 kDa) was slightly lessthan the monomer, yet larger than the freedigested Fc and Fab fragments.
Characterization of the Complex Dimer Formsand Proportions
The results of the SEC/rp-HPLC/MS experimentsshowed that the material from the ‘‘digesteddimerized fragment’’ peak generated three dis-crete peaks with molecular masses of 106494,101348, and 96444 Da (Fig. 8, inlay). Themolecular masses correspond to the homodimerFc:Fc (calculated polypeptide mass of 106476 Da),heterodimer Fc:Fab (calculated polypeptide massof 101460 Da), and homodimer Fab:Fab (calcu-lated polypeptide mass of 96444 Da), respectively.The approximate areas expressed as a percent areshown in the rp-HPLC chromatogram (inlay)indicating that the Fc:Fc constitutes �20%, theFab:Fc� 50%, and the Fab:Fab� 30%. Moreover,it is also possible to compare the 48C data withan overlayed 378C aged sample (incubated over5 months). Although the relative heights of thethree peaks for the aged sample appear the same,there is an increase in pre-eluting shouldercompanion peaks that made the mass spectro-metry data very heterogeneous. The heterogene-ity of the companion peaks is consistent withsignificant chemical modification (i.e., oxidation,deamidation) of the aged sample.
In addition to observed changes in the rp-HPLCdata of the aged sample, there were also differ-ences in the SEC data of Figure 8. For example,there were relative increases in the pre-elutingoligomeric digested forms. The band eluting near30 min is similar in mass to the undigestedmonomer. Moreover, the band eluting at 28.5 minhas an elutingmass between undigestedmonomerand dimer. Finally, the first band eluting near26minhasa corresponding elutingmass very closeto that of the dimer molecule. One can also pointout shifts to slightly longer retention times for theother bands in the SEC.
Another point to consider is the amount of freeFab and Fc fragmentation from the SEC data ofthe digested dimer in Figure 8. Note that the freeFc and Fab fragments are clearly resolved incomparison to the same peak in Figure 7 (bandeluting at�12min). The reason for this is ascribedto the use of two SEC columns in tandem.Improved resolution was attained using two TSKSWXL G3000 (5 mm particles) columns. If onecompares the integrated areas of each resolved
Figure 7. Size-exclusion data of the Epratuzumabpapain digested monomer (upper traces) and dimer(lower traces). Theupper trace shows theelutionpatternof the predigested (dots) and digested (solid) monomer.The lower trace compares the predigested dimer (solidgray), postdigested without papain (dots), postdigestedbuffer blank (dashed) to the papain digested dimer (bluesolid) elution profile. ‘‘Digested dimerized fragments’’can be observed in both the upper and lower trace ofpapain digested monomer and dimer. The large peakeluting at �12 min is assignable to digested Fc and Fabfragments (confirmed by MS and resolved in Fig. 8).
ACTIVE COMPLEX EPRATUZUMAB DIMER AGGREGATE 135
JOURNAL OF PHARMACEUTICAL SCIENCES, VOL. 95, NO. 1, JANUARY 2006
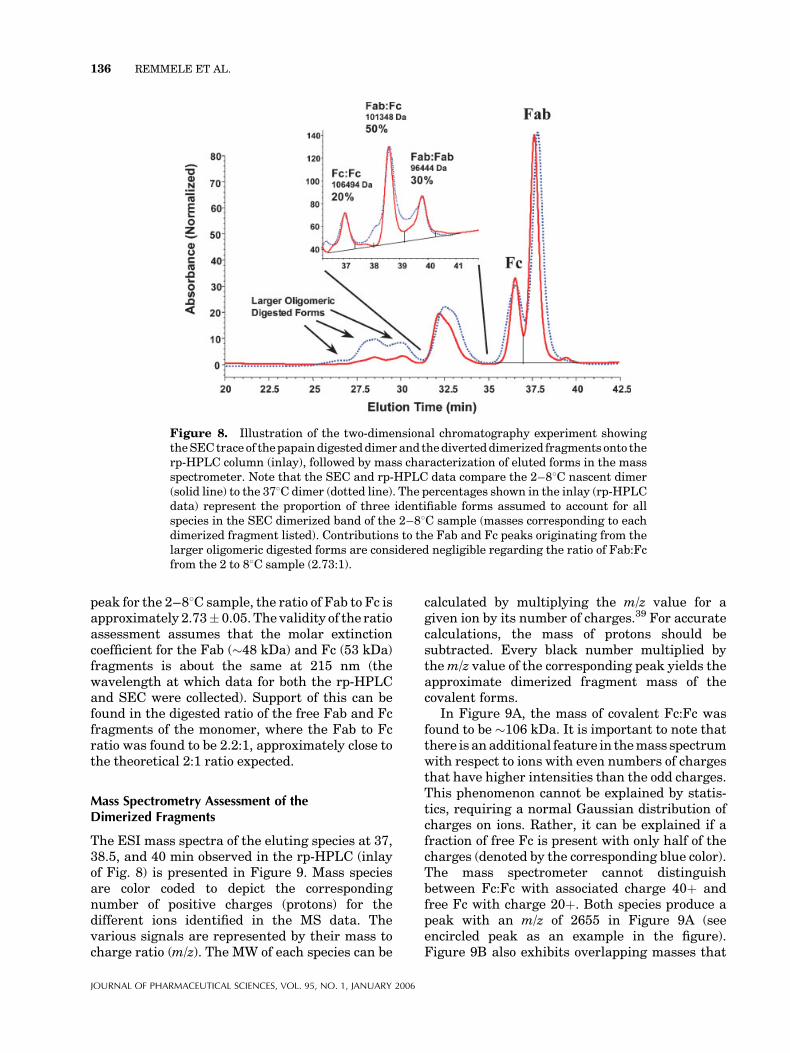
peak for the 2–88C sample, the ratio of Fab to Fc isapproximately 2.73� 0.05. The validity of the ratioassessment assumes that the molar extinctioncoefficient for the Fab (�48 kDa) and Fc (53 kDa)fragments is about the same at 215 nm (thewavelength at which data for both the rp-HPLCand SEC were collected). Support of this can befound in the digested ratio of the free Fab and Fcfragments of the monomer, where the Fab to Fcratio was found to be 2.2:1, approximately close tothe theoretical 2:1 ratio expected.
Mass Spectrometry Assessment of theDimerized Fragments
The ESI mass spectra of the eluting species at 37,38.5, and 40 min observed in the rp-HPLC (inlayof Fig. 8) is presented in Figure 9. Mass speciesare color coded to depict the correspondingnumber of positive charges (protons) for thedifferent ions identified in the MS data. Thevarious signals are represented by their mass tocharge ratio (m/z). The MW of each species can be
calculated by multiplying the m/z value for agiven ion by its number of charges.39 For accuratecalculations, the mass of protons should besubtracted. Every black number multiplied bythem/z value of the corresponding peak yields theapproximate dimerized fragment mass of thecovalent forms.
In Figure 9A, the mass of covalent Fc:Fc wasfound to be �106 kDa. It is important to note thatthere is anadditional feature in themass spectrumwith respect to ions with even numbers of chargesthat have higher intensities than the odd charges.This phenomenon cannot be explained by statis-tics, requiring a normal Gaussian distribution ofcharges on ions. Rather, it can be explained if afraction of free Fc is present with only half of thecharges (denoted by the corresponding blue color).The mass spectrometer cannot distinguishbetween Fc:Fc with associated charge 40þ andfree Fc with charge 20þ. Both species produce apeak with an m/z of 2655 in Figure 9A (seeencircled peak as an example in the figure).Figure 9B also exhibits overlapping masses that
Figure 8. Illustration of the two-dimensional chromatography experiment showingtheSECtrace of thepapaindigesteddimer and thediverteddimerized fragments onto therp-HPLC column (inlay), followed by mass characterization of eluted forms in the massspectrometer. Note that the SEC and rp-HPLC data compare the 2–88C nascent dimer(solid line) to the 378C dimer (dotted line). The percentages shown in the inlay (rp-HPLCdata) represent the proportion of three identifiable forms assumed to account for allspecies in the SEC dimerized band of the 2–88C sample (masses corresponding to eachdimerized fragment listed). Contributions to the Fab and Fc peaks originating from thelarger oligomeric digested forms are considered negligible regarding the ratio of Fab:Fcfrom the 2 to 88C sample (2.73:1).
136 REMMELE ET AL.
JOURNAL OF PHARMACEUTICAL SCIENCES, VOL. 95, NO. 1, JANUARY 2006
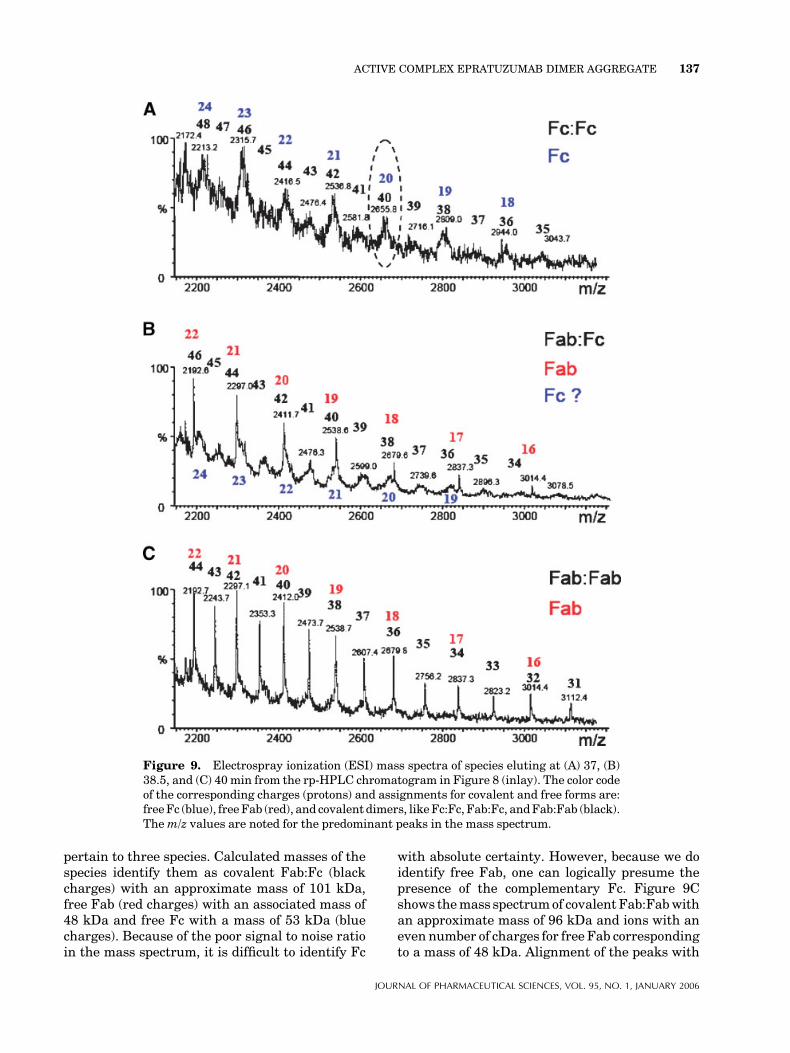
pertain to three species. Calculated masses of thespecies identify them as covalent Fab:Fc (blackcharges) with an approximate mass of 101 kDa,free Fab (red charges) with an associated mass of48 kDa and free Fc with a mass of 53 kDa (bluecharges). Because of the poor signal to noise ratioin the mass spectrum, it is difficult to identify Fc
with absolute certainty. However, because we doidentify free Fab, one can logically presume thepresence of the complementary Fc. Figure 9Cshows themass spectrumof covalent Fab:Fabwithan approximate mass of 96 kDa and ions with anevennumber of charges for free Fab correspondingto a mass of 48 kDa. Alignment of the peaks with
Figure 9. Electrospray ionization (ESI) mass spectra of species eluting at (A) 37, (B)38.5, and (C) 40min from the rp-HPLC chromatogram in Figure 8 (inlay). The color codeof the corresponding charges (protons) and assignments for covalent and free forms are:freeFc (blue), freeFab (red), and covalent dimers, likeFc:Fc, Fab:Fc, andFab:Fab (black).Them/z values are noted for the predominant peaks in the mass spectrum.
ACTIVE COMPLEX EPRATUZUMAB DIMER AGGREGATE 137
JOURNAL OF PHARMACEUTICAL SCIENCES, VOL. 95, NO. 1, JANUARY 2006
red charges confirms that the mass spectra inFigure 9B and C are indeed assignable to a smallportion of free Fab in both eluting fractions.
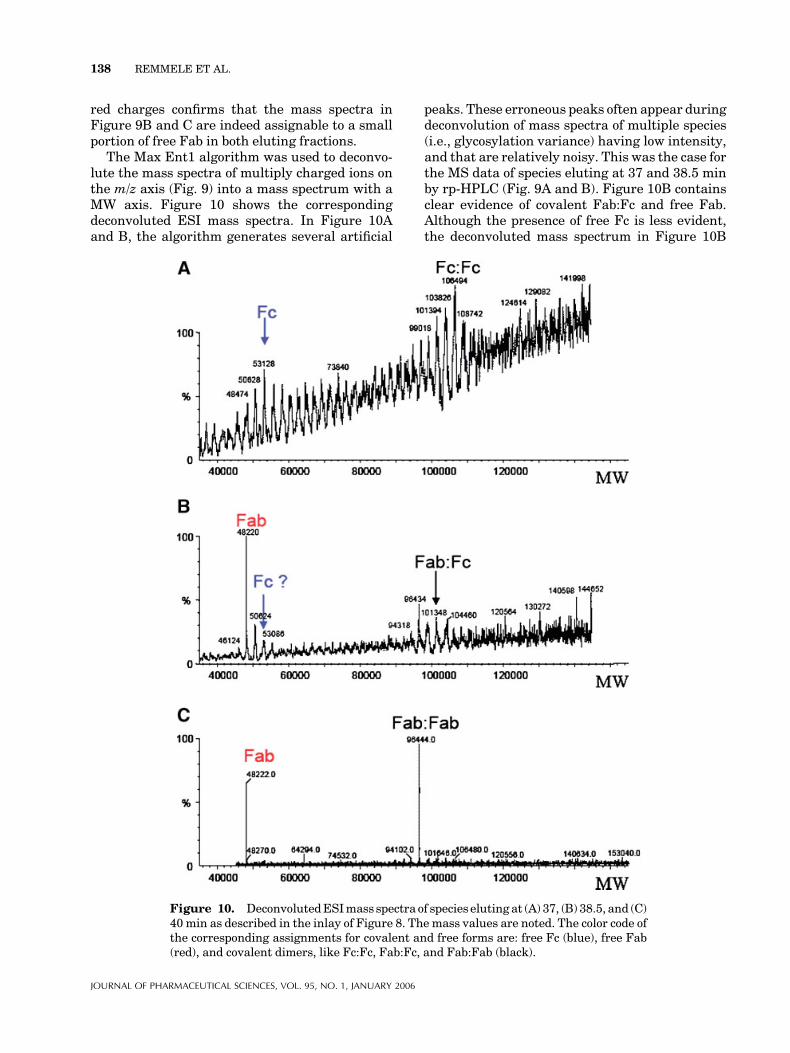
The Max Ent1 algorithm was used to deconvo-lute the mass spectra of multiply charged ions onthe m/z axis (Fig. 9) into a mass spectrum with aMW axis. Figure 10 shows the correspondingdeconvoluted ESI mass spectra. In Figure 10Aand B, the algorithm generates several artificial
peaks. These erroneous peaks often appear duringdeconvolution of mass spectra of multiple species(i.e., glycosylation variance) having low intensity,and that are relatively noisy. This was the case forthe MS data of species eluting at 37 and 38.5 minby rp-HPLC (Fig. 9A and B). Figure 10B containsclear evidence of covalent Fab:Fc and free Fab.Although the presence of free Fc is less evident,the deconvoluted mass spectrum in Figure 10B
Figure 10. DeconvolutedESImass spectra of species eluting at (A) 37, (B) 38.5, and (C)40 min as described in the inlay of Figure 8. The mass values are noted. The color code ofthe corresponding assignments for covalent and free forms are: free Fc (blue), free Fab(red), and covalent dimers, like Fc:Fc, Fab:Fc, and Fab:Fab (black).
138 REMMELE ET AL.
JOURNAL OF PHARMACEUTICAL SCIENCES, VOL. 95, NO. 1, JANUARY 2006
contains a peak corresponding to an Fc mass of53 kDa. In contrast, the species eluting at 40 min(Fig. 10C) show a deconvoluted mass spectrum forFab:Fab and free Fab with a much higher signal/noise ratio, consistent with the high signal/noiseratio shown in Figure 9C.
DISCUSSION
Elucidating the complex form or forms of anantibody, is an important first step towardgaining an accurate perspective of how suchforms contribute to stability and biological activ-ity. The data presented show characteristics ofpartial dissociation upon heating, no discernableperturbation of structure (as described by the 2ndderivative UV-spectroscopy and CD results) and atwofold increase in activity (relative to monomer).Without greater understanding of the complexforms that comprise the dimer, it becomes difficultto rationalize the behavior with regard to func-tionality and stability.
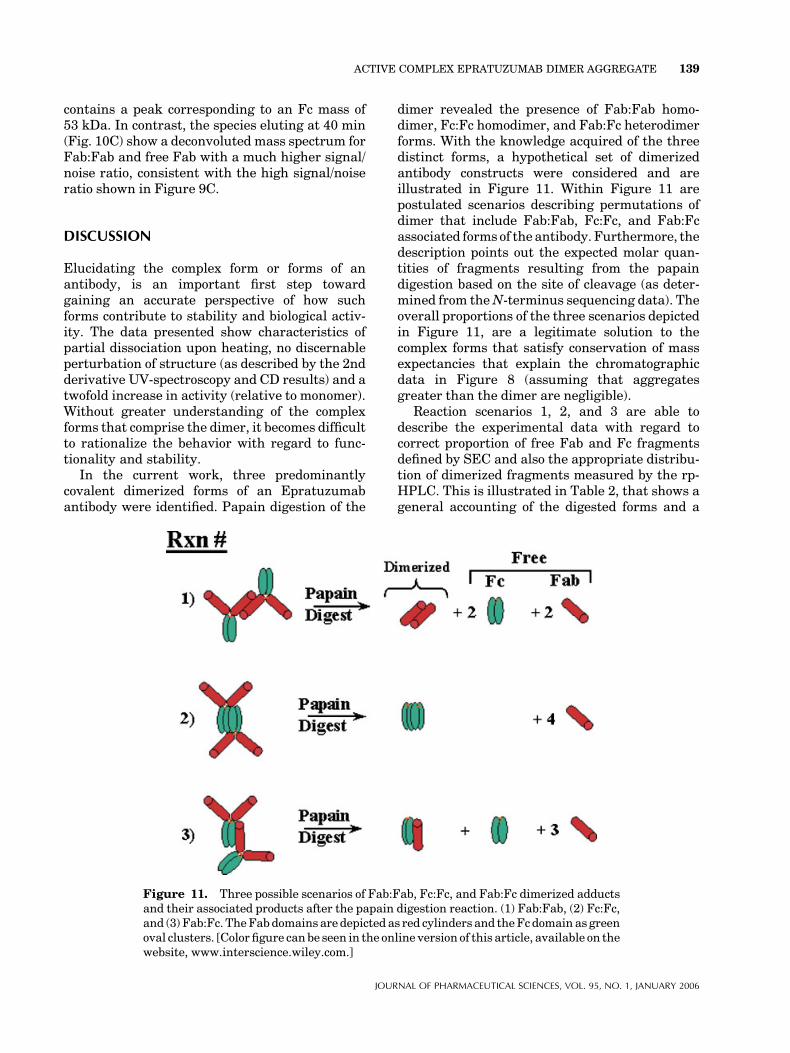
In the current work, three predominantlycovalent dimerized forms of an Epratuzumabantibody were identified. Papain digestion of the
dimer revealed the presence of Fab:Fab homo-dimer, Fc:Fc homodimer, and Fab:Fc heterodimerforms. With the knowledge acquired of the threedistinct forms, a hypothetical set of dimerizedantibody constructs were considered and areillustrated in Figure 11. Within Figure 11 arepostulated scenarios describing permutations ofdimer that include Fab:Fab, Fc:Fc, and Fab:Fcassociated forms of the antibody. Furthermore, thedescription points out the expected molar quan-tities of fragments resulting from the papaindigestion based on the site of cleavage (as deter-mined from theN-terminus sequencing data). Theoverall proportions of the three scenarios depictedin Figure 11, are a legitimate solution to thecomplex forms that satisfy conservation of massexpectancies that explain the chromatographicdata in Figure 8 (assuming that aggregatesgreater than the dimer are negligible).
Reaction scenarios 1, 2, and 3 are able todescribe the experimental data with regard tocorrect proportion of free Fab and Fc fragmentsdefined by SEC and also the appropriate distribu-tion of dimerized fragments measured by the rp-HPLC. This is illustrated in Table 2, that shows ageneral accounting of the digested forms and a
Figure 11. Three possible scenarios of Fab:Fab, Fc:Fc, and Fab:Fc dimerized adductsand their associated products after the papain digestion reaction. (1) Fab:Fab, (2) Fc:Fc,and (3) Fab:Fc. TheFabdomains are depicted as red cylinders and theFc domain as greenoval clusters. [Color figure canbe seen in the online version of this article, available on thewebsite, www.interscience.wiley.com.]
ACTIVE COMPLEX EPRATUZUMAB DIMER AGGREGATE 139
JOURNAL OF PHARMACEUTICAL SCIENCES, VOL. 95, NO. 1, JANUARY 2006
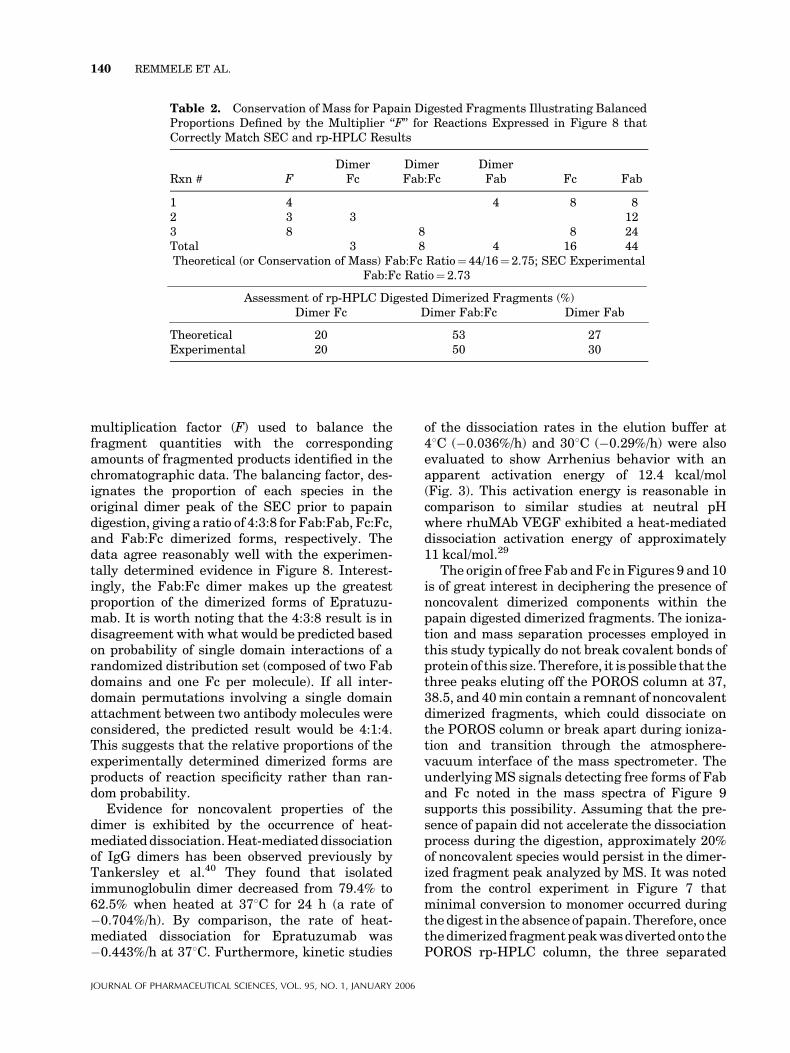
multiplication factor (F) used to balance thefragment quantities with the correspondingamounts of fragmented products identified in thechromatographic data. The balancing factor, des-ignates the proportion of each species in theoriginal dimer peak of the SEC prior to papaindigestion, giving a ratio of 4:3:8 for Fab:Fab, Fc:Fc,and Fab:Fc dimerized forms, respectively. Thedata agree reasonably well with the experimen-tally determined evidence in Figure 8. Interest-ingly, the Fab:Fc dimer makes up the greatestproportion of the dimerized forms of Epratuzu-mab. It is worth noting that the 4:3:8 result is indisagreement with what would be predicted basedon probability of single domain interactions of arandomized distribution set (composed of two Fabdomains and one Fc per molecule). If all inter-domain permutations involving a single domainattachment between two antibody molecules wereconsidered, the predicted result would be 4:1:4.This suggests that the relative proportions of theexperimentally determined dimerized forms areproducts of reaction specificity rather than ran-dom probability.
Evidence for noncovalent properties of thedimer is exhibited by the occurrence of heat-mediateddissociation.Heat-mediateddissociationof IgG dimers has been observed previously byTankersley et al.40 They found that isolatedimmunoglobulin dimer decreased from 79.4% to62.5% when heated at 378C for 24 h (a rate of�0.704%/h). By comparison, the rate of heat-mediated dissociation for Epratuzumab was�0.443%/h at 378C. Furthermore, kinetic studies
of the dissociation rates in the elution buffer at48C (�0.036%/h) and 308C (�0.29%/h) were alsoevaluated to show Arrhenius behavior with anapparent activation energy of 12.4 kcal/mol(Fig. 3). This activation energy is reasonable incomparison to similar studies at neutral pHwhere rhuMAb VEGF exhibited a heat-mediateddissociation activation energy of approximately11 kcal/mol.29
The origin of free Fab andFc in Figures 9 and 10is of great interest in deciphering the presence ofnoncovalent dimerized components within thepapain digested dimerized fragments. The ioniza-tion and mass separation processes employed inthis study typically do not break covalent bonds ofprotein of this size. Therefore, it is possible that thethree peaks eluting off the POROS column at 37,38.5, and 40min contain a remnant of noncovalentdimerized fragments, which could dissociate onthe POROS column or break apart during ioniza-tion and transition through the atmosphere-vacuum interface of the mass spectrometer. Theunderlying MS signals detecting free forms of Faband Fc noted in the mass spectra of Figure 9supports this possibility. Assuming that the pre-sence of papain did not accelerate the dissociationprocess during the digestion, approximately 20%of noncovalent species would persist in the dimer-ized fragment peak analyzed by MS. It was notedfrom the control experiment in Figure 7 thatminimal conversion to monomer occurred duringthedigest in the absence of papain. Therefore, oncethedimerized fragmentpeakwasdiverted onto thePOROS rp-HPLC column, the three separated
Table 2. Conservation of Mass for Papain Digested Fragments Illustrating BalancedProportions Defined by the Multiplier ‘‘F’’ for Reactions Expressed in Figure 8 thatCorrectly Match SEC and rp-HPLC Results
Rxn # FDimerFc
DimerFab:Fc
DimerFab Fc Fab
1 4 4 8 82 3 3 123 8 8 8 24Total 3 8 4 16 44Theoretical (or Conservation of Mass) Fab:Fc Ratio¼ 44/16¼ 2.75; SEC Experimental
Fab:Fc Ratio¼ 2.73
Assessment of rp-HPLC Digested Dimerized Fragments (%)Dimer Fc Dimer Fab:Fc Dimer Fab
Theoretical 20 53 27Experimental 20 50 30
140 REMMELE ET AL.
JOURNAL OF PHARMACEUTICAL SCIENCES, VOL. 95, NO. 1, JANUARY 2006
peaks would be expected to contain some smallportion of free Fab and Fc forms ascribed todissociated noncovalent dimerized fragments.
The MS data in Figure 9 do indeed show minorcontributions of free Fab and Fc underlyingthe predominant covalent dimerized fragments.Evidence of noncovalent Fc:Fc forms in Figure 9Awas observed by the presence of remnant levels offree Fc. In addition to this, the data exhibited freeFab in the Fab:Fc and Fab:Fab peaks (Fig. 9B andC). Moreover, in addition to free Fab in Figure 9B,free Fc may be also present accounting for bothdissociated Fab and Fc components that would beexpected for a heterodimer noncovalent species.Hence, the MS data exhibit evidence for thepresence of Fc:Fc, Fc:Fab, and Fab:Fab noncova-lent forms underlying the predominant covalentforms of each. Collectively, estimated contribu-tions from the mass signals suggests the composi-tion amounts to about 10%–20% of the dimerizedfragment forms, consistentwith expectations fromthe control experiments represented in Figure 7.
Tankersley et al. noted that dimer dissociationincreased with decreasing pH and increasing ionicstrength, which provided some evidence thatelectrostatic effects might play a role in theequilibrium defining the association. The samebehavior was also evident for similar studies withEpratuzumab (data obtained at pH 5 and 7.4 with150 mM NaCl). The decrease in dimer as aconsequence of gentle heating favors the hypoth-esis of an electrostatic interaction where solvationof naked charged groups stabilized the dissociatedform of the molecule. Furthermore, based uponsimilar findings from heating studies with anti-body fragments (scFv), it would seem plausible toascribe the equilibrium to the Fab region of themolecule.30 These findings differ from observa-tions made for rhuMAb VEGFwhere the effects ofpHand ionic strength on the rate of dimer dissocia-tion were modest and suggested that electrostaticforces were not the predominant interactionsresponsible for dimerization.29 These contrastingresults are presumably due to differences betweenthe variable regions of the Fab domains.
When Epratuzumab was aged by incubating at378C for over 5months, there was a 3% increase inthe dimer content of the samplemeasured by SEC.Isolation of the dimer from this sample followed bypapain digestion yielded the distribution of thethree forms shown in the reversed-phase inlay ofFigure 8. Even though heat-mediated dissociationoccurs at 378C over a short period of time, thiseventwas overtaken by irreversible processes that
yielded undissociable dimerized forms over anextended incubation period. Shifts in elution timeand band broadeningmark some of the differencesin the corresponding SEC trace of the aged sample.Although the distribution of the rp-HPLC patternof the three dimeric forms is relatively consistent(Fig. 8), alterationsare apparent by thepresence ofshoulders that emerge adjacent to the predomi-nant peaks. Mass spectrometry of these peaksexhibited significant heterogeneity, signifyingsubstantial physicochemical modifications hadoccurred. Hence, the equilibrium between formscould ultimately have been altered by this heattreatment resulting in dimerized species withdifferent elution properties. The covalent natureof the heated dimer as determined by CE-SDSrevealed 84% covalent and 16% noncovalentspecies. This result suggested that although somesmall proportion of dissociable dimer was in thesample, there was an increase in covalent contentby �14%. Some additional crosslinking had oc-curred in the sample heated for 5.5 months.
The influence of dilution on IgG dimers wasinvestigated by Tankersley et al.40 and found toexhibit incomplete dissociation dynamics. Whenan80mg/mLprotein solutionwas diluted 500-fold,a decrease in dimer content from 36% to 20% oftotal protein was observed instead of the expected0.2% based upon their assumption that all the IgGparticipated in the monomer-dimer equilibrium.This led them to conclude that many, distinctequilibria were involved in the reversible process.However, they did not take into account theproportion of covalently linked species that couldnot participate in the equilibrium between the twoforms.
One of the intriguing aspects of the Epratuzu-mab dimer is the rather high proportion ofcovalently attached dimer forms associated withan IgG1 molecule. For the IgG family of immuno-globulins, there has been recent evidence thatshows IgG2 molecules form covalent dimers, butlittle or no evidence has surfaced if this is possiblefor IgG1 molecules.41 Moreover, the vast majorityof IgG dimers detected in pooled plasma frommultiple donors are thought to be complexesthat associate noncovalently through the Fabregions.28,40 Based upon nonreduced SDS–PAGEresults reported by Tankersley et al.,40 approxi-mately 30% of the dimer did not break down tomonomer suggesting the presence of covalentlyassociated species. However in the case of Epra-tuzumab, it hasbeen shownthat thenascentdimeris�70% covalent. This is further complicated from
ACTIVE COMPLEX EPRATUZUMAB DIMER AGGREGATE 141
JOURNAL OF PHARMACEUTICAL SCIENCES, VOL. 95, NO. 1, JANUARY 2006
the standpoint that there are other associatedforms that involve more than just the Fab regions.Moreover, there is evidence from reduced SDS–PAGE data that the Epratuzumab dimer com-prises covalent forms that are not disulfide innature. In fact, preliminaryfindings suggest that asmall portion of all three forms possess covalentlylinked species that are not reducible in DTT (datanot shown).
The lack of any structural perturbation in thenascent or unheatedEpratuzumabdimer suggeststhat unfoldingwas not involved in the formation ofthe three dimerized forms. However this does notpreclude the possibility of conformational flexibil-ity especially in the hinge region. Enhanced hingeflexibility may be important with regard to thepropensity of antibodies to dimerize.28Moreover itis the extensive flexibility of the antibodymoleculethat permits it to adapt to a vast array of antigenshapes and sizes.42,43 Several studies have shownthat the hinge region of an IgG molecule is likeloose tethers that allow the Fabs to drift androtate relative to each other and to the Fc.44,45 Theextreme inter- and intra-domain flexibility of theIgG antibody molecule allows for many possibili-ties to associate or interact at multiple sites(more than those depicted in Fig. 11), resulting innumerous opportunities for contact between thedifferent domains. Although spectroscopic evi-dence of the secondary and tertiary structureindicated no distinction between monomer anddimer forms, it is likely that changes ascribed toantibody flexibility remain undetected by thesemethods. Since only an average structure compris-ing an ensemble of energy statesmay be comparedin this instance to show that there is no disparitybetween monomer and dimer forms, small con-tributions related to antibody flexibility may notbe distinguished from the major contributionsascribed to the overall secondary and tertiarystructure.
Among the three forms of dimer identified, wepostulate that all four Fab domainsmust be able tobind two CD22 receptors resulting in twofoldhigher activity than that observed by the mono-mer. Epratuzumab has a binding affinity of 1.43�109 M�1 based upon Biacore measurements.31
Assuming that the binding stoichiometry is 1:1(antibody: CD22), a dimer should bind two CD22receptors. Evidence in support of this can be foundin Table 1 where it is shown that when only oneFab can bind the receptor, the activity is insignif-icant. Recalling that the secondary structure ofthe partial antibody molecule (less one Fab) was
unaltered based on the far-UV CD results, thedata suggest that both Fab arms are requiredto adequately bind CD22. Therefore, if oneactive monomer unit is partnered with an in-active neighbor (in one of the dimerized forms), theexpected activity of this union would be equal tofull monomer activity. Since the dimer is twofoldmore active than the monomer, both joined mono-mers must fully participate in binding to CD22.This wouldmean that the necessary flexibility andspecificity of all three dimerized forms identifiedare retained.
It is also quite possible that the apparentbinding affinity of the resulting complex (1 anti-body dimer:2 CD22 receptors) is higher withslower dissociation rates than the monomer. Anumber of studies have shown that it is possible forIgG antibodies to display cooperativity in bindingto antigens that enhances their interaction affi-nity.46–48 Monoclonal antibodies have also beenshown to exhibit allosteric binding phenomena inthe presence of appropriate binding partners andsolution conditions.49
CONCLUSIONS
There is not much data on the domain interac-tions that make up the complex forms of mono-clonal antibody dimers. This study has shownthat the properties of the Epratuzumab dimer (asit pertains to partial dissociation during heating,the absence of detectable alterations in structure,enhanced activity, covalent, and noncovalentnature) may be explained by its complex dimerforms. Apparent from the SEC data was theinability to adequately resolve the three uniquedimerized forms, so a more sophisticatedapproach to elucidate the interdomain adductsdistinguishing the dimers was required. Thisstudy has demonstrated the potential use of apapain digest procedure to reveal the number andtype of species present. Although evidence forFab:Fab noncovalent species was shown by theMS data, there was also evidence presented forreminant Fab:Fc and Fc:Fc forms as well. Amongthe predominant covalent dimer species, therelative mole ratio composition of the Epratuzu-mab dimer prior to papain digestion was found tobe 4:3:8, corresponding to Fab:Fab, Fc:Fc, andFab:Fc dimer adducts. The nascent dimer contentwas composed of �70% covalent associated forms.When aged by heating for an extended period oftime at 378C, the covalent dimer had increased to
142 REMMELE ET AL.
JOURNAL OF PHARMACEUTICAL SCIENCES, VOL. 95, NO. 1, JANUARY 2006

84%. This heat-induced dimer showed massheterogeneity among the three dimerized formsin addition to the increased proportion of covalentforms. The latter observations suggest that acombination of chemically modified sites andcrosslinking had changed the physicochemicalproperties of the Epratuzumab dimer.
ACKNOWLEDGMENTS
We wish to extend thanks to Dr. Josette Carna-han for insightful discussions concerning theapparent binding affinity to CD22 and also forproviding supportive explanations for the twofoldenhanced Epratuzumab dimer activity. We alsothank Quyn Huynh for providing the bioassayresults. Special thanks also to Xurong Jiang forhelpful discussions regarding the activity assayand Ketaki Patel for her assistance carrying outthe CE-SDS work.
REFERENCES
1. Lumry R, Eyring H. 1954. Conformation changes ofproteins. J Phys Chem 58:110–120.
2. Joly M. 1965. A physico-chemical approach to thedenaturation of proteins. London: Academic Press,Inc.
3. Lepock JR, Ritchie KP, Kolios MC, Rodahl AM,Heinz KA, Kruuv J. 1992. Influence of transitionrates and scan rate on kinetic simulations ofdifferential scanning calorimetry profiles of rever-sible and irreversible protein denaturation.Biochemistry 31:12706–12712.
4. Roberts CJ. 2003. Kinetics of irreversible proteinaggregation: Analysis of extended Lumry-Eyringmodels and implications for predicting proteinshelf-life. J Phys Chem B 107:1194–1207.
5. Sanchez-Ruiz JM, Lopez-Lacomba JL, Cortijo M,Mateo PL. 1988. Differential scanning calorimetryof the irreversible thermal denaturation of thermo-lysin. Biochemistry 27:1648–1652.
6. Grinberg VY, Burova TV, Haertle T, TolstoguzovVB. 2000. Interpretation of DSC data on proteindenaturation complicated by kinetic and irreversi-ble effects. J Biotechnology 79:269–280.
7. Kendrick BS, Carpenter JF, Cleland JL, RandolphTW. 1998. A transient expansion of the native stateprecedes aggregation of recombinant human inter-feron-gamma. Proc Natl Acad Sci USA 95:14142–14146.
8. Chiti F, Stefani M, Taddei N, Ramponi G, DobsonCM. 2003. Rationalization of the effects of muta-tions on peptide and protein aggregation rates.Nature 424:805–808.
9. Podlisny MB, Ostaszewski BL, Squazzo SL, KooEH, Rydell RE, Teplow DB, Selkoe DJ. 1995.Aggregation of secreted amyloid b-protein intosodium dodecyl sulfate-stable oligomers in cellculture. J Biol Chem 270:9564–9570.
10. Krishnamurthy R, Manning M.C. 2002. The stabi-lity factor: importance in formulation development.Curr Pharm Biotechnol 3:361–371.
11. Pikal MJ, Dellerman KM, Roy ML, Riggin RM.1991. The effects of formulation variables on thestability of freeze-dried human growth hormone.Pharm Res 8:427–436.
12. Zhang MZ, Pikal K, Nguyen T, Arakawa T,Prestrelski SJ. 1996. The effect of the reconstitu-tion medium on aggregation of lyophilized recom-binant interleukin-2 and ribonuclease A. PharmRes 13:643–646.
13. Graddis TJ, Remmele RL, Jr., McGrew JT.2002. Designing proteins that work using recombi-nant technologies. Curr Pharm Biotechnol 3:285–297.
14. DeFelippis MR, Alter LA, Pekar AH, Havel HA,Brems D. 1993. Evidence for a self-associatingequilibrium intermediate during folding of humangrowth hormone. Biochemistry 32:1555–1562.
15. Pinckard RN, Weir DM, McBride WH. 1967.Factors influencing the immune response. I. Effectsof the physical state of the antigen and oflymphoreticular cell proliferation on the responseto intravenous injection of bovine serum albumin inrabbits. Clin Exp Immunol 2:331–341.
16. Moore WV, Leppert P. 1980. Role of aggregatedhuman growth hormone (hGH) in development ofantibodies to hGH. J Clin Endocrinol Metabolism51:691–697.
17. Robbins DC, Cooper SM, Fineberg SE, Mead PM.1987. Antibodies to covalent aggregates of insulinin blood of insulin-using diabetic patients. Diabetes36:838–841.
18. Remmele RL, Jr., Bhat SD, Phan DH, GombotzWR. 1999. Minimization of recombinant humanFlt3 ligand aggregation at the Tm plateau: Amatter of thermal reversibility. Biochemistry38:5241–5247.
19. Arakawa T, Yphantis DA, Lary JW, Narhi L, LuHS, Prestrelski SJ, Clogston CL, Zsebo KM,Mendiaz EA, Wypych J, Langley KE. 1991. Glyco-sylated and unglycosylated recombinant-derivedhuman stem cell factors are dimeric and haveextensive regular secondary structure. J Biol Chem266:18942–18948.
20. Kelley RF, O’Connell MP, Carter P, Presta L,Eigenbrot C, Covarruabias M, Snedecor B,Speckart R, Blank G, Vetterlein D, Kotts C. 1993.Characterization of humanized anti-p185HER2 anti-body fab fragments produced in Escherichia coli.ACS Symp Ser 526:218–239.
21. Fields BA, Goldbaum FA, Dall’Acqua W, MalchiodiEL, Cauerhff A, Schwarz FP, Ysern X, Poljak RJ,
ACTIVE COMPLEX EPRATUZUMAB DIMER AGGREGATE 143
JOURNAL OF PHARMACEUTICAL SCIENCES, VOL. 95, NO. 1, JANUARY 2006
Mariuzza RA. 1996. Hydrogen bonding and solventstructure in an antigen-antibody interface. Crystalstructures and thermodynamic characterizationof three Fv mutants complexed with lysozyme.Biochemistry 35:15494–15503.
22. Tsumoto K, Nakaoki Y, Ueda Y, Ogasahara K,Yutani K, Watanabe K, Kumagai I. 1994. Effect oforder of antibody variable regions on the expressionof the single-chain HyHEL10 Fv fragment in E. coliand the thermodynamic analysis of its antigen-binding properties. Biochem Biophys Res Commun201:546–551.
23. Starovasnik MA, O’Connell MP, Fairbrother WJ,Kelley RF. 1999. Antibody variable region bindingby staphylococcal protein A: Thermodynamic ana-lysis and location of Fv binding site on E-domain.Protein Sci 8:1423–1431.
24. Santora LC, Kaymakcalan Z, Sakorafas P, Krull IS,Grant K. 2001. Characterization of noncovalentcomplexes of recombinant human monoclonal anti-body and antigen using cation exchange, size exclu-sion chromatography. Anal Biochem 299:119–129.
25. James LC, Roversi P, Tawfik DS. 2003. Antibodymultispecificity mediated by conformational diver-sity. Science 299:1362–1367.
26. Gronski P, Seiler FR, Schwick HG. 1991. Discoveryof antitoxins and development of antibody prepara-tions for clinical uses from 1890 to 1990. MolImmunol 28:1321–1332.
27. Gronski P, Bauer R, Bodenbender L, Kanzy EJ,Schmidt K-H, Zilg H, Seiler FR. 1988. On thenature of IgG dimers. I. dimers in human poly-clonal IgG preparations: Kinetic studies. BehringInst Mitt 82:127–143.
28. Roux KH, Tankersley DL. 1990. A view of thehuman idiotypic repertoire: Electron microscopicand immunologic analysis of spontaneous idiotype-anti-idiotype dimers in pooled human IgG. JImmunol 144:1387–1395.
29. Moore JMR, Patapoff TW, Cromwell MEM. 1999.Kinetics and thermodynamics of dimer formationand dissociation for a recombinant humanizedmonoclonal antibody to vascular endothelialgrowth factor. Biochemistry 38:13960–13967.
30. Kortt AA, Malby RL, Caldwell JB, GruenLC, Ivancic N, Lawrence MC, Howlett GJ,Webster RG, Hudson PJ, Coleman PM. 1994.Recombinant anti-sialidase single-chain variablefragment antibody. Characterization, formationof dimer and higher-molecular-mass multimersand the solution of the crystal structure ofthe single-chain variable fragment/sialidase com-plex. Eur J Biochem 221:151–157.
31. Carnahan J, Wang P, Kendall R, Chen C, Hu S,Boone T, Juan T, Talvenheimo J, Montestruque S,Sun J, Elliott G, Thomas J, Ferbas J, Kern B,Briddell R, Leonard JP, Cesano A. 2003. Epratu-zumab, a humanized monoclonal antibody target-
ing cd22: Characterization of in vitro properties.Clin Cancer Res 9:3982s–3990s.
32. Wen J, Arakawa T, Philo JS. 1996. Size-exclusionchromatography with on-line light scattering,absorbance, and refractive index detectors forstudying proteins and their interactions. AnalBiochem 240:155–166.
33. Wen J, Arakawa T, Talvenheimo J, Welcher AA,Horan T, Kita Y, Tseng J, Nicholson M, Philo JS.1996. A light scattering/size exclusion chromato-graphy method for studying the stoichiometry of aprotein–protein complex. In: Marshak DR, editor.[Syposium of the Protein Society] Techniques inprotein chemistry VII Orlando, FL: AcademicPress. pp 23–31.
34. Ackland CE, Berndt WG, Frezza JE, Landgraf BE,Pritchard KW, Ciardelli TL. 1991. Monitoring ofprotein conformation by high-performance size-exclusion liquid chromatography and scanningdiode array second-derivative UV absorption spec-troscopy. J Chromatogr 540:187–198.
35. Mach H, Middaugh CR. 1994. Simultaneous mon-itoring of the environment of tryptophan, tyrosine,and phenylalanine residues in proteins by near-ultraviolet second-derivative spectroscopy. AnalBiochem 222:323–331.
36. Ragone R, Colonna G, Balestrieri C, Servillo L,Irace G. 1984. Determination of tyrosine exposurein proteins by second-derivative spectroscopy.Biochemistry 23:1871–1875.
37. Servillo L, Colonna G, Balestrieri C, Ragone R,Irace G. 1982. Simultaneous determination oftyrosine and tryptophan residues in proteins bysecond-derivative spectroscopy. Anal Biochem 126:251–257.
38. Venyaminov SY, Yang JT. 1996. Determination ofprotein secondary structure. In: Fasman GD,editor. Circular dichroism and the confromationalanalysis of biomolecules. New York, NY: PlenumPress. pp 69–107.
39. Fenn JB, Mann M, Meng CK, Wong SF, White-house CM. 1989. Electrospray ionization for massspectrometry of large biomolecules. Science 246:64–71.
40. Tankersley DL, Preston MS, Finlayson JS. 1988.Immunoglobulin G dimer: An idiotype-anti-idiotype complex. Mol Immunol 25:41–48.
41. Yoo EM, Wims LA, Chan LA, Morrison SL. 2003.Human IgG2 can form covalent dimers. J Immunol170:3134–3138.
42. Burton DR. 1985. Immunoglobulin G: Functionalsites. Mol Immunol 22:161–206.
43. Burton DR. 1990. Antibody: The flexible adaptormolecule. Trends Biochem Sci 15:64–69.
44. Saphire EO, Stanfield RL, Crispin MD, ParrenPWHI, Rudd PM, Dwek RA, Burton DR,Wilson IA.2002. Contrasting IgG structures reveal extremeasymmetry and flexibility. J Mol Biol 319:9–18.
144 REMMELE ET AL.
JOURNAL OF PHARMACEUTICAL SCIENCES, VOL. 95, NO. 1, JANUARY 2006
45. Hayashi Y, Miura N, Isobe J, Shinyashiki N,Yagihara S. 2000. Molecular dynamics of hinge-bending motion of IgG vanishing with hydrolysis bypapain. Biophys J 79:1023–1029.
46. Carayon P, Carella C. 1974. Evidence for positivecooperativity in antigen-antibody reactions. FEBSLett 40:13–17.
47. Augilar RC, Retegui LA, Postel-Vinay MC, RoguinLP. 1994. Allosteric effects of monoclonal antibo-
dies on human growth hormone. Mol Cell Biochem136:35–42.
48. Holmes NJ, Parham P. 1983. Enhancement ofmonoclonal antibodies against HLA-A2 is due toantibody bivalency. J Biol Chem 258:1580–1586.
49. Blake RC II, Delehanty JB, Khosraviani M, Yu H,Jones RM, Blake DA. 2003. Allosteric bindingproperties of a monoclonal antibody and its Fabfragment. Biochemistry 42:497–508.
ACTIVE COMPLEX EPRATUZUMAB DIMER AGGREGATE 145
JOURNAL OF PHARMACEUTICAL SCIENCES, VOL. 95, NO. 1, JANUARY 2006
Copyright © 2022 FDOKUMEN