Effectiveness of Individual and Aggregate Compensation Strategies
15
Effectiveness of Individual and Aggregate Compensation Strategies LUIS R. GOMEZ-MEJIA and DAVID B. Based on a sample of 175 scientists and engineers, this study shows that individual-based rewards (either in the form of merit pay or individual bonuses) are perceived as less effective than aggregate incentive strategies for R G, D workers. The pay effectiveness measures used here include pay satisfaction, propensity to leave, project performance, and individual performance. All things considered, team-based bonuses are perceived as the most effective rewards in an R G, D setting. The findings also indicate that employees with a low willingness to take risks are more likely to experience withdrawal cognition if they work for a firm that relies on variable compensaiion. SEVERAL STUDIES HAVE FOUND that high technology firms use a variety of reward strategies for R & D employees (Gomez-Mejia and Balkin, 1985; Balkin and Gomez-Mejia, 1984; Riggs, 1983). Individual-based rewards, which include merit pay and “key contributors” bonuses, typically are provided in addition to “pay equity adjustments” designed to maintain market parity. Aggregate pay incentives, which include profit sharing, stock- related plans, and project-based team bonuses, are also frequently used. This paper explores how scientists and engineers’ react to these different reward strategies and the extent to which individual differences mediate the perceived effectiveness of incentive systems. The results show aggregate incentive plans to be significant predictors of pay satisfaction, withdrawal cognition, and (self-reported) project performance. “The authors’ affiliations are, respectively, Management Department, College of Business, Arizona State University, and Department of Strategy and Organization Management, College of Business Administration, University of Colorado. The terms “scientists and engineers” and “R & D employees” are used interchangeably in this paper. INDUSTRIAL RELATIONS, Vol. 28, No. 3 (Fall 1989). 0 1989 Regents of the University of California 0019/8676/89/101/43 1/610.00 43 1
-
Upload
independent -
Category
Documents
-
view
0 -
download
0
Transcript of Effectiveness of Individual and Aggregate Compensation Strategies

Effectiveness of Individual and Aggregate Compensation Strategies
LUIS R. GOMEZ-MEJIA and DAVID B.
Based on a sample of 175 scientists and engineers, this study shows that individual-based rewards (either in the form of merit pay or individual bonuses) are perceived as less effective than aggregate incentive strategies for R G, D workers. The pay effectiveness measures used here include pay satisfaction, propensity to leave, project performance, and individual performance. All things considered, team-based bonuses are perceived as the most effective rewards in an R G, D setting. The findings also indicate that employees with a low willingness to take risks are more likely to experience withdrawal cognition if they work for a firm that relies on variable compensaiion.
SEVERAL STUDIES HAVE FOUND that high technology firms use a variety of reward strategies for R & D employees (Gomez-Mejia and Balkin, 1985; Balkin and Gomez-Mejia, 1984; Riggs, 1983). Individual-based rewards, which include merit pay and “key contributors” bonuses, typically are provided in addition to “pay equity adjustments” designed to maintain market parity. Aggregate pay incentives, which include profit sharing, stock- related plans, and project-based team bonuses, are also frequently used. This paper explores how scientists and engineers’ react to these different reward strategies and the extent to which individual differences mediate the perceived effectiveness of incentive systems. The results show aggregate incentive plans to be significant predictors of pay satisfaction, withdrawal cognition, and (self-reported) project performance.
“The authors’ affiliations are, respectively, Management Department, College of Business, Arizona State University, and Department of Strategy and Organization Management, College of Business Administration, University of Colorado.
The terms “scientists and engineers” and “R & D employees” are used interchangeably in this paper.
INDUSTRIAL RELATIONS, Vol. 28, No. 3 (Fall 1989). 0 1989 Regents of the University of California 0019/8676/89/101/43 1/610.00
43 1

432 / LUIS R. GOMEZ-MEJIA and DAVID B. BALKIN
Four Propositions
Preference for type of incentive strategy. Merit pay is an adjustment to base salary, presumably reflecting the employee’s performance during the review period. It is the most commonly used individual-based “pay-for-performance” method in industry (Lawler, 1987), and R & D units in high tech firms are no exception (Balkin and Gomez-Mejia, 1984). While virtually every organization reports that it has a merit pay system, there is considerable evidence that these programs generally fail to create a perceptual relationship between pay and performance and, as a result, they seldom produce the motivation effect expected of them (Lawler, 1987). Merit pay programs have several shortcomings: the appraisal ratings may reflect psychometric and perceptual errors (e.g., see Bernardin and Beatty, 1984); the timing of reward(s) is more often tied to the budget than to task accomplishment (Lawler, 198 1); nonperformance factors tend to be considered in “merit” raises (Fossum and Fitch, 1985); the increase in pay tends not to be meaningful after nonperformance factors such as seniority and cost of living are subtracted from the increase (Mount, 1987); and merit differentials between the highest and lowest performers are usually minimal (Greeley and Ochsner, 1986). Individual bonuses, usually one-time, lump-sum payments, tend to suffer from the same problems as merit pay, even though they are more flexible and do not raise the salary structure on a permanent basis (Lawler, 1981).
Unlike merit pay and individual bonuses, an aggregate incentive strategy provides financial rewards to multiple contributors based on the achievement of common goals. Aggregate incentive schemes bypass many of the drawbacks associated with individual-based rewards, but group incentives may be vitiated by the presence of “free riders” in the work unit (Albanese and Van Fleet, 1985). Free riders are individuals who provide low work inputs to a group task and receive the same reward as other group members. If no controls are available, free riders are likely to have a negative influence on group productivity. The free-rider problem may be less a threat to the effectiveness of group rewards in R & D units, however. There is some evidence that free riding does not occur when the task is difficult or unique and the employees are professionals who are intrinsically motivated, as would be the case with R & D work (Harkins and Petty, 1982).
We expect that R & D employees will view an aggregate incentive strategy as more effective than an individual-based reward strategy for several reasons: First, an aggregate incentive strategy is more congruent with the cooperative structure of R & D work than are individual-based rewards. Second, given the team nature of R & D work, measurement difficulties with an aggregate
Research Note I 433
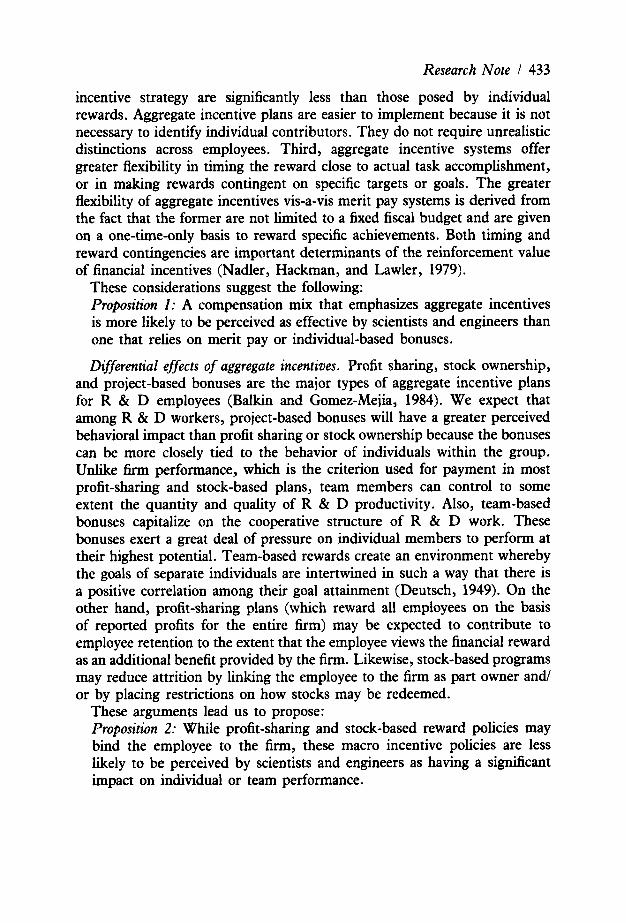
incentive strategy are significantly less than those posed by individual rewards. Aggregate incentive plans are easier to implement because it is not necessary to identify individual contributors. They do not require unrealistic distinctions across employees. Third, aggregate incentive systems offer greater flexibility in timing the reward close to actual task accomplishment, or in making rewards contingent on specific targets or goals. The greater flexibility of aggregate incentives vis-a-vis merit pay systems is derived from the fact that the former are not limited to a fixed fiscal budget and are given on a one-time-only basis to reward specific achievements. Both timing and reward contingencies are important determinants of the reinforcement vslue of financial incentives (Nadler, Hackman, and Lawler, 1979).
These considerations suggest the following: Proposition 1 .- A compensation mix that emphasizes aggregate incentives is more likely to be perceived as effective by scientists and engineers than one that relies on merit pay or individual-based bonuses.
Differential effects of aggregute incentives. Profit sharing, stock ownership, and project-based bonuses are the major types of aggregate incentive plans for R & D employees (Balkin and Gomez-Mejia, 1984). We expect that among R & D workers, project-based bonuses will have a greater perceived behavioral impact than profit sharing or stock ownership because the bonuses can be more closely tied to the behavior of individuals within the group. Unlike finn performance, which is the criterion used for payment in most profit-sharing and stock-based plans, team members can control to some extent the quantity and quality of R & D productivity. Also, team-based bonuses capitalize on the cooperative structure of R & D work. These bonuses exert a great deal of pressure on individual members to perform at their highest potential. Team-based rewards create an environment whereby the goals of separate individuals are intertwined in such a way that there is a positive correlation among their goal attainment (Deutsch, 1949). On the other hand, profit-sharing plans (which reward all employees on the basis of reported profits for the entire firm) may be expected to contribute to employee retention to the extent that the employee views the financial reward as an additional benefit provided by the firm. Likewise, stock-based programs may reduce attrition by linking the employee to the firm as part owner a n d or by placing restrictions on how stocks may be redeemed.
These arguments lead us to propose: Proposition 2: While profit-sharing and stock-based reward policies may bind the employee to the firm, these macro incentive policies are less likely to be perceived by scientists and engineers as having a significant impact on individual or team performance.

434 f LUIS R. GOMEZ-MEJIA and DAVID B. BALKIN
Proposition 3: All things considered, team-based bonus policies are expected to be perceived by scientists and engineers as being the most effective in an R & D setting.
Moderating effects of individual predispositions. There are two individual characteristics which are likely to interact with reward strategies and moderate their effect: willingness to take risks and tolerance for ambiguity. Gupta and Govindarajan (1984) used these two characteristics to differentiate between effective and ineffective general managers in strategic business units. The same predispositions may be relevant in the context of this study as well.
Hypotheses relating the R & D employee’s willingness to take risks and hidher tolerance for ambiguity to reward strategies are based on the following premises: (1) that employees receiving a significant portion of their pay on a variable basis face a more uncertain situation than do employees whose pay includes a lower variable component; and (2) reward strategies associated with greater uncertainty require a greater willingness to take risks and a greater tolerance for ambiguity on the part of individual employees. Individuals experiencing a conflict between their personal needs and the reward system would be more inclined to seek alternative employment opportunities.
These arguments lead to the final proposition: Proposition 4: As the firm’s reliance on variable compensation increases, R & D employees with a low tolerance for ambiguity and a low willingness to take risks are more likely to report withdrawal cognition and seek employment elsewhere.
Sample A total of 175 R & D employees from the Boston area participated in this
project. The sample was selected on the basis of several criteria: (a) participants were full-time scientists or engineers in R & D labs; (b) participants were a representative cross-section of scientists from various fields; (c) participants were employed by a representative mix of firms hiring scientists and engineers; (d) participants worked within the same geographical area (thus all were exposed to a similar environment; e.g., cost of living, unemployment rate, ease of mobility); and (e) the number of participants working under different types of reward policies was sufficiently large to allow meaningful comparisons. Two additional considerations guided our sample selection. We needed close enough contact with the participants to convince them that the data they provided for our study would be kept
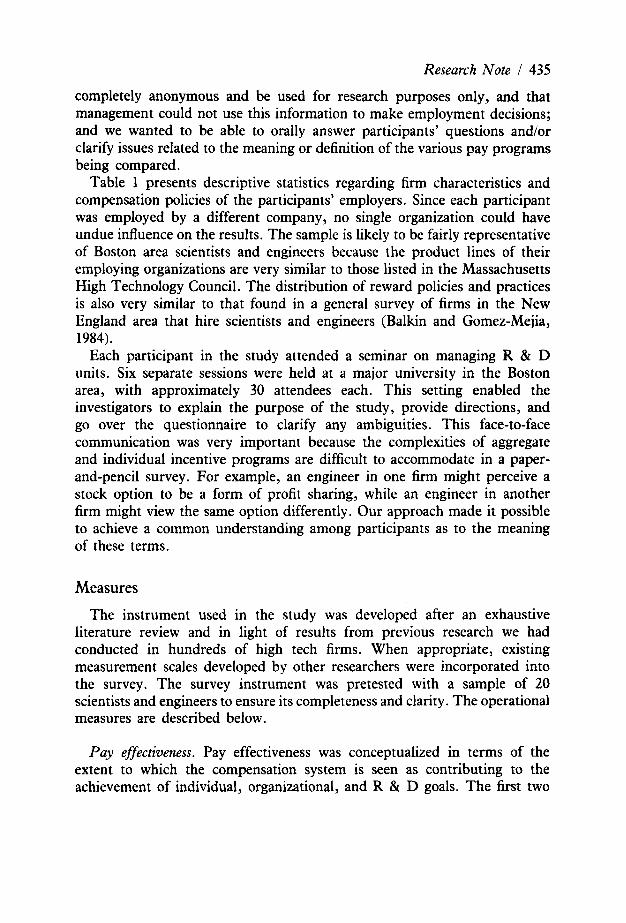
Research Note / 435 completely anonymous and be used for research purposes only, and that management could not use this information to make employment decisions; and we wanted to be able to orally answer participants’ questions and/or clarify issues related to the meaning or definition of the various pay programs being compared.
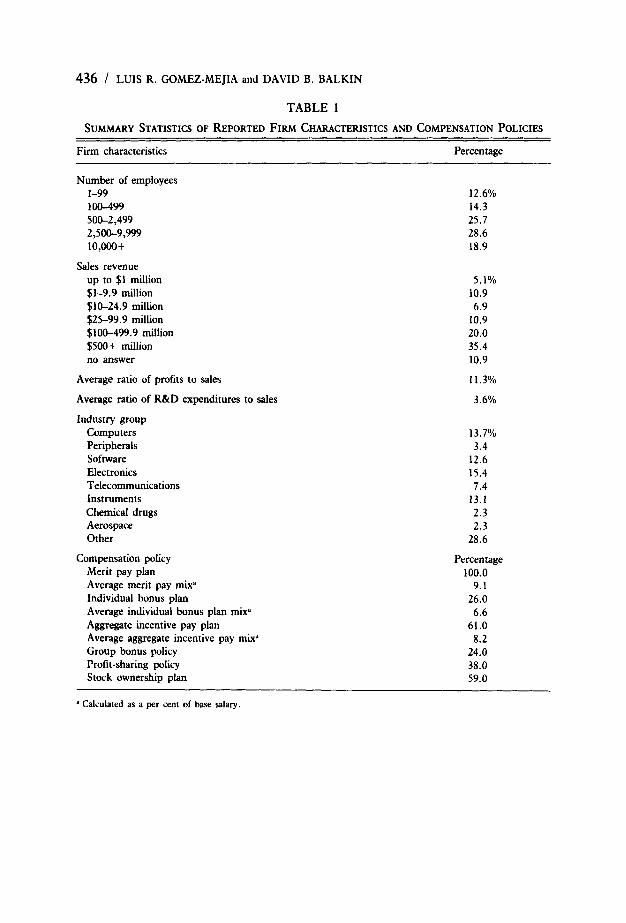
Table 1 presents descriptive statistics regarding firm characteristics and compensation policies of the participants’ employers. Since each participant was employed by a different company, no single organization could have undue influence on the results. The sample is likely to be fairly representative of Boston area scientists and engineers because the product lines of their employing organizations are very similar to those listed in the Massachusetts High Technology Council. The distribution of reward policies and practices is also very similar to that found in a general survey of firms in the New England area that hire scientists and engineers (Balkin and Gomez-Mejia, 1984).
Each participant in the study attended a seminar on managing R & D units. Six separate sessions were held at a major university in the Boston area, with approximately 30 attendees each. This setting enabled the investigators to explain the purpose of the study, provide directions, and go over the questionnaire to clarify any ambiguities. This face-to-face communication was very important because the complexities of aggregate and individual incentive programs are difficult to accommodate in a paper- and-pencil survey. For example, an engineer in one firm might perceive a stock option to be a form of profit sharing, while an engineer in another firm might view the same option differently. Our approach made it possible to achieve a common understanding among participants as to the meaning of these terms.
Measures
The instrument used in the study was developed after an exhaustive literature review and in light of results from previous research we had conducted in hundreds of high tech firms. When appropriate, existing measurement scales developed by other researchers were incorporated into the survey. The survey instrument was pretested with a sample of 20 scientists and engineers to ensure its completeness and clarity. The operational measures are described below.
Pay effectiveness. Pay effectiveness was conceptualized in terms of the extent to which the compensation system is seen as contributing to the achievement of individual, organizational, and R & D goals. The first two
436 / LUIS R. GOMEZ-MEJIA and DAVID B. BALKIN
TABLE 1
SUMMARY STATISTICS OF REPORTED FIRM CHARACTERISTICS AND COMPENSATION POLICIES
Firm characteristics Percentage
Number of employees 1-99 100-499 5W2,499 2,500-9,999 lO,OOo+
Sales revenue up to $1 million $1-9.9 million $1&24.9 million $25-99.9 million $100-499.9 million $500+ million no answer
Average ratio of profits to sales
Average ratio of R&D expenditures to sales
Industry group Computers Peripherals Software Electronics Telecommunications Instruments Chemical drugs Aerospace Other
Compensation policy Merit pay plan Average merit pay mixd Individual bonus plan Average individual bonus plan mix' Aggregate incentive pay plan Average aggregate incentive pay mix" Group bonus policy Profit-sharing policy Stock ownership plan
12.6% 14.3 25.7 28.6 18.9
5.1% 10.9 6.9
10.9 20.0 35.4 10.9
11.3%
3.6%
13.7% 3.4
12.6 15.4 7.4
13.1 2.3 2.3
28.6
Percentage 100.0
9.1 26.0 6.6
61.0 8.2
24.0 38.0 59.0
a Calculated as a per cent of base salary.

Research Note I 437
indicators of pay effectiveness, pay satisfaction (Lawler, 198 1; Dreher, 1981) and withdrawal cognition (Motowidlo, 1983), are attitudinal and both are important predictors of retention. Because of their relationship to turnover, these two measures have special significance in this study. For high tech firms, a critical challenge is how to attract and retain key technical talent. This industry is plagued by “pirating” of scientists and engineers from one firm to another, leading to notoriously high turnover rates (Balkin and Gomez-Mejia, 1984). The fact that firms hiring large numbers of scientists and engineers tend to be concentrated in a few “technology centers” adds to the turnover problem because the moving costs incurred when changing jobs are minimized.
The pay satisfaction scale used here consists of five items drawn from the Minnesota Satisfaction Questionnaire (MSQ) which were modified slightly to make them more meaningful to the present employee population. Using a five-point Likert scale, these items assess satisfaction with the amount of pay, pay policies, pay administration, the way employees are paid for the work they do, and the way pay policies motivate employees to perform better. The coefficient alpha reached .88 for the scale, indicating strong internal reliability.
The withdrawal cognition scale was borrowed from Motowidlo (1983), who concluded that withdrawal cognition, as measured by this scale, “ ... is the single most immediate antecedent of voluntary turnover and that other variables influence turnover primarily through their effects on withdrawal cognition” (p. 486). Withdrawal cognition was measured here by asking respondents to indicate on a five-point Likert scale the extent to which they agree with the statement “I intend to stay with this company.”
The third pay effectiveness measure, team performance, was assessed by asking each member of the sample to indicate on a five-point Likert scale whether each project on which heishe participated had performed above, below, or at a level expected of the R & D team, given the particular technical difficulties of the project. An average across all projects was then calculated. This rating scale and procedure were borrowed from the instrument developed by Katz and Allen (1985) in their study of R & D project performance in a matrix structure. While other “quantitative” measures of R & D performance may be used (e.g., number of patents, number of published papers), alternative discrete measures are not necessarily superior to more global assessments. Variations in discrete R & D performance measures may be attributed to a myriad of factors (e.g., nature of technology, product risk, product life cycle) which are difficult to isolate with any degree of confidence (Katz and Allen, 1985).
The last measure of pay effectiveness is individual performance. The

438 / LUIS R. GOMEZ-MEJIA and DAVID B. BALKIN
procedure and scale used for this variable are very similar to those developed by Gupta and Govindarajan (1984). Each participant was asked to indicate the rating that most closely matched the most recent performance appraisals received from hidher supervisor. In order to maintain anonymity, the investigators did not have access to company performance records and supervisors could not be contacted. Given the self-report nature of this performance measure, it is worth noting that Heneman (1974) found that where it is clear that the ratings will be used for research purposes only, self-ratings possessed less leniency, restriction of range, and halo error than did superiors’ ratings. Self-ratings were also correlated with supervisory ratings.
Compensation measures. The mix of merit pay, individual bonuses, and aggregate incentives were each calculated as a per cent of base salary. For example, a merit pay mix of .08 refers to 8 per cent of base salary. These compensation mix measures were used to test Proposition 1. The specific aggregate incentive policies (profit sharing, stock ownership, and team bonuses) were coded one if the participant received any of these three and zero otherwise. These compensation policy variables were used to test Propositions 2 and 3.
We explained the definitions of the aggregate pay policies to the participants prior to their filling out the questionnaires so that the meaning of the terms would be understood uniformly. Organizations with profit-sharing policies provide a payment to the employee (calculated as a per cent of base salary) based on the declared profits of the entire organization. Firms with stock ownership policies offer employees the option to buy stocks at a fixed favorable price or compensate workers with stocks in lieu of salary or cash payments. Companies with team-based bonus policies offer discretionary nonrecurring cash rewards (lump sum payments) to R & D employees based on the performance of their respective R & D group. These definitions focus on the key features differentiating the three major aggregate pay policy categories rather than on the variability within each of these types. Some variance in pay practices across organizations within any of these three categories is likely (e.g., one firm may have a profit-sharing plan that pays out a share of the profits on a quarterly basis, another company on an annual basis). Still, we believe that there is enough similarity in terms of the general meaning of each form of pay across organizations to justify their use in this study. Examining the impact of alternative forms of pay within each of these three categories (e.g., the effects of various stock options) would require several separate studies focusing on narrower research questions than those posed in this paper.
Research Note I 439
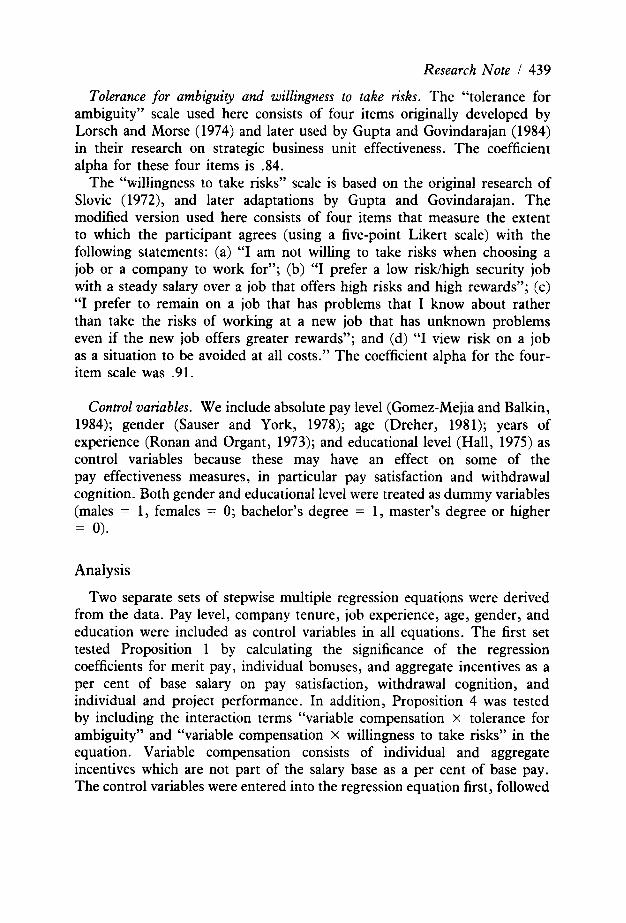
Tolerance for ambiguity and willingness to take risks. The “tolerance for ambiguity” scale used here consists of four items originally developed by Lorsch and Morse (1974) and later used by Gupta and Govindarajan (1984) in their research on strategic business unit effectiveness. The coefficient alpha for these four items is .84.
The “willingness to take risks” scale is based on the original research of Slovic (1972), and later adaptations by Gupta and Govindarajan. The modified version used here consists of four items that measure the extent to which the participant agrees (using a five-point Likert scale) with the following statements: (a) “I am not willing to take risks when choosing a job or a company to work for”; (b) “I prefer a low risk/high security job with a steady salary over a job that offers high risks and high rewards”; (c) “I prefer to remain on a job that has problems that I know about rather than take the risks of working at a new job that has unknown problems even if the new job offers greater rewards”; and (d) “I view risk on a job as a situation to be avoided at all costs.” The coefficient alpha for the four- item scale was .91.
Control variables. We include absolute pay level (Gomez-Mejia and Balkin, 1984); gender (Sauser and York, 1978); age (Dreher, 1981); years of experience (Ronan and Organt, 1973); and educational level (Hall, 1975) as control variables because these may have an effect on some of the pay effectiveness measures, in particular pay satisfaction and withdrawal cognition. Both gender and educational level were treated as dummy variables (males = 1, females = 0; bachelor’s degree = 1, master’s degree or higher = 0).
Analysis
Two separate sets of stepwise multiple regression equations were derived from the data. Pay level, company tenure, job experience, age, gender, and education were included as control variables in all equations. The first set tested Proposition 1 by calculating the significance of the regression coefficients for merit pay, individual bonuses, and aggregate incentives as a per cent of base salary on pay satisfaction, withdrawal cognition, and individual and project performance. In addition, Proposition 4 was tested by including the interaction terms “variable compensation x tolerance for ambiguity” and “variable compensation X willingness to take risks’’ in the equation. Variable compensation consists of individual and aggregate incentives which are not part of the salary base as a per cent of base pay. The control variables were entered into the regression equation first, followed
440 / LUIS R. GOMEZ-MEJIA and DAVID B. BALKIN
TABLE 2
REGRESSION EQUATION BETWEEN COMPENSATION ELEMENTS AS PREDICTORS AND REPORTED PAY EFFECTIVENESS MEASURES AS DEPENDENT VARIABLES, CONTROLLING FOR DEMOGRAPHIC
CHARACTERISTICS (STANDARD ERRORS IN PARENTHESES)
Reported Pay Effectiveness Measures
Variables Pay Withdrawal Project Individual
satisfaction cognition performance performance
Pay Level
Company Experience
Job Experience
Gender
Education
.092 ,552 .036 (.071) (.137) (.610) (.062) .238" ,081 .083 .048
- .026 .073'' .254 ,001 (.028) i.034) (.457) (.020) - ,089 .224 .051 ,063
- .019 ,046 .996 ' .002 (.028) (.041) ( ,429) (.021) - .074 ,062 ,208 ,072
.037 ,023 .064 ,008 (.026) (.026) (.354) (.011) ,091 .007 ,019 .066
.318' ,199 .417 ,385 '' *'
(.147) (.251) (.478) (.118) .224 .080 .062 .257
.056 ,129 .269 .156 (.159) (.241) (.407) (. 119) ,040 ,002 .076 .063
i!i ad
Merit Pay Mix .012 .016 .697 ,004 (.016) (.024) i.510) (.013) .045 .061 .121 ' .007
(Continued)
by merit pay and individual bonuses, aggregate incentive mix, tolerance for ambiguity and willingness to take risks, and the two interaction terms. The second set of regressions were calculated to test for the statistical significance of the specific aggregate incentive policy variables (i.e., profit sharing, stock ownership, and team bonus) on each of the pay effectiveness scales. The control variables were entered into the equation first, followed by each of the three aggregate incentive policies. This "fine-grained" analysis enabled us to compare the relative impact of specific aggregate compensation policies on the pay effectiveness measures (see Propositions 2 and 3).
Research Note I 441
TABLE 2 (CONTINUED)
Reported Pay Effectiveness Measures
pay Variables satisfaction
Individual Bonus Mix .015 (.013) ,068
Aggregate Incentive Mix .017" (.008) .216
Tolerance for Ambiguity .036 (.028) .017
Variable Compensation X ,021 Tolerance for Ambiguity (.045)
.013
Willingness to Take Risks ,041 (.035) .021
Variable Compensation X .023 Willingness to Take Risks (.124)
.018
N = 175 RZ .19
Withdrawal Project Individual cognition performance performance
.028
,033
.026a (.011) .211
,018 (.027) .009
.022 (.073) .024
.054 (.049) .018
.195 ' (.104) .204
(.021)
.17
.154 (.112) ,103
.323" (.155) .223
,063 ( . O W .032
,015 (.039) ,007
.036 (.031) .015
.189 (.181) .084
.25
.135 (.129) ,043
.008 ( .009) .062
.038
,013
.023
,014
.034 (.029) .016
.052 (.039) .018
(.021)
.10
:' p 5 .05; _ * p 5 .01. ' Unstandardized regression coefficient
Standardized regression coefficient,
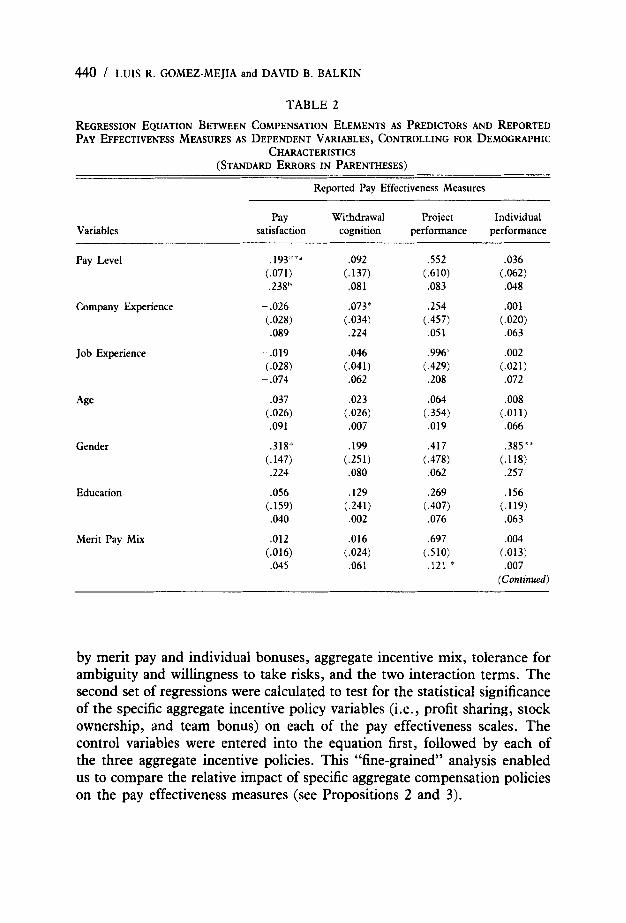
Results Table 2 shows the regression equations which incorporate as predictors
each of the compensation mix measures (merit pay, individual bonus, and aggregate incentives as a per cent of base salary); the individual predispositions (tolerance for ambiguity and willingness to take risks); and interaction terms for variable compensation x individual predispositions with perceived pay effectiveness measures (pay satisfaction, withdrawal cognition, project and individual performance) as dependent variables, controlling for demographic characteristics.
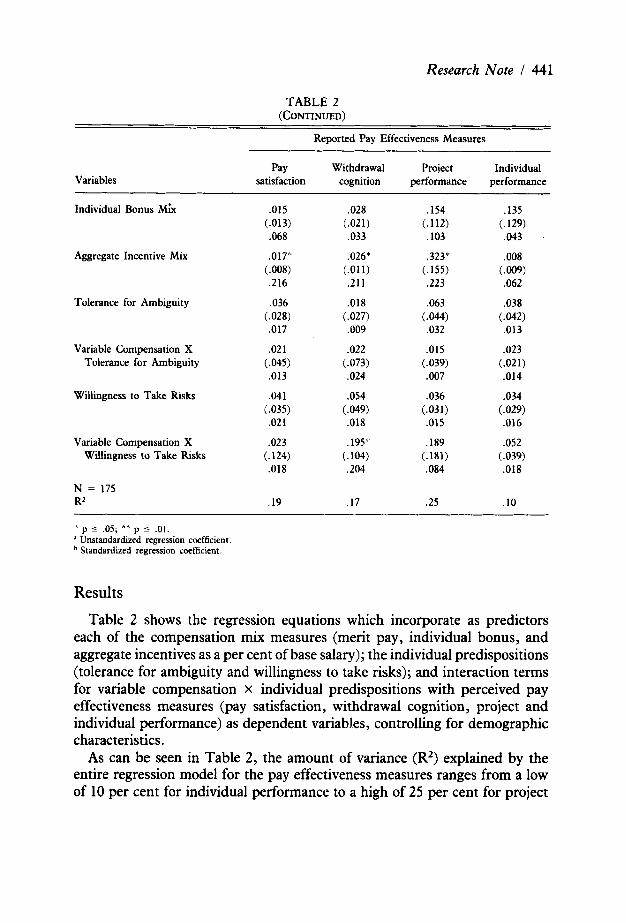
As can be seen in Table 2, the amount of variance (R2) explained by the entire regression model for the pay effectiveness measures ranges from a low of 10 per cent for individual performance to a high of 25 per cent for project
442 / LUIS R. GOMEZ-MEJIA and DAVID B. BALKIN
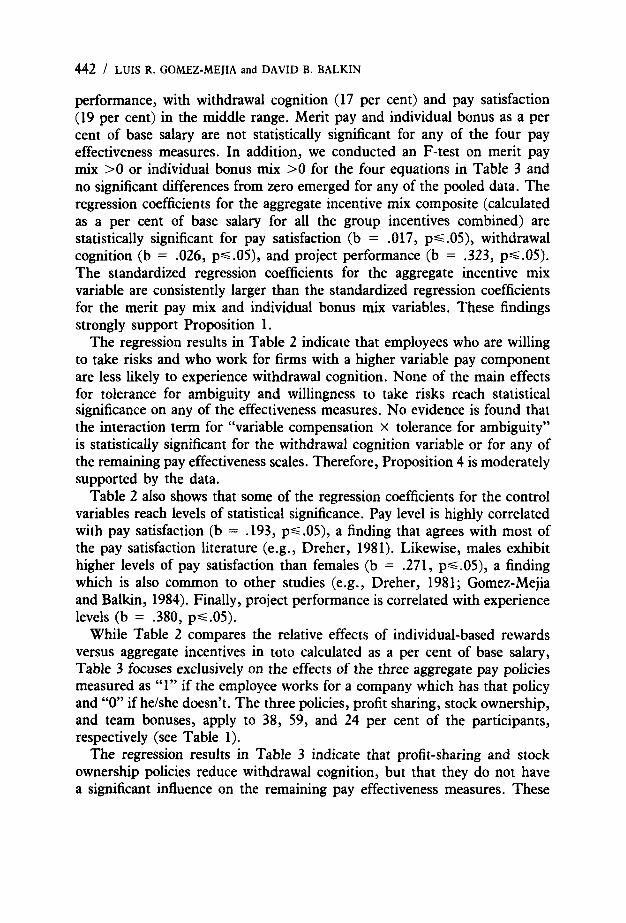
performance, with withdrawal cognition (17 per cent) and pay satisfaction (19 per cent) in the middle range. Merit pay and individual bonus as a per cent of base salary are not statistically significant for any of the four pay effectiveness measures. In addition, we conducted an F-test on merit pay mix >O or individual bonus mix >O for the four equations in Table 3 and no significant differences from zero emerged for any of the pooled data. The regression coefficients for the aggregate incentive mix composite (calculated as a per cent of base salary for all the group incentives combined) are statistically significant for pay satisfaction (b = .017, p s .05), withdrawal cognition (b = .026, p<.OS), and project performance (b = ,323, ps.05). The standardized regression coefficients for the aggregate incentive mix variable are consistently larger than the standardized regression coefficients for the merit pay mix and individual bonus mix variables. These findings strongly support Proposition 1.
The regression results in Table 2 indicate that employees who are willing to take risks and who work for firms with a higher variable pay component are less likely to experience withdrawal cognition. None of the main effects for tolerance for ambiguity and willingness to take risks reach statistical significance on any of the effectiveness measures. No evidence is found that the interaction term for “variable compensation x tolerance for ambiguity” is statistically significant for the withdrawal cognition variable or for any of the remaining pay effectiveness scales. Therefore, Proposition 4 is moderately supported by the data.
Table 2 also shows that some of the regression coefficients for the control variables reach levels of statistical significance. Pay level is highly correlated with pay satisfaction (b = .193, p<.05), a finding that agrees with most of the pay satisfaction literature (e.g., Dreher, 1981). Likewise, males exhibit higher levels of pay satisfaction than females (b = .271, p<.05), a finding which is also common to other studies (e.g., Dreher, 1981; Gomez-Mejia and Balkin, 1984). Finally, project performance is correlated with experience levels (b = .380, p<.05).
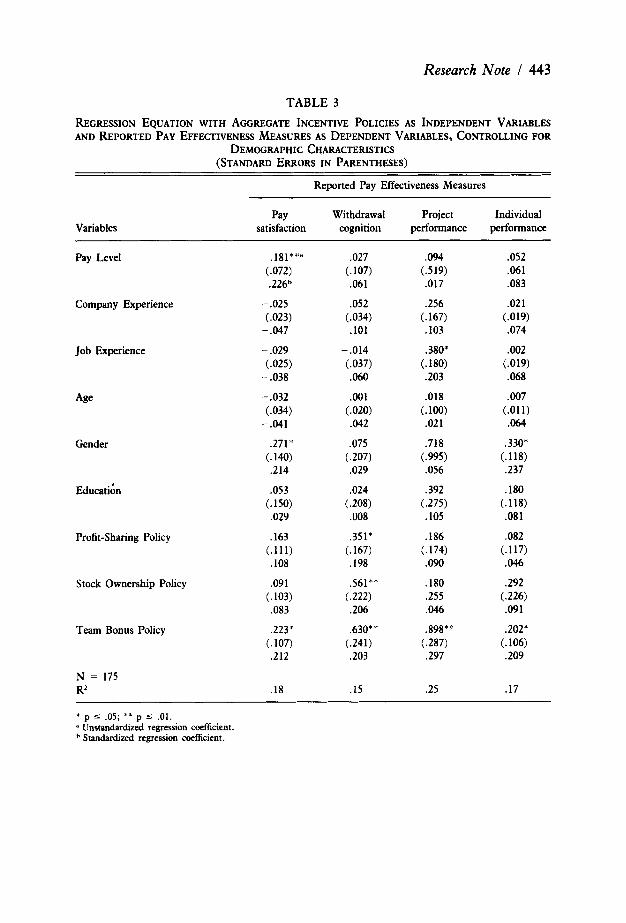
While Table 2 compares the relative effects of individual-based rewards versus aggregate incentives in toto calculated as a per cent of base salary, Table 3 focuses exclusively on the effects of the three aggregate pay policies measured as “1” if the employee works for a company which has that policy and “0” if he/she doesn’t. The three policies, profit sharing, stock ownership, and team bonuses, apply to 38, 59, and 24 per cent of the participants, respectively (see Table 1).
The regression results in Table 3 indicate that profit-sharing and stock ownership policies reduce withdrawal cognition, but that they do not have a significant influence on the remaining pay effectiveness measures. These
Research Note I 443
TABLE 3 REGRESSION EQUATION WITH AGGREGATE INCENTIVE POLICIES AS INDEPENDENT VARIABLES
DEMOGRAPHIC CHARACTERISTICS AND REPORTED PAY EFFECTIVENESS MEASURES AS DEPENDENT VARIABLES, CONTROLLING FOR
(STANDARD ERRORS IN PARENTHESES)
Reported Pay Effectiveness Measures
Variables Pay Withdrawal Project Individual
satisfaction cognition performance performance
Pay Level
Company Experience
Job Experience
Age
Gender
Educatiin
Profit-sharing Policy
Stock Ownership Policy
Team Bonus Policy
N = 175 R=
* I c y
(.072) .226h
-.025 (.023) - .047
- .029 (.025)
-.038
- .032
-.041 (.034)
.271* (.1W .214
.053 (.150) .029
.163 (.111) .lo8
.091 (.103) .083
.223* (.107) .212
.18
.027 (.107) .061
.052 (.034) .lo1
-.014 (.037) .060
.001 (.020) .042
.075 (.207) .029
.024 (.208) .008
.351* (.167) .198
.561** (.222) .206
.630** (.241) .203
.I5
,094 .052 (.519) .061 .017 .083
.256 .021 (.167) (.019) .lo3 .074
.380* .002 (. 180) (.019) .203 .068
.018 .007 (.011)
.02 1 .064
.718 .330* (.995) (.118) .056 .237
,392 ,180 (.275) (.118) .lo5 .081
,186 .082 (.174) (.117) .090 .046
.180 .292
.255 (.226)
.046 .091
.898* ' .202* (.287) (.106) .297 .209
.25 .17
* p 5 .05; * * p 5 .01. a Unstandardized regression coefficient.
Standardized regression coefficient.
444 / LUIS R. GOMEZ-MEJIA and DAVID B. BALKIN
findings support Proposition 2, which argues that these two policies may bind the employee to the firm, but that they are unlikely to have a significant motivational impact affecting individual or team performance as reported by R & D employees. On the other hand, Table 3 shows that the regression coefficients for team-based bonus policies were statistically significant for pay satisfaction (b = .223, p<.OS), withdrawal cognition (b = .630, p ~ . O l ) , project performance (b = .898, p<.Ol), and individual performance (b = .202, p s .OS). This means that, all things considered, team-based bonus policies are the most effective (as reported by R & D employees). This supports Proposition 3. The findings for the control variables in Table 3 are very similar to those shown in Table 2. Pay satisfaction is a function of pay level (b = .181, pS.01) and gender (b = .271, pS.OS), and project performance is correlated with job experience (b = .380, pS.05).
Conclusions This study examined the effects of several reward strategies on perceived
pay effectiveness for scientists and engineers. The results indicate that individual-based reward strategies for R & D workers do not relate to any of the perceived pay effectiveness measures. Aggregate incentive systems, on the other hand, are significant predictors of pay satisfaction, withdrawal cognition, and reported project performance. There is also some support for the notion that there is an interaction effect between reliance on variable pay and individual characteristics, in terms of their combined impact on withdrawal cognition. People who are less willing to take risks are more inclined to remain in organizations that rely on fixed rather than variable compensation.
The data also suggest that macro aggregate incentive policies such as profit sharing and stock-based plans are perceived to stimulate employee retention, but that they do not have a significant impact on reported performance or pay satisfaction. Team-based bonus policies, in contrast, have a significant positive effect on all reported pay effectiveness measures, i.e. , pay satisfaction, withdrawal cognition, and individual and project performance. Finally, there was little evidence that the “free rider” effect was a major problem with the use of aggregate incentives for R & D employees.
REFERENCES Albanese, Robert and David D. Van Fleet. “Rational Behavior in Groups: The Free-Riding
Tendency,” Academy of Management Review, X (April, 1985), 244-255. Balkin, David B. and Luis R. Gomez-Mejia. “Determinants of R & D Compensation
Strategies in the High Tech Industry,” Personnel Psychology, XXXVII (Winter, 1984), 635-650.
Bernardin, John and Richard W. Beatty . Perfwmance Appraisal: Assessing Human Behavior
Research Note I 445 at Work. Boston, MA: Kent, 1984.
Deutsch, Morton. “A Theory of Cooperation and Competition,” Human Relations, I1 (April, 1949), 129-152.
Dreher, George F. “Predicting the Salary Satisfaction of Exempt Employees,” Personnel Psychology, XXXIV (Autumn, 1981), 579-589.
Fossum, John A. and Mary K. Fitch. “The Effects of Individual and Contextual Attributes on the Sizes of Recommended Salary Increases,” Personnel Psychology, XXXVIII (Autumn, 1985), 587-602.
Gomez-Mejia, Luis R. and David B. Balkin. “Faculty Satisfaction with Pay and Other Job Dimensions Under Union and Nonunion Conditions,” Academy of Management Journal, XXVII (September, 1984), 591-602.
-. “Managing a High-Tech Venture,” Personnel, LXII (December, 1985), 31-36. Greeley, Thomas P. and Robert C. Ochsner. “Putting Merit Back into Salary Administration,”
Topics in Total Compensation, I (Fall, 1986), 15-23. Gupta, Anil and V. Govindarajan. “Business Unit Strategy, Managerial Characteristics, and
Business Unit Effectiveness at Strategy Implementation,” Academy of Management Journal, XXVII (March, 1984), 25-41.
Hall, Richard H. Occupations and the Social Structure. Englewood Cliffs, N J: Prentice-Hall, 1975.
Harkins, Stephen G. and Richard E. Petty. “Effects of Task Difficulty and Task Uniqueness on Social Loafing,” Journal of Personality and Social Psychology, LXIII (December, 1982), 1214-1229.
Heneman, Herbert G., 111. “Comparisons of Self and Superior Ratings of Managerial Performance,” Journal of Applied Psychology, LIX (October, 1974), 638-642.
Katz, Ralph and Thomas J. Allen. “Project Performance and the Locus of Influence in the R & D Matrix,” Academy of Management Journal, XXVIII (March, 1985), 67-87.
Lawler, Edward E., 111. “Pay for Performance: Future Directions.” In David B. Balkin and Luis R. Gomez-Mejia, eds., New Perspectives on Compensation. Englewood Cliffs, NJ: Prentice-Hall, 1987, pp. 162-168.
-. Pay and Organization Development. Reading, MA: Addison-Wesley, 198 1. Lorsch, Jay W. and John J. Morse. Organizations and Their Members: A Contingency Approach.
New York: Harper & Row, 1974. Motowidlo, Stephen J. “Predicting Sales Turnover from Pay Satisfaction and Expectation,”
Journal of Applied Psychology, LXVIII (August, 1983), 484-489. Mount, Michael K. “Coordinating Performance Appraisal with Merit Pay.” In David B.
Balkin and Luis R. Gomez-Mejia, eds., New Perspectives on Compensation. Englewood Cliffs, NJ: Prentice-Hall, 1987, pp. 187-195.
Nadler, David A., J. Richard Hackman, and Edward E. Lawler, 111. Managing Organizational Behavior. Boston, MA: Little Brown, 1979.
Riggs, Henry E. Managing High Technology Companies. Belmont, CA: Lifetime Learning Publication, 1983.
Ronan, W. W. and G. J. Organt. “Determinants of Pay Satisfaction,” Personnel Psychology, XXVI (Winter, 1973), 503-520.
Sauser, William I. and Michael York. “Sex Differences in Job Satisfaction: A Reexamination,” Personnel Psychology, XXXI (Autumn, 1978), 537-547.
Slovic, Paul. “Information Processing, Situation Specificity, and the Generality of Risk-taking Behavior,” Journal of Personality and Social Psychology, XXII (April, 1972), 128-134.