Activated K‐Ras, But Not H‐Ras or N‐Ras, Regulates Brain Neural Stem Cell Proliferation in a...
16
STEM CELLS 2014;00:00‐00 www.StemCells.com ©AlphaMed Press 2014 TISSUE‐SPECIFIC STEM CELLS 1 Department of Neurology, Wash‐ ington University School of Medi‐ cine, St. Louis MO; 2 Cancer Re‐ search Institute, Department of Medicine, Beth Israel Deaconess Medical Center, Boston MA Address correspondence to: David H. Gutmann, MD, PhD, Department of Neurology, Washington Univer‐ sity School of Medicine, Box 8111, 660 S. Euclid Avenue, St. Louis MO 63110. 314‐362‐7379 (Phone); 314‐ 362‐2388 (FAX); gut‐ [email protected] (Email).; This work was funded by grants from the National Institutes of Health (NS065547‐01 to D.H.G. and 1K01 CA118425 to K.M.H.). R.H.F.B. was supported by a National Insti‐ tute of General Medical Sciences Training Grant (GM: 007067) and a pre‐doctoral Young Investigator Award from the Children’s Tumor Foundation. Received August 06, 2014; accept‐ ed for publication February 19, 2015 ©AlphaMed Press 1066‐5099/2015/$30.00/0 This article has been accepted for publication and undergone full peer review but has not been through the copyediting, typeset‐ ting, pagination and proofreading process which may lead to differ‐ ences between this version and the Version of Record. Please cite this article as doi: 10.1002/stem.1990 Activated K‐Ras, But Not H‐Ras or N‐Ras, Regu‐ lates Brain Neural Stem Cell Proliferation in a Raf/Rb‐dependent Manner R. Hugh F. Bender 1 , Kevin M. Haigis 2 , David H. Gutmann 1 Key words. neural stem cells ras proteins cell proliferation raf kinases retinoblastoma protein ABSTRACT Neural stem cells (NSCs) give rise to all the major cell types in the brain, including neurons, oligodendrocytes, and astrocytes. However, the intra‐ cellular signaling pathways that govern brain NSC proliferation and differ‐ entiation have been incompletely characterized to date. Since some neu‐ rodevelopmental brain disorders (Costello syndrome, Noonan syndrome) are caused by germline activating mutations in the RAS genes, Ras small GTPases are likely critical regulators of brain NSC function. In the mamma‐ lian brain, Ras exists as three distinct molecules (H‐Ras, K‐Ras, and N‐Ras), each with different subcellular localizations, downstream signaling effec‐ tors, and biological effects. Leveraging a novel series of conditional activat‐ ed Ras molecule‐expressing genetically‐engineered mouse strains, we demonstrate that activated K‐Ras, but not H‐Ras or N‐Ras, expression in‐ creases brain NSC growth in a Raf‐dependent, but Mek‐independent, man‐ ner. Moreover, we show that activated K‐Ras regulation of brain NSC pro‐ liferation requires Raf binding and suppression of retinoblastoma (Rb) function. Collectively, these observations establish tissue‐specific differ‐ ences in activated Ras molecule regulation of brain cell growth that oper‐ ate through a non‐canonical mechanism. STEM CELLS 2014; 00:000–000 INTRODUCTION Neural stem cells (NSCs) represent a self‐renewing pop‐ ulation found in neurogenic regions of the embryonic and adult brain [1, 2]. In addition to forming new NSCs (self‐renewal and proliferation), these stem cells can also give rise to all the major cell types in the brain, in‐ cluding neurons, oligodendrocytes, and astrocytes, through multi‐lineage differentiation [3‐6]. Each of the‐ se cell fate decisions requires the activation of signaling pathways and transcriptional programs [3, 7‐11]. In this regard, numerous potential regulatory mechanisms involving p53, Bmi1, sonic hedgehog (SHH), Notch, p27, REST/NSRF, epidermal growth factor receptor, and oth‐ ers [12‐23], have been reported. While many of these signaling molecules are responsible for NSC growth and
Transcript of Activated K‐Ras, But Not H‐Ras or N‐Ras, Regulates Brain Neural Stem Cell Proliferation in a...

STEM CELLS 2014;00:00‐00 www.StemCells.com ©AlphaMed Press 2014
TISSUE‐SPECIFIC STEM CELLS 1Department of Neurology, Wash‐ington University School of Medi‐cine, St. Louis MO; 2Cancer Re‐search Institute, Department of Medicine, Beth Israel Deaconess Medical Center, Boston MA Address correspondence to: David H. Gutmann, MD, PhD, Department of Neurology, Washington Univer‐sity School of Medicine, Box 8111, 660 S. Euclid Avenue, St. Louis MO 63110. 314‐362‐7379 (Phone); 314‐362‐2388 (FAX); gut‐[email protected] (Email).; This work was funded by grants from the National Institutes of Health (NS065547‐01 to D.H.G. and 1K01 CA118425 to K.M.H.). R.H.F.B. was supported by a National Insti‐tute of General Medical Sciences Training Grant (GM: 007067) and a pre‐doctoral Young Investigator Award from the Children’s Tumor Foundation. Received August 06, 2014; accept‐ed for publication February 19, 2015 ©AlphaMed Press 1066‐5099/2015/$30.00/0 This article has been accepted for publication and undergone full peer review but has not been through the copyediting, typeset‐ting, pagination and proofreading process which may lead to differ‐ences between this version and the Version of Record. Please cite this article as doi: 10.1002/stem.1990
Activated K‐Ras, But Not H‐Ras or N‐Ras, Regu‐lates Brain Neural Stem Cell Proliferation in a Raf/Rb‐dependent Manner R. Hugh F. Bender1, Kevin M. Haigis2, David H. Gutmann1
Key words. neural stem cells ras proteins cell proliferation raf kinases retinoblastoma protein
ABSTRACT Neural stem cells (NSCs) give rise to all the major cell types in the brain, including neurons, oligodendrocytes, and astrocytes. However, the intra‐cellular signaling pathways that govern brain NSC proliferation and differ‐entiation have been incompletely characterized to date. Since some neu‐rodevelopmental brain disorders (Costello syndrome, Noonan syndrome) are caused by germline activating mutations in the RAS genes, Ras small GTPases are likely critical regulators of brain NSC function. In the mamma‐lian brain, Ras exists as three distinct molecules (H‐Ras, K‐Ras, and N‐Ras), each with different subcellular localizations, downstream signaling effec‐tors, and biological effects. Leveraging a novel series of conditional activat‐ed Ras molecule‐expressing genetically‐engineered mouse strains, we demonstrate that activated K‐Ras, but not H‐Ras or N‐Ras, expression in‐creases brain NSC growth in a Raf‐dependent, but Mek‐independent, man‐ner. Moreover, we show that activated K‐Ras regulation of brain NSC pro‐liferation requires Raf binding and suppression of retinoblastoma (Rb) function. Collectively, these observations establish tissue‐specific differ‐ences in activated Ras molecule regulation of brain cell growth that oper‐ate through a non‐canonical mechanism. STEM CELLS 2014; 00:000–000
INTRODUCTION
Neural stem cells (NSCs) represent a self‐renewing pop‐ulation found in neurogenic regions of the embryonic and adult brain [1, 2]. In addition to forming new NSCs (self‐renewal and proliferation), these stem cells can also give rise to all the major cell types in the brain, in‐cluding neurons, oligodendrocytes, and astrocytes,
through multi‐lineage differentiation [3‐6]. Each of the‐se cell fate decisions requires the activation of signaling pathways and transcriptional programs [3, 7‐11]. In this regard, numerous potential regulatory mechanisms involving p53, Bmi1, sonic hedgehog (SHH), Notch, p27, REST/NSRF, epidermal growth factor receptor, and oth‐ers [12‐23], have been reported. While many of these signaling molecules are responsible for NSC growth and
Ras molecule‐specific growth regulation
www.StemCells.com ©AlphaMed Press 2014
2
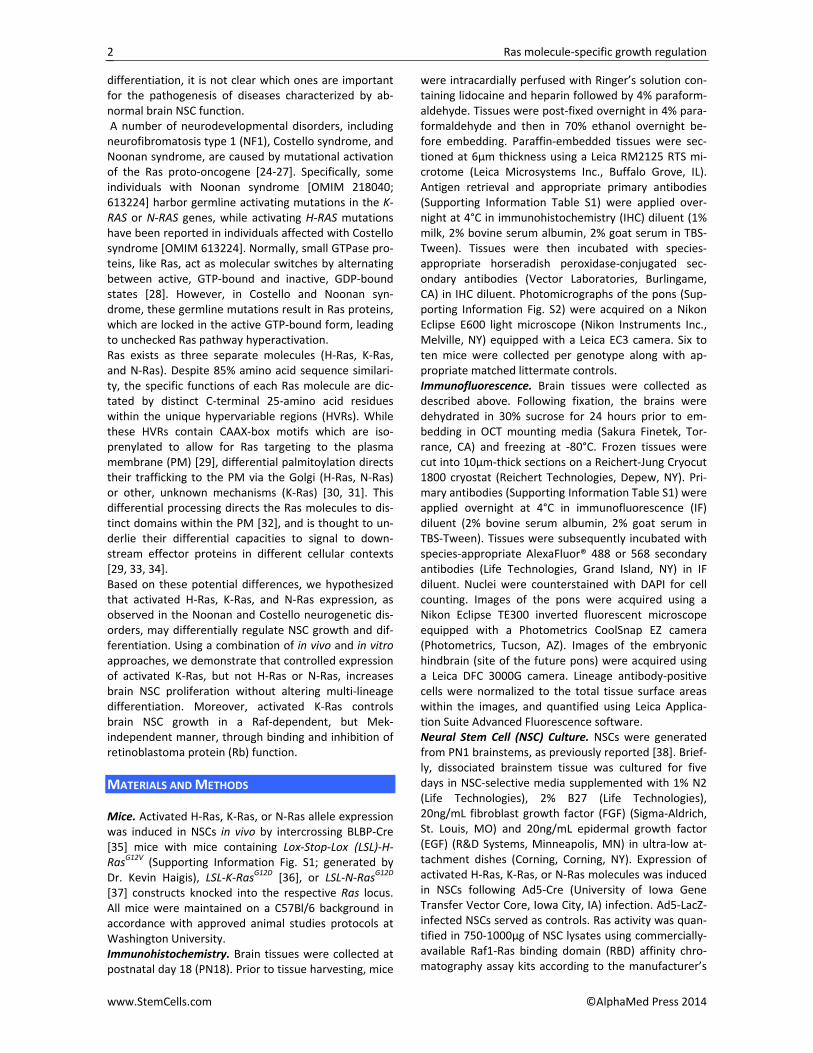
differentiation, it is not clear which ones are important for the pathogenesis of diseases characterized by ab‐normal brain NSC function. A number of neurodevelopmental disorders, including neurofibromatosis type 1 (NF1), Costello syndrome, and Noonan syndrome, are caused by mutational activation of the Ras proto‐oncogene [24‐27]. Specifically, some individuals with Noonan syndrome [OMIM 218040; 613224] harbor germline activating mutations in the K‐RAS or N‐RAS genes, while activating H‐RAS mutations have been reported in individuals affected with Costello syndrome [OMIM 613224]. Normally, small GTPase pro‐teins, like Ras, act as molecular switches by alternating between active, GTP‐bound and inactive, GDP‐bound states [28]. However, in Costello and Noonan syn‐drome, these germline mutations result in Ras proteins, which are locked in the active GTP‐bound form, leading to unchecked Ras pathway hyperactivation. Ras exists as three separate molecules (H‐Ras, K‐Ras, and N‐Ras). Despite 85% amino acid sequence similari‐ty, the specific functions of each Ras molecule are dic‐tated by distinct C‐terminal 25‐amino acid residues within the unique hypervariable regions (HVRs). While these HVRs contain CAAX‐box motifs which are iso‐prenylated to allow for Ras targeting to the plasma membrane (PM) [29], differential palmitoylation directs their trafficking to the PM via the Golgi (H‐Ras, N‐Ras) or other, unknown mechanisms (K‐Ras) [30, 31]. This differential processing directs the Ras molecules to dis‐tinct domains within the PM [32], and is thought to un‐derlie their differential capacities to signal to down‐stream effector proteins in different cellular contexts [29, 33, 34]. Based on these potential differences, we hypothesized that activated H‐Ras, K‐Ras, and N‐Ras expression, as observed in the Noonan and Costello neurogenetic dis‐orders, may differentially regulate NSC growth and dif‐ferentiation. Using a combination of in vivo and in vitro approaches, we demonstrate that controlled expression of activated K‐Ras, but not H‐Ras or N‐Ras, increases brain NSC proliferation without altering multi‐lineage differentiation. Moreover, activated K‐Ras controls brain NSC growth in a Raf‐dependent, but Mek‐independent manner, through binding and inhibition of retinoblastoma protein (Rb) function.
MATERIALS AND METHODS
Mice. Activated H‐Ras, K‐Ras, or N‐Ras allele expression was induced in NSCs in vivo by intercrossing BLBP‐Cre [35] mice with mice containing Lox‐Stop‐Lox (LSL)‐H‐RasG12V (Supporting Information Fig. S1; generated by Dr. Kevin Haigis), LSL‐K‐RasG12D [36], or LSL‐N‐RasG12D [37] constructs knocked into the respective Ras locus. All mice were maintained on a C57Bl/6 background in accordance with approved animal studies protocols at Washington University. Immunohistochemistry. Brain tissues were collected at postnatal day 18 (PN18). Prior to tissue harvesting, mice
were intracardially perfused with Ringer’s solution con‐taining lidocaine and heparin followed by 4% paraform‐aldehyde. Tissues were post‐fixed overnight in 4% para‐formaldehyde and then in 70% ethanol overnight be‐fore embedding. Paraffin‐embedded tissues were sec‐tioned at 6μm thickness using a Leica RM2125 RTS mi‐crotome (Leica Microsystems Inc., Buffalo Grove, IL). Antigen retrieval and appropriate primary antibodies (Supporting Information Table S1) were applied over‐night at 4°C in immunohistochemistry (IHC) diluent (1% milk, 2% bovine serum albumin, 2% goat serum in TBS‐Tween). Tissues were then incubated with species‐appropriate horseradish peroxidase‐conjugated sec‐ondary antibodies (Vector Laboratories, Burlingame, CA) in IHC diluent. Photomicrographs of the pons (Sup‐porting Information Fig. S2) were acquired on a Nikon Eclipse E600 light microscope (Nikon Instruments Inc., Melville, NY) equipped with a Leica EC3 camera. Six to ten mice were collected per genotype along with ap‐propriate matched littermate controls. Immunofluorescence. Brain tissues were collected as described above. Following fixation, the brains were dehydrated in 30% sucrose for 24 hours prior to em‐bedding in OCT mounting media (Sakura Finetek, Tor‐rance, CA) and freezing at ‐80°C. Frozen tissues were cut into 10μm‐thick sections on a Reichert‐Jung Cryocut 1800 cryostat (Reichert Technologies, Depew, NY). Pri‐mary antibodies (Supporting Information Table S1) were applied overnight at 4°C in immunofluorescence (IF) diluent (2% bovine serum albumin, 2% goat serum in TBS‐Tween). Tissues were subsequently incubated with species‐appropriate AlexaFluor® 488 or 568 secondary antibodies (Life Technologies, Grand Island, NY) in IF diluent. Nuclei were counterstained with DAPI for cell counting. Images of the pons were acquired using a Nikon Eclipse TE300 inverted fluorescent microscope equipped with a Photometrics CoolSnap EZ camera (Photometrics, Tucson, AZ). Images of the embryonic hindbrain (site of the future pons) were acquired using a Leica DFC 3000G camera. Lineage antibody‐positive cells were normalized to the total tissue surface areas within the images, and quantified using Leica Applica‐tion Suite Advanced Fluorescence software. Neural Stem Cell (NSC) Culture. NSCs were generated from PN1 brainstems, as previously reported [38]. Brief‐ly, dissociated brainstem tissue was cultured for five days in NSC‐selective media supplemented with 1% N2 (Life Technologies), 2% B27 (Life Technologies), 20ng/mL fibroblast growth factor (FGF) (Sigma‐Aldrich, St. Louis, MO) and 20ng/mL epidermal growth factor (EGF) (R&D Systems, Minneapolis, MN) in ultra‐low at‐tachment dishes (Corning, Corning, NY). Expression of activated H‐Ras, K‐Ras, or N‐Ras molecules was induced in NSCs following Ad5‐Cre (University of Iowa Gene Transfer Vector Core, Iowa City, IA) infection. Ad5‐LacZ‐infected NSCs served as controls. Ras activity was quan‐tified in 750‐1000μg of NSC lysates using commercially‐available Raf1‐Ras binding domain (RBD) affinity chro‐matography assay kits according to the manufacturer’s

Ras molecule‐specific growth regulation
www.StemCells.com ©AlphaMed Press 2014
3
instructions (Millipore, Billerica, MA). All NSC assays were performed on NSCs maintained in culture for few‐er than three passages. NSC Growth. NSC growth was assessed by direct cell counting following the seeding of 5,000 NSCs (in tripli‐cate) in 24‐well ultra‐low attachment dishes (Corning) containing NSC media. Cells were trypsinized and counted using a hemocytometer after five days in cul‐ture. Each experiment was repeated at least three times using NSCs harvested from three independently‐generated litters. For the immunocytochemistry exper‐iments, neurospheres were collected after five days in culture, washed twice in PBS, and fixed for 30 minutes in 4% paraformaldehyde. Neurospheres were then de‐hydrated in 30% sucrose for at least 24 hours prior to embedding in OCT mounting media (Sakura Finetek, Torrance, CA) and freezing at ‐80°C. All frozen embed‐ded neurospheres were cut into 10μm‐thick sections on a Reichert‐Jung Cryocut 1800 cryostat (Reichert Tech‐nologies, Depew, NY). Primary antibodies (Supporting Information Table S1) were applied overnight at 4°C in IF diluent. Tissues were subsequently incubated with species‐appropriate AlexaFluor® 488 or 568 secondary antibodies (Life Technologies) in IF diluent and counter‐stained with DAPI. At least eight neurospheres of similar diameter and cell number were imaged per sample and compared to LacZ‐infected control cells. In Vitro NSC Differentiation. Differentiation was as‐sessed by seeding150,000 NSCs in triplicate onto 24‐well plates coated with 50μg/mL poly‐D‐lysine (Sigma‐Aldrich) and 10μg/mL fibronectin (Life Technologies) in NSC media supplemented with 1% N2, 2% B27, and 1% fetal bovine serum. After six days in culture, adherent cells were fixed for 15 minutes in 4% paraformaldehyde and stained overnight at 4°C with appropriate primary antibodies (Supporting Information Table S1) in PBS containing 2% goat serum. Cells were next incubated with species‐appropriate AlexaFluor® 488 or 568 sec‐ondary antibodies (Life Technologies) in PBS with 2% goat serum and counterstained with DAPI. For the EdU studies, 20μM 5‐ethynyl‐2'‐deoxyuridine (EdU; Life Technologies) was added to the culture media 3 hours prior to fixation. EdU was detected using the Click‐IT® EdU Assay Kit (Life Technologies) prior to immunocyto‐chemistry staining according to manufacturer’s proto‐col. Each experiment was repeated at least three times using NSCs harvested from three independently‐generated litters. Flow Cytometry Analysis. Neurospheres were tryp‐sinized and fixed overnight in 50% ethanol in PBS con‐taining 0.02% IGEPAL (Sigma‐Aldrich). Following fixa‐tion, cells were washed three times in PBS prior to tryp‐sinization (0.003% trypsin type‐II [Sigma‐Aldrich] in DNase solution (0.1% IGEPAL, 0.05% spermine tetrahy‐drochloride [Sigma‐Aldrich] in 3.9mM sodium citrate buffer)) for 10 minutes at room temperature. Cells were subsequently incubated for 10 minutes at room tem‐perature in trypsinization inhibitor solution (0.05% tryp‐sin inhibitor type‐O [Sigma‐Aldrich], 0.001% RNase A
[Sigma‐Aldrich] in DNA analysis solution) prior to stain‐ing with 0.02% propidium iodide [Sigma‐Aldrich] solu‐tion containing 0.015% spermine tetrachloride in DNA analysis solution for 10 minutes at room temperature. Apoptosis was measured using trypsinized neuro‐spheres. Live cells were stained for annexin V and pro‐pidium iodide using an Annexin V‐FITC Apoptosis Detec‐tion Kit (Abcam, Cambridge, MA) according to manufac‐turer’s protocol. All samples were quantitated on a Beckton Dickinson FACScan machine (Beckton Dickin‐son, Franklin Lakes, NJ) using FlowJo acquisition and analysis software (TreeStar Inc., Ashland, OR). Western Blotting. NSCs were incubated in NSC media without B27, N2, EGF, and FGF growth supplements for two hours prior to a brief PBS wash and centrifugation. Cell pellets were lysed in cold lysis buffer (20mM Tris [pH 7.5], 10mM EGTA, 40mM β‐glycerophosphate, 1% NP40, 2.5mM MgCl2, and 2mM sodium orthovanadate) supplemented with aprotinin (1.4 μg/mL), leupeptin (1 μg/mL), and phenylmethanesulfonylfluoride (PMSF, 1mM) protease inhibitors) for protein quantitation us‐ing the Pierce BCA Protein Assay Kit (Thermo Fisher). The resulting cell lysates (20μg) were separated by SDS‐PAGE followed by transfer to polyvinylidene difluoride (PVDF) membranes (Immobilon, Fisher Scientific). Membranes were blocked with 5% milk in 1x TBS‐Tween prior to overnight incubation at 4°C with appro‐priate primary antibodies (Supporting Information Table S2). Detection was achieved using species‐appropriate HRP‐linked secondary antibodies (Cell Signaling, Dan‐vers, MA) and enhanced chemiluminescence imaging (Bio‐Rad Laboratories, Hercules, CA) using the Chemi‐Doc‐It Imaging System (UVP, Upland, CA). Pharmacological Inhibition Studies. The minimum ef‐fective inhibitor drug concentrations required to reduce K‐Ras* NSC signaling activity to the levels observed in control NSCs were empirically determined by dose esca‐lation experiments (data not shown). Using these doses, NSCs were treated with either 6.5μM GGTI‐286 (Milli‐pore), 200nM AZ628 (Selleck Chemicals, Houston TX), 2nM PD0325901 (Selleck Chemicals), 50nM MEK162 (Selleck Chemicals), 50nM AZD0530 (Selleck Chemicals), 20μM SB203580 (Selleck Chemicals), or 5μM RRD‐251 (Sigma‐Aldrich) for five days in culture. DMSO treat‐ment served as a vehicle control. Dominant‐Negative K‐Ras Inhibition. Dominant‐negative K‐Ras (dnK‐RasN17) in the MSCV retroviral plasmid vector p5Rα‐IRES‐GFP [39] was used to gener‐ate virus in human embryonic kidney 293T cells. MSCV‐IRES‐GFP served as control virus. Successful infection was confirmed by GFP expression in both control and dnK‐Ras
N17‐infected NSCs (Fig. 6C, Supporting Infor‐
mation Fig. S5B). Immunoprecipitation. Raf‐1 immunoprecipitation was performed using whole cell lysates in binding buffer containing 20mM HEPES (pH 7.9), 40mM KCl, 1mM MgCl2, 0.1mM EGTA, 0.1mM EDTA, 0.1mM dithio‐threitol, 0.1 NaF, 0.1mM Na3VO4, 0.5% IGEPAL, and 3mg/mL BSA. Total protein (500μg) in 400μl of binding
Ras molecule‐specific growth regulation
www.StemCells.com ©AlphaMed Press 2014
4
buffer was pre‐cleared with 30μl agarose protein G beads (Cell Signaling) for 2 hours at 4°C on a rotor. After removing the beads, lysates were incubated with Raf‐1 monoclonal antibodies (Millipore, Supporting Infor‐mation Table S1) overnight at 4°C on a rotor. Following the addition of agarose beads for an additional 2 hours, the beads were washed three times in 500μl binding buffer, boiled in 20μl 4x Laemmli buffer (Bio‐Rad Labor‐atories), and separated on 8% polyacrylamide gels for Western blotting. Raf‐1 pull‐down was confirmed by blotting with a different Raf‐1 antibody (Cell Signaling, Supporting Information Table S2). Data Analysis. Tissue and cell staining images were quantitated using ImageJ version 10.2 image analysis software (National Institutes of Health). The Grubbs outlier test was used to determine statistical outliers, and statistical significance (*p<0.05, **p<0.01, ***p<0.001) determined using an unpaired, two‐tailed Student’s t‐test and GraphPad Prism 5 software (GraphPad Software, La Jolla CA).
RESULTS
Activated NSC K‐Ras expression leads to increased as‐trogliogenesis in vivo. To define the impact of activated Ras expression on NSC function in vivo, we leveraged BLBP‐Cre mice to target activated Ras molecule expres‐sion to brain ventricular zone NSCs capable of giving rise to neurons, oligodendrocytes, and astrocytes in vivo (multi‐lineage differentiation) [35]. This specific Cre driver strain was chosen, since Ras activation in nestin+ cells (nestin‐Cre mice) is likely to result in embryonic lethality due to a defect in cardiac vessel septation [40]. Moreover, we have previously employed this particular BLBP‐Cre strain to examine the impact of neurofibroma‐tosis‐1 loss on gliogenesis in vivo [35]. The expression of each individual activated Ras allele was accomplished using mice in which an oncogenic version was knocked into the endogenous Ras locus. Specifically, these RasLSL (H‐RasLSL‐G12V, K‐RasLSL‐G12D, or N‐RasLSL‐G12D) mice contain a transcriptional stop element flanked by LoxP sites (Lox‐Stop‐Lox [LSL]) that prevents expression of the mutationally‐activated Ras alleles in the absence of Cre expression. Following Cre‐mediated recombination, mutationally‐activated Ras (Ras*) is expressed from its endogenous promoter. Since the majority of neuronal and non‐neuronal cell fate specification occurs by three weeks following birth, we examined the consequence of activated Ras mole‐cule expression on brain cell development at postnatal day 18 (PN18). At PN18, there was a greater percentage of astrocytes in K‐Ras*BLBP, but not H‐Ras*BLBP or N‐Ras*BLBP, mice relative to littermate controls using GFAP (1.8‐fold) and S100β (1.2‐fold) astrocyte antibodies (Fig. 1A, 1B). In contrast, there was no change in APC+ oli‐godendrocytes (Fig. 1C) or NeuN+ neurons (Fig. 1D) or differences in brain or body weights across the three Ras genotypes relative to controls (Supporting Infor‐mation Fig. S3). These data demonstrate that activated
K‐Ras, but not H‐Ras or N‐Ras, expression in NSCs leads to the generation of more astrocytes in vivo. Activated K‐Ras expression does not alter NSC astro‐cyte differentiation. To determine whether activated K‐Ras expression alters brain NSC astrocyte differentia‐tion, we employed neurosphere cultures generated from brainstems of PN1 pups infected with adenovirus expressing either LacZ (control cells, CTL) or Cre recom‐binase (activated H‐Ras, K‐Ras, or N‐Ras, denoted H‐Ras*, K‐Ras*, or N‐Ras*, respectively). Raf1‐RBD affinity chromatography confirmed that Ras activation was comparably increased after Ad5‐Cre infection (Fig. 2A). Following in vitro differentiation of these NSCs over six days in adherent culture, only K‐Ras*‐expressing NSCs exhibited increased numbers of GFAP+ astrocytes (1.8‐fold) relative to controls (Fig. 2B). Importantly, K‐Ras*‐expressing NSC cultures also showed an increase in the total number of DAPI+ cells (1.8‐fold) compared to con‐trol cells (Fig. 2C). The increase in GFAP+ cells propor‐tional to total DAPI+ cells resulted in no change in the percentage of GFAP+ cells compared to controls (Fig. 2D), indicating that activated K‐Ras expression does not directly change NSC astrocyte differentiation. To determine whether the increase in astrocyte num‐bers following K‐Ras* expression reflected an increase in the NSC pool during differentiation (EdU incorpora‐tion), we examined differentiating cells at both early (one day post‐plating) and late (five days post‐plating) time points (Fig. 3A). In addition to EdU incorporation, neuroglial lineage antibodies for NSCs (Sox2) and astro‐cytes (GFAP) were used to quantify changes in both populations. After one day in culture, K‐Ras*‐expressing cells were proliferating 7.4‐fold more than their control counterparts (Fig. 3B). These proliferating cells were exclusively Sox2+ NSCs, and not GFAP+ astrocytes (Fig. 3C). At this time, there was no change in the percentage of Sox2+ NSCs; however, a smaller percentage of K‐Ras*‐expressing cells were GFAP+ astrocytes relative to control cells (Fig. 3D). After five days in culture, K‐Ras*‐expressing cells were still proliferating 2.2‐fold more than controls (Fig. 3E), however, there was no differ‐ence in proliferating NSCs or astrocytes (Fig. 3F). While a higher percentage (1.6‐fold) of K‐Ras*‐expressing cells were Sox2+ NSCs relative to control cells, there was no difference in the percentage of GFAP+ astrocytes in ei‐ther K‐Ras* or control cell populations (Fig. 3G). To‐gether, these data demonstrate that activated K‐Ras expression increases the NSC pool, rather than driving NSCs towards astrocyte differentiation. Activated K‐Ras expression increases NSC proliferation in vitro. To determine whether the individual Ras* mol‐ecules differentially increase NSC growth in vitro, we directly counted NSCs after five days in culture. Similar to the above findings, 2.3‐fold more K‐Ras*‐, but not H‐Ras*‐ or N‐Ras*‐, expressing NSCs were observed rela‐tive to controls (Fig. 4A). At this time, K‐Ras*‐, but not H‐Ras*‐ or N‐Ras*‐, expressing neurospheres had a 1.6‐fold increase in the percentage of Ki67+ proliferating cells (Fig. 4B). Following continued in vitro passage, this
Ras molecule‐specific growth regulation
www.StemCells.com ©AlphaMed Press 2014
5
K‐Ras*‐expressing NSC growth advantage was sustained for approximately five passages, after which, both con‐trol and K‐Ras*‐expressing NSCs failed to survive (Sup‐porting Information Fig. S4). To determine whether the increased K‐Ras* NSC growth reflected increased prolif‐eration or decreased cell death, flow cytometry was employed. Using propidium iodide to analyze cellular DNA content, fewer K‐Ras*‐expressing NSCs were in the pre‐cycling G0/G1 phase (‐4.6%) of the cell cycle relative to controls, while more K‐Ras*‐expressing NSCs were in S phase (+3.6%) and G2/M phase (+2.6%) (Fig. 4C, 4D). Finally, using annexin‐V staining to identify cells under‐going programmed cell death (apoptosis), no differ‐ences were found between live and apoptotic K‐Ras*‐expressing and control NSCs (Fig. 4E, 4F). Collectively, these data are consistent with a model in which activat‐ed K‐Ras expression increases NSC proliferation to ex‐pand the NSC pool and result in a proportional increase in astrocytes following differentiation (Fig. 4G). K‐Ras*BLBP mice have more Sox2+ and Olig2+ progenitor cells. Based on the above in vitro findings, we sought to determine whether a similar expansion of NSCs was observed within the developing mouse brain in vivo. Specifically, two progenitor cell populations (Sox2+ NSCs, Olig2+ glial‐restricted progenitor cells) at two dif‐ferent developmental time, shortly after K‐Ras*
BLBP acti‐
vation (E12.5) and at birth (PN1). In the E12.5 hindbrain (the future postnatal pons), K‐Ras*BLBP mice harbored 2‐fold more Sox2+ NSCs per unit area (0.1mm2) relative to littermate controls (Fig. 5A). At PN1, no difference in the numbers of Sox2+ NSCs was observed in the brain‐stems of K‐Ras*BLBP versus littermate control mice (Fig. 5B). However, at PN1, there was a 1.9‐fold increase in the numbers of Olig2+ glial‐restricted progenitor cells following activated K‐Ras expression (Fig. 5C). Together, these data demonstrate that activated K‐Ras expression in NSCs results in an early expansion of progenitor cells, which likely underlies the increase in astrocytes ob‐served in the K‐Ras*BLBP mouse brainstem at PN18. Activated K‐Ras expression increases NSC proliferation in a Raf‐dependent, but Mek‐independent, manner. Using a Raf‐RBD affinity assay, K‐Ras activation activity was ~30‐fold higher in K‐Ras*‐expressing NSCs relative to controls (Fig. 6A). Based on this level of K‐Ras activa‐tion, pharmacological inhibitor studies were employed to define the downstream signaling pathway responsi‐ble for activated K‐Ras (K‐Ras*) control of NSC prolifera‐tion. We experimentally defined the minimal doses of pharmacological inhibitors required to reduce K‐Ras* effector pathway hyperactivation to WT control levels (data not shown). First, we confirmed that K‐Ras activa‐tion was required for K‐Ras*‐induced NSC hyperprolif‐eration using the GGTI‐286 geranylgeranyltransferase inhibitor. Following GGTI‐286 (6.5µM) treatment, the hyperproliferation of K‐Ras* NSCs was reduced to that of control cells, as measured by direct cell counting (Fig. 6B, Supporting Information Fig. S5A). Western blot analysis of the Ras downstream effector protein Erk revealed reduced p‐Erk activity following GGTI‐286 in‐
hibition. Similarly, infection of K‐Ras* NSCs with domi‐nant‐negative K‐Ras (dnK‐RasN17; [39]) reduced K‐Ras* NSC hyperproliferation to that of control cells, as meas‐ured by direct cell counting (Fig. 6C, Supporting Infor‐mation Fig. S5B). Second, after inhibition with the pan‐Raf inhibitor AZ628 (200nM), K‐Ras*‐induced NSC hyperproliferation was attenuated to that of control cells (Fig. 6D, Support‐ing Information Fig. S5C). As previously reported, in‐creased Erk activation was observed following Raf inhib‐itor treatment [41], thus precluding independent con‐firmation of AZ628 Raf inhibition. Consistent with Ras‐ and Raf‐mediated activation, increased Erk activation was observed in K‐Ras*‐expressing NSCs (Fig. 6E). Third, to determine whether Raf/Mek signaling was responsible for K‐Ras*‐induced NSC hyperproliferation, K‐Ras*‐expressing NSCs were treated with the PD0325901 (PD901; 2nM) or MEK162 (50nM) Mek in‐hibitors. Treatment with either PD901 or MEK162 re‐duced Erk hyperactivation, but did not attenuate K‐Ras*‐mediated NSC hyperproliferation (Fig. 6F, 6G, Supporting Information Fig. S5D, S5E). These unexpected results prompted a detailed exami‐nation of other potential Raf effector proteins. While we observed no change in Akt, Jnk, PKC‐γ, PKC‐ζ, Ran, β‐catenin, and Yap activity, Src and p38MAPK were hy‐peractivated (increased Src
Y416 and p38MAPK
T180/Y182
phosphorylation, respectively) in K‐Ras*‐expressing NSCs compared to controls (Supporting Information Fig. S6A, S6B). However, pharmacologic inhibition of Src (50nM AZD0530) or p38MAPK (20µM SB203580) activi‐ty did not reduce K‐Ras*‐induced NSC hyperprolifera‐tion (Supporting Information Fig. S6C, S6D). Similarly, neither GGTI‐286 (Ras inhibitor) nor AZ628 (Raf inhibi‐tor) treatments reduced Src or p38MAPK hyperactiva‐tion (Supporting Information Fig. S6E). Collectively, the‐se data demonstrate that K‐Ras* expression increases NSC proliferation in a Raf‐dependent, but Mek‐, Src‐, and p38MAPK‐independent, manner. Raf‐1 inhibition of Rb is responsible for activated K‐Ras‐induced NSC hyperproliferation. To determine how K‐Ras* regulates NSC proliferation, we focused on po‐tential Raf‐dependent mechanisms. Previous studies have shown that Raf‐1 (c‐Raf) directly binds the reti‐noblastoma tumor suppressor protein (Rb) to relieve Rb‐mediated suppression of cell cycle progression [42]. We found that endogenous Rb bound to Raf‐1 in K‐Ras*‐expressing NSCs, as assessed by Raf‐1 immuno‐precipitation (Fig. 7A). Based on these findings, we em‐ployed a small peptide inhibitor, RRD‐251, previously shown to disrupt the Raf‐1/Rb interaction [43, 44], to demonstrate that this particular interaction was re‐quired for K‐Ras*‐mediated NSC hyperproliferation. Treatment of K‐Ras*‐expressing NSCs with RRD‐251 (5 μM) reduced K‐Ras*‐induced NSC hyperproliferation to control levels (Fig. 7B, Supporting Information Fig. S7). Together, these data establish a new model for K‐Ras* regulation of NSC proliferation, in which K‐Ras activa‐tion of Raf leads to Rb binding and inhibition, and leads
Ras molecule‐specific growth regulation
www.StemCells.com ©AlphaMed Press 2014
6
to increased G0/G1 to S transition and proliferation (Fig. 7C).
DISCUSSION
Despite the central role of Ras in regulating embryonic development, the three Ras molecules do not equally impact on this process. For example, bi‐allelic K‐Ras deletion in mice results in lethality between 12 and 14 days of gestation, due to brainstem defects, hemato‐poietic abnormalities, and organ failure [45, 46]. In con‐trast, H‐Ras or N‐Ras deletion, either separately or in combination, does not impair normal embryonic devel‐opment, resulting in healthy adult mice [47, 48]. These differential effects are further highlighted by observa‐tions made in human neurogenetic disorders character‐ized by germline activating mutations in the three RAS genes (collectively termed “RASopathies”). In these RA‐Sopathies, H‐RAS mutations [26] have been reported in Costello syndrome, whereas individuals with Noonan syndrome harbor K‐RAS mutations [27], each with vary‐ing neurocognitive delays and learning disabilities. The importance of differential Ras molecule activation is additionally underscored by the finding of oncogenic K‐RAS, but not H‐RAS or N‐RAS, mutations in pediatric brain tumors [49, 50]. Herein, we demonstrate that activated K‐Ras, but not H‐Ras or N‐Ras, molecule expression increases the prolif‐eration of brain NSCs. While no prior studies have sys‐tematically compared the consequences of expressing these three individual activated Ras molecules in the brain, previous work in other tissue types has revealed divergent functions for each of these proteins. In neural crest‐derived hematopoietic cells, activated N‐Ras is the primary regulator of cell self‐renewal, proliferation, and cell fate decisions [51‐54], whereas activated K‐Ras pri‐marily drives cell growth in endoderm‐derived tissues (lungs, colon) [36, 55]. Similarly, in endoderm‐derived stem cells, overexpression of active H‐RasG12V promotes cell differentiation and suppresses cell growth, in con‐trast to K‐RasG12V overexpression that promotes stem cell proliferation and inhibits cell differentiation [56]. Moreover, K‐Ras
G12D expression increases the prolifera‐
tion of an intestinal stem cell population, whereas N‐RasG12D expression increases the resistance of these cells to apoptosis without changing cell proliferation [37]. Lastly, K‐RasG12D expression has also been reported to cause bronchioalveolar stem cell hyperproliferation in the lung [55]. Taken together, these studies identify K‐Ras* as a potent driver of progenitor cell prolifera‐tion, which is consistent with our finding that only acti‐vated K‐Ras expression promotes brain NSC prolifera‐tion. Deregulated RAS signaling is an important step in can‐cer initiation, with activating RAS mutations implicated in 30% of all cancers [57]. Of particular relevance to the current study is the prevalence of activating K‐RAS gene mutations (22% of all cancers) relative to mutations in either the H‐RAS or N‐RAS genes (11% of all cancers
combined). Although our study focused on the devel‐opmental implications of activated Ras expression on NSC function, the increased NSC proliferation observed following K‐Ras* expression prompted us to examine mice for tumor formation. In a small number of K‐Ras*BLBP mice (n=3) aged to 8 weeks of age, all devel‐oped squamous cell papillomas of the vagina/anus. Complete necropsy did not reveal any pathology indica‐tive of a brain tumor (data not shown). These findings are consistent with previous reports demonstrating that oncogenic Ras expression leads to increased prolifera‐tion without subsequent tumor formation. In these studies, expression of the same K‐RasLSL allele in colonic epithelial cells resulted in hyperplasia, but not neo‐plasia, of the intestinal epithelium [37]. It was only when K‐Ras* expression was combined with loss of Apc expression did colonic tumors form. Similarly, K‐Ras* expression alone in nestin+ or GFAP+ neural stem/progenitor cells in the brain was not sufficient for tumor formation [51, 58], yet led to glioblastoma when combined with constitutively‐active Akt expression [59]. Given the high level of sequence similarity between the three Ras molecules and their capacity to signal to a similar subset of downstream effector proteins, it is striking that these molecules have such divergent func‐tions. However, these differences are conferred by unique 25‐amino acid, C‐terminal HVRs. During post‐translational processing, the Ras molecules are first prenylated by farnesyltransferase, which allows for traf‐ficking to the endoplasmic reticulum [60, 61]. After this step, Ras molecule post‐translational processing diverg‐es: K‐Ras becomes more highly methylated than its H‐Ras and N‐Ras counterparts [30]. H‐Ras and N‐Ras are then palmitoylated and trafficked to the PM through the Golgi apparatus while methylated K‐Ras is trafficked to the PM independent of the Golgi [31, 58]. The exact mechanism responsible for mediating K‐Ras trafficking is unknown, however, its transport has been shown to be dependent on a polybasic, lysine‐rich portion of the K‐Ras HVR not found within the HVRs of H‐Ras or N‐Ras [62]. Following its PM localization, each Ras molecule occupies a different microdomain: N‐Ras is found in lipid raft domains, while K‐Ras localizes to non‐lipid raft portions of the membrane [32, 63]. H‐Ras occupies lipid raft domains when inactive, but translocates to non‐lipid raft membrane upon activation (in areas distinct from those occupied by K‐Ras) [32, 64]. In addition, H‐Ras and N‐Ras are also capable of signaling to down‐stream effectors from the Golgi, a capability not shared by K‐Ras [65, 66]. Collectively, the divergent processing and localization of the Ras molecules likely account for their capacities to signal to different subsets of down‐stream proteins to generate different biological out‐comes [33, 34]. Ras/Raf signal transduction most commonly operates through Raf activation of Mek1/2 [67‐69]. In striking contrast to this canonical signaling mechanism, we demonstrate that activated K‐Ras expression increases brain NSC proliferation in a Raf‐dependent manner that

Ras molecule‐specific growth regulation
www.StemCells.com ©AlphaMed Press 2014
7
operates independent of Mek. Precedent for Mek‐independent Ras/Raf growth control derives from sev‐eral studies performed in numerous different cell types. First, Raf‐1 overexpression has been shown to increase cell survival by inhibiting ASK‐1 function in the presence of the Mek pharmacological inhibitors PD98059 and U0126 [70]. Second, K‐Ras*‐expressing DLD‐1 cells con‐tinue to proliferate despite treatment with the Mek inhibitor CI‐1040. Proliferation of these cells was only inhibited in the presence of the Raf inhibitor AZ628 [37]. Third, protein binding discovery studies have re‐vealed several other potential Raf binding partners, including the 14‐3‐3‐zeta protein, which modulates Raf signaling during cell stress through its association with keratin 8/18 [71, 72]. Fourth, both B‐Raf and Raf‐1 as‐sociate with PKC‐theta to inactivate the pro‐apoptotic Bcl‐2 family protein BAD and increase cell survival [73]. While these studies collectively identify a role for Raf in cell growth, we found that K‐Ras*‐dependent brain NSC hyperproliferation depends on the productive interac‐tion between Raf‐1 and the retinoblastoma (Rb) cell cycle regulator [42]. The Rb tumor suppressor protein prevents cell cycle progression by inhibiting the expression of the E2F tran‐scription factors to prevent DNA synthesis. Upon growth factor stimulation, this inhibition is relieved, allowing cells to progress through the cell cycle. Using genetic and biochemical techniques to alter Ras expres‐sion in the presence or absence of Rb expression, early work established a hierarchy for Ras/Rb/cell cycle regu‐lation, whereby Ras inhibition of Rb function led to in‐creased proliferation [74, 75]. The mechanism underly‐ing this Ras/Rb connection was identified when direct binding between Raf‐1 and Rb was revealed [42]. Con‐sistent with previous studies demonstrating that the RRD‐251 small peptide interrupts this interaction and block tumor cell growth [42‐44, 76‐78], we found that K‐Ras*‐induced NSC hyperproliferation depended on Raf/Rb binding and inhibition of Rb function. In summary, using a novel collection of conditional Ras genetically‐engineered mouse strains and derivative NSCs, we establish differential effects of the three acti‐vated Ras molecules on brain NSC proliferation. Moreo‐ver, the elucidation of a non‐conventional mechanism underlying Ras/Raf‐mediated NSC growth control sug‐gests additional determinants relevant to the study of diseases characterized by de‐regulated RAS function. Future studies characterizing differences in Ras mole‐cule function in disease‐pertinent models will be critical to further defining and ultimately treating these disor‐ders.
CONCLUSION AND SUMMARY
To our knowledge, this is the first study to compare the impact of regulated expression of all three activated Ras alleles on brain NSC function using identically‐constructed genetically‐engineered mouse strains. Us‐ing this approach, activated K‐Ras, but not H‐Ras or N‐Ras, expression increases NSC proliferation without altering astrocyte differentiation. Additionally, K‐Ras* regulates NSC proliferation in a Raf‐dependent manner, not involving the Raf downstream effectors Mek and Erk. Instead, K‐Ras* increases brain NSC proliferation through Raf inhibition of the Rb tumor suppressor pro‐tein, thereby releasing Rb‐mediated suppression of cell cycle progression. This comparison of the activated Ras molecules will be relevant for future studies that aim to interpret the differential contributions of the Ras mole‐cules to neurodevelopmental disorders resulting from activated Ras molecule expression.
ACKNOWLEDGMENTS
This work was funded by grants from the National Insti‐tutes of Health (NS065547‐01 to D.H.G. and 1K01 CA118425 to K.M.H.). R.H.F.B. was supported by a Na‐tional Institute of General Medical Sciences Training Grant (GM: 007067) and a pre‐doctoral Young Investi‐gator Award from the Children’s Tumor Foundation. We thank the Alvin J. Siteman Cancer Center for the use of the Siteman Flow Cytometry Core (NCI Cancer Center Support Grant #P30 CA91842). The Rb antibody was obtained from the Developmental Studies Hybridoma Bank, created by the NICHD of the NIH and maintained at The University of Iowa (Department of Biology, Iowa City, IA 52242).
DISCLOSURE OF POTENTIAL CONFLICTS OF INTEREST
The authors report no potential conflicts of interest.
AUTHOR CONTRIBUTIONS
R.H.F.B.: Conception and design, collection and assem‐bly of data, data analysis and interpretation, manuscript writing, final approval of manuscript; K.M.H.: Provision of H‐RasG12V mouse, final approval of manuscript; D.H.G.: Conception and design, financial support, ad‐ministrative support, data analysis and interpretation, manuscript writing, final approval of manuscript
REFERENCES 1 McKay R. Stem cells in the central
nervous system. Science. 1997;276:66‐71. 2 Temple S, Alvarez‐Buylla A. Stem cells in
the adult mammalian central nervous system.
Current opinion in neurobiology. 1999;9:135‐141. 3 Reynolds BA, Weiss S. Generation of
neurons and astrocytes from isolated cells of the adult mammalian central nervous system. Science. 1992;255:1707‐1710.
4 Davis AA, Temple S. A self‐renewing multipotential stem cell in embryonic rat cerebral cortex. Nature. 1994;372:263‐266. 5 Luskin MB, Pearlman AL, Sanes JR. Cell
lineage in the cerebral cortex of the mouse studied in vivo and in vitro with a
Ras molecule‐specific growth regulation
www.StemCells.com ©AlphaMed Press 2014
8
recombinant retrovirus. Neuron. 1988;1:635‐647. 6 Qian X, Shen Q, Goderie SK et al. Timing
of CNS cell generation: a programmed sequence of neuron and glial cell production from isolated murine cortical stem cells. Neuron. 2000;28:69‐80. 7 Gaiano N, Fishell G. The role of notch in
promoting glial and neural stem cell fates. Annu Rev Neurosci. 2002;25:471‐490. 8 Morrison SJ, Perez SE, Qiao Z et al.
Transient Notch activation initiates an irreversible switch from neurogenesis to gliogenesis by neural crest stem cells. Cell. 2000;101:499‐510. 9 Tanigaki K, Nogaki F, Takahashi J et al.
Notch1 and Notch3 instructively restrict bFGF‐responsive multipotent neural progenitor cells to an astroglial fate. Neuron. 2001;29:45‐55. 10 Yamamoto N, Yamamoto S, Inagaki F et
al. Role of Deltex‐1 as a transcriptional regulator downstream of the Notch receptor. J Biol Chem. 2001;276:45031‐45040. 11 Nakamura Y, Sakakibara S, Miyata T et
al. The bHLH gene hes1 as a repressor of the neuronal commitment of CNS stem cells. J Neurosci. 2000;20:283‐293. 12 Liu H, Jia D, Li A et al. p53 regulates
neural stem cell proliferation and differentiation via BMP‐Smad1 signaling and Id1. Stem Cells Dev. 2013;22:913‐927. 13 Acquati S, Greco A, Licastro D et al.
Epigenetic regulation of survivin by Bmi1 is cell type specific during corticogenesis and in gliomas. Stem Cells. 2013;31:190‐202. 14 Chen BY, Wang X, Wang ZY et al. Brain‐
derived neurotrophic factor stimulates proliferation and differentiation of neural stem cells, possibly by triggering the Wnt/beta‐catenin signaling pathway. J Neurosci Res. 2013;91:30‐41. 15 Ihrie RA, Shah JK, Harwell CC et al.
Persistent sonic hedgehog signaling in adult brain determines neural stem cell positional identity. Neuron. 2011;71:250‐262. 16 Yadirgi G, Leinster V, Acquati S et al.
Conditional activation of Bmi1 expression regulates self‐renewal, apoptosis, and differentiation of neural stem/progenitor cells in vitro and in vivo. Stem Cells. 2011;29:700‐712. 17 Lee da Y, Yeh TH, Emnett RJ et al.
Neurofibromatosis‐1 regulates neuroglial progenitor proliferation and glial differentiation in a brain region‐specific manner. Genes & development. 2010;24:2317‐2329. 18 Aguirre A, Rubio ME, Gallo V. Notch and
EGFR pathway interaction regulates neural stem cell number and self‐renewal. Nature. 2010;467:323‐327. 19 Chapouton P, Skupien P, Hesl B et al.
Notch activity levels control the balance between quiescence and recruitment of adult neural stem cells. J Neurosci. 2010;30:7961‐7974. 20 Gao Z, Ure K, Ding P et al. The master
negative regulator REST/NRSF controls adult neurogenesis by restraining the neurogenic program in quiescent stem cells. J Neurosci. 2011;31:9772‐9786. 21 Ayuso‐Sacido A, Moliterno JA, Kratovac S
et al. Activated EGFR signaling increases
proliferation, survival, and migration and blocks neuronal differentiation in post‐natal neural stem cells. J Neurooncol. 2010;97:323‐337. 22 Abrajano JJ, Qureshi IA, Gokhan S et al.
Differential deployment of REST and CoREST promotes glial subtype specification and oligodendrocyte lineage maturation. PLoS One. 2009;4:e7665. 23 Schmidt‐Edelkraut U, Hoffmann A,
Daniel G et al. Zac1 regulates astroglial differentiation of neural stem cells through Socs3. Stem Cells. 2013;31:1621‐1632. 24 Tidyman WE, Rauen KA. The
RASopathies: developmental syndromes of Ras/MAPK pathway dysregulation. Curr Opin Genet Dev. 2009;19:230‐236. 25 DeClue JE, Papageorge AG, Fletcher JA et
al. Abnormal regulation of mammalian p21ras contributes to malignant tumor growth in von Recklinghausen (type 1) neurofibromatosis. Cell. 1992;69:265‐273. 26 Paquin A, Hordo C, Kaplan DR et al.
Costello syndrome H‐Ras alleles regulate cortical development. Dev Biol. 2009;330:440‐451. 27 Schubbert S, Zenker M, Rowe SL et al.
Germline KRAS mutations cause Noonan syndrome. Nat Genet. 2006;38:331‐336. 28 Lowy DR, Willumsen BM. Function and
regulation of ras. Annual review of biochemistry. 1993;62:851‐891. 29 Yan J, Roy S, Apolloni A et al. Ras
isoforms vary in their ability to activate Raf‐1 and phosphoinositide 3‐kinase. J Biol Chem. 1998;273:24052‐24056. 30 Choy E, Chiu VK, Silletti J et al.
Endomembrane trafficking of ras: the CAAX motif targets proteins to the ER and Golgi. Cell. 1999;98:69‐80. 31 Apolloni A, Prior IA, Lindsay M et al. H‐
ras but not K‐ras traffics to the plasma membrane through the exocytic pathway. Mol Cell Biol. 2000;20:2475‐2487. 32 Prior IA, Muncke C, Parton RG et al.
Direct visualization of Ras proteins in spatially distinct cell surface microdomains. J Cell Biol. 2003;160:165‐170. 33 Hamilton M, Wolfman A. Ha‐ras and N‐
ras regulate MAPK activity by distinct mechanisms in vivo. Oncogene. 1998;16:1417‐1428. 34 Walsh AB, Bar‐Sagi D. Differential
activation of the Rac pathway by Ha‐Ras and K‐Ras. J Biol Chem. 2001;276:15609‐15615. 35 Hegedus B, Dasgupta B, Shin JE et al.
Neurofibromatosis‐1 regulates neuronal and glial cell differentiation from neuroglial progenitors in vivo by both cAMP‐ and Ras‐dependent mechanisms. Cell Stem Cell. 2007;1:443‐457. 36 Tuveson DA, Shaw AT, Willis NA et al.
Endogenous oncogenic K‐ras(G12D) stimulates proliferation and widespread neoplastic and developmental defects. Cancer Cell. 2004;5:375‐387. 37 Haigis KM, Kendall KR, Wang Y et al.
Differential effects of oncogenic K‐Ras and N‐Ras on proliferation, differentiation and tumor progression in the colon. Nat Genet. 2008;40:600‐608. 38 Dasgupta B, Gutmann DH.
Neurofibromin regulates neural stem cell proliferation, survival, and astroglial
differentiation in vitro and in vivo. J Neurosci. 2005;25:5584‐5594. 39 Dasgupta B, Li W, Perry A et al. Glioma
formation in neurofibromatosis 1 reflects preferential activation of K‐RAS in astrocytes. Cancer Res. 2005;65:236‐245. 40 Lakkis MM, Epstein JA. Neurofibromin
modulation of ras activity is required for normal endocardial‐mesenchymal transformation in the developing heart. Development. 1998;125:4359‐4367. 41 Poulikakos PI, Zhang C, Bollag G et al.
RAF inhibitors transactivate RAF dimers and ERK signalling in cells with wild‐type BRAF. Nature. 2010;464:427‐430. 42 Wang S, Ghosh RN, Chellappan SP. Raf‐1
physically interacts with Rb and regulates its function: a link between mitogenic signaling and cell cycle regulation. Mol Cell Biol. 1998;18:7487‐7498. 43 Dasgupta P, Sun J, Wang S et al.
Disruption of the Rb‐‐Raf‐1 interaction inhibits tumor growth and angiogenesis. Mol Cell Biol. 2004;24:9527‐9541. 44 Kinkade R, Dasgupta P, Carie A et al. A
small molecule disruptor of Rb/Raf‐1 interaction inhibits cell proliferation, angiogenesis, and growth of human tumor xenografts in nude mice. Cancer Res. 2008;68:3810‐3818. 45 Koera K, Nakamura K, Nakao K et al. K‐
ras is essential for the development of the mouse embryo. Oncogene. 1997;15:1151‐1159. 46 Johnson L, Greenbaum D, Cichowski K et
al. K‐ras is an essential gene in the mouse with partial functional overlap with N‐ras. Genes Dev. 1997;11:2468‐2481. 47 Umanoff H, Edelmann W, Pellicer A et al.
The murine N‐ras gene is not essential for growth and development. Proceedings of the National Academy of Sciences of the United States of America. 1995;92:1709‐1713. 48 Esteban LM, Vicario‐Abejon C,
Fernandez‐Salguero P et al. Targeted genomic disruption of H‐ras and N‐ras, individually or in combination, reveals the dispensability of both loci for mouse growth and development. Mol Cell Biol. 2001;21:1444‐1452. 49 Janzarik WG, Kratz CP, Loges NT et al.
Further evidence for a somatic KRAS mutation in a pilocytic astrocytoma. Neuropediatrics. 2007;38:61‐63. 50 Sharma MK, Zehnbauer BA, Watson MA
et al. RAS pathway activation and an oncogenic RAS mutation in sporadic pilocytic astrocytoma. Neurology. 2005;65:1335‐1336. 51 Li Q, Bohin N, Wen T et al. Oncogenic
Nras has bimodal effects on stem cells that sustainably increase competitiveness. Nature. 2013;504:143‐147. 52 Darley RL, Pearn L, Omidvar N et al.
Protein kinase C mediates mutant N‐Ras‐induced developmental abnormalities in normal human erythroid cells. Blood. 2002;100:4185‐4192. 53 Shen SW, Dolnikov A, Passioura T et al.
Mutant N‐ras preferentially drives human CD34+ hematopoietic progenitor cells into myeloid differentiation and proliferation both in vitro and in the NOD/SCID mouse. Experimental hematology. 2004;32:852‐860. 54 Li Q, Haigis KM, McDaniel A et al.
Hematopoiesis and leukemogenesis in mice
Ras molecule‐specific growth regulation
www.StemCells.com ©AlphaMed Press 2014
9
expressing oncogenic NrasG12D from the endogenous locus. Blood. 2011;117:2022‐2032. 55 Kim CF, Jackson EL, Woolfenden AE et al.
Identification of bronchioalveolar stem cells in normal lung and lung cancer. Cell. 2005;121:823‐835. 56 Quinlan MP, Quatela SE, Philips MR et
al. Activated Kras, but not Hras or Nras, may initiate tumors of endodermal origin via stem cell expansion. Mol Cell Biol. 2008;28:2659‐2674. 57 Prior IA, Lewis PD, Mattos C. A
comprehensive survey of Ras mutations in cancer. Cancer Res. 2012;72:2457‐2467. 58 Hancock JF, Cadwallader K, Paterson H
et al. A CAAX or a CAAL motif and a second signal are sufficient for plasma membrane targeting of ras proteins. Embo J. 1991;10:4033‐4039. 59 Holland EC, Celestino J, Dai C et al.
Combined activation of Ras and Akt in neural progenitors induces glioblastoma formation in mice. Nat Genet. 2000;25:55‐57. 60 Reiss Y, Goldstein JL, Seabra MC et al.
Inhibition of purified p21ras farnesyl:protein transferase by Cys‐AAX tetrapeptides. Cell. 1990;62:81‐88. 61 Kim E, Ambroziak P, Otto JC et al.
Disruption of the mouse Rce1 gene results in defective Ras processing and mislocalization of Ras within cells. J Biol Chem. 1999;274:8383‐8390. 62 Hancock JF, Paterson H, Marshall CJ. A
polybasic domain or palmitoylation is
required in addition to the CAAX motif to localize p21ras to the plasma membrane. Cell. 1990;63:133‐139. 63 Matallanas D, Arozarena I, Berciano MT
et al. Differences on the inhibitory specificities of H‐Ras, K‐Ras, and N‐Ras (N17) dominant negative mutants are related to their membrane microlocalization. J Biol Chem. 2003;278:4572‐4581. 64 Prior IA, Harding A, Yan J et al. GTP‐
dependent segregation of H‐ras from lipid rafts is required for biological activity. Nat Cell Biol. 2001;3:368‐375. 65 Inder K, Harding A, Plowman SJ et al.
Activation of the MAPK module from different spatial locations generates distinct system outputs. Mol Biol Cell. 2008;19:4776‐4784. 66 Philips MR. Compartmentalized
signalling of Ras. Biochem Soc Trans. 2005;33:657‐661. 67 Kyriakis JM, App H, Zhang XF et al. Raf‐1
activates MAP kinase‐kinase. Nature. 1992;358:417‐421. 68 Dent P, Haser W, Haystead TA et al.
Activation of mitogen‐activated protein kinase kinase by v‐Raf in NIH 3T3 cells and in vitro. Science. 1992;257:1404‐1407. 69 Force T, Bonventre JV, Heidecker G et al.
Enzymatic characteristics of the c‐Raf‐1 protein kinase. Proc Natl Acad Sci U S A. 1994;91:1270‐1274. 70 Chen J, Fujii K, Zhang L et al. Raf‐1
promotes cell survival by antagonizing apoptosis signal‐regulating kinase 1 through a
MEK‐ERK independent mechanism. Proc Natl Acad Sci U S A. 2001;98:7783‐7788. 71 Ku NO, Fu H, Omary MB. Raf‐1 activation
disrupts its binding to keratins during cell stress. J Cell Biol. 2004;166:479‐485. 72 Luo ZJ, Zhang XF, Rapp U et al.
Identification of the 14.3.3 zeta domains important for self‐association and Raf binding. J Biol Chem. 1995;270:23681‐23687. 73 Hindley A, Kolch W. Raf‐1 and B‐Raf
promote protein kinase C theta interaction with BAD. Cellular signalling. 2007;19:547‐555. 74 Mittnacht S, Paterson H, Olson MF et al.
Ras signalling is required for inactivation of the tumour suppressor pRb cell‐cycle control protein. Curr Biol. 1997;7:219‐221. 75 Peeper DS, Upton TM, Ladha MH et al.
Ras signalling linked to the cell‐cycle machinery by the retinoblastoma protein. Nature. 1997;386:177‐181. 76 Johnson JL, Pillai S, Pernazza D et al.
Regulation of matrix metalloproteinase genes by E2F transcription factors: Rb‐Raf‐1 interaction as a novel target for metastatic disease. Cancer Res. 2012;72:516‐526. 77 Singh S, Davis R, Alamanda V et al. Rb‐
Raf‐1 interaction disruptor RRD‐251 induces apoptosis in metastatic melanoma cells and synergizes with dacarbazine. Molecular cancer therapeutics. 2010;9:3330‐3341. 78 Davis RK, Chellappan S. Disrupting the
Rb‐Raf‐1 interaction: a potential therapeutic target for cancer. Drug news & perspectives. 2008;21:331‐335.
See www.StemCells.com for supporting information available online. STEM
CELLS ; 00:000–000

Ras molecule‐specific growth regulation
www.StemCells.com ©AlphaMed Press 2014
10
Figure 1. Activated K‐Ras expression in NSCs leads to increased gliogenesis in vivo. At PN18, K‐Ras*BLBP, but not H‐Ras*BLBP or N‐Ras*BLBP, mice harbor an increased percentage of astrocytes in the brainstem as quantified using the (A) GFAP (1.8‐fold, **p<0.01) and (B) S100β (1.2‐fold) astrocyte markers. Representative images are shown in the right panels (20x, scale bar=50μm). There were no changes in the percentages of (C) APC+ oligodendrocytes or (D) NeuN+ neurons in the three Ras*BLBP genotypes relative to littermate controls. Error bars represent the standard errors of the mean.

Ras molecule‐specific growth regulation
www.StemCells.com ©AlphaMed Press 2014
11
Figure 2. Activated K‐Ras expression does not affect NSC multi‐lineage differentiation. (A) Ras activation (Ras‐GTP) is increased in all three Ras* NSC populations following Cre expression. (B) Differentiation of adherent NSC cultures demonstrates that K‐Ras*‐, but not H‐Ras*‐ or N‐Ras*‐, expressing NSCs have a greater number of GFAP+ astrocytes compared to controls (1.8‐fold, ***p<0.001). Graphs from representative experiments are shown with representative images included (GFAP+ (green) and DAPI+ (blue), 20x, scale bar=50µm). (C) K‐Ras*, but not H‐Ras* or N‐Ras*, ‐expressing NSCs also give rise to more total DAPI+ cells relative to control cells (1.8‐fold, ***p<0.001). (D) K‐Ras*‐, H‐Ras*‐, and N‐Ras*‐expressing NSCs have similar percentages of GFAP+ astrocytes relative to controls. Error bars rep‐resent the standard errors of the mean.

Ras molecule‐specific growth regulation
www.StemCells.com ©AlphaMed Press 2014
12
Figure 3. Activated K‐Ras expression increases NSC proliferation during differentiation. (A) EdU labeling at day 1 and day 5 post‐plating was employed to determine whether Sox2+ NSCs or GFAP+ astrocytes proliferate during NSC differ‐entiation. (B) K‐Ras*‐expressing cells proliferate 7.2‐fold more than control cells at day 1 (***p<0.001). (C) These EdU+ proliferating cells are exclusively Sox2+ NSCs, and not GFAP+ astrocytes. (D) There is no significant difference in the percentage of Sox2+ cells between K‐Ras* and control NSCs; however, there was a decrease in the percentage of GFAP+ astrocytes in K‐Ras*‐expressing cells relative to controls. (E) At day 5, K‐Ras*‐expressing cells proliferate 2.2‐fold more than controls (*p<0.05). (F) No differences in proliferating NSCs (Sox2+) and astrocytes (GFAP+) in K‐Ras*‐expressing cells relative to control cells were observed. (G) There was a 2.1‐fold increase in the percentage of Sox2+ cells in K‐Ras*‐expressing NSCs compared to control NSCs (**p<0.01), while there was no difference in the percent‐age of GFAP+ astrocytes. All graphs are from the same representative experiment; error bars represent the standard errors of the mean. Representative images for (D) and (G) appear below their respective graphs (20x, scale bar=50µm). Arrowheads mark representative EdU+/Lineage+ double‐positive cells, arrows mark cells positive for GFAP alone, and asterisks (*) mark cells positive for EdU alone.
Ras molecule‐specific growth regulation
www.StemCells.com ©AlphaMed Press 2014
13
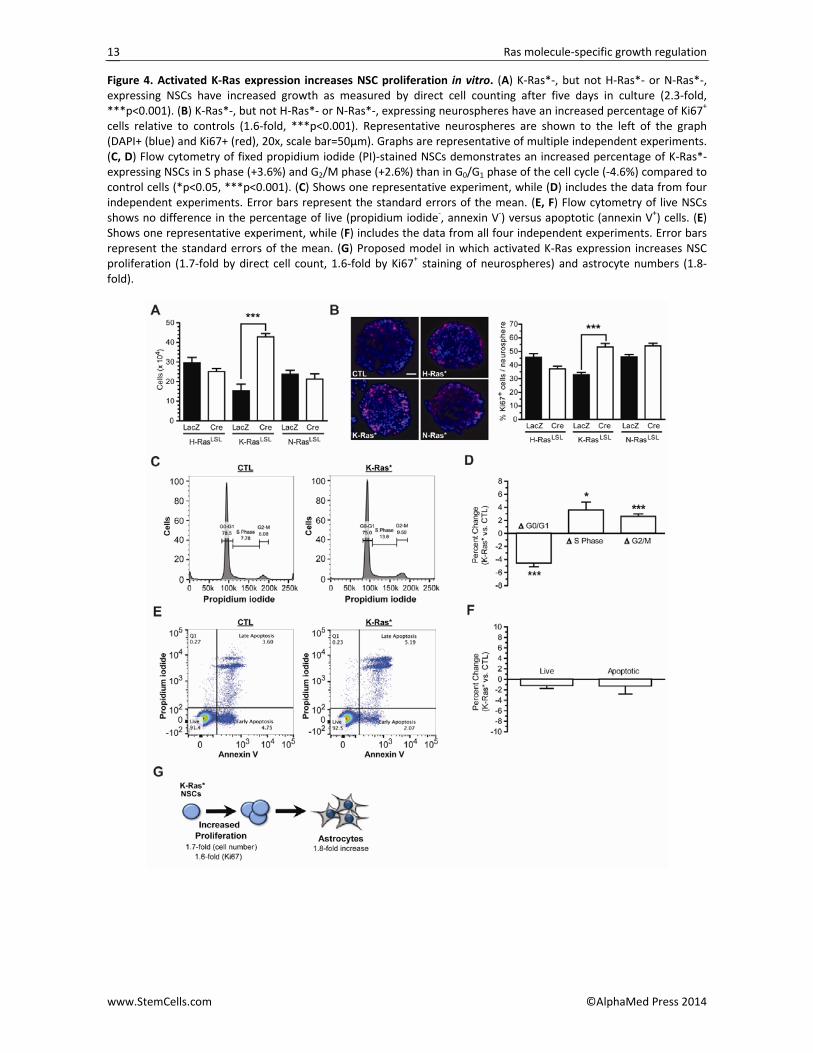
Figure 4. Activated K‐Ras expression increases NSC proliferation in vitro. (A) K‐Ras*‐, but not H‐Ras*‐ or N‐Ras*‐, expressing NSCs have increased growth as measured by direct cell counting after five days in culture (2.3‐fold, ***p<0.001). (B) K‐Ras*‐, but not H‐Ras*‐ or N‐Ras*‐, expressing neurospheres have an increased percentage of Ki67+ cells relative to controls (1.6‐fold, ***p<0.001). Representative neurospheres are shown to the left of the graph (DAPI+ (blue) and Ki67+ (red), 20x, scale bar=50µm). Graphs are representative of multiple independent experiments. (C, D) Flow cytometry of fixed propidium iodide (PI)‐stained NSCs demonstrates an increased percentage of K‐Ras*‐expressing NSCs in S phase (+3.6%) and G2/M phase (+2.6%) than in G0/G1 phase of the cell cycle (‐4.6%) compared to control cells (*p<0.05, ***p<0.001). (C) Shows one representative experiment, while (D) includes the data from four independent experiments. Error bars represent the standard errors of the mean. (E, F) Flow cytometry of live NSCs shows no difference in the percentage of live (propidium iodide‐, annexin V‐) versus apoptotic (annexin V+) cells. (E) Shows one representative experiment, while (F) includes the data from all four independent experiments. Error bars represent the standard errors of the mean. (G) Proposed model in which activated K‐Ras expression increases NSC proliferation (1.7‐fold by direct cell count, 1.6‐fold by Ki67+ staining of neurospheres) and astrocyte numbers (1.8‐fold).

Ras molecule‐specific growth regulation
www.StemCells.com ©AlphaMed Press 2014
14
Figure 5. K‐Ras*BLBP mice have more neuroglial progenitors during brain development. (A) At embryonic day 12.5 (E12.5), K‐Ras*BLBP mice have 2‐fold more Sox2+ NSCs per 0.1mm2 in the developing hindbrain (the future site of the pons) relative to littermate controls (**p<0.01). Representative images are shown at the right, with the Sox2+ cells in green and the dashed line denoting the ventricular surface (20x, scale bar=50μm). (B) At postnatal day 1 (PN1), there is no difference in the percentage of Sox2+ NSCs in the brainstem, however, (C) K‐Ras*BLBP mice have 1.9–fold more Olig2+ glial progenitor cells compared to littermate controls (NS=not significant, ***p<0.001). Representative images appear to the right of their respective graphs with arrowheads identifying Sox2+ or Olig2+ nuclei (red), respectively. DAPI (blue) marks total cells (20x, scale bar=50μm). Error bars represent the standard errors of the mean.

Ras molecule‐specific growth regulation
www.StemCells.com ©AlphaMed Press 2014
15
Figure 6. Activated K‐Ras regulates NSC proliferation in a Raf‐dependent, but Mek‐independent, manner. (A) In K‐Ras*‐expressing NSCs, K‐Ras activity is 30‐fold higher than that observed in control NSCs as determined using a com‐mercial Ras‐GTP affinity assay (n=3, ***p<0.001). (B) K‐Ras*‐induced NSC hyperproliferation is reduced to control levels (indicated by the horizontal dashed line) following pharmacological inhibition of Ras using the GGTI‐286 geranylgeranyltransferase inhibitor (6.5µM) (*p<0.05). Western blotting of Erk activity (above) was used as a readout for decreased Ras signaling in GGTI‐286‐treated NSCs. (C) Expression of a dominant‐negative K‐Ras molecule (dnK‐RasN17) reduced K‐Ras*‐induced NSC hyperproliferation to control levels. IRES‐GFP (GFP) and dnK‐RasN17‐IRES‐GFP (dnK‐RasN17) virus infection of neurospheres was confirmed by GFP expression in the images at the right (10x, scale bar=25µm). (D) K‐Ras*‐induced NSC hyperproliferation is reduced to control levels following pharmacological inhibi‐tion of Raf activity (AZ628, 200nM) (**p<0.01). (E) The downstream Ras effector, Erk1/2 (p‐ErkT202/Y204), is hyperac‐tivated in K‐Ras*‐expressing NSCs relative to controls. However, there is no reduction in K‐Ras*‐induced NSC hy‐perproliferation following pharmacological inhibition with the Mek inhibitors (F) PD0325901 (PD901, 2nM) or (G) MEK162 (50nM) (NS=not significant). Error bars represent the standard errors of the mean.

Ras molecule‐specific growth regulation
www.StemCells.com ©AlphaMed Press 2014
16
Figure 7. Activated K‐Ras regulates NSC proliferation in a Raf‐ and Rb‐dependent manner. (A) Raf‐1 immunoprecipi‐tation reveals that Rb binds to Raf‐1 in K‐Ras*‐expressing NSCs. (B) The small molecule inhibitor RRD‐251 reduces K‐Ras*‐induced NSC hyperproliferation to control levels, as measured by direct cell counting (**p<0.01). Error bars rep‐resent the standard errors of the mean. (C) Proposed model for K‐Ras*‐mediated regulation of NSC proliferation. Ac‐tive K‐Ras‐GTP activates Raf by binding to the Ras‐binding domain (RBD). This leads to subsequent Rb binding to and inhibition of Rb activity, culminating in increased cell cycle progression (proliferation).