Actinides AMS at CIRCE and 236U and Pu measurements of structural and environmental samples from in...
8
Actinides AMS at CIRCE and 236 U and Pu measurements of structural and environmental samples from in and around a mothballed nuclear power plant M. De Cesare a,b,⇑ , L.K. Fifield c , C. Sabbarese a,b , S.G. Tims c , N. De Cesare d,b , A. D’Onofrio a,b , A. D’Arco a , A.M. Esposito e , A. Petraglia a , V. Roca f,b , F. Terrasi a,b a CIRCE, INNOVA, and Dipartimento di Scienze Ambientali, Seconda Università di Napoli, via Vivaldi 43, 81100 Caserta, Italy b INFN Sezione di Napoli, via Cintia, Edificio G, 80126 Napoli, Italy c Department of Nuclear Physics, Research School of Physics and Engineering, Australian National University, ACT 0200, Canberra, Australia d CIRCE, INNOVA, and Dipartimento di Scienze della Vita, Seconda Università di Napoli , via Vivaldi 43, 81100 Caserta, Italy e Società Gestione Impianti Nucleari–SoGIN, via Torino 6, 00184 Roma, Italy f Dipartimento di Scienze Fisiche, Università Federico II, via Cintia, Edificio G, 80126 Napoli, Italy article info Article history: Received 1 July 2011 Received in revised form 1 March 2012 Available online 16 May 2012 Keywords: 236 U Pu isotopes Mass and isotopic ratio sensitivities Environmental and structural samples abstract Accelerator mass spectrometry (AMS) is presently the most sensitive technique for the measurement of long-lived actinides, e.g. 236 U and 239 Pu. A new actinide line is in operation at the Center for Isotopic Research on Cultural and Environmental heritage (CIRCE) in Caserta, Italy. Using the actinide line a ura- nium mass sensitivity of around 4 lg has been reached measuring with a 16-strip silicon detector, and a 239 Pu background level of below 0.1 fg has been obtained. In this work we also discuss preliminary results for environmental and structural samples from in and around the Garigliano nuclear power plant (GNPP), presently in the decommissioning phase. Measure- ments on environmental samples from the vicinity of the plant allow the assessment of contamination, if any, over the years. Measurements of structural samples from the plant are relevant to the optimization of the decommissioning program for the GNPP. Ó 2012 Elsevier B.V. All rights reserved. 1. Introduction Long-lived anthropogenic radionuclides have been released into the environment by nuclear weapons testing, nuclear accidents, fuel reprocessing and decommissioning of NPPs. In Italy no NPPs are in operation, but the four shutdown NPPs are now being decommissioned. An overriding concern in the dismantling process is to avoid possible contamination of the site by radionuclide release. At the GNPP several radiological assessment campaigns have been carried out using conventional radioactive decay counting techniques to determine the extent, if any, of environmental con- tamination by b- and c-emitters. Long-lived a-emitters, specifi- cally uranium-236 and isotopes of plutonium, are however difficult to measure with adequate sensitivity using a-particle counting techniques, and the ultra-sensitivity of AMS is crucial for the evaluation of any contamination from these important nuc- lides. In particular, the measurement of the activities in structural materials of the plant is required to inform the appropriate proce- dures for dismantling. Pu isotopes and 236 U are currently used in a broad domain rang- ing from tracing nuclear releases, through nuclear safeguards, to tracing soil loss and sediment transport [1–3]. The CIRCE [3,4], located in Caserta (Italy), in collaboration with SoGIN (Nuclear Plant Management Company) started a research program to establish a highly sensitive system for measuring the concentration and isotopic ratios of U and Pu isotopes based on AMS, applicable to the analysis of both environmental and structural samples (i.e. from the reactor building and related infrastructures) to quantify and determine the origin of any U or Pu. For 236 U, the measured quantity is 236 U/ 238 U, and the sensitivity limit for this ratio depends on the mass of uranium in the sample. To measure the isotopic ratio in environmental samples it is there- fore desirable to push the sensitivity down to natural abundance levels ( 236 U/ 238 U 10 13 ) in samples with sizeable amounts of U (1 mg). On the other hand, for anthropogenically influenced sam- ples, higher ratios are expected so the required sensitivity may be relaxed, and significantly smaller amounts of U may then be used [3]. In this paper we present the performance of the CIRCE system, the sensitivity reached and the measurement results on samples from the GNPP site, obtained both at the Australian National Uni- versity (ANU) [3] and at CIRCE. 0168-583X/$ - see front matter Ó 2012 Elsevier B.V. All rights reserved. http://dx.doi.org/10.1016/j.nimb.2012.05.020 ⇑ Corresponding author at: CIRCE, INNOVA, and Dipartimento di Scienze Ambientali, Seconda Università di Napoli, via Vivaldi 43, 81100, Caserta, Italy. E-mail address: [email protected] (M. De Cesare). Nuclear Instruments and Methods in Physics Research B 294 (2013) 152–159 Contents lists available at SciVerse ScienceDirect Nuclear Instruments and Methods in Physics Research B journal homepage: www.elsevier.com/locate/nimb
Transcript of Actinides AMS at CIRCE and 236U and Pu measurements of structural and environmental samples from in...

Nuclear Instruments and Methods in Physics Research B 294 (2013) 152–159
Contents lists available at SciVerse ScienceDirect
Nuclear Instruments and Methods in Physics Research B
journal homepage: www.elsevier .com/locate /n imb
Actinides AMS at CIRCE and 236U and Pu measurements of structural andenvironmental samples from in and around a mothballed nuclear power plant
M. De Cesare a,b,⇑, L.K. Fifield c, C. Sabbarese a,b, S.G. Tims c, N. De Cesare d,b, A. D’Onofrio a,b, A. D’Arco a,A.M. Esposito e, A. Petraglia a, V. Roca f,b, F. Terrasi a,b
a CIRCE, INNOVA, and Dipartimento di Scienze Ambientali, Seconda Università di Napoli, via Vivaldi 43, 81100 Caserta, Italyb INFN Sezione di Napoli, via Cintia, Edificio G, 80126 Napoli, Italyc Department of Nuclear Physics, Research School of Physics and Engineering, Australian National University, ACT 0200, Canberra, Australiad CIRCE, INNOVA, and Dipartimento di Scienze della Vita, Seconda Università di Napoli , via Vivaldi 43, 81100 Caserta, Italye Società Gestione Impianti Nucleari–SoGIN, via Torino 6, 00184 Roma, Italyf Dipartimento di Scienze Fisiche, Università Federico II, via Cintia, Edificio G, 80126 Napoli, Italy
a r t i c l e i n f o
Article history:Received 1 July 2011Received in revised form 1 March 2012Available online 16 May 2012
Keywords:236UPu isotopesMass and isotopic ratio sensitivitiesEnvironmental and structural samples
0168-583X/$ - see front matter � 2012 Elsevier B.V.http://dx.doi.org/10.1016/j.nimb.2012.05.020
⇑ Corresponding author at: CIRCE, INNOVA, anAmbientali, Seconda Università di Napoli, via Vivaldi
E-mail address: [email protected] (M. De
a b s t r a c t
Accelerator mass spectrometry (AMS) is presently the most sensitive technique for the measurement oflong-lived actinides, e.g. 236U and 239Pu. A new actinide line is in operation at the Center for IsotopicResearch on Cultural and Environmental heritage (CIRCE) in Caserta, Italy. Using the actinide line a ura-nium mass sensitivity of around 4 lg has been reached measuring with a 16-strip silicon detector, and a239Pu background level of below 0.1 fg has been obtained.
In this work we also discuss preliminary results for environmental and structural samples from in andaround the Garigliano nuclear power plant (GNPP), presently in the decommissioning phase. Measure-ments on environmental samples from the vicinity of the plant allow the assessment of contamination,if any, over the years. Measurements of structural samples from the plant are relevant to the optimizationof the decommissioning program for the GNPP.
� 2012 Elsevier B.V. All rights reserved.
236
1. IntroductionLong-lived anthropogenic radionuclides have been released intothe environment by nuclear weapons testing, nuclear accidents,fuel reprocessing and decommissioning of NPPs. In Italy no NPPsare in operation, but the four shutdown NPPs are now beingdecommissioned. An overriding concern in the dismantling processis to avoid possible contamination of the site by radionucliderelease.
At the GNPP several radiological assessment campaigns havebeen carried out using conventional radioactive decay countingtechniques to determine the extent, if any, of environmental con-tamination by b- and c-emitters. Long-lived a-emitters, specifi-cally uranium-236 and isotopes of plutonium, are howeverdifficult to measure with adequate sensitivity using a-particlecounting techniques, and the ultra-sensitivity of AMS is crucialfor the evaluation of any contamination from these important nuc-lides. In particular, the measurement of the activities in structuralmaterials of the plant is required to inform the appropriate proce-dures for dismantling.
All rights reserved.
d Dipartimento di Scienze43, 81100, Caserta, Italy.Cesare).
Pu isotopes and U are currently used in a broad domain rang-ing from tracing nuclear releases, through nuclear safeguards, totracing soil loss and sediment transport [1–3].
The CIRCE [3,4], located in Caserta (Italy), in collaboration withSoGIN (Nuclear Plant Management Company) started a researchprogram to establish a highly sensitive system for measuringthe concentration and isotopic ratios of U and Pu isotopes basedon AMS, applicable to the analysis of both environmental andstructural samples (i.e. from the reactor building and relatedinfrastructures) to quantify and determine the origin of any Uor Pu.
For 236U, the measured quantity is 236U/238U, and the sensitivitylimit for this ratio depends on the mass of uranium in the sample.To measure the isotopic ratio in environmental samples it is there-fore desirable to push the sensitivity down to natural abundancelevels (236U/238U � 10�13) in samples with sizeable amounts of U(�1 mg). On the other hand, for anthropogenically influenced sam-ples, higher ratios are expected so the required sensitivity may berelaxed, and significantly smaller amounts of U may then be used[3].
In this paper we present the performance of the CIRCE system,the sensitivity reached and the measurement results on samplesfrom the GNPP site, obtained both at the Australian National Uni-versity (ANU) [3] and at CIRCE.

M. De Cesare et al. / Nuclear Instruments and Methods in Physics Research B 294 (2013) 152–159 153
2. Results of AMS measurements
In a first phase of the project [4–6] aiming to build a beam linededicated to actinides AMS at CIRCE based on a 3-MV AMS Pelle-tron tandem system, we have performed preliminary measure-ments to characterize the system, shown in Fig. 1. In particular ithas been shown that the addition of a switching magnet just afterthe ESA of the CIRCE AMS system was able to reduce the back-ground in the 236U detection from 236U/238U � 3.0 � 10�9
to < 5 � 10�11, even without the use of a TOF-E detection system,that is in any case planned for the near future. The determinationof the background was achieved using a silicon strip detector thatprovides the spatial distribution of the incident ions to assist in theidentification and assessment of isotopic interferences.
2.1. CIRCE accelerator: 236U and Pu measurement procedures
UO or PuO molecular negative ions were extracted from an NEC40-sample MC–SNICS cesium sputter ion source and pre-acceler-ated to a total injection energy of 50 keV. Typical beam currentsare 50–300 nA for 238U16O� ions. The ions are energy selected bya spherical electrostatic analyzer with a bending angle of 45�, oper-ated up to ±15 kV. The 90� double focusing low energy (LE) injectormagnet allows high resolution mass analysis for all stable isotopesin the periodic table; mass resolution is M/DM � 500 for a slitsaperture of ±1 mm [4]. The insulated stainless steel chamber canbe biased up to 15 kV for beam sequencing (e.g. between238U16O�, 236U16O� or between 239Pu16O�, 240Pu16O�, 242Pu16O�).An argon gas stripper in the high-voltage terminal of the accelera-tor is used to dissociate the molecules and strip the resulting atom-ic ions to high positive charge states. After acceleration, the doublefocusing 90� high energy (HE) analyzing magnet (M/DM = 725 with
Fig. 1. Schematic layout of the CIRCE accelerator with the actinides line layout, includingdenotes Faraday Cup; arrows indicate system slits and collimators are identified by a C
slit opening of ±1 mm both at object and image points), efficientlyremoves molecular break-up products [4,5]. Subsequently, the two45� electrostatic spherical analyzers select ions of the correct en-ergy with an energy resolution E/DE = 700 for a typical beam sizeof 3–4 mm. A switching magnet is positioned after the ESA. Finallythe selected ions at 20� are counted in an appropriate detector. Thecontrol of the acquisition system is handled by the Fast IntercrateReadout (FaIR) system [7] via Ethernet or AccelNet interfaces.
Measurement of the 236U/238U ratio is effected by counting 236Uions in the final detector and periodically measuring the 238U cur-rent in the FC04 Faraday cup after the analyzing magnet. The trans-mission efficiency between the FC04 and FC5 at 20� is 80%, with a4 mm collimator in place. A tuning of the transport elements up tothe Faraday cup in front of the final detectors (LFC) is performed bysetting the parameters of the beam line to the detection of 238U. For238U5+ an energy of E = 17.3 MeV with a terminal voltage ofV = 2.900 MV is reached. The working pressure of the Ar in thestripper is about 1.3 mTorr for 238U5+ at 2.875 MV [5] and the strip-ping yield achieved for 238U5+ is around 3.1%.
Once the setup for the pilot 238U5+ beam is determined, the volt-age at the chamber of the injection magnet, the terminal voltageand the voltage of the ESA are scaled to transmit 236U5+.
For Pu isotopes, the system is also set up with a 238U5+ pilotbeam, and then the same parameters as above are scaled to trans-mit sequentially 239,240,242Pu.
2.2. Internal calibration and 236U and 239Pu mass sensitivity
2.2.1. Internal calibrationIn order to test the linearity of the response of the system, a ser-
ies of samples (Ratio Series) with nominal isotopic ratios from �5 � 10�8 down to � 1 � 10�10 were prepared by mixing different
the switching magnet, start and stop TOF-E detector and the Ionization Chamber. FC. ERNA is the acronym of European Recoil separator for Nuclear Astrophysics.

Table 1236U/238U isotopic ratio series, Vienna-KkU and IRMM-075/5,6: Nominal andmeasured values. The nominal isotopic ratios were obtained by mixing the Vienna-KkU material with various IRMM certified materials with higher isotopic ratio, toproduce an internal CIRCE isotopic ratio standard series. The RS nominal isotopic ratiouncertainty arises from the uncertainty of the Vienna-KkU mass and isotopic ratio,and from the dilution of the IRMM-075/1, 2, 3, 4 standards. The RS measured isotopicratio uncertainty (1 r) is dominated by the low FC5 currents.
236U/238U nominal values 236U/238U measured valuesa
Normalization samplesIRMM-075/5 (1.06519 ± 0.00075) � 10�8 (9.38 ± 0.47) � 10�9
IRMM-075/6 (1.0885 ± 0.0063) � 10�9 (9.40 ± 0.45) � 10�10
Average normalization 1.15 ± 0.04
Ratio series samplesRS0 (4.56 ± 0.28) � 10�8 (5.71 ± 0.45) � 10�8
RS1 (9.61 ± 0.58) � 10�9 (8.50 ± 0.67) � 10�9
RS2 (4.69 ± 0.28) � 10�9 (4.29 ± 0.34) � 10�9
RS3 (1.12 ± 0.06) � 10�9 (9.73 ± 0.80) � 10�10
RS4 (5.46 ± 0.29) � 10�10 (4.42 ± 0.36) � 10�10
RS5 (9.56 ± 0.36) � 10�11 (9.31 ± 0.93) � 10�11
Vienna-KkU (6.98 ± 0.32) � 10�11 (8.04 ± 0.82) � 10�11
aThe measured values for the ratio series have been normalized to the average ofthe two IRMM standards.
154 M. De Cesare et al. / Nuclear Instruments and Methods in Physics Research B 294 (2013) 152–159
amounts of the VERA in house standard Vienna-KkU [8] materialwith IRMM-075 (Institute for Reference Materials and Measure-ments) certified series material (IRMM-075/1,2,3,4) with higherisotopic ratios. The data, including the Vienna-KkU material itself,are shown in Table 1 and were normalized to the weighted averageof the IRMM-075/5 and IRMM-075/6 reference material. A goodlinear behavior is observed (Fig. 2) and the lowest point (Vienna-KkU) is in agreement with the VERA result. We could, however,take the difference between the measured and actual ratios ofthe Vienna-KkU material as an indication of the background atthe 236U settings due to 235U ions. This then corresponds to a back-ground of �1 � 10�11 in the 236U/238U ratio, or equivalently�1 � 10�9 (1 ppb) in the 236U/235U ratio (see Section 3.2.3).
2.2.2. 236U mass sensitivityIn order to study the 236U concentration sensitivity of the sys-
tem, we measured a series of samples from the RS1 material con-taining progressively smaller amounts of uranium. Four samples,DS1, DS2, DS3 and DS4, respectively containing 430, 43, 4.3 and
Fig. 2. Internal calibration series: 236U/238U Ratio Series. Measured vs. nominal values. Thcertified material with a higher isotopic ratio, to produce an internal CIRCE isotopic ratio sfall is also shown.
0.4 lg of U, were measured and compared to sample DS0 whichcontained 4.3 mg of U. The results are shown in Fig. 3. For samplesDS3 and DS4 where no 238U5+ current was measurable we counted234U5+ in the final detector as a proxy for 238U, since the isotopic ra-tio between 234U and 238U is well known. Both methods could beemployed for sample DS2, and Fig. 3 shows that good agreementwas achieved. For uranium masses down to about 4.3 lg the mea-sured 236U/238U ratio agrees well with the nominal value. The0.4 lg sample, however, gives a ratio that is almost a factor oftwo higher than expected (RS1). We conclude that at this level,uranium from the sample matrix, sample holder, and/or ion sourcebecomes significant. Furthermore, this extraneous uranium mustcontain 236U and have a 236U/238U ratio above 1 � 10�8. It is per-haps not surprising that the laboratory background is relativelyhigh in 236U, since ‘‘normal uranium’’ as found in present-day soil,surface water, ocean, reagents, and labware typically has 236U/238Uratios in the range 10�9–10�6 as a consequence of the �900 kg of236U that was distributed by global fallout [9,18]. For the momentthen, reliable measurements of 236U/238U ratios of � 1 � 10�8 canbe performed on samples containing as little as 4 lg of uranium,with a corresponding sensitivity of 40 fg of 236U, i.e. 1 � 108 atoms.
2.2.3. 239Pu mass sensitivityUsing the same system and tuning procedure as for U we per-
formed Pu isotope measurements, employing an ionization cham-ber in place of the Si strip detector. Such detectors are unable todiscriminate between 239Pu and 238U ions with the same mE/q2,due to their limited energy resolution. Although it is possible todiscriminate between the two with a Time-of-Flight system, thiscomes at the expense of reduced efficiency and increased complex-ity. The question then arises, is uranium background likely to be aserious concern in AMS measurements of plutonium with an ioni-zation chamber detector?
In order to address this question, we prepared a series of pluto-nium-free samples with decreasing uranium concentration, andmeasured the counting rate at the 239Pu setting from each. Thiscan be converted to an ‘‘apparent abundance’’ of 239Pu due to ura-nium background. A dilution series containing a decreasingamount of natural uranium, from 5 mg to 5 pg, was prepared fromVienna-KkU uranium which had been processed to remove anyplutonium that might have been present (Pu occurs naturally inuranium ores [10]). The results are shown in Fig. 4 as the apparent239Pu mass vs. the mass of uranium in the sample. For the samples
e nominal isotopic ratios were obtained by mixing Vienna-KkU material IRMM-075tandard series (see text). The 1:1 nominal ratio line along which the samples should

Fig. 3. Results of 236U/238U measurements for a series of samples of decreasing uranium content. Samples DS0, DS1, DS2, DS3, DS4 contained respectively 4300, 430, 43, 4.3and 0.4 lg of U with a nominal isotopic ratio of 9.61 � 10�9. The 238U5+ currents measured in the FC5 and 234U counts per second (cps) are also shown.
M. De Cesare et al. / Nuclear Instruments and Methods in Physics Research B 294 (2013) 152–159 155
containing 0.5 lg–5 mg of uranium, it can be seen that the ura-nium background at the 239Pu settings is at the level of 1 ppb. Since238U background arises from injection into the accelerator of both238U17O� and 238U16O1H� negative molecular ions, this apparentbackground will partly depend on the amount of hydrides pro-duced by the ion source. Note also that the abundance sensitivityfor mass 239 in the presence of 238 is essentially equivalent to236 in the presence of 235. The value of 1 ppb given here for239Pu/238U is in essential agreement with that deduced in Sec-tion 3.2.1 above for 236U/235U.
A similar study has been reported previously [11] using theAMS system at ANSTO (Australian Nuclear Science and TechnologyOrganization) in Australia, where the uranium background wasfound to be at the level of 10 ppm, i.e. a factor of 104 higher thanfound in the present work. CIRCE, however, has two major advan-tages over the ANSTO system. First, it has an electrostatic analyzer(ESA) between ion source and low energy magnet which essen-tially eliminates the high-energy tail of 238U16O� ions which wouldotherwise be injected with 239Pu16O�. Secondly, it has substantiallybetter vacuum, 9 � 10�9 Torr [5], in the high-energy acceleration
Fig. 4. Background from 238U ions at the 239Pu settings as a function of the amount of urato 5 pg, were prepared from Vienna-KkU uranium which had been processed to remove athe limits of the system (see text).
tube as a consequence of accelerator tube design (metal-bondedceramic at CIRCE versus epoxy-bonded glass at ANSTO), which re-duces the probability of charge-changing collisions with residualgas molecules that can lead to the production of 238U5+ ions ofthe correct energy to pass through the analyzing magnet [4,5].Hence, we would expect the background to be significantly lowerat CIRCE than at ANSTO. Similar unpublished work at the ANU,which does not have an ESA at the low-energy end either, but doeshave the advantage of higher vacuum, 2 � 10�8 Torr, in the acceler-ator tubes, indicates a background level of 100 ppb, i.e. still 2 or-ders of magnitude higher than at CIRCE. A comparison betweenthe three systems is shown in Fig. 4. Because uranium concentra-tions in the environmental sample can readily be reduced to verylow levels (<1 ppm, equivalent to <2 ng in a typical 2 mg sample)with appropriate chemistry, we can conclude from these resultsthat we are already sensitive to 239Pu at the level of <0.1 fg, since500 ng of uranium is required to produce an apparent 239Pu con-centration of 0.1 fg. If uranium background is negligible, then thefinal detection system need only be able to discriminate betweenPu ions and lower-energy ions in lower charge states.
nium in the sample. Samples containing a decreasing amount of uranium, from 5 mgny plutonium that may have been present. The circled CIRCE point at 0.1 fg indicates
156 M. De Cesare et al. / Nuclear Instruments and Methods in Physics Research B 294 (2013) 152–159
2.3. 236U and Pu GNPP measurements
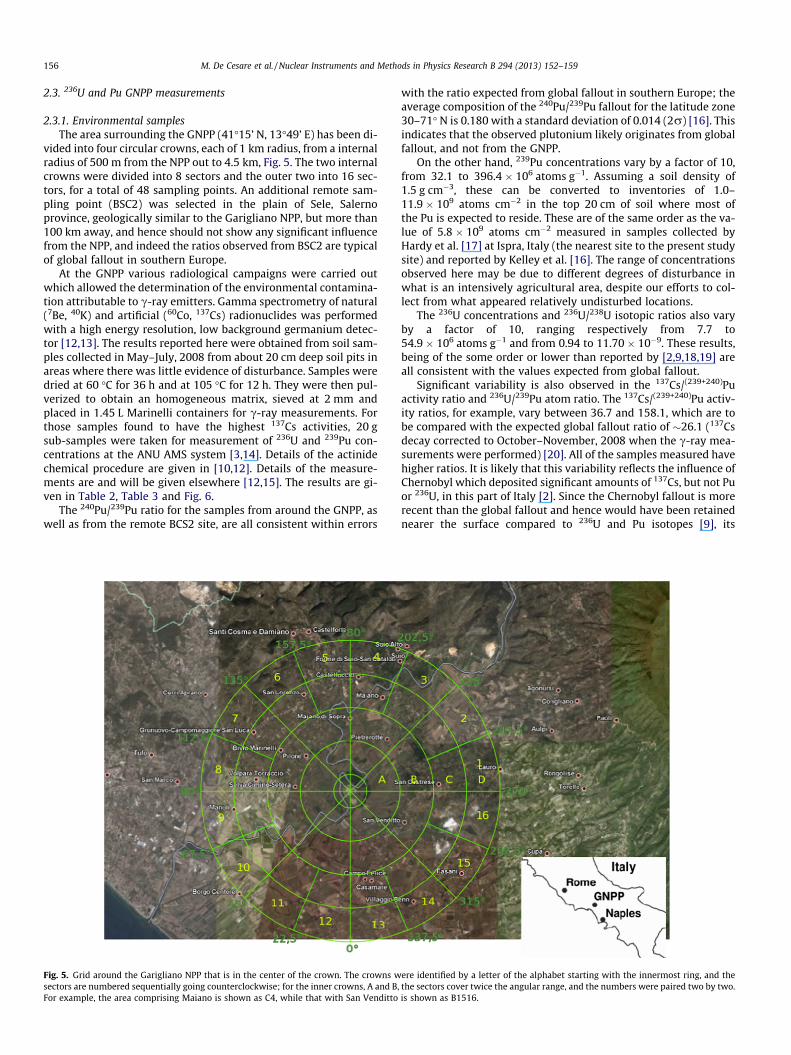
2.3.1. Environmental samplesThe area surrounding the GNPP (41�15’ N, 13�49’ E) has been di-
vided into four circular crowns, each of 1 km radius, from a internalradius of 500 m from the NPP out to 4.5 km, Fig. 5. The two internalcrowns were divided into 8 sectors and the outer two into 16 sec-tors, for a total of 48 sampling points. An additional remote sam-pling point (BSC2) was selected in the plain of Sele, Salernoprovince, geologically similar to the Garigliano NPP, but more than100 km away, and hence should not show any significant influencefrom the NPP, and indeed the ratios observed from BSC2 are typicalof global fallout in southern Europe.
At the GNPP various radiological campaigns were carried outwhich allowed the determination of the environmental contamina-tion attributable to c-ray emitters. Gamma spectrometry of natural(7Be, 40K) and artificial (60Co, 137Cs) radionuclides was performedwith a high energy resolution, low background germanium detec-tor [12,13]. The results reported here were obtained from soil sam-ples collected in May–July, 2008 from about 20 cm deep soil pits inareas where there was little evidence of disturbance. Samples weredried at 60 �C for 36 h and at 105 �C for 12 h. They were then pul-verized to obtain an homogeneous matrix, sieved at 2 mm andplaced in 1.45 L Marinelli containers for c-ray measurements. Forthose samples found to have the highest 137Cs activities, 20 gsub-samples were taken for measurement of 236U and 239Pu con-centrations at the ANU AMS system [3,14]. Details of the actinidechemical procedure are given in [10,12]. Details of the measure-ments are and will be given elsewhere [12,15]. The results are gi-ven in Table 2, Table 3 and Fig. 6.
The 240Pu/239Pu ratio for the samples from around the GNPP, aswell as from the remote BCS2 site, are all consistent within errors
Fig. 5. Grid around the Garigliano NPP that is in the center of the crown. The crowns wsectors are numbered sequentially going counterclockwise; for the inner crowns, A and B,For example, the area comprising Maiano is shown as C4, while that with San Venditto
with the ratio expected from global fallout in southern Europe; theaverage composition of the 240Pu/239Pu fallout for the latitude zone30–71� N is 0.180 with a standard deviation of 0.014 (2r) [16]. Thisindicates that the observed plutonium likely originates from globalfallout, and not from the GNPP.
On the other hand, 239Pu concentrations vary by a factor of 10,from 32.1 to 396.4 � 106 atoms g�1. Assuming a soil density of1.5 g cm�3, these can be converted to inventories of 1.0–11.9 � 109 atoms cm�2 in the top 20 cm of soil where most ofthe Pu is expected to reside. These are of the same order as the va-lue of 5.8 � 109 atoms cm�2 measured in samples collected byHardy et al. [17] at Ispra, Italy (the nearest site to the present studysite) and reported by Kelley et al. [16]. The range of concentrationsobserved here may be due to different degrees of disturbance inwhat is an intensively agricultural area, despite our efforts to col-lect from what appeared relatively undisturbed locations.
The 236U concentrations and 236U/238U isotopic ratios also varyby a factor of 10, ranging respectively from 7.7 to54.9 � 106 atoms g�1 and from 0.94 to 11.70 � 10�9. These results,being of the some order or lower than reported by [2,9,18,19] areall consistent with the values expected from global fallout.
Significant variability is also observed in the 137Cs/(239+240)Puactivity ratio and 236U/239Pu atom ratio. The 137Cs/(239+240)Pu activ-ity ratios, for example, vary between 36.7 and 158.1, which are tobe compared with the expected global fallout ratio of �26.1 (137Csdecay corrected to October–November, 2008 when the c-ray mea-surements were performed) [20]. All of the samples measured havehigher ratios. It is likely that this variability reflects the influence ofChernobyl which deposited significant amounts of 137Cs, but not Puor 236U, in this part of Italy [2]. Since the Chernobyl fallout is morerecent than the global fallout and hence would have been retainednearer the surface compared to 236U and Pu isotopes [9], its
ere identified by a letter of the alphabet starting with the innermost ring, and thethe sectors cover twice the angular range, and the numbers were paired two by two.is shown as B1516.

Table 2Concentrations of 137Cs, 239Pu, 240Pu and 236U, inventories of 239Pu, 236U and isotopic atom ratios of 240Pu/239Pu, 236U/238U as well as 236U/239Pu for the environmental samplesfrom around the GNPP. Errors correspond to one standard deviation, and reflect statistical uncertainties alone.
137Cs106 atoms g�1
239Pu106 atoms g�1
240Pu106 atoms g�1
239Pu109 atoms cm�2
240Pu/239Pu 236U106 atoms g�1
236U109 atoms cm�2
236U/238U10�9
236U/239Pu
A78 15.9 ± 0.3 106.8 ± 3.1 22.2 ± 1.2 3.2 ± 0.4 0.21 ± 0.01 15.4 ± 0.9 0.46 ± 0.06 4.61 ± 0.20 0.14 ± 0.01B56 23.3 ± 0.4 342.5 ± 8.6 63.7 ± 2.5 10.3 ± 1.3 0.19 ± 0.01 37.7 ± 1.9 1.13 ± 0.15 6.03 ± 0.24 0.11 ± 0.01B34 7.9 ± 0.3 85.5 ± 5.4 18.8 ± 3.9 2.6 ± 0.3 0.22 ± 0.05 27.2 ± 1.7 0.82 ± 0.11 2.18 ± 0.19 0.32 ± 0.03C7 4.2 ± 0.2 32.1 ± 2.6 5.6 ± 1.5 1.0 ± 0.1 0.17 ± 0.05 10.0 ± 0.8 0.30 ± 0.04 0.94 ± 0.07 0.31 ± 0.04C13 32.0 ± 0.9 92.3 ± 5.1 19.2 ± 1.8 2.8 ± 0.4 0.21 ± 0.02 7.7 ± 1.1 0.23 ± 0.04 1.30 ± 0.09 0.08 ± 0.01D12 32.6 ± 0.5 396.4 ± 7.2 67.0 ± 1.8 11.9 ± 1.4 0.17 ± 0.01 54.9 ± 2.0 1.65 ± 0.21 11.70 ± 0.27 0.14 ± 0.01BSC2 7.4 ± 0.2 95.6 ± 6.2 18.0 ± 2.0 2.9 ± 0.4 0.19 ± 0.02 10.1 ± 0.7 0.30 ± 0.04 4.67 ± 0.27 0.11 ± 0.01
Table 3Activity concentrations of 137Cs, 239Pu, 236U, 239+240Pu, and activity ratio of 137Cs /(239+240)Pu as well as 239Pu, 239+240Pu and 236U inventories for the environmental samples fromaround the GNPP. Errors correspond to one standard deviation, and reflect statistical uncertainties alone.
137Cs (mBq g�1) 239Pu (mBq g�1) 236U (lBq g�1) 239+240Pu (mBq g�1) 137Cs/(239+240)Pu 239Pu (mBq cm�2) 236U (lBq cm�2) 239+240Pu (mBq cm�2)
A78 11.6 ± 0.2 0.097 ± 0.003 0.0144 ± 0.0008 0.172 ± 0.005 67.4 ± 3.0 2.92 ± 0.09 0.43 ± 0.06 5.1 ± 0.1B56 17.0 ± 0.3 0.312 ± 0.008 0.0355 ± 0.0018 0.525 ± 0.011 32.4 ± 1.2 9.36 ± 0.23 1.07 ± 0.14 15.8 ± 0.3B34 5.8 ± 0.2 0.078 ± 0.006 0.0255 ± 0.0016 0.150 ± 0.072 38.7 ± 18.8 2.30 ± 0.29 0.77 ± 0.10 4.2 ± 0.5C7 3.1 ± 0.1 0.027 ± 0.004 0.0093 ± 0.0008 0.045 ± 0.006 68.9 ± 11.1 0.80 ± 0.12 0.28 ± 0.04 1.4 ± 0.2C13 23.4 ± 0.7 0.084 ± 0.005 0.0072 ± 0.0010 0.148 ± 0.008 158.1 ± 13.1 2.52 ± 0.14 0.22 ± 0.04 4.5 ± 0.2D12 23.8 ± 0.3 0.361 ± 0.007 0.0515 ± 0.0018 0.585 ± 0.009 40.7 ± 1.1 10.83 ± 0.20 1.55 ± 0.19 17.6 ± 0.3BSC2 5.4 ± 0.2 0.087 ± 0.006 0.0095 ± 0.0006 0.147 ± 0.009 36.7 ± 3.5 2.61 ± 0.17 0.29 ± 0.04 4.4 ± 0.3
Fig. 6. The 137Cs, 239Pu and 236U concentrations and 240Pu/239Pu ratios are respectively shown for the environmental samples. The solid line corresponds to the global fall outvalue �0.18.
M. De Cesare et al. / Nuclear Instruments and Methods in Physics Research B 294 (2013) 152–159 157
contribution would have been more sensitive to small amounts ofsoil loss or gain, particularly in the initial period after deposition,which could lead to considerable variability in the ratio.
The 236U/239Pu ratios vary between 0.08 and 0.32, which are tobe compared to the global fallout ratio results in the range of 0.05–0.50 [21], 0.212–0.253 [18] and 0.04–0.78 [19]. The wide range ob-tained by Ketterer et al. [21] and Srncik et al. [19] was attributed tothe evidently higher mobility of 236U fallout compared to 239Pu.However, this migration behavior of U and Pu was not observedby Sakaguchi et al. [18]. Our data seems to confirm the highermobility. The lower ratios may indicate that a significant amountof the 236U has been leached from the soil due to the greater solu-bility of uranium relative to plutonium. The two samples with thehigher ratios, B34 and C7, are the ones with the lowest Pu concen-trations; perhaps in this case we are seeing 236U that has moved
down the soil column while the high Pu surface material has beenlost.
We conclude, therefore, that the data presented here indicatethat there is little evidence of contamination by radionuclides fromthe GNPP in the surrounding environment. The uranium isotopicratio and concentrations results also confirm this statement. A sim-ilar conclusion was drawn from measurements on sediment sam-ples from the GNPP drain channel and Garigliano River [2,8].
2.3.2. Structural samplesA first attempt at quantitative measurements of 236U and pluto-
nium isotopes on structural material from the GNNP was per-formed at CIRCE to provide information valuable for thedecommissioning program. The details of these measurements

Table 4239Pu concentrations and inventories and Pu and U isotopic ratio results fromconcrete from the chimney, external wall and pipe cooling circuit (see text). Errorscorrespond to one standard deviation, and reflect statistical uncertainties alone. Thedensities to convert concentrations to inventories are 2.1 and 7.8 g cm�3 for theconcrete and metal (steel) and the depths are 1 mm for the internal, 5 mm for theexternal as well as the wall, and 0.6 mm for the metal.
239Pu106 ats g�1
239Pu107 ats cm�2
240Pu/239Pu 236U/238U10�8
I 734 ± 82 15.4 ± 2.4 0.32 ± 0.05 5.7 ± 4.0I8 340 ± 54 7.1 ± 1.4 0.33 ± 0.08 5.7 ± 5.7I12 559 ± 69 11.7 ± 2.0 0.18 ± 0.04 7.5 ± 3.8I16 449 ± 70 9.4 ± 1.8 0.19 ± 0.06 14.3 ± 5.4E1.5 25 ± 14 2.6 ± 1.5 0.51 ± 0.42 5.9 ± 4.2E5_1 45 ± 16 4.8 ± 1.8 0.24 ± 0.15 0.7 ± 0.12 46 ± 8 4.9 ± 1.0 0.70 ± 0.16 0.3 ± 0.13 30 ± 6 3.1 ± 0.7 0.46 ± 0.16 0.9 ± 0.74 30 ± 6 3.1 ± 0.7 0.38 ± 0.12 0.17 ± 0.085 42 ± 9 4.4 ± 1.0 0.31 ± 0.14 1.4 ± 1.4EW_1 13 ± 3 1.4 ± 0.3 0.73 ± 0.27 0.3 ± 0.12 3 ± 2 0.4 ± 0.2 0.69 ± 0.56 –3 14 ± 4 1.4 ± 0.4 1.31 ± 0.49 –4 8 ± 2 0.8 ± 0.3 0.48 ± 0.27 3.3 ± 3.3MCC1 270 ± 17 – 0.41 ± 0.02 18.1 ± 10.52 89 ± 7 – 0.41 ± 0.04 50.4 ± 13.13 48 ± 5 – 0.51 ± 0.07 5.8 ± 5.8
158 M. De Cesare et al. / Nuclear Instruments and Methods in Physics Research B 294 (2013) 152–159
are and will be given elsewhere [12,15]. The specific materials tar-geted for this proof-of-principle study were:
- Concrete from the ventilation chimney of the reactor system: foursamples were taken from the inner surface, starting at thechimney foundations, 4 m below ground level, and then at 8,12 and 16 m above this point (samples I, I8, I12, and I16). Anadditional sample was collected from the external surface,1.5 m above the foundations (sample E1.5). A further five exter-nal surface samples (E5_1, 2, 3, 4, 5) were taken at �5 m abovethe foundations, with horizontal spacing of �15 cm and verticaldistance of �15 cm. The chimney is considered to have been themost likely route for any contamination of the environment.
- Concrete from the external wall of the G-22 building close to theventilation chimney: four samples (EW_1, 2, 3, 4) were takenat �1.5 m above the ground level, with horizontal spacing of�30 cm and vertical distance of �8 cm.
Fig. 7. The 239Pu concentrations and 240Pu/239Pu ratios are respectively shown for the st239Pu concentrations of the inner surface of the chimney, exterior surface of the chimne
- Metal from the cooling circuit of the reactor (one sample was pro-gressive leached):1. MCC1: First leach of metal, 1 M HCl at room temperature for
10 h2. MCC2: Second leach of metal, 5 M HCl at room temperature
for 10 h3. MCC3: Third leach of metal, 5 M HCl on heating plate for 2 h
The results are shown in Table 4 and Fig. 7. Clearly, there is plu-tonium in the concrete from the inner surface of the chimney,although the inventories are lower than in the soils surroundingthe plant. The concentration appears to be a maximum at the base,but otherwise does not vary substantially with height. Althoughthe 240Pu/239Pu ratios appear to show differences between thetwo lower and the two upper samples, the statistical precisionsis very poor due to a low chemical yield of the extraction process,and the differences are not statistically significant. The exterior ofthe chimney as well as the external wall of the adjacent buildinghave very little plutonium and it was not possible to determine areliable 240Pu/239Pu ratio. A clear decreasing trend between the in-ner surface of the chimney, the exterior surface of the chimney andthe external wall is visible. The weighted means of the 239Pu con-centrations are respectively (480 ± 33) � 106atoms g�1,(35 ± 3) � 106atoms g�1 and (7 ± 1) � 106atoms g�1.
For the metal sample from the cooling circuit, a higher chemicalyield was achieved for extraction of the plutonium, and hence thestatistical precisions of both the concentration and especially the240Pu/239Pu ratio are substantially better. The metal leaching isclearly removing more Pu at each step, with significant Pu stillbeing removed at the third step. The summed 239Pu concentrations(239Pu = (407 ± 19) � 106 atoms g�1) from the three leaches arecomparable with the concentrations on the interior surface of thechimney, while the 240Pu/239Pu weighted means of 0.41 ± 0.02are characteristic of high burn-up fuel, and in marked contrast tothe global fallout ratio observed in the soil samples from aroundthe plant. Since, for the metal leaching, significant Pu is stillremoved at the third step (Fig. 7) and since the contaminationprobably resides mainly on the surface of the materials, wereport our results also as number of atoms per cm2, whichappears to be a more appropriate unit in order to compare theactivities of different surfaces exposed to contamination. Theinventory of the summed 239Pu concentrations is slightly higher
ructural samples. The solid lines correspond respectively to the mean weight of they and external wall, as well as a line at the global fall out value �0.180.

M. De Cesare et al. / Nuclear Instruments and Methods in Physics Research B 294 (2013) 152–159 159
(239Pu = (19.0 ± 2.3) � 107 atoms cm�2) respect to the interior sur-face of the chimney.
The 236U/238U ratios range from about 2 � 10�9 to 5 � 10�7.There was, however, very little uranium beam from these samples,suggesting that the uranium extraction efficiency was very low.One consequence of the small uranium beams is the possibilitythat a significant fraction of the observed 238U beam may havebeen coming from natural uranium intrinsic to the sample holdersor to the iron oxide and silver of the sample matrix, and accord-ingly the present ratios represent lower limits. Even so, the ob-served ratios are higher than in the environmental soil samples,again supporting the conclusion that any releases from the planthave been minimal. During sample preparation, all solutions wereretained, so it should be possible to find where the uranium residesand to recover it for future measurements.
In conclusion, this very preliminary study shows a clear excessof plutonium and 236U in the GNPP structural samples, relative toenvironmental samples from the surrounding area.
3. Summary and conclusions
An AMS system for measurement of U and Pu isotopes, based onthe CIRCE pelletron accelerator, has been established. The presentset up, using a Si strip and/or ionization chamber as the final detec-tor for U ions, and an ionization chamber for Pu measurements, hasbeen characterized both for concentration and isotopic ratio sensi-tivity. A TOF-E detector, presently under installation, will push the236U detection limits towards those needed to measure naturalabundances and isotopic ratios [12,22].
It has been shown 236U/238U ratios of �1 � 10�8 can be deter-mined on samples containing as little as 4 lg of uranium, with acorresponding sensitivity of 40 fg of 236U (i.e. 1 � 108 atoms). ForPu, an overall detection rate of 5 � 10�3 cps per fg was achieved.Background from uranium is <0.1 fg of 239Pu equivalent, providedthat the sample contains less than 500 ng of uranium.
With the present configuration, preliminary results on environ-mental and structural samples from the decommissioned GNPPhave been shown.
The data presented here for environmental sample indicate val-ues consistent with global fallout and an additional 137Cs contribu-tion from Chernobyl. There is little evidence of contamination byradionuclides from the GNPP in the surrounding environment. Asimilar conclusion was drawn from measurements on sedimentsamples from the GNPP drain channel and Garigliano River [2,8].The structural (concrete and metal samples) results show thecharacteristics of high burn-up fuel (0.32) in marked contrast tothe global fallout (�0.18). This further reinforces the conclusionthat the environmental signal is due to global fallout, and not toreleases from the plant, although the inventories are lowerthan in the soils surrounding the plant. For the metal samplefrom the cooling circuit the sum of the 239Pu concentrations(�400 � 106 atoms g�1) is comparable with the concentrations onthe interior surface of the chimney, while the weighted means of240Pu/239Pu ratio (0.41) is also characteristic of high burn-up fuel,and in marked contrast to the global fallout ratio observed in thesoil samples. The metal leaching is clearly removing more Pu ateach step, with significant Pu still being removed at the third stepand the inventory of the summed 239Pu concentrations is slightlyhigher respect to the interior surface of the chimney.
The work on the structural samples has, however, revealed thatsignificant improvements to the chemical extraction proceduresfor both plutonium and uranium are required, particularly for con-crete samples.
Acknowledgment
We kindly thank VERA (Vienna Environmental Research Accel-erator) laboratory for providing the Vienna-KkU samples.
References
[1] L.K. Fifield, Accelerator mass spectrometry of the actinides, Quatern.Geochronol. 3 (2008) 276.
[2] F. Quinto, P. Steier, G. Wallner, A. Wallner, M. Srncik, M. Bichler, W. Kutschera,F. Terrasi, A. Petraglia, C. Sabbarese, The first use of 236U in the generalenvironment and near a shutdown nuclear power plant, Appl. Radiat. Isotopes67 (2009) 1775.
[3] M. De Cesare, Origin and Detection of Actinides: Where Do We Stand with theAccelerator Mass Spectrometry Technique?, Nuclear Power – Control:Reliability and Human Factors, ISBN 978-953-307-599-0, 2011.
[4] M. De Cesare, L. Gialanella, D. Rogalla, A. Petraglia, Y. Guan, N. De Cesare, A.D’Onofrio, F. Quinto, V. Roca, C. Sabbarese, et al., Actinides AMS at CIRCE inCaserta (Italy), Nucl. Instrum. Meth. Phys. Res. B 268 (2010) 779.
[5] M. De Cesare, Y. Guan, F. Quinto, C. Sabbarese, N. De Cesare, A. D’Onofrio, L.Gialanella, A. Petraglia, V. Roca, F. Terrasi, Optimization of 236U AMS at CIRCE,Radiocarbon 52 (2010) 286.
[6] Yong-Jing GUAN, M. De Cesare, F. Terrasi, F. Quinto, C. Sabbarese, N. De Cesare,A. D’Onofrio, Hui-Juan WANG, 236U AMS measurement at CIRCE, Chin. Phys. C34 (2010) 1729.
[7] A. Ordine, A. Boiano, E. Vardaci, A. Zaghi, A. Brondi, FAIR: a new fast trigger andreadout bus system, IEEE Trans. Nucl. Sci. 45 (1998) 873.
[8] P. Steier, M. Bichler, L.K. Fifield, R. Golser, W. Kutschera, A. Priller, F. Quinto, S.Richter, M. Srncik, F. Terrasi, et al., Natural and anthropogenic 236U inenvironmental samples, Nucl. Instr. Meth. Phys. Res. B 266 (2008) 2246.
[9] A. Sakaguchi, K. Kawai, P. Steier, T. Imanaka, M. Hoshi, S. Endo, K. Zhumadilov,M. Yamamoto, Feasibility of using 236U to reconstruct close-in falloutdeposition from the Hiroshima atomic bomb, Sci. Total Environ. 408 (2010)5392.
[10] K.M. Wilcken, T.T. Barrows, L.K. Fifield, S.G. Tims, P. Steier, AMS of natural 236Uand 239Pu produced in uranium ores, Nucl. Instr. Meth. Phys. Res. B 259 (2007)727.
[11] D.P. Child, M.A.C. Hotchkis, M.L. Williams, Improvements in actinide andfission product analysis by AMS-raising the bar and lowering detection limitsin heavy element AMS, in: Proceedings of the 46th Annual Meeting of theInstitute for Nuclear Materials Management, July 10-14, 2005, AZ, USA.
[12] M. De Cesare, PhD thesis, Accelerator Mass Spectrometry of actinides at CIRCE,Department of Environmental Science - II University of Naples, 2006–2009.
[13] A. Petraglia, C. Sabbarese, M. De Cesare, N. De Cesare, F. Quinto, F. Terrasi, A.D’Onofrio, P. Steier, L. K. Fifield, A. M. Esposito, Assessment of the radiologicalimpact of a decommissioning nuclear power plant in Italy, Accepted byRadioprotection, 2012.
[14] L.K. Fifield, R.G. Cresswell, M.L. di Tada, T.R. Ophel, J.P. Day, A.P. Clacher, S.J.King, N. D Priest, Accelerator mass spectrometry of plutonium, Nucl. Instr.Meth. Phys. Res. B 117 (1996) 295.
[15] M. De Cesare et al. (to be published).[16] J.M. Kelley, L.A. Bond, T.M. Beasley, Priest, Global distribution of Pu isotopes
and 237Np, Sci. Total Environ. 23 (7/238) (1999) 483.[17] E.P. Hardy, P.W. Krey, H.L. Volchok, Global inventory and distribution of fallout
plutonium, Nature 241 (1973) 444.[18] A. Sakaguchi, K. Kawai, P. Steier, F. Quinto, K. Mino, J. Tomita, M. Hoshi, N.
Whitehead, M. Yamamoto, First results on 236U levels in global fallout, Sci.Total Environ. 407 (2009) 4238.
[19] M. Srncik, P. Steier, G. Wallner, Depth profile of 236U/238U in soil samples in LaPalma, Canary Islands, J. Environ. Radioactiv. 102 (2011) 614.
[20] S.E. Everett, S.G. Tims, G.J. Hancock, R. Bartley, L.K. Fifield, Comparison of Puand 137Cs as tracers of soil and sediment transport in a terrestrial environment,J. Environ. Radioactiv. 99 (2008) 383.
[21] M.E. Ketterer, A.D. Groves, B.J. Strick, 236U inventories, 236U/238U, and236U/239Pu: the stratospheric fallout signature, Goldschmidt conferenceabstracts. Geochim. Cosmochim. Ac. 71 (2007) A480.
[22] L.K.Fifield, S.G.Tims, J.O.Stone, D.C.Argento, M. De Cesare, Ultra-sensitivemeasurements of 36CI and 236U at the Australian National University.Accepted by Nucl. Instr. Meth. Phys. Res. B, 2012.