ACS Housing Summary - Village of Skokie
298
ACS Housing Summary 7353-7399 St Louis Ave Village Of Skokie Only 7353-7399 St Louis Ave, Skokie, Illinois, 60076 Latitude: 42.01519 Drive Time: 5 minute radius Longitude: -87.71717 2013-2017 ACS Estimate Percent MOE(±) Reliability TOTALS Total Population 19,576 794 Total Households 6,386 219 Total Housing Units 6,774 232 OWNER-OCCUPIED HOUSING UNITS BY MORTGAGE STATUS Total 5,530 100.0% 218 Housing units with a mortgage/contract to purchase/similar debt 3,498 63.3% 196 Second mortgage only 45 0.8% 20 Home equity loan only 417 7.5% 68 Both second mortgage and home equity loan 31 0.6% 32 No second mortgage and no home equity loan 3,005 54.3% 192 Housing units without a mortgage 2,032 36.7% 177 AVERAGE VALUE BY MORTGAGE STATUS Housing units with a mortgage $341,308 $30,413 Housing units without a mortgage $277,624 $34,394 OWNER-OCCUPIED HOUSING UNITS BY MORTGAGE STATUS & SELECTED MONTHLY OWNER COSTS Total 5,530 100.0% 218 With a mortgage: Monthly owner costs as a percentage of household income in past 12 months household income in past 12 months Less than 10.0 percent 154 2.8% 48 10.0 to 14.9 percent 295 5.3% 67 15.0 to 19.9 percent 710 12.8% 128 20.0 to 24.9 percent 552 10.0% 68 25.0 to 29.9 percent 514 9.3% 94 30.0 to 34.9 percent 335 6.1% 84 35.0 to 39.9 percent 148 2.7% 73 40.0 to 49.9 percent 233 4.2% 59 50.0 percent or more 553 10.0% 94 Not computed 3 0.1% 14 Without a mortgage: Monthly owner costs as a percentage of household income in past 12 months Less than 10.0 percent 622 11.2% 97 10.0 to 14.9 percent 304 5.5% 50 15.0 to 19.9 percent 250 4.5% 63 20.0 to 24.9 percent 221 4.0% 68 25.0 to 29.9 percent 193 3.5% 74 30.0 to 34.9 percent 96 1.7% 30 35.0 to 39.9 percent 56 1.0% 22 40.0 to 49.9 percent 110 2.0% 78 50.0 percent or more 158 2.9% 69 Not computed 22 0.4% 24 Source: U.S. Census Bureau, 2013-2017 American Community Survey Reliability: high medium low September 25, 2019 ©2019 Esri Page 1 of 15
-
Upload
khangminh22 -
Category
Documents
-
view
2 -
download
0
Transcript of ACS Housing Summary - Village of Skokie

ACS Housing Summary7353-7399 St Louis Ave Village Of Skokie Only7353-7399 St Louis Ave, Skokie, Illinois, 60076 Latitude: 42.01519Drive Time: 5 minute radius Longitude: -87.71717
2013-2017ACS Estimate Percent MOE(±) Reliability
TOTALSTotal Population 19,576 794
Total Households 6,386 219
Total Housing Units 6,774 232
OWNER-OCCUPIED HOUSING UNITS BY MORTGAGE STATUSTotal 5,530 100.0% 218
Housing units with a mortgage/contract to purchase/similar debt 3,498 63.3% 196Second mortgage only 45 0.8% 20Home equity loan only 417 7.5% 68Both second mortgage and home equity loan 31 0.6% 32No second mortgage and no home equity loan 3,005 54.3% 192
Housing units without a mortgage 2,032 36.7% 177
AVERAGE VALUE BY MORTGAGE STATUSHousing units with a mortgage $341,308 $30,413Housing units without a mortgage $277,624 $34,394
OWNER-OCCUPIED HOUSING UNITS BY MORTGAGE STATUS & SELECTED MONTHLY OWNER COSTSTotal 5,530 100.0% 218
With a mortgage: Monthly owner costs as a percentage of household income in past 12 monthshousehold income in past 12 months
Less than 10.0 percent 154 2.8% 4810.0 to 14.9 percent 295 5.3% 6715.0 to 19.9 percent 710 12.8% 12820.0 to 24.9 percent 552 10.0% 6825.0 to 29.9 percent 514 9.3% 9430.0 to 34.9 percent 335 6.1% 8435.0 to 39.9 percent 148 2.7% 7340.0 to 49.9 percent 233 4.2% 5950.0 percent or more 553 10.0% 94Not computed 3 0.1% 14
Without a mortgage: Monthly owner costs as a percentage of household income in past 12 months
Less than 10.0 percent 622 11.2% 9710.0 to 14.9 percent 304 5.5% 5015.0 to 19.9 percent 250 4.5% 6320.0 to 24.9 percent 221 4.0% 6825.0 to 29.9 percent 193 3.5% 7430.0 to 34.9 percent 96 1.7% 3035.0 to 39.9 percent 56 1.0% 2240.0 to 49.9 percent 110 2.0% 7850.0 percent or more 158 2.9% 69Not computed 22 0.4% 24
Source: U.S. Census Bureau, 2013-2017 American Community Survey Reliability: high medium low
September 25, 2019
©2019 Esri Page 1 of 15

ACS Housing Summary7353-7399 St Louis Ave Village Of Skokie Only7353-7399 St Louis Ave, Skokie, Illinois, 60076 Latitude: 42.01519Drive Time: 5 minute radius Longitude: -87.71717
2013-2017ACS Estimate Percent MOE(±) Reliability
RENTER-OCCUPIED HOUSING UNITS BY CONTRACT RENTTotal 856 100.0% 119
With cash rent 762 89.0% 110Less than $100 0 0.0% 0$100 to $149 0 0.0% 5$150 to $199 94 11.0% 54$200 to $249 0 0.0% 0$250 to $299 5 0.6% 11$300 to $349 3 0.4% 12$350 to $399 6 0.7% 11$400 to $449 0 0.0% 0$450 to $499 0 0.0% 0$500 to $549 2 0.2% 21$550 to $599 15 1.8% 18$600 to $649 14 1.6% 21$650 to $699 0 0.0% 9$700 to $749 44 5.1% 27$750 to $799 21 2.5% 24$800 to $899 34 4.0% 20$900 to $999 84 9.8% 37$1,000 to $1,249 88 10.3% 56$1,250 to $1,499 57 6.7% 36$1,500 to $1,999 169 19.7% 77$2,000 to $2,499 49 5.7% 31$2,500 to $2,999 38 4.4% 27$3,000 to $3,499 16 1.9% 17$3,500 or more 22 2.6% 21
No cash rent 94 11.0% 53
Median Contract Rent $1,166 N/AAverage Contract Rent N/A N/A
RENTER-OCCUPIED HOUSING UNITS BY INCLUSION OF UTILITIES IN RENTTotal 856 100.0% 119
Pay extra for one or more utilities 595 69.5% 106No extra payment for any utilities 261 30.5% 58
Source: U.S. Census Bureau, 2013-2017 American Community Survey Reliability: high medium low
September 25, 2019
©2019 Esri Page 2 of 15

ACS Housing Summary7353-7399 St Louis Ave Village Of Skokie Only7353-7399 St Louis Ave, Skokie, Illinois, 60076 Latitude: 42.01519Drive Time: 5 minute radius Longitude: -87.71717
2013-2017ACS Estimate Percent MOE(±) Reliability
RENTER-OCCUPIED HOUSING UNITS BY GROSS RENTTotal: 856 100.0% 119
With cash rent: 762 89.0% 110Less than $100 0 0.0% 0$100 to $149 0 0.0% 0$150 to $199 81 9.5% 52$200 to $249 11 1.3% 21$250 to $299 5 0.6% 11$300 to $349 0 0.0% 0$350 to $399 6 0.7% 18$400 to $449 5 0.6% 12$450 to $499 0 0.0% 0$500 to $549 0 0.0% 3$550 to $599 2 0.2% 34$600 to $649 15 1.8% 18$650 to $699 14 1.6% 20$700 to $749 16 1.9% 17$750 to $799 18 2.1% 14$800 to $899 36 4.2% 22$900 to $999 71 8.3% 37$1,000 to $1,249 97 11.3% 48$1,250 to $1,499 50 5.8% 41$1,500 to $1,999 178 20.8% 78
$2,000 to $2,499 55 6.4% 36$2,500 to $2,999 64 7.5% 28$3,000 to $3,499 16 1.9% 17$3,500 or more 22 2.6% 21
No cash rent 94 11.0% 53
Median Gross Rent $1,270 N/AAverage Gross Rent N/A N/A
Source: U.S. Census Bureau, 2013-2017 American Community Survey Reliability: high medium low
September 25, 2019
©2019 Esri Page 3 of 15

ACS Housing Summary7353-7399 St Louis Ave Village Of Skokie Only7353-7399 St Louis Ave, Skokie, Illinois, 60076 Latitude: 42.01519Drive Time: 5 minute radius Longitude: -87.71717
2013-2017ACS Estimate Percent MOE(±) Reliability
HOUSING UNITS BY UNITS IN STRUCTURETotal 6,774 100.0% 232
1, detached 4,946 73.0% 2251, attached 284 4.2% 692 207 3.1% 553 or 4 125 1.8% 575 to 9 71 1.0% 3310 to 19 86 1.3% 2820 to 49 70 1.0% 4550 or more 973 14.4% 93Mobile home 10 0.1% 17Boat, RV, van, etc. 1 0.0% 13
HOUSING UNITS BY YEAR STRUCTURE BUILTTotal 6,774 100.0% 232
Built 2014 or later 0 0.0% 0Built 2010 to 2013 18 0.3% 15Built 2000 to 2009 240 3.5% 85Built 1990 to 1999 166 2.5% 63Built 1980 to 1989 221 3.3% 58Built 1970 to 1979 375 5.5% 56Built 1960 to 1969 1,353 20.0% 148Built 1950 to 1959 3,273 48.3% 223Built 1940 to 1949 650 9.6% 101Built 1939 or earlier 479 7.1% 63
Median Year Structure Built 1957 N/A
OCCUPIED HOUSING UNITS BY YEAR HOUSEHOLDER MOVED INTO UNITTotal 6,386 100.0% 219
Owner occupiedMoved in 2015 or later 212 3.3% 41Moved in 2010 to 2014 944 14.8% 127Moved in 2000 to 2009 1,661 26.0% 161Moved in 1990 to 1999 950 14.9% 123Moved in 1980 to 1989 787 12.3% 99Moved in 1979 or earlier 976 15.3% 146
Renter occupiedMoved in 2015 or later 128 2.0% 50Moved in 2010 to 2014 423 6.6% 89Moved in 2000 to 2009 198 3.1% 69Moved in 1990 to 1999 87 1.4% 39Moved in 1980 to 1989 9 0.1% 20Moved in 1979 or earlier 11 0.2% 20
Median Year Householder Moved Into Unit 2002 N/A
Source: U.S. Census Bureau, 2013-2017 American Community Survey Reliability: high medium low
September 25, 2019
©2019 Esri Page 4 of 15

ACS Housing Summary7353-7399 St Louis Ave Village Of Skokie Only7353-7399 St Louis Ave, Skokie, Illinois, 60076 Latitude: 42.01519Drive Time: 5 minute radius Longitude: -87.71717
2013-2017ACS Estimate Percent MOE(±) Reliability
OCCUPIED HOUSING UNITS BY HOUSE HEATING FUELTotal 6,386 100.0% 219
Utility gas 5,479 85.8% 217Bottled, tank, or LP gas 48 0.8% 33Electricity 779 12.2% 95Fuel oil, kerosene, etc. 3 0.0% 8Coal or coke 0 0.0% 0Wood 0 0.0% 0Solar energy 0 0.0% 5Other fuel 23 0.4% 19No fuel used 53 0.8% 23
OCCUPIED HOUSING UNITS BY VEHICLES AVAILABLETotal 6,386 100.0% 219
Owner occupiedNo vehicle available 260 4.1% 951 vehicle available 1,641 25.7% 1632 vehicles available 2,444 38.3% 1663 vehicles available 893 14.0% 1294 vehicles available 233 3.6% 725 or more vehicles available 59 0.9% 44
Renter occupiedNo vehicle available 254 4.0% 561 vehicle available 336 5.3% 822 vehicles available 180 2.8% 663 vehicles available 72 1.1% 494 vehicles available 0 0.0% 05 or more vehicles available 14 0.2% 15
Average Number of Vehicles Available N/A N/A
Data Note: N/A means not available.
2013-2017 ACS Estimate: The American Community Survey (ACS) replaces census sample data. Esri is releasing the 2013-2017 ACS estimates, five-year period data collected monthly from January 1, 2011 through December 31, 2015. Although the ACS includes many of the subjects previously covered by the decennial census sample, there are significant differences between the two surveys including fundamental differences in survey design and residency rules.
Margin of error (MOE): The MOE is a measure of the variability of the estimate due to sampling error. MOEs enable the data user to measure the range of uncertainty for each estimate with 90 percent confidence. The range of uncertainty is called the confidence interval, and it is calculated by taking the estimate +/- the MOE. For example, if the ACS reports an estimate of 100 with an MOE of +/- 20, then you can be 90 percent certain the value for the whole population falls between 80 and 120.
Reliability: These symbols represent threshold values that Esri has established from the Coefficients of Variation (CV) to designate the usability of the estimates. The CV measures the amount of sampling error relative to the size of the estimate, expressed as a percentage.
High Reliability: Small CVs (less than or equal to 12 percent) are flagged green to indicate that the sampling error is small relative to the estimate and the estimate is reasonably reliable.
Medium Reliability: Estimates with CVs between 12 and 40 are flagged yellow-use with caution.
Low Reliability: Large CVs (over 40 percent) are flagged red to indicate that the sampling error is largerelative to the estimate. The estimate is considered very unreliable.
Source: U.S. Census Bureau, 2013-2017 American Community Survey Reliability: high medium low
September 25, 2019
©2019 Esri Page 5 of 15

ACS Housing Summary7353-7399 St Louis Ave Village Of Skokie Only7353-7399 St Louis Ave, Skokie, Illinois, 60076 Latitude: 42.01519Drive Time: 10 minute radius Longitude: -87.71717
2013-2017ACS Estimate Percent MOE(±) Reliability
TOTALSTotal Population 190,853 4,042
Total Households 65,619 1,065
Total Housing Units 71,869 1,088
OWNER-OCCUPIED HOUSING UNITS BY MORTGAGE STATUSTotal 40,530 100.0% 872
Housing units with a mortgage/contract to purchase/similar debt 25,964 64.1% 793Second mortgage only 823 2.0% 169Home equity loan only 3,561 8.8% 299Both second mortgage and home equity loan 181 0.4% 73No second mortgage and no home equity loan 21,399 52.8% 760
Housing units without a mortgage 14,567 35.9% 625
AVERAGE VALUE BY MORTGAGE STATUSHousing units with a mortgage N/A N/AHousing units without a mortgage N/A N/A
OWNER-OCCUPIED HOUSING UNITS BY MORTGAGE STATUS & SELECTED MONTHLY OWNER COSTSTotal 40,530 100.0% 872
With a mortgage: Monthly owner costs as a percentage of household income in past 12 monthshousehold income in past 12 months
Less than 10.0 percent 1,281 3.2% 18210.0 to 14.9 percent 3,482 8.6% 33115.0 to 19.9 percent 4,762 11.7% 38720.0 to 24.9 percent 4,028 9.9% 36525.0 to 29.9 percent 2,783 6.9% 29130.0 to 34.9 percent 2,106 5.2% 26435.0 to 39.9 percent 1,284 3.2% 19740.0 to 49.9 percent 2,011 5.0% 28250.0 percent or more 4,208 10.4% 380Not computed 19 0.0% 19
Without a mortgage: Monthly owner costs as a percentage of household income in past 12 months
Less than 10.0 percent 4,608 11.4% 35510.0 to 14.9 percent 2,551 6.3% 27915.0 to 19.9 percent 1,655 4.1% 23820.0 to 24.9 percent 1,071 2.6% 19425.0 to 29.9 percent 909 2.2% 17330.0 to 34.9 percent 592 1.5% 11935.0 to 39.9 percent 536 1.3% 14140.0 to 49.9 percent 695 1.7% 15450.0 percent or more 1,639 4.0% 241Not computed 310 0.8% 120
Source: U.S. Census Bureau, 2013-2017 American Community Survey Reliability: high medium low
September 25, 2019
©2019 Esri Page 6 of 15

ACS Housing Summary7353-7399 St Louis Ave Village Of Skokie Only7353-7399 St Louis Ave, Skokie, Illinois, 60076 Latitude: 42.01519Drive Time: 10 minute radius Longitude: -87.71717
2013-2017ACS Estimate Percent MOE(±) Reliability
RENTER-OCCUPIED HOUSING UNITS BY CONTRACT RENTTotal 25,088 100.0% 883
With cash rent 24,247 96.6% 878Less than $100 36 0.1% 48$100 to $149 117 0.5% 67$150 to $199 509 2.0% 153$200 to $249 215 0.9% 100$250 to $299 105 0.4% 52$300 to $349 171 0.7% 108$350 to $399 326 1.3% 155$400 to $449 155 0.6% 111$450 to $499 131 0.5% 96$500 to $549 409 1.6% 172$550 to $599 175 0.7% 73$600 to $649 285 1.1% 95$650 to $699 563 2.2% 145$700 to $749 1,068 4.3% 255$750 to $799 1,070 4.3% 222$800 to $899 3,037 12.1% 342$900 to $999 3,959 15.8% 461$1,000 to $1,249 6,254 24.9% 530$1,250 to $1,499 2,865 11.4% 387$1,500 to $1,999 1,962 7.8% 273$2,000 to $2,499 434 1.7% 117$2,500 to $2,999 291 1.2% 94$3,000 to $3,499 67 0.3% 39$3,500 or more 44 0.2% 35
No cash rent 841 3.4% 159
Median Contract Rent $995 N/AAverage Contract Rent N/A N/A
RENTER-OCCUPIED HOUSING UNITS BY INCLUSION OF UTILITIES IN RENTTotal 25,088 100.0% 883
Pay extra for one or more utilities 23,080 92.0% 863No extra payment for any utilities 2,008 8.0% 290
Source: U.S. Census Bureau, 2013-2017 American Community Survey Reliability: high medium low
September 25, 2019
©2019 Esri Page 7 of 15

ACS Housing Summary7353-7399 St Louis Ave Village Of Skokie Only7353-7399 St Louis Ave, Skokie, Illinois, 60076 Latitude: 42.01519Drive Time: 10 minute radius Longitude: -87.71717
2013-2017ACS Estimate Percent MOE(±) Reliability
RENTER-OCCUPIED HOUSING UNITS BY GROSS RENTTotal: 25,088 100.0% 883
With cash rent: 24,247 96.6% 878Less than $100 0 0.0% 0$100 to $149 26 0.1% 96$150 to $199 260 1.0% 107$200 to $249 348 1.4% 126$250 to $299 145 0.6% 71$300 to $349 84 0.3% 53$350 to $399 342 1.4% 158$400 to $449 275 1.1% 150$450 to $499 135 0.5% 92$500 to $549 188 0.7% 138$550 to $599 179 0.7% 87$600 to $649 231 0.9% 66$650 to $699 298 1.2% 105$700 to $749 456 1.8% 150$750 to $799 622 2.5% 166$800 to $899 2,208 8.8% 323$900 to $999 3,271 13.0% 444$1,000 to $1,249 6,978 27.8% 551$1,250 to $1,499 3,992 15.9% 444$1,500 to $1,999 2,996 11.9% 367
$2,000 to $2,499 673 2.7% 133$2,500 to $2,999 384 1.5% 112$3,000 to $3,499 112 0.4% 50$3,500 or more 44 0.2% 35
No cash rent 841 3.4% 159
Median Gross Rent $1,109 N/AAverage Gross Rent N/A N/A
Source: U.S. Census Bureau, 2013-2017 American Community Survey Reliability: high medium low
September 25, 2019
©2019 Esri Page 8 of 15

ACS Housing Summary7353-7399 St Louis Ave Village Of Skokie Only7353-7399 St Louis Ave, Skokie, Illinois, 60076 Latitude: 42.01519Drive Time: 10 minute radius Longitude: -87.71717
2013-2017ACS Estimate Percent MOE(±) Reliability
HOUSING UNITS BY UNITS IN STRUCTURETotal 71,869 100.0% 1,088
1, detached 30,678 42.7% 7211, attached 3,821 5.3% 3402 5,661 7.9% 3963 or 4 8,586 11.9% 5985 to 9 8,450 11.8% 63310 to 19 4,511 6.3% 45620 to 49 5,316 7.4% 44150 or more 4,754 6.6% 363Mobile home 80 0.1% 45Boat, RV, van, etc. 13 0.0% 15
HOUSING UNITS BY YEAR STRUCTURE BUILTTotal 71,869 100.0% 1,088
Built 2014 or later 70 0.1% 58Built 2010 to 2013 208 0.3% 61Built 2000 to 2009 2,625 3.7% 285Built 1990 to 1999 2,261 3.1% 273Built 1980 to 1989 1,901 2.6% 276Built 1970 to 1979 4,579 6.4% 455Built 1960 to 1969 9,719 13.5% 602Built 1950 to 1959 20,658 28.7% 795Built 1940 to 1949 8,129 11.3% 537Built 1939 or earlier 21,720 30.2% 806
Median Year Structure Built 1953 N/A
OCCUPIED HOUSING UNITS BY YEAR HOUSEHOLDER MOVED INTO UNITTotal 65,619 100.0% 1,065
Owner occupiedMoved in 2015 or later 1,606 2.4% 224Moved in 2010 to 2014 6,621 10.1% 461Moved in 2000 to 2009 12,692 19.3% 631Moved in 1990 to 1999 8,608 13.1% 503Moved in 1980 to 1989 5,255 8.0% 402Moved in 1979 or earlier 5,749 8.8% 392
Renter occupiedMoved in 2015 or later 3,992 6.1% 426Moved in 2010 to 2014 12,906 19.7% 717Moved in 2000 to 2009 6,194 9.4% 546Moved in 1990 to 1999 1,575 2.4% 272Moved in 1980 to 1989 234 0.4% 66Moved in 1979 or earlier 187 0.3% 60
Median Year Householder Moved Into Unit 2006 N/A
Source: U.S. Census Bureau, 2013-2017 American Community Survey Reliability: high medium low
September 25, 2019
©2019 Esri Page 9 of 15

ACS Housing Summary7353-7399 St Louis Ave Village Of Skokie Only7353-7399 St Louis Ave, Skokie, Illinois, 60076 Latitude: 42.01519Drive Time: 10 minute radius Longitude: -87.71717
2013-2017ACS Estimate Percent MOE(±) Reliability
OCCUPIED HOUSING UNITS BY HOUSE HEATING FUELTotal 65,619 100.0% 1,065
Utility gas 56,383 85.9% 1,042Bottled, tank, or LP gas 653 1.0% 134Electricity 7,398 11.3% 560Fuel oil, kerosene, etc. 109 0.2% 54Coal or coke 6 0.0% 10Wood 13 0.0% 21Solar energy 44 0.1% 30Other fuel 475 0.7% 122No fuel used 540 0.8% 119
OCCUPIED HOUSING UNITS BY VEHICLES AVAILABLETotal 65,619 100.0% 1,065
Owner occupiedNo vehicle available 2,055 3.1% 2521 vehicle available 14,491 22.1% 6642 vehicles available 17,408 26.5% 6493 vehicles available 4,986 7.6% 4014 vehicles available 1,286 2.0% 2065 or more vehicles available 304 0.5% 94
Renter occupiedNo vehicle available 5,634 8.6% 4881 vehicle available 12,986 19.8% 7652 vehicles available 5,302 8.1% 4393 vehicles available 958 1.5% 2174 vehicles available 149 0.2% 1035 or more vehicles available 60 0.1% 49
Average Number of Vehicles Available N/A N/A
Data Note: N/A means not available.
2013-2017 ACS Estimate: The American Community Survey (ACS) replaces census sample data. Esri is releasing the 2013-2017 ACS estimates, five-year period data collected monthly from January 1, 2011 through December 31, 2015. Although the ACS includes many of the subjects previously covered by the decennial census sample, there are significant differences between the two surveys including fundamental differences in survey design and residency rules.
Margin of error (MOE): The MOE is a measure of the variability of the estimate due to sampling error. MOEs enable the data user to measure the range of uncertainty for each estimate with 90 percent confidence. The range of uncertainty is called the confidence interval, and it is calculated by taking the estimate +/- the MOE. For example, if the ACS reports an estimate of 100 with an MOE of +/- 20, then you can be 90 percent certain the value for the whole population falls between 80 and 120.
Reliability: These symbols represent threshold values that Esri has established from the Coefficients of Variation (CV) to designate the usability of the estimates. The CV measures the amount of sampling error relative to the size of the estimate, expressed as a percentage.
High Reliability: Small CVs (less than or equal to 12 percent) are flagged green to indicate that the sampling error is small relative to the estimate and the estimate is reasonably reliable.
Medium Reliability: Estimates with CVs between 12 and 40 are flagged yellow-use with caution.
Low Reliability: Large CVs (over 40 percent) are flagged red to indicate that the sampling error is largerelative to the estimate. The estimate is considered very unreliable.
Source: U.S. Census Bureau, 2013-2017 American Community Survey Reliability: high medium low
September 25, 2019
©2019 Esri Page 10 of 15

ACS Housing Summary7353-7399 St Louis Ave Village Of Skokie Only7353-7399 St Louis Ave, Skokie, Illinois, 60076 Latitude: 42.01519Drive Time: 15 minute radius Longitude: -87.71717
2013-2017ACS Estimate Percent MOE(±) Reliability
TOTALSTotal Population 486,090 6,451
Total Households 178,924 1,793
Total Housing Units 197,125 1,817
OWNER-OCCUPIED HOUSING UNITS BY MORTGAGE STATUSTotal 97,105 100.0% 1,369
Housing units with a mortgage/contract to purchase/similar debt 62,674 64.5% 1,241Second mortgage only 1,878 1.9% 252Home equity loan only 8,649 8.9% 489Both second mortgage and home equity loan 351 0.4% 107No second mortgage and no home equity loan 51,795 53.3% 1,181
Housing units without a mortgage 34,431 35.5% 964
AVERAGE VALUE BY MORTGAGE STATUSHousing units with a mortgage N/A N/AHousing units without a mortgage N/A N/A
OWNER-OCCUPIED HOUSING UNITS BY MORTGAGE STATUS & SELECTED MONTHLY OWNER COSTSTotal 97,105 100.0% 1,369
With a mortgage: Monthly owner costs as a percentage of household income in past 12 monthshousehold income in past 12 months
Less than 10.0 percent 3,725 3.8% 33010.0 to 14.9 percent 8,437 8.7% 50715.0 to 19.9 percent 11,438 11.8% 61620.0 to 24.9 percent 9,654 9.9% 55525.0 to 29.9 percent 7,304 7.5% 48830.0 to 34.9 percent 5,024 5.2% 40935.0 to 39.9 percent 3,297 3.4% 32340.0 to 49.9 percent 4,298 4.4% 42050.0 percent or more 9,328 9.6% 565Not computed 169 0.2% 69
Without a mortgage: Monthly owner costs as a percentage of household income in past 12 months
Less than 10.0 percent 10,960 11.3% 56910.0 to 14.9 percent 6,188 6.4% 44415.0 to 19.9 percent 4,092 4.2% 36120.0 to 24.9 percent 2,514 2.6% 28125.0 to 29.9 percent 1,994 2.1% 25230.0 to 34.9 percent 1,478 1.5% 22235.0 to 39.9 percent 1,317 1.4% 20840.0 to 49.9 percent 1,568 1.6% 23850.0 percent or more 3,780 3.9% 382Not computed 541 0.6% 152
Source: U.S. Census Bureau, 2013-2017 American Community Survey Reliability: high medium low
September 25, 2019
©2019 Esri Page 11 of 15

ACS Housing Summary7353-7399 St Louis Ave Village Of Skokie Only7353-7399 St Louis Ave, Skokie, Illinois, 60076 Latitude: 42.01519Drive Time: 15 minute radius Longitude: -87.71717
2013-2017ACS Estimate Percent MOE(±) Reliability
RENTER-OCCUPIED HOUSING UNITS BY CONTRACT RENTTotal 81,820 100.0% 1,586
With cash rent 79,692 97.4% 1,571Less than $100 246 0.3% 93$100 to $149 243 0.3% 103$150 to $199 1,375 1.7% 248$200 to $249 794 1.0% 202$250 to $299 547 0.7% 170$300 to $349 504 0.6% 149$350 to $399 664 0.8% 192$400 to $449 658 0.8% 208$450 to $499 592 0.7% 196$500 to $549 794 1.0% 213$550 to $599 1,131 1.4% 223$600 to $649 2,048 2.5% 304$650 to $699 2,709 3.3% 375$700 to $749 4,010 4.9% 449$750 to $799 4,125 5.0% 453$800 to $899 11,417 14.0% 731$900 to $999 10,305 12.6% 708$1,000 to $1,249 18,229 22.3% 899$1,250 to $1,499 8,745 10.7% 634$1,500 to $1,999 6,771 8.3% 528$2,000 to $2,499 2,265 2.8% 318$2,500 to $2,999 939 1.1% 207$3,000 to $3,499 299 0.4% 99$3,500 or more 280 0.3% 121
No cash rent 2,128 2.6% 303
Median Contract Rent $978 N/AAverage Contract Rent N/A N/A
RENTER-OCCUPIED HOUSING UNITS BY INCLUSION OF UTILITIES IN RENTTotal 81,820 100.0% 1,586
Pay extra for one or more utilities 74,766 91.4% 1,542No extra payment for any utilities 7,054 8.6% 561
Source: U.S. Census Bureau, 2013-2017 American Community Survey Reliability: high medium low
September 25, 2019
©2019 Esri Page 12 of 15

ACS Housing Summary7353-7399 St Louis Ave Village Of Skokie Only7353-7399 St Louis Ave, Skokie, Illinois, 60076 Latitude: 42.01519Drive Time: 15 minute radius Longitude: -87.71717
2013-2017ACS Estimate Percent MOE(±) Reliability
RENTER-OCCUPIED HOUSING UNITS BY GROSS RENTTotal: 81,820 100.0% 1,586
With cash rent: 79,692 97.4% 1,571Less than $100 102 0.1% 42$100 to $149 137 0.2% 102$150 to $199 581 0.7% 170$200 to $249 1,129 1.4% 220$250 to $299 609 0.7% 183$300 to $349 482 0.6% 140$350 to $399 681 0.8% 197$400 to $449 632 0.8% 199$450 to $499 352 0.4% 140$500 to $549 717 0.9% 238$550 to $599 571 0.7% 150$600 to $649 1,134 1.4% 221$650 to $699 1,898 2.3% 295$700 to $749 2,323 2.8% 352$750 to $799 2,967 3.6% 386$800 to $899 8,557 10.5% 640$900 to $999 10,205 12.5% 719$1,000 to $1,249 20,541 25.1% 951$1,250 to $1,499 11,439 14.0% 720$1,500 to $1,999 9,692 11.8% 639
$2,000 to $2,499 2,992 3.7% 357$2,500 to $2,999 1,222 1.5% 227$3,000 to $3,499 414 0.5% 127$3,500 or more 316 0.4% 124
No cash rent 2,128 2.6% 303
Median Gross Rent $1,082 N/AAverage Gross Rent N/A N/A
Source: U.S. Census Bureau, 2013-2017 American Community Survey Reliability: high medium low
September 25, 2019
©2019 Esri Page 13 of 15

ACS Housing Summary7353-7399 St Louis Ave Village Of Skokie Only7353-7399 St Louis Ave, Skokie, Illinois, 60076 Latitude: 42.01519Drive Time: 15 minute radius Longitude: -87.71717
2013-2017ACS Estimate Percent MOE(±) Reliability
HOUSING UNITS BY UNITS IN STRUCTURETotal 197,125 100.0% 1,817
1, detached 66,163 33.6% 1,0771, attached 7,474 3.8% 4852 18,179 9.2% 8003 or 4 23,154 11.7% 1,0005 to 9 26,585 13.5% 1,07310 to 19 14,749 7.5% 76620 to 49 23,096 11.7% 92650 or more 17,486 8.9% 705Mobile home 212 0.1% 95Boat, RV, van, etc. 27 0.0% 20
HOUSING UNITS BY YEAR STRUCTURE BUILTTotal 197,125 100.0% 1,817
Built 2014 or later 331 0.2% 108Built 2010 to 2013 1,032 0.5% 165Built 2000 to 2009 10,345 5.2% 550Built 1990 to 1999 6,530 3.3% 466Built 1980 to 1989 5,774 2.9% 478Built 1970 to 1979 13,086 6.6% 725Built 1960 to 1969 22,432 11.4% 925Built 1950 to 1959 39,456 20.0% 1,129Built 1940 to 1949 18,551 9.4% 862Built 1939 or earlier 79,590 40.4% 1,523
Median Year Structure Built 1950 N/A
OCCUPIED HOUSING UNITS BY YEAR HOUSEHOLDER MOVED INTO UNITTotal 178,924 100.0% 1,793
Owner occupiedMoved in 2015 or later 4,578 2.6% 389Moved in 2010 to 2014 17,454 9.8% 743Moved in 2000 to 2009 31,396 17.5% 977Moved in 1990 to 1999 19,274 10.8% 757Moved in 1980 to 1989 11,452 6.4% 582Moved in 1979 or earlier 12,950 7.2% 605
Renter occupiedMoved in 2015 or later 14,045 7.8% 798Moved in 2010 to 2014 42,994 24.0% 1,313Moved in 2000 to 2009 18,998 10.6% 940Moved in 1990 to 1999 4,298 2.4% 432Moved in 1980 to 1989 899 0.5% 185Moved in 1979 or earlier 585 0.3% 158
Median Year Householder Moved Into Unit 2008 N/A
Source: U.S. Census Bureau, 2013-2017 American Community Survey Reliability: high medium low
September 25, 2019
©2019 Esri Page 14 of 15

ACS Housing Summary7353-7399 St Louis Ave Village Of Skokie Only7353-7399 St Louis Ave, Skokie, Illinois, 60076 Latitude: 42.01519Drive Time: 15 minute radius Longitude: -87.71717
2013-2017ACS Estimate Percent MOE(±) Reliability
OCCUPIED HOUSING UNITS BY HOUSE HEATING FUELTotal 178,924 100.0% 1,793
Utility gas 150,847 84.3% 1,783Bottled, tank, or LP gas 2,274 1.3% 266Electricity 21,299 11.9% 919Fuel oil, kerosene, etc. 303 0.2% 96Coal or coke 22 0.0% 18Wood 71 0.0% 75Solar energy 75 0.0% 51Other fuel 1,752 1.0% 230No fuel used 2,281 1.3% 255
OCCUPIED HOUSING UNITS BY VEHICLES AVAILABLETotal 178,924 100.0% 1,793
Owner occupiedNo vehicle available 6,142 3.4% 4491 vehicle available 36,783 20.6% 1,0392 vehicles available 40,348 22.6% 1,0133 vehicles available 10,386 5.8% 5694 vehicles available 2,737 1.5% 3045 or more vehicles available 710 0.4% 144
Renter occupiedNo vehicle available 25,058 14.0% 9951 vehicle available 39,128 21.9% 1,2772 vehicles available 14,584 8.2% 8023 vehicles available 2,636 1.5% 3864 vehicles available 270 0.2% 1225 or more vehicles available 145 0.1% 72
Average Number of Vehicles Available N/A N/A
Data Note: N/A means not available.
2013-2017 ACS Estimate: The American Community Survey (ACS) replaces census sample data. Esri is releasing the 2013-2017 ACS estimates, five-year period data collected monthly from January 1, 2011 through December 31, 2015. Although the ACS includes many of the subjects previously covered by the decennial census sample, there are significant differences between the two surveys including fundamental differences in survey design and residency rules.
Margin of error (MOE): The MOE is a measure of the variability of the estimate due to sampling error. MOEs enable the data user to measure the range of uncertainty for each estimate with 90 percent confidence. The range of uncertainty is called the confidence interval, and it is calculated by taking the estimate +/- the MOE. For example, if the ACS reports an estimate of 100 with an MOE of +/- 20, then you can be 90 percent certain the value for the whole population falls between 80 and 120.
Reliability: These symbols represent threshold values that Esri has established from the Coefficients of Variation (CV) to designate the usability of the estimates. The CV measures the amount of sampling error relative to the size of the estimate, expressed as a percentage.
High Reliability: Small CVs (less than or equal to 12 percent) are flagged green to indicate that the sampling error is small relative to the estimate and the estimate is reasonably reliable.
Medium Reliability: Estimates with CVs between 12 and 40 are flagged yellow-use with caution.
Low Reliability: Large CVs (over 40 percent) are flagged red to indicate that the sampling error is largerelative to the estimate. The estimate is considered very unreliable.
Source: U.S. Census Bureau, 2013-2017 American Community Survey Reliability: high medium low
September 25, 2019
©2019 Esri Page 15 of 15

ACS Population Summary7353-7399 St Louis Ave Village Of Skokie Only7353-7399 St Louis Ave, Skokie, Illinois, 60076 Latitude: 42.01519Drive Time: 5 minute radius Longitude: -87.71717
2013 - 2017ACS Estimate Percent MOE(±) Reliability
TOTALSTotal Population 19,576 794Total Households 6,386 219Total Housing Units 6,774 232
POPULATION AGE 3+ YEARS BY SCHOOL ENROLLMENTTotal 19,053 100.0% 779
Enrolled in school 5,252 27.6% 348Enrolled in nursery school, preschool 414 2.2% 62
Public school 156 0.8% 42Private school 258 1.4% 46
Enrolled in kindergarten 295 1.5% 68Public school 217 1.1% 66Private school 78 0.4% 21
Enrolled in grade 1 to grade 4 934 4.9% 118Public school 672 3.5% 119Private school 261 1.4% 41
Enrolled in grade 5 to grade 8 1,122 5.9% 147Public school 878 4.6% 146Private school 244 1.3% 43
Enrolled in grade 9 to grade 12 1,019 5.3% 120Public school 717 3.8% 109Private school 301 1.6% 50
Enrolled in college undergraduate years 1,191 6.3% 218Public school 746 3.9% 150Private school 445 2.3% 158
Enrolled in graduate or professional school 277 1.5% 105Public school 183 1.0% 76Private school 94 0.5% 51
Not enrolled in school 13,801 72.4% 442POPULATION AGE 65+ BY RELATIONSHIP AND HOUSEHOLD TYPETotal 4,059 100.0% 291
Living in Households 3,991 98.3% 289Living in Family Households 3,000 73.9% 274
Householder 1,387 34.2% 145Spouse 1,057 26.0% 126Parent 294 7.2% 74Parent-in-law 140 3.4% 58Other Relative 102 2.5% 45Nonrelative 19 0.5% 29
Living in Nonfamily Households 991 24.4% 137Householder 968 23.8% 137Nonrelative 23 0.6% 10
Living in Group Quarters 69 1.7% 54
Source: U.S. Census Bureau, 2013-2017 American Community Survey Reliability: high medium low
September 25, 2019
©2019 Esri Page 1 of 24

ACS Population Summary7353-7399 St Louis Ave Village Of Skokie Only7353-7399 St Louis Ave, Skokie, Illinois, 60076 Latitude: 42.01519Drive Time: 5 minute radius Longitude: -87.71717
2013 - 2017ACS Estimate Percent MOE(±) Reliability
HOUSEHOLDS BY TYPE AND SIZE Family Households 4,915 77.0% 200
2-Person 1,930 30.2% 1713-Person 986 15.4% 1344-Person 991 15.5% 1245-Person 514 8.0% 966-Person 291 4.6% 567+ Person 203 3.2% 45
Nonfamily Households 1,471 23.0% 1641-Person 1,373 21.5% 1622-Person 83 1.3% 253-Person 15 0.2% 194-Person 0 0.0% 05-Person 1 0.0% 96-Person 0 0.0% 07+ Person 0 0.0% 0
HOUSEHOLDS BY PRESENCE OF PEOPLE UNDER 18 YEARS BYHOUSEHOLD TYPEHouseholds with one or more people under 18 years 2,053 32.1% 145
Family households 2,053 32.1% 145Married-couple family 1,859 29.1% 143Male householder, no wife present 47 0.7% 19Female householder, no husband present 147 2.3% 40
Nonfamily households 0 0.0% 0Households with no people under 18 years 4,333 67.9% 229
Married-couple family 2,425 38.0% 189Other family 437 6.8% 91
Nonfamily households 1,471 23.0% 164
HOUSEHOLDS BY PRESENCE OF PEOPLE 65 YEARS AND OVER, HOUSEHOLD SIZE AND HOUSEHOLD TYPEHouseholds with Pop 65+ 2,747 43.0% 191
1-Person 941 14.7% 1372+ Person Family 1,777 27.8% 1562+ Person Nonfamily 30 0.5% 13
Households with No Pop 65+ 3,639 57.0% 1931-Person 432 6.8% 842+ Person Family 3,138 49.1% 1842+ Person Nonfamily 68 1.1% 26
Source: U.S. Census Bureau, 2013-2017 American Community Survey Reliability: high medium low
September 25, 2019
©2019 Esri Page 2 of 24

ACS Population Summary7353-7399 St Louis Ave Village Of Skokie Only7353-7399 St Louis Ave, Skokie, Illinois, 60076 Latitude: 42.01519Drive Time: 5 minute radius Longitude: -87.71717
2013 - 2017ACS Estimate Percent MOE(±) Reliability
POPULATION AGE 5+ YEARS BY LANGUAGE SPOKEN AT HOME AND ABILITY TO SPEAK ENGLISHTotal 18,548 100.0% 767
5 to 17 yearsSpeak only English 1,914 10.3% 173Speak Spanish 207 1.1% 62
Speak English "very well" or "well" 191 1.0% 62Speak English "not well" 8 0.0% 38Speak English "not at all" 8 0.0% 45
Speak other Indo-European languages 733 4.0% 211Speak English "very well" or "well" 732 3.9% 211Speak English "not well" 1 0.0% 15Speak English "not at all" 0 0.0% 0
Speak Asian and Pacific Island languages 380 2.0% 172Speak English "very well" or "well" 327 1.8% 156Speak English "not well" 53 0.3% 74Speak English "not at all" 0 0.0% 0
Speak other languages 254 1.4% 118Speak English "very well" or "well" 247 1.3% 110Speak English "not well" 7 0.0% 53Speak English "not at all" 0 0.0% 0
18 to 64 yearsSpeak only English 4,349 23.4% 383Speak Spanish 954 5.1% 153
Speak English "very well" or "well" 808 4.4% 141Speak English "not well" 72 0.4% 35Speak English "not at all" 74 0.4% 63
Speak other Indo-European languages 3,054 16.5% 399Speak English "very well" or "well" 2,728 14.7% 348Speak English "not well" 287 1.5% 82Speak English "not at all" 39 0.2% 39
Speak Asian and Pacific Island languages 1,716 9.3% 315Speak English "very well" or "well" 1,493 8.0% 257Speak English "not well" 186 1.0% 72Speak English "not at all" 37 0.2% 39
Speak other languages 927 5.0% 201Speak English "very well" or "well" 832 4.5% 137Speak English "not well" 62 0.3% 43Speak English "not at all" 33 0.2% 27
65 years and overSpeak only English 2,283 12.3% 232Speak Spanish 170 0.9% 74
Speak English "very well" or "well" 117 0.6% 68Speak English "not well" 50 0.3% 24Speak English "not at all" 3 0.0% 15
Speak other Indo-European languages 862 4.6% 135Speak English "very well" or "well" 593 3.2% 103Speak English "not well" 225 1.2% 61Speak English "not at all" 44 0.2% 38
Speak Asian and Pacific Island languages 460 2.5% 100Speak English "very well" or "well" 329 1.8% 77Speak English "not well" 71 0.4% 36Speak English "not at all" 60 0.3% 45
Speak other languages 285 1.5% 114Speak English "very well" or "well" 175 0.9% 69Speak English "not well" 51 0.3% 39Speak English "not at all" 59 0.3% 97
Source: U.S. Census Bureau, 2013-2017 American Community Survey Reliability: high medium low
September 25, 2019
©2019 Esri Page 3 of 24

ACS Population Summary7353-7399 St Louis Ave Village Of Skokie Only7353-7399 St Louis Ave, Skokie, Illinois, 60076 Latitude: 42.01519Drive Time: 5 minute radius Longitude: -87.71717
2013 - 2017ACS Estimate Percent MOE(±) Reliability
WORKERS AGE 16+ YEARS BY PLACE OF WORKTotal 8,562 100.0% 467
Worked in state and in county of residence 7,834 91.5% 453Worked in state and outside county of residence 662 7.7% 119Worked outside state of residence 65 0.8% 41
SEX BY CLASS OF WORKER FOR THE CIVILIAN EMPLOYED POPULATION 16 YEARSAND OVERTotal: 8,746 100.0% 476
Male: 4,535 51.9% 299Employee of private company workers
3,045 34.8% 247
Self-employed in own incorporated business workers
358 4.1% 83Private not-for-profit wage and salary workers 469 5.4% 118Local government workers 162 1.9% 75State government workers 43 0.5% 21Federal government workers 122 1.4% 57Self-employed in own not incorporated business workers 337 3.9% 74Unpaid family workers 0 0.0% 0
Female: 4,211 48.1% 256Employee of private company workers
2,518 28.8% 201Self-employed in own incorporated business workers
242 2.8% 81Private not-for-profit wage and salary workers 803 9.2% 120Local government workers 300 3.4% 67State government workers 84 1.0% 34Federal government workers 61 0.7% 50Self-employed in own not incorporated business workers 200 2.3% 29Unpaid family workers 3 0.0% 10
Source: U.S. Census Bureau, 2013-2017 American Community Survey Reliability: high medium low
September 25, 2019
©2019 Esri Page 4 of 24

ACS Population Summary7353-7399 St Louis Ave Village Of Skokie Only7353-7399 St Louis Ave, Skokie, Illinois, 60076 Latitude: 42.01519Drive Time: 5 minute radius Longitude: -87.71717
2013 - 2017ACS Estimate Percent MOE(±) Reliability
WORKERS AGE 16+ YEARS BY MEANS OF TRANSPORTATION TO WORKTotal 8,562 100.0% 467
Drove alone 6,092 71.2% 383Carpooled 1,013 11.8% 187Public transportation (excluding taxicab) 678 7.9% 131
Bus or trolley bus 193 2.3% 67Streetcar or trolley car 5 0.1% 33Subway or elevated 190 2.2% 24Railroad 290 3.4% 113Ferryboat 0 0.0% 0
Taxicab 69 0.8% 36Motorcycle 0 0.0% 0Bicycle 33 0.4% 25Walked 124 1.4% 38Other means 29 0.3% 34Worked at home 525 6.1% 98
WORKERS AGE 16+ YEARS (WHO DID NOT WORK FROM HOME) BY TRAVEL TIME TO WORKTotal 8,037 100.0% 462
Less than 5 minutes 141 1.8% 555 to 9 minutes 538 6.7% 10210 to 14 minutes 1,062 13.2% 14315 to 19 minutes 952 11.8% 17120 to 24 minutes 882 11.0% 14025 to 29 minutes 563 7.0% 11730 to 34 minutes 1,242 15.5% 19035 to 39 minutes 270 3.4% 5040 to 44 minutes 401 5.0% 11645 to 59 minutes 1,165 14.5% 16660 to 89 minutes 659 8.2% 10090 or more minutes 162 2.0% 47
Average Travel Time to Work (in minutes) N/A N/A
FEMALES AGE 20-64 YEARS BY AGE OF OWN CHILDREN AND EMPLOYMENT STATUSTotal 5,619 100.0% 298
Own children under 6 years only 348 6.2% 56In labor force 282 5.0% 55Not in labor force 66 1.2% 17
Own children under 6 years and 6 to 17 years 498 8.9% 73In labor force 302 5.4% 60Not in labor force 196 3.5% 67
Own children 6 to 17 years only 1,225 21.8% 130In labor force 975 17.4% 108Not in labor force 250 4.4% 76
No own children under 18 years 3,549 63.2% 289In labor force 2,547 45.3% 232Not in labor force 1,002 17.8% 172
Source: U.S. Census Bureau, 2013-2017 American Community Survey Reliability: high medium low
September 25, 2019
©2019 Esri Page 5 of 24

ACS Population Summary7353-7399 St Louis Ave Village Of Skokie Only7353-7399 St Louis Ave, Skokie, Illinois, 60076 Latitude: 42.01519Drive Time: 5 minute radius Longitude: -87.71717
2013 - 2017ACS Estimate Percent MOE(±) Reliability
CIVILIAN NONINSTITUTIONALIZED POPULATION BY AGE & TYPES OHEALINSURANCE COVERAGEOF HEALTH INSURANCE COVERAGETotal 19,482 100.0% 794
Under 19 years: 4,715 24.2% 320One Type of Health Insurance: 4,497 23.1% 313
Employer-Based Health Ins Only 2,961 15.2% 271Direct-Purchase Health Ins Only 412 2.1% 103Medicare Coverage Only 12 0.1% 27Medicaid Coverage Only 1,111 5.7% 284TRICARE/Military Hlth Cov Only 0 0.0% 0VA Health Care Only 0 0.0% 0
2+ Types of Health Insurance 112 0.6% 44No Health Insurance Coverage 105 0.5% 77
19 to 34 years: 2,992 15.4% 316One Type of Health Insurance: 2,507 12.9% 258
Employer-Based Health Ins Only 1,759 9.0% 207Direct-Purchase Health Ins Only 514 2.6% 146Medicare Coverage Only 12 0.1% 44Medicaid Coverage Only 222 1.1% 51TRICARE/Military Hlth Cov Only 0 0.0% 0VA Health Care Only 0 0.0% 0
2+ Types of Health Insurance 54 0.3% 33No Health Insurance Coverage 432 2.2% 13835 to 64 years: 7,784 40.0% 380
One Type of Health Insurance: 6,653 34.1% 359Employer-Based Health Ins Only 4,928 25.3% 320Direct-Purchase Health Ins Only 1,108 5.7% 194Medicare Coverage Only 57 0.3% 31Medicaid Coverage Only 548 2.8% 143TRICARE/Military Hlth Cov Only 0 0.0% 0VA Health Care Only 13 0.1% 14
2+ Types of Health Insurance 425 2.2% 99No Health Insurance Coverage 705 3.6% 14865+ years: 3,992 20.5% 289
One Type of Health Insurance: 1,178 6.0% 142Employer-Based Health Ins Only 143 0.7% 26Direct-Purchase Health Ins Only 20 0.1% 26Medicare Coverage Only 1,015 5.2% 141TRICARE/Military Hlth Cov Only 0 0.0% 0VA Health Care Only 0 0.0% 0
2+ Types of Health Insurance: 2,772 14.2% 264Employer-Based & Direct-Purchase Health Insurance 2 0.0% 10Employer-Based Health & Medicare Insurance 660 3.4% 112Direct-Purchase Health & Medicare Insurance 1,239 6.4% 220Medicare & Medicaid Coverage 459 2.4% 108Other Private Health Insurance Combos 0 0.0% 0Other Public Health Insurance Combos 20 0.1% 17Other Health Insurance Combinations 392 2.0% 57
No Health Insurance Coverage 42 0.2% 22
Source: U.S. Census Bureau, 2013-2017 American Community Survey Reliability: high medium low
September 25, 2019
©2019 Esri Page 6 of 24

ACS Population Summary7353-7399 St Louis Ave Village Of Skokie Only7353-7399 St Louis Ave, Skokie, Illinois, 60076 Latitude: 42.01519Drive Time: 5 minute radius Longitude: -87.71717
2013 - 2017ACS Estimate Percent MOE(±) Reliability
POPULATION BY RATIO OF INCOME TO POVERTY LEVELTotal 19,463 100.0% 790
Under .50 356 1.8% 144.50 to .99 856 4.4% 2521.00 to 1.24 840 4.3% 2921.25 to 1.49 596 3.1% 2161.50 to 1.84 692 3.6% 1861.85 to 1.99 639 3.3% 2502.00 and over 15,484 79.6% 770
CIVILIAN POPULATION AGE 18 OR OLDER BY VETERAN STATUSTotal 15,060 100.0% 636
Veteran 487 3.2% 79Nonveteran 14,573 96.8% 640
Male 6,955 46.2% 368Veteran 477 3.2% 78Nonveteran 6,478 43.0% 375
Female 8,105 53.8% 363Veteran 10 0.1% 13Nonveteran 8,095 53.8% 363
CIVILIAN VETERANS AGE 18 OR OLDER BY PERIOD OF MILITARY SERVICETotal 487 100.0% 79
Gulf War (9/01 or later), no Gulf War (8/90 to 8/01), no Vietnam Era 19 3.9% 20Gulf War (9/01 or later) and Gulf War (8/90 to 8/01), no Vietnam Era 4 0.8% 13Gulf War (9/01 or later), and Gulf War (8/90 to 8/01), and Vietnam Era 0 0.0% 0Gulf War (8/90 to 8/01), no Vietnam Era 56 11.5% 28Gulf War (8/90 to 8/01) and Vietnam Era 0 0.0% 0Vietnam Era, no Korean War, no World War II 159 32.6% 36Vietnam Era and Korean War, no World War II 0 0.0% 0Vietnam Era and Korean War and World War II 0 0.0% 0Korean War, no Vietnam Era, no World War II 56 11.5% 34Korean War and World War II, no Vietnam Era 10 2.1% 24World War II, no Korean War, no Vietnam Era 101 20.7% 47Between Gulf War and Vietnam Era only 46 9.4% 29Between Vietnam Era and Korean War only 35 7.2% 23Between Korean War and World War II only 0 0.0% 0Pre-World War II only 0 0.0% 0
HOUSEHOLDS BY POVERTY STATUSTotal 6,386 100.0% 219
Income in the past 12 months below poverty level 437 6.8% 94Married-couple family 193 3.0% 61Other family - male householder (no wife present) 6 0.1% 7Other family - female householder (no husband present) 35 0.5% 31Nonfamily household - male householder 72 1.1% 37Nonfamily household - female householder 131 2.1% 68
Income in the past 12 months at or above poverty level 5,949 93.2% 222Married-couple family 4,090 64.0% 196Other family - male householder (no wife present) 71 1.1% 29Other family - female householder (no husband present) 520 8.1% 92Nonfamily household - male householder 412 6.5% 93Nonfamily household - female householder 856 13.4% 126
Source: U.S. Census Bureau, 2013-2017 American Community Survey Reliability: high medium low
September 25, 2019
©2019 Esri Page 7 of 24

ACS Population Summary7353-7399 St Louis Ave Village Of Skokie Only7353-7399 St Louis Ave, Skokie, Illinois, 60076 Latitude: 42.01519Drive Time: 5 minute radius Longitude: -87.71717
2013 - 2017ACS Estimate Percent MOE(±) Reliability
HOUSEHOLDS BY OTHER INCOMESocial Security Income 2,397 37.5% 192No Social Security Income 3,988 62.4% 200
Retirement Income 1,326 20.8% 145No Retirement Income 5,060 79.2% 218
GROSS RENT AS A PERCENTAGE OF HOUSEHOLD INCOME IN THE PAST 12 MONTHS <10% of Income 39 4.6% 28
10-14.9% of Income 58 6.8% 2715-19.9% of Income 47 5.5% 2420-24.9% of Income 44 5.1% 5225-29.9% of Income 71 8.3% 3730-34.9% of Income 53 6.2% 3235-39.9% of Income 49 5.7% 3840-49.9% of Income 91 10.6% 4150+% of Income 309 36.1% 90Gross Rent % Inc Not Computed 94 11.0% 53
HOUSEHOLDS BY PUBLIC ASSISTANCE INCOME IN THE PAST 12 MONTHSTotal 6,386 100.0% 219
With public assistance income 143 2.2% 48No public assistance income 6,243 97.8% 221
HOUSEHOLDS BY FOOD STAMPS/SNAP STATUSTotal 6,386 100.0% 219
With Food Stamps/SNAP 373 5.8% 62With No Food Stamps/SNAP 6,013 94.2% 226
HOUSEHOLDS BY DISABILITY STATUSTotal 6,386 100.0% 219
With 1+ Persons w/Disability 1,646 25.8% 150With No Person w/Disability 4,740 74.2% 226
Data Note: N/A means not available. Population by Ratio of Income to Poverty Level represents persons for whom poverty status is determined. Household income represents income in 2015, adjusted for inflation.
2013-2017 ACS Estimate: The American Community Survey (ACS) replaces census sample data. Esri is releasing the 2013-2017 ACS estimates, five-year period data collected monthly from January 1, 2011 through December 31, 2015. Although the ACS includes many of the subjects previously covered by the decennial census sample, there are significant differences between the two surveys including fundamental differences in survey design and residency rules.
Margin of error (MOE): The MOE is a measure of the variability of the estimate due to sampling error. MOEs enable the data user to measure the range of uncertainty for each estimate with 90 percent confidence. The range of uncertainty is called the confidence interval, and it is calculated by taking the estimate +/- the MOE. For example, if the ACS reports an estimate of 100 with an MOE of +/- 20, then you can be 90 percent certain the value for the whole population falls between 80 and 120.
Reliability: These symbols represent threshold values that Esri has established from the Coefficients of Variation (CV) to designate the usability of the estimates. The CV measures the amount of sampling error relative to the size of the estimate, expressed as a percentage.
High Reliability: Small CVs (less than or equal to 12 percent) are flagged green to indicate that the sampling error is small relative to the estimate and the estimate is reasonably reliable.
Medium Reliability: Estimates with CVs between 12 and 40 are flagged yellow-use with caution.
Low Reliability: Large CVs (over 40 percent) are flagged red to indicate that the sampling error is largerelative to the estimate. The estimate is considered very unreliable.
Source: U.S. Census Bureau, 2013-2017 American Community Survey Reliability: high medium low
September 25, 2019
©2019 Esri Page 8 of 24

ACS Population Summary7353-7399 St Louis Ave Village Of Skokie Only7353-7399 St Louis Ave, Skokie, Illinois, 60076 Latitude: 42.01519Drive Time: 10 minute radius Longitude: -87.71717
2013 - 2017ACS Estimate Percent MOE(±) Reliability
TOTALSTotal Population 190,853 4,042Total Households 65,619 1,065Total Housing Units 71,869 1,088
POPULATION AGE 3+ YEARS BY SCHOOL ENROLLMENTTotal 183,011 100.0% 3,840
Enrolled in school 48,836 26.7% 1,752Enrolled in nursery school, preschool 3,725 2.0% 403
Public school 1,422 0.8% 255Private school 2,303 1.3% 312
Enrolled in kindergarten 2,637 1.4% 302Public school 2,060 1.1% 269Private school 577 0.3% 137
Enrolled in grade 1 to grade 4 10,453 5.7% 714Public school 8,373 4.6% 655Private school 2,080 1.1% 298
Enrolled in grade 5 to grade 8 9,097 5.0% 649Public school 7,079 3.9% 573Private school 2,019 1.1% 313
Enrolled in grade 9 to grade 12 10,182 5.6% 728Public school 8,424 4.6% 671Private school 1,758 1.0% 288
Enrolled in college undergraduate years 9,397 5.1% 743Public school 6,528 3.6% 636Private school 2,869 1.6% 387
Enrolled in graduate or professional school 3,345 1.8% 359Public school 1,445 0.8% 263Private school 1,900 1.0% 239
Not enrolled in school 134,176 73.3% 2,259POPULATION AGE 65+ BY RELATIONSHIP AND HOUSEHOLD TYPETotal 31,064 100.0% 1,154
Living in Households 29,768 95.8% 1,120Living in Family Households 21,068 67.8% 1,059
Householder 9,329 30.0% 511Spouse 6,681 21.5% 429Parent 3,071 9.9% 509Parent-in-law 894 2.9% 291Other Relative 922 3.0% 211Nonrelative 171 0.6% 102
Living in Nonfamily Households 8,700 28.0% 551Householder 8,292 26.7% 523Nonrelative 408 1.3% 120
Living in Group Quarters 1,296 4.2% 279
Source: U.S. Census Bureau, 2013-2017 American Community Survey Reliability: high medium low
September 25, 2019
©2019 Esri Page 9 of 24

ACS Population Summary7353-7399 St Louis Ave Village Of Skokie Only7353-7399 St Louis Ave, Skokie, Illinois, 60076 Latitude: 42.01519Drive Time: 10 minute radius Longitude: -87.71717
2013 - 2017ACS Estimate Percent MOE(±) Reliability
HOUSEHOLDS BY TYPE AND SIZE Family Households 45,182 68.9% 1,025
2-Person 17,196 26.2% 7393-Person 10,038 15.3% 6194-Person 9,551 14.6% 6015-Person 4,766 7.3% 4256-Person 2,120 3.2% 3087+ Person 1,510 2.3% 251
Nonfamily Households 20,436 31.1% 8061-Person 16,956 25.8% 7352-Person 2,743 4.2% 3353-Person 601 0.9% 1934-Person 111 0.2% 625-Person 26 0.0% 206-Person 0 0.0% 07+ Person 0 0.0% 0
HOUSEHOLDS BY PRESENCE OF PEOPLE UNDER 18 YEARS BYHOUSEHOLD TYPEHouseholds with one or more people under 18 years 22,006 33.5% 807
Family households 21,936 33.4% 807Married-couple family 16,208 24.7% 705Male householder, no wife present 1,314 2.0% 237Female householder, no husband present 4,413 6.7% 451
Nonfamily households 70 0.1% 37Households with no people under 18 years 43,613 66.5% 1,000
Married-couple family 18,093 27.6% 724Other family 5,153 7.9% 443
Nonfamily households 20,366 31.0% 805
HOUSEHOLDS BY PRESENCE OF PEOPLE 65 YEARS AND OVER, HOUSEHOLD SIZE AND HOUSEHOLD TYPEHouseholds with Pop 65+ 21,125 32.2% 741
1-Person 7,812 11.9% 5112+ Person Family 12,780 19.5% 6032+ Person Nonfamily 533 0.8% 128
Households with No Pop 65+ 44,493 67.8% 1,0401-Person 9,145 13.9% 5592+ Person Family 32,402 49.4% 9602+ Person Nonfamily 2,947 4.5% 370
Source: U.S. Census Bureau, 2013-2017 American Community Survey Reliability: high medium low
September 25, 2019
©2019 Esri Page 10 of 24

ACS Population Summary7353-7399 St Louis Ave Village Of Skokie Only7353-7399 St Louis Ave, Skokie, Illinois, 60076 Latitude: 42.01519Drive Time: 10 minute radius Longitude: -87.71717
2013 - 2017ACS Estimate Percent MOE(±) Reliability
POPULATION AGE 5+ YEARS BY LANGUAGE SPOKEN AT HOME AND ABILITY TO SPEAK ENGLISHTotal 177,629 100.0% 3,716
5 to 17 yearsSpeak only English 18,924 10.7% 1,208Speak Spanish 4,071 2.3% 603
Speak English "very well" or "well" 3,845 2.2% 581Speak English "not well" 195 0.1% 99Speak English "not at all" 31 0.0% 46
Speak other Indo-European languages 4,414 2.5% 574Speak English "very well" or "well" 4,232 2.4% 545Speak English "not well" 170 0.1% 98Speak English "not at all" 12 0.0% 20
Speak Asian and Pacific Island languages 1,643 0.9% 320Speak English "very well" or "well" 1,471 0.8% 303Speak English "not well" 164 0.1% 97Speak English "not at all" 8 0.0% 11
Speak other languages 3,302 1.9% 705Speak English "very well" or "well" 2,740 1.5% 582Speak English "not well" 494 0.3% 292Speak English "not at all" 68 0.0% 75
18 to 64 yearsSpeak only English 55,319 31.1% 1,723Speak Spanish 15,097 8.5% 1,336
Speak English "very well" or "well" 12,106 6.8% 957Speak English "not well" 2,157 1.2% 452Speak English "not at all" 833 0.5% 287
Speak other Indo-European languages 22,968 12.9% 1,657Speak English "very well" or "well" 19,609 11.0% 1,291Speak English "not well" 2,608 1.5% 416Speak English "not at all" 751 0.4% 232
Speak Asian and Pacific Island languages 10,315 5.8% 952Speak English "very well" or "well" 8,929 5.0% 800Speak English "not well" 1,237 0.7% 231Speak English "not at all" 148 0.1% 64
Speak other languages 10,510 5.9% 1,201Speak English "very well" or "well" 8,314 4.7% 873Speak English "not well" 1,619 0.9% 421Speak English "not at all" 577 0.3% 220
65 years and overSpeak only English 17,180 9.7% 802Speak Spanish 1,822 1.0% 342
Speak English "very well" or "well" 1,069 0.6% 241Speak English "not well" 493 0.3% 154Speak English "not at all" 260 0.1% 98
Speak other Indo-European languages 6,588 3.7% 631Speak English "very well" or "well" 4,168 2.3% 475Speak English "not well" 1,732 1.0% 326Speak English "not at all" 689 0.4% 196
Speak Asian and Pacific Island languages 3,682 2.1% 495Speak English "very well" or "well" 2,528 1.4% 429Speak English "not well" 819 0.5% 193Speak English "not at all" 335 0.2% 105
Speak other languages 1,792 1.0% 441Speak English "very well" or "well" 842 0.5% 210Speak English "not well" 451 0.3% 173Speak English "not at all" 498 0.3% 315
Source: U.S. Census Bureau, 2013-2017 American Community Survey Reliability: high medium low
September 25, 2019
©2019 Esri Page 11 of 24

ACS Population Summary7353-7399 St Louis Ave Village Of Skokie Only7353-7399 St Louis Ave, Skokie, Illinois, 60076 Latitude: 42.01519Drive Time: 10 minute radius Longitude: -87.71717
2013 - 2017ACS Estimate Percent MOE(±) Reliability
WORKERS AGE 16+ YEARS BY PLACE OF WORKTotal 87,542 100.0% 2,168
Worked in state and in county of residence 81,118 92.7% 2,088Worked in state and outside county of residence 5,948 6.8% 513Worked outside state of residence 476 0.5% 138
SEX BY CLASS OF WORKER FOR THE CIVILIAN EMPLOYED POPULATION 16 YEARSAND OVERTotal: 89,436 100.0% 2,197
Male: 46,654 52.2% 1,429Employee of private company workers
30,889 34.5% 1,259
Self-employed in own incorporated business workers
3,159 3.5% 330Private not-for-profit wage and salary workers 4,726 5.3% 412Local government workers 2,366 2.6% 275State government workers 722 0.8% 142Federal government workers 637 0.7% 163Self-employed in own not incorporated business workers 4,056 4.5% 447Unpaid family workers 99 0.1% 54
Female: 42,782 47.8% 1,296Employee of private company workers
26,266 29.4% 1,115Self-employed in own incorporated business workers
1,394 1.6% 203Private not-for-profit wage and salary workers 7,858 8.8% 544Local government workers 3,263 3.6% 320State government workers 1,062 1.2% 210Federal government workers 436 0.5% 102Self-employed in own not incorporated business workers 2,384 2.7% 283Unpaid family workers 119 0.1% 67
Source: U.S. Census Bureau, 2013-2017 American Community Survey Reliability: high medium low
September 25, 2019
©2019 Esri Page 12 of 24

ACS Population Summary7353-7399 St Louis Ave Village Of Skokie Only7353-7399 St Louis Ave, Skokie, Illinois, 60076 Latitude: 42.01519Drive Time: 10 minute radius Longitude: -87.71717
2013 - 2017ACS Estimate Percent MOE(±) Reliability
WORKERS AGE 16+ YEARS BY MEANS OF TRANSPORTATION TO WORKTotal 87,542 100.0% 2,168
Drove alone 55,129 63.0% 1,608Carpooled 8,766 10.0% 789Public transportation (excluding taxicab) 13,259 15.1% 848
Bus or trolley bus 5,527 6.3% 575Streetcar or trolley car 32 0.0% 41Subway or elevated 4,537 5.2% 513Railroad 3,155 3.6% 357Ferryboat 9 0.0% 21
Taxicab 469 0.5% 140Motorcycle 59 0.1% 34Bicycle 1,236 1.4% 230Walked 3,415 3.9% 492Other means 538 0.6% 143Worked at home 4,671 5.3% 424
WORKERS AGE 16+ YEARS (WHO DID NOT WORK FROM HOME) BY TRAVEL TIME TO WORKTotal 82,871 100.0% 2,123
Less than 5 minutes 1,181 1.4% 2395 to 9 minutes 4,966 6.0% 49610 to 14 minutes 9,406 11.4% 72615 to 19 minutes 8,816 10.6% 61620 to 24 minutes 9,537 11.5% 65925 to 29 minutes 4,597 5.5% 49630 to 34 minutes 12,951 15.6% 84935 to 39 minutes 3,160 3.8% 37540 to 44 minutes 4,679 5.6% 44845 to 59 minutes 12,244 14.8% 73760 to 89 minutes 9,764 11.8% 73290 or more minutes 1,571 1.9% 254
Average Travel Time to Work (in minutes) N/A N/A
FEMALES AGE 20-64 YEARS BY AGE OF OWN CHILDREN AND EMPLOYMENT STATUSTotal 56,839 100.0% 1,522
Own children under 6 years only 5,066 8.9% 466In labor force 3,273 5.8% 364Not in labor force 1,793 3.2% 296
Own children under 6 years and 6 to 17 years 4,362 7.7% 407In labor force 2,682 4.7% 305Not in labor force 1,680 3.0% 289
Own children 6 to 17 years only 11,547 20.3% 647In labor force 8,860 15.6% 553Not in labor force 2,686 4.7% 362
No own children under 18 years 35,865 63.1% 1,356In labor force 26,334 46.3% 1,107Not in labor force 9,531 16.8% 709
Source: U.S. Census Bureau, 2013-2017 American Community Survey Reliability: high medium low
September 25, 2019
©2019 Esri Page 13 of 24

ACS Population Summary7353-7399 St Louis Ave Village Of Skokie Only7353-7399 St Louis Ave, Skokie, Illinois, 60076 Latitude: 42.01519Drive Time: 10 minute radius Longitude: -87.71717
2013 - 2017ACS Estimate Percent MOE(±) Reliability
CIVILIAN NONINSTITUTIONALIZED POPULATION BY AGE & TYPES OHEALINSURANCE COVERAGEOF HEALTH INSURANCE COVERAGETotal 189,109 100.0% 4,033
Under 19 years: 47,403 25.1% 2,012One Type of Health Insurance: 44,297 23.4% 1,941
Employer-Based Health Ins Only 23,377 12.4% 1,280Direct-Purchase Health Ins Only 2,420 1.3% 442Medicare Coverage Only 98 0.1% 79Medicaid Coverage Only 18,366 9.7% 1,611TRICARE/Military Hlth Cov Only 36 0.0% 28VA Health Care Only 0 0.0% 0
2+ Types of Health Insurance 2,091 1.1% 436No Health Insurance Coverage 1,015 0.5% 264
19 to 34 years: 35,540 18.8% 1,576One Type of Health Insurance: 26,424 14.0% 1,265
Employer-Based Health Ins Only 17,700 9.4% 995Direct-Purchase Health Ins Only 3,428 1.8% 423Medicare Coverage Only 137 0.1% 90Medicaid Coverage Only 5,133 2.7% 649TRICARE/Military Hlth Cov Only 22 0.0% 28VA Health Care Only 3 0.0% 10
2+ Types of Health Insurance 1,295 0.7% 250No Health Insurance Coverage 7,821 4.1% 91135 to 64 years: 76,287 40.3% 1,943
One Type of Health Insurance: 61,843 32.7% 1,730Employer-Based Health Ins Only 44,336 23.4% 1,450Direct-Purchase Health Ins Only 7,579 4.0% 652Medicare Coverage Only 766 0.4% 167Medicaid Coverage Only 8,930 4.7% 930TRICARE/Military Hlth Cov Only 79 0.0% 60VA Health Care Only 152 0.1% 83
2+ Types of Health Insurance 4,205 2.2% 440No Health Insurance Coverage 10,240 5.4% 89165+ years: 29,879 15.8% 1,123
One Type of Health Insurance: 9,958 5.3% 698Employer-Based Health Ins Only 1,293 0.7% 256Direct-Purchase Health Ins Only 250 0.1% 91Medicare Coverage Only 8,414 4.4% 650TRICARE/Military Hlth Cov Only 0 0.0% 0VA Health Care Only 0 0.0% 6
2+ Types of Health Insurance: 19,161 10.1% 897Employer-Based & Direct-Purchase Health Insurance 12 0.0% 12Employer-Based Health & Medicare Insurance 5,185 2.7% 447Direct-Purchase Health & Medicare Insurance 6,784 3.6% 539Medicare & Medicaid Coverage 4,007 2.1% 546Other Private Health Insurance Combos 5 0.0% 9Other Public Health Insurance Combos 303 0.2% 104Other Health Insurance Combinations 2,866 1.5% 310
No Health Insurance Coverage 760 0.4% 253
Source: U.S. Census Bureau, 2013-2017 American Community Survey Reliability: high medium low
September 25, 2019
©2019 Esri Page 14 of 24

ACS Population Summary7353-7399 St Louis Ave Village Of Skokie Only7353-7399 St Louis Ave, Skokie, Illinois, 60076 Latitude: 42.01519Drive Time: 10 minute radius Longitude: -87.71717
2013 - 2017ACS Estimate Percent MOE(±) Reliability
POPULATION BY RATIO OF INCOME TO POVERTY LEVELTotal 188,813 100.0% 4,028
Under .50 11,088 5.9% 1,574.50 to .99 14,589 7.7% 1,8581.00 to 1.24 9,828 5.2% 1,4901.25 to 1.49 8,552 4.5% 1,2671.50 to 1.84 11,499 6.1% 1,3321.85 to 1.99 5,064 2.7% 9072.00 and over 128,193 67.9% 3,282
CIVILIAN POPULATION AGE 18 OR OLDER BY VETERAN STATUSTotal 145,233 100.0% 2,935
Veteran 4,663 3.2% 398Nonveteran 140,570 96.8% 2,916
Male 68,498 47.2% 1,716Veteran 4,353 3.0% 378Nonveteran 64,145 44.2% 1,701
Female 76,735 52.8% 1,736Veteran 310 0.2% 104Nonveteran 76,425 52.6% 1,732
CIVILIAN VETERANS AGE 18 OR OLDER BY PERIOD OF MILITARY SERVICETotal 4,663 100.0% 398
Gulf War (9/01 or later), no Gulf War (8/90 to 8/01), no Vietnam Era 345 7.4% 96Gulf War (9/01 or later) and Gulf War (8/90 to 8/01), no Vietnam Era 111 2.4% 62Gulf War (9/01 or later), and Gulf War (8/90 to 8/01), and Vietnam Era 0 0.0% 0Gulf War (8/90 to 8/01), no Vietnam Era 572 12.3% 156Gulf War (8/90 to 8/01) and Vietnam Era 26 0.6% 25Vietnam Era, no Korean War, no World War II 1,289 27.6% 184Vietnam Era and Korean War, no World War II 19 0.4% 23Vietnam Era and Korean War and World War II 0 0.0% 0Korean War, no Vietnam Era, no World War II 481 10.3% 135Korean War and World War II, no Vietnam Era 19 0.4% 25World War II, no Korean War, no Vietnam Era 612 13.1% 130Between Gulf War and Vietnam Era only 636 13.6% 167Between Vietnam Era and Korean War only 528 11.3% 124Between Korean War and World War II only 25 0.5% 34Pre-World War II only 0 0.0% 0
HOUSEHOLDS BY POVERTY STATUSTotal 65,619 100.0% 1,065
Income in the past 12 months below poverty level 8,356 12.7% 612Married-couple family 2,594 4.0% 365Other family - male householder (no wife present) 387 0.6% 140Other family - female householder (no husband present) 1,579 2.4% 296Nonfamily household - male householder 1,652 2.5% 249Nonfamily household - female householder 2,144 3.3% 315
Income in the past 12 months at or above poverty level 57,263 87.3% 1,061Married-couple family 31,708 48.3% 894Other family - male householder (no wife present) 2,647 4.0% 330Other family - female householder (no husband present) 6,268 9.6% 488Nonfamily household - male householder 6,741 10.3% 505Nonfamily household - female householder 9,899 15.1% 586
Source: U.S. Census Bureau, 2013-2017 American Community Survey Reliability: high medium low
September 25, 2019
©2019 Esri Page 15 of 24

ACS Population Summary7353-7399 St Louis Ave Village Of Skokie Only7353-7399 St Louis Ave, Skokie, Illinois, 60076 Latitude: 42.01519Drive Time: 10 minute radius Longitude: -87.71717
2013 - 2017ACS Estimate Percent MOE(±) Reliability
HOUSEHOLDS BY OTHER INCOMESocial Security Income 19,084 29.1% 719No Social Security Income 46,535 70.9% 1,045
Retirement Income 9,203 14.0% 512No Retirement Income 56,416 86.0% 1,085
GROSS RENT AS A PERCENTAGE OF HOUSEHOLD INCOME IN THE PAST 12 MONTHS <10% of Income 747 3.0% 152
10-14.9% of Income 1,738 6.9% 26715-19.9% of Income 2,766 11.0% 33720-24.9% of Income 2,929 11.7% 40425-29.9% of Income 2,548 10.2% 35530-34.9% of Income 2,135 8.5% 32835-39.9% of Income 1,427 5.7% 24340-49.9% of Income 2,637 10.5% 36550+% of Income 6,801 27.1% 577Gross Rent % Inc Not Computed 1,363 5.4% 250
HOUSEHOLDS BY PUBLIC ASSISTANCE INCOME IN THE PAST 12 MONTHSTotal 65,619 100.0% 1,065
With public assistance income 2,450 3.7% 331No public assistance income 63,168 96.3% 1,076
HOUSEHOLDS BY FOOD STAMPS/SNAP STATUSTotal 65,619 100.0% 1,065
With Food Stamps/SNAP 8,605 13.1% 587With No Food Stamps/SNAP 57,014 86.9% 1,070
HOUSEHOLDS BY DISABILITY STATUSTotal 65,619 100.0% 1,065
With 1+ Persons w/Disability 15,395 23.5% 728With No Person w/Disability 50,224 76.5% 1,149
Data Note: N/A means not available. Population by Ratio of Income to Poverty Level represents persons for whom poverty status is determined. Household income represents income in 2015, adjusted for inflation.
2013-2017 ACS Estimate: The American Community Survey (ACS) replaces census sample data. Esri is releasing the 2013-2017 ACS estimates, five-year period data collected monthly from January 1, 2011 through December 31, 2015. Although the ACS includes many of the subjects previously covered by the decennial census sample, there are significant differences between the two surveys including fundamental differences in survey design and residency rules.
Margin of error (MOE): The MOE is a measure of the variability of the estimate due to sampling error. MOEs enable the data user to measure the range of uncertainty for each estimate with 90 percent confidence. The range of uncertainty is called the confidence interval, and it is calculated by taking the estimate +/- the MOE. For example, if the ACS reports an estimate of 100 with an MOE of +/- 20, then you can be 90 percent certain the value for the whole population falls between 80 and 120.
Reliability: These symbols represent threshold values that Esri has established from the Coefficients of Variation (CV) to designate the usability of the estimates. The CV measures the amount of sampling error relative to the size of the estimate, expressed as a percentage.
High Reliability: Small CVs (less than or equal to 12 percent) are flagged green to indicate that the sampling error is small relative to the estimate and the estimate is reasonably reliable.
Medium Reliability: Estimates with CVs between 12 and 40 are flagged yellow-use with caution.
Low Reliability: Large CVs (over 40 percent) are flagged red to indicate that the sampling error is largerelative to the estimate. The estimate is considered very unreliable.
Source: U.S. Census Bureau, 2013-2017 American Community Survey Reliability: high medium low
September 25, 2019
©2019 Esri Page 16 of 24

ACS Population Summary7353-7399 St Louis Ave Village Of Skokie Only7353-7399 St Louis Ave, Skokie, Illinois, 60076 Latitude: 42.01519Drive Time: 15 minute radius Longitude: -87.71717
2013 - 2017ACS Estimate Percent MOE(±) Reliability
TOTALSTotal Population 486,090 6,451Total Households 178,924 1,793Total Housing Units 197,125 1,817
POPULATION AGE 3+ YEARS BY SCHOOL ENROLLMENTTotal 467,658 100.0% 6,139
Enrolled in school 125,704 26.9% 2,905Enrolled in nursery school, preschool 9,072 1.9% 681
Public school 4,204 0.9% 495Private school 4,869 1.0% 470
Enrolled in kindergarten 6,066 1.3% 513Public school 4,812 1.0% 467Private school 1,254 0.3% 218
Enrolled in grade 1 to grade 4 22,298 4.8% 1,048Public school 18,188 3.9% 972Private school 4,110 0.9% 423
Enrolled in grade 5 to grade 8 22,295 4.8% 1,054Public school 18,528 4.0% 979Private school 3,767 0.8% 406
Enrolled in grade 9 to grade 12 21,651 4.6% 1,028Public school 18,445 3.9% 959Private school 3,206 0.7% 379
Enrolled in college undergraduate years 32,508 7.0% 1,576Public school 15,979 3.4% 973Private school 16,529 3.5% 1,178
Enrolled in graduate or professional school 11,815 2.5% 742Public school 3,685 0.8% 396Private school 8,129 1.7% 626
Not enrolled in school 341,953 73.1% 3,715POPULATION AGE 65+ BY RELATIONSHIP AND HOUSEHOLD TYPETotal 71,166 100.0% 1,710
Living in Households 66,558 93.5% 1,632Living in Family Households 44,819 63.0% 1,509
Householder 20,660 29.0% 757Spouse 14,323 20.1% 625Parent 5,928 8.3% 693Parent-in-law 1,695 2.4% 363Other Relative 1,874 2.6% 315Nonrelative 338 0.5% 129
Living in Nonfamily Households 21,739 30.5% 876Householder 20,700 29.1% 830Nonrelative 1,039 1.5% 221
Living in Group Quarters 4,608 6.5% 522
Source: U.S. Census Bureau, 2013-2017 American Community Survey Reliability: high medium low
September 25, 2019
©2019 Esri Page 17 of 24

ACS Population Summary7353-7399 St Louis Ave Village Of Skokie Only7353-7399 St Louis Ave, Skokie, Illinois, 60076 Latitude: 42.01519Drive Time: 15 minute radius Longitude: -87.71717
2013 - 2017ACS Estimate Percent MOE(±) Reliability
HOUSEHOLDS BY TYPE AND SIZE Family Households 108,837 60.8% 1,625
2-Person 43,350 24.2% 1,1793-Person 24,940 13.9% 9644-Person 22,622 12.6% 9145-Person 10,966 6.1% 6626-Person 4,357 2.4% 4477+ Person 2,602 1.5% 326
Nonfamily Households 70,087 39.2% 1,4531-Person 55,596 31.1% 1,3402-Person 11,533 6.4% 6573-Person 1,932 1.1% 3164-Person 677 0.4% 1855-Person 232 0.1% 976-Person 56 0.0% 607+ Person 62 0.0% 47
HOUSEHOLDS BY PRESENCE OF PEOPLE UNDER 18 YEARS BYHOUSEHOLD TYPEHouseholds with one or more people under 18 years 51,798 28.9% 1,286
Family households 51,496 28.8% 1,283Married-couple family 38,513 21.5% 1,116Male householder, no wife present 3,389 1.9% 395Female householder, no husband present 9,594 5.4% 681
Nonfamily households 302 0.2% 101Households with no people under 18 years 127,127 71.1% 1,700
Married-couple family 44,561 24.9% 1,128Other family 12,780 7.1% 723
Nonfamily households 69,785 39.0% 1,450
HOUSEHOLDS BY PRESENCE OF PEOPLE 65 YEARS AND OVER, HOUSEHOLD SIZE AND HOUSEHOLD TYPEHouseholds with Pop 65+ 48,545 27.1% 1,127
1-Person 19,741 11.0% 8132+ Person Family 27,512 15.4% 8792+ Person Nonfamily 1,292 0.7% 220
Households with No Pop 65+ 130,379 72.9% 1,7521-Person 35,854 20.0% 1,1352+ Person Family 81,325 45.5% 1,5252+ Person Nonfamily 13,200 7.4% 711
Source: U.S. Census Bureau, 2013-2017 American Community Survey Reliability: high medium low
September 25, 2019
©2019 Esri Page 18 of 24

ACS Population Summary7353-7399 St Louis Ave Village Of Skokie Only7353-7399 St Louis Ave, Skokie, Illinois, 60076 Latitude: 42.01519Drive Time: 15 minute radius Longitude: -87.71717
2013 - 2017ACS Estimate Percent MOE(±) Reliability
POPULATION AGE 5+ YEARS BY LANGUAGE SPOKEN AT HOME AND ABILITY TO SPEAK ENGLISHTotal 454,851 100.0% 5,938
5 to 17 yearsSpeak only English 41,254 9.1% 1,712Speak Spanish 14,211 3.1% 1,183
Speak English "very well" or "well" 13,383 2.9% 1,131Speak English "not well" 719 0.2% 206Speak English "not at all" 108 0.0% 85
Speak other Indo-European languages 7,911 1.7% 794Speak English "very well" or "well" 7,593 1.7% 763Speak English "not well" 297 0.1% 138Speak English "not at all" 21 0.0% 24
Speak Asian and Pacific Island languages 4,011 0.9% 564Speak English "very well" or "well" 3,736 0.8% 539Speak English "not well" 236 0.1% 115Speak English "not at all" 39 0.0% 32
Speak other languages 4,696 1.0% 813Speak English "very well" or "well" 3,981 0.9% 698Speak English "not well" 577 0.1% 305Speak English "not at all" 138 0.0% 99
18 to 64 yearsSpeak only English 166,715 36.7% 3,113Speak Spanish 52,769 11.6% 2,447
Speak English "very well" or "well" 38,427 8.4% 1,712Speak English "not well" 9,815 2.2% 877Speak English "not at all" 4,527 1.0% 807
Speak other Indo-European languages 46,808 10.3% 2,285Speak English "very well" or "well" 40,699 8.9% 1,823Speak English "not well" 5,096 1.1% 592Speak English "not at all" 1,014 0.2% 291
Speak Asian and Pacific Island languages 27,527 6.1% 1,561Speak English "very well" or "well" 23,071 5.1% 1,266Speak English "not well" 3,606 0.8% 452Speak English "not at all" 849 0.2% 278
Speak other languages 17,783 3.9% 1,561Speak English "very well" or "well" 14,583 3.2% 1,216Speak English "not well" 2,288 0.5% 447Speak English "not at all" 912 0.2% 339
65 years and overSpeak only English 42,322 9.3% 1,253Speak Spanish 5,390 1.2% 585
Speak English "very well" or "well" 3,059 0.7% 403Speak English "not well" 1,526 0.3% 305Speak English "not at all" 806 0.2% 214
Speak other Indo-European languages 13,059 2.9% 856Speak English "very well" or "well" 8,244 1.8% 639Speak English "not well" 3,542 0.8% 446Speak English "not at all" 1,273 0.3% 270
Speak Asian and Pacific Island languages 7,564 1.7% 691Speak English "very well" or "well" 4,973 1.1% 548Speak English "not well" 1,809 0.4% 329Speak English "not at all" 782 0.2% 210
Speak other languages 2,831 0.6% 511Speak English "very well" or "well" 1,464 0.3% 283Speak English "not well" 699 0.2% 218Speak English "not at all" 668 0.1% 328
Source: U.S. Census Bureau, 2013-2017 American Community Survey Reliability: high medium low
September 25, 2019
©2019 Esri Page 19 of 24

ACS Population Summary7353-7399 St Louis Ave Village Of Skokie Only7353-7399 St Louis Ave, Skokie, Illinois, 60076 Latitude: 42.01519Drive Time: 15 minute radius Longitude: -87.71717
2013 - 2017ACS Estimate Percent MOE(±) Reliability
WORKERS AGE 16+ YEARS BY PLACE OF WORKTotal 236,666 100.0% 3,573
Worked in state and in county of residence 219,397 92.7% 3,447Worked in state and outside county of residence 15,597 6.6% 838Worked outside state of residence 1,671 0.7% 252
SEX BY CLASS OF WORKER FOR THE CIVILIAN EMPLOYED POPULATION 16 YEARSAND OVERTotal: 241,316 100.0% 3,610
Male: 127,477 52.8% 2,387Employee of private company workers
86,444 35.8% 2,097
Self-employed in own incorporated business workers
7,095 2.9% 516Private not-for-profit wage and salary workers 13,203 5.5% 781Local government workers 7,102 2.9% 519State government workers 2,036 0.8% 272Federal government workers 1,412 0.6% 230Self-employed in own not incorporated business workers 9,990 4.1% 721Unpaid family workers 196 0.1% 131
Female: 113,839 47.2% 2,136Employee of private company workers
69,683 28.9% 1,802Self-employed in own incorporated business workers
3,565 1.5% 346Private not-for-profit wage and salary workers 21,064 8.7% 927Local government workers 8,608 3.6% 566State government workers 2,807 1.2% 353Federal government workers 1,267 0.5% 233Self-employed in own not incorporated business workers 6,581 2.7% 528Unpaid family workers 264 0.1% 117
Source: U.S. Census Bureau, 2013-2017 American Community Survey Reliability: high medium low
September 25, 2019
©2019 Esri Page 20 of 24

ACS Population Summary7353-7399 St Louis Ave Village Of Skokie Only7353-7399 St Louis Ave, Skokie, Illinois, 60076 Latitude: 42.01519Drive Time: 15 minute radius Longitude: -87.71717
2013 - 2017ACS Estimate Percent MOE(±) Reliability
WORKERS AGE 16+ YEARS BY MEANS OF TRANSPORTATION TO WORKTotal 236,666 100.0% 3,573
Drove alone 132,618 56.0% 2,575Carpooled 19,094 8.1% 1,145Public transportation (excluding taxicab) 53,661 22.7% 1,726
Bus or trolley bus 17,663 7.5% 1,064Streetcar or trolley car 236 0.1% 88Subway or elevated 25,745 10.9% 1,192Railroad 10,003 4.2% 636Ferryboat 14 0.0% 23
Taxicab 1,052 0.4% 249Motorcycle 256 0.1% 110Bicycle 3,588 1.5% 410Walked 12,020 5.1% 810Other means 1,726 0.7% 283Worked at home 12,651 5.3% 745
WORKERS AGE 16+ YEARS (WHO DID NOT WORK FROM HOME) BY TRAVEL TIME TO WORKTotal 224,015 100.0% 3,490
Less than 5 minutes 2,838 1.3% 3615 to 9 minutes 12,072 5.4% 76610 to 14 minutes 20,688 9.2% 1,06015 to 19 minutes 20,495 9.1% 1,00920 to 24 minutes 24,550 11.0% 1,16025 to 29 minutes 11,425 5.1% 76730 to 34 minutes 35,084 15.7% 1,39235 to 39 minutes 8,967 4.0% 63340 to 44 minutes 15,218 6.8% 82545 to 59 minutes 38,770 17.3% 1,40960 to 89 minutes 28,703 12.8% 1,23390 or more minutes 5,206 2.3% 507
Average Travel Time to Work (in minutes) N/A N/A
FEMALES AGE 20-64 YEARS BY AGE OF OWN CHILDREN AND EMPLOYMENT STATUSTotal 148,370 100.0% 2,495
Own children under 6 years only 12,781 8.6% 743In labor force 8,356 5.6% 587Not in labor force 4,425 3.0% 466
Own children under 6 years and 6 to 17 years 9,364 6.3% 620In labor force 5,552 3.7% 482Not in labor force 3,812 2.6% 422
Own children 6 to 17 years only 26,614 17.9% 988In labor force 20,251 13.6% 867Not in labor force 6,363 4.3% 530
No own children under 18 years 99,610 67.1% 2,254In labor force 76,060 51.3% 1,885Not in labor force 23,550 15.9% 1,159
Source: U.S. Census Bureau, 2013-2017 American Community Survey Reliability: high medium low
September 25, 2019
©2019 Esri Page 21 of 24

ACS Population Summary7353-7399 St Louis Ave Village Of Skokie Only7353-7399 St Louis Ave, Skokie, Illinois, 60076 Latitude: 42.01519Drive Time: 15 minute radius Longitude: -87.71717
2013 - 2017ACS Estimate Percent MOE(±) Reliability
CIVILIAN NONINSTITUTIONALIZED POPULATION BY AGE & TYPES OHEALINSURANCE COVERAGEOF HEALTH INSURANCE COVERAGETotal 479,087 100.0% 6,416
Under 19 years: 109,441 22.8% 3,034One Type of Health Insurance: 102,085 21.3% 2,926
Employer-Based Health Ins Only 55,300 11.5% 1,937Direct-Purchase Health Ins Only 6,424 1.3% 683Medicare Coverage Only 205 0.0% 132Medicaid Coverage Only 39,962 8.3% 2,316TRICARE/Military Hlth Cov Only 139 0.0% 78VA Health Care Only 55 0.0% 88
2+ Types of Health Insurance 4,316 0.9% 691No Health Insurance Coverage 3,041 0.6% 449
19 to 34 years: 112,464 23.5% 2,949One Type of Health Insurance: 86,733 18.1% 2,468
Employer-Based Health Ins Only 60,521 12.6% 1,962Direct-Purchase Health Ins Only 13,212 2.8% 988Medicare Coverage Only 215 0.0% 100Medicaid Coverage Only 12,435 2.6% 1,021TRICARE/Military Hlth Cov Only 244 0.1% 126VA Health Care Only 106 0.0% 54
2+ Types of Health Insurance 3,701 0.8% 404No Health Insurance Coverage 22,031 4.6% 1,46235 to 64 years: 190,367 39.7% 3,028
One Type of Health Insurance: 153,681 32.1% 2,659Employer-Based Health Ins Only 113,283 23.6% 2,302Direct-Purchase Health Ins Only 19,066 4.0% 1,033Medicare Coverage Only 2,100 0.4% 316Medicaid Coverage Only 18,661 3.9% 1,255TRICARE/Military Hlth Cov Only 236 0.0% 111VA Health Care Only 336 0.1% 115
2+ Types of Health Insurance 9,587 2.0% 694No Health Insurance Coverage 27,098 5.7% 1,47465+ years: 66,815 13.9% 1,636
One Type of Health Insurance: 21,735 4.5% 1,031Employer-Based Health Ins Only 2,683 0.6% 347Direct-Purchase Health Ins Only 548 0.1% 160Medicare Coverage Only 18,485 3.9% 963TRICARE/Military Hlth Cov Only 0 0.0% 0VA Health Care Only 19 0.0% 20
2+ Types of Health Insurance: 43,709 9.1% 1,314Employer-Based & Direct-Purchase Health Insurance 73 0.0% 39Employer-Based Health & Medicare Insurance 12,205 2.5% 701Direct-Purchase Health & Medicare Insurance 14,712 3.1% 789Medicare & Medicaid Coverage 8,994 1.9% 751Other Private Health Insurance Combos 5 0.0% 9Other Public Health Insurance Combos 634 0.1% 154Other Health Insurance Combinations 7,086 1.5% 492
No Health Insurance Coverage 1,371 0.3% 307
Source: U.S. Census Bureau, 2013-2017 American Community Survey Reliability: high medium low
September 25, 2019
©2019 Esri Page 22 of 24

ACS Population Summary7353-7399 St Louis Ave Village Of Skokie Only7353-7399 St Louis Ave, Skokie, Illinois, 60076 Latitude: 42.01519Drive Time: 15 minute radius Longitude: -87.71717
2013 - 2017ACS Estimate Percent MOE(±) Reliability
POPULATION BY RATIO OF INCOME TO POVERTY LEVELTotal 471,150 100.0% 6,331
Under .50 31,298 6.6% 2,376.50 to .99 36,554 7.8% 2,6611.00 to 1.24 22,729 4.8% 2,2811.25 to 1.49 20,475 4.3% 1,8851.50 to 1.84 27,828 5.9% 2,0751.85 to 1.99 10,374 2.2% 1,2262.00 and over 321,893 68.3% 5,082
CIVILIAN POPULATION AGE 18 OR OLDER BY VETERAN STATUSTotal 382,657 100.0% 4,827
Veteran 12,393 3.2% 678Nonveteran 370,264 96.8% 4,788
Male 183,725 48.0% 2,925Veteran 11,462 3.0% 635Nonveteran 172,263 45.0% 2,891
Female 198,932 52.0% 2,883Veteran 931 0.2% 197Nonveteran 198,001 51.7% 2,876
CIVILIAN VETERANS AGE 18 OR OLDER BY PERIOD OF MILITARY SERVICETotal 12,393 100.0% 678
Gulf War (9/01 or later), no Gulf War (8/90 to 8/01), no Vietnam Era 1,112 9.0% 246Gulf War (9/01 or later) and Gulf War (8/90 to 8/01), no Vietnam Era 252 2.0% 93Gulf War (9/01 or later), and Gulf War (8/90 to 8/01), and Vietnam Era 14 0.1% 17Gulf War (8/90 to 8/01), no Vietnam Era 1,440 11.6% 270Gulf War (8/90 to 8/01) and Vietnam Era 52 0.4% 30Vietnam Era, no Korean War, no World War II 3,863 31.2% 348Vietnam Era and Korean War, no World War II 51 0.4% 37Vietnam Era and Korean War and World War II 0 0.0% 0Korean War, no Vietnam Era, no World War II 1,212 9.8% 192Korean War and World War II, no Vietnam Era 52 0.4% 36World War II, no Korean War, no Vietnam Era 1,402 11.3% 207Between Gulf War and Vietnam Era only 1,618 13.1% 262Between Vietnam Era and Korean War only 1,251 10.1% 194Between Korean War and World War II only 66 0.5% 40Pre-World War II only 7 0.1% 13
HOUSEHOLDS BY POVERTY STATUSTotal 178,924 100.0% 1,793
Income in the past 12 months below poverty level 24,645 13.8% 1,034Married-couple family 5,805 3.2% 538Other family - male householder (no wife present) 1,083 0.6% 225Other family - female householder (no husband present) 3,954 2.2% 466Nonfamily household - male householder 6,248 3.5% 536Nonfamily household - female householder 7,555 4.2% 563
Income in the past 12 months at or above poverty level 154,279 86.2% 1,763Married-couple family 77,269 43.2% 1,411Other family - male householder (no wife present) 6,590 3.7% 549Other family - female householder (no husband present) 14,136 7.9% 767Nonfamily household - male householder 25,441 14.2% 1,000Nonfamily household - female householder 30,844 17.2% 1,031
Source: U.S. Census Bureau, 2013-2017 American Community Survey Reliability: high medium low
September 25, 2019
©2019 Esri Page 23 of 24

ACS Population Summary7353-7399 St Louis Ave Village Of Skokie Only7353-7399 St Louis Ave, Skokie, Illinois, 60076 Latitude: 42.01519Drive Time: 15 minute radius Longitude: -87.71717
2013 - 2017ACS Estimate Percent MOE(±) Reliability
HOUSEHOLDS BY OTHER INCOMESocial Security Income 45,129 25.2% 1,122No Social Security Income 133,795 74.8% 1,767
Retirement Income 22,393 12.5% 809No Retirement Income 156,531 87.5% 1,824
GROSS RENT AS A PERCENTAGE OF HOUSEHOLD INCOME IN THE PAST 12 MONTHS <10% of Income 2,942 3.6% 374
10-14.9% of Income 6,390 7.8% 52015-19.9% of Income 8,971 11.0% 63120-24.9% of Income 9,433 11.5% 67325-29.9% of Income 9,099 11.1% 65730-34.9% of Income 7,130 8.7% 58535-39.9% of Income 5,465 6.7% 51840-49.9% of Income 7,683 9.4% 62950+% of Income 20,739 25.3% 975Gross Rent % Inc Not Computed 3,968 4.8% 441
HOUSEHOLDS BY PUBLIC ASSISTANCE INCOME IN THE PAST 12 MONTHSTotal 178,924 100.0% 1,793
With public assistance income 5,416 3.0% 484No public assistance income 173,509 97.0% 1,802
HOUSEHOLDS BY FOOD STAMPS/SNAP STATUSTotal 178,924 100.0% 1,793
With Food Stamps/SNAP 21,493 12.0% 954With No Food Stamps/SNAP 157,432 88.0% 1,781
HOUSEHOLDS BY DISABILITY STATUSTotal 178,924 100.0% 1,793
With 1+ Persons w/Disability 37,584 21.0% 1,174With No Person w/Disability 141,340 79.0% 1,899
Data Note: N/A means not available. Population by Ratio of Income to Poverty Level represents persons for whom poverty status is determined. Household income represents income in 2015, adjusted for inflation.
2013-2017 ACS Estimate: The American Community Survey (ACS) replaces census sample data. Esri is releasing the 2013-2017 ACS estimates, five-year period data collected monthly from January 1, 2011 through December 31, 2015. Although the ACS includes many of the subjects previously covered by the decennial census sample, there are significant differences between the two surveys including fundamental differences in survey design and residency rules.
Margin of error (MOE): The MOE is a measure of the variability of the estimate due to sampling error. MOEs enable the data user to measure the range of uncertainty for each estimate with 90 percent confidence. The range of uncertainty is called the confidence interval, and it is calculated by taking the estimate +/- the MOE. For example, if the ACS reports an estimate of 100 with an MOE of +/- 20, then you can be 90 percent certain the value for the whole population falls between 80 and 120.
Reliability: These symbols represent threshold values that Esri has established from the Coefficients of Variation (CV) to designate the usability of the estimates. The CV measures the amount of sampling error relative to the size of the estimate, expressed as a percentage.
High Reliability: Small CVs (less than or equal to 12 percent) are flagged green to indicate that the sampling error is small relative to the estimate and the estimate is reasonably reliable.
Medium Reliability: Estimates with CVs between 12 and 40 are flagged yellow-use with caution.
Low Reliability: Large CVs (over 40 percent) are flagged red to indicate that the sampling error is largerelative to the estimate. The estimate is considered very unreliable.
Source: U.S. Census Bureau, 2013-2017 American Community Survey Reliability: high medium low
September 25, 2019
©2019 Esri Page 24 of 24

Age 50+ Profile7353-7399 St Louis Ave Village Of Skokie Only7353-7399 St Louis Ave, Skokie, Illinois, 60076 Latitude: 42.01519Drive Time: 5 minute radius Longitude: -87.71717
2019-2024 2019-2024Demographic Summary Census 2010 2019 2024 Change Annual Rate
Total Population 19,211 19,188 19,016 -172 -0.18%Population 50+ 7,792 8,353 8,302 -51 -0.12%Median Age 42.6 44.2 44.4 0.2 0.09%Households 6,540 6,451 6,373 -78 -0.24%% Householders 55+ 55.9% 60.7% 60.9% 0.2 0.07%Total Owner-Occupied Housing Units 5,445 5,250 5,236 -14 -0.05%Total Renter-Occupied Housing Units 1,095 1,201 1,137 -64 -1.09%Owner/Renter Ratio (per 100 renters) 497 437 461 24.0 1.08%Median Home Value - $331,766 $350,612 $18,846 1.11%Average Home Value - $383,784 $411,082 $27,298 1.38%Median Household Income - $86,110 $97,707 $11,597 2.56%Median Household Income for Householder 55+ - $72,739 $79,132 $6,393 1.70%
Population by Age and Sex Census 2010 2019 2024
Male Population Number % of 50+ Number % of 50+ Number % of 50+Total (50+) 3,496 100.0% 3,794 100.0% 3,758 100.0%
50-54 685 19.6% 569 15.0% 534 14.2%55-59 651 18.6% 631 16.6% 541 14.4%60-64 636 18.2% 640 16.9% 608 16.2%65-69 400 11.4% 573 15.1% 566 15.1%70-74 307 8.8% 445 11.7% 489 13.0%75-79 275 7.9% 346 9.1% 416 11.1%80-84 252 7.2% 242 6.4% 258 6.9%85+ 290 8.3% 348 9.2% 346 9.2%
Census 2010 2019 2024Female Population Number % of 50+ Number % of 50+ Number % of 50+Total (50+) 4,295 100.0% 4,561 100.0% 4,546 100.0%
50-54 754 17.6% 606 13.3% 582 12.8%55-59 766 17.8% 719 15.8% 617 13.6%60-64 659 15.3% 731 16.0% 665 14.6%65-69 469 10.9% 661 14.5% 672 14.8%70-74 436 10.2% 570 12.5% 634 13.9%75-79 325 7.6% 408 8.9% 474 10.4%80-84 366 8.5% 320 7.0% 375 8.2%85+ 520 12.1% 546 12.0% 527 11.6%
Census 2010 2019 2024Total Population Number % of Total Pop Number % of Total Pop Number % of Total PopTotal(50+) 7,792 40.6% 8,353 43.5% 8,302 43.7%
50-54 1,439 7.5% 1,175 6.1% 1,116 5.9%55-59 1,416 7.4% 1,350 7.0% 1,158 6.1%60-64 1,295 6.7% 1,371 7.1% 1,272 6.7%65-69 869 4.5% 1,234 6.4% 1,237 6.5%70-74 744 3.9% 1,014 5.3% 1,123 5.9%75-79 600 3.1% 754 3.9% 890 4.7%80-84 619 3.2% 561 2.9% 633 3.3%85+ 810 4.2% 894 4.7% 873 4.6%
65+ 3,642 19.0% 4,457 23.2% 4,756 25.0%75+ 2,029 10.6% 2,209 11.5% 2,396 12.6%
Data Note - A "-" indicates that the variable was not collected in the 2010 Census.Source: U.S. Census Bureau, Census 2010 Summary File 1. Esri forecasts for 2019 and 2024.
September 25, 2019
©2019 Esri Page 1 of 9

Age 50+ Profile7353-7399 St Louis Ave Village Of Skokie Only7353-7399 St Louis Ave, Skokie, Illinois, 60076 Latitude: 42.01519Drive Time: 5 minute radius Longitude: -87.71717
2019 Households by Income and Age of Householder 55+55-64 Percent 65-74 Percent 75+ Percent Total Percent
Total 1,356 100% 1,163 100% 1,396 100% 3,915 100%<$15,000 60 4.4% 51 4.4% 168 12.0% 279 7.1%$15,000-$24,999 67 4.9% 94 8.1% 181 13.0% 342 8.7%$25,000-$34,999 33 2.4% 47 4.0% 150 10.7% 230 5.9%$35,000-$49,999 81 6.0% 90 7.7% 282 20.2% 453 11.6%$50,000-$74,999 173 12.8% 246 21.2% 280 20.1% 699 17.9%$75,000-$99,999 190 14.0% 194 16.7% 92 6.6% 476 12.2%$100,000-$149,999 356 26.3% 201 17.3% 159 11.4% 716 18.3%$150,000-$199,999 228 16.8% 101 8.7% 43 3.1% 372 9.5%$200,000+ 169 12.5% 138 11.9% 41 2.9% 348 8.9%
Median HH Income $106,822 $80,338 $44,362 $72,739Average HH Income $125,944 $108,658 $62,827 $98,303
2024 Households by Income and Age of Householder 55+55-64 Percent 65-74 Percent 75+ Percent Total Percent
Total 1,191 100% 1,204 100% 1,484 100% 3,879 100%<$15,000 41 3.4% 48 4.0% 164 11.1% 253 6.5%$15,000-$24,999 53 4.5% 85 7.1% 179 12.1% 317 8.2%$25,000-$34,999 23 1.9% 38 3.2% 146 9.8% 207 5.3%$35,000-$49,999 55 4.6% 79 6.6% 281 18.9% 415 10.7%$50,000-$74,999 132 11.1% 235 19.5% 293 19.7% 660 17.0%$75,000-$99,999 146 12.3% 181 15.0% 98 6.6% 425 11.0%$100,000-$149,999 313 26.3% 222 18.4% 202 13.6% 737 19.0%$150,000-$199,999 251 21.1% 133 11.0% 65 4.4% 449 11.6%$200,000+ 176 14.8% 183 15.2% 56 3.8% 415 10.7%
Median HH Income $117,447 $89,449 $47,975 $79,132Average HH Income $142,742 $125,878 $72,012 $110,477
Data Note: Income is reported for households as of July 1, 2019 and represents annual income for the preceding year, expressed in 2017 dollars. Income is reported for households as of July 1, 2024 and represents annual income for the preceding year, expressed in 2022 dollars.Source: U.S. Census Bureau, Census 2010 Summary File 1. Esri forecasts for 2019 and 2024.
September 25, 2019
©2019 Esri Page 2 of 9

Age 50+ Profile7353-7399 St Louis Ave Village Of Skokie Only7353-7399 St Louis Ave, Skokie, Illinois, 60076 Latitude: 42.01519Drive Time: 5 minute radius Longitude: -87.71717
Census 2010 Households and Age of Householder Number Percent % Total HHsTotal 3,656 100.0% 55.9%
Family Households 2,365 64.7% 36.2%Householder Age 55-64 1,139 31.2% 17.4%Householder Age 65-74 625 17.1% 9.6%Householder Age 75-84 410 11.2% 6.3%Householder Age 85+ 191 5.2% 2.9%
Nonfamily Households 1,291 35.3% 19.7%Householder Age 55-64 286 7.8% 4.4%Householder Age 65-74 255 7.0% 3.9%Householder Age 75-84 337 9.2% 5.2%Householder Age 85+ 413 11.3% 6.3%
Census 2010 Occupied Housing Units by Age of Householder Number Percent % Total HHsTotal 3,657 100.0% 55.9%Owner Occupied Housing Units 3,147 86.1% 48.1%
Householder Age 55-64 1,304 35.7% 19.9%Householder Age 65-74 800 21.9% 12.2%Householder Age 75-84 639 17.5% 9.8%Householder Age 85+ 404 11.0% 6.2%
Renter Occupied Housing Units 510 13.9% 7.8%Householder Age 55-64 121 3.3% 1.9%Householder Age 65-74 81 2.2% 1.2%Householder Age 75-84 108 3.0% 1.7%Householder Age 85+ 200 5.5% 3.1%
Data Note: A family is defined as a householder and one or more other people living in the same household who are related to the householder by birth, marriage, or adoption. Nonfamily households consist of people living alone and households that do not contain any members who are related to the householder. The base for "% Pop" is specific to the row. A Nonrelative is not related to the householder by birth, marriage, or adoption.Source: U.S. Census Bureau, Census 2010 Summary File 1. Esri forecasts for 2019 and 2024.
September 25, 2019
©2019 Esri Page 3 of 9

Age 50+ Profile7353-7399 St Louis Ave Village Of Skokie Only7353-7399 St Louis Ave, Skokie, Illinois, 60076 Latitude: 42.01519Drive Time: 10 minute radius Longitude: -87.71717
2019-2024 2019-2024Demographic Summary Census 2010 2019 2024 Change Annual Rate
Total Population 185,578 185,523 184,250 -1,273 -0.14%Population 50+ 64,046 69,873 71,085 1,212 0.34%Median Age 38.7 39.9 40.6 0.7 0.35%Households 66,618 66,502 66,011 -491 -0.15%% Householders 55+ 44.4% 49.9% 50.9% 1.0 0.40%Total Owner-Occupied Housing Units 41,966 40,239 40,480 241 0.12%Total Renter-Occupied Housing Units 24,652 26,263 25,531 -732 -0.56%Owner/Renter Ratio (per 100 renters) 170 153 159 6.0 0.77%Median Home Value - $347,418 $371,004 $23,586 1.32%Average Home Value - $396,119 $428,574 $32,455 1.59%Median Household Income - $72,067 $79,798 $7,731 2.06%Median Household Income for Householder 55+ - $63,209 $68,821 $5,612 1.72%
Population by Age and Sex Census 2010 2019 2024
Male Population Number % of 50+ Number % of 50+ Number % of 50+Total (50+) 28,742 100.0% 31,615 100.0% 32,234 100.0%
50-54 6,563 22.8% 5,657 17.9% 5,507 17.1%55-59 6,049 21.0% 5,941 18.8% 5,376 16.7%60-64 4,973 17.3% 5,600 17.7% 5,468 17.0%65-69 3,397 11.8% 4,721 14.9% 4,917 15.3%70-74 2,599 9.0% 3,576 11.3% 4,052 12.6%75-79 2,001 7.0% 2,494 7.9% 3,008 9.3%80-84 1,655 5.8% 1,737 5.5% 1,941 6.0%85+ 1,505 5.2% 1,889 6.0% 1,965 6.1%
Census 2010 2019 2024Female Population Number % of 50+ Number % of 50+ Number % of 50+Total (50+) 35,302 100.0% 38,259 100.0% 38,851 100.0%
50-54 7,096 20.1% 6,185 16.2% 5,962 15.3%55-59 6,861 19.4% 6,589 17.2% 5,956 15.3%60-64 5,669 16.1% 6,332 16.6% 6,060 15.6%65-69 4,075 11.5% 5,718 14.9% 5,758 14.8%70-74 3,390 9.6% 4,497 11.8% 5,136 13.2%75-79 2,678 7.6% 3,225 8.4% 3,901 10.0%80-84 2,523 7.1% 2,433 6.4% 2,714 7.0%85+ 3,010 8.5% 3,280 8.6% 3,364 8.7%
Census 2010 2019 2024Total Population Number % of Total Pop Number % of Total Pop Number % of Total PopTotal(50+) 64,046 34.5% 69,873 37.7% 71,085 38.6%
50-54 13,659 7.4% 11,842 6.4% 11,469 6.2%55-59 12,910 7.0% 12,530 6.8% 11,332 6.2%60-64 10,643 5.7% 11,932 6.4% 11,527 6.3%65-69 7,472 4.0% 10,439 5.6% 10,675 5.8%70-74 5,989 3.2% 8,073 4.4% 9,188 5.0%75-79 4,679 2.5% 5,719 3.1% 6,909 3.7%80-84 4,178 2.3% 4,169 2.2% 4,656 2.5%85+ 4,516 2.4% 5,169 2.8% 5,329 2.9%
65+ 26,834 14.5% 33,569 18.1% 36,757 19.9%75+ 13,373 7.2% 15,057 8.1% 16,894 9.2%
Data Note - A "-" indicates that the variable was not collected in the 2010 Census.Source: U.S. Census Bureau, Census 2010 Summary File 1. Esri forecasts for 2019 and 2024.
September 25, 2019
©2019 Esri Page 4 of 9

Age 50+ Profile7353-7399 St Louis Ave Village Of Skokie Only7353-7399 St Louis Ave, Skokie, Illinois, 60076 Latitude: 42.01519Drive Time: 10 minute radius Longitude: -87.71717
2019 Households by Income and Age of Householder 55+55-64 Percent 65-74 Percent 75+ Percent Total Percent
Total 13,398 100% 10,428 100% 9,375 100% 33,201 100%<$15,000 1,056 7.9% 993 9.5% 1,427 15.2% 3,476 10.5%$15,000-$24,999 874 6.5% 982 9.4% 1,270 13.5% 3,126 9.4%$25,000-$34,999 617 4.6% 720 6.9% 1,198 12.8% 2,535 7.6%$35,000-$49,999 1,060 7.9% 1,123 10.8% 1,706 18.2% 3,889 11.7%$50,000-$74,999 2,040 15.2% 2,005 19.2% 1,729 18.4% 5,774 17.4%$75,000-$99,999 1,938 14.5% 1,568 15.0% 611 6.5% 4,117 12.4%$100,000-$149,999 2,691 20.1% 1,441 13.8% 839 8.9% 4,971 15.0%$150,000-$199,999 1,473 11.0% 660 6.3% 289 3.1% 2,422 7.3%$200,000+ 1,647 12.3% 935 9.0% 306 3.3% 2,888 8.7%
Median HH Income $86,763 $65,238 $40,639 $63,209Average HH Income $114,802 $93,232 $60,846 $92,800
2024 Households by Income and Age of Householder 55+55-64 Percent 65-74 Percent 75+ Percent Total Percent
Total 12,305 100% 11,025 100% 10,292 100% 33,622 100%<$15,000 817 6.6% 957 8.7% 1,455 14.1% 3,229 9.6%$15,000-$24,999 719 5.8% 946 8.6% 1,297 12.6% 2,962 8.8%$25,000-$34,999 467 3.8% 663 6.0% 1,238 12.0% 2,368 7.0%$35,000-$49,999 820 6.7% 1,027 9.3% 1,755 17.1% 3,602 10.7%$50,000-$74,999 1,792 14.6% 2,059 18.7% 1,867 18.1% 5,718 17.0%$75,000-$99,999 1,714 13.9% 1,603 14.5% 713 6.9% 4,030 12.0%$100,000-$149,999 2,589 21.0% 1,645 14.9% 1,094 10.6% 5,328 15.8%$150,000-$199,999 1,655 13.4% 879 8.0% 439 4.3% 2,973 8.8%$200,000+ 1,731 14.1% 1,246 11.3% 433 4.2% 3,410 10.1%
Median HH Income $96,725 $72,635 $43,671 $68,821Average HH Income $128,494 $107,094 $69,711 $103,489
Data Note: Income is reported for households as of July 1, 2019 and represents annual income for the preceding year, expressed in 2017 dollars. Income is reported for households as of July 1, 2024 and represents annual income for the preceding year, expressed in 2022 dollars.Source: U.S. Census Bureau, Census 2010 Summary File 1. Esri forecasts for 2019 and 2024.
September 25, 2019
©2019 Esri Page 5 of 9

Age 50+ Profile7353-7399 St Louis Ave Village Of Skokie Only7353-7399 St Louis Ave, Skokie, Illinois, 60076 Latitude: 42.01519Drive Time: 10 minute radius Longitude: -87.71717
Census 2010 Households and Age of Householder Number Percent % Total HHsTotal 29,601 100.0% 44.4%
Family Households 18,160 61.3% 27.3%Householder Age 55-64 9,239 31.2% 13.9%Householder Age 65-74 4,974 16.8% 7.5%Householder Age 75-84 2,860 9.7% 4.3%Householder Age 85+ 1,087 3.7% 1.6%
Nonfamily Households 11,441 38.7% 17.2%Householder Age 55-64 3,990 13.5% 6.0%Householder Age 65-74 2,810 9.5% 4.2%Householder Age 75-84 2,669 9.0% 4.0%Householder Age 85+ 1,972 6.7% 3.0%
Census 2010 Occupied Housing Units by Age of Householder Number Percent % Total HHsTotal 29,601 100.0% 44.4%Owner Occupied Housing Units 22,169 74.9% 33.3%
Householder Age 55-64 9,789 33.1% 14.7%Householder Age 65-74 5,942 20.1% 8.9%Householder Age 75-84 4,197 14.2% 6.3%Householder Age 85+ 2,241 7.6% 3.4%
Renter Occupied Housing Units 7,432 25.1% 11.2%Householder Age 55-64 3,440 11.6% 5.2%Householder Age 65-74 1,842 6.2% 2.8%Householder Age 75-84 1,332 4.5% 2.0%Householder Age 85+ 818 2.8% 1.2%
Data Note: A family is defined as a householder and one or more other people living in the same household who are related to the householder by birth, marriage, or adoption. Nonfamily households consist of people living alone and households that do not contain any members who are related to the householder. The base for "% Pop" is specific to the row. A Nonrelative is not related to the householder by birth, marriage, or adoption.Source: U.S. Census Bureau, Census 2010 Summary File 1. Esri forecasts for 2019 and 2024.
September 25, 2019
©2019 Esri Page 6 of 9

Age 50+ Profile7353-7399 St Louis Ave Village Of Skokie Only7353-7399 St Louis Ave, Skokie, Illinois, 60076 Latitude: 42.01519Drive Time: 15 minute radius Longitude: -87.71717
2019-2024 2019-2024Demographic Summary Census 2010 2019 2024 Change Annual Rate
Total Population 475,588 477,852 475,755 -2,097 -0.09%Population 50+ 149,679 166,621 171,564 4,943 0.59%Median Age 36.8 38.2 39.0 0.8 0.42%Households 180,923 182,450 181,752 -698 -0.08%% Householders 55+ 38.7% 44.1% 45.4% 1.3 0.58%Total Owner-Occupied Housing Units 99,912 95,816 97,063 1,247 0.26%Total Renter-Occupied Housing Units 81,011 86,633 84,689 -1,944 -0.45%Owner/Renter Ratio (per 100 renters) 123 111 115 4.0 0.71%Median Home Value - $354,437 $382,162 $27,725 1.52%Average Home Value - $422,064 $456,076 $34,012 1.56%Median Household Income - $66,187 $74,914 $8,727 2.51%Median Household Income for Householder 55+ - $59,221 $64,161 $4,940 1.62%
Population by Age and Sex Census 2010 2019 2024
Male Population Number % of 50+ Number % of 50+ Number % of 50+Total (50+) 67,945 100.0% 76,775 100.0% 79,285 100.0%
50-54 15,985 23.5% 14,869 19.4% 14,461 18.2%55-59 14,547 21.4% 14,911 19.4% 13,907 17.5%60-64 11,863 17.5% 13,470 17.5% 13,644 17.2%65-69 7,962 11.7% 11,254 14.7% 11,766 14.8%70-74 5,912 8.7% 8,490 11.1% 9,604 12.1%75-79 4,521 6.7% 5,648 7.4% 7,053 8.9%80-84 3,796 5.6% 3,894 5.1% 4,422 5.6%85+ 3,359 4.9% 4,239 5.5% 4,428 5.6%
Census 2010 2019 2024Female Population Number % of 50+ Number % of 50+ Number % of 50+Total (50+) 81,732 100.0% 89,846 100.0% 92,276 100.0%
50-54 16,749 20.5% 15,000 16.7% 14,763 16.0%55-59 15,800 19.3% 15,823 17.6% 14,382 15.6%60-64 12,912 15.8% 14,820 16.5% 14,476 15.7%65-69 9,416 11.5% 13,130 14.6% 13,505 14.6%70-74 7,588 9.3% 10,257 11.4% 11,730 12.7%75-79 6,242 7.6% 7,398 8.2% 9,045 9.8%80-84 5,774 7.1% 5,551 6.2% 6,292 6.8%85+ 7,251 8.9% 7,867 8.8% 8,083 8.8%
Census 2010 2019 2024Total Population Number % of Total Pop Number % of Total Pop Number % of Total PopTotal(50+) 149,679 31.5% 166,621 34.9% 171,564 36.1%
50-54 32,734 6.9% 29,869 6.3% 29,224 6.1%55-59 30,347 6.4% 30,734 6.4% 28,289 5.9%60-64 24,775 5.2% 28,290 5.9% 28,120 5.9%65-69 17,378 3.7% 24,385 5.1% 25,272 5.3%70-74 13,501 2.8% 18,747 3.9% 21,334 4.5%75-79 10,763 2.3% 13,046 2.7% 16,099 3.4%80-84 9,570 2.0% 9,444 2.0% 10,714 2.3%85+ 10,611 2.2% 12,106 2.5% 12,512 2.6%
65+ 61,823 13.0% 77,728 16.3% 85,931 18.1%75+ 30,944 6.5% 34,596 7.2% 39,325 8.3%
Data Note - A "-" indicates that the variable was not collected in the 2010 Census.Source: U.S. Census Bureau, Census 2010 Summary File 1. Esri forecasts for 2019 and 2024.
September 25, 2019
©2019 Esri Page 7 of 9

Age 50+ Profile7353-7399 St Louis Ave Village Of Skokie Only7353-7399 St Louis Ave, Skokie, Illinois, 60076 Latitude: 42.01519Drive Time: 15 minute radius Longitude: -87.71717
2019 Households by Income and Age of Householder 55+55-64 Percent 65-74 Percent 75+ Percent Total Percent
Total 33,613 100% 25,294 100% 21,610 100% 80,517 100%<$15,000 3,179 9.5% 2,888 11.4% 3,920 18.1% 9,987 12.4%$15,000-$24,999 2,528 7.5% 2,710 10.7% 3,200 14.8% 8,438 10.5%$25,000-$34,999 1,713 5.1% 1,925 7.6% 2,734 12.7% 6,372 7.9%$35,000-$49,999 2,770 8.2% 2,772 11.0% 3,578 16.6% 9,120 11.3%$50,000-$74,999 5,318 15.8% 4,692 18.5% 3,763 17.4% 13,773 17.1%$75,000-$99,999 4,802 14.3% 3,493 13.8% 1,358 6.3% 9,653 12.0%$100,000-$149,999 5,895 17.5% 3,169 12.5% 1,741 8.1% 10,805 13.4%$150,000-$199,999 3,090 9.2% 1,465 5.8% 615 2.8% 5,170 6.4%$200,000+ 4,316 12.8% 2,179 8.6% 701 3.2% 7,196 8.9%
Median HH Income $80,391 $60,119 $38,025 $59,221Average HH Income $113,162 $89,666 $58,387 $91,083
2024 Households by Income and Age of Householder 55+55-64 Percent 65-74 Percent 75+ Percent Total Percent
Total 31,595 100% 26,885 100% 24,115 100% 82,595 100%<$15,000 2,552 8.1% 2,786 10.4% 4,121 17.1% 9,459 11.5%$15,000-$24,999 2,104 6.7% 2,618 9.7% 3,358 13.9% 8,080 9.8%$25,000-$34,999 1,363 4.3% 1,801 6.7% 2,894 12.0% 6,058 7.3%$35,000-$49,999 2,255 7.1% 2,604 9.7% 3,752 15.6% 8,611 10.4%$50,000-$74,999 4,825 15.3% 4,927 18.3% 4,174 17.3% 13,926 16.9%$75,000-$99,999 4,407 13.9% 3,668 13.6% 1,601 6.6% 9,676 11.7%$100,000-$149,999 5,903 18.7% 3,676 13.7% 2,281 9.5% 11,860 14.4%$150,000-$199,999 3,568 11.3% 1,942 7.2% 939 3.9% 6,449 7.8%$200,000+ 4,619 14.6% 2,864 10.7% 995 4.1% 8,478 10.3%
Median HH Income $88,608 $66,489 $40,513 $64,161Average HH Income $126,886 $102,714 $66,661 $101,432
Data Note: Income is reported for households as of July 1, 2019 and represents annual income for the preceding year, expressed in 2017 dollars. Income is reported for households as of July 1, 2024 and represents annual income for the preceding year, expressed in 2022 dollars.Source: U.S. Census Bureau, Census 2010 Summary File 1. Esri forecasts for 2019 and 2024.
September 25, 2019
©2019 Esri Page 8 of 9
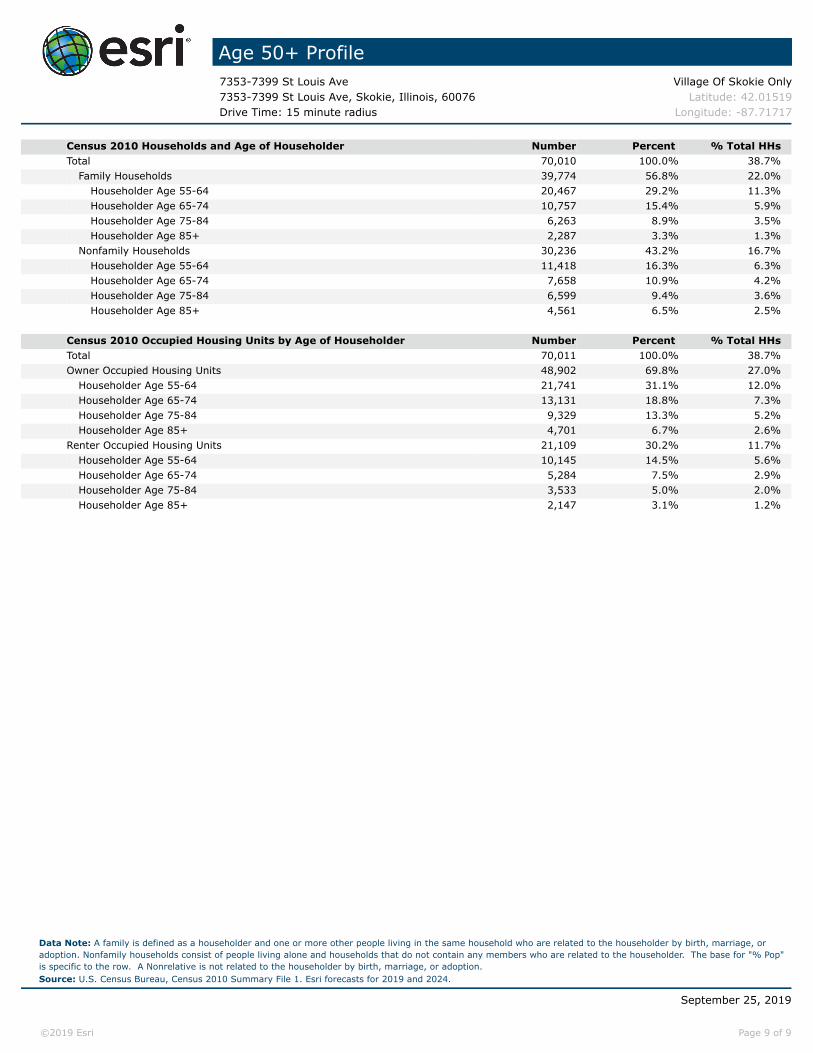
Age 50+ Profile7353-7399 St Louis Ave Village Of Skokie Only7353-7399 St Louis Ave, Skokie, Illinois, 60076 Latitude: 42.01519Drive Time: 15 minute radius Longitude: -87.71717
Census 2010 Households and Age of Householder Number Percent % Total HHsTotal 70,010 100.0% 38.7%
Family Households 39,774 56.8% 22.0%Householder Age 55-64 20,467 29.2% 11.3%Householder Age 65-74 10,757 15.4% 5.9%Householder Age 75-84 6,263 8.9% 3.5%Householder Age 85+ 2,287 3.3% 1.3%
Nonfamily Households 30,236 43.2% 16.7%Householder Age 55-64 11,418 16.3% 6.3%Householder Age 65-74 7,658 10.9% 4.2%Householder Age 75-84 6,599 9.4% 3.6%Householder Age 85+ 4,561 6.5% 2.5%
Census 2010 Occupied Housing Units by Age of Householder Number Percent % Total HHsTotal 70,011 100.0% 38.7%Owner Occupied Housing Units 48,902 69.8% 27.0%
Householder Age 55-64 21,741 31.1% 12.0%Householder Age 65-74 13,131 18.8% 7.3%Householder Age 75-84 9,329 13.3% 5.2%Householder Age 85+ 4,701 6.7% 2.6%
Renter Occupied Housing Units 21,109 30.2% 11.7%Householder Age 55-64 10,145 14.5% 5.6%Householder Age 65-74 5,284 7.5% 2.9%Householder Age 75-84 3,533 5.0% 2.0%Householder Age 85+ 2,147 3.1% 1.2%
Data Note: A family is defined as a householder and one or more other people living in the same household who are related to the householder by birth, marriage, or adoption. Nonfamily households consist of people living alone and households that do not contain any members who are related to the householder. The base for "% Pop" is specific to the row. A Nonrelative is not related to the householder by birth, marriage, or adoption.Source: U.S. Census Bureau, Census 2010 Summary File 1. Esri forecasts for 2019 and 2024.
September 25, 2019
©2019 Esri Page 9 of 9

Age by Sex by Race Profile7353-7399 St Louis Ave Village Of Skokie Only7353-7399 St Louis Ave, Skokie, Illinois, 60076 Latitude: 42.01519Drive Time: 5 minute radius Longitude: -87.71717
Summary Census 2010 2019 20242019-2024
Change2019-2024
Annual RatePopulation 19,211 19,188 19,016 -172 -0.18%Households 6,540 6,451 6,373 -78 -0.24%Median Age 42.6 44.2 44.4 0.2 0.09%Median Male Age 40.3 42.0 42.2 0.2 0.10%Median Female Age 44.5 46.2 46.4 0.2 0.09%
2019 Hispanic Population by Age
Total Males FemalesNumber Percent Number Percent Number Percent
Total 1,908 100.0% 939 100.0% 969 100.0%0 - 4 140 7.3% 73 7.8% 67 6.9%5 - 9 150 7.9% 78 8.3% 73 7.5%10 - 14 172 9.0% 87 9.3% 86 8.9%15 - 19 176 9.2% 94 10.0% 82 8.5%20 - 24 128 6.7% 68 7.2% 60 6.2%25 - 29 128 6.7% 64 6.8% 64 6.6%30 - 34 136 7.1% 64 6.8% 72 7.4%35 - 39 146 7.7% 70 7.5% 76 7.8%40 - 44 123 6.4% 52 5.5% 71 7.3%45 - 49 106 5.6% 57 6.1% 48 5.0%50 - 54 115 6.0% 60 6.4% 56 5.8%55 - 59 100 5.2% 45 4.8% 55 5.7%60 - 64 84 4.4% 36 3.8% 48 5.0%65 - 69 63 3.3% 24 2.6% 39 4.0%70 - 74 68 3.6% 33 3.5% 34 3.5%75 - 79 42 2.2% 19 2.0% 23 2.4%80 - 84 16 0.8% 8 0.9% 8 0.8%85+ 15 0.8% 7 0.7% 7 0.7%
Median Age 32.2 30.4 33.6
2024 Hispanic Population by Age
Total Males FemalesNumber Percent Number Percent Number Percent
Total 2,015 100.0% 995 100.0% 1,021 100.0%0 - 4 149 7.4% 79 7.9% 70 6.9%5 - 9 152 7.5% 78 7.8% 74 7.2%10 - 14 175 8.7% 88 8.8% 87 8.5%15 - 19 189 9.4% 103 10.4% 86 8.4%20 - 24 136 6.7% 70 7.0% 66 6.5%25 - 29 122 6.1% 67 6.7% 55 5.4%30 - 34 146 7.2% 71 7.1% 74 7.2%35 - 39 164 8.1% 78 7.8% 86 8.4%40 - 44 146 7.2% 58 5.8% 88 8.6%45 - 49 111 5.5% 61 6.1% 50 4.9%50 - 54 118 5.9% 61 6.1% 57 5.6%55 - 59 95 4.7% 43 4.3% 52 5.1%60 - 64 84 4.2% 35 3.5% 49 4.8%65 - 69 67 3.3% 25 2.5% 42 4.1%70 - 74 77 3.8% 37 3.7% 40 3.9%75 - 79 51 2.5% 23 2.3% 28 2.7%80 - 84 18 0.9% 9 0.9% 9 0.9%85+ 15 0.7% 7 0.7% 7 0.7%
Median Age 32.9 30.8 34.9
Source: U.S. Census Bureau, Census 2010 Summary File 1. Esri forecasts for 2019 and 2024.
September 25, 2019
©2019 Esri Page 1 of 24

Age by Sex by Race Profile7353-7399 St Louis Ave Village Of Skokie Only7353-7399 St Louis Ave, Skokie, Illinois, 60076 Latitude: 42.01519Drive Time: 5 minute radius Longitude: -87.71717
2019 White Population by Age
Total Males FemalesNumber Percent Number Percent Number Percent
Total 10,984 100.0% 5,253 100.0% 5,733 100.0%0 - 4 577 5.3% 306 5.8% 272 4.7%5 - 9 589 5.4% 322 6.1% 268 4.7%10 - 14 631 5.7% 326 6.2% 305 5.3%15 - 19 564 5.1% 289 5.5% 275 4.8%20 - 24 437 4.0% 220 4.2% 217 3.8%25 - 29 553 5.0% 273 5.2% 280 4.9%30 - 34 563 5.1% 272 5.2% 290 5.1%35 - 39 586 5.3% 292 5.6% 295 5.1%40 - 44 522 4.8% 256 4.9% 265 4.6%45 - 49 567 5.2% 279 5.3% 288 5.0%50 - 54 648 5.9% 297 5.7% 351 6.1%55 - 59 784 7.1% 369 7.0% 416 7.3%60 - 64 781 7.1% 372 7.1% 409 7.1%65 - 69 725 6.6% 339 6.5% 386 6.7%70 - 74 642 5.8% 276 5.3% 366 6.4%75 - 79 540 4.9% 244 4.6% 296 5.2%80 - 84 475 4.3% 205 3.9% 269 4.7%85+ 800 7.3% 316 6.0% 485 8.5%
Median Age 49.1 46.3 51.6
2024 White Population by Age
Total Males FemalesNumber Percent Number Percent Number Percent
Total 10,331 100.0% 4,946 100.0% 5,385 100.0%0 - 4 563 5.4% 303 6.1% 260 4.8%5 - 9 536 5.2% 292 5.9% 245 4.5%10 - 14 558 5.4% 293 5.9% 266 4.9%15 - 19 534 5.2% 282 5.7% 251 4.7%20 - 24 394 3.8% 196 4.0% 198 3.7%25 - 29 428 4.1% 220 4.4% 209 3.9%30 - 34 534 5.2% 251 5.1% 283 5.3%35 - 39 576 5.6% 286 5.8% 291 5.4%40 - 44 551 5.3% 278 5.6% 273 5.1%45 - 49 520 5.0% 261 5.3% 259 4.8%50 - 54 575 5.6% 257 5.2% 318 5.9%55 - 59 627 6.1% 293 5.9% 333 6.2%60 - 64 671 6.5% 328 6.6% 343 6.4%65 - 69 682 6.6% 313 6.3% 369 6.9%70 - 74 675 6.5% 287 5.8% 388 7.2%75 - 79 610 5.9% 283 5.7% 327 6.1%80 - 84 529 5.1% 216 4.4% 313 5.8%85+ 767 7.4% 308 6.2% 459 8.5%
Median Age 49.7 46.4 52.5
Source: U.S. Census Bureau, Census 2010 Summary File 1. Esri forecasts for 2019 and 2024.
September 25, 2019
©2019 Esri Page 2 of 24

Age by Sex by Race Profile7353-7399 St Louis Ave Village Of Skokie Only7353-7399 St Louis Ave, Skokie, Illinois, 60076 Latitude: 42.01519Drive Time: 5 minute radius Longitude: -87.71717
2019 Black Population by Age
Total Males FemalesNumber Percent Number Percent Number Percent
Total 665 100.0% 313 100.0% 353 100.0%0 - 4 33 5.0% 17 5.4% 16 4.5%5 - 9 45 6.8% 23 7.3% 22 6.2%10 - 14 55 8.3% 29 9.3% 26 7.4%15 - 19 59 8.9% 31 9.9% 28 7.9%20 - 24 39 5.9% 24 7.7% 15 4.2%25 - 29 37 5.6% 18 5.8% 18 5.1%30 - 34 38 5.7% 15 4.8% 22 6.2%35 - 39 41 6.2% 13 4.2% 28 7.9%40 - 44 44 6.6% 20 6.4% 24 6.8%45 - 49 48 7.2% 20 6.4% 28 7.9%50 - 54 54 8.1% 26 8.3% 29 8.2%55 - 59 48 7.2% 21 6.7% 27 7.6%60 - 64 41 6.2% 21 6.7% 20 5.7%65 - 69 31 4.7% 15 4.8% 16 4.5%70 - 74 27 4.1% 12 3.8% 15 4.2%75 - 79 13 2.0% 4 1.3% 10 2.8%80 - 84 7 1.1% 3 1.0% 5 1.4%85+ 5 0.8% 1 0.3% 4 1.1%
Median Age 38.2 34.8 40.3
2024 Black Population by Age
Total Males FemalesNumber Percent Number Percent Number Percent
Total 587 100.0% 278 100.0% 309 100.0%0 - 4 30 5.1% 15 5.4% 15 4.9%5 - 9 39 6.6% 21 7.6% 18 5.8%10 - 14 46 7.8% 24 8.6% 22 7.1%15 - 19 53 9.0% 28 10.1% 25 8.1%20 - 24 37 6.3% 23 8.3% 14 4.5%25 - 29 27 4.6% 15 5.4% 12 3.9%30 - 34 32 5.5% 13 4.7% 19 6.1%35 - 39 39 6.6% 14 5.0% 26 8.4%40 - 44 43 7.3% 21 7.6% 22 7.1%45 - 49 43 7.3% 18 6.5% 25 8.1%50 - 54 45 7.7% 22 7.9% 24 7.8%55 - 59 39 6.6% 16 5.8% 22 7.1%60 - 64 33 5.6% 16 5.8% 17 5.5%65 - 69 31 5.3% 16 5.8% 15 4.9%70 - 74 24 4.1% 10 3.6% 14 4.5%75 - 79 14 2.4% 4 1.4% 11 3.6%80 - 84 7 1.2% 2 0.7% 4 1.3%85+ 4 0.7% 1 0.4% 4 1.3%
Median Age 38.7 35.2 40.8
Source: U.S. Census Bureau, Census 2010 Summary File 1. Esri forecasts for 2019 and 2024.
September 25, 2019
©2019 Esri Page 3 of 24

Age by Sex by Race Profile7353-7399 St Louis Ave Village Of Skokie Only7353-7399 St Louis Ave, Skokie, Illinois, 60076 Latitude: 42.01519Drive Time: 5 minute radius Longitude: -87.71717
2019 American Indian Population by Age
Total Males FemalesNumber Percent Number Percent Number Percent
Total 25 100.0% 13 100.0% 10 100.0%0 - 4 3 12.0% 1 7.7% 2 20.0%5 - 9 3 12.0% 2 15.4% 1 10.0%10 - 14 2 8.0% 1 7.7% 1 10.0%15 - 19 2 8.0% 1 7.7% 0 0.0%20 - 24 1 4.0% 1 7.7% 0 0.0%25 - 29 1 4.0% 1 7.7% 0 0.0%30 - 34 1 4.0% 0 0.0% 1 10.0%35 - 39 3 12.0% 1 7.7% 2 20.0%40 - 44 1 4.0% 1 7.7% 0 0.0%45 - 49 2 8.0% 1 7.7% 1 10.0%50 - 54 2 8.0% 1 7.7% 1 10.0%55 - 59 2 8.0% 2 15.4% 0 0.0%60 - 64 0 0.0% 0 0.0% 0 0.0%65 - 69 1 4.0% 0 0.0% 0 0.0%70 - 74 0 0.0% 0 0.0% 0 0.0%75 - 79 1 4.0% 0 0.0% 1 10.0%80 - 84 0 0.0% 0 0.0% 0 0.0%85+ 0 0.0% 0 0.0% 0 0.0%
Median Age 32.5 27.5 35.0
2024 American Indian Population by Age
Total Males FemalesNumber Percent Number Percent Number Percent
Total 21 100.0% 10 100.0% 11 100.0%0 - 4 2 9.5% 0 0.0% 1 9.1%5 - 9 2 9.5% 2 20.0% 0 0.0%10 - 14 3 14.3% 1 10.0% 2 18.2%15 - 19 1 4.8% 0 0.0% 0 0.0%20 - 24 1 4.8% 1 10.0% 0 0.0%25 - 29 1 4.8% 0 0.0% 0 0.0%30 - 34 1 4.8% 0 0.0% 1 9.1%35 - 39 3 14.3% 1 10.0% 2 18.2%40 - 44 0 0.0% 0 0.0% 0 0.0%45 - 49 2 9.5% 1 10.0% 1 9.1%50 - 54 0 0.0% 0 0.0% 0 0.0%55 - 59 2 9.5% 1 10.0% 1 9.1%60 - 64 2 9.5% 2 20.0% 0 0.0%65 - 69 1 4.8% 0 0.0% 0 0.0%70 - 74 0 0.0% 0 0.0% 0 0.0%75 - 79 0 0.0% 0 0.0% 0 0.0%80 - 84 1 4.8% 0 0.0% 1 9.1%85+ 0 0.0% 0 0.0% 0 0.0%
Median Age 35.0 37.5 36.2
Source: U.S. Census Bureau, Census 2010 Summary File 1. Esri forecasts for 2019 and 2024.
September 25, 2019
©2019 Esri Page 4 of 24

Age by Sex by Race Profile7353-7399 St Louis Ave Village Of Skokie Only7353-7399 St Louis Ave, Skokie, Illinois, 60076 Latitude: 42.01519Drive Time: 5 minute radius Longitude: -87.71717
2019 Asian Population by Age
Total Males FemalesNumber Percent Number Percent Number Percent
Total 6,066 100.0% 2,916 100.0% 3,155 100.0%0 - 4 292 4.8% 145 5.0% 148 4.7%5 - 9 365 6.0% 193 6.6% 172 5.5%10 - 14 404 6.7% 210 7.2% 195 6.2%15 - 19 355 5.9% 180 6.2% 175 5.5%20 - 24 369 6.1% 187 6.4% 181 5.7%25 - 29 388 6.4% 188 6.4% 200 6.3%30 - 34 338 5.6% 178 6.1% 161 5.1%35 - 39 389 6.4% 176 6.0% 214 6.8%40 - 44 364 6.0% 165 5.7% 199 6.3%45 - 49 389 6.4% 178 6.1% 211 6.7%50 - 54 387 6.4% 195 6.7% 192 6.1%55 - 59 450 7.4% 208 7.1% 243 7.7%60 - 64 492 8.1% 224 7.7% 269 8.5%65 - 69 450 7.4% 205 7.0% 244 7.7%70 - 74 309 5.1% 142 4.9% 167 5.3%75 - 79 174 2.9% 87 3.0% 87 2.8%80 - 84 72 1.2% 28 1.0% 44 1.4%85+ 79 1.3% 27 0.9% 53 1.7%
Median Age 41.8 40.0 43.3
2024 Asian Population by Age
Total Males FemalesNumber Percent Number Percent Number Percent
Total 6,578 100.0% 3,173 100.0% 3,405 100.0%0 - 4 317 4.8% 158 5.0% 159 4.7%5 - 9 383 5.8% 200 6.3% 182 5.3%10 - 14 424 6.4% 221 7.0% 202 5.9%15 - 19 383 5.8% 200 6.3% 183 5.4%20 - 24 381 5.8% 190 6.0% 191 5.6%25 - 29 353 5.4% 177 5.6% 176 5.2%30 - 34 392 6.0% 205 6.5% 186 5.5%35 - 39 453 6.9% 205 6.5% 248 7.3%40 - 44 444 6.7% 202 6.4% 242 7.1%45 - 49 409 6.2% 191 6.0% 218 6.4%50 - 54 410 6.2% 204 6.4% 206 6.0%55 - 59 426 6.5% 198 6.2% 228 6.7%60 - 64 511 7.8% 240 7.6% 271 8.0%65 - 69 494 7.5% 222 7.0% 272 8.0%70 - 74 382 5.8% 173 5.5% 208 6.1%75 - 79 236 3.6% 118 3.7% 118 3.5%80 - 84 90 1.4% 36 1.1% 54 1.6%85+ 91 1.4% 32 1.0% 59 1.7%
Median Age 42.3 40.7 43.6
Source: U.S. Census Bureau, Census 2010 Summary File 1. Esri forecasts for 2019 and 2024.
September 25, 2019
©2019 Esri Page 5 of 24

Age by Sex by Race Profile7353-7399 St Louis Ave Village Of Skokie Only7353-7399 St Louis Ave, Skokie, Illinois, 60076 Latitude: 42.01519Drive Time: 5 minute radius Longitude: -87.71717
2019 Pacific Islander Population by Age
Total Males FemalesNumber Percent Number Percent Number Percent
Total 4 100.0% 2 100.0% 2 100.0%0 - 4 0 0.0% 0 0.0% 0 0.0%5 - 9 0 0.0% 0 0.0% 0 0.0%10 - 14 1 25.0% 0 0.0% 1 50.0%15 - 19 0 0.0% 0 0.0% 0 0.0%20 - 24 1 25.0% 0 0.0% 1 50.0%25 - 29 1 25.0% 1 50.0% 0 0.0%30 - 34 0 0.0% 0 0.0% 0 0.0%35 - 39 0 0.0% 0 0.0% 0 0.0%40 - 44 1 25.0% 1 50.0% 0 0.0%45 - 49 0 0.0% 0 0.0% 0 0.0%50 - 54 0 0.0% 0 0.0% 0 0.0%55 - 59 0 0.0% 0 0.0% 0 0.0%60 - 64 0 0.0% 0 0.0% 0 0.0%65 - 69 0 0.0% 0 0.0% 0 0.0%70 - 74 0 0.0% 0 0.0% 0 0.0%75 - 79 0 0.0% 0 0.0% 0 0.0%80 - 84 0 0.0% 0 0.0% 0 0.0%85+ 0 0.0% 0 0.0% 0 0.0%
Median Age 25.0 35.0 17.5
2024 Pacific Islander Population by Age
Total Males FemalesNumber Percent Number Percent Number Percent
Total 4 100.0% 2 100.0% 2 100.0%0 - 4 0 0.0% 0 0.0% 0 0.0%5 - 9 0 0.0% 0 0.0% 0 0.0%10 - 14 0 0.0% 0 0.0% 0 0.0%15 - 19 1 25.0% 0 0.0% 1 50.0%20 - 24 0 0.0% 0 0.0% 0 0.0%25 - 29 1 25.0% 0 0.0% 1 50.0%30 - 34 1 25.0% 1 50.0% 0 0.0%35 - 39 0 0.0% 0 0.0% 0 0.0%40 - 44 0 0.0% 0 0.0% 0 0.0%45 - 49 1 25.0% 1 50.0% 0 0.0%50 - 54 0 0.0% 0 0.0% 0 0.0%55 - 59 0 0.0% 0 0.0% 0 0.0%60 - 64 0 0.0% 0 0.0% 0 0.0%65 - 69 0 0.0% 0 0.0% 0 0.0%70 - 74 0 0.0% 0 0.0% 0 0.0%75 - 79 0 0.0% 0 0.0% 0 0.0%80 - 84 0 0.0% 0 0.0% 0 0.0%85+ 0 0.0% 0 0.0% 0 0.0%
Median Age 30.0 40.0 22.5
Source: U.S. Census Bureau, Census 2010 Summary File 1. Esri forecasts for 2019 and 2024.
September 25, 2019
©2019 Esri Page 6 of 24

Age by Sex by Race Profile7353-7399 St Louis Ave Village Of Skokie Only7353-7399 St Louis Ave, Skokie, Illinois, 60076 Latitude: 42.01519Drive Time: 5 minute radius Longitude: -87.71717
2019 Some Other Race Population by Age
Total Males FemalesNumber Percent Number Percent Number Percent
Total 710 100.0% 353 100.0% 359 100.0%0 - 4 49 6.9% 27 7.6% 22 6.1%5 - 9 56 7.9% 28 7.9% 28 7.8%10 - 14 58 8.2% 30 8.5% 28 7.8%15 - 19 67 9.4% 30 8.5% 36 10.0%20 - 24 59 8.3% 34 9.6% 24 6.7%25 - 29 50 7.0% 23 6.5% 27 7.5%30 - 34 66 9.3% 33 9.3% 34 9.5%35 - 39 60 8.5% 29 8.2% 32 8.9%40 - 44 47 6.6% 19 5.4% 28 7.8%45 - 49 47 6.6% 27 7.6% 20 5.6%50 - 54 45 6.3% 27 7.6% 18 5.0%55 - 59 38 5.4% 19 5.4% 19 5.3%60 - 64 32 4.5% 11 3.1% 21 5.8%65 - 69 12 1.7% 7 2.0% 5 1.4%70 - 74 8 1.1% 3 0.8% 5 1.4%75 - 79 10 1.4% 4 1.1% 7 1.9%80 - 84 1 0.1% 1 0.3% 1 0.3%85+ 5 0.7% 1 0.3% 4 1.1%
Median Age 31.2 30.7 32.1
2024 Some Other Race Population by Age
Total Males FemalesNumber Percent Number Percent Number Percent
Total 744 100.0% 367 100.0% 377 100.0%0 - 4 50 6.7% 28 7.6% 22 5.8%5 - 9 59 7.9% 29 7.9% 30 8.0%10 - 14 58 7.8% 30 8.2% 28 7.4%15 - 19 70 9.4% 33 9.0% 37 9.8%20 - 24 61 8.2% 35 9.5% 27 7.2%25 - 29 49 6.6% 24 6.5% 25 6.6%30 - 34 66 8.9% 33 9.0% 33 8.8%35 - 39 65 8.7% 30 8.2% 35 9.3%40 - 44 55 7.4% 21 5.7% 34 9.0%45 - 49 52 7.0% 29 7.9% 22 5.8%50 - 54 47 6.3% 28 7.6% 19 5.0%55 - 59 37 5.0% 18 4.9% 19 5.0%60 - 64 33 4.4% 11 3.0% 22 5.8%65 - 69 13 1.7% 7 1.9% 6 1.6%70 - 74 10 1.3% 5 1.4% 5 1.3%75 - 79 13 1.7% 4 1.1% 9 2.4%80 - 84 2 0.3% 1 0.3% 1 0.3%85+ 6 0.8% 2 0.5% 4 1.1%
Median Age 32.0 30.8 33.0
Source: U.S. Census Bureau, Census 2010 Summary File 1. Esri forecasts for 2019 and 2024.
September 25, 2019
©2019 Esri Page 7 of 24

Age by Sex by Race Profile7353-7399 St Louis Ave Village Of Skokie Only7353-7399 St Louis Ave, Skokie, Illinois, 60076 Latitude: 42.01519Drive Time: 5 minute radius Longitude: -87.71717
2019 Multiple Races Population by Age
Total Males FemalesNumber Percent Number Percent Number Percent
Total 735 100.0% 369 100.0% 364 100.0%0 - 4 77 10.5% 45 12.2% 32 8.8%5 - 9 75 10.2% 39 10.6% 36 9.9%10 - 14 88 12.0% 37 10.0% 51 14.0%15 - 19 79 10.7% 41 11.1% 38 10.4%20 - 24 49 6.7% 26 7.0% 23 6.3%25 - 29 41 5.6% 20 5.4% 21 5.8%30 - 34 54 7.3% 22 6.0% 31 8.5%35 - 39 42 5.7% 22 6.0% 20 5.5%40 - 44 32 4.4% 14 3.8% 18 4.9%45 - 49 35 4.8% 19 5.1% 16 4.4%50 - 54 39 5.3% 24 6.5% 15 4.1%55 - 59 29 3.9% 14 3.8% 15 4.1%60 - 64 24 3.3% 12 3.3% 12 3.3%65 - 69 16 2.2% 7 1.9% 9 2.5%70 - 74 29 3.9% 12 3.3% 17 4.7%75 - 79 15 2.0% 7 1.9% 8 2.2%80 - 84 6 0.8% 5 1.4% 1 0.3%85+ 5 0.7% 3 0.8% 1 0.3%
Median Age 24.9 24.3 25.5
2024 Multiple Races Population by Age
Total Males FemalesNumber Percent Number Percent Number Percent
Total 751 100.0% 381 100.0% 370 100.0%0 - 4 79 10.5% 45 11.8% 34 9.2%5 - 9 75 10.0% 40 10.5% 35 9.5%10 - 14 85 11.3% 37 9.7% 48 13.0%15 - 19 83 11.1% 46 12.1% 37 10.0%20 - 24 51 6.8% 27 7.1% 24 6.5%25 - 29 39 5.2% 19 5.0% 19 5.1%30 - 34 59 7.9% 25 6.6% 34 9.2%35 - 39 42 5.6% 22 5.8% 20 5.4%40 - 44 38 5.1% 16 4.2% 22 5.9%45 - 49 36 4.8% 20 5.2% 17 4.6%50 - 54 39 5.2% 23 6.0% 15 4.1%55 - 59 27 3.6% 13 3.4% 14 3.8%60 - 64 23 3.1% 11 2.9% 12 3.2%65 - 69 17 2.3% 7 1.8% 9 2.4%70 - 74 33 4.4% 15 3.9% 18 4.9%75 - 79 17 2.3% 7 1.8% 9 2.4%80 - 84 5 0.7% 4 1.0% 1 0.3%85+ 5 0.7% 3 0.8% 1 0.3%
Median Age 25.4 24.1 26.7
Data Note: Multiple Races population includes unique counts of the population who reported at least two races.Source: U.S. Census Bureau, Census 2010 Summary File 1. Esri forecasts for 2019 and 2024.
September 25, 2019
©2019 Esri Page 8 of 24

Age by Sex by Race Profile7353-7399 St Louis Ave Village Of Skokie Only7353-7399 St Louis Ave, Skokie, Illinois, 60076 Latitude: 42.01519Drive Time: 10 minute radius Longitude: -87.71717
Summary Census 2010 2019 20242019-2024
Change2019-2024
Annual RatePopulation 185,578 185,523 184,250 -1,273 -0.14%Households 66,618 66,502 66,011 -491 -0.15%Median Age 38.7 39.9 40.6 0.7 0.35%Median Male Age 37.0 38.2 38.8 0.6 0.31%Median Female Age 40.3 41.7 42.4 0.7 0.33%
2019 Hispanic Population by Age
Total Males FemalesNumber Percent Number Percent Number Percent
Total 29,983 100.0% 15,027 100.0% 14,955 100.0%0 - 4 2,777 9.3% 1,440 9.6% 1,338 8.9%5 - 9 2,713 9.0% 1,416 9.4% 1,297 8.7%10 - 14 2,801 9.3% 1,419 9.4% 1,382 9.2%15 - 19 2,610 8.7% 1,316 8.8% 1,294 8.7%20 - 24 2,410 8.0% 1,220 8.1% 1,191 8.0%25 - 29 2,487 8.3% 1,303 8.7% 1,183 7.9%30 - 34 2,394 8.0% 1,257 8.4% 1,137 7.6%35 - 39 2,335 7.8% 1,187 7.9% 1,148 7.7%40 - 44 1,930 6.4% 939 6.2% 991 6.6%45 - 49 1,725 5.8% 850 5.7% 874 5.8%50 - 54 1,436 4.8% 724 4.8% 712 4.8%55 - 59 1,239 4.1% 600 4.0% 638 4.3%60 - 64 918 3.1% 435 2.9% 483 3.2%65 - 69 807 2.7% 325 2.2% 482 3.2%70 - 74 617 2.1% 254 1.7% 363 2.4%75 - 79 389 1.3% 165 1.1% 224 1.5%80 - 84 222 0.7% 104 0.7% 118 0.8%85+ 173 0.6% 73 0.5% 100 0.7%
Median Age 28.4 27.7 29.1
2024 Hispanic Population by Age
Total Males FemalesNumber Percent Number Percent Number Percent
Total 31,962 100.0% 16,042 100.0% 15,920 100.0%0 - 4 2,981 9.3% 1,559 9.7% 1,421 8.9%5 - 9 2,754 8.6% 1,437 9.0% 1,317 8.3%10 - 14 2,760 8.6% 1,396 8.7% 1,364 8.6%15 - 19 2,684 8.4% 1,397 8.7% 1,287 8.1%20 - 24 2,535 7.9% 1,273 7.9% 1,262 7.9%25 - 29 2,696 8.4% 1,397 8.7% 1,298 8.2%30 - 34 2,776 8.7% 1,472 9.2% 1,304 8.2%35 - 39 2,459 7.7% 1,271 7.9% 1,188 7.5%40 - 44 2,163 6.8% 1,042 6.5% 1,122 7.0%45 - 49 1,757 5.5% 854 5.3% 903 5.7%50 - 54 1,538 4.8% 770 4.8% 769 4.8%55 - 59 1,260 3.9% 614 3.8% 647 4.1%60 - 64 982 3.1% 469 2.9% 513 3.2%65 - 69 904 2.8% 372 2.3% 531 3.3%70 - 74 756 2.4% 304 1.9% 453 2.8%75 - 79 500 1.6% 206 1.3% 293 1.8%80 - 84 263 0.8% 128 0.8% 135 0.8%85+ 193 0.6% 82 0.5% 111 0.7%
Median Age 29.2 28.4 30.0
Source: U.S. Census Bureau, Census 2010 Summary File 1. Esri forecasts for 2019 and 2024.
September 25, 2019
©2019 Esri Page 9 of 24

Age by Sex by Race Profile7353-7399 St Louis Ave Village Of Skokie Only7353-7399 St Louis Ave, Skokie, Illinois, 60076 Latitude: 42.01519Drive Time: 10 minute radius Longitude: -87.71717
2019 White Population by Age
Total Males FemalesNumber Percent Number Percent Number Percent
Total 99,825 100.0% 48,019 100.0% 51,805 100.0%0 - 4 5,366 5.4% 2,835 5.9% 2,531 4.9%5 - 9 5,375 5.4% 2,771 5.8% 2,604 5.0%10 - 14 5,664 5.7% 2,881 6.0% 2,783 5.4%15 - 19 5,097 5.1% 2,600 5.4% 2,497 4.8%20 - 24 4,940 4.9% 2,491 5.2% 2,448 4.7%25 - 29 5,506 5.5% 2,763 5.8% 2,743 5.3%30 - 34 5,662 5.7% 2,838 5.9% 2,824 5.5%35 - 39 5,797 5.8% 2,888 6.0% 2,909 5.6%40 - 44 5,668 5.7% 2,804 5.8% 2,864 5.5%45 - 49 6,348 6.4% 3,121 6.5% 3,228 6.2%50 - 54 6,676 6.7% 3,214 6.7% 3,462 6.7%55 - 59 7,516 7.5% 3,617 7.5% 3,898 7.5%60 - 64 7,210 7.2% 3,433 7.1% 3,777 7.3%65 - 69 6,302 6.3% 2,812 5.9% 3,490 6.7%70 - 74 5,130 5.1% 2,268 4.7% 2,862 5.5%75 - 79 4,008 4.0% 1,771 3.7% 2,237 4.3%80 - 84 3,249 3.3% 1,359 2.8% 1,890 3.6%85+ 4,311 4.3% 1,553 3.2% 2,758 5.3%
Median Age 45.7 43.5 47.6
2024 White Population by Age
Total Males FemalesNumber Percent Number Percent Number Percent
Total 95,554 100.0% 46,045 100.0% 49,509 100.0%0 - 4 5,154 5.4% 2,740 6.0% 2,414 4.9%5 - 9 4,903 5.1% 2,515 5.5% 2,388 4.8%10 - 14 4,972 5.2% 2,544 5.5% 2,429 4.9%15 - 19 4,670 4.9% 2,428 5.3% 2,242 4.5%20 - 24 4,527 4.7% 2,263 4.9% 2,264 4.6%25 - 29 5,129 5.4% 2,577 5.6% 2,552 5.2%30 - 34 5,661 5.9% 2,863 6.2% 2,797 5.6%35 - 39 5,471 5.7% 2,778 6.0% 2,693 5.4%40 - 44 5,696 6.0% 2,814 6.1% 2,882 5.8%45 - 49 5,628 5.9% 2,777 6.0% 2,851 5.8%50 - 54 6,199 6.5% 3,008 6.5% 3,192 6.4%55 - 59 6,501 6.8% 3,137 6.8% 3,364 6.8%60 - 64 6,625 6.9% 3,197 6.9% 3,428 6.9%65 - 69 6,161 6.4% 2,795 6.1% 3,367 6.8%70 - 74 5,631 5.9% 2,474 5.4% 3,158 6.4%75 - 79 4,681 4.9% 2,066 4.5% 2,615 5.3%80 - 84 3,574 3.7% 1,490 3.2% 2,084 4.2%85+ 4,369 4.6% 1,579 3.4% 2,791 5.6%
Median Age 46.4 44.1 48.7
Source: U.S. Census Bureau, Census 2010 Summary File 1. Esri forecasts for 2019 and 2024.
September 25, 2019
©2019 Esri Page 10 of 24

Age by Sex by Race Profile7353-7399 St Louis Ave Village Of Skokie Only7353-7399 St Louis Ave, Skokie, Illinois, 60076 Latitude: 42.01519Drive Time: 10 minute radius Longitude: -87.71717
2019 Black Population by Age
Total Males FemalesNumber Percent Number Percent Number Percent
Total 21,023 100.0% 9,628 100.0% 11,394 100.0%0 - 4 1,279 6.1% 640 6.6% 639 5.6%5 - 9 1,422 6.8% 715 7.4% 707 6.2%10 - 14 1,772 8.4% 915 9.5% 856 7.5%15 - 19 1,815 8.6% 907 9.4% 909 8.0%20 - 24 1,427 6.8% 702 7.3% 724 6.4%25 - 29 1,311 6.2% 624 6.5% 687 6.0%30 - 34 1,194 5.7% 509 5.3% 685 6.0%35 - 39 1,330 6.3% 581 6.0% 750 6.6%40 - 44 1,349 6.4% 584 6.1% 765 6.7%45 - 49 1,545 7.3% 687 7.1% 858 7.5%50 - 54 1,522 7.2% 666 6.9% 856 7.5%55 - 59 1,370 6.5% 616 6.4% 754 6.6%60 - 64 1,169 5.6% 521 5.4% 648 5.7%65 - 69 909 4.3% 395 4.1% 514 4.5%70 - 74 691 3.3% 279 2.9% 412 3.6%75 - 79 430 2.0% 139 1.4% 291 2.6%80 - 84 260 1.2% 90 0.9% 169 1.5%85+ 228 1.1% 58 0.6% 170 1.5%
Median Age 36.1 33.1 38.3
2024 Black Population by Age
Total Males FemalesNumber Percent Number Percent Number Percent
Total 19,046 100.0% 8,719 100.0% 10,327 100.0%0 - 4 1,157 6.1% 581 6.7% 576 5.6%5 - 9 1,203 6.3% 608 7.0% 595 5.8%10 - 14 1,458 7.7% 760 8.7% 698 6.8%15 - 19 1,577 8.3% 804 9.2% 773 7.5%20 - 24 1,269 6.7% 628 7.2% 641 6.2%25 - 29 1,190 6.2% 550 6.3% 640 6.2%30 - 34 1,187 6.2% 514 5.9% 673 6.5%35 - 39 1,144 6.0% 512 5.9% 632 6.1%40 - 44 1,250 6.6% 543 6.2% 707 6.8%45 - 49 1,350 7.1% 589 6.8% 761 7.4%50 - 54 1,387 7.3% 614 7.0% 773 7.5%55 - 59 1,152 6.0% 517 5.9% 635 6.1%60 - 64 1,110 5.8% 498 5.7% 612 5.9%65 - 69 894 4.7% 410 4.7% 484 4.7%70 - 74 738 3.9% 287 3.3% 451 4.4%75 - 79 486 2.6% 151 1.7% 335 3.2%80 - 84 264 1.4% 94 1.1% 170 1.6%85+ 231 1.2% 61 0.7% 170 1.6%
Median Age 37.1 34.2 39.5
Source: U.S. Census Bureau, Census 2010 Summary File 1. Esri forecasts for 2019 and 2024.
September 25, 2019
©2019 Esri Page 11 of 24

Age by Sex by Race Profile7353-7399 St Louis Ave Village Of Skokie Only7353-7399 St Louis Ave, Skokie, Illinois, 60076 Latitude: 42.01519Drive Time: 10 minute radius Longitude: -87.71717
2019 American Indian Population by Age
Total Males FemalesNumber Percent Number Percent Number Percent
Total 527 100.0% 265 100.0% 259 100.0%0 - 4 35 6.6% 20 7.5% 15 5.8%5 - 9 46 8.7% 27 10.2% 18 6.9%10 - 14 40 7.6% 21 7.9% 19 7.3%15 - 19 42 8.0% 19 7.2% 23 8.9%20 - 24 34 6.5% 15 5.7% 19 7.3%25 - 29 44 8.3% 23 8.7% 21 8.1%30 - 34 29 5.5% 11 4.2% 18 6.9%35 - 39 44 8.3% 22 8.3% 22 8.5%40 - 44 31 5.9% 19 7.2% 12 4.6%45 - 49 45 8.5% 22 8.3% 23 8.9%50 - 54 33 6.3% 16 6.0% 16 6.2%55 - 59 32 6.1% 15 5.7% 18 6.9%60 - 64 26 4.9% 14 5.3% 11 4.2%65 - 69 19 3.6% 11 4.2% 8 3.1%70 - 74 13 2.5% 3 1.1% 10 3.9%75 - 79 7 1.3% 2 0.8% 4 1.5%80 - 84 2 0.4% 2 0.8% 0 0.0%85+ 5 0.9% 3 1.1% 2 0.8%
Median Age 33.9 33.4 34.0
2024 American Indian Population by Age
Total Males FemalesNumber Percent Number Percent Number Percent
Total 506 100.0% 257 100.0% 249 100.0%0 - 4 33 6.5% 19 7.4% 14 5.6%5 - 9 37 7.3% 21 8.2% 15 6.0%10 - 14 40 7.9% 22 8.6% 18 7.2%15 - 19 38 7.5% 19 7.4% 20 8.0%20 - 24 34 6.7% 14 5.4% 20 8.0%25 - 29 40 7.9% 19 7.4% 21 8.4%30 - 34 32 6.3% 12 4.7% 21 8.4%35 - 39 40 7.9% 22 8.6% 17 6.8%40 - 44 27 5.3% 16 6.2% 11 4.4%45 - 49 40 7.9% 19 7.4% 21 8.4%50 - 54 34 6.7% 19 7.4% 16 6.4%55 - 59 28 5.5% 12 4.7% 15 6.0%60 - 64 28 5.5% 16 6.2% 11 4.4%65 - 69 23 4.5% 13 5.1% 10 4.0%70 - 74 14 2.8% 4 1.6% 10 4.0%75 - 79 9 1.8% 4 1.6% 5 2.0%80 - 84 3 0.6% 2 0.8% 1 0.4%85+ 5 1.0% 3 1.2% 2 0.8%
Median Age 34.8 35.5 33.8
Source: U.S. Census Bureau, Census 2010 Summary File 1. Esri forecasts for 2019 and 2024.
September 25, 2019
©2019 Esri Page 12 of 24

Age by Sex by Race Profile7353-7399 St Louis Ave Village Of Skokie Only7353-7399 St Louis Ave, Skokie, Illinois, 60076 Latitude: 42.01519Drive Time: 10 minute radius Longitude: -87.71717
2019 Asian Population by Age
Total Males FemalesNumber Percent Number Percent Number Percent
Total 42,580 100.0% 20,800 100.0% 21,781 100.0%0 - 4 2,390 5.6% 1,218 5.9% 1,171 5.4%5 - 9 2,559 6.0% 1,348 6.5% 1,211 5.6%10 - 14 2,671 6.3% 1,385 6.7% 1,286 5.9%15 - 19 2,492 5.9% 1,266 6.1% 1,227 5.6%20 - 24 2,733 6.4% 1,389 6.7% 1,344 6.2%25 - 29 3,254 7.6% 1,639 7.9% 1,615 7.4%30 - 34 2,912 6.8% 1,463 7.0% 1,449 6.7%35 - 39 3,184 7.5% 1,487 7.1% 1,697 7.8%40 - 44 2,763 6.5% 1,343 6.5% 1,420 6.5%45 - 49 2,548 6.0% 1,258 6.0% 1,291 5.9%50 - 54 2,599 6.1% 1,239 6.0% 1,359 6.2%55 - 59 2,839 6.7% 1,302 6.3% 1,537 7.1%60 - 64 2,922 6.9% 1,353 6.5% 1,569 7.2%65 - 69 2,696 6.3% 1,271 6.1% 1,425 6.5%70 - 74 1,904 4.5% 883 4.2% 1,022 4.7%75 - 79 1,065 2.5% 493 2.4% 572 2.6%80 - 84 558 1.3% 244 1.2% 313 1.4%85+ 491 1.2% 219 1.1% 273 1.3%
Median Age 38.6 37.3 39.7
2024 Asian Population by Age
Total Males FemalesNumber Percent Number Percent Number Percent
Total 46,500 100.0% 22,787 100.0% 23,714 100.0%0 - 4 2,600 5.6% 1,330 5.8% 1,269 5.4%5 - 9 2,685 5.8% 1,409 6.2% 1,275 5.4%10 - 14 2,721 5.9% 1,414 6.2% 1,307 5.5%15 - 19 2,573 5.5% 1,347 5.9% 1,225 5.2%20 - 24 2,870 6.2% 1,454 6.4% 1,416 6.0%25 - 29 3,366 7.2% 1,686 7.4% 1,680 7.1%30 - 34 3,361 7.2% 1,698 7.5% 1,663 7.0%35 - 39 3,497 7.5% 1,682 7.4% 1,815 7.7%40 - 44 3,217 6.9% 1,553 6.8% 1,664 7.0%45 - 49 2,680 5.8% 1,325 5.8% 1,355 5.7%50 - 54 2,778 6.0% 1,324 5.8% 1,455 6.1%55 - 59 2,867 6.2% 1,312 5.8% 1,555 6.6%60 - 64 3,131 6.7% 1,462 6.4% 1,669 7.0%65 - 69 3,024 6.5% 1,438 6.3% 1,586 6.7%70 - 74 2,401 5.2% 1,114 4.9% 1,287 5.4%75 - 79 1,458 3.1% 675 3.0% 783 3.3%80 - 84 696 1.5% 305 1.3% 391 1.6%85+ 575 1.2% 258 1.1% 317 1.3%
Median Age 39.4 38.1 40.6
Source: U.S. Census Bureau, Census 2010 Summary File 1. Esri forecasts for 2019 and 2024.
September 25, 2019
©2019 Esri Page 13 of 24

Age by Sex by Race Profile7353-7399 St Louis Ave Village Of Skokie Only7353-7399 St Louis Ave, Skokie, Illinois, 60076 Latitude: 42.01519Drive Time: 10 minute radius Longitude: -87.71717
2019 Pacific Islander Population by Age
Total Males FemalesNumber Percent Number Percent Number Percent
Total 51 100.0% 28 100.0% 24 100.0%0 - 4 1 2.0% 0 0.0% 1 4.2%5 - 9 4 7.8% 3 10.7% 1 4.2%10 - 14 3 5.9% 2 7.1% 1 4.2%15 - 19 2 3.9% 1 3.6% 1 4.2%20 - 24 2 3.9% 1 3.6% 1 4.2%25 - 29 7 13.7% 3 10.7% 4 16.7%30 - 34 4 7.8% 3 10.7% 2 8.3%35 - 39 5 9.8% 4 14.3% 1 4.2%40 - 44 4 7.8% 3 10.7% 1 4.2%45 - 49 1 2.0% 1 3.6% 0 0.0%50 - 54 2 3.9% 1 3.6% 1 4.2%55 - 59 6 11.8% 2 7.1% 4 16.7%60 - 64 6 11.8% 2 7.1% 4 16.7%65 - 69 2 3.9% 1 3.6% 1 4.2%70 - 74 1 2.0% 1 3.6% 0 0.0%75 - 79 0 0.0% 0 0.0% 0 0.0%80 - 84 0 0.0% 0 0.0% 0 0.0%85+ 1 2.0% 0 0.0% 1 4.2%
Median Age 37.5 36.2 40.0
2024 Pacific Islander Population by Age
Total Males FemalesNumber Percent Number Percent Number Percent
Total 50 100.0% 27 100.0% 23 100.0%0 - 4 1 2.0% 0 0.0% 1 4.3%5 - 9 2 4.0% 2 7.4% 0 0.0%10 - 14 4 8.0% 3 11.1% 1 4.3%15 - 19 2 4.0% 1 3.7% 1 4.3%20 - 24 2 4.0% 1 3.7% 1 4.3%25 - 29 5 10.0% 1 3.7% 4 17.4%30 - 34 6 12.0% 4 14.8% 2 8.7%35 - 39 3 6.0% 2 7.4% 2 8.7%40 - 44 6 12.0% 4 14.8% 2 8.7%45 - 49 3 6.0% 3 11.1% 0 0.0%50 - 54 2 4.0% 2 7.4% 0 0.0%55 - 59 2 4.0% 1 3.7% 1 4.3%60 - 64 4 8.0% 1 3.7% 3 13.0%65 - 69 4 8.0% 1 3.7% 3 13.0%70 - 74 0 0.0% 0 0.0% 0 0.0%75 - 79 1 2.0% 1 3.7% 0 0.0%80 - 84 0 0.0% 0 0.0% 0 0.0%85+ 1 2.0% 0 0.0% 1 4.3%
Median Age 38.3 38.8 37.5
Source: U.S. Census Bureau, Census 2010 Summary File 1. Esri forecasts for 2019 and 2024.
September 25, 2019
©2019 Esri Page 14 of 24

Age by Sex by Race Profile7353-7399 St Louis Ave Village Of Skokie Only7353-7399 St Louis Ave, Skokie, Illinois, 60076 Latitude: 42.01519Drive Time: 10 minute radius Longitude: -87.71717
2019 Some Other Race Population by Age
Total Males FemalesNumber Percent Number Percent Number Percent
Total 13,032 100.0% 6,607 100.0% 6,424 100.0%0 - 4 1,121 8.6% 578 8.7% 543 8.5%5 - 9 1,140 8.7% 577 8.7% 563 8.8%10 - 14 1,175 9.0% 578 8.7% 597 9.3%15 - 19 1,261 9.7% 611 9.2% 650 10.1%20 - 24 1,118 8.6% 582 8.8% 537 8.4%25 - 29 1,214 9.3% 655 9.9% 559 8.7%30 - 34 1,171 9.0% 631 9.6% 540 8.4%35 - 39 1,115 8.6% 566 8.6% 549 8.5%40 - 44 894 6.9% 452 6.8% 442 6.9%45 - 49 771 5.9% 387 5.9% 384 6.0%50 - 54 629 4.8% 321 4.9% 308 4.8%55 - 59 468 3.6% 236 3.6% 232 3.6%60 - 64 327 2.5% 156 2.4% 171 2.7%65 - 69 282 2.2% 133 2.0% 149 2.3%70 - 74 169 1.3% 63 1.0% 106 1.7%75 - 79 91 0.7% 40 0.6% 51 0.8%80 - 84 45 0.3% 21 0.3% 23 0.4%85+ 41 0.3% 20 0.3% 20 0.3%
Median Age 27.9 27.9 27.9
2024 Some Other Race Population by Age
Total Males FemalesNumber Percent Number Percent Number Percent
Total 13,752 100.0% 6,970 100.0% 6,782 100.0%0 - 4 1,180 8.6% 609 8.7% 571 8.4%5 - 9 1,156 8.4% 585 8.4% 571 8.4%10 - 14 1,148 8.3% 569 8.2% 579 8.5%15 - 19 1,288 9.4% 644 9.2% 644 9.5%20 - 24 1,170 8.5% 603 8.7% 566 8.3%25 - 29 1,290 9.4% 686 9.8% 605 8.9%30 - 34 1,339 9.7% 729 10.5% 610 9.0%35 - 39 1,148 8.3% 593 8.5% 555 8.2%40 - 44 985 7.2% 490 7.0% 496 7.3%45 - 49 791 5.8% 388 5.6% 403 5.9%50 - 54 675 4.9% 338 4.8% 337 5.0%55 - 59 487 3.5% 246 3.5% 242 3.6%60 - 64 348 2.5% 166 2.4% 182 2.7%65 - 69 313 2.3% 147 2.1% 166 2.4%70 - 74 208 1.5% 76 1.1% 132 1.9%75 - 79 125 0.9% 49 0.7% 76 1.1%80 - 84 56 0.4% 27 0.4% 28 0.4%85+ 46 0.3% 24 0.3% 21 0.3%
Median Age 28.6 28.5 28.8
Source: U.S. Census Bureau, Census 2010 Summary File 1. Esri forecasts for 2019 and 2024.
September 25, 2019
©2019 Esri Page 15 of 24

Age by Sex by Race Profile7353-7399 St Louis Ave Village Of Skokie Only7353-7399 St Louis Ave, Skokie, Illinois, 60076 Latitude: 42.01519Drive Time: 10 minute radius Longitude: -87.71717
2019 Multiple Races Population by Age
Total Males FemalesNumber Percent Number Percent Number Percent
Total 8,487 100.0% 4,202 100.0% 4,285 100.0%0 - 4 1,080 12.7% 550 13.1% 530 12.4%5 - 9 988 11.6% 513 12.2% 475 11.1%10 - 14 1,002 11.8% 492 11.7% 511 11.9%15 - 19 816 9.6% 423 10.1% 393 9.2%20 - 24 622 7.3% 311 7.4% 311 7.3%25 - 29 552 6.5% 266 6.3% 286 6.7%30 - 34 558 6.6% 265 6.3% 293 6.8%35 - 39 510 6.0% 269 6.4% 241 5.6%40 - 44 403 4.7% 193 4.6% 210 4.9%45 - 49 340 4.0% 166 4.0% 174 4.1%50 - 54 382 4.5% 199 4.7% 182 4.2%55 - 59 299 3.5% 153 3.6% 147 3.4%60 - 64 273 3.2% 120 2.9% 152 3.5%65 - 69 228 2.7% 97 2.3% 131 3.1%70 - 74 166 2.0% 79 1.9% 87 2.0%75 - 79 119 1.4% 49 1.2% 70 1.6%80 - 84 56 0.7% 20 0.5% 36 0.8%85+ 93 1.1% 37 0.9% 56 1.3%
Median Age 22.9 22.0 23.8
2024 Multiple Races Population by Age
Total Males FemalesNumber Percent Number Percent Number Percent
Total 8,842 100.0% 4,377 100.0% 4,465 100.0%0 - 4 1,137 12.9% 576 13.2% 560 12.5%5 - 9 989 11.2% 513 11.7% 476 10.7%10 - 14 981 11.1% 484 11.1% 497 11.1%15 - 19 846 9.6% 452 10.3% 395 8.8%20 - 24 651 7.4% 322 7.4% 329 7.4%25 - 29 594 6.7% 274 6.3% 320 7.2%30 - 34 617 7.0% 295 6.7% 322 7.2%35 - 39 514 5.8% 273 6.2% 240 5.4%40 - 44 435 4.9% 203 4.6% 232 5.2%45 - 49 346 3.9% 170 3.9% 176 3.9%50 - 54 393 4.4% 203 4.6% 189 4.2%55 - 59 294 3.3% 150 3.4% 144 3.2%60 - 64 280 3.2% 126 2.9% 154 3.4%65 - 69 254 2.9% 113 2.6% 141 3.2%70 - 74 195 2.2% 97 2.2% 99 2.2%75 - 79 149 1.7% 62 1.4% 88 2.0%80 - 84 63 0.7% 23 0.5% 40 0.9%85+ 102 1.2% 41 0.9% 61 1.4%
Median Age 23.6 22.5 24.6
Data Note: Multiple Races population includes unique counts of the population who reported at least two races.Source: U.S. Census Bureau, Census 2010 Summary File 1. Esri forecasts for 2019 and 2024.
September 25, 2019
©2019 Esri Page 16 of 24

Age by Sex by Race Profile7353-7399 St Louis Ave Village Of Skokie Only7353-7399 St Louis Ave, Skokie, Illinois, 60076 Latitude: 42.01519Drive Time: 15 minute radius Longitude: -87.71717
Summary Census 2010 2019 20242019-2024
Change2019-2024
Annual RatePopulation 475,588 477,852 475,755 -2,097 -0.09%Households 180,923 182,450 181,752 -698 -0.08%Median Age 36.8 38.2 39.0 0.8 0.42%Median Male Age 35.6 36.9 37.6 0.7 0.38%Median Female Age 38.0 39.5 40.4 0.9 0.45%
2019 Hispanic Population by Age
Total Males FemalesNumber Percent Number Percent Number Percent
Total 98,503 100.0% 50,463 100.0% 48,040 100.0%0 - 4 8,585 8.7% 4,318 8.6% 4,267 8.9%5 - 9 8,915 9.1% 4,581 9.1% 4,334 9.0%10 - 14 8,823 9.0% 4,492 8.9% 4,331 9.0%15 - 19 8,495 8.6% 4,341 8.6% 4,154 8.6%20 - 24 8,333 8.5% 4,360 8.6% 3,973 8.3%25 - 29 8,442 8.6% 4,583 9.1% 3,859 8.0%30 - 34 8,228 8.4% 4,451 8.8% 3,777 7.9%35 - 39 8,047 8.2% 4,216 8.4% 3,831 8.0%40 - 44 6,653 6.8% 3,395 6.7% 3,258 6.8%45 - 49 5,775 5.9% 2,953 5.9% 2,821 5.9%50 - 54 4,692 4.8% 2,458 4.9% 2,234 4.7%55 - 59 3,995 4.1% 2,037 4.0% 1,957 4.1%60 - 64 3,087 3.1% 1,478 2.9% 1,609 3.3%65 - 69 2,463 2.5% 1,092 2.2% 1,371 2.9%70 - 74 1,736 1.8% 758 1.5% 978 2.0%75 - 79 1,110 1.1% 464 0.9% 646 1.3%80 - 84 623 0.6% 271 0.5% 353 0.7%85+ 501 0.5% 215 0.4% 287 0.6%
Median Age 28.6 28.4 28.8
2024 Hispanic Population by Age
Total Males FemalesNumber Percent Number Percent Number Percent
Total 104,070 100.0% 53,266 100.0% 50,804 100.0%0 - 4 9,078 8.7% 4,592 8.6% 4,486 8.8%5 - 9 8,636 8.3% 4,442 8.3% 4,195 8.3%10 - 14 8,450 8.1% 4,293 8.1% 4,156 8.2%15 - 19 8,570 8.2% 4,398 8.3% 4,171 8.2%20 - 24 8,995 8.6% 4,666 8.8% 4,329 8.5%25 - 29 9,346 9.0% 4,971 9.3% 4,375 8.6%30 - 34 8,989 8.6% 4,913 9.2% 4,076 8.0%35 - 39 8,095 7.8% 4,306 8.1% 3,788 7.5%40 - 44 7,419 7.1% 3,769 7.1% 3,650 7.2%45 - 49 5,986 5.8% 3,025 5.7% 2,961 5.8%50 - 54 5,166 5.0% 2,658 5.0% 2,508 4.9%55 - 59 4,136 4.0% 2,136 4.0% 2,000 3.9%60 - 64 3,439 3.3% 1,702 3.2% 1,737 3.4%65 - 69 2,787 2.7% 1,256 2.4% 1,531 3.0%70 - 74 2,165 2.1% 938 1.8% 1,226 2.4%75 - 79 1,479 1.4% 609 1.1% 871 1.7%80 - 84 770 0.7% 343 0.6% 427 0.8%85+ 564 0.5% 248 0.5% 316 0.6%
Median Age 29.4 29.3 29.6
Source: U.S. Census Bureau, Census 2010 Summary File 1. Esri forecasts for 2019 and 2024.
September 25, 2019
©2019 Esri Page 17 of 24

Age by Sex by Race Profile7353-7399 St Louis Ave Village Of Skokie Only7353-7399 St Louis Ave, Skokie, Illinois, 60076 Latitude: 42.01519Drive Time: 15 minute radius Longitude: -87.71717
2019 White Population by Age
Total Males FemalesNumber Percent Number Percent Number Percent
Total 279,572 100.0% 136,474 100.0% 143,097 100.0%0 - 4 13,993 5.0% 7,204 5.3% 6,789 4.7%5 - 9 13,801 4.9% 7,059 5.2% 6,742 4.7%10 - 14 14,294 5.1% 7,286 5.3% 7,008 4.9%15 - 19 15,350 5.5% 7,755 5.7% 7,595 5.3%20 - 24 18,363 6.6% 9,051 6.6% 9,311 6.5%25 - 29 18,369 6.6% 9,366 6.9% 9,003 6.3%30 - 34 19,031 6.8% 9,666 7.1% 9,365 6.5%35 - 39 18,156 6.5% 9,268 6.8% 8,888 6.2%40 - 44 17,104 6.1% 8,618 6.3% 8,486 5.9%45 - 49 18,125 6.5% 9,260 6.8% 8,865 6.2%50 - 54 18,294 6.5% 9,190 6.7% 9,103 6.4%55 - 59 19,630 7.0% 9,668 7.1% 9,963 7.0%60 - 64 18,478 6.6% 8,893 6.5% 9,585 6.7%65 - 69 15,992 5.7% 7,309 5.4% 8,683 6.1%70 - 74 13,076 4.7% 5,908 4.3% 7,167 5.0%75 - 79 9,708 3.5% 4,263 3.1% 5,445 3.8%80 - 84 7,570 2.7% 3,133 2.3% 4,438 3.1%85+ 10,238 3.7% 3,577 2.6% 6,661 4.7%
Median Age 42.5 40.9 44.0
2024 White Population by Age
Total Males FemalesNumber Percent Number Percent Number Percent
Total 269,787 100.0% 131,929 100.0% 137,858 100.0%0 - 4 13,462 5.0% 6,962 5.3% 6,500 4.7%5 - 9 12,469 4.6% 6,369 4.8% 6,101 4.4%10 - 14 12,394 4.6% 6,349 4.8% 6,045 4.4%15 - 19 14,094 5.2% 7,182 5.4% 6,913 5.0%20 - 24 17,453 6.5% 8,534 6.5% 8,920 6.5%25 - 29 17,960 6.7% 9,038 6.9% 8,922 6.5%30 - 34 18,501 6.9% 9,628 7.3% 8,873 6.4%35 - 39 16,747 6.2% 8,671 6.6% 8,075 5.9%40 - 44 17,203 6.4% 8,730 6.6% 8,473 6.1%45 - 49 16,161 6.0% 8,188 6.2% 7,973 5.8%50 - 54 17,197 6.4% 8,623 6.5% 8,575 6.2%55 - 59 17,408 6.5% 8,695 6.6% 8,713 6.3%60 - 64 17,657 6.5% 8,668 6.6% 8,989 6.5%65 - 69 16,010 5.9% 7,390 5.6% 8,620 6.3%70 - 74 14,447 5.4% 6,489 4.9% 7,959 5.8%75 - 79 11,700 4.3% 5,220 4.0% 6,480 4.7%80 - 84 8,478 3.1% 3,511 2.7% 4,967 3.6%85+ 10,444 3.9% 3,684 2.8% 6,760 4.9%
Median Age 43.4 41.9 45.1
Source: U.S. Census Bureau, Census 2010 Summary File 1. Esri forecasts for 2019 and 2024.
September 25, 2019
©2019 Esri Page 18 of 24
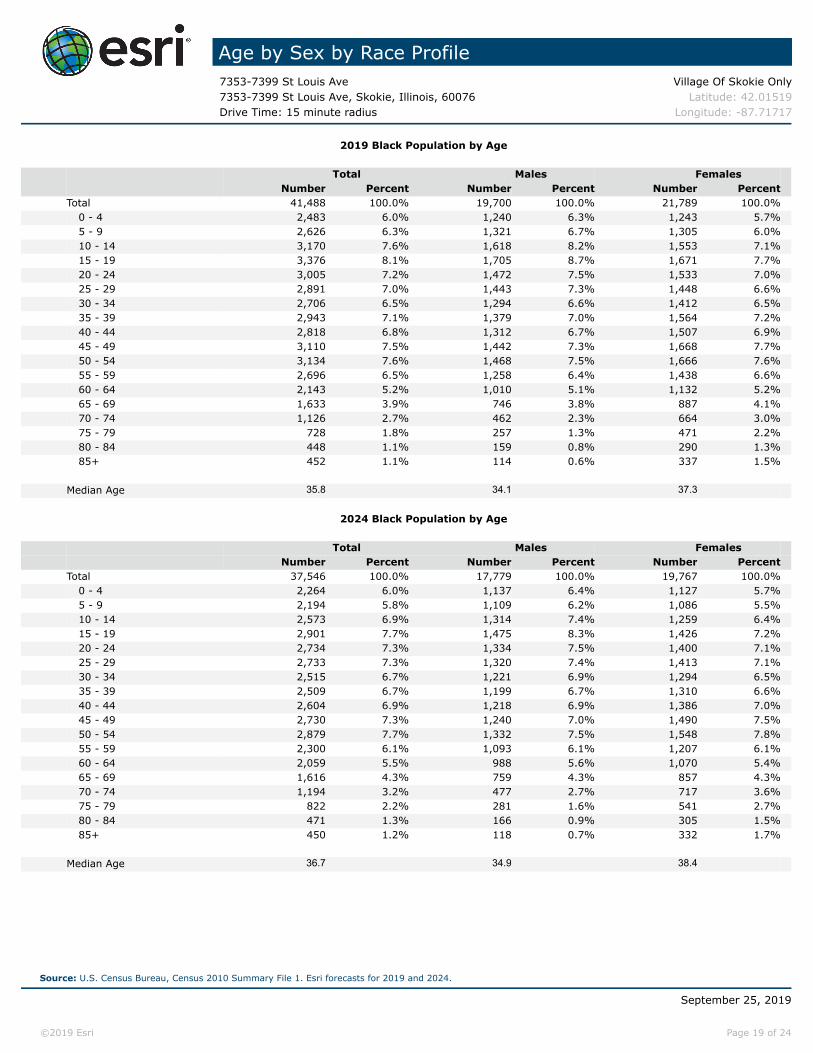
Age by Sex by Race Profile7353-7399 St Louis Ave Village Of Skokie Only7353-7399 St Louis Ave, Skokie, Illinois, 60076 Latitude: 42.01519Drive Time: 15 minute radius Longitude: -87.71717
2019 Black Population by Age
Total Males FemalesNumber Percent Number Percent Number Percent
Total 41,488 100.0% 19,700 100.0% 21,789 100.0%0 - 4 2,483 6.0% 1,240 6.3% 1,243 5.7%5 - 9 2,626 6.3% 1,321 6.7% 1,305 6.0%10 - 14 3,170 7.6% 1,618 8.2% 1,553 7.1%15 - 19 3,376 8.1% 1,705 8.7% 1,671 7.7%20 - 24 3,005 7.2% 1,472 7.5% 1,533 7.0%25 - 29 2,891 7.0% 1,443 7.3% 1,448 6.6%30 - 34 2,706 6.5% 1,294 6.6% 1,412 6.5%35 - 39 2,943 7.1% 1,379 7.0% 1,564 7.2%40 - 44 2,818 6.8% 1,312 6.7% 1,507 6.9%45 - 49 3,110 7.5% 1,442 7.3% 1,668 7.7%50 - 54 3,134 7.6% 1,468 7.5% 1,666 7.6%55 - 59 2,696 6.5% 1,258 6.4% 1,438 6.6%60 - 64 2,143 5.2% 1,010 5.1% 1,132 5.2%65 - 69 1,633 3.9% 746 3.8% 887 4.1%70 - 74 1,126 2.7% 462 2.3% 664 3.0%75 - 79 728 1.8% 257 1.3% 471 2.2%80 - 84 448 1.1% 159 0.8% 290 1.3%85+ 452 1.1% 114 0.6% 337 1.5%
Median Age 35.8 34.1 37.3
2024 Black Population by Age
Total Males FemalesNumber Percent Number Percent Number Percent
Total 37,546 100.0% 17,779 100.0% 19,767 100.0%0 - 4 2,264 6.0% 1,137 6.4% 1,127 5.7%5 - 9 2,194 5.8% 1,109 6.2% 1,086 5.5%10 - 14 2,573 6.9% 1,314 7.4% 1,259 6.4%15 - 19 2,901 7.7% 1,475 8.3% 1,426 7.2%20 - 24 2,734 7.3% 1,334 7.5% 1,400 7.1%25 - 29 2,733 7.3% 1,320 7.4% 1,413 7.1%30 - 34 2,515 6.7% 1,221 6.9% 1,294 6.5%35 - 39 2,509 6.7% 1,199 6.7% 1,310 6.6%40 - 44 2,604 6.9% 1,218 6.9% 1,386 7.0%45 - 49 2,730 7.3% 1,240 7.0% 1,490 7.5%50 - 54 2,879 7.7% 1,332 7.5% 1,548 7.8%55 - 59 2,300 6.1% 1,093 6.1% 1,207 6.1%60 - 64 2,059 5.5% 988 5.6% 1,070 5.4%65 - 69 1,616 4.3% 759 4.3% 857 4.3%70 - 74 1,194 3.2% 477 2.7% 717 3.6%75 - 79 822 2.2% 281 1.6% 541 2.7%80 - 84 471 1.3% 166 0.9% 305 1.5%85+ 450 1.2% 118 0.7% 332 1.7%
Median Age 36.7 34.9 38.4
Source: U.S. Census Bureau, Census 2010 Summary File 1. Esri forecasts for 2019 and 2024.
September 25, 2019
©2019 Esri Page 19 of 24

Age by Sex by Race Profile7353-7399 St Louis Ave Village Of Skokie Only7353-7399 St Louis Ave, Skokie, Illinois, 60076 Latitude: 42.01519Drive Time: 15 minute radius Longitude: -87.71717
2019 American Indian Population by Age
Total Males FemalesNumber Percent Number Percent Number Percent
Total 1,796 100.0% 947 100.0% 853 100.0%0 - 4 118 6.6% 64 6.8% 54 6.3%5 - 9 166 9.2% 89 9.4% 78 9.1%10 - 14 134 7.5% 74 7.8% 61 7.2%15 - 19 133 7.4% 62 6.5% 72 8.4%20 - 24 123 6.8% 68 7.2% 55 6.4%25 - 29 145 8.1% 88 9.3% 57 6.7%30 - 34 153 8.5% 75 7.9% 78 9.1%35 - 39 155 8.6% 82 8.7% 73 8.6%40 - 44 132 7.3% 76 8.0% 56 6.6%45 - 49 149 8.3% 82 8.7% 67 7.9%50 - 54 111 6.2% 59 6.2% 53 6.2%55 - 59 96 5.3% 45 4.8% 51 6.0%60 - 64 71 4.0% 32 3.4% 39 4.6%65 - 69 44 2.4% 22 2.3% 22 2.6%70 - 74 30 1.7% 14 1.5% 16 1.9%75 - 79 18 1.0% 8 0.8% 10 1.2%80 - 84 8 0.4% 2 0.2% 6 0.7%85+ 10 0.6% 5 0.5% 5 0.6%
Median Age 32.6 31.9 33.2
2024 American Indian Population by Age
Total Males FemalesNumber Percent Number Percent Number Percent
Total 1,753 100.0% 926 100.0% 828 100.0%0 - 4 115 6.6% 63 6.8% 53 6.4%5 - 9 139 7.9% 71 7.7% 69 8.3%10 - 14 125 7.1% 70 7.6% 55 6.6%15 - 19 123 7.0% 62 6.7% 61 7.4%20 - 24 128 7.3% 67 7.2% 61 7.4%25 - 29 149 8.5% 89 9.6% 60 7.2%30 - 34 149 8.5% 78 8.4% 71 8.6%35 - 39 147 8.4% 78 8.4% 69 8.3%40 - 44 131 7.5% 70 7.6% 60 7.2%45 - 49 142 8.1% 78 8.4% 65 7.9%50 - 54 119 6.8% 64 6.9% 55 6.6%55 - 59 87 5.0% 45 4.9% 43 5.2%60 - 64 71 4.1% 34 3.7% 37 4.5%65 - 69 50 2.9% 22 2.4% 28 3.4%70 - 74 33 1.9% 17 1.8% 16 1.9%75 - 79 21 1.2% 12 1.3% 9 1.1%80 - 84 13 0.7% 2 0.2% 11 1.3%85+ 10 0.6% 5 0.5% 5 0.6%
Median Age 33.3 32.7 33.9
Source: U.S. Census Bureau, Census 2010 Summary File 1. Esri forecasts for 2019 and 2024.
September 25, 2019
©2019 Esri Page 20 of 24

Age by Sex by Race Profile7353-7399 St Louis Ave Village Of Skokie Only7353-7399 St Louis Ave, Skokie, Illinois, 60076 Latitude: 42.01519Drive Time: 15 minute radius Longitude: -87.71717
2019 Asian Population by Age
Total Males FemalesNumber Percent Number Percent Number Percent
Total 91,289 100.0% 44,383 100.0% 46,903 100.0%0 - 4 4,635 5.1% 2,368 5.3% 2,267 4.8%5 - 9 4,938 5.4% 2,544 5.7% 2,393 5.1%10 - 14 5,172 5.7% 2,662 6.0% 2,510 5.4%15 - 19 6,003 6.6% 3,074 6.9% 2,929 6.2%20 - 24 7,292 8.0% 3,692 8.3% 3,600 7.7%25 - 29 7,543 8.3% 3,825 8.6% 3,718 7.9%30 - 34 6,744 7.4% 3,339 7.5% 3,405 7.3%35 - 39 7,065 7.7% 3,339 7.5% 3,726 7.9%40 - 44 5,947 6.5% 2,840 6.4% 3,107 6.6%45 - 49 5,400 5.9% 2,629 5.9% 2,772 5.9%50 - 54 5,422 5.9% 2,609 5.9% 2,813 6.0%55 - 59 5,945 6.5% 2,723 6.1% 3,221 6.9%60 - 64 5,886 6.4% 2,707 6.1% 3,178 6.8%65 - 69 5,290 5.8% 2,491 5.6% 2,798 6.0%70 - 74 3,628 4.0% 1,703 3.8% 1,925 4.1%75 - 79 2,065 2.3% 903 2.0% 1,162 2.5%80 - 84 1,166 1.3% 499 1.1% 667 1.4%85+ 1,148 1.3% 436 1.0% 712 1.5%
Median Age 37.3 36.0 38.5
2024 Asian Population by Age
Total Males FemalesNumber Percent Number Percent Number Percent
Total 100,212 100.0% 48,828 100.0% 51,384 100.0%0 - 4 5,047 5.0% 2,592 5.3% 2,455 4.8%5 - 9 5,122 5.1% 2,632 5.4% 2,491 4.8%10 - 14 5,207 5.2% 2,682 5.5% 2,526 4.9%15 - 19 6,264 6.3% 3,244 6.6% 3,020 5.9%20 - 24 7,844 7.8% 3,951 8.1% 3,893 7.6%25 - 29 8,162 8.1% 4,099 8.4% 4,063 7.9%30 - 34 7,677 7.7% 3,869 7.9% 3,808 7.4%35 - 39 7,596 7.6% 3,652 7.5% 3,944 7.7%40 - 44 6,946 6.9% 3,324 6.8% 3,623 7.1%45 - 49 5,740 5.7% 2,788 5.7% 2,952 5.7%50 - 54 5,873 5.9% 2,801 5.7% 3,072 6.0%55 - 59 6,057 6.0% 2,816 5.8% 3,241 6.3%60 - 64 6,457 6.4% 3,022 6.2% 3,435 6.7%65 - 69 6,009 6.0% 2,832 5.8% 3,176 6.2%70 - 74 4,579 4.6% 2,137 4.4% 2,443 4.8%75 - 79 2,853 2.8% 1,261 2.6% 1,592 3.1%80 - 84 1,454 1.5% 623 1.3% 831 1.6%85+ 1,324 1.3% 505 1.0% 819 1.6%
Median Age 38.1 36.8 39.4
Source: U.S. Census Bureau, Census 2010 Summary File 1. Esri forecasts for 2019 and 2024.
September 25, 2019
©2019 Esri Page 21 of 24

Age by Sex by Race Profile7353-7399 St Louis Ave Village Of Skokie Only7353-7399 St Louis Ave, Skokie, Illinois, 60076 Latitude: 42.01519Drive Time: 15 minute radius Longitude: -87.71717
2019 Pacific Islander Population by Age
Total Males FemalesNumber Percent Number Percent Number Percent
Total 194 100.0% 91 100.0% 100 100.0%0 - 4 2 1.0% 0 0.0% 2 2.0%5 - 9 14 7.2% 7 7.7% 7 7.0%10 - 14 13 6.7% 4 4.4% 9 9.0%15 - 19 11 5.7% 6 6.6% 5 5.0%20 - 24 14 7.2% 8 8.8% 5 5.0%25 - 29 20 10.3% 12 13.2% 8 8.0%30 - 34 17 8.8% 8 8.8% 9 9.0%35 - 39 17 8.8% 9 9.9% 7 7.0%40 - 44 18 9.3% 9 9.9% 8 8.0%45 - 49 9 4.6% 2 2.2% 7 7.0%50 - 54 7 3.6% 3 3.3% 4 4.0%55 - 59 18 9.3% 9 9.9% 9 9.0%60 - 64 13 6.7% 4 4.4% 9 9.0%65 - 69 8 4.1% 5 5.5% 3 3.0%70 - 74 5 2.6% 2 2.2% 3 3.0%75 - 79 0 0.0% 0 0.0% 0 0.0%80 - 84 3 1.5% 3 3.3% 0 0.0%85+ 5 2.6% 0 0.0% 5 5.0%
Median Age 36.8 35.3 38.6
2024 Pacific Islander Population by Age
Total Males FemalesNumber Percent Number Percent Number Percent
Total 185 100.0% 88 100.0% 97 100.0%0 - 4 2 1.1% 0 0.0% 2 2.1%5 - 9 7 3.8% 4 4.5% 3 3.1%10 - 14 13 7.0% 6 6.8% 7 7.2%15 - 19 10 5.4% 3 3.4% 7 7.2%20 - 24 12 6.5% 7 8.0% 5 5.2%25 - 29 20 10.8% 10 11.4% 10 10.3%30 - 34 13 7.0% 11 12.5% 2 2.1%35 - 39 16 8.6% 6 6.8% 10 10.3%40 - 44 17 9.2% 9 10.2% 8 8.2%45 - 49 18 9.7% 8 9.1% 10 10.3%50 - 54 6 3.2% 3 3.4% 3 3.1%55 - 59 9 4.9% 5 5.7% 5 5.2%60 - 64 16 8.6% 7 8.0% 9 9.3%65 - 69 11 5.9% 4 4.5% 7 7.2%70 - 74 3 1.6% 2 2.3% 1 1.0%75 - 79 5 2.7% 2 2.3% 3 3.1%80 - 84 2 1.1% 2 2.3% 0 0.0%85+ 5 2.7% 0 0.0% 5 5.2%
Median Age 39.8 37.9 41.6
Source: U.S. Census Bureau, Census 2010 Summary File 1. Esri forecasts for 2019 and 2024.
September 25, 2019
©2019 Esri Page 22 of 24

Age by Sex by Race Profile7353-7399 St Louis Ave Village Of Skokie Only7353-7399 St Louis Ave, Skokie, Illinois, 60076 Latitude: 42.01519Drive Time: 15 minute radius Longitude: -87.71717
2019 Some Other Race Population by Age
Total Males FemalesNumber Percent Number Percent Number Percent
Total 42,376 100.0% 22,042 100.0% 20,333 100.0%0 - 4 3,539 8.4% 1,783 8.1% 1,755 8.6%5 - 9 3,763 8.9% 1,946 8.8% 1,817 8.9%10 - 14 3,861 9.1% 1,968 8.9% 1,892 9.3%15 - 19 3,940 9.3% 1,991 9.0% 1,949 9.6%20 - 24 3,739 8.8% 2,002 9.1% 1,738 8.5%25 - 29 3,920 9.3% 2,209 10.0% 1,712 8.4%30 - 34 3,722 8.8% 2,050 9.3% 1,672 8.2%35 - 39 3,736 8.8% 1,977 9.0% 1,759 8.7%40 - 44 3,038 7.2% 1,551 7.0% 1,487 7.3%45 - 49 2,595 6.1% 1,321 6.0% 1,275 6.3%50 - 54 2,001 4.7% 1,054 4.8% 947 4.7%55 - 59 1,592 3.8% 822 3.7% 770 3.8%60 - 64 1,111 2.6% 545 2.5% 565 2.8%65 - 69 837 2.0% 405 1.8% 432 2.1%70 - 74 476 1.1% 207 0.9% 268 1.3%75 - 79 258 0.6% 102 0.5% 156 0.8%80 - 84 141 0.3% 59 0.3% 82 0.4%85+ 107 0.3% 50 0.2% 57 0.3%
Median Age 28.0 28.0 28.0
2024 Some Other Race Population by Age
Total Males FemalesNumber Percent Number Percent Number Percent
Total 44,263 100.0% 22,995 100.0% 21,268 100.0%0 - 4 3,694 8.3% 1,867 8.1% 1,827 8.6%5 - 9 3,633 8.2% 1,878 8.2% 1,755 8.3%10 - 14 3,687 8.3% 1,878 8.2% 1,809 8.5%15 - 19 3,963 9.0% 2,014 8.8% 1,950 9.2%20 - 24 3,994 9.0% 2,130 9.3% 1,864 8.8%25 - 29 4,271 9.6% 2,363 10.3% 1,908 9.0%30 - 34 4,033 9.1% 2,248 9.8% 1,785 8.4%35 - 39 3,696 8.4% 1,988 8.6% 1,708 8.0%40 - 44 3,343 7.6% 1,700 7.4% 1,643 7.7%45 - 49 2,688 6.1% 1,350 5.9% 1,339 6.3%50 - 54 2,201 5.0% 1,131 4.9% 1,069 5.0%55 - 59 1,662 3.8% 862 3.7% 800 3.8%60 - 64 1,231 2.8% 619 2.7% 612 2.9%65 - 69 937 2.1% 455 2.0% 482 2.3%70 - 74 592 1.3% 254 1.1% 338 1.6%75 - 79 347 0.8% 132 0.6% 215 1.0%80 - 84 171 0.4% 72 0.3% 100 0.5%85+ 119 0.3% 55 0.2% 64 0.3%
Median Age 28.7 28.7 28.7
Source: U.S. Census Bureau, Census 2010 Summary File 1. Esri forecasts for 2019 and 2024.
September 25, 2019
©2019 Esri Page 23 of 24

Age by Sex by Race Profile7353-7399 St Louis Ave Village Of Skokie Only7353-7399 St Louis Ave, Skokie, Illinois, 60076 Latitude: 42.01519Drive Time: 15 minute radius Longitude: -87.71717
2019 Multiple Races Population by Age
Total Males FemalesNumber Percent Number Percent Number Percent
Total 21,139 100.0% 10,583 100.0% 10,554 100.0%0 - 4 2,714 12.8% 1,401 13.2% 1,313 12.4%5 - 9 2,409 11.4% 1,203 11.4% 1,206 11.4%10 - 14 2,291 10.8% 1,152 10.9% 1,139 10.8%15 - 19 1,986 9.4% 1,020 9.6% 966 9.2%20 - 24 1,721 8.1% 840 7.9% 881 8.3%25 - 29 1,537 7.3% 768 7.3% 769 7.3%30 - 34 1,477 7.0% 740 7.0% 736 7.0%35 - 39 1,322 6.3% 669 6.3% 653 6.2%40 - 44 1,047 5.0% 521 4.9% 526 5.0%45 - 49 877 4.1% 441 4.2% 437 4.1%50 - 54 900 4.3% 485 4.6% 414 3.9%55 - 59 757 3.6% 386 3.6% 371 3.5%60 - 64 589 2.8% 278 2.6% 311 2.9%65 - 69 582 2.8% 276 2.6% 306 2.9%70 - 74 407 1.9% 193 1.8% 214 2.0%75 - 79 269 1.3% 114 1.1% 155 1.5%80 - 84 108 0.5% 39 0.4% 68 0.6%85+ 146 0.7% 57 0.5% 89 0.8%
Median Age 23.4 23.1 23.7
2024 Multiple Races Population by Age
Total Males FemalesNumber Percent Number Percent Number Percent
Total 22,008 100.0% 10,999 100.0% 11,009 100.0%0 - 4 2,864 13.0% 1,475 13.4% 1,389 12.6%5 - 9 2,371 10.8% 1,186 10.8% 1,185 10.8%10 - 14 2,220 10.1% 1,117 10.2% 1,102 10.0%15 - 19 2,033 9.2% 1,050 9.5% 983 8.9%20 - 24 1,824 8.3% 888 8.1% 936 8.5%25 - 29 1,684 7.7% 812 7.4% 873 7.9%30 - 34 1,574 7.2% 793 7.2% 780 7.1%35 - 39 1,309 5.9% 674 6.1% 636 5.8%40 - 44 1,143 5.2% 565 5.1% 577 5.2%45 - 49 884 4.0% 447 4.1% 438 4.0%50 - 54 948 4.3% 507 4.6% 441 4.0%55 - 59 765 3.5% 391 3.6% 373 3.4%60 - 64 629 2.9% 306 2.8% 323 2.9%65 - 69 638 2.9% 304 2.8% 334 3.0%70 - 74 485 2.2% 229 2.1% 256 2.3%75 - 79 352 1.6% 147 1.3% 205 1.9%80 - 84 124 0.6% 47 0.4% 78 0.7%85+ 160 0.7% 62 0.6% 98 0.9%
Median Age 24.2 23.8 24.5
Data Note: Multiple Races population includes unique counts of the population who reported at least two races.Source: U.S. Census Bureau, Census 2010 Summary File 1. Esri forecasts for 2019 and 2024.
September 25, 2019
©2019 Esri Page 24 of 24

Business Locator7353-7399 St Louis Ave Village Of Skokie Only7353-7399 St Louis Ave, Skokie, Illinois, 60076 Latitude: 42.01519Drive Time: 5, 10, 15 minute radii Longitude: -87.71717
2010 Residential Population: 475,588 2019 Total Sales ($000) $33,152,4932019 Residential Population: 477,852 2019 Total Employees 200,9572024 Residential Population: 475,755 Employee/Residential Population Ratio: 0.42:1Annual Population Growth 2019 - 2024 -0.09% Total Number of Businesses: 17,375
SICCode Business Name Franchise
Distance FromSite in Miles Employees Sales ($000)
078204 CONTOUR LANDSCAPING INC 0.02 SE 20 $2,371JARVIS AVESKOKIE, IL 60076
175203 ENVIROCOAT 0.06 NE 20 $3,271SAINT LOUIS AVESKOKIE, IL 60076
351103 HYDRAULIC SHOP 0.07 NE 1 $296SAINT LOUIS AVESKOKIE, IL 60076
177105 G & L CONTRACTORS 0.07 NE 25 $4,088SAINT LOUIS AVESKOKIE, IL 60076
553111 MCKENNA AUTOMOTIVE 0.07 NE 5 $842SAINT LOUIS AVESKOKIE, IL 60076
599999 DIET SHOPPE 0.07 NW 1 $178JARVIS AVESKOKIE, IL 60076
734902 SHARCO SUPPLY 0.08 SE 7 $766SAINT LOUIS AVESKOKIE, IL 60076
653118 GREYSTONE ASSOCIATES INC 0.08 SE 5 $662SAINT LOUIS AVESKOKIE, IL 60076
444906 AIR & OCEAN CONTNR SHIPPING 0.08 SE 2 $846SAINT LOUIS AVESKOKIE, IL 60076
508823 PRIME AIR LLC 0.10 NE 9 $0SAINT LOUIS AVESKOKIE, IL 60076
508403 ALL-VAC INDUSTRIES INC 0.10 SW 12 $15,415CENTRAL PARK AVESKOKIE, IL 60076
753801 MPH MOTORSPORTS 0.10 NW 8 $990JARVIS AVESKOKIE, IL 60076
414201 ALLTOWN BUS SVC INC 0.10 SW 70 $0SAINT LOUIS AVESKOKIE, IL 60076
999977 GHP GROUP INC 0.10 NE 0 $0SAINT LOUIS AVESKOKIE, IL 60076
Data Note: Businesses are listed based on their proximity to the study area location. A maximum of 250 records can be displayed on one report. Data on the Business Locations report is based on the businesses whose location falls within the area of study. Total Sales, Total Daytime Business Population, Total Number of Businesses, and the Daytime Business (pop)/Residential Ratio are calculated using the collection of business points that fall within the area of study.Source: Copyright 2019 Infogroup and Esri. Esri Total Residential Population forecasts for 2019. Infogroup Business Locations (April 2019).
September 25, 2019
©2019 Esri Page 1 of 16

Business Locator7353-7399 St Louis Ave Village Of Skokie Only7353-7399 St Louis Ave, Skokie, Illinois, 60076 Latitude: 42.01519Drive Time: 5, 10, 15 minute radii Longitude: -87.71717
SICCode Business Name Franchise
Distance FromSite in Miles Employees Sales ($000)
591205 PHARMORE DRUGS LLC 0.11 SE 160 $39,174W TOUHY AVESKOKIE, IL 60076
737415 GIBRALTAR BRAND 0.11 SW 7 $983SAINT LOUIS AVESKOKIE, IL 60076
152144 SITE CONSTRUCTION INC 0.11 SW 3 $1,001SAINT LOUIS AVESKOKIE, IL 60076
177105 COFAIR PRODUCTS 0.11 SW 17 $2,780SAINT LOUIS AVESKOKIE, IL 60076
753201 LINCOLNWOOD AUTO CONSTRUCTION 0.11 SW 9 $1,270CENTRAL PARK AVESKOKIE, IL 60076
152114 MIDWEST FREEZE-DRY LTD 0.11 SW 7 $2,335CENTRAL PARK AVESKOKIE, IL 60076
738913 PATRICK B KING & ASSOC 0.11 SW 6 $747CENTRAL PARK AVESKOKIE, IL 60076
399302 POWER GRAPHICS & PRINT 0.13 SW 1 $139MONTICELLO AVESKOKIE, IL 60076
177105 SCHROEDER & SCHROEDER INC 0.13 SW 6 $982CENTRAL PARK AVESKOKIE, IL 60076
508302 M & M EQUIPMENT CORP 0.13 SW 11 $13,909MONTICELLO AVESKOKIE, IL 60076
359903 PRECISION MACHINING & TOOL CO 0.13 SW 3 $447MONTICELLO AVESKOKIE, IL 60076
473104 GANDHI INTERNATIONAL SHIPPING 0.13 SW 6 $1,459MONTICELLO AVESKOKIE, IL 60076
573117 CHICAGO ELECTRONICS INC 0.13 SW 5 $1,443MONTICELLO AVESKOKIE, IL 60076
173101 JRT ELECTRIC 0.14 SW 5 $817MONTICELLO AVESKOKIE, IL 60076
175203 TIBU HARDWOOD FLOORS 0.14 SW 3 $491MONTICELLO AVESKOKIE, IL 60076
866107 AGUDATH IRSAEL OF ILLLINOIS 0.14 NE 3 $0SAINT LOUIS AVESKOKIE, IL 60076
Data Note: Businesses are listed based on their proximity to the study area location. A maximum of 250 records can be displayed on one report. Data on the Business Locations report is based on the businesses whose location falls within the area of study. Total Sales, Total Daytime Business Population, Total Number of Businesses, and the Daytime Business (pop)/Residential Ratio are calculated using the collection of business points that fall within the area of study.Source: Copyright 2019 Infogroup and Esri. Esri Total Residential Population forecasts for 2019. Infogroup Business Locations (April 2019).
September 25, 2019
©2019 Esri Page 2 of 16

Business Locator7353-7399 St Louis Ave Village Of Skokie Only7353-7399 St Louis Ave, Skokie, Illinois, 60076 Latitude: 42.01519Drive Time: 5, 10, 15 minute radii Longitude: -87.71717
SICCode Business Name Franchise
Distance FromSite in Miles Employees Sales ($000)
175106 CHICAGO WOOD WORKS DESIGNS INC 0.14 NE 6 $982SAINT LOUIS AVESKOKIE, IL 60076
414201 A I BUS SVC 0.14 NE 11 $1,215SAINT LOUIS AVESKOKIE, IL 60076
345101 MICRO-CRAFT MANUFACTURING 0.15 SW 7 $928SAINT LOUIS AVESKOKIE, IL 60076
731908 MIDTOWN DISTRIBUTION 0.16 NE 10 $2,747SAINT LOUIS AVESKOKIE, IL 60076
483201 CLEAR CHANNEL OUTDOOR HOLDINGS 0.16 NE 11 $2,036SAINT LOUIS AVESKOKIE, IL 60076
753801 AUTOMOTIVE TORQUE SHOP 0.16 SW 3 $372SAINT LOUIS AVESKOKIE, IL 60076
508740 AMERICAN VACUUM CO 0.16 SW 5 $3,975MONTICELLO AVESKOKIE, IL 60076
399903 MIDLAND MANUFACTURING CORP 0.16 NW 8 $1,386JARVIS AVESKOKIE, IL 60076
874213 GAERTNER SCIENTIFIC CORP 0.16 NW 11 $2,266JARVIS AVESKOKIE, IL 60076
508527 BURRELL LEDER BELTECH 0.16 NE 110 $142,270SAINT LOUIS AVESKOKIE, IL 60076
508410 AMMERAAL BELTECH INC 0.16 NE 50 $0SAINT LOUIS AVESKOKIE, IL 60076
571305 R G PRESTIGE 0.16 SW 2 $582MONTICELLO AVESKOKIE, IL 60076
721704 MONARCH RUG CLEANERS 0.16 SW 4 $262MONTICELLO AVESKOKIE, IL 60076
358906 ABLE SUPPLY CO 0.16 SW 6 $885MONTICELLO AVESKOKIE, IL 60076
509998 NAPA DISTRIBUTION CTR 0.16 NE 10 $10,064SAINT LOUIS AVESKOKIE, IL 60076
421401 GOLAN'S MOVING & STORAGE 0.17 NW 100 $14,070JARVIS AVESKOKIE, IL 60076
Data Note: Businesses are listed based on their proximity to the study area location. A maximum of 250 records can be displayed on one report. Data on the Business Locations report is based on the businesses whose location falls within the area of study. Total Sales, Total Daytime Business Population, Total Number of Businesses, and the Daytime Business (pop)/Residential Ratio are calculated using the collection of business points that fall within the area of study.Source: Copyright 2019 Infogroup and Esri. Esri Total Residential Population forecasts for 2019. Infogroup Business Locations (April 2019).
September 25, 2019
©2019 Esri Page 3 of 16

Business Locator7353-7399 St Louis Ave Village Of Skokie Only7353-7399 St Louis Ave, Skokie, Illinois, 60076 Latitude: 42.01519Drive Time: 5, 10, 15 minute radii Longitude: -87.71717
SICCode Business Name Franchise
Distance FromSite in Miles Employees Sales ($000)
738902 HESTER PAINTING & DECORATING 0.17 SW 60 $7,463MONTICELLO AVESKOKIE, IL 60076
177105 ACE CONSTRUCTION CORP 0.17 SW 5 $818MONTICELLO AVESKOKIE, IL 60076
874810 CREATIVE PROMOTIONAL PRODUCTS 0.17 SW 6 $1,097MONTICELLO AVESKOKIE, IL 60076
519917 GENESIS 0.17 SW 35 $31,076MONTICELLO AVESKOKIE, IL 60076
275498 CREATIVE DIGITAL GRAPHICS 0.17 SW 3 $508MONTICELLO AVESKOKIE, IL 60076
521142 HORIGAN URBAN FOREST PROD INC 0.17 SW 3 $1,021SAINT LOUIS AVESKOKIE, IL 60076
275902 SCREEN PRINT EXCHANGE 0.17 SW 4 $559SAINT LOUIS AVESKOKIE, IL 60076
769206 ROGERS METAL SVC INC 0.17 SW 20 $858MONTICELLO AVESKOKIE, IL 60076
508438 CREATIVE DESIGN & PACKAGING 0.18 NE 6 $7,708SAINT LOUIS AVESKOKIE, IL 60076
873303 LIBENU FOUNDATION 0.18 SW 4 $0SAINT LOUIS AVESKOKIE, IL 60076
504704 SLEEP RX LLC 0.18 NE 20 $26,995SAINT LOUIS AVESKOKIE, IL 60076
839907 CREATIVE PROMOTIONAL PRODUCTS 0.18 SW 6 $0MONTICELLO AVESKOKIE, IL 60076
735923 MICOR VIDEO EQUIPMENT SALES 0.19 NE 6 $2,341SAINT LOUIS AVESKOKIE, IL 60076
762212 MICOR MEDIA GROUP INC 0.19 NE 6 $333SAINT LOUIS AVESKOKIE, IL 60076
811103 ASSOCIATION-FORECLOSURE 0.19 NE 3 $867SAINT LOUIS AVESKOKIE, IL 60076
508520 MAC MILLIN HYDRAULIC ENGRNG 0.19 NW 12 $15,521LAWNDALE AVESKOKIE, IL 60076
Data Note: Businesses are listed based on their proximity to the study area location. A maximum of 250 records can be displayed on one report. Data on the Business Locations report is based on the businesses whose location falls within the area of study. Total Sales, Total Daytime Business Population, Total Number of Businesses, and the Daytime Business (pop)/Residential Ratio are calculated using the collection of business points that fall within the area of study.Source: Copyright 2019 Infogroup and Esri. Esri Total Residential Population forecasts for 2019. Infogroup Business Locations (April 2019).
September 25, 2019
©2019 Esri Page 4 of 16

Business Locator7353-7399 St Louis Ave Village Of Skokie Only7353-7399 St Louis Ave, Skokie, Illinois, 60076 Latitude: 42.01519Drive Time: 5, 10, 15 minute radii Longitude: -87.71717
SICCode Business Name Franchise
Distance FromSite in Miles Employees Sales ($000)
737206 REALLYTECH CORP 0.19 SW 20 $8,249SAINT LOUIS AVESKOKIE, IL 60076
999977 ENG HUA CARGO 0.19 SW 0 $0SAINT LOUIS AVESKOKIE, IL 60076
999977 GRACE TAYLOR DESIGNS INC 0.19 SW 0 $0SAINT LOUIS AVESKOKIE, IL 60076
871115 B-ELECTRIC INC 0.19 SW 13 $3,176SAINT LOUIS AVESKOKIE, IL 60076
653118 INTEGRA PROPERTIES 0.19 NE 3 $398SAINT LOUIS AVESKOKIE, IL 60076
999966 CENTRAL INFUSION ALLIANCE INC 0.19 NE 10 $0SAINT LOUIS AVESKOKIE, IL 60076
509223 CIA MEDICAL 0.19 NE 3 $3,832SAINT LOUIS AVESKOKIE, IL 60076
504704 REZNIK INSTRUMENTS INC 0.19 SW 3 $4,050LAWNDALE AVESKOKIE, IL 60076
329601 HARRIS SYSTEMS INC 0.19 NE 3 $841HOWARD STSKOKIE, IL 60076
371428 REX RADIATOR 0.19 NE 15 $5,436HOWARD STSKOKIE, IL 60076
653118 WEISS PROPERTIES INC 0.19 NE 5 $662HOWARD STSKOKIE, IL 60076
738983 KAFKO INTERNATIONAL LTD 0.19 NW 100 $12,438HOWARD STSKOKIE, IL 60076
502107 CHOICE FURNISHINGS 0.20 NE 15 $15,560SAINT LOUIS AVESKOKIE, IL 60076
501301 REX RADIATOR & WELDING CO 0.20 NE 8 $9,885SAINT LOUIS AVESKOKIE, IL 60076
509905 RAYAAN IMPORTS 0.20 NE 6 $6,039SAINT LOUIS AVESKOKIE, IL 60076
872101 ACCOUNTING ASSOCIATES C 0.20 NE 8 $1,583SAINT LOUIS AVESKOKIE, IL 60076
Data Note: Businesses are listed based on their proximity to the study area location. A maximum of 250 records can be displayed on one report. Data on the Business Locations report is based on the businesses whose location falls within the area of study. Total Sales, Total Daytime Business Population, Total Number of Businesses, and the Daytime Business (pop)/Residential Ratio are calculated using the collection of business points that fall within the area of study.Source: Copyright 2019 Infogroup and Esri. Esri Total Residential Population forecasts for 2019. Infogroup Business Locations (April 2019).
September 25, 2019
©2019 Esri Page 5 of 16

Business Locator7353-7399 St Louis Ave Village Of Skokie Only7353-7399 St Louis Ave, Skokie, Illinois, 60076 Latitude: 42.01519Drive Time: 5, 10, 15 minute radii Longitude: -87.71717
SICCode Business Name Franchise
Distance FromSite in Miles Employees Sales ($000)
999977 LIGHT THE POWER II LTD 0.20 SW 0 $0SAINT LOUIS AVESKOKIE, IL 60076
371103 FEDERAL-MOGUL CORP 0.20 NE 1,000 $1,309,102MCCORMICK BLVDSKOKIE, IL 60076
651298 RESINOID ENGINEERING CORP 0.21 NE 4 $2,209SAINT LOUIS AVESKOKIE, IL 60076
807129 MEDICAL DIAGNOSTIC SVC 0.21 NW 3 $476JARVIS AVESKOKIE, IL 60076
517214 MULLEN CIRCLE BRAND INC 0.21 SE 10 $158,930W TOUHY AVESKOKIE, IL 60076
581208 JOLLIBEE 0.22 SW 120 $7,144W TOUHY AVESKOKIE, IL 60076
726103 SMITH CORCORAN FUNERAL HM 0.22 SW 4 $698LAWNDALE AVESKOKIE, IL 60076
999977 INDUSTRIAL MODELS & PROTOTYPES 0.23 NW 0 $0LAWNDALE AVESKOKIE, IL 60076
807101 MEDICAL DIAGNOSTIC SVC 0.23 SW 5 $793LAWNDALE AVESKOKIE, IL 60076
591205 MDS PHARMACY INC 0.23 SW 6 $1,470LAWNDALE AVESKOKIE, IL 60076
078204 RON'S LANDSCAPE & SNOW REMOVAL 0.23 SW 1 $119LAWNDALE AVESKOKIE, IL 60076
421401 MOVING EXPERTS INC 0.23 NE 9 $1,267HOWARD STSKOKIE, IL 60076
421401 ELITE MOVING STORAGE CO 0.23 NE 10 $1,407HOWARD STSKOKIE, IL 60076
738987 TENFAB DESIGN LLC 0.23 NW 12 $1,493JARVIS AVESKOKIE, IL 60076
514105 GREAT LAKES KOSHER SALES INC 0.23 SW 4 $7,365LAWNDALE AVESKOKIE, IL 60076
999977 KAZAH LLC 0.23 SW 0 $0LAWNDALE AVESKOKIE, IL 60076
Data Note: Businesses are listed based on their proximity to the study area location. A maximum of 250 records can be displayed on one report. Data on the Business Locations report is based on the businesses whose location falls within the area of study. Total Sales, Total Daytime Business Population, Total Number of Businesses, and the Daytime Business (pop)/Residential Ratio are calculated using the collection of business points that fall within the area of study.Source: Copyright 2019 Infogroup and Esri. Esri Total Residential Population forecasts for 2019. Infogroup Business Locations (April 2019).
September 25, 2019
©2019 Esri Page 6 of 16

Business Locator7353-7399 St Louis Ave Village Of Skokie Only7353-7399 St Louis Ave, Skokie, Illinois, 60076 Latitude: 42.01519Drive Time: 5, 10, 15 minute radii Longitude: -87.71717
SICCode Business Name Franchise
Distance FromSite in Miles Employees Sales ($000)
573117 OVERSEAS ELECTRONICS 0.23 SW 6 $1,731LAWNDALE AVESKOKIE, IL 60076
553123 GOODYEAR TIRE & SVC NETWORK 0.23 SW 9 $1,514W TOUHY AVESKOKIE, IL 60076
553123 JUST TIRES 0.23 SW 3 $505W TOUHY AVESKOKIE, IL 60076
571220 MATTRESS FIRM 2 0.23 SW 2 $555W TOUHY AVESKOKIE, IL 60076
807129 SMART CHOICE MRI I 0.23 SW 5 $793W TOUHY AVESKOKIE, IL 60076
421304 JRC DEDICATED SVC TRUCKING 0.24 NE 15 $3,833HOWARD STSKOKIE, IL 60076
358101 LAUREL METAL PRODUCTS INC 0.24 SE 15 $2,215W TOUHY AVESKOKIE, IL 60076
596201 PREMIER VENDING INC 0.24 SW 7 $1,088LAWNDALE AVESKOKIE, IL 60076
422503 PUBLIC STORAGE P 0.24 SE 2 $328W TOUHY AVESKOKIE, IL 60077
509223 SKOKIE CASH & CARRY 0.24 SE 3 $3,832W TOUHY AVESKOKIE, IL 60076
152114 SERVPRO-WINNETKA WILMETTE SKK 0.24 SW 7 $2,335LAWNDALE AVESKOKIE, IL 60076
738988 HOWARD PACKAGING LLC 0.24 SE 13 $1,617W TOUHY AVESKOKIE, IL 60076
799101 X SPORT FITNESS 0.24 SE 30 $1,586W TOUHY AVESKOKIE, IL 60076
521138 LOWE'S HOME IMPROVEMENT L 0.25 SW 100 $34,018W TOUHY AVELINCOLNWOOD, IL 60712
581208 JIMMY JOHN'S 0.25 SW 15 $893TOUHY AVESKOKIE, IL 60076
769991 MINUTE KEY H 0.25 SW 0 $0W TOUHY AVELINCOLNWOOD, IL 60712
Data Note: Businesses are listed based on their proximity to the study area location. A maximum of 250 records can be displayed on one report. Data on the Business Locations report is based on the businesses whose location falls within the area of study. Total Sales, Total Daytime Business Population, Total Number of Businesses, and the Daytime Business (pop)/Residential Ratio are calculated using the collection of business points that fall within the area of study.Source: Copyright 2019 Infogroup and Esri. Esri Total Residential Population forecasts for 2019. Infogroup Business Locations (April 2019).
September 25, 2019
©2019 Esri Page 7 of 16

Business Locator7353-7399 St Louis Ave Village Of Skokie Only7353-7399 St Louis Ave, Skokie, Illinois, 60076 Latitude: 42.01519Drive Time: 5, 10, 15 minute radii Longitude: -87.71717
SICCode Business Name Franchise
Distance FromSite in Miles Employees Sales ($000)
723102 AMOUR NAIL SPA 0.25 SW 3 $102TOUHY AVESKOKIE, IL 60076
481207 T-MOBILE BRANDED STORE 0.25 SW 5 $4,951TOUHY AVESKOKIE, IL 60076
571925 ECOBRITE LINEN 0.25 NW 2 $353JARVIS AVESKOKIE, IL 60076
723106 SUPERCUTS U 0.25 SW 6 $204TOUHY AVESKOKIE, IL 60076
581208 WING ZONE 0.25 SW 12 $715TOUHY AVESKOKIE, IL 60076
519916 MIDWEST TROPICAL INC 0.25 SE 30 $26,636W TOUHY AVESKOKIE, IL 60076
514101 NEW WAY TRADING 0.25 SE 8 $14,729W TOUHY AVESKOKIE, IL 60076
509901 SETHNESS PRODUCTS CO 0.25 SE 17 $17,109W TOUHY AVESKOKIE, IL 60076
581208 HALAL GUYS 0.25 SW 5 $298TOUHY AVESKOKIE, IL 60076
999977 HALAL GUYS 0.25 SW 0 $0W TOUHY AVELINCOLNWOOD, IL 60712
308901 RESINOID ENGINEERING CORP 0.25 NE 11 $2,359HOWARD STSKOKIE, IL 60076
832218 DOUGLAS CENTRES 0.25 NE 30 $1,618HOWARD STSKOKIE, IL 60076
753801 RIDGEWAY AUTO SVC 0.25 SW 2 $248RIDGEWAY AVESKOKIE, IL 60076
599502 WALMART VISION & GLASSES V 0.25 SW 5 $656TOUHY AVESKOKIE, IL 60076
531102 WALMART SUPERCENTER m 0.25 SW 65 $10,396TOUHY AVESKOKIE, IL 60076
581208 BURGER KING C 0.25 SW 25 $1,489TOUHY AVESKOKIE, IL 60076
Data Note: Businesses are listed based on their proximity to the study area location. A maximum of 250 records can be displayed on one report. Data on the Business Locations report is based on the businesses whose location falls within the area of study. Total Sales, Total Daytime Business Population, Total Number of Businesses, and the Daytime Business (pop)/Residential Ratio are calculated using the collection of business points that fall within the area of study.Source: Copyright 2019 Infogroup and Esri. Esri Total Residential Population forecasts for 2019. Infogroup Business Locations (April 2019).
September 25, 2019
©2019 Esri Page 8 of 16

Business Locator7353-7399 St Louis Ave Village Of Skokie Only7353-7399 St Louis Ave, Skokie, Illinois, 60076 Latitude: 42.01519Drive Time: 5, 10, 15 minute radii Longitude: -87.71717
SICCode Business Name Franchise
Distance FromSite in Miles Employees Sales ($000)
737809 ECO ATM/GAZELLE 0.25 SW 0 $0TOUHY AVESKOKIE, IL 60076
738905 COINSTAR H 0.25 SW 0 $0TOUHY AVESKOKIE, IL 60076
769991 MINUTE KEY H 0.25 SW 0 $0TOUHY AVESKOKIE, IL 60076
546102 WALMART BAKERY O 0.25 SW 8 $486TOUHY AVESKOKIE, IL 60076
591205 WALMART PHARMACY J 0.25 SW 8 $1,959TOUHY AVESKOKIE, IL 60076
738401 WALMART PHOTO CENTER Q 0.25 SW 3 $156TOUHY AVESKOKIE, IL 60076
784108 REDBOX R 0.25 SW 0 $0TOUHY AVESKOKIE, IL 60076
526104 WALMART GARDEN CENTER 0.25 SW 10 $2,174TOUHY AVESKOKIE, IL 60076
306916 ALLIED SEALS INC 0.25 SW 7 $1,698RIDGEWAY AVESKOKIE, IL 60076
421401 JOEY'S MOVERS & TRUCKING INC 0.26 SW 4 $563RIDGEWAY AVESKOKIE, IL 60076
421401 GOLANS MOVING & STORAGE INC 0.26 SW 10 $1,407TOUHY AVESKOKIE, IL 60076
602101 BANK FINANCIAL 0.27 SE 10 $3,134W TOUHY AVELINCOLNWOOD, IL 60712
346598 ADA METAL PRODUCTS INC 0.27 SW 100 $46,874W TOUHY AVELINCOLNWOOD, IL 60712
509905 FRENCH STUDIO IMPORTS 0.27 SW 5 $5,032RIDGEWAY AVESKOKIE, IL 60076
539901 VACO PRODUCTS 0.27 SE 2 $303MCCORMICK BLVDSKOKIE, IL 60076
871159 METROPOLITAN WATER RECLAMATION 0.27 NE 100 $24,430HOWARD STSKOKIE, IL 60076
Data Note: Businesses are listed based on their proximity to the study area location. A maximum of 250 records can be displayed on one report. Data on the Business Locations report is based on the businesses whose location falls within the area of study. Total Sales, Total Daytime Business Population, Total Number of Businesses, and the Daytime Business (pop)/Residential Ratio are calculated using the collection of business points that fall within the area of study.Source: Copyright 2019 Infogroup and Esri. Esri Total Residential Population forecasts for 2019. Infogroup Business Locations (April 2019).
September 25, 2019
©2019 Esri Page 9 of 16

Business Locator7353-7399 St Louis Ave Village Of Skokie Only7353-7399 St Louis Ave, Skokie, Illinois, 60076 Latitude: 42.01519Drive Time: 5, 10, 15 minute radii Longitude: -87.71717
SICCode Business Name Franchise
Distance FromSite in Miles Employees Sales ($000)
162977 MWRDGC 0.27 NE 2 $648HOWARD STSKOKIE, IL 60076
602101 PNC BANK Y 0.28 SW 8 $2,507TOUHY AVESKOKIE, IL 60076
602103 ATM 0.28 SW 0 $0TOUHY AVESKOKIE, IL 60076
753801 FUTURE AUTOMOTIVE HILLESICH 0.28 SW 3 $372RIDGEWAY AVESKOKIE, IL 60076
371401 TOP CLASS MOVING CO 0.28 SW 12 $4,349RIDGEWAY AVESKOKIE, IL 60076
422503 PUBLIC STORAGE P 0.28 SE 4 $656W TOUHY AVELINCOLNWOOD, IL 60712
384104 ACCESS TECHNOLOGIES 0.29 NW 24 $4,684RIDGEWAY AVESKOKIE, IL 60076
999966 NORFOLK MEDICAL 0.29 NW 10 $0RIDGEWAY AVESKOKIE, IL 60076
999966 CELL-SAFE LIFE SCIENCES LLC 0.29 NW 10 $0RIDGEWAY AVESKOKIE, IL 60076
551103 PAYLESS CARS 0.29 SW 1 $579RIDGEWAY AVESKOKIE, IL 60076
571213 DESIGN GRANITE & MARBLE INC 0.29 SW 4 $1,109RIDGEWAY AVESKOKIE, IL 60076
421304 A C TRUCKING & WAREHOUSE CO 0.29 SW 5 $1,278RIDGEWAY AVESKOKIE, IL 60076
152105 UNITED STONE 0.29 SW 3 $1,001RIDGEWAY AVESKOKIE, IL 60076
421401 DONE RIGHT MOVING 0.29 SE 10 $1,407W TOUHY AVELINCOLNWOOD, IL 60712
999977 UBERLUBE INC 0.30 SW 0 $0RIDGEWAY AVESKOKIE, IL 60076
353101 ECHO MACHINING INC 0.30 SW 2 $731RIDGEWAY AVESKOKIE, IL 60076
Data Note: Businesses are listed based on their proximity to the study area location. A maximum of 250 records can be displayed on one report. Data on the Business Locations report is based on the businesses whose location falls within the area of study. Total Sales, Total Daytime Business Population, Total Number of Businesses, and the Daytime Business (pop)/Residential Ratio are calculated using the collection of business points that fall within the area of study.Source: Copyright 2019 Infogroup and Esri. Esri Total Residential Population forecasts for 2019. Infogroup Business Locations (April 2019).
September 25, 2019
©2019 Esri Page 10 of 16

Business Locator7353-7399 St Louis Ave Village Of Skokie Only7353-7399 St Louis Ave, Skokie, Illinois, 60076 Latitude: 42.01519Drive Time: 5, 10, 15 minute radii Longitude: -87.71717
SICCode Business Name Franchise
Distance FromSite in Miles Employees Sales ($000)
783201 SKOKIE CONCESSIONS 0.30 SE 7 $481MCCORMICK BLVDSKOKIE, IL 60076
267902 BAG TAGS INC 0.30 NE 3 $630HOWARD STSKOKIE, IL 60076
873104 CITI LABS 0.30 NE 5 $0HOWARD STSKOKIE, IL 60076
599970 AQUARIUM PROFESSIONALS GROUP 0.30 NE 12 $2,133HOWARD STSKOKIE, IL 60076
518101 LOUIS GLUNZ BEER INC 0.30 SE 40 $36,109N CAPITOL DRLINCOLNWOOD, IL 60712
999977 GREATER WA READING COUNCIL 0.30 SE 0 $0N CAPITOL DRLINCOLNWOOD, IL 60712
422503 LIGHTOLOGY CORPORATE WAREHOUSE 0.31 NW 3 $492HAMLIN AVESKOKIE, IL 60076
421401 CHICAGO BEST MOVING CO 0.31 NW 10 $1,407HAMLIN AVESKOKIE, IL 60076
541105 MARIANO'S 0.31 SE 100 $25,555W TOUHY AVESKOKIE, IL 60076
581208 WENDY'S X 0.31 SW 38 $2,263TOUHY AVESKOKIE, IL 60076
594508 OCTURA MODELS INC 0.31 NW 2 $297HAMLIN AVESKOKIE, IL 60076
359903 G S MACHINE & TOOL INC 0.31 SW 6 $893HAMLIN AVESKOKIE, IL 60076
999977 BENTLEY SPECIALTIES INC 0.31 SW 0 $0HAMLIN AVESKOKIE, IL 60076
874264 KNECHTEL LABORATORIES INC 0.32 SW 12 $2,472HAMLIN AVESKOKIE, IL 60076
829972 TOT LEARNING CTR 0.32 NW 50 $0HOWARD STSKOKIE, IL 60076
753801 VILLAGE AUTO REPAIR 0.32 SW 3 $372HAMLIN AVESKOKIE, IL 60076
Data Note: Businesses are listed based on their proximity to the study area location. A maximum of 250 records can be displayed on one report. Data on the Business Locations report is based on the businesses whose location falls within the area of study. Total Sales, Total Daytime Business Population, Total Number of Businesses, and the Daytime Business (pop)/Residential Ratio are calculated using the collection of business points that fall within the area of study.Source: Copyright 2019 Infogroup and Esri. Esri Total Residential Population forecasts for 2019. Infogroup Business Locations (April 2019).
September 25, 2019
©2019 Esri Page 11 of 16

Business Locator7353-7399 St Louis Ave Village Of Skokie Only7353-7399 St Louis Ave, Skokie, Illinois, 60076 Latitude: 42.01519Drive Time: 5, 10, 15 minute radii Longitude: -87.71717
SICCode Business Name Franchise
Distance FromSite in Miles Employees Sales ($000)
473104 ORIENT STAR SHIPPING-CHICAGO 0.32 SW 6 $1,459HAMLIN AVESKOKIE, IL 60076
347904 NORTH AMERICAN POLYMER CO LTD 0.33 SW 12 $2,299HAMLIN AVESKOKIE, IL 60076
508522 NAPCO LIMITED 0.33 SW 22 $28,454HAMLIN AVESKOKIE, IL 60076
651303 SHORELINE COMMUNITY APT LLC 0.33 SW 5 $1,227TOUHY AVESKOKIE, IL 60076
671901 S & Y HOLDINGS LLC 0.33 SW 3 $2,104TOUHY AVESKOKIE, IL 60076
481207 AT&T STORE D 0.33 SW 6 $5,942W TOUHY AVELINCOLNWOOD, IL 60712
422508 EXTRA SPACE STORAGE E 0.33 NE 3 $492MCCORMICK BLVDSKOKIE, IL 60076
602101 BANK OF AMERICA M 0.33 SE 11 $3,447W TOUHY AVESKOKIE, IL 60076
809907 VILLA HEALTHCARE MANAGEMENT 0.33 SW 8 $1,034CHASE AVESKOKIE, IL 60076
411902 LIFE LINE AMBULANCE INC 0.33 SW 18 $1,359CHASE AVESKOKIE, IL 60076
729101 MICHAEL WALSH & ASSOC 0.34 NE 3 $81HOWARD STSKOKIE, IL 60076
738998 ROSE TOWING & RECOVERING 0.34 NE 3 $374HOWARD STSKOKIE, IL 60076
833102 VILLA AT TRAVERSE POINT 0.34 SW 7 $0CHASE AVESKOKIE, IL 60076
999977 VILLA AT BRYN MAWR LLC 0.34 SW 0 $0CHASE AVESKOKIE, IL 60076
999977 VILLA AT ST LOUIS PARK LLC 0.34 SW 0 $0CHASE AVESKOKIE, IL 60076
504719 BOSWORTH CO 0.34 SW 50 $67,486HAMLIN AVESKOKIE, IL 60076
Data Note: Businesses are listed based on their proximity to the study area location. A maximum of 250 records can be displayed on one report. Data on the Business Locations report is based on the businesses whose location falls within the area of study. Total Sales, Total Daytime Business Population, Total Number of Businesses, and the Daytime Business (pop)/Residential Ratio are calculated using the collection of business points that fall within the area of study.Source: Copyright 2019 Infogroup and Esri. Esri Total Residential Population forecasts for 2019. Infogroup Business Locations (April 2019).
September 25, 2019
©2019 Esri Page 12 of 16
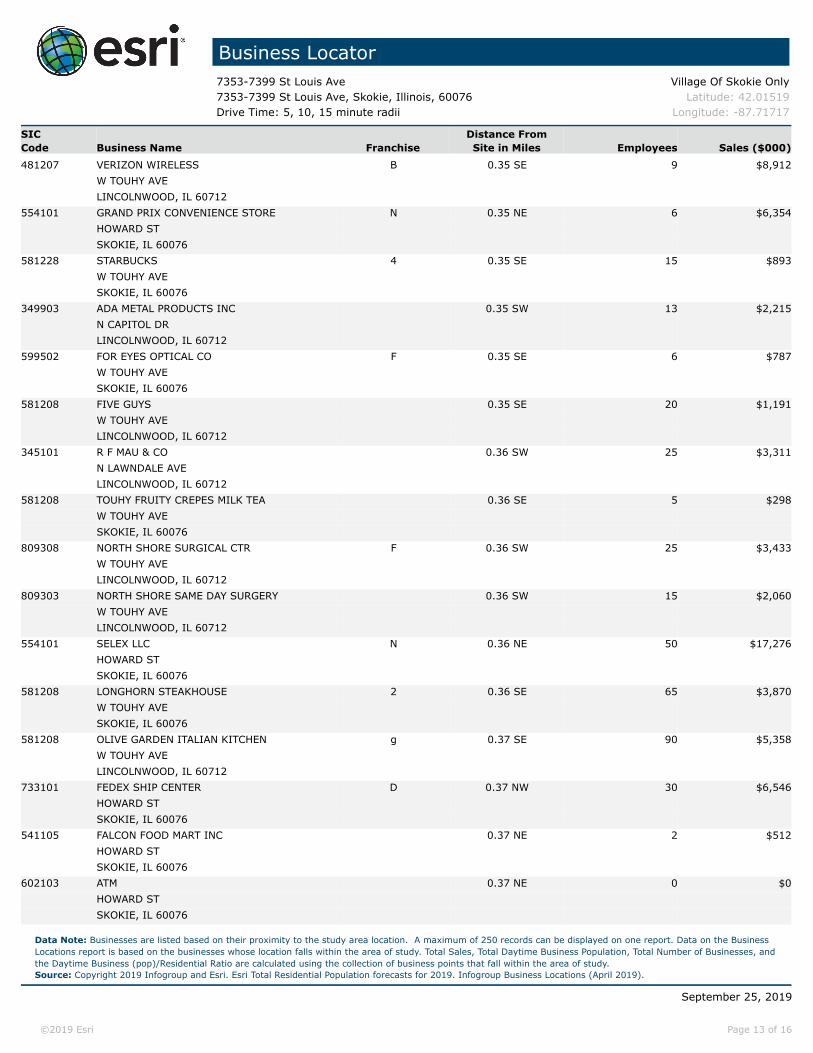
Business Locator7353-7399 St Louis Ave Village Of Skokie Only7353-7399 St Louis Ave, Skokie, Illinois, 60076 Latitude: 42.01519Drive Time: 5, 10, 15 minute radii Longitude: -87.71717
SICCode Business Name Franchise
Distance FromSite in Miles Employees Sales ($000)
481207 VERIZON WIRELESS B 0.35 SE 9 $8,912W TOUHY AVELINCOLNWOOD, IL 60712
554101 GRAND PRIX CONVENIENCE STORE N 0.35 NE 6 $6,354HOWARD STSKOKIE, IL 60076
581228 STARBUCKS 4 0.35 SE 15 $893W TOUHY AVESKOKIE, IL 60076
349903 ADA METAL PRODUCTS INC 0.35 SW 13 $2,215N CAPITOL DRLINCOLNWOOD, IL 60712
599502 FOR EYES OPTICAL CO F 0.35 SE 6 $787W TOUHY AVESKOKIE, IL 60076
581208 FIVE GUYS 0.35 SE 20 $1,191W TOUHY AVELINCOLNWOOD, IL 60712
345101 R F MAU & CO 0.36 SW 25 $3,311N LAWNDALE AVELINCOLNWOOD, IL 60712
581208 TOUHY FRUITY CREPES MILK TEA 0.36 SE 5 $298W TOUHY AVESKOKIE, IL 60076
809308 NORTH SHORE SURGICAL CTR F 0.36 SW 25 $3,433W TOUHY AVELINCOLNWOOD, IL 60712
809303 NORTH SHORE SAME DAY SURGERY 0.36 SW 15 $2,060W TOUHY AVELINCOLNWOOD, IL 60712
554101 SELEX LLC N 0.36 NE 50 $17,276HOWARD STSKOKIE, IL 60076
581208 LONGHORN STEAKHOUSE 2 0.36 SE 65 $3,870W TOUHY AVESKOKIE, IL 60076
581208 OLIVE GARDEN ITALIAN KITCHEN g 0.37 SE 90 $5,358W TOUHY AVELINCOLNWOOD, IL 60712
733101 FEDEX SHIP CENTER D 0.37 NW 30 $6,546HOWARD STSKOKIE, IL 60076
541105 FALCON FOOD MART INC 0.37 NE 2 $512HOWARD STSKOKIE, IL 60076
602103 ATM 0.37 NE 0 $0HOWARD STSKOKIE, IL 60076
Data Note: Businesses are listed based on their proximity to the study area location. A maximum of 250 records can be displayed on one report. Data on the Business Locations report is based on the businesses whose location falls within the area of study. Total Sales, Total Daytime Business Population, Total Number of Businesses, and the Daytime Business (pop)/Residential Ratio are calculated using the collection of business points that fall within the area of study.Source: Copyright 2019 Infogroup and Esri. Esri Total Residential Population forecasts for 2019. Infogroup Business Locations (April 2019).
September 25, 2019
©2019 Esri Page 13 of 16
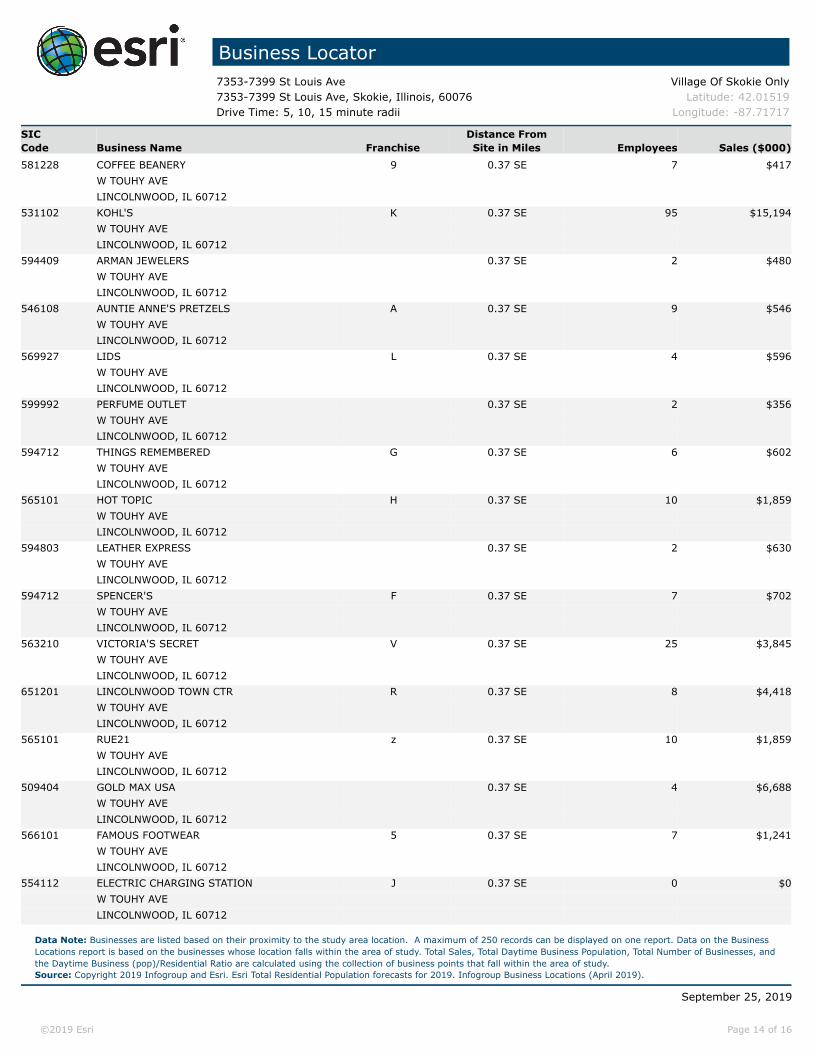
Business Locator7353-7399 St Louis Ave Village Of Skokie Only7353-7399 St Louis Ave, Skokie, Illinois, 60076 Latitude: 42.01519Drive Time: 5, 10, 15 minute radii Longitude: -87.71717
SICCode Business Name Franchise
Distance FromSite in Miles Employees Sales ($000)
581228 COFFEE BEANERY 9 0.37 SE 7 $417W TOUHY AVELINCOLNWOOD, IL 60712
531102 KOHL'S K 0.37 SE 95 $15,194W TOUHY AVELINCOLNWOOD, IL 60712
594409 ARMAN JEWELERS 0.37 SE 2 $480W TOUHY AVELINCOLNWOOD, IL 60712
546108 AUNTIE ANNE'S PRETZELS A 0.37 SE 9 $546W TOUHY AVELINCOLNWOOD, IL 60712
569927 LIDS L 0.37 SE 4 $596W TOUHY AVELINCOLNWOOD, IL 60712
599992 PERFUME OUTLET 0.37 SE 2 $356W TOUHY AVELINCOLNWOOD, IL 60712
594712 THINGS REMEMBERED G 0.37 SE 6 $602W TOUHY AVELINCOLNWOOD, IL 60712
565101 HOT TOPIC H 0.37 SE 10 $1,859W TOUHY AVELINCOLNWOOD, IL 60712
594803 LEATHER EXPRESS 0.37 SE 2 $630W TOUHY AVELINCOLNWOOD, IL 60712
594712 SPENCER'S F 0.37 SE 7 $702W TOUHY AVELINCOLNWOOD, IL 60712
563210 VICTORIA'S SECRET V 0.37 SE 25 $3,845W TOUHY AVELINCOLNWOOD, IL 60712
651201 LINCOLNWOOD TOWN CTR R 0.37 SE 8 $4,418W TOUHY AVELINCOLNWOOD, IL 60712
565101 RUE21 z 0.37 SE 10 $1,859W TOUHY AVELINCOLNWOOD, IL 60712
509404 GOLD MAX USA 0.37 SE 4 $6,688W TOUHY AVELINCOLNWOOD, IL 60712
566101 FAMOUS FOOTWEAR 5 0.37 SE 7 $1,241W TOUHY AVELINCOLNWOOD, IL 60712
554112 ELECTRIC CHARGING STATION J 0.37 SE 0 $0W TOUHY AVELINCOLNWOOD, IL 60712
Data Note: Businesses are listed based on their proximity to the study area location. A maximum of 250 records can be displayed on one report. Data on the Business Locations report is based on the businesses whose location falls within the area of study. Total Sales, Total Daytime Business Population, Total Number of Businesses, and the Daytime Business (pop)/Residential Ratio are calculated using the collection of business points that fall within the area of study.Source: Copyright 2019 Infogroup and Esri. Esri Total Residential Population forecasts for 2019. Infogroup Business Locations (April 2019).
September 25, 2019
©2019 Esri Page 14 of 16

Business Locator7353-7399 St Louis Ave Village Of Skokie Only7353-7399 St Louis Ave, Skokie, Illinois, 60076 Latitude: 42.01519Drive Time: 5, 10, 15 minute radii Longitude: -87.71717
SICCode Business Name Franchise
Distance FromSite in Miles Employees Sales ($000)
508702 ABE & CO 0.37 SE 3 $2,385W TOUHY AVELINCOLNWOOD, IL 60712
565101 CHARLOTTE RUSSE W 0.37 SE 2 $947W TOUHY AVELINCOLNWOOD, IL 60712
581208 CHIPOTLE MEXICAN GRILL 2 0.37 SE 21 $1,251W TOUHY AVELINCOLNWOOD, IL 60712
599502 LENSCRAFTERS L 0.37 SE 14 $1,836W TOUHY AVELINCOLNWOOD, IL 60712
581208 JNW 0.37 SE 8 $477W TOUHY AVELINCOLNWOOD, IL 60712
549904 GNC G 0.37 SE 4 $411W TOUHY AVELINCOLNWOOD, IL 60712
566101 FOOT LOCKER F 0.37 SE 6 $1,064W TOUHY AVELINCOLNWOOD, IL 60712
581208 A & D BUFFALO 0.37 SE 5 $298W TOUHY AVELINCOLNWOOD, IL 60712
565101 DOLCE VITA FASHION 0.37 SE 2 $372W TOUHY AVELINCOLNWOOD, IL 60712
734902 INTERSTATE CLEANING CORP 0.37 SE 6 $657W TOUHY AVELINCOLNWOOD, IL 60712
562101 FEMME FATALE 0.37 SE 1 $161W TOUHY AVELINCOLNWOOD, IL 60712
581208 RED LOBSTER 8 0.37 SE 85 $5,060W TOUHY AVELINCOLNWOOD, IL 60712
564103 CHILDREN'S PLACE B 0.37 SE 16 $1,960W TOUHY AVELINCOLNWOOD, IL 60712
594113 CHAMPS SPORTS F 0.37 SE 9 $1,844W TOUHY AVELINCOLNWOOD, IL 60712
594409 OXFORD JEWELERS INC 0.37 SE 3 $720W TOUHY AVELINCOLNWOOD, IL 60712
599992 BATH & BODY WORKS A 0.37 SE 13 $2,310W TOUHY AVELINCOLNWOOD, IL 60712
Data Note: Businesses are listed based on their proximity to the study area location. A maximum of 250 records can be displayed on one report. Data on the Business Locations report is based on the businesses whose location falls within the area of study. Total Sales, Total Daytime Business Population, Total Number of Businesses, and the Daytime Business (pop)/Residential Ratio are calculated using the collection of business points that fall within the area of study.Source: Copyright 2019 Infogroup and Esri. Esri Total Residential Population forecasts for 2019. Infogroup Business Locations (April 2019).
September 25, 2019
©2019 Esri Page 15 of 16

Business Locator7353-7399 St Louis Ave Village Of Skokie Only7353-7399 St Louis Ave, Skokie, Illinois, 60076 Latitude: 42.01519Drive Time: 5, 10, 15 minute radii Longitude: -87.71717
SICCode Business Name Franchise
Distance FromSite in Miles Employees Sales ($000)
565101 OLD NAVY I 0.37 SE 40 $7,436W TOUHY AVELINCOLNWOOD, IL 60712
481207 TCC WIRELESS-T-MOBILE PREMIUM 0.37 SE 7 $6,932W TOUHY AVELINCOLNWOOD, IL 60712
566101 UNDERGROUND BY JOURNEYS g 0.37 SE 4 $709W TOUHY AVELINCOLNWOOD, IL 60712
581208 VILLA FRESH ITALIAN KITCHEN 0.37 SE 7 $417W TOUHY AVELINCOLNWOOD, IL 60712
599902 SUNSHINE PHONE ACCESSORIES 0.37 SE 3 $534W TOUHY AVELINCOLNWOOD, IL 60712
481207 GO WIRELESS-VERIZON AUTH RTLR GO 0.37 SE 3 $2,971W TOUHY AVELINCOLNWOOD, IL 60712
561101 ATTITUDE INC 0.37 SE 1 $180W TOUHY AVELINCOLNWOOD, IL 60712
599502 VISIONWORKS E 0.37 SE 12 $1,574W TOUHY AVELINCOLNWOOD, IL 60712
481207 PAGECOMM WIRELESS 0.37 SE 2 $1,981W TOUHY AVELINCOLNWOOD, IL 60712
566101 KIDS FOOT LOCKER Q 0.37 SE 5 $887W TOUHY AVELINCOLNWOOD, IL 60712
566101 JOURNEYS O 0.37 SE 5 $887W TOUHY AVELINCOLNWOOD, IL 60712
723106 ZUNIS THREADING 0.37 SE 7 $238W TOUHY AVELINCOLNWOOD, IL 60712
Data Note: Businesses are listed based on their proximity to the study area location. A maximum of 250 records can be displayed on one report. Data on the Business Locations report is based on the businesses whose location falls within the area of study. Total Sales, Total Daytime Business Population, Total Number of Businesses, and the Daytime Business (pop)/Residential Ratio are calculated using the collection of business points that fall within the area of study.Source: Copyright 2019 Infogroup and Esri. Esri Total Residential Population forecasts for 2019. Infogroup Business Locations (April 2019).
September 25, 2019
©2019 Esri Page 16 of 16

Business Summary7353-7399 St Louis Ave Village Of Skokie Only7353-7399 St Louis Ave, Skokie, Illinois, 60076 Latitude: 42.01519Drive Time: 5, 10, 15 minute radii Longitude: -87.71717
Data for all businesses in area 5 minutes 10 minutes 15 minutesTotal Businesses: 1,172 6,416 16,225Total Employees: 13,567 70,311 200,567Total Residential Population: 19,188 185,523 477,852Employee/Residential Population Ratio (per 100 Residents) 71 38 42
Businesses Employees Businesses Employees Businesses Employeesby SIC Codes Number Percent Number Percent Number Percent Number Percent Number Percent Number PercentAgriculture & Mining 6 0.5% 34 0.3% 67 1.0% 518 0.7% 153 0.9% 1,138 0.6%Construction 70 6.0% 502 3.7% 341 5.3% 2,116 3.0% 835 5.1% 6,690 3.3%Manufacturing 69 5.9% 2,208 16.3% 249 3.9% 7,511 10.7% 552 3.4% 20,060 10.0%Transportation 41 3.5% 474 3.5% 212 3.3% 2,402 3.4% 420 2.6% 6,057 3.0%Communication 13 1.1% 71 0.5% 54 0.8% 478 0.7% 157 1.0% 1,297 0.6%Utility 1 0.1% 5 0.0% 4 0.1% 11 0.0% 14 0.1% 159 0.1%Wholesale Trade 69 5.9% 768 5.7% 219 3.4% 2,658 3.8% 476 2.9% 6,861 3.4%
Retail Trade Summary 233 19.9% 3,549 26.2% 1,249 19.5% 15,284 21.7% 3,446 21.2% 38,580 19.2%Home Improvement 11 0.9% 317 2.3% 57 0.9% 1,469 2.1% 132 0.8% 2,697 1.3%General Merchandise Stores 7 0.6% 140 1.0% 37 0.6% 1,150 1.6% 104 0.6% 3,139 1.6%Food Stores 26 2.2% 410 3.0% 147 2.3% 2,038 2.9% 392 2.4% 5,353 2.7%Auto Dealers, Gas Stations, Auto Aftermarket 28 2.4% 386 2.8% 104 1.6% 1,020 1.5% 233 1.4% 2,183 1.1%Apparel & Accessory Stores 24 2.0% 244 1.8% 81 1.3% 471 0.7% 252 1.6% 2,222 1.1%Furniture & Home Furnishings 16 1.4% 162 1.2% 97 1.5% 807 1.1% 264 1.6% 1,958 1.0%Eating & Drinking Places 56 4.8% 1,171 8.6% 415 6.5% 5,017 7.1% 1,239 7.6% 13,704 6.8%Miscellaneous Retail 64 5.5% 718 5.3% 312 4.9% 3,314 4.7% 831 5.1% 7,325 3.7%
Finance, Insurance, Real Estate Summary 116 9.9% 1,235 9.1% 617 9.6% 5,018 7.1% 1,493 9.2% 11,400 5.7%Banks, Savings & Lending Institutions 20 1.7% 190 1.4% 111 1.7% 1,128 1.6% 269 1.7% 2,814 1.4%Securities Brokers 7 0.6% 75 0.6% 52 0.8% 378 0.5% 173 1.1% 1,168 0.6%Insurance Carriers & Agents 29 2.5% 407 3.0% 151 2.4% 1,047 1.5% 330 2.0% 2,039 1.0%Real Estate, Holding, Other Investment Offices 59 5.0% 564 4.2% 303 4.7% 2,465 3.5% 721 4.4% 5,380 2.7%
Services Summary 464 39.6% 4,446 32.8% 2,864 44.6% 32,453 46.2% 7,165 44.2% 101,112 50.4%Hotels & Lodging 2 0.2% 15 0.1% 18 0.3% 251 0.4% 58 0.4% 1,189 0.6%Automotive Services 25 2.1% 167 1.2% 151 2.4% 991 1.4% 383 2.4% 2,193 1.1%Motion Pictures & Amusements 29 2.5% 340 2.5% 155 2.4% 1,414 2.0% 450 2.8% 4,620 2.3%Health Services 106 9.0% 1,108 8.2% 611 9.5% 7,173 10.2% 1,423 8.8% 26,723 13.3%Legal Services 16 1.4% 46 0.3% 101 1.6% 329 0.5% 261 1.6% 941 0.5%Education Institutions & Libraries 21 1.8% 593 4.4% 184 2.9% 8,369 11.9% 454 2.8% 21,404 10.7%Other Services 265 22.6% 2,177 16.0% 1,644 25.6% 13,927 19.8% 4,134 25.5% 44,044 22.0%
Government 8 0.7% 189 1.4% 51 0.8% 1,461 2.1% 171 1.1% 5,815 2.9%
Unclassified Establishments 82 7.0% 86 0.6% 488 7.6% 401 0.6% 1,345 8.3% 1,398 0.7%
Totals 1,172 100.0% 13,567 100.0% 6,416 100.0% 70,311 100.0% 16,225 100.0% 200,567 100.0%
Source: Copyright 2019 Infogroup, Inc. All rights reserved. Esri Total Residential Population forecasts for 2019.Date Note: Data on the Business Summary report is calculated using Esri’s Data allocation method which uses census block groups to allocate business summary data to custom areas.
September 25, 2019
©2019 Esri Page 1 of 2

Business Summary7353-7399 St Louis Ave Village Of Skokie Only7353-7399 St Louis Ave, Skokie, Illinois, 60076 Latitude: 42.01519Drive Time: 5, 10, 15 minute radii Longitude: -87.71717
Businesses Employees Businesses Employees Businesses Employeesby NAICS Codes Number Percent Number Percent Number Percent Number Percent Number Percent Number PercentAgriculture, Forestry, Fishing & Hunting 1 0.1% 2 0.0% 7 0.1% 46 0.1% 12 0.1% 149 0.1%Mining 1 0.1% 4 0.0% 2 0.0% 9 0.0% 2 0.0% 16 0.0%Utilities 0 0.0% 1 0.0% 2 0.0% 5 0.0% 6 0.0% 78 0.0%Construction 76 6.5% 554 4.1% 380 5.9% 2,421 3.4% 913 5.6% 7,412 3.7%Manufacturing 72 6.1% 2,163 15.9% 263 4.1% 7,392 10.5% 597 3.7% 19,305 9.6%Wholesale Trade 65 5.5% 723 5.3% 206 3.2% 2,554 3.6% 453 2.8% 6,700 3.3%Retail Trade 167 14.2% 2,290 16.9% 794 12.4% 9,953 14.2% 2,068 12.7% 23,923 11.9%
Motor Vehicle & Parts Dealers 16 1.4% 295 2.2% 57 0.9% 776 1.1% 133 0.8% 1,684 0.8%Furniture & Home Furnishings Stores 9 0.8% 71 0.5% 42 0.7% 240 0.3% 120 0.7% 934 0.5%Electronics & Appliance Stores 8 0.7% 247 1.8% 49 0.8% 1,538 2.2% 115 0.7% 1,910 1.0%Bldg Material & Garden Equipment & Supplies Dealers 11 0.9% 317 2.3% 57 0.9% 1,469 2.1% 132 0.8% 2,697 1.3%Food & Beverage Stores 17 1.5% 319 2.4% 114 1.8% 1,773 2.5% 322 2.0% 4,662 2.3%Health & Personal Care Stores 21 1.8% 359 2.6% 92 1.4% 1,022 1.5% 209 1.3% 2,336 1.2%Gasoline Stations 12 1.0% 91 0.7% 46 0.7% 244 0.3% 100 0.6% 499 0.2%Clothing & Clothing Accessories Stores 33 2.8% 273 2.0% 107 1.7% 554 0.8% 321 2.0% 2,526 1.3%Sport Goods, Hobby, Book, & Music Stores 9 0.8% 60 0.4% 58 0.9% 476 0.7% 143 0.9% 1,177 0.6%General Merchandise Stores 7 0.6% 140 1.0% 37 0.6% 1,150 1.6% 104 0.6% 3,139 1.6%Miscellaneous Store Retailers 18 1.5% 98 0.7% 114 1.8% 634 0.9% 315 1.9% 1,798 0.9%Nonstore Retailers 5 0.4% 20 0.1% 21 0.3% 78 0.1% 55 0.3% 562 0.3%
Transportation & Warehousing 27 2.3% 398 2.9% 128 2.0% 1,901 2.7% 271 1.7% 5,272 2.6%Information 28 2.4% 360 2.7% 143 2.2% 2,119 3.0% 415 2.6% 5,974 3.0%Finance & Insurance 56 4.8% 671 4.9% 319 5.0% 2,565 3.6% 795 4.9% 6,108 3.0%
Central Bank/Credit Intermediation & Related Activities 19 1.6% 188 1.4% 106 1.7% 1,113 1.6% 258 1.6% 2,750 1.4%Securities, Commodity Contracts & Other Financial Investments & Other Related Activities
8 0.7% 77 0.6% 62 1.0% 405 0.6% 205 1.3% 1,312 0.7%Insurance Carriers & Related Activities; Funds, Trusts & Other Financial Vehicles
29 2.5% 407 3.0% 151 2.4% 1,047 1.5% 332 2.0% 2,046 1.0%Real Estate, Rental & Leasing 67 5.7% 574 4.2% 334 5.2% 2,516 3.6% 791 4.9% 5,516 2.8%Professional, Scientific & Tech Services 119 10.2% 967 7.1% 684 10.7% 5,334 7.6% 1,706 10.5% 19,000 9.5%
Legal Services 18 1.5% 58 0.4% 107 1.7% 365 0.5% 278 1.7% 1,029 0.5%Management of Companies & Enterprises 2 0.2% 7 0.1% 6 0.1% 16 0.0% 14 0.1% 162 0.1%Administrative & Support & Waste Management & Remediation Services
38 3.2% 285 2.1% 255 4.0% 1,974 2.8% 567 3.5% 3,931 2.0%Educational Services 24 2.0% 605 4.5% 216 3.4% 8,428 12.0% 537 3.3% 21,061 10.5%Health Care & Social Assistance 128 10.9% 1,461 10.8% 765 11.9% 10,129 14.4% 1,809 11.1% 35,398 17.6%Arts, Entertainment & Recreation 20 1.7% 264 1.9% 111 1.7% 1,179 1.7% 339 2.1% 4,206 2.1%Accommodation & Food Services 63 5.4% 1,227 9.0% 448 7.0% 5,414 7.7% 1,341 8.3% 15,329 7.6%
Accommodation 2 0.2% 15 0.1% 18 0.3% 251 0.4% 58 0.4% 1,189 0.6%Food Services & Drinking Places 60 5.1% 1,212 8.9% 429 6.7% 5,163 7.3% 1,283 7.9% 14,140 7.1%
Other Services (except Public Administration) 125 10.7% 737 5.4% 815 12.7% 4,494 6.4% 2,071 12.8% 13,813 6.9%Automotive Repair & Maintenance 22 1.9% 154 1.1% 122 1.9% 797 1.1% 307 1.9% 1,760 0.9%
Public Administration 8 0.7% 189 1.4% 51 0.8% 1,461 2.1% 171 1.1% 5,815 2.9%
Unclassified Establishments 82 7.0% 86 0.6% 488 7.6% 401 0.6% 1,345 8.3% 1,398 0.7%
Total 1,172 100.0% 13,567 100.0% 6,416 100.0% 70,311 100.0% 16,225 100.0% 200,567 100.0%Source: Copyright 2019 Infogroup, Inc. All rights reserved. Esri Total Residential Population forecasts for 2019.Date Note: Data on the Business Summary report is calculated using Esri’s Data allocation method which uses census block groups to allocate business summary data to custom areas.
September 25, 2019
©2019 Esri Page 2 of 2

Community Profile7353-7399 St Louis Ave Village Of Skokie Only7353-7399 St Louis Ave, Skokie, Illinois, 60076 Latitude: 42.01519Drive Time: 5, 10, 15 minute radii Longitude: -87.71717
5 minutes 10 minutes 15 minutesPopulation Summary
2000 Total Population 18,580 186,997 494,7142010 Total Population 19,211 185,578 475,5882019 Total Population 19,188 185,523 477,852
2019 Group Quarters 123 2,301 14,9082024 Total Population 19,016 184,250 475,755
2019-2024 Annual Rate -0.18% -0.14% -0.09%2019 Total Daytime Population 24,735 168,530 442,265
Workers 14,322 72,008 204,172Residents 10,413 96,522 238,093
Household Summary2000 Households 6,697 67,825 183,628
2000 Average Household Size 2.76 2.72 2.612010 Households 6,540 66,618 180,923
2010 Average Household Size 2.92 2.75 2.552019 Households 6,451 66,502 182,450
2019 Average Household Size 2.96 2.76 2.542024 Households 6,373 66,011 181,752
2024 Average Household Size 2.96 2.76 2.542019-2024 Annual Rate -0.24% -0.15% -0.08%
2010 Families 4,872 45,737 110,0462010 Average Family Size 3.49 3.38 3.29
2019 Families 4,775 45,168 109,3182019 Average Family Size 3.54 3.40 3.30
2024 Families 4,708 44,702 108,3822024 Average Family Size 3.56 3.41 3.302019-2024 Annual Rate -0.28% -0.21% -0.17%
Housing Unit Summary2000 Housing Units 6,820 70,097 191,194
Owner Occupied Housing Units 84.9% 60.6% 50.3%Renter Occupied Housing Units 13.3% 36.2% 45.7%Vacant Housing Units 1.8% 3.2% 4.0%
2010 Housing Units 6,877 72,266 198,023Owner Occupied Housing Units 79.2% 58.1% 50.5%Renter Occupied Housing Units 15.9% 34.1% 40.9%Vacant Housing Units 4.9% 7.8% 8.6%
2019 Housing Units 6,873 72,756 199,881Owner Occupied Housing Units 76.4% 55.3% 47.9%Renter Occupied Housing Units 17.5% 36.1% 43.3%Vacant Housing Units 6.1% 8.6% 8.7%
2024 Housing Units 6,877 72,987 200,895Owner Occupied Housing Units 76.1% 55.5% 48.3%Renter Occupied Housing Units 16.5% 35.0% 42.2%Vacant Housing Units 7.3% 9.6% 9.5%
Median Household Income2019 $86,110 $72,067 $66,1872024 $97,707 $79,798 $74,914
Median Home Value2019 $331,766 $347,418 $354,4372024 $350,612 $371,004 $382,162
Per Capita Income2019 $36,888 $36,138 $37,4732024 $41,515 $40,678 $42,110
Median Age2010 42.6 38.7 36.82019 44.2 39.9 38.22024 44.4 40.6 39.0
Data Note: Household population includes persons not residing in group quarters. Average Household Size is the household population divided by total households. Persons in families include the householder and persons related to the householder by birth, marriage, or adoption. Per Capita Income represents the income received by all persons aged 15 years and over divided by the total population.Source: U.S. Census Bureau, Census 2010 Summary File 1. Esri forecasts for 2019 and 2024 Esri converted Census 2000 data into 2010 geography.
September 25, 2019
©2019 Esri Page 1 of 7

Community Profile7353-7399 St Louis Ave Village Of Skokie Only7353-7399 St Louis Ave, Skokie, Illinois, 60076 Latitude: 42.01519Drive Time: 5, 10, 15 minute radii Longitude: -87.71717
5 minutes 10 minutes 15 minutes2019 Households by Income
Household Income Base 6,451 66,502 182,450<$15,000 5.5% 8.8% 10.4%$15,000 - $24,999 7.4% 7.7% 8.6%$25,000 - $34,999 5.1% 7.1% 7.7%$35,000 - $49,999 10.8% 11.9% 11.9%$50,000 - $74,999 14.9% 15.8% 15.7%$75,000 - $99,999 12.2% 12.7% 12.4%$100,000 - $149,999 21.4% 17.4% 15.6%$150,000 - $199,999 11.9% 8.7% 7.7%$200,000+ 10.7% 9.8% 9.9%
Average Household Income $109,187 $100,143 $97,8382024 Households by Income
Household Income Base 6,373 66,011 181,752<$15,000 5.0% 8.0% 9.4%$15,000 - $24,999 6.8% 7.0% 7.9%$25,000 - $34,999 4.5% 6.2% 6.8%$35,000 - $49,999 9.7% 10.6% 10.7%$50,000 - $74,999 13.8% 15.2% 15.2%$75,000 - $99,999 11.0% 12.3% 12.2%$100,000 - $149,999 21.6% 18.4% 16.8%$150,000 - $199,999 14.6% 10.6% 9.5%$200,000+ 13.0% 11.6% 11.5%
Average Household Income $123,250 $112,777 $109,9212019 Owner Occupied Housing Units by Value
Total 5,250 40,239 95,816<$50,000 1.0% 0.8% 0.9%$50,000 - $99,999 1.8% 2.3% 2.4%$100,000 - $149,999 2.9% 3.5% 3.8%$150,000 - $199,999 5.3% 6.4% 6.7%$200,000 - $249,999 10.5% 9.5% 9.4%$250,000 - $299,999 17.9% 13.4% 12.6%$300,000 - $399,999 33.0% 29.5% 26.1%$400,000 - $499,999 12.5% 15.3% 14.2%$500,000 - $749,999 10.4% 13.9% 15.6%$750,000 - $999,999 1.4% 3.2% 4.7%$1,000,000 - $1,499,999 2.4% 1.4% 2.4%$1,500,000 - $1,999,999 0.2% 0.2% 0.5%$2,000,000 + 0.6% 0.6% 0.7%
Average Home Value $383,784 $396,119 $422,0642024 Owner Occupied Housing Units by Value
Total 5,236 40,480 97,063<$50,000 0.4% 0.3% 0.4%$50,000 - $99,999 1.1% 1.3% 1.4%$100,000 - $149,999 2.1% 2.2% 2.4%$150,000 - $199,999 4.4% 4.7% 4.8%$200,000 - $249,999 8.5% 7.7% 7.5%$250,000 - $299,999 16.1% 12.1% 11.3%$300,000 - $399,999 34.3% 30.5% 26.9%$400,000 - $499,999 14.3% 17.6% 16.5%$500,000 - $749,999 13.4% 17.3% 19.1%$750,000 - $999,999 1.8% 3.9% 5.9%$1,000,000 - $1,499,999 2.6% 1.5% 2.4%$1,500,000 - $1,999,999 0.2% 0.2% 0.5%$2,000,000 + 0.7% 0.7% 0.8%
Average Home Value $411,082 $428,574 $456,076
Data Note: Income represents the preceding year, expressed in current dollars. Household income includes wage and salary earnings, interest dividends, net rents, pensions, SSI and welfare payments, child support, and alimony. Source: U.S. Census Bureau, Census 2010 Summary File 1. Esri forecasts for 2019 and 2024 Esri converted Census 2000 data into 2010 geography.
September 25, 2019
©2019 Esri Page 2 of 7

Community Profile7353-7399 St Louis Ave Village Of Skokie Only7353-7399 St Louis Ave, Skokie, Illinois, 60076 Latitude: 42.01519Drive Time: 5, 10, 15 minute radii Longitude: -87.71717
5 minutes 10 minutes 15 minutes2010 Population by Age
Total 19,209 185,578 475,5890 - 4 5.8% 6.7% 6.5%5 - 9 6.4% 6.7% 6.1%10 - 14 6.6% 6.6% 5.8%15 - 24 12.2% 12.2% 13.8%25 - 34 10.5% 12.8% 15.2%35 - 44 11.2% 13.4% 14.1%45 - 54 14.2% 14.4% 13.9%55 - 64 14.1% 12.7% 11.6%65 - 74 8.4% 7.3% 6.5%75 - 84 6.3% 4.8% 4.3%85 + 4.2% 2.4% 2.2%
18 + 77.1% 75.9% 78.1%2019 Population by Age
Total 19,187 185,521 477,8510 - 4 5.4% 6.1% 5.8%5 - 9 5.9% 6.2% 5.8%10 - 14 6.5% 6.6% 6.1%15 - 24 10.8% 12.1% 13.6%25 - 34 11.1% 12.6% 14.3%35 - 44 11.1% 12.4% 13.3%45 - 54 11.8% 12.6% 12.6%55 - 64 14.2% 13.2% 12.4%65 - 74 11.7% 10.0% 9.0%75 - 84 6.9% 5.3% 4.7%85 + 4.7% 2.8% 2.5%
18 + 78.5% 77.2% 78.9%2024 Population by Age
Total 19,015 184,249 475,7560 - 4 5.5% 6.1% 5.8%5 - 9 5.8% 6.0% 5.5%10 - 14 6.2% 6.1% 5.5%15 - 24 10.8% 11.7% 13.3%25 - 34 10.4% 12.9% 14.6%35 - 44 12.2% 12.7% 13.3%45 - 54 11.5% 12.1% 12.1%55 - 64 12.8% 12.4% 11.9%65 - 74 12.4% 10.8% 9.8%75 - 84 8.0% 6.3% 5.6%85 + 4.6% 2.9% 2.6%
18 + 78.9% 78.1% 79.9%2010 Population by Sex
Males 9,186 89,280 232,655Females 10,025 96,298 242,933
2019 Population by SexMales 9,215 89,553 234,221Females 9,973 95,970 243,631
2024 Population by SexMales 9,157 89,181 233,544Females 9,859 95,068 242,211
Source: U.S. Census Bureau, Census 2010 Summary File 1. Esri forecasts for 2019 and 2024 Esri converted Census 2000 data into 2010 geography.
September 25, 2019
©2019 Esri Page 3 of 7

Community Profile7353-7399 St Louis Ave Village Of Skokie Only7353-7399 St Louis Ave, Skokie, Illinois, 60076 Latitude: 42.01519Drive Time: 5, 10, 15 minute radii Longitude: -87.71717
5 minutes 10 minutes 15 minutes2010 Population by Race/Ethnicity
Total 19,211 185,578 475,588White Alone 62.3% 57.5% 61.8%Black Alone 4.1% 12.9% 10.0%American Indian Alone 0.1% 0.3% 0.4%Asian Alone 26.7% 19.0% 15.7%Pacific Islander Alone 0.0% 0.0% 0.0%Some Other Race Alone 3.4% 6.3% 8.1%Two or More Races 3.4% 4.0% 3.9%
Hispanic Origin 9.1% 14.4% 18.8%Diversity Index 61.5 71.2 71.0
2019 Population by Race/EthnicityTotal 19,188 185,524 477,853
White Alone 57.2% 53.8% 58.5%Black Alone 3.5% 11.3% 8.7%American Indian Alone 0.1% 0.3% 0.4%Asian Alone 31.6% 23.0% 19.1%Pacific Islander Alone 0.0% 0.0% 0.0%Some Other Race Alone 3.7% 7.0% 8.9%Two or More Races 3.8% 4.6% 4.4%
Hispanic Origin 10.0% 16.2% 20.6%Diversity Index 64.8 74.1 74.0
2024 Population by Race/EthnicityTotal 19,016 184,250 475,754
White Alone 54.3% 51.9% 56.7%Black Alone 3.1% 10.3% 7.9%American Indian Alone 0.1% 0.3% 0.4%Asian Alone 34.6% 25.2% 21.1%Pacific Islander Alone 0.0% 0.0% 0.0%Some Other Race Alone 3.9% 7.5% 9.3%Two or More Races 3.9% 4.8% 4.6%
Hispanic Origin 10.6% 17.3% 21.9%Diversity Index 66.3 75.5 75.5
2010 Population by Relationship and Household TypeTotal 19,211 185,578 475,588
In Households 99.4% 98.8% 96.9%In Family Households 89.5% 84.9% 77.8%
Householder 25.5% 24.7% 23.1%Spouse 20.8% 18.5% 17.2%Child 34.4% 33.4% 29.7%Other relative 7.7% 6.7% 6.0%Nonrelative 1.1% 1.6% 1.8%
In Nonfamily Households 9.8% 13.8% 19.0%In Group Quarters 0.6% 1.2% 3.1%
Institutionalized Population 0.5% 0.9% 1.3%Noninstitutionalized Population 0.2% 0.3% 1.8%
Data Note: Persons of Hispanic Origin may be of any race. The Diversity Index measures the probability that two people from the same area will be from different race/ethnic groups.Source: U.S. Census Bureau, Census 2010 Summary File 1. Esri forecasts for 2019 and 2024 Esri converted Census 2000 data into 2010 geography.
September 25, 2019
©2019 Esri Page 4 of 7

Community Profile7353-7399 St Louis Ave Village Of Skokie Only7353-7399 St Louis Ave, Skokie, Illinois, 60076 Latitude: 42.01519Drive Time: 5, 10, 15 minute radii Longitude: -87.71717
5 minutes 10 minutes 15 minutes2019 Population 25+ by Educational AttainmentTotal 13,704 127,987 328,660
Less than 9th Grade 4.4% 6.0% 6.0%9th - 12th Grade, No Diploma 3.7% 4.6% 4.5%High School Graduate 17.0% 15.9% 15.6%GED/Alternative Credential 2.3% 2.2% 2.4%Some College, No Degree 14.2% 15.5% 15.2%Associate Degree 7.0% 5.7% 5.3%Bachelor's Degree 32.0% 29.6% 28.9%Graduate/Professional Degree 19.3% 20.5% 22.0%
2019 Population 15+ by Marital StatusTotal 15,785 150,390 393,716
Never Married 25.7% 32.0% 38.0%Married 61.9% 54.1% 48.7%Widowed 7.8% 6.6% 5.7%Divorced 4.6% 7.3% 7.6%
2019 Civilian Population 16+ in Labor Force Civilian Employed 96.8% 95.6% 95.9% Civilian Unemployed (Unemployment Rate) 3.2% 4.4% 4.1%2019 Employed Population 16+ by IndustryTotal 8,977 91,043 245,124 Agriculture/Mining 0.0% 0.1% 0.1% Construction 3.6% 3.4% 3.9% Manufacturing 6.8% 6.9% 6.8% Wholesale Trade 3.5% 2.7% 2.4% Retail Trade 10.5% 9.6% 9.0% Transportation/Utilities 7.9% 7.3% 6.6% Information 1.4% 2.0% 2.2% Finance/Insurance/Real Estate 10.1% 8.1% 7.9% Services 54.4% 57.4% 58.2% Public Administration 1.8% 2.5% 2.8%2019 Employed Population 16+ by OccupationTotal 8,976 91,041 245,124 White Collar 73.3% 67.0% 66.2% Management/Business/Financial 15.4% 15.0% 15.5% Professional 30.1% 28.9% 28.7% Sales 10.8% 10.3% 9.9% Administrative Support 17.0% 12.8% 12.0% Services 13.6% 18.2% 18.9% Blue Collar 13.1% 14.8% 15.0% Farming/Forestry/Fishing 0.0% 0.0% 0.0% Construction/Extraction 2.2% 2.4% 2.8% Installation/Maintenance/Repair 1.4% 1.6% 1.7% Production 4.7% 4.1% 4.0% Transportation/Material Moving 4.8% 6.8% 6.4%2010 Population By Urban/ Rural Status
Total Population 19,211 185,578 475,588Population Inside Urbanized Area 100.0% 100.0% 100.0%Population Inside Urbanized Cluster 0.0% 0.0% 0.0%Rural Population 0.0% 0.0% 0.0%
Source: U.S. Census Bureau, Census 2010 Summary File 1. Esri forecasts for 2019 and 2024 Esri converted Census 2000 data into 2010 geography.
September 25, 2019
©2019 Esri Page 5 of 7

Community Profile7353-7399 St Louis Ave Village Of Skokie Only7353-7399 St Louis Ave, Skokie, Illinois, 60076 Latitude: 42.01519Drive Time: 5, 10, 15 minute radii Longitude: -87.71717
5 minutes 10 minutes 15 minutes2010 Households by Type
Total 6,540 66,618 180,923Households with 1 Person 22.8% 26.0% 30.9%Households with 2+ People 77.2% 74.0% 69.1%
Family Households 74.5% 68.7% 60.8%Husband-wife Families 60.9% 51.3% 45.3%
With Related Children 27.2% 25.0% 21.9%Other Family (No Spouse Present) 13.6% 17.4% 15.6%
Other Family with Male Householder 4.2% 4.7% 4.5%With Related Children 1.5% 2.0% 2.0%
Other Family with Female Householder 9.4% 12.7% 11.1%With Related Children 4.0% 7.0% 6.1%
Nonfamily Households 2.7% 5.3% 8.3%
All Households with Children 32.8% 34.3% 30.3%
Multigenerational Households 6.4% 5.2% 4.2%Unmarried Partner Households 2.7% 4.8% 6.0%
Male-female 2.1% 3.6% 4.6%Same-sex 0.6% 1.2% 1.4%
2010 Households by SizeTotal 6,540 66,617 180,922
1 Person Household 22.8% 26.0% 30.9%2 Person Household 28.9% 29.0% 29.5%3 Person Household 15.7% 16.4% 15.1%4 Person Household 15.3% 14.3% 12.8%5 Person Household 9.0% 7.8% 6.6%6 Person Household 4.8% 3.5% 2.9%7 + Person Household 3.5% 2.9% 2.3%
2010 Households by Tenure and Mortgage StatusTotal 6,540 66,618 180,923
Owner Occupied 83.3% 63.0% 55.2%Owned with a Mortgage/Loan 54.6% 44.7% 39.8%Owned Free and Clear 28.6% 18.3% 15.4%
Renter Occupied 16.7% 37.0% 44.8%2010 Housing Units By Urban/ Rural Status
Total Housing Units 6,877 72,266 198,023Housing Units Inside Urbanized Area 100.0% 100.0% 100.0%Housing Units Inside Urbanized Cluster 0.0% 0.0% 0.0%Rural Housing Units 0.0% 0.0% 0.0%
Data Note: Households with children include any households with people under age 18, related or not. Multigenerational households are families with 3 or more parent-child relationships. Unmarried partner households are usually classified as nonfamily households unless there is another member of the household related to the householder. Multigenerational and unmarried partner households are reported only to the tract level. Esri estimated block group data, which is used to estimate polygons or non-standard geography.Source: U.S. Census Bureau, Census 2010 Summary File 1. Esri forecasts for 2019 and 2024 Esri converted Census 2000 data into 2010 geography.
September 25, 2019
©2019 Esri Page 6 of 7

Community Profile7353-7399 St Louis Ave Village Of Skokie Only7353-7399 St Louis Ave, Skokie, Illinois, 60076 Latitude: 42.01519Drive Time: 5, 10, 15 minute radii Longitude: -87.71717
5 minutes 10 minutes 15 minutesTop 3 Tapestry Segments1. Pleasantville (2B) City Lights (8A) International Marketplace
(13A)2. Pacific Heights (2C) Pleasantville (2B) City Lights (8A)3. Golden Years (9B) Downtown Melting Pot (8D) Trendsetters (3C)
2019 Consumer Spending Apparel & Services: Total $ $16,426,249 $162,337,571 $443,940,516
Average Spent $2,546.31 $2,441.09 $2,433.22Spending Potential Index 119 114 114
Education: Total $ $14,867,508 $137,962,567 $364,560,317Average Spent $2,304.68 $2,074.56 $1,998.14Spending Potential Index 145 130 125
Entertainment/Recreation: Total $ $25,617,347 $241,187,034 $642,499,726Average Spent $3,971.07 $3,626.76 $3,521.51Spending Potential Index 121 111 108
Food at Home: Total $ $38,563,574 $378,761,539 $1,031,302,615Average Spent $5,977.92 $5,695.49 $5,652.52Spending Potential Index 116 110 109
Food Away from Home: Total $ $27,888,450 $270,757,296 $746,631,735Average Spent $4,323.12 $4,071.42 $4,092.25Spending Potential Index 118 111 111
Health Care: Total $ $44,265,592 $411,198,203 $1,082,820,394Average Spent $6,861.82 $6,183.25 $5,934.89Spending Potential Index 116 104 100
HH Furnishings & Equipment: Total $ $16,458,780 $153,181,271 $410,778,535Average Spent $2,551.35 $2,303.41 $2,251.46Spending Potential Index 120 108 106
Personal Care Products & Services: Total $ $6,724,083 $63,782,848 $172,844,468Average Spent $1,042.33 $959.11 $947.35Spending Potential Index 118 108 107
Shelter: Total $ $154,217,559 $1,495,422,193 $4,055,172,583Average Spent $23,905.99 $22,486.88 $22,226.21Spending Potential Index 129 122 120
Support Payments/Cash Contributions/Gifts in Kind: Total $ $19,237,222 $180,155,452 $472,028,603Average Spent $2,982.05 $2,709.02 $2,587.17Spending Potential Index 120 109 104
Travel: Total $ $19,390,174 $177,252,510 $466,707,436Average Spent $3,005.76 $2,665.37 $2,558.00Spending Potential Index 134 119 114
Vehicle Maintenance & Repairs: Total $ $8,497,955 $78,536,683 $213,516,854Average Spent $1,317.31 $1,180.97 $1,170.28Spending Potential Index 115 103 102
Data Note: Consumer spending shows the amount spent on a variety of goods and services by households that reside in the area. Expenditures are shown by broad budget categories that are not mutually exclusive. Consumer spending does not equal business revenue. Total and Average Amount Spent Per Household represent annual figures. The Spending Potential Index represents the amount spent in the area relative to a national average of 100.Source: Consumer Spending data are derived from the 2016 and 2017 Consumer Expenditure Surveys, Bureau of Labor Statistics. Esri.Source: U.S. Census Bureau, Census 2010 Summary File 1. Esri forecasts for 2019 and 2024 Esri converted Census 2000 data into 2010 geography.
September 25, 2019
©2019 Esri Page 7 of 7

Crime Summary7353-7399 St Louis Ave Village Of Skokie Only7353-7399 St Louis Ave, Skokie, Illinois, 60076 Latitude: 42.01519Drive Time: 5, 10, 15 minute radii Longitude: -87.71717
5 minutes 10 minutes 15 minutes
Population Summary2019 Total Population 19,188 185,523 477,8522024 Total Population 19,016 184,250 475,7552019-2024 Annual Rate -0.18% -0.14% -0.09%
2019 Crime Indexes (AGS)Total Crime Index 98 78 85Personal Crime Index 46 83 90Murder Index 50 114 116Rape Index 29 62 76Robbery Index 59 115 129Assault Index 43 71 74Property Crime Index 105 78 84Burglary Index 75 74 70Larceny Index 121 78 87Motor Vehicle Theft Index 52 80 91
Data Note: The Crime Index is an indication of the relative risk of a crime occurring and is measured against the overall risk at a national level. Values above 100 indicate the area has an above average risk of occurring compared to the US. Values below 100 indicate the area has a below average risk of occurring compared to the US. The Crime Indexes provides an assessment of the relative risk of seven major crime types: murder, rape, robbery, assault, burglary, larceny, and motor vehicle theft. It is modeled using data from the FBI Uniform Crime Report and demographic data from the U.S. Census and Applied Geographic Solutions (AGS).Source: U.S. Census Bureau, Census 2010 Summary File 1. Esri forecasts for 2019 and 2024. Applied Geographic Solutions (AGS) (2019B).
September 25, 2019
©2019 Esri Page 1 of 1

Demographic and Income Comparison Profile7353-7399 St Louis Ave Village Of Skokie Only7353-7399 St Louis Ave, Skokie, Illinois, 60076 Latitude: 42.01519Drive Time: 5, 10, 15 minute radii Longitude: -87.71717
5 minutes 10 minutes 15 minutesCensus 2010 Summary
Population 19,211 185,578 475,588Households 6,540 66,618 180,923Families 4,872 45,737 110,046Average Household Size 2.92 2.75 2.55Owner Occupied Housing Units 5,445 41,966 99,912Renter Occupied Housing Units 1,095 24,652 81,011Median Age 42.6 38.7 36.8
2019 SummaryPopulation 19,188 185,523 477,852Households 6,451 66,502 182,450Families 4,775 45,168 109,318Average Household Size 2.96 2.76 2.54Owner Occupied Housing Units 5,250 40,239 95,816Renter Occupied Housing Units 1,201 26,263 86,633Median Age 44.2 39.9 38.2Median Household Income $86,110 $72,067 $66,187Average Household Income $109,187 $100,143 $97,838
2024 SummaryPopulation 19,016 184,250 475,755Households 6,373 66,011 181,752Families 4,708 44,702 108,382Average Household Size 2.96 2.76 2.54Owner Occupied Housing Units 5,236 40,480 97,063Renter Occupied Housing Units 1,137 25,531 84,689Median Age 44.4 40.6 39.0Median Household Income $97,707 $79,798 $74,914Average Household Income $123,250 $112,777 $109,921
Trends: 2019-2024 Annual RatePopulation -0.18% -0.14% -0.09%Households -0.24% -0.15% -0.08%Families -0.28% -0.21% -0.17%Owner Households -0.05% 0.12% 0.26%Median Household Income 2.56% 2.06% 2.51%
Source: U.S. Census Bureau, Census 2010 Summary File 1. Esri forecasts for 2019 and 2024.
September 25, 2019
©2019 Esri Page 1 of 7

Demographic and Income Comparison Profile7353-7399 St Louis Ave Village Of Skokie Only7353-7399 St Louis Ave, Skokie, Illinois, 60076 Latitude: 42.01519Drive Time: 5, 10, 15 minute radii Longitude: -87.71717
5 minutes 10 minutes 15 minutes2019 Households by Income Number Percent Number Percent Number Percent
<$15,000 357 5.5% 5,864 8.8% 18,936 10.4%$15,000 - $24,999 477 7.4% 5,120 7.7% 15,701 8.6%$25,000 - $34,999 328 5.1% 4,726 7.1% 14,099 7.7%$35,000 - $49,999 698 10.8% 7,912 11.9% 21,730 11.9%$50,000 - $74,999 963 14.9% 10,539 15.8% 28,726 15.7%$75,000 - $99,999 789 12.2% 8,447 12.7% 22,636 12.4%$100,000 - $149,999 1,379 21.4% 11,590 17.4% 28,542 15.6%$150,000 - $199,999 769 11.9% 5,768 8.7% 13,967 7.7%$200,000+ 692 10.7% 6,536 9.8% 18,114 9.9%
Median Household Income $86,110 $72,067 $66,187Average Household Income $109,187 $100,143 $97,838Per Capita Income $36,888 $36,138 $37,473
2024 Households by Income Number Percent Number Percent Number Percent<$15,000 321 5.0% 5,269 8.0% 17,154 9.4%$15,000 - $24,999 432 6.8% 4,647 7.0% 14,272 7.9%$25,000 - $34,999 284 4.5% 4,103 6.2% 12,348 6.8%$35,000 - $49,999 618 9.7% 7,013 10.6% 19,483 10.7%$50,000 - $74,999 882 13.8% 10,038 15.2% 27,687 15.2%$75,000 - $99,999 702 11.0% 8,117 12.3% 22,141 12.2%$100,000 - $149,999 1,376 21.6% 12,122 18.4% 30,541 16.8%$150,000 - $199,999 933 14.6% 7,030 10.6% 17,246 9.5%$200,000+ 827 13.0% 7,672 11.6% 20,879 11.5%
Median Household Income $97,707 $79,798 $74,914Average Household Income $123,250 $112,777 $109,921Per Capita Income $41,515 $40,678 $42,110
Data Note: Income is expressed in current dollars.
Source: U.S. Census Bureau, Census 2010 Summary File 1. Esri forecasts for 2019 and 2024.
September 25, 2019
©2019 Esri Page 2 of 7

Demographic and Income Comparison Profile7353-7399 St Louis Ave Village Of Skokie Only7353-7399 St Louis Ave, Skokie, Illinois, 60076 Latitude: 42.01519Drive Time: 5, 10, 15 minute radii Longitude: -87.71717
5 minutes 10 minutes 15 minutes2010 Population by Age Number Percent Number Percent Number Percent
Age 0 - 4 1,106 5.8% 12,419 6.7% 30,756 6.5%Age 5 - 9 1,225 6.4% 12,429 6.7% 29,072 6.1%Age 10 - 14 1,272 6.6% 12,328 6.6% 27,558 5.8%Age 15 - 19 1,247 6.5% 11,809 6.4% 30,280 6.4%Age 20 - 24 1,099 5.7% 10,883 5.9% 35,518 7.5%Age 25 - 34 2,025 10.5% 23,698 12.8% 72,428 15.2%Age 35 - 44 2,161 11.2% 24,842 13.4% 67,121 14.1%Age 45 - 54 2,722 14.2% 26,782 14.4% 65,910 13.9%Age 55 - 64 2,711 14.1% 23,553 12.7% 55,122 11.6%Age 65 - 74 1,613 8.4% 13,461 7.3% 30,879 6.5%Age 75 - 84 1,219 6.3% 8,857 4.8% 20,333 4.3%Age 85+ 810 4.2% 4,516 2.4% 10,611 2.2%
2019 Population by Age Number Percent Number Percent Number PercentAge 0 - 4 1,031 5.4% 11,272 6.1% 27,484 5.8%Age 5 - 9 1,133 5.9% 11,534 6.2% 27,717 5.8%Age 10 - 14 1,239 6.5% 12,327 6.6% 28,935 6.1%Age 15 - 19 1,126 5.9% 11,527 6.2% 30,799 6.4%Age 20 - 24 955 5.0% 10,876 5.9% 34,257 7.2%Age 25 - 34 2,129 11.1% 23,417 12.6% 68,275 14.3%Age 35 - 44 2,133 11.1% 23,095 12.4% 63,497 13.3%Age 45 - 54 2,263 11.8% 23,442 12.6% 60,135 12.6%Age 55 - 64 2,721 14.2% 24,462 13.2% 59,024 12.4%Age 65 - 74 2,248 11.7% 18,512 10.0% 43,132 9.0%Age 75 - 84 1,315 6.9% 9,888 5.3% 22,490 4.7%Age 85+ 894 4.7% 5,169 2.8% 12,106 2.5%
2024 Population by Age Number Percent Number Percent Number PercentAge 0 - 4 1,041 5.5% 11,261 6.1% 27,447 5.8%Age 5 - 9 1,094 5.8% 10,975 6.0% 25,936 5.5%Age 10 - 14 1,174 6.2% 11,324 6.1% 26,219 5.5%Age 15 - 19 1,124 5.9% 10,994 6.0% 29,389 6.2%Age 20 - 24 925 4.9% 10,522 5.7% 33,990 7.1%Age 25 - 34 1,982 10.4% 23,818 12.9% 69,440 14.6%Age 35 - 44 2,311 12.2% 23,434 12.7% 63,406 13.3%Age 45 - 54 2,178 11.5% 22,305 12.1% 57,589 12.1%Age 55 - 64 2,430 12.8% 22,859 12.4% 56,409 11.9%Age 65 - 74 2,360 12.4% 19,863 10.8% 46,606 9.8%Age 75 - 84 1,523 8.0% 11,565 6.3% 26,813 5.6%Age 85+ 873 4.6% 5,329 2.9% 12,512 2.6%
Source: U.S. Census Bureau, Census 2010 Summary File 1. Esri forecasts for 2019 and 2024.
September 25, 2019
©2019 Esri Page 3 of 7

Demographic and Income Comparison Profile7353-7399 St Louis Ave Village Of Skokie Only7353-7399 St Louis Ave, Skokie, Illinois, 60076 Latitude: 42.01519Drive Time: 5, 10, 15 minute radii Longitude: -87.71717
5 minutes 10 minutes 15 minutes2010 Race and Ethnicity Number Percent Number Percent Number Percent
White Alone 11,968 62.3% 106,623 57.5% 294,028 61.8%Black Alone 789 4.1% 24,017 12.9% 47,691 10.0%American Indian Alone 27 0.1% 591 0.3% 1,983 0.4%Asian Alone 5,120 26.7% 35,323 19.0% 74,833 15.7%Pacific Islander Alone 4 0.0% 59 0.0% 208 0.0%Some Other Race Alone 648 3.4% 11,633 6.3% 38,481 8.1%Two or More Races 655 3.4% 7,332 4.0% 18,364 3.9%Hispanic Origin (Any Race) 1,748 9.1% 26,801 14.4% 89,356 18.8%
2019 Race and Ethnicity Number Percent Number Percent Number PercentWhite Alone 10,984 57.2% 99,825 53.8% 279,571 58.5%Black Alone 664 3.5% 21,023 11.3% 41,489 8.7%American Indian Alone 24 0.1% 526 0.3% 1,798 0.4%Asian Alone 6,067 31.6% 42,580 23.0% 91,291 19.1%Pacific Islander Alone 4 0.0% 53 0.0% 191 0.0%Some Other Race Alone 710 3.7% 13,031 7.0% 42,376 8.9%Two or More Races 735 3.8% 8,486 4.6% 21,137 4.4%Hispanic Origin (Any Race) 1,911 10.0% 29,982 16.2% 98,504 20.6%
2024 Race and Ethnicity Number Percent Number Percent Number PercentWhite Alone 10,331 54.3% 95,554 51.9% 269,787 56.7%Black Alone 587 3.1% 19,046 10.3% 37,546 7.9%American Indian Alone 21 0.1% 506 0.3% 1,753 0.4%Asian Alone 6,578 34.6% 46,500 25.2% 100,212 21.1%Pacific Islander Alone 4 0.0% 50 0.0% 185 0.0%Some Other Race Alone 744 3.9% 13,752 7.5% 44,263 9.3%Two or More Races 751 3.9% 8,842 4.8% 22,008 4.6%Hispanic Origin (Any Race) 2,015 10.6% 31,962 17.3% 104,070 21.9%
Source: U.S. Census Bureau, Census 2010 Summary File 1. Esri forecasts for 2019 and 2024.
September 25, 2019
©2019 Esri Page 4 of 7

Demographic and Income Comparison Profile7353-7399 St Louis Ave Village Of Skokie Only7353-7399 St Louis Ave, Skokie, Illinois, 60076 Latitude: 42.01519Drive Time: 5, 10, 15 minute radii Longitude: -87.71717
5 minutes
AreaStateUSA
Trends 2019-2024Trends 2019-2024
Ann
ual R
ate
(in
perc
ent)
2.5
2
1.5
1
0.5
0
Population Households Families Owner HHs Median HH Income
20192024
Population by AgePopulation by Age
Perc
ent
14
12
10
8
6
4
2
00-4 5-9 10-14 15-19 20-24 25-34 35-44 45-54 55-64 65-74 75-84 85+
2019 Household Income 2019 Household Income
< $15K5.5%
$15K - $24K7.4%
$25K - $34K5.1%
$35K - $49K10.8%
$50K - $74K14.9%
$75K - $99K12.2%
$100K - $149K21.4%
$150K - $199K11.9%
$200K+10.7%
2019 Population by Race2019 Population by Race
Perc
ent
55
50
45
40
35
30
25
20
15
10
5
0White Black Am.Ind. Asian Pacific Other Two+ Hisp
Source: U.S. Census Bureau, Census 2010 Summary File 1. Esri forecasts for 2019 and 2024.
September 25, 2019
©2019 Esri Page 5 of 7

Demographic and Income Comparison Profile7353-7399 St Louis Ave Village Of Skokie Only7353-7399 St Louis Ave, Skokie, Illinois, 60076 Latitude: 42.01519Drive Time: 5, 10, 15 minute radii Longitude: -87.71717
10 minutes
AreaStateUSA
Trends 2019-2024Trends 2019-2024
Ann
ual R
ate
(in
perc
ent)
2.5
2
1.5
1
0.5
0
Population Households Families Owner HHs Median HH Income
20192024
Population by AgePopulation by Age
Perc
ent
12
10
8
6
4
2
00-4 5-9 10-14 15-19 20-24 25-34 35-44 45-54 55-64 65-74 75-84 85+
2019 Household Income 2019 Household Income
< $15K8.8%
$15K - $24K7.7%
$25K - $34K7.1%$35K - $49K
11.9%
$50K - $74K15.8%
$75K - $99K12.7%
$100K - $149K17.4%
$150K - $199K8.7%
$200K+9.8%
2019 Population by Race2019 Population by Race
Perc
ent
50
45
40
35
30
25
20
15
10
5
0White Black Am.Ind. Asian Pacific Other Two+ Hisp
Source: U.S. Census Bureau, Census 2010 Summary File 1. Esri forecasts for 2019 and 2024.
September 25, 2019
©2019 Esri Page 6 of 7

Demographic and Income Comparison Profile7353-7399 St Louis Ave Village Of Skokie Only7353-7399 St Louis Ave, Skokie, Illinois, 60076 Latitude: 42.01519Drive Time: 5, 10, 15 minute radii Longitude: -87.71717
15 minutes
AreaStateUSA
Trends 2019-2024Trends 2019-2024
Ann
ual R
ate
(in
perc
ent)
2.5
2
1.5
1
0.5
0
Population Households Families Owner HHs Median HH Income
20192024
Population by AgePopulation by Age
Perc
ent
14
12
10
8
6
4
2
00-4 5-9 10-14 15-19 20-24 25-34 35-44 45-54 55-64 65-74 75-84 85+
2019 Household Income 2019 Household Income
< $15K10.4%
$15K - $24K8.6%
$25K - $34K7.7%
$35K - $49K11.9%
$50K - $74K15.7%
$75K - $99K12.4%
$100K - $149K15.6%
$150K - $199K7.7%
$200K+9.9%
2019 Population by Race2019 Population by Race
Perc
ent
55
50
45
40
35
30
25
20
15
10
5
0White Black Am.Ind. Asian Pacific Other Two+ Hisp
Source: U.S. Census Bureau, Census 2010 Summary File 1. Esri forecasts for 2019 and 2024.
September 25, 2019
©2019 Esri Page 7 of 7

Detailed Age Profile7353-7399 St Louis Ave Village Of Skokie Only7353-7399 St Louis Ave, Skokie, Illinois, 60076 Latitude: 42.01519Drive Time: 5 minute radius Longitude: -87.71717
Summary Census 2010 2019 2024
2019-2024 Change
2019-2024 Annual Rate
Population 19,211 19,188 19,016 -172 -0.18%Households 6,540 6,451 6,373 -78 -0.24%Average Household Size 2.92 2.96 2.96 0.00 0.00%
Census 2010 2019 2024Total Population by Detailed Age Number Percent Number Percent Number PercentTotal 19,212 100.0% 19,187 100.0% 19,019 100.0%
<1 191 1.0% 193 1.0% 197 1.0%1 218 1.1% 207 1.1% 212 1.1%2 218 1.1% 191 1.0% 194 1.0%3 241 1.3% 221 1.2% 223 1.2%4 239 1.2% 220 1.1% 216 1.1%5 241 1.3% 220 1.1% 215 1.1%6 249 1.3% 219 1.1% 210 1.1%7 243 1.3% 234 1.2% 225 1.2%8 246 1.3% 236 1.2% 226 1.2%9 247 1.3% 223 1.2% 219 1.2%10 244 1.3% 234 1.2% 222 1.2%11 230 1.2% 229 1.2% 218 1.1%12 269 1.4% 253 1.3% 244 1.3%13 253 1.3% 261 1.4% 242 1.3%14 276 1.4% 263 1.4% 248 1.3%15 254 1.3% 229 1.2% 227 1.2%16 256 1.3% 240 1.3% 238 1.3%17 285 1.5% 246 1.3% 247 1.3%18 238 1.2% 209 1.1% 215 1.1%19 214 1.1% 201 1.0% 199 1.0%20 - 24 1,099 5.7% 955 5.0% 925 4.9%25 - 29 1,025 5.3% 1,069 5.6% 897 4.7%30 - 34 1,000 5.2% 1,060 5.5% 1,085 5.7%35 - 39 1,057 5.5% 1,122 5.8% 1,179 6.2%40 - 44 1,104 5.7% 1,011 5.3% 1,132 6.0%45 - 49 1,283 6.7% 1,088 5.7% 1,062 5.6%50 - 54 1,439 7.5% 1,175 6.1% 1,116 5.9%55 - 59 1,416 7.4% 1,350 7.0% 1,158 6.1%60 - 64 1,295 6.7% 1,371 7.1% 1,272 6.7%65 - 69 869 4.5% 1,234 6.4% 1,237 6.5%70 - 74 744 3.9% 1,014 5.3% 1,123 5.9%75 - 79 600 3.1% 754 3.9% 890 4.7%80 - 84 619 3.2% 561 2.9% 633 3.3%85+ 810 4.2% 894 4.7% 873 4.6%
<18 4,398 22.9% 4,118 21.5% 4,021 21.1%18+ 14,812 77.1% 15,070 78.5% 14,996 78.9%21+ 14,153 73.7% 14,472 75.4% 14,400 75.7%Median Age 42.6 44.2 44.4
Source: U.S. Census Bureau, Census 2010 Summary File 1. Esri forecasts for 2019 and 2024.
September 25, 2019
©2019 Esri Page 1 of 18

Detailed Age Profile7353-7399 St Louis Ave Village Of Skokie Only7353-7399 St Louis Ave, Skokie, Illinois, 60076 Latitude: 42.01519Drive Time: 5 minute radius Longitude: -87.71717
Census 201020192024
Total Population by Detailed AgeTotal Population by Detailed Age
Age
Gro
ups
<1
2
2
3
4
5
6
7
8
9
10
11
12
13
14
15
16
17
18
19
20-24
25-29
30-34
35-39
40-44
45-49
50-54
55-59
60-64
65-69
70-74
75-79
80-84
85+
Percent7.576.565.554.543.532.521.510.50
Source: U.S. Census Bureau, Census 2010 Summary File 1. Esri forecasts for 2019 and 2024.
September 25, 2019
©2019 Esri Page 2 of 18

Detailed Age Profile7353-7399 St Louis Ave Village Of Skokie Only7353-7399 St Louis Ave, Skokie, Illinois, 60076 Latitude: 42.01519Drive Time: 5 minute radius Longitude: -87.71717
Census 2010 2019 2024Male Population by Detailed Age Number Percent Number Percent Number PercentTotal 9,185 100.0% 9,213 100.0% 9,157 100.0%
<1 107 1.2% 101 1.1% 106 1.2%1 118 1.3% 113 1.2% 117 1.3%2 112 1.2% 101 1.1% 103 1.1%3 117 1.3% 107 1.2% 107 1.2%4 127 1.4% 118 1.3% 117 1.3%5 129 1.4% 115 1.2% 112 1.2%6 128 1.4% 115 1.2% 108 1.2%7 129 1.4% 127 1.4% 124 1.4%8 135 1.5% 132 1.4% 126 1.4%9 124 1.4% 116 1.3% 114 1.2%10 120 1.3% 115 1.2% 112 1.2%11 119 1.3% 119 1.3% 116 1.3%12 130 1.4% 129 1.4% 125 1.4%13 136 1.5% 145 1.6% 134 1.5%14 135 1.5% 124 1.3% 119 1.3%15 130 1.4% 115 1.2% 118 1.3%16 129 1.4% 118 1.3% 121 1.3%17 144 1.6% 126 1.4% 129 1.4%18 115 1.3% 105 1.1% 111 1.2%19 118 1.3% 109 1.2% 111 1.2%20 - 24 551 6.0% 492 5.3% 471 5.1%25 - 29 517 5.6% 524 5.7% 454 5.0%30 - 34 505 5.5% 520 5.6% 529 5.8%35 - 39 484 5.3% 533 5.8% 556 6.1%40 - 44 508 5.5% 476 5.2% 538 5.9%45 - 49 622 6.8% 524 5.7% 521 5.7%50 - 54 685 7.5% 569 6.2% 534 5.8%55 - 59 651 7.1% 631 6.8% 541 5.9%60 - 64 636 6.9% 640 6.9% 608 6.6%65 - 69 400 4.4% 573 6.2% 566 6.2%70 - 74 307 3.3% 445 4.8% 489 5.3%75 - 79 275 3.0% 346 3.8% 416 4.5%80 - 84 252 2.7% 242 2.6% 258 2.8%85+ 290 3.2% 348 3.8% 346 3.8%
<18 2,269 24.7% 2,138 23.2% 2,107 23.0%18+ 6,917 75.3% 7,077 76.8% 7,049 77.0%21+ 6,587 71.7% 6,775 73.5% 6,738 73.6%Median Age 40.3 42.0 42.2
Source: U.S. Census Bureau, Census 2010 Summary File 1. Esri forecasts for 2019 and 2024.
September 25, 2019
©2019 Esri Page 3 of 18

Detailed Age Profile7353-7399 St Louis Ave Village Of Skokie Only7353-7399 St Louis Ave, Skokie, Illinois, 60076 Latitude: 42.01519Drive Time: 5 minute radius Longitude: -87.71717
Census 201020192024
Male Population by Detailed AgeMale Population by Detailed Age
Age
Gro
ups
1
2
3
4
5
6
7
8
9
10
11
12
13
14
15
16
17
18
20
20-24
25-29
30-34
35-39
40-44
45-49
50-54
55-59
60-64
65-64
70-74
75-79
80-84
85+
Percent7.576.565.554.543.532.521.510.50
Source: U.S. Census Bureau, Census 2010 Summary File 1. Esri forecasts for 2019 and 2024.
September 25, 2019
©2019 Esri Page 4 of 18

Detailed Age Profile7353-7399 St Louis Ave Village Of Skokie Only7353-7399 St Louis Ave, Skokie, Illinois, 60076 Latitude: 42.01519Drive Time: 5 minute radius Longitude: -87.71717
Census 2010 2019 2024Female Population by Detailed Age Number Percent Number Percent Number PercentTotal 10,022 100.0% 9,975 100.0% 9,862 100.0%
<1 84 0.8% 91 0.9% 91 0.9%1 99 1.0% 94 0.9% 95 1.0%2 106 1.1% 90 0.9% 91 0.9%3 123 1.2% 114 1.1% 115 1.2%4 111 1.1% 101 1.0% 100 1.0%5 112 1.1% 105 1.1% 102 1.0%6 120 1.2% 104 1.0% 102 1.0%7 114 1.1% 107 1.1% 102 1.0%8 111 1.1% 104 1.0% 100 1.0%9 122 1.2% 107 1.1% 105 1.1%10 124 1.2% 119 1.2% 111 1.1%11 111 1.1% 110 1.1% 102 1.0%12 138 1.4% 124 1.2% 119 1.2%13 117 1.2% 116 1.2% 108 1.1%14 141 1.4% 139 1.4% 128 1.3%15 125 1.2% 114 1.1% 109 1.1%16 128 1.3% 122 1.2% 117 1.2%17 141 1.4% 120 1.2% 117 1.2%18 123 1.2% 105 1.1% 104 1.1%19 96 1.0% 92 0.9% 88 0.9%20 - 24 548 5.5% 463 4.6% 454 4.6%25 - 29 508 5.1% 545 5.5% 443 4.5%30 - 34 495 4.9% 539 5.4% 556 5.6%35 - 39 573 5.7% 590 5.9% 622 6.3%40 - 44 596 5.9% 534 5.4% 594 6.0%45 - 49 661 6.6% 565 5.7% 541 5.5%50 - 54 754 7.5% 606 6.1% 582 5.9%55 - 59 766 7.6% 719 7.2% 617 6.3%60 - 64 659 6.6% 731 7.3% 665 6.7%65 - 69 469 4.7% 661 6.6% 672 6.8%70 - 74 436 4.4% 570 5.7% 634 6.4%75 - 79 325 3.2% 408 4.1% 474 4.8%80 - 84 366 3.7% 320 3.2% 375 3.8%85+ 520 5.2% 546 5.5% 527 5.3%
<18 2,131 21.3% 1,980 19.9% 1,913 19.4%18+ 7,895 78.8% 7,992 80.1% 7,947 80.6%21+ 7,566 75.5% 7,700 77.2% 7,662 77.7%Median Age 44.5 46.2 46.4
Source: U.S. Census Bureau, Census 2010 Summary File 1. Esri forecasts for 2019 and 2024.
September 25, 2019
©2019 Esri Page 5 of 18

Detailed Age Profile7353-7399 St Louis Ave Village Of Skokie Only7353-7399 St Louis Ave, Skokie, Illinois, 60076 Latitude: 42.01519Drive Time: 5 minute radius Longitude: -87.71717
Census 201020192024
Female Population by Detailed AgeFemale Population by Detailed Age
Age
Gro
ups
<1
1
2
3
4
5
6
7
8
9
10
11
12
13
14
15
16
17
18
19
20-24
25-29
30-34
35-39
40-44
45-49
50-54
55-59
60-64
65-69
70-74
75-79
80-84
85+
Percent7.576.565.554.543.532.521.510.50
Source: U.S. Census Bureau, Census 2010 Summary File 1. Esri forecasts for 2019 and 2024.
September 25, 2019
©2019 Esri Page 6 of 18

Detailed Age Profile7353-7399 St Louis Ave Village Of Skokie Only7353-7399 St Louis Ave, Skokie, Illinois, 60076 Latitude: 42.01519Drive Time: 10 minute radius Longitude: -87.71717
Summary Census 2010 2019 2024
2019-2024 Change
2019-2024 Annual Rate
Population 185,578 185,523 184,250 -1,273 -0.14%Households 66,618 66,502 66,011 -491 -0.15%Average Household Size 2.75 2.76 2.76 0.00 0.00%
Census 2010 2019 2024Total Population by Detailed Age Number Percent Number Percent Number PercentTotal 185,579 100.0% 185,521 100.0% 184,250 100.0%
<1 2,337 1.3% 2,213 1.2% 2,218 1.2%1 2,456 1.3% 2,286 1.2% 2,291 1.2%2 2,513 1.4% 2,224 1.2% 2,233 1.2%3 2,519 1.4% 2,271 1.2% 2,257 1.2%4 2,594 1.4% 2,277 1.2% 2,263 1.2%5 2,526 1.4% 2,312 1.2% 2,218 1.2%6 2,531 1.4% 2,277 1.2% 2,170 1.2%7 2,474 1.3% 2,314 1.2% 2,213 1.2%8 2,449 1.3% 2,300 1.2% 2,169 1.2%9 2,449 1.3% 2,332 1.3% 2,204 1.2%10 2,437 1.3% 2,450 1.3% 2,266 1.2%11 2,418 1.3% 2,487 1.3% 2,289 1.2%12 2,511 1.4% 2,461 1.3% 2,257 1.2%13 2,447 1.3% 2,455 1.3% 2,250 1.2%14 2,516 1.4% 2,475 1.3% 2,263 1.2%15 2,547 1.4% 2,427 1.3% 2,291 1.2%16 2,504 1.3% 2,397 1.3% 2,278 1.2%17 2,563 1.4% 2,365 1.3% 2,252 1.2%18 2,289 1.2% 2,275 1.2% 2,188 1.2%19 1,907 1.0% 2,062 1.1% 1,985 1.1%20 - 24 10,883 5.9% 10,876 5.9% 10,522 5.7%25 - 29 11,839 6.4% 11,887 6.4% 11,615 6.3%30 - 34 11,859 6.4% 11,530 6.2% 12,203 6.6%35 - 39 12,372 6.7% 11,985 6.5% 11,817 6.4%40 - 44 12,470 6.7% 11,110 6.0% 11,617 6.3%45 - 49 13,123 7.1% 11,600 6.3% 10,836 5.9%50 - 54 13,659 7.4% 11,842 6.4% 11,469 6.2%55 - 59 12,910 7.0% 12,530 6.8% 11,332 6.2%60 - 64 10,643 5.7% 11,932 6.4% 11,527 6.3%65 - 69 7,472 4.0% 10,439 5.6% 10,675 5.8%70 - 74 5,989 3.2% 8,073 4.4% 9,188 5.0%75 - 79 4,679 2.5% 5,719 3.1% 6,909 3.7%80 - 84 4,178 2.3% 4,169 2.2% 4,656 2.5%85+ 4,516 2.4% 5,169 2.8% 5,329 2.9%
<18 44,790 24.1% 42,322 22.8% 40,381 21.9%18+ 140,788 75.9% 143,201 77.2% 143,869 78.1%21+ 134,642 72.6% 136,766 73.7% 137,692 74.7%Median Age 38.7 39.9 40.6
Source: U.S. Census Bureau, Census 2010 Summary File 1. Esri forecasts for 2019 and 2024.
September 25, 2019
©2019 Esri Page 7 of 18

Detailed Age Profile7353-7399 St Louis Ave Village Of Skokie Only7353-7399 St Louis Ave, Skokie, Illinois, 60076 Latitude: 42.01519Drive Time: 10 minute radius Longitude: -87.71717
Census 201020192024
Total Population by Detailed AgeTotal Population by Detailed Age
Age
Gro
ups
<1
2
2
3
4
5
6
7
8
9
10
11
12
13
14
15
16
17
18
19
20-24
25-29
30-34
35-39
40-44
45-49
50-54
55-59
60-64
65-69
70-74
75-79
80-84
85+
Percent76.565.554.543.532.521.510.50
Source: U.S. Census Bureau, Census 2010 Summary File 1. Esri forecasts for 2019 and 2024.
September 25, 2019
©2019 Esri Page 8 of 18

Detailed Age Profile7353-7399 St Louis Ave Village Of Skokie Only7353-7399 St Louis Ave, Skokie, Illinois, 60076 Latitude: 42.01519Drive Time: 10 minute radius Longitude: -87.71717
Census 2010 2019 2024Male Population by Detailed Age Number Percent Number Percent Number PercentTotal 89,278 100.0% 89,552 100.0% 89,184 100.0%
<1 1,214 1.4% 1,122 1.3% 1,139 1.3%1 1,289 1.4% 1,208 1.3% 1,217 1.4%2 1,323 1.5% 1,175 1.3% 1,179 1.3%3 1,300 1.5% 1,155 1.3% 1,149 1.3%4 1,332 1.5% 1,181 1.3% 1,173 1.3%5 1,291 1.4% 1,195 1.3% 1,142 1.3%6 1,236 1.4% 1,144 1.3% 1,085 1.2%7 1,252 1.4% 1,213 1.4% 1,155 1.3%8 1,236 1.4% 1,196 1.3% 1,129 1.3%9 1,223 1.4% 1,207 1.3% 1,144 1.3%10 1,176 1.3% 1,240 1.4% 1,151 1.3%11 1,245 1.4% 1,284 1.4% 1,193 1.3%12 1,251 1.4% 1,263 1.4% 1,161 1.3%13 1,229 1.4% 1,252 1.4% 1,158 1.3%14 1,276 1.4% 1,236 1.4% 1,132 1.3%15 1,324 1.5% 1,225 1.4% 1,180 1.3%16 1,308 1.5% 1,233 1.4% 1,206 1.4%17 1,318 1.5% 1,189 1.3% 1,165 1.3%18 1,109 1.2% 1,129 1.3% 1,111 1.2%19 986 1.1% 1,050 1.2% 1,033 1.2%20 - 24 5,546 6.2% 5,491 6.1% 5,285 5.9%25 - 29 5,853 6.6% 5,973 6.7% 5,793 6.5%30 - 34 5,858 6.6% 5,720 6.4% 6,115 6.9%35 - 39 6,021 6.7% 5,817 6.5% 5,862 6.6%40 - 44 6,004 6.7% 5,397 6.0% 5,623 6.3%45 - 49 6,336 7.1% 5,642 6.3% 5,270 5.9%50 - 54 6,563 7.4% 5,657 6.3% 5,507 6.2%55 - 59 6,049 6.8% 5,941 6.6% 5,376 6.0%60 - 64 4,973 5.6% 5,600 6.3% 5,468 6.1%65 - 69 3,397 3.8% 4,721 5.3% 4,917 5.5%70 - 74 2,599 2.9% 3,576 4.0% 4,052 4.5%75 - 79 2,001 2.2% 2,494 2.8% 3,008 3.4%80 - 84 1,655 1.9% 1,737 1.9% 1,941 2.2%85+ 1,505 1.7% 1,889 2.1% 1,965 2.2%
<18 22,824 25.6% 21,718 24.3% 20,857 23.4%18+ 66,455 74.4% 67,834 75.7% 68,325 76.6%21+ 63,381 71.0% 64,628 72.2% 65,196 73.1%Median Age 37.0 38.2 38.8
Source: U.S. Census Bureau, Census 2010 Summary File 1. Esri forecasts for 2019 and 2024.
September 25, 2019
©2019 Esri Page 9 of 18

Detailed Age Profile7353-7399 St Louis Ave Village Of Skokie Only7353-7399 St Louis Ave, Skokie, Illinois, 60076 Latitude: 42.01519Drive Time: 10 minute radius Longitude: -87.71717
Census 201020192024
Male Population by Detailed AgeMale Population by Detailed Age
Age
Gro
ups
1
2
3
4
5
6
7
8
9
10
11
12
13
14
15
16
17
18
20
20-24
25-29
30-34
35-39
40-44
45-49
50-54
55-59
60-64
65-64
70-74
75-79
80-84
85+
Percent76.565.554.543.532.521.510.50
Source: U.S. Census Bureau, Census 2010 Summary File 1. Esri forecasts for 2019 and 2024.
September 25, 2019
©2019 Esri Page 10 of 18

Detailed Age Profile7353-7399 St Louis Ave Village Of Skokie Only7353-7399 St Louis Ave, Skokie, Illinois, 60076 Latitude: 42.01519Drive Time: 10 minute radius Longitude: -87.71717
Census 2010 2019 2024Female Population by Detailed Age Number Percent Number Percent Number PercentTotal 96,298 100.0% 95,969 100.0% 95,067 100.0%
<1 1,123 1.2% 1,092 1.1% 1,078 1.1%1 1,167 1.2% 1,078 1.1% 1,074 1.1%2 1,190 1.2% 1,049 1.1% 1,055 1.1%3 1,219 1.3% 1,116 1.2% 1,108 1.2%4 1,262 1.3% 1,096 1.1% 1,090 1.1%5 1,236 1.3% 1,116 1.2% 1,077 1.1%6 1,296 1.3% 1,133 1.2% 1,085 1.1%7 1,221 1.3% 1,101 1.1% 1,057 1.1%8 1,212 1.3% 1,104 1.2% 1,041 1.1%9 1,226 1.3% 1,124 1.2% 1,060 1.1%10 1,261 1.3% 1,210 1.3% 1,115 1.2%11 1,173 1.2% 1,203 1.3% 1,096 1.2%12 1,260 1.3% 1,198 1.2% 1,096 1.2%13 1,218 1.3% 1,203 1.3% 1,092 1.1%14 1,239 1.3% 1,239 1.3% 1,130 1.2%15 1,223 1.3% 1,201 1.3% 1,111 1.2%16 1,196 1.2% 1,164 1.2% 1,072 1.1%17 1,245 1.3% 1,176 1.2% 1,087 1.1%18 1,179 1.2% 1,146 1.2% 1,077 1.1%19 921 1.0% 1,013 1.1% 952 1.0%20 - 24 5,338 5.5% 5,385 5.6% 5,238 5.5%25 - 29 5,986 6.2% 5,914 6.2% 5,822 6.1%30 - 34 6,001 6.2% 5,810 6.1% 6,088 6.4%35 - 39 6,351 6.6% 6,168 6.4% 5,955 6.3%40 - 44 6,466 6.7% 5,713 6.0% 5,994 6.3%45 - 49 6,787 7.0% 5,958 6.2% 5,566 5.9%50 - 54 7,096 7.4% 6,185 6.4% 5,962 6.3%55 - 59 6,861 7.1% 6,589 6.9% 5,956 6.3%60 - 64 5,669 5.9% 6,332 6.6% 6,060 6.4%65 - 69 4,075 4.2% 5,718 6.0% 5,758 6.1%70 - 74 3,390 3.5% 4,497 4.7% 5,136 5.4%75 - 79 2,678 2.8% 3,225 3.4% 3,901 4.1%80 - 84 2,523 2.6% 2,433 2.5% 2,714 2.9%85+ 3,010 3.1% 3,280 3.4% 3,364 3.5%
<18 21,967 22.8% 20,604 21.5% 19,524 20.5%18+ 74,332 77.2% 75,367 78.5% 75,544 79.5%21+ 71,261 74.0% 72,140 75.2% 72,496 76.3%Median Age 40.3 41.7 42.4
Source: U.S. Census Bureau, Census 2010 Summary File 1. Esri forecasts for 2019 and 2024.
September 25, 2019
©2019 Esri Page 11 of 18

Detailed Age Profile7353-7399 St Louis Ave Village Of Skokie Only7353-7399 St Louis Ave, Skokie, Illinois, 60076 Latitude: 42.01519Drive Time: 10 minute radius Longitude: -87.71717
Census 201020192024
Female Population by Detailed AgeFemale Population by Detailed Age
Age
Gro
ups
<1
1
2
3
4
5
6
7
8
9
10
11
12
13
14
15
16
17
18
19
20-24
25-29
30-34
35-39
40-44
45-49
50-54
55-59
60-64
65-69
70-74
75-79
80-84
85+
Percent76.565.554.543.532.521.510.50
Source: U.S. Census Bureau, Census 2010 Summary File 1. Esri forecasts for 2019 and 2024.
September 25, 2019
©2019 Esri Page 12 of 18

Detailed Age Profile7353-7399 St Louis Ave Village Of Skokie Only7353-7399 St Louis Ave, Skokie, Illinois, 60076 Latitude: 42.01519Drive Time: 15 minute radius Longitude: -87.71717
Summary Census 2010 2019 2024
2019-2024 Change
2019-2024 Annual Rate
Population 475,588 477,852 475,755 -2,097 -0.09%Households 180,923 182,450 181,752 -698 -0.08%Average Household Size 2.55 2.54 2.54 0.00 0.00%
Census 2010 2019 2024Total Population by Detailed Age Number Percent Number Percent Number PercentTotal 475,587 100.0% 477,851 100.0% 475,755 100.0%
<1 6,160 1.3% 5,558 1.2% 5,622 1.2%1 6,089 1.3% 5,538 1.2% 5,554 1.2%2 6,190 1.3% 5,434 1.1% 5,426 1.1%3 6,146 1.3% 5,523 1.2% 5,482 1.2%4 6,171 1.3% 5,431 1.1% 5,364 1.1%5 6,005 1.3% 5,630 1.2% 5,331 1.1%6 5,951 1.3% 5,513 1.2% 5,181 1.1%7 5,843 1.2% 5,598 1.2% 5,240 1.1%8 5,615 1.2% 5,457 1.1% 5,059 1.1%9 5,658 1.2% 5,519 1.2% 5,125 1.1%10 5,630 1.2% 5,860 1.2% 5,341 1.1%11 5,400 1.1% 5,809 1.2% 5,250 1.1%12 5,479 1.2% 5,716 1.2% 5,163 1.1%13 5,476 1.2% 5,815 1.2% 5,264 1.1%14 5,572 1.2% 5,735 1.2% 5,200 1.1%15 5,554 1.2% 5,642 1.2% 5,273 1.1%16 5,620 1.2% 5,605 1.2% 5,255 1.1%17 5,792 1.2% 5,604 1.2% 5,300 1.1%18 6,315 1.3% 6,500 1.4% 6,272 1.3%19 6,999 1.5% 7,448 1.6% 7,288 1.5%20 - 24 35,518 7.5% 34,257 7.2% 33,990 7.1%25 - 29 36,972 7.8% 34,426 7.2% 34,979 7.4%30 - 34 35,456 7.5% 33,849 7.1% 34,461 7.2%35 - 39 34,148 7.2% 33,393 7.0% 32,019 6.7%40 - 44 32,973 6.9% 30,104 6.3% 31,387 6.6%45 - 49 33,176 7.0% 30,266 6.3% 28,365 6.0%50 - 54 32,734 6.9% 29,869 6.3% 29,224 6.1%55 - 59 30,347 6.4% 30,734 6.4% 28,289 5.9%60 - 64 24,775 5.2% 28,290 5.9% 28,120 5.9%65 - 69 17,378 3.7% 24,385 5.1% 25,272 5.3%70 - 74 13,501 2.8% 18,747 3.9% 21,334 4.5%75 - 79 10,763 2.3% 13,046 2.7% 16,099 3.4%80 - 84 9,570 2.0% 9,444 2.0% 10,714 2.3%85+ 10,611 2.2% 12,106 2.5% 12,512 2.6%
<18 104,352 21.9% 100,987 21.1% 95,430 20.1%18+ 371,237 78.1% 376,865 78.9% 380,324 79.9%21+ 350,796 73.8% 355,597 74.4% 359,610 75.6%Median Age 36.8 38.2 39.0
Source: U.S. Census Bureau, Census 2010 Summary File 1. Esri forecasts for 2019 and 2024.
September 25, 2019
©2019 Esri Page 13 of 18

Detailed Age Profile7353-7399 St Louis Ave Village Of Skokie Only7353-7399 St Louis Ave, Skokie, Illinois, 60076 Latitude: 42.01519Drive Time: 15 minute radius Longitude: -87.71717
Census 201020192024
Total Population by Detailed AgeTotal Population by Detailed Age
Age
Gro
ups
<1
2
2
3
4
5
6
7
8
9
10
11
12
13
14
15
16
17
18
19
20-24
25-29
30-34
35-39
40-44
45-49
50-54
55-59
60-64
65-69
70-74
75-79
80-84
85+
Percent7.576.565.554.543.532.521.510.50
Source: U.S. Census Bureau, Census 2010 Summary File 1. Esri forecasts for 2019 and 2024.
September 25, 2019
©2019 Esri Page 14 of 18

Detailed Age Profile7353-7399 St Louis Ave Village Of Skokie Only7353-7399 St Louis Ave, Skokie, Illinois, 60076 Latitude: 42.01519Drive Time: 15 minute radius Longitude: -87.71717
Census 2010 2019 2024Male Population by Detailed Age Number Percent Number Percent Number PercentTotal 232,658 100.0% 234,223 100.0% 233,544 100.0%
<1 3,134 1.3% 2,820 1.2% 2,868 1.2%1 3,178 1.4% 2,862 1.2% 2,891 1.2%2 3,214 1.4% 2,820 1.2% 2,822 1.2%3 3,104 1.3% 2,771 1.2% 2,757 1.2%4 3,142 1.4% 2,788 1.2% 2,756 1.2%5 3,083 1.3% 2,879 1.2% 2,728 1.2%6 2,946 1.3% 2,754 1.2% 2,587 1.1%7 2,922 1.3% 2,858 1.2% 2,673 1.1%8 2,860 1.2% 2,814 1.2% 2,601 1.1%9 2,881 1.2% 2,864 1.2% 2,659 1.1%10 2,765 1.2% 2,977 1.3% 2,717 1.2%11 2,712 1.2% 2,925 1.2% 2,655 1.1%12 2,785 1.2% 2,921 1.2% 2,641 1.1%13 2,799 1.2% 2,996 1.3% 2,721 1.2%14 2,892 1.2% 2,945 1.3% 2,682 1.1%15 2,935 1.3% 2,916 1.2% 2,748 1.2%16 2,955 1.3% 2,885 1.2% 2,740 1.2%17 3,056 1.3% 2,915 1.2% 2,799 1.2%18 3,114 1.3% 3,207 1.4% 3,121 1.3%19 3,524 1.5% 3,689 1.6% 3,621 1.6%20 - 24 17,883 7.7% 17,133 7.3% 16,911 7.2%25 - 29 18,567 8.0% 17,710 7.6% 17,730 7.6%30 - 34 17,907 7.7% 17,172 7.3% 17,848 7.6%35 - 39 17,174 7.4% 16,723 7.1% 16,268 7.0%40 - 44 16,590 7.1% 14,928 6.4% 15,616 6.7%45 - 49 16,591 7.1% 15,176 6.5% 14,099 6.0%50 - 54 15,985 6.9% 14,869 6.3% 14,461 6.2%55 - 59 14,547 6.3% 14,911 6.4% 13,907 6.0%60 - 64 11,863 5.1% 13,470 5.8% 13,644 5.8%65 - 69 7,962 3.4% 11,254 4.8% 11,766 5.0%70 - 74 5,912 2.5% 8,490 3.6% 9,604 4.1%75 - 79 4,521 1.9% 5,648 2.4% 7,053 3.0%80 - 84 3,796 1.6% 3,894 1.7% 4,422 1.9%85+ 3,359 1.4% 4,239 1.8% 4,428 1.9%
<18 53,362 22.9% 51,709 22.1% 49,044 21.0%18+ 179,294 77.1% 182,513 77.9% 184,500 79.0%21+ 169,127 72.7% 172,036 73.5% 174,255 74.6%Median Age 35.6 36.9 37.6
Source: U.S. Census Bureau, Census 2010 Summary File 1. Esri forecasts for 2019 and 2024.
September 25, 2019
©2019 Esri Page 15 of 18

Detailed Age Profile7353-7399 St Louis Ave Village Of Skokie Only7353-7399 St Louis Ave, Skokie, Illinois, 60076 Latitude: 42.01519Drive Time: 15 minute radius Longitude: -87.71717
Census 201020192024
Male Population by Detailed AgeMale Population by Detailed Age
Age
Gro
ups
1
2
3
4
5
6
7
8
9
10
11
12
13
14
15
16
17
18
20
20-24
25-29
30-34
35-39
40-44
45-49
50-54
55-59
60-64
65-64
70-74
75-79
80-84
85+
Percent87.87.67.47.276.86.66.46.265.85.65.45.254.84.64.44.243.83.63.43.232.82.62.42.221.81.61.41.210.80.60.40.2
Source: U.S. Census Bureau, Census 2010 Summary File 1. Esri forecasts for 2019 and 2024.
September 25, 2019
©2019 Esri Page 16 of 18

Detailed Age Profile7353-7399 St Louis Ave Village Of Skokie Only7353-7399 St Louis Ave, Skokie, Illinois, 60076 Latitude: 42.01519Drive Time: 15 minute radius Longitude: -87.71717
Census 2010 2019 2024Female Population by Detailed Age Number Percent Number Percent Number PercentTotal 242,933 100.0% 243,629 100.0% 242,208 100.0%
<1 3,026 1.2% 2,739 1.1% 2,754 1.1%1 2,910 1.2% 2,676 1.1% 2,663 1.1%2 2,976 1.2% 2,614 1.1% 2,603 1.1%3 3,042 1.3% 2,752 1.1% 2,725 1.1%4 3,029 1.2% 2,643 1.1% 2,608 1.1%5 2,922 1.2% 2,751 1.1% 2,602 1.1%6 3,004 1.2% 2,759 1.1% 2,594 1.1%7 2,922 1.2% 2,740 1.1% 2,567 1.1%8 2,755 1.1% 2,643 1.1% 2,458 1.0%9 2,777 1.1% 2,655 1.1% 2,466 1.0%10 2,866 1.2% 2,882 1.2% 2,624 1.1%11 2,688 1.1% 2,884 1.2% 2,595 1.1%12 2,695 1.1% 2,795 1.1% 2,521 1.0%13 2,677 1.1% 2,819 1.2% 2,543 1.0%14 2,679 1.1% 2,790 1.1% 2,519 1.0%15 2,620 1.1% 2,726 1.1% 2,525 1.0%16 2,666 1.1% 2,720 1.1% 2,515 1.0%17 2,736 1.1% 2,688 1.1% 2,501 1.0%18 3,201 1.3% 3,293 1.4% 3,152 1.3%19 3,476 1.4% 3,759 1.5% 3,667 1.5%20 - 24 17,635 7.3% 17,125 7.0% 17,079 7.1%25 - 29 18,405 7.6% 16,716 6.9% 17,249 7.1%30 - 34 17,550 7.2% 16,678 6.8% 16,613 6.9%35 - 39 16,974 7.0% 16,670 6.8% 15,752 6.5%40 - 44 16,384 6.7% 15,176 6.2% 15,771 6.5%45 - 49 16,586 6.8% 15,090 6.2% 14,266 5.9%50 - 54 16,749 6.9% 15,000 6.2% 14,763 6.1%55 - 59 15,800 6.5% 15,823 6.5% 14,382 5.9%60 - 64 12,912 5.3% 14,820 6.1% 14,476 6.0%65 - 69 9,416 3.9% 13,130 5.4% 13,505 5.6%70 - 74 7,588 3.1% 10,257 4.2% 11,730 4.8%75 - 79 6,242 2.6% 7,398 3.0% 9,045 3.7%80 - 84 5,774 2.4% 5,551 2.3% 6,292 2.6%85+ 7,251 3.0% 7,867 3.2% 8,083 3.3%
<18 50,991 21.0% 49,277 20.2% 46,386 19.2%18+ 191,943 79.0% 194,353 79.8% 195,825 80.8%21+ 181,669 74.8% 183,564 75.3% 185,352 76.5%Median Age 38.0 39.5 40.4
Source: U.S. Census Bureau, Census 2010 Summary File 1. Esri forecasts for 2019 and 2024.
September 25, 2019
©2019 Esri Page 17 of 18

Detailed Age Profile7353-7399 St Louis Ave Village Of Skokie Only7353-7399 St Louis Ave, Skokie, Illinois, 60076 Latitude: 42.01519Drive Time: 15 minute radius Longitude: -87.71717
Census 201020192024
Female Population by Detailed AgeFemale Population by Detailed Age
Age
Gro
ups
<1
1
2
3
4
5
6
7
8
9
10
11
12
13
14
15
16
17
18
19
20-24
25-29
30-34
35-39
40-44
45-49
50-54
55-59
60-64
65-69
70-74
75-79
80-84
85+
Percent7.576.565.554.543.532.521.510.50
Source: U.S. Census Bureau, Census 2010 Summary File 1. Esri forecasts for 2019 and 2024.
September 25, 2019
©2019 Esri Page 18 of 18

Disposable Income Profile7353-7399 St Louis Ave Village Of Skokie Only7353-7399 St Louis Ave, Skokie, Illinois, 60076 Latitude: 42.01519Drive Time: 5 minute radius Longitude: -87.71717
2019-2024 2019-2024Census 2010 2019 2024 Change Annual Rate
Population 19,211 19,188 19,016 -172 -0.18%Median Age 42.6 44.2 44.4 0.2 0.09%Households 6,540 6,451 6,373 -78 -0.24%Average Household Size 2.92 2.96 2.96 0.00 0.00%
2019 Households by Disposable Income Number PercentTotal 6,451 100.0%
<$15,000 523 8.1%$15,000-$24,999 465 7.2%$25,000-$34,999 578 9.0%$35,000-$49,999 833 12.9%$50,000-$74,999 1,256 19.5%$75,000-$99,999 975 15.1%$100,000-$149,999 1,211 18.8%$150,000-$199,999 346 5.4%$200,000+ 264 4.1%
Median Disposable Income $64,156Average Disposable Income $79,314
Number of Households2019 Disposable Income by Age of Householder <25 25-34 35-44 45-54 55-64 65-74 75+Total 46 525 893 1,072 1,356 1,163 1,396
<$15,000 1 24 24 45 101 88 239$15,000-$24,999 6 42 53 57 50 75 183$25,000-$34,999 2 61 56 55 67 92 244$35,000-$49,999 14 75 79 109 129 175 253$50,000-$74,999 8 103 216 129 293 293 213$75,000-$99,999 6 77 192 215 250 120 115$100,000-$149,999 8 99 184 305 316 186 114$150,000-$199,999 0 24 64 87 85 64 22$200,000+ 1 20 25 69 66 71 12
Median Disposable Income $50,000 $62,240 $76,663 $89,352 $77,830 $60,141 $36,318Average Disposable Income $67,192 $76,747 $86,729 $99,218 $89,655 $81,035 $49,171
Data Note: Disposable Income is after-tax household income. Disposable income forecasts are based on the Current Population Survey, U.S. Census Bureau. Detail may not sum to totals due to roundingSource: U.S. Census Bureau, Census 2010 Summary File 1. Esri forecasts for 2019 and 2024.
September 25, 2019
©2019 Esri Page 1 of 3

Disposable Income Profile7353-7399 St Louis Ave Village Of Skokie Only7353-7399 St Louis Ave, Skokie, Illinois, 60076 Latitude: 42.01519Drive Time: 10 minute radius Longitude: -87.71717
2019-2024 2019-2024Census 2010 2019 2024 Change Annual Rate
Population 185,578 185,523 184,250 -1,273 -0.14%Median Age 38.7 39.9 40.6 0.7 0.35%Households 66,618 66,502 66,011 -491 -0.15%Average Household Size 2.75 2.76 2.76 0.00 0.00%
2019 Households by Disposable Income Number PercentTotal 66,502 100.0%
<$15,000 7,624 11.5%$15,000-$24,999 5,699 8.6%$25,000-$34,999 6,986 10.5%$35,000-$49,999 9,302 14.0%$50,000-$74,999 13,346 20.1%$75,000-$99,999 8,307 12.5%$100,000-$149,999 9,545 14.4%$150,000-$199,999 3,283 4.9%$200,000+ 2,410 3.6%
Median Disposable Income $54,917Average Disposable Income $71,842
Number of Households2019 Disposable Income by Age of Householder <25 25-34 35-44 45-54 55-64 65-74 75+Total 1,445 8,240 11,227 12,390 13,398 10,428 9,375
<$15,000 241 878 666 934 1,584 1,386 1,936$15,000-$24,999 220 1,001 690 779 772 879 1,357$25,000-$34,999 176 1,143 993 908 931 1,217 1,618$35,000-$49,999 314 1,294 1,375 1,696 1,541 1,540 1,543$50,000-$74,999 276 1,515 2,901 1,917 3,017 2,366 1,354$75,000-$99,999 88 872 1,904 2,059 1,885 868 632$100,000-$149,999 102 1,061 1,718 2,542 2,172 1,263 685$150,000-$199,999 7 267 703 870 839 437 161$200,000+ 21 208 277 685 657 473 89
Median Disposable Income $37,956 $47,034 $63,604 $74,295 $62,940 $51,293 $33,188Average Disposable Income $47,661 $62,587 $77,446 $87,496 $80,669 $69,275 $46,540
Data Note: Disposable Income is after-tax household income. Disposable income forecasts are based on the Current Population Survey, U.S. Census Bureau. Detail may not sum to totals due to roundingSource: U.S. Census Bureau, Census 2010 Summary File 1. Esri forecasts for 2019 and 2024.
September 25, 2019
©2019 Esri Page 2 of 3

Disposable Income Profile7353-7399 St Louis Ave Village Of Skokie Only7353-7399 St Louis Ave, Skokie, Illinois, 60076 Latitude: 42.01519Drive Time: 15 minute radius Longitude: -87.71717
2019-2024 2019-2024Census 2010 2019 2024 Change Annual Rate
Population 475,588 477,852 475,755 -2,097 -0.09%Median Age 36.8 38.2 39.0 0.8 0.42%Households 180,923 182,450 181,752 -698 -0.08%Average Household Size 2.55 2.54 2.54 0.00 0.00%
2019 Households by Disposable Income Number PercentTotal 182,450 100.0%
<$15,000 24,095 13.2%$15,000-$24,999 17,581 9.6%$25,000-$34,999 19,669 10.8%$35,000-$49,999 25,577 14.0%$50,000-$74,999 35,771 19.6%$75,000-$99,999 20,533 11.3%$100,000-$149,999 23,507 12.9%$150,000-$199,999 9,067 5.0%$200,000+ 6,649 3.6%
Median Disposable Income $52,032Average Disposable Income $69,436
Number of Households2019 Disposable Income by Age of Householder <25 25-34 35-44 45-54 55-64 65-74 75+Total 7,169 28,445 32,964 33,356 33,613 25,294 21,610
<$15,000 1,702 3,489 2,229 2,808 4,702 3,969 5,196$15,000-$24,999 1,168 3,887 2,331 2,328 2,193 2,398 3,276$25,000-$34,999 910 4,044 3,166 2,500 2,443 3,094 3,511$35,000-$49,999 1,307 4,469 4,165 4,662 4,018 3,651 3,306$50,000-$74,999 1,074 4,976 8,496 5,386 7,500 5,362 2,977$75,000-$99,999 347 2,646 5,174 4,985 4,137 1,915 1,330$100,000-$149,999 447 3,407 4,554 6,162 4,694 2,796 1,447$150,000-$199,999 78 861 2,033 2,525 2,199 1,008 361$200,000+ 135 665 816 1,999 1,726 1,101 206
Median Disposable Income $32,324 $43,207 $60,647 $68,858 $58,893 $47,515 $30,890Average Disposable Income $44,456 $59,595 $75,112 $87,121 $78,453 $66,257 $44,409
Data Note: Disposable Income is after-tax household income. Disposable income forecasts are based on the Current Population Survey, U.S. Census Bureau. Detail may not sum to totals due to roundingSource: U.S. Census Bureau, Census 2010 Summary File 1. Esri forecasts for 2019 and 2024.
September 25, 2019
©2019 Esri Page 3 of 3

Dominant Tapestry Map7353-7399 St Louis Ave Village Of Skokie Only7353-7399 St Louis Ave, Skokie, Illinois, 60076 Latitude: 42.01519Drive Time: 5, 10, 15 minute radii Longitude: -87.71717
Source: Esri
September 25, 2019
©2019 Esri Page 1 of 2

Dominant Tapestry Map7353-7399 St Louis Ave Village Of Skokie Only7353-7399 St Louis Ave, Skokie, Illinois, 60076 Latitude: 42.01519Drive Time: 5, 10, 15 minute radii Longitude: -87.71717
Tapestry Segmentation
Tapestry Segmentation represents the latest generation of market segmentation systems that began over 30 years ago. The 68-segment Tapestry Segmentation system classifies U.S. neighborhoods based on their socioeconomic and demographic composition. Each segment is identified by its two-digit Segment Code. Match the two-digit segment labels on the map to the list below. Click each segment below for a detailed description. Segment 1A (Top Tier) Segment 8C (Bright Young Professionals)Segment 1B (Professional Pride) Segment 8D (Downtown Melting Pot)Segment 1C (Boomburbs) Segment 8E (Front Porches)Segment 1D (Savvy Suburbanites) Segment 8F (Old and Newcomers)Segment 1E (Exurbanites) Segment 8G (Hardscrabble Road)Segment 2A (Urban Chic) Segment 9A (Silver & Gold)Segment 2B (Pleasantville) Segment 9B (Golden Years)Segment 2C (Pacific Heights) Segment 9C (The Elders)Segment 2D (Enterprising Professionals) Segment 9D (Senior Escapes)Segment 3A (Laptops and Lattes) Segment 9E (Retirement Communities)Segment 3B (Metro Renters) Segment 9F (Social Security Set)Segment 3C (Trendsetters) Segment 10A (Southern Satellites)Segment 4A (Soccer Moms) Segment 10B (Rooted Rural)Segment 4B (Home Improvement) Segment 10C (Diners & Miners)Segment 4C (Middleburg) Segment 10D (Down the Road)Segment 5A (Comfortable Empty Nesters) Segment 10E (Rural Bypasses)Segment 5B (In Style) Segment 11A (City Strivers)Segment 5C (Parks and Rec) Segment 11B (Young and Restless)Segment 5D (Rustbelt Traditions) Segment 11C (Metro Fusion)Segment 5E (Midlife Constants) Segment 11D (Set to Impress)Segment 6A (Green Acres) Segment 11E (City Commons)Segment 6B (Salt of the Earth) Segment 12A (Family Foundations)Segment 6C (The Great Outdoors) Segment 12B (Traditional Living)Segment 6D (Prairie Living) Segment 12C (Small Town Simplicity)Segment 6E (Rural Resort Dwellers) Segment 12D (Modest Income Homes)Segment 6F (Heartland Communities) Segment 13A (International Marketplace)Segment 7A (Up and Coming Families) Segment 13B (Las Casas)Segment 7B (Urban Villages) Segment 13C (NeWest Residents)Segment 7C (American Dreamers) Segment 13D (Fresh Ambitions)Segment 7D (Barrios Urbanos) Segment 13E (High Rise Renters)Segment 7E (Valley Growers) Segment 14A (Military Proximity)Segment 7F (Southwestern Families) Segment 14B (College Towns)Segment 8A (City Lights) Segment 14C (Dorms to Diplomas)Segment 8B (Emerald City) Segment 15 (Unclassified)
Source: Esri
September 25, 2019
©2019 Esri Page 2 of 2

Electronics and Internet Market Potential7353-7399 St Louis Ave Village Of Skokie Only7353-7399 St Louis Ave, Skokie, Illinois, 60076 Latitude: 42.01519Drive Time: 5 minute radius Longitude: -87.71717
Demographic Summary 2019 2024Population 19,188 19,016Population 18+ 15,070 14,996Households 6,451 6,373Median Household Income $86,110 $97,707
ExpectedProduct/Consumer Behavior Number of Adults or HHs Percent MPI
Own any tablet 8,246 54.7% 114Own any e-reader 1,719 11.4% 137Own e-reader/tablet: iPad 5,846 38.8% 138Own e-reader/tablet: Amazon Kindle 2,544 16.9% 117Own any portable MP3 player 3,248 21.6% 116Own portable MP3 player: Apple iPod 2,644 17.5% 123Own wearable tech: Apple Watch 718 4.8% 140Own wearable tech: Fitbit 1,849 12.3% 124Own digital camera/camcorder 1,493 9.9% 121Own digital point & shoot camera/camcorder 1,721 11.4% 114Own digital SLR camera/camcorder 1,576 10.5% 133Own 35mm camera/camcorder 954 6.3% 114Own telephoto/zoom lens 839 5.6% 141Own wide-angle lens 654 4.3% 141Own a selfie stick 969 6.4% 133Printed digital photos in last 12 months 3,767 25.0% 109Use a computer at work 7,338 48.7% 116Use desktop computer at work 3,648 24.2% 108Use laptop/notebook at work 3,334 22.1% 123HH owns a computer 5,288 82.0% 111Purchased home computer in last 12 months 793 12.3% 118HH owns desktop computer 2,934 45.5% 123HH owns laptop/notebook 3,962 61.4% 109Child (under 18 yrs) uses home computer 974 15.1% 117HH owns any Apple/Mac brand computer 1,693 26.2% 145HH owns any PC/non-Apple brand computer 4,157 64.4% 105
Data Note: An MPI (Market Potential Index) measures the relative likelihood of the adults or households in the specified trade area to exhibit certain consumer behavior or purchasing patterns compared to the U.S. An MPI of 100 represents the U.S. average.Source: These data are based upon national propensities to use various products and services, applied to local demographic composition. Usage data were collected by GfK MRI in a nationally representative survey of U.S. households. Esri forecasts for 2019 and 2024.
September 25, 2019
©2019 Esri Page 1 of 15

Electronics and Internet Market Potential7353-7399 St Louis Ave Village Of Skokie Only7353-7399 St Louis Ave, Skokie, Illinois, 60076 Latitude: 42.01519Drive Time: 5 minute radius Longitude: -87.71717
ExpectedProduct/Consumer Behavior Number of Adults or HHs Percent MPI
Purchased most recent home computer 1-2 years ago 1,087 16.9% 106Purchased most recent home computer 3-4 years ago 1,221 18.9% 119Purchased most recent home computer 5+ years ago 782 12.1% 107HH purchased most recent computer in a store 2,586 40.1% 111HH purchased most recent computer online 996 15.4% 114Spent on most recent home computer: $1-499 769 11.9% 81Spent on most recent home computer: $500-$999 1,184 18.4% 109Spent on most recent home computer: $1000-$1499 818 12.7% 132Spent on most recent home computer: $1500-$1999 411 6.4% 144Spent on most recent home computer: $2000+ 341 5.3% 134HH owns webcam 1,041 16.1% 95HH owns wireless router 1,880 29.1% 112HH owns all-in-one printer (print copy scan) 2,980 46.2% 120HH owns software: accounting 417 6.5% 114HH owns software: communications/fax 395 6.1% 142HH owns software: database/filing 365 5.7% 113HH owns software: desktop publishing 495 7.7% 113HH owns software: education/training 516 8.0% 90HH owns software: entertainment/games 1,122 17.4% 106HH owns software: personal finance/tax prep 837 13.0% 114HH owns software: presentation graphics 432 6.7% 123HH owns software: multimedia 746 11.6% 105HH owns software: networking 783 12.1% 112HH owns software: online meeting/conference 273 4.2% 117HH owns software: security/anti-virus 1,444 22.4% 112HH owns software: spreadsheet 1,690 26.2% 124HH owns software: utility 339 5.3% 116HH owns software: word processing 2,184 33.9% 122HH owns CD player 1,018 15.8% 115
Data Note: An MPI (Market Potential Index) measures the relative likelihood of the adults or households in the specified trade area to exhibit certain consumer behavior or purchasing patterns compared to the U.S. An MPI of 100 represents the U.S. average.Source: These data are based upon national propensities to use various products and services, applied to local demographic composition. Usage data were collected by GfK MRI in a nationally representative survey of U.S. households. Esri forecasts for 2019 and 2024.
September 25, 2019
©2019 Esri Page 2 of 15

Electronics and Internet Market Potential7353-7399 St Louis Ave Village Of Skokie Only7353-7399 St Louis Ave, Skokie, Illinois, 60076 Latitude: 42.01519Drive Time: 5 minute radius Longitude: -87.71717
ExpectedProduct/Consumer Behavior Number of Adults or HHs Percent MPI
HH owns portable GPS navigation device 1,612 25.0% 109HH purchased portable GPS navigation device/12 mo 104 1.6% 86HH owns headphones (ear buds) 2,833 43.9% 108HH owns noise reduction headphones 662 10.3% 103HH owns Bluetooth/wireless headphones 1,077 16.7% 105HH owns home theater/entertainment system 586 9.1% 109HH owns 1 TV 1,398 21.7% 103HH owns 2 TVs 1,750 27.1% 101HH owns 3 TVs 1,308 20.3% 97HH owns 4+ TVs 1,204 18.7% 107HH owns LCD TV 1,866 28.9% 117HH owns LED TV 2,174 33.7% 101HH owns plasma TV 821 12.7% 98HH has 3D TV 354 5.5% 106HH has HDTV 3,016 46.8% 105HH has 4K Ultra HDTV 643 10.0% 124HH has Internet connectable TV 2,039 31.6% 110HH owns small screen TV (<27 in) 993 15.4% 100HH owns medium screen TV (27-35 in) 1,947 30.2% 95HH owns large screen TV (36-42 in) 2,247 34.8% 105HH owns XLarge screen TV (43-54 in) 1,881 29.2% 108HH owns XXL screen TV (55 in+) 1,718 26.6% 112HH most recent TV purch: small screen (<27 in) 364 5.6% 88HH most recent TV purch: medium screen (27-35 in) 977 15.1% 88HH most recent TV purch: large screen (36-42 in) 1,321 20.5% 105HH most recent TV purch: Xlarge screen (43-54 in) 1,143 17.7% 104HH most recent TV purch: XXL screen (55 in+) 1,435 22.2% 117HH owns Internet video device for TV 1,767 27.4% 114HH owns internet device for TV - Amazon Fire 631 9.8% 123HH owns internet device for TV - Apple TV 587 9.1% 150HH owns internet device for TV - Google Chromecast 391 6.1% 107HH owns internet device for TV - Roku 641 9.9% 102HH purchased video game system in last 12 months 814 12.6% 153HH owns video game system: handheld 543 8.4% 96HH owns video game system: attached to TV/computer 2,451 38.0% 93HH owns video game system: Nintendo DS/Lite DSI/XL 261 4.0% 91HH owns video game system: Nintendo 3DS 212 3.3% 112HH owns video game system: Nintendo Wii 855 13.3% 96HH owns video game system: Nintendo Wii U 192 3.0% 90HH owns video game system: PlayStation 2 (PS2) 285 4.4% 81HH owns video game system: PlayStation 3 (PS3) 571 8.9% 88HH owns video game system: Playstation 4 (PS 4) 736 11.4% 93HH owns video game system: Xbox 360 855 13.3% 90HH owns video game system: Xbox One 649 10.1% 92HH purchased 5+ video games in last 12 months 298 4.6% 88HH spent $101+ on video games in last 12 months 479 7.4% 106Have access to Internet at home 14,244 94.5% 106Connection to Internet at home: via cable modem 7,944 52.7% 115Connection to Internet at home: via DSL 1,030 6.8% 64Connection to Internet at home: via fiber optic 4,032 26.8% 177Access Internet at home via high speed connection 14,046 93.2% 106Spend 10+ hrs online (excl email/IM time) daily 721 4.8% 84Spend 5-9.9 hrs online (excl email/IM time) daily 2,217 14.7% 102Spend 2-4.9 hrs online (excl email/IM time) daily 3,882 25.8% 103Spend 1-1.9 hrs online (excl email/IM time) daily 3,308 22.0% 121Spend 0.5-0.9 hrs online (excl email/IM time) daily 1,736 11.5% 108Spend <0.5 hrs online (excl email/IM time) daily 1,010 6.7% 91Used Internet in last 30 days 13,584 90.1% 105
Data Note: An MPI (Market Potential Index) measures the relative likelihood of the adults or households in the specified trade area to exhibit certain consumer behavior or purchasing patterns compared to the U.S. An MPI of 100 represents the U.S. average.Source: These data are based upon national propensities to use various products and services, applied to local demographic composition. Usage data were collected by GfK MRI in a nationally representative survey of U.S. households. Esri forecasts for 2019 and 2024.
September 25, 2019
©2019 Esri Page 3 of 15

Electronics and Internet Market Potential7353-7399 St Louis Ave Village Of Skokie Only7353-7399 St Louis Ave, Skokie, Illinois, 60076 Latitude: 42.01519Drive Time: 5 minute radius Longitude: -87.71717
ExpectedProduct/Consumer Behavior Number of Adults or HHs Percent MPI
Used Internet/30 days: at home 13,125 87.1% 106Used Internet/30 days: at work 7,205 47.8% 108Used Internet/30 days: at school/library 2,088 13.9% 102Used Internet/30 days: not hm/work/school/library 6,523 43.3% 108Accessed Internet in last 30 days using computer 11,709 77.7% 113Accessed Internet in last 30 days using cell phone 11,878 78.8% 103Accessed Internet in last 30 days using tablet 6,272 41.6% 119Accessed Internet in last 30 days w gaming console 1,199 8.0% 90Accessed Internet in last 30 days using television 2,724 18.1% 111Used Wi-Fi/wireless connection outside hm/30 days 4,946 32.8% 112Used tablet last 30 days for video call 846 5.6% 124Internet last 30 days: visited a chat room 673 4.5% 99Internet last 30 days: used email 12,026 79.8% 108Internet last 30 days: used IM 9,771 64.8% 100Internet last 30 days: made personal purchase 9,028 59.9% 115Internet last 30 days: made business purchase 2,321 15.4% 115Internet last 30 days: paid bills online 8,766 58.2% 109Internet last 30 days: took online class 1,361 9.0% 105Internet last 30 days: looked for employment 2,154 14.3% 94Internet last 30 days: traded/tracked investments 2,785 18.5% 144Internet last 30 days: made travel plans 4,327 28.7% 128Internet last 30 days: obtained auto info 2,246 14.9% 117Internet last 30 days: obtained financial info 5,154 34.2% 109Internet last 30 days: obtained medical info 5,277 35.0% 119Internet last 30 days: checked movie listing/times 3,576 23.7% 104Internet last 30 days: obtained latest news 8,253 54.8% 117Internet last 30 days: obtained parenting info 1,021 6.8% 106Internet last 30 days: obtained real estate info 2,551 16.9% 108Internet last 30 days: obtained sports news/info 5,450 36.2% 115Internet last 30 days: visited online blog 2,149 14.3% 109Internet last 30 days: wrote online blog 361 2.4% 114Internet last 30 days: used online dating website 515 3.4% 126Internet last 30 days: played games online 4,445 29.5% 96Internet last 30 days: sent greeting card 883 5.9% 128Internet last 30 days: made phone call 4,781 31.7% 100Internet last 30 days: shared photos via website 5,296 35.1% 101Internet last 30 days: looked for recipes 6,409 42.5% 104Internet last 30 days: added video to website 1,366 9.1% 103Internet last 30 days: downloaded a movie 1,690 11.2% 117Internet last 30 days: downloaded music 2,741 18.2% 97Internet last 30 days: download/listen to podcast 1,414 9.4% 102Internet last 30 days: downloaded TV program 837 5.6% 110Internet last 30 days: downloaded a video game 1,568 10.4% 86Internet last 30 days: watched movie online 4,449 29.5% 109Internet last 30 days: watched TV program online 3,249 21.6% 113Used online gaming srv/30 days: PlayStation Network 761 5.0% 82Used online gaming srv/30 days: Xbox Live 735 4.9% 87Played Massive Multi-Player Online game/30 days 524 3.5% 84Used Spanish language website/app last 30 days 496 3.3% 85Social Media last 30 days: facebook.com 9,504 63.1% 99Social media last 30 days: instagram.com 4,626 30.7% 108Social Media last 30 days: linkedin.com 2,658 17.6% 133Social Media last 30 days: shutterfly.com 644 4.3% 128Social Media last 30 days: tumblr.com 523 3.5% 92Social Media last 30 days: twitter.com 2,075 13.8% 99Social Media last 30 days: yelp.com 2,153 14.3% 193Social Media last 30 days: youtube.com 7,971 52.9% 105Social Media last 30 days: plus.google.com 1,779 11.8% 98Social Media last 30 days: pinterest.com 2,968 19.7% 94
Data Note: An MPI (Market Potential Index) measures the relative likelihood of the adults or households in the specified trade area to exhibit certain consumer behavior or purchasing patterns compared to the U.S. An MPI of 100 represents the U.S. average.Source: These data are based upon national propensities to use various products and services, applied to local demographic composition. Usage data were collected by GfK MRI in a nationally representative survey of U.S. households. Esri forecasts for 2019 and 2024.
September 25, 2019
©2019 Esri Page 4 of 15

Electronics and Internet Market Potential7353-7399 St Louis Ave Village Of Skokie Only7353-7399 St Louis Ave, Skokie, Illinois, 60076 Latitude: 42.01519Drive Time: 5 minute radius Longitude: -87.71717
ExpectedProduct/Consumer Behavior Number of Adults or HHs Percent MPI
Social network: updated status in last 30 days 3,788 25.1% 86Social network: updated profile in last 30 days 3,120 20.7% 90Social network: posted picture in last 30 days 6,786 45.0% 99Social network: posted video in last 30 days 2,957 19.6% 97Social network: posted link in last 30 days 2,205 14.6% 97Social network: saw friend`s page in last 30 days 7,257 48.2% 98Social network: commented on post in last 30 days 6,718 44.6% 97Social network: posted a blog in last 30 days 631 4.2% 115Social network: rated a product in last 30 days 1,475 9.8% 109Social network: sent email message in last 30 days 7,507 49.8% 103Social network: sent IM in last 30 days 2,896 19.2% 99Social network: played a game in last 30 days 2,787 18.5% 96Social network: invited to event in last 30 days 1,320 8.8% 91Social network: liked something in last 30 days 6,002 39.8% 97Social network: followed something in last 30 days 3,026 20.1% 87Social network: clicked on an ad in last 30 days 2,626 17.4% 108Social network: watched video in last 30 days 7,843 52.0% 102Social network: posted location in last 30 days 1,927 12.8% 107Social network: sent real or virtual gift/30 days 308 2.0% 98Social network: used to keep in touch w/ friends 5,723 38.0% 93Social network: used to reconnect w/ old friends 1,875 12.4% 84Social network: used to meet new friends 1,009 6.7% 82Social network: used to follow friends activities 2,886 19.2% 93Social network: used to find out about new prod. 1,103 7.3% 88Social network: used to review prod. or service 681 4.5% 79Social network: used for professional contacts 1,225 8.1% 103Social network: used to find mutual interests 831 5.5% 82Social network: used to track current events 2,232 14.8% 100Social network: used to find info on TV or movie 1,225 8.1% 96Social network: used to find local information 1,389 9.2% 85Social network: used for gaming 847 5.6% 74Social network: used to support favorite brands 597 4.0% 71Social network: used to get coupons or discounts 800 5.3% 78Social network: used to gain access to VIP events 524 3.5% 77Used website/search engine/30 days: ask.com 284 1.9% 89Used website/search engine/30 days: bing.com 1,551 10.3% 99Used website/search engine/30 days: google.com 12,865 85.4% 106Used website/search engine/30 days: yahoo.com 3,825 25.4% 110Used entertainment website/app last 30 days: BuzzFeed 1,256 8.3% 103Used entertainment website/app last 30 days: Fandango 1,411 9.4% 136Used news website/app last 30 days: abcnews.com 1,310 8.7% 120Used news website/app last 30 days: bbc.com 1,313 8.7% 135Used news website/app last 30 days: cbsnews.com 873 5.8% 104Used news website/app last 30 days: cnn.com 3,476 23.1% 135Used news website/app last 30 days: foxnews.com 2,353 15.6% 110Used news website/app last 30 days: huffpo.com 1,922 12.8% 121Used news website/app last 30 days: nbcnews.com 1,110 7.4% 131Used news website/app last 30 days: yahoonews.com 1,670 11.1% 125Used sports website/app last 30 days: ESPN 3,113 20.7% 111Used sports website/app last 30 days: FoxSports 1,192 7.9% 112Used sports website/app last 30 days: NBA.com 921 6.1% 112Used sports website/app last 30 days: NFL.com 1,465 9.7% 111Used website/app last 30 days: PBS 826 5.5% 127
Data Note: An MPI (Market Potential Index) measures the relative likelihood of the adults or households in the specified trade area to exhibit certain consumer behavior or purchasing patterns compared to the U.S. An MPI of 100 represents the U.S. average.Source: These data are based upon national propensities to use various products and services, applied to local demographic composition. Usage data were collected by GfK MRI in a nationally representative survey of U.S. households. Esri forecasts for 2019 and 2024.
September 25, 2019
©2019 Esri Page 5 of 15

Electronics and Internet Market Potential7353-7399 St Louis Ave Village Of Skokie Only7353-7399 St Louis Ave, Skokie, Illinois, 60076 Latitude: 42.01519Drive Time: 10 minute radius Longitude: -87.71717
Demographic Summary 2019 2024Population 185,523 184,250Population 18+ 143,201 143,869Households 66,502 66,011Median Household Income $72,067 $79,798
ExpectedProduct/Consumer Behavior Number of Adults or HHs Percent MPI
Own any tablet 71,669 50.0% 104Own any e-reader 13,009 9.1% 109Own e-reader/tablet: iPad 48,709 34.0% 121Own e-reader/tablet: Amazon Kindle 20,643 14.4% 100Own any portable MP3 player 29,977 20.9% 113Own portable MP3 player: Apple iPod 24,154 16.9% 118Own wearable tech: Apple Watch 5,745 4.0% 118Own wearable tech: Fitbit 14,404 10.1% 101Own digital camera/camcorder 11,795 8.2% 101Own digital point & shoot camera/camcorder 15,019 10.5% 105Own digital SLR camera/camcorder 12,221 8.5% 108Own 35mm camera/camcorder 7,843 5.5% 98Own telephoto/zoom lens 6,421 4.5% 113Own wide-angle lens 5,172 3.6% 117Own a selfie stick 7,319 5.1% 106Printed digital photos in last 12 months 34,482 24.1% 105Use a computer at work 64,566 45.1% 107Use desktop computer at work 33,146 23.1% 103Use laptop/notebook at work 26,583 18.6% 103HH owns a computer 52,900 79.5% 108Purchased home computer in last 12 months 7,563 11.4% 109HH owns desktop computer 27,292 41.0% 111HH owns laptop/notebook 39,442 59.3% 105Child (under 18 yrs) uses home computer 9,089 13.7% 106HH owns any Apple/Mac brand computer 17,762 26.7% 148HH owns any PC/non-Apple brand computer 40,928 61.5% 100
Data Note: An MPI (Market Potential Index) measures the relative likelihood of the adults or households in the specified trade area to exhibit certain consumer behavior or purchasing patterns compared to the U.S. An MPI of 100 represents the U.S. average.Source: These data are based upon national propensities to use various products and services, applied to local demographic composition. Usage data were collected by GfK MRI in a nationally representative survey of U.S. households. Esri forecasts for 2019 and 2024.
September 25, 2019
©2019 Esri Page 6 of 15

Electronics and Internet Market Potential7353-7399 St Louis Ave Village Of Skokie Only7353-7399 St Louis Ave, Skokie, Illinois, 60076 Latitude: 42.01519Drive Time: 10 minute radius Longitude: -87.71717
ExpectedProduct/Consumer Behavior Number of Adults or HHs Percent MPI
Purchased most recent home computer 1-2 years ago 11,142 16.8% 105Purchased most recent home computer 3-4 years ago 10,802 16.2% 102Purchased most recent home computer 5+ years ago 7,829 11.8% 104HH purchased most recent computer in a store 24,785 37.3% 103HH purchased most recent computer online 10,059 15.1% 111Spent on most recent home computer: $1-499 8,110 12.2% 83Spent on most recent home computer: $500-$999 11,084 16.7% 99Spent on most recent home computer: $1000-$1499 8,047 12.1% 126Spent on most recent home computer: $1500-$1999 3,600 5.4% 122Spent on most recent home computer: $2000+ 3,245 4.9% 123HH owns webcam 10,693 16.1% 95HH owns wireless router 17,712 26.6% 102HH owns all-in-one printer (print copy scan) 26,883 40.4% 105HH owns software: accounting 3,931 5.9% 104HH owns software: communications/fax 3,436 5.2% 119HH owns software: database/filing 3,481 5.2% 104HH owns software: desktop publishing 4,793 7.2% 106HH owns software: education/training 5,888 8.9% 100HH owns software: entertainment/games 10,773 16.2% 99HH owns software: personal finance/tax prep 7,549 11.4% 100HH owns software: presentation graphics 4,107 6.2% 114HH owns software: multimedia 7,796 11.7% 107HH owns software: networking 7,823 11.8% 109HH owns software: online meeting/conference 3,216 4.8% 133HH owns software: security/anti-virus 13,270 20.0% 100HH owns software: spreadsheet 15,097 22.7% 107HH owns software: utility 3,645 5.5% 121HH owns software: word processing 20,210 30.4% 109HH owns CD player 9,103 13.7% 100
Data Note: An MPI (Market Potential Index) measures the relative likelihood of the adults or households in the specified trade area to exhibit certain consumer behavior or purchasing patterns compared to the U.S. An MPI of 100 represents the U.S. average.Source: These data are based upon national propensities to use various products and services, applied to local demographic composition. Usage data were collected by GfK MRI in a nationally representative survey of U.S. households. Esri forecasts for 2019 and 2024.
September 25, 2019
©2019 Esri Page 7 of 15

Electronics and Internet Market Potential7353-7399 St Louis Ave Village Of Skokie Only7353-7399 St Louis Ave, Skokie, Illinois, 60076 Latitude: 42.01519Drive Time: 10 minute radius Longitude: -87.71717
ExpectedProduct/Consumer Behavior Number of Adults or HHs Percent MPI
HH owns portable GPS navigation device 14,734 22.2% 97HH purchased portable GPS navigation device/12 mo 1,110 1.7% 89HH owns headphones (ear buds) 28,257 42.5% 105HH owns noise reduction headphones 7,031 10.6% 107HH owns Bluetooth/wireless headphones 10,978 16.5% 104HH owns home theater/entertainment system 5,098 7.7% 92HH owns 1 TV 16,875 25.4% 121HH owns 2 TVs 18,395 27.7% 103HH owns 3 TVs 11,601 17.4% 83HH owns 4+ TVs 10,400 15.6% 90HH owns LCD TV 17,250 25.9% 105HH owns LED TV 21,407 32.2% 96HH owns plasma TV 8,827 13.3% 102HH has 3D TV 3,487 5.2% 102HH has HDTV 28,488 42.8% 96HH has 4K Ultra HDTV 6,193 9.3% 116HH has Internet connectable TV 19,250 28.9% 101HH owns small screen TV (<27 in) 9,486 14.3% 93HH owns medium screen TV (27-35 in) 18,780 28.2% 89HH owns large screen TV (36-42 in) 22,194 33.4% 100HH owns XLarge screen TV (43-54 in) 17,786 26.7% 99HH owns XXL screen TV (55 in+) 15,363 23.1% 97HH most recent TV purch: small screen (<27 in) 4,173 6.3% 98HH most recent TV purch: medium screen (27-35 in) 10,168 15.3% 89HH most recent TV purch: large screen (36-42 in) 13,437 20.2% 104HH most recent TV purch: Xlarge screen (43-54 in) 11,768 17.7% 104HH most recent TV purch: XXL screen (55 in+) 13,021 19.6% 103HH owns Internet video device for TV 17,851 26.8% 112HH owns internet device for TV - Amazon Fire 6,373 9.6% 120HH owns internet device for TV - Apple TV 5,229 7.9% 130HH owns internet device for TV - Google Chromecast 4,124 6.2% 110HH owns internet device for TV - Roku 6,678 10.0% 103HH purchased video game system in last 12 months 8,704 13.1% 159HH owns video game system: handheld 5,537 8.3% 95HH owns video game system: attached to TV/computer 25,010 37.6% 92HH owns video game system: Nintendo DS/Lite DSI/XL 2,794 4.2% 95HH owns video game system: Nintendo 3DS 1,859 2.8% 95HH owns video game system: Nintendo Wii 7,326 11.0% 80HH owns video game system: Nintendo Wii U 2,164 3.3% 99HH owns video game system: PlayStation 2 (PS2) 2,956 4.4% 82HH owns video game system: PlayStation 3 (PS3) 5,847 8.8% 88HH owns video game system: Playstation 4 (PS 4) 8,400 12.6% 102HH owns video game system: Xbox 360 8,374 12.6% 86HH owns video game system: Xbox One 6,122 9.2% 84HH purchased 5+ video games in last 12 months 2,977 4.5% 86HH spent $101+ on video games in last 12 months 4,981 7.5% 107Have access to Internet at home 132,804 92.7% 104Connection to Internet at home: via cable modem 72,096 50.3% 110Connection to Internet at home: via DSL 9,338 6.5% 61Connection to Internet at home: via fiber optic 36,433 25.4% 168Access Internet at home via high speed connection 130,675 91.3% 104Spend 10+ hrs online (excl email/IM time) daily 7,947 5.5% 98Spend 5-9.9 hrs online (excl email/IM time) daily 21,383 14.9% 104Spend 2-4.9 hrs online (excl email/IM time) daily 37,056 25.9% 103Spend 1-1.9 hrs online (excl email/IM time) daily 30,515 21.3% 118Spend 0.5-0.9 hrs online (excl email/IM time) daily 15,322 10.7% 101Spend <0.5 hrs online (excl email/IM time) daily 8,519 5.9% 81Used Internet in last 30 days 128,592 89.8% 104
Data Note: An MPI (Market Potential Index) measures the relative likelihood of the adults or households in the specified trade area to exhibit certain consumer behavior or purchasing patterns compared to the U.S. An MPI of 100 represents the U.S. average.Source: These data are based upon national propensities to use various products and services, applied to local demographic composition. Usage data were collected by GfK MRI in a nationally representative survey of U.S. households. Esri forecasts for 2019 and 2024.
September 25, 2019
©2019 Esri Page 8 of 15

Electronics and Internet Market Potential7353-7399 St Louis Ave Village Of Skokie Only7353-7399 St Louis Ave, Skokie, Illinois, 60076 Latitude: 42.01519Drive Time: 10 minute radius Longitude: -87.71717
ExpectedProduct/Consumer Behavior Number of Adults or HHs Percent MPI
Used Internet/30 days: at home 124,276 86.8% 105Used Internet/30 days: at work 67,028 46.8% 106Used Internet/30 days: at school/library 20,763 14.5% 107Used Internet/30 days: not hm/work/school/library 65,148 45.5% 113Accessed Internet in last 30 days using computer 104,986 73.3% 107Accessed Internet in last 30 days using cell phone 114,993 80.3% 105Accessed Internet in last 30 days using tablet 56,074 39.2% 112Accessed Internet in last 30 days w gaming console 11,160 7.8% 88Accessed Internet in last 30 days using television 24,086 16.8% 103Used Wi-Fi/wireless connection outside hm/30 days 44,304 30.9% 106Used tablet last 30 days for video call 7,384 5.2% 114Internet last 30 days: visited a chat room 7,708 5.4% 120Internet last 30 days: used email 112,094 78.3% 106Internet last 30 days: used IM 95,634 66.8% 103Internet last 30 days: made personal purchase 83,145 58.1% 112Internet last 30 days: made business purchase 20,824 14.5% 109Internet last 30 days: paid bills online 79,537 55.5% 104Internet last 30 days: took online class 12,774 8.9% 104Internet last 30 days: looked for employment 21,415 15.0% 98Internet last 30 days: traded/tracked investments 22,601 15.8% 123Internet last 30 days: made travel plans 37,809 26.4% 118Internet last 30 days: obtained auto info 19,480 13.6% 107Internet last 30 days: obtained financial info 46,860 32.7% 104Internet last 30 days: obtained medical info 49,266 34.4% 117Internet last 30 days: checked movie listing/times 32,443 22.7% 99Internet last 30 days: obtained latest news 76,565 53.5% 114Internet last 30 days: obtained parenting info 9,689 6.8% 106Internet last 30 days: obtained real estate info 23,426 16.4% 104Internet last 30 days: obtained sports news/info 47,538 33.2% 106Internet last 30 days: visited online blog 22,273 15.6% 119Internet last 30 days: wrote online blog 3,441 2.4% 114Internet last 30 days: used online dating website 4,509 3.1% 116Internet last 30 days: played games online 43,510 30.4% 98Internet last 30 days: sent greeting card 7,266 5.1% 111Internet last 30 days: made phone call 47,095 32.9% 103Internet last 30 days: shared photos via website 49,520 34.6% 99Internet last 30 days: looked for recipes 58,203 40.6% 100Internet last 30 days: added video to website 12,618 8.8% 101Internet last 30 days: downloaded a movie 15,924 11.1% 116Internet last 30 days: downloaded music 27,038 18.9% 100Internet last 30 days: download/listen to podcast 14,400 10.1% 110Internet last 30 days: downloaded TV program 8,969 6.3% 124Internet last 30 days: downloaded a video game 15,927 11.1% 92Internet last 30 days: watched movie online 44,071 30.8% 114Internet last 30 days: watched TV program online 32,061 22.4% 117Used online gaming srv/30 days: PlayStation Network 7,954 5.6% 90Used online gaming srv/30 days: Xbox Live 7,180 5.0% 89Played Massive Multi-Player Online game/30 days 5,287 3.7% 89Used Spanish language website/app last 30 days 8,231 5.7% 148Social Media last 30 days: facebook.com 91,809 64.1% 101Social media last 30 days: instagram.com 49,283 34.4% 121Social Media last 30 days: linkedin.com 23,141 16.2% 122Social Media last 30 days: shutterfly.com 5,292 3.7% 111Social Media last 30 days: tumblr.com 6,276 4.4% 116Social Media last 30 days: twitter.com 21,073 14.7% 106Social Media last 30 days: yelp.com 18,650 13.0% 176Social Media last 30 days: youtube.com 79,253 55.3% 109Social Media last 30 days: plus.google.com 16,423 11.5% 95Social Media last 30 days: pinterest.com 27,427 19.2% 92
Data Note: An MPI (Market Potential Index) measures the relative likelihood of the adults or households in the specified trade area to exhibit certain consumer behavior or purchasing patterns compared to the U.S. An MPI of 100 represents the U.S. average.Source: These data are based upon national propensities to use various products and services, applied to local demographic composition. Usage data were collected by GfK MRI in a nationally representative survey of U.S. households. Esri forecasts for 2019 and 2024.
September 25, 2019
©2019 Esri Page 9 of 15
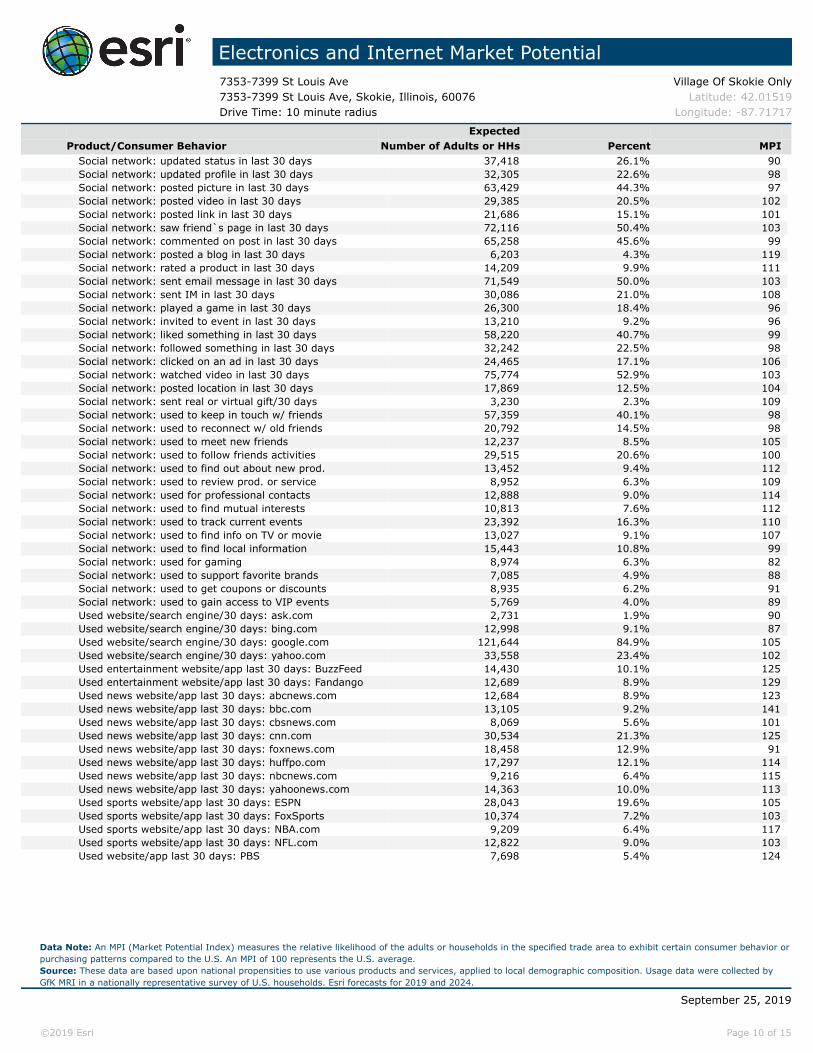
Electronics and Internet Market Potential7353-7399 St Louis Ave Village Of Skokie Only7353-7399 St Louis Ave, Skokie, Illinois, 60076 Latitude: 42.01519Drive Time: 10 minute radius Longitude: -87.71717
ExpectedProduct/Consumer Behavior Number of Adults or HHs Percent MPI
Social network: updated status in last 30 days 37,418 26.1% 90Social network: updated profile in last 30 days 32,305 22.6% 98Social network: posted picture in last 30 days 63,429 44.3% 97Social network: posted video in last 30 days 29,385 20.5% 102Social network: posted link in last 30 days 21,686 15.1% 101Social network: saw friend`s page in last 30 days 72,116 50.4% 103Social network: commented on post in last 30 days 65,258 45.6% 99Social network: posted a blog in last 30 days 6,203 4.3% 119Social network: rated a product in last 30 days 14,209 9.9% 111Social network: sent email message in last 30 days 71,549 50.0% 103Social network: sent IM in last 30 days 30,086 21.0% 108Social network: played a game in last 30 days 26,300 18.4% 96Social network: invited to event in last 30 days 13,210 9.2% 96Social network: liked something in last 30 days 58,220 40.7% 99Social network: followed something in last 30 days 32,242 22.5% 98Social network: clicked on an ad in last 30 days 24,465 17.1% 106Social network: watched video in last 30 days 75,774 52.9% 103Social network: posted location in last 30 days 17,869 12.5% 104Social network: sent real or virtual gift/30 days 3,230 2.3% 109Social network: used to keep in touch w/ friends 57,359 40.1% 98Social network: used to reconnect w/ old friends 20,792 14.5% 98Social network: used to meet new friends 12,237 8.5% 105Social network: used to follow friends activities 29,515 20.6% 100Social network: used to find out about new prod. 13,452 9.4% 112Social network: used to review prod. or service 8,952 6.3% 109Social network: used for professional contacts 12,888 9.0% 114Social network: used to find mutual interests 10,813 7.6% 112Social network: used to track current events 23,392 16.3% 110Social network: used to find info on TV or movie 13,027 9.1% 107Social network: used to find local information 15,443 10.8% 99Social network: used for gaming 8,974 6.3% 82Social network: used to support favorite brands 7,085 4.9% 88Social network: used to get coupons or discounts 8,935 6.2% 91Social network: used to gain access to VIP events 5,769 4.0% 89Used website/search engine/30 days: ask.com 2,731 1.9% 90Used website/search engine/30 days: bing.com 12,998 9.1% 87Used website/search engine/30 days: google.com 121,644 84.9% 105Used website/search engine/30 days: yahoo.com 33,558 23.4% 102Used entertainment website/app last 30 days: BuzzFeed 14,430 10.1% 125Used entertainment website/app last 30 days: Fandango 12,689 8.9% 129Used news website/app last 30 days: abcnews.com 12,684 8.9% 123Used news website/app last 30 days: bbc.com 13,105 9.2% 141Used news website/app last 30 days: cbsnews.com 8,069 5.6% 101Used news website/app last 30 days: cnn.com 30,534 21.3% 125Used news website/app last 30 days: foxnews.com 18,458 12.9% 91Used news website/app last 30 days: huffpo.com 17,297 12.1% 114Used news website/app last 30 days: nbcnews.com 9,216 6.4% 115Used news website/app last 30 days: yahoonews.com 14,363 10.0% 113Used sports website/app last 30 days: ESPN 28,043 19.6% 105Used sports website/app last 30 days: FoxSports 10,374 7.2% 103Used sports website/app last 30 days: NBA.com 9,209 6.4% 117Used sports website/app last 30 days: NFL.com 12,822 9.0% 103Used website/app last 30 days: PBS 7,698 5.4% 124
Data Note: An MPI (Market Potential Index) measures the relative likelihood of the adults or households in the specified trade area to exhibit certain consumer behavior or purchasing patterns compared to the U.S. An MPI of 100 represents the U.S. average.Source: These data are based upon national propensities to use various products and services, applied to local demographic composition. Usage data were collected by GfK MRI in a nationally representative survey of U.S. households. Esri forecasts for 2019 and 2024.
September 25, 2019
©2019 Esri Page 10 of 15

Electronics and Internet Market Potential7353-7399 St Louis Ave Village Of Skokie Only7353-7399 St Louis Ave, Skokie, Illinois, 60076 Latitude: 42.01519Drive Time: 15 minute radius Longitude: -87.71717
Demographic Summary 2019 2024Population 477,852 475,755Population 18+ 376,865 380,324Households 182,450 181,752Median Household Income $66,187 $74,914
ExpectedProduct/Consumer Behavior Number of Adults or HHs Percent MPI
Own any tablet 182,841 48.5% 101Own any e-reader 33,424 8.9% 106Own e-reader/tablet: iPad 123,700 32.8% 116Own e-reader/tablet: Amazon Kindle 53,405 14.2% 99Own any portable MP3 player 77,396 20.5% 111Own portable MP3 player: Apple iPod 62,664 16.6% 117Own wearable tech: Apple Watch 15,984 4.2% 125Own wearable tech: Fitbit 36,356 9.6% 97Own digital camera/camcorder 28,633 7.6% 93Own digital point & shoot camera/camcorder 36,546 9.7% 97Own digital SLR camera/camcorder 29,977 8.0% 101Own 35mm camera/camcorder 19,215 5.1% 92Own telephoto/zoom lens 15,651 4.2% 105Own wide-angle lens 12,824 3.4% 110Own a selfie stick 18,209 4.8% 100Printed digital photos in last 12 months 84,138 22.3% 98Use a computer at work 171,153 45.4% 108Use desktop computer at work 86,385 22.9% 102Use laptop/notebook at work 71,781 19.0% 106HH owns a computer 143,338 78.6% 107Purchased home computer in last 12 months 20,500 11.2% 108HH owns desktop computer 70,724 38.8% 105HH owns laptop/notebook 109,241 59.9% 106Child (under 18 yrs) uses home computer 22,464 12.3% 95HH owns any Apple/Mac brand computer 49,779 27.3% 151HH owns any PC/non-Apple brand computer 108,089 59.2% 96
Data Note: An MPI (Market Potential Index) measures the relative likelihood of the adults or households in the specified trade area to exhibit certain consumer behavior or purchasing patterns compared to the U.S. An MPI of 100 represents the U.S. average.Source: These data are based upon national propensities to use various products and services, applied to local demographic composition. Usage data were collected by GfK MRI in a nationally representative survey of U.S. households. Esri forecasts for 2019 and 2024.
September 25, 2019
©2019 Esri Page 11 of 15

Electronics and Internet Market Potential7353-7399 St Louis Ave Village Of Skokie Only7353-7399 St Louis Ave, Skokie, Illinois, 60076 Latitude: 42.01519Drive Time: 15 minute radius Longitude: -87.71717
ExpectedProduct/Consumer Behavior Number of Adults or HHs Percent MPI
Purchased most recent home computer 1-2 years ago 31,290 17.1% 108Purchased most recent home computer 3-4 years ago 28,820 15.8% 99Purchased most recent home computer 5+ years ago 20,836 11.4% 101HH purchased most recent computer in a store 67,089 36.8% 101HH purchased most recent computer online 27,765 15.2% 112Spent on most recent home computer: $1-499 22,279 12.2% 83Spent on most recent home computer: $500-$999 29,801 16.3% 97Spent on most recent home computer: $1000-$1499 21,327 11.7% 122Spent on most recent home computer: $1500-$1999 9,883 5.4% 122Spent on most recent home computer: $2000+ 9,903 5.4% 137HH owns webcam 30,508 16.7% 99HH owns wireless router 46,720 25.6% 98HH owns all-in-one printer (print copy scan) 69,776 38.2% 100HH owns software: accounting 10,226 5.6% 98HH owns software: communications/fax 8,607 4.7% 109HH owns software: database/filing 9,297 5.1% 102HH owns software: desktop publishing 12,742 7.0% 103HH owns software: education/training 16,438 9.0% 102HH owns software: entertainment/games 29,383 16.1% 99HH owns software: personal finance/tax prep 19,628 10.8% 95HH owns software: presentation graphics 11,159 6.1% 113HH owns software: multimedia 21,808 12.0% 109HH owns software: networking 21,704 11.9% 110HH owns software: online meeting/conference 8,908 4.9% 135HH owns software: security/anti-virus 35,881 19.7% 98HH owns software: spreadsheet 40,886 22.4% 106HH owns software: utility 8,935 4.9% 108HH owns software: word processing 54,722 30.0% 108HH owns CD player 23,971 13.1% 96
Data Note: An MPI (Market Potential Index) measures the relative likelihood of the adults or households in the specified trade area to exhibit certain consumer behavior or purchasing patterns compared to the U.S. An MPI of 100 represents the U.S. average.Source: These data are based upon national propensities to use various products and services, applied to local demographic composition. Usage data were collected by GfK MRI in a nationally representative survey of U.S. households. Esri forecasts for 2019 and 2024.
September 25, 2019
©2019 Esri Page 12 of 15

Electronics and Internet Market Potential7353-7399 St Louis Ave Village Of Skokie Only7353-7399 St Louis Ave, Skokie, Illinois, 60076 Latitude: 42.01519Drive Time: 15 minute radius Longitude: -87.71717
ExpectedProduct/Consumer Behavior Number of Adults or HHs Percent MPI
HH owns portable GPS navigation device 36,808 20.2% 88HH purchased portable GPS navigation device/12 mo 3,141 1.7% 92HH owns headphones (ear buds) 78,855 43.2% 106HH owns noise reduction headphones 19,447 10.7% 107HH owns Bluetooth/wireless headphones 30,171 16.5% 104HH owns home theater/entertainment system 13,771 7.5% 90HH owns 1 TV 49,171 27.0% 128HH owns 2 TVs 50,467 27.7% 103HH owns 3 TVs 30,139 16.5% 79HH owns 4+ TVs 25,127 13.8% 79HH owns LCD TV 46,483 25.5% 103HH owns LED TV 57,098 31.3% 94HH owns plasma TV 23,845 13.1% 100HH has 3D TV 9,234 5.1% 98HH has HDTV 77,165 42.3% 95HH has 4K Ultra HDTV 16,222 8.9% 111HH has Internet connectable TV 50,781 27.8% 97HH owns small screen TV (<27 in) 25,091 13.8% 89HH owns medium screen TV (27-35 in) 51,532 28.2% 89HH owns large screen TV (36-42 in) 58,994 32.3% 97HH owns XLarge screen TV (43-54 in) 46,085 25.3% 93HH owns XXL screen TV (55 in+) 39,275 21.5% 90HH most recent TV purch: small screen (<27 in) 11,597 6.4% 99HH most recent TV purch: medium screen (27-35 in) 29,111 16.0% 93HH most recent TV purch: large screen (36-42 in) 36,887 20.2% 104HH most recent TV purch: Xlarge screen (43-54 in) 31,067 17.0% 100HH most recent TV purch: XXL screen (55 in+) 33,093 18.1% 96HH owns Internet video device for TV 50,418 27.6% 115HH owns internet device for TV - Amazon Fire 17,060 9.4% 117HH owns internet device for TV - Apple TV 14,307 7.8% 129HH owns internet device for TV - Google Chromecast 12,306 6.7% 119HH owns internet device for TV - Roku 18,326 10.0% 104HH purchased video game system in last 12 months 22,805 12.5% 152HH owns video game system: handheld 14,059 7.7% 88HH owns video game system: attached to TV/computer 67,714 37.1% 91HH owns video game system: Nintendo DS/Lite DSI/XL 6,804 3.7% 84HH owns video game system: Nintendo 3DS 4,602 2.5% 86HH owns video game system: Nintendo Wii 19,189 10.5% 76HH owns video game system: Nintendo Wii U 5,588 3.1% 93HH owns video game system: PlayStation 2 (PS2) 7,140 3.9% 72HH owns video game system: PlayStation 3 (PS3) 15,749 8.6% 86HH owns video game system: Playstation 4 (PS 4) 23,622 12.9% 105HH owns video game system: Xbox 360 21,367 11.7% 80HH owns video game system: Xbox One 16,964 9.3% 85HH purchased 5+ video games in last 12 months 7,880 4.3% 83HH spent $101+ on video games in last 12 months 13,302 7.3% 104Have access to Internet at home 347,738 92.3% 103Connection to Internet at home: via cable modem 193,149 51.3% 112Connection to Internet at home: via DSL 25,577 6.8% 64Connection to Internet at home: via fiber optic 84,322 22.4% 148Access Internet at home via high speed connection 342,928 91.0% 103Spend 10+ hrs online (excl email/IM time) daily 22,600 6.0% 106Spend 5-9.9 hrs online (excl email/IM time) daily 61,460 16.3% 113Spend 2-4.9 hrs online (excl email/IM time) daily 101,732 27.0% 108Spend 1-1.9 hrs online (excl email/IM time) daily 75,331 20.0% 111Spend 0.5-0.9 hrs online (excl email/IM time) daily 37,611 10.0% 94Spend <0.5 hrs online (excl email/IM time) daily 20,896 5.5% 76Used Internet in last 30 days 338,310 89.8% 104
Data Note: An MPI (Market Potential Index) measures the relative likelihood of the adults or households in the specified trade area to exhibit certain consumer behavior or purchasing patterns compared to the U.S. An MPI of 100 represents the U.S. average.Source: These data are based upon national propensities to use various products and services, applied to local demographic composition. Usage data were collected by GfK MRI in a nationally representative survey of U.S. households. Esri forecasts for 2019 and 2024.
September 25, 2019
©2019 Esri Page 13 of 15

Electronics and Internet Market Potential7353-7399 St Louis Ave Village Of Skokie Only7353-7399 St Louis Ave, Skokie, Illinois, 60076 Latitude: 42.01519Drive Time: 15 minute radius Longitude: -87.71717
ExpectedProduct/Consumer Behavior Number of Adults or HHs Percent MPI
Used Internet/30 days: at home 327,296 86.8% 105Used Internet/30 days: at work 179,686 47.7% 108Used Internet/30 days: at school/library 58,373 15.5% 114Used Internet/30 days: not hm/work/school/library 168,607 44.7% 111Accessed Internet in last 30 days using computer 273,352 72.5% 106Accessed Internet in last 30 days using cell phone 306,263 81.3% 106Accessed Internet in last 30 days using tablet 144,037 38.2% 109Accessed Internet in last 30 days w gaming console 32,061 8.5% 96Accessed Internet in last 30 days using television 66,266 17.6% 108Used Wi-Fi/wireless connection outside hm/30 days 125,519 33.3% 114Used tablet last 30 days for video call 17,475 4.6% 103Internet last 30 days: visited a chat room 19,926 5.3% 118Internet last 30 days: used email 293,738 77.9% 106Internet last 30 days: used IM 256,062 67.9% 105Internet last 30 days: made personal purchase 215,805 57.3% 110Internet last 30 days: made business purchase 55,143 14.6% 109Internet last 30 days: paid bills online 213,345 56.6% 106Internet last 30 days: took online class 35,495 9.4% 109Internet last 30 days: looked for employment 62,630 16.6% 109Internet last 30 days: traded/tracked investments 57,091 15.1% 118Internet last 30 days: made travel plans 102,953 27.3% 122Internet last 30 days: obtained auto info 47,265 12.5% 99Internet last 30 days: obtained financial info 124,014 32.9% 105Internet last 30 days: obtained medical info 125,276 33.2% 113Internet last 30 days: checked movie listing/times 90,592 24.0% 105Internet last 30 days: obtained latest news 202,924 53.8% 115Internet last 30 days: obtained parenting info 24,744 6.6% 103Internet last 30 days: obtained real estate info 61,684 16.4% 104Internet last 30 days: obtained sports news/info 129,157 34.3% 109Internet last 30 days: visited online blog 62,895 16.7% 128Internet last 30 days: wrote online blog 9,234 2.5% 116Internet last 30 days: used online dating website 12,825 3.4% 125Internet last 30 days: played games online 112,914 30.0% 97Internet last 30 days: sent greeting card 18,113 4.8% 105Internet last 30 days: made phone call 127,271 33.8% 106Internet last 30 days: shared photos via website 135,369 35.9% 103Internet last 30 days: looked for recipes 152,441 40.4% 99Internet last 30 days: added video to website 35,331 9.4% 107Internet last 30 days: downloaded a movie 42,935 11.4% 119Internet last 30 days: downloaded music 73,208 19.4% 103Internet last 30 days: download/listen to podcast 43,278 11.5% 125Internet last 30 days: downloaded TV program 23,023 6.1% 121Internet last 30 days: downloaded a video game 43,651 11.6% 96Internet last 30 days: watched movie online 127,021 33.7% 125Internet last 30 days: watched TV program online 90,661 24.1% 126Used online gaming srv/30 days: PlayStation Network 24,537 6.5% 105Used online gaming srv/30 days: Xbox Live 20,343 5.4% 96Played Massive Multi-Player Online game/30 days 15,178 4.0% 98Used Spanish language website/app last 30 days 24,645 6.5% 168Social Media last 30 days: facebook.com 246,901 65.5% 103Social media last 30 days: instagram.com 140,206 37.2% 131Social Media last 30 days: linkedin.com 66,760 17.7% 133Social Media last 30 days: shutterfly.com 13,043 3.5% 104Social Media last 30 days: tumblr.com 18,732 5.0% 132Social Media last 30 days: twitter.com 61,896 16.4% 119Social Media last 30 days: yelp.com 53,296 14.1% 191Social Media last 30 days: youtube.com 210,701 55.9% 111Social Media last 30 days: plus.google.com 43,533 11.6% 96Social Media last 30 days: pinterest.com 72,110 19.1% 91
Data Note: An MPI (Market Potential Index) measures the relative likelihood of the adults or households in the specified trade area to exhibit certain consumer behavior or purchasing patterns compared to the U.S. An MPI of 100 represents the U.S. average.Source: These data are based upon national propensities to use various products and services, applied to local demographic composition. Usage data were collected by GfK MRI in a nationally representative survey of U.S. households. Esri forecasts for 2019 and 2024.
September 25, 2019
©2019 Esri Page 14 of 15

Electronics and Internet Market Potential7353-7399 St Louis Ave Village Of Skokie Only7353-7399 St Louis Ave, Skokie, Illinois, 60076 Latitude: 42.01519Drive Time: 15 minute radius Longitude: -87.71717
ExpectedProduct/Consumer Behavior Number of Adults or HHs Percent MPI
Social network: updated status in last 30 days 103,966 27.6% 95Social network: updated profile in last 30 days 91,266 24.2% 106Social network: posted picture in last 30 days 173,865 46.1% 102Social network: posted video in last 30 days 82,995 22.0% 109Social network: posted link in last 30 days 61,638 16.4% 109Social network: saw friend`s page in last 30 days 198,076 52.6% 107Social network: commented on post in last 30 days 175,607 46.6% 102Social network: posted a blog in last 30 days 17,223 4.6% 125Social network: rated a product in last 30 days 35,861 9.5% 106Social network: sent email message in last 30 days 193,733 51.4% 106Social network: sent IM in last 30 days 82,329 21.8% 112Social network: played a game in last 30 days 69,356 18.4% 96Social network: invited to event in last 30 days 37,732 10.0% 104Social network: liked something in last 30 days 159,421 42.3% 103Social network: followed something in last 30 days 91,615 24.3% 106Social network: clicked on an ad in last 30 days 65,393 17.4% 108Social network: watched video in last 30 days 206,785 54.9% 107Social network: posted location in last 30 days 50,212 13.3% 111Social network: sent real or virtual gift/30 days 8,618 2.3% 110Social network: used to keep in touch w/ friends 154,543 41.0% 100Social network: used to reconnect w/ old friends 57,680 15.3% 103Social network: used to meet new friends 34,364 9.1% 112Social network: used to follow friends activities 80,375 21.3% 104Social network: used to find out about new prod. 37,951 10.1% 120Social network: used to review prod. or service 25,054 6.6% 116Social network: used for professional contacts 36,033 9.6% 122Social network: used to find mutual interests 30,224 8.0% 119Social network: used to track current events 64,659 17.2% 116Social network: used to find info on TV or movie 37,159 9.9% 116Social network: used to find local information 44,174 11.7% 108Social network: used for gaming 26,611 7.1% 93Social network: used to support favorite brands 21,404 5.7% 101Social network: used to get coupons or discounts 27,598 7.3% 107Social network: used to gain access to VIP events 17,664 4.7% 104Used website/search engine/30 days: ask.com 6,722 1.8% 84Used website/search engine/30 days: bing.com 32,767 8.7% 84Used website/search engine/30 days: google.com 320,411 85.0% 105Used website/search engine/30 days: yahoo.com 82,627 21.9% 95Used entertainment website/app last 30 days: BuzzFeed 43,310 11.5% 142Used entertainment website/app last 30 days: Fandango 34,845 9.2% 134Used news website/app last 30 days: abcnews.com 33,926 9.0% 125Used news website/app last 30 days: bbc.com 38,477 10.2% 158Used news website/app last 30 days: cbsnews.com 21,566 5.7% 103Used news website/app last 30 days: cnn.com 83,809 22.2% 130Used news website/app last 30 days: foxnews.com 48,328 12.8% 90Used news website/app last 30 days: huffpo.com 52,232 13.9% 131Used news website/app last 30 days: nbcnews.com 24,349 6.5% 115Used news website/app last 30 days: yahoonews.com 36,764 9.8% 110Used sports website/app last 30 days: ESPN 77,731 20.6% 111Used sports website/app last 30 days: FoxSports 26,805 7.1% 101Used sports website/app last 30 days: NBA.com 25,439 6.8% 123Used sports website/app last 30 days: NFL.com 34,165 9.1% 104Used website/app last 30 days: PBS 20,736 5.5% 127
Data Note: An MPI (Market Potential Index) measures the relative likelihood of the adults or households in the specified trade area to exhibit certain consumer behavior or purchasing patterns compared to the U.S. An MPI of 100 represents the U.S. average.Source: These data are based upon national propensities to use various products and services, applied to local demographic composition. Usage data were collected by GfK MRI in a nationally representative survey of U.S. households. Esri forecasts for 2019 and 2024.
September 25, 2019
©2019 Esri Page 15 of 15

Executive Summary7353-7399 St Louis Ave Village Of Skokie Only7353-7399 St Louis Ave, Skokie, Illinois, 60076 Latitude: 42.01519Drive Time: 5, 10, 15 minute radii Longitude: -87.71717
5 minutes 10 minutes 15 minutesPopulation
2000 Population 18,580 186,997 494,7142010 Population 19,211 185,578 475,5882019 Population 19,188 185,523 477,8522024 Population 19,016 184,250 475,7552000-2010 Annual Rate 0.33% -0.08% -0.39%2010-2019 Annual Rate -0.01% 0.00% 0.05%2019-2024 Annual Rate -0.18% -0.14% -0.09%2019 Male Population 48.0% 48.3% 49.0%2019 Female Population 52.0% 51.7% 51.0%2019 Median Age 44.2 39.9 38.2
In the identified area, the current year population is 477,852. In 2010, the Census count in the area was 475,588. The rate of change since 2010 was 0.05% annually. The five-year projection for the population in the area is 475,755 representing a change of -0.09% annually from 2019 to 2024. Currently, the population is 49.0% male and 51.0% female.
Median Age
The median age in this area is 44.2, compared to U.S. median age of 38.5.Race and Ethnicity
2019 White Alone 57.2% 53.8% 58.5%2019 Black Alone 3.5% 11.3% 8.7%2019 American Indian/Alaska Native Alone 0.1% 0.3% 0.4%2019 Asian Alone 31.6% 23.0% 19.1%2019 Pacific Islander Alone 0.0% 0.0% 0.0%2019 Other Race 3.7% 7.0% 8.9%2019 Two or More Races 3.8% 4.6% 4.4%2019 Hispanic Origin (Any Race) 10.0% 16.2% 20.6%
Persons of Hispanic origin represent 20.6% of the population in the identified area compared to 18.6% of the U.S. population. Persons of Hispanic Origin may be of any race. The Diversity Index, which measures the probability that two people from the same area will be from different race/ethnic groups, is 74.0 in the identified area, compared to 64.8 for the U.S. as a whole.
Households2019 Wealth Index 157 123 1102000 Households 6,697 67,825 183,6282010 Households 6,540 66,618 180,9232019 Total Households 6,451 66,502 182,4502024 Total Households 6,373 66,011 181,7522000-2010 Annual Rate -0.24% -0.18% -0.15%2010-2019 Annual Rate -0.15% -0.02% 0.09%2019-2024 Annual Rate -0.24% -0.15% -0.08%2019 Average Household Size 2.96 2.76 2.54
The household count in this area has changed from 180,923 in 2010 to 182,450 in the current year, a change of 0.09% annually. The five-year projection of households is 181,752, a change of -0.08% annually from the current year total. Average household size is currently 2.54, compared to 2.55 in the year 2010. The number of families in the current year is 109,318 in the specified area.
Data Note: Income is expressed in current dollars. Housing Affordability Index and Percent of Income for Mortgage calculations are only available for areas with 50 or more owner-occupied housing units. Source: U.S. Census Bureau, Census 2010 Summary File 1. Esri forecasts for 2019 and 2024. Esri converted Census 2000 data into 2010 geography.
September 25, 2019
©2019 Esri Page 1 of 2

Executive Summary7353-7399 St Louis Ave Village Of Skokie Only7353-7399 St Louis Ave, Skokie, Illinois, 60076 Latitude: 42.01519Drive Time: 5, 10, 15 minute radii Longitude: -87.71717
5 minutes 10 minutes 15 minutesMortgage Income
2019 Percent of Income for Mortgage 18.9% 23.6% 26.2%Median Household Income
2019 Median Household Income $86,110 $72,067 $66,1872024 Median Household Income $97,707 $79,798 $74,9142019-2024 Annual Rate 2.56% 2.06% 2.51%
Average Household Income
2019 Average Household Income $109,187 $100,143 $97,8382024 Average Household Income $123,250 $112,777 $109,9212019-2024 Annual Rate 2.45% 2.40% 2.36%
Per Capita Income2019 Per Capita Income $36,888 $36,138 $37,4732024 Per Capita Income $41,515 $40,678 $42,1102019-2024 Annual Rate 2.39% 2.40% 2.36%
Households by IncomeCurrent median household income is $66,187 in the area, compared to $60,548 for all U.S. households. Median household income is projected to be $74,914 in five years, compared to $69,180 for all U.S. households
Current average household income is $97,838 in this area, compared to $87,398 for all U.S. households. Average household income is projected to be $109,921 in five years, compared to $99,638 for all U.S. households
Current per capita income is $37,473 in the area, compared to the U.S. per capita income of $33,028. The per capita income is projected to be $42,110 in five years, compared to $36,530 for all U.S. households Housing
2019 Housing Affordability Index 105 85 782000 Total Housing Units 6,820 70,097 191,194
2000 Owner Occupied Housing Units 5,789 42,456 96,2532000 Renter Occupied Housing Units 908 25,369 87,3752000 Vacant Housing Units 123 2,272 7,566
2010 Total Housing Units 6,877 72,266 198,0232010 Owner Occupied Housing Units 5,445 41,966 99,9122010 Renter Occupied Housing Units 1,095 24,652 81,0112010 Vacant Housing Units 337 5,648 17,100
2019 Total Housing Units 6,873 72,756 199,8812019 Owner Occupied Housing Units 5,250 40,239 95,8162019 Renter Occupied Housing Units 1,201 26,263 86,6332019 Vacant Housing Units 422 6,254 17,431
2024 Total Housing Units 6,877 72,987 200,8952024 Owner Occupied Housing Units 5,236 40,480 97,0632024 Renter Occupied Housing Units 1,137 25,531 84,6892024 Vacant Housing Units 504 6,976 19,143
Currently, 47.9% of the 199,881 housing units in the area are owner occupied; 43.3%, renter occupied; and 8.7% are vacant. Currently, in the U.S., 56.4% of the housing units in the area are owner occupied; 32.4% are renter occupied; and 11.2% are vacant. In 2010, there were 198,023 housing units in the area - 50.5% owner occupied, 40.9% renter occupied, and 8.6% vacant. The annual rate of change in housing units since 2010 is 0.42%. Median home value in the area is $354,437, compared to a median home value of $234,154 for the U.S. In five years, median value is projected to change by 1.52% annually to $382,162.
Data Note: Income is expressed in current dollars. Housing Affordability Index and Percent of Income for Mortgage calculations are only available for areas with 50 or more owner-occupied housing units. Source: U.S. Census Bureau, Census 2010 Summary File 1. Esri forecasts for 2019 and 2024. Esri converted Census 2000 data into 2010 geography.
September 25, 2019
©2019 Esri Page 2 of 2

Finances Market Potential7353-7399 St Louis Ave Village Of Skokie Only7353-7399 St Louis Ave, Skokie, Illinois, 60076 Latitude: 42.01519Drive Time: 5 minute radius Longitude: -87.71717
Demographic Summary 2019 2024Population 19,188 19,016Population 18+ 15,070 14,996Households 6,451 6,373Median Household Income $86,110 $97,707
Expected Number ofProduct/Consumer Behavior Adults Percent MPI
Did banking in person in last 12 months 8,892 59.0% 107Bank/financial institution used: Bank of America 3,194 21.2% 161Bank/financial institution used: Capital One 1,217 8.1% 142Bank/financial institution used: Chase 3,729 24.7% 181Bank/financial institution used: Citibank 1,137 7.5% 194Bank/financial institution used: PNC 515 3.4% 99Bank/financial institution used: U.S. Bank 493 3.3% 105Bank/financial institution used: Wells Fargo 2,266 15.0% 123Bank/financial institution used: credit union 2,308 15.3% 85Bank/financial inst used: local/community bank 952 6.3% 66Did banking by mail in last 12 months 571 3.8% 129Did banking by phone in last 12 months 1,553 10.3% 106Did banking online in last 12 months 6,839 45.4% 116Did banking on mobile device in last 12 months 4,142 27.5% 106Used ATM/cash machine in last 12 months 8,792 58.3% 110Used direct deposit of paycheck in last 12 months 6,766 44.9% 103Did banking w/paperless statements in last 12 months 3,968 26.3% 108Have interest checking account 5,311 35.2% 123Have non-interest checking account 4,762 31.6% 108Have savings account 9,844 65.3% 114Have overdraft protection 4,423 29.3% 108Have auto loan 3,164 21.0% 101Have personal loan for education (student loan) 902 6.0% 88Have personal loan - not for education 336 2.2% 65Have home mortgage (1st) 5,431 36.0% 116Have 2nd mortgage (home equity loan) 921 6.1% 125Have home equity line of credit 642 4.3% 127Have personal line of credit 606 4.0% 115Have 401(k) retirement savings plan 3,091 20.5% 128Have 403(b) retirement savings plan 497 3.3% 105Have Roth IRA retirement savings plan 1,500 10.0% 125Have Traditional IRA retirement savings plan 2,343 15.5% 144Own any securities investment 6,261 41.5% 128Own any annuity 568 3.8% 136Own certificate of deposit (more than 6 months) 432 2.9% 110Own shares in money market fund 712 4.7% 118Own shares in mutual fund (bonds) 844 5.6% 117Own shares in mutual fund (stock) 1,563 10.4% 145Own any stock 1,645 10.9% 152Own common stock in company you don`t work for 1,195 7.9% 155Own U.S. savings bond 1,007 6.7% 153Own investment real estate 766 5.1% 127Own vacation/weekend home 774 5.1% 139Used a real estate agent in last 12 months 771 5.1% 88Used financial planner in last 12 months 1,315 8.7% 123Own 1 credit card 2,315 15.4% 92Own 2 credit cards 2,542 16.9% 115Own 3 credit cards 2,170 14.4% 145Own 4 credit cards 1,153 7.7% 117Own 5 credit cards 832 5.5% 144Own 6+ credit cards 1,524 10.1% 158
Data Note: An MPI (Market Potential Index) measures the relative likelihood of the adults in the specified trade area to exhibit certain consumer behavior or purchasing patterns compared to the U.S. An MPI of 100 represents the U.S. average.Source: These data are based upon national propensities to use various products and services, applied to local demographic composition. Usage data were collected by GfK MRI in a nationally representative survey of U.S. households. Esri forecasts for 2019 and 2024.
September 25, 2019
©2019 Esri Page 1 of 9

Finances Market Potential7353-7399 St Louis Ave Village Of Skokie Only7353-7399 St Louis Ave, Skokie, Illinois, 60076 Latitude: 42.01519Drive Time: 5 minute radius Longitude: -87.71717
Expected Number ofProduct/Consumer Behavior Adults Percent MPI
Credit cards: Never or rarely carry a balance 5,975 39.6% 129Credit cards: Sometimes carry a balance 2,817 18.7% 112Credit cards: Usually or always carry a balance 2,564 17.0% 96Avg monthly credit card expenditures: <$1-110 1,433 9.5% 83Avg monthly credit card expenditures: $111-$225 1,216 8.1% 110Avg monthly credit card expenditures: $226-$450 1,443 9.6% 140Avg monthly credit card expenditures: $451-$700 1,385 9.2% 150Avg monthly credit card expenditures: $701-$1000 1,256 8.3% 149Avg monthly credit card expenditures: $1001+ 2,591 17.2% 148Own 1 debit card 7,105 47.1% 99Own 2 debit cards 2,357 15.6% 132Avg monthly debit card expenditures: $1-90 825 5.5% 123Avg monthly debit card expenditures: $91-$180 776 5.1% 93Avg monthly debit card expenditures: $181-$225 1,009 6.7% 134Avg monthly debit card expenditures: $226-$450 994 6.6% 84Avg monthly debit card expenditures: $451-$700 1,476 9.8% 115Avg monthly debit card expenditures: $701-$1000 1,241 8.2% 104Avg monthly debit card expenditures: $1001+ 1,111 7.4% 81Own/used last 12 months: any credit/debit card 13,033 86.5% 109Own/used last 12 months: any major credit/debit card 11,710 77.7% 111Own/used last 12 months: any store credit card 5,311 35.2% 129Credit/debit card rewards: airline miles 2,449 16.3% 163Credit/debit card rewards: cash back 5,803 38.5% 131Credit/debit card rewards: gasoline discounts 841 5.6% 133Credit/debit card rewards: gifts 669 4.4% 125Credit/debit card rewards: hotel/car rental awards 794 5.3% 161Have American Express Green card in own name 537 3.6% 173Have American Express Gold card in own name 641 4.3% 148Have American Express Blue card in own name 1,255 8.3% 199Have Discover card in own name 1,994 13.2% 126Have MasterCard Standard card in own name 2,705 17.9% 119Have MasterCard Gold card in own name 678 4.5% 143Have MasterCard Platinum card in own name 1,095 7.3% 131Have MasterCard debit card in own name 1,218 8.1% 99Have Visa Regular/Classic card in own name 4,719 31.3% 124Have Visa Gold card in own name 536 3.6% 140Have Visa Platinum card in own name 1,653 11.0% 123Have Visa Signature card in own name 1,344 8.9% 151Have Visa debit card in own name 2,915 19.3% 95Paid bills last 12 months: by mail 5,937 39.4% 108Paid bills last 12 months: online 8,403 55.8% 111Paid bills last 12 months: in person 2,706 18.0% 66Paid bills last 12 months: by phone using credit card 2,816 18.7% 87Paid bills last 12 months: by mobile phone 2,752 18.3% 96Paid bills last 12 months: charged to credit card 2,722 18.1% 114Paid bills last 12 months: deducted from bank account 3,839 25.5% 93Wired/sent money in last 6 months 2,611 17.3% 115Wired/sent money in last 6 months: using MoneyGram 361 2.4% 71Wired/sent money in last 6 months: using Western Union 664 4.4% 92Wired/sent money in last 6 months: bank wire transfer 746 5.0% 140Used Apple Pay digital payment service/30 days 658 4.4% 116Used PayPal digital payment service/30 days 2,783 18.5% 106Used Venmo digital payment service/30 days 858 5.7% 153Used Visa Checkout digital payment service/30 days 586 3.9% 120
Data Note: An MPI (Market Potential Index) measures the relative likelihood of the adults in the specified trade area to exhibit certain consumer behavior or purchasing patterns compared to the U.S. An MPI of 100 represents the U.S. average.Source: These data are based upon national propensities to use various products and services, applied to local demographic composition. Usage data were collected by GfK MRI in a nationally representative survey of U.S. households. Esri forecasts for 2019 and 2024.
September 25, 2019
©2019 Esri Page 2 of 9

Finances Market Potential7353-7399 St Louis Ave Village Of Skokie Only7353-7399 St Louis Ave, Skokie, Illinois, 60076 Latitude: 42.01519Drive Time: 5 minute radius Longitude: -87.71717
Expected Number ofProduct/Consumer Behavior Adults Percent MPI
Used other digital payment service/30 days 439 2.9% 92Tax preparation: did manually 2,148 14.3% 101Tax preparation: used software (TurboTax) 1,962 13.0% 106Tax preparation: used online tax srv (TurboTax) 799 5.3% 69Tax preparation: used H&R Block on-site 449 3.0% 65Tax preparation: used CPA/other tax professional 3,482 23.1% 143
Data Note: An MPI (Market Potential Index) measures the relative likelihood of the adults in the specified trade area to exhibit certain consumer behavior or purchasing patterns compared to the U.S. An MPI of 100 represents the U.S. average.Source: These data are based upon national propensities to use various products and services, applied to local demographic composition. Usage data were collected by GfK MRI in a nationally representative survey of U.S. households. Esri forecasts for 2019 and 2024.
September 25, 2019
©2019 Esri Page 3 of 9

Finances Market Potential7353-7399 St Louis Ave Village Of Skokie Only7353-7399 St Louis Ave, Skokie, Illinois, 60076 Latitude: 42.01519Drive Time: 10 minute radius Longitude: -87.71717
Demographic Summary 2019 2024Population 185,523 184,250Population 18+ 143,201 143,869Households 66,502 66,011Median Household Income $72,067 $79,798
Expected Number ofProduct/Consumer Behavior Adults Percent MPI
Did banking in person in last 12 months 80,715 56.4% 102Bank/financial institution used: Bank of America 27,671 19.3% 147Bank/financial institution used: Capital One 10,778 7.5% 133Bank/financial institution used: Chase 33,631 23.5% 172Bank/financial institution used: Citibank 9,710 6.8% 174Bank/financial institution used: PNC 4,469 3.1% 90Bank/financial institution used: U.S. Bank 4,432 3.1% 99Bank/financial institution used: Wells Fargo 17,953 12.5% 103Bank/financial institution used: credit union 18,577 13.0% 72Bank/financial inst used: local/community bank 8,492 5.9% 62Did banking by mail in last 12 months 5,495 3.8% 130Did banking by phone in last 12 months 15,153 10.6% 109Did banking online in last 12 months 58,685 41.0% 105Did banking on mobile device in last 12 months 36,860 25.7% 99Used ATM/cash machine in last 12 months 79,116 55.2% 104Used direct deposit of paycheck in last 12 months 57,617 40.2% 92Did banking w/paperless statements in last 12 months 35,822 25.0% 102Have interest checking account 42,332 29.6% 103Have non-interest checking account 41,553 29.0% 99Have savings account 85,875 60.0% 105Have overdraft protection 36,704 25.6% 94Have auto loan 24,658 17.2% 83Have personal loan for education (student loan) 8,094 5.7% 83Have personal loan - not for education 3,136 2.2% 64Have home mortgage (1st) 42,818 29.9% 96Have 2nd mortgage (home equity loan) 7,465 5.2% 106Have home equity line of credit 5,095 3.6% 106Have personal line of credit 4,786 3.3% 96Have 401(k) retirement savings plan 23,086 16.1% 100Have 403(b) retirement savings plan 4,579 3.2% 101Have Roth IRA retirement savings plan 12,226 8.5% 107Have Traditional IRA retirement savings plan 18,226 12.7% 118Own any securities investment 50,955 35.6% 110Own any annuity 4,425 3.1% 111Own certificate of deposit (more than 6 months) 3,570 2.5% 95Own shares in money market fund 6,302 4.4% 110Own shares in mutual fund (bonds) 7,966 5.6% 116Own shares in mutual fund (stock) 12,332 8.6% 121Own any stock 12,288 8.6% 120Own common stock in company you don`t work for 9,113 6.4% 124Own U.S. savings bond 8,044 5.6% 129Own investment real estate 6,483 4.5% 113Own vacation/weekend home 6,093 4.3% 115Used a real estate agent in last 12 months 7,493 5.2% 90Used financial planner in last 12 months 10,911 7.6% 108Own 1 credit card 21,251 14.8% 89Own 2 credit cards 24,436 17.1% 117Own 3 credit cards 18,105 12.6% 127Own 4 credit cards 10,429 7.3% 112Own 5 credit cards 6,424 4.5% 117Own 6+ credit cards 11,939 8.3% 130
Data Note: An MPI (Market Potential Index) measures the relative likelihood of the adults in the specified trade area to exhibit certain consumer behavior or purchasing patterns compared to the U.S. An MPI of 100 represents the U.S. average.Source: These data are based upon national propensities to use various products and services, applied to local demographic composition. Usage data were collected by GfK MRI in a nationally representative survey of U.S. households. Esri forecasts for 2019 and 2024.
September 25, 2019
©2019 Esri Page 4 of 9

Finances Market Potential7353-7399 St Louis Ave Village Of Skokie Only7353-7399 St Louis Ave, Skokie, Illinois, 60076 Latitude: 42.01519Drive Time: 10 minute radius Longitude: -87.71717
Expected Number ofProduct/Consumer Behavior Adults Percent MPI
Credit cards: Never or rarely carry a balance 51,230 35.8% 117Credit cards: Sometimes carry a balance 24,526 17.1% 103Credit cards: Usually or always carry a balance 25,465 17.8% 100Avg monthly credit card expenditures: <$1-110 14,397 10.1% 87Avg monthly credit card expenditures: $111-$225 11,211 7.8% 106Avg monthly credit card expenditures: $226-$450 11,510 8.0% 118Avg monthly credit card expenditures: $451-$700 11,653 8.1% 133Avg monthly credit card expenditures: $701-$1000 11,897 8.3% 148Avg monthly credit card expenditures: $1001+ 21,001 14.7% 126Own 1 debit card 67,712 47.3% 99Own 2 debit cards 20,201 14.1% 119Avg monthly debit card expenditures: $1-90 7,309 5.1% 115Avg monthly debit card expenditures: $91-$180 8,169 5.7% 104Avg monthly debit card expenditures: $181-$225 8,659 6.0% 121Avg monthly debit card expenditures: $226-$450 9,297 6.5% 83Avg monthly debit card expenditures: $451-$700 12,778 8.9% 105Avg monthly debit card expenditures: $701-$1000 11,664 8.1% 103Avg monthly debit card expenditures: $1001+ 11,736 8.2% 90Own/used last 12 months: any credit/debit card 120,054 83.8% 106Own/used last 12 months: any major credit/debit card 104,885 73.2% 105Own/used last 12 months: any store credit card 45,404 31.7% 116Credit/debit card rewards: airline miles 20,055 14.0% 140Credit/debit card rewards: cash back 51,777 36.2% 123Credit/debit card rewards: gasoline discounts 6,695 4.7% 112Credit/debit card rewards: gifts 5,551 3.9% 109Credit/debit card rewards: hotel/car rental awards 5,537 3.9% 118Have American Express Green card in own name 5,159 3.6% 175Have American Express Gold card in own name 6,167 4.3% 150Have American Express Blue card in own name 9,879 6.9% 165Have Discover card in own name 15,819 11.0% 105Have MasterCard Standard card in own name 22,082 15.4% 103Have MasterCard Gold card in own name 5,241 3.7% 116Have MasterCard Platinum card in own name 8,953 6.3% 112Have MasterCard debit card in own name 10,053 7.0% 86Have Visa Regular/Classic card in own name 42,067 29.4% 117Have Visa Gold card in own name 4,128 2.9% 114Have Visa Platinum card in own name 13,469 9.4% 106Have Visa Signature card in own name 9,710 6.8% 115Have Visa debit card in own name 26,574 18.6% 91Paid bills last 12 months: by mail 49,672 34.7% 95Paid bills last 12 months: online 75,401 52.7% 105Paid bills last 12 months: in person 29,101 20.3% 75Paid bills last 12 months: by phone using credit card 26,771 18.7% 87Paid bills last 12 months: by mobile phone 24,886 17.4% 91Paid bills last 12 months: charged to credit card 24,293 17.0% 107Paid bills last 12 months: deducted from bank account 33,431 23.3% 85Wired/sent money in last 6 months 25,782 18.0% 120Wired/sent money in last 6 months: using MoneyGram 4,517 3.2% 93Wired/sent money in last 6 months: using Western Union 7,886 5.5% 115Wired/sent money in last 6 months: bank wire transfer 6,466 4.5% 128Used Apple Pay digital payment service/30 days 6,405 4.5% 119Used PayPal digital payment service/30 days 26,734 18.7% 107Used Venmo digital payment service/30 days 8,120 5.7% 153Used Visa Checkout digital payment service/30 days 5,354 3.7% 116
Data Note: An MPI (Market Potential Index) measures the relative likelihood of the adults in the specified trade area to exhibit certain consumer behavior or purchasing patterns compared to the U.S. An MPI of 100 represents the U.S. average.Source: These data are based upon national propensities to use various products and services, applied to local demographic composition. Usage data were collected by GfK MRI in a nationally representative survey of U.S. households. Esri forecasts for 2019 and 2024.
September 25, 2019
©2019 Esri Page 5 of 9

Finances Market Potential7353-7399 St Louis Ave Village Of Skokie Only7353-7399 St Louis Ave, Skokie, Illinois, 60076 Latitude: 42.01519Drive Time: 10 minute radius Longitude: -87.71717
Expected Number ofProduct/Consumer Behavior Adults Percent MPI
Used other digital payment service/30 days 4,964 3.5% 110Tax preparation: did manually 19,132 13.4% 94Tax preparation: used software (TurboTax) 15,730 11.0% 90Tax preparation: used online tax srv (TurboTax) 9,171 6.4% 84Tax preparation: used H&R Block on-site 4,744 3.3% 73Tax preparation: used CPA/other tax professional 29,007 20.3% 126
Data Note: An MPI (Market Potential Index) measures the relative likelihood of the adults in the specified trade area to exhibit certain consumer behavior or purchasing patterns compared to the U.S. An MPI of 100 represents the U.S. average.Source: These data are based upon national propensities to use various products and services, applied to local demographic composition. Usage data were collected by GfK MRI in a nationally representative survey of U.S. households. Esri forecasts for 2019 and 2024.
September 25, 2019
©2019 Esri Page 6 of 9

Finances Market Potential7353-7399 St Louis Ave Village Of Skokie Only7353-7399 St Louis Ave, Skokie, Illinois, 60076 Latitude: 42.01519Drive Time: 15 minute radius Longitude: -87.71717
Demographic Summary 2019 2024Population 477,852 475,755Population 18+ 376,865 380,324Households 182,450 181,752Median Household Income $66,187 $74,914
Expected Number ofProduct/Consumer Behavior Adults Percent MPI
Did banking in person in last 12 months 207,446 55.0% 100Bank/financial institution used: Bank of America 73,752 19.6% 149Bank/financial institution used: Capital One 27,215 7.2% 127Bank/financial institution used: Chase 84,033 22.3% 163Bank/financial institution used: Citibank 23,404 6.2% 159Bank/financial institution used: PNC 10,298 2.7% 79Bank/financial institution used: U.S. Bank 11,221 3.0% 95Bank/financial institution used: Wells Fargo 48,121 12.8% 105Bank/financial institution used: credit union 50,052 13.3% 73Bank/financial inst used: local/community bank 20,729 5.5% 57Did banking by mail in last 12 months 13,014 3.5% 117Did banking by phone in last 12 months 39,523 10.5% 108Did banking online in last 12 months 151,475 40.2% 103Did banking on mobile device in last 12 months 99,581 26.4% 102Used ATM/cash machine in last 12 months 207,559 55.1% 104Used direct deposit of paycheck in last 12 months 151,066 40.1% 92Did banking w/paperless statements in last 12 months 95,816 25.4% 104Have interest checking account 105,868 28.1% 98Have non-interest checking account 108,324 28.7% 98Have savings account 220,189 58.4% 102Have overdraft protection 93,305 24.8% 91Have auto loan 62,486 16.6% 80Have personal loan for education (student loan) 23,551 6.2% 92Have personal loan - not for education 8,062 2.1% 62Have home mortgage (1st) 104,031 27.6% 89Have 2nd mortgage (home equity loan) 16,604 4.4% 90Have home equity line of credit 12,078 3.2% 95Have personal line of credit 12,126 3.2% 92Have 401(k) retirement savings plan 57,370 15.2% 95Have 403(b) retirement savings plan 11,915 3.2% 100Have Roth IRA retirement savings plan 30,802 8.2% 103Have Traditional IRA retirement savings plan 43,215 11.5% 106Own any securities investment 123,937 32.9% 101Own any annuity 10,296 2.7% 98Own certificate of deposit (more than 6 months) 8,773 2.3% 89Own shares in money market fund 15,111 4.0% 100Own shares in mutual fund (bonds) 19,735 5.2% 110Own shares in mutual fund (stock) 30,172 8.0% 112Own any stock 30,295 8.0% 112Own common stock in company you don`t work for 22,770 6.0% 118Own U.S. savings bond 17,736 4.7% 108Own investment real estate 15,816 4.2% 105Own vacation/weekend home 13,672 3.6% 98Used a real estate agent in last 12 months 18,716 5.0% 86Used financial planner in last 12 months 25,323 6.7% 95Own 1 credit card 58,676 15.6% 93Own 2 credit cards 63,682 16.9% 115Own 3 credit cards 45,148 12.0% 121Own 4 credit cards 26,269 7.0% 107Own 5 credit cards 14,940 4.0% 103Own 6+ credit cards 28,706 7.6% 119
Data Note: An MPI (Market Potential Index) measures the relative likelihood of the adults in the specified trade area to exhibit certain consumer behavior or purchasing patterns compared to the U.S. An MPI of 100 represents the U.S. average.Source: These data are based upon national propensities to use various products and services, applied to local demographic composition. Usage data were collected by GfK MRI in a nationally representative survey of U.S. households. Esri forecasts for 2019 and 2024.
September 25, 2019
©2019 Esri Page 7 of 9

Finances Market Potential7353-7399 St Louis Ave Village Of Skokie Only7353-7399 St Louis Ave, Skokie, Illinois, 60076 Latitude: 42.01519Drive Time: 15 minute radius Longitude: -87.71717
Expected Number ofProduct/Consumer Behavior Adults Percent MPI
Credit cards: Never or rarely carry a balance 127,232 33.8% 110Credit cards: Sometimes carry a balance 65,417 17.4% 104Credit cards: Usually or always carry a balance 68,933 18.3% 103Avg monthly credit card expenditures: <$1-110 37,847 10.0% 87Avg monthly credit card expenditures: $111-$225 29,825 7.9% 107Avg monthly credit card expenditures: $226-$450 29,425 7.8% 114Avg monthly credit card expenditures: $451-$700 29,109 7.7% 126Avg monthly credit card expenditures: $701-$1000 28,816 7.6% 137Avg monthly credit card expenditures: $1001+ 51,856 13.8% 118Own 1 debit card 183,675 48.7% 102Own 2 debit cards 48,594 12.9% 109Avg monthly debit card expenditures: $1-90 19,125 5.1% 114Avg monthly debit card expenditures: $91-$180 22,319 5.9% 108Avg monthly debit card expenditures: $181-$225 21,100 5.6% 112Avg monthly debit card expenditures: $226-$450 26,783 7.1% 91Avg monthly debit card expenditures: $451-$700 32,384 8.6% 101Avg monthly debit card expenditures: $701-$1000 31,349 8.3% 105Avg monthly debit card expenditures: $1001+ 30,310 8.0% 88Own/used last 12 months: any credit/debit card 312,763 83.0% 105Own/used last 12 months: any major credit/debit card 272,926 72.4% 104Own/used last 12 months: any store credit card 112,327 29.8% 109Credit/debit card rewards: airline miles 50,090 13.3% 133Credit/debit card rewards: cash back 129,373 34.3% 117Credit/debit card rewards: gasoline discounts 16,258 4.3% 103Credit/debit card rewards: gifts 13,655 3.6% 102Credit/debit card rewards: hotel/car rental awards 14,408 3.8% 117Have American Express Green card in own name 11,672 3.1% 150Have American Express Gold card in own name 14,811 3.9% 137Have American Express Blue card in own name 23,564 6.3% 149Have Discover card in own name 38,815 10.3% 98Have MasterCard Standard card in own name 56,526 15.0% 100Have MasterCard Gold card in own name 12,514 3.3% 105Have MasterCard Platinum card in own name 21,515 5.7% 103Have MasterCard debit card in own name 24,946 6.6% 81Have Visa Regular/Classic card in own name 111,435 29.6% 118Have Visa Gold card in own name 10,012 2.7% 105Have Visa Platinum card in own name 33,150 8.8% 99Have Visa Signature card in own name 23,998 6.4% 108Have Visa debit card in own name 71,592 19.0% 93Paid bills last 12 months: by mail 123,981 32.9% 90Paid bills last 12 months: online 197,406 52.4% 104Paid bills last 12 months: in person 77,335 20.5% 76Paid bills last 12 months: by phone using credit card 70,968 18.8% 88Paid bills last 12 months: by mobile phone 68,640 18.2% 95Paid bills last 12 months: charged to credit card 63,903 17.0% 107Paid bills last 12 months: deducted from bank account 89,551 23.8% 86Wired/sent money in last 6 months 67,114 17.8% 118Wired/sent money in last 6 months: using MoneyGram 13,099 3.5% 103Wired/sent money in last 6 months: using Western Union 20,942 5.6% 116Wired/sent money in last 6 months: bank wire transfer 17,191 4.6% 129Used Apple Pay digital payment service/30 days 19,278 5.1% 136Used PayPal digital payment service/30 days 70,325 18.7% 107Used Venmo digital payment service/30 days 23,793 6.3% 170Used Visa Checkout digital payment service/30 days 14,384 3.8% 118
Data Note: An MPI (Market Potential Index) measures the relative likelihood of the adults in the specified trade area to exhibit certain consumer behavior or purchasing patterns compared to the U.S. An MPI of 100 represents the U.S. average.Source: These data are based upon national propensities to use various products and services, applied to local demographic composition. Usage data were collected by GfK MRI in a nationally representative survey of U.S. households. Esri forecasts for 2019 and 2024.
September 25, 2019
©2019 Esri Page 8 of 9

Finances Market Potential7353-7399 St Louis Ave Village Of Skokie Only7353-7399 St Louis Ave, Skokie, Illinois, 60076 Latitude: 42.01519Drive Time: 15 minute radius Longitude: -87.71717
Expected Number ofProduct/Consumer Behavior Adults Percent MPI
Used other digital payment service/30 days 13,330 3.5% 112Tax preparation: did manually 50,417 13.4% 94Tax preparation: used software (TurboTax) 41,848 11.1% 90Tax preparation: used online tax srv (TurboTax) 25,634 6.8% 89Tax preparation: used H&R Block on-site 12,616 3.3% 73Tax preparation: used CPA/other tax professional 67,960 18.0% 112
Data Note: An MPI (Market Potential Index) measures the relative likelihood of the adults in the specified trade area to exhibit certain consumer behavior or purchasing patterns compared to the U.S. An MPI of 100 represents the U.S. average.Source: These data are based upon national propensities to use various products and services, applied to local demographic composition. Usage data were collected by GfK MRI in a nationally representative survey of U.S. households. Esri forecasts for 2019 and 2024.
September 25, 2019
©2019 Esri Page 9 of 9

Financial Expenditures7353-7399 St Louis Ave Village Of Skokie Only7353-7399 St Louis Ave, Skokie, Illinois, 60076 Latitude: 42.01519Drive Time: 5 minute radius Longitude: -87.71717
Demographic Summary 2019 2024Population 19,188 19,016Households 6,451 6,373Families 4,775 4,708Median Age 44.2 44.4Median Household Income $86,110 $97,707
Spending Potential Average Amount Index Total
AssetsValue of Checking/Savings/Money Market Accounts & CDs 138 $23,631.10 $152,444,195Value of Checking/Savings/Money Market Accounts & CDs (1 year ago) 138 $21,524.37 $138,853,680Value of Stocks/Bonds/Mutual Funds 150 $32,251.61 $208,055,168Value of Stocks/Bonds/Mutual Funds (1 year ago) 149 $29,922.44 $193,029,658Value of Other Financial Assets 155 $8,790.65 $56,708,454Value of Other Financial Assets (1 year ago) 155 $8,078.04 $52,111,409Value of Retirement Plans 139 $132,466.43 $854,540,944Value of Retirement Plans (1 year ago) 141 $119,546.50 $771,194,441Surrender Value of Whole Life Policies 113 $6,398.91 $41,279,378Surrender Value of Whole Life Policies (1 year ago)” 113 $5,131.65 $33,104,290
EarningsInterest/Dividends 158 $1,708.07 $11,018,778Royalty/Estate/Trust Income 135 $637.29 $4,111,135
LiabilitiesOriginal Mortgage Amount (Owned Home) 132 $14,886.80 $96,034,734Vehicle Loan Amount (1) 96 $2,729.73 $17,609,459Value of Credit Card Debt 122 $2,986.66 $19,266,937Value of Credit Card Debt (1 year ago) 127 $2,927.18 $18,883,263Value Owed on Student Loans 111 $7,273.33 $46,920,242Value Owed on Student Loans (1 year ago) 112 $6,848.55 $44,180,024Value Owed on Non-student Loans 108 $1,013.80 $6,539,997Value Owed on Non-student Loans (1 year ago) 99 $698.13 $4,503,639Owned Dwellings - Special Lump Sum Mortgage Payments 128 $382.03 $2,464,444Owned Dwellings - Special Assessments 134 $18.66 $120,357Owned Dwellings - Property Purchase Closing Costs 119 $293.17 $1,891,269
Amount Paid: InterestHome Mortgage 136 $5,162.99 $33,306,475Home Equity Loan 146 $52.52 $338,811Home Equity Line of Credit 161 $179.36 $1,157,036New Car/Truck/Van Loan 103 $137.15 $884,741Used Car/Truck/Van Loan 89 $114.48 $738,503Finance/Late/Interest Charges for Credit Cards 129 $123.62 $797,486Finance/Late/Interest Charges for Student Loans 132 $59.18 $381,789Finance/Late/Interest Charges for Non-student Loans 99 $10.44 $67,343
Amount Paid: PrincipalHome Mortgage 135 $2,577.68 $16,628,642Home Equity Loan 158 $101.94 $657,595Home Equity Line of Credit 152 $543.14 $3,503,810New Car/Truck/Van Loan 108 $1,172.90 $7,566,386Used Car/Truck/Van Loan 89 $822.26 $5,304,384
Checking Account and Banking Service Charges 106 $36.61 $236,199
Data Note: The Spending Potential Index (SPI) is household-based, and represents the amount spent for a product or service relative to a national average of 100. (1) Vehicle Loan Amount is the amount of a loan for a car, truck, van, SUV, motor home, boat, camper, motorcycle, motor scooter, moped, plane, snowmobile, dune buggy, ATV, or Segway, excluding interest.Source: Esri forecasts for 2019 and 2024; Consumer Spending data are derived from the 2016 and 2017 Consumer Expenditure Surveys, Bureau of Labor Statistics.
September 25, 2019
©2019 Esri Page 1 of 3

Financial Expenditures7353-7399 St Louis Ave Village Of Skokie Only7353-7399 St Louis Ave, Skokie, Illinois, 60076 Latitude: 42.01519Drive Time: 10 minute radius Longitude: -87.71717
Demographic Summary 2019 2024Population 185,523 184,250Households 66,502 66,011Families 45,168 44,702Median Age 39.9 40.6Median Household Income $72,067 $79,798
Spending Potential Average Amount Index Total
AssetsValue of Checking/Savings/Money Market Accounts & CDs 119 $20,474.27 $1,361,580,058Value of Checking/Savings/Money Market Accounts & CDs (1 year ago) 118 $18,429.49 $1,225,597,719Value of Stocks/Bonds/Mutual Funds 123 $26,406.72 $1,756,099,660Value of Stocks/Bonds/Mutual Funds (1 year ago) 123 $24,608.11 $1,636,488,844Value of Other Financial Assets 126 $7,155.63 $475,863,920Value of Other Financial Assets (1 year ago) 127 $6,612.21 $439,725,294Value of Retirement Plans 115 $109,427.21 $7,277,128,289Value of Retirement Plans (1 year ago) 116 $98,895.68 $6,576,760,269Surrender Value of Whole Life Policies 100 $5,628.65 $374,316,508Surrender Value of Whole Life Policies (1 year ago)” 98 $4,442.82 $295,456,103
EarningsInterest/Dividends 129 $1,386.74 $92,220,735Royalty/Estate/Trust Income 108 $509.80 $33,903,006
LiabilitiesOriginal Mortgage Amount (Owned Home) 108 $12,228.74 $813,235,453Vehicle Loan Amount (1) 88 $2,511.30 $167,006,236Value of Credit Card Debt 114 $2,779.12 $184,816,947Value of Credit Card Debt (1 year ago) 117 $2,708.25 $180,104,209Value Owed on Student Loans 119 $7,766.03 $516,456,800Value Owed on Student Loans (1 year ago) 119 $7,249.15 $482,082,841Value Owed on Non-student Loans 111 $1,047.12 $69,635,332Value Owed on Non-student Loans (1 year ago) 109 $763.29 $50,760,435Owned Dwellings - Special Lump Sum Mortgage Payments 102 $302.78 $20,135,788Owned Dwellings - Special Assessments 119 $16.53 $1,099,452Owned Dwellings - Property Purchase Closing Costs 105 $257.48 $17,122,777
Amount Paid: InterestHome Mortgage 111 $4,229.82 $281,291,465Home Equity Loan 123 $44.14 $2,935,725Home Equity Line of Credit 129 $144.04 $9,578,764New Car/Truck/Van Loan 92 $122.92 $8,174,500Used Car/Truck/Van Loan 87 $111.97 $7,446,313Finance/Late/Interest Charges for Credit Cards 120 $114.70 $7,627,650Finance/Late/Interest Charges for Student Loans 133 $59.48 $3,955,839Finance/Late/Interest Charges for Non-student Loans 90 $9.55 $635,214
Amount Paid: PrincipalHome Mortgage 110 $2,098.96 $139,584,826Home Equity Loan 130 $84.17 $5,597,258Home Equity Line of Credit 123 $438.11 $29,135,479New Car/Truck/Van Loan 96 $1,048.23 $69,709,092Used Car/Truck/Van Loan 87 $804.12 $53,475,465
Checking Account and Banking Service Charges 115 $39.86 $2,650,815
Data Note: The Spending Potential Index (SPI) is household-based, and represents the amount spent for a product or service relative to a national average of 100. (1) Vehicle Loan Amount is the amount of a loan for a car, truck, van, SUV, motor home, boat, camper, motorcycle, motor scooter, moped, plane, snowmobile, dune buggy, ATV, or Segway, excluding interest.Source: Esri forecasts for 2019 and 2024; Consumer Spending data are derived from the 2016 and 2017 Consumer Expenditure Surveys, Bureau of Labor Statistics.
September 25, 2019
©2019 Esri Page 2 of 3

Financial Expenditures7353-7399 St Louis Ave Village Of Skokie Only7353-7399 St Louis Ave, Skokie, Illinois, 60076 Latitude: 42.01519Drive Time: 15 minute radius Longitude: -87.71717
Demographic Summary 2019 2024Population 477,852 475,755Households 182,450 181,752Families 109,318 108,382Median Age 38.2 39.0Median Household Income $66,187 $74,914
Spending Potential Average Amount Index Total
AssetsValue of Checking/Savings/Money Market Accounts & CDs 113 $19,347.77 $3,530,000,832Value of Checking/Savings/Money Market Accounts & CDs (1 year ago) 111 $17,278.35 $3,152,435,823Value of Stocks/Bonds/Mutual Funds 112 $24,024.19 $4,383,213,181Value of Stocks/Bonds/Mutual Funds (1 year ago) 112 $22,399.37 $4,086,765,772Value of Other Financial Assets 115 $6,550.42 $1,195,123,565Value of Other Financial Assets (1 year ago) 116 $6,056.42 $1,104,992,982Value of Retirement Plans 104 $99,426.30 $18,140,329,211Value of Retirement Plans (1 year ago) 106 $89,712.69 $16,368,080,422Surrender Value of Whole Life Policies 92 $5,210.56 $950,667,166Surrender Value of Whole Life Policies (1 year ago)” 91 $4,140.96 $755,518,608
EarningsInterest/Dividends 115 $1,241.76 $226,559,980Royalty/Estate/Trust Income 104 $489.45 $89,300,607
LiabilitiesOriginal Mortgage Amount (Owned Home) 100 $11,318.75 $2,065,106,050Vehicle Loan Amount (1) 89 $2,550.66 $465,367,768Value of Credit Card Debt 111 $2,702.47 $493,066,186Value of Credit Card Debt (1 year ago) 114 $2,617.66 $477,591,176Value Owed on Student Loans 126 $8,216.78 $1,499,150,733Value Owed on Student Loans (1 year ago) 125 $7,611.78 $1,388,768,858Value Owed on Non-student Loans 110 $1,033.92 $188,638,833Value Owed on Non-student Loans (1 year ago) 107 $753.17 $137,415,161Owned Dwellings - Special Lump Sum Mortgage Payments 92 $275.54 $50,272,069Owned Dwellings - Special Assessments 117 $16.27 $2,967,945Owned Dwellings - Property Purchase Closing Costs 100 $245.63 $44,814,719
Amount Paid: InterestHome Mortgage 102 $3,875.07 $707,005,620Home Equity Loan 108 $38.95 $7,105,527Home Equity Line of Credit 112 $125.32 $22,864,329New Car/Truck/Van Loan 90 $120.41 $21,968,918Used Car/Truck/Van Loan 91 $117.00 $21,345,875Finance/Late/Interest Charges for Credit Cards 116 $111.00 $20,252,063Finance/Late/Interest Charges for Student Loans 132 $58.97 $10,759,851Finance/Late/Interest Charges for Non-student Loans 96 $10.16 $1,854,101
Amount Paid: PrincipalHome Mortgage 99 $1,898.39 $346,360,850Home Equity Loan 114 $73.88 $13,479,538Home Equity Line of Credit 107 $381.78 $69,656,277New Car/Truck/Van Loan 94 $1,017.88 $185,712,207Used Car/Truck/Van Loan 91 $841.18 $153,473,634
Checking Account and Banking Service Charges 120 $41.59 $7,588,769
Data Note: The Spending Potential Index (SPI) is household-based, and represents the amount spent for a product or service relative to a national average of 100. (1) Vehicle Loan Amount is the amount of a loan for a car, truck, van, SUV, motor home, boat, camper, motorcycle, motor scooter, moped, plane, snowmobile, dune buggy, ATV, or Segway, excluding interest.Source: Esri forecasts for 2019 and 2024; Consumer Spending data are derived from the 2016 and 2017 Consumer Expenditure Surveys, Bureau of Labor Statistics.
September 25, 2019
©2019 Esri Page 3 of 3

Graphic Profile7353-7399 St Louis Ave Village Of Skokie Only7353-7399 St Louis Ave, Skokie, Illinois, 60076 Latitude: 42.01519Drive Time: 5 minute radius Longitude: -87.71717
2019 Population by Race2019 Population by Race
12,000
10,000
8,000
6,000
4,000
2,000
0White Black Am.Ind. Asn/Pac Other Two+
57.2%
3.5%0.1%
31.6%
3.7% 3.8%
<55-1920-2425-3435-4445-5455-6465+
2019 Population by Age2019 Population by Age
5.4%
18.2%5.0%
11.1%
11.1%
11.8%
14.2%
23.2%
2019 Percent Hispanic Origin: 10.0%
HouseholdsHouseholds
8,0007,0006,0005,0004,0003,0002,0001,000
0Census 2010 2019 2024
6,540 6,451 6,373
<$100K$100-199K$200-299K$300-399K$400-499K$500K+
2019 Home Value2019 Home Value
2.9%
8.2%
28.4%
33.0%
12.5%
15.0%
2019-2024 Annual Growth Rate2019-2024 Annual Growth Rate
Perc
ent
3
2
1
0
-1Population Households Median Household Income Owner Occupied Housing Units
-0.18 -0.24
2.56
-0.05
20192024
Household IncomeHousehold Income
Perc
ent
20
15
10
5
0<$15K $15K-$25K $25K-$35K $35K-$50K $50K-$75K $75K-$100K $100K-$150K $150K-$200K $200K+
Source: U.S. Census Bureau, Census 2010 Summary File 1. Esri forecasts for 2019 and 2024.
September 25, 2019
©2019 Esri Page 1 of 3

Graphic Profile7353-7399 St Louis Ave Village Of Skokie Only7353-7399 St Louis Ave, Skokie, Illinois, 60076 Latitude: 42.01519Drive Time: 10 minute radius Longitude: -87.71717
2019 Population by Race2019 Population by Race
120,000110,000100,00090,00080,00070,00060,00050,00040,00030,00020,00010,000
0White Black Am.Ind. Asn/Pac Other Two+
53.8%
11.3%
0.3%
23.0%
7.0% 4.6%
<55-1920-2425-3435-4445-5455-6465+
2019 Population by Age2019 Population by Age
6.1%
19.1%5.9%
12.6%
12.4%
12.6%
13.2%
18.1%
2019 Percent Hispanic Origin: 16.2%
HouseholdsHouseholds
80,00070,00060,00050,00040,00030,00020,00010,000
0Census 2010 2019 2024
66,618 66,502 66,011
<$100K$100-199K$200-299K$300-399K$400-499K$500K+
2019 Home Value2019 Home Value
3.1%
9.9%
22.9%
29.5%
15.3%
19.2%
2019-2024 Annual Growth Rate2019-2024 Annual Growth Rate
Perc
ent
2.52
1.51
0.50
-0.5
Population Households Median Household Income Owner Occupied Housing Units-0.14 -0.15
2.06
0.12
20192024
Household IncomeHousehold Income
Perc
ent
181614121086420
<$15K $15K-$25K $25K-$35K $35K-$50K $50K-$75K $75K-$100K $100K-$150K $150K-$200K $200K+
Source: U.S. Census Bureau, Census 2010 Summary File 1. Esri forecasts for 2019 and 2024.
September 25, 2019
©2019 Esri Page 2 of 3

Graphic Profile7353-7399 St Louis Ave Village Of Skokie Only7353-7399 St Louis Ave, Skokie, Illinois, 60076 Latitude: 42.01519Drive Time: 15 minute radius Longitude: -87.71717
2019 Population by Race2019 Population by Race
300,000
250,000
200,000
150,000
100,000
50,000
0White Black Am.Ind. Asn/Pac Other Two+
58.5%
8.7%0.4%
19.1%
8.9%4.4%
<55-1920-2425-3435-4445-5455-6465+
2019 Population by Age2019 Population by Age
5.8%
18.3%7.2%
14.3%
13.3%
12.6%12.4%
16.3%
2019 Percent Hispanic Origin: 20.6%
HouseholdsHouseholds
200,000
150,000
100,000
50,000
0Census 2010 2019 2024
180,923 182,450 181,752
<$100K$100-199K$200-299K$300-399K$400-499K$500K+
2019 Home Value2019 Home Value
3.3%
10.5%
22.0%
26.1%
14.2%
23.9%
2019-2024 Annual Growth Rate2019-2024 Annual Growth Rate
Perc
ent
32.5
21.5
10.5
0-0.5
-1Population Households Median Household Income Owner Occupied Housing Units
-0.09 -0.08
2.51
0.26
20192024
Household IncomeHousehold Income
Perc
ent
1614121086420
<$15K $15K-$25K $25K-$35K $35K-$50K $50K-$75K $75K-$100K $100K-$150K $150K-$200K $200K+
Source: U.S. Census Bureau, Census 2010 Summary File 1. Esri forecasts for 2019 and 2024.
September 25, 2019
©2019 Esri Page 3 of 3

Health and Beauty Market Potential7353-7399 St Louis Ave Village Of Skokie Only7353-7399 St Louis Ave, Skokie, Illinois, 60076 Latitude: 42.01519Drive Time: 5 minute radius Longitude: -87.71717
Demographic Summary 2019 2024Population 19,188 19,016Population 18+ 15,070 14,996Households 6,451 6,373Median Household Income $86,110 $97,707
Expected Number ofProduct/Consumer Behavior Adults Percent MPI
Typically spend 7+ hours exercising per week 3,483 23.1% 113Typically spend 4-6 hours exercising per week 3,451 22.9% 118Typically spend 1-3 hours exercising per week 3,843 25.5% 109Exercise at home 2+ times per week 4,431 29.4% 107Exercise at club 2+ times per week 2,757 18.3% 127Exercise at other facility 2+ times/wk 1,646 10.9% 128Own elliptical 689 4.6% 110Own stationary bicycle 789 5.2% 102Own treadmill 1,243 8.2% 91Own weight lifting equipment 1,627 10.8% 93Control diet for blood sugar level 1,593 10.6% 105Control diet for cholesterol level 1,892 12.6% 127Control diet for food allergies 287 1.9% 100Control diet to maintain weight 2,015 13.4% 134Control diet for physical fitness 1,957 13.0% 120Control diet for salt restriction 675 4.5% 130Control diet for weight loss 2,217 14.7% 103Used doctor`s care/diet for diet method 316 2.1% 84Used exercise program for diet method 1,301 8.6% 103Buy foods specifically labeled as fat-free 1,344 8.9% 103Buy foods specifically labeled as gluten-free 1,089 7.2% 135Buy foods specifically labeled as high fiber 1,267 8.4% 119Buy foods specifically labeled as high protein 1,287 8.5% 107Buy foods specifically labeled as lactose-free 633 4.2% 129Buy foods specifically labeled as low-calorie 1,128 7.5% 101Buy foods specifically labeled as low-carb 1,032 6.8% 99Buy foods specifically labeled as low-cholesterol 963 6.4% 132Buy foods specifically labeled as low-fat 1,372 9.1% 111Buy foods specifically labeled as low-sodium 1,626 10.8% 109Buy foods specifically labeled as natural/organic 2,331 15.5% 118Buy foods specifically labeled as probiotic 751 5.0% 121Buy foods specifically labeled as sugar-free 1,406 9.3% 103Used meal/dietary/weight loss supplement last 6 months 1,296 8.6% 104Used vitamins/dietary supplements in last 6 months 9,475 62.9% 116Provide services as a primary caregiver/caretaker 971 6.4% 87Visited doctor in last 12 months 12,149 80.6% 105Visited doctor in last 12 months: 1-2 times 3,465 23.0% 94Visited doctor in last 12 months: 3-5 times 3,866 25.7% 110Visited doctor in last 12 months: 6+ times 4,819 32.0% 109Visited doctor in last 12 months: cardiologist 1,432 9.5% 122Visited doctor in last 12 months: chiropractor 1,085 7.2% 100Visited doctor in last 12 months: dentist 7,102 47.1% 126Visited doctor in last 12 months: dermatologist 1,860 12.3% 140Visited doctor in last 12 months: ear/nose/throat 889 5.9% 129Visited doctor in last 12 months: eye 3,856 25.6% 118Visited doctor in last 12 months: gastroenterologist 707 4.7% 109Visited doctor in last 12 months: general/family 6,748 44.8% 107Visited doctor in last 12 months: internist 1,306 8.7% 152Visited doctor in last 12 months: physical therapist 1,199 8.0% 152Visited doctor in last 12 months: podiatrist 649 4.3% 149Visited doctor in last 12 months: urologist 655 4.3% 114Visited nurse practitioner in last 12 months 627 4.2% 66
Data Note: An MPI (Market Potential Index) measures the relative likelihood of the adults in the specified trade area to exhibit certain consumer behavior or purchasing patterns compared to the U.S. An MPI of 100 represents the U.S. average.Source: These data are based upon national propensities to use various products and services, applied to local demographic composition. Usage data were collected by GfK MRI in a nationally representative survey of U.S. households. Esri forecasts for 2019 and 2024.
September 25, 2019
©2019 Esri Page 1 of 9

Health and Beauty Market Potential7353-7399 St Louis Ave Village Of Skokie Only7353-7399 St Louis Ave, Skokie, Illinois, 60076 Latitude: 42.01519Drive Time: 5 minute radius Longitude: -87.71717
Expected Number ofProduct/Consumer Behavior Adults Percent MPI
Wear regular/sun/tinted prescription eyeglasses 7,026 46.6% 120Wear bifocals 1,836 12.2% 86Wear disposable contact lenses 857 5.7% 93Wear soft contact lenses 1,417 9.4% 99Wear transition lenses 996 6.6% 121Spent on eyeglasses in last 12 months: $1-99 365 2.4% 90Spent on eyeglasses in last 12 months: $100-$199 777 5.2% 118Spent on eyeglasses in last 12 months: $200-$249 706 4.7% 155Spent on eyeglasses in last 12 months: $250+ 1,761 11.7% 126Spent on contact lenses in last 12 months: <$1-99 189 1.3% 69Spent on contact lenses in last 12 months: $100-$199 495 3.3% 92Spent on contact lenses in last 12 months: $200+ 673 4.5% 117Bought prescription eyewear: discount optical ctr 1,281 8.5% 97Bought prescription eyewear: private eye doctor 4,188 27.8% 115Bought prescription eyewear: retail optical chain 2,133 14.2% 117Bought prescription eyewear: online 454 3.0% 96Used prescription drug for acne 479 3.2% 123Used prescription drug for allergy/hay fever 801 5.3% 93Used prescription drug for anxiety/panic 648 4.3% 77Used prescription drug for arthritis/osteoarthritis 403 2.7% 84Used prescription drug for rheumatoid arthritis 272 1.8% 69Used prescription drug for asthma 573 3.8% 93Used prescription drug for backache/back pain 938 6.2% 91Used prescription drug for depression 662 4.4% 76Used prescription drug for diabetes (insulin dependent) 224 1.5% 62Used prescription drug for diabetes (non-insulin depend) 713 4.7% 108Used prescription drug for heartburn/acid reflux 697 4.6% 82Used prescription drug for high blood pressure 1,837 12.2% 93Used prescription drug for high cholesterol 1,284 8.5% 100Used prescription drug for insomnia 284 1.9% 80Used prescription drug for migraine headache 400 2.7% 91Used prescription drug for sinus congestion/headache 471 3.1% 88Used prescription remedy for sleep apnea 295 2.0% 80Used prescription drug for urinary tract infection 356 2.4% 69Filled prescription last 12 months: discount/dept store 366 2.4% 72Filled prescription last 12 months: drug store/pharmacy 5,573 37.0% 100Filled prescription last 12 months: supermarket 740 4.9% 67Filled prescription last 12 months: mail order 1,474 9.8% 131Spent out of pocket prescr drugs/30 days: <$1-9 886 5.9% 91Spent out of pocket prescr drugs/30 days: $10-19 1,251 8.3% 98Spent out of pocket prescr drugs/30 days: $20-29 1,067 7.1% 119Spent out of pocket prescr drugs/30 days: $30-49 994 6.6% 104Spent out of pocket prescr drugs/30 days: $50-99 822 5.5% 94Spent out of pocket prescr drugs/30 days: $100-149 421 2.8% 101Spent out of pocket prescr drugs/30 days: $150+ 519 3.4% 104
Data Note: An MPI (Market Potential Index) measures the relative likelihood of the adults in the specified trade area to exhibit certain consumer behavior or purchasing patterns compared to the U.S. An MPI of 100 represents the U.S. average.Source: These data are based upon national propensities to use various products and services, applied to local demographic composition. Usage data were collected by GfK MRI in a nationally representative survey of U.S. households. Esri forecasts for 2019 and 2024.
September 25, 2019
©2019 Esri Page 2 of 9

Health and Beauty Market Potential7353-7399 St Louis Ave Village Of Skokie Only7353-7399 St Louis Ave, Skokie, Illinois, 60076 Latitude: 42.01519Drive Time: 5 minute radius Longitude: -87.71717
Expected Number ofProduct/Consumer Behavior Adults Percent MPI
Used last 6 months: cold/sinus/allergy med (nonprescr) 7,789 51.7% 100Used last 6 months: cough syrup/suppressant(nonprescr) 5,382 35.7% 99Used last 6 months: medicated skin cream/lotion/spray 4,906 32.6% 107Used last 6 months: non-medicated nasal spray 2,472 16.4% 109Used last 6 months: pain relieving rub/liquid/patch 4,130 27.4% 109Used last 6 months: sleeping aid/snore relief 1,722 11.4% 100Used last 6 months: sore throat remedy/cough drops 7,662 50.8% 104Used last 12 months: sunburn remedy 2,400 15.9% 102Used last 12 months: suntan/sunscreen product 7,592 50.4% 123Used last 6 months: toothache/gum/canker sore remedy 1,327 8.8% 87HH used last 6 months: children`s cold tablets/liquids 591 9.2% 83HH used last 6 months: children`s cough syrup 501 7.8% 74HH used kids pain reliever/fever reducer last 6 months 1,022 15.8% 87HH used kids vitamins/nutritional suppl last 6 months 699 10.8% 90Used body wash/shower gel in last 6 months 8,770 58.2% 93Used breath freshener in last 6 months 6,354 42.2% 100Used breath freshener in last 6 months: gum 3,500 23.2% 93Used breath freshener in last 6 months: mints 2,903 19.3% 103Used breath freshener in last 6 months: thin film 441 2.9% 119Used breath freshener 8+ times in last 7 days 1,284 8.5% 91Used complexion care product in last 6 months 7,998 53.1% 111Used denture adhesive/fixative in last 6 months 702 4.7% 75Used denture cleaner in last 6 months 1,425 9.5% 88Used facial moisturizer in last 6 months 7,847 52.1% 118Used personal foot care product in last 6 months 3,272 21.7% 109Used hair coloring product (at home) last 6 months 3,256 21.6% 117Used hair conditioning treatment (at home)/6 months 4,122 27.4% 101Used hair growth product in last 6 months 528 3.5% 113Used hair spray (at home) in last 6 months 4,597 30.5% 98Used hair styling gel/lotion/mousse in last 6 months 5,453 36.2% 107Used mouthwash in last 6 months 9,925 65.9% 100Used mouthwash 8+ times in last 7 days 2,403 15.9% 100Used whitening toothpaste in last 6 months 4,545 30.2% 94Used tooth whitener (not toothpaste) in last 6 months 1,563 10.4% 102Used tooth whitener (gel) in last 6 months 247 1.6% 80Used tooth whitener (strips) in last 6 months 839 5.6% 106Visited a day spa in last 6 months 755 5.0% 107Purchased product at salon/day spa in last 6 months 782 5.2% 117Professional srv last 6 months: haircut 10,115 67.1% 111Professional srv last 6 months: hair color/highlights 2,697 17.9% 113Professional srv last 6 months: facial 398 2.6% 105Professional srv last 6 months: massage 1,344 8.9% 120Professional srv last 6 months: manicure 2,334 15.5% 125Professional srv last 6 months: pedicure 2,830 18.8% 124Spent $150+ at barber shops in last 6 months 541 3.6% 114Spent $150+ at beauty salons in last 6 months 2,356 15.6% 133
Data Note: An MPI (Market Potential Index) measures the relative likelihood of the adults in the specified trade area to exhibit certain consumer behavior or purchasing patterns compared to the U.S. An MPI of 100 represents the U.S. average.Source: These data are based upon national propensities to use various products and services, applied to local demographic composition. Usage data were collected by GfK MRI in a nationally representative survey of U.S. households. Esri forecasts for 2019 and 2024.
September 25, 2019
©2019 Esri Page 3 of 9

Health and Beauty Market Potential7353-7399 St Louis Ave Village Of Skokie Only7353-7399 St Louis Ave, Skokie, Illinois, 60076 Latitude: 42.01519Drive Time: 10 minute radius Longitude: -87.71717
Demographic Summary 2019 2024Population 185,523 184,250Population 18+ 143,201 143,869Households 66,502 66,011Median Household Income $72,067 $79,798
Expected Number ofProduct/Consumer Behavior Adults Percent MPI
Typically spend 7+ hours exercising per week 30,487 21.3% 104Typically spend 4-6 hours exercising per week 30,633 21.4% 110Typically spend 1-3 hours exercising per week 36,099 25.2% 108Exercise at home 2+ times per week 38,935 27.2% 99Exercise at club 2+ times per week 25,897 18.1% 126Exercise at other facility 2+ times/wk 15,043 10.5% 123Own elliptical 5,542 3.9% 93Own stationary bicycle 6,437 4.5% 87Own treadmill 10,685 7.5% 82Own weight lifting equipment 14,673 10.2% 88Control diet for blood sugar level 14,237 9.9% 99Control diet for cholesterol level 15,423 10.8% 109Control diet for food allergies 2,696 1.9% 99Control diet to maintain weight 15,995 11.2% 112Control diet for physical fitness 17,463 12.2% 113Control diet for salt restriction 5,413 3.8% 110Control diet for weight loss 20,772 14.5% 101Used doctor`s care/diet for diet method 3,406 2.4% 96Used exercise program for diet method 12,628 8.8% 105Buy foods specifically labeled as fat-free 14,255 10.0% 115Buy foods specifically labeled as gluten-free 8,667 6.1% 113Buy foods specifically labeled as high fiber 10,790 7.5% 107Buy foods specifically labeled as high protein 11,401 8.0% 100Buy foods specifically labeled as lactose-free 6,193 4.3% 133Buy foods specifically labeled as low-calorie 11,969 8.4% 113Buy foods specifically labeled as low-carb 9,598 6.7% 96Buy foods specifically labeled as low-cholesterol 8,733 6.1% 126Buy foods specifically labeled as low-fat 13,596 9.5% 116Buy foods specifically labeled as low-sodium 15,013 10.5% 106Buy foods specifically labeled as natural/organic 23,643 16.5% 126Buy foods specifically labeled as probiotic 6,733 4.7% 114Buy foods specifically labeled as sugar-free 14,814 10.3% 114Used meal/dietary/weight loss supplement last 6 months 11,609 8.1% 98Used vitamins/dietary supplements in last 6 months 85,775 59.9% 111Provide services as a primary caregiver/caretaker 9,696 6.8% 91Visited doctor in last 12 months 114,059 79.6% 104Visited doctor in last 12 months: 1-2 times 35,557 24.8% 102Visited doctor in last 12 months: 3-5 times 34,807 24.3% 105Visited doctor in last 12 months: 6+ times 43,669 30.5% 104Visited doctor in last 12 months: cardiologist 11,426 8.0% 103Visited doctor in last 12 months: chiropractor 10,136 7.1% 99Visited doctor in last 12 months: dentist 61,950 43.3% 115Visited doctor in last 12 months: dermatologist 17,702 12.4% 140Visited doctor in last 12 months: ear/nose/throat 8,044 5.6% 123Visited doctor in last 12 months: eye 33,978 23.7% 109Visited doctor in last 12 months: gastroenterologist 6,681 4.7% 108Visited doctor in last 12 months: general/family 59,747 41.7% 100Visited doctor in last 12 months: internist 11,129 7.8% 136Visited doctor in last 12 months: physical therapist 9,610 6.7% 128Visited doctor in last 12 months: podiatrist 5,511 3.8% 133Visited doctor in last 12 months: urologist 5,935 4.1% 109Visited nurse practitioner in last 12 months 6,542 4.6% 73
Data Note: An MPI (Market Potential Index) measures the relative likelihood of the adults in the specified trade area to exhibit certain consumer behavior or purchasing patterns compared to the U.S. An MPI of 100 represents the U.S. average.Source: These data are based upon national propensities to use various products and services, applied to local demographic composition. Usage data were collected by GfK MRI in a nationally representative survey of U.S. households. Esri forecasts for 2019 and 2024.
September 25, 2019
©2019 Esri Page 4 of 9

Health and Beauty Market Potential7353-7399 St Louis Ave Village Of Skokie Only7353-7399 St Louis Ave, Skokie, Illinois, 60076 Latitude: 42.01519Drive Time: 10 minute radius Longitude: -87.71717
Expected Number ofProduct/Consumer Behavior Adults Percent MPI
Wear regular/sun/tinted prescription eyeglasses 58,198 40.6% 105Wear bifocals 15,762 11.0% 77Wear disposable contact lenses 7,851 5.5% 90Wear soft contact lenses 12,577 8.8% 93Wear transition lenses 7,892 5.5% 101Spent on eyeglasses in last 12 months: $1-99 3,289 2.3% 85Spent on eyeglasses in last 12 months: $100-$199 6,549 4.6% 104Spent on eyeglasses in last 12 months: $200-$249 4,728 3.3% 109Spent on eyeglasses in last 12 months: $250+ 14,126 9.9% 106Spent on contact lenses in last 12 months: <$1-99 1,958 1.4% 75Spent on contact lenses in last 12 months: $100-$199 4,226 3.0% 83Spent on contact lenses in last 12 months: $200+ 5,966 4.2% 110Bought prescription eyewear: discount optical ctr 10,906 7.6% 87Bought prescription eyewear: private eye doctor 34,533 24.1% 100Bought prescription eyewear: retail optical chain 18,086 12.6% 104Bought prescription eyewear: online 4,767 3.3% 106Used prescription drug for acne 4,263 3.0% 115Used prescription drug for allergy/hay fever 8,030 5.6% 98Used prescription drug for anxiety/panic 6,562 4.6% 82Used prescription drug for arthritis/osteoarthritis 3,620 2.5% 80Used prescription drug for rheumatoid arthritis 2,816 2.0% 75Used prescription drug for asthma 5,957 4.2% 101Used prescription drug for backache/back pain 8,029 5.6% 82Used prescription drug for depression 6,825 4.8% 83Used prescription drug for diabetes (insulin dependent) 2,578 1.8% 75Used prescription drug for diabetes (non-insulin depend) 6,056 4.2% 96Used prescription drug for heartburn/acid reflux 6,426 4.5% 79Used prescription drug for high blood pressure 15,303 10.7% 81Used prescription drug for high cholesterol 10,042 7.0% 82Used prescription drug for insomnia 2,925 2.0% 87Used prescription drug for migraine headache 3,711 2.6% 89Used prescription drug for sinus congestion/headache 4,529 3.2% 89Used prescription remedy for sleep apnea 2,773 1.9% 79Used prescription drug for urinary tract infection 4,386 3.1% 90Filled prescription last 12 months: discount/dept store 3,381 2.4% 70Filled prescription last 12 months: drug store/pharmacy 52,813 36.9% 99Filled prescription last 12 months: supermarket 7,109 5.0% 68Filled prescription last 12 months: mail order 10,508 7.3% 98Spent out of pocket prescr drugs/30 days: <$1-9 7,272 5.1% 78Spent out of pocket prescr drugs/30 days: $10-19 10,439 7.3% 86Spent out of pocket prescr drugs/30 days: $20-29 9,170 6.4% 108Spent out of pocket prescr drugs/30 days: $30-49 8,916 6.2% 98Spent out of pocket prescr drugs/30 days: $50-99 8,141 5.7% 98Spent out of pocket prescr drugs/30 days: $100-149 3,572 2.5% 90Spent out of pocket prescr drugs/30 days: $150+ 4,381 3.1% 93
Data Note: An MPI (Market Potential Index) measures the relative likelihood of the adults in the specified trade area to exhibit certain consumer behavior or purchasing patterns compared to the U.S. An MPI of 100 represents the U.S. average.Source: These data are based upon national propensities to use various products and services, applied to local demographic composition. Usage data were collected by GfK MRI in a nationally representative survey of U.S. households. Esri forecasts for 2019 and 2024.
September 25, 2019
©2019 Esri Page 5 of 9

Health and Beauty Market Potential7353-7399 St Louis Ave Village Of Skokie Only7353-7399 St Louis Ave, Skokie, Illinois, 60076 Latitude: 42.01519Drive Time: 10 minute radius Longitude: -87.71717
Expected Number ofProduct/Consumer Behavior Adults Percent MPI
Used last 6 months: cold/sinus/allergy med (nonprescr) 76,036 53.1% 103Used last 6 months: cough syrup/suppressant(nonprescr) 56,562 39.5% 109Used last 6 months: medicated skin cream/lotion/spray 47,163 32.9% 108Used last 6 months: non-medicated nasal spray 23,088 16.1% 107Used last 6 months: pain relieving rub/liquid/patch 40,002 27.9% 111Used last 6 months: sleeping aid/snore relief 16,084 11.2% 99Used last 6 months: sore throat remedy/cough drops 73,574 51.4% 105Used last 12 months: sunburn remedy 22,785 15.9% 102Used last 12 months: suntan/sunscreen product 68,237 47.7% 117Used last 6 months: toothache/gum/canker sore remedy 12,751 8.9% 88HH used last 6 months: children`s cold tablets/liquids 6,568 9.9% 89HH used last 6 months: children`s cough syrup 6,008 9.0% 86HH used kids pain reliever/fever reducer last 6 months 11,166 16.8% 92HH used kids vitamins/nutritional suppl last 6 months 7,699 11.6% 96Used body wash/shower gel in last 6 months 86,624 60.5% 97Used breath freshener in last 6 months 62,054 43.3% 103Used breath freshener in last 6 months: gum 35,018 24.5% 98Used breath freshener in last 6 months: mints 26,230 18.3% 98Used breath freshener in last 6 months: thin film 4,528 3.2% 128Used breath freshener 8+ times in last 7 days 11,933 8.3% 89Used complexion care product in last 6 months 76,939 53.7% 112Used denture adhesive/fixative in last 6 months 8,192 5.7% 92Used denture cleaner in last 6 months 14,508 10.1% 95Used facial moisturizer in last 6 months 74,405 52.0% 118Used personal foot care product in last 6 months 31,976 22.3% 112Used hair coloring product (at home) last 6 months 29,998 20.9% 113Used hair conditioning treatment (at home)/6 months 42,523 29.7% 110Used hair growth product in last 6 months 5,235 3.7% 118Used hair spray (at home) in last 6 months 42,428 29.6% 95Used hair styling gel/lotion/mousse in last 6 months 50,423 35.2% 104Used mouthwash in last 6 months 97,307 68.0% 103Used mouthwash 8+ times in last 7 days 22,697 15.8% 100Used whitening toothpaste in last 6 months 43,607 30.5% 95Used tooth whitener (not toothpaste) in last 6 months 16,021 11.2% 110Used tooth whitener (gel) in last 6 months 2,782 1.9% 94Used tooth whitener (strips) in last 6 months 8,629 6.0% 115Visited a day spa in last 6 months 8,177 5.7% 122Purchased product at salon/day spa in last 6 months 6,453 4.5% 101Professional srv last 6 months: haircut 91,693 64.0% 106Professional srv last 6 months: hair color/highlights 23,636 16.5% 104Professional srv last 6 months: facial 4,407 3.1% 122Professional srv last 6 months: massage 11,857 8.3% 111Professional srv last 6 months: manicure 23,307 16.3% 132Professional srv last 6 months: pedicure 26,198 18.3% 121Spent $150+ at barber shops in last 6 months 5,096 3.6% 113Spent $150+ at beauty salons in last 6 months 20,028 14.0% 119
Data Note: An MPI (Market Potential Index) measures the relative likelihood of the adults in the specified trade area to exhibit certain consumer behavior or purchasing patterns compared to the U.S. An MPI of 100 represents the U.S. average.Source: These data are based upon national propensities to use various products and services, applied to local demographic composition. Usage data were collected by GfK MRI in a nationally representative survey of U.S. households. Esri forecasts for 2019 and 2024.
September 25, 2019
©2019 Esri Page 6 of 9

Health and Beauty Market Potential7353-7399 St Louis Ave Village Of Skokie Only7353-7399 St Louis Ave, Skokie, Illinois, 60076 Latitude: 42.01519Drive Time: 15 minute radius Longitude: -87.71717
Demographic Summary 2019 2024Population 477,852 475,755Population 18+ 376,865 380,324Households 182,450 181,752Median Household Income $66,187 $74,914
Expected Number ofProduct/Consumer Behavior Adults Percent MPI
Typically spend 7+ hours exercising per week 80,458 21.3% 105Typically spend 4-6 hours exercising per week 79,530 21.1% 109Typically spend 1-3 hours exercising per week 93,222 24.7% 106Exercise at home 2+ times per week 102,888 27.3% 100Exercise at club 2+ times per week 68,692 18.2% 127Exercise at other facility 2+ times/wk 39,408 10.5% 122Own elliptical 13,420 3.6% 85Own stationary bicycle 16,178 4.3% 83Own treadmill 26,240 7.0% 77Own weight lifting equipment 38,075 10.1% 87Control diet for blood sugar level 37,318 9.9% 98Control diet for cholesterol level 37,311 9.9% 100Control diet for food allergies 7,202 1.9% 100Control diet to maintain weight 38,261 10.2% 101Control diet for physical fitness 44,499 11.8% 109Control diet for salt restriction 12,996 3.4% 100Control diet for weight loss 52,189 13.8% 97Used doctor`s care/diet for diet method 8,703 2.3% 93Used exercise program for diet method 32,219 8.5% 102Buy foods specifically labeled as fat-free 35,335 9.4% 108Buy foods specifically labeled as gluten-free 22,091 5.9% 110Buy foods specifically labeled as high fiber 26,935 7.1% 101Buy foods specifically labeled as high protein 29,644 7.9% 98Buy foods specifically labeled as lactose-free 15,329 4.1% 125Buy foods specifically labeled as low-calorie 30,558 8.1% 109Buy foods specifically labeled as low-carb 24,681 6.5% 94Buy foods specifically labeled as low-cholesterol 21,135 5.6% 116Buy foods specifically labeled as low-fat 33,354 8.9% 108Buy foods specifically labeled as low-sodium 39,545 10.5% 106Buy foods specifically labeled as natural/organic 63,247 16.8% 128Buy foods specifically labeled as probiotic 17,491 4.6% 113Buy foods specifically labeled as sugar-free 37,640 10.0% 110Used meal/dietary/weight loss supplement last 6 months 30,957 8.2% 99Used vitamins/dietary supplements in last 6 months 221,125 58.7% 109Provide services as a primary caregiver/caretaker 25,210 6.7% 90Visited doctor in last 12 months 293,291 77.8% 101Visited doctor in last 12 months: 1-2 times 96,084 25.5% 105Visited doctor in last 12 months: 3-5 times 87,055 23.1% 99Visited doctor in last 12 months: 6+ times 110,090 29.2% 100Visited doctor in last 12 months: cardiologist 27,753 7.4% 95Visited doctor in last 12 months: chiropractor 24,895 6.6% 92Visited doctor in last 12 months: dentist 154,350 41.0% 109Visited doctor in last 12 months: dermatologist 42,128 11.2% 127Visited doctor in last 12 months: ear/nose/throat 18,564 4.9% 108Visited doctor in last 12 months: eye 83,228 22.1% 102Visited doctor in last 12 months: gastroenterologist 16,426 4.4% 101Visited doctor in last 12 months: general/family 150,173 39.8% 96Visited doctor in last 12 months: internist 27,777 7.4% 129Visited doctor in last 12 months: physical therapist 22,526 6.0% 114Visited doctor in last 12 months: podiatrist 13,433 3.6% 123Visited doctor in last 12 months: urologist 14,160 3.8% 99Visited nurse practitioner in last 12 months 17,050 4.5% 72
Data Note: An MPI (Market Potential Index) measures the relative likelihood of the adults in the specified trade area to exhibit certain consumer behavior or purchasing patterns compared to the U.S. An MPI of 100 represents the U.S. average.Source: These data are based upon national propensities to use various products and services, applied to local demographic composition. Usage data were collected by GfK MRI in a nationally representative survey of U.S. households. Esri forecasts for 2019 and 2024.
September 25, 2019
©2019 Esri Page 7 of 9

Health and Beauty Market Potential7353-7399 St Louis Ave Village Of Skokie Only7353-7399 St Louis Ave, Skokie, Illinois, 60076 Latitude: 42.01519Drive Time: 15 minute radius Longitude: -87.71717
Expected Number ofProduct/Consumer Behavior Adults Percent MPI
Wear regular/sun/tinted prescription eyeglasses 144,697 38.4% 99Wear bifocals 37,618 10.0% 70Wear disposable contact lenses 20,303 5.4% 88Wear soft contact lenses 34,524 9.2% 97Wear transition lenses 18,640 4.9% 91Spent on eyeglasses in last 12 months: $1-99 8,852 2.3% 87Spent on eyeglasses in last 12 months: $100-$199 16,363 4.3% 99Spent on eyeglasses in last 12 months: $200-$249 11,666 3.1% 103Spent on eyeglasses in last 12 months: $250+ 34,582 9.2% 99Spent on contact lenses in last 12 months: <$1-99 5,884 1.6% 86Spent on contact lenses in last 12 months: $100-$199 11,070 2.9% 83Spent on contact lenses in last 12 months: $200+ 15,345 4.1% 107Bought prescription eyewear: discount optical ctr 27,237 7.2% 82Bought prescription eyewear: private eye doctor 85,832 22.8% 94Bought prescription eyewear: retail optical chain 45,252 12.0% 99Bought prescription eyewear: online 13,124 3.5% 111Used prescription drug for acne 12,228 3.2% 126Used prescription drug for allergy/hay fever 20,679 5.5% 96Used prescription drug for anxiety/panic 17,008 4.5% 80Used prescription drug for arthritis/osteoarthritis 8,848 2.3% 74Used prescription drug for rheumatoid arthritis 7,395 2.0% 75Used prescription drug for asthma 15,937 4.2% 103Used prescription drug for backache/back pain 20,773 5.5% 80Used prescription drug for depression 18,894 5.0% 87Used prescription drug for diabetes (insulin dependent) 7,134 1.9% 79Used prescription drug for diabetes (non-insulin depend) 15,017 4.0% 91Used prescription drug for heartburn/acid reflux 15,943 4.2% 75Used prescription drug for high blood pressure 38,277 10.2% 77Used prescription drug for high cholesterol 24,522 6.5% 76Used prescription drug for insomnia 8,708 2.3% 99Used prescription drug for migraine headache 9,387 2.5% 86Used prescription drug for sinus congestion/headache 11,771 3.1% 88Used prescription remedy for sleep apnea 6,994 1.9% 76Used prescription drug for urinary tract infection 10,859 2.9% 84Filled prescription last 12 months: discount/dept store 8,136 2.2% 64Filled prescription last 12 months: drug store/pharmacy 136,922 36.3% 98Filled prescription last 12 months: supermarket 17,452 4.6% 63Filled prescription last 12 months: mail order 23,292 6.2% 82Spent out of pocket prescr drugs/30 days: <$1-9 19,495 5.2% 80Spent out of pocket prescr drugs/30 days: $10-19 27,330 7.3% 86Spent out of pocket prescr drugs/30 days: $20-29 20,963 5.6% 94Spent out of pocket prescr drugs/30 days: $30-49 22,205 5.9% 93Spent out of pocket prescr drugs/30 days: $50-99 19,641 5.2% 90Spent out of pocket prescr drugs/30 days: $100-149 8,557 2.3% 82Spent out of pocket prescr drugs/30 days: $150+ 10,374 2.8% 83
Data Note: An MPI (Market Potential Index) measures the relative likelihood of the adults in the specified trade area to exhibit certain consumer behavior or purchasing patterns compared to the U.S. An MPI of 100 represents the U.S. average.Source: These data are based upon national propensities to use various products and services, applied to local demographic composition. Usage data were collected by GfK MRI in a nationally representative survey of U.S. households. Esri forecasts for 2019 and 2024.
September 25, 2019
©2019 Esri Page 8 of 9

Health and Beauty Market Potential7353-7399 St Louis Ave Village Of Skokie Only7353-7399 St Louis Ave, Skokie, Illinois, 60076 Latitude: 42.01519Drive Time: 15 minute radius Longitude: -87.71717
Expected Number ofProduct/Consumer Behavior Adults Percent MPI
Used last 6 months: cold/sinus/allergy med (nonprescr) 199,541 52.9% 102Used last 6 months: cough syrup/suppressant(nonprescr) 151,895 40.3% 112Used last 6 months: medicated skin cream/lotion/spray 120,904 32.1% 105Used last 6 months: non-medicated nasal spray 60,959 16.2% 107Used last 6 months: pain relieving rub/liquid/patch 102,553 27.2% 108Used last 6 months: sleeping aid/snore relief 43,967 11.7% 103Used last 6 months: sore throat remedy/cough drops 192,118 51.0% 104Used last 12 months: sunburn remedy 61,659 16.4% 105Used last 12 months: suntan/sunscreen product 177,225 47.0% 115Used last 6 months: toothache/gum/canker sore remedy 36,006 9.6% 95HH used last 6 months: children`s cold tablets/liquids 17,936 9.8% 89HH used last 6 months: children`s cough syrup 16,037 8.8% 84HH used kids pain reliever/fever reducer last 6 months 29,628 16.2% 89HH used kids vitamins/nutritional suppl last 6 months 21,137 11.6% 96Used body wash/shower gel in last 6 months 232,821 61.8% 99Used breath freshener in last 6 months 168,236 44.6% 106Used breath freshener in last 6 months: gum 98,195 26.1% 104Used breath freshener in last 6 months: mints 70,884 18.8% 100Used breath freshener in last 6 months: thin film 11,590 3.1% 125Used breath freshener 8+ times in last 7 days 32,824 8.7% 93Used complexion care product in last 6 months 201,567 53.5% 112Used denture adhesive/fixative in last 6 months 21,364 5.7% 91Used denture cleaner in last 6 months 36,851 9.8% 91Used facial moisturizer in last 6 months 190,430 50.5% 115Used personal foot care product in last 6 months 82,613 21.9% 110Used hair coloring product (at home) last 6 months 77,110 20.5% 110Used hair conditioning treatment (at home)/6 months 110,427 29.3% 109Used hair growth product in last 6 months 14,396 3.8% 123Used hair spray (at home) in last 6 months 107,784 28.6% 92Used hair styling gel/lotion/mousse in last 6 months 135,892 36.1% 107Used mouthwash in last 6 months 255,912 67.9% 103Used mouthwash 8+ times in last 7 days 57,554 15.3% 96Used whitening toothpaste in last 6 months 117,946 31.3% 97Used tooth whitener (not toothpaste) in last 6 months 43,607 11.6% 114Used tooth whitener (gel) in last 6 months 8,015 2.1% 103Used tooth whitener (strips) in last 6 months 22,872 6.1% 116Visited a day spa in last 6 months 22,060 5.9% 126Purchased product at salon/day spa in last 6 months 17,218 4.6% 103Professional srv last 6 months: haircut 237,047 62.9% 104Professional srv last 6 months: hair color/highlights 59,733 15.8% 100Professional srv last 6 months: facial 11,924 3.2% 125Professional srv last 6 months: massage 32,006 8.5% 114Professional srv last 6 months: manicure 60,817 16.1% 130Professional srv last 6 months: pedicure 67,297 17.9% 118Spent $150+ at barber shops in last 6 months 13,839 3.7% 116Spent $150+ at beauty salons in last 6 months 49,449 13.1% 112
Data Note: An MPI (Market Potential Index) measures the relative likelihood of the adults in the specified trade area to exhibit certain consumer behavior or purchasing patterns compared to the U.S. An MPI of 100 represents the U.S. average.Source: These data are based upon national propensities to use various products and services, applied to local demographic composition. Usage data were collected by GfK MRI in a nationally representative survey of U.S. households. Esri forecasts for 2019 and 2024.
September 25, 2019
©2019 Esri Page 9 of 9

House and Home Expenditures7353-7399 St Louis Ave Village Of Skokie Only7353-7399 St Louis Ave, Skokie, Illinois, 60076 Latitude: 42.01519Drive Time: 5 minute radius Longitude: -87.71717
2019 Housing Summary 2019 Demographic SummaryHousing Units 6,873 Population 19,188
2019-2024 Percent Change 0.06% Households 6,451Percent Occupied 93.9% Families 4,775Percent Owner Households 81.4% Median Age 44.2Median Home Value $331,766 Median Household Income $86,110
Spending Potential Average AmountIndex Spent Total
Owned Dwellings 139 $17,768.41 $114,624,014Mortgage Interest 136 $5,162.99 $33,306,475Mortgage Principal 135 $2,577.68 $16,628,642Property Taxes 157 $4,072.75 $26,273,316Homeowners Insurance 113 $621.13 $4,006,911Ground Rent 120 $87.25 $562,877Maintenance and Remodeling Services 138 $2,948.08 $19,018,067Maintenance and Remodeling Materials 118 $576.74 $3,720,522Property Management and Security 144 $150.97 $973,882
Rented Dwellings 104 $5,325.22 $34,352,997Rent 104 $5,216.61 $33,652,332Renters' Insurance 92 $26.69 $172,208Maintenance and Repair Services 108 $58.96 $380,367Maintenance and Repair Materials 86 $22.96 $148,090
Other Lodging 140 $812.36 $5,240,548Owned Vacation Homes 139 $716.52 $4,622,257
Principal Paid on Home Loans 130 $94.87 $611,980Closing Costs 128 $24.73 $159,525Interest Paid on Home Loans 119 $122.00 $787,035Property Taxes 143 $197.87 $1,276,460Homeowners Insurance 106 $22.37 $144,332Maintenance and Remodeling 159 $219.38 $1,415,190Property Management and Security 155 $35.30 $227,736
Housing While Attending School 152 $95.84 $618,291Household Operations 125 $2,591.33 $16,716,674
Child Care 125 $636.00 $4,102,809Care for Elderly or Handicapped 137 $99.41 $641,313Appliance Rental and Repair 122 $24.84 $160,218Computer Information Services 113 $658.42 $4,247,494Home Security System Services 117 $48.37 $312,035Non-Apparel Household Laundry/Dry Cleaning 137 $38.63 $249,195Housekeeping Services 148 $274.99 $1,773,943Lawn and Garden 129 $605.40 $3,905,448Moving/Storage/Freight Express 113 $74.73 $482,090Installation of Computers 146 $0.89 $5,751PC Repair (Personal Use) 115 $7.46 $48,139Reupholstering/Furniture Repair 160 $15.70 $101,305Termite/Pest Control 121 $43.58 $281,161Water Softening Services 123 $7.82 $50,445Internet Services Away from Home 110 $9.15 $59,027Other Home Services (1) 162 $45.93 $296,301
Data Note: The Spending Potential Index (SPI) is household-based, and represents the amount spent for a product or service relative to a national average of 100. Detail may not sum to totals due to rounding.Source: Esri forecasts for 2019 and 2024; Consumer Spending data are derived from the 2016 and 2017 Consumer Expenditure Surveys, Bureau of Labor Statistics.
September 25, 2019
©2019 Esri Page 1 of 9

House and Home Expenditures7353-7399 St Louis Ave Village Of Skokie Only7353-7399 St Louis Ave, Skokie, Illinois, 60076 Latitude: 42.01519Drive Time: 5 minute radius Longitude: -87.71717
Spending Potential Average AmountIndex Spent Total
Utilities, Fuels, Public Services 112 $5,421.36 $34,973,210Bottled Gas 100 $45.64 $294,424Electricity 101 $1,809.07 $11,670,318Fuel Oil 206 $123.86 $798,992Natural Gas 129 $609.03 $3,928,848Phone Services 112 $1,957.90 $12,630,420Water and Other Public Services 119 $866.97 $5,592,837Coal/Wood/Other Fuel 129 $8.89 $57,370
Housekeeping Supplies 111 $830.36 $5,356,658Laundry and Cleaning Supplies 106 $220.97 $1,425,497Postage and Stationery 116 $209.19 $1,349,497Other HH Products (2) 111 $400.20 $2,581,665
Household Textiles 115 $115.12 $742,661Bathroom Linens 104 $16.42 $105,904Bedroom Linens 118 $62.49 $403,136Kitchen, Dining Room and other Linens 131 $14.54 $93,778Curtains and Draperies 102 $15.31 $98,752Slipcovers, Decorative Pillows 123 $6.37 $41,091
Furniture 116 $714.51 $4,609,335Mattresses and Box Springs 108 $129.79 $837,268Other Bedroom Furniture 104 $110.96 $715,795Sofas 121 $212.18 $1,368,754Living Room Chairs 122 $63.37 $408,808Living Room Tables 105 $16.77 $108,166Kitchen, Dining Room Furniture 134 $60.65 $391,283Infant Furniture 96 $13.16 $84,890Outdoor Furniture 137 $53.53 $345,332Wall Units, Cabinets, Other Furniture (3) 119 $54.11 $349,040
Major Appliances 113 $398.37 $2,569,869Dishwashers and Disposals 119 $39.72 $256,229Refrigerators and Freezers 113 $126.91 $818,722Clothes Washers & Dryers 106 $98.68 $636,584Cooking Stoves and Ovens 120 $62.93 $405,940Microwave Ovens 106 $17.14 $110,592Window Air Conditioners 124 $9.40 $60,645Electric Floor Cleaning Equipment 121 $31.67 $204,276Sewing Machines and Miscellaneous Appliances 99 $11.92 $76,882
Data Note: The Spending Potential Index (SPI) is household-based, and represents the amount spent for a product or service relative to a national average of 100. Detail may not sum to totals due to rounding.Source: Esri forecasts for 2019 and 2024; Consumer Spending data are derived from the 2016 and 2017 Consumer Expenditure Surveys, Bureau of Labor Statistics.
September 25, 2019
©2019 Esri Page 2 of 9

House and Home Expenditures7353-7399 St Louis Ave Village Of Skokie Only7353-7399 St Louis Ave, Skokie, Illinois, 60076 Latitude: 42.01519Drive Time: 5 minute radius Longitude: -87.71717
Spending Potential Average AmountIndex Spent Total
Other Household Furnishings and EquipmentRugs 120 $38.93 $251,136Housewares 120 $127.14 $820,196Small Appliances 117 $57.08 $368,239Sewing/Needlework/Quilt Materials/Items 108 $13.99 $90,263Window Coverings 154 $36.38 $234,694Lamps/Lighting Fixtures/Ceiling Fans 124 $55.20 $356,100Infant Equipment 110 $25.46 $164,223Rental of Furniture 68 $4.72 $30,451Laundry and Cleaning Equipment 119 $36.13 $233,075Closet and Storage Items 134 $33.70 $217,373Luggage 130 $18.15 $117,067Clocks and Other Household Decoratives 140 $269.02 $1,735,417Telephones and Accessories 134 $100.89 $650,867Grills and Outdoor Equipment 104 $35.81 $230,980Power Tools 128 $80.81 $521,281Hand Tools 96 $8.94 $57,677Office Furniture/Equipment for Home Use 127 $20.57 $132,690Computers and Hardware for Home Use 123 $204.08 $1,316,505Portable Memory 131 $5.85 $37,742Computer Software 128 $12.93 $83,400Computer Accessories 117 $22.13 $142,754Other Household Appliances 114 $18.99 $122,504Misc Equipment incl Ladders/Sheds/Etc 108 $96.46 $622,280
(1) Other Home Services include miscellaneous home services and small repair jobs not already specified.(2) Other HH Products includes paper towels, napkins, toilet tissue, facial tissue, and miscellaneous household products, such as paper, plastic and foil products.(3) Wall Units, Cabinets, Other Furniture includes entertainment centers, bookcases, cabinets, desks and other family, recreation, or living room furniture.
Data Note: The Spending Potential Index (SPI) is household-based, and represents the amount spent for a product or service relative to a national average of 100. Detail may not sum to totals due to rounding.Source: Esri forecasts for 2019 and 2024; Consumer Spending data are derived from the 2016 and 2017 Consumer Expenditure Surveys, Bureau of Labor Statistics.
September 25, 2019
©2019 Esri Page 3 of 9

House and Home Expenditures7353-7399 St Louis Ave Village Of Skokie Only7353-7399 St Louis Ave, Skokie, Illinois, 60076 Latitude: 42.01519Drive Time: 10 minute radius Longitude: -87.71717
2019 Housing Summary 2019 Demographic SummaryHousing Units 72,756 Population 185,523
2019-2024 Percent Change 0.32% Households 66,502Percent Occupied 91.4% Families 45,168Percent Owner Households 60.5% Median Age 39.9Median Home Value $347,418 Median Household Income $72,067
Spending Potential Average AmountIndex Spent Total
Owned Dwellings 114 $14,624.17 $972,536,797Mortgage Interest 111 $4,229.82 $281,291,465Mortgage Principal 110 $2,098.96 $139,584,826Property Taxes 131 $3,390.29 $225,461,024Homeowners Insurance 94 $517.30 $34,401,493Ground Rent 102 $73.70 $4,901,392Maintenance and Remodeling Services 113 $2,409.58 $160,241,956Maintenance and Remodeling Materials 97 $476.11 $31,662,153Property Management and Security 135 $141.16 $9,387,245
Rented Dwellings 139 $7,154.91 $475,815,957Rent 140 $7,042.03 $468,309,395Renters' Insurance 109 $31.66 $2,105,494Maintenance and Repair Services 101 $55.33 $3,679,248Maintenance and Repair Materials 97 $25.89 $1,721,820
Other Lodging 122 $707.79 $47,069,439Owned Vacation Homes 121 $624.69 $41,543,117
Principal Paid on Home Loans 116 $85.10 $5,659,561Closing Costs 126 $24.24 $1,612,115Interest Paid on Home Loans 109 $111.71 $7,429,059Property Taxes 125 $173.56 $11,542,389Homeowners Insurance 92 $19.33 $1,285,541Maintenance and Remodeling 131 $181.45 $12,066,873Property Management and Security 129 $29.29 $1,947,579
Housing While Attending School 132 $83.10 $5,526,322Household Operations 112 $2,330.59 $154,988,814
Child Care 118 $600.22 $39,916,051Care for Elderly or Handicapped 118 $85.40 $5,679,577Appliance Rental and Repair 106 $21.59 $1,435,755Computer Information Services 110 $639.13 $42,503,624Home Security System Services 97 $40.31 $2,680,732Non-Apparel Household Laundry/Dry Cleaning 141 $39.66 $2,637,781Housekeeping Services 123 $227.49 $15,128,291Lawn and Garden 106 $498.21 $33,132,101Moving/Storage/Freight Express 107 $71.03 $4,723,925Installation of Computers 136 $0.83 $55,226PC Repair (Personal Use) 109 $7.02 $466,581Reupholstering/Furniture Repair 126 $12.38 $823,490Termite/Pest Control 100 $36.02 $2,395,383Water Softening Services 104 $6.61 $439,396Internet Services Away from Home 110 $9.17 $609,662Other Home Services (1) 125 $35.51 $2,361,238
Data Note: The Spending Potential Index (SPI) is household-based, and represents the amount spent for a product or service relative to a national average of 100. Detail may not sum to totals due to rounding.Source: Esri forecasts for 2019 and 2024; Consumer Spending data are derived from the 2016 and 2017 Consumer Expenditure Surveys, Bureau of Labor Statistics.
September 25, 2019
©2019 Esri Page 4 of 9

House and Home Expenditures7353-7399 St Louis Ave Village Of Skokie Only7353-7399 St Louis Ave, Skokie, Illinois, 60076 Latitude: 42.01519Drive Time: 10 minute radius Longitude: -87.71717
Spending Potential Average AmountIndex Spent Total
Utilities, Fuels, Public Services 104 $5,057.01 $336,301,127Bottled Gas 82 $37.09 $2,466,864Electricity 95 $1,703.64 $113,295,286Fuel Oil 184 $110.41 $7,342,327Natural Gas 121 $573.98 $38,170,961Phone Services 107 $1,884.40 $125,316,193Water and Other Public Services 102 $739.93 $49,207,145Coal/Wood/Other Fuel 109 $7.55 $502,351
Housekeeping Supplies 104 $783.14 $52,080,387Laundry and Cleaning Supplies 102 $212.91 $14,158,892Postage and Stationery 109 $195.47 $12,998,891Other HH Products (2) 104 $374.76 $24,922,604
Household Textiles 108 $108.29 $7,201,295Bathroom Linens 103 $16.22 $1,078,682Bedroom Linens 111 $58.98 $3,922,230Kitchen, Dining Room and other Linens 115 $12.78 $850,171Curtains and Draperies 97 $14.44 $960,251Slipcovers, Decorative Pillows 114 $5.86 $389,961
Furniture 108 $663.97 $44,155,355Mattresses and Box Springs 102 $122.08 $8,118,651Other Bedroom Furniture 98 $104.40 $6,942,672Sofas 114 $199.36 $13,258,168Living Room Chairs 108 $56.10 $3,730,675Living Room Tables 101 $16.10 $1,070,351Kitchen, Dining Room Furniture 126 $56.99 $3,790,004Infant Furniture 101 $13.89 $923,426Outdoor Furniture 116 $45.42 $3,020,338Wall Units, Cabinets, Other Furniture (3) 109 $49.64 $3,301,069
Major Appliances 100 $352.43 $23,437,592Dishwashers and Disposals 99 $33.21 $2,208,366Refrigerators and Freezers 98 $110.45 $7,345,040Clothes Washers & Dryers 92 $86.02 $5,720,799Cooking Stoves and Ovens 103 $54.13 $3,599,538Microwave Ovens 107 $17.32 $1,151,831Window Air Conditioners 141 $10.72 $712,651Electric Floor Cleaning Equipment 111 $29.15 $1,938,516Sewing Machines and Miscellaneous Appliances 95 $11.44 $760,851
Data Note: The Spending Potential Index (SPI) is household-based, and represents the amount spent for a product or service relative to a national average of 100. Detail may not sum to totals due to rounding.Source: Esri forecasts for 2019 and 2024; Consumer Spending data are derived from the 2016 and 2017 Consumer Expenditure Surveys, Bureau of Labor Statistics.
September 25, 2019
©2019 Esri Page 5 of 9

House and Home Expenditures7353-7399 St Louis Ave Village Of Skokie Only7353-7399 St Louis Ave, Skokie, Illinois, 60076 Latitude: 42.01519Drive Time: 10 minute radius Longitude: -87.71717
Spending Potential Average AmountIndex Spent Total
Other Household Furnishings and EquipmentRugs 113 $36.69 $2,439,710Housewares 107 $114.12 $7,589,068Small Appliances 113 $54.88 $3,649,939Sewing/Needlework/Quilt Materials/Items 94 $12.14 $807,053Window Coverings 123 $29.04 $1,931,098Lamps/Lighting Fixtures/Ceiling Fans 106 $46.86 $3,116,582Infant Equipment 115 $26.43 $1,757,979Rental of Furniture 87 $6.07 $403,404Laundry and Cleaning Equipment 112 $33.95 $2,257,479Closet and Storage Items 118 $29.71 $1,975,453Luggage 119 $16.70 $1,110,381Clocks and Other Household Decoratives 118 $227.35 $15,119,059Telephones and Accessories 113 $85.28 $5,671,088Grills and Outdoor Equipment 90 $30.88 $2,053,748Power Tools 107 $67.44 $4,484,916Hand Tools 91 $8.52 $566,637Office Furniture/Equipment for Home Use 113 $18.23 $1,212,606Computers and Hardware for Home Use 117 $194.05 $12,904,735Portable Memory 117 $5.20 $345,706Computer Software 121 $12.25 $814,355Computer Accessories 108 $20.56 $1,367,104Other Household Appliances 102 $17.04 $1,133,334Misc Equipment incl Ladders/Sheds/Etc 95 $85.34 $5,675,594
(1) Other Home Services include miscellaneous home services and small repair jobs not already specified.(2) Other HH Products includes paper towels, napkins, toilet tissue, facial tissue, and miscellaneous household products, such as paper, plastic and foil products.(3) Wall Units, Cabinets, Other Furniture includes entertainment centers, bookcases, cabinets, desks and other family, recreation, or living room furniture.
Data Note: The Spending Potential Index (SPI) is household-based, and represents the amount spent for a product or service relative to a national average of 100. Detail may not sum to totals due to rounding.Source: Esri forecasts for 2019 and 2024; Consumer Spending data are derived from the 2016 and 2017 Consumer Expenditure Surveys, Bureau of Labor Statistics.
September 25, 2019
©2019 Esri Page 6 of 9

House and Home Expenditures7353-7399 St Louis Ave Village Of Skokie Only7353-7399 St Louis Ave, Skokie, Illinois, 60076 Latitude: 42.01519Drive Time: 15 minute radius Longitude: -87.71717
2019 Housing Summary 2019 Demographic SummaryHousing Units 199,881 Population 477,852
2019-2024 Percent Change 0.51% Households 182,450Percent Occupied 91.3% Families 109,318Percent Owner Households 52.5% Median Age 38.2Median Home Value $354,437 Median Household Income $66,187
Spending Potential Average AmountIndex Spent Total
Owned Dwellings 103 $13,211.36 $2,410,413,222Mortgage Interest 102 $3,875.07 $707,005,620Mortgage Principal 99 $1,898.39 $346,360,850Property Taxes 116 $3,005.66 $548,382,836Homeowners Insurance 85 $468.94 $85,557,830Ground Rent 96 $69.45 $12,671,054Maintenance and Remodeling Services 102 $2,170.97 $396,092,667Maintenance and Remodeling Materials 88 $431.80 $78,781,578Property Management and Security 128 $133.74 $24,400,383
Rented Dwellings 163 $8,368.64 $1,526,858,567Rent 164 $8,248.24 $1,504,891,500Renters' Insurance 127 $36.98 $6,746,733Maintenance and Repair Services 102 $55.64 $10,152,346Maintenance and Repair Materials 104 $27.78 $5,067,989
Other Lodging 112 $646.21 $117,900,794Owned Vacation Homes 111 $570.99 $104,177,225
Principal Paid on Home Loans 107 $78.54 $14,330,241Closing Costs 123 $23.75 $4,332,937Interest Paid on Home Loans 102 $104.17 $19,006,174Property Taxes 112 $155.63 $28,394,824Homeowners Insurance 83 $17.43 $3,180,122Maintenance and Remodeling 119 $165.16 $30,134,249Property Management and Security 116 $26.30 $4,798,679
Housing While Attending School 120 $75.22 $13,723,569Household Operations 109 $2,254.79 $411,387,000
Child Care 117 $594.97 $108,551,926Care for Elderly or Handicapped 108 $78.06 $14,242,671Appliance Rental and Repair 99 $20.10 $3,667,456Computer Information Services 110 $639.75 $116,721,590Home Security System Services 90 $37.28 $6,801,300Non-Apparel Household Laundry/Dry Cleaning 137 $38.69 $7,059,082Housekeeping Services 114 $210.61 $38,425,099Lawn and Garden 98 $459.29 $83,798,308Moving/Storage/Freight Express 115 $76.28 $13,917,410Installation of Computers 136 $0.83 $150,983PC Repair (Personal Use) 110 $7.09 $1,293,303Reupholstering/Furniture Repair 114 $11.13 $2,031,194Termite/Pest Control 90 $32.63 $5,952,845Water Softening Services 97 $6.22 $1,134,403Internet Services Away from Home 116 $9.64 $1,758,873Other Home Services (1) 113 $32.23 $5,880,555
Data Note: The Spending Potential Index (SPI) is household-based, and represents the amount spent for a product or service relative to a national average of 100. Detail may not sum to totals due to rounding.Source: Esri forecasts for 2019 and 2024; Consumer Spending data are derived from the 2016 and 2017 Consumer Expenditure Surveys, Bureau of Labor Statistics.
September 25, 2019
©2019 Esri Page 7 of 9

House and Home Expenditures7353-7399 St Louis Ave Village Of Skokie Only7353-7399 St Louis Ave, Skokie, Illinois, 60076 Latitude: 42.01519Drive Time: 15 minute radius Longitude: -87.71717
Spending Potential Average AmountIndex Spent Total
Utilities, Fuels, Public Services 102 $4,962.48 $905,404,884Bottled Gas 76 $34.32 $6,261,582Electricity 94 $1,691.08 $308,538,428Fuel Oil 160 $95.99 $17,513,889Natural Gas 115 $544.28 $99,304,465Phone Services 107 $1,880.03 $343,011,019Water and Other Public Services 98 $709.92 $129,524,050Coal/Wood/Other Fuel 99 $6.86 $1,251,451
Housekeeping Supplies 102 $768.01 $140,122,899Laundry and Cleaning Supplies 102 $212.17 $38,711,052Postage and Stationery 104 $187.43 $34,196,467Other HH Products (2) 102 $368.40 $67,215,380
Household Textiles 107 $107.10 $19,539,814Bathroom Linens 104 $16.53 $3,015,837Bedroom Linens 110 $58.68 $10,705,322Kitchen, Dining Room and other Linens 108 $12.04 $2,197,291Curtains and Draperies 94 $14.03 $2,560,612Slipcovers, Decorative Pillows 113 $5.81 $1,060,752
Furniture 107 $656.40 $119,759,285Mattresses and Box Springs 103 $123.29 $22,494,317Other Bedroom Furniture 100 $106.89 $19,502,799Sofas 112 $196.16 $35,789,703Living Room Chairs 104 $54.01 $9,854,210Living Room Tables 103 $16.49 $3,008,661Kitchen, Dining Room Furniture 121 $54.77 $9,992,649Infant Furniture 103 $14.20 $2,590,361Outdoor Furniture 106 $41.56 $7,582,924Wall Units, Cabinets, Other Furniture (3) 107 $49.02 $8,943,662
Major Appliances 95 $335.27 $61,170,702Dishwashers and Disposals 92 $30.68 $5,596,879Refrigerators and Freezers 93 $104.25 $19,019,788Clothes Washers & Dryers 90 $83.62 $15,255,954Cooking Stoves and Ovens 94 $49.61 $9,051,455Microwave Ovens 107 $17.31 $3,157,491Window Air Conditioners 134 $10.18 $1,857,042Electric Floor Cleaning Equipment 109 $28.71 $5,237,478Sewing Machines and Miscellaneous Appliances 91 $10.93 $1,994,615
Data Note: The Spending Potential Index (SPI) is household-based, and represents the amount spent for a product or service relative to a national average of 100. Detail may not sum to totals due to rounding.Source: Esri forecasts for 2019 and 2024; Consumer Spending data are derived from the 2016 and 2017 Consumer Expenditure Surveys, Bureau of Labor Statistics.
September 25, 2019
©2019 Esri Page 8 of 9

House and Home Expenditures7353-7399 St Louis Ave Village Of Skokie Only7353-7399 St Louis Ave, Skokie, Illinois, 60076 Latitude: 42.01519Drive Time: 15 minute radius Longitude: -87.71717
Spending Potential Average AmountIndex Spent Total
Other Household Furnishings and EquipmentRugs 107 $34.68 $6,326,596Housewares 104 $110.95 $20,243,566Small Appliances 114 $55.61 $10,146,945Sewing/Needlework/Quilt Materials/Items 88 $11.42 $2,082,929Window Coverings 113 $26.64 $4,859,975Lamps/Lighting Fixtures/Ceiling Fans 102 $45.26 $8,258,090Infant Equipment 123 $28.29 $5,161,295Rental of Furniture 104 $7.27 $1,325,659Laundry and Cleaning Equipment 113 $34.05 $6,211,606Closet and Storage Items 110 $27.74 $5,061,884Luggage 118 $16.53 $3,015,509Clocks and Other Household Decoratives 113 $217.70 $39,720,136Telephones and Accessories 111 $83.93 $15,312,553Grills and Outdoor Equipment 85 $29.18 $5,323,632Power Tools 103 $64.85 $11,832,777Hand Tools 94 $8.80 $1,606,051Office Furniture/Equipment for Home Use 111 $18.01 $3,286,018Computers and Hardware for Home Use 118 $194.81 $35,543,528Portable Memory 115 $5.14 $938,038Computer Software 123 $12.47 $2,275,813Computer Accessories 106 $20.13 $3,672,130Other Household Appliances 97 $16.21 $2,958,242Misc Equipment incl Ladders/Sheds/Etc 93 $83.01 $15,145,762
(1) Other Home Services include miscellaneous home services and small repair jobs not already specified.(2) Other HH Products includes paper towels, napkins, toilet tissue, facial tissue, and miscellaneous household products, such as paper, plastic and foil products.(3) Wall Units, Cabinets, Other Furniture includes entertainment centers, bookcases, cabinets, desks and other family, recreation, or living room furniture.
Data Note: The Spending Potential Index (SPI) is household-based, and represents the amount spent for a product or service relative to a national average of 100. Detail may not sum to totals due to rounding.Source: Esri forecasts for 2019 and 2024; Consumer Spending data are derived from the 2016 and 2017 Consumer Expenditure Surveys, Bureau of Labor Statistics.
September 25, 2019
©2019 Esri Page 9 of 9

Household Budget Expenditures7353-7399 St Louis Ave Village Of Skokie Only7353-7399 St Louis Ave, Skokie, Illinois, 60076 Latitude: 42.01519Drive Time: 5 minute radius Longitude: -87.71717
Demographic Summary 2019 2024Population 19,188 19,016Households 6,451 6,373Average Household Size 2.96 2.96Families 4,775 4,708Median Age 44.2 44.4Median Household Income $86,110 $97,707
Spending Potential Potential
Average AmountIndex Spent Total Percent
Total Expenditures 122 $90,852.12 $586,087,045 100.0%Food 116 $10,301.04 $66,452,024 11.3%
Food at Home 116 $5,977.92 $38,563,574 6.6%Food Away from Home 118 $4,323.12 $27,888,450 4.8%
Alcoholic Beverages 134 $775.98 $5,005,875 0.9%
Housing 126 $29,327.36 $189,190,769 32.3%Shelter 129 $23,905.99 $154,217,559 26.3%Utilities, Fuel and Public Services 112 $5,421.36 $34,973,210 6.0%
Household Operations 125 $2,591.33 $16,716,674 2.9%Housekeeping Supplies 111 $830.36 $5,356,658 0.9%Household Furnishings and Equipment 120 $2,551.35 $16,458,780 2.8%
Apparel and Services 119 $2,546.31 $16,426,249 2.8%Transportation 109 $9,285.95 $59,903,661 10.2%Travel 134 $3,005.76 $19,390,174 3.3%Health Care 116 $6,861.82 $44,265,592 7.6%Entertainment and Recreation 121 $3,971.07 $25,617,347 4.4%Personal Care Products & Services 118 $1,042.33 $6,724,083 1.1%Education 145 $2,304.68 $14,867,508 2.5%
Smoking Products 94 $378.85 $2,443,968 0.4%Lotteries & Pari-mutuel Losses 162 $92.76 $598,375 0.1%Legal Fees 144 $301.06 $1,942,125 0.3%Funeral Expenses 96 $80.62 $520,060 0.1%Safe Deposit Box Rentals 132 $6.55 $42,257 0.0%Checking Account/Banking Service Charges 106 $36.61 $236,199 0.0%Cemetery Lots/Vaults/Maintenance Fee 112 $9.47 $61,063 0.0%Accounting Fees 166 $189.57 $1,222,939 0.2%Miscellaneous Personal Services/Advertising/Fine 119 $65.94 $425,375 0.1%Occupational Expenses 161 $98.54 $635,650 0.1%Expenses for Other Properties 93 $126.38 $815,288 0.1%Credit Card Membership Fees 153 $13.54 $87,338 0.0%Shopping Club Membership Fees 129 $34.99 $225,745 0.0%
Support Payments/Cash Contributions/Gifts in Kind 120 $2,982.05 $19,237,222 3.3%Life/Other Insurance 122 $562.84 $3,630,870 0.6%Pensions and Social Security 127 $10,342.95 $66,722,349 11.4%
Data Note: The Spending Potential Index (SPI) is household-based, and represents the amount spent for a product or service relative to a national average of 100. Detail may not sum to totals due to rounding. Source: Esri forecasts for 2019 and 2024; Consumer Spending data are derived from the 2016 and 2017 Consumer Expenditure Surveys, Bureau of Labor Statistics.
September 25, 2019
©2019 Esri Page 1 of 3

Household Budget Expenditures7353-7399 St Louis Ave Village Of Skokie Only7353-7399 St Louis Ave, Skokie, Illinois, 60076 Latitude: 42.01519Drive Time: 10 minute radius Longitude: -87.71717
Demographic Summary 2019 2024Population 185,523 184,250Households 66,502 66,011Average Household Size 2.76 2.76Families 45,168 44,702Median Age 39.9 40.6Median Household Income $72,067 $79,798
Spending Potential Potential
Average AmountIndex Spent Total Percent
Total Expenditures 113 $84,115.29 $5,593,835,312 100.0%Food 110 $9,766.91 $649,518,835 11.6%
Food at Home 110 $5,695.49 $378,761,539 6.8%Food Away from Home 111 $4,071.42 $270,757,296 4.8%
Alcoholic Beverages 123 $708.44 $47,112,994 0.8%
Housing 118 $27,543.88 $1,831,723,320 32.7%Shelter 122 $22,486.88 $1,495,422,193 26.7%Utilities, Fuel and Public Services 104 $5,057.01 $336,301,127 6.0%
Household Operations 112 $2,330.59 $154,988,814 2.8%Housekeeping Supplies 104 $783.14 $52,080,387 0.9%Household Furnishings and Equipment 108 $2,303.41 $153,181,271 2.7%
Apparel and Services 114 $2,441.09 $162,337,571 2.9%Transportation 102 $8,705.65 $578,942,808 10.3%Travel 119 $2,665.37 $177,252,510 3.2%Health Care 104 $6,183.25 $411,198,203 7.4%Entertainment and Recreation 111 $3,626.76 $241,187,034 4.3%Personal Care Products & Services 108 $959.11 $63,782,848 1.1%Education 130 $2,074.56 $137,962,567 2.5%
Smoking Products 98 $393.76 $26,185,807 0.5%Lotteries & Pari-mutuel Losses 153 $87.33 $5,807,906 0.1%Legal Fees 126 $263.61 $17,530,832 0.3%Funeral Expenses 92 $77.47 $5,152,030 0.1%Safe Deposit Box Rentals 111 $5.53 $367,533 0.0%Checking Account/Banking Service Charges 115 $39.86 $2,650,815 0.0%Cemetery Lots/Vaults/Maintenance Fee 99 $8.41 $559,427 0.0%Accounting Fees 143 $163.04 $10,842,315 0.2%Miscellaneous Personal Services/Advertising/Fine 124 $68.77 $4,573,035 0.1%Occupational Expenses 141 $86.30 $5,739,445 0.1%Expenses for Other Properties 79 $107.39 $7,141,385 0.1%Credit Card Membership Fees 142 $12.56 $834,971 0.0%Shopping Club Membership Fees 118 $31.93 $2,123,612 0.0%
Support Payments/Cash Contributions/Gifts in Kind 109 $2,709.02 $180,155,452 3.2%Life/Other Insurance 107 $492.92 $32,780,437 0.6%Pensions and Social Security 115 $9,350.97 $621,858,284 11.1%
Data Note: The Spending Potential Index (SPI) is household-based, and represents the amount spent for a product or service relative to a national average of 100. Detail may not sum to totals due to rounding. Source: Esri forecasts for 2019 and 2024; Consumer Spending data are derived from the 2016 and 2017 Consumer Expenditure Surveys, Bureau of Labor Statistics.
September 25, 2019
©2019 Esri Page 2 of 3
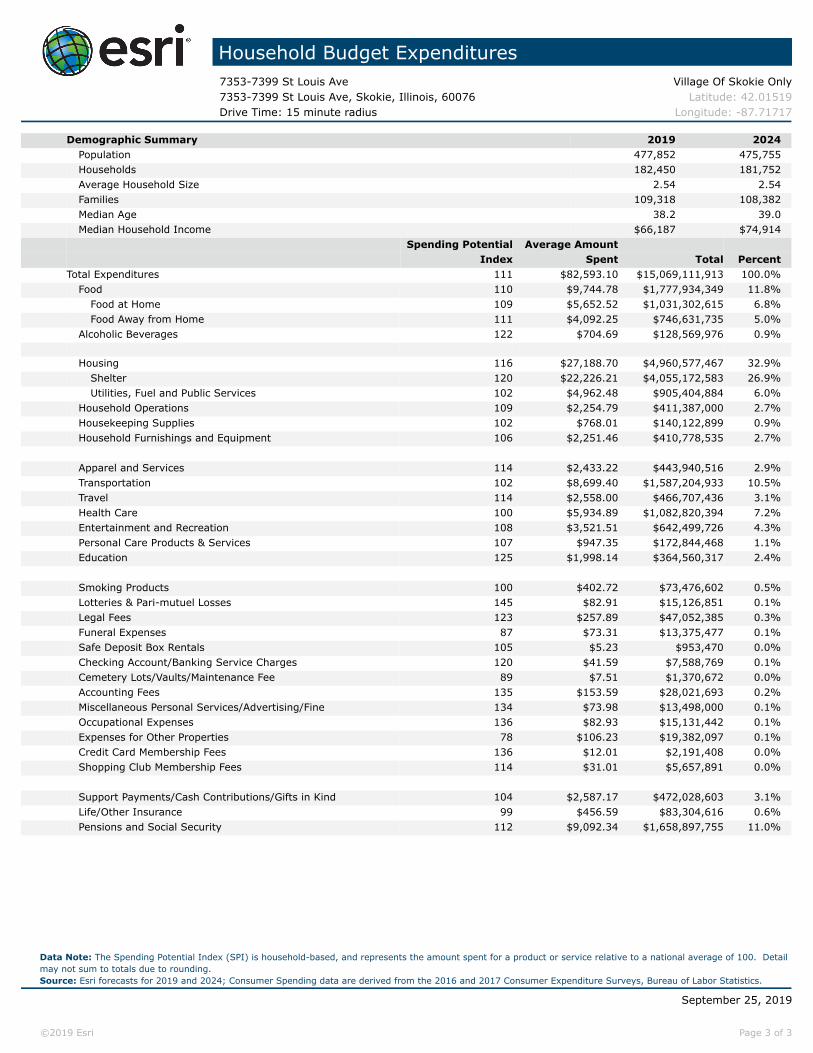
Household Budget Expenditures7353-7399 St Louis Ave Village Of Skokie Only7353-7399 St Louis Ave, Skokie, Illinois, 60076 Latitude: 42.01519Drive Time: 15 minute radius Longitude: -87.71717
Demographic Summary 2019 2024Population 477,852 475,755Households 182,450 181,752Average Household Size 2.54 2.54Families 109,318 108,382Median Age 38.2 39.0Median Household Income $66,187 $74,914
Spending Potential Potential
Average AmountIndex Spent Total Percent
Total Expenditures 111 $82,593.10 $15,069,111,913 100.0%Food 110 $9,744.78 $1,777,934,349 11.8%
Food at Home 109 $5,652.52 $1,031,302,615 6.8%Food Away from Home 111 $4,092.25 $746,631,735 5.0%
Alcoholic Beverages 122 $704.69 $128,569,976 0.9%
Housing 116 $27,188.70 $4,960,577,467 32.9%Shelter 120 $22,226.21 $4,055,172,583 26.9%Utilities, Fuel and Public Services 102 $4,962.48 $905,404,884 6.0%
Household Operations 109 $2,254.79 $411,387,000 2.7%Housekeeping Supplies 102 $768.01 $140,122,899 0.9%Household Furnishings and Equipment 106 $2,251.46 $410,778,535 2.7%
Apparel and Services 114 $2,433.22 $443,940,516 2.9%Transportation 102 $8,699.40 $1,587,204,933 10.5%Travel 114 $2,558.00 $466,707,436 3.1%Health Care 100 $5,934.89 $1,082,820,394 7.2%Entertainment and Recreation 108 $3,521.51 $642,499,726 4.3%Personal Care Products & Services 107 $947.35 $172,844,468 1.1%Education 125 $1,998.14 $364,560,317 2.4%
Smoking Products 100 $402.72 $73,476,602 0.5%Lotteries & Pari-mutuel Losses 145 $82.91 $15,126,851 0.1%Legal Fees 123 $257.89 $47,052,385 0.3%Funeral Expenses 87 $73.31 $13,375,477 0.1%Safe Deposit Box Rentals 105 $5.23 $953,470 0.0%Checking Account/Banking Service Charges 120 $41.59 $7,588,769 0.1%Cemetery Lots/Vaults/Maintenance Fee 89 $7.51 $1,370,672 0.0%Accounting Fees 135 $153.59 $28,021,693 0.2%Miscellaneous Personal Services/Advertising/Fine 134 $73.98 $13,498,000 0.1%Occupational Expenses 136 $82.93 $15,131,442 0.1%Expenses for Other Properties 78 $106.23 $19,382,097 0.1%Credit Card Membership Fees 136 $12.01 $2,191,408 0.0%Shopping Club Membership Fees 114 $31.01 $5,657,891 0.0%
Support Payments/Cash Contributions/Gifts in Kind 104 $2,587.17 $472,028,603 3.1%Life/Other Insurance 99 $456.59 $83,304,616 0.6%Pensions and Social Security 112 $9,092.34 $1,658,897,755 11.0%
Data Note: The Spending Potential Index (SPI) is household-based, and represents the amount spent for a product or service relative to a national average of 100. Detail may not sum to totals due to rounding. Source: Esri forecasts for 2019 and 2024; Consumer Spending data are derived from the 2016 and 2017 Consumer Expenditure Surveys, Bureau of Labor Statistics.
September 25, 2019
©2019 Esri Page 3 of 3

Household Income Profile7353-7399 St Louis Ave Village Of Skokie Only7353-7399 St Louis Ave, Skokie, Illinois, 60076 Latitude: 42.01519Drive Time: 5 minute radius Longitude: -87.71717
2019-2024 2019-2024Summary 2019 2024 Change Annual Rate
Population 19,188 19,016 -172 -0.18%Households 6,451 6,373 -78 -0.24%Median Age 44.2 44.4 0.2 0.09%Average Household Size 2.96 2.96 0.00 0.00%
2019 2024Households by Income Number Percent Number Percent
Household Income Base
6,451 100% 6,373 100%<$15,000 357 5.5% 321 5.0%$15,000-$24,999 477 7.4% 432 6.8%$25,000-$34,999 328 5.1% 284 4.5%$35,000-$49,999 698 10.8% 618 9.7%$50,000-$74,999 963 14.9% 882 13.8%$75,000-$99,999 789 12.2% 702 11.0%$100,000-$149,999 1,379 21.4% 1,376 21.6%$150,000-$199,999 769 11.9% 933 14.6%$200,000+ 692 10.7% 827 13.0%
Median Household Income $86,110 $97,707Average Household Income $109,187 $123,250Per Capita Income $36,888 $41,515
Data Note: Income is reported for households as of July 1, 2019 and represents annual income for the preceding year, expressed in 2017 dollars. Income is reported for households as of July 1, 2024 and represents annual income for the preceding year, expressed in 2022 dollarsSource: U.S. Census Bureau, Census 2010 Summary File 1. Esri Forecasts for 2019 and 2024.
September 25, 2019
©2019 Esri Page 1 of 9

Household Income Profile7353-7399 St Louis Ave Village Of Skokie Only7353-7399 St Louis Ave, Skokie, Illinois, 60076 Latitude: 42.01519Drive Time: 5 minute radius Longitude: -87.71717
2019 Households by Income and Age of Householder<25 25-34 35-44 45-54 55-64 65-74 75+
HH Income Base 46 525 893 1,072 1,356 1,163 1,396
<$15,000 1 18 24 34 60 51 168$15,000-$24,999 5 25 47 58 67 94 181$25,000-$34,999 3 31 34 30 33 47 150$35,000-$49,999 11 69 73 92 81 90 282$50,000-$74,999 11 76 84 92 173 246 280$75,000-$99,999 2 77 132 102 190 194 92$100,000-$149,999 10 127 236 289 356 201 159$150,000-$199,999 2 57 136 203 228 101 43$200,000+ 2 45 127 170 169 138 41
Median HH Income $55,679 $87,328 $107,291 $116,246 $106,822 $80,338 $44,362Average HH Income $80,410 $105,378 $128,456 $135,983 $125,944 $108,658 $62,827
Percent Distribution<25 25-34 35-44 45-54 55-64 65-74 75+
HH Income Base 100% 100% 100% 100% 100% 100% 100%
<$15,000 2.2% 3.4% 2.7% 3.2% 4.4% 4.4% 12.0%$15,000-$24,999 10.9% 4.8% 5.3% 5.4% 4.9% 8.1% 13.0%$25,000-$34,999 6.5% 5.9% 3.8% 2.8% 2.4% 4.0% 10.7%$35,000-$49,999 23.9% 13.1% 8.2% 8.6% 6.0% 7.7% 20.2%$50,000-$74,999 23.9% 14.5% 9.4% 8.6% 12.8% 21.2% 20.1%$75,000-$99,999 4.3% 14.7% 14.8% 9.5% 14.0% 16.7% 6.6%$100,000-$149,999 21.7% 24.2% 26.4% 27.0% 26.3% 17.3% 11.4%$150,000-$199,999 4.3% 10.9% 15.2% 18.9% 16.8% 8.7% 3.1%$200,000+ 4.3% 8.6% 14.2% 15.9% 12.5% 11.9% 2.9%
Data Note: Income is reported for households as of July 1, 2019 and represents annual income for the preceding year, expressed in 2017 dollars. Income is reported for households as of July 1, 2024 and represents annual income for the preceding year, expressed in 2022 dollarsSource: U.S. Census Bureau, Census 2010 Summary File 1. Esri Forecasts for 2019 and 2024.
September 25, 2019
©2019 Esri Page 2 of 9

Household Income Profile7353-7399 St Louis Ave Village Of Skokie Only7353-7399 St Louis Ave, Skokie, Illinois, 60076 Latitude: 42.01519Drive Time: 5 minute radius Longitude: -87.71717
2024 Households by Income and Age of Householder<25 25-34 35-44 45-54 55-64 65-74 75+
HH Income Base 45 470 960 1,019 1,191 1,204 1,484
<$15,000 1 14 23 30 41 48 164$15,000-$24,999 4 21 45 45 53 85 179$25,000-$34,999 3 23 31 20 23 38 146$35,000-$49,999 10 54 68 71 55 79 281$50,000-$74,999 12 59 81 69 132 235 293$75,000-$99,999 2 63 125 86 146 181 98$100,000-$149,999 8 121 243 266 313 222 202$150,000-$199,999 2 64 179 239 251 133 65$200,000+ 3 49 165 195 176 183 56
Median HH Income $56,701 $100,000 $116,496 $130,704 $117,447 $89,449 $47,975Average HH Income $85,224 $118,858 $144,972 $155,220 $142,742 $125,878 $72,012
Percent Distribution<25 25-34 35-44 45-54 55-64 65-74 75+
HH Income Base 100% 100% 100% 100% 100% 100% 100%
<$15,000 2.2% 3.0% 2.4% 2.9% 3.4% 4.0% 11.1%$15,000-$24,999 8.9% 4.5% 4.7% 4.4% 4.5% 7.1% 12.1%$25,000-$34,999 6.7% 4.9% 3.2% 2.0% 1.9% 3.2% 9.8%$35,000-$49,999 22.2% 11.5% 7.1% 7.0% 4.6% 6.6% 18.9%$50,000-$74,999 26.7% 12.6% 8.4% 6.8% 11.1% 19.5% 19.7%$75,000-$99,999 4.4% 13.4% 13.0% 8.4% 12.3% 15.0% 6.6%$100,000-$149,999 17.8% 25.7% 25.3% 26.1% 26.3% 18.4% 13.6%$150,000-$199,999 4.4% 13.6% 18.6% 23.5% 21.1% 11.0% 4.4%$200,000+ 6.7% 10.4% 17.2% 19.1% 14.8% 15.2% 3.8%
Data Note: Income is reported for households as of July 1, 2019 and represents annual income for the preceding year, expressed in 2017 dollars. Income is reported for households as of July 1, 2024 and represents annual income for the preceding year, expressed in 2022 dollarsSource: U.S. Census Bureau, Census 2010 Summary File 1. Esri Forecasts for 2019 and 2024.
September 25, 2019
©2019 Esri Page 3 of 9

Household Income Profile7353-7399 St Louis Ave Village Of Skokie Only7353-7399 St Louis Ave, Skokie, Illinois, 60076 Latitude: 42.01519Drive Time: 10 minute radius Longitude: -87.71717
2019-2024 2019-2024Summary 2019 2024 Change Annual Rate
Population 185,523 184,250 -1,273 -0.14%Households 66,502 66,011 -491 -0.15%Median Age 39.9 40.6 0.7 0.35%Average Household Size 2.76 2.76 0.00 0.00%
2019 2024Households by Income Number Percent Number Percent
Household Income Base
66,502 100% 66,011 100%<$15,000 5,864 8.8% 5,269 8.0%$15,000-$24,999 5,120 7.7% 4,647 7.0%$25,000-$34,999 4,726 7.1% 4,103 6.2%$35,000-$49,999 7,912 11.9% 7,013 10.6%$50,000-$74,999 10,539 15.8% 10,038 15.2%$75,000-$99,999 8,447 12.7% 8,117 12.3%$100,000-$149,999 11,590 17.4% 12,122 18.4%$150,000-$199,999 5,768 8.7% 7,030 10.6%$200,000+ 6,536 9.8% 7,672 11.6%
Median Household Income $72,067 $79,798Average Household Income $100,143 $112,777Per Capita Income $36,138 $40,678
Data Note: Income is reported for households as of July 1, 2019 and represents annual income for the preceding year, expressed in 2017 dollars. Income is reported for households as of July 1, 2024 and represents annual income for the preceding year, expressed in 2022 dollarsSource: U.S. Census Bureau, Census 2010 Summary File 1. Esri Forecasts for 2019 and 2024.
September 25, 2019
©2019 Esri Page 4 of 9

Household Income Profile7353-7399 St Louis Ave Village Of Skokie Only7353-7399 St Louis Ave, Skokie, Illinois, 60076 Latitude: 42.01519Drive Time: 10 minute radius Longitude: -87.71717
2019 Households by Income and Age of Householder<25 25-34 35-44 45-54 55-64 65-74 75+
HH Income Base 1,445 8,240 11,227 12,390 13,398 10,428 9,375
<$15,000 212 699 666 813 1,056 993 1,427$15,000-$24,999 187 590 568 648 874 982 1,270$25,000-$34,999 175 730 632 654 617 720 1,198$35,000-$49,999 265 1,248 1,232 1,277 1,060 1,123 1,706$50,000-$74,999 305 1,308 1,589 1,561 2,040 2,005 1,729$75,000-$99,999 113 1,120 1,655 1,442 1,938 1,568 611$100,000-$149,999 132 1,455 2,307 2,727 2,691 1,441 839$150,000-$199,999 25 574 1,183 1,563 1,473 660 289$200,000+ 32 515 1,395 1,706 1,647 935 306
Median HH Income $42,091 $64,190 $87,192 $95,725 $86,763 $65,238 $40,639Average HH Income $56,624 $86,866 $114,376 $120,845 $114,802 $93,232 $60,846
Percent Distribution<25 25-34 35-44 45-54 55-64 65-74 75+
HH Income Base 100% 100% 100% 100% 100% 100% 100%
<$15,000 14.7% 8.5% 5.9% 6.6% 7.9% 9.5% 15.2%$15,000-$24,999 12.9% 7.2% 5.1% 5.2% 6.5% 9.4% 13.5%$25,000-$34,999 12.1% 8.9% 5.6% 5.3% 4.6% 6.9% 12.8%$35,000-$49,999 18.3% 15.1% 11.0% 10.3% 7.9% 10.8% 18.2%$50,000-$74,999 21.1% 15.9% 14.2% 12.6% 15.2% 19.2% 18.4%$75,000-$99,999 7.8% 13.6% 14.7% 11.6% 14.5% 15.0% 6.5%$100,000-$149,999 9.1% 17.7% 20.5% 22.0% 20.1% 13.8% 8.9%$150,000-$199,999 1.7% 7.0% 10.5% 12.6% 11.0% 6.3% 3.1%$200,000+ 2.2% 6.2% 12.4% 13.8% 12.3% 9.0% 3.3%
Data Note: Income is reported for households as of July 1, 2019 and represents annual income for the preceding year, expressed in 2017 dollars. Income is reported for households as of July 1, 2024 and represents annual income for the preceding year, expressed in 2022 dollarsSource: U.S. Census Bureau, Census 2010 Summary File 1. Esri Forecasts for 2019 and 2024.
September 25, 2019
©2019 Esri Page 5 of 9

Household Income Profile7353-7399 St Louis Ave Village Of Skokie Only7353-7399 St Louis Ave, Skokie, Illinois, 60076 Latitude: 42.01519Drive Time: 10 minute radius Longitude: -87.71717
2024 Households by Income and Age of Householder<25 25-34 35-44 45-54 55-64 65-74 75+
HH Income Base 1,366 8,355 11,073 11,596 12,305 11,025 10,292
<$15,000 204 617 550 670 817 957 1,455$15,000-$24,999 169 528 466 523 719 946 1,297$25,000-$34,999 147 626 494 469 467 663 1,238$35,000-$49,999 237 1,134 1,029 1,010 820 1,027 1,755$50,000-$74,999 297 1,287 1,435 1,301 1,792 2,059 1,867$75,000-$99,999 112 1,126 1,553 1,295 1,714 1,603 713$100,000-$149,999 136 1,649 2,371 2,637 2,589 1,645 1,094$150,000-$199,999 30 740 1,502 1,786 1,655 879 439$200,000+ 36 649 1,673 1,904 1,731 1,246 433
Median HH Income $44,222 $74,622 $100,125 $106,793 $96,725 $72,635 $43,671Average HH Income $61,785 $99,195 $131,651 $137,486 $128,494 $107,094 $69,711
Percent Distribution<25 25-34 35-44 45-54 55-64 65-74 75+
HH Income Base 100% 100% 100% 100% 100% 100% 100%
<$15,000 14.9% 7.4% 5.0% 5.8% 6.6% 8.7% 14.1%$15,000-$24,999 12.4% 6.3% 4.2% 4.5% 5.8% 8.6% 12.6%$25,000-$34,999 10.8% 7.5% 4.5% 4.0% 3.8% 6.0% 12.0%$35,000-$49,999 17.3% 13.6% 9.3% 8.7% 6.7% 9.3% 17.1%$50,000-$74,999 21.7% 15.4% 13.0% 11.2% 14.6% 18.7% 18.1%$75,000-$99,999 8.2% 13.5% 14.0% 11.2% 13.9% 14.5% 6.9%$100,000-$149,999 10.0% 19.7% 21.4% 22.7% 21.0% 14.9% 10.6%$150,000-$199,999 2.2% 8.9% 13.6% 15.4% 13.4% 8.0% 4.3%$200,000+ 2.6% 7.8% 15.1% 16.4% 14.1% 11.3% 4.2%
Data Note: Income is reported for households as of July 1, 2019 and represents annual income for the preceding year, expressed in 2017 dollars. Income is reported for households as of July 1, 2024 and represents annual income for the preceding year, expressed in 2022 dollarsSource: U.S. Census Bureau, Census 2010 Summary File 1. Esri Forecasts for 2019 and 2024.
September 25, 2019
©2019 Esri Page 6 of 9

Household Income Profile7353-7399 St Louis Ave Village Of Skokie Only7353-7399 St Louis Ave, Skokie, Illinois, 60076 Latitude: 42.01519Drive Time: 15 minute radius Longitude: -87.71717
2019-2024 2019-2024Summary 2019 2024 Change Annual Rate
Population 477,852 475,755 -2,097 -0.09%Households 182,450 181,752 -698 -0.08%Median Age 38.2 39.0 0.8 0.42%Average Household Size 2.54 2.54 0.00 0.00%
2019 2024Households by Income Number Percent Number Percent
Household Income Base
182,450 100% 181,752 100%<$15,000 18,936 10.4% 17,154 9.4%$15,000-$24,999 15,701 8.6% 14,272 7.9%$25,000-$34,999 14,099 7.7% 12,348 6.8%$35,000-$49,999 21,730 11.9% 19,483 10.7%$50,000-$74,999 28,726 15.7% 27,687 15.2%$75,000-$99,999 22,636 12.4% 22,141 12.2%$100,000-$149,999 28,542 15.6% 30,541 16.8%$150,000-$199,999 13,967 7.7% 17,246 9.5%$200,000+ 18,114 9.9% 20,879 11.5%
Median Household Income $66,187 $74,914Average Household Income $97,838 $109,921Per Capita Income $37,473 $42,110
Data Note: Income is reported for households as of July 1, 2019 and represents annual income for the preceding year, expressed in 2017 dollars. Income is reported for households as of July 1, 2024 and represents annual income for the preceding year, expressed in 2022 dollarsSource: U.S. Census Bureau, Census 2010 Summary File 1. Esri Forecasts for 2019 and 2024.
September 25, 2019
©2019 Esri Page 7 of 9

Household Income Profile7353-7399 St Louis Ave Village Of Skokie Only7353-7399 St Louis Ave, Skokie, Illinois, 60076 Latitude: 42.01519Drive Time: 15 minute radius Longitude: -87.71717
2019 Households by Income and Age of Householder<25 25-34 35-44 45-54 55-64 65-74 75+
HH Income Base 7,169 28,445 32,964 33,356 33,613 25,294 21,610
<$15,000 1,520 2,769 2,229 2,430 3,179 2,888 3,920$15,000-$24,999 988 2,422 1,911 1,941 2,528 2,710 3,200$25,000-$34,999 934 2,731 2,122 1,940 1,713 1,925 2,734$35,000-$49,999 1,210 4,371 3,703 3,326 2,770 2,772 3,578$50,000-$74,999 1,141 4,499 4,848 4,464 5,318 4,692 3,763$75,000-$99,999 488 3,653 4,829 4,014 4,802 3,493 1,358$100,000-$149,999 501 4,421 6,267 6,547 5,895 3,169 1,741$150,000-$199,999 153 1,909 3,021 3,714 3,090 1,465 615$200,000+ 235 1,670 4,034 4,979 4,316 2,179 701
Median HH Income $36,267 $58,558 $82,039 $89,502 $80,391 $60,119 $38,025Average HH Income $55,017 $83,049 $111,474 $122,487 $113,162 $89,666 $58,387
Percent Distribution<25 25-34 35-44 45-54 55-64 65-74 75+
HH Income Base 100% 100% 100% 100% 100% 100% 100%
<$15,000 21.2% 9.7% 6.8% 7.3% 9.5% 11.4% 18.1%$15,000-$24,999 13.8% 8.5% 5.8% 5.8% 7.5% 10.7% 14.8%$25,000-$34,999 13.0% 9.6% 6.4% 5.8% 5.1% 7.6% 12.7%$35,000-$49,999 16.9% 15.4% 11.2% 10.0% 8.2% 11.0% 16.6%$50,000-$74,999 15.9% 15.8% 14.7% 13.4% 15.8% 18.5% 17.4%$75,000-$99,999 6.8% 12.8% 14.6% 12.0% 14.3% 13.8% 6.3%$100,000-$149,999 7.0% 15.5% 19.0% 19.6% 17.5% 12.5% 8.1%$150,000-$199,999 2.1% 6.7% 9.2% 11.1% 9.2% 5.8% 2.8%$200,000+ 3.3% 5.9% 12.2% 14.9% 12.8% 8.6% 3.2%
Data Note: Income is reported for households as of July 1, 2019 and represents annual income for the preceding year, expressed in 2017 dollars. Income is reported for households as of July 1, 2024 and represents annual income for the preceding year, expressed in 2022 dollarsSource: U.S. Census Bureau, Census 2010 Summary File 1. Esri Forecasts for 2019 and 2024.
September 25, 2019
©2019 Esri Page 8 of 9

Household Income Profile7353-7399 St Louis Ave Village Of Skokie Only7353-7399 St Louis Ave, Skokie, Illinois, 60076 Latitude: 42.01519Drive Time: 15 minute radius Longitude: -87.71717
2024 Households by Income and Age of Householder<25 25-34 35-44 45-54 55-64 65-74 75+
HH Income Base 7,049 28,654 32,072 31,381 31,595 26,885 24,115
<$15,000 1,474 2,415 1,815 1,991 2,552 2,786 4,121$15,000-$24,999 930 2,133 1,533 1,596 2,104 2,618 3,358$25,000-$34,999 836 2,351 1,662 1,441 1,363 1,801 2,894$35,000-$49,999 1,143 3,969 3,075 2,686 2,255 2,604 3,752$50,000-$74,999 1,145 4,446 4,346 3,824 4,825 4,927 4,174$75,000-$99,999 510 3,705 4,537 3,714 4,407 3,668 1,601$100,000-$149,999 557 5,049 6,553 6,522 5,903 3,676 2,281$150,000-$199,999 189 2,517 3,831 4,261 3,568 1,942 939$200,000+ 265 2,070 4,721 5,345 4,619 2,864 995
Median HH Income $37,824 $67,824 $93,656 $102,178 $88,608 $66,489 $40,513Average HH Income $60,735 $95,453 $128,591 $137,441 $126,886 $102,714 $66,661
Percent Distribution<25 25-34 35-44 45-54 55-64 65-74 75+
HH Income Base 100% 100% 100% 100% 100% 100% 100%
<$15,000 20.9% 8.4% 5.7% 6.3% 8.1% 10.4% 17.1%$15,000-$24,999 13.2% 7.4% 4.8% 5.1% 6.7% 9.7% 13.9%$25,000-$34,999 11.9% 8.2% 5.2% 4.6% 4.3% 6.7% 12.0%$35,000-$49,999 16.2% 13.9% 9.6% 8.6% 7.1% 9.7% 15.6%$50,000-$74,999 16.2% 15.5% 13.6% 12.2% 15.3% 18.3% 17.3%$75,000-$99,999 7.2% 12.9% 14.1% 11.8% 13.9% 13.6% 6.6%$100,000-$149,999 7.9% 17.6% 20.4% 20.8% 18.7% 13.7% 9.5%$150,000-$199,999 2.7% 8.8% 11.9% 13.6% 11.3% 7.2% 3.9%$200,000+ 3.8% 7.2% 14.7% 17.0% 14.6% 10.7% 4.1%
Data Note: Income is reported for households as of July 1, 2019 and represents annual income for the preceding year, expressed in 2017 dollars. Income is reported for households as of July 1, 2024 and represents annual income for the preceding year, expressed in 2022 dollarsSource: U.S. Census Bureau, Census 2010 Summary File 1. Esri Forecasts for 2019 and 2024.
September 25, 2019
©2019 Esri Page 9 of 9

Housing Profile7353-7399 St Louis Ave Village Of Skokie Only7353-7399 St Louis Ave, Skokie, Illinois, 60076 Latitude: 42.01519Drive Time: 5 minute radius Longitude: -87.71717
Population Households2010 Total Population 19,211 2019 Median Household Income $86,1102019 Total Population 19,188 2024 Median Household Income $97,7072024 Total Population 19,016 2019-2024 Annual Rate 2.56%2019-2024 Annual Rate -0.18%
Census 2010 2019 2024Housing Units by Occupancy Status and Tenure Number Percent Number Percent Number Percent
Total Housing Units 6,877 100.0% 6,873 100.0% 6,877 100.0%Occupied 6,540 95.1% 6,451 93.9% 6,373 92.7%
Owner 5,445 79.2% 5,250 76.4% 5,236 76.1%Renter 1,095 15.9% 1,201 17.5% 1,137 16.5%
Vacant 337 4.9% 422 6.1% 504 7.3%
2019 2024Owner Occupied Housing Units by Value Number Percent Number Percent
Total 5,251 100.0% 5,236 100.0%<$50,000 54 1.0% 23 0.4%$50,000-$99,999 96 1.8% 60 1.1%$100,000-$149,999 154 2.9% 110 2.1%$150,000-$199,999 279 5.3% 228 4.4%$200,000-$249,999 553 10.5% 446 8.5%$250,000-$299,999 939 17.9% 842 16.1%$300,000-$399,999 1,733 33.0% 1,796 34.3%$400,000-$499,999 654 12.5% 751 14.3%$500,000-$749,999 546 10.4% 702 13.4%$750,000-$999,999 73 1.4% 92 1.8%$1,000,000-$1,499,999 128 2.4% 138 2.6%$1,500,000-$1,999,999 9 0.2% 9 0.2%$2,000,000+ 33 0.6% 39 0.7%
Median Value $331,766 $350,612Average Value $383,784 $411,082
Census 2010 Housing Units Number PercentTotal 6,877 100.0%
In Urbanized Areas 6,877 100.0%In Urban Clusters 0 0.0%Rural Housing Units 0 0.0%
Data Note: Persons of Hispanic Origin may be of any race.Source: U.S. Census Bureau, Census 2010 Summary File 1. Esri forecasts for 2019 and 2024.
September 25, 2019
©2019 Esri Page 1 of 6

Housing Profile7353-7399 St Louis Ave Village Of Skokie Only7353-7399 St Louis Ave, Skokie, Illinois, 60076 Latitude: 42.01519Drive Time: 5 minute radius Longitude: -87.71717
Census 2010 Owner Occupied Housing Units by Mortgage Status Number PercentTotal 5,445 100.0%
Owned with a Mortgage/Loan 3,572 65.6%Owned Free and Clear 1,873 34.4%
Census 2010 Vacant Housing Units by StatusNumber Percent
Total 351 100.0%For Rent 64 18.2%Rented- Not Occupied 7 2.0%For Sale Only 103 29.3%Sold - Not Occupied 32 9.1%Seasonal/Recreational/Occasional Use 35 10.0%For Migrant Workers 0 0.0%Other Vacant 110 31.3%
Census 2010 Occupied Housing Units by Age of Householder and Home Ownership Owner Occupied Units
Occupied Units Number % of OccupiedTotal 6,542 5,447 83.3%
15-24 57 32 56.1%25-34 534 359 67.2%35-44 939 751 80.0%45-54 1,355 1,158 85.5%55-64 1,425 1,304 91.5%65-74 881 800 90.8%75-84 747 639 85.5%85+ 604 404 66.9%
Census 2010 Occupied Housing Units by Race/Ethnicity of Householder and Home Ownership Owner Occupied Units
Occupied Units Number % of OccupiedTotal 6,540 5,444 83.2%
White Alone 4,583 3,828 83.5%Black/African American Alone 229 153 66.8%American Indian/Alaska Native Alone
6 4 66.7%Asian Alone 1,428 1,250 87.5%Pacific Islander Alone 1 0 0.0%Other Race Alone 155 106 68.4%Two or More Races 138 103 74.6%
Hispanic Origin 432 325 75.2%
Census 2010 Occupied Housing Units by Size and Home Ownership Owner Occupied Units
Occupied Units Number % of OccupiedTotal 6,539 5,443 83.2%
1-Person 1,493 1,075 72.0%2-Person 1,890 1,651 87.4%3-Person 1,027 897 87.3%4-Person 998 865 86.7%5-Person 587 490 83.5%6-Person 311 271 87.1%7+ Person 233 194 83.3%
2019 Housing AffordabilityHousing Affordability Index 105Percent of Income for Mortgage 18.9%
Data Note: Persons of Hispanic Origin may be of any race.Source: U.S. Census Bureau, Census 2010 Summary File 1. Esri forecasts for 2019 and 2024.
September 25, 2019
©2019 Esri Page 2 of 6

Housing Profile7353-7399 St Louis Ave Village Of Skokie Only7353-7399 St Louis Ave, Skokie, Illinois, 60076 Latitude: 42.01519Drive Time: 10 minute radius Longitude: -87.71717
Population Households2010 Total Population 185,578 2019 Median Household Income $72,0672019 Total Population 185,523 2024 Median Household Income $79,7982024 Total Population 184,250 2019-2024 Annual Rate 2.06%2019-2024 Annual Rate -0.14%
Census 2010 2019 2024Housing Units by Occupancy Status and Tenure Number Percent Number Percent Number Percent
Total Housing Units 72,266 100.0% 72,756 100.0% 72,987 100.0%Occupied 66,618 92.2% 66,502 91.4% 66,011 90.4%
Owner 41,966 58.1% 40,239 55.3% 40,480 55.5%Renter 24,652 34.1% 26,263 36.1% 25,531 35.0%
Vacant 5,648 7.8% 6,254 8.6% 6,976 9.6%
2019 2024Owner Occupied Housing Units by Value Number Percent Number Percent
Total 40,240 100.0% 40,480 100.0%<$50,000 313 0.8% 124 0.3%$50,000-$99,999 936 2.3% 519 1.3%$100,000-$149,999 1,416 3.5% 896 2.2%$150,000-$199,999 2,586 6.4% 1,916 4.7%$200,000-$249,999 3,841 9.5% 3,131 7.7%$250,000-$299,999 5,391 13.4% 4,895 12.1%$300,000-$399,999 11,888 29.5% 12,336 30.5%$400,000-$499,999 6,151 15.3% 7,117 17.6%$500,000-$749,999 5,574 13.9% 6,991 17.3%$750,000-$999,999 1,272 3.2% 1,591 3.9%$1,000,000-$1,499,999 558 1.4% 595 1.5%$1,500,000-$1,999,999 88 0.2% 94 0.2%$2,000,000+ 226 0.6% 275 0.7%
Median Value $347,418 $371,004Average Value $396,119 $428,574
Census 2010 Housing Units Number PercentTotal 72,266 100.0%
In Urbanized Areas 72,266 100.0%In Urban Clusters 0 0.0%Rural Housing Units 0 0.0%
Data Note: Persons of Hispanic Origin may be of any race.Source: U.S. Census Bureau, Census 2010 Summary File 1. Esri forecasts for 2019 and 2024.
September 25, 2019
©2019 Esri Page 3 of 6

Housing Profile7353-7399 St Louis Ave Village Of Skokie Only7353-7399 St Louis Ave, Skokie, Illinois, 60076 Latitude: 42.01519Drive Time: 10 minute radius Longitude: -87.71717
Census 2010 Owner Occupied Housing Units by Mortgage Status Number PercentTotal 41,967 100.0%
Owned with a Mortgage/Loan 29,786 71.0%Owned Free and Clear 12,181 29.0%
Census 2010 Vacant Housing Units by StatusNumber Percent
Total 5,618 100.0%For Rent 2,292 40.8%Rented- Not Occupied 130 2.3%For Sale Only 1,201 21.4%Sold - Not Occupied 274 4.9%Seasonal/Recreational/Occasional Use 331 5.9%For Migrant Workers 0 0.0%Other Vacant 1,390 24.7%
Census 2010 Occupied Housing Units by Age of Householder and Home Ownership Owner Occupied Units
Occupied Units Number % of OccupiedTotal 66,618 41,966 63.0%
15-24 1,465 206 14.1%25-34 8,787 3,112 35.4%35-44 12,331 6,953 56.4%45-54 14,434 9,526 66.0%55-64 13,229 9,789 74.0%65-74 7,784 5,942 76.3%75-84 5,529 4,197 75.9%85+ 3,059 2,241 73.3%
Census 2010 Occupied Housing Units by Race/Ethnicity of Householder and Home Ownership Owner Occupied Units
Occupied Units Number % of OccupiedTotal 66,618 41,966 63.0%
White Alone 42,843 30,189 70.5%Black/African American Alone 8,459 3,221 38.1%American Indian/Alaska Native Alone
168 67 39.9%Asian Alone 10,494 6,625 63.1%Pacific Islander Alone 17 10 58.8%Other Race Alone 2,931 1,052 35.9%Two or More Races 1,706 802 47.0%
Hispanic Origin 6,912 2,999 43.4%
Census 2010 Occupied Housing Units by Size and Home Ownership Owner Occupied Units
Occupied Units Number % of OccupiedTotal 66,618 41,966 63.0%
1-Person 17,353 9,646 55.6%2-Person 19,334 12,985 67.2%3-Person 10,893 7,010 64.4%4-Person 9,549 6,345 66.4%5-Person 5,173 3,265 63.1%6-Person 2,357 1,443 61.2%7+ Person 1,959 1,272 64.9%
2019 Housing AffordabilityHousing Affordability Index 85Percent of Income for Mortgage 23.6%
Data Note: Persons of Hispanic Origin may be of any race.Source: U.S. Census Bureau, Census 2010 Summary File 1. Esri forecasts for 2019 and 2024.
September 25, 2019
©2019 Esri Page 4 of 6

Housing Profile7353-7399 St Louis Ave Village Of Skokie Only7353-7399 St Louis Ave, Skokie, Illinois, 60076 Latitude: 42.01519Drive Time: 15 minute radius Longitude: -87.71717
Population Households2010 Total Population 475,588 2019 Median Household Income $66,1872019 Total Population 477,852 2024 Median Household Income $74,9142024 Total Population 475,755 2019-2024 Annual Rate 2.51%2019-2024 Annual Rate -0.09%
Census 2010 2019 2024Housing Units by Occupancy Status and Tenure Number Percent Number Percent Number Percent
Total Housing Units 198,023 100.0% 199,881 100.0% 200,895 100.0%Occupied 180,923 91.4% 182,449 91.3% 181,752 90.5%
Owner 99,912 50.5% 95,816 47.9% 97,063 48.3%Renter 81,011 40.9% 86,633 43.3% 84,689 42.2%
Vacant 17,100 8.6% 17,431 8.7% 19,143 9.5%
2019 2024Owner Occupied Housing Units by Value Number Percent Number Percent
Total 95,818 100.0% 97,064 100.0%<$50,000 879 0.9% 400 0.4%$50,000-$99,999 2,317 2.4% 1,318 1.4%$100,000-$149,999 3,662 3.8% 2,362 2.4%$150,000-$199,999 6,398 6.7% 4,675 4.8%$200,000-$249,999 9,014 9.4% 7,289 7.5%$250,000-$299,999 12,034 12.6% 10,997 11.3%$300,000-$399,999 24,992 26.1% 26,157 26.9%$400,000-$499,999 13,647 14.2% 16,053 16.5%$500,000-$749,999 14,976 15.6% 18,583 19.1%$750,000-$999,999 4,505 4.7% 5,684 5.9%$1,000,000-$1,499,999 2,270 2.4% 2,340 2.4%$1,500,000-$1,999,999 452 0.5% 446 0.5%$2,000,000+ 672 0.7% 760 0.8%
Median Value $354,437 $382,162Average Value $422,064 $456,076
Census 2010 Housing Units Number PercentTotal 198,023 100.0%
In Urbanized Areas 198,023 100.0%In Urban Clusters 0 0.0%Rural Housing Units 0 0.0%
Data Note: Persons of Hispanic Origin may be of any race.Source: U.S. Census Bureau, Census 2010 Summary File 1. Esri forecasts for 2019 and 2024.
September 25, 2019
©2019 Esri Page 5 of 6

Housing Profile7353-7399 St Louis Ave Village Of Skokie Only7353-7399 St Louis Ave, Skokie, Illinois, 60076 Latitude: 42.01519Drive Time: 15 minute radius Longitude: -87.71717
Census 2010 Owner Occupied Housing Units by Mortgage Status Number PercentTotal 99,912 100.0%
Owned with a Mortgage/Loan 72,020 72.1%Owned Free and Clear 27,892 27.9%
Census 2010 Vacant Housing Units by StatusNumber Percent
Total 16,945 100.0%For Rent 7,869 46.4%Rented- Not Occupied 399 2.4%For Sale Only 3,231 19.1%Sold - Not Occupied 612 3.6%Seasonal/Recreational/Occasional Use 1,007 5.9%For Migrant Workers 0 0.0%Other Vacant 3,827 22.6%
Census 2010 Occupied Housing Units by Age of Householder and Home Ownership Owner Occupied Units
Occupied Units Number % of OccupiedTotal 180,922 99,911 55.2%
15-24 7,558 588 7.8%25-34 31,215 9,390 30.1%35-44 35,212 18,511 52.6%45-54 36,926 22,520 61.0%55-64 31,886 21,741 68.2%65-74 18,415 13,131 71.3%75-84 12,862 9,329 72.5%85+ 6,848 4,701 68.6%
Census 2010 Occupied Housing Units by Race/Ethnicity of Householder and Home Ownership Owner Occupied Units
Occupied Units Number % of OccupiedTotal 180,922 99,912 55.2%
White Alone 123,922 77,143 62.3%Black/African American Alone 18,304 4,803 26.2%American Indian/Alaska Native Alone
596 172 28.9%Asian Alone 23,226 13,008 56.0%Pacific Islander Alone 65 28 43.1%Other Race Alone 10,095 2,970 29.4%Two or More Races 4,714 1,788 37.9%
Hispanic Origin 24,085 8,415 34.9%
Census 2010 Occupied Housing Units by Size and Home Ownership Owner Occupied Units
Occupied Units Number % of OccupiedTotal 180,924 99,913 55.2%
1-Person 55,867 25,587 45.8%2-Person 53,367 31,822 59.6%3-Person 27,300 15,949 58.4%4-Person 23,086 14,406 62.4%5-Person 11,936 7,037 59.0%6-Person 5,196 2,846 54.8%7+ Person 4,172 2,266 54.3%
2019 Housing AffordabilityHousing Affordability Index 78Percent of Income for Mortgage 26.2%
Data Note: Persons of Hispanic Origin may be of any race.Source: U.S. Census Bureau, Census 2010 Summary File 1. Esri forecasts for 2019 and 2024.
September 25, 2019
©2019 Esri Page 6 of 6

Market Profile7353-7399 St Louis Ave Village Of Skokie Only7353-7399 St Louis Ave, Skokie, Illinois, 60076 Latitude: 42.01519Drive Time: 5, 10, 15 minute radii Longitude: -87.71717
5 minutes 10 minutes 15 minutesPopulation Summary
2000 Total Population 18,580 186,997 494,7142010 Total Population 19,211 185,578 475,5882019 Total Population 19,188 185,523 477,852
2019 Group Quarters 123 2,301 14,9082024 Total Population 19,016 184,250 475,755
2019-2024 Annual Rate -0.18% -0.14% -0.09%2019 Total Daytime Population 24,735 168,530 442,265
Workers 14,322 72,008 204,172Residents 10,413 96,522 238,093
Household Summary2000 Households 6,697 67,825 183,628
2000 Average Household Size 2.76 2.72 2.612010 Households 6,540 66,618 180,923
2010 Average Household Size 2.92 2.75 2.552019 Households 6,451 66,502 182,450
2019 Average Household Size 2.96 2.76 2.542024 Households 6,373 66,011 181,752
2024 Average Household Size 2.96 2.76 2.542019-2024 Annual Rate -0.24% -0.15% -0.08%
2010 Families 4,872 45,737 110,0462010 Average Family Size 3.49 3.38 3.29
2019 Families 4,775 45,168 109,3182019 Average Family Size 3.54 3.40 3.30
2024 Families 4,708 44,702 108,3822024 Average Family Size 3.56 3.41 3.302019-2024 Annual Rate -0.28% -0.21% -0.17%
Housing Unit Summary2000 Housing Units 6,820 70,097 191,194
Owner Occupied Housing Units 84.9% 60.6% 50.3%Renter Occupied Housing Units 13.3% 36.2% 45.7%Vacant Housing Units 1.8% 3.2% 4.0%
2010 Housing Units 6,877 72,266 198,023Owner Occupied Housing Units 79.2% 58.1% 50.5%Renter Occupied Housing Units 15.9% 34.1% 40.9%Vacant Housing Units 4.9% 7.8% 8.6%
2019 Housing Units 6,873 72,756 199,881Owner Occupied Housing Units 76.4% 55.3% 47.9%Renter Occupied Housing Units 17.5% 36.1% 43.3%Vacant Housing Units 6.1% 8.6% 8.7%
2024 Housing Units 6,877 72,987 200,895Owner Occupied Housing Units 76.1% 55.5% 48.3%Renter Occupied Housing Units 16.5% 35.0% 42.2%Vacant Housing Units 7.3% 9.6% 9.5%
Median Household Income2019 $86,110 $72,067 $66,1872024 $97,707 $79,798 $74,914
Median Home Value2019 $331,766 $347,418 $354,4372024 $350,612 $371,004 $382,162
Per Capita Income2019 $36,888 $36,138 $37,4732024 $41,515 $40,678 $42,110
Median Age2010 42.6 38.7 36.82019 44.2 39.9 38.22024 44.4 40.6 39.0
Data Note: Household population includes persons not residing in group quarters. Average Household Size is the household population divided by total households. Persons in families include the householder and persons related to the householder by birth, marriage, or adoption. Per Capita Income represents the income received by all persons aged 15 years and over divided by the total population.Source: U.S. Census Bureau, Census 2010 Summary File 1. Esri forecasts for 2019 and 2024 Esri converted Census 2000 data into 2010 geography.
September 25, 2019
©2019 Esri Page 1 of 7

Market Profile7353-7399 St Louis Ave Village Of Skokie Only7353-7399 St Louis Ave, Skokie, Illinois, 60076 Latitude: 42.01519Drive Time: 5, 10, 15 minute radii Longitude: -87.71717
5 minutes 10 minutes 15 minutes2019 Households by Income
Household Income Base 6,451 66,502 182,450<$15,000 5.5% 8.8% 10.4%$15,000 - $24,999 7.4% 7.7% 8.6%$25,000 - $34,999 5.1% 7.1% 7.7%$35,000 - $49,999 10.8% 11.9% 11.9%$50,000 - $74,999 14.9% 15.8% 15.7%$75,000 - $99,999 12.2% 12.7% 12.4%$100,000 - $149,999 21.4% 17.4% 15.6%$150,000 - $199,999 11.9% 8.7% 7.7%$200,000+ 10.7% 9.8% 9.9%
Average Household Income $109,187 $100,143 $97,8382024 Households by Income
Household Income Base 6,373 66,011 181,752<$15,000 5.0% 8.0% 9.4%$15,000 - $24,999 6.8% 7.0% 7.9%$25,000 - $34,999 4.5% 6.2% 6.8%$35,000 - $49,999 9.7% 10.6% 10.7%$50,000 - $74,999 13.8% 15.2% 15.2%$75,000 - $99,999 11.0% 12.3% 12.2%$100,000 - $149,999 21.6% 18.4% 16.8%$150,000 - $199,999 14.6% 10.6% 9.5%$200,000+ 13.0% 11.6% 11.5%
Average Household Income $123,250 $112,777 $109,9212019 Owner Occupied Housing Units by Value
Total 5,250 40,239 95,816<$50,000 1.0% 0.8% 0.9%$50,000 - $99,999 1.8% 2.3% 2.4%$100,000 - $149,999 2.9% 3.5% 3.8%$150,000 - $199,999 5.3% 6.4% 6.7%$200,000 - $249,999 10.5% 9.5% 9.4%$250,000 - $299,999 17.9% 13.4% 12.6%$300,000 - $399,999 33.0% 29.5% 26.1%$400,000 - $499,999 12.5% 15.3% 14.2%$500,000 - $749,999 10.4% 13.9% 15.6%$750,000 - $999,999 1.4% 3.2% 4.7%$1,000,000 - $1,499,999 2.4% 1.4% 2.4%$1,500,000 - $1,999,999 0.2% 0.2% 0.5%$2,000,000 + 0.6% 0.6% 0.7%
Average Home Value $383,784 $396,119 $422,0642024 Owner Occupied Housing Units by Value
Total 5,236 40,480 97,063<$50,000 0.4% 0.3% 0.4%$50,000 - $99,999 1.1% 1.3% 1.4%$100,000 - $149,999 2.1% 2.2% 2.4%$150,000 - $199,999 4.4% 4.7% 4.8%$200,000 - $249,999 8.5% 7.7% 7.5%$250,000 - $299,999 16.1% 12.1% 11.3%$300,000 - $399,999 34.3% 30.5% 26.9%$400,000 - $499,999 14.3% 17.6% 16.5%$500,000 - $749,999 13.4% 17.3% 19.1%$750,000 - $999,999 1.8% 3.9% 5.9%$1,000,000 - $1,499,999 2.6% 1.5% 2.4%$1,500,000 - $1,999,999 0.2% 0.2% 0.5%$2,000,000 + 0.7% 0.7% 0.8%
Average Home Value $411,082 $428,574 $456,076
Data Note: Income represents the preceding year, expressed in current dollars. Household income includes wage and salary earnings, interest dividends, net rents, pensions, SSI and welfare payments, child support, and alimony. Source: U.S. Census Bureau, Census 2010 Summary File 1. Esri forecasts for 2019 and 2024 Esri converted Census 2000 data into 2010 geography.
September 25, 2019
©2019 Esri Page 2 of 7

Market Profile7353-7399 St Louis Ave Village Of Skokie Only7353-7399 St Louis Ave, Skokie, Illinois, 60076 Latitude: 42.01519Drive Time: 5, 10, 15 minute radii Longitude: -87.71717
5 minutes 10 minutes 15 minutes2010 Population by Age
Total 19,209 185,578 475,5890 - 4 5.8% 6.7% 6.5%5 - 9 6.4% 6.7% 6.1%10 - 14 6.6% 6.6% 5.8%15 - 24 12.2% 12.2% 13.8%25 - 34 10.5% 12.8% 15.2%35 - 44 11.2% 13.4% 14.1%45 - 54 14.2% 14.4% 13.9%55 - 64 14.1% 12.7% 11.6%65 - 74 8.4% 7.3% 6.5%75 - 84 6.3% 4.8% 4.3%85 + 4.2% 2.4% 2.2%
18 + 77.1% 75.9% 78.1%2019 Population by Age
Total 19,187 185,521 477,8510 - 4 5.4% 6.1% 5.8%5 - 9 5.9% 6.2% 5.8%10 - 14 6.5% 6.6% 6.1%15 - 24 10.8% 12.1% 13.6%25 - 34 11.1% 12.6% 14.3%35 - 44 11.1% 12.4% 13.3%45 - 54 11.8% 12.6% 12.6%55 - 64 14.2% 13.2% 12.4%65 - 74 11.7% 10.0% 9.0%75 - 84 6.9% 5.3% 4.7%85 + 4.7% 2.8% 2.5%
18 + 78.5% 77.2% 78.9%2024 Population by Age
Total 19,015 184,249 475,7560 - 4 5.5% 6.1% 5.8%5 - 9 5.8% 6.0% 5.5%10 - 14 6.2% 6.1% 5.5%15 - 24 10.8% 11.7% 13.3%25 - 34 10.4% 12.9% 14.6%35 - 44 12.2% 12.7% 13.3%45 - 54 11.5% 12.1% 12.1%55 - 64 12.8% 12.4% 11.9%65 - 74 12.4% 10.8% 9.8%75 - 84 8.0% 6.3% 5.6%85 + 4.6% 2.9% 2.6%
18 + 78.9% 78.1% 79.9%2010 Population by Sex
Males 9,186 89,280 232,655Females 10,025 96,298 242,933
2019 Population by SexMales 9,215 89,553 234,221Females 9,973 95,970 243,631
2024 Population by SexMales 9,157 89,181 233,544Females 9,859 95,068 242,211
Source: U.S. Census Bureau, Census 2010 Summary File 1. Esri forecasts for 2019 and 2024 Esri converted Census 2000 data into 2010 geography.
September 25, 2019
©2019 Esri Page 3 of 7

Market Profile7353-7399 St Louis Ave Village Of Skokie Only7353-7399 St Louis Ave, Skokie, Illinois, 60076 Latitude: 42.01519Drive Time: 5, 10, 15 minute radii Longitude: -87.71717
5 minutes 10 minutes 15 minutes2010 Population by Race/Ethnicity
Total 19,211 185,578 475,588White Alone 62.3% 57.5% 61.8%Black Alone 4.1% 12.9% 10.0%American Indian Alone 0.1% 0.3% 0.4%Asian Alone 26.7% 19.0% 15.7%Pacific Islander Alone 0.0% 0.0% 0.0%Some Other Race Alone 3.4% 6.3% 8.1%Two or More Races 3.4% 4.0% 3.9%
Hispanic Origin 9.1% 14.4% 18.8%Diversity Index 61.5 71.2 71.0
2019 Population by Race/EthnicityTotal 19,188 185,524 477,853
White Alone 57.2% 53.8% 58.5%Black Alone 3.5% 11.3% 8.7%American Indian Alone 0.1% 0.3% 0.4%Asian Alone 31.6% 23.0% 19.1%Pacific Islander Alone 0.0% 0.0% 0.0%Some Other Race Alone 3.7% 7.0% 8.9%Two or More Races 3.8% 4.6% 4.4%
Hispanic Origin 10.0% 16.2% 20.6%Diversity Index 64.8 74.1 74.0
2024 Population by Race/EthnicityTotal 19,016 184,250 475,754
White Alone 54.3% 51.9% 56.7%Black Alone 3.1% 10.3% 7.9%American Indian Alone 0.1% 0.3% 0.4%Asian Alone 34.6% 25.2% 21.1%Pacific Islander Alone 0.0% 0.0% 0.0%Some Other Race Alone 3.9% 7.5% 9.3%Two or More Races 3.9% 4.8% 4.6%
Hispanic Origin 10.6% 17.3% 21.9%Diversity Index 66.3 75.5 75.5
2010 Population by Relationship and Household TypeTotal 19,211 185,578 475,588
In Households 99.4% 98.8% 96.9%In Family Households 89.5% 84.9% 77.8%
Householder 25.5% 24.7% 23.1%Spouse 20.8% 18.5% 17.2%Child 34.4% 33.4% 29.7%Other relative 7.7% 6.7% 6.0%Nonrelative 1.1% 1.6% 1.8%
In Nonfamily Households 9.8% 13.8% 19.0%In Group Quarters 0.6% 1.2% 3.1%
Institutionalized Population 0.5% 0.9% 1.3%Noninstitutionalized Population 0.2% 0.3% 1.8%
Data Note: Persons of Hispanic Origin may be of any race. The Diversity Index measures the probability that two people from the same area will be from different race/ethnic groups.Source: U.S. Census Bureau, Census 2010 Summary File 1. Esri forecasts for 2019 and 2024 Esri converted Census 2000 data into 2010 geography.
September 25, 2019
©2019 Esri Page 4 of 7

Market Profile7353-7399 St Louis Ave Village Of Skokie Only7353-7399 St Louis Ave, Skokie, Illinois, 60076 Latitude: 42.01519Drive Time: 5, 10, 15 minute radii Longitude: -87.71717
5 minutes 10 minutes 15 minutes2019 Population 25+ by Educational AttainmentTotal 13,704 127,987 328,660
Less than 9th Grade 4.4% 6.0% 6.0%9th - 12th Grade, No Diploma 3.7% 4.6% 4.5%High School Graduate 17.0% 15.9% 15.6%GED/Alternative Credential 2.3% 2.2% 2.4%Some College, No Degree 14.2% 15.5% 15.2%Associate Degree 7.0% 5.7% 5.3%Bachelor's Degree 32.0% 29.6% 28.9%Graduate/Professional Degree 19.3% 20.5% 22.0%
2019 Population 15+ by Marital StatusTotal 15,785 150,390 393,716
Never Married 25.7% 32.0% 38.0%Married 61.9% 54.1% 48.7%Widowed 7.8% 6.6% 5.7%Divorced 4.6% 7.3% 7.6%
2019 Civilian Population 16+ in Labor Force Civilian Employed 96.8% 95.6% 95.9% Civilian Unemployed (Unemployment Rate) 3.2% 4.4% 4.1%2019 Employed Population 16+ by IndustryTotal 8,977 91,043 245,124 Agriculture/Mining 0.0% 0.1% 0.1% Construction 3.6% 3.4% 3.9% Manufacturing 6.8% 6.9% 6.8% Wholesale Trade 3.5% 2.7% 2.4% Retail Trade 10.5% 9.6% 9.0% Transportation/Utilities 7.9% 7.3% 6.6% Information 1.4% 2.0% 2.2% Finance/Insurance/Real Estate 10.1% 8.1% 7.9% Services 54.4% 57.4% 58.2% Public Administration 1.8% 2.5% 2.8%2019 Employed Population 16+ by OccupationTotal 8,976 91,041 245,124 White Collar 73.3% 67.0% 66.2% Management/Business/Financial 15.4% 15.0% 15.5% Professional 30.1% 28.9% 28.7% Sales 10.8% 10.3% 9.9% Administrative Support 17.0% 12.8% 12.0% Services 13.6% 18.2% 18.9% Blue Collar 13.1% 14.8% 15.0% Farming/Forestry/Fishing 0.0% 0.0% 0.0% Construction/Extraction 2.2% 2.4% 2.8% Installation/Maintenance/Repair 1.4% 1.6% 1.7% Production 4.7% 4.1% 4.0% Transportation/Material Moving 4.8% 6.8% 6.4%2010 Population By Urban/ Rural Status
Total Population 19,211 185,578 475,588Population Inside Urbanized Area 100.0% 100.0% 100.0%Population Inside Urbanized Cluster 0.0% 0.0% 0.0%Rural Population 0.0% 0.0% 0.0%
Source: U.S. Census Bureau, Census 2010 Summary File 1. Esri forecasts for 2019 and 2024 Esri converted Census 2000 data into 2010 geography.
September 25, 2019
©2019 Esri Page 5 of 7

Market Profile7353-7399 St Louis Ave Village Of Skokie Only7353-7399 St Louis Ave, Skokie, Illinois, 60076 Latitude: 42.01519Drive Time: 5, 10, 15 minute radii Longitude: -87.71717
5 minutes 10 minutes 15 minutes2010 Households by Type
Total 6,540 66,618 180,923Households with 1 Person 22.8% 26.0% 30.9%Households with 2+ People 77.2% 74.0% 69.1%
Family Households 74.5% 68.7% 60.8%Husband-wife Families 60.9% 51.3% 45.3%
With Related Children 27.2% 25.0% 21.9%Other Family (No Spouse Present) 13.6% 17.4% 15.6%
Other Family with Male Householder 4.2% 4.7% 4.5%With Related Children 1.5% 2.0% 2.0%
Other Family with Female Householder 9.4% 12.7% 11.1%With Related Children 4.0% 7.0% 6.1%
Nonfamily Households 2.7% 5.3% 8.3%
All Households with Children 32.8% 34.3% 30.3%
Multigenerational Households 6.4% 5.2% 4.2%Unmarried Partner Households 2.7% 4.8% 6.0%
Male-female 2.1% 3.6% 4.6%Same-sex 0.6% 1.2% 1.4%
2010 Households by SizeTotal 6,540 66,617 180,922
1 Person Household 22.8% 26.0% 30.9%2 Person Household 28.9% 29.0% 29.5%3 Person Household 15.7% 16.4% 15.1%4 Person Household 15.3% 14.3% 12.8%5 Person Household 9.0% 7.8% 6.6%6 Person Household 4.8% 3.5% 2.9%7 + Person Household 3.5% 2.9% 2.3%
2010 Households by Tenure and Mortgage StatusTotal 6,540 66,618 180,923
Owner Occupied 83.3% 63.0% 55.2%Owned with a Mortgage/Loan 54.6% 44.7% 39.8%Owned Free and Clear 28.6% 18.3% 15.4%
Renter Occupied 16.7% 37.0% 44.8%2010 Housing Units By Urban/ Rural Status
Total Housing Units 6,877 72,266 198,023Housing Units Inside Urbanized Area 100.0% 100.0% 100.0%Housing Units Inside Urbanized Cluster 0.0% 0.0% 0.0%Rural Housing Units 0.0% 0.0% 0.0%
Data Note: Households with children include any households with people under age 18, related or not. Multigenerational households are families with 3 or more parent-child relationships. Unmarried partner households are usually classified as nonfamily households unless there is another member of the household related to the householder. Multigenerational and unmarried partner households are reported only to the tract level. Esri estimated block group data, which is used to estimate polygons or non-standard geography.Source: U.S. Census Bureau, Census 2010 Summary File 1. Esri forecasts for 2019 and 2024 Esri converted Census 2000 data into 2010 geography.
September 25, 2019
©2019 Esri Page 6 of 7

Market Profile7353-7399 St Louis Ave Village Of Skokie Only7353-7399 St Louis Ave, Skokie, Illinois, 60076 Latitude: 42.01519Drive Time: 5, 10, 15 minute radii Longitude: -87.71717
5 minutes 10 minutes 15 minutesTop 3 Tapestry Segments1. Pleasantville (2B) City Lights (8A) International Marketplace
(13A)2. Pacific Heights (2C) Pleasantville (2B) City Lights (8A)3. Golden Years (9B) Downtown Melting Pot (8D) Trendsetters (3C)
2019 Consumer Spending Apparel & Services: Total $ $16,426,249 $162,337,571 $443,940,516
Average Spent $2,546.31 $2,441.09 $2,433.22Spending Potential Index 119 114 114
Education: Total $ $14,867,508 $137,962,567 $364,560,317Average Spent $2,304.68 $2,074.56 $1,998.14Spending Potential Index 145 130 125
Entertainment/Recreation: Total $ $25,617,347 $241,187,034 $642,499,726Average Spent $3,971.07 $3,626.76 $3,521.51Spending Potential Index 121 111 108
Food at Home: Total $ $38,563,574 $378,761,539 $1,031,302,615Average Spent $5,977.92 $5,695.49 $5,652.52Spending Potential Index 116 110 109
Food Away from Home: Total $ $27,888,450 $270,757,296 $746,631,735Average Spent $4,323.12 $4,071.42 $4,092.25Spending Potential Index 118 111 111
Health Care: Total $ $44,265,592 $411,198,203 $1,082,820,394Average Spent $6,861.82 $6,183.25 $5,934.89Spending Potential Index 116 104 100
HH Furnishings & Equipment: Total $ $16,458,780 $153,181,271 $410,778,535Average Spent $2,551.35 $2,303.41 $2,251.46Spending Potential Index 120 108 106
Personal Care Products & Services: Total $ $6,724,083 $63,782,848 $172,844,468Average Spent $1,042.33 $959.11 $947.35Spending Potential Index 118 108 107
Shelter: Total $ $154,217,559 $1,495,422,193 $4,055,172,583Average Spent $23,905.99 $22,486.88 $22,226.21Spending Potential Index 129 122 120
Support Payments/Cash Contributions/Gifts in Kind: Total $ $19,237,222 $180,155,452 $472,028,603Average Spent $2,982.05 $2,709.02 $2,587.17Spending Potential Index 120 109 104
Travel: Total $ $19,390,174 $177,252,510 $466,707,436Average Spent $3,005.76 $2,665.37 $2,558.00Spending Potential Index 134 119 114
Vehicle Maintenance & Repairs: Total $ $8,497,955 $78,536,683 $213,516,854Average Spent $1,317.31 $1,180.97 $1,170.28Spending Potential Index 115 103 102
Data Note: Consumer spending shows the amount spent on a variety of goods and services by households that reside in the area. Expenditures are shown by broad budget categories that are not mutually exclusive. Consumer spending does not equal business revenue. Total and Average Amount Spent Per Household represent annual figures. The Spending Potential Index represents the amount spent in the area relative to a national average of 100.Source: Consumer Spending data are derived from the 2016 and 2017 Consumer Expenditure Surveys, Bureau of Labor Statistics. Esri.Source: U.S. Census Bureau, Census 2010 Summary File 1. Esri forecasts for 2019 and 2024 Esri converted Census 2000 data into 2010 geography.
September 25, 2019
©2019 Esri Page 7 of 7

Medical Expenditures7353-7399 St Louis Ave Village Of Skokie Only7353-7399 St Louis Ave, Skokie, Illinois, 60076 Latitude: 42.01519Drive Time: 5 minute radius Longitude: -87.71717
Demographic Summary 2019 2024Population 19,188 19,016Households 6,451 6,373Families 4,775 4,708Median Household Income $86,110 $97,707Males per 100 Females 92.4 92.9
Population By AgePopulation <5 Years 5.4% 5.5%Population 65+ Years 23.2% 25.0%Median Age 44.2 44.4
Spending Potential
Average Amount Index Spent Total
Health Care 116 $6,861.82 $44,265,592
Medical Care 115 $2,303.41 $14,859,300Physician Services 112 $297.95 $1,922,070Dental Services 134 $503.43 $3,247,636Eyecare Services 115 $77.74 $501,508Lab Tests, X-Rays 104 $67.27 $433,961Hospital Room and Hospital Services 99 $181.30 $1,169,559Convalescent or Nursing Home Care 109 $22.03 $142,101Other Medical services (1) 123 $147.73 $953,019Nonprescription Drugs 109 $156.18 $1,007,533Prescription Drugs 107 $390.38 $2,518,328Nonprescription Vitamins 111 $93.86 $605,514Medicare Prescription Drug Premium 114 $140.02 $903,256Eyeglasses and Contact Lenses 116 $105.44 $680,172Hearing Aids 126 $29.15 $188,057Medical Equipment for General Use 124 $7.81 $50,393Other Medical Supplies/Equipment (2) 115 $83.12 $536,193
Health Insurance 116 $4,558.41 $29,406,292Blue Cross/Blue Shield 111 $1,340.43 $8,647,101Fee for Service Health Plan 109 $848.84 $5,475,846HMO 128 $1,032.97 $6,663,688Medicare Payments 116 $764.81 $4,933,808Long Term Care Insurance 148 $98.67 $636,545Dental Care Insurance 114 $146.87 $947,455Vision Care Insurance 91 $24.24 $156,390Prescription Drug Insurance 94 $7.12 $45,916Other Single Service Insurance (3) 151 $28.23 $182,083Medicaid Premiums 116 $8.71 $56,184Tricare/Military Premiums 67 $4.36 $28,130Children's Health Ins Program Premiums 79 $1.11 $7,143
Data Note: The Spending Potential Index (SPI) is household-based, and represents the amount spent for a product or service relative to a national average of 100. Detail may not sum to totals due to rounding.(1) Other Medical Services includes Services by Medical Professionals other than Physicians, Outpatient Hospital Care, Blood Donation, and Ambulance, Dialysis, Emergency Room, Oxygen or Rescue Services. (2) Other Medical Supplies/Equipment includes Topicals, Dressings, Supportive and Convalescent Medical Equipment, Rental of Medical Equipment for General Use, and Rental of Supportive and Convalescent Medical Equipment.(3) Other Single Service Insurance Other Single Service Insurance includes health insurance coverage that provides for only one type of service, other than dental care, vision care, prescriptions, and long-term careSource: Esri forecasts for 2019 and 2024; Consumer Spending data are derived from the 2016 and 2017 Consumer Expenditure Surveys, Bureau of Labor Statistics.
September 25, 2019
©2019 Esri Page 1 of 3

Medical Expenditures7353-7399 St Louis Ave Village Of Skokie Only7353-7399 St Louis Ave, Skokie, Illinois, 60076 Latitude: 42.01519Drive Time: 10 minute radius Longitude: -87.71717
Demographic Summary 2019 2024Population 185,523 184,250Households 66,502 66,011Families 45,168 44,702Median Household Income $72,067 $79,798Males per 100 Females 93.3 93.8
Population By AgePopulation <5 Years 6.1% 6.1%Population 65+ Years 18.1% 19.9%Median Age 39.9 40.6
Spending Potential
Average Amount Index Spent Total
Health Care 104 $6,183.25 $411,198,203
Medical Care 103 $2,068.97 $137,590,465Physician Services 104 $277.44 $18,450,098Dental Services 117 $438.53 $29,163,229Eyecare Services 101 $68.19 $4,535,017Lab Tests, X-Rays 94 $61.15 $4,066,893Hospital Room and Hospital Services 91 $166.47 $11,070,794Convalescent or Nursing Home Care 84 $16.91 $1,124,606Other Medical services (1) 113 $135.78 $9,029,784Nonprescription Drugs 99 $141.99 $9,442,913Prescription Drugs 95 $347.46 $23,106,793Nonprescription Vitamins 102 $85.98 $5,717,781Medicare Prescription Drug Premium 101 $124.38 $8,271,849Eyeglasses and Contact Lenses 105 $94.81 $6,305,219Hearing Aids 113 $26.17 $1,740,165Medical Equipment for General Use 122 $7.68 $510,855Other Medical Supplies/Equipment (2) 105 $76.00 $5,054,469
Health Insurance 105 $4,114.28 $273,607,738Blue Cross/Blue Shield 100 $1,207.83 $80,323,015Fee for Service Health Plan 100 $777.11 $51,679,436HMO 118 $950.83 $63,232,242Medicare Payments 102 $673.02 $44,757,379Long Term Care Insurance 126 $83.67 $5,563,973Dental Care Insurance 106 $135.99 $9,043,748Vision Care Insurance 85 $22.47 $1,494,389Prescription Drug Insurance 86 $6.56 $436,529Other Single Service Insurance (3) 126 $23.63 $1,571,214Medicaid Premiums 115 $8.68 $577,247Tricare/Military Premiums 61 $3.93 $261,682Children's Health Ins Program Premiums 110 $1.54 $102,275
Data Note: The Spending Potential Index (SPI) is household-based, and represents the amount spent for a product or service relative to a national average of 100. Detail may not sum to totals due to rounding.(1) Other Medical Services includes Services by Medical Professionals other than Physicians, Outpatient Hospital Care, Blood Donation, and Ambulance, Dialysis, Emergency Room, Oxygen or Rescue Services. (2) Other Medical Supplies/Equipment includes Topicals, Dressings, Supportive and Convalescent Medical Equipment, Rental of Medical Equipment for General Use, and Rental of Supportive and Convalescent Medical Equipment.(3) Other Single Service Insurance Other Single Service Insurance includes health insurance coverage that provides for only one type of service, other than dental care, vision care, prescriptions, and long-term careSource: Esri forecasts for 2019 and 2024; Consumer Spending data are derived from the 2016 and 2017 Consumer Expenditure Surveys, Bureau of Labor Statistics.
September 25, 2019
©2019 Esri Page 2 of 3

Medical Expenditures7353-7399 St Louis Ave Village Of Skokie Only7353-7399 St Louis Ave, Skokie, Illinois, 60076 Latitude: 42.01519Drive Time: 15 minute radius Longitude: -87.71717
Demographic Summary 2019 2024Population 477,852 475,755Households 182,450 181,752Families 109,318 108,382Median Household Income $66,187 $74,914Males per 100 Females 96.1 96.4
Population By AgePopulation <5 Years 5.8% 5.8%Population 65+ Years 16.3% 18.1%Median Age 38.2 39.0
Spending Potential
Average Amount Index Spent Total
Health Care 100 $5,934.89 $1,082,820,394
Medical Care 99 $1,979.39 $361,140,103Physician Services 100 $266.40 $48,604,853Dental Services 110 $411.37 $75,054,227Eyecare Services 96 $64.89 $11,838,299Lab Tests, X-Rays 91 $59.08 $10,778,737Hospital Room and Hospital Services 89 $163.64 $29,856,434Convalescent or Nursing Home Care 84 $17.02 $3,104,853Other Medical services (1) 109 $130.43 $23,796,172Nonprescription Drugs 96 $138.22 $25,217,408Prescription Drugs 90 $330.25 $60,254,140Nonprescription Vitamins 100 $84.67 $15,447,348Medicare Prescription Drug Premium 95 $116.88 $21,324,553Eyeglasses and Contact Lenses 101 $91.05 $16,611,796Hearing Aids 103 $23.75 $4,333,538Medical Equipment for General Use 114 $7.14 $1,301,793Other Medical Supplies/Equipment (2) 103 $74.63 $13,615,952
Health Insurance 101 $3,955.50 $721,680,292Blue Cross/Blue Shield 96 $1,161.62 $211,937,228Fee for Service Health Plan 97 $753.86 $137,541,640HMO 116 $932.50 $170,135,132Medicare Payments 95 $629.79 $114,905,605Long Term Care Insurance 116 $77.19 $14,083,677Dental Care Insurance 104 $133.76 $24,404,602Vision Care Insurance 85 $22.53 $4,110,006Prescription Drug Insurance 81 $6.19 $1,128,675Other Single Service Insurance (3) 117 $21.82 $3,980,343Medicaid Premiums 124 $9.35 $1,705,419Tricare/Military Premiums 70 $4.55 $830,183Children's Health Ins Program Premiums 110 $1.54 $280,508
Data Note: The Spending Potential Index (SPI) is household-based, and represents the amount spent for a product or service relative to a national average of 100. Detail may not sum to totals due to rounding.(1) Other Medical Services includes Services by Medical Professionals other than Physicians, Outpatient Hospital Care, Blood Donation, and Ambulance, Dialysis, Emergency Room, Oxygen or Rescue Services. (2) Other Medical Supplies/Equipment includes Topicals, Dressings, Supportive and Convalescent Medical Equipment, Rental of Medical Equipment for General Use, and Rental of Supportive and Convalescent Medical Equipment.(3) Other Single Service Insurance Other Single Service Insurance includes health insurance coverage that provides for only one type of service, other than dental care, vision care, prescriptions, and long-term careSource: Esri forecasts for 2019 and 2024; Consumer Spending data are derived from the 2016 and 2017 Consumer Expenditure Surveys, Bureau of Labor Statistics.
September 25, 2019
©2019 Esri Page 3 of 3

Net Worth Profile7353-7399 St Louis Ave Village Of Skokie Only7353-7399 St Louis Ave, Skokie, Illinois, 60076 Latitude: 42.01519Drive Time: 5 minute radius Longitude: -87.71717
2019-2024 2019-2024Summary Census 2010 2019 2024 Change Annual Rate
Population 19,211 19,188 19,016 -172 -0.18%Median Age 42.6 44.2 44.4 0.2 0.09%Households 6,540 6,451 6,373 -78 -0.24%Average Household Size 2.92 2.96 2.96 0.00 0.00%
2019 Households by Net Worth Number PercentTotal 6,451 100.0%
<$15,000 612 9.5%$15,000-$34,999 243 3.8%$35,000-$49,999 152 2.4%$50,000-$74,999 277 4.3%$75,000-$99,999 290 4.5%$100,000-$149,999 428 6.6%$150,000-$249,999 608 9.4%$250,000-$499,999 944 14.6%$500,000-$999,999 988 15.3%$1000000-$1499999 649 10.1%$1500000-$1999999 244 3.8%$2000000+ 1,017 15.8%
Median Net Worth $384,150Average Net Worth $1,450,768
Number of Households2019 Net Worth by Age of Householder <25 25-34 35-44 45-54 55-64 65-74 75+
Total 46 525 893 1,072 1,356 1,163 1,396<$15,000 13 128 128 118 86 49 90$15,000-$34,999 9 47 55 48 26 23 35$35,000-$49,999 5 33 43 19 25 12 15$50,000-$74,999 3 66 60 38 25 26 59$75,000-$99,999 6 37 64 53 33 34 62$100,000-$149,999 5 52 84 80 69 75 62$150,000-$249,999 3 61 100 138 115 81 110$250,000-$499,999 1 66 150 139 161 168 258$500,000-$999,999 1 26 85 198 224 218 236$1000000+ 0 8 123 243 591 477 468
Median Net Worth $37,350 $69,155 $158,490 $303,790 $744,822 $694,336 $507,936Average Net Worth $80,938 $165,160 $688,369 $1,338,736 $2,071,457 $2,041,954 $1,457,697
Data Note: Net Worth is total household wealth minus debt, secured and unsecured. Net worth includes home equity, equity in pension plans, net equity in vehicles, IRAs and Keogh accounts, business equity, interest-earning assets and mutual fund shares, stocks, etc. Examples of secured debt include home mortgages and vehicle loans; examples of unsecured debt include credit card debt, certain bank loans, and other outstanding bills. Forecasts of net worth are based on the Survey of Consumer Finances, Federal Reserve Board.Source: U.S. Census Bureau, Census 2010 Summary File 1. Esri Forecasts for 2019 and 2024.
September 25, 2019
©2019 Esri Page 1 of 3

Net Worth Profile7353-7399 St Louis Ave Village Of Skokie Only7353-7399 St Louis Ave, Skokie, Illinois, 60076 Latitude: 42.01519Drive Time: 10 minute radius Longitude: -87.71717
2019-2024 2019-2024Summary Census 2010 2019 2024 Change Annual Rate
Population 185,578 185,523 184,250 -1,273 -0.14%Median Age 38.7 39.9 40.6 0.7 0.35%Households 66,618 66,502 66,011 -491 -0.15%Average Household Size 2.75 2.76 2.76 0.00 0.00%
2019 Households by Net Worth Number PercentTotal 66,502 100.0%
<$15,000 15,700 23.6%$15,000-$34,999 5,274 7.9%$35,000-$49,999 2,508 3.8%$50,000-$74,999 3,490 5.2%$75,000-$99,999 3,173 4.8%$100,000-$149,999 4,369 6.6%$150,000-$249,999 5,644 8.5%$250,000-$499,999 6,731 10.1%$500,000-$999,999 6,381 9.6%$1000000-$1499999 4,103 6.2%$1500000-$1999999 1,777 2.7%$2000000+ 7,354 11.1%
Median Net Worth $132,700Average Net Worth $1,001,990
Number of Households2019 Net Worth by Age of Householder <25 25-34 35-44 45-54 55-64 65-74 75+
Total 1,445 8,240 11,227 12,390 13,398 10,428 9,375<$15,000 1,034 4,114 3,318 2,835 2,062 1,409 928$15,000-$34,999 215 1,020 1,273 1,126 750 589 302$35,000-$49,999 55 478 623 453 462 292 145$50,000-$74,999 32 720 807 510 462 470 489$75,000-$99,999 51 344 725 743 495 416 400$100,000-$149,999 27 445 823 923 1,019 683 449$150,000-$249,999 16 454 921 1,307 1,245 921 780$250,000-$499,999 9 422 1,046 1,206 1,271 1,209 1,568$500,000-$999,999 7 164 689 1,276 1,433 1,435 1,376$1000000+ 0 78 1,002 2,011 4,197 3,006 2,940
Median Net Worth $10,488 $15,060 $60,670 $125,178 $276,754 $314,851 $415,487Average Net Worth $25,419 $87,198 $382,837 $887,830 $1,604,906 $1,497,380 $1,436,114
Data Note: Net Worth is total household wealth minus debt, secured and unsecured. Net worth includes home equity, equity in pension plans, net equity in vehicles, IRAs and Keogh accounts, business equity, interest-earning assets and mutual fund shares, stocks, etc. Examples of secured debt include home mortgages and vehicle loans; examples of unsecured debt include credit card debt, certain bank loans, and other outstanding bills. Forecasts of net worth are based on the Survey of Consumer Finances, Federal Reserve Board.Source: U.S. Census Bureau, Census 2010 Summary File 1. Esri Forecasts for 2019 and 2024.
September 25, 2019
©2019 Esri Page 2 of 3

Net Worth Profile7353-7399 St Louis Ave Village Of Skokie Only7353-7399 St Louis Ave, Skokie, Illinois, 60076 Latitude: 42.01519Drive Time: 15 minute radius Longitude: -87.71717
2019-2024 2019-2024Summary Census 2010 2019 2024 Change Annual Rate
Population 475,588 477,852 475,755 -2,097 -0.09%Median Age 36.8 38.2 39.0 0.8 0.42%Households 180,923 182,450 181,752 -698 -0.08%Average Household Size 2.55 2.54 2.54 0.00 0.00%
2019 Households by Net Worth Number PercentTotal 182,450 100.0%
<$15,000 54,157 29.7%$15,000-$34,999 16,512 9.1%$35,000-$49,999 7,457 4.1%$50,000-$74,999 10,069 5.5%$75,000-$99,999 8,846 4.8%$100,000-$149,999 11,577 6.3%$150,000-$249,999 14,268 7.8%$250,000-$499,999 15,839 8.7%$500,000-$999,999 13,782 7.6%$1000000-$1499999 9,047 5.0%$1500000-$1999999 4,241 2.3%$2000000+ 16,653 9.1%
Median Net Worth $82,503Average Net Worth $827,092
Number of Households2019 Net Worth by Age of Householder <25 25-34 35-44 45-54 55-64 65-74 75+
Total 7,169 28,445 32,964 33,356 33,613 25,294 21,610<$15,000 5,381 15,743 11,143 8,600 6,372 4,203 2,715$15,000-$34,999 843 3,607 3,977 3,307 2,267 1,695 816$35,000-$49,999 199 1,509 1,936 1,361 1,256 826 371$50,000-$74,999 159 2,303 2,388 1,487 1,312 1,234 1,186$75,000-$99,999 275 1,020 2,065 2,082 1,355 1,116 933$100,000-$149,999 125 1,265 2,273 2,354 2,646 1,746 1,168$150,000-$249,999 123 1,208 2,492 3,241 3,034 2,291 1,880$250,000-$499,999 29 1,175 2,550 2,980 3,001 2,685 3,419$500,000-$999,999 35 402 1,651 2,710 3,027 3,028 2,930$1000000+ 0 213 2,489 5,234 9,345 6,469 6,192
Median Net Worth $9,992 $13,551 $44,788 $97,705 $194,115 $223,751 $345,815Average Net Worth $24,044 $70,379 $304,888 $815,682 $1,457,790 $1,339,867 $1,322,498
Data Note: Net Worth is total household wealth minus debt, secured and unsecured. Net worth includes home equity, equity in pension plans, net equity in vehicles, IRAs and Keogh accounts, business equity, interest-earning assets and mutual fund shares, stocks, etc. Examples of secured debt include home mortgages and vehicle loans; examples of unsecured debt include credit card debt, certain bank loans, and other outstanding bills. Forecasts of net worth are based on the Survey of Consumer Finances, Federal Reserve Board.Source: U.S. Census Bureau, Census 2010 Summary File 1. Esri Forecasts for 2019 and 2024.
September 25, 2019
©2019 Esri Page 3 of 3

Pets and Products Market Potential7353-7399 St Louis Ave Village Of Skokie Only7353-7399 St Louis Ave, Skokie, Illinois, 60076 Latitude: 42.01519Drive Time: 5 minute radius Longitude: -87.71717
Demographic Summary 2019 2024Population 19,188 19,016Population 18+ 15,070 14,996Households 6,451 6,373Median Household Income $86,110 $97,707
Expected Number ofProduct/Consumer Behavior Households Percent MPI
HH owns any pet 3,114 48.3% 89HH owns any cat 1,183 18.3% 81HH owns any dog 2,251 34.9% 84HH owns 1 cat 645 10.0% 81HH owns 2+ cats 537 8.3% 78HH owns 1 dog 1,523 23.6% 93HH owns 2+ dogs 727 11.3% 68HH used canned/wet cat food in last 6 months 817 12.7% 94HH used packaged dry cat food in last 6 months 1,158 18.0% 82HH used cat treats in last 6 months 733 11.4% 85HH used cat litter in last 6 months 1,090 16.9% 83HH used canned/wet dog food in last 6 months 953 14.8% 92HH used packaged dry dog food in last 6 months 2,149 33.3% 83HH used dog biscuits/treats in last 6 months 1,813 28.1% 86HH used flea/tick/parasite prod cat/dog last 12 months 1,993 30.9% 82HH Bought pet food in last 12 months: from discount store 317 4.9% 67HH Bought pet food in last 12 months: from grocery store 1,329 20.6% 76HH Bought pet food in last 12 months: Internet/online 429 6.7% 119HH Bought pet food in last 12 months: from PETCO 632 9.8% 120HH Bought pet food in last 12 months: from PetSmart 797 12.4% 110HH Bought pet food last 12 months: other specialty pet store 417 6.5% 106HH Bought pet food in last 12 months: from wholesale club 399 6.2% 128HH Bought pet food in last 12 months: from veterinarian 287 4.4% 92HH Bought flea control in last 12 months: Internet/online 263 4.1% 94HH Bought flea control product from vet in last 12 mo 635 9.8% 73HH member took pet to vet in last 12 months: 1 time 769 11.9% 84HH member took pet to vet in last 12 months: 2 times 644 10.0% 88HH member took pet to vet in last 12 months: 3 times 383 5.9% 99HH member took pet to vet in last 12 months: 4 times 291 4.5% 104HH member took pet to vet in last 12 months: 5+ times 346 5.4% 94HH used professional pet service in last 12 months 1,201 18.6% 107
HH used professional pet service 3+ times last 12 754 11.7% 110HH used professional pet service: boarding/kennel 301 4.7% 99HH used professional pet service: grooming 914 14.2% 106HH has pet insurance 343 5.3% 138
Data Note: An MPI (Market Potential Index) measures the relative likelihood of households in the specified trade area to exhibit certain consumer behavior or purchasing patterns compared to the U.S. An MPI of 100 represents the U.S. average.Source: These data are based upon national propensities to use various products and services, applied to local demographic composition. Usage data were collected by GfK MRI in a nationally representative survey of U.S. households. Esri forecasts for 2019 and 2024.
September 25, 2019
©2019 Esri Page 1 of 3

Pets and Products Market Potential7353-7399 St Louis Ave Village Of Skokie Only7353-7399 St Louis Ave, Skokie, Illinois, 60076 Latitude: 42.01519Drive Time: 10 minute radius Longitude: -87.71717
Demographic Summary 2019 2024Population 185,523 184,250Population 18+ 143,201 143,869Households 66,502 66,011Median Household Income $72,067 $79,798
Expected Number ofProduct/Consumer Behavior Households Percent MPI
HH owns any pet 28,242 42.5% 78HH owns any cat 11,130 16.7% 74HH owns any dog 19,679 29.6% 71HH owns 1 cat 6,381 9.6% 78HH owns 2+ cats 4,813 7.2% 68HH owns 1 dog 13,563 20.4% 81HH owns 2+ dogs 6,110 9.2% 56HH used canned/wet cat food in last 6 months 7,414 11.1% 83HH used packaged dry cat food in last 6 months 10,714 16.1% 73HH used cat treats in last 6 months 7,102 10.7% 80HH used cat litter in last 6 months 10,402 15.6% 77HH used canned/wet dog food in last 6 months 8,743 13.1% 82HH used packaged dry dog food in last 6 months 18,901 28.4% 71HH used dog biscuits/treats in last 6 months 15,843 23.8% 73HH used flea/tick/parasite prod cat/dog last 12 months 18,357 27.6% 73HH Bought pet food in last 12 months: from discount store 3,312 5.0% 68HH Bought pet food in last 12 months: from grocery store 12,124 18.2% 67HH Bought pet food in last 12 months: Internet/online 3,883 5.8% 104HH Bought pet food in last 12 months: from PETCO 5,755 8.7% 106HH Bought pet food in last 12 months: from PetSmart 6,872 10.3% 92HH Bought pet food last 12 months: other specialty pet store 4,060 6.1% 100HH Bought pet food in last 12 months: from wholesale club 3,264 4.9% 102HH Bought pet food in last 12 months: from veterinarian 2,736 4.1% 85HH Bought flea control in last 12 months: Internet/online 2,603 3.9% 90HH Bought flea control product from vet in last 12 mo 5,975 9.0% 67HH member took pet to vet in last 12 months: 1 time 7,171 10.8% 76HH member took pet to vet in last 12 months: 2 times 5,976 9.0% 79HH member took pet to vet in last 12 months: 3 times 3,475 5.2% 87HH member took pet to vet in last 12 months: 4 times 2,656 4.0% 92HH member took pet to vet in last 12 months: 5+ times 2,968 4.5% 78HH used professional pet service in last 12 months 10,085 15.2% 87
HH used professional pet service 3+ times last 12 6,624 10.0% 94HH used professional pet service: boarding/kennel 2,862 4.3% 92HH used professional pet service: grooming 7,566 11.4% 85HH has pet insurance 3,197 4.8% 124
Data Note: An MPI (Market Potential Index) measures the relative likelihood of households in the specified trade area to exhibit certain consumer behavior or purchasing patterns compared to the U.S. An MPI of 100 represents the U.S. average.Source: These data are based upon national propensities to use various products and services, applied to local demographic composition. Usage data were collected by GfK MRI in a nationally representative survey of U.S. households. Esri forecasts for 2019 and 2024.
September 25, 2019
©2019 Esri Page 2 of 3

Pets and Products Market Potential7353-7399 St Louis Ave Village Of Skokie Only7353-7399 St Louis Ave, Skokie, Illinois, 60076 Latitude: 42.01519Drive Time: 15 minute radius Longitude: -87.71717
Demographic Summary 2019 2024Population 477,852 475,755Population 18+ 376,865 380,324Households 182,450 181,752Median Household Income $66,187 $74,914
Expected Number ofProduct/Consumer Behavior Households Percent MPI
HH owns any pet 75,770 41.5% 76HH owns any cat 30,508 16.7% 73HH owns any dog 52,187 28.6% 69HH owns 1 cat 17,943 9.8% 80HH owns 2+ cats 12,772 7.0% 66HH owns 1 dog 36,509 20.0% 79HH owns 2+ dogs 15,760 8.6% 52HH used canned/wet cat food in last 6 months 20,654 11.3% 84HH used packaged dry cat food in last 6 months 29,444 16.1% 73HH used cat treats in last 6 months 19,377 10.6% 80HH used cat litter in last 6 months 28,718 15.7% 77HH used canned/wet dog food in last 6 months 23,076 12.6% 78HH used packaged dry dog food in last 6 months 50,269 27.6% 69HH used dog biscuits/treats in last 6 months 42,134 23.1% 71HH used flea/tick/parasite prod cat/dog last 12 months 48,987 26.8% 71HH Bought pet food in last 12 months: from discount store 8,259 4.5% 61HH Bought pet food in last 12 months: from grocery store 33,648 18.4% 68HH Bought pet food in last 12 months: Internet/online 10,252 5.6% 100HH Bought pet food in last 12 months: from PETCO 16,008 8.8% 107HH Bought pet food in last 12 months: from PetSmart 18,212 10.0% 89HH Bought pet food last 12 months: other specialty pet store 10,830 5.9% 97HH Bought pet food in last 12 months: from wholesale club 7,751 4.2% 88HH Bought pet food in last 12 months: from veterinarian 7,249 4.0% 82HH Bought flea control in last 12 months: Internet/online 6,519 3.6% 82HH Bought flea control product from vet in last 12 mo 15,962 8.7% 65HH member took pet to vet in last 12 months: 1 time 19,418 10.6% 75HH member took pet to vet in last 12 months: 2 times 15,741 8.6% 76HH member took pet to vet in last 12 months: 3 times 8,632 4.7% 79HH member took pet to vet in last 12 months: 4 times 6,556 3.6% 83HH member took pet to vet in last 12 months: 5+ times 7,661 4.2% 73HH used professional pet service in last 12 months 26,463 14.5% 84
HH used professional pet service 3+ times last 12 16,752 9.2% 87HH used professional pet service: boarding/kennel 7,157 3.9% 84HH used professional pet service: grooming 19,320 10.6% 80HH has pet insurance 8,956 4.9% 127
Data Note: An MPI (Market Potential Index) measures the relative likelihood of households in the specified trade area to exhibit certain consumer behavior or purchasing patterns compared to the U.S. An MPI of 100 represents the U.S. average.Source: These data are based upon national propensities to use various products and services, applied to local demographic composition. Usage data were collected by GfK MRI in a nationally representative survey of U.S. households. Esri forecasts for 2019 and 2024.
September 25, 2019
©2019 Esri Page 3 of 3

Recreation Expenditures7353-7399 St Louis Ave Village Of Skokie Only7353-7399 St Louis Ave, Skokie, Illinois, 60076 Latitude: 42.01519Drive Time: 5 minute radius Longitude: -87.71717
Demographic Summary 2019 2024Population 19,188 19,016Households 6,451 6,373Families 4,775 4,708Median Age 44.2 44.4Median Household Income $86,110 $97,707
Spending Potential Average AmountIndex Spent Total
Tv/Video/Audio 110 $1,340.95 $8,650,497Cable & Satellite Television Services 110 $970.17 $6,258,570Televisions & Video 105 $255.01 $1,645,043Audio 116 $113.06 $729,364Rental of TV/VCR/Radio/Sound Equipment 75 $0.59 $3,804Repair of TV/Radio/Sound Equipment 90 $2.13 $13,716
Entertainment/Recreation Fees and Admissions 137 $974.07 $6,283,738Tickets to Theatre/Operas/Concerts 147 $110.91 $715,472Tickets to Movies 122 $66.84 $431,193Tickets to Parks or Museums 130 $42.13 $271,785Admission to Sporting Events, excl.Trips 125 $79.08 $510,137Fees for Participant Sports, excl.Trips 124 $132.95 $857,683Fees for Recreational Lessons 142 $203.87 $1,315,153Membership Fees for Social/Recreation/Civic Clubs 143 $337.35 $2,176,275Dating Services 134 $0.94 $6,040
Toys/Games/Crafts/Hobbies 112 $132.63 $855,564Toys/Games/Arts/Crafts/Tricycles 108 $109.50 $706,392Playground Equipment 115 $4.82 $31,117Play Arcade Pinball/Video Games 151 $6.22 $40,125Online Entertainment and Games 122 $5.46 $35,241Stamp & Coin Collecting 155 $6.62 $42,689
Recreational Vehicles and Fees 170 $271.74 $1,752,988Docking and Landing Fees for Boats and Planes 150 $14.25 $91,933Camp Fees 244 $163.60 $1,055,396Payments on Boats/Trailers/Campers/RVs 104 $61.12 $394,270Rental of Boats/Trailers/Campers/RVs 133 $32.77 $211,389
Sports, Recreation and Exercise Equipment 119 $245.84 $1,585,909Exercise Equipment and Gear, Game Tables 124 $80.99 $522,492Bicycles 132 $39.14 $252,464Camping Equipment 105 $20.84 $134,460Hunting and Fishing Equipment 108 $75.73 $488,557Winter Sports Equipment 176 $9.54 $61,557Water Sports Equipment 122 $9.19 $59,277Other Sports Equipment 112 $7.43 $47,963Rental/Repair of Sports/Recreation/Exercise Equipment 117 $2.97 $19,138
Photographic Equipment and Supplies 119 $61.97 $399,760Film 110 $0.87 $5,584Film Processing 125 $9.82 $63,334Photographic Equipment 129 $26.30 $169,634Photographer Fees/Other Supplies & Equip Rental/Repair 108 $24.99 $161,207
Reading 133 $141.62 $913,599Magazine/Newspaper Subscriptions 147 $54.83 $353,722Magazine/Newspaper Single Copies 146 $9.72 $62,725Books 129 $48.09 $310,214Digital Book Readers 114 $28.98 $186,938
Data Note: The Spending Potential Index (SPI) is household-based, and represents the amount spent for a product or service relative to a national average of 100. Detail may not sum to totals due to rounding. Source: Esri forecasts for 2019 and 2024; Consumer Spending data are derived from the 2016 and 2017 Consumer Expenditure Surveys, Bureau of Labor Statistics.
September 25, 2019
©2019 Esri Page 1 of 3

Recreation Expenditures7353-7399 St Louis Ave Village Of Skokie Only7353-7399 St Louis Ave, Skokie, Illinois, 60076 Latitude: 42.01519Drive Time: 10 minute radius Longitude: -87.71717
Demographic Summary 2019 2024Population 185,523 184,250Households 66,502 66,011Families 45,168 44,702Median Age 39.9 40.6Median Household Income $72,067 $79,798
Spending Potential Average AmountIndex Spent Total
Tv/Video/Audio 104 $1,273.44 $84,686,253Cable & Satellite Television Services 105 $919.76 $61,165,565Televisions & Video 101 $246.40 $16,385,834Audio 107 $104.38 $6,941,168Rental of TV/VCR/Radio/Sound Equipment 111 $0.88 $58,378Repair of TV/Radio/Sound Equipment 86 $2.03 $135,308
Entertainment/Recreation Fees and Admissions 123 $877.23 $58,337,452Tickets to Theatre/Operas/Concerts 133 $100.41 $6,677,212Tickets to Movies 118 $64.63 $4,297,870Tickets to Parks or Museums 122 $39.51 $2,627,681Admission to Sporting Events, excl.Trips 114 $71.91 $4,782,344Fees for Participant Sports, excl.Trips 108 $115.62 $7,688,909Fees for Recreational Lessons 129 $185.66 $12,346,488Membership Fees for Social/Recreation/Civic Clubs 126 $298.56 $19,854,506Dating Services 134 $0.94 $62,444
Toys/Games/Crafts/Hobbies 107 $126.35 $8,402,715Toys/Games/Arts/Crafts/Tricycles 104 $105.45 $7,012,390Playground Equipment 106 $4.44 $295,428Play Arcade Pinball/Video Games 133 $5.48 $364,381Online Entertainment and Games 126 $5.64 $375,259Stamp & Coin Collecting 125 $5.34 $355,257
Recreational Vehicles and Fees 145 $231.50 $15,395,458Docking and Landing Fees for Boats and Planes 119 $11.37 $756,449Camp Fees 215 $144.02 $9,577,828Payments on Boats/Trailers/Campers/RVs 84 $48.99 $3,257,887Rental of Boats/Trailers/Campers/RVs 110 $27.12 $1,803,294
Sports, Recreation and Exercise Equipment 104 $215.56 $14,334,922Exercise Equipment and Gear, Game Tables 110 $72.04 $4,790,483Bicycles 118 $35.05 $2,330,707Camping Equipment 96 $19.07 $1,268,431Hunting and Fishing Equipment 92 $64.63 $4,298,335Winter Sports Equipment 151 $8.17 $543,651Water Sports Equipment 100 $7.49 $498,345Other Sports Equipment 98 $6.54 $434,808Rental/Repair of Sports/Recreation/Exercise Equipment 101 $2.56 $170,161
Photographic Equipment and Supplies 113 $58.73 $3,905,424Film 111 $0.88 $58,803Film Processing 111 $8.76 $582,493Photographic Equipment 119 $24.33 $1,618,289Photographer Fees/Other Supplies & Equip Rental/Repair 107 $24.75 $1,645,839
Reading 119 $126.83 $8,434,175Magazine/Newspaper Subscriptions 125 $46.70 $3,105,746Magazine/Newspaper Single Copies 141 $9.36 $622,438Books 116 $43.49 $2,892,297Digital Book Readers 108 $27.27 $1,813,694
Data Note: The Spending Potential Index (SPI) is household-based, and represents the amount spent for a product or service relative to a national average of 100. Detail may not sum to totals due to rounding. Source: Esri forecasts for 2019 and 2024; Consumer Spending data are derived from the 2016 and 2017 Consumer Expenditure Surveys, Bureau of Labor Statistics.
September 25, 2019
©2019 Esri Page 2 of 3

Recreation Expenditures7353-7399 St Louis Ave Village Of Skokie Only7353-7399 St Louis Ave, Skokie, Illinois, 60076 Latitude: 42.01519Drive Time: 15 minute radius Longitude: -87.71717
Demographic Summary 2019 2024Population 477,852 475,755Households 182,450 181,752Families 109,318 108,382Median Age 38.2 39.0Median Household Income $66,187 $74,914
Spending Potential Average AmountIndex Spent Total
Tv/Video/Audio 103 $1,262.67 $230,373,536Cable & Satellite Television Services 102 $900.45 $164,287,075Televisions & Video 104 $253.99 $46,340,174Audio 108 $105.16 $19,186,259Rental of TV/VCR/Radio/Sound Equipment 119 $0.94 $172,191Repair of TV/Radio/Sound Equipment 90 $2.13 $387,836
Entertainment/Recreation Fees and Admissions 119 $848.85 $154,872,380Tickets to Theatre/Operas/Concerts 130 $97.58 $17,803,074Tickets to Movies 120 $65.55 $11,958,911Tickets to Parks or Museums 121 $39.11 $7,135,712Admission to Sporting Events, excl.Trips 109 $68.51 $12,499,985Fees for Participant Sports, excl.Trips 104 $111.78 $20,394,734Fees for Recreational Lessons 124 $177.14 $32,318,570Membership Fees for Social/Recreation/Civic Clubs 122 $288.19 $52,580,085Dating Services 141 $0.99 $181,309
Toys/Games/Crafts/Hobbies 107 $126.23 $23,030,217Toys/Games/Arts/Crafts/Tricycles 105 $105.96 $19,332,605Playground Equipment 97 $4.09 $746,698Play Arcade Pinball/Video Games 127 $5.24 $955,946Online Entertainment and Games 128 $5.73 $1,045,848Stamp & Coin Collecting 121 $5.20 $949,119
Recreational Vehicles and Fees 125 $200.28 $36,541,378Docking and Landing Fees for Boats and Planes 109 $10.37 $1,892,092Camp Fees 177 $118.48 $21,617,409Payments on Boats/Trailers/Campers/RVs 77 $44.97 $8,204,744Rental of Boats/Trailers/Campers/RVs 107 $26.46 $4,827,133
Sports, Recreation and Exercise Equipment 101 $209.27 $38,180,687Exercise Equipment and Gear, Game Tables 104 $68.09 $12,422,166Bicycles 115 $34.22 $6,243,491Camping Equipment 96 $19.00 $3,465,894Hunting and Fishing Equipment 91 $63.75 $11,630,586Winter Sports Equipment 147 $7.99 $1,457,962Water Sports Equipment 98 $7.35 $1,340,737Other Sports Equipment 97 $6.44 $1,174,209Rental/Repair of Sports/Recreation/Exercise Equipment 96 $2.44 $445,642
Photographic Equipment and Supplies 113 $58.61 $10,693,638Film 116 $0.92 $167,230Film Processing 107 $8.46 $1,543,137Photographic Equipment 117 $23.83 $4,347,568Photographer Fees/Other Supplies & Equip Rental/Repair 110 $25.41 $4,635,703
Reading 114 $121.48 $22,164,648Magazine/Newspaper Subscriptions 114 $42.58 $7,768,637Magazine/Newspaper Single Copies 131 $8.68 $1,584,203Books 115 $42.93 $7,831,747Digital Book Readers 108 $27.30 $4,980,060
Data Note: The Spending Potential Index (SPI) is household-based, and represents the amount spent for a product or service relative to a national average of 100. Detail may not sum to totals due to rounding. Source: Esri forecasts for 2019 and 2024; Consumer Spending data are derived from the 2016 and 2017 Consumer Expenditure Surveys, Bureau of Labor Statistics.
September 25, 2019
©2019 Esri Page 3 of 3

Restaurant Market Potential7353-7399 St Louis Ave Village Of Skokie Only7353-7399 St Louis Ave, Skokie, Illinois, 60076 Latitude: 42.01519Drive Time: 5 minute radius Longitude: -87.71717
Demographic Summary 2019 2024Population 19,188 19,016Population 18+ 15,070 14,996Households 6,451 6,373Median Household Income $86,110 $97,707
Expected Number of Product/Consumer Behavior Adults Percent MPI
Went to family restaurant/steak house in last 6 mo 11,775 78.1% 104Went to family restaurant/steak house 4+ times/mo 3,926 26.1% 98Spent at family restaurant/30 days: <$1-30 1,100 7.3% 90Spent at family restaurant/30 days: $31-50 1,369 9.1% 94Spent at family restaurant/30 days: $51-100 2,197 14.6% 98Spent at family restaurant/30 days: $101-200 1,582 10.5% 112Family restaurant/steak house last 6 months: breakfast 1,966 13.0% 98Family restaurant/steak house last 6 months: lunch 2,825 18.7% 97Family restaurant/steak house last 6 months: dinner 6,965 46.2% 100Family restaurant/steak house last 6 months: snack 392 2.6% 133Family restaurant/steak house last 6 months: weekday 4,386 29.1% 95Family restaurant/steak house last 6 months: weekend 6,301 41.8% 101Fam rest/steak hse/6 months: Applebee`s 3,315 22.0% 100Fam rest/steak hse/6 months: Bob Evans Farms 300 2.0% 64Fam rest/steak hse/6 months: Buffalo Wild Wings 1,413 9.4% 90Fam rest/steak hse/6 months: California Pizza Kitchen 926 6.1% 223Fam rest/steak hse/6 months: Carrabba`s Italian Grill 393 2.6% 91Fam rest/steak hse/6 months: The Cheesecake Factory 1,869 12.4% 169Fam rest/steak hse/6 months: Chili`s Grill & Bar 1,518 10.1% 93Fam rest/steak hse/6 months: CiCi`s 149 1.0% 35Fam rest/steak hse/6 months: Cracker Barrel 904 6.0% 55Fam rest/steak hse/6 months: Denny`s 1,317 8.7% 104Fam rest/steak hse/6 months: Golden Corral 501 3.3% 48Fam rest/steak hse/6 months: IHOP 1,636 10.9% 108Fam rest/steak hse/6 months: Logan`s Roadhouse 143 0.9% 30Fam rest/steak hse/6 months: LongHorn Steakhouse 528 3.5% 68Fam rest/steak hse/6 months: Olive Garden 2,485 16.5% 99Fam rest/steak hse/6 months: Outback Steakhouse 1,351 9.0% 109Fam rest/steak hse/6 months: Red Lobster 1,309 8.7% 89Fam rest/steak hse/6 months: Red Robin 1,292 8.6% 123Fam rest/steak hse/6 months: Ruby Tuesday 734 4.9% 106Fam rest/steak hse/6 months: Texas Roadhouse 953 6.3% 64Fam rest/steak hse/6 months: T.G.I. Friday`s 1,311 8.7% 160Fam rest/steak hse/6 months: Waffle House 350 2.3% 40Went to fast food/drive-in restaurant in last 6 months 13,541 89.9% 99Went to fast food/drive-in restaurant 9+ times/month 5,723 38.0% 97Spent at fast food restaurant/30 days: <$1-10 639 4.2% 94Spent at fast food restaurant/30 days: $11-$20 1,565 10.4% 96Spent at fast food restaurant/30 days: $21-$40 2,066 13.7% 84Spent at fast food restaurant/30 days: $41-$50 1,310 8.7% 99Spent at fast food restaurant/30 days: $51-$100 2,550 16.9% 102Spent at fast food restaurant/30 days: $101-$200 1,106 7.3% 90Spent at fast food restaurant/30 days: $201+ 555 3.7% 120
Data Note: An MPI (Market Potential Index) measures the relative likelihood of the adults in the specified trade area to exhibit certain consumer behavior or purchasing patterns compared to the U.S. An MPI of 100 represents the U.S. average.Source: These data are based upon national propensities to use various products and services, applied to local demographic composition. Usage data were collected by GfK MRI in a nationally representative survey of U.S. households. Esri forecasts for 2019 and 2024.
September 25, 2019
©2019 Esri Page 1 of 6

Restaurant Market Potential7353-7399 St Louis Ave Village Of Skokie Only7353-7399 St Louis Ave, Skokie, Illinois, 60076 Latitude: 42.01519Drive Time: 5 minute radius Longitude: -87.71717
Expected Number ofProduct/Consumer Behavior Adults Percent MPI
Fast food/drive-in last 6 months: eat in 5,177 34.4% 92Fast food/drive-in last 6 months: home delivery 1,041 6.9% 80Fast food/drive-in last 6 months: take-out/drive-thru 5,963 39.6% 84Fast food/drive-in last 6 months: take-out/walk-in 3,351 22.2% 107Fast food/drive-in last 6 months: breakfast 4,838 32.1% 90Fast food/drive-in last 6 months: lunch 6,977 46.3% 92Fast food/drive-in last 6 months: dinner 6,585 43.7% 94Fast food/drive-in last 6 months: snack 1,822 12.1% 102Fast food/drive-in last 6 months: weekday 8,558 56.8% 96Fast food/drive-in last 6 months: weekend 6,712 44.5% 94Fast food/drive-in last 6 months: A & W 250 1.7% 58Fast food/drive-in last 6 months: Arby`s 1,418 9.4% 53Fast food/drive-in last 6 months: Baskin-Robbins 994 6.6% 199Fast food/drive-in last 6 months: Boston Market 891 5.9% 191Fast food/drive-in last 6 months: Burger King 3,642 24.2% 81Fast food/drive-in last 6 months: Captain D`s 140 0.9% 25Fast food/drive-in last 6 months: Carl`s Jr. 1,562 10.4% 174Fast food/drive-in last 6 months: Checkers 429 2.8% 86Fast food/drive-in last 6 months: Chick-fil-A 2,833 18.8% 78Fast food/drive-in last 6 months: Chipotle Mex. Grill 2,860 19.0% 152Fast food/drive-in last 6 months: Chuck E. Cheese`s 422 2.8% 96Fast food/drive-in last 6 months: Church`s Fr. Chicken 177 1.2% 33Fast food/drive-in last 6 months: Cold Stone Creamery 574 3.8% 130Fast food/drive-in last 6 months: Dairy Queen 1,253 8.3% 51Fast food/drive-in last 6 months: Del Taco 927 6.2% 159Fast food/drive-in last 6 months: Domino`s Pizza 1,344 8.9% 71Fast food/drive-in last 6 months: Dunkin` Donuts 3,195 21.2% 155Went to Five Guys in last 6 months 1,554 10.3% 110Fast food/drive-in last 6 months: Hardee`s 271 1.8% 27Fast food/drive-in last 6 months: Jack in the Box 1,563 10.4% 138Went to Jimmy John`s in last 6 months 601 4.0% 66Fast food/drive-in last 6 months: KFC 2,551 16.9% 82Fast food/drive-in last 6 months: Krispy Kreme 741 4.9% 83Fast food/drive-in last 6 months: Little Caesars 1,005 6.7% 50Fast food/drive-in last 6 months: Long John Silver`s 295 2.0% 55Fast food/drive-in last 6 months: McDonald`s 7,184 47.7% 90Went to Panda Express in last 6 months 1,903 12.6% 131Fast food/drive-in last 6 months: Panera Bread 2,567 17.0% 134Fast food/drive-in last 6 months: Papa John`s 943 6.3% 71Fast food/drive-in last 6 months: Papa Murphy`s 439 2.9% 61Fast food/drive-in last 6 months: Pizza Hut 1,677 11.1% 64Fast food/drive-in last 6 months: Popeyes Chicken 1,298 8.6% 95Fast food/drive-in last 6 months: Sonic Drive-In 820 5.4% 45Fast food/drive-in last 6 months: Starbucks 3,769 25.0% 134Fast food/drive-in last 6 months: Steak `n Shake 427 2.8% 51Fast food/drive-in last 6 months: Subway 3,521 23.4% 91Fast food/drive-in last 6 months: Taco Bell 3,455 22.9% 80Fast food/drive-in last 6 months: Wendy`s 3,419 22.7% 89Fast food/drive-in last 6 months: Whataburger 283 1.9% 36Fast food/drive-in last 6 months: White Castle 529 3.5% 114Went to fine dining restaurant last month 1,941 12.9% 122Went to fine dining restaurant 3+ times last month 588 3.9% 125
Data Note: An MPI (Market Potential Index) measures the relative likelihood of the adults in the specified trade area to exhibit certain consumer behavior or purchasing patterns compared to the U.S. An MPI of 100 represents the U.S. average.Source: These data are based upon national propensities to use various products and services, applied to local demographic composition. Usage data were collected by GfK MRI in a nationally representative survey of U.S. households. Esri forecasts for 2019 and 2024.
September 25, 2019
©2019 Esri Page 2 of 6

Restaurant Market Potential7353-7399 St Louis Ave Village Of Skokie Only7353-7399 St Louis Ave, Skokie, Illinois, 60076 Latitude: 42.01519Drive Time: 10 minute radius Longitude: -87.71717
Demographic Summary 2019 2024Population 185,523 184,250Population 18+ 143,201 143,869Households 66,502 66,011Median Household Income $72,067 $79,798
Expected Number of Product/Consumer Behavior Adults Percent MPI
Went to family restaurant/steak house in last 6 mo 107,442 75.0% 100Went to family restaurant/steak house 4+ times/mo 35,142 24.5% 92Spent at family restaurant/30 days: <$1-30 9,736 6.8% 84Spent at family restaurant/30 days: $31-50 12,373 8.6% 90Spent at family restaurant/30 days: $51-100 20,860 14.6% 98Spent at family restaurant/30 days: $101-200 12,676 8.9% 94Family restaurant/steak house last 6 months: breakfast 18,286 12.8% 96Family restaurant/steak house last 6 months: lunch 26,284 18.4% 95Family restaurant/steak house last 6 months: dinner 62,527 43.7% 94Family restaurant/steak house last 6 months: snack 4,613 3.2% 164Family restaurant/steak house last 6 months: weekday 39,607 27.7% 91Family restaurant/steak house last 6 months: weekend 57,089 39.9% 96Fam rest/steak hse/6 months: Applebee`s 31,680 22.1% 101Fam rest/steak hse/6 months: Bob Evans Farms 2,705 1.9% 61Fam rest/steak hse/6 months: Buffalo Wild Wings 14,563 10.2% 97Fam rest/steak hse/6 months: California Pizza Kitchen 7,790 5.4% 198Fam rest/steak hse/6 months: Carrabba`s Italian Grill 3,522 2.5% 85Fam rest/steak hse/6 months: The Cheesecake Factory 17,607 12.3% 168Fam rest/steak hse/6 months: Chili`s Grill & Bar 12,563 8.8% 81Fam rest/steak hse/6 months: CiCi`s 2,938 2.1% 72Fam rest/steak hse/6 months: Cracker Barrel 9,014 6.3% 57Fam rest/steak hse/6 months: Denny`s 12,866 9.0% 107Fam rest/steak hse/6 months: Golden Corral 4,690 3.3% 47Fam rest/steak hse/6 months: IHOP 15,298 10.7% 106Fam rest/steak hse/6 months: Logan`s Roadhouse 2,169 1.5% 48Fam rest/steak hse/6 months: LongHorn Steakhouse 5,551 3.9% 75Fam rest/steak hse/6 months: Olive Garden 22,564 15.8% 94Fam rest/steak hse/6 months: Outback Steakhouse 11,636 8.1% 99Fam rest/steak hse/6 months: Red Lobster 13,862 9.7% 100Fam rest/steak hse/6 months: Red Robin 10,084 7.0% 101Fam rest/steak hse/6 months: Ruby Tuesday 6,346 4.4% 96Fam rest/steak hse/6 months: Texas Roadhouse 8,100 5.7% 57Fam rest/steak hse/6 months: T.G.I. Friday`s 11,903 8.3% 152Fam rest/steak hse/6 months: Waffle House 4,790 3.3% 58Went to fast food/drive-in restaurant in last 6 months 128,022 89.4% 98Went to fast food/drive-in restaurant 9+ times/month 51,683 36.1% 92Spent at fast food restaurant/30 days: <$1-10 6,014 4.2% 93Spent at fast food restaurant/30 days: $11-$20 15,651 10.9% 101Spent at fast food restaurant/30 days: $21-$40 19,352 13.5% 83Spent at fast food restaurant/30 days: $41-$50 12,279 8.6% 98Spent at fast food restaurant/30 days: $51-$100 20,232 14.1% 85Spent at fast food restaurant/30 days: $101-$200 11,701 8.2% 100Spent at fast food restaurant/30 days: $201+ 5,298 3.7% 121
Data Note: An MPI (Market Potential Index) measures the relative likelihood of the adults in the specified trade area to exhibit certain consumer behavior or purchasing patterns compared to the U.S. An MPI of 100 represents the U.S. average.Source: These data are based upon national propensities to use various products and services, applied to local demographic composition. Usage data were collected by GfK MRI in a nationally representative survey of U.S. households. Esri forecasts for 2019 and 2024.
September 25, 2019
©2019 Esri Page 3 of 6

Restaurant Market Potential7353-7399 St Louis Ave Village Of Skokie Only7353-7399 St Louis Ave, Skokie, Illinois, 60076 Latitude: 42.01519Drive Time: 10 minute radius Longitude: -87.71717
Expected Number ofProduct/Consumer Behavior Adults Percent MPI
Fast food/drive-in last 6 months: eat in 49,511 34.6% 93Fast food/drive-in last 6 months: home delivery 12,907 9.0% 104Fast food/drive-in last 6 months: take-out/drive-thru 52,333 36.5% 78Fast food/drive-in last 6 months: take-out/walk-in 33,520 23.4% 112Fast food/drive-in last 6 months: breakfast 46,079 32.2% 91Fast food/drive-in last 6 months: lunch 63,455 44.3% 88Fast food/drive-in last 6 months: dinner 59,779 41.7% 90Fast food/drive-in last 6 months: snack 18,270 12.8% 108Fast food/drive-in last 6 months: weekday 75,565 52.8% 89Fast food/drive-in last 6 months: weekend 64,636 45.1% 95Fast food/drive-in last 6 months: A & W 2,912 2.0% 71Fast food/drive-in last 6 months: Arby`s 12,512 8.7% 50Fast food/drive-in last 6 months: Baskin-Robbins 8,149 5.7% 172Fast food/drive-in last 6 months: Boston Market 9,209 6.4% 208Fast food/drive-in last 6 months: Burger King 36,897 25.8% 87Fast food/drive-in last 6 months: Captain D`s 2,606 1.8% 49Fast food/drive-in last 6 months: Carl`s Jr. 11,991 8.4% 140Fast food/drive-in last 6 months: Checkers 4,306 3.0% 91Fast food/drive-in last 6 months: Chick-fil-A 23,614 16.5% 69Fast food/drive-in last 6 months: Chipotle Mex. Grill 26,225 18.3% 147Fast food/drive-in last 6 months: Chuck E. Cheese`s 4,336 3.0% 103Fast food/drive-in last 6 months: Church`s Fr. Chicken 3,105 2.2% 61Fast food/drive-in last 6 months: Cold Stone Creamery 5,127 3.6% 122Fast food/drive-in last 6 months: Dairy Queen 12,132 8.5% 52Fast food/drive-in last 6 months: Del Taco 8,774 6.1% 158Fast food/drive-in last 6 months: Domino`s Pizza 17,111 11.9% 94Fast food/drive-in last 6 months: Dunkin` Donuts 32,698 22.8% 167Went to Five Guys in last 6 months 14,721 10.3% 109Fast food/drive-in last 6 months: Hardee`s 4,867 3.4% 51Fast food/drive-in last 6 months: Jack in the Box 13,290 9.3% 124Went to Jimmy John`s in last 6 months 6,043 4.2% 70Fast food/drive-in last 6 months: KFC 26,695 18.6% 91Fast food/drive-in last 6 months: Krispy Kreme 7,830 5.5% 92Fast food/drive-in last 6 months: Little Caesars 12,148 8.5% 63Fast food/drive-in last 6 months: Long John Silver`s 3,399 2.4% 67Fast food/drive-in last 6 months: McDonald`s 66,961 46.8% 89Went to Panda Express in last 6 months 16,037 11.2% 116Fast food/drive-in last 6 months: Panera Bread 21,938 15.3% 121Fast food/drive-in last 6 months: Papa John`s 10,380 7.2% 82Fast food/drive-in last 6 months: Papa Murphy`s 4,346 3.0% 64Fast food/drive-in last 6 months: Pizza Hut 17,601 12.3% 71Fast food/drive-in last 6 months: Popeyes Chicken 13,802 9.6% 106Fast food/drive-in last 6 months: Sonic Drive-In 9,515 6.6% 55Fast food/drive-in last 6 months: Starbucks 36,655 25.6% 137Fast food/drive-in last 6 months: Steak `n Shake 4,493 3.1% 57Fast food/drive-in last 6 months: Subway 31,832 22.2% 86Fast food/drive-in last 6 months: Taco Bell 31,743 22.2% 77Fast food/drive-in last 6 months: Wendy`s 31,501 22.0% 86Fast food/drive-in last 6 months: Whataburger 4,226 3.0% 56Fast food/drive-in last 6 months: White Castle 5,735 4.0% 130Went to fine dining restaurant last month 19,564 13.7% 130Went to fine dining restaurant 3+ times last month 6,632 4.6% 148
Data Note: An MPI (Market Potential Index) measures the relative likelihood of the adults in the specified trade area to exhibit certain consumer behavior or purchasing patterns compared to the U.S. An MPI of 100 represents the U.S. average.Source: These data are based upon national propensities to use various products and services, applied to local demographic composition. Usage data were collected by GfK MRI in a nationally representative survey of U.S. households. Esri forecasts for 2019 and 2024.
September 25, 2019
©2019 Esri Page 4 of 6

Restaurant Market Potential7353-7399 St Louis Ave Village Of Skokie Only7353-7399 St Louis Ave, Skokie, Illinois, 60076 Latitude: 42.01519Drive Time: 15 minute radius Longitude: -87.71717
Demographic Summary 2019 2024Population 477,852 475,755Population 18+ 376,865 380,324Households 182,450 181,752Median Household Income $66,187 $74,914
Expected Number of Product/Consumer Behavior Adults Percent MPI
Went to family restaurant/steak house in last 6 mo 275,811 73.2% 98Went to family restaurant/steak house 4+ times/mo 90,006 23.9% 90Spent at family restaurant/30 days: <$1-30 26,649 7.1% 88Spent at family restaurant/30 days: $31-50 31,215 8.3% 86Spent at family restaurant/30 days: $51-100 51,773 13.7% 93Spent at family restaurant/30 days: $101-200 31,871 8.5% 90Family restaurant/steak house last 6 months: breakfast 47,865 12.7% 95Family restaurant/steak house last 6 months: lunch 68,367 18.1% 94Family restaurant/steak house last 6 months: dinner 161,064 42.7% 92Family restaurant/steak house last 6 months: snack 11,044 2.9% 149Family restaurant/steak house last 6 months: weekday 101,488 26.9% 88Family restaurant/steak house last 6 months: weekend 147,873 39.2% 94Fam rest/steak hse/6 months: Applebee`s 79,401 21.1% 96Fam rest/steak hse/6 months: Bob Evans Farms 6,166 1.6% 53Fam rest/steak hse/6 months: Buffalo Wild Wings 38,258 10.2% 97Fam rest/steak hse/6 months: California Pizza Kitchen 20,107 5.3% 194Fam rest/steak hse/6 months: Carrabba`s Italian Grill 9,183 2.4% 85Fam rest/steak hse/6 months: The Cheesecake Factory 44,021 11.7% 160Fam rest/steak hse/6 months: Chili`s Grill & Bar 33,877 9.0% 83Fam rest/steak hse/6 months: CiCi`s 9,012 2.4% 84Fam rest/steak hse/6 months: Cracker Barrel 21,616 5.7% 52Fam rest/steak hse/6 months: Denny`s 35,323 9.4% 111Fam rest/steak hse/6 months: Golden Corral 12,048 3.2% 46Fam rest/steak hse/6 months: IHOP 40,747 10.8% 108Fam rest/steak hse/6 months: Logan`s Roadhouse 5,437 1.4% 45Fam rest/steak hse/6 months: LongHorn Steakhouse 14,385 3.8% 74Fam rest/steak hse/6 months: Olive Garden 57,851 15.4% 92Fam rest/steak hse/6 months: Outback Steakhouse 27,459 7.3% 88Fam rest/steak hse/6 months: Red Lobster 33,708 8.9% 92Fam rest/steak hse/6 months: Red Robin 24,372 6.5% 93Fam rest/steak hse/6 months: Ruby Tuesday 14,493 3.8% 83Fam rest/steak hse/6 months: Texas Roadhouse 20,935 5.6% 56Fam rest/steak hse/6 months: T.G.I. Friday`s 27,075 7.2% 132Fam rest/steak hse/6 months: Waffle House 13,262 3.5% 61Went to fast food/drive-in restaurant in last 6 months 336,574 89.3% 98Went to fast food/drive-in restaurant 9+ times/month 137,266 36.4% 93Spent at fast food restaurant/30 days: <$1-10 16,631 4.4% 98Spent at fast food restaurant/30 days: $11-$20 39,841 10.6% 98Spent at fast food restaurant/30 days: $21-$40 52,929 14.0% 87Spent at fast food restaurant/30 days: $41-$50 32,032 8.5% 97Spent at fast food restaurant/30 days: $51-$100 53,297 14.1% 85Spent at fast food restaurant/30 days: $101-$200 28,908 7.7% 94Spent at fast food restaurant/30 days: $201+ 13,114 3.5% 113
Data Note: An MPI (Market Potential Index) measures the relative likelihood of the adults in the specified trade area to exhibit certain consumer behavior or purchasing patterns compared to the U.S. An MPI of 100 represents the U.S. average.Source: These data are based upon national propensities to use various products and services, applied to local demographic composition. Usage data were collected by GfK MRI in a nationally representative survey of U.S. households. Esri forecasts for 2019 and 2024.
September 25, 2019
©2019 Esri Page 5 of 6

Restaurant Market Potential7353-7399 St Louis Ave Village Of Skokie Only7353-7399 St Louis Ave, Skokie, Illinois, 60076 Latitude: 42.01519Drive Time: 15 minute radius Longitude: -87.71717
Expected Number ofProduct/Consumer Behavior Adults Percent MPI
Fast food/drive-in last 6 months: eat in 131,327 34.8% 94Fast food/drive-in last 6 months: home delivery 36,601 9.7% 112Fast food/drive-in last 6 months: take-out/drive-thru 139,872 37.1% 79Fast food/drive-in last 6 months: take-out/walk-in 87,856 23.3% 112Fast food/drive-in last 6 months: breakfast 120,694 32.0% 90Fast food/drive-in last 6 months: lunch 168,074 44.6% 89Fast food/drive-in last 6 months: dinner 154,583 41.0% 88Fast food/drive-in last 6 months: snack 48,347 12.8% 109Fast food/drive-in last 6 months: weekday 197,420 52.4% 88Fast food/drive-in last 6 months: weekend 172,367 45.7% 97Fast food/drive-in last 6 months: A & W 7,965 2.1% 74Fast food/drive-in last 6 months: Arby`s 34,613 9.2% 52Fast food/drive-in last 6 months: Baskin-Robbins 20,316 5.4% 163Fast food/drive-in last 6 months: Boston Market 21,585 5.7% 185Fast food/drive-in last 6 months: Burger King 94,007 24.9% 84Fast food/drive-in last 6 months: Captain D`s 6,399 1.7% 46Fast food/drive-in last 6 months: Carl`s Jr. 32,633 8.7% 145Fast food/drive-in last 6 months: Checkers 10,912 2.9% 87Fast food/drive-in last 6 months: Chick-fil-A 65,460 17.4% 72Fast food/drive-in last 6 months: Chipotle Mex. Grill 69,218 18.4% 147Fast food/drive-in last 6 months: Chuck E. Cheese`s 12,172 3.2% 110Fast food/drive-in last 6 months: Church`s Fr. Chicken 8,452 2.2% 63Fast food/drive-in last 6 months: Cold Stone Creamery 12,795 3.4% 116Fast food/drive-in last 6 months: Dairy Queen 32,493 8.6% 53Fast food/drive-in last 6 months: Del Taco 24,435 6.5% 167Fast food/drive-in last 6 months: Domino`s Pizza 47,539 12.6% 100Fast food/drive-in last 6 months: Dunkin` Donuts 81,167 21.5% 158Went to Five Guys in last 6 months 38,735 10.3% 109Fast food/drive-in last 6 months: Hardee`s 11,858 3.1% 47Fast food/drive-in last 6 months: Jack in the Box 36,743 9.7% 130Went to Jimmy John`s in last 6 months 16,655 4.4% 73Fast food/drive-in last 6 months: KFC 68,673 18.2% 89Fast food/drive-in last 6 months: Krispy Kreme 22,002 5.8% 98Fast food/drive-in last 6 months: Little Caesars 34,177 9.1% 68Fast food/drive-in last 6 months: Long John Silver`s 8,269 2.2% 62Fast food/drive-in last 6 months: McDonald`s 178,439 47.3% 90Went to Panda Express in last 6 months 44,277 11.7% 121Fast food/drive-in last 6 months: Panera Bread 54,633 14.5% 114Fast food/drive-in last 6 months: Papa John`s 28,322 7.5% 85Fast food/drive-in last 6 months: Papa Murphy`s 10,485 2.8% 58Fast food/drive-in last 6 months: Pizza Hut 49,301 13.1% 76Fast food/drive-in last 6 months: Popeyes Chicken 35,794 9.5% 104Fast food/drive-in last 6 months: Sonic Drive-In 24,831 6.6% 55Fast food/drive-in last 6 months: Starbucks 100,011 26.5% 142Fast food/drive-in last 6 months: Steak `n Shake 12,698 3.4% 61Fast food/drive-in last 6 months: Subway 85,845 22.8% 88Fast food/drive-in last 6 months: Taco Bell 86,224 22.9% 79Fast food/drive-in last 6 months: Wendy`s 79,659 21.1% 83Fast food/drive-in last 6 months: Whataburger 13,291 3.5% 67Fast food/drive-in last 6 months: White Castle 13,095 3.5% 113Went to fine dining restaurant last month 51,791 13.7% 131Went to fine dining restaurant 3+ times last month 17,290 4.6% 147
Data Note: An MPI (Market Potential Index) measures the relative likelihood of the adults in the specified trade area to exhibit certain consumer behavior or purchasing patterns compared to the U.S. An MPI of 100 represents the U.S. average.Source: These data are based upon national propensities to use various products and services, applied to local demographic composition. Usage data were collected by GfK MRI in a nationally representative survey of U.S. households. Esri forecasts for 2019 and 2024.
September 25, 2019
©2019 Esri Page 6 of 6

Retail Demand Outlook7353-7399 St Louis Ave Village Of Skokie Only7353-7399 St Louis Ave, Skokie, Illinois, 60076 Latitude: 42.01519Drive Time: 5 minute radius Longitude: -87.71717
Top Tapestry Segments Percent Demographic Summary 2019 2024Pleasantville (2B) 41.7% Population 19,188 19,016Pacific Heights (2C) 29.8% Households 6,451 6,373Golden Years (9B) 11.4% Families 4,775 4,708Retirement Communities (9E) 7.7% Median Age 44.2 44.4Exurbanites (1E) 6.3% Median Household Income $86,110 $97,707
2019 2024 ProjectedConsumer Spending Forecasted Demand Spending Growth
Apparel and Services $16,426,249 $18,320,886 $1,894,637Men's $3,169,857 $3,535,607 $365,750Women's $5,941,249 $6,626,224 $684,975Children's $2,163,339 $2,412,851 $249,512Footwear $3,576,294 $3,988,925 $412,631Watches & Jewelry $999,977 $1,115,342 $115,365Apparel Products and Services (1) $575,534 $641,938 $66,404
ComputerComputers and Hardware for Home Use $1,316,505 $1,468,329 $151,824Portable Memory $37,742 $42,085 $4,343Computer Software $83,400 $93,014 $9,614Computer Accessories $142,754 $159,217 $16,463
Entertainment & Recreation $25,617,347 $28,571,632 $2,954,285Fees and Admissions $6,283,738 $7,008,233 $724,495
Membership Fees for Clubs (2) $2,176,275 $2,427,219 $250,944Fees for Participant Sports, excl. Trips $857,683 $956,526 $98,843Tickets to Theatre/Operas/Concerts $715,472 $798,017 $82,545Tickets to Movies $431,193 $480,873 $49,680Tickets to Parks or Museums $271,785 $303,124 $31,339Admission to Sporting Events, excl. Trips $510,137 $568,959 $58,822Fees for Recreational Lessons $1,315,153 $1,466,778 $151,625Dating Services $6,040 $6,738 $698
TV/Video/Audio $8,650,497 $9,648,689 $998,192Cable and Satellite Television Services $6,258,570 $6,980,967 $722,397Televisions $738,314 $823,492 $85,178Satellite Dishes $12,269 $13,681 $1,412VCRs, Video Cameras, and DVD Players $37,701 $42,043 $4,342Miscellaneous Video Equipment $167,819 $187,167 $19,348Video Cassettes and DVDs $75,097 $83,755 $8,658Video Game Hardware/Accessories $181,515 $202,445 $20,930Video Game Software $102,882 $114,746 $11,864Rental/Streaming/Downloaded Video $320,012 $356,905 $36,893Installation of Televisions $9,433 $10,521 $1,088Audio (3) $729,364 $813,423 $84,059Rental and Repair of TV/Radio/Sound Equipment $17,520 19,545 $2,025
Pets $4,918,290 $5,485,333 $567,043Toys/Games/Crafts/Hobbies (4) $855,564 $954,199 $98,635Recreational Vehicles and Fees (5) $1,752,988 $1,955,090 $202,102Sports/Recreation/Exercise Equipment (6) $1,585,909 $1,768,576 $182,667Photo Equipment and Supplies (7) $399,760 $445,874 $46,114Reading (8) $913,599 $1,018,963 $105,364Catered Affairs (9) $257,004 286,674 $29,670
Food $66,452,024 $74,117,256 $7,665,232Food at Home $38,563,574 $43,012,636 $4,449,062
Bakery and Cereal Products $5,021,381 $5,600,801 $579,420Meats, Poultry, Fish, and Eggs $8,532,248 $9,516,670 $984,422Dairy Products $4,050,398 $4,517,681 $467,283Fruits and Vegetables $7,944,233 $8,860,657 $916,424Snacks and Other Food at Home (10) $13,015,315 $14,516,827 $1,501,512
Food Away from Home $27,888,450 $31,104,621 $3,216,171Alcoholic Beverages $5,005,875 $5,583,037 $577,162
Data Note: The Consumer Spending data is household-based and represents the amount spent for a product or service by all households in an area. Detail may not sum to totals due to rounding. This report is not a comprehensive list of all consumer spending variables therefore the variables in each section may not sum to totals.Source: Esri forecasts for 2019 and 2024; Consumer Spending data are derived from the 2016 and 2017 Consumer Expenditure Surveys, Bureau of Labor Statistics.
September 25, 2019
©2019 Esri Page 1 of 9

Retail Demand Outlook7353-7399 St Louis Ave Village Of Skokie Only7353-7399 St Louis Ave, Skokie, Illinois, 60076 Latitude: 42.01519Drive Time: 5 minute radius Longitude: -87.71717
2019 2024 ProjectedConsumer Spending Forecasted Demand Spending Growth
FinancialValue of Stocks/Bonds/Mutual Funds $208,055,168 $232,041,145 $23,985,977Value of Retirement Plans $854,540,944 $953,050,882 $98,509,938Value of Other Financial Assets $56,708,454 $63,249,226 $6,540,772Vehicle Loan Amount excluding Interest $17,609,459 $19,639,047 $2,029,588Value of Credit Card Debt $19,266,937 $21,489,011 $2,222,074
HealthNonprescription Drugs $1,007,533 $1,123,824 $116,291Prescription Drugs $2,518,328 $2,808,879 $290,551Eyeglasses and Contact Lenses $680,172 $758,606 $78,434
HomeMortgage Payment and Basics (11) $90,911,543 $101,382,078 $10,470,535Maintenance and Remodeling Services $19,018,067 $21,208,405 $2,190,338Maintenance and Remodeling Materials (12) $3,720,522 $4,149,133 $428,611Utilities, Fuel, and Public Services $34,973,210 $39,007,341 $4,034,131
Household Furnishings and EquipmentHousehold Textiles (13) $742,661 $828,341 $85,680Furniture $4,609,335 $5,141,133 $531,798Rugs $251,136 $280,138 $29,002Major Appliances (14) $2,569,869 $2,866,134 $296,265Housewares (15) $820,196 $914,767 $94,571Small Appliances $368,239 $410,692 $42,453Luggage $117,067 $130,556 $13,489Telephones and Accessories $650,867 $725,758 $74,891
Household OperationsChild Care $4,102,809 $4,576,038 $473,229Lawn and Garden (16) $3,905,448 $4,355,376 $449,928Moving/Storage/Freight Express $482,090 $537,666 $55,576
Housekeeping Supplies (17) $5,356,658 $5,974,636 $617,978Insurance
Owners and Renters Insurance $4,179,119 $4,660,872 $481,753Vehicle Insurance $10,858,895 $12,111,498 $1,252,603Life/Other Insurance $3,630,870 $4,049,667 $418,797Health Insurance $29,406,292 $32,798,262 $3,391,970
Personal Care Products (18) $3,697,781 $4,124,190 $426,409School Books and Supplies (19) $1,199,390 1,337,607 $138,217Smoking Products $2,443,968 $2,726,424 $282,456Transportation
Payments on Vehicles excluding Leases $15,962,630 $17,803,517 $1,840,887Gasoline and Motor Oil $15,879,860 $17,710,623 $1,830,763Vehicle Maintenance and Repairs $8,497,955 $9,478,099 $980,144
TravelAirline Fares $5,023,151 $5,602,053 $578,902Lodging on Trips $5,391,689 $6,013,190 $621,501Auto/Truck Rental on Trips $233,727 $260,646 $26,919Food and Drink on Trips $4,591,587 $5,120,732 $529,145
Data Note: The Consumer Spending data is household-based and represents the amount spent for a product or service by all households in an area. Detail may not sum to totals due to rounding. This report is not a comprehensive list of all consumer spending variables therefore the variables in each section may not sum to totals.Source: Esri forecasts for 2019 and 2024; Consumer Spending data are derived from the 2016 and 2017 Consumer Expenditure Surveys, Bureau of Labor Statistics.
September 25, 2019
©2019 Esri Page 2 of 9

Retail Demand Outlook7353-7399 St Louis Ave Village Of Skokie Only7353-7399 St Louis Ave, Skokie, Illinois, 60076 Latitude: 42.01519Drive Time: 5 minute radius Longitude: -87.71717
(1) Apparel Products and Services includes shoe repair and other shoe services, apparel laundry and dry cleaning, alteration, repair and tailoring of apparel, clothing rental and storage, and watch and jewelry repair.
(2) Membership Fees for Clubs includes membership fees for social, recreational, and civic clubs.
(3) Audio includes satellite radio service, radios, stereos, sound components, equipment and accessories, digital audio players, records, CDs, audio tapes, streaming/downloaded audio, musical instruments and accessories, and rental and repair of musical instruments.
(4) Toys and Games includes toys, games, arts and crafts, tricycles, playground equipment, arcade games, online entertainment and games, and stamp and coin collecting.
(5) Recreational Vehicles & Fees includes docking and landing fees for boats and planes, payments on boats, trailers, campers and RVs, rental of boats, trailers, campers and RVs, and camp fees.
(6) Sports/Recreation/Exercise Equipment includes exercise equipment and gear, game tables, bicycles, camping equipment, hunting and fishing equipment, winter sports equipment, water sports equipment, other sports equipment, and rental/repair of sports/recreation/exercise equipment.
(7) Photo Equipment and Supplies includes film, film processing, photographic equipment, rental and repair of photo equipment, and photographer fees. (8) Reading includes digital book readers, books, magazine and newspaper subscriptions, and single copies of magazines and newspapers.
(9) Catered Affairs includes expenses associated with live entertainment and rental of party supplies.
(10) Snacks and Other Food at Home includes candy, chewing gum, sugar, artificial sweeteners, jam, jelly, preserves, margarine, fats and oils, salad dressing, nondairy cream and milk, peanut butter, frozen prepared food, potato chips and other snacks, nuts, salt, spices, seasonings, olives, pickles, relishes, sauces, gravy, other condiments, soup, prepared salad, prepared dessert, baby food, miscellaneous prepared food, and nonalcoholic beverages.
(11) Mortgage Payment and Basics includes mortgage interest, mortgage principal, property taxes, homeowners insurance, and ground rent on owned dwellings.
(12) Maintenance and Remodeling Materials includes supplies/tools/equipment for painting and wallpapering, plumbing supplies and equipment, electrical/heating/AC supplies, materials for roofing/gutters, materials for plaster/panel/siding, materials for patio/fence/brick work, landscaping materials, and insulation materials for owned homes.
(13) Household Textiles includes bathroom linens, bedroom linens, kitchen linens, dining room linens, other linens, curtains, draperies, slipcovers and decorative pillows.
(14) Major Appliances includes dishwashers, disposals, refrigerators, freezers, washers, dryers, stoves, ovens, microwaves, window air conditioners, electric floor cleaning equipment, sewing machines, and miscellaneous appliances.
(15) Housewares includes flatware, dishes, cups glasses, serving pieces, nonelectric cookware, and tableware.
(16) Lawn and Garden includes lawn and garden supplies, equipment and care service, indoor plants, fresh flowers, and repair/rental of lawn and garden equipment.
(17) Housekeeping Supplies includes soaps and laundry detergents, cleaning products, toilet tissue, paper towels, napkins, paper/plastic/foil products, stationery, giftwrap supplies, postage, and delivery services.
(18) Personal Care Products includes hair care products, nonelectric articles for hair, wigs, hairpieces, oral hygiene products, shaving needs, perfume, cosmetics, skincare, bath products, nail products, deodorant, feminine hygiene products, adult diapers, other miscellaneous care products and personal care appliances.
(19) School Books and Supplies includes school books and supplies for college, elementary school, high school, vocational/technical school, preschool and other schools.
Data Note: The Consumer Spending data is household-based and represents the amount spent for a product or service by all households in an area. Detail may not sum to totals due to rounding. This report is not a comprehensive list of all consumer spending variables therefore the variables in each section may not sum to totals.Source: Esri forecasts for 2019 and 2024; Consumer Spending data are derived from the 2016 and 2017 Consumer Expenditure Surveys, Bureau of Labor Statistics.
September 25, 2019
©2019 Esri Page 3 of 9
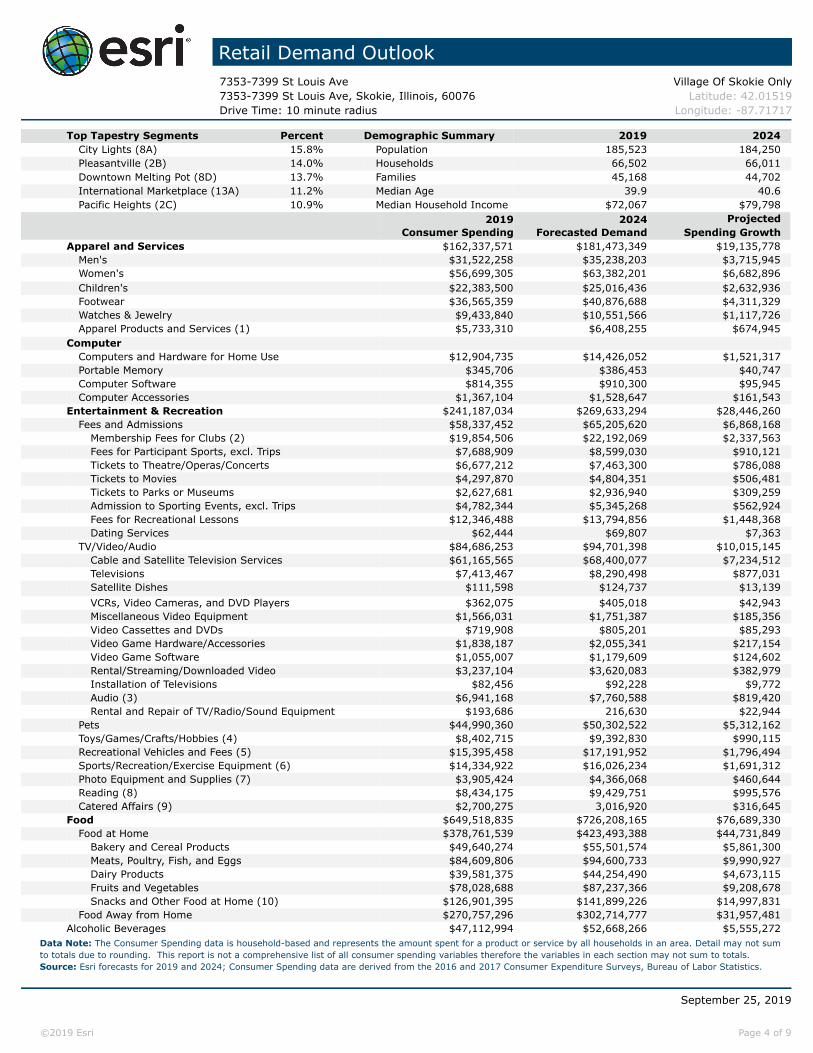
Retail Demand Outlook7353-7399 St Louis Ave Village Of Skokie Only7353-7399 St Louis Ave, Skokie, Illinois, 60076 Latitude: 42.01519Drive Time: 10 minute radius Longitude: -87.71717
Top Tapestry Segments Percent Demographic Summary 2019 2024City Lights (8A) 15.8% Population 185,523 184,250Pleasantville (2B) 14.0% Households 66,502 66,011Downtown Melting Pot (8D) 13.7% Families 45,168 44,702International Marketplace (13A) 11.2% Median Age 39.9 40.6Pacific Heights (2C) 10.9% Median Household Income $72,067 $79,798
2019 2024 ProjectedConsumer Spending Forecasted Demand Spending Growth
Apparel and Services $162,337,571 $181,473,349 $19,135,778Men's $31,522,258 $35,238,203 $3,715,945Women's $56,699,305 $63,382,201 $6,682,896Children's $22,383,500 $25,016,436 $2,632,936Footwear $36,565,359 $40,876,688 $4,311,329Watches & Jewelry $9,433,840 $10,551,566 $1,117,726Apparel Products and Services (1) $5,733,310 $6,408,255 $674,945
ComputerComputers and Hardware for Home Use $12,904,735 $14,426,052 $1,521,317Portable Memory $345,706 $386,453 $40,747Computer Software $814,355 $910,300 $95,945Computer Accessories $1,367,104 $1,528,647 $161,543
Entertainment & Recreation $241,187,034 $269,633,294 $28,446,260Fees and Admissions $58,337,452 $65,205,620 $6,868,168
Membership Fees for Clubs (2) $19,854,506 $22,192,069 $2,337,563Fees for Participant Sports, excl. Trips $7,688,909 $8,599,030 $910,121Tickets to Theatre/Operas/Concerts $6,677,212 $7,463,300 $786,088Tickets to Movies $4,297,870 $4,804,351 $506,481Tickets to Parks or Museums $2,627,681 $2,936,940 $309,259Admission to Sporting Events, excl. Trips $4,782,344 $5,345,268 $562,924Fees for Recreational Lessons $12,346,488 $13,794,856 $1,448,368Dating Services $62,444 $69,807 $7,363
TV/Video/Audio $84,686,253 $94,701,398 $10,015,145Cable and Satellite Television Services $61,165,565 $68,400,077 $7,234,512Televisions $7,413,467 $8,290,498 $877,031Satellite Dishes $111,598 $124,737 $13,139VCRs, Video Cameras, and DVD Players $362,075 $405,018 $42,943Miscellaneous Video Equipment $1,566,031 $1,751,387 $185,356Video Cassettes and DVDs $719,908 $805,201 $85,293Video Game Hardware/Accessories $1,838,187 $2,055,341 $217,154Video Game Software $1,055,007 $1,179,609 $124,602Rental/Streaming/Downloaded Video $3,237,104 $3,620,083 $382,979Installation of Televisions $82,456 $92,228 $9,772Audio (3) $6,941,168 $7,760,588 $819,420Rental and Repair of TV/Radio/Sound Equipment $193,686 216,630 $22,944
Pets $44,990,360 $50,302,522 $5,312,162Toys/Games/Crafts/Hobbies (4) $8,402,715 $9,392,830 $990,115Recreational Vehicles and Fees (5) $15,395,458 $17,191,952 $1,796,494Sports/Recreation/Exercise Equipment (6) $14,334,922 $16,026,234 $1,691,312Photo Equipment and Supplies (7) $3,905,424 $4,366,068 $460,644Reading (8) $8,434,175 $9,429,751 $995,576Catered Affairs (9) $2,700,275 3,016,920 $316,645
Food $649,518,835 $726,208,165 $76,689,330Food at Home $378,761,539 $423,493,388 $44,731,849
Bakery and Cereal Products $49,640,274 $55,501,574 $5,861,300Meats, Poultry, Fish, and Eggs $84,609,806 $94,600,733 $9,990,927Dairy Products $39,581,375 $44,254,490 $4,673,115Fruits and Vegetables $78,028,688 $87,237,366 $9,208,678Snacks and Other Food at Home (10) $126,901,395 $141,899,226 $14,997,831
Food Away from Home $270,757,296 $302,714,777 $31,957,481Alcoholic Beverages $47,112,994 $52,668,266 $5,555,272
Data Note: The Consumer Spending data is household-based and represents the amount spent for a product or service by all households in an area. Detail may not sum to totals due to rounding. This report is not a comprehensive list of all consumer spending variables therefore the variables in each section may not sum to totals.Source: Esri forecasts for 2019 and 2024; Consumer Spending data are derived from the 2016 and 2017 Consumer Expenditure Surveys, Bureau of Labor Statistics.
September 25, 2019
©2019 Esri Page 4 of 9

Retail Demand Outlook7353-7399 St Louis Ave Village Of Skokie Only7353-7399 St Louis Ave, Skokie, Illinois, 60076 Latitude: 42.01519Drive Time: 10 minute radius Longitude: -87.71717
2019 2024 ProjectedConsumer Spending Forecasted Demand Spending Growth
FinancialValue of Stocks/Bonds/Mutual Funds $1,756,099,660 $1,963,463,574 $207,363,914Value of Retirement Plans $7,277,128,289 $8,135,371,647 $858,243,358Value of Other Financial Assets $475,863,920 $532,144,405 $56,280,485Vehicle Loan Amount excluding Interest $167,006,236 $186,794,153 $19,787,917Value of Credit Card Debt $184,816,947 $206,604,249 $21,787,302
HealthNonprescription Drugs $9,442,913 $10,563,930 $1,121,017Prescription Drugs $23,106,793 $25,847,960 $2,741,167Eyeglasses and Contact Lenses $6,305,219 $7,049,720 $744,501
HomeMortgage Payment and Basics (11) $771,245,443 $861,954,333 $90,708,890Maintenance and Remodeling Services $160,241,956 $179,141,139 $18,899,183Maintenance and Remodeling Materials (12) $31,662,153 $35,396,400 $3,734,247Utilities, Fuel, and Public Services $336,301,127 $376,032,010 $39,730,883
Household Furnishings and EquipmentHousehold Textiles (13) $7,201,295 $8,052,054 $850,759Furniture $44,155,355 $49,370,318 $5,214,963Rugs $2,439,710 $2,726,613 $286,903Major Appliances (14) $23,437,592 $26,207,985 $2,770,393Housewares (15) $7,589,068 $8,485,527 $896,459Small Appliances $3,649,939 $4,080,501 $430,562Luggage $1,110,381 $1,241,174 $130,793Telephones and Accessories $5,671,088 $6,338,240 $667,152
Household OperationsChild Care $39,916,051 $44,603,590 $4,687,539Lawn and Garden (16) $33,132,101 $37,045,983 $3,913,882Moving/Storage/Freight Express $4,723,925 $5,284,680 $560,755
Housekeeping Supplies (17) $52,080,387 $58,240,942 $6,160,555Insurance
Owners and Renters Insurance $36,506,987 $40,826,688 $4,319,701Vehicle Insurance $105,706,278 $118,203,661 $12,497,383Life/Other Insurance $32,780,437 $36,645,746 $3,865,309Health Insurance $273,607,738 $305,960,387 $32,352,649
Personal Care Products (18) $35,866,505 $40,105,270 $4,238,765School Books and Supplies (19) $11,495,022 12,849,627 $1,354,605Smoking Products $26,185,807 $29,280,424 $3,094,617Transportation
Payments on Vehicles excluding Leases $152,855,960 $170,946,478 $18,090,518Gasoline and Motor Oil $152,829,302 $170,892,279 $18,062,977Vehicle Maintenance and Repairs $78,536,683 $87,839,462 $9,302,779
TravelAirline Fares $46,593,942 $52,080,327 $5,486,385Lodging on Trips $48,348,904 $54,045,243 $5,696,339Auto/Truck Rental on Trips $2,138,449 $2,390,174 $251,725Food and Drink on Trips $42,148,100 $47,115,521 $4,967,421
Data Note: The Consumer Spending data is household-based and represents the amount spent for a product or service by all households in an area. Detail may not sum to totals due to rounding. This report is not a comprehensive list of all consumer spending variables therefore the variables in each section may not sum to totals.Source: Esri forecasts for 2019 and 2024; Consumer Spending data are derived from the 2016 and 2017 Consumer Expenditure Surveys, Bureau of Labor Statistics.
September 25, 2019
©2019 Esri Page 5 of 9

Retail Demand Outlook7353-7399 St Louis Ave Village Of Skokie Only7353-7399 St Louis Ave, Skokie, Illinois, 60076 Latitude: 42.01519Drive Time: 10 minute radius Longitude: -87.71717
(1) Apparel Products and Services includes shoe repair and other shoe services, apparel laundry and dry cleaning, alteration, repair and tailoring of apparel, clothing rental and storage, and watch and jewelry repair.
(2) Membership Fees for Clubs includes membership fees for social, recreational, and civic clubs.
(3) Audio includes satellite radio service, radios, stereos, sound components, equipment and accessories, digital audio players, records, CDs, audio tapes, streaming/downloaded audio, musical instruments and accessories, and rental and repair of musical instruments.
(4) Toys and Games includes toys, games, arts and crafts, tricycles, playground equipment, arcade games, online entertainment and games, and stamp and coin collecting.
(5) Recreational Vehicles & Fees includes docking and landing fees for boats and planes, payments on boats, trailers, campers and RVs, rental of boats, trailers, campers and RVs, and camp fees.
(6) Sports/Recreation/Exercise Equipment includes exercise equipment and gear, game tables, bicycles, camping equipment, hunting and fishing equipment, winter sports equipment, water sports equipment, other sports equipment, and rental/repair of sports/recreation/exercise equipment.
(7) Photo Equipment and Supplies includes film, film processing, photographic equipment, rental and repair of photo equipment, and photographer fees. (8) Reading includes digital book readers, books, magazine and newspaper subscriptions, and single copies of magazines and newspapers.
(9) Catered Affairs includes expenses associated with live entertainment and rental of party supplies.
(10) Snacks and Other Food at Home includes candy, chewing gum, sugar, artificial sweeteners, jam, jelly, preserves, margarine, fats and oils, salad dressing, nondairy cream and milk, peanut butter, frozen prepared food, potato chips and other snacks, nuts, salt, spices, seasonings, olives, pickles, relishes, sauces, gravy, other condiments, soup, prepared salad, prepared dessert, baby food, miscellaneous prepared food, and nonalcoholic beverages.
(11) Mortgage Payment and Basics includes mortgage interest, mortgage principal, property taxes, homeowners insurance, and ground rent on owned dwellings.
(12) Maintenance and Remodeling Materials includes supplies/tools/equipment for painting and wallpapering, plumbing supplies and equipment, electrical/heating/AC supplies, materials for roofing/gutters, materials for plaster/panel/siding, materials for patio/fence/brick work, landscaping materials, and insulation materials for owned homes.
(13) Household Textiles includes bathroom linens, bedroom linens, kitchen linens, dining room linens, other linens, curtains, draperies, slipcovers and decorative pillows.
(14) Major Appliances includes dishwashers, disposals, refrigerators, freezers, washers, dryers, stoves, ovens, microwaves, window air conditioners, electric floor cleaning equipment, sewing machines, and miscellaneous appliances.
(15) Housewares includes flatware, dishes, cups glasses, serving pieces, nonelectric cookware, and tableware.
(16) Lawn and Garden includes lawn and garden supplies, equipment and care service, indoor plants, fresh flowers, and repair/rental of lawn and garden equipment.
(17) Housekeeping Supplies includes soaps and laundry detergents, cleaning products, toilet tissue, paper towels, napkins, paper/plastic/foil products, stationery, giftwrap supplies, postage, and delivery services.
(18) Personal Care Products includes hair care products, nonelectric articles for hair, wigs, hairpieces, oral hygiene products, shaving needs, perfume, cosmetics, skincare, bath products, nail products, deodorant, feminine hygiene products, adult diapers, other miscellaneous care products and personal care appliances.
(19) School Books and Supplies includes school books and supplies for college, elementary school, high school, vocational/technical school, preschool and other schools.
Data Note: The Consumer Spending data is household-based and represents the amount spent for a product or service by all households in an area. Detail may not sum to totals due to rounding. This report is not a comprehensive list of all consumer spending variables therefore the variables in each section may not sum to totals.Source: Esri forecasts for 2019 and 2024; Consumer Spending data are derived from the 2016 and 2017 Consumer Expenditure Surveys, Bureau of Labor Statistics.
September 25, 2019
©2019 Esri Page 6 of 9

Retail Demand Outlook7353-7399 St Louis Ave Village Of Skokie Only7353-7399 St Louis Ave, Skokie, Illinois, 60076 Latitude: 42.01519Drive Time: 15 minute radius Longitude: -87.71717
Top Tapestry Segments Percent Demographic Summary 2019 2024International Marketplace (13A) 15.2% Population 477,852 475,755City Lights (8A) 13.7% Households 182,450 181,752Trendsetters (3C) 12.4% Families 109,318 108,382Pleasantville (2B) 8.2% Median Age 38.2 39.0Downtown Melting Pot (8D) 7.4% Median Household Income $66,187 $74,914
2019 2024 ProjectedConsumer Spending Forecasted Demand Spending Growth
Apparel and Services $443,940,516 $496,961,932 $53,021,416Men's $86,685,266 $97,052,740 $10,367,474Women's $152,683,414 $170,894,262 $18,210,848Children's $61,803,477 $69,176,607 $7,373,130Footwear $101,450,260 $113,572,811 $12,122,551Watches & Jewelry $26,112,082 $29,252,086 $3,140,004Apparel Products and Services (1) $15,206,018 $17,013,426 $1,807,408
ComputerComputers and Hardware for Home Use $35,543,528 $39,797,296 $4,253,768Portable Memory $938,038 $1,049,904 $111,866Computer Software $2,275,813 $2,548,436 $272,623Computer Accessories $3,672,130 $4,111,061 $438,931
Entertainment & Recreation $642,499,726 $719,111,395 $76,611,669Fees and Admissions $154,872,380 $173,284,375 $18,411,995
Membership Fees for Clubs (2) $52,580,085 $58,830,605 $6,250,520Fees for Participant Sports, excl. Trips $20,394,734 $22,827,629 $2,432,895Tickets to Theatre/Operas/Concerts $17,803,074 $19,919,629 $2,116,555Tickets to Movies $11,958,911 $13,388,173 $1,429,262Tickets to Parks or Museums $7,135,712 $7,984,826 $849,114Admission to Sporting Events, excl. Trips $12,499,985 $13,988,051 $1,488,066Fees for Recreational Lessons $32,318,570 $36,142,367 $3,823,797Dating Services $181,309 $203,094 $21,785
TV/Video/Audio $230,373,536 $257,950,548 $27,577,012Cable and Satellite Television Services $164,287,075 $183,927,214 $19,640,139Televisions $20,662,992 $23,142,796 $2,479,804Satellite Dishes $290,630 $325,144 $34,514VCRs, Video Cameras, and DVD Players $1,022,449 $1,145,675 $123,226Miscellaneous Video Equipment $4,250,444 $4,759,556 $509,112Video Cassettes and DVDs $2,004,824 $2,245,773 $240,949Video Game Hardware/Accessories $5,370,609 $6,019,700 $649,091Video Game Software $3,126,673 $3,504,289 $377,616Rental/Streaming/Downloaded Video $9,412,933 $10,546,781 $1,133,848Installation of Televisions $198,620 $222,222 $23,602Audio (3) $19,186,259 $21,483,560 $2,297,301Rental and Repair of TV/Radio/Sound Equipment $560,027 627,838 $67,811
Pets $119,200,708 $133,423,031 $14,222,323Toys/Games/Crafts/Hobbies (4) $23,030,217 $25,784,797 $2,754,580Recreational Vehicles and Fees (5) $36,541,378 $40,821,822 $4,280,444Sports/Recreation/Exercise Equipment (6) $38,180,687 $42,738,042 $4,557,355Photo Equipment and Supplies (7) $10,693,638 $11,974,725 $1,281,087Reading (8) $22,164,648 $24,805,517 $2,640,869Catered Affairs (9) $7,442,534 8,328,538 $886,004
Food $1,777,934,349 $1,990,418,982 $212,484,633Food at Home $1,031,302,615 $1,154,474,246 $123,171,631
Bakery and Cereal Products $134,775,358 $150,868,009 $16,092,651Meats, Poultry, Fish, and Eggs $230,501,020 $258,023,293 $27,522,273Dairy Products $107,140,995 $119,928,211 $12,787,216Fruits and Vegetables $211,796,837 $237,055,848 $25,259,011Snacks and Other Food at Home (10) $347,088,404 $388,598,885 $41,510,481
Food Away from Home $746,631,735 $835,944,736 $89,313,001Alcoholic Beverages $128,569,976 $143,911,497 $15,341,521
Data Note: The Consumer Spending data is household-based and represents the amount spent for a product or service by all households in an area. Detail may not sum to totals due to rounding. This report is not a comprehensive list of all consumer spending variables therefore the variables in each section may not sum to totals.Source: Esri forecasts for 2019 and 2024; Consumer Spending data are derived from the 2016 and 2017 Consumer Expenditure Surveys, Bureau of Labor Statistics.
September 25, 2019
©2019 Esri Page 7 of 9

Retail Demand Outlook7353-7399 St Louis Ave Village Of Skokie Only7353-7399 St Louis Ave, Skokie, Illinois, 60076 Latitude: 42.01519Drive Time: 15 minute radius Longitude: -87.71717
2019 2024 ProjectedConsumer Spending Forecasted Demand Spending Growth
FinancialValue of Stocks/Bonds/Mutual Funds $4,383,213,181 $4,903,413,615 $520,200,434Value of Retirement Plans $18,140,329,211 $20,288,698,386 $2,148,369,175Value of Other Financial Assets $1,195,123,565 $1,337,278,985 $142,155,420Vehicle Loan Amount excluding Interest $465,367,768 $521,362,172 $55,994,404Value of Credit Card Debt $493,066,186 $551,781,188 $58,715,002
HealthNonprescription Drugs $25,217,408 $28,237,556 $3,020,148Prescription Drugs $60,254,140 $67,461,275 $7,207,135Eyeglasses and Contact Lenses $16,611,796 $18,593,198 $1,981,402
HomeMortgage Payment and Basics (11) $1,911,138,593 $2,136,830,479 $225,691,886Maintenance and Remodeling Services $396,092,667 $442,943,460 $46,850,793Maintenance and Remodeling Materials (12) $78,781,578 $88,115,443 $9,333,865Utilities, Fuel, and Public Services $905,404,884 $1,013,604,006 $108,199,122
Household Furnishings and EquipmentHousehold Textiles (13) $19,539,814 $21,876,174 $2,336,360Furniture $119,759,285 $134,076,699 $14,317,414Rugs $6,326,596 $7,079,754 $753,158Major Appliances (14) $61,170,702 $68,463,428 $7,292,726Housewares (15) $20,243,566 $22,661,504 $2,417,938Small Appliances $10,146,945 $11,361,579 $1,214,634Luggage $3,015,509 $3,375,053 $359,544Telephones and Accessories $15,312,553 $17,139,299 $1,826,746
Household OperationsChild Care $108,551,926 $121,472,339 $12,920,413Lawn and Garden (16) $83,798,308 $93,747,039 $9,948,731Moving/Storage/Freight Express $13,917,410 $15,595,296 $1,677,886
Housekeeping Supplies (17) $140,122,899 $156,869,915 $16,747,016Insurance
Owners and Renters Insurance $92,304,563 $103,295,007 $10,990,444Vehicle Insurance $289,868,876 $324,580,942 $34,712,066Life/Other Insurance $83,304,616 $93,192,016 $9,887,400Health Insurance $721,680,292 $807,817,505 $86,137,213
Personal Care Products (18) $98,520,760 $110,309,063 $11,788,303School Books and Supplies (19) $31,889,748 35,708,006 $3,818,258Smoking Products $73,476,602 $82,316,293 $8,839,691Transportation
Payments on Vehicles excluding Leases $422,185,191 $472,825,381 $50,640,190Gasoline and Motor Oil $422,706,060 $473,328,678 $50,622,618Vehicle Maintenance and Repairs $213,516,854 $239,122,295 $25,605,441
TravelAirline Fares $123,826,284 $138,547,181 $14,720,897Lodging on Trips $125,365,350 $140,257,005 $14,891,655Auto/Truck Rental on Trips $5,719,853 $6,400,725 $680,872Food and Drink on Trips $111,516,173 $124,788,613 $13,272,440
Data Note: The Consumer Spending data is household-based and represents the amount spent for a product or service by all households in an area. Detail may not sum to totals due to rounding. This report is not a comprehensive list of all consumer spending variables therefore the variables in each section may not sum to totals.Source: Esri forecasts for 2019 and 2024; Consumer Spending data are derived from the 2016 and 2017 Consumer Expenditure Surveys, Bureau of Labor Statistics.
September 25, 2019
©2019 Esri Page 8 of 9

Retail Demand Outlook7353-7399 St Louis Ave Village Of Skokie Only7353-7399 St Louis Ave, Skokie, Illinois, 60076 Latitude: 42.01519Drive Time: 15 minute radius Longitude: -87.71717
(1) Apparel Products and Services includes shoe repair and other shoe services, apparel laundry and dry cleaning, alteration, repair and tailoring of apparel, clothing rental and storage, and watch and jewelry repair.
(2) Membership Fees for Clubs includes membership fees for social, recreational, and civic clubs.
(3) Audio includes satellite radio service, radios, stereos, sound components, equipment and accessories, digital audio players, records, CDs, audio tapes, streaming/downloaded audio, musical instruments and accessories, and rental and repair of musical instruments.
(4) Toys and Games includes toys, games, arts and crafts, tricycles, playground equipment, arcade games, online entertainment and games, and stamp and coin collecting.
(5) Recreational Vehicles & Fees includes docking and landing fees for boats and planes, payments on boats, trailers, campers and RVs, rental of boats, trailers, campers and RVs, and camp fees.
(6) Sports/Recreation/Exercise Equipment includes exercise equipment and gear, game tables, bicycles, camping equipment, hunting and fishing equipment, winter sports equipment, water sports equipment, other sports equipment, and rental/repair of sports/recreation/exercise equipment.
(7) Photo Equipment and Supplies includes film, film processing, photographic equipment, rental and repair of photo equipment, and photographer fees. (8) Reading includes digital book readers, books, magazine and newspaper subscriptions, and single copies of magazines and newspapers.
(9) Catered Affairs includes expenses associated with live entertainment and rental of party supplies.
(10) Snacks and Other Food at Home includes candy, chewing gum, sugar, artificial sweeteners, jam, jelly, preserves, margarine, fats and oils, salad dressing, nondairy cream and milk, peanut butter, frozen prepared food, potato chips and other snacks, nuts, salt, spices, seasonings, olives, pickles, relishes, sauces, gravy, other condiments, soup, prepared salad, prepared dessert, baby food, miscellaneous prepared food, and nonalcoholic beverages.
(11) Mortgage Payment and Basics includes mortgage interest, mortgage principal, property taxes, homeowners insurance, and ground rent on owned dwellings.
(12) Maintenance and Remodeling Materials includes supplies/tools/equipment for painting and wallpapering, plumbing supplies and equipment, electrical/heating/AC supplies, materials for roofing/gutters, materials for plaster/panel/siding, materials for patio/fence/brick work, landscaping materials, and insulation materials for owned homes.
(13) Household Textiles includes bathroom linens, bedroom linens, kitchen linens, dining room linens, other linens, curtains, draperies, slipcovers and decorative pillows.
(14) Major Appliances includes dishwashers, disposals, refrigerators, freezers, washers, dryers, stoves, ovens, microwaves, window air conditioners, electric floor cleaning equipment, sewing machines, and miscellaneous appliances.
(15) Housewares includes flatware, dishes, cups glasses, serving pieces, nonelectric cookware, and tableware.
(16) Lawn and Garden includes lawn and garden supplies, equipment and care service, indoor plants, fresh flowers, and repair/rental of lawn and garden equipment.
(17) Housekeeping Supplies includes soaps and laundry detergents, cleaning products, toilet tissue, paper towels, napkins, paper/plastic/foil products, stationery, giftwrap supplies, postage, and delivery services.
(18) Personal Care Products includes hair care products, nonelectric articles for hair, wigs, hairpieces, oral hygiene products, shaving needs, perfume, cosmetics, skincare, bath products, nail products, deodorant, feminine hygiene products, adult diapers, other miscellaneous care products and personal care appliances.
(19) School Books and Supplies includes school books and supplies for college, elementary school, high school, vocational/technical school, preschool and other schools.
Data Note: The Consumer Spending data is household-based and represents the amount spent for a product or service by all households in an area. Detail may not sum to totals due to rounding. This report is not a comprehensive list of all consumer spending variables therefore the variables in each section may not sum to totals.Source: Esri forecasts for 2019 and 2024; Consumer Spending data are derived from the 2016 and 2017 Consumer Expenditure Surveys, Bureau of Labor Statistics.
September 25, 2019
©2019 Esri Page 9 of 9

Retail Goods and Services Expenditures7353-7399 St Louis Ave Village Of Skokie Only7353-7399 St Louis Ave, Skokie, Illinois, 60076 Latitude: 42.01519Drive Time: 5 minute radius Longitude: -87.71717
Top Tapestry Segments Percent Demographic Summary 2019 2024Pleasantville (2B) 41.7% Population 19,188 19,016Pacific Heights (2C) 29.8% Households 6,451 6,373Golden Years (9B) 11.4% Families 4,775 4,708Retirement Communities (9E) 7.7% Median Age 44.2 44.4Exurbanites (1E) 6.3% Median Household Income $86,110 $97,707
Spending Potential Average AmountIndex Spent Total
Apparel and Services 119 $2,546.31 $16,426,249Men's 119 $491.37 $3,169,857Women's 128 $920.98 $5,941,249Children's 104 $335.35 $2,163,339Footwear 115 $554.38 $3,576,294Watches & Jewelry 112 $155.01 $999,977Apparel Products and Services (1) 134 $89.22 $575,534
ComputerComputers and Hardware for Home Use 123 $204.08 $1,316,505Portable Memory 131 $5.85 $37,742Computer Software 128 $12.93 $83,400Computer Accessories 117 $22.13 $142,754
Entertainment & Recreation 121 $3,971.07 $25,617,347Fees and Admissions 137 $974.07 $6,283,738
Membership Fees for Clubs (2) 143 $337.35 $2,176,275Fees for Participant Sports, excl. Trips 124 $132.95 $857,683Tickets to Theatre/Operas/Concerts 147 $110.91 $715,472Tickets to Movies 122 $66.84 $431,193Tickets to Parks or Museums 130 $42.13 $271,785Admission to Sporting Events, excl. Trips 125 $79.08 $510,137Fees for Recreational Lessons 142 $203.87 $1,315,153Dating Services 134 $0.94 $6,040
TV/Video/Audio 110 $1,340.95 $8,650,497Cable and Satellite Television Services 110 $970.17 $6,258,570Televisions 106 $114.45 $738,314Satellite Dishes 121 $1.90 $12,269VCRs, Video Cameras, and DVD Players 101 $5.84 $37,701Miscellaneous Video Equipment 102 $26.01 $167,819Video Cassettes and DVDs 102 $11.64 $75,097Video Game Hardware/Accessories 101 $28.14 $181,515Video Game Software 105 $15.95 $102,882Rental/Streaming/Downloaded Video 106 $49.61 $320,012Installation of Televisions 128 $1.46 $9,433Audio (3) 116 $113.06 $729,364Rental and Repair of TV/Radio/Sound Equipment 86 $2.72 $17,520
Pets 115 $762.41 $4,918,290Toys/Games/Crafts/Hobbies (4) 112 $132.63 $855,564Recreational Vehicles and Fees (5) 170 $271.74 $1,752,988Sports/Recreation/Exercise Equipment (6) 119 $245.84 $1,585,909Photo Equipment and Supplies (7) 119 $61.97 $399,760Reading (8) 133 $141.62 $913,599Catered Affairs (9) 149 $39.84 $257,004
Food 116 $10,301.04 $66,452,024Food at Home 116 $5,977.92 $38,563,574
Bakery and Cereal Products 115 $778.39 $5,021,381Meats, Poultry, Fish, and Eggs 116 $1,322.62 $8,532,248Dairy Products 117 $627.87 $4,050,398Fruits and Vegetables 121 $1,231.47 $7,944,233Snacks and Other Food at Home (10) 112 $2,017.57 $13,015,315
Food Away from Home 118 $4,323.12 $27,888,450Alcoholic Beverages 134 $775.98 $5,005,875
Data Note: The Spending Potential Index (SPI) is household-based, and represents the amount spent for a product or service relative to a national average of 100. Detail may not sum to totals due to rounding. This report is not a comprehensive list of all consumer spending variables therefore the variables in each section may not sum to totals.Source: Esri forecasts for 2019 and 2024; Consumer Spending data are derived from the 2016 and 2017 Consumer Expenditure Surveys, Bureau of Labor Statistics.
September 25, 2019
©2019 Esri Page 1 of 9

Retail Goods and Services Expenditures7353-7399 St Louis Ave Village Of Skokie Only7353-7399 St Louis Ave, Skokie, Illinois, 60076 Latitude: 42.01519Drive Time: 5 minute radius Longitude: -87.71717
Spending Potential Average AmountIndex Spent Total
FinancialValue of Stocks/Bonds/Mutual Funds 150 $32,251.61 $208,055,168Value of Retirement Plans 139 $132,466.43 $854,540,944Value of Other Financial Assets 155 $8,790.65 $56,708,454Vehicle Loan Amount excluding Interest 96 $2,729.73 $17,609,459Value of Credit Card Debt 122 $2,986.66 $19,266,937
HealthNonprescription Drugs 109 $156.18 $1,007,533Prescription Drugs 107 $390.38 $2,518,328Eyeglasses and Contact Lenses 116 $105.44 $680,172
HomeMortgage Payment and Basics (11) 140 $14,092.63 $90,911,543Maintenance and Remodeling Services 138 $2,948.08 $19,018,067Maintenance and Remodeling Materials (12) 118 $576.74 $3,720,522Utilities, Fuel, and Public Services 112 $5,421.36 $34,973,210
Household Furnishings and EquipmentHousehold Textiles (13) 115 $115.12 $742,661Furniture 116 $714.51 $4,609,335Rugs 120 $38.93 $251,136Major Appliances (14) 113 $398.37 $2,569,869Housewares (15) 120 $127.14 $820,196Small Appliances 117 $57.08 $368,239Luggage 130 $18.15 $117,067Telephones and Accessories 134 $100.89 $650,867
Household OperationsChild Care 125 $636.00 $4,102,809Lawn and Garden (16) 129 $605.40 $3,905,448Moving/Storage/Freight Express 113 $74.73 $482,090
Housekeeping Supplies (17) 111 $830.36 $5,356,658Insurance
Owners and Renters Insurance 112 $647.82 $4,179,119Vehicle Insurance 109 $1,683.29 $10,858,895Life/Other Insurance 122 $562.84 $3,630,870Health Insurance 116 $4,558.41 $29,406,292
Personal Care Products (18) 114 $573.21 $3,697,781School Books and Supplies (19) 120 $185.92 $1,199,390Smoking Products 94 $378.85 $2,443,968Transportation
Payments on Vehicles excluding Leases 97 $2,474.44 $15,962,630Gasoline and Motor Oil 108 $2,461.61 $15,879,860Vehicle Maintenance and Repairs 115 $1,317.31 $8,497,955
TravelAirline Fares 143 $778.66 $5,023,151Lodging on Trips 135 $835.79 $5,391,689Auto/Truck Rental on Trips 138 $36.23 $233,727Food and Drink on Trips 132 $711.76 $4,591,587
Data Note: The Spending Potential Index (SPI) is household-based, and represents the amount spent for a product or service relative to a national average of 100. Detail may not sum to totals due to rounding. This report is not a comprehensive list of all consumer spending variables therefore the variables in each section may not sum to totals.Source: Esri forecasts for 2019 and 2024; Consumer Spending data are derived from the 2016 and 2017 Consumer Expenditure Surveys, Bureau of Labor Statistics.
September 25, 2019
©2019 Esri Page 2 of 9

Retail Goods and Services Expenditures7353-7399 St Louis Ave Village Of Skokie Only7353-7399 St Louis Ave, Skokie, Illinois, 60076 Latitude: 42.01519Drive Time: 5 minute radius Longitude: -87.71717
(1) Apparel Products and Services includes shoe repair and other shoe services, apparel laundry and dry cleaning, alteration, repair and tailoring of apparel, clothing rental and storage, and watch and jewelry repair.
(2) Membership Fees for Clubs includes membership fees for social, recreational, and civic clubs.
(3) Audio includes satellite radio service, radios, stereos, sound components, equipment and accessories, digital audio players, records, CDs, audio tapes, streaming/downloaded audio, musical instruments and accessories, and rental and repair of musical instruments.
(4) Toys and Games includes toys, games, arts and crafts, tricycles, playground equipment, arcade games, online entertainment and games, and stamp and coin collecting.
(5) Recreational Vehicles & Fees includes docking and landing fees for boats and planes, payments on boats, trailers, campers and RVs, rental of boats, trailers, campers and RVs, and camp fees.
(6) Sports/Recreation/Exercise Equipment includes exercise equipment and gear, game tables, bicycles, camping equipment, hunting and fishing equipment, winter sports equipment, water sports equipment, other sports equipment, and rental/repair of sports/recreation/exercise equipment.
(7) Photo Equipment and Supplies includes film, film processing, photographic equipment, rental and repair of photo equipment, and photographer fees. (8) Reading includes digital book readers, books, magazine and newspaper subscriptions, and single copies of magazines and newspapers.
(9) Catered Affairs includes expenses associated with live entertainment and rental of party supplies.
(10) Snacks and Other Food at Home includes candy, chewing gum, sugar, artificial sweeteners, jam, jelly, preserves, margarine, fats and oils, salad dressing, nondairy cream and milk, peanut butter, frozen prepared food, potato chips and other snacks, nuts, salt, spices, seasonings, olives, pickles, relishes, sauces, gravy, other condiments, soup, prepared salad, prepared dessert, baby food, miscellaneous prepared food, and nonalcoholic beverages.
(11) Mortgage Payment and Basics includes mortgage interest, mortgage principal, property taxes, homeowners insurance, and ground rent on owned dwellings.
(12) Maintenance and Remodeling Materials includes supplies/tools/equipment for painting and wallpapering, plumbing supplies and equipment, electrical/heating/AC supplies, materials for roofing/gutters, materials for plaster/panel/siding, materials for patio/fence/brick work, landscaping materials, and insulation materials for owned homes.
(13) Household Textiles includes bathroom linens, bedroom linens, kitchen linens, dining room linens, other linens, curtains, draperies, slipcovers and decorative pillows.
(14) Major Appliances includes dishwashers, disposals, refrigerators, freezers, washers, dryers, stoves, ovens, microwaves, window air conditioners, electric floor cleaning equipment, sewing machines, and miscellaneous appliances.
(15) Housewares includes flatware, dishes, cups glasses, serving pieces, nonelectric cookware, and tableware.
(16) Lawn and Garden includes lawn and garden supplies, equipment and care service, indoor plants, fresh flowers, and repair/rental of lawn and garden equipment.
(17) Housekeeping Supplies includes soaps and laundry detergents, cleaning products, toilet tissue, paper towels, napkins, paper/plastic/foil products, stationery, giftwrap supplies, postage, and delivery services.
(18) Personal Care Products includes hair care products, nonelectric articles for hair, wigs, hairpieces, oral hygiene products, shaving needs, perfume, cosmetics, skincare, bath products, nail products, deodorant, feminine hygiene products, adult diapers, other miscellaneous care products and personal care appliances.
(19) School Books and Supplies includes school books and supplies for college, elementary school, high school, vocational/technical school, preschool and other schools.
Data Note: The Spending Potential Index (SPI) is household-based, and represents the amount spent for a product or service relative to a national average of 100. Detail may not sum to totals due to rounding. This report is not a comprehensive list of all consumer spending variables therefore the variables in each section may not sum to totals.Source: Esri forecasts for 2019 and 2024; Consumer Spending data are derived from the 2016 and 2017 Consumer Expenditure Surveys, Bureau of Labor Statistics.
September 25, 2019
©2019 Esri Page 3 of 9

Retail Goods and Services Expenditures7353-7399 St Louis Ave Village Of Skokie Only7353-7399 St Louis Ave, Skokie, Illinois, 60076 Latitude: 42.01519Drive Time: 10 minute radius Longitude: -87.71717
Top Tapestry Segments Percent Demographic Summary 2019 2024City Lights (8A) 15.8% Population 185,523 184,250Pleasantville (2B) 14.0% Households 66,502 66,011Downtown Melting Pot (8D) 13.7% Families 45,168 44,702International Marketplace (13A) 11.2% Median Age 39.9 40.6Pacific Heights (2C) 10.9% Median Household Income $72,067 $79,798
Spending Potential Average AmountIndex Spent Total
Apparel and Services 114 $2,441.09 $162,337,571Men's 114 $474.00 $31,522,258Women's 118 $852.60 $56,699,305Children's 104 $336.58 $22,383,500Footwear 114 $549.84 $36,565,359Watches & Jewelry 103 $141.86 $9,433,840Apparel Products and Services (1) 130 $86.21 $5,733,310
ComputerComputers and Hardware for Home Use 117 $194.05 $12,904,735Portable Memory 117 $5.20 $345,706Computer Software 121 $12.25 $814,355Computer Accessories 108 $20.56 $1,367,104
Entertainment & Recreation 111 $3,626.76 $241,187,034Fees and Admissions 123 $877.23 $58,337,452
Membership Fees for Clubs (2) 126 $298.56 $19,854,506Fees for Participant Sports, excl. Trips 108 $115.62 $7,688,909Tickets to Theatre/Operas/Concerts 133 $100.41 $6,677,212Tickets to Movies 118 $64.63 $4,297,870Tickets to Parks or Museums 122 $39.51 $2,627,681Admission to Sporting Events, excl. Trips 114 $71.91 $4,782,344Fees for Recreational Lessons 129 $185.66 $12,346,488Dating Services 134 $0.94 $62,444
TV/Video/Audio 104 $1,273.44 $84,686,253Cable and Satellite Television Services 105 $919.76 $61,165,565Televisions 103 $111.48 $7,413,467Satellite Dishes 107 $1.68 $111,598VCRs, Video Cameras, and DVD Players 94 $5.44 $362,075Miscellaneous Video Equipment 93 $23.55 $1,566,031Video Cassettes and DVDs 95 $10.83 $719,908Video Game Hardware/Accessories 99 $27.64 $1,838,187Video Game Software 104 $15.86 $1,055,007Rental/Streaming/Downloaded Video 104 $48.68 $3,237,104Installation of Televisions 109 $1.24 $82,456Audio (3) 107 $104.38 $6,941,168Rental and Repair of TV/Radio/Sound Equipment 92 $2.91 $193,686
Pets 102 $676.53 $44,990,360Toys/Games/Crafts/Hobbies (4) 107 $126.35 $8,402,715Recreational Vehicles and Fees (5) 145 $231.50 $15,395,458Sports/Recreation/Exercise Equipment (6) 104 $215.56 $14,334,922Photo Equipment and Supplies (7) 113 $58.73 $3,905,424Reading (8) 119 $126.83 $8,434,175Catered Affairs (9) 152 $40.60 $2,700,275
Food 110 $9,766.91 $649,518,835Food at Home 110 $5,695.49 $378,761,539
Bakery and Cereal Products 110 $746.45 $49,640,274Meats, Poultry, Fish, and Eggs 111 $1,272.29 $84,609,806Dairy Products 111 $595.19 $39,581,375Fruits and Vegetables 115 $1,173.33 $78,028,688Snacks and Other Food at Home (10) 106 $1,908.23 $126,901,395
Food Away from Home 111 $4,071.42 $270,757,296Alcoholic Beverages 123 $708.44 $47,112,994
Data Note: The Spending Potential Index (SPI) is household-based, and represents the amount spent for a product or service relative to a national average of 100. Detail may not sum to totals due to rounding. This report is not a comprehensive list of all consumer spending variables therefore the variables in each section may not sum to totals.Source: Esri forecasts for 2019 and 2024; Consumer Spending data are derived from the 2016 and 2017 Consumer Expenditure Surveys, Bureau of Labor Statistics.
September 25, 2019
©2019 Esri Page 4 of 9

Retail Goods and Services Expenditures7353-7399 St Louis Ave Village Of Skokie Only7353-7399 St Louis Ave, Skokie, Illinois, 60076 Latitude: 42.01519Drive Time: 10 minute radius Longitude: -87.71717
Spending Potential Average AmountIndex Spent Total
FinancialValue of Stocks/Bonds/Mutual Funds 123 $26,406.72 $1,756,099,660Value of Retirement Plans 115 $109,427.21 $7,277,128,289Value of Other Financial Assets 126 $7,155.63 $475,863,920Vehicle Loan Amount excluding Interest 88 $2,511.30 $167,006,236Value of Credit Card Debt 114 $2,779.12 $184,816,947
HealthNonprescription Drugs 99 $141.99 $9,442,913Prescription Drugs 95 $347.46 $23,106,793Eyeglasses and Contact Lenses 105 $94.81 $6,305,219
HomeMortgage Payment and Basics (11) 115 $11,597.33 $771,245,443Maintenance and Remodeling Services 113 $2,409.58 $160,241,956Maintenance and Remodeling Materials (12) 97 $476.11 $31,662,153Utilities, Fuel, and Public Services 104 $5,057.01 $336,301,127
Household Furnishings and EquipmentHousehold Textiles (13) 108 $108.29 $7,201,295Furniture 108 $663.97 $44,155,355Rugs 113 $36.69 $2,439,710Major Appliances (14) 100 $352.43 $23,437,592Housewares (15) 107 $114.12 $7,589,068Small Appliances 113 $54.88 $3,649,939Luggage 119 $16.70 $1,110,381Telephones and Accessories 113 $85.28 $5,671,088
Household OperationsChild Care 118 $600.22 $39,916,051Lawn and Garden (16) 106 $498.21 $33,132,101Moving/Storage/Freight Express 107 $71.03 $4,723,925
Housekeeping Supplies (17) 104 $783.14 $52,080,387Insurance
Owners and Renters Insurance 95 $548.96 $36,506,987Vehicle Insurance 103 $1,589.52 $105,706,278Life/Other Insurance 107 $492.92 $32,780,437Health Insurance 105 $4,114.28 $273,607,738
Personal Care Products (18) 108 $539.33 $35,866,505School Books and Supplies (19) 111 $172.85 $11,495,022Smoking Products 98 $393.76 $26,185,807Transportation
Payments on Vehicles excluding Leases 90 $2,298.52 $152,855,960Gasoline and Motor Oil 100 $2,298.12 $152,829,302Vehicle Maintenance and Repairs 103 $1,180.97 $78,536,683
TravelAirline Fares 128 $700.64 $46,593,942Lodging on Trips 117 $727.03 $48,348,904Auto/Truck Rental on Trips 123 $32.16 $2,138,449Food and Drink on Trips 117 $633.79 $42,148,100
Data Note: The Spending Potential Index (SPI) is household-based, and represents the amount spent for a product or service relative to a national average of 100. Detail may not sum to totals due to rounding. This report is not a comprehensive list of all consumer spending variables therefore the variables in each section may not sum to totals.Source: Esri forecasts for 2019 and 2024; Consumer Spending data are derived from the 2016 and 2017 Consumer Expenditure Surveys, Bureau of Labor Statistics.
September 25, 2019
©2019 Esri Page 5 of 9

Retail Goods and Services Expenditures7353-7399 St Louis Ave Village Of Skokie Only7353-7399 St Louis Ave, Skokie, Illinois, 60076 Latitude: 42.01519Drive Time: 10 minute radius Longitude: -87.71717
(1) Apparel Products and Services includes shoe repair and other shoe services, apparel laundry and dry cleaning, alteration, repair and tailoring of apparel, clothing rental and storage, and watch and jewelry repair.
(2) Membership Fees for Clubs includes membership fees for social, recreational, and civic clubs.
(3) Audio includes satellite radio service, radios, stereos, sound components, equipment and accessories, digital audio players, records, CDs, audio tapes, streaming/downloaded audio, musical instruments and accessories, and rental and repair of musical instruments.
(4) Toys and Games includes toys, games, arts and crafts, tricycles, playground equipment, arcade games, online entertainment and games, and stamp and coin collecting.
(5) Recreational Vehicles & Fees includes docking and landing fees for boats and planes, payments on boats, trailers, campers and RVs, rental of boats, trailers, campers and RVs, and camp fees.
(6) Sports/Recreation/Exercise Equipment includes exercise equipment and gear, game tables, bicycles, camping equipment, hunting and fishing equipment, winter sports equipment, water sports equipment, other sports equipment, and rental/repair of sports/recreation/exercise equipment.
(7) Photo Equipment and Supplies includes film, film processing, photographic equipment, rental and repair of photo equipment, and photographer fees. (8) Reading includes digital book readers, books, magazine and newspaper subscriptions, and single copies of magazines and newspapers.
(9) Catered Affairs includes expenses associated with live entertainment and rental of party supplies.
(10) Snacks and Other Food at Home includes candy, chewing gum, sugar, artificial sweeteners, jam, jelly, preserves, margarine, fats and oils, salad dressing, nondairy cream and milk, peanut butter, frozen prepared food, potato chips and other snacks, nuts, salt, spices, seasonings, olives, pickles, relishes, sauces, gravy, other condiments, soup, prepared salad, prepared dessert, baby food, miscellaneous prepared food, and nonalcoholic beverages.
(11) Mortgage Payment and Basics includes mortgage interest, mortgage principal, property taxes, homeowners insurance, and ground rent on owned dwellings.
(12) Maintenance and Remodeling Materials includes supplies/tools/equipment for painting and wallpapering, plumbing supplies and equipment, electrical/heating/AC supplies, materials for roofing/gutters, materials for plaster/panel/siding, materials for patio/fence/brick work, landscaping materials, and insulation materials for owned homes.
(13) Household Textiles includes bathroom linens, bedroom linens, kitchen linens, dining room linens, other linens, curtains, draperies, slipcovers and decorative pillows.
(14) Major Appliances includes dishwashers, disposals, refrigerators, freezers, washers, dryers, stoves, ovens, microwaves, window air conditioners, electric floor cleaning equipment, sewing machines, and miscellaneous appliances.
(15) Housewares includes flatware, dishes, cups glasses, serving pieces, nonelectric cookware, and tableware.
(16) Lawn and Garden includes lawn and garden supplies, equipment and care service, indoor plants, fresh flowers, and repair/rental of lawn and garden equipment.
(17) Housekeeping Supplies includes soaps and laundry detergents, cleaning products, toilet tissue, paper towels, napkins, paper/plastic/foil products, stationery, giftwrap supplies, postage, and delivery services.
(18) Personal Care Products includes hair care products, nonelectric articles for hair, wigs, hairpieces, oral hygiene products, shaving needs, perfume, cosmetics, skincare, bath products, nail products, deodorant, feminine hygiene products, adult diapers, other miscellaneous care products and personal care appliances.
(19) School Books and Supplies includes school books and supplies for college, elementary school, high school, vocational/technical school, preschool and other schools.
Data Note: The Spending Potential Index (SPI) is household-based, and represents the amount spent for a product or service relative to a national average of 100. Detail may not sum to totals due to rounding. This report is not a comprehensive list of all consumer spending variables therefore the variables in each section may not sum to totals.Source: Esri forecasts for 2019 and 2024; Consumer Spending data are derived from the 2016 and 2017 Consumer Expenditure Surveys, Bureau of Labor Statistics.
September 25, 2019
©2019 Esri Page 6 of 9

Retail Goods and Services Expenditures7353-7399 St Louis Ave Village Of Skokie Only7353-7399 St Louis Ave, Skokie, Illinois, 60076 Latitude: 42.01519Drive Time: 15 minute radius Longitude: -87.71717
Top Tapestry Segments Percent Demographic Summary 2019 2024International Marketplace (13A) 15.2% Population 477,852 475,755City Lights (8A) 13.7% Households 182,450 181,752Trendsetters (3C) 12.4% Families 109,318 108,382Pleasantville (2B) 8.2% Median Age 38.2 39.0Downtown Melting Pot (8D) 7.4% Median Household Income $66,187 $74,914
Spending Potential Average AmountIndex Spent Total
Apparel and Services 114 $2,433.22 $443,940,516Men's 115 $475.12 $86,685,266Women's 116 $836.85 $152,683,414Children's 105 $338.74 $61,803,477Footwear 116 $556.04 $101,450,260Watches & Jewelry 104 $143.12 $26,112,082Apparel Products and Services (1) 125 $83.34 $15,206,018
ComputerComputers and Hardware for Home Use 118 $194.81 $35,543,528Portable Memory 115 $5.14 $938,038Computer Software 123 $12.47 $2,275,813Computer Accessories 106 $20.13 $3,672,130
Entertainment & Recreation 108 $3,521.51 $642,499,726Fees and Admissions 119 $848.85 $154,872,380
Membership Fees for Clubs (2) 122 $288.19 $52,580,085Fees for Participant Sports, excl. Trips 104 $111.78 $20,394,734Tickets to Theatre/Operas/Concerts 130 $97.58 $17,803,074Tickets to Movies 120 $65.55 $11,958,911Tickets to Parks or Museums 121 $39.11 $7,135,712Admission to Sporting Events, excl. Trips 109 $68.51 $12,499,985Fees for Recreational Lessons 124 $177.14 $32,318,570Dating Services 141 $0.99 $181,309
TV/Video/Audio 103 $1,262.67 $230,373,536Cable and Satellite Television Services 102 $900.45 $164,287,075Televisions 104 $113.25 $20,662,992Satellite Dishes 101 $1.59 $290,630VCRs, Video Cameras, and DVD Players 97 $5.60 $1,022,449Miscellaneous Video Equipment 92 $23.30 $4,250,444Video Cassettes and DVDs 96 $10.99 $2,004,824Video Game Hardware/Accessories 106 $29.44 $5,370,609Video Game Software 113 $17.14 $3,126,673Rental/Streaming/Downloaded Video 110 $51.59 $9,412,933Installation of Televisions 96 $1.09 $198,620Audio (3) 108 $105.16 $19,186,259Rental and Repair of TV/Radio/Sound Equipment 97 $3.07 $560,027
Pets 99 $653.33 $119,200,708Toys/Games/Crafts/Hobbies (4) 107 $126.23 $23,030,217Recreational Vehicles and Fees (5) 125 $200.28 $36,541,378Sports/Recreation/Exercise Equipment (6) 101 $209.27 $38,180,687Photo Equipment and Supplies (7) 113 $58.61 $10,693,638Reading (8) 114 $121.48 $22,164,648Catered Affairs (9) 153 $40.79 $7,442,534
Food 110 $9,744.78 $1,777,934,349Food at Home 109 $5,652.52 $1,031,302,615
Bakery and Cereal Products 109 $738.70 $134,775,358Meats, Poultry, Fish, and Eggs 110 $1,263.37 $230,501,020Dairy Products 110 $587.23 $107,140,995Fruits and Vegetables 114 $1,160.85 $211,796,837Snacks and Other Food at Home (10) 106 $1,902.38 $347,088,404
Food Away from Home 111 $4,092.25 $746,631,735Alcoholic Beverages 122 $704.69 $128,569,976
Data Note: The Spending Potential Index (SPI) is household-based, and represents the amount spent for a product or service relative to a national average of 100. Detail may not sum to totals due to rounding. This report is not a comprehensive list of all consumer spending variables therefore the variables in each section may not sum to totals.Source: Esri forecasts for 2019 and 2024; Consumer Spending data are derived from the 2016 and 2017 Consumer Expenditure Surveys, Bureau of Labor Statistics.
September 25, 2019
©2019 Esri Page 7 of 9

Retail Goods and Services Expenditures7353-7399 St Louis Ave Village Of Skokie Only7353-7399 St Louis Ave, Skokie, Illinois, 60076 Latitude: 42.01519Drive Time: 15 minute radius Longitude: -87.71717
Spending Potential Average AmountIndex Spent Total
FinancialValue of Stocks/Bonds/Mutual Funds 112 $24,024.19 $4,383,213,181Value of Retirement Plans 104 $99,426.30 $18,140,329,211Value of Other Financial Assets 115 $6,550.42 $1,195,123,565Vehicle Loan Amount excluding Interest 89 $2,550.66 $465,367,768Value of Credit Card Debt 111 $2,702.47 $493,066,186
HealthNonprescription Drugs 96 $138.22 $25,217,408Prescription Drugs 90 $330.25 $60,254,140Eyeglasses and Contact Lenses 101 $91.05 $16,611,796
HomeMortgage Payment and Basics (11) 104 $10,474.86 $1,911,138,593Maintenance and Remodeling Services 102 $2,170.97 $396,092,667Maintenance and Remodeling Materials (12) 88 $431.80 $78,781,578Utilities, Fuel, and Public Services 102 $4,962.48 $905,404,884
Household Furnishings and EquipmentHousehold Textiles (13) 107 $107.10 $19,539,814Furniture 107 $656.40 $119,759,285Rugs 107 $34.68 $6,326,596Major Appliances (14) 95 $335.27 $61,170,702Housewares (15) 104 $110.95 $20,243,566Small Appliances 114 $55.61 $10,146,945Luggage 118 $16.53 $3,015,509Telephones and Accessories 111 $83.93 $15,312,553
Household OperationsChild Care 117 $594.97 $108,551,926Lawn and Garden (16) 98 $459.29 $83,798,308Moving/Storage/Freight Express 115 $76.28 $13,917,410
Housekeeping Supplies (17) 102 $768.01 $140,122,899Insurance
Owners and Renters Insurance 87 $505.92 $92,304,563Vehicle Insurance 103 $1,588.76 $289,868,876Life/Other Insurance 99 $456.59 $83,304,616Health Insurance 101 $3,955.50 $721,680,292
Personal Care Products (18) 108 $539.99 $98,520,760School Books and Supplies (19) 113 $174.79 $31,889,748Smoking Products 100 $402.72 $73,476,602Transportation
Payments on Vehicles excluding Leases 91 $2,313.98 $422,185,191Gasoline and Motor Oil 101 $2,316.83 $422,706,060Vehicle Maintenance and Repairs 102 $1,170.28 $213,516,854
TravelAirline Fares 124 $678.69 $123,826,284Lodging on Trips 111 $687.12 $125,365,350Auto/Truck Rental on Trips 120 $31.35 $5,719,853Food and Drink on Trips 113 $611.21 $111,516,173
Data Note: The Spending Potential Index (SPI) is household-based, and represents the amount spent for a product or service relative to a national average of 100. Detail may not sum to totals due to rounding. This report is not a comprehensive list of all consumer spending variables therefore the variables in each section may not sum to totals.Source: Esri forecasts for 2019 and 2024; Consumer Spending data are derived from the 2016 and 2017 Consumer Expenditure Surveys, Bureau of Labor Statistics.
September 25, 2019
©2019 Esri Page 8 of 9

Retail Goods and Services Expenditures7353-7399 St Louis Ave Village Of Skokie Only7353-7399 St Louis Ave, Skokie, Illinois, 60076 Latitude: 42.01519Drive Time: 15 minute radius Longitude: -87.71717
(1) Apparel Products and Services includes shoe repair and other shoe services, apparel laundry and dry cleaning, alteration, repair and tailoring of apparel, clothing rental and storage, and watch and jewelry repair.
(2) Membership Fees for Clubs includes membership fees for social, recreational, and civic clubs.
(3) Audio includes satellite radio service, radios, stereos, sound components, equipment and accessories, digital audio players, records, CDs, audio tapes, streaming/downloaded audio, musical instruments and accessories, and rental and repair of musical instruments.
(4) Toys and Games includes toys, games, arts and crafts, tricycles, playground equipment, arcade games, online entertainment and games, and stamp and coin collecting.
(5) Recreational Vehicles & Fees includes docking and landing fees for boats and planes, payments on boats, trailers, campers and RVs, rental of boats, trailers, campers and RVs, and camp fees.
(6) Sports/Recreation/Exercise Equipment includes exercise equipment and gear, game tables, bicycles, camping equipment, hunting and fishing equipment, winter sports equipment, water sports equipment, other sports equipment, and rental/repair of sports/recreation/exercise equipment.
(7) Photo Equipment and Supplies includes film, film processing, photographic equipment, rental and repair of photo equipment, and photographer fees. (8) Reading includes digital book readers, books, magazine and newspaper subscriptions, and single copies of magazines and newspapers.
(9) Catered Affairs includes expenses associated with live entertainment and rental of party supplies.
(10) Snacks and Other Food at Home includes candy, chewing gum, sugar, artificial sweeteners, jam, jelly, preserves, margarine, fats and oils, salad dressing, nondairy cream and milk, peanut butter, frozen prepared food, potato chips and other snacks, nuts, salt, spices, seasonings, olives, pickles, relishes, sauces, gravy, other condiments, soup, prepared salad, prepared dessert, baby food, miscellaneous prepared food, and nonalcoholic beverages.
(11) Mortgage Payment and Basics includes mortgage interest, mortgage principal, property taxes, homeowners insurance, and ground rent on owned dwellings.
(12) Maintenance and Remodeling Materials includes supplies/tools/equipment for painting and wallpapering, plumbing supplies and equipment, electrical/heating/AC supplies, materials for roofing/gutters, materials for plaster/panel/siding, materials for patio/fence/brick work, landscaping materials, and insulation materials for owned homes.
(13) Household Textiles includes bathroom linens, bedroom linens, kitchen linens, dining room linens, other linens, curtains, draperies, slipcovers and decorative pillows.
(14) Major Appliances includes dishwashers, disposals, refrigerators, freezers, washers, dryers, stoves, ovens, microwaves, window air conditioners, electric floor cleaning equipment, sewing machines, and miscellaneous appliances.
(15) Housewares includes flatware, dishes, cups glasses, serving pieces, nonelectric cookware, and tableware.
(16) Lawn and Garden includes lawn and garden supplies, equipment and care service, indoor plants, fresh flowers, and repair/rental of lawn and garden equipment.
(17) Housekeeping Supplies includes soaps and laundry detergents, cleaning products, toilet tissue, paper towels, napkins, paper/plastic/foil products, stationery, giftwrap supplies, postage, and delivery services.
(18) Personal Care Products includes hair care products, nonelectric articles for hair, wigs, hairpieces, oral hygiene products, shaving needs, perfume, cosmetics, skincare, bath products, nail products, deodorant, feminine hygiene products, adult diapers, other miscellaneous care products and personal care appliances.
(19) School Books and Supplies includes school books and supplies for college, elementary school, high school, vocational/technical school, preschool and other schools.
Data Note: The Spending Potential Index (SPI) is household-based, and represents the amount spent for a product or service relative to a national average of 100. Detail may not sum to totals due to rounding. This report is not a comprehensive list of all consumer spending variables therefore the variables in each section may not sum to totals.Source: Esri forecasts for 2019 and 2024; Consumer Spending data are derived from the 2016 and 2017 Consumer Expenditure Surveys, Bureau of Labor Statistics.
September 25, 2019
©2019 Esri Page 9 of 9

Retail Market Potential7353-7399 St Louis Ave Village Of Skokie Only7353-7399 St Louis Ave, Skokie, Illinois, 60076 Latitude: 42.01519Drive Time: 5 minute radius Longitude: -87.71717
Demographic Summary 2019 2024Population 19,188 19,016Population 18+ 15,070 14,996Households 6,451 6,373Median Household Income $86,110 $97,707
Expected Number of Percent of Product/Consumer Behavior Adults or HHs Adults/HHs MPIApparel (Adults)
Bought any men's clothing in last 12 months 7,418 49.2% 104Bought any women's clothing in last 12 months 6,682 44.3% 103Bought clothing for child <13 years in last 6 months 3,644 24.2% 91Bought any shoes in last 12 months 8,239 54.7% 104Bought costume jewelry in last 12 months 2,589 17.2% 99Bought any fine jewelry in last 12 months 2,931 19.4% 109Bought a watch in last 12 months 2,440 16.2% 105
Automobiles (Households)HH owns/leases any vehicle 5,726 88.8% 104HH bought/leased new vehicle last 12 months 784 12.2% 124
Automotive Aftermarket (Adults)Bought gasoline in last 6 months 13,426 89.1% 104Bought/changed motor oil in last 12 months 6,741 44.7% 94Had tune-up in last 12 months 4,483 29.7% 120
Beverages (Adults)Drank bottled water/seltzer in last 6 months 11,688 77.6% 108Drank regular cola in last 6 months 5,441 36.1% 81Drank beer/ale in last 6 months 6,865 45.6% 108
Cameras (Adults)Own digital point & shoot camera/camcorder 1,721 11.4% 114Own digital SLR camera/camcorder 1,576 10.5% 133Printed digital photos in last 12 months 3,767 25.0% 109
Cell Phones (Adults/Households)Bought cell phone in last 12 months 5,116 33.9% 98Have a smartphone 13,002 86.3% 103Have a smartphone: Android phone (any brand) 5,131 34.0% 84Have a smartphone: Apple iPhone 7,813 51.8% 124Number of cell phones in household: 1 1,718 26.6% 87Number of cell phones in household: 2 2,453 38.0% 98Number of cell phones in household: 3+ 2,118 32.8% 117HH has cell phone only (no landline telephone) 2,497 38.7% 69
Computers (Households)HH owns a computer 5,288 82.0% 111HH owns desktop computer 2,934 45.5% 123HH owns laptop/notebook 3,962 61.4% 109HH owns any Apple/Mac brand computer 1,693 26.2% 145HH owns any PC/non-Apple brand computer 4,157 64.4% 105HH purchased most recent computer in a store 2,586 40.1% 111HH purchased most recent computer online 996 15.4% 114Spent <$1-499 on most recent home computer 769 11.9% 81Spent $500-$999 on most recent home computer"
1,184 18.4% 109Spent $1,000-$1,499 on most recent home computer 818 12.7% 132Spent $1,500-$1,999 on most recent home computer 411 6.4% 144Spent $2,000+ on most recent home computer 341 5.3% 134
Data Note: An MPI (Market Potential Index) measures the relative likelihood of the adults or households in the specified trade area to exhibit certain consumer behavior or purchasing patterns compared to the U.S. An MPI of 100 represents the U.S. average. Source: These data are based upon national propensities to use various products and services, applied to local demographic composition. Usage data were collected by GfK MRI in a nationally representative survey of U.S. households. Esri forecasts for 2019 and 2024.
September 25, 2019
©2019 Esri Page 1 of 12

Retail Market Potential7353-7399 St Louis Ave Village Of Skokie Only7353-7399 St Louis Ave, Skokie, Illinois, 60076 Latitude: 42.01519Drive Time: 5 minute radius Longitude: -87.71717
Expected Number of Percent of Product/Consumer Behavior Adults or HHs Adults/HHs MPIConvenience Stores (Adults)
Shopped at convenience store in last 6 months 8,662 57.5% 91Bought brewed coffee at convenience store in last 30 days 1,898 12.6% 91Bought cigarettes at convenience store in last 30 days 918 6.1% 56Bought gas at convenience store in last 30 days 3,599 23.9% 64Spent at convenience store in last 30 days: <$1-19 1,205 8.0% 116Spent at convenience store in last 30 days: $20-$39 1,427 9.5% 100Spent at convenience store in last 30 days: $40-$50 1,188 7.9% 96Spent at convenience store in last 30 days: $51-$99 583 3.9% 70Spent at convenience store in last 30 days: $100+ 2,402 15.9% 71
Entertainment (Adults)Attended a movie in last 6 months 9,498 63.0% 108Went to live theater in last 12 months 2,111 14.0% 127Went to a bar/night club in last 12 months 2,705 17.9% 104Dined out in last 12 months 8,658 57.5% 110Gambled at a casino in last 12 months 2,379 15.8% 119Visited a theme park in last 12 months 3,569 23.7% 125Viewed movie (video-on-demand) in last 30 days 3,767 25.0% 143Viewed TV show (video-on-demand) in last 30 days 3,189 21.2% 167Watched any pay-per-view TV in last 12 months 1,774 11.8% 120Downloaded a movie over the Internet in last 30 days 1,690 11.2% 117Downloaded any individual song in last 6 months 3,054 20.3% 106Watched a movie online in the last 30 days 4,449 29.5% 109Watched a TV program online in last 30 days 3,249 21.6% 113Played a video/electronic game (console) in last 12 months 993 6.6% 74Played a video/electronic game (portable) in last 12 months 546 3.6% 77
Financial (Adults)Have home mortgage (1st) 5,431 36.0% 116Used ATM/cash machine in last 12 months 8,792 58.3% 110Own any stock 1,645 10.9% 152Own U.S. savings bond 1,007 6.7% 153Own shares in mutual fund (stock) 1,563 10.4% 145Own shares in mutual fund (bonds) 844 5.6% 117Have interest checking account 5,311 35.2% 123Have non-interest checking account 4,762 31.6% 108Have savings account 9,844 65.3% 114Have 401K retirement savings plan 3,091 20.5% 128Own/used any credit/debit card in last 12 months 13,033 86.5% 109Avg monthly credit card expenditures: <$1-110 1,433 9.5% 83Avg monthly credit card expenditures: $111-$225 1,216 8.1% 110Avg monthly credit card expenditures: $226-$450 1,443 9.6% 140Avg monthly credit card expenditures: $451-$700 1,385 9.2% 150Avg monthly credit card expenditures: $701-$1,000 1,256 8.3% 149Avg monthly credit card expenditures: $1,001+ 2,591 17.2% 148Did banking online in last 12 months 6,839 45.4% 116Did banking on mobile device in last 12 months 4,142 27.5% 106Paid bills online in last 12 months 8,403 55.8% 111
Data Note: An MPI (Market Potential Index) measures the relative likelihood of the adults or households in the specified trade area to exhibit certain consumer behavior or purchasing patterns compared to the U.S. An MPI of 100 represents the U.S. average. Source: These data are based upon national propensities to use various products and services, applied to local demographic composition. Usage data were collected by GfK MRI in a nationally representative survey of U.S. households. Esri forecasts for 2019 and 2024.
September 25, 2019
©2019 Esri Page 2 of 12

Retail Market Potential7353-7399 St Louis Ave Village Of Skokie Only7353-7399 St Louis Ave, Skokie, Illinois, 60076 Latitude: 42.01519Drive Time: 5 minute radius Longitude: -87.71717
Expected Number of Percent of Product/Consumer Behavior Adults/HHs Adults/HHs MPIGrocery (Adults)
Used beef (fresh/frozen) in last 6 months 4,202 65.1% 95Used bread in last 6 months 5,935 92.0% 99Used chicken (fresh or frozen) in last 6 months 4,516 70.0% 101Used turkey (fresh or frozen) in last 6 months 986 15.3% 102Used fish/seafood (fresh or frozen) in last 6 months 3,729 57.8% 105Used fresh fruit/vegetables in last 6 months 5,742 89.0% 104Used fresh milk in last 6 months 5,477 84.9% 99Used organic food in last 6 months 2,080 32.2% 135
Health (Adults)Exercise at home 2+ times per week 4,431 29.4% 107Exercise at club 2+ times per week 2,757 18.3% 127Visited a doctor in last 12 months 12,149 80.6% 105Used vitamin/dietary supplement in last 6 months 9,475 62.9% 116
Home (Households)Did any home improvement in last 12 months 1,898 29.4% 106Used any housekeeper/professional cleaning service in last 12 monthsmonths
1,452 22.5% 154Purchased low ticket HH furnishings in last 12 months 1,145 17.7% 104Purchased big ticket HH furnishings in last 12 months 1,402 21.7% 98Bought any small kitchen appliance in last 12 months 1,415 21.9% 98Bought any large kitchen appliance in last 12 months 959 14.9% 107
Insurance (Adults/Households)Currently carry life insurance 6,849 45.4% 103Carry medical/hospital/accident insurance 12,318 81.7% 109Carry homeowner insurance 7,935 52.7% 111Carry renter's insurance 1,364 9.1% 106Have auto insurance: 1 vehicle in household covered 1,988 30.8% 99Have auto insurance: 2 vehicles in household covered 1,919 29.7% 104Have auto insurance: 3+ vehicles in household covered 1,624 25.2% 110
Pets (Households)Household owns any pet 3,114 48.3% 89Household owns any cat 1,183 18.3% 81Household owns any dog 2,251 34.9% 84
Psychographics (Adults)Buying American is important to me 5,389 35.8% 91Usually buy items on credit rather than wait 2,158 14.3% 109Usually buy based on quality - not price 3,054 20.3% 107Price is usually more important than brand name 3,807 25.3% 92Usually use coupons for brands I buy often 2,487 16.5% 96Am interested in how to help the environment 2,967 19.7% 102Usually pay more for environ safe product 2,199 14.6% 103Usually value green products over convenience 1,639 10.9% 96Likely to buy a brand that supports a charity 5,357 35.5% 101
Reading (Adults)Bought digital book in last 12 months 2,200 14.6% 113Bought hardcover book in last 12 months 3,478 23.1% 115Bought paperback book in last 12 month 4,698 31.2% 109Read any daily newspaper (paper version) 3,468 23.0% 125Read any digital newspaper in last 30 days 6,961 46.2% 116Read any magazine (paper/electronic version) in last 6 months 13,956 92.6% 102
Data Note: An MPI (Market Potential Index) measures the relative likelihood of the adults or households in the specified trade area to exhibit certain consumer behavior or purchasing patterns compared to the U.S. An MPI of 100 represents the U.S. average. Source: These data are based upon national propensities to use various products and services, applied to local demographic composition. Usage data were collected by GfK MRI in a nationally representative survey of U.S. households. Esri forecasts for 2019 and 2024.
September 25, 2019
©2019 Esri Page 3 of 12

Retail Market Potential7353-7399 St Louis Ave Village Of Skokie Only7353-7399 St Louis Ave, Skokie, Illinois, 60076 Latitude: 42.01519Drive Time: 5 minute radius Longitude: -87.71717
Expected Number of Percent of Product/Consumer Behavior Adults or HHs Adults/HHs MPIRestaurants (Adults)
Went to family restaurant/steak house in last 6 months 11,775 78.1% 104Went to family restaurant/steak house: 4+ times a month 3,926 26.1% 98Went to fast food/drive-in restaurant in last 6 months 13,541 89.9% 99Went to fast food/drive-in restaurant 9+ times/month 5,723 38.0% 97Fast food restaurant last 6 months: eat in 5,177 34.4% 92Fast food restaurant last 6 months: home delivery 1,041 6.9% 80Fast food restaurant last 6 months: take-out/drive-thru 5,963 39.6% 84Fast food restaurant last 6 months: take-out/walk-in 3,351 22.2% 107
Television & Electronics (Adults/Households)Own any tablet 8,246 54.7% 114Own any e-reader 1,719 11.4% 137Own e-reader/tablet: iPad 5,846 38.8% 138HH has Internet connectable TV 2,039 31.6% 110Own any portable MP3 player 3,248 21.6% 116HH owns 1 TV 1,398 21.7% 103HH owns 2 TVs 1,750 27.1% 101HH owns 3 TVs 1,308 20.3% 97HH owns 4+ TVs 1,204 18.7% 107HH subscribes to cable TV 3,432 53.2% 122HH subscribes to fiber optic 1,103 17.1% 242HH owns portable GPS navigation device 1,612 25.0% 109HH purchased video game system in last 12 months 814 12.6% 153HH owns any Internet video device for TV 1,767 27.4% 114
Travel (Adults)Took domestic trip in continental US last 12 months 8,920 59.2% 113Took 3+ domestic non-business trips in last 12 months 1,937 12.9% 109Spent on domestic vacations in last 12 months: <$1-999 1,795 11.9% 110Spent on domestic vacations in last 12 months: $1,000-$1,499 1,088 7.2% 115Spent on domestic vacations in last 12 months: $1,500-$1,999 811 5.4% 134Spent on domestic vacations in last 12 months: $2,000-$2,999 672 4.5% 107Spent on domestic vacations in last 12 months: $3,000+ 1,279 8.5% 131Domestic travel in last 12 months: used general travel website 1,422 9.4% 138Took foreign trip (including Alaska and Hawaii) in last 3 years 6,122 40.6% 148Took 3+ foreign trips by plane in last 3 years 1,580 10.5% 192Spent on foreign vacations in last 12 months: <$1-999 936 6.2% 134Spent on foreign vacations in last 12 months: $1,000-$2,999 1,031 6.8% 171Spent on foreign vacations in last 12 months: $3,000+ 1,731 11.5% 182Foreign travel in last 3 years: used general travel website 1,485 9.9% 172Nights spent in hotel/motel in last 12 months: any 7,717 51.2% 115Took cruise of more than one day in last 3 years 1,667 11.1% 124Member of any frequent flyer program 4,213 28.0% 155Member of any hotel rewards program 3,294 21.9% 121
Data Note: An MPI (Market Potential Index) measures the relative likelihood of the adults or households in the specified trade area to exhibit certain consumer behavior or purchasing patterns compared to the U.S. An MPI of 100 represents the U.S. average. Source: These data are based upon national propensities to use various products and services, applied to local demographic composition. Usage data were collected by GfK MRI in a nationally representative survey of U.S. households. Esri forecasts for 2019 and 2024.
September 25, 2019
©2019 Esri Page 4 of 12

Retail Market Potential7353-7399 St Louis Ave Village Of Skokie Only7353-7399 St Louis Ave, Skokie, Illinois, 60076 Latitude: 42.01519Drive Time: 10 minute radius Longitude: -87.71717
Demographic Summary 2019 2024Population 185,523 184,250Population 18+ 143,201 143,869Households 66,502 66,011Median Household Income $72,067 $79,798
Expected Number of Percent of Product/Consumer Behavior Adults or HHs Adults/HHs MPIApparel (Adults)
Bought any men's clothing in last 12 months 67,132 46.9% 99Bought any women's clothing in last 12 months 64,585 45.1% 105Bought clothing for child <13 years in last 6 months 35,092 24.5% 92Bought any shoes in last 12 months 78,688 54.9% 105Bought costume jewelry in last 12 months 28,781 20.1% 115Bought any fine jewelry in last 12 months 28,353 19.8% 111Bought a watch in last 12 months 23,330 16.3% 105
Automobiles (Households)HH owns/leases any vehicle 54,549 82.0% 96HH bought/leased new vehicle last 12 months 6,844 10.3% 105
Automotive Aftermarket (Adults)Bought gasoline in last 6 months 116,321 81.2% 95Bought/changed motor oil in last 12 months 58,734 41.0% 86Had tune-up in last 12 months 37,320 26.1% 105
Beverages (Adults)Drank bottled water/seltzer in last 6 months 111,159 77.6% 108Drank regular cola in last 6 months 57,432 40.1% 90Drank beer/ale in last 6 months 65,048 45.4% 108
Cameras (Adults)Own digital point & shoot camera/camcorder 15,019 10.5% 105Own digital SLR camera/camcorder 12,221 8.5% 108Printed digital photos in last 12 months 34,482 24.1% 105
Cell Phones (Adults/Households)Bought cell phone in last 12 months 48,091 33.6% 97Have a smartphone 123,556 86.3% 103Have a smartphone: Android phone (any brand) 49,368 34.5% 85Have a smartphone: Apple iPhone 73,131 51.1% 122Number of cell phones in household: 1 18,954 28.5% 94Number of cell phones in household: 2 24,709 37.2% 96Number of cell phones in household: 3+ 21,664 32.6% 116HH has cell phone only (no landline telephone) 30,556 45.9% 82
Computers (Households)HH owns a computer 52,900 79.5% 108HH owns desktop computer 27,292 41.0% 111HH owns laptop/notebook 39,442 59.3% 105HH owns any Apple/Mac brand computer 17,762 26.7% 148HH owns any PC/non-Apple brand computer 40,928 61.5% 100HH purchased most recent computer in a store 24,785 37.3% 103HH purchased most recent computer online 10,059 15.1% 111Spent <$1-499 on most recent home computer 8,110 12.2% 83Spent $500-$999 on most recent home computer"
11,084 16.7% 99Spent $1,000-$1,499 on most recent home computer 8,047 12.1% 126Spent $1,500-$1,999 on most recent home computer 3,600 5.4% 122Spent $2,000+ on most recent home computer 3,245 4.9% 123
Data Note: An MPI (Market Potential Index) measures the relative likelihood of the adults or households in the specified trade area to exhibit certain consumer behavior or purchasing patterns compared to the U.S. An MPI of 100 represents the U.S. average. Source: These data are based upon national propensities to use various products and services, applied to local demographic composition. Usage data were collected by GfK MRI in a nationally representative survey of U.S. households. Esri forecasts for 2019 and 2024.
September 25, 2019
©2019 Esri Page 5 of 12

Retail Market Potential7353-7399 St Louis Ave Village Of Skokie Only7353-7399 St Louis Ave, Skokie, Illinois, 60076 Latitude: 42.01519Drive Time: 10 minute radius Longitude: -87.71717
Expected Number of Percent of Product/Consumer Behavior Adults or HHs Adults/HHs MPIConvenience Stores (Adults)
Shopped at convenience store in last 6 months 85,418 59.6% 94Bought brewed coffee at convenience store in last 30 days 21,150 14.8% 106Bought cigarettes at convenience store in last 30 days 10,014 7.0% 65Bought gas at convenience store in last 30 days 35,065 24.5% 66Spent at convenience store in last 30 days: <$1-19 12,363 8.6% 125Spent at convenience store in last 30 days: $20-$39 13,594 9.5% 100Spent at convenience store in last 30 days: $40-$50 11,490 8.0% 97Spent at convenience store in last 30 days: $51-$99 6,641 4.6% 84Spent at convenience store in last 30 days: $100+ 23,162 16.2% 72
Entertainment (Adults)Attended a movie in last 6 months 86,480 60.4% 103Went to live theater in last 12 months 19,238 13.4% 122Went to a bar/night club in last 12 months 25,957 18.1% 105Dined out in last 12 months 76,637 53.5% 103Gambled at a casino in last 12 months 23,137 16.2% 122Visited a theme park in last 12 months 32,040 22.4% 118Viewed movie (video-on-demand) in last 30 days 30,090 21.0% 120Viewed TV show (video-on-demand) in last 30 days 23,985 16.7% 133Watched any pay-per-view TV in last 12 months 15,302 10.7% 109Downloaded a movie over the Internet in last 30 days 15,924 11.1% 116Downloaded any individual song in last 6 months 28,770 20.1% 105Watched a movie online in the last 30 days 44,071 30.8% 114Watched a TV program online in last 30 days 32,061 22.4% 117Played a video/electronic game (console) in last 12 months 10,642 7.4% 84Played a video/electronic game (portable) in last 12 months 6,677 4.7% 100
Financial (Adults)Have home mortgage (1st) 42,818 29.9% 96Used ATM/cash machine in last 12 months 79,116 55.2% 104Own any stock 12,288 8.6% 120Own U.S. savings bond 8,044 5.6% 129Own shares in mutual fund (stock) 12,332 8.6% 121Own shares in mutual fund (bonds) 7,966 5.6% 116Have interest checking account 42,332 29.6% 103Have non-interest checking account 41,553 29.0% 99Have savings account 85,875 60.0% 105Have 401K retirement savings plan 23,086 16.1% 100Own/used any credit/debit card in last 12 months 120,054 83.8% 106Avg monthly credit card expenditures: <$1-110 14,397 10.1% 87Avg monthly credit card expenditures: $111-$225 11,211 7.8% 106Avg monthly credit card expenditures: $226-$450 11,510 8.0% 118Avg monthly credit card expenditures: $451-$700 11,653 8.1% 133Avg monthly credit card expenditures: $701-$1,000 11,897 8.3% 148Avg monthly credit card expenditures: $1,001+ 21,001 14.7% 126Did banking online in last 12 months 58,685 41.0% 105Did banking on mobile device in last 12 months 36,860 25.7% 99Paid bills online in last 12 months 75,401 52.7% 105
Data Note: An MPI (Market Potential Index) measures the relative likelihood of the adults or households in the specified trade area to exhibit certain consumer behavior or purchasing patterns compared to the U.S. An MPI of 100 represents the U.S. average. Source: These data are based upon national propensities to use various products and services, applied to local demographic composition. Usage data were collected by GfK MRI in a nationally representative survey of U.S. households. Esri forecasts for 2019 and 2024.
September 25, 2019
©2019 Esri Page 6 of 12

Retail Market Potential7353-7399 St Louis Ave Village Of Skokie Only7353-7399 St Louis Ave, Skokie, Illinois, 60076 Latitude: 42.01519Drive Time: 10 minute radius Longitude: -87.71717
Expected Number of Percent of Product/Consumer Behavior Adults/HHs Adults/HHs MPIGrocery (Adults)
Used beef (fresh/frozen) in last 6 months 42,097 63.3% 92Used bread in last 6 months 61,296 92.2% 99Used chicken (fresh or frozen) in last 6 months 46,473 69.9% 101Used turkey (fresh or frozen) in last 6 months 9,802 14.7% 98Used fish/seafood (fresh or frozen) in last 6 months 38,855 58.4% 106Used fresh fruit/vegetables in last 6 months 58,743 88.3% 103Used fresh milk in last 6 months 56,172 84.5% 98Used organic food in last 6 months 21,568 32.4% 136
Health (Adults)Exercise at home 2+ times per week 38,935 27.2% 99Exercise at club 2+ times per week 25,897 18.1% 126Visited a doctor in last 12 months 114,059 79.6% 104Used vitamin/dietary supplement in last 6 months 85,775 59.9% 111
Home (Households)Did any home improvement in last 12 months 16,885 25.4% 92Used any housekeeper/professional cleaning service in last 12 monthsmonths
12,862 19.3% 133Purchased low ticket HH furnishings in last 12 months 11,462 17.2% 101Purchased big ticket HH furnishings in last 12 months 13,873 20.9% 94Bought any small kitchen appliance in last 12 months 15,190 22.8% 102Bought any large kitchen appliance in last 12 months 8,769 13.2% 95
Insurance (Adults/Households)Currently carry life insurance 56,165 39.2% 89Carry medical/hospital/accident insurance 108,706 75.9% 102Carry homeowner insurance 62,793 43.8% 93Carry renter's insurance 13,748 9.6% 113Have auto insurance: 1 vehicle in household covered 21,124 31.8% 102Have auto insurance: 2 vehicles in household covered 17,801 26.8% 94Have auto insurance: 3+ vehicles in household covered 13,170 19.8% 87
Pets (Households)Household owns any pet 28,242 42.5% 78Household owns any cat 11,130 16.7% 74Household owns any dog 19,679 29.6% 71
Psychographics (Adults)Buying American is important to me 46,007 32.1% 82Usually buy items on credit rather than wait 21,009 14.7% 112Usually buy based on quality - not price 28,525 19.9% 105Price is usually more important than brand name 34,922 24.4% 89Usually use coupons for brands I buy often 24,073 16.8% 97Am interested in how to help the environment 32,300 22.6% 116Usually pay more for environ safe product 22,706 15.9% 112Usually value green products over convenience 18,180 12.7% 112Likely to buy a brand that supports a charity 50,991 35.6% 101
Reading (Adults)Bought digital book in last 12 months 20,955 14.6% 113Bought hardcover book in last 12 months 31,677 22.1% 111Bought paperback book in last 12 month 44,262 30.9% 108Read any daily newspaper (paper version) 28,544 19.9% 108Read any digital newspaper in last 30 days 62,011 43.3% 109Read any magazine (paper/electronic version) in last 6 months 130,617 91.2% 100
Data Note: An MPI (Market Potential Index) measures the relative likelihood of the adults or households in the specified trade area to exhibit certain consumer behavior or purchasing patterns compared to the U.S. An MPI of 100 represents the U.S. average. Source: These data are based upon national propensities to use various products and services, applied to local demographic composition. Usage data were collected by GfK MRI in a nationally representative survey of U.S. households. Esri forecasts for 2019 and 2024.
September 25, 2019
©2019 Esri Page 7 of 12

Retail Market Potential7353-7399 St Louis Ave Village Of Skokie Only7353-7399 St Louis Ave, Skokie, Illinois, 60076 Latitude: 42.01519Drive Time: 10 minute radius Longitude: -87.71717
Expected Number of Percent of Product/Consumer Behavior Adults or HHs Adults/HHs MPIRestaurants (Adults)
Went to family restaurant/steak house in last 6 months 107,442 75.0% 100Went to family restaurant/steak house: 4+ times a month 35,142 24.5% 92Went to fast food/drive-in restaurant in last 6 months 128,022 89.4% 98Went to fast food/drive-in restaurant 9+ times/month 51,683 36.1% 92Fast food restaurant last 6 months: eat in 49,511 34.6% 93Fast food restaurant last 6 months: home delivery 12,907 9.0% 104Fast food restaurant last 6 months: take-out/drive-thru 52,333 36.5% 78Fast food restaurant last 6 months: take-out/walk-in 33,520 23.4% 112
Television & Electronics (Adults/Households)Own any tablet 71,669 50.0% 104Own any e-reader 13,009 9.1% 109Own e-reader/tablet: iPad 48,709 34.0% 121HH has Internet connectable TV 19,250 28.9% 101Own any portable MP3 player 29,977 20.9% 113HH owns 1 TV 16,875 25.4% 121HH owns 2 TVs 18,395 27.7% 103HH owns 3 TVs 11,601 17.4% 83HH owns 4+ TVs 10,400 15.6% 90HH subscribes to cable TV 32,902 49.5% 113HH subscribes to fiber optic 10,194 15.3% 217HH owns portable GPS navigation device 14,734 22.2% 97HH purchased video game system in last 12 months 8,704 13.1% 159HH owns any Internet video device for TV 17,851 26.8% 112
Travel (Adults)Took domestic trip in continental US last 12 months 79,622 55.6% 106Took 3+ domestic non-business trips in last 12 months 16,927 11.8% 100Spent on domestic vacations in last 12 months: <$1-999 14,850 10.4% 96Spent on domestic vacations in last 12 months: $1,000-$1,499 9,633 6.7% 107Spent on domestic vacations in last 12 months: $1,500-$1,999 6,601 4.6% 114Spent on domestic vacations in last 12 months: $2,000-$2,999 6,321 4.4% 106Spent on domestic vacations in last 12 months: $3,000+ 10,621 7.4% 115Domestic travel in last 12 months: used general travel website 12,003 8.4% 123Took foreign trip (including Alaska and Hawaii) in last 3 years 57,247 40.0% 145Took 3+ foreign trips by plane in last 3 years 13,287 9.3% 170Spent on foreign vacations in last 12 months: <$1-999 8,413 5.9% 126Spent on foreign vacations in last 12 months: $1,000-$2,999 8,812 6.2% 154Spent on foreign vacations in last 12 months: $3,000+ 14,930 10.4% 165Foreign travel in last 3 years: used general travel website 13,823 9.7% 168Nights spent in hotel/motel in last 12 months: any 66,871 46.7% 105Took cruise of more than one day in last 3 years 15,168 10.6% 119Member of any frequent flyer program 34,717 24.2% 134Member of any hotel rewards program 28,586 20.0% 111
Data Note: An MPI (Market Potential Index) measures the relative likelihood of the adults or households in the specified trade area to exhibit certain consumer behavior or purchasing patterns compared to the U.S. An MPI of 100 represents the U.S. average. Source: These data are based upon national propensities to use various products and services, applied to local demographic composition. Usage data were collected by GfK MRI in a nationally representative survey of U.S. households. Esri forecasts for 2019 and 2024.
September 25, 2019
©2019 Esri Page 8 of 12

Retail Market Potential7353-7399 St Louis Ave Village Of Skokie Only7353-7399 St Louis Ave, Skokie, Illinois, 60076 Latitude: 42.01519Drive Time: 15 minute radius Longitude: -87.71717
Demographic Summary 2019 2024Population 477,852 475,755Population 18+ 376,865 380,324Households 182,450 181,752Median Household Income $66,187 $74,914
Expected Number of Percent of Product/Consumer Behavior Adults or HHs Adults/HHs MPIApparel (Adults)
Bought any men's clothing in last 12 months 174,649 46.3% 98Bought any women's clothing in last 12 months 163,524 43.4% 101Bought clothing for child <13 years in last 6 months 89,049 23.6% 89Bought any shoes in last 12 months 204,372 54.2% 104Bought costume jewelry in last 12 months 73,062 19.4% 111Bought any fine jewelry in last 12 months 72,396 19.2% 107Bought a watch in last 12 months 61,967 16.4% 106
Automobiles (Households)HH owns/leases any vehicle 143,137 78.5% 92HH bought/leased new vehicle last 12 months 17,309 9.5% 97
Automotive Aftermarket (Adults)Bought gasoline in last 6 months 295,712 78.5% 92Bought/changed motor oil in last 12 months 146,669 38.9% 82Had tune-up in last 12 months 96,002 25.5% 103
Beverages (Adults)Drank bottled water/seltzer in last 6 months 289,325 76.8% 107Drank regular cola in last 6 months 154,223 40.9% 92Drank beer/ale in last 6 months 171,090 45.4% 108
Cameras (Adults)Own digital point & shoot camera/camcorder 36,546 9.7% 97Own digital SLR camera/camcorder 29,977 8.0% 101Printed digital photos in last 12 months 84,138 22.3% 98
Cell Phones (Adults/Households)Bought cell phone in last 12 months 124,719 33.1% 96Have a smartphone 327,686 87.0% 104Have a smartphone: Android phone (any brand) 128,556 34.1% 84Have a smartphone: Apple iPhone 195,733 51.9% 124Number of cell phones in household: 1 57,470 31.5% 103Number of cell phones in household: 2 66,875 36.7% 95Number of cell phones in household: 3+ 54,378 29.8% 106HH has cell phone only (no landline telephone) 96,965 53.1% 95
Computers (Households)HH owns a computer 143,338 78.6% 107HH owns desktop computer 70,724 38.8% 105HH owns laptop/notebook 109,241 59.9% 106HH owns any Apple/Mac brand computer 49,779 27.3% 151HH owns any PC/non-Apple brand computer 108,089 59.2% 96HH purchased most recent computer in a store 67,089 36.8% 101HH purchased most recent computer online 27,765 15.2% 112Spent <$1-499 on most recent home computer 22,279 12.2% 83Spent $500-$999 on most recent home computer"
29,801 16.3% 97Spent $1,000-$1,499 on most recent home computer 21,327 11.7% 122Spent $1,500-$1,999 on most recent home computer 9,883 5.4% 122Spent $2,000+ on most recent home computer 9,903 5.4% 137
Data Note: An MPI (Market Potential Index) measures the relative likelihood of the adults or households in the specified trade area to exhibit certain consumer behavior or purchasing patterns compared to the U.S. An MPI of 100 represents the U.S. average. Source: These data are based upon national propensities to use various products and services, applied to local demographic composition. Usage data were collected by GfK MRI in a nationally representative survey of U.S. households. Esri forecasts for 2019 and 2024.
September 25, 2019
©2019 Esri Page 9 of 12

Retail Market Potential7353-7399 St Louis Ave Village Of Skokie Only7353-7399 St Louis Ave, Skokie, Illinois, 60076 Latitude: 42.01519Drive Time: 15 minute radius Longitude: -87.71717
Expected Number of Percent of Product/Consumer Behavior Adults or HHs Adults/HHs MPIConvenience Stores (Adults)
Shopped at convenience store in last 6 months 224,874 59.7% 94Bought brewed coffee at convenience store in last 30 days 54,841 14.6% 105Bought cigarettes at convenience store in last 30 days 26,745 7.1% 66Bought gas at convenience store in last 30 days 93,135 24.7% 66Spent at convenience store in last 30 days: <$1-19 31,883 8.5% 123Spent at convenience store in last 30 days: $20-$39 35,500 9.4% 99Spent at convenience store in last 30 days: $40-$50 30,892 8.2% 99Spent at convenience store in last 30 days: $51-$99 17,126 4.5% 82Spent at convenience store in last 30 days: $100+ 60,173 16.0% 72
Entertainment (Adults)Attended a movie in last 6 months 233,223 61.9% 106Went to live theater in last 12 months 50,856 13.5% 122Went to a bar/night club in last 12 months 72,099 19.1% 111Dined out in last 12 months 199,940 53.1% 102Gambled at a casino in last 12 months 57,673 15.3% 116Visited a theme park in last 12 months 85,300 22.6% 120Viewed movie (video-on-demand) in last 30 days 73,226 19.4% 111Viewed TV show (video-on-demand) in last 30 days 56,441 15.0% 118Watched any pay-per-view TV in last 12 months 38,756 10.3% 105Downloaded a movie over the Internet in last 30 days 42,935 11.4% 119Downloaded any individual song in last 6 months 79,510 21.1% 111Watched a movie online in the last 30 days 127,021 33.7% 125Watched a TV program online in last 30 days 90,661 24.1% 126Played a video/electronic game (console) in last 12 months 31,106 8.3% 93Played a video/electronic game (portable) in last 12 months 17,676 4.7% 100
Financial (Adults)Have home mortgage (1st) 104,031 27.6% 89Used ATM/cash machine in last 12 months 207,559 55.1% 104Own any stock 30,295 8.0% 112Own U.S. savings bond 17,736 4.7% 108Own shares in mutual fund (stock) 30,172 8.0% 112Own shares in mutual fund (bonds) 19,735 5.2% 110Have interest checking account 105,868 28.1% 98Have non-interest checking account 108,324 28.7% 98Have savings account 220,189 58.4% 102Have 401K retirement savings plan 57,370 15.2% 95Own/used any credit/debit card in last 12 months 312,763 83.0% 105Avg monthly credit card expenditures: <$1-110 37,847 10.0% 87Avg monthly credit card expenditures: $111-$225 29,825 7.9% 107Avg monthly credit card expenditures: $226-$450 29,425 7.8% 114Avg monthly credit card expenditures: $451-$700 29,109 7.7% 126Avg monthly credit card expenditures: $701-$1,000 28,816 7.6% 137Avg monthly credit card expenditures: $1,001+ 51,856 13.8% 118Did banking online in last 12 months 151,475 40.2% 103Did banking on mobile device in last 12 months 99,581 26.4% 102Paid bills online in last 12 months 197,406 52.4% 104
Data Note: An MPI (Market Potential Index) measures the relative likelihood of the adults or households in the specified trade area to exhibit certain consumer behavior or purchasing patterns compared to the U.S. An MPI of 100 represents the U.S. average. Source: These data are based upon national propensities to use various products and services, applied to local demographic composition. Usage data were collected by GfK MRI in a nationally representative survey of U.S. households. Esri forecasts for 2019 and 2024.
September 25, 2019
©2019 Esri Page 10 of 12

Retail Market Potential7353-7399 St Louis Ave Village Of Skokie Only7353-7399 St Louis Ave, Skokie, Illinois, 60076 Latitude: 42.01519Drive Time: 15 minute radius Longitude: -87.71717
Expected Number of Percent of Product/Consumer Behavior Adults/HHs Adults/HHs MPIGrocery (Adults)
Used beef (fresh/frozen) in last 6 months 115,064 63.1% 92Used bread in last 6 months 167,358 91.7% 98Used chicken (fresh or frozen) in last 6 months 126,762 69.5% 100Used turkey (fresh or frozen) in last 6 months 25,196 13.8% 92Used fish/seafood (fresh or frozen) in last 6 months 104,376 57.2% 104Used fresh fruit/vegetables in last 6 months 160,182 87.8% 102Used fresh milk in last 6 months 151,389 83.0% 96Used organic food in last 6 months 60,571 33.2% 139
Health (Adults)Exercise at home 2+ times per week 102,888 27.3% 100Exercise at club 2+ times per week 68,692 18.2% 127Visited a doctor in last 12 months 293,291 77.8% 101Used vitamin/dietary supplement in last 6 months 221,125 58.7% 109
Home (Households)Did any home improvement in last 12 months 41,819 22.9% 83Used any housekeeper/professional cleaning service in last 12 monthsmonths
33,859 18.6% 127Purchased low ticket HH furnishings in last 12 months 32,439 17.8% 104Purchased big ticket HH furnishings in last 12 months 39,242 21.5% 97Bought any small kitchen appliance in last 12 months 41,382 22.7% 102Bought any large kitchen appliance in last 12 months 22,238 12.2% 88
Insurance (Adults/Households)Currently carry life insurance 139,892 37.1% 84Carry medical/hospital/accident insurance 280,950 74.5% 100Carry homeowner insurance 149,911 39.8% 84Carry renter's insurance 37,815 10.0% 118Have auto insurance: 1 vehicle in household covered 59,664 32.7% 105Have auto insurance: 2 vehicles in household covered 46,238 25.3% 89Have auto insurance: 3+ vehicles in household covered 31,014 17.0% 74
Pets (Households)Household owns any pet 75,770 41.5% 76Household owns any cat 30,508 16.7% 73Household owns any dog 52,187 28.6% 69
Psychographics (Adults)Buying American is important to me 116,655 31.0% 79Usually buy items on credit rather than wait 54,488 14.5% 110Usually buy based on quality - not price 75,821 20.1% 106Price is usually more important than brand name 93,990 24.9% 91Usually use coupons for brands I buy often 62,600 16.6% 96Am interested in how to help the environment 91,733 24.3% 126Usually pay more for environ safe product 62,812 16.7% 118Usually value green products over convenience 49,294 13.1% 116Likely to buy a brand that supports a charity 131,976 35.0% 100
Reading (Adults)Bought digital book in last 12 months 55,935 14.8% 115Bought hardcover book in last 12 months 81,482 21.6% 108Bought paperback book in last 12 month 114,479 30.4% 107Read any daily newspaper (paper version) 69,772 18.5% 101Read any digital newspaper in last 30 days 169,869 45.1% 113Read any magazine (paper/electronic version) in last 6 months 344,891 91.5% 101
Data Note: An MPI (Market Potential Index) measures the relative likelihood of the adults or households in the specified trade area to exhibit certain consumer behavior or purchasing patterns compared to the U.S. An MPI of 100 represents the U.S. average. Source: These data are based upon national propensities to use various products and services, applied to local demographic composition. Usage data were collected by GfK MRI in a nationally representative survey of U.S. households. Esri forecasts for 2019 and 2024.
September 25, 2019
©2019 Esri Page 11 of 12

Retail Market Potential7353-7399 St Louis Ave Village Of Skokie Only7353-7399 St Louis Ave, Skokie, Illinois, 60076 Latitude: 42.01519Drive Time: 15 minute radius Longitude: -87.71717
Expected Number of Percent of Product/Consumer Behavior Adults or HHs Adults/HHs MPIRestaurants (Adults)
Went to family restaurant/steak house in last 6 months 275,811 73.2% 98Went to family restaurant/steak house: 4+ times a month 90,006 23.9% 90Went to fast food/drive-in restaurant in last 6 months 336,574 89.3% 98Went to fast food/drive-in restaurant 9+ times/month 137,266 36.4% 93Fast food restaurant last 6 months: eat in 131,327 34.8% 94Fast food restaurant last 6 months: home delivery 36,601 9.7% 112Fast food restaurant last 6 months: take-out/drive-thru 139,872 37.1% 79Fast food restaurant last 6 months: take-out/walk-in 87,856 23.3% 112
Television & Electronics (Adults/Households)Own any tablet 182,841 48.5% 101Own any e-reader 33,424 8.9% 106Own e-reader/tablet: iPad 123,700 32.8% 116HH has Internet connectable TV 50,781 27.8% 97Own any portable MP3 player 77,396 20.5% 111HH owns 1 TV 49,171 27.0% 128HH owns 2 TVs 50,467 27.7% 103HH owns 3 TVs 30,139 16.5% 79HH owns 4+ TVs 25,127 13.8% 79HH subscribes to cable TV 89,725 49.2% 113HH subscribes to fiber optic 22,718 12.5% 177HH owns portable GPS navigation device 36,808 20.2% 88HH purchased video game system in last 12 months 22,805 12.5% 152HH owns any Internet video device for TV 50,418 27.6% 115
Travel (Adults)Took domestic trip in continental US last 12 months 205,715 54.6% 104Took 3+ domestic non-business trips in last 12 months 45,141 12.0% 101Spent on domestic vacations in last 12 months: <$1-999 41,272 11.0% 101Spent on domestic vacations in last 12 months: $1,000-$1,499 25,004 6.6% 106Spent on domestic vacations in last 12 months: $1,500-$1,999 16,870 4.5% 111Spent on domestic vacations in last 12 months: $2,000-$2,999 16,524 4.4% 105Spent on domestic vacations in last 12 months: $3,000+ 25,837 6.9% 106Domestic travel in last 12 months: used general travel website 32,464 8.6% 126Took foreign trip (including Alaska and Hawaii) in last 3 years 148,935 39.5% 144Took 3+ foreign trips by plane in last 3 years 34,876 9.3% 170Spent on foreign vacations in last 12 months: <$1-999 22,431 6.0% 128Spent on foreign vacations in last 12 months: $1,000-$2,999 22,974 6.1% 152Spent on foreign vacations in last 12 months: $3,000+ 38,500 10.2% 162Foreign travel in last 3 years: used general travel website 35,770 9.5% 165Nights spent in hotel/motel in last 12 months: any 170,388 45.2% 102Took cruise of more than one day in last 3 years 36,429 9.7% 109Member of any frequent flyer program 88,258 23.4% 130Member of any hotel rewards program 70,353 18.7% 104
Data Note: An MPI (Market Potential Index) measures the relative likelihood of the adults or households in the specified trade area to exhibit certain consumer behavior or purchasing patterns compared to the U.S. An MPI of 100 represents the U.S. average. Source: These data are based upon national propensities to use various products and services, applied to local demographic composition. Usage data were collected by GfK MRI in a nationally representative survey of U.S. households. Esri forecasts for 2019 and 2024.
September 25, 2019
©2019 Esri Page 12 of 12

Retail MarketPlace Profile7353-7399 St Louis Ave Village Of Skokie Only7353-7399 St Louis Ave, Skokie, Illinois, 60076 Latitude: 42.01519Drive Time: 5 minute radius Longitude: -87.71717
Summary Demographics2019 Population 19,1882019 Households 6,4512019 Median Disposable Income $64,1562019 Per Capita Income $36,888
NAICS Demand Supply Retail Gap Leakage/Surplus Number of2017 Industry Summary (Retail Potential) (Retail Sales) Factor Businesses
Total Retail Trade and Food & Drink 44-45,722 $298,865,329 $686,840,102 -$387,974,773 -39.4 226Total Retail Trade 44-45 $268,154,671 $626,489,655 -$358,334,984 -40.1 165Total Food & Drink 722 $30,710,658 $60,350,447 -$29,639,789 -32.5 61
NAICS Demand Supply Retail Gap Leakage/Surplus Number of2017 Industry Group (Retail Potential) (Retail Sales) Factor Businesses
Motor Vehicle & Parts Dealers 441 $53,505,887 $165,728,636 -$112,222,749 -51.2 16 Automobile Dealers 4411 $43,956,413 $161,631,793 -$117,675,380 -57.2 11 Other Motor Vehicle Dealers 4412 $4,394,619 $0 $4,394,619 100.0 0 Auto Parts, Accessories & Tire Stores 4413 $5,154,855 $4,096,843 $1,058,012 11.4 5Furniture & Home Furnishings Stores 442 $9,025,896 $8,386,837 $639,059 3.7 6 Furniture Stores 4421 $5,139,683 $6,053,287 -$913,604 -8.2 2 Home Furnishings Stores 4422 $3,886,213 $2,333,549 $1,552,664 25.0 4Electronics & Appliance Stores 443 $10,769,592 $18,683,815 -$7,914,223 -26.9 8Bldg Materials, Garden Equip. & Supply Stores 444 $19,111,271 $19,196,911 -$85,640 -0.2 6 Bldg Material & Supplies Dealers 4441 $17,318,259 $18,649,405 -$1,331,146 -3.7 5 Lawn & Garden Equip & Supply Stores 4442 $1,793,012 $547,506 $1,245,506 53.2 1Food & Beverage Stores 445 $44,220,178 $52,700,906 -$8,480,728 -8.8 17 Grocery Stores 4451 $38,571,572 $48,559,876 -$9,988,304 -11.5 10 Specialty Food Stores 4452 $2,265,908 $3,098,251 -$832,343 -15.5 6 Beer, Wine & Liquor Stores 4453 $3,382,698 $1,042,778 $2,339,920 52.9 1Health & Personal Care Stores 446,4461 $17,739,481 $71,339,061 -$53,599,580 -60.2 21Gasoline Stations 447,4471 $26,772,417 $63,204,789 -$36,432,372 -40.5 12Clothing & Clothing Accessories Stores 448 $15,638,824 $46,855,785 -$31,216,961 -50.0 41 Clothing Stores 4481 $10,381,201 $29,703,270 -$19,322,069 -48.2 22 Shoe Stores 4482 $2,119,709 $9,506,613 -$7,386,904 -63.5 9 Jewelry, Luggage & Leather Goods Stores 4483 $3,137,914 $7,645,902 -$4,507,988 -41.8 10Sporting Goods, Hobby, Book & Music Stores 451 $7,316,360 $7,500,192 -$183,832 -1.2 6 Sporting Goods/Hobby/Musical Instr Stores 4511 $6,063,345 $6,931,823 -$868,478 -6.7 6 Book, Periodical & Music Stores 4512 $1,253,015 $568,369 $684,646 37.6 1General Merchandise Stores 452 $46,749,027 $154,865,903 -$108,116,876 -53.6 13 Department Stores Excluding Leased Depts. 4521 $33,708,777 $151,429,885 -$117,721,108 -63.6 6 Other General Merchandise Stores 4529 $13,040,250 $3,436,018 $9,604,232 58.3 7Miscellaneous Store Retailers 453 $9,518,902 $10,854,995 -$1,336,093 -6.6 17 Florists 4531 $745,401 $270,856 $474,545 46.7 2 Office Supplies, Stationery & Gift Stores 4532 $1,769,715 $2,493,462 -$723,747 -17.0 4 Used Merchandise Stores 4533 $949,407 $1,163,356 -$213,949 -10.1 2 Other Miscellaneous Store Retailers 4539 $6,054,379 $6,927,322 -$872,943 -6.7 9Nonstore Retailers 454 $7,786,837 $7,171,825 $615,012 4.1 3 Electronic Shopping & Mail-Order Houses 4541 $5,984,470 $6,251,481 -$267,011 -2.2 1 Vending Machine Operators 4542 $204,017 $541,369 -$337,352 -45.3 1 Direct Selling Establishments 4543 $1,598,351 $378,975 $1,219,376 61.7 1Food Services & Drinking Places 722 $30,710,658 $60,350,447 -$29,639,789 -32.5 61 Special Food Services 7223 $709,040 $2,682,485 -$1,973,445 -58.2 4 Drinking Places - Alcoholic Beverages 7224 $1,021,021 $450,715 $570,306 38.8 2 Restaurants/Other Eating Places 7225 $28,980,597 $57,217,247 -$28,236,650 -32.8 55
Data Note: Supply (retail sales) estimates sales to consumers by establishments. Sales to businesses are excluded. Demand (retail potential) estimates the expected amount spent by consumers at retail establishments. Supply and demand estimates are in current dollars. The Leakage/Surplus Factor presents a snapshot of retail opportunity. This is a measure of the relationship between supply and demand that ranges from +100 (total leakage) to -100 (total surplus). A positive value represents 'leakage' of retail opportunity outside the trade area. A negative value represents a surplus of retail sales, a market where customers are drawn in from outside the trade area. The Retail Gap represents the difference between Retail Potential and Retail Sales. Esri uses the North American Industry Classification System (NAICS) to classify businesses by their primary type of economic activity. Retail establishments are classified into 27 industry groups in the Retail Trade sector, as well as four industry groups within the Food Services & Drinking Establishments subsector. For more information on the Retail MarketPlace data, please click the link below to view the Methodology Statement.http://www.esri.com/library/whitepapers/pdfs/esri-data-retail-marketplace.pdf
Source: Esri and Infogroup. Esri 2019 Updated Demographics. Esri 2017 Retail MarketPlace. Copyright 2019 Esri. Copyright 2017 Infogroup, Inc. All rights reserved.
September 25, 2019
©2019 Esri Page 1 of 6

Retail MarketPlace Profile7353-7399 St Louis Ave Village Of Skokie Only7353-7399 St Louis Ave, Skokie, Illinois, 60076 Latitude: 42.01519Drive Time: 5 minute radius Longitude: -87.71717
2017 Leakage/Surplus Factor by Industry Subsector2017 Leakage/Surplus Factor by Industry Subsector
Food Services & Drinking Places Nonstore Retailers
Miscellaneous Store Retailers General Merchandise Stores
Sporting Goods, Hobby, Book, and Music Stores Clothing and Clothing Accessories Stores
Gasoline Stations Health & Personal Care Stores
Food & Beverage Stores Bldg Materials, Garden Equip. & Supply Stores
Electronics & Appliance Stores Furniture & Home Furnishings Stores
Motor Vehicle & Parts Dealers
Leakage/Surplus Factor0-10-20-30-40-50-60
2017 Leakage/Surplus Factor by Industry Group2017 Leakage/Surplus Factor by Industry Group
Restaurants/Other Eating Places
Drinking Places (Alcoholic Beverages)
Special Food Services
Direct Selling Establishments
Vending Machine Operators
Electronic Shopping and Mail-Order Houses
Other Miscellaneous Store Retailers Used Merchandise Stores
Office Supplies, Stationery, and Gift Stores
Florists
Other General Merchandise Stores
Department Stores (Excluding Leased Depts.)
Book, Periodical, and Music Stores
Jewelry, Luggage, and Leather Goods Stores
Shoe Stores
Clothing Stores
Gasoline Stations
Health & Personal Care Stores
Beer, Wine, and Liquor Stores
Specialty Food Stores
Grocery Stores
Lawn and Garden Equipment and Supplies Stores Building Material and Supplies Dealers
Electronics & Appliance Stores
Home Furnishings Stores
Furniture Stores
Auto Parts, Accessories, and Tire Stores
Other Motor Vehicle Dealers
Automobile Dealers
Leakage/Surplus Factor100806040200-20-40-60
Source: Esri and Infogroup. Esri 2019 Updated Demographics. Esri 2017 Retail MarketPlace. Copyright 2019 Esri. Copyright 2017 Infogroup, Inc. All rights reserved.
September 25, 2019
©2019 Esri Page 2 of 6

Retail MarketPlace Profile7353-7399 St Louis Ave Village Of Skokie Only7353-7399 St Louis Ave, Skokie, Illinois, 60076 Latitude: 42.01519Drive Time: 10 minute radius Longitude: -87.71717
Summary Demographics2019 Population 185,5232019 Households 66,5022019 Median Disposable Income $54,9172019 Per Capita Income $36,138
NAICS Demand Supply Retail Gap Leakage/Surplus Number of2017 Industry Summary (Retail Potential) (Retail Sales) Factor Businesses
Total Retail Trade and Food & Drink 44-45,722 $2,895,295,608 $2,356,099,362 $539,196,246 10.3 1,274Total Retail Trade 44-45 $2,595,328,079 $2,090,562,426 $504,765,653 10.8 855Total Food & Drink 722 $299,967,529 $265,536,936 $34,430,593 6.1 419
NAICS Demand Supply Retail Gap Leakage/Surplus Number of2017 Industry Group (Retail Potential) (Retail Sales) Factor Businesses
Motor Vehicle & Parts Dealers 441 $515,096,219 $286,679,311 $228,416,908 28.5 57 Automobile Dealers 4411 $424,160,262 $261,621,686 $162,538,576 23.7 29 Other Motor Vehicle Dealers 4412 $41,555,890 $1,843,829 $39,712,061 91.5 2 Auto Parts, Accessories & Tire Stores 4413 $49,380,068 $23,213,796 $26,166,272 36.0 27Furniture & Home Furnishings Stores 442 $86,361,852 $41,226,804 $45,135,048 35.4 47 Furniture Stores 4421 $49,999,738 $20,302,400 $29,697,338 42.2 20 Home Furnishings Stores 4422 $36,362,114 $20,924,403 $15,437,711 26.9 28Electronics & Appliance Stores 443 $102,368,239 $90,131,697 $12,236,542 6.4 49Bldg Materials, Garden Equip. & Supply Stores 444 $177,427,689 $202,821,254 -$25,393,565 -6.7 62 Bldg Material & Supplies Dealers 4441 $160,586,878 $200,930,691 -$40,343,813 -11.2 59 Lawn & Garden Equip & Supply Stores 4442 $16,840,811 $1,890,563 $14,950,248 79.8 3Food & Beverage Stores 445 $435,864,238 $330,836,976 $105,027,262 13.7 123 Grocery Stores 4451 $380,806,507 $295,128,802 $85,677,705 12.7 76 Specialty Food Stores 4452 $22,459,551 $16,308,219 $6,151,332 15.9 31 Beer, Wine & Liquor Stores 4453 $32,598,180 $19,399,956 $13,198,224 25.4 16Health & Personal Care Stores 446,4461 $170,777,557 $195,839,957 -$25,062,400 -6.8 89Gasoline Stations 447,4471 $260,432,514 $202,219,700 $58,212,814 12.6 47Clothing & Clothing Accessories Stores 448 $152,574,386 $118,180,348 $34,394,038 12.7 133 Clothing Stores 4481 $101,653,030 $75,228,485 $26,424,545 14.9 86 Shoe Stores 4482 $21,021,695 $19,578,485 $1,443,210 3.6 19 Jewelry, Luggage & Leather Goods Stores 4483 $29,899,660 $23,373,378 $6,526,282 12.3 28Sporting Goods, Hobby, Book & Music Stores 451 $70,838,188 $62,945,056 $7,893,132 5.9 62 Sporting Goods/Hobby/Musical Instr Stores 4511 $58,470,840 $50,305,811 $8,165,029 7.5 47 Book, Periodical & Music Stores 4512 $12,367,348 $12,639,246 -$271,898 -1.1 15General Merchandise Stores 452 $457,225,513 $422,027,225 $35,198,288 4.0 49 Department Stores Excluding Leased Depts. 4521 $329,014,744 $258,732,333 $70,282,411 12.0 19 Other General Merchandise Stores 4529 $128,210,769 $163,294,892 -$35,084,123 -12.0 30Miscellaneous Store Retailers 453 $91,854,549 $76,165,302 $15,689,247 9.3 116 Florists 4531 $6,881,726 $3,003,996 $3,877,730 39.2 20 Office Supplies, Stationery & Gift Stores 4532 $17,109,808 $20,832,602 -$3,722,794 -9.8 26 Used Merchandise Stores 4533 $9,325,108 $4,209,770 $5,115,338 37.8 13 Other Miscellaneous Store Retailers 4539 $58,537,908 $48,118,934 $10,418,974 9.8 57Nonstore Retailers 454 $74,507,135 $61,488,796 $13,018,339 9.6 20 Electronic Shopping & Mail-Order Houses 4541 $57,364,869 $54,690,742 $2,674,127 2.4 10 Vending Machine Operators 4542 $2,016,020 $1,554,436 $461,584 12.9 4 Direct Selling Establishments 4543 $15,126,246 $5,243,618 $9,882,628 48.5 6Food Services & Drinking Places 722 $299,967,529 $265,536,936 $34,430,593 6.1 419 Special Food Services 7223 $7,014,474 $8,441,927 -$1,427,453 -9.2 13 Drinking Places - Alcoholic Beverages 7224 $10,024,382 $6,846,313 $3,178,069 18.8 21 Restaurants/Other Eating Places 7225 $282,928,673 $250,248,697 $32,679,976 6.1 385
Data Note: Supply (retail sales) estimates sales to consumers by establishments. Sales to businesses are excluded. Demand (retail potential) estimates the expected amount spent by consumers at retail establishments. Supply and demand estimates are in current dollars. The Leakage/Surplus Factor presents a snapshot of retail opportunity. This is a measure of the relationship between supply and demand that ranges from +100 (total leakage) to -100 (total surplus). A positive value represents 'leakage' of retail opportunity outside the trade area. A negative value represents a surplus of retail sales, a market where customers are drawn in from outside the trade area. The Retail Gap represents the difference between Retail Potential and Retail Sales. Esri uses the North American Industry Classification System (NAICS) to classify businesses by their primary type of economic activity. Retail establishments are classified into 27 industry groups in the Retail Trade sector, as well as four industry groups within the Food Services & Drinking Establishments subsector. For more information on the Retail MarketPlace data, please click the link below to view the Methodology Statement.http://www.esri.com/library/whitepapers/pdfs/esri-data-retail-marketplace.pdf
Source: Esri and Infogroup. Esri 2019 Updated Demographics. Esri 2017 Retail MarketPlace. Copyright 2019 Esri. Copyright 2017 Infogroup, Inc. All rights reserved.
September 25, 2019
©2019 Esri Page 3 of 6

Retail MarketPlace Profile7353-7399 St Louis Ave Village Of Skokie Only7353-7399 St Louis Ave, Skokie, Illinois, 60076 Latitude: 42.01519Drive Time: 10 minute radius Longitude: -87.71717
2017 Leakage/Surplus Factor by Industry Subsector2017 Leakage/Surplus Factor by Industry Subsector
Food Services & Drinking Places Nonstore Retailers
Miscellaneous Store Retailers General Merchandise Stores
Sporting Goods, Hobby, Book, and Music Stores Clothing and Clothing Accessories Stores
Gasoline Stations Health & Personal Care Stores
Food & Beverage Stores Bldg Materials, Garden Equip. & Supply Stores
Electronics & Appliance Stores Furniture & Home Furnishings Stores
Motor Vehicle & Parts Dealers
Leakage/Surplus Factor35302520151050-5
2017 Leakage/Surplus Factor by Industry Group2017 Leakage/Surplus Factor by Industry Group
Restaurants/Other Eating Places
Drinking Places (Alcoholic Beverages)
Special Food Services
Direct Selling Establishments
Vending Machine Operators
Electronic Shopping and Mail-Order Houses
Other Miscellaneous Store Retailers Used Merchandise Stores
Office Supplies, Stationery, and Gift Stores
Florists
Other General Merchandise Stores
Department Stores (Excluding Leased Depts.)
Book, Periodical, and Music Stores
Jewelry, Luggage, and Leather Goods Stores
Shoe Stores
Clothing Stores
Gasoline Stations
Health & Personal Care Stores
Beer, Wine, and Liquor Stores
Specialty Food Stores
Grocery Stores
Lawn and Garden Equipment and Supplies Stores Building Material and Supplies Dealers
Electronics & Appliance Stores
Home Furnishings Stores
Furniture Stores
Auto Parts, Accessories, and Tire Stores
Other Motor Vehicle Dealers
Automobile Dealers
Leakage/Surplus Factor9080706050403020100-10
Source: Esri and Infogroup. Esri 2019 Updated Demographics. Esri 2017 Retail MarketPlace. Copyright 2019 Esri. Copyright 2017 Infogroup, Inc. All rights reserved.
September 25, 2019
©2019 Esri Page 4 of 6

Retail MarketPlace Profile7353-7399 St Louis Ave Village Of Skokie Only7353-7399 St Louis Ave, Skokie, Illinois, 60076 Latitude: 42.01519Drive Time: 15 minute radius Longitude: -87.71717
Summary Demographics2019 Population 477,8522019 Households 182,4502019 Median Disposable Income $52,0322019 Per Capita Income $37,473
NAICS Demand Supply Retail Gap Leakage/Surplus Number of2017 Industry Summary (Retail Potential) (Retail Sales) Factor Businesses
Total Retail Trade and Food & Drink 44-45,722 $7,746,161,960 $6,081,853,027 $1,664,308,933 12.0 3,541Total Retail Trade 44-45 $6,935,822,767 $5,308,991,033 $1,626,831,734 13.3 2,279Total Food & Drink 722 $810,339,192 $772,861,994 $37,477,198 2.4 1,263
NAICS Demand Supply Retail Gap Leakage/Surplus Number of2017 Industry Group (Retail Potential) (Retail Sales) Factor Businesses
Motor Vehicle & Parts Dealers 441 $1,377,768,591 $634,500,238 $743,268,353 36.9 134 Automobile Dealers 4411 $1,136,818,275 $572,101,325 $564,716,950 33.0 59 Other Motor Vehicle Dealers 4412 $109,981,198 $7,746,876 $102,234,322 86.8 7 Auto Parts, Accessories & Tire Stores 4413 $130,969,118 $54,652,037 $76,317,081 41.1 68Furniture & Home Furnishings Stores 442 $229,393,087 $214,411,242 $14,981,845 3.4 145 Furniture Stores 4421 $134,581,544 $120,317,700 $14,263,844 5.6 69 Home Furnishings Stores 4422 $94,811,543 $94,093,541 $718,002 0.4 76Electronics & Appliance Stores 443 $272,049,961 $203,800,561 $68,249,400 14.3 123Bldg Materials, Garden Equip. & Supply Stores 444 $454,990,888 $395,788,390 $59,202,498 7.0 153 Bldg Material & Supplies Dealers 4441 $411,643,501 $375,328,927 $36,314,574 4.6 142 Lawn & Garden Equip & Supply Stores 4442 $43,347,386 $20,459,463 $22,887,923 35.9 11Food & Beverage Stores 445 $1,174,579,753 $959,383,449 $215,196,304 10.1 359 Grocery Stores 4451 $1,026,654,232 $825,813,365 $200,840,867 10.8 209 Specialty Food Stores 4452 $60,665,843 $59,943,458 $722,385 0.6 86 Beer, Wine & Liquor Stores 4453 $87,259,678 $73,626,627 $13,633,051 8.5 64Health & Personal Care Stores 446,4461 $452,374,806 $441,211,774 $11,163,032 1.2 201Gasoline Stations 447,4471 $702,560,033 $424,747,477 $277,812,556 24.6 103Clothing & Clothing Accessories Stores 448 $410,109,365 $490,703,355 -$80,593,990 -8.9 386 Clothing Stores 4481 $273,795,330 $363,708,829 -$89,913,499 -14.1 262 Shoe Stores 4482 $56,922,795 $53,702,507 $3,220,288 2.9 48 Jewelry, Luggage & Leather Goods Stores 4483 $79,391,240 $73,292,019 $6,099,221 4.0 76Sporting Goods, Hobby, Book & Music Stores 451 $190,265,472 $206,156,506 -$15,891,034 -4.0 174 Sporting Goods/Hobby/Musical Instr Stores 4511 $156,537,779 $159,196,540 -$2,658,761 -0.8 125 Book, Periodical & Music Stores 4512 $33,727,693 $46,959,966 -$13,232,273 -16.4 49General Merchandise Stores 452 $1,229,699,690 $887,932,637 $341,767,053 16.1 123 Department Stores Excluding Leased Depts. 4521 $884,327,679 $566,578,533 $317,749,146 21.9 47 Other General Merchandise Stores 4529 $345,372,010 $321,354,103 $24,017,907 3.6 76Miscellaneous Store Retailers 453 $245,793,968 $215,787,471 $30,006,497 6.5 326 Florists 4531 $17,409,567 $7,737,108 $9,672,459 38.5 46 Office Supplies, Stationery & Gift Stores 4532 $45,757,010 $55,389,711 -$9,632,701 -9.5 77 Used Merchandise Stores 4533 $25,334,667 $16,355,337 $8,979,330 21.5 58 Other Miscellaneous Store Retailers 4539 $157,292,723 $136,305,315 $20,987,408 7.1 145Nonstore Retailers 454 $196,237,156 $234,567,933 -$38,330,777 -8.9 53 Electronic Shopping & Mail-Order Houses 4541 $152,424,278 $218,976,123 -$66,551,845 -17.9 29 Vending Machine Operators 4542 $5,451,029 $3,650,426 $1,800,603 19.8 9 Direct Selling Establishments 4543 $38,361,850 $11,941,385 $26,420,465 52.5 15Food Services & Drinking Places 722 $810,339,192 $772,861,994 $37,477,198 2.4 1,263 Special Food Services 7223 $18,822,266 $51,943,249 -$33,120,983 -46.8 43 Drinking Places - Alcoholic Beverages 7224 $27,333,734 $29,295,355 -$1,961,621 -3.5 86 Restaurants/Other Eating Places 7225 $764,183,192 $691,623,390 $72,559,802 5.0 1,134
Data Note: Supply (retail sales) estimates sales to consumers by establishments. Sales to businesses are excluded. Demand (retail potential) estimates the expected amount spent by consumers at retail establishments. Supply and demand estimates are in current dollars. The Leakage/Surplus Factor presents a snapshot of retail opportunity. This is a measure of the relationship between supply and demand that ranges from +100 (total leakage) to -100 (total surplus). A positive value represents 'leakage' of retail opportunity outside the trade area. A negative value represents a surplus of retail sales, a market where customers are drawn in from outside the trade area. The Retail Gap represents the difference between Retail Potential and Retail Sales. Esri uses the North American Industry Classification System (NAICS) to classify businesses by their primary type of economic activity. Retail establishments are classified into 27 industry groups in the Retail Trade sector, as well as four industry groups within the Food Services & Drinking Establishments subsector. For more information on the Retail MarketPlace data, please click the link below to view the Methodology Statement.http://www.esri.com/library/whitepapers/pdfs/esri-data-retail-marketplace.pdf
Source: Esri and Infogroup. Esri 2019 Updated Demographics. Esri 2017 Retail MarketPlace. Copyright 2019 Esri. Copyright 2017 Infogroup, Inc. All rights reserved.
September 25, 2019
©2019 Esri Page 5 of 6

Retail MarketPlace Profile7353-7399 St Louis Ave Village Of Skokie Only7353-7399 St Louis Ave, Skokie, Illinois, 60076 Latitude: 42.01519Drive Time: 15 minute radius Longitude: -87.71717
2017 Leakage/Surplus Factor by Industry Subsector2017 Leakage/Surplus Factor by Industry Subsector
Food Services & Drinking Places Nonstore Retailers
Miscellaneous Store Retailers General Merchandise Stores
Sporting Goods, Hobby, Book, and Music Stores Clothing and Clothing Accessories Stores
Gasoline Stations Health & Personal Care Stores
Food & Beverage Stores Bldg Materials, Garden Equip. & Supply Stores
Electronics & Appliance Stores Furniture & Home Furnishings Stores
Motor Vehicle & Parts Dealers
Leakage/Surplus Factor35302520151050-5
2017 Leakage/Surplus Factor by Industry Group2017 Leakage/Surplus Factor by Industry Group
Restaurants/Other Eating Places
Drinking Places (Alcoholic Beverages)
Special Food Services
Direct Selling Establishments
Vending Machine Operators
Electronic Shopping and Mail-Order Houses
Other Miscellaneous Store Retailers Used Merchandise Stores
Office Supplies, Stationery, and Gift Stores
Florists
Other General Merchandise Stores
Department Stores (Excluding Leased Depts.)
Book, Periodical, and Music Stores
Jewelry, Luggage, and Leather Goods Stores
Shoe Stores
Clothing Stores
Gasoline Stations
Health & Personal Care Stores
Beer, Wine, and Liquor Stores
Specialty Food Stores
Grocery Stores
Lawn and Garden Equipment and Supplies Stores Building Material and Supplies Dealers
Electronics & Appliance Stores
Home Furnishings Stores
Furniture Stores
Auto Parts, Accessories, and Tire Stores
Other Motor Vehicle Dealers
Automobile Dealers
Leakage/Surplus Factor80706050403020100-10-20-30-40
Source: Esri and Infogroup. Esri 2019 Updated Demographics. Esri 2017 Retail MarketPlace. Copyright 2019 Esri. Copyright 2017 Infogroup, Inc. All rights reserved.
September 25, 2019
©2019 Esri Page 6 of 6

Site Details Map7353-7399 St Louis Ave Site Details Map7353-7399 St Louis Ave, Skokie, Illinois, 60076 Latitude: 42.01519Drive Time: 5, 10, 15 minute radii Longitude: -87.71717
This site is located in:City: Skokie
County: Cook County
State: Illinois
ZIP Code: 60076
Census Tract: 17031807600Census Block Group: 170318076003
CBSA: Chicago-Naperville-Elgin, IL-IN-WI Metropolitan Statistical Area
September 25, 2019
©2019 Esri Page 1 of 1

Sports and Leisure Market Potential7353-7399 St Louis Ave Village Of Skokie Only7353-7399 St Louis Ave, Skokie, Illinois, 60076 Latitude: 42.01519Drive Time: 5 minute radius Longitude: -87.71717
Demographic Summary 2019 2024Population 19,188 19,016Population 18+ 15,070 14,996Households 6,451 6,373Median Household Income $86,110 $97,707
Expected Product/Consumer Behavior Number of Adults/HHs Percent MPI
Participated in aerobics in last 12 months 1,170 7.8% 102Participated in archery in last 12 months 318 2.1% 77Participated in backpacking in last 12 months 471 3.1% 91Participated in baseball in last 12 months 710 4.7% 118Participated in basketball in last 12 months 1,144 7.6% 95Participated in bicycling (mountain) in last 12 months 581 3.9% 92Participated in bicycling (road) in last 12 months 1,526 10.1% 104Participated in boating (power) in last 12 months 532 3.5% 75Participated in bowling in last 12 months 1,184 7.9% 89Participated in canoeing/kayaking in last 12 months 861 5.7% 84Participated in fishing (fresh water) in last 12 months 874 5.8% 50Participated in fishing (salt water) in last 12 months 468 3.1% 79Participated in football in last 12 months 459 3.0% 65Participated in Frisbee in last 12 months 421 2.8% 70Participated in golf in last 12 months 1,151 7.6% 92Participated in hiking in last 12 months 2,132 14.1% 115Participated in horseback riding in last 12 months 248 1.6% 71Participated in hunting with rifle in last 12 months 258 1.7% 40Participated in hunting with shotgun in last 12 months 171 1.1% 34Participated in ice skating in last 12 months 506 3.4% 117Participated in jogging/running in last 12 months 1,982 13.2% 103Participated in motorcycling in last 12 months 320 2.1% 69Participated in Pilates in last 12 months 468 3.1% 125Participated in ping pong in last 12 months 659 4.4% 112Participated in skiing (downhill) in last 12 months 518 3.4% 124Participated in soccer in last 12 months 671 4.5% 111Participated in softball in last 12 months 379 2.5% 89Participated in swimming in last 12 months 2,401 15.9% 98Participated in target shooting in last 12 months 427 2.8% 65Participated in tennis in last 12 months 543 3.6% 104Participated in volleyball in last 12 months 435 2.9% 83Participated in walking for exercise in last 12 months 4,316 28.6% 116Participated in weight lifting in last 12 months 1,573 10.4% 101Participated in yoga in last 12 months 1,600 10.6% 131Participated in Zumba in last 12 months 577 3.8% 117Spent on sports/rec equip in last 12 months: $1-99 783 5.2% 85Spent on sports/rec equip in last 12 months: $100-$249 988 6.6% 107Spent on sports/rec equip in last 12 months: $250+ 1,163 7.7% 96Attend sports events 2,533 16.8% 101Attend sports events: baseball game - MLB reg seas 1,144 7.6% 136Attend sports events: basketball game-NBA reg seas 362 2.4% 142Attend sports events: football game (college) 339 2.2% 64Attend sports events: high school sports 350 2.3% 69
Data Note: An MPI (Market Potential Index) measures the relative likelihood of the adults or households in the specified trade area to exhibit certain consumer behavior or purchasing patterns compared to the U.S. An MPI of 100 represents the U.S. average.Source: These data are based upon national propensities to use various products and services, applied to local demographic composition. Usage data were collected by GfK MRI in a nationally representative survey of U.S. households. Esri forecasts for 2019 and 2024.
September 25, 2019
©2019 Esri Page 1 of 18

Sports and Leisure Market Potential7353-7399 St Louis Ave Village Of Skokie Only7353-7399 St Louis Ave, Skokie, Illinois, 60076 Latitude: 42.01519Drive Time: 5 minute radius Longitude: -87.71717
Expected Product/Consumer Behavior Number of Adults/HHs Percent MPI
Listen to sports on radio 1,807 12.0% 109Watch sports on TV 9,127 60.6% 105Watch on TV: alpine skiing/ski jumping 595 3.9% 110Watch on TV: auto racing (NASCAR) 967 6.4% 69Watch on TV: auto racing (not NASCAR) 491 3.3% 81Watch on TV: baseball (MLB regular season) 3,740 24.8% 127Watch on TV: baseball (MLB playoffs/World Series) 3,396 22.5% 128Watch on TV: basketball (college) 1,843 12.2% 91Watch on TV: basketball (NCAA tournament) 1,823 12.1% 91Watch on TV: basketball (NBA regular season) 2,908 19.3% 130Watch on TV: basketball (NBA playoffs/finals) 3,037 20.2% 122Watch on TV: basketball (WNBA) 485 3.2% 103Watch on TV: bicycle racing 335 2.2% 102Watch on TV: bowling 341 2.3% 117Watch on TV: boxing 790 5.2% 85Watch on TV: bull riding (pro) 237 1.6% 52Watch on TV: Equestrian events 282 1.9% 86Watch on TV: extreme sports (summer) 481 3.2% 92Watch on TV: extreme sports (winter) 540 3.6% 94Watch on TV: figure skating 1,093 7.3% 117Watch on TV: fishing 523 3.5% 76Watch on TV: football (college) 2,755 18.3% 78Watch on TV: football (NFL Sunday/Monday/Thursday night games) 4,699 31.2% 97Watch on TV: football (NFL weekend games) 4,418 29.3% 98Watch on TV: football (NFL playoffs/Super Bowl) 4,775 31.7% 100Watch on TV: golf (PGA) 1,788 11.9% 106Watch on TV: golf (LPGA) 591 3.9% 112Watch on TV: gymnastics 890 5.9% 98Watch on TV: high school sports 603 4.0% 84Watch on TV: horse racing (at track or OTB) 462 3.1% 121Watch on TV: ice hockey (NHL regular season) 1,818 12.1% 149Watch on TV: ice hockey (NHL playoffs/Stanley Cup) 1,610 10.7% 134Watch on TV: mixed martial arts (MMA) 587 3.9% 93Watch on TV: motorcycle racing 270 1.8% 67Watch on TV: Olympics (summer) 3,198 21.2% 125Watch on TV: Olympics (winter) 2,508 16.6% 122Watch on TV: rodeo 249 1.7% 55Watch on TV: soccer (MLS) 734 4.9% 101Watch on TV: soccer (World Cup) 1,412 9.4% 134Watch on TV: tennis (men`s) 1,266 8.4% 142Watch on TV: tennis (women`s) 1,238 8.2% 141Watch on TV: track & field 583 3.9% 89Watch on TV: volleyball (pro beach) 542 3.6% 119Watch on TV: wrestling (WWE) 446 3.0% 65Interest in sports: college basketball Super Fan 622 4.1% 103Interest in sports: college football Super Fan 1,084 7.2% 96Interest in sports: golf Super Fan 322 2.1% 115Interest in sports: high school sports Super Fan 868 5.8% 186Interest in sports: MLB Super Fan 1,383 9.2% 179Interest in sports: NASCAR Super Fan 610 4.0% 149Interest in sports: NBA Super Fan 1,146 7.6% 138Interest in sports: NFL Super Fan 1,940 12.9% 111Interest in sports: NHL Super Fan 803 5.3% 163Interest in sports: soccer Super Fan 675 4.5% 162
Data Note: An MPI (Market Potential Index) measures the relative likelihood of the adults or households in the specified trade area to exhibit certain consumer behavior or purchasing patterns compared to the U.S. An MPI of 100 represents the U.S. average.Source: These data are based upon national propensities to use various products and services, applied to local demographic composition. Usage data were collected by GfK MRI in a nationally representative survey of U.S. households. Esri forecasts for 2019 and 2024.
September 25, 2019
©2019 Esri Page 2 of 18

Sports and Leisure Market Potential7353-7399 St Louis Ave Village Of Skokie Only7353-7399 St Louis Ave, Skokie, Illinois, 60076 Latitude: 42.01519Drive Time: 5 minute radius Longitude: -87.71717
Expected Product/Consumer Behavior Number of Adults/HHs Percent MPI
Member of AARP 2,265 15.0% 124Member of charitable organization 670 4.4% 103Member of church board 320 2.1% 82Member of fraternal order 381 2.5% 113Member of religious club 590 3.9% 115Member of union 821 5.4% 145Member of veterans club 325 2.2% 86Attended adult education course in last 12 months 1,224 8.1% 101Went to art gallery in last 12 months 1,601 10.6% 134Attended auto show in last 12 months 1,124 7.5% 122Did baking in last 12 months 3,562 23.6% 105Barbecued in last 12 months 4,590 30.5% 109Went to bar/night club in last 12 months 2,705 17.9% 104Went to beach in last 12 months 5,601 37.2% 128Played billiards/pool in last 12 months 992 6.6% 99Played bingo in last 12 months 606 4.0% 91Did birdwatching in last 12 months 587 3.9% 87Played board game in last 12 months 2,415 16.0% 102Read book in last 12 months 5,411 35.9% 112Participated in book club in last 12 months 559 3.7% 124Went on overnight camping trip in last 12 months 1,713 11.4% 91Played cards in last 12 months 2,173 14.4% 88Played chess in last 12 months 605 4.0% 113Played computer game (offline w/software)/12 months 1,077 7.1% 98Played computer game (online w/o software)/12 months 1,883 12.5% 106Cooked for fun in last 12 months 3,114 20.7% 105Did crossword puzzle in last 12 months 1,483 9.8% 101Danced/went dancing in last 12 months 1,057 7.0% 97Attended dance performance in last 12 months 718 4.8% 106Dined out in last 12 months 8,658 57.5% 110Participated in fantasy sports league last 12 months 559 3.7% 80Participated in tailgating in last 12 months 569 3.8% 86Did furniture refinishing in last 12 months 579 3.8% 95Gambled at casino in last 12 months 2,379 15.8% 119Gambled in Las Vegas in last 12 months 833 5.5% 156Participate in indoor gardening/plant care 1,505 10.0% 112Attended horse races in last 12 months 488 3.2% 133Participated in karaoke in last 12 months 569 3.8% 99Bought lottery ticket in last 12 months 5,812 38.6% 110Played lottery 6+ times in last 30 days 1,781 11.8% 115Bought lottery ticket in last 12 months: Daily Drawing 444 2.9% 94Bought lottery ticket in last 12 months: Instant Game 2,678 17.8% 98Bought lottery ticket in last 12 months: Mega Millions 3,529 23.4% 145Bought lottery ticket in last 12 months: Powerball 3,599 23.9% 115Attended a movie in last 6 months 9,498 63.0% 108Attended movie in last 90 days: once/week or more 385 2.6% 107Attended movie in last 90 days: 2-3 times a month 929 6.2% 100Attended movie in last 90 days: once a month 1,410 9.4% 98Attended movie in last 90 days: < once a month 5,903 39.2% 111Movie genre seen at theater/6 months: action 4,769 31.6% 109
Data Note: An MPI (Market Potential Index) measures the relative likelihood of the adults or households in the specified trade area to exhibit certain consumer behavior or purchasing patterns compared to the U.S. An MPI of 100 represents the U.S. average.Source: These data are based upon national propensities to use various products and services, applied to local demographic composition. Usage data were collected by GfK MRI in a nationally representative survey of U.S. households. Esri forecasts for 2019 and 2024.
September 25, 2019
©2019 Esri Page 3 of 18

Sports and Leisure Market Potential7353-7399 St Louis Ave Village Of Skokie Only7353-7399 St Louis Ave, Skokie, Illinois, 60076 Latitude: 42.01519Drive Time: 5 minute radius Longitude: -87.71717
Expected Product/Consumer Behavior Number of Adults/HHs Percent MPI
Movie genre seen at theater/6 months: adventure 5,176 34.3% 107Movie genre seen at theater/6 months: comedy 4,140 27.5% 109Movie genre seen at theater/6 months: crime 1,692 11.2% 104Movie genre seen at theater/6 months: drama 4,122 27.4% 116Movie genre seen at theater/6 months: family 1,971 13.1% 109Movie genre seen at theater/6 months: fantasy 2,894 19.2% 113Movie genre seen at theater/6 months: horror 903 6.0% 81Movie genre seen at theater/6 months: romance 1,143 7.6% 124Movie genre seen at theater/6 months: science fiction 2,962 19.7% 111Movie genre seen at theater/6 months: thriller 1,992 13.2% 103Went to museum in last 12 months 2,842 18.9% 137Attended classical music/opera performance/12 months 681 4.5% 116Attended country music performance in last 12 months 755 5.0% 78Attended rock music performance in last 12 months 1,670 11.1% 116Played musical instrument in last 12 months 1,326 8.8% 111Did painting/drawing in last 12 months 1,410 9.4% 119Did photo album/scrapbooking in last 12 months 756 5.0% 113Did photography in last 12 months 1,687 11.2% 114Did Sudoku puzzle in last 12 months 1,112 7.4% 93Went to live theater in last 12 months 2,111 14.0% 127Visited a theme park in last 12 months 3,569 23.7% 125Visited a theme park 5+ times in last 12 months 817 5.4% 137Participated in trivia games in last 12 months 800 5.3% 80Played video/electronic game (console) last 12 months 993 6.6% 74Played video/electronic game (portable) last 12 months 546 3.6% 77Visited an indoor water park in last 12 months 491 3.3% 93Did woodworking in last 12 months 574 3.8% 77Participated in word games in last 12 months 1,599 10.6% 103Went to zoo in last 12 months 1,722 11.4% 93Purchased DVD/Blu-ray disc online in last 12 months 1,092 7.2% 116Rented DVDs in last 30 days: 1 360 2.4% 76Rented DVDs in last 30 days: 2 557 3.7% 118Rented DVDs in last 30 days: 3+ 868 5.8% 74Rented movie/oth video/30 days: action/adventure 2,958 19.6% 95Rented movie/oth video/30 days: classics 1,058 7.0% 116Rented movie/oth video/30 days: comedy 2,732 18.1% 93Rented movie/oth video/30 days: drama 2,015 13.4% 96Rented movie/oth video/30 days: family/children 1,264 8.4% 86Rented movie/oth video/30 days: foreign 546 3.6% 151Rented movie/oth video/30 days: horror 712 4.7% 69Rented movie/oth video/30 days: musical 416 2.8% 96Rented movie/oth video/30 days: news/documentary 643 4.3% 110Rented movie/oth video/30 days: romance 958 6.4% 87Rented movie/oth video/30 days: science fiction 1,122 7.4% 102Rented movie/oth video/30 days: TV show 1,136 7.5% 97Rented movie/oth video/30 days: western 322 2.1% 75
Data Note: An MPI (Market Potential Index) measures the relative likelihood of the adults or households in the specified trade area to exhibit certain consumer behavior or purchasing patterns compared to the U.S. An MPI of 100 represents the U.S. average.Source: These data are based upon national propensities to use various products and services, applied to local demographic composition. Usage data were collected by GfK MRI in a nationally representative survey of U.S. households. Esri forecasts for 2019 and 2024.
September 25, 2019
©2019 Esri Page 4 of 18

Sports and Leisure Market Potential7353-7399 St Louis Ave Village Of Skokie Only7353-7399 St Louis Ave, Skokie, Illinois, 60076 Latitude: 42.01519Drive Time: 5 minute radius Longitude: -87.71717
Expected Product/Consumer Behavior Number of Adults/HHs Percent MPI
Rented/purch DVD/Blu-ray/30 days: from amazon.com 1,427 9.5% 115Rented DVD/Blu-ray/30 days: from netflix.com 2,174 14.4% 111Rented/purch DVD/Blu-ray/30 days: from Redbox 1,841 12.2% 81HH owns ATV/UTV 168 2.6% 43Bought any children`s toy/game in last 12 months 4,805 31.9% 98Spent on toys/games for child last 12 months: <$50 803 5.3% 94Spent on toys/games for child last 12 months: $50-99 290 1.9% 79Spent on toys/games for child last 12 months: $100-199 946 6.3% 109Spent on toys/games for child last 12 months: $200-499 1,167 7.7% 84Spent on toys/games for child last 12 months: $500+ 758 5.0% 105Bought any toys/games online in last 12 months 1,883 12.5% 121Bought infant toy in last 12 months 881 5.8% 92Bought pre-school toy in last 12 months 990 6.6% 93Bought for child last 12 months: boy action figure 974 6.5% 89Bought for child last 12 months: girl action figure 532 3.5% 97Bought for child last 12 months: action game 450 3.0% 99Bought for child last 12 months: bicycle 780 5.2% 89Bought for child last 12 months: board game 1,699 11.3% 95Bought for child last 12 months: builder set 846 5.6% 112Bought for child last 12 months: car 937 6.2% 79Bought for child last 12 months: construction toy 871 5.8% 101Bought for child last 12 months: fashion doll 475 3.2% 74Bought for child last 12 months: large/baby doll 687 4.6% 66Bought for child last 12 months: doll accessories 411 2.7% 69Bought for child last 12 months: doll clothing 466 3.1% 76Bought for child last 12 months: educational toy 1,684 11.2% 97Bought for child last 12 months: electronic doll/animal 340 2.3% 85Bought for child last 12 months: electronic game 917 6.1% 104Bought for child last 12 months: mechanical toy 597 4.0% 93Bought for child last 12 months: model kit/set 468 3.1% 103Bought for child last 12 months: plush doll/animal 1,123 7.5% 89Bought for child last 12 months: sound game 242 1.6% 95Bought for child last 12 months: water toy 1,113 7.4% 82Bought for child last 12 months: word game 404 2.7% 104
Data Note: An MPI (Market Potential Index) measures the relative likelihood of the adults or households in the specified trade area to exhibit certain consumer behavior or purchasing patterns compared to the U.S. An MPI of 100 represents the U.S. average.Source: These data are based upon national propensities to use various products and services, applied to local demographic composition. Usage data were collected by GfK MRI in a nationally representative survey of U.S. households. Esri forecasts for 2019 and 2024.
September 25, 2019
©2019 Esri Page 5 of 18

Sports and Leisure Market Potential7353-7399 St Louis Ave Village Of Skokie Only7353-7399 St Louis Ave, Skokie, Illinois, 60076 Latitude: 42.01519Drive Time: 5 minute radius Longitude: -87.71717
Expected Product/Consumer Behavior Number of Adults/HHs Percent MPI
Bought digital book in last 12 months 2,200 14.6% 113Bought hardcover book in last 12 months 3,478 23.1% 115Bought paperback book in last 12 months 4,698 31.2% 109Bought 1-3 books in last 12 months 3,615 24.0% 120Bought 4-6 books in last 12 months 1,461 9.7% 98Bought 7+ books in last 12 months 2,615 17.4% 116Bought book (fiction) in last 12 months 3,941 26.2% 107Bought book (non-fiction) in last 12 months 3,921 26.0% 118Bought biography in last 12 months 1,142 7.6% 111Bought children`s book in last 12 months 1,645 10.9% 114Bought cookbook in last 12 months 1,045 6.9% 104Bought history book in last 12 months 1,448 9.6% 107Bought mystery book in last 12 months 1,453 9.6% 91Bought novel in last 12 months 2,094 13.9% 104Bought religious book (not bible) in last 12 months 812 5.4% 90Bought romance book in last 12 months 824 5.5% 98Bought science fiction book in last 12 months 888 5.9% 106Bought personal/business self-help book last 12 months 1,184 7.9% 126Bought travel book in last 12 months 432 2.9% 127Bought book online in last 12 months 3,776 25.1% 122Bought book last 12 months: amazon.com 3,955 26.2% 131Bought book last 12 months: barnes&noble.com 461 3.1% 130Bought book last 12 months: Barnes & Noble book store 2,460 16.3% 127Bought book last 12 months: other book store (not B&N) 1,362 9.0% 92Bought book last 12 months: mail order 237 1.6% 85Listened to/purchased audiobook in last 6 months 893 5.9% 99
Data Note: An MPI (Market Potential Index) measures the relative likelihood of the adults or households in the specified trade area to exhibit certain consumer behavior or purchasing patterns compared to the U.S. An MPI of 100 represents the U.S. average.Source: These data are based upon national propensities to use various products and services, applied to local demographic composition. Usage data were collected by GfK MRI in a nationally representative survey of U.S. households. Esri forecasts for 2019 and 2024.
September 25, 2019
©2019 Esri Page 6 of 18

Sports and Leisure Market Potential7353-7399 St Louis Ave Village Of Skokie Only7353-7399 St Louis Ave, Skokie, Illinois, 60076 Latitude: 42.01519Drive Time: 10 minute radius Longitude: -87.71717
Demographic Summary 2019 2024Population 185,523 184,250Population 18+ 143,201 143,869Households 66,502 66,011Median Household Income $72,067 $79,798
Expected Product/Consumer Behavior Number of Adults/HHs Percent MPI
Participated in aerobics in last 12 months 12,488 8.7% 114Participated in archery in last 12 months 3,131 2.2% 80Participated in backpacking in last 12 months 4,897 3.4% 100Participated in baseball in last 12 months 5,801 4.1% 101Participated in basketball in last 12 months 11,353 7.9% 99Participated in bicycling (mountain) in last 12 months 5,927 4.1% 99Participated in bicycling (road) in last 12 months 14,103 9.8% 101Participated in boating (power) in last 12 months 5,034 3.5% 75Participated in bowling in last 12 months 11,629 8.1% 92Participated in canoeing/kayaking in last 12 months 7,929 5.5% 81Participated in fishing (fresh water) in last 12 months 8,383 5.9% 51Participated in fishing (salt water) in last 12 months 5,450 3.8% 97Participated in football in last 12 months 5,693 4.0% 84Participated in Frisbee in last 12 months 4,747 3.3% 83Participated in golf in last 12 months 10,749 7.5% 90Participated in hiking in last 12 months 19,005 13.3% 108Participated in horseback riding in last 12 months 3,111 2.2% 93Participated in hunting with rifle in last 12 months 3,154 2.2% 52Participated in hunting with shotgun in last 12 months 2,662 1.9% 55Participated in ice skating in last 12 months 5,152 3.6% 126Participated in jogging/running in last 12 months 19,658 13.7% 107Participated in motorcycling in last 12 months 3,528 2.5% 80Participated in Pilates in last 12 months 3,892 2.7% 110Participated in ping pong in last 12 months 5,726 4.0% 102Participated in skiing (downhill) in last 12 months 4,251 3.0% 107Participated in soccer in last 12 months 7,320 5.1% 128Participated in softball in last 12 months 3,792 2.6% 94Participated in swimming in last 12 months 22,962 16.0% 98Participated in target shooting in last 12 months 4,306 3.0% 69Participated in tennis in last 12 months 5,832 4.1% 118Participated in volleyball in last 12 months 4,371 3.1% 87Participated in walking for exercise in last 12 months 40,885 28.6% 116Participated in weight lifting in last 12 months 15,498 10.8% 104Participated in yoga in last 12 months 15,231 10.6% 132Participated in Zumba in last 12 months 6,355 4.4% 136Spent on sports/rec equip in last 12 months: $1-99 7,638 5.3% 88Spent on sports/rec equip in last 12 months: $100-$249 8,080 5.6% 92Spent on sports/rec equip in last 12 months: $250+ 9,837 6.9% 85Attend sports events 22,851 16.0% 96Attend sports events: baseball game - MLB reg seas 9,132 6.4% 114Attend sports events: basketball game-NBA reg seas 2,897 2.0% 119Attend sports events: football game (college) 3,655 2.6% 72Attend sports events: high school sports 3,494 2.4% 73
Data Note: An MPI (Market Potential Index) measures the relative likelihood of the adults or households in the specified trade area to exhibit certain consumer behavior or purchasing patterns compared to the U.S. An MPI of 100 represents the U.S. average.Source: These data are based upon national propensities to use various products and services, applied to local demographic composition. Usage data were collected by GfK MRI in a nationally representative survey of U.S. households. Esri forecasts for 2019 and 2024.
September 25, 2019
©2019 Esri Page 7 of 18

Sports and Leisure Market Potential7353-7399 St Louis Ave Village Of Skokie Only7353-7399 St Louis Ave, Skokie, Illinois, 60076 Latitude: 42.01519Drive Time: 10 minute radius Longitude: -87.71717
Expected Product/Consumer Behavior Number of Adults/HHs Percent MPI
Listen to sports on radio 15,808 11.0% 101Watch sports on TV 81,354 56.8% 99Watch on TV: alpine skiing/ski jumping 5,543 3.9% 108Watch on TV: auto racing (NASCAR) 9,786 6.8% 74Watch on TV: auto racing (not NASCAR) 5,129 3.6% 89Watch on TV: baseball (MLB regular season) 32,892 23.0% 117Watch on TV: baseball (MLB playoffs/World Series) 29,777 20.8% 118Watch on TV: basketball (college) 16,634 11.6% 86Watch on TV: basketball (NCAA tournament) 16,320 11.4% 86Watch on TV: basketball (NBA regular season) 25,919 18.1% 122Watch on TV: basketball (NBA playoffs/finals) 25,797 18.0% 109Watch on TV: basketball (WNBA) 4,253 3.0% 95Watch on TV: bicycle racing 3,297 2.3% 106Watch on TV: bowling 2,664 1.9% 96Watch on TV: boxing 10,798 7.5% 122Watch on TV: bull riding (pro) 2,798 2.0% 65Watch on TV: Equestrian events 3,322 2.3% 106Watch on TV: extreme sports (summer) 4,638 3.2% 94Watch on TV: extreme sports (winter) 5,399 3.8% 99Watch on TV: figure skating 9,671 6.8% 109Watch on TV: fishing 5,029 3.5% 77Watch on TV: football (college) 24,421 17.1% 72Watch on TV: football (NFL Sunday/Monday/Thursday night games) 41,364 28.9% 90Watch on TV: football (NFL weekend games) 37,848 26.4% 89Watch on TV: football (NFL playoffs/Super Bowl) 41,335 28.9% 91Watch on TV: golf (PGA) 14,542 10.2% 90Watch on TV: golf (LPGA) 5,046 3.5% 101Watch on TV: gymnastics 8,814 6.2% 102Watch on TV: high school sports 5,440 3.8% 79Watch on TV: horse racing (at track or OTB) 4,365 3.0% 120Watch on TV: ice hockey (NHL regular season) 13,917 9.7% 120Watch on TV: ice hockey (NHL playoffs/Stanley Cup) 12,294 8.6% 107Watch on TV: mixed martial arts (MMA) 5,980 4.2% 100Watch on TV: motorcycle racing 3,040 2.1% 79Watch on TV: Olympics (summer) 26,047 18.2% 107Watch on TV: Olympics (winter) 21,194 14.8% 108Watch on TV: rodeo 2,776 1.9% 64Watch on TV: soccer (MLS) 7,872 5.5% 114Watch on TV: soccer (World Cup) 14,375 10.0% 143Watch on TV: tennis (men`s) 11,569 8.1% 137Watch on TV: tennis (women`s) 11,422 8.0% 137Watch on TV: track & field 5,839 4.1% 94Watch on TV: volleyball (pro beach) 4,774 3.3% 110Watch on TV: wrestling (WWE) 5,410 3.8% 82Interest in sports: college basketball Super Fan 6,323 4.4% 110Interest in sports: college football Super Fan 9,984 7.0% 93Interest in sports: golf Super Fan 2,923 2.0% 110Interest in sports: high school sports Super Fan 7,965 5.6% 180Interest in sports: MLB Super Fan 13,158 9.2% 179Interest in sports: NASCAR Super Fan 5,723 4.0% 147Interest in sports: NBA Super Fan 11,220 7.8% 142Interest in sports: NFL Super Fan 16,472 11.5% 99Interest in sports: NHL Super Fan 7,970 5.6% 171Interest in sports: soccer Super Fan 6,471 4.5% 164
Data Note: An MPI (Market Potential Index) measures the relative likelihood of the adults or households in the specified trade area to exhibit certain consumer behavior or purchasing patterns compared to the U.S. An MPI of 100 represents the U.S. average.Source: These data are based upon national propensities to use various products and services, applied to local demographic composition. Usage data were collected by GfK MRI in a nationally representative survey of U.S. households. Esri forecasts for 2019 and 2024.
September 25, 2019
©2019 Esri Page 8 of 18

Sports and Leisure Market Potential7353-7399 St Louis Ave Village Of Skokie Only7353-7399 St Louis Ave, Skokie, Illinois, 60076 Latitude: 42.01519Drive Time: 10 minute radius Longitude: -87.71717
Expected Product/Consumer Behavior Number of Adults/HHs Percent MPI
Member of AARP 18,512 12.9% 107Member of charitable organization 6,402 4.5% 103Member of church board 3,398 2.4% 91Member of fraternal order 3,200 2.2% 100Member of religious club 5,033 3.5% 103Member of union 6,270 4.4% 117Member of veterans club 2,610 1.8% 73Attended adult education course in last 12 months 13,318 9.3% 116Went to art gallery in last 12 months 15,973 11.2% 141Attended auto show in last 12 months 9,248 6.5% 106Did baking in last 12 months 32,692 22.8% 101Barbecued in last 12 months 38,641 27.0% 97Went to bar/night club in last 12 months 25,957 18.1% 105Went to beach in last 12 months 50,834 35.5% 122Played billiards/pool in last 12 months 10,492 7.3% 110Played bingo in last 12 months 6,600 4.6% 104Did birdwatching in last 12 months 5,983 4.2% 93Played board game in last 12 months 22,219 15.5% 99Read book in last 12 months 49,115 34.3% 107Participated in book club in last 12 months 6,234 4.4% 145Went on overnight camping trip in last 12 months 15,307 10.7% 86Played cards in last 12 months 21,471 15.0% 92Played chess in last 12 months 5,971 4.2% 117Played computer game (offline w/software)/12 months 10,575 7.4% 102Played computer game (online w/o software)/12 months 17,773 12.4% 106Cooked for fun in last 12 months 28,546 19.9% 101Did crossword puzzle in last 12 months 13,253 9.3% 95Danced/went dancing in last 12 months 12,399 8.7% 120Attended dance performance in last 12 months 8,323 5.8% 130Dined out in last 12 months 76,637 53.5% 103Participated in fantasy sports league last 12 months 6,381 4.5% 96Participated in tailgating in last 12 months 5,581 3.9% 88Did furniture refinishing in last 12 months 5,523 3.9% 95Gambled at casino in last 12 months 23,137 16.2% 122Gambled in Las Vegas in last 12 months 7,272 5.1% 143Participate in indoor gardening/plant care 13,962 9.7% 109Attended horse races in last 12 months 4,108 2.9% 118Participated in karaoke in last 12 months 6,391 4.5% 117Bought lottery ticket in last 12 months 54,282 37.9% 108Played lottery 6+ times in last 30 days 17,501 12.2% 119Bought lottery ticket in last 12 months: Daily Drawing 5,186 3.6% 116Bought lottery ticket in last 12 months: Instant Game 27,044 18.9% 105Bought lottery ticket in last 12 months: Mega Millions 32,375 22.6% 140Bought lottery ticket in last 12 months: Powerball 33,413 23.3% 112Attended a movie in last 6 months 86,480 60.4% 103Attended movie in last 90 days: once/week or more 4,174 2.9% 122Attended movie in last 90 days: 2-3 times a month 9,173 6.4% 104Attended movie in last 90 days: once a month 14,533 10.1% 107Attended movie in last 90 days: < once a month 50,773 35.5% 101Movie genre seen at theater/6 months: action 43,342 30.3% 105
Data Note: An MPI (Market Potential Index) measures the relative likelihood of the adults or households in the specified trade area to exhibit certain consumer behavior or purchasing patterns compared to the U.S. An MPI of 100 represents the U.S. average.Source: These data are based upon national propensities to use various products and services, applied to local demographic composition. Usage data were collected by GfK MRI in a nationally representative survey of U.S. households. Esri forecasts for 2019 and 2024.
September 25, 2019
©2019 Esri Page 9 of 18

Sports and Leisure Market Potential7353-7399 St Louis Ave Village Of Skokie Only7353-7399 St Louis Ave, Skokie, Illinois, 60076 Latitude: 42.01519Drive Time: 10 minute radius Longitude: -87.71717
Expected Product/Consumer Behavior Number of Adults/HHs Percent MPI
Movie genre seen at theater/6 months: adventure 47,650 33.3% 103Movie genre seen at theater/6 months: comedy 37,669 26.3% 105Movie genre seen at theater/6 months: crime 17,077 11.9% 111Movie genre seen at theater/6 months: drama 38,094 26.6% 113Movie genre seen at theater/6 months: family 17,262 12.1% 100Movie genre seen at theater/6 months: fantasy 26,144 18.3% 107Movie genre seen at theater/6 months: horror 10,648 7.4% 100Movie genre seen at theater/6 months: romance 11,012 7.7% 126Movie genre seen at theater/6 months: science fiction 28,379 19.8% 112Movie genre seen at theater/6 months: thriller 19,971 13.9% 108Went to museum in last 12 months 26,182 18.3% 133Attended classical music/opera performance/12 months 7,379 5.2% 132Attended country music performance in last 12 months 7,234 5.1% 79Attended rock music performance in last 12 months 13,923 9.7% 102Played musical instrument in last 12 months 11,748 8.2% 104Did painting/drawing in last 12 months 13,495 9.4% 120Did photo album/scrapbooking in last 12 months 7,007 4.9% 110Did photography in last 12 months 15,111 10.6% 108Did Sudoku puzzle in last 12 months 11,616 8.1% 102Went to live theater in last 12 months 19,238 13.4% 122Visited a theme park in last 12 months 32,040 22.4% 118Visited a theme park 5+ times in last 12 months 6,457 4.5% 114Participated in trivia games in last 12 months 9,067 6.3% 96Played video/electronic game (console) last 12 months 10,642 7.4% 84Played video/electronic game (portable) last 12 months 6,677 4.7% 100Visited an indoor water park in last 12 months 5,299 3.7% 106Did woodworking in last 12 months 5,854 4.1% 82Participated in word games in last 12 months 15,926 11.1% 108Went to zoo in last 12 months 16,133 11.3% 91Purchased DVD/Blu-ray disc online in last 12 months 8,939 6.2% 100Rented DVDs in last 30 days: 1 4,255 3.0% 95Rented DVDs in last 30 days: 2 4,525 3.2% 101Rented DVDs in last 30 days: 3+ 7,406 5.2% 66Rented movie/oth video/30 days: action/adventure 27,123 18.9% 92Rented movie/oth video/30 days: classics 9,461 6.6% 109Rented movie/oth video/30 days: comedy 26,148 18.3% 94Rented movie/oth video/30 days: drama 20,931 14.6% 105Rented movie/oth video/30 days: family/children 12,703 8.9% 91Rented movie/oth video/30 days: foreign 5,161 3.6% 150Rented movie/oth video/30 days: horror 7,776 5.4% 79Rented movie/oth video/30 days: musical 4,152 2.9% 101Rented movie/oth video/30 days: news/documentary 6,265 4.4% 113Rented movie/oth video/30 days: romance 9,997 7.0% 96Rented movie/oth video/30 days: science fiction 9,950 6.9% 95Rented movie/oth video/30 days: TV show 10,888 7.6% 97Rented movie/oth video/30 days: western 3,532 2.5% 86
Data Note: An MPI (Market Potential Index) measures the relative likelihood of the adults or households in the specified trade area to exhibit certain consumer behavior or purchasing patterns compared to the U.S. An MPI of 100 represents the U.S. average.Source: These data are based upon national propensities to use various products and services, applied to local demographic composition. Usage data were collected by GfK MRI in a nationally representative survey of U.S. households. Esri forecasts for 2019 and 2024.
September 25, 2019
©2019 Esri Page 10 of 18

Sports and Leisure Market Potential7353-7399 St Louis Ave Village Of Skokie Only7353-7399 St Louis Ave, Skokie, Illinois, 60076 Latitude: 42.01519Drive Time: 10 minute radius Longitude: -87.71717
Expected Product/Consumer Behavior Number of Adults/HHs Percent MPI
Rented/purch DVD/Blu-ray/30 days: from amazon.com 13,273 9.3% 113Rented DVD/Blu-ray/30 days: from netflix.com 19,299 13.5% 104Rented/purch DVD/Blu-ray/30 days: from Redbox 15,705 11.0% 72HH owns ATV/UTV 1,760 2.6% 43Bought any children`s toy/game in last 12 months 44,174 30.8% 95Spent on toys/games for child last 12 months: <$50 7,040 4.9% 87Spent on toys/games for child last 12 months: $50-99 2,802 2.0% 80Spent on toys/games for child last 12 months: $100-199 8,186 5.7% 99Spent on toys/games for child last 12 months: $200-499 11,963 8.4% 91Spent on toys/games for child last 12 months: $500+ 6,480 4.5% 95Bought any toys/games online in last 12 months 17,087 11.9% 115Bought infant toy in last 12 months 8,142 5.7% 90Bought pre-school toy in last 12 months 9,334 6.5% 92Bought for child last 12 months: boy action figure 9,290 6.5% 90Bought for child last 12 months: girl action figure 5,101 3.6% 98Bought for child last 12 months: action game 3,857 2.7% 89Bought for child last 12 months: bicycle 6,814 4.8% 82Bought for child last 12 months: board game 15,213 10.6% 89Bought for child last 12 months: builder set 6,832 4.8% 95Bought for child last 12 months: car 8,751 6.1% 78Bought for child last 12 months: construction toy 7,295 5.1% 89Bought for child last 12 months: fashion doll 4,954 3.5% 82Bought for child last 12 months: large/baby doll 7,642 5.3% 78Bought for child last 12 months: doll accessories 4,290 3.0% 75Bought for child last 12 months: doll clothing 4,392 3.1% 75Bought for child last 12 months: educational toy 14,084 9.8% 85Bought for child last 12 months: electronic doll/animal 3,341 2.3% 88Bought for child last 12 months: electronic game 7,851 5.5% 94Bought for child last 12 months: mechanical toy 5,508 3.8% 91Bought for child last 12 months: model kit/set 4,351 3.0% 101Bought for child last 12 months: plush doll/animal 10,325 7.2% 86Bought for child last 12 months: sound game 2,390 1.7% 98Bought for child last 12 months: water toy 10,043 7.0% 77Bought for child last 12 months: word game 3,202 2.2% 87
Data Note: An MPI (Market Potential Index) measures the relative likelihood of the adults or households in the specified trade area to exhibit certain consumer behavior or purchasing patterns compared to the U.S. An MPI of 100 represents the U.S. average.Source: These data are based upon national propensities to use various products and services, applied to local demographic composition. Usage data were collected by GfK MRI in a nationally representative survey of U.S. households. Esri forecasts for 2019 and 2024.
September 25, 2019
©2019 Esri Page 11 of 18

Sports and Leisure Market Potential7353-7399 St Louis Ave Village Of Skokie Only7353-7399 St Louis Ave, Skokie, Illinois, 60076 Latitude: 42.01519Drive Time: 10 minute radius Longitude: -87.71717
Expected Product/Consumer Behavior Number of Adults/HHs Percent MPI
Bought digital book in last 12 months 20,955 14.6% 113Bought hardcover book in last 12 months 31,677 22.1% 111Bought paperback book in last 12 months 44,262 30.9% 108Bought 1-3 books in last 12 months 33,501 23.4% 117Bought 4-6 books in last 12 months 14,117 9.9% 99Bought 7+ books in last 12 months 24,005 16.8% 112Bought book (fiction) in last 12 months 36,704 25.6% 105Bought book (non-fiction) in last 12 months 37,014 25.8% 117Bought biography in last 12 months 12,281 8.6% 125Bought children`s book in last 12 months 15,518 10.8% 113Bought cookbook in last 12 months 10,302 7.2% 108Bought history book in last 12 months 14,035 9.8% 109Bought mystery book in last 12 months 13,774 9.6% 91Bought novel in last 12 months 22,438 15.7% 118Bought religious book (not bible) in last 12 months 6,827 4.8% 79Bought romance book in last 12 months 7,579 5.3% 95Bought science fiction book in last 12 months 8,696 6.1% 109Bought personal/business self-help book last 12 months 11,510 8.0% 129Bought travel book in last 12 months 4,986 3.5% 155Bought book online in last 12 months 36,215 25.3% 123Bought book last 12 months: amazon.com 35,191 24.6% 122Bought book last 12 months: barnes&noble.com 4,586 3.2% 136Bought book last 12 months: Barnes & Noble book store 23,393 16.3% 127Bought book last 12 months: other book store (not B&N) 13,683 9.6% 97Bought book last 12 months: mail order 2,350 1.6% 89Listened to/purchased audiobook in last 6 months 8,538 6.0% 99
Data Note: An MPI (Market Potential Index) measures the relative likelihood of the adults or households in the specified trade area to exhibit certain consumer behavior or purchasing patterns compared to the U.S. An MPI of 100 represents the U.S. average.Source: These data are based upon national propensities to use various products and services, applied to local demographic composition. Usage data were collected by GfK MRI in a nationally representative survey of U.S. households. Esri forecasts for 2019 and 2024.
September 25, 2019
©2019 Esri Page 12 of 18

Sports and Leisure Market Potential7353-7399 St Louis Ave Village Of Skokie Only7353-7399 St Louis Ave, Skokie, Illinois, 60076 Latitude: 42.01519Drive Time: 15 minute radius Longitude: -87.71717
Demographic Summary 2019 2024Population 477,852 475,755Population 18+ 376,865 380,324Households 182,450 181,752Median Household Income $66,187 $74,914
Expected Product/Consumer Behavior Number of Adults/HHs Percent MPI
Participated in aerobics in last 12 months 33,346 8.8% 116Participated in archery in last 12 months 7,986 2.1% 78Participated in backpacking in last 12 months 13,101 3.5% 102Participated in baseball in last 12 months 14,964 4.0% 99Participated in basketball in last 12 months 33,126 8.8% 110Participated in bicycling (mountain) in last 12 months 16,678 4.4% 106Participated in bicycling (road) in last 12 months 38,663 10.3% 106Participated in boating (power) in last 12 months 12,657 3.4% 71Participated in bowling in last 12 months 32,562 8.6% 98Participated in canoeing/kayaking in last 12 months 22,265 5.9% 87Participated in fishing (fresh water) in last 12 months 22,987 6.1% 53Participated in fishing (salt water) in last 12 months 14,306 3.8% 97Participated in football in last 12 months 16,930 4.5% 95Participated in Frisbee in last 12 months 14,132 3.7% 94Participated in golf in last 12 months 28,348 7.5% 91Participated in hiking in last 12 months 50,979 13.5% 110Participated in horseback riding in last 12 months 8,029 2.1% 91Participated in hunting with rifle in last 12 months 8,029 2.1% 50Participated in hunting with shotgun in last 12 months 7,438 2.0% 59Participated in ice skating in last 12 months 13,422 3.6% 124Participated in jogging/running in last 12 months 54,526 14.5% 113Participated in motorcycling in last 12 months 8,992 2.4% 78Participated in Pilates in last 12 months 10,874 2.9% 117Participated in ping pong in last 12 months 16,143 4.3% 109Participated in skiing (downhill) in last 12 months 11,888 3.2% 114Participated in soccer in last 12 months 20,635 5.5% 137Participated in softball in last 12 months 10,996 2.9% 103Participated in swimming in last 12 months 59,367 15.8% 97Participated in target shooting in last 12 months 11,636 3.1% 71Participated in tennis in last 12 months 15,762 4.2% 121Participated in volleyball in last 12 months 12,901 3.4% 98Participated in walking for exercise in last 12 months 101,699 27.0% 110Participated in weight lifting in last 12 months 41,642 11.0% 106Participated in yoga in last 12 months 39,711 10.5% 130Participated in Zumba in last 12 months 16,355 4.3% 133Spent on sports/rec equip in last 12 months: $1-99 20,939 5.6% 91Spent on sports/rec equip in last 12 months: $100-$249 21,683 5.8% 94Spent on sports/rec equip in last 12 months: $250+ 24,762 6.6% 81Attend sports events 62,219 16.5% 99Attend sports events: baseball game - MLB reg seas 24,804 6.6% 118Attend sports events: basketball game-NBA reg seas 8,252 2.2% 129Attend sports events: football game (college) 10,831 2.9% 81Attend sports events: high school sports 8,944 2.4% 71
Data Note: An MPI (Market Potential Index) measures the relative likelihood of the adults or households in the specified trade area to exhibit certain consumer behavior or purchasing patterns compared to the U.S. An MPI of 100 represents the U.S. average.Source: These data are based upon national propensities to use various products and services, applied to local demographic composition. Usage data were collected by GfK MRI in a nationally representative survey of U.S. households. Esri forecasts for 2019 and 2024.
September 25, 2019
©2019 Esri Page 13 of 18

Sports and Leisure Market Potential7353-7399 St Louis Ave Village Of Skokie Only7353-7399 St Louis Ave, Skokie, Illinois, 60076 Latitude: 42.01519Drive Time: 15 minute radius Longitude: -87.71717
Expected Product/Consumer Behavior Number of Adults/HHs Percent MPI
Listen to sports on radio 40,398 10.7% 98Watch sports on TV 209,057 55.5% 96Watch on TV: alpine skiing/ski jumping 13,722 3.6% 102Watch on TV: auto racing (NASCAR) 23,540 6.2% 67Watch on TV: auto racing (not NASCAR) 12,915 3.4% 86Watch on TV: baseball (MLB regular season) 80,857 21.5% 110Watch on TV: baseball (MLB playoffs/World Series) 74,362 19.7% 112Watch on TV: basketball (college) 42,974 11.4% 85Watch on TV: basketball (NCAA tournament) 42,083 11.2% 84Watch on TV: basketball (NBA regular season) 67,374 17.9% 120Watch on TV: basketball (NBA playoffs/finals) 69,001 18.3% 111Watch on TV: basketball (WNBA) 10,989 2.9% 93Watch on TV: bicycle racing 9,838 2.6% 120Watch on TV: bowling 6,676 1.8% 92Watch on TV: boxing 27,514 7.3% 118Watch on TV: bull riding (pro) 8,542 2.3% 75Watch on TV: Equestrian events 8,532 2.3% 104Watch on TV: extreme sports (summer) 12,297 3.3% 94Watch on TV: extreme sports (winter) 13,662 3.6% 95Watch on TV: figure skating 22,547 6.0% 97Watch on TV: fishing 12,731 3.4% 74Watch on TV: football (college) 64,141 17.0% 72Watch on TV: football (NFL Sunday/Monday/Thursday night games) 105,430 28.0% 87Watch on TV: football (NFL weekend games) 97,698 25.9% 87Watch on TV: football (NFL playoffs/Super Bowl) 106,583 28.3% 89Watch on TV: golf (PGA) 36,557 9.7% 86Watch on TV: golf (LPGA) 12,725 3.4% 97Watch on TV: gymnastics 22,458 6.0% 99Watch on TV: high school sports 13,218 3.5% 73Watch on TV: horse racing (at track or OTB) 11,009 2.9% 115Watch on TV: ice hockey (NHL regular season) 34,709 9.2% 114Watch on TV: ice hockey (NHL playoffs/Stanley Cup) 32,043 8.5% 106Watch on TV: mixed martial arts (MMA) 15,869 4.2% 101Watch on TV: motorcycle racing 8,890 2.4% 88Watch on TV: Olympics (summer) 64,807 17.2% 101Watch on TV: Olympics (winter) 52,862 14.0% 103Watch on TV: rodeo 7,804 2.1% 69Watch on TV: soccer (MLS) 21,822 5.8% 120Watch on TV: soccer (World Cup) 36,072 9.6% 137Watch on TV: tennis (men`s) 29,558 7.8% 133Watch on TV: tennis (women`s) 28,359 7.5% 129Watch on TV: track & field 15,203 4.0% 93Watch on TV: volleyball (pro beach) 12,481 3.3% 109Watch on TV: wrestling (WWE) 15,235 4.0% 88Interest in sports: college basketball Super Fan 16,149 4.3% 107Interest in sports: college football Super Fan 25,456 6.8% 90Interest in sports: golf Super Fan 8,224 2.2% 117Interest in sports: high school sports Super Fan 18,139 4.8% 155Interest in sports: MLB Super Fan 31,473 8.4% 163Interest in sports: NASCAR Super Fan 12,839 3.4% 126Interest in sports: NBA Super Fan 28,055 7.4% 135Interest in sports: NFL Super Fan 40,005 10.6% 92Interest in sports: NHL Super Fan 21,727 5.8% 177Interest in sports: soccer Super Fan 16,409 4.4% 158
Data Note: An MPI (Market Potential Index) measures the relative likelihood of the adults or households in the specified trade area to exhibit certain consumer behavior or purchasing patterns compared to the U.S. An MPI of 100 represents the U.S. average.Source: These data are based upon national propensities to use various products and services, applied to local demographic composition. Usage data were collected by GfK MRI in a nationally representative survey of U.S. households. Esri forecasts for 2019 and 2024.
September 25, 2019
©2019 Esri Page 14 of 18

Sports and Leisure Market Potential7353-7399 St Louis Ave Village Of Skokie Only7353-7399 St Louis Ave, Skokie, Illinois, 60076 Latitude: 42.01519Drive Time: 15 minute radius Longitude: -87.71717
Expected Product/Consumer Behavior Number of Adults/HHs Percent MPI
Member of AARP 43,497 11.5% 96Member of charitable organization 16,394 4.4% 100Member of church board 8,395 2.2% 86Member of fraternal order 8,192 2.2% 97Member of religious club 12,251 3.3% 95Member of union 15,032 4.0% 106Member of veterans club 6,225 1.7% 66Attended adult education course in last 12 months 35,807 9.5% 118Went to art gallery in last 12 months 44,196 11.7% 148Attended auto show in last 12 months 22,995 6.1% 100Did baking in last 12 months 83,916 22.3% 99Barbecued in last 12 months 99,782 26.5% 95Went to bar/night club in last 12 months 72,099 19.1% 111Went to beach in last 12 months 132,991 35.3% 122Played billiards/pool in last 12 months 29,430 7.8% 118Played bingo in last 12 months 17,758 4.7% 106Did birdwatching in last 12 months 15,771 4.2% 93Played board game in last 12 months 59,847 15.9% 101Read book in last 12 months 127,117 33.7% 105Participated in book club in last 12 months 15,036 4.0% 133Went on overnight camping trip in last 12 months 41,639 11.0% 89Played cards in last 12 months 58,445 15.5% 95Played chess in last 12 months 15,415 4.1% 115Played computer game (offline w/software)/12 months 26,991 7.2% 98Played computer game (online w/o software)/12 months 45,344 12.0% 102Cooked for fun in last 12 months 77,853 20.7% 105Did crossword puzzle in last 12 months 34,227 9.1% 94Danced/went dancing in last 12 months 33,811 9.0% 125Attended dance performance in last 12 months 20,957 5.6% 124Dined out in last 12 months 199,940 53.1% 102Participated in fantasy sports league last 12 months 17,704 4.7% 101Participated in tailgating in last 12 months 14,660 3.9% 88Did furniture refinishing in last 12 months 13,934 3.7% 91Gambled at casino in last 12 months 57,673 15.3% 116Gambled in Las Vegas in last 12 months 19,749 5.2% 148Participate in indoor gardening/plant care 35,078 9.3% 104Attended horse races in last 12 months 10,765 2.9% 118Participated in karaoke in last 12 months 17,807 4.7% 124Bought lottery ticket in last 12 months 133,195 35.3% 101Played lottery 6+ times in last 30 days 40,798 10.8% 105Bought lottery ticket in last 12 months: Daily Drawing 12,506 3.3% 106Bought lottery ticket in last 12 months: Instant Game 65,146 17.3% 96Bought lottery ticket in last 12 months: Mega Millions 76,268 20.2% 125Bought lottery ticket in last 12 months: Powerball 80,887 21.5% 103Attended a movie in last 6 months 233,223 61.9% 106Attended movie in last 90 days: once/week or more 12,105 3.2% 134Attended movie in last 90 days: 2-3 times a month 26,759 7.1% 116Attended movie in last 90 days: once a month 39,336 10.4% 110Attended movie in last 90 days: < once a month 134,107 35.6% 101Movie genre seen at theater/6 months: action 118,151 31.4% 108
Data Note: An MPI (Market Potential Index) measures the relative likelihood of the adults or households in the specified trade area to exhibit certain consumer behavior or purchasing patterns compared to the U.S. An MPI of 100 represents the U.S. average.Source: These data are based upon national propensities to use various products and services, applied to local demographic composition. Usage data were collected by GfK MRI in a nationally representative survey of U.S. households. Esri forecasts for 2019 and 2024.
September 25, 2019
©2019 Esri Page 15 of 18

Sports and Leisure Market Potential7353-7399 St Louis Ave Village Of Skokie Only7353-7399 St Louis Ave, Skokie, Illinois, 60076 Latitude: 42.01519Drive Time: 15 minute radius Longitude: -87.71717
Expected Product/Consumer Behavior Number of Adults/HHs Percent MPI
Movie genre seen at theater/6 months: adventure 129,163 34.3% 107Movie genre seen at theater/6 months: comedy 103,498 27.5% 109Movie genre seen at theater/6 months: crime 48,347 12.8% 119Movie genre seen at theater/6 months: drama 102,224 27.1% 115Movie genre seen at theater/6 months: family 46,849 12.4% 103Movie genre seen at theater/6 months: fantasy 71,253 18.9% 111Movie genre seen at theater/6 months: horror 32,976 8.8% 118Movie genre seen at theater/6 months: romance 30,148 8.0% 131Movie genre seen at theater/6 months: science fiction 77,467 20.6% 116Movie genre seen at theater/6 months: thriller 55,092 14.6% 114Went to museum in last 12 months 70,304 18.7% 136Attended classical music/opera performance/12 months 19,229 5.1% 131Attended country music performance in last 12 months 18,909 5.0% 79Attended rock music performance in last 12 months 38,640 10.3% 107Played musical instrument in last 12 months 31,390 8.3% 105Did painting/drawing in last 12 months 36,994 9.8% 125Did photo album/scrapbooking in last 12 months 17,973 4.8% 108Did photography in last 12 months 40,207 10.7% 109Did Sudoku puzzle in last 12 months 30,694 8.1% 103Went to live theater in last 12 months 50,856 13.5% 122Visited a theme park in last 12 months 85,300 22.6% 120Visited a theme park 5+ times in last 12 months 16,009 4.2% 107Participated in trivia games in last 12 months 24,606 6.5% 99Played video/electronic game (console) last 12 months 31,106 8.3% 93Played video/electronic game (portable) last 12 months 17,676 4.7% 100Visited an indoor water park in last 12 months 13,990 3.7% 106Did woodworking in last 12 months 14,034 3.7% 75Participated in word games in last 12 months 40,749 10.8% 105Went to zoo in last 12 months 42,713 11.3% 92Purchased DVD/Blu-ray disc online in last 12 months 24,015 6.4% 102Rented DVDs in last 30 days: 1 11,559 3.1% 98Rented DVDs in last 30 days: 2 11,518 3.1% 98Rented DVDs in last 30 days: 3+ 21,433 5.7% 73Rented movie/oth video/30 days: action/adventure 73,934 19.6% 95Rented movie/oth video/30 days: classics 27,135 7.2% 119Rented movie/oth video/30 days: comedy 74,157 19.7% 101Rented movie/oth video/30 days: drama 56,627 15.0% 108Rented movie/oth video/30 days: family/children 33,483 8.9% 91Rented movie/oth video/30 days: foreign 14,846 3.9% 164Rented movie/oth video/30 days: horror 25,032 6.6% 97Rented movie/oth video/30 days: musical 11,675 3.1% 108Rented movie/oth video/30 days: news/documentary 18,472 4.9% 127Rented movie/oth video/30 days: romance 27,252 7.2% 99Rented movie/oth video/30 days: science fiction 27,617 7.3% 100Rented movie/oth video/30 days: TV show 31,474 8.4% 107Rented movie/oth video/30 days: western 10,101 2.7% 94
Data Note: An MPI (Market Potential Index) measures the relative likelihood of the adults or households in the specified trade area to exhibit certain consumer behavior or purchasing patterns compared to the U.S. An MPI of 100 represents the U.S. average.Source: These data are based upon national propensities to use various products and services, applied to local demographic composition. Usage data were collected by GfK MRI in a nationally representative survey of U.S. households. Esri forecasts for 2019 and 2024.
September 25, 2019
©2019 Esri Page 16 of 18

Sports and Leisure Market Potential7353-7399 St Louis Ave Village Of Skokie Only7353-7399 St Louis Ave, Skokie, Illinois, 60076 Latitude: 42.01519Drive Time: 15 minute radius Longitude: -87.71717
Expected Product/Consumer Behavior Number of Adults/HHs Percent MPI
Rented/purch DVD/Blu-ray/30 days: from amazon.com 35,289 9.4% 114Rented DVD/Blu-ray/30 days: from netflix.com 52,313 13.9% 107Rented/purch DVD/Blu-ray/30 days: from Redbox 41,853 11.1% 73HH owns ATV/UTV 4,380 2.4% 39Bought any children`s toy/game in last 12 months 113,995 30.2% 93Spent on toys/games for child last 12 months: <$50 18,703 5.0% 88Spent on toys/games for child last 12 months: $50-99 8,158 2.2% 89Spent on toys/games for child last 12 months: $100-199 20,414 5.4% 94Spent on toys/games for child last 12 months: $200-499 30,736 8.2% 89Spent on toys/games for child last 12 months: $500+ 16,065 4.3% 89Bought any toys/games online in last 12 months 43,351 11.5% 111Bought infant toy in last 12 months 20,564 5.5% 86Bought pre-school toy in last 12 months 23,405 6.2% 88Bought for child last 12 months: boy action figure 23,807 6.3% 87Bought for child last 12 months: girl action figure 13,161 3.5% 96Bought for child last 12 months: action game 9,824 2.6% 86Bought for child last 12 months: bicycle 18,109 4.8% 83Bought for child last 12 months: board game 39,590 10.5% 88Bought for child last 12 months: builder set 16,516 4.4% 87Bought for child last 12 months: car 24,590 6.5% 83Bought for child last 12 months: construction toy 18,156 4.8% 85Bought for child last 12 months: fashion doll 12,157 3.2% 76Bought for child last 12 months: large/baby doll 20,818 5.5% 80Bought for child last 12 months: doll accessories 11,013 2.9% 73Bought for child last 12 months: doll clothing 11,606 3.1% 76Bought for child last 12 months: educational toy 36,346 9.6% 84Bought for child last 12 months: electronic doll/animal 8,358 2.2% 83Bought for child last 12 months: electronic game 19,964 5.3% 91Bought for child last 12 months: mechanical toy 14,342 3.8% 90Bought for child last 12 months: model kit/set 10,787 2.9% 95Bought for child last 12 months: plush doll/animal 26,278 7.0% 83Bought for child last 12 months: sound game 5,834 1.5% 91Bought for child last 12 months: water toy 26,968 7.2% 79Bought for child last 12 months: word game 8,631 2.3% 89
Data Note: An MPI (Market Potential Index) measures the relative likelihood of the adults or households in the specified trade area to exhibit certain consumer behavior or purchasing patterns compared to the U.S. An MPI of 100 represents the U.S. average.Source: These data are based upon national propensities to use various products and services, applied to local demographic composition. Usage data were collected by GfK MRI in a nationally representative survey of U.S. households. Esri forecasts for 2019 and 2024.
September 25, 2019
©2019 Esri Page 17 of 18

Sports and Leisure Market Potential7353-7399 St Louis Ave Village Of Skokie Only7353-7399 St Louis Ave, Skokie, Illinois, 60076 Latitude: 42.01519Drive Time: 15 minute radius Longitude: -87.71717
Expected Product/Consumer Behavior Number of Adults/HHs Percent MPI
Bought digital book in last 12 months 55,935 14.8% 115Bought hardcover book in last 12 months 81,482 21.6% 108Bought paperback book in last 12 months 114,479 30.4% 107Bought 1-3 books in last 12 months 85,916 22.8% 114Bought 4-6 books in last 12 months 38,033 10.1% 102Bought 7+ books in last 12 months 60,545 16.1% 107Bought book (fiction) in last 12 months 96,590 25.6% 105Bought book (non-fiction) in last 12 months 95,967 25.5% 115Bought biography in last 12 months 32,630 8.7% 126Bought children`s book in last 12 months 38,767 10.3% 107Bought cookbook in last 12 months 27,614 7.3% 110Bought history book in last 12 months 37,769 10.0% 112Bought mystery book in last 12 months 37,899 10.1% 95Bought novel in last 12 months 59,639 15.8% 119Bought religious book (not bible) in last 12 months 17,612 4.7% 78Bought romance book in last 12 months 17,868 4.7% 85Bought science fiction book in last 12 months 23,360 6.2% 111Bought personal/business self-help book last 12 months 29,730 7.9% 126Bought travel book in last 12 months 13,454 3.6% 159Bought book online in last 12 months 95,140 25.2% 123Bought book last 12 months: amazon.com 91,414 24.3% 121Bought book last 12 months: barnes&noble.com 10,506 2.8% 119Bought book last 12 months: Barnes & Noble book store 59,247 15.7% 122Bought book last 12 months: other book store (not B&N) 37,981 10.1% 103Bought book last 12 months: mail order 6,349 1.7% 91Listened to/purchased audiobook in last 6 months 24,593 6.5% 109
Data Note: An MPI (Market Potential Index) measures the relative likelihood of the adults or households in the specified trade area to exhibit certain consumer behavior or purchasing patterns compared to the U.S. An MPI of 100 represents the U.S. average.Source: These data are based upon national propensities to use various products and services, applied to local demographic composition. Usage data were collected by GfK MRI in a nationally representative survey of U.S. households. Esri forecasts for 2019 and 2024.
September 25, 2019
©2019 Esri Page 18 of 18

Tapestry Segmentation Area Profile7353-7399 St Louis Ave Village Of Skokie Only7353-7399 St Louis Ave, Skokie, Illinois, 60076 Latitude: 42.01519Drive Time: 5 minute radius Longitude: -87.71717
Top Twenty Tapestry Segments
2019 Households 2019 U.S. HouseholdsCumulative Cumulative
Rank Tapestry Segment Percent Percent Percent Percent Index1 Pleasantville (2B) 41.7% 41.7% 2.2% 2.2% 19222 Pacific Heights (2C) 29.8% 71.5% 0.7% 2.9% 4,2383 Golden Years (9B) 11.4% 82.9% 1.3% 4.2% 8554 Retirement Communities (9E) 7.7% 90.6% 1.2% 5.4% 6375 Exurbanites (1E) 6.3% 96.9% 1.9% 7.3% 325
Subtotal 96.9% 7.3%
6 Savvy Suburbanites (1D) 2.3% 99.2% 3.0% 10.3% 787 International Marketplace (13A) 0.5% 99.7% 1.2% 11.5% 458 Downtown Melting Pot (8D) 0.2% 99.9% 0.6% 12.1% 26
Subtotal 3.0% 4.8%
Total 100.0% 12.2% 820
SiteU.S.
Top Ten Tapestry Segments Site vs. U.S.Top Ten Tapestry Segments Site vs. U.S.
Pleasantville (2B)
Pacific Heights (2C)
Golden Years (9B)
Retirement Communities (9E)
Exurbanites (1E)
Savvy Suburbanites (1D)
International Marketplace (13A)
Downtown Melting Pot (8D)
Percent of Households by Tapestry Segment4035302520151050
Data Note: This report identifies neighborhood segments in the area, and describes the socioeconomic quality of the immediate neighborhood. The index is a comparison of the percent of households or Total Population 18+ in the area, by Tapestry segment, to the percent of households or Total Population 18+ in the United States, by segment. An index of 100 is the US average.Source: Esri
September 25, 2019
©2019 Esri Page 1 of 18

Tapestry Segmentation Area Profile7353-7399 St Louis Ave Village Of Skokie Only7353-7399 St Louis Ave, Skokie, Illinois, 60076 Latitude: 42.01519Drive Time: 5 minute radius Longitude: -87.71717
2019 Tapestry Indexes by Households2019 Tapestry Indexes by Households
Tape
stry
Seg
men
ts
1A
1C
1E
2B
2D
3B
4A
4C
5B
5D
6A
6C
6E
7A
7C
7E
8A
8C
8E
8G
9B
9D
9F
10B
10D
11A
11C
11E
12B
12D
13B
13D
14A
14C
Index4,0003,5003,0002,5002,0001,5001,0005000
2019 Tapestry Indexes by Total Population 18+2019 Tapestry Indexes by Total Population 18+
Tape
stry
Seg
men
ts
1A
1C
1E
2B
2D
3B
4A
4C
5B
5D
6A
6C
6E
7A
7C
7E
8A
8C
8E
8G
9B
9D
9F
10B
10D
11A
11C
11E
12B
12D
13B
13D
14A
14C
Index3,5003,0002,5002,0001,5001,0005000
Data Note: This report identifies neighborhood segments in the area, and describes the socioeconomic quality of the immediate neighborhood. The index is a comparison of the percent of households or Total Population 18+ in the area, by Tapestry segment, to the percent of households or Total Population 18+ in the United States, by segment. An index of 100 is the US average.Source: Esri
September 25, 2019
©2019 Esri Page 2 of 18

Tapestry Segmentation Area Profile7353-7399 St Louis Ave Village Of Skokie Only7353-7399 St Louis Ave, Skokie, Illinois, 60076 Latitude: 42.01519Drive Time: 5 minute radius Longitude: -87.71717
Tapestry LifeMode Groups 2019 Households 2019 Adult PopulationNumber Percent Index Number Percent Index
Total: 6,450 100.0% 15,069 100.0%
1. Affluent Estates 557 8.6% 87 1,247 8.3% 78Top Tier (1A) 0 0.0% 0 0 0.0% 0Professional Pride (1B) 0 0.0% 0 0 0.0% 0Boomburbs (1C) 0 0.0% 0 0 0.0% 0Savvy Suburbanites (1D) 149 2.3% 78 308 2.0% 64Exurbanites (1E) 408 6.3% 326 939 6.2% 320
2. Upscale Avenues 4,613 71.5% 1274 11,328 75.2% 1280Urban Chic (2A) 0 0.0% 0 0 0.0% 0Pleasantville (2B) 2,690 41.7% 1,922 6,466 42.9% 1,769Pacific Heights (2C) 1,923 29.8% 4,238 4,862 32.3% 3,668Enterprising Professionals (2D) 0 0.0% 0 0 0.0% 0
3. Uptown Individuals 0 0.0% 0 0 0.0% 0Laptops and Lattes (3A) 0 0.0% 0 0 0.0% 0Metro Renters (3B) 0 0.0% 0 0 0.0% 0Trendsetters (3C) 0 0.0% 0 0 0.0% 0
4. Family Landscapes 0 0.0% 0 0 0.0% 0Soccer Moms (4A) 0 0.0% 0 0 0.0% 0Home Improvement (4B) 0 0.0% 0 0 0.0% 0Middleburg (4C) 0 0.0% 0 0 0.0% 0
5. GenXurban 0 0.0% 0 0 0.0% 0Comfortable Empty Nesters (5A) ( (5A)
0 0.0% 0 0 0.0% 0In Style (5B) 0 0.0% 0 0 0.0% 0Parks and Rec (5C) 0 0.0% 0 0 0.0% 0Rustbelt Traditions (5D) 0 0.0% 0 0 0.0% 0Midlife Constants (5E) 0 0.0% 0 0 0.0% 0
6. Cozy Country Living 0 0.0% 0 0 0.0% 0Green Acres (6A) 0 0.0% 0 0 0.0% 0Salt of the Earth (6B) 0 0.0% 0 0 0.0% 0The Great Outdoors (6C) 0 0.0% 0 0 0.0% 0Prairie Living (6D) 0 0.0% 0 0 0.0% 0Rural Resort Dwellers (6E) 0 0.0% 0 0 0.0% 0Heartland Communities (6F) 0 0.0% 0 0 0.0% 0
7. Ethnic Enclaves 0 0.0% 0 0 0.0% 0Up and Coming Families (7A) 0 0.0% 0 0 0.0% 0Urban Villages (7B) 0 0.0% 0 0 0.0% 0American Dreamers (7C) 0 0.0% 0 0 0.0% 0Barrios Urbanos (7D) 0 0.0% 0 0 0.0% 0Valley Growers (7E) 0 0.0% 0 0 0.0% 0Southwestern Families (7F) 0 0.0% 0 0 0.0% 0
Data Note: This report identifies neighborhood segments in the area, and describes the socioeconomic quality of the immediate neighborhood. The index is a comparison of the percent of households or Total Population 18+ in the area, by Tapestry segment, to the percent of households or Total Population 18+ in the United States, by segment. An index of 100 is the US average.Source: Esri
September 25, 2019
©2019 Esri Page 3 of 18

Tapestry Segmentation Area Profile7353-7399 St Louis Ave Village Of Skokie Only7353-7399 St Louis Ave, Skokie, Illinois, 60076 Latitude: 42.01519Drive Time: 5 minute radius Longitude: -87.71717
Tapestry LifeMode Groups 2019 Households 2019 Adult PopulationNumber Percent Index Number Percent Index
Total: 6,450 100.0% 15,069 100.0%
8. Middle Ground 11 0.2% 2 18 0.1% 1City Lights (8A) 0 0.0% 0 0 0.0% 0Emerald City (8B) 0 0.0% 0 0 0.0% 0Bright Young Professionals (8C) 0 0.0% 0 0 0.0% 0Downtown Melting Pot (8D) 11 0.2% 26 18 0.1% 16Front Porches (8E) 0 0.0% 0 0 0.0% 0Old and Newcomers (8F) 0 0.0% 0 0 0.0% 0Hardscrabble Road (8G) 0 0.0% 0 0 0.0% 0
9. Senior Styles 1,234 19.1% 330 2,404 16.0% 319Silver & Gold (9A) 0 0.0% 0 0 0.0% 0Golden Years (9B) 738 11.4% 855 1,673 11.1% 940The Elders (9C) 0 0.0% 0 0 0.0% 0Senior Escapes (9D) 0 0.0% 0 0 0.0% 0Retirement Communities (9E) 496 7.7% 637 731 4.9% 481Social Security Set (9F) 0 0.0% 0 0 0.0% 0
10. Rustic Outposts 0 0.0% 0 0 0.0% 0Southern Satellites (10A) 0 0.0% 0 0 0.0% 0Rooted Rural (10B) 0 0.0% 0 0 0.0% 0Diners & Miners (10C) 0 0.0% 0 0 0.0% 0Down the Road (10D) 0 0.0% 0 0 0.0% 0Rural Bypasses (10E) 0 0.0% 0 0 0.0% 0
11. Midtown Singles 0 0.0% 0 0 0.0% 0City Strivers (11A) 0 0.0% 0 0 0.0% 0Young and Restless (11B) 0 0.0% 0 0 0.0% 0Metro Fusion (11C) 0 0.0% 0 0 0.0% 0Set to Impress (11D) 0 0.0% 0 0 0.0% 0City Commons (11E) 0 0.0% 0 0 0.0% 0
12. Hometown 0 0.0% 0 0 0.0% 0Family Foundations (12A) 0 0.0% 0 0 0.0% 0Traditional Living (12B) 0 0.0% 0 0 0.0% 0Small Town Simplicity (12C) 0 0.0% 0 0 0.0% 0Modest Income Homes (12D) 0 0.0% 0 0 0.0% 0
13. Next Wave 35 0.5% 14 72 0.5% 11International Marketplace (13A) 35 0.5% 45 72 0.5% 35Las Casas (13B) 0 0.0% 0 0 0.0% 0NeWest Residents (13C) 0 0.0% 0 0 0.0% 0Fresh Ambitions (13D) 0 0.0% 0 0 0.0% 0High Rise Renters (13E) 0 0.0% 0 0 0.0% 0
14. Scholars and Patriots 0 0.0% 0 0 0.0% 0Military Proximity (14A) 0 0.0% 0 0 0.0% 0College Towns (14B) 0 0.0% 0 0 0.0% 0Dorms to Diplomas (14C) 0 0.0% 0 0 0.0% 0
Unclassified (15) 0 0.0% 0 0 0.0% 0
Data Note: This report identifies neighborhood segments in the area, and describes the socioeconomic quality of the immediate neighborhood. The index is a comparison of the percent of households or Total Population 18+ in the area, by Tapestry segment, to the percent of households or Total Population 18+ in the United States, by segment. An index of 100 is the US average.Source: Esri
September 25, 2019
©2019 Esri Page 4 of 18

Tapestry Segmentation Area Profile7353-7399 St Louis Ave Village Of Skokie Only7353-7399 St Louis Ave, Skokie, Illinois, 60076 Latitude: 42.01519Drive Time: 5 minute radius Longitude: -87.71717
Tapestry Urbanization Groups 2019 Households 2019 Adult PopulationNumber Percent Index Number Percent Index
Total: 6,450 100.0% 15,069 100.0%
1. Principal Urban Center 11 0.2% 2 18 0.1% 2Laptops and Lattes (3A) 0 0.0% 0 0 0.0% 0Metro Renters (3B) 0 0.0% 0 0 0.0% 0Trendsetters (3C) 0 0.0% 0 0 0.0% 0Downtown Melting Pot (8D) 11 0.2% 26 18 0.1% 16City Strivers (11A) 0 0.0% 0 0 0.0% 0NeWest Residents (13C) 0 0.0% 0 0 0.0% 0Fresh Ambitions (13D) 0 0.0% 0 0 0.0% 0High Rise Renters (13E) 0 0.0% 0 0 0.0% 0
2. Urban Periphery 1,958 30.4% 182 4,934 32.7% 185Pacific Heights (2C) 1,923 29.8% 4,238 4,862 32.3% 3,668Rustbelt Traditions (5D) 0 0.0% 0 0 0.0% 0Urban Villages (7B) 0 0.0% 0 0 0.0% 0American Dreamers (7C) 0 0.0% 0 0 0.0% 0Barrios Urbanos (7D) 0 0.0% 0 0 0.0% 0Southwestern Families (7F) 0 0.0% 0 0 0.0% 0City Lights (8A) 0 0.0% 0 0 0.0% 0Bright Young Professionals (8C) 0 0.0% 0 0 0.0% 0Metro Fusion (11C) 0 0.0% 0 0 0.0% 0Family Foundations (12A) 0 0.0% 0 0 0.0% 0Modest Income Homes (12D) 0 0.0% 0 0 0.0% 0International Marketplace (13A) 35 0.5% 45 72 0.5% 35Las Casas (13B) 0 0.0% 0 0 0.0% 0
3. Metro Cities 496 7.7% 42 731 4.9% 29In Style (5B) 0 0.0% 0 0 0.0% 0Emerald City (8B) 0 0.0% 0 0 0.0% 0Front Porches (8E) 0 0.0% 0 0 0.0% 0Old and Newcomers (8F) 0 0.0% 0 0 0.0% 0Hardscrabble Road (8G) 0 0.0% 0 0 0.0% 0Retirement Communities (9E) 496 7.7% 637 731 4.9% 481Social Security Set (9F) 0 0.0% 0 0 0.0% 0Young and Restless (11B) 0 0.0% 0 0 0.0% 0Set to Impress (11D) 0 0.0% 0 0 0.0% 0City Commons (11E) 0 0.0% 0 0 0.0% 0Traditional Living (12B) 0 0.0% 0 0 0.0% 0College Towns (14B) 0 0.0% 0 0 0.0% 0Dorms to Diplomas (14C) 0 0.0% 0 0 0.0% 0
Data Note: This report identifies neighborhood segments in the area, and describes the socioeconomic quality of the immediate neighborhood. The index is a comparison of the percent of households or Total Population 18+ in the area, by Tapestry segment, to the percent of households or Total Population 18+ in the United States, by segment. An index of 100 is the US average.Source: Esri
September 25, 2019
©2019 Esri Page 5 of 18

Tapestry Segmentation Area Profile7353-7399 St Louis Ave Village Of Skokie Only7353-7399 St Louis Ave, Skokie, Illinois, 60076 Latitude: 42.01519Drive Time: 5 minute radius Longitude: -87.71717
Tapestry Urbanization Groups 2019 Households 2019 Adult PopulationNumber Percent Index Number Percent Index
Total: 6,450 100.0% 15,069 100.0%4. Suburban Periphery 3,985 61.8% 194 9,386 62.3% 191Top Tier (1A) 0 0.0% 0 0 0.0% 0Professional Pride (1B) 0 0.0% 0 0 0.0% 0Boomburbs (1C) 0 0.0% 0 0 0.0% 0Savvy Suburbanites (1D) 149 2.3% 78 308 2.0% 64Exurbanites (1E) 408 6.3% 326 939 6.2% 320Urban Chic (2A) 0 0.0% 0 0 0.0% 0Pleasantville (2B) 2,690 41.7% 1,922 6,466 42.9% 1,769Enterprising Professionals (2D) 0 0.0% 0 0 0.0% 0Soccer Moms (4A) 0 0.0% 0 0 0.0% 0Home Improvement (4B) 0 0.0% 0 0 0.0% 0Comfortable Empty Nesters (5A) 0 0.0% 0 0 0.0% 0Parks and Rec (5C) 0 0.0% 0 0 0.0% 0Midlife Constants (5E) 0 0.0% 0 0 0.0% 0Up and Coming Families (7A) 0 0.0% 0 0 0.0% 0Silver & Gold (9A) 0 0.0% 0 0 0.0% 0Golden Years (9B) 738 11.4% 855 1,673 11.1% 940The Elders (9C) 0 0.0% 0 0 0.0% 0Military Proximity (14A) 0 0.0% 0 0 0.0% 0
5. Semirural 0 0.0% 0 0 0.0% 0Middleburg (4C) 0 0.0% 0 0 0.0% 0Heartland Communities (6F) 0 0.0% 0 0 0.0% 0Valley Growers (7E) 0 0.0% 0 0 0.0% 0Senior Escapes (9D) 0 0.0% 0 0 0.0% 0Down the Road (10D) 0 0.0% 0 0 0.0% 0Small Town Simplicity (12C) 0 0.0% 0 0 0.0% 0
6. Rural 0 0.0% 0 0 0.0% 0Green Acres (6A) 0 0.0% 0 0 0.0% 0Salt of the Earth (6B) 0 0.0% 0 0 0.0% 0The Great Outdoors (6C) 0 0.0% 0 0 0.0% 0Prairie Living (6D) 0 0.0% 0 0 0.0% 0Rural Resort Dwellers (6E) 0 0.0% 0 0 0.0% 0Southern Satellites (10A) 0 0.0% 0 0 0.0% 0Rooted Rural (10B) 0 0.0% 0 0 0.0% 0Diners & Miners (10C) 0 0.0% 0 0 0.0% 0Rural Bypasses (10E) 0 0.0% 0 0 0.0% 0
Unclassified (15) 0 0.0% 0 0 0.0% 0
Data Note: This report identifies neighborhood segments in the area, and describes the socioeconomic quality of the immediate neighborhood. The index is a comparison of the percent of households or Total Population 18+ in the area, by Tapestry segment, to the percent of households or Total Population 18+ in the United States, by segment. An index of 100 is the US average.Source: Esri
September 25, 2019
©2019 Esri Page 6 of 18

Tapestry Segmentation Area Profile7353-7399 St Louis Ave Village Of Skokie Only7353-7399 St Louis Ave, Skokie, Illinois, 60076 Latitude: 42.01519Drive Time: 10 minute radius Longitude: -87.71717
Top Twenty Tapestry Segments
2019 Households 2019 U.S. HouseholdsCumulative Cumulative
Rank Tapestry Segment Percent Percent Percent Percent Index1 City Lights (8A) 15.8% 15.8% 1.4% 1.4% 10902 Pleasantville (2B) 14.0% 29.8% 2.2% 3.6% 6463 Downtown Melting Pot (8D) 13.7% 43.5% 0.6% 4.2% 2,1304 International Marketplace (13A) 11.2% 54.7% 1.2% 5.4% 9195 Pacific Heights (2C) 10.9% 65.6% 0.7% 6.1% 1,544
Subtotal 65.6% 6.1%
6 Exurbanites (1E) 6.3% 71.9% 1.9% 8.0% 3267 Golden Years (9B) 4.7% 76.6% 1.3% 9.3% 3538 Top Tier (1A) 3.7% 80.3% 1.7% 11.0% 2189 Savvy Suburbanites (1D) 2.5% 82.8% 3.0% 14.0% 8310 Emerald City (8B) 2.1% 84.9% 1.4% 15.4% 150
Subtotal 19.3% 9.3%
11 Urban Chic (2A) 2.1% 87.0% 1.3% 16.7% 16312 Trendsetters (3C) 2.0% 89.0% 1.1% 17.8% 18413 City Strivers (11A) 1.8% 90.8% 0.8% 18.6% 23914 The Elders (9C) 1.8% 92.6% 0.7% 19.3% 23815 Enterprising Professionals (2D) 1.4% 94.0% 1.4% 20.7% 98
Subtotal 9.1% 5.3%
16 Retirement Communities (9E) 1.3% 95.3% 1.2% 21.9% 11117 Urban Villages (7B) 1.1% 96.4% 1.1% 23.0% 10618 In Style (5B) 0.9% 97.3% 2.2% 25.2% 4119 Parks and Rec (5C) 0.5% 97.8% 2.0% 27.2% 2420 Professional Pride (1B) 0.5% 98.3% 1.6% 28.8% 28
Subtotal 4.3% 8.1%
Total 98.3% 29.0% 339
SiteU.S.
Top Ten Tapestry Segments Site vs. U.S.Top Ten Tapestry Segments Site vs. U.S.
City Lights (8A)
Pleasantville (2B)
Downtown Melting Pot (8D)
International Marketplace (13A)
Pacific Heights (2C)
Exurbanites (1E)
Golden Years (9B)
Top Tier (1A)
Savvy Suburbanites (1D)
Emerald City (8B)
Percent of Households by Tapestry Segment14121086420
Data Note: This report identifies neighborhood segments in the area, and describes the socioeconomic quality of the immediate neighborhood. The index is a comparison of the percent of households or Total Population 18+ in the area, by Tapestry segment, to the percent of households or Total Population 18+ in the United States, by segment. An index of 100 is the US average.Source: Esri
September 25, 2019
©2019 Esri Page 7 of 18

Tapestry Segmentation Area Profile7353-7399 St Louis Ave Village Of Skokie Only7353-7399 St Louis Ave, Skokie, Illinois, 60076 Latitude: 42.01519Drive Time: 10 minute radius Longitude: -87.71717
2019 Tapestry Indexes by Households2019 Tapestry Indexes by Households
Tape
stry
Seg
men
ts
1A
1C
1E
2B
2D
3B
4A
4C
5B
5D
6A
6C
6E
7A
7C
7E
8A
8C
8E
8G
9B
9D
9F
10B
10D
11A
11C
11E
12B
12D
13B
13D
14A
14C
Index2,0001,5001,0005000
2019 Tapestry Indexes by Total Population 18+2019 Tapestry Indexes by Total Population 18+
Tape
stry
Seg
men
ts
1A
1C
1E
2B
2D
3B
4A
4C
5B
5D
6A
6C
6E
7A
7C
7E
8A
8C
8E
8G
9B
9D
9F
10B
10D
11A
11C
11E
12B
12D
13B
13D
14A
14C
Index1,5001,0005000
Data Note: This report identifies neighborhood segments in the area, and describes the socioeconomic quality of the immediate neighborhood. The index is a comparison of the percent of households or Total Population 18+ in the area, by Tapestry segment, to the percent of households or Total Population 18+ in the United States, by segment. An index of 100 is the US average.Source: Esri
September 25, 2019
©2019 Esri Page 8 of 18

Tapestry Segmentation Area Profile7353-7399 St Louis Ave Village Of Skokie Only7353-7399 St Louis Ave, Skokie, Illinois, 60076 Latitude: 42.01519Drive Time: 10 minute radius Longitude: -87.71717
Tapestry LifeMode Groups 2019 Households 2019 Adult PopulationNumber Percent Index Number Percent Index
Total: 66,500 100.0% 143,201 100.0%
1. Affluent Estates 8,606 12.9% 130 18,623 13.0% 123Top Tier (1A) 2,451 3.7% 218 5,508 3.8% 215Professional Pride (1B) 308 0.5% 28 596 0.4% 23Boomburbs (1C) 0 0.0% 0 0 0.0% 0Savvy Suburbanites (1D) 1,637 2.5% 83 3,709 2.6% 81Exurbanites (1E) 4,210 6.3% 326 8,810 6.2% 316
2. Upscale Avenues 18,892 28.4% 506 42,996 30.0% 511Urban Chic (2A) 1,419 2.1% 163 2,783 1.9% 157Pleasantville (2B) 9,324 14.0% 646 21,428 15.0% 617Pacific Heights (2C) 7,221 10.9% 1,544 17,209 12.0% 1,366Enterprising Professionals (2D) 928 1.4% 98 1,576 1.1% 83
3. Uptown Individuals 1,652 2.5% 65 3,312 2.3% 74Laptops and Lattes (3A) 159 0.2% 22 312 0.2% 25Metro Renters (3B) 187 0.3% 17 293 0.2% 16Trendsetters (3C) 1,306 2.0% 184 2,707 1.9% 199
4. Family Landscapes 0 0.0% 0 0 0.0% 0Soccer Moms (4A) 0 0.0% 0 0 0.0% 0Home Improvement (4B) 0 0.0% 0 0 0.0% 0Middleburg (4C) 0 0.0% 0 0 0.0% 0
5. GenXurban 927 1.4% 12 1,997 1.4% 13Comfortable Empty Nesters (5A) ( (5A)
0 0.0% 0 0 0.0% 0In Style (5B) 614 0.9% 41 1,215 0.8% 40Parks and Rec (5C) 313 0.5% 24 782 0.5% 28Rustbelt Traditions (5D) 0 0.0% 0 0 0.0% 0Midlife Constants (5E) 0 0.0% 0 0 0.0% 0
6. Cozy Country Living 0 0.0% 0 0 0.0% 0Green Acres (6A) 0 0.0% 0 0 0.0% 0Salt of the Earth (6B) 0 0.0% 0 0 0.0% 0The Great Outdoors (6C) 0 0.0% 0 0 0.0% 0Prairie Living (6D) 0 0.0% 0 0 0.0% 0Rural Resort Dwellers (6E) 0 0.0% 0 0 0.0% 0Heartland Communities (6F) 0 0.0% 0 0 0.0% 0
7. Ethnic Enclaves 739 1.1% 16 1,872 1.3% 16Up and Coming Families (7A) 0 0.0% 0 0 0.0% 0Urban Villages (7B) 739 1.1% 106 1,872 1.3% 90American Dreamers (7C) 0 0.0% 0 0 0.0% 0Barrios Urbanos (7D) 0 0.0% 0 0 0.0% 0Valley Growers (7E) 0 0.0% 0 0 0.0% 0Southwestern Families (7F) 0 0.0% 0 0 0.0% 0
Data Note: This report identifies neighborhood segments in the area, and describes the socioeconomic quality of the immediate neighborhood. The index is a comparison of the percent of households or Total Population 18+ in the area, by Tapestry segment, to the percent of households or Total Population 18+ in the United States, by segment. An index of 100 is the US average.Source: Esri
September 25, 2019
©2019 Esri Page 9 of 18

Tapestry Segmentation Area Profile7353-7399 St Louis Ave Village Of Skokie Only7353-7399 St Louis Ave, Skokie, Illinois, 60076 Latitude: 42.01519Drive Time: 10 minute radius Longitude: -87.71717
Tapestry LifeMode Groups 2019 Households 2019 Adult PopulationNumber Percent Index Number Percent Index
Total: 66,500 100.0% 143,201 100.0%
8. Middle Ground 21,329 32.1% 296 45,171 31.5% 313City Lights (8A) 10,475 15.8% 1,090 21,700 15.2% 1,032Emerald City (8B) 1,423 2.1% 150 2,387 1.7% 137Bright Young Professionals (8C) 289 0.4% 19 538 0.4% 19Downtown Melting Pot (8D) 9,142 13.7% 2,130 20,546 14.3% 1,968Front Porches (8E) 0 0.0% 0 0 0.0% 0Old and Newcomers (8F) 0 0.0% 0 0 0.0% 0Hardscrabble Road (8G) 0 0.0% 0 0 0.0% 0
9. Senior Styles 5,209 7.8% 135 9,886 6.9% 138Silver & Gold (9A) 0 0.0% 0 0 0.0% 0Golden Years (9B) 3,141 4.7% 353 6,402 4.5% 379The Elders (9C) 1,176 1.8% 238 2,106 1.5% 247Senior Escapes (9D) 0 0.0% 0 0 0.0% 0Retirement Communities (9E) 892 1.3% 111 1,378 1.0% 95Social Security Set (9F) 0 0.0% 0 0 0.0% 0
10. Rustic Outposts 0 0.0% 0 0 0.0% 0Southern Satellites (10A) 0 0.0% 0 0 0.0% 0Rooted Rural (10B) 0 0.0% 0 0 0.0% 0Diners & Miners (10C) 0 0.0% 0 0 0.0% 0Down the Road (10D) 0 0.0% 0 0 0.0% 0Rural Bypasses (10E) 0 0.0% 0 0 0.0% 0
11. Midtown Singles 1,698 2.6% 41 3,321 2.3% 43City Strivers (11A) 1,214 1.8% 239 2,319 1.6% 205Young and Restless (11B) 0 0.0% 0 0 0.0% 0Metro Fusion (11C) 236 0.4% 25 427 0.3% 23Set to Impress (11D) 248 0.4% 27 575 0.4% 34City Commons (11E) 0 0.0% 0 0 0.0% 0
12. Hometown 0 0.0% 0 0 0.0% 0Family Foundations (12A) 0 0.0% 0 0 0.0% 0Traditional Living (12B) 0 0.0% 0 0 0.0% 0Small Town Simplicity (12C) 0 0.0% 0 0 0.0% 0Modest Income Homes (12D) 0 0.0% 0 0 0.0% 0
13. Next Wave 7,448 11.2% 292 16,023 11.2% 254International Marketplace (13A) 7,435 11.2% 919 16,004 11.2% 818Las Casas (13B) 0 0.0% 0 0 0.0% 0NeWest Residents (13C) 13 0.0% 3 19 0.0% 2Fresh Ambitions (13D) 0 0.0% 0 0 0.0% 0High Rise Renters (13E) 0 0.0% 0 0 0.0% 0
14. Scholars and Patriots 0 0.0% 0 0 0.0% 0Military Proximity (14A) 0 0.0% 0 0 0.0% 0College Towns (14B) 0 0.0% 0 0 0.0% 0Dorms to Diplomas (14C) 0 0.0% 0 0 0.0% 0
Unclassified (15) 0 0.0% 0 0 0.0% 0
Data Note: This report identifies neighborhood segments in the area, and describes the socioeconomic quality of the immediate neighborhood. The index is a comparison of the percent of households or Total Population 18+ in the area, by Tapestry segment, to the percent of households or Total Population 18+ in the United States, by segment. An index of 100 is the US average.Source: Esri
September 25, 2019
©2019 Esri Page 10 of 18

Tapestry Segmentation Area Profile7353-7399 St Louis Ave Village Of Skokie Only7353-7399 St Louis Ave, Skokie, Illinois, 60076 Latitude: 42.01519Drive Time: 10 minute radius Longitude: -87.71717
Tapestry Urbanization Groups 2019 Households 2019 Adult PopulationNumber Percent Index Number Percent Index
Total: 66,500 100.0% 143,201 100.0%
1. Principal Urban Center 12,021 18.1% 254 26,196 18.3% 273Laptops and Lattes (3A) 159 0.2% 22 312 0.2% 25Metro Renters (3B) 187 0.3% 17 293 0.2% 16Trendsetters (3C) 1,306 2.0% 184 2,707 1.9% 199Downtown Melting Pot (8D) 9,142 13.7% 2,130 20,546 14.3% 1,968City Strivers (11A) 1,214 1.8% 239 2,319 1.6% 205NeWest Residents (13C) 13 0.0% 3 19 0.0% 2Fresh Ambitions (13D) 0 0.0% 0 0 0.0% 0High Rise Renters (13E) 0 0.0% 0 0 0.0% 0
2. Urban Periphery 26,395 39.7% 238 57,750 40.3% 228Pacific Heights (2C) 7,221 10.9% 1,544 17,209 12.0% 1,366Rustbelt Traditions (5D) 0 0.0% 0 0 0.0% 0Urban Villages (7B) 739 1.1% 106 1,872 1.3% 90American Dreamers (7C) 0 0.0% 0 0 0.0% 0Barrios Urbanos (7D) 0 0.0% 0 0 0.0% 0Southwestern Families (7F) 0 0.0% 0 0 0.0% 0City Lights (8A) 10,475 15.8% 1,090 21,700 15.2% 1,032Bright Young Professionals (8C) 289 0.4% 19 538 0.4% 19Metro Fusion (11C) 236 0.4% 25 427 0.3% 23Family Foundations (12A) 0 0.0% 0 0 0.0% 0Modest Income Homes (12D) 0 0.0% 0 0 0.0% 0International Marketplace (13A) 7,435 11.2% 919 16,004 11.2% 818Las Casas (13B) 0 0.0% 0 0 0.0% 0
3. Metro Cities 3,177 4.8% 26 5,555 3.9% 23In Style (5B) 614 0.9% 41 1,215 0.8% 40Emerald City (8B) 1,423 2.1% 150 2,387 1.7% 137Front Porches (8E) 0 0.0% 0 0 0.0% 0Old and Newcomers (8F) 0 0.0% 0 0 0.0% 0Hardscrabble Road (8G) 0 0.0% 0 0 0.0% 0Retirement Communities (9E) 892 1.3% 111 1,378 1.0% 95Social Security Set (9F) 0 0.0% 0 0 0.0% 0Young and Restless (11B) 0 0.0% 0 0 0.0% 0Set to Impress (11D) 248 0.4% 27 575 0.4% 34City Commons (11E) 0 0.0% 0 0 0.0% 0Traditional Living (12B) 0 0.0% 0 0 0.0% 0College Towns (14B) 0 0.0% 0 0 0.0% 0Dorms to Diplomas (14C) 0 0.0% 0 0 0.0% 0
Data Note: This report identifies neighborhood segments in the area, and describes the socioeconomic quality of the immediate neighborhood. The index is a comparison of the percent of households or Total Population 18+ in the area, by Tapestry segment, to the percent of households or Total Population 18+ in the United States, by segment. An index of 100 is the US average.Source: Esri
September 25, 2019
©2019 Esri Page 11 of 18

Tapestry Segmentation Area Profile7353-7399 St Louis Ave Village Of Skokie Only7353-7399 St Louis Ave, Skokie, Illinois, 60076 Latitude: 42.01519Drive Time: 10 minute radius Longitude: -87.71717
Tapestry Urbanization Groups 2019 Households 2019 Adult PopulationNumber Percent Index Number Percent Index
Total: 66,500 100.0% 143,201 100.0%4. Suburban Periphery 24,907 37.5% 117 53,700 37.5% 115Top Tier (1A) 2,451 3.7% 218 5,508 3.8% 215Professional Pride (1B) 308 0.5% 28 596 0.4% 23Boomburbs (1C) 0 0.0% 0 0 0.0% 0Savvy Suburbanites (1D) 1,637 2.5% 83 3,709 2.6% 81Exurbanites (1E) 4,210 6.3% 326 8,810 6.2% 316Urban Chic (2A) 1,419 2.1% 163 2,783 1.9% 157Pleasantville (2B) 9,324 14.0% 646 21,428 15.0% 617Enterprising Professionals (2D) 928 1.4% 98 1,576 1.1% 83Soccer Moms (4A) 0 0.0% 0 0 0.0% 0Home Improvement (4B) 0 0.0% 0 0 0.0% 0Comfortable Empty Nesters (5A) 0 0.0% 0 0 0.0% 0Parks and Rec (5C) 313 0.5% 24 782 0.5% 28Midlife Constants (5E) 0 0.0% 0 0 0.0% 0Up and Coming Families (7A) 0 0.0% 0 0 0.0% 0Silver & Gold (9A) 0 0.0% 0 0 0.0% 0Golden Years (9B) 3,141 4.7% 353 6,402 4.5% 379The Elders (9C) 1,176 1.8% 238 2,106 1.5% 247Military Proximity (14A) 0 0.0% 0 0 0.0% 0
5. Semirural 0 0.0% 0 0 0.0% 0Middleburg (4C) 0 0.0% 0 0 0.0% 0Heartland Communities (6F) 0 0.0% 0 0 0.0% 0Valley Growers (7E) 0 0.0% 0 0 0.0% 0Senior Escapes (9D) 0 0.0% 0 0 0.0% 0Down the Road (10D) 0 0.0% 0 0 0.0% 0Small Town Simplicity (12C) 0 0.0% 0 0 0.0% 0
6. Rural 0 0.0% 0 0 0.0% 0Green Acres (6A) 0 0.0% 0 0 0.0% 0Salt of the Earth (6B) 0 0.0% 0 0 0.0% 0The Great Outdoors (6C) 0 0.0% 0 0 0.0% 0Prairie Living (6D) 0 0.0% 0 0 0.0% 0Rural Resort Dwellers (6E) 0 0.0% 0 0 0.0% 0Southern Satellites (10A) 0 0.0% 0 0 0.0% 0Rooted Rural (10B) 0 0.0% 0 0 0.0% 0Diners & Miners (10C) 0 0.0% 0 0 0.0% 0Rural Bypasses (10E) 0 0.0% 0 0 0.0% 0
Unclassified (15) 0 0.0% 0 0 0.0% 0
Data Note: This report identifies neighborhood segments in the area, and describes the socioeconomic quality of the immediate neighborhood. The index is a comparison of the percent of households or Total Population 18+ in the area, by Tapestry segment, to the percent of households or Total Population 18+ in the United States, by segment. An index of 100 is the US average.Source: Esri
September 25, 2019
©2019 Esri Page 12 of 18

Tapestry Segmentation Area Profile7353-7399 St Louis Ave Village Of Skokie Only7353-7399 St Louis Ave, Skokie, Illinois, 60076 Latitude: 42.01519Drive Time: 15 minute radius Longitude: -87.71717
Top Twenty Tapestry Segments
2019 Households 2019 U.S. HouseholdsCumulative Cumulative
Rank Tapestry Segment Percent Percent Percent Percent Index1 International Marketplace (13A) 15.2% 15.2% 1.2% 1.2% 12502 City Lights (8A) 13.7% 28.9% 1.4% 2.6% 9483 Trendsetters (3C) 12.4% 41.3% 1.1% 3.7% 1,1634 Pleasantville (2B) 8.2% 49.5% 2.2% 5.9% 3775 Downtown Melting Pot (8D) 7.4% 56.9% 0.6% 6.5% 1,148
Subtotal 56.9% 6.5%
6 Pacific Heights (2C) 6.2% 63.1% 0.7% 7.2% 8767 Top Tier (1A) 4.8% 67.9% 1.7% 8.9% 2858 Metro Renters (3B) 4.1% 72.0% 1.7% 10.6% 2469 Urban Chic (2A) 4.0% 76.0% 1.3% 11.9% 30610 Golden Years (9B) 3.9% 79.9% 1.3% 13.2% 289
Subtotal 23.0% 6.7%
11 Exurbanites (1E) 3.0% 82.9% 1.9% 15.1% 15712 Emerald City (8B) 2.4% 85.3% 1.4% 16.5% 17113 Savvy Suburbanites (1D) 2.0% 87.3% 3.0% 19.5% 6614 College Towns (14B) 1.9% 89.2% 1.0% 20.5% 20415 Retirement Communities (9E) 1.6% 90.8% 1.2% 21.7% 129
Subtotal 10.9% 8.5%
16 Enterprising Professionals (2D) 1.2% 92.0% 1.4% 23.1% 8117 NeWest Residents (13C) 1.0% 93.0% 0.8% 23.9% 13218 Laptops and Lattes (3A) 0.9% 93.9% 1.1% 25.0% 8119 City Strivers (11A) 0.9% 94.8% 0.8% 25.8% 11320 Urban Villages (7B) 0.7% 95.5% 1.1% 26.9% 71
Subtotal 4.7% 5.2%
Total 95.5% 26.9% 356
SiteU.S.
Top Ten Tapestry Segments Site vs. U.S.Top Ten Tapestry Segments Site vs. U.S.
International Marketplace (13A)
City Lights (8A)
Trendsetters (3C)
Pleasantville (2B)
Downtown Melting Pot (8D)
Pacific Heights (2C)
Top Tier (1A)
Metro Renters (3B)
Urban Chic (2A)
Golden Years (9B)
Percent of Households by Tapestry Segment14121086420
Data Note: This report identifies neighborhood segments in the area, and describes the socioeconomic quality of the immediate neighborhood. The index is a comparison of the percent of households or Total Population 18+ in the area, by Tapestry segment, to the percent of households or Total Population 18+ in the United States, by segment. An index of 100 is the US average.Source: Esri
September 25, 2019
©2019 Esri Page 13 of 18

Tapestry Segmentation Area Profile7353-7399 St Louis Ave Village Of Skokie Only7353-7399 St Louis Ave, Skokie, Illinois, 60076 Latitude: 42.01519Drive Time: 15 minute radius Longitude: -87.71717
2019 Tapestry Indexes by Households2019 Tapestry Indexes by Households
Tape
stry
Seg
men
ts
1A
1C
1E
2B
2D
3B
4A
4C
5B
5D
6A
6C
6E
7A
7C
7E
8A
8C
8E
8G
9B
9D
9F
10B
10D
11A
11C
11E
12B
12D
13B
13D
14A
14C
Index1,2001,0008006004002000
2019 Tapestry Indexes by Total Population 18+2019 Tapestry Indexes by Total Population 18+
Tape
stry
Seg
men
ts
1A
1C
1E
2B
2D
3B
4A
4C
5B
5D
6A
6C
6E
7A
7C
7E
8A
8C
8E
8G
9B
9D
9F
10B
10D
11A
11C
11E
12B
12D
13B
13D
14A
14C
Index1,0008006004002000
Data Note: This report identifies neighborhood segments in the area, and describes the socioeconomic quality of the immediate neighborhood. The index is a comparison of the percent of households or Total Population 18+ in the area, by Tapestry segment, to the percent of households or Total Population 18+ in the United States, by segment. An index of 100 is the US average.Source: Esri
September 25, 2019
©2019 Esri Page 14 of 18

Tapestry Segmentation Area Profile7353-7399 St Louis Ave Village Of Skokie Only7353-7399 St Louis Ave, Skokie, Illinois, 60076 Latitude: 42.01519Drive Time: 15 minute radius Longitude: -87.71717
Tapestry LifeMode Groups 2019 Households 2019 Adult PopulationNumber Percent Index Number Percent Index
Total: 182,448 100.0% 376,868 100.0%
1. Affluent Estates 18,223 10.0% 100 38,723 10.3% 97Top Tier (1A) 8,763 4.8% 285 18,651 4.9% 277Professional Pride (1B) 308 0.2% 10 596 0.2% 9Boomburbs (1C) 0 0.0% 0 0 0.0% 0Savvy Suburbanites (1D) 3,595 2.0% 66 7,946 2.1% 66Exurbanites (1E) 5,557 3.0% 157 11,530 3.1% 157
2. Upscale Avenues 35,588 19.5% 347 76,764 20.4% 347Urban Chic (2A) 7,330 4.0% 306 13,077 3.5% 280Pleasantville (2B) 14,911 8.2% 377 33,682 8.9% 369Pacific Heights (2C) 11,244 6.2% 876 26,363 7.0% 795Enterprising Professionals (2D) 2,103 1.2% 81 3,642 1.0% 73
3. Uptown Individuals 31,772 17.4% 456 55,068 14.6% 467Laptops and Lattes (3A) 1,604 0.9% 81 2,806 0.7% 84Metro Renters (3B) 7,483 4.1% 246 11,832 3.1% 242Trendsetters (3C) 22,685 12.4% 1,163 40,430 10.7% 1,129
4. Family Landscapes 0 0.0% 0 0 0.0% 0Soccer Moms (4A) 0 0.0% 0 0 0.0% 0Home Improvement (4B) 0 0.0% 0 0 0.0% 0Middleburg (4C) 0 0.0% 0 0 0.0% 0
5. GenXurban 1,152 0.6% 6 2,465 0.7% 6Comfortable Empty Nesters (5A) ( (5A)
95 0.1% 2 167 0.0% 2In Style (5B) 614 0.3% 15 1,215 0.3% 15Parks and Rec (5C) 443 0.2% 12 1,083 0.3% 15Rustbelt Traditions (5D) 0 0.0% 0 0 0.0% 0Midlife Constants (5E) 0 0.0% 0 0 0.0% 0
6. Cozy Country Living 0 0.0% 0 0 0.0% 0Green Acres (6A) 0 0.0% 0 0 0.0% 0Salt of the Earth (6B) 0 0.0% 0 0 0.0% 0The Great Outdoors (6C) 0 0.0% 0 0 0.0% 0Prairie Living (6D) 0 0.0% 0 0 0.0% 0Rural Resort Dwellers (6E) 0 0.0% 0 0 0.0% 0Heartland Communities (6F) 0 0.0% 0 0 0.0% 0
7. Ethnic Enclaves 1,355 0.7% 10 3,369 0.9% 11Up and Coming Families (7A) 0 0.0% 0 0 0.0% 0Urban Villages (7B) 1,355 0.7% 71 3,369 0.9% 62American Dreamers (7C) 0 0.0% 0 0 0.0% 0Barrios Urbanos (7D) 0 0.0% 0 0 0.0% 0Valley Growers (7E) 0 0.0% 0 0 0.0% 0Southwestern Families (7F) 0 0.0% 0 0 0.0% 0
Data Note: This report identifies neighborhood segments in the area, and describes the socioeconomic quality of the immediate neighborhood. The index is a comparison of the percent of households or Total Population 18+ in the area, by Tapestry segment, to the percent of households or Total Population 18+ in the United States, by segment. An index of 100 is the US average.Source: Esri
September 25, 2019
©2019 Esri Page 15 of 18

Tapestry Segmentation Area Profile7353-7399 St Louis Ave Village Of Skokie Only7353-7399 St Louis Ave, Skokie, Illinois, 60076 Latitude: 42.01519Drive Time: 15 minute radius Longitude: -87.71717
Tapestry LifeMode Groups 2019 Households 2019 Adult PopulationNumber Percent Index Number Percent Index
Total: 182,448 100.0% 376,868 100.0%
8. Middle Ground 43,872 24.0% 222 91,061 24.2% 239City Lights (8A) 24,988 13.7% 948 51,059 13.5% 923Emerald City (8B) 4,436 2.4% 171 7,663 2.0% 167Bright Young Professionals (8C) 453 0.2% 11 828 0.2% 11Downtown Melting Pot (8D) 13,523 7.4% 1,148 30,507 8.1% 1,110Front Porches (8E) 417 0.2% 14 873 0.2% 15Old and Newcomers (8F) 55 0.0% 1 131 0.0% 2Hardscrabble Road (8G) 0 0.0% 0 0 0.0% 0
9. Senior Styles 12,000 6.6% 114 22,945 6.1% 122Silver & Gold (9A) 0 0.0% 0 0 0.0% 0Golden Years (9B) 7,054 3.9% 289 14,236 3.8% 320The Elders (9C) 1,176 0.6% 87 2,106 0.6% 94Senior Escapes (9D) 0 0.0% 0 0 0.0% 0Retirement Communities (9E) 2,851 1.6% 129 5,115 1.4% 135Social Security Set (9F) 919 0.5% 62 1,488 0.4% 60
10. Rustic Outposts 0 0.0% 0 0 0.0% 0Southern Satellites (10A) 0 0.0% 0 0 0.0% 0Rooted Rural (10B) 0 0.0% 0 0 0.0% 0Diners & Miners (10C) 0 0.0% 0 0 0.0% 0Down the Road (10D) 0 0.0% 0 0 0.0% 0Rural Bypasses (10E) 0 0.0% 0 0 0.0% 0
11. Midtown Singles 4,346 2.4% 39 8,015 2.1% 39City Strivers (11A) 1,576 0.9% 113 3,084 0.8% 104Young and Restless (11B) 931 0.5% 29 1,518 0.4% 29Metro Fusion (11C) 1,316 0.7% 51 2,314 0.6% 47Set to Impress (11D) 523 0.3% 21 1,099 0.3% 25City Commons (11E) 0 0.0% 0 0 0.0% 0
12. Hometown 0 0.0% 0 0 0.0% 0Family Foundations (12A) 0 0.0% 0 0 0.0% 0Traditional Living (12B) 0 0.0% 0 0 0.0% 0Small Town Simplicity (12C) 0 0.0% 0 0 0.0% 0Modest Income Homes (12D) 0 0.0% 0 0 0.0% 0
13. Next Wave 29,593 16.2% 422 65,323 17.3% 393International Marketplace (13A) 27,726 15.2% 1,250 61,062 16.2% 1,186Las Casas (13B) 0 0.0% 0 0 0.0% 0NeWest Residents (13C) 1,867 1.0% 132 4,261 1.1% 132Fresh Ambitions (13D) 0 0.0% 0 0 0.0% 0High Rise Renters (13E) 0 0.0% 0 0 0.0% 0
14. Scholars and Patriots 4,547 2.5% 155 13,135 3.5% 153Military Proximity (14A) 0 0.0% 0 0 0.0% 0College Towns (14B) 3,552 1.9% 204 10,977 2.9% 283Dorms to Diplomas (14C) 995 0.5% 107 2,158 0.6% 59
Unclassified (15) 0 0.0% 0 0 0.0% 0
Data Note: This report identifies neighborhood segments in the area, and describes the socioeconomic quality of the immediate neighborhood. The index is a comparison of the percent of households or Total Population 18+ in the area, by Tapestry segment, to the percent of households or Total Population 18+ in the United States, by segment. An index of 100 is the US average.Source: Esri
September 25, 2019
©2019 Esri Page 16 of 18

Tapestry Segmentation Area Profile7353-7399 St Louis Ave Village Of Skokie Only7353-7399 St Louis Ave, Skokie, Illinois, 60076 Latitude: 42.01519Drive Time: 15 minute radius Longitude: -87.71717
Tapestry Urbanization Groups 2019 Households 2019 Adult PopulationNumber Percent Index Number Percent Index
Total: 182,448 100.0% 376,868 100.0%
1. Principal Urban Center 48,738 26.7% 375 92,920 24.7% 369Laptops and Lattes (3A) 1,604 0.9% 81 2,806 0.7% 84Metro Renters (3B) 7,483 4.1% 246 11,832 3.1% 242Trendsetters (3C) 22,685 12.4% 1,163 40,430 10.7% 1,129Downtown Melting Pot (8D) 13,523 7.4% 1,148 30,507 8.1% 1,110City Strivers (11A) 1,576 0.9% 113 3,084 0.8% 104NeWest Residents (13C) 1,867 1.0% 132 4,261 1.1% 132Fresh Ambitions (13D) 0 0.0% 0 0 0.0% 0High Rise Renters (13E) 0 0.0% 0 0 0.0% 0
2. Urban Periphery 67,082 36.8% 221 144,995 38.5% 217Pacific Heights (2C) 11,244 6.2% 876 26,363 7.0% 795Rustbelt Traditions (5D) 0 0.0% 0 0 0.0% 0Urban Villages (7B) 1,355 0.7% 71 3,369 0.9% 62American Dreamers (7C) 0 0.0% 0 0 0.0% 0Barrios Urbanos (7D) 0 0.0% 0 0 0.0% 0Southwestern Families (7F) 0 0.0% 0 0 0.0% 0City Lights (8A) 24,988 13.7% 948 51,059 13.5% 923Bright Young Professionals (8C) 453 0.2% 11 828 0.2% 11Metro Fusion (11C) 1,316 0.7% 51 2,314 0.6% 47Family Foundations (12A) 0 0.0% 0 0 0.0% 0Modest Income Homes (12D) 0 0.0% 0 0 0.0% 0International Marketplace (13A) 27,726 15.2% 1,250 61,062 16.2% 1,186Las Casas (13B) 0 0.0% 0 0 0.0% 0
3. Metro Cities 15,293 8.4% 46 32,237 8.6% 51In Style (5B) 614 0.3% 15 1,215 0.3% 15Emerald City (8B) 4,436 2.4% 171 7,663 2.0% 167Front Porches (8E) 417 0.2% 14 873 0.2% 15Old and Newcomers (8F) 55 0.0% 1 131 0.0% 2Hardscrabble Road (8G) 0 0.0% 0 0 0.0% 0Retirement Communities (9E) 2,851 1.6% 129 5,115 1.4% 135Social Security Set (9F) 919 0.5% 62 1,488 0.4% 60Young and Restless (11B) 931 0.5% 29 1,518 0.4% 29Set to Impress (11D) 523 0.3% 21 1,099 0.3% 25City Commons (11E) 0 0.0% 0 0 0.0% 0Traditional Living (12B) 0 0.0% 0 0 0.0% 0College Towns (14B) 3,552 1.9% 204 10,977 2.9% 283Dorms to Diplomas (14C) 995 0.5% 107 2,158 0.6% 59
Data Note: This report identifies neighborhood segments in the area, and describes the socioeconomic quality of the immediate neighborhood. The index is a comparison of the percent of households or Total Population 18+ in the area, by Tapestry segment, to the percent of households or Total Population 18+ in the United States, by segment. An index of 100 is the US average.Source: Esri
September 25, 2019
©2019 Esri Page 17 of 18

Tapestry Segmentation Area Profile7353-7399 St Louis Ave Village Of Skokie Only7353-7399 St Louis Ave, Skokie, Illinois, 60076 Latitude: 42.01519Drive Time: 15 minute radius Longitude: -87.71717
Tapestry Urbanization Groups 2019 Households 2019 Adult PopulationNumber Percent Index Number Percent Index
Total: 182,448 100.0% 376,868 100.0%4. Suburban Periphery 51,335 28.1% 88 106,716 28.3% 87Top Tier (1A) 8,763 4.8% 285 18,651 4.9% 277Professional Pride (1B) 308 0.2% 10 596 0.2% 9Boomburbs (1C) 0 0.0% 0 0 0.0% 0Savvy Suburbanites (1D) 3,595 2.0% 66 7,946 2.1% 66Exurbanites (1E) 5,557 3.0% 157 11,530 3.1% 157Urban Chic (2A) 7,330 4.0% 306 13,077 3.5% 280Pleasantville (2B) 14,911 8.2% 377 33,682 8.9% 369Enterprising Professionals (2D) 2,103 1.2% 81 3,642 1.0% 73Soccer Moms (4A) 0 0.0% 0 0 0.0% 0Home Improvement (4B) 0 0.0% 0 0 0.0% 0Comfortable Empty Nesters (5A) 95 0.1% 2 167 0.0% 2Parks and Rec (5C) 443 0.2% 12 1,083 0.3% 15Midlife Constants (5E) 0 0.0% 0 0 0.0% 0Up and Coming Families (7A) 0 0.0% 0 0 0.0% 0Silver & Gold (9A) 0 0.0% 0 0 0.0% 0Golden Years (9B) 7,054 3.9% 289 14,236 3.8% 320The Elders (9C) 1,176 0.6% 87 2,106 0.6% 94Military Proximity (14A) 0 0.0% 0 0 0.0% 0
5. Semirural 0 0.0% 0 0 0.0% 0Middleburg (4C) 0 0.0% 0 0 0.0% 0Heartland Communities (6F) 0 0.0% 0 0 0.0% 0Valley Growers (7E) 0 0.0% 0 0 0.0% 0Senior Escapes (9D) 0 0.0% 0 0 0.0% 0Down the Road (10D) 0 0.0% 0 0 0.0% 0Small Town Simplicity (12C) 0 0.0% 0 0 0.0% 0
6. Rural 0 0.0% 0 0 0.0% 0Green Acres (6A) 0 0.0% 0 0 0.0% 0Salt of the Earth (6B) 0 0.0% 0 0 0.0% 0The Great Outdoors (6C) 0 0.0% 0 0 0.0% 0Prairie Living (6D) 0 0.0% 0 0 0.0% 0Rural Resort Dwellers (6E) 0 0.0% 0 0 0.0% 0Southern Satellites (10A) 0 0.0% 0 0 0.0% 0Rooted Rural (10B) 0 0.0% 0 0 0.0% 0Diners & Miners (10C) 0 0.0% 0 0 0.0% 0Rural Bypasses (10E) 0 0.0% 0 0 0.0% 0
Unclassified (15) 0 0.0% 0 0 0.0% 0
Data Note: This report identifies neighborhood segments in the area, and describes the socioeconomic quality of the immediate neighborhood. The index is a comparison of the percent of households or Total Population 18+ in the area, by Tapestry segment, to the percent of households or Total Population 18+ in the United States, by segment. An index of 100 is the US average.Source: Esri
September 25, 2019
©2019 Esri Page 18 of 18

Time Series Profile7353-7399 St Louis Ave Village Of Skokie Only7353-7399 St Louis Ave, Skokie, Illinois, 60076 Latitude: 42.01519Drive Time: 5 minute radius Longitude: -87.71717
2010 2011 2012 2013 2014 2015 2016 2017 2018 2019 Average MedianPopulation
Total 19,213 19,243 19,327 19,424 19,493 19,338 19,238 19,213 19,269 19,188 19,295 19,256Change - 30 84 97 69 -155 -100 -25 56 -81 -3 30Percent Change - 0.2% 0.4% 0.5% 0.4% -0.8% -0.5% -0.1% 0.3% -0.4% 0.0% 0.2%Annual Rate - 0.2% 0.3% 0.4% 0.4% 0.1% 0.0% 0.0% 0.0% 0.0% 0.2% 0.1%
2010 2011 2012 2013 2014 2015 2016 2017 2018 2019 Average MedianHouseholds
Total 6,536 6,540 6,561 6,591 6,612 6,556 6,513 6,490 6,494 6,451 6,534 6,538Change - 4 21 30 21 -56 -43 -23 4 -43 -9 4Percent Change - 0.1% 0.3% 0.5% 0.3% -0.8% -0.7% -0.4% 0.1% -0.7% -0.1% 0.1%Annual Rate - 0.1% 0.2% 0.3% 0.3% 0.1% -0.1% -0.1% -0.1% -0.1% 0.1% 0.1%
2010 2011 2012 2013 2014 2015 2016 2017 2018 2019 Average MedianHousing Units
Total 6,875 6,889 6,926 6,953 6,979 6,939 6,924 6,898 6,908 6,873 6,916 6,916Change - 14 37 27 26 -40 -15 -26 10 -35 0 10Percent Change - 0.2% 0.5% 0.4% 0.4% -0.6% -0.2% -0.4% 0.1% -0.5% 0.0% 0.1%Annual Rate - 0.2% 0.4% 0.4% 0.4% 0.2% 0.1% 0.0% 0.1% 0.0% 0.2% 0.2%
Data Note: The Esri Vintage 2019 Time Series (2010 thru 2019) represents July 1 annual estimates in 2019 geography. With each annual release, the entire Time Series is revised.Source: U.S. Census Bureau, Census 2010 Summary File 1. Esri forecasts for 2019 and 2024.
September 25, 2019
©2019 Esri Page 1 of 3

Time Series Profile7353-7399 St Louis Ave Village Of Skokie Only7353-7399 St Louis Ave, Skokie, Illinois, 60076 Latitude: 42.01519Drive Time: 10 minute radius Longitude: -87.71717
2010 2011 2012 2013 2014 2015 2016 2017 2018 2019 Average MedianPopulation
Total 185,766 186,239 187,057 188,031 188,834 188,207 188,030 187,496 187,253 185,523 187,244 187,374Change - 473 818 974 803 -627 -177 -534 -243 -1,730 -27 -177Percent Change - 0.3% 0.4% 0.5% 0.4% -0.3% -0.1% -0.3% -0.1% -0.9% 0.0% -0.1%Annual Rate - 0.3% 0.3% 0.4% 0.4% 0.3% 0.2% 0.1% 0.1% 0.0% 0.2% 0.3%
2010 2011 2012 2013 2014 2015 2016 2017 2018 2019 Average MedianHouseholds
Total 66,676 66,838 67,125 67,481 67,803 67,626 67,604 67,366 67,196 66,502 67,222 67,281Change - 162 287 356 322 -177 -22 -238 -170 -694 -19 -22Percent Change - 0.2% 0.4% 0.5% 0.5% -0.3% 0.0% -0.4% -0.3% -1.0% 0.0% 0.0%Annual Rate - 0.2% 0.3% 0.4% 0.4% 0.3% 0.2% 0.1% 0.1% 0.0% 0.2% 0.2%
2010 2011 2012 2013 2014 2015 2016 2017 2018 2019 Average MedianHousing Units
Total 72,351 72,597 72,969 73,359 73,717 73,614 73,687 73,434 73,314 72,756 73,180 73,336Change - 246 372 390 358 -103 73 -253 -120 -558 45 73Percent Change - 0.3% 0.5% 0.5% 0.5% -0.1% 0.1% -0.3% -0.2% -0.8% 0.1% 0.1%Annual Rate - 0.3% 0.4% 0.5% 0.5% 0.3% 0.3% 0.2% 0.2% 0.1% 0.3% 0.3%
Data Note: The Esri Vintage 2019 Time Series (2010 thru 2019) represents July 1 annual estimates in 2019 geography. With each annual release, the entire Time Series is revised.Source: U.S. Census Bureau, Census 2010 Summary File 1. Esri forecasts for 2019 and 2024.
September 25, 2019
©2019 Esri Page 2 of 3

Time Series Profile7353-7399 St Louis Ave Village Of Skokie Only7353-7399 St Louis Ave, Skokie, Illinois, 60076 Latitude: 42.01519Drive Time: 15 minute radius Longitude: -87.71717
2010 2011 2012 2013 2014 2015 2016 2017 2018 2019 Average MedianPopulation
Total 476,011 477,368 479,608 482,157 484,202 483,290 483,634 482,933 482,235 477,852 480,929 482,196Change - 1,357 2,240 2,549 2,045 -912 344 -701 -698 -4,383 205 344Percent Change - 0.3% 0.5% 0.5% 0.4% -0.2% 0.1% -0.1% -0.1% -0.9% 0.0% 0.1%Annual Rate - 0.3% 0.4% 0.4% 0.4% 0.3% 0.3% 0.2% 0.2% 0.0% 0.3% 0.3%
2010 2011 2012 2013 2014 2015 2016 2017 2018 2019 Average MedianHouseholds
Total 181,075 181,682 182,658 183,740 184,680 184,511 184,856 184,575 184,206 182,450 183,443 183,973Change - 607 976 1,082 940 -169 345 -281 -369 -1,756 153 345Percent Change - 0.3% 0.5% 0.6% 0.5% -0.1% 0.2% -0.2% -0.2% -1.0% 0.1% 0.2%Annual Rate - 0.3% 0.4% 0.5% 0.5% 0.4% 0.3% 0.3% 0.2% 0.1% 0.3% 0.3%
2010 2011 2012 2013 2014 2015 2016 2017 2018 2019 Average MedianHousing Units
Total 198,187 198,883 200,002 201,059 201,879 201,685 202,053 201,630 201,288 199,881 200,655 201,174Change - 696 1,119 1,057 820 -194 368 -423 -342 -1,407 188 368Percent Change - 0.4% 0.6% 0.5% 0.4% -0.1% 0.2% -0.2% -0.2% -0.7% 0.1% 0.2%Annual Rate - 0.4% 0.5% 0.5% 0.5% 0.4% 0.3% 0.2% 0.2% 0.1% 0.3% 0.4%
Data Note: The Esri Vintage 2019 Time Series (2010 thru 2019) represents July 1 annual estimates in 2019 geography. With each annual release, the entire Time Series is revised.Source: U.S. Census Bureau, Census 2010 Summary File 1. Esri forecasts for 2019 and 2024.
September 25, 2019
©2019 Esri Page 3 of 3

Traffic Count Map7353-7399 St Louis Ave Village Of Skokie Only7353-7399 St Louis Ave, Skokie, Illinois, 60076 Latitude: 42.01519Drive Time: 5, 10, 15 minute radii Longitude: -87.71717
Source: ©2019 Kalibrate Technologies (Q1 2019).
September 25, 2019
©2019 Esri Page 1 of 1