
putm-acs-agg-final.pdf - Phoenix Group
298
PHOENIX UNIT TRUST MANAGERS MANAGER’S ANNUAL REPORT For the year: 1 February 2021 to 31 January 2022 PUTM Authorised Contractual Scheme (“PUTM ACS Funds” or the “Scheme”)
-
Upload
khangminh22 -
Category
Documents
-
view
4 -
download
0
Transcript of putm-acs-agg-final.pdf - Phoenix Group

PHOENIX UNIT TRUST MANAGERS
MANAGER’S ANNUAL REPORTFor the year: 1 February 2021 to 31 January 2022
PUTM Authorised Contractual Scheme (“PUTM ACS Funds” orthe “Scheme”)

Contents
ACS manager’s report* 2
Accounting policies 3-6
PUTM ACS European ex UK Fund 7-34
PUTM ACS Japan Equity Fund 35-57
PUTM ACS Lothian European ex UK Fund 58-76
PUTM ACS Lothian North American Equity Fund 77-95
PUTM ACS Lothian UK All Share Listed Equity Fund 96-115
PUTM ACS Lothian UK Gilt Fund 116-135
PUTM ACS Lothian UK Listed Smaller Companies Fund 136-151
PUTM ACS North American Fund 152-190
PUTM ACS Sustainable Index European Equity Fund 191-203
PUTM ACS Sustainable Index Japan Equity Fund 204-216
PUTM ACS Sustainable Index UK Equity Fund 217-229
PUTM ACS Sustainable Index US Equity Fund 230-242
PUTM ACS UK All Share Listed Equity Fund 243-272
Responsibilities of the ACS manager and depositary* 273
Depositary’s report and directors’ statement 274
Independent auditor’s report 275-277
Appendix 278-283
Corporate information* 284-293
*These collectively comprise the ACS Manager’s Report.
1

ACS MANAGER’S REPORT
THE SCHEME
PUTM ACS Funds (“the Scheme”) is an Authorised Contractual Scheme. Subsequentreferences to the 'Scheme' relate to PUTM ACS Funds. The Scheme is organised as anumbrella co-ownership scheme comprising separate Sub-funds. Each Sub-fund shall havea segregated portfolio of assets and, accordingly, the assets of a Sub-fund are allocatedexclusively to that Sub-fund and shall not be used or made available to discharge (directlyor indirectly) the liabilities of, or claims against, any other person or body, including anyother Sub-fund and shall not be available for any other purpose.
Unitholders are not liable for the debts of a Sub-fund.
The Scheme is subject to the rules of the FCA as set out in the Collective InvestmentSchemes Sourcebook ("COLL") which form part of the FCA handbook.
The property of the Scheme is entrusted to HSBC Bank Plc as depositary (“theDepositary”).
The object of the Scheme is to invest the scheme property through its Sub-funds, and theobjective of each Sub-fund is for the ACS Manager on behalf of the unitholder's, as co-owners of the relevant Sub-fund's property, to invest that property in transferablesecurities, money market instruments, derivatives and forward transactions, deposits,cash, near cash, units in collective investment schemes and immovable property, inaccordance with the regulations applicable to the Scheme and each Sub-fund with theaim of spreading investment risk and giving the unitholders the results of the managementof that property.
Each Sub-fund has a different investment objective, and in the financial statements youwill find an investment review for each Sub-fund which includes details of the investmentobjectives. As at 31 January 2022 there were 13 active Sub-funds in the PUTM ACSFunds.
AUTHORISED STATUS
The Financial Conduct Authority authorised the PUTM ACS Funds as a UCITS Scheme.
THE FINANCIAL STATEMENTS
We are pleased to present the annual financial statements of the Scheme for the yearended 31 January 2022. As required by the regulations, information for each of the Sub-funds has also been included in these financial statements. On the following pages wereview the performance of each of those Sub-funds during the year. We hope that you findthe review useful and informative.
SUBSEQUENT EVENTS
Please note that the ACS Manager plans to transfer all of the assets out of the PUTM ACSUK All Share Listed Equity Fund into a new PUTM ACS Fund in the last quarter of 2022and has submitted an application to the FCA to wind-up PUTM ACS UK All Share ListedEquity Fund.
2

Accounting Policies
The following accounting policies apply to all Sub-funds, where applicable.
Note 1 Accounting policies
(a) Basis of preparationThe financial statements have been prepared under the historical cost basis, as modified bythe revaluation of investments in accordance with Financial Reporting Standard (FRS 102)and the Statement of Recommended Practice (SORP) for Financial Statements of UKAuthorised Funds issued by The Investment Association (‘IA’) in May 2014, and as amendedin June 2017.The financial statements (with the exception of the PUTM ACS UK All Share Listed EquityFund) have been prepared on a going concern basis. The ACS Manager has made anassessment of the Sub-funds’ ability to continue as a going concern, and is satisfied it has theresources to continue in business for the foreseeable future and is not aware of any materialuncertainties that may cast significant doubt on this assessment. This assessment is made fora period of 12 months from when the financial statements are authorised for issue andconsiders liquidity, declines in global capital markets, known redemption levels, expenseprojections, key service provider’s operational resilience, and the impact of COVID-19.The ACS Manager plans to transfer the assets of PUTM ACS UK All Share Listed Equity Fundinto the new PUTM ACS Fund through in-specie transactions in the last quarter of 2022. TheACS Manager has submitted an application to the FCA to wind up the PUTM ACS UK AllShare Listed Equity Fund and therefore does not consider it to be appropriate to adopt thegoing concern basis of accounting in preparing the financial statements. Accordingly, thefinancial statements for PUTM ACS UK All Share Listed Equity Fund only have been preparedon a break-up basis, all assets are measured at recoverable value and all liabilities atsettlement value. No adjustments were required in these financial statements to reduce assetsto their recoverable value or liabilities to their settlement value. The ACS Manager will bearthe costs relating to any such liabilities arising. Unless otherwise stated all accounting policiesare consistent with those of the prior year.
(b) Valuation of investmentsThe quoted investments of the Sub-funds have been valued at bid dealing prices as at closeof business on 31 January 2022, the last valuation point in the accounting year, inaccordance with the ACS Deed. Investments in collective investment schemes have beenvalued at bid price for dual priced funds or the single price for single priced funds. Wherethese investments are managed by the ACS Manager or an associate of the ACS Manager, theholdings have been valued at the cancellation price for dual priced funds or the single pricefor single priced funds. This price is the last available published price at the year end.Derivatives are valued as at close of business on 31 January 2022, the last valuation point ofthe accounting year. Exchange traded derivatives are priced at fair value, which is deemed tobe the bid price.Over-the-counter derivatives are priced at fair value using valuation models and data sourcedfrom market data providers.
(c) Foreign exchangeTransactions in foreign currencies during the year are translated into Sterling (the functionalcurrency of the Sub-funds), at the rates of exchange ruling on the transaction date. Amountsheld in foreign currencies have been translated at the rate of exchange ruling at close ofbusiness, 31 January 2022, the last valuation point in the accounting year.
3
4
Accounting Policies
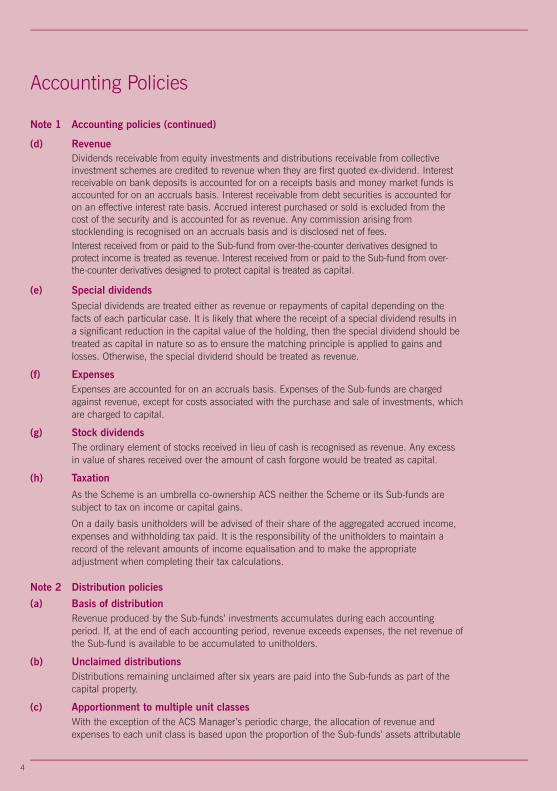
Note 1 Accounting policies (continued)
(d) RevenueDividends receivable from equity investments and distributions receivable from collectiveinvestment schemes are credited to revenue when they are first quoted ex-dividend. Interestreceivable on bank deposits is accounted for on a receipts basis and money market funds isaccounted for on an accruals basis. Interest receivable from debt securities is accounted foron an effective interest rate basis. Accrued interest purchased or sold is excluded from thecost of the security and is accounted for as revenue. Any commission arising fromstocklending is recognised on an accruals basis and is disclosed net of fees.Interest received from or paid to the Sub-fund from over-the-counter derivatives designed toprotect income is treated as revenue. Interest received from or paid to the Sub-fund from over-the-counter derivatives designed to protect capital is treated as capital.
(e) Special dividendsSpecial dividends are treated either as revenue or repayments of capital depending on thefacts of each particular case. It is likely that where the receipt of a special dividend results ina significant reduction in the capital value of the holding, then the special dividend should betreated as capital in nature so as to ensure the matching principle is applied to gains andlosses. Otherwise, the special dividend should be treated as revenue.
(f) ExpensesExpenses are accounted for on an accruals basis. Expenses of the Sub-funds are chargedagainst revenue, except for costs associated with the purchase and sale of investments, whichare charged to capital.
(g) Stock dividendsThe ordinary element of stocks received in lieu of cash is recognised as revenue. Any excessin value of shares received over the amount of cash forgone would be treated as capital.
(h) Taxation
As the Scheme is an umbrella co-ownership ACS neither the Scheme or its Sub-funds aresubject to tax on income or capital gains.
On a daily basis unitholders will be advised of their share of the aggregated accrued income,expenses and withholding tax paid. It is the responsibility of the unitholders to maintain arecord of the relevant amounts of income equalisation and to make the appropriateadjustment when completing their tax calculations.
Note 2 Distribution policies
(a) Basis of distributionRevenue produced by the Sub-funds’ investments accumulates during each accountingperiod. If, at the end of each accounting period, revenue exceeds expenses, the net revenue ofthe Sub-fund is available to be accumulated to unitholders.
(b) Unclaimed distributionsDistributions remaining unclaimed after six years are paid into the Sub-funds as part of thecapital property.
(c) Apportionment to multiple unit classesWith the exception of the ACS Manager’s periodic charge, the allocation of revenue andexpenses to each unit class is based upon the proportion of the Sub-funds’ assets attributable

Accounting Policies
5
Note 2 Distribution policies (continued)
(c) Apportionment to multiple unit classes (continued)to each unit class on the day the revenue is earned or the expense is suffered. Consequently,the revenue available to distribute for each unit class will differ.
(d) Special dividendsIt is the policy of the Sub-funds, where applicable, to distribute special dividends which havebeen treated as revenue.
(e) ExpensesIn determining the net revenue available for distribution, FCA fees and charges in relation tosafe custody of investments are ultimately borne by capital.
(f) Stock dividendsIt is the policy of the Sub-funds, where applicable, to distribute the revenue element of stockdividends.
Note 3 Risk management policiesThe risks arising from the Sub-funds’ financial instruments are market price risk, interest raterisk, foreign currency risk, liquidity risk, credit risk and counterparty risk. The ACS Manager'spolicies for managing these risks are summarised below and have been applied throughoutthe year.
(a) Market price risk
Market price risk arises mainly from uncertainty about future prices of financial instrumentsheld. It represents the potential loss the Sub-funds might suffer through holding marketpositions in the face of price movements. The Sub-funds' investment portfolios are exposed tomarket fluctuations which are monitored by the ACS Manager in pursuit of the investmentobjectives and policies. Adherence to investment guidelines and to investment and borrowingpowers set out in the ACS Deed, the Prospectus and in the Collective Investment SchemesSourcebook (“the Sourcebook”) mitigates the risk of excessive exposure to any particular typeof security or issuer.
(b) Interest rate risk
The majority of the Sub-funds' financial assets are equity shares and other investments whichneither pay interest nor have a maturity date.The Lothian UK Gilt Fund's assets are comprised of fixed interest rate securities. There is thereforea risk that the capital value of investments will vary as a result of the market's sentimentregarding future interest rates.Expectations of future rates may result in an increase or decrease in the value of investmentsheld. In general, if interest rates rise the revenue potential of the Sub-fund also rises but the valueof fixed interest rate securities will decline. A decline in interest rates will in general have theopposite effect.Any transactions in fixed interest securities must be used in accordance with the investmentobjective of the Sub-fund and must be deemed by the Investment Manager to be economicallyappropriate. Regular production of portfolio risk reports highlight concentrations of risk, includinginterest rate risk, for the Sub-funds.Interest receivable on bank deposits or payable on bank overdraft positions will be affected byfluctuations in interest rates.

6
Accounting Policies
Note 3 Risk management policies (continued)
(c) Foreign currency risk
On some of the Sub-funds a substantial proportion of the Sub-funds' investment portfolio isinvested in overseas securities and the Balance sheet can be significantly affected by movementsin foreign exchange rates. The Sub-funds may be subject to short term exposure to exchange ratemovements between placing the purchase or sale of securities and agreeing a related currencytransaction albeit usually the two transactions are agreed at the same time.Any such currency transactions must be used in accordance with the investment objective of theSub-funds and must be deemed by the Investment Manager to be economically appropriate.Regular production of portfolio risk reports highlight concentrations of risk, including currencyrisk, for the Sub-funds.
(d) Liquidity risk
The Sub-funds’ assets are comprised mainly of readily realisable securities. If insufficient cash isavailable to finance unitholder redemptions then securities held by the Sub-fund may need to besold. The risk of low market liquidity, through reduced trading volumes, may affect the ability ofthe Sub-funds to trade financial instruments at values previously indicated by financial brokers.From time to time, liquidity may also be affected by stock specific or economic events. Tomanage these risks the ACS Manager performs market research in order to achieve the best pricefor any transactions entered into on behalf of the Sub-funds. All stocks are valued daily but thosestocks identified as being less liquid are reviewed on a regular basis for pricing accuracy.
(e) Counterparty risk
Certain transactions in securities that the Sub-funds enter into expose them to the risk that thecounterparty will not deliver the investment (purchase) or cash (sale) after the Sub-fund hasfulfilled its responsibilities. The Sub-funds only buy and sell investments through brokers whichhave been approved by the ACS Manager as an acceptable counterparty. This list is reviewedannually.
(f) Derivatives
Derivative transactions may be used by the Sub-funds for the purposes of meeting its investmentobjectives and also for hedging. In doing so the ACS Manager may make use of a variety ofderivative instruments in accordance with the Sourcebook. The use of derivatives for investmentpurposes means that the net asset value of the Sub-funds may at times have high volatility,although derivatives will not be used with the intention of raising the risk profile of the Sub-funds.Where derivatives are used for hedging this will not compromise the risk profile of the Sub-funds.Use of derivatives will not knowingly contravene any relevant investment objective or limits.
The ACS Manager has used exchange traded futures to hedge the Sub-funds' assets againstmarket volatility in the FTSE All Share index and to hedge against assets denominated in foreigncurrency.
Interest rate swaps have been used to hedge the interest rate risk of holding fixed rate bondsduring the period.
The derivative counterparty is shown at the bottom of the Portfolio of investments in each Sub-fund where applicable.

7
Dear Investor
Welcome to the PUTM ACS European (ex-UK) Fund reportfor the 12 months to 31 January 2022.
Performance Review
Over the review period, the PUTM ACS European (ex-UK)Fund returned 15.84% (Source: Factset, Gross of AMC,GBP, based upon the movement in the Cancellation Pricefrom 31/01/21 to 31/01/22). This was compared to areturn of 13.97% for the benchmark index (Source:Factset, MSCI Europe (ex-UK), Total Return in GBP, from31/01/21 to 31/01/22).
Investment review
Source: Sub-fund performance: Factset, Gross of AMC, in GBP, based upon the movement in the Cancellation Pricefrom 31 January 2021 to 31 January 2022. Benchmark index performance: MSCI Europe (ex- UK), Total Return inGBP, from 31 January 2021 to 31 January 2022.
Past performance is not a guide to future performance.
Please note that all past performance figures are calculated without taking the initial charge into account.
The value of units and the income from them can go down as well as up and is not guaranteed. You maynot get back the full amount invested.
Standardised Past Performance
PUTM ACS European (ex-UK) Fund 15.84 6.75 10.40 – –
Benchmark Index 13.97 7.46 11.48 – –
Jan 21 - Jan22 Jan 20 - Jan21 Mar 19 - Jan 20% growth % growth % growth
PUTM ACS European ex UK Fund

8
PUTM ACS European ex UK Fund
Investment review
Market Review
European shares finished substantially higher over the 12months. Most European indices fell at the beginning of theperiod amid renewed lockdown measures. Nevertheless,the region's equities performed well from February onwards,despite ongoing lockdown measures and rising Covid-19cases. After rising for seven consecutive months, Europeanshares fell again in September, with Germany among theworst performers. Outgoing Chancellor Angela Merkel’sChristian Democratic Union-Christian Social Union bloc lostout to the Social Democratic Party in the federal election,although forming a coalition government is expected to takesome time. Equities fell again sharply at the end of theperiod, as tightening monetary policies and geopoliticaltensions between Russia and Ukraine weighed onsentiment.
September saw Norway’s Norges Bank became the firstmajor developed bank to raise interest rates since the startof the pandemic. Attempting to reassure investors that theEuropean Central Bank (ECB) would not follow suit,President Christine Lagarde said the central bank would nottaper bond market support. However, the ECB hasindicated it would end its Pandemic Emergency PurchaseProgramme in March 2022. Eurozone officials alsoacknowledged that rising inflation may not be as short-livedas predicted, with inflation reaching 5.1% in January.
Sub-fund Review
The investment process underlying the Sub-fund targetssimultaneous exposure to a broad range of factors thatacademic and empirical research has shown deliversuperior returns over the long term. Examples of suchfactors are value, quality and momentum. Combining thesefactors within a multifactor framework then allows the Sub-fund to reap the benefits of diversification, with the aim ofoutperforming throughout the market cycle.
The performance of our proprietary quality factors over theperiod was mixed, with accruals underperforming whileinvestment and profitability outperformed.
The Sub-fund’s composite value strategy (a blend of severalvalue metrics ranging from deep, cyclical measures ofvalue, such as book yield, to value metrics with moredefensive attributes, for example dividend yield and freecash flow yield) outperformed.
Drilling down to a stock level, an overweight position in theDanish shipping company A.P. Moller - Maersk was apositive contributor to performance. The stock rose 79.9%over the 12 months on the back of higher container linerrates due to the ongoing disruption in global supply chains.The stock had a high score based on our trend metrics. TheSub-fund also benefited from an active holding in theFrench bank BNP Paribas. The company performed wellafter it forecast higher revenue for this year and announceda share buyback programme. BNP Paribas has a positivescore according to our measures of sentiment. On thedownside, Airbus was one of the Sub-fund’s top detractorsafter its share price suffered from Omicron-relatedweakness towards the end of the period. Investors wereconcerned about the impact the new Covid-19 variantmight have on the travel sector. Santander and ZurichInsurance also weighed on the Sub-fund’s returns.
Outlook at Year End
Uncertainty around the new variant Omicron andgeopolitical tensions between Russia and Ukraine willcontinue to dominate news flow in the short term.However, many of the risk factors throughout 2021 havemoderated, with global vaccination rates rising and thedirection of Chinese policy becoming clearer. Meanwhile,the removal of central bank support has been priced in, tosome extent. Nevertheless, persistently high inflation andsupply-chain strains may lead to earnings pressure formany businesses.
As the market outlook was completed as of 31st January,there is no mention of the ongoing Ukraine crisis thatbegan at the end of February. Naturally, this woulddramatically affect any future expectations of marketoutlook that would not have been factored in at the time ofwriting.

9
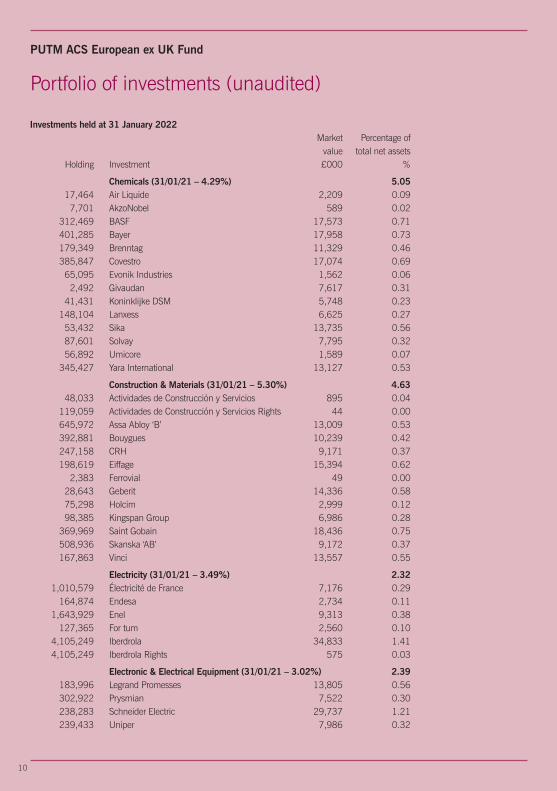
Portfolio of investments (unaudited)
Investments held at 31 January 2022 Market Percentage of value total net assets Holding Investment £000 %
Europe (31/01/21 – 98.99%) 99.68
Aerospace & Defence (31/01/21 – 1.03%) 0.68 75,504 Airbus 7,072 0.29 20,020 Safran 1,776 0.07 117,420 Thales 7,986 0.32
Alternative Energy (31/01/21 – 0.34%) 0.05 85,152 Gamesa 1,359 0.05
Automobiles & Parts (31/01/21 – 3.64%) 3.29 111,747 BMW 8,644 0.35 606,931 Daimler 35,239 1.43 245,158 Daimler Truck Holding 6,433 0.26 3,538 Faurecia 114 0.00 71,238 Michelin 8,788 0.35 53,006 Porsche Preference 3,627 0.15 587,194 Stellantis 8,321 0.34 9,057 Stellantis 128 0.01 64,342 Volkswagen Preference 9,792 0.40
Banks (31/01/21 – 5.96%) 7.18 4,919,640 Banco Bilbao Vizcaya Argentaria 23,151 0.94 3,834,978 Banco Santander 9,916 0.40 538,408 BNP Paribas 28,337 1.15 1,186,831 CaixaBank 2,822 0.12 1,052,820 Credit Agricole 11,680 0.47 399,396 Deutsche Bank 4,086 0.17 146,272 DNB 2,575 0.10 1,278,532 ING Groep 13,952 0.57 10,508,693 Intesa Sanpaolo 22,996 0.93 11,252 Julius Baer Group 541 0.02 93,210 KBC Group 5,991 0.24 1,541,468 Mediobanca 13,021 0.53 1,799,612 Nordea Bank 15,833 0.64 261,755 Raiffeisen Bank International 5,428 0.22 244,270 Skandinaviska Enskilda Banken ‘A’ 2,329 0.10 521 Skandinaviska Enskilda Banken ‘C’ 5 0.00 525,940 Société Générale 14,357 0.58
Beverages (31/01/21 – 1.38%) 2.11 202,421 Anheuser-Busch InBev 9,424 0.38 211,410 Carlsberg ‘B’ 25,509 1.03 163,047 Coca-Cola European Partners 6,938 0.28 68,011 Heineken 5,400 0.22 67,693 JDE Peets 1,503 0.06 21,193 Pernod Ricard 3,347 0.14
PUTM ACS European ex UK Fund
10
Portfolio of investments (unaudited)
Investments held at 31 January 2022 Market Percentage of value total net assets Holding Investment £000 %
Chemicals (31/01/21 – 4.29%) 5.05 17,464 Air Liquide 2,209 0.09 7,701 AkzoNobel 589 0.02 312,469 BASF 17,573 0.71 401,285 Bayer 17,958 0.73 179,349 Brenntag 11,329 0.46 385,847 Covestro 17,074 0.69 65,095 Evonik Industries 1,562 0.06 2,492 Givaudan 7,617 0.31 41,431 Koninklijke DSM 5,748 0.23 148,104 Lanxess 6,625 0.27 53,432 Sika 13,735 0.56 87,601 Solvay 7,795 0.32 56,892 Umicore 1,589 0.07 345,427 Yara International 13,127 0.53
Construction & Materials (31/01/21 – 5.30%) 4.63 48,033 Actividades de Construcción y Servicios 895 0.04 119,059 Actividades de Construcción y Servicios Rights 44 0.00 645,972 Assa Abloy ‘B’ 13,009 0.53 392,881 Bouygues 10,239 0.42 247,158 CRH 9,171 0.37 198,619 Eiffage 15,394 0.62 2,383 Ferrovial 49 0.00 28,643 Geberit 14,336 0.58 75,298 Holcim 2,999 0.12 98,385 Kingspan Group 6,986 0.28 369,969 Saint Gobain 18,436 0.75 508,936 Skanska ‘AB’ 9,172 0.37 167,863 Vinci 13,557 0.55
Electricity (31/01/21 – 3.49%) 2.32 1,010,579 Électricité de France 7,176 0.29 164,874 Endesa 2,734 0.11 1,643,929 Enel 9,313 0.38 127,365 For tum 2,560 0.10 4,105,249 Iberdrola 34,833 1.41 4,105,249 Iberdrola Rights 575 0.03
Electronic & Electrical Equipment (31/01/21 – 3.02%) 2.39 183,996 Legrand Promesses 13,805 0.56 302,922 Prysmian 7,522 0.30 238,283 Schneider Electric 29,737 1.21 239,433 Uniper 7,986 0.32
PUTM ACS European ex UK Fund

11
Portfolio of investments (unaudited)
Investments held at 31 January 2022 Market Percentage of value total net assets Holding Investment £000 %
Financial Services (31/01/21 – 4.64%) 4.85 159,415 Amundi 9,137 0.37 114,321 EQT 3,286 0.13 470,609 Hexagon B 4,673 0.19 33,042 Industrivärden ‘C’ 758 0.03 1,426,468 Investor B 22,855 0.93 307,650 Kinnevik 6,758 0.28 29,575 Partners Group 30,223 1.22 155,165 Prosus 9,519 0.39 8,540 Sofina 2,515 0.10 2,174,579 UBS 29,769 1.21
Fixed Line Telecommunications (31/01/21 – 1.02%) 0.82 15,530 Elisa 675 0.03 1,837,245 Koninklijke 4,493 0.18 949,541 Orange 8,264 0.33 158,014 Proximus 2,392 0.10 10,742 Swisscom 4,542 0.18
Food & Drug Retailers (31/01/21 – 2.05%) 1.89 392,124 Carrefour 5,542 0.22 40,232 Colruyt 1,213 0.05 38,979 ICA Gruppen 1,665 0.07 329,841 Jeronimo Martins 5,873 0.24 225,292 Kesko ‘B’ 5,256 0.21 1,130,760 Koninklijke Ahold Delhaiz 27,163 1.10
Food Producers (31/01/21 – 4.54%) 4.57 1,080 Barry Callebaut 1,835 0.07 340,248 Danone 15,704 0.64 247 Lindt & Spruengli 2,118 0.09 54,285 Marine Harvest 985 0.04 958,074 Nestle ‘R’ 91,333 3.70 89,377 Orkla 634 0.03
Forestry & Paper (31/01/21 – 0.00%) 0.06 111,998 SCA ‘B’ 1,439 0.06
Gas, Water & Multiutilities (31/01/21 – 2.26%) 2.62 550,059 E.On 5,616 0.23 279,312 Enagás 4,480 0.18 1,930,460 Engie 21,862 0.89 145,770 Naturgy Energy 3,426 0.14 1,178,916 Red Electrica Corporation 17,642 0.71 787,748 Snam 3,265 0.13 52,740 Suez Environnement 874 0.03 282,761 Veolia Environnement 7,544 0.31
PUTM ACS European ex UK Fund

12
Portfolio of investments (unaudited)
Investments held at 31 January 2022 Market Percentage of value total net assets Holding Investment £000 %
General Industrials (31/01/21 – 1.38%) 1.83 7,656 Knorr-Bremse 572 0.02 343,964 Siemens 40,057 1.62 118,976 Smurfit Kappa 4,626 0.19
General Retailers (31/01/21 – 2.20%) 1.97 1,199,137 Inditex 26,791 1.09 39,621 Kering 21,727 0.88
Healthcare Equipment & Services (31/01/21 – 3.76%) 3.61 40,094 Carl Zeiss Meditec 4,745 0.19 31,376 Coloplast ‘B’ 3,379 0.14 60,696 Essilor International 8,455 0.34 89,293 Eurofins Scientific 6,619 0.27 596,149 Fresenius 18,158 0.74 117,962 Fresenius Medical Care 5,902 0.24 127,828 Getinge ‘B’ 3,697 0.15 535,918 Koninklijke Philips 13,158 0.53 44,619 Qiagen 1,628 0.07 56,507 Sonova ‘N’ 14,792 0.60 6,951 Straumann Holdings 8,433 0.34
Household Goods (31/01/21 – 0.35%) 0.85 158,126 Electrolux AB 2,426 0.10 156,644 Henkel Preference 9,468 0.38 780,005 Husqvarna ‘B’ 8,032 0.33 8,719 SEB 977 0.04
Industrial Engineering (31/01/21 – 3.52%) 2.61 322,420 ABB 8,185 0.33 121,975 Alfa Laval 3,037 0.12 213,638 Alstom 5,114 0.21 286,717 Atlas Copco ‘A’ 12,441 0.50 147,327 CNH Industrial 1,641 0.07 113,636 Epiroc A 1,793 0.07 162,528 GEA Group 5,664 0.23 47,515 Kone ‘B’ 2,272 0.09 11,490 Sartorius Preference 4,564 0.19 40,386 Schindler participation certificates 7,439 0.30 295,326 Vestas Wind Systems 5,855 0.24 240,065 Volvo ‘B’ 3,996 0.16 264,315 Wartsila 2,390 0.10
Industrial Metals (31/01/21 – 0.32%) 0.21 454,943 Norsk Hydro 2,585 0.10 108,633 Voestalpine 2,681 0.11
PUTM ACS European ex UK Fund

13
Portfolio of investments (unaudited)
Investments held at 31 January 2022 Market Percentage of value total net assets Holding Investment £000 %
Industrial Transportation (31/01/21 – 2.45%) 3.89 7,698 A.P. Møller - Maersk A/S 20,496 0.83 884,861 Bolloré 3,519 0.14 701,447 Deutsche Post 30,881 1.25 153,843 DSV 23,150 0.94 86,138 Kuehne & Nagel International 17,950 0.73
Life Insurance (31/01/21 – 1.53%) 1.94 387,619 Aegon 1,617 0.07 134,199 Ageas 4,774 0.19 66,529 CNP Assurances 1,212 0.05 483,910 NN Group 20,042 0.81 1,078,307 Poste Italiane 10,676 0.43 20,209 Swiss Life Rentenanstalt 9,578 0.39
Media (31/01/21 – 1.50%) 1.33 276,151 Publicis Groupe 13,775 0.56 123,788 Universal Music Group 2,256 0.09 914,980 Vivendi 8,864 0.36 103,549 Wolters Kluwer Certificates 7,807 0.32
Mining (31/01/21 – 0.21%) 0.46 383,034 Boliden 11,415 0.46
Mobile Telecommunications (31/01/21 – 0.66%) 0.52 548,498 Deutsche Telekom 7,605 0.31 1,447,604 Telefónica Deutschland 3,071 0.13 28,857 Telenor 354 0.01 609,188 TeliaSonera 1,777 0.07
Non Equity Invest Instruments (31/01/21 – 0.20%) 0.00 Non-Life Insurance (31/01/21 – 3.26%) 2.50 202,196 Allianz 38,189 1.55 416,605 AXA 9,717 0.39 341,628 Gjensidige Forsikring 6,186 0.25 1,633 Muenchener Rueckver 380 0.02 50,625 Sampo Oyj 1,856 0.08 144,076 Tryg 2,539 0.10 7,846 Zurich Insurance Group 2,767 0.11
Oil & Gas Producers (31/01/21 – 2.57%) 2.51 126,290 OMV 5,690 0.23 723,915 Repsol 6,795 0.28 1,178,616 TotalEnergies 49,446 2.00
Personal Goods (31/01/21 – 6.42%) 8.09 136,288 Adidas 27,449 1.11 24,663 Beiersdorf 1,812 0.07
PUTM ACS European ex UK Fund

14
Portfolio of investments (unaudited)
Investments held at 31 January 2022 Market Percentage of value total net assets Holding Investment £000 %
Personal Goods (continued) 165,565 CIE Financiere Richemont ‘A’ 17,615 0.71 469,855 Essity ‘B’ 9,815 0.40 1,924 Hermes International 2,112 0.09 112,879 L’Oreal 35,533 1.44 138,048 LVMH 83,256 3.38 146,256 Moncler 6,885 0.28 70,373 Pandora 5,650 0.23 106,630 Puma 8,362 0.34
4,702 The Swatch Group ‘B’ 1,010 0.04
Pharmaceuticals & Biotechnology (31/01/21 – 10.98%) 11.36 45,424 BioMérieux 3,945 0.16 36,369 Genmab 9,083 0.37 49,578 Ipsen Promesses 3,572 0.14 48,279 Merck KGaA 7,838 0.32 784,514 Novartis ‘R’ 50,319 2.04 722,692 Novo Nordisk ‘B’ 53,409 2.17 20,717 Novozymes 1,056 0.04 258,535 Orion Oyj 7,794 0.32 28,795 Recordati 1,192 0.05 365,464 Roche Holding 104,404 4.23 418,775 Sanofi 32,450 1.31 20,871 Vifor Pharma 2,734 0.11 73,036 William Demant Holding 2,392 0.10
Real Estate & Investment Services (31/01/21 – 1.05%) 1.00 877,750 Aroundtown 4,019 0.16 16,051 Fastighets Balder ‘B’ 786 0.03 121,473 LEG Immobilien 11,931 0.49 56,272 Swiss Prime Site 4,111 0.17 89,025 Vonovia 3,724 0.15
Real Estate Investment Trusts (31/01/21 – 0.37%) 0.24 300,764 Klépierre 5,893 0.24
Software & Computer Services (31/01/21 – 3.95%) 3.51 138,976 Bechtle 6,117 0.25 102,501 Capgemini 16,910 0.68 175,247 Dassault Systems 6,215 0.25 139,475 Embracer Group ‘AB’ 1,021 0.04 486,798 SAP 44,660 1.81 3,510 Teleperformance 977 0.04 39,754 Temenos Group 3,501 0.14 85,808 United Internet 2,480 0.10 135,262 Worldline 4,821 0.20
PUTM ACS European ex UK Fund
15
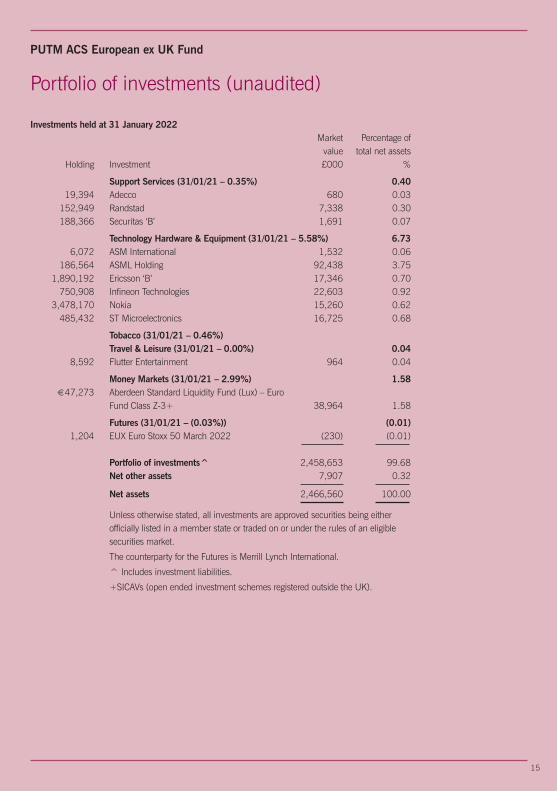
Portfolio of investments (unaudited)
Investments held at 31 January 2022 Market Percentage of value total net assets Holding Investment £000 %
Support Services (31/01/21 – 0.35%) 0.40 19,394 Adecco 680 0.03 152,949 Randstad 7,338 0.30 188,366 Securitas ‘B’ 1,691 0.07
Technology Hardware & Equipment (31/01/21 – 5.58%) 6.73 6,072 ASM International 1,532 0.06 186,564 ASML Holding 92,438 3.75 1,890,192 Ericsson ‘B’ 17,346 0.70 750,908 Infineon Technologies 22,603 0.92 3,478,170 Nokia 15,260 0.62 485,432 ST Microelectronics 16,725 0.68
Tobacco (31/01/21 – 0.46%) Travel & Leisure (31/01/21 – 0.00%) 0.04 8,592 Flutter Entertainment 964 0.04
Money Markets (31/01/21 – 2.99%) 1.58 €47,273 Aberdeen Standard Liquidity Fund (Lux) – Euro Fund Class Z-3+ 38,964 1.58
Futures (31/01/21 – (0.03%)) (0.01) 1,204 EUX Euro Stoxx 50 March 2022 (230) (0.01)
Portfolio of investments^ 2,458,653 99.68 Net other assets 7,907 0.32
Net assets 2,466,560 100.00
Unless otherwise stated, all investments are approved securities being eitherofficially listed in a member state or traded on or under the rules of an eligiblesecurities market.
The counterparty for the Futures is Merrill Lynch International.
^ Includes investment liabilities.
+SICAVs (open ended investment schemes registered outside the UK).
PUTM ACS European ex UK Fund

16
PUTM ACS European ex UK Fund
Top ten purchases and salesFor the year ended 31 January 2022
Purchases Cost£000
Aberdeen Standard Liquidity Fund (Lux) –Euro Fund Class Z-3 188,669Roche Holding 70,208ASML Holding 61,655Nestle ‘R’ 55,275LVMH 46,729TotalEnergies 45,896L’Oreal 36,951Novo Nordisk ‘B’ 35,290Siemens 33,535SAP 31,107
Subtotal 605,315Other purchases 1,713,952
Total purchases for the year 2,319,267
Sales Proceeds£000
Aberdeen Standard Liquidity Fund (Lux) –Euro Fund Class Z-3 179,381Vonovia 20,791BNP Paribas 19,646TotalEnergies 19,426Nestle ‘R’ 19,030Logitech ‘R’ 16,303Intesa Sanpaolo 15,112Hermes International 13,312L’Oreal 12,902Essilor International 11,881
Subtotal 327,784Other sales 728,027
Total sales for the year 1,055,811

17
PUTM ACS European ex UK Fund
Statistical information
Comparative tables Class ‘B’ Class ‘C’ Accumulation** Accumulation*** 31/01/22 31/01/21 31/01/22 31/01/21 31/01/20 pence pence pence pence penceChange in net assets per unitOpening net asset value per unit 99.45 100.00 117.27 110.29 100.00
Return before operating charges* 15.31 (0.53) 17.90 7.09 10.39Operating charges (0.07) (0.02) (0.10) (0.11) (0.10)
Return after operating charges* 15.24 (0.55) 17.80 6.98 10.29
Distributions on accumulation units (2.51) (0.19) (2.81) (2.18) (2.63)Retained distributions onaccumulation units 2.51 0.19 2.81 2.18 2.63
Closing net asset value per unit 114.69 99.45 135.07 117.27 110.29
*after direct transaction costs of:^ 0.06 0.05 0.07 0.05 0.04
PerformanceReturn after charges 15.32% (0.55%) 15.18% 6.33% 10.29%
Other informationClosing net asset value (£000) 701,329 33,302 277,004 159,660 172,567Closing number of units 611,492,402 33,485,372 205,079,222 136,142,138 156,472,423Operating charges 0.02%**** 0.09% 0.02%**** 0.10% 0.11%Direct transaction costs 0.05% 0.05% 0.05% 0.05% 0.04%
Prices+
Highest unit price (pence) 123.36 105.24 145.29 124.08 115.65Lowest unit price (pence) 99.97 99.45 117.84 83.48 100.00
^The direct transaction costs includes commission on futures.+ High and low price disclosures are based on quoted unit prices. Therefore, the opening and closing NAV pricesmay fall outside the high/low price threshold.**Class ‘B’ Accumulation launched on 27 November 2020.***Class ‘C’ Accumulation launched on 27 March 2019.****The AMC was updated during the year.

18
Statistical information
Comparative tables Class ‘D’ Class ‘H’ Accumulation** Accumulation*** 31/01/22 31/01/21 31/01/20 31/01/22 pence pence pence penceChange in net assets per unitOpening net asset value per unit 117.36 110.33 100.00 100.00
Return before operating charges* 17.93 7.14 10.43 0.27Operating charges (0.10) (0.11) (0.10) (0.50)
Return after operating charges* 17.83 7.03 10.33 (0.23)
Distributions on accumulation units (2.82) (2.22) (2.67) –Retained distributions onaccumulation units 2.82 2.22 2.67 –
Closing net asset value per unit 135.19 117.36 110.33 99.77
*after direct transaction costs of:^ 0.07 0.05 0.04 0.05
PerformanceReturn after charges 15.19% 6.37% 10.33% (0.23%)
Other informationClosing net asset value (£000) 1,405,958 882,206 910,988 9,864Closing number of units 1,040,009,023 751,688,098 825,719,542 9,886,946Operating charges 0.02%**** 0.10% 0.11% 1.52%Direct transaction costs 0.05% 0.05% 0.04% 0.05%
Prices+
Highest unit price (pence) 145.41 124.17 115.69 107.66Lowest unit price (pence) 117.94 83.52 100.00 97.55
^The direct transaction costs includes commission on futures.+ High and low price disclosures are based on quoted unit prices. Therefore, the opening and closing NAV pricesmay fall outside the high/low price threshold.**Class ‘D’ Accumulation class launched on 27 March 2019.***Class ‘H’ Accumulation class launched on 8 October 2021, hence there are no comparatives.****The AMC was updated during the year.
PUTM ACS European ex UK Fund

19
Statistical information
Comparative tables Class ‘I’ Class ‘X’ Accumulation** Accumulation*** 31/01/22 31/01/22 31/01/21 pence pence penceChange in net assets per unitOpening net asset value per unit 100.00 136.35 100.00
Return before operating charges* 0.28 20.74 36.46Operating charges (0.50) (0.13) (0.11)
Return after operating charges* (0.22) 20.61 36.35
Distributions on accumulation units – (3.15) (2.35)Retained distributions onaccumulation units – 3.15 2.35
Closing net asset value per unit 99.78 156.96 136.35
*after direct transaction costs of:^ 0.05 0.07 0.06
PerformanceReturn after charges (0.22%) 15.12% 36.35%
Other informationClosing net asset value (£000) 72,327 78 341Closing number of units 72,487,185 50,000 250,000Operating charges 1.52% 0.02%**** 0.10%Direct transaction costs 0.05% 0.05% 0.05%
Prices+
Highest unit price (pence) 107.66 168.85 144.30Lowest unit price (pence) 97.56 136.98 97.08
^The direct transaction costs includes commission on futures.+ High and low price disclosures are based on quoted unit prices. Therefore, the opening and closing NAV pricesmay fall outside the high/low price threshold.**Class ‘I’ Accumulation class launched on 8 October 2021, hence there are no comparatives.***Class ‘X’ Accumulation class launched on 14 March 2020.****The AMC was updated during the year.
PUTM ACS European ex UK Fund

20
PUTM ACS European ex UK Fund
Statistical information
Investment objective
The Sub-fund aims to provide a total return (a combination of capital growth andincome) by outperforming the MSCI Europe ex UK Index (the ‘Index’) before fees by0.5% to 1% per annum over any given 3 year period.
Investment policyThe Sub-fund aims to achieve its objective primarily by investing over 70% of theportfolio in equities or equity related securities of European excluding United Kingdomcompanies that are constituents of the MSCI Europe ex UK Index. The Sub-fund mayinvest up to 5% in European ex UK companies listed outside of the Index.
Equity related securities will include convertible stocks, stock exchange listedwarrants, depository receipts, and any other such investments which entitle the holderto subscribe for or convert into the equity of the company and/or where the share priceperformance is, in the opinion of the Investment Manager, influenced significantly bythe stock market performance of the company's ordinary shares. The Sub-fund mayalso invest in other transferable securities, moneymarket instruments, deposits, cashand near cash and other collective investment schemes.
Derivatives will be used for efficient portfolio management only.
Investment strategyAlthough over 70% is invested in components of the index. The Sub-fund is activelymanaged and the Investment Manager has discretion to select its investments. TheSub-fund does not concentrate on any particular sector.
Revenue distribution and pricingUnits of the Sub-fund are available as either Class ‘B’ Accumulation, ‘C’ Accumulation,‘D’ Accumulation, ‘H’ Accumulation,‘'I’ Accumulation or ‘X’ Accumulation units (whererevenue is reinvested to enhance the unit price). There will be two potentialdistributions in each accounting year: an interim distribution as at 31 July and a finaldistribution as at 31 January.
At each distribution the net revenue after deduction of expenses, from the investmentsof the Sub-fund, is apportioned amongst the unitholders. Unitholders receive a taxvoucher giving details of the distribution and the ACS Manager’s Report no later thantwo months after these dates.

21
Statistical information
Risk and reward profileThe Risk and Reward Indicator table demonstrates where the Sub-fund ranks in termsof its potential risk and reward. The higher the rank the greater the potential reward butthe greater the risk of losing money. It is based on past data, may change over time andmay not be a reliable indication of the future risk profile of the Sub-fund. The shadedarea in the table below shows the Sub-fund’s ranking on the Risk and Reward Indicator.
Typically lower rewards, Typically higher rewards,lower risk higher risk fi
1 2 3 4 5 6 7
This Sub-fund is ranked at 6 (31/01/21: 6) because funds of this type haveexperienced high rises and falls in value in the past. Although this is a high riskranking it is not the highest. The above figure applies to the following unit classes:
• Class ‘B’ Accumulation
• Class ‘C’ Accumulation
• Class 'D' Accumulation
• Class ‘H’ Accumulation
• Class ‘I’ Accumulation
• Class ‘X’ Accumulation
Please note that even the lowest risk class can lose you money and that extrememarket circumstances can mean you suffer severe losses in all cases. Please note theSub-fund’s risk category may change in the future. The indicator does not take intoaccount the following risks of investing in this Sub-fund:
• The Sub-fund may use derivatives to reduce risk or cost or to generate additionalcapital or income at low risk, or to meet its investment objective.
• Investing overseas can bring additional returns and spread risk to different markets.There are risks, however, that changes in currency rates will reduce the value ofyour investment.
• Emerging markets or less developed countries may face more political, economic orstructural challenges than developed countries. This means that your money is atgreater risk.
• Counterparty Risk: the insolvency of any institutions providing services such assafekeeping of assets or acting as counterparty to derivatives or other instruments,may expose the Sub-fund to financial loss.
For more information on the Risk and Reward profiles of our Funds, please refer to themost up to date relevant fund and Unit Class Key Investor Information Documents(KIIDs). These are available online at www.phoenixunittrust.co.uk.
fi
PUTM ACS European ex UK Fund

22
PUTM ACS European ex UK Fund
Annual financial statementsFor the year ended 31 January 2022
Statement of total return 31/01/22 31/01/21 Notes £000 £000 £000 £000
Income
Net capital gains 4 135,146 36,514 Revenue 5 34,031 23,934
Expenses 6 (1,508) (1,017)
Interest payable andsimilar charges (46) (70)
Net revenue before taxation 32,477 22,847
Taxation 7 (4,229) (2,005)
Net revenue after taxation 28,248 20,842
Total returnbefore distributions 163,394 57,356
Distributions 8 (28,435) (20,947)
Change in net assetsattributable to unitholdersfrom investment activities 134,959 36,409
Statement of change in net assets attributable to unitholders
31/01/22 31/01/21 £000 £000 £000 £000
Opening net assetsattributable to unitholders 1,075,509 1,083,555
Amounts receivableon issue of units 38,196 751,602
Amounts receivableon in-specie transfer* 1,405,597 –
Amounts payableon cancellation of units (218,041) (816,066) 1,225,752 (64,464)Change in net assetsattributable to unitholdersfrom investment activities 134,959 36,409
Dilution levy adjustment 139 122
Retained distributionson accumulation units 30,201 19,887
Closing net assetsattributable to unitholders 2,466,560 1,075,509
*Represents the value of units created by in-specie transfer of assets during the year.
23
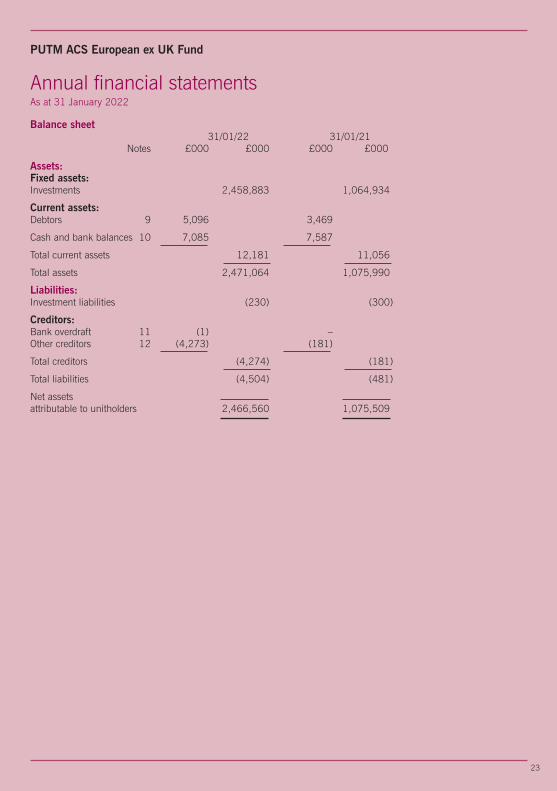
Balance sheet 31/01/22 31/01/21 Notes £000 £000 £000 £000
Assets:Fixed assets:Investments 2,458,883 1,064,934
Current assets:Debtors 9 5,096 3,469
Cash and bank balances 10 7,085 7,587
Total current assets 12,181 11,056
Total assets 2,471,064 1,075,990
Liabilities:Investment liabilities (230) (300)
Creditors:Bank overdraft 11 (1) – Other creditors 12 (4,273) (181)
Total creditors (4,274) (181)
Total liabilities (4,504) (481)
Net assetsattributable to unitholders 2,466,560 1,075,509
Annual financial statementsAs at 31 January 2022
PUTM ACS European ex UK Fund
24
PUTM ACS European ex UK Fund
Notes to the financial statements
Notes 1-3 Accounting policiesPlease see pages 3 to 6 for accounting basis and policies.
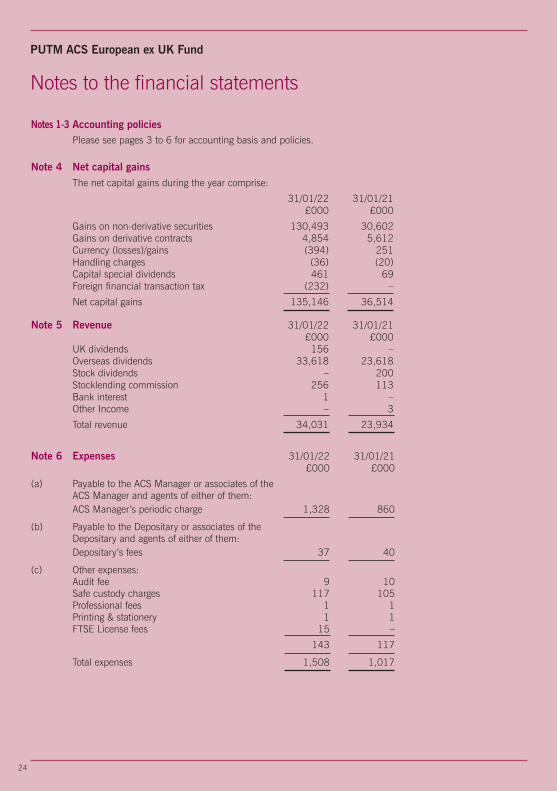
Note 4 Net capital gainsThe net capital gains during the year comprise:
31/01/22 31/01/21 £000 £000
Gains on non-derivative securities 130,493 30,602Gains on derivative contracts 4,854 5,612Currency (losses)/gains (394) 251Handling charges (36) (20)Capital special dividends 461 69Foreign financial transaction tax (232) –
Net capital gains 135,146 36,514
Note 5 Revenue 31/01/22 31/01/21 £000 £000
UK dividends 156 –Overseas dividends 33,618 23,618Stock dividends – 200Stocklending commission 256 113Bank interest 1 –Other Income – 3
Total revenue 34,031 23,934
Note 6 Expenses 31/01/22 31/01/21 £000 £000
(a) Payable to the ACS Manager or associates of theACS Manager and agents of either of them:
ACS Manager’s periodic charge 1,328 860
(b) Payable to the Depositary or associates of theDepositary and agents of either of them:
Depositary’s fees 37 40
(c) Other expenses: Audit fee 9 10
Safe custody charges 117 105Professional fees 1 1Printing & stationery 1 1
FTSE License fees 15 –
143 117
Total expenses 1,508 1,017

25
Notes to the financial statements
Note 7 Taxation 31/01/22 31/01/21 £000 £000(a) Analysis of tax charge for the year
Overseas withholding tax 4,229 2,005
Total taxation 4,229 2,005
As the scheme is an ACS it is not subject to UK tax on income or capital gains.
Note 8 DistributionsThe distributions take account of amounts added on the issue of units and amountsdeducted on the cancellation of units, and comprise:
31/01/22 31/01/21 £000 £000
Interim 19,213 14,742 Final 10,988 5,145
30,201 19,887
Amounts deducted on cancellation of units 936 2,201 Amounts added on issue of units (2,702) (1,141)
Net distribution for the year 28,435 20,947
Net revenue after taxation 28,248 20,842 Expenses taken to capital 117 105 Foreign Financial Transaction Tax charged in capital (76) – Income deficit transfer to capital 127 – Withholding tax on capital special dividend 19 –
Net distribution for the year 28,435 20,947
Details of the distribution per unit are set out in the tables on pages 32 to 34.
Note 9 Debtors 31/01/22 31/01/21 £000 £000
Creations awaiting settlement 80 –Accrued income 245 32Overseas tax recoverable 4,771 3,437
Total debtors 5,096 3,469
Note 10 Cash and bank balances 31/01/22 31/01/21 £000 £000
Cash and bank balances 733 1,722Amounts held at futures clearing houses 6,352 5,865
Total cash and bank balances 7,085 7,587
Note 11 Bank overdraft 31/01/22 31/01/21 £000 £000
Bank overdraft 1 –
Total bank overdraft 1 –
PUTM ACS European ex UK Fund

26
PUTM ACS European ex UK Fund
Notes to the financial statements
Note 12 Other creditors 31/01/22 31/01/21 £000 £000
Cancellations awaiting settlement 3,226 75ACS Manager’s periodic charge payable 803 75Trustee’s fees payable 9 7Safe custody charges payable 24 16Audit fee payable 9 8Foreign financial transaction tax payable 200 –Handling charges payable 2 –
Total other creditors 4,273 181
Note 13 Reconciliation of units Class ‘B’ Class ‘C’ Class ‘D’ Class ‘H’* Class ‘I’* Class ‘X’ Accumulation Accumulation Accumulation Accumulation Accumulation Accumulation
Opening units issuedat 01/02/21 33,485,372 136,142,138 751,688,098 – – 250,000Unit movements in year:Units issued 21,477,029 8,979,125 882,482 – 31,140 –-Units cancelled (43,433,572) (27,251,410) (97,261,450) (242,178) (1,487,357) (200,000)In-specie transactions 599,963,573 87,209,369 384,699,893 10,129,124 73,943,402 –
Closing units at 31/01/22 611,492,402 205,079,222 1,040,009,023 9,886,946 72,487,185 50,000
*Class ‘H’ Accumulation and ‘I’ Accumulation launched on 8 October 2021.
Note 14 Contingencies and commitmentsAt 31 January 2022 the Sub-fund had no outstanding calls on partly paid shares, no potential underwritingcommitments or any other contingent liabilities (31/01/21: £nil).
Note 15 StocklendingThe total value of securities on loan at the Balance sheet date was £1,136,994 (31/01/21: £276,493).Collateral was held in the following form:
31/01/22 31/01/21 £000 £000
UK Equities 1,284 323
1,284 323
The gross earnings and fees paid for the year were £312,539 (31/01/21: £137,538) and £56,257(31/01/21: £24,757) respectively.The gross earnings were split by the lending agent as follows:– 82% to the Lender (PUTM ACS European ex UK Fund)– 8% to the ACS Manager (Phoenix Unit Trust Managers Limited)– 10% retained by the Lending Agent (eSec)
The counterparties for the securities on loan are shown in the appendix on page 278.

27
Note 16 Unitholders’ fundsThere are six unit classes in issue within the Sub-fund. These are Class ‘B’ Accumulation, Class ‘C’Accumulation, Class ‘D’ Accumulation, Class ‘H’ Accumulation, Class ‘I’ Accumulation and Class ‘X’Accumulation. The ACS Manager’s periodic charge in respect of Class ‘B’, Class ‘C’, Class ‘D’, Class ‘X’ ,Class 'H' and Class 'I' is expressed as an annual percentage of the value of the property of the Sub-fundattributable to each unit class and is currently 0.005% in respect of Class ‘B’units, Class ‘C’ units, Class ‘D’units and Class ‘X’ units and 1.505% in respect of Class 'H' units and Class 'I' units.
Consequently, the level of net revenue attributable to each unit class will differ. Should it be necessary towind-up the Sub-fund, each unit class will have the same rights as regards to the distribution of the propertyof the Sub-fund.
Note 17 Related party transactionsThe ACS Manager is a related party to the Sub-fund by virtue of its controlling influence.
The ACS Manager is part of the Phoenix Group. Phoenix Life Limited which is also part of the PhoenixGroup, is a material unitholder in the Sub-fund and therefore a related party, holding the following percentageof the units at the year end.
Class ‘B’ Class ‘C’ Class ‘D’ Class ‘H’* Class ‘I’* Class ‘X’
% % % % % %
As at 31 January 2022: 100.00 100.00 100.00 100.00 100.00 100.00
As at 31 January 2021: 100.00 100.00 100.00 n/a n/a 100.00
*Class ‘H’ Accumulation and ‘I’ Accumulation launched on 8 October 2021, hence there are nocomparatives.
ACS Manager’s periodic charge paid to the ACS Manager, Phoenix Unit Trust Managers Limited, or itsassociates, is shown in Note 6(a) and details of the units issued and cancelled by the ACS Manager areshown in the Statement of change in net assets attributable to unitholders and Note 8.
Any balances due to/from the ACS Manager or its associates at 31 January 2022 in respect of thesetransactions are shown in Notes 9 and 12.
Note 18 Financial instrumentsIn accordance with the investment objective, the Sub-fund holds certain financial instruments. Thesecomprise:• securities held in accordance with the investment objective and policies;• derivative transactions which the Sub-fund may also enter into, the purpose of which is to manage the
currency and market risks arising from the Sub-fund’s investment activities; and• cash and short term debtors and creditors arising directly from operations.
Counterparty exposureThe economic exposure of future derivative contracts is equal to the market value. The value of exposure andthe related counterparty are disclosed in the Portfolio of investments.
Notes to the financial statements
PUTM ACS European ex UK Fund

28
PUTM ACS European ex UK Fund
Notes to the financial statements
Note 18 Financial instruments (continued)Currency exposureAn analysis of the monetary assets and liabilities at the year end is shown below:
Net currency assets Net currency assets 31/01/22 31/01/21
Currency Monetary Non- Total Monetary Non- Total exposure monetary exposure exposure monetary exposure exposure exposure £000 £000 £000 £000 £000 £000
Danish Krone 225 152,521 152,746 124 55,828 55,952 Euro 9,772 1,659,129 1,668,901 8,918 701,600 710,518 Norwegian Krone 8 26,446 26,454 42 13,753 13,795 Sterling (4,170) - (4,170) 407 - 407 Swedish Krona - 161,056 161,056 - 89,407 89,407 Swiss Franc 2,049 452,563 454,612 1,326 202,722 204,048 US Dollar 23 6,938 6,961 58 1,324 1,382
7,907 2,458,653 2,466,560 10,875 1,064,634 1,075,509
Income received in other currencies is converted to Sterling on or near the date ofreceipt. The Sub-fund does not hedge or otherwise seek to avoid, movement risk onaccrued income.
Interest profileAt the year end date, 1.87% (31/01/21: 3.70%) of the Sub-fund’s net assets byvalue were interest bearing.
Interest rates earned/paid on deposits are earned/paid at a rate linked to SONIA(Sterling Overnight Index Average) or international equivalent. Interest was alsoearned on the investments in the the Aberdeen Standard Liquidity Fund.
Sensitivity analysisInterest rate risk sensitivityAs the majority of the Sub-fund’s financial assets are non-interest bearing, theSub-fund is only subject to limited exposure to fair value interest rate risk due tofluctuations in levels of market interest rates and therefore, no sensitivity analysishas been provided.
Foreign currency risk sensitivityA five percent increase in the value of the Sub-fund’s foreign currency exposurewould have the effect of increasing the return and net assets by £123,536,493(31/01/21: £53,755,100). A five percent decrease would have an equal andopposite effect.
Price risk sensitivityA five percent increase in the value of the Sub-fund’s portfolio would have theeffect of increasing the return and net assets by £122,932,664 (31/01/21:£53,775,450). A five percent decrease would have an equal and oppositeeffect.

29
Notes to the financial statements
Note 19 Fair value of investmentsThe fair value of the Sub-fund’s investments has been determined using the hierarchy below.
This complies with the ‘Amendments to FRS 102 – Fair value hierarchy disclosures’ issuedby the Financial Reporting Council in March 2016.
Level 1 The unadjusted quoted price in an active market for identical assets orliabilities that the entity can access at the measurement date.
Level 2 Inputs other than quoted prices included within Level 1 that areobservable (i.e. developed using market data) for the asset or liability,either directly or indirectly.
Level 3 Inputs are unobservable (i.e. for which market data is unavailable) for theasset or liability.
For the year ended 31/01/22Level 1 2 3 Total
Investment assets £000 £000 £000 £000Equities 2,419,919 – – 2,419,919Money markets 38,964 – – 38,964
2,458,883 – – 2,458,883
Investment liabilities £000 £000 £000 £000Derivatives (230) – – (230)
(230) – – (230)
For the year ended 31/01/21Level 1 2 3 Total
Investment assets £000 £000 £000 £000Equities 1,032,777 – – 1,032,777Money markets 32,157 – – 32,157
1,064,934 – – 1,064,934
Investment liabilities £000 £000 £000 £000Derivatives (300) – – (300)
(300) – – (300)
PUTM ACS European ex UK Fund

30
PUTM ACS European ex UK Fund
Note 20 Portfolio transaction costs
For the year ended 31/01/22Other Total
Value Commission Taxes expenses costsAnalysis of total purchases costs £000 £000 % £000 % £000 % £000
Equity transactions 728,402 7 – 693 0.01 75 – 729,177Money markets 188,669 – – – – – – 188,669Corporate actions 3,977 – – – – – – 3,977In-specie transactions 1,397,444 – – – – – – 1,397,444
Total 2,318,492 7 693 75 2,319,267
Other TotalValue Commission Taxes expenses costs
Analysis of total sales costs £000 £000 % £000 % £000 % £000
Equity transactions 876,178 (10) – – – – – 876,168Money markets 179,381 – – –- – – – 179,381Corporate actions 262 – – – – – – 262
Total 1,055,821 (10) – – 1,055,811
The Sub-fund has paid £19,936 as commission on purchases and sales of derivatives transactions for the yearended 31/01/22.
Commission, taxes and other expenses as % of average net assets:Commission 0.00%Taxes 0.04%Other expenses 0.01%
For the year ended 31/01/21Other Total
Value Commission Taxes expenses costsAnalysis of total purchases costs £000 £000 % £000 % £000 % £000
Equity transactions 589,430 8 – 453 0.08 2 – 589,893Money markets 96,844 – – – – – – 96,844Corporate actions 475 – – – – – – 475
Total 686,749 8 453 2 687,212
Other TotalValue Commission Taxes expenses costs
Analysis of total sales costs £000 £000 % £000 % £000 % £000
Equity transactions 646,640 (9) – – – (1) – 646,630Money markets 86,658 – – – – – – 86,658Corporate actions 87 – – – – – – 87
Total 733,385 (9) – (1) 733,375
The Sub-fund has paid £14,569 as commission on purchases and sales of derivatives transactions for the yearended 31/01/21.
Commission, taxes and other expenses as % of average net assets:Commission 0.00%Taxes 0.05%Other expenses 0.00%
Notes to the financial statements
31
Note 20 Portfolio transaction costs (continued)
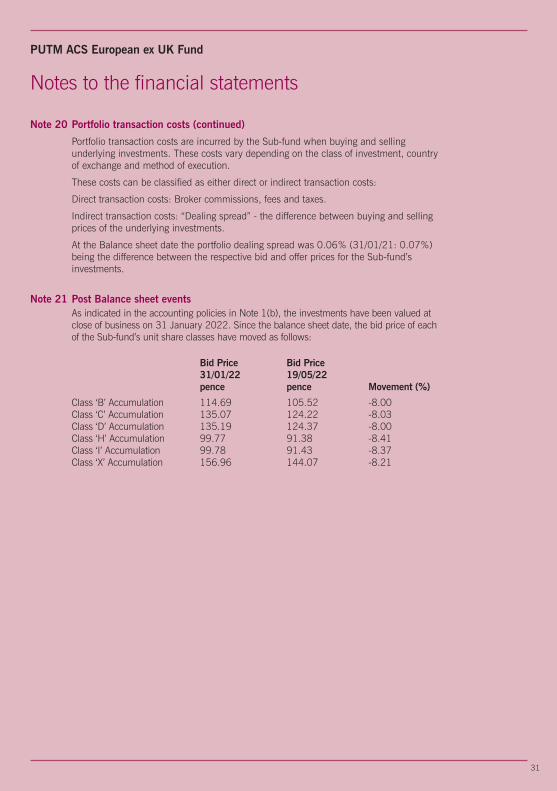
Portfolio transaction costs are incurred by the Sub-fund when buying and sellingunderlying investments. These costs vary depending on the class of investment, countryof exchange and method of execution.
These costs can be classified as either direct or indirect transaction costs:
Direct transaction costs: Broker commissions, fees and taxes.
Indirect transaction costs: “Dealing spread” - the difference between buying and sellingprices of the underlying investments.
At the Balance sheet date the portfolio dealing spread was 0.06% (31/01/21: 0.07%)being the difference between the respective bid and offer prices for the Sub-fund’sinvestments.
Notes to the financial statements
PUTM ACS European ex UK Fund
Note 21 Post Balance sheet eventsAs indicated in the accounting policies in Note 1(b), the investments have been valued atclose of business on 31 January 2022. Since the balance sheet date, the bid price of eachof the Sub-fund’s unit share classes have moved as follows:
Bid Price Bid Price 31/01/22 19/05/22
pence pence Movement (%)
Class ‘B’ Accumulation 114.69 105.52 -8.00Class ‘C’ Accumulation 135.07 124.22 -8.03Class ‘D’ Accumulation 135.19 124.37 -8.00Class ‘H’ Accumulation 99.77 91.38 -8.41Class ‘I’ Accumulation 99.78 91.43 -8.37Class ‘X’ Accumulation 156.96 144.07 -8.21

32
PUTM ACS European ex UK Fund
Interim distribution in pence per unitGroup 1: units purchased prior to 1 February 2021Group 2: units purchased 1 February 2021 to 31 July 2021 2021 2020 pence pence per unit per unit Net paid paid income Equalisation 30 Sep 30 Sep*
Class ‘B’ Accumulation
Group 1 1.897488 — 1.897488 n/aGroup 2 0.318815 1.578673 1.897488 n/a
2021 2020 pence pence per unit per unit Net paid paid income Equalisation 30 Sep 30 Sep
Class ‘C’ Accumulation
Group 1 2.213934 — 2.213934 1.621162Group 2 1.168133 1.045801 2.213934 1.621162
2021 2020 pence pence per unit per unit Net paid paid income Equalisation 30 Sep 30 Sep
Class ‘D’ Accumulation
Group 1 2.244345 — 2.244345 1.647188 Group 2 1.710504 0.533841 2.244345 1.647188
2021 2020 pence pence per unit per unit Net paid paid income Equalisation 30 Sep 30 Sep
Class ‘X’ Accumulation
Group 1 2.373533 — 2.373533 1.700340 Group 2 2.373533 0.000000 2.373533 1.700340
* The Class ‘B’ Accumulation launched on 27 November 2020, hence there are nocomparatives.
Distribution tablesFor the year ended 31 January 2022

33
Final distribution in pence per unitGroup 1: units purchased prior to 1 August 2021Group 2: units purchased 1 August 2021 to 31 January 2022 2022 2021 pence pence per unit per unit Net payable paid income Equalisation 31 Mar 31 Mar
Class ‘B’ Accumulation
Group 1 0.609258 — 0.609258 0.190516Group 2 0.360658 0.248600 0.609258 0.190516
2022 2021 pence pence per unit per unit Net payable paid income Equalisation 31 Mar 31 Mar
Class ‘C’ Accumulation
Group 1 0.596482 — 0.596482 0.558099 Group 2 0.349851 0.246631 0.596482 0.558099
2022 2021 pence pence per unit per unit Net payable paid income Equalisation 31 Mar 31 Mar
Class ‘D’ Accumulation
Group 1 0.580653 — 0.580653 0.574613 Group 2 0.383049 0.197604 0.580653 0.574613
2022 2021 pence pence per unit per unit Net payable paid income Equalisation 31 Mar 31 Mar*
Class ‘H’ Accumulation
Group 1 0.000000 — 0.000000 n/a Group 2 0.000000 0.000000 0.000000 n/a
*Class ‘H’ Accumulation launched on 8 October 2021, hence there are no comparatives.
Distribution tablesFor the year ended 31 January 2022
PUTM ACS European ex UK Fund

34
PUTM ACS European ex UK Fund
Final distribution in pence per unitGroup 1: units purchased prior to 1 August 2021Group 2: units purchased 1 August 2021 to 31 January 2022 2022 2021 pence pence per unit per unit Net payable paid income Equalisation 31 Mar 31 Mar*
Class ‘I’ Accumulation
Group 1 0.000000 — 0.000000 n/aGroup 2 0.000000 0.000000 0.000000 n/a
2022 2021 pence pence per unit per unit Net payable paid income Equalisation 31 Mar 31 Mar
Class ‘X’ Accumulation
Group 1 0.779660 — 0.779660 0.650976Group 2 0.779660 0.000000 0.779660 0.650976
*Class ‘I’ Accumulation launched on 8 October 2021, hence there are no comparatives.
Each Sub-fund is tax transparent for income purposes meaning that UK tax-payingunitholders are subject to tax on their share of income, net of allowable expenses, asit arises to the Sub-fund and not on distributions of income after deduction of expenses.
On a daily basis unitholders will be advised of their share of aggregated accrued income,expenses and withholding tax paid on overseas dividends, if applicable. When a unit ispurchased during the distribution period, part of the purchase price of the unit reflectsthe relevant share of income and expenses accrued by the Sub-fund, and this will bedisclosed on the contract note. This purchased income and expense, a capital sum,should be deducted from the aggregate accrued income or expense as applicable.
The subscription price disclosed on the contract note reflects the acquisition cost, whichshould be adjusted by the capital sum referred to above.
It is the responsibility of the unitholder to maintain a record of the relevant amount(s) ofincome equalisation and to make the appropriate adjustment when completing their taxcalculations.
Distribution tablesFor the year ended 31 January 2022

35
PUTM ACS Japan Equity Fund
Dear Investor
Welcome to the PUTM ACS Japan Equity Fund report forthe 12 months to 31 January 2022.
Performance Review
Over the review period, the PUTM ACS Japan EquityFund returned -2.16% (Source: FactSet, Gross of AMC,in GBP, based on the movement in the Cancellation Pricefrom 31/01/21 to 31/01/22). This was compared with areturn of 0.14% for the benchmark index (Source:FactSet, MSCI Japan, Total Return, GBP from 31/01/21to 31/01/22).
Investment review
Source: Sub-fund performance: FactSet, Gross of AMC, GBP, based on the movement in the Cancellation Price from 31January 2021 to 31 January 2022. Benchmark Index performance: MSCI Japan, Total Return in GBP, from 31January 2021 to 31 January 2022.
Past performance is not a guide to future performance.
Please note that all past performance figures are calculated without taking the initial charge into account.
The value of units and the income from them can go down as well as up and is not guaranteed. You maynot get back the full amount invested.
Standardised Past Performance
PUTM ACS Japan Equity Fund -2.16 4.92 9.76 – –
Benchmark Index 0.14 10.71 10.50 – –
Jan 21 - Jan 22 Jan 20 - Jan 21 Mar 19 - Jan 20% growth % growth % growth

36
PUTM ACS Japan Equity Fund
Investment review
Market Review
Japanese equities were flat over the 12-month period.While the coronavirus pandemic continued to dominatesentiment at the beginning of the period, stimulusmeasures announced in early 2020 helped support localequity markets.
Early in the period, markets benefited from positive investorsentiment arising from vaccine breakthroughs and positiveeconomic data. However, a rise in infection numbersdampened stock returns somewhat. The governmentdeclared an emergency lockdown in Tokyo and othereconomic hubs in July. Meanwhile, fears of risinginfections, the slow vaccination programme and Tokyoentering its third emergency lockdown weighed on markets.However, Japan was one of the strongest major developedmarkets in August and September, as investors reactedpositively to the change in the political landscape and animproving Covid-19 picture.
Prime Minister Yoshihide Suga’s approval rating sunk to arecord low due to the government's handling of Covid-19,and the decision to go ahead with staging the Olympicsduring a global pandemic. He has since been replaced byFumio Kishida as leader of the ruling Liberal DemocraticParty, and, against expectations, the party comfortablyretained power in the general election at the end of October.Kishida's ascent to power was initially welcomed byinvestors due to expectations of an additional economicstimulus. Sentiment soon turned, however. Investorsbecame concerned that the new prime minister would raisetaxes on financial income, primarily for the wealthy.
In November, Prime Minister Kishida released details of astimulus package of almost ¥56 trillion. The measuresincluded direct payments to families with children andsupport for businesses. There are also plans to supportconsumers who have been hit by high energy prices.
In common with global stock markets, Japanese equitiessold off abruptly in January, with the technology-focusedMothers market especially weak. Unlike the US FederalReserve, however, the Bank of Japan is not under pressureto raise interest rates. Japanese inflation remains relativelysubdued despite higher energy costs.
Sub-fund Review
The Sub-Fund’s mandate was changed during the periodfrom an enhanced index strategy to an active approach.The new strategy was implemented at the end of October2021.
In the period from 31 October 2021 to 31 January 2022,the top performing holding was the semiconductorequipment maker Tokyo Electron, whose recent results havesurprised on the upside. Profits significantly exceededmarket expectations and the company raised its guidance.The company expects strong demand from data centresand 5G. Automotive components maker Denso gained afterToyota upwardly revised its 2030 sales target for electricvehicles. Elsewhere, the electronics conglomerate Sonyadvanced, as its September-quarter results beat investorforecasts. Results were positive across business segments,and the company also revised up its full-year guidance.
On the downside, the brewer Asahi Group fell, asmanagement cautioned that rising raw material costs coulddelay achieving financial targets until next fiscal year.Musical instrument maker Yamaha detracted fromperformance as recent results were below consensus andthe company cut its full-year guidance substantially, due todifficulties securing supplies of semiconductors and logisticsdisruptions. West Japan Railway also lagged on concernsover the new Omicron variant.
Outlook at Year End
Japanese corporates have recovered as the global economyhas picked up. However, inflationary pressures are startingto impact profitability. While some companies are passinghigher prices on to their end customers, these actions comewith a lag. Meanwhile, the low number of Covid-19 casesin Japan should bolster a return to some normalcy after atough year. Companies with strong business models andmanagement teams have coped and even thrived in the lasttwo years. Alongside structural improvements ingovernance in Japan, we remain resolute in our belief thatthese companies will do well. Weighing the risk-reward inthe market, we believe valuations remain attractive forthese companies for the medium term.
As the market outlook was completed as of 31st January,there is no mention of the ongoing Ukraine crisis thatbegan at the end of February. Naturally, this woulddramatically affect any future expectations of marketoutlook that would not have been factored in at the time ofwriting.

37
Portfolio of investments (unaudited)
Investments held at 31 January 2022 Market Percentage of value total net assets Holding Investment £000 %
Basic Materials (31/01/21 – 4.17%) 5.48 Chemicals 821,900 Kansai Paint 12,611 0.46 5,152,000 Mitsubishi Chemical 29,814 1.10 2,240,000 Nippon Paint 13,171 0.49 607,400 Shin-Etsu Chemical 74,790 2.76 1,241,500 Taiyo Nippon Sanso 18,166 0.67
Consumer Goods (31/01/21 – 20.63%) 22.22 Automobiles & Parts 1,174,000 Denso 64,498 2.38 2,728,000 Honda Motor 59,169 2.18 11,567,000 Toyota Motor 167,978 6.19 Beverages 1,404,000 Asahi Breweries 42,386 1.56
Household Goods 735,000 Makita 20,211 0.74
Leisure Goods 64,000 Nintendo 23,250 0.86 1,936,500 Sony 159,275 5.87 666,500 Yamaha 22,333 0.82
Personal Goods 798,100 Kao 29,592 1.09 382,500 Shiseido 14,254 0.53
Consumer Services (31/01/21 – 9.02%) 9.04 Food & Drug Retailers 702,000 Welcia Holdings 14,054 0.52
General Retailers 255,000 Nitori Holdings 27,052 1.00 2,346,000 Seven & I Holdings 84,831 3.13
Media 390,900 So-Net M3 10,994 0.41
Travel & Leisure 357,500 Oriental Land 45,962 1.69 2,012,000 West Japan Railway 62,289 2.29
Financials (31/01/21 – 10.81%) 15.31 Banks 20,548,000 Mitsubishi UFJ Financial Group 91,860 3.38 2,710,000 Sumitomo Mitsui Financial 72,101 2.66
Financial Services 347,200 Century Tokyo Leasing 12,622 0.46 655,500 Nihon M&A Center 7,569 0.28
PUTM ACS Japan Equity Fund
38
PUTM ACS Japan Equity Fund
Portfolio of investments (unaudited)
Investments held at 31 January 2022 Market Percentage of value total net assets Holding Investment £000 %
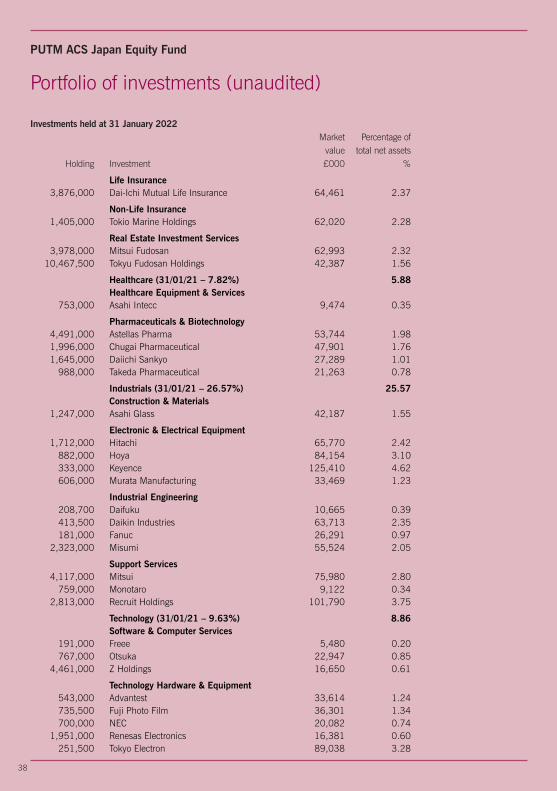
Life Insurance 3,876,000 Dai-Ichi Mutual Life Insurance 64,461 2.37
Non-Life Insurance 1,405,000 Tokio Marine Holdings 62,020 2.28
Real Estate Investment Services 3,978,000 Mitsui Fudosan 62,993 2.32 10,467,500 Tokyu Fudosan Holdings 42,387 1.56
Healthcare (31/01/21 – 7.82%) 5.88 Healthcare Equipment & Services 753,000 Asahi Intecc 9,474 0.35
Pharmaceuticals & Biotechnology 4,491,000 Astellas Pharma 53,744 1.98 1,996,000 Chugai Pharmaceutical 47,901 1.76 1,645,000 Daiichi Sankyo 27,289 1.01 988,000 Takeda Pharmaceutical 21,263 0.78
Industrials (31/01/21 – 26.57%) 25.57 Construction & Materials 1,247,000 Asahi Glass 42,187 1.55
Electronic & Electrical Equipment 1,712,000 Hitachi 65,770 2.42 882,000 Hoya 84,154 3.10 333,000 Keyence 125,410 4.62 606,000 Murata Manufacturing 33,469 1.23
Industrial Engineering 208,700 Daifuku 10,665 0.39 413,500 Daikin Industries 63,713 2.35 181,000 Fanuc 26,291 0.97 2,323,000 Misumi 55,524 2.05
Support Services 4,117,000 Mitsui 75,980 2.80 759,000 Monotaro 9,122 0.34 2,813,000 Recruit Holdings 101,790 3.75
Technology (31/01/21 – 9.63%) 8.86 Software & Computer Services 191,000 Freee 5,480 0.20 767,000 Otsuka 22,947 0.85 4,461,000 Z Holdings 16,650 0.61
Technology Hardware & Equipment 543,000 Advantest 33,614 1.24 735,500 Fuji Photo Film 36,301 1.34 700,000 NEC 20,082 0.74 1,951,000 Renesas Electronics 16,381 0.60 251,500 Tokyo Electron 89,038 3.28

39
Portfolio of investments (unaudited)
Investments held at 31 January 2022 Market Percentage of value total net assets Holding Investment £000 %
Telecommunications (31/01/21 – 7.19%) 6.59 Fixed Line Telecommunications 3,819,000 Nippon Telegraph & Telephone 80,707 2.97
Mobile Telecommunications 3,319,000 KDDI 78,235 2.88 618,500 Softbank 20,044 0.74
Utilities (31/01/21 – 0.14%) 0.00
Futures (31/01/21 – 0.08%) 0.00
Portfolio of investments 2,685,918 98.95 Net other assets 28,558 1.05
Net assets 2,714,476 100.00
Unless otherwise stated, all investments are approved securities being eitherofficially listed in a member state or traded on or under the rules of an eligiblesecurities market.
PUTM ACS Japan Equity Fund

40
PUTM ACS Japan Equity Fund
Top ten purchases and salesFor the year ended 31 January 2022
Purchases Cost£000
Sony 169,957Keyence 147,823Toyota Motor 145,632Recruit Holdings 129,445Hoya 104,026Mitsubishi UFJ Financial Group 90,589Tokyo Electron 90,550Dai-Ichi Mutual Life Insurance 81,040Shin-Etsu Chemical 76,164Asahi Breweries 75,735
Subtotal 1,110,961Other purchases 2,021,625
Total purchases for the year 3,132,586
Sales Proceeds£000
Asahi Breweries 31,760Dai-Ichi Mutual Life Insurance 21,865Softbank 20,665Makita 13,584NEC 13,428Nabtesco 12,828Renesas Electronics 12,677Yamaha 9,724So-Net M3 8,176Shiseido 8,051
Subtotal 152,758Other sales 393,095
Total sales for the year 545,853

41
PUTM ACS Japan Equity Fund
Statistical information
Comparative tables Class ‘B’ Class ‘C’ Accumulation** Accumulation*** 31/01/22 31/01/21 31/01/22 31/01/21 31/01/20 pence pence pence pence penceChange in net assets per unitOpening net asset value per unit 98.74 100.00 113.43 108.54 100.00
Return before operating charges* (2.22) (1.24) (2.59) 5.01 8.65Operating charges (0.08) (0.02) (0.10) (0.12) (0.11)
Return after operating charges* (2.30) (1.26) (2.69) 4.89 8.54
Distributions on accumulation units (1.93) (0.13) (2.21) (2.32) (1.38)Retained distributions onaccumulation units 1.93 0.13 2.21 2.32 1.38
Closing net asset value per unit 96.44 98.74 110.74 113.43 108.54
*after direct transaction costs of:^ 0.02 0.01 0.03 0.01 0.00
PerformanceReturn after charges (2.33%) (1.26%) (2.37%) 4.51% 8.54%
Other informationClosing net asset value (£000) 14,405 10,475 48,555 50,815 60,675Closing number of units 14,936,790 10,608,464 43,847,654 44,799,202 55,899,799Operating charges 0.02%**** 0.11% 0.02%**** 0.11% 0.12%Direct transaction costs 0.02% 0.01% 0.02% 0.01% 0.00%
Prices+
Highest unit price (pence) 111.70 104.07 128.26 119.50 111.90Lowest unit price (pence) 93.31 98.56 107.14 87.88 98.30
^The direct transaction costs includes commission on futures.+ High and low price disclosures are based on quoted unit prices. Therefore, the opening and closing NAV pricesmay fall outside the high/low price threshold.** Class ‘B’ Accumulation launched on 27 November 2020.***Class ‘C’ Accumulation launched on 27 March 2019.****The AMC was updated during the year.

42
Statistical information
Comparative tables Class ‘D’ Class ‘F’ Accumulation** Accumulation*** 31/01/22 31/01/21 31/01/20 31/01/22 pence pence pence penceChange in net assets per unitOpening net asset value per unit 113.42 108.54 100.00 100.00
Return before operating charges* (2.64) 5.00 8.65 (5.05)Operating charges (0.06) (0.12) (0.11) (0.01)
Return after operating charges* (2.70) 4.88 8.54 (5.06)
Distributions on accumulation units (2.19) (2.32) (1.37) (0.09)Retained distributions onaccumulation units 2.19 2.32 1.37 0.09
Closing net asset value per unit 110.72 113.42 108.54 94.94
*after direct transaction costs of:^ 0.03 0.01 0.00 0.02
PerformanceReturn after charges (2.38%) 4.50% 8.54% (5.06%)
Other informationClosing net asset value (£000) 2,616,231 295,766 324,773 35,222Closing number of units 2,362,915,134 260,763,744 299,218,230 37,098,184Operating charges 0.02%**** 0.11% 0.12% 0.02%Direct transaction costs 0.02% 0.01% 0.00% 0.02%
Prices+
Highest unit price (pence) 128.26 119.50 111.90 105.39Lowest unit price (pence) 107.12 87.88 98.30 91.86
^The direct transaction costs includes commission on futures.+ High and low price disclosures are based on quoted unit prices. Therefore, the opening and closing NAV pricesmay fall outside the high/low price threshold.**Class ‘D’ Accumulation launched on 27 March 2019.*** Class ‘F’ Accumulation class launched on 22 October 2021, hence there are no comparatives.****The AMC was updated during the year.
PUTM ACS Japan Equity Fund

43
PUTM ACS Japan Equity Fund
Statistical information
Comparative tables Class ‘X’ Accumulation** 31/01/22 31/01/21 pence pence Change in net assets per unitOpening net asset value per unit 128.69 100.00
Return before operating charges* (2.84) 28.81Operating charges (0.13) (0.12)
Return after operating charges* (2.97) 28.69
Distributions on accumulation units (2.54) (2.56)Retained distributions onaccumulation units 2.54 2.56
Closing net asset value per unit 125.72 128.69
*after direct transaction costs of:^ 0.03 0.01
PerformanceReturn after charges (2.31%) 28.69%
Other informationClosing net asset value (£000) 63 322Closing number of units 50,000 250,000Operating charges 0.03%*** 0.11% Direct transaction costs 0.02% 0.01%
Prices+
Highest unit price (pence) 145.63 135.63Lowest unit price (pence) 121.63 99.77
^The direct transaction costs includes commission on futures.+ High and low price disclosures are based on quoted unit prices. Therefore, the opening and closing NAV pricesmay fall outside the high/low price threshold.** Class ‘X’ Accumulation launched on 14 March 2020.***The AMC was updated during the year.
44
PUTM ACS Japan Equity Fund
Statistical information
Investment objective
The Sub-fund aims to provide a total return (a combination of capital growth andincome) by outperforming the MSCI Japan Index (the “Index”) before fees by 0.5% to1% per annum over any given 3 year period.
Investment policyThe Sub-fund aims to achieve its objective by investing over 70% of the portfolio inequities and equity related securities of Japanese companies that are constituents ofthe Index. The Sub-fund may invest up to 5% in Japanese companies listed outside ofthe Index.
Equity related securities will include convertible stocks, stock exchange listedwarrants, depository receipts, and any other such investments which entitle the holderto subscribe for or convert into the equity of the company and/or where the share priceperformance is, in the opinion of the Investment Manager, influenced significantly bythe stock market performance of the company’s ordinary shares. The Sub-fund mayalso invest in other transferable securities, money-market instruments, deposits, cashand near cash and other collective investment schemes.
Derivatives will be used for efficient portfolio management only.
Investment strategyAlthough over 70% is invested in components of the Index. The Sub-fund is activelymanaged and the Investment Manager has discretion to select its investments. TheSub-fund does not concentrate on any particular sector.
Revenue distribution and pricingUnits of the Sub-fund are available as either Class ‘B’ Accumulation, ‘C’ Accumulation,‘D’ Accumulation, ‘F’ Accumulation or ‘X’ Accumulation units (where revenue isreinvested to enhance the unit price). There will be two potential distributions in eachaccounting year: an interim distribution as at 31 July and a final distribution as at 31January.
At each distribution the net revenue after deduction of expenses, from the investmentsof the Sub-fund, is apportioned amongst the unitholders. Unitholders receive a taxvoucher giving details of the distribution and the ACS Manager’s Report no later thantwo months after these dates.

45
fi
PUTM ACS Japan Equity Fund
Statistical information
Risk and reward profile
The Risk and Reward Indicator table demonstrates where the Sub-fund ranks in terms of itspotential risk and reward. The higher the rank the greater the potential reward but the greater therisk of losing money. It is based on past data, may change over time and may not be a reliableindication of the future risk profile of the Sub-fund. The shaded area in the table below shows theSub-fund’s ranking on the Risk and Reward Indicator.
Typically lower rewards, Typically higher rewards, lower risk higher risk fi
1 2 3 4 5 6 7
This Sub-fund is ranked at 6 (31/01/21: 6) because funds of this type have experienced highrises and falls in value in the past. Although this is a high risk ranking it is not the highest. Theabove figure applies to the following unit classes:
• Class ‘B’ Accumulation• Class ‘C’ Accumulation• Class ‘D’ Accumulation• Class ‘F’ Accumulation• Class ‘X’ Accumulation
Please note that even the lowest risk class can lose you money and that extreme marketcircumstances can mean you suffer severe losses in all cases. Please note the Sub-fund’s riskcategory may change in the future. The indicator does not take into account the following risks ofinvesting in this Sub-fund:
• The Sub-fund may use derivatives to reduce risk or cost or to generate additional capital orincome at low risk, or to meet its investment objective.
• Investing overseas can bring additional returns and spread risk to different markets. There arerisks, however, that changes in currency rates will reduce the value of your investment.
• Counterparty Risk: the insolvency of any institutions providing services such as safekeeping ofassets or acting as counterparty to derivatives or other instruments, may expose the Sub-fund tofinancial loss.
For more information on the Risk and Reward profiles of our Funds, please refer to the most up todate relevant fund and Unit Class Key Investor Information Documents (KIIDs). These areavailable online at www.phoenixunittrust.co.uk.
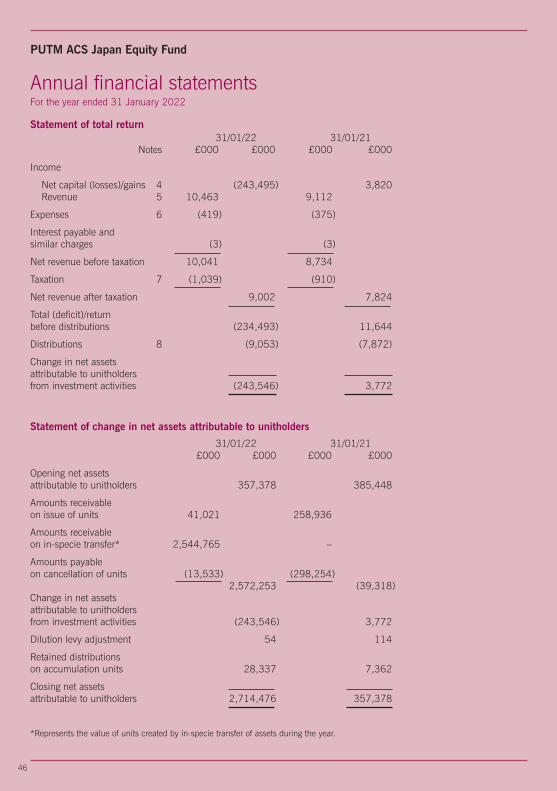
Annual financial statementsFor the year ended 31 January 2022
Statement of total return 31/01/22 31/01/21 Notes £000 £000 £000 £000
Income
Net capital (losses)/gains 4 (243,495) 3,820 Revenue 5 10,463 9,112
Expenses 6 (419) (375)
Interest payable andsimilar charges (3) (3)
Net revenue before taxation 10,041 8,734
Taxation 7 (1,039) (910)
Net revenue after taxation 9,002 7,824
Total (deficit)/returnbefore distributions (234,493) 11,644
Distributions 8 (9,053) (7,872)
Change in net assetsattributable to unitholdersfrom investment activities (243,546) 3,772
Statement of change in net assets attributable to unitholders
31/01/22 31/01/21 £000 £000 £000 £000
Opening net assetsattributable to unitholders 357,378 385,448
Amounts receivableon issue of units 41,021 258,936
Amounts receivableon in-specie transfer* 2,544,765 –
Amounts payableon cancellation of units (13,533) (298,254) 2,572,253 (39,318)Change in net assetsattributable to unitholdersfrom investment activities (243,546) 3,772
Dilution levy adjustment 54 114
Retained distributionson accumulation units 28,337 7,362
Closing net assetsattributable to unitholders 2,714,476 357,378
*Represents the value of units created by in-specie transfer of assets during the year.
46
PUTM ACS Japan Equity Fund

47
Balance sheet 31/01/22 31/01/21 Notes £000 £000 £000 £000
Assets:Fixed assets:Investments 2,685,918 343,305
Current assets:Debtors 9 22,026 17,930
Cash and bank balances 10 21,984 14,108
Total current assets 44,010 32,038
Total assets 2,729,928 375,343
Liabilities:Creditors:Other creditors 11 (15,452) (17,965)
Total creditors (15,452) (17,965)
Total liabilities (15,452) (17,965)
Net assetsattributable to unitholders 2,714,476 357,378
Annual financial statementsAs at 31 January 2022
PUTM ACS Japan Equity Fund

48
PUTM ACS Japan Equity Fund
Notes to the financial statements
Notes 1-3 Accounting policiesPlease see pages 3 to 6 for accounting basis and policies.
Note 4 Net capital (losses)/gainsThe net capital (losses)/gains during the year comprise:
31/01/22 31/01/21 £000 £000
(Losses)/gains on non-derivative securities (243,835) 2,813Gains on derivative contracts 1,642 1,069Currency losses (1,272) (46)Handling charges (30) (16)
Net capital (losses)/gains (243,495) 3,820
Note 5 Revenue 31/01/22 31/01/21 £000 £000
Overseas dividends 10,446 9,099Stocklending commission 17 13
Total revenue 10,463 9,112
Note 6 Expenses 31/01/22 31/01/21 £000 £000(a) Payable to the ACS Manager or associates of the
ACS Manager and agents of either of them:ACS Manager’s periodic charge 330 295
(b) Payable to the Depositary or associates of theDepositary and agents of either of them:Depositary’s fees 22 20
(c) Other expenses:Audit fee 9 10Safe custody charges 51 48Printing & stationery 1 1FTSE License fees 5 –Professional fees 1 1
67 60
Total expenses 419 375
Note 7 Taxation 31/01/22 31/01/21 £000 £000(a) Analysis of tax charge for the year
Overseas withholding tax 1,039 910
Total taxation 1,039 910
As the scheme is an ACS it is not subject to UK tax on income or capital gains.

49
Note 8 DistributionsThe distributions take account of amounts added on the issue of units andamounts deducted on the cancellation of units, and comprise:
31/01/22 31/01/21 £000 £000
Interim 3,867 4,032Final 24,470 3,330
28,337 7,362
Amounts deducted on cancellation of units 60 619Amounts added on issue of units (19,344) (109)
Net distribution for the year 9,053 7,872
Net revenue after taxation 9,002 7,824
Expenses taken to capital 51 48
Net distribution for the year 9,053 7,872
Details of the distribution per unit are set out in the tables on pages 55 to 57.
Note 9 Debtors 31/01/22 31/01/21 £000 £000
Creations awaiting settlement 3,520 –Sales awaiting settlement 16,079 17,414Accrued income 2,427 516
Total debtors 22,026 17,930
Note 10 Cash and bank balances 31/01/22 31/01/21 £000 £000
Cash and bank balances 21,984 13,757Amounts held at futures clearing houses – 351
Total cash and bank balances 21,984 14,108
Note 11 Other creditors 31/01/22 31/01/21 £000 £000
Cancellations awaiting settlement 69 170Purchases awaiting settlement 15,187 17,748ACS Manager’s periodic charge payable 160 25Depositary’s fees payable 9 3Safe custody charges payable 16 8Audit fee payable 9 9Handling charges payable 2 2
Total other creditors 15,452 17,965
Notes to the financial statements
PUTM ACS Japan Equity Fund

50
PUTM ACS Japan Equity Fund
Notes to the financial statements
Note 12 Reconciliation of units Class ‘B’ Class ‘C’ Class ‘D’ Class ‘F’ Class ‘X’ Accumulation Accumulation Accumulation Accumulation* Accumulation
Opening units issuedat 01/02/21 10,608,464 44,799,202 260,763,744 – 250,000Unit movements in year:Units issued 4,656,718 3,595,910 25,341,785 3,280,349 –Units cancelled (328,392) (4,547,458) (6,498,076) – (200,000)In-specie transactions – – 2,083,307,681 33,817,835 –
Closing units at 31/01/22 14,936,790 43,847,654 2,362,915,134 37,098,184 50,000
* Class ‘F’ Accumulation launched on 22 October 2021.
Note 13 Contingencies and commitmentsAt 31 January 2022 the Sub-fund had no outstanding calls on partly paid shares, no potentialunderwriting commitments or any other contingent liabilities (31/01/21: £nil).
Note 14 StocklendingThe total value of securities on loan at the Balance sheet date was £nil (31/01/21: £4,727,975).Collateral was held in the following form:
31/01/22 31/01/21 £000 £000Equity – 5,149
– 5,149
The gross earnings and fees paid for the year were £21,228 (31/01/21: £15,122) and £3,821(31/01/21: £2,722) respectively.The gross earnings were split by the lending agent as follows:– 82% to the Lender (PUTM ACS Japan Equity Fund)– 8% to the ACS Manager (Phoenix Unit Trust Managers Limited)– 10% retained by the Lending Agent (eSec)
Note 15 Unitholders’ fundsThere are five unit classes in issue within the Sub-fund. These are Class ‘B’ Accumulation, Class‘C’ Accumulation, Class ‘D’ Accumulation, Class ‘F’ Accumulation and Class ‘X’ Accumulation. TheACS Manager’s periodic charge in respect of Class ‘B’, Class ‘C’, Class ‘D’, Class ‘F’ and Class ‘X’is expressed as an annual percentage of the value of the property of the Sub-fund attributable toeach unit class and is currently 0.005% in respect of Class ‘B’, Class ‘C’, Class ‘D’, Class ‘F’ andClass ‘X’ units.
Consequently, the level of net revenue attributable to each unit class will differ. Should it benecessary to wind-up the Sub-fund, each unit class will have the same rights as regards to thedistribution of the property of the Sub-fund.

51
Note 16 Related party transactionsThe ACS Manager is a related party to the Sub-fund by virtue of its controlling influence.
The ACS Manager is part of the Phoenix Group. Phoenix Life Limited which is also part ofthe Phoenix Group, is a material unitholder in the Sub-fund and therefore a related party,holding the following percentage of the units at the year end:
Class ‘B’ Class ‘C’ Class ‘D’ Class ‘F’* Class ‘X’% % % % %
As at 31 January 2022: 100.00 100.00 100.00 100.00 100.00
As at 31 January 2021: n/a 100.00 100.00 n/a 100.00
* Class ‘F’ Accumulation launched on 22 October 2021
ACS Manager’s periodic charge paid to the ACS Manager, Phoenix Unit Trust ManagersLimited, or its associates, is shown in Note 6(a) and details of the units issued andcancelled by the ACS Manager are shown in the Statement of change in net assetsattributable to unitholder and Note 8.
Any balances due to/from the ACS Manager or its associates at 31 January 2022 in respectof these transactions are shown in Notes 9 and 11.
Note 17 Financial instrumentsIn accordance with the investment objective, the Sub-fund holds certain financialinstruments. These comprise:• securities held in accordance with the investment objective and policies;• derivative transactions which the Sub-fund may also enter into, the
purpose of which is to manage the currency and market risks arisingfrom the Sub-fund’s investment activities; and
• cash and short term debtors and creditors arising directly from operations.
Counterparty exposureThere was no counterparty exposure held at the year end.
Currency exposureAn analysis of the monetary assets and liabilities at the year end is shown below:
Net currency assets Net currency assets 31/01/22 31/01/21
Currency Monetary Non- Total Monetary Non- Total exposure monetary exposure exposure monetary exposure exposure exposure £000 £000 £000 £000 £000 £000
Sterling 3,261 – 3,261 735 – 735 Japanese Yen 25,297 2,685,918 2,711,215 13,338 343,305 356,643
28,558 2,685,918 2,714,476 14,073 343,305 357,378
Income received in other currencies is converted to Sterling on or near the date of receipt. TheSub-fund does not hedge or otherwise seek to avoid, movement risk on accrued income.
Notes to the financial statements
PUTM ACS Japan Equity Fund

52
PUTM ACS Japan Equity Fund
Notes to the financial statements
Note 17 Financial instruments (continued)
Interest profileAt the year end date, 0.81% (31/01/21: 3.95%) of the Sub-fund’s net assets by valuewere interest bearing.Interest rates earned/paid on deposits are earned/paid at a rate linked to SONIA (SterlingOvernight Index Average) or international equivalent.
Sensitivity analysisInterest rate risk sensitivityAs the majority of the Sub-fund’s financial assets are non-interest bearing, the Sub-fundis only subject to limited exposure to fair value interest rate risk due to fluctuations inlevels of market interest rates and therefore, no sensitivity analysis has been provided.
Foreign currency risk sensitivityA five percent increase in the value of the Sub-fund’s foreign currency exposure wouldhave the effect of increasing the return and net assets by £135,560,745 (31/01/21:£17,832,150). A five percent decrease would have an equal and opposite effect.
Market price risk sensitivityA five percent increase in the value of the Sub-fund’s portfolio would have the effect ofincreasing the return and net assets by £134,295,895 (31/01/21: £17,868,900). Afive percent decrease would have an equal and opposite effect.
Note 18 Fair value of investmentsThe fair value of the Sub-fund’s investments has been determined using the hierarchy below.
This complies with the ‘Amendments to FRS 102 – Fair value hierarchy disclosures’ issuedby the Financial Reporting Council in March 2016.
Level 1 The unadjusted quoted price in an active market for identical assets orliabilities that the entity can access at the measurement date.
Level 2 Inputs other than quoted prices included within Level 1 that areobservable (i.e. developed using market data) for the asset or liability,either directly or indirectly.
Level 3 Inputs are unobservable (i.e. for which market data is unavailable) for theasset or liability.
For the year ended 31/01/22Level 1 2 3 Total
Investment assets £000 £000 £000 £000Equities 2,685,918 – – 2,685,918
2,685,918 – – 2,685,918
For the year ended 31/01/21Level 1 2 3 Total
Investment assets £000 £000 £000 £000Equities 343,020 – – 343,020Derivatives 285 – – 285
343,305 – – 343,305

53
PUTM ACS Japan Equity Fund
Note 19 Portfolio transaction costs
For the year ended 31/01/22Other Total
Value Commission Taxes expenses costsAnalysis of total purchases costs £000 £000 % £000 % £000 % £000
Equity transactions 578,558 88 0.02 – – – – 578,646In-specie transactions 2,553,940 – – – – – – 2,553,940
Total 3,132,498 88 – – 3,132,586
Other TotalValue Commission Taxes expenses costs
Analysis of total sales costs £000 £000 % £000 % £000 % £000
Equity transactions 545,952 (99) (0.02) – – – – 545,853
Total 545,952 (99) – – 545,853
The Sub-fund has paid £2,023 as commission on purchases and sales of derivatives transactions for the yearended 31/01/22.
Commission, taxes and other expenses as % of average net assets:Commission 0.02%Taxes 0.00%Other expenses 0.00%
For the year ended 31/01/21Other Total
Value Commission Taxes expenses costsAnalysis of total purchases costs £000 £000 % £000 % £000 % £000
Equity transactions 228,994 7 0.00 – – – – 229,001
Total 228,994 7 – – 229,001
Other TotalValue Commission Taxes expenses costs
Analysis of total sales costs £000 £000 % £000 % £000 % £000
Equity transactions 264,710 (9) 0.00 – – – – 264,701Corporate actions 1 – – – – – – 1
Total 264,711 (9) – – 264,702
The Sub-fund has paid £2,538 as commission on purchases and sales of derivatives transactions for the yearended 31/01/21.
Commission, taxes and other expenses as % of average net assets:Commission 0.01%Taxes 0.00%Other expenses 0.00%
Notes to the financial statements
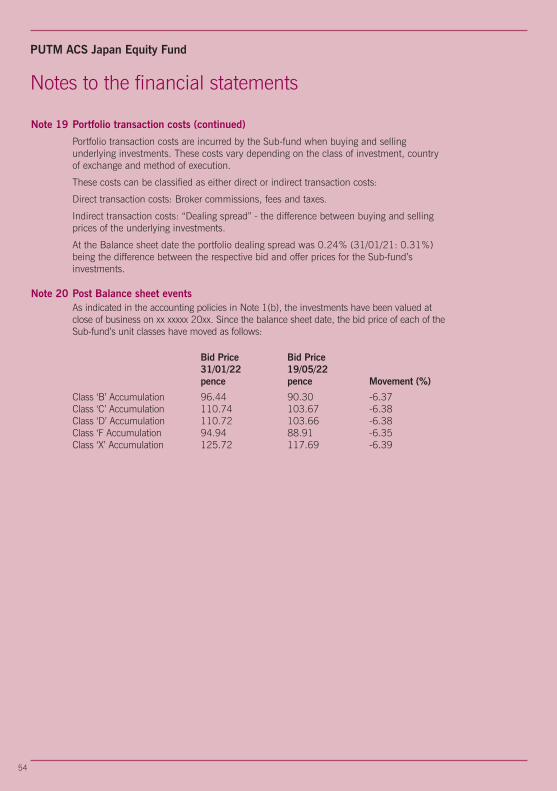
54
PUTM ACS Japan Equity Fund
Notes to the financial statements
Note 19 Portfolio transaction costs (continued)
Portfolio transaction costs are incurred by the Sub-fund when buying and sellingunderlying investments. These costs vary depending on the class of investment, countryof exchange and method of execution.
These costs can be classified as either direct or indirect transaction costs:
Direct transaction costs: Broker commissions, fees and taxes.
Indirect transaction costs: “Dealing spread” - the difference between buying and sellingprices of the underlying investments.
At the Balance sheet date the portfolio dealing spread was 0.24% (31/01/21: 0.31%)being the difference between the respective bid and offer prices for the Sub-fund’sinvestments.
Note 20 Post Balance sheet eventsAs indicated in the accounting policies in Note 1(b), the investments have been valued atclose of business on xx xxxxx 20xx. Since the balance sheet date, the bid price of each of theSub-fund’s unit classes have moved as follows:
Bid Price Bid Price 31/01/22 19/05/22
pence pence Movement (%)
Class ‘B’ Accumulation 96.44 90.30 -6.37Class ‘C’ Accumulation 110.74 103.67 -6.38Class ‘D’ Accumulation 110.72 103.66 -6.38Class ‘F Accumulation 94.94 88.91 -6.35Class ‘X’ Accumulation 125.72 117.69 -6.39

55
Interim distribution in pence per unitGroup 1: units purchased prior to 1 February 2021Group 2: units purchased 1 February 2021 to 31 July 2021 2021 2020 pence pence per unit per unit Net paid paid income Equalisation 30 Sep 30 Sep*
Class ‘B’ Accumulation
Group 1 1.038827 — 1.038827 n/a Group 2 0.149129 0.889698 1.038827 n/a
2021 2020 pence pence per unit per unit Net paid paid income Equalisation 30 Sep 30 Sep
Class ‘C’ Accumulation
Group 1 1.185503 — 1.185503 1.233863 Group 2 0.138122 1.047381 1.185503 1.233863
2021 2020 pence pence per unit per unit Net paid paid income Equalisation 30 Sep 30 Sep
Class ‘D’ Accumulation
Group 1 1.184811 — 1.184811 1.233053 Group 2 0.189773 0.995038 1.184811 1.233053
2021 2020 pence pence per unit per unit Net paid paid income Equalisation 30 Sep 30 Sep
Class ‘X’ Accumulation
Group 1 1.391560 — 1.391560 1.328640 Group 2 1.391560 0.000000 1.391560 1.328640
*Class ‘B’ Accumulation launched on 27 November 2020, hence there are no comparatives.
Distribution tablesFor the year ended 31 January 2022
PUTM ACS Japan Equity Fund

56
PUTM ACS Japan Equity Fund
Final distribution in pence per unitGroup 1: units purchased prior to 1 August 2021Group 2: units purchased 1 August 2021 to 31 January 2022 2022 2021 pence pence per unit per unit Net payable paid income Equalisation 31 Mar 31 Mar
Class ‘B’ Accumulation
Group 1 0.890076 — 0.890076 0.125795Group 2 0.097576 0.792500 0.890076 0.125795
2022 2021 pence pence per unit per unit Net payable paid income Equalisation 31 Mar 31 Mar
Class ‘C’ Accumulation
Group 1 1.021578 — 1.021578 1.084360Group 2 0.104650 0.916928 1.021578 1.084360
2022 2021 pence pence per unit per unit Net payable paid income Equalisation 31 Mar 31 Mar
Class ‘D’ Accumulation
Group 1 1.009524 — 1.009524 1.084520Group 2 0.096291 0.913233 1.009524 1.084520
2022 2021 pence pence per unit per unit Net payable paid income Equalisation 31 Mar 31 Mar*
Class ‘F’ Accumulation
Group 1 0.092458 — 0.092458 n/aGroup 2 0.003065 0.089393 0.092458 n/a
* The Class ‘F’ Accumulation launched on 22 October 2021, hence there are no comparatives.
Distribution tablesFor the year ended 31 January 2022

57
PUTM ACS Japan Equity Fund
Final distribution in pence per unitGroup 1: units purchased prior to 1 August 2021Group 2: units purchased 1 August 2021 to 31 January 2022 2022 2021 pence pence per unit per unit Net payable paid income Equalisation 31 Mar 31 Mar
Class ‘X’ Accumulation
Group 1 1.151480 — 1.151480 1.229144Group 2 1.151480 0.000000 1.151480 1.229144
Each Sub-fund is tax transparent for income purposes meaning that UK tax-paying Unitholders aresubject to tax on their share of income, net of allowable expenses, as it arises to the Sub-fund andnot on distributions of income after deduction of expenses.
On a daily basis unitholders will be advised of their share of aggregated accrued income, expensesand withholding tax paid on overseas dividends, if applicable. When a unit is purchased during thedistribution period, part of the purchase price of the unit reflects the relevant share of income andexpenses accrued by the Sub-fund, and this will be disclosed on the contract note. This purchasedincome and expense, a capital sum, should be deducted from the aggregate accrued income orexpense as applicable.
The subscription price disclosed on the contract note reflects the acquisition cost, which should beadjusted by the capital sum referred to above.
It is the responsibility of the unitholder to maintain a record of the relevant amount(s) of incomeequalisation and to make the appropriate adjustment when completing their tax calculations.
Distribution tablesFor the year ended 31 January 2022

58
Dear Investor
Welcome to the PUTM ACS Lothian European ex-UK Fundreport from 31 January 2021 to 31 January 2022.
Performance Review
Over the review period, the PUTM ACS Lothian Europeanex-UK Fund returned 11.21% (Source: Factset: Gross ofAMC; based on the movement in the Cancellation Pricefrom 31/01/21 to 31/01/22). This was compared to areturn of 13.76% for the benchmark index (Source:Factset: MSCI Europe (ex-UK) Index, Total Return from31/01/21 to 31/01/22, in GBP).
Investment review
Source: Sub-fund performance: Factset: Gross of AMC; based on the movement in the Cancellation Price from 31January 2021 to 31 January 2022. Benchmark index performance: MSCI Europe (ex- UK) Index, Total Return from31 January 2021 to 31 January 2022.
Past performance is not a guide to future performance.
Please note that all past performance figures are calculated without taking the initial charge into account.
The value of units and the income from them can go down as well as up and is not guaranteed. You maynot get back the full amount invested.
Standardised Past Performance
PUTM ACS Lothian European ex UK Fund
PUTM ACS Lothian Europeanex-UK Fund 11.21 1.05 – – –
Benchmark Index 13.76 1.12 – – –
31 Jan 21 - Jan 22 20 Nov 20 - Jan 21% growth % growth

59
PUTM ACS Lothian European ex UK Fund
Investment review
Market ReviewEuropean shares (excluding the UK) finished substantiallyhigher over the 12 months. Equities gained at the beginning ofthe period, helped by the earlier rollout of vaccinations, a newBrexit trade deal, the Biden election victory and the €500billion expansion of the European Central Bank's (ECB)monetary stimulus package all driving markets upwards. Theregion's equities performed well through the spring andsummer, despite ongoing lockdown measures and rising Covid-19 cases. After rising for seven consecutive months, Europeanshares finally fell in September, recovering in October beforebeing hit in November by the Omicron variant. European stocksthen rallied into the year-end, but sold off sharply alongsideglobal markets in January on the prospect of higher interestrates. In economic developments, September saw Norway’sNorges Bank became the first developed bank to raise interestrates since the start of the pandemic. Attempting to reassureinvestors that the ECB would not follow suit, President ChristineLagarde said the central bank would not taper bond marketsupport. However, with the Eurozone’s November inflation printreaching its highest level since the introduction of the euro, theECB indicated it would end its Pandemic Emergency PurchaseProgramme in March 2022. Eurozone officials alsoacknowledged that rising inflation may not be as short-lived aspredicted; indeed, the Bank adopted a more hawkish tone oninterest rates as the period ended.
Sub-fund ReviewThe Sub-fund made a positive return but underperformed overthe period. From a sector perspective, overweight exposures tothe utilities and industrials sectors detracted from performance.Stock selection in the consumer discretionary, industrials andenergy sectors also weighed on returns. On the other hand, anunderweight exposure to the telecommunications andhealthcare sectors helped returns, with stock selection in thehealthcare and basic materials also contributing.
On a stock-specific basis, Ørsted, the Danish developer andoperator of offshore wind farms, was another detractor fromreturns over the period. The prospect of rising interest rates hasweighed on long-duration green infrastructure assets like thoseof Ørsted. However, we believe the growth trajectory forsustainable energy sources and their positioning within thesector are underappreciated by investors in the currentenvironment. Integrated transportation systems manufacturerAlstom lagged due to concerns over short-term cash generationas it works through less profitable contracts inherited followingits acquisition of Bombardier. Elsewhere, digital transactionprovider Worldline underperformed due to the announcement ofa delay to the long-anticipated sale of its terminals business.Video game manufacturer Ubisoft was also weak due toconcerns over cost inflation, as well as being hit by a sectorrotation out of IT software names later in the period.
Conversely, within healthcare, the global leader in diabetestreatment Novo Nordisk performed solidly after its obesityfranchise continued to perform well. The firm also releasedupbeat results earlier in the period. Financials also contributed,amid rising interest-rate expectations, with AXA, Nordea Bank,Credit Agricole and BAWAG all performing well over the 12months. Elsewhere, the Sub-fund’s overweight holding insemiconductor supplier ASML contributed to returns, as a globalshortage of semiconductor chips and increased demand sawthe share price rise. A lack of exposure to utilities companiesIberdrola and Vestas Wind Systems also helped returns. Lastly,insulation supplier Kingspan also outperformed. The companywas negatively affected by its involvement in the Grenfell Towertragedy, but management has fully addressed the issues raisedand finally been able to repudiate any false allegations.
Outlook at Year EndGuidance for corporate earnings expectations for 2022 remainscautious, due to input cost inflation and logistics tightness.Attention is moving to the potential for central banks to unwindtheir extremely accommodative policy stance in the face ofstrong cost inflation, which is being exacerbated by supply-chain issues. However, the emergence of an incrediblycontagious variant of Covid-19 has resulted in furtherlockdowns and restrictions to activity globally, although there isincreasing evidence that its impact is less devastating. Theprevailing opinion seems to be that this should not completelyderail the economic recovery, but may continue to fuel inflationthrough continued supply-chain disruption. Therefore, webelieve that uncertainty quarter-by-quarter will continue as thepace of infection ebbs and flows, and volatility will continue tobe a feature of equity markets.
To reflect this uncertainty, and the variety of outcomes possible,the Sub-fund continues to maintain a balanced approach, withpositioning determined by our focus-on-change approach thatseeks to identify non-consensus insight not already priced intovaluations. Hence, the Sub-fund is able to use short-termvolatility to add to high-conviction positions, such as renewableenergy business Neste and Deutsche Boerse, which providesstock exchange and trading services and is a beneficiary ofrising interest rates. The transition of Covid-19 from pandemicto endemic is likely to continue accelerating certain longer-termgrowth trends to which the Sub-fund continues to seekexposure. For example, many companies have reported anacceleration in the trend to digitalisation to accommodate moreremote working, and the Sub-fund remains exposed to stockslikely to benefit from this theme, such as SAP, ASML andSchneider Electric.
As the market outlook was completed as of 31st January, thereis no mention of the ongoing Ukraine crisis that began at theend of February. Naturally, this would dramatically affect anyfuture expectations of market outlook that would not have beenfactored in at the time of writing.
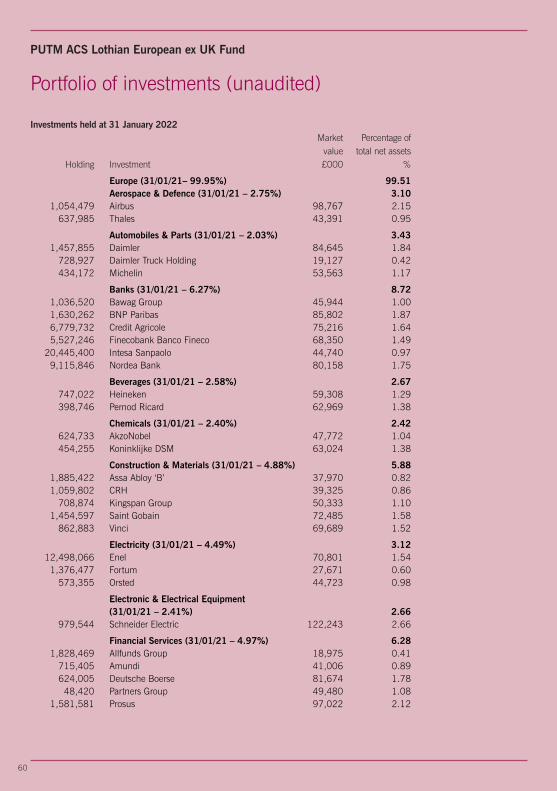
60
Portfolio of investments (unaudited)
Investments held at 31 January 2022 Market Percentage of value total net assets Holding Investment £000 %
Europe (31/01/21– 99.95%) 99.51 Aerospace & Defence (31/01/21 – 2.75%) 3.10 1,054,479 Airbus 98,767 2.15 637,985 Thales 43,391 0.95
Automobiles & Parts (31/01/21 – 2.03%) 3.43 1,457,855 Daimler 84,645 1.84 728,927 Daimler Truck Holding 19,127 0.42 434,172 Michelin 53,563 1.17
Banks (31/01/21 – 6.27%) 8.72 1,036,520 Bawag Group 45,944 1.00 1,630,262 BNP Paribas 85,802 1.87 6,779,732 Credit Agricole 75,216 1.64 5,527,246 Finecobank Banco Fineco 68,350 1.49 20,445,400 Intesa Sanpaolo 44,740 0.97 9,115,846 Nordea Bank 80,158 1.75
Beverages (31/01/21 – 2.58%) 2.67 747,022 Heineken 59,308 1.29 398,746 Pernod Ricard 62,969 1.38
Chemicals (31/01/21 – 2.40%) 2.42 624,733 AkzoNobel 47,772 1.04 454,255 Koninklijke DSM 63,024 1.38
Construction & Materials (31/01/21 – 4.88%) 5.88 1,885,422 Assa Abloy ‘B’ 37,970 0.82 1,059,802 CRH 39,325 0.86 708,874 Kingspan Group 50,333 1.10 1,454,597 Saint Gobain 72,485 1.58 862,883 Vinci 69,689 1.52
Electricity (31/01/21 – 4.49%) 3.12 12,498,066 Enel 70,801 1.54 1,376,477 Fortum 27,671 0.60 573,355 Orsted 44,723 0.98
Electronic & Electrical Equipment (31/01/21 – 2.41%) 2.66 979,544 Schneider Electric 122,243 2.66
Financial Services (31/01/21 – 4.97%) 6.28 1,828,469 Allfunds Group 18,975 0.41 715,405 Amundi 41,006 0.89 624,005 Deutsche Boerse 81,674 1.78 48,420 Partners Group 49,480 1.08 1,581,581 Prosus 97,022 2.12
PUTM ACS Lothian European ex UK Fund

61
Portfolio of investments (unaudited)
Investments held at 31 January 2022 Market Percentage of value total net assets Holding Investment £000 %
Food & Drug Retailers (31/01/21 – 0.73%) Food Producers (31/01/21 – 7.26%) 7.33 1,286,062 Danone 59,358 1.29 494,094 Kerry Group 46,196 1.01 2,420,448 Nestle ‘R’ 230,740 5.03
Gas, Water & Multiutilities (31/01/21 – 2.86%) 2.71 4,332,751 Engie 49,068 1.07 2,411,111 RWE 75,164 1.64
General Industrials (31/01/21 – 3.48%) 4.16 883,146 Siemens 102,849 2.24 2,635,248 Siemens Energy AG 43,409 0.95 7,807,473 Swedish Match 44,751 0.97
Industrial Engineering (31/01/21 – 3.79%) 2.51 575,441 Alstom 13,775 0.30 1,014,556 Atlas Copco ‘A’ 44,023 0.96 3,451,145 Volvo ‘B’ 57,445 1.25
Industrial Transportation (31/01/21 – 2.59%) 2.99 642,222 DSV 96,641 2.11 2,959,967 Ryanair 40,585 0.88
Media (31/01/21 – 2.57%) 2.89 717,484 Publicis Groupe 35,789 0.78 750,498 Schibsted 16,406 0.36 2,510,833 Universal Music Group 45,766 1.00 3,533,703 Vivendi 34,235 0.75
Mining (31/01/21 – 0.85%) Mobile Telecommunications (31/01/21 – 1.34%) 1.29 4,829,308 Telenor 59,205 1.29
Non-Life Insurance (31/01/21 – 5.58%) 5.40 4,239,041 AXA 98,872 2.16 3,472,593 Tryg 61,205 1.33 248,647 Zurich Insurance Group 87,703 1.91
Oil & Gas Producers (31/01/21 – 3.11%) 1.97 1,117,544 Lundin Energy 33,464 0.73 1,714,469 Neste Oyj 56,870 1.24
Personal Goods (31/01/21 – 3.23%) 4.35 231,811 LVMH 139,803 3.05 278,079 The Swatch Group ‘B’ 59,706 1.30
Pharmaceuticals & Biotechnology (31/01/21 – 11.73%) 10.67 190,309 Lonza Group 96,469 2.10 2,583,635 Novo Nordisk ‘B’ 190,938 4.16 282,043 Roche Holding 80,573 1.76 1,569,572 Sanofi 121,623 2.65
PUTM ACS Lothian European ex UK Fund

62
Portfolio of investments (unaudited)
Investments held at 31 January 2022 Market Percentage of value total net assets Holding Investment £000 %
Software & Computer Services (31/01/21 – 8.34%) 7.02 43,490 Adyen 64,986 1.42 1,267,430 SAP 116,277 2.53 244,988 Teleperformance 68,225 1.49 980,001 Ubisoft Entertainment 41,547 0.91 863,070 Worldline 30,763 0.67
Support Services (31/01/21 – 0.00%) 0.53 773,861 Edenred 24,506 0.53
Technology Hardware & Equipment (31/01/21 – 6.51%) 5.31 491,196 ASML Holding 243,375 5.31
Tobacco (31/01/21 – 0.87%) Travel & Leisure (31/01/21 – 1.62%) 1.71 438,263 Flutter Entertainment 49,160 1.07 821,060 Thule Group 29,255 0.64
Money Markets (31/01/21 – 0.71%) 0.39 €21,663 Aberdeen Standard Liquidity Fund (Lux) – Euro Fund Class Z-3+ 17,855 0.39
Portfolio of investments 4,564,753 99.51 Net other assets 22,396 0.49
Net assets 4,587,149 100.00
Unless otherwise stated, all investments are approved securities being either officiallylisted in a member state or traded on or under the rules of an eligible securities market.
+SICAVs (open ended investment schemes registered outside the UK).
PUTM ACS Lothian European ex UK Fund

63
PUTM ACS Lothian European ex UK Fund
Top ten purchases and salesFor the year ended 31 January 2022
Purchases Cost£000
Aberdeen Standard Liquidity Fund (Lux)– Euro Fund Class Z-3 252,464Aberdeen Standard Liquidity Fund (Lux)– Seabury Sterling Fund Class Z-1 211,145Lonza Group 100,451BNP Paribas 81,355Saint Gobain 73,281Danone 67,215Daimler 50,409Prosus 49,822Novo Nordisk ‘B’ 46,702Sanofi 46,549
Subtotal 979,393Other purchases 956,746
Total purchases for the year 1,936,139
Sales Proceeds£000
Aberdeen Standard Liquidity Fund (Lux)– Seabury Sterling Fund Class Z-1 239,040Aberdeen Standard Liquidity Fund (Lux)– Euro Fund Class Z-3 232,759Roche Holding 101,480Novartis ‘R’ 97,733Infineon Technologies 84,108Total Energies 72,228Muenchener Rueckver 59,303Julius Baer Group 44,012ArcelorMittal 42,876Amadeus IT Group 42,140
Subtotal 1,015,679Other sales 568,974
Total sales for the year 1,584,653

64
PUTM ACS Lothian European ex UK Fund
Statistical information
Comparative tables Class ‘D’ Class ‘X’ Accumulation** Accumulation*** 31/01/22 31/01/21 31/01/22 pence pence penceChange in net assets per unitOpening net asset value per unit 100.83 100.00 100.00
Return before operating charges* 11.11 0.83 (0.22)Operating charges (0.02) – (0.02)
Return after operating charges* 11.09 0.83 (0.24)
Distributions on accumulation units (2.38) (0.12) (0.66)Retained distributions onaccumulation units 2.38 0.12 0.66
Closing net asset value per unit 111.92 100.83 99.76
*after direct transaction costs of:^ 0.05 0.00 0.05
PerformanceReturn after charges 11.00% 0.83% (0.24%)
Other informationClosing net asset value (£000) 4,587,099 3,930,817 50Closing number of units 4,098,579,232 3,898,636,144 50,000Operating charges 0.02% 0.02% 0.02%Direct transaction costs 0.05% 0.00% 0.05%
Prices+
Highest unit price (pence) 122.43 106.65 109.13Lowest unit price (pence) 100.57 99.36 97.64
+ High and low price disclosures are based on quoted unit prices. Therefore, the opening and closing NAV pricesmay fall outside the high/low price threshold.**Class ‘D’ Accumulation launched on 20 November 2020.***Class ‘X’ Accumulation launched on 9 June 2021, hence there are no comparatives.

65
PUTM ACS Lothian European ex UK Fund
Statistical information
Investment objective
The Sub-fund aims to provide a total return (a combination of capital growth andincome) by outperforming the FTSE World Europe ex UK Index (the “Index”) beforefees by 1.5% to 2.5% per annum over any given 3 year period.
Investment policyThe Sub-fund aims to achieve its objective by investing at least 80% of the portfolio inshares of European companies which are constituents of the FTSE World Europe ex UKIndex, though not necessarily in the same proportions of the Index at all times.
The Sub-fund’s holdings will typically consist of equities or “equity related securities”which will include convertible stocks, stock exchange listed warrants, depositoryreceipts, and any other such investments which entitle the holder to subscribe for orconvert into the equity of the company and/or where the share price performance is, inthe opinion of the Investment Manager, influenced significantly by the stock marketperformance of the company’s ordinary shares. The Sub-fund may also invest in othertransferable securities, which are non-approved securities (essentially unlistedsecurities), money-market instruments, deposits, cash and near cash and othercollective investment schemes.
Derivatives may be used for efficient portfolio management only.
Investment strategyAlthough at least 80% of the Sub-fund is invested in components of the Index, theSub-fund is actively managed. The Investment Manager uses research techniques toselect individual holdings. The research process is focused on identifying companieswhere the management team have a different view of a company’s prospects to that ofthe market, and which align with their views regarding future economic and businessconditions. The Investment Manager references the Index, which means that while theSub-fund is not required to match the weightings of the Index and does notconcentrate on any particular sector, the Sub-fund is managed within constraints, sothat divergence from the Index is controlled. The Sub-fund’s portfolio may, therefore,be similar to the components of the Index.
Revenue distribution and pricingUnits of the Sub-fund are available as either Class ‘D’ Accumulation or ‘X’Accumulation units (where revenue is reinvested to enhance the unit price). There willbe two potential distributions in each accounting year: an interim distribution as at 31July and a final distribution as at 31 January.
At each distribution the net revenue after deduction of expenses, from the investmentsof the Sub-fund, is apportioned amongst the unitholders. Unitholders receive a taxvoucher giving details of the distribution and the ACS Manager’s Report no later thantwo months after these dates.

66
PUTM ACS Lothian European ex UK Fund
Statistical information
Risk and reward profileThe Risk and Reward Indicator table demonstrates where the Sub-fund ranks in termsof its potential risk and reward. The higher the rank the greater the potential reward butthe greater the risk of losing money. It is based on past data, may change over time andmay not be a reliable indication of the future risk profile of the Sub-fund. The shadedarea in the table below shows the Sub-fund’s ranking on the Risk and Reward Indicator.
Typically lower rewards, Typically higher rewards,lower risk higher risk fi
1 2 3 4 5 6 7
This Sub-fund is ranked at 6 (31/01/21: 6) because funds of this type haveexperienced high rises and falls in value in the past. Although this is a high riskranking it is not the highest. The above figure applies to the following unit classes:
• Class ‘D’ Accumulation• Class ‘X’ Accumulation
Please note that even the lowest risk class can lose you money and that extrememarket circumstances can mean you suffer severe losses in all cases. Please note theSub-fund’s risk category may change in the future. The indicator does not take intoaccount the following risks of investing in this Sub-fund:
• The Sub-fund may use derivatives to reduce risk or cost or to generate additionalcapital or income at low risk, or to meet its investment objective
• Investing overseas can bring additional returns and spread risk to different markets.There are risks, however, that changes in currency rates will reduce the value ofyour investment.
For more information on the Risk and Reward profiles of our Funds, please refer to themost up to date relevant fund and Unit Class Key Investor Information Documents(KIIDs). These are available online at www.phoenixunittrust.co.uk.
fi

67
Annual financial statementsFor the year ended 31 January 2022
Statement of total return 31/01/22 31/01/21* Notes £000 £000 £000 £000
Income
Net capital gains 4 284,125 32,711 Revenue 5 97,266 5,312
Expenses 6 (860) (72)
Interest payable andsimilar charges (44) (1)
Net revenue before taxation 96,362 5,239
Taxation 7 (7,419) (570)
Net revenue after taxation 88,943 4,669
Total returnbefore distributions 373,068 37,380
Distributions 8 (89,525) (4,669)
Change in unitholders’ fundsfrom investment activities 283,543 32,711
Statement of change in unitholders’ funds
31/01/22 31/01/21* £000 £000 £000 £000
Opening net assets attributableto unitholders 3,930,817 –
Amounts receivable on issueof units 25,378 12,598
Amounts receivable onin-specie transfer** 714,041 3,995,977
Amounts payable oncancellation of units (457,702) (115,154) 281,717 3,893,421Change in unitholders’ fundsfrom investment activities 283,543 32,711
Dilution levy adjustment 259 88
Retained distributions onaccumulation units 90,813 4,597
Closing net assets attributableto unitholders 4,587,149 3,930,817
*The Sub-fund launched on 20 November 2020.**Represents the value of units cancelled by in-specie transfer of assets during the year.
PUTM ACS Lothian European ex UK Fund
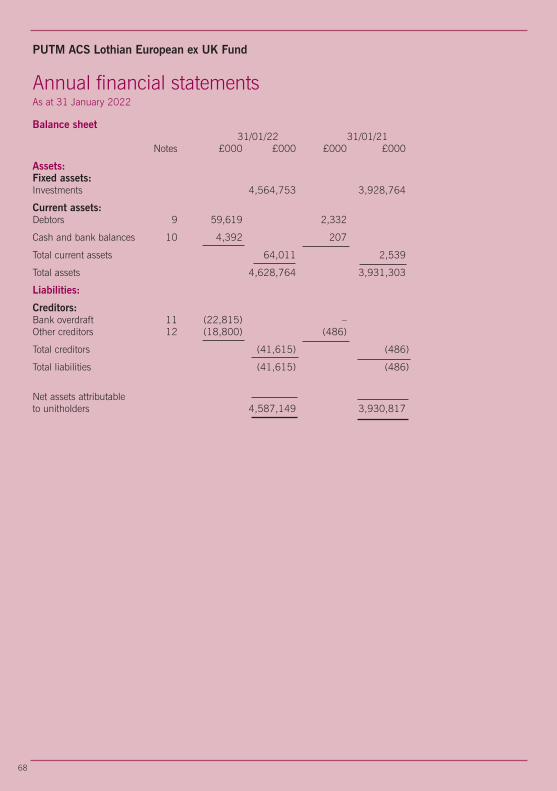
68
PUTM ACS Lothian European ex UK Fund
Balance sheet 31/01/22 31/01/21 Notes £000 £000 £000 £000
Assets:Fixed assets:Investments 4,564,753 3,928,764
Current assets:Debtors 9 59,619 2,332
Cash and bank balances 10 4,392 207
Total current assets 64,011 2,539
Total assets 4,628,764 3,931,303
Liabilities:
Creditors:Bank overdraft 11 (22,815) –Other creditors 12 (18,800) (486)
Total creditors (41,615) (486)
Total liabilities (41,615) (486)
Net assets attributableto unitholders 4,587,149 3,930,817
Annual financial statementsAs at 31 January 2022
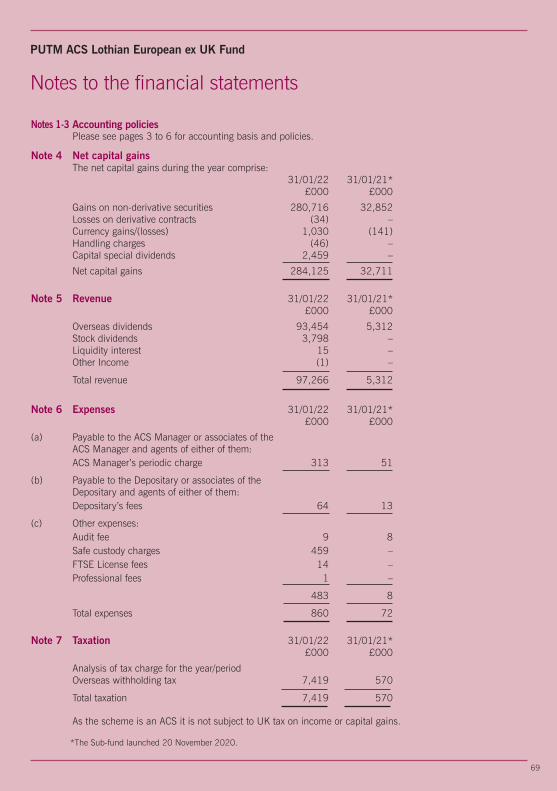
69
PUTM ACS Lothian European ex UK Fund
Notes to the financial statements
Notes 1-3 Accounting policiesPlease see pages 3 to 6 for accounting basis and policies.
Note 4 Net capital gainsThe net capital gains during the year comprise:
31/01/22 31/01/21* £000 £000
Gains on non-derivative securities 280,716 32,852Losses on derivative contracts (34) –Currency gains/(losses) 1,030 (141)Handling charges (46) –Capital special dividends 2,459 –
Net capital gains 284,125 32,711
Note 5 Revenue 31/01/22 31/01/21* £000 £000
Overseas dividends 93,454 5,312Stock dividends 3,798 –Liquidity interest 15 –Other Income (1) –
Total revenue 97,266 5,312
Note 6 Expenses 31/01/22 31/01/21* £000 £000
(a) Payable to the ACS Manager or associates of theACS Manager and agents of either of them:ACS Manager’s periodic charge 313 51
(b) Payable to the Depositary or associates of theDepositary and agents of either of them:Depositary’s fees 64 13
(c) Other expenses:Audit fee 9 8Safe custody charges 459 –FTSE License fees 14 –Professional fees 1 –
483 8
Total expenses 860 72
Note 7 Taxation 31/01/22 31/01/21* £000 £000
Analysis of tax charge for the year/periodOverseas withholding tax 7,419 570
Total taxation 7,419 570
As the scheme is an ACS it is not subject to UK tax on income or capital gains.
*The Sub-fund launched 20 November 2020.

70
PUTM ACS Lothian European ex UK Fund
Notes to the financial statements
Note 8 DistributionsThe distributions take account of amounts added on the issue of units andamounts deducted on the cancellation of units, and comprise:
31/01/22 31/01/21* £000
Interim 23,923 –Final 66,890 4,597
Total 90,813 4,597
Amounts deducted on cancellation of units 1,467 81Amounts added on issue of units (2,755) (9)
Net distribution for the year/period 89,525 4,669
Net revenue after taxation 88,943 4,669Capital Taxation 123 –Expenses taken to capital 459 –
Net distribution for the year/period 89,525 4,669
Details of the distribution per unit are set out in the tables on page 75.
*The Sub-fund launched on 20 November 2020.
Note 9 Debtors 31/01/22 31/01/21 £000 £000
Creations awaiting settlement 630 290Sales awaiting settlement 52,600 1,898Overseas tax recoverable 6,389 81Prepaid expenses – 63
Total debtors 59,619 2,332
Note 10 Cash and bank balances 31/01/22 31/01/21 £000 £000
Cash and bank balances 4,392 207
Total cash and bank balances 4,392 207
Note 11 Bank overdraft 31/01/22 31/01/21 £000 £000
Bank overdraft 22,815 –
Total bank overdraft 22,815 –
Note 12 Other creditors 31/01/22 31/01/21 £000 £000
Cancellations awaiting settlement 590 450Purchases awaiting settlement 18,003 –ACS Manager’s periodic charge payable 122 16Depositary’s fees payable 11 12Safe custody charges payable 65 –Audit fee payable 9 8
Total other creditors 18,800 486

Note 13 Reconciliation of units Class ‘D’ Class ‘X’ Accumulation Accumulation*
Opening units issued at 01/02/21 3,898,636,144 –Unit movements in year:Units issued 22,678,355 50,000Units cancelled (409,632,722) –In-specie transactions 586,897,455 –
Closing units at 31/01/22 4,098,579,232 50,000
*Class ‘X’ Accumulation launched on 9 June 2021.
Note 14 Contingencies and commitmentsAt 31 January 2022 the Sub-fund had no outstanding calls on partly paid shares, no potentialunderwriting commitments or any other contingent liabilities (31/01/21: £nil).
Note 15 Unitholders’ fundsThere are two unit classes in issue within the Sub-fund. These are Class ‘D’ Accumulation, andClass ‘X’ Accumulation.
The ACS Manager’s periodic charge in respect of Class ‘D’ and Class ‘X’, is expressed as anannual percentage of the value of the property of the Sub-fund attributable to each unit classand is currently 0.005% in respect of Class ‘D’ units and Class ‘X’ units. Consequently, thelevel of net revenue attributable to each unit class will differ. Should it be necessary to wind-upthe Sub-fund, each unit class will have the same rights as regards to the distribution of theproperty of the Sub-fund.
Note 16 Related party transactionsThe ACS Manager is a related party to the Sub-fund by virtue of its controlling influence.
The ACS Manager is part of the Phoenix Group. Phoenix Life Limited which is also part of thePhoenix Group, is a material unitholder in the Sub-fund and therefore a related party, holdingthe following percentage of the units at the year/period end:
Class ‘D’ Class ‘X’* % %
As at 31 January 2022: 100.00 100.00
As at 31 January 2021: 100.00 n/a
*Class ‘X’ Accumulation launched on 9 June 2021, hence there are no comparatives.
ACS Manager’s periodic charge paid to the ACS Manager, Phoenix Unit Trust ManagersLimited, or its associates, is shown in Note 6(a) and details of the units issued and cancelledby the ACS Manager are shown in the Statement of change in net assets attributable tounitholders and Note 8.
Any balances due to/from the ACS Manager or its associates at 31 January 2022 in respect ofthese transactions are shown in Notes 9 and 12.
Note 17 Financial instrumentsIn accordance with the investment objective, the Sub-fund holds certain financial instruments.These comprise:• securities held in accordance with the investment objective and policies;• derivative transactions which the Sub-fund may also enter into, the purpose of which is to
manage the currency and market risks arising from the Sub-fund’s investment activities; and• cash and short term debtors and creditors arising directly from operations.
71
PUTM ACS Lothian European ex UK Fund
Notes to the financial statements

Note 17 Financial instruments (continued)Counterparty exposureThere was no counterparty exposure held at the year end.
Currency exposureAn analysis of the monetary assets and liabilities at the year end is shown below:
Net currency assets Net currency assets 31/01/22 31/01/21
Currency Monetary Non- Total Monetary Non- Total exposure monetary exposure exposure monetary exposure exposure exposure £000 £000 £000 £000 £000 £000
Sterling 2,806 – 2,806 33 27,897 27,930 Danish Krone 616 393,506 394,122 33 319,275 319,308 Euro 10,020 3,244,057 3,254,077 1,938 2,659,274 2,661,212 Norwegian Krone 58 75,611 75,669 – 101,398 101,398 Swedish Krona (6,202) 246,908 240,706 – 178,614 178,614 Swiss Franc 15,098 604,671 619,769 49 642,306 642,355
22,396 4,564,753 4,587,149 2,053 3,928,764 3,930,817
Income received in other currencies is converted to Sterling on or near the date of receipt.The Sub-fund does not hedge or otherwise seek to avoid, movement risk on accrued income.Interest profileAt the year end date, 0.01% (31/01/21: 0.71%) of the Sub-fund’s net assets by valuewere interest paying/bearing.
Interest rates earned/paid on deposits are earned/paid at a rate linked to SONIA (SterlingOvernight Index Average) or international equivalent. Interest was also earned on theinvesments in the the Aberdeen Standard Liquidity Fund.
Sensitivity analysisInterest rate risk sensitivityAs the majority of the Sub-fund’s financial assets are non-interest bearing, the Sub-fund isonly subject to limited exposure to fair value interest rate risk due to fluctuations in levelsof market interest rates and therefore, no sensitivity analysis has been provided.
Foreign currency risk sensitivityA five percent increase in the value of the Sub-fund’s foreign currency exposure wouldhave the effect of increasing the return and net assets by £229,217,114 (31/01/21:£195,144,350). A five percent decrease would have an equal and opposite effect.
Market price risk sensitivityA five percent increase in the value of the Sub-fund’s portfolio would have the effect ofincreasing the return and net assets by £228,237,672 (31/01/21: £196,540,850). Afive percent decrease would have an equal and opposite effect.
Note 18 Fair value of investmentsThe fair value of the Sub-fund’s investments has been determined using the hierarchy below.
This complies with the ‘Amendments to FRS 102 – Fair value hierarchy disclosures’ issued bythe Financial Reporting Council in March 2016.
Level 1 The unadjusted quoted price in an active market for identical assets orliabilities that the entity can access at the measurement date.
72
PUTM ACS Lothian European ex UK Fund
Notes to the financial statements

73
PUTM ACS Lothian European ex UK Fund
Notes to the financial statements
Note 18 Fair value of investments (continued)Level 2 Inputs other than quoted prices included within Level 1 that are observable (i.e.
developed using market data) for the asset or liability, either directly or indirectly.
Level 3 Inputs are unobservable (i.e. for which market data is unavailable) for the asset orliability.
For the year ended 31/01/22Level 1 2 3 Total
Investment assets £000 £000 £000 £000Equities 4,546,898 – – 4,546,898Money markets 17,855 – – 17,855
4,564,753 – – 4,564,753
For the period ended 31/01/21Level 1 2 3 Total
Investment assets £000 £000 £000 £000Equities 3,900,867 – – 3,900,867Money markets 27,897 – – 27,897
3,928,764 – – 3,928,764
Note 19 Portfolio transaction costs
For the year ended 31/01/22Other Total
Value Commission Taxes expenses costsAnalysis of total purchases costs £000 £000 % £000 % £000 % £000
Equity transactions 740,444 387 0.05 1,167 0.16 – – 741,998Money markets 463,595 – – – – – – 463,595Corporate actions 15,521 – – – – – – 15,521In-specie transactions 715,025 – – – – – – 715,025
Total 1,934,585 387 1,167 – 1,936,139
Other TotalValue Commission Taxes expenses costs
Analysis of total sales costs £000 £000 % £000 % £000 % £000
Equity transactions 1,113,018 (455) (0.04) – – – – 1,112,563Money markets 471,799 – – – – – – 471,799Corporate actions 291 – – – – – – 291
Total 1,585,108 (455) – – 1,584,653
Commission, taxes and other expenses as % of average net assets:Commission 0.02%Taxes 0.03%Other expenses 0.00%
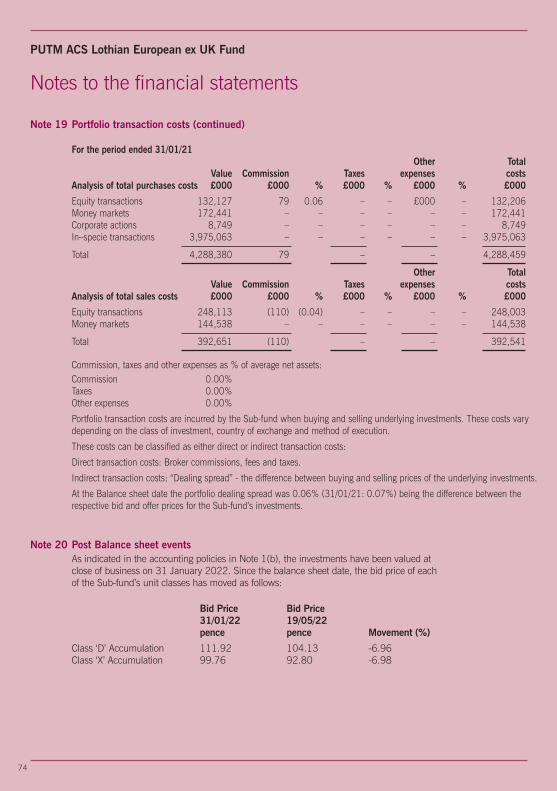
74
PUTM ACS Lothian European ex UK Fund
Note 19 Portfolio transaction costs (continued)
For the period ended 31/01/21Other Total
Value Commission Taxes expenses costsAnalysis of total purchases costs £000 £000 % £000 % £000 % £000
Equity transactions 132,127 79 0.06 – – £000 – 132,206Money markets 172,441 – – – – – – 172,441Corporate actions 8,749 – – – – – – 8,749In–specie transactions 3,975,063 – – – – – – 3,975,063
Total 4,288,380 79 – – 4,288,459
Other TotalValue Commission Taxes expenses costs
Analysis of total sales costs £000 £000 % £000 % £000 % £000
Equity transactions 248,113 (110) (0.04) – – – – 248,003Money markets 144,538 – – – – – – 144,538
Total 392,651 (110) – – 392,541
Commission, taxes and other expenses as % of average net assets:Commission 0.00%Taxes 0.00%Other expenses 0.00%
Portfolio transaction costs are incurred by the Sub-fund when buying and selling underlying investments. These costs varydepending on the class of investment, country of exchange and method of execution.
These costs can be classified as either direct or indirect transaction costs:
Direct transaction costs: Broker commissions, fees and taxes.
Indirect transaction costs: “Dealing spread” - the difference between buying and selling prices of the underlying investments.
At the Balance sheet date the portfolio dealing spread was 0.06% (31/01/21: 0.07%) being the difference between therespective bid and offer prices for the Sub-fund’s investments.
Notes to the financial statements
Note 20 Post Balance sheet eventsAs indicated in the accounting policies in Note 1(b), the investments have been valued atclose of business on 31 January 2022. Since the balance sheet date, the bid price of eachof the Sub-fund’s unit classes has moved as follows:
Bid Price Bid Price 31/01/22 19/05/22
pence pence Movement (%)
Class ‘D’ Accumulation 111.92 104.13 -6.96Class ‘X’ Accumulation 99.76 92.80 -6.98

75
PUTM ACS Lothian European ex UK Fund
Interim distribution in pence per unitGroup 1: units purchased prior to 1 February 2021Group 2: units purchased 1 February 2021 to 31 July 2021 2021 2020 pence pence per unit per unit Net paid paid income Equalisation 30 Sep 30 Sep*
Class ‘D’ Accumulation
Group 1 1.800167 — 1.800167 N/AGroup 2 0.657304 1.142863 1.800167 N/A
2021 2020 pence pence per unit per unit Net paid paid income Equalisation 30 Sep 30 Sep**
Class ‘X’ Accumulation
Group 1 0.143580 — 0.143580 N/AGroup 2 0.143580 0.000000 0.143580 N/A
Final distribution in pence per unitGroup 1: units purchased prior to 1 August 2021Group 2: units purchased 1 August 2021 to 31 January 2022 2022 2021 pence pence per unit per unit Net payable paid income Equalisation 31 Mar 31 Mar
Class ‘D’ Accumulation
Group 1 0.583690 — 0.583690 0.117918Group 2 0.146518 0.437172 0.583690 0.117918
2022 2021 pence pence per unit per unit Net payable paid income Equalisation 31 Mar 31 Mar**
Class ‘X’ Accumulation
Group 1 0.520320 — 0.520320 N/AGroup 2 0.520320 0.000000 0.520320 N/A
*Class ‘D’ Accumulation launched on 20 November 2020, hence there are no comparatives.**Class ‘X’ Accumulation launched on 9 June 2021, hence there are no comparatives.
Distribution tablesFor the year ended 31 January 2022

76
PUTM ACS Lothian European ex UK Fund
Each Sub-fund is tax transparent for income purposes meaning that UK tax-paying Unitholders aresubject to tax on their share of income, net of allowable expenses, as it arises to the Sub-fund and noton distributions of income after deduction of expenses.
On a daily basis unitholders will be advised of their share of aggregated accrued income, expensesand withholding tax paid on overseas dividends, if applicable. When a unit is purchased during thedistribution period, part of the purchase price of the unit reflects the relevant share of income andexpenses accrued by the Sub-fund, and this will be disclosed on the contract note. This purchasedincome and expense, a capital sum, should be deducted from the aggregate accrued income orexpense as applicable.
The subscription price disclosed on the contract note reflects the acquisition cost, which should beadjusted by the capital sum referred to above.
It is the responsibility of the unitholder to maintain a record of the relevant amount(s) of incomeequalisation and to make the appropriate adjustment when completing their tax calculations.
Distribution tablesFor the year ended 31 January 2022

77
Investment review
PUTM ACS Lothian North American Equity Fund
Dear Investor
Welcome to the PUTM ACS Lothian North AmericanEquity Fund report for the period covering the 12 monthsuntil 31 January 2022.
Performance Review
Over the review period, the PUTM ACS Lothian NorthAmerican Equity Fund returned 26.36% (Source: Factset:Gross of AMC; based on the movement in the CancellationPrice from 31/01/21 to 31/01/22, in GBP). This wascompared to a return of 26.19% for the benchmark index(Source: Factset: S&P 500 Index; Total Return from31/01/21 to 31/01/22, in GBP).
Source: Sub-fund performance: Factset: Gross of AMC; based upon the movement in the Cancellation Price from 31January 2021 to 31 January 2022, in GBP. Benchmark Index performance: S&P 500 Index; Total Return from 31January 2021 to 31 January 2022, in GBP.
Past performance is not a guide to future performance.
Please note that all past performance figures are calculated without taking the initial charge into account.
The value of units and the income from them can go down as well as up and is not guaranteed. You may not getback the full amount invested.
Standardised Past Performance
PUTM ACS Lothian North AmericanEquity Fund 26.36 -0.32 – – –
Benchmark Index 26.19 0.13 – – –
Jan 21 - Jan 22 Nov 20 - Jan 21% growth % growth

78
PUTM ACS Lothian North American Equity Fund
Investment review
Market Review
US equities made strong gains during the review perioddue to a successful vaccine rollout, economic reopeningand strong company earnings. A further boost came fromthe enactment of a US$1.9 trillion stimulus package.Early on, the roll-out of mass inoculation programmesacted as a catalyst for a sharp rotation away from growthstocks to cyclical stocks and those companies thatsuffered the most from lockdown restrictions. Shareprices continued to climb throughout the spring and intothe summer, driven mainly by investors’ ongoingoptimism regarding the distribution of Covid-19 vaccinesand generally positive economic data.
In September 2021, inflation expectations worsened andhelped lead to a substantial downturn in US equities.Investors were concerned by supply-chain challenges andcontinued Covid-19 cases. In addition, the US FederalReserve (Fed) also noted that a reduction in quantitativeeasing could be coming soon. This materialised in earlyNovember when the Fed confirmed that it would reducebond purchases by US$15 billion each month; it doubledthe pace of bond purchase tapering in December.
The S&P 500 Index, fuelled by a robust results season,hit new highs for eight consecutive days in November – arecord streak last achieved in 1997. The rally broke latein the month, as the headlines became dominated bynews of the Omicron variant of Covid-19. Stocks startedto move up again in December, boosted by retailers, asconcerns surrounding the impact of Omicron eased.Growth stocks, such as technology companies, which areespecially sensitive to higher interest rates, wereparticularly hard hit in January's sell-off.
Sub-fund Review
The Sub-fund outperformed the market over the period,with Alphabet one of the top contributors. The companybenefited from the surge in demand for digital advertisingdemand, despite regulatory concerns. Meanwhile,financials stocks outperformed, particularly CharlesSchwarb, Bank of America and Goldman Sachs. Thelatter gained on account of its strong investment bankpipeline, effective execution of its strategy and animproving capital position. The company increased itsdividend by 60% on the back of the stress test resultsannounced in June. Elsewhere, the overweight exposureto wholesale retailer Costco boosted returns afterreporting better-than-expected earnings during the period,driven by healthy traffic growth at its stores. A large sharebuyback programme announced by energy technology
business Baker Hughes helped its shares to rally, as wellas positive comments about future earnings. Lastly,AbbVie outperformed its peers in healthcare over theperiod.
Conversely, poor performance in software stocks likePayPal and RingCentral resulted in our technologyexposure detracting from relative performance. ForRingCentral, investors have become more concerned thatincreased competition from the likes of Zoom andMicrosoft will cause slower revenue growth. Meanwhile,our lack of exposure to computer graphics card makerNvidia dented performance. Its shares gained followingnews that a number of major chip makers supported itsplanned US$40 billion acquisition of UK chip designerArm Holdings. Meanwhile, NICE weighed onperformance after it sold off sharply following aconservative earnings guidance update for 2021. Lastly,Amazon underperformed, despite suffering no negativenews or fundamental change during the period. However,given its shares had made significant gains during thepandemic, it was not surprising to see attention shiftedtowards retailers that benefit more directly from thereopening of the economy after Covid-19 pandemic.
Outlook at Year End
We continue to expect rising inflation and interest rates,but for both to remain low relative to historical standards.Given the market strength in recent years, we expectcontinued economic growth. As a result, investors willremain sensitive to concerns about inflation and otherheadwinds. In addition, risk factors will continue to beregularly analysed to inform portfolio construction, asfactor behaviour continues to shift. We will review everysector, while also considering environmental, social andgovernance issues, and exposure to growth, value,industrial cycles and other risk factors. Although ourfocus remains on stock-picking from a bottom-upperspective, portfolio construction considerations are keyto recognising unintended thematic exposures. Our stockselection process has resulted in the portfolio currentlyhaving overweight positions in communication servicesand industrials. The biggest underweight positions are inhealthcare and consumer staples.
As the market outlook was completed as of 31stJanuary, there is no mention of the ongoing Ukrainecrisis that began at the end of February. Naturally, thiswould dramatically affect any future expectations ofmarket outlook that would not have been factored in atthe time of writing.

79
PUTM ACS Lothian North American Equity Fund
Portfolio of investments (unaudited)
Investments held at 31 January 2022 Market Percentage of value total net assets Holding Investment £000 %
United States (31/01/21 – 92.12%) 90.48 Automobiles & Parts (31/01/21 – 0.76%) Banks (31/01/21 – 4.40%) 3.23 3,107,708 Bank of America 106,852 1.84 7,185,980 Huntingdon Bancshares 80,663 1.39
Beverages (31/01/21 – 1.57%) 1.74 2,216,080 Coca-Cola 100,741 1.74
Chemicals (31/01/21 – 1.32%) 1.18 324,792 Air Products & Chemicals 68,292 1.18
Electricity (31/01/21 – 3.53%) 2.48 1,225,084 CMS Energy 58,787 1.01 1,458,675 NextEra Energy 84,956 1.47
Electronic & Electrical Equipment (31/01/21 – 1.32%) 1.63 1,383,916 Emerson Electric 94,847 1.63
Financial Services (31/01/21 – 8.66%) 9.50 590,788 American Express 79,205 1.37 342,614 Goldman Sachs Group 90,525 1.56 63,360 Intercontinental Exchange 5,981 0.10 465,712 LPL Financial Holdings 59,718 1.03 522,134 Mastercard 150,229 2.59 218,563 S&P Global 67,591 1.16 1,497,656 Schwab (Charles) 97,875 1.69
Fixed Line Telecommunications (31/01/21 – 1.60%) Food Producers (31/01/21 – 1.84%) Gas, Water & Multiutilities (31/01/21 – 0.00%) 1.13 3,113,089 CenterPoint Energy 65,782 1.13
General Industrials (31/01/21 – 1.96%) 1.28 487,296 Honeywell International 74,218 1.28
General Retailers (31/01/21 – 9.96%) 13.37 128,633 Amazon.com 286,626 4.94 232,815 Burlington Store 41,100 0.71 217,907 Costco Wholesale 81,996 1.41 641,339 Lowe’s Companies 113,497 1.96 152,577 O’Reilly Automotive 74,073 1.28 647,658 PayPal Holdings 82,972 1.43 1,778,492 TJX 95,417 1.64
Healthcare Equipment & Services (31/01/21 – 4.82%) 4.97 989,176 Baxter International 62,986 1.09 3,105,819 Boston Scientific 99,310 1.71 358,120 UnitedHealth Group 126,109 2.17

80
PUTM ACS Lothian North American Equity Fund
Portfolio of investments (unaudited)
Investments held at 31 January 2022 Market Percentage of value total net assets Holding Investment £000 %
Household Goods (31/01/21 – 0.00%) 1.02 452,294 Stanley Black & Decker 58,955 1.02
Industrial Engineering (31/01/21 – 1.36%) Industrial Transportation (31/01/21 – 3.46%) 1.79 725,371 J.B. Hunt Transport Services 104,011 1.79
Life Insurance (31/01/21- 0.00%) 1.22 1,416,075 Metlife 70,780 1.22
Media (31/01/21 – 1.53%) 1.38 180,533 Charter Communications ‘A’ 79,792 1.38
Mining (31/01/21- 0.00%) 0.83 3,095,114 Vertiv Holdings 48,146 0.83
Mobile Telecommunications (31/01/21 – 1.41%) Oil & Gas Producers (31/01/21 – 1.81%) 0.94 859,022 Phillips 66 54,282 0.94
Oil Equipment & Services (31/01/21 – 0.00%) 1.67 4,724,322 Baker Hughes 96,659 1.67
Personal Goods (31/01/21 – 0.32%) 2.30 766,155 Nike ‘B’ 84,527 1.46 589,891 Ralph Lauren 48,734 0.84
Pharmaceuticals & Biotechnology (31/01/21 – 6.74%) 4.01 1,498,076 AbbVie 152,783 2.64 1,145,650 Horizon Therapeutics 79,696 1.37
Real Estate Investment Trusts (31/01/21 – 2.17%) 1.27 392,208 American Tower 73,472 1.27
Software & Computer Services (31/01/21 – 18.25%) 19.82 753,173 Akamai Technologies 64,306 1.11 145,627 Alphabet ‘A’ 293,581 5.06 40,464 Alphabet ‘C’ 81,787 1.41 715,357 Meta Platforms 167,022 2.88 2,087,929 Microsoft 483,570 8.34 449,826 RingCentral ‘A’ 59,116 1.02
Support Services (31/01/21 – 3.84%) 1.18 872,259 Fiserv 68,707 1.18
Technology Hardware & Equipment (31/01/21 – 8.32%) 11.26 797,576 Analog Devices 97,470 1.68 2,805,908 Apple 365,114 6.30 256,575 Broadcom Corporation 112,060 1.93 1,468,398 Marvell Technology 78,156 1.35
Tobacco (31/01/21 – 1.17%) 1.28 969,432 Philip Morris International 74,316 1.28

81
Portfolio of investments (unaudited)
Investments held at 31 January 2022 Market Percentage of value total net assets Holding Investment £000 %
Bermuda (31/01/21 – 0.98%) Technology Hardware & Equipment (31/01/21 – 0.98%)
Canada (31/01/21 – 1.01%) 4.10 Food & Drug Retailers (31/01/21 – 1.01%) Industrial Transportation (31/01/21 – 0.00%) 1.53 976,556 Canadian National Railway 88,590 1.53
Oil Equipment & Services (31/01/21 – 0.00%) 1.04 1,905,736 Enbridge 60,021 1.04
Support Services (31/01/21 – 0.00%) 1.53 957,272 Waste Connections 88,960 1.53
Ireland (31/01/21 – 0.94%) 1.57 Healthcare Equipment & Services (31/01/21 – 0.94%) 1.57 461,135 ICON 91,151 1.57
Israel (31/01/21 – 1.50%) 1.33 Technology Hardware & Equipment (31/01/21 – 1.50%) 1.33 405,510 Nice ADR~ 77,393 1.33
Netherlands (31/01/21 – 1.21%) Technology Hardware & Equipment (31/01/21 – 1.21%)
United Kingdom (31/01/21 – 0.00%) 0.83 Pharmaceuticals & Biotechnology (31/01/21 – 0.00%) 0.83 1,616,587 Royalty Pharma 48,185 0.83
Money Markets (31/01/21 – 2.15%) 1.73 $134,427 Aberdeen Standard Liquidity Fund (Lux) – US Dollar Fund Class Z-1+ 100,195 1.73
Portfolio of investments 5,801,885 100.04 Net other liabilities (2,328) (0.04)
Net assets 5,799,557 100.00
Unless otherwise stated, all investments are approved securities being eitherofficially listed in a member state or traded on or under the rules of an eligiblesecurities market.+SICAVs (open ended investment schemes registered outside the UK).~ADR - American Depositary Receipt.
PUTM ACS Lothian North American Equity Fund

82
PUTM ACS Lothian North American Equity Fund
Top ten purchases and salesFor the year ended 31 January 2022
Purchases Cost£000
Aberdeen Standard Liquidity Fund(Lux) – US Dollar Fund Class Z-1 498,598Aberdeen Standard Liquidity Fund(Lux) – Seabury Sterling Class Z-1 192,255PayPal Holdings 138,874Costco Wholesale 103,793Analog Devices 98,460Procter & Gamble 97,090RingCentral ‘A’ 92,971Waste Connections 91,443Coca-Cola 91,428Nike ‘B’ 90,654
Subtotal 1,495,566Other purchases 1,414,736
Total purchases for the year 2,910,302
Sales Proceeds£000
Aberdeen Standard Liquidity Fund(Lux) – US Dollar Fund Class Z-1 403,413Aberdeen Standard Liquidity Fund(Lux) – Seabury Sterling Class Z-1 311,907JP Morgan Chase & Co 142,760Adobe 130,912Procter & Gamble 111,387Goldman Sachs Group 107,849Johnson & Johnson 104,420Mondelez International 103,022CSX 99,651Apple 98,838
Subtotal 1,614,159Other sales 2,375,515
Total sales for the year 3,989,674

83
PUTM ACS Lothian North American Equity Fund
Statistical information
Comparative tables Class ‘D’ Class ‘X’ Accumulation** Accumulation*** 31/01/22 31/01/21 31/01/22 pence pence penceChange in net assets per unitOpening net asset value per unit 99.50 100.00 100.00
Return before operating charges* 26.27 (0.50) 13.00Operating charges (0.01) – (0.01)
Return after operating charges* 26.26 (0.50) 12.99
Distributions on accumulation units (1.34) (0.23) (0.67)Retained distributions onaccumulation units 1.34 0.23 0.67
Closing net asset value per unit 125.76 99.50 112.99
*after direct transaction costs of:^ 0.02 0.00 0.02
PerformanceReturn after charges 26.39% (0.50%) 12.99%
Other informationClosing net asset value (£000) 5,799,500 5,572,834 57Closing number of units 4,611,379,719 5,600,725,285 50,000Operating charges 0.01% 0.01% 0.01%Direct transaction costs 0.02% 0.00% 0.02%
Prices+
Highest unit price (pence) 132.44 104.66 119.01Lowest unit price (pence) 100.06 99.48 100.16
+ High and low price disclosures are based on quoted unit prices. Therefore, the opening and closing NAV pricesmay fall outside the high/low price threshold.**Class ‘D’ Accumulation launched on 20 November 2020.***Class ‘X’ Accumulation launched on 9 June 2021, hence there are no comparatives.

84
PUTM ACS Lothian North American Equity Fund
Statistical information
Investment objective
The Sub-fund aims to provide a total return (a combination of capital growth andincome) by outperforming the S&P 500 Index (the “Index”) before fees by 1.5% to2.5% per annum over any given 3 year period.
Investment policyThe Sub-fund aims to achieve its objective by investing at least 80% of the portfolio inshares of US companies which are constituents of the S&P 500 Index, though notnecessarily in the same proportions of the Index at all times.
The Sub-fund’s holdings will typically consist of equities or “equity related securities”which will include convertible stocks, stock exchange listed warrants, depositoryreceipts, and any other such investments which entitle the holder to subscribe for orconvert into the equity of the company and/or where the share price performance is, inthe opinion of the Investment Manager, influenced significantly by the stock marketperformance of the company’s ordinary shares. The Sub-fund may also invest in othertransferable securities, which are non-approved securities (essentially unlistedsecurities), money-market instruments, deposits, cash and near cash and othercollective investment schemes.
Derivatives may be used for efficient portfolio management only.
Investment strategyAlthough at least 80% of the Sub-fund is invested in components of the Index, theSub-fund is actively managed. The Investment Manager uses research techniques toselect individual holdings. The research process is focused on identifying companieswhere the management team have a different view of a company’s prospects to that ofthe market, and which align with their views regarding future economic and businessconditions. The Investment Manager references the Index, which means that while theSub-fund is not required to match the weightings of the Index and does notconcentrate on any particular sector, the Sub-fund is managed within constraints, sothat divergence from the Index is controlled. The Sub-fund’s portfolio may, therefore,be similar to the components of the Index.
Revenue distribution and pricingUnits of the Sub-fund are available as either Class ‘D’ Accumulation or ‘X’Accumulation units (where revenue is reinvested to enhance the unit price). There willbe two potential distributions in each accounting year: an interim distribution as at 31July and a final distribution as at 31 January.
At each distribution the net revenue after deduction of expenses, from the investmentsof the Sub-fund, is apportioned amongst the unitholders. Unitholders receive a taxvoucher giving details of the distribution and the ACS Manager’s Report no later thantwo months after these dates.

85
PUTM ACS Lothian North American Equity Fund
Statistical information
Risk and reward profileThe Risk and Reward Indicator table demonstrates where the Sub-fund ranks in termsof its potential risk and reward. The higher the rank the greater the potential reward butthe greater the risk of losing money. It is based on past data, may change over time andmay not be a reliable indication of the future risk profile of the Sub-fund. The shadedarea in the table below shows the Sub-fund’s ranking on the Risk and Reward Indicator.
Typically lower rewards, Typically higher rewards,lower risk higher risk fi
1 2 3 4 5 6 7
This Sub-fund is ranked at 6 (31/01/21: 6) because funds of this type haveexperienced high rises and falls in value in the past. Although this is a high riskranking it is not the highest. The above figure applies to the following unit classes:
• Class ‘D’ Accumulation• Class ‘X’ Accumulation
Please note that even the lowest risk class can lose you money and that extrememarket circumstances can mean you suffer severe losses in all cases. Please note theSub-fund’s risk category may change in the future. The indicator does not take intoaccount the following risks of investing in this Sub-fund:
• The Sub-fund may use derivatives to reduce risk or cost or to generate additionalcapital or income at low risk, or to meet its investment objective.
• Investing overseas can bring additional returns and spread risk to different markets.There are risks, however, that changes in currency rates will reduce the value ofyour investment.
• Counterparty Risk: the insolvency of any institutions providing services such assafekeeping of assets or acting as counterparty to derivatives or other instruments,may expose the Sub-fund to financial loss.
For more information on the Risk and Reward profiles of our Funds, please refer to themost up to date relevant fund and Unit Class Key Investor Information Documents(KIIDs). These are available online at www.phoenixunittrust.co.uk.
fi

86
PUTM ACS Lothian North American Equity Fund
Annual financial statementsFor the year ended 31 January 2022
Statement of total return 31/01/22 31/01/21* Notes £000 £000 £000 £000
Income
Net capital gains/(losses) 4 1,310,173 (40,499) Revenue 5 68,400 12,832
Expenses 6 (719) (99)
Interest payable andsimilar charges (1) (1)
Net revenue before taxation 67,680 12,732
Taxation 7 (78) (20)
Net revenue after taxation 67,602 12,712
Total return/(deficit)before distributions 1,377,775 (27,787)
Distributions 8 (67,792) (12,712)
Change in net assets attributableto unitholders frominvestment activities 1,309,983 (40,499)
Statement of change in net assets attributable to unitholders
31/01/22 31/01/21* £000 £000 £000 £000
Opening net assetsattributable to unitholders 5,572,834 –
Amounts receivable onissue of units 42,412 19,555
Amounts receivable onin-specie transfer** – 5,617,651
Amounts payable oncancellation of units (1,190,475) (36,606)
(1,148,063) 5,600,600Change in net assetsattributable to unitholdersfrom investment activities 1,309,983 (40,499)
Dilution levy adjustment 595 29
Retained distributions onaccumulation units 64,208 12,704
Closing net assetsattributable to unitholders 5,799,557 5,572,834
*The Sub-fund launched on 20 November 2020.**Represents the value of units created by in-specie transfer of assets during the period.

87
Balance sheet 31/01/22 31/01/21 Notes £000 £000 £000 £000
Assets:Fixed assets:Investments 5,801,885 5,567,888
Current assets:Debtors 9 94,543 24,034
Cash and bank balances 10 1,270 1
Total current assets 95,813 24,035
Total assets 5,897,698 5,591,923
Liabilities:Creditors:Bank overdraft 11 – (514)
Other creditors 12 (98,141) (18,575)
Total creditors (98,141) (19,089)
Net assets attributableto unitholders 5,799,557 5,572,834
Annual financial statementsAs at 31 January 2022
PUTM ACS Lothian North American Equity Fund

88
PUTM ACS Lothian North American Equity Fund
Notes to the financial statements
Notes 1-3 Accounting policiesPlease see pages 3 to 6 for accounting basis and policies.
Note 4 Net capital gains/(losses)The net capital gains/(losses) during the year/period comprise:
31/01/22 31/01/21* £000 £000
Gains/(losses) on non-derivative securities 1,313,370 (40,829)Losses on derivative contracts – (33)Currency (losses)/gains (3,567) 363Handling charges (32) –Capital special dividends 402 –
Net capital gains/(losses) 1,310,173 (40,499)
Note 5 Revenue 31/01/22 31/01/21* £000 £000
UK dividends 373 –Overseas dividends 67,912 12,832Liquidity interest 115 –
Total revenue 68,400 12,832
Note 6 Expenses 31/01/22 31/01/21* £000 £000
(a) Payable to the ACS Manager or associates of theACS Manager and agents of either of them:ACS Manager’s periodic charge 428 74
(b) Payable to the Depositary or associates of theDepositary and agents of either of them:Depositary’s fees 80 17
(c) Other expenses:Audit fee 9 8Safe custody charges 190 –Professional fees 12 – 211 8
Total expenses 719 99
Note 7 Taxation 31/01/22 31/01/21* £000 £000
Analysis of tax charge for the year/periodOverseas withholding tax 78 20
Total taxation 78 20
As the scheme is an ACS it is not subject to UK tax on income or capital gains.
*The Sub-fund launched on 20 November 2020.

89
PUTM ACS Lothian North American Equity Fund
Notes to the financial statements
Note 8 DistributionsThe distributions take account of amounts added on the issue of units andamounts deducted on the cancellation of units, and comprise:
31/01/22 31/01/21* £000 £000
Interim 32,462 –Final 31,746 12,704
64,208 12,704
Amounts deducted on cancellation of units 3,677 42Amounts added on issue of units (93) (34)
Net distribution for the year/period 67,792 12,712
Net revenue after taxation 67,602 12,712Expenses taken to capital 190 –
Net distribution for the year/period 67,792 12,712
Details of the distribution per unit are set out in the tables on pages 94 and 95.
*The Sub-fund launched on 20 November 2020.
Note 9 Debtors 31/01/22 31/01/21 £000 £000
Creations awaiting settlement 570 –Sales awaiting settlement 91,251 19,403Accrued income 2,700 4,586Overseas tax recoverable 22 10Prepaid expenses – 35
Total debtors 94,543 24,034
Note 10 Cash and bank balances 31/01/22 31/01/21 £000 £000
Cash and bank balances 5 1Time deposit 1,265 –
Total cash and bank balances 1,270 1
Note 11 Bank overdraft 31/01/22 31/01/21 £000 £000
Bank overdraft – 514
Total bank overdraft – 514
Note 12 Other creditors 31/01/22 31/01/21 £000 £000
Cancellations awaiting settlement 690 600Purchases awaiting settlement 97,244 17,926ACS Manager's periodic charge payable 161 27Depositary's fees payable 11 14Safe custody charges payable 25 –Audit fee payable 9 8Handling charges payable 1 –
Total other creditors 98,141 18,575

90
PUTM ACS Lothian North American Equity Fund
Notes to the financial statements
Note 13 Reconciliation of units Class ‘D’ Class ‘X’ Accumulation Accumulation*
Opening units issued at 01/02/21 5,600,725,285 –Unit movements in year:Units issued 38,010,776 50,000Units cancelled (1,027,356,342) –
Closing units at 31/01/22 4,611,379,719 50,000
*Class ‘X’ Accumulation launched on 9 June 2021.
Note 14 Contingencies and commitmentsAt 31 January 2022 the Sub-fund had no outstanding calls on partly paid shares, nopotential underwriting commitments or any other contingent liabilities (31/01/21: £nil).
Note 15 Unitholders’ fundsThere are two unit classes in issue within the Sub-fund. These are Class ‘D’Accumulation and Class ‘X’ Accumulation. The ACS Manager’s periodic charge in respectof Class 'D' and Class ‘X’ is expressed as an annual percentage of the value of theproperty of the Sub-fund attributable to each unit class and is currently 0.005% inrespect of Class 'D' units and Class 'X' units.
Consequently, the level of net revenue attributable to each unit class will differ. Should itbe necessary to wind-up the Sub-fund,each unit class will have the same rights asregards to the distribution of the property of the Sub-fund.
Note 16 Related party transactionsThe ACS Manager is a related party to the Sub-fund by virtue of its controlling influence.
The ACS Manager is part of the Phoenix Group. Phoenix Life Limited which is also partof the Phoenix Group, is a material unitholder in the Sub-fund and therefore a relatedparty, holding the following percentage of the units at the year end.
Class ‘D’ Class ‘X’* % %
As at 31 January 2022: 100.00 100.00
As at 31 January 2021: 100.00 n/a
*Class ‘X’ Accumulation launched on 9 June 2021, hence there are no comparatives.
ACS Manager's periodic charge paid to the ACS Manager, Phoenix Unit Trust ManagersLimited, or its associates, is shown in Note 6(a) and details of the units issued andcancelled by the ACS Manager are shown in the Statement of change in net assetsattributable to unitholders and Note 8.
Any balances due to/from the ACS Manager or its associates at 31 January 2022 inrespect of these transactions are shown in Notes 9 and 12.
Note 17 Financial instrumentsIn accordance with the investment objective, the Sub-fund holds certain financialinstruments. These comprise:• securities held in accordance with the investment objective and policies;• derivative transactions which the Sub-fund may also enter into, the purpose of which
is to manage the currency and market risks arising from the Sub-fund’s investmentactivities; and
• cash and short term debtors and creditors arising directly from operations.
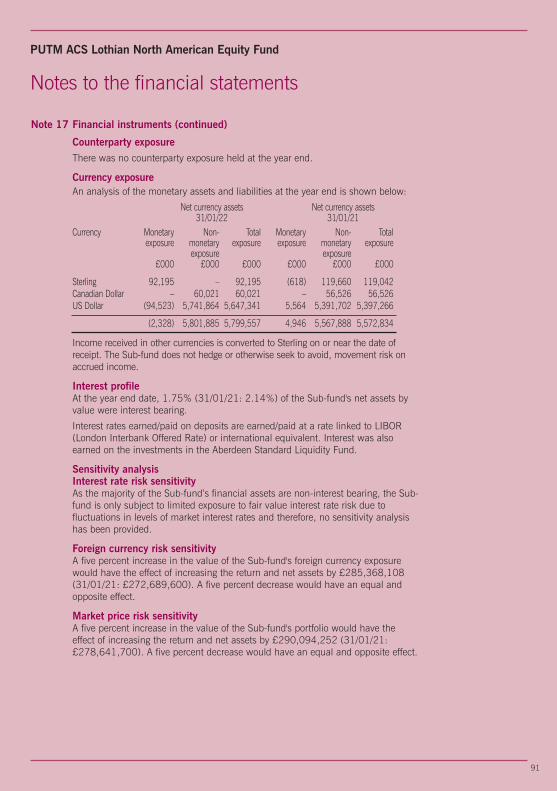
91
PUTM ACS Lothian North American Equity Fund
Notes to the financial statements
Note 17 Financial instruments (continued)
Counterparty exposureThere was no counterparty exposure held at the year end.
Currency exposureAn analysis of the monetary assets and liabilities at the year end is shown below:
Net currency assets Net currency assets 31/01/22 31/01/21
Currency Monetary Non- Total Monetary Non- Total exposure monetary exposure exposure monetary exposure exposure exposure £000 £000 £000 £000 £000 £000
Sterling 92,195 – 92,195 (618) 119,660 119,042 Canadian Dollar – 60,021 60,021 – 56,526 56,526 US Dollar (94,523) 5,741,864 5,647,341 5,564 5,391,702 5,397,266
(2,328) 5,801,885 5,799,557 4,946 5,567,888 5,572,834
Income received in other currencies is converted to Sterling on or near the date ofreceipt. The Sub-fund does not hedge or otherwise seek to avoid, movement risk onaccrued income.
Interest profileAt the year end date, 1.75% (31/01/21: 2.14%) of the Sub-fund's net assets byvalue were interest bearing.
Interest rates earned/paid on deposits are earned/paid at a rate linked to LIBOR(London Interbank Offered Rate) or international equivalent. Interest was alsoearned on the investments in the Aberdeen Standard Liquidity Fund.
Sensitivity analysisInterest rate risk sensitivityAs the majority of the Sub-fund’s financial assets are non-interest bearing, the Sub-fund is only subject to limited exposure to fair value interest rate risk due tofluctuations in levels of market interest rates and therefore, no sensitivity analysishas been provided.
Foreign currency risk sensitivityA five percent increase in the value of the Sub-fund's foreign currency exposurewould have the effect of increasing the return and net assets by £285,368,108(31/01/21: £272,689,600). A five percent decrease would have an equal andopposite effect.
Market price risk sensitivityA five percent increase in the value of the Sub-fund's portfolio would have theeffect of increasing the return and net assets by £290,094,252 (31/01/21:£278,641,700). A five percent decrease would have an equal and opposite effect.

92
PUTM ACS Lothian North American Equity Fund
Notes to the financial statements
Note 18 Fair value of investmentsThe fair value of the Sub-fund’s investments has been determined using the hierarchy below.
This complies with the ‘Amendments to FRS 102 – Fair value hierarchy disclosures’ issuedby the Financial Reporting Council in March 2016.
Level 1 The unadjusted quoted price in an active market for identical assets orliabilities that the entity can access at the measurement date.
Level 2 Inputs other than quoted prices included within Level 1 that areobservable (i.e. developed using market data) for the asset or liability,either directly or indirectly.
Level 3 Inputs are unobservable (i.e. for which market data is unavailable) for theasset or liability.
For the year ended 31/01/22Level 1 2 3 Total
Investment assets £000 £000 £000 £000Equities 5,701,690 – – 5,701,690Money markets 100,195 – – 100,195
5,801,885 – – 5,801,885
For the period ended 31/01/21Level 1 2 3 Total
Investment assets £000 £000 £000 £000Equities 5,448,228 – – 5,448,228Money markets 119,660 – – 119,660
5,567,888 – – 5,567,888
Note 19 Portfolio transaction costs
For the year ended 31/01/22Other Total
Value Commission Taxes expenses costsAnalysis of total purchases costs £000 £000 % £000 % £000 % £000
Equity transactions 2,218,965 483 0.02 – – – – 2,219,448Money markets 690,739 – – – – – – 690,739Corporate actions 115 – – – – – – 115
Total 2,909,819 483 – – 2,910,302
Other TotalValue Commission Taxes expenses costs
Analysis of total sales costs £000 £000 % £000 % £000 % £000
Equity transactions 3,275,065 (692) (0.02) –– – (18) – 3,274,355Money markets 715,319 – – – – – – 715,319
Total 3,990,384 (692) – (18) 3,989,674
Commission, taxes and other expenses as % of average net assets:Commission 0.02%Taxes 0.00%Other expenses 0.00%

93
Notes to the financial statements
PUTM ACS Lothian North American Equity Fund
Note 19 Portfolio transaction costs (continued)
For the period ended 31/01/21Other Total
Value Commission Taxes expenses costsAnalysis of total purchases costs £000 £000 % £000 % £000 % £000
Equity transactions 426,451 126 0.03 – – – – 426,577Money markets 210,095 – – – – – – 210,095In–specie transactions 5,462,274 – – – – – – 5,462,274
Total 6,098,820 126 – – 6,098,946
Other TotalValue Commission Taxes expenses costs
Analysis of total sales costs £000 £000 % £000 % £000 % £000
Equity transactions 399,940 (115) (0.03) – – (9) – 399,816Money markets 90,410 – – – – – – 90,410
Total 490,350 (115) – (9) 490,226
Commission, taxes and other expenses as % of average net assets:Commission 0.00%Taxes 0.00%Other expenses 0.00%
Portfolio transaction costs are incurred by the Sub-fund when buying and selling underlying investments. These costsvary depending on the class of investment, country of exchange and method of execution.
These costs can be classified as either direct or indirect transaction costs:
Direct transaction costs: Broker commissions, fees and taxes.Indirect transaction costs: “Dealing spread” - the difference between buying and selling prices of the underlyinginvestments.
At the Balance sheet date the portfolio dealing spread was 0.06% (31/01/21: 0.05%) being the difference betweenthe respective bid and prices for the Sub-fund’s investments.
Note 20 Post Balance sheet eventsAs indicated in the accounting policies in Note 1(b), the investments have been valued atclose of business on 31 January 2022. Since the balance sheet date, the bid price of eachof the Sub-fund’s unit classes have moved as follows:
Bid Price Bid Price 31/01/22 19/05/22
pence pence Movement (%)
Class ‘D’ Accumulation 125.76 115.09 -8.48Class ‘X’ Accumulation 112.99 103.34 -8.54

94
PUTM ACS Lothian North American Equity Fund
Interim distribution in pence per unitGroup 1: units purchased prior to 1 February 2021Group 2: units purchased 1 February 2021 to 31 July 2021 2021 2020 pence pence per unit per unit Net paid paid income Equalisation 30 Sep 30 Sep*
Class ‘D’ Accumulation
Group 1 0.656263 — 0.656263 N/AGroup 2 0.466550 0.189713 0.656263 N/A
2021 2020 pence pence per unit per unit Net paid paid income Equalisation 30 Sep 30 Sep**
Class ‘X’ Accumulation
Group 1 0.141552 — 0.141552 N/AGroup 2 0.141552 0.000000 0.141552 N/A
Final distribution in pence per unitGroup 1: units purchased prior to 1 August 2021Group 2: units purchased 1 August 2021 to 31 January 2022 2022 2021 pence pence per unit per unit Net payable paid income Equalisation 31 Mar 31 Mar
Class ‘D’ Accumulation
Group 1 0.688428 — 0.688428 0.22683Group 2 0.311717 0.376711 0.688428 0.22683
2022 2021 pence pence per unit per unit Net payable paid income Equalisation 31 Mar 31 Mar**
Class ‘X’ Accumulation
Group 1 0.530680 — 0.530680 N/AGroup 2 0.530680 0.000000 0.530680 N/A
*Class ‘D’ Accumulation launched on 20 November 2020, hence there are no comparatives.**Class ‘X’ Accumulation launched on 9 June 2021, hence there are no comparatives.
Distribution tablesFor the year ended 31 January 2022

95
PUTM ACS Lothian North American Equity Fund
Each Sub-fund is tax transparent for income purposes meaning that UK tax-payingunitholders are subject to tax on their share of income, net of allowable expenses, as itarises to the Sub-fund and not on distributions of income after deduction of expenses.
On a daily basis unitholders will be advised of their share of aggregated accrued income,expenses and withholding tax paid on overseas dividends, if applicable. When a unit ispurchased during the distribution period, part of the purchase price of the unit reflectsthe relevant share of income and expenses accrued by the Sub-fund, and this will bedisclosed on the contract note. This purchased income and expense, a capital sum,should be deducted from the aggregate accrued income or expense as applicable.
The subscription price disclosed on the contract note reflects the acquisition cost,which should be adjusted by the capital sum referred to above.
It is the responsibility of the unitholder to maintain a record of the relevant amount(s) ofincome equalisation and to make the appropriate adjustment when completing theirtax calculations.
Distribution tablesFor the year ended 31 January 2022

96
PUTM ACS Lothian UK Listed Equity Fund
Dear Investor
Welcome to the PUTM ACS Lothian UK Listed Equity Fundreport from 1 February 2021 to 31 January 2022.
Performance ReviewOver the review period, the PUTM ACS Lothian UK ListedEquity Fund returned 17.39% (Source: Factset: Gross ofAMC; based on the movement in the Cancellation Pricefrom 31/01/21 to 31/01/22, in GBP). This wascompared to a return of 18.93% for the benchmark index(Source: Factset: FTSE 350 Index; Total Return from31/01/21 to 31/01/22, in GBP).
Investment review
Source: Sub-fund performance: Factset: Gross of AMC; based upon the movement in the Cancellation Price from 31January 2021 to 31 January 2022, in GBP. Benchmark Index performance: FTSE 350 Index; Total Return from 31January 2021 to 31 January 2022, in GBP.
Past Performance is not a guide to future performance
Please note that all past performance figures are calculated without taking the initial charge into account.
The value of units and the income from them can go down as well as up and is not guaranteed. You may not get backthe full amount invested.
Standardised Past Performance
PUTM ACS Lothian UK ListedEquity Fund 17.39 2.41 – – –
Benchmark Index 18.93 1.90 – – –
31 Jan 21 - Jan 22 20 Nov 20 - Jan 21% growth % growth

97
PUTM ACS Lothian UK Listed Equity Fund
Investment review
Market Review
The UK stock market recorded double-digit gains over the12-month period. Investors continued to grapple with theeconomic fallout from the coronavirus pandemic as wellas mounting concerns about inflation. However, theeasing of lockdown restrictions following the successfulvaccine rollout maintained the positive economic andstock market momentum for most of the period.
The UK equity market advanced steadily through thespring and summer, albeit stocks suffered a slight setbackin July on higher Covid-19 numbers. Supportivegovernment policy, easing lockdown restrictions, positiveearnings results and a successful vaccine rolloutcollectively drove markets upwards. The market dipped inNovember following the emergence of the Omicronvariant but quickly recovered in December as fears aboutthe latest virus strain began to recede and furtherlockdown was avoided. The 'value' bias of the UK stockmarket and its exposure to old economy sectors, such asenergy and banks, helped it hold up much better thanmost other developed stock markets in January's volatility.Large-cap stocks, as measured by the FTSE 100,significantly outperformed mid-cap stocks over the period.
In economic news, inflation has continued to rise in theUK, hitting a three-decade high of 5.4% in December.High energy costs and supply shortages caused by kinksin global supply chains following the pandemic areamong the main reasons for escalating prices. In the faceof surging prices, the Bank of England increased its baserate by 0.15% to 0.25% in December 2021,representing its first rate hike in three years. It was thefirst major central bank to raise interest rates since thestart of the pandemic.
Sub-fund Review
By sector, stock selection in the telecommunications,consumer discretionary and technology sectors weighed onreturns, as did overweight exposure in technology andconsumer discretionary. However, stock selection in theconsumer staples, financials and basic materials helpedreturns. Overweight exposure to energy companies was alsoadditive for performance.
On a stock level, negative contributors included an off-benchmark position in online retailer ASOS. The shares ofASOS fell sharply after it warned about the impact ofsupply-chain issues and reduced its full-year earningsguidance during the period. Just Eat was also weak,following its removal from the benchmark after the primarylisting shifted to Amsterdam. The potential for increased
competition due to a partnership between Amazon andDeliveroo weighed on the firm's share price. Countrysideshares underperformed, reflecting the wind-down of itshousebuilding business. This led to forecasts being resetfor the business as it evolves into a standalone partnershipsbusiness. Ashmore also detracted from returns, as did alack of exposure to BT and Lloyds, with the latter benefitingfrom the rise in interest rates at the end of the period.
Conversely, the Sub-fund benefited from its overweightposition in Entain, which rose on news of a potential bidfrom US-listed DraftKings. Although the share price laterpulled back somewhat, we see potential for a deal to occur,supporting a material overweight position in the stock.Watches of Switzerland was another top performer, withthe share price rising significantly over the period due tostrong demand. A lack of exposure to Flutter contributedpositively as its shares were weak, given fears about UKregulation tightening, as well as the broader de-rating ofhighly valued US-listed peers in the market rotation. Zero-weight positions in Ocado and Scottish MortgageInvestment Trust also helped returns.
Outlook at Year End
The Sub-fund aims to deliver outperformance relative toits benchmark over a medium-term horizon based onstock-specific investment cases while minimising riskrelative to the benchmark. The manager aims to takeadvantage of abrdn’s large and well-resourced UK activeequities team to generate stock-specific insight. Overtime, the team process, has resulted in consistentoutperformance at a single-stock level. The Sub-fund willhold the highest conviction ideas from analysts in eachsector, while managing sector weights and risk exposureto ensure we are not taking factor bets unless we haveclear insight on those factors. The strategy should resultin a Sub-fund that is relatively style agnostic and candeliver outperformance through the cycle while remainingrisk aware. The manager will make use of risk tools tomonitor and control the risk profile of the Sub-fund. Theywill also make use of the environmental, social andgovernance resources to ensure factors such as carbonemissions are tracked and used as an input for Sub-fundconstruction.
As the market outlook was completed as of 31st January,there is no mention of the ongoing Ukraine crisis thatbegan at the end of February. Naturally, this woulddramatically affect any future expectations of marketoutlook that would not have been factored in at the time ofwriting.

98
PUTM ACS Lothian UK Listed Equity Fund
Portfolio of investments (unaudited)
Investments held at 31 January 2022 Market Percentage of value total net assets Holding Investment £000 %
UK Equities (31/01/21 – 99.71%) 99.84 Aerospace & Defence (31/01/21 – 1.96%) 1.26 22,928,862 BAE Systems 132,345 1.26
Banks (31/01/21 – 5.98%) 8.66 97,906,569 Barclays 193,091 1.83 101,523,207 HSBC Holdings 535,535 5.08 34,259,769 Standard Chartered 183,907 1.75
Beverages (31/01/21 – 5.42%) 6.00 4,666,861 Coca Cola 113,871 1.08 13,928,017 Diageo 518,540 4.92
Chemicals (31/01/21 – 1.46%) 0.04 222,171 Victrex 4,537 0.04
Construction & Materials (31/01/21 – 0.94%) 1.55 17,279,344 Balfour Beatty 43,406 0.41 13,695,972 Genuit Group 78,067 0.74 24,034,857 Kier Group 23,554 0.23 2,554,519 Marshalls Group 17,882 0.17
Electricity (31/01/21 – 0.63%) 1.17 1,489,244 Drax Group 8,950 0.09 7,193,743 SSE 113,841 1.08
Financial Services (31/01/21 – 4.91%) 4.38 20,949,732 Ashmore Group 58,995 0.56 7,114,383 Close Brothers 91,135 0.86 4,099,592 Intermediate Capital Group 77,728 0.74 2,148,475 London Stock Exchange 155,077 1.47 14,382,496 OSB Group 78,888 0.75
Fixed Line Telecommunications (31/01/21 – 0.46%) 0.94 30,152,075 Helios Towers 46,314 0.44 3,556,488 Telecom Plus 53,205 0.50
Food Producers (31/01/21 – 1.27%) Forestry & Paper (31/01/21 – 0.97%) 0.92 5,287,227 Mondi 97,232 0.92
Gas, Water & Multiutilities (31/01/21 – 3.25%) 2.29 13,897,720 National Grid 150,040 1.43 3,161,029 Severn Trent 90,785 0.86
General Industrials (31/01/21 – 1.93%) 1.04 2,738,844 Coats Group 1,786 0.02 10,828,897 Smith (DS) 40,651 0.39 14,640,401 Vesuvius 66,848 0.63

99
PUTM ACS Lothian UK Listed Equity Fund
Portfolio of investments (unaudited)
Investments held at 31 January 2022 Market Percentage of value total net assets Holding Investment £000 %
General Retailers (31/01/21 – 2.61%) 2.91 3,129,342 ASOS 69,190 0.66 2,391,647 Dunelm Group 31,809 0.30 13,739,063 Inchcape 115,408 1.09 4,036,499 Watches of Switzerland Group 51,183 0.49 2,364,773 WHSmith 38,959 0.37
Healthcare Equipment & Services (31/01/21 – 1.60%) 1.61 60,435,285 ConvaTec Group 106,064 1.01 5,079,822 Smith & Nephew 63,650 0.60
Household Goods (31/01/21 – 5.46%) 4.50 2,559,112 Bellway 72,576 0.69 27,016,479 Countryside Partnerships 82,724 0.79 13,219,176 Crest Nicholson Holdings 42,328 0.40 1,425,691 Persimmon 34,117 0.32 3,687,331 Reckitt Benckiser 221,609 2.10 14,137,478 Taylor Wimpey 21,312 0.20
Industrial Engineering (31/01/21 – 1.71%) 0.92 9,211,293 Bodycote 73,138 0.70 15,693,196 Melrose Industries 23,375 0.22
Life Insurance (31/01/21 – 3.94%) 2.58 45,777,590 Just Group 39,231 0.37 18,833,181 Prudential 232,684 2.21
Media (31/01/21 – 2.62%) 2.77 3,705,904 Euromoney Institutional Investor 33,798 0.32 11,382,203 RELX 258,148 2.45
Mining (31/01/21 – 9.90%) 8.33 7,829,426 Anglo American 252,734 2.40 4,513,273 BHP Group 105,926 1.00 29,477,318 Centamin 26,194 0.25 59,410,655 Glencore 227,543 2.16 5,120,196 Rio Tinto 265,482 2.52
Mobile Telecommunications (31/01/21 – 2.72%) 3.05 247,150,884 Vodafone 321,346 3.05
Non-Life Insurance (31/01/21 – 0.32%) 0.43 4,654,048 Hiscox 45,181 0.43
Oil & Gas Producers (31/01/21 – 8.19%) 11.23 99,660,312 BP 381,500 3.62 19,145,067 Cairn Energy 39,171 0.37 10,874,282 Energean Oil & Gas 102,599 0.98 33,804,631 Royal Dutch Shell 637,420 6.05 79,869,259 Savannah Energy 22,363 0.21

100
PUTM ACS Lothian UK Listed Equity Fund
Portfolio of investments (unaudited)
Investments held at 31 January 2022 Market Percentage of value total net assets Holding Investment £000 %
Oil Equipment & Services (31/01/21 – 0.64%) 0.43 20,468,071 John Wood Group 45,521 0.43
Personal Goods (31/01/21 – 4.11%) 3.28 9,124,066 Unilever 345,574 3.28
Pharmaceuticals & Biotechnology (31/01/21 – 10.82%) 11.43 8,219,121 AstraZeneca 708,159 6.72 1,597,226 Dechra Pharmaceuticals 66,253 0.63 993,029 Genus 37,676 0.36 19,300,187 GlaxoSmithKline 317,063 3.01 33,221,044 Indivior 74,681 0.71
Real Estate & Investment Services (31/01/21 – 0.76%) 0.73 7,466,495 Unite Group 77,204 0.73
Real Estate Investment Trusts (31/01/21 – 0.00%) 0.57 4,587,897 Segro REIT 59,734 0.57
Software & Computer Services (31/01/21 – 2.09%) 3.00 10,472,221 Auto Trader Group 69,892 0.66 4,451,991 Aveva Group 129,865 1.23 20,465,949 Moonpig Group 63,772 0.61 3,186,392 Softcat 52,320 0.50
Support Services (31/01/21 – 2.47%) 4.31 2,447,113 Ashtead Group 128,326 1.22 8,814,052 Electrocomponents 97,924 0.93 5,386,798 Grafton Group 61,948 0.59 10,553,036 Homeserve 80,520 0.76 10,566,857 Howden Joinery Group 85,803 0.81
Tobacco (31/01/21 – 4.61%) 4.68 11,962,679 British American Tobacco 378,380 3.59 6,549,996 Imperial Brands 114,723 1.09
Travel & Leisure (31/01/21 – 4.23%) 4.35 18,910,352 888 Holdings 48,221 0.46 31,324,181 Cineworld Group 12,260 0.12 14,636,521 Entain 232,867 2.21 10,903,002 FirstGroup 11,023 0.10 2,282,701 Go-Ahead Group 15,180 0.14 4,077,032 JET2 53,715 0.51 14,675,674 Mitchells & Butlers 36,719 0.35 19,334,728 National Express 48,337 0.46 159,523 Saga 454 0.00

101
PUTM ACS Lothian UK Listed Equity Fund
Portfolio of investments (unaudited)
Investments held at 31 January 2022 Market Percentage of value total net assets Holding Investment £000 %
Money Markets (31/01/21 – 1.73%) 0.48 £50,754 Aberdeen Standard Liquidity Fund (Lux) – Seabury Sterling 3 Fund Class Z-1~ 50,726 0.48
Portfolio of investments 10,519,812 99.84 Net other assets 17,169 0.16
Net assets 10,536,981 100.00
Unless otherwise stated, all investments are approved securities being eitherofficially listed in a member state or traded on or under the rules of an eligiblesecurities market.
~ SICAV (Open ended investment schemes registered outside the UK).

102
PUTM ACS Lothian UK Listed Equity Fund
Top ten purchases and salesFor the year ended 31 January 2022
Purchases Cost£000
Aberdeen Standard Liquidity Fund (Lux) –Seabury Sterling Class Z-1 1,232,034ASOS 130,621Ashtead Group 125,425HSBC Holdings 116,286Homeserve 108,532London Stock Exchange 100,679BT Group 90,089Electrocomponents 83,045Severn Trent 82,308Segro REIT 72,730
Subtotal 2,141,749Other purchases 1,041,804
Total purchases for the year 3,183,553
Sales Proceeds£000
Aberdeen Standard Liquidity Fund (Lux) –Seabury Sterling Class Z-1 1,350,734Johnson Matthey 136,467National Grid 135,777John Laing Group 98,257GlaxoSmithKline 96,258Rio Tinto 87,291Just Eat Takeaway.Com 85,127United Utilities Group 84,310Entain 78,599Aviva 77,950
Subtotal 2,230,770Other sales 1,393,477
Total sales for the year 3,624,247

103
PUTM ACS Lothian UK Listed Equity Fund
Statistical information
Comparative tables Class ‘D’ Class ‘X’ Accumulation** Accumulation*** 31/01/22 31/01/21 31/01/22 pence pence penceChange in net assets per unitOpening net asset value per unit 102.40 100.00 100.00
Return before operating charges* 17.74 2.40 3.16Operating charges (0.01) – (0.01)
Return after operating charges* 17.73 2.40 3.15
Distributions on accumulation units (3.90) (0.34) (1.92)Retained distributions onaccumulation units 3.90 0.34 1.92
Closing net asset value per unit 120.13 102.40 103.15
*after direct transaction costs of:^ 0.10 0.02 0.10
PerformanceReturn after charges 17.31% 2.40% 3.15%
Other informationClosing net asset value (£000) 10,536,930 9,805,781 51Closing number of units 8,771,020,552 9,575,957,842 50,000Operating charges 0.01% 0.01% 0.01%Direct transaction costs 0.10% 0.02% 0.10%
Prices+
Highest unit price (pence) 123.04 110.06 105.65Lowest unit price (pence) 103.11 98.42 96.13
+ High and low price disclosures are based on quoted unit prices. Therefore, the opening and closing NAV pricesmay fall outside the high/low price threshold.** Class ‘D’ Accumulation launched on 20 November 2020 .*** Class ‘X’ Accumulation launched on 9 June 2021, hence there are no comparatives.

Statistical information
Investment objective
The Sub-fund aims to provide a total return (a combination of capital growth andincome) by outperforming the FTSE 350 Total Return Index (the “Index”) before feesby 1% to 2% per annum over any given 3 year period.
Investment policyThe Sub-fund aims to achieve its objective by investing at least 80% of the portfolio inshares of UK companies which are constituents of the FTSE 350 Total Return Index.
The Sub-fund’s holdings will typically consist of equities or “equity related securities”which will include convertible stocks, stock exchange listed warrants, depositoryreceipts, and any other such investments which entitle the holder to subscribe for orconvert into the equity of the company and/or where the share price performance is, inthe opinion of the Investment Adviser, influenced significantly by the stock marketperformance of the company's ordinary shares. The Sub-fund may also invest in othertransferable securities, which are nonapproved securities (essentially unlistedsecurities), money-market instruments, deposits, cash and near cash and othercollective investment schemes.
Derivatives may be used for efficient portfolio management and hedging only.
Investment strategyAlthough at least 80% of the Sub-fund is invested in components of the Index, theSub-fund is actively managed. The Investment Manager uses research techniques toselect individual holdings.
The research process is focused on identifying companies where the managementteam have a different view of a company’s prospects to that of the market, and whichalign with their views regarding future economic and business conditions. TheInvestment Manager references the Index, which means that while the Sub-fund is notrequired to match the weightings of the Index and does not concentrate on anyparticular sector, the Sub-fund is managed within constraints, so that divergence fromthe Index is controlled. The Sub-fund’s portfolio may, therefore, be similar to thecomponents of the Index.
Revenue distribution and pricingUnits of the Sub-fund are available as either Class 'D' Accumulation or 'X'Accumulation units (where revenue is reinvested to enhance the unit price). There willbe two potential distributions in each accounting year: an interim distribution as at 31July and a final distribution as at 31 January.
At each distribution the net revenue after deduction of expenses, from the investmentsof the Sub-fund, is apportioned amongst the unitholders. Unitholders receive a taxvoucher giving details of the distribution and the ACS Manager’s Report no later thantwo months after these dates.
104
PUTM ACS Lothian UK Listed Equity Fund
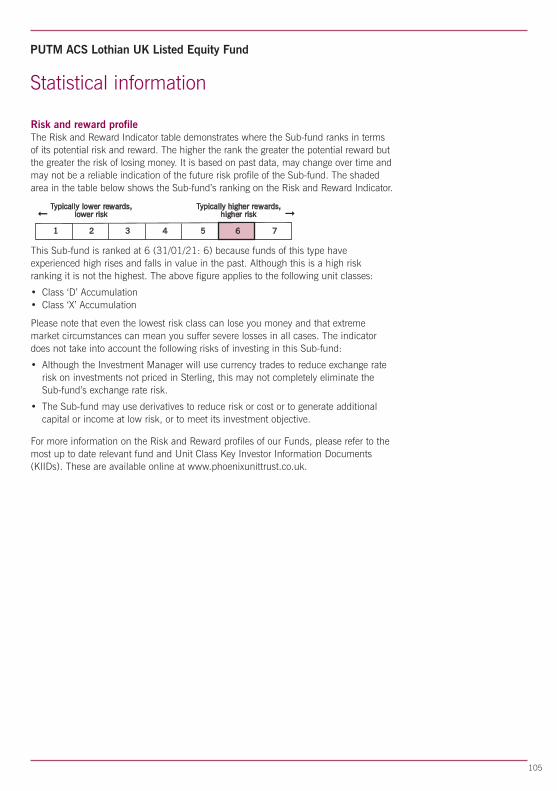
fi
Statistical information
Risk and reward profileThe Risk and Reward Indicator table demonstrates where the Sub-fund ranks in termsof its potential risk and reward. The higher the rank the greater the potential reward butthe greater the risk of losing money. It is based on past data, may change over time andmay not be a reliable indication of the future risk profile of the Sub-fund. The shadedarea in the table below shows the Sub-fund’s ranking on the Risk and Reward Indicator.
Typically lower rewards, Typically higher rewards,lower risk higher risk fi
1 2 3 4 5 6 7
This Sub-fund is ranked at 6 (31/01/21: 6) because funds of this type haveexperienced high rises and falls in value in the past. Although this is a high riskranking it is not the highest. The above figure applies to the following unit classes:
• Class ‘D’ Accumulation• Class ‘X’ Accumulation
Please note that even the lowest risk class can lose you money and that extrememarket circumstances can mean you suffer severe losses in all cases. The indicatordoes not take into account the following risks of investing in this Sub-fund:
• Although the Investment Manager will use currency trades to reduce exchange raterisk on investments not priced in Sterling, this may not completely eliminate theSub-fund’s exchange rate risk.
• The Sub-fund may use derivatives to reduce risk or cost or to generate additionalcapital or income at low risk, or to meet its investment objective.
For more information on the Risk and Reward profiles of our Funds, please refer to themost up to date relevant fund and Unit Class Key Investor Information Documents(KIIDs). These are available online at www.phoenixunittrust.co.uk.
105
PUTM ACS Lothian UK Listed Equity Fund
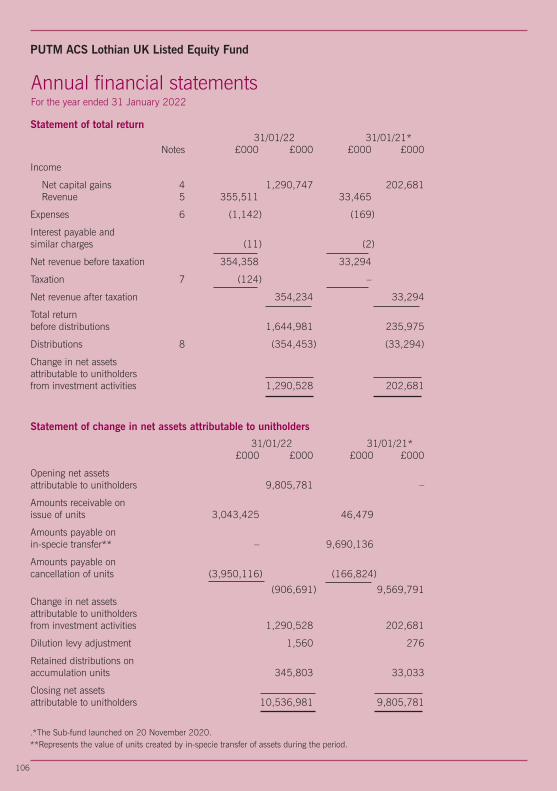
106
PUTM ACS Lothian UK Listed Equity Fund
Annual financial statementsFor the year ended 31 January 2022
Statement of total return 31/01/22 31/01/21* Notes £000 £000 £000 £000
Income
Net capital gains 4 1,290,747 202,681 Revenue 5 355,511 33,465
Expenses 6 (1,142) (169)
Interest payable andsimilar charges (11) (2)
Net revenue before taxation 354,358 33,294
Taxation 7 (124) –
Net revenue after taxation 354,234 33,294
Total returnbefore distributions 1,644,981 235,975
Distributions 8 (354,453) (33,294)
Change in net assetsattributable to unitholdersfrom investment activities 1,290,528 202,681
Statement of change in net assets attributable to unitholders
31/01/22 31/01/21* £000 £000 £000 £000
Opening net assetsattributable to unitholders 9,805,781 –
Amounts receivable onissue of units 3,043,425 46,479
Amounts payable onin-specie transfer** – 9,690,136
Amounts payable oncancellation of units (3,950,116) (166,824)
(906,691) 9,569,791Change in net assetsattributable to unitholdersfrom investment activities 1,290,528 202,681
Dilution levy adjustment 1,560 276
Retained distributions onaccumulation units 345,803 33,033
Closing net assetsattributable to unitholders 10,536,981 9,805,781
.*The Sub-fund launched on 20 November 2020.**Represents the value of units created by in-specie transfer of assets during the period.

107
PUTM ACS Lothian UK Listed Equity Fund
Annual financial statementsAs at 31 January 2022
Balance sheet 31/01/22 31/01/21 Notes £000 £000 £000 £000
Assets:Fixed assets:Investments 10,519,812 9,777,730
Current assets:Debtors 9 76,387 41,117
Cash and bank balances 10 1 1
Total current assets 76,388 41,118
Total assets 10,596,200 9,818,848
Liabilities:Creditors:Bank overdraft 11 (306) –
Other creditors 12 (58,913) (13,067)
Total creditors (59,219) (13,067)
Net assets attributableto unitholders 10,536,981 9,805,781

108
PUTM ACS Lothian UK Listed Equity Fund
Notes to the financial statements
Notes 1-3 Accounting policiesPlease see pages 3 to 6 for accounting basis and policies.
Note 4 Net capital gainsThe net capital gains during the year/period comprise:
31/01/22 31/01/21* £000 £000
Gains on non-derivative securities 1,290,819 195,134Currency loss (48) –Handling charges (24) –Capital special dividends – 7,547
Net capital gains 1,290,747 202,681
Note 5 Revenue 31/01/22 31/01/21* £000 £000
UK dividends 341,685 28,021UK property REIT income distributions 1,409 –Overseas dividends 4,477 702Stock dividends 7,854 4,742Liquidity interest 86 –
Total revenue 355,511 33,465
Note 6 Expenses 31/01/22 31/01/21* £000 £000
(a) Payable to the ACS Manager or associates of theACS Manager and agents of either of them:ACS Manager’s periodic charge 739 136
(b) Payable to the Depositary or associates of theDepositary and agents of either of them:Depositary’s fees 125 25
(c) Other expenses:Audit fee 17 8Safe custody charges 219 –Printing & stationery 1 –FTSE License 40 –Professional fees 1 –
278 8
Total expenses 1,142 169
Note 7 Taxation 31/01/22 31/01/21* £000 £000
Analysis of tax charge for the year/periodOverseas withholding tax 124 –
Total taxation 124 –
As the scheme is an ACS it is not subject to UK tax on income or capital gains.
*The Sub-fund launched on 20 November 2020.

109
PUTM ACS Lothian UK Listed Equity Fund
Notes to the financial statements
Note 8 DistributionsThe distributions take account of amounts added on the issue of units andamounts deducted on the cancellation of units, and comprise:
31/01/22 31/01/21* £000 £000
Interim 178,400 –Final 167,403 33,033 345,803 33,033
Amounts deducted on cancellation of units 45,817 379Amounts added on issue of units (37,167) (118)
Net distribution for the year/period 354,453 33,294
Net revenue after taxation 354,234 33,294
Expenses taken to capital 219 –
Net distribution for year/period 354,453 33,294
Details of the distribution per unit are set out in the tables on page 114 and 115.
*The Sub-fund launched on 20 November 2020.
Note 9 Debtors 31/01/22 31/01/21 £000 £000
Creations awaiting settlement 1,650 1,370Sales awaiting settlement 56,856 18,656Prepaid expenses – 21Accrued income 17,817 21,070Recoverable tax 64 –
Total debtors 76,387 41,117
Note 10 Cash and bank balances 31/01/22 31/01/21 £000 £000
Cash and bank balances 1 1
Total cash and bank balances 1 1
Note 11 Bank overdraft 31/01/22 31/01/21 £000 £000
Bank overdraftAmounts due to futures clearing houses 306 –
Total bank overdraft 306 –
Note 12 Other creditors 31/01/22 31/01/21 £000 £000
Cancellations awaiting settlement – 930Purchases awaiting settlement 58,572 12,055ACS Manager’s periodic charge payable 284 53Depositary’s fees payable 16 21Safe custody charges payable 31 –Audit fee payable 9 8Handling charges payable 1 –
Total other creditors 58,913 13,067

110
PUTM ACS Lothian UK Listed Equity Fund
Notes to the financial statements
Note 13 Reconciliation of units Class ‘D’ Class ‘X’ Accumulation Accumulation**
Opening units issued at 01/02/21 9,575,957,842 –Unit movements in year/period:Units issued 2,701,464,576 50,000Units cancelled (3,506,401,866) –
Closing units at 31/01/22 8,771,020,552 50,000
**Class “X” Accumulation launched on 09 June 2021.
Note 14 Contingencies and commitmentsAt 31 January 2022 the Sub-fund had no outstanding calls on partly paid shares, nopotential underwriting commitments or any other contingent liabilities (31/01/21: £nil).
Note 15 Unitholders’ fundsThere are two unit classes in issue within the Sub-fund. Class ‘X’ Accumulation andClass ‘D’ Accumulation. The ACS Manager’s periodic charge in respect of Class ‘X’, andClass ‘D’ is expressed as an annual percentage of the value of the property of the Sub-fund attributable to each unit class and is currently 0.005% in respect of Class ‘X’ unitsand Class ‘D’ units.
Consequently, the level of net revenue attributable to each unit class will differ. Should itbe necessary to wind-up the Sub-fund, each unit class will have the same rights asregards to the distribution of the property of the Sub-fund.
Note 16 Related party transactionsThe ACS Manager is a related party to the Sub-fund by virtue of its controlling influence.
The ACS Manager is part of the Phoenix Group. Phoenix Life Limited which is also partof the Phoenix Group, is a material unitholder in the Sub-fund and therefore a relatedparty, holding the following percentage of the units at the period end.
Class ‘D’ Class ‘X’ % %
As at 31 January 2022: 100.00 100.00
As at 31 January 2021: 100.00 N/A
ACS Manager’s periodic charge paid to the ACS Manager, Phoenix Unit Trust ManagersLimited, or its associates, is shown in Note 6(a) and details of the units issued andcancelled by the ACS Manager are shown in the Statement of change in unitholders’funds and Note 8.
Any balances due to/from the ACS Manager or its associates at 31 January 2022 inrespect of these transactions are shown in Notes 9 and 11.
Note 17 Financial instrumentsIn accordance with the investment objective, the Sub-fund holds certain financialinstruments. These comprise:• securities held in accordance with the investment objective and policies;• derivative transactions which the Sub-fund enters into, the purpose of which is to
manage the currency and market risks arising from the Sub-fund’s investmentactivities; and
• cash and short term debtors and creditors arising directly from operations.
There was no counterparty exposure held at the year end.

111
PUTM ACS Lothian UK Listed Equity Fund
Notes to the financial statements
Note 17 Financial instruments (continued)Currency exposureAn analysis of the monetary assets at the period end are shown below:
Net currency assets Net currency assets 31/01/22 31/01/21
Currency Monetary Non- Total Monetary Non- Total exposure monetary exposure exposure monetary exposure exposure exposure £000 £000 £000 £000 £000 £000
Sterling 8,724 10,519,812 10,528,536 19,547 9,777,730 9,797,277 Euro 8,184 – 8,184 8,504 – 8,504 US Dollar 261 – 261 – – –
17,169 10,519,812 10,536,981 28,051 9,777,730 9,805,781
Income received in other currencies is converted to Sterling on or near the date of receipt. Theotherwise seek to avoid, movement risk on accrued income.
Interest profileAt the year end date, 0.48% (31/01/21: 1.73%) of the Sub-fund’s net assets by valuewere interest bearing.
Interest rates earned/paid on deposits are earned/paid at a rate linked to SONIA (SterlingOvernight Index Average) or international equivalent. Interest was also earned on theinvesments in the the Aberdeen Standard Liquidity Fund.
Sensitivity analysisInterest rate risk sensitivityAs the majority of the Sub-fund’s financial assets are non-interest bearing, the Sub-fundis only subject to limited exposure to fair value interest rate risk due to fluctuations inlevels of market interest rates and therefore, no sensitivity analysis has been provided.
Foreign currency risk sensitivityA five percent increase in the value of the Sub-fund’s foreign currency exposure wouldhave the effect of increasing the return and net assets by £422,000 (31/01/21:£425,200). A five percent decrease would have an equal and opposite effect.
Market price risk sensitivityA five percent increase in the value of the Sub-fund's portfolio would have the effect ofincreasing the return and net assets by £525,991,000 (31/01/21: £490,289,050). Afive percent decrease would have an equal and opposite effect.
Note 18 Fair value of investmentsThe fair value of the Sub-fund’s investments has been determined using the hierarchy below.
This complies with the ‘Amendments to FRS 102 – Fair value hierarchy disclosures’ issuedby the Financial Reporting Council in March 2016.
Level 1 The unadjusted quoted price in an active market for identical assets orliabilities that the entity can access at the measurement date.
Level 2 Inputs other than quoted prices included within Level 1 that areobservable (i.e. developed using market data) for the asset or liability,either directly or indirectly.
Level 3 Inputs are unobservable (i.e. for which market data is unavailable) for theasset or liability.

Notes to the financial statements
Note 18 Fair value of investments (continued)
For the period ended 31/01/22 Level 1 2 3 Total
Investment assets £000 £000 £000 £000Equities 10,469,086 – – 10,469,086Money markets 50,726 – – 50,726
10,519,812 – – 10,519,812
For the period ended 31/01/21Level 1 2 3 TotalInvestment assets £000 £000 £000 £000Equities 9,608,270 – – 9,608,270Money markets 169,460 – – 169,460
9,777,730 – – 9,777,730
112
PUTM ACS Lothian UK Listed Equity Fund
Note 19 Portfolio transaction costs
For the period ended 31/01/22Other Total
Value Commission Taxes expenses costsAnalysis of total purchases costs £000 £000 % £000 % £000 % £000
Equity transactions 1,912,518 1,134 0.06 7,727 0.40 35 – 1,921,414Money markets 1,231,948 – – – – – – 1,231,948Corporate actions 30,191 – – – – – – 30,191
Total 3,174,657 1,134 7,727 35 3,183,553
Other TotalValue Commission Taxes expenses costs
Analysis of total sales costs £000 £000 % £000 % £000 % £000
Equity transactions 2,233,910 (1,234) (0.06) – – (1) – 2,232,675Money markets 1,350,734 – – – – – – 1,350,734Corporate actions 40,838 – – – – – – 40,838
Total 3,625,482 (1,234) – (1) 3,624,247
Commission, taxes and other expenses as % of average net assets:Commission 0.03%Taxes 0.07%Other expenses 0.00%

Notes to the financial statements
113
PUTM ACS Lothian UK Listed Equity Fund
Note 19 Portfolio transaction costs
For the period ended 31/01/21Other Total
Value Commission Taxes expenses costsAnalysis of total purchases costs £000 £000 % £000 % £000 % £000
Equity transactions 334,326 194 0.06 1,661 0.50 – – 336,181Money markets 457,284 – – – – – – 457,284Corporate actions 47,318 – – – – – – 47,318In–specie transactions 9,576,612 – – – – – – 9,576,612
Total 10,415,540 194 1,661 – 10,417,395
Other TotalValue Commission Taxes expenses costs
Analysis of total sales costs £000 £000 % £000 % £000 % £000
Equity transactions 547,315 (327) (0.06) – – – – 546,988Money markets 287,810 – – – – – – 287,810
Total 835,125 (327) – – 834,798
Commission, taxes and other expenses as % of average net assets:Commission 0.00%Taxes 0.02%Other expenses 0.00%
Portfolio transaction costs are incurred by the Sub-fund when buying and selling underlying investments. These costs varydepending on the class of investment, country of exchange and method of execution.These costs can be classified as either direct or indirect transaction costs:Direct transaction costs: Broker commissions, fees and taxes.Indirect transaction costs: “Dealing spread” - the difference between buying and selling prices of the underlying investments.At the Balance sheet date the portfolio dealing spread was 0.06% (31/01/21: 0.62%) being the difference between the respectivebid and offerprices for the Sub-fund’s investments.

114
PUTM ACS Lothian UK Listed Equity Fund
Interim distribution in pence per unitGroup 1: units purchased prior to 1 February 2021Group 2: units purchased 1 February 2021 to 31 July 2021 2021 2020 pence pence per unit per unit Net paid paid income Equalisation 30 Sep 30 Sep*
Class ‘D’ Accumulation
Group 1 1.991556 — 1.991556 N/AGroup 2 0.617024 1.374532 1.991556 N/A
2021 2020 pence pence per unit per unit Net paid paid income Equalisation 30 Sep 30 Sep**
Class ‘X’ Accumulation
Group 1 0.286148 — 0.286148 N/AGroup 2 0.286148 0.000000 0.286148 N/A *Class ‘D’ Accumulation launched on 20 November 2020, hence there are no comparatives.**Class ‘X’ Accumulation launched on 9 June 2021, hence there are no comparatives.
Distribution tablesFor the year ended 31 January 2022

115
PUTM ACS Lothian UK Listed Equity Fund
Final distribution in pence per unitGroup 1: units purchased prior to 1 August 2021Group 2: units purchased 1 August 2021 to 31 January 2022 2022 2021 pence pence per unit per unit Net payable paid income Equalisation 30 Mar 30 Mar
Class ‘D’ Accumulation
Group 1 1.908581 — 1.908581 0.344960Group 2 0.435115 1.473466 1.908581 0.344960
2022 2021 pence pence per unit per unit Net payable paid income Equalisation 30 Mar** 31 Mar*
Class ‘X’ Accumulation
Group 1 1.638740 — 1.638740 N/AGroup 2 1.638740 0.000000 1.638740 N/A
*Class ‘X’ Accumulation launched on 9 June 2021, hence there are no comparatives.
Each Sub-fund is tax transparent for income purposes meaning that UK tax-paying Unitholders aresubject to tax on their share of income, net of allowable expenses, as it arises to the Sub-fund and noton distributions of income after deduction of expenses. On a daily basis unitholders will be advised oftheir share of aggregated accrued income, expenses and withholding tax paid on overseas dividends,if applicable. When a unit is purchased during the distribution period, part of the purchase price ofthe unit reflects the relevant share of income and expenses accrued by the Sub-fund, and this will bedisclosed on the contract note. This purchased income and expense, a capital sum, should bededucted from the aggregate accrued income or expense as applicable.
The subscription price disclosed on the contract note reflects the acquisition cost, which should beadjusted by the capital sum referred to above.
It is the responsibility of the unitholder to maintain a record of the relevant amount(s) of incomeequalisation and to make the appropriate adjustment when completing their tax calculations.
Distribution tablesFor the year ended 31 January 2022

116
Dear Investor
Welcome to the PUTM ACS Lothian UK Gilt Fund interimreport for the period from 18 November 2021 (launch) to31 January 2022.
Performance Review
The PUTM ACS Lothian UK Gilt Fund delivered -3.28%over the review period. (Source: Factset). This iscompared to its benchmark index, which returned-3.68%. (Source: Factset, FTSE Actuaries UKConventional Gilts All Stocks Index, Total Return in GBPterms for the period to 31/01/22).
In the table below, you can see how the Fund performedagainst its benchmark index over the last five discreteone-year periods.
Investment review
Source: Sub-fund performance is Factset. Benchmark Index performance is Factset, FTSE Actuaries UK ConventionalGilts All Stocks Index , Total Return in GBP terms to 31 January for each year.
Past performance is not a guide to future performance.
Please note that all past performance figures are calculated without taking the initial charge into account.
The value of units and the income from them can go down as well as up and is not guaranteed. You may not getback the full amount invested.
Standardised Past Performance
PUTM ACS Lothian UK Gilt Fund -3.28 – – – –
Benchmark Index -3.68 – – – –
Jan 21 - Jan 22% growth
PUTM ACS Lothian UK Gilt Fund

117
Investment review
Market ReviewThe key event for the gilt market over the review period wasDecember’s unexpected Bank of England (BoE) interest rate hike.Going into the meeting, very little was expected. At the Novembermeeting, Governor Bailey had drawn the market’s attention to theimportance of the upcoming labour market data prints. They didnot disappoint. Both the official labour market data and the moreanecdotal REC report on jobs pointed to a very tight labourmarket. However, due to the unknown nature of the Omicronvariant of Covid-19, the market expected the BoE to sit on itshands for one more meeting and not hike. It was also felt thatafter the November meeting, the BoE was not in so much of arush as the market had previously thought. We had also heardfrom a couple of members of the Bank's Monetary PolicyCommittee; they had suggested that the Omicron variant wasgiving them cause for concern.
Despite all of this, the BoE did hike, taking the base rate from0.10% to 0.25%. The vote was comprehensive, with only SilvanaTenreyro voting against. The language from the central bank alsocame across as hawkish; it stated that while there was somevalue in waiting for more Omicron news, there was a strongercase for tightening.
From a market perspective, in the first three weeks of December,gilt yields were dominated by Omicron. The prospect of furtherlockdowns weighed on yields. In addition, a combination of verylimited gilt supply and investor risk reduction into year-endresulted in 10-year gilt yields dipping to 0.49%. As the monthprogressed, yields started to rise. The hike from the BoE, thehawkish action of the US Federal Reserve and positive newsabout the milder impact of Omicron caused gilt yields to finish themonth and year at 0.78%.
Sub-fund ReviewFor the period in question, the Sub-fund was positioned in a verysimple fashion. We believed yields globally would go higher. Wetherefore refrained from entering cross-market or curve positions.Our rationale for adopting this underweight stance versusbenchmark was primarily based on our anticipated path formonetary policy in the face of rising inflation expectations. Withthe BoE appearing more concerned about inflationary pressuresbecoming embedded, and the labour market reboundingimpressively after the expiry of the furlough scheme, a shift to amore hawkish monetary policy stance appeared inevitable – andwith it, higher nominal gilt yields. The discovery of a new Covid-19 variant, Omicron, caused gilt yields to decline further as aresult of risk-off sentiment. Although this was challenging for ourshort duration strategy, following extensive analysis we remainedsteadfast in our view that ultimately the emergence of this newvariant would not derail inflationary pressures, the need for tightermonetary policy and ultimately higher nominal yields. We took thedecision to increase the scale of the strategy in the middle ofDecember, close to the lows in yields. This decision paiddividends into year-end and into January 2022.
Our duration positioning took the form of being short UK in boththe 10-year and 50-year part of the curve and short US 10-year
Treasuries. We think the UK curve will have to re-price in 2022.However, until the fiscal year starts in April and gilt net supplydramatically increases, we do not believe the curve will steepen.Accordingly, we positioned the Sub-fund for higher yields, and notfor steeper curves.
As yields increased through January, we took profits on theduration positioning, closing both the UK and US 10-yearpositioning. We ended the period with a much-reduced shortduration position, held in the 50-year area of the curve.
In terms of other positioning, in January, we started to add someUK curve positions. With one eye on the gilt syndication in themiddle of February and the flattening of the UK curve in earlyJanuary, the Sub-fund added a 10-year/30-year steepener. Thiswas seen as a tactical position to run into February, with the viewthat the Sub-fund will add more strategic steepeners as we headcloser to April. The Sub-fund also added a front-end steepener one-year/two-year versus three-year/two-year. We felt this curve was tooflat, and as yields continued to move gradually higher, the belly ofthe UK curve would have to catch up; therefore, the curve wouldhave to steepen. The Sub-fund also added a 2s5s10s US fly trade.
Outlook at Year EndThe economic narrative has flipped from ensuring a recovery tosignificant concerns of overheating. This has forced a sharprethink in central bank policy, with ramifications for the economicoutlook and asset market valuations. This year will be a big test forequity and bond markets; inflation in most developed markets hasreached multi-decade highs, with confidence waning that we willreturn smoothly and quickly to a more normal level. Interest ratemarkets have begun to more accurately reflect the likely path forfuture policy. We are about to enter a scenario where centralbanks are almost forced to maintain a far more hawkishdisposition than experienced since the global financial crisis. Withcentral banks reducing purchases, ceasing purchases altogether oreven reducing the size of their balance sheet, the backdrop forgovernment bonds is more challenging. The UK will continue toraise interest rates and the US Federal Reserve (Fed) will begin itshiking cycle around the middle of the year. We view 2022 as ayear of higher front-end rates across most markets, with moremarginal weakness further out the curve.
The market was comfortable with pricing a full interest rate hike atFebruary’s BoE meeting. Both official and survey data continue topoint to an incredibly tight labour market. Vacancies were atrecord highs, and this fed through to wages. January data showedinflation continuing to shoot up across various categories. Inflationis expected to peak in April 2022 when the energy price increasesfeed through to consumer price inflation. The issue is how quicklyinflation subsides after April, or whether it starts to becomeembedded. For these reasons we expect the BoE to raise interestrates in February, and possibly once more in May.
As the market outlook was completed as of 31st January, thereis no mention of the ongoing Ukraine crisis that began at theend of February. Naturally, this would dramatically affect anyfuture expectations of market outlook that would not have beenfactored in at the time of writing.
PUTM ACS Lothian UK Gilt Fund

118
Portfolio of investments (unaudited)
Investments held at 31 January 2022 Market Percentage of value total net assets Holding Investment £000 %
United Kingdom 94.61 Corporate Bonds 0.69 £1,728,000 PRS Finance 1.5% 24/08/2034 1,670 0.10 £4,680,000 PRS Finance 1.75% 24/11/2026 4,476 0.27 £5,209,000 PRS Finance 2% 23/01/2029 5,352 0.32
Government Bonds 93.92 £3,487,000 Network Rail Infrastructure 3% 07/09/2023 3,586 0.22 £14,185,000 Network Rail Infrastructure 4.75% 22/01/2024 15,140 0.91 £24,165,000 UK Treasury 0.125% 31/01/2023 23,970 1.44 £24,369,000 UK Treasury 0.125% 31/01/2024 23,924 1.44 £30,049,400 UK Treasury 0.125% 30/01/2026 28,950 1.74 £32,242,000 UK Treasury 0.125% 31/01/2028 30,345 1.83 £8,970,900 UK Treasury 0.25% 31/01/2025 8,751 0.53 £30,589,700 UK Treasury 0.25% 31/07/2031 27,699 1.67 £9,550,700 UK Treasury 0.375% 22/10/2026 9,215 0.55 £36,591,000 UK Treasury 0.375% 22/10/2030 33,951 2.04 £40,307,900 UK Treasury 0.5% 22/07/2022 40,287 2.43 £8,278,100 UK Treasury 0.5% 31/01/2029 7,878 0.47 £17,259,200 UK Treasury 0.5% 22/10/2061 12,961 0.78 £37,981,500 UK Treasury 0.625% 07/06/2025 37,472 2.26 £64,680,900 UK Treasury 0.625% 31/07/2035 58,008 3.49 £27,660,000 UK Treasury 0.75% 22/07/2023 27,582 1.66 £36,437,416 UK Treasury 0.875% 22/10/2029 35,560 2.14 £48,324,200 UK Treasury 0.875% 31/07/2033 45,823 2.76 £47,371,500 UK Treasury 0.875% 31/01/2046 41,215 2.48 £13,246,650 UK Treasury 1.125% 31/01/2039 12,480 0.75 £36,312,800 UK Treasury 1.25% 22/07/2027 36,591 2.20 £29,844,000 UK Treasury 1.25% 22/10/2041 28,492 1.71 £58,381,000 UK Treasury 1.25% 31/07/2051 55,110 3.32 £26,539,200 UK Treasury 1.5% 22/07/2026 27,043 1.63 £26,747,503 UK Treasury 1.5% 22/07/2047 26,710 1.61 £15,573,000 UK Treasury 1.5% 31/07/2053 15,850 0.95 £34,322,000 UK Treasury 1.625% 22/10/2028 35,366 2.13 £1,013,100 UK Treasury 1.625% 22/10/2071 1,164 0.07 £52,909,300 UK Treasury 1.75% 07/09/2037 54,829 3.30 £26,363,700 UK Treasury 1.75% 22/01/2049 27,899 1.68 £60,881,100 UK Treasury 1.75% 22/07/2057 66,941 4.03 £13,593,871 UK Treasury 2% 07/09/2025 14,043 0.85 £12,346,000 UK Treasury 2.25% 07/09/2023 12,590 0.76 £22,902,606 UK Treasury 2.5% 22/07/2065 32,000 1.93 £580,000 UK Treasury 2.75% 07/09/2024 605 0.04
PUTM ACS Lothian UK Gilt Fund
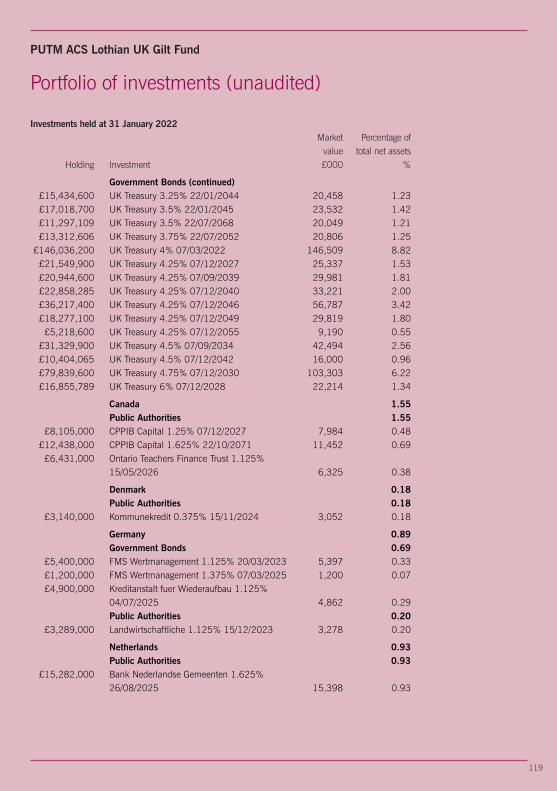
119
Portfolio of investments (unaudited)
Investments held at 31 January 2022 Market Percentage of value total net assets Holding Investment £000 %
Government Bonds (continued) £15,434,600 UK Treasury 3.25% 22/01/2044 20,458 1.23 £17,018,700 UK Treasury 3.5% 22/01/2045 23,532 1.42 £11,297,109 UK Treasury 3.5% 22/07/2068 20,049 1.21 £13,312,606 UK Treasury 3.75% 22/07/2052 20,806 1.25£146,036,200 UK Treasury 4% 07/03/2022 146,509 8.82 £21,549,900 UK Treasury 4.25% 07/12/2027 25,337 1.53 £20,944,600 UK Treasury 4.25% 07/09/2039 29,981 1.81 £22,858,285 UK Treasury 4.25% 07/12/2040 33,221 2.00 £36,217,400 UK Treasury 4.25% 07/12/2046 56,787 3.42 £18,277,100 UK Treasury 4.25% 07/12/2049 29,819 1.80 £5,218,600 UK Treasury 4.25% 07/12/2055 9,190 0.55 £31,329,900 UK Treasury 4.5% 07/09/2034 42,494 2.56 £10,404,065 UK Treasury 4.5% 07/12/2042 16,000 0.96 £79,839,600 UK Treasury 4.75% 07/12/2030 103,303 6.22 £16,855,789 UK Treasury 6% 07/12/2028 22,214 1.34
Canada 1.55 Public Authorities 1.55 £8,105,000 CPPIB Capital 1.25% 07/12/2027 7,984 0.48 £12,438,000 CPPIB Capital 1.625% 22/10/2071 11,452 0.69 £6,431,000 Ontario Teachers Finance Trust 1.125% 15/05/2026 6,325 0.38
Denmark 0.18 Public Authorities 0.18 £3,140,000 Kommunekredit 0.375% 15/11/2024 3,052 0.18
Germany 0.89 Government Bonds 0.69 £5,400,000 FMS Wertmanagement 1.125% 20/03/2023 5,397 0.33 £1,200,000 FMS Wertmanagement 1.375% 07/03/2025 1,200 0.07 £4,900,000 Kreditanstalt fuer Wiederaufbau 1.125% 04/07/2025 4,862 0.29 Public Authorities 0.20 £3,289,000 Landwirtschaftliche 1.125% 15/12/2023 3,278 0.20
Netherlands 0.93 Public Authorities 0.93 £15,282,000 Bank Nederlandse Gemeenten 1.625% 26/08/2025 15,398 0.93
PUTM ACS Lothian UK Gilt Fund

120
Portfolio of investments (unaudited)
Investments held at 31 January 2022 Market Percentage of value total net assets Holding Investment £000 %
Supranational 1.00 Supranational Bonds 1.00 £5,292,000 European Bank for Reconstruction 1.25% 15/12/2022 5,306 0.32 £4,502,000 European Investment Bank 1.125% 19/06/2025 4,463 0.27 £6,805,000 Nordic Investment Bank 1.125% 18/06/2025 6,754 0.41
Money Markets 0.31 £5,162 Aberdeen Standard Liquidity Fund (Lux) – Seabury Sterling Class Z-1~ 5,159 0.31
Futures (0.03) (1,388) CBT US 2Year Note Future March 2022 724 0.04 2,255 CBT US 5Year Note Future March 2022 (495) (0.03) (449) CBT US 10Year Ultra Future March 2022 6 0.00 (41) ICF Long Gilt Future March 2022 215 0.01 715 SFE Australia 10Year Government Bond Future March 2022 (891) (0.05)
Interest Rate Swaps – Capital Protection (0.03) €29,852,000 Morgan Stanley EURIB 18/09/2055 3,574 0.22(€29,852,000) Morgan Stanley 0.399% 18/09/2055 (2,761) (0.17) €89,522,000 Morgan Stanley 0.565% 18/09/2035 4,125 0.25(€89,522,000) Morgan Stanley EURIB 18/09/2035 (5,418) (0.33)
Overnight Index Swaps (0.09) £30,585,000 Morgan Stanley 0.933% 31/01/2024 560 0.04(£30,585,000) Morgan Stanley SONIA 31/01/2024 (796) (0.05) £12,249,000 Morgan Stanley 0.964% 22/04/2024 258 0.02(£12,249,000) Morgan Stanley SONIA 22/04/2024 (361) (0.02)£109,234,500 Morgan Stanley 1.218% 14/07/2025 2,559 0.15
(£109,234,500) Morgan Stanley SONIA 14/07/2025 (3,175) (0.19) £54,650,000 Morgan Stanley 1.3% 16/01/2025 1,376 0.08(£54,650,000) Morgan Stanley SONIA 16/01/2025 (1,655) (0.10) £56,100,000 Morgan Stanley SONIA 14/01/2027 1,340 0.08(£56,100,000) Morgan Stanley 1.135% 14/01/2027 (1,199) (0.07) £56,100,000 Morgan Stanley SONIA 20/01/2027 1,338 0.08(£56,100,000) Morgan Stanley 1.258% 20/01/2027 (1,329) (0.08) £54,650,000 Morgan Stanley 1.42% 19/01/2025 1,503 0.09(£54,650,000) Morgan Stanley SONIA 19/01/2025 (1,654) (0.10) £54,650,000 Morgan Stanley 1.417% 20/01/2025 1,500 0.09(£54,650,000) Morgan Stanley SONIA 20/01/2025 (1,654) (0.10) £56,100,000 Morgan Stanley SONIA 20/01/2027 1,338 0.08(£56,100,000) Morgan Stanley 1.247% 20/01/2027 (1,318) (0.08)
PUTM ACS Lothian UK Gilt Fund
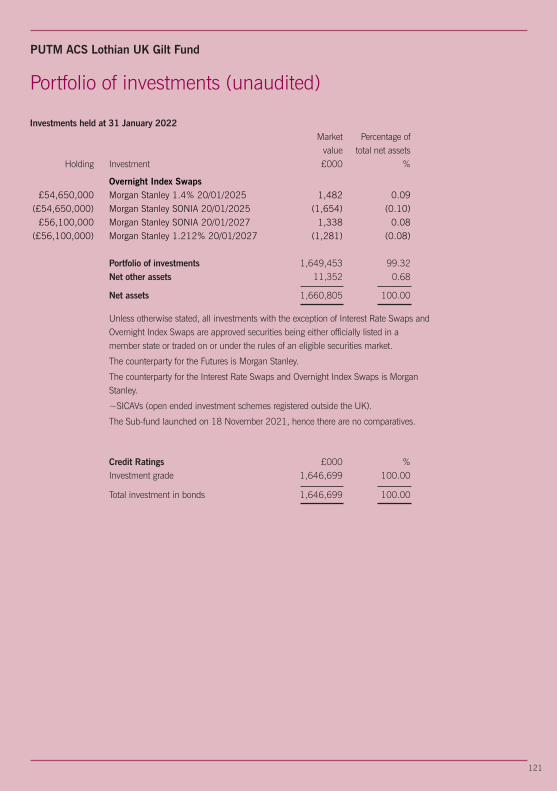
121
Portfolio of investments (unaudited)
Investments held at 31 January 2022 Market Percentage of value total net assets Holding Investment £000 %
Overnight Index Swaps £54,650,000 Morgan Stanley 1.4% 20/01/2025 1,482 0.09(£54,650,000) Morgan Stanley SONIA 20/01/2025 (1,654) (0.10) £56,100,000 Morgan Stanley SONIA 20/01/2027 1,338 0.08(£56,100,000) Morgan Stanley 1.212% 20/01/2027 (1,281) (0.08) Portfolio of investments 1,649,453 99.32 Net other assets 11,352 0.68
Net assets 1,660,805 100.00
Unless otherwise stated, all investments with the exception of Interest Rate Swaps andOvernight Index Swaps are approved securities being either officially listed in amember state or traded on or under the rules of an eligible securities market.
The counterparty for the Futures is Morgan Stanley.
The counterparty for the Interest Rate Swaps and Overnight Index Swaps is MorganStanley.
~SICAVs (open ended investment schemes registered outside the UK).
The Sub-fund launched on 18 November 2021, hence there are no comparatives.
Credit Ratings £000 % Investment grade 1,646,699 100.00
Total investment in bonds 1,646,699 100.00
PUTM ACS Lothian UK Gilt Fund
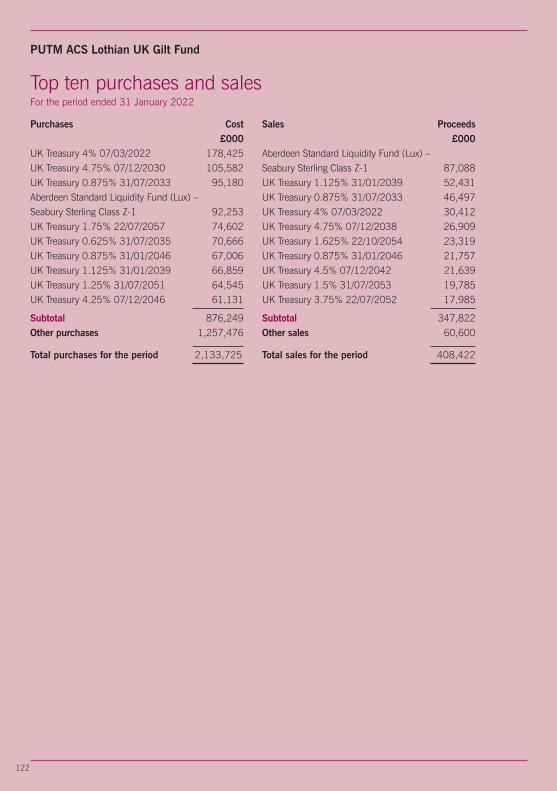
122
PUTM ACS Lothian UK Gilt Fund
Top ten purchases and salesFor the period ended 31 January 2022
Purchases Cost£000
UK Treasury 4% 07/03/2022 178,425UK Treasury 4.75% 07/12/2030 105,582UK Treasury 0.875% 31/07/2033 95,180Aberdeen Standard Liquidity Fund (Lux) –Seabury Sterling Class Z-1 92,253UK Treasury 1.75% 22/07/2057 74,602UK Treasury 0.625% 31/07/2035 70,666UK Treasury 0.875% 31/01/2046 67,006UK Treasury 1.125% 31/01/2039 66,859UK Treasury 1.25% 31/07/2051 64,545UK Treasury 4.25% 07/12/2046 61,131
Subtotal 876,249Other purchases 1,257,476
Total purchases for the period 2,133,725
Sales Proceeds£000
Aberdeen Standard Liquidity Fund (Lux) –Seabury Sterling Class Z-1 87,088UK Treasury 1.125% 31/01/2039 52,431UK Treasury 0.875% 31/07/2033 46,497UK Treasury 4% 07/03/2022 30,412UK Treasury 4.75% 07/12/2038 26,909UK Treasury 1.625% 22/10/2054 23,319UK Treasury 0.875% 31/01/2046 21,757UK Treasury 4.5% 07/12/2042 21,639UK Treasury 1.5% 31/07/2053 19,785UK Treasury 3.75% 22/07/2052 17,985
Subtotal 347,822Other sales 60,600
Total sales for the period 408,422

123
Statistical information
Comparative table Class ‘D’ Accumulation** 31/01/22 pence Change in net assets per unitOpening net asset value per unit 100.00
Return before operating charges* (3.82) Operating charges –
Return after operating charges* (3.82)
Distributions on accumulation units (0.17)Retained distributions onaccumulation units 0.17
Closing net asset value per unit 96.18
*after direct transaction costs of:^ 0.00
PerformanceReturn after charges (3.82%)
Other informationClosing net asset value (£000) 1,660,805Closing number of units 1,726,733,602Operating charges 0.01%Direct transaction costs 0.00%
Prices+
Highest unit price (pence) 103.39Lowest unit price (pence) 96.11
^The direct transaction costs includes commission on futures and clearing house feeson swaps.+ High and low price disclosures are based on quoted unit prices. Therefore, theopening and closing NAV prices may fall outside the high/low price threshold.**The Sub-fund launched on 18 November 2021, hence there are no comparatives.Therefore, this statement only covers the period from 18 November 2021 to 31January 2022.
PUTM ACS Lothian UK Gilt Fund

124
Statistical information
Investment objective
The Sub-fund aims to provide a total return (a combination of capital growth andincome) by outperforming the FTA British Government All Stocks Total Return IndexGBP (the “Index”) by 0% to 1% per annum over rolling three year periods (beforecharges).
Investment policyThe Sub-fund aims to achieve its objective by investing at least 80% of the portfolio infixed income securities that are constituents of the Index. The Sub-fund may alsoinvest in UK Government backed securities and GBP denominated (or hedged back toGBP) investment grade overseas government backed securities, including inflation-linked bonds.
The Sub-fund may also invest in other transferable debt securities, money-marketinstruments, cash and other collective investment schemes (including funds managedby the Investment Manager).
Derivatives may be used for efficient portfolio management and hedging only.
Investment strategyThe Sub-fund is actively managed. The management team use their discretion toidentify investments after analysing individual bonds and derivatives alongside globaleconomic and market conditions. In seeking to achieve the Performance Target, theIndex is used as a reference point for portfolio construction and as a basis for settingrisk constraints. The expected variation between the returns of the Sub-fund and theIndex is not ordinarily expected to exceed 1.5%. Due to the Sub-fund’s riskconstraints, the intention is that the Sub-fund's performance profile will not deviatesignificantly from that of the Index over the long term. Typical strategies employed bythe Sub-fund include taking directional positions on the future direction of interestrates, as well as analysing the relative value of various bonds to identify those with thebest risk/return characteristics.
Revenue distribution and pricingUnits of the Sub-fund are available as Class ‘D’ Accumulation units (where revenue isreinvested to enhance the unit price). There will be two potential distributions in eachaccounting year: an interim distribution as at 31 July and a final distribution as at 31January.
At each distribution the net revenue after deduction of expenses, from the investmentsof the Sub-fund, is apportioned amongst the unitholders. Unitholders receive a taxvoucher giving details of the distribution and the Manager’s Report no later than twomonths after these dates.
PUTM ACS Lothian UK Gilt Fund

Risk and reward profile
The Risk and Reward Indicator table demonstrates where the Sub-fund ranks in terms ofits potential risk and reward. The higher the rank the greater the potential reward but thegreater the risk of losing money. It is based on past data, may change over time and maynot be a reliable indication of the future risk profile of the Sub-fund. The shaded area inthe table below shows the Sub-fund’s ranking on the Risk and Reward Indicator.
Typically lower rewards, Typically higher rewards, lower risk higher risk fi
1 2 3 4 5 6 7
This Sub-fund is ranked at 4 because funds of this type have experienced averagerises and falls in value in the past. The above figure applies to the following unit class:• Class ‘D’ Accumulation
Please note that even the lowest risk class can lose you money and that extrememarket circumstances can mean you suffer severe losses in all cases. Please note theSub-fund’s risk category may change in the future. The indicator does not take intoaccount the following risks of investing in this Sub-fund:
• Bonds are affected by changes in interest rates, inflation and any decline Increditworthiness of the bond issuer. Bonds that produce a higher level of incomeusually also carry greater risk as such bond issuers may have difficulty in payingtheir debts.
• Although the Investment Manager will use currency trades to reduce exchange raterisk on investments not priced in Sterling, this may not completely eliminate theSub-fund’s exchange rate risk.
• The Sub-fund may use derivatives to reduce risk or cost or to generate additionalcapital or income at low risk, or to meet its investment objective.
For more information on the Risk and Reward profiles of our Funds, please refer to themost up to date relevant fund and Unit Class Key Investor Information Documents(KIIDs). These are available online at www.phoenixunittrust.co.uk.
125
fi
Statistical information
PUTM ACS Lothian UK Gilt Fund

126
Annual financial statementsFor the period ended 31 January 2022
Statement of total return 31/01/22* Notes £000 £000
Income
Net capital losses 4 (68,732) Revenue 5 2,933
Expenses 6 (45)
Net revenue before taxation 2,888
Net revenue after taxation 2,888
Total deficitbefore distributions (65,844)
Distributions 7 (2,897)
Change in unitholders’ fundsfrom investment activities (68,741)
Statement of change in unitholders’ funds
31/01/22* £000 £000
Opening net assets –
Amounts receivableon issue of units 3,475
Amounts receivableon in-specie transfer** 1,729,658
Amounts payableon cancellation of units (6,490) 1,726,643Change in unitholders’ fundsfrom investment activities (68,741)
Dilution levy adjustment 6
Retained distributionson accumulation units 2,897
Closing net assets 1,660,805
*The Sub-fund launched on 18 November 2021, hence there are no comparatives.Therefore, this statement only covers the period from 18 November 2021 to 31 January 2022.**Represents the value of units created by in-specie transfer of assets during the period.
PUTM ACS Lothian UK Gilt Fund

127
Balance sheet 31/01/22 Notes £000 £000
Assets:Fixed assets:Investments 1,653,843
Current assets:Debtors 8 15,505
Cash and bank balances 9 5,633
Total current assets 21,138
Total assets 1,674,981
Liabilities:Investment liabilities (4,390)
Creditors:Bank overdraft 10 (1,801)Other creditors 11 (7,985)
Total creditors (9,786)
Total liabilities (14,176)
Net assets 1,660,805
Unitholders’ funds 1,660,805
Annual financial statementsAs at 31 January 2022
PUTM ACS Lothian UK Gilt Fund

128
Notes to the financial statements
Notes 1-3 Accounting policiesPlease see pages 3 to 6 for accounting basis and policies.
Note 4 Net capital lossesThe net capital losses during the period comprise:
31/01/22* £000
Losses on non-derivative securities (70,411)Gains on derivative contracts 1,715Currency losses (33)Handling charges (3)
Net capital losses (68,732)
Note 5 Revenue 31/01/22* £000
Interest on debt securities 2,862Interest on derivative contracts 63Liquidity interest 8
Total revenue 2,933
Note 6 Expenses 31/01/22* £000(a) Payable to the ACS Manager or associates of the
ACS Manager and agents of either of them:ACS Manager’s periodic charge 17
(b) Payable to the Depositary or associates of theDepositary and agents of either of them:Trustee’s fees 10
(c) Other expenses:Audit fee 9Safe custody charges 9
18
Total expenses 45
Note 7 DistributionsThe distributions take account of amounts added on the issue of units andamounts deducted on the cancellation of units, and comprise:
31/01/22* £000
Final 2,897
Amounts deducted on cancellation of units 4Amounts added on issue of units (4)
Net distribution for the period 2,897
Net revenue after taxation 2,888Expenses taken to capital 9
Net distribution for the period 2,897
*The Sub-fund launched on 18 November 2021, hence there are no comparatives.Therefore, this statement only covers the period from 18 November 2021 to 31 January 2022.Details of the distribution per unit are set out in the table on page 135.
PUTM ACS Lothian UK Gilt Fund
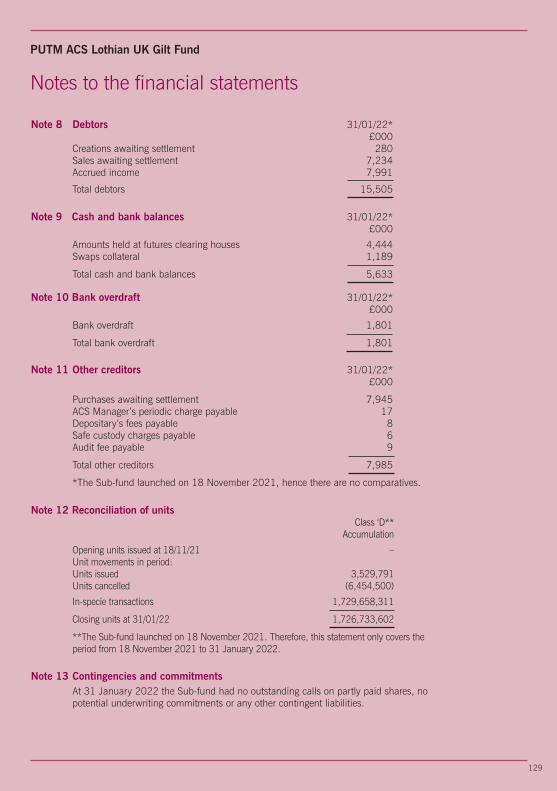
129
Notes to the financial statements
Note 8 Debtors 31/01/22* £000
Creations awaiting settlement 280Sales awaiting settlement 7,234Accrued income 7,991
Total debtors 15,505
Note 9 Cash and bank balances 31/01/22* £000
Amounts held at futures clearing houses 4,444Swaps collateral 1,189
Total cash and bank balances 5,633
Note 10 Bank overdraft 31/01/22* £000
Bank overdraft 1,801
Total bank overdraft 1,801
Note 11 Other creditors 31/01/22* £000
Purchases awaiting settlement 7,945ACS Manager’s periodic charge payable 17Depositary’s fees payable 8Safe custody charges payable 6Audit fee payable 9
Total other creditors 7,985
*The Sub-fund launched on 18 November 2021, hence there are no comparatives.
Note 12 Reconciliation of units Class ‘D** Accumulation
Opening units issued at 18/11/21 –Unit movements in period:Units issued 3,529,791Units cancelled (6,454,500)
In-specie transactions 1,729,658,311
Closing units at 31/01/22 1,726,733,602
**The Sub-fund launched on 18 November 2021. Therefore, this statement only covers theperiod from 18 November 2021 to 31 January 2022.
Note 13 Contingencies and commitmentsAt 31 January 2022 the Sub-fund had no outstanding calls on partly paid shares, nopotential underwriting commitments or any other contingent liabilities.
PUTM ACS Lothian UK Gilt Fund
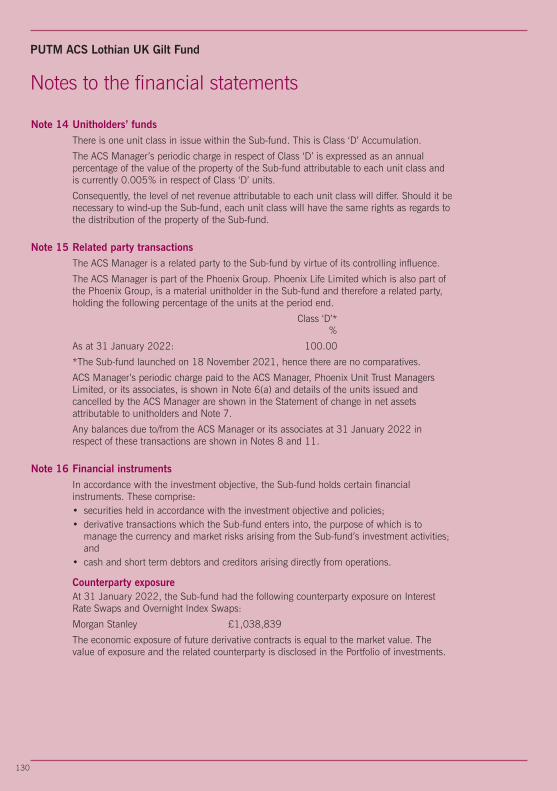
130
Notes to the financial statements
Note 14 Unitholders’ fundsThere is one unit class in issue within the Sub-fund. This is Class ‘D’ Accumulation.
The ACS Manager’s periodic charge in respect of Class ‘D’ is expressed as an annualpercentage of the value of the property of the Sub-fund attributable to each unit class andis currently 0.005% in respect of Class ‘D’ units.
Consequently, the level of net revenue attributable to each unit class will differ. Should it benecessary to wind-up the Sub-fund, each unit class will have the same rights as regards tothe distribution of the property of the Sub-fund.
Note 15 Related party transactionsThe ACS Manager is a related party to the Sub-fund by virtue of its controlling influence.
The ACS Manager is part of the Phoenix Group. Phoenix Life Limited which is also part ofthe Phoenix Group, is a material unitholder in the Sub-fund and therefore a related party,holding the following percentage of the units at the period end.
Class ‘D’* %
As at 31 January 2022: 100.00
*The Sub-fund launched on 18 November 2021, hence there are no comparatives.
ACS Manager’s periodic charge paid to the ACS Manager, Phoenix Unit Trust ManagersLimited, or its associates, is shown in Note 6(a) and details of the units issued andcancelled by the ACS Manager are shown in the Statement of change in net assetsattributable to unitholders and Note 7.
Any balances due to/from the ACS Manager or its associates at 31 January 2022 inrespect of these transactions are shown in Notes 8 and 11.
Note 16 Financial instrumentsIn accordance with the investment objective, the Sub-fund holds certain financialinstruments. These comprise:• securities held in accordance with the investment objective and policies;• derivative transactions which the Sub-fund enters into, the purpose of which is to
manage the currency and market risks arising from the Sub-fund’s investment activities;and
• cash and short term debtors and creditors arising directly from operations.
Counterparty exposureAt 31 January 2022, the Sub-fund had the following counterparty exposure on InterestRate Swaps and Overnight Index Swaps:
Morgan Stanley £1,038,839
The economic exposure of future derivative contracts is equal to the market value. Thevalue of exposure and the related counterparty is disclosed in the Portfolio of investments.
PUTM ACS Lothian UK Gilt Fund

131
Notes to the financial statements
Note 16 Financial instruments (continued)Currency exposureAn analysis of the monetary assets and liabilities at the period end is shown below:
Net currency assets 31/01/22*
Currency Monetary Non- Total exposure monetary exposure exposure £000 £000 £000
Sterling 10,214 1,650,589 1,660,803 Australian Dollar 1,138 (891) 247 Euro – (480) (480) US Dollar – 235 235
11,352 1,649,453 1,660,805
* The Sub-fund launched on 18 November 2021, hence there are no comparatives.Income received in other currencies is converted to Sterling on or near the date ofreceipt. The Sub-fund does not hedge or otherwise seek to avoid, movement risk onaccrued income.
Interest profileThe interest rate risk profile of financial assets and liabilities at 31 January 2022was:Currency Fixed rate Floating rate Financial assets Total
financial assets financial assets not carrying interest
£000 £000 £000 £000Sterling 1,646,700 9,654 30,312 1,686,666Australian Dollar – 1,138 – 1,138Euro – – 7,699 7,699US Dollar – – 730 730
1,646,700 10,792 38,741 1,696,233
Currency Floating rate Financial liabilities Totalfinancial liabilities not carrying interest
£000 £000 £000
Sterling (1,801) (24,062) (25,863)Australian Dollar – (891) (891)Euro – (8,179) (8,179)US Dollar – (495) (495)
(1,801) (33,627) (35,428)
Sensitivity analysisInterest rate risk sensitivityChanges in interest rates or changes in expectation of future interest rates mayresult in an increase or decrease in the the market value of the investments held. Aone percent increase in interest rates (based on current parameters used by theManager's Investment Risk department) would have the effect of increasing thereturn and net assets by by £•••. A one percent decrease would have an equaland opposite effect.
PUTM ACS Lothian UK Gilt Fund

132
Notes to the financial statements
Note 16 Financial instruments (continued)
Foreign currency risk sensitivityAs the majority of the Sub-fund’s financial assets are in the base currency of the Sub-fund (Sterling), the Sub-fund is only subject to limited exposure to fluctuations in foreigncurrency and therefore, no sensitivity analysis has been provided.
Market price risk sensitivityA five percent increase in the value of the Sub-fund’s portfolio would have the effect ofincreasing the return and net assets by £82,472,644. A five percent decrease wouldhave an equal and opposite effect.
Note 17 Fair value of investmentsThe fair value of the Sub-fund’s investments has been determined using the hierarchy below.
This complies with the ‘Amendments to FRS 102 – Fair value hierarchy disclosures’ issuedby the Financial Reporting Council in March 2016.
Level 1 The unadjusted quoted price in an active market for identical assets orliabilities that the entity can access at the measurement date.
Level 2 Inputs other than quoted prices included within Level 1 that areobservable (i.e. developed using market data) for the asset or liability,either directly or indirectly.
Level 3 Inputs are unobservable (i.e. for which market data is unavailable) for theasset or liability.
For the period ended 31/01/22*Level 1 2 3 Total
Investment assets £000 £000 £000 £000Bonds 1,635,201 11,498 – 1,646,699Derivatives 945 1,040 – 1,985Money markets 5,159 – – 5,159
1,641,305 12,538 – 1,653,843
Investment liabilities £000 £000 £000 £000Derivatives (1,386) (3,004) – (4,390)
(1,386) (3,004) – (4,390)
* The Sub‐fund launched on 18 November 2021, hence there are no comparatives.
PUTM ACS Lothian UK Gilt Fund
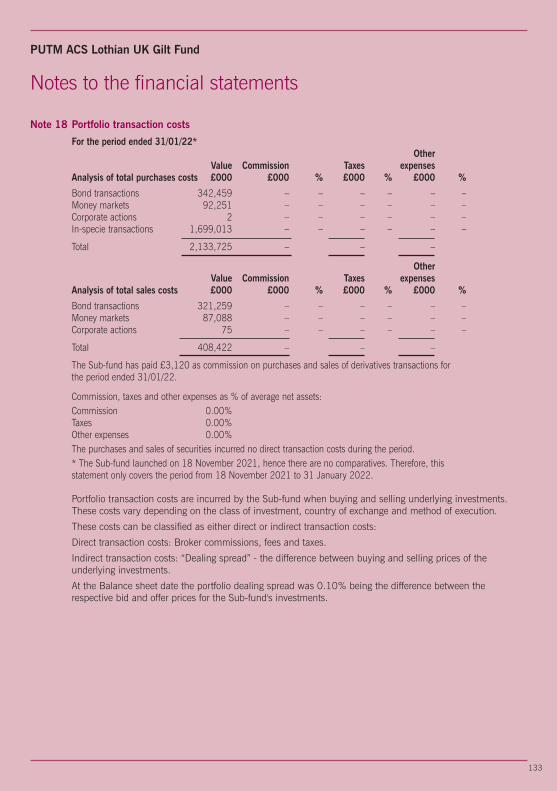
133
Notes to the financial statements
Note 18 Portfolio transaction costs
For the period ended 31/01/22*Other
Value Commission Taxes expensesAnalysis of total purchases costs £000 £000 % £000 % £000 %
Bond transactions 342,459 – – – – – –Money markets 92,251 – – – – – –Corporate actions 2 – – – – – –In-specie transactions 1,699,013 – – – – – –
Total 2,133,725 – – –
OtherValue Commission Taxes expenses
Analysis of total sales costs £000 £000 % £000 % £000 %
Bond transactions 321,259 – – – – – –Money markets 87,088 – – – – – –Corporate actions 75 – – – – – –
Total 408,422 – – –
The Sub-fund has paid £3,120 as commission on purchases and sales of derivatives transactions forthe period ended 31/01/22.
Commission, taxes and other expenses as % of average net assets:Commission 0.00%Taxes 0.00%Other expenses 0.00%The purchases and sales of securities incurred no direct transaction costs during the period.* The Sub-fund launched on 18 November 2021, hence there are no comparatives. Therefore, thisstatement only covers the period from 18 November 2021 to 31 January 2022.
Portfolio transaction costs are incurred by the Sub-fund when buying and selling underlying investments.These costs vary depending on the class of investment, country of exchange and method of execution.
These costs can be classified as either direct or indirect transaction costs:
Direct transaction costs: Broker commissions, fees and taxes.
Indirect transaction costs: “Dealing spread” - the difference between buying and selling prices of theunderlying investments.
At the Balance sheet date the portfolio dealing spread was 0.10% being the difference between therespective bid and offer prices for the Sub-fund's investments.
PUTM ACS Lothian UK Gilt Fund

134
Notes to the financial statements
Note 19 Post Balance sheet eventsAs indicated in the accounting policies in Note 1(b), the investments have been valued atclose of business on 31 January 2022. Since the balance sheet date, the bid price of eachof the Sub-fund’s unit classes have moved as follows:
Bid Price Bid Price 31/01/22 19/05/22
pence pence Movement (%)
Class ‘D’ Accumulation 96.18 89.74 -6.70
PUTM ACS Lothian UK Gilt Fund
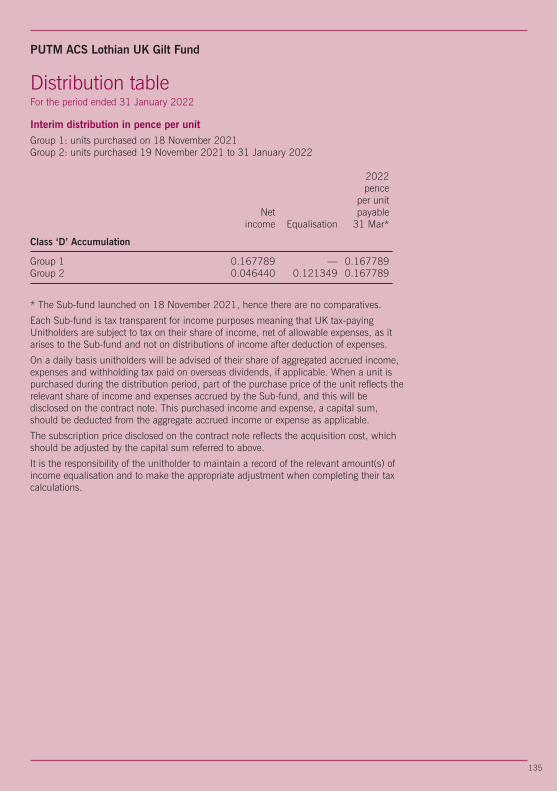
135
Interim distribution in pence per unitGroup 1: units purchased on 18 November 2021Group 2: units purchased 19 November 2021 to 31 January 2022 2022 pence per unit Net payable income Equalisation 31 Mar*
Class ‘D’ Accumulation
Group 1 0.167789 — 0.167789Group 2 0.046440 0.121349 0.167789
* The Sub-fund launched on 18 November 2021, hence there are no comparatives.
Each Sub-fund is tax transparent for income purposes meaning that UK tax-payingUnitholders are subject to tax on their share of income, net of allowable expenses, as itarises to the Sub-fund and not on distributions of income after deduction of expenses.
On a daily basis unitholders will be advised of their share of aggregated accrued income,expenses and withholding tax paid on overseas dividends, if applicable. When a unit ispurchased during the distribution period, part of the purchase price of the unit reflects therelevant share of income and expenses accrued by the Sub-fund, and this will bedisclosed on the contract note. This purchased income and expense, a capital sum,should be deducted from the aggregate accrued income or expense as applicable.
The subscription price disclosed on the contract note reflects the acquisition cost, whichshould be adjusted by the capital sum referred to above.
It is the responsibility of the unitholder to maintain a record of the relevant amount(s) ofincome equalisation and to make the appropriate adjustment when completing their taxcalculations.
Distribution tableFor the period ended 31 January 2022
PUTM ACS Lothian UK Gilt Fund

136
Dear Investor
Welcome to the PUTM ACS Lothian UK Listed SmallerCompanies Fund report from 30 November 2021 to 31January 2022.
Performance Review
Over the review period, the PUTM ACS Lothian UKListed Smaller Companies Fund returned -5.41%(Source: Factset: Gross of AMC; based on the movementin the Cancellation Price from 30/11/21 to 31/01/22, inGBP). This was compared to a return of -2.22% for thebenchmark index (Source: Factset: Numis SmallerCompanies Index ex Investment Companies; Total Returnfrom 30/11/21 to 31/01/22, in GBP).
Investment review
Source: Sub-fund performance: Factset: Gross of AMC; based upon the movement in the Cancellation Price from 30November 2021 to 31 January 2022, in GBP. Benchmark Index performance: Numis Smaller Companies Index exInvestment Companies; Total Return from 30 November 2021 to 31 January 2022, in GBP.
Past performance is not a guide to future performance.
Please note that all past performance figures are calculated without taking the initial charge into account.
The value of units and the income from them can go down as well as up and is not guaranteed. You maynot get back the full amount invested.
Standardised Past Performance
PUTM ACS Lothian UK Listed SmallerCompanies Fund -5.41 – – –
Benchmark Index -2.22 – – –
30 Nov 21 - 31 Jan% growth
PUTM ACS Lothian UK Listed Smaller Companies Fund

137
Investment review
Market ReviewUK smaller company stocks fell over the period under reviewduring a period of heightened volatility. Markets gained inDecember, with investors brushing off the threat of the Omicronvariant, with initial data indicating it causes a milder illness. Thebanking then sector rallied after the Bank of England made asurprise move and raised interest rates from 0.1% to 0.25% inDecember due to rising concerns about inflation. Although theBank of England’s next policy meeting will occur in earlyFebruary, the central bank is expected to raise rates, with themarket expecting five rate hikes in 2022.
However, mounting inflation concerns, tightening monetary policyfrom central banks and geopolitical tensions between Russia andUkraine led to a sharp drop in global equities in January, withinvestors rotating away from growth and into value stocks. As aresult, UK equities performed comparatively better than otherdevelopment markets, due to the lower exposure to largetechnology companies and higher weighting to energycompanies, as commodities continued to rally.
Nevertheless, inflation fears dented sentiment, with consumerprices hitting a 30-year high of 5.4% in December, up fromNovember’s 5.1%. The rising cost of living, particularly the costof fuel, has knocked consumer confidence in the UK, andbusiness sentiment is also shrinking. However, the UK’seconomy grew by 0.9% in November, taking it back to its pre-pandemic size.
Sub-fund ReviewThe Sub-fund underperformed over the period. The start of 2022saw a strong market rotation, which is not unusual for January.However, this market sell-off, and rotation away from growth-quality stocks into value, has been particularly sharp andaggressive. Impax Asset Management Group weakened given itscorrelation with market moves, as the broader investmentmanagement industry is likely to see mark-to-market earningsdowngrades. The shares were on a higher rating than peers,leaving it exposed to the sharp rotation away from high valuationcompanies. However, its success over recent years in growingassets under management has been supported by earningsupgrades. There was no company-specific news and itannounced solid quarterly results in early January with positivefund flows. Similarly, Kainos Group, the IT solutions consultant,also suffered in the market rotation away from growth stocks.There was also a concern about wage inflation. Nevertheless, weare confident that demand remains high across its business and,with the company’s investment in capacity, it is positioned togrow revenue. Auction Technology Group was also caught up inthe broader market sell-off. However, in December, the firmannounced better-than-expected earnings and upgraded forecastsfor the next two years. Elsewhere, shares of music and audioequipment manufacturer Focusrite paused for breath after anexceptional year of earnings and revenue upgrades in 2021.
More positively, maternity fashion retailer Seraphine did relativelywell after giving a positive update on supply chain issues. Thecompany’s revenue growth has returned to previous rates withhealthy inventory. Marketing expenditure also normalised, withcustomer-acquisition costs falling back to historical levels. Theshares were further boosted by the strides the business is makingwith its partnership with Zalando in the US and the signing of anew agreement with Next. Hollywood Bowl also benefitted fromincreased activity after reopening, giving a reassuring tradingupdate in December. The company is making progress on itsrollout of bowling and mini golf venues. Management hasnavigated well through a tough trading environment. Elsewhere,Somero outperformed after it also delivered a positive tradingupdate, with robust demand from North America supported byhealthy contributions from Europe and Australia.
Outlook at Year EndThe start of the year has seen a strong market rotation, which isnot unusual for January. However, this market sell-off, androtation away from growth-quality stocks into value, has beenparticularly sharp and aggressive. Top-down, macroeconomiceffects have driven this rather than stock specific issues. Higherinflation, interest rate rises, political tensions and supply chainchallenges have heightened investor uncertainty. Notwithstandingthis, we have been encouraged by the strong earnings reportedby holdings in the Trust, confirming that the sell-off in our quality-growth companies is inconsistent with the underlying trading andfundamentals of these businesses. It is encouraging that theMatrix scores (our proprietary screening tool) across the Trusthave remained strong, supported by the underlying earningsstrength and continued quality characteristics.
The market rotation has driven the valuation differential betweenvalue and quality-growth companies to compress. Many cyclical-value stocks will also face stiff headwinds, including thepossibility of further pandemic restrictions, inflationary pressures,rising interest rates, falling consumer disposable incomes andcontinued supply chain disruptions.
In such a challenging environment, we believe quality-growthbusinesses should prove more robust, resilient and reliable. Wehold companies with strong market positions and pricing power,with a better ability to pass on higher costs and protect margins.Such companies will have opportunities to gain market share.
Though difficult to predict when this macro-driven value rally willend, historically they have typically lasted no more than sixmonths. We continue to look through the top-downmacroeconomic ‘noise’ by remaining focused on companyreporting and fundamentals.
As the market outlook was completed as of 31st January, thereis no mention of the ongoing Ukraine crisis that began at the endof February. Naturally, this would dramatically affect any futureexpectations of market outlook that would not have beenfactored in at the time of writing.
PUTM ACS Lothian UK Listed Smaller Companies Fund
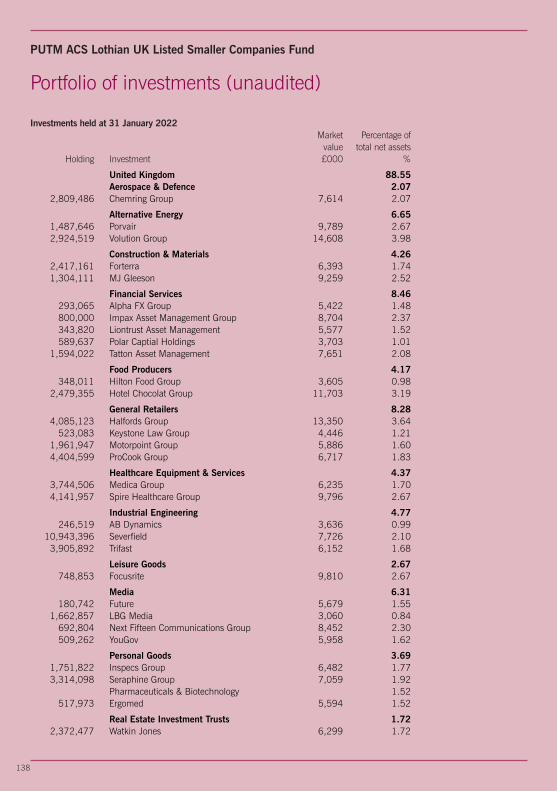
138
Portfolio of investments (unaudited)
Investments held at 31 January 2022 Market Percentage of value total net assets Holding Investment £000 %
United Kingdom 88.55 Aerospace & Defence 2.07 2,809,486 Chemring Group 7,614 2.07
Alternative Energy 6.65 1,487,646 Porvair 9,789 2.67 2,924,519 Volution Group 14,608 3.98
Construction & Materials 4.26 2,417,161 Forterra 6,393 1.74 1,304,111 MJ Gleeson 9,259 2.52
Financial Services 8.46 293,065 Alpha FX Group 5,422 1.48 800,000 Impax Asset Management Group 8,704 2.37 343,820 Liontrust Asset Management 5,577 1.52 589,637 Polar Captial Holdings 3,703 1.01 1,594,022 Tatton Asset Management 7,651 2.08
Food Producers 4.17 348,011 Hilton Food Group 3,605 0.98 2,479,355 Hotel Chocolat Group 11,703 3.19
General Retailers 8.28 4,085,123 Halfords Group 13,350 3.64 523,083 Keystone Law Group 4,446 1.21 1,961,947 Motorpoint Group 5,886 1.60 4,404,599 ProCook Group 6,717 1.83
Healthcare Equipment & Services 4.37 3,744,506 Medica Group 6,235 1.70 4,141,957 Spire Healthcare Group 9,796 2.67
Industrial Engineering 4.77 246,519 AB Dynamics 3,636 0.99 10,943,396 Severfield 7,726 2.10 3,905,892 Trifast 6,152 1.68
Leisure Goods 2.67 748,853 Focusrite 9,810 2.67
Media 6.31 180,742 Future 5,679 1.55 1,662,857 LBG Media 3,060 0.84 692,804 Next Fifteen Communications Group 8,452 2.30 509,262 YouGov 5,958 1.62
Personal Goods 3.69 1,751,822 Inspecs Group 6,482 1.77 3,314,098 Seraphine Group 7,059 1.92 Pharmaceuticals & Biotechnology 1.52 517,973 Ergomed 5,594 1.52
Real Estate Investment Trusts 1.72 2,372,477 Watkin Jones 6,299 1.72
PUTM ACS Lothian UK Listed Smaller Companies Fund
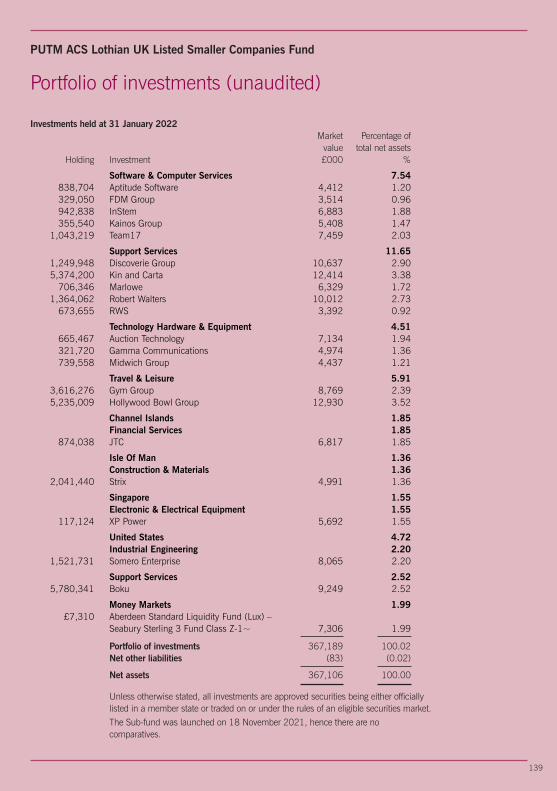
139
Portfolio of investments (unaudited)
Investments held at 31 January 2022 Market Percentage of value total net assets Holding Investment £000 %
Software & Computer Services 7.54 838,704 Aptitude Software 4,412 1.20 329,050 FDM Group 3,514 0.96 942,838 InStem 6,883 1.88 355,540 Kainos Group 5,408 1.47 1,043,219 Team17 7,459 2.03
Support Services 11.65 1,249,948 Discoverie Group 10,637 2.90 5,374,200 Kin and Carta 12,414 3.38 706,346 Marlowe 6,329 1.72 1,364,062 Robert Walters 10,012 2.73 673,655 RWS 3,392 0.92
Technology Hardware & Equipment 4.51 665,467 Auction Technology 7,134 1.94 321,720 Gamma Communications 4,974 1.36 739,558 Midwich Group 4,437 1.21
Travel & Leisure 5.91 3,616,276 Gym Group 8,769 2.39 5,235,009 Hollywood Bowl Group 12,930 3.52
Channel Islands 1.85 Financial Services 1.85 874,038 JTC 6,817 1.85
Isle Of Man 1.36 Construction & Materials 1.36 2,041,440 Strix 4,991 1.36
Singapore 1.55 Electronic & Electrical Equipment 1.55 117,124 XP Power 5,692 1.55
United States 4.72 Industrial Engineering 2.20 1,521,731 Somero Enterprise 8,065 2.20
Support Services 2.52 5,780,341 Boku 9,249 2.52
Money Markets 1.99 £7,310 Aberdeen Standard Liquidity Fund (Lux) – Seabury Sterling 3 Fund Class Z-1~ 7,306 1.99
Portfolio of investments 367,189 100.02 Net other liabilities (83) (0.02)
Net assets 367,106 100.00
Unless otherwise stated, all investments are approved securities being either officiallylisted in a member state or traded on or under the rules of an eligible securities market.The Sub-fund was launched on 18 November 2021, hence there are nocomparatives.
PUTM ACS Lothian UK Listed Smaller Companies Fund

140
Top ten purchases and salesFor the period ended 31 January 2022
Purchases Cost£000
Aberdeen Standard Liquidity Fund (Lux) -Seabury Sterling 3 Fund Class Z-1~ 40,009Kin and Carta 17,601Stock Spirits 15,076Volution Group 14,930Auction Technology 14,565Halfords Group 13,934Discoverie Group 13,199Hotel Chocolat Group 12,493Focusrite 12,347Hollywood Bowl Group 12,079
Subtotal 166,233Other purchases 314,890
Total purchases for the period 481,123
Sales Proceeds£000
Aberdeen Standard Liquidity Fund (Lux) -Seabury Sterling 3 Fund Class Z-1~ 32,700Stock Spirits 15,043Target Healthcare 9,802Auction Technology 4,937Chesnara 3,182Future 2,976Ergomed 2,208Gamma Communications 1,959Kainos Group 1,563RWS 750
Subtotal 75,120Other sales 1,035
Total sales for the period 76,155
PUTM ACS Lothian UK Listed Smaller Companies Fund
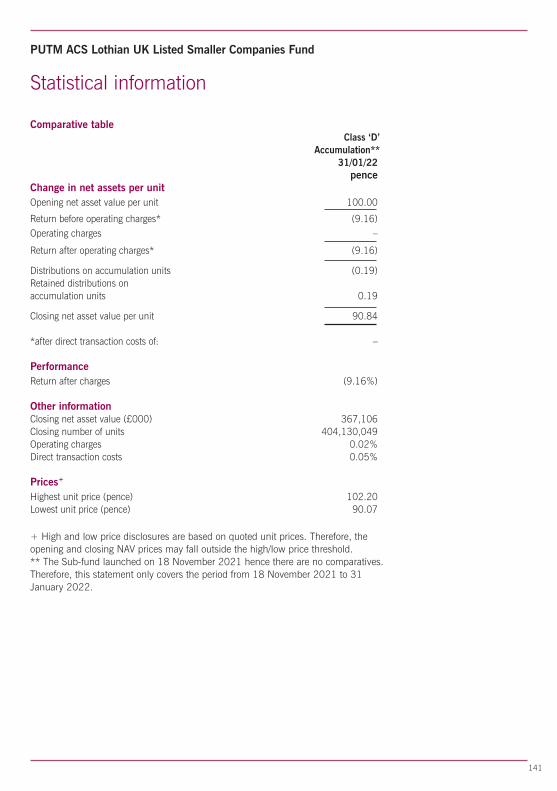
141
Statistical information
Comparative table Class ‘D’ Accumulation** 31/01/22 pence Change in net assets per unitOpening net asset value per unit 100.00
Return before operating charges* (9.16) Operating charges –
Return after operating charges* (9.16)
Distributions on accumulation units (0.19)Retained distributions onaccumulation units 0.19
Closing net asset value per unit 90.84
*after direct transaction costs of: –
PerformanceReturn after charges (9.16%)
Other informationClosing net asset value (£000) 367,106Closing number of units 404,130,049Operating charges 0.02%Direct transaction costs 0.05%
Prices+
Highest unit price (pence) 102.20Lowest unit price (pence) 90.07
+ High and low price disclosures are based on quoted unit prices. Therefore, theopening and closing NAV prices may fall outside the high/low price threshold.** The Sub-fund launched on 18 November 2021 hence there are no comparatives.Therefore, this statement only covers the period from 18 November 2021 to 31January 2022.
PUTM ACS Lothian UK Listed Smaller Companies Fund

142
Statistical information
Investment objective
The Sub-fund aims to provide a total return (a combination of capital growth andincome) by outperforming the Numis Smaller Companies excluding InvestmentCompanies Index (the “Index”) by 2.5% to 3.5% per annum over rolling three yearperiods (before charges).
Investment policyThe Sub-fund aims to achieve its objective by investing at least 50% of the portfolio insmall-capitalisation equities and equity related securities of companies listed,incorporated, or domiciled in the United Kingdom that are constituents of the Index.
Equity related securities include convertible stocks, stock exchange listed warrants,depository receipts, and any other such investments which entitle the holder tosubscribe for or convert into the equity of the company and/or where the share priceperformance is, in the opinion of the Investment Manager, influenced significantly bythe stock market performance of the company's ordinary shares.
Small capitalisation companies are defined as any stock having a market cap less thanthe 10th percentile stock of the overall UK equity market as at the Index reweightingdate.
The Sub-fund may also invest up to 45% of the portfolio in UK smaller companieslisted on the FTSE AIM All-Share Index. The Sub-fund may also invest in UKcompanies listed on the FTSE 250 Index, outside of the Index and in companies listedoutside of the UK that derive a significant proportion of their revenues or profits fromUK operations or have a significant proportion of their assets there.
The Sub-fund may also invest up to 10% in large capitalisation companies defined asthose listed, incorporated or domiciled in the UK and listed on the FTSE 100.
The Sub-fund may also invest in money-market instruments, deposits, cash and nearcash and other collective investment schemes including funds managed by theInvestment Manager.
Investment strategyThe Sub-fund is actively managed. The Investment Manager uses research techniquesto select individual holdings. The research process is focused on identifying companiesthrough fundamental research that exihibit quality, growth and momentumcharacteristics, which make them attractive stocks which the managers believe willoutperform the broader universe. The Investment Manager references the Index, whichmeans that while the Sub-fund is not required to match the weightings of the Indexand does not concentrate on any particular sector, the Sub-fund is managed withinconstraints, so that divergence from the Index is controlled.
Revenue distribution and pricingUnits of the Sub-fund are available as Class ‘D’ Accumulation units (where revenue isreinvested to enhance the unit price). There will be two potential distributions in eachaccounting year: an interim distribution as at 31 July and a final distribution as at 31January.
At each distribution the net revenue after deduction of expenses, from the investmentsof the Sub-fund, is apportioned amongst the unitholders. Unitholders receive a taxvoucher giving details of the distribution and the Manager's Report no later than twomonths after these dates.
PUTM ACS Lothian UK Listed Smaller Companies Fund
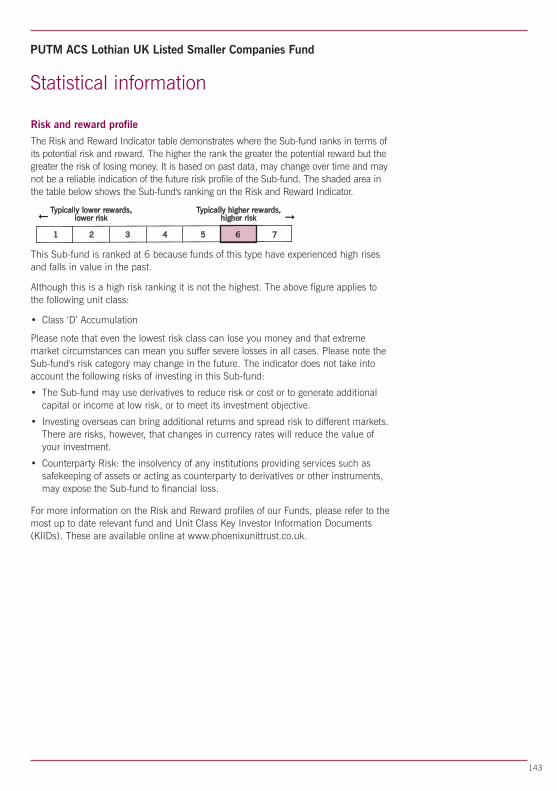
Risk and reward profile
The Risk and Reward Indicator table demonstrates where the Sub-fund ranks in terms ofits potential risk and reward. The higher the rank the greater the potential reward but thegreater the risk of losing money. It is based on past data, may change over time and maynot be a reliable indication of the future risk profile of the Sub-fund. The shaded area inthe table below shows the Sub-fund's ranking on the Risk and Reward Indicator.
Typically lower rewards, Typically higher rewards, lower risk higher risk fi
1 2 3 4 5 6 7
This Sub-fund is ranked at 6 because funds of this type have experienced high risesand falls in value in the past.
Although this is a high risk ranking it is not the highest. The above figure applies tothe following unit class:
• Class ‘D’ Accumulation
Please note that even the lowest risk class can lose you money and that extrememarket circumstances can mean you suffer severe losses in all cases. Please note theSub-fund's risk category may change in the future. The indicator does not take intoaccount the following risks of investing in this Sub-fund:
• The Sub-fund may use derivatives to reduce risk or cost or to generate additionalcapital or income at low risk, or to meet its investment objective.
• Investing overseas can bring additional returns and spread risk to different markets.There are risks, however, that changes in currency rates will reduce the value ofyour investment.
• Counterparty Risk: the insolvency of any institutions providing services such assafekeeping of assets or acting as counterparty to derivatives or other instruments,may expose the Sub-fund to financial loss.
For more information on the Risk and Reward profiles of our Funds, please refer to themost up to date relevant fund and Unit Class Key Investor Information Documents(KIIDs). These are available online at www.phoenixunittrust.co.uk.
143
fi
Statistical information
PUTM ACS Lothian UK Listed Smaller Companies Fund

144
Annual financial statementsFor the period 31 January 2022
Statement of total return 31/01/22* Notes £000 £000
Income
Net capital losses 4 (37,780) Revenue 5 778
Expenses 6 (19)
Net revenue before taxation 759
Taxation 7 –
Net revenue after taxation 759
Total deficitbefore distributions (37,021)
Distributions 8 (761)
Change in unitholders’funds from investmentactivities (37,782)
Statement of change in unitholders’ funds
31/01/22* £000 £000
Opening net assets –
Amounts receivableon issue of units 248
Amounts receivableon in-specie transfer** 404,007
Amounts payableon cancellation of units (131) 404,124Change in unitholders' funds frominvestment activities (37,782)
Dilution levy adjustment 3
Retained distributionson accumulation units 761
Closing net assets 367,106
* The Sub-fund was launched on 18 November 2021, hence there are no comparatives. Therefore,this statement only covers the period from 18 November 2021 to 31 January 2022.**Represents the value of units issued by in-specie transfer of assets during the period.
PUTM ACS Lothian UK Listed Smaller Companies Fund

145
Balance sheet 31/01/22 Notes £000 £000
Assets:Fixed assets:Investments 367,189
Current assets:Debtors 9 356
Total current assets 356
Total assets 367,545
Liabilities:Creditors:Bank overdraft 10 (19)
Other creditors 11 (420)
Total creditors (439)
Net assets 367,106
Unitholders’ funds 367,106
Annual financial statementsAs at 31 January 2022
PUTM ACS Lothian UK Listed Smaller Companies Fund

146
Notes to the financial statements
Notes 1-3 Accounting policiesPlease see pages 3 to 6 for accounting basis and policies.
Note 4 Net capital lossesThe net capital losses during the period comprise:
31/01/22* £000
Losses on non-derivative securities (37,779)Handling charges (1)
Net capital losses (37,780)
Note 5 Revenue 31/01/22* £000 UK dividends 752 Overseas dividends 25 Liquidity interest 1
Total revenue 778
Note 6 Expenses 31/01/22* £000(a) Payable to the ACS Manager or associates of the
ACS Manager and agents of either of them:ACS Manager’s periodic charge 4
(b) Payable to the Depositary or associates of theDepositary and agents of either of them:Depositary’s fees 4
(c) Other expenses:Audit fee 9Safe custody charges 2
11
Total expenses 19
Note 7 Taxation 31/01/22* £000 Analysis of tax charge for the period Overseas withholding tax –
Total taxation –
As the scheme is an ACS it is not subject to UK tax on income or capital gains.
* The Sub-fund was launched on 18 November 2021, hence there are no comparatives. Therefore,this statement only covers the period from 18 November 2021 to 31 January 2022.
PUTM ACS Lothian UK Listed Smaller Companies Fund

147
Notes to the financial statements
Note 8 DistributionsThe distributions take account of amounts added on the issue of units andamounts deducted on the cancellation of units, and comprise:
31/01/22* £000
Final 761
761
Amounts deducted on cancellation of units –Amounts added on issue of units –
Net distribution for the period 761
Net revenue after taxation 759Expenses taken to capital 2
Net distribution for the period 761
Details of the distribution per unit are set out in the table on page 151.* The Sub-fund was launched on 18 November 2021, hence there are no comparatives.Therefore, this statement only covers the period from 18 November 2021 to 31 January2022.
Note 9 Debtors 31/01/22* £000
Sales awaiting settlement 131Accrued income 225
Total debtors 356
Note 10 Bank overdraft 31/01/22* £000
Bank overdraft 19
Total bank overdraft 19
Note 11 Other creditors 31/01/22* £000
Purchases awaiting settlement 402ACS Manager’s periodic charge payable 4Depositary’s fees payable 4Safe custody charges payable 1Audit fee payable 9
Total other creditors 420
* The Sub-fund was launched on 18 November 2021, hence there are no comparatives.
PUTM ACS Lothian UK Listed Smaller Companies Fund

148
Notes to the financial statements
Note 12 Reconciliation of units Class ‘D’ Accumulation*
Opening units issued at 19/11/21 –Unit movements in period:Units issued 256,232Units cancelled (133,333)In-specie transactions 404,007,150
Closing units at 31/01/22 404,130,049
* The Sub-fund was launched on 18 November 202. Therefore, this statement only covers the period from 18November 2021 to 31 January 2022.
Note 13 Contingencies and commitmentsAt 31 January 2022 the Sub-fund had no outstanding calls on partly paid shares, nopotential underwriting commitments or any other contingent liabilities.
Note 14 Unitholders’ fundsThere is one unit class in issue within the Sub-fund. This is Class ‘D’ Accumulation. TheACS Manager’s periodic charge in respect of Class ‘D’ is expressed as an annual percentageof the value of the property of the Sub-fund attributable to each unit class and is currently0.005% in respect of Class 'D' units.Consequently, the level of net revenue attributable to each unit class will differ. Should it benecessary to wind-up the Sub-fund, each unit class will have the same rights as regards tothe distribution of the property of the Sub-fund.
Note 15 Related party transactionsThe ACS Manager is a related party to the Sub-fund by virtue of its controlling influence.
The ACS Manager is part of the Phoenix Group. Phoenix Life Limited which is also part ofthe Phoenix Group, is a material unitholder in the Sub-fund and therefore a related party,holding the following percentage of the units at the period end.
Class ‘D’* %
As at 31 January 2022: 100.00
*The Sub-fund was launched on 18 November 2021, hence there are no comparatives.
ACS Manager's periodic charge paid to the ACS Manager, Phoenix Unit Trust ManagersLimited, or its associates, is shown in Note 6(a) and details of the units issued andcancelled by the ACS Manager are shown in the Statement of change in unitholders' fundsand Note 8.
Any balances due to/from the ACS Manager or its associates at 31 January 2022 inrespect of these transactions are shown in Notes 9 and 11.
Note 16 Financial instrumentsIn accordance with the investment objective, the Sub-fund holds certain financialinstruments. These comprise:• securities held in accordance with the investment objective and policies;• derivative transactions which the Sub-fund may also enter into, the purpose of which is
to manage the currency and market risks arising from the Sub-fund's investmentactivities; and
• cash and short term debtors and creditors arising directly from operations.
PUTM ACS Lothian UK Listed Smaller Companies Fund

149
Notes to the financial statements
Note 16 Financial instruments (continued)Counterparty exposureThere was no counterparty exposure held at the period end.
Currency exposureThere was no currency exposure at the period end.
Interest profileAt the period end date, 1.98% of the Sub-fund's net assets by value were interestbearing.
Interest rates earned/paid on deposits are earned/paid at a rate linked to LIBOR (LondonInterbank Offered Rate) or international equivalent. Interest was also earned on theinvestments in the Aberdeen Standard Liquidity Fund.
Sensitivity analysis
Interest rate risk sensitivityAs the majority of the Sub-fund's financial assets are non-interest bearing, the Sub-fundis only subject to limited exposure to fair value interest rate risk due to fluctuations inlevels of market interest rates and therefore, no sensitivity analysis has been provided.
Foreign currency risk sensitivityAs the majority of the Sub-fund's financial assets are in the base currency of the Sub-fund (Sterling), the Sub-fund is only subject to limited exposure to fluctuations inforeign currency and therefore, no sensitivity analysis has been provided.
Price risk sensitivityA five percent increase in the value of the Sub-fund's portfolio would have the effect ofincreasing the return and net assets by £18,359,453. A five percent decrease wouldhave an equal and opposite effect.
Note 17 Fair value of investments
The fair value of the Sub-fund’s investments has been determined using the hierarchybelow.
This complies with the ‘Amendments to FRS 102 – Fair value hierarchy disclosures’ issuedby the Financial Reporting Council in March 2016.
Level 1 The unadjusted quoted price in an active market for identical assets orliabilities that the entity can access at the measurement date.
Level 2 Inputs other than quoted prices included within Level 1 that areobservable (i.e. developed using market data) for the asset or liability,either directly or indirectly.
Level 3 Inputs are unobservable (i.e. for which market data is unavailable) forthe asset or liability.
For the period ended 31/01/22*Level 1 2 3 Total
Investment assets £000 £000 £000 £000Equities 359,883 – – 359,883Money markets 7,306 – – 7,306
367,189 – – 367,189
* The Sub-fund was launched on 18 November 2021 hence there are no comparatives.
PUTM ACS Lothian UK Listed Smaller Companies Fund

Note 18 Portfolio transaction costs
For the period ended 31/01/22*Total
Value Commission Taxes costsAnalysis of total purchases costs £000 £000 % £000 % £000
Equity transactions 55,268 46 0.08 122 0.22 55,436Money markets 40,007 – – – – 40,007Corporate actions 2 – – – – 2In-specie transactions 385,678 – – – – 385,678
Total 480,955 46 122 481,123
TotalValue Commission Taxes costs
Analysis of total sales costs £000 £000 % £000 % £000Equity transactions 43,503 (48) 0.11 – – 43,455Money markets 32,700 – – – – 32,700
Total 76,203 (48) – 76,155
Commission, taxes and other expenses as % of average net assets:Commission 0.02%Taxes 0.03%Other expenses 0.00%* The Sub-fund was launched on 18 November 2021, hence there are no comparatives. Therefore,this statement only covers the period from 18 November 2021 to 31 January 2022.Portfolio transaction costs are incurred by the Sub-fund when buying and selling underlyinginvestments. These costs vary depending on the class of investment, country of exchange andmethod of execution.These costs can be classified as either direct or indirect transaction costs:Direct transaction costs: Broker commissions, fees and taxes.Indirect transaction costs: "Dealing spread" - the difference between buying and selling prices of theunderlying investments.At the Balance sheet date the portfolio dealing spread was 1.32% being the difference between therespective bid and offer prices for the Sub-fund's investments.
Note 19 Post Balance sheet eventsAs indicated in the accounting policies in Note 1(b), the investments have been valued at close of business on31 January 2022. Since the balance sheet date, the bid price of each of the Sub-fund’s unit classes have movedas follows:
Bid Price Bid Price 31/01/22 19/05/22
pence pence Movement (%)
Class ‘D’ Accumulation 90.84 72.75 -19.91
150
Notes to the financial statements
PUTM ACS Lothian UK Listed Smaller Companies Fund

151
PUTM ACS Lothian UK Listed Smaller Companies Fund
Final distribution in pence per unitGroup 1: units purchased on 18 November 2021Group 2: units purchased 19 November 2021 to 31 January 2022 2022 pence per unit Net payable income Equalisation 31 Mar*
Class ‘D’ Accumulation
Group 1 0.188185 - 0.188185Group 2 0.102903 0.085282 0.188185
* The Sub-fund launched on 18 November 2021, hence there are no comparatives.Therefore, this statement only covers the period from 18 November 2021 to 31 January2022.
Each Sub-fund is tax transparent for income purposes meaning that UK tax-payingUnitholders are subject to tax on their share of income, net of allowable expenses, as itarises to the Sub-fund and not on distributions of income after deduction of expenses.
On a daily basis unitholders will be advised of their share of aggregated accrued income,expenses and withholding tax paid on overseas dividends, if applicable. When a unit ispurchased during the distribution period, part of the purchase price of the unit reflects therelevant share of income and expenses accrued by the Sub-fund, and this will bedisclosed on the contract note. This purchased income and expense, a capital sum,should be deducted from the aggregate accrued income or expense as applicable.
The subscription price disclosed on the contract note reflects the acquisition cost, whichshould be adjusted by the capital sum referred to above.
It is the responsibility of the unitholder to maintain a record of the relevant amount(s) ofincome equalisation and to make the appropriate adjustment when completing their taxcalculations.
Distribution tableFor the period ended 31 January 2022
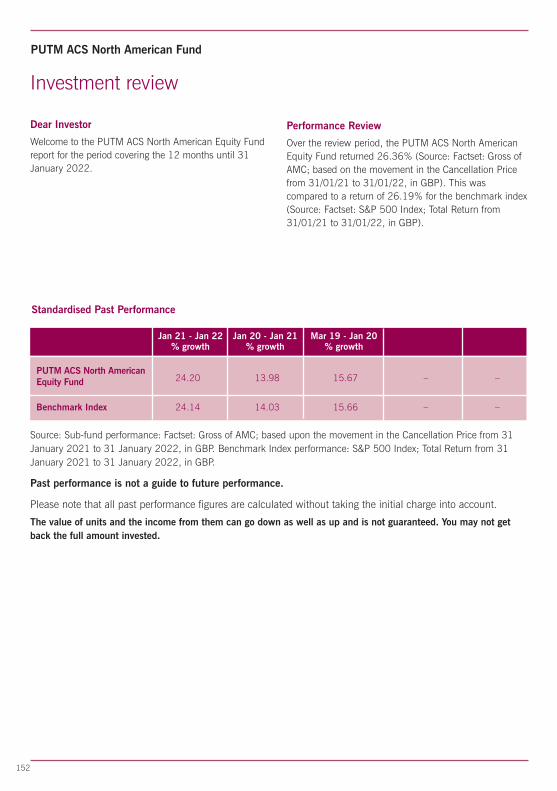
152
PUTM ACS North American Fund
Dear Investor
Welcome to the PUTM ACS North American Equity Fundreport for the period covering the 12 months until 31January 2022.
Performance Review
Over the review period, the PUTM ACS North AmericanEquity Fund returned 26.36% (Source: Factset: Gross ofAMC; based on the movement in the Cancellation Pricefrom 31/01/21 to 31/01/22, in GBP). This wascompared to a return of 26.19% for the benchmark index(Source: Factset: S&P 500 Index; Total Return from31/01/21 to 31/01/22, in GBP).
Investment review
Source: Sub-fund performance: Factset: Gross of AMC; based upon the movement in the Cancellation Price from 31January 2021 to 31 January 2022, in GBP. Benchmark Index performance: S&P 500 Index; Total Return from 31January 2021 to 31 January 2022, in GBP.
Past performance is not a guide to future performance.
Please note that all past performance figures are calculated without taking the initial charge into account.
The value of units and the income from them can go down as well as up and is not guaranteed. You may not getback the full amount invested.
Standardised Past Performance
PUTM ACS North AmericanEquity Fund 24.20 13.98 15.67 – –
Benchmark Index 24.14 14.03 15.66 – –
Jan 21 - Jan 22 Jan 20 - Jan 21 Mar 19 - Jan 20% growth % growth % growth

153
PUTM ACS North American Fund
Investment review
Market Review
US equities made strong gains during the review perioddue to a successful vaccine rollout, economic reopeningand strong company earnings. A further boost came fromthe enactment of a US$1.9 trillion stimulus package.Early on, the roll-out of mass inoculation programmesacted as a catalyst for a sharp rotation away from growthstocks to cyclical stocks and those companies thatsuffered the most from lockdown restrictions. Shareprices continued to climb throughout the spring and intothe summer, driven mainly by investors’ ongoingoptimism regarding the distribution of Covid-19 vaccinesand generally positive economic data.
In September 2021, inflation expectations worsened andhelped lead to a substantial downturn in US equities.Investors were concerned by supply-chain challenges andcontinued Covid-19 cases. In addition, the US FederalReserve (Fed) also noted that a reduction in quantitativeeasing could be coming soon. This materialised in earlyNovember when the Fed confirmed that it would reducebond purchases by US$15 billion each month; it doubledthe pace of bond purchase tapering in December.
The S&P 500 Index, fuelled by a robust results season,hit new highs for eight consecutive days in November – arecord streak last achieved in 1997. The rally broke latein the month, as the headlines became dominated bynews of the Omicron variant of Covid-19. Stocks startedto move up again in December, boosted by retailers, asconcerns surrounding the impact of Omicron eased.Growth stocks, such as technology companies, which areespecially sensitive to higher interest rates, wereparticularly hard hit in January’s sell-off.
Sub-fund Review
The Sub-fund outperformed the market over the period,with Alphabet one of the top contributors. The companybenefited from the surge in demand for digital advertisingdemand, despite regulatory concerns. Meanwhile,financials stocks outperformed, particularly CharlesSchwarb, Bank of America and Goldman Sachs. Thelatter gained on account of its strong investment bankpipeline, effective execution of its strategy and animproving capital position. The company increased itsdividend by 60% on the back of the stress test resultsannounced in June. Elsewhere, the overweight exposureto wholesale retailer Costco boosted returns afterreporting better-than-expected earnings during the period,driven by healthy traffic growth at its stores. A large sharebuyback programme announced by energy technology
business Baker Hughes helped its shares to rally, as wellas positive comments about future earnings. Lastly,AbbVie outperformed its peers in healthcare over theperiod.
Conversely, poor performance in software stocks likePayPal and RingCentral resulted in our technologyexposure detracting from relative performance. ForRingCentral, investors have become more concerned thatincreased competition from the likes of Zoom andMicrosoft will cause slower revenue growth. Meanwhile,our lack of exposure to computer graphics card makerNvidia dented performance. Its shares gained followingnews that a number of major chip makers supported itsplanned US$40 billion acquisition of UK chip designerArm Holdings. Meanwhile, NICE weighed onperformance after it sold off sharply following aconservative earnings guidance update for 2021. Lastly,Amazon underperformed, despite suffering no negativenews or fundamental change during the period. However,given its shares had made significant gains during thepandemic, it was not surprising to see attention shiftedtowards retailers that benefit more directly from thereopening of the economy after Covid-19 pandemic.
Outlook at Year End
We continue to expect rising inflation and interest rates,but for both to remain low relative to historical standards.Given the market strength in recent years, we expectcontinued economic growth. As a result, investors willremain sensitive to concerns about inflation and otherheadwinds. In addition, risk factors will continue to beregularly analysed to inform portfolio construction, asfactor behaviour continues to shift. We will review everysector, while also considering environmental, social andgovernance issues, and exposure to growth, value,industrial cycles and other risk factors. Although ourfocus remains on stock-picking from a bottom-upperspective, portfolio construction considerations are keyto recognising unintended thematic exposures. Our stockselection process has resulted in the portfolio currentlyhaving overweight positions in communication servicesand industrials. The biggest underweight positions are inhealthcare and consumer staples.
As the market outlook was completed as of 31stJanuary, there is no mention of the ongoing Ukrainecrisis that began at the end of February. Naturally, thiswould dramatically affect any future expectations ofmarket outlook that would not have been factored in atthe time of writing.

154
PUTM ACS North American Fund
Portfolio of investments (unaudited)
Investments held at 31 January 2022 Market Percentage of value total net assets Holding Investment £000 %
United States (31/01/21 – 91.63%) 90.88 Aerospace & Defence (31/01/21 – 1.01%) 0.97 24,779 Arconic 574 0.03 34,335 Boeing 5,124 0.25 15,941 General Dynamics 2,518 0.12 2,912 HEICO 296 0.01 5,115 HEICO ‘A’ 418 0.02 2,560 Huntington Ingalls Industries 357 0.02 15,877 Lockheed Martin 4,606 0.23 9,672 Northrop Grumman 2,666 0.13 2,938 Teledyne Technologies 923 0.05 14,447 Textron 733 0.04 3,307 TransDigm Group 1,518 0.07
Alternative Energy (31/01/21 – 0.00%) 0.10 8,443 Enphase Energy 884 0.05 29,021 Plug Power 473 0.02 3,293 SolarEdge Technologies 585 0.03
Automobiles & Parts (31/01/21 – 2.22%) 2.33 5,689 Autoliv 420 0.02 15,582 BorgWarner 509 0.03 250,873 Ford Motor 3,798 0.19 88,146 General Motors 3,463 0.17 15,548 Gentex 364 0.02 9,044 Genuine Parts 898 0.04 3,902 Lear 487 0.02 17,418 LKQ 712 0.04 8,955 Rivian Automotive 438 0.02 52,026 Tesla Motors 36,296 1.78
Banks (31/01/21 – 3.59%) 3.90 463,348 Bank of America 15,931 0.78 50,675 Bank of New York Mellon 2,238 0.11 129,954 Citigroup 6,309 0.31 27,212 Citizens Financial Group 1,044 0.05 8,566 Comerica 592 0.03 7,263 Commerce Bancshares 373 0.02 44,103 Fifth Third Bancorp 1,467 0.07 11,403 First Republic Bank 1,475 0.07 93,898 Huntingdon Bancshares 1,054 0.05 190,395 JP Morgan Chase & Co 21,084 1.04 61,060 KeyCorp 1,140 0.06 8,211 M&T Bank 1,037 0.05 27,199 PNC Financial Services 4,175 0.21 61,584 Regions Financial 1,053 0.05 3,513 SVB Financial 1,528 0.08 86,116 Truist Financial Corporation 4,032 0.20

155
PUTM ACS North American Fund
Portfolio of investments (unaudited)
Investments held at 31 January 2022 Market Percentage of value total net assets Holding Investment £000 %
Banks (continued) 86,063 US Bancorp 3,732 0.18 265,282 Wells Fargo 10,638 0.52 10,384 Zions Bancorporation 525 0.02
Beverages (31/01/21 – 1.34%) 1.33 11,742 Brown-Forman ‘B’ 590 0.03 248,988 Coca-Cola 11,319 0.56 10,240 Constellation Brands 1,815 0.09 11,611 Molson Coors Beverage 412 0.02 23,794 Monster Beverage 1,537 0.07 88,599 PepsiCo 11,456 0.56
Chemicals (31/01/21 – 0.97%) 0.87 14,169 Air Products & Chemicals 2,979 0.15 7,441 Albemarle 1,224 0.06 5,295 Avery Dennison 811 0.04 7,113 Celanese ‘A’ 825 0.04 13,689 CF Industries 703 0.03 47,914 Dow 2,132 0.10 33,560 Dupont De Nemours 1,916 0.09 8,691 Eastman Chemicals 770 0.04 16,021 Ecolab 2,262 0.11 8,247 FMC 679 0.03 15,951 International Flavours & Fragrances 1,568 0.08 15,160 PPG Industries 1,764 0.09 2,086 Westlake Chemical 153 0.01
Construction & Materials (31/01/21 – 0.39%) 0.43 8,843 Fortune Brands Home & Security 621 0.03 3,923 Generac Holdings 825 0.04 8,272 Jacobs Engineering Group 802 0.04 3,978 Martin Marietta Materials 1,154 0.06 15,776 Masco 745 0.04 15,631 Sherwin-Williams 3,338 0.16 8,464 Vulcan Materials 1,200 0.06
Electricity (31/01/21 – 1.89%) 1.73 42,305 AES 699 0.04 16,021 Alliant Energy 715 0.04 32,074 American Electric Power 2,161 0.11 3,612 Avangrid 126 0.01 18,511 CMS Energy 888 0.04 22,677 Consolidation Edison 1,461 0.07 51,641 Dominion Energy 3,105 0.15 12,356 DTE Energy 1,109 0.06 23,885 Edison International 1,118 0.05 12,833 Entergy 1,070 0.05 21,986 Eversource Energy 1,466 0.07

156
PUTM ACS North American Fund
Portfolio of investments (unaudited)
Investments held at 31 January 2022 Market Percentage of value total net assets Holding Investment £000 %
Electricity (continued) 62,567 Exelon 2,702 0.13 34,846 FirstEnergy 1,090 0.05 125,752 NextEra Energy 7,324 0.36 15,826 NRG Energy 471 0.02 91,057 PG&E 867 0.04 7,329 Pinnacle West Capital 380 0.02 49,369 PPL 1,092 0.05 32,309 Public Service Enterprise Group 1,602 0.08 67,820 Southern 3,513 0.17 31,155 Vistra Energy 506 0.03 34,495 Xcel Energy 1,791 0.09
Electronic & Electrical Equipment (31/01/21 – 0.85%) 1.10 19,489 Agilent Technologies 2,024 0.10 14,765 Ametek 1,504 0.07 37,410 Amphenol 2,219 0.11 4,646 Arrow Electronics 429 0.02 38,241 Emerson Electric 2,621 0.13 70,024 General Electric 4,931 0.25 2,352 IPG Photonics Corporation 271 0.01 11,871 Keysight Technologies 1,494 0.07 1,464 Mettler Toledo International 1,605 0.08 7,168 Perkinelmer 919 0.05 6,716 Roper Technologies 2,186 0.11 16,037 Trimble Navigation 862 0.04 3,406 Zebra Technologies ‘A’ 1,292 0.06
Financial Services (31/01/21 – 5.03%) 5.36 23,073 Ally Financial 820 0.04 41,325 American Express 5,540 0.27 7,279 Ameriprise Financial 1,653 0.08 9,161 BlackRock 5,622 0.28 43,652 Blackstone ‘A’ 4,293 0.21 28,390 Capital One Financial 3,105 0.15 6,805 CBOE Global Holdings 600 0.03 22,980 Chicago Mercantile Exchange 3,928 0.19 19,167 Discover Financial Services 1,654 0.08 7,757 Equifax 1,386 0.07 23,645 Equitable Holdings 593 0.03 18,809 Frank Resources 448 0.02 21,156 Goldman Sachs Group 5,590 0.27 35,645 Intercontinental Exchange 3,365 0.17 35,635 KKR & Co. 1,890 0.09 2,387 MarketAxess Holdings 612 0.03 56,109 Mastercard 16,144 0.79
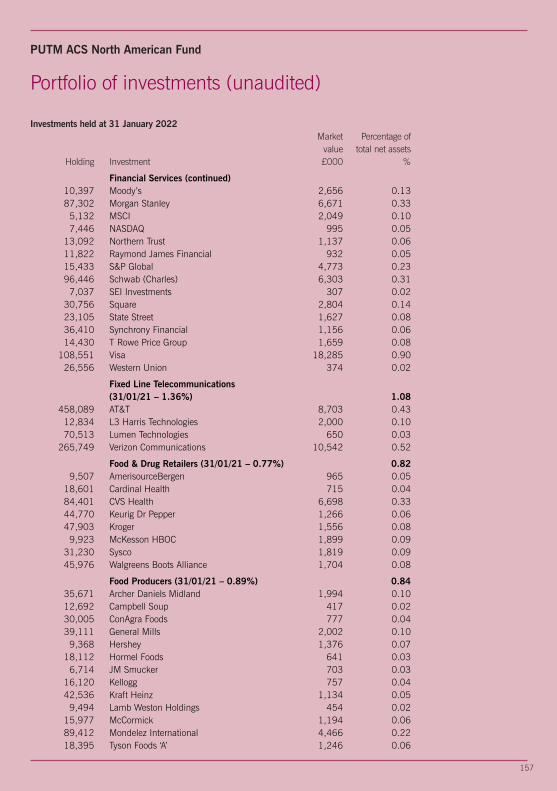
157
PUTM ACS North American Fund
Portfolio of investments (unaudited)
Investments held at 31 January 2022 Market Percentage of value total net assets Holding Investment £000 %
Financial Services (continued) 10,397 Moody’s 2,656 0.13 87,302 Morgan Stanley 6,671 0.33 5,132 MSCI 2,049 0.10 7,446 NASDAQ 995 0.05 13,092 Northern Trust 1,137 0.06 11,822 Raymond James Financial 932 0.05 15,433 S&P Global 4,773 0.23 96,446 Schwab (Charles) 6,303 0.31 7,037 SEI Investments 307 0.02 30,756 Square 2,804 0.14 23,105 State Street 1,627 0.08 36,410 Synchrony Financial 1,156 0.06 14,430 T Rowe Price Group 1,659 0.08 108,551 Visa 18,285 0.90 26,556 Western Union 374 0.02
Fixed Line Telecommunications (31/01/21 – 1.36%) 1.08 458,089 AT&T 8,703 0.43 12,834 L3 Harris Technologies 2,000 0.10 70,513 Lumen Technologies 650 0.03 265,749 Verizon Communications 10,542 0.52
Food & Drug Retailers (31/01/21 – 0.77%) 0.82 9,507 AmerisourceBergen 965 0.05 18,601 Cardinal Health 715 0.04 84,401 CVS Health 6,698 0.33 44,770 Keurig Dr Pepper 1,266 0.06 47,903 Kroger 1,556 0.08 9,923 McKesson HBOC 1,899 0.09 31,230 Sysco 1,819 0.09 45,976 Walgreens Boots Alliance 1,704 0.08
Food Producers (31/01/21 – 0.89%) 0.84 35,671 Archer Daniels Midland 1,994 0.10 12,692 Campbell Soup 417 0.02 30,005 ConAgra Foods 777 0.04 39,111 General Mills 2,002 0.10 9,368 Hershey 1,376 0.07 18,112 Hormel Foods 641 0.03 6,714 JM Smucker 703 0.03 16,120 Kellogg 757 0.04 42,536 Kraft Heinz 1,134 0.05 9,494 Lamb Weston Holdings 454 0.02 15,977 McCormick 1,194 0.06 89,412 Mondelez International 4,466 0.22 18,395 Tyson Foods ‘A’ 1,246 0.06

158
PUTM ACS North American Fund
Portfolio of investments (unaudited)
Investments held at 31 January 2022 Market Percentage of value total net assets Holding Investment £000 %
Forestry & Paper (31/01/21 – 0.06%) 0.05 25,066 International Paper 901 0.05 2,068 Sylvamo 46 0.00
Gas, Water & Multiutilities (31/01/21 – 0.64%) 0.61 16,300 Ameren 1,078 0.05 11,627 American Water Works 1,394 0.07 8,278 Atmos Energy 661 0.03 35,075 CenterPoint Energy 741 0.04 49,332 Duke Energy 3,864 0.19 14,643 Evergy 709 0.03 25,481 Nisource 554 0.03 19,853 Sempra Energy 2,044 0.10 20,215 WEC Energy Group 1,462 0.07
General Industrials (31/01/21 – 1.69%) 1.32 37,084 3M Co 4,589 0.23 20,588 Ball 1,490 0.08 40,656 Danaher 8,656 0.43 20,352 Fortive 1,070 0.05 44,556 Honeywell International 6,786 0.33 24,042 Ingersoll Rand 1,007 0.05 5,997 Packaging Coporation of America 673 0.03 8,237 Parker-Hannifin 1,902 0.09 16,890 WestRock Company 581 0.03
General Retailers (31/01/21 – 9.23%) 7.75 4,183 Advance Auto Parts 722 0.04 27,830 Amazon.com 62,012 3.05 1,373 Autozone 2,033 0.10 15,621 Best Buy 1,156 0.06 4,245 Burlington Store 749 0.04 10,440 Carmax 865 0.04 4,934 Carvana 596 0.03 13,386 Copart 1,288 0.06 28,346 Costco Wholesale 10,666 0.52 15,138 Dollar General 2,351 0.12 14,836 Dollar Tree 1,451 0.07 19,756 DraftKings 325 0.02 68,191 Home Depot 18,646 0.92 15,619 L Brands 653 0.03 45,358 Lowe’s Companies 8,027 0.39 2,926 MercadoLibre 2,466 0.12 27,692 NetFlix 8,814 0.43 4,362 O’Reilly Automotive 2,118 0.10 75,352 PayPal Holdings 9,653 0.47 14,739 Rollins 339 0.02 22,438 Ross Stores 1,634 0.08

159
PUTM ACS North American Fund
Portfolio of investments (unaudited)
Investments held at 31 January 2022 Market Percentage of value total net assets Holding Investment £000 %
General Retailers (continued) 31,877 Target 5,238 0.26 77,324 TJX 4,148 0.20 7,361 Tractor Supply Company 1,197 0.06 3,402 Ulta Beauty 922 0.05 91,991 Wal-Mart Stores 9,585 0.47
Healthcare Equipment & Services (31/01/21 – 4.71%) 4.45 2,833 Abiomed 624 0.03 5,038 Align Technology 1,857 0.09 15,700 Anthem 5,159 0.25 34,169 Avantor 951 0.05 32,217 Baxter International 2,051 0.10 18,294 Becton Dickinson 3,464 0.17 1,353 Bio-Rad Laboratories 605 0.03 90,947 Boston Scientific 2,908 0.14 37,072 Centene 2,148 0.10 21,407 Cigna Corporation 3,675 0.18 4,496 DaVita 363 0.02 14,136 Dentsply Sirona 563 0.03 6,171 Dexcom 1,978 0.10 39,609 Edwards Lifesciences 3,223 0.16 16,147 HCA Holdings 2,889 0.14 16,066 Hologic 841 0.04 8,262 Humana 2,418 0.12 5,416 Idexx Laboratories 2,045 0.10 4,229 Insulet 780 0.04 22,714 Intuitive Surgical 4,809 0.24 6,172 Laboratory Corporation of America Holdings 1,248 0.06 3,198 Masimo 524 0.03 7,804 Quest Diagnostics 786 0.04 9,213 ResMed 1,569 0.08 9,161 Schein Henry 514 0.03 22,351 Stryker 4,131 0.20 9,673 Teladoc Health 554 0.03 2,989 Teleflex 691 0.03 3,095 The Cooper Companies 918 0.04 25,192 Thermo Fisher Scientific 10,909 0.54 60,327 UnitedHealth Group 21,244 1.04 4,798 Universal Health Services 465 0.02 3,912 Waters 933 0.05 4,704 West Pharmaceutical Services 1,377 0.07 13,369 Zimmer Biomet Holdings 1,226 0.06
Household Goods (31/01/21 – 1.51%) 1.47 15,714 Church & Dwight 1,202 0.06 7,865 Clorox 984 0.05 21,303 D.R.Horton 1,417 0.07

160
PUTM ACS North American Fund
Portfolio of investments (unaudited)
Investments held at 31 January 2022 Market Percentage of value total net assets Holding Investment £000 %
Household Goods (continued) 17,382 Lennar 1,244 0.06 748 Lennar ‘B’ 45 0.00 3,677 Mohawk Industries 432 0.02 24,741 Newell Brands 428 0.02 201 NVR 794 0.04 156,138 Procter & Gamble 18,673 0.92 16,553 Pulte Group 650 0.03 7,423 Roku 907 0.04 3,415 Snap-on 530 0.03 10,335 Stanley Black & Decker 1,347 0.07 4,822 Wayfair ‘A’ 561 0.03 3,921 Whirlpool 614 0.03
Industrial Engineering (31/01/21 – 1.36%) 1.27 55,710 Carrier Global Corporation 1,979 0.10 35,134 Caterpillar 5,274 0.26 9,189 Cummins 1,512 0.07 18,073 Deere & Company 5,069 0.25 9,187 Dover 1,163 0.06 4,858 IDEX 780 0.04 20,163 Illinois Tool Works 3,515 0.17 27,534 Otis Worldwide Corporation 1,753 0.09 21,826 Paccar 1,512 0.07 7,432 Rockwell Automation 1,602 0.08 11,611 Wabtec 769 0.04 11,462 Xylem 897 0.04
Industrial Metals (31/01/21 – 0.19%) 0.24 93,781 Freeport McMoRan Copper 2,601 0.13 18,816 Nucor 1,422 0.07 5,475 Southern Copper Corporation 261 0.01 12,412 Steel Dynamics 513 0.03
Industrial Transportation (31/01/21 – 1.49%) 1.42 8,450 CH Robinson Worldwide 659 0.03 145,195 CSX 3,703 0.18 10,772 Expeditors International Washington 919 0.05 15,714 Fedex 2,882 0.14 6,243 GXO Logistics 378 0.02 5,378 J.B. Hunt Transport Services 771 0.04 15,795 Norfolk Southern 3,200 0.16 6,543 Old Dominion Freight Line 1,471 0.07 41,816 Union Pacific 7,619 0.37 46,407 United Parcel Services ‘B’ 6,992 0.34 6,246 XPO Logistics 308 0.02

161
PUTM ACS North American Fund
Portfolio of investments (unaudited)
Investments held at 31 January 2022 Market Percentage of value total net assets Holding Investment £000 %
Leisure Goods (31/01/21 – 0.44%) 0.36 49,506 Activision 2,915 0.14 18,166 Electronic Arts 1,796 0.09 8,186 Hasbro 564 0.03 16,908 Peloton Interactive 344 0.02 2,487 Pool.com 883 0.04 7,393 Take Two Interactive 900 0.04
Life Insurance (31/01/21 – 0.42%) 0.45 42,459 Aflac 1,988 0.10 3,813 Assurant 433 0.02 6,512 Globe Life 497 0.02 11,973 Lincoln National 624 0.03 46,487 Metlife 2,324 0.11 16,977 Principal Financial Group 924 0.05 24,751 Prudential Financial 2,058 0.10 7,331 Voya Financial 371 0.02
Media (31/01/21 – 2.24%) 1.72 32,835 AMC Entertainment Holdings 393 0.02 8,209 Charter Communications ‘A’ 3,628 0.18 292,475 Comcast 10,893 0.54 10,742 Discovery ‘A’ 223 0.01 20,516 Discovery Communications 418 0.02 16,160 Dish Network 378 0.02 2,422 FactSet 762 0.04 20,419 Fox Corporation ‘A’ 618 0.03 9,890 Fox Corporation ‘B’ 274 0.01 25,100 Interpublic Group of Companies 665 0.03 9,260 Liberty Broadband 1,024 0.05 1,611 Liberty Broadband ‘A’ 176 0.01 5,147 Liberty Siriusxm Group 177 0.01 10,548 Liberty Siriusxm Group ‘C’ 365 0.02 25,357 News 421 0.02 7,727 News Corporation ‘B’ 128 0.01 13,642 Omnicom 766 0.04 58,629 Sirius XM Holdings 278 0.01 37,347 ViacomCBS 931 0.04 116,437 Walt Disney 12,405 0.61
Mining (31/01/21 – 0.14%) 0.11 20,941 Newmont Goldcorp 940 0.04 30,442 Newmont Mining 1,388 0.07
Mobile Telecommunications (31/01/21 – 0.27%) 0.16 13,905 Altice USA 149 0.01 37,770 T-Mobile US 3,043 0.15 398 Ubiquiti 86 0.00
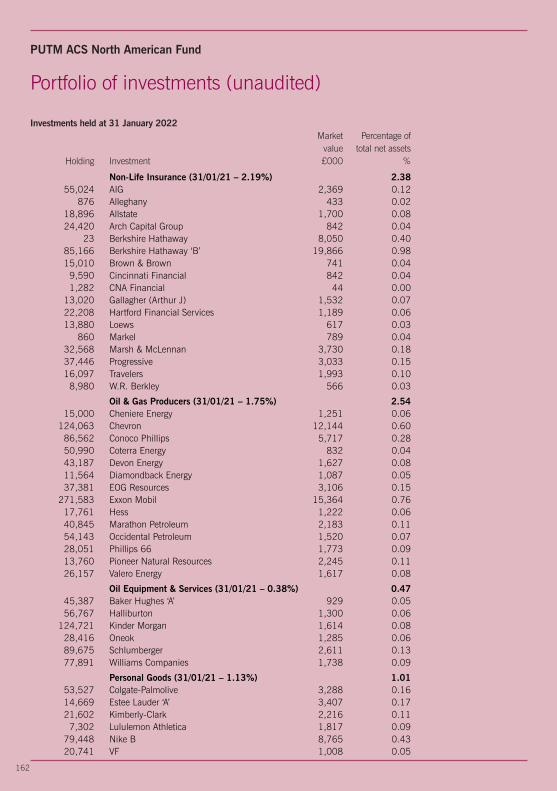
162
PUTM ACS North American Fund
Portfolio of investments (unaudited)
Investments held at 31 January 2022 Market Percentage of value total net assets Holding Investment £000 %
Non-Life Insurance (31/01/21 – 2.19%) 2.38 55,024 AIG 2,369 0.12 876 Alleghany 433 0.02 18,896 Allstate 1,700 0.08 24,420 Arch Capital Group 842 0.04 23 Berkshire Hathaway 8,050 0.40 85,166 Berkshire Hathaway ‘B’ 19,866 0.98 15,010 Brown & Brown 741 0.04 9,590 Cincinnati Financial 842 0.04 1,282 CNA Financial 44 0.00 13,020 Gallagher (Arthur J) 1,532 0.07 22,208 Hartford Financial Services 1,189 0.06 13,880 Loews 617 0.03 860 Markel 789 0.04 32,568 Marsh & McLennan 3,730 0.18 37,446 Progressive 3,033 0.15 16,097 Travelers 1,993 0.10 8,980 W.R. Berkley 566 0.03
Oil & Gas Producers (31/01/21 – 1.75%) 2.54 15,000 Cheniere Energy 1,251 0.06 124,063 Chevron 12,144 0.60 86,562 Conoco Phillips 5,717 0.28 50,990 Coterra Energy 832 0.04 43,187 Devon Energy 1,627 0.08 11,564 Diamondback Energy 1,087 0.05 37,381 EOG Resources 3,106 0.15 271,583 Exxon Mobil 15,364 0.76 17,761 Hess 1,222 0.06 40,845 Marathon Petroleum 2,183 0.11 54,143 Occidental Petroleum 1,520 0.07 28,051 Phillips 66 1,773 0.09 13,760 Pioneer Natural Resources 2,245 0.11 26,157 Valero Energy 1,617 0.08
Oil Equipment & Services (31/01/21 – 0.38%) 0.47 45,387 Baker Hughes ‘A’ 929 0.05 56,767 Halliburton 1,300 0.06 124,721 Kinder Morgan 1,614 0.08 28,416 Oneok 1,285 0.06 89,675 Schlumberger 2,611 0.13 77,891 Williams Companies 1,738 0.09
Personal Goods (31/01/21 – 1.13%) 1.01 53,527 Colgate-Palmolive 3,288 0.16 14,669 Estee Lauder ‘A’ 3,407 0.17 21,602 Kimberly-Clark 2,216 0.11 7,302 Lululemon Athletica 1,817 0.09 79,448 Nike B 8,765 0.43 20,741 VF 1,008 0.05

163
PUTM ACS North American Fund
Portfolio of investments (unaudited)
Investments held at 31 January 2022 Market Percentage of value total net assets Holding Investment £000 %
Pharmaceuticals & Biotechnology (31/01/21 – 6.73%) 6.13 111,384 Abbott Laboratories 10,582 0.52 113,295 AbbVie 11,555 0.57 7,589 Alnylam Pharmaceuticals 778 0.04 36,419 Amgen 6,162 0.30 9,504 Biogen IDEC 1,598 0.08 11,677 BioMarin Pharmaceutical 771 0.04 2,474 Bio-Techne 693 0.04 143,250 Bristol Myers Squibb 6,927 0.34 10,397 Catalent 805 0.04 3,185 Charles River Laboratories 782 0.04 47,287 Corteva 1,695 0.08 28,506 Elanco Animal Health 553 0.03 54,354 Eli Lilly 9,937 0.49 10,227 Exact Sciences Corporation 581 0.03 80,498 Gilead Sciences 4,118 0.20 13,429 Horizon Therapeutics 934 0.05 9,347 Illumina 2,427 0.12 11,827 Incyte 655 0.03 12,215 IQVIA Holdings 2,230 0.11 168,968 Johnson & Johnson 21,691 1.07 162,464 Merck & Co 9,861 0.48 21,688 Moderna 2,735 0.13 16,500 Organon 392 0.02 358,011 Pfizer 14,063 0.69 6,421 Regeneron Pharmaceuticals 2,911 0.14 8,541 Seagen 856 0.04 16,606 Vertex Pharmaceuticals 3,006 0.15 77,419 Viatris 863 0.04 30,441 Zoetis 4,533 0.22
Real Estate & Investment Services (31/01/21 – 0.27%) 0.27 21,386 CBRE Group 1,616 0.08 27,617 Crown Castle Real Estate Investment Trust 3,757 0.18 3,863 Zillow Group 143 0.01
Real Estate Investment Trusts (31/01/21 – 2.20%) 2.35 34,098 AGNC Investment Corporation Real Estate Investment Trust 378 0.02 9,320 Alexandria Real Estate 1,354 0.07 28,937 American Tower 5,421 0.27 89,506 Annaly Mortgage Management 526 0.03 8,925 AvalonBay Communities 1,625 0.08 9,993 Boston Properties 835 0.04 17,976 Digital Realty 1,999 0.10

164
PUTM ACS North American Fund
Portfolio of investments (unaudited)
Investments held at 31 January 2022 Market Percentage of value total net assets Holding Investment £000 %
Real Estate Investment Trusts (continued) 23,971 Duke Realty 1,032 0.05 5,724 Equinix Real Estate Investment Trust 3,093 0.15 11,123 Equity Lifestyle Properties 649 0.03 23,607 Equity Residential 1,561 0.08 4,145 Essex Property Real Estate Investment Trust 1,027 0.05 8,395 Extra Space Storage 1,240 0.06 5,018 Federal Realty Investment Trust 477 0.02 34,527 Healthpeak Properties REIT 910 0.04 45,279 Host Marriott 585 0.03 36,926 Invitation Homes Real Estate Investment Trust 1,155 0.06 18,343 Iron Mountain Real Estate Investment Trust 628 0.03 29,278 Kimco Realty 529 0.03 7,383 Mid-America Apartment Communities 1,137 0.05 3,584 Orion Office REIT 44 0.00 47,258 Prologis 5,521 0.27 9,655 Public Storage 2,580 0.13 35,285 Realty Income 1,825 0.09 10,809 Regency Centers 578 0.03 6,936 SBA Communications 1,681 0.08 20,893 Simon Property Group 2,292 0.11 7,219 Sun Communities Real Estate Investment Trust 1,017 0.05 18,910 UDR 801 0.04 24,909 Ventas 984 0.05 11,412 Vornado Realty Trust 349 0.02 11,680 W.P. Carey Real Estate Investment Trust 675 0.03 27,080 Welltower 1,748 0.09 48,000 Weyerhaeuser 1,446 0.07
Software & Computer Services (31/01/21 – 16.14%) 16.91 30,614 Adobe 12,191 0.60 10,291 Akamai Technologies 879 0.04 19,285 Alphabet ‘A’ 38,878 1.91 17,991 Alphabet ‘C’ 36,364 1.79 5,574 Ansys 1,411 0.07 14,112 Autodesk 2,625 0.13 2,622 Booking 4,797 0.24 17,601 Cadence Design Systems 1,994 0.10 8,785 CDW 1,237 0.06 8,128 Ceridian HCM Holding 459 0.02 18,937 Cerner 1,288 0.06 8,055 Citrix Systems 612 0.03 16,545 Cloudflare 1,189 0.06 33,755 CognizantTechnology Solutions 2,148 0.11 4,680 Coupa Software 467 0.02

165
PUTM ACS North American Fund
Portfolio of investments (unaudited)
Investments held at 31 January 2022 Market Percentage of value total net assets Holding Investment £000 %
Software & Computer Services (continued) 12,621 CrowdStrike Holdings ‘A’ 1,698 0.08 14,871 Datadog 1,617 0.08 12,215 Docusign 1,144 0.06 9,191 DoorDash 777 0.04 41,652 eBay 1,865 0.09 3,441 EPAM Systems 1,221 0.06 8,047 Etsy 942 0.05 1,788 Fair Isaac 660 0.03 8,574 Fortinet 1,898 0.09 5,207 Gartner ‘A’ 1,140 0.06 10,746 GoDaddy 607 0.03 83,284 Hewlett-Packard 1,014 0.05 2,818 HubSpot 1,027 0.05 4,971 IAC/Interactivecorp 506 0.02 57,301 International Business Machines 5,704 0.28 16,360 Intuit 6,766 0.33 4,722 Jack Henry & Associates 590 0.03 11,641 Kyndryl Holdings 146 0.01 9,036 Leidos Holdings 602 0.03 17,579 Lyft 505 0.02 17,697 Match Group 1,484 0.07 152,058 Meta Platforms 35,503 1.75 484,856 Microsoft 112,294 5.52 3,964 MongoDB 1,197 0.06 35,201 NortonLifeLock 682 0.03 7,919 Okta 1,168 0.06 108,087 Oracle 6,537 0.32 104,073 Palantir Technologies 1,063 0.05 6,109 Palo Alto Networks 2,353 0.12 3,243 Paycom Software 810 0.04 35,522 Pinterest ‘A’ 783 0.04 6,744 PTC 584 0.03 5,141 RingCentral ‘A’ 676 0.03 59,263 Salesforce.com 10,279 0.50 12,634 ServiceNow 5,514 0.27 12,536 Snowflake 2,578 0.13 10,489 Splunk 969 0.05 14,350 SS&C Technologies 854 0.04 9,717 Synopsys 2,247 0.11 27,442 The Trade Desk ‘A’ 1,422 0.07 10,665 Twilio 1,638 0.08 49,975 Twitter 1,397 0.07 2,574 Tyler Technologies 908 0.04 103,456 Uber Technologies 2,884 0.14 17,178 UiPath 468 0.02

166
PUTM ACS North American Fund
Portfolio of investments (unaudited)
Investments held at 31 January 2022 Market Percentage of value total net assets Holding Investment £000 %
Software & Computer Services (continued) 9,528 Unity Software 746 0.04 8,772 Veeva Systems 1,546 0.08 6,312 VeriSign 1,021 0.05 13,062 VMware 1,251 0.06 3,340 Wix.Com 327 0.02 12,031 Workday ‘A’ 2,265 0.11 7,616 Zendesk 559 0.03 10,146 Zillow 382 0.02 13,680 Zoom Video Communications ‘A’ 1,572 0.08 4,922 Zscaler 943 0.05
Support Services (31/01/21 – 1.69%) 1.55 14,905 Aramark Holdings 381 0.02 27,267 Automatic Data Processing 4,188 0.21 7,401 Broadridge Financial Solutions 878 0.04 5,591 Cintas 1,630 0.08 25,090 Costar Group 1,311 0.06 36,756 Fastenal 1,552 0.08 39,720 Fidelity National Information 3,551 0.18 38,344 Fiserv 3,020 0.15 5,216 FleetCor Technologies 925 0.05 17,464 FNFV Group 655 0.03 18,792 Global Payments 2,099 0.10 2,972 Grainger W.W. 1,097 0.05 20,629 Paychex 1,810 0.09 13,455 Republic Services 1,280 0.06 7,029 Robert Half International 594 0.03 12,256 TransUnion 942 0.05 4,628 United Rentals 1,103 0.05 10,165 Verisk Analytics 1,485 0.07 27,055 Waste Management 3,033 0.15
Technology Hardware & Equipment (31/01/21 – 12.01%) 12.57 77,606 Advanced Micro Devices 6,606 0.32 34,400 Analog Devices 4,204 0.21 993,079 Apple 129,223 6.35 58,700 Applied Materials 6,045 0.30 15,417 Arista Networks 1,428 0.07 25,595 Broadcom Corporation 11,179 0.55 271,010 Cisco Systems 11,241 0.55 48,749 Corning 1,527 0.07 17,361 Dell Technologies 735 0.04 3,852 F5 Networks 595 0.03 77,010 HP 2,108 0.10 259,212 Intel 9,432 0.46
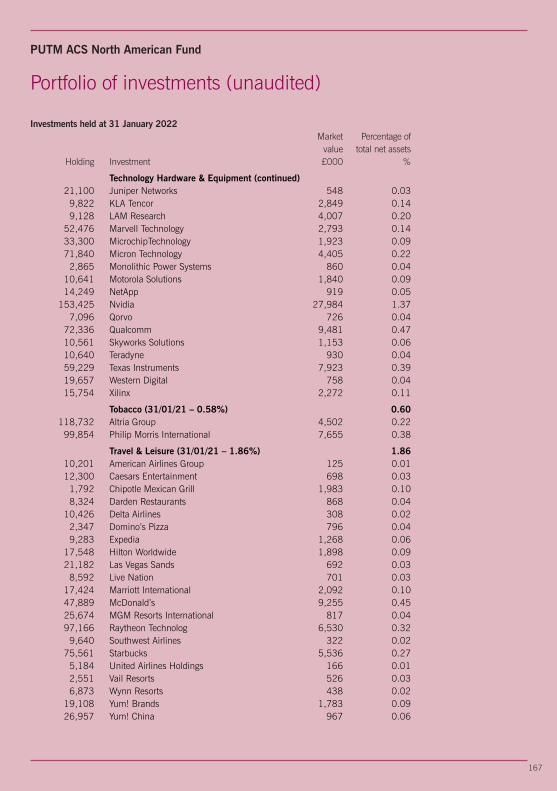
167
PUTM ACS North American Fund
Portfolio of investments (unaudited)
Investments held at 31 January 2022 Market Percentage of value total net assets Holding Investment £000 %
Technology Hardware & Equipment (continued) 21,100 Juniper Networks 548 0.03 9,822 KLA Tencor 2,849 0.14 9,128 LAM Research 4,007 0.20 52,476 Marvell Technology 2,793 0.14 33,300 MicrochipTechnology 1,923 0.09 71,840 Micron Technology 4,405 0.22 2,865 Monolithic Power Systems 860 0.04 10,641 Motorola Solutions 1,840 0.09 14,249 NetApp 919 0.05 153,425 Nvidia 27,984 1.37 7,096 Qorvo 726 0.04 72,336 Qualcomm 9,481 0.47 10,561 Skyworks Solutions 1,153 0.06 10,640 Teradyne 930 0.04 59,229 Texas Instruments 7,923 0.39 19,657 Western Digital 758 0.04 15,754 Xilinx 2,272 0.11
Tobacco (31/01/21 – 0.58%) 0.60 118,732 Altria Group 4,502 0.22 99,854 Philip Morris International 7,655 0.38
Travel & Leisure (31/01/21 – 1.86%) 1.86 10,201 American Airlines Group 125 0.01 12,300 Caesars Entertainment 698 0.03 1,792 Chipotle Mexican Grill 1,983 0.10 8,324 Darden Restaurants 868 0.04 10,426 Delta Airlines 308 0.02 2,347 Domino’s Pizza 796 0.04 9,283 Expedia 1,268 0.06 17,548 Hilton Worldwide 1,898 0.09 21,182 Las Vegas Sands 692 0.03 8,592 Live Nation 701 0.03 17,424 Marriott International 2,092 0.10 47,889 McDonald’s 9,255 0.45 25,674 MGM Resorts International 817 0.04 97,166 Raytheon Technolog 6,530 0.32 9,640 Southwest Airlines 322 0.02 75,561 Starbucks 5,536 0.27 5,184 United Airlines Holdings 166 0.01 2,551 Vail Resorts 526 0.03 6,873 Wynn Resorts 438 0.02 19,108 Yum! Brands 1,783 0.09 26,957 Yum! China 967 0.06

168
PUTM ACS North American Fund
Portfolio of investments (unaudited)
Investments held at 31 January 2022 Market Percentage of value total net assets Holding Investment £000 %
Bermuda (31/01/21 – 0.31%) 0.20 Banks (31/01/21 – 0.03%) 0.02 4,403 Credicorp 470 0.02
Financial Services (31/01/21 – 0.10%) 0.10 23,915 IHS Markit 2,082 0.10
Food Producers (31/01/21 – 0.03%) 0.03 8,794 Bunge 648 0.03
Non-Life Insurance (31/01/21 – 0.05%) 0.05 2,577 Everest Re Group 544 0.03 3,030 RenaissanceRe Holdings 355 0.02
Technology Hardware & Equipment (31/01/21 – 0.10%) Canada (31/01/21 – 4.01%) 4.10 Automobiles & Parts (31/01/21 – 0.06%) 0.05 17,997 Magna International 1,076 0.05
Banks (31/01/21 – 1.13%) 1.29 41,520 Bank of Montreal 3,499 0.17 77,822 Bank of Nova Scotia 4,158 0.21 28,100 Canadian Imperial Bank 2,627 0.13 21,593 National Bank of Canada 1,285 0.06 91,445 Royal Bank of Canada 7,761 0.38 116,686 Toronto Dominion Bank 6,951 0.34
Chemicals (31/01/21 – 0.08%) 0.09 36,587 Nutrien 1,901 0.09
Electricity (31/01/21 – 0.08%) 0.07 30,103 Fortis 1,065 0.05 20,563 Hydro One 395 0.02
Financial Services (31/01/21 – 0.16%) 0.18 85,434 Brookfield Asset 3,497 0.17 5,134 IGM Financial 132 0.01
Fixed Line Telecommunications (31/01/21 – 0.06%) 0.06 19,351 BCE 753 0.04 29,036 Telus 509 0.02
Food & Drug Retailers (31/01/21 – 0.14%) 0.15 50,816 Alimentation Couche-Tard 1,519 0.07 10,256 Loblaw 589 0.03 15,734 Metro 626 0.03 4,785 Weston George 389 0.02
Food Producers (31/01/21 – 0.02%) 0.01 15,499 Saputo Group 258 0.01
Gas, Water & Multiutilities (31/01/21 – 0.01%) 0.01 7,832 Canadian Utilities ‘A’ 169 0.01

169
PUTM ACS North American Fund
Portfolio of investments (unaudited)
Investments held at 31 January 2022 Market Percentage of value total net assets Holding Investment £000 %
General Retailers (31/01/21 – 0.05%) 0.05 3,689 Canadian Tire 395 0.02 18,502 Dollarama 709 0.03
Industrial Metals (31/01/21 – 0.02%) 0.03 29,700 Teck Resources ‘B’ 681 0.03
Industrial Transportation (31/01/21 – 0.34%) 0.32 37,977 Canadian National Railway 3,439 0.17 42,784 Canadian Pacific Rail 2,273 0.11 16,727 Canadian Pacific Railway 890 0.04
Life Insurance (31/01/21 – 0.24%) 0.23 17,608 Great West Lifeco 410 0.02 124,657 Manulife Financial Corporation 1,934 0.09 34,792 Power Corporation of Canada 832 0.04 37,572 Sun Life Financial 1,583 0.08
Media (31/01/21 – 0.06%) 0.07 27,432 Shaw Communications 607 0.03 10,786 Thomson Reuters 856 0.04
Mining (31/01/21 – 0.28%) 0.21 15,602 Agnico Eagle Mines 554 0.03 113,636 Barrick Gold 1,617 0.08 12,185 Franco Nevada 1,190 0.06 28,871 Silver Wheaton 859 0.04
Mobile Telecommunications (31/01/21 – 0.05%) 0.04 22,448 Rogers Communications 847 0.04
Non-Life Insurance (31/01/21 – 0.07%) 0.07 1,584 Fairfax Financial Holdings 569 0.03 9,137 Intact Financial 920 0.04
Oil & Gas Producers (31/01/21 – 0.30%) 0.42 74,495 Canadian Natural Resources 2,823 0.14 80,790 Cenovus Energy 875 0.04 13,957 Imperial Oil 425 0.02 95,298 Suncor Energy 2,027 0.10 62,793 TC Energy 2,416 0.12
Oil Equipment & Services (31/01/21 – 0.24%) 0.24 129,842 Enbridge 4,089 0.20 35,265 Pembina Pipeline 832 0.04
Pharmaceuticals & Biotechnology (31/01/21 – 0.02%) 0.02 20,354 Bausch Health 370 0.02
Software & Computer Services (31/01/21 – 0.47%) 0.37 13,956 CGI 883 0.04 1,218 Constellation Software 1,539 0.08 6,102 Shopify 4,385 0.21 1,112 Shopify ‘A’ 796 0.04

170
PUTM ACS North American Fund
Portfolio of investments (unaudited)
Investments held at 31 January 2022 Market Percentage of value total net assets Holding Investment £000 %
Support Services (31/01/21 – 0.08%) 0.08 16,798 Waste Connections 1,556 0.08
Travel & Leisure (31/01/21 – 0.05%) 0.04 19,440 Restaurant Brands International 808 0.04
Cayman Islands (31/01/21 – 0.01%) 0.02 Food Producers (31/01/21 – 0.01%) Software & Computer Services (31/01/21 – 0.00%) 0.02 20,293 Farfetch ‘A’ 328 0.01 13,938 Stoneco 162 0.01
Channel Islands (31/01/21 – 0.13%) 0.15 Automobiles & Parts (31/01/21 – 0.10%) 0.09 17,284 Aptiv 1,758 0.09
Healthcare Equipment & Services (31/01/21 – 0.00%) 0.02 6,657 Novocure 341 0.02
Software & Computer Services (31/01/21 – 0.03%) 0.04 8,412 Amdocs 476 0.02 27,764 Clarivate 340 0.02
Ireland (31/01/21 – 1.99%) 2.01 Chemicals (31/01/21 – 0.37%) 0.39 33,104 Linde 7,863 0.39
Electronic & Electrical Equipment (31/01/21 – 0.03%) 0.03 5,743 Allegion 525 0.03
General Industrials (31/01/21 – 0.24%) 0.24 25,518 Eaton 3,012 0.15 15,287 Trane Technologies 1,970 0.09
General Retailers (31/01/21 – 0.10%) 0.12 45,875 Johnson Controls International 2,484 0.12
Healthcare Equipment & Services (31/01/21 – 0.48%) 0.38 86,095 Medtronic 6,638 0.33 5,495 Steris 919 0.05
Industrial Engineering (31/01/21 – 0.03%) 0.02 10,582 Pentair 502 0.02
Non Equity Investment Instruments (31/01/21 – 0.00%) 0.01 567 iShares Core S&P UCITIS ETF 193 0.01
Non-Life Insurance (31/01/21 – 0.21%) 0.22 14,338 Aon 2,955 0.15 8,224 Willis Towers Watson 1,433 0.07
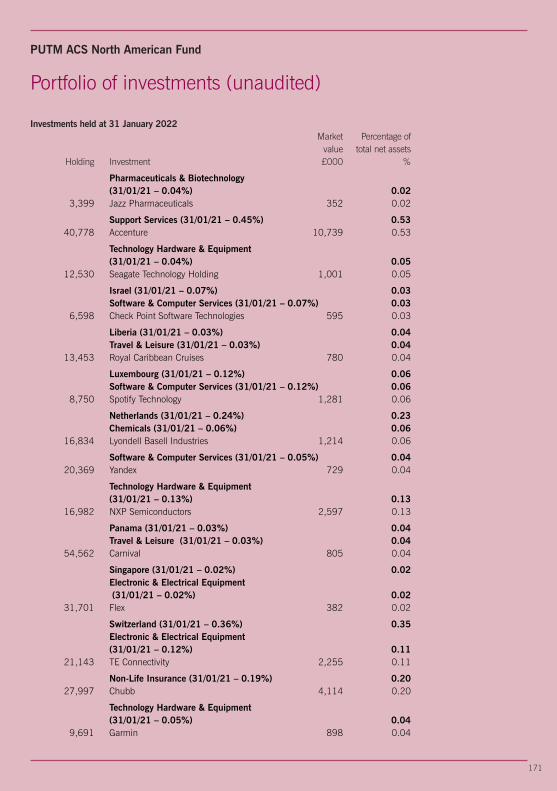
171
PUTM ACS North American Fund
Portfolio of investments (unaudited)
Investments held at 31 January 2022 Market Percentage of value total net assets Holding Investment £000 %
Pharmaceuticals & Biotechnology (31/01/21 – 0.04%) 0.02 3,399 Jazz Pharmaceuticals 352 0.02
Support Services (31/01/21 – 0.45%) 0.53 40,778 Accenture 10,739 0.53
Technology Hardware & Equipment (31/01/21 – 0.04%) 0.05 12,530 Seagate Technology Holding 1,001 0.05
Israel (31/01/21 – 0.07%) 0.03 Software & Computer Services (31/01/21 – 0.07%) 0.03 6,598 Check Point Software Technologies 595 0.03
Liberia (31/01/21 – 0.03%) 0.04 Travel & Leisure (31/01/21 – 0.03%) 0.04 13,453 Royal Caribbean Cruises 780 0.04
Luxembourg (31/01/21 – 0.12%) 0.06 Software & Computer Services (31/01/21 – 0.12%) 0.06 8,750 Spotify Technology 1,281 0.06
Netherlands (31/01/21 – 0.24%) 0.23 Chemicals (31/01/21 – 0.06%) 0.06 16,834 Lyondell Basell Industries 1,214 0.06
Software & Computer Services (31/01/21 – 0.05%) 0.04 20,369 Yandex 729 0.04
Technology Hardware & Equipment (31/01/21 – 0.13%) 0.13 16,982 NXP Semiconductors 2,597 0.13
Panama (31/01/21 – 0.03%) 0.04 Travel & Leisure (31/01/21 – 0.03%) 0.04 54,562 Carnival 805 0.04
Singapore (31/01/21 – 0.02%) 0.02 Electronic & Electrical Equipment (31/01/21 – 0.02%) 0.02 31,701 Flex 382 0.02
Switzerland (31/01/21 – 0.36%) 0.35 Electronic & Electrical Equipment (31/01/21 – 0.12%) 0.11 21,143 TE Connectivity 2,255 0.11
Non-Life Insurance (31/01/21 – 0.19%) 0.20 27,997 Chubb 4,114 0.20
Technology Hardware & Equipment (31/01/21 – 0.05%) 0.04 9,691 Garmin 898 0.04

172
PUTM ACS North American Fund
Portfolio of investments (unaudited)
Investments held at 31 January 2022 Market Percentage of value total net assets Holding Investment £000 %
United Kingdom (31/01/21 – 0.21%) 0.23 Beverages (31/01/21 – 0.03%) 0.03 13,098 Coca-Cola European Partners 557 0.03
Electronic & Electrical Equipment (31/01/21 – 0.02%) 0.02 10,118 Sensata Technologies Holding 432 0.02
Media (31/01/21 – 0.06%) 0.05 11,120 Liberty Global ‘A’ 225 0.01 22,528 Liberty Global ‘C’ 454 0.02 23,251 Nielsen Holdings 327 0.02
Pharmaceuticals & Biotechnology (31/01/21 – 0.01%) 0.03 20,825 Royalty Pharma 621 0.03
Software & Computer Services (31/01/21 – 0.09%) 0.10 8,727 Atlassian Corporation 2,105 0.10
Money Markets (31/01/21 – 0.63%) 0.51 $13,890 Aberdeen Standard Liquidity Fund (Lux) – US Dollar Fund Class Z-1+ 10,353 0.51
Futures (31/01/21 – 0.01%) 0.01 194 CME S&P 500 E Mini Index Futures March 2022 146 0.01
Portfolio of investments 2,011,201 98.88 Net other assets 22,877 1.12
Net assets 2,034,078 100.00
Unless otherwise stated, all investments are approved securities being either officiallylisted in a member state or traded on or under the rules of an eligible securities market.
The counterparty for the futures is Merrill Lynch International.
+SICAVs (open ended investment schemes registered outside the UK).

173
PUTM ACS North American Fund
Top ten purchases and salesFor the year ended 31 January 2022
Purchases Cost£000
Aberdeen Standard Liquidity Fund (Lux) –US Dollar Fund Class Z-1 268,584Microsoft 14,601Apple 14,255Amazon.com 10,139Tesla Motors 5,492Alphabet ‘A’ 5,185Meta Platforms 4,972Alphabet ‘C’ 4,866Blackstone ‘A’ 4,402Nvidia 3,297
Subtotal 335,793Other purchases 248,766
Total purchases for the year 584,559
Sales Proceeds£000
Aberdeen Standard Liquidity Fund (Lux) –US Dollar Fund Class Z-1 270,252Apple 22,214Microsoft 16,449Amazon.com 11,312Alphabet ‘C’ 7,102Meta Platforms 6,827Alphabet ‘A’ 6,152Tesla Motors 4,310JP Morgan Chase & Co 4,309Johnson & Johnson 3,548
Subtotal 352,475Other sales 258,372
Total sales for the year 610,847

174
PUTM ACS North American Fund
Statistical information
Comparative tables Class ‘B’ Class ‘C’ Accumulation** Accumulation*** 31/01/22 31/01/21 31/01/22 31/01/21 31/01/20 pence pence pence pence penceChange in net assets per unitOpening net asset value per unit 99.76 100.00 132.48 116.63 100.00
Return before operating charges* 23.94 (0.23) 31.82 15.93 16.70Operating charges (0.06) (0.01) (0.08) (0.08) (0.07)
Return after operating charges* 23.88 (0.24) 31.74 15.85 16.63
Distributions on accumulation units (1.32) (0.23) (1.81) (1.80) (1.53)Retained distributions onaccumulation units 1.32 0.23 1.81 1.80 1.53
Closing net asset value per unit 123.64 99.76 164.22 132.48 116.63
*after direct transaction costs of:^ 0.00 0.00 0.00 0.00 0.00
PerformanceReturn after charges 23.94% (0.24%) 23.96% 13.59% 16.63%
Other informationClosing net asset value (£000) 92,075 54,000 203,139 197,330 208,155Closing number of units 74,468,178 54,130,599 123,697,815 148,947,628 178,472,250Operating charges 0.05%**** 0.07% 0.05%**** 0.07% 0.07%Direct transaction costs 0.00% 0.00% 0.00% 0.00% 0.00%
Prices+
Highest unit price (pence) 131.17 104.44 174.16 138.66 121.98Lowest unit price (pence) 99.39 99.71 131.95 92.16 100.00
^The direct transaction costs includes commission on futures.+ High and low price disclosures are based on quoted unit prices. Therefore, the opening and closing NAV pricesmay fall outside the high/low price threshold.**Class ‘B’ Accumulation launched on 27 November 2020.***Class ‘C’ Accumulation launched on 27 March 2019.****The AMC was updated during the year.
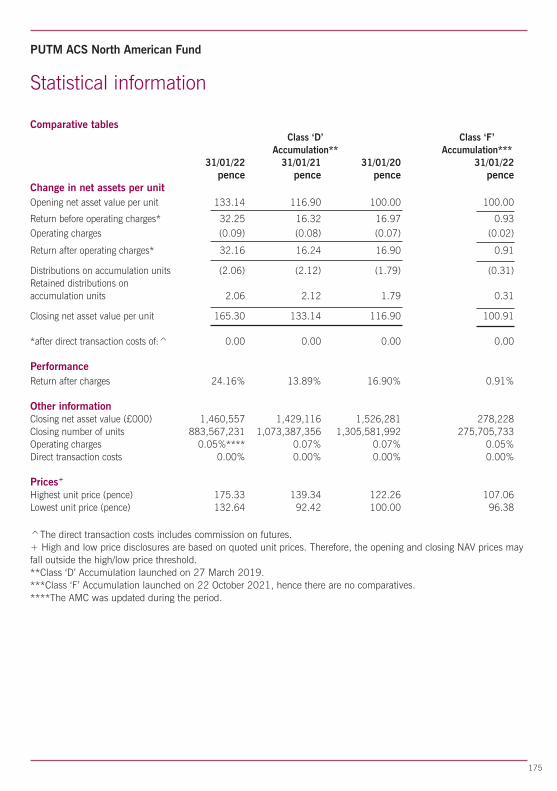
175
PUTM ACS North American Fund
Statistical information
Comparative tables Class ‘D’ Class ‘F’ Accumulation** Accumulation*** 31/01/22 31/01/21 31/01/20 31/01/22 pence pence pence penceChange in net assets per unitOpening net asset value per unit 133.14 116.90 100.00 100.00
Return before operating charges* 32.25 16.32 16.97 0.93Operating charges (0.09) (0.08) (0.07) (0.02)
Return after operating charges* 32.16 16.24 16.90 0.91
Distributions on accumulation units (2.06) (2.12) (1.79) (0.31)Retained distributions onaccumulation units 2.06 2.12 1.79 0.31
Closing net asset value per unit 165.30 133.14 116.90 100.91
*after direct transaction costs of:^ 0.00 0.00 0.00 0.00
PerformanceReturn after charges 24.16% 13.89% 16.90% 0.91%
Other informationClosing net asset value (£000) 1,460,557 1,429,116 1,526,281 278,228Closing number of units 883,567,231 1,073,387,356 1,305,581,992 275,705,733Operating charges 0.05%**** 0.07% 0.07% 0.05%Direct transaction costs 0.00% 0.00% 0.00% 0.00%
Prices+
Highest unit price (pence) 175.33 139.34 122.26 107.06Lowest unit price (pence) 132.64 92.42 100.00 96.38
^The direct transaction costs includes commission on futures.+ High and low price disclosures are based on quoted unit prices. Therefore, the opening and closing NAV prices mayfall outside the high/low price threshold.**Class ‘D’ Accumulation launched on 27 March 2019.***Class ‘F’ Accumulation launched on 22 October 2021, hence there are no comparatives.****The AMC was updated during the period.

176
PUTM ACS North American Fund
Statistical information
Comparative tables Class ‘X’ Accumulation** 31/01/22 31/01/21 pence pence Change in net assets per unitOpening net asset value per unit 127.75 100.00
Return before operating charges* 30.75 27.82Operating charges (0.09) (0.07)
Return after operating charges* 30.66 27.75
Distributions on accumulation units (1.71) (1.57)Retained distributions onaccumulation units 1.71 1.57
Closing net asset value per unit 158.41 127.75
*after direct transaction costs of:^ 0.00 0.00
PerformanceReturn after charges 24.00% 27.75%
Other informationClosing net asset value (£000) 79 319Closing number of units 50,000 250,000Operating charges 0.06%*** 0.07%Direct transaction costs 0.00% 0.00%
Prices+
Highest unit price (pence) 168.06 133.75Lowest unit price (pence) 127.29 88.81
^The direct transaction costs includes commission on futures.+ High and low price disclosures are based on quoted unit prices. Therefore, the opening and closing NAV pricesmay fall outside the high/low price threshold.**Class ‘X’ Accumulation launched on 14 March 2020.***The AMC was updated during the year.

177
PUTM ACS North American Fund
Statistical information
Investment objective
The Sub-fund aims to provide a total return (a combination of capital growth andincome), delivering an overall return in line with the FTSE North America Index (the“Index”), before management fees and expenses.
Investment policyIt will seek to achieve this objective by investing over 90% of the portfolio in equitiesand equity related securities of companies that are constituents of the Index inapproximate proportion to their weightings in the Index. From time to time, the Sub-fund may acquire or hold securities that are not index constituents, as a result ofcorporate actions.
Equity related securities will include convertible stocks, stock exchange listedwarrants, depository receipts, and any other such investments which entitle the holderto subscribe for or convert into the equity of the company and/or where the share priceperformance is, in the opinion of the Investment Manager, influenced significantly bythe stock market performance of the company's ordinary shares. The Sub-fund mayalso invest in other transferable securities, moneymarket instruments, deposits, cashand near cash and other collective investment schemes. Derivatives will be used forefficient portfolio management only.
Investment strategyA minimum of 90% of the Sub-fund is invested in components of the Index. The Sub-fund will seek to physically replicate the Index. This process will involve investing incomponents of the Index, though not necessarily in the same proportions of the Indexat all times. Consequently, the Sub-fund may not track the Index exactly but willcontain a meaningful exposure to the market. Stock index futures contracts may alsobe used to manage the cash portion of the Sub-fund. It is intended that the Sub-fundwill normally be close to fully invested as outlined above.
The Investment Manager may use various indexation or sampling techniques toachieve the objective of tracking the Index. In doing so the Investment Manager mayuse discretion in deciding which investments are to be included in the portfolio. Thenumber of investments so included may vary. Investment Manager may at itsdiscretion replace the current Index with such similar index as it may considerappropriate subject to regulatory approval.
Revenue distribution and pricingUnits of the Sub-fund are available as either Class ‘B’ Accumulation, ‘C’ Accumulation,‘D’ Accumulation, ‘F’ Accumulation or ‘X’ Accumulation units (where revenue isreinvested to enhance the unit price). There will be two potential distributions in eachaccounting year: an interim distribution as at 31 July and a final distribution as at 31January.
At each distribution the net revenue after deduction of expenses, from the investmentsof the Sub-fund, is apportioned amongst the unitholders. Unitholders receive a taxvoucher giving details of the distribution and the Manager’s Report no later than twomonths after these dates.
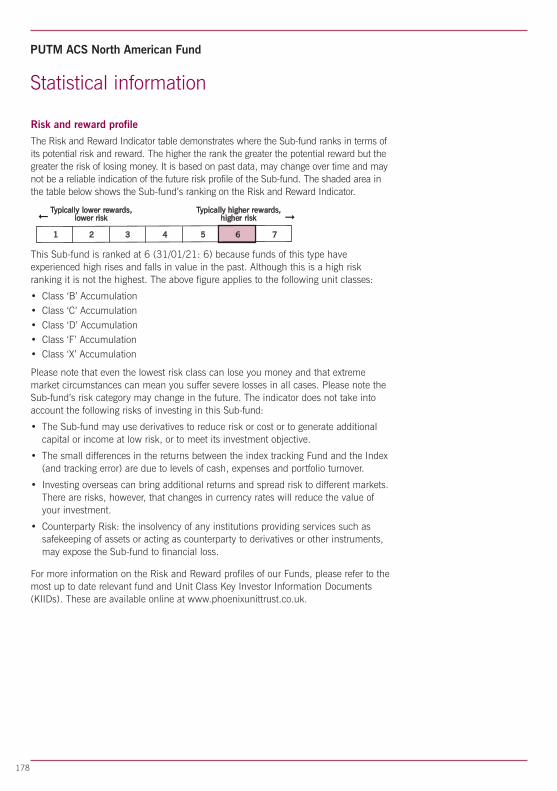
178
PUTM ACS North American Fund
fi
Statistical information
Risk and reward profile
The Risk and Reward Indicator table demonstrates where the Sub-fund ranks in terms ofits potential risk and reward. The higher the rank the greater the potential reward but thegreater the risk of losing money. It is based on past data, may change over time and maynot be a reliable indication of the future risk profile of the Sub-fund. The shaded area inthe table below shows the Sub-fund’s ranking on the Risk and Reward Indicator.
Typically lower rewards, Typically higher rewards, lower risk higher risk fi
1 2 3 4 5 6 7
This Sub-fund is ranked at 6 (31/01/21: 6) because funds of this type haveexperienced high rises and falls in value in the past. Although this is a high riskranking it is not the highest. The above figure applies to the following unit classes:
• Class ‘B’ Accumulation• Class ‘C’ Accumulation• Class ‘D’ Accumulation• Class ‘F’ Accumulation• Class ‘X’ Accumulation
Please note that even the lowest risk class can lose you money and that extrememarket circumstances can mean you suffer severe losses in all cases. Please note theSub-fund’s risk category may change in the future. The indicator does not take intoaccount the following risks of investing in this Sub-fund:
• The Sub-fund may use derivatives to reduce risk or cost or to generate additionalcapital or income at low risk, or to meet its investment objective.
• The small differences in the returns between the index tracking Fund and the Index(and tracking error) are due to levels of cash, expenses and portfolio turnover.
• Investing overseas can bring additional returns and spread risk to different markets.There are risks, however, that changes in currency rates will reduce the value ofyour investment.
• Counterparty Risk: the insolvency of any institutions providing services such assafekeeping of assets or acting as counterparty to derivatives or other instruments,may expose the Sub-fund to financial loss.
For more information on the Risk and Reward profiles of our Funds, please refer to themost up to date relevant fund and Unit Class Key Investor Information Documents(KIIDs). These are available online at www.phoenixunittrust.co.uk.

179
PUTM ACS North American Fund
Annual financial statementsFor the year ended 31 January 2022
Statement of total return 31/01/22 31/01/21 Notes £000 £000 £000 £000
Income
Net capital gains 4 365,280 184,034 Revenue 5 25,834 29,605
Expenses 6 (989) (1,053)
Interest payable andsimilar charges (13) (2)
Net revenue before taxation 24,832 28,550
Taxation 7 (649) (540)
Net revenue after taxation 24,183 28,010
Total returnbefore distributions 389,463 212,044
Distributions 8 (24,234) (28,103)
Change in net assetsattributable to unitholdersfrom investment activities 365,229 183,941
Statement of change in net assets attributable to unitholders
31/01/22 31/01/21 £000 £000 £000 £000
Opening net assetsattributable to unitholders 1,680,765 1,734,436
Amounts receivableon issue of units 63,187 1,338,905
Amounts payableon in-specie transfer* 260,543 –
Amounts payableon cancellation of units (359,133) (1,603,638) (35,403) (264,733)Change in net assetsattributable to unitholdersfrom investment activities 365,229 183,941
Dilution levy adjustment 225 225
Retained distributionson accumulation units 23,262 26,896
Closing net assetsattributable to unitholders 2,034,078 1,680,765
*Represents the value of units cancelled by in-specie transfer of assets during the year.

180
PUTM ACS North American Fund
Balance sheet 31/01/22 31/01/21 Notes £000 £000 £000 £000
Assets:Current assets:Investments 2,011,201 1,677,434Debtors 9 19,506 1,733
Cash and bank balances 10 4,599 2,108
Total current assets 24,105 3,841
Total assets 2,035,306 1,681,275
Liabilities:
Creditors:Other creditors 11 (1,228) (510)
Total creditors (1,228) (510)
Net assetsattributable to unitholders 2,034,078 1,680,765
Annual financial statementsAs at 31 January 2022

181
PUTM ACS North American Fund
Notes to the financial statements
Notes 1-3 Accounting policiesPlease see pages 3 to 6 for accounting basis and policies.
Note 4 Net capital gainsThe net capital gains during the year comprise:
31/01/22 31/01/21 £000 £000
Gains on non-derivative securities 360,069 172,493Gains on derivative contracts 4,985 8,416Currency (losses)/gains (200) 2,574Handling charges (37) (76)Capital special dividends 463 627
Net capital gains 365,280 184,034
Note 5 Revenue 31/01/22 31/01/21 £000 £000
UK dividends 82 74Overseas dividends 24,778 28,112US REIT 935 1,232Stocklending commission 8 48Bank interest 1 2Liquidity interest 30 137
Total revenue 25,834 29,605
Note 6 Expenses 31/01/22 31/01/21 £000 £000(a) Payable to the ACS Manager or associates of the
ACS Manager and agents of either of them:ACS Manager’s periodic charge 893 899
(b) Payable to the Depositary or associates of theDepositary and agents of either of them:Depositary’s fees 40 46
(c) Other expenses:Audit fee 9 10Safe custody charges 40 82FTSE License fee 6 14Printing & stationery – 1Professional fees 1 1
56 108
Total expenses 989 1053
Note 7 Taxation 31/01/22 31/01/21 £000 £000(a) Analysis of tax charge for the year
Overseas withholding tax 649 540
Total taxation 649 540
As the scheme is an ACS it is not subject to UK tax on income or capital gains.
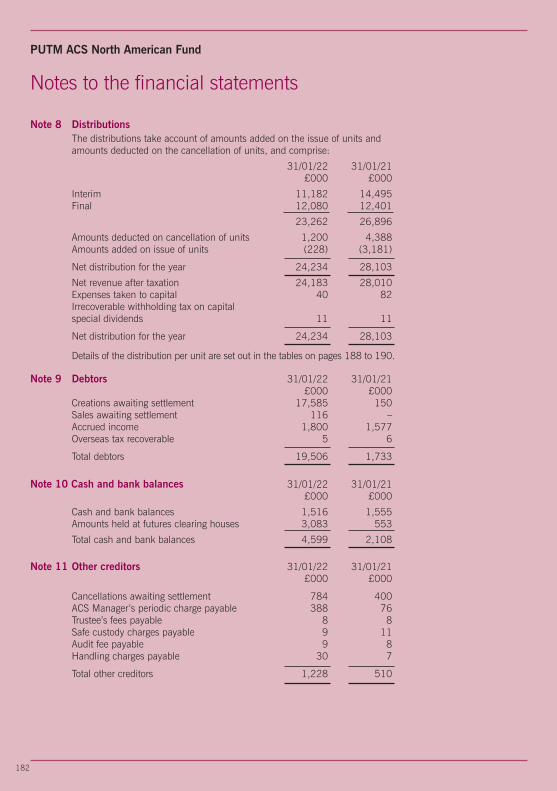
182
PUTM ACS North American Fund
Notes to the financial statements
Note 8 DistributionsThe distributions take account of amounts added on the issue of units andamounts deducted on the cancellation of units, and comprise:
31/01/22 31/01/21 £000 £000
Interim 11,182 14,495Final 12,080 12,401
23,262 26,896
Amounts deducted on cancellation of units 1,200 4,388Amounts added on issue of units (228) (3,181)
Net distribution for the year 24,234 28,103
Net revenue after taxation 24,183 28,010Expenses taken to capital 40 82Irrecoverable withholding tax on capitalspecial dividends 11 11
Net distribution for the year 24,234 28,103
Details of the distribution per unit are set out in the tables on pages 188 to 190.
Note 9 Debtors 31/01/22 31/01/21 £000 £000
Creations awaiting settlement 17,585 150Sales awaiting settlement 116 –Accrued income 1,800 1,577Overseas tax recoverable 5 6
Total debtors 19,506 1,733
Note 10 Cash and bank balances 31/01/22 31/01/21 £000 £000
Cash and bank balances 1,516 1,555Amounts held at futures clearing houses 3,083 553
Total cash and bank balances 4,599 2,108
Note 11 Other creditors 31/01/22 31/01/21 £000 £000
Cancellations awaiting settlement 784 400ACS Manager’s periodic charge payable 388 76Trustee’s fees payable 8 8Safe custody charges payable 9 11Audit fee payable 9 8Handling charges payable 30 7
Total other creditors 1,228 510

183
PUTM ACS North American Fund
Notes to the financial statements
Note 12 Reconciliation of units Class ‘B’ Class ‘C’ Class ‘D’ Class ‘F’ Class ‘X’ Accumulation Accumulation Accumulation Accumulation* Accumulation
Opening units issuedat 01/02/22 54,130,599 148,947,628 1,073,387,356 – 250,000Unit movements in year:Units issued 21,818,314 10,459,852 4,325,356 275,705,733 –Units cancelled (1,480,735) (35,709,665) (194,145,481) – (200,000)
Closing units at 31/01/22 74,468,178 123,697,815 883,567,231 275,705,733 50,000
*Class ‘F’ Accumulation launched on 22 October 2021.
Note 13 Contingencies and commitmentsAt 31 January 2022 the Sub-fund had no outstanding calls on partly paid shares, no potential underwritingcommitments or any other contingent liabilities (31/01/21: £nil).
Note 14 StocklendingThe total value of securities on loan at the Balance sheet date was £267,960 (31/01/21: £885,880).Collateral was held in the following form:
31/01/22 31/01/21 £000 £000Government bonds – 196UK Equities 321 763
321 959
The gross earnings and fees paid for the year were £10,031 (31/01/21: £57,961) and £1,806 (31/01/21:£10,433) respectively.The gross earnings were split by the lending agent as follows:– 82% to the Lender (PUTM ACS North American Fund)– 8% to the ACS Manager (Phoenix Unit Trust Managers Limited)– 10% retained by the Lending Agent (eSec)
The counterparties for the securities on loan are shown in the appendix on page 283.
Note 15 Unitholders’ fundsThere are five unit classes in issue within the Sub-fund. These are Class ‘B’ Accumulation, Class ‘C’Accumulation, Class ‘D’ Accumulation, Class ‘F’ Accumulation and Class ‘X’ Accumulation. The ACSManager’s periodic charge in respect of Class ‘B’, Class ‘C’, Class ‘D’, Class ‘F’' and Class ‘X’ is expressed asan annual percentage of the value of the property of the Sub-fund attributable to each unit class and iscurrently 0.045% in respect of Class ‘B’ units, Class ‘C’ units, Class ‘D’ units, Class ‘F’ units and Class ‘X’units.
Consequently, the level of net revenue attributable to each unit class will differ. Should it be necessary towind-up the Sub-fund, each unit class will have the same rights as regards to the distribution of the propertyof the Sub-fund.

184
PUTM ACS North American Fund
Notes to the financial statements
Note 16 Related party transactionsThe ACS Manager is a related party to the Sub-fund by virtue of its controlling influence.
The ACS Manager is part of the Phoenix Group. Phoenix Life Limited which is also partof the Phoenix Group, is a material unitholder in the Sub-fund and therefore a relatedparty, holding the following percentage of the units at the year end.
Class ‘B’ Class ‘C’ Class ‘D’ Class ‘F’* Class ‘X’ % % % % %
As at 31 January 2022: 100.00 100.00 100.00 100.00 100.00
As at 31 January 2021: 100.00 100.00 100.00 n/a 100.00
*Class ‘F’ Accumulation launched on 22 October 2021, hence there are no comparatives.
ACS Manager’s periodic charge paid to the ACS Manager, Phoenix Unit Trust ManagersLimited, or its associates, is shown in Note 6(a) and details of the units issued andcancelled by the ACS Manager are shown in the Statement of change in net assetsattributable to unitholders and Note 8.
Any balances due to/from the ACS Manager or its associates at 31 January 2022 inrespect of these transactions are shown in Notes 9 and 11.
Note 17 Financial instrumentsIn accordance with the investment objective, the Sub-fund holds certain financialinstruments. These comprise:• securities held in accordance with the investment objective and policies;• derivative transactions which the Sub-fund enters into, the purpose of which is to
manage the currency and market risks arising from the Sub-fund’s investmentactivities; and
• cash and short term debtors and creditors arising directly from operations.
Counterparty exposureThe economic exposure of future derivative contracts is equal to the market value. Thevalue of exposure and the related counterparty are disclosed in the Portfolio ofinvestments.
Currency exposureAn analysis of the monetary assets and liabilities at the year end is shown below:
Net currency assets Net currency assets 31/01/22 31/01/21
Currency Monetary Non- Total Monetary Non- Total exposure monetary exposure exposure monetary exposure exposure exposure £000 £000 £000 £000 £000 £000
Sterling 16,370 - 16,370 (174) - (174) Canadian Dollar 287 79,818 80,105 233 63,323 63,556 US Dollar 6,220 1,931,383 1,937,603 3,272 1,614,111 1,617,383
22,877 2,011,201 2,034,078 3,331 1,677,434 1,680,765
Income received in other currencies is converted to Sterling on or near the date of receipt. TheSub-fund does not hedge or otherwise seek to avoid, movement risk on accrued income.

185
PUTM ACS North American Fund
Notes to the financial statements
Note 17 Financial instruments (continued)Interest profileAt the year end date, 0.74% (31/01/21: 0.75%) of the Sub-fund’s net assets by valuewere interest bearing.Interest rates earned/paid on deposits are earned/paid at a rate linked to SONIA(Standard Overnight Index Average) or international equivalent. Interest was also earnedon the invesments in the the Aberdeen Standard Liquidity Fund.
Sensitivity analysisInterest rate risk sensitivityAs the majority of the Sub-fund’s financial assets are non-interest bearing, the Sub-fundis only subject to limited exposure to fair value interest rate risk due to fluctuations inlevels of market interest rates and therefore, no sensitivity analysis has been provided.
Foreign currency risk sensitivityA five percent increase in the value of the Sub-fund’s foreign currency exposure wouldhave the effect of increasing the return and net assets by £100,885,402 (31/01/21:£84,046,950). A five percent decrease would have an equal and opposite effect.
Market price risk sensitivityA five percent increase in the value of the Sub-fund’s portfolio would have the effect ofincreasing the return and net assets by £101,703,891 (31/01/21: £84,038,250). Afive percent decrease would have an equal and opposite effect.
Note 18 Fair value of investmentsThe fair value of the Sub-fund’s investments has been determined using the hierarchy below.
This complies with the ‘Amendments to FRS 102 – Fair value hierarchy disclosures’ issuedby the Financial Reporting Council in March 2016.
Level 1 The unadjusted quoted price in an active market for identical assets orliabilities that the entity can access at the measurement date.
Level 2 Inputs other than quoted prices included within Level 1 that areobservable (i.e. developed using market data) for the asset or liability,either directly or indirectly.
Level 3 Inputs are unobservable (i.e. for which market data is unavailable) for theasset or liability.
For the year ended 31/01/22Level 1 2 3 Total
Investment assets £000 £000 £000 £000Equities 2,000,702 – – 2,000,702Derivatives 146 – – 146Money markets 10,353 – – 10,353
2,011,201 – – 2,011,201
For the year ended 31/01/21Level 1 2 3 Total
Investment assets £000 £000 £000 £000Equities 1,666,793 – – 1,666,793Derivatives 88 – – 88Money markets 10,553 – – 10,553
1,677,434 – – 1,677,434

186
PUTM ACS North American Fund
Notes to the financial statements
Note 19 Portfolio transaction costs
For the year ended 31/01/22Other Total
Value Commission Taxes expenses costsAnalysis of total purchases costs £000 £000 % £000 % £000 % £000
Equity transactions 54,164 1 – – – – – 54,165Money markets 268,584 – – – – – – 268,584Corporate actions 1,267 – – – – – – 1,267In-specie transactions 260,543 – – – – – – 260,453
Total 584,558 1 – – 584,599
Other TotalValue Commission Taxes expenses costs
Analysis of total sales costs £000 £000 % £000 % £000 % £000
Equity transactions 336,963 (7) – – – (2) – 336,954Money markets 270,252 – – – – – – 270,252Corporate actions 3,641 – – – – – – 3,641
Total 610,856 (7) – (2) 610,847
The Sub-fund has paid £6,461 as commission on purchases and sales of derivatives transactions for the yearended 31/01/22.
Commission, taxes and other expenses as % of average net assets:Commission 0.00%Taxes 0.00%Other expenses 0.00%
For the year ended 31/01/21Other Total
Value Commission Taxes expenses costsAnalysis of total purchases costs £000 £000 % £000 % £000 % £000
Equity transactions 86,073 2 – – – – – 86,075Money markets 263,603 – – – – – – 263,603Corporate actions 194 – – – – – – 194
Total 349,870 2 – – 349,872
Other TotalValue Commission Taxes expenses costs
Analysis of total sales costs £000 £000 % £000 % £000 % £000
Equity transactions 306,087 (10) – – – (6) – 306,071Money markets 267,550 – – – – – – 267,550Corporate actions 3,095 – – – – – – 3,095
Total 576,732 (10) – (6) 576,716
The Sub-fund has paid £6,882 as commission on purchases and sales of derivatives transactions for the yearended 31/01/21.
Commission, taxes and other expenses as % of average net assets:Commission 0.00%Taxes 0.00%Other expenses 0.00%

187
PUTM ACS North American Fund
Notes to the financial statements
Note 19 Portfolio transaction costs (continued)
Portfolio transaction costs are incurred by the Sub-fund when buying and sellingunderlying investments. These costs vary depending on the class of investment, countryof exchange and method of execution.
These costs can be classified as either direct or indirect transaction costs:
Direct transaction costs: Broker commissions, fees and taxes.
Indirect transaction costs: “Dealing spread” - the difference between buying and sellingprices of the underlying investments.
At the Balance sheet date the portfolio dealing spread was 0.07% (31/01/21: 0.07%)being the difference between the respective bid and offer prices for the Sub-fund’sinvestments.
Note 20 Post Balance sheet eventsAs indicated in the accounting policies in Note 1(b), the investments have been valued atclose of business on 31 January 2022. Since the balance sheet date, the bid price of eachof the Sub-fund’s unit classes have moved as follows:
Bid Price Bid Price 31/01/22 19/05/22
pence pence Movement (%)
Class ‘B’ Accumulation 123.64 114.81 -7.14Class ‘C’ Accumulation 164.22 152.49 -7.14Class ‘D’ Accumulation 165.30 153.60 -7.08Class ‘F’ Accumulation 100.91 93.78 -7.07Class ‘X’ Accumulation 158.41 147.09 -7.15
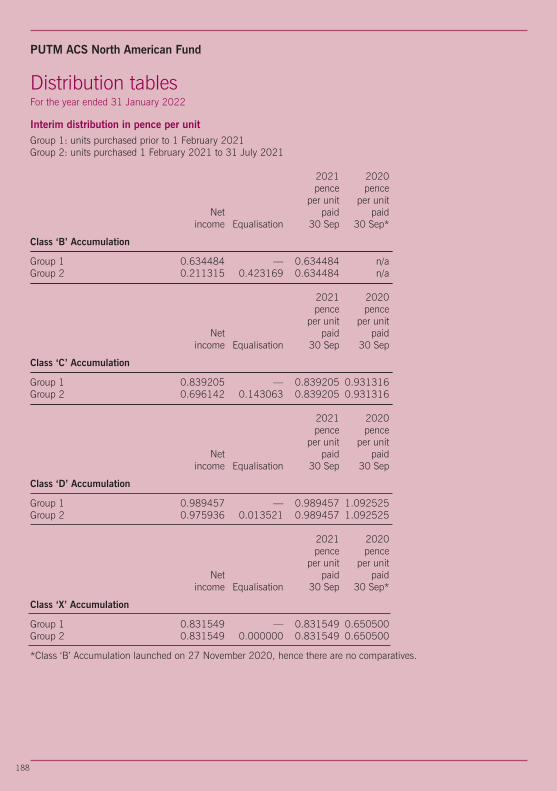
188
PUTM ACS North American Fund
Interim distribution in pence per unitGroup 1: units purchased prior to 1 February 2021Group 2: units purchased 1 February 2021 to 31 July 2021 2021 2020 pence pence per unit per unit Net paid paid income Equalisation 30 Sep 30 Sep*
Class ‘B’ Accumulation
Group 1 0.634484 — 0.634484 n/aGroup 2 0.211315 0.423169 0.634484 n/a
2021 2020 pence pence per unit per unit Net paid paid income Equalisation 30 Sep 30 Sep
Class ‘C’ Accumulation
Group 1 0.839205 — 0.839205 0.931316Group 2 0.696142 0.143063 0.839205 0.931316
2021 2020 pence pence per unit per unit Net paid paid income Equalisation 30 Sep 30 Sep
Class ‘D’ Accumulation
Group 1 0.989457 — 0.989457 1.092525Group 2 0.975936 0.013521 0.989457 1.092525
2021 2020 pence pence per unit per unit Net paid paid income Equalisation 30 Sep 30 Sep*
Class ‘X’ Accumulation
Group 1 0.831549 — 0.831549 0.650500Group 2 0.831549 0.000000 0.831549 0.650500
*Class ‘B’ Accumulation launched on 27 November 2020, hence there are no comparatives.
Distribution tablesFor the year ended 31 January 2022

189
PUTM ACS North American Fund
Final distribution in pence per unitGroup 1: units purchased prior to 1 August 2021Group 2: units purchased 1 August 2021 to 31 January 2022 2022 2021 pence pence per unit per unit Net payable paid income Equalisation 31 Mar 31 Mar
Class ‘B’ Accumulation
Group 1 0.686388 — 0.686388 0.225524Group 2 0.270115 0.416273 0.686388 0.225524
2022 2021 pence pence per unit per unit Net payable paid income Equalisation 31 Mar 31 Mar
Class ‘C’ Accumulation
Group 1 0.973050 — 0.973050 0.868620Group 2 0.350514 0.622536 0.973050 0.868620
2022 2021 pence pence per unit per unit Net payable paid income Equalisation 31 Mar 31 Mar
Class ‘D’ Accumulation
Group 1 1.074862 — 1.074862 1.023176Group 2 0.436616 0.638246 1.074862 1.023176
2022 2021 pence pence per unit per unit Net payable paid income Equalisation 31 Mar 31 Mar*
Class ‘F’ Accumulation
Group 1 0.314938 — 0.314938 n/aGroup 2 0.020252 0.294686 0.314938 n/a
*Class ‘F’ Accumulation launched on 22 October 2021, hence there are no comparatives.
Distribution tablesFor the year ended 31 January 2022

190
PUTM ACS North American Fund
Final distribution in pence per unitGroup 1: units purchased prior to 1 August 2021Group 2: units purchased 1 August 2021 to 31 January 2022 2022 2021 pence pence per unit per unit Net payable paid income Equalisation 31 Mar 31 Mar
Class ‘X’ Accumulation
Group 1 0.875900 — 0.875900 0.918272Group 2 0.875900 0.000000 0.875900 0.918272
Each Sub-fund is tax transparent for income purposes meaning that UK tax-payingUnitholders are subject to tax on their share of income, net of allowable expenses, as itarises to the Sub-fund and not on distributions of income after deduction of expenses.
On a daily basis unitholders will be advised of their share of aggregated accrued income,expenses and withholding tax paid on overseas dividends, if applicable. When a unit ispurchased during the distribution period, part of the purchase price of the unit reflectsthe relevant share of income and expenses accrued by the Sub-fund, and this will bedisclosed on the contract note. This purchased income and expense, a capital sum,should be deducted from the aggregate accrued income or expense as applicable.
The subscription price disclosed on the contract note reflects the acquisition cost, whichshould be adjusted by the capital sum referred to above.
It is the responsibility of the unitholder to maintain a record of the relevant amount(s) ofincome equalisation and to make the appropriate adjustment when completing their taxcalculations.
Distribution tablesFor the year ended 31 January 2022

191
PUTM ACS Sustainable Index European Equity Fund
Dear Investor
Welcome to the PUTM ACS Sustainable Index EuropeanEquity Fund final report for interim period to 31 January2022.
The Fund was launched on 15 October 2021 and seededon 25 January 2022. The first investment into the Fundoccurred after the end of the accounting period.
Performance Review
As the Fund was not invested until after the end of theaccounting period no performance review is available.
Investment review
Sub-fund performance: Factset: Gross of AMC: based on the movement in the Cancellation Price from 31 January2020 to 31 January 2021 in GBP. Benchmark index performance: FTSE North America Index, Total Return from 31January 2020 to 31 January 2021 in GBP).*Since launch.
Past performance is not a guide to future performance.
Please note that all past performance figures are calculated without taking the initial charge into account.
The value of units and the income from them can go down as well as up and is not guaranteed. You may not getback the full amount invested.
Standardised Past Performance
PUTM ACS North American Fund 13.98 15.67 – – –
Benchmark Index 14.03 15.66 – – –
Jan20 - Jan21 Mar 19* - Jan20% growth % growth
As the Fund was not invested until after the end of the accounting period no performance data is available.

Investment review
Market Review
European equities were affected by volatility in marketsfollowing the discovery of a new Covid-19 variant in lateNovember and geopolitical tensions between Russia andUkraine in January. Rising Covid-19 case numbers inEurope and news flow around the Omicron variant led tosharp falls in European markets in November, althoughthey rebounded in December as investors brushed off thethreat of further restrictions. The Swiss, French and Italianmarkets were particularly strong at year-end, helped bysolid economic growth in the latter two economies, withSpain the notable laggard amid the region’s main markets.
Hawkish comments from central banks, inflation concerns,as well as tightening monetary policies weighed on stocksin January. The Bank of England raised rates to 0.25% atits December meeting and, while the European CentralBank (ECB) is expected to keep rates unchanged at its nextpolicy meeting in early February, record-high food and fuelcost inflation is putting pressure on the ECB to react. Theannual inflation rate for the Eurozone reached 5.1% inJanuary from December’s 5%. Meanwhile, risinggeopolitical tensions further added to the challengingmacroeconomic backdrop, as Russian troops amassed onthe Ukrainian border towards the end of the month.
Market Outlook and Fund Strategy
Uncertainty around the new variant Omicron andgeopolitical tensions between Russia and Ukraine willcontinue to dominate news flow in the short term.However, many of the risk factors throughout 2021 havemoderated, with global vaccination rates rising and thedirection of Chinese policy becoming clearer. Meanwhile,the removal of central bank support has been priced in, tosome extent. Nevertheless, persistently high inflation andsupply-chain strains may lead to earnings pressure formany businesses.
As the market outlook was completed as of 31st January,there is no mention of the ongoing Ukraine crisis thatbegan at the end of February. Naturally, this woulddramatically affect any future expectations of marketoutlook that would not have been factored in at the time ofwriting.
192
PUTM ACS Sustainable Index European Equity Fund

193
PUTM ACS Sustainable Index European Equity Fund
Portfolio of investments (unaudited)For the period ended 31 January 2022
As there are no investments in the Sub-fund's portfolio, the portfolio statement has not been provided.

194
PUTM ACS Sustainable Index European Equity Fund
Top ten purchases and salesFor the period ended 31 January 2022
There have been no purchases or sales during the period, therefore the top ten purchases and sales havenot been provided.

195
Statistical information
Comparative table Class ‘D’ Accumulation** 31/01/22 pence Change in net assets per unitOpening net asset value per unit 100.00
Return before operating charges* 0.05 Operating charges (0.06)
Return after operating charges* (0.01)
Distributions on accumulation units 0.00Retained distributions onaccumulation units 0.00
Closing net asset value per unit 99.99
*after direct transaction costs of: –
PerformanceReturn after charges (0.01%)
Other informationClosing net asset value (£000) 68,632Closing number of units 68,640,990Operating charges 0.01%***Direct transaction costs 0.00%
Prices+
Highest unit price (pence) 100.00Lowest unit price (pence) 99.99
+ High and low price disclosures are based on quoted unit prices. Therefore, theopening and closing NAV prices may fall outside the high/low price threshold.**The Sub-fund launched on 24 January 2022, hence there are no comparatives.Therefore, this statement only covers the period from 24 January 2022 to 31 January2022.***This is an estimate due to the Sub-fund being newly launched.
PUTM ACS Sustainable Index European Equity Fund

196
Statistical information
Investment objective
The Sub-fund aims to provide a total return (a combination of capital growth and income),delivering an overall return in line with the MSCI Europe ex UK Select ESG Climate SolutionsTarget Index (the “Index”), before management fees and expenses.
Investment policy
The Sub-fund aims to achieve this objective by investing at least 90% of the portfolio inequities and equity related securities of companies that are constituents of the Index inapproximate proportion to their weightings in the Index.
From time to time, the Sub-fund may acquire or hold securities that are not indexconstituents, as a result of corporate actions.
All securities in the Sub-fund must be equity or equity related securities considered eitherlarge or midcap across Developed Markets in Europe.
Equity related securities will include convertible stocks, stock exchange listed warrants,depository receipts, and any other such
investments which entitle the holder to subscribe for or convert into the equity of thecompany and/or where the share price performance is, in the opinion of the InvestmentManager, influenced significantly by the stock market performance of the company's ordinaryshares.
The Sub-fund may also invest in other transferable securities, money-market instruments,deposits, cash and near cash and other collective investment schemes.
Derivatives will be used for efficient portfolio management only.
Investment strategy
A minimum of 90% of the Sub-fund is invested in components of the Index. The Sub-fundwill seek to physically replicate the Index. This process will involve investing in componentsof the Index, though not necessarily in the same proportions of the Index at all times.Consequently, the Sub-fund may not track the Index exactly but will contain a meaningfulexposure to the market.
Stock index futures contracts may also be used to manage the cash portion of the Sub-fund.It is intended that the Sub-fund will normally be close to fully invested as outlined above.
The Investment Manager may use various indexation or sampling techniques to achieve theobjective of tracking the Index.
In doing so the Investment Manager may use discretion in deciding which investments are tobe included in the portfolio. The number of investments so included may vary. In accordancewith the FCA Rules, the Investment Manager may at its discretion replace the current Indexwith such similar index as it may consider appropriate subject to regulatory approval.
Revenue distribution and pricing
Units of the Sub-fund are available as ‘D’ Accumulation units (where revenue is reinvested toenhance the unit price). There will be two potential distributions in each accounting year: aninterim distribution as at 31 July and a final distribution as at 31 January.
At each distribution the net revenue after deduction of expenses, from the investments of theSub-fund, is apportioned amongst the unitholders. Unitholders receive a tax voucher givingdetails of the distribution and the ACS Manager’s Report no later than two months afterthese dates.
PUTM ACS Sustainable Index European Equity Fund

Risk and reward profile
The Risk and Reward Indicator table demonstrates where the Sub-fund ranks in terms ofits potential risk and reward. The Higher the rank the greater the potential reward but thegreater the risk of losing money. It is based on past data, may change over time and maynot be a reliable indication of the future risk profile of the Sub-fund. The shaded area inthe table below shows the Sub-fund's ranking on the Risk and Reward Indicator.
Typically lower rewards, Typically higher rewards, lower risk higher risk fi
1 2 3 4 5 6 7
This Sub-fund is ranked at 6 because funds of this type have experienced high risesand falls in value in the past. Although this is a high risk ranking it is not the highest.The above figure applies to the following unit class:
• Class ‘D’ Accumulation
Please note that even the lowest risk class can lose you money and that extrememarket circumstances can mean you suffer severe losses in all cases. Please note theSub-fund’s risk category may change in the future. The indicator does not take intoaccount the following risk of investing in this Sub-fund:
• The Sub-fund may use derivatives to reduce risk or cost or to generate additionalcapital or income at low risk, or to meet its investment objective.
• Investing overseas can bring additional returns and spread risk to different markets.There are risks, however, that changes in currency rates will reduce the value ofyour investment.
• Emerging markets or less developed countries may face more political, economic orstructural challenges than developed countries. This means that your money is atgreater risk.
• Counterparty Risk: the insolvency of any institutions providing services such assafekeeping of assets or acting as counterparty to derivatives or other instruments,may expose the Sub-fund to financial loss.
For more information on the Risk and Reward profiles of our Funds, please refer to themost up to date relevant fund and Unit Class Key Investor Information Documents(KIIDs). These are available online at www.phoenixunittrust.co.uk.
197
fi
Statistical information
PUTM ACS Sustainable Index European Equity Fund

198
Annual financial statementsFor the year ended 31 January 2022
Statement of total return 31/01/22* Notes £000 £000
Income
Net capital gains/(losses) 4 – Revenue 5 –
Expenses 6 (9)
Net expense before taxation (9)
Taxation 7 –
Net expense after taxation (9)
Total deficitbefore distributions (9)
Distributions 8 –
Change in unitholders’funds from investmentactivities (9)
Statement of change in unitholders’ funds
31/01/22* £000 £000
Opening net assets –
Amounts receivableon issue of units 68,641 68,641
Change in unitholders’ funds frominvestment activities (9)
Closing net assets 68,632
*The Sub-fund launched on 24 January 2022, hence there are no comparatives.Therefore, this statement only covers the period from 24 January 2022 to 31 January 2022.
PUTM ACS Sustainable Index European Equity Fund

199
Balance sheet 31/01/22 Notes £000 £000
Assets:Fixed assets:Investments –
Current assets:Debtors 9 68,641Cash and bank balances 10 –
Total current assets 68,641
Total assets 68,641
Liabilities:Creditors:Other creditors 11 (9)
Total creditors (9)
Net assets 68,632
Unitholders’ funds 68,632
Annual financial statementsAs at 31 January 2022
PUTM ACS Sustainable Index European Equity Fund
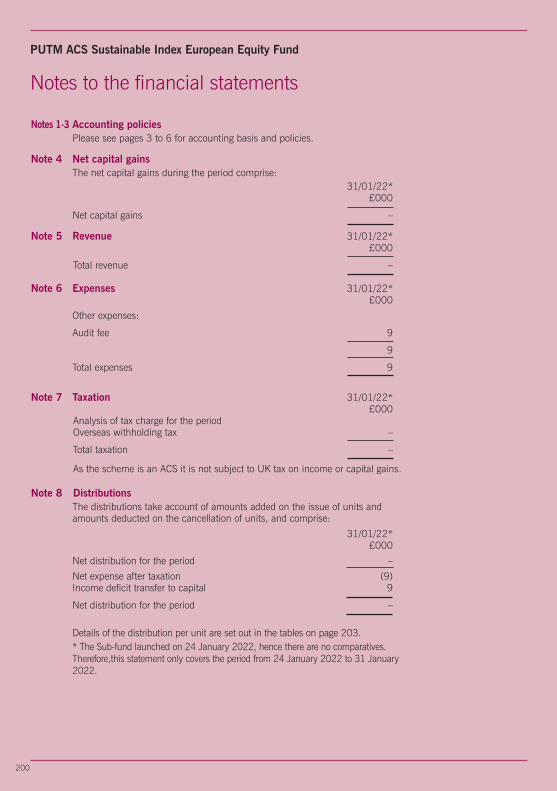
200
Notes to the financial statements
Notes 1-3 Accounting policiesPlease see pages 3 to 6 for accounting basis and policies.
Note 4 Net capital gainsThe net capital gains during the period comprise:
31/01/22* £000
Net capital gains –
Note 5 Revenue 31/01/22* £000
Total revenue –
Note 6 Expenses 31/01/22* £000
Other expenses:
Audit fee 9
9
Total expenses 9
Note 7 Taxation 31/01/22* £000 Analysis of tax charge for the period Overseas withholding tax –
Total taxation –
As the scheme is an ACS it is not subject to UK tax on income or capital gains.
Note 8 DistributionsThe distributions take account of amounts added on the issue of units andamounts deducted on the cancellation of units, and comprise:
31/01/22* £000
Net distribution for the period –
Net expense after taxation (9)Income deficit transfer to capital 9
Net distribution for the period –
Details of the distribution per unit are set out in the tables on page 203.* The Sub-fund launched on 24 January 2022, hence there are no comparatives.Therefore,this statement only covers the period from 24 January 2022 to 31 January2022.
PUTM ACS Sustainable Index European Equity Fund

201
Notes to the financial statements
Note 9 Debtors 31/01/22* £000
Creations awaiting settlement 68,641
Total debtors 68,641
Note 10 Cash and bank balances 31/01/22* £000
Total cash and bank balances –
Note 11 Other creditors 31/01/22* £000
Audit fee payable 9
Total other creditors 9
*The Sub-fund launched on 24 January 2022, hence there are no comparatives.
Note 12 Reconciliation of units Class ‘D’** Accumulation
Opening units issued at 24/01/22 –Unit movements in period:Units issued 68,640,990
Closing units at 31/01/22 68,640,990
**The Sub-fund launched on 24 January 2022. Therefore, this statement only covers the periodfrom 24 January 2022 to 31 January 2022.
Note 13 Contingencies and commitmentsAt 31 January 2022 the Sub-fund had no outstanding calls on partly paid shares, nopotential underwriting commitments or any other contingent liabilities.
Note 14 Unitholders’ fundsThere is one unit class in issue within the Sub-fund. This is Class ‘D’ Accumulation.
The ACS Manager’s periodic charge in respect of Class ‘D’ is expressed as an annualpercentage of the value of the property of the Sub-fund attributable to each unit class andis currently 0.005% in respect of Class ‘D’ units.
Consequently, the level of net revenue attributable to each unit class will differ. Should itbe necessary to wind-up the Sub-fund, each unit class will have the same rights asregards to the distribution of the property of the Sub-fund.
PUTM ACS Sustainable Index European Equity Fund

202
Notes to the financial statementsNote 15 Related party transactions
The ACS Manager is a related party to the Sub-fund by virtue of its controlling influence.
The ACS Manager is part of the Phoenix Group. Phoenix Life Limited which is also part of thePhoenix Group, is a material unitholder in the Sub-fund and therefore a related party, holding thefollowing percentage of the units at the year end.
Class ‘D’***
%
As at 31 January 2022: 100.00Details of the units issued and cancelled by the ACS Manager, Phoenix Unit Trust ManagersLimited, or its associates,are shown in the Statement of change in net assets attributable tounitholder and Note 8.Any balances due from the ACS Manager or its associates at 31 January 2022 in respect of thesetransactions are shown in Note 9 and 11.***The Sub-fund launched on 24 January 2022, hence there are no comparatives.
Note 16 Financial instrumentsThe Sub-fund launched on 24 January 2022. As of 31 January 2022 the Sub-fund held onlydebtors as financial instruments and had nil securities and nil derivative transactions.Counterparty exposureThere was no counterparty exposure held at the period end.
Currency exposureThere was no currency exposure at the period end.
Interest profileThere was no interest rate risk exposure at the period end.
Sensitivity analysisInterest rate risk sensitivityAs there are no investments in the Sub-fund’s portfolio, no sensitivity analysis has been provided.
Foreign currency risk sensitivityAs there is no exposure in currency other than sterling, no sensitivity analysis has been provided.
Market price risk sensitivityAs there are no investments in the Sub-fund’s portfolio, no sensitivity analysis has been provided.
Note 17 Fair value of investmentsAs there are no investments in the Sub-fund’s portfolio the fair value of investments has not beenprovided.
Note 18 Portfolio transaction costsThere have been no purchases or sales during the period, therefore portfolio transaction costs havenot been provided.
Note 19 Post Balance sheet eventsAs indicated in the accounting policies in Note 1(b), the investments have been valued at close ofbusiness on xx xxxxx 20xx. Since the balance sheet date, the bid price of each of the Sub-fund’s unitclasses have moved as follows:
Bid Price Bid Price 31/01/22 19/05/22
pence pence Movement (%)
Class ‘D’ Accumulation 99.99 91.71 -8.28
PUTM ACS Sustainable Index European Equity Fund

203
PUTM ACS Sustainable Index European Equity Fund
Final distribution in pence per unitDue to the net deficit of income for the D-class accumulation units for the period ending31 January 2022, no accumulation has been made.
Each Sub-fund is tax transparent for income purposes meaning that UK tax-payingUnitholders are subject to tax on their share of income, net of allowable expenses, as itarises to the Sub-fund and not on distributions of income after deduction of expenses.
On a daily basis unitholders will be advised of their share of aggregated accrued income,expenses and withholding tax paid on overseas dividends, if applicable. When a unit ispurchased during the distribution period, part of the purchase price of the unit reflects therelevant share of income and expenses accrued by the Sub-fund, and this will bedisclosed on the contract note. This purchased income and expense, a capital sum,should be deducted from the aggregate accrued income or expense as applicable.
The subscription price disclosed on the contract note reflects the acquisition cost, whichshould be adjusted by the capital sum referred to above.
It is the responsibility of the unitholder to maintain a record of the relevant amounts ofincome equalisation and to make the appropriate adjustment when completing their taxcalculations.
Distribution tableFor the period ended 31 January 2022

Dear Investor
Welcome to the PUTM ACS Sustainable Index JapanEquity Fund final report for the interim period to 31January 2022.
The Fund was launched on 15 October 2021 and seededon 25 January 2022. The first investment into the Fundoccurred after the end of the accounting period.
Performance Review
As the Fund was not invested until after the end of theaccounting period no performance review is available.
Investment review
Sub-fund performance: Factset: Gross of AMC: based on the movement in the Cancellation Price from 31 January2020 to 31 January 2021 in GBP. Benchmark index performance: FTSE North America Index, Total Return from 31January 2020 to 31 January 2021 in GBP).*Since launch.
Past performance is not a guide to future performance.
Please note that all past performance figures are calculated without taking the initial charge into account.
The value of units and the income from them can go down as well as up and is not guaranteed. You may not getback the full amount invested.
Standardised Past Performance
PUTM ACS North American Fund 13.98 15.67 – – –
Benchmark Index 14.03 15.66 – – –
Jan20 - Jan21 Mar 19* - Jan20% growth % growth
204
PUTM ACS Sustainable Index Japan Equity Fund
As the Fund was not invested until after the end of the accounting period no performance data is available.

205
PUTM ACS Sustainable Index Japan Equity Fund
Investment review
Market Review
Japanese equity sentiment turned negative in October.Prime Minister Yoshihide Suga was replaced by FumioKishida as leader of the ruling Liberal Democratic Party, andthe party comfortably retained power in the election duringthe third quarter of 2021. Kishida was initially welcomedbut equities fell as investors became concerned about taxrises. The new administration proposed a stimulus packageof almost ¥56 trillion as well as a record setting annualbudget for 2022. The package included Covid-19countermeasures, social spending for the elderly and recorddefence spending to prepare against rising regional threats.Recent polling on the government’s handling of Omicronhas been positive. Covid-19’s new Omicron variant wasfirst identified in late November and quickly spread globally.Though Japan had reopened its borders, it reversed thesechanges in late November. Cases surged early in 2022,while the government began a drive for booster shots.However, this was slower than other developed economies.
Shares fell again in January, as 2022 has started withoverall volatility in global stock markets. Investors aroundthe world sold equities, fearful of the impact of risinginflation and interest rates. The Bank of Japan (BoJ) heldrates throughout the period but will begin tapering marketsupport. Rising inflation has led to falling consumersentiment in Japan. Surveys released in the periodsuggested Kishida’s wage policies are unlikely to supportthe economy in 2022.
Recent prints of the Reuters Tankan index showedmanufacturing confidence dropping, as energy and rawmaterial costs rise. The au Jibun Bank Flash Japancomposite purchasing managers’ index report also fell atthe end of the period, led by services sector sentimentcontracting. Part of this pessimism is due to ongoing labourshortages.
Market Outlook and Fund Strategy
The escalation of the Russia-Ukraine conflict, and theimpact that it has on global commodity prices, has put achill on sentiment across global markets. While the directimpact on most Japanese corporates is minimal, theindirect impact from the sharp rise in commodity pricesputs further pressure on companies’ profitability. Broadlyspeaking, companies are passing on higher prices to theirend customers, but these actions will come with a lag,especially with the recent run up in prices. Meanwhile, thepeaking of the sixth wave of Covid-19 cases in Japanshould bolster a return to some normalcy after a tough year.With this backdrop, valuations have fallen sharply.Alongside structural improvements in governance in Japan,we are positive for Japan’s outlook over the medium tolonger term.
As the market outlook was completed as of 31st January,there is no mention of the ongoing Ukraine crisis thatbegan at the end of February. Naturally, this woulddramatically affect any future expectations of marketoutlook that would not have been factored in at the time ofwriting.
* The Sub-fund launched on 24 January 2022, hence there are no comparatives. Therefore, this statement only covers the period from24 January 2022 to 31 January 2022.

Portfolio of investments (unaudited)For the period ended 31 January 2022
As there are no investments in the Sub-fund's portfolio, the portfolio statement has not been provided.
206
PUTM ACS Sustainable Index Japan Equity Fund

207
PUTM ACS Sustainable Index Japan Equity Fund
Top ten purchases and salesFor the period ended 31 January 2022
There have been no purchases or sales during the period, therefore the top ten purchases and sales havenot been provided.

Statistical information
Comparative table Class ‘D’ Accumulation** 31/01/22 pence Change in net assets per unitOpening net asset value per unit 100.00
Return before operating charges* 0.28 Operating charges (0.35)
Return after operating charges* (0.07)
Distributions on accumulation units –Retained distributions onaccumulation units –
Closing net asset value per unit 99.93
*after direct transaction costs of: –
PerformanceReturn after charges (0.07%)
Other informationClosing net asset value (£000) 12,382Closing number of units 12,390,990Operating charges 0.01%***Direct transaction costs 0.00%
Prices+
Highest unit price (pence) 100.00Lowest unit price (pence) 99.93
+ High and low price disclosures are based on quoted unit prices. Therefore, theopening and closing NAV prices may fall outside the high/low price threshold.** The Sub-fund launched on 24 January 2022, hence there are no comparatives.Therefore, this statement only covers the period from 24 January 2022 to 31 January2022.***This is an estimate due to the Sub-fund being newly launched.
208
PUTM ACS Sustainable Index Japan Equity Fund

209
PUTM ACS Sustainable Index Japan Equity Fund
Statistical information
Investment objective
The Sub-fund aims to provide a total return (a combination of capital growth and income)delivering an overall return in line with the MSCI Japan Select ESG Climate Solutions TargetIndex (the “Index”) before management fees and expenses.
Investment policy
The Sub-fund aims to achieve its objective by investing at least 90% of the portfolio equitiesand equity related securities of companies that are constituents of the Index in approximateproportion to their weightings in the Index.
From time to time, the Sub-fund may acquire or hold securities that are not indexconstituents, as a result of corporate actions.
All securities in the Sub-fund must be equity or equity related securities considered eitherlarge or midcap on the Japanese equity markets.
Equity related securities include convertible stocks, stock exchange listed warrants,depository receipts, and any other such investments which entitle the holder to subscribe foror convert into the equity of the company and/or where the share price performance is, inthe opinion of the Investment Manager, influenced significantly by the stock marketperformance of the company's ordinary shares.
Derivatives will be used for efficient portfolio management only.
Investment strategy
A minimum of 90% of the Sub-fund is invested in components of the Index.
The Sub-fund will seek to physically replicate the Index. This process will involve investing incomponents of the Index, though not necessarily in the same proportions of the Index at alltimes. Consequently, the Sub-fund may not track the Index exactly but will contain ameaningful exposure to the market. Stock index futures contracts may also be used tomanage the cash portion of the Sub-fund. It is intended that the Sub-fund will normally beclose to fully invested as outlined above.
The Investment Manager may use various indexation or sampling techniques to achieve theobjective of tracking the Index. In doing so the Investment Manager may use discretion indeciding which investments are to be included in the portfolio. The number of investmentsso included may vary. In accordance with the FCA Rules, the Investment Manager may at itsdiscretion replace the current Index with such similar index as it may consider appropriatesubject to regulatory approval.
Revenue distribution and pricing
Units of the Sub-fund are available as Class ‘D’ Accumulation units (where revenue isreinvested to enhance the unit price). There will be two potential distributions in eachaccounting year: an interim distribution as at 31 July and a final distribution as at 31January.
At each distribution the net revenue after deduction of expenses, from the investments of theSub-fund, is apportioned amongst the unitholders. Unitholders receive a tax voucher givingdetails of the distribution and the Manager’s Report no later than two months after thesedates.

Risk and reward profile
The Risk and Reward Indicator table demonstrates where the Sub-fund ranks in terms ofits potential risk and reward. The higher the rank the greater the potential reward but thegreater the risk of losing money. It is based on past data, may change over time and maynot be a reliable indication of the future risk profile of the Sub-fund. The shaded area inthe table below shows the Sub-fund’s ranking on the Risk and Reward Indicator.
Typically lower rewards, Typically higher rewards, lower risk higher risk fi
1 2 3 4 5 6 7
This Sub-fund is ranked at 6 because funds of this type have experienced high risesand falls in value in the past. Although this is a high risk ranking it is not the highest.The above figure applies to the following unit class:
• Class ‘D’ Accumulation
Please note that even the lowest risk class can lose you money and that extrememarket circumstances can mean you suffer severe losses in all cases. Please note theSub-fund’s risk category may change in the future. The indicator does not take intoaccount the following risks of investing in this Sub-fund:
• The Sub-fund may use derivatives to reduce risk or cost or to generate additionalcapital or income at low risk, or to meet its investment objective.
• Investing overseas can bring additional returns and spread risk to different markets.There are risks, however, that changes in currency rates will reduce the value ofyour investment.
• Counterparty Risk: the insolvency of any institutions providing services such assafekeeping of assets or acting as counterparty to derivatives or other instruments,may expose the Sub-fund to financial loss.
For more information on the Risk and Reward profiles of our Funds, please refer to themost up to date relevant fund and Unit Class Key Investor Information Documents(KIIDs). These are available online at www.phoenixunittrust.co.uk.
fi
Statistical information
210
PUTM ACS Sustainable Index Japan Equity Fund

211
PUTM ACS Sustainable Index Japan Equity Fund
Annual financial statementsFor the period ended 31 January 2022
Statement of total return 31/01/22* Notes £000 £000
Income
Net capital gains 4 – Revenue 5 –
Expenses 6 (9)
Net expense before taxation (9)
Taxation 7 –
Net expense after taxation (9)
Total deficitbefore distributions (9)
Distributions 8 –
Change in unitholders’funds from investmentactivities (9)
Statement of change in unitholders’ funds
31/01/22* £000 £000
Opening net assets –
Amounts receivableon issue of units 12,391 12,391
Change in unitholders’ funds frominvestment activities (9)
Closing net assets 12,382
*The Sub-fund launched on 24 January 2022, hence there are no comparatives.Therefore, this statement only covers the period from 24 January 2022 to 31 January 2022.

Balance sheet 31/01/22 Notes £000 £000
Assets:Fixed assets:Investments –
Current assets:Debtors 9 12,391Cash and bank balances 10 –
Total current assets 12,391
Total assets 12,391
Liabilities:Creditors:Other creditors 11 (9)
Total creditors (9)
Net assets 12,382
Unitholders’ funds 12,382
Annual financial statementsAs at 31 January 2022
212
PUTM ACS Sustainable Index Japan Equity Fund

213
PUTM ACS Sustainable Index Japan Equity Fund
Notes to the financial statements
Notes 1-3 Accounting policiesPlease see pages 3 to 6 for accounting basis and policies.
Note 4 Net capital gainsThe net capital gains during the period comprise:
31/01/22* £000
Net capital gains –
Note 5 Revenue 31/01/22* £000
Total revenue –
Note 6 Expenses 31/01/22* £000
Other expenses:
Audit fee 9
9
Total expenses 9
Note 7 Taxation 31/01/22* £000 Analysis of tax charge for the period Overseas withholding tax –
Total taxation –
As the scheme is an ACS it is not subject to UK tax on income or capital gains.
Note 8 DistributionsThe distributions take account of amounts added on the issue of units andamounts deducted on the cancellation of units, and comprise:
31/01/22* £000
Net distribution for the period –
Net expense after taxation (9)Income deficit transfer to capital 9
Net distribution for the period –
Details of the distribution per unit are set out on page 216.
* The Sub-fund launched on 24 January 2022, hence there are no comparatives.Therefore, this statement only covers the period from 24 January 2022 to 31January 2022.

Notes to the financial statements
Note 9 Debtors 31/01/22* £000
Creations awaiting settlement 12,391
Total debtors 12,391
Note 10 Cash and bank balances 31/01/22* £000
Total cash and bank balances –
Note 11 Other creditors 31/01/22* £000
Audit fee payable 9
Total other creditors 9
*The Sub-fund launched on 24 January 2022, hence there are no comparatives.
Note 12 Reconciliation of units Class ‘D’ Accumulation**
Opening units issued at 24/01/22 –Unit movements in period:Units issued 12,390,990
Closing units at 31/01/22 12,390,990
**The Sub-fund launched on 24 January 2022. Therefore, this statement only covers the periodfrom 24 January 2022 to 31 January 2022.
Note 13 Contingencies and commitmentsAt 31 January 2022 the Sub-fund had no outstanding calls on partly paid shares, nopotential underwriting commitments or any other contingent liabilities.
Note 14 Unitholders’ fundsThere is one unit class in issue within the Sub-fund. This is Class ‘D’ Accumulation.The ACS Manager’s periodic charge in respect of Class ‘D’ is expressed as an annualpercentage of the value of the property of the Sub-fund attributable to each unit class andis currently 0.005% in respect of Class ‘D’ units.Consequently, the level of net revenue attributable to each unit class will differ. Should itbe necessary to wind-up the Sub-fund, each unit class will have the same rights asregards to the distribution of the property of the Sub-fund.
214
PUTM ACS Sustainable Index Japan Equity Fund

215
PUTM ACS Sustainable Index Japan Equity Fund
Notes to the financial statements
Note 15 Related party transactionsThe ACS Manager is a related party to the Sub-fund by virtue of its controlling influence.
The ACS Manager is part of the Phoenix Group. Phoenix Life Limited which is also part ofthe Phoenix Group, is a material unitholder in the Sub-fund and therefore a related party,holding the following percentage of the units at the year end.
Class ‘D’***
%
As at 31 January 2022: 100.00ACS Manager's periodic charge paid to the ACS Manager, Phoenix Unit Trust ManagersLimited, or its associates, is shown in Note 6(a) and details of the units issued andcancelled by the ACS Manager are shown in the Statement of change in net assetsattributable to unitholders and Note 8.Any balances due to/from the ACS Manager or its associates at 31 January 2022 inrespect of these transactions are shown in Notes 9 and 11.***The Sub-fund launched on 24 January 2022, hence there are no comparatives.
Note 16 Financial instrumentsThe Sub-fund launched on 24 January 2022. As of 31 January 2022 the Sub-fund heldonly debtors as financial instruments and had nil securities and nil derivative transactions.
Counterparty exposureThere was no counterparty exposure held at the period end.
Currency exposureThere was no currency exposure at the period end.
Interest profileThere was no interest rate risk exposure at the period end.
Sensitivity analysisInterest rate risk sensitivityAs there are no investments in the Sub-fund’s portfolio, no sensitivity analysis has beenprovided.
Foreign currency risk sensitivityAs there is no exposure in currency other than sterling, no sensitivity analysis has beenprovided.
Market price risk sensitivityAs there are no investments in the Sub-fund’s portfolio, no sensitivity analysis has beenprovided.
Note 17 Fair value of investmentsAs there are no investments in the Sub-fund’s portfolio the fair value of investments has notbeen provided.
Note 18 Portfolio transaction costsThere have been no purchases or sales during the period, therefore portfolio transaction costshave not been provided.

Final distribution in pence per unitDue to the net deficit of income for the D-class accumulation units for the period ending31 January 2022, no accumulation has been made.
Each Sub-fund is tax transparent for income purposes meaning that UK tax-payingUnitholders are subject to tax on their share of income, net of allowable expenses, as itarises to the Sub-fund and not on distributions of income after deduction of expenses.
On a daily basis unitholders will be advised of their share of aggregated accrued income,expenses and withholding tax paid on overseas dividends, if applicable. When a unit ispurchased during the distribution period, part of the purchase price of the unit reflects therelevant share of income and expenses accrued by the Sub-fund, and this will bedisclosed on the contract note. This purchased income and expense, a capital sum,should be deducted from the aggregate accrued income or expense as applicable.
The subscription price disclosed on the contract note reflects the acquisition cost, whichshould be adjusted by the capital sum referred to above.
It is the responsibility of the unitholder to maintain a record of the relevant amount(s) ofincome equalisation and to make the appropriate adjustment when completing their taxcalculations.
Distribution tableFor the period ended 31 January 2022
216
PUTM ACS Sustainable Index Japan Equity Fund

217
PUTM ACS Sustainable Index UK Equity Fund
Dear Investor
Welcome to the PUTM ACS Sustainable Index UK EquityFund final report for the interim period to 31 January2022.
The Fund was launched on 15 October 2021 and seededon 25 January 2022. The first investment into the Fundoccurred after the end of the accounting period.
Performance Review
As the Fund was not invested until after the end of theaccounting period no performance review is available.
Investment review
Sub-fund performance: Factset: Gross of AMC: based on the movement in the Cancellation Price from 31 January2020 to 31 January 2021 in GBP. Benchmark index performance: FTSE North America Index, Total Return from 31January 2020 to 31 January 2021 in GBP).*Since launch.
Past performance is not a guide to future performance.
Please note that all past performance figures are calculated without taking the initial charge into account.
The value of units and the income from them can go down as well as up and is not guaranteed. You may not getback the full amount invested.
Standardised Past Performance
PUTM ACS North American Fund 13.98 15.67 – – –
Benchmark Index 14.03 15.66 – – –
PUTM ACS Sustainable Index UK Equity Fund
As the Fund was not invested until after the end of the accounting period no performance data is available.

PUTM ACS Sustainable Index UK Equity Fund
Investment review
Market Review
UK equities performed well over the period despite thechallenging market backdrop for equities. The discovery ofa new Covid-19 variant in late November caused sharpfalls in most developed markets, although UK equitiesrebounded in December as investors brushed off the threatof Omicron, with the UK Government resisting calls to lockdown England before Christmas. The highly transmissiblevariant spread globally in December, with record dailyinfections in the US and most of Europe. However, initialdata indicated a less severe illness and, by the end of themonth, South Africa relaxed its curfew, stating the fourthwave may have already passed. The UK Government alsopushed ahead with the booster vaccination rollout – over28.1 million people in England had received the jab by theend of December.
In January, tightening monetary policy, inflation concernsand geopolitical tensions between Russia and Ukrainecaused UK equities to fall, although they performed betterthan other developed markets. The UK market wassupported by a strong performance from the FTSE 100Index, particularly banking companies. The banking sectorwas boosted by the Bank of England's decision inDecember to raise its base rate from 0.1% to 0.25% in theface of surging inflation, with annual consumer priceinflation reaching a decade high of 5.1% in Novemberfollowed by a 30-year high of 5.4% in December. Risingprices of clothing and second-hand cars contributed to theheadline-making inflation numbers, with ongoing globalsupply chain issues and a tight jobs market adding topressure on prices.
Market Outlook and Fund Strategy
Uncertainty around the new variant Omicron andgeopolitical tensions between Russia and Ukraine willcontinue to dominate news flow in the short term.However, many of the risk factors throughout 2021 havemoderated, with global vaccination rates rising and thedirection of Chinese policy becoming clearer. Meanwhile,the removal of central bank support has been priced in, tosome extent. Nevertheless, persistently high inflation andsupply-chain strains may lead to earnings pressure formany businesses.
As the market outlook was completed as of 31st January,there is no mention of the ongoing Ukraine crisis thatbegan at the end of February. Naturally, this woulddramatically affect any future expectations of marketoutlook that would not have been factored in at the time ofwriting.
218

219
Portfolio of investments (unaudited)For the period ended 31 January 2022
As there are no investments in the Sub-fund's portfolio, the portfolio statement has not been provided.
PUTM ACS Sustainable Index UK Equity Fund

Top ten purchases and salesFor the period ended 31 January 2022
There have been no purchases or sales during the period, therefore the top ten purchases and sales has notbeen provided.
220
PUTM ACS Sustainable Index UK Equity Fund

221
Statistical information
Comparative table Class ‘D’ Accumulation** 31/01/22 pence Change in net assets per unitOpening net asset value per unit 100.00
Return before operating charges* 0.21 Operating charges (0.26)
Return after operating charges* (0.05)
Distributions on accumulation units –Retained distributions onaccumulation units –
Closing net asset value per unit 99.95
*after direct transaction costs of: –
PerformanceReturn after charges (0.05%)
Other informationClosing net asset value (£000) 16,922Closing number of units 16,930,990Operating charges 0.01%***Direct transaction costs 0.00%
Prices+
Highest unit price (pence) 100.00Lowest unit price (pence) 99.95
+ High and low price disclosures are based on quoted unit prices. Therefore, theopening and closing NAV prices may fall outside the high/low price threshold.**The Sub-fund launched on 24 January 2022, hence there are no comparatives.Therefore, this statement only covers the period from 24 January 2022 to 31 January2022.***This is an estimate due to the Sub-fund being newly launched.
PUTM ACS Sustainable Index UK Equity Fund

Statistical information
Investment objective
The Sub-fund aims to provide a total return (a combination of capital growth and income),delivering an overall return in line with the MSCI UK IMI Select ESG Climate Solutions TargetIndex (the “Index”), before management fees and expenses.
Investment policy
The Sub-fund aims to achieve this objective by investing at least 90% of the portfolio inequities and equity related securities of companies that are constituents of the Index inapproximate proportion to their weightings in the Index.
From time to time, the Sub-fund may acquire or hold securities that are not indexconstituents, as a result of corporate actions.
Equity related securities will include convertible stocks, stock exchange listed warrants,depository receipts, and any other such investments which entitle the holder to subscribe foror convert into the equity of the company and/or where the share price performance is, inthe opinion of the Investment Manager, influenced significantly by the stock marketperformance of the company's ordinary shares.
The Sub-fund may also invest in other transferable securities, moneymarket instruments,deposits, cash and near cash and other collective investment schemes.
Derivatives will be used for efficient portfolio management only.
Investment strategy
A minimum of 90% of the Sub-fund is invested in components of the Index.
The Sub-fund will seek to physically replicate the Index. This process will involve investing incomponents of the Index, though not necessarily in the same proportions of the Index at alltimes. Consequently, the Sub-fund may not track the Index exactly but will contain ameaningful exposure to the market.
Stock index futures contracts may also be used to manage the cash portion of the Sub-fund.It is intended that the Sub-fund will normally be close to fully invested as outlined above.
The Investment Manager may use various indexation or sampling techniques to achieve theobjective of tracking the Index. In doing so the Investment Manager may use discretion indeciding which investments are to be included in the portfolio. The number of investmentsso included may vary. In accordance with the FCA Rules, the Investment Manager may at itsdiscretion replace the current Index with such similar index as it may consider appropriatesubject to regulatory approval.
Revenue distribution and pricing
Units of the Sub-fund are available as Class ‘D’ Accumulation units (where revenue isreinvested to enhance the unit price). There will be two potential distributions in eachaccounting year: an interim distribution as at 31 July and a final distribution as at 31January.
At each distribution the net revenue after deduction of expenses, from the investments of theSub-fund, is apportioned amongst the unitholders. Unitholders receive a tax voucher givingdetails of the distribution and the Manager’s Report no later than two months after thesedates.
222
PUTM ACS Sustainable Index UK Equity Fund

223
Risk and reward profile
The Risk and Reward Indicator table demonstrates where the Sub-fund ranks in terms ofits potential risk and reward. The higher the rank the greater the potential reward but thegreater the risk of losing money. It is based on past data, may change over time and maynot be a reliable indication of the future risk profile of the Sub-fund. The shaded area inthe table below shows the Sub-fund’s ranking on the Risk and Reward Indicator.
Typically lower rewards, Typically higher rewards, lower risk higher risk fi
1 2 3 4 5 6 7
This Sub-fund is ranked at 6 because funds of this type have experienced high risesand falls in value in the past. Although this is a high risk ranking it is not the highest.The above figure applies to the following unit class:
• Class ‘D’ Accumulation
Please note that even the lowest risk class can lose you money and that extrememarket circumstances can mean you suffer severe losses in all cases. Please note theSub-fund’s risk category may change in the future. The indicator does not take intoaccount the following risks of investing in this Sub-fund:
• The Sub-fund may use derivatives to reduce risk or cost or to generate additionalcapital or income at low risk, or to meet its investment objective.
• Investing overseas can bring additional returns and spread risk to different markets.There are risks, however, that changes in currency rates will reduce the value ofyour investment.
• UKs or less developed countries may face more political, economic or structuralchallenges than developed countries. This means that your money is at greater risk.
• Counterparty Risk: the insolvency of any institutions providing services such assafekeeping of assets or acting as counterparty to derivatives or other instruments,may expose the Sub-fund to financial loss.
For more information on the Risk and Reward profiles of our Funds, please refer to themost up to date relevant fund and Unit Class Key Investor Information Documents(KIIDs). These are available online at www.phoenixunittrust.co.uk.
fi
Statistical information
PUTM ACS Sustainable Index UK Equity Fund

Annual financial statementsFor the period ended 31 January 2022
Statement of total return 31/01/22* Notes £000 £000
Income
Net capital gains 4 – Revenue 5 –
Expenses 6 (9)
Net expense before taxation (9)
Taxation 7 –
Net expense after taxation (9)
Total deficitbefore distributions (9)
Distributions 8 –
Change in unitholdersfunds from investmentactivities (9)
Statement of change in unitholders’ funds
31/01/22* £000 £000
Opening net assets –
Amounts receivableon issue of units 16,931 16,931
Change in unitholders’ funds frominvestment activities (9)
Closing net assets 16,922
*The Sub-fund launched on 24 January 2022, hence there are no comparatives.Therefore, this statement only covers the period from 24 January 2022 to 31 January 2022.
224
PUTM ACS Sustainable Index UK Equity Fund

225
Balance sheet 31/01/22 Notes £000 £000
Assets:Fixed assets:Investments –
Current assets:Debtors 9 16,930Cash and bank balances 10 1
Total current assets 16,931
Total assets 16,931
Liabilities:Creditors:Other creditors 11 (9)
Total creditors (9)
Net assets 16,922
Unitholders’ funds 16,922
Annual financial statementsAs at 31 January 2022
PUTM ACS Sustainable Index UK Equity Fund

Notes to the financial statements
Notes 1-3 Accounting policiesPlease see pages 3 to 6 for accounting basis and policies.
Note 4 Net capital gainsThe net capital gains during the period comprise:
31/01/22* £000
Net capital gains –
Note 5 Revenue 31/01/22* £000
Total revenue –
Note 6 Expenses 31/01/22* £000
Other expenses:
Audit fee 9
Total expenses 9
Note 7 Taxation 31/01/22* £000 Analysis of tax charge for the period Overseas withholding tax –
Total taxation –
As the scheme is an ACS it is not subject to UK tax on income or capital gains.
Note 8 DistributionsThe distributions take account of amounts added on the issue of units andamounts deducted on the cancellation of units, and comprise:
31/01/22* £000
Net distribution for the period –
Net expense after taxation (9)Income deficit transfer to capital 9
Net distribution for the period –
Details of the distribution per unit are set out in the tables on page 229.
* The Sub-fund launched on 24 January 2022, hence there are no comparatives. Therefore,thisstatement only covers the period from 24 January 2022 to 31 January 2022.
226
PUTM ACS Sustainable Index UK Equity Fund

227
Notes to the financial statements
Note 9 Debtors 31/01/22* £000
Creations awaiting settlement 16,930
Total debtors 16,930
Note 10 Cash and bank balances 31/01/22* £000
Cash and bank balances 1
Total cash and bank balances 1
Note 11 Other creditors 31/01/22* £000
Audit fee payable 9
Total other creditors 9
*The Sub-fund launched on 24 January 2022, hence there are no comparatives.
Note 12 Reconciliation of units Class ‘D’ Accumulation**
Opening units issued at 24/01/22 –Unit movements in period:Units issued 16,930,990
Closing units at 31/01/22 16,930,990
**The Sub-fund launched on 24 January 2022. Therefore, this statement only covers the period from 24January 2022 to 31 January 2022.
Note 13 Contingencies and commitmentsAt 31 January 2022 the Sub-fund had no outstanding calls on partly paid shares, nopotential underwriting commitments or any other contingent liabilities.
Note 14 Unitholders’ fundsThere is one unit class in issue within the Sub-fund. This is Class ‘D’ Accumulation.The ACS Manager’s periodic charge in respect of Class ‘D’ is expressed as an annualpercentage of the value of the property of the Sub-fund attributable to each unit class andis currently 0.005% in respect of Class ‘D’ units.Consequently, the level of net revenue attributable to each unit class will differ. Should itbe necessary to wind-up the Sub-fund, each unit class will have the same rights asregards to the distribution of the property of the Sub-fund.
PUTM ACS Sustainable Index UK Equity Fund
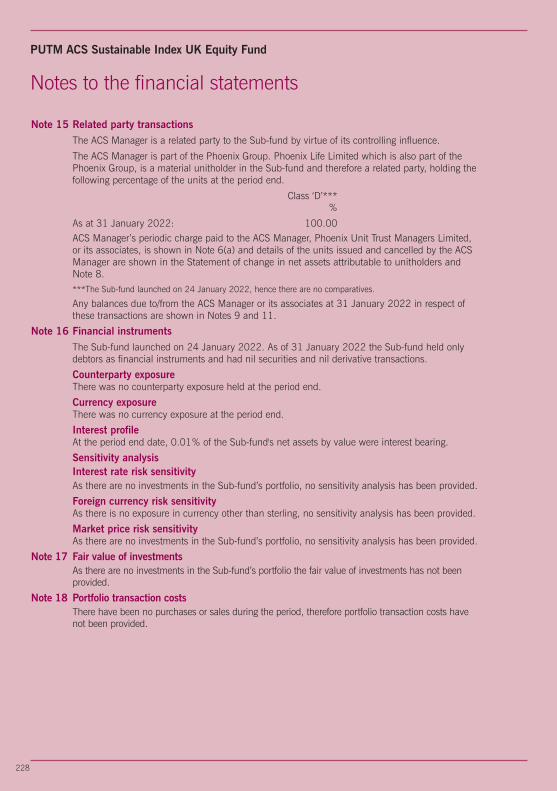
Notes to the financial statements
Note 15 Related party transactionsThe ACS Manager is a related party to the Sub-fund by virtue of its controlling influence.
The ACS Manager is part of the Phoenix Group. Phoenix Life Limited which is also part of thePhoenix Group, is a material unitholder in the Sub-fund and therefore a related party, holding thefollowing percentage of the units at the period end.
Class ‘D’*** %
As at 31 January 2022: 100.00ACS Manager’s periodic charge paid to the ACS Manager, Phoenix Unit Trust Managers Limited,or its associates, is shown in Note 6(a) and details of the units issued and cancelled by the ACSManager are shown in the Statement of change in net assets attributable to unitholders andNote 8.***The Sub-fund launched on 24 January 2022, hence there are no comparatives.
Any balances due to/from the ACS Manager or its associates at 31 January 2022 in respect ofthese transactions are shown in Notes 9 and 11.
Note 16 Financial instrumentsThe Sub-fund launched on 24 January 2022. As of 31 January 2022 the Sub-fund held onlydebtors as financial instruments and had nil securities and nil derivative transactions.
Counterparty exposureThere was no counterparty exposure held at the period end.
Currency exposureThere was no currency exposure at the period end.
Interest profileAt the period end date, 0.01% of the Sub-fund's net assets by value were interest bearing.
Sensitivity analysisInterest rate risk sensitivityAs there are no investments in the Sub-fund’s portfolio, no sensitivity analysis has been provided.
Foreign currency risk sensitivityAs there is no exposure in currency other than sterling, no sensitivity analysis has been provided.
Market price risk sensitivityAs there are no investments in the Sub-fund’s portfolio, no sensitivity analysis has been provided.
Note 17 Fair value of investmentsAs there are no investments in the Sub-fund’s portfolio the fair value of investments has not beenprovided.
Note 18 Portfolio transaction costsThere have been no purchases or sales during the period, therefore portfolio transaction costs havenot been provided.
228
PUTM ACS Sustainable Index UK Equity Fund

229
Final distribution in pence per unitDue to the net deficit of income for the D-class accumulation units for the period ending31 January 2022, no accumulation has been made.
Each Sub-fund is tax transparent for income purposes meaning that UK tax-payingunitholders are subject to tax on their share of income, net of allowable expenses, as itarises to the Sub-fund and not on distributions of income after deduction of expenses.
On a daily basis unitholders will be advised of their share of aggregated accrued income,expenses and withholding tax paid on overseas dividends, if applicable. When a unit ispurchased during the distribution period, part of the purchase price of the unit reflects therelevant share of income and expenses accrued by the Sub-fund, and this will bedisclosed on the contract note. This purchased income and expense, a capital sum,should be deducted from the aggregate accrued income or expense as applicable.
The subscription price disclosed on the contract note reflects the acquisition cost, whichshould be adjusted by the capital sum referred to above.
It is the responsibility of the unitholder to maintain a record of the relevant amounts ofincome equalisation and to make the appropriate adjustment when completing their taxcalculations.
Distribution tableFor the period ended 31 January 2022
PUTM ACS Sustainable Index UK Equity Fund

Dear Investor
Welcome to the PUTM ACS Sustainable Index US EquityFund final report for the period to 31 January 2022.
The Fund was launched on 15 October 2021 and seededon 25 January 2022. The first investment into the Fundoccurred after the end of the accounting period.
Performance Review
As the Fund was not invested until after the end of theaccounting period no performance review is available.
Investment review
Sub-fund performance: Factset: Gross of AMC: based on the movement in the Cancellation Price from 31 January2020 to 31 January 2021 in GBP. Benchmark index performance: FTSE North America Index, Total Return from 31January 2020 to 31 January 2021 in GBP).*Since launch.
Past performance is not a guide to future performance.
Please note that all past performance figures are calculated without taking the initial charge into account.
The value of units and the income from them can go down as well as up and is not guaranteed. You may not getback the full amount invested.
Standardised Past Performance
PUTM ACS North American Fund 13.98 15.67 – – –
Benchmark Index 14.03 15.66 – – –
Jan20 - Jan21 Mar 19* - Jan20% growth % growth
230
PUTM ACS Sustainable Index US Equity Fund
As the Fund was not invested until after the end of the accounting period no performance data is available.

231
PUTM ACS Sustainable Index US Equity Fund
Investment review
Market Review
Rising inflation expectations worsened and affected USstocks throughout the period. In particular, annualconsumer prices rose to 7% in December 2021, an almost40-year high. Investors were also concerned about supply-chain challenges and higher Covid-19 cases. In addition,the Federal Reserve (Fed) confirmed that it would reducebond purchases by US$15 billion each month; it doubledthe pace of bond-purchase tapering in December.Meanwhile, the S&P 500 Index, fuelled by a robust resultsseason, hit new highs for eight consecutive days inNovember – a record streak last achieved in 1997. Therally broke late in the month, as headlines becamedominated by news of the Omicron variant of Covid-19.Stocks started to move up again in December, boosted byretailers, as concerns surrounding the impact of Omicroneased.
Volatility returned in January, amid rising interest rates andgeopolitical tensions between the US and Russia. Growthstocks, such as technology companies, which are especiallysensitive to higher interest rates, were particularly hard hitin January's sell-off.
In economic news, the US labour market strengthened overthe period, with the unemployment rate dropping to 3.9%in December from 4.6% in October 2021. Meanwhile,annualised GDP growth in the fourth quarter of 2021 roseto 6.9%, driven by a resurgence in consumer spending andbusiness investment.
Market Outlook and Fund Strategy
The Russia-Ukraine conflict has introduced greateruncertainty to global markets. We believe that the conflictpresents risks of higher global inflation and the potential fordownside economic forecasts. Nonetheless, we maintainour baseline view that US economic growth will remainhealthy and the Fed will focus on raising interest rates,albeit potentially less swiftly than prior to the outbreak ofhostilities in Eastern Europe. We do not expect inflation torun out of control, as higher rates and the loosening ofsupply disruptions should reduce such pressures. As such,we are paying close attention to the oil and gas marketsand the ability of the US to increase production to easepotential supply constraints that the US market mayexperience.
As the market outlook was completed as of 31st January,there is no mention of the ongoing Ukraine crisis thatbegan at the end of February. Naturally, this woulddramatically affect any future expectations of marketoutlook that would not have been factored in at the time ofwriting.

Portfolio of investments (unaudited)For the period ended 31 January 2022
As there are no investments in the Sub-fund's portfolio, the portfolio statement has not been provided.
232
PUTM ACS Sustainable Index US Equity Fund

233
PUTM ACS Sustainable Index US Equity Fund
Top ten purchases and salesFor the period ended 31 January 2022
There have been no purchases or sales during the period, therefore the top ten purchases and saleshas not been provided.

Statistical information
Comparative table Class ‘D’ Accumulation** 31/01/22 pence Change in net assets per unitOpening net asset value per unit 100.00
Return before operating charges* 0.02 Operating charges (0.02)
Return after operating charges* –
Distributions on accumulation units –Retained distributions onaccumulation units –
Closing net asset value per unit 100.00
*after direct transaction costs of: –
PerformanceReturn after charges 0.00%
Other informationClosing net asset value (£000) 222,962Closing number of units 222,970,990Operating charges 0.01%***Direct transaction costs 0.00%
Prices+
Highest unit price (pence) 100.00Lowest unit price (pence) 100.00
+ High and low price disclosures are based on quoted unit prices. Therefore, theopening and closing NAV prices may fall outside the high/low price threshold.**The Sub-fund launched on 24 January 2022, hence there are no comparatives.Therefore, this statement only covers the period from 24 January 2022 to 31 January2022.***This is an estimate due to the Sub-fund being newly launched.
234
PUTM ACS Sustainable Index US Equity Fund
235
PUTM ACS Sustainable Index US Equity Fund
Statistical information
Investment objective
The Sub-fund aims to provide a total return (a combination of capital growth and income),delivering an overall return in line with the MSCI USA Select ESG Climate Solutions TargetIndex (the “Index”), before management fees and expenses.
Investment policy
The Sub-fund aims to achieve this objective by investing at least 90% of the portfolio inequities and equity related securities of companies that are constituents of the Index inapproximate proportion to their weightings in the Index.
All securities in the Sub-fund must be equity or equity related securities considered eitherlarge or midcap of the US and Canada markets.
Equity related securities will include convertible stocks, stock exchange listed warrants,depository receipts, and any other such investments which entitle the holder to subscribe foror convert into the equity of the company and/or where the share price performance is, inthe opinion of the Investment Manager, influenced significantly by the stock marketperformance of the company's ordinary shares.
The Sub-fund may also invest in other transferable securities, moneymarket instruments,deposits, cash and near cash and other collective investment schemes.
Derivatives will be used for efficient portfolio management only.
Investment strategy
A minimum of 90% of the Sub-fund is invested in components of the Index.
The Sub-fund will seek to physically replicate the Index. This process will involve investing incomponents of the Index, though not necessarily in the same proportions of the Index at alltimes. Consequently, the Sub-fund may not track the Index exactly but will contain ameaningful exposure to the market.
Stock index futures contracts may also be used to manage the cash portion of the Sub-fund.It is intended that the Sub-fund will normally be close to fully invested as outlined above.
The Investment Manager may use various indexation or sampling techniques to achieve theobjective of tracking the Index. In doing so the Investment Manager may use discretion indeciding which investments are to be included in the portfolio. The number of investmentsso included may vary. In accordance with the FCA Rules, the Investment Manager may at itsdiscretion replace the current Index with such similar index as it may consider appropriatesubject to regulatory approval.
Revenue distribution and pricing
Units of the Sub-fund are available as Class ‘D’ Accumulation units (where revenue isreinvested to enhance the unit price). There will be two potential distributions in eachaccounting year: an interim distribution as at 31 July and a final distribution as at 31January.
At each distribution the net revenue after deduction of expenses, from the investments of theSub-fund, is apportioned amongst the unitholders. Unitholders receive a tax voucher givingdetails of the distribution and the Manager’s Report no later than two months after thesedates.

Risk and reward profile
The Risk and Reward Indicator table demonstrates where the Sub-fund ranks in terms ofits potential risk and reward. The higher the rank the greater the potential reward but thegreater the risk of losing money. It is based on past data, may change over time and maynot be a reliable indication of the future risk profile of the Sub-fund. The shaded area inthe table below shows the Sub-fund’s ranking on the Risk and Reward Indicator.
Typically lower rewards, Typically higher rewards, lower risk higher risk fi
1 2 3 4 5 6 7
This Sub-fund is ranked at 6 because funds of this type have experienced high risesand falls in value in the past. Although this is a high risk ranking it is not the highest.
The above figure applies to the following unit class:
• Class ‘D’ Accumulation
Please note that even the lowest risk class can lose you money and that extrememarket circumstances can mean you suffer severe losses in all cases. Please note theSub-fund’s risk category may change in the future. The indicator does not take intoaccount the following risks of investing in this Sub-fund:
• The Sub-fund may use derivatives to reduce risk or cost or to generate additionalcapital or income at low risk or to meet its investment objective.
• Investing overseas can bring additional returns and spread risk to different markets.There are risks, however, that changes in currency rates will reduce the value ofyour investment.
• Emerging markets or less developed countries may face more political, economic orstructural challenges than developed countries. This means that your money is atgreater risk.
• Counterparty Risk: the insolvency of any institutions providing services such assafekeeping of assets or acting as counterparty to derivatives or other instruments,may expose the Sub-fund to financial loss.
For more information on the Risk and Reward profiles of our Funds, please refer to themost up to date relevant fund and Unit Class Key Investor Information Documents(KIIDs). These are available online at www.phoenixunittrust.co.uk.
fi
Statistical information
236
PUTM ACS Sustainable Index US Equity Fund

237
PUTM ACS Sustainable Index US Equity Fund
Annual financial statementsFor the period ended 31 January 2022
Statement of total return 31/01/22* Notes £000 £000
Income
Net capital gains 4 – Revenue 5 –
Expenses 6 (9)
Net expense before taxation (9)
Taxation 7 –
Net expense after taxation (9)
Total deficitbefore distributions (9)
Distributions 8 –
Change in unitholders’funds from investmentactivities (9)
Statement of change in unitholders’ funds
31/01/22* £000 £000
Opening net assets –
Amounts receivableon issue of units 222,971
Amounts payable oncancellation of units – 222,971
Change in unitholders’ funds frominvestment activities (9)
Closing net assets 222,962
*The Sub-fund launched on 24 January 2022, hence there are no comparatives. Therefore,this statement only covers the period from 24 January 2022 to 31 January 2022.

Balance sheet 31/01/22 Notes £000 £000
Assets:Fixed assets:Investments –
Current assets:Debtors 9 222,970Cash and bank balances 10 1
Total current assets 222,971
Total assets 222,971
Liabilities:Creditors:Other creditors 11 (9)
Total creditors (9)
Net assets 222,962
Unitholders’ funds 222,962
Annual financial statementsAs at 31 January 2022
238
PUTM ACS Sustainable Index US Equity Fund

239
PUTM ACS Sustainable Index US Equity Fund
Notes to the financial statements
Notes 1-3 Accounting policiesPlease see pages 3 to 6 for accounting basis and policies.
Note 4 Net capital gainsThe net capital gains during the period comprise:
31/01/22* £000
Net capital gains –
Note 5 Revenue 31/01/22* £000
Total revenue –
Note 6 Expenses 31/01/22* £000
Other expenses:
Audit fee 9
Total expenses 9
Note 7 Taxation 31/01/22* £000 Analysis of tax charge for the period Overseas withholding tax –
Total taxation –
As the scheme is an ACS it is not subject to UK tax on income or capital gains.
Note 8 DistributionsThe distributions take account of amounts added on the issue of units andamounts deducted on the cancellation of units, and comprise:
31/01/22* £000
Net distribution for the period –
Net revenue after taxation (9)Income deficit transfer to capital 9
Net distribution for the period –
Details of the distribution per unit are set out in the tables on page 242.
* The Sub-fund launched on 24 January 2022, hence there are no comparatives. Therefore,thisstatement only covers the period from 24 January 2022 to 31 January 2022.

Notes to the financial statements
Note 9 Debtors 31/01/22* £000
Creations awaiting settlement 222,970
Total debtors 222,970
Note 10 Cash and bank balances 31/01/22* £000
Cash and bank balances 1
Total cash and bank balances 1
Note 11 Other creditors 31/01/22* £000
Audit fee payable 9
Total other creditors 9
*The Sub-fund launched on 24 January 2022, hence there are no comparatives.
Note 12 Reconciliation of units Class ‘D’ Accumulation**
Opening units issued at 24/01/22 –Unit movements in period:Units issued 222,970,990Units cancelled –
Closing units at 31/01/22 222,970,990
**The Sub-fund launched on 24 January 2022.Therefore, this statement only covers the period from24 January 2022 to 31 January 2022.
Note 13 Contingencies and commitmentsAt 31 January 2022 the Sub-fund had no outstanding calls on partly paid shares, nopotential underwriting commitments or any other contingent liabilities.
Note 14 Unitholders’ fundsThere is one unit class in issue within the Sub-fund. This is Class ‘D’ Accumulation.The ACS Manager’s periodic charge in respect of Class ‘D’ is expressed as an annualpercentage of the value of the property of the Sub-fund attributable to each unit class andis currently 0.005% in respect of Class ‘D’ units.Consequently, the level of net revenue attributable to each unit class will differ. Should itbe necessary to wind-up the Sub-fund, each unit class will have the same rights asregards to the distribution of the property of the Sub-fund.
240
PUTM ACS Sustainable Index US Equity Fund

241
PUTM ACS Sustainable Index US Equity Fund
Notes to the financial statements
Note 15 Related party transactionsThe ACS Manager is a related party to the Sub-fund by virtue of its controlling influence.
The ACS Manager is part of the Phoenix Group. Phoenix Life Limited which is also part of thePhoenix Group, is a material unitholder in the Sub-fund and therefore a related party, holding thefollowing percentage of the units at the period end.
Class ‘D’*** %
As at 31 January 2022: 100.00ACS Manager’s periodic charge paid to the ACS Manager, Phoenix Unit Trust Managers Limited,or its associates, is shown in Note 6(a) and details of the units issued and cancelled by the ACSManager are shown in the Statement of change in net assets attributable to unitholders andNote 8.***The Sub-fund launched on 24 January 2022, hence there are no comparatives.
Note 15 Related party transactions (continued)Any balances due to/from the ACS Manager or its associates at 31 January 2022 in respect ofthese transactions are shown in Notes 9 and 11.
Note 16 Financial instrumentsThe Sub-fund launched on 24 January 2022. As of 31 January 2022 the Sub-fund held onlydebtors as financial instruments and had nil securities and nil derivative transactions.
Counterparty exposureThere was no counterparty exposure held at the period end.
Currency exposureThere was no currency exposure at the period end.
Sensitivity analysisInterest rate risk sensitivityAs there are no investments in the sub-fund’s portfolio, no sensitivity analysis has been provided.
Foreign currency risk sensitivityAs there is no exposure in currency other than sterling, no sensitivity analysis has been provided.
Market price risk sensitivityAs there are no investments in the Sub-fund’s portfolio, no sensitivity analysis has been provided.
Note 17 Fair value of investmentsAs there are no investments in the Sub-fund’s portfolio the fair value of investments has not beenprovided.
Note 18 Portfolio transaction costsThere have been no purchases or sales during the period, therefore portfolio transaction costs havenot been provided.
Note 19 Post Balance sheet eventsSince the balance sheet date, the bid price of each of the Sub-fund’s unit classes have moved asfollows:
Bid Price Bid Price 31/01/22 19/05/22
pence pence Movement (%)
Class ‘D’ Accumulation 100.00 91.99 -8.01

Final distribution in pence per unitDue to the net deficit of income for the ‘D’-class accumulation units for the period ending31 January 2022, no accumulation has been made.
Each Sub-fund is tax transparent for income purposes meaning that UK tax-payingUnitholders are subject to tax on their share of income, net of allowable expenses, as itarises to the Sub-fund and not on distributions of income after deduction of expenses.
On a daily basis unitholders will be advised of their share of aggregated accrued income,expenses and withholding tax paid on overseas dividends, if applicable. When a unit ispurchased during the distribution period, part of the purchase price of the unit reflects therelevant share of income and expenses accrued by the Sub-fund, and this will bedisclosed on the contract note. This purchased income and expense, a capital sum,should be deducted from the aggregate accrued income or expense as applicable.
The subscription price disclosed on the contract note reflects the acquisition cost, whichshould be adjusted by the capital sum referred to above.
It is the responsibility of the unitholder to maintain a record of the relevant amount(s) ofincome equalisation and to make the appropriate adjustment when completing their taxcalculations.
Distribution tableFor the period ended 31 January 2022
242
PUTM ACS Sustainable Index US Equity Fund

243
PUTM ACS UK All-Share Listed Equity Fund
Dear Investor
Welcome to the PUTM ACS UK All Share Listed EquityFund annual report for 12 months, since 31 January 2021to 31 January 2022.
Performance Review
The PUTM ACS UK All Share Listed Equity Fund returned20.52%. over the review period (Source: Invesco, for 12months to 31/01/2022). This is compared to itsbenchmark index which returned 18.90%. (Source:Invesco, FTSE All-Share Index Index for 12 months to31/01/2022).
Investment review
Source: Invesco, as of 31 January 2022.
Past performance is not a guide to future performance.
Please note that all past performance figures are calculated without taking the initial charge into account.
The value of units and the income from them can go down as well as up and is not guaranteed. You maynot get back the full amount invested.
Standardised Past Performance
PUTM ACS UK All-ShareListed Equity Fund 20.52 11.25 – – –
Benchmark Index 18.90 12.47 – – –
Jan 21 Aug 20 (inception)- Jan 22 - Jan 21% growth % growth

PUTM ACS UK All-Share Listed Equity Fund
Investment review
Portfolio and Market Review
The UK market started the review period on a positive notedue to the swift rollout of the Covid-19 vaccine andbolstered hopes of an economic rebound once lockdownrestrictions end. This positive momentum continued intoMarch, April and May, due to increased optimismsupported by the easing of Covid-19 restrictions, thecontinued progress on vaccine rollouts, favourable GDPdata from Q42020 and further economic stimulusmeasures announced. However, the Organisation forEconomic Co-operation and Development (OECD) did warnthat the UK may face a deeper economic ‘scarring’ thanother G7 economies because of the impact of Covid-19 andBrexit. In addition, some of this optimism wasovershadowed by rising inflation and a new Covid variant.In June, rising cases of the Delta Covid-19 variant delayedthe lifting of remaining restrictions. The Monetary PolicyCommittee decided to keep its benchmark interest rate atan all-time low of 0.1%. However, it warned inflation wouldsurpass 3%, well above its target of 2%, as the economyreopens from coronavirus-related lockdowns, but officialsinsisted that the surge in prices will be transitory. The UKequity market started the third quarter with a slightlypositive performance, after which gains picked up inAugust. These months were characterised by the UK’sstrong economic recovery, albeit it being slower thanpredicted and lagging the recoveries seen in the US andEurope. Equity markets were supported by strongvaccination rates, positive earnings season, favourableemployment numbers and greater clarity on the trajectory ofthe world economy. However, the UK equity market endedSeptember lower as economic growth showed signs ofslowing. Consumers generally spent less, and theconstruction sector contracted for the fourth consecutivemonth due to a shortage of raw materials. The UK equitymarket finished the last fourth quarter of the year on apositive note, driven by promising economic data, strongemployment numbers and predictions of faster economicgrowth and lower borrowings, despite continued supply andstaff shortages. Furthermore, the newly discovered Covid-variant Omicron that spurred significant concerns aboutfurther economic recovery turned out to result in lowerhospitalisation rates. Finally, the UK Equity market endedthe reporting period in neutral territory, amid a turbulent
start to the new year due to fears over interest rate hikes, acontinued rise in inflation, and geopolitical tensions inUkraine. UK inflation rose to its highest level in 30 years asit hit 5.4 per cent at the end of 2021, which put furtherpressure on the Bank of England to raise interest ratesagain as the cost of living continued to squeezehouseholds. Sterling climbed to its strongest level againstthe euro in nearly two years, while also hitting a near three-month high against the US dollar.
The UK Enhanced strategy implements diversified factorexposures to the proprietary factors Momentum, Qualityand Value in a strictly risk controlled framework. Theapproach overweights stocks with attractive factorexposures relative to its benchmark subject to riskconstraints. The resulting portfolio is a disciplined risk-managed multi-factor strategy that seeks to earn factorpremiums while staying away from risk factors deemed notrewarding. It efficiently uses its risk budget (tracking error)to apply diversified factor weightings relative to acapitalization-weighted index.
Over the reporting period, the multi-factor modelcontributed positively to the fund’s relative performance.Performance was mainly driven by positive contributionsfrom the Value factor, as attractively valued stocksoutperformed the broader market, in particular at thebeginning of 2022. Contributions from Momentum factorswere also positive. Here, the factor performance was mainlydriven by stocks with positive earnings momentum. Stockswith positive price momentum contributed positively aswell. Contributions from the Quality factor, which favourscompanies with a strong balance sheet, were muted.Implied active weights in sectors, a residual of our multi-factor portfolio optimisation, and other risk factors that arestrictly controlled during the optimisation, contributedslightly positively.
Market Outlook and Fund Strategy
The fund strategy is based on a research-driven,quantitative, bottom-up multi-factor investment process.The Invesco Quantitative Strategies (IQS) multi-factor UKEnhanced strategy evaluates the attractiveness of stocksbased on the proprietary IQS factors Momentum (PriceMomentum and Earnings Momentum), Quality and Value
244

245
PUTM ACS UK All-Share Listed Equity Fund
Investment review
and invests in stocks with high exposure to these factors.Academics as well as practitioners agree that factors haveproven to explain wide parts of both returns and risks inequity markets over the long term. Over a full market cycle,the major part of relative performance is expected to bedriven by these factors. In terms of portfolio construction,the IQS team tightly constrains the risks taken in sectorsand industries, and over time the contribution to return fromthese sources is expected to be marginal.
The IQS team continues to expect the market to rewardstocks with rising earnings outlooks, positive pricemomentum, strong fundamentals and attractive valuationsgoing forward. Based on the IQS tactical asset allocationmodel (not applied to the PUTM ACS UK All Share ListedEquity Fund), the team considers the UK Equity marketattractively valued, to have low levels of risk aversion and apositive price trend. On the other hand, the economicoutlook is in neutral territory.
As the market outlook was completed as of 31st January,there is no mention of the ongoing Ukraine crisis thatbegan at the end of February. Naturally, this woulddramatically affect any future expectations of marketoutlook that would not have been factored in at the time ofwriting.

Portfolio of investments (unaudited)
Investments held at 31 January 2022 Market Percentage of value total net assets Holding Investment £000 %
UK Equities (31/01/21– 98.11%) 96.76 Aerospace & Defence 0.22 201,158 BAE Systems 1,161 0.03 935,513 Chemring Group 2,535 0.06 2,146,975 QinetiQ 5,750 0.13
Alternative Energy 0.03 940,414 Bluefield Solar Income Fund 1,164 0.03
Banks 7.53 35,868,982 Barclays 70,741 1.65 31,206,721 HSBC Holdings 164,615 3.83 120,859,101 Lloyds Banking Group 61,699 1.44 8,655,855 NatWest Group 20,973 0.49 281,673 Standard Chartered 1,512 0.04 1,817,575 Virgin Money UK 3,453 0.08
Beverages 3.10 228,258 Coca Cola 5,570 0.13 3,421,509 Diageo 127,383 2.97
Chemicals 0.47 1,007,320 Johnson Matthey 19,537 0.45 295,092 Synthomer 1,076 0.02
Construction & Materials 1.14 446,308 Balfour Beatty 1,121 0.03 797,419 CRH (London Listed) 29,600 0.69 198,506 Genuit Group 1,132 0.03 181,786 Marshalls Group 1,273 0.03 51,277 Morgan Sindall Group 1,085 0.03 1,411,249 Redrow 8,747 0.20 100,540 RHI Magnesita 3,420 0.08 69,325 Travis Perkins 1,031 0.02 305,114 Tyman 1,137 0.03
Electricity 1.20 2,018,895 Drax Group 12,134 0.28 2,496,902 SSE 39,513 0.92
Electronic & Electrical Equipments 0.60 36,357 BH Global* – 0.00 376,532 Morgan Advanced Materials 1,205 0.03 78,919 Oxford Instruments 1,709 0.04 23,262 Renishaw 1,055 0.02 326,792 Rotork 1,102 0.03 555,742 Spectris 18,706 0.44 34,639 XP Power 1,683 0.04
PUTM ACS UK All-Share Listed Equity Fund
246

247
PUTM ACS UK All-Share Listed Equity Fund
Portfolio of investments (unaudited)
Investments held at 31 January 2022 Market Percentage of value total net assets Holding Investment £000 %
Equity Investment Instruments 3.72 365,344 Aberdeen Asia Income Fund 822 0.02 93,485 Aberdeen China Investment 628 0.01 629,781 Aberdeen Diversified Income and Growth Trust 639 0.01 231,772 Aberdeen New Dawn Investment Trust 702 0.02 113,527 Aberdeen New India Investment Trust 668 0.02 184,288 Aberdeen UK Smaller Companies Growth Trust 1,187 0.03 161,888 Aberforth Smaller Companies 2,318 0.05 519,122 Alliance Trust 5,103 0.12 236,824 Asia Dragon Trust 1,156 0.03 869,770 Avi Global Trust 1,762 0.04 140,484 Baillie Gifford China Growth Trust 474 0.01 162,143 Baillie Gifford Japan Investment Trust 1,365 0.03 575,614 Baillie Gifford Shin Nippon Investment 998 0.02 293,770 Baillie Gifford UK Growth Fund 596 0.01 79,363 Biotech Growth Trust 737 0.02 429,931 BlackRock Frontiers Investment Trust 546 0.01 166,074 BlackRock Greater European Investment Trust 980 0.02 88,962 BlackRock Smaller Companies 1,612 0.04 181,527 BlackRock Throgmorton Trust 1,512 0.04 319,030 BlackRock World Mining Investment Trust 1,997 0.05 215,413 BMO Capital and Income Investment Trust 707 0.02 148,374 BMO Private Equity Trust 712 0.02 62,645 Brunner Investment Trust 658 0.02 26,769 Capital Gearing Trust 1,357 0.03 736,176 City of London Investment Trust 2,967 0.07 1,038,018 CQS New City High Yield Fund 575 0.01 323,041 Dragon Capital Vietnam Enterprise Investment 2,394 0.06 296,976 Dunedin Income Growth Investment Trust 909 0.02 309,568 Edinburgh Investment Trust 1,966 0.05 177,763 European Opportunities Trust 1,299 0.03 141,683 Fidelity Asian Values Investment Trust 665 0.02 252,099 Fidelity Japanese Values Investment Trust 447 0.01 373,484 Finsbury Growth and Income Trust 3,238 0.08 899,116 Foreign & Colonial Investment Trust 7,741 0.18 52,603 Fundsmith Emerging Equities Trust 652 0.02 1,574,585 GCP Infrastructure Investments 1,644 0.04 125,898 Graphite Enterprise Trust 1,503 0.03 45,668 Henderson European Focus Trust 701 0.02 278,955 Henderson Far East Income 812 0.02 395,374 Henderson International Income Trust 666 0.02 135,195 Henderson Smaller Companies Investment Trust 1,509 0.03 109,641 Herald Investment Trust 2,215 0.05
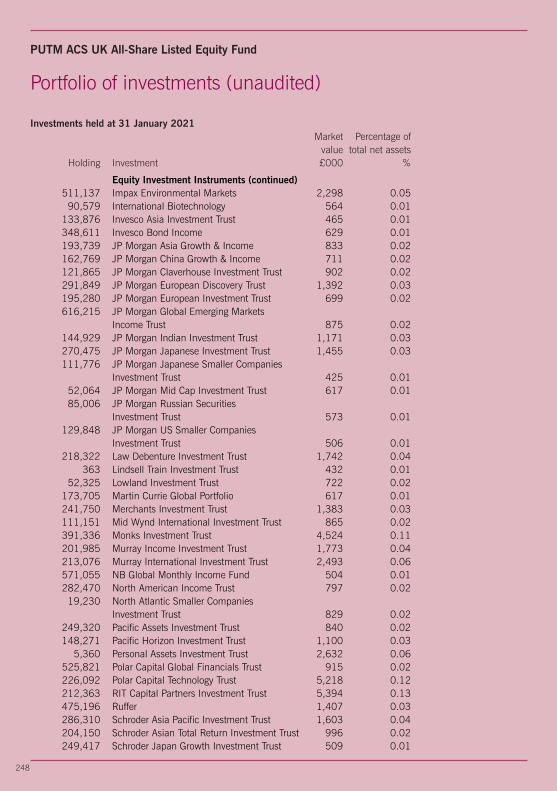
PUTM ACS UK All-Share Listed Equity Fund
Portfolio of investments (unaudited)
Investments held at 31 January 2021 Market Percentage of value total net assets Holding Investment £000 %
Equity Investment Instruments (continued) 511,137 Impax Environmental Markets 2,298 0.05 90,579 International Biotechnology 564 0.01 133,876 Invesco Asia Investment Trust 465 0.01 348,611 Invesco Bond Income 629 0.01 193,739 JP Morgan Asia Growth & Income 833 0.02 162,769 JP Morgan China Growth & Income 711 0.02 121,865 JP Morgan Claverhouse Investment Trust 902 0.02 291,849 JP Morgan European Discovery Trust 1,392 0.03 195,280 JP Morgan European Investment Trust 699 0.02 616,215 JP Morgan Global Emerging Markets Income Trust 875 0.02 144,929 JP Morgan Indian Investment Trust 1,171 0.03 270,475 JP Morgan Japanese Investment Trust 1,455 0.03 111,776 JP Morgan Japanese Smaller Companies Investment Trust 425 0.01 52,064 JP Morgan Mid Cap Investment Trust 617 0.01 85,006 JP Morgan Russian Securities Investment Trust 573 0.01 129,848 JP Morgan US Smaller Companies Investment Trust 506 0.01 218,322 Law Debenture Investment Trust 1,742 0.04 363 Lindsell Train Investment Trust 432 0.01 52,325 Lowland Investment Trust 722 0.02 173,705 Martin Currie Global Portfolio 617 0.01 241,750 Merchants Investment Trust 1,383 0.03 111,151 Mid Wynd International Investment Trust 865 0.02 391,336 Monks Investment Trust 4,524 0.11 201,985 Murray Income Investment Trust 1,773 0.04 213,076 Murray International Investment Trust 2,493 0.06 571,055 NB Global Monthly Income Fund 504 0.01 282,470 North American Income Trust 797 0.02 19,230 North Atlantic Smaller Companies Investment Trust 829 0.02 249,320 Pacific Assets Investment Trust 840 0.02 148,271 Pacific Horizon Investment Trust 1,100 0.03 5,360 Personal Assets Investment Trust 2,632 0.06 525,821 Polar Capital Global Financials Trust 915 0.02 226,092 Polar Capital Technology Trust 5,218 0.12 212,363 RIT Capital Partners Investment Trust 5,394 0.13 475,196 Ruffer 1,407 0.03 286,310 Schroder Asia Pacific Investment Trust 1,603 0.04 204,150 Schroder Asian Total Return Investment Trust 996 0.02 249,417 Schroder Japan Growth Investment Trust 509 0.01
248

249
PUTM ACS UK All-Share Listed Equity Fund
Investments held at 31 January 2022 Market Percentage of value total net assets Holding Investment £000 %
Equity Investment Instruments (continued) 80,609 Schroder UK Mid Cap Fund 514 0.01 1,635,458 Schroder UK Public Private Trust 464 0.01 299,119 Scottish American Investment Trust 1,508 0.03 121,070 Scottish Investment Trust 1,067 0.02 2,402,728 Scottish Mortgage Investment Trust 25,913 0.60 51,101 Scottish Oriental Smaller Companies 575 0.01 1,521,935 SDCL Energy Efficiency Income Trust 1,727 0.04 2,893,368 Sequoia Economic Infrastructure Income Fund 2,969 0.07 138,011 Standard Life European Private Equity Trust 737 0.02 130,949 Temple Bar Investment Trust 1,579 0.04 762,304 The European Smaller Companies Trust 1,265 0.03 572,953 TR Property Investment Trust 2,807 0.07 690,660 Troy Income & Growth Trust 522 0.01 374,833 Utilico Emerging Markets Trust 810 0.02 287,566 VinaCapital Vietnam Opportunity Fund 1,472 0.03 107,323 Worldwide Healthcare Trust 3,348 0.08
Financial Services 4.73 3,319,588 3i Group 45,478 1.06 763,951 Apax Global Alpha 1,597 0.04 739,373 Brewin Dolphin 2,418 0.06 930,385 Chrysalis Investment 1,819 0.04 75,913 Hargreaves Lansdown 1,018 0.02 452,252 Henderson EuroTrust 635 0.01 1,704,836 IG Group Holdings 13,886 0.32 267,063 Intermediate Capital Group 5,064 0.12 2,869,823 International Public Partnership 4,810 0.11 5,150,961 Investec 21,861 0.51 3,729,883 IP Group 3,592 0.08 126,536 Liontrust Asset Management 2,052 0.05 589,018 London Stock Exchange 42,515 0.99 5,950,779 M&G Prudential 12,824 0.30 5,910,311 Man Group 11,371 0.26 362,999 Montanaro European Smaller Companies Trust 624 0.01 326,333 Network International 857 0.02 846,337 Octopus Renewables Infrastructure Trust 899 0.02 251,521 OSB Group 1,380 0.03 498,997 Petershill Partners 1,073 0.02 826,515 Plus500 12,146 0.28 2,852,556 Quilter 3,901 0.09 499,388 Schroder Oriental Income Fund 1,333 0.03
Portfolio of investments (unaudited)
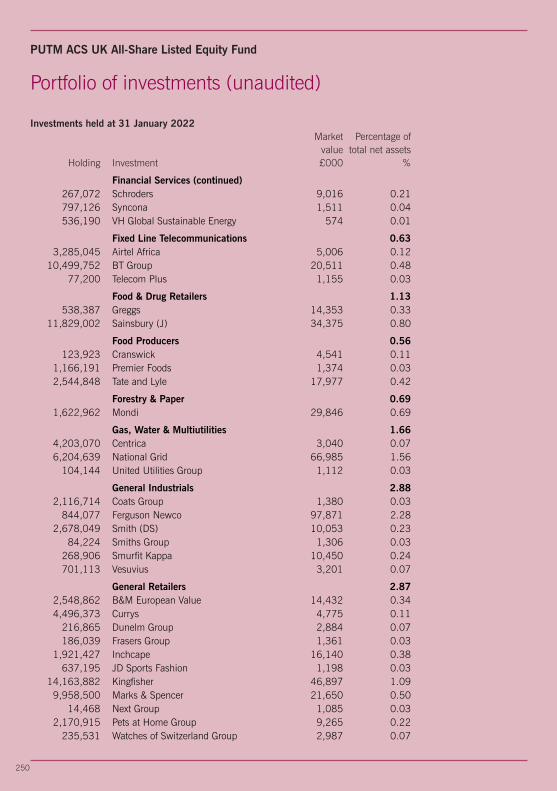
PUTM ACS UK All-Share Listed Equity Fund
Portfolio of investments (unaudited)
Investments held at 31 January 2022 Market Percentage of value total net assets Holding Investment £000 %
Financial Services (continued) 267,072 Schroders 9,016 0.21 797,126 Syncona 1,511 0.04 536,190 VH Global Sustainable Energy 574 0.01
Fixed Line Telecommunications 0.63 3,285,045 Airtel Africa 5,006 0.12 10,499,752 BT Group 20,511 0.48 77,200 Telecom Plus 1,155 0.03
Food & Drug Retailers 1.13 538,387 Greggs 14,353 0.33 11,829,002 Sainsbury (J) 34,375 0.80
Food Producers 0.56 123,923 Cranswick 4,541 0.11 1,166,191 Premier Foods 1,374 0.03 2,544,848 Tate and Lyle 17,977 0.42
Forestry & Paper 0.69 1,622,962 Mondi 29,846 0.69
Gas, Water & Multiutilities 1.66 4,203,070 Centrica 3,040 0.07 6,204,639 National Grid 66,985 1.56 104,144 United Utilities Group 1,112 0.03
General Industrials 2.88 2,116,714 Coats Group 1,380 0.03 844,077 Ferguson Newco 97,871 2.28 2,678,049 Smith (DS) 10,053 0.23 84,224 Smiths Group 1,306 0.03 268,906 Smurfit Kappa 10,450 0.24 701,113 Vesuvius 3,201 0.07
General Retailers 2.87 2,548,862 B&M European Value 14,432 0.34 4,496,373 Currys 4,775 0.11 216,865 Dunelm Group 2,884 0.07 186,039 Frasers Group 1,361 0.03 1,921,427 Inchcape 16,140 0.38 637,195 JD Sports Fashion 1,198 0.03 14,163,882 Kingfisher 46,897 1.09 9,958,500 Marks & Spencer 21,650 0.50 14,468 Next Group 1,085 0.03 2,170,915 Pets at Home Group 9,265 0.22 235,531 Watches of Switzerland Group 2,987 0.07
250

251
PUTM ACS UK All-Share Listed Equity Fund
Investments held at 31 January 2022 Market Percentage of value total net assets Holding Investment £000 %
Healthcare Equipment & Services 0.30 7,294,969 ConvaTec Group 12,803 0.30 540,763 NMC Health - 0.00
Household Goods 2.67 5,652,280 Barratt Developments 34,569 0.80 34,009 Bellway 965 0.02 318,915 Crest Nicholson Holdings 1,021 0.02 1,804,244 Persimmon 43,176 1.00 514,323 Reckitt Benckiser 30,911 0.72 754,081 Taylor Wimpey 1,137 0.03 353,691 Vistry Group 3,617 0.08
Industrial Engineering 0.44 1,090,803 IMI 17,966 0.42 7,900 Spirax Sarco Engineering 1,047 0.02
Industrial Metals 0.65 4,007,369 Evraz Group 20,009 0.47 3,286,289 Ferrexpo 7,946 0.18
Industrial Transportation 0.75 29,796 Clarkson 979 0.02 7,087,761 Royal Mail 31,215 0.73
Life Insurance 3.20 10,753,264 Aviva 46,691 1.09 15,627,609 Legal & General 44,914 1.05 2,262,175 Prudential 27,949 0.65 1,048,972 St.James’s Place 15,918 0.37 780,768 Standard Life Aberdeen 1,881 0.04
Media 3.34 116,146 Euromoney Institutional Investor 1,059 0.02 183,249 Future 5,758 0.13 22,911,573 ITV 25,684 0.60 2,497,615 RELX 56,646 1.32 4,738,893 WPP 54,545 1.27
Mining 6.11 673,778 Anglo American 21,750 0.51 1,411,743 Centamin 1,254 0.03 24,995,742 Glencore 95,734 2.23 106,396 Polymetal International 1,129 0.03 2,742,775 Rio Tinto 142,213 3.31
Mobile Telecommunications 1.22 40,226,390 Vodafone Group 52,302 1.22
Portfolio of investments (unaudited)

PUTM ACS UK All-Share Listed Equity Fund
Portfolio of investments (unaudited)
Investments held at 31 January 2022 Market Percentage of value total net assets Holding Investment £000 %
Non-Equity Investment Instruments 0.21 58,281 Aberdeen Standard Asia Focus 784 0.02 1,211,858 Bilfinger Berger Global Infrastructure SICAV~ 2,089 0.05 702,820 Diverse Income Trust 777 0.02 615,333 Fidelity China Special Situations 1,840 0.04 158,979 Fidelity Emerging Markets 1,238 0.03 410,153 Fidelity Special Values 1,230 0.03 248,992 Polar Capital Global Healthcare Growth & Income Trust 685 0.02
Non-Life Insurance 0.55 380,676 Admiral Group 11,968 0.28 3,763,763 Direct Line Insurance Group 11,472 0.27
Oil & Gas Producers 7.94 23,482,201 BP 89,890 2.09 4,022,079 Diversified Gas & Oil 4,271 0.10 13,105,965 Royal Dutch Shell 247,126 5.75
Oil Equipment & Services 0.15 2,946,520 John Wood Group 6,553 0.15
Other Equities 0.33 722,652 Allianz Technology Trust 2,063 0.05 325,964 Augmentum Fintech 445 0.01 673,806 Baillie Gifford European Growth Trust 817 0.02 2,296,236 Bankers Investment Trust 2,627 0.06 93,462 Pennon Group 1,012 0.02 2,068,871 Templeton Emerging Markets Investment Trust 3,587 0.08 1,339,308 Tesco 3,978 0.09
Personal Goods 3.39 54,306 Burberry Group 1,014 0.02 767,414 PZ Cussons 1,473 0.03 3,792,590 Unilever 143,644 3.34
Pharmaceuticals & Biotechnology 10.10 2,345,461 AstraZeneca 202,085 4.70 250,011 Dechra Pharmaceuticals 10,370 0.24 11,909,859 GlaxoSmithKline 195,655 4.55 1,190,693 Hikma Pharmaceuticals 24,743 0.58 544,658 Indivior 1,224 0.03
Real Estate & Investment Services 2.88 1,022,772 3i Infrastructure Fund 3,534 0.08 547,452 Baillie Gifford US Growth Trust 1,278 0.03 965,851 BB Healthcare Trust 1,613 0.04
252
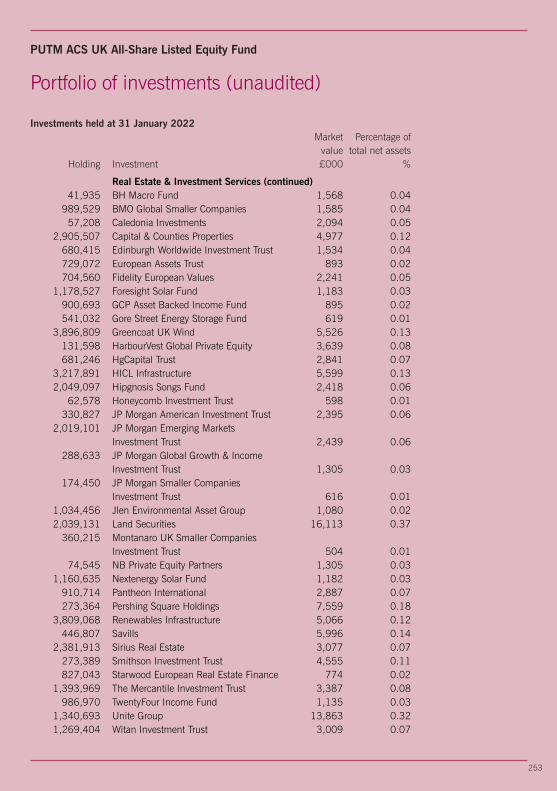
253
PUTM ACS UK All-Share Listed Equity Fund
Investments held at 31 January 2022 Market Percentage of value total net assets Holding Investment £000 %
Real Estate & Investment Services (continued) 41,935 BH Macro Fund 1,568 0.04 989,529 BMO Global Smaller Companies 1,585 0.04 57,208 Caledonia Investments 2,094 0.05 2,905,507 Capital & Counties Properties 4,977 0.12 680,415 Edinburgh Worldwide Investment Trust 1,534 0.04 729,072 European Assets Trust 893 0.02 704,560 Fidelity European Values 2,241 0.05 1,178,527 Foresight Solar Fund 1,183 0.03 900,693 GCP Asset Backed Income Fund 895 0.02 541,032 Gore Street Energy Storage Fund 619 0.01 3,896,809 Greencoat UK Wind 5,526 0.13 131,598 HarbourVest Global Private Equity 3,639 0.08 681,246 HgCapital Trust 2,841 0.07 3,217,891 HICL Infrastructure 5,599 0.13 2,049,097 Hipgnosis Songs Fund 2,418 0.06 62,578 Honeycomb Investment Trust 598 0.01 330,827 JP Morgan American Investment Trust 2,395 0.06 2,019,101 JP Morgan Emerging Markets Investment Trust 2,439 0.06 288,633 JP Morgan Global Growth & Income Investment Trust 1,305 0.03 174,450 JP Morgan Smaller Companies Investment Trust 616 0.01 1,034,456 Jlen Environmental Asset Group 1,080 0.02 2,039,131 Land Securities 16,113 0.37 360,215 Montanaro UK Smaller Companies Investment Trust 504 0.01 74,545 NB Private Equity Partners 1,305 0.03 1,160,635 Nextenergy Solar Fund 1,182 0.03 910,714 Pantheon International 2,887 0.07 273,364 Pershing Square Holdings 7,559 0.18 3,809,068 Renewables Infrastructure 5,066 0.12 446,807 Savills 5,996 0.14 2,381,913 Sirius Real Estate 3,077 0.07 273,389 Smithson Investment Trust 4,555 0.11 827,043 Starwood European Real Estate Finance 774 0.02 1,393,969 The Mercantile Investment Trust 3,387 0.08 986,970 TwentyFour Income Fund 1,135 0.03 1,340,693 Unite Group 13,863 0.32 1,269,404 Witan Investment Trust 3,009 0.07
Portfolio of investments (unaudited)

PUTM ACS UK All-Share Listed Equity Fund
Portfolio of investments (unaudited)
Investments held at 31 January 2022 Market Percentage of value total net assets Holding Investment £000 %
Real Estate Investment Trust 1.78 663,690 Aberdeen Standard European Real Estate Investment Trust 733 0.02 1,918,486 Assura Real Estate Investment Trust 1,283 0.03 323,805 Big Yellow Group Real Estate Investment Trust 4,828 0.11 2,135,492 British Land Real Estate Investment Trust 11,749 0.27 107,705 Derwent London Real Estate Investment Trust 3,666 0.09 535,363 Great Portland Real Estate Investment Trust 4,077 0.09 3,550,622 Hammerson 1,375 0.03 1,470,734 LondonMetric Property 3,921 0.09 173,701 Safestore Holdings Real Estate Investment Trust 2,199 0.05 2,184,747 Segro Real Estate Investment Trust 28,445 0.66 483,345 Shaftesbury Real Estate Investment Trust 2,999 0.07 3,711,655 Tritax Big Box Real Estate Investment Trust 8,811 0.21 292,618 Workspace Group Real Estate Investment Trust 2,471 0.06
Software & Computer Services 2.90 3,972,296 Auto Trader Group 26,511 0.62 310,878 Computacenter 8,263 0.19 294,383 FDM Group Holdings 3,144 0.07 228,078 Kainos Group 3,469 0.08 2,455,330 Micro Focus International 11,108 0.26 4,159,293 Rightmove 27,027 0.63 5,378,416 Sage Group 38,757 0.90 388,158 Softcat 6,374 0.15
Support Services 6.25 1,677,736 Ashtead Group 87,980 2.05 593,302 Babcock International 1,791 0.04 987,268 Biffa 3,347 0.08 1,474,337 Bunzl 40,795 0.95 520,210 DCC (London listed) 32,284 0.75 42,658 Diploma 1,174 0.03 118,933 Electrocomponents 1,321 0.03 1,241,653 Experian Group 38,206 0.89 958,563 Grafton Group 11,023 0.26 6,006,158 Hays 8,643 0.20 1,724,649 Howden Joinery Group 14,004 0.33 319,900 IntegraFin Holdings 1,575 0.04 225,547 Intertek Group 12,049 0.28 1,228,013 PageGroup 7,116 0.17 921,442 Redde Northgate 3,534 0.08 2,214,236 Serco Group 2,963 0.07
254

255
PUTM ACS UK All-Share Listed Equity Fund
Investments held at 31 January 2022 Market Percentage of value total net assets Holding Investment £000 %
Technology Hardware & Equipment 0.16 2,811,158 Spirent Communications 6,910 0.16
Tobacco 5.60 5,234,868 British American Tobacco 165,579 3.85 4,299,384 Imperial Brands 75,304 1.75
Travel & Leisure 2.68 2,024,952 888 Holdings 5,164 0.12 3,564,451 Compass Group 59,473 1.38 2,247,587 Domino’s Pizza 8,689 0.20 160,854 easyJet 994 0.02 9,879 Flutter Entertainment 1,105 0.03 315,122 InterContinental Hotels 15,312 0.36 662,397 International Consolidated Airlines 1,033 0.02 429,006 Mitchells & Butlers 1,073 0.02 560,527 Wizz Air Holdings 22,617 0.53
Futures (31/01/21– (0.02%)) 0.02 1,363 ICF FTSE 100 Index Future March 2022 752 0.02 Portfolio of investments 4,157,462 96.78 Net other assets 138,284 3.22
Net assets 4,295,746 100.00
Unless otherwise stated, all investments are approved securities being either officially listed in amember state or traded on or under the rules of an eligible securities market.The counterparty for the Future is Merrill Lynch International.
*Suspended security
Portfolio of investments (unaudited)

PUTM ACS UK All-Share Listed Equity Fund
Top ten purchases and salesFor the year ended 31 January 2022
Purchases Cost£000
GlaxoSmithKline 82,649Glencore 71,988Ashtead Group 66,753Diageo 46,047Ferguson Newco 41,230Compass Group 40,097Wizz Air Holdings 36,778Next Group 35,163Johnson Matthey 33,139British American Tobacco 32,912
Subtotal 486,756Other purchases 717,115
Total purchases for the year 1,203,871
Sales Proceeds£000
BHP Group 131,997Anglo American 70,194BP 51,552Prudential 48,069Flutter Entertainment 45,459Next Group 43,736HSBC Holdings 43,210AstraZeneca 41,803Diageo 40,114
Reckitt Benckiser 35,562
Subtotal 551,696Other sales 944,925
Total sales for the year 1,496,621
256
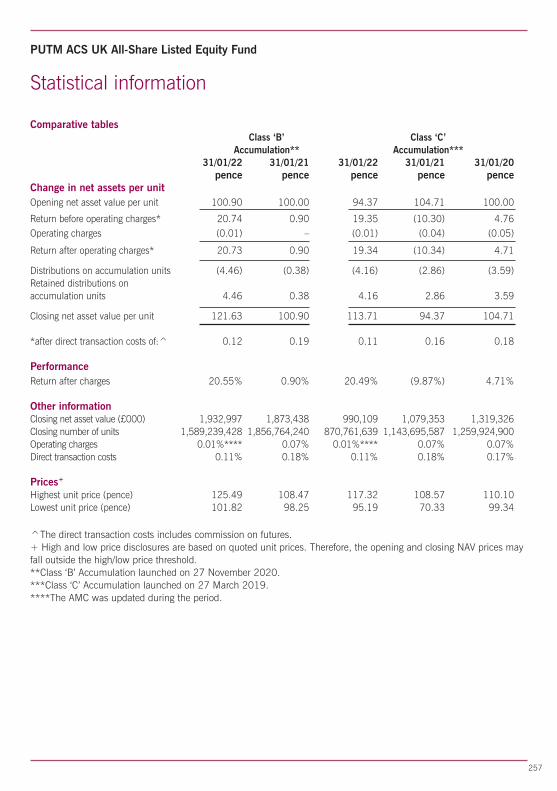
257
PUTM ACS UK All-Share Listed Equity Fund
Statistical information
Comparative tables Class ‘B’ Class ‘C’ Accumulation** Accumulation*** 31/01/22 31/01/21 31/01/22 31/01/21 31/01/20 pence pence pence pence penceChange in net assets per unitOpening net asset value per unit 100.90 100.00 94.37 104.71 100.00
Return before operating charges* 20.74 0.90 19.35 (10.30) 4.76Operating charges (0.01) – (0.01) (0.04) (0.05)
Return after operating charges* 20.73 0.90 19.34 (10.34) 4.71
Distributions on accumulation units (4.46) (0.38) (4.16) (2.86) (3.59)Retained distributions onaccumulation units 4.46 0.38 4.16 2.86 3.59
Closing net asset value per unit 121.63 100.90 113.71 94.37 104.71
*after direct transaction costs of:^ 0.12 0.19 0.11 0.16 0.18
PerformanceReturn after charges 20.55% 0.90% 20.49% (9.87%) 4.71%
Other informationClosing net asset value (£000) 1,932,997 1,873,438 990,109 1,079,353 1,319,326Closing number of units 1,589,239,428 1,856,764,240 870,761,639 1,143,695,587 1,259,924,900Operating charges 0.01%**** 0.07% 0.01%**** 0.07% 0.07%Direct transaction costs 0.11% 0.18% 0.11% 0.18% 0.17%
Prices+
Highest unit price (pence) 125.49 108.47 117.32 108.57 110.10Lowest unit price (pence) 101.82 98.25 95.19 70.33 99.34
^The direct transaction costs includes commission on futures.+ High and low price disclosures are based on quoted unit prices. Therefore, the opening and closing NAV prices mayfall outside the high/low price threshold.**Class ‘B’ Accumulation launched on 27 November 2020.***Class ‘C’ Accumulation launched on 27 March 2019.****The AMC was updated during the period.

PUTM ACS UK All-Share Listed Equity Fund
Statistical information
Comparative tables Class ‘D’ Class ‘X’ Class ‘F’ Accumulation Accumulation** Accumulation*** 31/01/22 31/01/21 31/01/20 31/01/22 31/01/21 31/01/22 pence pence pence pence Change in net assets per unitOpening net asset value per unit 94.39 104.75 100.00 n/a 100.00 100.00
Return before operating charges* 19.27 (10.32) 4.80 n/a 11.57 1.00
Operating charges (0.01) (0.04) (0.05) n/a (0.03) 0.00
Return after operating charges* 19.26 (10.36) 4.75 n/a 11.54 1.00
Distributions on accumulation units (4.15) (2.82) (3.60) n/a (0.95) (0.19)Retained distributions onaccumulation units 4.15 2.82 3.60 n/a 0.95 0.19
Cancellation price – – – n/a (111.54) –
Closing net asset value per unit 113.65 94.39 104.75 n/a – 101.00
*after direct transaction costs of:^ 0.11 0.16 0.18 n/a 0.20 0.11
PerformanceReturn after charges 20.40% (9.89%) 4.75% n/a 11.54% 1.00%
Other informationClosing net asset value (£000) 981,558 985,458 1,231,539 n/a n/a 391,082Closing number of units 863,648,459 1,044,075,237 1,175,667,727 n/a n/a 387,199,357Operating charges 0.01%**** 0.07% 0.07% n/a 0.07% 0.01%Direct transaction costs 0.11% 0.18% 0.17% n/a 0.18% 0.11%
Prices+
Highest unit price (pence) 117.27 108.55 110.09 n/a 120.66 104.21Lowest unit price (pence) 95.15 70.30 99.34 n/a 90.67 97.89
^The direct transaction costs includes commission on futures.+ High and low price disclosures are based on quoted unit prices. Therefore, the opening and closing NAV prices may falloutside the high/low price threshold.**Class ‘X’ Accumulation launched on 14 March 2020 and terminated on 21 October 2020.***Class ‘F’ Accumulation launched on 10 December 2021.****The AMC was updated during the period.
258
259
PUTM ACS UK All-Share Listed Equity Fund
Statistical information
Investment objective
The Sub-fund aims to provide a total return (a combination of capital and income) byoutperforming the FTSE All Share Index (the “Index”) before fees by 0.5% to 1% perannum over any given 3 year period.
Investment policy
The Sub-fund aims to achieve its objective primarily by investing over 70% of theportfolio in equities and equity related securities of companies listed in the UnitedKingdom that are constituents of the Index. The Sub-fund may invest up to 5% in UKcompanies listed outside of the Index.
“Equity related securities” will include convertible stocks, stock exchange listedwarrants, depository receipts, and any other such investments which entitle the holderto subscribe for or convert into the equity of the company and/or where the share priceperformance is, in the opinion of the investment manager influenced significantly bythe stock market performance of the company’s ordinary shares. The Sub-fund mayalso invest in other transferable securities, money market instruments, deposits, cashand near cash and other collective investment schemes. Derivatives will be used forefficient portfolio management only.
Investment strategy
Although over 70% is invested in components of the Index, the Sub-fund is activelymanaged and the investment manager has discretion to select its investment. TheSub-fund does not concentrate on any particular sector.
Revenue distribution and pricing
Units of the Sub-fund are available as either Class ‘B’ Accumulation, ‘C’ Accumulation,'D' Accumulation or ‘X’ Accumulation units (where revenue is reinvested to enhancethe unit price). There will be two potential distributions in each accounting year: aninterim distribution as at 31 July and a final distribution as at 31 January.
At each distribution the net revenue after deduction of expenses, from the investmentsof the Sub-fund, is apportioned amongst the unitholders. Unitholders receive a taxvoucher giving details of the distribution and the ACS Manager’s Report no later thantwo months after these dates.

PUTM ACS UK All-Share Listed Equity Fund
fi
Statistical information
Risk and reward profile
The Risk and Reward Indicator table demonstrates where the Sub-fund ranks in terms of itspotential risk and reward. The higher the rank the greater the potential reward but the greater therisk of losing money. It is based on past data, may change over time and may not be a reliableindication of the future risk profile of the Sub-fund. The shaded area in the table below shows theSub-fund's ranking on the Risk and Reward Indicator.
Typically lower rewards, Typically higher rewards, lower risk higher risk fi
1 2 3 4 5 6 7
This Sub-fund is ranked at 6 (31/01/21: 6) because funds of this type have experienced highrises and falls in value in the past. Although this is a high risk ranking it is not the highest. Theabove figure applies to the following unit classes:
• Class ‘B’ Accumulation• Class ‘C’ Accumulation• Class ‘D’ Accumulation• Class ‘F’ Accumulation• Class ‘X’ Accumulation
Please note that even the lowest risk class can lose you money and that extreme marketcircumstances can mean you suffer severe losses in all cases. Please note the Sub-fund's riskcategory may change in the future. The indicator does not take into account the following risks ofinvesting in this Sub-fund:
• The Sub-fund may use derivatives to reduce risk or cost or to generate additional capital orincome at low risk, or to meet its investment objective.
• The small differences in the returns between the index tracking Fund and the Index (andtracking error) are due to levels of cash, expenses and portfolio turnover.
• Counterparty Risk: the insolvency of any institutions providing services such as safekeeping ofassets or acting as counterparty to derivatives or other instruments, may expose the Sub-fund tofinancial loss.
For more information on the Risk and Reward profiles of our Funds, please refer to the most up todate relevant fund and Unit Class Key Investor Information Documents (KIIDs). These areavailable online at www.phoenixunittrust.co.uk.
260

261
PUTM ACS UK All-Share Listed Equity Fund
Annual financial statementsFor the year ended 31 January 2022
Statement of total return 31/01/22 31/01/21 Notes £000 £000 £000 £000
Income
Net capital gains/(losses) 4 597,894 (318,313) Revenue 5 161,930 75,744
Expenses 6 (482) (2,101)
Interest payable andsimilar charges (1) –
Net revenue before taxation 161,447 73,643
Taxation 7 (1,125) (709)
Net revenue after taxation 160,322 72,934
Total return/(deficit)before distributions 758,216 (245,379)
Distributions 8 (160,252) (73,113)
Change in net assetsattributable to unitholdersfrom investment activities 597,964 (318,492)
Statement of change in net assets attributable to unitholders
31/01/22 31/01/21 £000 £000 £000 £000
Opening net assetsattributable to unitholders 3,938,249 2,550,865
Amounts receivableon issue of units 53,978 927,074
Amounts payable onin-specie transfer* 387,199 1,716,554
Amounts payableon cancellation of units (833,531) (1,009,819)
(392,354) 1,633,809
Change in net assetsattributable to unitholdersfrom investment activities 597,964 (318,492)
Dilution levy adjustment 863 1,118
Retained distributionson accumulation units 151,024 70,949
Closing net assetsattributable to unitholders 4,295,746 3,938,249
*Represents the value of units created by in-specie transfer of assets during the year.

PUTM ACS UK All-Share Listed Equity Fund
Balance sheet 31/01/22 31/01/21 Notes £000 £000 £000 £000
Assets:Current assets:Investments 4,157,462 3,863,749Debtors 9 8,481 18,365
Cash and bank balances 10 190,101 77,045
Total current assets 198,582 95,410
Total assets 4,356,044 3,959,159
Liabilities:Investment liabilities – (658)
Creditors:Other creditors 11 (60,298) (20,252)
Total creditors (60,298) (20,252)
Total liabilities (60,298) (20,910)
Net assetsattributable to unitholders 4,295,746 3,938,249
Annual financial statementsAs at 31 January 2022
262

263
PUTM ACS UK All-Share Listed Equity Fund
Notes to the financial statements
Notes 1-3 Accounting policiesPlease see pages 3 to 6 for accounting basis and policies.
Note 4 Net capital gains/(losses)The net capital gains/(losses) during the year comprise:
31/01/22 31/01/21 £000 £000
Gains/(losses) on non-derivative securities 585,716 (309,686)Gains/(losses) on derivative contracts 8,580 (10,287)Currency losses (27) (11)Handling charges (18) (2)Capital special dividends 3,643 1,673
Net capital gains/(losses) 597,894 (318,313)
Note 5 Revenue 31/01/22 31/01/21 £000 £000
UK dividends 144,948 66,167UK property REIT income distributions 2,447 525Overseas dividends 13,217 8,784Interest on debt securities 35 24Stocklending commission 121 126Bank interest 1 –Liquidity interest 1,161 118
Total revenue 161,930 75,744
Note 6 Expenses 31/01/22 31/01/21 £000 £000(a) Payable to the ACS Manager or associates of the
ACS Manager and agents of either of them:ACS Manager’s periodic charge 314 812
(b) Payable to the Depositary or associates of theDepositary and agents of either of them:Depositary’s fees 62 54
(c) Other expenses:Audit fee 9 10Safe custody charges 79 30FTSE License fees 16 30Printing & stationery 1 –Professional fees 1 2Broker adjustments – 1,163
106 1,235
Total expenses 482 2,101

PUTM ACS UK All-Share Listed Equity Fund
Note 7 Taxation 31/01/22 31/01/21 £000 £000(a) Analysis of tax charge for the year
Overseas withholding tax 1,125 709
Total taxation 1,125 709
As the scheme is an ACS it is not subject to UK tax on income or capital gains.
Note 8 DistributionsThe distributions take account of amounts added on the issue of units andamounts deducted on the cancellation of units, and comprise:
31/01/22 31/01/21 £000 £000
Interim 80,576 33,015Final 70,448 37,934
151,024 70,949
Amounts deducted on cancellation of units 9,788 8,412Amounts added on issue of units (560) (6,248)
Net distribution for the year 160,252 73,113
Net revenue after taxation 160,322 72,934Expenses taken to capital 79 30Capital tax balances (149) 149
Net distribution for the year 160,252 73,113
Details of the distribution per unit are set out in the tables on page 271 and 272.
Note 9 Debtors 31/01/22 31/01/21 £000 £000
Sales awaiting settlement 279 10,330Accrued income 7,434 7,584Overseas tax recoverable 768 449Handling charges prepaid – 2
Total debtors 8,481 18,365
Note 10 Cash and bank balances 31/01/22 31/01/21 £000 £000
Cash and bank balances 184,825 74,042Amounts held at futures clearing houses 5,276 3,003
Total cash and bank balances 190,101 77,045
Notes to the financial statements
264

265
PUTM ACS UK All-Share Listed Equity Fund
Notes to the financial statements
Note 11 Other creditors 31/01/22 31/01/21 £000 £000
Cancellations awaiting settlement 54,979 10,451Purchases awaiting settlement 5,175 9,731ACS Manager’s periodic charge payable 112 49Depositary’s fees payable 10 12Safe custody charges payable 12 1Audit fee payable 9 8Handling charges payable 1 –
Total other creditors 60,298 20,252
Note 12 Reconciliation of units Class ‘B’ Class ‘C’ Class ‘D’ Class ‘F’ Accumulation Accumulation Accumulation Accumulation*
Opening units issuedat 31/01/21 1,856,764,240 1,143,695,587 1,044,075,237 –Unit movements in year:Units issued 44,081,389 2,831,574 935,429 –Units cancelled (311,606,201) (275,765,522) (181,362,207) –In-specie transactions – – – 387,199,357
Closing units at 31/01/22 1,589,239,428 870,761,639 863,648,459 387,199,357
*Class ‘F’ Accumulation launched on 10 December 2021.
Note 13 Contingencies and commitmentsAt 31 January 2022 the Sub-fund had no outstanding calls on partly paid shares, nopotential underwriting commitments or any other contingent liabilities (31/01/21: £nil).
Note 14 StocklendingThe total value of securities on loan at the Balance sheet date was £5,208,211 (31/01/21:£30,579,448). Collateral was held in the following form:
31/01/22 31/01/21 £000 £000Government bonds 3,884 10,255UK equities 1,769 22,508
5,653 32,763
The gross earnings were split by the lending agent as follows:
- 82% to the Lender (PUTM ACS UK All Share Listed Equity Fund)
- 8% to the ACS manager (Phoenix unit trust managers Limited)
- 10% retained by the Lending Agent (eSec)
The counterparties for the securities on loan are shown in the appendix on page 282.

PUTM ACS UK All-Share Listed Equity Fund
Note 15 Unitholders’ fundsThere are four unit classes in issue within the Sub-fund. These are Class ‘B’Accumulation, Class ‘C’ Accumulation, Class ‘D’ Accumulation and Class ‘F’Accumulation. The ACS Manager’s periodic charge in respect of Class ‘B’, Class‘C’, Class ‘D’ and Class ‘F’ is expressed as an annual percentage of the value of theproperty of the Sub-fund attributable to each unit class and is currently 0.005% inrespect of Class ‘B’ units, Class ‘C’ units, Class ‘D’ units and Class ‘F’ units.Consequently, the level of net revenue attributable to each unit class will differ.Should it be necessary to wind-up the Sub-fund, each unit class will have thesame rights as regards to the distribution of the property of the Sub-fund.
Note 16 Related party transactionsThe ACS Manager is a related party to the Sub-fund by virtue of its controllinginfluence.
The ACS Manager is part of the Phoenix Group. Phoenix Life Limited which is alsopart of the Phoenix Group, is a material unitholder in the Sub-fund and therefore arelated party, holding the following percentage of the units at the year end.
Class ‘B’ Class ‘C’ Class ‘D’ Class ‘F’* % % % %
As at 31 January 2022: 100.00 100.00 100.00 100.00As at 31 January 2021: 98.92 100.00 100.00 n/a
*Class ‘F’ Accumulation launched on 10 December 2021, hence there are nocomparatives.
ACS Manager's periodic charge paid to the ACS Manager, Phoenix Unit TrustManagers Limited, or its associates, is shown in Note 6(a) and details of the unitsissued and cancelled by the ACS Manager are shown in the Statement of changein net assets attributable to unitholders and Note 8.
Any balances due to/from the ACS Manager or its associates at 31 January 2022in respect of these transactions are shown in Notes 9 and 11.
Note 17 Financial instrumentsIn accordance with the investment objective, the Sub-fund holds certain financialinstruments. These comprise:• securities held in accordance with the investment objective and policies;• derivative transactions which the Sub-fund enters into, the purpose of which is
to manage the currency and market risks arising from the Sub-fund's investmentactivities; and
• cash and short term debtors and creditors arising directly from operations.
Counterparty exposureThe economic exposure of future derivative contracts is equal to the market value.The value of exposure and the related counterparty are disclosed in the Portfolio ofinvestments.
Notes to the financial statements
266

267
PUTM ACS UK All-Share Listed Equity Fund
Notes to the financial statements
Note 17 Financial instruments (continued)Currency exposureAn analysis of the monetary assets and liabilities at the year end is shown below:
Net currency assets Net currency assets 31/01/22 31/01/21
Currency Monetary Non- Total Monetary Non- Total exposure monetary exposure exposure monetary exposure exposure exposure £000 £000 £000 £000 £000 £000
Sterling 135,810 4,157,462 4,293,272 72,066 3,863,091 3,935,157 Euro 1,522 – 1,522 2,630 – 2,630 US Dollar 952 – 952 462 – 462
138,284 4,157,462 4,295,746 75,158 3,863,091 3,938,249
Income received in other currencies is converted to Sterling on or near the date of receipt.The Sub-fund does not hedge or otherwise seek to avoid, movement risk on accruedincome.
Interest profileAt the year end date, 4.43% (31/01/21: 1.96%) of the Sub-fund's net assets byvalue were interest bearing.Interest rates earned/paid on deposits are earned/paid at a rate linked to LIBOR(London Interbank Offered Rate) or international equivalent.
Sensitivity analysisInterest rate risk sensitivityAs the majority of the Sub-fund's financial assets are non-interest bearing, the Sub-fund is only subject to limited exposure to fair value interest rate risk due tofluctuations in levels of market interest rates and therefore, no sensitivity analysis hasbeen provided.
Foreign currency risk sensitivityA five percent increase in the value of the Sub-fund's foreign currency exposure wouldhave the effect of increasing the return and net assets by £123,728 (31/01/21:£154,600). A five percent decrease would have an equal and opposite effect.
Price risk sensitivityA five percent increase in the value of the Sub-fund's portfolio would have the effectof increasing the return and net assets by £207,835,508 (31/01/21:£196,912,450). A five percent decrease would have an equal and opposite effect.
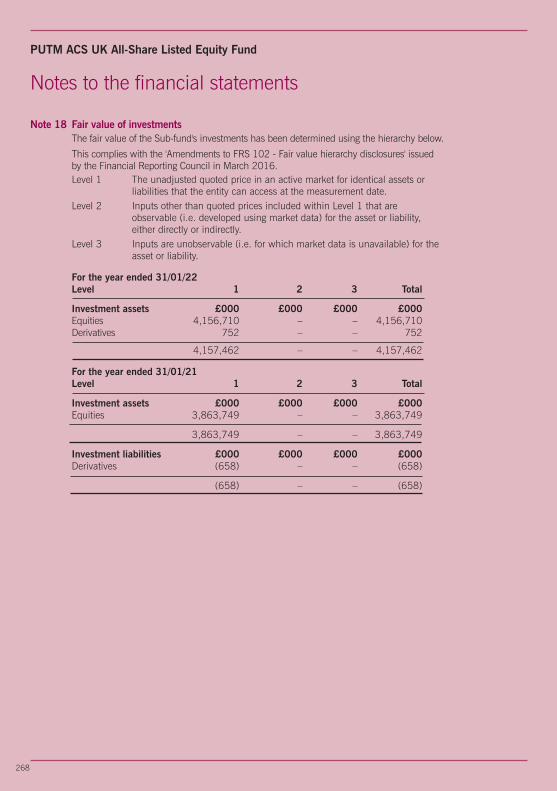
PUTM ACS UK All-Share Listed Equity Fund
Note 18 Fair value of investmentsThe fair value of the Sub-fund's investments has been determined using the hierarchy below.
This complies with the 'Amendments to FRS 102 - Fair value hierarchy disclosures' issuedby the Financial Reporting Council in March 2016.Level 1 The unadjusted quoted price in an active market for identical assets or
liabilities that the entity can access at the measurement date.Level 2 Inputs other than quoted prices included within Level 1 that are
observable (i.e. developed using market data) for the asset or liability,either directly or indirectly.
Level 3 Inputs are unobservable (i.e. for which market data is unavailable) for theasset or liability.
For the year ended 31/01/22Level 1 2 3 Total
Investment assets £000 £000 £000 £000Equities 4,156,710 – – 4,156,710Derivatives 752 – – 752
4,157,462 – – 4,157,462
For the year ended 31/01/21Level 1 2 3 Total
Investment assets £000 £000 £000 £000Equities 3,863,749 – – 3,863,749
3,863,749 – – 3,863,749
Investment liabilities £000 £000 £000 £000Derivatives (658) – – (658)
(658) – – (658)
Notes to the financial statements
268

269
PUTM ACS UK All-Share Listed Equity Fund
Notes to the financial statements
Note 19 Portfolio transaction costs
For the year ended 31/01/22Other Total
Value Commission Taxes expenses costsAnalysis of total purchases costs £000 £000 % £000 % £000 % £000
Equity transactions 811,740 389 0.05 3,462 0.43 – – 815,591Corporate actions 1,081 – – – – – – 1,081In-specie transactions 387,199 – – – – – – 387,199
Total 1,200,020 389 3,462 – 1,203,871
Other TotalValue Commission Taxes expenses costs
Analysis of total sales costs £000 £000 % £000 % £000 % £000
Equity transactions 1,490,893 (803) (0.05) (1) – (3) – 1,490,086Corporate actions 6,535 – – – – – – 6,535
Total 1,497,428 (803) (1) (3) 1,496,621
The Sub-fund has paid £18,926 as commission on purchases and sales of derivatives transactions for the year ended31/01/22.
Commission, taxes and other expenses as % of average net assets:Commission 0.03%Taxes 0.08%Other expenses 0.00%
For the period ended 31/01/21Other Total
Value Commission Taxes expenses costsAnalysis of total purchases costs £000 £000 % £000 % £000 % £000
Equity transactions 1,269,120 463 0.04 6,347 0.50 – – 1,275,930Money markets 97,807 – – – – – – 97,807Corporate actions 325 – – – – – – 325In–specie transactions 1,705,114 – – – – – – 1,705,114
Total 3,072,366 463 6,347 – 3,079,176
Other TotalValue Commission Taxes expenses costs
Analysis of total sales costs £000 £000 % £000 % £000 % £000
Equity transactions 1,272,341 (482) (0.04) (1) – – – 1,271,858Money markets 172,072 – – – – – – 172,072Corporate actions 4,019 – – – – – – 4,019
Total 1,448,432 (482) (1) – 1,447,949
The Sub-fund has paid £16,692 as commission on purchases and sales of derivatives transactions for the yearended 31/01/21.
Commission, taxes and other expenses as % of average net assets:Commission 0.02%Taxes 0.16%Other expenses 0.00%

PUTM ACS UK All-Share Listed Equity Fund
Notes to the financial statements
Note 19 Portfolio transaction costs (continued)
The purchases and sales of securities incurred no direct transaction costs during the yearor prior year.
Portfolio transaction costs are incurred by the Sub-fund when buying and sellingunderlying investments. These costs vary depending on the class of investment, countryof exchange and method of execution.
These costs can be classified as either direct or indirect transaction costs:
Direct transaction costs: Broker commissions, fees and taxes.
Indirect transaction costs: "Dealing spread" - the difference between buying and sellingprices of the underlying investments.
At the Balance sheet date the portfolio dealing spread was 0.08% (31/01/21: 0.08%)being the difference between the respective bid and offer prices for the Sub-fund'sinvestments.
270

271
PUTM ACS UK All-Share Listed Equity Fund
Interim distribution in pence per unitGroup 1: units purchased prior to 1 February 2021Group 2: units purchased 1 February 2021 to 31 July 2021 2021 2020 pence pence per unit per unit Net paid paid income Equalisation 30 Sep 30 Sep*Class ‘B’ Accumulation
Group 1 2.280734 — 2.280734 n/a Group 2 1.184301 1.096433 2.280734 n/a
2021 2020 pence pence per unit per unit Net paid paid income Equalisation 30 Sep 30 SepClass ‘C’ Accumulation
Group 1 2.129276 — 2.129276 1.441730 Group 2 0.378099 1.751177 2.129276 1.441730
2021 2020 pence pence per unit per unit Net paid paid income Equalisation 30 Sep 30 SepClass ‘D’ Accumulation
Group 1 2.129518 — 2.129518 1.402367 Group 2 0.059406 2.070112 2.129518 1.402367
2021 2020 pence pence per unit per unit Net paid paid income Equalisation 30 Sep** 30 SepClass ‘X’ Accumulation
Group 1 n/a n/a n/a 0.952328 Group 2 n/a n/a n/a 0.952328
*Class ‘B’ Accumulation launched on 27 November 2020, hence there are no comparatives.**Class ‘X’ Accumulation launched on 14 March 2020 and terminated on 21October 2020.
Distribution tablesFor the year ended 31 January 2022

PUTM ACS UK All-Share Listed Equity Fund
Final distribution in pence per unitGroup 1: units purchased prior to 1 August 2021Group 2: units purchased 1 August 2021 to 31 January 2022 2022 2021 pence pence per unit per unit Net payable paid income Equalisation 31 Mar 31 MarClass ‘B’ Accumulation
Group 1 2.176641 — 2.176641 0.375229 Group 2 1.034812 1.141829 2.176641 0.375229
2022 2021 pence pence per unit per unit Net payable paid income Equalisation 31 Mar 31 MarClass ‘C’ Accumulation
Group 1 2.030714 — 2.030714 1.414274 Group 2 0.332533 1.698181 2.030714 1.414274
2022 2021 pence pence per unit per unit Net payable paid income Equalisation 31 Mar 31 MarClass ‘D’ Accumulation
Group 1 2.020732 — 2.020732 1.416738 Group 2 0.749050 1.271682 2.020732 1.416738
2022 2021 pence pence per unit per unit Net payable paid income Equalisation 31 Mar 31 Mar*Class ‘F’ Accumulation
Group 1 0.186314 — 0.186314 n/a Group 2 0.186314 0.000000 0.186314 n/a
*Class ‘F’ Accumulation launched on 10 December 2021 hence there are no comparatives.Each Sub-fund is tax transparent for income purposes meaning that UK tax-paying Unitholders aresubject to tax on their share of income, net of allowable expenses, as it arises to the Sub-fund and not ondistributions of income after deduction of expenses.On a daily basis unitholders will be advised of their share of aggregated accrued income, expenses andwithholding tax paid on overseas dividends, if applicable. When a unit is purchased during the distributionperiod, part of the purchase price of the unit reflects the relevant share of income and expenses accruedby the Sub-fund, and this will be disclosed on the contract note. This purchased income and expense, acapital sum, should be deducted from the aggregate accrued income or expense as applicable.The subscription price disclosed on the contract note reflects the acquisition cost, which should beadjusted by the capital sum referred to above.It is the responsibility of the unitholder to maintain a record of the relevant amount(s) of incomeequalisation and to make the appropriate adjustment when completing their tax calculations.
Distribution tablesFor the year ended 31 January 2022
272

273
Responsibilities of the ACS manager and the depositarya) The ACS Manager of the Sub-funds is required by the Financial Conduct Authority’s Collective
Investment Schemes Sourcebook ('the Sourcebook') to prepare financial statements for each annualaccounting period which give a true and fair view of the financial position of the Sub-funds at theend of that period and the net revenue or expense and the net gains or losses on the property of theSub-funds for the year then ended.
In preparing these financial statements, the ACS Manager is required to:
• select suitable accounting policies and then apply them consistently;
• make judgements and estimates that are prudent and reasonable;
• state whether applicable accounting standards have been followed subject to any materialdeparture disclosed and explained in the financial statements; and
• prepare the financial statements on a going concern basis unless it is inappropriate to presumethat the Sub-funds will continue in operation. For the reasons stated in the ACS Manager’sReport and Note 1(a), the financial statements for the PUTM ACS UK All Share Listed EquityFund only have been prepared on a break-up basis as the PUTM ACS UK All Share Listed EquityFund only is not a going concern.
The ACS Manager is also required to manage the Sub-funds in accordance with the ACS Deed, theProspectus and the Sourcebook, maintain proper financial records to enable them to ensure that thefinancial statements comply with the Statement of Recommended Practice for Authorised Funds asissued by the IA in May 2014 (amended June 2017) and the Sourcebook and take reasonable stepsfor the prevention and detection of fraud and other irregularities.
b) The Depositary must ensure that the Scheme is managed in accordance with the Financial ConductAuthority’s Collective Investment Schemes Sourcebook, the Financial Services and Markets Act 2000,as amended, the Collective Investment in Transferable Securities (Contractual Scheme) Regulations2013 (together ‘the Regulations’) and the Contractual Scheme Deed and Prospectus (together the'Scheme documents') as detailed below.
The Depositary must in the context of its role act honestly, fairly, professionally, independently andin the interests of the Scheme and its investors.
The Depositary is responsible for the safekeeping of all custodial assets and maintaining a record ofall other assets of the Scheme in accordance with the Regulations.
The Depositary must ensure that:
• the Scheme’s cash flows are properly monitored and that cash of the Scheme is booked in cashaccounts in accordance with the Regulations;
• the sale, issue, repurchase, redemption and cancellation of units are carried out in accordancewith the Regulations;
• the value of units of the Scheme are calculated in accordance with the Regulations;
• any consideration relating to transactions in the Scheme’s assets is remitted to the Schemewithin the usual time limits;
• the Scheme’s income is applied in accordance with the Regulations; and
• the instructions of the Authorised Fund Manager (‘the AFM’), which is the UCITS ManagementCompany, are carried out (unless they conflict with the Regulations).
The Depositary also has a duty to take reasonable care to ensure that the Scheme is managed inaccordance with the Regulations and the Scheme documents in relation to the investment andborrowing powers applicable to the Scheme.

274
Depositary’s report and directors’ statement
Statement of the Depositary’s Responsibilities in Respect of the Scheme andReport of the Depositary to the Unitholders of the PUTM Authorised ContractualScheme (“the Scheme”) for the Period Ended 31 January 2022.
Having carried out such procedures as we considered necessary to discharge ourresponsibilities as Depositary of the Scheme, it is our opinion, based on the informationavailable to us and the explanations provided, that, in all material respects the AFM:
i) has carried out the issue, sale, redemption and cancellation, and calculation of theprice of the Scheme’s units and the application of the Scheme’s income inaccordance with the Regulations and the Scheme documents of the Scheme; and
ii) has observed the investment and borrowing powers and restrictions applicable tothe Scheme in accordance with the Regulations and the Scheme documents of theScheme.
London HSBC Bank plc31 May 2022
Directors’ statementIn accordance with the requirements of the Collective Investment Schemes Sourcebookas issued and amended by the Financial Conduct Authority, we hereby certify the reporton behalf of the Directors of Phoenix Unit Trust Managers Limited.
Birmingham Craig Baker, Director
31 May 2022 Andrew Moss, Director

275
Independent auditor’s report to the unitholders ofPUTM Authorised Contractual Scheme
OpinionWe have audited the financial statements of PUTM Authorised Contractual Scheme (“the Scheme”)comprising each of its sub-funds for the year ended 31 January 2022, which comprise the Statement ofTotal Return, the Statement of Change in Net Assets Attributable to Unitholders, the Balance Sheet, therelated notes and the Distribution Tables for each of the Scheme’s sub-funds, and the accounting policies ofthe Scheme set out on pages 3 and 4, which include a summary of significant accounting policies. Thefinancial reporting framework that has been applied in their preparation is applicable law and UnitedKingdom Accounting Standards including FRS 102 ‘The Financial Reporting Standard applicable to the UKand Republic of Ireland’ (United Kingdom Generally Accepted Accounting Practice).
In our opinion, the financial statements:
• give a true and fair view of the financial position of the Scheme comprising of its sub-funds as at 31January 2022 and of the net revenue/expenses and the net capital gains/losses on the property of theScheme comprising its sub-funds for the year then ended; and
• have been properly prepared in accordance with United Kingdom Generally Accepted Accounting Practice.
Basis for opinionWe conducted our audit in accordance with International Standards on Auditing (UK) (“ISAs (UK)”) andapplicable law. Our responsibilities under those standards are further described in the Auditor’sresponsibilities for the audit of the financial statements section of our report below. We are independent ofthe Scheme in accordance with the ethical requirements that are relevant to our audit of the financialstatements in the UK, including the Financial Reporting Council’s (“FRC”) Ethical Standard, and we havefulfilled our other ethical responsibilities in accordance with these requirements.
We believe that the audit evidence we have obtained is sufficient and appropriate to provide a basis for ouropinion.
Emphasis of matter – PUTM ACS UK All Share Listed Equity Fund (the “closing sub-fund”)Financial Statements prepared on break-up basisWe draw attention to Note 1(a) of the financial statements which explains that the ACS Manager (the“Manager”) intends to close the PUTM ACS UK All Share Listed Equity Fund and therefore does not considerit to be appropriate to adopt the going concern basis of accounting in preparing the financial statements.Accordingly, the financial statements for the closing sub-fund only have been prepared on a break-up basis asdescribed in Note 1(a). The financial statements for the Scheme as a whole remain prepared on a goingconcern basis. Our opinion is not modified in respect of this matter.
Conclusions relating to going concernThe financial statements for the PUTM ACS UK All Share Listed Equity Fund have been prepared on break-up basis as disclosed in Note 1(a)
In auditing the financial statements of the remaining sub-funds, we have concluded that the Manager’s useof the going concern basis of accounting in the preparation of the financial statements is appropriate.
Based on the work we have performed, we have not identified any material uncertainties relating to events orconditions that, individually or collectively, may cast significant doubt on the Scheme’s (except for the PUTMACS UK All Share Listed Equity Fund) ability to continue as a going concern for a period of 12 months fromwhen the financial statements are authorised for issue.
Our responsibilities and the responsibilities of the Manager with respect to going concern are described in therelevant sections of this report. However, because not all future events or conditions can be predicted, thisstatement is not a guarantee as to the Scheme’s ability to continue as a going concern.

276
Independent auditor’s report to the unitholders ofPUTM Authorised Contractual Scheme
Other informationThe other information comprises the information included in the Annual Report other than the financialstatements and our auditor’ report thereon. The Manager is responsible for the other information containedwithin the Annual Report.
Our opinion on the financial statements does not cover the other information and, except to the extentotherwise explicitly stated in this report, we do not express any form of assurance conclusion thereon.
Our responsibility is to read the other information and, in doing so, consider whether the other information ismaterially inconsistent with the financial statements or our knowledge obtained in the audit or otherwiseappears to be materially misstated. If we identify such material inconsistencies or apparent materialmisstatements, we are required to determine whether this gives rise to a material misstatement in thefinancial statements themselves. If, based on the work we have performed, we conclude that there is amaterial misstatement of the other information, we are required to report that fact.
We have nothing to report in this regard.
Opinions on other matters prescribed by the rules of the Collective Investment SchemesSourcebook of the Financial Conduct Authority (“the FCA”)In our opinion:
• the financial statements have been properly prepared in accordance with the Statement of RecommendedPractice relating to Authorised Funds, the rules of the Collective Investment Schemes Sourcebook of theFinancial Conduct Authority and the Contractual Scheme Deed;
• there is nothing to indicate that adequate accounting records have not been kept or that the financialstatements are not in agreement with those records; and
• the information given in the Manager’s report for the financial year for which the financial statements areprepared is consistent with the financial statements.
Matters on which we are required to report by exceptionWe have nothing to report in respect of the following matter in relation to which the Collective InvestmentSchemes Sourcebook of the Financial Conduct Authority requires us to report to you if, in our opinion:
• we have not received all the information and explanations which, to the best of our knowledge and belief,are necessary for the purposes of our audit.
Responsibilities of the ManagerAs explained more fully in the Manager’s responsibilities statement set out on page 273, the Manager isresponsible for the preparation of the financial statements and for being satisfied that they give a true and fairview, and for such internal control as the Manager determines is necessary to enable the preparation offinancial statements that are free from material misstatement, whether due to fraud or error.
In preparing the financial statements, the Manager is responsible for assessing the Scheme’s ability tocontinue as a going concern, disclosing, as applicable, matters related to going concern and using the goingconcern basis of accounting unless the Manager either intends to wind up or terminate the Scheme or tocease operations, or has no realistic alternative but to do so.
Auditor’s responsibilities for the audit of the financial statementsOur objectives are to obtain reasonable assurance about whether the financial statements as a whole are freefrom material misstatement, whether due to fraud or error, and to issue an auditor’s report that includes ouropinion. Reasonable assurance is a high level of assurance but is not a guarantee that an audit conducted inaccordance with ISAs (UK) will always detect a material misstatement when it exists. Misstatements canarise from fraud or error and are considered material if, individually or in the aggregate, they could reasonablybe expected to influence the economic decisions of users taken on the basis of these financial statements.
277
Independent auditor’s report to the unitholders ofPUTM Authorised Contractual Scheme
Explanation as to what extent the audit was considered capable of detecting irregularities,including fraudIrregularities, including fraud, are instances of non-compliance with laws and regulations. We designprocedures in line with our responsibilities, outlined above, to detect irregularities, including fraud. The risk ofnot detecting a material misstatement due to fraud is higher than the risk of not detecting one resulting fromerror, as fraud may involve deliberate concealment by, for example, forgery or intentional misrepresentations,or through collusion. The extent to which our procedures are capable of detecting irregularities, includingfraud is detailed below. However, the primary responsibility for the prevention and detection of fraud restswith both those charged with governance of the entity and management.
Our approach was as follows:
• We obtained an understanding of the legal and regulatory frameworks that are applicable to the Schemeand determined that the most significant are United Kingdom Generally Accepted Accounting Practice, theInvestment Management Association Statement of Recommended practice (the “IMA SORP”), the FCACollective Investment Schemes Sourcebook, the Contractual Scheme Deed and the Prospectus.
• We understood how the Scheme is complying with those frameworks through discussions with the Managerand the Scheme’s administrator and a review of the Scheme’s documented policies and procedures.
• We assessed the susceptibility of the Scheme’s financial statements to material misstatement, includinghow fraud might occur by considering the risk of management override, specifically management’spropensity to influence revenue and amounts available for distribution. We identified a fraud risk withrespect to the incomplete or inaccurate income recognition through incorrect classification of specialdividends and the resulting impact to amounts available for distribution. We tested the appropriateness ofmanagement’s classification of material special dividends as either a capital or revenue return andincorporated unpredictability into the nature, timing and extent of our testing.
• Based on this understanding we designed our audit procedures to identify non-compliance with such lawsand regulations. Our procedures involved review of the reporting to the Manager with respect to theapplication of the documented policies and procedures and review of the financial statements to testcompliance with the reporting requirements of the Scheme.
• Due to the regulated nature of the Scheme, the Statutory Auditor considered the experience and expertiseof the engagement team to ensure that the team had the appropriate competence and capabilities toidentify non-compliance with the applicable laws and regulations.
A further description of our responsibilities for the audit of the financial statements is located on the FinancialReporting Council’s website at https://www.frc.org.uk/auditorsresponsibilities. This description forms part ofour auditor’s report.
Use of our reportThis report is made solely to the Scheme’s unitholders, as a body, pursuant to Paragraph 4.5.12 of the rulesof the Collective Investment Schemes Sourcebook of the Financial Conduct Authority. Our audit work hasbeen undertaken so that we might state to the unitholders of the Scheme those matters we are required tostate to them in an auditor’s report and for no other purpose. To the fullest extent permitted by law, we donot accept or assume responsibility to anyone other than the Scheme and the unitholders of the Scheme as abody, for our audit work, for this report, or for the opinions we have formed.
Ernst & Young LLPStatutory AuditorEdinburgh
31 May 20222. Legislation in the United Kingdom governing the preparation and dissemination offinancial statements may differ from legislation in other jurisdictions.

278
Appendix (unaudited)
The Sub-fund carried out stocklending activities for the purpose of efficient portfolio managementand in order to generate income.
Revenue earned from these activities is shown in the Statement of Total Return.
Global DataAmount of securities and commodities on loan % of total lendable assets*
Securities 0.05
Amount of assets engaged in each type of SFT
Amount of assets % of AUM
£1,136,994 0.05
* Total lendable assets excludes cash and cash equivalents. It also excludes other monetary amounts such asnet debtors and creditors which are not deemed ‘lendable assets’.
Concentration DataTop ten collateral issuers (across all SFT) Collateral Fair valueIssuer Holding £000
Freeport-Mcmoran 2,233 60Exxon Mobil 1,069 60Paypal Holdings 492 60Twitter 2,281 60Walmart 585 60Philip Morris 777 60Dollar Tree 626 60Fidelity 'N' 685 60Salesforce 362 60Disney Walt 580 60
All counterparties Gross volume of outstanding transactions Fair valueCounterparty £000
Bank of Nova Scotia 1,137
PUTM ACS European ex UK Fund

279
Appendix (unaudited)
Aggregate DataType and quality of collateral Fair valueType Quality* £000
Equity n/a 1,284
1,284
* Quality of collateral has been interpreted as pertaining to bond instruments, which have been assessed andreported in accordance with whether they are considered investment grade, below investment grade or not-rated.
Maturity tenor of collateral Fair valueMaturity £000
Rolling Maturity 5,1,284
1,284
Currency of collateral Fair valueCurrency £000
Sterling 1,284
1,284
Maturity tenor of SFTs Fair valueMaturity £000
Rolling Maturity 1,137
1,137
Country in which counterparties are established
Counterparty
All counterparties are UK based
Return and cost Gross return Cost % of overall Net return £000 £000 returns £000
Fund 313 (57) 82.00 256
313 (57) 256
The gross earnings were split by the lending agent as follows:- 82% to the Lender (PUTM ACS European ex UK Fund)- 8% to the Manager (Phoenix Unit Trust Managers Limited)- 10% retained by the Lending Agent (eSec)
PUTM ACS European ex UK Fund

Appendix (unaudited)
The Sub-fund carried out stocklending activities for the purpose of efficient portfolio managementand in order to generate income.
Revenue earned from these activities is shown in the Statement of Total Return.
Global DataAmount of securities and commodities on loan % of total lendable assets*
Securities 0.01
Amount of assets engaged in each type of SFT
Amount of assets % of AUM
£267,960 0.01
* Total lendable assets excludes cash and cash equivalents. It also excludes other monetary amounts such asnet debtors and creditors which are not deemed ‘lendable assets’.
Concentration DataTop ten collateral issuers (across all SFT) Collateral Fair valueIssuer Holding £000
Intuitive Surgical 74 15Twitter 570 15Activision 254 15Veolia 569 15Walt Disney 145 15ExxonMobil 267 15Apple 118 15International Paper 426 15Centene 260 15Comcast 404 15
All counterparties Gross volume of outstanding transactions Fair valueCounterparty £000
Bank of Nova Scotia 268
PUTM ACS North American Fund
280

281
Appendix (unaudited)
Aggregate DataType and quality of collateral Fair valueType Quality* £000
Equities n/a 321
321
* Quality of collateral has been interpreted as pertaining to bond instruments, which have been assessed andreported in accordance with whether they are considered investment grade, below investment grade or not-rated.
Maturity tenor of collateral Fair valueMaturity £000
Rolling Maturity 321
321
Currency of collateral Fair valueCurrency £000
Sterling 321
321
Maturity tenor of SFTs Fair valueMaturity £000
Rolling Maturity 268
268
Country in which counterparties are established
Counterparty
All counterparties are UK based
Return and cost Gross return Cost % of overall Net return £000 £000 returns £000
Fund 10 (2) 82.00 8
10 (2) 8
The gross earnings were split by the lending agent as follows:- 82% to the Lender (PUTM ACS North American Fund)- 8% to the ACS Manager (Phoenix Unit Trust Managers Limited)- 10% retained by the Lending Agent (eSec)
PUTM ACS North American Fund
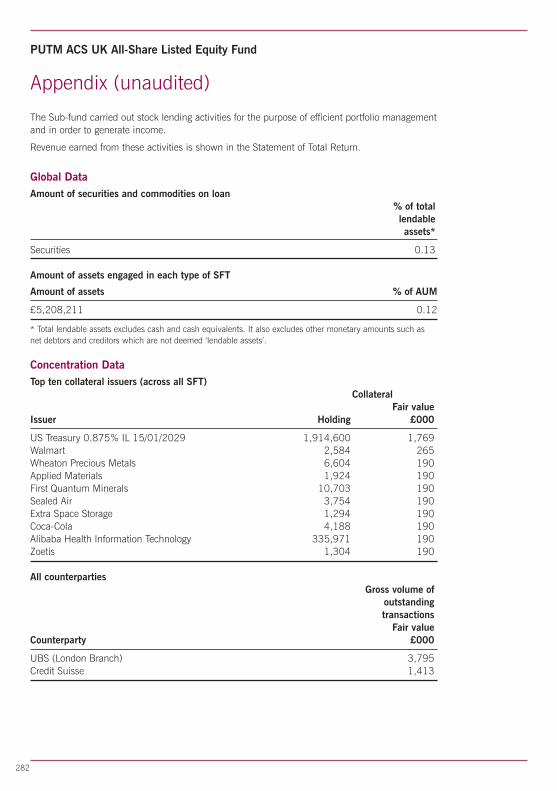
282
Appendix (unaudited)
The Sub-fund carried out stock lending activities for the purpose of efficient portfolio managementand in order to generate income.
Revenue earned from these activities is shown in the Statement of Total Return.
Global DataAmount of securities and commodities on loan % of total lendable assets*
Securities 0.13
Amount of assets engaged in each type of SFT
Amount of assets % of AUM
£5,208,211 0.12
* Total lendable assets excludes cash and cash equivalents. It also excludes other monetary amounts such asnet debtors and creditors which are not deemed ‘lendable assets’.
Concentration DataTop ten collateral issuers (across all SFT) Collateral Fair valueIssuer Holding £000
US Treasury 0.875% IL 15/01/2029 1,914,600 1,769Walmart 2,584 265Wheaton Precious Metals 6,604 190Applied Materials 1,924 190First Quantum Minerals 10,703 190Sealed Air 3,754 190Extra Space Storage 1,294 190Coca-Cola 4,188 190Alibaba Health Information Technology 335,971 190Zoetis 1,304 190
All counterparties Gross volume of outstanding transactions Fair valueCounterparty £000
UBS (London Branch) 3,795Credit Suisse 1,413
PUTM ACS UK All-Share Listed Equity Fund
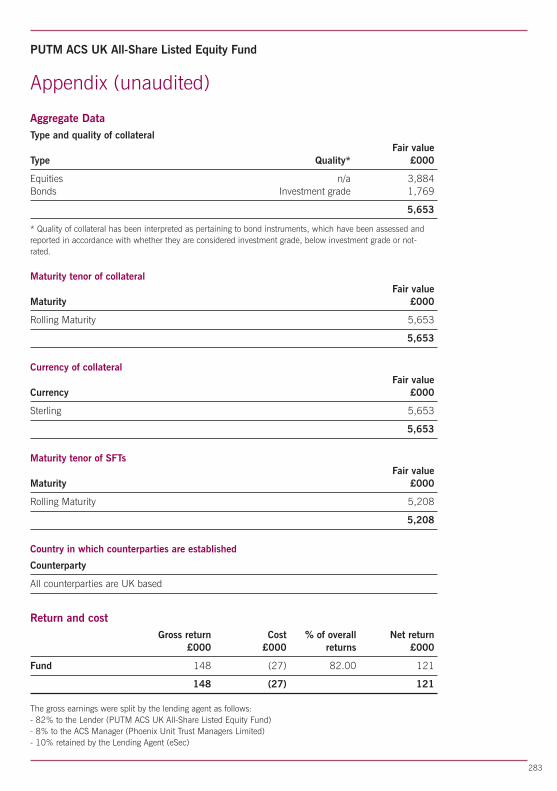
283
Appendix (unaudited)
Aggregate DataType and quality of collateral Fair valueType Quality* £000
Equities n/a 3,884Bonds Investment grade 1,769
5,653
* Quality of collateral has been interpreted as pertaining to bond instruments, which have been assessed andreported in accordance with whether they are considered investment grade, below investment grade or not-rated.
Maturity tenor of collateral Fair valueMaturity £000
Rolling Maturity 5,653
5,653
Currency of collateral Fair valueCurrency £000
Sterling 5,653
5,653
Maturity tenor of SFTs Fair valueMaturity £000
Rolling Maturity 5,208
5,208
Country in which counterparties are established
Counterparty
All counterparties are UK based
Return and cost Gross return Cost % of overall Net return £000 £000 returns £000
Fund 148 (27) 82.00 121
148 (27) 121
The gross earnings were split by the lending agent as follows:- 82% to the Lender (PUTM ACS UK All-Share Listed Equity Fund)- 8% to the ACS Manager (Phoenix Unit Trust Managers Limited)- 10% retained by the Lending Agent (eSec)
PUTM ACS UK All-Share Listed Equity Fund

284
Corporate information (unaudited)
The information in this report is designed to enable unitholders to make an informed judgement on theactivities of the Sub-funds during the period it covers and the results of those activities at the end of theperiod.
Phoenix Unit Trust Managers Limited is part of the Phoenix Group.
Ignis Investment Services Limited is part of the Standard Life Aberdeen plc group and its subsidiaries.
Unit prices appear daily on our website www.phoenixunittrust.co.uk.
Administration & Dealing: 0345 584 2803 (between the hours of 9am & 5pm).
Remuneration
The ACS Manager has adopted a remuneration policy, up-to-date details of which can be found onwww.phoenixunittrust.co.uk. This statement describes how remuneration and benefits are calculatedand identifies the committee which oversees and controls this policy. A paper copy of these details canbe requested free of charge from the ACS Manager.
This statement fulfils Phoenix Unit Trust Managers Limited‘s (‘the ACS Manager’) obligations as anauthorised UCITS Manager in respect of compliance with the UCITS V Remuneration Code and containsrelevant remuneration disclosures.
PUTM Unit Trusts are managed by Phoenix Unit Trust Managers Limited, which is a subsidiary ofPhoenix Life Limited, part of The Phoenix Group plc (‘the Group’).
The Remuneration Committee (‘the Committee’) of the Group has established a Remuneration Policywhich applies to all entities of the Group. The guiding principles of this policy ensure sound andeffective risk management so as not to encourage risk-taking outside of the Group’s risk appetite, andsupport management in the operation of their business through identification of minimum controlstandards and key controls. The Committee approves the list of UCITS Code Staff annually andidentified UCITS Code Staff are annually notified of their status and the associated implications.
Further information on the Group Remuneration Policy can be found in the Group annual reports andaccounts which can be found on www.phoenixgroup.com.
The below table provides detail of remuneration provided, split between fixed and variableremuneration, for UCITS Code Staff (defined as all staff whose professional activities have materialimpact on the risk profiles of the fund it manages).
As at 31 December 2021 Headcount Total remuneration
Phoenix Unit Trust Managers 2 90,655.88of whichFixed Remuneration 2 59,744.92Variable Remuneration 1 30,910.96Carried Interest n/a
Highest paid Director’s Remuneration 40,843,47
The Directors are employed by fellow entities of the Group. The total compensation paid to the Directorsof the ACS Manager is in respect of services to the ACS Manager, irrespective of which entity within thePhoenix Group has paid the compensation.
Please note that due to the employment structure and resourcing practices of the Group, the staffindicated in this table may also provide services to other companies in the Group.

285
Corporate information (unaudited)
The table states the actual number of employees who are fully or partly involved in the activities of theACS Manager, no attempt has been made to apportion the time spent specifically in support of each Sub-fund as this data is not captured as part of the ACS Manager’s normal processes.
The remuneration disclosed is the total remuneration for the year and has been apportioned between theprovisions of services to the ACS Manager and not the Sub-funds.
Total remuneration can include any of the following;
– Fixed pay and annual/long term incentive bonuses.
– Where fixed pay is directly attributable to PUTM Unit Trusts (for example, fees for Phoenix Unit TrustManagers Limited), 100% of those fees.
– For other individuals, pro-rated using the average AUM of PUTM Unit Trusts (as a proportion of theaggregate average AUM of The Phoenix Group plc) as proxy.
Senior Management includes – PUTM Board and PUTM Executive Committees.
Other Code Staff includes all other UCITS Code Staff not covered by the above.
Assessment of Value – PUTM ACS European ex UK Fund
We are required to perform an annual assessment of the value for money for each unit class of PUTMACS European Ex UK Fund, a sub-fund within the PUTM Authorised Contractual Scheme (ACS). Thishas been performed based on the information available as at 31 January 2022.We have performed this review having regard to a wide range of factors. In doing so, we have madecomparison with the other unit classes of the relevant fund, with the unit classes and sub-funds withinour fund ranges and also with comparable unit classes and sub-funds in the rest of the market.Broadly speaking, assessment of value requires consideration of a combination of factors, including thereturn achieved, the price paid, the risk taken and the quality and range of services provided by the assetmanager.
This also needs to be considered in the context of the investment objectives and policy for the Fund, thetarget investor and the recommended holding period.
In considering cost, regard needs to be had to the total cost of investing, including any adviser charges,platform charges, adviser fees and the on-going annual management charge. Regard also needs to behad to the degree of active management; as an investor, you would not be receiving value, if you werebeing charged fees for active portfolio management, where in fact, the Fund’s composition ofperformance is staying very close to a benchmark. These factors also need to be considered in thecontext of the size of the portfolio and the ability of larger funds to benefit from economies of scale. Asregards performance, it is important that performance is considered over an appropriate timescale giventhe Fund’s objectives, and should be measured net of fees.
Based on our assessment of the value of each unit class, PUTM are comfortable that the Fund meets therequired Assessment of Value criteria. No immediate action is required.
Further details of the Assessment of Value can be found at the following link:https://www.phoenixunittrust.co.uk/report-and-accounts.aspx
Assessment of Value – PUTM ACS Japan Equity Fund
We are required to perform an annual assessment of the value for money for each unit class of PUTMACS Japan Equity Fund. This has been performed based on the information available as at 31 January2022.
We have performed this review having regard to a wide range of factors. In doing so, we have madecomparison with the other unit classes of the relevant fund, with the unit classes and sub-funds withinour fund ranges and also with comparable unit classes and sub-funds in the rest of the market.
286
Corporate information (unaudited)
Broadly speaking, assessment of value requires consideration of a combination of factors, including thereturn achieved, the price paid, the risk taken and the quality and range of services provided by the assetmanager.
This also needs to be considered in the context of the investment objectives and policy for the Fund, thetarget investor and the recommended holding period.
In considering cost, regard needs to be had to the total cost of investing, including any adviser charges,platform charges, adviser fees and the on-going annual management charge. Regard also needs to behad to the degree of active management; as an investor, you would not be receiving value, if you werebeing charged fees for active portfolio management, where in fact, the Fund’s composition ofperformance is staying very close to a benchmark. These factors also need to be considered in thecontext of the size of the portfolio and the ability of larger funds to benefit from economies of scale. Asregards performance, it is important that performance is considered over an appropriate timescale giventhe Fund’s objectives, and should be measured net of fees.
Based on our assessment of the value of each unit class, PUTM are comfortable that the Fund meets therequired Assessment of Value criteria. No immediate action is required.
Further details of the Assessment of Value can be found at the following link:https://www.phoenixunittrust.co.uk/report-and-accounts.aspx
Assessment of Value – PUTM ACS Lothian European ex UK Fund
We are required to perform an annual assessment of the value for money for each unit class of PUTMACS Lothian European ex UK Fund, a sub-fund within the PUTM Authorised Contractual Scheme (ACS).This has been performed based on the information available as at 31 January 2022.
We have performed this review having regard to a wide range of factors. In doing so, we have madecomparison with the other unit classes of the relevant fund, with the unit classes and sub-funds withinour fund ranges and also with comparable unit classes and sub-funds in the rest of the market.
Broadly speaking, assessment of value requires consideration of a combination of factors, including thereturn achieved, the price paid, the risk taken and the quality and range of services provided by the assetmanager.
This also needs to be considered in the context of the investment objectives and policy for the Fund, thetarget investor and the recommended holding period.
In considering cost, regard needs to be had to the total cost of investing, including any adviser charges,platform charges, adviser fees and the on-going annual management charge. Regard also needs to behad to the degree of active management; as an investor, you would not be receiving value, if you werebeing charged fees for active portfolio management, where in fact, the Fund’s composition ofperformance is staying very close to a benchmark. These factors also need to be considered in thecontext of the size of the portfolio and the ability of larger funds to benefit from economies of scale. Asregards performance, it is important that performance is considered over an appropriate timescale giventhe Fund’s objectives, and should be measured net of fees.
Based on our assessment of the value of each unit class, PUTM are comfortable that the Fund meets therequired Assessment of Value criteria. No immediate action is required.
Further details of the Assessment of Value can be found at the following link:https://www.phoenixunittrust.co.uk/report-and-accounts.aspx
Assessment of Value – PUTM ACS Lothian North American Equity Fund
We are required to perform an annual assessment of the value for money for each unit class of PUTMACS Lothian North American Equity Fund, a sub-fund within the PUTM Authorised Contractual Scheme(ACS). This has been performed based on the information available as at 31 January 2022.

287
Corporate information (unaudited)
We have performed this review having regard to a wide range of factors. In doing so, we have madecomparison with the other unit classes of the relevant fund, with the unit classes and sub-funds withinour fund ranges and also with comparable unit classes and sub-funds in the rest of the market.
Broadly speaking, assessment of value requires consideration of a combination of factors, including thereturn achieved, the price paid, the risk taken and the quality and range of services provided by the assetmanager.
This also needs to be considered in the context of the investment objectives and policy for the Fund, thetarget investor and the recommended holding period.
In considering cost, regard needs to be had to the total cost of investing, including any adviser charges,platform charges, adviser fees and the on-going annual management charge. Regard also needs to behad to the degree of active management; as an investor, you would not be receiving value, if you werebeing charged fees for active portfolio management, where in fact, the Fund’s composition ofperformance is staying very close to a benchmark. These factors also need to be considered in thecontext of the size of the portfolio and the ability of larger funds to benefit from economies of scale. Asregards performance, it is important that performance is considered over an appropriate timescale giventhe Fund’s objectives, and should be measured net of fees.
Based on our assessment of the value of each unit class, PUTM are comfortable that the Fund meets therequired Assessment of Value criteria. No immediate action is required.
Further details of the Assessment of Value can be found at the followinglink:https://www.phoenixunittrust.co.uk/report-and-accounts.aspx
Assessment of Value – PUTM ACS Lothian All Share UK Listed Equity Fund
We are required to perform an annual assessment of the value for money for each unit class of PUTMACS Lothian UK Listed Equity Fund, a sub-fund within the PUTM Authorised Contractual Scheme (ACS).This has been performed based on the information available as at 31 January 2022.
We have performed this review having regard to a wide range of factors. In doing so, we have madecomparison with the other unit classes of the relevant fund, with the unit classes and sub-funds withinour fund ranges and also with comparable unit classes and sub-funds in the rest of the market.
Broadly speaking, assessment of value requires consideration of a combination of factors, including thereturn achieved, the price paid, the risk taken and the quality and range of services provided by the assetmanager.
This also needs to be considered in the context of the investment objectives and policy for the Fund, thetarget investor and the recommended holding period.
In considering cost, regard needs to be had to the total cost of investing, including any adviser charges,platform charges, adviser fees and the on-going annual management charge. Regard also needs to behad to the degree of active management; as an investor, you would not be receiving value, if you werebeing charged fees for active portfolio management, where in fact, the Fund’s composition ofperformance is staying very close to a benchmark. These factors also need to be considered in thecontext of the size of the portfolio and the ability of larger funds to benefit from economies of scale. Asregards performance, it is important that performance is considered over an appropriate timescale giventhe Fund’s objectives, and should be measured net of fees.
Based on our assessment of the value of each unit class, PUTM are comfortable that the Fund meets therequired Assessment of Value criteria.
Further details of the Assessment of Value can be found at the following link:https://www.phoenixunittrust.co.uk/report-and-accounts.aspx

288
Corporate information (unaudited)
Assessment of Value – PUTM ACS Lothian UK Gilt Fund
We are required to perform an annual assessment of the value for money for each unit class of PUTMACS Lothian UK Gilt Fund, a sub-fund within the PUTM Authorised Contractual Scheme (ACS). This hasbeen performed based on the information available as at 31 January 2022.
We have performed this review having regard to a wide range of factors. In doing so, we have madecomparison with the other unit classes of the relevant sub-fund, with the unit classes and sub-fundswithin our fund ranges and also with comparable unit classes and sub-funds in the rest of the market.
Broadly speaking, assessment of value requires consideration of a combination of factors, including thereturn achieved, the price paid, the risk taken and the quality and range of services provided by the assetmanager. This also needs to be considered in the context of the investment objectives and policy for theFund, the target investor and the recommended holding period.
In considering cost, regard needs to be had to the total cost of investing, including any adviser charges,platform charges, adviser fees and the on-going annual management charge. Regard also needs to behad to the degree of active management; as an investor, you would not be receiving value, if you werebeing charged fees for active portfolio management, where in fact, the Fund’s composition ofperformance is staying very close to a benchmark. These factors also need to be considered in thecontext of the size of the portfolio and the ability of larger funds to benefits from economies of scale. Asregards performance, it is important that performance is considered over an appropriate timescale giventhe Fund’s objectives, and should be measured net of fees.
Based on our assessment of the value of each unit class, PUTM are comfortable that the Fund meets therequired Assessment of Value criteria. No immediate action is required.
Further details on our Assessment of Value methodology can be found at the following link:https://www.phoenixunittrust.co.uk/report-and-accounts.aspx
Assessment of Value – PUTM ACS Lothian UK Listed Smaller Companies Fund
We are required to perform an annual assessment of the value for money for each unit class of PUTMACS Lothian UK Listed Smaller Companies Fund, a sub-fund within the PUTM Authorised ContractualScheme (ACS). This has been performed based on the information available as at 31 January 2022.
We have performed this review having regard to a wide range of factors. In doing so, we have madecomparison with the other unit classes of the relevant fund, with the unit classes and sub-funds withinour fund ranges and also with comparable unit classes and sub-funds in the rest of the market.
Broadly speaking, assessment of value requires consideration of a combination of factors, including thereturn achieved, the price paid, the risk taken and the quality and range of services provided by the assetmanager.
This also needs to be considered in the context of the investment objectives and policy for the Fund, thetarget investor and the recommended holding period.
In considering cost, regard needs to be had to the total cost of investing, including any adviser charges,platform charges, adviser fees and the on-going annual management charge. Regard also needs to behad to the degree of active management; as an investor, you would not be receiving value, if you werebeing charged fees for active portfolio management, where in fact, the Fund’s composition ofperformance is staying very close to a benchmark. These factors also need to be considered in thecontext of the size of the portfolio and the ability of larger funds to benefit from economies of scale. Asregards performance, it is important that performance is considered over an appropriate timescale giventhe Fund’s objectives, and should be measured net of fees.

289
Corporate information (unaudited)
Based on our assessment of the value of each unit class, PUTM are comfortable that the Fund meets therequired Assessment of Value criteria. No immediate action is required. Performance is being monitoredby the Manager Oversight Team and Investment Committee, who may take action to change strategy ormanager, if required.
Further details of the Assessment of Value can be found at the following link:https://www.phoenixunittrust.co.uk/report-and-accounts.aspx
Assessment of Value – PUTM ACS North American Fund
We are required to perform an annual assessment of the value for money for each unit class of PUTMACS North America Fund, a sub-fund within the PUTM Authorised Contractual Scheme (ACS). This hasbeen performed based on the information available as at 31 Janaury 2022.
We have performed this review having regard to a wide range of factors. In doing so, we have madecomparison with the other unit classes of the relevant fund, with the unit classes and sub-funds withinour fund ranges and also with comparable unit classes and sub-funds in the rest of the market.
Broadly speaking, assessment of value requires consideration of a combination of factors, including thereturn achieved, the price paid, the risk taken and the quality and range of services provided by the assetmanager.
This also needs to be considered in the context of the investment objectives and policy for the Fund, thetarget investor and the recommended holding period.
In considering cost, regard needs to be had to the total cost of investing, including any adviser charges,platform charges, adviser fees and the on-going annual management charge. Regard also needs to behad to the degree of active management; as an investor, you would not be receiving value, if you werebeing charged fees for active portfolio management, where in fact, the Fund’s composition ofperformance is staying very close to a benchmark. These factors also need to be considered in thecontext of the size of the portfolio and the ability of larger funds to benefit from economies of scale. Asregards performance, it is important that performance is considered over an appropriate timescale giventhe Fund’s objectives, and should be measured net of fees.
Based on our assessment of the value of each unit class, PUTM are comfortable that the Fund meets therequired Assessment of Value criteria. No immediate action is required.
Further details of the Assessment of Value can be found at the following link:https://www.phoenixunittrust.co.uk/report-and-accounts.aspx
Assessment of Value – PUTM ACS Sustainable Index European Equity Fund
We are required to perform an annual assessment of the value for money for each unit class of PUTMACS Sustainable Index European Equity Fund, a sub-fund within the PUTM Authorised ContractualScheme (ACS). This has been performed based on the information available as at 31 January 2022.
We have performed this review having regard to a wide range of factors. In doing so, we have madecomparison with the other unit classes of the relevant fund, with the unit classes and sub-funds withinour fund ranges and also with comparable unit classes and sub-funds in the rest of the market.
Broadly speaking, assessment of value requires consideration of a combination of factors, including thereturn achieved, the price paid, the risk taken and the quality and range of services provided by the assetmanager.
This also needs to be considered in the context of the investment objectives and policy for the Fund, thetarget investor and the recommended holding period.
In considering cost, regard needs to be had to the total cost of investing, including any adviser charges,platform charges, adviser fees and the on-going annual management charge. Regard also needs to be

290
Corporate information (unaudited)
had to the degree of active management; as an investor, you would not be receiving value, if you werebeing charged fees for active portfolio management, where in fact, the Fund’s composition ofperformance is staying very close to a benchmark. These factors also need to be considered in thecontext of the size of the portfolio and the ability of larger funds to benefit from economies of scale. Asregards performance, it is important that performance is considered over an appropriate timescale giventhe Fund’s objectives, and should be measured net of fees.
Based on our assessment of the value of each unit class, PUTM are comfortable that the Fund meets therequired Assessment of Value criteria. No immediate action is required.
Further details of the Assessment of Value can be found at the following link:https://www.phoenixunittrust.co.uk/report-and-accounts.aspx
Assessment of Value – PUTM ACS Sustainable Index Japan Equity Fund
We are required to perform an annual assessment of the value for money for each unit class of PUTMACS Sustainable Index Japan Equity Fund, a sub-fund within the PUTM Authorised Contractual Scheme(ACS). This has been performed based on the information available as at 31 January 2022.
We have performed this review having regard to a wide range of factors. In doing so, we have madecomparison with the other unit classes of the relevant fund, with the unit classes and sub-funds withinour fund Broadly speaking, assessment of value requires consideration of a combination of factors,including the return achieved, the price paid, the risk taken and the quality and range of servicesprovided by the asset manager.
This also needs to be considered in the context of the investment objectives and policy for the Fund, thetarget investor and the recommended holding period.
In considering cost, regard needs to be had to the total cost of investing, including any adviser charges,platform charges, adviser fees and the on-going annual management charge. Regard also needs to behad to the degree of active management; as an investor, you would not be receiving value, if you werebeing charged fees for active portfolio management, where in fact, the Fund’s composition ofperformance is staying very close to a benchmark. These factors also need to be considered in thecontext of the size of the portfolio and the ability of larger funds to benefit from economies of scale. Asregards performance, it is important that performance is considered over an appropriate timescale giventhe Fund’s objectives, and should be measured net of fees.
Based on our assessment of the value of each unit class, PUTM are comfortable that the Fund meets therequired Assessment of Value criteria. No immediate action is required.
Further details of the Assessment of Value can be found at the following link:https://www.phoenixunittrust.co.uk/report-and-accounts.aspx
Assessment of Value – PUTM ACS Sustainable Index UK Equity Fund
We are required to perform an annual assessment of the value for money for each unit class of PUTMACS Sustainable Index UK Equity Fund, a sub-fund within the PUTM Authorised Contractual Scheme(ACS). This has been performed based on the information available as at 31 January 2022.
We have performed this review having regard to a wide range of factors. In doing so, we have madecomparison with the other unit classes of the relevant fund, with the unit classes and sub-funds withinour fund ranges and also with comparable unit classes and sub-funds in the rest of the market.
Broadly speaking, assessment of value requires consideration of a combination of factors, including thereturn achieved, the price paid, the risk taken and the quality and range of services provided by the assetmanager.
This also needs to be considered in the context of the investment objectives and policy for the Fund, thetarget investor and the recommended holding period.

291
Corporate information (unaudited)
In considering cost, regard needs to be had to the total cost of investing, including any adviser charges,platform charges, adviser fees and the on-going annual management charge. Regard also needs to behad to the degree of active management; as an investor, you would not be receiving value, if you werebeing charged fees for active portfolio management, where in fact, the Fund’s composition ofperformance is staying very close to a benchmark. These factors also need to be considered in thecontext of the size of the portfolio and the ability of larger funds to benefit from economies of scale. Asregards performance, it is important that performance is considered over an appropriate timescale giventhe Fund’s objectives, and should be measured net of fees.
Based on our assessment of the value of each unit class, PUTM are comfortable that the Fund meets therequired Assessment of Value criteria. No immediate action is required.
Further details of the Assessment of Value can be found at the following link:https://www.phoenixunittrust.co.uk/report-and-accounts.aspx
Assessment of Value – PUTM ACS Sustainable Index US Equity Fund
We are required to perform an annual assessment of the value for money for each unit class of PUTMACS Sustainable Index US Equity Fund. This has been performed based on the information available asat 31 January 2022.
We have performed this review having regard to a wide range of factors. In doing so, we have madecomparison with the other unit classes of the relevant fund, with the unit classes and sub-funds withinour fund ranges and also with comparable unit classes and sub-funds in the rest of the market.
Broadly speaking, assessment of value requires consideration of a combination of factors, including thereturn achieved, the price paid, the risk taken and the quality and range of services provided by the assetmanager. This also needs to be considered in the context of the investment objectives and policy for theFund, the target investor and the recommended holding period.
In considering cost, regard needs to be had to the total cost of investing, including any adviser charges,platform charges, adviser fees and the on-going annual management charge. Regard also needs to behad to the degree of active management; as an investor, you would not be receiving value, if you werebeing charged fees for active portfolio management, where in fact, the Fund’s composition ofperformance is staying very close to a benchmark. These factors also need to be considered in thecontext of the size of the portfolio and the ability of larger funds to benefit from economies of scale. Asregards performance, it is important that performance is considered over an appropriate timescale giventhe Fund’s objectives, and should be measured net of fees.
Based on our assessment of the value of each unit class, PUTM can confirm that the Fund meets therequired Assessment of Value criteria. No immediate action is required.
Further details of the Assessment of Value can be found at the following link:https://www.phoenixunittrust.co.uk/report-and-accounts.aspx
Assessment of Value – PUTM ACS UK All-Share Listed Equity Fund
We are required to perform an annual assessment of the value for money for each unit class of PUTMACS UK All Share Listed Equity Fund, a sub-fund within the PUTM Authorised Contractual Scheme(ACS). This has been performed based on the information available as at 31 January 2022.
We have performed this review having regard to a wide range of factors. In doing so, we have madecomparison with the other unit classes of the relevant fund, with the unit classes and sub-funds withinour fund ranges and also with comparable unit classes and sub-funds in the rest of the market.
Broadly speaking, assessment of value requires consideration of a combination of factors, including thereturn achieved, the price paid, the risk taken and the quality and range of services provided by the assetmanager.

292
Corporate information (unaudited)
This also needs to be considered in the context of the investment objectives and policy for the Fund, thetarget investor and the recommended holding period.
In considering cost, regard needs to be had to the total cost of investing, including any adviser charges,platform charges, adviser fees and the on-going annual management charge. Regard also needs to behad to the degree of active management; as an investor, you would not be receiving value, if you werebeing charged fees for active portfolio management, where in fact, the Fund’s composition ofperformance is staying very close to a benchmark. These factors also need to be considered in thecontext of the size of the portfolio and the ability of larger funds to benefit from economies of scale. Asregards performance, it is important that performance is considered over an appropriate timescale giventhe Fund’s objectives, and should be measured net of fees.
Based on our assessment of the value of each unit class, PUTM are comfortable that the Fund meets therequired Assessment of Value criteria.
Further details of the Assessment of Value can be found at the following link:https://www.phoenixunittrust.co.uk/report-and-accounts.aspx"
Risks
The price of units and the revenue from them can go down as well as up and investors may not get backthe amount they invested, particularly in the case of early withdrawal. Tax levels and reliefs are thosecurrently applicable and may change. The value of any tax relief depends on personal circumstances.
Management charges on some funds are charged to capital and therefore a reduction in capital mayoccur.
Depending on the Sub-fund, the value of your investment may change with currency movements.

293
Corporate information (unaudited)
Investment AdviserIgnis Investment Services Limited1 George StreetEdinburgh EH2 2LLRegistered in Scotland – No.SC101825Authorised and regulated by the Financial Conduct Authority.
Investment Adviser (PUTM ACS UK All-Share ListedEquity)Invesco Asset Management LimitedPerpetual ParkPerpetual Park DriveHenley-On-ThamesOxfordshire RG9 1HHAuthorised and regulated by the Financial Conduct Authority.
DepositaryHSBC Bank plc1-2 Lochside WayEdinburgh ParkEdinburgh EH12 9DTAuthorised by the Prudential Regulation Authority andregulated by the Financial Conduct Authority and thePrudential Regulation Authority.
Independent AuditorErnst & Young LLPAtria One144 Morrison StreetEdinburgh EH3 8EX
Authorised statusPUTM ACS Funds is an authorised contractual scheme inco-ownership form authorised by the FCA with effect from19 December 2018.
Authorised Contractual Scheme (“ACS”) ManagerPhoenix Unit Trust Managers Limited (PUTM)1 Wythall Green WayWythallBirmingham B47 6WGTel: 0345 584 2803Registered in England – No.03588031Authorised and regulated by the Financial Conduct Authority.
DirectorsAndrew Moss PUTM Director, Chief Executive
Phoenix Life;
Craig Baker PUTM Director, Head of InvestmentManagement Phoenix Life;
Mike Urmston Non Executive Director of PUTM;
Nick Poyntz-Wright Non Executive Director of PUTM.
Registrar and correspondence addressPhoenix Unit Trust Managers LimitedFloor 1, 1 Grand Canal SquareGrand Canal HarbourDublin 2IrelandAuthorised and regulated by the Financial Conduct Authority.
Corporate information (unaudited)

294
Notes


Telephone calls may be monitored and/or recorded for the purposes of security, internal training, accurate accountoperation, internal customer monitoring and to improve the quality of service.
Please note the Key Investor Information Document (KIID), the Supplementary Information Document (SID) and thefull prospectus are available free of charge. These are available by contacting Client Services on 0345 584 2803.
Phoenix Unit Trust Managers Limited does not accept liability for any claims or losses of any nature arising directlyor indirectly from use of the data or material in this report. The information supplied is not intended to constituteinvestment, tax, legal or other advice.
Phoenix Unit Trust Managers Limited* is a Phoenix Group Company. Registered in England No 3588031.Registered office: 1 Wythall Green Way, Wythall, Birmingham B47 6WG.*Authorised and regulated by the Financial Conduct Authority.
Contact: Client ServicesCall: 0345 584 2803Correspondence Address: Floor 1, 1 Grand Canal Square, Grand Canal Harbour, Dublin 2, IrelandVisit: phoenixunittrust.co.uk