Acid extractable” metal concentrations in solid matrices: A comparison and evaluation of...
10
Available online at www.sciencedirect.com Talanta 75 (2008) 1338–1347 “Acid extractable” metal concentrations in solid matrices: A comparison and evaluation of operationally defined extraction procedures and leaching tests Val´ erie Cappuyns a,b,∗ , Rudy Swennen b,1 a European University College Brussels, Centre for Corporate Sustainability, Stormstraat 2, 1000 Brussels, Belgium b Geologie, Katholieke Universiteit Leuven, Celestijnenlaan 200E, B-3001 Heverlee, Belgium Received 21 June 2007; received in revised form 18 January 2008; accepted 24 January 2008 Available online 2 February 2008 Abstract Different frequently used methods to determine the influence of acid conditions on heavy metal release from soils, sediments and waste materials, namely pH stat leaching tests and acid extractions with acetic acid (HOAc) (0.11 M and 0.43 M) and sodium acetate (NaOAc) (1 M) were compared for 30 samples (soils, sediments and waste materials) with different physico-chemical properties and a different degree of contamination. However, no distinct relationship was found between physico-chemical sample characteristics, total element concentrations and acid-extractable metal concentrations in the presented dataset. pH played an important role in explaining the release of metals from the contaminated soils, sediments and waste materials. The pH-shift after extraction with the different acetic acid solutions (0.11 M and 0.43 M) was both explained by the initial pH of the sample and its acid neutralizing capacity. The pH of the NaOAc extract was well buffered and the release of elements from solid matrices by NaOAc was both the result of the complexation with acetate and pH (pH 5). Generally, a linear correlation was found between the amount of Zn and Cd extracted by 0.11M HOAc, 0.43 M HOAc and 1 M NaOAc. The amounts of Zn and Cd extracted with HOAc (0.11 M and 0.43 M) were comparable with amounts of respectively Zn and Cd released during pH stat leaching at pH 4. However, for Cu, Pb and As, it was often not possible to relate the results of a pH stat leaching test to the results of single extractions with acetic acid solutions. © 2008 Elsevier B.V. All rights reserved. Keywords: Acidification; Acid neutralizing capacity; Extractions; Leaching; pH stat ; Pollution 1. Introduction The pH is one of the key parameters that determine heavy metal mobility in soils and sediments. The influence of a pH- decrease on element release from soils, sediments and waste materials can be assessed by means of extractions with acid solutions (for example in single and sequential extractions) or by Abbreviations: ANC, acid neutralizing capacity; BCR, Community Bureau of Reference; CEC, cation exchange capacity; CEN, Comit´ e Europ´ een de Nor- malisation; HOAc, acetic acid; NaOAc, sodium acetate; L/S, liquid/solid ratio; SM&T, Standards Measurements and Testing Program. ∗ Corresponding author at: European University College Brussels, Centre for Corporate Sustainability, Stormstraat 2, 1000 Brussels, Belgium. Tel.: +32 22101675; fax: +32 22101619. E-mail addresses: [email protected] (V. Cappuyns), [email protected] (R. Swennen). 1 Tel.: +32 16327297; fax: +32 16327981. pH stat titrations. In many respects leaching behaviour as reflected by single and sequential extractions, pH stat leaching tests and related characterisation leaching tests provide a better means of assessing environmental impact than analysis of total compo- sition. Although column tests give a better simulation of field conditions than batch tests (e.g. more realistic liquid/solid (L/S) ratio, laminar instead of turbulent flow), column tests require a more sophisticated equipment than batch tests and usually they last much longer than batch tests. 1.1. Single extractions Single extractions represent a relatively fast, cheap and sim- ple way to assess heavy metal mobility in contaminated soils and sediments. Depending on the objectives of the extraction, water, diluted salt solutions or stronger reagents such as ethylenedi- aminetetraacetic acid (EDTA) are used. Single extractions are 0039-9140/$ – see front matter © 2008 Elsevier B.V. All rights reserved. doi:10.1016/j.talanta.2008.01.047
-
Upload
trismegistos -
Category
Documents
-
view
1 -
download
0
Transcript of Acid extractable” metal concentrations in solid matrices: A comparison and evaluation of...

A
nfnc
ectHrl©
K
1
mdms
omS
CB
R
0d
Available online at www.sciencedirect.com
Talanta 75 (2008) 1338–1347
“Acid extractable” metal concentrations in solid matrices:A comparison and evaluation of operationally defined
extraction procedures and leaching tests
Valerie Cappuyns a,b,∗, Rudy Swennen b,1
a European University College Brussels, Centre for Corporate Sustainability, Stormstraat 2, 1000 Brussels, Belgiumb Geologie, Katholieke Universiteit Leuven, Celestijnenlaan 200E, B-3001 Heverlee, Belgium
Received 21 June 2007; received in revised form 18 January 2008; accepted 24 January 2008Available online 2 February 2008
bstract
Different frequently used methods to determine the influence of acid conditions on heavy metal release from soils, sediments and waste materials,amely pHstat leaching tests and acid extractions with acetic acid (HOAc) (0.11 M and 0.43 M) and sodium acetate (NaOAc) (1 M) were comparedor 30 samples (soils, sediments and waste materials) with different physico-chemical properties and a different degree of contamination. However,o distinct relationship was found between physico-chemical sample characteristics, total element concentrations and acid-extractable metaloncentrations in the presented dataset.
pH played an important role in explaining the release of metals from the contaminated soils, sediments and waste materials. The pH-shift afterxtraction with the different acetic acid solutions (0.11 M and 0.43 M) was both explained by the initial pH of the sample and its acid neutralizingapacity. The pH of the NaOAc extract was well buffered and the release of elements from solid matrices by NaOAc was both the result of
he complexation with acetate and pH (pH 5). Generally, a linear correlation was found between the amount of Zn and Cd extracted by 0.11 MOAc, 0.43 M HOAc and 1 M NaOAc. The amounts of Zn and Cd extracted with HOAc (0.11 M and 0.43 M) were comparable with amounts ofespectively Zn and Cd released during pHstat leaching at pH 4. However, for Cu, Pb and As, it was often not possible to relate the results of a pHstat
eaching test to the results of single extractions with acetic acid solutions.2008 Elsevier B.V. All rights reserved.
stat; P
pbra
eywords: Acidification; Acid neutralizing capacity; Extractions; Leaching; pH
. Introduction
The pH is one of the key parameters that determine heavyetal mobility in soils and sediments. The influence of a pH-
ecrease on element release from soils, sediments and wasteaterials can be assessed by means of extractions with acid
olutions (for example in single and sequential extractions) or by
Abbreviations: ANC, acid neutralizing capacity; BCR, Community Bureauf Reference; CEC, cation exchange capacity; CEN, Comite Europeen de Nor-alisation; HOAc, acetic acid; NaOAc, sodium acetate; L/S, liquid/solid ratio;M&T, Standards Measurements and Testing Program.∗ Corresponding author at: European University College Brussels, Centre fororporate Sustainability, Stormstraat 2, 1000 Brussels,elgium. Tel.: +32 22101675; fax: +32 22101619.
E-mail addresses: [email protected] (V. Cappuyns),[email protected] (R. Swennen).1 Tel.: +32 16327297; fax: +32 16327981.
scrml
1
psda
039-9140/$ – see front matter © 2008 Elsevier B.V. All rights reserved.oi:10.1016/j.talanta.2008.01.047
ollution
Hstat titrations. In many respects leaching behaviour as reflectedy single and sequential extractions, pHstat leaching tests andelated characterisation leaching tests provide a better means ofssessing environmental impact than analysis of total compo-ition. Although column tests give a better simulation of fieldonditions than batch tests (e.g. more realistic liquid/solid (L/S)atio, laminar instead of turbulent flow), column tests require aore sophisticated equipment than batch tests and usually they
ast much longer than batch tests.
.1. Single extractions
Single extractions represent a relatively fast, cheap and sim-
le way to assess heavy metal mobility in contaminated soils andediments. Depending on the objectives of the extraction, water,iluted salt solutions or stronger reagents such as ethylenedi-minetetraacetic acid (EDTA) are used. Single extractions are
/ Tala
aaohPe0‘e[tt
1
oieTotirsus‘c
Tko(
oteBdDossdrt
Hestotsoe
ei‘hcade
1
llctoofa
hciuiicasceavo
to(me1mwwmpo
for
V. Cappuyns, R. Swennen
lso widely applied in soil science for the quantification of themount of Fe- and Al-oxides in soils. Within the frameworkf harmonisation of leaching procedures for risk assessment ofeavy metals in soils, the Standards Measurements and Testingrogram (SM&T) of the European Commission performed anxtensive collaborative study, which resulted in the selection of.43 M acetic acid (HOAc) (‘mobilisable fractions’, indicate thepotential availability’) as a soil extractant to estimate the influ-nce of acidifications on element release of soils and sediments1]. The extraction with 0.43 M HOAc allows an estimation ofhe metal fraction remobilised after acidification of the soil tohe pH of the extractant [2].
.2. Sequential extractions
Sequential extractions provide semi-quantitative informationn element distribution between operationally defined geochem-cal fractions. Therefore, the fractions obtained from sequentialxtractions do not necessarily reflect true chemical speciation.he different extractions in a sequential extraction schemeften intend to simulate processes in nature such as acidifica-ion or oxidation. However, the physico-chemical conditionsn sequential extraction experiments (strong reagents and rapideactions) differ from natural conditions (weak reagents andlow reactions) [3]. Although leaching techniques such as col-mn leaching tests are probably more realistic to field conditions,equential extractions can give an indication of the ‘pools’ orsinks’ of heavy metals that are potentially available underhanging environmental conditions.
In the eighties and the beginning of the nineties, theessier sequential extraction scheme [4] was probably the bestnown and most applied extraction scheme. Moreover, numer-us modifications have been made to the original procedure[5–7]).
Standardisation of sequential extraction procedures is thenly way to achieve comparability when using sequential extrac-ions [8]. In the past decade, much effort has been made tovaluate sequential extraction schemes. The best example is theCR sequential extraction scheme, a simple three-stage proce-ure that was thoroughly tested by interlaboratory trials [9,10].ifferent extraction procedures, applied on the same sample, areften compared to select the procedure that is most suited for theoil or sediment of concern [11]. However, the direct compari-on between methods is difficult to carry out, especially whenifferent reagents are applied to extract a specific phase or wheneagents with different concentrations are used in the methodso be compared.
1 M sodium acetate (NaOAc), acidified to pH 5 and 0.11 MOAc are the most widely used reagents to determine ‘acid
xtractable’ metal concentrations in sequential extractionschemes: NaOAc is used to determine the ‘carbonate fraction’ inhe Tessier sequential extraction procedure, whereas the first stepf the BCR sequential extraction procedure consists of an extrac-
ion with 0.11 M HOAc. In recent years, attempts to improveequential extractions towards higher selectivity and higherperational efficiency have been made. One of the major param-ters that influence the selectivity of reagents during sequential(wrd
nta 75 (2008) 1338–1347 1339
xtractions, is the pH of the extracts. 0.11 M HOAc (fraction 1n the BCR sequential extraction scheme) is supposed to releaseexchangeable’ elements and to dissolve some poorly crystallineydroxy- and carbonate-metal phases [12]. It is of major con-ern that this extraction is as complete as possible since pHnd changes in pH during extractions are key parameters thatetermine the potential redistribution of trace elements duringxtractions [13].
.3. pHstat leaching tests
Different types of tests are available to assess pH dependenteaching. In the United States, the TCLP (toxicity characteristiceaching procedure) is commonly used to determine the toxicityharacteristics of a material. The TCLP is a batch test in whichhe size-reduced material is leached with HOAc at a L/S ratiof 20 for 18 h. This test is less suited to estimate metal releasever a long period of time, especially since the extraction timeor a TCLP is arbitrarily chosen (18 h). Moreover, leaching isddressed at only one pH value.
Although buffer solutions represent a simple way to assesseavy metal mobility as a function of pH (e.g. [14]), bufferomponents can induce heavy metal complexation, resultingn unusually high leaching [15]. Manual titrations are rathernpractical and require some knowledge of the acid neutral-zing capacity of the sample. Acid-neutralizing capacity (ANC)s a measure for the overall buffering capacity against acidifi-ation for a sample, e.g. surface water or soil. ANC is defineds the difference between cations of strong bases and anions oftrong acids, or dynamically as the amount of acid needed tohange the pH value from the sample’s value to a chosen differ-nt value [16]. In the present study, the amount of acid added tosoil/water suspension to keep the pH at a predefined constantalue gives an estimate of the acid neutralizing capacity (ANC)f this sample. ANC depends on the reference pH.
Cremer and Obermann [17] introduced a computer-baseditration system allowing continuous registration and fine-tuningf pH during leaching experiments. In the nineties, the CENComite Europeen de Normalisation; [18]) started with the har-onisation of new European leaching tests, partly based on
xisting leaching tests. The pH dependence leaching test (PrEN4429), which has been developed by the Network for the har-onisation of leaching/extraction tests (SMT-CT96-2066) andhich is currently being standardised within the CEN frame-ork (CEN-TC292/WG6), consists of parallel extractions of theaterial at a liquid/solid ratio of 10 (L kg−1) for 48 h at a series of
re-set pH values. The pHstat test is used for the characterisationf waste materials and building materials.
The aim of this study was to compare and to evaluate dif-erent methods to determine the influence of acid conditionsn heavy metal release from soils, sediments and waste mate-ials. Therefore, extractions with NaOAc (1 M, pH 5), HOAc
0.11 M), HOAc (0.43 M) and pHstat titrations (at pH 2, 4 and 6)ere carried out on 30 samples (soils, sediments and waste mate-ials) with different physico-chemical properties and a differentegree of contamination.

1 / Talanta 75 (2008) 1338–1347
•
•
•
2
2
SsaawBBrp1
cftbds(
2
(mcvtHwCatTfmoaa
Table 1Detection limits (mg L−1) for As, Cd, Cr, Cu, Ni, Pb and Zn metals in differentsolutions
0.1 M HNO3
(�g g−1)0.11 M HOAc(�g g−1)
0.43 M HOAc(�g g−1)
1 M NaOAc(�g g−1)
As 0.016 0.016 0.012 0.008Cd 0.004 0.001 0.001 0.006Cr 0.007 0.007 0.014 0.026Cu 0.004 0.004 0.005 0.008Ni 0.003 0.002 0.001 0.005PZ
2
Ha1SwPd
(sMrbpmdGrdtpM
2
HL
oefHo
340 V. Cappuyns, R. Swennen
Our objectives were to
investigate the mobilisation of Cd, Zn, Pb and Cu from severalcontaminated soils with different contamination histories inresponse to acidification;compare the amounts of heavy metals mobilised by threeconventional single batch extractions with acid solutions;compare the amounts of heavy metals mobilised by pHstatleaching experiments with the results of conventional singlebatch extractions.
. Experimental
.1. Sampling and sample pre-treatment
Sampling was performed between September 2001 andeptember 2004. Land-disposed dredged sediments (DR) wereampled along the Leie (samples 1–5), Scheldt (samples 6–8)nd Grote Beek (sample 10) rivers (Flanders, North Belgium) byugering and digging of profile pits. Alluvial soil samples (AS)ere taken from overbank sediment profiles along the Groteeek (North-Belgium, samples 11, 12), Grote Laak (North-elgium, sample 14) and Geul (East-Belgium, samples 17–24)
ivers. River sediments (RS) from the Upper Scheldt river (sam-le 9), the Grote Beek (sample 13) and the Grote Laak (sample5) were sampled with a Van Veen Grab.
Surface samples from two mine tailings (MT) from the pro-essing of Pb- and Zn-ores (sample 25 and 26) (East-Belgium),rom a zinc smelter (North-Belgium) (samples 27–29) and fromhe surrounding of the zinc smelter (sample 30) were takeny augering [19]. The samples were dried in oven at 30 ◦Curing 5 days. For the physico-chemical analysis, part of theample was disaggregated in a porcelain mortar and sieved<2 mm).
.2. General sample characterisation
pH (H2O) was measured in a soil/water suspension (1/2.5)pH Hamilton single pore electrode). Organic carbon was deter-ined according to the Walkley and Black method [20]; effective
ation exchange capacity (CEC) was analysed applying the ‘sil-er thiourea method’ [21,22]. CaCO3 content was measured withhe rapid titration method [23]. The sample was treated withCl 0.2 M, followed by a backtitration of the unreacted HClith NaOH 0.1 M. Total element concentrations (Al, As, Cd,o, Cr, Cu, Ni, Pb, Zn, Fe, Mg, Mn, K and Ca) were determinedfter dissolution of the samples with a mixture of three concen-
rated acids (4 mL HClconc, 2 mL HNO3conc and 2 mL HFconc).hese solutions were analysed by AAS (Varian® Techtron AA6)or Ca, Fe, K and Al. For As, Cd, Cr, Cu, Mn, Ni, Pb and Zn aulti-element analysis by ICP-MS (HP 4500 series) was carried
ut. Two reference materials (BCR701 and GBW07411 soil)nd sample duplicates were used for quality assurance of thenalytical data.
iA
2
i
b 0.019 0.010 0.006 0.086n 0.022 0.024 0.033 0.071
.3. Apparatus
An induced coupled plasma mass spectrometer (ICP-MS,P4500) was used for the analysis of As, Cd, Cu, Ni, Pb
nd Zn digests and extracts. Zn- and Pb-concentrations above000 �g L−1 were measured with Flame Atomic Absorptionpectrometry (Thermo Electron Corporation S Series AA). Theavelengths selected were 213.9 nm for Zn and 217.0 nm forb. Detection limits for As, Cd, Cr, Cu, Ni, Pb and Zn for theifferent solutions are given in Table 1.
Total S was determined with the Strohlein Sulfur Analyzermodel S-mat, Carbolite Co. Ltd., Bamford-Sheffield). Grainize was determined by laser diffraction analysis (Malvern
astersizer S long bed, Malvern, Worcestershire, UK) afteremoving carbonates (0.1 M HCl), iron oxides (0.5% oxalic acid,oiling) and organic carbon (35% H2O2, 60 ◦C) and applying aeptising solution (10 g L−1 sodium polyphosphate, boiling). Aineralogical sample characterisation was conducted by X-ray
iffraction (XRD, Philips®, Co-target, λ = 1.79 A). A BeckmanS-6 centrifuge was used for the separation of the extracts. A
eciprocal shaker (SM) was employed to shake the samplesuring extractions. For the pH-measurements, a pH Hamil-on single pore electrode was used. pHstat leaching tests wereerformed with an automatic multititration system (Titro-Wicoultititrator®, Wittenfield and Cornelius, Bochum, Germany).
.4. Reagents
All reagents used were of analytical grade Suprapur quality:OAc (Riedel-de Haen), NaOAc (Merck) and HNO3 (Chem-ab).
Standard solutions for FAAS were made by serial dilutionf 1000 �g L−1 standard solutions (Merck) of the appropriatelements. Standard series for ICP-MS were made up startingrom the “10 ppm multi-element calibration standard 2A in 5%NO3” from Hewlett Packard®. The spectroscopic interferencef ArCl, which has the same m/z as As (75) was corrected accord-ng to the recommendations of the US Environmental Protectiongency (EPA) (method 200.8, [24]).
.5. Extractions
The extraction with 0.11 M HOAc was performed accord-ng to the BCR sequential extraction procedure [10]. 40 mL of

V. Cappuyns, R. Swennen / Tala
Table 2Overview of the extractions and leaching test applied in this study
Extraction orleaching test
L/S (L kg−1) Extraction time Reference
1 M NaOAc,acidified topH 5 withHOAc
40 5 h [8]
0.11 M HOAc 40 Overnight (16 h) [29]0.43 M HOAc 40 Overnight (16 h) [1]p
aistoHstAwA(Zeq
g
2
m<tzeeoettt2ostaAapaara
9d
3
3
c(ieat(
3
m(cetv
3
dltsa
HHrodifference of less than 1 standard deviation, was obtained forCd, Cu, Cr, Ni, Pb and Zn, except for Cu in step 1. Nevertheless,the result for the latter elements still differed less than 2 standarddeviations from the indicative values.
Table 3Comparison between aqua regia extractable and ‘three-acids’ extractable (thiswork) concentrations (mg kg−1) of Cd, Cr, Cu, Ni, Pb, Zn and As in referencematerials BCR-701 (indicative values, [28]) and GBW07411
BCR-701 BCR-701 GBW07411 GBW07411
Indicative values This work Certified values This work
Cd 11.7 ± 1.0 10.9 ± 0.2 28.2 ± 1.3 25.9 ± 0.8Cr 272 ± 20 284 ± 5 59.6 ± 5.0 25.9 ± 3.5Cu 275 ± 13 242 ± 2 65.4 ± 4.7 62.9 ± 3.7Ni 103 ± 4 99 ± 7 24.2 ± 2.1 22.3 ± 1.5
Hstat test 10 96 h [18]
0.11 M HOAc solution was added to 1 g of oven dry sed-ment. The suspension was shaken for 16 h in a reciprocalhaker, centrifuged (3500 rpm, 10 min), decanted off and fil-ered (0.45 �m). For the 0.43 M HOAc extraction the protocolf the SM&T program [8] was followed. 40 mL of a 0.43 MOAc solution was added to 1 g of oven dry sediment. The
uspension was shaken for 16 h in a reciprocal shaker, cen-rifuged (3500 rpm, 10 min), decanted off and filtered (0.45 �m).fter measurement of the pH, the HOAc and NaOAc extractsere acidified with concentrated HNO3 to bring the pH < 2.reference material (CRM 483), certified for its acetic acid
0.43 M HOAc) extractable content of Cd, Cr, Cu, Ni, Pb andn, was also included in quadruplicate. For the 0.11 M HOAcxtraction, reference material BCR701 was analysed (also inuadruplicate).
An overview of the different extractions and leaching test isiven in Table 2.
.6. pHstat leaching tests
The pHstat experiments were carried out with an automaticultititration system (Titro-Wico Multititrator®). 80 g of the2 mm fraction of the sample was put in an Erlenmeyer flask
ogether with 800 mL of distilled water and placed on a hori-ontal shaking device. A pH-electrode (pH Hamilton single porelectrode) and an automatic titration dispenser were attached toach flask. The suspensions were first shaken for 30 min with-ut addition of acid and then the titration was started. Previousxperiments performed in our laboratory [25] demonstrated thathe rapid addition of acid to the soil/water suspension could leado an overpassing of the set-point pH. Therefore, the concentra-ion of the titration solution was adapted to the set-point pH (pH: 2.5 M HNO3; pH 4: 1 M HNO3; pH 6: 0.25 M HNO3). Basedn previous experiments [26], the interval of pH-acquisition waset to 200 s (instead of 1 s). By doing so, after addition of acido the suspension, the system is given enough time to reactnd eventually neutralise the acid before more acid is added.fter 96 h, the suspension was filtered. Part of the solution was
cidified with a drop of concentrated HNO3, whereas anotherart of the solution was left unaltered and the solution was put
side for analysis of anions, dissolved organic carbon (DOC)nd electrical conductivity. To assess the kinetics of elementelease during pHstat leaching, samples of the suspension werelso taken after 0.5 h, 1 h, 3 h, 6 h, 12 h, 24 h, 48 h, 72 h andPZA
M
nta 75 (2008) 1338–1347 1341
6 h for a selection of samples (only samples 25 and 26 will beiscussed here).
. Results and discussion
.1. Quality control of analytical data
The quality of the analytical data was evaluated by analysingertified reference materials. The BCR-701 [27] and CRM483indicative values [30]) reference materials are used for the ver-fication of the 0.11 M acetic acid extraction following the BCRxtraction protocols. Metal concentrations extracted with 0.43 Mcetic acid were analysed for CRM 483. Total metal concentra-ions were also determined in two reference materials (BCR-701indicative values [28]) and GBW07411 soil).
.1.1. Total metal concentrationsTotal concentrations of Cd, Cr, Cu, Ni, Pb and Zn reference
aterials BCR-701 ([28] indicative values) and GBW07411 soilcertified values) were determined by dissolution with three con-entrated acids (HF, HCl and HNO3) (Table 3). Although thextraction procedure is different from the aqua regia extraction,he own values were within 1 standard deviation of the indicativealues, except for Cu in BCR-701.
.1.2. ExtractionsA very good accuracy was obtained for all elements since the
ifference between the own results and the certified values wasess than one standard deviation (Table 4). It has to be mentionedhat a reciprocal shaker was used instead of an end-over-endhaker. This may lead to a difference between our own resultsnd the certified values.
The reference material CRM 483, which was certified for theOAc extractable contents [9], was also extracted using 0.11 MOAc (first step of the BCR sequential extraction scheme) [10],
esulting in indicative values. A very good agreement betweenur experimental values and indicative values (Table 4), with a
b 143 ± 6 141 ± 3 2700 ± 100 2944 ± 89n 454 ± 19 465 ± 4 3800 ± 300 3665 ± 147s – – 205 ± 11 193 ± 2.0
ean ± S.D. of three replicates.

1342 V. Cappuyns, R. Swennen / Tala
Table 4Comparison of the results of the 0.11 M HOAc extraction (first step of the BCRsequential extraction) of sample BCR-701 [29] and CRM483 [30] and the HOAc0.43 M extraction of sample CRM483 [27] with certified and indicative values
0.11 M HOAc
BCR-701: certified valuesCd 7.3 ± 0.4Cr 2.3 ± 0.2Cu 49.3 ± 1.7Ni 15.4 ± 0.9Pb 3.2 ± 0.2Zn 205 ± 6
BCR701: this work (4)Cd 7.3 ± 0.04Cr 2.1 ± 0.03Cu 47.3 ± 0.4Ni 13.2 ± 0.1Pb 2.5 ± 0.1Zn 199 ± 0.9
CRM483: indicative valuesCd 10 ± 0.77Cr 9.4 ± 3.5Cu 17 ± 1.5Ni 18 ± 2Pb 0.8 ± 0.7Zn 441 ± 39
CRM483: this work (4)Cd 9.1 ± 0.1Cr 7.8 ± 1.6Cu 14 ± 0.4Ni 16 ± 0.5Pb 0.7 ± 0.1Zn 425 ± 14.7
0.43 M HOAc
CRM483: certified valuesCd 18.3 ± 0.6Cr 18.7 ± 1Cu 33.5 ± 1.6Ni 25.8 ± 1Pb 3.1 ± 0.3Zn 620 ± 24
CRM483: this work (6)Cd 15.2 ± 1.5Cr 13.3 ± 2.0Cu 28.1 ± 0.5Ni 21.5 ± 0.8Pb 1.7 ± 0.2
C
3
ro3
c3t
daettnosewfe
3
ZTHtGa
0tHHeifattetwstms
seAa
a0t5i
Zn 556 ± 23
oncentrations in mg kg−1. The number of replicates is given between brackets.
.2. General sample characteristics
The pH of the samples investigated in this study was in theange 4–8 (Table 5). The calcium carbonate content, which wasnly determined for samples with a pH above 6, was between.8% and 12%.
The grainsize of the samples varied from clayey to sandy andation exchange capacity (CEC) was between 6 cmol kg−1 and6 cmol kg−1. All the samples were polluted with at least one ofhe following heavy metals: Zn, Cd, Pb, Cu, As and/or Ni.
dt[b
nta 75 (2008) 1338–1347
Principal component analysis was applied on the completeataset, including total element concentrations, HOAC (0.11 Mnd 0.43 M) and NaOAc extractable metal concentrations. How-ver, no definite conclusion could be reached with PCA andherefore it will not be discussed. It can only be concluded thathe variability in acid-extractable element concentrations couldot significantly be explained by total element concentrationsr physico-chemical soil or sediment properties. In a previoustudy on land-disposed dredged sediments [31], HOAc (0.11 M)xtractable Zn- and Cd-concentrations were linearly correlatedith total Zn- and Cd-concentrations. All the samples originated
rom the same river catchment and were characterised by andlevated clay and organic carbon content.
.3. Extraction efficiency
The HOAc 0.43 M solution extracted 33–94% of the totaln-content of the samples and 33–95% of the total Cd-content.he amount of Zn, Cd, Cu, Pb and Ni extracted with 0.11 MOAc and NaOAc was linearly correlated with the amount of
he respective metals extracted with 0.43 M HOAc (Table 6).enerally, the lowest amount of heavy metals (Zn, Cd, Cu, Pb
nd Ni) was released from the sediments with 0.11 M HOAc.For Cd, the highest extraction efficiency was obtained with
.43 M HOAc, because the final pH of this solution is lower thanhe pH of the 0.11 M HOAc solution (the final pH of the 0.43 MOAc solution is 0.1–0.8 units lower than the pH of the 0.11 MOAc solution) and NaOAc solutions. Although Cd and Zn gen-
rally display a similar release behaviour towards pH-changesn soils and sediments, NaOAc was a more effective extractantor Zn than 0.43 M HOAc, whereas for Cd, 0.43 M HOAc wasble to release more Cd from the samples than NaOAc, despitehe fact that the pH of the NaOAc solution is generally lowerhan the pH of the 0.43 M HOAc solution (Fig. 1). A possiblexplanation would be that the more concentrated acetate solu-ion is favourable for the formation of Zn-acetate complexes,hich enhances the solubility of Zn. However, the stability con-
tants of acetate complexes of Zn were not significantly higherhan the stability constants of Cd (Table 7). It should also be
entioned that the stability constants found in literature showedome variation (Table 7).
Complexes of Cd and Zn with acetate are characterised byignificantly lower stability constants than Pb and Cu, whichxplains the important extractability of Cu and Pb with HOAc.dditionally, Zn and Cd are more easily mobilised from soils
nd sediments upon a pH-decrease compared to Cu and Pb [25].For Pb, Cu and Ni, the extraction efficiency of 0.11 M HOAc
nd 1 M NaOAc was comparable, despite the lower pH of the.11 M HOAc solution. Since the pH of the 1 M NaOAc solu-ion is well buffered and thus almost constant (average pH is.15 ± 0.06) (Fig. 1), acetate-complexation is more importantn explaining Pb, Cu and Ni solubility than pH.
The high solubility of Pb from sample 26 is caused by the
issolution of anglesite (PbSO4). PbSO4 dissolves in concen-rated solutions of hydroxide or acetate ions. In a previous study34], X-ray diffraction patterns of this sample were comparedefore and after extraction with HOAc. Anglesite was effectively
V.Cappuyns,R
.Swennen
/Talanta75
(2008)1338–1347
1343
Table 5Type (DR = dredged sediment, AS = alluvial soil, RS = river sediment, MT = mine tailing, IS = industrial soil and SS = soil) and origin of the samples analysed in this work
No. Type Locality Zn(mg kg−1)
Cd(mg kg−1)
Pb(mg kg−1)
Cumg kg−1)
Asmg kg−1)
Nimg kg−1)
Al (%) Fe (%) S(g kg−1)
CaCO3
(%)pH CEC
(cmol kg−1)OC(%)
Clay(%)
Loam(%)
Sand(%)
1 DR Ghent 1,103 7 132 428 67 20 1.90 3.83 1.97 0.94 4.5 7.6 22 5.1 27 52 212 DR Deinze 767 3 70 168 17 29 2.18 2.99 2.67 2.07 3.8 7.1 36 10.4 27 59 143 DR Deinze 1,263 7 122 756 68 51 2.15 4.56 3.19 1.12 7.7 7.7 30 6.3 34 55 114 DR Deinze 2,105 19 244 421 36 52 3.33 3.52 3.33 4.94 9.6 7.5 24 5.2 35 59 65 DR Bavikhove 1,226 10 177 162 16 56 3.81 3.46 3.09 3.62 8.5 7.3 28 6.6 37 57 66 DR Antwerp 336 6 49 93 31 21 4.30 2.96 4.74 2.78 10.6 7.6 17 2.7 38 28 347 DR Antwerp 406 9 65 95 43 27 4.16 3.63 5.37 4.24 9.8 7.7 22 3.4 51 33 178 DR Antwerp 452 9 66 134 38 27 4.61 3.91 3.93 5.29 12.0 7.7 25 3.9 54 37 109 RS Kluisbergen 1,851 8 112 101 12 43 4.26 3.93 3.26 0.76 10.3 7.7 34 8.9 46 47 7
10 DR Diest 4,083 213 54 182 254 84 1.67 1.21 8.2 0.35 ND 6.8 19 8.8 45 42 1311 AS Diest 320 40 67 11 196 36 0.51 1.33 14.7 0.57 ND 6.3 31 9.0 21 29 5012 AS Diest 545 11 30 26 103 20 0.26 3.38 11.9 0.16 ND 6.4 33 5.3 81 15 413 RS Diest 574 17 214 97 516 29 2.41 1.33 6.3 0.60 ND 6.9 14 3.5 17 13 7014 AS Diest 799 19 84 109 161 25 2.62 1.84 12.6 0.23 ND 6.7 30 10.7 35 41 2415 RS Laakdal 282 8 92 42 260 14 2.89 0.90 21.3 0.22 ND 6.9 31 14.2 31 33 3616 AS Laakdal 433 14 84 68 242 15 2.61 1.31 23.2 0.15 ND 6.3 33 8.9 23 31 4617 AS Plombieres 8,000 21 4,788 60 107 29 0.24 1.33 2.33 0.19 ND 6.1 5 1.7 17 46 3818 AS Plombieres 9,832 23 4,066 69 84 25 0.39 1.84 2.11 0.02 ND 6.4 8 2.4 17 50 3319 AS Plombieres 6,683 10 1,242 15 36 14 0.22 0.90 2.04 0.02 ND 5.5 6 1.5 16 47 3720 AS Sippenaken 3,625 9 1,153 18 40 27 0.38 2.82 1.57 0.04 ND 5.9 7 2.2 14 42 4321 AS Sippenaken 2,458 4 678 15 38 26 0.19 3.81 1.87 0.01 ND 5.8 6 0.8 14 48 3722 AS Sippenaken 702 3 264 17 28 12 0.12 3.46 1.69 0.01 ND 6.1 7 0.5 15 49 3623 AS Epen 2,735 10 1,267 23 50 25 0.22 2.99 1.89 0.04 ND 6.0 10 2.6 17 47 3624 AS Epen 1,274 4 1,274 12 29 18 0.10 3.22 1.82 0.01 ND 5.6 7 0.9 15 49 3725 MT Angleur 30,900 124 19,500 1,704 1,928 104 2.22 2.45 9.48 ND 2.72 8.0 ND ND ND ND ND26 MT La Calamine 108,108 297 20,592 60 1,491 71 4.72 3.08 11.77 12.7 ND 6.5 ND ND ND ND ND27 IS Ruisbroek 1,263 10 1,477 180 25 37 1.80 2.74 23.5 ND 1.79 7.5 ND ND ND ND ND28 IS Lommel 882 27 4 12 4 2 0.21 0.94 0.10 ND ND 4.0 ND ND ND ND ND29 IS Lommel 561 25 8 101 4 216 0.12 0.643 0.19 ND ND 4.0 ND ND ND ND ND30 SS Lommel 25 4 10 1 4 1 0.02 0.75 0.36 ND ND 4.0 ND ND ND ND ND
Total concentrations of Zn, Cd, Pb, Cu, As, Ni, Ca, Al, Fe and S, CaCO3 content, pH, cation exchange capacity, organic carbon (OC content) and grainsize distribution of the samples. ND = not determined.

1344 V. Cappuyns, R. Swennen / Talanta 75 (2008) 1338–1347
Table 6Linear relation between 0.43 M HOAc (x)-, 0.11 M HOAc (y)- and NaOAc (z)-extractable Zn-, Cd-, Cu-, Pb- and Ni-concentrations (30 samples)
R2
Zn y = 0.76x + 140 0.94Cd y = 0.64x + 1.3 0.93Cu y = 0.59x + 3.5 0.98Pb y = 0.48x + 18 0.77*Ni y = 0.74x + 0.4 0.85Zn y = 0.48z + 111 0.90Cd y = 0.89z + 1.7 0.91Cu y = 0.64z + 3.6 0.97Pb y = 0.47z + 313 0.58*N
x
dPsp
oaw
P
P
Ig
(s
2nsuwsiriathracr
sppsc
Fc
3
rwbpemtq
opwtahcCp
2lshp
3
The relationship between a pHstat test and a single extractionwith HOAc is highly dependent on the ANC of the sample. The
Table 7Stability constant values of various metals for mononuclear monoligand andbiligand complex systems with acetic acid [32,33]
Stability constant Number of ligands
Zn2+ 0.91, 1.9 22+
i y = 0.61z + 0.4 0.82
= 0.43 M HOAc; y = 0.11 M HOAc; z = 1 M NaOAc. *28 samples.
issolved during the 0.11 M HOAc extraction. Nevertheless,b-concentrations were lower than expected on basis of theolubility of anglesite in acetic acid because of readsorptionhenomena.
Calmano et al. [35] also observed the unexpected dissolutionf PbSO4 from a soil extracted with ammonium acetate and Nacetate (pH 5), due to the formation of easily soluble complexesith acetate anions of the extractant.
bSO4(s) + 4OH−(aq) ⇔ [Pb(OH)4]2−(aq) + SO42−(aq)
bSO4(s) + 2CH3CO2−(aq)⇔Pb(CH3CO2)2(aq) + SO4
2−(aq)
n highly contaminated samples, precipitation of species with aood solubility can occur.
Since Pb-acetate has a solubility of 44.3 g L−1 in water20 ◦C) [36], there was no precipitation of Pb-acetate for thisample.
The pH after extractions with 0.11 M HOAc was between.83 and 4.41, which is up to 1.6 units higher than the origi-al pH of the HOAc solution. For the more concentrated HOAcolution (0.43 M), this difference was even larger (2.46–4.10 pHnits). The final pH of the HOAc (0.11 M and 0.43 M) extractsas clearly dependent on the acid neutralising capacity of the
ample, since the pH increased with increasing acid neutraliz-ng capacity (Fig. 1). Contrary, the pH of the NaOAc solutionemained almost constant (between 5.05 and 5.30) and was notnfluenced by the acid neutralizing capacity of the samples. Thecid neutralizing capacity (ANC at pH 4) was related to the ini-ial pH of the samples: samples with a high pH also displayed aigher ANC (at pH 4). Additionally, the ANC (pH 4) was alsoelated to the Ca-content of the samples, because samples withn elevated ANC usually are characterised by a high CaCO3ontent, which is an important contributor to acid neutralizingeactions in soils and sediments.
For none of the reagents, the extractability of the metals wasignificantly influenced by the original pH of the sample. For a
articular heavy metal, the different solubility in different sam-les could not directly be explained by other physico-chemicalediment characteristics such as the organic matter and clayontent of the sample.CCPN
ig. 1. Final pH of the different extracts as a function of the acid neutralizingapacity (ANC) of the samples.
.4. pHstat leaching versus single extractions
For weakly adsorbed metals, such as Cd and Zn, the amountseleased in pHstat leaching experiments corresponded wellith the amounts extracted. There was a log-linear correlationetween the amount of Zn and Cd released at pH 4 during theHstat leaching test and the amount of respectively Zn and Cdxtracted with HOAc (0.11 M and 0.43 M) (Fig. 2). Generally,ore Cd was extracted with the acetic acid solutions than by
he pHstat leaching tests at pH 4, whereas for Zn a comparableuantity was released by both methods.
For Pb and Cu, no trend was observed between the amountf these elements released by extractions with HOAc and theHstat leaching test (pH 4). For most samples, more Pb and Cuas extracted with acetic acid compared to the pHstat leaching
est at pH 4, due to the ability of HOAc to complex these met-ls. As mentioned before, this can be attributed to the muchigher stability of Cu- and Pb-acetate complexes compared toomplexes with Cd and Zn (Table 7) and to the fact that Zn andd are more easily mobilised from soils and sediments upon aH-decrease compared to Cu and Pb.
The sample from the mine tailing of La Calamine (sample6), is a notable exception, since more Cu was released by pHstateaching at pH 4 than after extraction with 0.11 M HOAc (Fig. 2,ample 26 is indicated with an arrow). This is explained by theigh acid neutralizing capacity of this sample, resulting in a finalH of 4.2 for the 0.11 M HOAc extract.
.5. Influence of acid neutralizing capacity (ANC)
d 1.19, 1.23, 1.32, 1.82, 3.15 2u2+ 1.76, 1.87, 2.71, 3.09, 3.63 2b2+ 3.5, 2.98, 4.08 2i2+ 0.74, 0.83, 1.43 1
V. Cappuyns, R. Swennen / Talanta 75 (2008) 1338–1347 1345
Fal
fiAcihwfu
ampq
Fig. 3. Release of Zn and Pb (mg kg−1) as a function of pH (determined with902
saaovw(pai2(aaptditio
ig. 2. Concentrations (in mg kg−1) of Zn, Cd, Cu and Pb extracted with aceticcid vs. concentrations released after 96 h pHstat leaching at pH 4. The diagonaline on each graph is the 1:1 line.
nal pH of the extract can therefore give an indication of theNC and function as a kind of ‘reference value’ that allows
omparison with a pHstat test. Nevertheless, is has to be takennto account that the single HOAc extraction is performed at aigher L/S ratio than the pHstat test and that HOAc is a weak acidith a certain metal-complexing capacity (especially important
or Pb), while HNO3 is a strong acid and that both acids weresed at different concentrations.
In some cases, the mineralogical sample composition can
lso provide information concerning potential release of heavyetals upon acidification. This is illustrated by the two sam-les originating from two mine tailings. Sample 26 containsuartz, kaolinite, illite, smectite, calcite, gypsum, siderite and
ePlt
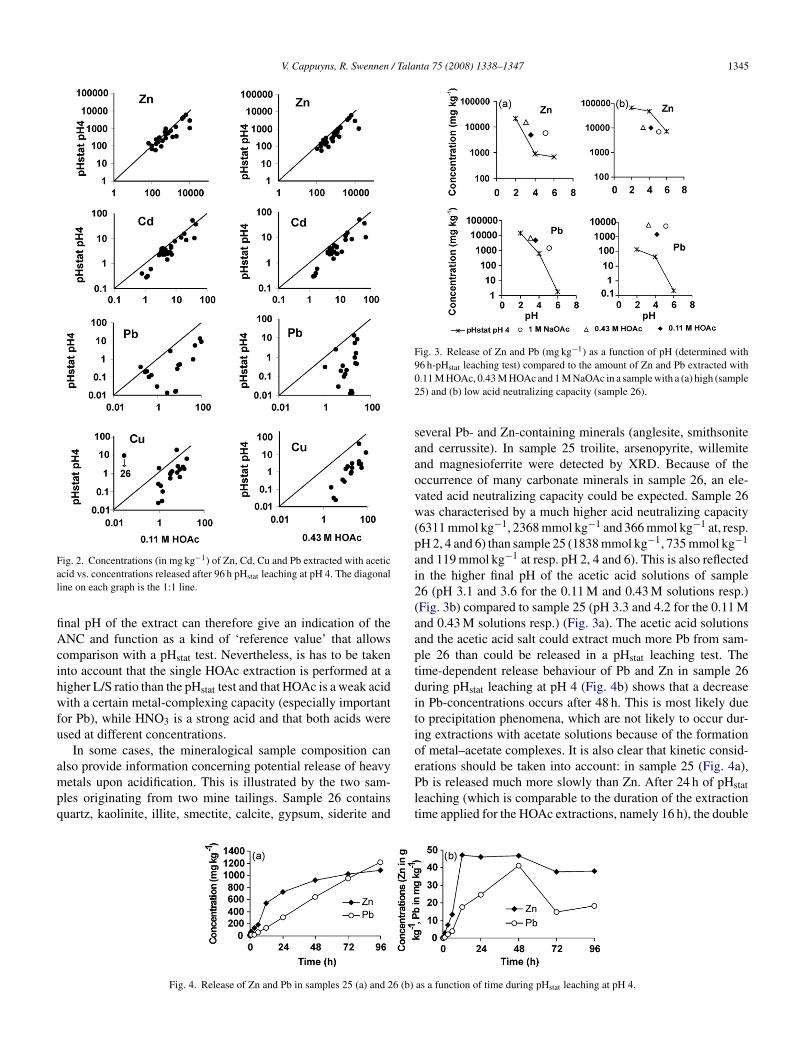
Fig. 4. Release of Zn and Pb in samples 25 (a) and 26 (b)
6 h-pHstat leaching test) compared to the amount of Zn and Pb extracted with.11 M HOAc, 0.43 M HOAc and 1 M NaOAc in a sample with a (a) high (sample5) and (b) low acid neutralizing capacity (sample 26).
everal Pb- and Zn-containing minerals (anglesite, smithsonitend cerrussite). In sample 25 troilite, arsenopyrite, willemitend magnesioferrite were detected by XRD. Because of theccurrence of many carbonate minerals in sample 26, an ele-ated acid neutralizing capacity could be expected. Sample 26as characterised by a much higher acid neutralizing capacity
6311 mmol kg−1, 2368 mmol kg−1 and 366 mmol kg−1 at, resp.H 2, 4 and 6) than sample 25 (1838 mmol kg−1, 735 mmol kg−1
nd 119 mmol kg−1 at resp. pH 2, 4 and 6). This is also reflectedn the higher final pH of the acetic acid solutions of sample6 (pH 3.1 and 3.6 for the 0.11 M and 0.43 M solutions resp.)Fig. 3b) compared to sample 25 (pH 3.3 and 4.2 for the 0.11 Mnd 0.43 M solutions resp.) (Fig. 3a). The acetic acid solutionsnd the acetic acid salt could extract much more Pb from sam-le 26 than could be released in a pHstat leaching test. Theime-dependent release behaviour of Pb and Zn in sample 26uring pHstat leaching at pH 4 (Fig. 4b) shows that a decreasen Pb-concentrations occurs after 48 h. This is most likely dueo precipitation phenomena, which are not likely to occur dur-ng extractions with acetate solutions because of the formationf metal–acetate complexes. It is also clear that kinetic consid-
rations should be taken into account: in sample 25 (Fig. 4a),b is released much more slowly than Zn. After 24 h of pHstateaching (which is comparable to the duration of the extractionime applied for the HOAc extractions, namely 16 h), the double
as a function of time during pHstat leaching at pH 4.
1346 V. Cappuyns, R. Swennen / Tala
Fc
amp
3e
ifooSaapp
iHeHEa(uIasttetcrda
4
•
•
•
•
•
•
A
dm
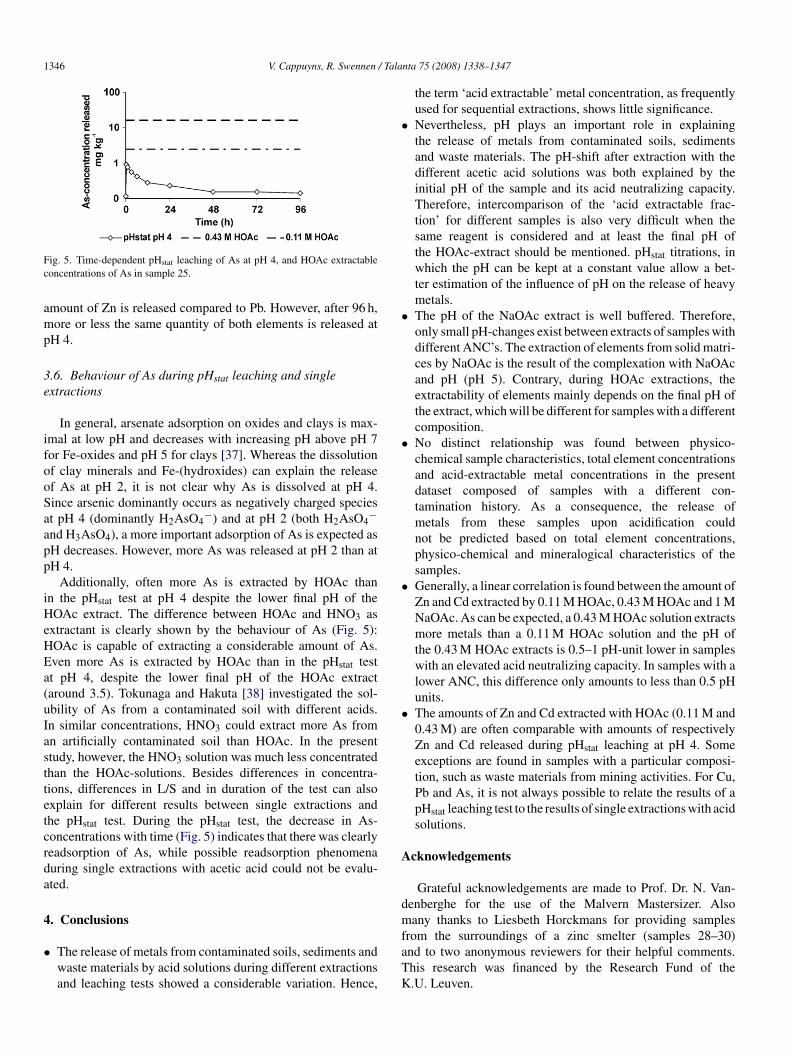
ig. 5. Time-dependent pHstat leaching of As at pH 4, and HOAc extractableoncentrations of As in sample 25.
mount of Zn is released compared to Pb. However, after 96 h,ore or less the same quantity of both elements is released at
H 4.
.6. Behaviour of As during pHstat leaching and singlextractions
In general, arsenate adsorption on oxides and clays is max-mal at low pH and decreases with increasing pH above pH 7or Fe-oxides and pH 5 for clays [37]. Whereas the dissolutionf clay minerals and Fe-(hydroxides) can explain the releasef As at pH 2, it is not clear why As is dissolved at pH 4.ince arsenic dominantly occurs as negatively charged speciest pH 4 (dominantly H2AsO4
−) and at pH 2 (both H2AsO4−
nd H3AsO4), a more important adsorption of As is expected asH decreases. However, more As was released at pH 2 than atH 4.
Additionally, often more As is extracted by HOAc thann the pHstat test at pH 4 despite the lower final pH of theOAc extract. The difference between HOAc and HNO3 as
xtractant is clearly shown by the behaviour of As (Fig. 5):OAc is capable of extracting a considerable amount of As.ven more As is extracted by HOAc than in the pHstat testt pH 4, despite the lower final pH of the HOAc extractaround 3.5). Tokunaga and Hakuta [38] investigated the sol-bility of As from a contaminated soil with different acids.n similar concentrations, HNO3 could extract more As fromn artificially contaminated soil than HOAc. In the presenttudy, however, the HNO3 solution was much less concentratedhan the HOAc-solutions. Besides differences in concentra-ions, differences in L/S and in duration of the test can alsoxplain for different results between single extractions andhe pHstat test. During the pHstat test, the decrease in As-oncentrations with time (Fig. 5) indicates that there was clearlyeadsorption of As, while possible readsorption phenomenauring single extractions with acetic acid could not be evalu-ted.
. Conclusions
The release of metals from contaminated soils, sediments andwaste materials by acid solutions during different extractionsand leaching tests showed a considerable variation. Hence,
faTK
nta 75 (2008) 1338–1347
the term ‘acid extractable’ metal concentration, as frequentlyused for sequential extractions, shows little significance.Nevertheless, pH plays an important role in explainingthe release of metals from contaminated soils, sedimentsand waste materials. The pH-shift after extraction with thedifferent acetic acid solutions was both explained by theinitial pH of the sample and its acid neutralizing capacity.Therefore, intercomparison of the ‘acid extractable frac-tion’ for different samples is also very difficult when thesame reagent is considered and at least the final pH ofthe HOAc-extract should be mentioned. pHstat titrations, inwhich the pH can be kept at a constant value allow a bet-ter estimation of the influence of pH on the release of heavymetals.The pH of the NaOAc extract is well buffered. Therefore,only small pH-changes exist between extracts of samples withdifferent ANC’s. The extraction of elements from solid matri-ces by NaOAc is the result of the complexation with NaOAcand pH (pH 5). Contrary, during HOAc extractions, theextractability of elements mainly depends on the final pH ofthe extract, which will be different for samples with a differentcomposition.No distinct relationship was found between physico-chemical sample characteristics, total element concentrationsand acid-extractable metal concentrations in the presentdataset composed of samples with a different con-tamination history. As a consequence, the release ofmetals from these samples upon acidification couldnot be predicted based on total element concentrations,physico-chemical and mineralogical characteristics of thesamples.Generally, a linear correlation is found between the amount ofZn and Cd extracted by 0.11 M HOAc, 0.43 M HOAc and 1 MNaOAc. As can be expected, a 0.43 M HOAc solution extractsmore metals than a 0.11 M HOAc solution and the pH ofthe 0.43 M HOAc extracts is 0.5–1 pH-unit lower in sampleswith an elevated acid neutralizing capacity. In samples with alower ANC, this difference only amounts to less than 0.5 pHunits.The amounts of Zn and Cd extracted with HOAc (0.11 M and0.43 M) are often comparable with amounts of respectivelyZn and Cd released during pHstat leaching at pH 4. Someexceptions are found in samples with a particular composi-tion, such as waste materials from mining activities. For Cu,Pb and As, it is not always possible to relate the results of apHstat leaching test to the results of single extractions with acidsolutions.
cknowledgements
Grateful acknowledgements are made to Prof. Dr. N. Van-enberghe for the use of the Malvern Mastersizer. Alsoany thanks to Liesbeth Horckmans for providing samples
rom the surroundings of a zinc smelter (samples 28–30)nd to two anonymous reviewers for their helpful comments.his research was financed by the Research Fund of the.U. Leuven.

/ Tala
R
[
[
[
[[[[[
[
[[
[
[
[
[
[
[
[
[
[
[
[
[
[
[[
V. Cappuyns, R. Swennen
eferences
[1] Ph. Quevauviller, Trends Anal. Chem. 17 (10) (1998) 642.[2] H.A. Van der Sloot, R.N.J. Comans, O. Hjelmar, Sci. Total Environ. 178
(1996) 126.[3] P.M.V. Nirel, F.M.M. Morel, Water Res. 24 (8) (1990) 1056.[4] A. Tessier, P.G.C. Campbell, M. Bisson, Anal. Chem. 51 (7) (1979)
844.[5] M. Kersten, U. Forstner, Water Sci. Technol. 18 (1986) 121.[6] C.S. Kirby, J.D. Rimstidt, Environ. Sci. Technol. 27 (1993) 652.[7] X. Li, B.J. Coles, M.H. Ramsey, I. Thornton, Chem. Geol. 124 (1995) 88.[8] Ph. Quevauviller, Trends Anal. Chem. 17 (5) (1998) 289.[9] A. Ure, Ph. Quevauviller, H. Munteau, B. Griepink. Improvements in the
determination of extractable contents of trace metals in soils and sedimentsprior to certification. Community Bureau of Reference, Commission of theEuropean Communities, 1993.
10] G. Rauret, J. Lopez-Sanchez, A. Sauquillo, R. Rubio, C. Davidson, A. Ure,Ph. Quevauviller, J. Environ. Monit. 1 (1999) 57.
11] J.L. Gomez, I. Ariza Giraldez, D. Sanchez-Rodas, E. Morales, Sci. TotalEnviron. 246 (2000) 271.
12] W.P. Miller, D.C. Martens, L.W. Zelazny, E.T. Kornegay, J. Environ. Qual.15 (1986) 69.
13] A. Bermond, Anal. Chim. Acta 445 (2001) 79.14] S.L. Tackett, E.R. Winters, M.J. Puz, Can. J. Soil Sci. 66 (1986) 763.15] H.E. Gabler, J. Geochem. Explor. 58 (1997) 185.16] N. Van Breemen, J. Mulder, T. Driscoll. Plant Soil 75 (1983) 283.17] S. Cremer, P. Obermann, Mobilisierung von Schwermetalen in
Porenwassern von belasteten Boden und Deponien: entwicklung einesaussagekraftigen Elutionsverfahrens, Landeramt fur Wasser und AbfallNRW.-XI, 127 S.: graph. Darst., Kt (Materialien zur Ermitterlung undSanierung van Altlasten), 1992.
18] CEN (Comitee Europeen de Normalisation), pH-stat test, draft 7, BasicCharacterization Test for Leaching Behaviour, doc. Nr. CEN/TC292/WG6N213, 2000.
19] L. Horckmans, R. Swennen, J. Deckers, Sci. Total Environ. 376 (2007) 86.20] D.W. Nelson, L.E. Sommers, Methods of Soil Analysis, Part 2: Chemical
and Biological Properties., Second ed., 1982, pp. 516–593.21] R. Chhabra, J. Pleysier, A. Cremers, The measurement of the cation
exchange capacity and exchangeable cations in soils: a new method, in:S.W. Bailey (Ed.), Proceedings of the International Clay Conference,Applied Publishing Ltd., Wilmette, IL, 1975, pp. 439–449.
22] L.P. Van Reeuwijk, Procedures for Soil Analysis, Third ed., ISRIC,Wageningen, The Netherlands, 1992.
[
[[
nta 75 (2008) 1338–1347 1347
23] L.E. Allison, C.D. Moodie, in: C.A. Black (Ed.), Methods of soil analysis.Part 2: Chemical and Microbiological Properties. Agronomy Monograph9, Second ed., ASA, Madison, Wisconsin, 1965, pp. 1379–1396.
24] C.A. Brockhoff, J.T. Creed, T.D. Martin, E.R. Martin, S.E. Long, EPAMethod 200.8, Revision 5.5: Determination of trace metals in waters andwastes by inductively coupled plasma-mass spectrometry, EPA-821R-99-017, 1999, 61 pp.
25] V. Cappuyns, R. Swennen, J. Verhulst, Sci. Total Environ. 333 (1–3) (2004)233.
26] S. Van Herreweghe, R. Swennen, V. Cappuyns, C. Vandecasteele, J.Geochem. Explor. 76 (2002) 113.
27] Ph. Quevauviller, G. Rauret, A. Ure, J. Bacon, H. Muntau, The certifica-tion of the EDTA and acetic acid-extractable contents (mass fractions) ofCd, Cr, Cu, Pb and Zn in sewage sludge amended soils CRMs 484 and484. European Commission, BCR information, Reference materials. EUR17127 EN, 1997, 99 pp.
28] M. Pueyo, G. Rauret, D. Luck, M. Yli-Halla, H. Muntau, Ph. Quevauviller,J.F. Lopez-Sanchez, J. Environ. Monit. 3 (2) (2001) 243.
29] G. Rauret, J.F. Lopez-Sanchez, D. Luck, M. Yli-Halla, H. Muntau, Ph.Quevauviller, The certification of the extractable contents (mass fractions)of Cd, Cr, Cu, Pb and Zn in freshwater sediment following a sequentialextraction procedure BCR-701. European Commission, BCR information,Reference materials. EUR 19775 EN, 2001, 82 pp.
30] G. Rauret, J.F. Lopez-Sanchez, A. Sahuquillo, E. Barahona, M. Lachica, A.Ure, H. Muntau, Ph. Quevauviller, Indicative values for extractable contents(mass fractions) of Cd, Cr, Cu, Ni, Pb and Zn in sewage sludge amendedsoil (CRM 483) following the modified BCR-sequential extraction proce-dure (addendum to EUR-report 17127 EN). European Commission, BCRinformation, Reference materials. EUR 19503 EN, 2000, 22 pp.
31] V. Cappuyns, R. Swennen, R. Verhulst, J. Soil Sediment. Contam. 15 (2)(2006) 169.
32] A.E. Martell, R.M. Smith (Eds.), Critical Stability Constants. Other OrganicLigands, 3, Plenum Press, New York, 1977.
33] A.E. Martell, R.M. Smith (Eds.), Critical stability constants. First supple-ment, 5, Plenum Press, New York, 1982.
34] V. Cappuyns, R. Swennen, M. Niclaes, J. Geochem. Explor. 93 (2007) 78.35] W. Calmano, S. Mangold, E. Welter, J. Fresenius’, Anal. Chem. 371 (2001)
823.
36] D.R. Lide, in: D.R. Lide (Ed.), Handbook of Chemistry and Physics: AReady-Reference Book of Chemical and Physical Data, CRC press, BocaRaton, 2005.
37] S. Goldberg, Soil Sci. Soc. Am. J. 66 (2000) 413.38] S. Tokunga, T. Hakuta, Chemosphere 46 (2002) 31.