ACI Structural Journal, May-June 2013, V. 110, No. 3
209
VOL. 110, NO. 3 MAY-JUNE 2013 ACI STRUCTURAL J O U R N A L A JOURNAL OF THE AMERICAN CONCRETE INSTITUTE
-
Upload
independent -
Category
Documents
-
view
0 -
download
0
Transcript of ACI Structural Journal, May-June 2013, V. 110, No. 3

VOL. 110, NO. 3MAY-JUNE 2013
ACISTRUCTURAL
J O U R N A L
A J O U R N A L O F T H E A M E R I C A N C O N C R E T E I N S T I T U T E

ACI Structural Journal/May-June 2013 377
Discussion is welcomed for all materials published in this issue and will appear in the March-April 2014 issue if received by November 1, 2013. Discussion of material received after specified dates will be considered individually for publication or private response.ACI Standards published in ACI Journals for public comment have discussion due dates printed with the Standard.Annual index published online at www.concrete.org/pubs/journals/sjhome.asp.ACI Structural JournalCopyright © 2013 American Concrete Institute. Printed in the United States of America.
The ACI Structural Journal (ISSN 0889-3241) is published bimonthly by the American Concrete Institute. Publica-tion office: 38800 Country Club Drive, Farmington Hills, MI 48331. Periodicals postage paid at Farmington, MI, and at additional mailing offices. Subscription rates: $161 per year (U.S. and possessions), $170 (elsewhere), payable in advance. POSTMASTER: Send address changes to: ACI Structural Journal, 38800 Country Club Drive, Farmington Hills, MI 48331.
Canadian GST: R 1226213149.
Direct correspondence to 38800 Country Club Drive, Farmington Hills, MI 48331. Telephone: (248) 848-3700. Facsimile (FAX): (248) 848-3701. Website: http://www.concrete.org.
CONTENTSBoard of Direction
PresidentAnne M. Ellis
Vice PresidentsWilliam E. Rushing Jr.Sharon L. Wood
DirectorsNeal S. AndersonKhaled AwadRoger J. BeckerDean A. BrowningJeffrey W. ColemanRobert J. FroschJames R. HarrisCecil L. JonesCary S. KopczynskiSteven H. KosmatkaKevin A. MacDonaldDavid M. Suchorski
Past President Board MembersJames K. WightKenneth C. HoverFlorian G. Barth
Executive Vice PresidentRon Burg
Technical Activities CommitteeRonald Janowiak, ChairDaniel W. Falconer, Staff LiaisonJoAnn P. BrowningChiara F. FerrarisCatherine E. FrenchFred R. GoodwinTrey HamiltonKevin A. MacDonaldAntonio NanniJan OlekMichael SprinkelPericles C. StivarosAndrew W. TaylorEldon G. Tipping
StaffExecutive Vice PresidentRon Burg
EngineeringManaging DirectorDaniel W. Falconer
Managing EditorKhaled Nahlawi
Staff EngineersMatthew R. SenecalGregory Zeisler
Publishing ServicesManagerBarry M. Bergin
EditorsCarl R. BischofKaren CzedikKelli R. SlaydenDenise E. Wolber
Editorial AssistantAshley Poirier
ACI StruCturAl JournAl
MAy-June 2013, V. 110, no. 3a journal of the american concrete institutean international technical society
Contents cont. on next page
379 On the Effectiveness of Steel Fibers as Shear Reinforcement, by Fausto Minelli and Giovanni A. Plizzari
391 Crack Protocols for Anchored Components and Systems, by Richard L. Wood and Tara C. Hutchinson
403 Cyclic Loading Test for Beam-Column Connection with Prefabricated Reinforcing Bar Details, by Tae-Sung Eom, Jin-Aha Song, Hong-Gun Park, Hyoung-Seop Kim, and Chang-Nam Lee
415 Shear Strength of Reinforced Concrete Walls for Seismic Design of Low-Rise Housing, by Julian Carrillo and Sergio M. Alcocer
427 Reducing Steel Congestion without Violating Seismic Performance Requirements, by Gerasimos M. Kotsovos, Emmanuel Vougioukas, and Michael D. Kotsovos
437 Recommended Procedures for Development and Splicing of Post-Installed Bonded Reinforcing Bars in Concrete Structures, by Finley A. Charney, Kamalika Pal, and John Silva
447 Two-Parameter Kinematic Theory for Shear Behavior of Deep Beams, by Boyan I. Mihaylov, Evan C. Bentz, and Michael P. Collins
457 Design Formulas for Cracking Torque and Twist in Hollow Reinforced Concrete Members, by Chyuan-Hwan Jeng, Hao-Jan Chiu, and Sheng-Fu Peng
469 Breakout Capacity of Headed Anchors in Confined Concrete: Experi-mental Evidence, by Roberto Piccinin, Sara Cattaneo, and Luigi Biolzi
481 Cracking Behavior of Steel Fiber-Reinforced Concrete Members Containing Conventional Reinforcement, by Jordon R. Deluce and Frank J. Vecchio
491 Performance of AASHTO-Type Bridge Model Prestressed with Carbon Fiber-Reinforced Polymer Reinforcement, by Nabil Grace, Kenichi Ushijima, Vasant Matsagar, and Chenglin Wu
503 Testing of Normal- and High-Strength Concrete Walls Subjected to Both Standard and Hydrocarbon Fires, by Tuan Ngo, Sam Fragomeni, Priyan Mendis, and Binh Ta
511 Effect of Washout Loss on Bond Behavior of Steel Embedded in Underwater Concrete, by Joseph J. Assaad and Camille A. Issa
521 Experimental Evaluation of Disproportionate Collapse Resistance in Reinforced Concrete Frames, by Stephen M. Stinger and Sarah L. Orton
531 Discussion
Cyclic Crack and Inertial Loading System for Investigating Anchor Seismic Behavior. Paper by Derrick A. Watkins, Tara C. Hutchinson, and Matthew S. Hoehler

378 ACI Structural Journal/May-June 2013
Permission is granted by the American Concrete Institute for libraries and other users registered with the Copyright Clearance Center (CCC) to photocopy any article contained herein for a fee of $3.00 per copy of the article. Payments should be sent directly to the Copyright Clearance Center, 21 Congress Street, Salem, MA 01970. ISSN 0889-3241/98 $3.00. Copying done for other than personal or internal reference use without the express written permission of the American Concrete Institute is prohibited. Requests for special permission or bulk copying should be addressed to the Managing Editor, ACI Structural Journal, American Concrete Institute.
The Institute is not responsible for statements or opinions expressed in its publications. Institute publications are not able to, nor intend to, supplant individual training, responsibility, or judgment of the user, or the supplier, of the information presented.
Papers appearing in the ACI Structural Journal are reviewed according to the Institute’s Publication Policy by individuals expert in the subject area of the papers.
Contributions to ACI Structural Journal
The ACI Structural Journal is an open forum on concrete technology and papers related to this field are always welcome. All material submitted for possible publi-cation must meet the requirements of the “American Concrete Institute Publi-cation Policy” and “Author Guidelines and Submission Procedures.” Prospective authors should request a copy of the Policy and Guidelines from ACI or visit ACI’s website at www.concrete.org prior to submitting contributions.
Papers reporting research must include a statement indicating the significance of the research.
The Institute reserves the right to return, without review, contributions not meeting the requirements of the Publication Policy.
All materials conforming to the Policy requirements will be reviewed for editorial quality and technical content, and every effort will be made to put all acceptable papers into the information channel. However, potentially good papers may be returned to authors when it is not possible to publish them in a reasonable time.
Discussion
All technical material appearing in the ACI Structural Journal may be discussed. If the deadline indicated on the contents page is observed, discussion can appear in the designated issue. Discussion should be complete and ready for publication, including finished, reproducible illustra-tions. Discussion must be confined to the scope of the paper and meet the ACI Publi-cation Policy.
Follow the style of the current issue. Be brief—1800 words of double spaced, typewritten copy, including illustrations and tables, is maximum. Count illustrations and tables as 300 words each and submit them on individual sheets. As an approxi-mation, 1 page of text is about 300 words. Submit one original typescript on 8-1/2 x 11 plain white paper, use 1 in. margins, and include two good quality copies of the entire discussion. References should be complete. Do not repeat references cited in original paper; cite them by original number. Closures responding to a single discussion should not exceed 1800-word equivalents in length, and to multiple discussions, approximately one half of the combined lengths of all discussions. Closures are published together with the discussions.
Discuss the paper, not some new or outside work on the same subject. Use references wherever possible instead of repeating available information.
Discussion offered for publication should offer some benefit to the general reader. Discussion which does not meet this requirement will be returned or referred to the author for private reply.
Send manuscripts to:http://mc.manuscriptcentral.com/aci
Send discussions to:[email protected]
UPCOMING ACI CONVENTIONSThe following is a list of scheduled ACI conventions:2013—October 20-24, Hyatt Regency & Phoenix Convention Center, Phoenix, AZ2014—March 23-27, Grand Sierra Resort, Reno, NV2014—October 26-30, Hilton Washington, Washington, DC
For additional information, contact:Event Services, ACI38800 Country Club Drive, Farmington Hills, MI 48331Telephone: (248) 848-3795e-mail: [email protected]
ON COVER: 110-S37, p. 473, Fig. 5(b)—Built-in frame for application of compressive prestress with two hydraulic jacks per side, concrete block, tying bars, and extracting machine.
Investigation of Load-Transfer Mechanisms in Deep Beams and Corbels. Paper by Zhi-Qi He, Zhao Liu, and Zhongguo John Ma
Reinforced Concrete T-Beams Externally Prestressed with Unbonded Carbon Fiber-Reinforced Polymer Tendons. Paper by Anders Bennitz, Jacob W. Schmidt, Jonny Nilimaa, Björn Täljsten, Per Goltermann, and Dorthe Lund Ravn
Energy Dissipation Capacity of Reinforced Concrete Columns under Cyclic Displacements. Paper by Bora Acun and Haluk Sucuoglu
Energy-Based Hysteresis Model for Flexural Response of Reinforced Concrete Columns. Paper by Haluk Sucuoglu and Bora Acun
541 In ACI Materials Journal
MEETINGS2013
MAY
2-4—2013 Structures Congress, Pittsburgh, PA, www.seinstitute.org/Structures2013.html
5-7—2013 PTI Convention, Scottsdale, AZ, www.post-tensioning.org/annual_ conference.php
6-8—International IABSE Spring Conference, Rotterdam, the Netherlands, www.iabse2013rotterdam.nl
6-8—International Concrete Sustainability Conference, San Francisco, CA, www.concretesustainabilityconference.org/sanfrancisco/index.html
12-15—Fifth North American Conference on the Design and Use of Self- Consolidating Concrete, Chicago, IL, www.intrans.iastate.edu/events/scc2013
13-15—2013 APWA Sustainability in Public Works Conference, San Diego, CA, www.apwa.net/sustainability
17-18—ACPA 2013 Education Conference, Scottsdale, AZ, www.concretepumpers.com/content/2013-education-conference
20-22—Seventh National Seismic Conference on Bridges & Highways, Oakland, CA, www.7nsc.info
26-29—Twin International Conferences on Civil Engineering Towards a Better Environment and The Concrete Future, Covilhã, Portugal, www.uc.pt/en/iii/novidades/2012/twinconferencesucubi
27-29—International Conference on Concrete Sustainability (ICCS13), Tokyo, Japan, www.jci-iccs13.jp
JUNE
2-5—International Bridge Conference 2013, Pittsburgh, PA, www.eswp.com/bridge
2-5—12th Canadian Masonry Symposium, Vancouver, BC, Canada, www.cms2013.ca/index.php/cms/2013
Contents cont.

ACI Structural Journal/May-June 2013 379
Title no. 110-S29
ACI STRUCTURAL JOURNAL TECHNICAL PAPER
ACI Structural Journal, V. 110, No. 3, May-June 2013.MS No. S-2010-278.R3 received September 14, 2012, and reviewed under Institute
publication policies. Copyright © 2013, American Concrete Institute. All rights reserved, including the making of copies unless permission is obtained from the copyright proprietors. Pertinent discussion including author’s closure, if any, will be published in the March-April 2014 ACI Structural Journal if the discussion is received by November 1, 2013.
On the Effectiveness of Steel Fibers as Shear Reinforcementby Fausto Minelli and Giovanni A. Plizzari
An experimental study on steel fiber-reinforced concrete (SFRC) beams subjected to shear loading tested at the University of Brescia in recent years is presented and discussed. A total of 18 full-scale experiments were carried out, aimed at investigating the effect of randomly distributed steel fibers within the concrete matrix on shear behavior. The focus was on the parameters influ-encing the shear response of members, including concrete class, fiber content, and mixture of different fibers. All tested members contained no conventional shear reinforcement. All SFRCs used were characterized in tension according to the provision included in the fib Model Code 2010. A useful database—with other tests published elsewhere—was developed, linking the shear strength of members to the codified residual strengths of the corresponding fiber-reinforced concrete (FRC) materials.
Results show that a relatively low amount of fibers (Vf < 0.7%) can significantly increase the shear strength and ductility of concrete beams without transverse reinforcement. Moreover, visible cracking and noticeable deflections offer ample warning of impending collapse in FRC members.
A critical discussion of two recent analytical models for calcu-lating the shear strength of FRC materials is also provided.
Keywords: diagonal failure; shear strength; shear-critical beams; steel fiber-reinforced concrete.
INTRODUCTIONThe behavior and design of reinforced concrete (RC)
members subjected to shear remain an area of much concern in spite of the vast number of experiments that have been conducted to assess the shear capacity of structural concrete members. A consensus regarding mechanisms of shear transfer and the interpretation of collapse modes for members without web reinforcement that fail in shear are still missing. A pressing need remains to establish design and analytical methods that provide realistic assessments of the strength, stiffness, and ductility of structural elements subjected to shear loading.1,2
Interest in fiber-reinforced concrete (FRC) structures is growing due to their enhanced toughness. Steel fiber-reinforced concrete (SFRC) is already widely used in structures where fiber reinforcement is not essential for integrity and safety (for example, slabs-on-ground3).
SFRC offers many potential benefits as a structural material. In the precast industry, where high-strength concrete (HSC) is commonly employed, diffused fiber reinforcement could be used to reduce or eliminate conven-tional transverse reinforcement; this would give rise to advantages in the production process, reducing member dimensions constrained by cover requirements.4,5 In this context, fibers can be used to enhance the shear capacity of concrete or to replace, in part, the vertical stirrups in RC structural members. This practice relieves reinforcement congestion at critical sections such as beam-column junc-tions—an attribute particularly important in seismic appli-cations. Fiber reinforcement may also significantly reduce
construction time and costs because conventional stirrups involve relatively high labor input to bend and fix in place.
Many studies carried out over the past 25 years6-12 have addressed, through experimental and analytical investigation, the shear resistance of SFRC and defined new equations for calculating the ultimate shear strength of SFRC beams. Even though these studies have resulted in a significant advance-ment in the understanding of shear behavior of FRC members, many of them were characterized by tests on elements of special geometry with only a limited range of critical param-eters and conditions (for example, concrete class, fiber geom-etry, content and composition, size, and longitudinal and transverse reinforcement ratio) being investigated.
Among the analytical models proposed, the Variable Engagement Model (VEM)13 calculates the tensile strength provided by the fibers over a plane of unit area. For the predic-tion of shear strength of FRC beams, the Simplified Modified Compression Field Theory (SMCFT) approach14 was used together with the VEM as the basis for a proposed model for SFRC beams and one-way slabs by Foster.13
A wide and recent discussion on shear-resistant models can be found in Reference 15, where critical comments on the shear design approaches included in the fib Model Code 2010 (MC2010)16,17 are also reported.
The details of 18 tests on full-scale SFRC beams are presented in this paper, broadening the range of conditions currently considered in the literature. The tests performed focus on fiber’s role in delaying shear crack localization and allowing stable crack development with associated load and ductility increases.
The main goal of this study is to define a set of require-ments and design guidelines for the safe shear design of FRC members. The first outcomes of this effort can be seen in References 18 and 19, CNR DT 204/2006,20 and the fib MC201016,17; the latter will be discussed and compared against experimental results in this paper.
RESEARCH SIGNIFICANCEAlthough the shear behavior of members not containing
steel fibers has been widely investigated, there is an unre-solved need to understand the fundamental phenomena related to shear resistance of FRC members. An experi-mental investigation is presented with the purpose of studying the effects of various factors, including concrete class, reinforcement ratio, fiber type, geometry and quantity, visible shear cracking prior to collapse, postcracking stiff-ness, and shear ductility in members containing fibers as the

380 ACI Structural Journal/May-June 2013
Fausto Minelli is an Assistant Professor of structural engineering at the University of Brescia, Brescia, Italy. His research interests include shear behavior of lightly trans-verse reinforced beams, high-performance concrete, fiber-reinforced concrete, and nonlinear analyses of reinforced concrete structures.
ACI member Giovanni A. Plizzari is a Professor of structural engineering at the University of Brescia. His research interests include material properties and structural applications of high-performance concrete, fiber-reinforced concrete, concrete pave-ments, fatigue and fracture of concrete, and steel-concrete interaction in reinforced concrete structures.
only transverse reinforcement. Unlike previous investiga-tions, this study examines a broader range of parameters and focuses on the development of suitable design requirements and guidelines.
EXPERIMENTAL INVESTIGATIONMaterials and specimen geometry
The experiments reported herein are comprised of six different experimental series.
The overall test program was primarily aimed at analyzing the effect of adding randomly distributed fibrous reinforce-ment to concrete. An additional goal was to investigate mech-anisms of shear transfer dependent on the concrete matrix
(that is, interface shear transfer, dowel action of longitudinal reinforcement, residual tensile stresses across cracks, and the uncracked concrete flexural compression zone).
Much of the details and discussion provided herein will focus on the first four test series (1 to 4), which are char-acterized by a larger number of specimens. For Series 1 to 4, 11 shear-critical beams were tested using a four-point loading system; the beams had a longitudinal reinforce-ment ratio of 1.04% and a shear span-depth ratio (a/d) of 2.5 (recognized to be the most critical in terms of shear strength in ordinary RC members21) and were cast with different amounts and types of steel fibers. All beams had the same geometry and contained no conventional steel stirrups as shear reinforcement.
A beam depth of 480 mm (18.9 in.) was chosen with a gross cover of 45 mm (1.8 in.) and a clear cover of 33 mm (1.3 in.). The typical beam spanned 4350 mm (171.3 in.), while the overall length of the specimen was 4450 mm (175.2 in.). Two deformed longitudinal bars with a diameter of 24 mm (0.9 in.) were added to each specimen, corresponding to a reinforcement percentage of 1.04%. Figure 1(a) illustrates the geometry of the specimens and details of the reinforce-ment provided, while Table 1 summarizes the main charac-
Fig. 1—Geometry and reinforcement details of specimens.
Table 1—Geometry characteristics of specimens
Series 1 to 4 Series 5 Series 6
Total length, mm 4450 2400 4600
Span, mm 4350 2280 4550
Shear span a, mm 1090 1140 2275
Width, mm 200 200 200
Total depth, mm 480 500 1000
Gross cover, mm 45 45 90
Effective depth d, mm 435 455 910
Reinforcement area (2f24), mm2 905 905 1884
Reinforcement details 2f24 2f24 6f20
Reinforcement ratio, % 1.04 0.99 1.03
Notes: 1 mm = 0.0394 in.; 1 mm2 = 0.0015 in.2

ACI Structural Journal/May-June 2013 381
teristics of the beams. The chosen geometry reflects actual full-scale beams often used in practice.
Mechanical anchorage of longitudinal reinforcing bars (by means of steel plates), as illustrated in Fig. 1, and 200 x 35 x 15 mm (7.9 x 1.38 x 0.59 in.) bearing steel plates (the latter being the thickness) were provided to all specimens. Partic-ular attention was paid to the design of the anchorage plates to avoid local failure prior to the development of the desired shear collapse. Table 2 provides details of the composition of concrete mixtures employed for each series of specimens; the concrete was provided by a local supplier. Note that the four series of specimens were constructed with different concrete strengths and fiber characteristics.
Table 3 lists the mechanical properties of the concrete for all series of specimens, measured at the time of the corre-sponding beam tests. The concrete compressive and tensile strengths (measured with a uniaxial tensile test) and the Young’s modulus (secant static modulus in compression according to the Italian Standard UNI 655622) are listed; all were measured from f 80 x 210 mm (f 3.1 x 8.3 in.) cylin-ders. Note that different measurements are reported for the
HSC series (HSC1), as each specimen was cast separately. Conversely, all of the other specimens belonging to the same series were cast simultaneously by adding the chosen fiber content. Also reported in Table 3 are the different fiber contents and combinations used. The denomination “PC” refers to a beam cast with plain concrete (PC), whereas “FRC2” indicates a beam with a greater amount of fibers compared to the corresponding FRC1 or, in Series HSC1, a beam with fibers having stronger mechanical and fracture properties (that is, toughness).
Both full-scale elements and material specimens were cast simultaneously; internal vibration was used for full-scale elements and cubes, while external vibration was used for cylinders. In addition, all FRCs were characterized according to UNI 11039,23 which requires that four-point bending tests be performed on notched prismatic speci-mens (150 x 150 x 600 mm [5.91 x 5.91 x 23.6 in.]). From the conventional maximum stress (that is, determined by assuming a linear stress distribution in the notched section, even after cracking) versus crack tip opening displacement (CTOD) curves, two equivalent postcracking strengths (one
Table 2—Composition of NSC and HSC
NSC1 NSC2 and NSC3 HSC1 NSC4 HSC2
Cement type CEM I-32.5R CEM I-42.5R CEM I-52.5R CEM I-32.5R CEM I-52.5R
Cement content, kg/m3 345 345 380 345 380
Maximum aggregate size, mm 20 20 15 20 20
Water-cement ratio (w/c) 0.5 0.55 0.31 0.5 0.31
High-range water-reducing admixture, L/m3 3.8 3.8 2.75 5.2 3.8
Notes: 1 mm = 0.0394 in.; 1 kg/m3 = 1.685 lb/yd3; 1 L/m3 = 0.160 fl oz/gal.
Table 3—Mechanical properties of concrete and fiber contents
Series No. Specimen designationfc,
MPafct,
MPaEc,
GPafR,3, MPa
Volume fraction of steel fibers Vf
Fibers 50/1.0, % vol.
Fibers 30/0.6, % vol.
Fibers 12/0.18, % vol.
Fibers 30/0.62, % vol.
Fibers 30/0.38, % vol.
Vf,tot, kg/m3
1
NSC1-PC
24.8 2.30 31.4
— — — — — — —
NSC1-FRC 1 2.40 — 0.38 — — — 30
NSC1-FRC 2 2.76 — 0.38 0.19 — — 45
2
NSC2-PC
33.5 3.15 32.6
— — — — — — —
NSC2-FRC 1 2.29 0.38 — — — — 30
NSC2-FRC 2* 3.98 0.38 — 0.19 — — 45
3NSC3-PC
38.6 2.60 33.1— — — — — — —
NSC3-FRC 1 2.73 — 0.38 — — — 30
4
HSC1-PC 60.5 3.15 34.4 — — — — — — —
HSC1-FRC 1 61.1 3.48 36.8 2.81 — — — 0.64 — 50
HSC1-FRC 2 58.3 3.20 32.7 5.39 — — — 0.64 50
5
NSC4-PC-500 25.9 2.63 27.5 — — — — — — —
NSC4-FRC-500-124.4 2.80 26.2
1.54 0.25 — — — — 20
NSC4-FRC-500-2 1.54 0.25 — — — — 20
6
NSC4-PC-1000 25.9 2.63 27.5 — — — — — — —
NSC4-FRC-1000 24.4 2.80 26.2 1.54 0.25 — — — — 20
HSC2-PC-100055.0 3.15 34.2
— — — — — — —
HSC2-FRC-1000 2.52 0.25 — — — — 20*Faulty casting in top 80 mm (3.15 in.) of specimen (fiber-free). Notes: 1 MPa = 145 psi; 1 GPa = 145,038 psi; 1 kg/m3 = 1.685 lb/yd3.

382 ACI Structural Journal/May-June 2013
relating to serviceability limit states [SLSs]—feq(0,0.6); the other to ultimate limit states [ULSs]—feq(0.6,3.0)) were experi-mentally measured. UNI 1103923 is slightly different from EN 14651-524 for FRC mechanical characterization adopted in MC2010. However, at ULS, the most significant parameter in MC2010 is the residual flexural strength fR,3,24 whose rela-tion with feq(0.6-3) was experimentally found to be as follows25
,3 (0.6-3)0.90R eqf f= × (1)
Given this relationship, all values of fR,3 are provided for all specimens in Table 3.
The yield and ultimate tensile strength of the longitudinal reinforcing bars for Series 1 to 4 were 512 and 645 MPa (74.2 and 93.5 ksi), respectively. The Young’s modulus was measured as 211,000 MPa (30,595 ksi)—typical for S500 steel according to the current Eurocode 2 (EC2).26
Table 4 summarizes the main characteristics of all five fiber typologies. Note that the designations used for the fiber types denote the fiber length as the first number and the fiber diameter as the second number. Except for Type 12/0.18, all fibers can be considered macrofibers. Furthermore, with the exception of Types 30/0.38 and 12/0.18, all fibers have a normal tensile strength. The microfibers were only used in addition to macrofibers, creating a hybrid system that can better contrast both early cracking (mainly controlled by the microfibers) and diffused macrocracking (mainly controlled by the macrofibers).27
Regarding Series 5 and 6, the first set refers to sample beams having a total depth of 500 mm (19.7 in.; that is, small-sized specimens), while the second consists of elements 1000 mm (39.4 in.) deep (that is, large-sized specimens).
For Series 5, as reported in Table 1, the section properties are identical for all shear-critical beams of Series 1 to 4 (except for H and d). The deeper beams (large-sized specimens; Series 6) were cast with a total depth of 1000 mm (39.4 in.), an effective depth of 910 mm (35.8 in.), a width of 200 mm (7.9 in.), and a span of 4550 mm (179.1 in.). Further details can be found in Table 1 and Fig. 1(b). A three-point loading scheme was used for Series 5 and 6, resulting in an a/d of 2.5.
Concerning Series 5 and 6, all specimens having a total depth of 500 mm (19.7 in.) were cast by using a normal-strength concrete (NSC), whereas both NSC and HSC were used for deeper beams (Series 6). Table 2 reports the mixture compositions for the two different concrete batches, denoted “NSC4” and “HSC2.”
Among the small-sized specimens, one beam was cast without any transverse reinforcement (Specimen NSC4-PC-500) and two were produced with 20 kg/m3 (1.25 lb/
ft3) of steel hooked-end fibers 50/1.0 (Specimens NSC4-FRC-500-1 and NSC4-FRC-500-2); all details are reported in Table 4.
Concerning the large-sized specimens, two beams were cast for each concrete composition (NSC4 and HSC2): the reference element (NSC4-PC-1000 and HSC2-PC-1000) and the fibrous elements containing 20 kg/m3 (1.25 lb/ft3) of fibers 50/1.0 (NSC4-FRC-1000 and HSC2-FRC-1000). It should be noted that the fiber content of 20 kg/m3 (1.25 lb/ft3) allows for a low fracture toughness: both ACI 318-1128 and MC201016,17 do not permit the use of such a low content for structural applications. However, the aim of Series 5 and 6 was also the evaluation of steel fibers—intentionally provided at low dosages—as a minimum trans-verse shear reinforcement.
The yield and ultimate tensile strength of the longitudinal reinforcing bars were 550 and 672 MPa (79.8 and 97.4 ksi) for the 24 mm (0.9 in.) reinforcing bars and 530 and 646 MPa (76.9 and 93.7 ksi) for the 20 mm (0.8 in.) reinforcing bars.
Setup and instrumentationAs with all experiments involving unstable loading
regimes and possible brittle and sudden failure, a displace-ment-controlled loading system was used; the latter was achieved by adopting an electro-mechanical screw jack with a loading capacity of 1000 kN (225 kip) and a stroke of 350 mm (13.8 in.). The load was applied to the specimen as shown in Fig. 2, which depicts a schematic of the loading frame used for the four-point loading tests.
A consistent number of instruments were used for moni-toring critical displacements and deformations of specimens, in addition to the applied loads, as detailed in Appendix A.*
Experimental resultsFigure 3 summarizes the load-displacement and load-
main shear crack curves for the three specimens of Series NSC1. Specimen NSC1-PC, the reference specimen, showed the typical behavior exhibited by shear-critical beams of PC1,18—that is, a brittle collapse occurring at rela-tively modest levels of load, deflection, and cracking.
The addition of a low content (30 kg/m3 [1.87 lb/ft3]) of hooked-end steel fibers (Specimen NSC1-FRC1 with 30/0.6 fibers and fR,3 = 2.40 MPa [348 psi]; refer to Table 3) allowed the specimen to resist twice as much the load as the reference specimen, with increased deflection capacity
*The Appendixes are available at www.concrete.org in PDF format as an addendum to the published paper. They are also available in hard copy from ACI headquarters for a fee equal to the cost of reproduction plus handling at the time of the request.
Table 4—Characteristics of fibers employedDesignation 50/1.0 30/0.6 12/0.18 30/0.62 30/0.38
Type of steel Carbon Carbon Carbon Carbon High-carbon
Shape Hooked-end Hooked-end Straight Hooked-end Hooked-end
Minimum tensile strength, MPa 1100 1100 1800 1250 2300
Length, mm 50 30 12 30 30
Diameter, mm 1.00 0.60 0.18 0.62 0.38
Aspect ratio l/f 50 50 66.6 48 79
Fibers per kg 3200 15,000 417,000 14,000 37,000
Notes: 1 MPa = 145 psi; 1 mm = 0.0394 in.; 1 kg = 2.20 lb.

ACI Structural Journal/May-June 2013 383
and an enhanced stiffness in the cracked stage. Evidence of cracking in the shear span appeared at a load of approximately 110 to 120 kN (24.8 to 27 kip) compared to 70 kN (15.8 kip) of the reference specimen. The develop-ment of the shear cracking was well-controlled until a brittle collapse mechanism occurred at a load of 258 kN (58.1 kip).
Specimen NSC1-FRC2, with 30 kg/m3 (1.87 lb/ft3) of macrofibers (the same used for Specimen NSC1-FRC1) and 15 kg/m3 (0.94 lb/ft3) of microfibers (fR,3 = 2.76 MPa [400 psi]), proved to be able to resist enough shear to achieve a flexure failure mode with corresponding ductility. The midspan deflection and the shear strength of this specimen were 8.5 and 2.7 times greater, respectively, than those of the PC beam. Therefore, it is evident that adding a low content of fibers (Vf,tot = 0.57%), which does not significantly influ-ence the costs and workability of the mixture, can alter the final collapse mode of a specimen, ameliorating brittle shear mechanisms in members without conventional shear reinforcement. Consider also the load-crack width curves shown in Fig. 3(b), in which the measurement of the main shear cracks is reported. Regarding the number of cracks detected by each transducer, in most cases, only one macro-crack was detected by each instrument. Also, in the case of 1000 mm (39.37 in.) beams, two shear crack transducers were placed at the same section at different depths, resulting in the measurement of only one macrocrack each. In some cases, no cracks were detected. In a few cases (FRC samples
only), minor secondary combined flexure-shear cracks were also detected by the instruments, but their amplitude (esti-mated with local microscope measurements) was insignifi-cant with respect to the main shear crack recorded.
While the specimen constructed of PC was not able to resist load beyond a shear crack width of approximately 0.3 mm (0.012 in.), the two specimens containing fibers resisted shear cracks of up to 10 times larger due to the bridging action of the fibers across adjacent crack surfaces. The main shear crack recorded for Specimen NSC1-FRC2 reached a width of 3 mm (0.12 in.); yet, the shear cracking developed in a comparatively stable fashion until flexural collapse occurred. Another indi-cator of the relative differences in response can be obtained by considering the loads sustained by each specimen at the stage corresponding to a shear crack width of 0.33 mm (0.013 in.). In the PC beam (NSC1-PC), this occurred at failure with a load of 127 kN (28.6 kip). For the FRC beams (NSC1-FRC1 and NSC1-FRC2), the corresponding loads were 185 and 177 kN (41.6 and 39.9 kip), respectively, representing increases in load of 45% and 39%, respectively.
Figure 4 presents the experimental results of Series NSC2, which has a slightly higher compressive strength than that of Series NSC1. Unlike with Specimen NSC1-FRC2, the addition of 45 kg/m3 (2.81 lb/ft3) of fibers (a combination of macro- and microfibers; refer to Table 2) was not sufficient to bring Specimen NSC2-FRC2 to flexure failure. This is likely due to the casting process, where a certain amount of
Fig. 2—Schemes of frame used for loading specimens under four-point system.
Fig. 3—Response of Series NSC1 beams: (a) load-displacement curve; and (b) load-shear crack width curve. (Note: 1 MPa = 145 psi; 1 kg/m3 = 1.685 lb/yd3.)

384 ACI Structural Journal/May-June 2013
concrete without fibers had to be added to the top part of the specimen to completely fill the formwork. For this reason, the upper part of the shear-critical beam (almost 80 mm [3.15 in.] out of 480 mm [18.9 in.] in depth) was fiber-free. This upper part is well-known to be crucial, being the zone where the second branch of the shear-critical crack develops.18 Nevertheless, Specimen NSC2-FRC2 exhibited the best performance with increases of 73% and 85% in the load capacity and midspan deflection, respectively, relative to the corresponding reference specimen (NSC2-PC).
The crack width data, also shown in Fig. 4(b), indi-cate the stable development of the main shear crack in the FRC specimens that, in Specimen NSC2-FRC2, was equal to 2.65 mm (0.10 in.). This value was approximately 26.5 times wider than that in Specimen NSC2-PC (w = 0.1 mm [0.004 in.]). Unfortunately, no instrument detected the main shear crack in Specimen NSC2-FRC1; only a secondary measurement is reported in the plot; however, just before failure, the main shear crack was measured with
a microscope and showed a width of approximately 1.5 mm (0.06 in.).
Figure 5 illustrates the load-deflection and load-main shear crack curves for the three specimens constructed with HSC (Series HSC1). Specimen HSC1-PC’s behavior was similar to that exhibited by the PC beams having normal strength. The increase in the ultimate load (related to the tensile strength of concrete) was only 37% if compared to NSC2-PC and NSC3-PC (with a maximum load of 157 and 156 kN [35.3 and 35.1 kip], respectively), while the ratio of the corresponding compressive strengths was more than 2. It is evident that HSCs are much more brittle than NSCs.29
Specimen HSC1-FRC1 exhibited behavior governed by a shear failure, even though it was not extremely brittle. The main shear crack, which reached 2.2 mm (0.087 in.) in width, developed gradually, appearing first in the left shear span and then developing in the right span, where the shear failure occurred. However, the total load attained was close to the full flexural capacity of the member.
Fig. 4—Response of Series NSC2 beams: (a) load-displacement curve; and (b) load-shear crack width curve. (Note: 1 MPa = 145 psi; 1 kg/m3 = 1.685 lb/yd3.)
Fig. 5—Response of Series HSC1 beams: (a) load-displacement curve; and (b) load-shear crack width curve. (Note: 1 MPa = 145 psi; 1 kg/m3 = 1.685 lb/yd3.)

ACI Structural Journal/May-June 2013 385
Specimen HSC1-FRC2 achieved its full flexural capacity with a midspan deflection 6.5 times greater than that of Specimen HSC1-PC. The test was then terminated to prevent a brittle and dangerous final failure; however, yielding of the longitudinal reinforcing bars occurred.
One should note that the typical shear crack development, especially for Specimen HSC1-FRC2, was not character-ized by a single large crack, as one would expect. On the contrary, many secondary shear cracks developed and none grew significantly toward the point load. The high-carbon fibers (that is, high-strength fibers, especially suitable for HSC) and the consequent enhanced toughness of FRC (fR3 = 5.39) (5.39 MPa [782 psi]) were able to prevent the growth of such critical cracks. The main cracks developed within the two loading points, where many flexural cracks were observed and two large cracks (almost at the load point loca-tions) determined local yielding of the reinforcing bars.
Thus, as a general finding, for the PC shear-critical beams, just prior to collapse, the maximum value of the shear crack width in the shear span was equal to 0.1 to 0.3 mm
(0.004 to 0.012 in.); for the FRC beams, it increased signifi-cantly up to 1.5 to 3 mm (0.06 to 0.12 in.), depending on the typology and amount of fibers (except for Specimen HSC1-FRC2, as previously mentioned). This is significant from a structural point of view; in fact, the structure’s cracking pattern and its stable development can be used as an alert to potential danger if sufficient fibers are provided (that is,
0.08Ftuk ckf f≥ according to MC201016,17).Similar results were observed for Series 5 and 6, whose
main experimental results are presented in Fig. 6 and 7. With regard to the small-sized specimens (H = 500 mm [19.7 in.]), Fig. 6 plots the load-displacement and load-shear-crack width curves of the three experiments. Whereas the specimen made only from PC exhibited the well-known brittle shear failure mechanism, the two elements made of FRC (containing only 20 kg/m3 [1.25 lb/ft3] of steel fibers 50/1.0) showed visible cracking with stable propagation, accompanied by a nontrivial increase in load capacity. Specimen FRC-20-2 doubled the ultimate load and regis-tered a displacement at failure that was four times larger
Fig. 6—(a) Load-displacement curve; and (b) load-shear crack width curve for small-sized specimens. (Note: 1 mm = 0.0394 in.; 1 MPa = 145 psi.)
Fig. 7—Load-displacement curves for large-sized specimens in Series NSC4 and HSC2. (Note: 1 mm = 0.0394 in.; 1 MPa = 145 psi.)

386 ACI Structural Journal/May-June 2013
than the reference sample (NSC4-PC-500). Also, the main shear crack plot shown in Fig. 6(b) confirms the role played by fibers.
As widely reported in the literature, the primary role of the minimum shear reinforcement is to limit the growth of inclined cracks, improve ductility, and ensure that the concrete contri-bution to shear resistance is maintained, at least until yield of the shear reinforcement. It can be clearly stated that FRC, even in this small amount (20 kg/m3 [1.25 lb/ft3]), provides such benefits and is an economical alternative to traditional stirrups, whose handling and placing can be expensive, espe-cially when dealing with precast beams or structural elements characterized by nonrectangular cross sections.
Figure 7 shows the load-displacement curves for the large-sized specimens for Series NSC4 and HSC2, respectively; Fig. 8 plots the load-versus-main-shear-crack curve only in the case of Series HSC2. Note that the main shear crack is the average of six measurements performed in both shear spans (refer to the sketch on the plot).
As a further general finding, well-supported by Fig. 6 through 9, fibers provide significant performance at SLS by rather improving the tension-stiffening effect30 and, therefore, reducing displacement. Also, cracks for both Series NSC4 and HSC2 were fewer and narrower at service level than for PC specimens.
Concerning the crack pattern of deeper elements, the size of the elements and the low fracture toughness (due to the low fiber content) did not allow for the formation of multiple cracks, which would have brought the specimens to a higher ductility and bearing capacity, as evident in all FRC speci-mens belonging to Series 1 to 5 (H = 500 mm [19.68 in.]). Because the ultimate nominal shear stress decreases with size, it can be concluded (also by looking at Table 5) that the size effect surely played a significant role, even though it was mitigated by fibers.31
Figure 9 depicts the evolution of the crack patterns for specimens in Series NSC1. It is worth noting that, for small loadings (that is, 40 kN [9 kip]) corresponding to a nominal shear stress v = 0.23 MPa (33 psi), far fewer cracks were reported in the FRC specimens. In fact, no crack was observed for Specimen NSC1-FRC2 until a load of 70 kN (15.8 kip) was reached. However, with increasing load, the FRC speci-mens revealed a more diffused crack pattern and narrower crack spacing. In Specimen NSC1-PC, inclined cracking in the shear span first developed at a load of 70 kN (15.8 kip) and became prominent at a load of 90 kN (20.2 kip), whereas no significant shear cracks were observed in the FRC speci-mens before a load level of 120 kN (27 kip). Subsequently,
Fig. 8—Load-shear crack width curve for Series HSC2. (Note: 1 mm = 0.0394 in.; 1 MPa = 145 psi.)
Fig. 9—Crack pattern evolution in test specimens: (a) NSC1-PC; (b) NSCI-FRC1; and (c) NSC1-FRC2.
Fig. 10—Crack pattern at failure in test Specimens HSC1-PC, HSC1-FRC1, and HSC1-FRC2.

ACI Structural Journal/May-June 2013 387
in both FRC specimens, widespread shear cracks developed prior to collapse. The same observations can be extended to Series HSC1, as illustrated in Fig. 10, which only reports the final crack pattern. In Specimen HSC1-FRC1, the clear shear failure was accompanied by flexural cracks wider than 1 mm (0.0394 in.), whereas in Specimen HSC1-FRC2, the crack evolution and its final appearance were governed by flexure and were not significantly influenced by shear.
Table 5 reports the main displacement values and crack widths at failure for all series of specimens. The ratio between the maximum moment Mu (recorded during the experiment) and the analytical ultimate moment due to flexure failure Mu,fl is also provided. Note that for PC beams, the ultimate flexural moment was calculated by assuming the yielding of reinforcing bars within a classical stress-block approach according to EC2.26 For FRC members, the ultimate moment was calculated according to the MC2010.16,17 This formula, basically including a stress block also in tension (with a constant value of fFtu = fR,3/3 for the entire tensile area), proved to be in agreement with the experimental results of HSC1-FRC2 and NSC1-FRC2, which both exhibited a flexure failure. The increase in the flexural moment capacity due to the addition of fibers was, in all cases, approximately 15% or less when compared to that of the corresponding PC element. Moreover, mean values of compressive strength and steel tensile yield strength were adopted for the calculation of ulti-mate moments. The type of failure, maximum load, midspan displacement, and main shear crack, where available, are also listed in Table 5.
MC2010 FORMULATION FOR SHEAR IN FRCThe model proposed in the final draft of fib MC201016,17 for
the shear resistance of FRC members without shear reinforce-ment includes a fiber contribution according to the current EC226 formulation, as first published by Minelli.18 This contribution is a function of the FRC toughness.18,19 As in MC2010,16,17 the toughness parameter is conventionally assumed as the residual postcracking strength fFTu (fFTu = fR,3/3). Moreover, as fibers act as a distributed reinforcement, the shear contribution of fibers was introduced by modifying the longitudinal reinforcement ratio by means of a factor that includes the toughness properties of FRC
1/3
, 10.18 100 1 7.5 0.15
W
FtukRd F ck CP
c ctk
fV k f
f
b d
= ⋅ ⋅ ⋅r ⋅ + ⋅ ⋅ + ⋅s γ ⋅ ⋅
(2)
The details of this model are reported in Appendix B.Although it is based on an empirical approach, this equa-
tion has a very simple formulation and it is already exten-sively used in Eurocodes for the design of PC beams. Hence, Eq. (2) may be easily transferred into the design of FRC members. Note that Eq. (2) applies in the case of shear diagonal failure (beam behavior; a/d ≥ 2.5). In this equation, FRC is considered a concrete exhibiting a remarkable tough-ness that cannot be neglected, contrary to what is generally assumed in PC.
This model is not consistent with the design approach described in the MC2010 (Section 7.3) for RC members
Table 5—Ultimate loads, midspan displacements, and main shear cracks achieved by all experiments
SpecimenType of failure
Maximum loadPu, kN vu, MPa vu/(fc)1/2 Mu, kN-m Mu,fl, kN-m Mu/Mu,fl
Midspan displacement du, mm
Main shear crack, mm
NSC1-PC Shear 127 0.79 0.16 75 179 0.42 9.1 0.33
NSC1-FRC1 Shear 258 1.54 0.31 146 192 0.76 19.6 1.80
NSC1-FRC2 Flexure 349 2.07 0.42 196 194 1.01 77.1 2.99
NSC2-PC Shear 157 0.97 0.17 92 185 0.50 11.5 0.10
NSC2-FRC1 Shear 229 1.38 0.24 131 199 0.66 18.8 0.38*
NSC2-FRC2† Shear 273 1.63 0.28 155 209 0.74 21.3 2.65
NSC3-PC Shear 156 0.95 0.15 90 187 0.48 9.5 0.15
NSC3-FRC Shear 272 1.62 0.26 154 204 0.75 20.1 2.98
HSC1-PC Shear 216 1.30 0.17 123 192 0.64 12.8 0.24
HSC1-FRC1 Shear‡ 372 2.20 0.28 208 212 0.98 26.4 2.21
HSC1-FRC2 Flexure 435 2.56 0.34 243 229 1.06 78.0 0.50
NSC4-PC-500 Shear 216 1.22 0.24 124 203 0.61 2.74 0.59
NSC4-FRC-500-1 Shear‡ 388 2.13 0.44 222 214 1.04 10.95 3.71
NSC4-FRC-500-2 Shear 308 1.69 0.35 177 214 0.83 4.77 1.30
NSC4-PC-1000 Shear 365 1.07 0.21 428 813 0.53 7.60 —
NSC4-FRC-1000 Shear 494 1.42 0.29 575 858 0.67 11.05 —
HSC2-PC-1000 Shear 393 1.14 0.15 460 864 0.53 9.79 —
HSC2-FRC-1000 Shear 656 1.86 0.25 759 940 0.81 12.01 —*Main shear crack developed outside instrument gauge lengths. †Faulty casting in top 80 mm (3.15 in.) of specimen (fiber-free). ‡Shear failure with yielding of longitudinal reinforcing bars (full flexural capacity reached). Notes: 1 kN = 0.2248 kip; 1 MPa = 145 psi; 1 kN-m = 0.737 kip-ft; 1 mm = 0.0394 in.

388 ACI Structural Journal/May-June 2013
(without fibers). According to another model proposed for the determination of the shear strength,13 consistent with Chapter 7.3 of the MC2010 and explained in the commen-tary section of the MC2010 (Chapter 7.7) as a further design model, the shear strength of FRC elements without stirrups can be written as follows
( ),1 cotRd F v ck f Ftuk w
F
V k f k f z b= + qγ (3)
The details of this model are also reported in Appendix B.Note that both models (Eq. (2) and (3)) are based on the
residual postcracking strength fFTu of fibers, which can be experimentally determined according to EN 14651-5.24
The two aforementioned models were validated against the entire set of FRC specimens presented herein (11 FRC speci-mens out of a total of 18 specimens). In these experiments, a broad variety of fiber properties, fiber geometry and type, specimen geometry, size, and concrete class (all typical for practical applications in the field) are included. Moreover, no PC members are included in the following discussion.
Table 6 reports the ultimate experimental shear and the prediction of the proposed model (Vu,MC; Eq. (2)) and the Foster Model (Vu,VEM; Eq. (3) with qmin). Also, the ratios between the calculated and experimental shear strength (a value of this ratio greater than 1 signifies that the model overestimates the shear capacity), the standard deviation, and the coefficient of variation (COV) are reported. It can be observed that the two models give satisfactory and similar results, considering the high uncertainty prevalent in all phenomena related to shear and brittle collapses (no ratios are reported in the case of the two FRC elements that failed under flexure).
In all cases, Eq. (3) gives higher shear strength than Eq. (2). In three cases, the Foster Model overestimates the shear strength, whereas in two cases, the main MC2010 Model is extremely conservative. The COV is only slightly smaller in the MC2010 Model (Eq. (2)).
Both models should be checked against a broader set of experiments covering further practical design situations, especially in specimens with longitudinal reinforcement ratios greater than 1% (the only significant parameter that is constant in all data sets considered herein). However, Eq. (2) was already widely validated19 and can be considered safe for structural design. Furthermore, in spite of its empirical nature, the equation represents a unified approach for RC and FRC structural design because FRC is modeled as an enhanced toughness concrete.
CONCLUSIONSFull-scale tests were performed on 18 shear-critical
beams. Some were constructed from PC, while others employed varying amounts of steel fibers. No conventional shear reinforcement (that is, stirrups) was provided in any of the beams. Both NSC and HSC were investigated.
The following conclusions emerged:1. Fibers, even in a relatively low amount (that is, Vf =
0.57%) and with no significant influence on costs or work-ability of the mixture, provide a concrete toughness that can greatly influence the shear behavior of beams. They do so by basically delaying the occurrence of the shear failure mecha-nism and, eventually, by altering the collapse from shear to flexure with enhanced load capacity and ductility.
2. FRC allows for the formation of a well-distributed crack pattern in the critical area under shear, delaying or even avoiding the formation of a single critical shear crack, which brings the member to failure. If this happens, it is associated with visible warning, cracking, and deflections, unlike with similar shear-critical PC members.
3. The main shear crack in FRC beams develops steadily with a width of up to 20 to 30 times larger than that in PC samples.
4. Fibers can effectively replace the minimum amount of transverse reinforcement and the skin reinforcement required to control crack propagation and give visible warning before the structural collapse.
5. High-strength fibers are needed as the concrete strength increases because the brittleness related to shear failure
Table 6—Prediction of two analytical models of MC2010
FRC specimen designation fc, MPa fR,3, MPa fFtu, MPa Type of failure Vu, kN Vu,MC, kN Vu,MC/Vu Vu,VEM, kN Vu,VEM/Vu
NSC1-FRC 124.8
2.4 0.80 Shear 134 116 0.87 125 0.93
NSC1-FRC 2 2.76 0.92 Flexure 180 120 — 133 —
NSC2-FRC 133.5
2.29 0.76 Shear 120 121 1.01 130 1.08
NSC2-FRC 2* 3.98 1.33 Shear 142 138 0.97 150 1.06
NSC3-FRC 1 38.6 2.73 0.91 Shear 141 130 0.92 142 1.01
HSC1-FRC 1 61.1 2.81 0.94 Shear 191 146 0.76 148 0.77
HSC1-FRC 2 58.3 5.39 1.80 Flexure 223 168 — 155 —
NSC4-FRC-500-124.4
1.54 0.51 Shear 154 107 0.69 110 0.71
NSC4-FRC-500-2 1.54 0.51 Shear 194 107 0.55 110 0.57
NSC4-FRC-1000 24.4 1.54 0.51 Shear 258 192 0.74 203 0.79
HSC2-FRC-1000 55.0 2.52 0.84 Shear 339 254 0.75 281 0.83
Mean — — — — — — 0.81 — 0.86
Standard deviation — — — — — — 0.14 — 0.16
COV — — — — — — 0.17 — 0.19*Faulty casting in top 80 mm (3.15 in.) of specimen (fiber-free). Notes: 1 MPa = 145 psi; 1 kN = 0.2248 kip.

ACI Structural Journal/May-June 2013 389
increases. The combination of micro- and macrofibers with a suitable dosage and toughness allows for an enhanced control of the shear cracking—both at early and ultimate crack stages.
6. The fib MC2010 provides a useful equation for the calculation of the shear capacity in FRC members. This equation has been validated through comparisons with many tests, and it performs reasonably well, as demonstrated by its application to the specimens considered in this paper. Hence, the equation can be safely used in structural design. Further-more, in spite of its empirical nature, the equation represents a unified approach for RC and FRC structural design because FRC is modeled as an improved toughness concrete. In addi-tion, a second model presented based on the SMCFT and VEM for modeling shear strength of FRC beams is quite promising and fits reasonably well with the experiments.
7. A useful database of shear tests on FRC beams with, in all cases, a material mechanical characterization giving fFtu is now available.
REFERENCES1. Joint ACI-ASCE Committee 445, “Recent Approaches to Shear
Design of Structural Concrete,” Journal of Structural Engineering, ASCE, V. 124, No. 12, 1998, pp. 1375-1417.
2. Vecchio, F. J., “Analysis of Shear-Critical Reinforced Concrete Beams,” ACI Structural Journal, V. 97, No. 1, Jan.-Feb. 2000, pp. 102-110.
3. Sorelli, G.; Meda, A.; and Plizzari, G. A., “Steel Fiber Concrete Slabs on Ground: A Structural Matter,” ACI Structural Journal, V. 103, No. 4, July-Aug. 2006, pp. 551-558.
4. Meda, A.; Minelli, F.; Plizzari, G. A.; and Riva, P., “Shear Behavior of Steel Fiber Reinforced Concrete Beams,” Materials and Structures, V. 38, No. 3, 2005, pp. 343-351.
5. Noghabai, K., “Beams of Fibrous Concrete in Shear and Bending: Experiment and Model,” Journal of Structural Engineering, ASCE, V. 126, No. 2, 2000, pp. 243-251.
6. Imam, M.; Vandewalle, L.; Mortelmans, F.; and Van Gemert, D., “Shear Domain of Fiber-Reinforced High-Strength Concrete Beams,” Engineering Structures, V. 19, No. 9, 1997, pp. 738-747.
7. Casanova, P.; Rossi, P.; and Schaller, I., “Can Steel Fibers Replace Transverse Reinforcement in Reinforced Concrete Beams?” ACI Materials Journal, V. 94, No. 5, Sept.-Oct. 1997, pp. 341-354.
8. Khuntia, M.; Stojadinovic, B.; and Goel, S., “Shear Strength of Normal and High-Strength Fiber Reinforced Concrete Beams without Stir-rups,” ACI Structural Journal, V. 96, No. 2, Mar.-Apr. 1999, pp. 282-289.
9. Gustafsson, J., and Noghabai, K., “Steel Fibers as Shear Reinforce-ment in High Strength Concrete Beams,” Technical Report, Division of Structural Engineering, Luleå University of Technology, Luleå, Sweden, 1999, pp. 1-18.
10. Choi, K.-K.; Park, H.-G.; and Wight, J., “Shear Strength of Steel Fiber-Reinforced Concrete Beams without Web Reinforcement,” ACI Structural Journal, V. 104, No. 1, Jan.-Feb. 2007, pp. 12-22.
11. Dinh, H. H.; Parra-Montesinos, G. J.; and Wight, J., “Shear Behavior of Steel Fiber-Reinforced Concrete Beams without Stirrup Reinforcement,” ACI Structural Journal, V. 107, No. 5, Sept.-Oct. 2010, pp. 597-606.
12. Susetyo, J.; Gauvreau, P.; and Vecchio, F. J., “Effectiveness of Steel Fiber as Minimum Shear Reinforcement,” ACI Structural Journal, V. 108, No. 4, July-Aug. 2011, pp. 488-496.
13. Foster, S. J.; Voo, Y. L.; and Chong, K. T., “FE Analysis of Steel Fiber Reinforced Concrete Beams Failing in Shear: Variable Engage-ment Model,” Finite Element Analysis of Reinforced Concrete Structures, SP-237, L. Lowes and F. Filippou, eds., American Concrete Institute, Farm-ington Hills, MI, 2006, pp. 55-70. (CD-ROM)
14. Bentz, E. C.; Vecchio, F. J.; and Collins, M. P., “The Simplified MCFT for Calculating the Shear Strength of Reinforced Concrete Elements,” ACI Structural Journal, V. 103, No. 4, July-Aug. 2006, pp. 614-624.
15. Minelli, F., and Plizzari, G., eds., “Shear and Punching Shear in RC and FRC Elements,” fib Bulletin 57, Fédération Internationale du Béton, Lausanne, Switzerland, Oct. 2010, 268 pp.
16. Fédération Internationale du Béton, “Model Code 2010—Final Draft,” fib Bulletin 65, V. 1, 2012, 350 pp.
17. Fédération Internationale du Béton, “Model Code 2010—Final Draft,” fib Bulletin 66, V. 2, 2012, 370 pp.
18. Minelli, F., “Plain and Fiber Reinforced Concrete Beams under Shear Loading: Structural Behavior and Design Aspects,” PhD thesis, Depart-ment of Civil Engineering, University of Brescia, Brescia, Italy, Feb. 2005, 422 pp.
19. Minelli, F., and Plizzari, G. A., “Steel Fibers as Shear Reinforce-ment for Beams,” Proceedings of the Second fib Congress, Naples, Italy, 5-8 June 2006, 12 pp.
20. CNR DT 204/2006, “Guidelines for the Design, Construction and Production Control of Fiber Reinforced Concrete Structures,” National Research Council of Italy, Rome, Italy, 2006, 59 pp.
21. Kani, G. N. J., “How Safe Are Our Large Reinforced Concrete Beams?” ACI Journal, V. 64, No. 3, Mar. 1967, pp. 128-141.
22. UNI 6556, “Testing Concrete. Determination of Secant Modulus of Elasticity in Compression,” Italian Board for Standardization, Milan, Italy, 1976, 3 pp.
23. UNI 11039, “Steel Fiber Reinforced Concrete—Part I: Definitions, Classification Specification and Conformity—Part II: Test Method for Measuring First Crack Strength and Ductility Indexes,” Italian Board for Standardization, Milan, Italy, 2003, 11 pp.
24. EN 14651-5, “Precast Concrete Products—Test Method for Metallic Fiber Concrete—Measuring the Flexural Tensile Strength,” European Committee for Standardization, Brussels, Belgium, 2005, 20 pp.
25. Minelli, F., and Plizzari, G. A., “A New Round Panel Test for the Characterization of Fiber Reinforced Concrete: A Broad Experimental Study,” ASTM Journal of Testing and Evaluation, V. 39, No 5, Sept. 2011, pp. 889-897.
26. EN 1992-1-1, “Eurocode 2: Design of Concrete Structures. General Rules and Rules for Buildings,” European Committee for Standardization, Brussels, Belgium, 2005, 209 pp.
27. Meda, A.; Plizzari, G. A.; Sorelli, L.; and Banthia, N., “Uni-Axial and Bending Tests on Hybrid Fiber Reinforced Concrete,” Role of Concrete in Sustainable Development, K. Dhir, M. D. Newlands, and K. A. Paine, eds., Dundee, UK, Sept. 3-4, 2003, pp. 709-718.
28. ACI Committee 318, “Building Code Requirements for Structural Concrete (ACI 318-11) and Commentary,” American Concrete Institute, Farmington Hills, MI, 2011, 503 pp.
29. Angelakos, D.; Bentz, E. C.; and Collins, M. P., “Effect of Concrete Strength and Minimum Stirrups on Shear Strength of Large Members,” ACI Structural Journal, V. 98, No. 3, May-June 2001, pp. 290-300.
30. Bischoff, P. H., “Tension Stiffening and Cracking of Steel Fiber-Reinforced Concrete,” Journal of Materials in Civil Engineering, ASCE, V. 15, No. 2, 2003, pp. 174-182.
31. Minelli, F.; Plizzari, G. A.; and Vecchio, F. J., “Influence of Steel Fibers on Full-Scale RC Beams under Shear Loading,” Proceedings of the 6th International Conference FraMCoS—High Performance Concrete, Brick-Masonry and Environmental Aspects, Catania, Italy, 17-22 June 2007, pp. 1523-1531.

390 ACI Structural Journal/May-June 2013
NOTES:

22
APPENDIX A
A consistent number of instruments were utilized for monitoring critical displacements and
deformations of specimens, in addition to the applied loads. Linear Variable Differential
Transformers (LVDTs) enabled the measurement of the vertical beam and support
displacements. Potentiometric transducers were placed on both sides (back and front), in the
area of high shear stresses (i.e., within the shear spans), to measure crack openings (gauge
length of 250 mm (~10 in.)) and strut deformations (gauge length of 600 mm (~24 in.)).
These transducers, depicted in Figure 1, were placed with an inclination of 40° (for the strut
deformation) and 130° (for the crack opening) with respect to the horizontal line. Such
inclinations were selected on the basis of the common observation that, for plain concrete
elements, the collapse mechanism is characterized by a sudden macro-crack running from the
point load to the bottom reinforcement, at a distance from the support approximately equal to
the depth of the member. From that point, a splitting crack develops toward the nearest
support. This assumption was confirmed during most tests carried out in this experimental
program.
In sum, a total number of 16 instruments were used in each test: two load cells (see Figure 3);
two LVDTs for measuring support displacements; four LVDTs for measuring vertical
displacements, one at each load point and two at the midspan (the latter two for monitoring
possible twisting); seven potentiometric transducers for measuring strut deformations and
crack openings in the panel area; and one potentiometric transducer for measuring the bottom
horizontal flange deformation at the midspan (see Figure 1).
Concerning the loading process, several cycles of preloading (generally three loading and
unloading cycles) in the elastic range (i.e. for a load of 40 kN for both 480 mm or 500 mm
deep elements; for a load of 80 kN for members 1000 mm deep) were applied in order to
ensure that the instruments were working properly. Thereafter, the test typically began by

23
imposing a rate of 0.5 mm/min (0.02 in./min) to the screw jack. After reaching the flexural
cracking point, the loading rate was reduced to 0.25 mm/min. When the first shear crack
appeared, the rate was further reduced to 0.1mm/min (0.004 in./min); this final rate was kept
up to failure.
A slightly different instrumentation scheme was adopted for the Large Size Specimens.
APPENDIX B
The model proposed in the final draft of fib MC2010 for the shear resistance of FRC
members without stirrups includes a fiber contribution according to the current EC2
formulation [26], by modifying the longitudinal-reinforcement ratio, via a factor that includes
the toughness properties of FRC as follows:
dbfffkV
WCPckctk
Ftuk
cFRd ⋅⋅
⋅+
⋅
⋅+⋅⋅⋅⋅= σρ
γ15.05.71100
18.03/1
1, (2)
where γc is the partial safety factor for concrete, k is a factor taking into account the size
effect (k=1+(200/d)1/2, with d in mm; ≤ 2); ρl is the longitudinal reinforcement ratio (≤ 2%);
fFtuk is the characteristic value of the ultimate residual tensile strength for FRC at the crack
width wu=1.5 mm; fck is the characteristic value of the compressive strength; σcp is the
average axial stress on the cross section, due to the loads or to prestressing; bw is the
minimum cross-sectional width and d is the effective depth.
The model proposed by Foster [15] is presented and explained in the commentary section of
MC2010 as a further design model. According to it, the shear strength of FRC elements
without stirrups can be written as follows:
( ) wFtukfckvF
FRd bzfkfkV θγ
cot1
, += (1)

24
where ckf shall not be taken as greater than 8 MPa, kf = 0.8 and z is the internal moment
lever arm. Moreover, the angle of the compressive stress field is:
xεθ 700029o += (2)
where εx is the longitudinal strain at the mid-depth of the effective shear depth, as determined
in Section 7.3 of MC2010 [17], and:
0.4 13000.08
1 1500 1000
0.40.08
1 1500
ckv w
x dg yk
ckw
x yk
fk
k z f
ff
ρε
ρε
= ⋅ <+ +
= ≥+
(3)
320.75
16dgg
kd
= ≥+
(4)
where dg is the maximum size of the aggregate particles (if dg is lower than 16 mm, take
kdg=1.0), and fFtuk is the characteristic value of the ultimate residual tensile strength for FRC,
corresponding to the crack width at ultimate (wu), as follows:
mm125.010002.0 ≥+= xuw ε (5)
The limits of the angle of the compressive stress field, θ, relative to the longitudinal axis of
the member, are:
min 45θ θ≤ ≤ ° (6)
where the minimum strut inclination angle is [17]:
min 29 7000 xθ ε= ° + (7)
This model is a combination of the Simplified Modified Compression Field Theory [14] and
the Variable Engagement Model [13]. It is therefore based on a stronger base-physical-model
for shear.

25
FIGURE APPENDIX A
4350
strut displacement and crack width
bottom flange displacement
4550
A C D E B
strut displacement and crack width
1090 2170 1090
Figure 1- Deployment of instrumentation for measuring crack openings and strut
displacements on the front side on the tested beam.
(85.4)(42.9) (42.9) (171.3)(179.1)

ACI Structural Journal/May-June 2013 391
Title no. 110-S30
ACI STRUCTURAL JOURNAL TECHNICAL PAPER
ACI Structural Journal, V. 110, No. 3, May-June 2013.MS No. S-2011-135.R2 received November 8, 2011, and reviewed under Institute
publication policies. Copyright © 2013, American Concrete Institute. All rights reserved, including the making of copies unless permission is obtained from the copyright proprietors. Pertinent discussion including author’s closure, if any, will be published in the March-April 2014 ACI Structural Journal if the discussion is received by November 1, 2013.
Crack Protocols for Anchored Components and Systemsby Richard L. Wood and Tara C. Hutchinson
The opening and closing of cracks in concrete, also referred to as “crack cycling,” can be induced during an earthquake and has been shown to significantly influence the tension behavior of anchors. This paper presents a protocol for testing anchors in cycling cracks in an effort to represent earthquake loading of anchored components and systems. In the proposed protocol, cyclic cracking is simulated while a representative tension or shear load history is simultaneously applied. The protocol is devel-oped by performing rainflow counting of the curvature histories extracted from nonlinear history analyses of a suite of building models. Herein, the focus is on development of the crack histories; loading histories are outside the scope of this paper. The selec-tion of earthquake motions is guided by results from a probabilistic seismic hazard analysis of a seismically active region in Southern California. The resulting cyclic crack protocol is presented in statistical terms and an example application of these statistics to the assessment of anchors used in bracing nonstructural compo-nents and systems is provided.
Keywords: anchor; crack cycling protocol; cracked concrete; fastener; rainflow counting; seismic.
INTRODUCTIONWhen a building is subjected to an earthquake, the struc-
tural system and its attached nonstructural components and systems (NCSs) are subjected to the dynamic envi-ronment of the structure. The motions to which anchorage connecting both the structural and nonstructural components are subjected may be filtered by the building, resulting in motions with increased amplitude and relatively narrow band frequency characteristics. Moreover, if the anchorage is to concrete, as is most often the case, the anchor may be situ-ated in cracks. Under earthquake loading, these cracks may cycle open and close, particularly if the member is structur-ally attached to or is a part of the lateral load-bearing system of the building. Understanding the behavior of the anchorage subjected to cyclic cracks (that is, cracks opening and closing) is important for successful design of the connection. Unfortunately, experimental protocols to address anchor behavior under seismic conditions have received limited attention, and investigations to gain a specific understanding of the influence of cyclic cracks on anchor behavior are rare.
In the following sections, a description of selected existing protocols that are being adopted in some form by the experi-mental community are presented. Subsequently, the short-comings, as related to the application of concrete anchorage, are noted and the scope of a proposed cyclic crack protocol is described. It is noted that a holistic protocol during testing would incorporate the resulting crack cyclic protocol applied to the concrete substrate coupled with a load history applied to the anchor. Characteristics of the loading histories are beyond the scope of this paper.
RESEARCH SIGNIFICANCECrack cycling, which can be induced in concrete struc-
tures during an earthquake, has been shown to significantly
influence the behavior of anchors. This paper presents a methodology for establishing a cracking protocol, which may be adopted in anchor test programs to account for the influence of cyclic cracking on anchor behavior. Using real-istic earthquake inputs and nonlinear time history analyses of seven buildings, cycle counting and statistics are used to develop the simulated seismic crack protocol. In its current form, the protocol is intended for the testing of anchored components, with applicability to both structural and nonstructural connections.
PREVIOUSLY DEVELOPED PROTOCOLSCyclic protocols
Cyclic protocols of particular interest to the develop-ment of a crack protocol include the strategies presented by CUREE,1 CANDU,2 SEAOSC,3 DIBt,4 ACI 355.2-07,5 and Hoehler.6 The protocols proposed by CANDU, SEAOSC, DIBt, ACI 355.2, and Hoehler specifically relate to anchorage in concrete; however, only DIBt and Hoehler address simu-lated seismic crack cycling. The CUREE protocol, however, is targeted toward the performance evaluation of wood frame components; the methodology adopted has informed the work described herein. Therefore, the CUREE protocol is discussed first, followed by a review of those protocols more focused on anchorage applications.
CUREE cyclic load protocolIn the CUREE “Basic Loading History” protocol, “ordi-
nary” ground motions typical of far-field locations with a seismic hazard associated with a 10%-in-50-year-return period are adopted. This protocol is characterized by a symmetric pattern of primary loading cycles (defined as a cycle in which a given displacement level is reached for the first time) followed by a number of trailing cycles that are equal to 75% of the previous primary cycle. The decrease in cycle count as deformation amplitude increases is due to the observation that ground motions impose fewer cycles of strong motion as the period of the system elongates due to nonlinear behavior.7
Anchorage-specific cyclic load protocolsAnchorage-specific loading protocols are prescribed in a
number of design codes. For example, seismic testing require-ments for anchors used in Canadian nuclear power plants are specified in CSA-N287.2.2 The CSA-N287.22 loading protocol requires that anchors be subjected to simulated seismic tests characterized by a stepwise decreasing loading

392 ACI Structural Journal/May-June 2013
Richard L. Wood is a Postdoctoral Research Fellow at the University of California, San Diego, La Jolla, CA. He received his BS in civil engineering from Clarkson University, Potsdam, NY, and his MS and PhD in structural engineering from the University of California, San Diego. His research interests include numerical building and nonstructural component simulations considering earthquake effects.
Tara C. Hutchinson is a Professor at the University of California, San Diego. She received her doctorate from the University of California, Davis, Davis, CA, and her MS from the University of Michigan, Ann Arbor, MI. Her research interests include earthquake engineering, including performance evaluation of soil-foundation systems, concrete components, nonstructural systems and components, and development of damage monitoring strategies.
protocol with a loading frequency of 5 Hz (Fig. 1(a)) in uncracked concrete. After completion of the load cycles, the anchor is loaded monotonically to failure. This loading history was developed largely based on the study of Tang and Deans,8 who subjected single degree-of-freedom (SDOF) oscillators to a range of seismic excitation. In their studies, an artificial spectrum compatible ground motion with a total length of 30 seconds was applied to an elastic SDOF system with frequencies ranging from 1.7 to 10 Hz. These frequen-cies were selected as representative of structures antici-pated in nuclear power facilities. Response histories from the elastic SDOF oscillator analyses were then applied to a secondary set of SDOF oscillators with the intended goal of simulating equipment resonance characteristics representa-tive of nonstructural components and systems. Responses of the secondary SDOF oscillators were then used in the protocol development. The authors recommend a stepwise decreasing protocol because, in general, the peak accelera-tion response occurred in the first 4 seconds of their artifi-cial motion. The recommended loading protocol for either tension or shear had four steps: 30 cycles at 53%; 30 cycles at 45%; 80 cycles at 30%; and 200 cycles at 15% of the calculated yield strength of the anchor, Fy (Fig. 1(a)).
The Structural Engineers Association of Southern Cali-fornia (SEAOSC) proposed the SEAOSC “Standard Method of Cyclic Load Test for Anchors in Concrete or Grouted Masonry.”3 The anchors are loaded cyclically with five steps per amplitude up to failure. The load steps are determined by first identifying the first major event (FME) from static test data, which is the load level at which the load-displace-ment curve undergoes a significant response change—for example, in stiffness. The load steps are then established as
25% increments of the FME—that is, 25%FME, 50%FME, 75%FME, 100%FME, 125%FME—and continued in 25% increments until failure (Fig. 1(b)). These specifications do not indicate if the tests should be performed in cracked or uncracked concrete.
In 1998, the Deutsches Institut für Bautechnik4 (DIBt) issued guidelines applicable to anchors in German nuclear facilities. The guidelines are applicable for anchors used to fasten nuclear-safety-relevant components, which may be subject to extreme loading conditions such as earthquakes, explosions, or aircraft impact. The required pulsating tension tests consist of 15 tension load cycles to approximately 45% of the mean ultimate reference load Nu,m, followed by mono-tonic loading to failure in an open crack of either 0.039 or 0.059 in. (1.0 or 1.5 mm). It is noted that Nu,m varies based on the protocol and anchorage type; however, in general, it is taken as the average ultimate load level from multiple static tests in uncracked concrete. Crack movement suitability or crack opening and closing behavior tests are also specified where a sustained axial load of 45% Nu,m is applied to the anchor and subjected to 10 crack cycles between 0.039 and 0.059 in. (1.0 and 1.5 mm).
ACI 355.2-075 prescribes prequalification seismic load tests, which involve placing post-installed mechanical anchors in cracked concrete (crack widths of 0.02 in. [0.5 mm]) and subjecting them to stepwise decreasing, pulsating tension, or alternating shear load cycles (Fig. 1(c)) with a frequency between 0.1 and 2 Hz while holding a constant crack width of 0.02 in. (0.5 mm). The load steps are determined based on the mean ultimate strength from the reference tests in cracked concrete with a width of 0.012 in. (0.3 mm), according to Table 4.2 of ACI 355.2-07.5 After completion of the load cycles, the anchor is loaded monotonically to failure.
Hoehler6 presents anchor load cycling and crack cycling protocols based largely on cumulative damage studies of building and NCS response during earthquakes performed by Malhotra9 and Malhotra et al.10 Similar to other seismic anchor testing methods (for example, ACI 355.2-075), simu-lated seismic load and crack cycling tests are recommended to evaluate the response of the anchor independently to pulsating tension and alternating shear loading in a crack width of 0.031 in. (0.8 mm). The cyclic load is applied with a frequency between 0.1 and 2 Hz. Following the load cycling, the anchor is loaded monotonically to failure to determine its residual capacity. Stepwise increasing load levels in seven equal steps are prescribed (Fig. 1(d)). Simulated seismic crack cycling tests are proposed to evaluate the cyclic crack widths outside of the plastic hinge zone. The criteria involve 10 crack cycles from a fully closed crack to an open crack (width = 0.031 in. [0.8 mm]) with a sustained tension load of 40% Nu,m.
SCOPE OF DEVELOPED CRACK PROTOCOLWhile the aforementioned protocols individually cover
many aspects critical for assessing the component’s (anchorage or other) behavior during an earthquake, no test method combines all elements consistently and comprehen-sively using a modern understanding of seismic demand and response of systems. The cyclic crack protocol devel-oped in this work, while informed from the aforementioned protocols, both implements and contrasts the prior work as follows:• Earthquake demand is highly uncertain. For this reason,
seismic hazard analysis in practice has moved toward a
Fig. 1—Existing seismic tension load protocols relevant to anchorage: (a) CSA-N287.22; (b) SEAOSC3; (c) ACI 355.2-075; and (d) Hoehler.6

ACI Structural Journal/May-June 2013 393
probabilistic assessment of demand via the use of prob-abilistic seismic hazard analysis (PSHA) methods. This should be reflected in the development of any seismic testing protocol. Therefore, in this work, the selection of a large suite of realistic ground motions is guided by PSHA. This contrasts prior work, such as that of Tang and Deans,8 which led to the CSA-N287.22 standards, where artificial motions were used.
• Structures located in seismic regions are often designed to respond nonlinearly during an earthquake. Nonlinear structural response should therefore be considered in the protocol. This strategy is consistent with the work of CUREE, for example.
• Anchors used in buildings or other structures provide restraint for anchored components (structural and nonstructural). The response of these components to seismic loading is largely dictated by the building dynamic characteristics—that is, the building may filter the input motion to the anchorage system. Real-istic input histories to the anchorage must therefore be considered in a protocol developed for seismic testing of anchorage.
• Load and crack cycling protocols should have stepped amplitudes with weighting that realistically reflect earthquake and building response characteristics. Earthquake input motions are asymmetric and contain varying amplitudes and, as a result, so do the responses of a building and its anchored components. Absent of the consideration of the building and its nonlinear response history, this protocol could not have been previously possible. To statistically capture this, in a similar fashion with the CUREE work, rainflow counting is performed on the nonlinear history response of the building. Subsequently, similar to both CUREE and ACI 355.2-07,5 these are ordered in stepwise ampli-tude bins.
• The proposed cyclic crack protocol adopts application of crack cycling using increasing amplitude bins—unlike ACI 355.2-07,5 for example—in an effort to focus on concrete breakout rather than fatigue behavior failure modes. This increasing amplitude fashion of the protocol mimics the general trend of seismic responses, where lesser-amplitude cycles occur prior to the largest amplitudes. It should also be mentioned that counting cycles post-peak (largest amplitudes) allows for a conservative estimate of all of the cycles experienced in a realistic seismic event. Furthermore, the application of ordering into stepwise bins contrasts the work by DIBt4 and Hoehler6 which, rather randomly, select and specify 10 crack cycles.
Seismic hazardSite selection and selection of ground motions—The site
selected for this study is located within a densely populated region of Southern California within the Los Angeles basin (34.10° N, 117.86° W). The site was selected due to its high rate of seismic activity and proximity to a number of known fault zones. The site class was selected as C (dense soil), as defined by ASCE 7-05.11 Using the updated online National Seismic Hazard Maps,12 the spectral accelerations in the vicinity of the site at short periods (Ss) and at a period of 1 second (S1) were conservatively estimated as 2.01 g and 0.61 g, respectively. Using procedures of ASCE 7-05,11 a target design acceleration response spectrum was generated
considering a return period of 475 years corresponding approximately to a design-level event.
A PSHA of the site was undertaken to estimate the magnitude and source-to-site distance (M, R) bins associ-ated with a seismic hazard with a probability of exceedance of 10% in 50 years. The hazard analysis was conducted using the United States Geological Survey (USGS) PSHA tools,13 which are based on the 2002 edition of the National Seismic Hazards Mapping Project models.12 The binning intervals were selected as 6.2 miles (10 km) for distance and 0.25 for the event magnitude based on engineering judg-ment. The deaggregation indicates that 98% of the hazard is associated with sources within 12.4 miles (20 km) or less, and approximately 60% of the hazard is associated with sources within 6.2 miles (10 km) of the site.
The hazard deaggregation is used to guide the selec-tion of ground motion records, which will subsequently be scaled to represent the design spectrum. The selection and scaling of ground motions is a broad and currently debated topic. However, based on the recommendations of ASCE 7-05,11 Bommer and Acevedo,14 Bommer et al.,15 and similarly done in Haselton’s16 Group I from the FEMA P695 (ATC-63) project, the ground motion records are selected to conform to the following requirements:• Strong motion records are selected such that they are
compatible with the tectonic regime anticipated at the site and of similar anticipated source mechanisms (that is, strike-slip, reverse, or normal).
• Magnitude-distance (M, R) pairs of the selected records are compatible with results of the deaggregation analysis from the PSHA for the site of interest. With regard to magnitude selection, records were sought with magni-tudes within 0.2 units of the target magnitude, as the dependency on seismological characteristics and its site-specific record selection is not as critical when undertaking nonlinear analysis.17
• The selected ground motion records are compatible with the soil characteristics of the site of interest (namely Site Class C, with a shear wave velocity in the upper 100 ft [30 m] ranging from 1200 to 2500 ft/s [360 to 760 m/s]). Records at soft soil sites were excluded.
• Ground motion records were obtained from strong motion instruments installed in the free field.
To obtain meaningful statistical results, a suite of 21 strong motion records with the aforementioned characteristics were selected and are shown in Table 1 as obtained from the PEER-NGA strong motion database.18 The magnitudes and distance pairs of the selected ground motions repre-sent 94% of the deaggregated contributions with ground motions of PGA > 0.51 g, where PGA denotes peak ground acceleration. The source fault mechanisms of the selected records were diverse, including strike-slip, reverse, and reverse-oblique types as anticipated at the site of interest. Of the selected motions, 11 were from the United States and Canada, two were from Italy and Japan, and one each were from Taiwan, Uzbekistan, Iran, Mexico, and El Salvador. Additional details on the selected ground motions can be found in Wood et al.19
Ground motion scaling—For each of the ground motion records, only amplitude scaling was performed (that is, frequency was not scaled) and it was deemed appropriate to minimize the scaling factor needed to modify a selected record to meet the design spectrum. For this work, the motions were selected such that their scale factor did not

394 ACI Structural Journal/May-June 2013
exceed a value of 3 in an effort to limit the unknown impact that large-scale factors might have on the natural character-istics of real earthquake motions. The motions were scaled to achieve the target design spectrum using the Geometric Mean Method implemented by Huang et al.20 and first proposed by Somerville et al.21 In this approach, the ground motion scale factor is selected to minimize the sum of the squared errors between the design (target) spectral accelera-tion and spectral acceleration ordinate of the selected record over a given period range. The benefit of this approach is that scaling is performed across a defined period range, which can be broad. This feature is important because there
is a range of components and systems with, correspondingly, a large range of fundamental periods of interest. The scale factor a for an individual record is determined as follows
1
21
n ti i i
ni i
y ya
y=
=
∑=∑
(1)
where yi is the spectral acceleration at period i; and yit is
the target design spectral acceleration at period i through n number of periods considered. In this work, a period range encapsulating the period of the buildings is consid-ered—namely, 0 to 4 seconds—with a period increment of 0.02 seconds. The average scale factor for the 21 records is 1.45, with a minimum of 0.55 and a maximum of 2.68. Figure 2 displays the elastic 5% damped pseudo-spectral acceleration for scaled motions. The design hazard accelera-tion spectrum and average are also shown for comparison.
Parametric building spaceFive concrete special moment-resisting frame (SMRF)
buildings of two, four, eight, 12, and 20 stories and two dual lateral load-resisting systems of four and eight stories were selected for this study. The two dual lateral load-resisting systems consisted of concrete ordinary moment-resisting frames (OMRFs) coupled with a structural concrete shear wall. The suite of buildings is intended to nominally represent typical building stock used in low-to-high-rise construction in the United States within regions of high seis-micity, as these represent the most critical seismic design cases. The buildings within this study had the same foot-
Table 1—Selected ground motion details
Event Date Location Focal mechanism Magnitude, Mw Closest distance, miles Scale factor
Baja California 5/2/87 Mexicali, Mexico Strike-slip 5.50 2.29 0.78
Cape Mendocino 4/25/92 Cape Mendocino, CA Reverse 7.01 8.90 1.36
Cape Mendocino 4/25/92 Cape Mendocino, CA Reverse 7.01 5.28 1.45
Chi Chi 9/25/99 Taichung City, Taiwan Reverse 6.30 7.16 1.89
Friuli 11/12/99 Fruili, Italy Reverse 6.50 9.83 1.82
Gazli 5/17/76 Gazli, Russia Reverse 6.80 3.39 1.03
Irpinia 11/23/80 Irpinia, Italy Normal 6.90 10.96 2.68
Kobe 1/16/95 Kobe, Japan Strike-slip 6.90 4.40 1.17
Kobe 1/16/95 Nishi-Akashi, Japan Strike-slip 6.90 4.40 0.91
Landers 6/28/92 Lucerne, CA Strike-slip 7.28 1.36 1.82
Loma Prieta 10/18/89 San Jose, CA Reverse-oblique 6.93 9.13 2.06
Loma Prieta 10/18/89 Saratoga, CA Reverse-oblique 6.93 5.78 1.23
Morgan Hill 4/24/84 Morgan Hill, CA Strike-slip 6.19 6.13 1.38
Nahanni 12/23/85 Nahanni, Canada Reverse 6.76 3.06 2.37
Northridge 1/17/94 Castaic, CA Reverse 6.69 12.87 0.97
Northridge 1/17/94 Los Angeles, CA Reverse 6.69 13.97 1.57
San Fernando 2/9/71 Castaic, CA Reverse 6.61 14.06 2.27
San Salvador 10/10/86 San Salvador, El Salvador Strike-slip 5.80 4.34 1.16
Superstition 11/24/87 Superstition Mountain, CA Strike-slip 6.54 3.49 0.87
Tabas 6/28/91 Tabas, Iran Reverse 7.35 1.27 0.55
Victoria 6/9/80 Mexicali, Mexico Strike-slip 6.33 8.93 1.19
Note: 1 mile = 1.609 km.
Fig. 2—Elastic 5% damped pseudo-spectral acceleration for scaled motions (individual motions are shown in gray).

ACI Structural Journal/May-June 2013 395
print of 150 x 120 ft (45.7 x 36.6 m) with five bays in each direction. The building dimensions were chosen to have a longitudinal bay width of 30 ft (9.1 m), transverse bay width of 24 ft (7.3 m), and story height of 12 ft (3.7 m).
Design and analysis were conducted for the longitudinal direction of each prototype building. For the SMRF build-ings, only a single bay was analyzed, whereas for the dual systems, the full 150 ft (45.7 m) longitudinal length with multiple bays was analyzed. A floor live load of 50 lb/ft2 (2.4 kPa) was assumed, which is code-compliant for an office building.22 The dead load included a superimposed load of 20 lb/ft2 (0.9 kPa) in addition to the self-weight of the members and a 10 in. (250 mm) thick two-way floor slab. Conventional reinforced concrete was used for the design with a 28-day unconfined compressive strength of 5 ksi (34 MPa) for the beams and structural walls and between 5 and 10 ksi (34 and 68 MPa) for the columns. Grade 60 reinforcing steel with a design yield tensile strength of 60 ksi (413 MPa) was used throughout.
The design was carried out in accordance with IBC22 and ACI 318-08.23 The ASCE 7-0511 design code provided esti-mates of the base shear, response modification factor, code-based period estimates, and lateral force distribution. ACI 318-0823 was used for the general concrete design and detailing (Chapter 21). In the frame designs, the strong-column/weak-beam philosophy was adopted—that is, the sum of the moment capacity at the columns was designed to be at least 20% greater than the sum of the moment capacity at the beams. The final SRMF building designs are presented in Table 2 and Fig. 3. The longitudinal reinforcement ratio rl was calculated for a tension area of reinforcement over the gross concrete area for the beams. The range of longitudinal
reinforcing steel ratios rl for the columns and beams was 1.1 to 2.7%.
The layout for the prototypical dual frame-wall systems for each of the four- and eight-story buildings is shown in Fig. 4. Note that rigid links were provided between the wall and OMRF to transfer loads to the lateral-load-resisting walls and that the structural shear walls were placed symmetric about the cross section to reduce any torsional
Table 2—SMRF building design summary
Memberb, in.
h, in.
fc′, ksi
Longitudinal reinforcement
rl, % Confinement
2st-beam 24 28 5 9 No. 9 1.28 No. 5 at 6.0 in.
2st-column 30 30 5 20 No. 9 2.22 No. 5 at 5.5 in.
4st-beam 26 30 5 10 No. 9 1.28 No. 5 at 6.0 in.
4st-column 30 30 5 24 No. 9 2.67 No. 5 at 5.5 in.
8st-beam1 30 30 5 12 No. 9 1.34 No. 5 at 5.5 in.
8st-beam2 26 30 5 10 No. 9 1.28 No. 5 at 6.0 in.
8st-column 32 32 6 20 No. 10 2.67 No. 5 at 4.0 in.
12st-beam1 30 30 5 12 No. 9 1.34 No. 5 at 5.5 in.
12st-beam2 28 30 5 11 No. 9 1.10 No. 5 at 5.5 in.
12st-beam3 24 28 5 9 No. 9 1.28 No. 5 at 6.0 in.
12st-column1 32 32 8 20 No. 10 2.48 No. 5 at 3.0 in.
12st-column2 32 32 8 16 No. 10 1.98 No. 5 at 3.0 in.
20st-beam1 32 32 5 13 No. 9 1.27 No. 5 at 5.0 in.
20st-beam2 30 30 5 12 No. 9 1.34 No. 5 at 5.5 in.
20st-beam3 24 28 5 9 No. 9 1.28 No. 5 at 6.0 in.
20st-column1 36 36 10 24 No. 10 2.35 No. 5 at 3.0 in.
20st-column2 34 34 10 20 No. 10 2.20 No. 5 at 3.0 in.
20st-column3 32 32 10 16 No. 10 1.98 No. 5 at 3.0 in.
Notes: 1 in. = 25.4 mm; 1 ksi = 6.895 MPa; No. 9 soft converted to No. 29M, No. 10 to No. 32M, and No. 5 to No. 16M.
Fig. 3—SMRF building designs (note: base of model and column bottom are fixed).
Fig. 4—Elevation view of dual frame-wall buildings (in feet): (a) four-story building; and (b) eight-story building. (Note: 1 ft = 0.3048 m.)

396 ACI Structural Journal/May-June 2013
effects. Design codes22 specify a minimum base shear of 25% be resisted by the OMRFs when a dual lateral-load-resisting system is used. However, it was also desirable to maintain compatibility of stiffness between the frames and wall. This resulted in 30% of the base shear proportioned to the OMRFs. The OMRFs were controlled by gravity and not seismic loads; therefore, the same beam design as for the two-story SMRF building was used. The design of the lowest-story structural shear walls is shown in Fig. 5. Additional details on the building designs can be found in Wood et al.19
Dynamic characteristics of prototypical buildingsAn eigenvalue analysis was carried out for all building
models to determine their dynamic characteristics (Table 3). The range of fundamental building periods is 0.24 seconds for the two-story SMRF to 2.07 seconds for the 20-story SMRF. In comparison to the SMRF systems, the dual systems are stiffer due to the presence of the shear wall, as one may anticipate. In addition to determining the periods, the mass participation was estimated. The first modal mass participation estimates range from 69% in the eight-story dual frame to 85% in the two-story SMRF. Mass participa-tion estimates in the higher modes are significant, with 18%, 7%, and 0.3% maximums for the eight-story dual frame
in the second, third, and fourth modes, respectively, high-lighting the significance of the higher mode participation.
Nonlinear static pushover analyses were conducted on each of the building models to assess their global capaci-ties. The shape of the lateral force distribution used for the pushover was a normalized curve accounting for 100% of the fundamental mode and 20% of the second mode. This lateral load distribution was implemented to account nomi-nally for higher mode effects. The nonlinear static pushover analysis provided an estimation of the force-deformation characteristics of the buildings in the linear and nonlinear range (Fig. 6).
Nonlinear time history analysis results—Nonlinear time history analyses were conducted in OpenSees24 using Newmark’s method in the solution strategy. Constant average acceleration was considered per iteration step by defining γ and β as 0.5 and 0.25, respectively, to solve the nonlinear equilibrium equation. In the transient analysis, the Newton Line Search algorithm was used with a radius of 0.8. The displacement tolerance was set as 10–8 for each incre-ment. In the solution of the dual-frame systems, to assure numerical stability, the additional integrators of the Hilbert-Hughes-Taylor Method (HHT) and Krylov Newton algo-rithms were used when needed.
In what follows, nonlinear time history results are presented in terms of acceleration and curvature responses. The acceleration time histories of the models provide an understanding of how the building filters the ground exci-tation and the distribution of acceleration throughout the building floors, while the curvature time histories provide the ability to determine how the yielding mechanisms are developed in the buildings as nonlinearity progresses. The curvature time histories were used to develop the crack cycling protocol for anchored components.
Maximum floor level accelerations—Using acceleration time histories, it is instructive to evaluate the correlation between maximum input acceleration of the motions and maximum floor level acceleration. This comparison is often termed the uncorrelated acceleration amplification ratio
( )maxPGA
ii
uΩ =
(2)
where üi is the acceleration response of floor level i; and PGA is the peak ground acceleration. This relationship is uncorre-lated in the sense that the maximum floor level acceleration may not necessarily occur simultaneously with the PGA. The average uncorrelated acceleration amplification ratio distri-
Fig. 5—Dual-system structural shear wall detailing for lowest stories of: (a) four-story building (rl = 1.74%); and (b) eight-story building (rl = 1.74%). Units are provided in inches and reinforcing bars are converted to their corre-sponding soft metric sizes. (Note: 1 in. = 25.4 mm.)
Table 3—Dynamic characteristics and properties of numerical building models
Building
First mode Second mode Third mode Fourth modeYield drift
γy, %Yield acceleration
cy, gT, seconds MP, % T, seconds MP, % T, seconds MP, % T, seconds MP, %
2 SMRF 0.24 84.5 0.06 15.5 — — — — 0.37 1.39
4 SMRF 0.47 80.4 0.13 12.7 0.07 5.2 0.04 1.7 0.44 0.85
8 SMRF 0.89 76.8 0.29 12.2 0.15 4.1 0.10 2.7 0.43 0.39
12 SMRF 1.33 75.3 0.45 11.4 0.24 4.6 0.16 2.3 0.45 0.23
20 SMRF 2.07 72.8 0.71 12.1 0.39 4.1 0.26 2.5 0.45 0.14
4 dual system 0.43 74.8 0.10 18.0 0.05 7.0 0.05 0.3 0.65 0.85
8 dual system 0.78 68.8 0.17 17.6 0.07 6.8 0.05 3.7 0.65 0.45

ACI Structural Journal/May-June 2013 397
butions are shown in Fig. 7 for all records and compared with the corresponding expected code-based11 values. As shown in Fig. 7, the eight-, 12-, and 20-story SMRF struc-tures demonstrate the significant influence of higher modes. As a result of these higher mode effects, the prescribed code values underestimated the acceleration amplifica-tion in the lowermost floors for the taller buildings while overestimating amplifications in the uppermost floors. The first-mode-dominated building responses of the two- and four-story SMRFs and the two dual systems are reasonably estimated by the prescribed codified acceleration demands, with an improved comparison with the acceleration amplifi-cation (linear distribution) suggested in ASCE 7-05.11
Curvature histories—Modeling within OpenSees24 allows for the extraction of the curvature time history response at beam and column end regions. The curvature time histo-ries are vital to determine the extent of building plasticity and, subsequently, for the development of the crack cycling protocol. The curvatures presented in this section are extracted from the beam ends. In examining the end-point curvature, two sample records, Chi Chi and Northridge #1, are displayed for the eight-story SMRF building model in Fig. 8. As one examines the two records, it may be noted that the maximum curvature values generally occur in the lower stories, as would be expected. The maximum absolute curvature values obtained are also influenced by the beam cross-sectional geometry. As a result of the change in beam geometry and reduced loads, the maximum curvature values in the upper four stories are much smaller than the curvature values in the lower four stories.
Application of curvature histories—The goal of this portion of the investigation is to develop protocols for crack opening and closing in reinforced concrete members from the investigated buildings and ground motion suite for use in investigations of anchor behavior under a cyclic crack protocol. To achieve this, curvature histories from the beams just outside of the plastic hinge zone are extracted and directly correlated to member crack widths. The curvature values are obtained just outside of the plastic hinge zones in recognition of the fact that anchorage design provisions do not apply in the seismic critical plastic hinge regions. Outside of the plastic hinge zone, the member remains linear elastic; therefore, the relationship between curvature and strain is linear. Rainflow counting is then used to count and bin the curvature histories and develop a series of stepped amplitude cycles. The rainflow cycles for each member location are combined to develop crack protocols represen-tative of the building space in this study. In what follows, the methodology is presented along with the statistics associated with its development.
PROTOCOL METHODOLOGYThe methodology used to develop the crack cycling
protocol is illustrated in Fig. 9. Key parameters include the curvature time histories, rainflow counting, combination rules, and final synthesis of the protocol. The use of curva-ture time histories is sought because with sectional analysis of each beam cross section, the strain in the reinforcing steel could be obtained from the curvature. For the purpose of cycle counting of crack widths, one obtains identical results by counting the curvature reversals directly due to the linear relationship between curvature and crack width.
Considering the seven buildings, two beam ends per frame bay, and 21 ground motions, a total of 2436 curva-
Fig. 6—Pushover response of building models.
Fig. 7—Uncorrelated acceleration amplification ratio distri-bution for eight-story SMRF for all records.
Fig. 8—Curvature time history for eight-story SMRF example: (a) Chi Chi; and (b) Northridge #1. Curvature time histories shown for floors (top to bottom): roof, sixth, fourth, and second along with input acceleration (g). (Note: 1 in. = 25.4 mm.)

398 ACI Structural Journal/May-June 2013
ture time history results were evaluated. For the dual-system buildings, only the two beam ends nearest to the structural shear wall were considered. Motions used are scaled to the 475-year return period hazard. Curvature time histories are summarized using the rainflow counting algorithm into a series of binned constant-amplitude cycles (units of 1/length) and associated counts. In fatigue analysis, a widely used method to reduce complex irregular loading histories to a series of constant (stepped) amplitude cycles is the Rainflow Counting Method,25 using the Matlab functions developed by Nieslony.26 In counting cycles, the entire (pre- and post-peak) curvature cycles are counted for two reasons: 1) to capture the building “ring out” associated with continued oscillation of taller structures; and 2) for the protocol to be used for anchor qualification should the anchor survive the entire earthquake, including the post-peak cycles.
Initially, 20 equally spaced bins are created by the rainflow counting algorithm. The constant series of amplitudes and asso-ciated cycle counts are then combined on a per-building basis. All curvature time histories associated with each building are used to develop a weighted building combination—namely, both sides of each beam for all 21 ground motions. A 10% cutoff is imposed for reduction of noise and low-amplitude cycles. This limit is based on two practical considerations. First, measurements of crack widths below 0.002 in. (0.05 mm) are not feasible with typical crack measurement equipment. Thus, a protocol with crack cycles at these very small widths is not practical. Second, if one compares the cracking to the yield moment for the various beams, the average is found to be 12%, ranging from 9 to 13% for all but the two-story building beams. The two-story beam is governed by service-load deflection and thus its design varied significantly (23%). As will be described later, the final protocol is scaled to the yield curvature (crack width associated with yield); therefore, theoretically, the cycles associated with first surface cracking are captured. As a result, the Mcr/My ratios provide additional justification for application of a 10% cutoff.
After consideration of the cutoff, weighted combinations per building are constructed. The weights associated with the combinations per building are determined as follows: 1) a weight of 1.0 is assigned to a cycle count greater than zero; and 2) if a cycle count is zero, a weight factor of zero is applied. The weighted combinations per building for the seven buildings are shown in Fig. 10 and Table 4. These data indicate a range in mean total cycle count from 31 to 62 for the seven buildings considered at the mean level. Consid-
Fig. 9—Crack protocol methodology.
Fig. 10—Building-specific details and resulting overall crack protocol.
Table 4—Cycle count on per-building basis: mean (standard deviation) number of cycles per amplitude and resulting overall crack protocol
Amplitude 20 SMRF 12 SMRF 8 SMRF 4 SMRF 2 SMRF 8 Dual System 4 Dual System Average
0.1 6 (3.6) 8 (4.8) 8 (4.6) 10 (7.0) 20 (11.8) 7 (3.9) 10 (5.7) 10
0.2 5 (2.7) 5 (3.1) 5 (3.1) 7 (4.6) 11 (6.6) 6 (3.2) 8 (5.0) 7
0.3 3 (1.8) 4 (2.1) 4 (2.4) 5 (3.3) 7 (3.9) 4 (2.4) 6 (3.4) 5
0.4 3 (1.4) 3 (1.6) 3 (1.9) 4 (2.4) 5 (3.2) 3 (1.7) 4 (2.3) 4
0.5 3(1.1) 3 (1.3) 3 (1.6) 4 (2.1) 4 (2.1) 3 (1.7) 4 (2.5) 3
0.6 3 (1.1) 3 (1.2) 3 (1.4) 3 (1.8) 3 (1.5) 3 (1.2) 3 (1.4) 3
0.7 2 (0.9) 2 (0.9) 2 (0.8) 3 (1.7) 3 (1.4) 2 (0.9) 3 (1.0) 2
0.8 2 (0.8) 2 (0.7) 2 (1.0) 3 (1.2) 3 (1.1) 2 (0.4) 2 (0.7) 2
0.9 2 (0.8) 2 (1.0) 2 (0.8) 3 (1.0) 3 (1.0) 2 (0.0) 2 (0.5) 2
1.0 2 (0.0) 2 (0.8) 2 (1.2) 3 (1.7) 3 (0.0) 2 (0.0) 3 (0.4) 2
Sum 31 34 34 45 62 34 45 40

ACI Structural Journal/May-June 2013 399
ering one standard deviation above the mean, the total range of cycle counts increases from 45 to 93. At this point in the analysis, the cycle counts are not rounded to preserve their true contribution to the final protocol. One may observe that the larger overall cycle counts are more prevalent in the shorter structures.
Using each of the seven combinations per building, an overall average representative of the building space is constructed. Because all of the combinations per buildings are developed for an amplitude range of 0.10 to 1.0, in steps of 0.05, the data are first rebinned to be consistent with an amplitude step of 0.10 for the final overall building average. This overall average is then the resulting crack protocol shown in Table 5.
Statistical analysisStatistical analysis of the cycle count data is performed
to provide a sense of the numerical range. Namely, four statistical levels of this protocol are developed: 1) the mean plus one standard deviation; 2) the mean plus 1.28 times the standard deviation; 3) the mean plus 1.65 times the standard deviation; and 4) the mean plus two standard deviations. Additional crack cycling protocols are statistically represen-tative of the 68% confidence interval, the 80% confidence interval (representative of the 90th percent fractile), the 90% confidence interval (representative of the 95th percent frac-tile), and the 95% confidence interval, respectively. Note that the statistics are extracted on a per-building basis—that is, with the combinations per building calculations—and the standard deviations associated with these combinations are also calculated (Table 4). Table 5 shows the resulting crack protocols considering various levels of the standard devia-tion. Considering the broad range of statistics (up to 95% of the data), the total cycle count more than doubles (40 versus 85) at the mean plus two standard deviations.
DISCUSSIONProtocol scaling and empirical crack widths
While the crack cycling protocols are presented in a normalized fashion to implement the protocol, an analyst must determine the actual maximum crack width to scale the protocol. Consequently, the yield crack widths of the beams within the building parametric space are deter-mined for reference using the empirical relationship devel-oped by Gergely and Lutz.27 Gergely and Lutz27 developed their relationship through experimental testing and the empirical equation presented is valid only for when the reinforcing steel remains below its yield strain. The Gergely and Lutz27 expression was also simplified and specified as Eq. (10-5) in ACI 350R-8928 (Eq. (3) to (4))
Aeff = 2b(h – dx) (3)
13
2
1
0.076 effmax s c
Ahw d
h m
= s
(4)
where Aeff is the concrete area surrounding reinforcement of effective depth; b is the width of the member; dc is the distance from the tension face to the extreme tension rein-forcement centroid; dx is the effective depth of the tension reinforcement; h is the height of the member; h1 is the
distance from the compression face to the centroid of the tension reinforcement; h2 is the distance from the tension face to the neutral axis; m is the number of reinforcement bars in tension; and ss is the stress in the reinforcing bar. Using this relationship, the yield crack widths for the buildings investi-gated are determined to have a range of 0.0154 to 0.0165 in. (0.39 to 0.42 mm). This analysis—particularly compared with maximum crack width wmax—provides insight regarding the practical implementation of the crack protocol.
Application of protocol to anchorage testingIt is envisioned that the proposed cyclic crack protocol
will support future testing of anchorage for both: 1) basic scientific performance assessment; and 2) anchorage prequalification. In either case, an experimentalist will require a definition of the load level and characteristics of load application to the anchor, which would be applied in parallel with the cyclic crack protocol. In the context of prequalification testing, passing criteria for performance limit states will also need to be defined. Considering first the definition of a suitable load onto the anchor, this will be dictated by the anchors’ expected load history under seismic demands. The authors are aware of ongoing studies into this issue; however, concrete proposals in the context of prequal-ification testing are not yet available. For the moment, one may envision a constant load level applied during either one or multiple phases of the cyclic crack history, the amplitude of which may depend on the target performance limit state of interest.
Considering the definition of performance limit states, one may consider two scenarios: 1) serviceability displacement demands; and 2) suitability peak/residual loads. Achieving the former ensures that the anchorage will remain in service at a defined “limit” displacement, and achieving the latter ensures that the anchor will still carry its intended load and remain suitable at an ultimate state. What remains, then, is the selection of statistics associated with achieving these performance limits. For example, one may assume that serviceability constraints on the anchorage are represented by the mean response (that is, on average, the anchor will remain within serviceability displacement limits) with a maximum crack width wmax = 0.02 in. (0.5 mm), while the suitability is characterized by the 80% confidence interval (90th percent fractile) and a maximum crack width wmax =
Table 5—Crack count statistical variation considering overall building average
Amplitude m m + s m + 1.28s m + 1.65s m + 2.0s
0.1 10 16 17 20 22
0.2 7 11 12 13 15
0.3 5 7 8 9 10
0.4 4 6 6 7 8
0.5 3 5 5 6 7
0.6 3 4 5 5 6
0.7 2 4 4 4 5
0.8 2 3 3 4 4
0.9 2 3 3 4 4
1.0 2 3 3 4 4
Sum 40 62 66 76 85

400 ACI Structural Journal/May-June 2013
0.031 in. (0.8 mm). It should be mentioned that the selection of the maximum crack widths must be made with special care and represent the anticipated state of the concrete under the target performance levels. In this example, values of 0.02 and 0.031 in. (0.5 and 0.8 mm) are used for achieving serviceability and suitability, respectively. Using these two assessment levels, the ability to perform one experiment to assess both simultaneously is ideal. To do this, the mean response is rebinned to five bins (0.004 to 0.02 in. [0.1 to 0.5 mm]) to correspond with a rebinned 80% confidence interval in eight bins from 0.004 to 0.031 in. (0.1 to 0.8 mm). The overlay of the two assessment criteria and a unified protocol are shown in Fig. 11. The unified protocol is devel-oped by comparing the two assessment levels and applying Miner’s Rule29 to account for the cycle count differences in the lower amplitudes associated with the suitability assess-ment level.
CONCLUSIONSBased on the numerical procedure outlined herein, this
work resulted in the following:1. A cyclic crack (crack opening and closing) protocol
for anchored components and systems with increasing amplitude crack widths, the statistics of which are derived from nonlinear time history analyses of a suite of buildings subjected to a range of earthquake motions. The earthquake motion selection is guided by PSHA and deaggregation.
2. The cyclic crack protocol is presented in terms of the average response; however, statistical variations considering the 68, 80, 90, and 95% confidence intervals are calculated to demonstrate the crack cycles’ numerical range.
3. Yield crack widths for the beams used in the numerical study are presented to provide insight regarding practical implementation of the crack protocol.
4. An application of the cyclic crack protocol is presented in the context of anchorage testing and specifically toward development of prequalification test procedures. It is envi-sioned that, at a minimum, a pair of performance states—denoted herein as serviceability and suitability—would be desired from such a test procedure and, as such, a unification of statistics to render the cyclic crack history associated with these states is presented. To completely assess the anchor’s performance, however, requirements for load characteris-
tics and “passing” criteria are needed. This is the subject of ongoing work of the authors and others.
ACKNOWLEDGMENTSThis project was supported by the Hilti Corporation. Helpful sugges-
tions of project team and oversight committee members are appreciated. Project team members include R. Dowell, R. Eligehausen, P. Mahrenholtz, C. Mahrenholtz, D. Watkins, and J. Smith. Oversight committee members include M. Hoehler, U. Bourgund, R. Hüttenberger, J. Silva of Hilti, and F. Seible of the University of California, San Diego. Review and comments of this work by A. Filiatrault, H. Krawinkler, R. Retamales, and R. Bachman are appreciated. The opinions, findings, and conclusions expressed in this paper are those of the authors and do not necessarily reflect those of the sponsoring organization.
REFERENCES1. Krawinkler, H.; Parisi, F.; Ibarra, L.; Ayoub, A.; and Medina, R.,
“Development of a Testing Protocol for Wood Frame Structures,” Report No. W-02, CUREE, Richmond, CA, 2000, 93 pp.
2. CSA-N287.2, “Material Requirements for Concrete Containment Structures for CANDU Nuclear Power Plants (Reaffirmed 2003),” Cana-dian Standards Association, Toronto, ON, Canada, 2003, 63 pp.
3. Structural Engineers Association of Southern California, “Standard Method of Cyclic Load Test for Anchors in Concrete or Grouted Masonry,” SEAOSC, Whittier, CA, 1997, 6 pp.
4. Deutsches Institut für Bautechnik, “Verwendung von Dübeln in Kernkraftwerken und Kerntechnischen Anlagen, Leitfaden zur Beurteilung von Dübelbefestigungen bei der Erteilung von Zustimmungen im Einzelfall nach den Landesbauordnung der Bundesländer (Use of Anchors in Nuclear Power Plants and Nuclear Technology Installations, Guideline for Evalu-ating Fastenings for Granting Permission in Individual Cases According to the Regulations of the Federal States of Germany),” DIBt, Berlin, Germany, 1998, 14 pp. (in German)
5. ACI Committee 355, “Qualification of Post-Installed Mechanical Anchors in Concrete (ACI 355.2-07) and Commentary,” American Concrete Institute, Farmington Hills, MI, 2007, 34 pp.
6. Hoehler, M. S., “Behavior and Testing of Fastenings to Concrete for Use in Seismic Applications,” PhD dissertation, Universität Stuttgart, Stutt-gart, Germany, 2006, 261 pp.
7. Krawinkler, H., “Cyclic Loading Histories for Seismic Experimenta-tion on Structural Components,” Earthquake Spectra, V. 12, No. 1, 1996, pp. 1-12.
8. Tang, J. H. K., and Deans, J. J., “Test Criteria and Method for Seismic Qualification of Concrete Expansion Anchors,” Proceedings of the Fourth Canadian Conference on Earthquake Engineering, University of British Columbia, Vancouver, BC, Canada, 1983, pp. 58-69.
9. Malhotra, P. K., “Cyclic-Demand Spectrum,” Earthquake Engineering & Structural Dynamics, V. 31, No. 7, 2002, pp. 1441-1457.
10. Malhotra, P. K.; Senseny, P. E.; Braga, A. C.; and Allard, R. L., “Testing of Sprinkler-Pipe Seismic-Brace Components,” Earthquake Spectra, V. 19, No. 1, 2003, pp. 87-109.
11. ASCE 7-05, “Minimum Design Loads for Buildings and Other Struc-tures,” American Society of Civil Engineers, Reston, VA, 2006, 388 pp.
12. United States Geological Survey (USGS), “National Seismic Hazard Maps,” USGS, Reston, VA, 2008, http://gldims.cr.usgs.gov/nshmp2008.
13. United States Geological Survey (USGS), “Custom Mapping and Analysis Tools,” Reston, VA, 2009, http://earthquake.usgs.gov/research/hazmaps/interactive.
14. Bommer, J. J., and Acevedo, A. B., “The Use of Real Earthquake Accelerograms as Input to Dynamic Analysis,” Journal of Earthquake Engineering, V. 8, No. 1, 2004, pp. 43-91.
15. Bommer, J. J.; Douglas, J.; and Strasser, F. O., “Style-of-Faulting in Ground-Motion Prediction Equations,” Bulletin of Earthquake Engi-neering, V. 1, No. 2, 2003, pp. 171-203.
16. Haselton, C. B., ed., “Evaluation of Ground Motion Selection and Modification Methods: Predicting Median Interstory Drift Response of Buildings,” PEER Technical Report 2009/01, 2009, 288 pp.
17. Iervolino, I., and Cornell, C. A., “Record Selection for Nonlinear Seismic Analysis of Structures,” Earthquake Spectra, V. 21, No. 3, 2005, pp. 685-713.
18. PEER-NGA, “Pacific Earthquake Engineering Research Center: Next Generation Attenuation Database,” http://peer.berkeley.edu/nga.
19. Wood, R. L.; Hutchinson, T. C.; and Hoehler, M. S., “Cyclic Load and Crack Protocol for Anchored Nonstructural Components and Systems,” Structural Systems Research Program Report SSRP 2009/12, University of California, San Diego, La Jolla, CA, 2009, 229 pp.
Fig. 11—Crack protocol application for anchor testing. (Note: 1 mm = 0.0393 in.)

ACI Structural Journal/May-June 2013 401
20. Huang, Y. N.; Whittaker, A. S.; and Luco, N., “Performance Assess-ment of Conventional and Base-Isolated Nuclear Power Plants for Earth-quake and Blast Loadings,” MCEER Report 08-0019, Multidisciplinary Center for Earthquake Engineering Research, State University of New York at Buffalo, Buffalo, NY, July 2008, 396 pp.
21. Somerville, P.; Smith, N.; Punyamurthula, S.; and Sun, J., “Devel-opment of Ground Motion Time Histories for Phase 2 of the FEMA/SAC Steel Project,” Report SAC/BC-97/04, SAC Joint Venture, Sacramento, CA, 1997, 610 pp.
22. International Code Council (ICC), “International Building Code 2006,” Falls Church, VA, 2006, 666 pp.
23. ACI Committee 318, “Building Code Requirements for Structural Concrete (ACI 318-08) and Commentary,” American Concrete Institute, Farmington Hills, Michigan, 2008, 473 pp.
24. Mazzoni, S.; McKenna, F.; Scott, M. H.; and Fenves, G. L., Open System for Engineering Simulation User-Command-Language Manual,
version 2.0, Pacific Earthquake Engineering Research Center, University of California, Berkeley, Berkeley, CA, 2009, http://opensees.berkeley.edu.
25. ASTM E1049-85, “Cycle Counting in Fatigue Analysis,” ASTM International, West Conshohocken, PA, 1985, 13 pp.
26. Nieslony, A., “Rain Flow Counting Method,” MATLAB Math-works Central, Jan 2005, http://www.mathworks.com/matlabcentral/fileexchange/3026-rain-flow-counting-method.
27. Gergely, P., and Lutz, L. A., “Maximum Crack Width in Reinforced Concrete Flexural Members,” Cracking in Concrete, SP-20, American Concrete Institute, Farmington Hills, MI, 1968, pp. 87-117.
28. ACI Committee 350, “Environmental Engineering Concrete Struc-tures (ACI 350R-89),” American Concrete Institute, Farmington Hills, MI, 1997, 20 pp.
29. Miner, M. A., “Cumulative Damage in Fatigue,” Journal of Applied Mechanics, V. 12, 1945, pp. A159-A162.

ACI is now accepting color graphics and full-color photos for publication in the online versions (only) of the ACI Materials Journal and the ACI Structural Journal.
Increase the impact of your messages with vibrant, eye-catching color graphics and photos!
Refer to the Author Guidelines in Manuscript CentralRefer to the Author Guidelines in Manuscript Central at www.concrete.org/pubs/pubs_authorguidelines.htm for details.
POP!Make your art...
Color Your Online World
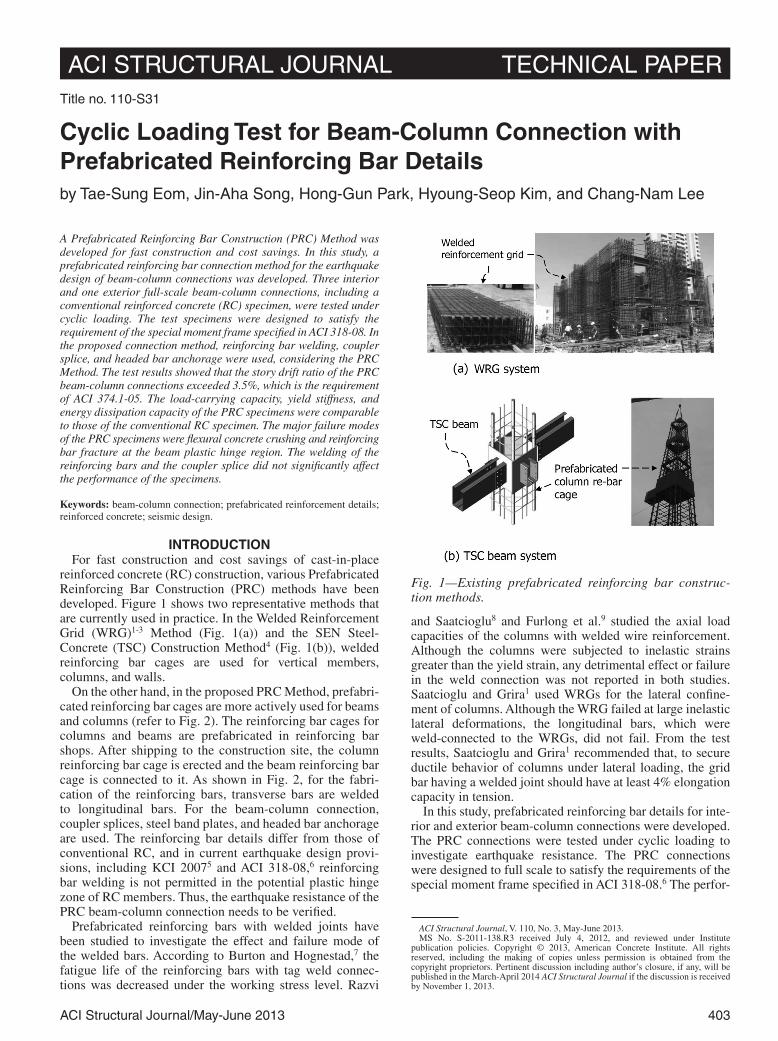
ACI Structural Journal/May-June 2013 403
Title no. 110-S31
ACI STRUCTURAL JOURNAL TECHNICAL PAPER
ACI Structural Journal, V. 110, No. 3, May-June 2013.MS No. S-2011-138.R3 received July 4, 2012, and reviewed under Institute
publication policies. Copyright © 2013, American Concrete Institute. All rights reserved, including the making of copies unless permission is obtained from the copyright proprietors. Pertinent discussion including author’s closure, if any, will be published in the March-April 2014 ACI Structural Journal if the discussion is received by November 1, 2013.
Cyclic Loading Test for Beam-Column Connection with Prefabricated Reinforcing Bar Detailsby Tae-Sung Eom, Jin-Aha Song, Hong-Gun Park, Hyoung-Seop Kim, and Chang-Nam Lee
A Prefabricated Reinforcing Bar Construction (PRC) Method was developed for fast construction and cost savings. In this study, a prefabricated reinforcing bar connection method for the earthquake design of beam-column connections was developed. Three interior and one exterior full-scale beam-column connections, including a conventional reinforced concrete (RC) specimen, were tested under cyclic loading. The test specimens were designed to satisfy the requirement of the special moment frame specified in ACI 318-08. In the proposed connection method, reinforcing bar welding, coupler splice, and headed bar anchorage were used, considering the PRC Method. The test results showed that the story drift ratio of the PRC beam-column connections exceeded 3.5%, which is the requirement of ACI 374.1-05. The load-carrying capacity, yield stiffness, and energy dissipation capacity of the PRC specimens were comparable to those of the conventional RC specimen. The major failure modes of the PRC specimens were flexural concrete crushing and reinforcing bar fracture at the beam plastic hinge region. The welding of the reinforcing bars and the coupler splice did not significantly affect the performance of the specimens.
Keywords: beam-column connection; prefabricated reinforcement details; reinforced concrete; seismic design.
INTRODUCTIONFor fast construction and cost savings of cast-in-place
reinforced concrete (RC) construction, various Prefabricated Reinforcing Bar Construction (PRC) methods have been developed. Figure 1 shows two representative methods that are currently used in practice. In the Welded Reinforcement Grid (WRG)1-3 Method (Fig. 1(a)) and the SEN Steel-Concrete (TSC) Construction Method4 (Fig. 1(b)), welded reinforcing bar cages are used for vertical members, columns, and walls.
On the other hand, in the proposed PRC Method, prefabri-cated reinforcing bar cages are more actively used for beams and columns (refer to Fig. 2). The reinforcing bar cages for columns and beams are prefabricated in reinforcing bar shops. After shipping to the construction site, the column reinforcing bar cage is erected and the beam reinforcing bar cage is connected to it. As shown in Fig. 2, for the fabri-cation of the reinforcing bars, transverse bars are welded to longitudinal bars. For the beam-column connection, coupler splices, steel band plates, and headed bar anchorage are used. The reinforcing bar details differ from those of conventional RC, and in current earthquake design provi-sions, including KCI 20075 and ACI 318-08,6 reinforcing bar welding is not permitted in the potential plastic hinge zone of RC members. Thus, the earthquake resistance of the PRC beam-column connection needs to be verified.
Prefabricated reinforcing bars with welded joints have been studied to investigate the effect and failure mode of the welded bars. According to Burton and Hognestad,7 the fatigue life of the reinforcing bars with tag weld connec-tions was decreased under the working stress level. Razvi
and Saatcioglu8 and Furlong et al.9 studied the axial load capacities of the columns with welded wire reinforcement. Although the columns were subjected to inelastic strains greater than the yield strain, any detrimental effect or failure in the weld connection was not reported in both studies. Saatcioglu and Grira1 used WRGs for the lateral confine-ment of columns. Although the WRG failed at large inelastic lateral deformations, the longitudinal bars, which were weld-connected to the WRGs, did not fail. From the test results, Saatcioglu and Grira1 recommended that, to secure ductile behavior of columns under lateral loading, the grid bar having a welded joint should have at least 4% elongation capacity in tension.
In this study, prefabricated reinforcing bar details for inte-rior and exterior beam-column connections were developed. The PRC connections were tested under cyclic loading to investigate earthquake resistance. The PRC connections were designed to full scale to satisfy the requirements of the special moment frame specified in ACI 318-08.6 The perfor-
Fig. 1—Existing prefabricated reinforcing bar construc-tion methods.

404 ACI Structural Journal/May-June 2013
Tae-Sung Eom is an Assistant Professor at Catholic University of Daegu, Daegu, South Korea. He received his BS, MS, and PhD in architectural engineering from Seoul National University, Seoul, South Korea. His research interests include numer-ical analysis and earthquake design of reinforced concrete structures.
Jin-Aha Song is a Graduate Student at Seoul National University. She received her BS in architectural engineering from Ewha Womans University, Seoul, South Korea. Her research interests include earthquake resistance of beam-column connections.
Hong-Gun Park is a Professor of architectural engineering at Seoul National University. He received his BS and MS in architectural engineering from Seoul National University and his PhD in civil engineering from the University of Texas, Austin, Austin, TX. His research interests include numerical analysis and earthquake design of reinforced concrete structures.
Hyoung-Seop Kim is a Project Manager at SEN Structural Engineers Co., Ltd., Seoul, South Korea. He received his BE and MS in architectural engineering from Incheon National University, Yeonsu-gu, South Korea, and Dankook University, Yongin, South Korea, respectively. His research interests include seismic control and design of buildings.
Chang-Nam Lee is a CEO and President of SEN Structural Engineers Co., Ltd. He received his BS and MS in architectural engineering from Seoul National University. His research interests include seismic retrofit design, structural safety monitoring, and structural safety inspection.
mance of the PRC connections—including load-carrying capacity, stiffness, deformation capacity, energy dissipation capacity, and failure mode—was evaluated on the basis of the requirements of ACI 374.1-05.10 In this test, axial load was not applied to columns. If axial load were applied to columns, the overall behavior of beam-column connections would be more realistic. However, this study focused on the effects of the proposed reinforcing bar details such as coupler splice, endplate anchorage, weld connection, and others on the overall earthquake resistance of beam-column connec-tions. The performance of such reinforcing bar details is not directly affected by the axial load of the columns.
PRFABRICATED REINFORCING BAR DETAILSFigure 2 shows the proposed PRC Method. The column
reinforcing bar cage is prefabricated by shop welding between the longitudinal reinforcing bars and transverse hoops. At the location of the beam-column joint, steel band plates with holes and U-grooves for the connection of beam reinforcing bars are welded to the column reinforcing bars. The holes are used to connect the reinforcing bars in the beam reinforcing bar cage, and the U-grooves are used to place additional beam reinforcing bars after assembling the column cage and the beam cage. The beam reinforcing bar cage is also prefabricated by shop welding and consists of top and bottom reinforcing bars (four longitudinal reinforcing bars), transverse hoops, and diagonal bars (Fig. 2(a)). The prefabricated beam reinforcing bar cage has a form of truss so that the beam reinforcing bar cage can resist full or partial construction load, including its self-weight.
As shown in Fig. 2(b), couplers are used to connect the beam cage reinforcing bars to the reinforcing bars in the joint. To prevent reinforcing bar slip in the beam-column joint, the couplers are tightened toward the steel band plate. Only four reinforcing bars in the beam cage are connected to the joint reinforcing bars via couplers. Figure 2(c) shows the assembly of the PRC moment frame. When the four reinforcing bars are not sufficient to resist the negative and positive moments of the beam, additional top and bottom reinforcing bars are placed in the beam reinforcing bar cage. Figure 2(d) shows the prefabricated reinforcing bar detail of an exterior beam-column connection. In the exterior beam-column joint, headed bars are used for the anchorage of the beam reinforcing bars.
Fig. 2—Proposed PRC Method.

ACI Structural Journal/May-June 2013 405
RESEARCH SIGNIFICANCEAs shown in Fig. 2, the proposed PRC Method uses
reinforcing bar welding, coupler splice, and headed bar anchorage, which differ from the reinforcing bar details for conventional RC structures. Therefore, the effects of the following aspects on the earthquake resistance of the proposed PRC beam-column connection should be verified:
1. The coupler splices for the top and bottom reinforcing bars of the beam are located at the column face that is the flexural critical section of the beam. Thus, large plastic strains are concentrated at the coupler splices, and this may cause premature tensile fracture of the couplers or the reinforcing bars.
2. In current design codes, reinforcing bar welding is not permitted in potential plastic hinge zones. Reinforcing bar welding used in the proposed PRC Method may cause tensile fracture in the reinforcing bars by developing residual stresses and microcracks due to welding heat and/or by making a change to the reinforcing bar section.
3. The coupler splices and the headed bars should prevent excessive reinforcing bar slip in the beam-column joint.
TEST PROGRAMFour full-scale beam-column connections, including
a conventional RC specimen, were tested under cyclic loading. Figure 3 shows the dimensions and details of the specimens. Table 1 presents the properties of the specimens. Specimens PRC1, PRC2, and RC (a conventional RC spec-imen) were cruciform specimens. Specimen PRC3 was a T-shaped specimen. All specimens were designed according to the strong-column/weak-beam concept. The spacing and number of lateral reinforcing bars in the column and beam, shear strength of the beam-column joint, and
ratio of the column depth to the reinforcing bar diameter (hc/db) satisfied the requirements for the special moment frame in ACI 318-08.6 The design details of the specimens are presented in the Appendix.*
Figure 3(a) shows the cruciform Specimen PRC1. The net height of the column and the net length of the beam were 2100 and 4760 mm (82.7 and 187 in.), respectively. The dimensions of the cross sections were 600 x 700 mm (23.6 x 27.6 in.) for the column and 400 x 500 mm (15.7 x 19.7 in.) for the beam. Six D29 (db = 29 mm [1.14 in.]) and four D22 (db = 22 mm [0.866 in.]) bars were used as the longitudinal reinforcing bars in the column. For transverse hoops, D16 (db = 16 mm [0.63 in.]) bars with 100 mm (3.94 in.) spacing were used. The hoops were welded to the longitudinal reinforcing bars by tack welding. As shown in Fig. 3(a), at the beam-column joint, the upper and lower band plates with holes and U-grooves were welded to the longitudinal column reinforcing bars. The size, location, and number of the holes and U-grooves are determined by those of the beam reinforcing bars passing through. Four D29 (r = 0.0149) and two D22 + one D25 (db = 25 mm [0.984 in.]) (r = 0.0073) were used as the top and bottom reinforcing bars of the beam, respectively. For the reinforcing bar connection at the beam-column joint, coupler splices were used for the two D29 and two D22 bars located at the four corners of the beam cross section (refer to Fig. 4). To minimize the number of coupler splices, the remaining two D29 bars and one D25 bar were placed through the U-grooves of the steel band plates without coupler splices after assembling the column and beam cages
*The Appendix is available at www.concrete.org in PDF format as an addendum to the published paper. It is also available in hard copy from ACI headquarters for a fee equal to the cost of reproduction plus handling at the time of the request.
Fig. 3—Dimensions and reinforcing bar details of test specimens. (Note: Dimensions in mm; 1 mm = 0.03937 in.)

406 ACI Structural Journal/May-June 2013
Figure 3(b) shows the reinforcing bar detail of the cruci-form Specimen PRC2. The configuration, dimensions, and reinforcement of the column were the same as those of PRC1. In PRC2, to avoid the shear damage and reinforcing bar slip that could occur at the beam-column joint, the beam-column joint was strengthened with four additional hooked reinforcing bars. By using the strengthening strategy, it was intended that plastic hinges of beams would develop away from the column face (refer to the Appendix). The top hooked reinforcing bars (two D29; 180-degree hook) and the bottom hooked reinforcing bars (two D22; 90-degree hook) were extended to 250 and 400 mm (9.84 and 15.7 in.) from the column face, respectively (refer to Fig. 3(b)), so that concrete damage was not concentrated at a location. The 180-degree hook was used for the top D29 bars because the beam depth did not accommodate the vertical bar length of the standard 90-degree hook (ACI 318-08,6 Section 12.5)—that is, 12 times the bar diameter extension. As shown in Fig. 3(b) and Table 1, two D29 + two D25 (r = 0.0133) and three D22 (r = 0.0066) bars were used for the top and bottom reinforcing bars in the beam, respectively. The reinforcing bar areas of PRC2 were less than those of PRC1. However, because the critical sections for the beam flexural moment were moved by 250 and 400 mm (9.84 and 15.7 in.) away from the column face, the load-carrying capacity of PRC2 was expected to be slightly greater than that of PRC1.
Figure 3(c) shows the T-shaped Specimen PRC3, which is an exterior beam-column connection. The net height of the column and the net length of the beam were 2100 and 2380 mm (82.7 and 93.7 in.), respectively. The dimensions of the cross section were 500 x 500 mm (19.7 x 19.7 in.) for the column and 400 x 500 mm (15.7 x 19.7 in.) for the beam. As shown in Table 1 and Fig. 3(c), the reinforcing bar details of the beam were the same as those of PRC1. Because the top and bottom reinforcing bars of the beam were terminated at the
Fig. 4—Coupler splice and headed bar anchorage. (Note: 1 mm = 0.03937 in.)
Table 1—Properties of test specimens
Specimens RC (cruciform) PRC1 (cruciform) PRC2 (cruciform) PRC3 (T-shaped)
Beam
Dimensions, mm x mm 400 x 500 400 x 500 400 x 500 400 x 500
Top reinforcing bars (r, %) 4 D29 (1.49) 4 D29 (1.49) 2 D29+ 2 D25 (1.33) 4 D29 (1.49)
Bottom reinforcing bars (r, %) 2 D22 + 1 D25 (0.73) 2 D22 + 1 D25 (0.73) 3 D22 (0.66) 2 D22 + 1 D25 (0.73)
Joint strengthening bars* (dj, mm) — —2 D29 and 2 D22
(250 and 400)—
Stirrups at plastic hinge (rv, %) D13 at 100 (0.66) D13 at 100 (0.66) D13 at 100 (0.66) D13 at 100 (0.66)
Positive and negative Mn (Mn′)†, kN∙m 300 and 524 301 and 530264 and 521
(422 and 747)302 and 537
Column
Dimensions, mm x mm 700 x 600 700 x 600 700 x 600 500 x 500
Main reinforcing bar ratio (r, %) 6 D29 + 4 D22 (1.31) 6 D29 + 4 D22 (1.31) 6 D29 + 4 D22 (1.31) 6 D29 + 4 D22 (1.89)
Hoops (rh, %) D16 at 100 (1.31) D16 at 100 (1.31) D16 at 100 (1.31) D16 at 100 (1.89)
Mn (=Mnc), kN∙m 779 782 785 449
Jointhc/db
‡ 24.4 24.4 41.8 14.5
Joint shear Vjn and Vju, kN§ 2390 and 2163 2538 and 2160 2723 and 2375 1750 and 1419
Column-to-beam moment ratio SMnc/SMnb|| 1558/824 = 1.89 1563/831 = 1.98 1569/1169 = 1.34 898/537 = 1.67
*Ninety-degree hooked bars—two D22 and two D29—were used at top and bottom of beam section, respectively (refer to Fig. 3(b)). †Mn is positive and negative moment capacity at critical section. In case of PRC2, Mn′ is moment capacity at column face, including contribution of strengthening 90-degree hooked bars (refer to the Appendix). ‡hc is column dimension parallel to beam reinforcing bars and db is maximum diameter of beam top and bottom reinforcing bars. For PRC2 and PRC3, (hc + Sdj)/db and ldh/db were used, respectively. Refer to the Appendix. §Calculations are presented in detail in the Appendix and Fig. A1. ||In RC, PRC1, and PRC3, Mnb = Mn. In PRC2, Mnb = Mnln/(ln – dj), where dj = 250 or 400 mm (9.84 or 15.7 in.) and ln = 2030 mm (79.9 in.). Refer to the Appendix and Fig. A1. Notes: 1 mm = 0.03937 in.; 1 kN∙m = 8851 lbf; 1 kN = 0.2248 kip.
(refer to Fig. 3(a)). In the beam cage, transverse hoops (D13) were connected to the top and bottom reinforcing bars by tack welding (flare-bevel-groove welding; refer to Fig. 5(a)). The lap splice of the transverse hoops was welded by flare-V-groove welding, and the effective weld length of the lap splice was lh = 65 mm (2.65 in.) (=5.0dh ≥ 4.4dh; refer to Fig. 5(b)). According to ACI 318-08,6 Chapter 21, the first hoop was located within 50 mm (2 in.) from the column face, and the spacing of the hoops was 100 mm (4 in.) (rv = 0.0066). Diagonal reinforcing bars (D13; db = 13 mm [0.512 in.]) on each side of the beam were also welded to the top and bottom reinforcing bars by flare-bevel-groove welding (refer to Fig. 5(a)).

ACI Structural Journal/May-June 2013 407
beam-column joint, a mechanical anchorage consisting of a nut and washer was used for the reinforcing bar development (refer to Fig. 3(c) and 4). The nut and washer were tightened with band plates to prevent anchorage slip. The development length of the headed bars (=420 mm [16.5 in.]) satisfied the minimum requirement 0.75afydb/(6.2 cf ′ )(=281 mm [11.1 in.]) specified in ACI 352R-0211 (a = material over-strength factor = 1.25; fy = yield stress of reinforcing bar = 519 MPa [75.3 ksi]; fc′ = 61.0 MPa [8.85 ksi]; and db = 29 mm [1.14 in.]).11-13
Cruciform Specimen RC was a conventional beam-column connection constructed by in-place reinforcing bar work. Figure 3(d) shows the reinforcing bar details of Specimen RC. The dimensions and reinforcing bar arrange-ment of the column and beam were the same as those of PRC1 (refer to Table 1). However, reinforcing bar welding, coupler splice, band plate, diagonal reinforcing bar, and headed reinforcing bar anchorage were not used.
Table 2 shows the material properties of the concrete and reinforcing bars. High-strength concrete of fc′ equaling approximately 47.0 to 61.0 MPa (6.96 to 8.85 ksi) was used. The concrete strengths were the means of three compression tests. For the D22, D25, and D29 reinforcing bars, SD500W steel grade (Korean Industrial Standard Grade 500, weldable reinforcing bars) was used. Table 2 shows the areas, yield strengths, tensile strengths, strains at hardening, and strains at fracture of the reinforcing bars. The tension tests of rein-forcing bar specimens were conducted in accordance with
the Korean Industrial Standard (KS B 0802) for direct tension test of steel bars, which is an equivalent to ASTM A370. The material properties were the mean values of three tension tests. Particularly, D25 bars used for the beam bottom bars showed a relatively small fracture strain—5.36%—which was less than 12%, the minimum requirement specified in the Korean Industrial Standard. The couplers for reinforcing bar splice were verified by direct tension tests, satisfying the requirement of Type 2 mechanical splice specified in ACI 318-08.6 For shop welding between reinforcing bars, flux-cored arc welding (FCAW) and YFW-C50DR (E71T-1; fy = 545 MPa [79 ksi]; fu = 572 MPa [83 ksi]) were used for the welding method and the weld metal, respectively.
Figure 5 shows the shop welding details of the hoop and diagonal bars, according to KS B ISO 17660-1:2007 (Korean Industrial Standard for reinforcing bar welding certified by the International Organization for Standardization [ISO]). The hoops and diagonal bars were welded to the outside face and the inside face of the top and bottom longitudinal bars, respectively (refer to Fig. 5(a)). Basically, the welding between the reinforcing bars is used for the temporary erec-tion and fabrication of the column and beam bar cages during construction. For this purpose, the standard welding details specified in KS B ISO 17660-1:2007 provide suffi-cient strength and rigidity for the reinforcing bar joints. An exception, however, is the welded lap splice of the trans-verse hoops in the beam cage (refer to Fig. 5(b)). Because the transverse hoops are designed to develop the yield stress,
Fig. 5—Details of reinforcing bar welding.
Table 2—Material tests
Concrete Reinforcing bars
Specimen RC PRC1 PRC2 PRC3 Bar size D22 D25 D29
Compressive strength fc′, MPa 47 53 61 61
Area, mm2 387 507 642
Yield stress fy, MPa 538 564 519
Tensile strength fu, MPa 684 594 661
Strain at hardening 0.0179 0.0105 0.0092
Strain at fracture 0.121 0.0536 0.120
Notes: 1 MPa = 145 psi; 1 mm2 = 0.00155 in.2
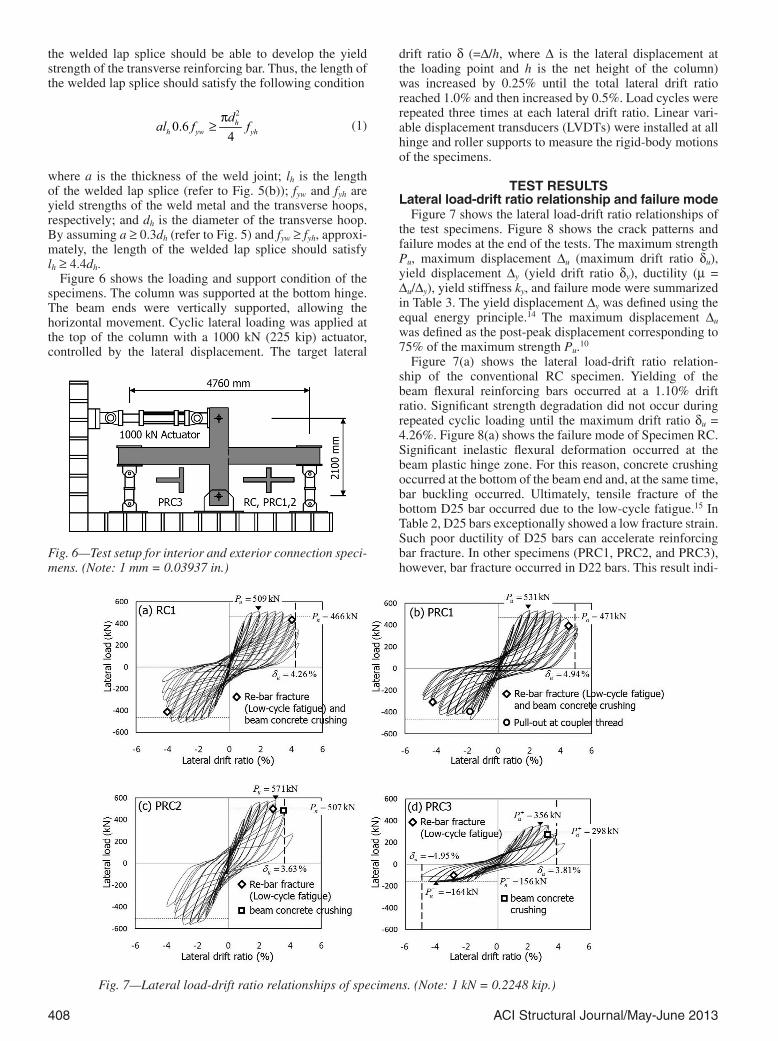
408 ACI Structural Journal/May-June 2013
the welded lap splice should be able to develop the yield strength of the transverse reinforcing bar. Thus, the length of the welded lap splice should satisfy the following condition
2
0.64
hh yw yh
dal f f
p≥ (1)
where a is the thickness of the weld joint; lh is the length of the welded lap splice (refer to Fig. 5(b)); fyw and fyh are yield strengths of the weld metal and the transverse hoops, respectively; and dh is the diameter of the transverse hoop. By assuming a ≥ 0.3dh (refer to Fig. 5) and fyw ≥ fyh, approxi-mately, the length of the welded lap splice should satisfy lh ≥ 4.4dh.
Figure 6 shows the loading and support condition of the specimens. The column was supported at the bottom hinge. The beam ends were vertically supported, allowing the horizontal movement. Cyclic lateral loading was applied at the top of the column with a 1000 kN (225 kip) actuator, controlled by the lateral displacement. The target lateral
drift ratio d (=D/h, where D is the lateral displacement at the loading point and h is the net height of the column) was increased by 0.25% until the total lateral drift ratio reached 1.0% and then increased by 0.5%. Load cycles were repeated three times at each lateral drift ratio. Linear vari-able displacement transducers (LVDTs) were installed at all hinge and roller supports to measure the rigid-body motions of the specimens.
TEST RESULTSLateral load-drift ratio relationship and failure mode
Figure 7 shows the lateral load-drift ratio relationships of the test specimens. Figure 8 shows the crack patterns and failure modes at the end of the tests. The maximum strength Pu, maximum displacement Du (maximum drift ratio du), yield displacement Dy (yield drift ratio dy), ductility (m = Du/Dy), yield stiffness ky, and failure mode were summarized in Table 3. The yield displacement Dy was defined using the equal energy principle.14 The maximum displacement Du was defined as the post-peak displacement corresponding to 75% of the maximum strength Pu.10
Figure 7(a) shows the lateral load-drift ratio relation-ship of the conventional RC specimen. Yielding of the beam flexural reinforcing bars occurred at a 1.10% drift ratio. Significant strength degradation did not occur during repeated cyclic loading until the maximum drift ratio du = 4.26%. Figure 8(a) shows the failure mode of Specimen RC. Significant inelastic flexural deformation occurred at the beam plastic hinge zone. For this reason, concrete crushing occurred at the bottom of the beam end and, at the same time, bar buckling occurred. Ultimately, tensile fracture of the bottom D25 bar occurred due to the low-cycle fatigue.15 In Table 2, D25 bars exceptionally showed a low fracture strain. Such poor ductility of D25 bars can accelerate reinforcing bar fracture. In other specimens (PRC1, PRC2, and PRC3), however, bar fracture occurred in D22 bars. This result indi-
Fig. 6—Test setup for interior and exterior connection speci-mens. (Note: 1 mm = 0.03937 in.)
Fig. 7—Lateral load-drift ratio relationships of specimens. (Note: 1 kN = 0.2248 kip.)

ACI Structural Journal/May-June 2013 409
cates that the low ductility of the D25 bars was not the direct cause for the bar fracture.
As presented in Table 1, hc/db (=24.4) of RC was greater than the minimum requirement (=20fy/420 = 23.8; fy in MPa) specified in ACI 352R-0211 (hc is the column dimension parallel to beam reinforcing bars, and db is the maximum diameter of beam reinforcing bars). Furthermore, in Table 1, the nominal shear capacity Vjn at the beam-column joint was greater than the shear demand Vju (refer to the Appendix). As a result, bond slip and diagonal cracking were minimized at the beam-column joint (refer to Fig. 8(a)). Thus, pinching was not severe in the lateral load-drift ratio relationship in Fig. 7(a).
Figures 7(b) and 8(b) show the lateral load-drift ratio relationship and the failure mode of PRC1. The test result of PRC1 was similar to that of Specimen RC. Yielding of the beam plastic hinge occurred at a 1.23% drift ratio. At the maximum drift ratio du = 4.94%, flexural concrete crushing occurred at the beam end. Ultimately, tensile fracture occurred in the bottom D22 bars due to the low-cycle fatigue15 (refer to Fig. 8(b) and Table 3). Similarly to Specimen RC, diagonal cracking at the beam-column joint
was minimized. As shown in Fig. 7(b), however, a sudden strength decrease occurred during the second load cycle at a –1.85% drift ratio. The investigation after the end of the test showed that in one out of eight couplers, reinforcing bar slip occurred due to the loosened thread of the coupler (refer to Fig. 8(b)). The reinforcing bar, however, was not pulled out from the coupler completely. Thus, the reinforcing bar slip did not significantly decrease the overall load-carrying capacity of PRC1.
Figures 7(c) and 8(c) show the test results of Specimen PRC2, which was strengthened with hooked reinforcing bars. The maximum strength Pu of PRC2 was 9.8% greater than that of RC and PRC1. However, the maximum drift ratio du = 3.63% of PRC2 was less than that of RC and PRC1. As shown in Fig. 8(c), due to the hooked reinforcing bars strengthening the beam-column joint, the beam plastic hinge occurred far from the column face. At the plastic hinge zone, flexural concrete crushing occurred. Ultimately, PRC2 failed due to crushing of the bottom and web concrete and tensile fracture of the bottom D22 bars (refer to Fig. 8(c)). Neither the reinforcing bar slip nor the fracture occurred at the coupler splice. As mentioned,
Fig. 8—Crack patterns and failure modes of specimens.
Table 3—Summary of test results
Specimen
Load-carrying capacity, kN Deformation capacity (mm, %)Yield stiffness,
kN/mmky (=Py/Dy)
Failure mode*
Observed Pu Predicted Pn Pu/Pn Yield Dy (dy)Maximum
Du (du)Ductility m
(=Du/Dy)Beam plastic
hingeCoupler splice
RC(+) 509 460 1.11 23.1 (1.10) 80.5 (4.26) 3.87 20.8EC/BF NA
RC (–) 508 460 1.10 23.1 (1.10) 86.9 (4.14) 3.76 20.9
PRC1 (+) 531 464 1.14 25.8 (1.23) 104 (4.94) 4.02 19.4EC/BF Bar slip
PRC1 (–) 470 464 1.01 23.3 (1.11) 87.4 (4.16) 3.75 17.9
PRC2 (+) 578 515 1.12 28.4 (1.35) 76.2 (3.63) 2.79 19.6 EC/WB/BFNo failure
PRC2 (–) 564 515 1.10 28.8 (1.37) 80.6 (3.84) 2.80 18.5 EC/WB/BF
PRC3 (+) 356 286 1.25 34.2 (1.63) 80.0 (3.81) 2.34 10.0 ECNo failure
PRC3 (–) 164 161 1.02 30.9 (1.47) 104 (4.95) 3.37 4.9 BF*EC is flexural concrete crushing at bottom end; BF is reinforcing bar fracture; WC is web concrete crushing; NA is not available; 1 kN = 0.2248 kip; 1 mm = 0.03937 in.; 1 kN/mm = 5.710 kip/in.

410 ACI Structural Journal/May-June 2013
the beam plastic hinge of PRC2 was moved by dj = 250 and 400 mm (9.84 and 15.7 in.) from the column face due to the hooked reinforcing bars, and this allowed the ability to increase the development length of the beam reinforcing bars in the beam-column joint. Thus, the hc/db ratio of PRC2 was increased to 41.8 by the increased effective joint depth hc + Sdj (that is, the distance between the right and left beam critical sections) (refer to Table 1 and the Appendix). As a result, diagonal cracking and bond slip were restrained at the beam-column joint, and pinching was significantly reduced in the lateral load-drift ratio relationship.
Figure 7(d) shows the test result of the exterior beam-column connection Specimen PRC3. Because the amount of bottom reinforcing bars in the beam was half of that of the top reinforcing bars, the lateral load-drift ratio relationship showed an asymmetric cyclic curve. The maximum strength Pu (= +356 kN [+80.0 kip]) of the positive loading was two times greater than Pu = –164 kN (–36.9 kip) of the negative loading. However, the maximum drift ratio du = 3.81% of the positive loading was less than du = 4.95% of the negative loading. As shown in Fig. 7(d) and 8(d), a sudden strength degradation occurred at a 3.30% drift ratio due to the flexural concrete crushing at the beam bottom. Ultimately, tensile fracture of the bottom D22 bars occurred under the nega-tive loading (refer to Fig. 8(d)). The development length of
the headed bars satisfied the minimum requirement specified in ACI 352R-0211 (refer to the Appendix). Thus, significant bond slip and anchorage failure did not occur at the beam-column joint. There was no failure at the coupler splices of the top and bottom reinforcing bars in the beam.
Load-carrying capacityBecause the specimens were designed according to
the strong-column/weak-beam concept, the load-carrying capacity of the specimens can be calculated by using the moment capacities at the beam plastic hinge zone. In Fig. 9, the load-carrying capacity Pn of the interior and exterior connections can be calculated as follows.
( )1 2 for interior connection2nlP R Rh
= + (2a)
for exterior connectionnlP Rh
= (2b)
where R1, R2, and R are the vertical reactions at the beam supports; h is the net height of the column; and l is the net length of the beam. The vertical reactions at the beam supports (R1, R2, and R) can be calculated by dividing the moment capacity at the beam critical section by the beam shear span between the roller support and the critical section (refer to Fig. 9). As shown in Fig. 9, the beam critical sections of RC, PRC1, and PRC3 are located at the column face. In PRC2, the beam critical sections are located at the end of the hooked reinforcing bars (refer to Fig. 3(b)).
The nominal load-carrying capacities Pn of the test speci-mens predicted by Eq. (2a) and (2b) are presented in Table 3. The predicted load-carrying capacities Pn of the specimens were less than the measured maximum strengths Pu. Such underestimation of the load-carrying capacity is attributed to the cyclic strain hardening of the flexural reinforcing bars, which was not considered in the calculation. In Table 3, the Pu/Pn ratio for PRC1(–) with a loosened coupler is 1.01, which is 10% less than the other Pu/Pn ratios. The other Pu/Pn ratios are greater than 1.10, except for that of PRC3(–). Thus, considering the effect of reinforcing bar strain hard-ening increasing the strength by 10%, the strength Pu of PRC1(–) was decreased by 10% by the loosened thread of the coupler.
In the case of the PRC specimens, the diagonal D13 bars may contribute somewhat to the strength, stiffness, and diagonal cracking of the specimens. However, such favor-able effects of the diagonal D13 reinforcing bars are not reliable in the ultimate state because the tag weld connec-tion between the diagonal and longitudinal reinforcing bars cannot guarantee full development of the reinforcing bar strength. Therefore, in this study, the favorable effect of the diagonal D13 bars was not considered in the calculation of the lateral load-carrying capacity of the specimens.
Deformation capacity and ductilityFigure 10(a) shows the envelope curve of the test speci-
mens. The maximum drift ratio du, yield drift ratio dy, and ductility m obtained from the test are presented in Table 3. Figure 10(b) shows the definition of du and dy. According to the equal energy principle, the yield drift ratio dy was defined by using the idealized bilinear curve (solid line in Fig. 10(b)),
Fig. 9—Calculation of load-carrying capacity. (Note: Dimensions in mm; 1 mm = 0.03937 in.)

ACI Structural Journal/May-June 2013 411
dissipating the same energy as the envelope curve (dashed line in Fig. 10(b)).14 The ductility m was then calculated as du/ dy. As shown in Table 3, the maximum drift ratio du of the conventional Specimen RC was 4.26%. The PRC Specimens PRC1, PRC2, and PRC3 showed du = 3.63 to 4.95%, which were greater than the minimum requirement of 3.5% for the earthquake-resistant moment frame specified in ACI 374.1-05.10 The displacement ductility m of the test specimens ranged from 2.34 to 4.02.
As presented in Table 3, the maximum drift ratio and ductility of PRC1 were du = 4.94% and m = 4.02, respec-tively, which are comparable to those of the conventional Specimen RC (du = 4.26% and m = 3.87). On the other hand, PRC2, which was strengthened by hooked reinforcing bars, showed less deformation capacity (du = 3.63% and m = 2.69) than that of RC. The reason for this can be explained as follows. First, because of the strengthening hooked reinforcing bars, the yielding of beam reinforcing bars and subsequent flexural concrete crushing were concentrated at the location of the hook anchorage, which was the beam critical section. Furthermore, because of the relocation of the beam plastic hinge zone, the net beam length between the critical section and the vertical support was decreased, which increased the plastic rotation demand at the critical section (refer to Fig. 11).
In the exterior beam-column connection in Specimen PRC3, the maximum deformation capacity was du = 3.81% and m = 2.34 for the positive loading and du = 4.95% and m = 3.37 for the negative loading. The deformation capacity of PRC3 was less in the positive loading, which caused a negative moment in the beam.
Yield stiffness and hysteretic energy dissipationThe yield stiffnesses ky (=Py/Dy; Py is yield strength
[refer to Fig. 10(b)]) of the test specimens are presented in Table 3. As shown in Table 3, the yield stiffnesses of PRC1 and PRC2 were comparable to that of the conven-tional connection in Specimen RC.
Figure 12(a) and (b) compare the hysteretic energy dissipa-tion ED per load cycle and the hysteretic energy ratio ED/Eep, respectively. The variable ED denotes the area enclosed by a load cycle, and Eep denotes the area of the parallelogram by the idealized elastic-perfectly plastic behavior (refer to Fig. 12(b)). The maximum strength Pu of PRC2 was greater than that of RC and PRC1. Furthermore, reinforcing bar slip was minimized at the beam-column joint (refer to the following section). For this reason, as shown in Fig. 12(a), the hysteretic energy dissipation ED per load cycle of PRC2 was slightly greater than that of RC and PRC1. In the exterior beam-column connection Specimen PRC3, only one plastic hinge developed at the beam. Thus, ED of PRC3 was approx-imately half of RC or PRC1. ACI 374.1-0510 requires that at the lateral drift ratio du = 3.5%, the hysteretic energy ratio ED/Eep should be greater than 0.125. As shown in Fig. 12(b), all specimens with the proposed connection details satisfied the energy requirement of ACI 374.1-05.10
Reinforcing bar strain at beam-column jointFigure 13 compares the strains of the bottom reinforcing
bars in the beams. In the figure, BB1 and BB2 are reinforcing bar strain gauges located at the center of the beam-column joint and at 30 mm (1.18 in.) inside the joint, respectively. BB3 and BB4 indicate strain gauges outside the joint at 30 and 400 mm (1.18 and 15.7 in.) from the column face,
Fig. 10—Envelope curves of test specimens. (Note: 1 kN = 0.2248 kip.)
Fig. 11—Beam plastic rotation demand varying with plastic hinge location.
respectively. In the case of RC, PRC1, and PRC3, BB3 and BB4 were subjected to tensile plastic strains during cyclic loading, while BB1—at the center of the joint—remained elastic (refer to Fig. 13(a), (b), and (d)). Although BB2 was located inside the joint, plastic strains were developed by the propagation of reinforcing bar yielding from the beam

412 ACI Structural Journal/May-June 2013
Fig. 13—Strains of bottom reinforcing bars in beams. (Note: 1 mm = 0.03937 in.; 1 kN = 0.2248 kip.)
Fig. 12—Hysteretic energy dissipation of beam-column connections. (Note: 1 kN-m = 0.737 kip-ft.)
BB4, located 400 mm (15.7 in.) from the column face, was subjected to tensile plastic strain.
The beam reinforcing bars of RC, PRC1, and PRC3 were subjected to tensile plastic strains at BB2, which was inside the joint. Such plastic strains inside the joint can create reinforcing bar slip to some extent at the column face of RC, PRC1, and PRC3, as shown in Fig. 14. On the other hand, the beam reinforcing bars of PRC2 remained elastic at BB2 and BB3 because the beam-column joint was strengthened with
plastic hinge. In particular, BB2 of Specimen RC was subjected to greater plastic strains than those of PRC1 and PRC3. This is because the couplers and steel band plates for the beam reinforcing bar splice restrained the propa-gation of reinforcing bar yielding. Figure 13(c) shows the reinforcing bar strains of PRC2 strengthened with addi-tional hooked reinforcing bars. Because the hook anchorage was located 250 mm (9.84 in.) from the column face, BB1, BB2, and BB3 remained elastic during cyclic loading, while

ACI Structural Journal/May-June 2013 413
hooked reinforcing bars (refer to Fig. 3(b)). Therefore, the reinforcing bar slip at the joint can be minimized.
SUMMARY AND CONCLUSIONSIn this study, the earthquake resistance of the beam-column
connections with prefabricated reinforcing bar details was investigated. In the proposed PRC Method, reinforcing bar welding, coupler splice, steel band plates, and headed bar anchorage were used for the fabrication of the reinforcing bar cages of the beams, columns, and beam-column connec-tions. Cyclic loading tests were performed for full-scale interior and exterior beam-column connections, including a conventional RC specimen. The structural capacity of the specimens, such as the yield stiffness, load-carrying capacity, deformation capacity, energy dissipation capacity, and failure mode, were compared with those of the conven-tional RC specimen. The test results and design consider-ations for the PRC connections are summarized as follows:
1. The structural performance of the PRC specimens, including the load-carrying capacity, deformation capacity, energy dissipation capacity, and yield stiffness, was compa-rable to that of the conventional RC specimen. The structural performance satisfies the requirements for the earthquake-resistant moment frame specified by ACI 374.1-05.10
2. The PRC specimens failed due to the flexural concrete crushing at the beam plastic hinge zone. The failure mode was the same as that of the conventional RC specimen. Bond slip and diagonal cracking at the beam-column joint were minimized.
3. The coupler splices at the beam-column joint success-fully transferred the reinforcing bar forces without brittle failure, even though they were located at the beam critical sections. In one out of 15 couplers, however, reinforcing bar slip occurred due to the loosened threads of the coupler, which decreased the load-carrying capacity of Specimen PRC1 by 10%. Attention should be paid to the coupler splice in the PRC connections.
4. In Specimen PRC2, the beam-column joint was strength-ened by hooked bars to avoid probable brittle failure at the beam-column joint. The use of hooked bars successfully relocated the plastic hinge zone far away from the column face and minimized concrete cracking and bond slip at the beam-column joint. However, the deformation capacity of the beam-column connection decreased due to the stress concentration at the hook anchorage and increased rotation demand at the beam plastic hinge zone.
5. The reinforcing bar welding at the beam plastic hinge zones did not have a detrimental effect on the structural performance of the specimens. The fracture of the beam reinforcing bars in the PRC specimens occurred at the same story drift ratio as that for the RC specimen. The reinforcing bar fracture in the beam plastic hinge was caused by the low-cycle fatigue after concrete crushing, rather than by the reinforcing bar welding. However, because ACI 318-086 does not permit the use of reinforcing bar welding at the poten-tial plastic hinge zones, further studies on the effect of reinforcing bar welding are required.
In the proposed PRC Method, the potential problems of the coupler splice and weld connection of reinforcing bars under large inelastic deformations are significantly affected by the prefabricated reinforcement details, construction quality, and stress and strain conditions. Thus, to ensure the structural capacity of the PRC Method, further studies on the coupler splice and weld connection subjected to significant load and strain reversals are required.
ACKNOWLEDGMENTSThis research was financially supported by SEN Engineering Corporation
and the Small and Medium Business Administration in Korea (No. 00045821).
REFERENCES1. Saatcioglu, M., and Grira, M., “Confinement of Reinforced Concrete
Columns with Welded Reinforcement Grids,” ACI Structural Journal, V. 96, No. 1, Jan.-Feb. 1999, pp. 29-39.
2. Choi, C. S., and Saatcioglu, M., “An Experimental Study on the Structural Behavior of Concrete Columns Confined with Welded Reinforcement Grids,” Journal of the Korea Concrete Institute, V. 11, No. 2, 1999, pp. 187-196.
3. Saatcioglu, M., and Grira, M., “Concrete Columns Confined with Welded Reinforcement Grids,” Report OCEERC 96-05, Ottawa Carleton Earthquake Engineering Research Center, Ottawa, ON, Canada, 1996, 89 pp.
4. Hwang, H.; Park, H.; Lee, C.; Park, C.; Lee, C.; Kim, H.; and Kim, S., “Seismic Resistance of Concrete-Filled U-Shaped Steel Beam-to-RC Column Connections,” Journal of the Korean Society of Steel Construction, V. 23, No. 1, 2011, pp. 83-97.
5. Korea Concrete Institute, “Code Requirements for Structural Concrete (KCI 2007),” Korea Concrete Institute, Seoul, Korea, 2007, 334 pp.
6. ACI Committee 318, “Building Code Requirements for Structural Concrete (ACI 318-08) and Commentary,” American Concrete Institute, Farmington Hills, MI, 2008, 473 pp.
7. Burton, K. T., and Hognestad, E., “Fatigue Tests of Reinforcing Bars—Tack Welding of Stirrups,” ACI Journal, V. 64, No. 5, May 1967, pp. 244-252.
8. Razvi, S. R., and Saatcioglu, M., “Confinement of Reinforced Concrete Columns with Welded Wire Fabric,” ACI Structural Journal, V. 86, No. 5, Sept.-Oct. 1989, pp. 615-623.
9. Furlong, R. W.; Fenvs, G. L.; and Kasl, E. P., “Welded Structural Wire Reinforcement for Columns,” ACI Structural Journal, V. 88, No. 5, Sept.-Oct. 1991, pp. 585-591.
10. ACI Committee 374, “Acceptance Criteria for Moment Frames Based on Structural Testing and Commentary (ACI 374.1-05),” American Concrete Institute, Farmington Hills, MI, 2005, 9 pp.
11. ACI Committee 352, “Recommendations for Design of Beam-Column Connections in Monolithic Reinforced Concrete Structures (ACI 352R-02),” American Concrete Institute, Farmington Hills, MI, 2002, 38 pp.
12. ACI Committee 439, “Types of Mechanical Splices for Reinforcing Bars (ACI 439.3R-07),” American Concrete Institute, Farmington Hills, MI, 2007, 20 pp.
13. Chun, S.; Oh, B.; Lee, S.; and Naito, C. J., “Anchorage Strength and Behavior of Headed Bars in Exterior Beam-Column Joints,” ACI Structural Journal, V. 106, No. 5, Sept.-Oct. 2009, pp. 579-590.
14. Park, R., “Ductility Evaluation from Laboratory and Analytical Testing,” Proceedings of Ninth World Conference on Earthquake Engineering, Tokyo, Japan, V. 8, 1988, pp. 605-616.
15. Higai, T.; Nakamumra, H.; and Saito, S., “Fatigue Failure Criterion for Deformed Bars Subjected to Large Deformation Reversals,” Finite Element Analysis of Reinforced Concrete Structures, SP-237, L. Lowes and F. Filippou, eds., American Concrete Institute, Farmington Hills, MI, 2006, pp. 37-54.
Fig. 14—Mechanism of reinforcing bar slip at beam-column joint.

414 ACI Structural Journal/May-June 2013
NOTES:

20
APPENDIX –EARTHQUAKE DESIGN OF SPECIMENS
The beam-column connection specimens were designed to satisfy the requirements for the
Special Moment Frame in ACI 318-08,6 as follows (see Table 1).
1) Table 1 shows the moment capacity ratios between the column and beam at the faces of
the joint, nc nbM / MΣ Σ . The moment capacities ncM and nbM of the column and beam
were calculated from sectional analysis, using the material strengths cf ′ and yf presented
in Table 2. In case of PRC2 with strengthening bars, the beam moment capacity nbM at
the column face was calculated as
( )nb n n n jM M l / l d= − where nM is the moment
capacity at the critical section located at jd = 250 or 400 mm [9.84 or 15.7 in] from the
column face (see Fig. 9(b)). nl is the net length of the beam from the vertical support to
the column face (= 2030 mm [79.9 in]). As presented in Table 1, all specimens satisfied
the requirement of strong column- weak beam behavior specified in ACI 318-087 sec. 21,
nc nbM / MΣ Σ ≥ 1.2.
2) ACI 318-087 requires the column depth-to bar diameter ratio, c bh d ≥ 20. ACI 352R-0211
requires c bh d ≥ 20 yf / 420 ( yf in MPa). In RC and PRC1, c bh d = 24.4, which
satisfied the requirements. In PRC2, because of the strengthening 90°-hooked bars, the
actual embedment length of the beam re-bars was increased to the effective joint depth
c jh dΣ+ = 700 + 250 + 400 = 1350 mm [53.2 in] between the left and right critical
sections of the beam (see Table 1 and Fig. 9(b)). Thus, the effective joint depth-to-bar
diameter ratio was increased to c j b( h d ) dΣ+ = 41.8. In the exterior connection PRC3,
the embedment length of the headed bars was dhl = 420 mm [16.5 in]): dh bl d =14.5. The
development length of the headed bars was greater than the minimum requirement

21
0.75 /(6.2 )y b cf d fα ′ (= 281mm [11.1 in], yf = 519 MPa [75.3 ksi] and cf ′ = 61.0 MPa
[8.85 ksi] ], and bd = 29 mm [1.14 in]) specified in ACI 352R-02.11
3) In PRC2 with the strengthening bars, to assure flexural yielding at the beam critical
section, the beam moment capacity at the column face should be greater than the moment
demand that is developed by the moment capacity at the critical section. Fig. A1 shows
the beam moment capacities and demands, and the location of the beam critical section.
The positive moment capacity nM at the beam critical section and nM′ at the column face,
respectively, were calculated as 264 kN-m [194 kip-ft] and 422 kN-m [310 kip-ft] from
sectional analysis (see Table 1 and Fig. A1). In the calculation of nM′ , the contribution of
the strengthening 90° hooked bars to the flexural strength was included. The negative
moment capacity nM at the beam critical section and nM′ at the column face were
calculated as 521 kN-m [383 kip-ft] and 747 kN-m [549 kip-ft], respectively (see Table 1
and Fig. A1). At the column face, the moment capacities nM ′± = 422 kN-m [310 kip-ft]
and 747 kN-m [549 kip-ft] were greater than the moment demands
( )nb n n n jM M l / l d± = ± − = 328 kN-m [241 kip-ft] and 594 kN-m [437 kip-ft], respectively
(see Fig. A1). Thus, first yielding of the beam re-bars was expected to occur at the beam
critical sections.
4) The nominal shear capacities and shear demands of the beam-column joints are presented
in Table 1. The nominal shear capacity was calculated as jnV 0.083 c j cf b hγ ′= , where
γ = constant depending on connection type and classification, jb = effective joint width,
and ch = joint depth. The shear demand was calculated as juV ( )y st sb colf A A Vα= + − for

22
RC and PRC1 and y st colf A Vα − for PRC3, where stA and sbA = areas of top and bottom
re-bars of the beam, respectively, colV = column shear force from the test (= uP , see Table
3), and α = 1.25.11 In case of PRC2, since the beam plastic hinge was shifted by the
hooked re-bars, the ultimate joint shear force was modified
as juV 1 2( / ) ( / )y st n s y sb n s colf A l l f A l l Vα α= + − , where nl = net length of the beam between
the roller support to the column face (= 2030 mm [79.9 in]), and 1sl and 2sl = shear span
lengths of the beam between roller supports to the critical section ( 1sl =1780 mm [70.1 in]
and 2sl = 1630 mm [64.2 in], see Fig. A1). γ = 12 for all specimens. jb and ch were 500
mm [19.7 in] and 700 mm [27.6 in] for RC, PRC1, and PRC2, and 450 mm [17.7 in] and
500 mm [19.7 in] for PRC3. stA and sbA were 2580 and 1284 mm2 [4.00 and 1.99 in2]
for RC, PRC1, and PRC3 and 2310 and 1161 mm2 [3.58 and 1.80 in2] for PRC2. The
hooked re-bars were not included in stA and sbA of PRC2. In the calculation of jnV and
juV , the actual material strengths cf ′ and yf shown in Table 2 were used. As shown in
Table 1, the nominal shear capacities jnV at the beam-column joint were greater than the
shear demands juV .

23
Fig. A1 Moment capacities and demands of beams in PRC2 [1 in = 25.4 mm, 1 kips-ft =
1.36 kN-m]

ACI Structural Journal/May-June 2013 415
Title no. 110-S32
ACI STRUCTURAL JOURNAL TECHNICAL PAPER
ACI Structural Journal, V. 110, No. 3, May-June 2013.MS No. S-2011-157.R1 received February 7, 2012, and reviewed under Institute
publication policies. Copyright © 2013, American Concrete Institute. All rights reserved, including the making of copies unless permission is obtained from the copyright proprietors. Pertinent discussion including author’s closure, if any, will be published in the March-April 2014 ACI Structural Journal if the discussion is received by November 1, 2013.
Shear Strength of Reinforced Concrete Walls for Seismic Design of Low-Rise Housingby Julian Carrillo and Sergio M. Alcocer
In the last decade, the construction of low-rise housing made of reinforced concrete (RC) walls and slabs in Latin America has increased considerably. These box-type structures commonly have large lateral stiffness and strength, thus exhibiting low lateral displacements and shear forces demands. The low level of seismic response has prompted designers to use concrete strengths of 15 to 20 MPa (2175 to 2900 psi), as well as of 100 mm (4 in.) thick walls with web steel reinforcement ratios smaller than the minimum prescribed by most design codes. Considering these particular wall characteristics, design requirements in current codes are not directly applicable. Moreover, a blind application of current requirements may lead to an unjustifiable excessive cost of a housing unit, especially because of the web steel ratio required. To improve design methods for this type of construction, a behavioral model and equations capable of estimating the peak shear strength of walls for low-rise housing were developed and calibrated from test results. The experimental program included quasi-static and shake-table tests of walls with different height-to-length ratios (hw/lw) and walls with openings. Variables studied were the type of concrete, web steel ratio, and type of web reinforcement. Statistical analysis of the ratios between predicted and measured shear forces demonstrated that the proposed model is a suitable design tool that may be adopted for design and evaluation guidelines and codes.
Keywords: concrete walls; lightweight concrete; low-rise housing; shake-table testing; shear strength; welded-wire mesh.
INTRODUCTIONTo cope with housing demand in several Latin American
countries, concrete housing has become a preferred choice because of the speed of construction and availability of materials in most parts of these countries. The construc-tion system is highly developed, as it uses industrial forms, a precise sequence of forming-casting-removal of forms, and a timely supply of ready mix concrete. A significant portion of concrete houses is one to two stories high and has been constructed with reinforced concrete (RC) walls; slabs may be solid, cast monolithically with walls, or made of precast panels. Due to the lateral stiffness and strength of concrete wall structures, seismic response in terms of forces and displacements is relatively low. Therefore, walls are made of concrete with strengths between 15 and 20 MPa (2175 and 2900 psi) and are of low thickness (100 mm [4 in.]). Also, in zones where the seismic demands are so small that structural design is controlled by vertical or wind loads, or by temperature effects on concrete, dynamic and quasi-static test results (Carrillo and Alcocer 2012; Sánchez 2010; Flores et al. 2007) have revealed that the minimum shear wall reinforcement ratio prescribed by ACI 318-11 (ACI Committee 318 2011) appears to be excessive for controlling diagonal tension cracking. Thus, web steel ratios smaller than the minimum ratio prescribed by ACI 318 are often used. In addition, to accelerate the construction, web shear reinforcement made of welded-
wire mesh is commonly used. However, the adequacy of this design and construction practice is still lacking.
An experimental and analytical study was carried out, which aimed at better understanding the seismic behavior of walls in concrete housing and developing a guideline for analysis and design of low-rise housing. The experimental program included quasi-static and shake-table testing of 39 walls. Variables studied were the height-to-length ratio (hw/lw), solid walls and walls with openings, type of concrete, web steel ratio, and type of web shear reinforcement.
Based on observed trends from experimental results, a model for estimating the peak shear strength of concrete walls for typical low-rise housing is proposed. Results and design models from previous studies, test observations, and fundamentals of RC structural behavior were used for selecting the most representative variables in setting the functional form of the predictive equations. Existing trends between residuals and design variables were used for improving the form of the equations.
RESEARCH SIGNIFICANCEConsidering the particular characteristics of RC walls
used in low-rise housing in Latin America, most available models and code requirements are not directly applicable for design. In this study, a set of semi-empirical design equations capable of estimating the shear strength of walls for low-rise housing is presented and discussed. It was found that proposed design equations provide a robust tool for design professionals and code developers for promoting safe and economical concrete housing under seismic actions, as well as for assessing the adequacy of current design procedures.
EXPERIMENTAL PROGRAMIn the experimental program, 39 isolated walls were tested
in cantilever. The variables studied were those obtained from current design and construction practice of low-rise housing in Latin America (Table 1). Typical geometry of some of the full-scale walls tested is illustrated in Fig. 1. The ranges of measured mechanical properties of materials for the 39 specimens are presented in Table 2.
For evaluating the observed wall behavior, three failure modes were defined: 1) diagonal tension failure (DT) when concrete inclined cracking, yielding of most web shear reinforce-ment, and no web crushing of concrete were observed; 2) diagonal compression failure (DC) when yielding of some
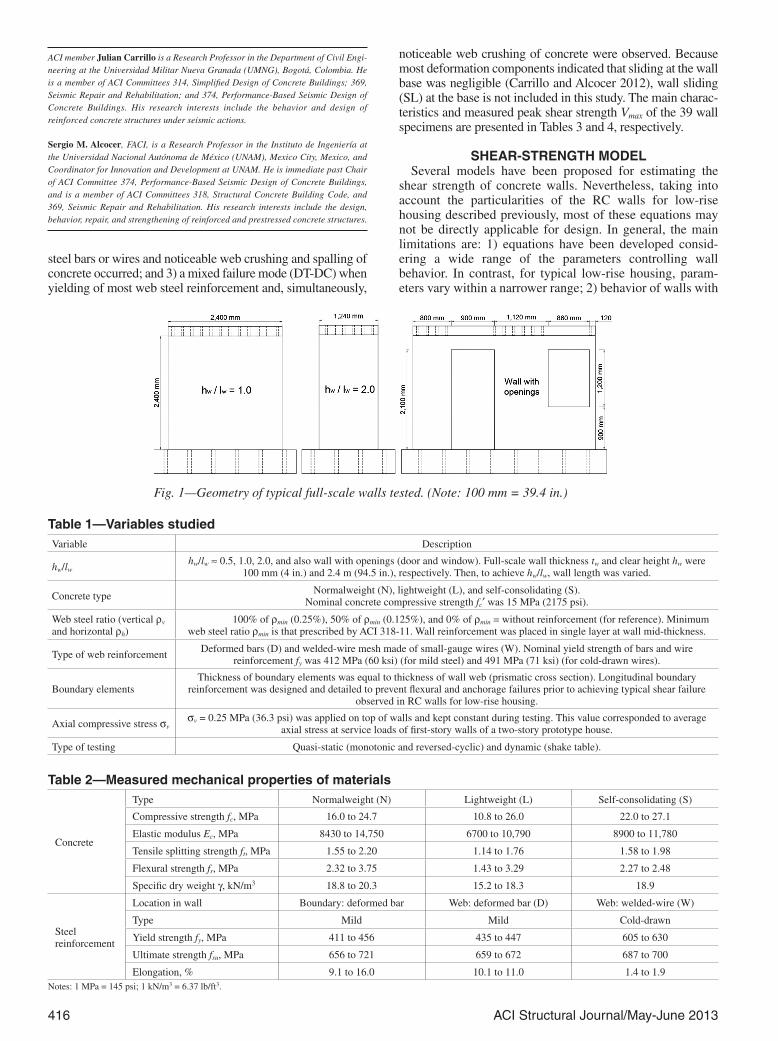
416 ACI Structural Journal/May-June 2013
ACI member Julian Carrillo is a Research Professor in the Department of Civil Engi-neering at the Universidad Militar Nueva Granada (UMNG), Bogotá, Colombia. He is a member of ACI Committees 314, Simplified Design of Concrete Buildings; 369, Seismic Repair and Rehabilitation; and 374, Performance-Based Seismic Design of Concrete Buildings. His research interests include the behavior and design of reinforced concrete structures under seismic actions.
Sergio M. Alcocer, FACI, is a Research Professor in the Instituto de Ingeniería at the Universidad Nacional Autónoma de México (UNAM), Mexico City, Mexico, and Coordinator for Innovation and Development at UNAM. He is immediate past Chair of ACI Committee 374, Performance-Based Seismic Design of Concrete Buildings, and is a member of ACI Committees 318, Structural Concrete Building Code, and 369, Seismic Repair and Rehabilitation. His research interests include the design, behavior, repair, and strengthening of reinforced and prestressed concrete structures.
steel bars or wires and noticeable web crushing and spalling of concrete occurred; and 3) a mixed failure mode (DT-DC) when yielding of most web steel reinforcement and, simultaneously,
Table 1—Variables studiedVariable Description
hw/lwhw/lw ≈ 0.5, 1.0, 2.0, and also wall with openings (door and window). Full-scale wall thickness tw and clear height hw were
100 mm (4 in.) and 2.4 m (94.5 in.), respectively. Then, to achieve hw/lw, wall length was varied.
Concrete typeNormalweight (N), lightweight (L), and self-consolidating (S).
Nominal concrete compressive strength fc′ was 15 MPa (2175 psi).
Web steel ratio (vertical rv and horizontal rh)
100% of rmin (0.25%), 50% of rmin (0.125%), and 0% of rmin = without reinforcement (for reference). Minimum web steel ratio rmin is that prescribed by ACI 318-11. Wall reinforcement was placed in single layer at wall mid-thickness.
Type of web reinforcementDeformed bars (D) and welded-wire mesh made of small-gauge wires (W). Nominal yield strength of bars and wire
reinforcement fy was 412 MPa (60 ksi) (for mild steel) and 491 MPa (71 ksi) (for cold-drawn wires).
Boundary elementsThickness of boundary elements was equal to thickness of wall web (prismatic cross section). Longitudinal boundary
reinforcement was designed and detailed to prevent flexural and anchorage failures prior to achieving typical shear failure observed in RC walls for low-rise housing.
Axial compressive stress svsv = 0.25 MPa (36.3 psi) was applied on top of walls and kept constant during testing. This value corresponded to average
axial stress at service loads of first-story walls of a two-story prototype house.
Type of testing Quasi-static (monotonic and reversed-cyclic) and dynamic (shake table).
Fig. 1—Geometry of typical full-scale walls tested. (Note: 100 mm = 39.4 in.)
Table 2—Measured mechanical properties of materials
Concrete
Type Normalweight (N) Lightweight (L) Self-consolidating (S)
Compressive strength fc, MPa 16.0 to 24.7 10.8 to 26.0 22.0 to 27.1
Elastic modulus Ec, MPa 8430 to 14,750 6700 to 10,790 8900 to 11,780
Tensile splitting strength ft, MPa 1.55 to 2.20 1.14 to 1.76 1.58 to 1.98
Flexural strength fr, MPa 2.32 to 3.75 1.43 to 3.29 2.27 to 2.48
Specific dry weight γ, kN/m3 18.8 to 20.3 15.2 to 18.3 18.9
Steel reinforcement
Location in wall Boundary: deformed bar Web: deformed bar (D) Web: welded-wire (W)
Type Mild Mild Cold-drawn
Yield strength fy, MPa 411 to 456 435 to 447 605 to 630
Ultimate strength fsu, MPa 656 to 721 659 to 672 687 to 700
Elongation, % 9.1 to 16.0 10.1 to 11.0 1.4 to 1.9Notes: 1 MPa = 145 psi; 1 kN/m3 = 6.37 lb/ft3.
noticeable web crushing of concrete were observed. Because most deformation components indicated that sliding at the wall base was negligible (Carrillo and Alcocer 2012), wall sliding (SL) at the base is not included in this study. The main charac-teristics and measured peak shear strength Vmax of the 39 wall specimens are presented in Tables 3 and 4, respectively.
SHEAR-STRENGTH MODELSeveral models have been proposed for estimating the
shear strength of concrete walls. Nevertheless, taking into account the particularities of the RC walls for low-rise housing described previously, most of these equations may not be directly applicable for design. In general, the main limitations are: 1) equations have been developed consid-ering a wide range of the parameters controlling wall behavior. In contrast, for typical low-rise housing, param-eters vary within a narrower range; 2) behavior of walls with
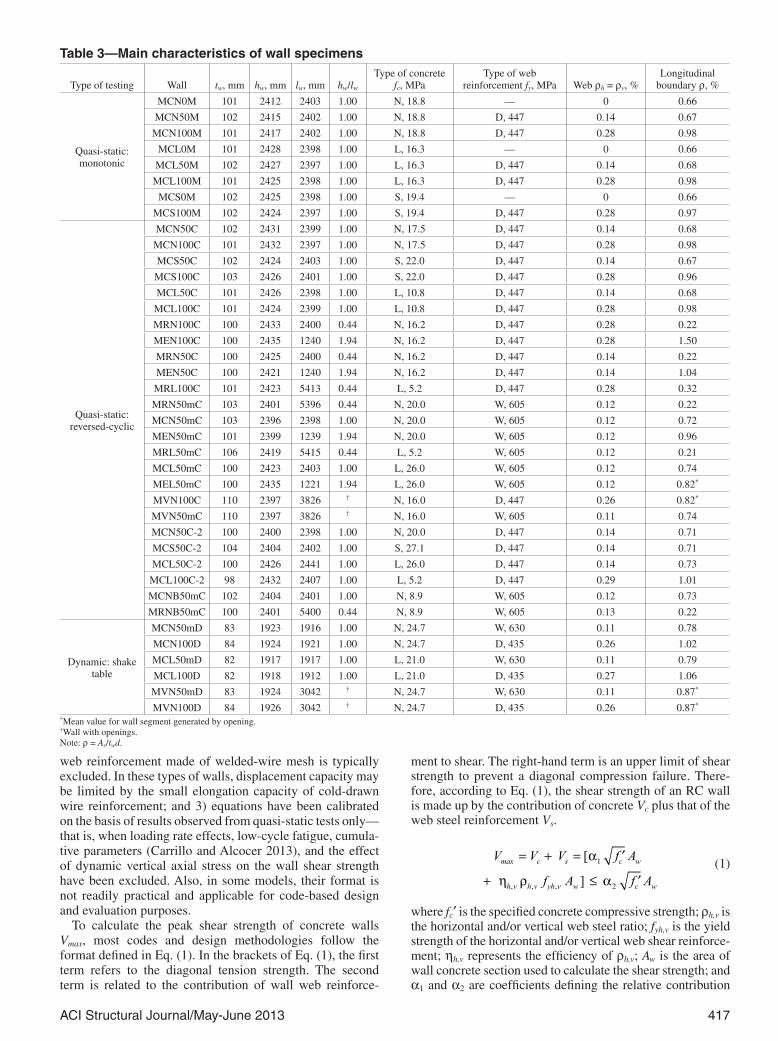
ACI Structural Journal/May-June 2013 417
web reinforcement made of welded-wire mesh is typically excluded. In these types of walls, displacement capacity may be limited by the small elongation capacity of cold-drawn wire reinforcement; and 3) equations have been calibrated on the basis of results observed from quasi-static tests only—that is, when loading rate effects, low-cycle fatigue, cumula-tive parameters (Carrillo and Alcocer 2013), and the effect of dynamic vertical axial stress on the wall shear strength have been excluded. Also, in some models, their format is not readily practical and applicable for code-based design and evaluation purposes.
To calculate the peak shear strength of concrete walls Vmax, most codes and design methodologies follow the format defined in Eq. (1). In the brackets of Eq. (1), the first term refers to the diagonal tension strength. The second term is related to the contribution of wall web reinforce-
ment to shear. The right-hand term is an upper limit of shear strength to prevent a diagonal compression failure. There-fore, according to Eq. (1), the shear strength of an RC wall is made up by the contribution of concrete Vc plus that of the web steel reinforcement Vs.
1
, , , 2
[
]max c s c w
h v h v yh v w c w
V V V f A
f A f A
= + = a ′
+ h r ≤ a ′ (1)
where fc′ is the specified concrete compressive strength; rh,v is the horizontal and/or vertical web steel ratio; fyh,v is the yield strength of the horizontal and/or vertical web shear reinforce-ment; hh,v represents the efficiency of rh,v; Aw is the area of wall concrete section used to calculate the shear strength; and a1 and a2 are coefficients defining the relative contribution
Table 3—Main characteristics of wall specimens
Type of testing Wall tw, mm hw, mm lw, mm hw/lw
Type of concrete fc, MPa
Type of web reinforcement fy, MPa Web rh = rv, %
Longitudinal boundary r, %
Quasi-static: monotonic
MCN0M 101 2412 2403 1.00 N, 18.8 — 0 0.66
MCN50M 102 2415 2402 1.00 N, 18.8 D, 447 0.14 0.67
MCN100M 101 2417 2402 1.00 N, 18.8 D, 447 0.28 0.98
MCL0M 101 2428 2398 1.00 L, 16.3 — 0 0.66
MCL50M 102 2427 2397 1.00 L, 16.3 D, 447 0.14 0.68
MCL100M 101 2425 2398 1.00 L, 16.3 D, 447 0.28 0.98
MCS0M 102 2425 2398 1.00 S, 19.4 — 0 0.66
MCS100M 102 2424 2397 1.00 S, 19.4 D, 447 0.28 0.97
Quasi-static: reversed-cyclic
MCN50C 102 2431 2399 1.00 N, 17.5 D, 447 0.14 0.68
MCN100C 101 2432 2397 1.00 N, 17.5 D, 447 0.28 0.98
MCS50C 102 2424 2403 1.00 S, 22.0 D, 447 0.14 0.67
MCS100C 103 2426 2401 1.00 S, 22.0 D, 447 0.28 0.96
MCL50C 101 2426 2398 1.00 L, 10.8 D, 447 0.14 0.68
MCL100C 101 2424 2399 1.00 L, 10.8 D, 447 0.28 0.98
MRN100C 100 2433 2400 0.44 N, 16.2 D, 447 0.28 0.22
MEN100C 100 2435 1240 1.94 N, 16.2 D, 447 0.28 1.50
MRN50C 100 2425 2400 0.44 N, 16.2 D, 447 0.14 0.22
MEN50C 100 2421 1240 1.94 N, 16.2 D, 447 0.14 1.04
MRL100C 101 2423 5413 0.44 L, 5.2 D, 447 0.28 0.32
MRN50mC 103 2401 5396 0.44 N, 20.0 W, 605 0.12 0.22
MCN50mC 103 2396 2398 1.00 N, 20.0 W, 605 0.12 0.72
MEN50mC 101 2399 1239 1.94 N, 20.0 W, 605 0.12 0.96
MRL50mC 106 2419 5415 0.44 L, 5.2 W, 605 0.12 0.21
MCL50mC 100 2423 2403 1.00 L, 26.0 W, 605 0.12 0.74
MEL50mC 100 2435 1221 1.94 L, 26.0 W, 605 0.12 0.82*
MVN100C 110 2397 3826 † N, 16.0 D, 447 0.26 0.82*
MVN50mC 110 2397 3826 † N, 16.0 W, 605 0.11 0.74
MCN50C-2 100 2400 2398 1.00 N, 20.0 D, 447 0.14 0.71
MCS50C-2 104 2404 2402 1.00 S, 27.1 D, 447 0.14 0.71
MCL50C-2 100 2426 2441 1.00 L, 26.0 D, 447 0.14 0.73
MCL100C-2 98 2432 2407 1.00 L, 5.2 D, 447 0.29 1.01
MCNB50mC 102 2404 2401 1.00 N, 8.9 W, 605 0.12 0.73
MRNB50mC 100 2401 5400 0.44 N, 8.9 W, 605 0.13 0.22
Dynamic: shake table
MCN50mD 83 1923 1916 1.00 N, 24.7 W, 630 0.11 0.78
MCN100D 84 1924 1921 1.00 N, 24.7 D, 435 0.26 1.02
MCL50mD 82 1917 1917 1.00 L, 21.0 W, 630 0.11 0.79
MCL100D 82 1918 1912 1.00 L, 21.0 D, 435 0.27 1.06
MVN50mD 83 1924 3042 † N, 24.7 W, 630 0.11 0.87*
MVN100D 84 1926 3042 † N, 24.7 D, 435 0.26 0.87*
*Mean value for wall segment generated by opening. †Wall with openings. Note: r = As/twd.

418 ACI Structural Journal/May-June 2013
Table 4—Measured response of wall specimens
Type of testing Wall Failure mode Vmax = Vm, kN
Vp/Vm (p is predicted, m is measured)
This studyACI 318-11,Chapter 21
ACI 318-11,Chapter 11
Flores et al. (2007)
Gulec and Whittaker (2009)
Sánchez and Alcocer (2010)
Quasi-static: monotonic
MCN0M DT 197 — — — — — —
MCN50M DT 408 — — — — — —
MCN100M DC-DT 617 — — — — — —
MCL0M DT 229 — — — — — —
MCL50M DT 390 — — — — — —
MCL100M DC-DT 377 — — — — — —
MCS0M DT 275 — — — — — —
MCS100M DT-DC 509 — — — — — —
Quasi-static: reversed-
cyclic
MCN50C DT 352 0.90 1.16 1.01 0.81 0.89 1.18
MCN100C DC-DT 453 0.92 1.23 1.05 0.87 0.87 1.17
MCS50C DT 382 0.88 1.13 0.99 0.78 0.85 1.16
MCS100C DT-DC 475 0.98 1.26 1.08 0.89 0.87 1.21
MCL50C DT 261 1.05 1.35 1.18 0.94 * 1.36
MCL100C DC 336 0.97 1.96 1.57 1.48 * 1.35
MRN100C DC-SL 766 1.05 1.83 1.83 * * *
MEN100C DC-DT 208 0.98 1.15 1.16 0.96 0.85 1.06
MRN50C DT 670 1.06 1.32 1.16 0.92 1.13 1.47
MEN50C DT 157 0.95 1.03 1.14 0.90 0.89 1.12
MRL100C SL 800 0.89 0.57 0.57 * * *
MRN50mC DT 776 1.01 1.28 1.12 0.92 1.07 1.46
MCN50mC DT 329 1.02 1.34 1.17 0.97 1.04 1.41
MEN50mC DT 154 1.05 1.15 1.28 1.06 0.96 1.31
MRL50mC DT 568 0.97 1.23 1.07 0.92 * 1.35
MCL50mC DT 400 0.90 1.18 1.03 0.85 0.90 1.25
MEL50mC DT 172 0.99 1.09 1.22 1.00 0.88 1.24
MVN100C DT-DC 383 0.91 1.12 1.02 0.85 * 1.08
MVN50mC DT 252 1.02 1.25 1.20 0.99 * 1.34
MCN50C-2 DT 329 0.99 1.28 1.12 0.89 1.04 1.31
MCS50C-2 DT 321 1.15 1.49 1.31 1.03 1.16 1.54
MCL50C-2 DT 375 0.96 1.24 1.09 0.86 0.98 1.28
MCL100C-2 DC 336 0.87 1.33 1.06 1.00 * 0.91
MCNB50mC DT 237 1.12 1.46 1.28 1.08 * 1.52
MRNB50mC DT 612 0.99 1.26 1.10 0.94 * 1.41
Dynamic: shake table
MCN50mD DT 234 0.95 1.25 1.09 0.91 0.90 1.30
MCN100D DT-DC 274 1.09 1.41 1.21 0.99 0.94 1.35
MCL50mD DT 240 0.87 1.14 1.00 0.83 0.85 1.19
MCL100D DT-DC 250 1.13 1.46 1.25 1.03 0.99 1.38
MVN50mD DT 184 0.95 1.15 1.11 0.92 * 1.26
MVN100D DT-DC 226 1.04 1.27 1.17 0.96 * 1.25
Mean 0.99 1.27 1.15 0.95 0.95 1.28
Coefficient of variation (CV), % 7.7 18.2 17.1 13.1 10.0 10.8
Overpredictions Op, % 19.4 93.5 80.6 10.3 15.8 96.6*Failure mode, value of fc, or value of hw/lw is not included in model.
of concrete to diagonal tension and to diagonal compression strength, respectively. The factors hh,v, a1, and a2 depend on drift ratio and may be used to calculate strength at any defor-mation level. In this paper, the factors hh,v, a1, and a2 are only referred to at drifts associated with peak strength.
Approaches to calculate web steel contributionFor estimating the web steel contribution to peak shear
strength, several models have been reported in the literature. The models proposed by Barda et al. (1977), Hernández and Zermeño (1980), Wood (1990), Leiva and Montaño (2001), Flores et al. (2007), Gulec and Whittaker (2009), Sánchez
and Alcocer (2010), ASCE-43 (2005), and ACI 318-11 are shown graphically in Fig. 2.
According to a literature review, the main parameters affecting the contribution of web reinforcement are the wall hw/lw, web steel ratio, yield strength of web reinforcement, and geometry of the wall cross section. From Fig. 2, the lack of a consistent trend of the contribution of horizontal and vertical web reinforcement to wall peak shear strength is readily apparent.
The Barda et al. (1977) and ASCE-43 (2005) models are proposed for walls with boundary elements. In the develop-ment of the model proposed by Hernández and Zermeño (1980), 75% of wall specimens also had boundary elements.

ACI Structural Journal/May-June 2013 419
According to Barda et al. (1977), for walls with hw/lw < 1 and with boundary elements, horizontal reinforcement becomes less effective as compared to vertical reinforcement, particu-larly for walls with hw/lw < 0.5 (Fig. 2(e)). For walls with M/Vlw < 1 (M/Vlw is the ratio between bending moment and shear force times wall length), the Hernández and Zermeño (1980) model is comparable to the model originally proposed by Barda et al. (1977)—that is, only the contribution of hori-zontal web reinforcement is accounted for shear strength. With minor adjustments, ASCE-43 (2005) expands the Barda et al. (1977) model to walls with hw/lw < 2 (Fig. 2(d)). The model proposed by Wood (1990) is based on a shear-friction analogy (Fig. 2(h)); thus, the contribution of steel reinforcement is calculated using all vertical reinforcement of the wall cross section.
In the model proposed by Gulec and Whittaker (2009), the web steel contribution to wall shear strength is limited to vertical reinforcement (Fig. 2(g)). Gulec and Whittaker (2009) identified that when walls are reinforced using steel ratios smaller than the minimum prescribed by ACI 318, horizontal web reinforcement has a more pronounced effect on peak shear strength. Also, their model assumes that for the displacement associated with peak shear strength, web steel strains are close to yield. However, in their results, for walls with hw/lw = 1.0, contribution of vertical web reinforcement is equal to 25% for walls with a rectangular cross section and equal to 40% for walls with boundary elements.
Several experimental studies have validated the adequacy of the design approach included in Chapter 21 of ACI 318 for calculating the contribution of web steel reinforcement (Fig. 2(a)). For example, Hidalgo et al. (2002) reported on the beneficial effect of using web horizontal reinforcement to promote a more ductile behavior. Moreover, Hidalgo et al. (2002) observed a negligible contribution of vertical web reinforcement to the shear strength of walls with M/Vlw ratios varying between 0.3 and 1.0; this observa-tion is especially true for walls with M/Vlw ≥ 0.5. In the models proposed by Sánchez and Alcocer (2010), Flores et al. (2007), and Leiva and Montaño (2001), which were
calibrated using experimental results, contribution of web reinforcement to the wall peak shear strength is also associ-ated with the horizontal web steel ratio (Fig. 2(b) and (c)). In these three models, horizontal web reinforcement contri-bution to wall shear strength is, for most cases, smaller than the contribution calculated from ACI 318-11.
The results of tests reported herein slightly deviate from the ACI 318 approach for calculating the contribution of web steel reinforcement to wall peak shear strength. The approach considers that not all reinforcement is at yielding when peak shear strength is reached. Therefore, the concept of an efficiency factor is introduced to reflect the amount of wall reinforcement at yielding. Such a factor mainly depends on the drift ratio, as well as on the type and amount of web reinforcement. The efficiency factors for wall reinforcement (web and boundary reinforcement) measured during the shake-table tests of low-rise RC walls are presented in Fig. 3. The efficiency factor is calculated as the ratio of mean steel strain measured at wall peak shear strength and yield steel strain measured from a coupon test (e′/ey). In ACI 318, it is implicitly assumed that the efficiency factor of horizontal wall reinforce-ment is constant and equal to 1.0 at any drift level, all amounts of reinforcement, and all ranges of wall aspect ratios. In short, it is assumed in ACI 318 that all web reinforcement will attain yield at wall shear strength. From Fig. 3, it is readily apparent that during shake-table tests, yielding of web reinforcement was attained only in horizontal bars or wires. Therefore, in these tests, web steel contribution to wall shear strength was fundamentally associated with the horizontal reinforcement. Regarding the mean value of the efficiency factor (e′/ey), it is noted in Fig. 3(a) and (b) that yielding of all horizontal web steel reinforcement was never measured; therefore, the efficiency factor was always smaller than 1.0. By comparing Fig. 3(a) and (b), it is clear that values of the efficiency factor mainly depended on the type of reinforcement and much less on the hw/lw. The latter rejects the assumption of ACI 318 with regard to the lack of dependency of the contribution of hori-zontal web reinforcement on hw/lw. However, measured results
Fig. 2—Contribution of wall reinforcement to peak shear strength.

420 ACI Structural Journal/May-June 2013
contrast with the postulation of ACI 318 about the contribution being independent of the type of web reinforcement (Fig. 3(c)).
Strains measured in the vertical web reinforcement during shake-table tests reported herein were mainly associated with the uniform distribution of inclined cracks. As reported by Benjamin and Williams (1957) and Barda et al. (1977), the contribution to wall strength (that is, its efficiency) depends on hw/lw. For example, as the hw/lw diminishes, strain of the vertical reinforcement increases because the angle of inclina-tion of cracks becomes flatter (that is, cracks exhibit a smaller inclination). Thus, as the angle between vertical bars/wires and inclined cracks is closer to 90 degrees, vertical web reinforcement is more effective for producing a distributed crack pattern and for reducing crack widths. In this way, as specified by ACI 318, a minimum vertical web reinforce-ment ratio should be placed and should depend on the hori-zontal web steel ratio and hw/lw. As shown in Fig. 3(c), the contribution of vertical web reinforcement to strength does not appear to depend on the type of web reinforcement used in the testing program.
Strains in the longitudinal boundary reinforcement were within the elastic range of behavior (Fig. 3(d)). Strains were mostly associated with flexural demands. The small magni-tude of strains is consistent with the design criterion by which specimens tested were purposely dimensioned and detailed to attain a shear failure, as that observed in RC walls for low-rise housing.
Functional form of equation to estimate peak shear strength Vmax
For estimating the peak shear strength of RC walls used in typical low-rise housing, Eq. (2) is proposed.
1 2[ ]max c h h yh w c wV f f A f A= a + h r ≤ a′ ′ (2)
Similar to Eq. (1), the first term in brackets in Eq. (2) is associated with a diagonal tension failure. Diagonal tension is regarded as a more preferable failure mode as compared to diagonal compression and sliding failures. Following the
discussion presented previously, the steel contribution to strength is assigned to horizontal web reinforcement. The modification factor for lightweight concrete l specified by ACI 318 was not considered for Eq. (2) because measured results demonstrated that the application of this factor is not needed for the lightweight concrete with the character-istics studied herein (Table 2). For simplicity, Eq. (2) was calibrated on the basis of the gross area of wall concrete bounded by wall thickness and wall length (Aw = tw × lw).
Efficiency of horizontal web reinforcement—As shown in Fig. 3(a) and (b), in most cases, the efficiency factor of hori-zontal web reinforcement at peak shear strength was smaller than 1.0. Thus, factor hh is included in Eq. (2) to better char-acterize the contribution of horizontal web reinforcement to peak shear strength. Trends of experimental results were studied; from this analysis, it was concluded that the main variables affecting hh are distribution of steel strains along web diagonals, web steel ratio, and type of web reinforcement.
Analysis of test data indicated that the distribution of steel strain in the horizontal reinforcement is not uniform along the wall height. Steel strain depends on the width of inclined cracks that are minimal near the base and top of the wall. In most cases, horizontal reinforcement crossing the cracks in these zones remains elastic. Then, yielding is usually concen-trated in bars/wires located in the middle portion of the wall (around midheight and midlength). Similarly, if a strain distri-bution of horizontal reinforcement is drawn along the wall diagonal, peak strain would be observed at midlength along the diagonal. This phenomenon was observed in specimens tested under shake-table excitations and has also been observed in walls tested under quasi-static loading (Leiva and Montaño 2001; Flores et al. 2007; Sánchez and Alcocer 2010).
Regarding the effect of web steel ratio on hh, Sánchez and Alcocer (2010) detected that as the horizontal web steel ratio increases, the efficiency factor hh becomes smaller. Analogously, Wood (1990) noticed that the rate of increase of peak shear strength attributable to web reinforcement in low-rise walls appears to be overestimated by the equation proposed by ACI 318 for seismic design of concrete walls.
Fig. 3—Efficiency of wall reinforcement at peak shear strength measured during shake-table tests: (a) web horizontal reinforcement made of deformed bars; (b) web horizontal reinforcement made of welded-wire mesh; (c) web vertical reinforcement; and (d) longi-tudinal boundary reinforcement.

ACI Structural Journal/May-June 2013 421
Wood’s (1990) statement supports the fact that the efficiency factor of horizontal reinforcement is not constant. Hori-zontal web steel ratios of specimens studied by Wood (1990) and Sánchez and Alcocer (2010) varied between 0.1% and 1.9% and 0.12% and 1.4%, respectively. In contrast, in the tests reported in this study, walls tested under dynamic loads (with web steel ratios of 0.11 and 0.28%) did not exhibit a reduction in factor hh when the horizontal web steel ratio increased. The factor hh remained nearly constant for these two steel ratios tested (Fig. 4(a)).
Despite significant differences in the stress-strain behavior of deformed bars and welded-wire mesh used in this study, current design methodologies do not explicitly consider the effect of the type of horizontal web reinforcement on peak shear strength. “Yielding” is clearly defined for reinforcement made of mild steel where an increment of tensile strength is not observed until a well-defined yielding platform is devel-oped (Fig. 4(b)). In contrast, cold-drawn wire reinforce-ment used in this study did not exhibit a specific yield point, and thus the correct term for welded-wire mesh is “plastic yielding.” Because minimum web steel reinforcement aims at maintaining the inclined cracking load (that is, diagonal tension cracking), design codes allow a reduction of the web steel ratio in proportion to the increase of yield strength as compared to that of Grade 60 steel. This effect is consid-ered in ACI 318 and in the Mexico City Building Standards for Masonry Design (NTC-M 2004). However, the concept of reducing the steel ratio is applicable when higher-yield reinforcement exhibits a minimum elongation capacity to that minimum ductile behavior.
In the welded-wire mesh used in this study, the loading branch between onset of “yielding” and maximum deforma-tion capacity (at fracture) was much shorter than that of mild-steel bars (Fig. 4(b) and Table 2). The behavior of this type of material was characterized by wire fracture with a slight increment of strain. As observed during wall testing, welded-wire mesh suddenly fractured, thus leading to a brittle and undesirable failure mode. Based on this observation, for seismic design of walls with web shear reinforcement made of welded-wire mesh similar to those used in this study, the reduction of the web steel ratio in proportion to the increase of yield strength should not be allowed by codes. Addition-ally, safety factors in allowable drift ratios should be higher than those of walls reinforced with deformed mild-steel bars.
As can be observed in Fig. 3(a) and (b), the efficiency factor of horizontal web reinforcement, measured in walls reinforced with deformed bars and the minimum code-prescribed steel ratio, was 86%. The efficiency factor measured in walls
using welded-wire mesh and half of the minimum speci-fied by ACI 318 was 78%. On the basis of test observations and trends from experimental results, Eq. (3) is proposed for calculating the efficiency factor hh. The factor hh is consid-ered to be constant within the range of steel web ratios used in low-cost housing. Two values of hh are proposed; the highest value is when deformed steel bars are used for web reinforcement. When welded-wire mesh—with the charac-teristics shown in Table 2—is used, a lower value is required. The proposed values are lower than those measured during tests and are shown in Fig. 4(a) with the label “This study.” Measured values for deformed bars and welded-wire mesh are also shown in Fig. 4(a) using square- and diamond-shaped markers, respectively. Values of hh should be used when rh fyh ≤ 1.25 MPa (0.18 ksi); this upper limit corresponds to the highest value of specimens tested under dynamic and quasi-static loading in this program (Table 3).
for deforme0 d bars.8 hh = (3a)
for welded-wire mesh0.7 hh = (3b)
According to Eq. (3), when wall peak shear strength is attained, horizontal web steel reinforcement would attain, on average, strains corresponding to 80% of yield strain if deformed bars are used. Conversely, if welded-wire mesh is used, reinforcement will reach an average strain of 70% of yield strain. This phenomenon departs from the typical ACI 318-11 approach, in which all the horizontal reinforce-ment is assumed to reach yielding at wall peak shear strength. Also included in Fig. 4(a) are the trends of hh in other models and results measured during shake-table testing.
The model proposed by Sánchez and Alcocer (2010) follows trends observed from data of walls with rh fyh varying between 0.3 and 8.5 MPa (0.04 and 1.23 ksi). Models proposed by Leiva and Montaño (2001) and Flores et al. (2007) use a constant value of hh equal to 0.7 and 0.75, respectively. As expected, important differences in the effi-ciency factors of horizontal web reinforcement in concrete and masonry walls are evident. In Fig. 4(a), it is apparent that for horizontally reinforced masonry walls, the factor hh decreases with the amount of web steel reinforcement. This phenomenon was observed in tests under quasi-static loading of masonry walls (NTC-M 2004).
Requirements for web vertical reinforcement—As mentioned previously, strains measured in the vertical web reinforcement during tests were mainly associated with the
Fig. 4—Efficiency and behavior of horizontal web reinforcement at peak shear strength: (a) variation of efficiency factor during shake-table tests; and (b) typical stress-strain behavior of reinforcing bars and wires of welded-wire mesh used in this study. (Note: 1 MPa = 145 psi.)

422 ACI Structural Journal/May-June 2013
uniform distribution of inclined cracks on the wall panel—that is, several minor cracks instead of a single or very few major cracks. Thus, a minimum amount of vertical steel should be placed in the web. As the hw/lw decreased—that is, the wall became squatter—the relative contribution of vertical bars to strength was expected to become higher compared to that of horizontal reinforcement (Fig. 5(b)).
In Chapter 11 of ACI 318-11, applicable for design of ordi-nary walls, both horizontal and vertical web reinforcement are required. For effectively restraining inclined cracks, this reinforcement should be uniformly distributed in the web. Also, the ratio of vertical web reinforcement shall not be less than that computed using Eq. (4). Calculated ratios for vertical reinforcement using Eq. (4) are shown in Fig. 5(a) for different values of horizontal reinforcement expressed as a fraction of the minimum web steel ratio (rh = Xrmin, where X = 1, 1.5, 2, 2.5, 3, and 4).
0.0025 0.5 2.5 ( 0.0025) 0.0025wv h
w
hl
r = + − r − ≥
(4)
For seismic design of special walls, Chapter 21 of ACI 318 specifies that for walls with hw/lw < 2, the vertical web steel ratio rv shall not be less than the horizontal web steel ratio rh. It also indicates that it is not necessary to provide a rv ratio higher than the rh ratio required by the design shear force (Fig. 5(b)). To prevent a rapid shear failure after web steel yielding, Hernández and Zermeño (1980) recommended providing similar web steel ratios in both directions. A 1:0.67 relation between the largest and smallest web steel ratios was proposed. The requirements for the vertical web steel ratio according to Barda et al. (1977), Hernández and Zermeño (1980), and the results measured during the shake-table testing of low-rise RC walls are also shown in Fig. 5(b). When comparing measured results to
Chapter 21 requirements, two relevant issues are observed: 1) the trend of data does not support the abrupt change of rv at hw/lw = 2; and 2) as the hw/lw decreases, the relative effi-ciency between vertical and horizontal reinforcement (that is, ev/eh) augment; however, in all cases, the magnitude of the relative efficiency is much smaller than that obtained using ACI 318 criterion. Based on observed trends and data from the experiments reported herein, Eq. (5) is proposed for calculating the vertical web steel ratio of RC walls for low-rise housing (labeled “This study” in Fig. 5(c)). It is recog-nized that Eq. (5) provides a conservative estimate for rv.
0.5 2 ( )wv min h min min
w
hl
r = r + − r − r ≥ r (5)
In Eq. (5), when rmin = 0.0025 and the numerical constant 2 is replaced by 2.5, results obtained from Eq. (4) and (5) are similar. Besides, when rh = rmin, then rv = rmin; otherwise, rv diminishes gradually with hw/lw up to a steel ratio equal to rmin.
Concrete contribution to diagonal tension shear strength—The concrete contribution of shear strength comprises the diagonal tension strength of the wall. Typically, such strength is calculated from the square root of concrete strength. In Eq. (2), a1 is a constant that modifies the square root of the specified concrete compressive strength. This coefficient mainly depends on wall geometry and boundary conditions (that is, the M/Vlw ratio), as well as on the vertical axial stress acting on the wall cross section sv. The fact that the shear strength of squat walls (low M/Vlw ratio) is higher than that of slender walls with similar material properties is widely accepted. Recently, it has been proposed that diagonal tension shear strength also depends on wall ductility or wall drift (Leiva and Montaño 2001; Sánchez and Alcocer 2010). As
Fig. 5—Requirements for web vertical reinforcement: (a) ordinary walls; (b) earth-quake-resistant walls; and (c) observed trend of results measured during shake-table tests and proposed model for seismic design.

ACI Structural Journal/May-June 2013 423
indicated, the model proposed herein is applicable to drifts associated with peak strength.
Finite element analysis indicated that the average vertical axial stress at service loads of first-story walls was equal to 0.25 MPa (36.3 psi). Under actual seismic actions, vertical accelerations and/or coupling between walls may augment or diminish such stress. A reduction in compression axial stress or more so, if tension axial stress is generated, will cause a decrement in wall shear strength. Evidently, this effect was not observed during quasi-static testing because there was no inertial force developed and, thus, the vertical axial stress always contributed to the wall shear strength. Due to limited data available, a conservative, yet simple approach was followed. It was assumed that the contribu-tion of vertical axial stress to shear strength was unimportant so that sv was set equal to zero. This assumption, although conservative for medium and low seismic hazard zones, is considered reasonable for these box-type structures located in areas of high seismic hazard, where vertical accelerations may be close to or exceed 1 g (9.81 m/s2).
To estimate the coefficient a1 by means of measured results, the uc/√fc ratio was calculated for specimens tested under shake-table and quasi-static reversed-cyclic loading regimes. Only solid walls, where a diagonal tension (DT) or mixed failure mode (DT-DC) occurred, were included (Table 3). Walls with openings were not included because they cannot be associated with a unique M/Vlw ratio. Concrete contribution to diagonal tension shear strength was estimated using Eq. (6).
max sc
w w
V Vt l
−u = (6)
where Vmax is the peak shear force measured during the tests; and Vs is the contribution of horizontal web shear reinforce-ment calculated using the efficiency factor defined in Eq. (3). As-built wall dimensions and measured mechanical proper-ties of materials were used in the calculations (Table 3). The concrete contribution estimated by Eq. (6) for specimens tested is shown in Fig. 6(a). The line labeled as “This study” is the best fit of calculated points. Other models proposed are also shown in Fig. 6(a).
The estimated concrete contribution obtained from test results can be compared to that obtained from models proposed in the literature. In Flores et al. (2007), concrete contribution is independent from hw/lw. For this case, calcu-lated concrete contribution was conservative for most speci-mens (that is, predicted contribution was lower than or equal
to the estimated concrete contribution). In contrast, concrete contribution calculated using ACI 318, Chapter 21, was higher than that derived from test results for walls with M/Vlw < 1.5, thus indicating that ACI 318 predictions are unconser-vative for seismic design of squat walls for low-cost housing. In the model proposed by Sánchez and Alcocer (2010), predicted contribution was always higher than the estimated contribution. In the model proposed by Gulec and Whittaker (2009), the predicted contribution was found to be conserva-tive for walls with M/Vlw ≈ 0.5; however, it may be argued that it was quite conservative for walls with M/Vlw > 0.75. On the basis of experimental results, Eq. (7) is proposed for estimating a1 (“This study” in Fig. 6(a)).
( )1 MP0.21 0. a02 w
MVl
a = −
(7)
Equation (7) was found to be applicable to all types of concrete tested. Because Eq. (7) was derived using data from shake-table experiments, loading-rate effects, low-cycle fatigue, and the dynamic effect of the vertical axial stress on the wall shear strength are also included.
Upper limit to design shear strength—RC walls subjected to larger plastic shear demands may exhibit a failure mode characterized by crushing and spalling of web concrete. This mode of failure may occur after yielding of web reinforce-ment, so that a mixed behavior diagonal tension-diagonal compression may occur. Also, a compression failure may occur without significant plastification of web steel. This is particularly the case when low-strength concrete and/or large steel ratios are used. Diagonal compression failures are characterized by a sudden and rapid deterioration of strength and stiffness, as well as by a pronounced pinching of the hysteretic response. Then, it is recommendable to avoid this type of failure and thus to limit the magnitude of plastic shear stress. In Eq. (2), the factor a2 is critical to establish such an upper limit. Similarly to a1, factor a2 was derived from measured results—that is, the umax/√fc ratio was derived from results of specimens tested under shake-table and quasi-static reversed-cyclic loading. Only solid walls where a diagonal compression (DC) or mixed failure mode (DC-DT and DC-SL) occurred were included (Table 3). Maximum concrete contribution required for avoiding a diagonal compression failure of walls with a web steel ratio smaller than or equal to 0.25% was calculated using Eq. (8).
maxmax
w w
Vt l
u = (8)
Fig. 6—Contribution of concrete to peak shear strength measured during cyclic testing: (a) diagonal tension failure mode; and (b) diagonal compression failure mode. (Note: 1 MPa = 145 psi.)
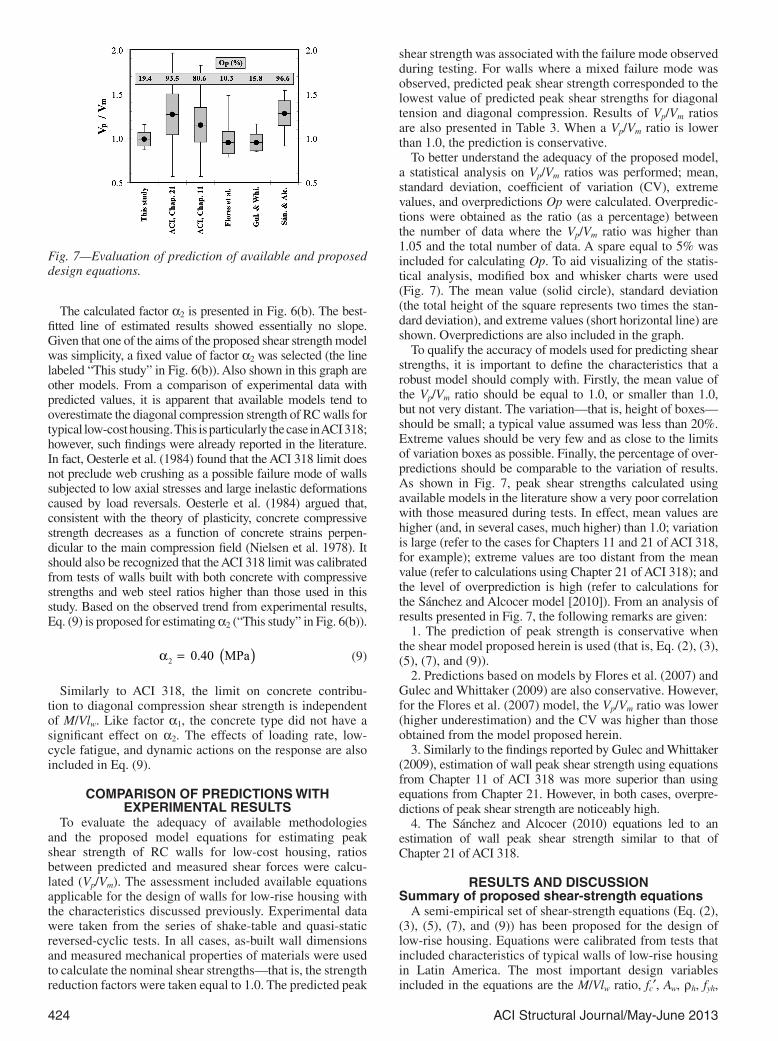
424 ACI Structural Journal/May-June 2013
The calculated factor a2 is presented in Fig. 6(b). The best-fitted line of estimated results showed essentially no slope. Given that one of the aims of the proposed shear strength model was simplicity, a fixed value of factor a2 was selected (the line labeled “This study” in Fig. 6(b)). Also shown in this graph are other models. From a comparison of experimental data with predicted values, it is apparent that available models tend to overestimate the diagonal compression strength of RC walls for typical low-cost housing. This is particularly the case in ACI 318; however, such findings were already reported in the literature. In fact, Oesterle et al. (1984) found that the ACI 318 limit does not preclude web crushing as a possible failure mode of walls subjected to low axial stresses and large inelastic deformations caused by load reversals. Oesterle et al. (1984) argued that, consistent with the theory of plasticity, concrete compressive strength decreases as a function of concrete strains perpen-dicular to the main compression field (Nielsen et al. 1978). It should also be recognized that the ACI 318 limit was calibrated from tests of walls built with both concrete with compressive strengths and web steel ratios higher than those used in this study. Based on the observed trend from experimental results, Eq. (9) is proposed for estimating a2 (“This study” in Fig. 6(b)).
( )2 0.4 Pa0 Ma = (9)
Similarly to ACI 318, the limit on concrete contribu-tion to diagonal compression shear strength is independent of M/Vlw. Like factor a1, the concrete type did not have a significant effect on a2. The effects of loading rate, low-cycle fatigue, and dynamic actions on the response are also included in Eq. (9).
COMPARISON OF PREDICTIONS WITH EXPERIMENTAL RESULTS
To evaluate the adequacy of available methodologies and the proposed model equations for estimating peak shear strength of RC walls for low-cost housing, ratios between predicted and measured shear forces were calcu-lated (Vp/Vm). The assessment included available equations applicable for the design of walls for low-rise housing with the characteristics discussed previously. Experimental data were taken from the series of shake-table and quasi-static reversed-cyclic tests. In all cases, as-built wall dimensions and measured mechanical properties of materials were used to calculate the nominal shear strengths—that is, the strength reduction factors were taken equal to 1.0. The predicted peak
shear strength was associated with the failure mode observed during testing. For walls where a mixed failure mode was observed, predicted peak shear strength corresponded to the lowest value of predicted peak shear strengths for diagonal tension and diagonal compression. Results of Vp/Vm ratios are also presented in Table 3. When a Vp/Vm ratio is lower than 1.0, the prediction is conservative.
To better understand the adequacy of the proposed model, a statistical analysis on Vp/Vm ratios was performed; mean, standard deviation, coefficient of variation (CV), extreme values, and overpredictions Op were calculated. Overpredic-tions were obtained as the ratio (as a percentage) between the number of data where the Vp/Vm ratio was higher than 1.05 and the total number of data. A spare equal to 5% was included for calculating Op. To aid visualizing of the statis-tical analysis, modified box and whisker charts were used (Fig. 7). The mean value (solid circle), standard deviation (the total height of the square represents two times the stan-dard deviation), and extreme values (short horizontal line) are shown. Overpredictions are also included in the graph.
To qualify the accuracy of models used for predicting shear strengths, it is important to define the characteristics that a robust model should comply with. Firstly, the mean value of the Vp/Vm ratio should be equal to 1.0, or smaller than 1.0, but not very distant. The variation—that is, height of boxes—should be small; a typical value assumed was less than 20%. Extreme values should be very few and as close to the limits of variation boxes as possible. Finally, the percentage of over-predictions should be comparable to the variation of results. As shown in Fig. 7, peak shear strengths calculated using available models in the literature show a very poor correlation with those measured during tests. In effect, mean values are higher (and, in several cases, much higher) than 1.0; variation is large (refer to the cases for Chapters 11 and 21 of ACI 318, for example); extreme values are too distant from the mean value (refer to calculations using Chapter 21 of ACI 318); and the level of overprediction is high (refer to calculations for the Sánchez and Alcocer model [2010]). From an analysis of results presented in Fig. 7, the following remarks are given:
1. The prediction of peak strength is conservative when the shear model proposed herein is used (that is, Eq. (2), (3), (5), (7), and (9)).
2. Predictions based on models by Flores et al. (2007) and Gulec and Whittaker (2009) are also conservative. However, for the Flores et al. (2007) model, the Vp/Vm ratio was lower (higher underestimation) and the CV was higher than those obtained from the model proposed herein.
3. Similarly to the findings reported by Gulec and Whittaker (2009), estimation of wall peak shear strength using equations from Chapter 11 of ACI 318 was more superior than using equations from Chapter 21. However, in both cases, overpre-dictions of peak shear strength are noticeably high.
4. The Sánchez and Alcocer (2010) equations led to an estimation of wall peak shear strength similar to that of Chapter 21 of ACI 318.
RESULTS AND DISCUSSIONSummary of proposed shear-strength equations
A semi-empirical set of shear-strength equations (Eq. (2), (3), (5), (7), and (9)) has been proposed for the design of low-rise housing. Equations were calibrated from tests that included characteristics of typical walls of low-rise housing in Latin America. The most important design variables included in the equations are the M/Vlw ratio, fc′, Aw, rh, fyh,
Fig. 7—Evaluation of prediction of available and proposed design equations.

ACI Structural Journal/May-June 2013 425
the efficiency of horizontal web reinforcement, and the type of web reinforcement (deformed bars and welded-wire mesh).
Limitations of proposed shear-strength equationsEquations are applicable to walls with the characteristics
found in one- to two-story concrete housing. Proposed equa-tions best predict peak shear strength of walls with M/Vlw ratios less than or equal to 2.0, a prismatic cross section, a response governed by shear deformations, concrete compressive strength that varies between 15 and 25 MPa (2175 and 2900 psi), axial stress less than 0.03fc′, a web steel ratio smaller than or equal to 0.25%, wall web reinforcement made of deformed bars or welded-wire mesh, and the same ratios of horizontal and vertical reinforcement.
Scope and evaluation of proposed equationsThe set of shear-strength equations proposed has been
developed to be included in design codes and evaluation guidelines. Variables considered in the testing program were obtained from the design and construction practice of low-rise concrete housing in Latin America. Other characteristics found in low-rise housing were also taken into account, such as normalweight (19 ≤ γ ≤ 21 kN/m3 [121 to 134 lb/ft3]), light-weight (15 ≤ γ ≤ 19 kN/m3 [96 to 121 lb/ft3]), and self-consol-idating (19 ≤ γ ≤ 21 kN/m3 [121 to 134 lb/ft3]) concretes and walls with openings (door and window). Proposed equations were calibrated on the basis of results observed from both quasi-static and dynamic tests. Shake-table testing includes the dynamic effects observed in real structures subjected to actual earthquake loads—that is, loading-rate effects, low-cycle fatigue, and cumulative parameters (Carrillo and Alcocer 2013).
Statistical analysis of the predicted-to-measured shear-strength ratio Vp/Vm provided clear evidence that the proposed equations lead to predicted peak shear strengths that are very similar to those measured. Statistical analysis also demonstrated that scatter was also lower than that observed when other equations available in the literature are used.
CONCLUSIONSBased on test results, the following conclusions can
be obtained:1. A set of semi-empirical equations for estimating shear
strength of RC walls for low-rise construction were devel-oped. These equations are based on a limited number of data points but, in the absence of more data, they are indicative of the performance of walls similar to those tested and studied in the research program presented herein. Proposed equa-tions may be improved when more data become available. The format of equations is similar to that accepted in most design codes. Equations comprise concrete and web steel contributions to strength. A limit on plastic shear demand to avoid a diagonal compression failure was established.
2. The concrete contribution to shear strength corresponds to the diagonal tension strength of the wall. The diagonal tension strength term depends on the concrete strength and the M/Vlw ratio. Factor a1 that multiplies √fc in the shear-stress equation was calibrated from test results.
3. The web steel contribution to strength was found to be dependent on the efficiency of horizontal reinforcement. An efficiency factor was proposed as a measure of the amount
of yielding of horizontal web reinforcement. The efficiency factor depended on the type of reinforcement used; an effi-ciency factor of 0.8 is proposed for deformed bars and 0.7 for welded-wire mesh.
4. Ideally, the design wall strength should be controlled by the diagonal tension strength of concrete plus web steel contribution. Thus, the magnitude of plastic shear demand should have a maximum value. A numerical factor a2 was calibrated from test results for establishing such a limit. That factor was found to be constant and independent of other variables; a value of 0.4 was proposed for a2.
ACKNOWLEDGMENTSThe authors wish to express their gratitude and sincere appreciation to Grupo
CEMEX for financing this research work, and to staff and students of the Shake Table Laboratory of the Instituto de Ingeniería at UNAM for their extensive assistance during the tests. The views expressed in this paper are solely those of the authors and do not necessarily reflects the views of the sponsor.
REFERENCESACI Committee 318, 2011, “Building Code Requirements for Structural
Concrete (ACI 318-11) and Commentary,” American Concrete Institute, Farmington Hills, MI, 503 pp.
ASCE-43, 2005, “Seismic Design Criteria for Structures, Systems, and Components in Nuclear Facilities,” American Society of Civil Engineers, Reston, VA, 96 pp.
Barda, F.; Hanson, J.; and Corley, W., 1977, “Shear Strength of Low-Rise Walls with Boundary Elements,” Reinforced Concrete Structures in Seismic Zones, SP-53, N. M. Hawkins and D. Mitchell, eds., American Concrete Institute, Farmington Hills, MI, pp. 149-202.
Benjamin, J., and Williams, H., 1957, “The Behavior of One-Story Reinforced Concrete Shear Walls,” Journal of the Structural Division, ASCE, V. 83, No. ST3, pp. 1-49.
Carrillo, J., and Alcocer, S., 2012, “Seismic Performance of Concrete Walls for Housing Subjected to Shaking Table Excitations,” Engineering Structures, V. 41, pp. 98-107.
Carrillo, J., and Alcocer, S., 2013, “Experimental Investigation on Dynamic and Quasi-Static Behavior of Low-Rise Reinforced Concrete Walls,” Earthquake Engineering & Structural Dynamics, V. 42. (in press)
Flores, L.; Alcocer, S.; and Carrillo, J., 2007, “Tests of Concrete Walls with Various Aspect Ratios and Small Steel Ratios, to be Used for Housing,” Paper 11-2, Proceedings of the XVI National Conference on Earthquake Engineering, Ixtapa-Zihuatanejo, Mexico, 29 pp. (in Spanish)
Gulec, C., and Whittaker, A., 2009, “Performance-Based Assessment and Design of Squat Reinforced Concrete Shear Walls,” Report No. MCEER-09-0010, Multidisciplinary Center for Earthquake Engineering Research, Buffalo, NY, 291 pp.
Hernández, O., and Zermeño, M., 1980, “Strength and Behavior of Struc-tural Walls with Shear Failure,” Proceedings of the 7th World Conference on Earthquake Engineering, V. 4, Istanbul, Turkey, pp. 121-124.
Hidalgo, P.; Ledezma, C.; and Jordán, R., 2002, “Seismic Behavior of Squat Reinforced Concrete Walls,” Earthquake Spectra, V. 18, No. 2, pp. 287-308.
Leiva, G., and Montaño, E., 2001, “Shear Strength of Concrete Walls,” Ingeniería Sísmica, No. 64, pp. 1-18. (in Spanish)
Nielsen, M.; Braestrup, M.; and Bach, F., 1978, “Rational Analysis of Shear in Reinforced Concrete Beams,” Paper P15/78, Proceedings of the IABSE Conference, Zurich, Switzerland, 16 pp.
NTC-M, 2004, “Mexico City Building Standards for Design and Construction of Masonry Structures,” Gaceta Oficial del Distrito Federal, Mexico City, Mexico, 48 pp. (in Spanish)
Oesterle, R.; Aristizabal-Ochoa, J.; Shiu, K.; and Corley, W., 1984, “Web Crushing of Reinforced Concrete Structural Walls,” ACI Structural Journal, V. 81, No. 3, May-June, pp. 231-241.
Sánchez, A., 2010, “Seismic Behavior of Housing with Concrete Walls,” Technical Report, Institute of Engineering, Universidad Nacional Autónoma de México, Mexico City, Mexico, 475 pp. (in Spanish)
Sánchez, A., and Alcocer, S., 2010, “Shear Strength of Squat Reinforced Concrete Walls Subjected to Earthquake Loading—Trends and Models,” Engineering Structures, V. 32, No. 8, pp. 2466-2476.
Wood, S., 1990, “Shear Strength of Low-Rise Reinforced Concrete Walls,” ACI Structural Journal, V. 87, No. 1, Jan.-Feb., pp. 99-107.

426 ACI Structural Journal/May-June 2013
NOTES:

ACI Structural Journal/May-June 2013 427
Title no. 110-S33
ACI STRUCTURAL JOURNAL TECHNICAL PAPER
ACI Structural Journal, V. 110, No. 3, May-June 2013.MS No. S-2011-177.R3 received March 9, 2012, and reviewed under Institute
publication policies. Copyright © 2013, American Concrete Institute. All rights reserved, including the making of copies unless permission is obtained from the copyright proprietors. Pertinent discussion including author’s closure, if any, will be published in the March-April 2014 ACI Structural Journal if the discussion is received by November 1, 2013.
Reducing Steel Congestion without Violating Seismic Performance Requirementsby Gerasimos M. Kotsovos, Emmanuel Vougioukas, and Michael D. Kotsovos
This paper is concerned with an experimental investigation of the behavior of reinforced concrete (RC) beam-column speci-mens subjected to cyclic loading combined with a constant axial force. The specimens have the same geometry and longitudinal reinforcement but differ, on one hand, in that the portion of the longitudinal reinforcement within the critical regions is debonded from concrete in certain specimens and, on the other hand, in the transverse reinforcement arrangement; the latter is designed either in compliance with the earthquake-resistant design clauses of the current European codes or in accordance with the method of the compressive force path. The results obtained indicate that adopting the latter method yields significantly less transverse reinforcement in the critical regions without compromising the code performance requirements. Moreover, when the application of this method is combined with debonding the longitudinal reinforcement within these regions from concrete, a significant improvement in struc-tural behavior is achieved.
Keywords: beam-column elements; bond; concrete-steel interaction; design; earthquake-resistant design; experiment; reinforced concrete.
INTRODUCTIONIt is well-established that bond failure at the inter-
face between concrete and flexural reinforcement leads to inclined (“shear”) cracking in reinforced concrete (RC) beam-column elements.1 Because it is the extension of such cracking that underlies the brittle modes of failure that may be suffered by RC structures, a large—if not the largest—amount of research work carried out to date on RC design is concerned with the solution of what is widely known as the “shear” problem. Solutions to this problem are invari-ably obtained through the development of design methods, which adopt various arrangements of transverse reinforce-ment in an amount sufficient to delay failure due to inclined crack extension until the code2-4 performance requirements for load-carrying capacity and ductility are satisfied.
However, the application of the aforementioned methods in earthquake-resistant design often leads to reinforce-ment congestion and, hence, in difficulties in placing and compacting concrete, particularly in the critical regions of RC beam-column elements—that is, the regions subjected to a large bending moment combined with a large shear force.5,6 Moreover, experimental evidence7-9 has been published that indicates that, in spite of the dense reinforce-ment arrangement specified, the resulting design solutions do not always safeguard the intended structural performance.
To this end, the experimental work described herein investigates the possibility of solving the shear problem by preventing the formation, rather than the extension, of inclined cracking in the critical regions of beam-column elements. Because the causes of such cracking are inextricably linked with the interaction between concrete and the longitudinal steel bars, it is attempted to prevent inclined crack forma-
tion by preventing concrete-steel interaction through the use of a polyvinyl chloride (PVC) pipe cover to the portion of the steel bars within the critical regions of simply supported beam-column specimens. This technique for eliminating bond has been adopted in previous work concerned with, on one hand, the causes of shear failure10,11 and, on the other hand, the improvement of the earthquake performance of bridge piers12,13 and beam-column joints.14 The specimens investigated are subjected to transverse cyclic loading exerted at midspan, with half of the specimens tested also being subjected to axial compression. This work is based on a comparative study of the results obtained from similar tests, in which the specimens were manufactured without using a PVC pipe to cover the steel bars.
RESEARCH SIGNIFICANCEThis work forms part of a wider research program
concerned with the development of a sound theoretical basis that could form the basis of alternative methods capable of unifying and simplifying the analysis and design of concrete structures. Within the aforementioned framework, this work is concerned with an investigation of the possibility of reducing reinforcement congestion through the elimination of the bond between concrete and the flexural reinforcement within the critical lengths of beam-column elements.
EXPERIMENTAL PROGRAMStructural forms investigated
The structural forms investigated are simply supported beam-column specimens such as those shown in Fig. 1, which also shows the specimens’ cross-sectional character-istics, load arrangement, and relevant bending-moment and shear-force diagrams. At midspan, the specimens are mono-lithically connected to a transversely oriented short prismatic element (with a width equal to the specimen width), which is over-reinforced so as to remain undamaged throughout the test. It is interesting to note in the figure that Portions AB and CD of the structural element are subjected to internal actions similar to those of the portion of a column between its point of inflection and one of its ends. From the geometric characteristics of the aforementioned portions indicated in the figure, the value of the shear span (av) to depth (d) ratio for Portions AB and CD is approximately equal to 4.9.
From Fig. 1, it can be seen that the specimens had a span of 1950 mm (76.77 in.) and a 200 mm (7.87 in.) side square

428 ACI Structural Journal/May-June 2013
Gerasimos M. Kotsovos is a Research Associate at the Laboratory of Concrete Struc-tures of the National Technical University of Athens, Athens, Greece. He received his civil engineering diploma from the University of Patras, Patras, Greece, and his MSc and PhD from the National Technical University. His research interests include earthquake-resistant design of concrete structures.
Emmanuel Vougioukas is a Lecturer in the Civil Engineering Department of the National Technical University of Athens. He received his civil engineering diploma and PhD from the National Technical University of Athens. His research interests include the design of concrete structures and earthquake-resistant design.
ACI member Michael D. Kotsovos is a Professor of civil engineering at the National Technical University of Athens and Director of the Laboratory of Concrete Structures. He is a member of Joint ACI-ASCE Committee 447, Finite Element Analysis of Reinforced Concrete Structures.
cross section. The longitudinal reinforcement comprised three top and three bottom 16 mm (0.63 in.) diameter deformed bars with average values of yield stress and strength equal to 550 and 650 MPa (79.7 and 94.2 ksi), respectively. The stirrups were made from 6 mm (0.24 in.) diameter mild
steel bars with a yield stress of 300 MPa (43.5 ksi), which is smaller than the code limiting value of 400 MPa (58 ksi); the use of such stirrups, dictated by the specimen size adopted, does not affect the comparative study forming the subject of the work described herein. The concrete mixture proportions by weight were: portland pozzolan cement (CEM Type IP), 1; fine aggregate (95 to 100% < No. 4), 3.06; coarse aggre-gate No. 89, 1.83; coarse aggregate No. 67, 1.23; and effec-tive water 0.52. The cylinder strength of concrete at the time of testing of the specimens was 34 MPa (4.9 ksi) at an age of approximately 2.5 months. The specimens (both the control cylinders and the beam-column elements) were cured under wet hessian for 1 month, after which they were stored under laboratory ambient conditions (with a tempera-ture of approximately 20°C [68°F] and a relative humidity of approximately 50%).
Loading pathThree of the specimens tested were subjected to trans-
verse cyclic loading and the other three to sequential loading comprising axial (N) and transverse (P) components, as indicated in Fig. 1. In the latter case, N was applied first; it increased to a predefined value equal to N ≈ 0.2Nu = 0.2fcbh (where Nu is the maximum value of N that can be sustained by the specimen in concentric compression; fc is the uniaxial cylinder compressive strength of concrete; and b and h are the cross-sectional dimensions of the specimens), where it was maintained constant (with an accuracy of ±5 kN [±1.12 kip-ft]) during the subsequent application of P. For all specimens tested, P was applied at midspan in a cyclic manner inducing deflections varying between predefined values progressively increasing, as shown in Fig. 2. Three load cycles were induced at each predefined value.
Experimental setupThe experimental arrangement used for the tests comprised
two identical steel portal frames with a double-T cross section bolted in parallel onto the laboratory strong floor at a distance equal to the specimen’s span. As shown in Fig. 1 and 3, the specimens were supported on roller supports positioned underneath the bottom flange of the frame beams so that the reactions could act either upward or downward depending on the sense of the transverse point load. The transverse load was applied at the end faces of the prismatic element at the midspan of the specimens through a double-stroke 500 kN (112.4 kip-ft) hydraulic actuator fixed to the laboratory strong floor. The axial-compressive force was applied concentrically using an external prestressing force by means of four high-yield steel rods symmetrically arranged about the longitu-dinal axis of the specimen. The rods were anchored at each end with two steel plates, with one of them being attached at one end face of the element through a load-platen arrange-ment ensuring concentric loading, while the other was attached at the end face of a 1000 kN (224.8 kip-ft) hydraulic actuator acting against another steel load-platen arrangement attached to the other end face of the specimen. The actuator was capable of maintaining the axial force constant with an accuracy of ±5 kN (±1.12 kip-ft).
The transverse load was displacement-controlled. It was interrupted at regular intervals, corresponding to displace-ment increments of approximately 5 mm (0.2 in.), during which the load was maintained constant for at least 1 minute to mark cracks and take photographs of the specimen’s crack pattern. The load was measured by using a load cell, while the
Fig. 1—Structural forms investigated. (Note: 1 mm = 0.03937 in.)
Fig. 2—Loading history adopted for cyclic tests.

ACI Structural Journal/May-June 2013 429
deformation response was measured by linear voltage differ-ential transducers (LVDTs) measuring the specimen deflec-tion at the location of the transverse load point. The forces and displacements were recorded by using a computer-based data acquisition system.
Specimen designThe specimens tested were designed either in compli-
ance with the earthquake-resistant current code provi-sions3,4 or in accordance with the Compressive Force Path (CFP) Method,7,15 with all safety factors being taken equal to 1. In all cases, it was assumed that load-carrying capacity is reached when the specimen attains its flexural capacity at its interface with the prismatic element—the latter condition being referred to henceforth as plastic-hinge formation. Using the cross-sectional and material characteristics of the speci-mens, together with a rectangular compressive stress block with a depth equal to the neutral axis depth and a stress inten-sity equal to fc, as recommended by the CFP Method,7 the flexural capacity of the specimen was calculated as Mf (for a value of N equal to N ≈ aNu, with a obtaining values equal to 0 or 0.2 corresponding to values of N equal to 0 and 280 kN [0 and 62.9 kip-ft], respectively). Henceforth, the aforemen-
tioned structural elements are referred to by using a three-part denomination arranged in sequence to denote whether: 1) bond was allowed (B) or not (NB) to develop between concrete and the portion of the longitudinal steel bars within the critical region of the specimens (extending to a length of 300 mm [11.8 in.] from the beam-prismatic element inter-face); 2) the specimens were designed in accordance with the CFP (CFP) or the Code (EC) Method; and 3) an axial force was applied (N) or not (0).
Using Mf, the specimen’s load-carrying capacity Pf = 4Mf /L (where L is the specimen’s span) and, hence, the corre-sponding shear force Vf = Pf/2 was easily calculated. The values of Mf and Pf for each of the specimens tested are given in Table 1 together with the experimentally estab-lished values of the load-carrying capacity Pexp. The table also includes the values of bending moment My and load Py, which correspond at yielding of the cross sections; the latter values were used as discussed later to assess the ductility factor m of the specimens tested.
As discussed previously, the transverse reinforcement (stirrups) of the specimens was designed either in accor-dance with the CFP Method7,15 or in compliance with the earthquake-resistant design clauses of EC23 and EC8.4 The
Fig. 3—Experimental setup. (Note: 1 mm = 0.03937 in.; 1 kN = 0.2248 kip.)
Table 1—Calculated values of bending moment My and corresponding force Py at yield, flexural capacity Mf and corresponding load-carrying capacity Pf, and experimentally established values of load-carrying capacity Pexp
Specimens Design method N, kN My, kNm Py, kN Mf, kNm Pf, kN Pexp, kN Mexp, kNm
B-CFP-0 CFP 0 52.7 120.4 53.8 123.0 128.7 56.3
B-EC-0 EC2, EC8 0 52.7 120.4 53.8 123.0 126.8 55.5
NB-CFP-0 CFP 0 49.9 114.0 50.7 115.9 127.2 55.6
B-CFP-N CFP 280 54.2 123.5 72.7 166.1 164.5 75.9
B-EC-N EC2, EC8 280 54.2 123.5 72.7 166.1 170.3 78.2
NB-CFP-N CFP 280 49.5 113.4 68.2 155.8 158.7 73.6
Notes: 1 kN = 0.2248 kip; 1 kNm = 0.737 kip-ft.

430 ACI Structural Journal/May-June 2013
calculated values of the spacing of the 6 mm (0.24 in.) diam-eter bars used to form the stirrup reinforcement are given in Table 2, whereas the stirrup arrangement of the speci-mens tested is shown in Fig. 4. From the table, it is inter-esting to note the densely spaced stirrups within the “critical regions” (which, as shown in Fig. 4, extend to a distance of 300 mm [11.8 in.] from the beam-prismatic element interfaces) specified by the codes to provide confinement to concrete. Such spacing (resulting from expressions (5) to (15) in EC8 [Clause 5.4.3.2.2]4 using a rotation ductility factor mj = 5, which corresponds to a behavior factor q = qo = 3 and a displacement ductility factor md = 3 [refer to Clause 5.2.3.4(3)]) is considered to safeguard ductile specimen behavior. For Specimen B-EC-0 subjected only to cyclic transverse loading, the stirrup spacing used was equal to 80 mm (3.15 in.), which is slightly smaller than the maximum code-specified value of d/2 = 90 mm (3.54 in.) (refer to Eq. (5-18) in EC8 [Clause 5.4.3.2.2(11)]).4
As discussed elsewhere,7 in contrast with the code reasoning behind the calculation of the stirrups within the critical regions, the CFP Method specifies such reinforce-ment not for providing confinement to concrete, but to sustain the transverse tensile stresses developing within the compressive zone as a result of stress redistribution due to the loss of bond between concrete and the flexural reinforce-ment within the critical regions. A full description of the method used for calculating the stirrups within the critical regions in accordance with the CFP Method is provided in Reference 15.
On the other hand, transverse reinforcement within the remainder of the shear spans designed in compliance with the code requirements (refer to Clauses 6.2 and 9.6 in EC23) is considered to prevent shear failure of the specimens before their flexural capacity is exhausted. This reasoning is also in conflict with that underlying the design of the trans-verse reinforcement in accordance with the CFP Method: in this case, transverse reinforcement is designed (as discussed in Reference 15) to sustain the tensile force developing in the region of abrupt change in the direction of the path of the compressive force (due to the bending action) at a distance of approximately 2.5d from the support. However, to ensure plastic hinge formation before any other type of nonflexural failure, the calculated value of Mf incorporated an over-strength factor of 1.2 in all cases (that is, the calculated value of the flexural capacity was multiplied by 1.2).
It should also be noted that for the beams in which inter-action between concrete and steel was prevented, the trans-verse reinforcement provided was that specified by the CFP Method. As indicated in Table 2, this method specifies less reinforcement within the critical regions, particularly when the specimens are also subjected to axial loading, with the
Table 2—Spacing of 6 mm diameter stirrups
Spacing, mm
Specimen Critical region Shear span
B-CFP-0 90 90
B-EC-0 80 160
NB-CFP-0 90 90
B-CFP-N 90 90
B-EC-N 30 90
NB-CFP-N 90 90
Note: 1 mm = 0.03937 in.
Fig. 4—Transverse reinforcement arrangement. (Note: 1 mm = 0.03937 in.)
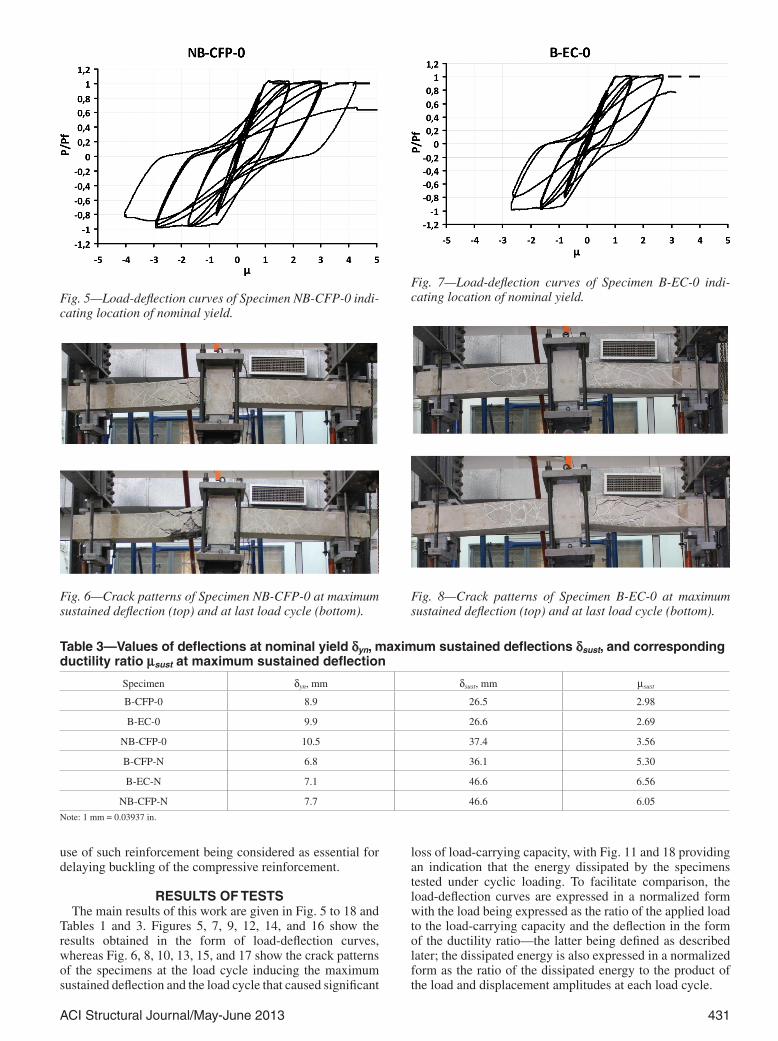
ACI Structural Journal/May-June 2013 431
use of such reinforcement being considered as essential for delaying buckling of the compressive reinforcement.
RESULTS OF TESTSThe main results of this work are given in Fig. 5 to 18 and
Tables 1 and 3. Figures 5, 7, 9, 12, 14, and 16 show the results obtained in the form of load-deflection curves, whereas Fig. 6, 8, 10, 13, 15, and 17 show the crack patterns of the specimens at the load cycle inducing the maximum sustained deflection and the load cycle that caused significant
loss of load-carrying capacity, with Fig. 11 and 18 providing an indication that the energy dissipated by the specimens tested under cyclic loading. To facilitate comparison, the load-deflection curves are expressed in a normalized form with the load being expressed as the ratio of the applied load to the load-carrying capacity and the deflection in the form of the ductility ratio—the latter being defined as described later; the dissipated energy is also expressed in a normalized form as the ratio of the dissipated energy to the product of the load and displacement amplitudes at each load cycle.
Fig. 5—Load-deflection curves of Specimen NB-CFP-0 indi-cating location of nominal yield.
Fig. 6—Crack patterns of Specimen NB-CFP-0 at maximum sustained deflection (top) and at last load cycle (bottom).
Fig. 7—Load-deflection curves of Specimen B-EC-0 indi-cating location of nominal yield.
Fig. 8—Crack patterns of Specimen B-EC-0 at maximum sustained deflection (top) and at last load cycle (bottom).
Table 3—Values of deflections at nominal yield dyn, maximum sustained deflections dsust, and corresponding ductility ratio msust at maximum sustained deflection
Specimen dyn, mm dsust, mm msust
B-CFP-0 8.9 26.5 2.98
B-EC-0 9.9 26.6 2.69
NB-CFP-0 10.5 37.4 3.56
B-CFP-N 6.8 36.1 5.30
B-EC-N 7.1 46.6 6.56
NB-CFP-N 7.7 46.6 6.05
Note: 1 mm = 0.03937 in.

432 ACI Structural Journal/May-June 2013
The calculated and experimentally established values of the load at yield and the load-carrying capacity, together with the corresponding bending moments, are given in Table 1. On the other hand, Table 3 includes the assessed (as described in the following) values of the deflection at nominal yield dyn, the measured values of the maximum sustained deflection dsust, and the values of the ductility ratio
(that is, the ratio of the measured deflection to the deflection at nominal yield) at the hysteretic loops corresponding to the maximum sustained deflection msust.
The load-deflection curves also include the location of the nominal yield point used for assessing the specimen ductility ratio msust. The location of this point was determined as follows:
(a) The section bending moment at first yield, My (assessed by assuming that yielding occurs when either the concrete strain at the extreme compressive fiber attains a value of 0.002 or the tension reinforcement yields), and the section flexural capacity Mf are first calculated.
(b) Using the values of My and Mf derived in (a), the corre-sponding values of the transverse load at yield, Py = My/av, and at flexural capacity, Pf = Mf /av, are obtained from the equilibrium equations, with av (=875 mm [34.4 in.]) being the distance of the point of application of the applied load from the support (refer to Fig. 1).
(c) In Fig. 5, 7, 9, 11, 13, and 15, lines are drawn through the points of the load-deflection curves at P = 0 and P = Py. These lines are extended to the load level Pf, which is considered to define the nominal yield point, and to the corresponding value of the deflection dyn, which is used to calculate the ductility ratios msust = dsust/dyn in Table 3.
Fig. 9—Load-deflection curves of Specimen NB-CFP-0 indi-cating location of nominal yield.
Fig. 10—Crack patterns of Specimen B-CFP-0 at maximum sustained deflection (top) and at last load cycle (bottom).
Fig. 11—Variation of dissipated energy (normalized with respect to product of load and displacement amplitudes of each load cycle) with increasing ductility ratio for speci-mens subjected to transverse cyclic loading.
Fig. 12—Load-deflection curves of Specimen B-CFP-N indi-cating location of nominal yield.
Fig. 13—Crack patterns of Specimen NB-CFP-N at maximum sustained deflection (top) and at last full load cycle (bottom).

ACI Structural Journal/May-June 2013 433
DISCUSSION OF RESULTSSpecimens without axial force
From Fig. 5 and 7 and Tables 1 and 3, a comparison of the load-deflection curves of the specimens with the longitudinal reinforcement bonded to concrete throughout the specimen length (Specimens B-CFP-0 and B-EC-0) indicates that both specimens exhibited a similar load-carrying capacity and a maximum sustained deflection corresponding to values of the ductility ratio of nearly 3, for Specimen B-CFP-0, and nearly 2.7, for Specimen B-EC-0 (refer to Table 3). However, in contrast with the beam designed in accordance with EC23 and EC8,4 which failed during the following load cycle as soon as the deflection exceeded the maximum sustained deflection, the beam designed in accordance with the CFP Method suffered a significant loss of load-carrying capacity during the second load cycle to a maximum deflec-tion of over 35 mm (1.38 in.) (corresponding to a ductility ratio of approximately 4.2). It should be noted that the afore-mentioned trends of behavior are similar to those reported elsewhere for the case of simply supported beams under cyclic transverse loading.15
As indicated in Fig. 6 and 8, the aforementioned speci-mens are also characterized by different modes of failure; Specimen B-CFP-0 suffered extensive cracking within its critical region (at the left-hand side of the specimen inter-face with its prismatic portion) due to plastic hinge forma-tion, whereas Specimen B-EC-0 failed due to near-horizontal
Fig. 14—Load-deflection curves of Specimen B-EC-N indi-cating location of nominal yield.
Fig. 15—Crack patterns of Specimen B-EC-N at maximum sustained deflection (top) and at last load cycle (bottom).
Fig. 16—Load-deflection curves of Specimen NB-CFP-N indicating location of nominal yield.
Fig. 17—Crack patterns of Specimen B-CFP-N2 at maximum sustained deflection (top) and at last load cycle (bottom).
Fig. 18—Variation of dissipated energy (normalized with respect to product of load and displacement amplitudes of each load cycle) with increasing ductility ratio for speci-mens subjected to combined action of transverse cyclic loading and constant axial force.

434 ACI Structural Journal/May-June 2013
cracking throughout the specimen depth, which initiated at approximately the middle of the right-hand side shear span and extended throughout this span. The location of crack initiation that caused failure of the latter specimen appears to essentially coincide with the location of change in the compressive force path direction which, in accordance with the CFP Method, is critical and the amount of transverse reinforcement required is larger than the code-specified amount. As indicated in Table 2, the CFP Method specifies 90 mm (3.5 in.) spacing for the 6 mm (0.24 in.) diameter stirrups adopted as opposed to the 160 mm (6.3 in.) code-specified spacing.
An indication of the effect of the lack of bond between concrete and flexural reinforcement can be obtained by comparing the experimentally established behavior of Speci-mens B-CFP-0 and NB-CFP-0, which are identical except for the PVC pipe used to cover the portion of the longitudinal steel bars within the critical spans of Specimen NB-CFP-0. From Fig. 5 and 9, a comparison of the load-deflection curves of the aforementioned specimens indicates that Specimen NB-CFP-0 exhibited a maximum sustained deflection corresponding to a ductility ratio of over 3.5, which is nearly 20% larger than that of Specimen B-CFP-0, whereas it started suffering loss of load-carrying capacity at the second cycle at a ductility ratio of approximately 5.5. On the other hand, by comparing the crack patterns of Speci-mens B-CFP-0 and NB-CFP-0 in Fig. 6 and 10, respectively, it can be seen that, in contrast with Specimen B-CFP-0, which suffered significant cracking within its left-hand-side critical region, for Specimen NB-CFP-0, severe cracking occurred within its regions (where the bond between concrete and reinforcement was not eliminated through the use of a PVC pipe cover) adjacent to the critical regions, with the latter regions suffering only flexural cracking along their interfaces with the prismatic element at the specimen midspan. Such behavior clearly demonstrates that the lack of bond between concrete and longitudinal reinforcement within the critical regions prevented the occurrence of inclined cracking and led to a significant improvement of the specimen ductility. This improvement in structural behavior is also reflected by the amount of the energy dissipated (that is, the damage suffered) by Specimen NB-CFP-0, which is significantly smaller than the amount of energy dissipated by Specimens B-CFP-0 and B-EC-0 throughout the specimens’ loading history (refer to Fig. 11).
Similar conclusions regarding the beneficial effect of the lack of bond between concrete and the flexural reinforce-ment have already been reported for the case of bridge piers12,13 and beam-column joints.14 It is also of interest to note that, in contrast with the case of bridge piers, which were designed in compliance with the code conditions, the beam-column joints were designed in accordance with an alternative design method, which led to a significant reduc-tion of the joint reinforcement to an amount less than 50% of the amount specified by the European codes of practice.3,4
Specimens with axial forceFrom Fig. 12 and 14 and Tables 1 and 3, a comparison of
the load-deflection curves of the specimens with the longi-tudinal reinforcement bonded to concrete throughout the specimen length (Specimens B-CFP-N and B-EC-N) indi-cates that both specimens exhibited a similar load-carrying capacity and a maximum sustained deflection corresponding to a ductility ratio of 5.3 for Specimen B-CFP-N and 6.5 for Specimen B-EC-N (refer to Table 3)—in both cases signifi-
cantly larger than the design value of 3. As for the case of the specimens under cyclic transverse loading only, the afore-mentioned trends of behavior are similar to those reported elsewhere for the case of simply supported beams under the combined action of a constant axial force and cyclic trans-verse loading.15
In contrast with the specimens without axial force, Fig. 13 and 15 indicate that Specimens B-CFP-N and B-EC-N exhibited similar crack patterns. It should be noted, however, that the earlier failure of Specimen B-CFP-N was due to abrupt localized buckling of a small portion of the flexural reinforcement between successive stirrups which, for the case of Specimen B-EC-N, was delayed by denser stirrup arrangement within the critical region of the latter specimen. In fact, as indicated in Fig. 4, the stirrup spacing within the critical region of the latter specimens is only one-third of the spacing of the former.
On the other hand, from the load-deflection curves shown in Fig. 16 and Table 3, it appears that, for Specimen NB-CFP-N, the lack of bond between concrete and the longitudinal steel bars improved structural behavior when compared with that of Specimen B-CFP-N, in that it allowed an additional load cycle to a maximum deflection of over 45 mm (1.8 in.) corresponding to a ductility ratio of over 6, as for Specimen B-EC-N, in spite of a stirrup spacing within the critical region considerably larger than that of the latter specimen. It appears that the lack of bond compensated for adopting stirrup spacing as small as that of Specimen B-CFP-N which, as discussed previously, failed at a smaller displacement (corresponding to a ductility ratio of 5.3) due to abrupt buckling of the small portion of the flexural reinforcement between successive stirrups. In fact, in contrast with Specimen B-CFP-N, failure of Specimen NB-CFP-N occurred due to progressive, rather than abrupt, buckling of a much larger portion of the flexural reinforcement—the unbonded portion rather than the portion between successive stirrups—which led to spalling of the concrete cover and a gradual loss of the specimen load-carrying capacity. More-over, as for the case of Specimen NB-CFP-0, the amount of energy dissipated by Specimen NB-CFP-N was smaller, although by a smaller margin, than the amount dissipated by the specimens with bonded reinforcement (refer to Fig. 18).
CONCLUSIONSThe specimens designed in accordance with the CFP
Method without eliminating the bond between concrete and the longitudinal reinforcement within the critical region are found to exhibit trends of behavior that are in agreement with already-published experimental information.
Moreover, it is found that designing in accordance with the CFP Method leads to savings in stirrup reinforcement within the critical regions of the specimens investigated without compromising the code-specified performance requirements. In fact, when transverse loading is combined with an axial force, the stirrup savings is considerable, as the resulting stirrup reinforcement is only one-third of the code-specified amount.
When the application of the CFP Method is combined with the use of a PVC pipe cover to the portion of the flexural bars within the critical regions of the beam-column elements, it is found that the lack of bond between concrete and longitudinal bars leads to a significant improvement of structural behavior.
The results obtained on the beneficial effect of the use of unbonded reinforcement confirm similar findings reported in the literature for the case of bridge piers and beam-column joints.

ACI Structural Journal/May-June 2013 435
NOTATIONav = shear spanb = width of cross sectiond = effective depth of cross sectionfc = uniaxial cylinder compressive strength of concretefu = strength of steel barfy = yield stress of steel barMexp = bending moment corresponding to Pexp
Mf = flexural capacityMy = bending moment at first yield assumed to occur when either
concrete strain at extreme compressive fiber attains value of 0.002 or tension reinforcement yields
Nu = maximum axial force sustained by specimen under concentric compression
Pexp = experimentally established load-carrying capacityPf = load-carrying capacity of wall corresponding to Mf
Py = load corresponding to My
dsust = maximum sustained deflectiondyn = deflection at nominal yieldmsust = ductility ratio (dsust/dyn)
REFERENCES1. Kong, F. K., and Evans, R. H, Reinforced and Prestressed Concrete,
third edition, Van Nostrand Reinhold, Wokingham, Berkshire, UK, 1987, 507 pp.
2. ACI Committee 318, “Building Code Requirements for Structural Concrete (ACI 318-11) and Commentary,” American Concrete Institute, Farmington Hills, MI, 2011, 503 pp.
3. EN 1992-1-1:2004, “Eurocode 2: Design of Concrete Structures—Part 1-1: General Rules and Rules of Buildings,” European Committee for Standardization, Brussels, Belgium, 2004, 225 pp.
4. EN 1998-1:2004: “Eurocode 8: Design of Structures for Earthquake Resistance—Part 1: General Rules, Seismic Actions and Rules for Build-ings,” European Committee for Standardization, Brussels, Belgium, 2004, 215 pp.
5. Cotsovos, D. M., and Kotsovos, M. D., “Seismic Design of Structural Concrete Walls: An Attempt to Reduce Reinforcement Congestion,” Maga-zine of Concrete Research, V. 59, No. 9, Nov. 2007, pp. 627-637.
6. Kotsovos, G. M.; Cotsovos, D. M.; Kotsovos, M. D.; and Kounadis, A. N., “Seismic Behaviour of RC Walls: An Attempt to Reduce Reinforcement Congestion,” Magazine of Concrete Research, V. 63, No. 4, Apr. 2011, pp. 235-246.
7. Kotsovos, M. D., and Pavlovic, M. N., “Ultimate Limit-State Design of Concrete Structures: A New Approach,” Thomas Telford, London, UK, 1999, 164 pp.
8. Kotsovou, G., and Mouzakis, H., “Seismic Behaviour of RC External Joints,” Magazine of Concrete Research, V. 63, No. 4, Apr. 2011, pp. 247-264.
9. Kotsovou, G., and Mouzakis, H., “Seismic Design of RC External Beam-Column Joints,” Bulletin of Earthquake Engineering, V. 10, No. 2, Apr. 2012, pp. 645-677.
10. Zielinski, Z. A., and Abdulezer, A., “Ultimate Strength in Diagonal Splitting of Reinforced Concrete Thin Wall Panels,” Canadian Journal of Civil Engineering, V. 4, No. 2, 1977, pp. 226-239.
11. Kim, W., and White, R. N., “Shear-Critical Cracking in Slender Reinforced Concrete Beams,” ACI Structural Journal, V. 96, No. 5, Sept.-Oct. 1999, pp. 757-766.
12. Pandey, G. R., and Mutsuyoshi, H., “Seismic Damage Mitigation of Reinforced Concrete Bridge Piers by Unbonding Longitudinal Reinforce-ments,” Paper No. 154, 13th World Conference on Earthquake Engi-neering, Vancouver, BC, Canada, 2004.
13. Iemura, H.; Takahashi, Y.; and Socabe, N., “Development of Unbonded Bar Reinforced Concrete Structure,” Paper No. 1357, 13th World Conference on Earthquake Engineering, Vancouver, BC, Canada, 2004.
14. Kotsovou, G., and Mouzakis, H., “Exterior RC Beam-Column Joints: New Design Approach,” Magazine of Concrete Research, V. 33, No. 4, Apr. 2011, pp. 247-264.
15. Kotsovos, G. M., “Seismic Design of RC Beam-Column Structural Elements,” Magazine of Concrete Research, V. 63, No. 7, 2011, pp. 527-537.

CALL FOR ACTIONDo you have EXPERTISE in any of these areas?• BIM • Chimneys • Circular Concrete Structures Prestressed by Wrapping
with Wire and Strand• Circular Concrete Structures Prestressed with
Circumferential Tendons• Concrete Properties • Demolition• Deterioration of Concrete in Hydraulic Structures• Electronic Data Exchange• Insulating Concrete Forms, Design, and Construction• Nuclear Reactors, Concrete Components• Pedestal Water Towers• Pipe, Cast-in-Place• Strengthening of Concrete Members• Sustainability
en become a REVIEWER for the ACI Structural Journal or the ACI Materials Journal.
How to become a Reviewer:1. Go to: http://mc.manuscriptcentral.com/aci;2. Click on “Create Account” in the upper right-hand corner; and 3. Enter your E-mail/Name, Address, User ID and Password, and
Area(s) of Expertise.
Did you know that the database for MANUSCRIPT CENTRAL, our manuscript submission program, is separate from the ACI membership database? How to update your user account:1. Go to http://mc.manuscriptcentral.com/aci;2. Log in with your current User ID & Password; and3. Update your E-mail/Name, Address, User ID and Password,
and Area(s) of Expertise.
A
ACI Invites You To...
QUESTIONS?E-mail any questions to [email protected].

ACI Structural Journal/May-June 2013 437
Title no. 110-S34
ACI STRUCTURAL JOURNAL TECHNICAL PAPER
ACI Structural Journal, V. 110, No. 3, May-June 2013.MS No. S-2011-182.R2 received September 29, 2011, and reviewed under Institute
publication policies. Copyright © 2013, American Concrete Institute. All rights reserved, including the making of copies unless permission is obtained from the copyright proprietors. Pertinent discussion including author’s closure, if any, will be published in the March-April 2014 ACI Structural Journal if the discussion is received by November 1, 2013.
Recommended Procedures for Development and Splicing of Post-Installed Bonded Reinforcing Bars in Concrete Structuresby Finley A. Charney, Kamalika Pal, and John Silva
The use of post-installed anchors for connections in both new and existing structures is commonplace and growing. A related type of post-installed connection that has been employed for decades is the bonding of reinforcing bars into holes drilled into concrete to facil-itate structural extensions and strengthening of reinforced concrete structures. Although ACI 318-11 includes provisions for the design of adhesive anchors in concrete (anchor rods bonded with adhesive in a drilled hole), it does not address the design of post-installed reinforcing bars. This paper addresses the issue by providing back-ground into the adhesive anchor design and development length provisions of ACI 318 as well as the provisions for post-installed reinforcing bars available in international standards. The paper makes recommendations for the development of a new procedure that is applicable to the design of post-installed reinforcing bars.
Keywords: adhesive; anchorage; bond; development; post-installed; reinforcement.
INTRODUCTIONThe use of post-installed anchors for connections in both
new and existing structures is commonplace and growing (Fig. 1). A related type of post-installed connection that has been employed for decades is the bonding of reinforcing bars into holes drilled into concrete to facilitate structural extensions and strengthening. A variety of cases may be considered in this respect: creating a lap splice of a post-installed reinforcing bar with existing reinforcing to facili-tate the extension of an existing slab (Fig. 2(a)) or an existing column (Fig. 2(b)), providing starter bars for a new column on an existing foundation (Fig. 2(c)), or installing dowels for a new corbel to be added to an existing column (Fig. 2(d)).
Anchorage to concrete is addressed in ACI 318-11,1 Appendix D, which includes provisions for the design of adhesive anchors in addition to post-installed expansion and undercut anchors and cast-in L-, J-, and headed bolts. Prior to the issuance of the 2011 edition of ACI 3181 and the companion qualification standard ACI 355.42 in late 2011, however, provisions for adhesive anchors did not exist in the code. Therefore, since 2006, most adhesive anchors have been tested, assessed, and designed using procedures provided by the ICC Evaluation Service in AC308.3
The adhesive anchor design provisions in AC3083 are intended to augment the anchor design provisions of earlier versions of ACI 318, Appendix D, by adding the expres-sions for determining the bond strength of the anchor or anchor group. This limit state replaces the check for pullout resistance that applies to post-installed expansion or undercut anchors.
AC3083 further provides the criteria for determining the bond strength and other parameters used in adhe-sive anchor design. AC3083 specifically excludes the
qualification of adhesive anchor systems for post-installed reinforcing bar lap-splice-type applications, as described in Fig. 2(a) and (b). Applications, as shown in Fig. 2(c) and (d), are potentially addressed, provided they do not exceed the maximum bond length of 20 bar diameters speci-fied in AC308.3 The adhesive anchor design provisions included in ACI 318-111 are in substantial agreement with those incorporated into AC308.3 The provisions and nomenclature from ACI 318-111 are used herein. ACI 318-111 and ACI 355.4-112 likewise do not address post-installed reinforcing bar lap-splice-type applications.
Embedment requirements for cast-in reinforcing bars are addressed through the development length and splice provisions of Chapter 12 of ACI 318-11.1 These provisions likewise do not address post-installed reinforcing. Thus, at
Fig. 1—Adhesive anchors used to secure column baseplate.

438 ACI Structural Journal/May-June 2013
ACI member Finley A. Charney is a Professor in the Department of Civil and Environmental Engineering at Virginia Polytechnic Institute and State University, Blacksburg, VA. His research interests include the design and behavior of structures subjected to extreme loads.
Kamalika Pal is a Technical Services Engineer with Hilti North America, Tulsa, OK.
John Silva, FACI, is Director of Codes and Standards for Hilti North America and a licensed structural engineer. His research interests include anchorage to concrete, seismic strengthening, and seismic restraint of nonstructural components.
present, there are no U.S. standards for the design of post-installed adhesively bonded reinforcing bars to be used as reinforcing—that is, as depicted in Fig. 2. For the purposes of this discussion, such applications will be referred to simply as “post-installed reinforcing bars.”
The European Organization for Technical Approvals (EOTA) developed a guide document for post-installed reinforcing bar connections that has been in use in Europe for over a decade. This document, TR023,4 provides testing and assessment procedures to determine the fitness of proprietary systems for anchoring post-installed reinforcing bars. TR0234 asserts that development length concepts applicable to cast-in bars can be used directly if it can be shown that adhesively bonded reinforcing bars demonstrate
strength characteristics that are comparable to those required for cast-in deformed bars. Similar concepts are the basis of design recommendations provided by Spieth,5 Kunz and Münger,6 Simons,7 and Simons and Eligehausen.8
RESEARCH SIGNIFICANCEAs stated previously, there are no U.S. standards available
for the design of post-installed reinforcing bars in concrete structures. Design guidelines can be proposed, however, based on research already performed. The objective of this paper is to serve as a basis for the development of such guidelines and identify areas of needed research.
Distinguishing post-installed adhesive anchors from post-installed reinforcing bars
Design of post-installed adhesive anchors under ACI 318-11,1 Appendix D, generally proceeds under the assumption that the free (unembedded) end of the anchor will be used to secure a structural element—often a structural steel shape, as shown in Fig. 1. In contrast, the applications shown in Fig. 2 involve reinforcing bars post-installed in existing concrete at one end and cast into new concrete at the opposite end. Theoreti-cally, the loading on the bars is exclusively tensile, resulting either from direct tension forces in the concrete member or
Fig. 2—Typical applications of post-installed reinforcing bars.

ACI Structural Journal/May-June 2013 439
from the strut-and-tie action associated with shear friction. Incidental dowel action resulting from interface shear is generally discounted.
A second—but equally critical—distinction between the connection types illustrated in Fig. 2 and the baseplate detail shown in Fig. 1 is associated with failure modes assumed for the design. ACI 318-11,1 Appendix D, lists a variety of failure modes that must be accounted for in the design of post-installed anchors. These include steel failure, pullout, various forms of concrete breakout, and bond failure. Not directly accounted for, however, is split-ting of the concrete—a failure mode that is highly depen-dent on a number of factors that can be difficult to quantify. Rather than explicitly calculating the splitting resistance of an anchorage, ACI 318-11,1 Appendix D, provides edge distance, spacing, and member thickness requirements that are intended to preclude this failure mode. In contrast, the principal failure mode addressed by the development length provisions of ACI 318-11,1 Chapter 12, is splitting. The complementary nature of the two sets of provisions permits the potential formulation of a harmonized approach to the design of post-installed reinforcing bars that considers all relevant failure modes.
It is clear that the applications in Fig. 2(c) and (d) could be designed using the basic principles of anchor theory as stipulated by ACI 318-11,1 Appendix D, for post-installed adhesive anchors. However, the applications in Fig. 2(a) and (b) involve the transmission of force between parallel reinforcing bars and are likely governed by splitting. These types of connections are more closely related to the princi-ples of bond, development length, and splicing of reinforce-ment, as covered in ACI 318-11,1 Chapter 12. A methodology for determining the required embedment of post-installed reinforcing bars that addresses both the splitting-dominated behavior of near-edge bars and the classical anchor behavior of bars embedded in larger concrete masses far from edges would address all of these cases.
REQUIRED PARAMETERS FOR ASSESSMENT AND DESIGN
The development of a methodology for determining the embedment length and splice length of post-installed reinforcing bars must necessarily draw extensively from cast-in reinforcement development length theory. This theory must be amended, however, to include certain concepts already incorporated into the design of adhesive anchors, including all parameters relevant for the bond strength of the adhesive (for example, hole drilling and cleaning, tempera-ture, and loading type).
Any procedure for the design of adhesively bonded reinforcing bars must consider the body of research already performed on such reinforcement, design proce-dures that have been developed for adhesive anchors, and recommendations already provided by other standards organizations.4,5,7,9,10
Critical installation parameters and system assessment
The choice of anchor type, adhesive, and installation technique is interrelated and is a function of use, loading direction, loading duration, and a variety of environmental considerations. In nearly all cases, regardless of the system selected, a hole is drilled and cleaned, the adhesive is injected, the bar is inserted, and the adhesive is allowed to
cure. Bond stress values provided in product literature and in assessment documents—for example, reports issued by the ICC Evaluation Service—are generally predicated on the use of a particular hole-drilling method and associated hole-cleaning and preparation procedure. One should strictly adhere to these requirements to avoid unanticipated reduc-tions in bond strength.
Hole drilling—Holes for adhesive anchors are sized to keep the annular gap between the anchor rod and the concrete as small as practically possible. This minimizes the effects of adhesive shrinkage and improves the stiffness of the resulting connection. Holes for use with threaded rods are generally not more than 1/8 in. (3 mm) larger in diam-eter than the nominal rod diameter. Drilling methods include hammer drilling, compressed air drilling, and diamond core drilling. A summary of the effect of use of different drilling methods on bond behavior is provided in Eligehausen et al.11
Hole cleaning—Hole cleaning, as specified by the manu-facturer, typically consists of initial dust removal using a vacuum or compressed air followed by a mechanical scouring operation (for example, wire brush) and a final dust removal procedure. Use of compressed air alone (without scouring) is generally not adequate to remove the dust from the sides of the hole. Previous investigations12,13 have indi-cated that failure to clean the hole in accordance with the manufacturer’s specifications can reduce the strength of the connection by as much as 50%, depending on the type of adhesive and the method of adhesive injection.
Adhesive type and delivery system—Various types of adhesive anchor systems are in use in different parts of the world, such as Europe and Asia, including cartridge injec-tion systems, capsule systems, and bulk delivery systems, whereas cartridge injection systems are predominant in the United States.
It is important that delivery of the adhesive into the hole be accomplished with an absolute minimum of entrained air. This is usually achieved by injecting the adhesive from the bottom of the hole. For deeper holes, an extension is attached to the nozzle to permit injection from the bottom of the hole. For horizontal and overhead applications, the extension may be equipped with a stopper that contains the adhesive during injection. Holes are typically filled from one-half to two-thirds of their total length to ensure that the annular gap around the anchor element is filled with adhe-sive to the surface of the concrete.
Installation of reinforcing bars of larger diameter in deep holes may require use of case-specific methods to ensure that the installation proceeds without premature setting of the adhesive and/or binding of the bar before or after inser-tion to the required embedment.
AssessmentThe assessment of the adhesive anchor system under
AC3083 and ACI 355.4-112 results in design bond stresses and other parameters to be used in conjunction with the design model developed by Eligehausen et al.14 at the University of Stuttgart, which is the basis for the design provisions in AC3083 and ACI 318-11.1 Factors included in the evaluation include performance in uncracked and cracked concrete service conditions, response to variations in concrete temperature, sensitivity to deviations from speci-fied hole-cleaning procedures, and response to long-term loading. The assessment specifically excludes development of bond stresses for post-installed reinforcing bars,2 whereby

440 ACI Structural Journal/May-June 2013
such an assessment would necessarily include the effects of near-edge performance and longer embedment lengths than typically considered for anchors.
An assessment procedure that addresses the post-installed reinforcing bar application for U.S. practice is not yet available. Such an assessment procedure should include many of the criteria addressed in the aforementioned docu-ments but should additionally set minimum thresholds on the design bond stress to ensure behavior that is compat-ible with cast-in-place reinforcing. It is also reasonable to expect that the assessment should mandate an accept-able stiffness range to preclude zipper-type failures due to shear lag, as discussed by Spieth5; this is a parameter not currently considered in TR023.4 The assessment must also include an evaluation of the adhesive delivery system and requirements for installers to ensure that installation in larger hole diameters and lengths can be executed prop-erly—for example, without air entrainment.
DEVELOPMENT LENGTH CALCULATIONS— CAST-IN REINFORCING BARS
A review of the procedures to determine the required development and splice lengths for cast-in reinforcing bars, as provided in Chapter 12 of ACI 318-11,1 follows. The expression currently used for determination of the basic development length ld is given as
3 (lb, in.)40
y t e sd b
b trc
b
fd
c Kfd
y y y =
+ l ′
l (1)
where the confinement term (cb + Ktr)/db may not be taken as greater than 2.5; and Ktr is a function of the cross-sectional area of transverse reinforcement available to restrain splitting cracks along the bar being developed. (Refer to Appendix A* for SI-metric equivalents for the equations presented in this paper that are unit-dependent.)
In Eq. (1), fy and fc′ are the tension yield and compres-sive strengths (psi) of the reinforcing steel and concrete, respectively; db is the diameter of the bar being developed; l is a modifier for lightweight concrete; cb is the minimum edge distance; Ktr is a confinement term; and yt, ye, and ys are modifiers for top reinforcement, epoxy coating, and bar size, respectively.
It is important to note that a strength reduction factor f of 0.8 was used in the development of the expression on which Eq. (1) is based; however, simplifications to the original equation developed by Orangun et al.15 led to the f factor effectively becoming 0.9.16
Under normal circumstances, the size of the reinforcing bar being developed is based on calculations that include a strength reduction factor (for example, 0.9 for flexure) and, thus, the overall strength reduction for development length is the product of these two factors. For typical flexure, the combined strength reduction factor inherent in Eq. (1) is approximately 0.8 (0.9 × 0.9).
*The Appendix is available at www.concrete.org in PDF format as an addendum to the published paper. It is also available in hard copy from ACI headquarters for a fee equal to the cost of reproduction plus handling at the time of the request.
While not explicitly stated in ACI 318-11,1 the term “development length” implies that this is the minimum bond length required to develop the expected yield strength of the reinforcement at the critical section. The physical mechanism that allows the strength of the bar to be developed is more complex than that idealized by bond stress alone, as it relies on bearing between the concrete and the projecting ribs on the bar, the distance between the embedded bar and the closest free edge of the concrete, and the presence (or lack thereof) of confining reinforcement. The confinement term in Eq. (1), (cb + Ktr)/db, accounts for both confining reinforcement and edge distance. According to the ACI 318-111 commentary, where this term is less than 2.5, splitting failure is expected to occur. For values greater than 2.5, pullout—as character-ized by crushing of the concrete around the bar lugs—is the presumed concrete failure mode under an overload condi-tion. Where the computed confinement term is greater than or equal to 2.5, ACI 318-111 requires a limiting value of 2.5 to be used in the computation of development length—that is, shorter lengths that might lead to concrete breakout failure are precluded. Nevertheless, failure due to bar rupture is unlikely due to the fact that the actual rupture strength of the bar is significantly greater than the nominal yield strength.
In the section on excess reinforcement, ACI 318-111 permits a linear reduction of the development length where the area of steel provided exceeds the area of steel required. In such cases, it becomes more likely that concrete breakout—not pullout or splitting—will be the controlling failure mode in overload conditions. As mentioned previously, failure by concrete breakout is explicitly considered in Appendix D of ACI 318-111 but not in Chapter 12.
While Eq. (1) is not a bond stress equation per se, it is instructive to recast it in terms of an equivalent bond stress equation as follows.
Let teq be the equivalent bond stress. Then
s y eq b dA f d⋅ = t ⋅ p ⋅ ⋅ l (2)
Using As = p(db)2/4 and substituting Eq. (1) for ld on the right-hand side of Eq. (2) results in the following
13.33 (lb, in.)b treq c
b t e s
c Kf
d +
t = ⋅l ⋅ ⋅′ y ⋅ y ⋅ y (3)
For post-installed reinforcing bars, with yt and ye set to unity, the expressions for required bond stress for smaller- and larger-diameter bars are as follows.
No. 6 (No. 19 [19.05 mm]) bars and smaller
4.16 10.3 (lb, in.)b treq c c
b
c Kf f
d +
t = ⋅l ⋅ ⋅ ≤ ⋅′ ′ (4a)
No. 7 (No. 22 [22.23 mm]) bars and larger
3.33 8.33 (lb, in.)b treq c c
b
c Kf f
d +
t = ⋅l ⋅ ⋅ ≤ ⋅′ ′ (4b)
where the upper limits on development length assume the maximum value of 2.5 for the confinement factor. Table 1 provides calculated development lengths and the

ACI Structural Journal/May-June 2013 441
associated effective uniform bond stresses as a function of bar diameter for a range of reinforcing bar sizes.
The bond stress values in Table 1 pertain to cast-in deformed reinforcing bars. However, if it can be shown that the behavior of post-installed bonded reinforcing bars at ultimate is comparable (for the same concrete strengths and concrete types) to that of cast-in bars, it can be argued that the use of the expressions for development length provided in ACI 318-11,1 Chapter 12, is acceptable for the post-installed case as well.
It is important to note that development length, as specified in ACI 318-11,1 Chapter 12, is not dependent on the degree of cracking in the concrete in which the bars are embedded, whereas the anchor provisions of ACI 318-11,1 Appendix D, require significant adjustments to the design resistance where anchors are located in regions where cracking is expected. Furthermore, the development length and splice provisions of ACI 318-11,1 Chapter 12, consider the influence of trans-verse reinforcement only (as a means of limiting splitting crack opening). In contrast, anchor theory does not consider the influence of reinforcing bars placed orthogonally to the direction of applied tension but instead provides specific provisions for so-called anchor reinforcement (reinforce-ment placed parallel to the anchor direction and developed within the presumed failure body). While at first glance these approaches seem incompatible, they are in fact closely related. As stated previously, ACI 318-11,1 Appendix D, does not contain explicit predictor equations for splitting failure. Instead, the anchor edge distance, anchor spacing, and member thickness are controlled such that split-ting should not preclude other failure modes. (An excep-tion is made in connection with the term ycp,N defined in ACI 318-11,1 Section D.5.2.7. This term, described in more detail in the section on ACI 318-11,1 Appendix D, concrete breakout provisions of this paper, applies when “supple-mentary reinforcement to control splitting” is not present. In this case, it may be assumed that the supplementary reinforcement is perpendicular to the anchor tension load direction, in contrast to the use of this term elsewhere in ACI 318-11,1 Appendix D.)
Because the splitting failure mode is one of the two admis-sible failure modes associated with the development length provisions of ACI 318-11,1 Chapter 12, the explicit inclusion of the influence of transverse reinforcement to control the splitting crack width is appropriate. On the other hand, anchor reinforcement, as defined in ACI 318-11,1 Appendix D, is closely related to the (noncontact) lap splice provisions of ACI 318-11,1 Chapter 12. Note that, in accordance with Eq. (1), where no confining reinforcement is present, the confinement term achieves a maximum at a value of cb/db equal to 2.5. That is, beyond an edge distance of 2.5db, the presence of transverse reinforcement does not influence the development length. For reasons of practicality, the use of post-installed reinforcing bars generally occurs at edge distances in excess of 2.5 bar diameters, so the presence of transverse reinforcement is not decisive.
For cases where post-installed reinforcing bars are to be spliced with existing reinforcing, it must be kept in mind that the capacity of the existing bar, as dictated by the develop-ment length provisions, may govern the splice length. For example, if a post-installed bar is spliced with a bar that is placed near the top of a wall, the yt term does not apply to the post-installed bar but may apply to the cast-in bar.
ANCHOR THEORY AS APPLIED TO POST-INSTALLED REINFORCING BARS
In general, the design of anchors consists of checking single anchors or groups of anchors for tension, shear, or combined tension and shear. As discussed previously, reinforcing bars are not typically designed for dowel action; thus, the design of post-installed reinforcing bars used as reinforcing is focused on the tension case only.
Design requirements for cast-in and post-installed anchors are given in ACI 318-11,1 Appendix D.
ACI 318-11,1 Appendix D, concrete breakout provisions
ACI 318-11,1 Appendix D, provides five basic tension failure modes for which strength calculations are explic-itly required:
1. Bolt rupture (Section D.5.1);2. Concrete breakout (Section D.5.2);3. Anchor pullout (Section D.5.3);4. Side-face blowout failure (Section D.5.4); and5. Bond failure (Section D.5.5).The pullout provisions in Section D.5.3 are related to
the behavior of headed, undercut, and expansion anchors and do not apply to adhesive anchors because these provi-sions do not consider the effect of anchor spacing and edge distance on pullout strength. Instead, in ACI 318-11,1 the bond failure mode is explicitly addressed with a formulation closely related to the concrete breakout predictive equations. That is, the effect of anchor spacing and edge distance on bond strength is directly incorporated. Because the concrete breakout strength associated with a given embedment depth represents the “maximum carrying capacity” of the concrete locally around the anchor, it is the lesser of the concrete breakout strength and the computed bond strength that is decisive for adhesive anchor tension design.
For anchors in tension, the basic strength requirement in ACI 318-11,1 Appendix D, is given by
n uaN Nf ≤ (5)
where Nn is the computed nominal strength (steel fracture, concrete capacity, and pullout); Nua is the factored design load; and f is the strength reduction factor. The strength reduction factors for concrete failure modes are a function of load type (tension or shear) failure mode, presence of supple-mentary reinforcement, sensitivity to installation proce-dures, and expected reliability. They range between 0.65 and
Table 1—Required development length and effective uniform bond stress as function of bar diameter in accordance with ACI 318-11,1 Section 12.2*†
Bar size
Concrete strength, psi
3000 4000 5000 6000 7000 8000
≤No. 6 (No. 19 [19.05 mm])
26.3 in. 22.8 in. 20.4 in. 18.6 in. 17.2 in. 16.1 in.
566 psi 653 psi 730 psi 800 psi 864 psi 924 psi
≥No. 7 (No. 22 [22.23 mm])
32.9 in. 28.5 in. 25.5 in. 23.2 in. 21.5 in. 20.1 in.
456 psi 527 psi 589 psi 645 psi 697 psi 745 psi*ASTM A615 Grade 60 (414 MPa) reinforcing bar (Grade 60 [414 MPa] reinforcing bar has minimum yield strength of 60 ksi [413.68 MPa]). †(cb + Ktr)/db = 2.5. Notes: 1 in. = 25.4 mm; 1000 psi = 7 MPa.

442 ACI Structural Journal/May-June 2013
0.45. The strength reduction factors for steel failure modes are 0.75 and 0.65 for ductile and brittle steels, respectively.
The nominal steel strength in tension of an anchor or uniformly loaded anchor group is given by
,sa se N utaN n A f= ⋅ ⋅ (6)
where n is the number of anchors in the group; Ase,N is the effective cross-sectional area of a single anchor in tension; and futa is the steel-specified minimum ultimate strength. The commentary of ACI 318-11,1 Appendix D, states that the steel fracture capacity is best represented by futa instead of fya because the large majority of anchor materials do not exhibit a well-defined yield point. On the other hand, deformed reinforcing bars, which are assumed to be inherently ductile when used as reinforcing in accordance with ACI 318-11,1 are specified in terms of yield—not ultimate—strength. For these reasons, the ACI 318-11,1 Appendix D, approach to the steel resistance is not applicable for the design of post-installed reinforcing bars.
The breakout strength is based on the Concrete Capacity Design (CCD) Method, as described by Fuchs et al.17 In terms of ACI 318-11,1 the breakout strength of an anchor group loaded in direct tension is given by
, , , ,Nc
cbg ed N c N cp N ec N bNco
AN N
A= ⋅ y ⋅ y ⋅ y ⋅ y ⋅ (7)
The term yec,N is related to anchor groups loaded in eccen-tric tension. As it is assumed that for the purposes of post-installed reinforcing bars, the eccentricity of the tension is zero, this term is neglected.
The term yc,N accounts for the anticipated condition of the concrete in the vicinity of the anchor (cracked/uncracked) over the anchor service life. This is typically accounted for in the efficiency factor, kc, value used for design (refer to Eq. (9)). The term ycp,N is a unique modifier related to post-installed anchors that accounts for localized hoop stresses generated (primarily) by expansion anchors and other anchors that must be tightened with a torque wrench as part of the installation. A detailed description of these terms may be obtained from ACI 318-11,1 Appendix D. As neither of these terms is uniquely relevant to the post-installed reinforcing bar case, they are not discussed further herein.
The quantity ANc is the actual projected concrete failure area of a single anchor or group of anchors. This failure area may be affected (reduced) by the proximity of the anchor or anchor group to the edge of the concrete element to which the anchors are attached. The quantity ANc is the theoretical projected failure area for a single anchor that is located so far from the edge that the failure is not influenced by the prox-imity to an edge. For a single anchor, the ratio ANc/ANco will always be less than or equal to 1.0. For a group of closely spaced anchors away from an edge, the ratio will be less than or equal to the number of anchors in the group.
The critical dimensions (spacing and edge distance beyond which the anchor resistance is not influenced) used for the evaluation of ANc and ANco are 3hef and 1.5hef, respectively, corresponding roughly to a breakout surface with an angle of inclination to the horizontal of 35 degrees. For example, if a single anchor is located a distance further than 1.5hef from any edge, the ratio ANc/ANco is unity.
The term yed,N is an additional modifier for near-edge anchors that reflects the disturbed stress state caused by the presence of the edge. It is given in ACI 318-111 as follows
,, 0.7 0.3 1.0
1.5a min
ed Nef
ch
y = + ⋅ ≤ (8)
where ca,min is the edge distance; and hef is the anchor embed-ment. As with the ratio ANc/ANco, the term is taken as unity when the anchor is no closer than 1.5hef from any edge.
The basic breakout strength of a single anchor far from the edge, Nb, is
1.5 (lb, in.)b c c efN k f h= ⋅l ⋅ ⋅′ (9)
where the effectiveness factor kc for cracked concrete is based on product-specific testing but is limited to a maximum of 24; l is the lightweight concrete adjustment factor; fc′ is the concrete compressive strength; and hef is the anchor embed-ment depth. The adjustment factor for lightweight materials is specified in ACI 318-11,1 Section 8.6, and is the same as used in development length calculations.
It is important to note that the term l in Eq. (9) has been replaced by la in ACI 318-111, where la is taken as 0.8l for adhesive anchor concrete failure and 0.6l for adhesive anchor bond failure. For typical lightweight concrete, these reductions become 0.68 and 0.51, respectively.
ACI 318-11,1 Appendix D, bond strength provisionsACI 318-111 restricts the maximum allowable adhesive
anchor embedment to 20 times the anchor diameter. These restrictions represent the limits over which the bond model was verified both experimentally and analytically.18
As discussed previously, whereas pullout strength is not relevant for the design of adhesive anchors, ACI 318-111 provides a procedure for computing the bond strength asso-ciated with a single adhesive anchor or group of anchors, considering both edge distance and anchor spacing. The expressions for computing the bond capacity are based on the uniform bond model presented by Eligehausen et al.14 and are very similar in appearance to those used for computing concrete breakout capacity. For a group of anchors, the bond strength is given as
, , ,Na
ag ec Na ed Na cp Na baNao
AN N
A= ⋅ y ⋅ y ⋅ y ⋅ (10)
As with the expressions for concrete breakout, the terms ANa and ANao represent the projected area of the failure surface of the anchor group and a single anchor, respectively. The difference here is that the critical spacing (or edge distance) on which these terms is evaluated is not a function of the anchor embedment but instead is rather dependent on the anchor diameter and the design bond stress for uncracked concrete. This critical spacing is given as
10 (lb, in.)1100
uncrNa ac d= ⋅ ⋅ (11)

ACI Structural Journal/May-June 2013 443
For tuncr in the range of 2000 psi (14 MPa), the critical spacing is approximately 13.5da. As noted previously, the equivalent term for concrete breakout is 1.5hef.
The term ycp,Na is generally not relevant for the post-installed reinforcing bar case and is not discussed further herein. For additional information on this factor, refer to ACI 318-11.1 The multiplier yed,Na is relevant when the anchor is closer than cNa to an edge and is of the same form as Eq. (8) with the term cNa substituted for 1.5hef as follows
,, 0.7 0.3 1.0a min
ed NNa
cc
y = + ⋅ ≤ (12)
According to the uniform bond model, the basic bond strength of a single anchor in cracked concrete is given by
ba cr a a efN d h= t ⋅l ⋅ p ⋅ ⋅ (13)
where tcr is the design bond stress evaluated from tests on anchors in cracks. In the case of anchors in concrete that will remain uncracked at service load levels, this term may be replaced by the tuncr design bond stress evaluated from tests in uncracked concrete.
The bond strength is based on test methods and statistical analysis procedures that are described in ACI 355.4-11.2 Values for the design bond stress, as given in evaluation reports, are dependent on a number of factors. These include expected concrete temperature extremes over the anchor service life as well as installation conditions (for example, damp or dry concrete) and bar size. Tests for the response to sustained tension loading at elevated temperature are also reflected in the design bond stress values.
For cases where adhesive anchors are subjected to sustained tension loads, a supplementary check on the resis-tance of the most-loaded anchor for a reduced design bond stress is required. The reduction on the design bond stress specified in ACI 318-111 is 0.55. This check is required over and above the extensive testing for sustained loads and the corresponding reductions in design bond stress.
APPLICATION TO POST-INSTALLED REINFORCING BARS
The procedures for adhesive anchors contained in ACI 318-111 are clearly applicable to the design of anchors consisting of deformed reinforcing and, as indicated, design bond stress values are currently available via evaluation reports issued by ICC-ES. These bond strength values are used exclusively in the assessment of the bond strength capacity of a single anchor or anchor group. With the publi-cation of ACI 318-111 and ACI 355.4-11,2 a design method-ology is in place for post-installed reinforcing bars used—for example, as anchor elements in the application shown in Fig. 1.
Considering the applications shown in Fig. 2(a) and (b), while ACI 318-11,1 Chapter 12, does not apply to post-installed reinforcement, it is conceivable that the development length and tension splice design procedures of Chapter 12 be used if it could be shown that the bond strengths associated with post-installed reinforcing bars are comparable to those shown in Table 1 for cast-in reinforcing bars.
The basic requirements for hole drilling, hole cleaning, installation, and curing are the same for post-installed reinforcing bars as for adhesive anchors. These require-
ments must be extended to hole depths substantially larger than 20 bar diameters through suitable testing and assess-ment of the adhesive anchor system. Such an assessment must include verification that deep holes can be drilled close to edges and can be adequately cleaned. In addition, it must be verified that the adhesive can be properly placed in these longer and often larger-diameter holes. Finally, the assessment must consider the effect of large diameter and bond length on the design bond stress and whether the stiffness of the adhesive is suitable to ensure force transfer over a sufficient bond length to avoid zipper-type failure of the embedment.
Other issues that arise in the consideration of what bond stresses to use for post-installed reinforcing bars include:
1. Whether the substantial reductions in the design bond stress applied to post-installed adhesive anchors subject to sustained tension loading are applicable to post-installed reinforcing bars;
2. Whether bond stresses resulting from testing of anchors in cracks are applicable;
3. Whether a strength reduction factor should be applied to the bond stress; and
4. Whether an overstrength factor on bar yield is required to achieve development in the context of ACI 318-111 devel-opment length provisions.
The assumptions related to bond strength and bar yield are discussed further in the following section.
Bond strength determinationThe selection of the appropriate bond strength for estab-
lishing the development length of post-installed reinforcing bars will depend on several factors. One of the most decisive factors is whether the concrete is considered to be cracked or uncracked. For anchor design, the assessment of whether to use cracked or uncracked concrete strengths is determined by an evaluation of the likelihood that the concrete in the anchor vicinity will crack over the anchor service life. For post-installed reinforcing bar connections, these assump-tions are less likely to be applicable. The use of cracked or uncracked concrete bond stress values may also be dictated by the specifics of the application. For example, it may be appropriate to use a cracked concrete bond stress value (and cracked kc value) for the placement of reinforcing dowels in an existing shear wall as part of work to add a new (onlay) shear wall because the performance of the dowels could be materially affected by shear cracking in the existing wall under earthquake conditions. Other factors that may affect the bond stress, such as temperature, may also be less rele-vant for longer and larger post-installed reinforcing bar applications. Nevertheless, these should be considered in the context of the specific application as well. Finally, use of the relatively conservative anchor-based strength reduc-tion factors (the aforementioned Issue 3) offsets the need to consider a wider range of influencing factors.
Assumptions for reinforcing bar yieldAs noted in the previous section on development length
calculations—cast-in reinforcing bars, the development length provisions of ACI 318-111 are intended to result in yielding of the bar prior to failure, either due to splitting or pullout. The degree to which overstrength of the reinforcing bar is taken into account is not clear. For the purposes of establishing yield in a bar designed using anchor concepts,

444 ACI Structural Journal/May-June 2013
it seems reasonable to use the common assumption of 125% of the nominal yield value.19
RECOMMENDED DESIGN METHODOLOGYOn the basis of the previous discussion, a recommended
design methodology is provided in the following sections.
Design basisFor the design of single anchors far from edges where
the strength is governed by a steel limit state (for example, yield); concrete breakout; or bond failure, the following expressions apply
steel s s sN A f= f ⋅ ⋅ (14)
1.5breakout concrete c efN k f h= f ⋅ ⋅ ⋅′ (15)
bond concrete b efN d h= f ⋅ t⋅ p ⋅ ⋅ (16)
To establish an embedded length for which the steel strength controls, Eq. (14) must be set equal to both Eq. (15) and (16) and in each case solved for hef, whereby the larger value of the two cases controls
1.5s s s concrete c efA f k f hf ⋅ ⋅ = f ⋅ ⋅ ⋅′
giving
2/3 2/32/3
s s s s s sef
concreteconcrete c c
A f A fh
k f k f
f ⋅ ⋅ f ⋅= = f f ⋅ ⋅ ⋅′ ′
(17)
or
s s s concrete b efA f d hf ⋅ ⋅ = f ⋅ t ⋅ p ⋅ ⋅
giving
s s s s s sef
concrete b concrete b
A f A fh
d d f ⋅ ⋅ f ⋅
= = f ⋅ t ⋅ p ⋅ f t ⋅ p ⋅ (18)
In general, the ratio of strength reduction factors for these two cases will exceed 1.0 and can range between 1.67 to 1.00, depending on the classification of the steel as ductile or brittle (in accordance with ACI 318-11,1 Appendix D) and the reliability of the anchor system being considered. If one assumes a middle value of 1.3, Eq. (17) and (18) reduce to the following
2/3 2/3
For concrete breakout:
1.31.2s s s s
efc c
A f A fh
k f k f
⋅ ⋅ ⋅= =
⋅ ⋅′ ′
(19)
1.3 0.3For bond: s s b s
efb
A f d fh
d⋅ ⋅ ⋅ ⋅
= =t ⋅ p ⋅ t
(20)
Alternately, recognizing that the nominal concrete resis-tances are calculated as 5% fractile values (that is, values that will be exceeded by 95% of the population with a 90% confidence level), one can set all strength reduction factors equal to 1.0—that is, use nominal strengths to determine required development length and consider instead an over-strength factor of 125% on the steel limit state (yield).
Recommended design assumptionsAs mentioned previously, an assessment procedure
for post-installed reinforcing bar applications is needed. Lacking this, some simplifying assumptions are necessary to proceed with the design of post-installed reinforcing bars:
1. Bond stresses may conservatively be taken as those associated with cracked concrete.
2. Assume reinforcing steel to be developed when the force in the bar corresponds to 125% of specified yield.
3. Strength reduction factors (f factors) on bond strength and concrete breakout failure as for anchor applications may be neglected in the determination of development length.
4. Reductions on bond strength for sustained load are not necessary for the general case. For specific cases—for example, where a small number of bars are subjected to direct tension as a result of dead loads—use of the reduced bond stress check may be appropriate.
5. Reductions on bond strength for concrete temperature; presence of water (for example, saturated concrete); and installation in lightweight concrete should be employed as appropriate for the application.
6. For cases where the force in the post-installed bar is being transferred to existing reinforcing, the development length requirement for the existing reinforcing should be satisfied in any case. That is, where the calculated devel-opment length for the post-installed bar is less than that required by the code for the cast-in bar that it is assumed to transfer load to, the splice length is dictated by the cast-in bar requirement. Where the splice is assumed to occur between bars of different sizes, the provisions of ACI 318-111 require that the larger of the development length of the larger bar and the tension splice length of the smaller bar be used, whereby the tension splice length may be 130% of the development length, depending on the percentage of reinforcing being spliced at a given section.
Suggested design procedureThe use of post-installed reinforcing bars can be grouped
into three broad cases:• Case I: Bars installed in near-edge conditions, typically
to transfer load directly to existing reinforcing bars (that is, lap-spliced) in walls, slabs, and columns.
• Case II: Bars installed away from edges (relative to their embedment length) in the face of walls, slabs, and columns.
• Case III: Applications that lie somewhere between Cases I and II.
Case I applications are assumed to be dictated by split-ting and, as such, should be addressed using the provisions of ACI 318-11,1 Chapter 12. These cases almost uniformly involve splicing of new reinforcing to existing. Critical issues are the effective drilling of long holes at close edge distances without damage to the surrounding concrete and accurate location of existing reinforcing. It is noted that hole depths will almost certainly exceed the 20-bar-diameter limit allowed for adhesive anchors.

ACI Structural Journal/May-June 2013 445
Case II applications are assumed to occur far enough from edges that splitting will not control the behavior and the concrete breakout and bond resistance is likewise unaffected by the edge. In such cases, the use of the design paradigm developed for adhesive anchors is appropriate, provided that sufficiently conservative assumptions are employed. A subset of Case II occurs in members of limited depth—that is, where cast-in reinforcing would ordinarily be provided with a hook. This is discussed further in the following. Note that Case II conditions would be applicable only when a single bar is placed further from any edge that the greater of 1.5hef (for breakout) and cNa (for bond). Anchors placed closer to an edge than this would be subject to reductions associated with the area ratio and edge distance reduction factors (yed,N, yed,Na).
Case III applications are those for which a clear distinction between the use of Chapter 12 development length provi-sions and Appendix D anchor provisions of ACI 318-111 is not identifiable. Where using anchor theory to determine embedment, iteration is required because the area ratios and edge distance multiplier for breakout capacity (refer to Eq. (7)) is a function of the embedment.
In all cases where anchor provisions apply, it is appro-priate to calculate the required development length both ways and use the lesser value.
Case I design—Step 1: Select an adhesive anchor system that offers design bond stresses equal to or exceeding the values back-calculated from the development length that would be associated with a cast-in bar in the same condition (refer to Table 1). The stiffness of the adhesive should also be checked to ensure that it falls within the normal range for epoxies and other common structural adhesives. Elevated adhesive stiffness could result in zipper-type failure of the tension-loaded bar. The selected adhesive anchor system should also offer a delivery system that is appropriate for the diameter and length of the hole required and that will permit the successful installation of the bar prior to expiration of the gel time.
Step 2: Determine the required edge distance to prevent damage to the surrounding concrete during drilling. This is associated with the drilling method used, the condition of the existing concrete, the presence of existing reinforcing steel, and the diameter and length of the hole required. For questionable cases, consultation with a drilling equipment supplier or specialty contractor is advisable.
Step 3: Determine the development length/splice length in accordance with ACI 318-11,1 Chapter 12.
Case II design—Step 1: From the selected adhesive anchor system, determine the design bond stresses and k factors for establishment of the required development length.
Step 2: Calculate the required development length as required to satisfy the following
1.25c b yN A f≥ ⋅ ⋅ (21)
where fy is the specified bar yield strength; and Nc represents the limiting strength associated with concrete breakout and bond failure evaluated from Eq. (7) and (10).
For the special case of a single bar, the ratio of areas terms reduce to 1. Solving Eq. (21) for the embedment depth and taking this as the development length in each case, these expressions can be simplified for concrete breakout and bond failure, respectively, as follows (compare Eq. (19) and (20))
2 3
1.2 b yd
cr c
A f
k f
⋅=
⋅ ′ l (22)
0.3 b yd
cr
d f⋅ ⋅=
tl (23)
For a single Grade 60 No. 8 (No. 25 [25.4 mm]) bar to be installed in 5000 psi (34.4 MPa) concrete away from edges and assuming a value of 17 for kcr and 900 psi (6.2 MPa) for tk,cr, these expressions yield development lengths of 15 and 20 in. (381 and 508 mm) for concrete breakout and bond failure, respectively. For the controlling embedment of 20 in. (508 mm) to apply, these bars need to be further than the greater of 1.5hef (=1.5ld) or cNa from any edge. For this case, the controlling edge distance is approximately 30 in. (762 mm). Note also that the required development length of 20 in. (381 mm) corresponds to the upper limit of 20 bar diameters allowed in ACI 318-11,1 Appendix D. For cases where greater development lengths are indicated, it may be appropriate to use a reduced value for the uniform bond strength to account for the uncertainties associated with application of the model to deeper embedments.
For all cases, it is conservative to use the development/splice length calculated in accordance with the provisions of ACI 318-11,1 Chapter 12. For the bar in this example, taking the confinement term as 2.5 and all other modification factors as 1.0, the required development length per Eq. (1) is 28.5 in. (724 mm).
Case III design—Case III designs proceed essentially as for Case II, except that for cases where the edge proximity could affect the breakout and bond strength determination, the inclusion of the ratio of area terms and the edge modi-fication terms (yed,N, yed,Na) is required. This substantially complicates the establishment of a closed-form solution for the development length. Furthermore, as the edge distance gets smaller, it is possible that the required development length, as dictated by concrete breakout or bond failure, may exceed that associated with splitting, as per the devel-opment length equations of ACI 318-11,1 Chapter 12. In this respect, it is necessary to recognize when the use of the ACI 318-11,1 Appendix D, expressions is no longer rational in terms of the anticipated failure mode. For most cases, edge distances less than six bar diameters should be evalu-ated solely in terms of the development length provisions of the code.
Special casesAs discussed previously, for cases where cast-in reinforcing
would ordinarily be provided with a hook, assessment of the force path in terms of using a strut-and-tie model may be advisable. This case is addressed in detail in Hamad et al.20
The use of such strut-and-tie models is in accordance with the provisions established in ACI 318-11,1 Appendix A.
RESEARCH NEEDSBecause many adhesives are capable of developing signif-
icantly higher bond strengths than those associated with cast-in bars, it is conceivable that the development length requirements of the code could be used for cases where suffi-cient transverse reinforcement is present to resist the higher

446 ACI Structural Journal/May-June 2013
splitting stresses. In this regard, previous investigations by Spieth5 indicate the need to consider the stiffness of the bond mechanism associated with specific adhesive types to avoid zipper failures. Further work is needed, however, to deter-mine the range of stiffness values that are acceptable for the total range of bar sizes and potential development lengths.
The applicability of the uniform bond stress assumption for adhesive anchors needs to be validated for embedments greater than 20 bar diameters.
The response of adhesively bonded reinforcing bars to fire exposure is not well-understood and there are no design procedures in place for such cases, nor are there accepted procedures of assessing the post-fire viability of adhesively bonded bars.
CONCLUSIONSDespite their widespread use in construction, post-
installed reinforcing bars are not currently addressed in U.S. building standards. Qualification standards for adhe-sive anchor systems to determine their appropriateness for such uses and design methodologies suited to the anticipated failure modes are both lacking. While it is probable that these issues will be addressed by ACI or another standards body at some future time, in the interim, a practical approach to the design problem that recognizes the assumptions inherent in the provisions for anchorage and development length in ACI 318 is offered. As with all design problems, engineering judgment is required in the application of this approach to the broad class of details associated with post-installed reinforcing bars.
REFERENCES1. ACI Committee 318, “Building Code Requirements for Structural
Concrete (ACI 318-11) and Commentary,” American Concrete Institute, Farmington Hills, MI, 2011, 503 pp.
2. ACI Committee 355, “Qualification of Post-Installed Adhesive Anchors in Concrete (ACI 355.4-11) and Commentary,” American Concrete Insti-tute, Farmington Hills, MI, 2011, 55 pp.
3. ICC Evaluation Service Inc., “AC308—Acceptance Criteria for Post-Installed Adhesive Anchors in Concrete Elements,” International Code Council, Whittier, CA, 2009, 122 pp.
4. TR023, “Assessment of Post-Installed Rebar Connections,” ETA Tech-nical Report, European Organisation for Technical Approvals (EOTA), Brussels, Belgium, 2006, 20 pp.
5. Spieth, H., “Structural Behavior and Design of Rebar (Tragverhalten und Bemessung von Eingemörtelten Bewehrungsstäben),” doctoral thesis, University of Stuttgart, Stuttgart, Germany, 2002, 285 pp. (in German)
6. Kunz, J., and Münger, F., “Splitting and Bond Failure of Post-Installed Rebar Splices and Anchorings,” Bond in Concrete—From Research to Stan-dards, Budapest, Hungary, 2002, pp. 447-454.
7. Simons, I., “Bond Behavior of Rebar Rods under Cyclic Loading (Verbundverhalten von Bewehrungsstahl Stäbe unter Zyklischer Belas-tung),” doctoral thesis, University of Stuttgart, Stuttgart, Germany, 2007, 246 pp. (in German)
8. Simons, I., and Eligehausen, R., “Structural Behavior and Design of Rebar Rods under Cyclic Loading in Uncracked and Cracked Concrete (Tragverhalten und Bemessung von eingemörtelten Bewehrungsstäben unter zyklischer Beanspruchung im ungerissenen und gerissenen Beton),” Beton- und Stahlbetonbau, V. 103, 2008, pp. 598-608. (in German)
9. Appl, J., “Structural Behavior of Composite Anchors under Tensile Load (Tragverhalten von Verbunddübeln unter Zugbelastung),” doctoral thesis, University of Stuttgart, Stuttgart, Germany, 2008, 252 pp. (in German)
10. Spieth, H.; Ozbolt, J.; Eligehausen, R.; and Appl, J., “Numerical and Experimental Analysis of Post-Installed Rebars Spliced with Cast-In-Place Rebars,” International Symposium on Connections between Steel and Concrete, RILEM Publications, Stuttgart, Germany, 2001, pp. 889-898.
11. Eligehausen, R.; Mallée, R.; and Silva, J., Anchorage in Concrete Construction, Ernst & Sohn, Berlin, Germany, 2006, pp. 181-210.
12. Cook, R., and Konz, R., “Factors Influencing Bond Strength of Adhesive Anchors,” ACI Structural Journal, V. 98, No. 1, Jan.-Feb. 2001, pp. 76-86.
13. Meszaros, J., and Eligehausen, R., “Load Bearing Behavior and Design of Single Adhesive Anchors,” Proceedings of the International Symposium on Connections between Steel and Concrete, RILEM Publica-tions, Cachan, France, 2001, pp. 422-432.
14. Eligehausen, R.; Cook, R.; and Appl, J., “Behavior and Design of Adhesive Bonded Anchors,” ACI Structural Journal, V. 103, No. 6, Nov.-Dec. 2006, pp. 822-831.
15. Orangun, C.; Jirsa, J.; and Breen, J., “The Strength of Anchored Bars: A Reevaluation of Test Data on Development Length and Splices,” Research Report 154-3F, Center for Highway Research, University of Texas at Austin, Austin, TX, 1975, 94 pp.
16. Joint ACI-ASCE Committee 408, “Bond and Development of Straight Reinforcing Bars in Tension (ACI 408R-03) (Reapproved 2012),” American Concrete Institute, Farmington Hills, MI, 2003, 49 pp.
17. Fuchs, W.; Eligehausen, R.; and Breen, J., “Concrete Capacity Design (CCD) Approach for Fastening to Concrete,” ACI Structural Journal, V. 92, No. 1, Jan.-Feb. 1995, pp. 73-94.
18. Cook, R.; Kunz, J.; Fuchs, W.; and Konz, R., “Behavior and Design of Single Adhesive Anchors under Tensile Load in Uncracked Concrete,” ACI Structural Journal, V. 95, No. 1, Jan.-Feb. 1998, pp. 9-26.
19. Joint ACI-ASCE Committee 352, “Recommendations for Design of Beam-Column Connections in Monolithic Reinforced Concrete Structures (ACI 352R-02) (Reapproved 2010),” American Concrete Institute, Farm-ington Hills, MI, 2002, 38 pp.
20. Hamad, B.; Hammoud, R.; and Kunz, J., “Evaluation of Bond Strength of Bonded-In or Post-Installed Reinforcement,” ACI Structural Journal, V. 103, No. 2, Mar.-Apr. 2006, pp. 207-218.

APPENDIX A. SI EQUIVALENTS OF EQUATIONS
'
1
1.1y t e s
d bb trc
b
fdc Kf
d
ψ ψ ψλ
= +
(1)
' 140.1 b tr
eq cb t e s
c Kfd
τ λψ ψ ψ
+= ⋅ ⋅ ⋅ ⋅ ⋅ (3)
' '50.1 125.3b treq c c
b
c Kf fd
τ λ += ⋅ ⋅ ⋅ ≤ ⋅
(4a)
' '40.1 100.3b treq c c
b
c Kf fd
τ λ += ⋅ ⋅ ⋅ ≤ ⋅
(4b)
' 1.50.42b c c efN k f hλ= ⋅ ⋅ ⋅ (9)
107.59
uncrNa ac d τ= ⋅ ⋅ (11)
' 1.50.42breakout concrete c efN k f hφ= ⋅ ⋅ ⋅ (15)
2/3 2/32/3
' '0.42 0.42s s s s s s
efconcreteconcrete c c
A f A fhk f k f
φ φφφ
⋅ ⋅ ⋅ = = ⋅ ⋅ ⋅ (17)
2/3 2/3
' '
1.31.2
0.42 0.42s s s s
ef
c c
A f A fhk f k f
⋅ ⋅ ⋅ = = ⋅ ⋅
(19)

ACI Structural Journal/May-June 2013 447
Title no. 110-S35
ACI STRUCTURAL JOURNAL TECHNICAL PAPER
ACI Structural Journal, V. 110, No. 3, May-June 2013.MS No. S-2011-185.R1 received October 14, 2011, and reviewed under Institute
publication policies. Copyright © 2013, American Concrete Institute. All rights reserved, including the making of copies unless permission is obtained from the copyright proprietors. Pertinent discussion including author’s closure, if any, will be published in the March-April 2014 ACI Structural Journal if the discussion is received by November 1, 2013.
Two-Parameter Kinematic Theory for Shear Behavior of Deep Beamsby Boyan I. Mihaylov, Evan C. Bentz, and Michael P. Collins
This paper presents a kinematic model for deep beams capable of describing the deformed shape of such members in terms of just two primary parameters. The kinematic model is combined with equilibrium equations and stress-strain relationships to form a theory to predict the shear strength and deformations patterns of deep beams at shear failure. These deformation patterns include crack widths, maximum deflections, and the complete displacement field for the beam. The kinematic theory predicts the components of shear strength of deep beams and how they vary with a/d ratio. These components indicate a significant size effect for the shear strength of deep beams, even for members with transverse reinforce-ment. The theory has been validated against a large number of experimental results.
Keywords: deep beams; kinematics; shear; size effect; ultimate deformations.
INTRODUCTIONPredicting the load-deformation response of slender
beams such as those shown in Fig. 1(a) is made possible by using the simple but very powerful hypothesis that “plane sections remain plane” first demonstrated by Robert Hooke in 16781 (Fig 1(b)). Measured deformations2,3 of cracked slender reinforced concrete members (Fig. 1(c)) show that this hypothesis, which is the basis of the flexure and axial load procedures of the ACI code,4 is accurate and general for such members. Procedures for calculating moment-curvature response based on the plane sections hypothesis can also be extended to account for the effects of shear.5 However, in deep beams such as transfer girders (Fig. 1(a)), plane sections do not remain plane, shear strains become dominant, and the pattern of deformations becomes more complex (refer to Fig. 1(d)).2 Thus, for such members, a different approach is required.
In deep beams, a significant portion of the shear is carried by strut action, where compressive stresses flow directly from the load to the supports. Because of this, the ACI code4 recom-mends the use of strut-and-tie models6,7 for designing deep beams. Many experimental and analytical studies involving large deep beams8-22 focus primarily on studying param-eters that influence shear strength while some papers suggest improvements to the strut-and-tie method. Though the strut-and-tie method is a powerful design approach, it is not always capable of predicting the sometimes subtle influence of the many parameters that influence the shear behavior of deep beams. If it were possible to predict the deformation patterns such as those shown in Fig. 1(d), then a theoretical model using equilibrium, compatibility, and stress-strain relation-ships could be used to predict the shear behavior of deep beams in an analogous way to the plane-sections theory for flexure. It is the purpose of this paper to present such a model.
RESEARCH SIGNIFICANCEThe two-parameter kinematic theory presented in this
paper enables engineers to evaluate safety and assess defor-mations and crack widths of deep reinforced concrete beams such as the transfer girder in Fig. 1(a).
KINEMATICS OF DEEP BEAMSA recent Toronto experimental study involved four pairs
of large, deep, reinforced concrete beams subjected to either monotonic or reversed cyclic shear.2,3 The tests indicated
Fig. 1—Deformation patterns of slender beams and deep beams.

448 ACI Structural Journal/May-June 2013
Boyan I. Mihaylov is an Assistant Professor at the University of Liege, Liege, Belgium. He received his PhD from the ROSE School, Pavia, Italy, in 2009.
Evan C. Bentz, FACI, is an Associate Professor of Civil Engineering at the University of Toronto, Toronto, ON, Canada, and is Chair of ACI Committee 365, Service Life Prediction, and a member of Joint ACI-ASCE Committee 445, Shear and Torsion.
ACI Honorary Member Michael P. Collins is a University Professor and the Bahen-Tanenbaum Professor of Civil Engineering at the University of Toronto. He is a member of Joint ACI-ASCE Committee 445, Shear and Torsion.
that cyclic loading does not have a significantly detrimental effect on the shear behavior of deep beams, provided that the longitudinal reinforcement remains elastic. For specimens with stirrups, the measured monotonic load-displacement curves provided an almost perfect envelope to the cyclic response. Similar conclusions for deep beams were reported by Alcocer and Uribe.12 The kinematic model presented in this section is intended to form the basis of methods capable of predicting this load-deformation envelope.
The detailed deformed shapes of the Toronto specimens were measured at different load levels using a grid of targets. Figure 2(a) shows Specimen S1C, which had a shear span-depth ratio (a/d) of 1.55 and was tested under reversed cyclic loading. Measurements of crack patterns and crack widths at failure (peak load) are shown in Fig. 2(b), while the measured ultimate deformed shape of the beam is shown in Fig. 2(c). The dashed line on the crack diagram depicts how the measured longitudinal strains in the bottom reinforce-
ment varied from 2.42 × 10⁻³ at midspan to 1.74 × 10⁻³ at the inner edge of the support. The triangles in Fig. 2(c) have been shaded to illustrate the magnitude of strains in the web, where black corresponds to the highest strain range.
Specimen S1C failed in shear along a crack extending between the loading and support zones (refer to Fig. 2(a)). The failure was brittle and occurred both with crushing of the concrete in the vicinity of the loading plate and severe distortions near the support plate.
It can be seen from Fig. 2(c) that the concrete above the failure crack deformed relatively little. The cracks in this zone were caused by the previous load reversals and closed almost completely under the downward load. The shear deformations were concentrated near the critical diagonal crack whose width at failure was 3.0 mm (0.12 in.) at middepth of the beam. The rest of the cracks caused by the downward load had maximum widths of only 0.2 to 0.5 mm (0.008 to 0.02 in.) and extended from the bottom of the beam to the vicinity of the load (refer to Fig. 2(b)). This pattern of radial cracks was associated with a curved bottom edge of the specimen (refer to Fig. 2(c)). These observations were used by the first author to develop a kinematic model with only two degrees of freedom capable of describing the deformed shape of diagonally-cracked point-loaded deep beams subjected to single curvature.
The details of the kinematic model are shown in Fig. 3(a). The model assumes that the critical crack extends from the inner edge of the support to the far edge of the tributary area of the loading plate responsible for the shear force V. The concrete above the critical crack is modeled as a single rigid block, while the concrete below the crack is represented by a series of rigid radial struts (er = 0). The struts connect the loading point to the bottom longitudinal reinforcement. The regions of the model on each side of the critical crack are connected by the critical loading zone (CLZ) at the top of the section, by the bottom flexural reinforcement, and by the stirrups.
The basic assumption of the kinematic model is that, with respect to the loading plate, the motion of the concrete block above the critical crack can be described as a rotation about the top of the crack and a vertical translation (Fig. 3(a)). The rotation is proportional to the average strain in the bottom reinforcement, et,avg, while the translation equals the vertical displacement Dc of the critical loading zone. Thus et,avg and Dc represent the two degrees of freedom of the model (Fig. 3(b)). The elongation of the bottom reinforce-ment causes the rigid radial struts to rotate about the loading point and the cracks to widen. The transverse displacement in the critical loading zone is associated with both widening and slip displacement of the critical diagonal crack. It can be seen from Fig. 3(b) that both degrees of freedom cause tensile strains in the transverse reinforcement. As the a/d increases (Fig. 3(c)), the angle of the critical crack, a1, should not be taken smaller than the angle q of the cracks that develop in a uniform stress field. The angle q can be calculated from the simplified Modified Compression Field Theory (MCFT),23 or can be taken equal to 35 degrees.
Based on the aforementioned assumptions, the horizontal and vertical displacements of all points in the beam can be expressed from the two degrees of freedom (DOFs) as follows:
Points below the critical crack
( ) ,,x t avgx z xd = e (1)
Fig. 2—Shear failure of Specimen S1C. (Note: 1 mm = 0.03937 in.)

ACI Structural Journal/May-June 2013 449
( )2
,, t avgz
xx z
h ze
d =−
(2)
Points above the critical crack
( ) ( ),, cotx t avgx z h zd = e − a (3)
( ) ,, cotz t avg cx z xd = e a + D (4)
These displacements are with respect to the x-z axis system shown in Fig. 3(a). Equation (1) shows that vertical lines below the critical crack remain vertical and translate by dx away from the origin. Vertical lines drawn above the critical crack, however, will rotate and, hence, plane sections do not remain plane. The derivation of these equations is explained more fully in the Appendix.* As Eq. (1) to (4) describe the complete deformed shape of the member, they can be used to calculate the strain between any two points on the surface of the beam.
The ability of the equations to predict the deformed shape of the entire surface of a deep beam is demonstrated in Fig 2(c). The circles plotted on the deformed shape are the predicted locations of the targets, whereas the corners of the triangles show the experimentally measured locations. It can be seen that the x and z displacements of 27 out of the 28 targets are very accurately modeled. One target was predicted to be just above the critical crack while in the test it remained just below the crack. For this verification, the values of the two DOFs of the model, et,avg = 2.52 × 10⁻³ and Dc = 2.04 mm (0.08 in.), were obtained by minimizing the sum of the squares of the errors in the calculated displacements. Procedures for predicting the values of these DOFs are discussed later in the paper. Similar comparisons were made for the critical shear spans of all eight specimens from the experimental study3 and equally good agreements were found.24
In addition to predicting the deformation patterns of deep beams, the kinematic model can also be used to estimate the width of critical diagonal cracks. Based on Fig. 3, it can be shown that the crack width at mid-depth is
,1
1
cos2sin
t min kc
lw
e= D a +
a (5)
where the two terms of this expression are associated with the two DOFs of the kinematic model. Quantity lk in Eq. (5) is the length of the bottom reinforcement whose elongation contributes to the width of the critical crack. It is assumed that lk equals the distance between the kinks that develop in the longitudinal bars near the support (Fig. 3) and thus
( )0 1cot cotkl l d= + a − a (6)
( )0 11.5 cot maxl h d s= − a ≥ (7)
*The Appendix is available at www.concrete.org in PDF format as an addendum to the published paper. It is also available in hard copy from ACI headquarters for a fee equal to the cost of reproduction plus handling at the time of the request.
( )2.50.28 b
maxl
h dds
d−
=r
(8)
where l0 is the length of the heavily cracked zone at the bottom of the critical crack; smax is the spacing of the radial cracks at the bottom of the section25; and quantity 2.5(h – d) is the approximate depth of interaction between the bottom bars and the surrounding concrete.25
To demonstrate that Eq. (5) captures well the influence of the various parameters on the crack width, Fig. 4 was prepared. On the horizontal axis of the plot are the crack widths obtained from Eq. (5) and on the vertical axis are the widths measured in the experimental study.2,3 Quan-tities a1 and lk were calculated using the equations of the kinematic model, while deformation parameters Dc and et,min were obtained in the same manner as explained for Fig. 2(c). Each experimental value represents the average of two to four measurements taken along the middle third of the widest diagonal crack. As is evident from Fig. 4, the
Fig. 3—Kinematic model for deep beams.

450 ACI Structural Journal/May-June 2013
predictions obtained using Eq. (5) match the experimentally measured crack widths well.
CRITICAL LOADING ZONEThe critical loading zone (CLZ) represents a key compo-
nent of the two-parameter kinematic theory (2PKT). Figure 5(a) shows a photograph of the critical loading zone of Specimen S1C after failure. The spalled concrete and the orientation of the cracks in this zone indicate that it failed due to high diagonal compressive stresses.
The approximate dimensions of the CLZ can be determined with the help of the simple model depicted in Fig. 5(b). In this model, the zone of concrete above the critical diagonal crack is represented as a variable-depth elastic cantilever fixed at one end and loaded at the other. It is assumed that plane sections perpendicular to the bottom face of the canti-lever remain plane and that the tip section is subjected to
uniform compressive stresses. The analysis showed that the compressive stress along the bottom edge of the cantilever reaches its maximum value at a distance of 1.5lb1ecosa from the tip section and returns to the applied stress at a distance of 3lb1ecosa from the same section. This result is used to define a triangular critical loading zone with a bottom length of 3lb1ecosa and a top vertex located opposite to the location of the maximum compressive stress. A comparison between Fig. 5(a) and 5(b) shows that the chosen geometry agrees reasonably well with the shape of the crushed zone observed in Specimen S1C. To obtain realistic results for specimens loaded with very small loading plates, the effective width of the loading plate, lb1e, should not be taken less than three times the maximum size of coarse aggregate, ag.
Knowing the geometry of the critical loading zone, the ultimate shear displacement Dc can be calculated by assuming values for the average strains along the bottom and top sides of this zone (refer to Fig. 5(c)). As the zone fails due to combined moment and compression, the bottom strain is assumed equal to –0.0035 and the top strain is assumed equal to zero. Using these values, it can be shown that
Dc = 0.0105lb1ecota (9)
The derivation of this equation is presented in the Appendix.The appropriateness of Eq. (9) is illustrated in Fig. 6,
which shows the relationship between the shear force and the measured shear displacement of the critical loading zones of the eight Toronto specimens.2,3 The two vertical dashed lines in Fig. 6 represent the predicted values of Dc at failure from Eq. (9) for beams with a/d of 1.55 (Beams S0M/C, S1M/C) and 2.29 (L0M/C, L1M/C). It can be seen that the experi-mental results agree reasonably well with the predictions.
The shear capacity of the critical loading, VCLZ, can be derived with the help of Fig. 5(c). As shown in the figure, it is assumed that the compressive strain e varies linearly from zero at the edge of the loading plate to –0.0035 just above the critical crack. The average compressive stress from this strain profile is thus
Fig. 4—Predictions of kinematic model for crack widths.
Fig. 5—Modeling of CLZ.
Fig. 6—CLZ: test results and predictions.

ACI Structural Journal/May-June 2013 451
0.80 1.43 , MPa
0.0035avg cf fΩ
= ≈ ′
(10)
where W0 is the area under the stress-strain curve of concrete in uniaxial compression taken up to a strain of –0.0035. The suggested approximate expression for favg was derived by calculating W0 from stress-strain relationships available in the literature.26 Considering the triangle of forces shown in Fig. 5(c), the shear strength of the critical loading zone is expressed as
21 sinCLZ avg b eV kf bl= a (11)
where k is a crack shape coefficient. This coefficient accounts for the fact that, in slender beams, the critical diag-onal crack is not straight but has an S-shape and approaches the loading plate at a very flat angle. This results in a more slender critical loading zone that contributes little to the shear strength of the member. Based on comparisons with tests, it is suggested that k equal 1 for beams with cota ≤ 2 and zero for beams with cota ≥ 2.5, with a linear transition for intermediate values of cota.
Figure 6 also shows very high values of shear resistance at a very small value of Dc. This shows that a significant part of the shear in deep beams is carried by mechanisms other than diagonal compression in the critical loading zones.
CALCULATING SHEAR STRENGTH OF DEEP BEAMS
Detail A in Fig. 3(a) shows that, due to the displacement Dc, the critical diagonal crack undergoes widening and a significant slip displacement. Due to aggregate interlock, this slip will generate significant shear stresses contributing to the shear resistance of the member. The photograph of Specimen S1C in Fig. 7 shows a close-up view of the region corresponding to Detail A. It can be seen that there was a significant slip on the critical crack, which caused visible damage associated with aggregate interlock forces.
Detail B in Fig. 3(a) shows that the bottom longitudinal bars in deep beams are subjected to double curvature near the support and thus will resist shear by dowel action. The dowels of length lk can be very effective, as at one end they push upon the support plate and at the other end upon the concrete of the web. The aggregate interlock and the dowel action are included in the free body diagram in Fig. 8, which shows that the shear resistance of deep beams can be expressed as
CLZ ci s dV V V V V= + + + (12)
where VCLZ, Vci, Vs, and Vd are the shear forces resisted by the critical loading zone, by aggregate interlock, by stirrups, and by dowel action, respectively.
The shear resisted by aggregate interlock is expressed as27
0.18240.31
16
cci
ge
fV bd
wa
′=
++
(13)
The effective aggregate size age equals ag for concrete strengths less than 60 MPa (8700 psi) and zero for strengths larger than 70 MPa (10,150 psi), with a linear transition for intermediate strengths.23 The crack width w is calculated from Eq. (5) using the following simplification
( ), , 0.9max
t min t maxs s s s
T VaE A E A d
e ≈ e = = (14)
where Tmax is the tension force in the flexural reinforcement at the section with maximum bending moment.
The shear resisted by the stirrups is calculated from
( )1 0 1cot 1.5 0s v b e vV b d l l f= r a − − ≥
(15)
where the expression in the brackets represents the length along the shear span within which the critical crack is wide enough to cause significant tension in the stirrups (refer to Fig. 8). The stress in the stirrups is calculated by assuming elastic-perfectly plastic behavior of the steel
v s v yvf E f= e ≤
(16)
where the transverse strain at the middle of the shear span, ev, is derived from the kinematic model
( )2, 1
1.51 0.25 cot0.9 0.9
cv c t avgd
d dD
e = D + e a ≈
(17)
Finally, the shear resisted by the dowel action of the bottom reinforcement is calculated from
Fig. 7—Evidence of aggregate interlock in Specimen S1C at ultimate load. (Note: 1 mm = 0.03937 in.)
Fig. 8—Shear strength components in deep beam.

452 ACI Structural Journal/May-June 2013
3
3b
d b yek
dV n f
l= (18)
where nb is the number of bars, and db is the bar diameter. This expression is derived by assuming that the dowels of length lk (Eq. (6)) work in double curvature with plastic hinges forming at each end. The moment capacity of the hinges is calculated with an effective yield strength fye to account for the effect of the tension in the bars
2
1 500 MPa (72.5 ksi)minye y
y s
Tf f
f A
= − ≤
(19)
For simplicity, the tension force in the reinforcement near the support, Tmin, can be replaced by Tmax from Eq. (14). The limit of 500 MPa (72.5 ksi) in Eq. (19) accounts approxi-mately for the fact that the transverse displacement at the dowel may not be sufficiently large to cause plastic hinges in bars with high yield strength.
Equations (12) to (19) for the shear strength of deep beams were derived under the assumption that the member fails along the critical diagonal crack. Beams with large quanti-ties of stirrups, however, may fail by crushing of the concrete along a steep section near the load (sliding shear failure). The shear Vmax corresponding to this failure mode can also be calculated from Eq. (12) to (19), but for an appropriately selected shorter beam. It is suggested that the length of this beam is such that the zone of effective stirrups vanishes (refer to Fig. 8). The angle of the critical crack, a0, for calculating Vmax is thus derived by setting Vs from Eq. (15) equal to zero
0
1
tan1.5max b e
ds l
a =+
(20)
To avoid iterations when calculating Vmax, the expressions for the crack width w and for the effective yield strength of the dowels, fye, can be simplified as follows
0 0coscw ≈ D a
(21)
fye0 ≈ fy ≤500 MPa (72.5 ksi) (22)
Figure 9 summarizes the predicted components of shear strength and how these components change with the a/d for beams having the same section as that used in the experi-mental program.2,3 The 2PKT method has been developed to apply to members with short shear spans where the shear strength predicted by this method will exceed the shear strength predicted by sectional design procedures intended for longer spans. The sectional shear strength predictions plotted in Fig. 9 result from the CSA sectional model28 based on the simplified MCFT.23 It can be seen that, for this section, the transition from deep beams to slender beams occurs at an a/d of approximately 2.3. For slender beams, the sectional model predicts that the concrete contribution Vci accounts for 55% of the shear capacity. For deep beams, the concrete contribution, Vci + VCLZ, varies from 67% when a/d is 2.3 up to 97% at an a/d of 0.5. At this low a/d, and for this section, the dowel force provided by the longitudinal reinforcement accounts for the remaining 3% of the shear strength. As the a/d increases, the angle of the critical crack will decrease, resulting in a larger stirrup contribution Vs as more stirrup legs cross the critical crack. At the same time, the shape of the critical loading zone becomes more slender, reducing both its strength VCLZ and its stiffness. The reduction in stiff-ness results in a wider critical crack and, thus, lower aggre-gate interlock contribution Vci as a/d increases.
An important motivation for the development of the 2PKT model was the need for a better understanding of the size effect in deep beams. The question is whether very large beams will fail at lower shear stresses than geometri-cally similar, smaller beams. Figure 10 compares the shear strength predictions to the results of 12 size effect tests by Zhang and Tan.11 Eight of the specimens were without web reinforcement (hollow dots) and four of the specimens contained 0.41% of stirrups (solid dots). It can be seen that the 2PKT method captures well the size effect observed in these tests. The components of shear resistance—VCLZ, Vd, and Vci—for the beams without stirrups predict that the size effect in deep beams is caused mainly by aggregate interlock. As the member size increases, the larger critical loading zone deforms more, causing wider diagonal cracks that in turn result in diminishing shear stresses transferred across the cracks. Unlike slender beams, the tests and the 2PKT indicate that the addition of a significant number of stirrups may not eliminate the size effect in deep beams. Figure 10 also shows that the AASHTO29 strut-and-tie model, which does not account for the size effect, provides an approximate lower bound to the predictions of the 2PKT method. For these beams, the ACI strut-and-tie model, which also neglects the size effect, produces similar predic-tions. With respect to the magnitude of the size effect in deep beams, it is of interest to note that if the 2PKT predictions are extended to d = 10 m (32 ft), the reduction of failure shear stress compared to a laboratory-size, 500 mm (19.7 in.) deep specimen will be 19.7% for the members with stirrups and 27.2% for the members without stirrups.
Fig. 9—Predicted shear strength components for different a/d. (Note: 1 mm = 0.03937 in.; 1 MPa = 145 psi.)

ACI Structural Journal/May-June 2013 453
Similar predictions to those shown in Fig. 9 and 10 were made for a total of 434 published tests on simply supported beams with a/d between 0.5 and 3, and the results are summarized in Fig. 11. Also shown in this figure are the ratios of experimental to predicted shear strengths given by the AASHTO29 and ACI4 codes. As with the 2PKT method,
the predicted capacities for the AASHTO and ACI codes are taken as the larger of the sectional and strut-and-tie shear capacities. Specimen details and capacity calculation details are given in the Appendix to this paper. The top three plots show the ratios of experimental to predicted shear strengths as a function of a/d, while the bottom three plots show the same ratios as a function of the effective depth d. It can be seen that the 2PKT method provides significantly more consistent predictions than the two design codes across the entire range of a/d and d values. The predictions of the AASHTO code have a large number of conservative values for a/d between 1 and 2.5 and it is in this region that the 2PKT method provides the most significant improvement in accuracy. Because the ACI code does not account for the size effect in shear, there is a clear decrease in conservatism as member depth increases.
CALCULATING ULTIMATE DEFORMATIONSBased on the kinematic model, the deflection at the shear
failure load of deep beams can be taken as the sum of Dc and Dt (Fig. 3), where Dc is calculated from Eq. (9), and Dt can be expressed as
, cott t avgaD = e a
(23)
( ), , ,
tancott avg t max k t min kd l ld
a e = e a − + e
(24)
While it is recommended that Eq. (14) be used in calcu-lating et,min for strength predictions, a more precise, if some-what more complex, expression is appropriate for deflection calculations. Such an expression can be derived with the help of the free body diagram in Fig. 8
( ) ( ) 1
,
/ 0.9 0.5 cots dmint min
s s s s
Va d V VTE A E A
− + ae = = (25)
Fig. 10—Size effect in deep beams: theoretical predictions and experimental results.11 (Note: 1 mm = 0.03937 in.; 1 MPa = 145 psi.)
Fig. 11—Comparison between 2PKT, AASHTO, and ACI shear provisions for 434 tests. (Note: 1 mm = 0.03937 in.)

454 ACI Structural Journal/May-June 2013
where V, Vs, and Vd are calculated from Eq. (12), (15), and (18), respectively.
Having calculated Dc from Eq. (9) and et,avg from Eq. (24), the kinematic model can be used to predict the complete deformed shape of a deep beam. In Fig. 12, these predicted deformed shapes are compared to the measured deformed shapes of four of the Toronto specimens.2,3 It can be seen that the kinematic model with only two DOFs captures the complex deformation patterns of these beams surprisingly well.
CONCLUSIONSThe two-parameter kinematic theory (2PKT) presented in
this paper is capable of predicting the shear failure load, the crack widths near failure, and the complete deformed shapes of diagonally cracked point-loaded deep beams subjected to single curvature. A key component of the 2PKT is the modeling of the critical loading zone which is the area of highly stressed concrete near the point of load application. The ultimate vertical displacement of this zone is one of the two kinematic parameters of the model, while the other is the average tensile strain in the longitudinal reinforcement on the flexural tension side. In addition to the kinematic conditions, the theory includes equations for equilibrium and stress-strain relationships for the materials. The theory allows for the components of shear resistance of deep beams to be evaluated at failure.
The kinematic theory has been validated using 434 tests of simply supported deep beams covering a large range of experimental variables. The average ratio of experimental to predicted shear strengths for these tests is 1.10 with a coeffi-cient of variation of 13.7%. It is shown that the 2PKT captures
well the size effect in deep beams and predicts that this effect can be significant even for members with transverse reinforce-ment. Research is currently underway to extend this theory to a wider range of loading and support conditions.
NOTATIONAs = area of longitudinal bars on flexural tension sidea = shear spanag = maximum size of coarse aggregateage = effective size of coarse aggregated = effective depth of sectiondb = diameter of bottom longitudinal barsdbv = diameter of stirrupsfavg = average diagonal compressive stress in CLZfc′ = concrete cylinder strengthfv = stress in stirrupsfy = yield strength of bottom longitudinal barsfye = effective yield strength of bottom longitudinal barsfyv = yield strength of stirrupsh = total depth of sectionk = crack shape factorl0 = length of heavily cracked zone at bottom of critical diagonal cracklb1 = width of loading plate parallel to longitudinal axis of memberlb1e = effective width of loading plate parallel to longitudinal axis
of memberlb2 = width of support plate parallel to longitudinal axis of memberlk = length of dowels provided by bottom longitudinal reinforcementnb = number of bottom longitudinal barsP = applied concentrated loadsmax = distance between radial cracks along bottom edge of memberTmax = maximum tensile force in bottom reinforcementTmin = minimum tensile force in bottom reinforcementV = shear forceVCLZ = shear resisted by CLZVci = shear resisted by aggregate interlockVd = shear resisted by dowel actionVmax = shear force corresponding to shear failure along steep section
near loadVs = shear resisted by stirrupsw = crack widtha = angle of line extending from inner edge of support plate to far
edge of tributary area of loading plate responsible for shear force V
a0 = angle a of short beam used for Vmax calculationsa1 = angle of critical diagonal crackDc = shear distortion of critical loading zoneDt = deflection due to elongation of bottom longitudinal reinforcementdx = displacement along x-axisdz = displacement along z-axiset,avg = average strain along bottom longitudinal reinforcementet,max = maximum strain along bottom longitudinal reinforcementet,min = minimum strain along bottom longitudinal reinforcementev = transverse web strainq = angle of diagonal cracks in uniform stress fieldrl = ratio of bottom longitudinal reinforcementrv = ratio of transverse reinforcementW0 = area under stress-strain curve of concrete in uniaxial compres-
sion up to a strain of –0.0035
REFERENCES1. Hooke, R., “Lectures de Potentia Restitutiva (Spring Explaining the
Power of Springing Bodies),” printed for John Martyn Printer to The Royal Society, at the Bell in St. Paul’s Church-Yard, 1678, 24 pp.
2. Mihaylov, B. I., “Behavior of Deep Reinforced Concrete Beams under Monotonic and Reversed Cyclic Load,” doctoral thesis, European School for Advanced Studies in Reduction of Seismic Risk, Pavia, Italy, 2008, 379 pp.
3. Mihaylov, B. I.; Bentz, E. C.; and Collins, M. P., “Behavior of Large Deep Beam Subjected to Monotonic and Reversed Cyclic Shear,” ACI Structural Journal, V. 107, No. 6, Nov.-Dec. 2010, pp. 726-734.
4. ACI Committee 318, “Building Code Requirements for Structural Concrete (ACI 318-08) and Commentary,” American Concrete Institute, Farmington Hills, MI, 2008, 473 pp.
5. Vecchio, F. J., and Collins, M. P., “Predicting the Response of Reinforced Concrete Beams Subjected to Shear Using the Modified Compression Field Theory,” ACI Structural Journal, V. 85, No. 3, May-June 1988, pp. 258-268.
Fig. 12—Comparisons of predicted and observed deformed shapes (displacements ×30).

ACI Structural Journal/May-June 2013 455
6. Collins, M. P., and Mitchell, D., “A Rational Approach to Shear Design—The 1984 Canadian Code Provisions,” ACI Journal, V. 83, No. 6, Nov.-Dec. 1986, pp. 925-933.
7. Schlaich, J.; Schäfer, K.; and Jennewein, M., “Toward a Consistent Design of Structural Concrete,” PCI Journal, V. 32, No. 3, 1987, pp. 74-150.
8. Rogowsky, D. M., and MacGregor, J. G., “Tests of Reinforced Concrete Deep Beams,” ACI Journal, V. 83, No. 4, July-Aug. 1986, pp. 614-623.
9. Walraven, J., and Lehwalter, N., “Size Effects in Short Beams Loaded in Shear,” ACI Structural Journal, V. 91, No. 5, Sept.-Oct. 1994, pp. 585-593.
10. Yang, K.-H.; Chung, H.-S.; Lee, E.-T.; and Eun, H.-C., “Shear Char-acteristics of High-Strength Concrete Deep Beams without Shear Reinforce-ments,” Engineering Structures, V. 25, No. 10, Aug. 2003, pp. 1343-1352.
11. Zhang, N., and Tan, K.-H., “Size Effect in RC Deep Beams: Experi-mental Investigation and STM Verification,” Engineering Structures, V. 29, No. 12, Dec. 2007, pp. 3241-3254.
12. Alcocer, S. M., and Uribe, C. M., “Monotonic and Cyclic Behavior of Deep Beams Designed Using Strut-and-Tie Models,” ACI Structural Journal, V. 105, No. 3, May-June 2008, pp. 327-337.
13. Senturk, A. E., and Higgins, C., “Evaluation of Reinforced Concrete Deck Girder Bridge Bent Caps with 1950s Vintage Details: Laboratory Tests,” ACI Structural Journal, V. 107, No. 5, Sept.-Oct. 2010, pp. 534-543.
14. Senturk, A. E., and Higgins, C., “Evaluation of Reinforced Concrete Deck Girder Bridge Bent Caps with 1950s Vintage Details: Analytical Methods,” ACI Structural Journal, V. 107, No. 5, Sept.-Oct. 2010, pp. 544-553.
15. Birrcher, D.; Tuchscherer, R.; Huizinga, M.; Bayrak, O.; Wood, S.; and Jirsa, J., “Strength and Serviceability Design of Reinforced Concrete Deep Beams,” Report No. FHWA/TX-09/0-5253-1, Center for Transporta-tion Research, University of Texas at Austin, Austin, TX, 2009.
16. Hwang, S. J.; Wen, Y. L.; and Lee, H. J., “Shear Strength Prediction for Deep Beams,” ACI Structural Journal, V. 87, No. 3, May-June 2000, pp. 367-376.
17. Matamoros, A. B., and Wong, K. H., “Design of Simply Supported Deep Beams Using Strut-and-Tie Models,” ACI Structural Journal, V. 100, No. 6, Nov.-Dec. 2003, pp. 429-437.
18. Russo, G.; Venir, R.; and Pauletta, M., “Reinforced Concrete Deep Beams—Shear Strength Model and Design Formula,” ACI Structural Journal, V. 102, No. 3, May-June 2005, pp. 429-437.
19. Tang, C. Y., and Tan, K. H., “Interactive Mechanical Model for Shear Strength of Deep Beams,” Journal of Structural Engineering, ASCE, V. 130, No. 10, 2004, pp. 1534-1544.
20. Park, J. W., and Kuchma, D., “Strut-and-Tie Model Analysis for Strength Prediction of Deep Beams,” ACI Structural Journal, V. 104, No. 6, Nov.-Dec. 2007, pp. 657-666.
21. Uzel, A.; Podgorniak, B.; Bentz, E. C.; and Collins, M. P., “Design of Large Footings for One-Way Shear,” ACI Structural Journal, V. 108, No. 2, Mar.-Apr. 2011, pp. 131-138.
22. Hong, S. G.; Namhee, K. H.; and Jang, S. K., “Deformation Capacity of Structural Concrete in Disturbed Regions,” ACI Structural Journal, V. 108, No. 3, May-June 2011, pp. 267-275.
23. Bentz, E. C.; Vecchio, F. J.; and Collins, M. P., “Simplified Modified Compression Field Theory for Calculating Shear Strength of Reinforced Concrete Members,” ACI Structural Journal, V. 103, No. 4, July-Aug. 2006, pp. 614-624.
24. Mihaylov, B. I.; Bentz, E. C.; and Collins, M. P., “A Two Degree of Freedom Kinematic Model for Predicting the Deformations of Deep Beams,” CSCE 2nd International Engineering Mechanics and Materials Specialty Conference, June 2011.
25. CEB-FIP Model Code 1990, “Design Code,” Thomas Telford, London, 1993, 437 pp.
26. Popovics, S., “A Review of Stress-Strain Relationships for Concrete,” ACI Journal, V. 67, No. 3, Mar. 1970, pp. 243-248.
27. Vecchio, F. J., and Collins, M. P., “The Modified Compression Field Theory for Reinforced Concrete Elements Subjected to Shear,” ACI Journal, V. 83, No. 2, Mar.-Apr. 1986, pp. 219-231.
28. CSA Committee A23.3, “Design of Concrete Structures,” Canadian Standards Association, Mississauga, ON, Canada, 2004, 214 pp.
29. AASHTO, “AASHTO LRFD Bridge Design Specifications,” fourth edition, American Association of State Highway Officials, Washington, DC, 2007, 1526 pp.

456 ACI Structural Journal/May-June 2013
NOTES:

34
34
Appendix to ACI Paper Paper Title: A Two Parameter Kinematic Theory for the Shear Behavior of Deep Beams
Authors: Boyan I. Mihaylov, Evan C. Bentz, Michael P. Collins
Summary: This appendix provides data from 529 tests which are used to verify the proposed two parameter kinematic theory (2PKT) and code procedures for deep beams. Worked examples of 2PKT calculations and ACI strut-and-tie calculations are included. The derivation of some of the equations of the 2PKT method is provided.
Derivation of Eqs. (1) to (5) - terms associated with DOF εt,avg
strut
kl =l0
εt,min
Δ t
δz
δx
DOF ε t,avg(h
-z)
x
x(h-z) d
=
(h-z)
ε t,avgx
(h-z) d d
φ
φx
=φ
=φ
α =α1
d
O
A
CB
φblock
w
It is assumed that the displacements are small compared to the dimensions of the member.
- Displacements of points below the critical crack
Consider point A(x,y) from strut OAB.
dzh
xBC−
= and dzh
xavgtBx −
= ,, εδ
Strut rotation about point O:
zhx
d avgtBx
−== ,
, εδ
φ
Displacements of point A:
( ) xzh avgtx ,εφδ =−=
zhx
x avgtz −
==2
,εφδ
- Displacements of points above the critical crack
Rotation of rigid block about point O:
αεαεδ
φ cotcot
,,,
avgtavgtdx
block dd
d===
Displacements of a point on the rigid block:

35
35
( ) ( ) αεφδ cot, zhzh avgtblockx −=−=
αεφδ cot, xx avgtblockx ==
- Crack width associated with DOF εt,avg
Elongation of the bottom reinforcement over length lk by the support:
ktk ll min,ε=Δ
Crack width at middepth:
1
min,
sin2 αε kt l
w =
Derivation of Eq. (9)
α
b1el
Δc
α b1e3l
cosα
b1e
0.0035 3lcosα
ε ΔcΔc cosα
α
α
αα
αcot0105.0
sin
cos30035.01
1eb
ebc l
l=
×=Δ
Rules for selecting members for the database - reinforced concrete (no limits on concrete strength) - normalweight concrete - steel reinforcement (no limits on yield strength) - point loads, simply supported - shear-span-to-depth ratios (a/d ratios) not larger than 3 - rectangular cross sections - no bar cutoffs - no axial load, no prestressing - with and without transverse reinforcement, no fibres - with reported important test parameters - no anchorage failures - no geometrical limits on member size were used.
Columns in the database Ref. # Number of reference from the reference list at the end of the Appendix a/d Shear-span-to-depth ratio b Cross section width d Member effective depth h Member total depth a: M/V Length of shear span measured from the center of the support to the center of the
loading plate lb2 Longitudinal length of support plate lb1 Longitudinal length of loading plate V/P Ratio of shear force to applied point load ≤1.0 ρl=100As/(bd) Ratio of longitudinal reinforcement on flexural tension side of section # bars Number of longitudinal bars on flexural tension side of section

36
36
fy Yield strength of flexural tension reinforcement ag Maximum specified size of course aggregate fc' Concrete cylinder strength at date of testing ρv Ratio of transverse reinforcement dbv Stirrups bar diameter fyv Yield strength of stirrups ρh Ratio of longitudinal web reinforcement Rep. mode Reported mode of failure: “F” = flexure, “S” = shear (which includes diagonal tension,
shear compression, etc.) Mmax/Mn Ratio of maximum observed moment to nominal moment capacity according to ACI
code Vu Maximum observed shear force 2PKT mode Predicted mode of failure by kinematic theory and CSA sectional model: “F” = flexural,
“S” = sectional shear failure by breakdown of beam action, “C” = crushing shear failure of critical loading zone
2PKT Exp/Pred Ratio of observed shear strength to predicted shear strength for members that were reported to fail in shear and which failed with Mmax/Mn≤1.10
AASHTO mode Predicted mode of failure by AASHTO code: “F” = flexural, “S” = sectional shear failure by breakdown of beam action, “C” = crushing shear failure of strut in strut-and-tie model
AASHTO Exp/Pred
Ratio of observed shear strength to predicted shear strength for members that were reported to fail in shear and which failed with Mmax/Mn≤1.10
ACI mode Predicted mode of failure by ACI code: “F” = flexural, “S” = sectional shear failure by breakdown of beam action, “C” = crushing shear failure of strut in strut-and-tie model
ACI Exp/Pred Ratio of observed shear strength to predicted shear strength for members that were reported to fail in shear and which failed with Mmax/Mn≤1.10
Note: Cells in the database that are shaded contain assumed values as the original values were not provided by the authors of the publication.
Example 2PKT calculations
The following example is given for beam 1DB100bw of Zhang and Tan specimens (#421 in database).
V
Pb1(V/P)lb1l
Δc
ε r
ε t,min εt,max
A
CLZ
=0
b1el =
d
B
ε t,avg
x
zΔ
h
α =α1εv
b2l
slip
w
Aα1
a+ d cot αε t,avg
B
2.5(
h-d)
kl =l0

37
37
• Calculations for shear strength V:
( )[ ] [ ] mmalPVl gbeb 150103,1501max3,/max 11 =××==
006.11502/1502/150994
1000
2/2/tan
121
=+−−
=+−−
=ebbb llla
hα → °= 17.45α
[ ] [ ] °=°°== 17.459.35,17.45max,max1 θαα
where θ =35.9˚ was obtained from the equations of the simplified modified compression field theory (ref. 23 in the paper).
mmd 6.8139049.09.0 =×=
mmd 6.8139049.09.0 =×=
( ) ( ) mmd
dhds
l
b 142904
90410005.2
0120.0
2328.05.228.0max =−×=−=
ρ (8)
( )[ ] ( )[ ] mmsdhl 143142,17.45cot90410005.1max,cot5.1max max10 =°−=−= α (7)
( ) mmdllk 143cotcot 10 =−+= αα (6)
( )0
0.1cot25
≥≤
−= αk → ( ) 0.101.3006.1/25 >=− → 0.1=k
MPaff cavg 0.217.2843.1'43.1 8.08.0=×== (10)
kNblkfV ebavgCLZ 4.3641000/17.45sin1502300.210.1sin 221 =°×××== α (11)
mml ebc 566.117.45cot1500105.0cot0105.0 1 =°××==Δ α (9)
00289.06.813
566.15.1
9.0
5.1=×=
Δ=
dc
vε (17)
[ ] [ ] MPafEf yvvsv 426426,00289.0200000,min =×== ε (16)
( ) ( ) kNflldbV vebvs 2.2131000/4261505.114317.45cot9042300041.05.1cot 101 =×−−°×=−−= αρ (15)
1) Assume ( ) kNVVV sCLZ 6902.1 ≈+=
2) kNd
VaT 0.8436.813
994690
9.0max =×== and 001689.02495200000
843000maxmax, =
×==
sst AE
Tε (14)
3) mml
w ktc 27.1
17.45sin2
143001689.017.45cos566.1
sin2cos
1
min,1 =
°×+°=+Δ=
αε
α (5)
4) kNbd
aw
fV
ge
cci 9.1341000/904230
1610
27.12431.0
7.2818.0
16
2431.0
'18.0=×
+×+
=
++
= (13)
5) MPaMPaAf
Tffsy
yye 5003.3492495555
84300015551
22
min <=
×−=
−= (19)
6) kNl
dfnV
k
byebd 4.591000/
1433
233.3496
3
33
=×
×== (18)

38
38
7) kNkNVVVVV dsciCLZ 6909.7714.592.2139.1344.364' ≠=+++=+++= (12)
Return to 2) with the average value of V and V’; repeat steps 2) to 7) until the prediction converges to:
kNVVVVV dsciCLZ 7627.512.2134.1334.364 =+++=+++=
• Calculations for Vmax:
463.21505.1142
904
5.1tan
1max0 =
×+=
+=
eblsdα → °=>°= 17.4590.670 αα →Vmax
calculation is required (20)
kNVCLZ 0.6221000/90.67sin1502300.211 2 =°×××= (11)
( ) mmw c 24.090.67cos90.67cot0035.01503cos 00 =°°×××=Δ= α (21)
kNVci 8.3761000/904230
1610
24.02431.0
7.2818.0 =×
+×+
= (13)
mmslk 142max == (6)
MPaMPaf y 500555 >= → MPaf ye 5000 = (22)
kNVd 1.851000/1433
235006
3
=×
×= (18)
kNVkNV 76210841.858.3760.622max =>=++= → Diagonal failure at V=762kN (12)
Finally:
02.1762
775exp ==predV
V
Example ACI strut-and-tie calculations
The following example is given for beam 1DB100bw of Zhang and Tan specimens (#421 in database).
V
P
ρh
ρv C
T
Tv
T1θ
D
lb1
lb2
c
w
dh
acl /2acl /2
a
8185.0994
9049.09.0tan =×==
adα → °= 30.39α
( ) ( ) 003.00032.030.3990sin0041.090sinsin >=°−°=−°+ αραρ vh → Strut strength = 0.64fc’=0.64×28.7=18.4 MPa
( ) ( ) kNbafT clvyvvy 5.1691000/2308445.00041.04265.0 =××××== ρ

39
39
1) Assume c=0.1d=0.1×904=90.4 mm
2) ( ) kNTC 2.5071000/4.902307.2885.0 =×××==
3) ( ) ( ) kNlPVla
cdTVbbcl
2.4381505.01505.0844
4.905.09042.507
)/(5.05.0
5.0
12
=×+×+
×−×=++−=
4) ( ) [ ] ( )
=−
+×−++=
cdlPVaVTlPVlaV
T bclvybbcl
5.0
)/(5.05.0,min)/(5.05.0 1121
( ) [ ] ( ) kN1.4094.905.0904
1505.08445.02.438,5.169min1505.01505.08442.438 =×−
×+××−×+×+×=
5) 071.11.409/2.438/tan 1 === TVθ → °= 97.46θ
6) ( ) ( ) mmdhlw b 24197.46cos9041000297.46sin150cos2sin2 =°−+°=−+= θθ
7) kNbwfD c 10181000/2412304.18'64.0 =××==
8) kNkNDV 2.4383.74497.46sin1018sin' ≠=°== θ
Return to 2) with a new estimate of c and repeat steps 2) to 5) until the prediction converges to V=705 kN and θ=43.45˚.
If θ is smaller than 25˚, the strut action is neglected and the shear strength prediction is governed by the ACI sectional model.
Finally:
10.1705
775exp ==predV
V

Conversion Factors: 25.4 mm = 1 in.; 1 MPa = 145 psi; 1 kN = 225 lbs.
40
# Ref. Year Beam a/d b d h a: M/V lb1 lb2 V/P ρl # fy ag fc' ρv dbv fyv ρh Rep. Mmax Vu 2PKT 2PKT AASHTO AASHTO ACI ACI
# Name (mm) (mm) (mm) (mm) (mm) (mm) (%) bars (MPa) (mm) (MPa) (%) (mm) (MPa) (%) mode Mn (kN) mode Exp/Pred mode Exp/Pred mode Exp/Pred
1 1 1951 A1-1 2.35 203 389 457 914 89 89 0.5 3.10 3 321 10 24.6 0.38 9.5 331 0 S 0.87 222.5 S 1.03 S 1.03 S 1.24
2 A1-2 2.35 203 389 457 914 89 89 0.5 3.10 3 321 10 23.6 0.38 9.5 331 0 S 0.83 209.1 S 0.97 S 0.97 C 1.00
3 A1-3 2.35 203 389 457 914 89 89 0.5 3.10 3 321 10 23.4 0.38 9.5 331 0 S 0.89 222.5 S 1.04 S 1.04 C 1.07
4 A1-4 2.35 203 389 457 914 89 89 0.5 3.10 3 321 10 24.8 0.38 9.5 331 0 S 0.96 244.7 S 1.13 S 1.13 S 1.36
5 B1-1 1.96 203 389 457 762 89 89 1 3.10 3 321 10 23.4 0.37 9.5 331 0 S 0.93 278.8 C 1.18 S 1.27 C 1.23
6 B1-2 1.96 203 389 457 762 89 89 1 3.10 3 321 10 25.4 0.37 9.5 331 0 S 0.83 256.6 C 1.06 S 1.16 C 1.06
7 B1-3 1.96 203 389 457 762 89 89 1 3.10 3 321 10 23.7 0.37 9.5 331 0 S 0.94 284.8 C 1.20 S 1.30 C 1.24
8 B1-4 1.96 203 389 457 762 89 89 1 3.10 3 321 10 23.3 0.37 9.5 331 0 S 0.89 268.1 C 1.13 S 1.23 C 1.19
9 B1-5 1.96 203 389 457 762 89 89 1 3.10 3 321 10 24.6 0.37 9.5 331 0 S 0.79 241.4 C 1.00 S 1.10 C 1.02
10 B2-1 1.96 203 389 457 762 89 89 1 3.10 3 321 10 23.2 0.73 9.5 331 0 S 1.00 301.1 F 0.93 F 0.93 S 1.10
11 B2-2 1.96 203 389 457 762 89 89 1 3.10 3 321 10 26.3 0.73 9.5 331 0 S 1.03 322.2 F 0.99 F 0.99 C 1.15
12 B2-3 1.96 203 389 457 762 89 89 1 3.10 3 321 10 24.9 0.73 9.5 331 0 S 1.09 334.8 F 1.03 F 1.03 S 1.21
13 B6-1 1.96 203 389 457 762 89 89 1 3.10 3 321 10 42.1 0.37 9.5 331 0 S 1.10 379.3 C 1.32 C 1.48 F 0.99
14 C1-1 1.57 203 389 457 610 89 89 1 2.07 2 321 10 25.6 0.34 9.5 331 0 S 0.98 277.7 C 1.18 C 1.29 C 1.19
15 C1-2 1.57 203 389 457 610 89 89 1 2.07 2 321 10 26.3 0.34 9.5 331 0 S 1.09 311.1 C 1.31 C 1.41 C 1.30
16 C1-3 1.57 203 389 457 610 89 89 1 2.07 2 321 10 24.0 0.34 9.5 331 0 S 0.88 245.9 C 1.08 C 1.19 C 1.12
17 C1-4 1.57 203 389 457 610 89 89 1 2.07 2 321 10 29.0 0.34 9.5 331 0 S 0.99 285.9 C 1.15 C 1.22 C 1.09
18 C2-1 1.57 203 389 457 610 89 89 1 2.07 2 321 10 23.6 0.69 9.5 331 0 S 1.04 289.9 F 0.99 F 0.99 F 1.04
19 C2-2 1.57 203 389 457 610 89 89 1 2.07 2 321 10 25.0 0.69 9.5 331 0 S 1.07 301.1 F 1.02 F 1.02 F 1.02
20 C2-4 1.57 203 389 457 610 89 89 1 2.07 2 321 10 27.0 0.69 9.5 331 0 S 1.01 288.1 F 0.97 F 0.97 F 0.92
21 C3-1 1.57 203 389 457 610 89 89 1 2.07 2 321 10 14.1 0.34 9.5 331 0 S 0.93 223.6 C 1.21 S 1.21 S 1.44
22 C3-2 1.57 203 389 457 610 89 89 1 2.07 2 321 10 13.8 0.34 9.5 331 0 S 0.84 200.3 S 1.09 S 1.09 S 1.30
23 C3-3 1.57 203 389 457 610 89 89 1 2.07 2 321 10 13.9 0.34 9.5 331 0 S 0.79 188.1 S 1.02 S 1.02 S 1.22
24 C4-1 1.57 203 389 457 610 89 89 1 3.10 3 321 10 24.5 0.34 9.5 331 0 S 0.81 309.3 C 1.11 C 1.41 C 1.38
25 C6-2 1.57 203 389 457 610 89 89 1 3.10 3 321 10 45.2 0.34 9.5 331 0 S 0.97 423.8 C 1.20 C 1.24 C 1.07
26 C6-3 1.57 203 389 457 610 89 89 1 3.10 3 321 10 44.7 0.34 9.5 331 0 S 1.00 434.9 C 1.24 C 1.28 C 1.11
27 C6-4 1.57 203 389 457 610 89 89 1 3.10 3 321 10 47.6 0.34 9.5 331 0 S 0.98 428.6 C 1.19 C 1.21 C 1.03
28 D1-1 1.16 203 395 457 457 89 89 1 1.63 2 335 10 26.2 0.46 9.5 331 0 S 0.91 301.1 C 1.10 C 1.03 C 0.91
29 D1-3 1.16 203 395 457 457 89 89 1 1.63 2 335 10 24.5 0.46 9.5 331 0 S 0.78 256.6 C 0.97 C 0.92 C 0.83
30 D2-1 1.16 203 395 457 457 89 89 1 1.63 2 335 10 24.0 0.61 9.5 331 0 S 0.88 289.9 S 1.07 C 1.02 C 0.94
31 D2-2 1.16 203 395 457 457 89 89 1 1.63 2 335 10 25.9 0.61 9.5 331 0 S 0.94 312.2 C 1.12 C 1.04 F 0.94
32 D3-1 1.16 203 395 457 457 89 89 1 2.44 3 335 10 28.2 0.92 9.5 331 0 S 0.84 394.9 S 1.02 S 1.02 C 1.07
33 D4-1 1.16 203 395 457 457 89 89 1 1.63 2 335 10 23.1 1.22 9.5 331 0 S 0.96 312.2 C 1.01 F 0.75 F 0.92
34 D1-6 1.95 152 313 381 610 89 89 1 3.42 2 335 10 27.6 0.46 9.5 331 0 S 0.83 174.7 C 1.01 S 1.13 C 0.93
35 D1-7 1.95 152 313 381 610 89 89 1 3.42 2 335 10 28.0 0.46 9.5 331 0 S 0.84 179.2 C 1.03 S 1.16 C 0.94
36 D1-8 1.95 152 313 381 610 89 89 1 3.42 2 335 10 27.8 0.46 9.5 331 0 S 0.88 185.8 C 1.07 S 1.20 C 0.98
37 E1-2 2.03 152 313 381 635 89 89 1 3.42 2 321 10 30.2 0.73 9.5 331 0 S 1.10 221.8 F 1.09 F 1.09 F 1.05

Conversion Factors: 25.4 mm = 1 in.; 1 MPa = 145 psi; 1 kN = 225 lbs.
41
# Ref. Year Beam a/d b d h a: M/V lb1 lb2 V/P ρl # fy ag fc' ρv dbv fyv ρh Rep. Mmax Vu 2PKT 2PKT AASHTO AASHTO ACI ACI
# Name (mm) (mm) (mm) (mm) (mm) (mm) (%) bars (MPa) (mm) (MPa) (%) (mm) (MPa) (%) mode Mn (kN) mode Exp/Pred mode Exp/Pred mode Exp/Pred
38 D2-6 2.43 152 313 381 762 89 89 1 3.42 2 321 10 29.5 0.61 9.5 331 0 S 1.00 168.4 F 0.96 F 0.96 S 1.13
39 D2-7 2.43 152 313 381 762 89 89 1 3.42 2 321 10 28.4 0.61 9.5 331 0 S 0.95 157.3 F 0.90 F 0.90 S 1.06
40 D2-8 2.43 152 313 381 762 89 89 1 3.42 2 321 10 26.1 0.61 9.5 331 0 S 1.04 168.4 F 0.97 F 0.97 S 1.15
41 D4-1 2.43 152 313 381 762 89 89 1 3.42 2 321 10 27.4 0.49 9.5 331 0 S 1.03 168.4 S 1.10 S 1.10 S 1.31
42 D4-2 2.43 152 313 381 762 89 89 1 3.42 2 321 10 25.6 0.49 9.5 331 0 S 0.98 157.3 S 1.03 S 1.03 S 1.23
43 D4-3 2.43 152 313 381 762 89 89 1 3.42 2 321 10 22.1 0.49 9.5 331 0 S 1.11 165.1 F F S
44 D5-1 2.43 152 313 381 762 89 89 1 3.42 2 321 10 27.7 0.37 9.5 331 0 S 0.89 146.2 S 1.10 S 1.10 S 1.33
45 D5-2 2.43 152 313 381 762 89 89 1 3.42 2 321 10 29.0 0.37 9.5 331 0 S 0.94 157.3 S 1.18 S 1.18 S 1.42
46 D5-3 2.43 152 313 381 762 89 89 1 3.42 2 321 10 27.1 0.37 9.5 331 0 S 0.96 157.3 S 1.19 S 1.19 S 1.44
47 A0-1 2.35 203 389 457 914 89 89 0.5 0.98 2 370 10 21.5 0 0 S 0.81 89.0 C 1.11 C 1.35 S 1.40
48 A0-2 2.35 203 389 457 914 89 89 0.5 0.98 2 370 10 26.0 0 0 S 0.96 107.9 C 1.23 C 1.41 S 1.55
49 B0-1 1.96 203 389 457 762 89 89 1 0.98 2 370 10 23.6 0 0 S 0.91 121.0 C 0.99 C 1.26 S 1.79
50 B0-2 1.96 203 389 457 762 89 89 1 0.98 2 370 10 23.9 0 0 S 0.71 94.2 C 0.77 C 0.97 S 1.38
51 B0-3 1.96 203 389 457 762 89 89 1 0.98 2 370 10 23.5 0 0 S 0.96 128.0 C 1.05 C 1.34 S 1.89
52 C0-1 1.57 203 389 457 610 89 89 1 0.98 2 370 10 24.7 0 0 S 1.04 174.3 C 1.06 C 1.19 F 0.85
53 C0-3 1.57 203 389 457 610 89 89 1 0.98 2 370 10 23.6 0 0 S 1.01 166.9 C 1.05 C 1.18 F 0.85
54 D0-1 1.17 203 389 457 457 89 89 1 0.98 2 370 10 25.9 0 0 S 0.99 221.6 F 0.96 F 0.95 F 0.84
55 D0-3 1.17 203 389 457 457 89 89 1 0.98 2 370 10 26.0 0 0 S 1.00 223.2 F 0.96 F 0.95 F 0.84
56 2 1954 III-24a 1.52 178 533 609 813 203 203 1 2.72 4 315 25 17.8 0 0 S 0.78 296.5 C 1.09 C 1.70 C 1.56
57 III-24b 1.52 178 533 609 813 203 203 1 2.72 4 315 25 20.6 0 0 S 0.75 303.2 C 1.03 C 1.53 C 1.38
58 III-25a 1.52 178 533 609 813 203 203 1 3.46 4 313 25 24.3 0 0 S 0.54 267.6 C 0.76 C 1.13 C 1.03
59 III-25b 1.52 178 533 609 813 203 203 1 3.46 4 313 25 17.2 0 0 S 0.76 289.8 C 0.99 C 1.67 C 1.58
60 III-26a 1.52 178 533 609 813 203 203 1 4.25 4 302 25 21.7 0 0 S 0.88 421.1 C 1.18 C 1.94 C 1.83
61 III-26b 1.52 178 533 609 813 203 203 1 4.25 4 302 25 20.6 0 0 S 0.86 396.6 C 1.14 C 1.90 C 1.81
62 III-27a 1.52 178 533 609 813 203 203 1 2.72 4 315 25 21.4 0 0 S 0.85 347.7 C 1.16 C 1.70 C 1.53
63 III-27b 1.52 178 533 609 813 203 203 1 2.72 4 315 25 22.9 0 0 S 0.86 356.6 C 1.14 C 1.65 C 1.46
64 III-28a 1.52 178 533 609 813 203 203 1 3.46 4 313 25 23.3 0 0 S 0.62 303.2 C 0.89 C 1.34 C 1.22
65 III-28b 1.52 178 533 609 813 203 203 1 3.46 4 313 25 22.4 0 0 S 0.71 341.0 C 1.02 C 1.55 C 1.43
66 III-29a 1.52 178 533 609 813 203 203 1 4.25 4 302 25 21.7 0 0 S 0.81 389.9 C 1.09 C 1.79 C 1.69
67 III-29b 1.52 178 533 609 813 203 203 1 4.25 4 302 25 25.0 0 0 S 0.81 436.6 C 1.14 C 1.77 C 1.64
68 III-30 1.52 178 533 609 813 203 203 1 4.25 4 302 25 25.4 0.52 9.5 326 0 S 0.87 478.2 C 1.07 S 1.40 C 1.31
69 III-31 1.52 178 533 609 813 203 203 1 4.25 4 302 25 22.4 0.95 12.7 303 0 S 1.03 507.1 S 1.08 S 1.08 S 1.28
70 A1 3.06 178 262 305 800 102 102 0.5 2.17 1 380 25 30.3 0 0 S 0.57 60.1 S S S
71 A2 3.00 178 267 305 800 102 102 0.5 2.15 2 380 25 31.0 0 0 S 0.61 66.7 S 1.10 S 1.10 S 1.39
72 A3 2.99 178 268 305 800 102 102 0.5 2.22 3 380 25 31.0 0 0 S 0.67 75.6 S 1.23 S 1.23 S 1.56
73 A4 2.96 178 270 305 800 102 102 0.5 2.37 4 380 25 31.5 0 0 S 0.59 71.2 S 1.12 S 1.12 S 1.43
74 B1 3.00 178 267 305 800 102 102 0.5 1.62 3 380 25 21.2 0 0 S 0.70 56.3 S 1.16 S 1.16 S 1.44

Conversion Factors: 25.4 mm = 1 in.; 1 MPa = 145 psi; 1 kN = 225 lbs.
42
# Ref. Year Beam a/d b d h a: M/V lb1 lb2 V/P ρl # fy ag fc' ρv dbv fyv ρh Rep. Mmax Vu 2PKT 2PKT AASHTO AASHTO ACI ACI
# Name (mm) (mm) (mm) (mm) (mm) (mm) (%) bars (MPa) (mm) (MPa) (%) (mm) (MPa) (%) mode Mn (kN) mode Exp/Pred mode Exp/Pred mode Exp/Pred
75 B2 2.99 178 268 305 800 102 102 0.5 1.63 2 380 25 21.6 0 0 S 0.73 60.1 S 1.22 S 1.22 S 1.51
76 B3 2.96 178 270 305 800 102 102 0.5 1.60 3 380 25 19.2 0 0 S 0.69 55.6 S 1.17 S 1.17 S 1.46
77 B4 2.95 178 272 305 800 102 102 0.5 1.66 4 380 25 16.8 0 0 S 0.69 55.6 S 1.21 S 1.21 S 1.54
78 C1 2.99 178 268 305 800 102 102 0.5 0.81 1 380 25 6.3 0 0 S 0.59 20.0 S 0.77 S 0.77 S 0.94
79 C2 2.94 178 272 305 800 102 102 0.5 0.83 2 380 25 6.1 0 0 S 0.73 24.5 S 0.93 S 0.93 S 1.15
80 C3 2.93 178 273 305 800 102 102 0.5 0.80 3 380 25 6.9 0 0 S 0.68 25.4 S 0.93 S 0.93 S 1.12
81 C4 2.92 178 274 305 800 102 102 0.5 0.82 4 380 25 6.8 0 0 S 0.67 25.1 S 0.91 S 0.91 S 1.11
82 3 1957 B14-E2 1.42 305 375 410 533 356 102 0.5 0.57 4 450 6 12.7 0 0 S 1.53 278.0 F C C
83 B14-E4 1.45 305 368 406 533 356 102 0.5 1.24 5 450 6 28.9 0 0 S 1.33 511.5 F C C
84 B14-B2 1.45 305 368 406 533 356 102 0.5 1.85 6 450 6 14.6 0 0 S 0.97 367.0 C 0.99 C 1.90 C 2.17
85 B14-B4 1.45 305 368 406 533 356 102 0.5 1.85 6 450 6 26.3 0 0 S 0.95 500.4 C 0.98 C 1.57 C 1.65
86 B14-B6 1.45 305 368 406 533 356 102 0.5 1.85 6 450 6 46.8 0 0 S 1.35 778.4 F C C
87 B14-A4 1.47 305 362 406 533 356 102 0.5 2.50 6 450 6 22.6 0 0 S 0.93 511.5 C 0.99 C 1.70 C 1.85
88 B14-A6 1.50 305 356 406 533 356 102 0.5 3.83 7 450 6 45.4 0 0 S 0.97 900.7 C 1.07 C 1.52 C 1.53
89 B21-E2 1.90 305 375 406 711 356 102 0.5 0.57 4 450 6 11.3 0 0 S 1.58 211.7 F C C
90 B21-F4 1.92 305 370 406 711 356 102 0.5 1.17 3 450 6 31.4 0 0 S 1.68 467.6 F C C
91 B21-E4R 1.93 305 368 406 711 356 102 0.5 1.24 5 450 6 31.9 0 0 S 1.49 434.2 F C C
92 B21-E4 1.95 305 365 406 711 356 102 0.5 1.24 5 450 6 24.2 0 0 S 1.53 423.0 F C C
93 B21-B6 1.90 305 375 406 711 356 102 0.5 1.82 6 450 6 45.5 0 0 S 1.31 578.7 F C C
94 B21-B4 1.93 305 368 406 711 356 102 0.5 1.85 6 450 6 27.1 0 0 S 1.00 396.4 C 1.10 C 2.13 C 1.71
95 B21-B2 1.94 305 367 406 711 356 102 0.5 1.86 6 450 6 13.9 0 0 S 0.89 238.5 C 0.94 C 2.27 C 1.97
96 B21-A4 1.93 305 368 406 711 356 102 0.5 2.46 6 450 6 29.8 0 0 S 1.04 523.1 C 1.24 C 2.48 C 2.05
97 B21-A6 2.00 305 356 406 711 356 102 0.5 3.83 7 450 6 45.3 0 0 S 0.83 578.8 C 0.99 C 1.71 C 1.32
98 B28-E2 2.39 308 372 406 889 356 102 0.5 0.57 4 450 6 13.7 0 0 S 1.19 130.0 F S S
99 B28-E4 2.41 305 368 406 889 356 102 0.5 1.24 5 450 6 33.1 0 0 S 1.15 267.9 F C S
100 B28-B4 2.41 305 368 406 889 356 102 0.5 1.85 6 450 6 32.3 0 0 S 0.78 256.8 C 1.02 C 1.95 S 2.15
101 B28-B6 2.41 305 368 406 889 356 102 0.5 1.85 6 450 6 43.9 0 0 S 0.94 323.5 C 1.06 C 1.92 S 2.38
102 B28-B2 2.46 305 362 406 889 356 102 0.5 1.88 6 450 6 14.7 0 0 S 0.92 201.2 C 1.29 S 2.12 S 2.37
103 B28-A4 2.41 305 368 406 889 356 102 0.5 2.46 6 450 6 27.5 0 0 S 0.82 323.5 C 1.31 S 2.48 S 2.75
104 B28-A6 2.52 308 353 406 889 356 102 0.5 3.83 7 450 6 47.2 0 0 S 0.59 334.7 C 0.90 C 1.53 S 2.18
105 B40-B4 3.24 305 368 406 1194 356 102 0.5 1.85 6 450 6 34.8 0 0 S 0.64 157.6 S S S
106 B56-E2 4.34 305 368 406 1600 356 102 0.5 0.58 4 450 6 14.7 0 0 S 1.37 82.7 S S F
107 B56-E4 4.34 305 368 406 1600 356 102 0.5 1.24 5 450 6 28.4 0 0 S 0.88 112.1 S S S
108 B56-B6 4.31 305 372 406 1600 356 102 0.5 1.83 6 450 6 45.7 0 0 S 0.72 139.8 S S S
109 B56-B2 4.34 305 368 406 1600 356 102 0.5 1.85 6 450 6 14.7 0 0 S 0.82 103.2 S S S
110 B56-B4 4.34 305 368 406 1600 356 102 0.5 1.85 6 450 6 27.2 0 0 S 0.71 125.4 S S S
111 B56-A4 4.27 305 375 406 1600 356 102 0.5 2.41 6 450 6 25.0 0 0 S 0.67 140.9 S S S
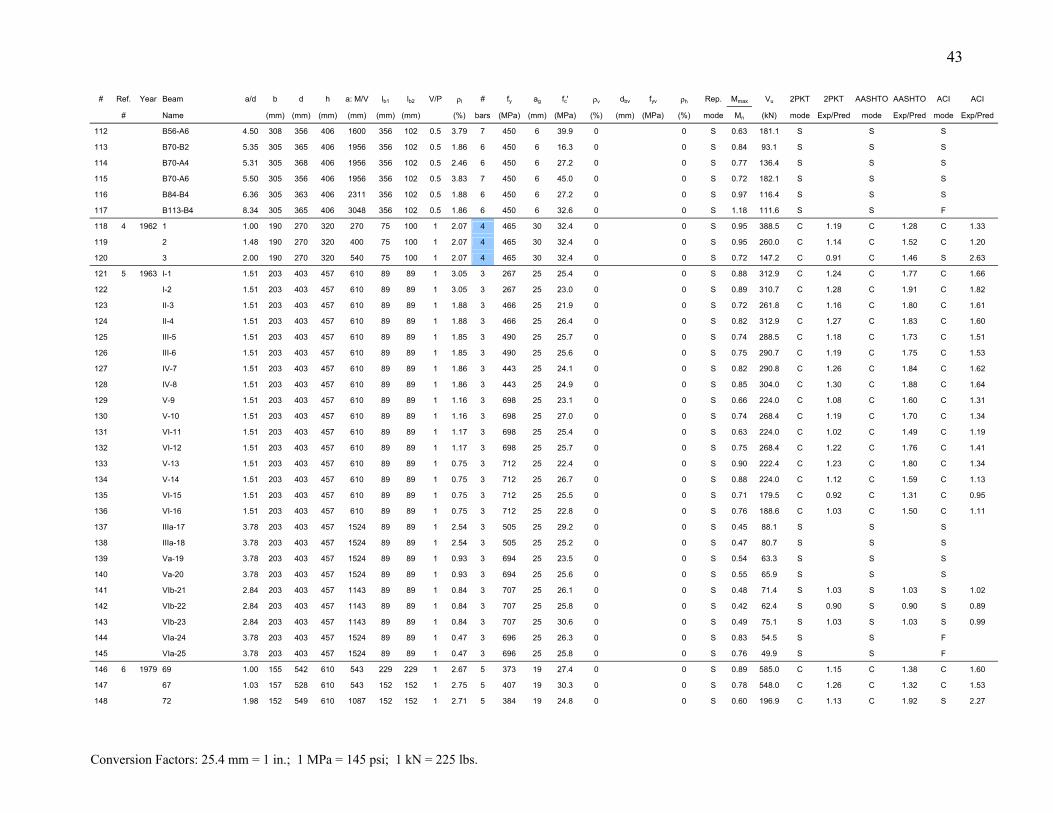
Conversion Factors: 25.4 mm = 1 in.; 1 MPa = 145 psi; 1 kN = 225 lbs.
43
# Ref. Year Beam a/d b d h a: M/V lb1 lb2 V/P ρl # fy ag fc' ρv dbv fyv ρh Rep. Mmax Vu 2PKT 2PKT AASHTO AASHTO ACI ACI
# Name (mm) (mm) (mm) (mm) (mm) (mm) (%) bars (MPa) (mm) (MPa) (%) (mm) (MPa) (%) mode Mn (kN) mode Exp/Pred mode Exp/Pred mode Exp/Pred
112 B56-A6 4.50 308 356 406 1600 356 102 0.5 3.79 7 450 6 39.9 0 0 S 0.63 181.1 S S S
113 B70-B2 5.35 305 365 406 1956 356 102 0.5 1.86 6 450 6 16.3 0 0 S 0.84 93.1 S S S
114 B70-A4 5.31 305 368 406 1956 356 102 0.5 2.46 6 450 6 27.2 0 0 S 0.77 136.4 S S S
115 B70-A6 5.50 305 356 406 1956 356 102 0.5 3.83 7 450 6 45.0 0 0 S 0.72 182.1 S S S
116 B84-B4 6.36 305 363 406 2311 356 102 0.5 1.88 6 450 6 27.2 0 0 S 0.97 116.4 S S S
117 B113-B4 8.34 305 365 406 3048 356 102 0.5 1.86 6 450 6 32.6 0 0 S 1.18 111.6 S S F
118 4 1962 1 1.00 190 270 320 270 75 100 1 2.07 4 465 30 32.4 0 0 S 0.95 388.5 C 1.19 C 1.28 C 1.33
119 2 1.48 190 270 320 400 75 100 1 2.07 4 465 30 32.4 0 0 S 0.95 260.0 C 1.14 C 1.52 C 1.20
120 3 2.00 190 270 320 540 75 100 1 2.07 4 465 30 32.4 0 0 S 0.72 147.2 C 0.91 C 1.46 S 2.63
121 5 1963 I-1 1.51 203 403 457 610 89 89 1 3.05 3 267 25 25.4 0 0 S 0.88 312.9 C 1.24 C 1.77 C 1.66
122 I-2 1.51 203 403 457 610 89 89 1 3.05 3 267 25 23.0 0 0 S 0.89 310.7 C 1.28 C 1.91 C 1.82
123 II-3 1.51 203 403 457 610 89 89 1 1.88 3 466 25 21.9 0 0 S 0.72 261.8 C 1.16 C 1.80 C 1.61
124 II-4 1.51 203 403 457 610 89 89 1 1.88 3 466 25 26.4 0 0 S 0.82 312.9 C 1.27 C 1.83 C 1.60
125 III-5 1.51 203 403 457 610 89 89 1 1.85 3 490 25 25.7 0 0 S 0.74 288.5 C 1.18 C 1.73 C 1.51
126 III-6 1.51 203 403 457 610 89 89 1 1.85 3 490 25 25.6 0 0 S 0.75 290.7 C 1.19 C 1.75 C 1.53
127 IV-7 1.51 203 403 457 610 89 89 1 1.86 3 443 25 24.1 0 0 S 0.82 290.8 C 1.26 C 1.84 C 1.62
128 IV-8 1.51 203 403 457 610 89 89 1 1.86 3 443 25 24.9 0 0 S 0.85 304.0 C 1.30 C 1.88 C 1.64
129 V-9 1.51 203 403 457 610 89 89 1 1.16 3 698 25 23.1 0 0 S 0.66 224.0 C 1.08 C 1.60 C 1.31
130 V-10 1.51 203 403 457 610 89 89 1 1.16 3 698 25 27.0 0 0 S 0.74 268.4 C 1.19 C 1.70 C 1.34
131 VI-11 1.51 203 403 457 610 89 89 1 1.17 3 698 25 25.4 0 0 S 0.63 224.0 C 1.02 C 1.49 C 1.19
132 VI-12 1.51 203 403 457 610 89 89 1 1.17 3 698 25 25.7 0 0 S 0.75 268.4 C 1.22 C 1.76 C 1.41
133 V-13 1.51 203 403 457 610 89 89 1 0.75 3 712 25 22.4 0 0 S 0.90 222.4 C 1.23 C 1.80 C 1.34
134 V-14 1.51 203 403 457 610 89 89 1 0.75 3 712 25 26.7 0 0 S 0.88 224.0 C 1.12 C 1.59 C 1.13
135 VI-15 1.51 203 403 457 610 89 89 1 0.75 3 712 25 25.5 0 0 S 0.71 179.5 C 0.92 C 1.31 C 0.95
136 VI-16 1.51 203 403 457 610 89 89 1 0.75 3 712 25 22.8 0 0 S 0.76 188.6 C 1.03 C 1.50 C 1.11
137 IIIa-17 3.78 203 403 457 1524 89 89 1 2.54 3 505 25 29.2 0 0 S 0.45 88.1 S S S
138 IIIa-18 3.78 203 403 457 1524 89 89 1 2.54 3 505 25 25.2 0 0 S 0.47 80.7 S S S
139 Va-19 3.78 203 403 457 1524 89 89 1 0.93 3 694 25 23.5 0 0 S 0.54 63.3 S S S
140 Va-20 3.78 203 403 457 1524 89 89 1 0.93 3 694 25 25.6 0 0 S 0.55 65.9 S S S
141 VIb-21 2.84 203 403 457 1143 89 89 1 0.84 3 707 25 26.1 0 0 S 0.48 71.4 S 1.03 S 1.03 S 1.02
142 VIb-22 2.84 203 403 457 1143 89 89 1 0.84 3 707 25 25.8 0 0 S 0.42 62.4 S 0.90 S 0.90 S 0.89
143 VIb-23 2.84 203 403 457 1143 89 89 1 0.84 3 707 25 30.6 0 0 S 0.49 75.1 S 1.03 S 1.03 S 0.99
144 VIa-24 3.78 203 403 457 1524 89 89 1 0.47 3 696 25 26.3 0 0 S 0.83 54.5 S S F
145 VIa-25 3.78 203 403 457 1524 89 89 1 0.47 3 696 25 25.8 0 0 S 0.76 49.9 S S F
146 6 1979 69 1.00 155 542 610 543 229 229 1 2.67 5 373 19 27.4 0 0 S 0.89 585.0 C 1.15 C 1.38 C 1.60
147 67 1.03 157 528 610 543 152 152 1 2.75 5 407 19 30.3 0 0 S 0.78 548.0 C 1.26 C 1.32 C 1.53
148 72 1.98 152 549 610 1087 152 152 1 2.71 5 384 19 24.8 0 0 S 0.60 196.9 C 1.13 C 1.92 S 2.27

Conversion Factors: 25.4 mm = 1 in.; 1 MPa = 145 psi; 1 kN = 225 lbs.
44
# Ref. Year Beam a/d b d h a: M/V lb1 lb2 V/P ρl # fy ag fc' ρv dbv fyv ρh Rep. Mmax Vu 2PKT 2PKT AASHTO AASHTO ACI ACI
# Name (mm) (mm) (mm) (mm) (mm) (mm) (%) bars (MPa) (mm) (MPa) (%) (mm) (MPa) (%) mode Mn (kN) mode Exp/Pred mode Exp/Pred mode Exp/Pred
149 61 2.00 156 542 610 1085 64 76 1 2.75 5 349 19 26.8 0 0 S 0.51 163.3 C 1.08 S 1.61 S 1.82
150 65 2.46 150 552 610 1359 152 152 1 2.82 5 374 19 27.0 0 0 S 0.41 112.4 S 1.17 S 1.17 S 1.32
151 76 2.62 152 518 610 1359 64 64 1 2.87 5 372 19 30.8 0 0 S 0.45 114.8 S 1.20 S 1.20 S 1.36
152 71 2.99 155 544 610 1628 229 229 1 2.41 5 373 19 27.4 0 0 S 0.50 102.1 S 1.12 S 1.12 S 1.24
153 75 3.11 152 524 610 1631 152 152 1 2.84 5 367 19 27.3 0 0 S 0.52 107.9 S S S
154 74 3.12 152 523 610 1631 152 152 1 2.84 5 366 19 27.2 0 0 S 0.52 107.7 S S S
155 7 1982 SD-1 1.56 200 900 1000 1400 300 200 0.5 1.89 12 498 19 33.5 0.5 11.3 529 0 S 1.06 967.5 C 1.21 S 1.31 C 1.34
156 SD-2 1.62 200 863 1000 1400 300 200 0.5 1.97 12 498 19 29.3 0.5 11.3 529 0 S 1.15 967.5 S S C
157 SD-3 1.70 200 825 1000 1400 300 200 0.5 2.06 12 498 19 28.0 0.5 11.3 529 0 S 1.07 840.0 S 1.24 S 1.24 C 1.10
158 SD-4 1.78 200 788 1000 1400 300 200 0.5 2.16 12 498 19 27.4 0.5 11.3 529 0 S 1.14 840.0 S S F
159 8 1982 0A0-44 1.00 102 305 356 305 102 102 1 1.94 3 422 13 20.5 0 0 S 0.72 139.5 C 1.02 C 1.18 C 1.36
160 0A0-48 1.00 102 305 356 305 102 102 1 1.94 3 422 13 20.9 0 0 S 0.69 136.1 C 0.98 C 1.13 C 1.30
161 1A1-10 1.00 102 305 356 305 102 102 1 1.94 3 422 13 18.7 0.28 6.4 460 0.23 S 0.87 161.2 C 1.23 C 1.39 C 1.36
162 1A2-11 1.00 102 305 356 305 102 102 1 1.94 3 422 13 18.0 0.28 6.4 460 0.45 S 0.82 148.3 C 1.16 C 1.31 C 1.30
163 1A3-12 1.00 102 305 356 305 102 102 1 1.94 3 422 13 16.1 0.28 6.4 460 0.68 S 0.86 141.2 C 1.18 C 1.37 C 1.38
164 1A4-51 1.00 102 305 356 305 102 102 1 1.94 3 422 13 20.5 0.28 6.4 460 0.68 S 0.88 170.9 C 1.24 C 1.36 C 1.32
165 1A6-37 1.00 102 305 356 305 102 102 1 1.94 3 422 13 21.1 0.28 6.4 460 0.91 S 0.94 184.1 C 1.31 C 1.44 C 1.38
166 2A1-38 1.00 102 305 356 305 102 102 1 1.94 3 422 13 21.7 0.63 6.4 460 0.23 S 0.88 174.5 C 1.21 C 1.25 C 1.24
167 2A3-39 1.00 102 305 356 305 102 102 1 1.94 3 422 13 19.8 0.63 6.4 460 0.45 S 0.89 170.6 C 1.24 S 1.25 C 1.32
168 2A4-40 1.00 102 305 356 305 102 102 1 1.94 3 422 13 20.3 0.63 6.4 460 0.68 S 0.88 171.9 C 1.23 S 1.26 C 1.29
169 2A6-41 1.00 102 305 356 305 102 102 1 1.94 3 422 13 19.1 0.63 6.4 460 0.91 S 0.85 161.9 S 1.19 S 1.21 C 1.29
170 3A1-42 1.00 102 305 356 305 102 102 1 1.94 3 422 13 18.4 1.25 6.4 460 0.23 S 0.88 161.0 C 1.14 C 1.18 C 1.26
171 3A3-43 1.00 102 305 356 305 102 102 1 1.94 3 422 13 19.2 1.25 6.4 460 0.45 S 0.91 172.7 C 1.19 C 1.23 C 1.30
172 3A4-45 1.00 102 305 356 305 102 102 1 1.94 3 422 13 20.8 1.25 6.4 460 0.68 S 0.91 178.6 C 1.17 C 1.20 C 1.25
173 3A6-46 1.00 102 305 356 305 102 102 1 1.94 3 422 13 19.9 1.25 6.4 460 0.91 S 0.87 168.1 C 1.13 C 1.17 C 1.22
174 0B0-49 1.21 102 305 356 368 102 102 1 1.94 3 422 13 21.7 0 0 S 0.91 149.0 C 1.24 C 1.56 C 1.56
175 1B1-01 1.21 102 305 356 368 102 102 1 1.94 3 422 13 22.1 0.24 6.4 460 0.23 S 0.89 147.5 C 1.15 C 1.39 C 1.20
176 1B3-29 1.21 102 305 356 368 102 102 1 1.94 3 422 13 20.1 0.24 6.4 460 0.45 S 0.89 143.6 C 1.18 C 1.45 C 1.27
177 1B4-30 1.21 102 305 356 368 102 102 1 1.94 3 422 13 20.8 0.24 6.4 460 0.68 S 0.86 140.3 C 1.13 C 1.38 C 1.20
178 1B6-31 1.21 102 305 356 368 102 102 1 1.94 3 422 13 19.5 0.24 6.4 460 0.91 S 0.96 153.4 C 1.28 C 1.59 C 1.40
179 2B1-05 1.21 102 305 356 368 102 102 1 1.94 3 422 13 19.2 0.42 6.4 460 0.23 S 0.82 129.0 C 1.05 S 1.24 C 1.16
180 2B3-0.6 1.21 102 305 356 368 102 102 1 1.94 3 422 13 19.0 0.42 6.4 460 0.45 S 0.84 131.2 C 1.07 S 1.27 C 1.19
181 2B4-07 1.21 102 305 356 368 102 102 1 1.94 3 422 13 17.5 0.42 6.4 460 0.68 S 0.86 126.1 C 1.07 S 1.23 C 1.23
182 2B4-52 1.21 102 305 356 368 102 102 1 1.94 3 422 13 21.8 0.42 6.4 460 0.68 S 0.91 149.9 C 1.14 C 1.34 C 1.20
183 2B6-32 1.21 102 305 356 368 102 102 1 1.94 3 422 13 19.8 0.42 6.4 460 0.91 S 0.91 145.2 C 1.16 S 1.40 C 1.27
184 3B1-08 1.21 102 305 356 368 102 102 1 1.94 3 422 13 16.2 0.63 6.4 460 0.23 S 0.95 130.8 C 1.00 S 1.15 S 1.18
185 3B1-36 1.21 102 305 356 368 102 102 1 1.94 3 422 13 20.4 0.77 6.4 460 0.23 S 0.99 159.0 C 1.06 S 1.11 S 1.27

Conversion Factors: 25.4 mm = 1 in.; 1 MPa = 145 psi; 1 kN = 225 lbs.
45
# Ref. Year Beam a/d b d h a: M/V lb1 lb2 V/P ρl # fy ag fc' ρv dbv fyv ρh Rep. Mmax Vu 2PKT 2PKT AASHTO AASHTO ACI ACI
# Name (mm) (mm) (mm) (mm) (mm) (mm) (%) bars (MPa) (mm) (MPa) (%) (mm) (MPa) (%) mode Mn (kN) mode Exp/Pred mode Exp/Pred mode Exp/Pred
186 3B3-33 1.21 102 305 356 368 102 102 1 1.94 3 422 13 19.0 0.77 6.4 460 0.45 S 1.01 158.4 C 1.10 S 1.19 S 1.30
187 3B4-34 1.21 102 305 356 368 102 102 1 1.94 3 422 13 19.2 0.77 6.4 460 0.68 S 0.98 155.0 C 1.07 S 1.15 S 1.27
188 3B6-35 1.21 102 305 356 368 102 102 1 1.94 3 422 13 20.7 0.77 6.4 460 0.91 S 1.03 166.1 C 1.10 S 1.15 S 1.32
189 4B1-09 1.21 102 305 356 368 102 102 1 1.94 3 422 13 17.1 1.25 6.4 460 0.23 S 1.07 153.5 C 1.14 S 1.28 S 1.33
190 0C0-50 1.50 102 305 356 457 102 102 1 1.94 3 422 13 20.7 0 0 S 0.89 115.7 C 1.23 C 1.76 C 1.52
191 1C1-14 1.50 102 305 356 457 102 102 1 1.94 3 422 13 19.2 0.18 6.4 460 0.23 S 0.94 119.0 C 1.18 C 1.65 C 1.56
192 1C3-02 1.50 102 305 356 457 102 102 1 1.94 3 422 13 21.9 0.18 6.4 460 0.45 S 0.93 123.4 C 1.15 C 1.56 C 1.19
193 1C4-15 1.50 102 305 356 457 102 102 1 1.94 3 422 13 22.7 0.18 6.4 460 0.68 S 0.98 131.0 C 1.20 C 1.61 C 1.22
194 1C6-16 1.50 102 305 356 457 102 102 1 1.94 3 422 13 21.8 0.18 6.4 460 0.91 S 0.92 122.3 C 1.14 C 1.55 C 1.19
195 2C1-17 1.50 102 305 356 457 102 102 1 1.94 3 422 13 19.9 0.31 6.4 460 0.23 S 0.96 124.1 C 1.14 S 1.45 C 1.26
196 2C3-03 1.50 102 305 356 457 102 102 1 1.94 3 422 13 19.2 0.31 6.4 460 0.45 S 0.81 103.6 C 0.96 S 1.22 C 1.09
197 2C3-27 1.50 102 305 356 457 102 102 1 1.94 3 422 13 19.3 0.31 6.4 460 0.45 S 0.90 115.3 C 1.07 S 1.35 C 1.20
198 2C4-18 1.50 102 305 356 457 102 102 1 1.94 3 422 13 20.4 0.31 6.4 460 0.68 S 0.96 124.6 C 1.12 S 1.45 C 1.23
199 2C6-19 1.50 102 305 356 457 102 102 1 1.94 3 422 13 20.8 0.31 6.4 460 0.91 S 0.95 124.1 C 1.11 S 1.44 C 1.21
200 3C1-20 1.50 102 305 356 457 102 102 1 1.94 3 422 13 21.0 0.56 6.4 460 0.23 S 1.08 141.5 C 1.12 S 1.15 C 1.28
201 3C3-21 1.50 102 305 356 457 102 102 1 1.94 3 422 13 16.5 0.56 6.4 460 0.45 S 1.11 125.0 F F S
202 3C4-22 1.50 102 305 356 457 102 102 1 1.94 3 422 13 18.3 0.56 6.4 460 0.68 S 1.05 127.7 S 1.05 S 1.05 S 1.27
203 3C6-23 1.50 102 305 356 457 102 102 1 1.94 3 422 13 19.0 0.56 6.4 460 0.91 S 1.09 137.2 S 1.13 S 1.13 C 1.35
204 4C1-24 1.50 102 305 356 457 102 102 1 1.94 3 422 13 19.6 0.77 6.4 460 0.23 S 1.14 146.6 F F S
205 4C3-04 1.50 102 305 356 457 102 102 1 1.94 3 422 13 18.5 0.63 6.4 460 0.45 S 1.04 128.6 F 0.98 F 0.99 S 1.17
206 4C3-28 1.50 102 305 356 457 102 102 1 1.94 3 422 13 19.2 0.77 6.4 460 0.45 S 1.20 152.4 F F S
207 4C4-25 1.50 102 305 356 457 102 102 1 1.94 3 422 13 18.5 0.77 6.4 460 0.68 S 1.24 152.6 F F S
208 4C6-26 1.50 102 305 356 457 102 102 1 1.94 3 422 13 21.2 0.77 6.4 460 0.91 S 1.21 159.5 F F S
209 0D0-47 2.08 102 305 356 635 102 102 1 1.94 3 422 13 19.5 0 0 S 0.80 73.4 C 1.24 C 2.14 S 2.71
210 4D1-13 2.08 102 305 356 635 102 102 1 1.94 3 422 13 16.1 0.42 6.4 460 0.23 S 1.11 87.4 F F F
211 9 1986 BM1/1.0 T1 1.05 200 950 1000 1000 300 200 0.5 0.95 6 380 10 26.1 0.15 6.0 570 0 S 1.01 602.0 C 1.09 C 1.19 C 1.46
212 BM1/1.0 T2 1.05 200 950 1000 1000 300 200 0.5 0.95 6 380 10 26.1 0 0 F 1.17 699.0 C C C
213 BM2/1.0 T1 1.05 200 950 1000 1000 300 200 0.5 0.95 6 380 10 26.8 0 0.09 S 1.17 700.0 C C C
214 BM2/1.0 1.05 200 950 1000 1000 300 200 0.5 0.95 6 380 10 26.8 0.15 6.0 570 0.09 F 1.17 700.0 C C C
215 BM1/1.5 T1 1.87 200 535 600 1000 300 200 0.5 1.12 6 380 10 42.4 0 0 S 1.32 303.0 F F F
216 BM1/1.5 T2 1.87 200 535 600 1000 300 200 0.5 1.12 6 455 10 42.4 0.19 6.0 570 0 F 1.30 354.0 F F F
217 BM2/1.5 T1 1.87 200 535 600 1000 300 200 0.5 1.12 6 455 10 42.4 0 0.18 S 0.83 226.0 F 0.72 C 0.90 F 0.55
218 BM2/1.5 T2 1.87 200 535 600 1000 300 200 0.5 1.12 6 455 10 42.4 0.19 6.0 570 0.18 F 1.28 348.0 F F F
219 BM1/2.0 T1 2.20 200 455 500 1000 200 200 0.5 0.88 4 455 10 43.2 0 0 F 1.13 177.0 F C S
220 BM1/2.0 T2 2.20 200 455 500 1000 200 200 0.5 0.88 4 455 10 43.2 0.14 6.0 570 0 F 1.27 199.0 F F F
221 BM2/2.0 T1 2.20 200 455 500 1000 200 200 0.5 0.88 4 455 10 43.2 0 0.21 S 1.18 185.0 F C S
222 BM2/2.0 T2 2.20 200 455 500 1000 200 200 0.5 0.88 4 455 10 43.2 0.14 6.0 570 0.21 F 1.30 204.0 F F F

Conversion Factors: 25.4 mm = 1 in.; 1 MPa = 145 psi; 1 kN = 225 lbs.
46
# Ref. Year Beam a/d b d h a: M/V lb1 lb2 V/P ρl # fy ag fc' ρv dbv fyv ρh Rep. Mmax Vu 2PKT 2PKT AASHTO AASHTO ACI ACI
# Name (mm) (mm) (mm) (mm) (mm) (mm) (%) bars (MPa) (mm) (MPa) (%) (mm) (MPa) (%) mode Mn (kN) mode Exp/Pred mode Exp/Pred mode Exp/Pred
223 10 1988 N220-l 2.99 400 190 220 569 100 100 1 1.20 3 433 20 34.2 0 0 S 0.86 103.6 S 1.20 S 1.20 S 1.37
224 N350-l 2.81 400 313 350 880 100 100 1 1.20 3 436 20 34.2 0 0 S 0.75 158.0 S 1.17 S 1.17 S 1.26
225 N485-l 2.72 400 440 485 1195 100 100 1 1.20 3 385 20 34.2 0 0 S 0.68 187.5 S 1.04 S 1.04 S 1.06
226 N960-l 2.57 400 889 960 2289 100 100 1 1.20 6 385 20 34.2 0 0 S 0.62 366.6 S 1.18 S 1.18 S 1.03
227 N220-h 2.99 400 190 220 569 100 100 1 2.00 5 433 20 34.2 0 0 S 0.66 122.7 S 1.21 S 1.21 S 1.54
228 N350-h 2.81 400 313 350 880 100 100 1 2.00 5 436 20 34.2 0 0 S 0.54 178.6 S 1.13 S 1.13 S 1.36
229 N485-h 2.72 400 440 485 1195 100 100 1 2.00 5 385 20 34.2 0 0 S 0.50 215.4 S 1.02 S 1.02 S 1.16
230 N960-h 2.57 400 889 960 2289 100 100 1 2.00 10 385 20 34.2 0 0 S 0.42 386.1 S 1.08 S 1.08 S 1.03
231 H220-l 2.99 400 190 220 569 100 100 1 1.20 3 433 10 58.6 0 0 S 0.85 105.9 S 1.07 S 1.07 S 1.09
232 H350-l 2.81 400 313 350 880 100 100 1 1.20 3 436 10 58.6 0 0 S 0.71 157.3 S 1.03 S 1.03 S 0.98
233 H485-l 2.72 400 440 485 1195 100 100 1 1.20 3 385 10 58.6 0 0 S 0.70 198.5 S 0.98 S 0.98 S 0.88
234 H960-l 2.57 400 889 960 2289 100 100 1 1.20 6 385 10 58.6 0 0 S 0.52 316.7 S 0.94 S 0.94 S 0.69
235 H220-h 2.99 400 190 220 569 100 100 1 2.00 5 433 10 58.6 0 0 S 0.67 135.3 S 1.15 S 1.15 S 1.34
236 H350-h 2.81 400 313 350 880 100 100 1 2.00 5 436 10 58.6 0 0 S 0.54 189.6 S 1.05 S 1.05 S 1.13
237 H485-h 2.72 400 440 485 1195 100 100 1 2.00 5 385 10 58.6 0 0 S 0.43 199.0 S 0.84 S 0.84 S 0.84
238 H960-h 2.57 400 889 960 2289 100 100 1 2.00 10 385 10 58.6 0 0 S 0.34 337.4 S 0.87 S 0.87 S 0.71
239 11 1994 V011 1.00 250 360 400 360 90 90 0.5 1.13 4 420 8 16.1 0 0 S 0.64 226.0 C 1.06 C 1.04 C 1.30
240 V012 1.00 250 360 400 360 90 90 0.5 1.13 4 420 8 21.8 0 0 S 0.86 322.0 C 1.29 C 1.16 C 1.37
241 V013 1.00 250 360 400 360 90 90 0.5 1.13 4 420 8 22.1 0 0 S 0.92 344.0 C 1.37 C 1.22 C 1.44
242 V014 1.00 250 360 400 360 90 90 0.5 1.13 4 420 8 24.3 0 0 S 1.12 425.0 C C C
243 V021 1.00 250 360 400 360 90 90 0.5 1.13 4 420 16 13.9 0 0 S 0.64 220.0 C 1.04 C 1.14 C 1.47
244 V023 1.00 250 360 400 360 90 90 0.5 1.13 4 420 16 20.1 0 0 S 0.94 347.0 C 1.35 C 1.33 C 1.60
245 V024 1.00 250 360 400 360 90 90 0.5 1.13 4 420 16 25.2 0 0 S 1.04 396.0 C 1.37 C 1.27 C 1.46
246 V031 1.00 250 360 400 360 90 90 0.5 1.13 4 420 32 20.0 0 0 S 0.88 323.0 C 1.02 C 1.24 C 1.50
247 V032 1.00 250 360 400 360 90 90 0.5 1.13 4 420 32 18.2 0 0 S 0.88 318.0 C 1.06 C 1.32 C 1.62
248 V033 1.00 250 360 400 360 90 90 0.5 1.13 4 420 32 19.8 0 0 S 0.67 246.0 C 0.78 C 0.96 C 1.15
249 V034 1.00 250 360 400 360 90 90 0.5 1.13 4 420 32 26.4 0 0 S 1.14 437.0 C C C
250 V711 1.00 250 160 200 160 40 40 0.5 1.52 3 420 16 18.1 0 0 S 0.82 165.0 C 1.07 C 1.07 C 1.22
251 V022 1.00 250 360 400 360 90 90 0.5 1.13 4 420 16 19.9 0 0 S 0.73 270.0 C 1.06 C 1.04 C 1.26
252 V511 1.00 250 560 600 560 140 140 0.5 1.12 5 420 16 19.8 0 0 S 0.62 350.0 C 0.94 C 1.00 C 1.26
253 V411 1.00 250 740 800 740 185 185 0.5 1.10 8 420 16 19.4 0 0 S 0.50 365.0 C 0.79 C 0.78 C 0.97
254 V211 1.00 250 930 1000 930 233 233 0.5 1.08 8 420 16 20.0 0 0 S 0.55 505.0 C 0.90 C 0.85 C 1.06
255 V711/4 1.00 250 160 200 160 40 40 0.5 1.50 3 420 16 19.6 0.13 4.0 420 0 S 1.01 207.0 C 1.28 C 1.24 C 1.40
256 V711/4 1.00 250 360 400 360 90 90 0.5 1.13 4 420 16 18.2 0.13 6.0 420 0 S 0.87 317.0 C 1.25 C 1.27 C 1.58
257 V511/4 1.01 250 560 600 565 140 140 0.5 1.12 5 420 16 18.7 0.14 8.0 420 0 S 0.84 465.0 C 1.19 C 1.34 C 1.72
258 V411/4 0.97 250 760 800 740 190 190 0.5 0.78 8 420 16 17.0 0.17 10.0 420 0 S 0.82 467.0 C 1.00 C 1.15 C 1.48
259 V711/4 1.00 250 160 200 160 40 40 0.5 1.50 3 420 16 18.3 0.28 6.0 420 0 S 1.03 207.0 C 1.33 C 1.27 C 1.48

Conversion Factors: 25.4 mm = 1 in.; 1 MPa = 145 psi; 1 kN = 225 lbs.
47
# Ref. Year Beam a/d b d h a: M/V lb1 lb2 V/P ρl # fy ag fc' ρv dbv fyv ρh Rep. Mmax Vu 2PKT 2PKT AASHTO AASHTO ACI ACI
# Name (mm) (mm) (mm) (mm) (mm) (mm) (%) bars (MPa) (mm) (MPa) (%) (mm) (MPa) (%) mode Mn (kN) mode Exp/Pred mode Exp/Pred mode Exp/Pred
260 V022/3 1.00 250 360 400 360 90 90 0.5 1.13 4 420 16 19.6 0.35 10.0 420 0 S 1.03 380.0 C 1.36 C 1.36 C 1.71
261 V511/3 1.01 250 560 600 565 140 140 0.5 1.12 5 420 16 21.3 0.33 10.0 420 0 S 1.02 580.0 C 1.28 C 1.43 S 1.81
262 V411/3 0.97 250 760 800 740 190 190 0.5 0.78 8 420 16 19.8 0.33 14.0 420 0 S 1.15 665.0 C C S
263 12 1998 S1-1 2.50 250 292 350 730 100 100 1 2.80 2 452 7 63.6 0.16 5.0 569 0 S 0.70 228.3 C 0.97 C 0.99 S 1.48
264 S1-2 2.50 250 292 350 730 100 100 1 2.80 2 452 7 63.6 0.16 5.0 569 0 S 0.64 208.3 C 0.89 C 0.90 S 1.35
265 S1-3 2.50 250 292 350 730 100 100 1 2.80 2 452 7 63.6 0.16 5.0 569 0 S 0.63 206.1 C 0.88 C 0.89 S 1.34
266 S1-4 2.50 250 292 350 730 100 100 1 2.80 2 452 7 63.6 0.16 5.0 569 0 S 0.85 277.9 C 1.18 C 1.20 S 1.80
267 S1-5 2.50 250 292 350 730 100 100 1 2.80 2 452 7 63.6 0.16 5.0 569 0 S 0.78 253.3 C 1.08 C 1.09 S 1.64
268 S1-6 2.50 250 292 350 730 100 100 1 2.80 2 452 7 63.6 0.16 5.0 569 0 S 0.69 224.1 C 0.96 C 0.97 S 1.45
269 S2-1 2.50 250 292 350 730 100 100 1 2.80 2 452 7 72.5 0.11 5.0 569 0 S 0.78 260.3 C 1.09 C 1.12 S 1.83
270 S2-2 2.50 250 292 350 730 100 100 1 2.80 2 452 7 72.5 0.13 5.0 569 0 S 0.70 232.5 C 0.97 C 0.97 S 1.56
271 S2-3 2.50 250 292 350 730 100 100 1 2.80 2 452 7 72.5 0.16 5.0 569 0 S 0.76 253.3 C 1.04 C 1.01 S 1.58
272 S2-4 2.50 250 292 350 730 100 100 1 2.80 2 452 7 72.5 0.16 5.0 569 0 S 0.66 219.4 C 0.90 C 0.88 S 1.37
273 S2-5 2.50 250 292 350 730 100 100 1 2.80 2 452 7 72.5 0.21 5.0 569 0 S 0.85 282.1 C 1.13 C 1.05 S 1.60
274 S2-6 2.50 250 292 350 730 100 100 1 2.80 2 452 7 72.5 0.26 5.0 569 0 F 1.08 359.0 C C S
275 S3-1 2.49 250 297 350 740 100 100 1 1.66 2 450 7 67.4 0.10 4.0 632 0 S 1.01 209.2 C 1.11 C 1.06 S 1.53
276 S3-2 2.49 250 297 350 740 100 100 1 1.66 2 450 7 67.4 0.10 4.0 632 0 S 0.86 178.0 C 0.95 C 0.90 S 1.31
277 S3-3 2.49 250 293 350 730 100 100 1 2.79 2 452 7 67.4 0.10 4.0 632 0 S 0.69 228.6 C 0.98 C 1.02 S 1.63
278 S3-4 2.49 250 293 350 730 100 100 1 2.79 2 452 7 67.4 0.10 4.0 632 0 S 0.53 174.9 C 0.75 C 0.78 S 1.24
279 S3-5 2.51 250 287 350 720 100 100 1 3.85 6 442 7 67.4 0.10 4.0 632 0 S 0.72 296.6 C 1.13 C 1.23 S 2.07
280 S3-6 2.51 250 287 350 720 100 100 1 3.85 6 442 7 67.4 0.10 4.0 632 0 S 0.68 282.9 C 1.08 C 1.18 S 1.97
281 S4-1 2.48 250 524 600 1300 100 100 1 3.12 4 452 7 87.3 0.16 5.0 569 0 S 0.52 354.0 S 0.91 C 0.81 S 1.15
282 S4-2 2.50 250 428 500 1070 100 100 1 3.07 4 433 7 87.3 0.16 5.0 569 0 F 1.11 572.8 S C S
283 S4-3 2.50 250 332 400 830 100 100 1 2.97 4 450 7 87.3 0.16 5.0 569 0 S 0.60 243.4 C 0.81 C 0.76 S 1.25
284 S4-4 2.50 250 292 350 730 100 100 1 2.80 2 452 7 87.3 0.16 5.0 569 0 S 0.76 258.1 C 0.96 C 0.92 S 1.52
285 S4-5 2.50 250 236 300 590 100 100 1 3.12 4 442 7 87.3 0.16 5.0 569 0 F 1.09 321.1 F C S
286 S4-6 2.53 250 198 250 500 100 100 1 2.79 3 442 7 87.3 0.16 5.0 569 0 S 0.92 202.9 F 0.73 C 0.95 S 1.76
287 S5-1 3.01 250 292 350 880 100 100 1 2.80 2 452 7 89.4 0.16 5.0 569 0 S 0.86 241.7 S C S
288 S5-2 2.74 250 292 350 800 100 100 1 2.80 2 452 7 89.4 0.16 5.0 569 0 S 0.84 259.9 S 1.26 C 1.03 S 1.53
289 S5-3 2.50 250 292 350 730 100 100 1 2.80 2 452 7 89.4 0.16 5.0 569 0 S 0.72 243.8 C 0.90 C 0.86 S 1.42
290 S5-4 1.99 250 292 350 580 100 100 1 2.80 2 452 7 89.4 0.16 5.0 569 0 S 1.12 476.7 C C S
291 S5-5 1.75 250 292 350 510 100 100 1 2.80 2 452 7 89.4 0.16 5.0 569 0 S 1.18 573.4 C C F
292 S5-6 1.51 250 292 350 440 100 100 1 2.80 2 452 7 89.4 0.16 5.0 569 0 F 1.15 647.7 F F F
293 S7-1 3.49 250 278 350 970 100 100 0.5 4.73 4 433 7 74.8 0.11 5.0 569 0 S 0.64 217.2 S C S
294 S7-2 3.49 250 278 350 970 100 100 0.5 4.73 4 433 7 74.8 0.13 5.0 569 0 S 0.60 205.4 S C S
295 S7-3 3.49 250 278 350 970 100 100 0.5 4.73 4 433 7 74.8 0.16 5.0 569 0 S 0.72 246.5 S C S
296 S7-4 3.49 250 278 350 970 100 100 0.5 4.73 4 433 7 74.8 0.20 5.0 569 0 S 0.80 273.6 S C S

Conversion Factors: 25.4 mm = 1 in.; 1 MPa = 145 psi; 1 kN = 225 lbs.
48
# Ref. Year Beam a/d b d h a: M/V lb1 lb2 V/P ρl # fy ag fc' ρv dbv fyv ρh Rep. Mmax Vu 2PKT 2PKT AASHTO AASHTO ACI ACI
# Name (mm) (mm) (mm) (mm) (mm) (mm) (%) bars (MPa) (mm) (MPa) (%) (mm) (MPa) (%) mode Mn (kN) mode Exp/Pred mode Exp/Pred mode Exp/Pred
297 S7-5 3.49 250 278 350 970 100 100 0.5 4.73 4 433 7 74.8 0.22 5.0 569 0 S 0.89 304.4 S C S
298 S7-6 3.49 250 278 350 970 100 100 0.5 4.73 4 433 7 74.8 0.26 5.0 569 0 S 0.91 310.6 S C S
299 S8-1 2.50 250 292 350 730 100 100 1 2.80 2 452 7 74.6 0.11 5.0 569 0 S 0.82 272.1 C 1.12 C 1.15 S 1.91
300 S8-2 2.50 250 292 350 730 100 100 1 2.80 2 452 7 74.6 0.13 5.0 569 0 S 0.75 250.9 C 1.03 C 1.03 S 1.69
301 S8-3 2.50 250 292 350 730 100 100 1 2.80 2 452 7 74.6 0.16 5.0 569 0 S 0.93 309.6 C 1.25 C 1.22 S 1.91
302 S8-4 2.50 250 292 350 730 100 100 1 2.80 2 452 7 74.6 0.16 5.0 569 0 S 0.80 265.8 C 1.07 C 1.04 S 1.64
303 S8-5 2.50 250 292 350 730 100 100 1 2.80 2 452 7 74.6 0.20 5.0 569 0 S 0.87 289.2 C 1.15 C 1.08 S 1.66
304 S8-6 2.50 250 292 350 730 100 100 1 2.80 2 452 7 74.6 0.22 5.0 569 0.00 S 0.85 283.9 C 1.12 C 1.02 S 1.56
305 13 1998 BN100 2.92 300 925 1000 2700 152 152 0.5 0.76 4 550 10 37.2 0 0 S 0.52 192.0 S 1.05 S 1.05 S 0.69
306 BN50 3.00 300 450 500 1350 152 152 0.5 0.81 4 490 10 37.2 0 0 S 0.78 132.0 S 1.17 S 1.17 S 0.97
307 BN25 3.00 300 225 250 675 76 76 0.5 0.89 4 437 10 37.2 0 0 S 0.89 73.0 S 1.11 S 1.11 S 1.06
308 BN12.5 3.07 300 110 125 338 38 38 0.5 0.91 4 458 10 37.2 0 0 S 0.96 40.0 S S S
309 14 2000 YB2000/0 2.86 300 1890 2000 5400 292 150 0.5 0.74 6 457 10 33.6 0 0 S 0.40 255.0 S 0.95 S 0.95 S 0.47
310 YB2000/4 2.86 300 1890 2000 5400 292 150 0.5 0.74 6 457 10 36.4 0.07 12.7 468 0 S 1.06 674.0 F 1.02 F 1.02 F 0.92
311 15 2000 DF-1 2.33 500 1000 1090 2325 200 150 0.5 0.42 3 600 20 21.0 0 0 S 0.85 429.0 C 1.43 S 1.62 S 1.14
312 DF-2 2.33 500 1000 1090 2325 200 150 0.5 0.42 3 600 20 18.4 0 0 S 0.63 315.0 C 1.12 S 1.25 S 0.89
313 DF-2R 2.33 500 1000 1090 2325 200 150 0.5 0.42 3 600 20 18.4 0 0 S 0.76 378.0 C 1.34 S 1.49 S 1.07
314 DF-3 2.33 500 1000 1090 2325 200 150 0.5 0.42 3 600 20 18.4 0 0 S 0.66 329.0 C 1.17 S 1.30 S 0.93
315 DF-4 2.33 500 1000 1090 2325 200 150 0.5 0.60 10 600 20 25.5 0 0 S 0.55 387.0 C 1.04 S 1.22 S 0.92
316 DF-5 2.33 500 996 1090 2325 200 150 0.5 0.66 12 600 20 25.5 0 0 S 0.50 381.0 C 1.01 S 1.17 S 0.90
317 DF-6 2.20 500 1000 1090 2200 300 200 0.5 0.98 7 600 20 21.0 0 0 S 0.69 771.0 C 1.58 S 2.18 S 1.92
318 DF-7 2.33 500 1000 1090 2325 200 150 0.5 0.98 7 600 20 20.6 0 0 S 0.41 435.0 C 1.13 S 1.27 S 1.10
319 DF-8 2.33 500 1000 1090 2325 600 150 0.5 0.98 7 600 20 22.4 0 0 S 0.50 531.0 C 0.95 S 1.46 S 1.28
320 DF-8R 2.33 500 1000 1090 2325 600 150 0.5 0.98 7 600 20 22.4 0 0 S 0.54 579.0 C 1.03 S 1.59 S 1.40
321 DF-9 2.33 500 1000 1090 2325 200 150 0.5 0.98 7 600 20 31.7 0 0 S 0.47 532.0 C 1.12 S 1.33 S 1.10
322 DF-10 2.33 500 1000 1090 2325 200 150 0.5 0.98 7 600 20 31.7 0 0 S 0.47 524.0 C 1.10 S 1.31 S 1.09
323 DF-10R 2.33 500 1000 1090 2325 200 150 0.5 0.98 7 600 20 31.7 0 0 S 0.54 605.0 C 1.27 S 1.51 S 1.26
324 DF-11 2.00 250 1000 1090 2000 200 150 0.5 0.84 3 600 20 19.5 0 0 S 0.62 330.0 C 1.34 S 1.96 C 1.35
325 DF-13 1.50 250 1000 1090 1500 200 150 0.5 0.84 3 600 20 20.3 0 0 S 0.77 550.0 C 1.49 C 1.87 C 1.68
326 DF-14 1.75 250 1000 1090 1750 200 150 0.5 0.84 3 600 20 19.5 0 0 S 0.67 409.0 C 1.31 C 1.89 C 1.48
327 DF-15 1.82 250 962 1090 1750 200 150 0.5 1.75 6 600 20 20.3 0 0 S 0.40 330.0 C 0.94 C 1.17 C 0.93
328 DF-16 1.43 250 1000 1090 1425 200 150 0.5 0.84 3 600 20 20.3 0 0 S 0.50 380.0 C 0.98 C 1.19 C 1.11
329 16 2003 L5-100 0.53 160 935 1000 500 100 100 1 0.90 4 804 19 31.4 0 0 S 0.33 582.1 C 0.93 C 1.04 C 1.72
330 L5-75 0.55 160 685 750 375 100 100 1 1.05 4 804 19 31.4 0 0 S 0.42 596.8 C 1.12 C 1.11 C 1.77
331 L5-60 0.54 160 555 600 300 100 100 1 0.97 3 804 19 31.4 0 0 S 0.49 535.1 C 1.10 C 1.17 C 1.82
332 L5-60R 0.54 160 555 600 300 100 100 1 0.97 3 804 19 31.4 0 0 S 0.44 479.2 C 0.99 C 1.05 C 1.63
333 L5-40 0.56 160 355 400 200 100 100 1 1.01 2 804 19 31.4 0 0 S 0.64 446.9 C 1.13 C 1.12 C 1.54

Conversion Factors: 25.4 mm = 1 in.; 1 MPa = 145 psi; 1 kN = 225 lbs.
49
# Ref. Year Beam a/d b d h a: M/V lb1 lb2 V/P ρl # fy ag fc' ρv dbv fyv ρh Rep. Mmax Vu 2PKT 2PKT AASHTO AASHTO ACI ACI
# Name (mm) (mm) (mm) (mm) (mm) (mm) (%) bars (MPa) (mm) (MPa) (%) (mm) (MPa) (%) mode Mn (kN) mode Exp/Pred mode Exp/Pred mode Exp/Pred
334 L10-100 1.07 160 935 1000 1000 100 100 1 0.90 4 804 19 31.4 0 0 S 0.62 543.9 C 1.36 C 1.72 C 1.94
335 L10-75 1.09 160 685 750 750 100 100 1 1.05 4 804 19 31.4 0 0 S 0.38 271.5 C 0.80 C 0.93 C 0.99
336 L10-75R 1.09 160 685 750 750 100 100 1 1.05 4 804 19 31.4 0 0 S 0.47 330.3 C 0.98 C 1.14 C 1.20
337 L10-60 1.08 160 555 600 600 100 100 1 0.97 3 804 19 31.4 0 0 S 0.69 375.3 C 1.22 C 1.59 C 1.67
338 L10-40 1.13 160 355 400 400 100 100 1 1.01 2 804 19 31.4 0 0 S 0.55 192.1 C 0.78 C 0.99 C 0.90
339 L10-40R 1.13 160 355 400 400 100 100 1 1.01 2 804 19 31.4 0 0 S 0.90 311.6 C 1.26 C 1.61 C 1.45
340 UH5-100 0.53 160 935 1000 500 100 100 1 0.90 4 804 19 78.5 0 0 S 0.54 1029.0 C 1.10 C 0.89 C 1.22
341 UH5-75 0.55 160 685 750 375 100 100 1 1.05 4 804 19 78.5 0 0 S 0.64 1010.4 C 1.21 C 0.93 C 1.20
342 UH5-60 0.54 160 555 600 300 100 100 1 0.97 3 804 19 78.5 0 0 S 0.68 823.2 C 1.05 C 0.90 C 1.12
343 UH5-40 0.56 160 355 400 200 100 100 1 1.01 2 804 19 78.5 0 0 S 0.95 733.0 C 1.08 C 0.95 C 1.01
344 UH10-100 1.07 160 935 1000 1000 100 100 1 0.90 4 804 19 78.5 0 0 S 0.80 769.3 C 1.36 C 1.23 C 1.10
345 UH10-75 1.09 160 685 750 750 100 100 1 1.05 4 804 19 78.5 0 0 S 0.43 338.1 C 0.67 C 0.59 C 0.49
346 UH10-75R 1.09 160 685 750 750 100 100 1 1.05 4 804 19 78.5 0 0 S 0.46 360.6 C 0.71 C 0.63 C 0.53
347 UH10-60 1.08 160 555 600 600 100 100 1 0.97 3 804 19 78.5 0 0 S 0.95 573.3 C 1.22 C 1.24 C 1.02
348 UH10-40 1.06 160 355 400 375 100 100 1 1.01 2 804 19 78.5 0 0 S 1.22 498.8 F C F
349 UH10-40R 1.06 160 355 400 375 100 100 1 1.01 2 804 19 78.5 0 0 S 0.94 385.1 F 0.87 C 0.95 F 0.69
350 17 2005 1 0.50 300 400 450 200 100 100 1 2.14 4 458 10 23.2 0 0 S 0.49 853.0 C 1.14 C 1.21 C 2.01
351 2 0.50 300 400 450 200 100 100 1 2.14 4 458 10 23.2 0.21 6.0 370 0 S 0.47 821.0 C 1.10 C 1.16 C 1.93
352 3 0.50 300 400 450 200 100 100 1 2.14 4 458 10 23.2 0.48 10.0 388 0 S 0.48 833.0 C 1.12 C 1.18 C 1.96
353 4 0.50 300 400 450 200 100 100 1 2.14 4 458 10 23.2 0.84 13.0 368 0 S 0.50 869.0 C 1.16 C 1.23 C 1.63
354 5 1.00 300 400 450 400 100 100 1 2.14 4 458 10 29.0 0 0 S 0.67 632.0 C 1.12 C 1.25 C 1.49
355 6 1.00 300 400 450 400 100 100 1 2.14 4 458 10 29.1 0.21 6.0 370 0 S 0.78 731.0 C 1.26 C 1.39 C 1.68
356 7 1.00 300 400 450 400 100 100 1 2.14 4 458 10 29.2 0.48 10.0 388 0 S 0.79 750.0 C 1.23 C 1.35 C 1.36
357 8 1.00 300 400 450 400 100 100 1 2.14 4 458 10 29.3 0.84 13.0 368 0 S 0.85 804.0 C 1.26 C 1.38 C 1.42
358 9 1.50 300 400 450 600 100 100 1 2.14 4 458 10 22.9 0 0 S 0.49 284.0 C 0.80 C 1.24 C 1.14
359 10 1.50 300 400 450 600 100 100 1 2.14 4 458 10 22.5 0.21 6.0 370 0 S 0.82 464.0 C 1.15 C 1.74 C 1.73
360 11 1.50 300 400 450 600 100 100 1 2.14 4 458 10 23.0 0.48 10.0 388 0 S 0.85 491.0 C 1.03 S 1.23 C 1.37
361 12 1.50 300 400 450 600 100 100 1 2.14 4 458 10 23.5 0.84 13.0 368 0 S 0.97 570.0 C 1.02 S 1.04 S 1.15
362 13 1.00 300 400 450 400 100 100 1 2.14 4 458 10 32.0 0 0 S 0.69 661.0 C 1.11 C 1.20 C 1.41
363 14 1.00 300 400 450 400 100 100 1 2.14 4 458 10 32.0 0.21 6.0 370 0 S 0.78 751.0 C 1.23 C 1.32 C 1.57
364 15 1.00 300 400 450 400 100 100 1 2.14 4 458 10 32.0 0.48 10.0 388 0 S 0.80 774.0 C 1.22 C 1.30 C 1.28
365 16 1.00 300 400 450 400 100 100 1 2.14 4 458 10 32.0 0.84 13.0 368 0 S 0.88 849.0 C 1.28 C 1.36 C 1.38
366 17 1.00 300 400 450 400 100 100 1 2.14 4 458 10 31.3 0.21 6.0 370 0 S 0.59 570.0 C 0.94 C 1.02 C 1.22
367 18 1.00 300 400 450 400 100 100 1 2.14 4 458 10 31.5 0.48 10.0 388 0 S 0.80 773.0 C 1.22 C 1.31 C 1.30
368 19 1.00 300 400 450 400 100 100 1 2.14 4 458 10 31.8 0.84 13.0 368 0 S 0.79 756.0 C 1.14 C 1.22 C 1.23
369 20 1.00 300 400 450 400 100 100 1 2.14 4 702 10 24.3 0.48 10.0 952 0 S 0.74 665.0 C 0.98 S 1.01 C 1.35
370 21 1.00 300 400 450 400 100 100 1 2.14 4 702 10 26.9 0.84 13.0 1051 0 S 0.68 661.0 C 0.92 S 0.91 C 1.14

Conversion Factors: 25.4 mm = 1 in.; 1 MPa = 145 psi; 1 kN = 225 lbs.
50
# Ref. Year Beam a/d b d h a: M/V lb1 lb2 V/P ρl # fy ag fc' ρv dbv fyv ρh Rep. Mmax Vu 2PKT 2PKT AASHTO AASHTO ACI ACI
# Name (mm) (mm) (mm) (mm) (mm) (mm) (%) bars (MPa) (mm) (MPa) (%) (mm) (MPa) (%) mode Mn (kN) mode Exp/Pred mode Exp/Pred mode Exp/Pred
371 22 1.50 300 400 450 600 100 100 1 2.14 4 702 10 26.2 0.48 10.0 952 0 S 0.84 537.0 F 0.76 F 0.76 C 1.14
372 23 1.50 300 400 450 600 100 100 1 2.14 4 702 10 26.3 0.84 13.0 1051 0 S 0.88 566.0 F 0.80 F 0.80 S 1.05
373 24 0.50 300 400 450 200 100 100 1 2.14 4 702 10 79.9 0 0 S 0.61 1958.0 C 1.24 C 0.94 C 1.34
374 25 1.00 300 400 450 400 100 100 1 2.14 4 702 10 76.4 0 0 S 0.88 1403.0 C 1.39 C 1.30 C 1.25
375 26 1.50 300 400 450 600 100 100 1 2.14 4 702 10 78.3 0 0 S 0.85 904.0 C 1.30 C 1.48 C 1.06
376 27 2.00 300 400 450 800 100 100 1 2.14 4 702 10 77.8 0 0 S 0.94 752.0 C 1.59 C 2.07 S 4.16
377 28 0.75 300 400 450 300 100 100 1 2.14 4 458 10 25.5 0.48 10.0 388 0 S 0.53 647.0 C 1.01 C 1.00 C 1.19
378 29 0.75 300 400 450 300 100 100 1 2.14 4 458 10 26.2 0.84 13.0 368 0 S 0.54 666.0 C 1.02 C 0.99 C 1.18
379 30 0.75 300 400 450 300 100 100 1 2.14 4 458 10 26.4 0.88 16.0 389 0 S 0.57 701.0 C 1.07 C 1.03 C 1.23
380 31 2.00 300 400 450 800 100 100 1 2.14 4 702 10 26.6 0.48 10.0 388 0 S 0.86 416.0 C 0.96 S 1.06 C 1.18
381 32 2.00 300 400 450 800 100 100 1 2.14 4 702 10 27.4 0.84 13.0 368 0 S 0.89 440.0 F 0.82 F 0.82 S 0.89
382 33 1.00 300 400 450 400 100 100 1 2.14 4 458 10 24.7 0.95 10.0 388 0 S 0.72 647.0 S 1.01 S 1.01 S 1.21
383 34 1.00 300 400 450 400 100 100 1 2.14 4 458 10 24.8 0.95 19.0 375 0 S 0.66 598.0 S 0.96 S 0.96 S 1.12
384 35 0.50 300 400 450 200 100 100 1 0.42 4 1330 10 25.3 0 0 S 0.50 588.0 C 0.98 C 1.01 C 1.27
385 36 0.50 300 400 450 200 100 100 1 0.42 4 1330 10 24.5 0.48 10.0 388 0 S 0.47 539.0 C 0.92 C 0.94 C 1.20
386 37 0.50 300 400 450 200 100 100 1 0.42 4 1330 10 25.8 0.84 13.0 368 0 S 0.47 554.0 C 0.91 C 0.92 C 0.93
387 38 1.00 300 400 450 400 100 100 1 0.42 4 1330 10 25.2 0 0 S 0.61 358.0 C 0.92 C 1.16 C 0.97
388 39 1.00 300 400 450 400 100 100 1 0.42 4 1330 10 25.4 0.48 10.0 388 0 S 0.81 470.0 C 1.20 C 1.32 C 0.97
389 40 1.00 300 400 450 400 100 100 1 0.42 4 1330 10 25.9 0.84 13.0 368 0 S 0.80 470.0 C 1.18 C 1.21 C 0.93
390 41 2.50 300 400 450 1000 100 100 1 2.14 4 750 10 20.6 0.48 10.0 388 0 S 1.02 324.0 F 0.89 F 0.89 F 0.99
391 42 2.50 300 400 450 1000 100 100 1 2.14 4 750 10 21.4 0.84 13.0 368 0 S 1.15 376.0 F F F
392 45 2.50 300 400 450 1000 100 100 1 2.14 4 750 10 97.2 0 0 S 0.50 345.0 C 1.37 C 1.25 S 1.96
393 46 1.00 300 400 450 400 100 100 1 2.14 4 750 10 97.5 0.21 6.0 957 0 S 0.71 1243.0 C 1.02 C 0.93 C 0.86
394 47 1.00 300 400 450 400 100 100 1 2.14 4 750 10 96.3 0.48 10.0 953 0 S 0.75 1300.0 C 1.03 C 0.93 F 0.72
395 48 1.50 300 400 450 600 100 100 1 2.14 4 750 10 94.5 0.21 6.0 957 0 S 0.81 932.0 C 1.02 C 1.15 C 0.86
396 49 1.50 300 400 450 600 100 100 1 2.14 4 750 10 94.2 0.48 10.0 953 0 S 0.85 980.0 C 0.95 C 1.05 F 0.70
397 L6 1.00 200 1000 1050 1000 200 200 1 0.40 4 1016 10 31.2 0.29 10.0 389 0 S 0.89 665.0 C 0.96 C 1.39 C 1.35
398 L7 1.00 400 2000 2100 2000 400 400 1 0.40 4 1016 10 30.5 0.29 19.0 375 0 S 0.86 2584.0 C 1.01 C 1.38 C 1.34
399 18 2005 B-2 0.50 240 400 475 200 100 100 1 2.02 5 376 20 36.2 0 0 S 0.61 775.0 C 1.02 C 0.78 C 1.25
400 B-3 0.50 240 400 475 200 100 100 1 2.02 5 376 20 36.2 0.4 6.0 376 0 S 0.60 768.0 C 1.01 C 0.77 C 1.24
401 B-4 0.50 240 400 475 200 100 100 1 2.02 5 376 20 31.3 0.8 10.0 376 0 S 0.78 975.5 C 1.40 C 1.09 C 1.45
402 B-6 1.00 240 400 475 400 100 100 1 2.02 5 376 20 31.3 0 0 S 0.84 525.0 C 1.13 C 1.05 C 1.15
403 B-7 1.00 240 400 475 400 100 100 1 2.02 5 376 20 31.3 0.4 6.0 376 0 S 0.94 590.5 C 1.23 C 1.12 C 1.26
404 B-8 1.00 240 400 475 400 100 100 1 2.02 5 376 20 37.8 0.8 10.0 376 0 S 1.17 750.5 C C F
405 B-10-1 1.50 240 400 475 600 100 100 1 2.02 5 376 20 29.2 0 0 S 0.75 308.0 C 1.01 C 1.15 C 0.94
406 B-10-2 1.50 240 400 475 600 100 100 1 2.02 5 376 20 23.0 0 0 S 0.90 351.5 C 1.31 C 1.60 C 1.37
407 B-11 1.50 240 400 475 600 100 100 1 2.02 5 376 20 29.2 0.4 6.0 376 0 S 1.24 512.5 C C F

Conversion Factors: 25.4 mm = 1 in.; 1 MPa = 145 psi; 1 kN = 225 lbs.
51
# Ref. Year Beam a/d b d h a: M/V lb1 lb2 V/P ρl # fy ag fc' ρv dbv fyv ρh Rep. Mmax Vu 2PKT 2PKT AASHTO AASHTO ACI ACI
# Name (mm) (mm) (mm) (mm) (mm) (mm) (%) bars (MPa) (mm) (MPa) (%) (mm) (MPa) (%) mode Mn (kN) mode Exp/Pred mode Exp/Pred mode Exp/Pred
408 B-12 1.50 240 400 475 600 100 100 1 2.02 5 376 20 31.3 0.8 10.0 376 0 S 1.39 580.5 F F F
409 B-10.3-1 1.50 360 600 675 900 150 150 1 2.11 9 388 20 37.8 0 0 S 0.95 980.0 C 1.34 C 1.57 C 1.32
410 B-10.3-2 1.50 360 600 675 900 150 150 1 2.11 9 372 20 31.2 0 0 S 0.93 893.5 C 1.38 C 1.68 C 1.46
411 B-13-1 1.50 480 800 905 1200 200 200 1 2.07 10 398 20 31.6 0 0 S 0.84 1492.5 C 1.33 C 1.53 C 1.31
412 B-13-2 1.50 480 800 905 1200 200 200 1 2.07 10 398 20 24.0 0 0 S 0.67 1128.5 C 1.17 C 1.46 C 1.31
413 B-14 1.50 600 1000 1105 1500 250 250 1 2.04 14 398 20 31.0 0 0 S 0.72 1984.5 C 1.20 C 1.46 C 1.29
414 B-17 1.50 600 1000 1105 1500 250 250 1 2.04 14 398 20 28.7 0.4 13.0 398 0 S 0.96 2607.0 C 1.18 S 1.41 C 1.32
415 B15 1.50 720 1200 1305 1800 300 300 1 1.99 18 402 20 27.0 0 0 S 0.71 2695.0 C 1.27 C 1.66 C 1.54
416 B-16 1.50 840 1400 1505 2100 350 350 1 2.05 18 394 20 27.3 0 0 S 0.57 2987.5 C 1.03 C 1.41 C 1.33
417 B-18 1.50 840 1400 1505 2100 350 350 1 2.05 18 398 20 23.5 0.4 16.0 398 0 S 0.83 4198.0 C 1.03 S 1.18 S 1.37
418 19 2007 1DB35bw 1.10 80 313 350 344 53 53 1 1.25 4 455 10 25.9 0.4 6.0 426 0 S 0.88 99.5 C 1.02 C 1.27 C 1.22
419 1DB50bw 1.10 115 454 500 499 75 75 1 1.28 4 520 10 27.4 0.39 6.0 426 0 S 0.69 186.5 C 0.92 C 1.17 C 1.13
420 1DB70bw 1.10 160 642 700 706 105 105 1 1.22 4 522 10 28.3 0.45 8.0 426 0 S 0.83 427.0 C 1.07 S 1.34 C 1.35
421 1DB100bw 1.10 230 904 1000 994 150 150 1 1.20 6 555 10 28.7 0.41 10.0 426 0 S 0.71 775.0 C 1.02 C 1.16 C 1.10
422 2DB35 1.10 80 314 350 345 53 53 1 1.25 4 469 10 27.4 0 0 S 0.73 85.0 C 1.05 C 1.22 C 1.32
423 2DB50 1.10 80 459 500 505 75 75 1 1.18 4 520 10 32.4 0 0 S 0.75 135.5 C 1.12 C 1.32 C 1.42
424 2DB70 1.10 80 650 700 715 105 105 1 1.33 4 520 10 24.8 0 0 S 0.57 155.5 C 1.10 C 1.38 C 1.63
425 2DB100 1.10 80 926 1000 1019 150 150 1 1.30 6 520 10 30.6 0 0 S 0.61 241.5 C 1.20 C 1.25 C 1.41
426 3DB35b 1.10 80 314 350 345 53 53 1 1.25 4 469 10 27.4 0 0 S 0.73 85.0 C 1.05 C 1.22 C 1.32
427 3DB50b 1.10 115 454 500 499 75 75 1 1.28 4 520 10 28.3 0 0 S 0.61 167.0 C 1.02 C 1.19 C 1.30
428 3DB70b 1.10 160 642 700 706 105 105 1 1.22 4 522 10 28.7 0 0 S 0.70 360.5 C 1.20 C 1.36 C 1.51
429 3DB100b 1.10 230 904 1000 994 150 150 1 1.20 6 555 10 29.3 0 0 S 0.61 672.0 C 1.16 C 1.16 C 1.24
430 20 2007 L-10N1 2.89 300 1400 1510 4050 150 150 0.5 0.83 5 452 10 38.4 0 0 S 0.52 265.0 S 1.09 S 1.09 S 0.61
431 L-10N2 2.89 300 1400 1510 4050 150 150 0.5 0.83 5 452 10 40.3 0 0 S 0.47 242.0 S 0.98 S 0.98 S 0.55
432 L-10H 2.89 300 1400 1510 4050 150 150 0.5 0.83 5 452 10 73.6 0 0 S 0.45 240.0 S 1.05 C 0.76 F 0.42
433 L-10HS 2.89 300 1400 1510 4050 150 150 0.5 1.33 8 452 10 71.2 0.10 9.5 494 0 S 0.86 710.0 S 0.95 S 0.95 S 0.93
434 L-20N1 2.89 300 1400 1510 4050 150 150 0.5 0.83 5 452 19 31.4 0 0 S 0.52 265.0 S 1.02 S 1.02 S 0.68
435 L-20N2 2.89 300 1400 1510 4050 150 150 0.5 0.83 5 452 19 33.2 0 0 S 0.52 266.0 S 1.01 S 1.01 S 0.66
436 L-40N1 2.89 300 1400 1510 4050 150 150 0.5 0.83 5 452 38 28.1 0 0 S 0.48 242.0 S 0.91 S 0.91 S 0.65
437 L-40N2 2.89 300 1400 1510 4050 150 150 0.5 0.83 5 452 38 28.5 0 0 S 0.57 288.0 S 1.08 S 1.08 S 0.77
438 L-50N1 2.89 300 1400 1510 4050 150 150 0.5 0.83 5 452 51 41.0 0 0 S 0.53 272.0 S 0.90 S 0.90 S 0.61
439 L-50N2 2.89 300 1400 1510 4050 150 150 0.5 0.83 5 452 51 40.1 0 0 S 0.58 298.0 S 1.00 S 1.00 S 0.68
440 L-50N2R 2.89 300 1400 1510 4050 150 150 0.5 0.83 5 452 51 40.1 0 0 S 0.63 323.0 S 1.08 S 1.08 S 0.73
441 S-10N1 2.89 122 280 330 810 30 30 0.5 0.83 4 494 10 41.9 0 0 S 0.80 36.6 S 1.12 S 1.12 S 1.00
442 S-10N2 2.89 122 280 330 810 30 30 0.5 0.83 4 494 10 41.9 0 0 S 0.84 38.3 S 1.18 S 1.18 S 1.05
443 S-10H 2.89 122 280 330 810 30 30 0.5 0.83 4 494 10 77.3 0 0 S 0.80 37.7 S 1.15 C 0.88 S 0.81
444 S-10HS 2.89 122 280 330 810 30 30 0.5 1.34 5 506 10 77.3 0.10 5.0 496 0 S 0.87 66.3 S 1.07 C 0.96 S 1.07

Conversion Factors: 25.4 mm = 1 in.; 1 MPa = 145 psi; 1 kN = 225 lbs.
52
# Ref. Year Beam a/d b d h a: M/V lb1 lb2 V/P ρl # fy ag fc' ρv dbv fyv ρh Rep. Mmax Vu 2PKT 2PKT AASHTO AASHTO ACI ACI
# Name (mm) (mm) (mm) (mm) (mm) (mm) (%) bars (MPa) (mm) (MPa) (%) (mm) (MPa) (%) mode Mn (kN) mode Exp/Pred mode Exp/Pred mode Exp/Pred
445 S-20N1 2.89 122 280 330 810 30 30 0.5 0.83 4 494 19 39.2 0 0 S 0.86 39.1 S 1.17 S 1.17 S 1.10
446 S-20N2 2.89 122 280 330 810 30 30 0.5 0.83 4 494 19 38.1 0 0 S 0.84 38.2 S 1.15 S 1.15 S 1.09
447 S-40N1 2.89 122 280 330 810 30 30 0.5 0.83 4 494 38 29.1 0 0 S 0.94 41.8 S 1.35 S 1.35 S 1.36
448 S-40N2 2.89 122 280 330 810 30 30 0.5 0.83 4 494 38 29.1 0 0 S 0.79 34.9 S 1.13 S 1.13 S 1.13
449 S-50N1 2.89 122 280 330 810 30 30 0.5 0.83 4 494 51 43.5 0 0 S 0.84 38.5 S 1.09 S 1.09 S 1.03
450 S-50N2 2.89 122 280 330 810 30 30 0.5 0.83 4 494 51 43.5 0 0 S 0.89 40.6 S 1.15 S 1.15 S 1.09
451 21 2008 MS1-1 1.20 300 501 607 600 200 200 1 0.52 6 838 10 46.0 0.333 11.3 420 0.25 F 1.21 626.0 F F F
452 MS1-2 1.19 300 503 607 600 200 200 1 1.13 6 870 10 44.0 0.333 11.3 420 0.45 F 0.99 1071.0 C C F
453 MS1-3 1.19 300 506 607 600 200 200 1 2.29 9 880 10 44.0 0.333 11.3 420 0.45 S 0.96 1373.5 C 1.22 C 1.35 C 0.99
454 MS2-2 1.79 300 503 607 900 200 200 1 1.13 6 870 10 47.0 0.333 11.3 420 0.45 F 0.98 716.0 C C F
455 MS2-3 1.78 300 506 607 900 200 200 1 2.29 9 880 10 43.0 0.333 11.3 420 0.45 S 1.09 1027.5 C 1.34 C 1.70 F 1.05
456 MS3-2 2.39 300 503 607 1200 200 200 1 1.13 6 870 10 48.0 0.444 11.3 420 0.45 F 1.06 577.0 C C S
457 22 2009 0.60/0.60/P 1.40 150 428 500 600 150 150 1 1.24 6 484 10 41.2 0.35 10.0 328 0 S 1.00 250.1 F 0.77 F 0.94 F 0.71
458 0.60/0.60/2P 1.40 150 428 500 600 150 150 0.83 1.24 6 484 10 41.2 0.35 10.0 328 0 S 1.22 305.6 F F F
459 0.60/0.60/5P 1.40 150 428 500 600 150 150 0.73 1.24 6 484 10 41.2 0.35 10.0 328 0 S 1.02 256.8 F 0.89 F 0.93 F 0.71
460 0.45/0.75/P 1.75 150 428 500 750 150 150 0.83 1.24 6 484 10 41.2 0.35 10.0 328 0 S 1.19 240.1 F F F
461 0.30/0.90/P 2.10 150 428 500 900 150 150 0.67 1.24 6 484 10 41.2 0.35 10.0 328 0 S 1.24 207.3 F F S
462 0.30/0.90/5P 0.70 150 428 500 300 150 150 0.93 1.24 6 484 10 41.2 0.35 10.0 328 0 S 0.91 458.1 F 0.87 F 0.78 F 0.88
463 0.75/0.75/P 1.42 160 527 600 750 150 150 0.98 1.43 6 495 10 38.3 0.42 8.0 369 0 S 1.14 424.5 C C F
464 0.75/0.75/2P 1.42 160 527 600 750 150 150 0.83 1.43 6 495 10 38.3 0.42 8.0 369 0 S 1.06 396.6 C 1.12 C 1.23 F 0.88
465 0.75/0.75/4P 1.42 160 527 600 750 150 150 0.75 1.43 6 495 10 38.3 0.42 8.0 369 0 S 1.18 440.1 C C F
466 0.75/0.75/6P 1.42 160 527 600 750 150 150 0.71 1.43 6 495 10 38.3 0.42 8.0 369 0 S 0.82 307.2 C 0.90 C 0.94 F 0.68
467 0.45/1.05/P 1.99 160 527 600 1050 150 150 0.73 1.43 6 495 10 38.3 0.42 8.0 369 0 S 1.09 291.8 C 1.11 S 1.24 F 0.82
468 0.45/1.05/2P 0.85 160 527 600 450 150 150 1.02 1.43 6 495 10 38.3 0.42 8.0 369 0 S 0.89 552.7 C 1.06 C 1.01 C 1.14
469 0.30/1.20/P 2.28 160 527 600 1200 150 150 0.59 1.43 6 495 10 38.3 0.42 8.0 369 0 S 1.14 266.5 S S F
470 0.30/1.20/2P 0.57 160 527 600 300 150 150 1 1.43 6 495 10 38.3 0.42 8.0 369 0 S 0.71 665.4 C 1.02 C 0.87 C 1.22
471 23 2009 I-03-2 1.84 533 978 1118 1799 508 406 0.72 2.29 42 503 19 36.1 0.29 12.7 462 0.33 S 0.95 2531.0 C 1.19 C 1.49 C 1.02
472 I-03-4 1.84 533 978 1118 1799 508 406 0.72 2.29 42 503 19 36.8 0.3 9.5 503 0.33 S 1.10 2922.5 C 1.34 C 1.66 C 1.14
473 I-02-2 1.84 533 978 1118 1799 508 406 0.72 2.29 42 503 19 27.2 0.2 12.7 462 0.2 S 0.85 2019.5 C 1.18 C 1.54 C 1.29
474 I-02-4 1.84 533 978 1118 1799 508 406 0.72 2.29 42 503 19 28.7 0.21 9.5 503 0.2 S 0.96 2348.7 C 1.30 C 1.69 C 1.41
475 II-03-CCC2021 1.84 533 980 1067 1804 508 254 0.72 2.31 12 441 19 22.7 0.31 15.9 448 0.45 S 1.08 2224.1 C 1.32 S 1.51 S 1.86
476 II-02-CCC1021 1.84 533 980 1067 1804 254 254 0.72 2.31 12 476 19 31.9 0.2 15.9 462 0.19 S 0.59 1463.5 C 0.93 S 1.15 C 1.18
477 II-03-CCT1021 1.84 533 980 1067 1804 914 254 0.72 2.31 12 455 19 30.4 0.31 15.9 490 0.45 S 1.19 2829.1 C S C
478 II-03-CCT0507 1.84 533 980 1067 1804 914 127 0.72 2.31 12 455 19 29.0 0.31 15.9 490 0.45 S 1.13 2660.0 C S S
479 II-02-CCT0507 1.84 533 980 1067 1804 914 127 0.72 2.31 12 476 19 21.5 0.2 15.9 441 0.19 S 0.90 1783.7 C 1.04 S 1.50 S 1.84
480 II-02-CCT0521 1.84 533 980 1067 1804 508 127 0.72 2.31 12 476 19 32.7 0.2 15.9 462 0.19 S 1.01 2526.6 C 1.42 S 1.96 C 2.44
481 III-1.85-00 1.84 533 980 1067 1804 508 406 0.72 2.31 12 455 19 21.9 0 0 S 0.81 1623.6 C 1.22 C 2.19 C 1.76

Conversion Factors: 25.4 mm = 1 in.; 1 MPa = 145 psi; 1 kN = 225 lbs.
53
# Ref. Year Beam a/d b d h a: M/V lb1 lb2 V/P ρl # fy ag fc' ρv dbv fyv ρh Rep. Mmax Vu 2PKT 2PKT AASHTO AASHTO ACI ACI
# Name (mm) (mm) (mm) (mm) (mm) (mm) (%) bars (MPa) (mm) (MPa) (%) (mm) (MPa) (%) mode Mn (kN) mode Exp/Pred mode Exp/Pred mode Exp/Pred
482 III-2.5-00 2.47 533 980 1067 2422 508 406 0.63 2.31 12 455 19 22.1 0 0 S 0.24 364.8 C 0.63 S 0.80 S 0.76
483 III-1.85-02 1.84 533 980 1067 1804 508 406 0.72 2.31 12 476 19 28.3 0.2 15.9 441 0.19 S 0.90 2170.7 C 1.19 S 1.78 C 1.61
484 III-1.85-025 1.84 533 980 1067 1804 508 406 0.72 2.31 12 476 19 28.3 0.24 15.9 441 0.14 S 0.95 2295.3 C 1.22 S 1.73 C 1.67
485 III-1.85-03 1.84 533 980 1067 1804 508 406 0.72 2.31 12 476 19 34.4 0.29 15.9 441 0.29 S 0.72 1832.7 C 0.87 S 1.23 C 0.92
486 III-1.85-01 1.84 533 980 1067 1804 508 406 0.72 2.31 12 476 19 34.5 0.1 12.7 434 0.14 S 0.48 1214.4 C 0.64 C 0.99 C 0.79
487 III-1.85-03b 1.84 533 980 1067 1804 508 406 0.72 2.31 12 476 19 22.8 0.31 12.7 427 0.29 S 1.02 2095.1 C 1.17 S 1.46 C 1.51
488 III-1.85-02b 1.84 533 980 1067 1804 508 406 0.72 2.31 12 476 19 22.8 0.2 12.7 427 0.19 S 1.01 2081.8 C 1.25 S 1.80 C 1.88
489 III-1.2-02 1.20 533 980 1067 1177 508 406 0.82 2.31 12 455 19 28.3 0.2 12.7 414 0.19 S 1.05 3763.2 C 1.35 C 1.82 C 1.98
490 III-1.2-03 1.20 533 980 1067 1177 508 406 0.82 2.31 12 455 19 29.1 0.31 15.9 469 0.29 S 1.02 3687.6 C 1.27 C 1.68 C 1.52
491 III-2.5-02 2.49 533 980 1067 2441 508 406 0.62 2.31 12 455 19 31.9 0.2 12.7 427 0.19 S 0.74 1325.6 S 1.13 S 1.13 S 1.34
492 III-2.5-03 2.49 533 980 1067 2441 508 406 0.62 2.31 12 455 19 34.7 0.31 15.9 448 0.29 S 1.27 2295.3 S S S
493 IV-2175-1.85-02 1.85 533 1750 1905 3238 737 406 0.50 2.37 22 469 19 34.0 0.21 12.7 455 0.19 S 0.75 3394.0 C 1.23 S 1.45 C 1.47
494 IV-2175-1.85-03 1.85 533 1750 1905 3238 737 406 0.50 2.37 22 469 19 34.0 0.31 15.9 455 0.29 S 0.83 3745.4 C 1.21 S 1.33 C 1.29
495 IV-2175-2.5-02 2.50 533 1750 1905 4375 610 406 0.33 2.37 22 469 19 34.5 0.21 15.9 441 0.21 S 0.67 2268.6 S 1.04 S 1.04 C 1.17
496 IV-2175-1.2-02 1.20 533 1750 1905 2100 610 406 0.68 2.37 22 469 19 34.5 0.21 15.9 441 0.21 S 0.78 5440.2 C 1.41 C 1.51 C 1.76
497 IV-2123-1.85-03 1.85 533 495 584 916 419 406 0.86 2.32 12 455 19 28.7 0.3 12.7 455 0.3 S 1.24 1463.5 F C S
498 IV-2123-1.85-02 1.85 533 495 584 916 419 406 0.86 2.32 12 455 19 29.1 0.2 9.5 558 0.17 S 1.30 1543.5 F C C
499 IV-2123-2.5-02 2.50 533 495 584 1238 394 406 0.81 2.32 12 448 19 31.5 0.2 9.5 400 0.17 S 0.81 716.2 C 0.81 S 1.23 S 1.45
500 IV-2123-1.2-02 1.20 533 495 584 594 457 406 0.91 2.32 12 448 19 31.9 0.2 9.5 400 0.17 F 1.42 2633.3 F C F
501 M-03-4-CCC2436 1.85 914 1016 1219 1880 610 406 0.71 2.93 27 462 19 28.3 0.31 15.9 421 0.27 S 1.11 5017.6 C C C
502 M-03-4-CCC0812 1.85 914 1016 1219 1880 203 406 0.71 2.93 27 448 19 20.7 0.31 15.9 434 0.27 S 1.18 4136.8 S S C
503 M-09-4-CCC2436 1.85 914 1016 1219 1880 610 406 0.71 2.93 27 462 19 28.3 0.86 15.9 421 0.27 F 1.39 6294.2 F F F
504 M-02-4-CCC2436 1.85 914 1016 1219 1880 610 406 0.71 2.93 27 448 19 19.3 0.22 12.7 434 0.22 S 1.48 4901.9 C S C
505 M-03-2-CCC2436 1.85 914 1016 1219 1880 610 406 0.71 2.93 27 469 19 33.8 0.31 22.2 427 0.27 F 0.95 4875.3 C C C
506 24 2010 BML-0-0 0.50 100 400 450 200 100 100 0.8 1.13 4 400 10 45.2 0 0 S 1.09 371.2 C 1.22 F 0.94 C 1.34
507 BML-85-85 0.50 100 400 450 200 100 100 0.8 1.13 4 400 10 40.8 0.2 3.3 260 0.20 S 1.06 359.2 C 1.26 F 0.98 C 1.44
508 BML-68-83 0.50 100 400 450 200 100 100 0.8 1.13 4 400 10 43.2 0.25 3.3 260 0.21 S 1.09 371.2 C 1.26 F 0.97 C 1.12
509 BML-57-57 0.50 100 400 450 200 100 100 0.8 1.13 4 400 10 37.7 0.3 3.3 260 0.30 S 1.04 348.8 C 1.29 F 1.01 C 1.20
510 BML-57-0 0.50 100 400 450 200 100 100 0.8 1.13 4 400 10 40.5 0.3 3.3 260 0 S 0.98 331.2 C 1.17 F 0.90 C 1.34
511 BML-0-57 0.50 100 400 450 200 100 100 0.8 1.13 4 400 10 39.3 0 0.30 S 1.03 348.8 C 1.25 F 0.98 C 1.45
512 BML-0-36 0.50 100 400 450 200 100 100 0.8 1.13 4 400 10 38.9 0 0.48 S 1.07 360.0 C 1.30 F 1.02 C 1.51
513 BML-26-0 0.50 100 400 450 200 100 100 0.8 1.13 4 400 10 43.2 0.66 3.3 260 0 S 0.89 303.2 C 1.03 F 0.79 C 0.91
514 BML-0-50 0.50 100 400 450 200 100 100 0.8 1.13 4 400 10 44.8 0 0.34 S 1.06 360.0 C 1.19 F 0.91 C 1.31
515 BML-53-100 0.50 100 400 450 200 100 100 0.8 1.13 4 400 10 44.9 0.32 3.3 260 0.17 S 1.04 354.4 C 1.17 F 0.90 F 1.03
516 BMМ-125-125 0.50 100 400 450 200 100 100 0.8 1.13 4 400 10 36.3 0.2 4.0 440 0.20 S 1.09 365.6 C 1.38 F 1.09 C 1.64
517 25 2010 D6.A4.G60#5S 1.37 406 1778 1829 2438 203* 610 1 0.56** 4 490 25 26.7 0.444 16.0 429 0 S 0.74† 2253.0 C 0.94 S 1.33 C 1.12
518 D6.A4.G40#4S 1.37 406 1778 1829 2438 203 610 1 0.56 4 470 25 26.2 0.286 13.0 348 0 S 0.61 1809.0 C 1.04 C 1.34 C 1.20

Conversion Factors: 25.4 mm = 1 in.; 1 MPa = 145 psi; 1 kN = 225 lbs.
54
# Ref. Year Beam a/d b d h a: M/V lb1 lb2 V/P ρl # fy ag fc' ρv dbv fyv ρh Rep. Mmax Vu 2PKT 2PKT AASHTO AASHTO ACI ACI
# Name (mm) (mm) (mm) (mm) (mm) (mm) (%) bars (MPa) (mm) (MPa) (%) (mm) (MPa) (%) mode Mn (kN) mode Exp/Pred mode Exp/Pred mode Exp/Pred
519 D6.A2.G60#5S 1.37 406 1778 1829 2438 203 610 1 0.28 2 470 25 27.5 0.444 16.0 429 0 F 0.59 1754.0 C C C
520 D6.A2.G40#4S 1.37 406 1778 1829 2438 203 610 1 0.28 2 478 25 24.4 0.286 13.0 346 0 S 0.44 1307.0 C 0.84 C 1.18 C 0.92
521 D4.A2.G40#4S 2.09 406 1168 1219 2438 203 610 1 0.42 2 469 25 25.2 0.286 13.0 349 0 S 0.63 922.0 C 0.99 S 1.34 C 0.99
522 26 2010 S0M 1.55 400 1095 1200 1700 300 150 0.5 0.70 6 652 20 34.2 0 0 S 0.61 721.0 C 0.88 C 1.01 C 0.75
523 S0C 1.55 400 1095 1200 1700 300 150 0.5 0.70 6 652 20 34.2 0 0 S 0.98 1162.0 C 1.42 C 1.62 C 1.21
524 L0M 2.28 400 1095 1200 2500 300 150 0.5 0.70 6 652 20 29.1 0 0 S 0.52 416.0 C 1.02 C 1.35 S 1.05
525 L0C 2.28 400 1095 1200 2500 300 150 0.5 0.70 6 652 20 29.1 0 0 S 0.62 492.0 C 1.21 C 1.59 S 1.24
526 S1M 1.55 400 1095 1200 1700 300 150 0.5 0.70 6 652 20 33.0 0.10 9.5 490 0 S 0.80 941.0 C 0.97 C 1.17 C 0.96
527 S1C 1.55 400 1095 1200 1700 300 150 0.5 0.70 6 652 20 33.0 0.10 9.5 490 0 S 0.80 943.0 C 0.97 C 1.17 C 0.96
528 L1M 2.28 400 1095 1200 2500 300 150 0.5 0.70 6 652 20 37.8 0.10 9.5 490 0 S 0.82 663.0 C 1.04 S 1.09 F 0.78
529 L1C 2.28 400 1095 1200 2500 300 150 0.5 0.70 6 652 20 37.8 0.10 9.5 490 0 S 0.79 642.0 C 1.01 S 1.06 F 0.75
# of beams 434 434 434
Avg= 1.10 1.25 1.30
COV= 13.7% 24.6% 29.0%
For the specimens by Senturk and Higgins25 which had indirect loading and bar cut-offs: *- Taken as the distance between the end bars of hanger reinforcement within the width of the transverse members loading the test specimen **- Based on the bars anchored in the support zone †- Considering the bottom longitudinal bars in the section with maximum bending moment
55References
1. Clark, A.P., “Diagonal tension in reinforced concrete beams,” ACI Journal Proceedings, V. 48, No. 10, Oct. 1951, pp. 145-156.
2. Moody, K.G., Viest, I.M., Elstner, R.C., and Hognestad, E., “Shear Strength of Reinforced Concrete Beams Part 1 -Tests of Simple Beams,” ACI Journal Proceedings, V. 51, No. 12, Dec. 1954, pp. 317-332.
3. Morrow, J., and Viest, I.M., “Shear Strength of Reinforced Concrete Frame Members Without Web Reinforcement,” ACI Journal Proceedings, V. 53, No. 3, March 1957, pp. 833-869.
4. Leonhardt, F., and Walther, R., “The Stuttgart Shear Tests 1961,” A translation of the articles that appeared in Beton und Stahlbetonbau, V.56, No. 12, 1961 and V.57, No. 2,3,6,7 and 8, 1962, Cement and Concrete Association Library Translation No. 111, Wexham Springs, United Kingdom, Dec. 1964, 134 pp.
5. Mathey, R.G., Watstein, D., “Shear Strength of Beams without Web Reinforcement Containing Deformed Bars of Different Yield Strengths,” ACI Journal Proceedings, V. 60, No. 2, Feb. 1963, pp. 183-208.
6. Kani, M.W., Huggins, M.W. and Wittkopp, R.R. “Kani on Shear in Reinforced Concrete,” University of Toronto Press, Toronto, Canada, 1979, 225pp.
7. Lee, D., “An experimental investigation in the effects of detailing on the shear behaviour of deep beams,” Master Thesis, Department of Civil Engineering, University of Toronto, 1982, 138 pp.
8. Smith, K.N., and Vantsiotis, A.S., “Shear Strength of Deep Beams, “ACI Journal Proceedings, V. 79, No. 3, May 1982, pp. 201-213.
9. Rogowsky, D.M., and MacGregor, J.G., “Tests of Reinforced Concrete Deep Beams,” ACI Journal Proceedings, V. 83, No. 4, July 1986, pp. 614-623.
10. Ghannoum, W.M., “Size effect on shear strength of reinforced concrete beams,” Masters Thesis, Department of Civil Engineering and Applied Mechanics, McGill University, 1988, 126 pp.
11. Walraven, J., Lehwalter, N., “Size Effects in Short Beams Loaded in Shear,” ACI Structural Journal, V. 91, No. 5, Sept. 1994, pp. 585-593.
12. Kong, P.Y.L., Rangan, B.V., “Shear strength of high-performance concrete beams,” ACI Structural Journal, V. 95, No. 6, Nov. 1998, pp. 677-688.
13. Podgórniak-Stanik, B. “The influence of concrete strength, distribution of longitudinal reinforcement, amount of transverse reinforcement and member size on shear strength of reinforced concrete members”, Masters Thesis, Department of Civil Engineering, University of Toronto, 1998, 711 pp.
14. Yoshida, Y., “Shear reinforcement for large lightly reinforced concrete members,” Masters Thesis, Department of Civil Engineering, University of Toronto, 2000, 160 pp.
15. Adebar, P., “One way shear strength of large footings,” Canadian Journal of Civil Engineering, V. 27, No. 3, June 2000, pp. 553-562.
16. Yang, K.-H., Chung, H.-S., Lee, E.-T., Eun, H.-C., “Shear characteristics of high-strength concrete deep beams without shear reinforcements,” Engineering Structures, V. 25, No. 10, Aug. 2003, pp. 1343-1352.
17. Tanimura, Y., Sato, T., “Evaluation of shear strength of deep beams with stirrups,” Quarterly Report of RTRI, V. 46, No. 1, Feb. 2005, pp. 53-58.
18. Salamy M. R., Kobayashi H. and Unjoh S.: Experimental and analytical study on RC deep beams, Asian Journal of Civil Engineering (AJCE), V.6, No.5, November 2005, pp.409-422.
19. Zhang, N., Tan, K.-H., “Size effect in RC deep beams: Experimental investigation and STM verification,” Engineering Structures, V. 29, No. 12, Dec. 2007, pp. 3241-3254.
20. Sherwood, E.G., Bentz, E.C., and Collins, M.P., “Effect of Aggregate Size on Beam- Shear Strength of Thick Slabs,” ACI Structural Journal, V. 104, No. 2, Mar. 2007, pp. 180-190.
21. Garay, J.D., Lubell, A.S., “Behavior of concrete deep beams with high strength reinforcement,” 2008 Structures Congress - Crossing Borders, Vancouver, Canada, April 2008, 10 pp.

5622. Zhang, N., Tan, K.-H., Leong, C.-L., “Single-span deep beams subjected to unsymmetrical loads,” ASCE
Journal of Structural Engineering, V. 135, No. 3, March 2009, pp. 239-252.
23. Birrcher, D., Tuchscherer, R., Huizinga, M., Bayrak, O., Wood, S., Jirsa, J., “Strength and serviceability design of reinforced concrete deep beams,” Report No. FHWA/TX-09/0-5253-1, Center for Transportation Research, The University of Texas at Austin, 2009.
24. Sahoo, D.K., Sagi, M.S.V., Singh, B., Bhargava, B., “Effect of detailing of web reinforcement on the behavior of bottle-shaped struts,” Journal of Advanced Concrete Technology, V. 8, No. 3, Oct. 2010, pp. 303-314.
25. Senturk, A.E., Higgins, C., “Evaluation of Reinforced Concrete Deck Girder Bridge Bent Caps with 1950s Vintage Details: Laboratory Tests,” ACI Structural Journal, V. 107, No. 5, Sep. 2010, pp. 534-543.
26. Mihaylov, B.I., Bentz, E.C., Collins, M.P., “Behavior of Large Deep Beam Subjected to Monotonic and Reversed Cyclic Shear,” ACI Structural Journal, V. 107, No. 6, Nov. 2010, pp. 726-734.

ACI Structural Journal/May-June 2013 457
Title no. 110-S36
ACI STRUCTURAL JOURNAL TECHNICAL PAPER
ACI Structural Journal, V. 110, No. 3, May-June 2013.MS No. S-2011-189.R1 received February 17, 2012, and reviewed under Institute
publication policies. Copyright © 2013, American Concrete Institute. All rights reserved, including the making of copies unless permission is obtained from the copyright proprietors. Pertinent discussion including author’s closure, if any, will be published in the March-April 2014 ACI Structural Journal if the discussion is received by November 1, 2013.
Design Formulas for Cracking Torque and Twist in Hollow Reinforced Concrete Membersby Chyuan-Hwan Jeng, Hao-Jan Chiu, and Sheng-Fu Peng
Hollow concrete members are in wide use and are becoming increasingly important in terms of energy savings and carbon reduction. To date, the prediction of cracking torque in hollow reinforced concrete (RC) members still relies on simplistic empir-ical formulas, and the accuracy of the existing formulas is rarely examined. In this study, four existing formulas are used to calcu-late the cracking torques Tcr and twists qcr of 44 hollow RC beam specimens currently available in the literature. An existing empir-ical formula for Tcr is modified to fit the test values. Based on the latest rational formula for solid members, a new formula for the Tcr and qcr of hollow RC members is developed to form a unified formula for solid and hollow sections. The predicting accuracies of these formulas are compared and evaluated. It is shown that the proposed formulas produce significantly more accurate and reli-able predictions than the existing formulas.
Keywords: cracking angle of twist; cracking torque; design formula; hollow; reinforced concrete; softened membrane model; torsion.
INTRODUCTIONHollow concrete members are common types of struc-
tural members and are used as bridge columns, box girders, and concrete piles. Due to characteristics such as low self-weight, high efficiency in flexural and torsional resistance, and energy savings and carbon reduction, hollow sections have become a prevalent form of concrete members.
As pointed out in Reference 1, the significance of cracking torque can be expressed in terms of at least four associated concepts: 1) cracking torque is the torsional elastic limit of a reinforced concrete (RC) section; 2) threshold torsion (the maximum torque when torsion effects can be neglected) is taken to be one-fourth (lower for hollow sections) of cracking torque2; 3) cracking torque is regulated as the maximum design torque for compatibility torsion2; and 4) cracking torque has been the major parameter used for setting the design minimum torsion reinforcement.3-5 Hence, even though a hollow concrete member such as a bridge column, box girder, or concrete pile seldom undergoes pure torsion without bending or shear, its cracking torque is still a vital design parameter. At any rate, for the torsion effect to be neglected, the applied torque must be less than the threshold torsion. Furthermore, the ratio of cracking torque to cracking twist can be used as the initial torsional stiff-ness of a member in, for example, a three-dimensional (3-D) finite element analysis for the structure.
For many decades, the cracking torque of RC members could only be predicted by using simplistic empirical formulas because of the lack of a rational torsion model capable of predicting cracking torque. Recently, a rational torsion model called the Softened Membrane Model for Torsion (SMMT) has been developed,6-10 which can predict the entire torque-twist curve, including the cracking point. On the basis of rational reasoning and simplification, a
noniterative formula has also been derived from the SMMT to facilitate direct calculation of the cracking torque Tcr and the cracking angle of twist qcr.1,10 This formula is simple enough to be used for design purposes and is also capable of producing more rational and accurate predictions than other empirical formulas.1,10 However, the SMMT and the simple rational formula for Tcr and qcr are currently limited to solid-sectioned RC members. To date, the prediction of cracking torque in hollow RC members still relies on a couple of simplistic empirical formulas. Furthermore, the accuracy of these existing empirical formulas for hollow sections is rarely examined because tested hollow specimens are rela-tively scarce in the literature.
This paper presents an investigation of design formulas for cracking torque Tcr and twist qcr in hollow RC members. Four existing formulas are used to calculate the cracking torques and twists of the hollow RC beam specimens currently available in the literature. An existing formula for Tcr is modified to fit the test values. Based on the rational formula for solid members and the collected experimental data on hollow specimens, a new formula for Tcr and qcr is developed to form a unified formula for solid and hollow sections. The predicting accuracies of these formulas are compared and evaluated. It is shown that the proposed new formulas predict the cracking torque and twist of the speci-mens very well and exhibit significantly better correlation with tests than the existing formulas.
SMMT model for torsion in solid RC membersAs illustrated in Fig. 1(a), the current SMMT1,8-10 models
a solid RC torsional member using the well-known thin tube concept, and uses the latest shear theory, the Softened Membrane Model (SMM),6 to deal with Shear Element A in the tube wall. The effective wall thickness td of the space tube (Fig. 1(a)), commonly known as the shear flow zone thick-ness, is explicitly derived from three compatibility equations in the SMMT.10 The SMMT also successfully incorporates the effect of concrete tensile stress and, for the first time, is able to delineate the entire torque-twist response, including both the pre- and post-cracking stages. The entire SMMT-computed response curves in Fig. 1(b) show that the calcu-lated td for a solid RC beam drops from approximately (0.39)b before cracking to (0.16)b after cracking.
The small values of the postcracking td, as shown in Fig. 1(b), can explain why hollow members exhibit almost
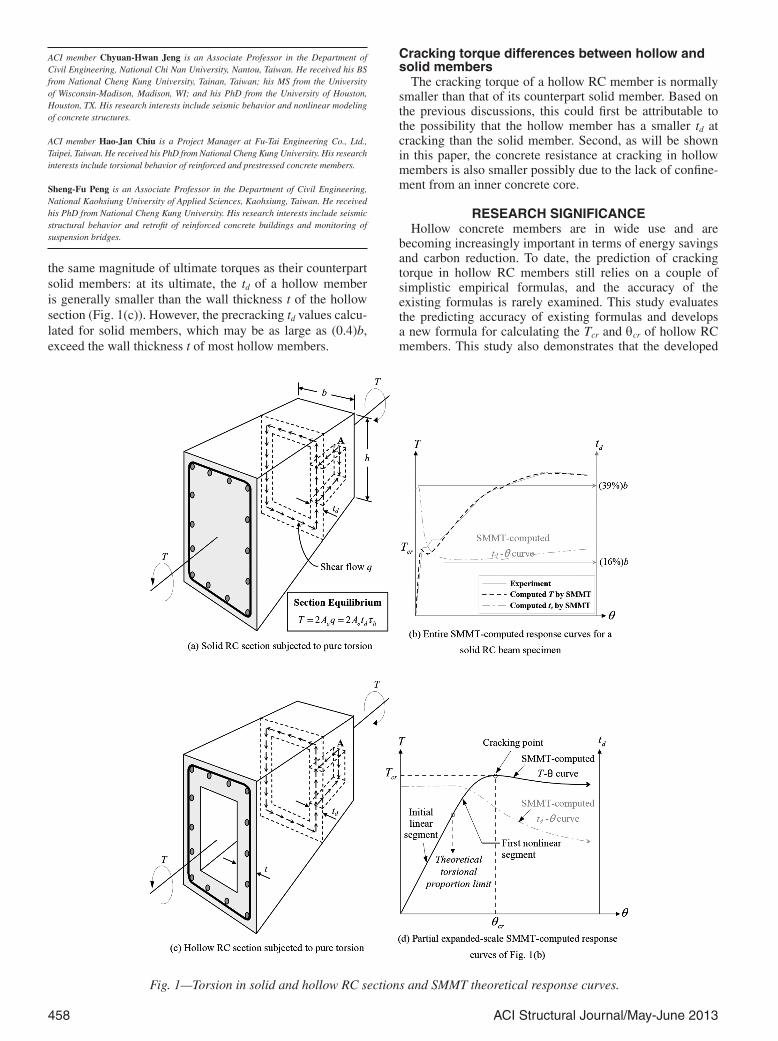
458 ACI Structural Journal/May-June 2013
ACI member Chyuan-Hwan Jeng is an Associate Professor in the Department of Civil Engineering, National Chi Nan University, Nantou, Taiwan. He received his BS from National Cheng Kung University, Tainan, Taiwan; his MS from the University of Wisconsin-Madison, Madison, WI; and his PhD from the University of Houston, Houston, TX. His research interests include seismic behavior and nonlinear modeling of concrete structures.
ACI member Hao-Jan Chiu is a Project Manager at Fu-Tai Engineering Co., Ltd., Taipei, Taiwan. He received his PhD from National Cheng Kung University. His research interests include torsional behavior of reinforced and prestressed concrete members.
Sheng-Fu Peng is an Associate Professor in the Department of Civil Engineering, National Kaohsiung University of Applied Sciences, Kaohsiung, Taiwan. He received his PhD from National Cheng Kung University. His research interests include seismic structural behavior and retrofit of reinforced concrete buildings and monitoring of suspension bridges.
the same magnitude of ultimate torques as their counterpart solid members: at its ultimate, the td of a hollow member is generally smaller than the wall thickness t of the hollow section (Fig. 1(c)). However, the precracking td values calcu-lated for solid members, which may be as large as (0.4)b, exceed the wall thickness t of most hollow members.
Cracking torque differences between hollow and solid members
The cracking torque of a hollow RC member is normally smaller than that of its counterpart solid member. Based on the previous discussions, this could first be attributable to the possibility that the hollow member has a smaller td at cracking than the solid member. Second, as will be shown in this paper, the concrete resistance at cracking in hollow members is also smaller possibly due to the lack of confine-ment from an inner concrete core.
RESEARCH SIGNIFICANCEHollow concrete members are in wide use and are
becoming increasingly important in terms of energy savings and carbon reduction. To date, the prediction of cracking torque in hollow RC members still relies on a couple of simplistic empirical formulas, and the accuracy of the existing formulas is rarely examined. This study evaluates the predicting accuracy of existing formulas and develops a new formula for calculating the Tcr and qcr of hollow RC members. This study also demonstrates that the developed
Fig. 1—Torsion in solid and hollow RC sections and SMMT theoretical response curves.
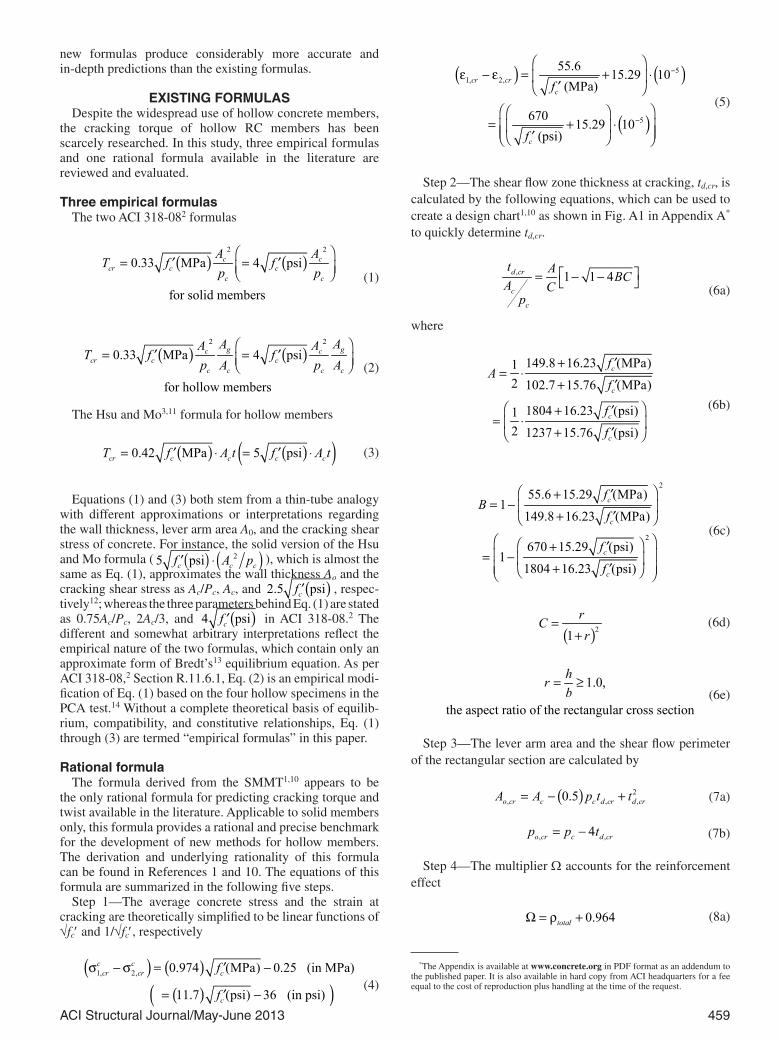
ACI Structural Journal/May-June 2013 459
new formulas produce considerably more accurate and in-depth predictions than the existing formulas.
EXISTING FORMULASDespite the widespread use of hollow concrete members,
the cracking torque of hollow RC members has been scarcely researched. In this study, three empirical formulas and one rational formula available in the literature are reviewed and evaluated.
Three empirical formulasThe two ACI 318-082 formulas
( ) ( )2 2
for solid mem
0.33 MPa 4 p
be
i
r
s
s
c ccr c c
c c
A AT f f
p p
= =′ ′ (1)
( ) ( )2 2
for hollow
0.33 MP
members
a 4 psig gc ccr c c
c c c c
A AA AT f f
p A p A
= =′ ′ (2)
The Hsu and Mo3,11 formula for hollow members
( ) ( )( )0.42 MPa 5 psicr c c c cT f A t f A t= ⋅ = ⋅′ ′ (3)
Equations (1) and (3) both stem from a thin-tube analogy with different approximations or interpretations regarding the wall thickness, lever arm area A0, and the cracking shear stress of concrete. For instance, the solid version of the Hsu and Mo formula ( ( ) ( )25 psic c cf A p⋅′ ), which is almost the same as Eq. (1), approximates the wall thickness Ao and the cracking shear stress as Ac/Pc, Ac, and ( )2.5 psicf ′ , respec-tively12; whereas the three parameters behind Eq. (1) are stated as 0.75Ac/Pc, 2Ac/3, and ( )4 psicf ′ in ACI 318-08.2 The different and somewhat arbitrary interpretations reflect the empirical nature of the two formulas, which contain only an approximate form of Bredt’s13 equilibrium equation. As per ACI 318-08,2 Section R.11.6.1, Eq. (2) is an empirical modi-fication of Eq. (1) based on the four hollow specimens in the PCA test.14 Without a complete theoretical basis of equilib-rium, compatibility, and constitutive relationships, Eq. (1) through (3) are termed “empirical formulas” in this paper.
Rational formulaThe formula derived from the SMMT1,10 appears to be
the only rational formula for predicting cracking torque and twist available in the literature. Applicable to solid members only, this formula provides a rational and precise benchmark for the development of new methods for hollow members. The derivation and underlying rationality of this formula can be found in References 1 and 10. The equations of this formula are summarized in the following five steps.
Step 1—The average concrete stress and the strain at cracking are theoretically simplified to be linear functions of √fc′ and 1/√fc′, respectively
( ) ( )( )( )
1, 2, 0.974 (MPa) 0.25 (in MPa)
11.7 (psi) 36 (in psi)
c ccr cr c
c
f
f
s − s = −′
= −′ (4)
( ) ( )
( )
51, 2,
5
55.6 15.29 10 (MPa)
670 15.29 10 (psi)
cr crc
c
f
f
−
−
e − e = + ⋅
′
= + ⋅ ′
(5)
Step 2—The shear flow zone thickness at cracking, td,cr, is calculated by the following equations, which can be used to create a design chart1,10 as shown in Fig. A1 in Appendix A* to quickly determine td,cr.
, 1 1 4d cr
c
c
t A BCA C
p
= − − (6a)
where
149.8 16.23 (MPa)12 102.7 15.76 (MPa)
1804 16.23 (psi)12 1237 15.76 (psi)
c
c
c
c
fA
f
ff
+ ′= ⋅
+ ′
+ ′= ⋅
+ ′ (6b)
2
2
55.6 15.29 (MPa)1
149.8 16.23 (MPa)
670 15.29 (psi)1
1804 16.23 (psi)
c
c
c
c
fB
f
ff
+ ′= −
+ ′
+ ′ = − + ′
(6c)
( )21rCr
=+
(6d)
,
the aspect ratio of the rectangular cross sectio
.
n
1 0hrb
= ≥ (6e)
Step 3—The lever arm area and the shear flow perimeter of the rectangular section are calculated by
( ) 2, , ,0.5o cr c c d cr d crA A p t t= − + (7a)
, ,4o cr c d crp p t= − (7b)
Step 4—The multiplier W accounts for the reinforcement effect
0.964totalΩ = r + (8a)
*The Appendix is available at www.concrete.org in PDF format as an addendum to the published paper. It is also available in hard copy from ACI headquarters for a fee equal to the cost of reproduction plus handling at the time of the request.

460 ACI Structural Journal/May-June 2013
, , ,
l ttotal l t
o cr d cr d cr
A Ap t st
r = r + r = + (8b)
Step 5—The cracking torque and twist
( ), , 1, 2,c c
cr o cr d cr cr crT A t= s − s ⋅Ω (9a)
( ),1, 2,
,2o cr
cr cr cro cr
pA
q = e − e ⋅Ω (9b)
EXPERIMENTAL SAMPLESRectangular hollow torsion specimens are secondary to,
and considerably outnumbered by, solid specimens in the literature. For instance, only four out of a total of 53 beam specimens reported in Hsu14 were rectangular hollow speci-mens, while in the beam series tested by Leonhardt and Schelling,15 only two out of 42 were hollow. The series of 16 square hollow specimens recently tested by Bernardo and Lopes16 and Lopes and Bernardo17 are a rare excep-tion, which involved a fairly large number of specimens and focused only on hollow sections.
In this study, a total of 48 available rectangular hollow RC specimens under pure torsion were collected from the literature.14-24 Of these specimens, three with unsymmetrical reinforcement18,19 and one that was deliberately insuffi-ciently reinforced to fail at a condition Tn ≈ Tcr
16,17 were excluded. The remaining 44 specimens were all selected for the evaluation of existing formulas and the development of new formulas. In contrast, the number of solid specimens used to validate the rational formula (Eq. (4) through (9)) is as high as 93.1,10
Defining cracking point for torsionAlmost seen as a self-evident quantity, cracking torque
has been put into practice without explicit definition.
However, the experimental determination of the cracking point is found to be varied. In the well-known PCA tests, for example, the cracking torque Tcr was considered to be reached when cracking was first seen on the concrete surface and the stresses in the reinforcement increased suddenly.14
In light of the latest SMMT theory, the theoretical cracking point can be uniquely located at the first local maximum torque after the initial linear segment of the torque-twist curve,1,10 as illustrated in Fig. 1(d). In this study, to fit the theoretical perspective, an experimental cracking point is taken as the point at which the recorded torque-twist curve approximately turns from the first nonlinear segment into the second, softer linear segment. Thus, the cracking point is determined entirely by its location on the recorded torque-twist curve, regardless of visual observation during the test.
Because the available hollow specimens are not abundant in number, to make best use of the experimental data, the reported experimental cracking data were examined and modifications were made according to the preceding defi-nitions where experimental torque-twist curve data with sufficient resolution are available. Figure 2 demonstrates the modification of the experimental cracking points for some of the specimens.
Evaluation of existing formulasEmpirical formulas—The two ACI formulas (Eq. (1) and
(2)) and the Hsu and Mo3,11 formula (Eq. (3)) are used to calculate the cracking torques of the 44 hollow specimens. The average ratios of the test data to the values calculated using Eq. (1) through (3) are 0.9517, 1.3566, and 0.9461, respectively. The standard deviations for these ratios are 25.21%, 22.26%, and 11.79%, respectively.
As is well known, the ACI formula for solid members (Eq. (1)) is unconservative for hollow members. Never-theless, the average of 0.9517 reveals that it is, in fact, not as unconservative as has been commonly expected. This is because this formula considerably underestimates the cracking torque for solid members (the average of the test-
Fig. 2—Modification of experimental cracking points.

ACI Structural Journal/May-June 2013 461
to-calculated ratios for the 93 solid specimens is 1.5249, with a standard deviation of 19.63%1,10) and its inaccuracy for solid members accidentally makes it less inaccurate for hollow members. To make matters worse, the 0.9517 average implies an unconservative use of this formula (Eq. (1)) in ACI 318-08,2 Section 11.5.2.2, for the design torque Tu of hollow sections under compatibility torsion2,25: the design torques Tu = fTcr = (0.75)Tcr of the specimens designated using Eq. (1) are, on average, 21.2% less than the test values.
On the other hand, the ACI formula for hollow members (Eq. (2)), which has an average of 1.3566, underestimates the cracking torques of the 44 hollow specimens and, thus, is generally conservative.
With an average of 0.9461, the Hsu and Mo3,11 formula for hollow members (Eq. (3)) appears to be as unconservative as the ACI solid formula (Eq. (1)). However, as a matter of fact, this formula gives significantly more reliable predic-tions than the ACI solid and hollow formulas, as its standard deviation of 11.79% is only around half of those of the two ACI formulas.
The rational formula—The rational formula for solid members (Eq. (4) through (9)) is also used to calculate the cracking torques of the 44 specimens. As this formula has proved to be the most accurate for solid members (the average test-to-calculated ratio for the 93 solid specimens is 0.9777 and the standard deviation is 11.76%1,10), the average test-to-calcu-lated ratio for the 44 hollow specimens is unsurprisingly as small as 0.6099, with a standard deviation of 15.21%.
Figure 3 plots the test-to-calculated ratio against normal-ized wall thickness t/td,cr,Solid for the 44 hollow specimens, where t is the wall thickness of a hollow section, and td,cr,Solid is the shear flow zone thickness at cracking of the corre-sponding solid section calculated using Eq. (6). The regres-sion line drawn from the 44 data points is also shown in Fig. 3, with the correlation coefficient being 0.790. The rela-tive wall thickness t/td,cr,Solid appears to be a good linear indi-cator of the test-to-calculated ratio, Tcr,Hollow,test/Tcr,Solid,calc.
DEVELOPMENT OF NEW FORMULASFormula A—modified Hsu and Mo3,11 formula
Because the Hsu and Mo3,11 formula (Eq. (3)) gives rather reliable Tcr predictions for the 44 specimens, it is modi-fied to generate a new formula: Formula A. The Hsu and Mo3,11 formula is scaled down by the 0.9461 average test-to-calculated ratio of the 44 hollow specimens
( ) ( )( )0.40 MPa 4.7 psicr c c c cT f A t f A t= ⋅ = ⋅′ ′ (10)
Using this formula, the average test-to-calculated ratio for the 44 hollow specimens is 0.9934, with a standard deviation of 12.38%.
Formula BAs previously mentioned, there are two differences
between the torsion-resisting mechanisms of hollow and solid members at cracking: 1) most hollow members have smaller td at cracking than their counterpart solid members; and 2) the concrete resistance at cracking in hollow members may be smaller than that in solid members. As Formula B will be developed by modifying the existing rational formula for solid members (Eq. (4) through (9)), two assumptions are used to deal with these two differences.
Two assumptions—The two assumptions for deriving the new Formula B are: 1) for a hollow section with a wall thick-
ness of t ≤ (0.9)td,cr,Solid, the shear-flow zone thickness at cracking is equal to the wall thickness—that is, td,cr = t; and 2) the concrete stress at cracking (sc
1,cr – sc2,cr) for a hollow
section is a linear function of √fc′.The first assumption is based on three observations found
from Fig. 3. First, the cracking torques of the four hollow specimens with t/td,cr,Solid ratios greater than 1.3 are practi-cally the same as those calculated for their counterpart solid sections; their Tcr,Hollow,test/Tcr,Solid,calc ratios are very close to unity. Second, for t/td,cr,Solid ratios ranging between around 0.9 and 1.3, the two available specimens are currently inade-quate for providing decisive information. Third, for t/td,cr,Solid ratios ranging between 0.55 and 0.9, the remaining 38 speci-mens have considerably lower cracking torques than those calculated for their counterpart solid members. Hence, it is assumed that, for a hollow section with wall thickness t ≤ (0.9)td,cr,Solid, the shear flow zone occupies the entire wall thickness and, thus, td,cr = t. Also, the 38 specimens with t/td,cr,Solid ratios ranging between 0.55 and 0.9 are used to develop Formula B.
The second assumption simply follows a theoretical infer-ence in the rational formula for solid members (Eq. (4) through (9)). In the derivation of this rational formula from the SMMT, it was found that the average uniaxial compres-sive strain at cracking, e2,cr, can be closely approximated by a linear function of 1/√fc′.1,10 By applying this linear approximation and two other minor simplifications, the average concrete stress at cracking (sc
1,cr – sc2,cr) for solid
members was theoretically derived as a linear function of √fc′, as shown in Eq. (4).1,10 Now, it is assumed that a linear relationship of (sc
1,cr – sc2,cr) in terms of √fc′ also exists for
hollow members. Based on these two assumptions, Formula B is determined as follows.
Average concrete stress at cracking for hollow sections—According to the SMMT equilibrium equations,1,10 for the entire torque-twist history
( )1 22 c co d lt o dT A t A t= t = s − s (11)
and, therefore, the average concrete stress at cracking
( )1, 2,, ,
c c crcr cr
o cr d cr
TA t
s − s = (12)
Fig. 3—Cracking torque predictions for 44 hollow speci-mens using rational formula for solid members (Eq. (4) through (9)).

462 ACI Structural Journal/May-June 2013
For the 38 hollow specimens with t ≤ (0.9)td,cr,Solid, the first assumption gives that td,cr = t. Thus, we have the following equation for the 38 specimens
( )1, 2,,
c c crcr cr
o cr
TA t
s − s = (13a)
where
( ) ( )2 2, , ,0.5 0.5o cr c c d cr d cr c cA A p t t A p t t= − + = − + (13b)
The experimental cracking torques are then used in either Eq. (12) or (13) to calculate the average concrete stress at cracking for the 44 hollow specimens. The calculated results versus √fc′ are plotted in Fig. 4. The theoretical linear rela-tionship for solid sections (Eq. (4)) and the data points for the 93 solid specimens1,10 are also shown in Fig. 4 for comparison.
As can be seen from Fig. 4, there is indeed a strong linear correlation between √fc′ and the average concrete stress at cracking (sc
1,cr – sc2,cr) calculated using Eq. (13) for
the 38 hollow specimens. The linear regression drawn from the 38 data points in Fig. 4 is y = (0.429)x + (1.1114) and the correlation coefficient is as high as 0.850. Hence, a linear relationship for (sc
1,cr – sc2,cr) in terms of √fc′ for hollow
sections with wall thickness t ≤(0.9)td,cr,Solid is proposed as
( ) ( ) ( )( ) ( )( )
1, 2, 0.43 MPa 1.1 (in MPa)
5.2 psi 160 (in psi)
c ccr cr c
c
f
f
s − s = +′
= +′ (14)
The average concrete stress (sc1,cr – sc
2,cr) for the six hollow specimens with t/td,cr,Solid > 1.0 is calculated using Eq. (12), in which the td,cr is the td,cr,Solid calculated using Eq. (6). These six data points are labeled with hollow stars in Fig. 4, denoted as thicker-walled hollow specimens. Of the six thicker-walled specimens, the calculated (sc
1,cr – sc2,cr) of the four speci-
mens with t/td,cr,Solid > 1.3 are very close to those of their coun-terpart solid sections; these four data points in Fig. 4 gather beside the theoretical line for solid sections. Based on the
distribution of these four points in both Fig. 3 and 4, it is assumed that the average concrete stress at cracking for a hollow section with t/td,cr,Solid ≥ 1.3 is equal to that calculated by Eq. (4) for its counterpart solid section.
As for the two thicker-walled specimens with t/td,cr,Solid ≈ 1.0, one of the two data points in Fig. 4 occurs midway between the theoretical line for solid sections and the regres-sion line for hollow sections, and the other point occurs near the regression line. Again, with only two available data points, the data are currently inadequate to establish any conclusive rules.
Equations for cracking torque—Now, the cracking torque of a hollow section with wall thickness t ≤ (0.9)td,cr,Solid or t ≥ (1.3)td,cr,Solid can be calculated as follows. First, the shear flow zone thickness at cracking of a representative solid section, td,cr,Solid, is calculated using Eq. (6). If the wall thick-ness t ≤ (0.9)td,cr,Solid, then td,cr = t and (sc
1,cr – sc2,cr) and
Ao,cr are respectively calculated using Eq. (14) and Eq. (13b). Otherwise, if t ≥ (1.3)td,cr,Solid, then td,cr = td,cr,Solid and (sc
1,cr – sc
2,cr) can be calculated using Eq. (4) in the rational formula for solid sections. Finally, one can calculate the cracking torque using the SMMT equilibrium equation
( ), , 1, 2,c c
cr o cr d cr cr crT A t= s − s (15)
Cracking angle of twist—It is considerably more diffi-cult to measure the cracking angle of twist in a test than the cracking torque. The cracking angles of twist of seven of the 44 hollow specimens are not available in the source references. Equation (9b) in the rational formula for solid members is used to calculate the cracking angles of twist for the remaining 37 hollow specimens. The calculated results versus the relative wall thickness, t/td,cr,Solid, are plotted in Fig. 5. Unlike those in Fig. 3, the data points in Fig. 5 are widely scattered.
Again, according to the SMMT compatibility equa-tions,1,10 for the entire torque-twist history
( )1 22o
o
pA
q = e − e (16)
and, therefore, the average strain at cracking
( ) ( )1, 2,, ,/ 2
crcr cr
o cr o crp Aq
e − e = (17)
For a hollow section with t ≤ (0.9)td,cr,Solid, td,cr = t
, ,4 4o cr c d cr cp p t p t= − = − (18)
Similar to the average concrete stress at cracking, the average strain at cracking for the 37 hollow specimens is calculated using Eq. (17) and the results are plotted in Fig. 6.
Figures 5 and 6 both show that the experimental cracking-twist values are prone to significant and varied deviation—systematical and/or accidental. However, as can be seen in Fig. 6, the calculated values for the 15 specimens from Bernardo and Lopes16 and Lopes and Bernardo17 exhibit a significantly high degree of consistency. Because the experi-ment conducted by Bernardo and Lopes also has the largest number of hollow specimens with the greatest cross-sectional
Fig. 4—Linear relation between average concrete stress at cracking and √fc′.

ACI Structural Journal/May-June 2013 463
size (600 x 600 mm [23.6 x 23.6 in.]), the cracking twists of these 15 specimens are adopted to generate an equation for the average strain at cracking. As shown in Fig. 6, the linear regression drawn from these 15 data points is y = (98.073)x + (11.874). Hence, a linear relationship based on the 15 data points is recommended, at least, as a good reference at present for a hollow section with t ≤ (0.9)td,cr,Solid
( )( )
( )
( )( )
51, 2,
5
98 12 10MPa
1180 12 10psi
cr cr
c
c
f
f
−
−
e − e = + ⋅
′
= + ⋅
′
(19)
The cracking angle of twist can then be calculated using the SMMT compatibility equation
( ),1, 2,
,2o cr
cr cr cro cr
pA
q = e − e (20)
Figure 5 also shows that, similar to the case of cracking torque, the cracking twists of the four hollow specimens with t/td,cr,Solid ratios greater than 1.3 are practically the same as those calculated for their counterpart solid sections; their qcr,Hollow,test/qcr,Solid,calc ratios are very close to unity. In other words, a thicker-walled hollow section with t/td,cr,Solid ≥ 1.3 can be treated as a solid section in terms of both Tcr and qcr by using the rational formula for solid members (Eq. (4) through (9)).
Unified formula for solid and hollow RC members—By incorporating the proposed Formula B, the rational formula for solid members (Eq. (4) through (9)) can now be modified to form a unified formula for solid and hollow members, as shown in Fig. 7. A numerical example illustrating the simple application of Formula B is given in Appendix B.
COMPARISON AND DISCUSSIONCracking torque
The values and test-to-calculated ratios of the cracking torques of the 38 hollow specimens with t ≤ (0.9)td,cr,Solid calcu-lated using the ACI formula for hollow sections (Eq. (2)), Formula A, and Formula B are depicted and compared in Fig. 8 and 9. The calculated data are listed in Table C1 in Appendix C. As also indicated in Fig. 9, the averages of the test-to-calculated ratios of the cracking torques for the 38 specimens are 1.3352, 0.9947, and 1.0007, respec-tively, using the ACI hollow formula (Eq. (2)), Formula A, and Formula B, with corresponding standard deviations of 22.56%, 13.02%, and 11.87%.
Figures 8 and 9 clearly show that the cracking torques calculated for the 38 specimens using the proposed Formula B are very close to the experimental values, with the computing errors limited to between +20% and –25%. Although slightly inferior to Formula B, Formula A also exhibits fairly good predictive accuracy. In comparison, the predicted values using the ACI hollow formula (Eq. (2)) are rather conservative and widely scattered.
Cracking angle of twistThe cracking angles of twist for seven of the 38 hollow
specimens with t ≤ (0.9)td,cr,Solid are not available in the
source references.21,23 One specimen with exception-ally large qcr,Hollow,test/qcr,Solid,calc ratios of greater than 3.3 (Fig. 5)24 are excluded for comparison. Formula B (Eq. (19) and (20)) is used to calculate the cracking angles of twist for the remaining 30 specimens. The calculated values compared with test values are shown in Fig. C1 in Appendix C. The calcuated data are given in Table C1 in Appendix C.
As Eq. (19) is drawn from the experimental data of the 15 specimens from Bernardo and Lopes16 and Lopes and Bernardo,17 the cracking twist values calculated for the 15 specimens agree with the test data very well, as shown in Fig. C1 in Appendix C. The average test-to-calculated ratio for the 15 specimens is 0.9951 and the standard devia-tion is 16.50% (the errors are limited almost within ±25%). The calculated values for most of the other 15 specimens also agree with the test values reasonably well, considering the difficulties in measuring small deformations. Besides, unlike Formula B, the ACI hollow formula and Formula A are both unable to calculate the cracking angle of twist.
Difference between Formula A, Formula B, and ACI hollow formula
The difference between Formula A and Formula B in predicting cracking torque is not very pronounced. Thus, the simplicity of Formula A may seem more appealing for
Fig. 5—Cracking twist predictions for 37 hollow speci-mens using rational formula for solid members (Eq. (4) through (9)).
Fig. 6—Relation between average strain at cracking and √fc′.

464 ACI Structural Journal/May-June 2013
design purposes than Formula B. However, some aspects deserve more in-depth consideration.
Formula B can discern the extent of the wall thickness of a hollow section from the relative wall thickness t/td,cr,Solid and, at present, can distinguish between thicker (t/td,cr,Solid ≥ 1.3) and thinner (t/td,cr,Solid ≤ 0.9) wall thicknesses. There-fore, Formula B should be more invariable to future larger experimental databases than Formula A. The predecessor of Formula B, the rational formula for solid members (Eq. (4) through (9)), exhibited such a characteristic, in that it is based on the experimental data of 59 specimens and still predicted the 34 other specimens very well.1,10 On the other hand, the coefficient 0.42 in Eq. (3)
( )( )0.42 MPac cf A t′
has to be modified to 0.40 in Formula A
( )( )0.40 MPa , Eq. (10)c cf A t′
to adapt to different experimental databases. In addition, as mentioned previously, Formula B can predict both Tcr and qcr, whereas Formula A can only calculate Tcr and not qcr.
The more in-depth discernment of Formula B relative to Formula A can be traced back to the different origins of
Fig. 7—Unified formula of cracking torque and twist for solid and hollow members.

ACI Structural Journal/May-June 2013 465
the two formulas. Formula B is based on the latest rational formula for solid members (Eq. (4) through (9)) and the two assumptions. In Formula B, only two parameters—the concrete stress and the strain at cracking (Eq. (14) and (19), or Step 3 in Fig. 7)—are quantified from regression of experimental data, while the remaining equations are rational (equilibrium or compatibility equations). On the other hand, Formula A (0.40√fc′, Eq. (10)) and its prede-cessor (0.42√fc′Act, Eq. (3)) are empirical, because the latter was developed at a time when there was no rational theory available that incorporated the precracking portion.
On any account, Formula A gives apparently better Tcr predictions than the ACI hollow formula (Eq. (2)). This should be because variable t in Formula A almost directly reflects the shear flow zone thickness at cracking, td,cr, of a hollow section. The ACI hollow formula lacks such a direct representative variable and therefore cannot compete with Formula A.
CONCLUSIONSBased on the results of this study, the following conclu-
sions are drawn:1. Because the ACI solid formula (Eq. (1)) considerably
underestimates the cracking torque of solid RC members, it is not as unconservative for hollow RC members as has been commonly expected. The cracking torques of 44 hollow specimens calculated using this formula are greater than the test values, on average, by only 5.08%. This implies an unconservative use of this formula (Eq. (1)) in ACI 318-08,2 Section 11.5.2.2, for the design torque Tu of hollow sections under compatibility torsion,2,25 as the design torques Tu = fTcr = (0.75)Tcr of the 44 hollow specimens designated using Eq. (1) are on average 21.2% less than the test values.
2. The ACI hollow formula (Eq. (2)) provides relatively conservative and unreliable Tcr predictions for hollow RC
Fig. 8—Cracking torque predictions for thinner-walled hollow specimens using three formulas.

466 ACI Structural Journal/May-June 2013
members. The average test-to-calculated ratio of cracking torque for the 44 hollow specimens is 1.3566, with a stan-dard deviation of 22.26%.
3. Formula A gives significantly better Tcr predictions than the ACI hollow formula (Eq. (2)). The average test-to-calculated ratio for the 44 hollow specimens is 0.9934, with a standard deviation of 12.38%.
4. The proposed Formula B can discern the extent of the wall thickness of a hollow section from the relative wall thickness t/td,cr,Solid and, at present, can distinguish between thicker (t/td,cr,Solid ≥ 1.3) and thinner (t/td,cr,Solid ≤ 0.9) wall thicknesses. Also, Formula B can predict both Tcr and qcr for hollow RC members, whereas all the other hollow formulas can calculate Tcr but not qcr. The cracking torques calculated for the 38 thinner-walled hollow specimens using Formula B are very close to the test values, with the average test-to-calculated ratio for the 38 specimens being 1.0007, with a standard deviation of 11.87%. The calculated cracking angles of twist also agree with the test values reasonably well.
5. Combining Formula B and the rational formula for solid members1,10 creates a unified formula for calculating Tcr and qcr for solid and hollow RC members (Fig. 7).
ACKNOWLEDGMENTSThis research is funded by the National Science Council of Taiwan,
through Grants NSC100-2221-E-260-022 and NSC101-3113-S-151-002. The authors also gratefully acknowledge the assistance of J.-S. Chen and Y.-T. Chen, formerly graduate students at National Chi Nan University, Nantou, Taiwan.
NOTATIONA = variable as defined by Eq. (6b)Ac = cross-sectional area bounded by outer perimeter
of concreteAg = gross cross-sectional area, Ac minus sectional area of
inner hollow portionAl = total cross-sectional area of longitudinal steel barsAo, Ao,cr = lever arm area, area enclosed by centerline of shear
flow; Ao at cracking stateAt = cross-sectional area of one transverse steel barB = variable as defined by Eq. (6c)b = width of rectangular cross sectionC = variable as defined by Eq. (6d)fc′ = cylinder compressive strength of concreteh = depth of rectangular cross sectionpc = perimeter of outer concrete cross sectionpo, po,cr = perimeter of centerline of shear flow; po at cracking stater = aspect ratio of rectangular cross sections = spacing of transverse hoop barsT, Tcr = torque; cracking torqueTcr,Hollow,test = experimental cracking torque of hollow specimen, as
shown in Fig. 3Tcr,Solid,calc
= cracking torque calculated for hollow specimen using
rational formula for solid members (Eq. (4) through (9)), as shown in Fig. 3
Tn = torsional strength, maximum torque in entire torque-twist response
t = wall thickness of hollow cross sectiontd, td,cr = thickness of shear flow zone; td at cracking statetd,cr,Solid = td,cr of corresponding solid section calculated using
Eq. (6)e1, e2 = smeared biaxial strain in 1- and 2-direction, respectivelye1,cr, e2,cr = e1, e2 at cracking state, respectivelyq, qcr = angle of twist per unit length; cracking angle of twist
per unit lengthqcr,Hollow,test = experimental cracking angle of twist of hollow spec-
imen, as shown in Fig. 5qcr,Solid,calc = cracking angle of twist calculated for hollow specimen
using rational formula for solid members (Eq. (4) through (9)), as shown in Fig. 5
rl, rt = longitudinal and transverse steel ratios, respectively; rl = Al/potd and rt = At/std
rtotal = rl + rt , as defined by Eq. (8b)sc
1, sc2 = average smeared normal stresses of concrete in 1- and
2-direction, respectivelysc
1,cr, sc2,cr = sc
1, sc2 at cracking state, respectively
tlt = applied shear stresses in l-t coordinateW = recorrecting multiplier accounting for reinforcement
steel effect as defined by Eq. (8a) or taken as unity when neglecting this effect
REFERENCES1. Jeng, C.-H., “Simple Rational Formulas for Cracking Torque and
Twist of Reinforced Concrete Members,” ACI Structural Journal, V. 107, No. 2, Mar.-Apr. 2010, pp. 189-198.
2. ACI Committee 318, “Building Code Requirements for Structural Concrete (ACI 318-08) and Commentary,” American Concrete Institute, Farmington Hills, MI, 2008, 473 pp.
3. Hsu, T. T. C., and Mo, Y. L., “Softening of Concrete in Torsional Members—Design Recommendations,” ACI Journal, V. 82, No. 4, July-Aug. 1985, pp. 443-452.
4. Ali, M. A., and White, R. N., “Toward a Rational Approach for Design of Minimum Torsion Reinforcement,” ACI Structural Journal, V. 96, No. 1, Jan.-Feb. 1999, pp. 40-45.
5. Koutchoukali, N., and Belarbi, A., “Torsion of High-Strength Reinforced Concrete Beams and Minimum Reinforcement Requirement,” ACI Structural Journal, V. 98, No. 4, July-Aug. 2001, pp. 462-469.
6. Hsu, T. T. C., and Zhu, R. R. H., “Softened Membrane Model for Reinforced Concrete Elements in Shear,” ACI Structural Journal, V. 99, No. 4, July-Aug. 2002, pp. 460-469.
Fig. 9—Comparison of three formulas in predicting cracking torque of thinner-walled hollow specimens.

ACI Structural Journal/May-June 2013 467
7. Jeng, C.-H., and Chang, C.-M., “Quantifying the Reduction Factor for Hsu/Zhu Ratio for RC Members under Torsion,” Structural Engineers World Congress, Bangalore, India, Nov. 2-7, 2007. (CD-ROM)
8. Jeng, C.-H., and Hsu, T. T. C., “A Softened Membrane Model for Torsion in Reinforced Concrete Members,” Engineering Structures, V. 31, No. 9, Sept. 2009, pp. 1944-1954.
9. Jeng, C.-H.; Peng, X.; and Wong, Y. L., “Strain Gradient Effect in RC Elements Subjected to Torsion,” Magazine of Concrete Research, V. 63, No. 5, May 2011, pp. 343-356.
10. Jeng, C.-H., “Softened Membrane Model for Torsion in Reinforced Concrete Members,” Advances in Engineering Research. Volume 2, V. M. Petrova, ed., Nova Science Publishers, Inc., Hauppauge, NY, Mar. 2012, pp. 251-338.
11. Hsu, T. T. C., and Mo, Y. L., “Softening of Concrete in Torsional Members—Theory and Tests,” ACI Journal, V. 82, No. 3, May-June 1985, pp. 290-303.
12. Hsu, T. T. C., and Mo, Y. L., “Softening of Concrete in Torsional Members,” Research Report No. ST-TH-001-83, Department of Civil Engi-neering, University of Houston, Houston, TX, Mar. 1983, 107 pp.
13. Bredt, R., “Kritische BemerKungen zür Drehungselastizitat,” Zeitschrift des Vereines Deutscher Ingenieure, V. 40, No. 28, July 11, 1896, pp. 785-790, No. 29, July 18, 1896, pp. 813-817. (in German)
14. Hsu, T. T. C., “Torsion of Structural Concrete—Behavior of Reinforced Concrete Rectangular Members,” Torsion of Structural Concrete, SP-18, G. P. Fisher, ed., American Concrete Institute, Farmington Hills, MI, 1968, pp. 261-306.
15. Leonhardt, F., and Schelling, G., “Torsionsversuche an Stahlbeton-balken,” Bulletin No. 239, Deutscher Ausschuss für Stahlbeton, Berlin, Germany, 1974, 122 pp.
16. Bernardo, L. F. A., and Lopes, S. M. R., “Torsion in High-Strength Concrete Hollow Beams: Strength and Ductility Analysis,” ACI Structural Journal, V. 106, No. 1, Jan.-Feb. 2009, pp. 39-48.
17. Lopes, S. M. R., and Bernardo, L. F. A., “Twist Behavior of High-Strength Concrete Hollow Beams—Formation of Plastic Hinges along the Length,” Engineering Structures, V. 31, No. 1, 2009, pp. 138-149.
18. Lampert, P., and Thürlimann, B., Torsionsversuche an Stahlbeton-balken (Torsion Tests of Reinforced Concrete Beams), Bericht Nr. 6506-2, Institute fur Baustatik, ETH, Zurich, Switzerland, June 1968.
19. Lampert, P.; Lüchinger P.; and Thürlimann, B., Torsionsversuche an Stahl-und Spannbetonbalken (Torsion Tests on Reinforced and Prestressed Concrete Beams), Bericht Nr. 6506-4, Institute für Baustatik, ETH, Zurich, Switzerland, Feb. 1971, 99 pp.
20. Mitchell, D., “The Behaviour of Structural Concrete Beams in Pure Torsion,” PhD thesis, Department of Civil Engineering, University of Toronto, Toronto, ON, Canada, Mar. 1974, 140 pp.
21. Lai, Y.-G., “Investigation on Thickness of Shear Flow Zone for RC Beams Subjected to Pure Torsion,” master’s thesis, Department of Civil Engineering, National Cheng Kung University, Tainan, Taiwan, June 1998, 71 pp. (in Chinese)
22. Li, W.-K., “Behavior of Reinforced Concrete Box Beams Subjected to Pure Torsion,” master’s thesis, Department of Civil Engineering, Chung Yuan Christian University, Chung Li, Taiwan, 1999. (in Chinese)
23. Chu, S.-C., “The Behavior of Reinforced Concrete Beam Subjected to Combined Torsion and Shear,” master’s thesis, Department of Civil Engi-neering, National Cheng Kung University, Tainan, Taiwan, 2002. (in Chinese)
24. Chiu, H.-J.; Fang, I.-K.; Young, W.-T.; and Shiau, J.-K., “Behavior of Reinforced Concrete Beams with Minimum Torsional Reinforcement,” Engineering Structures, V. 29, 2007, pp. 2193-2205.
25. Wight, J. K., “Concrete Q&A: Torsion Calculations for Hollow Sections,” Concrete International, V. 27, No. 7, July 2005, p. 68.

468 ACI Structural Journal/May-June 2013
NOTES:

25
APPENDIX A
Fig. A1–Design chart for determination of shear flow zone thickness at cracking td,cr for
solid members 1, 10
30 40 50 60 70 80 90 100 110
f'c ( MPa )
0.70
0.75
0.80
0.85
0.90
0.95
1.00
1.05
1.10
1.15t d
, cr
/ (
A c /
p c )
3 4 5 6 7 8 9 10 11 12 13 14 15( ksi )
r = 1.0
r = 1.5
r = 2.0
r = 2.5
r = 3.0
r = 3.5
r = 4.0
r = 4.5
r = 5.0
r = 5.5
r = 6.0
r = Aspect Ratio h/b = 1.0, 1.5, 2.0 ~ 5.5, 6.0
(0.9526) for the example in Appendix B
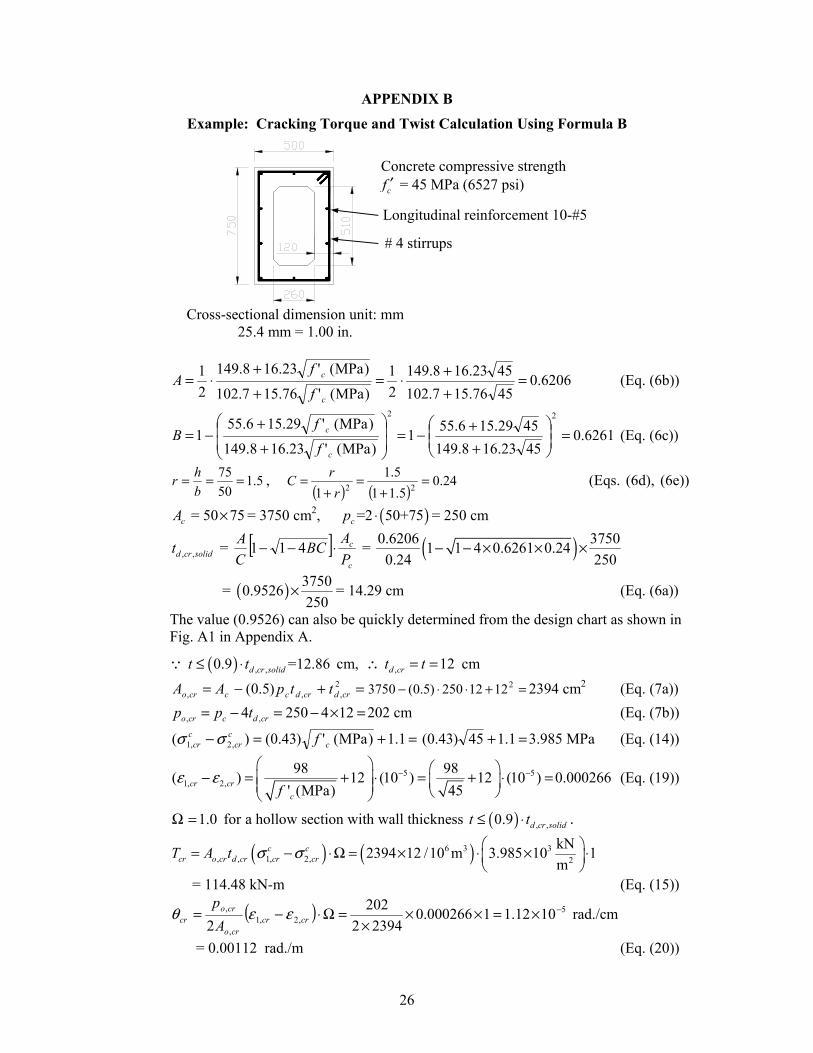
26
APPENDIX B Example: Cracking Torque and Twist Calculation Using Formula B
6206.04576.157.102
4523.168.149
2
1
)MPa('76.157.102
)MPa('23.168.149
2
1 =++⋅=
+
+⋅=
c
c
f
fA (Eq. (6b))
6261.04523.168.149
4529.156.551
)MPa('23.168.149
)MPa('29.156.551
22
=
++−=
+
+−=
c
c
f
fB (Eq. (6c))
5.150
75 ===bhr ,
( ) ( )24.0
5.11
5.1
1 22=
+=
+=
rrC (Eqs. (6d), (6e))
= 50 75cA × = 3750 cm2, ( )=2 50+75cp ⋅ = 250 cm
, ,d cr solidt = [ ]c
c
PABC
CA ⋅−− 411 = ( )0.6206 3750
1 1 4 0.6261 0.240.24 250
− − × × ×
= ( ) 37500.9526
250× = 14.29 cm (Eq. (6a))
The value (0.9526) can also be quickly determined from the design chart as shown in Fig. A1 in Appendix A.
( ) , , 0.9 =12.86d cr solidt t≤ ⋅ cm, , 12d crt t∴ = = cm
=+−= 2,,, )5.0( crdcrdcccro ttpAA =+⋅⋅− 21212250)5.0(3750 2394 cm2 (Eq. (7a))
, ,4 250 4 12o cr c d crp p t= − = − × = 202 cm (Eq. (7b))
=+=− 1.1)MPa(')43.0()( ,2,1 cc
crc
cr fσσ =+ 1.145)43.0( 3.985 MPa (Eq. (14))
5 51, 2,
98 98( ) 12 (10 ) 12 (10 )
' (MPa) 45cr cr
cfε ε − −
− = + ⋅ = + ⋅ = 0.000266 (Eq. (19))
Ω 1.0= for a hollow section with wall thickness ( ) , ,0.9 d cr solidt t≤ ⋅ .
( ) ( )6 3 3, , 1, 2, 2
kN2394 12 /10 m 3.985 10 1
mc c
cr o cr d cr cr crT A t σ σ = − ⋅Ω = × ⋅ × ⋅
= 114.48 kN-m (Eq. (15))
( ) =×××
=Ω⋅−= 1000266.023942
202
2 ,2,1,
,crcr
cro
crocr A
pεεθ 1.12 510−× rad./cm
= 0.00112 rad./m (Eq. (20))
Longitudinal reinforcement 10-#5
# 4 stirrups
Concrete compressive strength
cf ′ = 45 MPa (6527 psi)
Cross-sectional dimension unit: mm 25.4 mm = 1.00 in.

1
APPENDIX C 1
Table C1–Calculated data compared with tests and other formulas (1/2) 2 So
urce
R
efer
ence
Specimen ,cr testT
kN-m (in-kips)
calccr
testcr
TT
,
, ,cr testθ 10-3 rad/m
(10-3 deg/in)
calccr
testcr
,
,
θθ
ACI 318-08 Formula A Formula B Formula B
Hsu
(196
8) 1
4
1 D1 15.03 (133) 1.1977 1.1851 1.1791 1.402 (2.04) 0.5384 2 D2 13.90 (123) 1.1298 1.1179 1.1050 1.292 (1.88) 0.4902 3 D3 15.14 (134) 1.1680 1.1557 1.1623 1.422 (2.07) 0.5573 4 D4 15.82 (140) 1.1755 1.1631 1.1838 1.539 (2.24) 0.6168
Group Average 1.1677 1.1554 1.1575
0.5507 Group Standard Deviation 2.83% 2.80% 3.63% 5.23%
Lam
pert
et a
l. (1
968,
197
1) 1
8, 1
9 5 T0 44.13 (390.6) 1.3232 0.9170 0.8482 0.292(0.424) 0.2165 6 T1 44.13 (390.6) 1.5644 1.0841 0.9511 0.993(1.446) 0.6673 7 T2 45.31 (401.0) 1.5596 1.0808 0.9574 0.620(0.902) 0.4241 8 T5 54.03 (478.2) 1.1843 0.8468 0.7756 0.468(0.682) 0.3742
Group Average 1.4079 0.9822 0.8831
0.4205 Group Standard Deviation 18.68% 11.93% 8.74% 18.68%
L. &
S.
(197
4) 1
5 9 VH1 11.77 (104.2) 1.3611 0.8456 0.8575 2.90 (4.220) 0.9923 10 VH2 12.45 (110.2) 1.4405 0.8950 0.9075 2.00 (2.911) 0.6843
Group Average 1.4008 0.8703 0.8825
0.8383 Group Standard Deviation 5.61% 3.49% 3.54% 21.77%
Mitc
hell
(197
4) 2
0
11 PT4 17.29 (153) 0.7088 0.8765 0.7943 1.155(1.681) 0.6046 12 PT5 19.55 (173) 0.9073 1.3088 1.1507 2.224(3.236) 1.1742 13 PT6 30.17 (267) 0.7966 0.7976 0.8123 1.651(2.403) 0.9701
Group Average 0.8042 0.9943 0.9191
0.9163 Group Standard Deviation 9.95% 27.52% 20.08% 28.86%
Ber
nard
o &
Lop
es (2
009)
16,
17
14 A1 104.08 (921.2) 1.5359 1.0601 1.0300 1.239(1.803) 1.1923 15 A2 109.50 (969.2) 1.5244 1.0333 1.0378 1.117(1.626) 1.0490 16 A3 113.27(1002.5) 1.5726 1.0617 1.0715 0.995(1.448) 0.9245 17 A4 120.87(1069.8) 1.5986 1.0903 1.1030 1.100(1.600) 1.0805 18 A5 120.93(1070.3) 1.6248 1.1081 1.1165 0.768(1.118) 0.7484 19 B2 116.72(1033.1) 1.3279 0.8983 0.9515 0.768(1.118) 0.7961 20 B3 130.45(1154.6) 1.3957 0.9422 1.0146 0.751(1.092) 0.7972 21 B4 142.93(1265.0) 1.4785 0.9921 1.0845 1.065(1.549) 1.1309 22 B5 142.26(1259.1) 1.4641 0.9744 1.0775 1.152(1.676) 1.2010 23 C1 117.31(1038.3) 1.2681 0.8770 0.9161 0.663(0.965) 0.7502 24 C2 124.46(1101.6) 1.2912 0.8877 0.9417 0.855(1.245) 0.9690 25 C3 131.93(1167.7) 1.3600 0.9294 0.9943 1.117(1.626) 1.2481 26 C4 132.60(1173.6) 1.3684 0.9351 1.0002 0.890(1.295) 0.9941 27 C5 138.34(1224.4) 1.3774 0.9394 1.0147 0.890(1.295) 1.0050 28 C6 139.09(1231.1) 1.4558 0.9929 1.0613 0.943(1.372) 1.0399
Group Average 1.4429 0.9815 1.0277 0.9951
Group Standard Deviation 11.25% 7.48% 5.99% 16.50%
Note: The source reference abbreviated by ‘L. & S. (1974) 15’ is Leonhardt and Schelling (1974) 15 . 3 4

2
Table C1–Calculated data compared with tests and other formulas (2/2) 1
Sour
ce
Ref
eren
ce
Specimen ,cr testT
kN-m (in-kips)
calccr
testcr
TT
,
, ,cr testθ 10-3 rad/m
(10-3 deg/in)
calccr
testcr
,
,
θθ
ACI 318-08 Formula A Formula B Formula B
Lai (
1998
) 21
29 H-4H 33.1 (293.0) 1.1220 0.7623 0.8110 N/A -- 30 H-5H 31.4 (277.9) 1.0644 0.7232 0.7693 N/A -- 31 H-6H 39.4 (348.7) 1.3356 0.9074 0.9653 N/A -- 32 N-4H 29.3 (259.3) 1.5441 1.0491 0.9867 N/A -- 33 N-5H 29.4 (260.2) 1.5494 1.0527 0.9901 N/A -- 34 N-6H 29.5 (261.1) 1.5547 1.0563 0.9935 N/A --
Group Average 1.3617 0.9252 0.9193 -- Group Standard Deviation 22.46% 15.26% 10.14% --
* 35 H-5-10 14.47 (128.1) 1.0148 1.2502 1.1981 1.420(2.067) 0.6517
**
36 HH-1 39.8 (352.3) 1.4171 0.9628 1.0122 N/A --
Chi
u et
al.
(200
7) 2
4
37 HAH-81-35 48.32 (427.7) 1.5256 1.0339 1.1052 Excluded --
38 NCH-62-33 36.61 (324.0) 1.4488 1.0065 1.0941 1.963(2.857) 1.0265
Group Average 1.4872 1.0202 1.0996
-- Group Standard Deviation 5.43% 1.93% 0.79% --
Total Average 1.3352 0.9947 1.0007
0.8305
Total Standard Deviation 22.56% 13.02% 11.87% 27.50%
Note: 1. The source references labeled with ‘*’ and ‘**’ are Li (1999) 22 and Chu (2002) 23 , respectively. 2 2. ‘N/A’ represents that the ,cr testθ value is not available in the respective source reference. 3

29
Fig. C1–Cracking twist predictions for thinner-walled hollow specimens.
No. of data pts. = 30
0 0.001 0.002 0.003θcr, test (rad/m)
0.0
0.5
1.0
1.5
2.0
θ cr,
test
/ θcr
, cal
c
0 0.001 0.002 0.003 0.004(deg/in)
, , cr test cr calcθ θ
Entire 30 specimens Average = 0.8305 Std. dev. = 27.50%
B. & L. 15 specimens Average = 0.9951 Std. dev. = 16.50%
0.2 0.4 0.6 0.8 1 1.2 1.4 1.6 1.80
0.05
0.1
Fre
quen
cy o
f oc
cure
nce Bernardo & Lopes
Others
No. of data pts. = 30
0 0.001 0.002 0.003θcr, test (rad/m)
0.000
0.001
0.002
0.003θ c
r, ca
lc (r
ad/m
)
0 0.001 0.002 0.003 0.004(deg/in)
0
0.001
0.002
0.003
0.004
(deg
/in)
Hsu (1968): No. of data pts. = 4Lampert et al. (1968, 1971): 4Leonhardt & Schelling (1974): 2Mitchell (1974): 3Bernardo & Lopes (2009): 15Li (1999): 1Chiu et al. (2007): 1

ACI Structural Journal/May-June 2013 469
Title no. 110-S37
ACI STRUCTURAL JOURNAL TECHNICAL PAPER
ACI Structural Journal, V. 110, No. 3, May-June 2013.MS No. S-2011-193.R2 received February 4, 2012, and reviewed under Institute
publication policies. Copyright © 2013, American Concrete Institute. All rights reserved, including the making of copies unless permission is obtained from the copyright proprietors. Pertinent discussion including author’s closure, if any, will be published in the March-April 2014 ACI Structural Journal if the discussion is received by November 1, 2013.
Breakout Capacity of Headed Anchors in Confined Concrete: Experimental Evidenceby Roberto Piccinin, Sara Cattaneo, and Luigi Biolzi
While provisions are available in current design codes that account for the presence of tensile fields causing concrete cracking, no provisions are available for anchors embedded in compressively prestressed concrete. Because of this lack of information, a series of experiments were performed to evaluate the tensile breakout capacity of headed anchors embedded in confined and unconfined concrete. To simulate the confinement, uniform biaxial compres-sion (prestress) was applied to concrete specimens in the directions orthogonal to the anchors’ stems.
This paper discusses the influence of embedment depth and confinement on the behavior of headed anchors in terms of strength, ductility, and failure pattern. A comparison between actual code provisions for unconfined concrete and the experimental results reported herein is provided. Proposals for the extension of the actual provisions to take the effects of confinement into account are provided and are contingent on completion of further investigation.
Keywords: breakout capacity; confinement; failure; headed anchors; prestress.
INTRODUCTIONIn recent years, the tensile behavior of steel-headed anchors
embedded in a concrete matrix has been studied extensively. Under tension loading, the fastening systems can experi-ence five different types of failures, as shown in Fig. 1 for expansion anchors1-4: steel failure, pullout, pull-through, concrete breakout, and concrete splitting. The pullout (or pull-through) failures are failures from the anchor (or part of it) sliding out of the concrete or pulling out a relatively small portion of the concrete matrix. Currently, there is no established procedure to theoretically determine the design ultimate load for pullout, pull-through, and splitting failures. Some recommendations were proposed by Eligehausen et al.,5 who numerically and experimentally investigated the effect of the bearing pressure, anchor location, and concrete strength on the ultimate load. For these cases, however, an estimate of the ultimate load needs to be supported by experimental evidence.2
When the dimension of the head of a preinstalled anchor is large enough to prevent pullout or pull-through fail-ures,2 the tensile capacity of the anchor is governed by the tensile strength (yield or fracture) of the steel or by the tensile breakout capacity of the concrete in which the bolt is embedded. While in the former case, the capacity of the anchor can be accurately predicted by multiplying the steel yield or tensile strength and the cross-sectional area of the stem, in the latter, predicting the concrete breakout capacity is a much more difficult task.
The concrete breakout predictions rely on several models.2,3,6-8 According to plasticity-based models, the capacity (limit load) of the anchor is equal to the force produced by an average prescribed traction distribution ft acting on the projected area of an assumed conical failure surface AN and can be expressed in the following form
u t NP f A= (1)
Differences among the proposed models2,3,6-8 are related to the definition of the failure surface, the tensile strength of the concrete matrix, and account for the concrete’s size effect. The first ACI Code6 provisions, for example, allowed the capacity of a headed anchor of diameter c, embedded at a depth d, to be determined using a uniform tensile stress
4 (psi) (0.33 [MPa])t c cf f f= ′ ′ acting on the projected area of a conical failure surface inclined at 45 degrees with respect to the free surface (Fig. 2(a)).
The limit load derived using this model and the empirical relation between the tensile and compressive strengths is given by
Fig. 1—Failure modes for anchors under tensile loading.1

470 ACI Structural Journal/May-June 2013
Roberto Piccinin is a Technical Service Engineer for Hilti North America, Tulsa, OK. His research interests include fracture mechanics of concrete (and other quasi-brittle materials) and anchoring to concrete.
Sara Cattaneo is an Associate Professor at the Politecnico di Milano, Milan, Italy, where she received both her MS and PhD in structural engineering. Her research interests include fracture and damage of quasi-brittle materials, constitutive behavior, structural response of high-performance and self-consolidating concrete, and steel-concrete bond.
Luigi Biolzi is a Professor in the Department of Structural Engineering at the Politec-nico di Milano. His research interests include the use of high-performance materials, durability of concrete, and composite materials.
( )2 2 2, 1 4 1u ACI t c t
c cP f d f d f dd d
= f p + = f⋅ ⋅ p + ≈′ (2)
where f is the strength reduction factor. The value of the tensile stress considered in the original ACI 349-976 formula comes from the averaging of the principal stress distribution along the assumed failure surface. Subsequent experimental observations led to the conclusion that the failure surface is inclined at 45 degrees with respect to the free surface only in the early stages of the breakout process: in fact, during the crack propagation process, bending of the uncracked portion of the base material generates compression around the failure surface and, in turn, reduces its propagation angle. This phenomenon has been identified as disc action
and is more significant for shallow embedment depths (less than 5 in. [127 mm]).6
In an attempt to improve the plasticity-based model predic-tions, the Variable Angle Cone (VAC) Method9 was devel-oped. This approach is identical in all aspects to that of ACI 349-976 (no concrete’s size effect is taken into account), except for the way in which the concrete failure surface is defined. In this case, in fact, the concrete cone inclination a is assumed to vary with the embedment depth as
( )45 degrees 5 in.efha = ≥ (3a)
( ) ( )28 0.13386 degrees 5 in.ef efh ha = + < (3b)
The corresponding ultimate load-carrying capacity predicted by the VAC Method is then
( ) ( ) ( )( ) 2, 4 cot cotu VAC c ef ef tP f h h c f d= ⋅ a a + ≈′ (4)
Analytical studies and experimental data9-14 have convinc-ingly demonstrated that the d2 dependence demanded by dimensional consistency and expressed by Eq. (1) is incor-rect and unconservative for typical embedment depths. Recognizing that the concrete breakout capacity is governed by a progressive crack propagation process10-13 and not by plasticity, the Concrete Capacity Design (CCD) Method3 was developed. This method, derived from the Kappa Method,14 is both user-friendly and takes the so-called concrete’s size effect into account.
The general equation of the CCD Method3 can be expressed as follows
2 0.5 1.5, 1 2 3u CCD c e f ef nc c efP k f k h k h k f h−= ⋅ ⋅ =′ ′ (5)
where Pu is the ultimate load; fc′ is the compressive strength of the concrete; hef is the effective embed-ment depth of the anchor; k1, k2, and k3 are calibration factors; and knc = k1∙k2∙k3. The factor 1 ck f ′ represents the nominal concrete tensile stress at failure over the failure area k2hef
2. The factor k3hef–0.5 takes the concrete’s size effect
into account. Finally, the concrete surface is idealized by a 35-degree pyramid (Fig. 2(b)). This latter assumption is reasonably supported by experimental evidence, whereas the theoretical angle of 45 degrees in the earlier versions of ACI 349-976 was based on limited data.
Currently, because of the accuracy in predicting ultimate load capacities, crack propagation patterns, and concrete’s size effect, several structural design provisions2,7,15,16 are based on the CCD Method.
From Eq. (5),3 the nominal concrete breakout strength of headed anchors in uncracked concrete is given by
1.5 1.5, 30 (lb)u CCD nc c ef c efP k f h f h= =′ ′ (6)
Equation (6) is valid only for anchors with relatively small heads (that is, mean bearing pressure at breakout load approximately equal to 13fc′), embedment depths hef ≤ 11 in. (279.4 mm), and normal concrete strengths (fc′ < 8000 psi [55.16 MPa]). Other coefficients and exponents have been proposed to account for the effect of larger embedment depths
Fig. 2—Comparison of failure surfaces: (a) cone; ACI 349-976; and (b) prism; CCD Method.3

ACI Structural Journal/May-June 2013 471
(hef >11 in. [279.4 mm]),17 high-performance concretes,4 and larger head diameters.17 The capacities obtained from Eq. (6) can be reduced to account for cases where cracking due to external loads (that is, tension zones and negative-moment loading conditions) or imposed deformations (that is, creep, shrinkage, and temperature) are expected in the region where the anchor is placed.18 In most of the tests performed to assess the effect of concrete cracking,19 the concrete cone failure load is approximately 75% of the value in uncracked concrete. If anchors were to be located at the intersection of two cracks, the concrete failure load would further reduce by approximately 20%. The reason for the reduction in capacity, according to these studies, is the disturbance of the axisymmetrical stress field, which reduces the surface area over which tensile stresses are redistributed. In general, as a consequence of concrete cracking, Eq. (6) could be modified as follows
1.5 1.5, 24 (lb)u CCD c c ef c efP k f h f h= =′ ′ (7)
The problem of predicting the load capacity of cast-in-place inserts placed in precast, prestressed concrete members to facilitate connections between different elements has received much less attention. In fact, ACI 318-082 does not provide modifications to Eq. (2) or (6) that account for prestress. The connection of cast-in-place concrete diaphragms or floor beams to precast concrete girders in bridges (Fig. 3) is but one example of applications involving prestress. Baran et al.20 performed experiments on different types of cast-in-place inserts to determine the influence of reinforcement and prestress. As expected, they observed that the presence of a prestressing force in the direction orthogonal to the axes of the inserts embedded in reinforced concrete resulted in an increase in load capacity and ductility. Thirty-two pullout tests on four different types
of inserts were carried out in unreinforced and reinforced concrete with and without axial compression. An increase in capacity was observed when one-way axial compres-sion was applied and when concrete was reinforced. Failure cone inclination angles for the unreinforced specimens ranged from 29 to 45 degrees and were consistent with the large amount of observations for the prediction of concrete breakout strength. While comparisons with the actual code provisions were carried out and a discussion on the necessity to use or avoid the reduction factor for cracked concrete was completed, no design recommendations were suggested for anchors installed in prestressed concrete. Further analytical and experimental investigations21,22 were recently carried out, providing a fundamental mechanics-based explanation to the problem. In these investigations, a fracture-mechanics-based formula for the prediction of the breakout capacity of headed anchors in prestressed concrete was proposed and can be expressed as follows
3/2( 0.015 ) (lb)u nc c cP k f d= + ⋅s ⋅ ⋅′ (8)
where sc and fc′ are expressed in psi.Equation (8) was developed in an attempt to provide a
simplified design formula. The nominal concrete breakout capacity, as shown in Eq. (6), was modified to take the effect of compressive stresses applied to the concrete matrix into account. Note that the coefficient knc was preferred to kc because of the presence of compression, which acts against crack formation and propagation.21,22 The beneficial contri-bution of the compressive stresses to the concrete breakout capacity was included in the coefficient 0.015∙sc, which was calibrated through experiments and linear elastic and nonlinear elastic fracture mechanics finite element models. More specifically, the multiplication factor 0.015 was intro-duced to: 1) calibrate analytical and experimental investiga-
Fig. 3—Example of installation of steel anchors in prestressed concrete members.20

472 ACI Structural Journal/May-June 2013
tions; and 2) provide a dimensionally meaningful factor to be added to the constant knc.
RESEARCH SIGNIFICANCEThis paper attempts to provide experimental evidence on
the tensile breakout behavior of headed anchors embedded in compressively prestressed concrete. Because of the lack of research experience in the field, observations and compari-sons of the obtained results with the actual code provisions for unstressed concrete and the proposed Eq. (8) are provided.
EXPERIMENTAL INVESTIGATIONA series of axisymmetrical pullout tests were performed
using normal-strength concrete as a matrix material. To
investigate the effects of confinement on anchors embedded at different embedment depths, a two-phase test program was carried out (Table 1). In the first phase, the investiga-tion focused on the potential changes in load-carrying capacity and load-versus-displacement behavior of anchors embedded in confined concrete. Phase II provided support and validation to the results observed in Phase I. Note that, in Table 1, the italicized test numbers refer to Phase II of the experimental program.
Test specimensTests were performed using normal-strength concrete
blocks. The mixture components of the concrete were Type CEM I 52.5 R portland cement, according to the Euro-pean Standard ENV 197/1, and a natural river aggregate with a maximum size of 25 mm (0.98 in.). No high-range water-reducing admixtures were added. The concrete had an aggre-gate-cement ratio of 6.24 and a water-cement ratio (w/c) of 0.7. The compressive strength of the mixture was obtained from compression tests performed on cylinders with a diam-eter of 4 in. (100 mm) and a height of 8 in. (200 mm) and on cubes with a 6 in. (150 mm) side. The compression tests were completed between 21 and 35 days after the speci-mens were cast. The concrete properties were recorded and then averaged. Standard-size cylinders (conforming to ASTM C31/C31M and C496/C496M) were tested to obtain the Young’s modulus and the uniaxial tensile strength of the material (Brazilian splitting test). For the second set of experiments only (Phase II), the Young’s modulus of the material E was obtained from available standard design formulas ( 57,000 [psi]cE f= ′ ). The mixture design and the averaged concrete properties at the time of the tests are reported in Table 2. All specimens were prepared using steel molds and consolidated with a high-frequency vibrating table, removed from the mold after 24 hours, and air-cured at a temperature of approximately 22°C (71.6°F). The tests were performed at an age between 28 and 35 days. In all of the experimental tests, the specimens consisted of concrete blocks with dimensions of 39.37 x 39.37 x 7.87 in. (1 x 1 x 0.2 m) and 49.21 x 61.02 x 9.45 in. (1.25 x 1.55 x 0.24 m). The differences in size were based on the effective embed-ment depths of anchors. Besides these aspects, the size of the blocks represented a limiting parameter of investigation in that the maximum applicable confining pressure is directly (that is, inversely) proportional to their thickness.
Headed anchorsThe concrete anchors (Fig. 4) had a stem diameter
cs of 0.5 in. (12.7 mm) and a head diameter c between 0.98 and 1 in. (25 and 25.4 mm). They had an ultimate
Table 1—Details and parameters of experimental investigation
Nominal embedment depth, in. (mm)
Effective embedment depth (average), in. (mm)
Confining pressure, % fc
0 5 7.5 10 15
0.71 (18.03) 0.76 (19.30) 1, 2, 3 4, 5, 6, 7 8, 9, 10, 11 12, 13, 14 15, 16
0.98 (24.89) 1.01 (25.65) 8, 9, 10, 11 12, 15, 16 18, 19 13, 14, 17 —
1.97 (50.04) 1.98 (50.29)1, 2, 6, 7; 17, 18, 19
20, 21; 20, 21
24, 25, 26, 27; 22, 23, 24
22, 23; 25, 26, 27, 28
29, 20, 31, 32
2.70 (6.86) 2.71 (68.83) 33, 34 35, 36 37, 38, 39 40 —
4.92 (124.97) 4.92 (124.97) 3, 4, 5 — — — —
Note: Italicized test numbers refer to Phase II of experimental program.
Table 2—Material properties, ksi (MPa)
Material Property
Part I Part II
Value Value
Concrete
28-day cylinder strength 4.73 (32.59) 3.36 (23.17)
28-day cubic strength 5.26 (36.30) 4.05 (27.91)
21-day cylinder strength 3.90 (26.90) NA
21-day cubic strength 4.70 (32.40) NA
Tensile strength ft 0.42 (2.88) 0.41 (2.84)
Young’s modulus 3408 (23,500) 3300 (22,750)
SteelYield strength, 0.2% offset, fy 51 (350) 51 (350)
Ultimate strength fu 65 (450) 65 (450)
Note: NA is not available.
Fig. 4—Headed anchors used in experimental investigations.15

ACI Structural Journal/May-June 2013 473
strength of 65 ksi (450 MPa) and a yield characteristic strength of 51 ksi (350 MPa). The anchors were cast into the concrete specimens in a single cast. Wood formworks were used as a support for the anchors during the casting process so that they could easily be positioned at different embed-ment depths.
Four anchors were placed on the four corners of each concrete specimen. Because the objective of the investiga-tion was to determine the breakout capacity of the inserts and their load-versus-displacement behavior, their spacing and setup were chosen to avoid any interaction among them; any free-edge effect; and, in turn, any undesired mode of failure (that is, splitting, concrete blowout, and so on). In Phase I, two different nominal embedment depths were employed: 0.98 and 1.97 in. (25 and 50 mm). These values were preliminarily chosen to obtain embedment-depth-versus-head-diameter ratios (d/c) equal to 1 and 2, respectively. An additional embedment depth d of 4.9 in. (125 mm) was only preliminarily considered. However, few tests confirmed that such an embedment depth was too large to avoid steel failure. In Phase II, three different nominal embedment depths were employed: 0.71, 1.97, and 2.70 in. (18, 50, and 69 mm). The corresponding values of d/c were 0.75, 2, and 2.75, respec-tively. The embedment depths were normalized to work with nondimensional parameters, regardless of the units used in all the investigated formulas. Due to the vibrating process and to settlements during the curing process, the values of the embedment depths at the time of the tests were slightly different. Their measured average values are reported in Table 1, where they are also compared to the nominal values.
Test setupA representation of the testing machine employed in the
pullout tests is shown in Fig. 5(a). The pullout load was applied by means of a hydraulic jack connected to a reaction frame. The reaction frame consisted of a steel structure, with the section shown in Fig. 5(a). The load was applied through a steel rod connected to the reaction frame at the top and a special device that connected the anchor at the end, designed to apply a concentric load to the anchor (by means of hinges between the loading device and the anchor).
The tests were displacement-controlled and the relative displacements between the anchors and the upper surface of the concrete blocks were monitored by two linear vari-able differential transformers (LVDTs) (±0.2 in. [±5 mm]) symmetrically positioned at a distance of 10.4 in. (264.2 mm) for short embedment depths and 15.2 in. (385 mm) for larger embedment depths from the axis of the anchor. In all cases, all of the data (load and displacement) were acquired with a data acquisition system. The effect of confinement was simulated by applying biaxial compression (prestress) along the sides of the concrete specimens in the directions orthog-onal to the axis of the anchor. As shown in Fig. 5(b), the compression was applied by means of horizontally oriented hydraulic jacks inserted in a special built-in reaction frame. The steel beams used to build the reaction frame were tied together in the two plane directions by using six special tying bars. On the two sides of the specimens where the hydraulic jacks were acting, two additional steel beams were used to uniformly distribute the horizontal pressure. The opposite sides of the specimens were loaded by contrast through the reaction frame. To allow for a more uniform load distribution, a 0.4 in. (10 mm) layer of rubber was positioned between the specimens and the frame. The number of hydraulic jacks per
side used in the experiments was dependent on the thickness of the specimen (one jack per side for thin blocks and two jacks per side for thicker blocks).
The pullout tests were initially performed in unconfined concrete for each embedment depth. Biaxial compression was subsequently considered. In Phase I, the tests in confined concrete were performed considering three different amounts of compression sc: 5%, 7.5%, and 10% of the cylindrical compressive strength of the concrete measured at 21 days (3.9 ksi [26.9 MPa]), respectively—that is, 0.19, 0.29, and 0.39 ksi (1.34, 2.02, and 2.69 MPa), respectively. In Phase II, the tests in confined concrete were performed considering values of compression sc equal to 5%, 7.5%, 10%, and 15% of the cylindrical compressive strength of the concrete at 28 days, respectively—that is, 0.17, 0.25, 0.34, and 0.50 ksi (1.16, 1.74, 2.32, and 3.47 MPa), respectively. (Details of the amount of force applied to each specimen are shown in Table 1.) The applied compression was constantly monitored during each pullout test with standard manometers. Because of the investigative nature of this study, the choice of the aforementioned values of compression (prestress) was solely
Fig. 5—(a) Testing machine; and (b) built-in frame for appli-cation of compressive prestress with two hydraulic jacks per side, concrete block, tying bars, and extracting machine.

474 ACI Structural Journal/May-June 2013
based on: 1) the necessity to provide a perturbation of the axial-symmetric stress field originating from the pullout force and observe its repercussions on the general state of stress of the system; and 2) avoiding an excessive perturba-tion of the pullout process under investigation. It is noted that practical values of prestress for precast concrete beams or slabs could be difficult to estimate given their dependence on cross-sectional area and loading conditions.
EXPERIMENTAL RESULTSUltimate load-carrying capacity
Depending on the anchor’s embedment depth and the amount of lateral confinement provided to the concrete matrix, different values for the concrete breakout capaci-ties were obtained. In Table 3, the obtained results for each embedment depth and applied lateral compression are reported for the two sets of experiments. The failure mode (C for concrete cone failure; S for yielding and rupture of the steel) is also reported. Table 4 summarizes the average ultimate loads and the coefficients of variation (COVs) as a function of the embedment depth and the lateral confine-ment. Figures 6 (Phase I) and 7 (Phase II), where the ultimate breakout capacities are normalized with respect to the area of a circle with a radius equal to the effective embedment depth d, illustrate that the application of a confining pressure
to the concrete matrix in which the anchors are embedded is, overall, beneficial. While the benefits of the confinement are almost not visible for shallow anchors (Fig. 6(a)), an increase in capacity of approximately 20% with respect to the uncon-fined case (Fig. 6(b)) is observed at a larger embedment depth (d/c = 2) for the largest confining pressure considered in Phase I (0.39 ksi [2.69 MPa]). In addition to this, it is shown that the increase in pullout load is linearly dependent
Table 3—Ultimate load and failure mode
Phase I Phase II
Test Failure mode Ultimate load, kip (kN) Test Failure mode Ultimate load, kip (kN)
1 Concrete cone 6.62 (29.43) 1 Concrete cone 1.06 (4.71)
2 Concrete cone 6.17 (27.45) 2 Concrete cone 1.44 (6.42)
3 Steel 15.86 (70.53) 3 Concrete cone 1.01 (4.49)
4 Steel 15.95 (70.95) 4 Concrete cone 0.76 (3.36)
5 Steel 15.21 (67.70) 5 Concrete cone 2.10 (9.34)
6 Concrete cone 6.33 (28.17) 6 Concrete cone 1.24 (5.50)
7 Concrete cone 5.82 (25.89) 7 Concrete cone 0.65 (2.91)
8 Concrete cone 2.35 (10.45) 8 Concrete cone 0.90 (4.02)
9 Concrete cone 2.41 (10.74) 9 Concrete cone 1.17 (5.23)
10 Concrete cone 2.14 (9.53) 10 Concrete cone 1.40 (6.25)
11 Concrete cone 2.29 (10.19) 11 Concrete cone 0.86 (3.81)
12 Concrete cone 3.13 (13.92) 12 Concrete cone 1.02 (4.53)
13 Concrete cone 2.25 (10.01) 13 Concrete cone 0.95 (4.20)
14 Concrete cone 2.34 (10.40) 14 Concrete cone 1.13 (5.05)
15 Concrete cone 2.58 (11.49) 15 Concrete cone 0.72 (3.189)
16 Concrete cone 3.94 (17.53) 16 Concrete cone 0.69 (3.06)
17 Concrete cone 2.52 (11.21) 17 Concrete cone 4.77 (21.22)
18 Concrete cone 3.48 (15.50) 18 Concrete cone 5.26 (23.38)
19 Concrete cone 3.49 (15.53) 19 Concrete cone 5.08 (22.61)
20 Concrete cone 6.25 (27.80) 20 Concrete cone 5.35 (23.81)
21 Concrete cone 6.61 (29.39) 21 Concrete cone 4.80 (21.38)
22 Concrete cone 8.96 (39.88) 22 Concrete cone 4.83 (21.47)
23 Concrete cone 7.82 (34.77) 23 Concrete cone 5.27 (23.42)
24 Concrete cone 6.32 (28.10) 24 Concrete cone 4.87 (21.65)
25 Concrete cone 6.83 (30.38) 25 Concrete cone 7.51 (33.39)
26 Concrete cone 8.55 (38.01) 26 Concrete cone 5.12 (22.76)
27 Concrete cone 8.27 (36.77) 27 Concrete cone 7.55 (33.57)
28 Concrete cone 6.24 (27.78)
29 Concrete cone 4.85 (21.59)
30 Concrete cone 6.91 (30.72)
31 Concrete cone 6.91 (30.75)
32 Concrete cone 6.29 (27.99)
33 Concrete cone 9.29 (41.33)
34 Concrete cone 8.85 (39.37)
35 Concrete cone 8.82 (39.25)
36 Concrete cone 9.42 (41.89)
37 Steel 8.96 (39.86)
38 Concrete cone 9.34 (41.53)
39 Concrete cone 10.16 (45.22)
40 Concrete cone 10.23 (45.49)

ACI Structural Journal/May-June 2013 475
Table 4—Average ultimate load Nu and COV as function of embedment depth and confining pressure
d/cCompressive
strength, ksi (MPa)
Confining pressure sc, % fc′
0 5 7.5 10 15
Average Nu, kip (kN) COV, %
Average Nu, kip (kN) COV, %
Average Nu, kip (kN) COV, %
Average Nu, kip (kN) COV, %
Average Nu, kip (kN) COV, %
0.71 3.36 (23.17) 1.17 (5.21) 20.3 1.18 (5.28) 55.6 1.09 (4.83) 23.5 1.03 (4.59) 9.3 0.70 (3.12) 2.9
1 4.73 (32.59) 2.3 (10.23) 5.0 3.21 (14.31) 21.2 3.49 (15.52) 0.1 2.37 (10.54) 5.8 — —
2 4.73 (32.59) 6.24 (27.74) 5.3 5.08 (22.60) 7.6 4.99 (22.18) 4.9 6.60 (29.38) 17.6 6.24 (27.76) 15.5
2 3.36 (23.17) 5.04 (22.40) 4.9 7.13 (31.73) 17.3 7.14 (31.75) 14.2 8.39 (37.33) 9.7 — —
2.7 3.36 (23.17) 9.07 (40.35) 3.4 9.12 (40.57) 4.6 9.49 (42.20) 6.5 10.23 (45.49) — — —
Fig. 6—Phase I: Effect of confining pressure on breakout capacity of headed anchors: (a) nominal embedment depth of 0.98 in. (25 mm), d/c = 1, and (b) nominal embedment depth of 1.97 in. (50 mm), d/c = 2.
Fig. 7—Effect of confining pressure on breakout capacity of headed anchors: (a) nominal embedment depth of 0.71 in. (18 mm), d/c = 0.71; (b) nominal embedment depth of 1.97 in. (50 mm), d/c = 2; and (c) nominal embedment depth of 2.70 in. (69 mm), d/c = 2.75.
on the prestress. As for Phase II, a similar behavior is shown in Fig. 7(a) through (c). In this case, the effects of confining stresses, however, clearly do not contribute to any increase in capacity for anchors embedded at d/c = 0.71.23 For this geometry, larger COVs (Table 4) were observed for low lateral confinements.
Load-versus-displacement behaviorThe load-versus-displacement behavior observed in the
experiments (Fig. 8) reflects the behavior of the ultimate load-carrying capacities. In fact, it is shown that the area under the load-versus-displacement curves increases with the applied confinement (that is, compressive prestress). Therefore, the ability of the material to resist fracture in the presence of cracks seems to be improved.
Crack patterns and concrete cone surfacesThe experimental results show that the application of a
confining pressure changes the crack patterns and the cone dimensions (Experimental Phase I; Fig. 9 and 10). While for the unconfined case, the inclination between the failure surface and the surface of the concrete is approximately 35 degrees, when confinement is applied, the angle reduces and, in turn, the superficial area of the failure surface increases. An explanation of this phenomenon—based on the interaction between stress intensity factors at the tip of the propagating crack front—was recently provided by using linear-elastic fracture mechanics principles.21,22 The presence of compres-sive stresses produces two substantial effects. The compo-nent of these stresses perpendicular to the line defining the crack surfaces resists crack opening and, in turn, crack
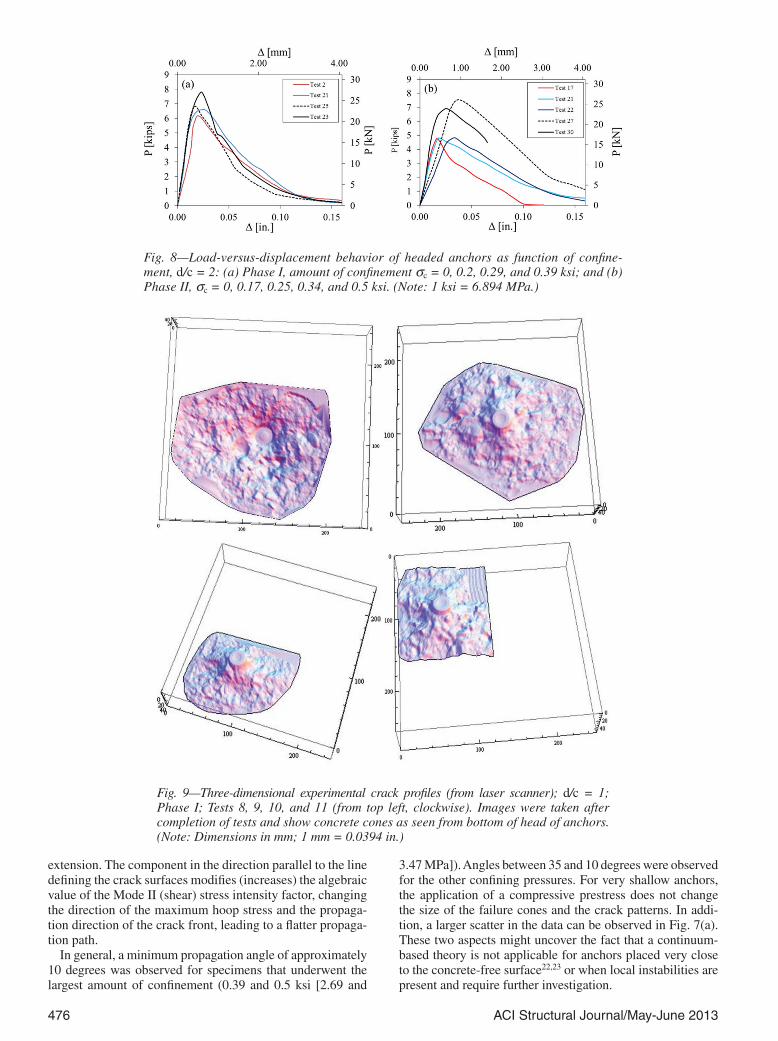
476 ACI Structural Journal/May-June 2013
extension. The component in the direction parallel to the line defining the crack surfaces modifies (increases) the algebraic value of the Mode II (shear) stress intensity factor, changing the direction of the maximum hoop stress and the propaga-tion direction of the crack front, leading to a flatter propaga-tion path.
In general, a minimum propagation angle of approximately 10 degrees was observed for specimens that underwent the largest amount of confinement (0.39 and 0.5 ksi [2.69 and
3.47 MPa]). Angles between 35 and 10 degrees were observed for the other confining pressures. For very shallow anchors, the application of a compressive prestress does not change the size of the failure cones and the crack patterns. In addi-tion, a larger scatter in the data can be observed in Fig. 7(a). These two aspects might uncover the fact that a continuum-based theory is not applicable for anchors placed very close to the concrete-free surface22,23 or when local instabilities are present and require further investigation.
Fig. 8—Load-versus-displacement behavior of headed anchors as function of confine-ment, d/c = 2: (a) Phase I, amount of confinement sc = 0, 0.2, 0.29, and 0.39 ksi; and (b) Phase II, sc = 0, 0.17, 0.25, 0.34, and 0.5 ksi. (Note: 1 ksi = 6.894 MPa.)
Fig. 9—Three-dimensional experimental crack profiles (from laser scanner); d/c = 1; Phase I; Tests 8, 9, 10, and 11 (from top left, clockwise). Images were taken after completion of tests and show concrete cones as seen from bottom of head of anchors. (Note: Dimensions in mm; 1 mm = 0.0394 in.)

ACI Structural Journal/May-June 2013 477
Fig. 10—Two-dimensional experimental crack profiles; d/c = 1; Phase I; Tests 11, 15, 19, and 14 (from top to bottom). (Note: Dimensions in mm; 1 mm = 0.0394 in.)
COMPARISON WITH OTHER PREDICTION MODELSIn this section, a comparison between the experimental
evidence and the available design formulas is carried out. First, the results are compared to the actual code provisions for unstressed concrete. Figure 11, where the experimental concrete cone breakout capacities are normalized with respect to the predictions obtained from Eq. (2), (6), and (7), respectively, illustrates the behavior of headed anchors in unconfined concrete. The CCD Method for uncracked concrete seems to better fit the obtained experimental data, while the cracked concrete condition and the plasticity-based (ACI 349-976) approaches are abundantly conserva-tive. For the latter case, this conclusion would be expected only for deeper embedments, as the formula is based on a plasticity model. However, a significant degree of conserva-tism is also seen for the shallow embedments investigated
herein. It is noted that in Fig. 11(b) and Table 4, the results for very shallow anchors (d/c = 0.75) show much larger scatter and unpredictability.
In the same fashion, the effects of prestress are shown in Fig. 12 and 13, where the experimentally obtained capacities are normalized with respect to the predictions from Eq. (8). Figures 12(a) and 13(a) show that for shallow embedment depths, the fracture-mechanics-based approach is not suit-able to develop a reliable prediction. This, however, repre-sents a very rare and unpractical case because the embed-ment depths are equal to or smaller than the maximum aggre-gate size.22,23 Nevertheless, for all other cases, the proposed fracture-mechanics-based design Eq. (8) represents a good and conservative fit to the experimental data.
While the CCD Method seems to be suitable for the unstressed case, it is interesting to test its effectiveness on
Fig. 11—Comparison between experimental data and available prediction formulas in unstressed case: (a) Phase I; and (b) Phase II.

478 ACI Structural Journal/May-June 2013
the stressed cases. Figure 14 shows the distributions of the ratio between the experimental ultimate load and the one predicted by both the CCD Method and Eq. (8). In both cases, the distributions show a high dispersion, but the fracture-mechanics-based design formula exhibits a large number of tests close to 1, suggesting a better prediction of the results.
With the objective of providing a more practical design formula, the ratios between the experimental results and the predicted ultimate load were evaluated, assuming the concrete characteristic strength instead of the actual strength.
Figure 15 shows the average values and the COV as a function of the lateral confinement. Due to its limited appli-cability, the shorter embedment depth was neglected. The predicted value is a characteristic value, and a safety factor should be adopted to obtain a design value. For this reason, the CCD Method seems too conservative, and further research is needed—particularly for higher confinements, where the difference between the two approaches increases with the lateral pressure.
CONCLUSIONSThe experimental evidence supports the fact that the appli-
cation of a compressive confining pressure (prestress) to the concrete matrix in the direction orthogonal to the axis of headed anchors is beneficial in terms of ultimate breakout capacity and load-versus-displacement behavior. Overall, the application of prestress increases the concrete cone breakout capacity and the size of the cone dimensions and decreases the value of the crack propagation angle from the head of the anchor.
Fig. 12—Phase I: Comparison between experimental data and proposed prediction Eq. (8) from Piccinin et al.21: (a) d = 0.98 in. (25 mm), d/c = 1; and (b) d = 1.97 in. (50 mm), d/c = 2.
Fig. 13—Phase II: Comparison between experimental data and proposed prediction Eq. (8): (a) d = 0.71 in. (18 mm); d/c = 0.75; (b) d = 1.97 in. (50 mm), d/c = 2; and (c) d = 2.70 in. (69 mm), d/c = 2.75.
Fig. 14—Distribution of ratio between experimental and predicted results.

ACI Structural Journal/May-June 2013 479
For typical embedments (d > 1 in. [25.4 mm]), the breakout capacity linearly increases with the applied confining pres-sure. For unpractical (anchors usually being installed at deeper embedments) but conceptually interesting shal-lower embedments (d ≤ 1 in. [25.4 mm]), the application of prestress seems to be irrelevant (d = 1 in. [25.4 mm]) or coun-terproductive (d = 0.75 in. [19.05 mm]), showing scattered results and a reduction in capacity for larger prestress values. Previous investigations21-23 have proven that a continuum-based approach might not be applicable for this case and that instabilities for cracks or steel inserts positioned very close to the free surface23 or splitting phenomena for highly compressed aggregate materials with superficial imperfec-tions should be investigated.
Finally, the proposed design Eq. (8), which takes the effect of prestress on the concrete breakout capacity into account, is shown to be conservative and in agreement with the experi-mental evidence. Validation and introduction of the proposed formula in design recommendations should still, however, be contingent on completion of further investigation.
ACKNOWLEDGMENTSThis research was carried out with the support of the Yucatan Decima
concrete precast plant and the Politecnico di Milano. For their help and their intellectual and moral support, R. Ballarini, A. Schultz, G. Rosati, H. Stolarski, and D. Spinelli of the Laboratorio Prove Materiali of the Politecnico di Milano are gratefully acknowledged.
NOTATIONAN = projected area of failure surfacec = nominal head diameter of headed anchorcs = nominal stem diameter of headed anchord, hef = embedded depth of headed anchorE = Young’s modulusfc′ = compressive strengthft = tensile strengthk1, k2, k3, knc, kc = factors of CCD MethodPu = ultimate loadf = strength reduction factor
sc = amount of compression (prestress) applied to concrete base material in direction orthogonal to axis of anchor
REFERENCES1. ACI Committee 355, “Qualification of Post-Installed Mechanical
Anchors in Concrete (ACI 355.2-04) and Commentary,” American Concrete Institute, Farmington Hills, MI, 2002, 31 pp.
2. ACI Committee 318, “Building Code Requirements for Structural Concrete (ACI 318-08) and Commentary,” American Concrete Institute, Farmington Hills, MI, 2008, 473 pp.
3. Fuchs, W.; Eligehausen, R.; and Breen, J., “Concrete Capacity Design (CCD) Approach for Fastening to Concrete,” ACI Structural Journal, V. 92, No. 1, Jan.-Feb. 1995, pp. 73-94.
4. Cattaneo, S., “Wedge-Type Expansion Anchors in High-Perfor-mance Concrete,” ACI Structural Journal, V. 104, No. 2, Mar.-Apr. 2007, pp. 191-198.
5. Eligehausen, R.; Mallée, R.; and Silva, J. F., Anchorage in Concrete Construction, Ernst & Sohn, Berlin, Germany, 2006, 378 pp.
6. ACI Committee 349, “Code Requirements for Nuclear Safety-Related Concrete Structures (ACI 349-97) and Commentary,” American Concrete Institute, Farmington Hills, MI, 1997, 123 pp.
7. ACI Committee 349, “Code Requirements for Nuclear Safety Related Concrete Structures (ACI 349-01) and Commentary,” American Concrete Institute, Farmington Hills, MI, 2001, 134 pp.
8. Farrow, C. B.; Frigui, I.; and Klinger, R. E., “Tensile Capacity of Single Anchors in Concrete: Evaluation of Existing Formulas on LRFD Basis,” ACI Structural Journal, V. 93, No. 1, Jan.-Feb. 1996, pp. 128-137.
9. Klinger, R. E., and Mendonca, J. A., “Tensile Capacity of Short Anchor Bolts and Welded Studs: A Literature Review,” ACI Journal, V. 79, No. 4, July-Aug. 1982, pp. 270-279.
10. Ballarini, R.; Shah, S. P.; and Keer, L. M., “Failure Characteristics of Short Anchor Bolts Embedded in a Brittle Material,” Royal Society, Proceedings, V. 404, No. 1826, London, UK, Mar. 1986, pp. 35-54.
11. Ballarini, R.; Keer, L. M.; and Shah, S. P., “An Analytical Model for the Pull-Out of Rigid Anchors,” International Journal of Fracture, V. 33, No. 2, Feb. 1987, pp. 75-94.
12. Eligehausen, R., and Sawade, G., “Analysis of Anchorage Behaviour (Literature Review),” Fracture Mechanics of Concrete Structures: From Theory to Applications, L. Elfgren, ed., Chapman & Hall, London, UK, 1989, pp. 263-280.
13. Ozbolt, J., and Eligehausen, R., “Fastening Elements in Concrete Structures—Numerical Solutions,” Fracture of Concrete and Rock, Proceedings, 2nd International Conference, H. P. Rossmanith, ed., London, UK, 1992, pp. 527-547.
14. Ozbolt, J.; Eligehausen, R.; and Reinhardt, H. W., “Size Effect on the Concrete Cone Pull-Out Load,” International Journal of Fracture, V. 95, No. 1-4, Jan. 1999, pp. 391-404.
15. CEB, “Fastenings to Concrete and Masonry Structures—State of the Art Report,” Comité Euro-International du Béton, Thomas Telford Services Ltd., London, UK, 1994, 249 pp.
16. UNI ENV, “Eurocode 2—Design of Concrete Structures,” revised version, European Committee for Standardization (CEN), Brussels, Belgium, Mar. 2008, 209 pp.
17. Lee, N. H.; Kim, K. S.; Bang, C. J.; and Park, K. R., “Tensile-Headed Anchors with Large Diameter and Deep Embedment in Concrete,” ACI Structural Journal, V. 104, No. 4, July-Aug. 2007, pp. 479-486.
18. Eligehausen, R., and Balogh, T., “Behavior of Fasteners Loaded in Tension in Cracked Reinforced Concrete,” ACI Structural Journal, V. 92, No. 3, May-June 1995, pp. 365-379.
19. Eligehausen, R.; Mattis, L.; Wollmershauser, R.; and Hoehler, M., “Testing Anchors in Cracked Concrete,” Concrete International, V. 26, No. 7, July 2004, pp. 66-71.
20. Baran, E.; Schultz, A. E.; and French, C. E., “Tension Tests on Cast-In-Place Inserts: The Influence of Reinforcement and Prestress,” PCI Precast/Prestressed Concrete Institute Journal, V. 51, No. 5, Sept.-Oct. 2006, pp. 88-108.
21. Piccinin, R.; Ballarini, R.; and Cattaneo, S., “Linear Elastic Frac-ture Mechanics Pullout Analyses of Headed Anchors in Stressed Concrete,” Journal of Engineering Mechanics, ASCE, V. 136, No. 6, June 2010, pp. 761-768.
22. Piccinin, R.; Ballarini, R.; and Cattaneo, S., “Pullout Capacity of Headed Anchors in Prestressed Concrete,” Journal of Engineering Mechanics, ASCE, V. 138, No. 7, July 2012, pp. 877-887.
23. Piccinin, R., “Effects of Compressive and Tensile Fields on the Load Carrying Capacity of Headed Anchors,” PhD dissertation, University of Minnesota, Minneapolis, MN, Feb. 2011, 205 pp.
Fig. 15—Ratio between experimental and predicted results, average value, and COV as function of lateral confinement.

480 ACI Structural Journal/May-June 2013
NOTES:
ACI Structural Journal/May-June 2013 481
Title no. 110-S38
ACI STRUCTURAL JOURNAL TECHNICAL PAPER
ACI Structural Journal, V. 110, No. 3, May-June 2013.MS No. S-2011-199.R1 received July 29, 2011, and reviewed under Institute
publication policies. Copyright © 2013, American Concrete Institute. All rights reserved, including the making of copies unless permission is obtained from the copyright proprietors. Pertinent discussion including author’s closure, if any, will be published in the March-April 2014 ACI Structural Journal if the discussion is received by November 1, 2013.
Cracking Behavior of Steel Fiber-Reinforced Concrete Members Containing Conventional Reinforcementby Jordon R. Deluce and Frank J. Vecchio
Uniaxial tension tests were conducted on 12 plain reinforced concrete (RC) and 48 large-scale steel fiber-reinforced concrete (SFRC) specimens, each containing conventional longitudinal reinforcement, to study their cracking and tension-stiffening behavior. The test parameters included fiber volumetric content, fiber length and aspect ratio, conventional reinforcement ratio, and steel reinforcing bar diameter. “Dog-bone” tension tests and bending tests were also performed to quantify the tensile proper-ties of the concrete. It was found that the cracking behavior of SFRC was significantly altered by the presence of conventional reinforcement. Crack spacings and crack widths were influenced by the reinforcement ratio and bar diameter of the conventional reinforcing bar, as well as by the volume fraction and aspect ratio of the steel fiber. Details and results of the experimental investiga-tion are provided and discussed.
Keywords: crack spacing; crack spacing formulation; crack width; steel fiber; stiffness; strength; tension; tension stiffening; test.
INTRODUCTIONThe concept of using discrete fibers to improve the perfor-
mance of brittle materials has existed since ancient times, with evidence showing that the ancient Egyptians used straw to improve the cracking behavior of sun-dried mud bricks used in construction (Mansour et al. 2007). Today, the use of steel fibers is becoming increasingly common in the construction industry, with fibers gaining recognition as a reinforcement that can be mixed directly into concrete to improve the tensile behavior and cracking characteristics of this brittle material. In addition, studies have shown that conventional shrinkage and temperature reinforcement can be reduced—and in many cases, eliminated—with the addition of fibers to concrete. While the addition of fibers does not appear to reduce the inherent shrinkage characteristics of the concrete, in sufficient volumes, the fibers can give the material improved cracking characteristics (Susetyo 2009). Fibers can also significantly improve the structural behavior of a member, enhancing post-cracking tensile behavior characteristics and crack control. For example, studies have shown that steel fibers can be used to significantly reduce the amount of transverse shear reinforcement in beams while maintaining the required shear resistance (Casanova et al. 1997).
Several parameters affect the tensile behavior of steel fiber-reinforced concrete (SFRC); primary factors include the volumetric fiber content, fiber geometry, fiber tensile strength, and strength of the concrete matrix. Increasing the fiber content directly increases the number of indi-vidual fibers present in the concrete matrix; an increase in fiber content from 0.5 to 1.0% has been found to increase the direct tensile strength from 1.1 to 1.3 times that of plain concrete and the toughness from 1.8 to 2.7 times that of plain concrete (Shah and Rangan 1971). Using fibers with a high aspect ratio allows for a more efficient use of the material
because each individual fiber can attain larger stresses and thus resist higher loads. However, it must be ensured that the ultimate strength of the fibers is sufficient to avoid rupture. Also, while an increase in the aspect ratio of the fibers does not enhance the cracking strength of concrete, it does improve the post-cracking tensile strength and toughness of the composite material (Shah and Rangan 1971).
The addition of steel fibers has a significant effect on the tensile stress-strain behavior of concrete. In typical dosages, the material exhibits strain-softening behavior, albeit with significantly greater toughness and energy absorp-tion capacity than a plain concrete of the same strength. In addition, the ability of fibers to aid in the transmission of loads across cracks leads to smaller crack widths than with plain concrete; if conventional steel reinforcing bars are present, multiple cracking can occur with crack spac-ings significantly less than with conventional reinforced concrete (RC). Conversely, if the fiber content of an SFRC is sufficiently high, strain-hardening behavior can develop, in which multiple closely spaced cracks will form in the composite with or without the presence of conventional steel reinforcing bars. This results in post-cracking stresses equal to or larger than the cracking stress and greatly enhanced ductility (Chao et al. 2009).
Much research has been performed to investigate the cracking characteristics of SFRC, but only a limited number of specimens containing both steel fibers and conventional steel reinforcing bars (collectively referred to as R/SFRC) have been tested. Abrishami and Mitchell (1997) tested two R/SFRC specimens containing 1.0% of 30 mm (1.18 in.) hooked-end steel fibers by volume. Noghabai (2000) tested three R/SFRC specimens containing 1.0% of 30 mm (1.18 in.) hooked-end steel fibers or 6 mm (0.24 in.) steel microfibers by volume. Bischoff (2003) tested four R/SFRC specimens containing 0.78% of 50 mm (1.97 in.) hooked-end steel fibers by volume, and these were subjected to both monotonic and cyclic loading. While the data generated by these investigations are valuable, the parameters investigated were of limited range.
The research program presented herein sets out to test a comprehensive number of R/SFRC specimens with substan-tially varied parameters to expand the database of test results for this material. The subsequent objective is to study and better quantify the material’s post-cracking characteristics,

482 ACI Structural Journal/May-June 2013
ACI member Jordon R. Deluce is currently employed at Morrison Hershfield Ltd. in Vancouver, BC, Canada. He received his MASc from the Department of Civil Engi-neering at the University of Toronto, Toronto, ON, Canada, in 2011. His research interests include nonlinear analysis and performance assessment of reinforced concrete structures, shear effects in reinforced concrete, and the tensile behavior and cracking characteristics of steel fiber-reinforced concrete.
Frank J. Vecchio, FACI, is a Professor of civil engineering at the University of Toronto. He is a member of Joint ACI-ASCE Committees 441, Reinforced Concrete Columns, and 447, Finite Element Analysis of Concrete Structures. He received the ACI Structural Research Award in 1998, the ACI Structural Engineering Award in 1999, and the Wason Medal for Most Meritorious Paper in 2011. His research inter-ests include advanced constitutive modeling, assessment and rehabilitation of concrete structures, and response under extreme load conditions.
particularly in regard to crack widths and crack spacings, leading to improved design formulations.
RESEARCH SIGNIFICANCEThis paper describes an experimental program in which RC
and R/SFRC specimens were tested under uniaxial tension. The effect of various parameters were investigated, including
fiber content, length, aspect ratio, reinforcing bar diameter, and reinforcement ratio. Although tests like these have been performed previously to a limited extent, none have been as comprehensive in terms of the number of specimens tested or the parameters considered. The results of this investigation can be used to develop improved formulations for crack spac-ings, crack widths, and tension-stiffening behavior of SFRC.
EXPERIMENTAL INVESTIGATIONThis experimental program was designed so that a compre-
hensive database of uniaxial tension tests of RC and R/SFRC could be generated. Special consideration was given to cracking and tension-stiffening behavior. The parameters of the study included fiber content Vf, fiber length lf, fiber aspect ratio lf/df, conventional reinforcement ratio rs, and reinforcing bar diameter db. A total of 12 uniaxial tension RC and 48 uniaxial tension R/SFRC specimens were tested in this program in addition to numerous material tests to quantify the behavior of the concretes used in the different test series. Complete details of the experimental program and the full experimental results are provided by Deluce (2011).
Uniaxial tension RC and R/SFRC test specimen configurations
A total of six test series were cast and tested: one nonfi-brous control series (PC) and five series containing steel fibers (refer to Table 1). Three types of hooked-end steel fibers were used in this experimental program in varied volumetric contents. For Series FRC1, FRC2, and FRC3, fibers 30 mm (1.18 in.) long and 0.38 mm (0.015 in.) in diam-eter were added to the concrete for volumetric contents of 0.5%, 1.0%, and 1.5%, respectively; the fibers had a manu-facturer-specified rupture strength of 2300 MPa (334 ksi). Test Series FRC4 contained 1.5% steel fibers by volume, in which the fibers were 30 mm (1.18 in.) long and 0.55 mm (0.022 in.) in diameter with a specified tensile strength of 1100 MPa (160 ksi). Test Series FRC5 also contained 1.5% steel fibers by volume, with fibers 50 mm (1.97 in.) long and 1.05 mm (0.041 in.) in diameter and with a speci-fied tensile strength of 1000 MPa (145 ksi).
Each RC and R/SFRC test specimen consisted of a concrete prism, square in cross section and 1000 mm (39.4 in.) in length, cast around a single deformed steel reinforcing bar that was 1500 mm (59.1 in.) in length, such that 250 mm (9.84 in.) of the bar protruded from each end of the concrete section for gripping in the testing rig (refer to Fig. 1). The square concrete cross sections varied from 50 x 50 mm (1.97 x 1.97 in.) to 200 x 200 mm (7.87 x 7.87 in.), while the deformed steel reinforcing bar sizes varied from 10M to 30M (Canadian bar sizes). The properties of the reinforcing bars used in this experimental program are reported in Table 2, and the geometric configurations of the specimens are noted in Table 3. The combinations of concrete cross sections and reinforcing bar sizes used generated reinforcement ratios ranging from 1.33 to 4.00%, which simulate a range of struc-tural configurations found in practice. Although it is common to have reinforcement ratios less than 1.33% in practice, it was not practical to do so in this test program because the transfer of loads across cracks by fibers would make it diffi-cult to yield the reinforcing bar within the concrete section before it ruptured outside of the concrete section.
It must also be noted that each RC and R/SFRC test spec-imen configuration was repeated in a duplicate specimen (the two specimens for each configuration were differenti-
Table 1—Fiber parameters of concretes used
Concrete type Vf, % lf, mm df, mm lf /df sfu, MPa
PC 0.0 — — — —
FRC1 0.5 30 0.38 79 2300
FRC2 1.0 30 0.38 79 2300
FRC3 1.5 30 0.38 79 2300
FRC4 1.5 30 0.55 55 1100
FRC5 1.5 50 1.05 48 1000
Notes: 1 mm = 0.0394 in.; 1 MPa = 145 psi.
Fig. 1—Conventionally reinforced direct tension specimen: (a) instrumentation and dimensions; and (b) test setup.

ACI Structural Journal/May-June 2013 483
ated as S1 and S2). Because tension tests are prone to scatter in their results, the duplicate specimens were meant to be a measure of the degree of variation between test results.
Material testsA number of material tests were conducted to quantify the
material behavior of the concretes used in the RC and R/SFRC direct tension tests. Standard tests on 150 x 300 mm (6.0 x 12.0 in.) concrete cylinders were conducted to obtain a measure of the compressive strength of the material. These values were also used as a measure from which other material properties, such as the modulus of elasticity, could be esti-mated. In addition to cylinder tests, free shrinkage prism tests were conducted to estimate the restrained shrinkage within the RC and R/SFRC specimens. In the direct tension RC and R/SFRC specimens, restrained shrinkage effects were significant because both the free shrinkage strains and reinforcement ratios were quite high. From the free shrinkage strains, the shrinkage-induced offset strain could be calcu-lated, which was necessary for the conversion of observed specimen elongations to net concrete strains. The shrinkage-induced offset strain was the total strain of a convention-ally reinforced RC or R/SFRC specimen immediately prior to testing, which took into account the shrinkage of the concrete as well as the restraining action of the reinforcing bar. Given the conventional reinforcement ratio and free shrinkage strain of concrete, this offset strain was calcu-lated using the principles of equilibrium (Deluce 2011). The cylinder compressive strengths and free shrinkage strains can be found in Table 3.
Because the primary focus of this experimental investiga-tion was the tension response of the RC and R/SFRC speci-mens, it was advantageous to perform additional material tests related to measures of the direct and flexural tensile strengths of the concretes used. The flexural tensile strength tests were performed on beams 150 x 150 mm (6.0 x 6.0 in.) in cross section and 533 mm (21.0 in.) in length. The span length was 450 mm (18.0 in.). Two types of bending tests were performed. The first consisted of a four-point loading configuration, with the points spaced at 150 mm (6.0 in.). The second consisted of a three-point loading system with a 25 mm (1.0 in.) deep notch cut at midspan. The notch was instrumented with a linear variable differential transformer (LVDT) on each side of the beam to obtain plots of stress versus crack mouth opening displacement; summary plots are provided by Deluce (2011). The modulus of rupture values for these beam tests are reported in Table 4 for values at initial cracking and at peak load. It should be noted that the peak tensile stresses observed in the PC specimens were larger than some of those observed in the FRC specimens. This was because the plain concrete mixture had inherently higher compressive and tensile strength than the SFRC mixtures used in the study. Although the addition of steel
Table 2—Properties of steel reinforcing bars
Reinforcing bar As, mm2 db, mm Es, GPa fy, MPa Esh, GPa esh, × 10–3 fult, MPa eult, × 10–3
10M 100 11.3 199 442 3.78 27.0 564 164.0
20M-1* 300 19.5 194 456 3.63 21.2 592 144.2
20M-2* 300 19.5 188 525 3.93 17.3 653 111.6
30M 700 29.9 187 376 3.97 11.0 558 177.0*20M bars came from two different production heats. Notes: 1 mm = 0.0394 in.; 1 MPa = 145 psi; 1 mm2 = 0.00155 in.2; 1 GPa = 145 ksi.
Table 3—Geometric properties, compressive strength, and free shrinkage strain of specimens
Specimen nameb,
mmReinforcing
bar type rs, % fc′, MPaec,shr, × 10–3
PC-50/10-S1,S2 50 10M 4.00 91.8 –0.31
PC-80/10-S1,S2 80 10M 1.56 91.7 –0.31
PC-100/20-S1,S2 100 20M-1 3.00 92.2 –0.31
PC-150/20-S1,S2 150 20M-1 1.33 92.6 –0.38
PC-150/30-S1,S2 150 30M 3.11 91.9 –0.31
PC-200/30-S1,S2 200 30M 1.7595.0S1 95.6S2 NA
FRC1-50/10-S1,S2 50 10M 4.0087.2S1 93.3S2 –0.55
FRC1-80/10-S1,S2 80 10M 1.56 79.2 –0.60
FRC1-100/20-S1,S2 100 20M-1 3.00 91.4 –0.54
FRC1-150/20-S1,S2 150 20M-1 1.33 81.8 –0.60
FRC1-150/30-S1,S2 150 30M 3.11 55.8 NA
FRC1-200/30-S1,S2 200 30M 1.7562.1S1 69.4S2
–0.55S1 –0.49S2
FRC2-50/10-S1,S2 50 10M 4.00 57.8 NA
FRC2-80/10-S1,S2 80 10M 1.56 57.5 NA
FRC2-100/20-S1,S2 100 20M-1 3.00 58.1 NA
FRC2-150/20-S1,S2 150 20M-1 1.33 45.2 –0.83
FRC2-150/30-S1,S2 150 30M 3.11 55.0 –0.76
FRC2-200/30-S1,S2 200 30M 1.7559.4S1 63.4S2
NAS1 –0.63S2
FRC3-50/10-S1,S2 50 10M 4.0052.0S1 52.6S2 –0.83
FRC3-80/10-S1,S2 80 10M 1.5652.6S1 53.2S2 –0.83
FRC3-100/20-S1,S2 10020M-1S1 20M-2S2 3.00 62.0 –0.78
FRC3-150/20-S1,S2 150 20M-1 1.33 62.0 –0.78
FRC3-150/30-S1,S2 150 30M 3.11 46.0 –0.81
FRC3-200/30-S1,S2 200 30M 1.75 63.1 –0.77
FRC4-150/20-S1,S2 150 20M-2 1.33 52.8 –0.71
FRC4-150/30-S1,S2 150 30M 3.11 32.5 –0.77
FRC4-200/30-S1,S2 200 30M 1.75 46.5 –0.72
FRC5-150/20-S1,S2 150 20M-1 1.33 78.8 –0.42
FRC5-150/30-S1 150 30M 3.11 77.0 –0.49
FRC5-200/30-S1,S2 200 30M 1.75 70.3 –0.40S1: Value refers to Specimen S1. S2: Value refers to Specimen S2. Notes: 1 mm = 0.0394 in.; 1 MPa = 145 psi; NA is not available.

484 ACI Structural Journal/May-June 2013
fibers improved the ductility of the material, only when they were introduced to the mixture in sufficient quantity to allow strain hardening to occur did the tensile strengths become larger than those observed for plain concrete.
In addition to the indirect flexural tensile strength tests, uniaxial tension “dog-bone” tests were also performed. These test specimens contained no conventional steel reinforcement and were 500 mm (19.7 in.) in total length with a reduced cross section of 100 x 70 mm (3.94 x 2.76 in.) over a length of 200 mm (7.87 in.). Each “dog-bone” spec-imen was instrumented with four LVDTs to obtain a load-elongation plot of the response. A 245 kN (55 kip) MTS universal testing machine was used, and the specimens were fixed to the testing machine using rotating joints to mini-mize bending moments. “Dog-bone” specimens were cast for each type of SFRC. The test setup is shown in Fig. 2.
Table 4 reports the values of stress and strain at cracking, the peak values of stress and strain (if greater than those at cracking), and the initial modulus of elasticity of the speci-mens. It can be seen from Table 4 that the mechanical prop-erties of several specimens were identical; this was because concrete from a single batch would be used to fabricate multiple specimens.
Uniaxial tension RC and R/SFRC test setup and instrumentation
Each RC and R/SFRC test specimen was instrumented with four LVDTs. One LVDT was located on each side of the specimen so that differences in the readings of the various LVDTs allowed for the determination of unintended flexural effects. A gauge length of 950 mm (37.4 in.) was used for the LVDTs.
Table 4—Concrete tensile properties of specimens
Specimen name
Bending tests “Dog-bone” tests
fr,crack, MPa fr,peak, MPa ft′, MPa et′, × 10–3 ftu, MPa etu, × 10–3 Ect, GPa
PC-50/10-S1,S2 5.90 — NA NA NA NA NA
PC-80/10-S1,S2 5.90 — NA NA NA NA NA
PC-100/20-S1,S2 6.83 — NA NA NA NA NA
PC-150/20-S1,S2 6.83 — NA NA NA NA NA
PC-150/30-S1,S2 5.90 — NA NA NA NA NA
PC-200/30-S1,S2 7.24S1; 6.77S2 —S1; —S2 NA NA NA NA NA
FRC1-50/10-S1,S2 5.12 5.76 NA NA NA NA NA
FRC1-80/10-S1,S2 4.28 5.48 3.62 0.141 — — 42.5
FRC1-100/20-S1,S2 NA NA 3.28 0.137 — — 33.9
FRC1-150/20-S1,S2 6.00 9.60 NA NA NA NA NA
FRC1-150/30-S1,S2 NA NA 3.85 0.121 — — 41.4
FRC1-200/30-S1,S2 4.28S1; 5.12S2 5.48S1; 5.76S2 3.62S1; NAS2 0.141S1; NAS2 —S1; NAS2 —S1; NAS2 42.5S1; NAS2
FRC2-50/10-S1,S2 5.63 10.43 3.41 0.185 3.66 0.583 26.5
FRC2-80/10-S1,S2 5.63 10.43 3.41 0.185 3.66 0.583 26.5
FRC2-100/20-S1,S2 5.63 10.43 3.41 0.185 3.66 0.583 26.5
FRC2-150/20-S1,S2 5.64 7.22 NA NA NA NA NA
FRC2-150/30-S1,S2 NA NA 3.26 0.142 3.29 0.673 34.2
FRC2-200/30-S1,S2 5.63S1; 5.48S2 10.43S1; 7.18S2 3.41S1; 3.56S2 0.185S1; 0.201S2 3.66S1; —S2 0.583S1; —S2 26.5S1; 27.5S2
FRC3-50/10-S1,S2 6.54 8.30 3.12 0.127 3.14 0.591 33.0
FRC3-80/10-S1,S2 6.54 8.30 3.12 0.127 3.14 0.591 33.0
FRC3-100/20-S1,S2 5.64 7.28 3.40 0.242 4.35 3.621 26.7
FRC3-150/20-S1,S2 5.64 7.28 3.40 0.242 4.35 3.621 26.7
FRC3-150/30-S1,S2 6.54 8.30 3.12 0.127 3.14 0.591 33.0
FRC3-200/30-S1,S2 5.94 7.72 NA NA NA NA NA
FRC4-150/20-S1,S2 4.93 5.46 2.90 0.244 — — 22.1
FRC4-150/30-S1,S2 4.25 4.74 2.58 0.210 2.64 0.493 20.1
FRC4-200/30-S1,S2 5.01 7.10 3.16 0.204 3.24 0.266 23.3
FRC5-150/20-S1,S2 6.25 8.69 3.15 0.148 — — 29.6
FRC5-150/30-S1 4.61 6.09 3.06 0.129 — — 35.3
FRC5-200/30-S1,S2 NA NA 3.37 0.123 — — 45.8
S1: Value refers to Specimen S1. S2: Value refers to Specimen S2. Notes: 1 MPa = 145 psi; 1 GPa = 145 ksi; NA is not available.

ACI Structural Journal/May-June 2013 485
For testing, the specimens were loaded vertically into a 1000 kN (225 kip) capacity MTS universal testing machine, and the protruding steel reinforcing bar from both ends of the specimens were gripped. The specimens were loaded in tension at a rate of 0.0015 mm/s (59 × 10–6 in./s) up to the observance of the first crack, after which the loading rate was increased to 0.0025 mm/s (98 × 10–6 in./s). The loading rate was gradually increased to 0.004 mm/s (157 × 10–6 in./s) prior to the yielding of the reinforcing bar. After the onset of reinforcing bar yielding, the loading rate was increased to 0.040 mm/s (1.57 × 10⁻³ in./s). The load was transmitted using flat grips for the 10M and 20M reinforcing bars and with V-grips for the 30M bars.
In a typical test, loading was paused at periodic load stages to mark crack locations, measure crack widths with a crack width comparator, and take photographs. The first load stage occurred at the observance of the first crack, while the second and third stages occurred prior to reinforcing bar yielding. The fourth stage was taken at the onset of reinforcing bar yielding within the concrete region of the specimen, while the fifth and sixth stages were taken at points farther into the region of plastic behavior. Occasion-ally, specimens were precracked due to shrinkage; if this was the case, the shrinkage cracks were measured and marked as an additional load stage at the start of the test.
TEST RESULTSTypical specimen behavior
Plots of load, mean crack spacing, and maximum crack width versus elongation of a typical nonfibrous RC spec-
Fig. 2—“Dog-bone” test setup.
Fig. 3—Typical behavior of uniaxial RC and R/SFRC tension specimens: (a) axial load versus elongation; (b) mean crack spacing versus elongation; and (c) maximum crack width versus elongation.
imen and a typical R/SFRC specimen are shown in Fig. 3. In an RC specimen, the elastic stiffness remained relatively high until the initial crack occurred, at which point tension-stiffening behavior initiated and the stiffness reduced significantly. Because no fibers were present to transmit loads across cracks, the load-deformation response quickly

486 ACI Structural Journal/May-June 2013
approached that of the bare bar and the maximum load was limited by the yield strength of the bare steel reinforcing bar (refer to Fig. 3(a)). Numerous transverse tensile cracks developed over the course of the tension-stiffening behavior regime as the mean crack spacing gradually decreased (refer to Fig. 3(b)). However, once the steel reinforcing bar began to yield, the strains tended to concentrate at one or two domi-nant cracks, causing the widths of these dominant cracks to increase rapidly (refer to Fig. 3(c)).
In a typical R/SFRC specimen, the uncracked response was similar to that of a nonfibrous specimen. However, it must be noted that the SFRC used in this experimental program experienced particularly large shrinkage strains because of the large quantity of chemical admixtures and supplementary cementitious materials used in the mixture. This caused the apparent cracking load to decrease relative to that of a nonfi-brous concrete specimen. In addition, the shrinkage strains caused the apparent elongations relating to the onset of
cracking and the onset of plastic behavior to decrease, shifting the load-elongation curve to the left (refer to Fig. 3(a)). Note that these initial shrinkage effects are accounted for in the following sections of this paper by including the shrinkage-induced offset strain, calculated from the shrinkage strains measured in the free-shrinkage prisms.
The tension-stiffening behavior of the R/SFRC specimens was more pronounced than that of the RC specimens; thus, the post-cracking reduction in load-carrying capacity was significantly more gradual for R/SFRC than in the RC speci-mens. In addition, the presence of steel fibers allowed the ultimate load of the specimen to not be limited by the yield strength of the reinforcing bar, and forces larger than that that would cause reinforcing bar yielding were routinely seen. In fact, for some specimens with small reinforcement ratios, the reinforcing bar extending from the concrete section at the ends of the specimen would rupture prior to the yielding of the reinforcing bar within the concrete section because the additional load-carrying capacity provided by the fibers was greater than the difference between the yield load and rupture load of the reinforcing bar. However, for the vast majority of specimens in which yielding occurred within the concrete section, the specimen deformations tended to concentrate at one or two cracks post-yield.
Transverse cracks developed through the tension-stiff-ening phase of behavior. The transverse cracks in the R/SFRC specimens were significantly more numerous and closely spaced than those of the RC specimens because of the ability of SFRC to transmit loads across cracks (refer to Fig. 3(b)). In the service range of specimen behavior, the maximum crack widths exhibited by the R/SFRC specimens were significantly lower than those for nonfibrous concrete (refer to Fig. 3(c)). However, the post-yield localization of deformations at cracks was more pronounced in the R/SFRC specimens than in those not containing fibers. This is because once crack widths progressed beyond a certain threshold, fibers began to pull out, and the ability of the fibers to bridge the cracks began to decrease. This essentially caused the weakest section of the specimen to become even weaker, ensuring further local yielding of the reinforcing bar at this crack location. However, once the strain in the reinforcing bar progressed to the strain-hardening regime, the increased load-carrying capacity of the bar overcame the loss of the fibers in some instances and increased the resis-tance of the section at the first dominant crack to the point that localization began to occur at a second dominant crack. Some splitting cracks were detected in both the R/SFRC and RC specimens; however, these were determined to have little effect on the tensile behavior of the specimens.
Observed trends in behaviorAs the geometric and material parameters were varied
with different specimens, the effect of these parameters on the cracking behavior could be investigated. Table 5 presents the mean crack spacings at the onset of stabilized cracking and the maximum crack widths just prior to the yielding of the reinforcing bar for each RC and R/SFRC specimen. Figure 4 shows the effect of varying reinforcement ratio and reinforcing bar diameter on the mean crack spacing and maximum crack width of the nonfibrous PC specimens. It can be seen from Fig. 4(a) and (b) that as the conventional reinforcement ratio increased, the mean crack spacing and maximum crack width decreased at a given net concrete strain. This occurred because an RC member with a large
Table 5—Test results: cracking behavior
Specimen
Sm, mm wmax, mm
S1 S2 S1 S2
PC-50/10 50 48 0.163 0.175
PC-80/10 98 97 0.488 0.313
PC-100/20 100 102 0.475 0.425
PC-150/20 134 126 0.575 0.613
PC-150/30 121 144 0.438 0.450
PC-200/30 155 146 0.563 0.600
FRC1-50/10 42 37 0.188 0.175
FRC1-80/10 46 47 0.225 0.188
FRC1-100/20 55 51 0.238 0.263
FRC1-150/20 61 59 0.513 0.238
FRC1-150/30 65 67 0.500 0.400
FRC1-200/30 79 69 0.538 0.675
FRC2-50/10 41 37 0.425 0.275
FRC2-80/10 45 44 0.300 0.238
FRC2-100/20 31 36 0.363 0.288
FRC2-150/20 70 53 0.325 0.188
FRC2-150/30 53 44 0.388 0.163
FRC2-200/30 55 61 0.200 0.575
FRC3-50/10 38 34 0.325 0.188
FRC3-80/10 40 39 0.200 0.238
FRC3-100/20 46 37 0.588 0.550
FRC3-150/20 64 49 0.613 0.538
FRC3-150/30 59 52 0.363 0.188
FRC3-200/30 49 66 0.438 0.313
FRC4-150/20 88 75 0.388 0.325
FRC4-150/30 62 59 0.388 0.225
FRC4-200/30 89 87 0.200 0.338
FRC5-150/20 76 61 0.363 0.525
FRC5-150/30 68 NA 0.250 NA
FRC5-200/30 85 75 0.488 0.363
Notes: 1 mm = 0.0394 in.; NA is not available.

ACI Structural Journal/May-June 2013 487
Fig. 4—Effect of reinforcing ratio and reinforcing bar diameter on mean crack spacing and maximum crack width for PC specimens (Vf = 0.0%): (a) effect of reinforcement ratio on mean crack spacing; (b) effect of reinforcement ratio on maximum crack width; (c) effect of reinforcing bar diameter on mean crack spacing; and (d) effect of reinforcing bar diameter on maximum crack width.
amount of reinforcing steel generates less stress in its reinforcing bars when it transfers the concrete load across cracks. A lower stress in the reinforcing bar at a crack loca-tion translates to a shorter development length and thus shorter crack spacings, as well as a lower strain at the crack and thus smaller crack widths.
Figures 4(c) and (d) demonstrate the effect of changing the reinforcing bar diameter on the mean crack spacing and maximum crack width. The specimen configurations in these figures were chosen because while the reinforcing bar size varied, the reinforcement ratio remained rela-tively uniform. It can be seen that the mean crack spacing and maximum crack width increased as the reinforcing bar diameter increased. This occurred because as the bar size increases for a given reinforcement ratio, the ratio of cross-sectional bar perimeter to bar area decreases. Because the development length is a function of the cross-sectional bar perimeter, if the reinforcement ratio remains unchanged, larger bars require a longer development length to develop the localized stress in the reinforcing bar at a crack location. This translates into the larger crack spacings and widths seen in Fig. 4(c) and (d).
Figure 5 demonstrates the effect of reinforcement ratio and reinforcing bar diameter on the mean crack spacings and maximum crack widths of the FRC1 specimens containing
0.5% steel fibers, which were 30 mm (1.18 in.) long and 0.38 mm (0.015 in.) in diameter. The same trends observed in Fig. 4 for RC specimens were again evident in the SFRC specimens: as the reinforcement ratio increased, the mean crack spacings and maximum crack widths decreased; and while the bar diameter increased for a given reinforcement ratio, the mean crack spacings and maximum crack widths increased as well. The same mechanisms that caused this behavior in the nonfibrous PC specimens also influenced the behavior of the R/SFRC specimens.
Figure 6 demonstrates the effect of varying the fiber content and fiber type on the cracking behavior of the R/SFRC specimens. Figures 6(a) and (b) demonstrate the effect of varying the fiber content on the mean crack spacing and maximum crack width, respectively. It can be seen from Fig. 6(a) that as the fiber content increased, the mean crack spacing decreased. It can also be seen from Fig. 6(b) that as the fiber content increased, the maximum crack width decreased. These two tendencies occurred because as the fiber content increased, more fibers were available to transmit loads across cracks in the concrete. As the number of fibers bridging the crack increased, a larger load was maintained by the fibers across the crack, which reduced the load resisted by the conventional reinforcing bar. As the load resisted by the reinforcing bar decreased, a shorter development length

488 ACI Structural Journal/May-June 2013
Fig. 5—Effect of reinforcing ratio and reinforcing bar diameter on mean crack spacing and maximum crack width for FRC1 specimens (Vf = 0.5%, lf = 30 mm, df = 0.38 mm, lf/df = 79): (a) effect of reinforcement ratio on mean crack spacing; (b) effect of reinforcement ratio on maximum crack width; (c) effect of reinforcing bar diameter on mean crack spacing; and (d) effect of reinforcing bar diameter on maximum crack width.
Fig. 6—Effect of fiber parameters on mean crack spacing and maximum crack width: (a) effect of fiber-volume content Vf on mean crack spacing; (b) effect of fiber-volume content Vf on maximum crack width; (c) effect of fiber geometry on mean crack spacing; and (d) effect of fiber geometry on maximum crack width.

ACI Structural Journal/May-June 2013 489
was required and more closely spaced cracks could develop. The reduction in the reinforcing bar load caused by fibers also had the effect of decreasing the crack widths because as more fibers bridged a crack, the reinforcing bar experi-enced lower strains and, on average, the fibers experienced less slip, resulting in a smaller localized elongation at the crack location.
Figures 6(c) and (d) demonstrate the effect of changing the fiber type on the cracking behavior. These figures plot the averaged cracking behavior of: FRC3-200/30, which contained 1.5% of steel fibers 30 mm (1.18 in.) long, 0.38 mm (0.015 in.) in diameter (aspect ratio of 79), having a rupture strength of 2300 MPa (334 ksi); FRC4-200/30, which contained 1.5% of steel fibers 30 mm (1.18 in.) long, 0.55 mm (0.022 in.) in diameter (aspect ratio of 55), having a rupture strength of 1100 MPa (160 ksi); and FRC5-200/30, which contained 1.5% of steel fibers 50 mm (1.97 in.) long, 1.05 mm (0.041 in.) in diameter (aspect ratio of 48), having a rupture strength of 1000 MPa (145 ksi). It can be seen that for R/SFRC specimens, which had concretes that contained fibers of the same length but differing aspect ratios (FRC3 and FRC4), the specimens with the higher aspect ratio had smaller mean crack spacings and widths. This was because fibers that had the same length but differing aspect ratios had different ratios of cross-sectional perim-eter to area; although fibers that had a higher aspect ratio had a smaller diameter, there were a greater number of them in the concrete matrix as long as the fiber content remained constant. These smaller-diameter fibers required a shorter development length to achieve a relatively high fraction of their ultimate strength, which resulted in a more efficient use of fibers. Therefore, the total fiber load component was greater for those fibers that had a higher aspect ratio, and this reduced the stress and strain of the conventional reinforcing bars as well as the crack spacings and widths. It must also be noted that to achieve this higher fiber efficiency, the fiber strength must be sufficient to avoid rupture; in this experi-mental program, no fiber rupture was detected. It can also be seen from Fig. 6(c) and (d) that R/SFRC specimens that contained fibers of differing lengths but similar aspect ratios (FRC4 and FRC5) behaved quite similarly in regard to both mean crack spacing and maximum crack width. The inherent conclusion is that for a given aspect ratio, fiber length has little effect on the cracking behavior of the R/SFRC speci-mens. However, it should be noted that this observation may not remain true if the crack spacing is small enough for a single fiber to bridge multiple cracks.
Examination of crack spacing formulationsA number of crack spacing formulations for SFRC
can be found in literature. One of the most frequently used formulations was proposed by RILEM Committee TC 162 (Dupont and Vandewalle 2003). This model modi-fies the Eurocode 2 formulation for nonfibrous concrete by a factor that accounts for the reduction in mean crack spacing caused by increasing fiber aspect ratio
1 25050 0.25 b
meff f f
ds k k
l d
= + r (1)
where [50/(lf /df)] ≤ 1.0. The variable sm is the mean crack spacing of the specimen (mm); k1 is a factor accounting for the bond characteristics of reinforcing bars; k2 is a factor
accounting for strain gradient effects; db is the conventional reinforcing bar diameter (mm); reff is the effective reinforce-ment ratio of conventional reinforcing bar; lf is the fiber length (mm); and df is the fiber diameter (mm). The variable reff can be calculated as the ratio of the cross-sectional area of the embedded tension reinforcement to the cross-sectional area of the effective embedment zone of concrete in tension, which extends from the longitudinal reinforcing bars to a distance of 7.5db in all directions. The factor k1 can be taken as 0.8 for deformed reinforcing bars and 1.6 for smooth bars. The factor k2 can be calculated from the following equation
( )1 22
12k
e + e=
e (2)
where e1 and e2 are the largest and smallest tensile strains in the specimen, respectively.
The primary weakness of this model is that it does not consider the effect of the volumetric fiber content; whether the fiber content is 0.1% or 5.0%, the prediction for mean crack spacing remains constant.
An alternative crack spacing model was proposed by Moffatt (2001), modifying the Eurocode 2 crack spacing formulation by a factor that reduces the crack spacing based on the ratio of the post-cracking residual stress of SFRC to the cracking stress
1 250 0.25 1b resm
eff cr
d fs k k
f
= + − r (3)
where fres is the post-cracking residual concrete stress (MPa); fcr is the cracking stress of the concrete (MPa); and the other terms are as defined for Eq. (1). Note that this formulation is only applicable to strain-softening materials.
Although the post-cracking residual stress fres can be easily determined from standard material tests, the prediction of this value without tests is not straightforward. Therefore, its use in the prediction of behavior or for design purposes is not recommended unless the post-cracking residual stress is known with confidence.
Plots of the crack spacings predicted by the RILEM TC 162 and Moffatt (2001) Models against those observed in this experimental program are presented in Fig. 7(a) and (b), respectively. It is evident that neither model predicts the crack spacings adequately, and an improved formulation is required. Current work is progressing in this regard.
CONCLUSIONSThe observations made through this experimental program
have led to the following conclusions:1. Steel fibers added to concrete reinforced with conven-
tional reinforcing bars improve the cracking characteristics and tension-stiffening behavior of the material compared to nonfibrous RC.
2. Steel fibers can increase the post-yield load-carrying capacity of a uniaxial concrete tension member reinforced with conventional reinforcement to levels significantly higher than the bare-bar yield load.
3. An increase in fiber content tends to decrease the mean crack spacings and maximum crack widths of SFRC reinforced with conventional steel reinforcing bars.

490 ACI Structural Journal/May-June 2013
Fig. 7—Results of common crack spacing formulations for R/SFRC: (a) RILEM TC 162; and (b) Moffatt (2001).
4. An increase in fiber aspect ratio tends to decrease the mean crack spacings and maximum crack widths of SFRC reinforced with conventional steel reinforcing bars.
5. An increase in reinforcement ratio of the conven-tional steel reinforcing bar decreases the mean crack spacings and maximum crack widths of both SFRC and nonfibrous concrete.
6. For a given reinforcement ratio, an increase in the conventional reinforcing bar diameter increases the mean crack spacings and maximum crack widths of both SFRC and nonfibrous concrete.
7. Fiber length does not appear to play a significant role in the post-cracking behavior of SFRC containing conventional reinforcing bars, provided that the crack spacing is not so short that a fiber bridges multiple cracks.
8. The currently available crack spacing models are not adequate for calculating the mean crack spacing of R/SFRC members. Improved formulations are required.
ACKNOWLEDGMENTSThis project was funded by the National Sciences and Engineering
Research Council of Canada (NSERC) under the Engage Grant program, with Bekaert Canada Ltd. being the industrial collaborator. The authors would like to gratefully acknowledge the funding provided by NSERC. In addition, generous material donations were made by N.V. Bekaert S.A., Sika Canada Inc., Holcim Canada Inc., Dufferin Aggregates, and BASF Canada. This project was part of a collaborative program undertaken jointly with the University of Brescia; their participation is also gratefully acknowledged.
NOTATIONAs = cross-sectional area of conventional steel reinforcing bars in
tension memberb = specimen widthdb = conventional reinforcing bar diameterdf = fiber diameterEct = tensile modulus of elasticity of concreteEs = modulus of elasticity of steelEsh = initial strain-hardening modulus of elasticity of steelfc′ = peak concrete compression cylinder strengthfcr = concrete cracking stressfr,crack = flexural tensile stress at onset of crackingfres = post-cracking residual tensile stressfr,peak = maximum post-cracking flexural tensile stressft′ = concrete cracking stressftu = maximum post-peak concrete tensile stressfult = ultimate strength of steelfy = yield strength of steelk1 = factor accounting for effect of bond characteristics of conven-
tional reinforcing bars on cracking behaviork2 = factor accounting for strain gradient effects on cracking behaviorlf = fiber length
sm = mean stabilized crack spacingsm,exp = experimentally observed stabilized mean crack spacingsm,pred = predicted stabilized mean crack spacingT = tensile forceVf = volumetric fiber contentwmax = maximum crack widthDL = elongatione1 = largest tensile stress through specimen cross sectione2 = smallest tensile stress through specimen cross sectionecf = net concrete strainec,shr = concrete free-shrinkage strainesh = strain at onset of strain-hardening behavior of steelet′ = concrete cracking strainetu = strain corresponding to maximum post-peak concrete tensile stresseult = strain corresponding to ultimate strength of steelreff = effective reinforcement ratiors = conventional reinforcement ratiosf = fiber rupture strength
REFERENCESAbrishami, H. H., and Mitchell, D., 1997, “Influence of Steel Fibers on Tension
Stiffening,” ACI Structural Journal, V. 94, No. 6, Nov.-Dec., pp. 769-776.Bischoff, P. H., 2003, “Tension Stiffening and Cracking of Steel Fiber-
Reinforced Concrete,” Journal of Materials in Civil Engineering, ASCE, V. 15, No. 2, Apr., pp. 174-182.
Casanova, P.; Rossi, P.; and Schaller, I., 1997, “Can Steel Fibers Replace Transverse Reinforcements in Reinforced Concrete Beams?” ACI Materials Journal, V. 94, No. 5, Sept.-Oct., pp. 341-354.
Chao, S. H.; Naaman, A. E.; and Parra-Montesinos, G. J., 2009, “Bond Behavior of Reinforcing Bars in Tensile Strain-Hardening Fiber-Reinforced Cement Composites,” ACI Structural Journal, V. 106, No. 6, Nov.-Dec., pp. 897-906.
Deluce, J., 2011, “Cracking Behaviour of Steel Fibre Reinforced Concrete Containing Conventional Steel Reinforcement,” MASc thesis, University of Toronto, Toronto, ON, Canada, 506 pp., www.civ.utoronto.ca/vector/theses.html.
Dupont, D., and Vandewalle, L., 2003, “Calculation of Crack Widths with the s-e Method,” Test and Design Methods for Steel Fibre Reinforced Concrete: Background and Experiences—Proceedings of the RILEM TC162-TDF Workshop, RILEM Technical Committee 162-TDF, Bochum, Germany, pp. 119-144.
Mansour, A.; Srebic, J.; and Burley, B. J., 2007, “Development of Straw-Cement Composite Sustainable Building Material for Low-Cost Housing in Egypt,” Journal of Applied Sciences Research, V. 3, No. 11, pp. 1571-1580.
Moffatt, K., 2001, “Analyse de Dalles de Pont avec Armature Réduite et Béton de Fibres Metalliques,” MScA thesis, École Polytechnique de Montréal, Montréal, QC, Canada, 248 pp. (in French)
Noghabai, K., 2000, “Behavior of Tie Elements of Plain and Fibrous Concrete and Varying Cross Sections,” ACI Structural Journal, V. 97, No. 2, Mar.-Apr., pp. 277-285.
Shah, S. P., and Rangan, B. V., 1971, “Fiber Reinforced Concrete Prop-erties,” ACI Journal, V. 68, No. 2, Feb., pp. 126-137.
Susetyo, J., 2009, “Fibre Reinforcement for Shrinkage Crack Control in Prestressed, Precast Segmental Bridges,” PhD dissertation, University of Toronto, Toronto, ON, Canada, 532 pp., www.civ.utoronto.ca/vector/theses.html.

ACI Structural Journal/May-June 2013 491
Title no. 110-S39
ACI STRUCTURAL JOURNAL TECHNICAL PAPER
ACI Structural Journal, V. 110, No. 3, May-June 2013.MS No. S-2011-204.R1 received July 11, 2011, and reviewed under Institute
publication policies. Copyright © 2013, American Concrete Institute. All rights reserved, including the making of copies unless permission is obtained from the copyright proprietors. Pertinent discussion including author’s closure, if any, will be published in the March-April 2014 ACI Structural Journal if the discussion is received by November 1, 2013.
Performance of AASHTO-Type Bridge Model Prestressed with Carbon Fiber-Reinforced Polymer Reinforcementby Nabil Grace, Kenichi Ushijima, Vasant Matsagar, and Chenglin Wu
Carbon fiber-reinforced polymer (CFRP) composite material has been widely studied and applied in bridge engineering as an alter-native solution to the corrosion-related problems posed by steel reinforcement. Nevertheless, adoption of CFRP reinforcement to replace conventional steel reinforcement in highway bridges has not been fully realized yet in the field. Therefore, large-scale experimental investigations on bridges with CFRP reinforcement are essential to encourage its widespread application in highway bridges. This paper presents an experimental investigation conducted on a one-third-scale AASHTO-type bridge model prestressed with carbon fiber composite cable (CFCC) strands. The bridge model was designed, constructed, instrumented, and tested to thoroughly investigate its flexural behavior, strain response, and ultimate load failure. A separate one-third-scale single AASHTO-type I-beam was also constructed and tested to study its flexural and shear behavior as a control beam. In general, both the control beam and the bridge model experienced compression-controlled failure as anticipated. Significant cracking and deflection were experienced prior to failure. The ultimate strength of the control beam and the bridge model were in close agreement with the values estimated using the Unified Design Approach.
Keywords: AASHTO; carbon fiber composite cable; carbon fiber-reinforced polymer; ductility; fiber-reinforced polymer; flexure; prestress; reinforcement.
INTRODUCTIONCorrosion of steel strands and reinforcement is one of the
major reasons the structural integrity of prestressed concrete bridges is compromised before the bridges reach their full life span. The viable solution to eliminate the corrosion-related problems associated with conventional prestressed and reinforced concrete bridges is the application of fiber-reinforced polymer (FRP) materials. The high strength-to-weight ratio, superior fatigue resistance, ease of handling, low thermal expansion, and low relaxations are some of the advantages of the FRP materials over conventional steel reinforcement. These excellent characteristics made carbon fiber-reinforced polymers (CFRPs) a potential future construction material in the bridge construction industry.
The various types of I-beam cross sections specified in AASHTO1 have been extensively used in the recent construc-tion of prestressed concrete bridges.2 Features such as a simpler cross section, higher flexural capacities, and reduced manufacturing costs make the AASHTO beam a modest choice for constructing long-span bridges. In addition, FRP materials can help sustain a longer life span with minimal maintenance costs. To adopt the innovative CFRP materials in the bridge construction industry, thorough investigations are essential; however, an extensive review of the literature reveals that limited research is available on the application of CFRP materials in AASHTO-type beams.
In 1997, Fam et al.3 tested five I-beams prestressed and reinforced with CFRP materials with a span of 9.5 m (30.5 ft) and one conventionally reinforced beam prestressed
and reinforced with steel with the same geometry and span. In this study, it states that the flexural behavior of the beams prestressed with CFRP strands exhibited stiffness similar to the beam prestressed with steel strands. Also, the variation of the web reinforcement ratio did not significantly influ-ence the flexural behavior of the beams, and the failures were controlled by bending capacity. Further, the shape of the stirrups did affect the shear failure of the beam.
To further investigate the load-deflection relationship of concrete beams fully prestressed with CFRP, Abdelrahman and Rizkalla4 conducted an experimental study that included four prestressed concrete T-beams with a total length of 6.3 m (21 ft) and a depth of 330 mm (13 in.). The results of the study show that the load-deflection relationship of these beams was bilinear up to failure, and negligible residual deformations were experienced during the tests.
To provide guidelines in the design and construction of the Bridge Street Bridge—the first concrete bridge prestressed with CFRP materials in the United States—Grace et al.5 conducted a full-scale test on a CFRP prestressed double-tee beam. It was concluded that the anticipated prestressing levels were maintained during the test. The strain-compat-ibility-based Unified Design Approach was proposed by Grace and Singh,6 which was validated by experimental results conducted on a double-tee beam bridge model reinforced and prestressed using carbon fiber composite cable (CFCC) strands. Furthermore, a compression-controlled failure mode was recommended as the design failure mode for CFRP prestressed concrete beams.7 This recommenda-tion was based on the better ductility characteristics of over-reinforced sections. Also, an ultimate concrete compressive strain of 0.0025 was reported, as experienced in the experi-mental work.
In typical designs of concrete highway bridges prestressed with conventional reinforcement, tension-controlled failure mode dominates, as higher ductility is exhibited by yielding of the steel reinforcement. CFRP, however, is a brittle mate-rial exhibiting a linear stress-strain relationship up to rupture. Because a compression-controlled failure mode provides better ductility than a tension-controlled failure mode in terms of extensive deflections, ACI 440.1R-068 recom-mends a compression-controlled design failure mode for the concrete bridges reinforced and prestressed with the CFRP

492 ACI Structural Journal/May-June 2013
ACI member Nabil Grace is the Dean of the College of Engineering, University Distinguished Professor, and Director of the Center for Innovative Materials Research (CIMR) at Lawrence Technological University (LTU), Southfield, MI.
Kenichi Ushijima is a Senior Engineer at Cable Technologies North America, Inc. He received his bachelor’s degree in engineering from Yamaguchi National University, Yamaguchi, Japan.
ACI member Vasant Matsagar is a Visiting Professor at CIMR at LTU.
Chenglin Wu is a former Research Assistant in the Department of Civil Engineering at LTU.
materials. In this experimental investigation, therefore, the compression-controlled design failure mode was adopted.
RESEARCH SIGNIFICANCEThe experimental study presented in this paper explains
the design philosophy, construction techniques employed, and flexural performance of AASHTO I-beam and bridge model reinforced and prestressed with CFCC strands. Experimental results of this investigation were validated with the Unified Design Approach.6 This investigation also compliments the ongoing research on merits gained by using the CFRP reinforcement for the construction of highway bridges. Further, the results presented in this paper should allow engineers and designers to take full advantage of this potential, emerging technology to overcome the corrosion-related problems in the current practice of AASHTO-type beam bridges.
CONSTRUCTION DETAILSThe control beam and bridge model was constructed,
instrumented, and tested at the Center for Innovative
Materials Research (CIMR) at Lawrence Technological University (LTU). The AASHTO Type IV I-beams9 were designed as over-reinforced sections as per the flexural design philosophy8 to be used in the experimental inves-tigation. The one-third-scale (1:3.6) control beam consisted of a single precast prestressed AASHTO I-beam with a span of 12,141 mm (39 ft 10 in.) and a 64 mm (2.5 in.) thick CFCC-reinforced composite deck slab. The cross section of the AASHTO I-beams used in this investigation was 502 mm (19.75 in.) deep with top and bottom flange widths of 203 mm (8 in.) and a web thickness of 95 mm (3.75 in.), as shown in Fig. 1. The one-third-scale (1:3.6) bridge model consisted of five AASHTO I-beams placed at a center-to-center distance of 502 mm (19.75 in.), joined with five equally spaced 64 mm (2.5 in.) thick transverse diaphragms (404 mm [15.875 in.] in depth below the deck slab soffit), and topped with a 2.5 m (98.75 in.) wide and 64 mm (2.5 in.) thick deck slab,9 as shown in Fig. 2. The structural integrity of the bridge model was ensured by extending transverse reinforcement of the diaphragms into the beams and tying protruded vertical reinforcement of the diaphragms and protruded stirrups of the beams to transverse reinforcement of the deck slab.10
Each precast prestressed AASHTO I-beam consisted of three longitudinal CFCC prestressed strands and seven longi-tudinal non-prestressed CFCC strands—all with a diameter of 15.2 mm (0.6 in.)—as flexural reinforcement distributed vertically along the depth of the beam. The CFCC stir-rups, measuring 7.5 mm (0.3 in.) in diameter and spaced at a center-to-center distance of 102 mm (4 in.), were used as shear reinforcement and protruded in the deck slab by 38 mm (1.5 in.). The details of the CFCC reinforcement in the I-beam are presented in Fig. 1 and 3. Each beam was subjected to a total prestressing force of 266.89 kN (60 kip) equally distributed among the three longitudinal CFCC
Fig. 1—Cross-sectional details of I-beam.

ACI Structural Journal/May-June 2013 493
prestressed strands. A rectangular end block 533 mm (21 in.) long, 203 mm (8 in.) wide, and 502 mm (19.75 in.) deep was provided on each side of the beams to resist bursting stresses generated during the transfer of the pretensioning forces. Moreover, confinement in the end-block regions was provided with rectangular stirrups spaced at a center-to-center distance of 51 mm (2 in.), as shown in Fig. 3.
The deck slab of the bridge model was reinforced by 20 longitudinal non-prestressed CFCC strands 15.2 mm (0.6 in.) in diameter and 62 transverse non-prestressed CFCC strands 7.5 mm (0.3 in.) in diameter spaced at a center-to-center distance of 203 mm (8 in.). CFCC strands 7.5 mm (0.3 in.) in diameter were passed through transverse holes provided at the web of the I-beams as diaphragm reinforce-ment for the bridge model. The mechanical properties of
the CFCC strands and stirrups are shown in Tables 1 and 2, respectively. Because the CFCC stirrups were bent at two ends by 90 and 180 degrees, tensile strength tests were conducted on different portions of the CFCC stirrups to determine the actual strength. The minimum strength was selected as the design strength of the CFCC stirrups.
Construction of AASHTO I-beamsUpon completion of constructing the formwork for the
AASHTO I-beams, CFCC reinforcement cages were assem-bled and placed inside the formwork. The required concrete cover (38 mm [1.5 in.]) at the bottom of the beams was provided by attaching 76 mm (3 in.) diameter plastic circular chairs under the cages. The CFCC prestressing strands were passed through the reinforcement cages at designated layers
Fig. 2—Dimensions of bridge model.
Fig. 3—Cross-sectional details of control beam.

494 ACI Structural Journal/May-June 2013
and positioned between two bulkheads. Calibrated load cells were mounted on the prestressing strands at the dead end and connected to a data acquisition system to monitor and record the level of pretensioning forces applied. In addition, the strain gauges mounted on the prestressing strands and the pressure gauge installed on the hydraulic jack were used to monitor the applied pretensioning forces.
The pretensioning force was applied through a 305 mm (12 in.) center hole hydraulic jack positioned at the live end. A custom-made steel chair was attached to the hydraulic jack and supported on the bulkhead to transfer the reactions generated during the application of the pretensioning forces. Moreover, to verify the pretensioning force applied, elon-gations experienced in the CFCC prestressing strands were measured during the prestressing operation by measuring ram displacement of the hydraulic jack. Each prestressing strand was stressed to an average jacking force of 88.96 kN (20 kip) to achieve a total pretensioning force of 266.89 kN (60 kip) on each beam. The applied pretensioning force of 88.96 kN (20 kip) in each CFCC prestressing strand was approximately 30% of the average breaking load (Table 1).
After the prestressing operation, the concrete was placed in the formwork and proper uniform compaction was achieved using three electrical pencil vibrators. The average 28-day compressive strength of the concrete was 44.82 MPa (6500 psi). After placing the concrete, the beams were wet-cured by covering them with soaked burlap for 7 days. When the concrete attained the required compressive strength, pretensioning forces were released by saw-cutting the CFCC prestressed strands simultaneously from both ends of the beams.
Construction of control beam and bridge modelOne of the six AASHTO I-beams was selected as the
control beam and was moved to the testing area underneath a loading frame and was positioned on steel supports 762 mm
(30 in.) tall, measuring 356 x 1372 mm (14 x 54 in.). Elas-tomeric bearing pads 25.4 mm (1 in.) thick were placed between the beams and steel supports at each end to simulate the field conditions. Upon placing the control beam under the loading frame, a CFCC-reinforced 64 mm (2.5 in.) thick and 502 mm (19.75 in.) wide deck slab was cast. The average compressive strength of the concrete for the deck slab was 44.82 MPa (6500 psi). After the concrete in the deck slab gained adequate strength, the control beam consisting of the single AASHTO I-beam and the cast-in-place deck slab was instrumented and tested for flexure.
The other five AASHTO I-beams were moved to another testing area underneath a loading frame, and the beams were positioned on steel supports to allow the construction of the deck slab and transverse diaphragms for the bridge model. The five beams were maintained at a center-to-center distance of 502 mm (19.75 in.). Non-prestressing CFCC strands 7.5 mm (0.3 in.) in diameter were passed through the holes kept in the beams and epoxied to brace the beams in the transverse direction. Vertical reinforcement of the trans-verse diaphragm was attached to its transverse reinforcement and formwork was provided around the reinforcement. Prior to the deck slab reinforcement placement, formwork for the deck slab was attached to the beams and diaphragm form-work and supported on the ground as typically practiced in shored construction. The deck slab reinforcement consisted of 20 No. CFCC 1 × 7 f 15.2 mm (0.6 in.) strands in the longitudinal direction and CFCC 1 × 7 f 7.5 mm (0.3 in.) strands at 203 mm (8 in.) in the transverse direction. The concrete was placed in the diaphragms and the deck slab, and compacted properly with pencil vibrators and metallic rods. After finishing the top surface of deck slab the bridge model was covered with soaked burlap for 7 days. Upon hardening of the concrete for 7 days, supports of the formwork were removed. The average 28-day compressive strength of the
Table 1—Mechanical properties of tested CFCC prestressing and non-prestressing strands
Types Transverse non-prestressing strands Longitudinal prestressing strands Longitudinal non-prestressing strands
Diameter, mm (in.) 1 x 7, 7.5 (0.3) 1 x 7, 15.2 (0.6) 1 x 7, 15.2 (0.6)
Effective area, mm2 (in.2) 30.97 (0.048) 115.48 (0.179) 115.48 (0.179)
Breaking load
Maximum, kN (kip) 95.01 (21.36) 305.99 (68.79) 305.99 (68.79)
Minimum, kN (kip) 91.02 (20.46) 274.99 (61.82) 274.99 (61.82)
Average*, kN (kip) 91.99 (20.68) 295.98 (66.54) 295.98 (66.54)
Tensile strength, MPa (ksi) 2972 (431) 2558 (371) 2558 (371)
Modulus of elasticity, MPa (ksi) 164,000 (23,786) 157,000 (22,771) 157,000 (22,771)*Five specimens were tested.
Table 2—Mechanical properties of tested CFCC stirrups
Types CFCC rod at straight portion CFCC rod at 180-degree bent end CFCC rod at 90-degree bent end
Diameter, mm (in.) 7 (0.28) 7 (0.28) 7 (0.28)
Effective area, mm2 (in.2) 30.97 (0.048) 30.97 (0.048) 30.97 (0.048)
Breaking load
Maximum, kN (kip) 72.02 (16.19) 37.2 (8.36) 40.5 (9.10)
Minimum, kN (kip) 60.00 (13.49) 30.4 (6.83) 25.6 (5.76)
Average*, kN (kip) 64.99 (14.61) 34.0 (7.64) 38.6 (8.68)
Tensile strength, MPa (ksi) 2096 (304) 1098 (159) 1246 (181)
Modulus of elasticity, MPa (ksi) 145,000 (21,030) 145,000 (21,030) 145,000 (21,030)*Five specimens were tested.

ACI Structural Journal/May-June 2013 495
concrete in the deck slab and the transverse diaphragms was 27.58 MPa (4000 psi).
Instrumentation and test setupPrior to the casting of the AASHTO I-beams, electrical
strain gauges were attached to the CFCC prestressing strands to measure the strain responses. After the concrete in the deck slab gained adequate strength, two linear motion transducers were installed at the quarter-span and midspan, respectively, to measure the deflections of the control beam during the flexural load test. Two strain gauges were mounted on the top surface of the deck slab at midspan to record the strain response of the extreme compressive concrete fiber of the control beam. Meanwhile, to observe the strain response of the CFCC stirrups, five DEMEC stations (Rosette type) were also installed at the shear-critical sections. A steel loading frame—that is, a spreader with two loading points spaced at a distance of 965 mm (38 in.)—was placed on the deck slab at midspan. An actuator with a maximum loading capacity of 889.64 kN (200 kip) was used to apply load at the center of the spreader. A load cell with a capacity of 889.64 kN (200 kip) was connected to the actuator to record the applied load. To prevent the possible twist that might be caused during the loading process, custom-made steel guides were installed around the beam at both quarter-span points and beam ends. The test setup for the control beam is shown in Fig. 4.
The control beam was subjected to several loading and unloading cycles to separate the elastic and inelastic ener-gies. These loading cycles were 13.34, 31.14, 35.59, 53.38, 66.72, 88.96, and 111.21 kN (3, 7, 8, 12, 15, 20, 25 kip) and ultimate load cycle. Figure 5 shows the control beam during the flexural load test.
Different sensors were installed and used to analyze the behavior of the bridge model according to the test program. The test program for the bridge model consisted of the flex-ural performance, decompression and cracking load, and ultimate load tests.
In the flexural performance test, each beam of the bridge model was loaded at quarter-span and midspan with a single point load of 66.72 kN (15 kip). Linear motion transducers were installed at both quarter-span and midspan to measure the deflections of the beams under different loading cases.
In the decompression load test, a 1.22 m (48 in.) long spreader was used to load the bridge model at midspan. Linear motion transducers were installed at the midspan of the bridge model to monitor and record the deflection. Strain gauges were attached at the bottom surface of the center beam at midspan to determine the decompression load.
In the ultimate load test, the bridge model was loaded using a steel square tube with a length of 1.22 m (48 in.) mounted at the midspan covering the center beam and its two adjacent beams, as shown in Fig. 6. The strain gauges installed on the CFCC strands, linear motion transducers
Fig. 4—Test setup for control beam.
Fig. 5—Flexural load test of control beam.

496 ACI Structural Journal/May-June 2013
installed at midspan, and strain gauges installed on the top surface of the deck slab at midspan were used to analyze the behavior of the bridge model. Similar to the flexural load test conducted on the control beam, the bridge model was subjected to several loading and unloading cycles before failure to separate the elastic and inelastic energies. These cycles were conducted at 311.38, 355.86, 422.58, 444.82, 489.30, 533.79, and 578.27 kN (70, 80, 95, 100, 110, 120, and 130 kip) and at ultimate load.
RESULTS AND DISCUSSIONThe control beam failed with an ultimate load-carrying
capacity of 162.05 kN (36.43 kip) and a corresponding deflection of 292 mm (11.5 in.). The ultimate load-carrying capacity of the control beam is in close agreement with the designed value of 164.58 kN (37 kip) using the Unified Design Approach proposed by Grace and Singh6 (important steps in the design procedure are shown in the Appendix*). Because the control beam was over-reinforced with a
* The Appendix is available at www.concrete.org in PDF format as an addendum to the published paper. It is also available in hard copy from ACI headquarters for a fee equal to the cost of reproduction plus handling at the time of the request.
reinforcement ratio of 0.0046 (the balanced reinforce-ment ratio for the section was calculated as 0.00196), a compression-controlled flexural failure initiated by the concrete crushing at the midspan was observed. The load-deflection behavior of the control beam experienced a bilinear response, as shown in Fig. 7, with cracking load of 28.91 kN (6.5 kip). The load-strain responses of the top and bottom layers of the CFCC prestressing strands also experi-enced a bilinear response, as shown in Fig. 8. However, the strain gauges on the strands stopped functioning at a load of 62.28 kN (14 kip). The CFCC prestressing strands were further examined after the beam failure and no damage was experienced. Meanwhile, the load-strain response of the extreme compressive concrete fiber was also recorded, as shown in Fig. 9. The maximum strain experienced by the extreme compressive concrete fiber was 2000 me at failure.
The ductility of the control beam was evaluated by the energy ratio, which was calculated using the energy-based approach.11 Accordingly, the failure of a structure is defined as brittle failure if the energy ratio is lower than 70%. Therefore, the failure of the control beam was defined as a brittle failure with an energy ratio of 46.88%, as shown in Fig. 10. However, a sufficient warning prior to the failure
Fig. 6—Test setup for ultimate load test of bridge model.
Fig. 7—Load-deflection behavior of control beam.

ACI Structural Journal/May-June 2013 497
Fig. 8—Strain experienced by CFCC prestressing strands in control beam.
Fig. 9—Compressive strain of top concrete fiber at midspan of control beam.
Fig. 10—Ductility of control beam.

498 ACI Structural Journal/May-June 2013
was provided by the excessive deflection and extensive cracks of the control beam before reaching the ultimate load of 162.05 kN (36.43 kip).
A significant number of diagonal cracks were observed in the shear zone (between the loading points and beam ends) of the control beam. Details of the cracks mapped at different load levels are shown in Fig. 11. As the control beam was designed to have a flexural failure, adequate CFCC stir-rups were provided to avoid any premature shear failure. Therefore, the widths of the cracks were insignificant and the maximum width of the shear cracks was approximately 0.2 mm (0.009 in.) at a corresponding load of 111.21 kN
(25 kip). Thus, the CFCC stirrups provided in the AASHTO I-beams in the desired bent shapes served the intended purpose satisfactorily.
The strain responses of the CFCC stirrups at DEMEC Station 2 were recorded and compared to the estimated values using ACI 440.4R-047 and ACI 318-0512 approaches, as shown in Fig. 12. It can be seen that both the shear design approaches proposed by ACI 440.4R-047 and ACI 318-0512 conservatively predicted the strains of the CFCC stirrups at a load of 111.21 kN (25 kip). However, the estimated strain responses of the CFCC stirrups using the approach proposed by ACI 440.4R-047 were closer to the
Fig. 11—Cracks developed in control beam.
Fig. 12—Strain experienced by CFCC stirrup at DEMEC Station 2.

ACI Structural Journal/May-June 2013 499
actual strains experienced as compared to those estimated using ACI 318-05.12 Furthermore, the maximum strain of the CFCC stirrups measured at DEMEC Station 2 was 500 me, which was less than the ultimate strain of the CFCC stirrups (756 me). This fact signifies adequate strength of the CFCC stirrups during the flexural load test. The shear failure load for the control beam, predicted based on the strains experi-enced, was 178 kN (40 kip).
As mentioned previously, the test program conducted on the bridge model included the flexural performance test, decompression and cracking load test, and ultimate load test. In addition, the flexural performance test was repeated after the decompression and cracking load test to examine the behavior of the bridge model at the cracked stage.
The decompression and cracking load test was conducted to determine the effective prestress and the cracking load of the bridge model. During the test, the bridge model was subjected to a single point load positioned on a 1.22 m (48 in.) long spreader located on the center beam (B-3) at midspan. The first flexural crack was observed at the bottom of Beam B-3 at the midspan with the corresponding load of 104.53 kN (23.5 kip). The bridge model was then unloaded to allow installing a set of four strain gauges at both sides of the initial flexural cracks. Upon completing the installa-tion, the bridge model was reloaded. The strain of the bottom concrete fiber increased proportionally to the applied load immediately after the reloading started. When the stress of the bottom concrete fiber approached zero, however, the strain stopped increasing and remained constant as the load applied on the bridge model was still increasing, as shown in Fig. 13. The decompression load determined through the load-strain response of the bottom concrete fiber was 57.83 kN (13 kip). The overall prestress loss was subsequently calculated as 11% based on the decompression load, which is less than the typical 15% prestress loss, as usually reported for beams prestressed using steel strands.13 At the end of the test, the bridge model was loaded up to 266.89 kN (60 kip) to allow the development of the flexural cracks. The flexural performance test was then repeated after the bridge model was extensively cracked.
The ultimate load test was conducted by applying a uniformly distributed load on a 1.22 m (48 in.) long and 152 mm (6 in.) wide steel square tube placed across the bridge model at the midspan. After several loading and unloading cycles, the bridge model failed at a load of 689.47 kN (155 kip) with the corresponding deflection of 240 mm (9.45 in.) at center beam, B-3. This ultimate load-carrying capacity of the bridge model was in close agree-ment with the designed6 value of 733.96 kN (165 kip). The failure was initiated by concrete crushing at top compres-sion fibers at the midspan of the bridge model, and the CFCC prestressing strands were still intact after the bridge model failed. The load-deflection behavior of the bridge model, as shown in Fig. 14, showed bilinear response due to the concrete cracking, similar to what was observed in the control beam. The load-strain response of the extreme compressive concrete fiber for the bridge model was also recorded, as shown in Fig. 15. The maximum concrete strain reached by the extreme fiber was 2520 me in compression. The strain responses of the CFCC strands in the bridge model were monitored throughout the test. The load-strain responses of different layers of the CFCC strands and the extreme compressive concrete fiber during the ultimate load cycle are shown in Fig. 16. The maximum strain reached by the bottom prestressing strands was 10,000 me, which was 66.7% of the ultimate strain for the CFCC strands (15,000 me). This fact suggests that perhaps a higher preten-sioning force can be applied to increase the cracking load.
The energy ratio of the bridge model was 26.67%, which was calculated using the energy-based approach,11 as shown in Fig. 17. Although the ductility of the bridge model was low in the terms of the energy ratio and the excessive deflec-tion and extensive cracks experienced, the bridge model provided significant warning before failure.
CONCLUSIONS AND RECOMMENDATIONSThis paper presents an experimental investigation
addressing the application of CFRP strands in prestressed AASHTO I-beams and bridges. The ACI 440.4R-047 design
Fig. 13—Strain experienced at bottom concrete fiber in bridge model.

500 ACI Structural Journal/May-June 2013
guidelines and the Unified Design Approach proposed by Grace and Singh6 were used in the flexural and shear design of the control beam and bridge model. The test results were analyzed and compared with the estimated values, and several conclusions are drawn as follows.
1. Both the control beam and the bridge model experienced a compression-controlled failure as expected. The calcu-lated ultimate load-carrying capacities for both the control beam and the bridge model were 164.58 and 733.96 kN (37 and 165 kip), respectively. These values are in close agree-ment with the experimental values (162.05 kN [36.43 kip] for the control beam and 689.47 kN [155 kip] for the bridge model). This verified that the Unified Design Approach6 is suitable in designing the AASHTO I-beams and bridges.
2. The maximum strain of the CFCC stirrups measured at the shear-critical sections was 500 me, which was less than the ultimate strain of 756 me. This demonstrates the excellent performance of the CFCC stirrups in resisting the shear load experienced by the AASHTO I-beams.
3. The calculated strain of the CFCC stirrup using ACI 440.4R-047 approach was conservative as compared to
the experimental value experienced at the load of 111.21 kN (25 kip). This fact further indicates that ACI 440.4R-047 shear design approach can be adequately used in the design of the AASHTO I-beams using CFCC stirrups.
4. An 11% prestress loss was calculated through the decompression test conducted on the bridge model, which is less than the typical 15% prestress loss, as traditionally reported for beams prestressed using steel strands. This further demonstrates the excellent performance of the CFCC strands in prestressed concrete AASHTO I-beams.
5. The CFCC strands were not damaged after the failure of the control beam and the bridge model. The maximum strain experienced by the prestressing CFCC strands was 66.7% of the ultimate strain. Therefore, a higher pretensioning force may be recommended to be applied on the CFCC prestressing strands.
6. The energy ratios of the control beam and bridge model were 46.88% and 26.67%, respectively. These values clas-sified the failures of both the control beam and bridge model as brittle failure.11 However, the excessive deflec-tions and the extensive cracks provided sufficient warning
Fig. 14—Load-deflection behavior of bridge model.
Fig. 15—Compressive strain experienced by extreme concrete fiber of bridge model.

ACI Structural Journal/May-June 2013 501
prior to the failure for this type of AASHTO I-beam bridge with CFCC strands.
ACKNOWLEDGMENTSThis investigation was supported by the U.S. Department of Transpor-
tation (US-DOT) (Contract No. DTOS 59-06-G-0030) and MDOT-LTU Center of Excellence. The support and guidance of B. Jacob, Senior Policy Analyst, US-DOT; and L. N. Triandafilou, Senior Structural Engineer, FHWA, are truly appreciated. Moreover, the Tokyo Rope Manufacturing Company Limited, Japan, supplied the CFCC reinforcement.
REFERENCES1. AASHTO, “AASHTO Load and Resistance Factor Design (LRFD)
Bridge Design Specifications,” third edition, American Association of State Highway and Transportation Officials, Washington DC, 2004.
2. Martin, R. D.; Kang, T. H.-K.; and Pei, J.-S., “Experimental and Code Analyses for Shear Design of AASHTO Prestressed Concrete Girders,” PCI Journal, V. 56, No. 1, Dec. 2011, pp. 54-74.
3. Fam, A. Z.; Rizkalla, S. H.; and Tadros, G., “Behavior of CFRP for Prestressing and Shear Reinforcements of Concrete Highway Bridges,” ACI Structural Journal, V. 94, No. 1, Jan.-Feb. 1997, pp. 77-86.
4. Abdelrahman, A. A., and Rizkalla, S. H., “Deflection Control of Concrete Beams Pretensioned by CFRP Reinforcements,” Journal of Composites for Construction, ASCE, V. 3, No. 2, May 1999, pp. 55-62.
5. Grace, N. F.; Enomoto, T.; Abdel-Sayed, G.; Yagi, K.; and Colla-vino, L., “Experimental Study and Analysis of a Full-Scale CFRP/CFCC Double-Tee Bridge Beam,” PCI Journal, V. 48, No. 4, July 2003, pp. 120-139.
6. Grace, N. F., and Singh, S. B., “Design Approach for Carbon Fiber-Reinforced Polymer Prestressed Concrete Bridge Beams,” ACI Structural Journal, V. 100, No. 3, May-June 2003, pp. 365-376.
7. ACI Committee 440, “Prestressing Concrete Structures with FRP Tendons (ACI 440.4R-04),” American Concrete Institute, Farmington Hills, MI, 2004, 35 pp.
8. ACI Committee 440, “Guide for the Design and Construction of Concrete Reinforced with FRP Bars (ACI 440.1R-06),” American Concrete Institute, Farmington Hills, MI, 2006, 44 pp.
9. MDOT, “Bridge Design Guides,” Bureau of Highway Development, MI, 2001, p. 6.60.01.
10. MDOT, “Bridge Design Manual,” Bureau of Highway Development, MI, 2006, 466 pp.
11. Grace, N. F.; Soliman, A. K.; Abdel-Sayed, G.; and Saleh, K. R., “Behavior and Ductility of Simple and Continuous FRP Reinforced Beams,” Journal of Composites for Construction, ASCE, V. 2, No. 4, Nov. 1998, pp. 186-194.
12. ACI Committee 318, “Building Code Requirements for Reinforced Concrete (ACI 318-05),” American Concrete Institute, Farmington Hills, MI, 2005, 430 pp.
13. Nawy, E. G., Prestressed Concrete: Fundamental Approach, fourth edition, Prentice Hall, Saddle River, NJ, 2003, 960 pp.
Fig. 16—Strain experienced by CFCC strands at ultimate load of bridge model.
Fig. 17—Ductility of bridge model.

online
Scanto read this
journal

37
APPENDIX: DESIGN OF AASHTO I-BEAM AND BRIDGE MODEL
The appendix presents briefly steps in the uniform design approach6 for design of the AASHTO
I-beam and bridge model, both reinforced and prestressed by the CFCC strands. If md denotes
distance from the extreme compression fiber to the centroid of the bottom prestressing strands,
the assumed distance from the extreme compression fiber to the neutral axis,
mu dkn = (A1)
where, for the over-reinforced section neutral axis depth is calculated as,
2
42 BAAku++= (A2)
Here,
1 1
10.85
qm
fb fj pbji fu pui fp cu fj fj u fu fpj j
c m
A E A E A E A EA
f b d
ε ε ε
β= =
+ − + Ω=
′
(A3)
and 2
1
1
85.0 mc
q
jufpfuujfjfjcu
dbf
dEAhEAB
β
ε
′
Ω+=
= (A4)
where, fjA = cross-sectional area of prestressing or non-prestressing bonded strands in an
individual row; fjE = modulus of elasticity of bonded strands of an individual row; fpE =
modulus of elasticity of unbonded strands of an individual row; pbjiε = strain in bonded strand of
an individual row at ultimate; puiε = strain in unbonded strand of an individual row at ultimate;
cuε = strain in extreme compression fiber of concrete at ultimate; 1β = factor defined as the ratio
of the depth of equivalent rectangular stress block to the distance from the extreme compression
fiber to the neutral axis; ud = distance of centroid of unbounded strands from the extreme
compression fiber; b = flange width of beam; q = total number of layers of bonded prestressing

38
and non-prestressing strands; m = total number of layers of pre-tensioning strands; n = depth of
area subjected to compression; uΩ = bonded reduction factor for unbonded post-tensioning
strands; cf ′ = concrete compressive strength; fbA = total cross-sectional area of bonded
prestressing strands in each row; and fuA = total cross-sectional area of unbonded strands.
As no unbonded post-tensioning strands were used and the neutral axis lies below the deck slab,
( )1 1
1
0.85
0.3340.85
qm
fb f pbji fu pui fp cu fj fj c w fj j
c m
A E A E A E f b b hA
f b d
ε ε ε
β= =
′+ − − −
= = −′
(A5)
124.0
85.0 21
1 =′
=
=
mc
q
jjfjfjcu
dbf
hEAB
β
ε (A6)
where, wb = width of web; fh = deck slab thickness; jh = distance of bonded strands from the
extreme compression fiber.
Therefore,
22.02
42
=++= BAAku (A7)
Hence, neutral axis depth, )in. 48.4( mm 79.113== mu dkn (A8)
Consequently, strain at each layer of the reinforcement was computed, thereby the corresponding
stresses were also computed. Forces in each layer of the CFCC reinforcement were calculated
subsequently. Also, compression force from the concrete is calculated as,
10.85 ( ) 0.85 1,162.32 kN (261.3 kip)c c w f c wF f b b h f b nβ′ ′= − + = (A9)
Moment of resistance of the mid-span section,

39
2
1 1 1 1 2 2 3 3
4 4 5 5 6 6 6 6 7 7
3
0.85 ( ) 0.85 ( 0.5 ) ( ) ( ) ( )2
( ) ( ) ( ) ( ) (
511 82 kN - m (4 53 10 kip - in)
fn c w c w
pr pr
hM f b b f b n n n F n d F n d F d n
F d n F d n F d n F d n F d n)
. .
β β′ ′= − + − + − + − + −
+ − + − + − + − + −
= ×
(A10)
where, iF = force in ith layer of reinforcement at respective distance of id from top compression
fiber.
Dead load moment, 2
0 43.28 kN-m (383.08 kip-in)8,000
ddead
w LM = = (A11)
where, dw = dead weight per unit length along the span; 0L = span length of 478 in. (12,141
mm). Therefore, the ultimate load can be computed from the ultimate moment for the composite
section,
0
4( ) 164.58 kN (37 kip)
( )u n deads
P M ML L
= − =−
(A12)
where, sL = spreader length of 0.965 m (38 in.). The ultimate load for the bridge model was
computed following the similar procedure for the beam. However, the concrete compressive
strength for the bridge deck was 27.58 MPa (4,000 psi) and the spreader length is omitted as the
bridge model was loaded at mid-span. The computed ultimate load resistance for one of the
girder for the bridge model was 146.79 kN (33 kip). Therefore, the total load resistance for the
bridge model was computed as 733.96 kN (165 kip).

ACI Structural Journal/May-June 2013 503
Title no. 110-S40
ACI STRUCTURAL JOURNAL TECHNICAL PAPER
ACI Structural Journal, V. 110, No. 3, May-June 2013.MS No. S-2011-207.R1 received July 22, 2011, and reviewed under Institute
publication policies. Copyright © 2013, American Concrete Institute. All rights reserved, including the making of copies unless permission is obtained from the copyright proprietors. Pertinent discussion including author’s closure, if any, will be published in the March-April 2014 ACI Structural Journal if the discussion is received by November 1, 2013.
Testing of Normal- and High-Strength Concrete Walls Subjected to Both Standard and Hydrocarbon Firesby Tuan Ngo, Sam Fragomeni, Priyan Mendis, and Binh Ta
Ten large-scale concrete wall panels were tested in this study. Four walls were of normal-strength concrete (NSC)—two of which were axially loaded at an eccentricity of 10 mm (0.39 in.) and two with no load—and exposed to either standard or hydrocarbon fires. Four identically dimensioned high-strength concrete (HSC) walls were also tested using these variables. An additional two HSC walls, with polypropylene fibers added, were tested under hydro-carbon fire conditions only. All walls were tested in a vertical posi-tion in a large furnace and supported at the top and bottom only. The results indicate that all concrete wall panels exposed to the standard fire tests survived the 120-minute fire period, with low to moderate spalling evident. The NSC walls exposed to hydrocarbon fires also survived the 120-minute test, whereas the HSC walls experienced severe spalling under these fire conditions with failure at 31 minutes. The addition of polypropylene fibers in the concrete improved the fire resistance of HSC walls in hydrocarbon fire to 65 minutes.
Keywords: fire resistance; high-strength concrete; hydrocarbon fire; spalling; standard fire; wall.
INTRODUCTIONThe performance of concrete structures in fire has become
increasingly significant in the past decade. This is due in part to the increased incidence of accidental fires, explo-sions, and terrorist attacks. The types of fires evident have exceeded the scope of standard fire tests and, in many recent events, are those of the hydrocarbon type. Also, the increased use of high-strength concrete (HSC) with concrete strengths greater than 65 MPa (9430 psi), which is perceived to have less adequate fire performance compared to normal-strength concrete (NSC), has necessitated dedicated research in this area.
The behavior of concrete subjected to fire has been the subject of wide-ranging research studies over a number of years. Most recently, studies have focused on the fire behavior of HSC and high-performance concretes (Ali 2002; Castillo and Durrani 1990; Chan et al. 1999; Han et al. 2009; Kodur 2008; Phan 2008; Ting et al. 1992). According to the results of laboratory-focused fire tests in these research studies, there are remarkable differences between the prop-erties of HSC and NSC in terms of the loss of cross section, the timing of loss of strength, and the degrees of deforma-tion and spalling at elevated temperatures. The most notable finding is that HSC is considered to suffer more seriously from spalling due to fire than NSC.
Previous fire research on vertical concrete elements has mainly focused on concrete columns (Han et al. 2009; Kodur 2008; Kodur and Raut 2009; Kodur et al. 2004; Lie and Lin 1985). Concrete walls have attracted less attention, with only a few experimental studies and analytical studies (for example, Ongah et al. [2003]) conducted on these elements. The very limited experimental work includes the
studies of Crozier and Sanjayan (2000) and Guerrieri and Fragomeni (2010).
Crozier and Sanjayan (2000) focused on the fire perfor-mance of slender NSC and HSC load-bearing walls subjected to standard fire conditions under eccentric in-plane loading combined with lateral loading. The lateral load was a conse-quence of self-weight of the wall panels, which were placed horizontally and exposed to fire on the tension side. The testing was to be representative of the in-service situation given in Fig. 1. The walls were exposed to a standard fire test using the standard temperature-versus-time relation-ship given in AS1530.4 (2005). The tests used different variables that included concrete strength (44 and 70 MPa [6.38 and 10.15 ksi]); reinforcement cover (30 to 110 mm [1.18 to 4.33 in.]); and slenderness ratio (24, 36, and 48) with eccentric axial loading at half-wall thickness. Eighteen walls 3600 mm (141.73 in.) high x 1200 mm (47.24 in.) wide with varying thicknesses from 75, 100, and 150 mm (2.95, 3.94, and 5.91 in.) were tested. Fire testing was under-taken until one of the following structural limits occurred: 1) collapse of loaded specimen; or 2) excessive deflec-tion—greater than span/20. The fire exposure achieved was
Fig. 1—In-service representation used to model fire tests (Crozier and Sanjayan 2000).

504 ACI Structural Journal/May-June 2013
Tuan Ngo is a Senior Lecturer and Technical Director of the Advanced Protective Technologies for Engineering Structures (APTES) Research Group at the University of Melbourne, Victoria, Australia. He is also the Research Manager of the ARC Research Network for a Secure Australia. His research interests include the dynamic behavior of concrete structures under extreme loadings such as blast, impact, and fire.
Sam Fragomeni is an Associate Professor and Director of Engineering Studies at Victoria University, Melbourne, Australia. His research interests include the behavior of concrete structures and high-performance concrete.
ACI member Priyan Mendis is a Professor at the University of Melbourne and the Convenor of the ARC Research Network for a Secure Australia. He is past Chair of the ACI International Subcommittee of ACI Committee 363, High-Strength Concrete. His research interests include protective technologies for structures, including fire, high-strength and high-performance concrete, and the design of bridges and tall buildings.
Binh Ta is a Senior Lecturer at the University of Civil Engineering, Hanoi, Vietnam. He received his PhD in performance of high-strength concrete walls under fire loading from the University of Melbourne.
between 32 and 90 minutes before either of the aforemen-tioned criterions was reached.
Crozier and Sanjayan (2000) found that the NSC walls experienced major spalling as compared to the HSC walls, which had minor degrees of spalling. This is contrary to the well-accepted theory that suggests HSC is more susceptible to spalling due to its inability to dissipate pore pressure buildup as easily as more permeable NSC. The explana-tion given by the authors of this opposite occurrence was that the HSC test panels had higher amounts of flexural cracking, which allowed the escape of pore water pressure and thus reduced the amount of spalling. It was also found that spalling was more dominant in thicker concrete walls, which is mainly due to the increased length the pore water pressures needed to travel to escape. The conclusions need to be treated with caution for two reasons: 1) the actual walls were tested in a horizontal position with fire exposure occur-ring on the tension side contrary to the in-service representa-
tion of Fig. 1; and 2) the amount of flexural cracking played a significant part in fire resistance irrespective of whether the walls were made of NSC or HSC.
Guerrieri and Fragomeni (2010) reported on recent stan-dard fire tests at Victoria University on four half-scale concrete wall panels with two types of loading conditions. The walls were fire-tested in a vertical position and gave a closer representation of Fig. 1. The first loading condition considered the effect of eccentric in-plane loading created by a pulley system of weights at midspan in addition to self-weight. This loading condition is representative of a load-bearing wall, which supports the above floors and roof struc-tures with the internal compression side of the wall exposed to fire (as shown in Fig. 1 and 2). The second load case considered the effect of self-weight only, which is repre-sentative of tilt-up wall panels. In each loading condition, two identical samples were tested to ascertain their spalling performance and resistance period when subjected to a stan-dard fire test.
The specimens (1300 mm [51.18 in.] high x 1300 mm [51.18 in.] wide x 50 mm [1.97 in.] thick) were tested at an age of 6 months when the compressive strengths were in the order of 40 MPa (5.80 ksi). The specimens were exposed to the standard fire on one side (compression side) and reinforced with one layer of ribbed wire mesh (100 x 100 mm [3.94 x 3.94 in.] spacing and 6 mm [0.24 in.] diameter) placed at middepth of thickness. For the two specimens tested with the first loading condition, one failed in a brittle manner, while the other panel survived the fire test. In both instances, only surface spalling was observed to have occurred on the side exposed to fire; no explosive spalling was evident. Both specimens with the second loading condition failed after a fire exposure of 15 minutes, with explosive spalling occur-ring in one of these two panels. It was concluded that the flexural cracking that occurred on the unexposed surface of the walls with the first loading condition allowed significant amounts of steam and water (arising from the high temper-atures) to migrate out of the specimen during the testing, eliminating the buildup of pore water pressure and the threat of explosive spalling. Even though the concrete strength was moderate, spalling could still occur if pore pressure buildup was allowed to occur (Guerrieri and Fragomeni 2010).
The limited research highlighted on wall panels in fire, although very informative, has produced some conflicting results, in that spalling of varying degrees could occur in both NSC and HSC walls. What is clear is that the presence of flexural cracking in walls exposed to fire helps reduce the amount of spalling that occurs. It should also be noted that all walls reached relatively low fire exposure levels (ranging from 15 to 90 minutes). This fire exposure level could be due to a range of variables, including the cover to reinforce-ment provided, concrete mixture density and strength, and possibly aggregate size used. Support and loading condi-tions also play a major role.
This paper presents the results and discussion of fire tests on 10 reinforced concrete wall panels subjected to fire. Four walls were of NSC—two of which were axially loaded at an eccentricity of 10 mm (0.39 in.) and two with no load—and exposed to either standard or hydrocarbon fires. Four identi-cally dimensioned HSC walls were also tested using these variables. An additional two HSC walls with polypropylene fibers added were tested under hydrocarbon fire. Emphasis was given to observing failure mode, spalling characteris-tics, thermal transfer, and wall displacements.
Fig. 2—In-plane fire test setup (Guerrieri and Fragomeni 2010).

ACI Structural Journal/May-June 2013 505
RESEARCH SIGNIFICANCEThis is the first systematic testing program covering the
fire behavior of NSC and HSC walls exposed not only to standard fires but also hydrocarbon fires. Previous research on concrete walls focused on standard fire testing only. Compared to a standard fire, a hydrocarbon fire creates a significant increase in temperature in the initial period of the fire (that is, it reaches 1000°C [1832°F] in only 8 minutes). As a result, hydrocarbon fires could have the potential to create violent explosive spalling in concrete structures, especially in HSC, which is generally considered to be more susceptible to spalling than NSC walls.
EXPERIMENTAL PROGRAMThe fire test specimens, experimental setup, and proce-
dure are described in detail in this section. The studies were conducted at the University of Melbourne in Australia, and experimental tests were carried out in the laboratory at the Insti-tute for Building Science and Technology (IBST) in Vietnam.
Test specimens and material propertiesTen reinforced concrete walls 2400 mm (94.49 in.) high
x 1000 mm (39.37 in.) wide x 150 mm (5.91 in.) thick were tested under standard and hydrocarbon fires. Four walls were of NSC—two of which were axially loaded at an eccentricity of 10 mm (0.39 in.) and two with no load—and exposed to either standard or hydrocarbon fires. Four identi-cally dimensioned HSC walls were also tested using these same conditions. An additional two HSC walls with poly-propylene fibers added were tested under hydrocarbon fires.
The concrete materials and mixture proportions used in these walls are shown in Table 1. Three batches were used for the wall fabrication: Batch 1 for NSC, Batch 2 for HSC, and Batch 3 for the fiber-added HSC. Apart from variations in cement, aggregate, sand, and water contents, the HSC mixture also included silica fume and high-range water-reducing admixture. Calcareous aggregates were used as coarse aggregates. Mixtures HSC5 and HSC6 also included 2 kg/m3 (0.12 lb/ft3) of polypropylene fibers.
The concrete was mixed using a horizontal drum-type mixer. For every batch, six concrete cylinders (150 mm
[5.91 in.] in diameter x 300 mm [11.81 in.] in height) were cast along with the wall specimens to monitor the compres-sive strength at 28 days and on the day of testing. Heat treat-ment was used in the form of steam curing at 90°C (194°F) for 48 hours. After this, the specimens were in storage until testing at temperatures ranging from 20 to 30°C (68 to 86°F), with approximately 80% humidity. This process was adopted to ensure sufficient curing and drying occurred under surrounding conditions prior to testing. The specimens were in storage for approximately 4 months at temperatures ranging from 20 to 30°C (68 to 86°F), with approximately 80% humidity before testing.
The walls were cast horizontally in specially designed timber forms. Reinforcement was placed in two layers in both vertical (N16 at 300 mm [11.81 in.]) and horizontal (N14 at 300 mm [11.81 in.]) directions, with clear cover of 25 mm (0.98 in.), as shown in Fig. 3. The concrete was carefully placed in the formwork using buckets, shovels, and scoops. A vibrator was used to consolidate the concrete. The open surface of the wall specimens was screened and finished with a trowel. Thermocouples were secured into the specimens at the specific locations indicated in Fig. 3 and 4.
The results of the 28-day and test day compres-sive strengths are provided in Table 2. Compressive strengths for NSC specimens on the day of testing were approximately 35 MPa (5.08 ksi), whereas HSC specimens had strengths of approximately 87 to 89 MPa (12.62 to 12.91 ksi). Initial moisture content (just before testing) was also measured, as given in Table 1. As expected, the NSC walls had higher moisture contents than the HSC walls.
Test apparatus/eccentric loading systemThe furnace chamber has a side door area of 3000 x
3000 mm (118.11 x 118.11 in.) and is 1500 mm (59.06 in.) deep, with the interior lined by insulation materials that effi-ciently transfer heat to the specimen. The furnace can reach temperatures of 3000°C (5432°F) and work continuously for up to 6 hours. The vertically standing furnace was designed to produce the conditions that a member might be exposed to during a fire, such as elevated temperatures, structural
Table 1—Concrete mixture constituents and properties
Component
Wall number
NSC-3,4 NSC-5,1 HSC-1,2,3,4 HSC-5,6
Cement PC50, kg (lb) 320 (704) 320 (704) 600 (1320) 600 (1320)
Microsilica fume, kg (lb) — — 70 (154) 70 (154)
Polypropylene fibers, kg (lb) — — — 2 (4.4)
Aggregate (coarse aggregate), kg (lb)828 (1821.6)
(Size: 10 to 20 mm [0.39 to 0.79 in.])
828 (1821.6)(Size: 10 to 20 mm [0.39 to 0.79 in.])
1029 (2263.8)(Size: 5 to 10 mm [0.20 to 0.39 in.])
1030 (2266)(Size: 5 to 10 mm [0.20 to 0.39 in.])
Sand (natural sand), kg (lb) 925 (2035) 925 (2035) 586 (1289.2) 586 (1289.2)
Water, L (qt) 189 (199.71) 189 (199.71) 140 (147.94) 140 (147.94)
High-range water-reducing admixture, L (qt) — — 8.5 (8.98) 8.5 (8.98)
Water-binder ratio 0.59 0.59 0.235 0.235
Slump, mm (in.) 17.65 (0.69) 17.65 (0.69) 18.92 (0.74) 19.6 (0.77)
28-day compressive strength, MPa (ksi) 31.8 (4.61) 31.5 (4.61) 81.8 (11.86) 84.6 (12.27)
Test day compressive strength, MPa (ksi) 35.6 (5.16) 36.2 (5.25) 87.6 (12.71) 89.3 (12.95)
Initial moisture content, % 8.4 8.4 5.7 5.7

506 ACI Structural Journal/May-June 2013
loads and heat transfer, and to meet the requirements of ASTM E119 (1998) and ISO 834 (1999).
The furnace was large enough to enable simultaneous fire testing of two wall panels plus an additional two column specimens from a parallel research program, enabling a cost-effective testing regime. The setup was representative of simply supported conditions top and bottom, which also allowed the simultaneous testing of two walls, as indicated in the schematic views in Fig. 5(a) and (b). The walls were installed in the furnace by fixing the end of the wall into a concrete base, with the loading at the top of the wall applied via a steel beam. The loading device consisted of 1000 kN (224.81 kip) hydraulic jacks mounted on top of the chamber and transferring the load through a steel beam to the top of the wall. The hydraulic jacks applied an eccentric load at 10 mm (0.39 in.) from the central axis of the wall. Insula-tion was applied along the sides of the wall to prevent heat from escaping.
The perpendicular axial deformation of the test wall panels was determined by measuring the displacement of three points (D1, D2, and D3) at 700, 1200, and 1700 mm (2.76, 47.27, and 66.93 in.) from the top of the wall, as indi-cated in Fig. 3. These displacements were measured using transducers with an accuracy of 0.002 mm (7.87 × 10⁻⁵ in.).
Test procedure and instrumentationThe walls were tested under fire conditions with a constant
eccentric load of approximately 15 to 20% of axial load capacity or no axial load, as indicated for each test panel in Table 2. The standard fire curves used for each spec-imen are also indicated, with the fire test duration sched-uled to be 2 hours following ASTM E119 (1998) and ISO 834 (1999). The ambient temperature at the start of each test was approximately 27°C (80.60°F). During testing, each wall was exposed to heating controlled in such a way that the average temperature in the furnace followed, as closely as possible, the standard fire (ISO) or hydrocarbon (HF) fire curve, as shown in Fig. 6. Note the rapid increase in temper-ature of a hydrocarbon fire in the 5 minutes compared to the standard fire.
All the measurements were logged onto a personal computer (PC) via a data-logging system. In addition, hard copies of the load-displacement plots were generated using an online plotter. This was to ensure that data could be recre-
Fig. 3—Details of wall specimen. (Note: Dimensions in mm; 1 mm = 0.03937 in.)
Fig. 4—Thermocouples set up inside concrete wall. (Note: Dimensions in mm; 1 mm = 0.03937 in.)
Table 2—Summary of test parameters and results
Wall No.
Concrete strength, MPa (ksi)Relative humidity
Test load, kN (kip)
E, mm (in.) Fire curve Failure mode
Fire time test, minutes28 days Test day
NSC 3 31.8 (4.61) 35.6 (5.16) 80 485 (109.03) 10 (0.39) ISO None 120
NSC 4 31.8 (4.61) 35.6 (5.16) 80 0 — ISO None 120
NSC5 31.5 (4.57) 35.2 (5.11) 85 485 (109.03) 10 (0.39) HF None 120
NSC1 31.5 (4.57) 35.2 (5.11) 85 0 — HF None 120
HSC1 81.8 (11.86) 87.6 (12.17) 84 970 (218.06) 10 (0.39) ISO None 120
HSC2 81.8 (11.86) 87.6 (12.17) 84 0 — ISO None 120
HSC3 81.8 (11.86) 87.6 (12.17) 95 970 (218.06) 10 (0.39) HF Collapsed spalling 31
HSC4 81.8 (11.86) 87.6 (12.17) 95 0 — HF — 31
HSC5 84.6 (12.27) 89.3 (12.95) 92 970 (218.06) 10 (0.39) HF Located damage spalling 65
HSC6 84.6 (12.27) 89.3 (12.95) 92 0 — HF — 65
Notes: HF is hydrocarbon fire; ISO is ISO 834 (1999) standard fire; E is eccentricity.

ACI Structural Journal/May-June 2013 507
ated from the hard copy in the event of failure or loss of the electronic data. All linear variable differential transducers (LVDTs) and load cells used for data acquisition were cali-brated prior to commencing the experiments, with the cali-bration checked at regular intervals during the period of the experiments. The temperatures inside concrete walls were measured at 1-minute intervals by thermocouples inserted at variable depths, as shown in Fig. 3 and 4.
Crack propagation, deflections, and the occurrence of spalling in the walls were monitored and noted during the fire testing via four small portal openings on the furnace. The wall testing was deemed completed and the tests termi-nated when one of the following occurred: 1) the hydraulic jack could no longer maintain the axial load; 2) the wall collapsed; or 3) 120 minutes was reached. In the case of 1) or 2), the wall was deemed to have failed.
RESULTS AND DISCUSSIONThe behavior of the concrete wall specimens subjected
to fire is discussed under two broad categories: 1) thermal analysis; and 2) structural behavior.
The emphasis will be on the performance of NSC and HSC wall panels under fire conditions. Also, the differences in behavior of the test panels when subjected to standard fires as opposed to hydrocarbon fires are examined.
The following overall conclusions are based on the obser-vations from results given in Table 2:
1. Hydrocarbon fires give rise to earlier spalling and hence premature failure in HSC wall panels, although the addition of fibers seems to provide an increase in the fire resistance of HSC panels.
2. NSC wall panels survived the 120-minute standard and hydrocarbon fire tests with moderate damage only.
3. The moderate axial load, at an eccentricity of 10 mm (0.39 in.), did not seem to adversely affect the fire behavior of wall panels.
Thermal analysisThe temperature profiles inside the 10 concrete walls
tested were anticipated to vary because of a number of significant variables that include fire conditions (standard fire and hydrocarbon fire), axial loads (related to the problem of spalling), differences in concrete type (NSC and HSC), and moisture content.
Figure 7 shows a comparison of the heat transfer inside Concrete Walls NSC3 (with a constant eccentric axial load of 485 kN [109.03 kip]) and HSC1 (with a constant eccen-tric axial load of 970 kN [218.06 kip]) at Point T2 when subjected to an ISO 834 (1999) standard fire test. The results
Fig. 5—(a) Elevation of test panel setup in furnace; and (b) section of test panel setup in furnace. (Note: Dimensions in mm; 1 mm = 0.03937 in.; 1 kN = 0.2248 kip.)
Fig. 6—Test fire curves used.
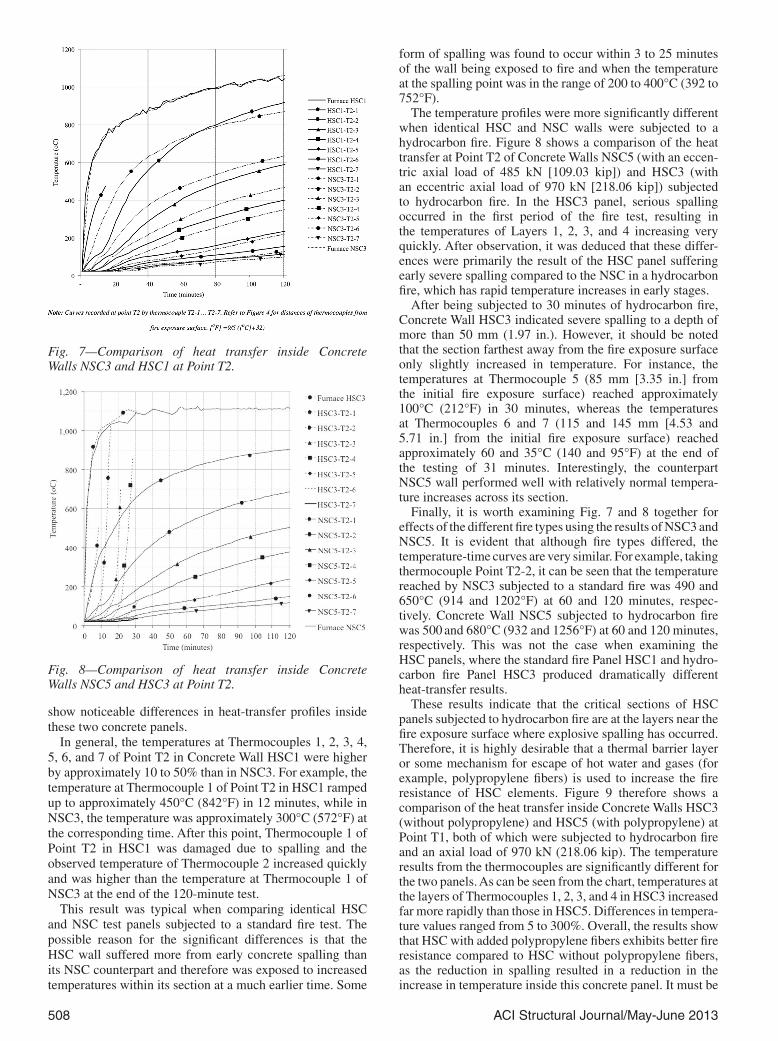
508 ACI Structural Journal/May-June 2013
show noticeable differences in heat-transfer profiles inside these two concrete panels.
In general, the temperatures at Thermocouples 1, 2, 3, 4, 5, 6, and 7 of Point T2 in Concrete Wall HSC1 were higher by approximately 10 to 50% than in NSC3. For example, the temperature at Thermocouple 1 of Point T2 in HSC1 ramped up to approximately 450°C (842°F) in 12 minutes, while in NSC3, the temperature was approximately 300°C (572°F) at the corresponding time. After this point, Thermocouple 1 of Point T2 in HSC1 was damaged due to spalling and the observed temperature of Thermocouple 2 increased quickly and was higher than the temperature at Thermocouple 1 of NSC3 at the end of the 120-minute test.
This result was typical when comparing identical HSC and NSC test panels subjected to a standard fire test. The possible reason for the significant differences is that the HSC wall suffered more from early concrete spalling than its NSC counterpart and therefore was exposed to increased temperatures within its section at a much earlier time. Some
form of spalling was found to occur within 3 to 25 minutes of the wall being exposed to fire and when the temperature at the spalling point was in the range of 200 to 400°C (392 to 752°F).
The temperature profiles were more significantly different when identical HSC and NSC walls were subjected to a hydrocarbon fire. Figure 8 shows a comparison of the heat transfer at Point T2 of Concrete Walls NSC5 (with an eccen-tric axial load of 485 kN [109.03 kip]) and HSC3 (with an eccentric axial load of 970 kN [218.06 kip]) subjected to hydrocarbon fire. In the HSC3 panel, serious spalling occurred in the first period of the fire test, resulting in the temperatures of Layers 1, 2, 3, and 4 increasing very quickly. After observation, it was deduced that these differ-ences were primarily the result of the HSC panel suffering early severe spalling compared to the NSC in a hydrocarbon fire, which has rapid temperature increases in early stages.
After being subjected to 30 minutes of hydrocarbon fire, Concrete Wall HSC3 indicated severe spalling to a depth of more than 50 mm (1.97 in.). However, it should be noted that the section farthest away from the fire exposure surface only slightly increased in temperature. For instance, the temperatures at Thermocouple 5 (85 mm [3.35 in.] from the initial fire exposure surface) reached approximately 100°C (212°F) in 30 minutes, whereas the temperatures at Thermocouples 6 and 7 (115 and 145 mm [4.53 and 5.71 in.] from the initial fire exposure surface) reached approximately 60 and 35°C (140 and 95°F) at the end of the testing of 31 minutes. Interestingly, the counterpart NSC5 wall performed well with relatively normal tempera-ture increases across its section.
Finally, it is worth examining Fig. 7 and 8 together for effects of the different fire types using the results of NSC3 and NSC5. It is evident that although fire types differed, the temperature-time curves are very similar. For example, taking thermocouple Point T2-2, it can be seen that the temperature reached by NSC3 subjected to a standard fire was 490 and 650°C (914 and 1202°F) at 60 and 120 minutes, respec-tively. Concrete Wall NSC5 subjected to hydrocarbon fire was 500 and 680°C (932 and 1256°F) at 60 and 120 minutes, respectively. This was not the case when examining the HSC panels, where the standard fire Panel HSC1 and hydro-carbon fire Panel HSC3 produced dramatically different heat-transfer results.
These results indicate that the critical sections of HSC panels subjected to hydrocarbon fire are at the layers near the fire exposure surface where explosive spalling has occurred. Therefore, it is highly desirable that a thermal barrier layer or some mechanism for escape of hot water and gases (for example, polypropylene fibers) is used to increase the fire resistance of HSC elements. Figure 9 therefore shows a comparison of the heat transfer inside Concrete Walls HSC3 (without polypropylene) and HSC5 (with polypropylene) at Point T1, both of which were subjected to hydrocarbon fire and an axial load of 970 kN (218.06 kip). The temperature results from the thermocouples are significantly different for the two panels. As can be seen from the chart, temperatures at the layers of Thermocouples 1, 2, 3, and 4 in HSC3 increased far more rapidly than those in HSC5. Differences in tempera-ture values ranged from 5 to 300%. Overall, the results show that HSC with added polypropylene fibers exhibits better fire resistance compared to HSC without polypropylene fibers, as the reduction in spalling resulted in a reduction in the increase in temperature inside this concrete panel. It must be
Fig. 7—Comparison of heat transfer inside Concrete Walls NSC3 and HSC1 at Point T2.
Fig. 8—Comparison of heat transfer inside Concrete Walls NSC5 and HSC3 at Point T2.

ACI Structural Journal/May-June 2013 509
noted, however, that the fire resistance period only increased to approximately 60 minutes with these HSC walls, which is still significantly less than the 120 minutes desired.
Deflection analysisAs indicated in Fig. 3, the lateral displacement of the test
panels was measured in three places (D1, D2, and D3) at a distance from the top of the wall of 500, 1200, and 1700 mm (19.69, 47.24, and 66.93 in.), respectively.
Figure 10 shows a comparison of the displacements of Concrete Walls NSC3 and HSC3, both of which carried proportionately similar eccentric axial loads (as indicated in Table 2) exposed to an ISO 834 (1999) standard fire for over 120 minutes. The displacements at Point D2 were obviously largest for both panels and almost double the displacement values when compared to values at D1 and D3. Generally, the NSC displacements were greater than those of the HSC wall, which is most likely due to the fact that the HSC wall has a higher modulus of elasticity and its thermal expansion is also less than its NSC counterpart. Peak deflections at Point D2 were recorded at approxi-mately 90-minute fire exposure, where readings were approximately 7 and 8.5 mm (0.28 and 0.33 in.) for the HSC and NSC wall, respectively. This equates to deflec-tions of approximately span/340 and span/280. Interest-ingly, after 90 minutes, displacements reduced, which can be explained by the increase in thermal expansion of the exposed wall surface, while the thermal expansion on the outer surface remained the same. This seems to be a typical observation in fire testing, where walls bow back toward the fire as temperature and exposure time increases.
Figure 11 shows a comparison of the displacements of Concrete Wall NSC5 with those of Concrete Wall HSC3—both of which carried proportionately similar eccentric axial loads, as indicated in Table 2, and were exposed to a hydro-carbon fire test. Again, the displacements at the middle of the walls (D2) were largest for both NSC5 and HSC3 when compared to the displacements at D1 and D3.
During the first 20-minute period of the fire test, HSC3 deflected slightly less than NSC5, which is possibly due to the thermal expansion of HSC being less than that of NSC. However, beyond 20 minutes, the displacement of HSC3 increased remarkably and surpassed that of NSC5. The main reason for this can be attributed to the spalling in HSC3, which was more serious and deeper than that in NSC5, leading to a significantly reduced cross section. Under eccentric axial load, the displacements of HSC3 increased rapidly until premature failure occurred.
Further observation of the trends in Fig. 10 and 11 gives interesting results. The hydrocarbon fire-exposed wall HSC3 reached a maximum deflection of approximately 9 mm (0.35 in.) at 30-minute exposure, whereas the standard-fire-exposed wall HSC1 reached its maximum deflection of approximately 7 mm (0.28 in.) at 90 minutes. This direct comparison highlights the significant effect of a hydrocarbon fire in HSC, where the fire exposure period before failure is significantly reduced with severe spalling—a major contrib-uting factor.
In the case of the hydrocarbon fire-exposed wall NSC5, it can be noted that maximum deflection again was reached at 90 minutes; but this time, a higher deflection of 13 mm (0.51 in.) was reached (span/180), as compared to the stan-dard fire-exposed wall NSC3, which had a maximum deflec-tion of 8.5 mm (0.33 in.). The effect of hydrocarbon fire in
Fig. 9—Effect of polypropylene mixture on heat transfer inside Concrete Wall HSC5 (adding polypropylene) and HSC3 (without polypropylene).
Fig. 10—Comparison of displacements of Concrete Walls NSC3 and HSC1 subjected to ISO 834 standard fire.
Fig. 11—Comparison of displacements of Concrete Walls NSC5 and HSC3 subjected to hydrocarbon fire.

510 ACI Structural Journal/May-June 2013
this case did not cause a decrease in the fire exposure period but instead contributed to a 65% increase in the lateral deflection of the specimen.
As noted previously, the effect of moderate eccentric loading did not seem to affect the fire behavior of wall panels. As indicated in Table 2, for example, the hydro-carbon fire-exposed walls HSC3 and HSC4 that differed only in loading regime both collapsed in a similar fashion at 31 minutes. The same observation can be made about the fiber-added walls HSC5 and HSC6, where both failed at approximately 60 minutes. Interestingly, there was no evidence of any significant cracking in these cases, whereas the presence of some low-level cracking would possibly have resulted in extended fire periods. This was experienced in the previous testing by Guerrieri and Fragomeni (2010), where large amounts of water and hot vapors were allowed to escape through cracks, reducing the amount of spalling that occurred. Similarly, for NSC walls that survived the 120-minute fire periods, the low-level loading did not seem to affect the behavior.
The differences in behavior between HSC and NSC walls, particularly in the case of hydrocarbon fire exposure, have been partly attributed to differences in thermal conductivity properties. It is worth noting that aggregate size may have also been a contributing factor, where the HSC mixture had maximum aggregate half the size of the NSC mixture, as indicated in Table 1. It must be noted that the wall panels were cast horizontally, and the nonuniform distribution of coarse aggregates around the placing face by overcompac-tion or segregation was not considered in these observations.
CONCLUSIONSFor the 10 NSC and HSC walls tested in accordance with
either the ISO 834 (1999) standard fire or hydrocarbon fire curves, the following conclusions can be drawn based on the results of the experimental work and the discussion in the previous section:• The behavior of HSC walls subjected to ISO (1999)
standard fire showed reasonably different thermal and structural characteristics when compared to their NSC wall counterparts. This, in part, was observed to be due to higher thermal conductivity and evidence of some early spalling in the HSC walls. In both types of cases, however, the walls survived the 120-minute fire period.
• The thermal and structural behavior of HSC walls subjected to hydrocarbon fires differed more signifi-cantly from that of NSC walls. Thermal behavior in the HSC walls differed from the NSC walls with HSC walls having significantly less fire resistance periods of 31 minutes compared to the NSC walls that lasted the 120-minute hydrocarbon fires.
• The addition of polypropylene fibers in HSC walls subjected to hydrocarbon fires had the effect of increasing fire exposure resistance by 100%, but the issue of severe spalling was still evident in this type of fire.
More specifically:
• The hydrocarbon fires created explosive spalling, which was significant in the HSC walls when compared to that in the NSC walls. The hydrocarbon fire produces far more intense and greater spalling in HSC walls than a standard fire.
• The critical regions of a concrete wall when it is subjected to fire are the layers near the fire exposure surface. This suggests that using a thermal barrier layer is highly effective in increasing fire resistance in such walls.
ACKNOWLEDGMENTSThis project was partlially funded by the Vietnamese government and
the Vietnam Institute for Building Science and Technology (IBST). The authors would also like to thank the staff at IBST, where the experimental work was conducted.
REFERENCESAli, F., 2002, “Is High Strength Concrete More Susceptible to Explo-
sive Spalling than Normal Strength Concrete in Fire?” Fire and Materials, V. 26, No. 3, pp. 127-130.
AS1530.4, 2005, “Methods for Fire Tests on Building Materials, Compo-nents and Structures: Part 4—Fire Resistance Test of Elements of Construc-tion,” Standards Australia, Sydney, Australia, pp. 1-163.
ASTM E119-98, 1998, “Standard Methods of Fire Tests on Building Construction and Materials,” ASTM International, West Conshohocken, PA, 1998, pp. 1-21.
Castillo, C., and Durrani, A. J., 1990, “Effect of Transient High Temper-ature on High-Strength Concrete,” ACI Materials Journal, V. 87, No. 1, Jan.-Feb., pp. 47-53.
Chan, S. Y. N.; Peng, G.-F.; and Anson, M., 1999, “Fire Behaviour of High-Performance Concrete Made with Silica Fume at Various Moisture Contents,” ACI Materials Journal, V. 96, No. 3, May-June, pp. 405-409.
Crozier, D. A., and Sanjayan, J. G., 2000, “Tests of Load-Bearing Slender Reinforced Concrete Walls in Fire,” ACI Structural Journal, V. 97, No. 2, Mar.-Apr., pp. 243-251.
Guerrieri, M., and Fragomeni, S., 2010, “Spalling of Normal Strength Concrete Walls in Fire,” Proceedings of the 6th International Conference on Structures in Fire, Detroit, MI, June, pp. 301-311.
Han, C.-G.; Han, M.-C.; and Heo, Y.-S., 2009, “Improvement of Residual Compressive Strength and Spalling Resistance of High-Strength RC Columns Subjected to Fire,” Construction & Building Materials, V. 23, No. 1, pp. 107-116.
ISO 834, 1999, “Fire Resistance Tests—Elements of Building Construc-tion,” International Standard ISO, Geneva, Switzerland, pp. 1-25.
Kodur, V. K. R., 2008, “Strategies for Improving the Performance of High-Strength Concrete Columns under Fire Hazard,” Structural Control and Health Monitoring, V. 15, No. 6, pp. 921-938.
Kodur, V. K. R., and Raut, N. K., 2009, “Design Equation for Predicting Fire Resistance of Reinforced Concrete Columns,” Structural Concrete, V. 10, No. 2, pp. 73-86.
Kodur, V. K. R.; Wang, T. C.; and Cheng, F. P., 2004, “Predicting the Fire Resistance Behaviour of High Strength Concrete Columns,” Magazine of Cement and Concrete Composites, V. 26, No. 2, pp. 141-153.
Lie, T. T., and Lin, T. D., 1985, “Fire Performance of Reinforced Concrete Columns,” Fire Safety: Science and Engineering, ASTM STP 882, Phila-delphia, PA, pp. 176-205.
Ongah, R.; Mendis, P.; and Sanjayan, J., 2003, “Performance of Normal and High-Strength Reinforced Concrete Walls in Fire,” Proceedings of International Conference on Advances in Structures (ASSCCA’03), Sydney, Australia, June, pp. 643-649.
Phan, L. T., 2008, “Pore Pressure and Explosive Spalling in Concrete,” Materials and Structures, V. 41, No. 10, pp. 1623-1632.
Ting, E. S. K.; Patnaikuni, I.; Johanssons. H.; and Pendyala. R., 1992, “Compressive Strength Testing of Very High Strength Concrete,” Proceed-ings of the 17th Conference on Our World in Concrete and Structures, Singapore, pp. 217-226.

ACI Structural Journal/May-June 2013 511
Title no. 110-S41
ACI STRUCTURAL JOURNAL TECHNICAL PAPER
ACI Structural Journal, V. 110, No. 3, May-June 2013.MS No. S-2011-219 received July 12, 2011, and reviewed under Institute
publication policies. Copyright © 2013, American Concrete Institute. All rights reserved, including the making of copies unless permission is obtained from the copyright proprietors. Pertinent discussion including author’s closure, if any, will be published in the March-April 2014 ACI Structural Journal if the discussion is received by November 1, 2013.
Effect of Washout Loss on Bond Behavior of Steel Embedded in Underwater Concreteby Joseph J. Assaad and Camille A. Issa
Limited studies have been undertaken to investigate the bond prop-erties of reinforcing steel bars embedded in underwater concrete (UWC). Approximately 60 pullout tests were carried out to eval-uate the effect of washout loss (W) on residual compressive and bond strengths. Washout was determined using the CRD C61 test and by simulation using a newly developed air-pressurized tube. Reference mixtures sampled in dry conditions were also tested.
Test results showed that bond between steel and UWC is affected by a combination of parameters that complement those documented in the literature for concrete cast and consolidated above water. These include the level of W, degree of segregation, hydrostatic water head (H), and interfacial concrete-water velocity. The bond-stress-versus-slip behavior of UWC is remarkably different from the one obtained using reference mixtures. Initially, the linear response is less stiff due to a coupled effect related to lower strength and increase in the relative coarse aggregate concentration. The slip at ultimate bond strength was found to decrease for UWC mixtures exhibiting higher levels of W.
Keywords: bond properties; segregation; underwater concrete; washout loss.
INTRODUCTIONThe construction or repair of reinforced concrete structures
under water requires understanding of the bond behavior between reinforcing bars and concrete to achieve adequate transfer of stresses. Underwater concrete (UWC) develops lower in-place performance than concrete cast and consoli-dated above water due to washout loss (W) and aggregate segregation, which arise from a combination of factors, such as turbulence of water, interfacial concrete-water velocity Ivelocity, hydrostatic water pressure, exceeding the specified water-cementitious material ratio (w/cm), and improper placement and consolidation.
The bond of steel reinforcement to concrete cast above water has been studied extensively over the last decades and a huge amount of experimental and analytical data have been published in the literature.1-3 For deformed bars, ACI 408R-031 reported that force transfer from the reinforcement to surrounding concrete occurs by chemical adhesion between both materials, frictional forces arising from the roughness of the interface, and mechanical bearing of the steel ribs against the concrete surface. Numerous parameters were found to affect the behavior of such bond, including bar properties (that is, yielding strength, cover, size, position in the cast element, geometry, epoxy coating, and others) and concrete properties (that is, compressive strength, density, presence of mineral admixtures, work-ability, method of consolidation, and others). The devel-oped length or spliced length for proper transfer of stresses can be calculated using currently available equations speci-fied in various building codes.4,5
Limited studies have been carried out to evaluate the bond behavior between reinforcing steel and UWC. Also, no
design provisions or descriptive equations have been made available to estimate the effect of W and aggregate segrega-tion on the corresponding development and splice lengths. McLeish6 suggested that the minimum length of lapped joints in tension for UWC works can be determined using ordinary design equations specified in ACI 318-084 or BS 8110.5 For example, for deformed bars or wires in tension, the development length is inversely proportional to the square root of concrete compressive strength, multiplied by additional factors to account for special considerations due to top bars, epoxy-coated bars, reinforcement size, light-weight concrete, and contribution of confining reinforce-ment (ACI 318-08, Eq. (12-1)4). ACI 546.2R-107 on UWC repair reported that the reduced cross section of reinforcing steel can be strengthened with the addition of new reinforcing bars, provided that the original reinforcement is exposed beyond the corroded section at a distance equal to the required design lap-splice length.
Theoretically speaking, bond and transfer of stresses between steel and UWC cannot be the same as those expe-rienced in concrete cast and consolidated above water. This is due to the fact that performance of materials and appli-cation procedures that perform well in dry conditions are often inadequate for underwater applications.7 For instance, the pullout strength of anchors embedded in polyester resin under submerged conditions was found to be as much as 50% lower than the strength of similar anchors installed under dry conditions.8 Also, in underwater reinforced concrete works, the current knowledge for bond behavior and direct use of existing equations for development length becomes unwar-ranted, as it is difficult to establish a realistic estimation of the contribution of concrete strength to the bond against steel bars. Sonebi and Khayat9 found that self-consolidated UWC developed in-place compressive strength greater than 70% of control samples when Ivelocity is less than 0.4 m/s (1.3 ft/s). Such strength ranged between 50 and 65% when Ivelocity increased to 0.65 m/s (2.13 ft/s). The authors9 concluded that the in-place compressive strength determined on 100 mm (3.93 in.) diameter cores is highly dependent on mixture composition and casting conditions, whereby relatively low values are obtained near the casting position due to the initial freefall of concrete in water and turbulence caused by the placement process. The strength was found to be slightly higher downstream from the placement point and then decreased near the end of the cast element due to progressive

512 ACI Structural Journal/May-June 2013
Joseph J. Assaad is a part-time Professor at Lebanese American University, Byblos, Lebanon, and an R&D Manager at Holderchem Building Chemicals S.A.L., Baabda, Lebanon. He received his PhD from the University of Sherbrooke, Sherbrooke, QC, Canada. His research interests include concrete materials and properties, repair systems, durability, formwork pressure, and rheological behavior of cementitious-based materials modified with chemical and mineral admixtures.
Camille A. Issa is a Professor of civil engineering at Lebanese American Univer-sity. He received his PhD in civil engineering from Virginia Polytechnic Institute and State University, Blacksburg, VA, in 1985. His research interests include structural rehabilitation and strengthening using carbon fiber-reinforced polymer and epoxy and reinforced concrete structural design.
reduction in the consolidation effort away from the casting point and increase in water erosion and segregation.9
CONTEXT AND SCOPE OF RESEARCH PROGRAMThis paper is part of a comprehensive research project
undertaken to evaluate the effect of W, segregation, Ivelocity, and depth of casting on bond behavior of reinforcing steel bars embedded in UWC. Three series of mixtures propor-tioned to exhibit compressive strength in dry conditions of 30, 45, and 60 MPa (4.3, 6.5, and 8.7 ksi) were tested. W of investigated UWC mixtures was evaluated using the CRD C61-89A10 test method and by simulation. The CRD C61-89A10 test was adopted by the U.S. Army Corps of Engineers and thought to simulate concrete freefall from a pump delivery hose through 1 to 2 m (3.3 to 6.6 ft) of water. However, only limited information concerning the behavior of the concrete-water interface during real placements can be deduced from the CRD C61 test, particularly when the concrete is subjected to various Ivelocity rates and/or high hydrostatic pressure resulting from deep placements.11 The air-pressurized tube was developed to simulate deep place-ments down to 140 m (460 ft) below the water surface level at various Ivelocity rates, which may vary from 0.1 to 2.5 m/s (0.33 to 8.2 ft/s).11 Low Ivelocity rates may simulate placements in stagnant water, where the concrete is slowly discharged to reduce turbulence and W. Conversely, high Ivelocity rates may simulate casting in flowing water particularly encountered in tidal zones as well as high stresses arising at the pipe’s bottom end during concrete pumping in deep water.
Scattered data and lack of correlation exist in the literature between W of UWC and its hardened properties due to the fact that the samples used to assess strength were different than those used for washout determination. For example, the common approach to evaluate compressive strength of UWC consists of dropping concrete into molds placed in water tanks. This approach does not simulate practical conditions and does not accurately estimate the degree of W that the fresh UWC sample has undergone during the drop-ping process in water.12,13 Also, it is not accurate to correlate W to compressive strength determined on cores extracted from existing underwater structures, given the direct effect of the casting method on W.6,9 Therefore, special care was placed throughout this project to determine the residual compressive and bond strengths using the same concrete samples that were used for W measurement. Such samples can better reflect actual UWC properties characterized by lower content of cementitious phase and higher w/cm than the specified value due to W and water infiltration inside the specimen. Also, the resulting relative increase in coarse aggregate concentration in the obtained sample may reflect the segregation phenomenon that takes place upon concrete casting under water and self-consolidation. It is to be noted that the direct pullout bond method was selected in this
project, given that it requires the least amounts of material, as will be described in a later section of the paper.
RESEARCH SIGNIFICANCEThe performance of underwater reinforced concrete struc-
tures depends on adequate bond strength between concrete and reinforcing steel. This paper presents useful information to contractors and engineers regarding the residual compressive and bond strengths of UWC with respect to mixture compo-sition, hydrostatic water pressure, and Ivelocity. Correlations with respect to W determined using the CRD C61-89A10 test and a newly developed tube for simulation of deep place-ments are established.
EXPERIMENTAL PROGRAMMaterials
Portland cement and silica fume conforming to ASTM C150/C150M, Type I, and ASTM C1240, respec-tively, were used in this study. The surface area of the cement (Blaine) and silica fume (using the BET Method) were 340 and 20,120 m2/kg (166 and 9815 ft2/lb), respec-tively; and their specific gravities were 3.1 and 2.22, respec-tively. A polycarboxylate-based high-range water-reducing admixture (HRWRA) and liquid cellulosic-based anti-washout admixture (AWA) with specific gravities of 1.1 and 1.12, respectively, and solid contents of 40% and 30%, respectively, were incorporated in all mixtures. A sodium-gluconate-based set-retarding agent was also used to reduce slump loss during testing.
Continuously graded crushed limestone aggregate with a nominal maximum particle size of 20 mm (0.78 in.) and well-graded siliceous sand were employed. Their grada-tions were within ASTM C33/C33M recommendations. The coarse aggregate and sand had fineness moduli of 6.4 and 2.5, respectively. Their bulk specific gravities were 2.72 and 2.65 and their absorptions were 0.6% and 1.1%, respectively.
Deformed steel bars were used to evaluate bond behavior and pullout strength of reinforcement embedded in UWC. The steel bars complied with ASTM A615/A615M No. 13 (No. 4) with a nominal diameter of 12.7 mm (0.5 in.). The Young’s modulus and yield strength were equal to 203 GPa (29,435 ksi) and 420 MPa (60.9 ksi), respectively.
Mixture proportioningAs summarized in Table 1, three series of UWC mixtures
proportioned to achieve different compressive strengths in dry condition (fc′(dry)) of 30 ± 3, 45 ± 4, and 60 ± 5 MPa (4.3 ± 0.4, 6.5 ± 0.6, and 8.7 ± 0.7 ksi) were tested; the corresponding cement content increased from 350 to 400 and 450 kg/m3 (588 to 672 and 756 lb/yd3), respectively, and the w/cm decreased from 0.56 to 0.49 and 0.4, respectively. In each series, five different combinations of admixtures commonly used for proportioning flowable to highly flowable UWC for repair or new construction were used. The AWA was added at either 0.5% or 0.85% of cement weight, while the HRWRA was adjusted to secure a slump of 220 mm (8.7 in.) or a slump flow of 450 mm (17.7 in.), respectively. The silica fume was added at either 6% or 10% of cement weight and the HRWRA was adjusted, as described previously. Also, a reference UWC mixture with a slump of 220 mm (8.7 in.) made without AWA or silica fume was tested. Addi-tional discussion regarding the mixture composition and optimization of W of UWC can be seen in other publica-tions.11,14-16 The sand-to-total-aggregate ratio was fixed at

ACI Structural Journal/May-June 2013 513
0.46 for all tested concrete. The set retarder was added at a relatively high dosage of 0.7% of cement weight to mini-mize slump or slump-flow loss during testing.
Specimen preparation and experimental testingAll mixtures were prepared in an open-pan mixer with a
capacity of 50 L (13 gal.). The mixing sequence consisted of homogenizing the sand and cementitious materials for 1 minute before introducing half of the mixing water along with the HRWRA. After 1 minute of mixing, the AWA diluted in the remaining part of the water was introduced and the concrete was mixed for 2 minutes. The ambient tempera-ture during mixing and sampling was fixed at 21°C ± 3°C (70°F ± 38°F).
Following the end of mixing, the workability, air content, and washout mass loss were evaluated. The slump, slump flow, and air content were determined as per ASTM C143/C143M, ASTM C1611/C1611M, and ASTM C231/C231M, respectively. Values of air content were found to be equal to 2.5% ± 0.5% for all tested mixtures. The filling ability of flowable mixtures with a slump flow of 450 mm (17.7 in.) was evaluated using the L-box test11 and was found to vary from 38 to 54%.
W determination—As previously mentioned, W of UWC was determined using two different methods. The first complies with the CRD C61 test and consists of subjecting a fresh concrete sample placed in a perforated basket to free fall in a 1.7 m (5.6 ft) high column of water.10 After 15 seconds at the bottom of the test tube, the sample is retrieved at a constant speed of 0.5 m/s (1.6 ft/s) and measured to deter-mine washout mass loss. Cumulative Ws after three drops (W3) in water are reported. Approximately 2 kg (4.4 lb) are normally used when testing W as per the CRD C61 test; however, this quantity was increased to approximately 3 kg (6.6 lb) in this testing program to secure enough material for subsequent testing of hardened UWC properties.
The second method for determining W is by simulation using a pressurized steel column with a height of 1200 mm (47.2 in.) and a diameter of 200 mm (7.8 in.).11 The testing procedure consists of filling the column with water and dropping approximately 3 kg (6.6 lb) of the fresh concrete sample to the bottom placed in a perforated basket similar to that used in the CRD C61 test method. The top cover is then tightly closed and an overhead air pressure is introduced at a fixed rate to simulate different water heads (Hs). Air pres-sure is monitored using two dial gauges of different ranges (0 to 6 bars [0 to 87 psi] or 0 to 14 bars [0 to 203 psi]) connected to an air compressor, thus enabling the simulation of increased heads of water reaching 140 m (460 ft) in height. The rate of increase in overhead pressure can be
controlled by adjusting the amount of air introduced in the tube by unit of time, thus simulating various Ivelocity rates. For example, to simulate W resulting from an H of 60 m (197 ft) at an Ivelocity of 0.5 m/s (1.6 ft/s), the pressure is gradually increased from 0 to 6 bars (0 to 87 psi) (corresponding to the desired simulated head of 60 m [197 ft]) over a period of 120 seconds (corresponding to the specified rate of 0.5 m/s [1.6 ft/s]). After opening the air valves to release the pres-sure, the basket containing the concrete sample is retrieved at a constant rate of 0.5 m/s (1.6 ft/s) and W is noted along with the corresponding applied H. As will be discussed later, the air-pressurized tube allows the determination of a certain threshold H, beyond which significant deterioration of the UWC specimen can occur.
Determination of unit weight and residual compressive and bond strengths—The procedure used to determine hardened properties of UWC, using the same concrete samples that were used for W measurement, is presented in Reference 14 and summarized as follows.
Immediately after measuring W3 (using the CRD C61) or W (using the pressurized tube), the fresh concrete sample was moved to a clean container and covered by a wet burlap. Subsequently, another fresh sample of approximately 3 kg (6.6 lb) was taken from the same batch, subjected to similar W testing, and then stored in the same container again. This process was repeated four times to obtain a total mass of approximately 10 kg (22 lb) (taking into consideration the material lost due to washout), which was then rigorously mixed for use in strength determination. It is important to note that the time needed to complete the four cycles of washout testing did not exceed 20 to 25 minutes, whereby slump or slump-flow loss thresholds were limited to less than 25 or 40 mm (1 or 1.6 in.), respectively. In case higher workability loss was encountered (particularly for the 220 mm [8.7 in.] slump mixture containing 0.5% AWA), a new batch was mixed and used for testing. It is to be noted that the variations in W obtained between the first and last cycle of testing using either the CRD C61 test or the pressurized tube were found to be less than 1.4% or 3.7%, respectively.
The so-obtained UWC samples were filled in 100 x 200 mm (3.94 x 7.88 in.) steel cylinders to determine the corresponding residual compressive strength. The method for compacting the concrete in the cylinder, demolding after 24 hours, curing in water, capping, and testing at 28 days complied with ASTM C39/C39M. Also, the strength of reference mixtures sampled in dry conditions (that is, without immer-sion in water) was determined. Prior to crushing at 28 days, the corresponding unit weight γ was calculated by dividing the weight of the concrete sample by volume. It is impor-tant to note that some air voids were visually noticed on the
Table 1—Mixture composition of tested UWC
fc′(dry) = 30 ± 3 MPa fc′(dry) = 45 ± 4 MPa fc′(dry) = 60 ± 5 MPa
Cement content is 350 kg/m3 and w/cm = 0.56
Cement content is 400 kg/m3 and w/cm = 0.49
Cement content is 450 kg/m3 and w/cm = 0.40
Mixture No. 1 HRWRA adjusted to yield slump of 220 mm
Mixture No. 2 AWA = 0.5% of cement weight; HRWRA adjusted to yield slump of 220 mm
Mixture No. 3 AWA = 0.85% of cement weight; HRWRA adjusted to yield slump flow of 450 mm
Mixture No. 4 Silica fume = 6% of cement weight; HRWRA adjusted to yield slump of 220 mm
Mixture No. 5 Silica fume = 10% of cement weight; HRWRA adjusted to yield slump flow of 450 mm
Notes: 1 kg/m3 = 1.68 lb/yd3; 100 mm = 3.94 in.; 1 MPa = 0.145 ksi.

514 ACI Structural Journal/May-June 2013
external surfaces of the hardened cylinders, particularly for UWC mixtures with washed-out fine particles greater than approximately 15%. The presence of such air voids is mainly related to deficiencies in aggregate gradations resulting from W, which can decrease concrete compacity in the cylinders.
The pullout specimens were cast in 150 mm (5.9 in.) diameter cylinders with a height of 120 mm (4.7 in.), again
using concrete sampled in a dry condition or after washout measurement. The reinforcing bars were placed vertically in the bottom of the molds before casting. The embedded length was 60 mm (2.35 in.) (five times the nominal bar diameter), and a polyvinyl chloride (PVC) bond breaker with a length of 60 mm (2.35 in.) (five times the nominal bar diameter) was inserted around the reinforcing bar at the concrete surface in accordance with RILEM/CEB/FIB recommendations.17 The steel was cleaned with a wire brush to remove any rust from the surface prior to use, and a highly elastic silicon material was placed between the reinforcing bar and PVC tube. The concrete samples were compacted in the molds in a similar manner as the cylinders used for compression, demolded after 24 hours, covered with plastic bags, and allowed to cure at 23°C (73.4°F) for 28 days. The pullout test was performed using a universal testing machine and recording the pullout load of the steel bar at one end with the concrete block being encased in the steel reaction frame, as shown in Fig. 1. The reinforcing bar’s relative slips to concrete were monitored from measurements of two linear variable differential trans-formers (LVDTs) placed at the free end (d1) and loaded end (d2) of the specimen. To minimize eccentricity effects and tangential stresses, neoprene pads were placed between the concrete top surface and reaction frame.
TEST RESULTS AND DISCUSSIONTable 2 summarizes the characteristics of reference
concrete mixtures sampled in dry conditions, including fc′(dry), γ(dry), ultimate bond stress t(dry) representing the maximum load, and slip at the free end d1(dry) coinciding with the maximum load. Assuming a uniform load distribution along the embedded length, the bond stresses were calculated as the ratios of measured pullout load divided by the corre-sponding reinforcing bar’s embedded area. The normalized bond stress, which is the ratio of t(dry) to the square root of fc′(dry), is also given in Table 2.
The washout characteristics of UWC mixtures tested as per the CRD C61 test or by simulation at Ivelocity of 2.5 m/s (8.2 ft/s), along with the resulting fc′, γ, t, d1, and normal-ized bond stress, are summarized in Table 3. The d2 values measured at the loaded end of the specimen are not reported for clarity reasons, as they were similar to d1 (note that bond failure for all tested UWC mixtures occurred at loads less than the bars’ yield strength). The residual Dfc′ and Dt values indicated in Table 3 are calculated as [1 – (fc′(dry) or t(dry) – fc′ or t)/fc′(dry) or t(dry)] × 100. Such indexes will be used in this paper to quantify the relative decrease in UWC strength resulting from the loss of cementitious particles due to washout and increase in specified w/cm due to water infiltration inside the tested specimen. Also, Dγ, which is the difference between γ and γ(dry) absolute values, is indicated in Table 3. Such an index reflects the relative increase in unit weight due to a higher concentration of coarse aggregate resulting from Ws of fine particles in the UWC sample.
Several mixtures were tested three times to evaluate the validity of the testing procedure developed to evaluate strength and bond properties of UWC using the same samples that were used for washout measurement. Acceptable repro-ducibility of fc′, γ, and t values was obtained throughout testing, as the coefficient of variation (COV) varied from 5.1 to 13.7%.1 A higher COV—reaching 18.5%—was obtained for the d1 values.
Table 2—Compressive strength, unit weight, and pullout properties of tested concrete sampled in dry conditions (that is, without immersion in water)
fc′(dry), MPa
γ(dry), kg/m3
tu(dry), MPa
d1(dry), mm τ dry c dryf( ) ( )′
350-0.56-S22 29.4 2345 10.70 1.92 1.97
350-0.56-S22-AWA 30.2 2355 11.85 1.30 2.16
350-0.56-SF45-AWA 28.7 2340 12.34 1.86 2.30
350-0.56-S22-Silica 33.3 2360 12.92 1.55 2.24
350-0.56-SF45-Silica 32.5 2340 11.77 2.14 2.06
400-0.49-S22 43.6 2310 14.02 1.89 2.12
400-0.49-S22-AWA 44.8 2305 16.99 2.50 2.54
400-0.49-SF45-AWA 42.5 2315 14.51 1.92 2.23
400-0.49-S22-Silica 48.5 2310 15.97 2.16 2.29
400-0.49-SF45-Silica 48.7 2315 17.47 2.45 2.50
450-0.4-S22 57.3 2270 20.17 2.77 2.66
450-0.4-S22-AWA 58.2 2275 19.20 2.30 2.52
450-0.4-SF45-AWA 56.1 2260 20.30 2.15 2.71
450-0.4-S22-Silica 64.5 2275 23.04 3.10 2.87
450-0.4-SF45-Silica 63.2 2280 21.45 2.86 2.70
Notes: 1 kg/m3 = 1.68 lb/yd3; 100 mm = 3.94 in.; 1 MPa = 0.145 ksi.
Fig. 1—Schematic of specimen dimensions and setup for pullout strength of bars. (Note: 100 mm = 3.94 in.)

ACI Structural Journal/May-June 2013 515
Phase 1—W versus properties of tested UWC mixtures
Effect of mixture composition on WWashout determined using CRD C61 test—Generally
speaking, W determined using the CRD C61 test method is directly affected by the mixture composition (Table 3). For example, lower W3 values are obtained for UWC prepared with combinations of higher cement content and lower w/cm. The addition of an increased concentration of either AWA or silica fume also resulted in lower W3 values for a given level of consistency. This can be attributed to the mode of function of such additives, which binds part of the mixing water, increases cohesiveness, and leads to lower washout upon contact of concrete with surrounding water.16 The increase in the level of consistency (that is, from a slump of
220 mm [8.7 in.] to slump flow of 450 mm [17.7 in.]) led to higher washout. Additional discussion regarding the effect of mixture composition on W3 variations can be found in References 11 and 14 through 16.
Washout determined by simulation—A typical example of the variation of placement depths, simulated by varying the overhead pressure in the pressurized tube, on W is plotted in Fig. 2 for UWC mixtures made with 450 kg/m3 (756 lb/yd3) cement. A new concrete sample was used for each simulation test realized at an Ivelocity of 2.5 m/s (8.2 ft/s). The gradual increase in air pressure over the submerged unhardened specimen led to a greater degree of W, thus indicating that washout is directly dependent on water depth at the casting point. For any given mixture, the increase in washout with H is shown to increase sharply when the applied pressure
Table 3—Washout, compressive strength, unit weight, and bond properties obtained using UWC mixtures sampled following testing using CRD C61 test or air-pressurized tube at Ivelocity of 2.5 m/s
W3, % H, m W, % fc′, MPa γ, kg/m3 tu, MPa d1, mm τu cf ′ Dγ = γ – γ(dry), kg/m3
Residual properties, %
fc′ tu
350-0.56-S228.9 — — 26.5 2405 10.1 1.43 1.96 60 90.1 94.2
— 25 17.5 17.2 2450 7.2 0.38 1.75 105 58.5 67.8
350-0.56-S22-AWA6.3 — — 28.9 2435 10.8 0.78 2.02 80 95.7 91.4
— 50 18.7 22.5 2445 8.6 0.13 1.81 90 74.5 72.4
350-0.56-SF45-AWA10.5 — — 26.1 2420 11.1 1.45 2.17 80 90.9 89
— 15 15.4 18.8 2420 9.6 0.8 2.22 80 65.5 78.1
350-0.56-S22-Silica7.7 — — 27.9 2380 11.7 1.34 2.22 20 83.8 90.7
— 35 16.4 23.9 2420 9.7 0.69 1.98 60 71.8 75
350-0.56-SF45-Silica11.8 — — 25.8 2415 10.7 1.59 2.10 75 79.4 90.6
— 10 13.5 24.2 2390 8.8 0.74 1.76 50 74.5 73.7
400-0.49-S227.1 — — 38.8 2380 11.9 1.54 1.91 70 89 84.9
— 35 15.4 30.4 2405 9.5 0.89 1.72 95 69.7 67.5
400-0.49-S22-AWA4.8 — — 42.5 2325 15.9 1.97 2.44 20 94.9 93.5
— 70 20.2 24.8 2410 10.9 1.12 2.18 105 55.4 64.1
400-0.49-SF45-AWA9.2 — — 37.1 2380 11.8 2.08 1.95 65 87.3 81.7
— 20 16.1 29.5 2390 10.2 0.46 1.88 75 69.4 70.4
400-0.49-S22-Silica6.2 — — 42.2 2355 14.4 1.45 2.21 45 87 90
— 45 18.4 31.4 2400 11.1 0.75 1.98 90 64.7 69.5
400-0.49-SF45-Silica10.1 — — 38.9 2360 14.4 2.14 2.31 45 79.9 82.5
— 10 12.8 37.6 2370 13.4 1.08 2.18 55 77.2 76.5
450-0.4-S225.4 — — 50.1 2280 18.5 2.04 2.62 10 87.4 91.9
— 50 18.4 30.2 2365 12.6 0.65 2.29 95 52.7 62.3
450-0.4-S22-AWA3.3 — — 56.2 2290 18.8 1.74 2.51 15 96.6 97.9
— 85 21.8 28.5 2355 11.4 0.96 2.14 80 49 59.4
450-0.4-SF45-AWA5.1 — — 48.9 2280 18.3 2.48 2.62 20 87.2 90.2
— 40 16.6 30.2 2305 11.8 0.83 2.15 45 53.8 58.2
450-0.4-S22-Silica4.8 — — 54.7 2295 21.5 2.75 2.91 20 84.8 93.3
— 60 19.5 33.4 2310 13.9 0.86 2.41 35 51.8 60.5
450-0.4-SF45-Silica6.7 — — 51.8 2300 19.7 2.20 2.74 20 81.9 91.9
— 25 15.5 40.6 2320 15.6 1.24 2.44 40 64.2 72.6
Mixture codification: Cement content-w/cm-consistency (S22 is slump of 220 mm; SF45 is slump flow of 450 mm)-AWA-silica fume
Notes: 1 kg/m3 = 1.68 lb/yd3; 100 mm = 3.94 in.; 1 MPa = 0.145 ksi; 1 m/s = 3.28 ft/s; 1 m = 3.28 ft.

516 ACI Structural Journal/May-June 2013
exceeds a certain threshold H. For example, W increased from 21.8 to 31.5% when the overhead pressure increased from 8.5 to 9 bars (123 to 130 psi) for Mixture 450-0.4-S22-AWA. This notion of critical threshold overhead pressure is supported by visual inspection of the tested concrete after removal from the pressurized column.11 Beyond such value, deteriorations of the tested samples with clear signs of water inclusion inside the tested concrete can be observed. The
H value was considered to be reached when W determined following a 0.5 bar (7.25 psi) pressure increment exceeded 35% of the previous washout value.11
From Table 3, the H values determined at an Ivelocity of 2.5 m/s (8.2 ft/s) using the air-pressurized tube are shown to increase for UWC mixtures prepared with combinations of higher cement content and a lower w/cm. This can be related to the coupled effect of increased cement paste and mortar volumes associated with lower free water content, which would create a denser concrete-water interface capable of resisting washout and erosion at greater hydrostatic pres-sure.11 On the other hand, for each combination of cement and w/cm, the incorporation of AWA or silica fume resulted in increased H values due to the capability of such admix-tures to increase mixture cohesiveness and reduce tendency of fines to migrate out of the matrix when subjected to higher water pressure.11
Parameters affecting normalized bond stress of tested UWCEffect of mixture composition—The effect of mixture
composition on the normalized bond stress is plotted in Fig. 3 for various UWCs possessing given W values. The coupled effect of higher cement content and lower w/cm is shown to increase the normalized bond stress. For example, such an increase was from 2.1 to 2.74 when the cement content increased from 350 to 450 kg/m3 (588 to 756 lb/yd3) and the w/cm decreased from 0.56 to 0.4, respectively. This can normally be related to the improved particle packing and bearing strength capacity of the concrete in front of the bar ribs, which lead to an increase in the maximum bond stresses.1
With a few exceptions (Table 3), the addition of AWA or silica fume resulted in improvements in the normal-ized bond stress. For example, such an improvement was 0.53 or 0.3 when adding AWA or silica fume, respectively, to Mixture 400-0.49-S22 (Fig. 3). This may be related to the reduction in the bleed water and strengthening of the cement paste in the transition zone adjacent to the reinforcing bars.1,3 No clear conclusion was drawn regarding the effect of increased consistency (that is, slump of 220 mm [8.7 in.] versus slump flow of 450 mm [17.7 in.]) on the normalized bond stress (Table 3).
Effect of W—The effect of washout is evaluated by plotting the relationship between washout and the difference between normalized bond stress determined on concrete sampled in a dry condition minus the one determined on UWC after being subjected to some washout (Fig. 4). Although there is scatter in the data, it is evident that such a difference is always positive (with the exception of three tests), thus confirming that bond strength of concrete to embedded steel decreases when casting is realized under water. On the other hand, it can be noted that the extent of reduction in the normalized bond stress increases for UWC mixtures exhibiting higher Ws. In fact, such mixtures are characterized by a decrease in the cementitious phase coupled with an increase in the specified w/cm, which can both decrease the contribution of concrete strength to the bond against steel.
Effect of H—Mixtures 450-0.4-S22-AWA and 450-0.4-S22-Silica were subjected to different heads of water using the air-pressurized tube at an Ivelocity of 2.5 m/s (8.2 ft/s) and then sampled for bond evaluation as per the testing procedure described previously. The normalized bond stresses obtained along with the Hs applied and resulting Ws are plotted in Fig. 5. Regardless of the mixture composition, it is clear that UWC subjected to lower heads of water results in higher
Fig. 2—Effect of applied pressure simulating different place-ment depths on variations of washout loss of UWC. “H” and “W” refer to threshold water head and corresponding maximum washout loss, respectively. (Note: 1 m/s = 3.28 ft/s; 1 bar = 14.5 psi.)
Fig. 3—Effect of mixture composition on normalized bond stress.
Fig. 4—Effect of W on difference between normalized bond stress determined on concrete sampled in dry condition and one determined on UWC.

ACI Structural Journal/May-June 2013 517
normalized bond stress. For example, such stress increased from 2.41 to 2.85 for Mixture 450-0.4-S22-Silica when H decreased from 60 to 30 m (196.8 to 98.4 ft), respectively. This can indirectly be attributed to the decrease in W (that is, from 19.5% to 10.6%, respectively), which decreases the risks of water inclusion inside the UWC and migration of fines out of the matrix. Practically, this indicates that bond strength of steel embedded in UWC is directly dependent on water depth at the casting point for a given Ivelocity.
Effect of Ivelocity—The normalized bond stress determined on three UWC mixtures tested at an Ivelocity of 2.5 or 0.5 m/s (8.2 to 1.6 ft/s) is plotted in Fig. 6. The H applied on the tested specimen using the air-pressurized tube along with the resulting measured W are also reported. The results show that reducing the outflow velocity at which the UWC comes into contact with water leads to a remarkable increase in the normalized bond stress. For example, the stress increased from 1.81 to 2.16 for Mixture 350-0.56-S22-AWA when the Ivelocity decreased from 2.5 to 0.5 m/s (8.2 to 1.6 ft/s), respectively. Concrete cast at a relatively low Ivelocity rate possesses enough time to undergo structural buildup, leading to a decrease in slump consistency and an improvement in washout resistance,11 thus resulting in a higher contribution of concrete strength to the bond properties. In other words, this indicates that reducing turbulence and interfacial concrete-water velocity is crucial to limit W and increase bond strength of embedded steel.
Inadequacy of using fc′(dry) to evaluate bond between steel and UWC—Typical variations of the normalized bond stress of tested UWC with compressive strength determined either in a dry condition or after washout for mixtures made with 450 kg/m3 (756 lb/yd3) cement and 0.4 w/cm are plotted in Fig. 7. For a fixed fc′(dry) of 60 ± 5 MPa (8.7 ± 0.7 ksi), significant variations in the normalized bond stress ranging from approximately 2 to 3 are obtained. This indicates that fc′(dry) cannot be used as an index to reflect the contribution of UWC strength to the bond against steel. In other words, the use of fc′(dry) in current design equations to evaluate development and splice lengths is inadequate whenever concrete casting is to take place under water. Conversely, the normalized bond stress and fc′ values determined on concrete subjected to washout are shown to normally increase within each other (that is, for a stress ranging from 2 to 3, the corre-sponding fc′ varied from 28 to 56 MPa [4.06 to 8.12 ksi]).
Effect of W on UWC propertiesPrediction of UWC residual strengths through washout
testing—The effect of W determined using the CRD C61
test or by simulation at Ivelocity of 2.5 m/s (8.2 ft/s) on the variations of UWC residual strengths and unit weight is plotted in Fig. 8. Three categories depending on the level of W can be distinguished as follows:• W greater than 15%: UWC samples possessing such
levels of washout are characterized by a relative increase in coarse aggregate concentration resulting from the loss of cementitious paste and fine sand particles, thus
Fig. 5—Effect of H on normalized bond stress for Ivelocity of 2.5 m/s. (Note: 1 m/s = 3.28 ft/s; 1 m = 3.28 ft.)
Fig. 6—Effect of Ivelocity on normalized bond stress. (Note: 1 m/s = 3.28 ft/s; 1 m = 3.28 ft.)
Fig. 7—Variations of normalized bond stress for UWC mixtures with respect to compressive strength determined either in dry condition or after W. (Note: 1 MPa = 0.145 ksi; 1 kg/m3 = 1.68 lb/yd3.)
Fig. 8—Effect of W on residual bond and compressive strengths and difference in unit weights. (Note: 1 kg/m3 = 1.68 lb/yd3.)

518 ACI Structural Journal/May-June 2013
leading to a Dγ greater than approximately 95 kg/m3 (160 lb/yd3). A dramatic drop in the residual strength is noticed due to the coupled effects of cementitious loss and an increase in specified w/cm. The corresponding Dfc′ and Dt values ranged from 50% to 75% and 55% to 75%, respectively.
• W varying from 7.5 to 15%: The corresponding Dγ ranged from 70 to 95 kg/m3 (117 to 160 lb/yd3), whereas
the Dfc′ and Dt values both varied from approximately 65 to 90%.
• W less than 7.5%: Obviously, this category of mixtures is characterized by an improved concrete-water inter-face capable of resisting loss of fines and water inclu-sion inside the specimen, thus leading to Dfc′ and Dt values greater than approximately 80% with a Dγ less than 70 kg/m3 (117 lb/yd3).Effect of intrinsic W (W3) on threshold H and normalized
bond stress—The relationships between W3 determined using the CRD C61 test with respect to H determined using the pressurized tube at an Ivelocity of 2.5 to 0.5 m/s (8.2 to 1.6 ft/s) along with the corresponding normalized bond stress are plotted in Fig. 9. The data points shown in this figure are gathered from this study and Reference 11. UWC mixtures with lower intrinsic W can enable casting in deeper water prior to complete deterioration, particularly when decreasing the Ivelocity rate from 2.5 to 0.5 m/s (8.2 to 1.6 ft/s). Also, such mixtures can result in an increase in the normalized bond stress (R2 of 0.42). For example, at an Ivelocity of 2.5 m/s (8.2 ft/s), the decrease in W3 from 10% to 2.5% led to an increase in the threshold water depth from 10 to 80 m (32.8 to 262.8 ft), respectively, while the corresponding normalized bond stress at these H values increased from 1.9 to 2.8, respectively. This can be attributed to the fact that such a category of UWC mixtures exhibiting lower W3 values possesses a more cohesive concrete-water interface, which improves resistance against water pressure and increases contribution of concrete strength to bond against steel bars.
Phase 2—Bond-stress-versus-displacement responses of tested UWC
All specimens sampled in either a dry condition or after being subjected to washout exhibited a pullout mode of failure characterized by crushing and shearing of the local-ized embedded region around the bar. No cracks were observed on their external surfaces, indicating that the concrete cover provided adequate confinement.
Typical variations of the bond-stress-versus-displacement (slip of the bar at the free end) curves determined using the direct pullout test for the 350-0.56 and 450-0.4 series of mixtures sampled after being subjected to some W are plotted in Fig. 10 and 11, respectively. Reference mixtures sampled in a dry condition are also shown. It is important to note, however, that the pullout specimens do not represent actual beam or column conditions in reinforced concrete structures, as the measured slips are much greater than the slip values that are typically encountered in real structures.1 Therefore, the test results are only used for comparison purposes to evaluate the effect of W on bond stress and slippage between steel and UWC.
Behavior of reference mixtures—Generally speaking, the local t-versus-d1 curves determined on reference mixtures sampled in a dry condition are divided into three distinct regions: elastic, nonlinear, and dynamic.1,18-20 Initially, the curves shown in Fig. 10 and 11 yielded a stiff linear response that varied up to approximately 15 to 20% of the ultimate bond strength, beyond which the bars’ free end started to slip noticeably. In this region, the bond resistance consists mainly of chemical adhesion and friction until internal circumferential cracks develop in the concrete at the inter-face between the bar and concrete matrix. Following the formation of internal cracks, the response on the ascending curve becomes nonlinear due to initiation of debonding. As
Fig. 9—Relationships between intrinsic W3 with respect to threshold water depth (H) determined at Ivelocity of 2.5 and 0.5 m/s and normalized bond stress. (Note: 1 m/s = 3.28 ft/s; 1 m = 3.28 ft.)
Fig. 10—Bond-stress-versus-slip responses for mixtures exhib-iting different levels of W. (Note: 100 mm = 3.94 in.; 1 MPa = 0.145 ksi.)
Fig. 11—Bond-stress-versus-slip responses for mixtures exhib-iting different levels of W. (Note: 100 mm = 3.94 in.; 1 MPa = 0.145 ksi.)

ACI Structural Journal/May-June 2013 519
the debonding propagates along the embedded length, the stiffness of the ascending curves gradually softens until it reaches a maximum bond stress value. The ultimate bond strength is directly dependent on the contribution of concrete strength and quality of the interfacial transition zone between the paste and embedded steel.18,19 For example, the bond strength increased from 11.8 to 12.9 and 21.45 MPa (1.71 to 1.87 and 3.11 ksi) for Mixtures 350-0.56-S22-AWA, 350-0.56-S22-Silica, and 450-0.4-SF45-Silica, respectively (with fc′(dry) equal to 30.2, 33.3, and 63.2 MPa [4.38, 4.83, and 9.17 ksi], respectively). The debonding still continues in the post-peak region until the entire length is totally debonded, causing the steel bars to slide out dynamically. Concrete possessing higher compressive strength yielded generally more sharp decay in the t-versus-d1 curves as compared to lower-strength concrete (Fig. 10 and 11).
Behavior of UWC—Regardless of the composition, all mixtures subjected to a certain degree of W exhib-ited different t-versus-d1 behaviors than those described previously for concrete sampled in a dry condition. In the elastic region, the bars’ free end started to slip at rela-tively lower bond stress, thus attenuating the stiffness of UWC linear responses. For example, at the very small d1 of 0.05 mm (2 × 10⁻³ in.), the bond stress decreased from approximately 5 to 3.5 and 1.3 MPa (0.73 to 0.51 and 0.19 ksi) for Mixture 450-0.4-S22-Silica having nil or a W of 4.8% and 19.5%, respectively (Fig. 10). In a direct pullout test, where the bar is placed in tension, the bond behavior is affected by the surrounding concrete that is placed in compression. Therefore, as discussed previously, UWC mixtures sampled after being subjected to washout are char-acterized by lower fc′, which decreases bond resistance and leads to internal cracking at lower bond stress. Furthermore, the attenuation of the UWC linear stiffness responses may be related to a more pronounced compression strain-softening phenomenon due to the relative increase in coarse aggregate concentration and air voids within the concrete samples. This is particularly the case for UWC mixtures with washed-out fine particles greater than approximately 15%, where some air voids were visually noticed on the external surfaces of the hardened concrete. Such a phenomenon is known to occur in the pre-peak portion of the stress-strain curve when air voids and microcracks coalesce to form a damaged zone around the aggregate particles, thus weakening the concrete load-carrying capacity.21
The t-versus-d1 curves of UWC mixtures in the nonlinear zone are characterized by a decrease in the ultimate bond strengths as compared to those obtained for concrete sampled in dry conditions. For example, a decrease from 11.6 to 8.5 MPa (1.68 to 1.23 ksi) was measured for Mixture 350-0.56-S22-AWA having nil or 18.7% W, respec-tively (Fig. 10). This can normally be related to the reduction in fc′ from 30.2 to 22.5 MPa (4.38 to 3.26 ksi), respectively, which decreases contribution of concrete strength to the bond against steel. On the other hand, the decrease in ulti-mate bond strength is shown to be coupled with a shifting of the corresponding bars’ free-end displacement toward lower values. The relationships between ultimate bond strength and corresponding d1 for mixtures sampled in a dry condition or after washout using the CRD C61 test or by simulation are plotted in Fig. 12. Even with the data scatter, it is clear that displacements at ultimate bond strength tend to decrease for mixtures yielding higher W values. For example, for a bond stress of 12 MPa (1.74 ksi), d1 decreased from approxi-
Fig. 12—Relationships between ultimate bond stress and slip for mixtures tested in dry conditions or after W. (Note: 100 mm = 3.94 in.; 1 MPa = 0.145 ksi.)
mately 1.7 to 1.5 and 1 mm (0.066 to 0.059 and 0.039 in.) for mixtures exhibiting 0%, 7%, and 17% washout, respec-tively. Practically, this indicates that the pullout deformation capacity and ability to redistribute load tend to decrease for mixtures (such as the case of UWC) characterized by lower matrix strength and toughness.20
SUMMARY AND CONCLUSIONSThis study offers a step toward a better understanding of
the various phenomena affecting bond of reinforcing steel to UWC. The residual compressive and bond strengths of UWC were determined using the same concrete samples that were used for W measurement. Test results showed that fc′(dry) determined in dry conditions cannot be used as an index to reflect contribution of UWC strength to the bond behavior. This therefore limits the applicability of current design equations formulated for concrete cast and consolidated above water to evaluate development and splice lengths of tension reinforcing bars.
Bond between steel and UWC is affected by a combination of parameters that complement those documented in the literature for concrete cast above water. For example, the effect of increased Hs and/or Ivelocity rates can increase W, thus reducing the overall contribution of concrete strength to bond against steel. On the other hand, the increase in cement content and decrease in w/cm can improve bond stress due to higher strength-bearing capacity of the concrete in front of the bar ribs. Also, the addition of AWA and silica fume resulted in improved bond stress.
The bond-stress-versus-slip behavior of UWC is remark-ably different than the one obtained using reference mixtures sampled in a dry condition. Initially, the linear response is less stiff due to a coupled effect related to lower fc′ and an increase in the relative coarse aggregate concentration. UWC mixtures exhibiting a certain degree of W led to a decrease in the ultimate bond strength together with a shift of the corre-sponding slip toward lower values.
ACKNOWLEDGMENTSThis project was funded by the National Council for Scientific Research
(NCSR)—Lebanon and the University Research Council of Lebanese American University (LAU), Byblos, Lebanon. The authors wish to acknowledge the experimental support provided by the Laboratory of the Civil Engineering Department at LAU.
REFERENCES1. Joint ACI-ASCE Committee 408, “Bond and Development of Straight
Reinforcing Bars in Tension (ACI 408R-03) (Reapproved 2012),” American Concrete Institute, Farmington Hills, MI, 2003, 49 pp.

520 ACI Structural Journal/May-June 2013
2. Harajli, M. H., “Development/Splice Strength of Reinforcing Bars Embedded in Plain and Fiber Reinforced Concrete,” ACI Structural Journal, V. 91, No. 5, Sept.-Oct. 1994, pp. 511-520.
3. Valcuende, M., and Parra, C., “Bond Behaviour of Reinforcement in Self-Compacting Concrete,” Construction & Building Materials, V. 23, 2009, pp. 162-170.
4. ACI Committee 318, “Building Code Requirements for Structural Concrete (ACI 318-08) and Commentary,” American Concrete Institute, Farmington Hills, MI, 2008, 473 pp.
5. BS 8110, “Structural Use of Concrete, Part 1: Code for Practice for Design and Construction,” British Standards Institution, London, UK, 2004, 173 pp.
6. McLeish, A., ed., Underwater Concreting and Repairing, Taylor & Francis, London, UK, 1994, 160 pp.
7. ACI Committee 546, “Guide to Underwater Repair of Concrete (ACI 546.2R-10),” American Concrete Institute, Farmington Hills, MI, 2010, 32 pp.
8. Best, J. F., and McDonald, J. E., “Evaluation of Polyester Resin, Epoxy, and Cement Grouts for Embedding Reinforcing Steel Bars in Hard-ened Concrete,” Technical Report REMR-CS-23, U.S. Army Corps of Engi-neers, 1990, 25 pp.
9. Sonebi, M., and Khayat, K. H., “Effect of Water Velocity on the Performance of Underwater Self-Consolidating Concrete,” ACI Materials Journal, V. 96, No. 5, Sept.-Oct. 1999, pp. 519-528.
10. CRD C61-89A, “Test Method for Determining the Resistance of Freshly-Mixed Concrete to Washing Out in Water,” Handbook for Cement and Concrete, U.S. Army Waterways Experiment Station, Vicksburg, MS, 1989, 3 pp.
11. Assaad, J. J.; Daou, Y.; and Khayat, K. H., “Simulation of Water Pres-sure on Washout of Underwater Concrete Repair,” ACI Materials Journal, V. 106, No. 6, Nov.-Dec. 2009, pp. 529-536.
12. Perry, S. H., and Holmyard, J. M., “Scaling of Underwater Concrete Repair Materials,” Technical Report OTH 89-298, Imperial College of Science and Technology, London, UK, 1992, 62 pp.
13. Moon, H. Y., and Shin, K. J., “Evaluation on Steel Bar Corrosion Embedded in Antiwashout Underwater Concrete Containing Mineral Admixtures,” Cement and Concrete Research, V. 36, 2006, pp. 521-529.
14. Assaad, J. J.; Daou, Y.; and Salman, H., “Correlating Washout to Strength Loss of Underwater Concrete,” Institute of Civil Engineers, V. 164, No. CM3, 2011, pp. 153-162.
15. Assaad, J. J.; Daou, Y.; and Harb, J., “Use of CEM Approach to Develop and Optimize High-Performance Underwater Concrete,” Journal of Materials in Civil Engineering, ASCE, V. 23, No. 7, 2011, 9 pp.
16. Khayat, K. H., and Assaad, J. J., “Relationship between Washout Resistance and Rheological Properties of High-Performance Under-water Concrete,” ACI Materials Journal, V. 100, No. 3, May-June 2003, pp. 185-193.
17. RILEM/CEB/FIB, “Bond Test for Reinforcing Steel: 2, Pullout Test,” Materials and Structures, V. 3, No. 5, 1970, pp. 175-178.
18. Sueki, S.; Soranakom, C.; Mobasher, B.; and Peled, A., “Pullout-Slip Response of Fabrics Embedded in a Cement Paste Matrix,” Journal of Materials in Civil Engineering, ASCE, V. 19, No. 9, 2007, pp. 718-727.
19. Haskett, M.; Oehlers, D. J.; and Ali, M., “Local and Global Bond Characteristics of Steel Reinforcing Bars,” Engineering Structures, V. 30, 2008, pp. 376-383.
20. Watson, A. K., and LaFave, J. M., “Effect of Increased Tensile Strength and Toughness on Reinforcing-Bar Bond Behavior,” Cement and Concrete Composites, V. 16, 1994, pp. 129-141.
21. Uebayasi, K.; Fujikake, K.; and Ohno, T., “Strain Softening Behav-iors of Concrete Materials under Compressive Rapid Loading,” Trans-actions of the 15th International Conference on Structural Mechanics, SMiRT-15, Seoul, South Korea, 1999, pp. 15-20.

ACI Structural Journal/May-June 2013 521
Title no. 110-S42
ACI STRUCTURAL JOURNAL TECHNICAL PAPER
ACI Structural Journal, V. 110, No. 3, May-June 2013.MS No. S-2011-220 received July 12, 2011, and reviewed under Institute
publication policies. Copyright © 2013, American Concrete Institute. All rights reserved, including the making of copies unless permission is obtained from the copyright proprietors. Pertinent discussion including author’s closure, if any, will be published in the March-April 2014 ACI Structural Journal if the discussion is received by November 1, 2013.
Experimental Evaluation of Disproportionate Collapse Resistance in Reinforced Concrete Framesby Stephen M. Stinger and Sarah L. Orton
Reinforced concrete frame structures may possess an inherent ability to withstand collapse through the use of alternative resis-tance mechanisms. These mechanisms include Vierendeel action, catenary action, compressive arch action, and contributions from infill walls. This research tested a series of three one-quarter-scale, two-bay-by-two-story frames. The column between the two bays was removed to simulate a collapse scenario. Flexural analysis of the frame with discontinuous reinforcement indicated little load capacity; however, it reached a load of 2.34 kip (10.4 kN) under compressive arch action and 8.19 kip (36.4 kN) under catenary tension before the top bars ripped out of the stirrups. The frame with continuous reinforcement also reached 8.3 kip (36.9 kN) in catenary action before the longitudinal bars fractured under the tensile load. A frame with partial-height infill walls showed only a minor increase in strength in the compressive arch phase. The results show that both compressive arch and catenary action are viable resistance mechanisms in frames under a collapse loading.
Keywords: catenary action; compressive arch; disproportionate collapse; progressive collapse; reinforced concrete frame; structural integrity.
INTRODUCTIONDisproportionate (or progressive) collapse is an event when
a “local failure of a primary structural component leads to the collapse of adjoining members,” which results in further collapse (Department of Defense [DoD] 2009). Therefore, a “domino” effect takes place and the eventual destruction is disproportionate to the original cause. Disproportionate collapse may occur in a building when the structure is exposed to unexpected loadings beyond the building’s design limits. Usually, these extreme loadings are the result of natural disasters, accidental explosions, or terrorist attacks. Although these are rare occurrences, they can lead to severe consequences, such as significant loss of life. This has been demonstrated by the collapse of several buildings, such as the Ronan Point Apartment Building in England in 1968 and the Murrah Building in Oklahoma City in 1995. Due to these infamous events, research on disproportionate collapse has gained momentum over the last decade.
It is possible for buildings to be designed to reduce the risk of disproportionate collapse according to current disproportionate collapse design procedures, as found in the DoD guidelines (2009). However, typically, only resis-tance from flexural action (bending in the beams) is consid-ered in collapse design. A more accurate disproportionate collapse analysis procedure that takes into account alterna-tive collapse-resisting mechanisms will lead to the identifi-cation of detailing requirements that could be implemented economically in new buildings or retrofit measures for existing buildings. These alternate resistance mechanisms include catenary action, Vierendeel action, compressive arch action, and contributions from infill walls. Catenary action—or membrane action—is the resisting of vertical
forces through horizontal tension in members undergoing extreme deflection. Vierendeel action—or frame action—is the resisting of forces through moment connections at beams and columns. Compressive arch action uses axial restraint of the surrounding structure to keep beams from rotating and thus forming a compressive arch. Infill walls create addi-tional stiffness to help resist vertical forces.
RESEARCH SIGNIFICANCECurrently, there is a very limited amount of information
and experimental research on alternative resistance mecha-nisms for disproportionate collapse of reinforced concrete buildings. The purpose of this study is to experimentally evaluate the collapse resistance of reinforced concrete frames and determine contributions from alternative resisting mech-anisms. This understanding may lead to better analysis tech-niques for new buildings or more efficient retrofit procedures for existing buildings that will allow buildings to economi-cally counteract disproportionate collapse.
PREVIOUS RESEARCH AND GUIDELINESThere have been limited experimental studies conducted
studying the various resistance mechanisms to dispropor-tionate collapse. Only a few tests have been conducted to study catenary action. Catenary tests on precast floor strips were conducted at Imperial College in London (Regan 1975). In his conclusions, Regan (1975) stated “successful development of a catenary action requires that the members in question possess not only tensile strength but also rota-tional ductility, which is largely determined by the detailing of the longitudinal reinforcement.” In 2009, Orton et al. found that beams without continuous reinforcement were able to develop catenary action by transferring the tensile forces from the positive-moment reinforcement to the nega-tive-moment reinforcement through the transverse reinforce-ment. Orton et al. (2009) also found that in beams with continuous reinforcement, the reinforcement fractured due to limited rotational ductility in the beam hinge region, making the beam behave like one without continuous reinforcement under catenary action. Bazan (2008) tested a 3/8-scale beam and found similar experimental results. Bazan (2008) also created an OpenSees model of the beam that replicated the experimental results. Yi et al. (2008) tested a three-floor, two-bay reinforced concrete frame and found that contributions from catenary action contributed an additional 50% in load-

522 ACI Structural Journal/May-June 2013
ACI member Stephen M. Stinger is a Structural Engineer at Black & Veatch, Overland Park, KS. He recently received his master’s degree from the University of Missouri-Columbia, Columbia, MO.
ACI member Sarah L. Orton is an Assistant Professor at the University of Missouri-Columbia. She received her BS from the University of Texas at Austin, Austin, TX; her MS from the University of Illinois at Urbana-Champaign, Urbana, IL; and her PhD from the University of Texas at Austin. Her research interests include structural strengthening, extreme events on structures, and innovative materials.
carrying capacity, with the ultimate failure being caused by fracture of the reinforcing steel. Several researchers (Orton et al. 2009; Sasani and Sagiroglu 2008a; Abruzzo et al. 2006) have noted the fact that the ACI 318-08 structural integrity requirements may not provide enough continuous reinforce-ment to resist the bending moments or provide catenary action in the event of the loss of one support column. With the limited testing for catenary action, there has been an attempt at developing equations to quantify the behavior. Mitchell and Cook (1984), Orton (2007), and Izzuddin et al. (2008) have all developed equations based on the under-lying principles of equilibrium, compatibility, and material characteristics. However, these equations have yet to be compared to a wide range of test data, and some equations ignore geometric constraints.
Compressive arch action in beams has been studied by Su et al. (2009). The researchers found that the additional load capacity provided by compressive arch action in the beams was between 1.53 and 2.63 times that of the flexural capacity of the beams, with the greatest increases for the specimens with lower span-depth ratios. Furthermore, their tests showed that the loading speed had little effect on the strength of the specimens. The specimens continued into catenary action and the tests were stopped when the bottom reinforcing bars fractured near the column stub.
Contributions for compressive arch action in infill walls and Vierendeel action have been cited as the reason for building survival in several accidental and experi-mental tests of full-size buildings. Sasani et al. (2007) and Sasani and Sagiroglu (2008b, 2010) studied the potential for collapse of reinforced concrete buildings slated for demolition. They found that Vierendeel action in conjunc-tion with increased stiffness from infill walls contributed significantly to resisting collapse. Sasani et al. (2007) and Sasani and Sagiroglu (2008b, 2010) further mentioned that the development of Vierendeel action required detailing of reinforcement to be able to accommodate the change in moments. Sucuoglu et al. (1994) attributed the survival of a building damaged by a boiler explosion to the contributions of the infill wall panels. However, there are no equations describing how much these actions can contribute to resis-tance of disproportionate collapse.
Guidance for design against disproportionate collapse is also limited. ASCE 7 (2005) and ACI 318-08 (ACI Committee 318 2008) have provisions requiring general structural integrity; however, these provisions do not specifically address the design of buildings for dispro-portionate collapse. ACI 318-08 requires continuous steel in the perimeter beams of a building, even though the amount required may not be effective in developing collapse resis-tance (Orton et al. 2009).
The most in-depth guideline has been developed by the U.S. DoD (2009). The uniform facilities criteria (UFC) provide methodologies to address disproportionate collapse that apply an underlying theme of redundancy, continuity,
and ductility (DoD 2009). Existing design procedures use two approaches: indirect design and direct design (DoD 2009). Indirect design is a non-threat specific approach that emphasizes providing the minimum levels of strength, conti-nuity, and ductility. The DoD 2009 procedure relies on an integrated system of tie forces that must be placed outside of the beam or column strip unless they can provide a plastic rotation of 0.2 rad. The ties are intended to permit the devel-opment of catenary or membrane action in the floor slabs so that they can bridge over a damaged member. The restric-tion on the rotation ensures that the tie remains intact until catenary or membrane action becomes significant. However, there is no research evidence that the tie forces provided in the UFC are able to provide sufficient catenary tension to resist collapse.
Direct design includes the Specific Local Resistance and Alternate Load Path Methods. The Specific Local Resistance Method requires designing critical structural elements to resist a specific threat. Because the threat must be identified, the Specific Local Resistance Method is difficult to imple-ment. The Alternate Load Path Method is a threat-inde-pendent approach in the sense that the cause of the initial failure of a structural element is not explicitly considered. The basic concept of this approach is that, when one or more primary load-carrying elements fail due to abnormal loads, the remaining structure shall be able to bridge over the missing elements, thereby reducing the risk of a dispropor-tionate failure. Although a real-life scenario may not involve the removal of one primary load-carrying element, this procedure does give an indication of the general robustness and collapse resistance of the building. As such, this type of approach is used in the specimens tested in this research. The center supporting column is removed to determine the overall collapse resistance of the frame.
Although the DoD guidelines (2009) do make an attempt to specifically address disproportionate collapse design, much of the text is based on good design philosophies and computational analysis rather than experimental data. There has been little experimental testing of reinforced concrete elements to verify the collapse resistance.
EXPERIMENTAL PROCEDURESpecimen design
The tests discussed in this paper were designed to repre-sent a typically constructed reinforced concrete office building. The prototype model building was six bays by three bays on 24 ft (7.3 m) center-to-center spacing. The building had six stories; each story was 12 ft (3.6 m) tall. The test specimens represent quarter-scale sections of two bays and two stories from the center of the long side of the building (Fig. 1). The center column in each of the test frames repre-sents the removed column in an alternate load-path analysis.
The test specimen designations are given in Table 1 and the material properties of the concrete and reinforcement are given in Table 2. The first frame was designed to comply with ACI 318-71 (ACI Committee 318 1971) to represent existing older concrete structures and does not have contin-uous reinforcement. Figure 2 gives the reinforcement design for the three frames (the bottom beam in Fig. 2 represents the discontinuous details and the top represents the contin-uous details). The reinforcement consisted of four 0.25 in. (6.3 mm) diameter bars in the maximum negative-moment region and three 0.25 in. (6.3 mm) diameter bars in the maximum positive-moment region. The cold drawing manu-

ACI Structural Journal/May-June 2013 523
facture process of small reinforcing bars generally reduces their ductility and eliminates the yield plateau. Therefore, the reinforcing bars were all annealed to increase ductility. The shear reinforcement consisted of W2 smooth wires spaced at 1.5 in. (38 mm). The stirrups consisted of 90-degree lap splices at the top of the beam, consistent with older design practices. The second frame was designed to comply with ACI 318-08, which does have requirements for continuous reinforcement; however, the stirrup design remained the same. The design of the reinforcement is the same as for the first frame, except for 15.5 in. (394 mm) lap splices of two longitudinal bars at the center of the beams and at the column. The third frame consisted of the same details as Frame 1 but with the addition of a partial-height (four courses) unreinforced concrete masonry unit (CMU) infill wall. All frames had a specified cover depth of 3/8 in. (10 mm); however, on some frames, the reinforcement cage moved during the pour, resulting in a greater cover depth. The concrete was supplied by a local ready mix company and had a specified concrete strength of 4000 psi (27 MPa) and a 3/8 in. (90 mm) maximum
aggregate size. However, based on cylinder tests done at the time of frame testing, the compressive strength of the infill wall frame was significantly greater at 6000 psi (41 MPa).
Test setupFor these tests, a disproportionate collapse situation was
simulated by removing the center support column of each
Fig. 1—Relationship of test specimen to prototype building.
Table 1—Test specimen designation
Test Frame Details
1 Discontinuous reinforcement frameControl frame based on
ACI 318-71
2 Continuous reinforcement frameModern frame based on
ACI 318-08
3 Infill wall frame Addition of infill walls
Table 2—Material properties
Property Value
Concrete compressive strength
Discontinuous reinforcement 4405 psi (30.4 MPa)
Continuous reinforcement 3618 psi (24.9 MPa)
Infill 6035 psi (41.6 MPa)
0.375 in. (9.5 mm) diameter reinforcing bar
Yield 58 ksi (399 MPa)
Ultimate 94 ksi (648 MPa)
Strain at fracture 0.2
0.05 in. (6.3 mm) diameter reinforcing bar
Yield 82 ksi (565 MPa)
Ultimate 95 ksi (655 MPa)
Strain at fracture 0.12
Masonry
Mortar compressive strength 864 psi (5.9 MPa)
Concrete masonry unit (CMU) prism compressive strength
2510 psi (17.3 MPa)
Mortar tensile strength 188 psi (1.3 MPa)
Fig. 2—Reinforcement design of test specimens. (Note: 1 in. = 25.4 mm.)

524 ACI Structural Journal/May-June 2013
frame just below the lower beam. A hydraulic loading ram, placed at the top of the center column, loaded the frames at a constant rate of displacement. Loading continued until complete failure of the frame was achieved.
The test specimens were attached to a reaction frame system designed to represent the same stiffness the frame would experience from the surrounding members of the prototype
structure. An analytical model of the prototype building structure was constructed and fictitious horizontal loads placed where the specimen would connect to the rest of the building. After inputting the loads, the displacements were found and the desired stiffness could be calculated. Based on this model, the stiffness of the surrounding full-scale frame was 5000 kip/in. (875 kN/mm). This correlated to a stiffness of 1250 kip/in. (219 kN/mm) for the quarter-scale test frame. Therefore, the reaction frame had to mimic the building by having a stiffness of 1250 kip/in. (219 kN/mm). Each side of the reaction frame consisted of two W14x22 columns; HSS4.5x4.5x5/16 and HSS3.5x3.5x1/4 braces; and a number of plates, as shown in Fig. 3. The test specimen was connected to the reaction frame by two 0.15 in. (12.7 mm) diameter bars embedded into concrete beam stubs at the ends of the frame.
To prevent unwanted failures due to twisting of the frame (which would be resisted in a real structure by the floor slab), a collar connected to the center column was designed to only allow the center column to move vertically, as shown in Fig. 4. The collar consisted of four steel tube sections that bolted together tightly around the center column. Linear ball bearings were bolted on two sides of the collar and slid down the shafts as the frame was pushed down.
Instrumentation for the tests included a vertical load cell and string pot to measure the applied load and resulting displace-ment at the center column. Horizontal load cells connected between the test frame and reaction frame measured the axial compressive and tension loads. Horizontal linear vari-able differential transformers (LVDTs) measured the move-ment of the ends of the test frame (center of outer test frame column) relative to the testing floor. Strain gauges attached to the reinforcing bars measured the strains in the beams.
EXPERIMENTAL RESULTS AND DISCUSSIONDiscontinuous reinforcement frame
The control frame was based on ACI 318-71 and thus had discontinuous reinforcement throughout the beams. An actuator applied load to the center of the frame over the
Fig. 3—Reaction frame.
Fig. 4—Collar for center column.
Fig. 5—Vertical load versus displacement.
Fig. 6—Horizontal load versus displacement.

ACI Structural Journal/May-June 2013 525
location of the lost column. Due to a technical error, the first 12 in. (300 mm) of displacement was loaded at a rate of 3 in./s (76 mm/s). The remaining part was tested at a rate of 1/300 in./s (1/5 mm/s) and then 1/120 in./s (1/12 mm/s).
Figures 5 and 6 show the vertical- and axial-load-versus-displacement graphs and Fig. 7 shows the final state of the frame. The frame experienced two phases of resistance mechanism actions: compressive arch and catenary action. Upon loading, the frame initially responded in an elastic manner. At a load of approximately 250 lb (1.12 kN), cracks began to form at the locations of discontinuous reinforce-ment (21.5 in. [550 mm] from the outer column and at the face of the center column). Secondary hinges also formed at the discontinuous ends of the negative-moment reinforce-ment coming from the center column (21.5 in. [550 mm] from the center column). This correlated well to the predicted cracking moment of the beams (8.5 kip-in. [9.6 kN-m]), which translated to a load of 237 lb (1 kN). These regions were designed in the prototype structure for moments in the opposite direction (negative moment at the column face and positive moment at the reinforcement cutoff). Due to loss of the center column simulated in these tests, the moment was applied in an opposite direction and, consequently, the sections with little or no tensile reinforcement had little-to-no moment resistance. Because no reinforcement crossed these cracks, they continued to open widely and formed hinges with little further cracking in the rest of the beam. Despite having only 237 lb (1 kN) in load capacity according to flexural beam theory (based on the cracking moment of
the beams), the frame was able to reach 2.34 kip (10.4 kN) in compressive arch action. As the beam blocks try to rotate, the corners of the blocks try to push outward but are restrained by the horizontal stiffness of the frame, creating a compres-sive arch. The high stresses at the end corners of the beam blocks eventually caused the concrete to crush and lose the compressive arch resistance. After the compressive arch phase, the frame continued to deflect with little increase of load until approximately 6.70 in. (170 mm) of displacement. Once this displacement was reached, any further deflections caused tensile strains in the beam blocks and catenary action began. In catenary action, the beam rapidly gained load due to the tension in the reinforcing bars. Because the reinforce-ment was discontinuous, the tension had to be transferred from the positive- to the negative-moment reinforcing bars through the stirrups. At the end of the catenary action phase, the frame was able to reach a maximum vertical load of 8.19 kip (36.4 kN). At this level of load, the negative-moment reinforcement tore out of the stirrups. The stirrups, as described previously, were lapped 90 degrees at the top and were popped open by the longitudinal bars.
Horizontal load and displacement data was recorded at the ends of the beams. The load data showed compressive axial forces transitioning into tensile forces during catenary action (Fig. 6). Peak load and displacement values for each phase are given in Table 3. The lack of compressive load in the top load cell may be due to insufficient tightening of the connections before the test. The horizontal displacements (measured at the outer test specimen column) were also much higher than expected and were probably due to improper seating in the connections to the reaction frame. This means that the frame did not achieve the desired level of horizontal stiffness representative of the surrounding building. For the catenary action phase, decreased stiffness would cause increased displacements and increased vertical load.
Strain gauge data showed that at the peak catenary action load, the highest strains for the negative-moment bars were at the ends of the beams adjacent to the columns and the highest strains for the positive-moment bars were at the middle of the beams. The middle of the positive-moment bars (where there is no negative-moment steel) reached a strain of 0.003, corresponding to a stress of 56 ksi (388 MPa) and a tensile force in the three bars of 8.5 kip (37.8 kN). In the negative-moment bars (at the face of the column where the positive-moment steel terminates), the strain was
Table 3—Test results
Peak catenary vertical load, kip (kN)
Peak compressive arch vertical load, kip (kN)
End of compressive arch phase, in. (mm)
Tensile load of middle positive bars at peak catenary, kip (kN)
Tensile load of end negative bars at peak
catenary, kip (kN)
Discontinuous frame 8.19 (36.4) 2.34 (10.4) 6.70 (170) 8.5 (37.8) 6.7 (29.8)
Continuous frame 8.30 (36.9) 5.81 (25.8) 7.60 (193) 9.75 (43.4) 6.4 (28.5)
Infill wall frame 7.42 (33.0) 2.87 (12.7) 5.76 (146) 8.5 (37.8) 7.8 (34.7)
Top load cell Top LVDT Bottom load cell Bottom LVDT
Peak tensile load,
kip (kN)
Peak compressive
load, kip (kN)
Peak tensile displacement,
in. (mm)
Peak compressive
displacement, in. (mm)
Peak tensile load,
kip (kN)
Peak compressive
load, kip (kN)
Peak tensile displacement,
in. (mm)
Peak compressive
displacement, in. (mm)
Discontinuous frame 9.23 (40.9) 0 0.54 (14) 0.127 (3.2) 7.64 (34.0) 2.30 (10.2) 0.28 (7.1) 0.104 (2.6)
Continuous frame 12.49 (55.5) 0.97 (4.3) 0.56 (14) 0.078 (1.9) 5.95 (26.4) 1.94 (8.6) 0.35 (8.9) 0.088 (2.2)
Infill wall frame 12.25 (54.5) 1.94 (8.6) 0.52 (13) 0.159 (4.0) 1.09 (4.8) 3.16 (14.1) 0.28 (7.1) 0.089 (2.3)
Fig. 7—Discontinuous reinforcement frame at failure.

526 ACI Structural Journal/May-June 2013
0.002, corresponding to a stress of 33.3 ksi (230 MPa) and a tensile force in the four bars of 6.7 kip (29.8 kN). The load measured by the load cells was 7.64 kip (34 kN) in the bottom load cell and 9.23 kip (41 kN) in the top load cell. These values indicate that the catenary tensile force is being transferred through the positive-moment reinforcement to the negative-moment reinforcement and out to the horizontal restraints (load cells). The high strain readings in the posi-tive-moment steel indicate that it is nearing fracture and the frame would likely not have carried much more load if the bars had not ripped out of the stirrups. The discrepancies in the force readings are likely due to the strain in one of the bars not being completely representative of the strain in all the bars and the possibility of some forces being transferred through the concrete and ends of positive-moment bars at the face of the column (the actual hinge location was 21.5 in. [550 mm] away from the face of the column). Furthermore, the columns were fixed at the base and provided some hori-zontal restraint not measured in the load cells. This restraint would be greater for the bottom beam than for the top beam, leading to greater loads in the top load cell.
Continuous reinforcement frameThe continuous reinforcement frame was designed
according to ACI 318-08, which calls for continuous reinforcement throughout beams. The actuator applied load to the center of the frame over the location of the lost column at a constant displacement rate of 1/300 in./s (1/12 mm/s).
Figures 5 and 6 show the vertical- and axial-load-versus-displacement graphs and Fig. 8 shows the final state of the frame. Upon loading, the frame initially responded in an elastic manner. At a load of approximately 250 lb (1.1 kN), cracks began to form at the locations where the shorter bars of the negative-moment reinforcement ended (11.5 in. [290 mm] from the column) and adjacent to the center column. With further loading, this cracking increased and flexural hinges were formed. According to plastic flex-ural theory, the frame would be able to carry a load of 4.7 kip (20.9 kN) when the hinges develop. During testing, the frame was able to reach 5.81 kip (25.8 kN) before formation of hinges, indicating that there may have been some contri-bution from compressive arch action or Vierendeel action. Once hinges formed, the frame continued to deflect with little increase of load until approximately 7.60 in. (193 mm) of displacement, when the rotational capacity of the hinges was exhausted and the tensile reinforcement fractured (Fig. 8). After fracture of the reinforcement, the frame was still able to carry load via catenary action. At the end of the catenary action phase, the frame was able to reach a maximum load of 8.30 kip (36.9 kN). At this level of load, the remaining bars adjacent to the column fractured.
Horizontal load and displacement data were also recorded at the ends of the beams and peak values for each phase are given in Table 3. Like the discontinuous frame, the load cells showed compressive forces followed by a tension phase. Displacements were higher than expected and were probably due to slack in the connections to the reaction frame.
Strain gauge data for the positive- and negative-moment bars on the bottom beam are given in Fig. 9. The dots repre-sent the strain at the peak flexural action load (5.81 kip [25.8 kN]) and the diamonds represent the strain at the peak catenary action or ultimate load (8.30 kip [36.9 kN]). At the peak flexural action load, the strain in the positive-moment bars increased toward the middle column, while the strain
Fig. 8—Continuous reinforcement frame at failure.
Fig. 9—Strain gauge reading in bottom beam of continuous reinforcement frame.
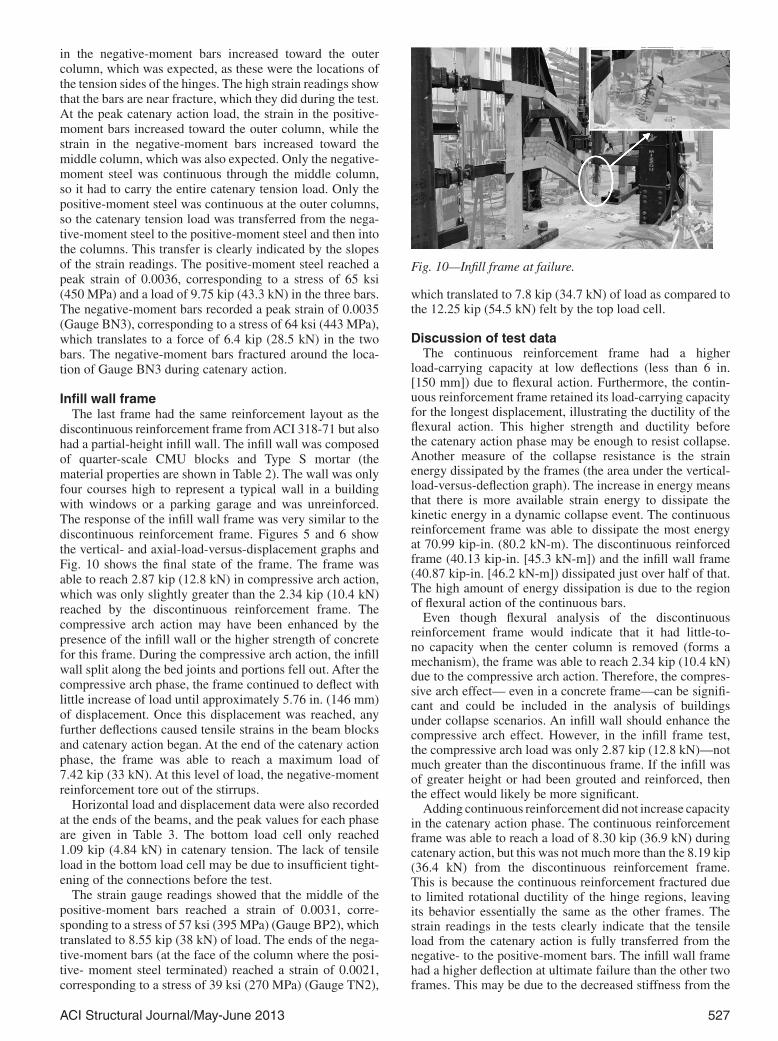
ACI Structural Journal/May-June 2013 527
in the negative-moment bars increased toward the outer column, which was expected, as these were the locations of the tension sides of the hinges. The high strain readings show that the bars are near fracture, which they did during the test. At the peak catenary action load, the strain in the positive-moment bars increased toward the outer column, while the strain in the negative-moment bars increased toward the middle column, which was also expected. Only the negative-moment steel was continuous through the middle column, so it had to carry the entire catenary tension load. Only the positive-moment steel was continuous at the outer columns, so the catenary tension load was transferred from the nega-tive-moment steel to the positive-moment steel and then into the columns. This transfer is clearly indicated by the slopes of the strain readings. The positive-moment steel reached a peak strain of 0.0036, corresponding to a stress of 65 ksi (450 MPa) and a load of 9.75 kip (43.3 kN) in the three bars. The negative-moment bars recorded a peak strain of 0.0035 (Gauge BN3), corresponding to a stress of 64 ksi (443 MPa), which translates to a force of 6.4 kip (28.5 kN) in the two bars. The negative-moment bars fractured around the loca-tion of Gauge BN3 during catenary action.
Infill wall frameThe last frame had the same reinforcement layout as the
discontinuous reinforcement frame from ACI 318-71 but also had a partial-height infill wall. The infill wall was composed of quarter-scale CMU blocks and Type S mortar (the material properties are shown in Table 2). The wall was only four courses high to represent a typical wall in a building with windows or a parking garage and was unreinforced. The response of the infill wall frame was very similar to the discontinuous reinforcement frame. Figures 5 and 6 show the vertical- and axial-load-versus-displacement graphs and Fig. 10 shows the final state of the frame. The frame was able to reach 2.87 kip (12.8 kN) in compressive arch action, which was only slightly greater than the 2.34 kip (10.4 kN) reached by the discontinuous reinforcement frame. The compressive arch action may have been enhanced by the presence of the infill wall or the higher strength of concrete for this frame. During the compressive arch action, the infill wall split along the bed joints and portions fell out. After the compressive arch phase, the frame continued to deflect with little increase of load until approximately 5.76 in. (146 mm) of displacement. Once this displacement was reached, any further deflections caused tensile strains in the beam blocks and catenary action began. At the end of the catenary action phase, the frame was able to reach a maximum load of 7.42 kip (33 kN). At this level of load, the negative-moment reinforcement tore out of the stirrups.
Horizontal load and displacement data were also recorded at the ends of the beams, and the peak values for each phase are given in Table 3. The bottom load cell only reached 1.09 kip (4.84 kN) in catenary tension. The lack of tensile load in the bottom load cell may be due to insufficient tight-ening of the connections before the test.
The strain gauge readings showed that the middle of the positive-moment bars reached a strain of 0.0031, corre-sponding to a stress of 57 ksi (395 MPa) (Gauge BP2), which translated to 8.55 kip (38 kN) of load. The ends of the nega-tive-moment bars (at the face of the column where the posi-tive- moment steel terminated) reached a strain of 0.0021, corresponding to a stress of 39 ksi (270 MPa) (Gauge TN2),
which translated to 7.8 kip (34.7 kN) of load as compared to the 12.25 kip (54.5 kN) felt by the top load cell.
Discussion of test dataThe continuous reinforcement frame had a higher
load-carrying capacity at low deflections (less than 6 in. [150 mm]) due to flexural action. Furthermore, the contin-uous reinforcement frame retained its load-carrying capacity for the longest displacement, illustrating the ductility of the flexural action. This higher strength and ductility before the catenary action phase may be enough to resist collapse. Another measure of the collapse resistance is the strain energy dissipated by the frames (the area under the vertical-load-versus-deflection graph). The increase in energy means that there is more available strain energy to dissipate the kinetic energy in a dynamic collapse event. The continuous reinforcement frame was able to dissipate the most energy at 70.99 kip-in. (80.2 kN-m). The discontinuous reinforced frame (40.13 kip-in. [45.3 kN-m]) and the infill wall frame (40.87 kip-in. [46.2 kN-m]) dissipated just over half of that. The high amount of energy dissipation is due to the region of flexural action of the continuous bars.
Even though flexural analysis of the discontinuous reinforcement frame would indicate that it had little-to-no capacity when the center column is removed (forms a mechanism), the frame was able to reach 2.34 kip (10.4 kN) due to the compressive arch action. Therefore, the compres-sive arch effect— even in a concrete frame—can be signifi-cant and could be included in the analysis of buildings under collapse scenarios. An infill wall should enhance the compressive arch effect. However, in the infill frame test, the compressive arch load was only 2.87 kip (12.8 kN)—not much greater than the discontinuous frame. If the infill was of greater height or had been grouted and reinforced, then the effect would likely be more significant.
Adding continuous reinforcement did not increase capacity in the catenary action phase. The continuous reinforcement frame was able to reach a load of 8.30 kip (36.9 kN) during catenary action, but this was not much more than the 8.19 kip (36.4 kN) from the discontinuous reinforcement frame. This is because the continuous reinforcement fractured due to limited rotational ductility of the hinge regions, leaving its behavior essentially the same as the other frames. The strain readings in the tests clearly indicate that the tensile load from the catenary action is fully transferred from the negative- to the positive-moment bars. The infill wall frame had a higher deflection at ultimate failure than the other two frames. This may be due to the decreased stiffness from the
Fig. 10—Infill frame at failure.

528 ACI Structural Journal/May-June 2013
horizontal support (the bottom load cell did not experience high tension in the catenary action phase) or the presence of the infill wall may have delayed the secondary hinge forma-tion, changing the deflected shape of the beam.
Table 3 shows the peak forces determined from the strain readings developed in the reinforcing bars at peak catenary action. With an ultimate tensile strength of 95 ksi (623 MPa), the force at fracture for two reinforcing bars is 9.5 kip (40 kN), which is comparable to the force derived from the strain readings when the two remaining negative-moment bars fractured at the end of the catenary action phase of the continuous frame test. The forces in the negative-moment bars at the end of the catenary phase for the discontinuous and infill frame tests were 6.4 and 7.8 kip (28.5 and 34.7 kN), respectively. This indicates that the bars were nearing frac-ture load when they tore out of the stirrups. If the stirrups had been designed with 135-degree bends, then it is likely that the bars would not have torn out and would have frac-tured like in the continuous frame.
Comparison of test data to previous research and guidelines
To compare the results of the frames to the requirements of the UFC and other test data, it is necessary to scale up the results to the full-scale frame. To adjust the point load to represent an equivalent uniform load, the point load was divided by the combined length of the four beams (24 ft [7.3 m]) and multiplied by a factor of 2 to convert the point load to a distributed load. Because these test frames were quarter-scale models, the distributed load was multiplied by a scale factor of 4 to give a peak catenary action load of 2.73 kip/ft (40.4 kN/m) for the discontinuous reinforce-ment frame and 2.76 kip/ft (40.9 kN/m) for the continuous reinforcement frame. Doing the same for the compressive arch action load gives 0.78 kip/ft (7.1 kN/m) for the discon-tinuous reinforcement frame and 1.93 kip/ft (17.6 kN/m) for the continuous reinforcement frame for flexural action.
The DoD guidelines (2009) give the load the frame is required to resist in a nonlinear static analysis (similar to this test). The load includes a dynamic increase factor based on the rotational ductility of the beams. For the continuous frame, this factor turns out to be 1.08; for the noncontin-uous beams, there is no way to compute the factor because the hinge regions fail (only compression reinforcement crossing the crack) at the cracking moment. The required load according to the UFC for the continuous frame due to immediate removal of a column is 2.36 kip/ft (35 kN/m). The capacity reached by the test frame in flexural action was only 1.93 kip/ft (17.6 kN/m), indicating that flexural action alone may not be enough to resist collapse of the frame. The catenary tension capacity was 2.76 kip/ft (40.9 kN/m). This indicates that the frame would be able to survive a collapse due to the catenary tension but would be beyond the flexural and compressive arch action loads.
Orton (2007) performed similar tests for two half-scale beams of nearly the same design. The continuous reinforce-ment beam reached approximately 1.3 kip/ft (19.3 kN/m) of load scaled to full-size beams in flexural action. The discontinuous reinforced beam reached a load of 1.8 kip/ft (26.7 kN/m) in catenary tension; however, the testing was stopped before failure of the beam due to problems in the test setup. These loads are less than the loads reached in the frame tests. The difference may be due to the different test setups and scales or the presence of a second beam in the
frame test. Yi et al. (2008) also performed a similar test on a four-bay-by-three-story continuous reinforcement one-third-scale frame. This frame reached a maximum load of approximately 2.03 kip/ft (30 kN/m) in catenary tension.
FURTHER RESEARCHThe test results and conclusions highlight the need for
the future research that can be performed in this field. Suggestions for future research include: additional tests on frames of the same and different designs, tests on frames with better control of support lateral stiffness, tests on frames with infill walls of different heights and reinforce-ment to determine how much this affects the compressive arch action capacity, dynamic tests to replicate the actual loading conditions under collapse and compared with the static tests’ results, tests on full-scale frames, tests that include a reinforced concrete slab, and analysis methods to predict the capacities of compressive arch action and catenary tension and determine the performance of reinforced concrete structures under collapse loading.
CONCLUSIONSThe conclusions drawn from the results of this research are:
• The implementation of continuous reinforcement throughout beams can greatly enhance the flexural action resistance over discontinuous reinforcement. However, the increased flexural resistance has a limited ductility due to the limited rotational ductility of the hinge regions. Once this ductility is reached, the frame essen-tially behaves like a discontinuously reinforced frame. Therefore, continuous reinforcement may improve the collapse resistance of a frame, but if the collapse loads are high, it will not exhibit a significantly better resistance than a discontinuously reinforced frame. Therefore, ACI 318-08 provisions that require contin-uous reinforcement in perimeter beams may not be suffi-cient to resist disproportionate collapse of the frame.
• The specimen with partial-height infill walls did not perform significantly better than the specimen without them. Therefore, partial-height, nongrouted walls may not be significant in increasing the collapse resistance of a frame.
• Both compressive arch and catenary action are viable resistance mechanisms in frames under a collapse loading. Compressive arch action in a discontinuous frame was able to provide 40% of the strength of the flexural action in a continuously reinforced frame. Catenary tension was able to provide 33% more vertical load-carrying capacity than flexural action. Therefore, if methods are developed to determine these capacities, they can be incorporated into design guidelines, leading to more efficient design of structural members.
ACKNOWLEDGMENTSThe funding for this project came from the University of Missouri’s
Research Board program. Special thanks are given to the hardworking graduate (J. Kirby) and undergraduate (J. Kasinger, T. Witt, R. Voss, M. Muenks, M. Wombacher, and M. Brune) students and the lab technicians R. Oberto and R. Gish.
REFERENCESAbruzzo, J.; Matta, A.; and Panariello, G., 2006, “Study of Mitigation
Strategies for Progressive Collapse of a Reinforced Concrete Commercial Building,” Journal of Performance of Constructed Facilities, V. 20, No. 4, Nov., pp. 384-390.

ACI Structural Journal/May-June 2013 529
ACI Committee 318, 1971, “Building Code Requirements for Reinforced Concrete (ACI 318-71),” American Concrete Institute, Farmington Hills, MI, 1971, 78 pp.
ACI Committee 318, 2008, “Building Code Requirements for Structural Concrete (ACI 318-08) and Commentary,” American Concrete Institute, Farmington Hills, MI, 2008, 473 pp.
ASCE/SEI 7, 2005, “Minimum Design Loads for Buildings and Other Structures,” Structural Engineering Institute, American Society of Civil Engineers, Reston, VA, 388 pp.
Bazan, M. L., 2008, “Response of Reinforced Concrete Elements and Structures Following Loss of Load Bearing Elements,” PhD dissertation, Northeastern University, Boston, MA, 317 pp.
Department of Defense (DOD), 2009, “Design of Buildings to Resist Progressive Collapse,” Unified Facilities Criteria (UFC) 4-023-03, July, 176 pp.
Izzuddin, B. A.; Vlassis, A. G.; Elghazouli, A. Y.; and Nethercot, D. A., 2008, “Progressive Collapse of Multi-Story Buildings due to Sudden Column Loss—Part I: Simplified Assessment Framework,” Engineering Structures, V. 30, pp. 1308-1318.
Mitchell, D., and Cook, W. D., 1984, “Preventing Progressive Collapse of Slab Structures,” Journal of Structural Engineering, ASCE, V. 110, No. 7, July, pp. 1513-1532.
Orton, S. L., 2007, “Development of a CFRP System to Provide Continuity in Existing Reinforced Concrete Buildings Vulnerable to Progressive Collapse,” PhD dissertation, University of Texas at Austin, Austin, TX, 363 pp.
Orton, S. L.; Jirsa, J. O.; and Bayrak, O., 2009, “Carbon Fiber-Reinforced Polymer for Continuity in Existing Reinforced Concrete Buildings
Vulnerable to Collapse,” ACI Structural Journal, V. 106, No. 5, Sept.-Oct., pp. 608-616.
Regan, P. E., 1975, “Catenary Action in Damaged Concrete Structures,” Industrialization in Concrete Building Construction, SP-48, E. F. P. Burnett, ed., American Concrete Institute, Farmington Hills, MI, pp. 191-225.
Sasani, M., and Sagiroglu, S., 2008a, “Progressive Collapse of Reinforced Concrete Structures: A Multihazard Perspective,” ACI Structural Journal, V. 105, No. 1, Jan.-Feb., pp. 96-103.
Sasani, M., and Sagiroglu, S., 2008b, “Progressive Collapse Resistance of Hotel San Diego,” Journal of Structural Engineering, ASCE, V. 134, No. 4, Mar., pp. 478-488.
Sasani, M., and Sagiroglu, S., 2010, “Gravity Load Redistribution and Progressive Collapse Resistance of 20-Story Concrete Structure Following Loss of Interior Column,” ACI Structural Journal, V. 107, No. 6, Nov.-Dec., pp. 636-644.
Sasani, M.; Bazan, M.; and Sagiroglu, S., 2007, “Experimental and Analytical Progressive Collapse Evaluation of Actual Reinforced Concrete Structures,” ACI Structural Journal, V. 104, No. 6, Nov.-Dec., pp. 731-739.
Su, Y.; Tian, Y.; and Song, X., 2009, “Progressive Collapse Resistance of Axially-Restrained Frame Beams,” ACI Structural Journal, V. 106, No. 5, Sept.-Oct., pp. 600-607.
Sucuoglu, H.; Citipitioglu, E.; and Altin, S., 1994, “Resistance Mechanisms in RC Building Frames Subjected to Column Failure,” Journal of Structural Engineering, ASCE, V. 120, No. 3, Mar., pp. 765-782.
Yi, W. J.; He, Q. F.; Xiao, Y.; and Kunnath, S. K., 2008, “Experimental Study on Progressive Collapse-Resistant Behavior of Reinforced Concrete Frame Structures,” ACI Structural Journal, V. 105, No. 4, July-Aug., pp. 433-439.

530 ACI Structural Journal/May-June 2013
NOTES:

ACI Structural Journal/May-June 2013 531
DISCUSSIONDISCUSSIONDisc. 109-S39/From the July-August 2012 ACI Structural Journal, p. 457
Cyclic Crack and Inertial Loading System for Investigating Anchor Seismic Behavior. Paper by Derrick A. Watkins, Tara C. Hutchinson, and Matthew S. Hoehler
Discussion by Shiming Chen and Qingxiang PanProfessor, School of Civil Engineering, Tongji University, Shanghai, China; Research Student, School of Civil Engineering, Tongji University
The dynamic behavior of anchorages depends on many factors, such as the parameters of the imposed actions, the state of the surrounding concrete, and the characteristics of the anchor.34 During an earthquake, a post-installed anchor may be subjected to a combination of cyclic tension and shear forces. Therefore, the seismic behavior of anchors in cracked concrete is a key consideration in the design and assessment of the post-installed connections in the earth-quake-influenced areas. The work and methodology reported are interesting to the discussers and will fill the knowledge gap in the understanding of the interaction between anchors and nonstructural components under earthquake loading in the cyclic cracked concrete base. Some factors need further discussion and clarification.
Cyclic cracked inertial loading rig Simulations of the crack width and floor acceleration
time histories are illustrated in Fig. 1(a) and (b). Concrete cracking was induced in the vicinity of a plastic hinge where the anchor connection is located in the reinforced concrete (RC) framed beams under the horizontal floor acceleration, as shown in Fig. 1(a). However, the pattern of cracks in a concrete beam (or slab) induced by flexural loading should have crack opening in the tension side and crack closing in the compression side. Accordingly, crack width under flexural bending converted from beam curva-ture would be different from that of the experimental simu-lation, as shown in Fig. 1(b), in which vertical cracks were produced by horizontal inertial force, being induced under the floor input acceleration. This would influence the state of cracking and hence the constrained action of the concrete to the embedded anchors.
Several key parameters are presented and discussed. The crack cycling predominant period Tp,cr is defined and related to the maximum crack width. Based on the simulation results of Wood et al.29 shown in Table 1, the average crack cycling predominant period is generally up to 10% greater than the first modal period of vibration of the building. The discussers wonder whether Tp,cr corresponds to the period when the first maximum crack width is attained or just when the cracks first appear in the buildings. Is Tp,cr sensitive to the value of the maximum crack width? Where do these cracks likely occur in the framed buildings? It is presumed that only the cracked concrete members at the anchor connec-tions are of interest; however, in a real building, early cracks may occur in the concrete members other than the positions where the anchor connections are located. The crack cycling predominant period Tp,cr should represent the cracked state in the location of the anchor connections in the building.
Nonstructural component or system (NCS) experimental model
The NCS model (or weighted anchor loading laboratory equipment [WALLE]) must be representative. An NCS with a low aspect ratio will have embedded anchors predomi-nantly in shear, and an NCS with a tall aspect ratio will have tension-predominated embedded anchors. The discussers noticed that two WALLE configurations were used to achieve both the stiff and flexible NCS models in the pilot study. However, it is not clearly illustrated whether the alteration in the period of the WALLE is caused just by changing the weights of mass or any other design parameters.
In an uncoupled structure equipment model, the predomi-nated frequency of the NCS model will mainly depend on the mass and rigidity of the system. The primary period of the system (a single mass-spring system) will depend on
mk
where m is the mass; and k is the rigidity of the system. In the paper, when the weight of the mass increases from 390 to 1160 kg (860 to 2550 lb), the period increases by 2.5 times from 0.1 seconds to 0.25 seconds, which is not equal to
11601.725390
=
as expected when simply increasing the weight of the mass. It appears that the structure equipment model must be a nonlinear dynamic system. Another influence would be contributed by cracking in the concrete slab, which certainly reduced the constrained action at the NCS model base. Can the authors clarify what other design parameters were changed in the test?
Experimental resultsFigure 8 illustrates the curve of load-versus-crack-width
calibration for the 20-story building in the Kobe earthquake motion. Does the crack width denoted in the abscissa of Fig. 8 represent the cracked state in the anchor connections in the eighth floor of the building analyzed? It is not clearly illustrated whether the input to the shake table is the Kobe earthquake ground motion or the acceleration response of the eighth floor of the building studied under the excitation of the Kobe earthquake motion.
Only the floor acceleration response should be input to the uniaxial shake slab of the cyclic cracked inertial loading rig
532 ACI Structural Journal/May-June 2013
(CCILR). In practice, nonstructural components (NCSs) are normally installed on the floor levels of the main structure. The direct earthquake action exerted on the nonstructural components is the floor response transferred from the main structure during the ground motion excitation. Due to the earthquake response of the main structure itself, the ground motion will usually be amplified along the main structure height.35 Therefore, it must distinguish the ground motion from the floor acceleration response.
The ultimate displacement capacity of the anchor must play an important role in the seismic response of the tension-load-cycling-dominated test rig. The anchor axial displace-ment history, as shown in Fig. 14, has a stair-like shape. The discontinuous rise in the axial displacement of the anchors is also not understood. This phenomenon must be associated with substantial deformation and regular spacing of cracks in the base material. Please clarify.
REFERENCES34. Rodriguez, M.; Zhang, Y. G.; Lotez, D.; Graves, H. L.; and Klingner,
R. E., “Dynamic Behaviour of Anchors in Cracked and Uncracked Concrete: A Progress Report,” Nuclear Engineering and Design, V. 168, No. 1, 1997, pp. 23-34.
35. Huang, B.; Chen, S.; and Lu, W., Discussion of “Simulation of Floor Response Spectra in Shake Table Experiments,” Earthquake Engineering and Structural Dynamics, V. 41, No. 9, 2012, pp. 1341-1343.
AUTHORS’ CLOSUREThe authors would like to thank the discussers for their
interest in the paper. They raise several questions in their discussion, which the authors enumerate and respond to in the following.
1. The discussers state that “…crack width under flexural bending converted from beam curvature would be different from that of the experimental simulation, as shown in Fig. 1(b), in which vertical cracks were produced by hori-zontal inertial force...”• This point is addressed in the paper on page 461, para-
graph 2. The authors state, “It is recognized that real flexural-shear cracks in beams, for example, are inclined and tend to be wider at the surface and decrease in width toward the compression face of the member; however, the local characteristics of the crack at the location of the bearing element of an installed anchor are similar to those produced in the test slabs. Moreover, the tension cracks formed by the crack inducers represent the worst-case scenario of the crack parallel to the anchor tension axis and are the same type of crack used in prior multi- and single-anchor tests, including ACI anchor qualification testing.”
2(a). “The discussers wonder whether Tp,cr corresponds to the period when the first maximum crack width is attained or just when the cracks first appear in the buildings…”• The variable Tp,cr is the predominant period of crack
cycling over the duration of the earthquake—from initiation of cracking through maximum crack width. Although it is theoretically changing, its variation is slight; in other words, once sufficient cracks in a concrete component form, Tp,cr will stabilize. It is noted that to estimate Tp,cr, the authors extracted the period associated with the peak in the force transfer function (FFT) of the entire normalized curvature history; thus, the authors obtained more of an average predominant period of cracking.
2(b). The discussers wonder: “Is Tp,cr sensitive to the value of the maximum crack width?”• As shown in Fig. 2 of the paper, Tp,cr tends to correspond
to the first mode period of the structure; therefore, Tp,cr was not found to be sensitive to the maximum crack width selected in these studies.
2(c). The discussers wonder: “Where do these cracks likely occur in the framed buildings?”• Cracks will occur in framed buildings anywhere that
stresses exceed the tensile strength of the concrete. Cracks tend to be concentrated in regions of large bending moments, especially in plastic hinge regions. For these studies, the authors assume that anchors are placed outside of plastic hinge regions, as they are not allowed in current U.S. and other guidelines; therefore, the cyclic crack histories are similarly extracted outside of the plastic hinge regions.
3. The discussers state that “...it is not clearly illustrated whether the alteration in the period of the WALLE is caused just by changing the weights of mass or any other design parameters… Can the authors clarify what other design parameters were changed in the test?”• To modify the period of WALLE from rigid to flex-
ible, the only change was the addition of weight plates at the top of WALLE, as shown in Fig. 15. It is noted that the body of WALLE, which remained constant in both configurations, weighs 216 kg (476 lb)—most of which is concentrated near the base. Therefore, when the number of weight plates, which govern the change in period, increases from 10 plates to 54 plates, the mass at the top of WALLE changes from 174 to 941 kg (384 to 2074 lb). Therefore, the period ratio should be calculated as
941
2.3 times174
=
which is approximately equal to the theoretical period ratio of 0.25 seconds/0.10 seconds = 2.5 times. The actual period ratio from experimentally measured values was 0.21 seconds/0.097 seconds = 2.2 times.
4(a). The discussers state that “Figure 8 illustrates the curve of load-versus-crack-width calibration for the 20-story building in the Kobe earthquake motion.”• Figure 8 is not the load-versus-crack-width calibration
for a 20-story building in the Kobe earthquake; rather, it is the load versus crack width achieved during cali-bration of the concrete slab-test fixture assembly when tested, as shown in Fig. 3 (absent the WALLE assembly) and 4. During the calibration of the test fixture, many crack histories were input into the slab. Figure 8 shows the results of one of these motions—namely, a floor-level history from a 20-story building subjected to an earthquake input motion from the Kobe earthquake (refer to the work of Wood et al.29 for details of the numerical simulation used to generate this motion). This load-versus-crack-width relationship is required because the actuators that open and close cracks in the slab were driven in force control.
4(b). The discussers wonder: “Does the crack width denoted in the abscissa of Fig. 8 represent the cracked state in the anchor connections in the eighth floor of the building analyzed?”

ACI Structural Journal/May-June 2013 533
• The abscissa of Fig. 8 represents the achieved crack width in the slab of the experimental setup when subjected to varying axial load in the slab applied by the actuators. The ordinate of Fig. 8 is the axial load applied to the slab per actuator.
4(c). The discussers state that “It is not clearly illustrated whether the input to the shaking table is the Kobe earthquake ground motion or the acceleration response of the eighth floor of the building studied under the excitation of the Kobe earthquake motion.”• The discussers are correct—the input to the shake table
and CCILR test frame are the floor-level acceleration response history and the floor-level crack width history, respectively, as shown in Fig. 1(b), 7(a), and 11.
5(a). The discussers state that “The ultimate displace-ment capacity of the anchor must play an important role in the seismic response of the tension-load-cycling-domi-nated test rig.”• The test rig imposes floor motions (accelerations) and
cyclic cracks in the slab (cracks opening and closing). The anchored WALLE system (anchors + WALLE) responds to the imposed floor motions and crack widths. As such, the ultimate displacement capacity of the anchor does not affect the test rig itself but, rather, affects the rocking response of the anchored WALLE component. It is noted that the mass of the model is small compared to that of the CCILR-slab-WALLE system (approximately 16%); therefore, little feedback to the test rig was observed due to the response of the WALLE.
5(b). The discussers state that “The anchor axial displace-ment history, as shown in Fig. 14, has a stair-like shape. The discontinuous jump rise in the axial displacement of the anchors is also not understood.”• An anchored NCS whose seismic behavior is governed
by the NCS rocking back and forth is best under-stood by carefully considering the behavior at the baseplate anchorage at instances in time. In the case of the WALLE, the anchor is fastened through a steel baseplate to a concrete slab, where there is only a nut located on the top side of the steel plate (no leveling nut underneath), as is the case with most nonstructural components. When the steel baseplate pulls up on the anchor, it loads the anchor in tension, resulting in an upward (positive) displacement of the anchor. When the WALLE rocks in the other direction, the steel base-plate is pushed downward until the steel plate bears on the concrete slab. However, the steel baseplate does not push the anchor back into the hole because there is only a nut on the top side of the plate. Then, when the WALLE rocks back to the original direction, it reloads the anchor in tension, causing an increase in anchor displacement (if the seismic demand is sufficient). This, in turn, results in a stair-step-like displacement profile as the anchor is ratcheted out of the hole during succes-sive loading cycles.
Fig. 15—WALLE models showing two mass configurations associated with: (a) stiff; and (b) flexible configurations.

534 ACI Structural Journal/May-June 2013
Discussion 109-S40/From the July-August ACI Structural Journal, p. 467
Investigation of Load-Transfer Mechanisms in Deep Beams and Corbels. Paper by Zhi-Qi He, Zhao Liu, and Zhongguo John Ma
Discussion by Emil de Souza Sánchez Filho, Marta de Souza Lima Velasco, Júlio J. Holtz Silva Filho, and Dario Vaca Diez-BuschACI member, DSc, Professor, Fluminense Federal University, Rio de Janeiro, Brazil; DSc, Professor, Pontifical Catholic University of Rio de Janeiro (PUC-Rio), Rio de Janeiro, Brazil; DSc, Professor, PUC-Rio; DSc, Professor, Federal University of Juiz de Fora, Minas Gerais, Brazil
The authors have made an interesting contribution to the theoretical study regarding corbels and deep beams and should be complimented for their prospective and interesting model that furnishes—for related data—good estimates for the ultimate shear force by a strut-and-tie model (STM). However, the discussers would like to offer the following comments to enhance the model.
1. The statement “Because deep beams are very similar to double corbels due to their geometry, loading arrangement, and failure models…” is not correct because:• The geometry of the two elements is different; for double
corbels, several STMs exist that consider the loading applied on a column and strut formed into this element;
• The bottom node of the corbel is a CCC type and on the top is a CCT node (where the force is applied). For the deep beam, the bottom node is a CCT type and on the top is a CCC type (where the force is applied). All the nodes need to be verified because they depend on concrete strength and reinforcement arrangements; and
• Jennewein and Schäfer39 show the main differences between the three distinct D-regions.
2. The concrete effectiveness factor n is an important parameter in limit analysis applied to structural concrete. The best agreement between theory and experimental data is obtained by the appropriate choice of n. The concrete effec-tiveness factor depends on the strut type, longitudinal and transversal reinforcement arrangements, and dimensions of the structural element. The discussers would like to know what expression was adopted for this parameter.
3. The methodology to determinate the depth of neutral axis in corbels is inconsistent. The authors proposed some considerations about the adoption of the Bernouille-Navier hypothesis, which are all groundless and not in agreement with the basic conception of the STM (classification of the D-region). The coefficient of relative efficiency m = 0.2 is obtained by Eq. (A4), which considers k = 0.4, but Eq. (10) for the determination of the depth of neutral axis k depends on Eq. (11), which depends on m. This is an inconsistent approach that needs to be modified.
4. The discussers suggest the iterative approach found in FIP7 (pages 63 and 64), which establishes that it is possible to find z for corbels in a more reliable way. The discussers also suggest that the authors refer to Jennewein and Schäfer39—
pages 13, 16, and 19—where the authors will find a complete formula to determine all forces in the stirrups, longitudinal reinforcement, anchorage node, and strut angle.
5. The statement “Deep beams can be treated as inverted double corbels…” is not correct. The expressions obtained for corbels when adapted for deep beams should be evalu-ated very carefully and adjusted to a greater number of test results for several different conditions of concrete strength and reinforcement arrangements. The strength of deep beams has larger scatter in test results, but the authors compared the results of the model with only eight specimens, although they refer to 87 experimental test results found in the litera-ture: Smith and Vantsiotis30 (52 beams), Rogowsky et al.31 (17 beams), and Tan et al.32 (18 beams with high-strength concrete). Why weren’t those experimental data used in comparison with the theoretical results?
6. For Specimen 71 tested by Kani et al.,34 the authors used a very simple expression for the concrete effective-ness factor, where the coefficient 0.85 considers the time of loading duration (Rüsch effect) and 0.6 is a very restricted empiric value, which does not contemplate all the param-eters involved in the acceptable determination of n. The choice of a more appropriate expression for n considerably modifies the value l = 0.17. The conclusion obtained from Eq. (22) about the dependence of Vu in relation to the ratio a/d is obvious and can be found in literature.
7. The results obtained by Eq. (19) and (20) are compared with beams with 1.49 ≤ a/z ≤ 2.00 (or 1.66 ≤ a/d ≤ 2.22 if z = 0.9d) situated in the interval classified by the authors as regular deep beams, but this interval is very restrictive; the intervals 0.46 ≤ a/z ≤ 1.49 (or 0.51 ≤ a/d ≤ 1.66) and 2.00 < a/z < 2.72 (or 2.22 < a/d < 3.02) are not studied.
8. If the theoretical formulation is based on corbel behavior, why didn’t the authors compare the ultimate load of corbels with experimental data found in the literature?
9. The discussers enjoyed the authors’ effort in producing a valuable contribution to the STM applied to corbels and deep beams and would greatly appreciate if the authors could clarify their queries and provide some complementary information about the research.
REFERENCES39. Jennewein, M., and Schäfer, K., Standardisierte Nachweise von
häufigen D- Bereichen, DafStb, Heft 430, 1992, 64 pp.

ACI Structural Journal/May-June 2013 535
Discussion 109-S40/From the July-August ACI Structural Journal, p. 467
Investigation of Load-Transfer Mechanisms in Deep Beams and Corbels. Paper by Zhi-Qi He, Zhao Liu, and Zhongguo John Ma
Discussion by Andor WindischACI member, PhD, Karlsfeld, Germany
“The purpose of this paper is to provide theoretical models and explicit equations…towards better understanding of the shear behavior of structural concrete.”
Deep beams and corbels can fail in flexure (due to weak flexural reinforcement) due to poor anchorage of the flexural reinforcement or due to poor dimensions of the loading and/or support plate—but never in shear.
The failure patterns shown in Fig. 1, the treatise of Node F in Fig. 4(d) (as a node of the compression zone), and the test results quoted by the authors support this well-known fact. It is helpful to see in Fig. 2 how a single stirrup (tie) can move/shift/turn the struts.
Regarding Fig. 4 and 5, the following questions arise:• How is the distance a to b calculated? What is the posi-
tion of Point F?• Why is z = 0.9d independent of the amount of the
tensile reinforcement or the size of the failure load? If a/d < 1/2, then z is much smaller than 0.9d; otherwise, the deep beam or the corbel will fail due to too-weak flexural reinforcement—that is, the angle q cannot be chosen freely. The classical bending theory cannot be used in all cases.
• The strut Cht,l strikes under an inclined angle—the CCC Node F. This causes shear stresses along the length as. How is this effect taken into account?
• The failure of the node shall not be defined as the crushing of the diagonal compression strut.
• The elastic stress diagram shown in Fig. 5 contradicts the fundamental application of the effective compres-sive strength of concrete uniformly distributed along the length as.
After crossing the thicket of optical topology; elastic, plastic, and trigonometric assumptions; and derivations, the reason why the model yields lower-bound design is the extremely conservative key figures m = 0.2 and n for the effective compressive strength of concrete. The authors should refer to the conclusion in Part II of the paper19 of Brown and Bayrak40: the proper size of factor n depends on the geometry of the structural member.
The authors are encouraged to continue their efforts for a better understanding of the shear behavior of structural concrete.
REFERENCES40. Brown, M. D., and Bayrak, O., “Design of Deep Beams Using Strut-
and-Tie Models—Part II: Design Recommendations,” ACI Structural Journal, V. 105, No. 4, July-Aug. 2008, pp. 405-413.
AUTHORS’ CLOSUREClosure to discussion by Sánchez Filho et al.
The authors are grateful to the discussers for their interest and perspective related to the paper. Items raised in the discussion are addressed herein.
1. The deep beams were treated as inverted double corbels in the paper, considering that the top node (CCC type) and the bottom node (CCT type) in a deep beam have very similar properties with the bottom node (CCC type) and the top node (CCT type) in a double corbel, respectively.
2. Regarding the three parameters (n, m, and z) in the paper, the authors agree with the discussers that more sophisticated approaches can be used to determine them: 1) the concrete efficiency factor n is related to the amount of reinforcement and the geometry of the structural member; 2) when calculating the coefficient of relative efficiency m, the depth of the neutral axis kd can be determined by a closed-form solution; and 3) the level arm z can be more accurately determined by equilibrium conditions. The use of a sophisticated expression for n, m, and z, however, will make the decoupling solution much more complex, such that an explicit expression of truss action contribution could not be expected anymore.
3. The focus of the paper was to decouple the direct strut action and the indirect truss action in structural members with relatively small shear span-depth ratios. For this purpose, in experimental tests, instruments must be placed at specific locations of the specimens to collect information regarding various shear-transfer paths. There are a very limited number of such tests in the literature. The range of a/d is also very restrictive, as pointed out by the discussers. Therefore, more experimental tests for the purpose of decoupling shear-transfer actions should be conducted in future studies.
4. When comparing the test results by Kani et al.,34 the concrete efficiency factor n was selected according to the strut-and-tie provisions in Appendix A of ACI 318-08.5 The authors agree that more accurate expressions for n will considerably modify the prediction accuracy of ultimate shear strengths.
5. The discussers suggest that the authors directly verify the theoretical formulas using the experimental data of corbels. The authors accept this good suggestion and will carry out further studies.
Closure to discussion by WindischThe authors thank the discusser for his thoughtful comments
and would like to respond to several of the points raised.1. Besides anchorage and flexure, shear is also a typical
failure mode in deep beams. For example, in Part I of the paper by Brown and Bayrak,19 a database of 596 deep beams that failed in shear was compiled from the literature.
2. The shear span a in a reinforced concrete corbel can be determined by equilibrium conditions, such as the approach suggested by CEB-FIP Model Code 19906 (page 218).
3. The authors agree that the level arm z and the concrete efficiency factor n are related to the amount of reinforce-ment and the geometry of the structural member, and more reliable approaches for determining these parameters can be found in the literature. The use of a sophisticated expres-sion for z and n, however, will make the decoupling solu-tion much more complex, such that an explicit expression of truss action contribution could not be expected anymore.
4. The authors agree with the discusser that Node F is a nonhydrostatic node with shear stresses acting on its faces. However, in the paper, the shear strength of the corbel was assumed to be governed by the crushing of inclined struts

536 ACI Structural Journal/May-June 2013
Discussion 109-S45/From the July-August ACI Structural Journal, p. 521
Reinforced Concrete T-Beams Externally Prestressed with Unbonded Carbon Fiber-Reinforced Polymer Tendons. Paper by Anders Bennitz, Jacob W. Schmidt, Jonny Nilimaa, Björn Täljsten, Per Goltermann, and Dorthe Lund Ravn
Discussion by Shiming Chen and Cong ZhouProfessor, College of Civil Engineering, Tongji University, Shanghai, China; PhD Student, College of Civil Engineering, Tongji University
Fiber-reinforced polymer (FRP) materials are brittle in nature with linearly elastic behavior until failure. Therefore, the ductility or deformability is one of the main concerns in prestressed concrete beams with bonded and/or unbonded FRP tendons. The work reported in the paper verifies that structural behavior of external carbon fiber-reinforced polymer (CFRP) tendon beams is similar to that of external steel tendon beams. The analytical and test results are worthy of further discussion and should have consolidated the current knowledge of this structural system.
Factors affecting external prestressing stressOne important feature in an external prestressing beam is
that at ultimate, the prestressing force in the external tendons will increase substantially from its initial value. To prevent likely brittle fracture in the CFRP tendons, one key consid-eration in design of the external prestressed beams is to eval-uate the stress in external tendons. A common approach for determining the stress in the unbonded tendons, fps, at any load is normally expressed as follows
ps pe psf f f= + D (1)
where fpe is the effective prestressing stress; and Dfps is the increase in the tendon stress beyond the effective stress.
For the analysis of members with external prestressing tendons, the stress in the prestressing tendon is assumed constant over its entire length. The stress increase in the prestressing tendon must be determined from the analysis of the deformation of the entire member other than by the conventional strain compatibility method of the cross section. To simplify the analysis of the external prestressing system at the ultimate stage, several equations were proposed by researchers (Ng 2003; Ghallab and Beeby 2004; He and Liu 2010; Yang and Kang 2011) and adopted by many codes (ACI Committee 318 2011; BS EN 1992-1-1:2004 2004; AASHTO 2010). However, most of these equations are based on experimental results related to steel tendons only, and many of them are only valid when the effective prestressing stress is not less than 0.5 of the yield strength of tendons.
In the experimental study, the designed initial prestressing level of the studied beams was lower than 50% or even down to 14% (shown in Table 1). A different amount of incremental stress in the external tendons was developed for
different specimens, as shown in Fig. 8. The apparent linear increase of the tendon forces with the midspan deflection is also illustrated in Fig. 8(b). It appears that under the same prestressing setup, the higher the initial prestressing force and the higher the load-carrying capacity of the beam; the deeper the depth of the initial position of tendons, dps0, the higher the load-carrying capacity of the beam.
The apparent incremental tendon force shown in Fig. 8(a) was approximately 105 kN (23.6 kip) for Specimen B4 and 80 kN (18.0 kip) for Specimen B5, corresponding to a 264% and 89.6% increase of the initial prestressing force in the tendons of Specimens B4 and B5, respectively. One concern should be the determination of the likely maximum tendon force at the ultimate state. How is the incremental force in the tendons at ultimate predicted? Can the authors clarify what criteria were used in the determination of the initial tendon force?
Another concern that affects the external prestressing stress is the temperature change. The thermal properties of FRPs vary from product to product and depend on the type of fiber and resin matrix used and the fiber-volume ratio. CFRPs, for example, have a coefficient of thermal expan-sion in the longitudinal direction, afL, close to zero. Under rise of temperature, the small expansion of CFRP will cause compressive stresses in the concrete and tensile stresses in the tendon. These stresses can also delay initiation of cracking in non-prestressed concrete members and can be beneficial in members prestressed by CFRP tendons.
Effect of prestressing reinforcement indexTo evaluate the prestressing level of a member, the
prestressing reinforcement index vp is defined as
p psp
p c
A fbd f
v = (2)
where b is the flange width; dp is the maximum effective depth of the prestressed cross section; and fc is the compres-sive strength of concrete. For a T-section, bdp in Eq. (2) is replaced by the area of the cross section. Based on Table 2, it is computed that the prestressing reinforcement index is 0.061, 0.099, 0.026, 0.075, 0.052, and 0.092 for the prestressed Specimens B2, B3, B4, B5, B6, and B7, respectively.
4. The authors agree with the discusser that Node F is a nonhydrostatic node with shear stresses acting on its faces. However, in the paper, the shear strength of the corbel was assumed to be governed by the crushing of inclined struts instead of Node F. The inclined struts are bottle-shaped, so their failure can be defined as the
crushing of concrete at their ends immediately adjoining Node F.
5. The elastic stress diagram was used to determine the height of the vertical face of Node F. As emphasized in the paper, this hypothesis was somewhat uncertain in theory but still yielded acceptable results in practice.

ACI Structural Journal/May-June 2013 537
Discussion 109-S46/From the July-August ACI Structural Journal, p. 531
Energy Dissipation Capacity of Reinforced Concrete Columns under Cyclic Displacements. Paper by Bora Acun and Haluk Sucuoglu
Discussion by Huanjun Jiang and Bo FuProfessor, State Key Laboratory of Disaster Reduction in Civil Engineering, Tongji University, Shanghai, China; Doctoral Candidate, State Key Laboratory of Disaster Reduction in Civil Engineering, Tongji University
The authors should be complimented for investigating the energy dissipation capacity of reinforced concrete (RC) columns under constant- and variable-amplitude cyclic displacement cycles. Some findings are interesting to the discussers and are worthy of further discussion.
The discussers have some doubts concerning Eq. (2) of the paper. It can be concluded from the statement “The E1/E2 ratio decreases linearly with rotation ductility for both groups in the observed ductility range” that the equations of E1/E2 should be expressed as follows by using a slope-intercept form.
1 2E E k bq= m +
[ ] 12 1Then, E E k b −
q= m +
However, the discussed paper applied the form of E2 = E1[kμq + b].
In addition, Eq. (2a) and (2b) represent the group of well-confined sections and poorly confined sections, respectively. However, it should be noted that well-confined and poorly confined are merely qualitative definitions. How should they be quantified? Moreover, if both Eq. (2a) and (2b) are applied to a moderately confined section—that is, between well-confined and poorly confined—will the two results have a sharp contrast?
The proposed equations are able to predict the energy dissipation capacity of RC columns to some extent; however, it should be noted that most of the equations developed in the paper were based on fitting of experimental data. In other words, the mechanism behind the experimental phenomenon should be further studied.
Last but not least, the notations were not fully provided, which might hinder the readers from understanding the paper.
AUTHORS’ CLOSUREThe authors appreciate all comments received and would
like to thank the discussers for their interest in the paper. The following items provide clarifications and explana-tions to the points raised in the same order as they appear in the discussion.• The authors define the ratio of dissipated energy at first
cycle to dissipated energy at second cycle as E1/E2 and state that the ratio decreases linearly as rotation ductility increases. They also present this relation in Fig. 8. Indeed, Eq. (2) represents this relation as
[ ]2 1E E A Bq= m + (5)
where A and B are constants obtained from regression analysis for two different types of specimens. Hence, the
It appears that the beams with prestressed CFRP external tendons exhibit similar response characteristics as the beams with external steel tendons. Because a different prestressing reinforcement index was adopted in each specimen, it would affect initiation of crack yielding and even the failure pattern. The variables Pcr, Py, and Pu denoted in Table 3 represent cracking, the onset of yielding of the lower steel reinforce-ment, and the ultimate capacity. They also illustrate the influence of the prestressing reinforcement index on the performance of the prestressed beams. It is expected that with an increase of the prestressing reinforcement index, the cracking, yielding, and ultimate loads (moments) of the beams would be enhanced, while the ductility dimin-ishes gradually. However, it is noticed that all beams behave without declining in the load-deflection curves. Except for Specimens B6 and B7, the tested specimens had an ulti-mate deflection du very close to the failure deflection dfail. It implies that as far as the load reached Pu in the test, the beam failed (brittle failure). Can the authors clarify what criteria
were used to terminate each test and what definitions were used for Pfail and dfail?
REFERENCESAASHTO, 2010, “AASHTO LRFD Bridge Design Specifications (5th
Edition),” American Association of State Highway and Transportation Officials, Washington, DC.
ACI Committee 318, 2011, “Building Code Requirements for Structural Concrete (ACI 318-11) and Commentary,” American Concrete Institute, Farmington Hills, MI, 503 pp.
BS EN 1992-1-1:2004, 2004, “Design of Concrete Structures—Part 1-1: General Rules and Rules for Buildings,” British Standards Institution, London, UK.
Ghallab, A., and Beeby, A. W., 2004, “Calculating Stress of External Prestressing Tendons,” Proceedings of the ICE—Structures and Buildings, V. 157, No. 4, pp. 263-278.
He, Z., and Liu, Z., 2010, “Stresses in External and Internal Unbonded Tendons: Unified Methodology and Design Equations,” Journal of Structural Engineering, ASCE, V. 136, No. 9, pp. 1055-1065.
Yang, K., and Kang, T., 2011, “Equivalent Strain Distribution Factor for Unbonded Tendon Stress at Ultimate,” ACI Structural Journal, V. 108, No. 2, Mar.-Apr., pp. 217-226.

538 ACI Structural Journal/May-June 2013
Discussion 109-S47/From the July-August ACI Structural Journal, p. 541
Energy-Based Hysteresis Model for Flexural Response of Reinforced Concrete Columns. Paper by Haluk Sucuoglu and Bora Acun
Discussion by Xilin Lu and Dun WangPhD, Professor, Research Institute of Structural Engineering and Disaster Reduction, State Key Laboratory of Disaster Reduction in Civil Engineering, Tongji University, Shanghai, China; ACI member, PhD Student, Research Institute of Structural Engineering and Disaster Reduction, State Key Laboratory of Disaster Reduction in Civil Engineering, Tongji University
employing dissipated energy as a memory agent for defining the effect of displacement history on cyclic response of RC columns. Their results may improve the understanding of the relationship between energy dissipation capacity and the deterioration characteristics of RC columns, eventually lead to more accurate analytical modeling of the hysteretic behavior, and accordingly contribute to the development of more rational seismic performance assessment and perfor-mance-based seismic design procedures for columns.
The research conducted by the authors is based on tests of 11 column specimens responding in pure flexure under constant- and variable-amplitude displacement cycles. The following is a list of some technical comments on the paper:• Two types of test specimens labeled Type-1 and
Type-2 were designed for pure flexural failure. It is not true that the specimens were under a pure flexure
It is inevitable that deterioration exists in the mechanical properties of reinforced concrete (RC) members under inelastic displacement reversals representing strong seismic excitation. Numerous hysteresis models were proposed for RC members and components in the past to estimate their deterioration behavior under reversed cyclic loading. Different from other studies, the authors propose an energy-based hysteresis model that accounts for deterioration in cyclic energy dissipation capacity, as well as strength and stiffness, including pinching for the moment-rotation (curva-ture) response of 11 column specimens responding in pure flexure under constant- and variable-amplitude displace-ment cycles. Furthermore, the proposed hysteresis model is verified with experi mental observations. It is a good idea to combine all deterioration characteris tics into an energy-based moment-curvature (rotation) hysteresis model by
Reference 21. Equation (3) is the definition of a param-eter (that is, rotational ductility) and Eq. (4) is the well-known expression of effective damping.
• All symbols used within the paper were intended to be listed after the first place they appear (Notation Option 1 according to the ACI Structural Journal author guidelines). However, for the sake of complete-ness, the authors present a dedicated notation section within this closure.
NOTATIONAg = gross cross-sectional area of reinforced concrete membersa = shear spanbw = section widthd = section depthE1 = dissipated energy at first full cycleE2 = dissipated energy at second full cycleED,n = normalized energy dissipation capacityEh,n = normalized energy dissipation capacityfc = compressive strength of concretefw = yield strength of transverse reinforcing barsfy = yield strength of longitudinal reinforcing barsMn = peak moment at n-th cycleN = axial loadn = cycle numberne = equivalent number of cyclesV = shear demandVn = shear strengtha, β = characteristic parameter of low-cycle fatigue modelDq = algebraic difference of rotations at peak consecutive half-cyclesd = first cycle displacement drift ratiomq = rotation ductilityqn = maximum rotation at n-th cycleqyield = yield rotationrl = longitudinal reinforcement ratiort = transverse reinforcement ratioξeq,n = effective damping
REFERENCES21. Acun, B., “Energy Based Seismic Performance Assessment of
Reinforced Concrete Columns,” PhD thesis, Middle East Technical University, Ankara, Turkey, 2010, 214 pp.
authors see no flaw in Eq. (2) according to the aforemen-tioned definition. • The authors share the opinion of the discussers that
the definition of confinement level at a section (well-confined or poorly confined) is merely qualitative, although the volumetric transverse reinforcement ratio can be used as a parameter to quantify this level. However, to the authors’ understanding, if a structural member is designed according to an up-to-date design code (in this case, the Turkish Earthquake Code20) and satisfy the conditions for detailing requirements defined in the design code, the section shall be defined as a well-confined section (Type-2 specimens in the paper). Otherwise, the rest that do not comply with the design rules of the aforementioned design code can be clas-sified as poorly confined structural members (Type-1 specimens in the paper). As such, the authors do not consider any section as moderately confined; hence, the proposed formulations apply to two distinct cases of confinement level only. Although it is not included in the paper, the authors have also investigated the correlation of the volumetric transverse reinforcement ratio with the E1/E2 ratio21 for the compiled database of experimental results and identified that the E1/E2 ratio decreases with an increase in the transverse reinforce-ment ratio when the latter ratio changes in the range of 0.5 to 1.5%; however, the trend is not very strong. A better understanding of this correlation can be achieved by using a broader database of experimental test results.
• The authors present four equations within their paper. Equation (1), as indicated within the text, is a modi-fied version of the low-cycle fatigue model proposed by Erberik and Sucuoglu10 in 2004. A detailed explana-tion of the model can be found therein. Equations 2(a) and (b) are the outputs of a linear regression analysis conducted on the results of an experimental database. The details of the regression analysis can be found in

ACI Structural Journal/May-June 2013 539
and (b) for Type-1 and Type-2 speci mens, respectively, and that the agreement is satisfactory. The discussers agree with the authors regarding Fig. 6(a) for Type-1 specimens. However, the discussers wonder about the application of such a conclusion to the Type-2 speci-mens. As can be seen in Fig. 6(b) for Type-2 specimens, there are two group curves in accordance with each other for Specimens 1D2 and 2D3, while the other two group curves are not in accordance with each other for Specimens 4D5 and 3D4 when verifying the proposal model. How can the conclusion that the agreement is satisfactory be made? Please clarify. It is also noted that the cycle number of Type-1 and Type-2 specimens in Fig. 5 is more than 5—such as 6 and 7—while Fig. 6(a) and (b) show results of only up to the cycle number of 5. What is the meaning of such a dealing technique? Are there some other considerations, such as getting rid of negative data? It can be assumed from Fig. 6(b) that the trends of curves for Specimens 4D5 and 3D4 are worse with the proposed model than with the Takeda Model.
• In the section on cyclic energy dissipation capacity under variable-amplitude loading, the authors reported that the energy dissipated at the i-th half-cycle of the vari able-amplitude loading can be predicted by using the cyclic energy dissipation capacity under constant-amplitude loading. However, no explanations are made about the relation between the variable-amplitude loading and the constant-amplitude loading. Is it true for such a conclusion being applied to an extensively general case? In addition, attention should be paid to the underlined phrases in the following: “Similar rules and features introduced previously for constant-amplitude hyster esis prediction, such as strength deterioration, amplitude-dependent unloading stiffness, equivalent number of cycle definition, and quadratic formulation for the loading branch, are also applicable in exactly the same way they were defined for constant-amplitude loading” from page 547 to 548. Does there appear to be a mistake for expression?
• Last but not least, the discussers wonder about the pinching effect considered in the proposal model. As is noted in the abstract, the proposal model accounts for deterioration in cyclic energy dissipation capacity, including pinching. The appearance of the pinching effect can be attributed to shear distortion, bond slip between reinforcement and concrete, and opening and closing of cracks in concrete. What is the kind of pinching referred to in the paper and how is the pinching effect considered in the proposed hysteresis model?
The discussers are also waiting with great interest for the discussions in the announced follow-up paper.
AUTHORS’ CLOSUREThe authors appreciate all of the comments received and
would like to thank the discussers for their interest in the paper. The following items provide clarifications and expla-nations to the points raised in the same order as they appear in the discussion.• The authors agree with the discussers that the loading
conditions are not pure flexural loading conditions. However, both types of column specimens were designed for flexure failure, which is the expected mode of failure with a relatively low level of axial load. There-
condition because shear load existed due to applied lateral displacement and an axial load level was kept constant at 0.2fc′Ag for all specimens during cyclic tests. Please clarify.
• Two kinds of displacement-controlled loading history—that is, constant- and variable-amplitude displacement cycles—were exerted on column specimens. It is known that a particular loading history defined for one test is not necessarily applicable to all other test cases. What are the main considerations for the displacement-controlled loading history of the test conducted? What are the specific values for constant- and variable-amplitude displacement, such as twice or three times of the yield displacement of the column? How are they changing with cycle numbers for variable-amplitude displace-ment cycles? Please clarify.
• It can be seen in Fig. 1 that the ratio of height to width size of the specimen column is nearly equal to 5.1, and it is mentioned in the paper that “The Vp/Vn ratios for the first and second group of specimens were 0.32 and 0.20, respectively, indicating that flexure failure was ensured for both types of specimens.” It is known that the defor-mation mode of an RC member is controlled by the shear-span ratio M/(Vh0), whereas it was always briefly dealt with by the aspect ratio. What is the exact meaning of such an index Vp/Vn and what is the relation between the aspect ratio and the Vp/Vn ratios? In addition, what is the scale of the specimens for the test? Are they proto-type columns or scaled specimens? Please clarify.
• It can be seen in Table 1 that different transverse reinforcement ratios are specified for the Type-1 and Type-2 specimens and that in Table 2, rotation ductility mq and chord rotation (drift ratio) amplitude are listed. How is the yield rotation qy determined when calcu-lating the rotation ductility mq? Is the ratio of transverse reinforcement affecting the aforementioned results and how is it reflected? Please clarify.
• It is mentioned that the normalized cyclic strength in all specimens has a steadily decreasing trend with the number of cycles, as can be seen in Fig. 5. Figure 5 suggests a simple linear expression for the variation of normalized cyclic flexural strength with the number of inelastic cycles. The discussers wonder what the differ-ence is between the Type-1 and Type-2 specimens for the steadily decreasing trend with the number of cycles. Where is the different slope of decreasing strength for Type-1 and Type-2 specimens reflected in Eq. (1)?
• The authors state that the relations of energy dissipa-tion between the first cycle and the second cycle and between the second cycle and the following cycle for well-confined (Type-2) and poorly confined (Type-1) column specimens were obtained as Eq. (2) and (3) by indexes of mq, a, and b. The discussers are interested in knowing how the values of a and b are determined in Table 3; are they applicable to other columns? Further-more, what is the meaning of index s/mean a? It can be calculated that different values of s are obtained by substituting mean a and mean b into s/mean a and s/mean b for Type-1 and Type-2 specimens in Table 3. Please clarify.
• The authors reported that the comparison of energy dissi-pation capacity predicted by the proposed procedure and that measured from the column specimens tested under constant-amplitude cyclic loading are shown in Fig. 6(a)

540 ACI Structural Journal/May-June 2013
fore, the columns were identified as specimens designed for pure flexure failure.
• The main consideration of the authors for applying presented histories (Table 2) was to investigate the effect of displacement history on energy dissipation capaci-ties. Displacement histories were selected according to the calculated yield rotation of the Type-1 speci-mens. The very first specimen (1P2) was tested under constant-amplitude displacement cycles at its first stage of loading that corresponds approximately to 2mq (1.91mq). Afterward, other specimens were tested with different levels of constant-amplitude displacements corresponding approximately to 3mq, 4mq, and 6mq. Although the rotation ductilities were different, to be able to compare the results of Type-1 and Type-2 speci-mens, Type-2 columns were also tested under the same displacement histories to form pairs. Variable-amplitude displacement histories are constructed as a combination of the constant-amplitude histories applied previously to the same types of specimens.
• According to the ASCE/SEI 4115 update, the Vp/Vn ratio can be used to classify the column members according to their failure modes. If the Vp/Vn ratio is less than 0.6 and the transverse reinforcement detailing complies with ACI 318-0513 with 135-degree hooks, the member is classified in Condition i, which indicates the flexural failure. Tested column specimens are real-size column members satisfying the minimum dimension conditions of the seismic design codes.14
• Yield rotations of the members were calculated by a moment-curvature program. Transverse reinforcement ratios for two different types of specimens were taken into account at the moment-curvature analysis. Calcu-lated yield rotation values were also compared with the experimental observations.
• As is also stated and presented in the paper, the authors observed a narrow band for strength degradation of both types of specimens. Hence, they proposed a single linear expression for the prediction of strength degrada-tion, regardless of the type of specimen. However, the authors underlined the fact that, although cyclic strength deterioration for RC members is known to be a complex phenomenon, the strength deterioration behavior of the column specimens with an axial load ratio less than 0.20 can be expressed with a simple linear expression for brevity.
• The prediction of dissipated energy capacity under constant-amplitude loading and the related character-istic parameters (a and β) are explained and presented in the authors’ companion paper11; therefore, the details of regression analysis and the calculated values were not presented in the paper but are referred to in the companion paper.
• According to the authors’ point of view, the comparison between the predicted and measured cyclic dissipated energy capacities of Type-2 Specimens 1D2 and 2D3 can be called “good” and those of Specimens 3D4 and 4D5 can be called “satisfactory.” The largest difference in any of the predicted-versus-experimental dissipated energy values for any of these specimens is approxi-mately 15%. Therefore, the authors prefer to call the overall prediction “satisfactory.” The predicted values for Specimens 3D4 and 4D5 show an offset from the experimental values due to a rather inaccurate estima-
tion of the first-cycle dissipated energy, which affects the rest of the predicted values accordingly but does not increase the cumulative error. The first-cycle dissipated energy values of specimens are calculated from a modi-fied version of the Takeda Model.11
The displacement histories of all of the specimens are shown in Table 2 of the paper. Although Specimens 1P2, 1D2, and 2D3 have seven cycles for their first stages, to be able to compare the predictions for all specimens at the very same cycle, only the first five cycles were presented in Fig. 6. The authors completely disagree with the discussers’ statement that the authors did not present entire cycles to avoid negative data. The Dissipated Energy Prediction Model is an exponential function and it reaches its limit value almost after the fifth cycle for the aforementioned specimens. Hence, the difference between the predicted and experimental dissipated energy values will also not be larger than 15%.• The authors already refer to their companion paper
at the end of the statement that the discussers are commenting on, where detailed information regarding the relation between dissipated energy at variable-amplitude loading and constant-amplitude loading is presented. Conceptually, for a selected RC column member designed for flexure, it is possible to predict the dissipated energy at any cycle of a random-ampli-tude loading from a constant-amplitude loading with a definition for an equivalent number of cycles. Although the authors proved this, for a selected range of vari-able-amplitude loading experiments, they refrain from stating that the proposed model (as it stands) adequately predicts the dissipated energy of all types of random-amplitude loadings (for example, earthquake loading). The discussers extracted the underlined statements
from the subsection on the construction of vari-able-amplitude hysteresis cycles of the paper. The authors recommend that the discussers read this statement as: “For constructing the variable-ampli-tude hysteresis, similar rules and features intro-duced previously for constant-amplitude hysteresis prediction, such as strength deterioration, ampli-tude-dependent unloading stiffness, equivalent number of cycle definition, and quadratic formu-lation for the loading branch, are also applicable in exactly the same way they were defined for constant-amplitude loading.”
• It is a well-known fact that dissipated energy at any given hysteretic cycle can be calculated as the area under the force-displacement curve. Therefore, the dissipated energy value is correlated to the stiffness and strength, as well as the shape of the loading/unloading branches of the hysteretic response. The proposed model employs dissipated energy as a memory agent and predicts the dissipated energy of any proceeding cycle (or half-cycle) by taking into account the degradation in energy dissipation capacity due to cyclic loading (represented as an exponential relation). Hence, although implic-itly, this degradation in energy dissipation capacity comprises the effect of pinching.
REFERENCES15. Elwood, J. K.; Matamoros, A. B.; Wallace, J. W.; Lehman, D. E.;
Heintz, J. A.; Mitchell, A. D.; Moore, M. A.; Valley, M. T.; Lowes, M. T.; Comartin, C. D.; and Moehle, J. P., “Update to ASCE/SEI 41 Concrete Provisions,” Earthquake Spectra, V. 23, No. 3, 2007, pp. 493-523.

ACI Structural Journal/May-June 2013 541
The American Concrete Institute also publishes the ACI Materials Journal. This section presents brief synopses of papers appearing in the current issue.
From the May-June 2013 issue
PDF versions of these papers are available for download at the ACI website, www.concrete.org, for a nominal fee.
IN ACI MATERIALS JOURNAL
110-M21—Effect of Microcracking on Frost Durability of High-Volume-Fly-Ash- and Slag-Incorporated Engineered Cementitious Compositesby Erdogan Özbay, Mustafa Sahmaran, Mohamed Lachemi, and Hasan Erhan Yücel
This paper reports the durability performance of high-volume fly ash (FA) and slag-incorporated engineered cementitious composites (ECCs) when subjected to mechanical loading and freezing-and-thawing cycles. Composites containing two different contents of FA and slag as a replace-ment of cement (55 and 70% by weight of total cementitious materials) are examined. To find out the effect of mechanical preloading on the frost durability of ECCs, prism specimens were preloaded up to a certain defor-mation level under four-point bending loading to generate microcracks. Then, the preloaded and pristine (sound) specimens were subjected to the freezing-and-thawing test in accordance with ASTM C666/C666M. Experi-mental tests consisted of measuring the change in mass and ultrasonic pulse velocity (UPV) and residual flexural properties of ECC specimens exposed to the freezing-and-thawing cycles up to 300. Test results revealed that the frost resistance of ECCs was significantly influenced by the mineral admix-ture type and amount and preloading deformation. The deterioration with an increasing number of freezing-and-thawing cycles was relatively more for ECC mixtures with FA than for slag mixtures at the same replacement level. In addition, an increase in the FA replacement rate was observed to exacerbate the deterioration caused by freezing-and-thawing cycles. Apart from some reduction in flexural properties and UPV and an increase in mass loss and residual crack width, the results presented in this study, however, confirm the durability performance of ECC material under freezing-and-thawing cycles, even in cases where the material experiences mechanical loading that deforms it into the strain-hardening stage prior to exposure. It is important to note that this durability of ECCs under freezing and thawing was achieved without deliberate air entrainment, and contrary to conven-tional concrete, no relationship of frost resistance was found to the air-void structure of the ECC mixtures.
110-M22—Evaluation of Concrete Drying Shrinkage Related to Moisture Lossby Reza Abbasnia, Mohammad Shekarchi, and Jamal Ahmadi
Drying shrinkage, defined as the volumetric change of concrete induced by moisture loss, can change characteristics of concrete such as durability, stress distribution, and deformation.
Considering the importance of shrinkage effects and the absence of any comprehensive method to estimate shrinkage value, this paper attempts to integrate numerical and experimental methods to predict shrinkage strain based on internal moisture loss.
The hypothesis of volume changes being proportional to internal mois-ture loss is used to evaluate the shrinkage strain, where the proportionality coefficient—called the shrinkage factor—is to be determined experimen-tally and is a function of the material properties and humidity conditions.
Results show that the proposed method has acceptable accuracy for esti-mating the shrinkage and evaluating the shrinkage strain distribution.
110-M23—Mechanical Energy Dissipation Using Cement-Based Materials with Admixturesby Po-Hsiu Chen and D. D. L. Chung
Silica fume and a novel graphite network (8 vol.%) cementitious admix-ture are effective for enhancing the mechanical energy dissipation of cement-based materials, as shown under small-strain dynamic flexure at 0.2 Hz. The fraction of energy dissipated reaches 0.26, 0.58, and 0.22 for
cement paste, mortar, and concrete, respectively, as provided by silane-treated silica fume and the cementitious admixture, which cause steel-reinforced concrete to increase the dissipation, loss modulus, loss tangent, and storage modulus by 16,000%, 450,000%, 16,000%, and 170%, respec-tively. The highest loss tangent and loss modulus obtained are 0.14 and 3.5 GPa (20.3 and 507.5 ksi), respectively. Silane-treated silica fume alone causes steel-reinforced concrete to increase the dissipation by 9900%; untreated silica fume alone gives an 8000% increase. Without steel or admixtures, the dissipation decreases from cement paste to mortar and concrete. With steel and/or the admixtures, the dissipation increases from paste to mortar and decreases from mortar to concrete. The dissipation decreases with increasing frequency, such that the presence of silica fume reduces the frequency effect.
110-M24—Effect of Leaching on pH of Surrounding Water by David W. Law and Jane Evans
When concrete structures, such as pier supports, are placed in water, they can have a detrimental effect on the surrounding environment by causing the pH to rise. This rise in pH can harm and kill animal and plant life. The concentration of hydroxyl ions leached from concrete can be affected by a number of factors, including cement type, shape of structure, ratio of surface area, and volume and the flow of the water. This paper presents the results of a research project that investigated three mixtures: 100% ordi-nary portland cement, 30% pulverized fly ash, and 65% ground-granulated blast-furnace slag. Tests were conducted in both stagnant and flowing water using a range of specimen geometries and sizes. The results showed that the mixture, volume/surface area, and geometry of the specimen can affect both the rate of leaching and the cumulative number of moles of hydroxyl ions leached.
110-M25—Novel Cementitious Binder Incorporating Cement Kiln Dust: Strength and Durabilityby Piyush Chaunsali and Sulapha Peethamparan
Fresh and hardened properties of a suite of cementitious binders with cement kiln dust (CKD) as the main binding component (70% by weight) are evaluated in this study. Two CKDs with different chemical and physical properties were used in formulating CKD-fly ash and CKD-slag mixtures without portland cement. The setting time, workability, and strength devel-opment of these pastes were evaluated first and the best-performing binders were then used as a component in making concrete. The strength and dura-bility of such concrete is also evaluated. The CKD (I)-slag combination outperformed all other mixtures with respect to the strength and the dura-bility performance under various curing conditions. The elevated tempera-ture curing was found to be essential for the property development of CKD-fly ash binder. The performance of CKD containing mortar mixtures with respect to the delayed ettringite formation and the alkali-silica reaction was also good. The CKD that exhibited better performance contained 5% free lime, 3% Na2Oeq alkali, and 10.6% SO3 with an average particle size of 4 mm.
110-M26—Sustainable Processing of Cellulose Fiber Cement Compositesby Parviz Soroushian, Jong-Pil Won, and Maan Hassan
The aim of this study was to develop an efficient approach to the processing of cellulose fiber-reinforced cement composites that makes value-added use of carbon dioxide. Two categories of cellulose fiber cement boards were evaluated: pressed and unpressed. Comparisons were made between physical and mechanical properties of cellulose fiber cement prod-

542 ACI Structural Journal/May-June 2013
ucts fabricated with conventional and CO2 curing using different processing conditions. This paper describes the results of an attempt at sustainable processing of cementitious composite products—preferably environmen-tally friendly—that incorporate cellulose fiber. Response surface analyses of experimental results are used to identify optimum curing conditions. Analysis results yielded the preferred processing conditions of cellulose fiber cement boards. In both pressed and unpressed boards, oven tempera-ture and duration have significant effects on the performance of the end product. CO2 curing, in some conditions, yielded better results when compared with conventional curing, even at half the autoclave duration.
110-M27—Effect of Curing Water Availability and Composition on Cement Hydrationby Md Sarwar Siddiqui, Wesley Nyberg, Wilson Smith, Brett Blackwell, and Kyle A. Riding
Curing can help concrete reach its full strength and durability potential. The effect of sealing the concrete with plastic or formwork, use of a liquid curing compound, wet curing, and internal curing with saturated lightweight aggregates on the cement degree of hydration development with time was examined using isothermal calorimetry. Curing water amount, curing water ionic concentration, and sample thickness were varied. Finally, curing appli-cation timing was studied by comparing strength development of concrete cylinders sealed, placed in a moist room after 24 hours, and immersed in a water bath immediately after finishing. Increasing the height of the curing water decreased the height of heat of hydration rate peaks. Curing water ionic concentration affected the setting time and heat of hydration rate peak heights. Strength results show that delayed curing can result in significant strength loss because of the difficulty for water to penetrate the already-hardened concrete.
110-M28—Detection and Characterization of Early-Age Thermal Cracks in High-Performance Concreteby David Hubbell and Branko Glisic
Streicker Bridge is a new pedestrian bridge built on the Princeton Univer-sity campus. Structural health monitoring (SHM) was applied with the aim of transforming the bridge into an on-site laboratory for various research and educational purposes. Two fiber-optic sensing technologies were permanently deployed: discrete long-gauge sensing technology based on fiber Bragg gratings (FBGs) and truly distributed sensing technology based on Brillouin optical time domain analysis (BOTDA). The sensors were embedded in the concrete during construction. This paper describes the real-time detection and characterization of early-age thermal cracks in the high-performance concrete deck of Streicker Bridge. The deployed moni-toring strategy and the monitoring systems, which successfully detected cracking, are described. The observed crack propagation trajectories are presented. Details of a simple finite element model of the bridge are given, and the analysis procedure used to demonstrate the formation of thermal cracks using this model is outlined.
110-M29—Alkali-Activated Natural Pozzolan Concrete as New Construction Materialby Dali Bondar, Cyril J. Lynsdale, and Neil B. Milestone
In the near future, geopolymers or alkali-activated cementitious materials as new construction materials will be used as high-performance materials of low environmental impact that are produced at a reasonable cost. These materials can replace the binder in concrete as a major construction material that plays an outstanding role in the construction of different structures. Geopolymer materials are inorganic polymers based on alumina and silica units. They are synthesized from a wide range of dehydroxylated alumina-silicate powders condensed with alkaline silicate in a highly alkaline envi-ronment. Geopolymeric materials can be produced from a wide range of alumina-silica, including natural products—such as natural pozzolan and metakaolin—or co-products—such as fly ash (coal and lignite), oil fuel ash, blast furnace or steel slag, and silica fume—and provide a route toward sustainable development. Using lower amounts of calcium-based raw materials, a lower manufacturing temperature, and lower amounts of fuel results in reduced carbon emissions for geopolymer cement manufacture up to 22 to 72% in comparison with portland cement. The authors conducted a research study on the intrinsic nature of different types of Iranian natural pozzolans to determine the activators and methods that could be used to produce a geopolymer concrete based on an alkali-activated natural pozzolan (AANP) and optimize the mixture design. The mechanical behavior and durability of these types of geopolymer concrete were investi-gated and compared with normal ordinary portland cement (OPC) concrete mixtures cast by the authors and also reported in the literature. This paper summarizes the main conclusions of the research regarding pozzolanic activity, activator properties, engineering and durability properties, applica-tions and evaluation of carbon footprint, and cost of AANP concrete.
110-M30—Impact Resistance of Blast Mitigation Material Using Modified ACI Drop-Weight Impact Testby John J. Myers and Matthew Tinsley
This experimental program was conducted to evaluate the effectiveness of a high-volume fly ash-wood fiber material at resisting repeated low-velocity drop-weight impact. A modified version of the ACI drop-weight test proposed by ACI Committee 544 was conducted on seven groups of specimens. Each group was unique, consisting of various quantities of materials, including cement, fly ash, and wood fibers. Testing procedures for the drop-weight test were consistent with test procedures listed in a previous research study on drop-weight impact testing of polypropylene fiber-reinforced concrete (Badr and Ashour). However, a few modifica-tions were made to the previous test setup to better accommodate this study. These modifications are discussed.
Test results revealed that the fly ash-wood fiber specimens have a signifi-cant resistance to drop-weight impact as compared to unreinforced concrete specimens. Although results show that polypropylene fiber-reinforced concrete has the highest drop-weight impact resistance, the fly ash-wood fiber material is a likely candidate for use in a barrier system due to its low stiffness and ductile failure mode. Impact test results also coincided with results from previous drop-weight impact tests.

ACI Structural Journal/May-June 2013 543

544 ACI Structural Journal/May-June 2013
NOTES: