Accuracy of Digital Image Correlation for Measuring Deformations in Transparent Media
9
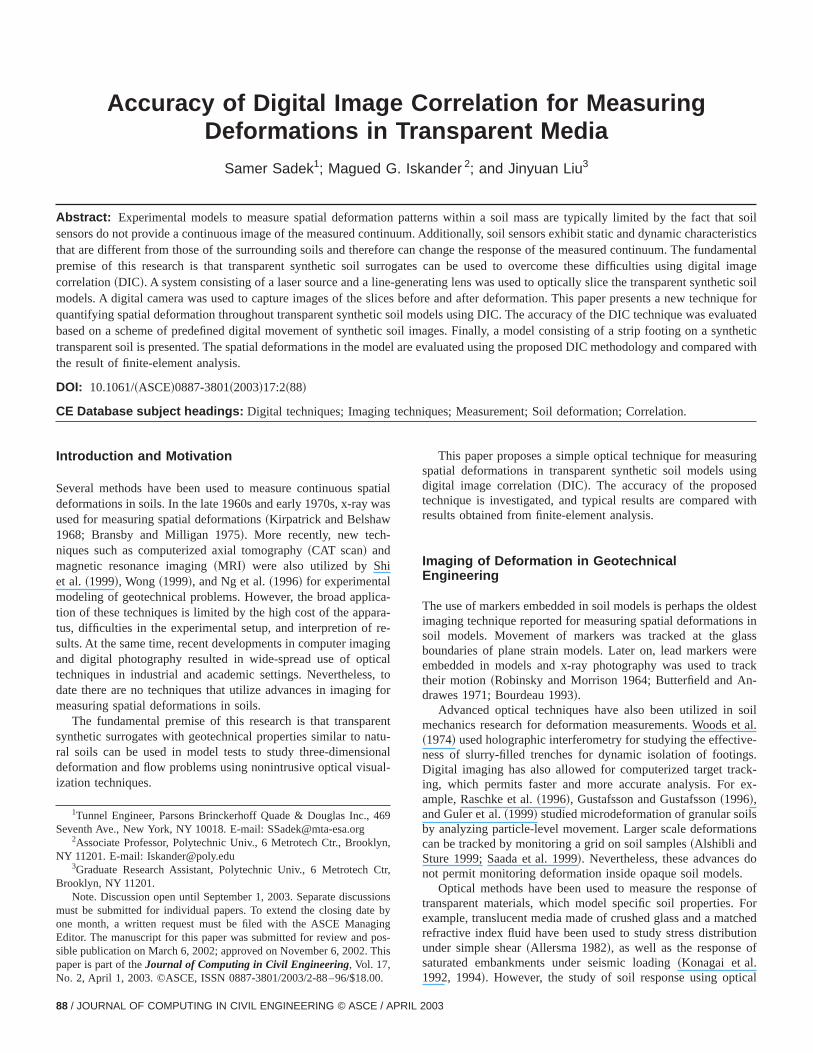
Accuracy of Digital Image Correlation for Measuring Deformations in Transparent Media Samer Sadek 1 ; Magued G. Iskander 2 ; and Jinyuan Liu 3 Abstract: Experimental models to measure spatial deformation patterns within a soil mass are typically limited by the fact that soil sensors do not provide a continuous image of the measured continuum. Additionally, soil sensors exhibit static and dynamic characteristics that are different from those of the surrounding soils and therefore can change the response of the measured continuum. The fundamental premise of this research is that transparent synthetic soil surrogates can be used to overcome these difficulties using digital image correlation ~DIC!. A system consisting of a laser source and a line-generating lens was used to optically slice the transparent synthetic soil models. A digital camera was used to capture images of the slices before and after deformation. This paper presents a new technique for quantifying spatial deformation throughout transparent synthetic soil models using DIC. The accuracy of the DIC technique was evaluated based on a scheme of predefined digital movement of synthetic soil images. Finally, a model consisting of a strip footing on a synthetic transparent soil is presented. The spatial deformations in the model are evaluated using the proposed DIC methodology and compared with the result of finite-element analysis. DOI: 10.1061/~ASCE!0887-3801~2003!17:2~88! CE Database subject headings: Digital techniques; Imaging techniques; Measurement; Soil deformation; Correlation. Introduction and Motivation Several methods have been used to measure continuous spatial deformations in soils. In the late 1960s and early 1970s, x-ray was used for measuring spatial deformations ~Kirpatrick and Belshaw 1968; Bransby and Milligan 1975!. More recently, new tech- niques such as computerized axial tomography ~CAT scan! and magnetic resonance imaging ~MRI! were also utilized by Shi et al. ~1999!, Wong ~1999!, and Ng et al. ~1996! for experimental modeling of geotechnical problems. However, the broad applica- tion of these techniques is limited by the high cost of the appara- tus, difficulties in the experimental setup, and interpretion of re- sults. At the same time, recent developments in computer imaging and digital photography resulted in wide-spread use of optical techniques in industrial and academic settings. Nevertheless, to date there are no techniques that utilize advances in imaging for measuring spatial deformations in soils. The fundamental premise of this research is that transparent synthetic surrogates with geotechnical properties similar to natu- ral soils can be used in model tests to study three-dimensional deformation and flow problems using nonintrusive optical visual- ization techniques. This paper proposes a simple optical technique for measuring spatial deformations in transparent synthetic soil models using digital image correlation ~DIC!. The accuracy of the proposed technique is investigated, and typical results are compared with results obtained from finite-element analysis. Imaging of Deformation in Geotechnical Engineering The use of markers embedded in soil models is perhaps the oldest imaging technique reported for measuring spatial deformations in soil models. Movement of markers was tracked at the glass boundaries of plane strain models. Later on, lead markers were embedded in models and x-ray photography was used to track their motion ~Robinsky and Morrison 1964; Butterfield and An- drawes 1971; Bourdeau 1993!. Advanced optical techniques have also been utilized in soil mechanics research for deformation measurements. Woods et al. ~1974! used holographic interferometry for studying the effective- ness of slurry-filled trenches for dynamic isolation of footings. Digital imaging has also allowed for computerized target track- ing, which permits faster and more accurate analysis. For ex- ample, Raschke et al. ~1996!, Gustafsson and Gustafsson ~1996!, and Guler et al. ~1999! studied microdeformation of granular soils by analyzing particle-level movement. Larger scale deformations can be tracked by monitoring a grid on soil samples ~Alshibli and Sture 1999; Saada et al. 1999!. Nevertheless, these advances do not permit monitoring deformation inside opaque soil models. Optical methods have been used to measure the response of transparent materials, which model specific soil properties. For example, translucent media made of crushed glass and a matched refractive index fluid have been used to study stress distribution under simple shear ~Allersma 1982!, as well as the response of saturated embankments under seismic loading ~Konagai et al. 1992, 1994!. However, the study of soil response using optical 1 Tunnel Engineer, Parsons Brinckerhoff Quade & Douglas Inc., 469 Seventh Ave., New York, NY 10018. E-mail: [email protected] 2 Associate Professor, Polytechnic Univ., 6 Metrotech Ctr., Brooklyn, NY 11201. E-mail: [email protected] 3 Graduate Research Assistant, Polytechnic Univ., 6 Metrotech Ctr, Brooklyn, NY 11201. Note. Discussion open until September 1, 2003. Separate discussions must be submitted for individual papers. To extend the closing date by one month, a written request must be filed with the ASCE Managing Editor. The manuscript for this paper was submitted for review and pos- sible publication on March 6, 2002; approved on November 6, 2002. This paper is part of the Journal of Computing in Civil Engineering, Vol. 17, No. 2, April 1, 2003. ©ASCE, ISSN 0887-3801/2003/2-88 –96/$18.00. 88 / JOURNAL OF COMPUTING IN CIVIL ENGINEERING © ASCE / APRIL 2003
Transcript of Accuracy of Digital Image Correlation for Measuring Deformations in Transparent Media
hat soilacteristicsndamentalital imagehetic soilhnique forvaluated
syntheticpared with
Accuracy of Digital Image Correlation for MeasuringDeformations in Transparent Media
Samer Sadek1; Magued G. Iskander 2; and Jinyuan Liu3
Abstract: Experimental models to measure spatial deformation patterns within a soil mass are typically limited by the fact tsensors do not provide a continuous image of the measured continuum. Additionally, soil sensors exhibit static and dynamic charthat are different from those of the surrounding soils and therefore can change the response of the measured continuum. The fupremise of this research is that transparent synthetic soil surrogates can be used to overcome these difficulties using digcorrelation~DIC!. A system consisting of a laser source and a line-generating lens was used to optically slice the transparent syntmodels. A digital camera was used to capture images of the slices before and after deformation. This paper presents a new tecquantifying spatial deformation throughout transparent synthetic soil models using DIC. The accuracy of the DIC technique was ebased on a scheme of predefined digital movement of synthetic soil images. Finally, a model consisting of a strip footing on atransparent soil is presented. The spatial deformations in the model are evaluated using the proposed DIC methodology and comthe result of finite-element analysis.
DOI: 10.1061/~ASCE!0887-3801~2003!17:2~88!
CE Database subject headings: Digital techniques; Imaging techniques; Measurement; Soil deformation; Correlation.
pawa
icarareginicas,
f
reatonal
inging
ith
destinssereack-
oilt al.
e-s.k-ex-
sns
o
e ofor
chedionf
al
6
yn
Ct
siob
inosh
.
Introduction and Motivation
Several methods have been used to measure continuous sdeformations in soils. In the late 1960s and early 1970s, x-rayused for measuring spatial deformations~Kirpatrick and Belshaw1968; Bransby and Milligan 1975!. More recently, new tech-niques such as computerized axial tomography~CAT scan! andmagnetic resonance imaging~MRI! were also utilized by Shiet al.~1999!, Wong~1999!, and Ng et al.~1996! for experimentalmodeling of geotechnical problems. However, the broad appltion of these techniques is limited by the high cost of the appatus, difficulties in the experimental setup, and interpretion ofsults. At the same time, recent developments in computer imaand digital photography resulted in wide-spread use of opttechniques in industrial and academic settings. Neverthelesdate there are no techniques that utilize advances in imagingmeasuring spatial deformations in soils.
The fundamental premise of this research is that transpasynthetic surrogates with geotechnical properties similar to nral soils can be used in model tests to study three-dimensideformation and flow problems using nonintrusive optical visuization techniques.
1Tunnel Engineer, Parsons Brinckerhoff Quade & Douglas Inc., 4Seventh Ave., New York, NY 10018. E-mail: [email protected]
2Associate Professor, Polytechnic Univ., 6 Metrotech Ctr., BrooklNY 11201. E-mail: [email protected]
3Graduate Research Assistant, Polytechnic Univ., 6 MetrotechBrooklyn, NY 11201.
Note. Discussion open until September 1, 2003. Separate discusmust be submitted for individual papers. To extend the closing dateone month, a written request must be filed with the ASCE ManagEditor. The manuscript for this paper was submitted for review and psible publication on March 6, 2002; approved on November 6, 2002. Tpaper is part of theJournal of Computing in Civil Engineering, Vol. 17,No. 2, April 1, 2003. ©ASCE, ISSN 0887-3801/2003/2-88–96/$18.00
88 / JOURNAL OF COMPUTING IN CIVIL ENGINEERING © ASCE / APRI
tials
---gltoor
ntu-al-
This paper proposes a simple optical technique for measurspatial deformations in transparent synthetic soil models usdigital image correlation~DIC!. The accuracy of the proposedtechnique is investigated, and typical results are compared wresults obtained from finite-element analysis.
Imaging of Deformation in GeotechnicalEngineering
The use of markers embedded in soil models is perhaps the olimaging technique reported for measuring spatial deformationssoil models. Movement of markers was tracked at the glaboundaries of plane strain models. Later on, lead markers wembedded in models and x-ray photography was used to trtheir motion~Robinsky and Morrison 1964; Butterfield and Andrawes 1971; Bourdeau 1993!.
Advanced optical techniques have also been utilized in smechanics research for deformation measurements. Woods e~1974! used holographic interferometry for studying the effectivness of slurry-filled trenches for dynamic isolation of footingDigital imaging has also allowed for computerized target tracing, which permits faster and more accurate analysis. Forample, Raschke et al.~1996!, Gustafsson and Gustafsson~1996!,and Guler et al.~1999! studied microdeformation of granular soilby analyzing particle-level movement. Larger scale deformatiocan be tracked by monitoring a grid on soil samples~Alshibli andSture 1999; Saada et al. 1999!. Nevertheless, these advances dnot permit monitoring deformation inside opaque soil models.
Optical methods have been used to measure the responstransparent materials, which model specific soil properties. Fexample, translucent media made of crushed glass and a matrefractive index fluid have been used to study stress distributunder simple shear~Allersma 1982!, as well as the response osaturated embankments under seismic loading~Konagai et al.1992, 1994!. However, the study of soil response using optic
9
,
r,
nsy
g-
is
L 2003
entow-el
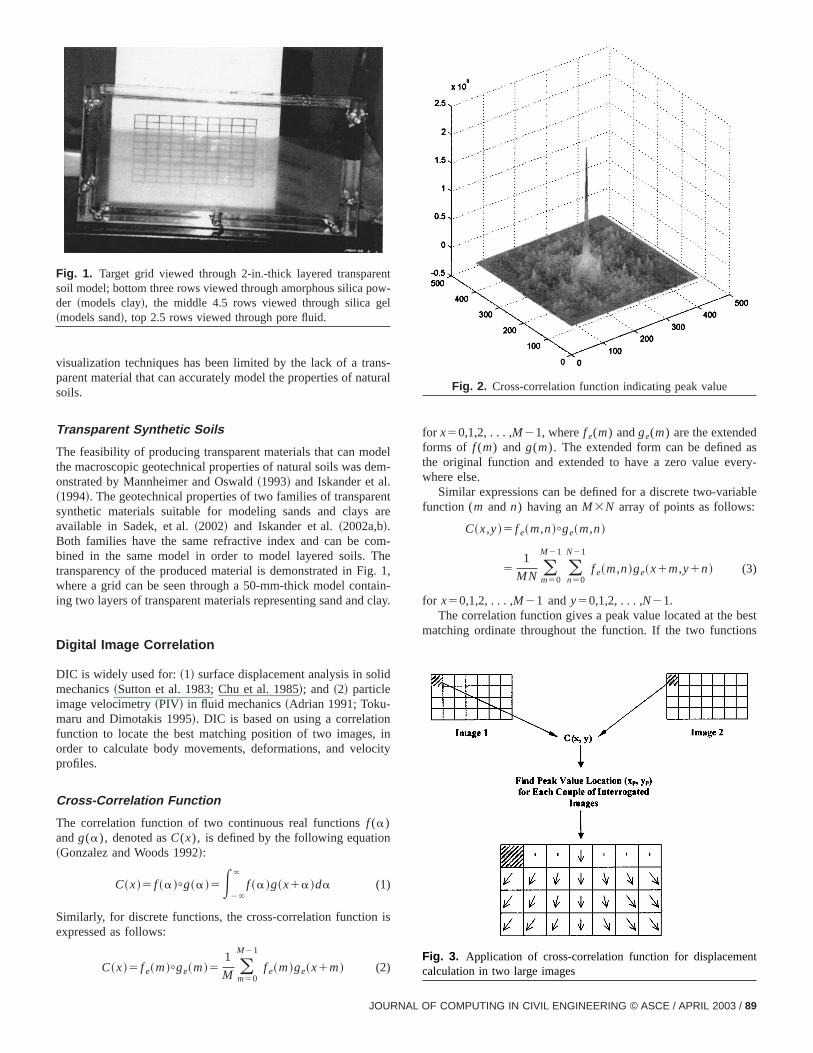
Fig. 1. Target grid viewed through 2-in.-thick layered transparsoil model; bottom three rows viewed through amorphous silica pder ~models clay!, the middle 4.5 rows viewed through silica g~models sand!, top 2.5 rows viewed through pore fluid.
ns-tura
deem
.entare
omTheg. 1taincla
lid
n, incity
n
is
JOURNAL
lFig. 2. Cross-correlation function indicating peak value
asery-
ble
estns
nt
visualization techniques has been limited by the lack of a traparent material that can accurately model the properties of nasoils.
Transparent Synthetic Soils
The feasibility of producing transparent materials that can mothe macroscopic geotechnical properties of natural soils was donstrated by Mannheimer and Oswald~1993! and Iskander et al~1994!. The geotechnical properties of two families of transparsynthetic materials suitable for modeling sands and claysavailable in Sadek, et al.~2002! and Iskander et al.~2002a,b!.Both families have the same refractive index and can be cbined in the same model in order to model layered soils.transparency of the produced material is demonstrated in Fiwhere a grid can be seen through a 50-mm-thick model coning two layers of transparent materials representing sand and
Digital Image Correlation
DIC is widely used for:~1! surface displacement analysis in somechanics~Sutton et al. 1983; Chu et al. 1985!; and ~2! particleimage velocimetry~PIV! in fluid mechanics~Adrian 1991; Toku-maru and Dimotakis 1995!. DIC is based on using a correlatiofunction to locate the best matching position of two imagesorder to calculate body movements, deformations, and veloprofiles.
Cross-Correlation Function
The correlation function of two continuous real functionsf (a)andg(a), denoted asC(x), is defined by the following equatio~Gonzalez and Woods 1992!:
C~x!5 f ~a!+g~a!5E2`
`
f ~a!g~x1a!da (1)
Similarly, for discrete functions, the cross-correlation functionexpressed as follows:
C~x!5 f e~m!+ge~m!51
M (m50
M21
f e~m!ge~x1m! (2)
l-
-
,-y.
for x50,1,2, . . . ,M21, wheref e(m) andge(m) are the extendedforms of f (m) and g(m). The extended form can be definedthe original function and extended to have a zero value evwhere else.
Similar expressions can be defined for a discrete two-variafunction (m andn) having anM3N array of points as follows:
C~x,y!5 f e~m,n!+ge~m,n!
51
MN (m50
M21
(n50
N21
f e~m,n!ge~x1m,y1n! (3)
for x50,1,2, . . . ,M21 andy50,1,2, . . . ,N21.The correlation function gives a peak value located at the b
matching ordinate throughout the function. If the two functio
Fig. 3. Application of cross-correlation function for displacemecalculation in two large images
OF COMPUTING IN CIVIL ENGINEERING © ASCE / APRIL 2003 / 89
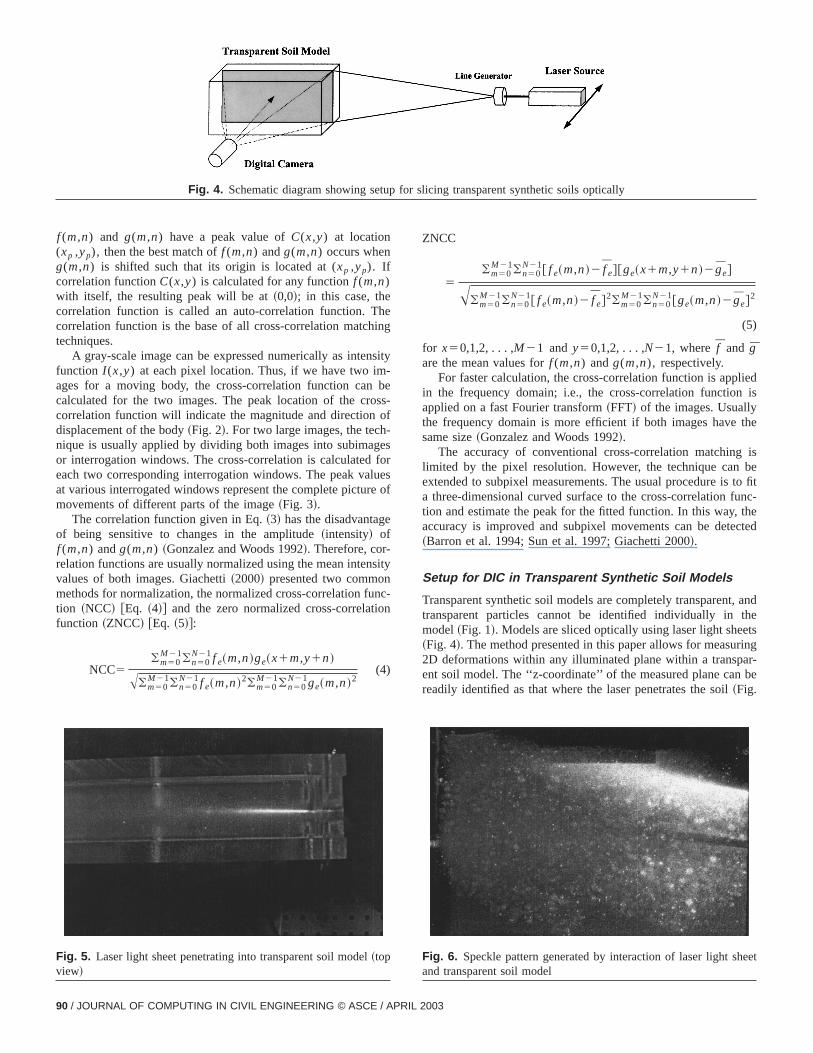
Fig. 4. Schematic diagram showing setup for slicing transparent synthetic soils optically
hein
s-bso-efoue
si
nn
liedis
the
isbeto fitunc-thected
andhets
ringar-be
eet
f (m,n) and g(m,n) have a peak value ofC(x,y) at location(xp ,yp), then the best match off (m,n) andg(m,n) occurs wheng(m,n) is shifted such that its origin is located at (xp ,yp). Ifcorrelation functionC(x,y) is calculated for any functionf (m,n)with itself, the resulting peak will be at~0,0!; in this case, thecorrelation function is called an auto-correlation function. Tcorrelation function is the base of all cross-correlation matchtechniques.
A gray-scale image can be expressed numerically as intenfunction I (x,y) at each pixel location. Thus, if we have two images for a moving body, the cross-correlation function cancalculated for the two images. The peak location of the crocorrelation function will indicate the magnitude and directiondisplacement of the body~Fig. 2!. For two large images, the technique is usually applied by dividing both images into subimagor interrogation windows. The cross-correlation is calculatedeach two corresponding interrogation windows. The peak valat various interrogated windows represent the complete picturmovements of different parts of the image~Fig. 3!.
The correlation function given in Eq.~3! has the disadvantageof being sensitive to changes in the amplitude~intensity! off (m,n) andg(m,n) ~Gonzalez and Woods 1992!. Therefore, cor-relation functions are usually normalized using the mean intenvalues of both images. Giachetti~2000! presented two commonmethods for normalization, the normalized cross-correlation fution ~NCC! @Eq. ~4!# and the zero normalized cross-correlatiofunction ~ZNCC! @Eq. ~5!#:
NCC5(m50
M21(n50N21f e~m,n!ge~x1m,y1n!
A(m50M21(n50
N21f e~m,n!2(m50M21(n50
N21ge~m,n!2(4)
Fig. 5. Laser light sheet penetrating into transparent soil model~topview!
90 / JOURNAL OF COMPUTING IN CIVIL ENGINEERING © ASCE / APR
g
ity
es-f
sr
esof
ty
c-
ZNCC
5(m50
M21(n50N21@ f e~m,n!2 f e#@ge~x1m,y1n!2ge#
A(m50M21(n50
N21@ f e~m,n!2 f e#2(m50
M21(n50N21@ge~m,n!2ge#
2
(5)
for x50,1,2, . . . ,M21 andy50,1,2, . . . ,N21, where f and gare the mean values forf (m,n) andg(m,n), respectively.
For faster calculation, the cross-correlation function is appin the frequency domain; i.e., the cross-correlation functionapplied on a fast Fourier transform~FFT! of the images. Usuallythe frequency domain is more efficient if both images havesame size~Gonzalez and Woods 1992!.
The accuracy of conventional cross-correlation matchinglimited by the pixel resolution. However, the technique canextended to subpixel measurements. The usual procedure isa three-dimensional curved surface to the cross-correlation ftion and estimate the peak for the fitted function. In this way,accuracy is improved and subpixel movements can be dete~Barron et al. 1994; Sun et al. 1997; Giachetti 2000!.
Setup for DIC in Transparent Synthetic Soil Models
Transparent synthetic soil models are completely transparent,transparent particles cannot be identified individually in tmodel~Fig. 1!. Models are sliced optically using laser light shee~Fig. 4!. The method presented in this paper allows for measu2D deformations within any illuminated plane within a transpent soil model. The ‘‘z-coordinate’’ of the measured plane canreadily identified as that where the laser penetrates the soil~Fig.
Fig. 6. Speckle pattern generated by interaction of laser light shand transparent soil model
IL 2003
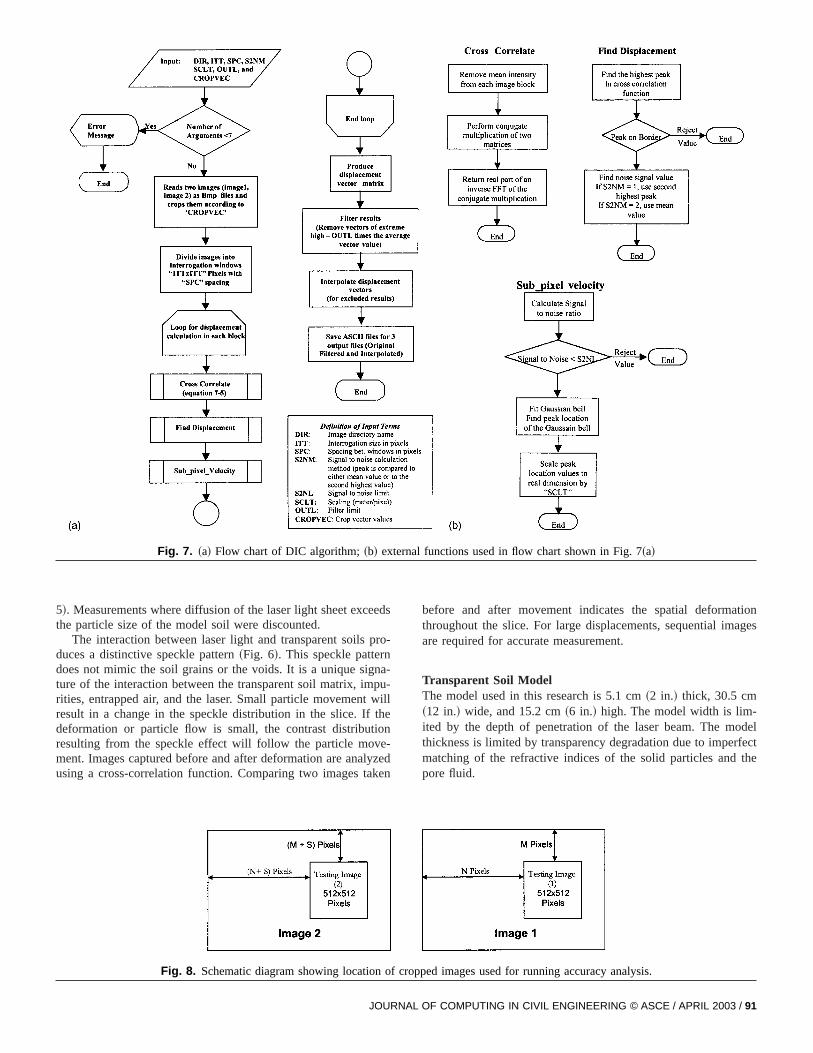
Fig. 7. ~a! Flow chart of DIC algorithm;~b! external functions used in flow chart shown in Fig. 7~a!
ed
ro
a-uile
n-zeen
tionages
odelrfectthe
JOURNAL
s
-
-l
d
before and after movement indicates the spatial deformathroughout the slice. For large displacements, sequential imare required for accurate measurement.
Transparent Soil ModelThe model used in this research is 5.1 cm~2 in.! thick, 30.5 cm~12 in.! wide, and 15.2 cm~6 in.! high. The model width is lim-ited by the depth of penetration of the laser beam. The mthickness is limited by transparency degradation due to impematching of the refractive indices of the solid particles andpore fluid.
Fig. 8. Schematic diagram showing location of cropped images used for running accuracy analysis.
5!. Measurements where diffusion of the laser light sheet excethe particle size of the model soil were discounted.
The interaction between laser light and transparent soils pduces a distinctive speckle pattern~Fig. 6!. This speckle patterndoes not mimic the soil grains or the voids. It is a unique signture of the interaction between the transparent soil matrix, imprities, entrapped air, and the laser. Small particle movement wresult in a change in the speckle distribution in the slice. If thdeformation or particle flow is small, the contrast distributioresulting from the speckle effect will follow the particle movement. Images captured before and after deformation are analyusing a cross-correlation function. Comparing two images tak
OF COMPUTING IN CIVIL ENGINEERING © ASCE / APRIL 2003 / 91
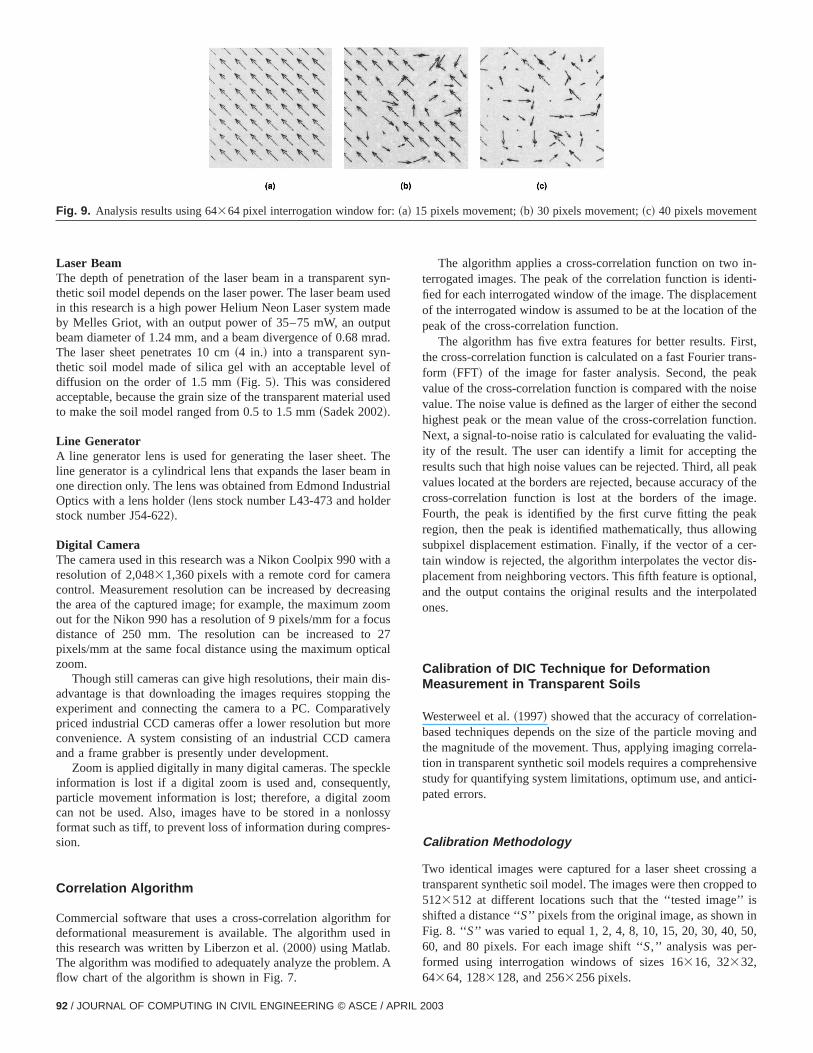
Fig. 9. Analysis results using 64364 pixel interrogation window for:~a! 15 pixels movement;~b! 30 pixels movement;~c! 40 pixels movement
nee
d
inl
a
7
-
l
a
rn
n-ti-
entthe
st,ns-akiseondon.id-eeakf thee.k
ngr-is-al,ted
-andla-ivei-
g ad tois
,
92 / JOURNAL OF COMPUTING IN CIVIL ENGINEERING © ASCE / APRIL
-d
.
ed
e
g
l
ey
y
The algorithm applies a cross-correlation function on two iterrogated images. The peak of the correlation function is idenfied for each interrogated window of the image. The displacemof the interrogated window is assumed to be at the location ofpeak of the cross-correlation function.
The algorithm has five extra features for better results. Firthe cross-correlation function is calculated on a fast Fourier traform ~FFT! of the image for faster analysis. Second, the pevalue of the cross-correlation function is compared with the novalue. The noise value is defined as the larger of either the sechighest peak or the mean value of the cross-correlation functiNext, a signal-to-noise ratio is calculated for evaluating the vality of the result. The user can identify a limit for accepting thresults such that high noise values can be rejected. Third, all pvalues located at the borders are rejected, because accuracy ocross-correlation function is lost at the borders of the imagFourth, the peak is identified by the first curve fitting the pearegion, then the peak is identified mathematically, thus allowisubpixel displacement estimation. Finally, if the vector of a cetain window is rejected, the algorithm interpolates the vector dplacement from neighboring vectors. This fifth feature is optionand the output contains the original results and the interpolaones.
Calibration of DIC Technique for DeformationMeasurement in Transparent Soils
Westerweel et al.~1997! showed that the accuracy of correlationbased techniques depends on the size of the particle movingthe magnitude of the movement. Thus, applying imaging corretion in transparent synthetic soil models requires a comprehensstudy for quantifying system limitations, optimum use, and anticpated errors.
Calibration Methodology
Two identical images were captured for a laser sheet crossintransparent synthetic soil model. The images were then croppe5123512 at different locations such that the ‘‘tested image’’shifted a distance ‘‘S’’ pixels from the original image, as shown inFig. 8. ‘‘S’’ was varied to equal 1, 2, 4, 8, 10, 15, 20, 30, 40, 5060, and 80 pixels. For each image shift ‘‘S, ’’ analysis was per-formed using interrogation windows of sizes 16316, 32332,64364, 1283128, and 2563256 pixels.
Laser BeamThe depth of penetration of the laser beam in a transparent sythetic soil model depends on the laser power. The laser beam usin this research is a high power Helium Neon Laser system madby Melles Griot, with an output power of 35–75 mW, an outputbeam diameter of 1.24 mm, and a beam divergence of 0.68 mraThe laser sheet penetrates 10 cm~4 in.! into a transparent syn-thetic soil model made of silica gel with an acceptable level ofdiffusion on the order of 1.5 mm~Fig. 5!. This was consideredacceptable, because the grain size of the transparent material usto make the soil model ranged from 0.5 to 1.5 mm~Sadek 2002!.
Line GeneratorA line generator lens is used for generating the laser sheet. Thline generator is a cylindrical lens that expands the laser beamone direction only. The lens was obtained from Edmond IndustriaOptics with a lens holder~lens stock number L43-473 and holderstock number J54-622!.
Digital CameraThe camera used in this research was a Nikon Coolpix 990 withresolution of 2,04831,360 pixels with a remote cord for cameracontrol. Measurement resolution can be increased by decreasinthe area of the captured image; for example, the maximum zoomout for the Nikon 990 has a resolution of 9 pixels/mm for a focusdistance of 250 mm. The resolution can be increased to 2pixels/mm at the same focal distance using the maximum opticazoom.
Though still cameras can give high resolutions, their main disadvantage is that downloading the images requires stopping thexperiment and connecting the camera to a PC. Comparativepriced industrial CCD cameras offer a lower resolution but moreconvenience. A system consisting of an industrial CCD camerand a frame grabber is presently under development.
Zoom is applied digitally in many digital cameras. The speckleinformation is lost if a digital zoom is used and, consequently,particle movement information is lost; therefore, a digital zoomcan not be used. Also, images have to be stored in a nonlossformat such as tiff, to prevent loss of information during compres-sion.
Correlation Algorithm
Commercial software that uses a cross-correlation algorithm fodeformational measurement is available. The algorithm used ithis research was written by Liberzon et al.~2000! using Matlab.The algorithm was modified to adequately analyze the problem. Aflow chart of the algorithm is shown in Fig. 7.
2003
ls
al to
nts
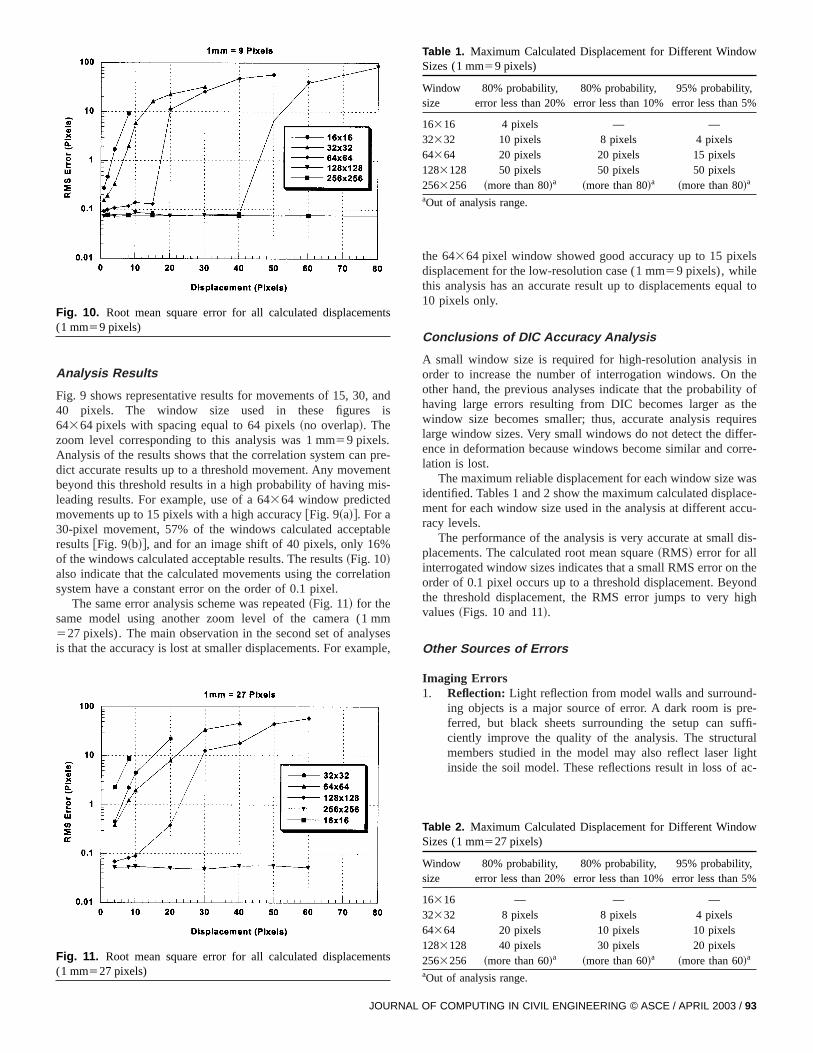
Fig. 10. Root mean square error for all calculated displaceme(1 mm59 pixels)andis
preenis-
ble
tion
mmsesple
inthey oftheires
er-rre-
asce-cu-
dis-
theondigh
-e-ffi-alghtac-
nts
JOURNAL
-t
,
the 64364 pixel window showed good accuracy up to 15 pixedisplacement for the low-resolution case (1 mm59 pixels), whilethis analysis has an accurate result up to displacements equ10 pixels only.
Conclusions of DIC Accuracy Analysis
A small window size is required for high-resolution analysisorder to increase the number of interrogation windows. Onother hand, the previous analyses indicate that the probabilithaving large errors resulting from DIC becomes larger aswindow size becomes smaller; thus, accurate analysis reqularge window sizes. Very small windows do not detect the diffence in deformation because windows become similar and colation is lost.
The maximum reliable displacement for each window size widentified. Tables 1 and 2 show the maximum calculated displament for each window size used in the analysis at different acracy levels.
The performance of the analysis is very accurate at smallplacements. The calculated root mean square~RMS! error for allinterrogated window sizes indicates that a small RMS error onorder of 0.1 pixel occurs up to a threshold displacement. Beythe threshold displacement, the RMS error jumps to very hvalues~Figs. 10 and 11!.
Other Sources of Errors
Imaging Errors1. Reflection: Light reflection from model walls and surround
ing objects is a major source of error. A dark room is prferred, but black sheets surrounding the setup can suciently improve the quality of the analysis. The structurmembers studied in the model may also reflect laser liinside the soil model. These reflections result in loss of
Table 1. Maximum Calculated Displacement for Different WindowSizes (1 mm59 pixels)
Windowsize
80% probability,error less than 20%
80% probability,error less than 10%
95% probability,error less than 5%
16316 4 pixels — —32332 10 pixels 8 pixels 4 pixels64364 20 pixels 20 pixels 15 pixels1283128 50 pixels 50 pixels 50 pixels2563256 ~more than 80!a ~more than 80!a ~more than 80!a
aOut of analysis range.
w
Analysis Results
Fig. 9 shows representative results for movements of 15, 30,40 pixels. The window size used in these figures64364 pixels with spacing equal to 64 pixels~no overlap!. Thezoom level corresponding to this analysis was 1 mm59 pixels.Analysis of the results shows that the correlation system candict accurate results up to a threshold movement. Any movembeyond this threshold results in a high probability of having mleading results. For example, use of a 64364 window predictedmovements up to 15 pixels with a high accuracy@Fig. 9~a!#. For a30-pixel movement, 57% of the windows calculated acceptaresults@Fig. 9~b!#, and for an image shift of 40 pixels, only 16%of the windows calculated acceptable results. The results~Fig. 10!also indicate that the calculated movements using the correlasystem have a constant error on the order of 0.1 pixel.
The same error analysis scheme was repeated~Fig. 11! for thesame model using another zoom level of the camera (1527 pixels). The main observation in the second set of analyis that the accuracy is lost at smaller displacements. For exam
Fig. 11. Root mean square error for all calculated displaceme(1 mm527 pixels)
Table 2. Maximum Calculated Displacement for Different WindoSizes (1 mm527 pixels)
Windowsize
80% probability,error less than 20%
80% probability,error less than 10%
95% probability,error less than 5%
16316 — — —32332 8 pixels 8 pixels 4 pixels64364 20 pixels 10 pixels 10 pixels1283128 40 pixels 30 pixels 20 pixels2563256 ~more than 60!a ~more than 60!a ~more than 60!a
aOut of analysis range.
OF COMPUTING IN CIVIL ENGINEERING © ASCE / APRIL 2003 / 93
l
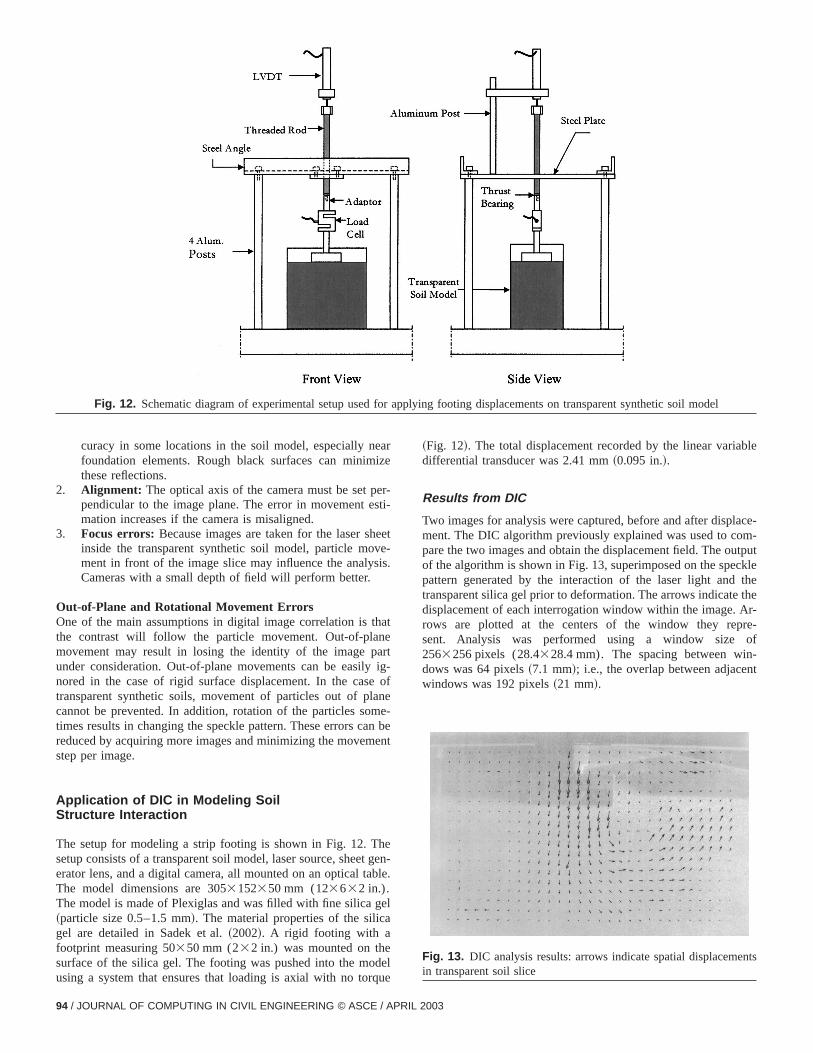
Fig. 12. Schematic diagram of experimental setup used for applying footing displacements on transparent synthetic soil modearze
r-ti-
ete-is.
atertig-o
nee-
n bent
egele
el
elue
ble
ce-m-tputklethether-
re-of-t
nts
94 / JOURNAL OF COMPUTING IN CIVIL ENGINEERING © ASCE / APRIL
f
e
n-.
~Fig. 12!. The total displacement recorded by the linear variadifferential transducer was 2.41 mm~0.095 in.!.
Results from DIC
Two images for analysis were captured, before and after displament. The DIC algorithm previously explained was used to copare the two images and obtain the displacement field. The ouof the algorithm is shown in Fig. 13, superimposed on the specpattern generated by the interaction of the laser light andtransparent silica gel prior to deformation. The arrows indicatedisplacement of each interrogation window within the image. Arows are plotted at the centers of the window they repsent. Analysis was performed using a window size2563256 pixels (28.4328.4 mm). The spacing between windows was 64 pixels~7.1 mm!; i.e., the overlap between adjacenwindows was 192 pixels~21 mm!.
Fig. 13. DIC analysis results: arrows indicate spatial displacemein transparent soil slice
curacy in some locations in the soil model, especially nefoundation elements. Rough black surfaces can minimithese reflections.
2. Alignment: The optical axis of the camera must be set pependicular to the image plane. The error in movement esmation increases if the camera is misaligned.
3. Focus errors: Because images are taken for the laser sheinside the transparent synthetic soil model, particle movment in front of the image slice may influence the analysCameras with a small depth of field will perform better.
Out-of-Plane and Rotational Movement ErrorsOne of the main assumptions in digital image correlation is ththe contrast will follow the particle movement. Out-of-planmovement may result in losing the identity of the image paunder consideration. Out-of-plane movements can be easilynored in the case of rigid surface displacement. In the casetransparent synthetic soils, movement of particles out of placannot be prevented. In addition, rotation of the particles somtimes results in changing the speckle pattern. These errors careduced by acquiring more images and minimizing the movemstep per image.
Application of DIC in Modeling SoilStructure Interaction
The setup for modeling a strip footing is shown in Fig. 12. Thsetup consists of a transparent soil model, laser source, sheeterator lens, and a digital camera, all mounted on an optical tabThe model dimensions are 3053152350 mm (123632 in.).The model is made of Plexiglas and was filled with fine silica g~particle size 0.5–1.5 mm!. The material properties of the silicagel are detailed in Sadek et al.~2002!. A rigid footing with afootprint measuring 50350 mm (232 in.) was mounted on thesurface of the silica gel. The footing was pushed into the modusing a system that ensures that loading is axial with no torq
2003
si
si
si
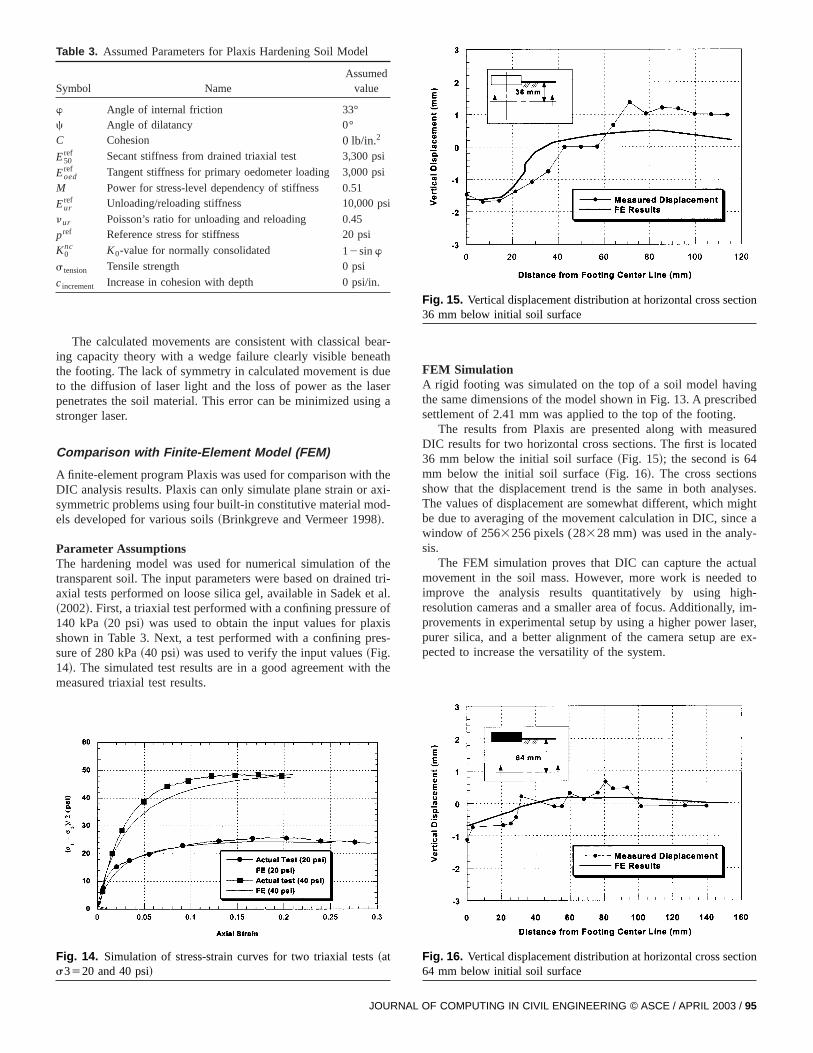
Table 3. Assumed Parameters for Plaxis Hardening Soil Model
Symbol NameAssumed
value
w Angle of internal friction 33°c Angle of dilatancy 0°C Cohesion 0 lb/in.2
E50ref Secant stiffness from drained triaxial test 3,300 p
Eoedref Tangent stiffness for primary oedometer loading 3,000 p
M Power for stress-level dependency of stiffness 0.51
Eurref Unloading/reloading stiffness 10,000 p
nur Poisson’s ratio for unloading and reloading 0.45
pref Reference stress for stiffness 20 psi
K0nc K0-value for normally consolidated 12sinw
s tension Tensile strength 0 psi
cincrement Increase in cohesion with depth 0 psi/in.
earathdueser
ng a
theaxi-od-
thed trt alof
xisres-
the
ion
JOURNAL
Fig. 15. Vertical displacement distribution at horizontal cross sect36 mm below initial soil surface
-
ngbed
redted
ses.ighte a-
ualto
h-im-ser,ex-
The calculated movements are consistent with classical bing capacity theory with a wedge failure clearly visible benethe footing. The lack of symmetry in calculated movement isto the diffusion of laser light and the loss of power as the lapenetrates the soil material. This error can be minimized usistronger laser.
Comparison with Finite-Element Model (FEM)
A finite-element program Plaxis was used for comparison withDIC analysis results. Plaxis can only simulate plane strain orsymmetric problems using four built-in constitutive material mels developed for various soils~Brinkgreve and Vermeer 1998!.
Parameter AssumptionsThe hardening model was used for numerical simulation oftransparent soil. The input parameters were based on draineaxial tests performed on loose silica gel, available in Sadek e~2002!. First, a triaxial test performed with a confining pressure140 kPa~20 psi! was used to obtain the input values for plashown in Table 3. Next, a test performed with a confining psure of 280 kPa~40 psi! was used to verify the input values~Fig.14!. The simulated test results are in a good agreement withmeasured triaxial test results.
ion
i-.
FEM SimulationA rigid footing was simulated on the top of a soil model havithe same dimensions of the model shown in Fig. 13. A prescrisettlement of 2.41 mm was applied to the top of the footing.
The results from Plaxis are presented along with measuDIC results for two horizontal cross sections. The first is loca36 mm below the initial soil surface~Fig. 15!; the second is 64mm below the initial soil surface~Fig. 16!. The cross sectionsshow that the displacement trend is the same in both analyThe values of displacement are somewhat different, which mbe due to averaging of the movement calculation in DIC, sincwindow of 2563256 pixels (28328 mm) was used in the analysis.
The FEM simulation proves that DIC can capture the actmovement in the soil mass. However, more work is neededimprove the analysis results quantitatively by using higresolution cameras and a smaller area of focus. Additionally,provements in experimental setup by using a higher power lapurer silica, and a better alignment of the camera setup arepected to increase the versatility of the system.
Fig. 16. Vertical displacement distribution at horizontal cross sect64 mm below initial soil surface
Fig. 14. Simulation of stress-strain curves for two triaxial tests~ats3520 and 40 psi!
OF COMPUTING IN CIVIL ENGINEERING © ASCE / APRIL 2003 / 95
thehees
emay
or-deseul. Ire-ysedbleof
for:
ine,
e-
ls
s-
’’
g
rties
s
f
ughe
hec-ivil
toils,
r-
on,
c-
ilsiv.,
f
on
, J.tal
s of
nd
System Limitations
The presence of impurities in transparent soils combined withlimited power of the available laser resulted in attenuation of tlaser light sheet for distances greater than 10 cm. The largmodel tested so far was 30315310 cm.
Out-of-plane movement cannot be measured using this systAdditionally, the presence of large out-of-plane movement mresult in decorrelation.
Conclusions
DIC was shown to be a reliable technique for measuring defmation in transparent media. The accuracy of the techniquepends on the displacement magnitude and the window size uin the analysis. In general, the technique provides accurate resfor small displacements using large interrogation window sizeswas shown that, for every window size, there is a maximumliable displacement that can be calculated. Finite-element analof a strip footing on a transparent synthetic soil model showgood agreement with the DIC results. DIC can provide valuainput in analyzing complicated models by visualizing modesfailure and ranges of influence.
Acknowledgment
The writers are grateful to the National Science Foundationfunding this work through NSF Grant No. CMS 9733064CAREER: Modeling 3D Flow & Soil Structure Interaction UsingOptical Tomography.
References
Adrian, R. ~1991!. ‘‘Particle-imaging techniques for experimental fluidmechanics.’’Annu. Rev. Fluid Mech.,23, 261–304.
Allersma, H. G. B.~1982!. ‘‘Photo-elastic stress analysis and strainssimple shear.’’Proc., IUTAM Symposium on Deformation and Failurof Granular Materials, P. A. Vermeer and H. J. Luger, eds., IUTAMDelft, The Netherlands, 345–353.
Alshibli, K., and Sture, S.~1999!. ‘‘Sand shear band thickness measurment by digital imaging techniques.’’J. Comput. Civ. Eng.,13~2!,103–109.
Barron, J., Fleet, D., and Beauchemin, S.~1994!. ‘‘Performance of opticalflow techniques.’’Int. J. Comput. Vis.,12~1!, 43–77.
Bourdeau, P.~1993!. ‘‘Radiographic visualization in experimental soimechanics.’’Proc., Conf. on Digital Image Processing: Techniqueand Applications in Civil Engineering, ASCE, New York, 125–134.
Bransby, P. L., and Milligan, G. W. E.~1975!. ‘‘Soil deformation nearcantilever sheet pile.’’Geotechnique,25~2!, 175–195.
Brinkgreve, R., and Vermeer, P.~1998!. Plaxis finite element code for soiland rock analysis: Plaxis manual version 7, Balkema, Rotterdam, TheNetherlands.
Butterfield, R., and Andrawes, K.~1971!. ‘‘The visualization of planerdisplacement field.’’Proc., Roscoe Memorial Symposium: StresStrain Behavior of Soils, R. Perry, ed., Cambridge University, Cambridge, U.K., 467–475.
Chu, T., Ranson, W., Sutton, M., and Peters, W.~1985!. ‘‘Application ofdigital image correlation techniques to experimental mechanics.’’Exp.Mech.,25~3!, 232–244.
Giachetti, A.~2000!. ‘‘Matching techniques to compute image motion.Image Vis. Comput.,18, 247–260.
96 / JOURNAL OF COMPUTING IN CIVIL ENGINEERING © ASCE / APRIL
t
.
-dtst
is
Gonzalez, R., and Woods, R.~1992!. Digital image processing, Addison-Wesley, Reading, Mass.
Guler, M., Edil, T., and Bosscher, P.~1999!. ‘‘Measurement of particlemovement in granular soils using image analysis.’’J. Comput. Civ.Eng.,13~2!, 116–122.
Gustafsson, L., and Gustafsson, P.~1996!. ‘‘Studying mixed granularflows by image analysis.’’Proc., 11th Conf. of the ASCE EngineerinMechanics Division, ASCE, Reston, Va., 100–103.
Iskander, M., Lai, J., Oswald, C., and Mannheimer, R.~1994!. ‘‘Devel-opment of a transparent material to model the geotechnical propeof soils.’’ ASTM Geotech. Test. J.,17~4!, 425–433.
Iskander, M., Liu, J., and Sadek, S.~2002a!. ‘‘Transparent amorphousilica to model clay.’’J. Geotech. Geoenviron. Eng.,128~3!, 262–273.
Iskander, M., Sadek, S., and Liu, J.~2002b!. ‘‘Optical measurement odeformation using transparent silica gel to model sand.’’Int. J. Phys.Model. Geotech.,4~2002!, 27–40.
Kirpatrick, W. M., and Belshaw, D. J.~1968!. ‘‘On interpretation of tri-axial test.’’Geotechnique,18~3!, 336–350.
Konagi, K. Rangelow, P., and Sato, T.~1994!. ‘‘Real-time observation ofdynamic changes in the fabric of granular material structures throlaser-aided tomography.’’Proc., 10th European Conf. on EarthquakEngineering, 459–466.
Konagai, K., Tamura, C., Rangelow, P., and Matsushima, T.~1992!.‘‘Laser-aided tomography: A tool for visualization of changes in tfabric of granular assemblage.’’Proc., JSCE Number 455 I-21, Strutural Engineering/Earthquake Engineering, Japan Society of CEngineers, Tokyo,9~3!, 193s–201s.
Liberzon, A., Gurka, R., and Shavit, U.~2000!. URAPIV Particle ImageVelocimetry Research Group, ^http://urapiv.tripod.com/&.
Mannheimer, R. J., and Oswald, C.~1993!. ‘‘Development of transparenporous media with permeabilities and porosities comparable to saquifers, and petroleum reservoirs.’’Ground Water,31~5!, 781–788.
Ng, T.-T., Kelley, M., and Sampson, J.~1996!. ‘‘MRI studies of directshear tests on round particles.’’Proc., 11th Conf. of ASCE, Engineeing Mechanics Div., ASCE, Reston, Va., 572–575.
Raschke, S., Hryciw, R., and Donohoe, G.~1996!. ‘‘Microdeformations insands by digital image processing and analysis.’’Transportation Re-search Record 1548, Transportation Research Board, WashingtD.C., 31–37.
Robinsky, E., and Morrison, C.~1964!. ‘‘Sand displacement and compation around model friction piles.’’Can. Geotech. J.,1~2!, 81–91.
Saada, A., Liang, L., Figueroa, J., and Cope, T.~1999!. ‘‘Bifurcationshear band propagation in sands.’’Geotechnique,49~3!, 367–385.
Sadek, S.~2002!. ‘‘Soil structure interaction in transparent synthetic sousing digital image correlation.’’ PhD thesis, Polytechnic UnBrooklyn, N.Y.
Sadek, S., Iskander, M., and Liu, J.~2002!. ‘‘Geotechnical properties otransparent silica.’’Can. Geotech. J.,39~1!, 111–124.
Shi, B., Murakami, Y., Wu, Z., Chen, J., and Inyang, H.~1999!. ‘‘Moni-toring of internal failure evolution in soils using computerizatix-ray tomography.’’Eng. Geol. (Amsterdam),54~3–4!, 321–328.
Sun, Z., Lyons, J., and McNeill, S.~1997!. ‘‘Measuring microscopic de-formations with digital image correlation.’’Opt. Lasers Eng.,27,409–428.
Sutton, M., Chung, M., Peters, W., Chao, Y., McNeill, S., and Helm~1983!. ‘‘Determination of displacements using an improved digicorrelation method.’’Image Vis. Comput.,1~3!, 133–139.
Tokumaru, P., and Dimotakis, P.~1995!. ‘‘Image correlation velocim-etry.’’ Experimental Fluid Mechanics,19, 1–15.
Westerweel, J., Dabiri, D., and Gharib, M.~1997!. ‘‘The effect of a dis-crete window offset on the accuracy of cross-correlation analysidigital PIV recordings.’’Exp. Fluids,23, 20–28.
Wong, R.~1999!. ‘‘Mobilized strength components of athabasca oil sain triaxial compression.’’Can. Geotech. J.,36~4!, 718–735.
Woods, R., Barnett, N., and Sagesser, R.~1974!. ‘‘Holography—a newtool for soil dynamics.’’J. Geotech. Eng.,100~11!, 1231–1247.
2003