
Similitudine, evidenza, fantasia: Apoll.Rh. Arg. 4, 1280-1289, SemRom VII (2), 2004, pp. 225-238
Upload
khangminh22Category
view
1download
0
Investigating in vitro anticancer properties
of Malaysian Rainforest plants:
Acalypha wilkesiana Müll, Arg.
Archidendron ellipticum (Blume) Hassk.
Duabanga grandiflora Walp.
Pseuduvaria macrophylla (Oliv.) Merr
Jessica Hoi-Yan Chu
BSc (Hons), MSc
Thesis submitted to the University of Nottingham for the degree of
Doctor of Philosophy
June 2013

I
Abstract
Malaysia is ranked the 12
th richest country for its biological diversity of plant
species by the Convention on Biological Diversity and this project aims to
contribute to existing knowledge of Malaysian rainforest plants, Acalypha
wilkesiana, Duabanga grandiflora, Archidendron ellipticum and Pseuduvaria
macrophylla, for the treatment of cancer.
A. wilkesiana (Euphorbiaceae) whole plant EtOH and EtOAc extracts inhibited
growth of breast cancer MDA-MB-468 cells (GI50: 22.7 and 15.9 μg/ml) and
revealed preference over non-transformed MRC5 fibroblasts (GI50: 46.6 and
53.3 μg/ml, respectively). EtOH and HEX extracts were able to impair cell
survival and colony-forming abilities in MDA-MB-468 cells after 24 h.
Detection of increased MDA-MB-468 sub-G1 cell populations after 48 h
treatment to EtOH and HEX extracts, suggest that cells may be undergoing
apoptosis.
A. ellipticum (Leguminosae) crude polar bark and leaf extracts inhibited MDA-
MB-468 cell growth (GI50 of bark EtOH, EtOAc extracts: 1.7 and 40.4 μg/ml,
respectively and leaf EtOH and EtOAc extracts: 9.3 and 9.3 μg/ml,
respectively). However, MDA-MB-468 cell growth was unaffected by HEX
extracts (> 200 μg/ml). Separation of crude extracts revealed sub-fractions of
greater activity, in particular a 50-fold enhanced potency in sub-fractions of
HEX extract thus overcoming masking or antagonistic activity in the crude
mixture. Following 24 h, bark and leaf extracts impaired MDA-MB-468 cells‟
proliferative and colony-forming abilities at 1X and 2X GI50 values suggesting
significant damage was induced leading to observed cellular senescence and
inhibition of cell proliferation. After 48 h exposure to EtOH and HEX extracts,
MDA-MB-468 cells accumulated cellular damage, possibly affecting
microtubule functions resulted in activation of apoptosis as shown by increased
of sub-G1 and G2/M MDA-MB-468 cell populations and presence of
phosphatidyl serine on the outer membrane of cells. Modest levels of
flavonoid and phenolic compounds were found in bark and leaf extracts, which
correlated to moderate level of free radical scavenging activity observed.

II
D. grandiflora (Lythraceae) bark and leaf extracts revealed growth inhibitory
effects against colorectal cancer HCT116 cells (GI50 of bark Water, EtOH,
EtOAc and HEX extracts: 42.4, 37.5, 21.69 and 28.9 μg/ml, respectively; leaf
Water, EtOH, EtOAc and HEX extracts GI50: 38.0, 40.9, 24.7 and > 200 μg/ml,
respectively). Separation of crude bark extracts resulted in fractions of greater
activity, whereas separation of leaf extracts revealed reduced activity
suggesting synergistic activity in the mixture. Following 24 h, bark and leaf
extracts impaired HCT116 cells‟ proliferative and colony-forming abilities at
1X and 2X GI50 values indicating significant damage incurred leading to
observed cellular senescence and cell proliferation inhibition. After 48 h
exposure to D. grandiflora extracts, increased sub-G1 HCT116 cell population
and a G1/0 cell cycle block accompanied by decreased S and G2/M cell
populations were measured. Detection of phosphatidyl serine on cells‟ outer
membrane and activated apoptotic caspase 3 protein confirmed D. grandiflora
extracts induced apoptosis. Highest levels of flavonoid and phenolic
compounds were found in polar bark and leaf D. grandiflora extracts, which
may correlate to the highest free radical scavenging activity measured.
P. macrophylla (Annonaceae) extracts collectively displayed greatest HCT116
cell growth inhibition (EtOH, EtOAc and HEX extracts GI50: 5.2, 1.6 and 5.4
μg/ml) and separation of EtOH and EtOAc extracts revealed even greater
activity in sub-fractions. After 24 h, polar extracts at 2X GI50 completely
impaired HCT116 cells‟ proliferative and colony-forming abilities suggesting
extract-induced significant damage led to inability of cells to proliferate.
Analysis of cell cycle distribution revealed increased sub-G1 HCT116 cell
population and high levels of early apoptotic HCT116 cells following 48 h
exposure to P. macrophylla extracts coupled with detection of caspase 3
activation confirming execution of apoptosis. Modest levels of flavonoid and
phenolic compounds were detected in EtOH, EtOAc and HEX extracts, which
correlated to modest free radical scavenging activity.
The findings in this project should justify further separation and in vitro
investigations.

III
Acknowledgement
First of all, I would like to express my sincere gratitude to Dr. Tracey
Bradshaw, a super mentor and great friend who I have shared with much
laughter and little tears. I am grateful for her encouragement, enthusiasm and
wisdom throughout my postgraduate studies. My gratitude also extends to Dr.
Charles Laughton for his support and guidance, Dr. Lodewijk Dekker for
sharing his honest thoughts and advice, and Prof. Neil Thomas for his
recommendation. I am also thankful to the University of Nottingham for
funding this project.
An enormous thank-you to Dr Ashraf Abdalla for his generosity with his time
and sharing his research experience with me. I am also very grateful for the
assistance and expertise of Dr. Charlie Matthews (in exchange for at least 3
dumplings) and Dr. Christophe Fromont for his support and offering of
analytical equipment. I would like to thank Dr. Jaroslav Havlik and his
colleagues at the Department of Microbiology, Czech University of Life Sciences
for their expertise in antimicrobial assays. Another thank-you to UNMC
Pharmacy and Bioscience colleagues for the collection of the Malaysian
rainforest plant materials and the friendship of SuWen Lim (my UNMC-
double). I would also like to also thank Dr. Jim (Anthony) Wilson from Chris
Moody‟s group, for trusting me with their equipment. The PhDs that I have
had the pleasure to work with includes Jihong Zhang, Sarentha Chetty,
Xiangrui Liu, Hannah Scott, Lyn Warner and William Drewe. This project
was supported by our technical staff, Graeme Parry, Lee Hibbert, Garry Clarke
and Irene. Also, must not forget tea break therapy sessions with my regular tea
buddies Arpan, Paul and Abi, lab-talks with Tiangong, my housemates Emma
and Yads and my dearest (old) friend Myna for providing suitable distractions.
A big thank-you to my uncle Philip Li for his time and feedback, as always.
I am really thankful for patience and support from Dr. Gavin Hackett who had
to endure my „princess syndrome‟ during my writing-up period. I am
extremely lucky to have the support and love from my family, who made this
possible, so I would like to dedicate this thesis to my uncles Michael, Sam and
Tak, my aunties Katie, Rosanna and May, my cousins Terry and Tommy, my
grandparents Kwai Tim and Lee and my mother Candy.

IV
Abbreviations
ADME Adsorption, distribution, metabolism and excretion
B Biological drug
Calcein-AM Calcein acetoxymethylester
CDK Cyclin-dependent kinase
CAM Complementary and alternative medicine
CML Chronic myeloid leukemia
COX Cyclooxygenases
CRC Colorectal cancer
DAPI 4‟,6-diamidino-2-phenylindole
DNP Dictionary of Natural Products
DOS Diversity Orientated Synthesis
DTP Developmental Therapeutics Program
ECM Extracellular matrix
EGCG Epigallocatechin-3-gallate
EMT Epithelial-mesenchymal transition
ER Oestrogen receptor
FADD Fas-Associated protein with Death Domain
FC Folin-Ciocalteau
FDA US Food and Drug Administration
GA Gallic acid
GAE Gallic acid equivalent
GC Gas chromatography
GI50 50% Growth inhibition concentration
GR Glucocorticoid receptors
G6PD Glucose-6-phosphate dehydrogenase
HPLC High performance liquid chromatography
HPV Human papillomavirus
HSV Herpes simplex virus
HTS High-throughput screening
IF Interferon
IL Interleukin

V
IP Intellectual property
KCM Korean Chinese Medicine
LDH Lactate dehydrogenase
MAPK Mitogen-activated protein kinase
MIC Minimum Inhibitory concentration
MMP Metalloproteinase
MS Mass Spectroscopy
MTT 3-(4,5-dimethylthiazol-2-yl)-2,5-diphenyltetrazolium
bromide
NBI National Biodiversity Index
NCDDG National Cooperative Drug Discovery Group
NCE New chemical entity
NCI National Cancer Institute
ND Natural product derivative
NF–B Nuclear factor–B
NF-1 Neurofibromatosis type I
NHF Normal human fibroblast
NM Natural product mimic
NMR Nuclear Magnetic Resonance
NP Natural product
NPDD Natural product drug discovery and development
NSCLC Non-small cell lung cancer
PARP Poly(ADP-ribose) polymerase
PI Propidium iodide
P13K Phosphatidylinositol-3-kinase
PR Progesterone receptor
PS Phosphatidylserine
PTEN Phosphatase and tensin homolog
QE Quercetin equivalent
Rb Retinoblastoma
ROI Reactive oxygen intermediates
ROS Reactive oxygen species
RO5 Rule-of-five
S Synthetic drug

VI
S* Synthetic drug with a natural product pharmacophore
SAR Structure-activity relationship
SRB Sulforhodamine B
TCM Traditional Chinese Medicine
TM Traditional Medicine
TNF-α Tumour necrosis factor α
TPSA Topological polar surface area
TSG Tumour suppressor gene
TSP Tumour suppressor protein
tR Retention time
T0 Initial treatment time (0 hour)
UNMC University of Nottingham, Malaysia Campus
UNMC 9 Acalypha wilkesiana
UNMC 20 Pseuduvaria macrophylla
UNMC 35 Archidendron ellipticum
UNMC 37 Duabanga grandiflora
UV Ultraviolet
V Vaccine
VEGF Vascular endothelial growth factor
WCMC World Conservation Monitoring Centre
WDI Derwent World Drug Index
WHO World Health Organisation
XTT 2,3-bis-(2-methoxy-4-nitro-5-sulfophenyl)-2H-
tetrazolium-5-carboxanilide
VII
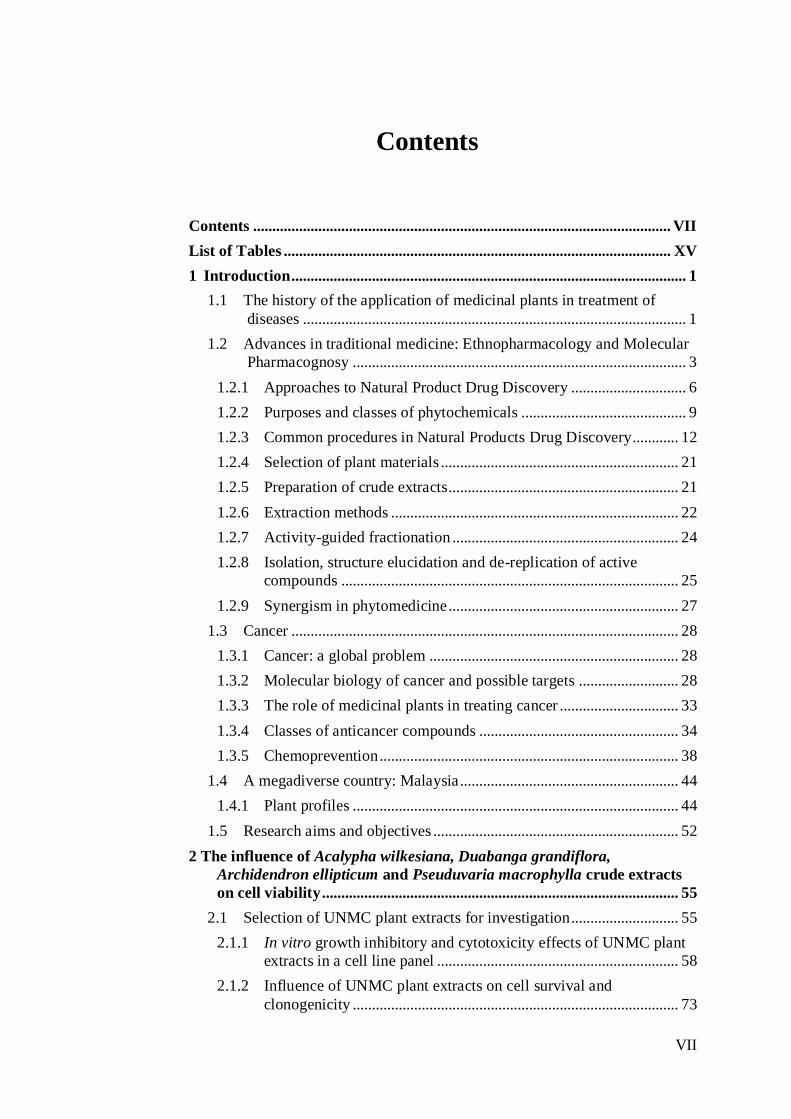
Contents
Contents ............................................................................................................. VII
List of Tables ..................................................................................................... XV
1 Introduction ....................................................................................................... 1
1.1 The history of the application of medicinal plants in treatment of
diseases .................................................................................................... 1
1.2 Advances in traditional medicine: Ethnopharmacology and Molecular
Pharmacognosy ....................................................................................... 3
1.2.1 Approaches to Natural Product Drug Discovery .............................. 6
1.2.2 Purposes and classes of phytochemicals ........................................... 9
1.2.3 Common procedures in Natural Products Drug Discovery ............ 12
1.2.4 Selection of plant materials .............................................................. 21
1.2.5 Preparation of crude extracts ............................................................ 21
1.2.6 Extraction methods ........................................................................... 22
1.2.7 Activity-guided fractionation ........................................................... 24
1.2.8 Isolation, structure elucidation and de-replication of active
compounds ........................................................................................ 25
1.2.9 Synergism in phytomedicine ............................................................ 27
1.3 Cancer ..................................................................................................... 28
1.3.1 Cancer: a global problem ................................................................. 28
1.3.2 Molecular biology of cancer and possible targets .......................... 28
1.3.3 The role of medicinal plants in treating cancer ............................... 33
1.3.4 Classes of anticancer compounds .................................................... 34
1.3.5 Chemoprevention .............................................................................. 38
1.4 A megadiverse country: Malaysia ......................................................... 44
1.4.1 Plant profiles ..................................................................................... 44
1.5 Research aims and objectives ................................................................ 52
2 The influence of Acalypha wilkesiana, Duabanga grandiflora,
Archidendron ellipticum and Pseuduvaria macrophylla crude extracts
on cell viability ............................................................................................. 55
2.1 Selection of UNMC plant extracts for investigation ............................ 55
2.1.1 In vitro growth inhibitory and cytotoxicity effects of UNMC plant
extracts in a cell line panel ............................................................... 58
2.1.2 Influence of UNMC plant extracts on cell survival and
clonogenicity ..................................................................................... 73

VIII
2.1.3 Influence of Acalypha wilkesiana extracts on MDA-MB-468 cells‟
survival and clonogenicity ............................................................... 73
2.1.4 Influence of Archichendron ellipticum extracts to MDA-MB-468
cells‟ survival and clonogenicity ..................................................... 74
2.1.5 Influence of Duabanga grandiflora extracts on HCT116 cells‟
survival and clonogenicity ............................................................... 76
2.1.6 Influence of Pseuduvaria macrophylla extracts to HCT116 cells‟
survival and clonogenicity ............................................................... 77
3 The influence of UNMC crude extracts on cell cycle and apoptosis
induction ....................................................................................................... 82
3.1 UNMC plant extracts effects‟ on cell cycle distribution ..................... 83
3.1.1 Acalypha wilkesiana extracts‟ effects on MDA-MB-468 cell cycle
distribution ........................................................................................ 83
3.1.2 Archidendron ellipticum extracts‟ effects on MDA-MB-468 cell
cycle distribution ............................................................................... 87
3.1.3 Duabanga grandiflora extracts‟ effects on HCT116 cell cycle
distribution ........................................................................................ 91
3.1.4 Pseuduvaria macrophylla extracts‟ effects on HCT116 cell cycle
distribution ........................................................................................ 95
3.1.5 Summary of cell cycle analysis after exposure to UNMC extracts 98
3.2 Detection of apoptotic cells after exposure to UNMC plant extracts 101
3.2.1 Time-dependent apoptosis induction in MDA-MB-468 cells after
exposure to Archidendron ellipticum extracts .............................. 101
3.2.2 Time-dependent apoptosis induction in HCT116 cells after
exposure to Duabanga grandiflora extracts ................................. 105
3.2.3 Time-dependent apoptosis induction in HCT116 cells after
exposure to Pseuduvaria macrophylla extract .............................. 108
3.3 Identification of caspase 3 and Mcl-1 protein expressions................ 110
3.3.1 Effect of Duabanga grandiflora and Pseuduvaria macrophylla
extracts on protein expression ........................................................ 110
3.4 Summary of studies to investigate UNMC extract-induced apoptosis
.............................................................................................................. 112
4 Effects of UNMC plant extracts on cell migration ................................ 116
4.1 Effects of UNMC plant extracts on cell migration ............................ 116
4.1.1 Effect of Archidendron ellipticum extracts on HCT116 cell
migration ......................................................................................... 117
4.1.2 Effect of Duabanga grandiflora extracts on cell migration......... 119
4.1.3 Effect of Pseuduvaria macrophylla extracts on HCT116 cell
migration ......................................................................................... 121
4.1.4 Summary of migration inhibition properties of UNMC extracts . 122
4.2 Effect of UNMC plant extracts on cellular senescence ..................... 124

IX
4.2.1 Effect of Archidendron ellipticum extracts on cellular
senescence………. .......................................................................... 125
4.2.2 Effect of Duabanga grandiflora extracts on cellular senescence 128
4.2.3 Effect of Pseuduvaria macrophylla extracts on cellular
senescence………. .......................................................................... 130
4.2.4 Summary of migration inhibition properties of UNMC extracts . 132
5 Chemical content and fractionation of Pseuduvaria macrophylla,
Archidendron ellipticum and Duabanga grandiflora crude extracts .. 134
5.1 Chemical content and free radical scavenging ability of UNMC crude
extracts ................................................................................................. 134
5.1.1 Flavonoid and Phenolic content and free radical scavenging
activity of Archidendron ellipticum extracts ................................. 136
5.1.2 Flavonoid and Phenolic content and free radical scavenging
activity of Duabanga grandiflora extracts .................................... 138
5.1.3 Chemical content and free radical scavenging ability of
Pseuduvaria macrophylla extracts................................................. 140
5.1.4 Summary of chemical contents and free radical scavenging activity
in UNMC extracts ........................................................................... 143
5.2 Chromotography of UNMC crude extracts and effects of fractions on
cell growth ........................................................................................... 145
5.2.1 Chromotography of Archidendron ellipticum crude extracts and in
vitro growth inhibitory properties of fractions in MDA-MB-468
cells .................................................................................................. 145
5.2.2 Chromotography of Duabanga grandiflora crude extracts and in
vitro growth inhibitory properties of fractions in HCT116 cells . 157
5.2.3 Chromotography of Pseuduvaria macrophylla crude extracts and in
vitro growth inhibitory properties of fractions in HCT116 cells . 166
6 Conclusion and future direction ................................................................ 172
7 Materials and Methods ................................................................................ 184
7.1 Materials ............................................................................................... 184
7.1.1 Plant collection and identification ................................................. 184
7.1.2 Mammalian cell lines...................................................................... 184
7.1.3 Bacterial strains ............................................................................... 184
7.1.4 Antibodies ....................................................................................... 187
7.1.5 Chemicals and reagents .................................................................. 187
7.1.6 Equipment and Software ................................................................ 189
7.2 Methods ................................................................................................ 189
7.2.1 Extraction of UNMC plants ........................................................... 189
7.2.2 General cell culture and maintenance ............................................ 190
7.2.3 MTT (in vitro cell viability) assay ................................................. 191

X
7.2.4 Clonogenic assay (in vitro cell sensitivity assay) ......................... 193
7.2.5 Flow cytometric techniques ........................................................... 194
7.2.6 Western blot procedures ................................................................. 197
7.2.7 Senescence assay (β-galactosidase staining)............................... 201
7.2.8 Cell migration assay (Wound healing) .......................................... 202
7.3 Phytochemical composition of plant extracts ..................................... 203
7.3.1 Total flavonoid content................................................................... 203
7.3.2 Total phenolic content .................................................................... 204
7.4 In vitro free radical scavenging assay ................................................. 205
7.5 Broth microdilution method (anti-microbial assay) ........................... 206
7.6 Fractionation and analysis of UNMC extract fractions using High
Performance Liquid Chromatography (HPLC) ................................. 207
7.7 Statistical Analysis ................................................................................... 5
References .......................................................................................................... 209
Appendices ......................................................................................................... 220
Appendix I ......................................................................................................... 220
Appendix II ........................................................................................................ 237
Appendix III ...................................................................................................... 239
Appendix IV ...................................................................................................... 255
IV-1 Antimicrobial activity of UNMC crude extracts ................................ 255
IV-2 Antimicrobial activity of Duabanga grandiflora crude extracts ....... 256
IV-C Antimicrobial activity of Pseuduvaria macrophylla crude extracts . 258
Appendix V ........................................................................................................ 259
V-1 In vitro growth inhibitory and cytotoxicity effects of Uvaria
macrophylla extracts in a cell line panel ........................................... 259
V-2 Influence of Uvaria macrophylla extracts on MCF-7 and HCT116 cells‟
survival and clonogenicity .................................................................. 260
V-3 Uvaria macrophylla extracts effects on HCT116 cell cycle distribution
.............................................................................................................. 262

XI
List of Figures
Figure 1-1: Explanatory model for molecular pharmacognosy.......................... 4
Figure 1-2: The chemical structure of acetylsalicylic acid (1). .......................... 5
Figure 1-3: The chemical structures of chloroquine (2) and cryptolepine (3). . 5
Figure 1-4: The common chemical structures of Shikimic acid (4)................. 10
Figure 1-5: The chemical structure of the acetate group (5). ........................... 11
Figure 1-6: Depiction of Hanahan and Weinberg‟s hallmarks of cancer
illustration.......................................................................................... 29
Figure 1-7: The chemical structure of vinblastine (7) and vincristine (8). ...... 34
Figure 1-8: The chemical structure of taxol (9) and docetaxel (10). ............... 35
Figure 1-9: The chemical structure of podophyllotoxin (11), etoposide (12)
and teniposide (13). .......................................................................... 35
Figure 1-10: The chemical structure of camptothecin (14), topotecan (15) and
irinotecan (16). .................................................................................. 36
Figure 1-11: A simple representation of the cell cycle phrases, G1, S, G2, M,
and the corresponding anticancer compounds that targets those
specific phases................................................................................... 37
Figure 1-12: The chemical structure of the cyclin-dependent kinase inhibitor,
flavopiridol (17) ................................................................................ 37
Figure 1-13: Diagram displaying some relevant targets for anti-cancer activity
and examples of phytochemicals which interact with these targets
............................................................................................................ 38
Figure 1-14: A flow chart listing some sub-families of phytochemicals:
carotenoids, phenolics, alkaloids, nitrogen-containing compounds
and organosulphur compounds ........................................................ 40
Figure 1-15: The chemical structures of carotenoids such as -carotene (18),
β-carotene (19), β -cryptoxanthin (20), lutein (21), zeaxanthin
(22), astaxanthin (23) and lycopene (24)......................................... 41
Figure 1-16: The chemical structures of phenolic acids such as caffeic acid
(25), ferulic acid (26), sinapic acid (27), syringic acid (28),
protocatechuic acid (29), 3,4-dihydroxyphenylacetic acid (30). ... 42
Figure 1-17: The chemical structures of flavonoids such as flavonols (31),
flavones (32), flavanols (catechins) (33), flavanones (34),
anthocyanidins (35) and isoflavonoids (36) .................................... 43
Figure 1-18: The chemical structure of eugeniin (37). ..................................... 49
Figure 1-19: The chemical structures of 1,2,3-trimethoxy-4,5-dioxo-6a,7-
dehydroaporphine (38) and O-methylmoschatoline (39). .............. 51
Figure 2-1: NCI-style mean fingerprint graphs for A. wilkesiana extracts...... 60
Figure 2-2: NCI-style mean fingerprint graphs for A. ellipticum extracts. ...... 63
Figure 2-3: NCI-style mean fingerprint graphs for D. grandiflora extracts.. .. 66
Figure 2-4: NCI-style mean fingerprint graphs for P. macrophylla extracts. . 68

XII
Figure 2-5: Effects of A. wilkesiana extracts to MDA-MB-468 cells‟ survival
and clonogenicity. ............................................................................. 74
Figure 2-6: Effects of A. ellipticum extracts on MDA-MB-468 cells‟ survival
and clonogenicity. ............................................................................. 75
Figure 2-7: Effects of D. grandiflora extracts to HCT116 cells‟ survival and
clonogenicity ..................................................................................... 77
Figure 2-8: Effects of P. macrophylla extracts on HCT116 cells‟ survival and
clonogenicity.. ................................................................................... 78
Figure 3-1: MDA-MB-468 cell cycle distributions after 48-hour exposure to A.
wilkesiana extracts. ........................................................................... 85
Figure 3-2: Detection of PI staining of MDA-MB-468 cellular DNA content
after exposure to A. wilkesiana extracts .......................................... 86
Figure 3-3: MDA-MB-468 cell cycle distributions after 48-hour exposure to A.
ellipticum extracts. ............................................................................ 89
Figure 3-4: Detection of PI staining of MDA-MB-468 cellular DNA content
after exposure to A. ellipticum extracts. .......................................... 90
Figure 3-5: HCT116 cell cycle distributions after 48-hour exposure to D.
grandiflora extracts.. ........................................................................ 93
Figure 3-6: Detection of PI staining of HCT116 cellular DNA content after
exposure to D. grandiflora extracts. ................................................ 94
Figure 3-7: HCT116 cell cycle distributions after 48-hour exposure to P.
macrophylla extracts......................................................................... 96
Figure 3-8: Detection of PI staining of HCT116 cellular DNA content after
exposure to P. macrophylla extracts ................................................ 97
Figure 3-9: Phosphatidylserine detection in MDA-MB-468 cells after
exposure to A. ellipticum bark (top) and leaf (bottom) extracts. . 103
Figure 3-10: Apoptosis induced in HCT116 cells by A. ellipitcum extracts
after 24 and 48 hour exposure. Cells were exposed to 4X GI50
concentrations of bark (A) and leaf (B) extracts. .......................... 104
Figure 3-11: Detection of apoptotic populations of HCT116 cells after
exposure to D. grandiflora bark (top) and leaf (bottom) extracts 106
Figure 3-12: Apoptosis induced in HCT116 cells by D. grandiflora extracts
after 24 and 48 hour exposure.. ...................................................... 107
Figure 3-13: Phosphatidylserine detection in HCT116 cells after exposure to P.
macrophylla extracts ....................................................................... 108
Figure 3-14: Apoptosis induced in HCT116 cells by P. macrophylla extracts
after 24 and 48 hour exposure. ....................................................... 109
Figure 3-15: Caspase 3 protein expressions after 48-hour exposure to D.
grandiflora and P. macrophylla extracts....................................... 111
Figure 3-16: Mcl-1 protein expressions after 48-hour exposure to D.
grandiflora and P. macrophylla extracts. ...................................... 112
Figure 4-1: Inhibitory effect of A. ellipitcum bark and leaf extracts on MDA-
MB-468 wound healing (%) over a 64 h period.. ......................... 118

XIII
Figure 4-2: Inhibitory effect of D. grandiflora bark extracts on HCT116
wound healing (%) over a 56 h period. ......................................... 120
Figure 4-3: Inhibitory effect of P. macrophylla extracts on HCT116 wound
healing (%) over a 56 hour period. ................................................ 121
Figure 4-4: Images of β-galactosidase positive (senescent) HCT116 cells..
.......................................................................................................... 124
Figure 4-5: MDA-MB-468 cells undergoing senescence after exposure to A.
ellipticum extracts.)......................................................................... 125
Figure 4-6: Images of β-galactosidase positive (senescent) MDA-MB-468
cells. ................................................................................................. 127
Figure 4-7: HCT116 cells (%) undergoing senescence after exposure to D.
grandiflora extracts. ....................................................................... 129
Figure 4-8: Images of β-galactosidase positive (senescent) HCT116 cells..
.......................................................................................................... 129
Figure 4-9: HCT116 cells undergoing senescence after exposure to P.
macrophylla extracts....................................................................... 131
Figure 4-10: Images of β-galactosidase positive (senescent) HCT116 cells.
.......................................................................................................... 131
Figure 5-1: HPLC traces of A. ellipticum crude bark extracts using Reversed
Phase chromatography.................................................................... 148
Figure 5-2: HPLC traces of A. ellipticum crude leaf extracts using Reversed
Phase chromatography.................................................................... 149
Figure 5-3: HPLC traces of A. ellipticum bark extract „active‟ fractions using
Reversed Phase chromatography. .................................................. 150
Figure 5-4: HPLC traces of A. ellipticum leaf extract „active‟ fractions using
Reversed Phase chromatography.. ................................................. 151
Figure 5-5: HPLC traces of A. ellipticum leaf extract „active‟ fractions using
Reversed Phase chromatography. .................................................. 152
Figure 5-6: HPLC traces of A. ellipticum leaf extract „active‟ fractions using
Reversed Phase chromatography. .................................................. 153
Figure 5-7: The chemical structure of elliptoside (40) isolated from
Archidendron ellipticum. ................................................................ 155
Figure 5-8: NCI-60 mean fingerprint graphs for an elliptoside extracted from
A. ellipticum (synonym Archidendron ellipticum) leaf extracts
adapted from GI50 values (log10) published by Beutler et al. (1997)..
.......................................................................................................... 156
Figure 5-9: HPLC traces of D. grandiflora crude bark extracts using Reversed
Phase chromatography.................................................................... 161
Figure 5-10: HPLC traces of D. grandiflora crude leaf extracts using Reversed
Phase chromatography.................................................................... 162
Figure 5-11: HPLC traces of D. grandiflora bark extract „active‟ fractions
using Reversed Phase chromatography.. ....................................... 163

XIV
Figure 5-12: HPLC traces of D. grandiflora bark extract „active‟ fractions
using Reversed Phase chromatography. ........................................ 164
Figure 5-13: HPLC traces of D. grandiflora bark extract „active‟ fractions
using Reversed Phase chromatography.. ....................................... 165
Figure 5-14: HPLC traces of P. macrophylla extracts using Reversed Phase
chromatography. ............................................................................. 168
Figure 5-15: HPLC traces of P. macrophylla extract fractions using Reversed
Phase chromatography.................................................................... 169
Figure 5-16: HPLC traces of P. macrophylla extract fractions using Reversed
Phase chromatography.................................................................... 170
Figure 5-17: HPLC traces of P. macrophylla extract fractions using Reversed
Phase chromatography.................................................................... 171
Figure 6-1: The downstream signaling pathways of TNF-α as illustrated by
Wu and Zhou (2010)....................................................................... 180
Figure 7-1: An example of flow cytometry diagram of double-staining with
Annexin V-FITC and Propidium iodide…………………….…..196

XV
List of Tables
Table 1-1: Lipinski‟s Rule of Five (RO5) criteria for predicting orally active
compounds.38
....................................................................................... 7
Table 1-2: Physicochemical properties of medicinally useful natural
products.34
............................................................................................ 8
Table 1-3: A list of drugs derived from plants with their corresponding uses
and source discovered between the years 1981 and 2010. ............. 13
Table 1-4: Polarity of solvent molecules used for UNMC extraction process. 22
Table 1-5: Common methods employed for extracting chemicals from crude
plant extracts. .................................................................................... 23
Table 2-1: Mammalian cell lines used for primary selection. .......................... 56
Table 2-2: In vitro growth inhibitory effects of A. wilkesiana extracts in a cell
line panel revealed by the MTT assay. ............................................ 59
Table 2-3: In vitro growth inhibitory effects of A. ellipticum extracts in a cell
line panel revealed by the MTT assay. ............................................ 62
Table 2-4: In vitro growth inhibitory effects of D. grandiflora extracts in a cell
line panel revealed by the MTT assay. ............................................ 65
Table 2-5: In vitro growth inhibitory effects of P. macrophylla extracts in a
cell line panel revealed by the MTT assay. ..................................... 67
Table 3-1: Cell cycle distribution of MDA-MB-468 cells after exposure to A.
wilkesiana extracts. ........................................................................... 84
Table 3-2: Cell cycle distribution of MDA-MB-468 cells after exposure to A.
ellipticum extracts ............................................................................. 88
Table 3-3: Cell cycle distribution of HCT116 cells after exposure to D.
grandiflora extracts. ......................................................................... 92
Table 3-4: Cell cycle distribution of HCT116 cells after exposure to P.
macrophylla extracts ......................................................................... 95
Table 5-1: Flavonoid content in Archidendron ellipticum extracts ................ 136
Table 5-2: Free radical scavenging ability of Archidendron ellipticum extracts.
.......................................................................................................... 137
Table 5-4: Free radical scavenging ability of Duabanga grandiflora extracts
.......................................................................................................... 139
Table 5-5: Flavonoid content in Pseuduvaria macrophylla extracts ............. 141
Table 5-6: Free radical scavenging ability of Pseuduvaria macrophylla
extracts ............................................................................................. 142
Table 5-7: Retention time and colour of Archidendron ellipticum extracts
dominant peaks using reversed phase chromatography. .............. 146
Table 5-8: In vitro growth inhibition effect of Archidendron ellipticum extracts
fractions in MDA-MB-468 cells. ................................................... 147
Table 5-9: Retention time and the colour of Duabanga grandiflora extracts
dominant peaks using reversed phase chromatography. .............. 158

XVI
Table 5-10: In vitro growth inhibitory effects of Duabanga grandiflora extract
fractions in a HCT116 cells revealed by the MTT assay. ............ 159
Table 5-11: Retention time of Pseuduvaria macrophylla extracts dominant
peaks using reversed phase chromatography. ............................... 166
Table 6-1: Summary table outlining each activity performed ........................ 173
Table 7-1: UNMC Plant name and reference number, place of collection and
UNMC plant extraction solvents. .................................................. 185
Table 7-2: Mammalian cell lines and maintenance conditions ...................... 186
Table 7-3: Receipe for Sodium dodecyl sulphate polyacrylamide gel
electrophoresis (SDS-PAGE) gel................................................... 199
Table 7-4 Primary and secondary antibodies used for western blotting. ....... 200
Table 7-5: Solvent gradient used in crude extract separation. ........................ 208

1
1
Introduction
1.1 The history of the application of medicinal plants in
treatment of diseases
Prehistoric evidence has revealed mankind‟s application of natural products to
treat various symptoms as well as benign and malignant diseases.1-3
Ancient
accounts, dated approximately 2,600 BC, originating from the Sumerians and
Akkaidians describe uses for approximately 1,000 plants and their derived
substances such as oil, resin and juice.3, 4
Our ancestors chewed on particular
herbs to relieve pain, used plants as tinctures or dressings to heal wounds and
also used plants as poisons.3-5
Several surviving ancient recipes of plant-based
treatment of diseases are still in use, for example the Egyptian Ebers Papyrus
dated around 1550 to 2900 B.C, which includes over 700 drugs and 800
formulae consisting of plants, animal organs and some minerals. The Chinese
Materia Medica dated from circa 1100 B.C describes the use of over 600
plants in treating diseases.6, 7
Natural products used traditionally for treatment
could incorporate entire or parts of organisms such as plants (flower, stems or
roots), animal products (glands or organs), microorganisms or inorganic salts
without extensive processing.5, 8
The selection and application of natural
products for human well-being have prospered and evolved over the centuries
through a process of trial and error.9 Indigenous knowledge and practices (or
systems) are passed down generations worldwide for example, Traditional
Chinese Medicine (TCM; China), Japanese Chinese Medicine or Kampo
(Japan), Korean Chinese Medicine (KCM; Korea), Jamu (Indonesia),
Ayurvedic Medicine (India), and more recently Phytotherapy (Europe).2 The
World Health Organisation (WHO) defines traditional medicine (TM) as
indigenous practice, which “incorporates plant, animal, and/or mineral based

2
medicines, spiritual therapies, manual techniques and exercises applied
singularly or in combination to maintain well-being, as well as to treat,
diagnose or prevent illness”.8 TM is also known as „complementary and
alternative‟ (CAM) or „non-conventional‟ medicine in countries where TM is
not a part of the country‟s national health care system.10, 11
At present, an
estimated 80% of the world‟s population, primarily in undeveloped countries,
is reported to use TM as their primary healthcare.8 Whereas the other 20% of
the world‟s population, primarily in developed countries, is being prescribed
drugs that are derived directly from natural products or designed from semi-
synthetic natural product pharmacophores.12
Since there is an extended record
of using natural products for human consumption and treatment of diseases, it
deems rational to investigate plant materials as a source for biologically active
therapeutic compounds.13
Nevertheless, mankind‟s desire to pursue a better life-style has led to increased
commercial pressure for habitable areas, food sources and employment (e.g.
farming). As a result, there is an ever-growing concern over the effect of the
deforestation and industrialisation of the planet on the natural habitat of
wildlife and plant species. The decline and potential extinction of species
could result in the loss of interesting novel therapeutic compounds as well as
the gradual loss of indigenous traditions and ethnobotanical knowledge.14, 15
Therefore the race to identify useful natural compounds could ease commercial
pressures and preserve natural habitats if governments and authority bodies
enforce stricter regulations on deforestation.

3
1.2 Advances in traditional medicine: Ethnopharmacology and
Molecular Pharmacognosy
Herbal remedy recipes are rich sources of phytochemicals (the term „phyto-‟ is
derived from the Greek word for plant) and thus provide guidance for potential
drug-leads.16, 17
The observation of natural products‟ use by indigenous groups
accompanied by the scientific investigation of herbal recipes to identify active
phytochemicals is an area of drug research termed ethnopharmacology.3
Ethnopharmacology is enhanced by multicultural exposure and global
communication enabling methodological collection and validation of medicinal
valuable ethnobotanical evidence.18
In the 18th
century when medicines were
mainly limited to natural products, Johann Adam Schmidt (1759–1809)
adopted the term „pharmacognosy‟ to incorporate the area of drug knowledge
and „ethnobotanic medicine‟.3, 11, 14
Consequently, pharmacognosy has
advanced to incorporating various disciplines such as ethnobotany,
phytochemistry, biochemistry, organic chemistry, taxonomy and pharmacology.
Each discipline contributes to the accurate identification of plant species (plant
selection), extraction of plant materials, verification of biological activity and
the isolation and structure elucidation of novel active compounds or of already
known active compounds by validating on compound databases (de-
replication); this is termed „molecular pharmacognosy‟, which “explores
naturally occurring structure-activity relationships (SAR) with a drug potential”
to increase chances of finding new structures, biological activity and targets
(Figure 1-1).19

4
Figure 1-1: Explanatory model for molecular pharmacognosy.
At the beginning of the 19th
century, approximately 80% of all medicines were
derived from different plant sections e.g. root, leaf and/or bark.20
For instance,
Solanum dulcamara bark extract is used in TCM for its analgesic properties to
relieve pain.21
By the late 19th
century, aspirin (or acetylsalicylic acid) (1),
from the bark of Salix alba was developed. Aspirin is the first synthetic
pharmaceutical drug for the relief of minor pains, which highlights the
significance of nature in drug development.5, 22, 23
Upon tissue damage,
algogenic chemicals such as prostaglandins are released to cause hyperalgesia,
and aspirin acts to inhibit the biosynthesis of such molecules.23-25
Later,
morphine was isolated from opium poppy, Papaver somniferum, and the search
and isolation for new drug leads continues today with approximately 75% of
drugs for infectious and parasitic diseases consisting of natural products or
natural product derivatives.11, 20

5
Figure 1-2: The chemical structure of acetylsalicylic acid (1).
Between 1981 and 2002, 52% of the 868 new chemical entities (NCEs) were
natural products, natural product derivatives or compounds containing a
pharmacophore from natural products.26
In 2004, 70 natural product-related
compounds were in clinical trials.5 Recently, approved drugs based on natural
products include artemether (isolated from Artemisia annua L. (Asteraceae)
used in TCM), galantamine (isolated from Galanthus woronowii Losinsk
(Amaryllidaceae)), calanolide A (isolated from Calophyllum lanigerum var.
austrocoriaceum (Whitmore) (Clusiaceae)) and nitisinone (modified from
mesotrione, from Callistemon citrinus Stapf. (Myrtaceae)), which are available
in the United States (U.S.) for indications such as malaria, Alzheimer‟s,
HIV/AIDS and tyrosinaemia, respectively.11
Patients commonly acquire
resistance to their treatment e.g. malaria patients develop resistance to
chloroquine (2) over prolonged use, therefore drug development is a continual
process to ensure new leads such as cryptolepine (3), an alkaloid from the
African Cryptolepis sanguiolenta, with an alternative mechanism of action will
be available as another treatment option.27
Figure 1-3: The chemical structures of chloroquine (2) and cryptolepine (3).

6
Fabricant and Farnsworth (2001) outlined several key objectives of
investigating plants for therapeutic compounds, including the use of isolated
bioactive compounds as direct drugs, structural templates for semisynthesis,
pharmacologic tools and/or using the crude plant as a herbal remedy.14, 28
The
number of unexplored higher plant species, angiosperms and gymnosperms, in
the world is estimated between 215,000 to 500,000.2, 29
Of these, only 6% have
been screened for their biological activity and < 20% have been subjected to
laboratory investigation for potential therapeutic use.13, 30
Sneader (2005)
suggested that < 3,200 (1%) plant species are used in TM, highlighting that
there are many unexplored areas in drug discovery from plant species.2
Interestingly, Farnsworth et al. (1985) identified that of the 122 active
compounds found in 94 different ethnomedicinal plant species, 80% of the
active compounds have been used to treat identical or related indications to
their ethnomedicinal use. Consequently, attesting extracts‟ traditional
application could provide direction and selection of more specific assays for
the plant species.28
1.2.1 Approaches to Natural Product Drug Discovery
Many different approaches are available to identify biologically active
phytochemicals. Random collection and screening of phytochemicals is
perhaps one of the most economical and popular approaches to isolate
phytochemicals such as flavonoids, alkaloids, isothiocyanates, triterpenes etc.1,
7, 12, 27 In vivo and in vitro bioassays could be employed to determine the
activity of crude plant extracts prior to committing to extensive extraction,
isolation and characterisation procedures for active fractions.1, 31
Alternatively,
guidance from archived literature documenting traditional medicinal systems
could assist in identification of plants (extracts) with interesting bioactivity
followed by isolation and characterisation of compounds present to enable
investigation of their potential application in disease.32
Collection and
organisation of ethnomedicinal information should facilitate the identification
of possible positive hits.14

7
Between the period of 1970 and 1990, the emergence of high-throughput
screening (HTS) and generation of chemical compound libraries via
combinatorial chemistry enabled identification of defined molecular targets
and NCEs, respectively.33-36
These technologies have the potential to produce
and screen numerous drug candidates where typically a small team of
researchers can screen over a million of samples annually. This is appealing
compared to natural product drug discovery and development (NPDD), which
often demand high expenditures, long discovery timelines, high possibility of
re-discovery and sourcing of natural products as well as the fierce competition
between big pharmaceutical companies to deliver first-in-class drugs with well-
defined mechanism of actions.35, 37
HTS enabled vast numbers of plant species
to be validated, and companies with such facilities have the ability to screen
thousands of plant extracts per week. Hence Lipinski‟s „rule-of-five‟ (RO5)
criteria were established to rationalise and respond to numerous chemical
compound libraries and to assess the relationship between a compound‟s
chemical structure and biological properties. Lipinski‟s RO5 predicts and
selects for orally active compounds by fulfilling the criteria shown in Table 1-
1.38
Table 1-1: Lipinski‟s Rule of Five (RO5) criteria for predicting orally active
compounds.38
Lipinski’s Rules Criterion
Molecular weight (MWT) ≤ 500
Log P ≤ 5
Hydrogen bond donors ≤ 5
Hydrogen bond acceptors ≤ 10
In 2004, Lipinski suggested other factors for example the number of aromatic
rings, number of rotational bonds and topological polar surface area (TPSA)
should be included. Collectively, physicochemical features affecting drug
absorption, distribution, metabolism, excretion (ADME) and interaction with
target receptor will impact the quality of lead-like compounds used in
screening libraries such as small molecule fragment and chemical libraries.38, 39
However, applying the RO5 on a single combinational chemical core will

8
restrict the structural diversity of combinatorial libraries and satisfying the
RO5 does not guarantee a drug-like compound.38
Zhang et al. (2007) reported
that just over 50% of the 1,204 US Food and Drug Administration (FDA)-
approved orally administered small-molecule drugs obey the RO5, therefore
the RO5 should be followed with caution and its compatibility in rational drug
design and development should be re-evaluated. It has already been stated that
natural products do not comply with Lipinski‟s RO5.26
Kumar and Soni (2010)
revealed statistical results from their data collection suggesting medicinally
useful natural products tend to contain physicochemical features violating the
Lipinski‟s RO5 criteria (Table 1-2).
Table 1-2: Physicochemical properties of medicinally useful natural
products.34
Lipinski’s Rules Criterion
Molecular weight (MWT) 201 ≤ MWT ≤ 600
Log P -2 ≤ log P ≤ 5
Hydrogen bond donors (HBD) 0 ≤ HBD ≤ 5
Hydrogen bond acceptors (HBA) 2 ≤ HBA ≤ 16
Nitrogen atoms 0 ≤ nitrogen atoms ≤6
Oxygen atoms 2 ≤ oxygen atoms ≤ 7
Topological polar surface area (TPSA) 26 ≤ TPSA ≤ 225
Aromatic rings 0 ≤ aromatic rings ≤ 2
Rotatable bonds 0 ≤ rotatable bonds ≤ 12
Lee and Schneider (2000) have cross-analysed 1,748 and 807 different ring
systems from natural products (in the BioscreenNP collection) and from trade
drugs (in the Derwent World Drug Index (WDI)), respectively. Interestingly,
results emphasised the diversity of natural product structures revealing that
approximately 35% of trade drugs contained a ring system also present in the
natural product collection whereas only 17% of natural products share the same
ring system present in trade drugs.13
Natural products have significantly higher
numbers of chiral centres and greater steric complexity.40
Therefore,
information gained from the structure of natural products will introduce

9
diversity and increase opportunities for strong drug candidates not necessarily
complying with the RO5, hence encouraging new drugs with novel
mechanisms of action.41, 42
This revived interest could be due to the low
success rate of chemical libraries over the last two decades, with only one de
novo compound approved by the FDA in 2005. Sorafenib (BAY43-9006;
Nexavar®
) is an oral multiple kinase inhibitor for the treatment of advanced
renal cell carcinoma from Bayer Pharmaceuticals. Despite the short discovery
timeline of 11 years, more systematic approaches should be employed to
maintain the progression of drug discovery.43
This could be achieved by
changing from large libraries to using smaller focused libraries (termed
Diversity Oriented Synthesis (DOS)) with approximately 100 to 3,000
compounds, and most of which are structurally related to natural products.44
Additionally, natural product skeletons could act as templates in combinatorial
chemistry to generate compound libraries of novel natural product scaffolds for
screening.13, 35
The extended history of phytochemicals used in medicine and
evidence of their structural complexity could be deemed unsurprising since the
co-evolution between plants and animals has resulted in compatibility between
the building blocks present in both species (Figure 1-13).33
Natural products
have structural homogeneity across many plant species hence sharing
comparable structural domains to biological targets.5, 20
Therefore,
phytochemicals may fit better into the „chemical space‟ of target proteins e.g.
interaction with targets in human signal transduction pathways.16
1.2.2 Purposes and classes of phytochemicals
Plants produce phytochemicals to serve different purposes including self-
protection from destructive toxins and predators e.g. carcinogens or mutagens.
Several tree species produce tannins as their defense mechanism in response to
damaged leaves caused by predators or for communication with neighbouring
plants to increase their survival chances.2, 45, 46
As previously mentioned,
exploring phytochemicals can offer advantages such as uncovering new drug
leads or additional sources for currently available compounds.11
Nonetheless,
undesired side effects are also associated with phytochemicals because their
purpose is to enhance survival and competitiveness of plants by defending

10
against possible threats and not for treating human diseases.2, 20
Many natural
products possess structures that are beyond the imaginative designs of
scientists and often contain multiple stereocentres, „chiral centres, aromatic
rings, complex ring systems, degree of molecule saturation, and number and
ratio of heteroatoms’.11 Phytochemicals can be grouped in different ways such
as by their chemical structures, physiological effects, or by their biosynthesis
mechanisms.3
1.2.2.1 Shikimic acid derivatives
Shikimic acid (4) is a common precursor of aromatic amino acids
(phenylalanine, tryptophan and tyrosine) as well as other proteins and peptides,
alkaloids, phenols, coumarins, chromones, xanthones, stilbenes, flavonoids,
lignans and gallic acid.47
Gallic acid is the precursor for many types of tannin,
which is abundant in all plants, and forms insoluble compounds with proteins.
Tannins can be obtained from galls produced on various plants and used to
treat diarrhoea and bleeding gums.
4
Figure 1-4: The common chemical structures of Shikimic acid (4).
1.2.2.2 Carbohydrates
Carbohydrates, Cn(H2O)n, are the main constituents of living organisms and are
present in abundance on cell surfaces with diverse fundamental functions
including molecular recognition and signal transduction.48
In plants,
carbohydrates are one type of photosynthetic products, whose functions
include providing structural support (e.g. cellulose), and energy storage (e.g.
starch). Carbohydrates can be grouped into monosaccharides (3 to 9 carbons),
disaccharides, oligosaccharides (2 to 10 monosaccharide molecules) and

11
polysaccharides (over 10 monosaccharide molecules). One example of
medicinal use of mucilage (polysaccharide) from Linseed, (flax; Linum
usitatissimum L. (Linaeceae)), is use as a laxative.47
1.2.2.3 Acetate derivatives
Acetate (5) is a common precursor for fatty acids (saturated and unsaturated
triglycerides), fats and waxes, phospholipids, polyketides, monoterpenes,
sesquiterpenes, diterpenes, triterpenes and steroids. Synthetic steroids are used
for cancer treatments and to reduce adverse reactions to chemotherapy. Low
doses of glucocorticoids can treat adverse reactions such as chemotherapy-
induced emesis and dyspnoea in cancer patients via interaction with
intracellular glucocorticoid (steroid) receptors (GR) to trigger signaling
pathways and down-regulation of GR.49
5
Figure 1-5: The chemical structure of the acetate group (5).
1.2.2.4 Alkaloids
Alkaloids are derived from amino acids and there are over 3,000 known
alkaloids such as cocaine, vincristine and vinblastine. Alkaloids are naturally
occurring organic compounds that have nitrogen as part of a heterocyclic ring
system. Only present in some plant families, the types of alkaloids range from
pyridine and piperidine, tropane, isoquinoline, indole, quinolone and imidazole.
Common alkaloids include caffeine and nicotine.

12
1.2.3 Common procedures in Natural Products Drug Discovery
Application of modern technologies such as analytical, structural chemistry
and various „-omics‟ techniques has enabled thorough studies to be conducted
into compounds‟ SARs and their biological effects. Collecting and verifying
such information has resulted in comprehensive databases such as the
Dictionary of Natural Products (DNP), which has > 214,000 entries of natural
compounds and their derivatives.50
Rational design of chemical compounds
could offer a secondary role for natural products in drug discovery and
development by providing a template for combinatorial chemistry and
molecular biology. Only by addressing the challenges would the enormous
potential to discover novel compounds from natural sources be unlocked.2
Bruhn and Bohlin (1997) mentioned four possible relationships of a bioactive
compound: known activity and known structure, known activity and new
structure, new activity and known structure or new activity and new structure;
the last being of greatest interest.19
There are thousands of reports of antiviral, antibacterial and antifungal drugs
derived from plants that are used to treat various indications. Newman and
Cragg (2012) published a comprehensive list of NCEs with accompanying
plants source and treatment indication(s).51
Interestingly, several plants
containing anticancer compounds were also used traditionally as anticancer
agents. Diseases such as cancer where resistance is common will require
continuous efforts to find novel compounds. Table 1-3 illustrates a
compilation of the anticancer agents that are either directly from nature or
natural products-derived in clinical use between the periods of 1981 to 2010.

13
Table 1-3: A list of drugs derived from plants with their corresponding uses and source discovered between the years 1981 and 2010.
Drug Plant Source of Natural
Product-derivatives
Phytochemical
compound class Main Target(s)
Ethno-medical
correlation/
Reference
Andrographolide
Andrographis paniculata Diterpenoid Caspase-3 and -8, p16, p21,
p27 Yes 52
Arglabin
Artemisia glabella Sesquiterpene Raf kinase cascade No 53
Belotecan hydrochloride
Camptotheca acuminate Decne Alkaloid Topoisomerase I No 54

14
Cabazitaxel
Taxol derivative Diterpene Tubulin α-1 and β-1 chains No 55
Camptothecin
Camptotheca acuminate Decne Alkaloid DNA Topoisomerase I No 56, 57
Docetaxel
Taxol derivative Diterpene Tubulin β-1 chain, VEGF No 58
Demecolcine
Colchicum autumnale L. Alkaloid
30S ribosomal protein S9 and 30S ribosomal protein
S4
Yes 59

15
Elliptinium acetate
Bleekeria vitensis Alkaloid DNA Topoisomerase II-α No 60
Etoposide Etoposide phosphatec
Podophyllotoxin derivative Alkaloid DNA Topoisomerase II-α Yes 61
Glaucine
Glaucium flavum Crantz Alkaloid DNA No 62, 63

16
Homoharringtonine Omacetaxine mepesuccinate
Cephalotaxus harringtonia var.
drupacea Alkaloid 80S ribosome (eukaryotes) No 64
Irinotecan (prodrug) Irinotecan hydrochloride
Camptothecin derivative Alkaloid DNA Topoisomerase I No 65, 66
Masoprocol Nordihydroguaiarectic acid
Larrea divaricata Cav. Phenolic Arachidonate 5-
lipoxygenase No 67, 68
Monocrotaline
Crotolaria sessiliflora L Alkaloid Microtubules Yes 69

17
Paclitaxel Paclitaxel nanoparticles
Taxus brevifolia Nutt Taxol derivative
Diterpene Tubulin β-1 chain and Bcl-2 No 70, 71
Podophyllotoxin
Podophyllum peltatum L. Alkaloid Structure used for
derivatives Yes 72, 73
Solamargines
Solanum incanum Alkaloid TNFR and Bcl-2 No 74
Talaporfin Chlorophyll Aspartyl chlorin Tumour tissues o 75, 76

18
Talaporfin sodium
Chlorophyll Aspartyl chlorin Tumour tissues No 75, 76
Teniposide
Podophyllotoxin derivative Alkaloid DNA Topoisomerase II-α Yes 77
Topotecan hydrochloride
Camptothecin derivative Alkaloid DNA Topoisomerase I No 78

19
Vinblastine
Cantharanthus roseus (L.) G. Don Alkaloid
Tubulin -α-3, -β, -δ, -ϒ and -ε chains and Transcription
factor AP-1
No 79
Vincristine
Cantharanthus roseus (L.) G. Don Alkaloid Tubulin α-1 and β chains No 80

20
The listed anticancer compounds are either isolated directly from plants or are a plant derivative from the period of 1981 to 2010. The
ethnomedical correlation is noted for each plant and its active compound(s). Information regarding the mechanism of action of each drug was
obtained from DrugBank, the NCI and/or the given references.78, 83, 84
Vinflunine
Vinca alkaloids derivative Alkaloid Tubulin No 81
Vinorelbine (di-)tartrate
Vinca alkaloids derivative Alkaloid Tubulin-β chain No 82

21
1.2.4 Selection of plant materials
The selection of plants (or specific plant sections) for investigation could begin
with searching random collections, literature and/or ethnopharmacology
systems.18, 85
The accuracy of documentation and authentication of the plant
specimen should be verified by experts prior to standardised methodical
processes. Specimen selection based on ethnopharmacological evidence
should acknowledge the intellectual property (IP) of the traditional healers. A
record of collection including harvest time (day or evening), season (month,
weather and soil condition), age of the plant and location (specific area) should
be kept because inconsistency will lead to differences in phytochemical
compositions between samples. Furthermore, the endemic status of the plant
and deforestation status are factors affecting the collector‟s judgment to
investigating certain plants for their therapeutic properties.85
The order of
procedures from selection to identification of active plant extracts using bio-
guided fractionation and subsequent structure elucidation of the active
compound(s) has been extensively described.85-87
The following procedures in
this chapter were adapted from Houghton and Raman (1998), Samuelsson
(1999) and Arnason et al. (1995).18, 47, 87
1.2.5 Preparation of crude extracts
In general, the starting plant material must be reduced in size through processes
such as grinding and pulverisation prior to extraction. There are three types of
extracts: dry i.e. prepared without solvent (extracta sicca), soft (extracta
spissa) and fluid (extracta fluida) which are prepared with solvents of varying
polarity (Table 1-4).3 The choice of solvent determines which type of
phytochemicals are eluted from the crude extract and the polarity provides
indication of the electron distribution across the molecule such as π electrons
(aromatic rings, carbon-carbon double bonds and carbonyl groups) and lone-
pair electrons (electronegative atoms).18
Other pressures on solvent selection
include boiling temperature, reactivity, viscosity, vapour pressure, safety, cost
and recovery. Plant extracts should be checked for contamination e.g.
microorganisms, prior to preservation of samples. The samples could be dried

22
either by leaving in a warm, dry atmosphere or by freeze-drying then stored in
the dark and at a sub-zero temperature.
Table 1-4: Polarity of solvent molecules used for UNMC extraction process.
Solvent Structure Polarity Chemical class
extracted
Hexane Non-polar
waxes, fats and
fixed oils
(volatile oils)
Ethylacetate
Moderate polarity;
electrons (π and
lone-pair) on oxygen
alkaloids,
aglycones,
glycosides
Ethanol Polar glycosides
Water Polar, no lipophilic
non-polar areas
sugars, amino
acids, glycosides
1.2.6 Extraction methods
The selection of a suitable extraction method is essential as this will impact on
(active) phytochemicals present in the crude plant mixture for validation in
bioassays. Many extraction methods are available to extract chemicals from
plant extracts (see Table 1-5). Description of general extraction procedures are
adapted from Houghton and Raman 1998, Gunnar and Samuelsson 1999 and
Arnason et al.1995 and will be briefly described.3, 18, 87

23
Table 1-5: Common methods employed for extracting chemicals from crude
plant extracts.
Extraction method Procedure
Maceration
Coarsely powdered extract is soaked in a solvent
contained in a sealed container at room temperature
for at least three days. Material should be stirred until
soluble matter has dissolved before straining; it is then
pressed and filtered with liquid.
Infusion
Like maceration, plant materials undergo intermittent
exposure to cold and boiling water and soluble matter
should be contained in the solution.
Digestion Like maceration, plant material is subjected to gentle
heating during the whole extraction process.
Decoction
The material is boiled in a specified volume of
menstruum for a set period at a fixed ratio. The
macerated material is then cooled and strained.
Percolation
The material is placed in a sealed container with a
specified volume of menstruum and incubated for 4 h;
then packed into a percolator with added menstruum to
macerate overnight. The liquid is allowed to drip
slowly.
Soxhlet
The material is placed in folded filter paper then in
apparatus where heat is applied to small volume of
menstruum so the vapours condense and the
condensed extractant drips into another chamber for
collection.
Fermentation The sample is soaked for a specified time to enable
fermentation, hence alcohol is formed.
Counter-current
The material is processed into a slurry and fine sample
prior to being placed with a solvent in a cylindrical
extractor and moved in a unidirectional manner.
Sonication
The ultrasound frequency used ranges from 20 kHz to
2000 kHz to extract chemicals from material following
disruption of permealising cell walls.
Supercritical Fluid
The use of CO2 or argon as the extracting fluid means
a low temperature can be used as well as recycling the
solvents.
Phytonics Process
A technology using fluorocarbon (1,1,2,2-
tetrafluoroethane) solvent for the extraction of plant
materials.
Description of extraction processes are adapted from Handa 2008.85
The term
material refers to the crude plant material and menstrum refers to the extraction
solvent. Some of the techniques are used in the Ayurveda system.

24
A series of other procedures will follow extraction such as filtering the extract
obtained from the residues following extraction (marc) and spray drying to
obtain a dry powder.85
Extracts should be stored correctly at low temperatures
(< -20°C) and away from light to minimise deterioration, decomposition and
formation of artefacts to allow identification of constituent compound(s).
1.2.7 Activity-guided fractionation
Extract fractions should be tested in the appropriate in vitro systems so any
extract fractions that are more active than the crude extract can be further
separated and re-tested until the active substance(s) is isolated and identified.
With respect to anticancer drug discovery, many cell-based assays intend to
measure cancer cells‟ viability after exposure to an investigational compound
since cancer cells are commonly associated with dysregulated cell proliferation
and death; results could be indicative of an effective anticancer candidate.88
Alternatively, mechanism-of-action-based bioassays can be used where the
agent is directed to a molecular target of interest e.g. proteasome inhibition
assay.11, 86, 89
It is of interest to determine the characteristics of any observed cytotoxic
effects induced by the extracts such as those consistent with the hallmarks of
cell death e.g. the loss of plasma membrane integrity, fragmentation of cells
into apoptotic bodies or the fragments taken up by neighbouring cells. Several
assays can indirectly test for induced cytotoxicity by measuring biochemical
processes of viability markers since a reduction in metabolism is expected in
dying cells.88
A common approach to assessing in vitro cell viability is to
measure its ability to inhibit vital dyes from crossing the intact plasma
membrane. Vital dyes are used in a variety of techniques such as those that
only label dead cells (e.g. trypan blue, propidium iodide and 4‟,6-diamidino-2-
phenylindole (DAPI)) by entering the cell via a compromised plasma
membrane. These dyes are widely adopted in flow cytometric techniques. In
contrast, fluorogenic esterase substrates (e.g. calcein acetoxymethylester
(calcein-AM)) are taken up by viable cells and hydrolysed by intracellular
esterases to its active fluorescent form to be captured by microscopy.90, 91
Alternatively, the loss of plasma membrane integrity resulting in the release of

25
intracellular protein such as glucose-6-phosphate dehydrogenase (G6PD) and
lactate dehydrogenase (LDH) or intracellular ATP concentrations could be
measured using conventional assay kits to assess cell viability. Furthermore,
several colorimetric assays such as sulforhodamine B (SRB) and tetrazolium
salts are dependent on the binding between the cationic aminoxanthine (pink
dye) to basic amino acids in the cells or viable cells reducing tetrazolium salts
to formazan compounds, respectively, and the absorbance intensity measured is
proportionate to the cell numbers (indicating cell growth, viability or death).92-
94 Since the abovementioned cell death detection methods could be subjected
to interference from other intracellular processes, it is important that the results
are validated in a subsequent assay, which measure bona fide cell death
markers such as phosphatidylserine or (cleaved) poly(ADP-ribose) polymerase
(PARP) protein.94
Assays that are simple, effective and economical should be considered for
initial screening. The choice of cytotoxicity assay is also of importance to
avoid false negatives since active compounds may be present in trace amounts
or their activity may be masked by other toxins in the crude extract.2, 95
Since
1990, the NCI has been screening for potential active compounds using in vitro
screening methods comprising a panel of 60 different human tumour cell-lines
from nine organ sites, (including leukemia, melanoma and cancers of the lung,
colon, brain, ovary, breast, prostate and kidney) and a simple cell
viability/cytotoxicity assay (e.g. SRB and tetrazolium salt assay).96, 97
Since
1990, this programme has allowed the screening of > 80,000 compounds.93, 98
1.2.8 Isolation, structure elucidation and de-replication of
active compounds
Analysis of active compounds can be assisted by techniques such as solid
phase chromatography, nuclear magnetic resonance (NMR), high performance
liquid chromatography (HPLC or LC) linked to ultraviolet (UV) absorption
detector and mass spectroscopy (MS).5 These well-established technologies
can be „linked‟ together, otherwise known as „hyphenated‟ methods, for
facilitating the separation, isolation and identification of phytochemicals in

26
mixtures. The combined, hence hyphenated, use of HPLC, NMR, gas
chromatography (GC) and MS systems (e.g. LC-NMR, LC-MS, LC-NMR-
MS) are becoming increasingly common in facilitating the drug discovery
process. These systems provide information on the molecular mass, carbon
skeleton and proton distribution and characteristics (e.g. polarity) of
compounds, which enable accurate determination of compound structures.37
Furthermore, hyphenated techniques minimise wasted efforts by supporting the
process of de-replication (e.g. avoiding re-discovery) via reconciliation with
established databases of already known compounds thus prioritising unknown
or novel compounds for further testing.2, 11, 35
A thorough investigation
concluded that approximately 80% of several global database entries regarding
plant information, genome, phytochemical composition, taxonomy,
ethnomedicinal uses and authentication information are inaccurate.99
For
instance, approximately 75% of the GenBank plant records are incorrect.99, 100
At present, lack of reliable genomic data for the metabolomes of medicinal
plants proves unaccommodating to creating authenticated libraries of
„metabolite fingerprints‟ of plants.100
Metabolomic analysis is a very useful
tool to avoid de-replication, misidentification and SAR determination of
metabolomes from medicinal plants, the latter can improve estimation of the
efficacy and toxicity of investigational compounds before commercial
development.101
Employment opportunities are promising if medicinal plants
are to be grown on a larger scale for pharmaceutical use and may persuade
growers of „illegal plants‟ to cultivate these profitable crops instead.20
Nevertheless, the issue of inaccurate and insufficient plant records is
acknowledged and considerable efforts are being invested into creating
accessible international databanks of information such as The Plant List for
validated entries of information.102

27
1.2.9 Synergism in phytomedicine
Crude plant extracts contain a mixture of secondary metabolites, which are
biologically active. Whole plant extracts represent some of the most
therapeutic drugs in the market and may rely on the synergistic effect of these
bioactive compounds including their by-products.16, 46, 103
Synergy is an
overall greater effect caused by using a combination of drugs than the total
effect of using a single compound.104, 105
Williamson (2001) presented several
examples whereby volunteers given ginseng and gingko together have
improved cognitive function compared to those who were only given one of
the extracts.105, 106
There are two broad types of synergy described by Spinella
(2002), which are pharmacodynamic or pharmacokinetic.109
Pharmacodynamic synergy occurs when two compounds are targeting a similar
receptor target or physiological system. Pharmacokinetic refers to absorption,
distribution, biotransformation, or elimination of the drug e.g. some
polyphenols can facilitate absorption of agents.16, 103, 107
Interaction between
phytochemicals can also evoke antagonism, where the overall effect is less
than that of a single compound or potentiation whereby an inactive compound
can further increase the activity of an active compound. Another possible
outcome is „masking‟ where two compounds with opposing effects cancel each
other out therefore, resulting in no net effect.16
Berenbaum‟s isobol method is
used to “differentiate between real synergy and additional effects of a mixture
of two plant constituents or extracts”.16, 104
Recently, a multidrug approach is
preferred over monodrug therapy in conventional medicine. This could be due
to activation or inhibition of multiple targets in signaling pathways giving rise
to synergistic effects.103, 104, 108
Hence, perturbation of multiple modes of action
could increase therapeutic efficacy allowing use of lower dosage.109
Also
using a lower dose of multiple agents acting via distinct mechanisms of action
could reduce toxicities as well as minimise emergence of acquired drug
resistance. However, this approach (common in standard cytotoxic
chemotherapy use) raises concerns in natural product medicinal use as it is
difficult to rationalise and standardise treatment without identifying the
mechanisms that generate the synergistic effects.103, 105

28
1.3 Cancer
1.3.1 Cancer: a global problem
Cancer is a group of fatal diseases with more than 200 cancer types and each
are quite distinct to each other (e.g. secretion, expression and or mutation of
different proteins), of which the most common are breast, colorectal, lung,
prostate and stomach cancers, however the highest incidence of mortality rates
occurs within lung, breast, stomach, liver and colorectal cancers.110-114
In 2011,
WHO published a Global Status Report, which revealed cancer accounts for
approximately 7.6 million (13%) world deaths in 2008.115, 116
There are
approximately 6 million new cancer incidences worldwide per year, those
figures are predicted to increase to 27 million new cancer cases and 17.5
million cancer deaths by 2050.117
Around 325,000 people are diagnosed with
cancer annually in the United Kingdom (UK) and it is the second leading cause
of death in the U.S.118, 119
1.3.2 Molecular biology of cancer and possible targets
The process of carcinogenesis is a multistep process requiring initiation,
promotion and progression and metastasis. Cells undergoing unregulated
growth within a specific tissue of any organ could, over time, usually decades,
accumulate further mutations. As a result, acquiring the ability to invade
surrounding areas and metastasise to distant sites by hijacking vessels formed
by tumour angiogenesis.120-122
This process presents various opportunities to
intervene at the different stages.112, 123
Cancers arising from epithelial cells
(carcinoma) are the most common (85%) compared to those from mesoderm
layer (sarcoma) or glandular tissue (adenocarcinomas).112
During treatment
tumour cells may progress into a more aggressive phenotype and become
resistant to conventional anticancer drugs, therefore anticancer drugs with
original modes of action e.g. that molecular targeted, are desired and so
constant efforts to discover novel agents are needed. The biology of cancer is
very complex and its surrounding microenvironment is equally as important in
tumourigenesis. Different types of cancers acquire different genetic mutations

29
and phenotypes, however there are several essential capabilities shared by most,
if not all, cancers enabling neoplastic cells to progress in multistep
carcinogenesis.124
The hallmarks of cancer described by Hanahan and
Weinberg (2011 and 2000), unveil promising pathways as targets for
therapeutic anti-cancer intervention.122, 124
These hallmarks include self-
sufficiency in growth signals, insensitivity to anti-growth signals, apoptosis
evasion, sustained angiogenesis, tissue invasion and metastasis, limitless
replicative potential, evasion of immune destruction and reprogramming of
energy metabolism (Figure 1-6).124
Figure 1-6: Depiction of Hanahan and Weinberg‟s hallmarks of cancer
illustration. The diagram illustrates the cancer hallmarks as representative of
drug targets and the examples of compounds that interfere with the targets‟
functions. Many drugs under development are found to be both intentionally
and unintentionally directed to interfere with these hallmarks.124
Self-sufficiency in growth signals: Transformed cells, unlike normal cells, are
self-sufficient in mitogenic growth signals, which sustain continuous cell
proliferation. Cancer cells may produce growth factor ligands, which act
autonomously on their own receptors or by increasing the level of protein

30
receptors on the cell membrane enabling capture of minute/normal levels of
growth factors, translating into an exaggerated response. An example is the
mutation of the ras gene, which is present in 30% of all human cancers. The
Ras proteins are membrane-associated guanine nucleotide-binding proteins,
and its activation requires the transient binding of an extrinsic ligand e.g.
growth factors, resulting in cell proliferation. However, mutated Ras is
permanently in its activated conformation and is independent of GTP binding
resulting in constitutive activation of downstream signaling cascade (Ras-Raf-
MEK-ERK) and cell proliferation.125
Insensitivity to anti-growth signals: Transformed cells are unresponsive to
antigrowth signals e.g. soluble growth inhibitors and immobilised inhibitors,
that are found on the surface of neighbouring cells hence disregarding such
anti-growth signals will maintain the transformed cells in a permanently active
state.122
An example is the loss of the retinoblastoma protein (pRb) function
where pRb is a mediator of anti-proliferative signals. In a hypophosphorylated
state, pRB is bound to E2F (transcription factor) thus altering its function and
inhibiting cell cycle progression from G1 phase. Mutations in the pRB gene
caused by the human papillomavirus (HPV) E7 oncoprotein liberate E2F
allowing transcription hence cell cycle progression through the restriction „R‟
point into S phase.126
Evading apoptosis: Homeostasis is maintained by a balanced level of cell
proliferation and cell attrition (e.g. apoptosis). Cancer cells acquire various
mechanisms, which overcome cell death such as through the loss of tumour
suppressor proteins (TSPs) and overexpression of survival proteins. For
instance, the wild-type p53 protein is a DNA damage sensor and a component
of the apoptotic signaling pathway. Loss of p53 protein (a consequence of
point mutation in p53 gene) is found to occur in over 50% of human cancers
and 75-80% of colon carcinomas are without both p53 alleles.127
One of the
roles of p53 act as a regulator of cell cycle by making necessary cell cycle
arrests at G1/S phase and binding to any damaged DNA, repair can be initiated
before commitment to the entire cycle upon passing the R point. If the damage
is irreparable then p53 can initiate apoptosis.128
Over-expressions of certain

31
anti-apoptotic Bcl-2 family members e.g. Bcl-2, Bcl-XL and Mcl-1, are
essential in inhibiting apoptosis, hence supporting deregulated oncogene
expressions.
Sustained angiogenesis: Cancer cells can initiate angiogenesis and generate
blood vessels from the existing capillary network; this „angiogenic switch‟ is
vital for tumour growth and metastasis. The tumour can modulate its own
supply of angiogenic factors, classed into activators (e.g. vascular endothelial
growth factor (VEGF) and angiogenin) and inhibitors (e.g. thrombospondin
and angiostatin); production levels are increased and decreased by the tumour
cells, respectively.129
However, the tumour vasculature formed under the
influence of VEGF is of poor quality and highly disorganised leading to
hypoxia and additional VEGF production hence leading to a more aggressive
phenotype.130
Tissue invasion and metastasis: Transformed epithelial cells can invade local
tissues and metastasise via various processes such as the „epithelial-
mesenchymal transition‟ (EMT) process. Although less than 0.01% of
metastatic cells are successful in colonisation at the distant site, metastases
confer a highly unfavourable patient prognosis, and are responsible for >90%
of cancer deaths.131
A tumour cell can acquire the ability to remodel the host
tissue extracellular matrix (ECM) and secrete proteases such as matrix
metalloproteinases (MMPs). Increased MMPs levels e.g. MMP-2, MMP-9 and
MMP-13, in cancer cells can facilitate the detachment of tumour cells from the
primary site, cell migration towards the lymph and/blood vessels, degradation
of the vascular basement membrane and penetration of the vascular lumen to
invade a distant site.132
Limitless replicative potential (immortalisation): Normal cells are
constricted to undergo a finite number of replications (Hayflick number) and
enter senescence due to the degradation of the protective cap of DNA,
telomeres (a repeating DNA sequence TTAGGG), found at the end of
chromosome arms. Eventually, the shortened chromosome ends will be
exposed resulting in chromosomal fusion and apoptosis.133
Approximately 85-
90% of cancerous cells become immortalised by upregulating telomerases

32
(DNA polymerase) to replenish telomeres on the chromosomes, hence cells
become capable of unlimited cycles of replications.122
Evading immune destruction: The immune system offers several
mechanisms to prevent or detect and eliminate tumour cells by infiltrating
tumour masses e.g. eliminating virus-induced tumours, which account for 20%
of tumours. Secondly, during inflammation many growth factors, survival
factors, pro-angiogenic factors and enzymes facilitating EMT and ROS are
released into the tumour microenvironment contributing to tumourigenesis and
progression.124
Also, immune immunoediting, which is based on the concept
of detection and elimination of tumour cells expressing tumour-specific
antigens or stress-induced antigens, consists of three phases: designated
elimination, equilibrium and escape.134
Firstly the immune system will
eliminate the detected tumour cells, however elimination may only be partial
therefore the remaining tumour cells may exist in an equilibrium state.
However, the immune system will continue to eliminate any tumour clones that
continue to grow and accumulate further alterations translating to antigen
expression. Any tumour clones that escape elimination are more resistant and
surpass immune surveillance.134
Reprogramming energy metabolism: The rate of cancer cell metabolism
should support the rate of rapid neoplastic cell proliferation, resulting in further
accumulation of genetic alterations and instability, which may translate to
additional cancerous traits. A subpopulation of cancer cells can reprogramme
„switch‟ their metabolism to glycolysis even in the presence of oxygen, and it
has been shown to be associated with activated oncogenes Ras, Myc, P13K
(phosphatidylinositol-3-kinase) and mutated TSPs, p53, PTEN (Phosphatase
and tensin homolog) and NF-1 (neurofibromatosis type I).135, 136
Adoption of
glycolysis may present several advantages for cancer cells such as providing
macromolecules and organelles for new cells formation as a result of the
upregulation of glucose transporters and enzymes of the glycolytic pathway as
well as providing various glycolytic intermediates for various biosynthetic
pathways.124, 137

33
1.3.3 The role of medicinal plants in treating cancer
A series of publications by Dr J. Hartwell has described the traditional
application of over 3,000 plant species in cancer treatment.30, 32
The task of
cancer diagnosis is not straightforward therefore evaluation of historical
evidence of plants in cancer treatment should be validated using appropriate
techniques. During the peak of NP drug discovery between 1960 and 1982, the
NCI collected and tested over 114,000 plant-derived extracts for their
cytotoxicity. Introduction of new screening technologies in the following years
(1986 to 2004) led to the establishment of the Natural Products Branch of the
Developmental Therapeutics Program (DTP) by the NCI. The DTP has
collected approximately 60,000 higher plant samples worldwide for screening
in a cell-line panel consisting of 60-tumour cell lines and further in vivo
evaluation. More recently extensive reviews by Newman and Cragg (2007 and
2012) classified all the therapeutic compounds marketed between 1981 and
2010 into to their treatment category and origin.44, 51
NCEs approved between
1940 to mid-2006, have been subdivided into the following categories
biological (B), natural product (N), natural product derivative (ND), totally
synthetic drug (S), synthetic drug with a natural product pharmacophore (S*),
natural product mimic (NM) and vaccine (V). Of the 1,184 NCEs, 174 are
anticancer agents related to natural products (52%; 10% S/NM, 4% S*, 10%
S*/NM, 5% N, 23% ND), and the majority are inspired by natural products
(48%; 4% V, 14% B, and 30% S).26
There have been reviews highlighting that
the compounds in the synthetic category are essentially isosteres of peptide
substrates and therefore act as NMs.44, 138
Chemotherapy for many common
solid tumours has limited anti-solid tumour activity without significant effects
on patients‟ survival rates; moreover, many tumours will acquire resistance to
currently available antineoplastic treatments.45
Therefore a continuous effort
to search for novel active compounds from nature to create a library for high
throughput screening is vital in order to impede carcinogenesis. Such a goal
has inspired this project combined with a long history of successful anticancer
drug candidates from nature.5, 139

34
1.3.4 Classes of anticancer compounds
Since the 1940‟s, > 60% of all the available anticancer drugs introduced into
the clinic are related to natural products and > 70% of compounds in clinical
trial in 2004 were related to natural products.140-142
The sources of these active
natural products is not limited just to plants but also include microorganisms
and marine organisms as well since many marine compounds possess antibiotic
and anti-inflammatory properties and as such could play a role in cancer
treatment.5 The current plant-based anticancer drugs used in the clinic can be
categorised into four main classes of compounds: vinca (or Catharanthus)
alkaloids, epipodophyllotoxins, taxanes, and camptothecins (shown in Table 1-
3).11, 86, 140
The success of natural compounds is reflected by their worth in the
global anti-cancer marker of over $2.75 billion US dollars in 2002.11
1.3.4.1 Vinca alkaloids
Vinca alkaloids isolated from the Madagascan periwinkle, Catharanthus
roseus G. Don. (Apocynaceae), were the first natural product-based anticancer
agents to be used clinically.11
Vinca alkaloids such as vinblastine (7) and
vincristine (8) were found to be active against murine lymphocytic leukaemia.
This discovery led to development of semi-synthetic analogues of these active
agents vinflunine, vinorelbine and vindesine, which are used in multidrug
therapy to treat various cancers including leukaemias, lymphomas, advanced
testicular cancer, breast and lung cancers and Kaposi‟s sarcoma.143
Vinca
alkaloids and their derivatives bind to tubulin leading to microtubule
depolymerisation in metaphase therefore they act as anti-microtubule, anti-
mitotic agents.11, 26, 140
7; R= CH3 8; R= CHO
Figure 1-7: The chemical structure of vinblastine (7) and vincristine (8).

35
1.3.4.2 Taxanes
Paclitaxel (taxol®
) isolated from the bark of the Pacific Yew, Taxus brevifolia
Nutt (Taxaceae), is used to treat several cancers of the breast, ovary and non-
small cell lung cancer (NSCLC).140
Paclitaxel (9) was discovered during the
NCI‟s screening program and serves as a precursor for 23 analogues, which are
currently in pre-clinical development for various cancers indications. The
taxanes bind to and stabilise microtubules to halt cell division at the G2-M
phase of cell cycle.5
9 10
Figure 1-8: The chemical structure of taxol (9) and docetaxel (10).
1.3.4.3 Epipodophyllotoxins
Podophyllotoxin and other closely related lignans isolated from the
Podophyllum species (Podophyllaceae) revealed antitumour activity
accompanied by serious toxicity. This observation resulted in development of
safer semi-synthetic analogues such as etoposide and teniposide. These
analogues exert cytotoxicity against lymphomas, bronchial and testicular
cancers via DNA strand breaks, induced by permanently binding to DNA
topoisomerase II in the G2 phase of the cell cycle.140
11 12 13
Figure 1-9: The chemical structure of podophyllotoxin (11), etoposide (12)
and teniposide (13).

36
1.3.4.4 Camptothecins
Camptothecin is isolated from the Chinese Camptotheca acuminata Decne
(Nyssaceae), which contains an -hydroxylactone system and an unsaturated
conjugated pyridine moiety.144
Initial studies demonstrated severe bladder
toxicity and therefore more water soluble and potent derivatives topotecan and
irinotecan were developed for treating advanced ovarian and small cell lung
cancers and metastatic colorectal cancers, respectively.140
The mechanism of
action involves selectively inhibiting topoisomerase I, which interferes with the
cleavage and reassembly of DNA.
14 15
16
Figure 1-10: The chemical structure of camptothecin (14), topotecan (15) and
irinotecan (16).
Many other compounds from plants with antitumour activity have already been
used traditionally such as homoharringtonine (Cephalotaxus harringtonia var.
drupaecea), an active alkaloid administered to chronic myeloid leukemia
(CML) patients. Homoharringtonine and its analogues with reduced methyl
groups can inhibit DNA topoisomerase II.89
It also inhibits CDK9 and protein
translation, downregulating the survival protein Mcl-1. It is thought that CDK9
inhibition contributes to anticancer activity. Salvia species roots and rhizome
extracts have shown to inhibit proliferation of cancer cell lines of the liver,
colon (colon-205), cervical (HeLa), nasopharynx (KB) and larynx (Hep-2).89

37
Extracts from several other plant species including Brucea, Euphorbia, Rubia,
Cocculus trilobus, Curcuma (turmeric) and Maytenus are also used in therapy.
Many analogues of existing anticancer drugs isolated from plants are in clinical
trials and many are found to affect the cell cycle (Figure 1-11).
Figure 1-11: A simple representation of the cell cycle phrases, G1, S, G2, M,
and the corresponding anticancer compounds that targets those specific phases.
A totally synthetic flavone, flavopiridol (17), was synthesised based on the
structure of the natural product rohitukine, which was initially found to induce
cell-cycle arrest and apoptosis in murine ovarian cancer cells, OCA-I.140, 145
Flavopiridol is the first cyclin-dependent kinase inhibitor in clinical trial.146-148
Flavopiridol is currently being investigated in eighteen Phase I and Phase II
clinical trials either alone or in combination with other chemotherapy agents.89
17
Figure 1-12: The chemical structure of the cyclin-dependent kinase inhibitor,
flavopiridol (17).149

38
1.3.5 Chemoprevention
Besides importance as drugs, natural products can be a vital source of
compounds to “suppress, arrest or reverse carcinogenesis, in its early
stages”.17, 110
A balance between oxidants and antioxidants (phytochemicals)
obtained from diets rich in fruits and vegetables are essential for an optimal
physiological state.150, 151
Many epidemiologic studies support the proposed
inverse correlation between increased consumption of fruits and vegetables in
the diet and cancer risk.110, 152, 153
Several phytochemicals possess
chemopreventive properties that act on various pathways (apoptosis,
angiogenesis and metastasis) and targets (oncogenes, tumour suppressor genes
(TSG) etc.) to maintain cellular health and homeostasis. Certain
phytochemicals act on normal cellular processes such as cell division, and
hence inhibit proliferation of (cancer) cells. Further considerations to facilitate
drug discovery from plants include improved sourcing and advances in
combinatorial biosynthesis, microbial genomics and synthetic biology by
addressing issues of complex structural synthesis.41
Figure 1-13: Diagram displaying some relevant targets for anti-cancer activity
and examples of phytochemicals which interact with these targets, adapted
from Williamson (2010).16

39
Phytochemicals have the ability to modulate certain molecules in key signal
transduction pathways relating to cancer such as the nuclear factor–B (NF–
B), receptor tyrosine kinases, mitogen-activated protein kinase (MAPK) and
cyclooxygenases (COX).46
Additionally, phytochemicals may modulate the
immune system and possess antimicrobial, anti-inflammatory, anti-asthmatic
and anti-anaphylactic activity.154, 155
Exogenous antioxidants found only in
plants can be classed as water-soluble or lipid-soluble e.g. vitamin C and -
carotene respectively.156
Sufficient amounts of antioxidants are required to
counteract endogenous free radicals otherwise the resulting oxidative stress
could lead to oxidative damage to macromolecules, lipids, proteins and DNA.16,
140, 141 Data from in vitro measurements and cell-free models suggest that
compared to other cellular processes such as methylation, deamination and
depurination, oxidation from normal metabolism causes the highest levels of
DNA bases (around 26,000) loss daily subsequently leading to an increased
risk of developing chronic diseases such as cancer.157, 158
Many research
projects such as that of the National Cooperative Drug Discovery Group
(NCDDG) are characterising potential anticancer compounds from plants of
the tropical rainforest to isolate compounds from edible plant species and
dietary supplements.11
Several clinical trials are being conducted by the NCI
on potential cancer chemopreventive agents including curcumin (phenolic acid;
Phase I colon), genistein (flavonoid; Phase I breast and endometrial), soy
isoflavones (isoflavonoid; Phase II prostate), epigallocatechin gallate
(flavonoids; Phase II breast, Phase I unspecified cancer, Phase II bladder
recurrence) and resveratrol (alkaloid; Phase I unspecified cancer).11
Phytochemicals can be classified into the categories of terpenes, carotenoids,
phenolics e.g. flavonoids, alkaloids, nitrogen-containing compounds and
organosulfur compounds, which may be sub-divided into further categories
(Figure 1.15).17

40
Figure 1-14: A flow chart listing some sub-families of phytochemicals:
carotenoids, phenolics, alkaloids, nitrogen-containing compounds and
organosulphur compounds.17
1.3.5.1 Terpenes
There are over 600 different caroteniods identified, of which there are two
main classes: xanthophylls (oxygen containing) and carotenes (non-oxygen
containing).159
This predominant pigment possesses provitamin and
antioxidant activities. The basic structure usually contains a 40-carbon
skeleton structure of isoprene units and often occur in the all-trans form.17
The
number of double bonds determines the shape, chemical reactivity and light-
absorbing properties of carotenoids.159
Carotenoids have the ability to quench
and inactivate reactive oxygen species (ROS) preventing genomic instability
and carcinogenesis.118, 160, 161
Diets rich in carotenoid pigments (vitamin A
(retinol)) e.g. eggs and carrots can prevent the development and progression of
epithelial cancers.11, 110, 162
However, studies have suggested that in the long-
term high levels of retinol are associated with an increased risk of osteoporotic
hip fracture in women due to reducing bone mineral density.163

41
Figure 1-15: The chemical structures of carotenoids such as -carotene (18),
β-carotene (19), β -cryptoxanthin (20), lutein (21), zeaxanthin (22), astaxanthin
(23) and lycopene (24).17
1.3.5.2 Phenolics
Phenolics are protective secondary metabolites produced by plants. Their
structure consists of 1 aromatic ring(s) with 1 hydroxyl group.17
The
phenolic ring can exist in an oxidised or reduced states giving rise to a quinone
or phenol, respectively.156
Phenolics can be grouped into phenolic acids
(hydroxybenzoic acids and hydroxycinnamic acids), flavonoids (flavanols,
flavones, flavonols, flavonones, anthocyanidins and isoflavonoids), stibenes,
coumarins and tannins, as shown in Figure 1-16: and Figure 1-17. It is
estimated that 2/3 of the phenolics consumed in our diet (in foods such as nuts,
fruits, vegetables, red wine, coffee and tea) consist of mainly flavonoids and

42
1/3 phenolic acids.17
Flavonoids may also have a role in chemotherapy to
induce or inhibit the metabolism of drugs by interfering with the function of
cytochrome P450 (CYP) enzymes.105, 164
Figure 1-16: The chemical structures of phenolic acids such as caffeic acid
(25), ferulic acid (26), sinapic acid (27), syringic acid (28), protocatechuic acid
(29), 3,4-dihydroxyphenylacetic acid (30).156
However, tannins may act adversely on health by forming complexes with
proteins, starch and digestive enzymes, thus lowering nutritional values.
Tannins may also have an adverse effect on the absorption of amino acids and
alkaloids.105, 154, 165
The net effect may include “a decrease in food intake,
growth rate…net metabolisable energy, protein digestibility…damage of the
mucosal lining of gastrointestinal tract and alteration of excretion of certain
cations, and increased excretion of proteins and essential amino acids.” 165
Paradoxically, certain tannins also appear to possess chemopreventive
properties and together with the above mentioned adverse activities make
tannins a concern for use.

43
Figure 1-17: The chemical structures of flavonoids such as flavonols (31),
flavones (32), flavanols (catechins) (33), flavanones (34), anthocyanidins (35)
and isoflavonoids (36).17
1.3.5.3 Alkaloids
Alkaloids are nitrogen-containing compounds and thousands have been
identified, and many have been used for their medicinal value for centuries.154
Examples of alkaloids used medicinally include atropine, cocaine, hyoscine,
morphine, emetine and ergometrine.166
As discussed, vinca alkaloids are used
in treatment of cancers such as leukaemias and lymphomas. Currently under
Phase II/III clinical trial for chronic myeloid leukemia (CML) is the plant
alkaloid homoharringtonine (6), which functions by inhibiting protein synthesis
at the ribosome level.30, 143
44
1.4 A megadiverse country: Malaysia
Malaysia has been ranked the 12th
richest country for its biological diversity of
plant species according to the National Biodiversity Index (NBI), which is
evaluated by the World Conservation Monitoring Centre (WCMC).167, 168
In
Malaysia, the estimated 40,000 plant species can be sub-divided into
approximately 12,500 flowering plants, 15,000 higher plants and over 1,100
ferns and related species.167, 169
Malaysia‟s favourable climate offers a variety of habitats to suit diverse life
forms. The majority of the total land area (57.5% - 59.9%) is forest area of
which large proportions (57%) are tropical rainforests on the hills and
mountains.168
Areas in Pasoh, Peninsular Malaysia, Lambir, Sabah, and
Sarawak contain particularly dense forests with hundreds of tree species.170
The lowlands have been largely converted to agricultural land, mainly for
growth of cash crops, oil palm and rubber. Apart from other crops such as
coconut, rice and sugar cane, the agricultural lowlands support pineapple,
cocoa, tapioca, maize and coffee plant growth. The main economic product of
Malaysia‟s forest is timber and the most important timber producing families
are the Dipterocarpaceae and Leguminosae.169
1.4.1 Plant profiles
Colleagues from the University of Nottingham Malaysia Campus (UNMC)
collected various plants in Malaysia, and the following have been selected for
investigation.

45
1.4.1.1 Acalypha wilkesiana Müll, Arg. (Euphorbiaceae)
Latin name: Acalypha wilkesiana Müll, Arg.
Synonymous name: A. amentacea f. circinata (Müll, Arg.) Fosberg, A.
Wilkesiana (Müll, Arg.) Fosberg, A. compacta Guilf. ex C.T. White, A.
godseffiana Mast, A. godseffiana var. heterophylla L.H. Bailey, A.
hamiltoniana Briant, A. macafeeana Veitch, A. musaica auct, A. tricolor Seem,
A. triumphans. Linden & Rodigas, A. wilkesiana f. appendiculata J.W. Moore,
A. wilkesiana f. circinata (Müll, Arg.), A. wilkesiana f. illustris J.J. Sm, A.
wilkesiana f. macrophylla J.J.Sm, A.
wilkesiana var. marginata E. Morren, A.
wilkesiana f. monstrosa J. J. Sm, A.
wilkesiana f. triumphans (Linden &
Rodigas) J. J. Sm, Ricinocarpus
wilkesianus (Müll, Arg.) Kuntze.171
Vernacular name: Beef steak plant,
copper plant (leaf), fire dragon and
Jacob‟s coat 171
Order: Malpighiales 171
Family: Euphorbiaceae 171
Genus: Acalypha 171
Species: Acalypha 171
Description: Tropical bush of up to 1.5 m high with red spiral leaves. Flowers
are apetalous and without a nectary disc. The male inflorescences are spikes
found at the top whilst the female are found at the base. Fruits are three-lobed
capsules splitting into 3 valves.172
Distribution: Asia-Pacific 173
Uses: In Malaysia, this plant is boiled in goat‟s milk and the milk is drank to
lower blood pressure, treat fever and pimples and relieve coughs or it is boiled
in sugar to treat thrombocytopaenic purpura and allergic purpura. In Nigeria,
the leaves are boiled in water and given to those with gastrointestinal disorders
or suffering from skin infections such as Impetigo contagiosa, Candida
intetrigo, Pityriasis versicolor, Tinea corporis, Tinea pedis and Tinea

46
versicolor.174 It is also recognized as an abortifacient herb in Nigeria besides
its common use to treat headache, common cold and swelling.175
Constituents: Anthraquinone, corilagin, gallic acid, geraniin, kaempferol- and
quercetin-3-0-rutinoside.176
Pharmaceutical Interest: It has shown antibacterial and antifungal properties
in the aqueous and ethanolic extracts by inhibiting the growth of bacteria
(Staphylococcus aureus) and fungus (Candida albicans, Trichophyton rubrum,
Trichophyton mentagrophytes and Aspergillus flavus).177
It has been shown to
cause apoptosis in lymphocytes and stimulate the release of tumour necrosis
factor α (TNF-α), interleukin (IL) -5 and -6 and interferon-γ.175
The collection took place in May 2007 at Broga forest, Malaysia. The whole
plant was extracted in increasing polarity solvents: hexane (HEX), ethyl acetate
(EtOAc) and ethanol (EtOH).
1.4.1.2 Archidendron ellipticum (Blume) Hassk. (Leguminosae)
Latin name: Archidendron ellipticum
(Blanco)
Synonymous name: Abarema elliptica
(Blanco) Kosterm, Abarema elliptica
(Blume) Kosterm, Albizia asciculate
(Benth.) Kurz, Inga elliptica Blume,
Pithecellobium ellipticum (Blanco) Hassk,
Pithecellobium ellipticum (Blume) Hassk,
Pithecellobium fasciculatum Benth,
Pithecellobium waitzii Kosterm.102, 178, 179
Vernacular name: Langir (antu), Borneo
Indelebah, Jaring, Jering-jering.180
Order: Fabales 171
Family: Fabaceae 173

47
Genus: Archidendron 178, 179, 181
Species: Ellipticum 181
Description: A small flowering tree which can grow up to 20 m in height and
50 cm in diameter.178
The leaves are flat and the rachis can be between 4 and
15 cm bearing yellow and yellowish-green flowers (0.3 cm in diameter). The
fruits are orange-red (13.8 cm) containing black seeds.178, 180
Habitat: It is found in lowland primary and secondary rain forest, along
rivers, on hillsides with sandy soils and in areas of limestone.181, 182
Distribution: Widespread in Malaysian states: Johor, Kedah, Kelantan,
Melaka, Megeri Sembilan, Pahang, Perak, Penang, Perlis, Selangor, Singapore,
Terengganu and Langkawi. Also found in Nicobar Islands, Peninsular Thailand,
Sumatra, Java, Borneo and Philippines.178
Uses: The fruits of this plant can be consumed for food flavouring, the leaves
are used for lice problems and the roots are use as piscicide.178, 180, 183
Constituents: Possibly djenkol acid, rotenoids, coumarins, lignans, terpenoids,
polyacetylenes, alkaloids, saponins, toxalbumins, which are present in other
piscicidal plants.178, 184
Pharmaceutical Interest: Traditional healers often employ many piscicidal
plants in their practice. Previously, active antitumour compounds have been
isolated from several piscicidal plants.184
Kunitz proteinase inhibitors were
identified in the seeds and are commonly used to inhibit the digestive
proteinases of insects leading to possible starvation.185
Whereas, trypsin
inhibitors of Glycine max inhibited 50% of MCF-7 breast cancer cell
proliferation at a low concentration of 4.3 μM.186
Plant material was collected on 21st April 2008 in Sg. Congkak forest,
Malaysia. The bark and leaf specimens were extracted in solvents of
increasing polarity: HEX, EtOAc and EtOH.

48
1.4.1.3 Duabanga grandiflora Walp. (Lythraceae)
Latin name: Duabanga grandiflora (DC.) Walp
Synonymous name: Duabanga sonneratioides
Buch.-Ham, Lagerstroemia grandiflora Roxb. Ex
DC and Leptospartion grandiflorum (Roxb. ex
DC.) Griff.181, 187
Vernacular name: Khykan, Hokol, Lomatia,
Magasawih, Bondraphulla
Order: Myrtales 181
Family: Lythraceae 170, 187
Genus: Duabanga 181
Species: Grandiflora 181
Description: A fast-growing flowering tree of
30 - 40 m in height with straight trunks, light
brown branches with leaves of 25 cm in length
and 10 cm broad. The flowers are 5-7cm in size
and are white in colour with a strong unpleasant
smell. The calyx is bell-shaped and separated
into six segments with many stamens. The fruit
contains many seeds in a leathery capsule and
can be collected in April.188-191
Habitat: They live in mixed evergreen and deciduous forests at an altitude
range of 650 – 1450 M, also commonly found in stream valleys.190, 192
Distribution: Eastern Himalayas (riverbanks of sub-Himalayan valleys),
southwards through Assam to Burma, Andaman Island, India, Malaysia and
Bangladesh, the Philippines, Japan, Thailand, Nepal, Bhutan, Cambodia,
Eastern India, Laos, Myanmar, Northern Thailand and Vietnam.188, 189, 193
Traditional value: In Nepal, the bark of D. grandiflora has been used as a
piscicide.194
The leaf extracts are used traditionally in Thai medicine for their

49
skin whitening, anti-aging and anti-inflammatary properties.195
Additional
dermatological properties include improving sagging, burns, liver spots and
dullness. In Northern Thailand, the seeds of D. grandiflora are used
traditionally for abdominal pain, food poisoning and peptic ulcer.196
The
timber is used for furniture.191
Constituents: Eugeniin (ellagitannin), ellagic acid, hentriacontane,
hentriacontanol, hentriacontanone, b-sitosterol, a-amyrin, epioleanolic acid,
epifriedelinol, lignoceryl ferulate, betulinic acid, acacetin, tetramethylellagic
acid, quercetin 3-glucoside and 3-galactoside, genkwanin and gentianin 40-
galactoside.195-197
Furthermore,duabanganals, latifolinal, 3b-hydroxyursane-
9(11),12-diene, 3b-hydroxy-12-oleanen-11-one, oleanolic acid, 3-O-(E)-
coumaroyloleanolic acid, 3b-hydroxyolean-9(11),12-diene, hyptatic acid,
betulenic acid 12, divergioic acid, (E)-5-(2-form-ylvinyl)-7-methoxy-2(3,4-
methylenedioxyphenyl)benzofuran, 3,4-O-methylenedioxy-30,40,50-tri-O-
methylellagic acid, vanillin, b-sitosterol, b-sitosterol glucoside, 3-hydroxy-4-
methoxycinnamaldehyde and 5-formyl- furfurol.193
Eugeniin (37) has also
been isolated from Geum japonicum and Syzygium aromaticum.198
37
Figure 1-18: The chemical structure of eugeniin (37).
Pharmaceutical Interest: The extracts contain antioxidants and can inhibit
collagenase activity, fat accumulation and melanin formation. Eugeniin has
been shown to stimulate strong dose dependent type III collagen production.196

50
Eugeniin is also found in the bud of Syzygium aromatica and possesses
virucidal effects against herpes simplex virus (HSV) (GI50: 10 μg/ml) and type
A influenza virus.199
Antiviral activity is achieved by hindering RNA and
DNA replication.198, 200
Further investigations on the antiviral properties of
Eugeniin have been published.198-204
Antimicrobial activity was seen in a
range of Gram-negative and Gram-positive bacteria e.g. E. coli and S. aureus,
respectively.205
Cytotoxicity in Walker Carcinosarcoma 256 has also
reported.197
Recently, crude methanolic extracts of D. grandiflora have been
shown to act as a repellent for rice weevil, Sitophilus oryzae.206
The plant material was collected on 21st April 2008 at Semenyih Dam,
Malaysia. HEX, EtOAc, EtOH and water bark and leaf extracts were prepared.
1.4.1.4 Pseuduvaria macrophylla (Oliv.) Merr (Annonaceae)
Latin name: Pseuduvaria macrophylla
(Oliv.) Merr 207, 208
Synonymous name: Mitrephora
macrophylla Oliv 207, 208
Vernacular name: Unknown
Order: Magnoliales 170
Family: Annonaceae 200
Genus: Pseuduvaria 201
Species: Macrophylla 170, 207, 208
Description: A small tree with a wide spread growing up to 20-30 ft.173
Pseuduvaria genus could be informally classed into: basal grade, long branch
clade (47 genera and 1,500 species) and short branch clade (50 genera and 700
species) based on the differing rates of molecular divergence recorded. The
flowers appearance resembles three sepals and two whorls of three petals,

51
usually unisexual. The inner petals are differentiated into a blade and basal
claw and usually longer than the outer petals.209
Distribution: Malaysia hosts 12 species of the short branch clade, of which,
eight are endemic. Found in the lowland and hill forest of Pulau Tioman,
Peninsular Malaysia, Sungai Air Besar and southern Thailand.173, 210, 211
Traditional value: P. macrophylla has been reported to treat coughs, fever,
nausea and vomiting.211, 212
Constituents: Dioxoaporphine alkaloid: 1,2,3-trimethoxy-4,5-dioxo-6a,7-
dehydroaporphine and O-methylmoschatoline.213
1,2,3-trimethoxy-4,5-dioxo-
6a,7-dehydroaporphine (yellow colour, melting point 199-201 °C) was also
isolated from Peperomia sui and Pseuduvaria setsoa.214
38 39
Figure 1-19: The chemical structures of 1,2,3-trimethoxy-4,5-dioxo-6a,7-
dehydroaporphine (38) and O-methylmoschatoline (39).
Pharmaceutical Interest: Antimicrobial activity was seen in a range of
Gram-negative and Gram-positive bacteria such as Escherichia coli and
Staphylococcus aureus, respectively.205
Due to the decreasing endemic status
of this species, not many reports have been published on this species.209
Other
dioxoaporphines such as cepharadione and artabotrine have shown
antimicrobial activies as well as anticancer activity against P-388 leukaemia
cell lines, respectively.215
The collection took place on 8th
August 2007 at Sg. Congkak forest in
Malaysia. Extracts from whole plant were prepared in HEX, EtOAc and EtOH.

52
1.5 Research aims and objectives
Mankind has a long history of using natural products to prevent and treat
diseases such as cancers. The biology and chemistry of natural products and
their associated mechanisms of action are becoming better understood as
research methods and technologies progress. Previously, limited reports
described antitumour activities of A. ellipticum and D. grandiflora extracts
whereas P. macrophylla has never before been examined for its biological
activity therefore these plants‟ extracts are worthy of investigation to validate
their use(s), to build on existing knowledge and explore the potential of these
traditional medicinal plants for treatment of cancer and/or other diseases.
The aims of this project were to investigate selected Malaysian Rainforest
plants for their potential antitumour properties and possible mechanism(s) of
action. The rationale for selecting the aforementioned plants for investigation
is based on the lack of available data on the biological activities of the species
in general or the lack of scientific evidence for it as a potential anticancer
activity specifically. Plant specimens were selected to coincide with studies
being conducted by University of Nottingham, Malaysia Campus (UNMC)
colleagues. A systematic approach was taken to study these plant extracts. It
is the major goal of this project to determine whether UNMC plant extracts
contain active phytochemicals, which may affect the survival of cancer cells.
This project is in its infancy and will require interdisciplinary skills and
techniques to evaluate the in vitro biological activities of UNMC plant extracts.
This will support mechanistic studies of the UNMC plant extracts in order to
justify the use of these plants to treat malignant disease.

53
The objectives of this thesis are:
1. To evaluate the in vitro growth inhibitory activities of crude extracts in
a panel of cancer cell lines by measuring the cell viability and analysing
cell cycle distribution. The assays employed to achieve the objectives
are:
i. MTT assay
ii. Clonogenic assay
iii. Flow cytometric techniques using fluorescent staining of DNA
with propidium iodide (PI)
2. To investigate whether the UNMC plant extracts induce apoptosis and
to confirm any positive findings in a sensitive cell line.
i. Using flow cytometric analysis to measure dual Annexin V and
PI florescent staining
ii. Confirmation of apoptosis by Western blotting techniques by
employing specific antibodies to detect caspases and survival
proteins.
3. To evaluate additional putative anticancer properties of extracts
including the ability to
i. Inhibit cancer cell migration adopting the wound-healing
(scratch) assay.
ii. Induce cellular senescence, an irreversible process leading to
cell death. The assay employed to achieve this objective is
intracellular detection the senescence marker β-galactosidase.
4. To evaluate potential chemopreventive properties of UNMC plant
extracts by determining extract chemical contents as well as measuring
the in vitro free radical scavenging activity. The following methods
were employed:
a. Aluminium chloride method to determine the total flavonoid
content

54
b. Folin Cioulteau methods to determine the total phenolic content
c. DPPH assay to measure the free radical scavenging activity.
5. To conduct initial activity-guided fractionation of crude extracts to
enable identification of fraction(s) containing possible active
components, if any. The following methods were employed:
i. Crude fractionation of UNMC extracts using extraction
cartridge then analysing the collected material via HPLC
techniques.
ii. To determine growth inhibitory properties of the crude extract
fractions in selected cell lines using the MTT assay.
A literature search was performed on the medicinal uses and chemical
constituents of A. wilkesiana, P. macrophylla, A. ellipticum and D. grandiflora.
For instance D. grandiflora extracts have been used to treat stomach pain and
for skin whitening through traditional practice in Thailand and its activity has
been verified by identifying eugeniin, the active compound responsible.196
There is a lack of evidence of P. macrophylla's biological activity, however it
was found to possess high levels of compounds possessing alkaloid
functionality.213, 214
A range of phytochemicals such as alkaloids found in
plants possess therapeutic properties, thus suggesting the aforementioned
plants are worthy of further investigation into their potential anticancer
properties (refer to Plant profiles 1.4.1).28, 32, 89, 216

55
2
The influence of Acalypha wilkesiana, Duabanga grandiflora,
Archidendron ellipticum and Pseuduvaria macrophylla crude
extracts on cell viability
Approaches to select natural compounds as sources of potential anticancer drug
leads include evaluating evidence of medicinal plants used in traditional
systems or through random screening of natural compounds. Either approach
would require validation via rapid, inexpensive and robust methods. Assays
assessing cell viability are widely adopted in the preliminarily selection to
identify those extracts with good activity. For instance the sulforhodamine B
(SRB) assay is currently employed by the NCI in vitro anticancer-drug
discovery program.217
Other popular cell viability assays used in small-scale
assessment of cancer cell viability after exposure to investigational compounds
include tetrazolium salt-based assays such as 2,3-bis-(2-methoxy-4-nitro-5-
sulfophenyl)-2H-tetrazolium-5-carboxanilide (XTT) and 3-(4,5-
dimethylthiazol-2-yl)-2,5-diphenyltetrazolium bromide (thaizolyl blue;
MTT).93, 218
Identification of „active‟ extracts in primary screening would
facilitate selection of „active‟ crude extracts to undergo further investigations.
2.1 Selection of UNMC plant extracts for investigation
Following the literature search, it was proposed that a primary screen
investigating the anticancer activity of the plant extracts would enable
preliminary selection of UNMC plant extracts. A range of bioassays has been
considered and the robust and inexpensive, MTT and clonogenic assays were
employed to examine in vitro growth inhibitory and cytotoxicity effects of the
extracts in human-derived cancer cell lines. A cell panel was employed
consisting of two breast adenocarcinoma cell lines, two ovarian carcinoma cell
lines, two renal carcinoma cell lines, two colon carcinoma cell lines and a non-
transformed lung fibroblast cell line. Non-transformed MRC-5 fibroblasts

56
were employed as a preliminary control to assess the putative selectivity of the
in vitro growth inhibitory and cytotoxicity effects of UNMC plant extracts to
cancer cells. A cervical cell line, SiHa, containing human papilloma virus
(HPV) was included in the cell line panel to test D. grandiflora extracts due to
previous reports of anti-viral activity by eugeniin.202
Subsequently, sensitive
cell lines were selected to conduct further in vitro examination to assess
potential anticancer effects of UNMC plant extracts. The details of each type
of cancer cell line and the specific cell lines utilised are shown in Table 2-1.
Table 2-1: Mammalian cell lines used for primary selection.
Cell
type Cell line Characteristics Reference
Bre
ast
ad
eno
carc
ino
ma
MCF-7
Er+; p53
+; express WNT7B
oncogene. Growth is inhibited
TNF-α.
Cellular products: insulin-like
growth factor binding proteins
BP-2, BP-4 and BP-5. Isolated
from adult Caucasian female.
ATCC no‟: HTB-22; Brooks et al.
1973219
MDA-MB-
468
Er- ; PR
- ; Her 2
-; expression of
EGF and TNF-α. Isolated from
African female.
ATCC no‟: HTB-132; Cailleau et
al. 1978220
Ov
aria
n a
den
oca
rcin
om
a IGROV1 Isolated from adult female. Bénard et al.
1985221
SK-OV-3
Blood type B (Rh+). Isolated
from adult Caucasian female.
Resistant to TNF-α and several
cytotoxic drugs including
diphtheria toxin, cis-platinum
and adriamycin.
ATCC no‟: HTB-77; Frogh et al.
1975222
Ren
al c
ell
carc
ino
ma
Caki-1
Blood type O (Rh-). Contains
many microvilli, few filaments,
many small mitochondria, well-
developed Golgi and ER, lipid
droplets and multilaminate
bodies, secondary lysosomes.
Isolated from adult Caucasian
male.
ATCC no‟: HTB-
46; Frogh et al. 1975222

57
TK-10 Human spindle cell carcinoma
isolated from adult male. Bear et al. 1987223
Co
lore
ctal
car
cin
om
a HCT116
TGFβ-1+; P53 (wild-type) and
mutation in codon 13 of ras
protooncogene. Cellular
products: keratin and
carcinoembryonic antigen.
Isolated from adult male.
ATCC no‟: CCL-
247; Brattain et al. 1981224
HCC2998 P53 (mutated) and K-ras (wild-
type)
Goldwasser et al. 1995225 and
Kobayashi et al. 1999226
Cer
vic
al s
qu
amo
us
cell
car
cin
om
a
SiHa
P53+; pRB
+; HPV-16 (1 to 2
copies per cell). Grade II
squamous cell carcinoma with
an abundance of tonofilaments
in the cytoplasm. Isolated from
adult Asian female.
ATCC no‟: HTB-
35; Durst et al. 1992227
No
rmal
hu
man
fo
etal
lun
g f
ibro
bla
st
MRC-5
Isolated from 14 weeks gestation
Caucasian male. Onset of
senescence occurs after 42 to 46
population doublings.
ATCC no‟: CCL-171; Jacobs et al.
1970228
Information on the human cell lines used can be obtained from American Type
Cell Culture (www.atcc.org) and National Cancer Institute
(http://dtp.nci.nih.gov).
58
2.1.1 In vitro growth inhibitory and cytotoxicity effects of
UNMC plant extracts in a cell line panel
An established method to observe the cell viability of a cell line after exposure
to a compound of interest is the MTT assay.229, 230
The method is mediated by
substrates of mitochondrial dehydrogenases such as succinate, NADH and
NADPH in viable cells to reduce soluble MTT dye into insoluble formazan
with adsorption range between 510 and 570 nm.231, 232
Therefore, the MTT
assay can be used to investigate the effect of plant extracts on cell viability and
proliferation in a panel of cancer cell lines. The mean absorbances were used
to construct a dose-response curve, from which the estimated extract
concentration inducing 50% growth inhibition (GI50 value) was calculated.
The selection criteria for „active‟ crude extracts are GI50 values of ≤ 20 μg/ml
from in vitro assays.95
The cell lines were exposed to serial dilution of UNMC extracts for 72 h,
followed by the addition of MTT. The cells were then incubated for 4 h at
37 °C before absorbance at 555 nm was read according to the MTT assay
protocol outlined in Section 9.2.3. The absorbance of formazan for the cells at
time of treatment (T0) was also measured to determine basal level formazan
produced by the viable cells. The T0 value then allowed the calculation of the
concentration of plant extract required to inhibit cell proliferation by 50%
(GI50). Furthermore, the anti-carcinogenic flavonoid, quercetin, was used as a
positive control.233
Quercetin was used to ensure that any activity seen for the
extracts was not due to experimental error. Therefore, quercetin was tested
against the cell line panel (n = 4) in at least three independent experiments.
2.1.1.1 In vitro growth inhibitory and cytotoxicity effects of Acalypha
wilkesiana extracts in a cell line panel
A. wilkesiana (whole plant) EtOH and EtOAc extracts have demonstrated
growth inhibitory effects across the cell line panel as shown in Table 2-2 (see
appendix 1 for dose-response curves). Interestingly, both breast MCF-7 and
MDA-MB-468, ovarian SK-OV-3 and CRC HCT116 cell lines appear to be

59
amongst the most sensitive to the growth inhibitory effects of the EtOH and
EtOAc extracts.
Table 2-2: In vitro growth inhibitory effects of A. wilkesiana extracts in a cell
line panel revealed by the MTT assay.
Mean GI50 values (μg/ml)
A.
wil
kesi
ana
extr
acts
MC
F-7
MD
A-M
B-4
68
IGR
OV
1
SK
-OV
-3
Ca
ki-
1
TK
-10
HC
T1
16
HC
C29
98
MR
C-5
EtO
H 43.41
± 9.85
22.67 ±
3.66
44.66 ±
1.47
41.80 ±
7.29
64.23 ±
4.51
77.99 ±
7.18
35.98 ±
1.53
88.74 ±
3.71
46.60 ±
8.03
EtO
Ac 35.96
± 1.27
15.88
±
4.28
60.32
± 8.13
46.23
± 8.52
120.99
± 20.34
52.23
± 5.96
39.14
± 0.84
79.86
± 3.42
53.26
± 9.23
HE
X
>200 >200 >200 >200 >200 >200 >200 >200 >200
Qu
erce
tin
5.33 ±
6.31
22.88±
8.08
9.66 ±
0.24
4.49 ±
1.37
5.03 ±
0.48
14.53±
1.24
21.47 ±
9.26
20.76±
12.61
18.56 ±
9.25
Extract concentration (μg/ml) at which cell growth is inhibited by 50% (GI50)
after 72 h exposure. Mean GI50 values (μg/ml) ± SEM were obtained from ≥ 3
(n = 4) individual experiments where active crude extracts (GI50 values ≤ 20
μg/ml) are highlighted in bold, extracts ± SEM values that could be considered
active are highlighted in italics; the lowest GI50 values are underlined.
Fingerprint graphs (Figure 2-1) highlight MDA-MB-468 as the most sensitive
cell line to EtOH and EtOAc extracts, with mean GI50 values of 22.67 μg/ml
and 15.88 μg/ml, respectively. However EtOH and EtOAc extracts did not
demonstrate selectivity between cancer cell lines and MRC-5 fibroblasts.
EtOH and EtOAc extract-treated MDA-MB-468 cells produced GI50 values of
22.67 μg/ml and 15.88 μg/ml, respectively, which are near or lower than the
selection criteria set (~ 20 μg/ml).

60
Figure 2-1: NCI-style mean fingerprint graphs for A. wilkesiana extracts.
EtOH, EtOAc and HEX extracts were screened against a cell line panel and the
bars represent the individual mean GI50 value of the cell line. The overall
mean GI50 value of all the cell lines was set to the center (0.0); all values were
to the function of log10. Bars to the left indicate cell lines that are less sensitive
than the mean and bars to the right indicate cell lines that are more sensitive
than the mean to the extract.
-0.50 -0.25 0.00 0.25 0.50
MCF-7
MDA-MB-468
IGROV-1
SKOV-3
Caki-1
TK-10
HCT116
HCC2998
MRC-5
Log10 C
ell lin
es
Mean cell line panel GI50: 51.79 µg/ml
EtOH
-0.50 -0.25 0.00 0.25 0.50
MCF-7
MDA-MB-468
IGROV-1
SKOV-3
Caki-1
TK-10
HCT116
HCC2998
MRC-5
Log10
Cel
l lin
es
Mean cell line panel GI50: 55.99 µg/ml
EtOAc
-0.50 -0.25 0.00 0.25 0.50
MCF-7
MDA-MB-468
IGROV-1
SKOV-3
Caki-1
TK-10
HCT116
HCC2998
MRC-5
Cel
l lin
es
Log10
Mean cell line panel GI50: > 200 µg/ml
HEX

61
In addition, HCT116 cells revealed modest sensitivity towards EtOH and
EtOAc extracts with GI50 values of 35.98 and 39.14 μg/ml, respectively. The
difference between EtOH and EtOAc extract-treated mean cell line panel
(GI50) is 4.20 μg/ml, suggesting growth inhibitory and cytotoxic effects of both
extracts are similar. There was no difference between the mean GI50 values for
cell lines exposed to HEX extracts (> 200 μg/ml) since no growth inhibitory
effects were demonstrated at the concentrations used.
2.1.1.2 In vitro growth inhibitory and cytotoxicity effects of Archidendron
ellipticum extracts in a cell line panel
GI50 values for A. ellipticum extracts were determined using the MTT assay
and are summarised in Table 2-3 (see Appendix 1 for dose-response curves).
EtOH bark and leaf extracts inhibited the growth of cancer cell lines at low
concentrations, MDA-MB-468 (1.73 and 9.32 μg/ml), Caki-1 (21.71 and 5.07
μg/ml), HCT116 (11.65 and 3.51 μg/ml) and HCC2998 (3.74 and 2.94 μg/ml)
cells, respectively. To a lesser extent, growth of ovarian SK-OV-3 cells
responded to EtOH bark extract (10.00 μg/ml), whereas renal TK-10 cells only
responded to EtOH leaf extract (28.77 μg/ml).
In comparison, growth inhibitory effect of EtOH extracts appeared to be
greater than EtOAc extracts as represented by mean cell line panel GI50 (EtOH
bark: 45.28 and EtOH leaf: 45.73; EtOAc bark: 54.47 and EtOAc leaf: 138.82
μg/ml). Whereas, > 2-fold observed difference between the mean cell line
panel GI50 values of EtOAc bark (54.47 μg/ml) and EtOAc leaf (135.82 μg/ml)
extracts. Data from Table 2-3 revealed EtOH bark and leaf extracts
demonstrated comparable activity (GI50 values) in MDA-MB-468, SK-OV-3,
Caki-1, TK-10, HCT116, HCC2998 and MRC-5 cells (Figure 2-2).
Overall, EtOH extracts induced the greatest growth inhibitory effects across the
cell line panel, particularly, in renal and CRC cell lines. It is interesting to note
comparable mean GI50 values was observed across the cell line panel in bark
and leaf extracts of the same solvents, e.g. EtOH bark = 45.73 μg/ml and leaf =
45.28 μg/ml; HEX bark = 189.81 μg/ml and leaf = > 200 μg/ml) extracts. In
general, cell growth remained unaffected by HEX extracts even at high
concentration of 200 μg/ml, which is 10X greater than the NCI‟s selection

62
criteria for crude extract activity. Furthermore, MRC-5 fibroblasts responded
to EtOH and EtOAc bark and EtOH leaf extracts at low GI50 values: 3.82,
18.80 and 3.29 μg/ml, respectively.
Table 2-3: In vitro growth inhibitory effects of A. ellipticum extracts in a cell
line panel revealed by the MTT assay.
Mean GI50 values (μg/ml)
A.
elli
pti
cum
extr
acts
MC
F-7
MD
A-M
B-
468
IGR
OV
1
SK
-OV
-3
Ca
ki-
1
TK
-10
HC
T1
16
HC
C29
98
MR
C-5
BA
RK
EtO
H 151.85
±
5.82
1.73
±
1.52
174.2
1±
19.37
10.00
±
4.01
21.71
±
6.78
28.77
±
3.29
11.65
±
2.43
3.74
±
0.26
3.82
±
1.78
EtO
Ac 82.35
± 4.07
40.43
± 7.13
53.78
± 12.80
62.26
± 11.17
75.22
± 7.38
32.45
± 2.98
72.24
± 2.21
52.68
± 4.26
18.80
± 5.90
2.1
.1.3
H
EX
>200 >200
166.93
±
10.46
>200 >200 >200
141.36
±
10.07
>200 >200
LE
AF
EtO
H 97.64
±
2.67
9.32
±
5.98
242.05
±
4.97
42.51
±
4.49
5.07
±
0.59
5.24
±
0.50
3.51
±
0.16
2.94
±
0.51
3.29
±
0.42
EtO
Ac
>200 9.28
±
1.16
198.50
±
26.67
108.12
±
7.10
>200 >200
122.22
±
5.89
19.97
±
9.66
69.73
±
0.95
HE
X 193.42
±
14.52
>200 >200 >200 >200 >200 >200 >200 >200
Qu
erce
tin
5.33 ±
6.31
22.88 ±
8.08
9.66 ±
0.24
4.49 ±
1.37
5.03 ±
0.48
14.53±
1.24
21.47 ±
9.26
20.76±
12.61
18.56 ±
9.25
Extract concentration (μg/ml) at which cell growth is inhibited by 50% (GI50)
after 72 h exposure. Mean GI50 values (μg/ml) ± SEM were obtained from ≥ 3
(n = 4) individual experiments where active crude extracts (GI50 values ≤ 20
μg/ml) are highlighted in bold, extracts ± SEM values that could be considered
active are highlighted in italics; the lowest GI50 values are underlined.

63
Figure 2-2: NCI-style mean fingerprint graphs for A. ellipticum extracts. EtOH, EtOAc and HEX extracts were screened against a cell line panel and the
bars represent the individual mean GI50 value of the cell line. The overall
mean GI50 value of all the cell lines was set to the center (0.0); all values were
to the function of log10. Bars to the left indicate cell lines that are less sensitive
than the mean and bars to the right indicate cell lines that are more sensitive
than the mean to the extract.
-1.5 -1.0 -0.5 0.0 0.5 1.0 1.5
MCF-7
MDA-MB-468
IGROV-1
SKOV-3
Caki-1
TK-10
HCT116
HCC2998
MRC-5
Log10
Cell lin
es
Mean cell line panel GI50: 45.28 µg/ml
EtOH
-1.5 -1.0 -0.5 0.0 0.5 1.0 1.5
MCF-7
MDA-MB-468
IGROV-1
SKOV-3
Caki-1
TK-10
HCT116
HCC2998
MRC-5
Log10
Cell lin
es
Mean cell line panel GI50: 54.47 µg/ml
EtOAc
-1.5 -1.0 -0.5 0.0 0.5 1.0 1.5
MCF-7
MDA-MB-468
IGROV-1
SKOV-3
Caki-1
TK-10
HCT116
HCC2998
MRC-5
Log10
Cell lin
es
Mean cell line panel GI50: 189.81 µg/ml
HEX
-1.5 -1.0 -0.5 0.0 0.5 1.0 1.5
MCF-7
MDA-MB-468
IGROV-1
SKOV-3
Caki-1
TK-10
HCT116
HCC2998
MRC-5
Log10
Cell lin
es
Mean cell line panel GI50: 45.73 µg/ml
EtOH
-1.5 -1.0 -0.5 0.0 0.5 1.0 1.5
MCF-7
MDA-MB-468
IGROV-1
SKOV-3
Caki-1
TK-10
HCT116
HCC2998
MRC-5
Cell lin
es
Log10
Mean cell line panel GI50: 138.82 µg/ml
EtOAc
-1.5 -1.0 -0.5 0.0 0.5 1.0 1.5
MCF-7
MDA-MB-468
IGROV-1
SKOV-3
Caki-1
TK-10
HCT116
HCC2998
MRC-5
Log10
Cell lin
es
Mean cell line panel GI50
: > 200 µg/ml
HEX
Bark Leaf

64
2.1.1.4 In vitro growth inhibitory and cytotoxicity effects of Duabanga
grandiflora extracts in a cell line panel
The in vitro growth inhibitory and cytotoxicity activities of D. grandiflora bark
and leaf extracts across the cell line panel are summarised in Table 2-4 (see
Appendix 1 for dose-response curves). Interestingly, polar Water bark extracts
induced growth inhibition only in breast cancer MCF-7 cells at concentrations
within NCI‟s selection criteria (19.53 μg/ml). Growth inhibition of renal
cancer Caki-1 and CRC HCT116 cells was observed at a lesser extent when
exposed to EtOH bark extract (GI50 values: 34.40 and 37.54 μg/ml,
respectively). EtOAc bark extract demonstrated greatest growth inhibitory
effects across the cell panel, in particular, MCF-7 (19.87 μg/ml), HCT116
(21.69 μg/ml) and HCC2998 (4.65 μg/ml) cell lines. The cell lines most
susceptible to growth inhibitory effects of HEX bark extracts were breast
cancer MCF-7 (29.70 μg/ml) and CRC HCT116 (28.88 μg/ml) cells.
Overall, EtOAc and HEX extracts appeared to induce growth inhibitory effects
in the greatest number of cell lines amongst the bark extracts. In comparison,
EtOAc leaf extract emerged as effective in inhibiting the growth of CRC
HCT116 (24.73 μg/ml) and breast cancer MDA-MB-468 (33.24 μg/ml) cells at
similar concentrations to bark extracts. However, this trend was not seen in
cells under the influence of Water leaf extract treated e.g. MDA-MB-468 (GI50
37.40 μg/ml) and HCT116 (GI50 38.02 μg/ml) cells and EtOH leaf extracts-
treated breast cancer MCF-7 (34.47 μg/ml) and HCT116 (40.92 μg/ml) cells.
A lack of cellular response to HEX leaf extract was observed at the highest
concentration tested (> 200 μg/ml). In general, bark extracts presented the
most number of active extracts against the cell line panel with mean cell line
panel GI50 values of 65.04, 105.54, 31.58 and 36.36 and μg/ml for Water,
EtOH, EtOAc and HEX extracts respectively, as compared to 79.80, 61.41,
43.78 and > 200 μg/ml for Water, EtOH, EtOAc and HEX leaf extracts,
respectively. D. grandiflora bark extracts demonstrated broader growth
inhibitory properties against the cell line panel compared to leaf extracts,
suggesting different components are embedded in the extracts. MDA-MB-468,
MCF-7 Caki-1, HCT116 and HCC2998 cells have shown broad sensitivity
towards D. grandiflora extracts; contrarily IGROV1, SK-OV-3 and TK-10
cells were less sensitive to D. grandiflora extracts (Figure 2-3). Undesirably,

65
low GI50 (μg/ml) values of 7.37 and 20.88 in MRC-5 fibroblasts were obtained
in both EtOAc and HEX bark extracts, respectively.
Table 2-4: In vitro growth inhibitory effects of D. grandiflora extracts in a cell
line panel revealed by the MTT assay.
Mean GI50 values (μg/ml)
D.
gra
ndif
lora
extr
acts
MC
F-7
MD
A-M
B-
468
IGR
OV
1
SK
-OV
-3
Ca
ki-
1
TK
-10
HC
T1
16
HC
C29
98
SiH
a
MR
C-5
BA
RK
Wat
er 19.53
±
3.97
47.28
±
7.34
69.98
±
7.83
63.93
±
6.12
46.69
±
3.38
113.6
5 ±
11.03
42.44
±
3.28
106.94
±
11.07
-
74.9
1 ±
12.8
2
EtO
H 146.0
9 ±
9.35
40.04
±
3.32
194.1
5 ±
15.77
135.6
9 ±
8.00
34.40
±
12.25
153.3
6 ±
22.06
37.54
±
5.68
141.46
±
18.31
64.
76
±
9.4
1
67.1
2 ±
3.60
EtO
Ac 19.87
±
1.43
36.24
±
4.10
29.49
±
3.00
71.60
±
8.00
31.53
±
10.66
61.78
±
0.56
21.69
±
0.64
4.65
±
2.13
69.01
±
3.54
7.37
±
1.32
HE
X 29.70
±
0.53
34.95
±
1.79
31.47
±
2.57
56.59
±
7.63
52.93
±
4.97
36.65
±
5.79
28.88
±
1.55
35.22
±
3.27
67.06
±
3.28
20.8
8 ±
1.34
LE
AF
Wat
er 57.85
±
6.40
37.40
±
5.45
79.9
±
3.78
66.58
±
3.64
88.52
±
2.71
150.1
7 ±
2.96
38.02
±
3.25
111.34
±
20.11
-
88.3
8 ±
15.7
9
EtO
H 34.47
±
2.78
44.59
±
7.84
71.01
±
7.40
49.65
±
9.12
40.79
±
7.36
108.4
8 ±
12.99
40.92
±
5.14
91.23
±
8.45
49.21
±
8.63
71.5
8 ±
2.96
EtO
Ac 47.52
±
2.77
33.24
±
7.37
49.36
±
3.94
36.13
±
4.87
43.05
±
8.86
62.85
±
2.32
24.73
±
1.11
66.33
±
7.72
73.62
±
3.05
30.7
7 ±
4.83
HE
X
>200 >200 >200 >200 >200 >200 >200 >200 >200 >200
Extract concentration (μg/ml) at which cell growth is inhibited by 50% (GI50)
after 72 h exposure. Mean GI50 values (μg/ml) ± SEM were obtained from ≥ 3
(n = 4) individual experiments where active crude extracts (GI50 values ≤ 20
μg/ml) are highlighted in bold, extracts ± SEM values that could be considered
active are highlighted in italics; the lowest GI50 values are underlined.

66
Figure 2-3: NCI-style mean fingerprint graphs for D. grandiflora extracts. Water, EtOH, EtOAc and HEX extracts were screened against a cell line panel
and the bars represent the individual mean GI50 value of the cell line. The
overall mean GI50 value of all the cell lines was set to the center (0.0); all
values were to the function of log10. Bars to the left indicate cell lines that are
less sensitive than the mean and bars to the right indicate cell lines that are
more sensitive than the mean to the extract.
-0.8 -0.4 0.0 0.4 0.8
MCF-7
MDA-MB-468
IGROV-1
SKOV-3
Caki-1
TK-10
HCT116
HCC2998
MRC-5
MRC5
Log10
Cel
l lin
es
Mean cell line panel GI50: 105.54 µg/ml
EtOH
-0.8 -0.4 0.0 0.4 0.8
MCF-7
MDA-MB-468
IGROV-1
SKOV-3
Caki-1
TK-10
HCT116
HCC2998
MRC-5
MRC5
Log10
Cel
l lin
es
Mean cell line panel GI50: 31.58 µg/ml
EtOAc
-0.8 -0.4 0.0 0.4 0.8
MCF-7
MDA-MB-468
IGROV-1
SKOV-3
Caki-1
TK-10
HCT116
HCC2998
MRC-5
MRC5
Log10
Cel
l lin
es
Mean cell line panel GI50: 36.36 µg/ml
HEX
-0.8 -0.4 0.0 0.4 0.8
MCF-7
MDA-MB-468
IGROV-1
SKOV-3
Caki-1
TK-10
HCT116
HCC2998
MRC-5
Log10
Cel
l lin
es
Mean cell line panel GI50
: 65.04 µg/ml
Water
-0.8 -0.4 0.0 0.4 0.8
MCF-7
MDA-MB-468
IGROV-1
SKOV-3
Caki-1
TK-10
HCT116
HCC2998
MRC-5
MRC5
Log10
Cel
l lin
esMean cell line panel GI
50: 61.41 µg/ml
EtOH
-0.8 -0.4 0.0 0.4 0.8
MCF-7
MDA-MB-468
IGROV-1
SKOV-3
Caki-1
TK-10
HCT116
HCC2998
MRC-5
MRC5
Log10
Cel
l lin
es
Mean cell line panel GI50
: 43.78 µg/ml
EtOAc
-0.8 -0.4 0.0 0.4 0.8
MCF-7
MDA-MB-468
IGROV-1
SKOV-3
Caki-1
TK-10
HCT116
HCC2998
MRC-5
MRC5
Cel
l lin
es
Log10
Mean cell line panel GI50
: > 200.00 µg/ml
HEX
-0.8 -0.4 0.0 0.4 0.8
MCF-7
MDA-MB-468
IGROV-1
SKOV-3
Caki-1
TK-10
HCT116
HCC2998
MRC-5
Cel
l lin
es
Log10
Mean cell line panel GI50: 79.80 µg/ml
Water
Bark Leaf

67
2.1.1.5 In vitro growth inhibitory and cytotoxicity effects of Pseuduvaria
marcophylla extracts in a cell line panel
The MTT assay demonstrated P. macrophylla extracts exerted in vitro growth
inhibitory activity in all the cell line panel: potency EtOAc > EtOH > HEX
(summarised in Table 2-5 and dose-response curves are shown in Appendix 1).
Table 2-5: In vitro growth inhibitory effects of P. macrophylla extracts in a
cell line panel revealed by the MTT assay.
Mean GI50 values (μg/ml)
P. m
acr
op
hyl
la
extr
acts
MC
F-7
MD
A-M
B-4
68
IGR
OV
1
SK
-OV
-3
Ca
ki-
1
TK
-10
HC
T1
16
HC
C2
99
8
MR
C-5
EtO
H 4.16
±
1.84
5.36
±
2.45
6.59
±
1.07
3.73
±
1.17
4.53
±
1.49
6.98
±
3.04
5.16
±
1.07
3.96
±
1.59
5.01
±
1.13
EtO
Ac 1.23
±
0.61
1.15
±
0.37
5.38
±
0.12
1.52
±
0.66
1.47
±
0.66
2.12
±
0.48
1.61
±
0.39
2.00
±
1.08
1.71
±
0.57
HE
X 18.72
±
4.00
6.49
±
0.94
9.32
±
2.06
5.88
±
1.98
12.95
±
6.92
13.10
±
5.81
5.41
±
1.58
9.82
±
2.34
26.23
±
6.82
Qu
erce
tin
5.33 ±
6.31
22.88±
8.08
9.66 ±
0.24
4.49 ±
1.37
5.03 ±
0.48
14.53±
1.24
21.47 ±
9.26
20.76±
12.61
18.56 ±
9.25
Extract concentration (μg/ml) at which cell growth is inhibited by 50% (GI50)
after 72 h exposure. Mean GI50 values (μg/ml) ± SEM was obtained from ≥ 3
(n = 4) individual experiments where active crude extracts (GI50 values ≤ 20
μg/ml) are highlighted in bold, extracts ± SEM values that could be considered
active are highlighted in italics; the lowest GI50 values are underlined.
EtOAc extract yielded GI50 values ≤ 2 μg/ml in MCF-7, MDA-MB-468, SK-
OV-3, Caki-1, HCC2998 and HCT116 cancer cells as well as in MRC-5
fibroblasts. The activity between the EtOH and HEX extracts showed
comparable growth inhibitory effects. HEX extracts revealed moderate
selectivity (~ 5-fold) towards cancer cell lines MDA-MB-468, SK-OV-3 and
HCT116 (GI50 values of 6.49, 5.88 and 5.41, μg/ml, respectively), over non-
transformed MRC-5 fibroblasts (GI50 values: 26.23 μg/ml). However, EtOAc

68
and EtOH extracts did not demonstrate selectivity towards cancer cells
compared with MRC-5 fibroblasts (Figure 2-4). Subtle differences in cell
panel GI50 values were observed in cell line panel GI50 values following
treatment with EtOH (GI50 value: 5.05 μg/ml) and EtOAc (GI50 value: 2.02
μg/ml) extracts whereas cancer cells‟ sensitivity towards HEX extract varied
(GI50 values: 5.41 to 18.72 μg/ml).
Figure 2-4: NCI-style mean fingerprint graphs for P. macrophylla extracts. EtOH, EtOAc and HEX extracts were screened against a cell line panel and the
bars represent the individual mean GI50 value of the cell line. The overall
mean GI50 value of all the cell lines was set to the center (0.0); all values were
to the function of log10. Bars to the left indicate cell lines that are less sensitive
than the mean whereas bars to the right indicate cell lines that are more
sensitive than the mean to the extract.
-0.50 -0.25 0.00 0.25 0.50
MCF-7
MDA-MB-468
IGROV-1
SKOV-3
Caki-1
TK-10
HCT116
HCC2998
MRC-5
Log10
Cel
l lin
es
EtOH
Mean cell line panel GI50: 5.05 µg/ml
-0.50 -0.25 0.00 0.25 0.50
MCF-7
MDA-MB-468
IGROV-1
SKOV-3
Caki-1
TK-10
HCT116
HCC2998
MRC-5
Log10
Cel
l lin
es
Mean cell line panel GI50: 2.02 µg/ml
EtOAc
-0.50 -0.25 0.00 0.25 0.50
MCF-7
MDA-MB-468
IGROV-1
SKOV-3
Caki-1
TK-10
HCT116
HCC2998
MRC-5
Log10
Cel
l lin
es
Mean cell line panel GI50: 11.99 µg/ml
HEX

69
2.1.1.6 Summary of the in vitro growth inhibitory and cytotoxicity effects
of UNMC extracts in a cell line panel
The MTT assay was used to examine in vitro growth inhibition and
cytotoxicity of UNMC plant extracts‟ effects in human-derived cancer cells;
extracts‟ selectivity against cancer cell line was compared in non-transformed
fibroblasts.
Acalypha wilkesiana: Extracts of A. wilkesiana primarily affected breast
cancer cell line, MDA-MB-468 (GI50 values: EtOH: 22.67 and EtOAc: 15.88
μg/ml, respectively) and MCF-7 breast cancer (EtOH: 43.41 and EtOAc: 35.96
μg/ml, respectively). In support of this finding, Büssing et al. (1999) reported
the verification of ethnopharmacological use of A. wilkesiana seeds to treat
breast tumours and inflammation owing to their cytotoxic and
immunomodulatory effects via generation of reactive oxygen intermediates
(ROI), release of pro-inflammatory cytokines TNF-α and IL-6, T-cell-
associated cytokines IL-5 and IL-γ.175
This could be due to the presence of
amphiphilic saponins in the extracts, which has ability to permeabilise cell
membranes.
Another study has reported mean GI50 values of 28.03 and 89.63 μg/ml for
U87MG (grade IV human gliobastoma) and A549 (human lung carcinoma)
cells following 72 h exposure to A. wilkesiana EtOAc extracts. U87MG cells
required almost two times greater concentration of EtOAc extracts to induce
growth inhibitory effects when compared to MDA-MB-468 cells treated with
EtOAc extracts (GI50 15.88 μg/ml).234
Both U87MG and A549 cells were
insensitive to EtOH and HEX extracts (GI50 values between 166.30 to > 300
μg/ml), which corresponded to the trend observed for HEX extracts (see Table
2-2), suggesting unseparated components in crude HEX extract to be least
effective in inducing growth inhibition.
There was minimal selectivity between MDA-MB-468 and MRC-5 cells. No
evidence of growth inhibition was seen in HEX-treated cell lines. The absence
of oestrogen (ER) and progesterone (PR) receptors on MDA-MB-468 cells
may not to be a factor to cells‟ sensitivity towards these extracts, suggesting
the active constituents may not be in the phytochemical class of isoflavonoids
(phyto-oestrogens) or flavonoids (anti-oestrogens). Results from MTT assays

70
revealed MDA-MB-468 cells to be among the most sensitive to the growth
inhibitory properties of A. wilkesiana extracts; therefore MDA-MB-468 cells
were selected for further study with this plant.
Archidendron ellipticum: EtOH extracts from A. ellipticum demonstrated good
activity across the cell line panel. With the exception of ovarian carcinoma
SK-OV-3 cells, the same cell lines responded to growth inhibitory effects of
EtOH bark and leaf extract (MDA-MB-468 > HCC2998 > MRC-5 > HCT116
> TK-10 > Caki-1, in order of sensitivity), suggesting similar compounds are
embedded. MDA-MB-468 cells were sensitive to EtOH and EtOAc extracts at
low concentrations between 1.73 - 9.32 μg/ml. Only MCF-7 and IGROV1
cells revealed less sensitivity towards growth inhibitory effects of the extracts.
Comparable GI50 values suggest that similar phytochemicals might be present
in the EtOH bark and leaf extracts based on the similar sensitivity observed in
MDA-MB-468, SK-OV-3, Caki-1, TK-10, HCT116, HCC2998 and MRC-5
cells.
Beutler et al (1997) stated that in vitro cytotoxicity of several crude legume
extracts from the NCI natural product repository were comparable to that of A.
ellipticum, such as Albizia zygia and Albizia altissima, sharing similar mean
fingerprint patterns with saponins from A. ellipticum.235
Many leguminous
plant seeds contain biologically active compounds that could inhibit proteases
and amylases. Kunitz (serine) proteinase inhibitor, which is present in
germinative tissues of A. ellipticum and many Mimosoideae species possesses
dual functions as storage protein and a part of the plant‟s defensive mechanism
against seed predators.236, 237
Inagaki et al. (2012) identified Kunitz-type
protease inhibitors may affect ion channels (K+, Na
+ and Ca
2+) and inhibit
MMP2 activity hence may have a role in cancer metastasis inhibition.238
Results from MTT assays revealed MDA-MB-468 cells to be among the most
sensitive to growth inhibitory properties of A. ellipticum extracts; therefore
MDA-MB-468 was selected for further study with this plant.
Duabanga grandiflora: EtOAc bark extract of D. grandiflora exerted greatest
activity across the cell line panel with growth inhibition in 70% of the cell line
panel at near 20 μg/ml (NCI‟s selection criteria), in the order of sensitivity:

71
HCC2998 > MRC-5 > MCF-7 > HCT116 > IGROV-1 > Caki-1 > MDA-MB-
468. Overall, HCT116 cells were most sensitive to D. grandiflora extracts
EtOAc (bark) > EtOAc (leaf) > HEX (bark) > EtOH (bark) > Water (leaf)
extracts with GI50 between 21.69 - 38.02 μg/ml. Interestingly, HEX extracts
appeared to induce broad activity against MRC5 > HCT116 > MCF-7 >
IGROV-1 > MDA-MB-468 > HCC2998 > TK-10 cells (in order of sensitivity)
with GI50 values between 20.88 to 36.65 μg/ml. In contrast no growth
inhibition was observed in cells exposed to HEX leaf extracts even at 200
μg/ml. The unresponsiveness of cells to HEX leaf extract (> 200 μg/ml) could
either indicate a lack of potent compounds present in the extract or the masking
of activity by other compounds present.
It is noted that the cervical cell line, SiHa, containing copies of HPV-16 (DNA)
virus was included in the cell line panel due to reports identifying an anti-viral
compound, eugeniin, present in D. grandiflora extracts. Eugeniin interferes
with HSV DNA polymerase therefore it is also a reason to test if these
conserved DNA reading proteins are also affected in HPV.34
Traditional uses
e.g. for anti-aging and anti-whitening, were supported by Tsukiyama et al.
(2010) as the active hydrolysable tannin, eugeniin could stimulate type III
collagen production.196, 198
It was found that 2.74 μg/ml of eugeniin was
effective at inducing cytotoxic effects against 50% of melanoma cells (RPMI-
7951).239
Another study revealed EtOH bark extract of D. grandiflora from
India to be active in Walker carcinosarcoma 256 in rats.197
Conversely,
eugeniin extracted from leaf extracts using MeOH induced growth of human
skin cells, normal human fibroblast (NHF) cells at concentration range between
31 – 125 μg/ml.196
The constituents, oleanane triterpene (pentacyclic
triterpenes) and lupine triterpene (betulinic acid) revealed cytotoxic activity
against an acute lymphoblastic leukaemia cell line, MOLT-3, (GI50: 9.5 and
14.1 μM) and a hepatocarcinoma, HepG2 (GI50: 19.9 and 11.0 μM) cell line.
These constituents were found to be inactive against (GI50 > 50 μM) HuCCA-1
(human chlolangiocarcinoma), A549 (human lung cancer), HeLa (human
cervical carcinoma), and MDA-MB-231 (hormone independent breast cancer)
cell lines.193

72
However, MTT results did not reveal any extract potency against or ability to
promote proliferation of SiHa cells, which may be due to the „masking‟ or
antagonism of eugeniin‟s activity by other compounds in the mixture.
Results from MTT assays revealed HCT116 cells to be among the most
sensitive to growth inhibitory properties of D. grandiflora extracts, therefore
this cell line was selected for further study with this plant.
Pseuduvaria macrophylla: The order of P. macrophylla extracts potency can
be ranked as follow EtOAc > EtOH > HEX based on mean cell line panel GI50
values (5.05, 2.02 and 11.99 μg/ml, respectively). Remarkably, P.
macrophylla extracts were able to inhibit growth across the cell line panel at
concentrations lower than those observed for A. wilkesiana, D. grandiflora and
A. ellipticum hence the most active plant in this collection. Good selectivity
was observed between cancer cells and MRC5 fibroblasts treated with HEX
extract. P. macrophylla plant extracts are the most active against cancer cell
lines and exhibited GI50 effects < 10 μg/ml, which is lower (i.e. more potent)
than selection requirement. There are no previous studies on the biological
activity of P. macrophylla.214
Aporphinoid (38) isolated from aerial parts of
Pseuduvaria setosa has reveal cytotoxicity in small cell lung cancer cells, NCI-
H187 at IC50 value of 3.0 μg/ml. Whereas reduced activity was observed in
KB (epidermoid carcinoma) and BC (breast cancer) cells (IC50: > 20 μg/ml).214
CRC HCT116 cells were amongst the most sensitive to growth inhibitory
properties of P. macrophylla extracts, in particular to HEX extract; therefore
this cell line was selected for further study of P. macrophylla in vitro
anticancer properties.
Further examination of in vitro activity of plant extracts were explored using
other comparable cell-based assays. Growth inhibition was seen in most
cancer lines treated with the above mentioned UNMC plant extracts; HCT116
and MDA-MB-468 cell lines were amongst the most sensitive cell lines hence
chosen for further investigations into in vitro activity of UNMC extracts.

73
2.1.2 Influence of UNMC plant extracts on cell survival and
clonogenicity
The clonogenic assay is another established method to examine the abilities of
cancer cells to survive, proliferate and form colonies. Cytotoxic agents may
exert their effects via various mechanisms including induction of cell cycle
arrest or apoptosis leading to a loss of proliferative potential and protein
degradation, respectively.240, 241
This bioassay determines survival and
subsequent proliferative and colony formation capacity of single cells
following brief exposure (~ 24 h) to extracts of interest.145, 242
The end-point is
considered when the control populations contain ≥ 50 cells per colony.
Subsequently, cell colony(ies) are fixed with methanol then stained with
methylene blue dye then quantified by counting.243, 244
Plumb et al. (1987) and
Carmichael et al. (1987) have reported the positive correlation between the
clonogenic and the MTT assay.243, 245
Hence both assays were used in
conjunction to compare the cytotoxic effects of the aforementioned plant
extracts on the cell survival and proliferation of a panel of cancer cell lines.
The cell lines and treatment concentrations (0.5X, 1X and 2X GI50 values)
chosen to examine the sensitivity to the UNMC extracts were guided by results
of MTT assays. Dunnett‟s multiple comparison (One-way ANOVA) analysis
was used to compare each extract-treated group to the control group. Any
statistically significant values are denoted: * = 0.01< p < 0.05.
2.1.3 Influence of Acalypha wilkesiana extracts on MDA-MB-
468 cells’ survival and clonogenicity
Due to the unavailability of EtOAc extract only the clonogenicity of A.
wilkesiana EtOH and HEX extracts were assessed. Results from clonogenic
assay illustrated decreasing colony formation capacity of MDA-MB-468 cells
with increasing extract concentration shown in Figure 2-5. Significant
inhibition of colony formation was observed with EtOH extract at 36 and 72
μg/ml (1X and 2X GI50) where < 40% of the cells formed colonies when at 1X
GI50 EtOH and > 50% colony formation inhibition at 2X GI50. Likewise,
inhibition of colony formation following exposure to 1X and 2X GI50 of HEX

74
extracts was determined to be significant when compared to the control (p <
0.05). Although HEX extracts were able to inhibit colony formation, the
treatment concentrations used (100, 200 and 400 μg/ml) were ≥ 5-fold greater
than EtOH extract concentrations used.
Figure 2-5: Effects of A. wilkesiana extracts to MDA-MB-468 cells’
survival and clonogenicity. Bars (error bar = SEM) denote the mean % of
HCT116 colonies formed after 24 h exposure to whole extracts from ≥ 3 (n =
4) individual experiments; plating efficiencies were ≥ 80% per experiment.
Dunnett‟s multiple comparison (One-way ANOVA) analysis was used to
compare each extract-treated group to the control group. Any statistically
significant values are denoted: * = 0.01< p < 0.05 and *** = 0.001 < p < 0.01.
2.1.4 Influence of Archichendron ellipticum extracts to MDA-
MB-468 cells’ survival and clonogenicity
Dose-dependent inhibition of MDA-MB-468 colony formation was determined
after 24 h exposure to A. ellipticum extracts (Figure 2-6). Constituents from
bark EtOAc extractions appeared to be most active against breast cancer MDA-
MB-468 cells with only 24% of treated cells retaining colony forming ability at
0.5X GI50, which is significant compared to the control. Whereas EtOAc leaf
extracts at ~ 5-fold less concentration than EtOAc bark extracts significantly
inhibited colony formation. MDA-MB-468 cells‟ colony formation inhibition
Eth
anol
[18,
36,
72]
Hex
ane [1
00, 2
00, 4
00]
0
20
40
60
80
100
Extract GI50
concentration [µg/ml]
Colo
ny (
%)
Control [0]
0.5 X GI50
1 X GI50
2 X GI50
*
******
*
GI50 concentration

75
ability was comparable at the same treatment range of EtOH and EtOAc leaf
extracts (4.5, 9 and 18 μg/ml). Conversely, no significant difference in colony
formation was observed when cells were exposed to EtOH and HEX bark
extracts at 0.5X GI50 (77% and 88% control respectively; p > 0.05).
Comparable numbers of MDA-MB-468 colonies (%) were counted after
treatment with HEX extracts. Colony formation was affected by HEX leaf
extract at high treatment concentrations (100, 200 and 400 μg/ml), which were
up to 100-fold higher than other extracts used.
Figure 2-6: Effects of A. ellipticum extracts on MDA-MB-468 cells’
survival and clonogenicity. Bars (error bar = SEM) denote the mean % of
HCT116 colonies formed after 24 h exposure to bark and leaf extracts from ≥ 3
(n = 4) individual experiments; plating efficiencies were ≥ 80% per experiment.
Dunnett‟s multiple comparison (One-way ANOVA) analysis was used to
compare each extract-treated group to the control group. Any statistically
significant values are denoted: * = 0.01< p < 0.05, ** = 0.001 < p < 0.01 and
*** = p < 0.001.
Overall, bark and leaf EtOH and EtOAc extracts were most effective in
inhibition of MDA-MB-468 colony formation with consideration of the low
concentrations used (EtOH bark: 1, 2, and 4 μg/ml; EtOH leaf: 4.5, 9 and 18
Eth
anol
[1, 2
, 4]
Eth
ylace
tate
[20
, 40,
80]
Hex
ane [1
00, 200, 4
00]
Eth
anol [4
.5, 9
, 18]
Eth
ylac
etat
e [4
.5, 9
, 18]
Hex
ane [1
00, 200, 4
00]0
20
40
60
80
100
Extract GI50
concentration [µg/ml]
Colo
ny (
%)
Control [0]
0.5 X
1 X
2 X
GI50 concentration
Bark Leaf
*
******
******
***
***
*
****
***
*

76
μg/ml; EtOAc leaf: 4.5, 9 and 18 μg/ml), and verified to be statistically
different from colony-forming ability of DMSO-treated control cells (p < 0.05).
Again, a general dose-dependent trend of decreased colony formation with
increasing extract concentration was observed. All treatments of A. ellipticum
EtOAc extracts affected MDA-MB-468 cells‟ ability to proliferate (p < 0.05).
2.1.5 Influence of Duabanga grandiflora extracts on HCT116
cells’ survival and clonogenicity
The effect of D. grandiflora extracts on HCT116 colony formation is shown in
Figure 2-7. Polar Water and EtOH extractions appeared to be the most
effective in inhibiting HCT116 cell survival and clonogenicity in comparison
to EtOAc and HEX extracts.
Significant inhibition of colony formation was noted with 1X and 2X GI50
treatments of polar bark and leaf extracts, revealing > 90% colony formation
inhibition. Overall, greatest cell response was noticed with D. grandiflora
EtOH extracts at all concentrations tested and verified to be statistically
different to the DMSO control cells (p < 0.001). HCT116 cells responded in
similarly to both HEX extracts in regards to the number of colonies formed,
however concentrations of HEX bark extract (14.5, 29 and 58 μg/ml) used
were almost 7-fold lower than that of HEX leaf extract (100, 200 and 400
μg/ml). Therefore, polar extracts demonstrated greatest colony formation
inhibitory effects on HCT116 cells.

77
Figure 2-7: Effects of D. grandiflora extracts to HCT116 cells’ survival and
clonogenicity. Bars (error bar = SEM) denote the mean % of HCT116
colonies formed after 24 h exposure to bark and leaf extracts from ≥ 3 (n = 4)
individual experiments; plating efficiencies were ≥ 80% per experiment.
Dunnett‟s multiple comparison (One-way ANOVA) analysis was used to
compare each extract-treated group to the control group. Any statistically
significant values are denoted: * = 0.01< p < 0.05, ** = 0.001 < p < 0.01 and
*** = p < 0.001.
2.1.6 Influence of Pseuduvaria macrophylla extracts to HCT116
cells’ survival and clonogenicity
The effects of P. macrophylla extracts on HCT116 colony formation after 24 h
exposure are summarised in Figure 2-8. Both P. macrophylla EtOH and
EtOAc extracts significantly inhibited HCT116 colony formation (P < 0.001)
at 0.5X GI50 (47.35% and 42.87% colony counted, respectively), 1X GI50
(2.75% and 3.33% counted, respectively) and 2X GI50 (0.75% and 0.50%
counted, respectively). Contrastingly, there was no evidence to suggest HEX
extract induced significant inhibition of HCT116 colony formation at the
concentrations tested at 2.5 μg/ml. Effects of HEX extract at 1X and 2X GI50
(5 and 10 μg/ml) revealed only a ~ 5% difference in the number of colonies
formed. Whereas a greater ~ 40% difference in colony formation inhibition
Wate
r [2
1, 42, 8
4]
Eth
anol
[19,
38,
76]
Eth
ylace
tate
[11
, 22
44]
Hex
ane [1
4.5, 2
9, 58]
Wate
r [1
9, 38, 7
6]
Eth
anol
[20
.5, 4
1, 8
2]
Eth
ylace
tate
[12
.5, 2
5, 50]
Hex
ane [1
00, 200, 4
00]
0
20
40
60
80
100
Extract GI50
concentration [µg/ml]
Colo
ny (
%) Control [0]
0.5 X
1 X
2 X
GI50
concentration
Bark Leaf
**
***
******
***
**
******
***
***
***
* **

78
was observed between EtOH and EtOAc extracts treated cells at 1X and 2X
GI50.
Figure 2-8: Effects of P. macrophylla extracts on HCT116 cells’ survival
and clonogenicity. Bars (error bar = SEM) denote the mean % of HCT116
colonies formed after 24 h exposure to whole extracts from ≥ 3 (n = 4)
individual experiments; plating efficiencies were ≥ 80% per experiment.
Dunnett‟s multiple comparison (One-way ANOVA) analysis was used to
compare each extract-treated group to the control group. Any statistically
significant values are denoted: * = 0.01< p < 0.05, ** = 0.001 < p < 0.01 and
*** = p < 0.001.
2.1.6.1 Summary of the effects of UNMC extracts on cancer cell colony
formation
The clonogenic assay examined the in vitro anti-proliferative and clonogenicity
of human-derived cancer cells post exposure to UNMC extracts, hence reveals
the ability of individual cancer cells to survive UNMC extract challenge (24 h)
and form colonies post-treatment, hence repopulate a tumour. HCT116 cells
were exposed to D. grandiflora and P. macrophylla extracts, whereas MDA-
MB-468 cells were treated with A. wilkesiana and A. ellipticum extracts for
reasons stated earlier. Although significant inhibition of colony formation was
observed in several extracts, further experiments are necessary to conclude
whether the growth inhibition is a consequence of cytostasis or cytotoxicity.
Eth
anol [
2.5,
5, 1
0]
Eth
ylac
etat
e [1
, 2, 4
]
Hex
ane
[2.5
, 5, 1
0]0
20
40
60
80
100
Extract GI50
concentration [µg/ml]
Colo
ny (
%)
Control [0]
0.5 X
1 X
2 X
GI50 concentration
**
******
**
******
***

79
Acalypha wilkesiana: EtOH and HEX extracts at 1X and 2X GI50 significantly
inhibited > 50% MDA-MB-468 colonies, however, HEX extract required
concentrations of > 5-fold higher than that of EtOH used to achieve similar
colony formation inhibitory effects. Significant colony formation inhibitory
effect following exposure of cells to EtOH extracts is consistent with
irreversible cytotoxicity. EtOH extract concentration inhibited MDA-MB-468
colony formation by 50% (IC50) at 35.51 μg/ml, therefore comparable to the
GI50 value (35.98 μg/ml) obtained in the MTT assay.
Archidendron ellipticum: Remarkably, EtOH extracts induced good inhibitory
effects in MDA-MB-468 cells at 20-fold and 100-fold less concentration than
EtOAc and HEX extracts, respectively. The presence of EtOAc extract
resulted in fewest colonies formed (5.8 %) suggesting EtOAc possesses
irreversible growth inhibitory (cytotoxic) effects (seen in MTT assay).
Although, HEX extracts of A. ellipticum bark and leaf demonstrated modest
anti-proliferative activity in MDA-MB-468 cells, the concentrations used were
very high. At higher concentrations (1X and 2X GI50), cells treated with bark
and leaf polar extracts failed to recover suggesting irreversible cytotoxic
effects; the cells may have died or failed to proliferate and remained as a single
cell. The IC50 (μg/ml) values for EtOH, EtOAc and HEX bark extracts were
13.31, 18.93 and 69.78, respectively; EtOH, EtOAc and HEX leaf extracts IC50
values were 2.71, 61.22 and > 200, respectively. These values varied slightly
from those obtained from the MTT assay. The difference in IC50 values
suggests that HEX bark extract of A. ellipticum may not affect cell viability
even at high concentrations yet cells‟ ability to proliferate and recover after
treatment was affected, which could lead to senescence.
Duabanga grandiflora: Inhibitory effects of D. grandiflora bark extracts in
order of highest activity (lowest IC50) on HCT116 colony formation was Water
>EtOH >EtOAc >HEX. EtOH leaf extract showed the highest anti-
proliferative activity even at a low concentration (20.5 μg/ml, 0.5X GI50) and
colony forming ability was almost completely inhibited by EtOH extracts at 1X
and 2X GI50. The presence of significantly fewer colonies with surviving cells

80
and maintained proliferative capacity after initial insult with polar extracts may
suggest extracts to contain compounds, which exerts irreversible cytotoxic
effects. Intriguingly, at 1X and 2X GI50 treatment of bark and leaf polar
extracts, HCT116 cells failed to recover suggesting irreversible cytotoxic
effects; cells may have died or remained as a single cell. The IC50 values for
Water, EtOH, EtOAc, and HEX bark extracts were 15.02, 25.49, 16.47 and
18.09 μg/ml, respectively; these values are comparable to MTT GI50 values:
42.44, 37.54, 21.69 and 28.77 μg/ml, respectively. The IC50 values for Water,
EtOH, EtOAc and HEX leaf extracts were 40.69, 16.95, 16.48 and > 200 μg/ml
were also comparable to leaf GI50: 38.02, 40.92, 24.73 and > 200 μg/ml.
Pseuduvaria macrophylla: Both in vitro assays revealed the same order of
potency of P. macrophylla extracts against HCT116 cells (EtOAc > EtOH >
HEX) based on GI50 (1.61, 5.16 and 5.41 μg/ml) and IC50 values (0.33, 2.24
and 3.57 μg/ml, respectively). Less than 10% of cells were able to form
colonies after exposure to EtOH and EtOAc extracts at 1X and 2X GI50 and
modest anti-proliferative activity was observed in HEX extract. Results
illustrated EtOH and EtOAc extracts induced significant inhibitory effects and
the growth inhibitory effects of extracts observed in MTT assay were
irreversible. Comparable EtOH and EtOAc extracts-treated HCT116 cell
proliferation profiles suggest that similar phytochemicals may be embedded in
these extracts. The anticancer activity of 1,2,3-trimethoxy-4,5-dioxo-6a,7-
dehydroaporphine (38) has been previously reported to be active against NCI-
H187 (GI50: 5.6 μg/ml). Interestingly, a similar dioxoaporphine with N-methyl
substitution have shown increased activity against NCI-H187 cells (GI50: 0.8
μg/ml).214
Aristolochic acids and aristolactam share distinct similarity to the
chemical skeleton of aporphinoids are known immunuostimulants and
anticancer agents.214
In summary, greatest anti-proliferative effects observed with low extract
concentration used resides with D. grandiflora bark and leaf EtOH and Water,
A. ellipticum bark EtOAc and P. macrophylla whole EtOH and EtOAc extracts.
Extracts active in both MTT and clonogenic assays suggest cells‟ viability is
affected and therefore their ability to proliferate and recover after exposure.

81
Results illustrating modest activity in the MTT assay (~ 20 μg/ml to inhibit
50% of cell growth) yet high activity (almost complete colony formation
inhibition) in the clonogenic assay could be due to the extracts‟ ability to
induce irreversible anti-proliferative properties without affecting cells‟ viability
e.g. A. wilkesiana EtOH, A. ellipticum bark EtOAc, D. grandiflora polar bark
and leaf (Water and EtOH) extracts. Therefore, single viable cells with
inhibited proliferative abilities could be present but fail to be detected, which
may be the effects of more polar D. grandiflora bark EtOH and Water extracts.
Therefore, cytotoxic and cytostatic effects of the extracts could be
distinguished by comparing results from MTT and clonogenic assays;
furthermore, if MTT results reveal a lower cell density than the seeding density
it could imply a cytotoxic effect.
Overall, the IC50 values and GI50 values vary but are not too dissimilar and this
may be due to low seeding densities, however the values still reveal anti-
proliferative effects of UNMC extracts and a trend of decreased colony
formation ability with increasing extract concentration.
Flow cytometric techniques were adopted to further investigate the
observations of UNMC extracts on sensitive cell lines to determine whether
embedded compounds halt cell cycle or exert cytotoxicity.

82
3
The influence of UNMC crude extracts on cell cycle and
apoptosis induction
Flow cytometry is a widely used technique where single cell particles in sheath
fluid are delivered rapidly to a focused light source (laser beam). The
fluorescence or photons scattered by particles (e.g. cells sorted by their DNA
content) are deflected at different angles, then pass through a series of optical
filters, are captured by photomultiplier detectors, converted to digital signals,
(that are proportional to the strength of emitted or deflected light) and sent to
the computer.91
Agents that are effective modulators of cell cycle (checkpoints) can drive cells
into apoptosis and potentially have a role on carcinogenesis.246
It is now
evident that anticancer agents can exert their activity by interfering with cell
cycle mechanisms; camptothecin, etoposide and doxorubicin are S-phase
blockers and inhibit cyclin-dependent kinases (CDKs).247
One common
application of flow cytometry is the measurement of DNA content to
understand cell cycle distributions. Fluorescent stains such as propidium
iodide (PI) bind stoichiometrically to nucleic acids and emit enhanced signals
that can be detected by the instrument.248
The detection of DNA-bound PI
hence DNA content (hypodiploid, diploid, hyperdiploid and tetraploid
compared to control cells) can reveal the cell cycle phase of the cell population
i.e. sub-G1, G1/0, S and G2/M, respectively. Any disruptions in the DNA
histograms (representative of the cell cycle) can be indicative of investigative
agents having an (cytotoxic or growth arresting) effect on the cell cycle.249

83
3.1 UNMC plant extracts effects’ on cell cycle distribution
The effect of UNMC plant extracts on cell cycle distribution was measured
after 48 h exposure, using an Epics XL-MCL flow cytometer. Cells and
treatment concentrations chosen to examine effects of UNMC extracts on cell
cycle distribution were guided by results from the selection assays, and were
1X, 2X and 4X GI50 concentrations. The samples were kept overnight in a
solution containing buffer, detergent and ribonuclease A, prior to analysis. The
results were established from three or more individual experiments (≥ 15,000
cells per sample, n = 2 per experiment). Data are represented as histograms
and processed using EXPO32 software. Further analyses of cell cycle data
were conducted using cell cycle analysis software, Cylchred. Dunnett‟s
multiple comparison (One-way ANOVA) analysis was used to compare each
extract-treated group to the control group. Any statistically significant values
are denoted: * = 0.01< p < 0.05. Regretfully, the investigation of A. wilkesiana
EtOAc extract could not be examined due to a lack of supply.
3.1.1 Acalypha wilkesiana extracts’ effects on MDA-MB-468
cell cycle distribution
MDA-MB-468 cell populations detected in sub-G1 phase increased with A.
wilkesiana extracts concentrations, which is indicative of apoptotic cell death
(Table 3-1). Following 48 h exposure to EtOH and HEX extracts at 4X GI50,
the cell population in sub-G1 population (2.7% and 2.3%, respectively) was at
similar levels as control cells (2.4%) accompanied by a slight decrease in the
G2/M population.

84
Table 3-1: Cell cycle distribution of MDA-MB-468 cells after exposure to A.
wilkesiana extracts.
A. wilkesiana
extract
concentration
GI50 value [μg/ml]
Cell cycle phase
Sub-G1 G1/0 S G2/M
DMSO
control [0] 2.4 ± 0.3 45.1 ± 5.3 15.1 ± 1.6 36.9 ± 3.4
EtOH
1X [36] 1.6 ± 0.0 49.6 ± 1.0 15.8 ± 1.0 32.7 ± 1.3
2X [72] 3.8 ± 1.2 48.2 ± 8.8 17.7 ± 7.05 30.3 ± 0.6
4X [144] 2.7 ± 12.3 47.1 ± 5.5 15.4 ± 1.2 34.4 ± 5.8
HEX
1X [200]
2X [400]
4X [800]
3.0 ± 1.0 45.4 ± 17.8 17.8 ± 1.50 33.2 ± 2.7
4.9 ± 0.0 43.0 ± 0.0 18.4 ± 0.0 34.0 ± 0.0
2.3 ± 1.3 42.1 ± 0.1 16.8 ± 0.8 39.4 ± 2.6
Mean MDA-MB-468 cell population (%) in each cell cycle phase (± SEM)
obtained from DNA content histograms analysis generated by flow cytometry.
Control (DMSO treated) samples were compared with extract-treated groups
using Dunnett‟s multiple comparison (One-way ANOVA) analysis. Any
statistically significant values (p < 0.05) are highlighted bold.
Figure 3-1 illustrates that at lower concentrations (1X and 2X GI50: 36 and 72
μg/ml, respectively) of EtOH extracts, the % of cell population in sub-G1,
G1/0, S and G2/M were comparable to the control cells. The % of MDA-MB-
468 cell population in each of the cell cycle phases of control cells were
comparable to HEX extract-treated cells at very high concentrations (200, 400
and 800 μg/ml), as shown in Figure 3-2. There seem to no overall significant
effects induced by extracts on MDA-MB-468 cells cycle.

85
Figure 3-1: MDA-MB-468 cell cycle distributions after 48-hour exposure
to A. wilkesiana extracts. Bars (error bar = SEM) denote the mean cell
population (%) in each cell cycle phase after exposure to EtOH (A) and HEX
(B) extracts from ≥ 4 (n = 2) individual experiments. Dunnett‟s multiple
comparison (One-way ANOVA) analysis was used to compare each extract-
treated group to the control group. Any statistically significant values are
denoted: * = statistically significant (p < 0.05).
Sub-G1
G1/
0 S
G2/
M
0
20
40
60
EtOH extract
Cell cycle phase
Cel
l p
op
ula
tion
(%
)
Control [0]
1 X GI50 [36]
2 X GI50 [72]
4 X GI50 [144]
GI50 Concentration
Sub-G1
G1/
0 S
G2/
M
0
20
40
60
Cell cycle phase
Cel
l p
op
ula
tion
(%
)
HEX extract
Control [0]
1 X GI50 [200]
2 X GI50 [400]
4 X GI50 [800]
GI50 Concentration

86
Figure 3-2: Detection of PI staining of MDA-MB-468 cellular DNA content
after exposure to A. wilkesiana extracts at 4X GI50 concentration for 48
hour. Data is represented as histogram of cellular DNA content revealing %
events in each cell cycle phase; images from a single representative experiment
are shown. The samples were kept chilled overnight in a solution containing
buffer, detergent and ribonuclease A prior to analysis. The results were
established from three ≥ 15,000 cells per sample and processed using EXPO32
software. Image is representative of cell cycle distribution of one sample
following treatment with UNMC extract as described above.

87
3.1.2 Archidendron ellipticum extracts’ effects on MDA-MB-
468 cell cycle distribution
MDA-MB-468 cell cycle distribution after exposure to A. ellipticum extracts
varied between extracts and concentrations used, shown in Table 3-2. Flow
cytometric analysis of cells exposed to EtOH bark extract revealed increased
G2/M cell population (≥ 2-fold), which coincided with significant decrease in
G1/0 cell populations (p < 0.05), while no comparable changes were noticed in
sub-G1 and S phases (p > 0.05). Exposure of MDA-MB-468 cells to high
concentrations of EtOAc bark extract (80 and 160 μg/ml) caused increased
sub-G1 events by 3.8% and 8.6%, respectively, accompanied by decreased
G1/0 cell populations compared to control cells (Figure 3-3). There is
insufficient evidence to suggest changes in G1/0, S and G2/M cell cycle phases
were influenced by EtOAc bark extract (p > 0.05). Concentrations of HEX
bark and leaf extracts used were very high and appeared unable to cause
perturbation to the distribution of the cell cycle.
Interestingly, EtOH bark and leaf extracts displayed similar trends where
increased levels of sub-G1 and S phase cell populations were accompanied by
a significant decrease in G1/0 and G2/M phase cell populations (p < 0.05).
The slight changes in cell cycle distribution of EtOAc leaf extract were
statistically insignificant when compared to the control cells. Again, at very
high concentrations of HEX leaf extracts (193 to 772 μg/ml), no significant cell
cycle distribution perturbation was observed with HEX leaf treated cells
(Figure 3-4). Overall, comparable cell cycle distributions were observed
following exposure to A. ellipticum extracts; therefore it is probable that
similar extracts are present in the respective extracts.

88
Table 3-2: Cell cycle distribution of MDA-MB-468 cells after exposure to A.
ellipticum extracts
A. ellipticum extract
concentration
GI50 value [μg/ml]
Cell cycle phase
Sub-G1 G1/0 S G2/M
Ba
rk
DMSO
control [0] 2.2 ± 0.3 50.0 ± 1.7 32.1 ± 1.0 15.7 ± 1.4
1X [2] 2.6 ± 0.4 35.6 ± 2.3 35.0 ± 2.4 26.8 ± 0.8
EtOH 2X [4] 2.6 ± 0.5 33.1 ± 2.1 36.9 ± 3.1 27.4 ± 1.2
4X [8] 3.5 ± 1.1 33.0 ± 3.0 36.1 ± 2.7 27.4 ± 2.4
1X [40] 3.9 ± 0.8 47.5 ± 2.2 32.3 ± 1.2 16.3 ± 0.5
EtOAc 2X [80] 6.0 ± 1.1 44.2 ± 2.6 32.5 ± 2.7 17.3 ± 1.0
4X [160] 10.8 ± 1.2 43.3 ± 3.1 25.8 ± 3.3 20.1 ± 3.7
1X [200] 3.1 ± 1.1 46.4 ± 4.2 31.7 ± 2.4 18.8 ± 1.7
HEX 2X [400] 2.5 ± 0.4 48.7 ± 3.5 31.4 ± 2.4 17.6 ± 1.7
4X [800] 2.8 ± 1.2 44.1 ± 3.9 37.2 ± 3.0 15.9 ± 1.2
Lea
f
DMSO
control [0] 2.2 ± 0.3 50.0 ± 1.7 32.1 ± 1.0 15.7 ± 1.4
1X [9] 3.2 ± 1.7 32.6 ± 2.7 34.9 ± 2.7 22.4 ± 3.6
EtOH 2X [18] 3.7 ± 1.8 33.3 ± 1.4 35.9 ± 2.7 21.0 ± 3.4
4X [36] 5.3 ± 1.7 29.4 ± 1.5 41.2 ± 0.8 24.1 ± 0.9
1X [9] 4.0 ± 1.3 45.9 ± 4.5 33.9 ± 2.6 16.1 ± 1.1
EtOAc 2X [18] 3.2 ± 0.4 50.6 ± 2.1 32.0 ± 1.7 14.3 ± 1.1
4X [36] 3.0 ± 0.4 51.9 ± 2.0 31.0 ± 1.7 14.2 ± 0.4
1X [193] 3.5 ± 1.2 51.6 ± 2.2 29.8 ± 2.4 15.0 ± 1.3
HEX 2X [386] 3.8 ±0.9 50.6 ± 2.6 30.6 ± 3.2 15.0 ± 0.6
4X [772] 4.7 ± 1.4 52.8 ± 2.4 27.5 ± 2.5 15.0 ± 1.0
Mean MDA-MB-468 cell population (%) in each cell cycle phase (± SEM)
obtained from DNA content histograms analysis generated by flow cytometry.
Control (DMSO treated) samples were compared with extract-treated groups
using Dunnett‟s multiple comparison (One-way ANOVA) analysis. Any
statistically significant values (p < 0.05) are highlighted bold.

89
Figure 3-3: MDA-MB-468 cell cycle distributions after 48-hour exposure
to A. ellipticum extracts. Bars (error bar = SEM) denote the mean cell
population (%) in each cell cycle phase after exposure to EtOH, EtOAc and
HEX extracts from ≥ 4 (n = 2) individual experiments. Dunnett‟s multiple
comparison (One-way ANOVA) analysis was used to compare each extract-
treated group to the control group. Any statistically significant values are
denoted: * = statistically significant (p < 0.05).
Sub-G
1
G1/
0 S
G2/
M
0
20
40
60
EtOH extract
Cell cycle phase
Cell p
op
ula
tion
(%
)
Control [0]
1 X GI50 [2]
2 X GI50
[4]
4 X GI50
[8]
GI50 Concentration
** *
* * *
Sub-G
1
G1/
0 S
G2/
M
0
20
40
60
EtOAc extract
Cell cycle phase
Cell p
op
ula
tion
(%
)
Control [0]
1 X GI50 [40]
2 X GI50 [80]
4 X GI50
[160]
GI50 Concentration
*
Sub-G
1
G1/
0 S
G2/
M
0
20
40
60
HEX extract
Cell cycle phase
Cell p
op
ula
tion
(%
)
Control [0]
1 X GI50 [200]
2 X GI50 [400]
4 X GI50 [800]
GI50 Concentration
Sub-
G1
G1/
0 S
G2/
M
0
20
40
60
EtOH extract
Cell cycle phase
Cell p
op
ula
tion
(%
)
Control [0]
1 X GI50 [9]
2 X GI50 [18]
4 X GI50
[36]
GI50 Concentration
* * *
*
*
Sub-
G1
G1/
0 S
G2/
M
0
20
40
60
EtOAc extract
Cell cycle phase
Cell p
op
ula
tion
(%
)
Control [0]
1 X GI50 [9]
2 X GI50 [18]
4 X GI50 [36]
GI50 Concentration
Sub-G
1
G1/
0 S
G2/
M
0
20
40
60
HEX extract
Cell cycle phase
Cell p
op
ula
tion
(%
)
Control [0]
1 X GI50 [193]
2 X GI50 [386]
4 X GI50 [772]
GI50 Concentration

90
Figure 3-4: Detection of PI staining of MDA-MB-468 cellular DNA content
after exposure to A. ellipticum extracts at 4X GI50 concentration for 48
hour. Data is represented as histogram of cellular DNA content revealing %
events in each cell cycle phase; images from a single representative experiment
are shown. The samples were kept chilled overnight in a solution containing
buffer, detergent and ribonuclease A prior to analysis. Results were established
from three ≥ 15,000 cells per sample and processed using EXPO32 software.
Image is representative of cell cycle distribution of one sample following
treatment with UNMC extract as described above.

91
3.1.3 Duabanga grandiflora extracts’ effects on HCT116 cell
cycle distribution
HCT116 cell cycle distribution after exposure to D. grandiflora extracts varied
between extracts and concentrations used shown in Table 3-3. The % of cells
measured in sub-G1 phase following exposure to bark extracts (Water, EtOH,
EtOAc and HEX) was significantly higher than the control populations and
accompanied by decreased cell populations in S-phase. HCT116 cells treated
with HEX bark extracts displayed cell cycle distribution that is statistically
different to the control population, with at least 20%, of cells in sub-G1 (p <
0.05) and S-phase populations accompanied by decreasing cell populations in
G1/0 and G2/M phases (Figure 3-5). EtOAc bark extract induced similar cell
cycle response to HEX extracts in HCT116 cells.
Overall, HCT116 cells exposed to D. grandiflora bark extracts displayed
general trends, which includes emerging events in sub-G1 phase, accumulation
of G1/0 events accompanied by decreased S and G2/M phase events. Whereas,
high HEX leaf extract concentrations (200, 400 and 800 μg/ml) caused a
decrease in G2/M cell populations (12.6, 12.6 and 8.8 %). Cell cycle
perturbation effects of D. grandiflora bark extracts were distinctly more
prominent than leaf extracts in HCT116 cells. There was insufficient evidence
to suggest that cells treated with Water, EtOH and EtOAc leaf extracts induced
any significant perturbations in cell cycle compared with the control population.
Overall, D. grandiflora leaf extracts appeared to positively influence sub-G1
and G1/0 populations accompanied by decreasing HCT116 cells in S and
G2/M phases.

92
Table 3-3: Cell cycle distribution of HCT116 cells after exposure to D.
grandiflora extracts.
D. grandiflora extract
concentration
GI50 value [μg/ml]
Cell cycle phase
Sub-G1 G1/0 S G2/M B
ark
DMSO
control [0] 0.9 ± 0.1 37.9 ± 3.4 41.8 ± 2.31 19.3 ± 1.9
1X [42] 1.9 ± 0.4 51.4 ± 2.3 31.5 ± 2.1 15.2 ± 1.8
Water 2X [82] 2.3 ± 0.5 47.8 ± 3.5 33.0 ± 1.8 16.9 ± 1.5
4X [168] 2.9 ± 1.0 43.1 ± 6.3 36.4 ± 4.4 17.6 ± 2.0
1X [38] 2.1 ± 0.4 47.2 ± 3.2 34.9 ± 1.8 15.8 ± 1.9
EtOH 2X [76] 3.9 ± 1.3 40.7 ± 5.0 36.9 ± 1.9 18.5 ± 2.7
4X [152] 3.1 ± 0.8 39.5 ± 6.7 41.6 ± 6.1 15.8 ± 0.9
1X [22] 2.9 ± 0.7 46.1 ± 4.2 34.1 ± 3.0 16.9 ± 1.9
EtOAc 2X [44] 4.8 ± 1.2 49.9 ± 4.5 31.9 ± 5.0 13.4 ± 1.1
4X [88] 5.4 ± 1.9 60.7 ± 2.3 22.3 ± 2.9 11.1 ± 2.1
1X [29] 4.1 ± 0.9 57.7 ± 3.5 27.3 ± 3.4 10.9 ± 1.0
HEX 2X [58] 9.0 ± 1.6 57.8 ± 4.3 23.4 ± 4.1 9.7 ± 0.6
4X [116] 8.5 ± 1.9 60.1 ± 3.4 23.1 ± 3.0 8.2 ± 0.9
Lea
f
DMSO
control [0] 1.1 ± 0.3 43.7 ± 2.3 35.6 ± 2.6 19.6 ± 1.6
1X [38] 1.3 ± 0.2 50.7 ± 1.5 33.1 ± 2.5 15.0 ± 2.1
Water 2X [76] 1.6 ± 0.4 49.1 ± 1.9 33.1 ± 2.5 16.0 ± 2.1
4X [152] 1.7 ± 0.3 47.6 ± 3.8 33.5 ± 2.6 17.2 ± 2.6
1X [41] 2.7 ± 0.9 48.0 ± 1.9 31.0 ± 1.0 18.4 ± 1.8
EtOH 2X [82] 3.6 ± 1.2 36.0 ± 4.5 42.6 ± 5.8 17.8 ± 2.3
4X [164] 4.7 ± 1.3 33.5 ± 4.5 41.8 ± 4.7 20.0 ± 2.1
1X [25] 1.3 ± 0.2 50.2 ± 2.1 33.5 ± 2.0 15.1 ± 1.5
EtOAc 2X [50] 2.6 ± 0.6 56.0 ± 3.2 27.6 ± 1.9 13.9 ± 1.3
4X [100] 3.5 ± 0.3 48.4 ± 3.9 30.7 ± 4.1 17.5 ± 1.4
1X [200] 1.5 ± 0.5 51.7 ± 2.9 34.3 ± 2.0 12.6 ± 1.3
HEX 2X [400] 1.2 ± 0.3 58.0 ± 4.2 28.1 ± 3.5 12.6 ± 3.0
4X [800] 1.8 ± 0.4 64.7 ± 4.9 24.7 ± 3.5 8.8 ± 1.7
Mean HCT116 cell population (%) in each cell cycle phase (± SEM) obtained
from DNA content histograms analysis generated by flow cytometry. Control
(DMSO treated) samples were compared with extract-treated groups using
Dunnett‟s multiple comparison (One-way ANOVA) analysis. Any statistically
significant values (p < 0.05) are highlighted bold.

93
Figure 3-5: HCT116 cell cycle distributions after 48-hour exposure to D.
grandiflora extracts. Bars (error bar = SEM) denote the mean cell population
(%) in each cell cycle phase after exposure to Water, EtOH, EtOAc and HEX
extracts from ≥ 4 (n = 2) individual experiments. Dunnett‟s multiple
comparison (One-way ANOVA) analysis was used to compare each extract-
treated group to the control group. Any statistically significant values are
denoted: * = statistically significant (p < 0.05).
Sub-G1
G1/0 S
G2/
M
0
20
40
60
Water extract
Cell cycle phase
Cel
l p
op
ula
tion
(%
)
Control [0]
1X GI50
[42]
2X GI50 [84]
4X GI50
[168]
GI50
Concentration
**
* *
*
Sub-G1
G1/0 S
G2/
M
0
20
40
60
EtOH extract
Cell cycle phase
Cel
l p
op
ula
tion
(%
)
Control [0]
1 X GI50 [38]
2 X GI50 [76]
4 X GI50 [152]
GI50 Concentration
**
Sub-G1
G1/0 S
G2/
M
0
20
40
60
80
EtOAc extract
Cell cycle phase
Cel
l p
op
ula
tion
(%
)
Control [0]
1 X GI50 [22]
2 X GI50 [44]
4 X GI50 [88]
GI50 Concentration
*
*
*
Sub-G1
G1/
0 S
G2/
M
0
20
40
60
80
HEX extract
Cell cycle phase
Cel
l p
op
ula
tion
(%
)
Control [0]
1 X GI50 [29]
2 X GI50 [58]
4 X GI50
[116]
GI50
Concentration
** *
*
* *
* * *
Sub-G1
G1/0 S
G2/
M
0
20
40
60
Water extract
Cell cycle phase
Cel
l p
op
ula
tion
(%
)
Control [0]
1 X GI50 [38]
2 X GI50 [76]
4 X GI50 [152]
GI50 Concentration
* *
*
Sub-G1
G1/0 S
G2/
M
0
20
40
60
EtOH extract
Cell cycle phaseC
ell p
op
ula
tion
(%
)
Control [0]
1 X GI50 [38]
2 X GI50 [76]
4 X GI50
[152]
GI50
Concentration
Sub-G1
G1/0 S
G2/M
0
20
40
60
80
EtOAc extract
Cell cycle phase
Cel
l p
op
ula
tion
(%
)
Control [0]
1 X GI50 [41]
2 X GI50
[82]
4 X GI50 [164]
GI50 Concentration
* *
*
Sub-G1
G1/0 S
G2/
M
0
20
40
60
80
HEX extract
Cell cycle phase
Cel
l p
op
ula
tion
(%
)
Control [0]
1 X GI50 [200]
2 X GI50 [400]
4 X GI50 [800]
GI50 Concentration
**
*

94
Figure 3-6: Detection of PI staining of HCT116 cellular DNA content after
exposure to D. grandiflora extracts at 4X GI50 concentration for 48 hour. Data is represented as histogram of cellular DNA content revealing % events in
each cell cycle phase; images from a single representative experiment are
shown. The samples were kept chilled overnight in a solution containing
buffer, detergent and ribonuclease A prior to analysis. The results were
established from three ≥ 15,000 cells per sample and processed using EXPO32
software. Image is representative of cell cycle distribution of one sample
following treatment with UNMC extract as described above.

95
3.1.4 Pseuduvaria macrophylla extracts’ effects on HCT116 cell
cycle distribution
The change in HCT116 cell distribution after exposure to P. macrophylla
extracts is illustrated in Table 3-4. Flow cytometric analysis of HCT116 cells
treated with P. macrophylla extracts revealed a significant rise in sub-G1
populations of ~ 1% - 8 % compared to control population (0.9 %), shown in
Figure 3-7. In general, cells exposed to low concentrations of EtOH, EtOAc
and HEX extracts displayed increased G2/M cell populations accompanied by
a decreasing G1/0 cell population. Moreover, the level of sub-G1 events is
significantly higher than the control when exposed to higher extract
concentrations (p < 0.05). Overall, similar cell cycle distribution patterns were
observed across P. macrophylla extract-treated HCT116 cells (Figure 3-8).
Table 3-4: Cell cycle distribution of HCT116 cells after exposure to P.
macrophylla extracts
P. macrophylla
extract concentration
GI50 value [μg/ml]
HCT116 cell cycle phase
Sub-G1 G1/0 S G2/M
DMSO
control [0] 0.9 ± 0.1 37.6 ± 1.7 39.5 ± 0.7 22.1 ± 0.9
EtOH
1X [5] 2.2 ± 0.3 44.9 ± 3.7 35.0 ± 1.35 17.9 ± 2.1
2X [10] 9.0 ± 0.0 29.2 ± 0.9 33.0 ± 0.6 28.8 ± 0.4
4X [20] 8.4 ± 0.2 25.7 ± 0.9 42.2 ± 1.3 23.7 ± 0.1
DMSO
control [0] 2.1 ± 0.6 41.1 ± 2.5 38.4 ± 1.4 18.4 ± 2.2
EtOAc
1X [2] 3.4 ± 0.9 25.3 ± 4.0 44.7 ± 3.5 26.6 ± 2.7
2X [4] 5.5 ± 1.0 22.4 ± 2.1 37.7 ± 3.8 34.4 ± 5.2
4X [8] 7.4 ± 0.9 25.8 ± 3.0 41.1 ± 2.6 25.7 ± 3.0
DMSO
control [0] 2.1 ± 0.6 41.1 ± 2.5 38.4 ± 1.2 18.4 ± 2.2
HEX
1X [5] 3.2 ± 0.5 35.7 ± 3.0 36.2 ± 1.6 24.9 ± 2.3
2X [10] 4.7 ± 0.9 34.9 ± 2.0 39.8 ± 2.1 20.6 ± 2.1
4X [20] 6.2 ± 1.0 33.4 ± 2.9 38.1 ± 3.3 22.6 ± 2.5
Mean HCT116 cell population (%) in each cell cycle phase (± SEM) obtained
from DNA content histograms analysis generated by flow cytometry. Control
(DMSO treated) samples were compared with extract-treated groups using
Dunnett‟s multiple comparison (One-way ANOVA) analysis. Any statistically
significant values (p < 0.05) are highlighted bold.

96
Figure 3-7: HCT116 cell cycle distributions after 48-hour exposure to P.
macrophylla extracts. Bars (error bar = SEM) denote the mean cell population
(%) in each cell cycle phase after exposure to EtOH, EtOAc and HEX extracts
from ≥ 4 (n = 2) individual experiments. Dunnett‟s multiple comparison (One-
way ANOVA) analysis was used to compare each extract-treated group to the
control group. Any statistically significant values are denoted: * = statistically
significant (p < 0.05).
Sub-G1
G1/0 S
G2/
M
0
10
20
30
40
50
EtOH extract
Cell cycle phase
Cel
l p
op
ula
tion
(%
)
Control [0]
1 X GI50 [5]
2 X GI50 [10]
4 X GI50 [20]
*
* *
*
*
GI50 Concentration
Sub-G1
G1/0 S
G2/
M
0
10
20
30
40
50
EtOAc extract
Cell cycle phase
Cel
l p
op
ula
tion
(%
)
Control [0]
1 X GI50 [2]
2 X GI50 [4]
4 X GI50 [8]
GI50 Concentration
*
* *
Sub-G1
G1/0 S
G2/
M
0
10
20
30
40
50
HEX extract
Cell cycle phase
Cel
l p
op
ula
tion
(%
)
Control [0]
1 X GI50 [5]
2 X GI50 [10]
4 X GI50 [20]
GI50 Concentration
*
*

97
Figure 3-8: Detection of PI staining of HCT116 cellular DNA content after
exposure to P. macrophylla extracts at 4X GI50 concentration for 48 hour. Data is represented as histogram of cellular DNA content representation of cell
population % in each cell cycle phase; images from a single representative
experiment are shown. The samples were kept chilled overnight in a solution
containing buffer, detergent and ribonuclease A prior to analysis. Results were
established from three experiments ≥ 15,000 cells per sample (n = 2) and
processed using EXPO32 software. Image is representative of cell cycle
distribution of one sample following treatment with UNMC extract as
described above.

98
3.1.5 Summary of cell cycle analysis after exposure to UNMC
extracts
The measurement of DNA content (hypodiploid, diploid and hyperdiploid)
after exposure of cells to UNMC extracts revealed disturbances in specific cell
cycle phases i.e. sub-G1, G1/0, S and G2/M.
Acalypha wilkesiana: Inhibition of HCT116 cell growth and clonogenicity was
observed following exposure to EtOH extract, this could be associated to an
increase in sub-G1 (apoptotic) cell population at higher treatment
concentrations, hence inability to proliferate and form colonies. Overall, 2X
and 4X GI50 EtOH and HEX treatment were more active in increasing cell
numbers in sub-G1 and G1/0 phases and less active in causing G2/M arrest.
This could be that compounds in EtOH extract are DNA damaging agents
hence cell cycle halted at G1 phase to allow repair of DNA damaged cells
before proceeding in the rest of the cell cycle. Since no significant differences
were observed between DNA histograms of extract-treated cells and DMSO
control cells, which can suggest DNA repair mechanisms are in place or that
extracts might be eliciting a cytostatic effect. Neutral and alkaline comet
assays have previously shown that U87MG and A549 cells following 72 h
exposure to EtOAc and HEX extracts contain single and double DNA strand
breaks resulting in apoptosis at concentrations as low as 0.1 μg/ml in a dose-
dependent manner.234
Bussing et al. (1999) have shown induction of apoptosis
in Ficoll-isolated lymphocytes following treatment with A. wilkesiana seeds
extract (1 - 100 μg/ml) as a possible consequent of granulocytes recruitment
leading to excess ROI production hence cell death.175
Archidendron ellipticum: MDA-MB-468 cells treated with EtOH extracts
revealed greatest levels of G2/M cell population accompanied by a decreased
G1/0 cell population, which suggests that cells in G1/0 phase could not proceed
past mitosis, i.e. G2 block. Compounds which enhance the G2 block and
pushing the cell to override G2/M block (e.g. disruption in mitosis) can
enhance cytotoxicity of DNA damaging agents hence leading to the observed
apoptotic sub-G1 cell population (treated cells in sub-G1 phase (%) is 4 - 8 %

99
greater than control). Interestingly, EtOH leaf and bark extracts displayed
similar cell cycle effects, and is suggestive of similar phytochemicals are
present in the extracts to arrest cells in the G2/M phase. There was not enough
evidence to suggest EtOAc and HEX leaf extracts are affecting the cell cycle
distribution.
Duabanga grandiflora: Growth inhibitory effects of bark extracts complement
effects seen in cell cycle profiles where a similar trend of potency was
observed EtOAc > HEX > EtOH > Water. Cell cycle analysis revealed
increased sub-G1 populations in all D. grandiflora extracts treated cells,
however no significant differences was detected between cell cycle
perturbation measured in D. grandiflora leaf extracts and control population.
Increased sub-G1 and G1/0 populations in the presence of bark extracts is
accompanied by decrease S and G2/M phases, which is indicative of cell death
hence cells not proceeding pass G1/0 phase i.e. G1/0 block. Together with
clonogenicity results revealing HCT116 cells were able to overcome the G1/0
block when extracts were removed from the cells; this may suggest DNA
damage in cells are reversible and upon DNA repair, cells could proceed in the
cell cycle.
Pseuduvaria macrophylla: An emergence of HCT116 cells in the sub-G1 and
G1/0 phase was observed in association with decreased S and G2/M cell
populations after exposure to P. macrophylla extracts. Results imply cell death
was induced by the extracts, and as sub-G1 cells increased, fewer cells were
able to enter and progress past G1/0 phase. Generally extract-treated cells
displayed increased G2/M cell populations accompanied by decreasing G1/0
cell populations, which is evidence of a G2/M block preceding cell death; as
well as significantly higher levels of sub-G1 events (> 5-fold) when compared
to than the control. The high potency and lack of clonogenicity suggests
compounds may induce permanent cellular damage.
In summary, UNMC extracts contributed to increasing sub-G1 (hypodiploid)
cell population, however further analysis was required to confirm if the sub-G1
populations were apoptotic cells induced by UNMC plant extracts since it is

100
unclear whether DNA fragmentation was a result of apoptotic enzyme cleavage
or DNA damaging agents. Apoptosis serves several purposes throughout
development in life e.g. when in response to pathological and physiological
stimuli, cells respond by triggering signaling cascades ultimately resulting in
caspase activation.250
Characteristics of apoptosis include morphological
changes (cell shrinkage) and biochemical features such as the degradation of
DNA into oligomers (180 bp) by endonuclease; this could be measured and
determined as hypodiploid (sub-G1) cells.91

101
3.2 Detection of apoptotic cells after exposure to UNMC plant
extracts
Dysfunction of the apoptosis mechanism is often associated with cancers.120
One of the hallmarks of early apoptosis involves the translocation of
phosphatidylserine (PS) from the inner to the intact outer plasma membrane.
The membrane integrity of an apoptotic cell diminishes when progressing into
late apoptosis/necrosis. A calcium ion (Ca2+
) dependent phospholipid-binding
protein, annexin V, possesses high PS binding affinity.251
Dual staining with
annexin V (conjugated to FITC, a green fluorescent dye) and PI was employed
to detect and distinguish early apoptotic (FITC+/PI
-) and late apoptotic/necrotic
(FITC+/PI
+) cell populations using flow cytometric techniques. Hence,
detection of PS is one method of confirming apoptosis in cells treated with
UNMC plant extracts.94
The cell lines and treatment concentrations chosen to
examine the ability of UNMC extracts to induce apoptosis were guided by
results from the selection assays, 1X, 2X and 4X GI50 concentrations.
Dunnett‟s multiple comparison (One-way ANOVA) analysis was used to
compare each extract-treated group to the control group. Any statistically
significant values are denoted: * = 0.01< p < 0.05. Regrettably, due to the
unavailability of A. wilkesiana extracts it could not be determined whether the
significant increase in sub-G1 cell population caused by EtOH extracts was a
consequence of cells undergoing apoptosis.
3.2.1 Time-dependent apoptosis induction in MDA-MB-468
cells after exposure to Archidendron ellipticum extracts
The increase in healthy cells (FITC-/PI
-) entering apoptosis and progressing to
late apoptosis/necrosis during exposure to A. ellipticum extracts is shown in
Figure 3-9. At 24 h, the levels of apoptosis in EtOH, EtOAc and HEX bark
extract-treated cells were greater than that seen in the control population by
36.1%, 26.5% and 35.6%, respectively (p < 0.05). Between 24 h to 48 h,
EtOAc bark extract caused an overall 1.6% increase in early apoptotic MDA-
MB-468 cells progressing to late apoptosis/necrosis. Conversely, a longer
exposure period to EtOH and HEX bark extracts revealed that there were fewer

102
apoptotic cells measured than at 24 h (-2.4% and -5.0%, respectively; shown in
Figure 3-10). Likewise a longer exposure period to EtOH and HEX leaf
extracts displayed fewer apoptotic cells than at 24 h (-16.1% and -3.3%,
respectively; shown in Figure 3-10). In addition, the decrease in healthy cell
populations treated with EtOH, EtOAc and HEX leaf extracts was
accompanied by increased apoptotic cell populations: 48.3%, 26.5% and 37.4%,
respectively. Between 24 h and 48 h, HEX leaf extract caused an overall 3.3%
increase of early apoptotic MDA-MB-468 cells progressing to late
apoptosis/necrosis.

103
Figure 3-9: Phosphatidylserine detection in MDA-MB-468 cells after exposure to A. ellipticum bark (top) and leaf (bottom) extracts at 4X
GI50 concentration after 24 and 48 hour exposure. Dot plots of annexin V-FITC (green dye) and PI (red dye) analysis from a single
representative experiment is shown. Dual staining of FITC and PI were used to determine the number of cells (%) that are healthy (FITC-/PI
-;
lower left quadrant), undergoing early apoptosis, (FITC+/PI
-; lower right quadrant) and late apoptosis/necrosis (FITC
+/PI
+ top right quadrant).

104
Figure 3-10 Apoptosis induced in HCT116 cells by A. ellipticum extracts
after 24 and 48 hour exposure. Cells were exposed to 4X GI50 concentrations
of bark and leaf extracts and stained with annexin V-FITC and PI. Bars denote
the mean % cell population (± SEM) in early apoptosis (annexin V-FITC+ /PI
-)
(top). Bars denotes the mean % cell population (± SEM) in early apoptosis, late
apoptosis/necrosis (annexin V-FITC+ /PI
+) and healthy (annexin V-FITC
- /PI
-)
(bottom). ≥ 4 independent experiments (≥ 15,000 cells/sample; n ≥ 3) were
performed. Dunnett‟s multiple comparison (One-way ANOVA) analysis was
used to compare each extract-treated group to the control group. Any
statistically significant values are denoted: * = statistically significant (p ≤
0.05).
Con
trol
[0]
Eth
anol
[8]
Eth
ylac
etat
e [1
60]
Hex
ane [8
00]
0
20
40
60
80
100
Annex
in V
-FIT
C+
/ P
I- ce
ll p
opula
tion (%
)
**
*
Con
trol
[0]
Eth
anol
[8]
Eth
ylac
etat
e [1
60]
Hex
ane [8
00]
0
20
40
60
80
100
Cel
l popula
tion (
%)
Extract concentration [µg/ml]
Annexin V-FITC- / PI-
Annexin V-FITC+ / PI-
Annexin V-FITC+ / PI+
Con
trol
[0]
Eth
anol
[8]
Eth
ylac
etat
e [1
60]
Hex
ane [8
00]
0
20
40
60
80
100
Annex
in V
-FIT
C+
/ P
I- ce
ll p
opula
tion (%
)
** *
Con
trol
[0]
Eth
anol
[8]
Eth
ylac
etat
e [1
60]
Hex
ane [8
00]
0
20
40
60
80
100
Cel
l p
op
ula
tion
(%
)
Extract concentration [µg/ml]
Annexin V-FITC- / PI-
Annexin V-FITC+ / PI-
Annexin V-FITC+ / PI+
24 h 48 h
Bark
Con
trol
[0]
Eth
anol
[36]
Eth
ylac
etat
e [3
6]
Hex
ane [7
72]
0
20
40
60
80
100
Annex
in V
-FIT
C+
/ P
I- ce
ll p
opula
tion (%
)
*
*
*
Con
trol
[0]
Eth
anol
[36]
Eth
ylac
etat
e [3
6]
Hex
ane [7
72]
0
20
40
60
80
100
Cel
l p
op
ula
tion
(%
)
Extract concentration [µg/ml]
Annexin V-FITC- / PI-
Annexin V-FITC+ / PI-
Annexin V-FITC+ / PI+
Con
trol
[0]
Eth
anol
[36]
Eth
ylac
etat
e [3
6]
Hex
ane [7
72]
0
20
40
60
80
100
An
nex
in V
-FIT
C+
/ P
I- ce
ll p
op
ula
tion
(%
)
**
*
Con
trol
[0]
Eth
anol
[36]
Eth
ylac
etat
e [3
6]
Hex
ane [7
72]
0
20
40
60
80
100
Cel
l p
op
ula
tion
(%
)
Extract concentration [µg/ml]
Annexin V-FITC- / PI-
Annexin V-FITC+ / PI-
Annexin V-FITC+ / PI+
24 h 48 h
Leaf

105
3.2.2 Time-dependent apoptosis induction in HCT116 cells
after exposure to Duabanga grandiflora extracts
There was a gradual progression of early apoptotic cells (lower right quadrant)
to late apoptotic/necrotic cells (top right quadrant) as exposure period to D.
grandiflora extracts increased (Figure 3-11). Following 24 h exposure to bark
extracts, approximately 33% to 49 % of HCT116 cells underwent early
apoptosis (FITC+/PI
-) as illustrated in Figure 3-12. Early apoptotic HCT116
cells were detected: 33.8%, 39.7%, 41.3%, and 48.5% of total population when
exposed to Water, EtOH, EtOAc and HEX bark extracts, respectively; this is at
least twice as many than that of early apoptotic control cell population (16.8%).
Between 24 h and 48 h, in the presence of Water, EtOH and EtOAc and bark
no considerable increase in levels of early apoptotic to late apoptotic/necrotic
HCT116 cells (< 7%) was observed.
A gradual progression of early apoptotic cells to late apoptotic/necrotic cells as
the cellular exposure period to D. grandiflora leaf extracts was observed
(Figure 3-11). At 48 h, the percentage of early to late apoptotic cells increased
significantly by 24.1%, and 38.1% in the presence of EtOH extract and Water
leaf extracts, respectively, when compared to the control population (p < 0.05).
The apoptotic/necrotic cells induced by Water leaf extracts at 48 h is
significantly higher by 50.3% than the control population and comparable to
the level of apoptotic cells following treatment with Water bark extract
(49.9%). Overall, the concentrations used and cytotoxic effects of EtOH and
Water extracts were comparable with only minor differences in apoptotic
populations of 5.76% (24 h) and 5.23% (48 h), respectively. There was no
considerable increase in the level of early apoptotic to late apoptotic/necrotic
HCT116 cells treated with EtOAc leaf extract between 24 h and 48 h (6.7%);
this is comparable to activity seen in EtOAc bark extract (Figure 3-12). The
percentage of early to late apoptotic cells increased significantly by 31.9% in
the presence of HEX leaf extracts (p < 0.05). HEX leaf extract at the highest
concentration (800 μg/ml) appeared to be less active than lower concentrations
of HEX bark extract (116 μg/ml).

106
Figure 3-11: Detection of apoptotic populations of HCT116 cells after exposure to D. grandiflora bark (top) and leaf (bottom) extracts at
4X GI50 concentration after 24 and 48 hour exposure. Dot plots of annexin V-FITC (green dye) and PI (red dye) analysis from a single
representative experiment is shown. Dual staining of FITC and PI were used to determine the number of cells (%) that are healthy (FITC-/PI
-;
lower left quadrant), undergoing early apoptosis, (FITC+/PI
-; lower right quadrant) and late apoptosis/necrosis (FITC
+/PI
+ top right quadrant).

107
Figure 3-12: Apoptosis induced in HCT116 cells by D. grandiflora extracts
after 24 and 48 hour exposure. Cells were exposed to 4X GI50 concentrations
of bark and leaf extracts and stained with annexin V-FITC and PI. Bars denote
the mean % cell population (± SEM) in early apoptosis (annexin V-FITC+ /PI
-)
(top). Bars denote the mean % cell population (± SEM) in early apoptosis, late
apoptosis/necrosis (annexin V-FITC+ /PI
+) and healthy (annexin V-FITC
- /PI
-)
(bottom). ≥ 4 independent experiments (≥ 15,000 cells/sample; n ≥ 3) were
performed. Dunnett‟s multiple comparison (One-way ANOVA) analysis was
used to compare each extract-treated group to the control group. Any
statistically significant values are denoted: * = statistically significant (p ≤
0.05).
Con
trol
[0]
Wat
er [1
68]
Eth
anol
[152
]
Eth
ylac
etat
e [8
8]
Hex
ane [1
16]
0
20
40
60
80
100
Annex
in V
-FIT
C+
/ P
I- ce
ll p
opula
tion (%
)
*
Con
trol
[0]
Wat
er [1
68]
Eth
anol
[152
]
Eth
ylac
etat
e [8
8]
Hex
ane [1
16]
0
20
40
60
80
100
Cel
l popula
tion (
%)
Extract concentration [µg/ml]
Annexin V-FITC- / PI-
Annexin V-FITC+ / PI-
Annexin V-FITC+ / PI+
Con
trol
[0]
Wat
er [1
68]
Eth
anol
[152
]
Eth
ylac
etat
e [8
8]
Hex
ane [1
16]
0
20
40
60
80
100
Annex
in V
-FIT
C+
/ P
I- ce
ll p
opula
tion (%
)
*
*
**
Con
trol
[0]
Wat
er [1
68]
Eth
anol
[152
]
Eth
ylac
etat
e [8
8]
Hex
ane [1
16]
0
20
40
60
80
100
Extract concentration [µg/ml]
Cel
l popula
tion (
%)
Annexin V-FITC- / PI-
Annexin V-FITC+ / PI-
Annexin V-FITC+ / PI+
24 h 48 h
Bark
Con
trol
[0]
Wat
er [8
00]
Eth
anol
[152
]
Eth
ylac
etat
e [1
64]
Hex
ane [1
00]
0
20
40
60
80
100
Annex
in V
-FIT
C+
/ P
I- ce
ll p
opula
tion (%
)
*
Con
trol
[0]
Wat
er [8
00]
Eth
anol
[152
]
Eth
ylac
etat
e [1
64]
Hex
ane [1
00]
0
20
40
60
80
100
Cel
l popula
tion (
%)
Extract concentration [µg/ml]
Annexin V-FITC- / PI-
Annexin V-FITC+ / PI-
Annexin V-FITC+ / PI+
Contr
ol [0]
Wate
r [8
00]
Eth
anol
[15
2]
Eth
ylace
tate
[16
4]
Hex
ane [1
00]0
20
40
60
80
100
An
nex
in V
-FIT
C+
/ P
I- ce
ll p
op
ula
tion
(%
)
**
Con
trol
[0]
Wat
er [8
00]
Eth
anol
[152
]
Eth
ylac
etat
e [1
64]
Hex
ane [1
00]
0
20
40
60
80
100
Cel
l popula
tion (
%)
Extract concentration [µg/ml]
Annexin V-FITC- / PI-
Annexin V-FITC+ / PI-
Annexin V-FITC+ / PI+
24 h 48 h
Leaf

108
3.2.3 Time-dependent apoptosis induction in HCT116 cells
after exposure to Pseuduvaria macrophylla extract
The numbers of healthy cells (FITC-/PI
-) entering apoptosis and progressing to
late apoptosis/necrosis as the exposure period to P. macrophylla extracts
increases is illustrated in Figure 3-13.
Figure 3-13: Phosphatidylserine detection in HCT116 cells after exposure
to P. macrophylla extracts at 4X GI50 concentration after 24 and 48 hour
exposure. Dot plots of annexin V-FITC (green dye) and PI (red dye) analysis
from a single representative experiment is shown. Dual staining of FITC and PI
were used to determine the number of cells (%) that are healthy (FITC-/PI
-;
lower left quadrant), undergoing early apoptosis, (FITC+/PI
-; lower right
quadrant) and late apoptosis/necrosis (FITC+/PI
+ top right quadrant).

109
Following 48 h exposure, cell populations undergoing late apoptosis were
evident, < 20% viable cells (FITC-/ PI-) were detected in cells exposed to
EtOH extracts and < 40% viable cells following exposure to EtOAc and HEX
extracts (Figure 3-14). During 24 h and 48 h, the decrease in healthy cell
population was accompanied by an increase in apoptotic cell populations:
33.6%, 13.5% and 15.4% for EtOH, EtOAc and HEX extracts, respectively.
At both time points, all P. macrophylla extracts caused significantly increased
levels of early apoptotic HCT116 populations (p < 0.05).
Figure 3-14: Apoptosis induced in HCT116 cells by P. macrophylla
extracts after 24 and 48 hour exposure. Cells were exposed to 4X GI50
concentrations of extracts and stained with annexin V-FITC and PI. Bars
denote the mean % cell population (± SEM) in early apoptosis (annexin V-
FITC+ /PI
-) (top). Bars denotes the mean % cell population (± SEM) in early
apoptosis, late apoptosis/necrosis (annexin V-FITC+ /PI
+) and healthy (annexin
V-FITC- /PI
-) (bottom). ≥ 4 independent experiments (≥15,000 cells/sample; n
≥ 3) were performed. Dunnett‟s multiple comparison (One-way ANOVA)
analysis was used to compare each extract-treated group to the control group.
Any statistically significant values are denoted: * = statistically significant (p ≤
0.05).
Con
trol
[0]
Eth
anol
[20]
Eth
ylac
etat
e [8
]
Hex
ane [2
0]0
20
40
60
80
100
Annex
in V
-FIT
C+
/ P
I- ce
ll p
opula
tion (%
)
***
Con
trol
[0]
Eth
anol
[20]
Eth
ylac
etat
e [8
]
Hex
ane [2
0]0
20
40
60
80
100
Cel
l popula
tion (
%)
Extract concentration [µg/ml]
Annexin V-FITC- / PI-
Annexin V-FITC+ / PI-
Annexin V-FITC+ / PI+
Annex
in V
-FIT
C+
/ P
I- ce
ll p
opula
tion (%
)
Con
trol
[0]
Eth
anol
[20]
Eth
ylac
etat
e [8
]
Hex
ane [2
0]0
20
40
60
80
100
*
* *
Con
trol
[0]
Eth
anol
[20]
Eth
ylac
etat
e [8
]
Hex
ane [2
0]0
20
40
60
80
100
Cel
l popula
tion (
%)
Extract concentration [µg/ml]
Annexin V-FITC- / PI-
Annexin V-FITC+ / PI-
Annexin V-FITC+ / PI+
24 hour 48 hour

110
3.3 Identification of caspase 3 and Mcl-1 protein expressions
Detection of changes in protein expression in cells following their treatment
with UNMC extracts could provide information on possible mechanism(s) of
action. As mentioned in section 1.3.2, cancer cells gain the ability to evade
apoptosis therefore disrupting homeostasis. Apoptosis is co-ordinated by
initiator and executioner proteins involved in two main apoptotic pathways,
known as the intrinsic (mitochondrial) and extrinsic (death receptor) pathways.
Both pathways eventually converge on the same execution pathway, which is
irreversibly initiated by executioner caspase 3. Caspase 3 is activated by
cleavage commonly by multiple death signals and this activation is essential
for apoptosis-associated DNA fragmentation.260
The overexpression of anti-apoptotic (pre-survival) proteins of the Bcl-2 family
e.g. Bcl-2, Bcl-XL and Mcl-1 can inhibit apoptosis and enable deregulated
oncogene expression. Apoptosis failure is a major contributor to
tumourigenesis; therefore induction of cancer cell apoptosis by
inhibition/downregulation of survival proteins is an important goal of
experimental cancer therapies.
Western blot analysis was employed to detect presence of proteins within
cellular extracts. Proteins could be extracted from samples, denatured and
separated according to molecular weight by gel electrophoresis. Analysis of
band densities as relative density to control was carried out using Image J
software.
3.3.1 Effect of Duabanga grandiflora and Pseuduvaria
macrophylla extracts on protein expression
The in vitro anticancer properties of P. macrophylla EtOH and EtOAc extracts
and D. grandiflora EtOH and HEX extracts were examined. Water and EtOAc
extracts induced anti-proliferative effects, which would be worthy of
investigation, however stocks remaining were insufficient for repeating
independent experiments. HCT116 cells were exposed to control treatments
(DMSO and camptothecin) and available UNMC extracts. Whole cell lysates

111
were prepared 48 h later and SDS-PAGE/Western blot analysis was performed
to examine Mcl-1 and caspase 3 expressions (Figure 3-16 and Figure 3-15).
Caspase 3 expression was examined in UNMC extracts treated HCT116 cell
lysates after 48 h exposure. Distinct full length and cleaved forms of caspase 3
were expressed in P. macrophylla EtOAc and D. grandiflora EtOH and HEX
extract-treated HCT116 cells (Figure 3-15). Caspase 3 expression was not
detected in DMSO treated cells, however expression of full-length caspase 3
protein was detected in camptothecin-treated cells.
Figure 3-15 Caspase 3 protein expressions after 48-hour exposure to D.
grandiflora and P. macrophylla extracts. HCT116 cells were treated with P.
macrophylla EtOAc extract and D. grandiflora EtOH and HEX extracts for 48
h. Western blots of whole cell lysates representative of two independent
experiments are presented. DMSO (-) and camptothecin (+) were used as
control.
Noticeably, relative density of bands illustrating cleaved caspase 3 in cell
lysates treated with 1X GI50 of D. grandiflora EtOH and HEX extracts
increased as concentration increased to 5X GI50 and was accompanied by
decreased relative density of full-length caspase 3 protein expression, therefore
suggesting dose-dependent cleavage and expression of caspase 3. A similar
trend was observed with P. macrophylla EtOAc extracts, higher relative
densities of cleaved caspase 3 bands were noticed accompanied by lower
relative density of full-length caspase 3 band (relative band density of 1X GI50:
1.08 and 5X GI50: 0.96). Expression of Mcl-1 in negative control cells was
illustrated as a band that is ~6-fold higher in relative density than positive
control cells. D. grandiflora EtOH and HEX (1X GI50) treated cell lysates

112
illustrated Mcl-1 expression similar to relative band density of negative control
(1.0). Whereas at HEX 5X GI50 treatment resulted in Mcl-1 expression that
was less than half of the relative band density (0.3) than that detected in lysates
of negative control.
In lysates of P. macrophylla EtOH extract-treated cells, Mcl-1 expression was
comparable to that in control lysates (relative band density1.1 and 1.0,
respectively), whereas lysates prepared from cells exposed to EtOAc extracts
revealed bands of lower relative density (0.7).
Figure 3-16: Mcl-1 protein expressions after 48-hour exposure to D.
grandiflora and P. macrophylla extracts. HCT116 cells were treated with P.
macrophylla EtOH and EtOAc extracts and D. grandiflora EtOH and HEX
extracts for 48 h. Western blots of whole cell lysates representative of two
independent experiments are presented. DMSO (-) and camptothecin (+) were
used as control.
3.4 Summary of studies to investigate UNMC extract-induced
apoptosis
Morphological changes in cancer cells were apparent under a phase-contrast
microscope after 24 h and 48 h exposure to UNMC extracts. A proportion of
cells appeared smaller, circular and „blebbling‟ of the cell membrane was
evident. Morphological observations accompanied by dual staining of cells
with annexin V-FITC and PI confirmed the induction of apoptosis. The
apoptosis-inducing capacity of UNMC extracts was highlighted by increased
numbers of cells displaying FITC+/PI
- fluorescence compared with the DMSO-
treated control cells after 24 h and 48 h exposures (Figure 3-14). Furthermore,
Caspase-3 is susceptible to activation by any of the initiator caspases (caspase -
8, -9 or -10). Detection of caspase 3 fragments suggests the execution pathway

113
has been initiated, however it is not certain whether initiation of caspase 3 was
a consequence of the extrinsic or the intrinsic pathway activation. Activation
of caspase 3 would lead to DNA fragmentation and these results are agreement
with the sub-G1 cell population (lower DNA content) detected in the cell cycle
distribution with apparent morphological changes. Quantifying expression of
caspase 3 initiators e.g. caspase 8 or caspase 9 could reveal information on
possible pathways employed by compounds in the extracts. Whereas,
detection of anti-apoptotic Mcl-1 protein in D. grandiflora or P. macrophylla
treated cells may suggest that Mcl-1 is not an influential factor in induction of
apoptosis and that compounds embedded do not inhibit cdk-9.
It is noted that Mcl-1 and caspase 3 proteins expression were detected in D.
grandiflora- and P. macrophylla-treated HCT116 cell lysates.
Archidendron ellipticum: Time-dependent induction of apoptosis by A.
ellipticum extracts in MDA-MB-468 cells (increased sub-G1 cell populations)
was confirmed by Annexin-V FITC/PI staining. At 48 h, significantly higher
levels of early and late apoptotic HCT116 cells were detected than in control
cells. Previously observed enhanced levels of EtOH extract-treated G2/M cell
populations at 48 h suggested inhibition of or interference with mitosis;
however, cellular/DNA repair mechanisms may be operating to overcome
damage leading to the observation of slightly fewer apoptotic cells or cells may
remain viable but unable to proceed to G2/M phase. Familiar examples of
marketed anticancer drugs, which demonstrated similar effects on cells include
taxol, an inhibitor of β-subunit of tubulin, which binds to the inner surfaces of
microtubule leading to inhibition of microtubule depolymerisation and disrupts
the normal dynamic reorganisation of the microtubule network causing G2/M
cell cycle arrest and consequently interference with mitotic spindles resulting
in cell death.141
Additionally, effects of docetaxel are prominently observed in
G2/M phase of the cell cycle and have minimal toxicity against cells in G1
phase. Contrastingly, vinca alkaloids can affect cells by inhibiting mitotic
spindle assembly and reducing tension at the kinetochores of the chromosomes,
also resulting in G2/M block. It has been reported that taxanes can cause cell
arrest in G2/M phase (by inhibiting of depolymerisation) and phosphorylate
Bcl-2 proteins and this provides additional basis to investigate possible pro-

114
apoptotic activity induced by UNMC extracts as cell cycle data of A. ellipticum
revealed G2/M block and increased sub-G1 population. Kuntiz inhibitor found
in A. ellipticum is able to activate caspase 3 and 8, which is suggestive of
extrinsic pathway activation. Acacia genus of the Fabaceae family, which is
also rich in saponins, has demonstrated apoptosis-inducing abilities in Jurkat
cells via permeablisation of mitochondrial membrane (time-dependent
cytochrome C release) and caspase 3 activation.
Duabanga grandiflora: The presence of sub-G1 HCT116 cell populations
were observed following exposure of cells to D. grandiflora extracts and the
Annexin-V FITC assay confirmed the sub-G1 cell population to be apoptotic
cells. The observed G1/0 block is indicative of possible DNA damage
resulting in inability to progress past G1/0 and apoptosis. Significant levels of
early apoptotic HCT116 cells were measured in all D. grandiflora treated cells,
in particular, following polar Water and EtOH extracts treatments. The level
of apoptotic/necrotic cells emerging following exposure of cells to Water and
HEX bark, Water and EtOH leaf extracts were time-dependent and significant
compared to untreated control populations (p < 0.05). This is supported by the
detection of cleaved caspase 3 proteins.
Pseuduvaria macrophylla: The ability of P. macrophylla extracts to induce
apoptosis in HCT116 cells was evident in this series of in vitro assays
(potency: EtOH > EtOAc > HEX). Initially, early apoptosis was detected in all
P. macrophylla extracts treated cells at significant levels (39 % to 48 %). As
exposure time increased, a distinct progression of early apoptotic cells into late
apoptosis was noticed hence appearance of apoptotic/necrotic cells was time-
dependent (62% to 86 %; 24 h – 48 h). An aporphinoid, liriodenine (8H-
benzo[g]-1,3-benzodioxolo[6,5,4-de]-quinolin-8-one), similar to that isolated
from P. macrophylla revealed cytotoxicity against A549 lung cancer cells
between 2 and 20 μM of liriodenine causing G2/M cell cycle arrest, together
with 67% and 80% early apoptosis (Annexin-V FITC+/PI- cells),
respectively.252
As previously mentioned, liriodenine, similar to 38 isolated
from P. macrophylla has revealed the ability to cleave PARP in A459 cells,
which is suggestive of caspase 3 activation.252
Both aporphinoids could be

115
exerting their cytotoxicity via similar mechanisms since similar trends of cell
cycle perturbations were also observed.
Cell cycle perturbations and appearance of apoptotic cells have been detected,
which suggest involvement of proteins such as cysteine-dependent aspartate-
directed proteases caspases (executors of apoptosis). It has been reported that
Fas, caspase -3 and -8 are involved in PS externalisation facilitating non-
inflammatory phagocytic recognition hence uptake of apoptotic cells.250
Overall, detection of cleaved (activated) caspase 3 by Western blot and
Annexin V positive, PI negative cells by flow cytometry provide robust
evidence of cells undergoing early apoptosis. Both sets of data together with
evidence of morphological changes can confirm caspase-dependent apoptosis;
these preliminary results illustrating execution of apoptosis provide support for
further investigation of constituents in UNMC plants as potential anti-tumour
agents.

116
4
Effects of UNMC plant extracts on cell migration
The ability of malignant cells to migrate and invade surrounding tissue,
vascular beds, ECM is crucial to cancer metastasis. Invasion and metastasis
represent one of the hallmarks of cancer. It is interesting that the cancer cells‟
acquired resistance mechanism to VEGF inhibitors leads to enhanced
migratory capacity.124
4.1 Effects of UNMC plant extracts on cell migration
A simple in vitro assay was used to mimic in vivo cell migration during wound
healing. A „wound‟ is created in a cell monolayer and observations (images
captured) at timed intervals will enable analysis of the migration rate of the
cells.253
Wound images (n = 2) of the marked section were analysed using
ImageJ and the wound area was measured as area covered (%). At 0 h, the
wound is considered as 100% and over time, the area of the wound can
decrease (as cells migrate), increase (cell death; floating cells) and/or remain
the same (migration inhibition); if necessary, medium was replenished to
remove floating cells for clearer images of the wound. The end point was
considered when wound size of the control cells is 0% regardless of the wound
size of treated cells. Dunnett‟s multiple comparison (One-way ANOVA)
analysis was used to compare each extract-treated group to the control group.
Any statistically significant values are denoted: * = 0.01< p < 0.05. Certain
extracts were selected for anti-migration activities based on the acquired
growth inhibitory/cytotoxicity data and extract availability.

117
4.1.1 Effect of Archidendron ellipticum extracts on HCT116 cell
migration
The investigation of in vitro anticancer properties of HEX bark extract was
terminated due to the lack of supply.
At 24 h treatment period, significant differences in wound area (%) were
observed between bark extract-treated and control cells (Figure 4-1). A
comparable migration rate in EtOAc bark and EtOH leaf extract-treated cells
was observed after 24 h treatment, however EtOH bark and EtOAc leaf extract
treatment led to emergence of a larger wound area observed as a consequence
of detached cells (p < 0.05) . This result supports the observation seen in the
MTT assay that EtOH bark and EtOAc leaf extracts were the most active
against MDA-MB-468 cells. At 56 h, remaining wound area of MDA-MB-468
cells at 62.2% and 87.9% after exposure to low concentrations EtOH bark
extracts (2 and 8 μg/ml) revealed strong anti-migration properties.
The remaining wound sizes of 42.1% and 43.5% after treatment of cells with
1X and 4X GI50 EtOAc bark extract, respectively, were significant compared to
control cells; statistical analyses have shown significant differences in wound
size (p = 0.005 and 0.020, respectively). To a lesser extent, a steady cell
migration rate was observed following EtOH leaf extract treatment than
compared to control cells until 64 h where a significant wound area was
observed, ~ 30%, with both concentrations of EtOH extract. Whereas
following 24 h treatment, similar effects of EtOAc leaf extract at 1X GI50
illustrate a steady migration rate comparable to the control cells. Only at 4X
GI50 treatment, were cells unable to migrate completely due to cytotoxicity of
EtOAc extracts; the cell monolayer was lost due to cell death. Anti-migration
effects of HEX leaf extracts were only observed at very high concentrations
(772 μg/ml) in MDA-MB-468 cells. It is interesting to note that between 0 h
and 48 h, the healing (migration) rate of MDA-MB-468 cells supersedes the
control cells under the influence of HEX extract (p < 0.05).

118
Figure 4-1: Inhibitory effect of A. ellipticum bark and leaf extracts on
MDA-MB-468 wound healing (%) over a 64 h period. Cells were exposed
to 1X and 4X GI50 concentrations of EtOH (A), EtOAc (B) and HEX (C)
extracts measured at specific sections every 24 h (monitored closely when
wound is ~ 10%). Mean measurements are from 3 independent experiments (n
= 2). Dunnett‟s multiple comparison (One-way ANOVA) analysis was used to
compare each extract-treated group to the control group. Any statistically
significant values are denoted: * = statistically significant (p ≤ 0.05).
0 20 40 60 800
50
100
150
Time (Hour)
Wou
nd
siz
e (
%)
Control
[22 µg/ml]
[88 µg/ml]
EtOH extract
****
0 20 40 60 800
20
40
60
80
100
Wou
nd
siz
e (
%)
Time (Hour)
Control
[42 µg/ml]
[168 µg/ml]
EtOAc extract
**
0 20 40 60 800
20
40
60
80
100
Wou
nd
siz
e (
%)
Time (Hour)
Control
[38 µg/ml]
[152 µg/ml]
EtOH extract
**
Time (Hour)W
ou
nd
siz
e (
%)
0 20 40 60 800
50
100
150Control
[41 µg/ml]
[164 µg/ml]
EtOAc extract
*
* *
0 20 40 60 800
20
40
60
80
100
Wou
nd
siz
e (
%)
Time (Hour)
Control
[25 µg/ml]
[100 µg/ml]
HEX extract

119
4.1.2 Effect of Duabanga grandiflora extracts on cell migration
The investigation of in vitro anticancer properties of EtOH and HEX bark
extracts was carried out. Water and EtOAc extracts induced anti-proliferative
effects, which would be worthy of investigation, however supply was
insufficient to allow for repeated independent experiments.
A positive correlation was observed between extracts‟ concentration and
potency against HCT116 cell migration inhibition as prominent effects were
observed (Figure 4-2). At 56 h, EtOH extracts at 38 and 152 μg/ml were able
to significantly inhibit HCT116 cell migration as wound area remained at
38.6% and 53.6%, respectively (p = 0.005). A steady inhibition of HCT116
cell migration under the influence of EtOH bark extract was revealed; wound
areas of > 50% remained without the loss of cell monolayer, suggesting that
cells are viable but reluctant to migrate. Inhibitory effects on cell migration
were observed when HCT116 cells were treated with 1X GI50 HEX extract, as
wound sizes remained constant at 81.4% to 75.0%. While, detached dead cells
were noticed with HEX extract treatment at 4X GI50, resulting in a significantly
greater wound area (> 100%); HEX extracts appeared to be cytotoxic to
HCT116 cells as the cell monolayer was lost during longer treatment times (>
48 h; represented by a wound area of > 100%.

120
Figure 4-2: Inhibitory effect of D. grandiflora bark extracts on HCT116
wound healing (%) over a 56 h period. Cells were exposed to 1X and 4X
GI50 concentrations of EtOH (A) and HEX (B) extracts and measured at
specific sections every 24 h (monitored closely when wound is ~ 10%). Mean
measurements are from 3 independent experiments (n = 2). Dunnett‟s multiple
comparison (One-way ANOVA) analysis was used to compare each extract-
treated group to the control group. Any statistically significant values are
denoted: * = statistically significant (p ≤ 0.05).
0 20 40 600
20
40
60
80
100
Wou
nd
siz
e (%
)
Time (Hour)
Control
[38 µg/ml]
[152 µg/ml]
EtOH extract
* *
0 20 40 600
50
100
150
200
Time (Hour)
Wou
nd
siz
e (%
)
Control
[29 µg/ml]
[116 µg/ml]
HEX extract
****
*

121
4.1.3 Effect of Pseuduvaria macrophylla extracts on HCT116
cell migration
The rate of wound healing decreased when HCT116 cells were treated with
EtOH and EtOAc extracts, when compared to control cells at 56 h; hence
results suggest the anti-migration effects were induced by P. macrophylla
extracts. There was no significant difference in wound area between EtOH
extract-treated and control cells (p < 0.05) between 0 h and 48 h (Figure 4-3).
Figure 4-3: Inhibitory effect of P. macrophylla extracts on HCT116 wound
healing (%) over a 56 hour period. Cells were exposed to 1X and 4X GI50
concentrations of EtOH (A) and EtOAc (B) extracts and measured at specific
sections every 24 h (monitored closely when wound is ~ 10%). Mean
measurements are from 3 independent experiments (n = 2). Dunnett‟s multiple
comparison (One-way ANOVA) analysis was used to compare each extract-
treated group to the control group. Any statistically significant values are
denoted: * = statistically significant (p ≤ 0.05).
0 20 40 600
20
40
60
80
100
Time (Hour)
Wou
nd
siz
e (%
)
Control
[5 µg/ml]
[20 µg/ml]
EtOH extract
**
0 20 40 600
20
40
60
80
100
Time (Hour)
Wou
nd
siz
e (%
)
Control
[2 µg/ml]
[8 µg/ml]
EtOAc extract
**

122
At 56 h, the remaining wound area in cells exposed to 5 and 20 μg/ml EtOH
were 33.7% and 42.5%, respectively and cell migration was significantly
inhibited by 2 and 8 μg/ml EtOAc extract with remaining wound size of 42.1%
and 43.5%, respectively compared to control cells. Statistical analyses have
shown significant differences in wound size after 40 h of exposure (p = 0.005
and 0.020, respectively).
4.1.4 Summary of migration inhibition properties of UNMC
extracts
A wound-healing assay was performed to assess the UNMC extracts‟ ability to
inhibit cell migration as this could have potential therapeutic uses specifically
for cancer metastasis inhibition and also to overcome acquired resistance to
VEGF inhibitors.
Archidendron ellipticum: Comparable migration rates to the control cells
were observed in MDA-MB-468 cells following 0 h to 48 h exposure to EtOAc
bark and EtOH leaf. To a greater extent, this trend was also observed with
EtOAc leaf extracts with remaining wound size of 43.0%. However, cell
migration could no longer be observed due to loss of cell monolayer (> 100%,
hence cell death) at higher concentrations of EtOAc leaf extract. EtOH bark
induced greatest significant anti-migration effects at lowest concentrations
used compared with wound area of control cells; the wound area of cells
following EtOH bark treatment (40 and 160 μg/m) remained at 46.1% and
46.5%, respectively. It is interesting to note the enhanced migration rate of
MDA-MB-468 cells under the influence of HEX extract, suggesting embedded
compounds could encourage cell migration prior to inhibitory effects at longer
exposure time. It is anticipated that HEX bark extract would have comparable
low anti-migration effects as to HEX leaf extract based on previous in vitro
assays results of HEX extracts on HCT116 cells e.g. MTT, cell cycle and
annexin-V FITC.

123
Duabanga grandiflora: Inhibition of HCT116 cell migration was observed
following treatment with EtOH and HEX bark extracts. A steady decrease in
wound area was observed with EtOH-treated HCT116 cells. From 12 h
onwards, inhibition of HCT116 cell migration following HEX extract
treatment was evident as the remaining wound areas were preserved at 75% to
82%. Following 24 h, detachment of cells was clearly observed following
replenishment of medium containing extracts, suggesting cytotoxicity with
high concentrations of HEX extract where wound area (%) was measured at >
100%, which indicated cell death. It may be expected that EtOAc bark and
leaf extracts would induce greater inhibitory effects on HCT116 migration,
based on previous in vitro assays results of EtOAc extracts on HCT116 cells
from e.g. MTT, cell cycle and annexin-V FITC assays.
Pseuduvaria macrophylla: Extracts exhibited a gradual inhibition of cell
migration with slightly greater effects seen with EtOAc extract than EtOH
extract: larger wound areas were observed at lower concentrations of EtOAc
applied. It is expected that HEX extract may induce similar inhibitory effects
on HCT116 migration, based on previous in vitro assay results of HEX extracts
on HCT116 cells (e.g. MTT, cell cycle and annexin-V FITC) which yielded
comparable results to EtOH and EtOAc extracts.
Overall, inhibition of cell migration was observed in several of the UNMC
extracts. It is speculated that compounds present in the extracts could be
influencing the TNF-α pathway resulting in lack of survival and inflammation
signals via inactivation of NF-κB signaling and induction of apoptosis by
caspase 3 activation.254
TNF-α can induce cytokines, angiogenic factors and
metalloproteinases (MMPs). Polyphenols such as (-)-epigallocatechin-3-
gallate (EGCG) can modulate MMP-2 and MMP-9, which affect the basement
membrane turnover and tissue remodeling that are associated in tumour
invasion and metastasis, which requires changing the dynamics of extra
cellular matrix (ECM) to gain motility.255, 256

124
4.2 Effect of UNMC plant extracts on cellular senescence
Cellular senescence describes the irreversible growth arrest, which is the
underlying mechanistic cause of aging in normal somatic cells upon reaching
their Hayflick replicative limit; hence senescence is also a tumour suppression
mechanism. Many tumours possessing unlimited and/or extended replicative
potential, hence escaping mortality, can progress to malignant transformation;
however several chemotherapeutic agents can induce senescence in tumours.257
The biomarker, β-galactosidase, present in the lysosomes of senescent cells has
been measured to determine the effects of UNMC plant extracts on senescence
and, indirectly, cancer cell immortality. Increased detection of blue-green-
stained β-galactosidase within the cytosol of cells undergoing senescence
following incubation of cells with X-gal has been used to determine senescent
cells. The level of β-galactosidase in cells treated with UNMC plant extracts at
1X and 2X GI50 was determined by counting the number of blue/green cells
under the microscope as a result of the binding of X-gal to β-galactosidase in
senescent cells. DMSO and RHPS4 were used as negative and positive control
treatments for the detection of senescence in HCT116 cells (Figure 4-4).
Pentacyclic acridine RHPS4 is a telomere-targeted agent that stabilises G-
quadruplex structures within telomeric DNA, hence preventing telomere-
telomere interaction.258
Dunnett‟s multiple comparison (One-way ANOVA)
analysis was used to compare each extract-treated group to the control group.
Any statistically significant values are denoted: * = 0.01< p < 0.05.
Figure 4-4: Images of β-galactosidase positive (senescent) HCT116 cells.
Senescence of HCT116 cells treated with DMSO as negative control (left) and
RHPS4 as positive control (right) were assessed using X-gal staining. Cells
were exposed to DMSO and RHPS4 (1 µM) for 8 days; β-galactosidase+ cells
appearing blue/green in colour. Images shown were captured by Nikon
Coolpix camera (100X magnification).
RHP
S4
Control

125
4.2.1 Effect of Archidendron ellipticum extracts on cellular
senescence
EtOH bark and all leaf extracts were investigated for senescence-inducing
activity. The level of senescence in MDA-MB-468 cells induced by A.
ellipticum extracts is illustrated in Figure 4-5 and Figure 4-6. All extract-
treated cells have significantly higher numbers of β-galactosidase positive cells
than the DMSO control population (1.9%) by 10- to 23-fold. The percentage
of senescent cells was significantly higher than control cells by 21.7% and
25.3% when exposed to 1X and 2X GI50 of EtOH bark extract (2 and 4 μg/ml).
Figure 4-5: MDA-MB-468 cells undergoing senescence after exposure to A.
ellipticum extracts. Cells were exposed to 1X and 2X GI50 concentrations of
bark and leaf extracts for 7 days then stained with X-gal followed by 24 h
incubation at 37 °C in the dark. Blue/green β-galactosidase+ cells were counted
under a light microscope. Bars represent mean measurements are from 3
independent experiments (n = 2). Dunnett‟s multiple comparison (One-way
ANOVA) analysis was used to compare each extract-treated group to the
control group. Any statistically significant values are denoted: * = statistically
significant (p ≤ 0.05).
Levels of senescent cells were more significant following treatment with
extract at high concentrations of EtOH and EtOAc leaf extracts (p ≤ 0.05). The
difference in the levels of senescent cells after exposure to 1X GI50 (26.5%)
Con
trol
[0]
EtO
H [2]
EtO
H [4]
EtO
H [19
]
EtO
H [38
]
EtO
Ac
[9]
EtO
Ac
[18]
HEX
[20
0]
HEX
[40
0]0
25
50
75
100
Extract concentration [µg/ml]
Sen
esce
nt
cells
(%)
Control [0]
EtOH [2]
EtOH [4]
EtOH [19]
EtOH [38]
EtOAc [9]
EtOAc [18]
HEX [200]
HEX [400]
Bark Leaf
* *
*
*
*
**
*

126
and 2X GI50 (34.1%) EtOH leaf extracts was 7.7%. A larger 14.5% difference
in the level of senescence cells between 1X GI50 (28.8%) and 2X GI50 (43.3%)
between EtOAc leaf extracts was observed. Significant numbers of senescent
cells were induced at very high concentrations of HEX leaf extracts (p < 0.05).
Images of MDA-MB-468 cells were captured to illustrate the appearance of
senescent cells (Figure 4-6); cells exposed to A. ellipticum EtOH bark extracts
appeared to have swelled up and are more circular whereas smaller circular
shapes were seen with the EtOAc-treated MDA-MB-468 cells, which is
suggestive of apoptotic bodies. Following statistical analysis, significant
differences in the level of senescence observed between extract treated cells
and control was measured.

127
Figure 4-6: Images of β-galactosidase positive (senescent) MDA-MB-468 cells. Senescence was assessed using X-gal staining. Cells were
exposed to 1X and 2X GI50 A. ellipticum extracts concentrations and β-galactosidase+ cells appearing blue/green in colour (highlighted by
arrows) were counted under a light microscope. Images shown were captured by Nikon Coolpix camera (100X magnification) and are from a
single representative experiment (n = 2).
Control EtOH EtOAc EtOAc
1X
GI50
2X
GI50
HEX
Bark Leaf

128
4.2.2 Effect of Duabanga grandiflora extracts on cellular
senescence
The investigation of in vitro anticancer properties of Water and EtOAc bark
and leaf extracts was terminated due to the lack of supply. EtOH and HEX
bark extracts were investigated for senescence-inducing activity.
The level of senescence in HCT116 cells induced by D. grandiflora extracts is
illustrated in Figure 4-7. All extract-treated cells appeared to have a higher
level of senescence than those measured in the DMSO control population
(1.5%) by 2- to 5- fold. Levels of senescent HCT116 cells following exposure
to EtOH bark extracts (38 and 76 μg/ml) were measured at 5.8% and 6.0%,
respectively. The % of senescent HCT116 cells treated with 1X GI50 HEX
bark extracts (29 μg/ml) was 2.2% higher than the control population and
greater effects were seen at 2X GI50 of HEX extract (58 μg/ml) treatment
yielding a significant senescent population of 5.6% compared with control cells.
Images of HCT116 cells were captured to illustrate the appearance of senescent
cells (Figure 4-8). Observation of single cells individually enabled careful
examination of each cell to determine not only β-galactosidase status but also
morphological changes. HCT116 cells became longer and fibroblast-like with
long spindle-like protrusions. Following statistical analysis, significant
differences were noticed between control and HEX bark extract-treated cells,
however there was no significant difference in the level of senescence observed
between the EtOH and low concentrations of HEX extract treated cells (p >
0.5).

129
Figure 4-7: HCT116 cells (%) undergoing senescence after exposure to D.
grandiflora extracts. Cells were exposed to 1X and 4X GI50 concentrations of
extracts for 7 days then stained with X-gal followed by 24 h incubation at
37 °C in the dark. Blue/green β-galactosidase+ cells were counted under a light
microscope. Bars represent mean measurements are from 3 independent
experiments (n = 2). Dunnett‟s multiple comparison (One-way ANOVA)
analysis was used to compare each extract-treated group to the control group.
Any statistically significant values are denoted: * = statistically significant (p ≤
0.05).
Figure 4-8: Images of β-galactosidase positive (senescent) HCT116 cells.
Senescence was assessed using X-gal staining. Cells were exposed to 1X and
2X GI50 concentrations of D. grandiflora bark extracts and β-galactosidase+
cells appearing blue/green in colour (highlighted by arrows) were counted
under a light microscope. Images shown were captured by Nikon Coolpix
camera (100X magnification) and are from a single representative experiment
(n = 2).
Con
trol
[0]
EtO
H [38
]
EtO
H [76
]
HEX
[29
]
HEX
[58
]0
2
4
6
8
10
Extract concentration [µg/ml]
Sen
esce
nt
cells
(%)
Control [0]
EtOH [38]
EtOH [76]
HEX [29]
HEX [58]
*

130
4.2.3 Effect of Pseuduvaria macrophylla extracts on cellular
senescence
EtOH and EtOAc extracts were investigated for senescence-inducing activity.
The level of senescence induced in HCT116 cells by P. macrophylla extracts is
illustrated in Figure 4-9. All extract-treated cells had greater levels of X-gal
(β-galactosidase) staining than the DMSO control population (1.5%) by 2- to
5- fold. The percentage of senescent cells was greater by 2.0% and 5.9% when
exposed to 1X and 2X GI50 of EtOH extract (5 and 20 μg/ml) than control
population. Similarly, EtOAc extracts induced greater levels of senescent cells
compared to control cells by 3.2% and 7.0% at 2 and 4 μg/ml, respectively.
The difference in the level of senescent cells after exposure to 1X GI50 (3.5%)
and 2X GI50 (7.4%) EtOH extracts was 3.9%. A larger difference in the level
of senescence cells between 1X GI50 (4.7%) and 2X GI50 (8.5%) EtOH leaf
extracts was 3.8%. There was not enough evidence to conclude P.
macrophylla extracts induced significant levels of senescence in sensitive
HCT116 cells (Figure 4-9).
Images of HCT116 cells were captured to illustrate the appearance of senescent
cells (Figure 4-6). Increased number of „blue/green‟ cells covering a wider
area can be observed in extract-treated HCT116 cells (Figure 4-10) and extract-
treated cells appeared small and circular which could be indicative of apoptotic
bodies. A low level of naturally occurring senescent cells was detected in the
control population, which may be due to high cell density in certain sections.
Statistical analysis revealed significant difference in the level of senescence
observed between extract treated cells at 2X GI50 and the control (p < 0.5).

131
Figure 4-9: HCT116 cells undergoing senescence after exposure to P.
macrophylla extracts. Cells were exposed to 1X and 2X GI50 extract
concentrations for 7 days then stained with X-gal followed by 24 h incubation
at 37 °C in the dark. β-galactosidase+ cells appear blue/green in colour and
were counted under a light microscope. Blue/green β-galactosidase+ cells were
counted under a light microscope. Bars represent mean measurements are
from 3 independent experiments (n = 2). Dunnett‟s multiple comparison (One-
way ANOVA) analysis was used to compare each extract-treated group to the
control group. Any statistically significant values are denoted: * = statistically
significant (p ≤ 0.05).
Figure 4-10: Images of β-galactosidase positive (senescent) HCT116 cells.
Senescence was assessed using X-gal staining. Cells were exposed to 1X and
2X GI50 concentrations of P. macrophylla extracts and β-galactosidase+ cells
appearing blue/green in colour (highlighted by arrows) were counted under a
light microscope. Images shown were captured by Nikon Coolpix camera
(100X magnification) and are from a single representative experiment (n = 2).
Con
trol
[0]
EtO
H [5]
EtO
H [10
]
EtO
Ac
[2]
EtO
Ac
[4]
0
2
4
6
8
10
Extract concentration [µg/ml]
Sen
esce
nt
cells
(%)
Control [0]
EtOH [5]
EtOH [10]
EtOAc [2]
EtOAc [4]
* *

132
4.2.4 Summary of migration inhibition properties of UNMC
extracts
The detection of β-galactosidase in senescence cell populations after exposure
to UNMC plant extracts at 1X and 4X GI50 was determined by counting the
numbers of blue/green (senescent) cells. Low levels of naturally occurring
senescent cells seen in the control population could due to high cell density in
certain areas.
Archidendron ellipticum: All extracts examined were capable of inducing
senescence in the cells at a significantly higher level than control cells.
Considering the concentrations of A. ellipticum extracts and corresponding
senescence, EtOH bark extract (2 and 4 μg/ml) appeared to be the most potent
since higher concentrations (of ~ 1.5 to > 22 –fold) of EtOH (9 and 18 μg/ml),
EtOAc (9 and 18 μg/ml) and HEX (200 and 400 μg/ml) leaf extracts induced
only slightly greater levels of cellular senescence.
Duabanga grandiflora: The ability of extracts to induce senescence in
HCT116 cells was observed and in particular HEX bark extract (58 μg/ml;
7.1%) causing significant senescence compared to the DMSO control sample
(1.5%). Slight increase in senescence was observed with higher concentrations
of EtOH bark extract (76 μg/ml).
Pseuduvaria macrophylla: EtOAc extract was slightly more effective at
inducing cellular senescence than EtOH extract even at lower concentrations.
The level of senescent cells measured after exposure to P. macrophylla extracts
was similar to cells exposed to D. grandiflora extracts, however A. ellipticum
extracts were most active at inducing cellular senescence in cells.
Certain compounds present in UNMC extract cells may induce low levels of
DNA damage in cells which activate DNA repair mechanisms resulting in a
slower transition through the S and G2/M phase, maintaining G1 phase
senescence equilibrium, as shown by some sesquiterpene lactone
dehydroleucodine.259
Previous results also suggest accumulated damage will

133
stimulate the activation of apoptosis and impair cell proliferation. A
telomerase inhibitor, telomestatin, isolated from Streptomyces anultus can bind
to the terminal G-quatert of a DNA quadruplex thus affecting the binding of
protective capping proteins with telomerase; this may induce a DNA damage
response leading to cell growth arrest, senescence or death by inhibiting
telomerase activities (e.g. elongation of telomeres).260, 261

134
5
Chemical content and fractionation of Pseuduvaria macrophylla,
Archidendron ellipticum and Duabanga grandiflora crude
extracts
5.1 Chemical content and free radical scavenging ability of
UNMC crude extracts
Plants live in a conspecific and heterospecific environment. This can depend
on complex phytochemical interactions to increase survival chances for
themselves and surrounding plants. Plants are able to produce and emit
phytochemicals to fend off harmful or unfavourable conditions. Recent reports
explain that some plants are also able to emit semi-volatile compounds to
„communicate‟ to neighbouring plants in order to reduce harm caused by
herbivores.262
For many years, these phytochemicals have been exploited by
mankind to treat many adverse biological conditions e.g. use as chemical
structures templates to synthesise and develop therapeutic compounds. Plant
extracts were subjected to analysis for their flavonoid and phenolic contents
using the aluminium trichloride and Folin-Ciocalteau (FC) colorimetric
methods. Subsequently, their corresponding antioxidant activity was measured
using the DPPH assay.
The aluminium trichloride (AlCl3) colorimetric method was adapted from
Meda et al. (2005)263
and Chang et al. (2002).264
AlCl3 can form acid-stable
complexes with reactive groups of flavones and flavonols and form acid-labile
complexes with the flavonoids. Quercetin is a widely distributed flavonoid
found in nature hence was employed as a standard to measure against the
UNMC extracts for total flavonoid content determination. Secondly, an FC
colorimetric method was adapted from Singleton et al. (1999) and Meda et al.
(2005).263
FC reagent contains phosphomolybdate and phosphotungstate,
which reacts with reducing substances such as polyphenolic compounds.
Gallic acid (GA) is a widely distributed phenolic compound found in nature

135
and is the chosen standard used to measure against the UNMC extracts for total
phenolic content determination. Pearson‟s correlation analysis was used to
calculate the coefficient (r) to determine the strength of the association of the
quercetin and gallic acid standard curves; a strong association is considered if r
= (-) 1.
Phenolic compounds also act as antioxidants and scavenge free radicals, hence
the 2,2-diphenyl-1-picrylhydrazyl radical (DPPH.) assay was employed to
determine antioxidant capacity of UNMC extracts. Antioxidant activity is
correlated to phenolic content. In brief, DPPH. is a stable free radical, which
can be used to indirectly assess the radical scavenging activity of plant extracts.
On reaction with an antioxidant such as polyphenol compounds, DPPH- is
reduced to the molecular form (DPPHH) resulting in a colour change from
yellow to purple. This change in absorbance can be used to measure the
radical scavenging power of the plant extracts. The following method was
adapted from the method described by Amic et al. (2003)265
and Nara et al.
(2006).266
Antioxidants play a crucial role in the prevention of chronic
diseases such as heart disease, cancer and Alzheimer‟s disease by reducing
oxidative stress.267
Extracts of UNMC plants A. ellipticum, D. grandiflora and P. macrophylla
were tested for their chemical contents and free radical scavenging activity.
There was insufficient A. wilkesiana extracts for testing and the latest batch of
A. wilkesiana specimen have been collected from a different location and was
not subjected to analytical tests to determine its chemical profile and the
variability between batches.

136
5.1.1 Flavonoid and Phenolic content and free radical
scavenging activity of Archidendron ellipticum extracts
Flavonoid and phenolic content was determined using 1 mg of A. ellipticum
extracts. There were comparable quantities of flavonoids detected in the leaf
and bark extracts, shown in Table 5-1. The total flavonoids in bark extracts
(EtOH, EtOAc and HEX) were estimated to be 2.65, 2.87 and 2.44 mg
quercetin equivalent/g, respectively, which is slightly lower than the total
flavonoids detected in leaf extracts: 3.57, 3.56 and 2.65 mg quercetin
equivalent/g, respectively. Pearson‟s correlation analysis suggests a strong
association of the quercetin standard curve, r = 0.84. Ranked in the order of
highest flavonoids present in bark extracts: EtOAc > EtOH > HEX and in leaf
extracts: EtOH > EtOAc > HEX.
Table 5-1: Flavonoid content in Archidendron ellipticum extracts
A. ellipticum extract
Total flavonoids as
quercetin equivalent
mg/ 1g extract (QE)
Total phenolics as gallic
acid equivalent mg / 1 g
of extract (GAE)
Ba
rk
EtOH 2.65 ± 0.00 1.03 ± 0.01
EtOAc 2.87 ± 0.00 4.23 ± 0.02
HEX 2.44 ± 0.00 3.09 ± 0.04
Lea
f
EtOH 3.57 ± 0.00 2.44 ± 0.02
EtOAc 3.56 ± 0.00 0.69 ± 0.00
HEX 2.65 ± 0.00 0.69 ± 0.01
Flavonoid and Phenolic contents from 1 mg of A. ellipticum extracts are
presented as quercetin equivalents (QE), mg/ gram of extract and gallic acid
equivalents (GAE), mg, /gram of extract (n = 3). Pearson product-moment
correlation coefficients were 0.84 and 0.83 for flavonoids and phenolic
standard curves, respectively.
Phenolic compounds were detected in the leaf and bark extracts, shown in
Table 5-1. The levels of phenolic compounds varied between bark and leaf
extracts. The total phenolic compounds in A. ellipticum bark extracts (EtOH,
EtOAc and HEX) were estimated to be 1.03, 4.23 and 3.09 mg GAE/g,
respectively; this is considerably less than the total phenolic compounds

137
detected in leaf extracts: 2.44, 0.69 and 0.69 mg GAE/g. Pearson‟s correlation
analysis suggests a strong association of the gallic acid standard curve, r = 0.83.
Ranked in the order of highest phenolic content in bark extracts: EtOAc > HEX
> EtOH and in leaf extracts: EtOH > EtOAc = HEX. Previously, Beutler et al.
(1997) reported detection of a series of new saponins in A. ellipticum
Ch2Cl2:MeOH extracts; plants of this genus have been found to contain sterols,
triterpenes and coumarins, which may contribute to phenolic content.235
A. ellipticum extracts displayed modest direct antioxidant behavior (Table 5-2);
EtOH extracts emerged as the most active and HEX bark extracts were least
active compared with the other extracts. Ranked in the order of highest free
radical scavenging ability (%) in bark and leaf extracts, respectively: EtOH
(43.8, 66.7) > EtOAc (24.1, 41.8) > HEX (3.9, 24.1). Overall, a corresponding
order of extract potency and % of radical scavenging ability was observed in
leaf extracts. No particular trend was noted between antioxidant activity and
the amount of phenolics present in the bark extracts and the amount of
flavonoids present in the bark and leaf extracts.
Table 5-2: Free radical scavenging ability of Archidendron ellipticum extracts.
A. ellipticum extract Free radical scavenging (%)
Ba
rk
EtOH 43.8 ± 0.5
EtOAc 24.1 ± 0.6
HEX 3.9 ± 2.6
Lea
f
EtOH 66.7 ± 0.5
EtOAc 41.8 ± 0.6
HEX 24.1 ± 2.6
Average % free radical scavenging ability of extracts ± SEM are shown; the
antioxidant content was determined using a standard curve of quercetin (0 – 1.2
mg/ml). Pearson product-moment correlation coefficient was used to measure
correlations of free radical scavenging (%) between extracts; three independent
experiments were performed (n = 4).

138
5.1.2 Flavonoid and Phenolic content and free radical
scavenging activity of Duabanga grandiflora extracts
Flavonoid and phenolic content were determined using 1 mg of D. grandiflora
extracts. There were considerably greater amounts of flavonoids detected in
the leaf extracts compared to bark extracts, shown in (Table 5-3). The total
flavonoids in D. grandiflora bark extracts (Water, EtOH, EtOAc and HEX)
were estimated to be 3.01, 0.08, 0.97 and 0.08 mg quercetin equivalent/g,
respectively. This was considerably less than the total flavonoids detected in
leaf extracts: 2.39, 3.17, 3.20 and 2.35 mg quercetin equivalent/g, respectively.
Ranked in the order of highest flavonoids present in bark extracts: Water >
EtOAc > EtOH = HEX and in leaf extracts: EtOAc > EtOH > Water > HEX.
Phenolic agents were detected in the leaf and bark extracts. The total phenolic
compounds in D. grandiflora bark extracts (Water, EtOH, EtOAc and HEX)
were estimated to be 12.73, 34.87, 9.57 and 2.20 mg gallic acid equivalent
(GAE)/g, respectively. This is less than the total phenolic compounds detected
in leaf extracts: 12.60, 27.81, 17.92 and 0.37 mg GAE/g, respectively. Ranked
in the order of highest phenolics present in bark extracts: EtOH > Water >
EtOAc > HEX and in leaf extracts: EtOH > EtOAc > Water > HEX. The
levels of phenolic compounds varied; however, the ranking order of phenolics
present was comparable between corresponding extracts in bark and leaf.
Overall, HEX extracts contained the least flavonoid and phenolic content.
Othman et al (2011) found appreciable amounts of phenolic agents in EtOH
bark and leaf extracts whilst moderate amounts were detected in EtOAc bark
and leaf extracts. There were appreciable amounts of flavonoids in EtOAc
bark and EtOH leaf extracts whereas trace amounts were noticed in EtOH bark
extract.205
Additionally, Othman et al (2011) investigated the presence of
alkaloids, tannins, saponins, steroids and triterpenes in D. grandiflora extracts;
the aforementioned chemicals were detected in D. grandiflora EtOH bark and
leaf extracts excluding alkaloids and triterpenes. Whereas, trace amounts of
saponins and triterpenes and steroids and triterpenes were found in EtOAc bark
and leaf extracts, respectively.205

139
Table 5-3: Flavonoid and Phenolic contents in Duabanga grandiflora extracts
D. grandiflora
extract
Total flavonoids as
quercetin equivalent
mg/ 1g extract (QE)
Total phenolics as gallic
acid equivalent mg / 1 g
of extract (GAE)
Ba
rk
Water 3.01 ± 0.00 12.73 ± 0.23
EtOH 0.08 ± 0.00 34.87 ± 0.03
EtOAc 0.97 ± 0.00 9.57 ± 0.01
HEX 0.08 ± 0.00 2.20 ± 0.01
Lea
f
Water 2.39 ± 0.00 12.60 ± 0.05
EtOH 3.17 ± 0.00 27.81 ± 0.01
EtOAc 3.20 ± 0.00 17.92 ± 0.01
HEX 2.35 ± 0.00 0.37 ± 0.00
Flavonoid and Phenolic contents from 1 mg of D. grandiflora extracts are
presented as quercetin equivalents (QE), mg/ gram of extract and gallic acid
equivalents (GAE), mg, /gram of extract (n= 3). Pearson product-moment
correlation coefficients were 0.84 and 0.83 for flavonoids and phenolic
standard curves, respectively.
Table 5-4: Free radical scavenging ability of Duabanga grandiflora extracts
D. grandiflora extract Free radical scavenging (%)
Ba
rk
Water 94.4 ± 0.4
EtOH 38.3 ± 0.5
EtOAc 86.3 ± 0.6
HEX 28.7 ± 2.6
Lea
f
Water 95.3 ± 0.1
EtOH 96.3 ± 0.1
EtOAc 95.7 ± 1.1
HEX 9.4 ± 1.0
Average % of free radical scavenging abilities of extracts ± SEM are shown;
the antioxidant content was determined using a standard curve of quercetin (0 –
1.2 mg/ml). Pearson product-moment correlation coefficient was used to
measure correlations of free radical scavenging (%) between extracts; three
independent experiments were performed (n = 4).

140
D. grandiflora extracts displayed direct antioxidant behavior in the DPPH
radical scavenging assay (Table 5-4), with Water and EtOAc extracts emerging
as the most active (> 85%) and leaf extracts with greater free radical
scavenging ability in general. Ranked in the order of highest free radicals
scavenging ability (%) in bark extracts: Water (94.4)> EtOAc (86.3)> EtOH
(38.3)> HEX (28.7) and in leaf extracts: EtOH (96.3)> EtOAc (95.7)> Water
(95.3)> HEX (9.4).
The results suggest that flavonoid levels in bark extracts correlated to their
ability in free radical scavenging ability, which was also observed with Water,
EtOH and EtOAc extracts possessing high levels of flavonoids. However it
was interesting to observe that HEX leaf extract contained similar levels of
flavonoids to Water leaf extract, and did not yield comparable antioxidant
activity as expected; this maybe due to the difference in different flavonoids,
hence difference in activity. There was a general positive correlation between
antioxidant activity and phenolic compounds in the extracts; the amount of
phenolics detected in leaf extracts corresponded to level of free radical
scavenging activity. Whereas no obvious correlation was observed between
phenolics level in bark extract and the level of free radical scavenging activity.
In general, the extracts (Water, EtOH and EtOAc) with higher quantities of
phenolic agents displayed greater levels of DPPH scavenging ability.
5.1.3 Chemical content and free radical scavenging ability of
Pseuduvaria macrophylla extracts
Flavonoid and phenolic contents were determined using 1 mg of P.
macrophylla extracts. Flavonoid contents in the leaf and bark extracts is
shown in Table 5-5. The total flavonoids in whole extract (EtOH, EtOAc and
HEX) were estimated to be 2.39, 2.39 and 1.71 mg QE/g, respectively.
Pearson‟s correlation analysis suggests a strong association of the quercetin
standard curve, r = 0.84. Ranked in the order of highest flavonoids present in
whole extract: EtOAc = EtOH > HEX.

141
Table 5-5: Flavonoid content in Pseuduvaria macrophylla extracts
P. macrophylla
extract
Total flavonoids as
quercetin equivalent
mg/ 1g extract (QE)
Total phenolics as gallic
acid equivalent mg / 1 g
of extract (GAE)
EtOH 2.39 ± 0.00 7.09 ± 0.07
EtOAc 2.39 ± 0.01 5.72 ± 0.02
HEX 1.71 ± 0.00 4.06 ± 0.02
Flavonoid and Phenolic contents from 1 mg of P. macrophylla extracts are
presented as quercetin equivalents (QE), mg/ gram of extract and gallic acid
equivalents (GAE), mg, /gram of extract (n= 3). Pearson product-moment
correlation coefficients were 0.84 and 0.83 for flavonoids and phenolic
standard curves, respectively.
Phenolic compounds were detected in whole extract, shown in Table 5-5. The
total phenolic compounds in P. macrophylla extracts (EtOH, EtOAc and HEX)
were estimated to be 7.09, 5.72 and 4.06 mg GAE/g, respectively. Pearson‟s
correlation analysis suggests a strong association of the gallic acid standard
curve, r = 0.83. Ranked in the order of highest phenolics present in extracts:
EtOH > EtOAc > HEX. Othman et al. (2011) reported phytochemical tests for
alkaloids, tannins, phenolics, saponins, flavonoids, steroids and triterpenes
were performed revealing moderate amount of alkaloids and phenolics, trace
amount of saponins and appreciable amount of steroids within EtOH extracts.
In addition, moderate quantities of alkaloids, tannins and steroid, trace amount
of triterpenes were present in EtOAc extracts.205
Several of these
phytochemicals were found in bark and leaf P. macrophylla EtOH and EtOAc
extracts.
P. macrophylla extracts varied in their direct antioxidant ability summarised in
Table 5-2, with EtOH extracts emerging as the most active. Highest DPPH
radical scavenging ability was observed in the EtOH extract (58.9%), whereas
the EtOAc and HEX extracts shared similar antioxidant activity (9.8% and
8.9% respectively). A positive correlation was noted between antioxidant
activity and phenolic content.

142
Table 5-6: Free radical scavenging ability of Pseuduvaria macrophylla
extracts
P. macrophylla extract Free radical scavenging (%)
EtOH 58.9 ± 15.9
EtOAc 9.8 ± 2.9
HEX 8.9 ± 3.0
Average % of free radical scavenging ability of extracts ± SEM are shown; the
antioxidant content was determined using a standard curve of quercetin (0 – 1.2
mg/ml). Pearson product-moment correlation coefficient was used to measure
correlations of free radical scavenging (%) between extracts; three independent
experiments were performed (n = 4).

143
5.1.4 Summary of chemical contents and free radical
scavenging activity in UNMC extracts
In general, UNMC extracts do possess moderate amounts of phenolic and
flavonoid compounds and displayed potent antioxidant activity. As previously
mentioned, many of the already known plant-derived drugs are naturally
occurring phytochemicals e.g. flavonoids and phenolics and it is known that
compounds with antioxidant activity can be used in chemoprevention.255
Archidendron ellipticum: Similar quantities of flavonoids were detected
across the bark (~ 2.5 mg QE) and leaf (~ 3.5 mg GAE) extracts. The level of
phenolic compounds varied across the extracts and bark extracts contained
greater amounts than leaf extracts. Leaf EtOH extract contained good levels of
flavonoids and phenolics and demonstrated greatest DDPH scavenging activity
(66.7%). EtOH and EtOAc bark and EtOAc and HEX leaf extracts
demonstrated modest antioxidant activity (24.1% to 43.8%). HEX bark extract
was the least active in free radical scavenging (3.9%). It was interesting to
observe that HEX leaf extract demonstrated greater antioxidant activity
(24.1%) to HEX bark extract that are of similar levels of the aforementioned
extracts.
Duabanga grandiflora: In general, Water bark extract and Water, EtOH and
EtOAc leaf extracts contained ~ ≥ 2.35 mg of flavonoids (as QE) and ~ ≥ 12.60
mg of phenolics (as GAE) and yielded ≥ 94 % free radical scavenging activity.
Interestingly, EtOH bark extract contained the greatest amount of phenolics
and the least amount of flavonoids, however the antioxidant activity was only
38.3%. Whereas, EtOAc bark extract contained modest amounts of flavonoids
(0.97 mg) and phenolics (9.57 mg) yet the antioxidant activity was 86.3% as
compared 94.4% Water bark extract (flavonoids: 3.01 mg and phenolics:
12.73). Both HEX extracts contained the least amount of flavonoid and
phenolic compounds accompanied by lowest % of DPPH scavenging.
Pseuduvaria macrophylla: EtOH and EtOAc extracts contained the same
flavonoid content (2.39 mg, GE) and in comparison, HEX extract contained ~

144
2-fold less flavonoid compounds; and modest levels of phenolic compounds
were present in all extracts. The highest antioxidant activity was seen in EtOH
(58.9%) whereas EtOAc (9.8%) and HEX (8.9%) displayed similar levels of
antioxidant activity. Previously, Mahmood et al. (1986) isolated an
aporphinoid from P. macrophylla extracts.
Collectively the ranking of highest level of flavonoid compounds present in
extracts is: A. ellipticum extracts leaf > D. grandiflora leaf > A. ellipticum
extracts bark > P. macrophylla whole > D. grandiflora bark extracts. The
ranking of highest level of phenolic compounds present in extracts is: D.
grandiflora bark > D. grandiflora leaf > P. macrophylla whole > A. ellipticum
extracts bark > A. ellipticum extracts leaf extracts. The ranking of highest level
of free radical scavenging activity seen in extracts is: D. grandiflora leaf > D.
grandiflora bark > A. ellipticum extracts leaf > A. ellipticum extracts bark > P.
macrophylla whole extracts.

145
5.2 Chromotography of UNMC crude extracts and effects of
fractions on cell growth
Compound mixtures can be separated using a mobile and a stationary phase in
chromatography. Reverse column chromatography solid-phase extraction
(SPE) can separate crude extracts using different eluents (of varying polarity)
and a non-polar stationary phase into phytochemicals groups with similar
physicochemical characteristics such as solubility, size, shape and electrical
charge.18, 193
Subsequent analysis using hyphenated techniques such as HPLC
and MS can produce a unique spectrum for each extract. Each compound has a
unique profile, which can be matched against in a database. UNMC crude
extracts were separated using a C-18 extraction cartridge and solvents of
varying polarity; subsequently the fractions were analysed using LC-MS (see
Appendix 2 for the fraction yields (%)). Fractions were examined for their
bioactivity by MTT assay to determine whether concentrating the active
component(s) and/or reducing putative antagonistic or synergistic interactions
with other phytochemicals in the complex mixture could achieve greater or the
same activity (active fraction) or lower activity (inactive fraction). The results
could provide fraction leads for further bio-guided sub-fractionation and lead
to possible study into synergistic or antagonistic activities and isolation of
active component(s).
5.2.1 Chromotography of Archidendron ellipticum crude
extracts and in vitro growth inhibitory properties of
fractions in MDA-MB-468 cells
HPLC spectra of A. ellipticum bark and leaf extracts measured at 220 and 254
nm, are shown in Figure 5-1 and the main dominant peaks are represented in
Table 5-7. Due to insufficient HEX bark extracts, fractionation could not be
performed on this extract. A solvent peak is illustrated in the spectra at tR
~0.32 min. There was no dominant peak present in EtOH crude bark extracts,
which suggest glycoside compounds are unlikely to be present. The most
abundant peak detected in the EtOAc bark spectrum was at tR 3.10 min
amongst several peaks between tR 2.10 to 3.00 min. This implies that alkaloids,

146
aglycones and glycosides could be present in these crude extracts. Similarly,
the spectrum of crude HEX bark extract revealed various minor peaks detected
and a major peak at tR 3.09 min at 220 nm (Figure 5-1; C); the compounds
embedded in HEX crude extract are likely to be waxes, fats and oils. Both
spectra of EtOAc and HEX bark extracts reveal a peak detected at tR ~3.10 min.
The appearance of a major peak tR ~2.10 min in EtOH and EtOAc could be
indicative of similar components present in leaf extracts and not found in bark
extracts. Whereas, the appearance of tR ~ 3.11 min in HEX leaf crude extract
suggests that some of the components are also present in the HEX bark crude
extract; a dominate peak at tR ~ 4.97 min was also observed in HEX leaf crude
extract.
Table 5-7: Retention time and colour of Archidendron ellipticum extracts
dominant peaks using reversed phase chromatography.
A. ellipticum
extracts
Retention time (tR, min) an colour of A. ellipticum extracts
Crude F1 F2 F3 F4 F5 F6
Ba
rk
EtOH
2.08 2.41 4.24 2.15 2.34 3.75 4.24
Golden
brown Clear
Pale
yellow Golden Yellow
Green
tint Clear
EtOAc 3.10 - - 2.21 3.12 3.11 4.15
Dark green/
brown tint
Yellow
tint Clear
Yellow
tint
Pale
yellow
Pale
yellow
Pale
yellow
HEX 4.09
Light green - - - - - -
Lea
f
EtOH
2.10 2.63 4.21 2.27 2.47 2.70 4.14
Dark green Yellow
tint Clear
Yellow
/brown
hint
Yellow
Yellow
/green
tint
Pale
yellow
EtOAc 2.12 4.27 2.64 2.11 3.19 4.05 3.65
Very dark
green Clear Clear Clear
Yellow
tint
Dark
green Green
HEX 4.97 2.91 4.23 5.09 2.89 3.12 3.16
Dark green Clear Clear Clear Yellow
tint Yellow
Pale
yellow
Extracts (1 mg/ml in DMSO) in 1:1 distilled water and MeOH were analysed
using 10% B for 1 min, 10-98% B over 2 min, at 98% for 2 min, (Phenomenex
C18 Gemini-NX 3μ-110A 50x2 mm column). The eluent compounds were
detected at a wavelength of 220 nm. Data of active fractions are highlighted in
bold, data of inactive fractions are displayed in grey and „-„ denotes not
available data.

147
Following chromatography of A. ellipticum crude extracts of varying polarity
into six fractions; in vitro growth inhibitory properties of these fractions in
MDA-MB-468 cells were examined (Table 5-8). HPLC spectra of the active
fractions are shown Figure 5-3 to Figure 5-6 and spectra of inactive fractions
are shown in Appendix 3, Figure 8-15 to 8-21. Interestingly, fractionation of
crude EtOH bark extract revealed that F4 was the only active fraction with a
very low GI50 value (1.75 μg/ml), almost identical to that of whole extract,
hence it is very likely that the active component is present in this fraction and
is worthy of sub-fractionation. There appears to be a mixture of components in
EtOAc bark F4 and F5 as represented by various peaks in the HPLC spectra;
F4 and F5 exhibited greater in vitro growth inhibition in MDA-MB-468 cells
compared to crude EtOAc extract.
Table 5-8: In vitro growth inhibition effect of Archidendron ellipticum extracts
fractions in MDA-MB-468 cells.
A. ellipticum crude
extract
GI50 value [μg/ml]
GI50 values of A. ellipticum fractions (μg/ml)
F1 F2 F3 F4 F5 F6
Ba
rk
EtOH
[1.73] > 50 > 50 > 50 1.75 > 50 > 50
EtOAc
[40.44] > 50 > 50 > 50 26.35 32.13 > 50
HEX
[>200] - - - - - -
Lea
f
EtOH
[40.92] > 50 > 50 > 50 2.00 7.66 > 50
EtOAc
[24.73] > 50 > 50 > 50 14.26 5.63 7.61
HEX
[>200] > 50 > 50 > 50 4.10 6.02 12.64
Extract concentration (μg/ml) at which cell growth is inhibited by 50% (GI50)
after 72 h. The mean GI50 values (μg/ml) ± SEM were obtained from ≥ 3 (n =
4) individual experiments. Fractions exhibiting GI50 values less than GI50
parent crude extract are considered active and highlighted in bold, fractions
with GI50 values > 50 μg/ml are considered as inactive and „-„ denotes
unavailable extracts.

148
Figure 5-1: HPLC traces of A. ellipticum crude bark extracts using
Reversed Phase chromatography. EtOH (A), EtOAc (B) and HEX (C)
extract eluents (1 mg/ml in DMSO) in 1:1 distilled water and MeOH were
analysed using 10% B for 1 min, 10-98% B over 2 min, at 98% for 2 min,
(Phenomenex C18 Gemini-NX 3μ-110A 50x2 mm column). The eluent
compounds were detected at a wavelength of 220 nm (i) and 254 (ii) nm.

149
Figure 5-2: HPLC traces of A. ellipticum crude leaf extracts using
Reversed Phase chromatography. EtOH (A), EtOAc (B) and HEX (C)
extract eluents (1 mg/ml in DMSO) in 1:1 distilled water and MeOH were
analysed using 10% B for 1 min, 10-98% B over 2 min, at 98% for 2 min,
(Phenomenex C18 Gemini-NX 3μ-110A 50x2 mm column). The eluent
compounds were detected at a wavelength of 220 nm (i) and 254 (ii) nm.

150
Figure 5-3: HPLC traces of A. ellipticum bark extract ‘active’ fractions
using Reversed Phase chromatography. EtOH: F4 (A) and EtOAc: F4 (B)
and F5 (C) (1 mg/ml in DMSO) in 1:1 distilled water and MeOH were
analysed using 10% B for 1 min, 10-98% B over 2 min, at 98% for 2 min,
(Phenomenex C18 Gemini-NX 3μ-110A 50x2 mm column). The eluent
compounds were detected at a wavelength of 220 nm (i) and 254 (ii) nm.

151
Figure 5-4: HPLC traces of A. ellipticum leaf extract ‘active’ fractions
using Reversed Phase chromatography. EtOH: F4 (D) and F5 (E) (1 mg/ml
in DMSO) in 1:1 distilled water and MeOH were analysed using 10% B for 1
min, 10-98% B over 2 min, at 98% for 2 min, (Phenomenex C18 Gemini-NX
3μ-110A 50x2 mm column). The eluent compounds were detected at a
wavelength of 220 nm (i) and 254 (ii) nm.

152
Figure 5-5: HPLC traces of A. ellipticum leaf extract ‘active’ fractions
using Reversed Phase chromatography. EtOAc: F4 (F), F5 (G) and F6 (H)
(1 mg/ml in DMSO) in 1:1 distilled water and MeOH were analysed using 10%
B for 1 min, 10-98% B over 2 min, at 98% for 2 min, (Phenomenex C18
Gemini-NX 3μ-110A 50x2 mm column). The eluent compounds were detected
at a wavelength of 220 nm (i) and 254 (ii) nm.

153
Figure 5-6: HPLC traces of A. ellipticum leaf extract ‘active’ fractions
using Reversed Phase chromatography. HEX: F4 (I), F5 (J) and F6 (K) (1
mg/ml in DMSO) in 1:1 distilled water and MeOH were analysed using 10% B
for 1 min, 10-98% B over 2 min, at 98% for 2 min, (Phenomenex C18 Gemini-
NX 3μ-110A 50x2 mm column). The eluent compounds were detected at a
wavelength of 220 nm (i) and 254 (ii) nm.

154
EtOH leaf F4 and F5 displayed by 20.5- and 5.3- fold greater activity,
respectively against MDA-MB-468 cells compared to the crude extract;
whereas all the other fractions induced no growth inhibition at ≤ 50 μg/ml;
hence F4 and F5 should be further fractionated and apoptotic and anticancer
properties of sub-fractions examined. The spectra of EtOH leaf F4 revealed an
abundance of peaks between tR ~ 2.10 to 3.16 min at 220 nm. Major peaks at
tR 1.98, 2.23, 2.54 and 2.70 were detected in EtOH leaf F5 at both wavelengths
(220 and 254 nm), which could be indicative of amino acids with aromatic
groups. Likewise, EtOAc leaf F4, F5 and F6 exerted in vitro cytotoxic effects
greater than previously observed in the crude extract by 1.7-, 4.4 and 3.2- fold,
respectively; the spectra of F4, F5 and F6 reveal that several components
eluted in these fractions share similar retention time. Astoundingly, fractions
from “inactive” crude HEX leaf extracts (GI50 > 200 μg/ml) displayed very
potent in vitro activity revealing GI50 value < 13 μg/ml where previously no
activity was seen in MDA-MB-468 cells at 200 μg/ml HEX crude leaf extract
(Table 5-8). Two dominant peaks at tR ~ 2.89 and 3.14 min were detected in
HEX leaf F4as well as in F5 and F6 at a lower concentration. The peaks which
appeared in all three spectra were measured at tR ~2.89, 4.05, 4.20, 4.79 and
4.98 min. Overall, fractionation of A. ellipticum extract yielded fractions with
greater in vitro activity than the crude extract. Interestingly, EtOH bark F4 was
the only active fraction with an almost identical activity to that seen in the
crude extract; HEX leaf extract fractions F4, F5 and F6 displayed intriguing
activity suggesting that in the whole extract components interact
antagonistically or the activity of the active component(s) was „masked‟ by all
the other components and needs to be concentrated for its activity to be
detected.
Previous NCI 60 screening in the 60 cell line panel conducted by Beutler et al.
(1997) illustrated in vitro cytotoxicity of an elliptoside isolated from A.
ellipticum DCM:MeOH (1:1 v/v) leaf extract with mean panel GI50 of 1 μg/ml.
This biologically active elliptoside possesses a novel structure yet shares
similarities to saponins reported from other leguminosae.235
The NCI-60 mean
fingerprint graph for saponin of Acer negundo and 8 unrelated cytotoxic

155
saponins was reported to have a similar cytotoxicity profile to that of the
elliptoside (40) (Figure 5-8).235
40
Figure 5-7: The chemical structure of elliptoside (40) isolated from
Archidendron ellipticum.
However, in vivo screening results with a human melanoma (LOX) xenograft
model in athymic mice and elliptoside (40) administered by intravenous and
intraperitoneal methods only hinted at modest activity, which was expected as
the fingerprint graph reveals that most melanoma cell lines including
LOX1MV1, are insensitive to compound 40.235
The fingerprint graphs of
elliptoside (40) and A. ellipticum bark extracts reveal similar sensitivity
patterns of the cell lines hence compound 40 could reside in bark sections of A.
ellipticum plant.

156
Figure 5-8: NCI-60 mean fingerprint graphs for an elliptoside extracted
from A. ellipticum (synonym Archidendron ellipticum) leaf extracts
adapted from GI50 values (log10) published by Beutler et al. (1997).235
Bars
represent the individual mean GI50 value to the function of log10 of the cell
line. The overall mean GI50 value of all the cell lines was set to the center (0.0).
Bars to the left indicate cell lines that are less sensitive than the mean whereas
bars to the right indicate cell lines that are more sensitive than the mean to the
extract.
Archidendron ellipticum DCM:Methanol leaf extract
Log10
NC
I-60 c
ell lin
e p
an
el
-1.5 -1.0 -0.5 0.0 0.5 1.0 1.5
MCF7MDA-MB-231
HS 578MDA-MB-435
MDA-NBT-549T-47D
Breast cancerPC-3
DU-145Prostate cancer
786-0ACHNCaki-1
RXF-393SN12CTK-10U0-31Renal
IGROV-1OVCAR-3OVCAR-4OVCAR-5OVCAR-8SK-OV-3
OvarianLOX1MV1
MALME-3MM14
SK-MEL-2SK-MEL-28
SK-MEL-5UACC-257
UACC-62Melanoma
SF-268SF-295SF-539
SNB-19SNB-75
U251CNS cancerCOLO 205HCC2998
HCT116HCT-15
HT-29KM-12
SW-620Colon cancer
HOP-62HOP-92
NCI-H226NCI-H23
NCI-H3221HCI-H460NCI-H522
Non-small cell lung cancerCCRF-CEM
HL-60K-562
MOLT-4RPMI-8226
SRLeukaemia

157
5.2.2 Chromotography of Duabanga grandiflora crude extracts
and in vitro growth inhibitory properties of fractions in
HCT116 cells
There was insufficient Water extract stock to perform analysis. HPLC spectra
of D. grandiflora bark and leaf extracts were measured at 220 and 254 nm
(Figure 5-9 and Figure 5-10, respectively) and dominant peaks recorded
(Figure 5-2). A solvent peak is illustrated in all spectra at retention time (tR)
~0.32 min. The major peaks in bark extracts were revealed at tR 1.97 min
(Water) and 1.96 min (EtOH) and minor peaks at tR 2.10 min (Water) and 2.11
min (EtOH); similarly, the major and minor peaks in leaf extract were revealed
at tR 1.96 (Water) min and 1.98 min (EtOH). This suggests compounds
(represented by the peaks) present in the crude extracts eluted are likely to be
of the same class such as sugars, amino acids and glycosides. A major peak at
tR 1.99 min and a minor peak at tR 2.10 from EtOAc bark and leaf analyses also
implies that sugars, amino acids and glycosides could be present in these crude
extracts. Nevertheless, the spectra of crude HEX bark extract revealed various
minor peaks detected at 220 nm and several major peaks at tR 4.09, 4.18, 4.95
and 5.28 min; significant peaks were not detected in HEX leaf extract (Figure
5-11; D) at 220 nm. Due to the non-polar nature of HEX, the compounds
embedded in the crude extract are likely to be waxes, fats and oils.
Chromatography of D. grandiflora crude extracts into six fractions, the sub-
fractions obtained were examined for their in vitro growth inhibitory properties
using the MTT assay. HPLC spectra of the active fractions are shown in
Figure 5-11 to Figure 5-13. Fractions from leaf extracts did not demonstrate
any in vitro growth inhibition at concentrations ≤ 50 μg/ml (HPLC spectra of
inactive fractions are presented in Appendix III-I to M). Several fractions from
bark extracts displayed growth inhibitory effects at < 50 μg/ml in HCT116
cells (Figure 5-11 to Figure 5-13). A major peak at tR ~1.97 min and minor
peaks were revealed in F3, F4 and F5 from EtOH active fractions, which
suggest this peak area contains some of the active components. Although
EtOH bark F2 contained the same major peak, the concentrations detected
were much less (2-fold). The presence of tR ~1.97 major peak in inactive F2
and F3 EtOAc was found at a level similar to F1, F4, F5 and F6 of EtOAc

158
extracts in which activity was observed, however the spectra identifies several
minor peaks suggesting minor components could be responsible for the activity
or other components in F2 and F3 could cause antagonistic effects.
Table 5-9: Retention time and the colour of Duabanga grandiflora extracts
dominant peaks using reversed phase chromatography.
D.
grandiflora
extract
Retention time (tR, min) and colour of D. grandiflora
extracts
Crude F1 F2 F3 F4 F5 F6
Ba
rk
Water 1.97
- - - - - - Dark brown
EtOH
1.96 4.25 2.24 1.98 1.97 1.98 2.90
Tan brown Tan
brown
Darker
tan
brown
Light
brown Clear Clear Clear
EtOAc 1.99 1.99 2.51 2.74 2.00 1.97 2.70
Light ‘pine’
brown Light
brown
Pale
brown Golden Golden Golden
Yellow
hint
HEX
4.09 4.22 4.22 2.64 3.09 4.12 4.11 Dark
yellow/
green hint Clear Clear Clear Clear
Pale
yellow
Pale
yellow
Lea
f
Water 1.96
- - - - - - Dark brown
EtOH
1.98 2.12 2.24 4.22 2.83 4.13 4.22
Medium
brown Golden
brown
Golden
brown
Pale
yellow/
brown
hint
Clear Yellow
hint Clear
EtOAc
1.99 2.08 2.06 2.54 2.91 3.72 3.64 Dark
green/
brown hint
Pale
yellow
Pale
yellow
Pale
yellow
Pale
yellow Yellow Yellow
HEX 4.96 4.21 4.21 4.22 4.22 3.74 4.21
Green/
brown hint Clear Clear Clear Clear Clear Clear
Extracts (1 mg/ml in DMSO) in 1:1 distilled water and MeOH were analysed
using 10% B for 1 min, 10-98% B over 2 min, at 98% for 2 min, (Phenomenex
C18 Gemini-NX 3μ-110A 50x2 mm column). The eluent compounds were
detected at a wavelength of 220 nm. Data of active fractions are highlighted in
bold, inactive fractions are displayed in grey and „-„ denotes not available data.
Interestingly, active F5 and F6 of HEX bark fractions revealed a different set
of minor and major peaks (tR = 4.12 min; 2.75, 3.00 and 3.11 min,
respectively); these peaks were absent from corresponding leaf fractions. A
major peak at tR ~1.98 min was detected in HEX bark fractions at low
concentrations in F2, F3 and F4 amongst several minor peaks at 220 and 254

159
nm. Noticeably, D. grandiflora EtOAc bark F1 displayed a conjoined major
peak at tR ~1.99 min and a single major peak at tR ~1.99 in all the other
fractions. This major peak was the only peak detected in HEX F3 at 220 nm.
Comparable spectra of EtOAc fractions containing a conjoined major peak in
EtOAc leaf F1, which is similar to that seen in EtOH; the major peak at tR
~1.99 was detected at 220 nm in all fractions. There were few significant
peaks detected in HEX bark fractions at 220 and 254 nm suggesting that there
is a lack of aromatic groups, amide bonds (proteins or amino acids) present.
Table 5-10: In vitro growth inhibitory effects of Duabanga grandiflora extract
fractions in a HCT116 cells revealed by the MTT assay.
D. grandiflora
crude extract
GI50 value [μg/ml]
GI50 values of D. grandiflora fractions (μg/ml)
F1 F2 F3 F4 F5 F6
Ba
rk
EtOH
[37.54] > 50 > 50 30.01 27.41 15.90 > 50
EtOAc
[21.69] 38.76 > 50 > 50 39.30 28.99 27.09
HEX
[28.88] > 50 > 50 > 50 > 50 29.62 41.60
Lea
f
EtOH
[40.92] > 50 > 50 > 50 > 50 > 50 > 50
EtOAc
[24.73] > 50 > 50 > 50 > 50 > 50 > 50
HEX
[>200] > 50 > 50 > 50 > 50 > 50 > 50
Extract concentrations (μg/ml) at which cell growth is inhibited by 50% (GI50)
after 72 h treatment. Mean GI50 values (μg/ml) ± SEM were obtained from ≥ 3
(n = 4) individual experiments. Fractions exhibiting GI50 values less than GI50
parent crude extract are considered active and highlighted in bold, fractions
with GI50 values > 10 μg/ml are considered as inactive and „-„ denotes
unavailable extracts.

160
Overall, only F4 and F5 of EtOH bark fractions revealed greater growth
inhibitory activity than that of the crude extract by 1.4- and 2.4- fold,
respectively, therefore these two fractions should be subjected to further bio-
guided fractionation in order to isolate and identify the active components.
The decrease in activity of EtOAc bark F2 suggests that the embedded
phytochemicals interact synergistically. Furthermore, HEX bark F5 displayed
a similar GI50 value to that of the crude suggesting that the active component(s)
is embedded in this fraction and is worthy of further investigation. Since
eugeniin has been isolated from D. grandiflora, the presence of aromatic
groups should be expected. Cytotoxic effects of compounds extracted from D.
grandiflora on HuCCA-1, A549, HeLa, HepG2 and MDA-MB-231 have been
demonstrated by Kaweetripob (2012) et al.193

161
Figure 5-9: HPLC traces of D. grandiflora crude bark extracts using
Reversed Phase chromatography. Water (A), EtOH (B), EtOAc (C) and
HEX (D) extract eluents (1 mg/ml in DMSO) in 1:1 distilled water and MeOH
were analysed using 10% B for 1 min, 10-98% B over 2 min, at 98% for 2 min,
(Phenomenex C18 Gemini-NX 3μ-110A 50x2 mm column). The eluent
compounds were detected with a UV light at λ = 220 (i) and 254 (ii) nm.

162
Figure 5-10: HPLC traces of D. grandiflora crude leaf extracts using
Reversed Phase chromatography. Water (A), EtOH (B), EtOAc (C) and
HEX (D) extract eluents (1 mg/ml in DMSO) in 1:1 distilled water and MeOH
were analysed using 10% B for 1 min, 10-98% B over 2 min, at 98% for 2 min,
(Phenomenex C18 Gemini-NX 3μ-110A 50 x 2 mm column). The eluent
compounds were detected at a wavelength of 220 nm (i) and 254 (ii) nm.

163
Figure 5-11: HPLC traces of D. grandiflora bark extract ‘active’ fractions
using Reversed Phase chromatography. EtOH: F3 (A), F4 (B), F5 (C) and
F6 (D) (1 mg/ml in DMSO) in 1:1 distilled water and MeOH were analysed
using 10% B for 1 min, 10-98% B over 2 min, at 98% for 2 min, (Phenomenex
C18 Gemini-NX 3μ-110A 50x2 mm column). The eluent compounds were
detected at a wavelength of 220 nm (i) and 254 (ii) nm.

164
Figure 5-12: HPLC traces of D. grandiflora bark extract ‘active’ fractions
using Reversed Phase chromatography. EtOAc: F1 (E), F4 (F), F5 (G) and
F6 (H) (1 mg/ml in DMSO) in 1:1 distilled water and MeOH were analysed
using 10% B for 1 min, 10-98% B over 2 min, at 98% for 2 min, (Phenomenex
C18 Gemini-NX 3μ-110A 50x2 mm column). The eluent compounds were
detected at a wavelength of 220 nm (i) and 254 (ii) nm.

165
Figure 5-13: HPLC traces of D. grandiflora bark extract ‘active’ fractions
using Reversed Phase chromatography. HEX: F5 (I) and F6 (J) (1 mg/ml in
DMSO) in 1:1 distilled water and MeOH were analysed using 10% B for 1 min,
10-98% B over 2 min, at 98% for 2 min, (Phenomenex C18 Gemini-NX 3μ-
110A 50x2 mm column). The eluent compounds were detected at a wavelength
of 220 nm (i) and 254 (ii) nm.

166
5.2.3 Chromotography of Pseuduvaria macrophylla crude
extracts and in vitro growth inhibitory properties of
fractions in HCT116 cells
HPLC spectra of available P. macrophylla crude extracts measured at 220 and
254 nm are shown in Figure 5-14 and a summary of the main dominant peak is
represented in Table 5-11. A solvent peak is illustrated in all spectra at tR
~0.31 min. The major peak present in EtOH, EtOAc and HEX crude extracts
was detected at tR ~2.18 min. Compounds present in EtOH and EtOAc could
be in the class of alkaloid, aglycone and glycoside compounds. Figure 5-14
displayed spectra, which revealed other peaks in both extracts were at tR ~2.40
min and 2.74 min amongst several minor peaks.
Table 5-11: Retention time of Pseuduvaria macrophylla extracts dominant
peaks using reversed phase chromatography.
P.
macrophylla
extracts
Retention time (tR, min) and colour of P. macrophylla
extracts
Crude F1 F2 F3 F4 F5 F6
EtOH
2.40 4.24 1.11 2.18 2.76 3.58 2.71
Dark brown/
green hint
Yellow
tint
Yellow
tint
Light
brown Tan brown
Light
brown
Light
brown
EtOAc
2.16 2.43 1.11 2.18 2.73 3.58 4.25
Dark brown/
green hint
Yellow
tint Yellow
tint Yellow
tint
Yellow/
green hint Yellow
Yellow
tint
HEX -
- - - - - - Green
Extracts (1 mg/ml in DMSO) in 1:1 distilled water and MeOH were analysed
using 10% B for 1 min, 10-98% B over 2 min, at 98% for 2 min, (Phenomenex
C18 Gemini-NX 3μ-110A 50x2 mm column). The eluent compounds were
detected at a wavelength of 220 nm. Data of active fractions are highlighted in
bold, data of inactive fractions are displayed in grey and „-„ denotes not
available data.
Comparable peaks were observed in HPLC spectra of EtOH crude extract
analysed at 220 and 254 nm suggesting aromatic compounds and amide bonds
are present in the fraction; the same observation was noticed for EtOAc crude
extract. Following chromatography of P. macrophylla crude extracts of
varying polarity were separated into six fractions. Following freeze-drying and
reconstitution (100 mg/ml DMSO) growth inhibitory properties of fractions

167
were examined in HCT116 cells using the MTT assay. HPLC spectra of the
active fractions are shown in Figure 5-16 to Figure 5-17 and spectra of inactive
fractions are shown in Appendix 3, Figure 8-22 and 8-23. P. macrophylla
EtOH and EtOAc F3 displayed potent growth inhibitory effects in HCT116
cells yielding GI50 concentrations lower than the crude extracts by 2.1-fold (
Table 5-12). Results from the MTT assay revealed that the most active
components in EtOH and EtOAc is embedded in F3; spectra of F3 illustrated a
major peak at tR ~2.18 min (254 nm) as well as several minor peaks. There
were many minor peaks detected in EtOH F4 and F6, which suggest the
presence of aromatic groups; however this fraction was less active than the
crude extract. The detection of EtOAc F4 at both wavelengths suggests that
components with aromatic rings and amide bonds were present in the fraction;
however F4 is less active than the crude extract. Mahmood et al (1986)
elucidated aporphinoid (1,2,3-trimethoxy-4,5-dioxo-6a,7-dehydroaporphine) in
P. macrophylla and Wirasathien et al. (2006) reported the same alkaloid in
Pseuduvaria setosa, described as a yellow amorphous powder, which may
possibly be present in EtOH F1 and F2 and/or EtOAc F2 to F6 in varying
quantities.213
Table 5-12: In vitro growth inhibition effects of Pseuduvaria macrophylla
extract fractions in HCT116 cells.
P. macrophylla
crude extract
GI50 value
[μg/ml]
GI50 values of P. macrophylla fractions (μg/ml)
F1 F2 F3 F4 F5 F6
EtOH
[5.16] > 10 > 10
2.50 ±
0.74
6.48 ±
1.27 > 10
8.06 ±
1.17
EtOAc
[1.61] > 10 > 10
0.75 ±
0.13
3.33 ±
0.61 > 10 > 10
HEX
[5.41] - - - - - - -
Extract concentration (μg/ml) at which cell growth is inhibited by 50% (GI50)
after 72 h. The mean GI50 values (μg/ml) ± SEM were obtained from ≥ 3 (n =
4) individual experiments. Fractions exhibiting GI50 values less than GI50
parent crude extract are considered active and highlighted in bold, fractions
with GI50 values > 10 μg/ml are considered as inactive and „-„ denotes
unavailable extracts.

168
Figure 5-14: HPLC traces of P. macrophylla extracts using Reversed Phase
chromatography. EtOH (A) and EtOAc (B) extract eluents (1 mg/ml in
DMSO) in 1:1 distilled water and MeOH were analysed using 10% B for 1 min,
10-98% B over 2 min, at 98% for 2 min, (Phenomenex C18 Gemini-NX 3μ-
110A 50x2 mm column). The eluent compounds were detected at a
wavelength of 220 nm (i) and 254 (ii) nm.

169
Figure 5-15: HPLC traces of P. macrophylla extract fractions using Reversed
Phase chromatography. EtOH: F3 (A), F4 (B) and F6 (C) (1 mg/ml in DMSO) in
1:1 distilled water and MeOH were analysed using 10% B for 1 min, 10-98% B over
2 min, at 98% for 2 min, (Phenomenex C18 Gemini-NX 3μ-110A 50x2 mm column).
The eluent compounds were detected at a wavelength of 220 nm (i) and 254 (ii) nm.

170
Figure 5-16: HPLC traces of P. macrophylla extract fractions using Reversed
Phase chromatography. EtOAc: F3 (A) and F4 (B) (1 mg/ml in DMSO) in 1:1
distilled water and MeOH were analysed using 10% B for 1 min, 10-98% B over 2
min, at 98% for 2 min, (Phenomenex C18 Gemini-NX 3μ-110A 50x2 mm column).
The eluent compounds were detected at a wavelength of 220 nm (i) and 254 (ii) nm.

171
Figure 5-17: HPLC traces of P. macrophylla extract fractions using
Reversed Phase chromatography. EtOAc: F3 (D) and F4 (E) (1 mg/ml in
DMSO) in 1:1 distilled water and MeOH were analysed using 10% B for 1 min,
10-98% B over 2 min, at 98% for 2 min, (Phenomenex C18 Gemini-NX 3μ-
110A 50x2 mm column). The eluent compounds were detected at a wavelength
of 220 nm (i) and 254 (ii) nm.

172
6
Conclusion and future direction
Selection of UNMC plants Acalypha wilkesiana, Duabanga grandiflora,
Archidendron ellipticum and Pseuduvaria macrophylla, for investigation was
based on different approaches e.g. random screening of plants with unknown
biological activity or selection on the basis of traditional use reported in
literature. A range of bioassays and a panel of cancer cell lines were employed
in systematic examination of UNMC plants‟ extracts, starting with examination
of any untoward activity (cytotoxicity, cytostasis) against cancer cells. Data
from initial stages of this project provided direction to explore extracts‟-
induced growth inhibition observed and the induction of apoptosis to provide
information on the mechanism of action of UNMC extracts. Simultaneously,
extracts were also tested for activities against cell migration (important in
invasion and metastasis), colony formation ability (responsiveness to cell death
signals) and induction of senescence (limiting replicative potential).
Furthermore, preliminary fractionation of UNMC crude extracts was
performed alongside in vitro examination of crude extracts to further explore
anticancer activities of extract fractions and to provide guidance on selection of
isolation of compounds in active sub-fractions in earlier stages. Malaysian
rainforest plants selected for this project have revealed interesting and valuable
information from a series of assays and are worthy of further investigation as
summarised overleaf.

173
Table 6-1: Summary table outlining each activity performed
Assay
(indication) Description
Most active
plant(s)
MTT
(viability)
[0 μg/ml - 200 μg/ml]: A.
wilkesiana, A. ellipticum, D.
grandiflora
[0 μg/ml - 50 μg/ml]: P.
macrophylla
Exposure: 72 h
P.
macrophylla
Clonogenic
(survival)
GI50: [0X, 0.5X, 1X and 2X]
Exposure: 24 h
D.
grandiflora
PI staining
(cell cycle distribution) GI50: [0X, 1X, 2X and 4X]
Exposure: 48 h
D.
grandiflora
and P.
macrophylla
Annexin V-FITC/PI
staining
Western blot
(Apoptosis)
GI50: [0X, 1X, 2X and 4X]
GI50: [0X, 1X and 5X]
Exposure: 24 h and 48 h
D.
grandiflora
and P.
macrophylla
Scratch
(Migration)
GI50: [0X, 1X and 4X]
Exposure: 52 h and ≤ 64 h
P.
macrophylla
Β-galactodase detection
(Senescence)
GI50: [0X, 1X and 2X]
Exposure: 7 to 12 days A. ellipticum
Aluminium trichloride
Folin-Ciolteau
(Chemical content)
Extract concentration [1 mg/ml],
total flavonoid content as quercetin
equivalent.
Extract concentration [1 mg/ml],
total phenolic content as gallic acid
equivalent.
D.
grandiflora
DPPH
(Free radical scavenging)
Extract concentration [1 mg/ml]. D.
grandiflora
HPLC
(Fractionation)
Fractionation using solvent
gradients consisting of Water,
MeOH and MeCN, a total of 6
fractions of decreasing polarity
Detection wavelengths: 220 and
254
A. ellipticum
Broth dilution assay
(Antimicrobial activity)
[1 – 128 µg/ml]: D. grandiflora, P.
macrophylla
Exposure: 24 h and 48 h
D.
grandiflora
and P.
macrophylla
Summary table listing the assays performed and the respective UNMC plant(s)
that contributed towards the most favourable result for that assay.
174
Acalypha wilkesiana (Euphorbiaceae)
Polar (EtOH and EtOAc) extracts of A. wilkesiana were able to cause growth
inhibitory effects across the cell line panel (cell line panel mean GI50 (μg/ml):
EtOH = 51.79; EtOAc = 55.99; HEX = > 200). Breast cancer MDA-MB-468
cells without ER, PR and Her-2 expressions revealed the greatest sensitivity
towards compounds present in EtOH and EtOAc extracts (GI50: 22.67 and
15.88, respectively) and some selectivity was observed as GI50 values against
MRC-5 fibroblasts (GI50: 46.60 μg/ml and 53.26 μg/ml, respectively) was
observed. Inhibition of colony formation induced by EtOH extracts (at 36
μg/ml and 72 μg/ml) was observed in approximately 70% of MDA-MB-468
cells within 24 h. A similar effect was observed with HEX extracts, however
the concentrations used were too high to be considered as „active‟ according to
the NCI‟s active crude extract criteria. Detection of increased sub-G1 cell
population suggests EtOH extract was able to cause cellular damage leading to
cell death; however this effect was not deemed as significant in MDA-MB-468
cell cycle distribution. A. wilkesiana illustrated significant growth inhibitory
effects in triple-negative MDA-MB-468 cells, therefore, the presence of HER,
ER and PR receptors may not be a factor determining sensitivity of cells to
these plant extracts suggesting the active constituents may or may not be in the
phytochemical class of isoflavonoids or flavonoids.
Collectively, results may suggest impaired proliferation and colony formation
inhibition were due to DNA damage leading to cell cycle arrest (for repair) or
cell death (irreparable damage); such findings are in agreement with data
previously reported of double-strand break (DSB) and single-strand break
(SSB) accumulation and execution of apoptosis by A. wilkesiana.234
The
effects observed could be due to cytotoxic constituents previously identified in
A. wilkisiana extracts that have the ability to induce apoptosis such as
anthraquinone (via caspase 8), corilagin (via G2/M arrest), gallic acid (via
G0/G1 arrest), geraniin (by up-regulation of Fas ligand), kaempferol (by p53
activation).175
Since cytotoxic compounds have been previously found in this
plant, continuing with detailed in vitro investigations may not serve much
purpose (response will be observed due to known cytotoxic compounds),
whereas fractionating extracts from this plant would be of greater interest to
isolate potential new compounds and investigate any potential novel effects.

175
Archidendron ellipticum (Leguminosae)
Polar (EtOH and EtOAc) extracts of A. ellipticum contain compounds causing
most potent growth inhibition in MDA-MB-468 cells (Bark GI50 (μg/ml):
EtOH = 1.7; EtOAc = 40.9; HEX = > 200; Leaf GI50 (μg/ml): EtOH = 9.3;
EtOAc = 9.3; HEX = > 200). On the whole, bark extracts were more active
than leaf extracts against the cell line panel, however only leaf EtOAc extract
demonstrated selectivity between MDA-MB-468 cells and MRC5 fibroblasts
(GI50 = 69.7 μg/ml). Separation of bark EtOH extract revealed a single active
fraction (F4; GI50: ~1.75 μg/ml) causing growth inhibition at the same
concentration of the crude extract (GI50: ~1.73 μg/ml), further fraction
separation is justified, towards isolation of single active compounds.
Although, crude HEX extracts failed to inhibit growth at concentrations as
great as 200 μg/ml, it is intriguing that extract separation yielded fractions with
significantly enhanced (> 50-fold) growth inhibitory activity in the fractions
(GI50 (μg/ml): F4 = 10.0; F5 = 6.0; F6 = 12.6), which strongly suggests
antagonism and/or masking of hydrophobic compounds present in the crude
extracts. A. ellipticum fractions illustrated comparable or greater activity than
their crude extracts, which suggests antagonism or „masking‟ of activity.
Further fractionation may reveal compounds of greater activity in sensitive cell
lines worthy of isolation and testing. A. ellipticum illustrated greatest growth
inhibition in triple-negative MDA-MB-468 cells, therefore the active
constituents may not be in the phytochemical class of isoflavonoids or
flavonoids. Polar extracts of bark and leaf were most active against MDA-
MB-468 colony formation with ≥ 40% of cells unable to proliferate and form
colonies. This could be as a result of apoptosis initiation by compounds
present in the extracts, as shown by increased sub-G1 populations and
detection of PS on the outer membrane in ≥ 40% of the cells after 48 h
treatment. Induction of apoptosis will lead to the inability of cells to
proliferate and inhibit colony growth. Bark and leaf HEX extracts were able to
induce highest numbers of senescent cells detected in comparison to other
extracts examined. Other compounds in the crude mixture, possibly sterols,
triterpenes, coumarins and saponins can scavenge free radicals and it appears
that extracts‟ ability to induce senescence is inversely related to their ability to
scavenge free radicals.235

176
Duabanga grandiflora (Lythracae)
Sensitivity of cancer cells varied towards D. grandiflora extracts. Modest
growth inhibitory activity and selectivity between MRC5 fibroblasts and CRC
HCT116 cells were seen with polar (Water and EtOH) extracts. Moreover,
EtOAc extracts were the most active against the panel of cell lines tested (mean
GI50 (μg/ml): bark EtOAc = 31.58 and leaf EtOAc = 43.78). Interestingly,
non-polar bark HEX extract also demonstrated good growth inhibitory effects
against the cell line panel (GI50 = 36.36 μg/ml), which is in contrast to leaf
HEX extract (GI50 = > 200 μg/ml). However, lack of selectivity between
cancer cell lines and MRC5 fibroblast was observed with less polar extracts.
Separation of crude bark extracts has revealed antagonistic interaction or
masking of activity in the crude mixture. It will be of interest to priortise
additional fractionation of EtOH and HEX bark fractions in an attempt to
identify sub-fractions with greater growth inhibitory activity in HCT116 cells
than seen with the crude extracts. While loss of activity seen in all leaf extracts
following fractionation suggests separated compounds contained in different
fractions may have been interacting in a synergistic manner previously.
Unexpectedly, SiHa cells‟ growth was not affected by low concentrations D.
grandiflora polar extracts although studies revealed eugeniin activity against
Walker carcinosarcoma 256 in rats, which may be due to „masking‟ or
antagonism of (a) particular compound(s) activity by other compounds which
comprise the chemical mixtures of crude extracts. It would be of interest to
investigate the expression levels of viral proteins in light of reports of
eugeniin‟s activity hindering HSV RNA and DNA replication. Accumulation
of sub-G1 and G1/0 cell populations accompanied by decreased events in S
and G2/M suggest cells were unable to progress through G1 phase and as
apoptosis was triggered (positive Annexin V+/PI
- binding and activated caspase
3 protein). These observations imply that damage induced by compounds
present in D. grandiflora polar extracts were sufficient to affect cell survival
and prevent subsequent colony formation; this effect was seen to a lesser extent
in less polar extracts.
Previously, a range of compounds has been isolated from D. grandiflora
extracts and some constituents can induce apoptosis such as ellagic acid (by G1
phase arrest), hentriacontane, hentriacontanol, b-sitosterol, a-amyrin,

177
epifriedelinol, betulinic acid, acacetin and tetramethylellagic acid. Similarly, D.
grandiflora EtOH bark fractions and all leaf extract fractions possessed greater
activity than the crude extract suggesting antagonistic or masking activity of
compounds in crude mixtures.
Furthermore, D. grandiflora crude EtOH and HEX bark extracts appear to
contain compounds that may inhibit cell migration, possibly via TNF-α
pathway, which may be due to the detected caspase 3 activation (Figure 6-1).
A low level of senescence (< 10%) was present in EtOH treated cells but was
comparable to the control. Greatest free radical scavenging (FRS) activity was
seen in D. grandiflora in comparison to all of the UNMC plants tested. Free
radical scavenging activity decreased with extract polarity; highest levels of
free radical scavenging (~ 95%) was seen with polar extracts since significant
quantities of phenolics and flavonoids were detected. Extraction of plants
using polar solvents (Water, EtOH and EtOAc) yielded extracts with good to
moderate activity implying compounds such as sugars, amino acids, glycosides,
alkaloids, aglycones, glycosides could be present in the crude extracts. D.
grandiflora bark HEX extracts revealed growth inhibitory effects in HCT116
cells. Compounds of chemical class of waxes, fats and oils could be extracted
in non-polar hexane solvent, hence may be responsible for the activity. It is
also interesting to note that in agreement with recent studies, D. grandiflora
extracts were able to inhibit both Gram –ve and Gram +ve bacteria (8 – 32
mg/L), which may be due to ellagic acid and betulinic acid.189
Pseuduvaria macrophylla (Annonaceae)
P. macrophylla extracts demonstrated the greatest growth inhibitory and anti-
clonogenic effects across the cell line panel (mean GI50: EtOH: 5.05, EtOAc:
2.02 and HEX: 11.99 μg/ml) in the MTT and clonogenic assays.
P. macrophylla HEX extract-treated cells were able to form colonies following
extract removal suggesting cellular damage was reversible, therefore different
compounds influencing different mechanisms may be responsible for the
effects observed or longer exposure time might be required for accumulation of
damage that is beyond repair. Collectively, P. macrophylla crude extracts
may contain compounds that can inhibit cell growth and colony formation by
inducing DNA damage. This may result in cell cycle arrest to allow for DNA

178
repair, activation of apoptosis due to irreparable DNA damage or induction of
cellular senescence or impairing cells‟ proliferative potential. Alkaloids
contained in P. macrophylla (Annonaceae) are very likely to be accountable
for the observed effects such as increased G2/M cell population preceding cell
death.209
In comparison, it is known that vinca alkaloids isolated from C.
roseus (Apocynaceae) possess anti-microtubule, anti-mitotic activity leading to
G2/M block.10
Subsequently, flow cytometric and Western blotting techniques
have confirmed apoptotic cell populations and caspase-3 (cleavage) activation.
P. macrophylla HEX extracts revealed selective growth inhibitory effects in
HCT116 cells, compounds classes comprising of chemical class of waxes, fats
and oils could be extracted in non-polar hexane solvent, hence the above
mentioned chemicals could be responsible for the observed activity.
Compound 38 previously isolated from P. macrophylla may also be
responsible for the observed effects since similar activity was observed in NCI-
H187 cells (3.0 μg/ml).214
However compounds (possibly compound 38) in F3
yielded greater effects in HCT116 cells (0.75 μg/ml). Similarly low levels (<
10%) of senescent cells were observed following EtOH and EtOAc treatments
and were similar to levels observed in control cells. Remarkably, P.
macrophylla extracts were able to inhibit both Gram –ve and Gram +ve
bacteria at very low concentrations (8 – 32 mg/).
In comparison, there is also limited information on the biological activity of a
related species Uvaria Macrophylla due to its decline in recent years.
Nevertheless, U. macrophylla bark and leaf (EtOH, CHL and HEX) extracts
appeared to be potent against MCF-7 and HCT116 cells (see appendix 4).
CHL and HEX extracts were able to inhibit growth of both cell lines by 50% at
low concentrations (3.25 to 27.03 μg/ml). These GI50 values are comparable to
that observed in HCT116 cells exposed to P. macrophylla EtOH, EtOAc and
HEX extracts (GI50: 5.16, 1.61 and 5.41 μg/ml, respectively). In general,
similar inhibition of colony formation was observed with U. macrophylla
extracts, however EtOH concentrations used were ≥ 5-fold greater than P.
macrophylla EtOH extract. Preliminary cell cycle distribution data suggest
that no changes were induced by U. macrophylla EtOH and HEX extracts
(Appendix 4, Figure 10-24), whereas increased sub-G1 HCT116 cell
population with CHL extracts is indicative of apoptotic cells and should be

179
confirmed by the Annexin V-FITC assay. Other studies in China revealed
EtOH root extract from U. macrophylla and isolated a new dihydroflavone,
macrophyllol as well as uvamalols and uvarimacrophin, dihydroflavones,
acetogenins, polyoxgenated cyclohexenes and (benzylisoquinoline)
alkaloids.268, 269
Since the Annonaceae family is known for possessing
alkaloids and both Uvaria and Pseuduvaria genus have been previously
identified to possess new compounds, these two plants are worthy of further
investigation such as bio-guided fractionation leading to isolation and structure
elucidation of the active compound(s).
Overall, all of the UNMC plants selected for this investigation revealed
intriguing anticancer properties worthy for further examination. It is important
to continue fractionation of these crude extracts in order to isolate and
elucidate structures of active compounds. This could be achieved by using
hyphenated methods consisting of e.g. HPLC, MS, NMR, technologies that
would provide information of chemical composition of pure active compounds
for identification on natural compound databases (de-replication). Analytical
results obtained would offer a deeper insight into the class of chemical group
present; hence enabling estimation of activity (reaction groups) and hypotheses
of mechanism(s) of action(s). It may be considered inefficient to only
performing bioassays on crude extracts containing a mixture of compounds;
likewise, it maybe inefficient to spend significant time conducting only
separation and isolation procedures to identify various compounds present in
the crude extracts since there may be no suitable (inactive or already known)
compounds present. A selection of in vitro tests should be performed in
parallel with analytical assays, the efficiency of two processes may be
improved and decisions regarding pursuit of investigation could be facilitated
based on the preliminary biological and analytical data obtained. This is also
of importance for sub-fractions, which demonstrate activity where the whole
crude extract failed to show activity.
On isolation of the active compound, detection of pro-apoptotic members of
Bcl-2 family expression e.g. BAX, and BAK and regulators of the anti-
apoptotic Bcl-2 proteins to promote apoptosis e.g. BAD, NOXA and PUMA,
could provide insight into the possible involvement of proteins from the

180
extrinsic or intrinsic apoptotic pathways e.g. FasL, TNF and TRAIL or
mitochondria-caspase interaction leading to apoptosis, respectively.270
Bid is
the common modulator between the intrinsic and extrinsic pathways; cleavage
of Bid by caspase 8 (extrinsic pathway) enables communication with the
intrinsic pathway by activating Bax/Bak protein leading to cytochrome c
release and mitochondrial fragmentation.270
Hence it is important to consider
the detection of caspase 8 and cleaved Bid (tBid) protein expression in UNMC
extract-treated cells to distinguish between intrinsic or extrinsic pathway that
has led to activation of caspase 3. In addition, expression of other proteins of
interest may also provide further mechanistic insight including γH2AX, a
marker of DNA double-strand breaks (histone γH2AX is phosphorylated on
serine 139 by PI3-family) H2AX protein is also involved in DNA repair and
regulation cell cycle division hence possesses a role in genomic stability.88
Cytosolic cytochrome C levels would distinguish intrinsic apoptotic pathway;
cleaved PARP protein could confirm subsequent activation of caspase 3.271
Inhibition of cell migration following treatment of UNMC extracts may be due
to involvement of the TNF-α pathway and subsequently activating caspase 3
activation and inhibition of NF-kB inhibition hence preventing signals to EMT
induction (Figure 6-1).272
Figure 6-1: The downstream signaling pathways of TNF-α as illustrated by
Wu and Zhou (2010). TNF-α can activate two types of TNF receptors (TNFR 1
and 2). TNFR1 can induce apoptosis by binding caspase 8 to Fas-Associated
protein with Death Domain (FADD). TNFR2 can promote inflammation and
cell survival via activation of NF-kB and Akt signaling pathways, which can
give rise to EMT and invasion in tumour cells.272

181
Furthermore, another interesting assay to investigate possible targets of active
compounds would be using micro-array techniques to enable a range of protein
targets to be identified thus generating a fingerprint profile for the plants.
Similarly, metabolite profiling could provide information on extracts‟ influence
on metabolism pathways in a biological system.273
Any similarity with
existing profiles could provide suggestions of possible mechanism of action or
reveal any unique patterns.
Determination of the type of DNA damage induced by different compounds
present in UNMC extracts could provide additional insight into possible
mechanisms. For example COMET assay would be able to detect whether
single strand breaks or double strand breaks have occurred within the DNA,
however there will be a need to distinguish between the causes of DNA strand
breaks i.e. a consequence of caspase cleavage (during apoptosis) or extracts per
se. Subsequently, it would be of interest to examine isolated compounds‟
abilities to inhibit invasion, angiogenesis and metastasis by growing cells on
wells with a matrigel and measure if cells are able to migrate through this
barrier. Additional „normal‟ cell lines should be used to determine therapeutic
window and any active compounds could be used as a template for structural
modification in order to achieve selectivity between cancer cells and normal
cells.
There is such a huge variety of assays that are available, however it is
important to consider the nature of compound(s) isolated from these plants in
order to select purposeful assays to yield more significant results. In addition,
compounds testing negative for anticancer properties does not mean they are
unsuccessful candidates for other disease areas and it is important to document
both positive and negative findings to avoid replication of work and for use by
other researchers.
From this body of work, it is concluded that there are several general yet
critical points to be made when investigating natural products for therapeutic
use, in particularly as anticancer agents.
These points could be broadly categorised into non-practical and practical
concerns.

182
Firstly, one of the main concerns in natural product research surrounds the
processes of collection (e.g. random versus literature/ethnopharmacological
systems, correct verification of specimens and sustainability of the source) and
standardisation of raw material (e.g. location and the environment,
developmental stage of the plant, storage conditions of collected material,
techniques) as well as the subsequent extraction process used. In addition,
publication of results is necessary for de-replication and further information on
the plant profile. The lack of supply of A. wilkesiana and P. macrophylla from
their primary collection location has highlighted a non-practical concern
experienced in this project as it could mean that the interesting results obtained
so are in vain if endangered P. macrophylla became extinct; whereas an A.
wilkesiana specimen was found and collected from a secondary location and it
is very likely that variability in compounds of the second batch will affect cells‟
response and produce different in vitro results. Therefore the importance of
standardization is raised; use of analytical equipment to determine the variation
between batches is essential, and decisions made as to acceptance of identical
compound profiles or compromise for the most abundant compounds. This
may be overcome by ensuring enough supply prior to selection. Once in vitro
experiments have verified activity, enough specimens should be collected to
perform separation and analytical analyses. Alternatively, if the active
compound(s) is identified then analysis of analytical data could be focused on
the detection of the active compound(s).
It is important to not cease testing of crude extracts prematurely and give more
attention to bio-guided fractionation activity of these extracts; this has been
supported by the differences observed in growth inhibition of cancer cells
when exposed to crude (inactive) and fractionated A. ellipticum HEX extracts
(„active‟). Collectively, the results revealed that selection of cell lines are
dependent on the in vitro experiments being performed due to the characteristic
variability of cell types, hence their different level of sensitivity towards
different compounds, and the indication of the assay. However, it is
unnecessary to continuously test crude extracts against different cell lines in
the early stages of in vitro testing as long as the mixture still proves to be
„active‟ (with reference to the NCI‟s guidance) against the cell line(s) being
tested. It is important to employ analytical equipment for bio-guided

183
fractionation process, to separate and elucidate the structure(s) of active
compound(s). Natural product research should aim to obtain pure active
compounds so that investigation into mechanism of action (defined targets) can
be conducted, which would be favourable in obtaining a investigation license
approved by regulatory bodies for clinical development in a defined population
and indication(s), and subsequently a marketing license. On the contrary, it is
difficult to predict the interaction (in vivo) for a mixture of compounds (shot-
gun effect) and adverse events that may arise - hence inadequate safety profile
and poor benefit-risk assessment of the compound. Therefore, the UNMC
extracts examined in this project should be subjected to further bio-guided
fractionation and reconcile on verified databases (de-replication). If UNMC
extracts contain active compound(s), which are subsequently verified to be a
novel compounds (or compounds lacking biological data) then it will be
interesting to initiate in vivo studies.
In general, identification and structure elucidation of active compounds and
mechanisms of action are considerably long processes without evening
considering antagonistic, masking or synergistic activities of crude extracts, so
supply of material is a critical factor. Furthermore it is also important to
acknowledge that the „inactive‟ fractions may still have a role to play in other
therapeutic areas, therefore it is important to analyse the results, which may
reveal alternative uses and may be followed. Above all, this work requires the
experience and expertise of botanists to correctly verify specimens and vigilant
record-keeping as well as international efforts to communicate and maintain an
authenticate database.
For potential therapeutic compounds to be identified from the diverse botanic
systems, pharmaceutical companies will need to invest significantly into
natural product drug discovery programs or find the balance with their
investment into high-throughput screening technologies and compound
libraries. Therefore there is still a prominent role for natural compounds in
drug discovery.

184
7
Materials and Methods
7.1 Materials
7.1.1 Plant collection and identification
Malaysian rainforest flora Acalypha wilkesiana Müll Arg., Duabanga
grandiflora Walp, Archidendron ellipticum (Blume) Hassk and Pseuduvaria
macrophylla (Oliv.) Merr were collected in Malaysian rainforests and
authenticated by Dr. Christophe Wiart (Table 7-1). The extraction of collected
plant specimens was conducted by colleagues of the UNMC School of
Biosciences and School of Pharmacy (chapter 4.2.1). The UNMC plant
extracts were delivered to the University of Nottingham, UK, and kept at –
20 °C until use.
7.1.2 Mammalian cell lines
Human–derived cancer cell lines MCF7, MDA-MB-468, SK-OV-3, Caki-1,
HCT116 and non-transformed cell line MRC-5 fibroblasts were purchased
from the American Type Cell Culture (ATCC), Rockville, U.S.A. Human
cancer cell lines IGROV 1, TK10 and HCC 2998 and were purchased from the
National Cancer Institute (NCI), Bethesda, U.S.A (Table 7-2).
7.1.3 Bacterial strains
Gram-negative bacteria (Pseudomonas aeruginosa, (P. aeruginosa) and
Escherichia coli (E. coli)), Gram-positive (Staphylococcus aureus (S. aureas)
and Enterococcus faecalis (E. faecalis) and yeast Candida albicans (C.
albicans) were purchased from ATCC.

185
Table 7-1 UNMC Plant name and reference number, place of collection and UNMC plant extraction solvents.
UNMC
Number Genus Species Family
Place of
collection
(Forest)
Extraction solvent and Yield (%)
Ch
loro
form
Hex
an
e
Eth
yl
aceta
te
Eth
an
ol
Wa
ter
9 Acalypha Wilkesiana Euphorbiaceae Broga Whole - 0.32 0.18 3.29 -
20 Pseuduvaria Macrophylla Annonaceae Sg. Congkak Whole - n/a n/a n/a -
35 Archidendron Ellipticum Leguminosae Sg. Congkak Leaf - 1.79 1.82 2.33 -
35 Archidendron Ellipticum Leguminosae Sg. Congkak Bark - n/a 0.10 2.30 -
37 Duabanga Grandiflora Lythraceae Semenyih Dam Leaf - 2.54 4.72 18.27 6.63
37 Duabanga Grandiflora Lythraceae Semenyih Dam Bark - 1.02 0.64 4.11 2.73
- Uvaria Macrophylla Annonaceae - Whole n/a n/a - n/a -
Each plant was assigned a UNMC number and was subjected to extraction in solvents of varying polarity: chloroform (CHL), hexane (HEX),
ethylacetate (EtOAc), ethanol (EtOH) and water (Water) and the corresponding yield (%) displayed; several extracts‟ yields could not be
determined and indicated as n/a (not available).

186
Table 7-2 Mammalian cell lines and maintenance conditions
Further information on the human cell lines used can be obtained from the
American Type Cell Culture (www.atcc.org) and the National Cancer Institute
(http://dtp.nci.nih.gov).
Cell
type
Cell line Reference Supplement
Bre
ast
Ad
eno
carc
ino
ma
MCF7 ATCC no. HTB-22
Brooks et al. 1973219
RPMI 1640 medium
supplemented with 10%
FBS in a humidified
atmosphere at 37°C in 5%
CO2.
MDA-MB-
468
ATCC no. HTB-132
Cailleau et al. 1978220
Ov
aria
n
Ad
eno
carc
ino
ma
IGROV1 Bénard et al. 1985221
SK-OV-3 ATCC no. HTB-77
Frogh et al. 1975222
Ren
al c
ell
carc
ino
ma Caki-1
ATCC no. HTB-46
Frogh et al. 1975222
TK-10 Bear et al. 1987223
Co
lore
ctal
carc
ino
ma
HCT116 ATCC no. CCL-247
Brattain et al. 1981224
HCC2998
Goldwasser et al.
1995225
Kobayashi et al.
1999226
No
n-t
ran
sfo
rmed
foet
al l
un
g
fib
rob
last
MRC-5 ATCC no. CCL-171
Jacobs et al. 1970228
MEME medium
supplemented with 10%
FBS, 7.5% sodium
bicarbonate, 1% 0.1 mM
Non essential amino acids,
1 M HEPES, 1% 200 mM
L-glutamine and 1%
penicillin. Cells are kept in
Humidified atmosphere at
37°C in 5% CO2.

187
7.1.4 Antibodies
Rabbit polyclonal antibodies (Ab) to histone H2A.X (phosphor S139; product
code: ab11174) and rabbit monoclonal Ab to α-Mcl1 (product code: Ab32087)
were purchased from Abcam plc, Cambridge, UK. Rabbit monoclonal Ab to
PARP1 (46D11, site Gly 523; product code: 9532S), rabbit Ab to Bax (product
code: 2772S) and mouse monoclonal Ab to Caspase 3 (product code: 9668S)
were purchased from Cell Signaling Technology Inc., Hertfordshire, UK.
Anti-rabbit IgG, peroxidase-linked species-specific whole Ab from donkey
enhanced chemiluminescence (ECL; product code: NA934) were purchased
from GE Healthcare, UK. Mouse IgG1 Ab to αBcl-2 (produce code: mAB827)
was purchased from R & D systems. All antibodies were stored at -20 °C in
the dark in accordance to the manufacturers‟ guidance unless otherwise stated.
7.1.5 Chemicals and reagents
2,2-Diphenyl-1-picrylhydrazyl radical (DPPH), 2-mercaptoethanol, 3-(4,5-
dimethylthiazol-2-yl)-2,5-diphenyltetrazolium bromide (MTT), 5-bromo-4-
chloro-3-indolylβ-D-galactopyranoside (X-gal), N-[2-hydroxyethyl]piperazine-
N‟-[2-ethanesulfonic acid] (HEPES), N,N,N′,N′-tetramethylethylenediamine
(TEMED), β-mercaptoethanol, aluminium chloride (AlCl3) anhydrous,
ammonium persulfate (AMPS), bovine serum albumin (BSA), bromophenol
blue, calcium chloride (CaCl2), citric acid, dimethyl sulfoxide (DMSO), foetal
bovine serum (FBS), Folin-Ciocalteau (FC) phenol reagent, gallic acid (GA),
glycerol, glycine, L-glutamine, Kodak® GBX fixer (for autoradiography films),
magnesium chloride (MgCl2), methylene blue, minimum essential medium
eagle (MEME), non-essential amino acids (NEAA) solution,
penicillin/streptomycin, polyoxyethylenesorbitan monolaureate (Tween® 20),
potassium ferricyanide, potassium ferrocyanide, propidium iodide (PI),
protease inhibitor cocktail (AEBSF: 104 mM, aprotinin: 80 μM, bestatin, 4
mM: E-64: 1.4 mM, leupeptin: 2 mM, pepstatin A: 1.5mM, in DMSO; product
code: P8340), quercetin, ribnonuclease A from bovine pancreas (RNAse A),
Roswell Park Memorial Institute (RPMI)-1640 liquid medium (containing 0.3
g/L L-glutamine and 2 g/L sodium bicarbonate), sodium bicarbonate, sodium
carbonate (Na2CO3), sodium chloride (NaCl), sodium citrate, sodium dodecyl

188
sulphate (SDS), sodium deoxycholate, sodium phosphate (Na3PO4), sodium
pyruvate, tris(hydroxymethyl) aminomethane (Trizma®
base),
tris(hydroxymethyl) aminomethane hydrochloride (Trizma®
hydrochloride)
and triton-X-100, trypsin/ethylenediamine tetra-acetic acid (EDTA) solution
were purchased from Sigma Aldrich Ltd., Dorset UK.
Phosphate buffered saline Dulbecco A (PBS) tablets (8.0 g sodium chloride,
0.2 g potassium chloride, 1.15 g di-sodium hydrogen phosphate, 0.2 g
potassium dihydrogen phosphate per litre at pH 7.1 -7.5) were purchased from
Oxoid, Hampshire, UK. Annexin V-FITC reagent was purchased from BD
Biosciences, Oxford, UK. Coulter Clenz®
Cleaning Agent, Flow Check®
beads
and IsoFlowTM
Sheath Fluid were purchased from Beckman Coulter Ltd.,
Buckinghamshire, UK. Formaldehyde (16%, MeOH free) solution ampoules
were purchased from Thermo Scientific Inc, Rockford, IL, U.S.A. 30% w/v
acrylamide-bis acrylamide stock solution was purchased from Severn Biotech
Ltd, Worcestershire, UK.
MagicMark™ XP Western protein standard, Novex®
ECL kit, Novex®
Sharp
pre-stained protein standard, NuPAGE®
4-12% bis tris gel 1.5 mm 15-well
cassette, NuPAGE®
antioxidant, NuPAGE®
LDS sample buffer, NuPAGE®
MOPS SDS running buffer, NuPAGE®
sample reducing agent, NuPAGE®
transfer buffer were purchased from Life Technologies-Invitrogen, Paisley, UK.
Bio-Rad DC protein assay kit, bovine serum albumin (BSA) standard solution
and polyvinylidene difluoride (PVDF) membrane were purchased from Bio-
Rad Laboratories, Hertfordshire, UK. X-ray films processing solutions
(Developer) was purchased from Champion Photochemistry International
Limited (CPIL), Brentwood, UK. Analytical grade acetonitrile Far UV (ACN),
ethanol (EtOH), ethylacetate (AcOEt), hexane (HEX), industrial methylated
spirits (IMS), methanol (MeOH) were purchased from Fisher Scientific Ltd.,
Leicestershire, UK. All chemicals and reagents were stored according to the
manufacturers‟ guidance unless otherwise stated.

189
7.1.6 Equipment and Software
Class II microbiological safety cabinet was supplied by BioMAT2 MDH. Cell
culture CO2 incubator Sterisonic GxP supplied by Sanyo-Panasonic. UV/Vis
spectrophotometer Ultraspec 2000, orbital shaker ZLE 164 was supplied by
Amersham. Spectrophotometer 2104 multi-label reader and Wallac Evision
software manager was by PerkinElmer Wallac Evision. Allegra®
X-15R
bench-top centrifuge, Epics XL-MCLTM
flow cytometer and EXPO32TM
software were purchased from Beckman Coulter. Micro-centrifuge Heraeus
Fresco 17 was supplied by Thermo Electron Corporation. XCell SureLockTM
Mini-Cell electrophoresis chamber system, PowerEase®
500 power supply,
Novex®
Semi-Dry blotter were products obtained from Invitrogen. Nikon
Coolpix 4500 camera was by Nikon. UFLCXR system coupled to an Applied
Biosystems API2000 was by Shimadzu. Strata C18-E (55 µm, 70 Å) 1 g/ml
tubes were purchased from Phenomenex®
, Cheshire, UK. C18 Gemini-NX 3u-
110A 50x2 mm column purchased from Phenomenex was kindly donated by
Dr. A. Abdallah. Cylchred program was created by Terry Hoy, University of
Cardiff, UK. WinMDI program was created by Joe Trotter of the Scripps
Institute, La Jolla, U.S.A. GraphPad Prism version 5.0d for Mac OS X was
created by GraphPad software Inc. and Software MacKiev. ImageJ program
was created by the National Institute of Health (NIH).
7.2 Methods
7.2.1 Extraction of UNMC plants
The extraction process was conducted at UNMC, Malaysia, and was previously
described in Othman et al. (2011) and modified from Spigno and Marco
(2007).205,
274
Collected plant materials were air dried in an enclosed room (25-
28 °C) for approximately two weeks. Dried plant samples (1 g) were refined
using a Waring®
commercial heavy-duty grinder by macerating with organic
solvent (1:8 ratio) at room temperature (RT) for 24 h. Plant samples were then
subjected to sequential extraction solvents of increasing polarity: HEX >
AcOEt > EtOH > Water. Ground samples were macerated with solvents for 24

190
h before being filtered. The filtrates were then concentrated by evaporation of
the solvent in vacuum at 40 °C using a rotary evaporator (Buchi, USA).
Concentrated crude extracts were desiccated for 1 - 2 weeks. The dried crude
extracts were kept at ≥ – 20 °C in the dark prior to freeze-drying. The known
percentage yields of corresponding plant extracts are shown in Table 7-1.
7.2.1.1 UNMC extract stocks
The plant samples were received as dried powder and stored at -20 °C in the
dark. Ailquots of UNMC extracts were prepared in DMSO as 100 mg/ml top-
stocks and kept at -20 °C, protected from light until use.
7.2.2 General cell culture and maintenance
All cell culture procedures were conducted aseptically in a Class II
microbiological safety cabinet with a laminar flow system. The safety cabinet
was disinfected with 70% IMS in d.H2O prior to each use. Cell lines were
routinely cultured in tissue culture flasks (25 cm2 or 75 cm
2) in culture media
RPMI-1640 (supplemented with 10% heat inactivated FBS) or MEME
(supplemented with 10% FBS, 7.5% sodium bicarbonate, 1% 0.1 mM NEAA,
1% 1 M HEPES, 1% 200 mM L-glutamine and 1% penicillin) and grown in a
humidified incubator containing 5% CO2 in air at 37 °C. FBS was heat
inactivated at 56 °C for 30 min prior to addition into culture medium to
denature complement proteins and cell growth inhibitors. When the observed
cell growth exceeds approximately 80% confluence, the cells were sub-
cultured into new culture flasks with fresh culture medium to ensure
maintenance of logarithmic growth when used in experiments.
Prior to cell subculture, medium (RPMI-1640 and MEME) stored at 4 °C were
warmed in a water bath to 37 °C. To subculture adherent cells, medium was
aspirated and cells were washed with 1 ml PBS. The cells were treated with 1
ml trypsin-EDTA solution (1X; 1 in 10 dilution in sterile PBS) and incubated
for 2-5 min at 37 °C until the cells were visibly detached from the flask. Cells
were re-suspended in 5 ml fresh medium then 0.5 ml cell suspension was
transferred to a new flask containing 7 ml of fresh culture medium. The cells

191
were returned to the incubator until subsequent subculture or usage. Cells were
discarded once they reached their recommended passage number to minimise
phenotypic drift and assay variation (usually after ~ 25 passages).
7.2.2.1 Cell Preservation
Batches of mycoplasma-free cells were stored in cryovials in the liquid
nitrogen cell bank (-180 °C) as stock for future use. Cells were grown in a 75
cm2 flask until approximately 80% confluent then the medium was aspirated
from the cells then the cells were washed with 3 ml sterile PBS, followed by
incubation in 2 ml 1X trypsin-EDTA solution at RT for 2 min. The trypsin-
EDTA solution was carefully removed and cells were incubated for a further 5
minutes at 37 °C until they had detached. The detached cells were re-
suspended in freezing medium (5% DMSO in 1:1 FBS and medium).
Subsequently, 1 ml cell suspension was aliquoted into Nalgene cryovials.
Cells secured in cryovials were immediately stored at -20 °C for 24 h then
transferred to -80 °C storage overnight before permanently stored at -180 °C in
the liquid nitrogen cell bank. Frozen cells were retrieved by thawing rapidly in
a water bath at 37 °C and re-suspending in 7 ml of fresh culture medium before
incubation at 37 °C for 16 h to allow attachment. Thereafter, liquid contents
were aspirated from the flask and fresh nutrient medium introduced.
7.2.3 MTT (in vitro cell viability) assay
The following method has been adapted from Mosmann (1983), exploiting the
colour change upon reduction of MTT by mitchondrial dehydrogenase in living
cells, from a yellow tetrazole to purple formazan.229
Thus the increase in
cellular formazan can be quantified and directly related to the activity of
mitochondrial dehydrogenase.245
In apoptotic or necotic cells mitchondrial
dehydrogenase activity is lost as a result of irreversible mitchondrial
fragmentation.275
The MTT assay can therefore be used to assess cell viability
and determine growth inhibitory or cytotoxic potential of investigative agents.
Cells were harvested at 70-80% confluence and were gently syringed through a
23-gauge needle to obtain a near-single cell suspension. The average number

192
of cells counted on a haemocytometer was used to calculate the desired cell
seeding density for 72 h treatment (2 - 3.5 x 10³ for MCF7, IGROV1, HCT116,
TK-10, MRC-5 cells; 4 - 6 x 10³ for MDA-MB-468, SK-OV-3, Caki-1,
HCC2998 cells). Using a 96-well micro-titre plate, cells were seeded in 180 μl
medium per well and incubated overnight at 37 °C (5% CO2). A separate time
zero (T0) plate was set-up to measure the initial viability of cells at the time of
UNMC extract addition. After 24 h, serial dilutions of UNMC extract stocks in
culture medium (concentration at 100 mg/ml in DMSO) were prepared to 10X
the final concentrations required. The final treatment concentration ranges
used for UNMC 20 [0 μg/ml - 50 μg/ml] and for UNMC 9, 35 and 37 [0 μg/ml
– 200 μg/ml] were tested in quadruplicate. To each well, 20 µl extract solution
was added to achieve a final volume of 200 µl (DMSO concentration < 1%).
To the peripheral lanes, 20 µl medium was added to control cells and cells in
the T0 plate. Cell viability was quantified at the time of extract addition for T0
plate and following 72 h exposure of cells to test extract for treated plates using
the MTT assay. Initially, 50 µl MTT solution (2 mg/ml MTT in sterile PBS;
stored at 4 °C in the dark) was added to each well and further incubated for 4 h
at 37 °C in the dark. The medium and any unconverted MTT were aspirated
then 150 µl DMSO was added to each well and the plates were placed on a
plate shaker for 2 min. The optical density (OD) was read on a
spectrophotometer at 555 nm using Wallac Envision software.
The absorbance intensity is directly proportional to cell viability and there is a
linear relationship between cell number and the amount of formazan present.
The mean absorbance for treated and control cells at treatment concentration
range could be used as a quantitative measure of cell viablity by constructing a
dose-response curve using the mean absorbances to enable the estimated
extract concentration inducing 50% growth inhibition (GI50 value) to be
calculated (Equation 1). Additionally, vehicle control (DMSO) was tested to
ensure that DMSO did not compromise cell viability in extract-treated wells.
Another set of assays using quercetin as a positive control was performed. The
GI50 values established from the MTT cytotoxicity assay will be used in all the
subsequent assays.

193
Equation 1: Following MTT assay, concentration which inhibit cell growth by
50%, GI50 value was determined from optical density readings of extract
treated and control cells absorbancies.
7.2.4 Clonogenic assay (in vitro cell sensitivity assay)
The following method was adapted from the method described by Brown and
Wouters (1999) and Plumb (2004) to determine cell death or recovery by
determining subsequent proliferative and colony formation capacity of cells
following brief exposure to investigative agents.276, 277
HCT116 cells were harvested at 70-80% confluence and were gently syringed
through a 23-gauge needle to obtain a near-single cell suspension. Cells were
counted on a haemocytometer and the average number of counted cells was
used to calculate the desired cell seeding density for 24 h treatment. HCT116
cells were seeded in 6-well plate at a density of 250 cells per well in 2 ml
culture medium and incubated overnight at 37 °C for cellular attachment.
Freshly prepared dilutions of UNMC extract in medium were added to wells in
triplicate to obtain treatment concentrations of 0.5X, 1X and 2X GI50 values.
DMSO vehicle was added to the control wells. After 24 h exposure to extracts,
culture medium was aspirated from all wells and cells washed with 2 ml PBS
to remove any remaining extract in the well; 2 ml fresh culture medium was
then introduced to each well. The cells were kept in the incubator at 37 °C to
allow recovery and the end-point was considered when control cell colonies
size reached ≥ 50 cells, usually 8 to 11 days. To quantify the number of
colonies formed, each well was rinsed in 1 ml chilled PBS and fixed with 1 ml
chilled MeOH at RT for 10 min. The solvent was removed and the colonies
were stained with 500 µl methylene blue solution (0.5% methylene blue in 1:1
MeOH and d.H20 (v/v); stored at 4 °C) for 10 min. The plates were washed
gently with d.H2O, air-dried and cell colonies were counted. The plating
efficiency for each well was > 90% (Equation 2).

194
Equation 2: % of plating efficiency determined by the number of colony (ies)
counted in comparison to the total number of cells seeded in clonogenic assay.
7.2.5 Flow cytometric techniques
7.2.5.1 Cell cycle analysis
Analyses of cell cycle distributions were performed by flow cytometric
measurement of cellular DNA content using fluorescent dyes such as
propidium iodide (PI), which intercalates DNA bases stoichiometrically. Any
disruption in the DNA histogram, which is representative of the cell cycle,
could indicate a DNA damaging or cytotoxic effect on the cell cycle induced
by investigative agents. The following method was adapted from the method
described by Nicoletti et al. (1991).249
MDA-MB-468 and HCT116 cells were harvested at 70-80% confluence and
counted on a haemocytometer. The average number of counted cells was used
to calculate the desired cell seeding density for 48 h treatment. The cells were
seeded in 6-well plates in duplicate at a density of 1.5 x 10⁵ in 2 ml of culture
medium. The cells were allowed 24 h at 37 ºC to adhere and commence cell
division. Freshly prepared dilutions of UNMC extract stock solution in
medium were introduced to MDA-MB-468 cells (treated with UNMC 35) and
HCT116 cells (treated with UNMC 20 or UNMC 37) at final concentrations
1X, 2X and 4X GI50 values. The cells were treated for 48 h at 37 ºC. DMSO
vehicle was added to the control cells. Cell cycle analysis preparation was
conducted at 4 ºC. Floating and trypsinised cells were pooled and pelleted by
centrifugation (306 x g, 5 min at 4 ºC), washed with 2 ml chilled PBS. Cells
were pelleted again and the supernatant was discarded. Cells were incubated in
400 µl fluorochrome solution (0.1% sodium citrate, 0.1% triton-X-100, 50
µg/ml PI, 0.1 mg/ml Ribonuclease A in d. H20; stored at 4 ºC in the dark)

195
overnight at 4 ºC protected from light. Samples remained protected from light
on ice and gently syringed prior to cell cycle distribution analysis. Cell cycle
distribution analysis was performed on a Beckman Coulter EPICS-XL
MCLTM flow cytometer. The FL3 channel was used to detect propidium
iodide (PI) and at least 15,000 events were recorded for each sample. Data
were further analysed using WinMDI and Cylchred softwares.
7.2.5.2 Apoptosis detection
One of the hallmarks of early apoptosis involves the translocation of
phosphatidylserine (PS) from the inner to the intact outer plasma membrane (as
membrane asymmetry is lost). The membrane integrity of an apoptotic cell
diminishes when progressing into late apoptosis/necrosis. A calcium ion
(Ca2+
) dependent phospholipid-binding protein, annexin V, possesses high PS
binding affinity. Analyses of apoptotic cell populations were performed using
flow cytometric techniques. Dual staining of annexin V (conjugated to FITC, a
green fluorescent dye) and PI to detect early apoptotic (annexin V-FITC+/PI
-)
and late/necrotic cell populations (annexin V-FITC+/PI
+) can be analysed using
flow cytometric techniques. The method was adapted from the method
described by Vermes et al. (1995).94
MDA-MB-468 and HCT116 cells were harvested at 70-80% confluence and
counted on a haemocytometer. The average number of counted cells was used
to calculate the desired cell seeding density of 2 x 10⁵ and 1.5 x 10
5 for 24 h
and 48 h treatment, respectively. MDA-MB-468 and HCT116 cells were
seeded in 6-well plates in duplicate at the aforementioned densities in 2 ml
culture medium and allowed 24 h to adhere at 37 ºC. Freshly prepared
dilutions of UNMC extract stock solution in medium were introduced to MDA-
MB-468 cells (treated with UNMC 35) and HCT116 cells (treated with UNMC
20 or UNMC 37) at final concentrations 1X, 2X and 4X GI50 values. DMSO
vehicle was added to the control cells. Preparation for apoptosis analysis was
conducted at 4 ºC. After 24 h and 48 h treatment, floating and trypsinised cells
were pooled and wells were washed twice with PBS. Cells were counted and 1
x 105 cells were transferred to FACS polyproplene tubes on ice prior to

196
centrifugation at 306 x g for 5 min at 4 ºC. The supernatant was discarded and
the cell pellets were incubated in 100 µl binding buffer (10 mM HEPES/NaOH
at pH 7.4, 0.14 M NaCl, 2.5 mM CaCl2 in d. H20; stored at 4 ºC) with 5 µl
Annexin V-FITC (stored at 4 ºC in the dark). Pellets were gently vortexed and
kept in the dark for 15 min. Subsequently, 5 µl PI solution (50 µg/ml in d.H20;
stored at 4 ºC) and 400 µl binding buffer were added to the samples, which
were gently vortexted and kept at 4 ºC until analysis. Analysis of intact, early
apoptotic and late apoptotic/necrotic cells were detected within 1 h on a flow
cytometer.
Figure 21: An example of flow cytometry diagram (dot plot) of double-
staining with Annexin V-FITC and Propidium iodide. The dot plot is
representation of annexin V-FITC log fluorescence versus PI log fluorescence.
Cells in the top left quadrant (PI+/FITC
-) represent cells with nuclear fragments,
cells in the lower left quadrant (PI-/FITC
-) represent living cells, cells in the
lower right quadrant (PI-/FITC
+) are early apoptotic cells and cells in the top
right quadrant (PI+/FITC
+) are late apoptotic/necrotic cells.

197
7.2.6 Western blot procedures
Western blot analysis is a widely used quantitative method for investigating
presence of proteins within cellular extracts. Proteins extracted from samples,
denatured and separated according to molecular weight by gel electrophoresis.
The proteins are then electrophoretically transferred to a membrane to allow
protein(s) of interest to be probed using specific primary antibodies, which can
be recognised by a secondary antibody conjugated with horseradish peroxidase
(HRP) enzyme. The light released (from illuminating substrate 3-
aminophthalate) in chemiluminescence reaction is captured on film. Protein
size can be determined from the bands on the film against molecular weight
markers of proteins of known molecular weight. Camptothecin was chosen as
a positive control for apoptosis. A series of procedures adapted from Towbin
et al. (1979) were performed to obtain the protein-bound membrane for
detection.278
7.2.6.1 Cell lysis
MDA-MB-468 and HCT116 cells were seeded in 10 cm plates at a density of
1.5 x 10⁶ in 5 ml of culture medium and incubated for 24 h to adhere at 37 ºC
to allow cells to adhere and reach ~70 % confluency. Freshly prepared
dilutions of UNMC extract stock solution in medium were introduced to MDA-
MB-468 cells (treated with UNMC 35) and HCT116 cells (treated with UNMC
20 or UNMC 37) at final concentrations 1X, 2X and 4X GI50 values.
Camptothecin (300 nM stock solution) and DMSO vehicles were added to the
control cells. Cell lysis preparation was conducted at 4 ºC. At elected time
points, 24 and 48 h, floating and scraped cells were pooled and wells were
washed with 3 ml chilled PBS. The procedure was repeated 4X before the cell
suspension was transferred to FACS polypropylene tubes prior to
centrifugation (306 x g for 5 min at 4 ºC). Cell pellets were retained and
incubated with 80 µl NP-40 cell lysis buffer (150 mM NaCl, 1% Triton-X-100
and 50 mM Tris at pH 8.0) supplemented with protease inhibitor cocktail
(AEBSF: 104 mM, aprotinin: 80 μM, bestatin, 4 mM: E-64: 1.4 mM,
leupeptin: 2 mM, pepstatin A: 1.5mM, in DMSO; Sigma Aldrich product code:
P8340). The cell pellets in NP-40 lysis buffer were mixed gently by pipetting

198
at 4 ºC was performed to separate the cell pellet from the supernatant. The cell
pellet was discarded and the supernatant lysate containing protein content were
kept in labeled eppendorfs on ice for immediate protein concentration
determination or stored at –20 ºC.
7.2.6.2 Protein determination
The principle of Bio-Rad DC protein assay kit is that reduction of the
phosphomolybdic-tungstic mixed acid chromogen (present in Folin-Ciocalteau
phenol reagent) by proteins. The level of reduction is proportional to the
amount of protein present in the sample, which is determined by measuring the
absorbance on a spectrophotometer at 750 nm. The principle of the assay is
based on the method described in Lowry et al. 1951.279
Protein concentrations
in the lysates were determined using the Bio-Rad DC protein assay kit in 96-
well plates according to the manufacturer‟s instructions. Briefly, 5 µl lysate
sample, 25 µl reagentA+S and 200 µl reagentB were added into triplicate wells.
Triplicates of BSA standards (concentration range: 0.1-10 mg/ml) were
measured with every set of samples requiring protein determination. The OD
was analysed by a spectrophotometer at 750 nm using Wallac Envision
software. The protein content in each sample was determined using a standard
curve using BSA standards against the lysate protein concentration.
7.2.6.3 Sodium dodecyl sulfate polyacrylamide gel electrophoresis (SDS-
PAGE)
The separation of protein mixtures could be achieved by loading the protein
sample in an anionic sodium dodecyl sulfate (SDS) gel and passing an electric
current through the gel. SDS denatures proteins into their peptide chains and
binds to them at a constant ratio of 1.4 g of SDS per 1 g of protein, which gives
the same charge-to-mass ratio of SDS and protein therefore the ability to
migrate through the gel is dependent on the molecular weight of the protein.280
Protein samples were prepared using NuPAGE®
4X LDS sample buffer (3.75 -
7.50 µl), NuPAGE®
reducing agent (1.5 – 3.0 µl) and a calculated volume of
cell lysate equivalent to 100 µg of protein; the total sample volume is ≤ 30 µl.
The samples were denatured for 5 min at 95 ºC then briefly centrifuged and

199
kept at 4 ºC. Samples were loaded on a polyacrylamide gel (8 - 12%)
depending on the size of the protein of interest. Molecular weight markers
were also loaded onto the gel before submersion in running buffer (25 mM
Trizma base, 200 mM glycine, 1.00 g SDS, pH 8.5 HCl in 1L of d.H2O).
Proteins were then separated by electrophoresis using 125 V on a
polyacrylamide gel for 90 min at RT until the dye front of the loading buffer
reached the bottom of the gel. Pre-made NuPAGE®
Bis-Tris gel (4-12%) and
pre-made NuPAGE®
MOPS SDS running buffer were used at times in place of
the corresponding materials according to manufacturer‟s manual.
Table 7-3 Receipe for Sodium dodecyl sulphate polyacrylamide gel
electrophoresis (SDS-PAGE) gel.
Gel
Material Resolving (ml) Stacking
(ml)
8% 10% 12% -
10% AMPS 0.20 0.20 0.20 0.10
10% SDS 0.20 0.20 0.20 0.10
30% Acrylamide mix 5.30 6.70 8.00 1.70
TEMED 0.012 0.010 0.008 0.01
Tris 5.0
(1.5M, pH 8.8)
1.25
(1M, pH 6.8)
d. H2O 9.3 7.9 6.6 6.8
7.2.6.4 Western Blot
The PDVF membrane was calibrated prior to electroblotting by being fully
immersed in 100% MeOH for 20 min then in 10 ml of transfer buffer (25 mM
Trizma base, 200 mM glycine, 0.375 g SDS, pH 7.6, 20% MeOH, HCl in 1L of
d.H2O) with blotting paper for a further 10 min. Gels were washed with 10 ml
transfer buffer for 2 min. Protein bands on the gels were electroblotted onto
PDVF membranes at 100 V for 90 min at RT using Novex®
Semi-Dry Blotter.
The membranes were washed using 20 ml TBST (25 mM Tris, 113 mM NaCl,
0.05% Tween 20 (v/v) at pH 7.4. To reduce non-specific binding, membranes
were kept in blocking solution (10 % fat-free milk powder in TBST) overnight
at 4 ºC on a roller. Subsequently, blocked membranes were washed to remove

200
excess blocking solution with TBST for 3 min, which was repeated 5 times.
To enable any specific binding of Ab, the membranes were incubated with 10
ml primary (1º) Ab dilution (Table 7-4) overnight at 4 ºC on a roller.
Table 7-4 Primary and secondary antibodies used for western blotting.
Antibody (Ab) Polyacrylamide
gel (%)
Concentration of
Antibody
(in 3% milk-TBST)
Blocking
Pri
mar
y
Caspase 3 10 - 14 1:1000
10%
milk-
TBST
Mcl-1 10 - 12 1:1000
Sec
on
dar
y
Donkey Anti rabbit
Goat Anti mouse - 1:5000
The membrane was washed again with 20 ml of TBST for 5 min, which was
repeated 6 times. After washing, the membrane was incubated with 15 ml
secondary (2º) Ab (Table 7-4) for overnight at 4 ºC on a roller. The membrane
was washed with 20 ml TBST for 3 min and repeated 3 times. Novex®
ECL
Chemiluminescent Substrate Reagent Kit was used to wash the PDVF
membranes and developed onto x-ray film. The reaction was stopped after 2
min by washing the membrane with TBST and stored at 4 ºC.

201
7.2.7 Senescence assay (β-galactosidase staining)
Cellular senescence describes the irreversible growth arrest, which is the
underlying mechanism cause of aging in normal somatic cells upon reaching
their Hayflick replicative limit. Hence senescence is also a tumour suppression
mechanism. A biomarker, β-galactosidase, is present in the lysosome of
senescent cells. Several chemotherapeutic agents are able to induce senescence
in tumours.257
The assay is based on detecting an increased abundance of β-
galactosidase using X-gal where senescent cells are stained blue-green. The
following method was adapted from the method described by Dimri et al.
(1995).257
MDA-MB-468 cells were seeded at 1 x 10⁴ and 5 x 10
4 for vehicle control and
treatment cells, respectively, in 6-well plates in duplicates. HCT116 cells were
seeded at 5 x 10³ and
1 x 10
4 for vehicle control and treatment cells,
respectively, in 6-well plates in duplicates. MDA-MB-468 and HCT-116 cells
were seeded into wells containing 2 ml culture medium and allowed to attach
overnight at 37 °C. Freshly prepared dilutions of UNMC extract fraction stock
solution were introduced to MDA-MB-468 cells (treated with UNMC 35) and
HCT116 cells (treated with UNMC 20 or 37) at final concentrations of 1X and
2X GI50 values. DMSO vehicle was added to the control cells and 5 µM of
RHPS4 was used as the positive control.
At day 7 and 12 of treatment for HCT116 and MDA-MB-468 cells,
respectively, culture media were aspirated from the wells and cells were
washed twice with 2 ml PBS to remove any remaining extracts in the well.
The cells were fixed using 1 ml fixative solution (2% formaldehyde, 0.2%
glutaraldehyde in PBS) for 10 min then the fixative solution was removed and
1 ml senescence buffer (5 mM potassium ferricyanide, 5 mM potassium
ferrocyanide, 150 mM NaCl, 2 mM MgCl2, 40mM Na3PO4/citric acid buffer
pH 6.0, 1 mg/ml X-gal in DMF in 1L of d. H20) was added to each well. The
plates were protected from light and incubated at 37 °C for 24 h. The number
of senescent (blue-green stained) cells and total number of cells in the sample
were counted (observation under phase contrast light microscope) and
photographs of the cells were captured using a Nikon camera at 200X - 400X

202
magnification. To quantify the proportion of senescent cell population, cells
were scraped from the wells, syringed and counted on a haemocytometer.
7.2.8 Cell migration assay (Wound healing)
The ability of malignant cells to invade and migrate is crucial to cancer
metastasis. This simple in vitro assay mimics in vivo cell migration during
wound healing. A „wound‟ is created in a cell monolayer and observations
(images captured) at timed intervals enable analysis of the migration wound-
healing capacity rate of the cells. The following method was adapted from the
method described by Liang et al. (2007).253
The under side of 6-well culture plates was marked with two crosses „x‟
aligned in the center. HCT116 cells were harvested and seeded at 3 x 10⁵ in 6-
well plate containing 2 ml culture medium with reduced 7.5% FBS. The cells
were incubated overnight at 37 °C to allow cellular attachment. The scratch
was created when cells were ~80% cellular confluent by applying a sterile 200
µl pipette tip through the center, aligned with „x‟. Dilutions of UNMC extract
stock solution were freshly prepared and introduced to the cells at final
concentrations 1X and 4X GI50 values. DMSO vehicle was added to the
control wells. Each extract and control sample were tested in duplicate. The
scratch was evaluated under phase contrast microscopy and images of the
scratch were captured with a Nikon camera (100X magnification) at 0, 24, 48,
52 and 64 h. Images of the wound were taken just above and below the „x‟
mark to ensure consistency. Occassional replenishment of the medium (with
control or extracts) is required to capture clear images of the wound. The level
of wound healing was analysed using ImageJ software by measuring the
difference in total percentage wound area (%) of treated cells and untreated
control cells.

203
7.3 Phytochemical composition of plant extracts
UNMC plant extracts were tested for phytochemical composition using
colorimetric assays.
7.3.1 Total flavonoid content
The aluminium trichloride (AlCl3) colorimetric method was adapted from
Meda et al. (2005) and Chang et al. (2002).263, 264
AlCl3 could form acid stable
complexes with reactive groups of flavones and flavonols and form acid labile
complexes with the flavonoids. Quercetin is a widely distributed flavonoid
hence employed as a standard to measure against the UNMC extracts for total
flavonoid content determination.
UNMC extract stock solution (100 mg/ml in DMSO), quercetin stock solution
(0.5 mg/ml in DMSO) and 2% AlCl3 working solution (20 mg/ml in MeOH
(w/v)) were freshly prepared prior to the assay. Due to the natural pigment of
the extract samples, a set of UNMC control extract samples were prepared in
glass vials to account for baseline absorbance. Sets of control UNMC extract
samples were prepared in triplicate in glass vials and consisted of 1998 µl
MeOH to which 2 µl UNMC extracts stock solution was added to achieve
concentration of 1 mg/ml in a final volume of 2 ml. The UNMC extract test
samples were also prepared in triplicates in glass vials, which consisted of 1.98
ml of 2% AlCl3 working solution to which 20 µl UNMC extracts stock solution
was added to achieve a concentration of 1 mg/ml in a total volume of 2 ml.
Both sets of UNMC extract control and UNMC extract samples were incubated
for 10 min at RT protected from light.
Quercetin stock solution was diluted with MeOH (total volume of 2 ml) and
prepared at a range of [0-100 µg/ml] to construct the calibration curve. A
„blank‟ cuvette containing 1 ml 2% AlCl3 and 1 ml MeOH was used for
calibration prior to each set of readings. The OD of quercetin standard
solutions, UNMC extract controls and UNMC extract samples solutions were
measured at 415 nm using UV/Vis spectrophotometer. The mean absorbances
of control UNMC extract control samples were determined and deducted from

204
the mean UNMC extract sample absorbances. The total flavonoid content in
UNMC extracts was calculated using a quercetin standard curve and expressed
as quercetin equivalents (QE)/100 g of extract.
7.3.2 Total phenolic content
The Folin-Ciocalteau colorimetric method was adapted from Singleton et al.
(1999) and Meda et al. (2005).263
FC reagent contains phosphomolybdate and
phosphotungstate, which react with reducing substances such as polyphenolic
compounds. Gallic acid (GA) is a widely distributed phenolic compound and
is the chosen standard used to measure against the UNMC extracts for total
phenolic content determination.
UNMC extract stock solution (100 mg/ml in DMSO), GA stock solution (500
µg/ml in DMSO), 0.2 N FC working solution (0.40 ml of 20 N FC reagent in
19.60 ml of d.H20) and sodium carbonate solution (75 mg/ml in d.H20, total
volume of 50 ml) were freshly prepared prior to the assay. UNMC extract
control samples were prepared in glass vials in triplicates, of which, each vial
consisted of 985 µl d.H2O, 500 µl NaCO3 and 15 µl UNMC extract stock
solution in a total volume of 1.50 ml. The UNMC extract test samples were
prepared in triplicate in glass vials by mixing 140 µl d.H2O and 15 µl UNMC
extract solutions then added to 845 µl 0.2 N FC reagent and incubated for 5
min at RT protected from light. Subsequently, 500 µl NaCO3 was added to all
UNMC extract test samples. Both sets of UNMC extract control and UNMC
extract test samples were incubated for 2 h at RT in the dark. The final extract
concentration was 1 mg/ml in 1.50 ml final volume.
GA stock solution was diluted with d.H20 (total volume 1.50 ml) and prepared
at a concentration range of [0-100 µg/ml] to construct the calibration curve. A
„blank‟ cuvette containing 155 µl d.H2O, 845 µl 0.2N FC reagent and 500 µl
NaCO3 was used for calibration prior to each set of reading. The OD of GA
standard solutions and UNMC extract sample solutions were measured at 760
nm using UV/Vis spectrophotometer. The mean OD of UNMC extract control
samples was deducted from the mean UNMC extract test sample absorbances.
The total phenolic content in UNMC extracts was calculated using a GA
standard curve and expressed as GA equivalents (GAE)/100 g of extract.

205
7.4 In vitro free radical scavenging assay
2,2-Diphenyl-1-picrylhydrazyl radical (DPPH.) is a stable free radical, which
can be used to assess the radical scavenging activity of plant extracts. In the
presence of an antioxidant such as quercetin, DPPH- is reduced to the
molecular form (DPPHH) resulting in a colour change from yellow to purple.
This change in absorbance can be used to measure the radical scavenging
potency of the plant extracts. The following method was adapted from the
method described by Amic et al. (2003)265
and Nara et al. (2006).266
UNMC extract stock solution (100 mg/ml in DMSO), quercetin stock solution
(500 mg/ml of quercetin in DMSO) and DPPH stock solution (1 mg/ml of
DPPH in MeOH) were freshly prepared prior to the assay. DPPH stock
solution was further diluted in MeOH to a 4 % working solution. Two 96-well
micro-titre plates were labeled „sample+DPPH‟ or „sample-DPPH‟. To determine
UNMC extract test samples‟ radical scavenging activity, the sample+DPPH plate
was prepared with wells containing 180 µl 4% DPPH working solution to
which 20 µl of UNMC extract stock solution were added. To account for the
pigmented UNMC extract control samples, the sample-DPPH‟ plate was prepared
with wells containing 180 µl MeOH (sample-DPPH) to which 20 µl UNMC
extract stock solution were added. All tests were conducted in quadruplicate
wells. The baseline absorbance was considered by measuring wells containing
solvents only (solvent0), such as MeOH, DMSO or MeOH and DMSO.
Quercetin stock solution was diluted with MeOH in order to construct a
calibration curve at a concentration range of [0 - 100 µg/ml] (sample+DPPH).
Plates were wrapped in foil and incubated for 15 min at 37 °C then placed on
an orbital plate shaker for 2 min. Absorbances were analysed by
spectrophotometry at 517 nm using Wallac Envision software. The
absorbances for plates: sample-DPPH and solvent0, were taken into consideration
when calculating the free radical scavenging activity of the UNMC extracts.
The average solvent0 values were subtracted from the all UNMC extract test
sample and quercetin measurements. The radical scavenging activity could be
calculated using the following equation to create a graph of radical scavenging
(%) against UNMC concentration:

206
Equation 3: % of radical scavenging ability of extracts determined from
optical density readings obtained from the DPPH assay.
7.5 Broth microdilution method (anti-microbial assay)
Assessment of UNMC extracts in broth microdilution method, described
below, was performed by Dr. Jaroslav Havlík and his group from the
Department of Microbiology, Nutrition and Dietetics, Czech Universitiy of
Life Sciences, in Prague.
The minimum inhibitory concentrations (MICs) were determined by the broth
microdilution method according to the CLSI guidelines (2009) using 96-well
microtitre plates. Briefly, extract samples were two-fold diluted in Mueller
Hinton broth (Oxoid, Basingstoke, UK), inoculated with bacterial suspension at
a density of 5x10⁷ cfu/ml (5x 10
4 for C. albicans) and then incubated in
thermostat at 37° C for 24 h (48 h for C. albicans). Growth turbidity was
measured by Multiscan Ascent Microplate Reader (Thermo Fisher Scientific,
Waltham, USA) at 405 nm. Extract concentration range used was 1 – 128
µg/ml. MICs were calculated based on the density of the growth control and
were expressed as the lowest extract concentrations that resulted in 80%
growth reduction compared to that of the extract-free growth control. The
bacterial strains tested were obtained from Oxoid (Basingstoke, UK) and all
reference antibiotics used were purchased from Sigma-Aldrich (Prague, CZ).
DMSO (Lach-Ner, Neratovice, CZ) was used as a solvent for all extracts;
except for C. albicans, MICs of reference antibiotics used as positive controls
were in range of acceptable limits as published by CLSI guidelines (2009).281

207
7.6 Fractionation and analysis of UNMC extract fractions
using High Performance Liquid Chromatography (HPLC)
The mixture of compounds embedded within UNMC extracts can be separated
using a mobile and a stationary phase. Reversed solid-phase extraction (SPE)
can separate crude extracts using different eluents (of varying polarity) and a
non-polar stationary phase into phytochemicals groups with similar
physicochemical characteristics such as solubility, size, shape and electrical
charge.18
Crude fractionations of UNMC 20, 35 and 37 extracts were prepared in d.H2O
and MeOH at a ratio of 50:50 in a total volume of 1 ml. Separation was
performed using Strata extraction cartridge. Prior to fractionation, each
cartridge was equilibrated using 4 ml MeOH and 4 ml d.H2O. The crude
UNMC extracts were weighed then loaded on a Strata C18-E extraction
cartridge (C18-E (55 µm, 70 Å) 50 mg/ml tube). Glass vials used to collect the
fractions were also weighed. Employing solvents of increasing polarity MeOH
> MeCN > d.H20, UNMC extracts were fractionated using different solvent
gradients. Fractions were collected in clearly labeled glass vials. A new
cartridge was used for loading a different UNMC extract to prevent
contamination. Solvents were removed using nitrogen and d.H2O was removed
by freeze-drying to obtain dried powder compounds (for yield (%) and
description of compounds, see Appendix II). The dried compounds were kept
protected from light at – 20 °C until further examination of the isolated
analytes using HPLC. Extract eluents were dissolved in DMSO (1 mg/ml) and
1:1 d.H2O and MeOH before analysis using a Phenomenex C18 Gemini-NX
3u-110A 50x2 mm column in a HPLC (Shimadzu UFLCXR system coupled to
an Applied Biosystems API2000) system. The solvents used for the gradient
were solvents A (0.1% formic acid in d.H2O) and B (0.1% formic acid in
MeCN). Samples were run on a solvent gradient of 10% B for 1 min, 10-98%
B over 2 min, isocratic elution at 98% for 2 min, re-equilibrated to 10% B over
0.5 min (0.5 ml/min). The samples were detected with a UV light at λ = 220
and 254 nm.

208
Table 7-5 Solvent gradient used in crude extract separation.
Fraction
Solvent (%)
Water MeOH MeCN
1 100 0 0
2 75 25 0
3 50 50 0
4 25 75 0
5 0 100 0
6 0 0 100
Strata C18-E extraction cartridge was equilibrated with equal volume of d. H20
and MeOH prior to loading the cartridge with UNMC extract. The solvents
were passed through the extract and collected then removed to obtain the
extract fraction for analysis.
Fractions collected required solvent evaporation via freeze-drying and/or
nitrogen gas to separate solvents from extract fractions. Once solvent is
removed, the vials were weighed again to calculate the difference in weight,
hence determine the % yield of extract fraction material collected.
7.7 Statistical Analysis
Data from the assays are presented as the means ± SEM. Data analysis was
conducted using GraphPad Prism software (Version 6.0 c, San Diego, CA,
USA). The differences between treatment groups and control groups were
deteremined by one-way ANOVA for the following assays: clonogenic, cell
cycle distribution, apoptosis detection, migration, senescence; p < 0.05 was
considered to be statistically significant. The correlation of chemical contents
in the extract samples was measured against a reference compound (standard
cruve) and analysed using the Pearson coefficient.

209
References
1. G. M. Cragg and D. J. Newman, presented at the Natural product
research network for Eastern and Central Africa (NAPRECA),
Madagascar, 2005 (unpublished).
2. W. Sneader, Drug Discovery A History. (John Wiley & Sons Ltd, 2005).
3. G. S. L. Bohlin, Drugs of Natural Origin: A Textbook of
Pharmacognosy, Fourth Edition. (Swedish Pharmaceutical Press,
Sweden, 2001).
4. H. F. Ji, X. J. Li and H. Y. Zhang, EMBO reports 10 (3), 194-200
(2009).
5. A. L. Harvey, Curr Opin Chem Biol 11 (5), 480-484 (2007).
6. D. Karou, W. M. C. Nadembega, L. Ouattara, D. P. Ilboudo, A. Canini,
J. B. Nikiéma, J. Simpore, V. Colizzi and A. S. Traore, (2007).
7. D. J. Newman, G. M. Cragg and K. M. Snader, Nat. Prod. Rep. 17 (3),
215-234 (2000).
8. W. H. Organization, 2002-2005.
9. S. D. Sarker and L. Nahar, presented at the Trends in Natural Products
Research, DeMontfort University, Leicester, UK, 2010 (unpublished).
10. F. N. Lamari and P. Cordopatis, Anticancer TheraExploring the
Potential of Natural Products in Cancer Treatmentpeutics. (John Wiley
& Sons, Ltd, 2008).
11. M. J. Balunas and A. D. Kinghorn, Life Sci 78 (5), 431-441 (2005).
12. G. M. Cragg and D. J. Newman.
13. M. L. Lee and G. Schneider, Journal of combinatorial chemistry 3 (3),
284-289 (2001).
14. D. S. Fabricant and N. R. Farnsworth, Environmental health
perspectives 109 (Suppl 1), 69 (2001).
15. L. Teo, G. Pachiaper, K. Chan, H. Hadi, J. Weber, J. Deverre, B. David
and T. Sevenet, Journal of ethnopharmacology 28 (1), 63-101 (1990).
16. E. M. Williamson, (The University of Reading, Reading, 2010), pp. 1-
23.
17. R. H. Liu, J Nutr 134 (12 Suppl), 3479S-3485S (2004).
18. P. J. Houghton and A. Raman, Laboratory handbook for the
fractionation of natural extracts. (Springer, 1998).
19. J. G. Bruhn and L. Bohlin, Drug discovery today 2 (6), 243-246 (1997).
20. J. D. McChesney, S. K. Venkataraman and J. T. Henri, Phytochemistry
68 (14), 2015-2022 (2007).
21. S. Yu, L. Xu, P. K. Wei, Z. F. Qin, J. Li and H. D. Peng, Chin J Integr
Med 14 (2), 151-156 (2008).
22. F. N. Lamari and P. Cordopatis, Exploring the Potential of Natural
Products in Cancer Treatment. (2008).
23. M. A. Mehlman, R. B. Tobin, M. M. Madappally and H. K. Hahn, J
Biol Chem 246 (6), 1618-1622 (1971).
24. J. R. Vane, Agents Actions 8 (4), 430-431 (1978).
25. J. B. Dahl and H. Kehlet, Br J Anaesth 66 (6), 703-712 (1991).

210
26. D. J. Newman and G. M. Cragg, J Nat Prod 70 (3), 461-477 (2007).
27. C. W. Wright, presented at the Trends in Natural Product Research,
DeMontfort University, Leicester, 2010 (unpublished).
28. N. R. Farnsworth, O. Akerele, A. S. Bingel, D. D. Soejarto and Z. Guo,
Bulletin of the world health organization 63 (6), 965 (1985).
29. R. Verpoorte, Journal of pharmacy and pharmacology 52 (3), 253-262
(2000).
30. L. Pan, H. Chai and A. D. Kinghorn, Phytochem Lett 3 (1), 1-8.
31. D. J. Newman, G. M. Cragg and K. M. Snader, J Nat Prod 66 (7), 1022-
1037 (2003).
32. J. Graham, M. Quinn, D. Fabricant and N. Farnsworth, Journal of
ethnopharmacology 73 (3), 347-377 (2000).
33. K. Grabowski and G. Schneider, Current Chemical Biology 1 (1), 115-
127 (2007).
34. B. R. P. Kumar, M. Soni, U. B. Bhikhalal, I. R. Kakkot, M. Jagadeesh,
P. Bommu and M. Nanjan, Medicinal Chemistry Research 19 (8), 984-
992 (2010).
35. K. S. Lam, Trends in microbiology 15 (6), 279-289 (2007).
36. R. Macarron, Drug discovery today 11 (7-8), 277 (2006).
37. F. E. Koehn and G. T. Carter, Nature Reviews Drug Discovery 4 (3),
206-220 (2005).
38. C. A. Lipinski, Drug Discovery Today: Technologies 1 (4), 337-341
(2004).
39. J. Sadowski and H. Kubinyi, Journal of medicinal chemistry 41 (18),
3325-3329 (1998).
40. J. Y. Ortholand and A. Ganesan, Current opinion in chemical biology 8
(3), 271-280 (2004).
41. M. Q. Zhang and B. Wilkinson, Current opinion in biotechnology 18
(6), 478-488 (2007).
42. B. Giménez, M. Santos, M. Ferrarini and J. Fernandes, Die Pharmazie-
An International Journal of Pharmaceutical Sciences 65 (2), 148-152
(2010).
43. S. Wilhelm, C. Carter, M. Lynch, T. Lowinger, J. Dumas, R. A. Smith,
B. Schwartz, R. Simantov and S. Kelley, Nature Reviews Drug
Discovery 5 (10), 835-844 (2006).
44. D. J. Newman and G. M. Cragg, Journal of Natural Products 70 (3),
461-477 (2007).
45. D. R. Mans, A. B. da Rocha and G. Schwartsmann, Oncologist 5 (3),
185-198 (2000).
46. S. HemaIswarya and M. Doble, Phytother Res 20 (4), 239-249 (2006).
47. G. Samuelsson, Recherche 67, 02 (1999).
48. Z. J. Witczak, Curr. Med. Chem. 1 (5), 392-405 (1995).
49. D. W. Kufe, R. E. Pollock, R. R. Weichselbaum, R. C. Bast, T. S.
Gansler, J. F. Holland and E. Frei, (2003).
50. T. F. Group, (2012).
51. D. J. Newman and G. M. Cragg, Journal of Natural Products 75 (3),
311-335 (2012).
52. A. Varma, H. Padh and N. Shrivastava, Evidence-Based
Complementary and Alternative Medicine 2011 (2011).
53. S. M. ADEKENOV, (WO Patent WO/1998/048,789, 1998).

211
54. Y. M. Kim, S. W. Lee, D. Y. Kim, J. H. Kim, J. H. Nam and Y. T. Kim,
Journal of Chemotherapy 22 (3), 197-200 (2010).
55. C. J. Paller and E. S. Antonarakis, Drug design, development and
therapy 5, 117 (2011).
56. Y. H. Hsiang, R. Hertzberg, S. Hecht and L. Liu, Journal of Biological
Chemistry 260 (27), 14873-14878 (1985).
57. J. T. L. Jr and J. A. McCubrey, Expert opinion on therapeutic targets 6
(6), 659-678 (2002).
58. M. Gordaliza, Clinical and Translational Oncology 9 (12), 767-776
(2007).
59. J. C. Belisario, Archives of dermatology 92 (3), 293 (1965).
60. H. Malonne and G. Atassi, Anti-cancer drugs 8 (9), 811 (1997).
61. K. Hande, European journal of cancer (Oxford, England: 1990) 34 (10),
1514 (1998).
62. Y. Kondo, Y. Imai, H. Hojo, T. Endo and S. Nozoe, Journal of
pharmacobio-dynamics 13 (7), 426 (1990).
63. S. Hoet, C. Stevigny, S. Block, F. Opperdoes, P. Colson, B. Baldeyrou,
A. Lansiaux, C. Bailly and J. Quetin-Leclercq, Planta Medica-Natural
Products and Medicinal Plant Research 70 (5), 407-413 (2004).
64. H. M. Kantarjian, M. Talpaz, V. Santini, A. Murgo, B. Cheson and S.
M. O'Brien, Cancer 92 (6), 1591-1605 (2001).
65. K. W. Kohn and Y. Pommier, Annals of the New York Academy of
Sciences 922 (1), 11-26 (2000).
66. H. Furue, Gan to kagaku ryoho. Cancer & chemotherapy 20 (1), 42
(1993).
67. D. De Berker, J. McGregor and B. Hughes, British Journal of
Dermatology 156 (2), 222-230 (2007).
68. D. L. Rowe, T. Ozbay, L. M. Bender and R. Nahta, Molecular cancer
therapeutics 7 (7), 1900-1908 (2008).
69. T. W. Petry, G. T. Bowden, R. J. Huxtable and I. G. Sipes, Cancer
Research 44 (4), 1505-1509 (1984).
70. W. P. McGuire, E. K. Rowinsky, N. B. Rosenshein, F. C. Grumbine, D.
S. Ettinger, D. K. Armstrong and R. C. Donehower, Annals of Internal
Medicine 111 (4), 273 (1989).
71. L. Brannon-Peppas and J. O. Blanchette, Advanced drug delivery
reviews (2012).
72. C. Canel, R. M. Moraes, F. E. Dayan and D. Ferreira, Phytochemistry
54 (2), 115-120 (2000).
73. Y. Qian Liu, L. Yang and X. Tian, Current Bioactive Compounds 3 (1),
37-66 (2007).
74. L. F. Liu, C. H. Liang, L. Y. Shiu, W. L. Lin, C. C. Lin and K. W. Kuo,
FEBS letters 577 (1), 67-74 (2004).
75. S. Wang, E. Bromley, L. Xu, J. C. Chen and L. Keltner, Expert Opinion
on Pharmacotherapy 11 (1), 133-140 (2010).
76. H. Namatame, J. Akimoto, H. Matsumura, J. Haraoka and K. Aizawa,
Photodiagnosis and Photodynamic Therapy 5 (3), 198-209 (2008).
77. J. Van Maanen, J. Retel, J. De Vries and H. Pinedo, Journal of the
National Cancer Institute 80 (19), 1526-1533 (1988).
78. N. C. Institute, (NCI, 2012).

212
79. L. H. Einhorn and J. Donohue, Annals of Internal Medicine 87 (3), 293
(1977).
80. J. F. Holland, C. Scharlau, S. Gailani, M. J. Krant, K. B. Olson, J.
Horton, B. I. Shnider, J. J. Lynch, A. Owens and P. P. Carbone, Cancer
Research 33 (6), 1258-1264 (1973).
81. M. S. Butler, Journal of Natural Products 67 (12), 2141-2153 (2004).
82. S. Lobert, B. Vulevic and J. J. Correia, Biochemistry 35 (21), 6806-
6814 (1996).
83. DrugBank, (Genome Alberta & Genome Canada, 2012), Vol. 2012.
84. D. S. Wishart, C. Knox, A. C. Guo, D. Cheng, S. Shrivastava, D. Tzur,
B. Gautam and M. Hassanali, Nucleic acids research 36 (suppl 1),
D901-D906 (2008).
85. S. Handa, Extraction Technologies for Medicinal and Aromatic Plants,
21 (2008).
86. P. M. Dey and J. B. Harbourne, Methods in Plant Biochemistry.
(Academic Press Limited, 1991).
87. J. T. Arnason, R. Mata and J. T. Romeo, Phytochemistry of medicinal
plants. (Springer, 1995).
88. O. Kepp, L. Galluzzi, M. Lipinski, J. Yuan and G. Kroemer, Nature
Reviews Drug Discovery 10 (3), 221-237 (2011).
89. H. Itokawa, S. L. Morris-Natschke, T. Akiyama and K. H. Lee, J Nat
Med 62 (3), 263-280 (2008).
90. C. Riccardi and I. Nicoletti, Nat Protoc 1 (3), 1458-1461 (2006).
91. M. G. Ormerod, Flow Cytometry, second ed. (Bios Scientific Publishers,
Surrey, 1999).
92. P. Skehan, R. Storeng, D. Scudiero, A. Monks, J. McMahon, D. Vistica,
J. T. Warren, H. Bokesch, S. Kenney and M. R. Boyd, Journal of the
National Cancer Institute 82 (13), 1107-1112 (1990).
93. P. Houghton, R. Fang, I. Techatanawat, G. Steventon, P. J. Hylands and
C. C. Lee, Methods 42 (4), 377-387 (2007).
94. I. Vermes, C. Haanen, H. Steffens-Nakken and C. Reutellingsperger,
Journal of immunological methods 184 (1), 39-51 (1995).
95. M. Suffness and J. M. Pezzuto, Methods in Plant Biochemistry.
(Academic Press Limited, 1991).
96. J. A. Beutler, J. H. C. II, J. B. McMahon, R. H. Shoemaker and M. R.
Boyd, Antiviral and Antitumor Plant Metabolites. (Plenum Press, New
York and London, 1995).
97. M. R. Boyd and K. D. Paull, Drug Development Research (34), 91-109
(1995).
98. M. Monga and E. A. Sausville, Leukemia 16 (4), 520-526 (2002).
99. M. Simmonds, presented at the Trends in Natural Products Research,
DeMontfort University, Leicester, 2010 (unpublished).
100. M. Beale, presented at the Trends in Natural Products Research,
DeMontfort University, Leicester, 2010 (unpublished).
101. J. D. McChesney, in Human Medicinal Agents from Plants, edited by A.
D. Kinghorn and M. F. Balandrin (ACS Symposium, 1993).
102. T. P. List, (Royal Botanic Gardens, Kew and Missouri Botanical
Garden, 2010), Vol. 2012.
103. H. Wagner, Nat Prod Commun 4 (2), 303-304 (2009).
104. H. Wagner, Natural Product Communications 3, 1-2 (2008).

213
105. E. M. Williamson, Phytomedicine 8 (5), 401-409 (2001).
106. E. M. Williamson, presented at the Trends in Natural Products
Research, DeMontfort University, Leicester, 2010 (unpublished).
107. M. Spinella, Altern Med Rev 7 (2), 130-137 (2002).
108. G. Hussain and B. V. Manyam, Phytotherapy Research 11, 419-423
(1997).
109. T. C. Chou, Pharmacological reviews 58 (3), 621-681 (2006).
110. G. L. Russo, Biochem Pharmacol 74 (4), 533-544 (2007).
111. G. Galati and P. J. O'Brien, Free Radic Biol Med 37 (3), 287-303
(2004).
112. L. Pecorino, Molecular Biology of Cancer: Mechanism, Targets, and
Therapeutics, 2 ed. (Oxford University Press, 2008).
113. CRUK, (2010).
114. T. D. Bradshaw, edited by J. Chu (2010).
115. W. H. Organization, (2003), Vol. 2012.
116. A. Jemal, F. Bray, M. M. Center, J. Ferlay, E. Ward and D. Forman,
CA: a cancer journal for clinicians (2011).
117. V. Srivastava, A. S. Negi, J. K. Kumar, M. M. Gupta and S. P. Khanuja,
Bioorg Med Chem 13 (21), 5892-5908 (2005).
118. R. H. Liu, Am J Clin Nutr 78 (3 Suppl), 517S-520S (2003).
119. C. R. U. (CRUK), (2010).
120. R. A. Weinberg, The Biology of Cancer. (Garland Science, Taylor &
Francis Group, LLC, 2007).
121. J. Folkman, J Natl Cancer Inst 82 (1), 4-6 (1990).
122. D. Hanahan and R. A. Weinberg, Cell 100 (1), 57-70 (2000).
123. S. Ramos, J Nutr Biochem 18 (7), 427-442 (2007).
124. D. Hanahan and R. A. Weinberg, Cell 144 (5), 646-674 (2011).
125. A. A. Adjei, Journal of the National Cancer Institute 93 (14), 1062-
1074 (2001).
126. R. A. Weinberg, Cell 81 (3), 323-330 (1995).
127. A. Levine, J. Momand and C. Finlay, nature 351 (6326), 453 (1991).
128. A. J. Levine, Cell 88, 323-331 (1997).
129. J. Folkman, Nature medicine 1 (1), 27-30 (1995).
130. D. Liao and R. S. Johnson, Cancer and Metastasis Reviews 26 (2), 281-
290 (2007).
131. L. A. Liotta and W. G. Stetler-Stevenson, Cancer Research 51 (18
Supplement), 5054s-5059s (1991).
132. I. Stamenkovic, presented at the Seminars in cancer biology, 2000
(unpublished).
133. L. Hayflick, Experimental cell research 37, 614-636 (1965).
134. J. B. Swann and M. J. Smyth, Journal of Clinical Investigation 117 (5),
1137 (2007).
135. O. Warburg, Science 123 (3191), 309-314 (1956).
136. G. Kroemer and J. Pouyssegur, Cancer cell 13 (6), 472-482 (2008).
137. P. P. Hsu and D. M. Sabatini, Cell 134 (5), 703-707 (2008).
138. H. E. Pelish, N. J. Westwood, Y. Feng, T. Kirchhausen and M. D. Shair,
The library 13, 18 (2001).
139. C. Cordier, D. Morton, S. Murrison, A. Nelson and C. O'Leary-Steele,
Nat Prod Rep 25 (4), 719-737 (2008).

214
140. G. M. Cragg and D. J. Newman, J Ethnopharmacol 100 (1-2), 72-79
(2005).
141. S. Missailidis, Anticancer Therapeutics. (John Wiley & Sons, Ltd,
2008).
142. M. S. Butler, Nat Prod Rep 22 (2), 162-195 (2005).
143. K. H. Lee, Med Res Rev 19 (6), 569-596 (1999).
144. M. E. Wall and M. C. Wani, Cancer Res 55 (4), 753-760 (1995).
145. U. Raju, E. Nakata, K. A. Mason, K. K. Ang and L. Milas, Cancer Res
63 (12), 3263-3267 (2003).
146. A. M. Senderowicz, Invest New Drugs 17 (3), 313-320 (1999).
147. E. A. Sausville, D. Zaharevitz, R. Gussio, L. Meijer, M. Louarn-Leost,
C. Kunick, R. Schultz, T. Lahusen, D. Headlee, S. Stinson, S. G.
Arbuck and A. Senderowicz, Pharmacol Ther 82 (2-3), 285-292 (1999).
148. T. Bradshaw, in Anticancer Therapeutics, edited by S. Missailidis (John
Wiley & Sons Ltd, 2008), pp. 223-238.
149. L. Meijer, Trends Cell Biol 6 (10), 393-397 (1996).
150. Y. F. Chu, J. Sun, X. Wu and R. H. Liu, J Agric Food Chem 50 (23),
6910-6916 (2002).
151. J. Sun, Y. F. Chu, X. Wu and R. H. Liu, J Agric Food Chem 50 (25),
7449-7454 (2002).
152. E. J. Park and J. M. Pezzuto, Cancer Metastasis Rev 21 (3-4), 231-255
(2002).
153. P. A. Kroon, presented at the Trends in Natural Products Research,
DeMontfort University, Leicester, 2010 (unpublished).
154. D. A. Akinpelu, A. O. Aiyegoro and A. I. Okoh, Biol Res 42 (3), 339-
349 (2009).
155. R. F. Raffauf, Plant Alkaloids: A Guide to Their Discovery and
Distribution. (The Haworth Press, Binghamton, New York, 1996).
156. M. Kampa, V. I. Alexaki, G. Notas, A. P. Nifli, A. Nistikaki, A.
Hatzoglou, E. Bakogeorgou, E. Kouimtzoglou, G. Blekas, D. Boskou,
A. Gravanis and E. Castanas, Breast Cancer Res 6 (2), R63-74 (2004).
157. B. N. Ames and L. S. Gold, Mutat Res 250 (1-2), 3-16 (1991).
158. R. L. Saul and B. N. Ames, Basic Life Sci 38, 529-535 (1986).
159. G. A. Armstrong and J. E. Hearst, FASEB J 10 (2), 228-237 (1996).
160. D. C. Wallace, Annu Rev Genet 39, 359-407 (2005).
161. G. E. Bartley and P. A. Scolnik, Plant Cell 7 (7), 1027-1038 (1995).
162. T. Moore, British Medical Journal, 52-60 (1941).
163. D. Feskanich, V. Singh, W. C. Willett and G. A. Colditz, JAMA 287
(1), 47-54 (2002).
164. Y. J. Moon, X. Wang and M. E. Morris, Toxicol In Vitro 20 (2), 187-
210 (2006).
165. K. T. Chung, T. Y. Wong, C. I. Wei, Y. W. Huang and Y. Lin, Crit Rev
Food Sci Nutr 38 (6), 421-464 (1998).
166. T. A. Henry, The Plant Alkaloids, 4 ed. (J. & A. Churchill Ltd., London,
1949).
167. A. HAMZAH, Vinod B MATHUR.
168. C. o. B. Diversity, edited by S. o. t. C. o. B. Diversity (Secretariat of the
Convention on Biological Diversity, Montreal, Canada), Vol. 2012.

215
169. T. A. T. E. MINISTRY OF SCIENCE, edited by T. A. T. E.
MINISTRY OF SCIENCE (Convention on Biological Diversity,
Malaysia, 1998), Vol. 1, pp. 1 - 33.
170. T. M. G. a. F. R. I. Malaysia, in Biological Diversity (Malaysia, 2008),
Vol. 2012.
171. T. P. List, (Royal Botanic Gardens, Kew and Missouri Botanical
Garden, 2010), Vol. 2012.
172. U. o. Florida, (Edward F. Gilman, Gainesveille, Florida, 1999), pp. 3.
173. C. Wiart, Medicinal Plants of the Asia-Pacific Drugs for the Future?
(World Scientific Publishing Co. Pte. Ltd, 2006).
174. O. A. Oyelami, O. Onayemi, F. A. Oladimeji, A. O. Ogundaini, T. A.
Olugbade and G. O. Onawunmi, Phytother Res 17 (5), 555-557 (2003).
175. A. Büssing, G. Stein, I. Herterich-Akinpelu and U. Pfüller, Journal of
ethnopharmacology 66 (3), 301-309 (1999).
176. S. K. Adesina, O. Idowu, A. O. Ogundaini, H. Oladimeji, T. A.
Olugbade, G. O. Onawunmi and M. Pais, Phytother Res 14 (5), 371-
374 (2000).
177. P. I. Alade and O. N. Irobi, J Ethnopharmacol 39 (3), 171-174 (1993).
178. C. G. G. J. v. C. G. G. J. S.-K. Steenis, M. J. van; Indonesia.
Departemen Pertanian; Lembaga Ilmu Pengetahuan Indonesia; Kebun
Raya Indonesia, Flora Malesiana. (Djakarta : Noordhoff-Kolff, 1950).
179. R. White, (Araneus program (version Araneus), Cardiff University,
2005), Vol. 2012.
180. F. D. Sarawak, (Forest Department Sarawak, Sarawak, 2009), Vol.
2010.
181. F. R. I. M. (FRIM), (Malaysia, 2008).
182. P. Hovenkamp, (Nationaal Herbarium Nederland, 2009), Vol. 2010.
183. K. Kawazu.
184. K. Sakata, Kyoto University, 1971.
185. M. L. V. Oliva, M. C. C. Silva, R. C. Sallai, M. V. Brito and M. U.
Sampaio, Biochimie 92 (11), 1667-1673 (2010).
186. Y. XiuJuan, Planta medica 75 (5), 550-556 (2009).
187. T. P. List, (Royal Botanic Gardens, Kew and Missouri Botanical
Garden, 2010), Vol. 2012.
188. B. Datta and G. Sharma, Current science. Bangalore 58 (10), 574-575
(1989).
189. M. Othman, H. S. Loh, C. Wiart, T. J. Khoo and K. N. Ting, presented
at the 33rd Annual Conference of the Malaysian Society for
Biochemistry and Molecular Biology, Kuala Lumpur, 2008
(unpublished).
190. D. Blakesley, S. Elliott, C. Kuarak, P. Navakitbumrung, S. Zangkum
and V. Anusarnsunthorn, Forest Ecology and Management 164 (1-3),
31-38 (2002).
191. K. S. G. S. C. Lim, K. T. Choo, Timber Technology Bulletin (30), 6
(2004).
192. J. Maxwell, S. Elliott and V. ANUNSARN-SUNTHORN, Natural
History Bulletin of the Siamese Society 45, 71-97 (1997).
193. W. Kaweetripob, C. Mahidol, V. Prachyawarakorn, H. Prawat and S.
Ruchirawat, Phytochemistry (2012).
194. A. R. Joshi and K. Joshi, Ethnobotanical Leaflets 2006 (1), 37 (2006).

216
195. W. Auamcharoen, A. Chandrapatya, A. Kijjoa, A. Silva and W. Herz,
Biochemical systematics and ecology 37 (4), 535-537 (2009).
196. M. Tsukiyama, T. Sugita, H. Kikuchi, Y. Yasuda, M. Arashima, H.
Okumura, S. Lhieochaiphant and Y. Shoyama, Am J Chin Med 38 (2),
387-399 (2010).
197. S. Sharma, Y. Shukla, J. Tandon and M. Dhar, Phytochemistry 13 (2),
527-528 (1974).
198. M. Kurokawa, T. Hozumi, P. Basnet, M. Nakano, S. Kadota, T. Namba,
T. Kawana and K. Shiraki, Journal of Pharmacology and Experimental
Therapeutics 284 (2), 728 (1998).
199. M. Takechi and Y. Tanaka, Planta med 42 (1), 69-74 (1981).
200. S. Jassim and M. Naji, Journal of Applied Microbiology 95 (3), 412-
427 (2003).
201. M. Kurokawa, T. Hozumi, M. Tsurita, S. Kadota, T. Namba and K.
Shiraki, Journal of Pharmacology and Experimental Therapeutics 297
(1), 372 (2001).
202. M. Kurokawa, T. Shimizu, W. Watanabe and K. Shiraki, The Open
Antimicrobial Agents Journal 2, 49-57 (2010).
203. T. Namba, M. Kurokawa, S. Kadota and K. Shiraki, Yakugaku zasshi:
Journal of the Pharmaceutical Society of Japan 118 (9), 383 (1998).
204. M. Takechi, Y. Tanaka, M. Takehara, G. I. Nonaka and I. Nishioka,
Phytochemistry 24 (10), 2245-2250 (1985).
205. M. Othman, S. Genapathy, P. S. Liew, Q. T. Ch‟ng, H. San Loh, T. J.
Khoo, C. Wiart and K. N. Ting, (2011).
206. W. Auamcharoen, A. Chandrapatya, A. Kijjoa and Y. Kainoh, Pakistan
J. Zool 44 (1), 227-232 (2012).
207. T. P. List, (Royal Botanic Gardens, Kew and Missouri Botanical
Garden, 2010), Vol. 2012.
208. T. I. P. N. I. (IPNI), edited by K. The Royal Botanic Gardens, The
Harvard University Herbaria, and the Australian National Herbarium
(2004), Vol. 2012.
209. Y. Su, G. Smith and R. Saunders, Molecular phylogenetics and
evolution 48 (1), 188 (2008).
210. A. Latiff, I. Faridah Hanum, A. Zainudin Ibrahim, M. Goh, A. Loo and
H. T. W. Tan, Raffles Bulletin of Zoology 47, 11-72 (1999).
211. N. S. Wongsatit Chuakul, Tanucha Boonjaras, Ampol Boonpleng, Thai
Journal of Phytopharmacy 11 (2), 23 (2004).
212. A. R. Li, (2007).
213. K. Mahmood, K. C. Chan, M. H. Park, Y. N. Han and B. H. Han,
Phytochemistry 25 (6), 1509-1510 (1986).
214. L. Wirasathien, C. Boonarkart, T. Pengsuparp and R. Suttisri,
Pharmaceutical biology 44 (4), 274-278 (2006).
215. V. Kumar, A. K. Prasad and V. S. Parmar, Natural product reports 20
(6), 565-583 (2003).
216. M. F. Balandrin, A. D. Kinghorn and N. R. Farnsworth, in Human
Medicinal Agents from Plants, edited by A. D. Kinghorn and M. F.
Balandrin (American Chemical Society 1993).
217. R. H. Shoemaker, Nature Reviews Cancer 6 (10), 813-823 (2006).
218. M. R. Boyd, Anticancer drug development guide; preclinical screening,
clinical trials and approval. Humana Press: Ottowa, 30 (1997).

217
219. S. C. Brooks, E. R. Locke and H. D. Soule, Journal of Biological
Chemistry 248 (17), 6251-6253 (1973).
220. R. Cailleau, M. Olivé and Q. Cruciger, In Vitro Cellular &
Developmental Biology - Plant 14 (11), 911-915 (1978).
221. J. Bénard, J. Da Silva, M. C. De Blois, P. Boyer, P. Duvillard, E. Chiric
and G. Riou, Cancer Research 45 (10), 4970 (1985).
222. J. Fogh and G. Trempe, Human tumor cells in vitro, 115-159 (1975).
223. A. Bear, R. V. Clayman, J. Elbers, C. Limas, N. Wang, K. Stone, R.
Gebhard, W. Prigge and J. Palmer, Cancer Research 47 (14), 3856
(1987).
224. M. G. Brattain, W. D. Fine, F. M. Khaled, J. Thompson and D. E.
Brattain, Cancer Research 41 (5), 1751 (1981).
225. F. Goldwasser, I. Bae, M. Valenti, K. Torres and Y. Pommier, Cancer
Research 55 (10), 2116 (1995).
226. M. Kobayashi, S. Nagata, T. Iwasaki, K. Yanagihara, I. Saitoh, Y.
Karouji, S. Ihara and Y. Fukui, Proceedings of the National Academy
of Sciences 96 (9), 4874 (1999).
227. M. Durst, D. Glitz, A. Schneider and H. zur Hausen, Virology 189 (1),
132-140 (1992).
228. J. Jacobs, C. Jones and J. Baille, (1970).
229. T. Mosmann, Journal of immunological methods 65 (1-2), 55-63 (1983).
230. P. Twentyman and M. Luscombe, British journal of cancer 56 (3), 279
(1987).
231. M. Berridge and A. S. Tan, Archives of biochemistry and biophysics
303 (2), 474 (1993).
232. P. Dhanjal and J. R. Fry, Biomarkers 2 (2), 111-116 (1997).
233. E. Middleton Jr, C. Kandaswami and T. C. Theoharides,
Pharmacological reviews 52 (4), 673-751 (2000).
234. S. Lim, K. Ting, T. Bradshaw, N. Zeenathul, C. Wiart, T. Khoo, K. Lim
and H. Loh, Journal of ethnopharmacology (2011).
235. J. A. Beutler, Y. Kashman, L. K. Pannell, J. H. Cardellina, M. R. A.
Alexander, M. S. Balaschak, T. R. Prather, R. H. Shoemaker and M. R.
Boyd, Bioorganic & medicinal chemistry 5 (8), 1509-1517 (1997).
236. A. Bhattacharyya, S. Mazumdar, S. M. Leighton and C. R. Babu,
Phytochemistry 67 (3), 232-241 (2006).
237. S. González, M. Fló, M. Margenat, R. Durán, G. González-Sapienza, M.
Graña, J. Parkinson, R. M. Maizels, G. Salinas and B. Alvarez, PloS
one 4 (9), e7009 (2009).
238. H. Inagaki, H. Kimoto, Y. Yamauchi, M. Toriba and T. Kubo, Toxicon
(2011).
239. Y. Kashiwada, G.-i. Nonaka, I. Nishioka, J.-J. Chang and K.-H. Lee,
Journal of Natural Products 55 (8), 1033-1043 (1992).
240. Y. A. Hannun, Blood 89 (6), 1845-1853 (1997).
241. D. T. Hung, T. F. Jamison and S. L. Schreiber, Chemistry & Biology 3
(8), 623-639 (1996).
242. B. Subramanian, A. Nakeff, K. Tenney, P. Crews, L. Gunatilaka and F.
Valeriote, Journal of experimental therapeutics & oncology 5 (3), 195
(2006).
243. J. Carmichael, W. G. DeGraff, A. F. Gazdar, J. D. Minna and J. B.
Mitchell, Cancer Research 47 (4), 936 (1987).

218
244. N. A. P. Franken, H. M. Rodermond, J. Stap, J. Haveman and C. Van
Bree, Nature protocols 1 (5), 2315-2319 (2006).
245. J. A. Plumb, R. Milroy and S. Kaye, Cancer Research 49 (16), 4435
(1989).
246. R. S. DiPaola, Clinical cancer research 8 (11), 3311-3314 (2002).
247. S. J. Robles, P. W. Buehler, A. Negrusz and G. R. Adami, Biochemical
pharmacology 58 (4), 675-685 (1999).
248. M. G. Ormerod and R. M. Society, Flow cytometry. (Wiley Online
Library, 1994).
249. I. Nicoletti, G. Migliorati, M. Pagliacci, F. Grignani and C. Riccardi,
Journal of immunological methods 139 (2), 271-279 (1991).
250. S. Elmore, Toxicologic pathology 35 (4), 495-516 (2007).
251. S. Orrenius, B. Zhivotovsky and P. Nicotera, Nature Reviews
Molecular Cell Biology 4 (7), 552-565 (2003).
252. H.-C. Chang, F.-R. Chang, Y.-C. Wu and Y.-H. Lai, The Kaohsiung
Journal of Medical Sciences 20 (8), 365-371 (2004).
253. C. C. Liang, A. Y. Park and J. L. Guan, Nature protocols 2 (2), 329-333
(2007).
254. W.-l. Zhang, Clinical Oncology and Cancer Research 8 (2), 77-84
(2011).
255. N. Khan, F. Afaq, M. Saleem, N. Ahmad and H. Mukhtar, Cancer
Research 66 (5), 2500-2505 (2006).
256. P. Friedl and K. Wolf, Nature Reviews Cancer 3 (5), 362-374 (2003).
257. G. P. Dimri, X. Lee, G. Basile, M. Acosta, G. Scott, C. Roskelley, E. E.
Medrano, M. Linskens, I. Rubelj and O. Pereira-Smith, Proceedings of
the National Academy of Sciences 92 (20), 9363 (1995).
258. S. M. Gowan, R. Heald, M. F. Stevens and L. R. Kelland, Molecular
Pharmacology 60 (5), 981-988 (2001).
259. V. V. Costantino, S. F. Mansilla, J. Speroni, C. Amaya, D. Cuello-
Carrión, D. R. Ciocca, H. A. Priestap, M. A. Barbieri, V. Gottifredi and
L. A. Lopez, PloS one 8 (1), e53168 (2013).
260. T. Tauchi, K. Shin-ya, G. Sashida, M. Sumi, A. Nakajima, T.
Shimamoto, J. H. Ohyashiki and K. Ohyashiki, Oncogene 22 (34),
5338-5347 (2003).
261. L. Kelland, Clinical cancer research 13 (17), 4960-4963 (2007).
262. S. J. Himanen, J. D. Blande, T. Klemola, J. Pulkkinen, J. Heijari and J.
K. Holopainen, New Phytologist 186 (3), 722-732 (2010).
263. A. Meda, C. E. Lamien, M. Romito, J. Millogo and O. G. Nacoulma,
Food Chemistry 91 (3), 571-577 (2005).
264. C. Chang, M. H. Yang, H. M. Wen and J. C. Chern, Journal of food and
drug analysis 10 (3), 178-182 (2002).
265. D. Amic, D. Davidovic-Amic, D. Beslo and N. Trinajstic, Croatica
chemica acta 76 (1), 55-61 (2003).
266. K. Nara, T. Miyoshi, T. Honma and H. Koga, Bioscience,
biotechnology, and biochemistry 70 (6), 1489-1491 (2006).
267. C. Zongo, A. Savadogo, L. Ouattara, I. Bassole, C. Ouattara, A.
Ouattara, N. Barro, J. Koudou and A. Traore, International Journal of
Pharmacology 6 (6), 880-887 (2010).
268. H. L. Zhang and R. Y. Chen, Chinese Chemical Letters 12 (9), 791-792
(2001).

219
269. S. Wang, P.-C. Zhang, R.-Y. Chen, S.-J. Dai, S.-S. Yu and D.-Q. Yu,
Journal of Asian natural products research 7 (5), 687-694 (2005).
270. R. J. Youle and A. Strasser, Nature Reviews Molecular Cell Biology 9
(1), 47-59 (2008).
271. I. Rakiman, M. Chinnadurai, U. Baraneedharan, S. F. Paul and P.
Venkatachalam.
272. Y. Wu and B. Zhou, British journal of cancer 102 (4), 639-644 (2010).
273. J. Schripsema, Phytochemical Analysis 21 (1), 14-21 (2010).
274. G. Spigno and D. M. De Faveri, Journal of Food Engineering 78 (3),
793-801 (2007).
275. S. Y. Jeong and D. W. Seol, BMB Rep 41 (1), 11-22 (2008).
276. J. M. Brown and B. G. Wouters, Cancer Research 59 (7), 1391 (1999).
277. J. A. Plumb, Cytotoxic Drug Resistance Mechanisms, 17-23 (1999).
278. H. Towbin, T. Staehelin and J. Gordon, Proceedings of the National
Academy of Sciences 76 (9), 4350 (1979).
279. O. H. Lowry, N. J. Rosebrough, A. L. Farr and R. J. Randall, J Biol
Chem 193 (1), 265-275 (1951).
280. U. K. Laemmli, nature 227 (5259), 680-685 (1970).
281. L. S. I. Clinical, CLSI Document (2009).

220
Appendices
Appendix I
The MTT assay was used to determine cell viability after exposure to UNMC
extracts by measuring the conversion of MTT to formazan crystals in viable
cells. The optical density readings were used to construct dose-response curves
hence determination of the extract concentration (μg/ml) at which cell growth
is inhibited by 50% (GI50) after 72 h exposure.
Appendix I-A: Dose-response curve of MDA-MB-468 cells after exposure to
Acalypha Wilkesiana extracts for 72 hour. The optical readings (n= 4) ± SE
obtained from a single representative experiment are shown. The GI50 value
(μg/ml) of EtOH, EtOAc and HEX extracts are: 17.38, 10.51 and >200 μg/ml,
respectively.
0.00
0.20
0.40
0.60
0.80
1.00
1.20
2.50E-09 2.50E-08 2.50E-07 2.50E-06 2.50E-05
OD
at 555nm
Concentration (μg/ml)
EtOH
EtOAc
HEX
T0

221
Appendix I-B: Dose-response curve of HCT116 cells after exposure to
Duabanga grandiflora bark extracts for 72 hour. The optical readings (n= 4) ±
SE obtained from a single representative experiment are shown. The GI50
value (μg/ml) of Water, EtOH, EtOAc and HEX and extracts are: 49.00, 36.29,
20.43, 27.74 and >200 μg/ml, respectively.
Appendix I-C: Dose-response curve of HCT116 cells after exposure to
Duabanga grandiflora leaf extracts for 72 hour. The optical readings (n= 4) ±
SE obtained from a single representative experiment are shown. The GI50
value (μg/ml) of Water, EtOH, EtOAc and HEX and extracts are: 31.53, 39.81,
22.51 and >200 μg/ml, respectively.
0.00
0.25
0.50
0.75
1.00
1.25
1.50
1.75
2.00
5.00E-08 5.00E-07 5.00E-06 5.00E-05
OD
at 5
55
nm
Concentration (μg/ml)
EtOH
EtOAc
HEX
Water
T0
0.00
0.25
0.50
0.75
1.00
1.25
1.50
1.75
2.00
5.00E-08 5.00E-07 5.00E-06 5.00E-05
OD
at 555 n
m
Concentration (μg/ml)
Water
EtOH
EtOAc
HEX
T0

222
Appendix I-D: Dose-response curve of MDA-MB-468 cells after exposure to
Archidendron ellipticum bark extracts for 72 hour. The optical readings (n= 4)
± SE obtained from a single representative experiment are shown. The GI50
value (μg/ml) of EtOH, EtOAc and HEX extracts are: 4.76, 49.31 and >200
μg/ml, respectively.
Appendix I-E: Dose-response curve of MDA-MB-468 cells after exposure to
Archidendron ellipticum leaf extracts for 72 hour. The optical readings (n= 4) ±
SE obtained from a single representative experiment are shown. The GI50
value (μg/ml) of EtOH, EtOAc, HEX and Water extracts are: 6.12, 8.06 and
>200 μg/ml, respectively.
0.00
0.20
0.40
0.60
0.80
1.00
1.20
1.40
1.00E-07 1.00E-06 1.00E-05 1.00E-04
OD
at 5
55
nm
Concentration (µg/ml)
EtOH
EtOAc
HEX
T0
0.00
0.25
0.50
0.75
1.00
1.25
1.50
1.75
2.00
1.00E-09 1.00E-08 1.00E-07 1.00E-06 1.00E-05
OD
at 555nm
Concentration (μg/ml)
EtOH
EtOAc
HEX
T0

223
Appendix I-F: Dose-response curve of HCT116 cells after exposure to
Pseuduvaria macrophylla extracts for 72 hour. The optical readings (n= 4) ±
SE obtained from a single representative experiment are shown. The GI50
value (μg/ml) of EtOH, EtOAc and HEX extracts are: 4.02, 1.63 and 4.50
μg/ml, respectively.
0.00
0.25
0.50
0.75
1.00
1.25
1.50
1.75
2.00
5.00E-08 5.00E-07 5.00E-06 5.00E-05
OD
at 5
50
nm
Concentration (µg/ml)
EtOH
EtOAc
HEX
T0

224
Appendix I-G: Dose-response curve of MDA-MB-468 cells after exposure to
Archidendron ellipticum EtOH bark extract fractions for 72 hour. The optical
readings (n= 4) ± SE obtained from a single representative experiment are
shown. The GI50 value (μg/ml) of F1, F2, F3, F4, F6 and F6 extracts are: > 50,
> 50, > 50, 1.49, > 50 and > 50 μg/ml, respectively.
0.00
0.50
1.00
1.50
2.00
1.00E-08 1.01E-06 2.01E-06 3.01E-06 4.01E-06
OD
at
555 n
m
Concentration (µg/ml)
Fraction 1
Fractino 2
Fraction 3
T0
0.00
0.50
1.00
1.50
2.00
1.00E-08 1.00E-07 1.00E-06 1.00E-05
OD
at
55
5 n
m
Concentrataion (µg/ml)
Fraction 4 Fraction 5 Fraction 6 T0

225
Appendix I-H: Dose-response curve of MDA-MB-468 cells after exposure to
Archidendron ellipticum EtOAc bark extract fractions for 72 hour. The optical
readings (n= 4) ± SE obtained from a single representative experiment are
shown. The GI50 value (μg/ml) of F1, F2, F3, F4, F6 and F6 extracts are: > 50,
> 50, > 50, 19.74, 32.32 and > 50 μg/ml, respectively.
0.00
0.50
1.00
1.50
2.00
1.00E-07 1.00E-06 1.00E-05
OD
at
555 n
m
Concentraton (µg/ml)
Fraction 1
Fraction 2
Fraction 3
T0
0.00
0.50
1.00
1.50
2.00
1.00E-07 1.00E-06 1.00E-05 1.00E-04
OD
at
55
5 n
m
Concentration (µg/ml)
Fraction 4 Fraction 5 Fraction 6 T0

226
Appendix I-I: Dose-response curve of MDA-MB-468 cells after exposure to
Archidendron ellipticum EtOH leaf extract fractions for 72 hour. The optical
readings (n= 4) ± SE obtained from a single representative experiment are
shown. The GI50 value (μg/ml) of F1, F2, F3, F4, F6 and F6 extracts are: > 50,
> 50, > 50, 2.20, 10.11 and > 50 μg/ml, respectively.
0.00
0.50
1.00
1.50
2.00
1.00E-08 1.00E-07 1.00E-06 1.00E-05
OD
at
555 n
m
Concentration (µg/ml)
Fraction 1
Fraction 2
Fraction 3
T0
0.00
0.50
1.00
1.50
2.00
1.00E-08 1.00E-07 1.00E-06 1.00E-05
OD
at
55
5 n
m
Concentration (µg/ml)
Fraction 4
Fraction 5
Fraction 6
T0
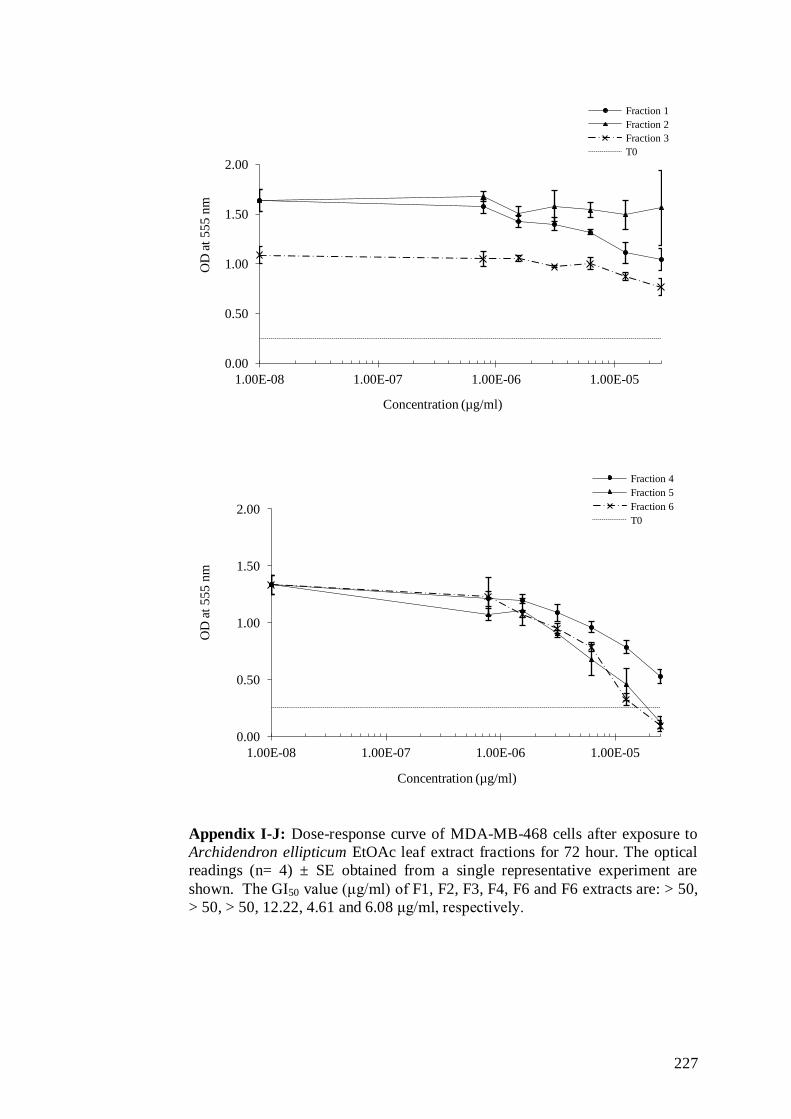
227
Appendix I-J: Dose-response curve of MDA-MB-468 cells after exposure to
Archidendron ellipticum EtOAc leaf extract fractions for 72 hour. The optical
readings (n= 4) ± SE obtained from a single representative experiment are
shown. The GI50 value (μg/ml) of F1, F2, F3, F4, F6 and F6 extracts are: > 50,
> 50, > 50, 12.22, 4.61 and 6.08 μg/ml, respectively.
0.00
0.50
1.00
1.50
2.00
1.00E-08 1.00E-07 1.00E-06 1.00E-05
OD
at
55
5 n
m
Concentration (µg/ml)
Fraction 1
Fraction 2
Fraction 3
T0
0.00
0.50
1.00
1.50
2.00
1.00E-08 1.00E-07 1.00E-06 1.00E-05
OD
at
55
5 n
m
Concentration (µg/ml)
Fraction 4
Fraction 5
Fraction 6
T0

228
Appendix I-K: Dose-response curve of MDA-MB-468 cells after exposure to
Archidendron ellipticum HEX leaf extract fractions for 72 hour. The optical
readings (n= 4) ± SE obtained from a single representative experiment are
shown. The GI50 value (μg/ml) of F1, F2, F3, F4, F6 and F6 extracts are: > 50,
> 50, > 50, 2.89, 6.50 and 14.23 μg/ml, respectively.
0.00
0.50
1.00
1.50
2.00
1.00E-07 1.00E-06 1.00E-05
OD
at
55
5 n
m
Concentration (µg/ml)
Fraction 1
Fraction 2
Fraction 3
T0
0.00
0.50
1.00
1.50
2.00
2.50
1.00E-07 1.00E-06 1.00E-05
OD
at
55
5 n
m
Concentration (µg/ml)
Fraction 4
Fraction 5
Fraction 6
T0

229
Appendix I-L: Dose-response curve of HCT116 cells after exposure to
Duabanga grandiflora EtOH bark extract fractions for 72 hour. The optical
readings (n= 4) ± SE obtained from a single representative experiment are
shown. The GI50 value (μg/ml) of F1, F2, F3, F4, F6 and F6 extracts are: > 50,
> 50, 37.75, 26.31, 18.50 and > 50 μg/ml, respectively.
0.00
0.50
1.00
1.50
2.00
2.50
1.00E-07 1.00E-06 1.00E-05
OD
at
555 n
m
Concentration. (µg/ml)
Fraction 1
Fraction 2
Fraction 3
T0
0.00
0.50
1.00
1.50
2.00
2.50
1.00E-07 1.00E-06 1.00E-05
OD
at
55
0n
m
Concentration (µg/ml)
Fraction 4
Fraction 5
Fraction 6
T0

230
Appendix I-M: Dose-response curve of HCT116 cells after exposure to
Duabanga grandiflora EtOAc bark extract fractions for 72 hour. The optical
readings (n= 4) ± SE obtained from a single representative experiment are
shown. The GI50 value (μg/ml) of F1, F2, F3, F4, F6 and F6 extracts are:
41.17, > 50, > 50, 35.08, 28.78 and 28.60 μg/ml, respectively.
0.00
0.50
1.00
1.50
2.00
2.50
3.00
1.00E-07 1.00E-06 1.00E-05
OD
at
55
5 n
m
Concentration (µg/ml)
Fraction 1
Fraction 2
Fraction 3
T0
0.00
0.50
1.00
1.50
2.00
2.50
1.00E-07 1.00E-06 1.00E-05
OD
at
55
5 n
m
Concentration (µg/ml)
Fraction 4
Fraction 5
Fraction 6 T0

231
Appendix I-N: Dose-response curve of HCT116 cells after exposure to
Duabanga grandiflora HEX bark extract fractions for 72 hour. The optical
readings (n= 4) ± SE obtained from a single representative experiment are
shown. The GI50 value (μg/ml) of F1, F2, F3, F4, F6 and F6 extracts are: > 50,
>50, >50, > 50, 31.77 and 36.18μg/ml, respectively.
0.00
0.50
1.00
1.50
2.00
2.50
3.00
1.00E-07 1.00E-06 1.00E-05
OD
at
55
5 n
m
Concentration (µg/ml)
Fraction 1
Fraction 2
Fraction 3
T0
0.00
0.50
1.00
1.50
2.00
2.50
3.00
1.00E-07 1.00E-06 1.00E-05
OD
at
55
5 n
m
Concentration (µg/ml)
Fraction 4 Fraction 5 Fraction 6 T0

232
Appendix I-O: Dose-response curve of HCT116 cells after exposure to
Duabanga grandiflora EtOH leaf extract fractions for 72 hour. The optical
readings (n= 4) ± SE obtained from a single representative experiment are
shown. The GI50 value (μg/ml) of F1, F2, F3, F4, F6 and F6 extracts are: > 50,
>50, >50, > 50, >50 and > 50 μg/ml, respectively.
0.00
0.50
1.00
1.50
2.00
2.50
3.00
1.00E-07 1.00E-06 1.00E-05
OD
at
555 n
m
Concentration (µg/ml)
Fraction 1
Fraction 2
Fraction 3
T0
0.00
0.50
1.00
1.50
2.00
2.50
3.00
1.00E-07 1.00E-06 1.00E-05
OD
at
55
5 n
m
Concentration (µg/ml)
Fraction 4
Fraction 5
Fraction 6
T0

233
Appendix I-P: Dose-response curve of HCT116 cells after exposure to
Duabanga grandiflora EtOAc leaf extract fractions for 72 hour. The optical
readings (n= 4) ± SE obtained from a single representative experiment are
shown. The GI50 value (μg/ml) of F1, F2, F3, F4, F6 and F6 extracts are: > 50,
>50, >50, > 50, >50 and > 50 μg/ml, respectively.
0.00
0.50
1.00
1.50
2.00
2.50
3.00
1.00E-07 1.00E-06 1.00E-05
OD
at
555 n
m
Concentration (µg/ml)
Fraction 1
Fraction 2
Fraction 3
T0
0.00
0.50
1.00
1.50
2.00
2.50
3.00
1.00E-07 1.00E-06 1.00E-05
OD
at
55
5 n
m
Concentration (µg/ml)
Fraction 4
Fraction 5
Fraction 6
T0

234
Appendix I-P: Dose-response curve of HCT116 cells after exposure to
Duabanga grandiflora HEX leaf extract fractions for 72 hour. The optical
readings (n= 4) ± SE obtained from a single representative experiment are
shown. The GI50 value (μg/ml) of F1, F2, F3, F4, F6 and F6 extracts are: > 50,
>50, >50, > 50, >50 and > 50 μg/ml, respectively.
0.00
0.50
1.00
1.50
2.00
2.50
3.00
1.00E-07 1.00E-06 1.00E-05
OD
at
555 n
m
Concentration (µg/ml)
Fraction 1 Fraction 2 Fraction 3 T0
0.00
0.50
1.00
1.50
2.00
2.50
3.00
1.00E-07 1.00E-06 1.00E-05
OD
at
55
5 n
m
Concentration (µg/ml)
Fraction 4
Fraction 5
Fraction 6
T0

235
Appendix I-P: Dose-response curve of HCT116 cells after exposure to
Pseuduvaria macrophylla EtOH extract fractions for 72 hour. The optical
readings (n= 4) ± SE obtained from a single representative experiment are
shown. The GI50 value (μg/ml) of F1, F2, F3, F4, F6 and F6 extracts are: > 10,
>10, 2.29, 8.73, > 10 and 9.67μg/ml, respectively.
0.00
0.50
1.00
1.50
2.00
2.50
1.00E-08 1.00E-07 1.00E-06 1.00E-05
OD
at
55
5 n
m
Concentration (µg/ml)
Fraction 1
Fraction 2
Fraction 3
T0
0.00
0.50
1.00
1.50
2.00
2.50
3.00
1.00E-08 1.00E-07 1.00E-06 1.00E-05
OD
at
55
5 n
m
Concentration (µg/ml)
Fraction 4 Fraction 5 Fraction 6 T0

236
Appendix I-Q: Dose-response curve of HCT116 cells after exposure to
Pseuduvaria macrophylla EtOAc extract fractions for 72 hour. The optical
readings (n= 4) ± SE obtained from a single representative experiment are
shown. The GI50 value (μg/ml) of F1, F2, F3, F4, F6 and F6 extracts are: > 10,
>10, 0.61, 3.83, >10 and > 10 μg/ml, respectively.
0.00
0.50
1.00
1.50
2.00
2.50
3.00
1.00E-08 1.00E-07 1.00E-06
OD
at
555 n
m
Concentration (µg/ml)
Fraction 1
Fraction 2
Fraction 3
T0
0.00
0.50
1.00
1.50
2.00
2.50
3.00
1.00E-08 1.00E-07 1.00E-06
OD
at
55
5 n
m
Concentraction (µg/ml)
Fraction 4
Fraction 5
Fraction 6
T0

237
Appendix II
Fractionation of extracts were performed using a Strata C18-E extraction
cartridge equilibrated with equal volume of d. H20 and MeOH prior to loading
the cartridge with UNMC extract. The solvents were passed through the
extract and collected in a pre-weighed glass vial followed by evaporation of
solvent to obtain the extract fraction. The yield was determined by the
difference in weight of glass vial before fraction collection and after solvent
evaporation then subjected to HPLC analysis as described in Chapter 7.5.
Appendix II-A: The yield (%) of Duabanga grandiflora extract fractions.
D.
grandiflora
extracts
% Yield of D. grandiflora extract fractions
F1 F2 F3 F4 F5 F6 Total %
(mg)
Ba
rk
Water - - - - - - -
EtOH 13.0 15.5 19.3 3.4 0.5 1.9
53.6
(11.1)
EtOAc 20.3 2.1 5.7 6.0 14.9 2.9
51.8
(19.1)
HEX 2.3 0.9 3.5 6.0 23.4 13.9
50.2
(14.5)
Lea
f
Water - - - - - - -
EtOH 71.6 4.6 4.4 1.2 1.7 1.4
84.8
(23.5)
EtOAc 25.6 3.8 2.4 1.2 24.4 2.3
59.6
(16.8)
HEX 21.8 0.5 6.2 1.1 1.2 6.4
47.3
(3.12)
Strata C18-E extraction cartridge was equilibrated with equal volume of d. H20
and MeOH prior to loading the cartridge with D. grandiflora extracts. The
solvents were passed through the extract and collected then removed to obtain
the extract fraction for analysis. The weigh (mg) used to determine % yield of
extracts were of the glass vial prior to collection and after solvent evaporation.

238
Appendix II-B: The yield (%) of Archidendron ellipticum extract fractions.
A. ellipticum
extracts
% Yield of A. ellipticum extract fractions
F1 F2 F3 F4 F5 F6 Total %
(mg)
Ba
rk
EtOH 39.1 4.4 7.8 14.9 2.6 3.2
24.6
(72.0)
EtOAc 10.5 1.5 8.6 3.9 10.0 15.3
9.9
(49.8)
HEX - - - - - - -
Lea
f
EtOH 10.4 3.3 3.0 6.5 2.7 1.2
21.7
(27.2)
EtOAc 0.0 0.3 2.0 2.8 7.8 6.2
10.6
(19.0)
HEX 1.0 0.0 3.1 2.1 8.7 1.2
10.72
(16.2)
Strata C18-E extraction cartridge was equilibrated with equal volume of d. H20
and MeOH prior to loading the cartridge with A. ellipticum extracts. The
solvents were passed through the extract and collected then removed to obtain
the extract fraction for analysis. The weigh (mg) used to determine % yield of
extracts were of the glass vial prior to collection and after solvent evaporation.
Appendix II-C: The yield (%) of Pseuduvaria macrophylla extract fractions.
P.
macrophylla
extracts
% Yield of P. macrophylla extract fractions
F1 F2 F3 F4 F5 F6 Total %
(mg)
Wh
ole
EtOH 2.8 1.1 9.1 3.8 1.7 0.4
18.82
(76.5)
EtOAc 0.2 1.3 8.5 6.5 6.8 0.6
23.8
(27.9)
HEX - - - - - - -
Strata C18-E extraction cartridge was equilibrated with equal volume of d. H20
and MeOH prior to loading the cartridge with P. macrophylla extracts. The
solvents were passed through the extract and collected then removed to obtain
the extract fraction for analysis. The weigh (mg) used to determine % yield of
extracts were of the glass vial prior to collection and after solvent evaporation.

239
Appendix III
Appendix III-A: HPLC trace of Duabanga grandiflora bark extract
‘inactive’ fractions using Reversed Phase chromatography. EtOH: F1 (A),
and F2 (B) and EtOAc F2 (C) and F3 (D) (1 mg/ml in DMSO) in 1:1 distilled
water and MeOH were analysed using 10% B for 1 min, 10-98% B over 2 min,
at 98% for 2 min, (Phenomenex C18 Gemini-NX 3μ-110A 50x2 mm column).
The eluent compounds were detected at a wavelength of 220 nm (i) and 254 (ii)
nm.

240
Appendix III-B: HPLC trace of Duabanga grandiflora bark extract
‘inactive’ fractions using Reversed Phase chromatography. HEX: F1 (E),
F2 (F), F3 (G) and F4 (H) (1 mg/ml in DMSO) in 1:1 distilled water and
MeOH were analysed using 10% B for 1 min, 10-98% B over 2 min, at 98%
for 2 min, (Phenomenex C18 Gemini-NX 3μ-110A 50x2 mm column). The
eluent compounds were detected at a wavelength of 220 nm (i) and 254 (ii) nm.

241
Appendix III-C: HPLC trace of Duabanga grandiflora leaf extract
‘inactive’ fractions using Reversed Phase chromatography. EtOH: F1 (A),
F2 (B) and F3 (C) (1 mg/ml in DMSO) in 1:1 distilled water and MeOH were
analysed using 10% B for 1 min, 10-98% B over 2 min, at 98% for 2 min,
(Phenomenex C18 Gemini-NX 3μ-110A 50x2 mm column). The eluent
compounds were detected at a wavelength of 220 nm (i) and 254 (ii) nm.

242
Appendix III-D: HPLC trace of Duabanga grandiflora leaf extract
‘inactive’ fractions using Reversed Phase chromatography. EtOH: F4 (D),
F5 (E) and F6 (F) (1 mg/ml in DMSO) in 1:1 distilled water and MeOH were
analysed using 10% B for 1 min, 10-98% B over 2 min, at 98% for 2 min,
(Phenomenex C18 Gemini-NX 3μ-110A 50x2 mm column). The eluent
compounds were detected at a wavelength of 220 nm (i) and 254 (ii) nm.

243
Appendix III-E: HPLC trace of Duabanga grandiflora leaf extract
‘inactive’ fractions using Reversed Phase chromatography. EtOAc: F1 (G),
F2 (H) and F3 (I) (1 mg/ml in DMSO) in 1:1 distilled water and MeOH were
analysed using 10% B for 1 min, 10-98% B over 2 min, at 98% for 2 min,
(Phenomenex C18 Gemini-NX 3μ-110A 50x2 mm column). The eluent
compounds were detected at a wavelength of 220 nm (i) and 254 (ii) nm.

244
Appendix III-F: HPLC trace of Duabanga grandiflora leaf extract
‘inactive’ fractions using Reversed Phase chromatography. EtOAc: F4 (J),
F5 (K) and F6 (L) (1 mg/ml in DMSO) in 1:1 distilled water and MeOH were
analysed using 10% B for 1 min, 10-98% B over 2 min, at 98% for 2 min,
(Phenomenex C18 Gemini-NX 3μ-110A 50x2 mm column). The eluent
compounds were detected at a wavelength of 220 nm (i) and 254 (ii) nm.

245
Appendix III-G: HPLC trace of Duabanga grandiflora leaf extract
‘inactive’ fractions using Reversed Phase chromatography. HEX: F1 (M), F2
(N) and F3 (O) (1 mg/ml in DMSO) in 1:1 distilled water and MeOH were
analysed using 10% B for 1 min, 10-98% B over 2 min, at 98% for 2 min,
(Phenomenex C18 Gemini-NX 3μ-110A 50x2 mm column). The eluent
compounds were detected at a wavelength of 220 nm (i) and 254 (ii) nm.

246
Appendix III-H: HPLC trace of Duabanga grandiflora leaf extract
‘inactive’ fractions using Reversed Phase chromatography. HEX: F4 (P), F5
(Q) and F6 (R) (1 mg/ml in DMSO) in 1:1 distilled water and MeOH were
analysed using 10% B for 1 min, 10-98% B over 2 min, at 98% for 2 min,
(Phenomenex C18 Gemini-NX 3μ-110A 50x2 mm column). The eluent
compounds were detected at a wavelength of 220 nm (i) and 254 (ii) nm.

247
Appendix III-I: HPLC trace of Archidendron ellipticum bark extract
‘inactive’ fractions using Reversed Phase chromatography. EtOH: F1 (A),
F2 (B) and F3 (C) (1 mg/ml in DMSO) in 1:1 distilled water and MeOH were
analysed using 10% B for 1 min, 10-98% B over 2 min, at 98% for 2 min,
(Phenomenex C18 Gemini-NX 3μ-110A 50x2 mm column). The eluent
compounds were detected at a wavelength of 220 nm (i) and 254 (ii) nm.

248
Appendix III-J: HPLC trace of Archidendron ellipticum bark extract
‘inactive’ fractions using Reversed Phase chromatography. EtOH: F5 (D)
and F6 (E) (1 mg/ml in DMSO) in 1:1 distilled water and MeOH were analysed
using 10% B for 1 min, 10-98% B over 2 min, at 98% for 2 min, (Phenomenex
C18 Gemini-NX 3μ-110A 50x2 mm column). The eluent compounds were
detected at a wavelength of 220 nm (i) and 254 (ii) nm.

249
Appendix III-K: HPLC trace of Archidendron ellipticum bark extract
‘inactive’ fractions using Reversed Phase chromatography. EtOAc: F1 (F),
F2 (G), F3 (H) and F6 (I) (1 mg/ml in DMSO) in 1:1 distilled water and MeOH
were analysed using 10% B for 1 min, 10-98% B over 2 min, at 98% for 2 min,
(Phenomenex C18 Gemini-NX 3μ-110A 50x2 mm column). The eluent
compounds were detected at a wavelength of 220 nm (i) and 254 (ii) nm.

250
Appendix III-xii: HPLC trace of Archidendron ellipticum leaf extract
‘inactive’ fractions using Reversed Phase chromatography. EtOH: F1 (J),
F2 (K), F3 (L) and F6 (M) (1 mg/ml in DMSO) in 1:1 distilled water and
MeOH were analysed using 10% B for 1 min, 10-98% B over 2 min, at 98%
for 2 min, (Phenomenex C18 Gemini-NX 3μ-110A 50x2 mm column). The
eluent compounds were detected at a wavelength of 220 nm (i) and 254 (ii) nm.

251
Appendix III-L: HPLC trace of Archidendron ellipticum leaf extract
‘inactive’ fractions using Reversed Phase chromatography. EtOAc: F1 (N),
F2 (O) and F3 (P) (1 mg/ml in DMSO) in 1:1 distilled water and MeOH were
analysed using 10% B for 1 min, 10-98% B over 2 min, at 98% for 2 min,
(Phenomenex C18 Gemini-NX 3μ-110A 50x2 mm column). The eluent
compounds were detected at a wavelength of 220 nm (i) and 254 (ii) nm.

252
Appendix III-M: HPLC trace of Archidendron ellipticum leaf extract
‘inactive’ fractions using Reversed Phase chromatography. HEX: F1 (Q),
F2 (R) and F3 (S) (1 mg/ml in DMSO) in 1:1 distilled water and MeOH were
analysed using 10% B for 1 min, 10-98% B over 2 min, at 98% for 2 min,
(Phenomenex C18 Gemini-NX 3μ-110A 50x2 mm column). The eluent
compounds were detected at a wavelength of 220 nm (i) and 254 (ii) nm.

253
Appendix III-N: HPLC trace of Pseuduvaria macrophylla extract ‘inactive’
fractions using Reversed Phase chromatography. EtOH: F1 (A), F2 (B) and
F5 (C) (1 mg/ml in DMSO) in 1:1 distilled water and MeOH were analysed
using 10% B for 1 min, 10-98% B over 2 min, at 98% for 2 min, (Phenomenex
C18 Gemini-NX 3μ-110A 50x2 mm column). The eluent compounds were
detected at a wavelength of 220 nm (i) and 254 (ii) nm.

254
Appendix III-O: HPLC trace of Pseuduvaria macrophylla extract ‘inactive’
fractions using Reversed Phase chromatography. EtOAc: F1 (D), F2 (E), F5
(F) and F6 (G) (1 mg/ml in DMSO) in 1:1 distilled water and MeOH were
analysed using 10% B for 1 min, 10-98% B over 2 min, at 98% for 2 min,
(Phenomenex C18 Gemini-NX 3μ-110A 50x2 mm column). The eluent
compounds were detected at a wavelength of 220 nm (i) and 254 (ii) nm.

255
Appendix IV
IV-1 Antimicrobial activity of UNMC crude extracts
Rapamycin is a well-known antibiotic used in organ transplant with
serine/threonine kinase inhibitory effects that can also affect protein
translation, cell proliferation and transcription via inhibition of mTOR
(mammalian target of rapamycin).78
Therefore compounds embedded in
UNMC extracts may have multiple functions. Aporphinoid (38) present in P.
macrophylla has been reported to demonstrate anti-tuberculosis activity against
Mycobacterium tuberculosis with MIC of 100 μg/ml, however it is inactive
against Plasmodium falciparum in antimalarial assays.214
Previously, an anti-
herpesvirus compound, eugeniin, was isolated from D. grandiflora EtOAc
extracts and has demonstrated antiviral effects on HSV strains (at 20 μg/ml),
inhibition of viral DNA synthesis of HSV strains in Vero cells (at 20 μg/ml)
and dose-dependent inhibition of HSV DNA and late HSV proteins.198
Additionally, D. grandiflora extracts have been shown to inhibit accumulation
of fat in melanoma cells and increase type II collagen production in dermal
fibroblasts.196
Therefore, further anti-microbial properties of these species are
justified.
Antimicrobial properties of UNMC extracts were determined using broth
microdilution assay performed by Dr. Jaroslav Havlík and his team from the
Department of Microbiology, Nutrition and Dietetics, Czech Universitiy of
Life Sciences, in Prague.
The bacterial panel selected consists of both Gram-negative (S. aureus and E.
faecalis) and Gram-positive bacteria (P. aeruginosa and E. coli), cocci and
rods, as well as one strain of yeast (C. albicans). Reference antibiotics were
used as positive controls. A. ellipticum extracts were not assessed in this assay
due to insufficient stock. Two-fold dilutions of each sample tested were tested
in the concentration range of 1–128 mg/L. Each well was inoculated with 5 μl
of microbial suspension at a density of 107 CFU/ml (10
8 for the yeast strain).
The microtitre plates were incubated overnight at 37 °C. DMSO was assayed
as the negative control and has been shown not to affect bacterial growth.

256
Growth turbidity was measured at 405 nm and the minimum extract
concentration required to inhibit bacterial growth (MICs) was calculated based
on the density of the growth control and were expressed as the lowest extract
concentrations that resulted in 80% growth reduction compared to that of
extract-free growth control. All samples were tested in triplicate.
IV-2 Antimicrobial activity of Duabanga grandiflora crude
extracts
D. grandiflora bark and leaf extracts revealed comparable MIC values against
E. faecalis (16 mg/L), P. aeruginosa (8 mg/L), E. coli (16 mg/L) and C.
albicans (8 mg/L) in the broth microdilution assay (). Activity against S.
aureus varied amongst the extracts, with polar (Water and EtOH) bark extracts
and leaf EtOH and EtOAc extracts yielding the lowest MIC (16 mg/L).
Growth inhibition of Gram-negative bacteria possessing a good natural barrier
suggests that these extracts contain compounds that could diffuse through the
bacterial wall and impair its cellular function affecting its growth.
In a recently published screening of Malaysian antimicrobial plants, both D.
grandiflora extracts showed highest activity in an agar diffusion assay,
revealing sensitivity of S. aureus to EtOH bark and EtOAc leaf extracts (0.094
mg/ml) and less sensitivity to EtOAc bark and EtOH leaf extracts (0.75 and
0.38 mg/ml, respectively).205
Higher concentrations of bark and leaf extracts
were need to inhibit E. coli growth (0.75 – 1.5 mg/ml). The activity was
among the most potent plants in the test and was non-specific against both
Gram-negative and Gram-positive bacteria. Recently, a time-dependent
insecticidal study demonstrated D. grandiflora MeOH extract-treated rice was
toxic to Sitophilus oryzae adults and toxicity increased significantly with
increasing concentrations (0 - 32 mg/ml).206

257
Appendix IV-A: Antimicrobial activity of extracts against selected bacterial
strains.
D. grandiflora
extracts/ Reference
bacteria
Minimum Inhibitory Concentration (mg/L)
Gram-positive Gram-negative Yeast
S.
aureus
E.
faecalis
P.
aeruginosa E. coli
C.
albicans B
ark
Water 16 16 8 16 8
EtOH 32 16 8 16 8
EtOAc 16 16 8 16 8
HEX 32 16 8 16 8
Lea
f
Water 32 16 8 16 8
EtOH 16 16 8 16 8
EtOAc 16 16 8 16 8
HEX 32 16 8 16 8
Refe
ren
ce
an
tib
ioti
c
Oxacillin 0.25 - - - -
Vancomycin - 2 - - -
Ciprofloxacin - - 0.25 - -
Tetracycline - - - 1 -
Nystatin - - - - 2
The bacterial panel consisted of S. aureus (ATCC 29213), E. faecalis (ATCC
29212), P. aeruginosa (ATCC 27853), E. coli (ATCC 25922) and yeast C.
albicans (ATCC 10231). The minimum extract concentration (mg/L; MIC)
required to inhibit growth of selected bacteria and yeast were determined in the
broth microdilution assay according to the CLSI guidelines (2009).281
MICs of
reference antibiotics used as positive controls were in range of acceptable
limits.

258
IV-C Antimicrobial activity of Pseuduvaria macrophylla crude
extracts
Similarly, P. macrophylla extracts possess comparable antimicrobial activity
against E. faecalis (16 mg/L), P. aeruginosa (8 mg/L), E. coli (16 mg/L) and
C. albicans (8 mg/L) in a broth microdilution assay (). Activity against S.
aureus varied amongst extracts, and the lowest MIC (16 mg/L) was seen with
EtOH extract.
Appendix IV-B: Antimicrobial activity of extracts against selected bacterial
strains.
UNMC extracts/
Reference bacteria
Minimum Inhibitory Concentration (mg/L)
Gram-positive Gram-negative Yeast
S.
aureus
E.
faecalis
P.
aeruginosa E. coli
C.
albicans
P. m
acro
ph
yll
a
EtOH 16 16 8 16 8
EtOAc 32 16 8 16 8
HEX 32 16 8 16 8
Refe
ren
ce
an
tib
ioti
c
Oxacillin 0.25 - - - -
Vancomycin - 2 - - -
Ciprofloxacin - - 0.25 - -
Tetracycline - - - 1 -
Nystatin - - - - 2
Bacterial panel consisted of S. aureus (ATCC 29213), E. faecalis (ATCC
29212), P. aeruginosa (ATCC 27853), E. coli (ATCC 25922) and yeast C.
albicans (ATCC 10231). The minimum extract concentration (mg/L; MIC)
required to inhibit growth of selected bacteria and yeast were determined in the
broth microdilution assay according to the CLSI guidelines (2009).281
MICs of
reference antibiotics used as positive controls were in range of acceptable
limits.
Overall, UNMC extracts were potent at very low concentrations against the
panel of Gram-positive and Gram-negative bacteria and yeast strains.
Antimicrobial results concurred with previously reports that very low
concentration of D. grandiflora and P. macrophylla extracts could inhibit the
growth of Gram-negative bacteria even though they have a good natural barrier
against antimicrobial compounds.

259
Appendix V
Investigating in vitro anticancer activity of Uvaria macrophylla (Annonaceace,
related to P. macrophylla) performed by Mr Vijay Raja under my supervision.
Extraction of U. macrophylla bark and leaf extracts using solvents (in order of
polarity): EtOH > chloroform (CHL) > HEX was prepared by UNMC
colleagues. Activity of these extracts has been tested against MCF-7 and
HCT116 cancer cells in several bioassays.
V-1 In vitro growth inhibitory and cytotoxicity effects of Uvaria
macrophylla extracts in a cell line panel
The growth inhibitory properties of U. macrophylla extracts in MCF-7 and
HCT116 cells were assessed using the MTT assay following 72 h exposure (as
outlined in section 7.2.3). Both breast and colorectal carcinoma cell lines did
not demonstrate comparable level of sensitivity towards U. macrophylla EtOH
extracts as observed4 with P. macrophylla extracts (Table 8-4).
Appendix IV-A: In vitro growth inhibitory effects of Uvaria macrophylla
extracts in breast and colorectal carcinoma cells revealed by the MTT assay.
Cell line U. macrophylla
extracts
Mean GI50 Values (μg/ml)
Bark Leaf
MCF-7
EtOH 79.08 ± 18.58 102.3 ± 12.88
CHL 11.69 ± 4.45 5.89 ± 2.12
HEX 4.72 ± 1.50 27.03 ± 7.23
HCT116
EtOH 68.20 ± 21.80 97.23 ± 19.97
CHL 3.25 ± 0.66 4.55 ± 0.90
HEX 5.59 ± 1.16 21.75 ± 8.60
Extract concentration (μg/ml) at which cell growth is inhibited by 50% (GI50)
after 72 h exposure. Mean GI50 values (μg/ml) ± SEM was obtained from ≥ 3
(n = 4) individual experiments where active crude extracts (GI50 values ≤ 20
μg/ml) are highlighted in bold, extracts ± SEM values that could be considered
active are highlighted in italics.
HEX bark extracts demonstrated greater potency than leaf extracts by 4 to 6
folds. CHL bark and leaf extracts were the most active against both cell lines
at low concentrations between (3.25 to 11.69 μg/ml). Extracts of CHL (used in
U. macrophylla extraction) and EtOAc (used in P. macrophylla extraction)

260
reveal greatest activity against MCF-7 and HCT116 compared to other
extraction solvents used, therefore it is likely that similar „active‟ compounds
in this plant family are extracted by solvents this polarity range.
On the whole, P. macrophylla extracts exerted greater growth inhibition
activity against cancer cells than U. macrophylla extracts. Unexpectedly,
EtOH and HEX U. macrophylla extracts did not yield comparable GI50 values
as that seen with P. macrophylla extracts.
V-2 Influence of Uvaria macrophylla extracts on MCF-7 and
HCT116 cells’ survival and clonogenicity
The clonogenic assay was employed to assess the influence of U. macrophylla
extracts on MCF-7 and HCT116 cells‟ survival and colony formation ability
(outlined in section 7.2.4). U. macrophylla extracts inhibited colony formation
ability of both cells at similar or lower concentrations than determined in the
MTT assay (Table 8-5).
Appendix IV-B: Effects of Uvaria macrophylla extracts to MCF-7 and
HCT116 cells‟ survival and clonogenicity.
Cell line U. macrophylla
extracts
Mean IC50 Values (μg/ml)
Bark Leaf
MCF-7
EtOH 19.61 ± 1.94 29.60 ± 2.81
CHL 4.72 ± 1.77 3.44 ± 1.23
HEX 6.60 ± 3.00 12.83 ± 4.34
HCT116
EtOH 42.62 ± 11.70 94.66 ± 22.41
CHL 3.01 ± 0.67 5.17 ± 0.87
HEX 3.68 ± 0.63 28.30 ± 7.57
Extract concentration (μg/ml) at which colony formation is inhibited after 24 h
exposure. Mean IC50 values (μg/ml) ± SEM was obtained from ≥ 3 (n = 4)
individual experiments.
It is possible that due to low seeding density, EtOH bark and leaf extracts were
able to inhibit colony formation at lower extract concentration than expected
than expected with the exception of leaf bark extract against HCT116 cells.
Whereas CHL extracts were able to inhibit clonogenicity of MCF-7 and
HCT116 cells at similar concentrations seen in the MTT assay (<11 μg/ml).
Overall, U. macrophylla bark extracts were more active against MCF-7 cells‟

261
survival and clonogenicity (Figure 8-24), even though greater GI50 results were
seen in the MTT assay, this may suggest cells remain viable but unable to
proliferate following exposure to U. macrophylla extracts. Whereas similar
GI50 and IC50 values for U. macrophylla extracts against HCT116 cells
suggests that extracts are potent to HCT116 cells causing lost in viability and
colony forming abilities.
Appendix V-C: Effects of U. macrophylla extracts to HCT116 (A: bark and
leaf) and MCF-7 (B: bark and leaf) cells’ survival and clonogenicity. Bars
(error bar = SEM) denote the mean % of MCF-7/HCT116 colonies formed
after 24 h exposure to extracts from ≥ 3 (n = 4) individual experiments; plating
efficiencies were ≥ 80% per experiment. ANOVA univariate analysis was used
to compare each extract-treated group to the control group. Any statistically
significant values are denoted: * = 0.05< p.
Bark
EtO
H [30
, 60, 120
]
CHL [2.5, 5, 1
0]
HEX [2.5, 5, 1
0]
0
20
40
60
80
100
Colo
ny (
%)
Extract GI50 concentration [µg/ml]
* ** * *
Leaf
EtO
H [4
2, 84, 168
]
CHL [4, 8, 1
6]
HEX [12
.5, 2
5, 50]
0
20
40
60
80
100
Colo
ny (
%)
Extract GI50 concentration [µg/ml]
0 X
0.5 X
1 X
2 X
GI50 concentration
*
*
*
*
*
* *
*
*
A
EtO
H [25
, 50, 100
]
CHL [2, 4, 8
]
HEX [3, 6, 1
2]
0
20
40
60
80
100
Extract GI50
concentration [µg/ml]
Colo
ny (
%)
Bark
* **
Leaf
EtO
H [4
5, 90, 180
]
CHL [2
, 4, 8
]
HEX [10
, 20, 40]
0
20
40
60
80
100
Colo
ny (
%)
Extract GI50
concentration [µg/ml]
0 X
0.5 X
1 X
2 X
GI50 concentration
**
*
B

262
V-3 Uvaria macrophylla extracts effects on HCT116 cell cycle
distribution
Flow cytometric technique was employed to determine HCT116 cell cycle
distribution following treatment to U. macrophylla extracts as outlined in
section 7.2.5.1. In general, cell cycle distribution of HCT116 cells appeared to
be comparable to that of DMSO control cells (Figure 8-25). Cell cycle
histograms of cells exposed to EtOH extracts revealed subtle differences when
compared to that of the control, such as decrease in G1/0 phase accompanied
by increased S phase levels. Whereas HEX bark extract treatment suggests a
possible increase in G2/M cell population accompanied by a decrease in G1/0
cell population. Interestingly, CHL extract treated cells revealed increased
sub-G1 cell population, which is indicative of apoptotic cells; CHL leaf extract
appeared to be most active in increasing % of sub-G1 HCT116 cells. In
summary, preliminary data suggests low concentration of U. macrophylla CHL
extracts could possess compounds causing cells to undergo apoptosis, however
further analysis are required to confirm this finding and enable the use of
statistical analysis to reveal if the cell cycle distribution of extract-treated cells
are indeed different to the control population.

263
Appendix V-D: Detection of propidium iodide staining of HCT116 cellular DNA content after exposure to U. macrophylla extracts at 4X
GI50 concentration for 48 hour. Data is represented as histogram of cellular DNA content representation of cell population % in each cell cycle
phase; images from a single representative experiment are shown. The samples were kept chilled overnight in a solution conta ining buffer,
detergent and ribonuclease A prior to analysis. Results were established from three experiments of ≥ 15,000 cells per sample (n = 2) and
processed using EXPO32 software.
Copyright © 2022 FDOKUMEN