Abundance of harbour porpoise and other cetaceans in the North Sea and adjacent waters
16
Journal of Applied Ecology 2002 39, 361– 376 © 2002 British Ecological Society Blackwell Science Ltd Abundance of harbour porpoise and other cetaceans in the North Sea and adjacent waters P.S. HAMMOND*, P. BERGGREN†, H. BENKE‡, D.L. BORCHERS§, A. COLLET¶, M.P. HEIDE-JØRGENSEN**, S. HEIMLICH*, A.R. HIBY††, M.F. LEOPOLD‡‡ and N. ØIEN§§ *Sea Mammal Research Unit, Gatty Marine Laboratory, University of St Andrews, St Andrews, Fife KY16 8LB, UK; †Department of Zoology, Stockholm University, S-106 91 Stockholm, Sweden; ‡Deutsches Museum für Meereskunde und Fischerei, Katharinenberg 14/20, D-18439, Stralsund, Germany; §Research Unit for Wildlife Population Assessment, Mathematical Institute, North Haugh, University of St Andrews, St Andrews, Fife KY16 9SS, UK; ¶CIRCE, Musée Maritime de La Rochelle, BP 3053, 17031 La Rochelle cedex 1, France; **Danbiu ApS., Tornagervej 2, DK-2920 Charlottenlund, Denmark; ††Conservation Research Ltd, 110, Hinton Way, Great Shelford, Cambridge CB2 5AL, UK; ‡‡Alterra-Texel, Postbus 167 1790 AD Den Burg, the Netherlands; and §§Institute of Marine Research, PO Box 1870 Nordnes, N-5024 Bergen, Norway Summary 1. The status of small cetaceans in the North Sea and adjacent waters has been of concern for many years. Shipboard and aerial line transect surveys were conducted to provide accurate and precise estimates of abundance as a basis for conservation strategy in European waters. 2. The survey, known as SCANS (Small Cetacean Abundance in the North Sea), was conducted in summer 1994 and designed to generate precise and unbiased abundance estimates. Thus the intensity of survey was high, and data collection and analysis methods allowed for the probability of detection of animals on the transect line being less than unity and, for shipboard surveys, also allowed for animal movement in response to the survey platform. 3. Shipboard transects covered 20 000 km in an area of 890 000 km 2 . Aerial transects covered 7000 km in an area of 150 000 km 2 . 4. Three species dominated the data. Harbour porpoise Phocoena phocoena were encountered throughout the survey area except in the Channel and the southern North Sea. Whitebeaked dolphin Lagenorhynchus albirostris and minke whale Balaenoptera acutorostrata were found mainly in the north-western North Sea. 5. Phocoena phocoena abundance for the entire survey area was estimated as 341 366 [coefficient of variation (CV) = 0·14; 95% confidence interval (CI) = 260 000 – 449 000]. The estimated number of B. acutorostrata was 8445 (CV = 0·24; 95% CI 5000 – 13 500). The estimate for L. albirostris based on confirmed sightings of this species was 7856 (CV = 0·30; 95% CI = 4000 –13 000). When Atlantic whitesided dolphin Lagenorhynchus acutus and Lagenorhynchus spp. sightings were included, this estimate increased to 11 760 (CV = 0·26; 95% CI 5900 –18 500). 6. Shortbeaked common dolphin Delphinus delphis were found almost exclusively in the Celtic Sea. Abundance was estimated as 75 450 (CV = 0·67; 95% CI = 23 000–149 000). 7. Current assessments and recommendations by international fora concerning the impact on P. phocoena of bycatch in gillnet fisheries in the North Sea and adjacent waters are based on these estimates. Key-words: conservation, line transect sampling, management, minke whale, Phocoena phocoena, shortbeaked common dolphin, sightings survey, whitebeaked dolphin. Journal of Applied Ecology (2002) 39, 361– 376 Correspondence: Dr P.S. Hammond, Sea Mammal Research Unit, Gatty Marine Laboratory, University of St Andrews, Fife KY16 8LB, UK (fax +44 1334 462632; e-mail [email protected]).
-
Upload
st-andrews -
Category
Documents
-
view
2 -
download
0
Transcript of Abundance of harbour porpoise and other cetaceans in the North Sea and adjacent waters

Journal of Applied Ecology 2002 39, 361–376
© 2002 British Ecological Society
Blackwell Science LtdAbundance of harbour porpoise and other cetaceans in the North Sea and adjacent waters
P.S. HAMMOND*, P. BERGGREN†, H. BENKE‡, D.L. BORCHERS§, A. COLLET¶, M.P. HEIDE-JØRGENSEN**, S. HEIMLICH*, A.R. HIBY††, M.F. LEOPOLD‡‡ and N. ØIEN§§*Sea Mammal Research Unit, Gatty Marine Laboratory, University of St Andrews, St Andrews, Fife KY16 8LB, UK; †Department of Zoology, Stockholm University, S-106 91 Stockholm, Sweden; ‡Deutsches Museum für Meereskunde und Fischerei, Katharinenberg 14/20, D-18439, Stralsund, Germany; §Research Unit for Wildlife Population Assessment, Mathematical Institute, North Haugh, University of St Andrews, St Andrews, Fife KY16 9SS, UK; ¶CIRCE, Musée Maritime de La Rochelle, BP 3053, 17031 La Rochelle cedex 1, France; **Danbiu ApS., Tornagervej 2, DK-2920 Charlottenlund, Denmark; ††Conservation Research Ltd, 110, Hinton Way, Great Shelford, Cambridge CB2 5AL, UK; ‡‡Alterra-Texel, Postbus 167 1790 AD Den Burg, the Netherlands; and §§Institute of Marine Research, PO Box 1870 Nordnes, N-5024 Bergen, Norway
Summary
1. The status of small cetaceans in the North Sea and adjacent waters has been of concernfor many years. Shipboard and aerial line transect surveys were conducted to provideaccurate and precise estimates of abundance as a basis for conservation strategy inEuropean waters.2. The survey, known as SCANS (Small Cetacean Abundance in the North Sea), wasconducted in summer 1994 and designed to generate precise and unbiased abundanceestimates. Thus the intensity of survey was high, and data collection and analysis methodsallowed for the probability of detection of animals on the transect line being less thanunity and, for shipboard surveys, also allowed for animal movement in response to thesurvey platform.3. Shipboard transects covered 20 000 km in an area of 890 000 km2. Aerial transectscovered 7000 km in an area of 150 000 km2.4. Three species dominated the data. Harbour porpoise Phocoena phocoena wereencountered throughout the survey area except in the Channel and the southern NorthSea. Whitebeaked dolphin Lagenorhynchus albirostris and minke whale Balaenopteraacutorostrata were found mainly in the north-western North Sea.5. Phocoena phocoena abundance for the entire survey area was estimated as 341 366[coefficient of variation (CV) = 0·14; 95% confidence interval (CI) = 260 000–449 000].The estimated number of B. acutorostrata was 8445 (CV = 0·24; 95% CI 5000–13 500).The estimate for L. albirostris based on confirmed sightings of this species was 7856(CV = 0·30; 95% CI = 4000–13 000). When Atlantic whitesided dolphin Lagenorhynchusacutus and Lagenorhynchus spp. sightings were included, this estimate increased to11 760 (CV = 0·26; 95% CI 5900–18 500).6. Shortbeaked common dolphin Delphinus delphis were found almost exclusively in theCeltic Sea. Abundance was estimated as 75 450 (CV = 0·67; 95% CI = 23 000–149 000).7. Current assessments and recommendations by international fora concerning theimpact on P. phocoena of bycatch in gillnet fisheries in the North Sea and adjacentwaters are based on these estimates.
Key-words: conservation, line transect sampling, management, minke whale, Phocoenaphocoena, shortbeaked common dolphin, sightings survey, whitebeaked dolphin.
Journal of Applied Ecology (2002) 39, 361–376
Correspondence: Dr P.S. Hammond, Sea Mammal Research Unit, Gatty Marine Laboratory, University of St Andrews, FifeKY16 8LB, UK (fax +44 1334 462632; e-mail [email protected]).

362P.S. Hammond et al.
© 2002 British Ecological Society, Journal of Applied Ecology, 39,361–376
Introduction
The status of small cetaceans, particularly the harbourporpoise Phocoena phocoena L., in the North Sea andadjacent waters has been of concern for many years.This concern has stemmed from substantial incidentalcatches in fishing operations (Clausen & Andersen1988; Berggren 1994; Lowry & Teilmann 1995;Tregenza et al. 1997; Vinther 1999), from declines inthe number of stranding records (Smeenk 1987; Colletet al. 1994) and incidental sightings in coastal waters(Verwey & Wolff 1983; Evans et al. 1986; Evans 1990;Berggren & Arrhenius 1995a,b), and from the possiblerisks from contaminants (Morris et al. 1989; Law &Whinnett 1992; Law et al. 1992; Simmonds 1992;Kuiken et al. 1993; Berggren et al. 1999; Jepson et al.1999) and disturbance (Evans, Canwell & Lewis 1992).
There is a need for basic information on the biologyof P. phocoena and other small cetaceans, includingtheir current abundance. Some quantitative data havebeen used to estimate relative or absolute abundance(Heide-Jørgensen et al. 1992, 1993; Leopold, Wolf &van der Meer 1992; Camphuysen & Leopold 1993;Berggren & Arrhenius 1995b; Bjørge & Øien 1995;Northridge et al. 1995). Except for Northridge et al.(1995), these studies have covered only parts of the NorthSea and adjacent waters and in all cases the methodo-logies limit the inferences possible from the data. In par-ticular, where line transect sampling was conducted,the standard assumption was that all animals on thetransect line were detected. This is unlikely for ceta-ceans in general and certainly not for P. phocoena.
The need for accurate and precise estimates of abund-ance of P. phocoena and other small cetaceansthroughout the North Sea and adjacent waters hasbeen recognized by the UN Convention on the Con-servation of Migratory Species (Bonn Conven-tion), through its Agreement on the Conservation ofSmall Cetaceans of the Baltic and North Seas(ASCOBANS); the European Union, through itsDirective on the Conservation of Natural Habitats andof Wild Fauna and Flora; the UN Environment Pro-gramme, through its Global Plan of Action for Ceta-ceans; the International Council for the Exploration ofthe Sea (ICES); the North Sea Ministerial Conference;and the International Whaling Commission (IWC).The latter specifically recommended that P. phocoenaabundance should be estimated using dedicated sight-ings surveys in the North and Baltic Seas (IWC 1992).
Project SCANS (small cetacean abundance in theNorth Sea and adjacent waters) was initiated in 1993 tofulfil this need. The objectives were to identify con-centrations of P. phocoena and other small cetaceansin this area and to estimate their abundance in orderto provide essential information for conservation,management and future monitoring.
The project involved an intensive shipboard andaerial survey using line transect sampling (Hiby &Hammond 1989; Buckland et al. 1993). Phocoena phocoena
is a difficult species for such surveys because its smallsize and undemonstrative behaviour at the surface makeit hard to detect except in good conditions. Because ofthis and the aim of obtaining precise abundance esti-mates, the survey intensity was greater than is typical.
In addition, the aim of obtaining accurate estimatesof abundance dictated that important potential sourcesof bias in methodology needed to be addressed. Thisparticularly applied to estimation of the probability ofdetecting animals on the transect line and the possibil-ity that animals might respond to the survey ships. Pre-vious shipboard surveys for P. phocoena have usedmethods that allowed estimation of the probability ofdetecting animals on the transect line (Barlow 1988;Palka 1995a) but have not addressed the potentialproblem of responsive movement. In aerial surveys,Barlow et al. (1988) did not directly estimate the prob-ability of detecting animals on the transect line. Thedevelopment of methods for shipboard and aerial linetransect surveys specifically tailored to the estimationof absolute abundance of P. phocoena thus formed anintegral part of the project. This methodology shouldalso be appropriate for other species.
Survey area and design
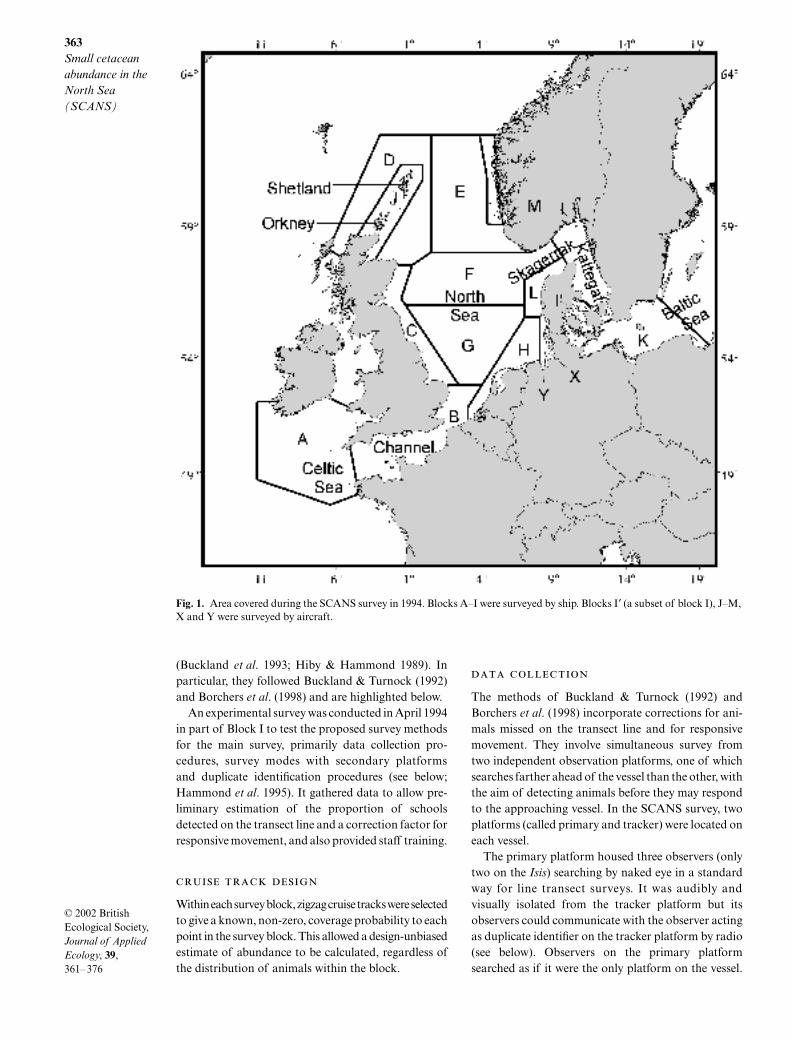
The survey area (Fig. 1) covered that area specifiedin ASCOBANS (http://www.ascobans.org) excludingmost of the Baltic Sea proper, where densities wereexpected to be too low to conduct an effective survey.The Celtic Sea was included because of a particularconcern about the impact of P. phocoena bycatches inbottom set gillnet fisheries (Tregenza et al. 1997).
The survey area was stratified into blocks on thebasis of logistical constraints and taking account ofexisting information on cetacean distribution and rel-ative abundance, particularly for P. phocoena (Heide-Jørgensen et al. 1992, 1993; Camphuysen & Leopold1993; Northridge et al. 1995; P.G.H. Evans, unpub-lished data).
Most blocks were surveyed by ship. Aerial surveyswere flown in blocks covering coastal waters that wereeither difficult to survey by ship and/or that wereexpected to have high densities of P. phocoena. Block Kwas also surveyed by air as an efficient way to obtainsome information on distribution but was not expectedto yield an estimate of abundance. Blocks A–I were sur-veyed by nine ships for a total of 7 ship months between27 June and 26 July 1994. With the exception of blockG, a single vessel surveyed each block. Two aircraftsurveyed in tandem formation blocks I′ (a subset ofblock I), L, X and Y and a single aircraft surveyedblocks J, K and M between 26 June and 3 August 1994(Table 1).
Shipboard survey methods
Methods to estimate abundance from shipboard sur-veys were based on standard line transect sampling
363Small cetacean abundance in the North Sea (SCANS)
© 2002 British Ecological Society, Journal of Applied Ecology, 39,361–376
(Buckland et al. 1993; Hiby & Hammond 1989). Inparticular, they followed Buckland & Turnock (1992)and Borchers et al. (1998) and are highlighted below.
An experimental survey was conducted in April 1994in part of Block I to test the proposed survey methodsfor the main survey, primarily data collection pro-cedures, survey modes with secondary platformsand duplicate identification procedures (see below;Hammond et al. 1995). It gathered data to allow pre-liminary estimation of the proportion of schoolsdetected on the transect line and a correction factor forresponsive movement, and also provided staff training.
Within each survey block, zigzag cruise tracks were selectedto give a known, non-zero, coverage probability to eachpoint in the survey block. This allowed a design-unbiasedestimate of abundance to be calculated, regardless ofthe distribution of animals within the block.
The methods of Buckland & Turnock (1992) andBorchers et al. (1998) incorporate corrections for ani-mals missed on the transect line and for responsivemovement. They involve simultaneous survey fromtwo independent observation platforms, one of whichsearches farther ahead of the vessel than the other, withthe aim of detecting animals before they may respondto the approaching vessel. In the SCANS survey, twoplatforms (called primary and tracker) were located oneach vessel.
The primary platform housed three observers (onlytwo on the Isis) searching by naked eye in a standardway for line transect surveys. It was audibly andvisually isolated from the tracker platform but itsobservers could communicate with the observer actingas duplicate identifier on the tracker platform by radio(see below). Observers on the primary platformsearched as if it were the only platform on the vessel.
Fig. 1. Area covered during the SCANS survey in 1994. Blocks A–I were surveyed by ship. Blocks I′ (a subset of block I), J–M,X and Y were surveyed by aircraft.

364P.S. Hammond et al.
© 2002 British Ecological Society, Journal of Applied Ecology, 39,361–376
They were instructed to concentrate within 500 mof the vessel and to attempt to obtain data from twoor three resightings of detected schools to facilitateduplicate identification. Primary observers co-operatedin recording times, angles and radial distances todetected schools as accurately as possible, togetherwith other relevant data (species, school size, orienta-tion, etc.). Angles from the transect line to the detectedschools were measured using angle-boards mountedon the platforms. Radial distances were estimatedvisually.
On the tracker platform, there were three observers(only two on the Isis): two trackers, searching far aheadof the vessel using 7 × 50 reticule binoculars, and oneduplicate identifier. The trackers’ responsibility wasthe detection of animals sufficiently far ahead of thevessel that they would not yet have reacted to thevessel’s presence, and the tracking of these schoolsuntil they had either passed abeam or had been detectedby the primary observers. Trackers were instructedto concentrate beyond 500 m ahead of the vessel. Assoon as one tracker made an initial sighting of a school,the other tracker assisted him/her in obtaining andrecording times, angles and radial distances for thisand all repeat sightings as accurately as possible, togetherwith other relevant data for a sighting as describedabove. Radial distances were estimated using thereticules in the binoculars, which were mounted onmonopods passing through angle-boards on theplatform.
The duplicate identifier received information from boththe trackers and from the observers on the primaryplatform (by radio) immediately when sightings weremade. His/her responsibility was the identification ofduplicates, i.e. schools detected from both the tracker andprimary platforms. In consultation with the two trackers,the duplicate identifier classified duplicates in real timeas ‘definite’, ‘likely’ or ‘possible’ according to the degreeof certainty that the pair were indeed duplicates, basedprimarily on times and locations of detected schools.
All data on detected schools were recorded byobservers onto audio-tape and transcribed at the endof each day. Data on searching effort and sighting con-ditions were recorded in real time on a computer linkedto the ship’s global positioning system (GPS).
Experiments were conducted during the survey toallow estimation of the bias and variance of radial dis-tances estimated by eye and using reticule binoculars,for each observer on each vessel. The experiments wereconducted while the vessels were stationary, using din-ghies as targets. One vessel used a polystyrene modelporpoise as a target. While surveying, vessels towed aline with buoys attached every 100 m as a means forobservers to practise and calibrate their distanceestimations while off duty.
Data analysis followed Borchers et al. (1998); thefollowing summarizes relevant points for this survey.
Table 1. Survey vessels, survey effort and surface areas for each survey block. Aerial survey block I′ was a subset of shipboardsurvey block I. See text for description of good and moderate conditions for aerial survey
Block Survey ship Searching effort (km) % sea state 4 or less % sea state 2 or less Surface area (km2)
Shipboard surveysA Dana 2 974 100 67 201 490B Henny 1 470 100 54 105 223C Henny 1 557 100 77 43 744D Abel-J 2 552 99 43 102 277E Gorm 2 556 96 49 109 026F Corvette 3 118 100 50 118 985G Holland + Tridens 3 372 99 65 113 741H Isis 854 100 80 45 515I Gunnar Thorsen 1 475 100 94 49 485Total 19 927 99 61 889 486
Block Aerial survey mode Searching effort (km)% good + moderateconditions % good conditions Surface area (km2)
Aerial surveysI′ Tandem aircraft 1891 80 51 8 170
Single aircraft 26 47 0J Single aircraft 684 47 0 31 059K Single aircraft 685 90 51 65 369L Tandem aircraft 551 79 35 18 176M Single aircraft 1712 88 45 12 612X Tandem aircraft 200 87 77 5 810
Single aircraft 705 91 64Y Tandem aircraft 608 96 46 7 278Total 7062 82 45 148 747

365Small cetacean abundance in the North Sea (SCANS)
© 2002 British Ecological Society, Journal of Applied Ecology, 39,361–376
Modelling school detection probability
The probability of detecting a school from the primaryplatform can be modelled as a function of any observ-able explanatory variable and not just perpendiculardistance. This is important because methods that relyon duplicate detection data can be biased if detectionprobabilities vary among schools. Here, variables toinclude in estimating abundance were selected only ifthey had a significant effect on detection probability(see below).
Interval estimation
Coefficients of variation (CV) and confidence intervals(CI) were estimated using a non-parametric bootstrapprocedure, which does not require the assumption ofindependence, in which transects were the samplingunit. Resampling was performed separately withineach survey block, conditioning on the total searchingeffort in the block. Confidence limits were obtainedas the 2·5 and 97·5 percentiles of the bootstrapdistributions.
Data selection
Guidelines for truncating data with respect to perpen-dicular distance given by Buckland et al. (1993) werefollowed as far as possible, keeping in mind the need tokeep the truncation distance sufficiently large so thatthe chance of a school moving into the detection areaof the primary platform from outside the truncationdistance was small. The data were also truncated athigher sea states. Detection probabilities of P. phocoenadecline with sea state (Barlow 1988; Palka 1995a,b).Preliminary estimates indicated a sharp decline in theirdetectability between Beaufort 2 and 3. Consequently,for P. phocoena, data from sea states Beaufort 0–2 onlywere used in analyses. For all other species, data fromBeaufort 0–4 were used.
Detection function estimation
There were sufficient data to estimate abundance forP. phocoena, Balaenoptera acutorostrata Lacepede andLagenorhynchus albirostris Gray. Explanatory vari-ables tested for inclusion in the model included: seastate; school size; vessel; aspect (a nominal variableindicating the orientation of the animal with respect tothe observer’s line of sight); cue (a nominal variableindicating the type of detection cue presented by theanimal); behaviour (a nominal variable indicatingbehaviour type); glare (an ordinal variable indexingthe degree to which glare interfered with detection);and swell height (a continuous variable measuringthe height of ocean swell). For B. acutorostrataand L. albirostris, there was no evidence that anyobserved variables other than perpendicular dis-tance affected detection probability, and this was
consequently modelled only as a function of perpen-dicular distance.
For P. phocoena, however, three explanatory vari-ables other than perpendicular distance significantlyaffected detection probability: sea state, school size andvessel. For the vessel effect, precision was improved bylimited pooling of data from vessels that had smallsample sizes, using the similarity of the estimatedvessel-effect parameters as the primary criterion forpooling. Separate vessel-effect parameters were esti-mated for the vessels Abel-J, Gunnar Thorsen andHenny; further vessel-effect parameters were estimatedfor Corvette, Dana and Gorm, combined, and Holland,Tridens and Isis, combined.
Mean school size
In Borchers et al. (1998), observed school sizes wereincorporated directly into the estimation of animalabundance, avoiding the need to estimate mean schoolsize as in conventional line transect methods. Meanschool size can be estimated, however, as the ratio ofthe estimate of animal abundance to school abundance.Variances and confidence intervals of mean school sizewere estimated using the transect-based bootstrap pro-cedure described above.
Estimated distance experiments
Only distance and angle data from the tracker platformwere used in the analysis (Borchers et al. 1998). Bias inestimated distance was estimated using the slope andintercept of a linear regression of estimated reticuleagainst true reticule. True reticule was obtained byconverting the radar distance to the target object to areticule reading, using the known angle of declinationbetween reticules for the binoculars used. Bias in angledata was estimated in the same way.
In the case of angles, an additive error model wasfound to be adequate and no significant bias was foundon any vessel. In the case of reticules, multiplicativeerror models, in which variance increases with increas-ing reticule, described the data better. No experimentaldata were available from the Isis, but some reticule esti-mation bias was found on all other vessels. A signi-ficant observer effect was found on the Dana, Hennyand Tridens.
Bias in the observed reticules was corrected bysubtracting from them the intercept of the regressionline (if the intercept was significant) and/or dividingthem by the slope of the regression line (if the slopewas significant). This bias-corrected reticule was thenconverted to a distance, using the known angle ofdeclination between reticules on the binoculars.
Sensitivity to duplicate identification
In this analysis, duplicates identified as definite andlikely were considered to be true duplicates. The
366P.S. Hammond et al.
© 2002 British Ecological Society, Journal of Applied Ecology, 39,361–376
sensitivity of the abundance estimates to this assump-tion was investigated by also estimating abundance: (i)taking only definite duplicates to be true duplicates;and (ii) taking definite, likely and possible duplicates tobe true duplicates.
Aerial survey methods
Methods to estimate abundance from aerial surveyswere based on standard line transect sampling tech-niques (Hiby & Hammond 1989; Buckland et al. 1993)but used the specific methods of Hiby & Lovell (1998);important points are highlighted below.
Replicate zigzag tracks were constructed in each blockby first defining a set of parallel lines perpendicular toa common axis, and then using the intersections ofthose lines with the block boundaries as successivewaypoints for the track. Each set of parallel lines pro-vided two replicate tracks; for example, one starting atthe eastern end of the southern-most line and the otherat the western end. Further tracks were constructed byshifting the set of parallel lines along the axis (Hiby &Lovell 1998).
The tracks were designed to give twice the mean cov-erage in block I′ (the area of expected highest density)and half the mean coverage in block K (the area ofexpected lowest density) compared with the remainingblocks (J, M, L, X and Y). Inevitably, the coverageacross a block varied in response to the shape of theblock boundary, but the variation was minimized byadjusting the orientation of the common axis, and thisremaining variation was allowed for by the methodused to estimate abundance (Hiby & Lovell 1998).
Aircraft flew at 167 km h–1 (90 knots) at 182 m (600feet). In survey blocks I′ L, X and Y, two aircraft weredeployed in tandem formation (one flying about 9 kmbehind the other) to provide the potential for detectionof the same school by both aircraft. The exact timesand positions of sightings during these tandem phasesof the survey were used to estimate the proportion oftime P. phocoena was visible from the survey aircraftunder different conditions.
Bubble windows allowed the two rear observers oneach aircraft to search the sea area on their side of theaircraft, from the abeam line forward to the transectline with no blind area under the aircraft. All sightinginformation was recorded on acoustic tape. A con-tinuous time signal was recorded on the same tape sothat, on transcription, the time that each sighting wasabeam of the aircraft could be determined to thenearest second. This was important for data collectedduring the tandem surveys because the times at whichthe aircraft drew abeam of detected schools provided
the most powerful indication of which schools were‘duplicates’, i.e. were detected from both aircraft.Given the time the leading aircraft draws abeam of adetected school, the expected time the trailing aircraftwill draw abeam of the same school can be calculatedfrom the record of aircraft positions. These were loggedfrom the GPS in each aircraft onto a computer thatalso relayed the GPS time signal to the acoustic tape,ensuring that time signals used in both aircraft weresynchronous.
Species, school size and the declination angle to theschool as it came abeam were recorded for each sight-ing. Declination angle was estimated using a hand-helddeclinometer and, in conjunction with aircraft altitude,provided an estimate of the perpendicular distance toeach school. Altitude was continuously logged on theleading aircraft from the radar altimeter. The trailingaircraft used a pressure altimeter, which was calibratedbefore each flight.
Beaufort sea state, cloud cover, angle obscured byglare, turbidity, and an overall subjective assessment ofsighting conditions of ‘good’, ‘moderate’ or ‘poor’,were recorded by one of the two observers in the lead-ing aircraft at the commencement of each track leg andwhenever any of these values changed.
The waypoint coordinates of each planned transectwere stored in the aircraft GPS. During the flight, allrecorded positions could therefore be related to theplanned track line allowing the cross-track error, i.e.the perpendicular distance of the aircraft from theplanned track line, to be calculated and the expectedposition for a school seen by the leading aircraft rel-ative to the trailing aircraft to be calculated.
The same protocol was followed when the aircraftdid not fly in tandem (in blocks J, K and M) except thatobservers on each aircraft were then responsible forrecording sighting conditions.
Data were analysed using the methods of Hiby &Lovell (1998). Reduction in detection probability withdistance from the track line was estimated by fittingdetection functions with the hazard rate form (Buckland1985) to the perpendicular distance data for all schoolsdetected on tandem and non-tandem effort, assumingthat both aircraft had the same detection function.Because of the limited data available, stratificationwas limited to the overall subjective assessmentsof good and moderate sighting conditions. Search-ing effort under poor conditions yielded almost nosightings and was excluded from analysis.
The effective strip width also depended on the prob-ability of detection of schools directly on the track line.Both this probability and the reduction in detectionprobability with perpendicular distance affected theproportion of duplicate sightings so that, given an esti-mate of the detection function, the observed duplicateproportion would allow the probability of detection on

367Small cetacean abundance in the North Sea (SCANS)
© 2002 British Ecological Society, Journal of Applied Ecology, 39,361–376
the track line, and hence the effective strip width, to becalculated.
It was impossible to ‘track’ sightings from the lead-ing aircraft back to the trailing aircraft. However, itwas possible to predict at what time a sighting from theleading aircraft would come abeam of the trailing air-craft. Sightings from the trailing aircraft that occurredclose to this predicted time were thus likely candidatesfor duplicates. Because it was difficult to know howclose to the predicted time a sighting from the trailingaircraft should be in order to be classed as a duplicate,the sightings were not classified in this way. Instead, thelikelihood of all intersighting intervals was calculatedand maximized with respect to the probability of detec-tion of a school on the track line and the parameters ofa movement model for P. phocoena, which also incorpo-rated the effect of positioning errors by the observers.The likelihood was calculated for all possible arrange-ments of leading and trailing sightings into duplicatesand non-duplicates and summed over all the possibili-ties. The resulting estimate of detection probability wasfound to be insensitive to the type of movementassumed (diffusive or directed) and was consistent withtelemetry estimates of time spent at or near the surfaceby P. phocoena, made by Westgate et al. (1995).
Abundance from a given track was estimated usingthe inverse selection probability method (Hansen &Hurwitz 1943). The cruise track design program wasused to calculate coverage probabilities based on anominal strip width of 1 km, for all locations alongeach track where schools were detected from bothtandem and non-tandem effort. These were then multi-plied by the average estimated effective strip widthfor that track to give the probabilities of detecting eachschool on the transect line required to estimate abund-ance. This method requires that every point of the surveyarea has a non-zero chance of being surveyed; thecruise track design program was used to verify this.
Analysis of replicate tracks within each survey blockgave a mean abundance estimate with CV and con-fidence limits for each block.
Results
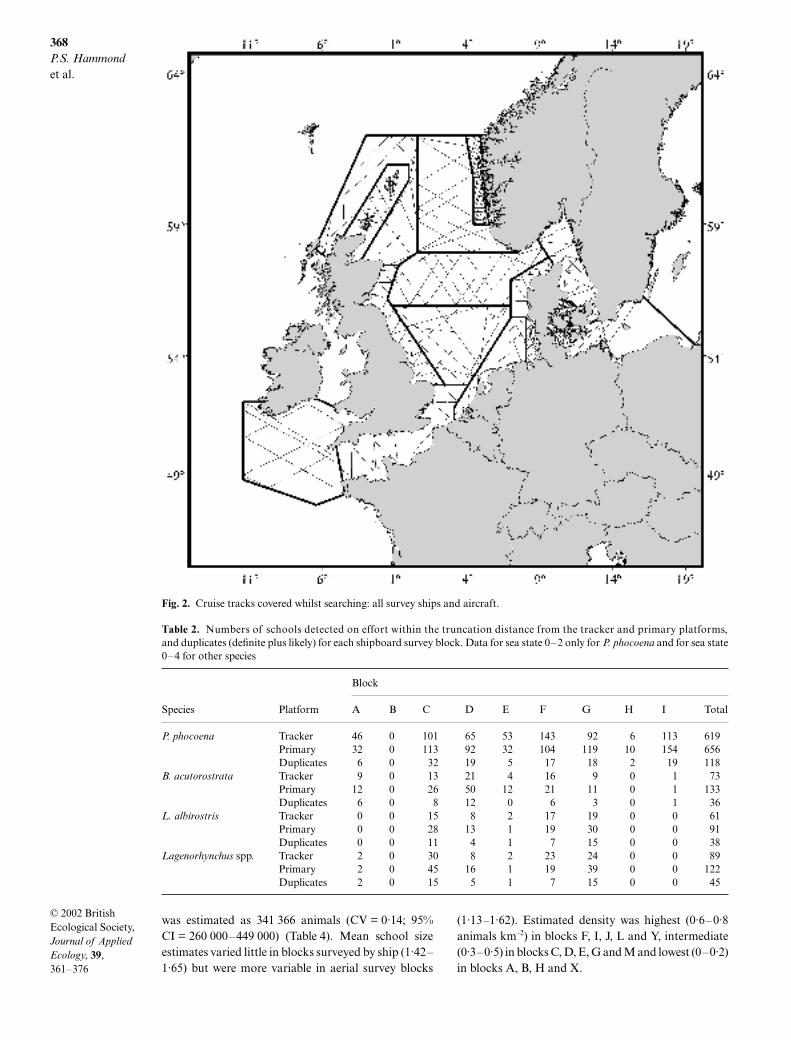
Excellent coverage was achieved over most of the sur-vey area (Fig. 2). Two blocks received substantially lesseffort than planned: aerial survey blocks J (Shetlandand Orkney) and K (western Baltic), as a result ofdeteriorating weather towards the end of the surveyperiod. Note that searching effort did not extend tocoastal inlets in some areas. In particular, because ofthe complexity of the terrain, the fjord waters of west-ern Norway were not covered by block M.
Phocoena phocoena were seen throughout most ofthe North Sea, Skagerrak and Kattegat and the CelticSea. None were seen in the Channel or the southern
part of the North Sea, and only a few were seen in theBaltic Sea (Fig. 3). Sightings were concentrated in thecentral North Sea, but it is important not to overinter-pret the data presented in this way. The number ofschools detected was a function of the distribution ofeffort and of the sighting conditions, which wereaccounted for in estimating abundance. Nevertheless, itwas clear that during the survey period of July therewere large numbers of P. phocoena offshore as well as incoastal waters.
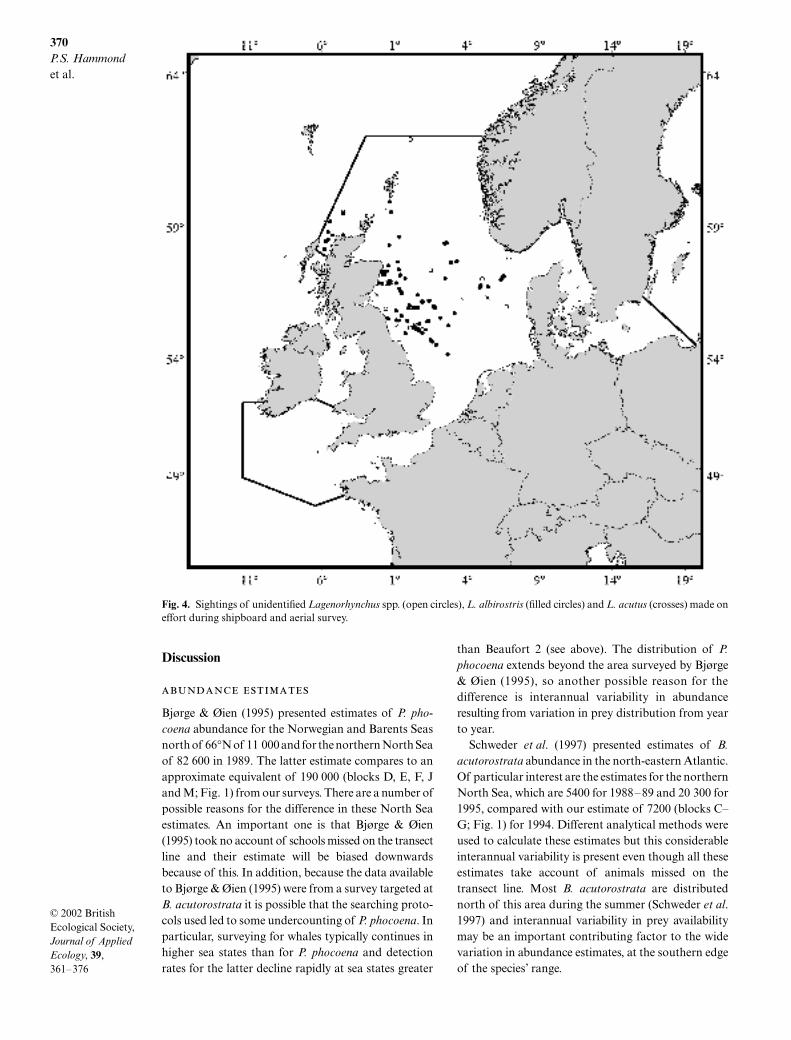
Lagenorhynchus albirostris was concentrated in aband across the North Sea between 54° and 60°N,mostly to the west of 4°E (Fig. 4). Nine Lagenorhyn-chus acutus Gray schools were identified but there were43 sightings of unidentified Lagenorhynchus, so it islikely that the large majority of these were L. albirostrisand that the abundance for this species based on con-firmed sightings alone was underestimated. For thisreason, an estimate of all Lagenorhynchus sightingscombined was also calculated.
Balaenoptera acutorostrata was also mostly detectedin the north-western North Sea (north of 55°N andwest of about 4°E) and in the Celtic Sea (Fig. 5).
Twenty-eight of 29 sightings of Delphinus delphis L.were made in the Celtic Sea.
Almost all (99%) searching effort on shipboard surveyswas in sea state 4 or less; the percentage in sea state 2 orless varied between 43% in block D and 94% in block I(Table 1). Most (82%) aerial survey effort was categor-ized as moderate or good (Table 1). There were suffi-cient sightings from the shipboard surveys to estimateabundance for P. phocoena, B. acutorostrata and L.albirostris using the methods described above(Table 2). For the aerial survey, abundance could onlybe estimated for P. phocoena (Table 3); only one B.acutorostrata sighting and one L. albirostris sightingwere made (in block J).
Duplicates as a percentage of tracker sightings, overall blocks, were 19% for P. phocoena, 49% for B. acuto-rostrata, 62% for L. albirostris and 49% for Lageno-rhynchus spp. Duplicate percentages varied markedlyamong vessels, with ranges of 9–32% for P. phocoena,23–67% for B. acutorostrata, 41–73% for L. albirostrisand 30–63% for L. albirostris, for blocks with at leastfive tracker sightings (Table 2).
There were no unexpected patterns in detectionprobability as a function of perpendicular distance. Inthe shipboard surveys, detection probability declinedsteadily for P. phocoena, declined quite sharply in thefirst 100 m for B. acutorostrata, and was fairly flat outto 800 m for L. albirostris. In the aerial surveys, detectionprobability for P. phocoena was fairly flat out to about200 m and then declined sharply.
Abundance of P. phocoena was estimated for allsurvey blocks except block K (because of insufficientcoverage; Fig. 2). Total abundance in the survey area
368P.S. Hammond et al.
© 2002 British Ecological Society, Journal of Applied Ecology, 39,361–376
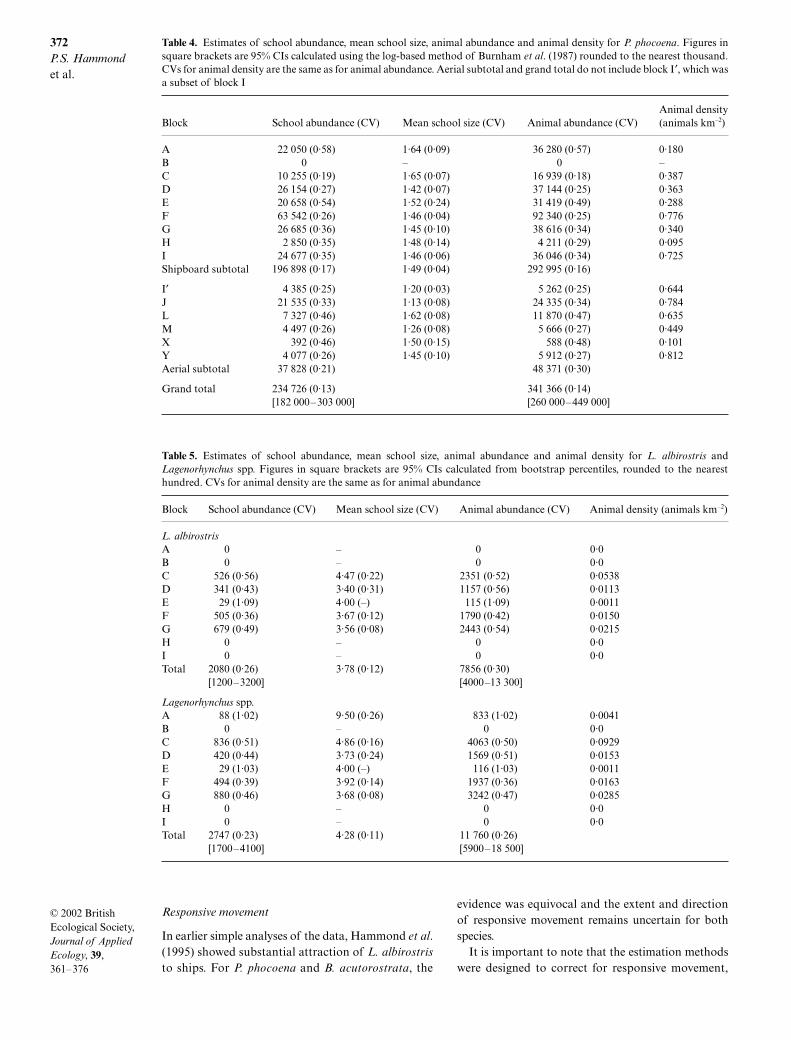
was estimated as 341 366 animals (CV = 0·14; 95%CI = 260 000–449 000) (Table 4). Mean school sizeestimates varied little in blocks surveyed by ship (1·42–1·65) but were more variable in aerial survey blocks
(1·13–1·62). Estimated density was highest (0·6–0·8animals km–2) in blocks F, I, J, L and Y, intermediate(0·3–0·5) in blocks C, D, E, G and M and lowest (0–0·2)in blocks A, B, H and X.
Fig. 2. Cruise tracks covered whilst searching: all survey ships and aircraft.
Table 2. Numbers of schools detected on effort within the truncation distance from the tracker and primary platforms,and duplicates (definite plus likely) for each shipboard survey block. Data for sea state 0–2 only for P. phocoena and for sea state0–4 for other species
Species Platform
Block
A B C D E F G H I Total
P. phocoena Tracker 46 0 101 65 53 143 92 6 113 619Primary 32 0 113 92 32 104 119 10 154 656Duplicates 6 0 32 19 5 17 18 2 19 118
B. acutorostrata Tracker 9 0 13 21 4 16 9 0 1 73Primary 12 0 26 50 12 21 11 0 1 133Duplicates 6 0 8 12 0 6 3 0 1 36
L. albirostris Tracker 0 0 15 8 2 17 19 0 0 61Primary 0 0 28 13 1 19 30 0 0 91Duplicates 0 0 11 4 1 7 15 0 0 38
Lagenorhynchus spp. Tracker 2 0 30 8 2 23 24 0 0 89Primary 2 0 45 16 1 19 39 0 0 122Duplicates 2 0 15 5 1 7 15 0 0 45

369Small cetacean abundance in the North Sea (SCANS)
© 2002 British Ecological Society, Journal of Applied Ecology, 39,361–376
Abundance of L. albirostris, based on confirmedsightings of this species, was estimated as 7856 animals(CV = 0·30; 95% CI = 4000–13 300) (Table 5). Meanschool size ranged from 3·4 to 4·5. The estimatednumber of L. albirostris plus L. acutus (including un-identified Lagenorhynchus spp.) was 11 760 (CV = 0·26;95% CI 5900–18 900). Mean school size ranged from3·7 to 9·5. Estimated density was highest (0·05–0·09animals km–2) along the coast of Britain (block C).
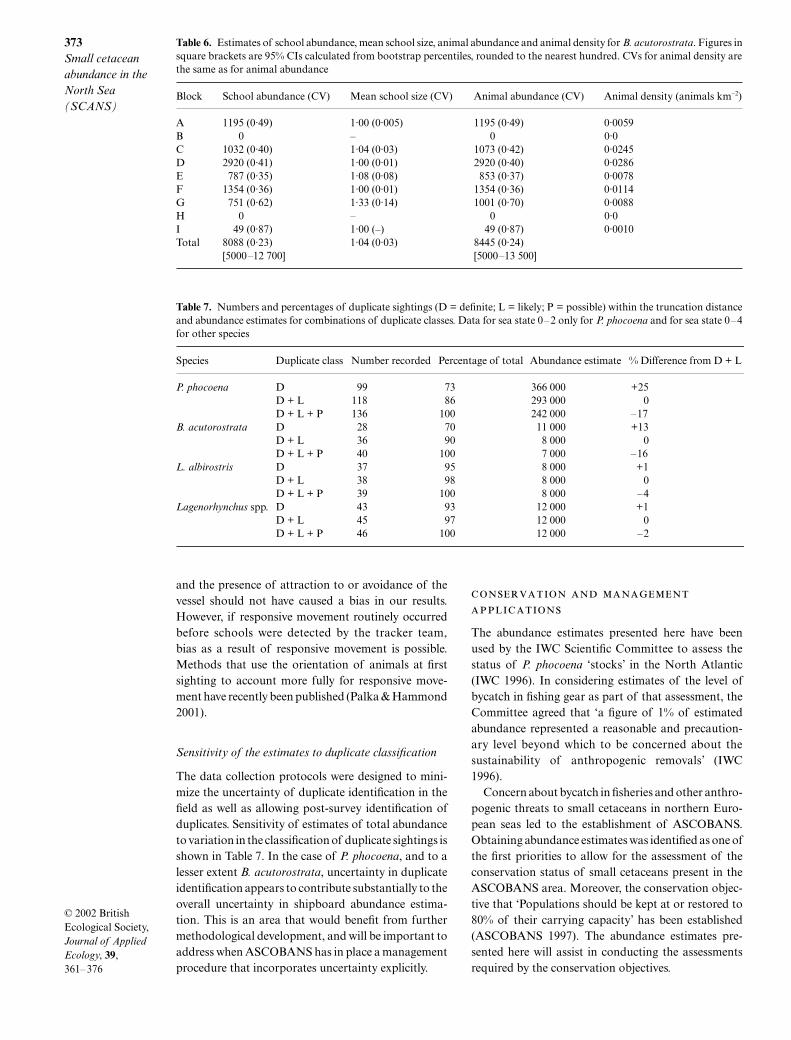
Abundance of B. acutorostrata was estimated as8445 animals (CV = 0·24; 95% CI = 5000–13 500)(Table 6). Mean school size ranged from 1·0 to 1·33.Estimated density was highest (0·025–0·03 animalskm–2) in the north and along the coast of Britain(blocks C and D) and lower (around 0·01) in otherareas of the central and northern North Sea (blocks E,F and G).
There were insufficient data to estimate abundanceof D. delphis using the methods described above, but anestimate was made for block A using standard linetransect methods; that is, with correction neither foranimals missed on the transect line nor for responsive
movement. The estimates were: school abundance 6986(CV = 0·62; 95% CI 2100–23 300), mean school size10·8 (CV = 0·25) and animal abundance 75 450(CV = 0·67; 95% CI 23 000–249 000).
Fig. 3. Sightings of Phocoena phocoena made on effort during shipboard and aerial survey.
Table 3. Sightings used in aerial abundance estimation for P.phocoena. Numbers of schools detected on effort from theleading and trailing aircraft under tandem effort and on singleaircraft effort are shown for each survey block
Block
Number of sightings of P. phocoena
Tandem aircraft
Single aircraftLeading Trailing
I′ 71 75 20J – – 32K – – 3L 23 22 –M – – 45X 5 1 5Y 31 21 –Total 130 119 105
370P.S. Hammond et al.
© 2002 British Ecological Society, Journal of Applied Ecology, 39,361–376
Discussion
Bjørge & Øien (1995) presented estimates of P. pho-coena abundance for the Norwegian and Barents Seasnorth of 66°N of 11 000 and for the northern North Seaof 82 600 in 1989. The latter estimate compares to anapproximate equivalent of 190 000 (blocks D, E, F, Jand M; Fig. 1) from our surveys. There are a number ofpossible reasons for the difference in these North Seaestimates. An important one is that Bjørge & Øien(1995) took no account of schools missed on the transectline and their estimate will be biased downwardsbecause of this. In addition, because the data availableto Bjørge & Øien (1995) were from a survey targeted atB. acutorostrata it is possible that the searching proto-cols used led to some undercounting of P. phocoena. Inparticular, surveying for whales typically continues inhigher sea states than for P. phocoena and detectionrates for the latter decline rapidly at sea states greater
than Beaufort 2 (see above). The distribution of P.phocoena extends beyond the area surveyed by Bjørge& Øien (1995), so another possible reason for thedifference is interannual variability in abundanceresulting from variation in prey distribution from yearto year.
Schweder et al. (1997) presented estimates of B.acutorostrata abundance in the north-eastern Atlantic.Of particular interest are the estimates for the northernNorth Sea, which are 5400 for 1988–89 and 20 300 for1995, compared with our estimate of 7200 (blocks C–G; Fig. 1) for 1994. Different analytical methods wereused to calculate these estimates but this considerableinterannual variability is present even though all theseestimates take account of animals missed on thetransect line. Most B. acutorostrata are distributednorth of this area during the summer (Schweder et al.1997) and interannual variability in prey availabilitymay be an important contributing factor to the widevariation in abundance estimates, at the southern edgeof the species’ range.
Fig. 4. Sightings of unidentified Lagenorhynchus spp. (open circles), L. albirostris (filled circles) and L. acutus (crosses) made oneffort during shipboard and aerial survey.

371Small cetacean abundance in the North Sea (SCANS)
© 2002 British Ecological Society, Journal of Applied Ecology, 39,361–376
Northridge et al. (1997) examined the available datafor L. albirostris in the North Sea and around theBritish Isles and concluded that the observed distribu-tion suggested that these animals may form a separatepopulation from those found further north and west.The summer distribution comprised the survey areacovered by SCANS (Fig. 1) and the shelf waters tothe west of Scotland. Our estimate can therefore beviewed as a first estimate of the size of this putativepopulation, albeit biased downwards through notincluding animals west of Scotland. It is also biaseddownwards because many of the unidentifiedLagenorhynchus sightings are likely to have been ofL. albirostris.
The two central assumptions of conventional linetransect theory that are most likely to be violated whensurveying small cetaceans are that all animals on thetransect line are detected and that animals remain
stationary or move little before they are detected. Anotherimportant factor is that detection probabilities maybe influenced by factors other than perpendiculardistance The new methods developed as part of projectSCANS and used to estimate abundance here (Borcherset al. 1998; Hiby & Lovell 1998) were designed toimprove significantly previously available methodsof data collection and analysis. The methods weresuccessfully implemented and we believe they doconstitute an improvement to cetacean surveymethodology.
Data collection
Measuring distance at sea remains difficult but is acritical determinant of accurate data for line transectsampling, including the determination of duplicates(see below). Recent developments in the use of photo-graphic and video images for distance measurement(Gordon 2001) may help to improve shipboard surveydata in the future.
Fig. 5. Sightings of B. acutorostrata made on effort during shipboard and aerial survey.
372P.S. Hammond et al.
© 2002 British Ecological Society, Journal of Applied Ecology, 39,361–376
Responsive movement
In earlier simple analyses of the data, Hammond et al.(1995) showed substantial attraction of L. albirostristo ships. For P. phocoena and B. acutorostrata, the
evidence was equivocal and the extent and directionof responsive movement remains uncertain for bothspecies.
It is important to note that the estimation methodswere designed to correct for responsive movement,
Table 4. Estimates of school abundance, mean school size, animal abundance and animal density for P. phocoena. Figures insquare brackets are 95% CIs calculated using the log-based method of Burnham et al. (1987) rounded to the nearest thousand.CVs for animal density are the same as for animal abundance. Aerial subtotal and grand total do not include block I′, which wasa subset of block I
Block School abundance (CV) Mean school size (CV) Animal abundance (CV)Animal density(animals km–2)
A 22 050 (0·58) 1·64 (0·09) 36 280 (0·57) 0·180B 0 – 0 –C 10 255 (0·19) 1·65 (0·07) 16 939 (0·18) 0·387D 26 154 (0·27) 1·42 (0·07) 37 144 (0·25) 0·363E 20 658 (0·54) 1·52 (0·24) 31 419 (0·49) 0·288F 63 542 (0·26) 1·46 (0·04) 92 340 (0·25) 0·776G 26 685 (0·36) 1·45 (0·10) 38 616 (0·34) 0·340H 2 850 (0·35) 1·48 (0·14) 4 211 (0·29) 0·095I 24 677 (0·35) 1·46 (0·06) 36 046 (0·34) 0·725Shipboard subtotal 196 898 (0·17) 1·49 (0·04) 292 995 (0·16)
I′ 4 385 (0·25) 1·20 (0·03) 5 262 (0·25) 0·644J 21 535 (0·33) 1·13 (0·08) 24 335 (0·34) 0·784L 7 327 (0·46) 1·62 (0·08) 11 870 (0·47) 0·635M 4 497 (0·26) 1·26 (0·08) 5 666 (0·27) 0·449X 392 (0·46) 1·50 (0·15) 588 (0·48) 0·101Y 4 077 (0·26) 1·45 (0·10) 5 912 (0·27) 0·812Aerial subtotal 37 828 (0·21) 48 371 (0·30)
Grand total 234 726 (0·13) 341 366 (0·14)[182 000–303 000] [260 000–449 000]
Table 5. Estimates of school abundance, mean school size, animal abundance and animal density for L. albirostris andLagenorhynchus spp. Figures in square brackets are 95% CIs calculated from bootstrap percentiles, rounded to the nearesthundred. CVs for animal density are the same as for animal abundance
Block School abundance (CV) Mean school size (CV) Animal abundance (CV) Animal density (animals km–2)
L. albirostrisA 0 – 0 0·0B 0 – 0 0·0C 526 (0·56) 4·47 (0·22) 2351 (0·52) 0·0538D 341 (0·43) 3·40 (0·31) 1157 (0·56) 0·0113E 29 (1·09) 4·00 (–) 115 (1·09) 0·0011F 505 (0·36) 3·67 (0·12) 1790 (0·42) 0·0150G 679 (0·49) 3·56 (0·08) 2443 (0·54) 0·0215H 0 – 0 0·0I 0 – 0 0·0Total 2080 (0·26) 3·78 (0·12) 7856 (0·30)
[1200–3200] [4000–13 300]
Lagenorhynchus spp.A 88 (1·02) 9·50 (0·26) 833 (1·02) 0·0041B 0 – 0 0·0C 836 (0·51) 4·86 (0·16) 4063 (0·50) 0·0929D 420 (0·44) 3·73 (0·24) 1569 (0·51) 0·0153E 29 (1·03) 4·00 (–) 116 (1·03) 0·0011F 494 (0·39) 3·92 (0·14) 1937 (0·36) 0·0163G 880 (0·46) 3·68 (0·08) 3242 (0·47) 0·0285H 0 – 0 0·0I 0 – 0 0·0Total 2747 (0·23) 4·28 (0·11) 11 760 (0·26)
[1700–4100] [5900–18 500]
373Small cetacean abundance in the North Sea (SCANS)
© 2002 British Ecological Society, Journal of Applied Ecology, 39,361–376
and the presence of attraction to or avoidance of thevessel should not have caused a bias in our results.However, if responsive movement routinely occurredbefore schools were detected by the tracker team,bias as a result of responsive movement is possible.Methods that use the orientation of animals at firstsighting to account more fully for responsive move-ment have recently been published (Palka & Hammond2001).
Sensitivity of the estimates to duplicate classification
The data collection protocols were designed to mini-mize the uncertainty of duplicate identification in thefield as well as allowing post-survey identification ofduplicates. Sensitivity of estimates of total abundanceto variation in the classification of duplicate sightings isshown in Table 7. In the case of P. phocoena, and to alesser extent B. acutorostrata, uncertainty in duplicateidentification appears to contribute substantially to theoverall uncertainty in shipboard abundance estima-tion. This is an area that would benefit from furthermethodological development, and will be important toaddress when ASCOBANS has in place a managementprocedure that incorporates uncertainty explicitly.
The abundance estimates presented here have beenused by the IWC Scientific Committee to assess thestatus of P. phocoena ‘stocks’ in the North Atlantic(IWC 1996). In considering estimates of the level ofbycatch in fishing gear as part of that assessment, theCommittee agreed that ‘a figure of 1% of estimatedabundance represented a reasonable and precaution-ary level beyond which to be concerned about thesustainability of anthropogenic removals’ (IWC1996).
Concern about bycatch in fisheries and other anthro-pogenic threats to small cetaceans in northern Euro-pean seas led to the establishment of ASCOBANS.Obtaining abundance estimates was identified as one ofthe first priorities to allow for the assessment of theconservation status of small cetaceans present in theASCOBANS area. Moreover, the conservation objec-tive that ‘Populations should be kept at or restored to80% of their carrying capacity’ has been established(ASCOBANS 1997). The abundance estimates pre-sented here will assist in conducting the assessmentsrequired by the conservation objectives.
Table 6. Estimates of school abundance, mean school size, animal abundance and animal density for B. acutorostrata. Figures insquare brackets are 95% CIs calculated from bootstrap percentiles, rounded to the nearest hundred. CVs for animal density arethe same as for animal abundance
Block School abundance (CV) Mean school size (CV) Animal abundance (CV) Animal density (animals km–2)
A 1195 (0·49) 1·00 (0·005) 1195 (0·49) 0·0059B 0 – 0 0·0C 1032 (0·40) 1·04 (0·03) 1073 (0·42) 0·0245D 2920 (0·41) 1·00 (0·01) 2920 (0·40) 0·0286E 787 (0·35) 1·08 (0·08) 853 (0·37) 0·0078F 1354 (0·36) 1·00 (0·01) 1354 (0·36) 0·0114G 751 (0·62) 1·33 (0·14) 1001 (0·70) 0·0088H 0 – 0 0·0I 49 (0·87) 1·00 (–) 49 (0·87) 0·0010Total 8088 (0·23) 1·04 (0·03) 8445 (0·24)
[5000–12 700] [5000–13 500]
Table 7. Numbers and percentages of duplicate sightings (D = definite; L = likely; P = possible) within the truncation distanceand abundance estimates for combinations of duplicate classes. Data for sea state 0–2 only for P. phocoena and for sea state 0–4for other species
Species Duplicate class Number recorded Percentage of total Abundance estimate % Difference from D + L
P. phocoena D 99 73 366 000 +25D + L 118 86 293 000 0D + L + P 136 100 242 000 –17
B. acutorostrata D 28 70 11 000 +13D + L 36 90 8 000 0D + L + P 40 100 7 000 –16
L. albirostris D 37 95 8 000 +1D + L 38 98 8 000 0D + L + P 39 100 8 000 –4
Lagenorhynchus spp. D 43 93 12 000 +1D + L 45 97 12 000 0D + L + P 46 100 12 000 –2
374P.S. Hammond et al.
© 2002 British Ecological Society, Journal of Applied Ecology, 39,361–376
In recent years, levels of P. phocoena bycatch inbottom set gillnet fisheries have been estimated in theCeltic Sea (Tregenza et al. 1997), the North Sea(Northridge & Hammond 1999; Vinther 1999) and theSkagerrak Sea (Carlström & Berggren 1996; Harwoodet al. 1999). Using the 1% criterion agreed by the IWC,bycatches estimated in all these areas are consideredto be unsustainable. Continued monitoring ofabundance, bycatch rates and levels of fishing effort arenecessary to enable further assessments of the impactof bycatch on P. phocoena populations in particular.
In summary, the results presented here fill one of thekey information gaps hindering assessment of theimpact of threats to small cetacean populations inthe North Sea and adjacent waters. The main reasonfor undertaking this work was to provide the data onabundance to complete one of the essential first steps inthe formulation of a conservation and managementplan for small cetaceans in this area. In this primary aim,the work has been successful. Similarly, assessments ofthe impact of bycatch would not have been possiblewithout the estimates of abundance calculated from thiswork. There now exist baseline estimates of abundancefor the main species of cetacean in the North Sea andadjacent waters that will serve as a reference point forthe future and upon which a framework for a manage-ment and monitoring programme can be founded.
The surveys covered a large area, but there are signi-ficant parts of the range of P. phocoena in Europeanwaters that were not surveyed. One such area is theBaltic Sea, where P. phocoena used to be common(Skora, Pawliczka & Klinowska 1988; Berggren 1994;Berggren & Arrhenius 1995a) but is now scarce. Addi-tional surveys were conducted in the Baltic Sea in 1995that resulted in an abundance estimate of about 600(CV = 0·57) animals in the southern Baltic Sea excludingPolish coastal waters (P. Berggren et al., unpublisheddata). It is important that a future survey be conductedthat covers the entire known range of P. phocoena inthe Baltic Sea to allow for a complete assessment ofthe species in this area.
Another important area encompasses the waters tothe west and north of the British Isles where P. phocoenaare known to be abundant (Leopold, Wolf & van derMeer 1992; Pollock et al. 1997; Weir et al. 2001; Skovet al. 2002; Reid et al., in press). It is important that theseareas are surveyed so that a more complete picture ofP. phocoena abundance in European waters can emerge.
Our results provide baseline estimates of abundancebut tell us nothing about whether or not any of the spe-cies are increasing, decreasing or are stable in numbers.There are a number of ways to determine this status.Recent analytical developments (Bravington 2000) fordata collected from so-called platforms of opportunity(Northridge et al. 1995) may allow useful informationon temporal and spatial changes in relative abundance
to be gleaned in some areas. The SCANS survey wasintended to provide the first of a series of absoluteabundance estimates. The interval between such sur-veys depends on a number of factors both scientific andpolitical, but the interval should probably not exceed10 years. Future dedicated surveys will eventuallyprovide data for the estimation of a long-term rate ofpopulation change.
Acknowledgements
This work was funded by the European CommissionLIFE programme under project LIFE 92-2/UK/027,by the governments of Denmark, France, Germany,Ireland, the Netherlands, Norway, Sweden and theUK, and by WWF Sweden. The work would not havebeen possible without the contribution of the manycrew, the cruise leaders (B. Couperus, G. Desportes, G.Donovan, J. Forcada, D. Palka and J. Teilmann, inaddition to authors) and the 60 observers that parti-cipated in the shipboard and aerial surveys. Themanuscript was improved by comments fromthree anonymous referees. S. Buckland, S. Hedley andP. Lovell made significant additional contributionsto data collection methodology and logistics. KateGrellier created the figures.
References
ASCOBANS (1997) Report of the Second Meeting of Parties toASCOBANS, 17–19 November 1997. ASCOBANS Secretariat,Bonn, Germany.
Barlow, J. (1988) Harbour porpoise, Phocoena phocoena,abundance estimation for California, Oregon and Wash-ington. I. Ship surveys. Fishery Bulletin (US), 86, 417–432.
Barlow, J., Oliver, C.W., Jackson, T.D. & Taylor, B.L. (1988)Harbour porpoise, Phocoena phocoena, abundance estima-tion for California, Oregon and Washington. II. Aerialsurveys. Fishery Bulletin (US), 86, 433–444.
Berggren, P. (1994) Bycatches of the harbour porpoise (Phocoenaphocoena) in the Swedish Skagerrak, Kattegat and BalticSeas 1973–1993. Reports of the International Whaling Com-mission, Special Issue, 15, 211–215.
Berggren, P. & Arrhenius, F. (1995a) Sightings of harbourporpoises (Phocoena phocoena) in Swedish waters before1990. Reports of the International Whaling Commission,Special Issue, 16, 99–107.
Berggren, P. & Arrhenius, F. (1995b) Densities and seasonaldistribution of harbour porpoises (Phocoena phocoena) inthe Swedish Skagerrak, Kattegat and Baltic Seas. Reportsof the International Whaling Commission, Special Issue, 16,109–121.
Berggren, P., Ishaq, R., Zebühr, Y., Näf, C., Bandh, C. &Broman, D. (1999) Patterns and levels of organochlorinecontaminants (DDTs, PCBs, non-ortho PCBs and PCDD/Fs)in male harbour porpoises (Phocoena phocoena) from theBaltic Sea, the Kattegat–Skagerrak Seas and the West Coastof Norway. Marine Pollution Bulletin, 12, 1070–1084.
Bjørge, A. & Øien, N. (1995) Distribution and abundance ofharbour porpoise, Phocoena phocoena, in Norwegian waters.Reports of the International Whaling Commission, SpecialIssue, 16, 89–98.
Borchers, D.L., Buckland, S.T., Goedhart, P.W., Clarke, E.D.& Hedley, S.L. (1998) Horvitz–Thompson estimators for double-platform line transect surveys. Biometrics, 54, 1221–1237.

375Small cetacean abundance in the North Sea (SCANS)
© 2002 British Ecological Society, Journal of Applied Ecology, 39,361–376
Bravington, M.V. (2000) Covariate Models for Continuous-Time Sightings Data. Document SC/52/RMP14. ScientificCommittee of the International Whaling Commission,Cambridge, UK.
Buckland, S.T. (1985) Perpendicular distance models for linetransect sampling. Biometrics, 41, 177–195.
Buckland, S.T. & Turnock, B.J. (1992) A robust line transectmethod. Biometrics, 48, 901–909.
Buckland, S.T., Anderson, D.R., Burnham, K.P. & Laake, J.L.(1993) Distance Sampling: Estimating Abundance of Biolo-gical Populations. Chapman & Hall, London, UK.
Burnham, K.P., Anderson, D.R., White, G.C., Brownie, C. &Pollock, K.H. (1987) Design and analysis methods for fishsurvival experiments based on release–recapture. AmericanFisheries Society Monograph 5, Bethesda, Maryland,USA.
Camphuysen, C.J. & Leopold, M.F. (1993) The harbourporpoise Phocoena phocoena in the southern North Sea,particularly the Dutch sector. Lutra, 36, 1–24.
Carlström, C. & Berggren, P. (1996) Bycatch Estimates ofHarbour Porpoises (Phocoena phocoena) in the SwedishSkagerrak Sea Obtained from Independent Observer Data.Document SC/48/SM25. The Scientific Committee of theInternational Whaling Commission, Cambridge, UK.
Clausen, B. & Andersen, S. (1988) Evaluation of bycatch andhealth status of the harbour porpoise (Phocoena phocoena)in Danish waters. Danish Review of Game Biology, 13, 1–20.
Collet, A., Gourvenec, A., Firmin, V. & Leboulanger, F. (1994)Harbour Porpoises and other Small Cetaceans off the FrenchChannel coasts. Internal Report. Centre de Recherche surles Mammifères Marins, Musée Océanographique, LaRochelle, France.
Evans, P.G.H. (1990) Harbour Porpoises (Phocoena phocoena)in British and Irish Waters. Document SC/42/SM49. TheScientific Committee of the International Whaling Com-mission, Cambridge, UK.
Evans, P.G.H., Canwell, P.J. & Lewis, E.J. (1992) An experi-mental study of the effects of pleasure craft noise upon bottle-nosed dolphins in Cardigan Bay, West Wales. EuropeanResearch on Cetaceans, 6, 43–46.
Evans, P.G.H., Harding, S., Tyler, G. & Hall, S. (1986) Ana-lysis of Cetacean Sightings in the British Isles, 1958–1985.Nature Conservancy Council, Peterborough, UK.
Gordon, J. (2001) Measuring the range to animals at sea fromboats using photographic and video images. Journal ofApplied Ecology, 38, 879–887.
Hammond, P.S., Benke, H., Berggren, P., Borchers, D.L.,Buckland, S.T., Collet, A., Heide-Jørgensen, M.P.,Heimlich-Boran, S., Hiby, A.R., Leopold, M.F. & Øien, N.(1995) Distribution and Abundance of the Harbour Porpoiseand other Small Cetaceans in the North Sea and AdjacentWaters. Final Report under European Commission, ProjectLIFE 92-2/UK/027. Sea Mammal Research Unit, GattyMarine Laboratory, University of St Andrews, Fife, UK.
Hansen, M.M. & Hurwitz, W.N. (1943) On the theory ofsampling from finite populations. Annals of MathematicalStatistics, 14, 333–362.
Harwood, J., Andersen, L.W., Berggren, P., Carlström, J.,Kinze, C.C., Mcglade, J., Metuzals, K., Larsen, F.,Lockyer, C.H., Northridge, S., Rogan, E., Walton, M. &Vinther, M. (1999) Assessment and Reduction of the By-catch of Small Cetaceans (BY-CARE). Final Report underEuropean Commission, Project FAIR-CT05-0523. SeaMammal Research Unit, Gatty Marine Laboratory, Uni-versity of St Andrews, Fife, UK.
Heide-Jørgensen, M.P., Mosbech, A., Teilmann, J., Benke, H.& Schulz, W. (1992) Harbour porpoise (Phocoenaphocoena) densities obtained from aerial surveys north ofFyn and in the Bay of Kiel. Ophelia, 35, 133–146.
Heide-Jørgensen, M.P., Teilmann, J., Benke, H. & Wulf, J.
(1993) Abundance and distribution of harbour porpoisesPhocoena phocoena in selected areas of the western Balticand the North Sea. Helgoländer Meeresuntersuchungen, 47,335–346.
Hiby, A.R. & Hammond, P.S. (1989) Survey techniquesfor estimating the abundance of cetaceans. Reports of theInternational Whaling Commission, Special Issue, 11, 47–80.
Hiby, L. & Lovell, P. (1998) Using aircraft in tandem forma-tion to estimate abundance of harbour porpoise. Biometrics,54, 1280–1289.
IWC (1992) Report of the Scientific Committee. Reports of theInternational Whaling Commission, 42, 210.
IWC (1996) Report of the Scientific Committee. Reports of theInternational Whaling Commission, 46, 160–171.
Jepson, P.D., Bennett, P.M., Allchin, C.R., Law, R.J., Kuiken, T.,Baker, J.R., Rogan, E. & Kirkwood, J.K. (1999) Investigat-ing potential associations between chronic exposure topolychlorinated biphenyls and infectious disease mortalityin harbour porpoises from England and Wales. Science ofthe Total Environment, 243/244, 339–348.
Kuiken, T., Hofle, U., Bennett, P.M., Allchin, C.R., Kirkwood, J.K.,Baker, J.R., Appleby, E.C., Lockyer, C.H., Wotton, M.J. &Sheldrick, M.C. (1993) Adrenocortical hyperplasia, diseaseand chlorinated hydrocarbons in the harbour porpoise(Phocoena phocoena). Marine Pollution Bulletin, 26,440–446.
Law, R.J. & Whinnett, J.A. (1992) Polycyclic aromatic hydro-carbons in muscle tissue of harbour porpoises (Phocoenaphocoena) from UK waters. Marine Pollution Bulletin, 24,550–553.
Law, R.J., Jones, B.R., Baker, J.R., Kennnedy, S., Milne, R. &Morris, R.J. (1992) Trace metals in the livers of marinemammals from the Welsh coast and the Irish Sea. MarinePollution Bulletin, 24, 296–304.
Leopold, M.F., Wolf, P.A. & van der Meer, J. (1992) Theelusive harbour porpoise exposed: strip transect counts offsouthwestern Ireland. Netherlands Journal of Sea Research,29, 395–402.
Lowry, N. & Teilmann, J. (1995) Bycatch and bycatchreduction of the harbour porpoise (Phocoena phocoena)in Danish waters. Reports of the International WhalingCommission, Special Issue, 15, 203–209.
Morris, R.J., Law, R.J., Allchin, C.R., Kelly, C.A. & Fileman, C.F.(1989) Metals and organochlorines in dolphins andporpoises in Cardigan Bay, West Wales. Marine PollutionBulletin, 20, 512–523.
Northridge, S.P. & Hammond, P.S. (1999) Estimation ofPorpoise Mortality in UK Gill and Tangle Net Fisheries in theNorth Sea and west of Scotland. Document SC/51/SM42.The Scientific Committee of the International WhalingCommission, Cambridge, UK.
Northridge, S.P., Tasker, M.L., Webb, A., Camphuysen, K.& Leopold, M. (1997) White-beaked Lagenorhyncusalbirostris and Atlantic white-sided dolphin L. acutusdistributions in northwest European and US NorthAtlantic waters. Reports of the International WhalingCommission, 47, 797–805.
Northridge, S.P., Tasker, M.L., Webb, A. & Williams, J.M.(1995) Distribution and relative abundance of harbourporpoises (Phocoena phocoena, L.), whitebeaked dolphins(Lagenorhyncus albirostris, Gray) and minke whales(Balaenoptera acutorostrata, Lacepede) around the BritishIsles. ICES Journal of Marine Science, 52, 55–66.
Palka, D. (1995a) Abundance estimate of the Gulf of Maineharbor porpoise. Reports of the International WhalingCommission, Special Issue, 16, 27–50.
Palka, D. (1995b) Influences on spatial patterns of Gulfof Maine harbor porpoises. Whales, Seals, Fish andMan (eds A.S. Blix, L. Walløe & Ø. Ulltang), pp. 69–75.
376P.S. Hammond et al.
© 2002 British Ecological Society, Journal of Applied Ecology, 39,361–376
Developments in Marine Biology No. 4. Elsevier ScienceBV, Amsterdam, the Netherlands.
Palka, D.L. & Hammond, P.S. (2001) Accounting for responsivemovement in line transect estimates of abundance. CanadianJournal of Fisheries and Aquatic Sciences, 58, 777–787.
Pollock, C.M., Reid, J.B., Webb, A. & Tasker, M.L. (1997)The Distribution of Seabirds and Cetaceans in the Watersaround Ireland. JNCC Report No. 267. Joint Nature Con-servation Committee, Peterborough, UK.
Reid, J.B., Evans, P.G.H. & Northridge, S.P. (in press) Atlas ofCetacean Distribution in Northwest European Waters. JointNature Conservation Committee, Peterborough, UK, in press.
Schweder, T., Skaug, H.J., Dimakos, X.K., Langaas, M. &Øien, N. (1997) Abundance of northeastern Atlantic minkewhales, estimates for 1989 and 1995. Reports of the Inter-national Whaling Commission, 47, 453–483.
Simmonds, M.P. (1992) Cetacean mass mortalities and theirpotential relationship with pollution. Whales: Biology, Threatsand Conservation (ed. J.J. Symoens), pp. 217–245. RoyalAcademy of Overseas Sciences, Brussels, Belgium.
Skora, K.E., Pawliczka, I. & Klinowska, M. (1988) Observa-tions of the harbour porpoise (Phocoena phocoena) on thePolish Baltic coast. Aquatic Mammals, 14, 113–119.
Skov, H., Upton, A.J., Reid, J.B., Webb, A., Taylor, S.J. &Durinck, J. (2002) Dispersion and Vulnerability of Marine
Birds and Cetaceans in Faroese Waters. Joint Nature Con-servation Committee, Peterborough, UK, 106pp.
Smeenk, C. (1987) The harbour porpoise Phocoena phocoena(L., 1758) in the Netherlands: stranding records and decline.Lutra, 30, 77–90.
Tregenza, N.J.C., Berrow, S.D., Hammond, P.S. & Leaper, R.(1997) Harbour porpoise (Phocoena phocoena L.) by-catchin set gillnets in the Celtic Sea. ICES Journal of MarineScience, 54, 896–904.
Verwey, J. & Wolff, W.J. (1983) The common or harbourporpoise (Phocoena phocoena). Ecology of the WaddenSea, Vol. 2, Part 7: Marine Mammals. (ed. W.J. Wolff ),pp. 51–58. A.A. Balkema, Rotterdam, the Netherlands.
Vinther, M. (1999) Bycatches of harbour porpoises Phocoenaphocoena (L.) in Danish set-net fisheries. Journal of Ceta-cean Research and Management, 1, 123–135.
Weir, C.R., Pollock, C., Cronin, C. & Taylor, S. (2001) Ceta-ceans of the Atlantic Frontier, north and west of Scotland.Continental Shelf Research, 21, 1047–1071.
Westgate, A., Read, A., Berggren, P., Koopman, H. & Gaskin, D.(1995) Diving behaviour of harbour porpoises (Phocoenaphocoena) in the Bay of Fundy. Canadian Journal of Fisheriesand Aquatic Sciences, 52, 1064–1073.
Received 14 March 2001; final copy received 9 January 2002