Seasonal monitoring of cetaceans and validation of the REPCET system in terms of monitoring
12
— 37 — Sci. Rep. Port-Cros natl. Park, 28: 37-48 (2014) Seasonal monitoring of cetaceans and validation of the REPCET system in terms of monitoring Antonella ARCANGELI 1* , Simone COMINELLI 2 , Léa DAVID 3,6 , Nathalie DI-MEGLIO 3,6 , Aurélie MOULINS 2 , Pascal MAYOL 4,6 , Luca MARINI 5 , Massimiliano ROSSO 2 , Paola TEPSICH 2 1 ISPRA, Via Brancati 48, 00144 Rome, Italie. 2 CIMA Research Foundation, via Magliotto 2, 17100 Savona, Italie. 3 EcoOcean Institut : EcoOcéan Institut, 18 rue des hospices, 34090 Montpellier, France. 4 Souffleurs d’Ecume, Hôtel de ville, 83170 La Celle, France. 5 Accademia del Leviatano, V.le Astronomia 19, 00144 Rome, Italie. 6 GIS3M : Groupement d’Intérêt Scientifique pour les Mammifères Marins de Méditerranée et leur environnement, Le Kalliste Bât B4, 1 avenue Clément Monnier, 13960 Sausset-les- Pins, France. *Contact : [email protected] Résumé. Monitoring saisonnier des cétacés et validation du système REPCET en termes de monitoring. Un suivi des cétacés en mer à « petite échelle » temporelle et spatiale a été réalisé par le biais d’embarquements d’observateurs expérimentés (Marine Mammal Observers – MM0s) sur des plateformes opportunistes : les ferries. En 2011/2012 des MMOs ont embarqué sur quatre lignes couvrant le Sanctuaire Pelagos et ont utilisé la méthode de collecte standardisée du transect linéaire. Les traversées se sont faites selon un plan d’échantillonnage régulier tout au long de l’année. Pour les analyses, l’année a été divisée en trois périodes différentes : mars à mai 2011 - juin à septembre 2011 - octobre 2011 à avril 2012. Les résultats montrent que, aussi bien au niveau du peuplement (proportion des espèces), qu’au niveau des taux de rencontres ou de la distribution, il existe une hétérogénéité spatiale à petite échelle (inter-ligne) et à échelle locale (intra-ligne) ainsi qu’une hétérogénéité temporelle (entre l’été et les autres saisons) dans la zone du Sanctuaire. L’étude cherchait aussi à valider l’intérêt du système REPCET en tant qu’instrument de monitoring des cétacés. Pour ce faire, plusieurs compagnies maritimes ont été approchées et sensibilisées. Les résultats de l’analyse exploratoire des observations réalisées en 2011 apportent de nouveaux éclairages sur les potentialités scientifiques offertes par le système REPCET. Mots-clés : cétacés, mer Méditerranée, AMP, monitoring, plateforme opportuniste, ferry, REPCET. Abstract. A systematic monitoring programme on cetaceans at sea on a “large temporal and spatial scale” was carried out by Marine Mammal Observers (MMOs) on board of opportunist platforms (ferries). In 2011/2012 MMOs embarked on four routes crossing the Pelagos Sanctuary. The method for data collecting at sea was the standardized transect line and the surveys were undertaken according to a regular sampling design throughout the year. For the analysis, the sampled year was divided into three different periods: March to May 2011 - June to September 2011 - October 2011 to April 2012. Results showed that the proportion of species, the encounter rates per species and the distribution of
-
Upload
isprambiente -
Category
Documents
-
view
0 -
download
0
Transcript of Seasonal monitoring of cetaceans and validation of the REPCET system in terms of monitoring
— 37 —
Sci. Rep. Port-Cros natl. Park, 28: 37-48 (2014)
Seasonal monitoring of cetaceans and validation of the REPCET system
in terms of monitoring
Antonella ARCANGELI1*, Simone COMINELLI2, Léa DAVID3,6, Nathalie DI-MEGLIO3,6, Aurélie MOULINS2, Pascal MAYOL4,6,
Luca MARINI5 , Massimiliano ROSSO2, Paola TEPSICH2
1ISPRA, Via Brancati 48, 00144 Rome, Italie.2CIMA Research Foundation, via Magliotto 2, 17100 Savona, Italie.3EcoOcean Institut : EcoOcéan Institut, 18 rue des hospices, 34090 Montpellier, France.4Souffleurs d’Ecume, Hôtel de ville, 83170 La Celle, France.5Accademia del Leviatano, V.le Astronomia 19, 00144 Rome, Italie.6GIS3M : Groupement d’Intérêt Scientifique pour les Mammifères Marins de Méditerranée et leur environnement, Le Kalliste Bât B4, 1 avenue Clément Monnier, 13960 Sausset-les-Pins, France.*Contact : [email protected]
Résumé. Monitoring saisonnier des cétacés et validation du système REPCET en termes de monitoring. Un suivi des cétacés en mer à « petite échelle » temporelle et spatiale a été réalisé par le biais d’embarquements d’observateurs expérimentés (Marine Mammal Observers – MM0s) sur des plateformes opportunistes : les ferries. En 2011/2012 des MMOs ont embarqué sur quatre lignes couvrant le Sanctuaire Pelagos et ont utilisé la méthode de collecte standardisée du transect linéaire. Les traversées se sont faites selon un plan d’échantillonnage régulier tout au long de l’année. Pour les analyses, l’année a été divisée en trois périodes différentes : mars à mai 2011 - juin à septembre 2011 - octobre 2011 à avril 2012. Les résultats montrent que, aussi bien au niveau du peuplement (proportion des espèces), qu’au niveau des taux de rencontres ou de la distribution, il existe une hétérogénéité spatiale à petite échelle (inter-ligne) et à échelle locale (intra-ligne) ainsi qu’une hétérogénéité temporelle (entre l’été et les autres saisons) dans la zone du Sanctuaire. L’étude cherchait aussi à valider l’intérêt du système REPCET en tant qu’instrument de monitoring des cétacés. Pour ce faire, plusieurs compagnies maritimes ont été approchées et sensibilisées. Les résultats de l’analyse exploratoire des observations réalisées en 2011 apportent de nouveaux éclairages sur les potentialités scientifiques offertes par le système REPCET.
Mots-clés : cétacés, mer Méditerranée, AMP, monitoring, plateforme opportuniste, ferry, REPCET.
Abstract. A systematic monitoring programme on cetaceans at sea on a “large temporal and spatial scale” was carried out by Marine Mammal Observers (MMOs) on board of opportunist platforms (ferries). In 2011/2012 MMOs embarked on four routes crossing the Pelagos Sanctuary. The method for data collecting at sea was the standardized transect line and the surveys were undertaken according to a regular sampling design throughout the year. For the analysis, the sampled year was divided into three different periods: March to May 2011 - June to September 2011 - October 2011 to April 2012. Results showed that the proportion of species, the encounter rates per species and the distribution of
— 38 —
sightings per species changed during the monitored periods spatially, on both a large scale (inter-routes) and a local scale (intra-route), as well as temporarily (during summer and between seasons) within the Sanctuary. The study also sought to validate the interest of the REPCET system as a tool to monitor cetaceans. With this intention, several maritime companies were approached and made aware. The results of the exploratory analysis of the observations carried out in 2011 brought new insight on the scientific potentialities offered by the REPCET system.
Keywords: cetaceans, Mediterranean Sea, MPA, monitoring, platform of opportunity, ferry, REPCET.
Introduction
A synoptic large-scale cetacean monitoring program was realized within the Pelagos Sanctuary by a network of research organisms, using ferries as platforms of observation. In 2007 the ISPRA (Italian Institute for Research and Nature Protection), started a partnership with the maritime company Corsica Sardinia Ferries to embark Marine Mammals Observers (MMOs) to record data on cetaceans from the command deck of ferries. The results and the effectiveness of the method were remarkable in order to monitor cetaceans populations (Arcangeli et al., 2012; Arcangeli et al., 2010), so that the method was extended to other lines. In 2010 several French and Italian research organizations worked together to perform seasonal monitoring of cetacean in the Marine Protected Area. The project was founded by the open call “Programme de recherche 2010-2012” of Pelagos France.
Materials and methods
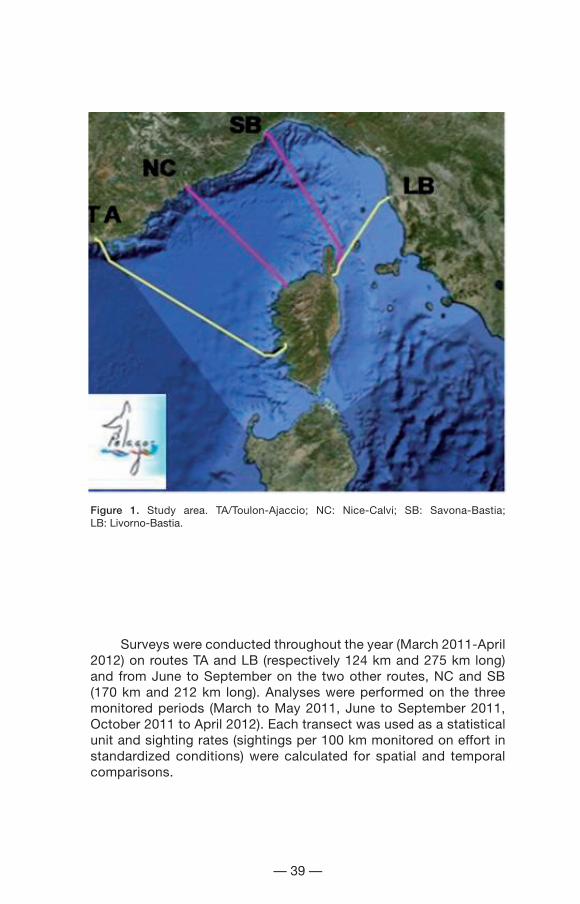
In 2011/2012, dedicated MMOs embarked on four routes crossing the Pelagos Sanctuary: Toulon-Ajaccio (TA) in the western part, Nice-Calvi (NC) and Savona-Bastia (SB) in the central area and Livorno-Bastia (LB) in the eastern part (Fig. 1). These four routes cover the whole Pelagos Sanctuary allowing a synoptic vision on it. Surveys were conducted weekly in “passing mode”, using ferries as platforms of observation for dedicated surveys (Donovan, 2005). Data were gathered only from observations undertaken in fine weather conditions (Beaufort ≤ 3). The MMOs were located on both sides of the command deck of the ferries. Each observer focused primarily on a 130° arc ahead of the ship and continuously scanned the area by naked eye and with binoculars. Data on species, radial distance, angle between the detected group and the track line, presence of juvenile and weather conditions were recorded. Group size was estimated based the number of individuals in apparent association, engaged in the same activity (Shane, 1990) and within 10 m of one another (Smolker et al.,1992).
— 39 —
Figure 1. Study area. TA/Toulon-Ajaccio; NC: Nice-Calvi; SB: Savona-Bastia; LB: Livorno-Bastia.
Surveys were conducted throughout the year (March 2011-April 2012) on routes TA and LB (respectively 124 km and 275 km long) and from June to September on the two other routes, NC and SB (170 km and 212 km long). Analyses were performed on the three monitored periods (March to May 2011, June to September 2011, October 2011 to April 2012). Each transect was used as a statistical unit and sighting rates (sightings per 100 km monitored on effort in standardized conditions) were calculated for spatial and temporal comparisons.
— 40 —
Spatial analysis were performed on a 10 x 10 km grid cell using ArcGIS 9.1 to calculate the encounter rate per cell and the species richness (max number of species detected per km monitored on effort within each cell) during the three investigated periods.
In order to investigate the possibility of using data collected during this project for density and abundance estimation of cetacean in the whole area, we tested the consistency of dataset. First, we evaluated Effective Width Strip (EWS) separately for each region and for each species, attempting to minimize the variability of the dataset. We also tested the effect of height of observation point, speed and MMOs on sighting distance by applying Generalized Linear Models (GLMs). This second analysis was conducted to further investigate the differences raised by the use of different platforms and by the fact that different MMOs collected data along the season and on different routes.
EWS was estimated using DISTANCE software separately for each species and for each route. GLMs using the R software was performed and model fitting was done applying stepwise-backward procedure and model selection was based on best Akaike’s Information Criterion (AIC).
Results and discussion
Cetacean monitoring
A total of 565 sightings were recorded over more than 27 000 km (634 hours) covered on effort (2 667 during the Winter/Spring 2011, 15 088 during the Summer 2011 and 3 670 during the Autumn/Winter 2011-2012).
All 8 species considered regular in the Mediterranean Sea were recorded, with differences depending on the seasons and the location within the Pelagos Sanctuary. Results showed a temporal heterogeneity on species composition, distribution and sighting rates between the summer (June to September 2011) and the two other periods of the year (March to May 2011, October 2011 to April 2012) as well as a spatial heterogeneity within the Pelagos Sanctuary, on both a large scale (inter-routes) and a local scale (intra-route).
On the two routes monitored year round (TA and LB), during the whole study period the sighting rates on TA were always higher than those on LB. However, the intra-routes results indicated that on TA, the sighting rate was higher during the summer season whereas, on LB, the richest period was from October to April.
— 41 —
During summer, comparing the four monitored routes, the highest sighting rates were in the western part of the Sanctuary, along the NC (6.3 sightings of cetacean per 100 km) and the TA (3.6 sightings of cetacean per 100 km) routes.
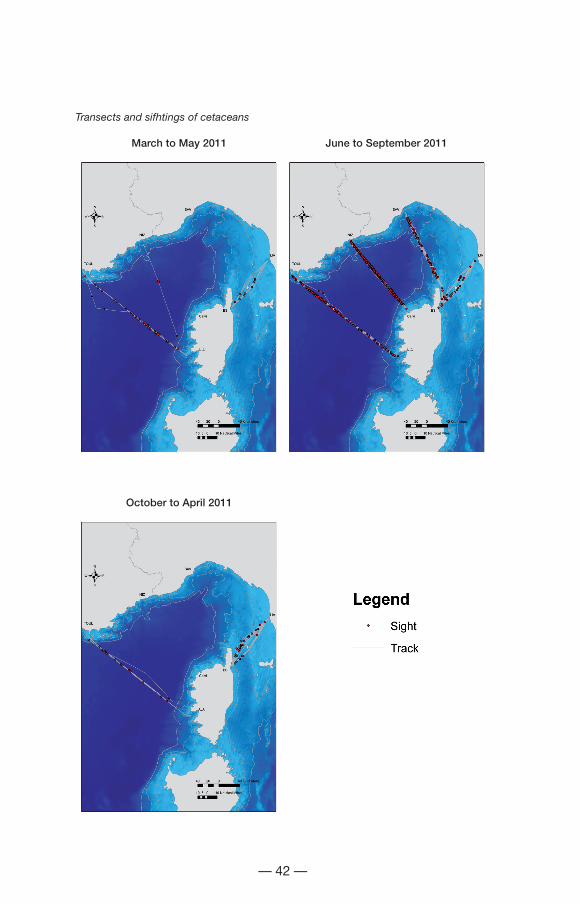
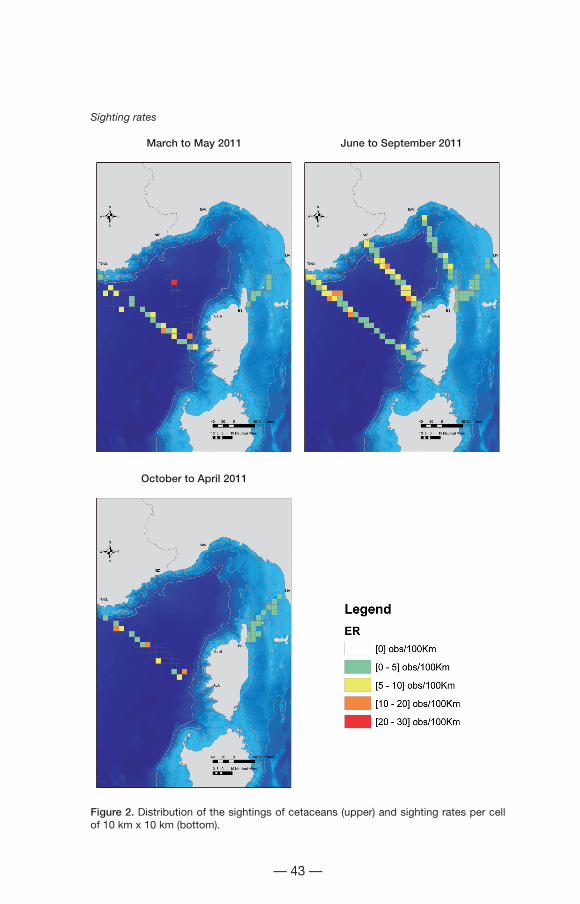
The spatial analysis indicate that the sighting rates per cell were, on all the routes, comprised between 0.2 and 10 sightings per 100 km. Spatially, the highest sighting rates (Fig. 2) were along the Toulon-Ajaccio route for the duration of the whole periods with hot spots in the middle of the abyssal plain between Toulon and Ajaccio during spring and in the north of Corsica (on NC and SB) during summer.
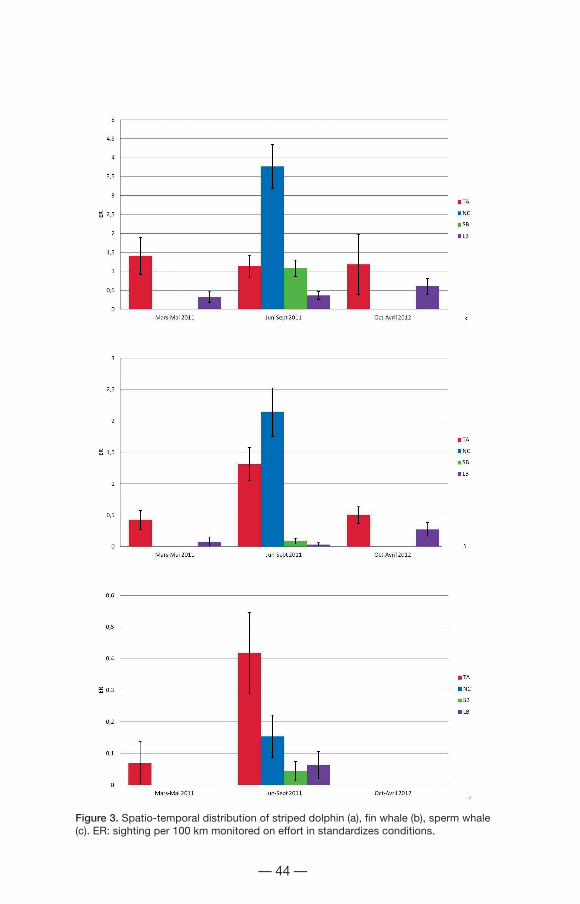
Considering the species, the striped dolphin (Stenella coeruleoalba) was the most frequently sighted species on all the routes and during all seasons (ER max = 3.8±0.58 on NC during summer) except on the TA route during summer when the most sighted species was the fin whale (Balaenoptera physalus) (ER = 1.31±0.26). Fin whale was, in general, the second most sighted species (ER max = 2.1±0.39 on NC during summer). The other frequently sighted species were the bottlenose dolphin (Tursiops truncatus), especially on the LB route, and the sperm whale (Physeter macrocephalus). Overall the species sighted less frequently were the Risso’s dolphin (Grampus griseus), the common dolphin (Delphinus delphis), the long-finned pilot whale (Globicephala melas) and the Cuvier’s beaked whale (Ziphius cavirostris). The latter were mainly sighted on the central lines (NC and SB).
Dolphin distributions reflect respective habitat preferences: the highest sighting rate of striped dolphin was recorded during summer mostly in the pelagic area along the NC route while the highest sighting rate of bottlenose dolphin was obtained mainly in the long continental shelf along the LB route. Sighting rate of fin whale showed inverse seasonal trends in the two transects at the borders of the Pelagos Sanctuary: the highest sighting rate on the TA route was obtained during summer and coincides with the lowest sighting rate recorded on the SB route. These trends can point out different uses of these areas. Sperm whale showed a clear preference for the western area (TA) during the summer season (Fig. 3).
— 42 —
Transects and sifhtings of cetaceans
March to May 2011 June to September 2011
October to April 2011
— 43 —
Sighting rates
March to May 2011 June to September 2011
October to April 2011
Figure 2. Distribution of the sightings of cetaceans (upper) and sighting rates per cell of 10 km x 10 km (bottom).
— 44 —
Figure 3. Spatio-temporal distribution of striped dolphin (a), fin whale (b), sperm whale (c). ER: sighting per 100 km monitored on effort in standardizes conditions.
— 45 —
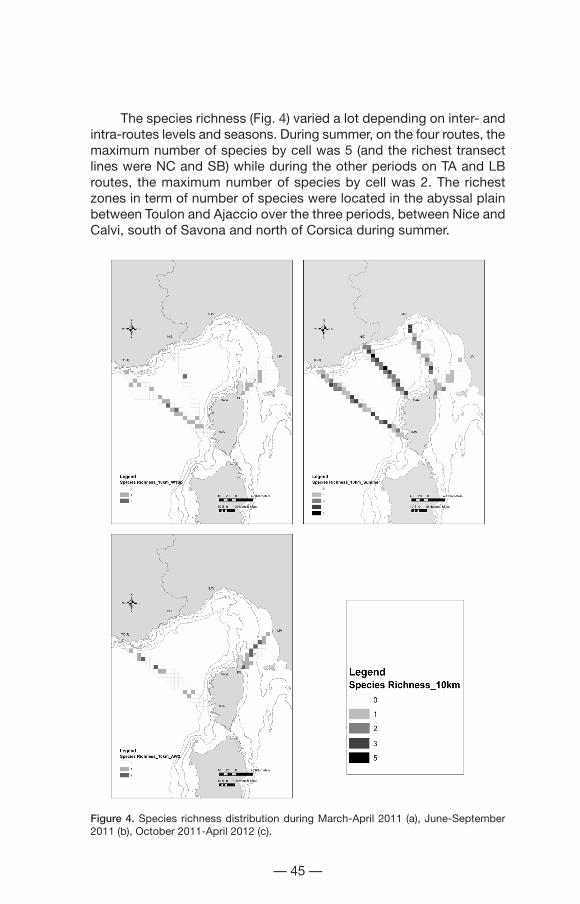
The species richness (Fig. 4) varied a lot depending on inter- and intra-routes levels and seasons. During summer, on the four routes, the maximum number of species by cell was 5 (and the richest transect lines were NC and SB) while during the other periods on TA and LB routes, the maximum number of species by cell was 2. The richest zones in term of number of species were located in the abyssal plain between Toulon and Ajaccio over the three periods, between Nice and Calvi, south of Savona and north of Corsica during summer.
Figure 4. Species richness distribution during March-April 2011 (a), June-September 2011 (b), October 2011-April 2012 (c).
— 46 —
Distance analysis
The species-specific analysis, performed on striped dolphin and fin whale sightings, evidences that species influences ESW. Indeed, ESWBP is wider than ESWSC (ESWBP ranges from 1400 m to 1800 m while ESWSC ranges from 300 m to 500 m). Moreover, when computing species-specific ESW, variability of ESW values among routes diminishes. As a consequence, the dataset can be used for density estimation of fin whales and striped dolphins on the whole area, by considering all tracks together as representative of the Pelagos Sanctuary.
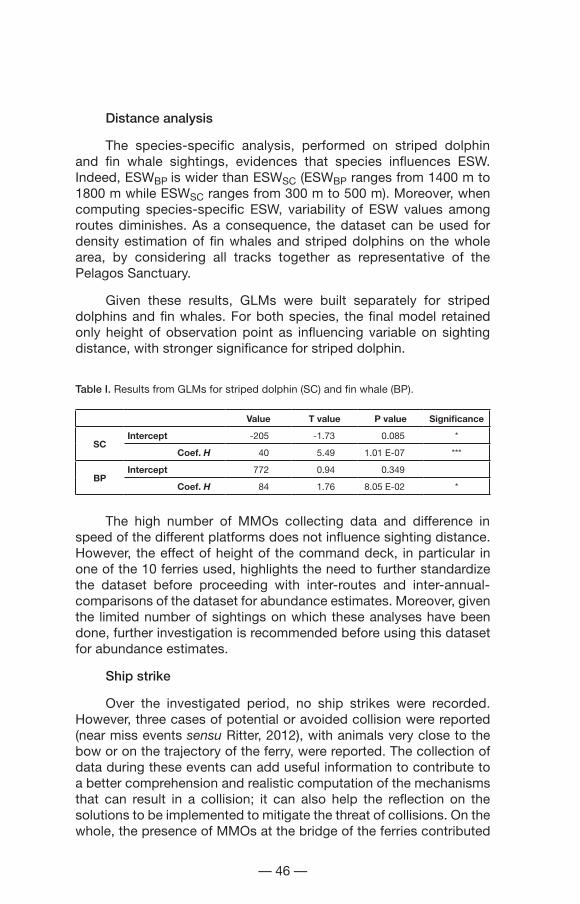
Given these results, GLMs were built separately for striped dolphins and fin whales. For both species, the final model retained only height of observation point as influencing variable on sighting distance, with stronger significance for striped dolphin.
Table I. Results from GLMs for striped dolphin (SC) and fin whale (BP).
Value T value P value Significance
SCIntercept -205 -1.73 0.085 *
Coef. H 40 5.49 1.01 E-07 ***
BPIntercept 772 0.94 0.349
Coef. H 84 1.76 8.05 E-02 *
The high number of MMOs collecting data and difference in speed of the different platforms does not influence sighting distance. However, the effect of height of the command deck, in particular in one of the 10 ferries used, highlights the need to further standardize the dataset before proceeding with inter-routes and inter-annual- comparisons of the dataset for abundance estimates. Moreover, given the limited number of sightings on which these analyses have been done, further investigation is recommended before using this dataset for abundance estimates.
Ship strike
Over the investigated period, no ship strikes were recorded. However, three cases of potential or avoided collision were reported (near miss events sensu Ritter, 2012), with animals very close to the bow or on the trajectory of the ferry, were reported. The collection of data during these events can add useful information to contribute to a better comprehension and realistic computation of the mechanisms that can result in a collision; it can also help the reflection on the solutions to be implemented to mitigate the threat of collisions. On the whole, the presence of MMOs at the bridge of the ferries contributed
— 47 —
to building contact between the crews and the scientists. It helped raise awareness among the crews as regards the risk of collision with cetaceans and, it made the scientists aware about the procedures aboard the ship.
Real-time Plotting of CETaceans (REPCET) validation
REPCET is a software system dedicated to navigation aiming to limit the risks of collision between large cetaceans and large vessels (www.repcet.com). The study also sought to validate the interest of this system REPCET as a tool to monitor cetaceans. With this intention, several maritime companies were approached and made aware: the system was installed on board of two ships belonging to SNCM in addition to the three ships already equipped, belonging to La Méridionale. A synthesis of the sightings broadcasted from January 1st
to December 31th 2011 was carried out. Seven ships were equipped with the system, plus the CROSSMED and the Port-Cros National Parc de (both equipped with a “shore system” which allows transmitting cetacean’s positions provided by different sea users). This work revealed that the device allowed to collect 145 observations including 53 of large cetaceans. The exploratory analysis of these data brings new lightings on the scientific potentialities offered by the system.
Thus, the dissemination of REPCET remains slow, but it is engaged (since the present study, 5 new ships have been equipped with the system). The increase in the number of contributors allows to rise the number of observations, including winter ones. These elements are both encouraging for conservation and for monitoring perspectives.
Conclusion
The study highlights how different seasons and areas in the Pelagos Sanctuary are of different significance in terms of species diversity, relative abundance and habitat use. Also, the many sightings made during the summer on the TA and LB lines highlight that the Pelagos Sanctuary constitutes an important area for the cetaceans throughout the year. As a consequence, a multi-scale and multi-temporal managing approach would be of more valuable effectiveness for species conservation.
The use of ferries as platforms for systematic researches on cetacean was found to be a valuable and sustainable method for monitoring programs on cetacean presence and distribution within wide and high sea areas for either common or elusive or rare species.
The analysis of bias in the methodology implemented in this study points out the efficiency of the method, which leads to a reliable
— 48 —
dataset useful for density estimations within the area. However, a larger dataset is indeed essential for further investigation of bias sources not tested in the present study.
Moreover, monitoring cetaceans along the main shipping routes aboard ferries makes a fundamental contribution to enhance the understanding of ship strike/near miss events in order to find solutions to mitigate the risk of collision. On the whole, the presence of MMOs at the bridge of the ferries contributed to building contact between the crews and the scientists. It helped raise awareness among the crews as regards the risk of collision with cetaceans and the importance of their conservation.
Acknowlegments. We wish to thank all the crew members aboard the ferries, all the MMOs and the maritime companies that supported the project.
References
ARCANGELI A., MARINI L., CROSTI R., 2012. Changes in cetacean presence, relative abundance and distribution over 20 years along a trans-regional fixed line transect in the Central Tyrrhenian Sea. Marine Ecology (2012) 1–10.
ARCANGELI A. 2010. ISPRA cetacean monitoring network along fixed transect. Biologia Marina Mediterranea 17 (1):400-401.
DONOVAN, 2005. Cetaceans: can we manage to conserve them The role of long term monitoring. Long term Monitoring: why, whot, where, when and how? Ed. John Solbé.
RITTER, F, 2012. - Collisions of sailing vessels with cetaceans worldwide: First insights into a seemingly growing problem. J. Cetacean Res. Manage. 12(1): 119–127.