Abundance, age, sex, and size statistics for Pacific salmon in ...
242
ABUNDANCE, AGE, SEX, AND SIZE STATISTICS FOR PACIFIC SALMON IN BRISTOL BAY, 1993 - 1995 by Jim Menard Regional Information ~ e ~ o r t ' No. 2A97-13 Alaska Department of Fish and Game Division of Commercial Fisheries Management and Development Regional Office 333 Raspberry Road Anchorage, Alaska 995 18-1 599 March 1997 '~ontribution 97-13 from the Anchorage regional ofice. The Regional Information Report Series was established in 1987 to provide an information access system for all unpublished divisional reports. These reports frequently serve diverse ad hoc informational purposes or archive basic uninterpreted data. To accommodate needs for up-to-date information, reports in this series may contain preliminary data.
-
Upload
khangminh22 -
Category
Documents
-
view
0 -
download
0
Transcript of Abundance, age, sex, and size statistics for Pacific salmon in ...

ABUNDANCE, AGE, SEX, AND SIZE STATISTICS FOR PACIFIC SALMON IN BRISTOL BAY, 1993 - 1995
by
Jim Menard
Regional Information ~ e ~ o r t ' No. 2A97-13
Alaska Department of Fish and Game Division of Commercial Fisheries Management and Development
Regional Office 333 Raspberry Road
Anchorage, Alaska 995 18-1 599
March 1997
'~ontribution 97-13 from the Anchorage regional ofice. The Regional Information Report Series was established in 1987 to provide an information access system for all unpublished divisional reports. These reports frequently serve diverse ad hoc informational purposes or archive basic uninterpreted data. To accommodate needs for up-to-date information, reports in this series may contain preliminary data.

ABUNDANCE, AGE, SEX, AND SIZE STATISTICS FOR
PACIFIC SALMON IN BRISTOL BAY, 1993 - 1995
by
Jim Menard
Regional Information Report No. 2A97-13
Alaska Department of Fish and Game Division of Commercial Fisheries Management and Development
333 Raspberry Road Anchorage, Alaska 995 18
March 1997

AUTHOR
Jim Menard is a Region I1 Bristol Bay Assistant Research Biologist for the Alaska Department of Fish and Game, Division of Commercial Fisheries Management and Development, 333 Raspberry Road, Anchorage, AK 995 18.
ACKNOWLEDGMENTS
The Bristol Bay full-time and seasonal staff of the Alaska Department of Fish and Game, Division of Commercial Fisheries Management and Development, assisted in collecting the data summarized in this report. Bev Cross provided assistance in all phases of the report. Critical review of the manuscript was provided by Drew Crawford and Bev Cross.

TABLE OF CONTENTS
... LIST OF TABLES ........................................................................................................................................ v i~ i
... LIST OF FIGURES ....................................................................................................................................... xi11
LIST OF APPENDICES ............................................................................................................................. xiv
.................................................................................................................................................. ABSTRACT xv
INTRODUCTION ...................................................................................................................................... 1
METHODS ................................................................................................................................................. 1
.................................................................................................................................... Catch Estimation 1
Escapement Enumeration ....................................................................................................................... 2
Age. Sex, and Size Estimation ........................................................................................................... 2
............................................................................. Estimation of Sockeye Salmon Catch Composition 3
......................................................................................................................................................... RESULTS 4
........................................................................................................... Bristol Bay Sockeye Run 4
.......................................................................... Naknek-Kvichak District Sockeye Run 4 .......................................................................................... Egegik District Sockeye Run 5
Ugashik District Sockeye Run ....................................................................................... 5 Nushagak District Sockeye Run ..................................................................................... 6 Togiak District Sockeye Run .......................................................................................... 6
Bristol Bay Chinook Run ........................................................................................................... 7
Nushagak District Chinook Run .................................................................................... 7 Togiak District Chinook Run ......................................................................................... 7
Bristol Bay Chum Run ............................................................................................................. 7
Nushagak District Chum Run ......................................................................................... 7 Togiak District Chum Run ............................................................................................. 7

TABLE OF CONTENTS (Continued)
Page
Bristol Bay Coho Run ..................................................................................................... 7
Nushagak District Coho Run .............................................................................. 8
................................................................................................ Bristol Bay Sockeye Run 8
................................................................ Naknek-Kvichak District Sockeye Run 8 Egegik District Sockeye Run ............................................................................... 9 Ugashik District Sockeye Run .............................................................................. 9 Nushagak District Sockeye Run .......................................................................... 9
.............................................................................. Togiak District Sockeye Run 10
.............................................................................................. Bristol Bay Chinook Run 10
......................................................................... Nushagak District Chinook Run 10 .............................................................................. Togiak District Chinook Run 10
Bristol Bay Chum Run ............................................................................................ 11
Nushagak District Chum Run ............................................................................. 11 .................................................................................. Togiak District Chum Run 11
Bristol Bay Coho Run ................................................................................................... 11
Nushagak District Coho Run ............................................................................. 11
Bristol Bay Sockeye Run ............................................................................................ 11
............................................................. Naknek-Kvichak District Sockeye Run 12 ............................................................................. Egegik District Sockeye Run 12 ........................................................................... Ugashik District Sockeye Run 12 ........................................................................ Nushagak District Sockeye Run 13
............................................................................. Togiak District Sockeye Run 14
Bristol Bay Chinook Run .............................................................................................. 14
........................................................................ Nushagak District Chinook Run 14 ............................................................................. Togiak District Chinook Run 14

TABLE OF CONTENTS (Continued)
............................................................................................................. Bristol Bay Chum Run 14
Nushagak District Chum Run ..................................................................................... 15 ............................................................................................ Togiak District Chum Run 15
Bristol Bay Coho Run ............................................................................................................. 15
Egegik District Coho Run ............................................................................................ 15 Nushagak District Coho Run ........................................................................................ 15
............................................................................................. Togiak District Coho Run 15
LITERATURE CITED ................................................................................................................................ 16
TABLES ........................................................................................................................................................ 22
FIGURE ........................................................................................................................................................ 2 15
APPENDIX .............................................................................................................................................. 2 17
vii

LIST OF TABLES
T Y ~ - . .; S'C ' .-.-I . _, Bay sockeye salmon run, 1993 .................................................................................................. 22
.Age, sex, and size, (length in mm and weight in kg) composition of sockeye salmon commercial catch znd escapement, Bristol Bay, 1993 .............................................................................................. 23
Age, sex, and size (length in mm and weight in kg) composition of sockeye salmon commercial catch, Naknek-Kvichak District, 1993 .................................................................................................. 24
Age, sex, and size (length in mm and weight in kg) composition of sockeye salmon escapement, Kvichak River, 1993 .............................................................................................................................. 3 1
Age, sex, and size (length in rnm and weight in kg) composition of sockeye salmon escapement, .............................................................................................................................. Naknek River, 1993 .35
Age, sex, and size (length in mm and weight in kg) composition of sockeye salmon commercial catch, Egegik District, 1993 ................................................................................................................. 3 8
Age, sex, and size (length in mm and weight in kg) composition of sockeye salmon escapement, Egegik River, 1993 ................................................................................................................................. 43
Age, sex, and size (length in mm and weight in kg) composition of sockeye salmon commercial catch, Ugashik District, 1993 .............................................................................................................. 4 6
Age, sex, and size (length in mm and weight in kg) composition of sockeye salmon escapement, Ugashik River, 1993 ................................................................................................................... 5 0
Age, sex, and size (length in mm and weight in kg) composition of sockeye salmon commercial catch, Nushagak District, 1993 ............................................................................................................. 53
Age, sex, and size (length in mm and weight in kg) composition of sockeye salmon commercial ............................................................................................. catch, Igushik Beach setnet fishery, 1993 57
Age, sex, and size (length in mm and weight in kg) composition of sockeye salmon escapement, Wood River, 1993 .............................................................................................................................. 5 8
Age, sex, and size (length in mm and weight in kg) composition of sockeye salmon escapement, Igushik River, 1993 ................................................................................................................................ 6 1
Age, sex, and size (length in mm and weight in kg) composition of sockeye salmon escapement, Nushagak River, 1993 ............................................................................................................................ 64
Age, sex, and size (length in mm and weight in kg) composition of sockeye salmon commercial catch, Togiak River Section, 1993 ....................................................................................................... 67

LIST OF TABLES (Continued)
Table Page
Age, sex, and size (length in mm and weight in kg) composition of sockeye salmon esdapement, Togiak River, 1993 ............................................................................................................................ 7 0
Age and size (length in mm and weight in kg) composition of chinook salmon commercial catch, Nushagak District, 1993 ............................................................................................................. 72
Age and size (length in mm and weight in kg) composition of chinook salmon escapement, ........................................................................................................................... Nushagak River, 1993 7 4
Age and size (length in mm and weight in kg) composition of chinook salmon commercial ......................................................................................................... catch, Togiak River Section, 1993 75
Age, sex, and size (length in mm and weight in kg) composition of chum salmon commercial catch, Nushagak District, 1993 .............................................................................................................. 76
Age, sex, and size (length in mm and weight in kg) composition of chum salmon escapement, Nushagak River, 1993 ............................................................................................................................ 78
Age, sex, and size (length in mm and weight in kg) composition of chum salmon commercial catch, Togiak River Section, 1993 ......................................................................................................... 79
Age, sex, and size (length in mm and weight in kg) composition of coho salmon escapement, Nushagak River, 1993 ............................................................................................................................ 82
.................................................................................................. Bristol Bay sockeye salmon run, 1994 83
Age, sex, and size (length in mm and weight in kg) composition of sockeye salmon commercial .............................................................................................. catch and escapement, Bristol Bay, 1994 84
Age, sex, and size (length in mrn and weight in kg) composition of sockeye salmon commercial ................................................................................................... catch, Naknek-Kvichak District, 1994 85
Age, sex, and size (length in mm and weight in kg) composition of sockeye salmon escapement, Kvichak River, 1994 ............................................................................................................................. .93
Age, sex, and size (length in mm and weight in kg) composition of sockeye salmon escapement, Naknek River, 1994 ................................................................................................................................ 96
Age, sex, and size (length in mm and weight in kg) composition of sockeye salmon commercial ................................................................................................................... catch, Egegik District, 1994 98
Age, sex, and size (length in mm and weight in kg) composition of sockeye salmon escapement, Egegik River, 1994 ............................................................................................................................... 106

LIST OF TABLES (Continued)
Table PaRe
!\,g::, sex, and size (length in mm and weight in kg) composition of sockeye salmon commercial . . ............................................................................................................... cat&, Ugashik Dlstnct, 1994 1 10
Age, sex, and size (length in mm and weight in kg) composition of sockeye salmon escapement, Ugashik River, 1994 ...................................................................................................................... 1 15
Age, sex, and size (length in mm and weight in kg) composition of sockeye salmon commercial ............................................................................................................ catch, Nushagak District, 1994 1 1 8
Age, sex, and size (length in mm and weight in kg) composition of sockeye salmon commercial catch, Igushik Beach setnet fishery, 1994 ......................................................................................... 122
Age, sex, and size (length in mm and weight in kg) composition of sockeye salmon escapement, Wood River, 1994 ............................................................................................................................ 123
Age, sex, and size (length in mm and weight in kg) composition of sockeye salmon escapement, Igushik River, 1994 ......................................................................................................................... 126
Age, sex, and size (length in mm and weight in kg) composition of sockeye salmon escapement, .......................................................................................................................... Nushagak River, 1994 129
Age, sex, and size (length in mm and weight in kg) composition of sockeye salmon commercial ....................................................................................................... catch, Togiak River Section, 1994 13 1
Age, sex, and size (length in mm and weight in kg) composition of sockeye salmon commercial catch, Kulukuk Section, Togiak District, 1994 ................................................................................... 133
Age, sex, and size (length in mm and weight in kg) composition of sockeye salmon escapement Togiak River, 1994 .............................................................................................................................. 134
Age, sex, and size (length in mm and weight in kg) composition of sockeye salmon escapement, Kulukuk River, 1994 ......................................................................................................................... 136
Age and size (length in rnm and weight in kg) composition of chinook salmon commercial ............................................................................................................ catch, Nushagak District, 1994 13 7
Age and size (length in rnm and weight in kg) composition of chinook salmon escapement, .......................................................................................................................... Nushagak River, 1994 1 3 8
Age and size (length in mm and weight in kg) composition of chinook salmon commercial ....................................................................................................... catch, Togiak River Section, 1994 139
Age, sex, and size (length in mm and weight in kg) composition of chum salmon commercial catch, Nushagak District, 1994 ...................................................................................................... 140

Table
LIST OF TABLES (Continued)
&
Age, sex, and size (length in mm and weight in kg) composition of chum salmon escapement, Nushagak River, 1994 ...................................................................................................................... 142
Age, sex, and size (length in mm and weight in kg) composition of chum salmon commercial catch, Togiak River Section, 1994 ..................................................................................................... 144
Age, sex, and size (length in mm and weight in kg) composition of chum salmon escapement, Kulukuk River, 1994 .......................................................................................................................... 146
~ g e , sex, and size (length in mm and weight in kg) composition of coho salmon escapement, .......................................................................................................................... Nushagak River, 1994 147
Bristol Bay sockeye salmon run, 1995 ............................................................................................ 148
Age, sex, and size (length in mm and weight in kg) composition of sockeye salmon commercial catch and escapement, Bristol Bay, 1995 ........................................................................................ 149
Age, sex, and size (length in mrn and weight in kg) composition of sockeye salmon commercial catch, Naknek-Kvichak District 1995 .................................................................................................. 1 50
Age, sex, and size (length in mm and weight in kg) composition of sockeye salmon escapement, Kvichak River, 1995 ............................................................................................................................ 1 5 8
Age, sex, and size (length in mm and weight in kg) composition of sockeye salmon escapement, Naknek River, 1995 ............................................................................................................................ 1 62
Age, sex, and size (length in mm and weight in kg) composition of sockeye salmon commercial ................................................................................................................. catch, Egegik District, 1995 164
Age, sex, and size (length in mm and weight in kg) composition of sockeye salmon escapement, Egegik River, 1995 ............................................................................................................................ 1 7 1
Age, sex, and size (length in mm and weight in kg) composition of sockeye salmon commercial ............................................................................................................... catch, Ugashik District, 1995 175
Age, sex, and size (length in mm and weight in kg) composition of sockeye salmon escapement, ............................................................................................................................. Ugashik River, 1995 180
Age, sex, and size (length in mm and weight in kg) composition of sockeye salmon commercial ............................................................................................................ catch, Nushagak District, 1995 183
Age, sex, and size (length in mm and weight in kg) composition of sockeye salmon commercial catch, Igushik Beach setnet fishery, 1995 ............................................................................................ 1 87

LIST OF TABLES (Continued)
Age, sex, and size (length in rnm and weight in kg) composition of sockeye salmon escapement, V?wd Fiver, 1995 ................................................................................................................................ 188
Age, sex, and size (length in mm and weight in kg) composition of sockeye salmon escapement, Igushik River, 1995 .......................................................................................................................... 19 1
Age, sex, and size (length in mm and weight in kg) composition of sockeye salmon escapement, Nushagak River, 1995 .......................................................................................................................... 194
Age, sex, and size (length in mm and weight in kg) composition of sockeye salmon escapement, ........................................................................................................................... Nuyakuk River, 1995 196
Age, sex, and size (length in mm and weight in kg) composition of sockeye salmon commercial catch, Togiak River Section, 1995 ................................................................................................... 197
Age, sex, and size (length in mm and weight in kg) composition of sockeye salmon commercial .................................................................................... catch, Kulukuk Section, Togiak District, 1995 199
Age, sex, and size (length in mm and weight in kg) composition of sockeye salmon escapement, Togiak River, 1995 ............................................................................................................................. 200
Age, sex, and size (length in mm and weight in kg) composition of sockeye salmon escapement, Kulukuk River, 1995 ....................................................................................................................... 202
Age and size (length in mm and weight in kg) composition of chinook salmon commercial catch, Nushagak District, 1995 ...................................................................................................... 2 0 3
Age and size (length in mm and weight in kg) composition of chinook salmon escapement, Nushagak River, 1995 ......................................................................................................................... 204
Age and size (length in mm and weight in kg) composition of chinook salmon commercial ....................................................................................................... catch, Togiak River Section, 1995 205
Age, sex, and size (length in mm and weight in kg) composition of chum salmon commercial ............................................................................................................ catch, Nushagak District, 1995 206
Age, sex, and size (length in mm and weight in kg) composition of chum salmon escapement, Nushagak River, 1995 .......................................................................................................................... 208
Age, sex, and size (length in mm and weight in kg) composition of chum salmon commercial catch, Togiak River Section, 1995 ...................................................................................................... 209
xii

LIST OF TABLES (Continued)
Pace - Age, sex, and size (length in mm and weight in kg) composition of chum salmon escapement,
.......................................................................................................................... Kulukuk River, 1995 2 1 1
Age, sex, and size (length in rnrn and weight in kg) composition of coho salmon escapement, Egegik River, 1995 ............................................................................................................................... 2 12
Age, sex, and size (length in rnrn and weight in kg) composition of coho salmon escapement, .......................................................................................................................... Nushagak River, 1995 2 13
Age, sex, and size (length in mm and weight in kg) composition of coho salmon escapement, Kulukuk River, 1995 ........................................................................................................................... 2 14
LIST OF FIGURES
Figure Pane
1. Bristol Bay major river systems and commercial fishing districts ..................................................... 215
... Xl l l

LIST OF APPENDICES
Appendix
Kvkhak River sockeye salmon escapement and return by brood year including estimated interception catch (in thousands), 1950 - 1993 .............................................................................. 2 19
Branch River sockeye salmon escapement and return by brood year including estimated interception catch (in thousands), 1950 - 1993 .......................................................................... 220
Naknek River sockeye salmon escapement and return by brood year including estimated interception catch (in thousands), 1950 - 1992 ............................................................................. 221
Egegik River sockeye salmon escapement and return by brood year including estimated interception catch (in thousands), 1949 - 1993 ........................................................................... 2 2 2
Ugashik River sockeye salmon escapement and return by brood year including estimated interception catch (in thousands), 1949 - 1993 .............................................................................. 223
Wood River sockeye salmon escapement and return by brood year including estimated interception catch (in thousands), 1950 - 1993 ........................................................................... 2 2 4
Igushik River sockeye salmon escapement and return by brood year including estimated interception catch (in thousands), 1950 - 1992 ............................................................................. 225
Nushagak River sockeye salmon escapement and return by brood year including estimated ................................................................................ interception catch (in thousands), 1983 - 1993 226
A.9. Togiak River sockeye salmon escapement and return by brood year including estimated interception catch (in thousands), 1950 - 1993 ................................................................................. 227
xiv

ABSTRACT
Abundance, age, sex, and size data are summarized for 1993 - 1995 Bristol Bay commercial catches and spawning escapements of Pacific salmon Oncorhynchus as part of an ongoing project to collect baseline information. These data have been used to determine spawner-recruit relationships, establish spawning escapement goals, and forecast future run sizes. Age, sex, and size of sockeye salmon 0. nerka were estimated with systematic stratified sampling programs. Using age and sex composition data combined with escapement information, sockeye salmon harvests were assigned to river of origin to estimate each river's run. sampling efforts for other salmon species were limited. In the years 1993, 1994, and 1995 the total number of sockeye salmon commercially harvested in Bristol Bay were over 40, 35, and 44 million fish respectively. Total escapements of sockeye salmon in Bristol Bay for 1993, 1994, and 1995 were over 1 1, 15, and 16 million fish, respectively. Age-2.2 and age-2.3 sockeye salmon were the largest returning age group in each of the three years.
KEY WORDS: Bristol Bay, Pacific salmon, Oncorhynchus, catch, escapement, age composition, sex composition, size composition

INTRODUCTION
The Bristol Bay Management Area encompasses all waters east of a line from Cape Newenharn to Cape Menshikof (Figure 1). Bristol Bay supports harvests of five species of Pacific salmon including the largest sockeye salmon Oncorhynchus nerka fishery in the world.
The area is divided into five fishing districts for the regulation of commercial salmon fisheries: Naknek- Kvichak, Egegik, Ugashik, Nushagak, and Togiak Districts (Figure 1). Naknek-Kvichak, Egegik, and Ugashik Districts are referred to as the Eastside fishery, and Nushagak and Togiak Districts are referred to as the W-estside fishery. Rivers that produce major salmon runs include Kvichak, Naknek, Branch, Egegik, Ugashik, Wood, Igushik, Nushagak, and Togiak Rivers. Bristol Bay sockeye salmon are intercepted in the North Alaska Peninsula fishery (Geiger 1989, Swanton and Murphy 1992), and the South Alaska Peninsula June fishery (Gilbert 1924, Gilbert and Rich 1926, Eggers et al. 1988). At this time the magnitude of interceptions of Bristol Bay salmon in other fisheries are unknown.
The Alaska Department of Fish and Game (ADF&G) conducts a variety of programs that supply the information used to manage Bristol Bay salmon fisheries. These programs include (1) compiling catch statistics, (2) sampling catches for age, sex, and size, (3) counting major spawning escapements, (4) sampling escapements for age, sex, and size, and (5) estimating stock composition of eastside district catches based on scale pattern analyses. Data generated from these programs are used to manage fisheries in season, establish optimum escapement goals, and forecast future run sizes. This report summarizes 1993 - 1995 commercial catch, escapement, age, sex, and size data for Bristol Bay salmon. Such data for Bristol Bay salmon have been summarized annually since 1972 (McCurdy and Paulus 1972; Paulus and Nelson 1972% 1972b; McCurdy and Schroeder 1972; Krasnowski and Randall 1975% 1975b, 1976; Randall and Yuen 1978; Meacham and Randall 1979; Meacham and Nelson 1980; Yuen et al. 1981; Yuen and Nelson 1983, 1984a, 1984b, 1985, 1987; Yuen and Meacham 1983; Yuen et al. 1984; Yuen 1984; Yuen et al. 1986; Cross and Stratton 1988; Yuen and Bill 1989% 1989b, 1990; Stratton 1990, 1991 ; Stratton and Cross 1990; Stratton and Crawford 1992,1994).
METHODS
Catch Estimation
Commercial catches in numbers of salmon by Bristol Bay districts were taken from summaries of fish tickets, sales receipts, given to fishers by buyers at the time of delivery. The final catch numbers used for each of the three years encompassing this report were compiled by ADF&G, Division of Commercial Fisheries Management and Development and received from Computer Services approximately one year after the fishing season. The number of Bristol Bay sockeye salmon caught in the North Alaska Peninsula fishery is unknown. All sockeye caught during the South Alaska Peninsula fishery around Unimak and Shumagin Islands in June were assumed to be of Bristol Bay origin. A 1987 tagging study (Eggers et al.

A) indicated that sockeye stocks other than Bristol Bay composed a small percentage of the South Alaska ininsula harvest.
Escapement Enumeration
-- 2,scapements of salmon in Bristol Bay in 1993 - 1995 were estimated with various methods by Division of Commercial Fisheries Management and Development (ADF&G 1994, 1995, 1996). Sockeye salmon escapement estimates were based on visual counts made from towers erected on the banks of Kvichak, Naknek, Egegik, Ugashik, Wood, Igushik, and Togiak Rivers. In addition, in 1994 and 1995 there was a counting tower project on the Kulukuk River operated by United States Fish and Wildlife Service (USF&WS). -USF&WS also provided funds to extend Egegik River tower to count coho salmon escapement during 1994 and 1995. In 1995 the Nuyakuk River tower was reactivated by ADF&G. At all tower projects counts were made daily for 10 min every hour on both river banks. Counting began on one bank at the start of each hour, followed by counting on the opposite bank. Each 10-min count was expanded into an hourly estimate to calculate the total daily escapement. Escapements in Branch and Snake Rivers, as well as various rivers in Egegik, Ugashik, and Togiak Districts, were estimated from aerial surveys of major spawning grounds (Russell et al. 1994; Weiland et al. 1994; Brookover et al. 1996). Side-scanning sonar located in the lower Nushagak River near Portage Creek was used to estimate salmon escapements for the entire Nushagak River drainage (Miller et al. 1994; Miller 1995, 1996).
Age, Sex, and Size Estimation
Ages for all 1993 - 1995 Bristol Bay salmon runs were determined by examining scales (Mosher 1968), except ages of sockeye salmon spawning in Branch River were determined from otolith (Bilton and Jenkinson 1968). European notation (e.g., 2.2; Koo 1962) was used to record ages: numerals preceding the decimal refer to number of freshwater annuli, numerals following the decimal refer to number of marine annuli. Total age from time of egg deposition or brood year is the sum of these numbers plus one.
Scales were collected from the left side of the fish approximately two rows above the lateral line in the area crossed by a diagonal from the posterior insertion of the dorsal fin to the anterior insertion of the ma1 fin (INPFC 1963). Scales were mounted on gum cards and impressions made on cellulose acetate cards with a heated hydraulic press (Clutter and Whitesel 1956). Salmon were measured to the nearest millimeter from the middle of the eye to the fork of the tail. Weights were taken to the nearest 0.1 kg. Sex was determined from external characteristics.
Catch sampling was stratified spatially by district; escapement sampling was stratified by major drainage. The number of time strata sampled differed among fisheries and rivers. District catches of sockeye salmon were usually sampled each fishing period during the emergency order period for 1993 - 1995, except when fishing periods were greater than 24 h. When this occurred, each district catch was generally sampled every

72 h. For dates not sampled, the age composition of sockeye salmon harvested was assumed to be the same as that estimated for the most recent catch date. Chinook and chum salmon catches were sampled less frequently than sockeye salmon. Coho salmon catches were not sampled.
Sample size goals for sockeye and chinook salmon catches were set at 600 fish per species per stratum. Chum salmon catch sample goals were set at 400 individuals per stratum. These goals were originally selected to ensure that a sufficient sample would be collected, such that with repeated sampling, each major age group in each stratum would be estimated within 5% of its true value 90% of the time, based on the normal approximation of a binomial proportion (Goodman 1965; Cochran 1977). However, Thompson's (1987) work on the "worst-case" parameter value for the multinomial distribution suggested that our sample size would result in simultaneously estimating the true percentage of each age within 5% of its true value 95% of @e time.
Sample size goals for sockeye salmon escapements were set at 200 fish per day, which in practice, was only reached during the peak of the run. Daily age composition estimates were compared, and samples from successive dates were combined into the same time stratum if significant (a = 0.05) differences were not found.
Estimation of Sockeye Salmon Catch Composition
Sockeye salmon harvested in Egegik and Ugashik Districts were assumed to be destined for Egegik and Ugashik Rivers, respectively. Similarly, sockeye salmon caught in Togiak River Section of Togiak District were assumed to be destined for Togiak River. Sockeye salmon harvested in other sections of Togiak District were assumed to be returning to systems not monitored for escapement or age composition and were not assigned to Togiak River. In 1994 the United States Fish and Wildlife Service initiated a counting tower project on the Kulukuk River and ADF&G started taking scale samples from the Kulukuk Section catch. However, the data have not been included in the Bristol Bay run table. All sockeye salmon caught in set gillnets fished from Igushik Beach were included in total run estimates for Igushik River and all sockeye salmon caught in set gillnets fished from Snake River Beach were assigned to Snake River. Sockeye salmon harvested in Naknek-Kvichak District were assumed to be returning to Kvichak, Branch, and Naknek Rivers. Sockeye harvested in Nushagak District were assumed to be returning to Wood, Igushik and Nushagak Rivers. Sockeye salmon caught in Naknek-Kvichak and Nushagak Districts were assigned to a natal river under the assumption that age and sex proportion within the catch was the same as within the combined escapement:

#. c,k = estimated catch of sockeye salmon from river i age j and sex k
A
Cjk = estimated district catch sockeye salmon age j and sex k, and
A
E,, = estimated escapement to river i of sockeye salmon age j and sex k, and
n = number of rivers contributing to the mixed stock catch.
This has been referred to as the standard method (STD).
F.scently, run-size estimates for individual Eastside Bristol Bay river systems, Kvichak, Naknek, Egegik, zrid Ugashik Rivers, have been estimated using scale pattern analyses (SPA; Miller 1995% 1995b) and have Giffcrcd from estimates based on STD.
RESULTS
Bristol Bay Sockeye Run
In 1993 the total number of sockeye salmon commercially harvested in Bristol Bay was 40,462,124 fish, of which 40,397,990 were assigned to river of origin (Table 1). The age, sex and size composition for over 99% of the Bristol Bay catch and escapement were estimated. The 1993 total Bristol Bay sockeye run was comprised primarily of age-2.2 (33.3%) and age-2.3 (33.0%) fish (Table 2). The mean length of all sockeye salmon returning to Bristol Bay in 1993 was 545 mm and the mean weight was 2.6 kg. The results from each district are discussed below and the brood year tables are presented in Appendices A.l - A.9. The brood year tables summarize the total sockeye salmon return from escapement by brood year for nine Bristol Bay river systems. These return-per-spawner data are extremely important in the forecast of Bristol Bay sockeye salmon runs.
Naknek-Kvichak District Sockeye Run The inshore run of sockeye salmon to Naknek-Kvichak District, which included catch and escapements estimated to Kvichak, Branch, and Naknek Rivers, was 14,816,675 (Table 1). Age-2.2 sockeye salmon were the predominant (32.4%) age group; ages 2.3 (26.0%), 1.3 (22.0%), and 1.2 (17.3%) followed in abundance. Nine other age groups composed the remaining 2.3% of the run.

An estimated 9,3 12,689 Kvichak River sockeye salmon returned to Bristol Bay: 5,287,523 were caught and 4,025,166 escaped to spawn (Table 1). Age-2.2 sockeye salmon accounted for 43.6% of the run, or 4,062,969 fish.
Of the 816,736 Branch River sockeye salmon that returned to Bristol Bay, 468,761 were harvested and 347,975 escaped to spawn (Table 1). Sockeye salmon returning to Branch River were primarily age 1.2. (40.7%), 2.2 (31.7%), and 1.3 (17.3%).
The estimated total inshore run to Naknek River was 4,687,250 sockeye salmon, of which 3,15 1,592 were harvested and 1,535,658 escaped the fishery (Table 1). The total inshore run to Naknek River was comprised mostly (66.1 %) of age-2.3 sockeye salmon.
The Naknek-Kvichak commercial catch of 8,907,876 sockeye salmon was composed of 3 1.1% age-2.3, 30.3% age-2.2,21.6% age-1.3, and 15.8% age-1.2 fish (Table 3). Mean length of sockeye salmon harvested was 550 mm and mean weight was 2.7 kg.
The 4,025,166 sockeye salmon escaping into the Kvichak River were primarily (44.1 %; 1,776,665) age-2.2 fish (Table 4). Mean length of sockeye salmon in the escapement was 54 1 mm.
An estimated 1,535,658 sockeye salmon entered the Naknek River of which 867,410 (56.5%) were age 2.3 fish (Table 5). Overall, the proportion of age-.3 sockeye salmon accounted for 76.7% of the escapement in Naknek River. Sockeye salmon escaping into Naknek River were on average 555 rnrn long.
Egegik District Sockeye Run. Inshore catch and escapement of Egegik River sockeye salmon totaled 23,117,858 (Table 1). Age-2.3 sockeye salmon composed most (46.7%) of the run, followed closely by 44.3% age-2.2,5.3% age-1.3, and 2.1% age-1.2 fish. The commercial fishery harvested a record 21,600,858 sockeye salmon which were predominantly age 2.3 (46.5%) and age 2.2 (44.6%). Mean length in the catch was 552 mm and mean weight was 2.7 kg (Table 6).
An estimated l,5 16,980 sockeye salmon escaped into the Egegik River. The escapement was comprised mostly of age-2.3 (49.6%) and age-2.2 (40.8%). Mean length of sockeye salmon in the escapement was 548 mrn (Table 7).
Ugashik District Sockeye Run. An estimated 5,590,354 Ugashik River sockeye salmon returned to Bristol Bay: 74.7% were caught and 25.3% escaped to spawn (Table 1). Most sockeye salmon returning to Ugashik River were age 2.3 (39.7%), age 2.2 (35~5%)~ age 1.3 (1 1.8%), and age 1.2 (1 1.7%). The commercial fishery harvested 4,176,900 sockeye salmon; their mean length was 55 1 mm, and mean weight was 2.8 kg (Table 8). Mean length of the 1,389,354 sockeye salmon escaping into Ugashik River was 553 rnm (Table 9). The proportion of age-.2 sockeye salmon in the escapement increased while the proportion of age-.3 decreased through time (NSC; Table 9).

nagak District Sockeye Run. The inshore run of sockeye salmon to Nushagak District, which included ich and escapements to the Wood, Igushik, Snake, and Nushagak Rivers, was estimated at 7,533,346
,Table 1). While age-1.3 (49.6), and -1.2 (36.5%) sockeye salmon composed most of the sampled run, age 0. composed 8.9%.
3f tI.2 estimated 3,725,173 inshore run of sockeye salmon bound for Wood River, 2,549,047 were caught a,d !,!46,126 escaped to spawn (Table 1). Age-1.2 sockeye salmon composed 57.9% of the Wood River inshore run and age-1.3 fish composed 36.6%.
An estimated 1,580,076 Igushik River sockeye salmon returned to Bristol Bay: 1,1743 12 were harvested and 405,564 escaped into the river (Table 1). The 1993 Igushik River sockeye salmon inshore run was 63.9% age 1.3. -
Of the estimated 2,228,083 sockeye salmon that returned to Bristol Bay, bound for Nushagak River, 1,5 12,984 were caught and 7 15,099 escaped (Table 1). Sockeye salmon returning to Nushagak River were mostly ages 1.3 (6 1.2%) and 0.3 (20.9%).
The 4,927,735 Nushagak District catch, excluding Igushik Beach setnets, was composed of 47.7% age-1.3, 37.5% age-1.2, and 9.7% age-0. sockeye salmon. Mean length of sockeye salmon in the Nushagak District catch, excluding Igushik setnets, was 539 mm and mean weight was 2.7 kg (Table 10). Igushik Beach setnets caught 308,822 sockeye salmon (Table 11): 64.5% were age 1.3 and 24.3% were age 1.2. Mean length of sockeye salmon in the Igushik Beach setnet catch was 556 mm and mean weight was 2.9 kg.
The 1,176,126 sockeye salmon escaping into Wood River were primarily (57.1 %) age- 1.2 fish (Table 12). Mean length of the sockeye salmon escapement was 5 18 mm.
An estimated 405,564 sockeye salmon entered the Igushik River of which 269,908 (66.6%) were age-1.3 fish (Table 13). Sockeye salmon escaping into the Igushik River were on average 55 1 mm long.
Age-1.3 (64.0%) and age-0.3 (15.2%) sockeye salmon accounted for most of the escapement into the Nushagak River (Table 14). Mean length of the sockeye salmon escapement was 563 mm.
Togiak District Sockeye Run. An estimated 664,409 Togiak River sockeye salmon returned to Bristol Bay: 71.6% were caught and 28.4% escaped into the river (Table 1). Of the 475,799 sockeye salmon harvested from Togiak River Section, most (55.1%) were age 1.3 (Table 15). Mean length in Togiak River Section catch was 562 mrn; mean weight was 3.3 kg. Escapement into Togiak Lake was estimated to be 172,680 sockeye salmon (Table 16), and an additional 15,930 were counted, in the mainstem and tributaries, below the counting towers. Most sockeye salmon in the escapement were age 1.3 (65.2%). Mean length of sockeye salmon in the escapement was 564 mm.

Bristol Bay Chinook Run
In 1993 the total number of chinook salmon commercially harvested in Bristol Bay was 85,857 fish. Most (73,827) were caught in the Westside (Nushagak and Togiak Districts) fishery. The age and size composition for Nushagak District and Togiak River Section catches, 85.1% of the Bristol Bay catch, and escapement to the Nushagak River were estimated.
Nusizagak District Cizinook Run. An estimated 62,976 chinook salmon were caught in Nushagak District with age 1.3 (35.1%), age 1.4 (32.6%), and age 1.2 (31.5%) being harvested in nearly equal proportions (NSC; Table 17). Mean length of the chinook salmon in the catch was 720 mm; mean weight was 6.5 kg. An estimated 97,812 chinook salmon passed the Nushagak River sonar site (Table 18). The escapement was composed of 44.9% age-1.4,35.8% age-1.3 and 17.3% age-1.2 fish. Mean length of chinook salmon in the escapement was 776 mm.
Togiak District Chinook Run. Of the 1 O,85 1 chinook salmon caught in Togiak District, most (1 0,054) were harvested in Togiak River Section (Table 19). Age-1.4 (38.4%), age-1.3 (34.8%), and age-1.2 (23.7%) chinook salmon dominated the Togiak River Section catch. Mean length of chinook salmon in the catch was 7 18 mm; mean weight was 7.1 kg.
Bristol Bay Chum Run
In 1993 the total number of chum salmon commercially harvested in Bristol Bay was 838,382 fish. Most (650,668) were caught in the Westside fishery. The age, sex, and size composition for Nushagak District and Togiak River Section catches, 75.9% of the Bristol Bay catch, and escapement to the Nushagak River were estimated.
Nuslragak District Chum Run. An estimated 505,799 chum salmon were caught in Nushagak District. Age-0.4 (53.4%) and age-0.3 (42.8%) chum salmon dominated the catch (Table 20). Mean length of the chum salmon in the catch was 559 mm; mean weight was 2.8 kg. An estimated 217,230 chum salmon passed the Nushagak River sonar site (Table 21). The escapement was composed of 64.3% age-0.4,3 1.2% age-0.3, and 4.5% age-0.5 fish. Mean length of chum salmon in the escapement was 577 mm.
Togiak District Chum Run. Of the 144,869 chum salmon caught in Togiak District, most (130,679) were harvested in Togiak River Section (Table 22). Age-0.4 (67.6%), age-0.3 (27.5%), and age-0.5 (4.8%) chum salmon composed the Togiak River Section catch. Mean length of chum salmon commercially harvested was 563 rnrn; mean weight was 3.0 kg.
Bristol Bay Coho Run
In 1993 the total number of coho salmon commercially harvested in Bristol Bay was 72,729 fish. Most (41,603) were caught in Egegik District. No coho salmon catches were sampled.

gak District Coho Run. An estimated 14,345 coho salmon were harvested in Nushagak District. An ,tated 42,742 coho salmon passed the Nushagak River sonar site (Table 23). The escapement was
mposed of 97.8% age-2.1 and 2.2% age-3.1 fish. Mean length of coho salmon in the escapement was j49 mm.
Bristol Bay Sockeye Run
In 1994 the total number of sockeye salmon commercially harvested in Bristol Bay was 35,224,050 fish of which 35,125,526 were assigned to river of origin (Table 24). The age, sex, and size composition for over 99% of the Bristol Bay catch and escapement were estimated. The 1994 total Bristol Bay sockeye run was comprised primarily of age-2.2 (56.1%) fish (Table 25). The mean length of all sockeye salmon returning to Bristol Bay in 1994 was 522 mrn and the mean weight was 2.3 kg. The results from each district are discussed below.
Naknek-Kvichak District Sockeye Run. The inshore run of sockeye salmon to Naknek-Kvichak District, which included catch and escapements estimated to Kvichak, Branch, and Naknek Rivers, was 25,899,103 (Table 24). Age-2.2 sockeye salmon were the predominant (76.5%) age group; ages 1.3 (10.0%), 1.2 (8.3%), and 2.3 (4.3%) followed in abundance.
An estimated 22,231,453 Kvichak River sockeye salmon returned to Bristol Bay: 13,893,613 were caught and 8,337,840 escaped to spawn (Table 24). Age-2.2 sockeye salmon accounted for 83.3% of the inshore run, or 18,507,920.
Of the 634,296 Branch River sockeye salmon that returned to Bristol Bay, 391,701 were harvested and 242,595 escaped to spawn (Table 24). Sockeye salmon returning to Branch River were primarily age 1.2 (40.3%), 2.2 (27.7%), and 1.3 (25.4%).
The estimated total inshore run to Naknek River was 3,033,354 sockeye salmon, of which 2,042,544 were harvested and 990,810 escaped the fishery (Table 24). Age-2.2 (37.4%) and age-1.3 (28.7%) sockeye salmon comprised most of the run.
The Naknek-Kvichak commercial catch of 16,327,858 sockeye salmon was composed of 75.2% age-2.2, 13.4% age-1.3, 6.1% age-1.2, and 4.9% age-2.3 fish (Table 26). The remaining 0.4% of the catch was composed of eight other age groups. Mean length of sockeye salmon harvested was 522 mm and mean weight was 2.3 kg.
The 8,337,840 sockeye salmon escaping into the Kvichak River were primarily (84.4%; 7,037,285) age-2.2 fish (Table 27). Mean length of sockeye salmon in the Kvichak River escapement was 502 mm.

Sockeye salmon escaping (990,810) to Naknek River were mostly age 2.2 (43.7%), age 1.2 (21.5%), and age 2.3 (14.8%). Mean length of sockeye salmon escapement into Naknek River was 486 mm (Table 28).
Egegik District Sockeye Run. Inshore catch and escapement of Egegik River sockeye salmon totaled 12,648,190 (Table 24). Age-2.2 (47.1 %) sockeye salmon composed most of the run, followed by 43.1 % age 2.3, 3.4% age 1.3, and 3.1% age 1.2. Nine minor age groups composed 3.3% of the total run. The commercial fishery harvested 10,750,213 sockeye salmon. Mean length of sockeye salmon in the catch was 541 mm and mean weight was 2.4 kg (Table 29). The mean length of the 1,897,932 sockeye salmon escaping into Egegik River was 505 mm (Table 30).
Ugasltik District Sockeye Run. An estimated 5,447,865 Ugashik River sockeye salmon returned to Bristol Bay: 79.9% were caught and 20.1% escaped to spawn (Table 24). Most sockeye salmon returning to Ugashik River were age 2.2 (44.7%), age 2.3 (39.9%), age 1.3 (6.7%), and age 1.2 (6.2%); eight minor age groups composed the remaining 2.5% of the run. The commercial fishery harvested 4,352,797 sockeye salmon; their mean length was 548 mm, and mean weight was 2.6 kg (Table 3 1). Mean length of sockeye salmon in the escapement was 503 mm (Table 32). The proportion of age-.2 sockeye salmon in the escapement increased while the proportion of age-3 decreased through time (NSC; Table 32).
Nushagak District Sockeye Run. The inshore run of sockeye salmon to Nushagak District, which included catch and escapements to the Wood, Igushik, Snake, and Nushagak Rivers, was estimated at 5,842,759 (Table 24). Age-1.3 (60.3%), and -1 -2 (21.8%) and age-0.3 (12.9%) sockeye salmon composed most of the sampled run.
Of the estimated 2,956,862 inshore run of sockeye salmon bound for Wood River, 1,484,972 were caught and 1,471,890 escaped to spawn (Table 24). Age-1.3 sockeye salmon composed 60.8% of the inshore run and age-1.2 fish composed 36.4%.
An estimated 1,300,346 Igushik River sockeye salmon returned to Bristol Bay: 854,426 were harvested and 445,920 escaped into the river (Table 1). The 1994 Igushik River sockeye salmon inshore run was 80.4% age 1.3.
Of the estimated 1,543,465 Nushagak River sockeye salmon that returned to Bristol Bay, 1,034,139 were caught and 509,326 escaped (Table 24). Sockeye salmon returning to Nushagak River were mostly ages 0.3 (47.8%) and 1.3 (42.5%).
Most of the 3,150,870 Nushagak District catch, excluding Igushik Beach setnets, was composed of 66.1% age-1.3, 17.6% age-0.3, and 11.8% age-1.2 sockeye salmon. Mean length of sockeye salmon in the Nushagak District catch, excluding Igushik setnets, was 543 mm and mean weight was 2.7 kg (Table 33). Igushik Beach setnets caught 242,273 sockeye salmon (Table 34): 79.5% were age 1.3 and 9.7% were age 1.2 . Mean length of sockeye salmon in the Igushik Beach setnet catch was 555 mm and mean weight was 2.9 kg.

The 1,47 1,890 sockeye salmon escaping into Wood River were primarily (5 1.5%) age-1.2 fish (Table 35). Mean length of the sockeye salmon escapement was 508 mm.
An estimated 445,920 sockeye salmon entered the Igushik River of which 317,266 (71.2%) were age-1.3 fish (Table 36). Sockeye salmon escaping into the Igushik River were on average 539 rnrn long.
p,go-l.:? (47.8%) and age-0.3 (38.1%) sockeye salmon accounted for most of the escapement into the idushagak River (Table 37). Mean length of the sockeye salmon escapement was 546 mm.
Togiak District Sockeye Run. An estimated 495,293 Togiak River sockeye salmon returned to Bristol Bay: 64.8% were caught and 35.2% escaped into the river (Table 24). The run was dominated by age-1.3 (62.0%) fish. Of the 321,121 harvested from Togiak River Section, most (72.3%) were age 1.3 (Table 38). Mean length of sockeye salmon in Togiak River Section catch was 564 rnrn; mean weight was 3.2 kg. Kulukuk Section fishers caught 76,781 sockeye salmon; age-1.3 fish comprised 73.0% of the harvest (Table 39). Mean length of sockeye salmon in the Kulukuk Section catch was 563 mm and mean weight was 3.1 !<g. Escapement into Togiak Lake was estimated to be 154,752 sockeye salmon (Table 40), and an additional 19,420 were counted, in the mainstem and tributaries, below the counting towers. Most sockeye salmon in the escapement were age 1.3 (44.9%) and age 1.2 (41.4%). Mean length of sockeye salmon in the Togiak River escapement was 53 1 rnrn. Escapement into Kulukuk River was estimated by aerial survey to be 20,540 sockeye salmon. Most (68.3%) sockeye salmon in the escapement were age 1.3 (Table 41). Mean length of escaping sockeye salmon in Kulukuk River was 541 rnrn.
Bristol Bay Chinook Run
In 1994 the total number of chinook salmon commercially harvested in Bristol Bay was 140,910 fish. Most (129,966) were caught in the Westside fishery. The age and size composition for Nushagak District and Togiak River Section catches, 91.4% of the Bristol Bay chinook catch, and escapement to the Nushagak River were estimated.
Nusltagak District Chinook Run. An estimated 119,480 chinook salmon were caught in Nushagak District. The catch was composed of age-1.4 (49.1%), age-1.3 (38.4%), and age-1.2 (10.8%) chinook salmon (Table 42). Mean length of chinook salmon in the catch was 790 rnm; mean weight was 9.9 kg. An estimated 95,954 chinook salmon passed the Nushagak River sonar site (Table 43). The escapement was composed of 41.5% age-1.4,35.4% age-1.3, and 18.8% age-1.2 fish. Mean length of chinook salmon in the escapement
was 766 mm.
Togiak District Chinook Run. Of the 10,486 chinook salmon caught in Togiak District, most (9,352) were harvested in Togiak River Section (Table 44). Age-1.3 (43.6%), age-1.4 (33.5%), and age-1.2 (15.9%) chinook salmon dominated the Togiak River Section catch. Mean length of chinook salmon in the catch was 765 mm; mean weight was 9.0 kg.

Bristol Bay Chum Run
In 1994 the total number of chum salmon commercially harvested in Bristol Bay was 895,032 fish. Most (560,826) chum salmon were caught in the Westside fishery. The age, sex, and size composition for Nushagak District and Togiak River Sections, 60.5% of the Bristol Bay catch, and escapement to the
Nushagak and Kulukuk Rivers were estimated.
Nushagak District Clturn Run. An estimated 328,267 chum salmon were caught in Nushagak District. Age-0.4 (58.7%) and age-0.3 (38.1%) chum salmon dominated the catch (Table 45). Mean length of chum salmon catch was 580 rnrn; mean weight was 3.3 kg. An estimated 378,928 chum salmon passed the Nushagak River sonar site (Table 46). The escapement was composed predominantly of age-0.4 (62.0%) and age-0.3 (35.3%) fish. Mean length of chum salmon in the escapement was 568 mm.
Togiak District Chum Run. Of the 232,559 chum salmon caught in Togiak District, most (213,284) were harvested in Togiak River Section (Table 47). Age-0.3 chum salmon accounted for 51.5% and age-0.4 43.4% of the Togiak River Section harvest. Mean length of chum salmon in the catch was 563 rnm; mean weight was 3.1 kg. Based on aerial surveys an estimated 32,100 churn salmon escaped into the Kulukuk River. Escapement to the Kulukuk River was composed of age-0.4 (50.6%), age-0.3 (39.5%), and age-0.5 (9.9%) chum salmon (Table 48). Mean length of chum salmon in the Kulukuk River escapement was 573 m.
Bristol Bay Coho Run
In 1994 the total number of coho salmon commercially harvested in Bristol Bay was 175,240 fish. Most (96,062) were caught in Togiak District. No coho salmon catches were sampled.
Nusltagak District Coho Run. An estimated 5,615 coho salmon were harvested in Nushagak District. An estimated 82,019 coho salmon passed the Nushagak River sonar site (Table 49). The escapement was composed mostly of age-2.1 (86.1%) and age-3.1 (9.8%) fish. Mean length of coho salmon in the escapement was 563 mm.
Bristol Bay Sockeye Run
In 1995 the total number of sockeye salmon commercially harvested in Bristol Bay was 44,266,217 fish of which 44,185,372 were assigned to river of origin (Table 50). The age, sex, and size composition for over 99% of the Bristol Bay catch and escapement were estimated. The 1995 total Bristol Bay sockeye run was comprised primarily of age-2.2 (56.3%) fish. The mean length of all sockeye salmon returning to Bristol Bay in 1995 was 526 mm and the mean weight was 2.4 kg (Table 51). The results from each district are discussed below.

Naknek-Kviclrak District Sockeye Run. The inshore run of sockeye salmon to Naknek-Kvichak District, which included catch and escapements estimated to Kvichak, Branch, and Naknek Rivers, was 3 1,645,154 (Table 50). Age-2.2 sockeye salmon were the predominant (69.8%) age group; ages 2.3 (12.0%), 1.2 (10.4%), and 1.3 (7.7%) followed in abundance. Nine other age groups composed the remaining 0.1% of the run.
iln estimated 27,430,626 Kvichak River sockeye salmon returned to Bristol Bay: 17,39 1,906 were caught and 10,038,720 escaped to spawn (Table 50). Age-2.2 sockeye salmon accounted for 74.6% of the inshore run, or 20,455,349.
Of the 650,954 Branch River sockeye salmon that returned to Bristol Bay, 435,241 were harvested and 215,713 escaped to spawn (Table 50). Sockeye salmon returning to Branch River were primarily age 2.2 (49.2%), 1.2 (29.5%), and 1.3 (18.1%).
The estimated total inshore run to Naknek River was 3,563,574 sockeye salmon, of which 2,452,434 were hawested and 1,111,140 escaped the fishery (Table 50). Age-2.2 (36.6%) and age-1.3 (33.0%) sockeye salmon comprised most of the inshore run.
The Naknek-Kvichak commercial catch of 20,279,581 sockeye salmon was composed of 66.6% age-2.2, 12.9% age-2.3, 11.3% age-1.2, and 9.2% age-1.3 fish (Table 52). The remainder of the catch was less than 0.1% and was composed of four other age groups. Mean length of sockeye salmon harvested was 526 mm and mean weight was 2.4 kg.
The 10,038,720 sockeye salmon escaping into the Kvichak River were primarily (79.3%; 7,956,929) age-2.2 fish (Table 53). Mean length of sockeye salmon in the Kvichak River escapement was 5 17 mm.
Sockeye salmon escaping to Naknek River were mostly (45.1%) age-2.2 fish (Table 54). Overall, the proportion of age-2 sockeye salmon accounted for 59.4% of the escapement in Naknek River. Mean length of sockeye salmon escaping to Naknek River was 520 mrn.
Egegik District Sockeye Run. Inshore catch and escapement of Egegik River sockeye salmon totaled 15,692,671 (Table 50). Age-2.2 (59.3%) sockeye salmon composed most of the run, followed by 24.7% age 2.3, 5.6% age 1.2, and 5.3% age 1.3. Six other age groups composed 2.1% of the total run. The commercial ikhery harvested 14,425,979 sockeye salmon with the majority (58.8%) being age-2.2 fish (Table 55). Mean length of sockeye salmon in the catch was 538 mm and mean weight was 2.4 kg. The mean length of the 1,265,862 sockeye salmon in the escapement was 523 mm (Table 56) and the predominant (65.3%) age was 2.2.
Ugashik District Sockeye Run. An estimated 5,830,554 Ugashik River sockeye salmon returned to Bristol Bay: 77.3% were caught and 22.7% escaped to spawn (Table 50). Most sockeye salmon returning to Ugashik River were age 2.2 (38.3%), age 1.2 (33.5%), age 2.3 (15.9%), and age 1.3 ( I 1.6%); nine minor age

groups composed the remaining 0.7% of the run. The commercial fishery harvested 4,509,446 sockeye salmon; their mean length was 539 mm, and mean weight was 2.4 kg (Table 57). Sockeye salmon harvested in Ugashik District were mostly (40.3%) age-2.2 fish; while those in the escapement were predominantly (47.9%) age-1.2 fish (Table 58). The mean length of the 1,304,058 sockeye salmon escaping into Ugashik River was 522 mm.
Nushagak District Sockeye Run. The inshore run of sockeye salmon to Nushagak District, which includes catch and escapements to Wood, Igushik, Snake, and Nushagak Rivers, was estimated at 6,700,13 1 (Table 50). Age- 1.2 (45 .O) and - 1.3 (4 1.2%) sockeye salmon composed most of the sampled run. Age-0. sockeye salmon composed only 5.0% of the sampled run.
Of the estimated - 4,021,812 sockeye salmon that returned to Bristol Bay, bound for Wood River, 2,539,650 were caught and 1,482,162 escaped to spawn (Table 50). Age-1.2 sockeye salmon composed 63.0% of the inshore run to Wood River.
An estimated 1,9O 1,963 Igushik River sockeye salmon returned to Bristol Bay: 1,428,58 1 were harvested and 473,382 escaped into the river (Table 50). The 1995 Igushik River sockeye salmon inshore run was 71.5% age 1.3.
Of the estimated 756,300 sockeye salmon that returned to Bristol Bay, bound for Nushagak River, 474,993 were caught and 281,307 escaped (Table 50). Sockeye salmon returning to Nushagak River were age 1.3 (31.9%), age 1.2 (21.9%), age 0.3 (16.6%), age 0.4 (13.7%), and age 0.2 (10.8%); four age groups composed the remaining 5.1 % of the run.
The 3,952,963 Nushagak District catch, excluding Igushik Beach setnets, was mostly composed of 46.0% age-1.2, 39.3% age-1.3, and 8.0% age-2.2 sockeye salmon. Mean length of the Nushagak District catch, excluding Igushik setnets, was 519 mm and mean weight was 2.4 kg (Table 59). Igushik Beach setnets caught 492,937 sockeye salmon (Table 60), and age 1.3 (82.0%), age 1.2 (8.1%), and age 2.2 (6.6%) composed most of the run. Mean length of sockeye salmon in the Igushik Beach setnet catch was 553 mm and mean weight was 2.8 kg.
The 1,482,162 sockeye salmon escaping into Wood River were primarily (67.0%) age-1.2 fish (Table 61). Mean length of sockeye salmon in the escapement was 507 mm.
An estimated 473,382 sockeye salmon entered the Igushik River of which 324,166 (68.5%) were age-1.3 fish (Table 62). Sockeye salmon escaping into the Igushik River were on average 544 mm long.
The 281,307 sockeye salmon'escaping into the Nushagak River were composed mainly of five ages; age- 1.3 (29. I%), age-1.2 (1 9.2%), age-0.2 (1 8.7%), age-0.3 (1 7.2), and age-0.4 (1 1.3%) sockeye salmon. Mean length of sockeye salmon in the escapement was 5 14 rnrn (Table 63).

;ms about escapement to the Nushagak River drainage in the 1990s resulted in initiating, after a six , suspension, the Nuyakuk River counting tower project. Sampling was done by Fisheries Research
stitute personnel from University of Washington, and age composition of the 69,702 escaping sockeye salmon was predominantly age-1.3 (46.1%) and age-1.2 (40.6%) fish (Table 64).
Togia,'r ,L)iarict Sockeye Run. An estimated 738,368 Togiak River sockeye salmon returned to Bristol Bay: 7 1.4% were caught and 28.6% escaped into the river (Table 50). Of the 527,142 sockeye salmon harvested from Togiak River Section, most (59.2%) were age 1.3 (Table 65). Mean length of sockeye salmon in Togiak River Section catch was 553 mm; mean weight was 3.0 kg. Kulukuk Section fishers caught 76,056 sockeye salmon; age-1.3 fish composed 61.6% of the harvest (Table 66). Mean length of sockeye salmon in the Kulukuk Section catch was 554 mm and mean weight was 2.9 kg. Escapement into Togiak Lake was estimated to be 185,718 sockeye salmon (Table 67), and an additional 25,508 were counted, in the mainstem and tributaries, below the counting towers. Most sockeye salmon in the escapement were age 1.3 (59.8%) and age 1.2 (3 1.1%). Mean length of sockeye salmon in the Togiak River escapement was 550 mrn. Esiapemcnt into Kulukuk River was estimated by aerial survey to be 6,000 sockeye salmon. Most (61.3%) sockeyc salmon in the escapement were age 1.3 (Table 68). Mean length of escaping Kulukuk River sockeye salmon was 539 mm.
Bristol Bay Chinook Run
In 1995, a total of 99,318 chinook salmon harvested commercially in Bristol Bay. Most (91,923) were caught in the Westside fishery. The age and size composition for Nushagak District and Togiak River Section catches, 91.3% of the Bristol Bay catch, and escapement to the Nushagak River were estimated.
NmItagak Disrrict Chinook Run. An estimated 79,942 chinook salmon were caught in Nushagak District. The catch was composed of age-1.4 (54.3%), age-1.3 (23.2%), and age-1.2 (21.0%) chinook salmon (Table 69). Mean length of the chinook salmon in the catch was 773 mm and mean weight was 7.7 kg. An estimated 85,622 chinook salmon passed the Nushagak River sonar site (Table 70). The escapement was composed of 42.0% age-1.4, 39.8% age-1.2 and 15.8% age-1.3 fish. Mean length of chinook salmon in the escapement was 7 18 rnm.
Togiak Dktrict Chinook Run. Of the 11,981 chinook salmon caught in Togiak District, most (10,768) were harvested in Togiak River Section (Table 71). Age-1.4 (45.0%), age-1.2 (34.3%), and age-1.3 (18.7%) (:hir;ook salmon dominated the Togiak River Section catch. Mean length of chinook salmon in the catch was 735 mm; mean weight was 8.2 kg.
Bristol Bay Chum Run 4
In 1995 the total number of chum salmon commercially harvested in Bristol Bay was 978,882 fish. Most (61 1,284) were caught in the Westside fishery. The age, sex, and size composition for Nushagak District

and Togiak River Section catches, 60.1% of the Bristol Bay catch, and escapement to the Nushagak and Kulukuk Rivers were estimated.
Nusltagak District Chum Run. An estimated 390,158 chum salmon were caught in Nushagak District. Age-0.3 (51.8%) and age-0.4 (37.4%) chum salmon dominated the catch (Table 72). Mean length of the chum salmon catch was 560 mm; mean weight was 2.9 kg. An estimated 212,612 chum salmon passed the Nushagak River sonar site (Table 73). The escapement was composed predominantly of age-0.3 (44.3%) and age-0.4 (42.7%) fish. Mean length of chum salmon in the escapement was 577 rnrn.
Togiak District Chum Run. Of the 221,126 chum salmon caught in Togiak District, most (l98,l4 1) were harvested in Togiak River Section (Table 74). Age-0.4 chum salmon accounted for 45.9% and age-0.3 41.3% of the Togiak River Section harvest. Mean length of chum salmon in the catch was 571 mm; mean weight was 3.1 kg. Escapement to the Kulukuk River was composed of age-0.4 (57.4%), age-0.3 (30.7%), age-0.5 (9.2%), and age-0.2 (2.7%) chum salmon (Table 75). Mean length of chum salmon in the Kulukuk River escapement was 594 mm.
Bristol Bay Coho Run
In 1995 the total number of coho salmon commercially harvested in Bristol Bay was 49,444 fish. Most (36,392) were caught in the Eastside fishery. No coho salmon catches were sampled.
Egegik District Coho Run. An estimated 21,810 coho salmon were harvested in Egegik District. An estimated 7,470 coho salmon passed the Egegik River counting tower (Table 76). The escapement was composed of 65.4% age-2.1, and 29.5% age-1.1 fish. Mean length of coho salmon in the escapement was 544 mm.
Nushagak District Coho Run. An estimated 4,181 coho salmon were harvested in Nushagak District. An estimated 46,340 coho salmon passed the Nushagak River sonar site (Table 77). The escapement was composed of 90.5% age-2.1, 5.0% age3.1, and 4.5% age-1.1 fish. Mean length of coho salmon in the escapement was 540 mm.
Togiak District Coho Run. An estimated 8,871 coho salmon were caught in Togiak District. The only coho salmon sampled for age composition were from Kulukuk River escapement (Table 78). An estimated 13,503 coho salmon passed the Kulukuk River counting tower. Age composition was composed of 77.6% age-2.1, 18.9% age-1.1, and 3.5% age3.1 fish. Mean length of coho salmon in the Kulukuk River escapement was 569 rnrn.

LITERATURE CITED
hnF&G (Alaska Department of Fish and Game). 1994. Bristol Bay Area annual management report, 1993. Alaska Department of Fish and Game, Division of Commercial Fisheries Management and Development, Regional Information Report 2A94-02, Anchorage.
ADF&G. 1995. Bristol Bay Area annual management report, 1994. Alaska Department of Fish and Game, Division of Commercial Fisheries Management and Development, Regional Information Report 2A95-11, Anchorage.
ADF&G. 1996. Bristol Bay Area annual management report, 1995. Alaska Department of Fish and Game, Division of Commercial Fisheries Management and Development, Regional Information Report 2A96-06, Anchorage.
Bilton, H., and D. Jenkinson. 1968. Comparison of the otolith and scale methods for aging sockeye (Oncorhynchus nerka) and chum (0. keta) salmon. Journal of the Fisheries Research Board of Canada 25 (5).
Brookover, T.E., J. Browning, J. Regnart, R. Russell, and K. Weiland. 1996. Salmon spawning ground surveys in the Bristol Bay area, 1995. Alaska Department of Fish and Game, Division of Commercial Fisheries Management and Development, Regional Information Report 2A96- 3 1, Anchorage.
Clutter, R., and L. Whitesel. 1956. Collection and interpretation of sockeye salmon scales. International Pacific Salmon Fisheries Commission Bulletin 9.
Cochran, W. 1977. Sampling techniques, 3rd edition. John Wiley & Sons, Inc. New York.
Cross, B., and B. Stratton. 1988. Abundance, age, sex, and size statistics for Pacific salmon in Bristol Bay, 1987. Alaska Department of Fish and Game, Division of Commercial Fisheries, Technical Fishery Report 88-1 8, Juneau.
Eggers, D., K. Rowell, and B. Barrett. 1988. The stock composition of the catches of sockeye and chum in the 1987 South Peninsula June fishery based on tagging. Alaska Department of Fish and Game, Division of Commercial Fisheries, Regional Information Report 5588-03, Juneau.
Geiger, H. 1989. A stock identification study in the Northern Alaska Peninsula sockeye salmon fishery, from Harbor Point to Strogonof Point. Alaska Department of Fish and Game, Division of Commercial Fisheries, Regional Informational Report 5J89-11, Juneau.

LITERATURE CITED (Continued)
Gilbert, C. 1924. Experiment in tagging adult red salmon, Alaska Peninsula fisheries reservation, summer of 1922. Bulletin of the United States Bureau of Fisheries, Volume 39.
Gilbert, C., and W. Rich. 1926. Second experiment in tagging adult red salmon in the Alaska Peninsula fisheries reservation, summer of 1923. Bulletin of the United States Bureau of Fisheries, Volume 42.
Goodman, L. 1965. On simultaneous confidence intervals for multinomial populations. Technometrics 7:247-254.
INPFC (International North Pacific Fisheries Commission). 1963. Annual Report 196 1, Vancouver, British Columbia.
Koo, T. S. Y. 1962. Age designation in salmon. Pages 3 7 4 8 in T. S. Y. Koo, editor. Studies of Alaska red salmon. University of Washington Publications in Fisheries, New Series, Volume I, Seattle.
Krasnowski, P., and R. Randall. 1975a. Bristol Bay sockeye salmon (Oncorhynchus nerka) 1972 - a compilation of catch and escapement data. Alaska Department of Fish and Game, Division of Commercial Fisheries, Technical Data Report 19, Juneau.
Krasnowski, P., and R. Randall. 1975b. Bristol Bay sockeye salmon (Oncorhynchus nerka) 1973 - a compilation of catch and escapement data. Alaska Department of Fish and Game, Division of Commercial Fisheries, Technical Data Report 22, Juneau.
Krasnowski, P., and R. Randall. 1976. Bristol Bay sockeye salmon (Oncorhynchus nerka) 1974 - a compilation of catch and escapement data. Alaska Department of Fish and Game, Division of Commercial Fisheries, Technical Data Report 24, Juneau.
McCurdy, M., and R. Paulus. 1972. Bristol Bay sockeye salmon (Oncorhynchus nerka) 1968 - a compilation of catch and escapement data. Alaska Department of Fish and Game, Division of Commercial Fisheries, Technical Data Report 1, Juneau.
McCurdy, M., and T. Schroeder. 1972. Bristol Bay sockeye salmon (Oncorhynchus nerka) 1971 - a compilation of catch and escapement data. Alaska Department of Fish and Game, Division of Commercial Fisheries, Technical Data Report 7, Juneau.

LITERATURE CITED (Continued)
Meacham, C., and M. Nelson. 1980. Bristol Bay sockeye salmon (Oncorhynchus nerka) 1977 - a compilation of catch and escapement data. Alaska Department of Fish and Game, Division of Commercial Fisheries, Technical Data Report 47, Juneau.
Meacham, C., and R. Randall. 1979. Bristol Bay sockeye salmon (Oncorhynchus nerka) 1976 - a compilation of catch and escapement data. Alaska Department of Fish and Game, Division of Commercial Fisheries, Technical Data Report 43, Juneau.
-
Miller, J. D. 1995a. Origins of sockeye salmon in 1993 eastside Bristol Bay fisheries based on linear discriminant function analysis of scale patterns. Alaska Department of Fish and Game, Division of Commercial Fisheries Management and Development, Regional Information Report 2A9.5-24, Anchorage.
Miller, J. D. 1995b. Origins of sockeye salmon in 1994 eastside Bristol Bay fisheries based on linear discriminant function analysis of scale patterns. Alaska Department of Fish and Game, Division of Commercial Fisheries Management and Development, Regional Information Report 2A95-25, Anchorage.
Miller, J. D. 19%. Sonar enumeration of Pacific salmon into Nushagak River, 1994. Alaska Department of Fish and Game, Division of Commercial Fisheries Management and Development, Regional Information Report 2A9.5-10, Anchorage.
Miller, J. D. 1996. Sonar enumeration of Pacific salmon into Nushagak River, 1995. Alaska Department of Fish and Game, Division of Commercial Fisheries Management and Development, Regional Information Report 2A96-08, Anchorage.
Miller, J. D., L. K. Brannian, and B. A. Cross. 1994. Sonar enumeration of Pacific salmon into Nushagak River, 1993. Alaska Department of Fish and Game, Division of Commercial Fisheries Management and Development, Regional Information Report 2A94-20, Anchorage.
Mosher, K. 1968. Photographic atlas of sockeye salmon scales. Fishery Bulletin 67:243-280.
Paulus, R., and M. Nelson. 1972a. Bristol Bay sockeye salmon (Oncorhynchus nerka) 1969 - a compilation of catch and escapement data. Alaska Department of Fish and Game, Division of Commercial Fisheries, Technical Data Report 5, Juneau.

LITERATURE CITED (Continued)
Paulus, R., and M. Nelson. 1972b. Bristol Bay sockeye salmon (Oncorhynchus nerka) 1970 - a compilation of catch and escapement data. Alaska Department of Fish and Game, Division of Commercial Fisheries, Technical Data Report 6, Juneau.
Randall, R., and H. Yuen. 1978. Bristol Bay sockeye salmon (Oncorhynchus nerka) 1975 - a compilation of catch and escapement data. Alaska Department of Fish and Game, Division of Commercial Fisheries, Technical Data Report 40, Juneau.
Russell, R., J. Regnart, and T. Brookover. 1994. Salmon spawning ground surveys in the Bristol Bay area, 1993. Alaska Department of Fish and Game, Division of Commercial Fisheries, Regional Information Report 2A94-06, Anchorage.
Stratton, B. 1990. Abundance, age, sex, and size statistics for Pacific salmon in Bristol Bay, 1989. Alaska Department of Fish and Game, Division of Commercial Fisheries, Technical Fishery Report 90-09, Juneau.
Stratton, B. 1991. Abundance, age, sex, and size statistics for Pacific salmon in Bristol Bay, 1990. Alaska Department of Fish and Game, Division of Commercial Fisheries, Technical Fishery Report 9 1-1 5, Juneau.
Stratton, B.L., and D. L. Crawford. 1992. Abundance, age, sex, and size statistics for Pacific salmon in Bristol Bay, 1991. Alaska Department of Fish and Game, Division of Commercial Fisheries, Technical Fishery Report 92-1 7, Juneau.
Stratton, B.L., and D. L. Crawford. 1994. Abundance, age, sex, and size statistics for Pacific salmon in Bristol Bay, 1992. Alaska Department of Fish and Game, Division of Commercial Fisheries Management and Development, Technical Fishery Report 94-1 6, Juneau.
Stratton, B., and B. Cross. 1990. Abundance, age, sex, and size statistics for Pacific salmon in Bristol Bay, 1988. Alaska Department of Fish and Game, Division of Commercial Fisheries, Technical Fishery Report 90-06, Juneau.
Swanton, C. O., and R. L. Murphy. 1992. Origins of sockeye salmon caught within the Harbor Point to Strogonof Point reach of the Alaska Peninsula Management Area, 8 July through 2 1 July, 1990. Alaska Department of Fish and Game, Division of Commercial Fisheries, Technical Fishery Report 92-04, Juneau

LITERATURE CITED (Continued)
Thompson, S. 1987. Sample size for estimating multinomial proportions. The American Statistician 41 :42- 46.
' t i / t i l < \ \ ~ i l , K.A., R. Russell, J. Regnart, and T. Brookover. 1994. Salmon spawning ground surveys in the Bristol Bay area, 1994. Alaska Department of Fish and Game, Division of Commercial Fisheries Management and Development, Regional Information Report 2A94-34, Anchorage.
Yuen, H. 1984. Bristol Bay salmon (Uncorhynchur sp.) 198 1 - a compilation of catch, escapement, and biological data. Alaska Department of Fish and Game, Division of Commercial Fisheries, Technical Data Report 129, Juneau.
Yuen, H., and D. Bill. 1989a. Abundance, age, sex, and size statistics for Pacific salmon (Oncorhynchus sp.) in Bristol Bay, 1984. Alaska Department of Fish and Game, Division of Commercial Fisheries, Technical Fishery Report 89-06, Juneau.
Yuen, H., and D. Bill. 1989b. Abundance, age, sex, and size statistics for Pacific salmon (Oncorhynchus sp.) in Bristol Bay, 1985. Alaska Department of Fish and Game, Division of Commercial Fisheries, Technical Fishery Report 89-07, Juneau.
Yuen, H., and D. Bill. 1990. Abundance, age, sex, and size statistics for Pacific salmon (Oncorhynchus sp.) in Bristol Bay, 1986. Alaska Department of Fish and Game, Division of Commercial Fisheries, Technical Fishery Report 90-14, Juneau.
Yuen, H., and C. Meacham. 1983. Bristol Bay salmon (Oncorhynchus sp.) 1979 - a compilation of catch, escapement, and biological data. Alaska Department of Fish and Game, Division of Commercial Fisheries, Technical Data Report 94, Juneau.
Yucn, H., and M. Nelson. 1983. Bristol Bay salmon (Oncorhynchus sp.) 1978 - a compilation of catch and escapement data. Alaska Department of Fish and Game, Division of Commercial Fisheries, Technical Data Report 88, Juneau.
Yuen, H., and M. Nelson. 1984a. Bristol Bay chinook salmon (Oncorhynchus tshawytscha) sex, age, weight, and length statistics, 1966-1977. Alaska Department of Fish and Game, Division of Commercial Fisheries, Technical Data Report 120, Juneau.

LITERATURE CITED (Continued)
Yuen, H., and M. Nelson. 1984b. Bristol Bay chum salmon (Oncorhynchus keta) sex, age, weight, and length statistics, 1960 to 1977. Alaska Department of Fish and Game, Division of Commercial Fisheries, Technical Data Report 127, Juneau.
Yuen, H., and M. Nelson. 1985. Bristol Bay pink (Oncorhynchus gorbuscha) and coho salmon (0. kisutch) sex, age, weight, and length statistics, 1961-1976. Alaska Department of Fish and Game, Division of Commercial Fisheries, Technical Data Report 156, Juneau.
Yuen, H,, and M. Nelson. 1987. 1983 Bristol Bay salmon (Oncorhynchus sp.) - a compilation of catch, escapement, and biological data. Alaska Department of Fish and Game, Division of Commercial Fisheries, Technical Data Report 19 1, Juneau.
Yuen, H., B. Bue, and C. Meacham. 198 1. Bristol Bay sockeye salmon (Oncorhynchus nerka) age, weight, and length statistics, 1957-1977. Alaska Department of Fish and Game, Division of Commercial Fisheries, Technical Data Report 67, Juneau.
Yuen, H., M. Nelson, and R. Minard. 1986. Bristol Bay salmon (Oncorhynchus sp.) 1982 - a compilation of catch, escapement, and biological data. Alaska Department of Fish and Game, Division of Commercial Fisheries, Technical Data Report 175, Juneau.
Yuen, H., and four coauthors. 1984. Bristol Bay salmon (Oncorhynchus sp.) 1980 - a compilation of catch, escapement, and biological data. Alaska Department of Fish and Game, Division of Commercial Fisheries, Technical Data Report 128, Juneau.

Table 1. Bristol Bay sockeye salmon run, 1993.
Age Gmup
.'/strni8 0.2 1.1 0.3 1.2 2.1 0.4 1.3 2.2 3.1 1.4 2.3 3.2 2 4 3.3 3 4 Total
- ~ . ~ ~ u > s k C 0 3.953 5.481 1.108.954 1,113 01.388.262 2.286.304 0 2.142 484.170 3.544 0 3.600 0 5.287.523
E 5,310 4.138 46.934 910.608 115.822 896 973.736 1,776,665 0 2.592 188.465 0 0 0 0 4.025.166 1 5.310 8.091 52.415 2.019.562 116.935 896 2.361.998 4.062.969 0 4.734 672.635 3.544 0 3.600 0 9.312.689
S 523 0 1.926 127.813 144 35 108.334 322.184 0 233 27.113 543 0 264 0 589.113 T 5.833 8.091 54.341 2.147.375 117.079 931 2.470.332 4.385.153 0 4.967 699.748 - 4.087 0 3.864 0 9.901.802
Branch C 0 0 0 182.615 10 0 83.194 145.511 0 1.721 55.076 314 0 320 0 468,761 E 0 2.437 0 149,901 2.113 0 58.134 113.231 0 750 21.409 0 0 0 0 347.975 I 0 2.437 0 332.516 2.123 0 141,328 258.742 0 2.471 76.485 314 0 320 0 816.736
S O 0 0 21.044 3 0 6,482 20.518 0 122 3.083 48 0 24 0 51.323 T 0 2.437 0 353.560 2.126 0 147.810 279.260 0 2.593 79.568 362 0 344 0 868.059
-
Naknek C 0 0 0 116.859 657 0 450.392 268.604 0 54.131 2.232.874 2.112 23.819 2.144 0 3,151,592 E O O 0 95.857 4.388 0 310.303 209.405 0 36.054 867.410 0 12,241 0 0 1.535.658 1 0 0 0 212.716 5,045 0 760.695 478.009 0 90.185 3,100,284 2.112 36.060 2.144 0 4.687.250
S O 0 0 13.462 6 0 34.890 37.905 0 4,435 124,967 324 2.147 157 0 218.294 T 0 0 0 226,178 5.051 0 795.585 515.914 0 94.620 3.225.251 2.436 38.207 2.301 0 4.905.544
--
Egegik C 0 0 6.141 467.614 0 0 1.149.266 9.629.905 0 86.283 10.051.082 106.349 75.104 29.114 0 21.600.858 E 0 0 0 14,832 33.519 0 72.585 618.354 0 10.392 752.415 9.308 3.093 2.502 0 1.517.000 I 0 0 6.141 482.446 33.519 0 1,221.851 10,248.259 0 96.675 10.803.497 115.657 78.197 31.616 0 23.1 17.858
S 0 0 226 30.533 41 0 56,041 812.663 0 4.754 435.470 17.729 4.656 2.323 0 1.364.436 T 0 0 6.367 512.979 33.560 0 1.277.892 11,060.922 0 101.429 11.238.967 133.386 82.853 33,939 0 24.482.294
Ugashik C 0 0 E 188 1.131 I 188 1.131
S 19 0 T 207 1.131
Wood C 6.913 E 2,056
1 8.969 S 883 '1' 9.852
lgushik C 580 E 0
1 580 S 57 T 637
Snak:: C 0 0 0 0 0 0 0 0 0 0 0 0 0 0 0 14 E O O 0 0 0 0 0 0 0 0 0 0 0 0 0 1 0 0 0 0 0 0 0 0 0 0 0 0 0 0 0 14
S O 0 0 0 0 0 0 0 0 0 0 0 0 0 0 0 T O O 0 0 0 0 0 0 0 0 0 0 0 0 0 14
Nushagak C 12.331 0 356.983 83.250 0 83,198 906,347 9,756 0 53.898 7.221 0 0 0 0 1.512.984 E 35.687 0 108.828 33.281 0 32.663 457.304 1.450 0 42.831 2.661 0 394 0 0 715,099
1 48.018 0 465.811 116.531 0 115.861 1,363.651 11.206 0 96.729 9.882 0 394 0 0 2.228.083 S 4.726 0 17.118 7.375 0 4.534 62.545 889 0 4.757 398 0 23 0 0 102.365 T 52,744 0 482.929 123.906 0 120.395 1.426.196 12.095 0 101.486 10.280 0 417 0 0 2.330.448
Togiak C 1.001 0 34.041 89.758 0 2.720 262.278 19.355 0 6.557 60.089 0 0 0 0 475.799 E 0 0 1.119 34.596 0 0 123.118 11.796 0 361 17.620 0 0 0 0 188.610 I 1.001 0 35.160 124.354 0 2.720 385.3% 31.151 0 6.918 77.709 0 0 0 0 664.409
S 99 0 1.292 7.870 0 106 17.676 2.470 0 340 3.132 0 0 0 0 32.986 T 1,100 0 36.452 132.224 0 2.826 403.072 33.621 0 7.258 80.841 0 0 0 0 697.395
Summary C 20.825 3.953 430.712 4.252.830 4.127 89.357 6329.861 14,076.149 0 236.013 14.688.189 121.380 109,402 35.178 0 40.397.990 E 43.241 8.523 164,315 2.321.885 167.561 34.607 2,938,867 3.122.221 0 103.805 2,388.647 9.308 19.170 2.502 0 11.324.652
1 64.066 12.476 595.027 6.574.715 171.688 123.964 9.268.728 17,198,370 0 339.818 17.076.836 130.688 128,572 37.680 0 51.722.642 S 6.306 0 21.867 416.097 212 4.851 425.115 1.363.790 0 16.711 688,338 20.033 7.656 2.768 0 2.973.744 T 70.372 12.476 616.894 6.990.812 171.900 128.815 9,693,843 18.562.160 0 356.529 17.765.174 150.721 136.228 40.448 0 54,696.386
a C = Catch, E = Escapement, I = Inshore Return, S = South Peninsula Catch, and T = Total. Egegik escapement includes Shosky Creek; Ugashik escapement includes King Salmon and Dog Salmon Rivers; Togiak catch is Togiak River Section only and Togiak escapement includes the tower counts, and lower river and tributaries aerial survey estimate.

Table 2. Age, sex, and size (length in mm and weight in kg) composition of sockeye salmon commercial catch and escapement, Bristol Bay, 1993.
Age Group
- - -- -- --- -
0.2 1.1 0.3 1.2 2.1 0.4 1.3 2.2 1.4 2.3 3.2 2.4 3 3 Total
Males Percent Sample Size Mean Length Std. Error Sample Size Mean Weight Std. Error Sample Size
Females Percent Sample Size Mean Length Std. Error Sample Size Mean Weight Std. Error Sample Size
Both Sexes
Percent Sample Size Mean Length Std. Error Sample Size Mean Weight Std. Error Sample Size

Table 3. Age, sex, and size (length in mrn and weight in kg) composition of sockeye salmon commercial catch, Naknek-Kvichak District, 1993.
--7
Age Group
1.1 0.3 1.2 2.1 1.3 2.2 1.4 2.3 3.2 2.4 3.3 Total
.?.ample Penod 1
Males Percent Sample Size Mean Length Std. Error Sample Size Mean Weight Std. Error Sample Size
Females Percent Sample Size Mean Length Std. Error Sample Size Mean Weight Std. Error Sample Size
Both Sexes Percent Sample Size Mean Length Std. Error Sample Size Mean Weight Std. Error Sample Size
Sample Penod 2:
Males Percent Sample Size Mean Length Std. Error Sample Size Mean Weight Std. Error Sample Size
Females Percent Sample Size Mean Length Std. Error Sample Size Mean Weight Std. Error Sample Size
Both Sexes Percent Sample Size Mean Length Std. Error Sample Sue Mean Weight Std. Error Sample Size
. June 2 - June 23
47,409 5.71
29 513
6 29
2.19
1
14,713 1.77
9 512
15 9
June 24 - June 26
- - -- -
- Continued -
2 4

Table 3. (p 2 of 7)
Age Group
1.1 0.3 1.2 2.1 1.3 2.2 1.4 2.3 3.2 2.4 3.3 Total
Sample Penod 3: June 27
Males Percent Sample Size Mean Length Std. Error Sample Size Mean Weight Std. Error Sample Size
Females Percent Sample Size Mean Length Std. Error Sample Size Mean Weight Std. Error Sample Size
Both Sexes Percent Sample Sue Mean Length Std. Error Sample Sue Mean Weight Std. Error Sample Sue
Sample Period 4: June 28 - June 29
Males Percent Sample Size Mean Length Std. Error Sample Size Mean Weight Std. Error Sample Size
Females Percent Sample Sue Mean Length Std. Error Sample Size Mean Weight Std. Error Sample Sue
Both Sexes Percent Sample Sue Mean Length Std. Error Sample Sue Mean Weight Std. Error Sample Sue
- Continued -

Table 3. (p 3 of 7)
Age Group
1.1 0.3 1.2 2.1 1.3 2.2 1.4 2.3 3.2 2.4 3.3 Total
.;ampla Period 5: June 30 -July 1
,iak - ,"arc;-?n1 Sample Size Mean Length Std. Error Sample Size Mean Weight Std. Error Sample Size
Females Percent Sample Sue Mean Length Sld. Error Sample Sue Mean Weight Std. Error Sample Sue
Both Sexes Percent Sample Size Mean Length Std. Error Sample Size Mean Weight Std. Error Sample Size
Sample Period 6: July 2 -July 3
Males Percent Sample Sue Mean Length Std. Error Sample Size Mean Weight Std. Error Sample Size
Females Percent Sample Sue Mean Length Std. Error Sample Size Mean Weight Std. Error Sample Size
Both Sexes Percent Sample Size Mean Length Std. Error Sample Size Mean Weight Std. Error Sample Size
- Continued -
26

Table 3. (p 4 of 7)
Age Group
1.1 0.3 1.2 2.1 1.3 2.2 1.4 2.3 3.2 2.4 3.3 Total
Sample Period 7: July 4 - July 5
Males Percent Sample Size Mean Length Std. Error Sample Slze Mean We~ght Std. Error Sample Size
Females Percent Sample Size Mean Length Std. Error Sample S~ze Mean Weight Std. Error Sample Size
Both Sexes Percent Sample Size Mean Length Std. Error Sample Size Mean Weight Std. Error Sample Size
Sample Period 8: July 6 - July 7
Males Percent Sample Size Mean Length Std. Error Sample Size Mean Weight Std. Error Sample Size
Females Percent Sample Size Mean Length Std. Error Sample Size Mean Weight Std. Error Sample Size
Both Sexes Percent Sample Sue Mean Length Std. Error Sample Sue Mean Weight Std. Error Sample Size
- Continued -

Table 3. (p 5 of 7)
Age Group
1.1 0.3 1.2 2.1 1.3 2.2 1.4 2.3 3.2 2.4 3.3 Total
Sarr~p!a Period 9: July 8 - July 9
Mnlos Percent Sample Size Mean Length Std. Error Sample Size Mean Weight Std. Error Sample Sue
Females 1,082 Percent 0.19 Sample Sue 1 Mean Length 500 Std. Error Sample Sue 1 Mean Weight Std. Error Sample Sue
Both Sexes 1.082 Percent 0.19 Sample Sue 1 Mean Length 500 Std. Error Sample Sue 1 Mean Weight Std. Error Sample Size
Sample Period 10: July 10 -July 11
Males Percent Sample Sue Mean Length Std. Error Sample Size Mean Weight Std. Error Sample Size
Females Percent Sample Size Mean Length Std. Error Sample Size Mean Weight Std. Error Sample Size
Both Sexes Percent Sample Sue Mean Length Std. Enor Sample Sue Mean Weight Std. Error Sample Sue
- Continued -
28

Table 3. @ 6 of7)
Age Group
1.1 0.3 1.2 2.1 1.3 2.2 1.4 2.3 3.2 2.4 3.3 Total
Sample Period 11: July 12 - July 14
Males Percent Sample Size Mean Length Std. Error Sample Size Mean Weight Std. Error Sample Size
Females Percent Sample Size Mean Length Std. Error Sample Sue Mean Weight Std. Error Sample Size
Both Sexes Percent Sample Sue Mean Length Std. Error Sample Sue Mean Weight Std. Error Sample Size
Sample Period 12: July 15 -August 6
Males Percent Sample Sue Mean Length Std. Error Sample Size
Females Percent Sample Size Mean Length Std. Error Sample Size
Both Sexes Percent Sample Size Mean Length Std. Error Sample Size
- Continued -

Table 3. (p 7 of 7)
- Age Group
1.1 0.3 1.2 ----- Ail Pe~iods C~mbined:
hie:; 3,953 678,620 Percent 0.04 7.62 Sample Sue 1 370 Mean Length 622 521 Std. Error 2 Sample Size 1 370 Mean Weight 2.33 Std. Error 0.05 Sample Sue - 55
Females 3.953 1.528 729.808 Percent 0.04 0.02 8.19 Sample Sue 1 2 461 Mean Length 598 515 504 Std. Error 1 Sample Size 1 2 461 Mean Weight 2.00 Std. Error 0.05 Sample Sue 51
Both Sexes 3,953 5,481 1,408,428 Percent 0.04 0.06 15.81 Sample Size 1 3 831 Mean Length 598 592 512 Std. Error 1 Sample Size 1 3 831 Mean Weight 2.16 Std. Error 0.03 Sample Size 106
2.4 3.3 Total

Table 4. Age, sex, and size (length in mm and weight in kg) composition of sockeye salmon escapement, Kvichak River, 1993.
Age Group
0.2 1.1 0.3 1.2 2.1 0.4 1.3 2.2 7.4 2.3 Total
Sample Period 1: June 22 - June 28
Males Percent SampleSize Mean Length Std. Error Sample Size
Females Percent Sample Size Mean Length Std. Error Sample Size
Both Sexes Percent Sample Size Mean Length Std. Error Sample Size
Sample Period 2: June 29 - July 3
Males Percent Sample Size Mean Length Std. Error Sample Size
Females Percent Sample Size Mean Length Std. Error Sample Size
Both Sexes Percent Sample Size Mean Length Std. Error Sample Size
- Continued -

Table 4. (p 2 of 4)
0.2 1.1 0.3 1.2 2.1 0.4 1.3 2.2 1.4 2.3 Total
--- Sample Per~od 3: July 4 -July 6
Males 2.069 11 1,735 22,761 184,156 244,161 26,899 591,781 Percent 0.17 9.39 1.91 15.48 20.52 2.26 49.74 Sample Size 1 54 11 89 118 13 286 Mean Length - 340 514 353 604 546 589 552 Std. Error 5 7 4 3 8 2 Sample Size 1 54 11 89 118 13 286
Females Percent Sample Size Mean Length Std. Error Sample Size
Both Sexes 2,069 235,885 22,761 337.274 535,914 55.867 1,189,770 Percent 0.17 19.83 1.91 28.35 45.04 4.70 100.00 Sample Size 1 114 11 163 259 27 575 Mean Length 340 507 353 590 536 587 544 Std. Error 3 7 3 2 4 1 Sample Size 1 114 11 163 259 27 575
Sample Period 4: July 7 -July 9
Males Percent Sample Size Mean Length Std. Error Sample Size
Females Percent Sample Size Mean Length Std. Error Sample Size
Both Sexes Percent Sample Size Mean Length Std. Error Sample Size
- Continued -

Table 4. (p 3 of 4)
Age Group
0.2 1.1 0.3 1.2 2.1 0.4 1.3 2.2 1.4 2.3 Total
Sample Period 5: July 10 -July 12
Males 1,792 10,754 50,183 18,819 Percent 0.38 2.28 10.63 3.98 Sample Size 2 12 56 2 1 Mean Length 407 566 517 363 Std. Error 32 9 5 7 Sample Size 2 12 56 21
Females Percent Sample Size Mean Length Std. Error Sample Size
Both Sexes 1,792 896 23,300 107,535 19,715 896 Percent 0.38 0.19 4.93 22.77 4.17 0.19 Sample Size 2 1 26 120 22 1 Mean Length 407 530 559 510 369 575 Std. Error 32 5 3 7 Sample Size 2 1 26 120 22 1
Sample Period 6: July 13 - July 25
Males 3,518 1,173 4,690 48,073 28,140 Percent 0.78 0.26 1.04 10.65 6.23 Sample Size 3 1 4 4 1 24 Mean Length 450 382 562 501 366 Std. Error 46 9 5 4 Sample Size 3 1 4 41 24
Females Percent Sample Size Mean Length Std. Error Sample Size
Both Sexes 3,518 1,173 11,725 130.149 28,140 Percent 0.78 0.26 2.60 28.83 6.23 Sample Size 3 1 10 111 24 Mean Length 450 382 536 502 366 Std. Error 46 12 3 4 Sample Size 3 1 10 111 24
- Continued -

Table 4. (p 4 of 4)
Age Group
0.2 1.1 0.3 1.2 2.1 0.4 1.3 2.2 1.4 2.3 Total
--
All Per~ods Combined:
Males 5,310 3,242 23,544 424,679 113,507 Percent 0.13 0.08 0.58 10.55 2.82 Sample Size 5 2 23 343 93 Mean Length - 435 355 562 516 361 Std. Error 32 8 2 3 Sample Size 5 2 23 343 93
Females Percent Sample Size Mean Length Std. Error Sample Size
Both Sexes 5,310 4,138 46.934 910,608 115.822 Percent 0.13 0.10 1.17 22.62 2.88 Sample Size 5 3 46 728 95 Mean Length 435 393 553 511 362 Std. Error 32 5 1 3 Sample Size 5 3 46 728 95

Table 5. Age, sex, and size (length in mm and weight in kg) composition of sockeye salmon escapement, Naknek River, 1993.
Age Group
1.2 2.1 1.3 2.2 1.4 2.3 2.4 Total
Sample Period 1: June 20 -June 28
Males 8,014 668 Percent 2.37 0.20 Sample Size 12 1 Mean Length 462 320 Std. Error 7 Sample Size 12 1
Females 3,339 Percent 0.99 Sample Size 5 Mean Length 488 Std. Error 12 Sample Size 5
Both Sexes 11,353 668 Percent 3.35 0.20 Sample Size 17 1 Mean Length 469 320 Std. Error 6 Sample Size 17 1
Sample Period 2: June 29 - July 5
Males Percent Sample Size Mean Length Std. Error Sample Size
Females Percent Sample Size Mean Length Std. Error Sample Size
Both Sexes Percent Sample Size Mean Length Std. Error Sample Size
--
- Continued -

Table 5 . (p 2 of 3)
1.2 2.1 1.3 2.2 1.4 2.3 2.4 Total
Sample Period 3: July 6 -July 9
Males Percent Sample Size ' Mean Length Std. Error Sample Size
Females Percent Sample Size Mean Length Std. Error Sample Size
Both Sexes Percent Sample Size Mean Length Std. Error Sample Size
Sample Period 4: July 10 - July 13
Males 1,480 Percent 1.16 Sample Size 5 Mean Length . 477 Std. Error 28 Sample Size 5
Females 4,439 Percent 3.47 Sample Size 15 Mean Length 480 Std. Error 6 Sample Size 15
Both Sexes 5,919 Percent 4.63 Sample Size 20 Mean Length 479 Std. Error 8 Sample Size 20
- Continued -
36

Table 5. (p 3 of 3)
Age Group
1.2 2.1 1.3 2.2 1.4 2.3 2.4 Total
Sample Period 5: July 14 - July 22
Males 2,677 Percent 3.42 samplesize 11 Mean Length 483 Std. Error 13 Sample Size 11
Females 2,920 Percent 3.73 Sample Size 12 Mean Length 470 Std. Error 7 Sample Size 12
Both Sexes 5,597 Percent 7.14 Sample Size 23 Mean Length 476 Std. Error 7 Sample Size 23
All Periods Combined:
Males 54,605 Percent 3.56 Sample Size 75 Mean Length 463 Std. Error 5 Sample Size 74
Females 41,252 Percent 2.69 Sample Size 77 Mean Length 471 Std. Error 7 Sample Size 75
Both Sexes 95,857 Percent 6.24 Sample Size 152 Mean Length 467 Std. Error 4 Sample Size 149

Table 6. Age, sex, and size (length in mm and weight in kg) composition of sockeye salmon commercial catch, Egegik District, 1993.
- -. - -
Age Group - - - - - - - -
0.3 1.2 1 3 2.2 1 4 2.3 3.2 2 4 3.3 Total -
Males Percent Sample Size Mean Length Std. Error Sample Size Mean Weight Std. Error Sample Size
Females Percent Sample Size Mean Length Std. Error Sample Size Mean Weight Std. Error Sample Size
Both Sexes , Percent
Sample Size Mean Length Std. Error Sample Size Mean Weight Std. Error Sample Size
Sample Period 2:
Males Percent Sample Size Mean Length Std. Error Sample Size Mean Weight Std. Error Sample Size
Females Percent Sample Size Mean Length Std. Error Sample Size Mean Weight Std. Error Sample Size
Both Sexes Percent Sample Size Mean Length Std. Error Sample Size Mean Weight Std. Error Sample Size
June 17 -June 21
1.820 0.21
1 549
June 22 - June 24
17.991 1.07
3 533
15 3
2.64
- Continued -
3 8

Table 6 . (p 2 of 5 )
Age Group
0.3 1.2 1.3 2.2 1.4 2.3 3.2 2.4 3.3 Total
Sample Period 3: June 25
Males Percent Sample Size Mean Length Std. Error Sample Size Mean Weight Std. Error Sample Size
Females Percent Sample Sue Mean Length Std. Error Sample Size Mean Weight Std. Error Sample Size
Both Sexes Percent Sample Size Mean Length Std. Error Sample Size Mean Weight Std. Error Sample Size
Sample Period 4: June 28.
Males Percent Sample Size Mean Length Std. Error Sample Size Mean Weight Std. Error Sample Size
Females Percent Sample Size Mean Length Std. Error Sample Size Mean Weight Std. Error Sample Size
Both Sexes Percent Sample Size Mean Length Std. Error Sample Size Mean Weight Std. Error Sample Size
-June 27
6.032 0.18
1 542
1
24.128 0.74
4 516 24 4
30.160 0.92
5 521 24 5
June 29
41,660 1.70
9 524
10 9
2.48 0.18
2
37,031 1.51
8 51 1
5 8
1.82 0.05
2
78,691 3.21
17 518
6 17
2.17 0.10
4
- Continued -
3 9

Table 6 . (p 3 of 5 )
Age Group
0.3 1.2 1.3 2.2 1.4 2.3 3.2 2.4 3.3 Total
3 n p l e Period 5: June 30 - July 3
;\isle- ?erce!lt Sample Size Mean Length Std. Error Sample Size Mean Weight Std. Error Sample Sue - Females Percent Sample Size Mean Length Std. Error Sample Size Mean Weight Std. Error Sample Size
Both Sexes Percent Sample Size Mean Length Std. Error Sample Size Mean Weight Std. Error Sample Size
Sample Period 6: July 4 - July 6
Males Percent Sample Size Mean Length Std. Error Sample Size Mean Weight Std. Error Sample Sue
Females Percent Sample Size Mean Length Std. Error Sample Size Mean Weight Std. Error Sample Sue
Both Sexes Percent Sample Sue Mean Length Std. Error Sample Size Mean Weight Std. Error Sample Size
- Continued -
4 0

Table 6. (p 4 of 5 )
- -
Age Group
0.3 1.2 1.3 2.2 1.4 2.3 3.2 2.4 3.3 Total
Sample Period 7:
Males Percent Sample Size Mean Length Std. Error Sample Size Mean Weight Std. Error Sample Size
Females Percent Sample Size Mean Length Std. Error Sample Sue Mean Weight Std. Error Sample Size
Both Sexes Percent Sample Sue Mean Length Std. Error Sample Size Mean Weight Std. Error Sample Size
Sample Period 8:
Males Percent Sample Size Mean Length Std. Error Sample Size Mean Weight Std. Error Sample Sue
Females Percent Sample Size Mean Length Std. Error Sample Size Mean Weight Std. Error Sample Size
Both Sexes Percent Sample Sue Mean Length Std. Error Sample Size Mean Weight Std. Error Sample Sue
July 7 - July 8
3.129 0.18
1 444
- Continued -
4 1

Table 6 . (p 5 of 5 )
Age Group -
0.3 1.2 1.3 2.2 1.4 2.3 3.2 2 4 3.3 Total - - a- Sar~lple Period 9: July 12 - August 27
Males Percent Sample Sue Mean Length Std. Error Sample Size Mean Weight Std. Error Sample Size
Females Percent Sample Size Mean Length Std. Error Sample Size Mean Weight Std. Error Sample Sue
Both Sexes Percent Sample Size Mean Length Std. Error Sample Sue Mean Weight Std. Error Sample Sue
All Periods Combi~
Males Percent Sample Sue Mean Length Std. Error Sample Size Mean Weight Std. Error Sample Size
Females Percent Sample Size Mean Length Std. Error Sample Size Mean Weight Std. Error Sample Size
Both Sexes Percent Sample Sue Mean Length Std. Error Sample Sue Mean Weight Std. Error Sample Size
ned:
6.141 0.03
1 556
1
6,141 0.03
1 556
1

Table 7. Age, sex, and size (length in mm and weight in kg) composition of sockeye salmon escapement, Egegik River, 1993.
Age Group
1.2 2.1 1.3 2.2 1.4 2.3 3.2 2 4 3 3 Total
Sample Period 1: June 19 -June 23
Males Percent Sample Size Mean Length Std. Error Sample Size
Females Percent Sample Size Mean Length Std. Error Sample Size
Both Sexes Percent Sample Size Mean Length Std. Error Sample Size
Sample Period 2: June 24 - June 28
Males Percent Sample Size Mean Length Std. Error Sample Size
Females Percent Sample Size Mean Length Std. Error Sample Size
Both Sexes Percent Sample Size Mean Length Std. E m r Sample Size
- Continued -

Table 7. (p 2 of 3)
Age Group
1.2 2.1 1.3 2.2 1.4 2.3 3.2 2.4 3.3 Total
-- .
Sample Period 3: June 29 -July 5
Males 377 4,150 Percent 0.18 2.01 Sample Size 1 11 Mean Length - 567 376 Std. Error 26 Sample Size 1 11
Females 754 377 Percent 0.37 0.18 Sample Size 2 1 Mean Length 492 398 Std. Error 22 Sample Size 2 1
Both Sexes 1,131 4,527 Percent 0.55 2.19 Sample Size 3 12 Mean Length 517 378 Std. Error 22 26 Sample Size 3 12
Sample Period 4: July 6 -July 8
Males Percent Sample Size Mean Length Std. Error Sample Size
Females Percent Sample Size Mean Length Std. Error Sample Size
Both Sexes Percent Sample Size Mean Length Std. Error Sample Size
- Continued -

Table 7. (p 3 of 3)
-- - -
Age Group
1.2 2.1 1.3 2.2 1.4 2.3 3.2 2.4 3.3 Total a
Sample Period 5: July 9 - July 22
Males 802 Percent 0.27 Sample Size 2 Mean Le_ngth 426 Std. Error 74 Sample Size 2
Females 2,407 Percent 0.80 Sample Size 6 Mean Length 481 Std. Error 8 Sample Sue 6
Both Sexes 3,209 Percent 1.06 Sample Size 8 Mean Length 467 Std. Error 19 Sample Size 8
All Periods Combined:
Males 4,787 Percent 0.32 Sample Size 9 Mean Length 540 Std. Error 20 Sample Sue 9
Females 10,045 Percent 0.66 Sample Size 23 Mean Length 504 Std. Error 6 Sample Size 23
Both Sexes 14,832 Percent 0.98 Sample Size 32 Mean Length 516 Std. Error 8 Sample Sue 32
' Total does not include Shosky Creek escapement (20)

Table 8. Age, sex, and size (length in mm and weight in kg) composition of sockeye salmon commercial catch, Ugashik District, 1993.
---
Age Group
0.3 1.2 2.1 1.3 2.2 1.4 2.3 3.2 2.4 Total
Sample Period 1: June 8 - June 30
Males Percent Sample Size Mean Length Std. Error Sample Size -
Females Percent Sample Size Mean Length Std. Error Sample Size
Both Sexes Percent Sample Size Mean Length Std. Error Sample Size
Sample Period 2: July 1 - July 6
Males 1,499 88,449 Percent 0.16 9.25 Sample Size 1 59 Mean Length 578 534 Std. Error 4 Sample Size 1 57
Females 1,499 55,468 Percent 0.16 5.80 Sample Size 1 37 Mean Length 561 509 Std. Error 3 Sample Size 1 37
Both Sexes 2,998 143,917 Percent 0.31 15.05 Sample Size 2 96 Mean Length 570 524 Std. Error 2 Sample Size 2 94
- Continued -

Table 8. (p 2 of 4)
Age Group
0.3 1.2 2.1 1.3 2.2 1.4 2.3 3.2 2 4 Total
Sample Period 3: July 7 -July 8
Males Percent Sample Size Mean Length Std. Error Sample S~ze Mean We~ght Std. Error Sample Size
Females Percent Sample Size Mean Length Std. Error Sample Size Mean Weight Std. Error Sample Size
Both Sexes Percent Sample Size Mean Length Std. Error Sample Size Mean Weight Std. Error Sample Size
Sample Period
Males Percent Sample Size Mean Length Std. Error Sample Size Mean Weight Std. Error Sample Size
Females Percent Sample Size Mean Length Std. Error Sample Size Mean Weight Std. Error Sample Size
Both Sexes Percent Sample Size Mean Length Std. Error Sample Size Mean Weight Std. Error Sample Size
4: July 9
785 0.18
1 547
1
785 0.18
1 547
1
-
- Continued -

Table 8. (p 3 of 4)
Age Group
0.3 1.2 2.1 1.3 2.2 1.4 2.3 ' 3.2 2.4 Total
:hniplc Period 5: July 10
!Males Percent Sample Size Mean Length Std. Error Sample Size Mean Weight - Std. Error Sample Size
Females Percent Sample Size Mean Length Std. Error Sample Size Mean Weight Std. Error Sample Size
Both Sexes Percent Sample Size Mean Length Std. Error Sample Size Mean Weight Std. Error Sample Size
Sample Period 6: July 13
Males Percent Sample Size Mean Length Std. Error Sample Size
Females Percent Sample Size Mean Length Std. Error Sample Size
Both Sexes Percent Sample Size Mean Length Std. Error Sample Size
-July 12
23,437 2.88
15 548
9 15
2.76
1
29.687 3.65
19 51 1
5 19
1.99 0.25
2
53,124 6.53
34 527
5 34
2.33 0.25
3
- August 17
8,544 1.43
7 526
12 7
26,852 4.50
22 526
9 22
35,396 5.93
29 526
7 29
- Continued -

Table 8. (p 4 of 4)
Age Group
0.3 1.2 2.1 1.3 2.2 1.4 2.3 3.2 2.4 Total
All Periods Combined:
Males 2,184 Percent 0.05 Sample Size 3 Mean Length 568 Std. Error 19 Sample Size 3 Mean Weight Std. ~ r r o r Sample Size
Females 2,626 Percent 0.06 Sample Size 3 Mean Length 551 Std. Error Sample Size 3 Mean Weight Std. Error Sample Size
Both Sexes 4,810 Percent 0.12 Sample Size 6 Mean Length 559 Std. Error 19 Sample Size 6 Mean Weight Std. Error Sample Size

Table 9. Age, sex, and size (length in mm and weight in kg) composition of sockeye salmon escapement, Ugashik River, 1993.
Age Group
0.2 1.1 0.3 1.2 2.1 1.3 2.2 1.4 2.3 2.4 Total
Sample Period 1: June 28 - July 8
Males Percent - Sample Size Mean Length Std. Error Sample Size
Females Percent Sample Size Mean Length Std. Error Sample Size
Both Sexes Percent Sample Size Mean Length Std. Error Sample Size
Sample Period 2: July 9 - July 10
Males Percent Sample Size Mean Length Std. Error Sample Size
Females Percent Sample Size Mean Length Std. Error Sample Size
Both Sexes Percent Sample Size Mean Length Std. Enor Sample Size
- Continued -

Table 9. (p 2 of 3)
Age Group
0.2 1 . 0.3 1.2 2.1 1.3 2.2 1.4 2.3 2.4 Total
Sample Period 3: July 11 -July 14
Males Percent Sample Size Mean Length Std. Error Sample Size
Females Percent Sample Size Mean Length Std. Error Sample Size
Both Sexes Percent Sample Size Mean Length Std. Error Sample Size
Sample Period 4: July 15 - July 27
Males 185 1,112 556 Percent 0.18 1.09 0.54 Sample Size 1 6 3 Mean Length 409 331 573 Std. Error 6 5 Sample Size 1 6 3
Females Percent Sample Size Mean Length Std. Error Sample Size
Both Sexes 185 1,112 1,482 Percent 0.18 1.09 1.45 Sample Size 1 6 8 Mean Length 409 331 555 Std. Error 6 5 Sample Size 1 6 8
- Continued -

Table 9. @ 3 of 3)
Age Group
0.2 1.1 0.3 1.2 2.1 1.3 2.2 1.4 2.3 2.4 Total'
All Periods Combined:
Males 185 1.112 556 135,748 11,336 110,422 155,315 1,978 243,332 659,984 Percent 0.01 0.08 0.04 9.77 0.82 7.95 11.18 0.14 17.51 47.50 Sample Size 1 6 3 293 19 168 202 3 329 1,024 Mean Length 409 331 573 529 388 591 548 597 596 566 Std. Error 6 5 2 8 3 2 2 1 Sample Size 1 6 3 292 19 168 202 3 329 1.023
Females Percent Sample Size Mean Length Std. Error Sample Size
Both Sexes Percent Sample Size Mean Length Std. Error Sample Size
Total does not include escapement to King Salmon (22,570) and Dog Salmon (1,350) Rivers.

Table 10. Age, sex, and size (length in mm and weight in kg) composition of sockeye salmon commercial catch, Nushagak District, 1993.
0.2 0.3 1.2 0.4 1.3 2.2 1.4 2.3 Total
Sample Period 1: June 8 - June 24
Males Percent Sample Size Mean Length Std. Error Sample Size Mean Weight Std. Error Sample Size
Females Percent Sample Size Mean Length Std. Error Sample Size Mean Weight Std. Error Sample Size
Both Sexes Percent Sample Size Mean Length Std. Error Sample Size Mean Weight Std. Error Sam~le Size
Sample Period 2: June 25 - June 27
Males Percent Sample Size Mean Length Std. Error Sample Size Mean Weight Std. Error Sample Size
Females Percent Sample Size Mean Length Std. Error Sample Sue Mean Weight Std. Error Sample Size
Both Sexes Percent Sample Size Mean Length Std. Error Sample Size Mean Weight Std. Error Sample Size
- Continued -
5 3

Table 10. (p 2 of 4)
Age Group - - --
0.2 0.3 1.2 0.4 1.3 2.2 1.4 2.3 Total
Sample Period 3: June 28 -June 30
Males 12.493 Percent 1.68 Sample Size 9 Mean Length 558 Std. Error 9 Sample Size 9 Mean Weight 2.97 Std. Error 0.30 Sample Size - 2
Females Percent Sample Size Mean Length Std. Error Sample Size Mean Weight Std. Error Sample Size
Both Sexes Percent Sample Size Mean Length Std. Error Sample Size Mean Weight Std. Error Sample Size
Sample Period 4: July 1 -July 3
Males Percent Sample Size Mean Length Std. Error Sample Size Mean Weight Std. Error Sample Size
Females Percent Sample Size Mean Length Std. Error Sample Size Mean Weight Std. Error Sample Size
Both Sexes Percent Sample Size Mean Length Std. Ermr Sample Size Mean Weight Std. Error Sample Size
- Continued -
54

Table 10. (p 3 of 4)
Age Group
0.2 0.3 1.2 0.4 1.3 2.2 1.4 2.3 Total
Sample Period 5: July 4 - July 7
Males 26.222 Percent 2.45 Sample Size 13 Mean Length 577 Std. Error 8 Sample Size 13 Mean Weight 3.67 Std. Error- 0.46 Sample Size 3
Females 76.650 Percent 7.16 Sample Size 38 Mean Length 542 Std. Error 3 Sample Size 38 Mean Weight 2.79 Std. Error 0.04 Sample Size 10
Both Sexes 102.872 Percent 9.60 Sample Size 51 Mean Length 551 Std. Error 3 Sample Size 51 Mean Weight 3.01 Std. Error 0.12 Sample Size 13
Sample Period 6: July 8 -July 10
Males Percent Sample Size Mean Length Std. Error Sample Size Mean Weight Std. Error Sample Size
Females Percent Sample Size Mean Length Std. Error Sample Size Mean Weight Std. Error Sample Size
Both Sexes Percent Sample Size Mean Length Std. Error Sample Sue Mean Weight Std. Error Sample Size
- Continued -
5 5

Table 10. (p 4 of 4)
Age Group
0.2 0.3 1.2 0.4 1.3 2.2 1.4 2.3 Total '
Sample Period 7: July 11 - July 28
Males 4.324 9,513 Percent 0.96 2.11 Sample Size 5 11 Mean Length 418 562 Std. Error 5 12 Sample Size 5 11 Mean Weight 3.30 Std. Error . 0.45 Sample Size 4
Females Percent Sample Size Mean Length Std. Error Sample Size Mean Weight Std. Error Sample Size
Both Sexes Percent Sample Size Mean Length Std. E m r Sample Size Mean Weight Std. Error Sample Size
All Periods Combined:
Males 12.646 Percent 0.26 Sample Size 10 Mean Length 434 Std. Error 14 Sample Size 10 Mean Weight Std. E m r Sample Size
Females 6.598 Percent 0.13 Sample Sue 5 Mean Length 496 Std. Error 27 Sample Sue 5 Mean Weight 1.81 Std. Error Sample Sue 1
Both Sexes 19,244 Percent 0.39 Sample Sue 15 Mean Length 455 Std. Error 12 Sample Sue 15 Mean Weight 1 .El Std. Error Sample Size 1
' Nushagak District catch does not include lgushik Beach setnet catch (308,822) which was sampled separately.
5 6

Table 1 1. Age, sex, and size (length in mm and weight in kg) composition of sockeye salmon commercial catch, Igushik Beach setnet fishery, 1993.
Age Group
0.2 0.3 1.2 0.4 1.3 2.2 1.4 2.3 Total
Sample period: June 8 -July 27
Males - Percent Sample Size Mean Length Std. Error Sample Size Mean Weight Std. Error Sample Size
Females Percent Sample Size Mean Length Std. Error Sample Size Mean Weight Std. Error Sample Size
Both Sexes Percent Sample Size Mean Length Std. Error Sample Size Mean Weight Std. Error Sample Size

Table 12. Age, sex, and size (length in mm and weight in kg) composition of sockeye salmon escapement, Wood River, 1993.
Age Group
0.2 1.1 0.3 1.2 0.4 1.3 2.2 1.4 2.3 Total
Sample Period 1: June 20 -June 30
Males - Percent Sample Size Mean Length Std. Error Sample Size
Females 752 Percent 0.16 Sample Size 1 Mean Length 435 Std. Error Sample Size 1
Both Sexes 752 Percent 0.16 Sample Size 1 Mean Length 435 Std. Error Sample Size 1
Sample Period 2: July 1 - July 3
Males Percent Sample Size Mean Length Std. Error Sample Size
Females Percent Sample Size Mean Length Std. Error Sample Size
Both Sexes Percent Sample Size Mean Length Std. Error Sample Size
- Continued -
58

Table 12. @ 2 of 3)
Age Group
0.2 1.1 0.3 1.2 0.4 1.3 2.2 1.4 2.3 Total
Sample Period 3: July 4 -July 5
Males 288 Percent 0.17 Sample Size 1 Mean Length 412 Std. Error Sample Size 1
Females Percent Sample Size Mean Length Std. Error Sample Size
Both Sexes 288 Percent 0.17 Sample Size 1 Mean Length 412 Std. Error Sample Size 1
Sample Period 4: July 6 -July 8
Males Percent Sample Size Mean Length Std. Error Sample Size
Females 185 Percent 0.17 Sample Size 1 Mean Length 475 Std. Error Sample Size 1
Both Sexes 185 Percent 0.17 Sample Size 1 Mean Length 475 Std. Error Sample Size 1
- Continued -

Table 12. (p 3 of 3)
Age Group
0.2 1.1 0.3 1.2 0.4 1.3 2.2 1.4 2.3 Total
Sample Period 5: July 9 -July 21
Males 623 Percent 0.46 Sample Size- 3 Mean Length 414 Std. Error 11 Sample Size 3
Females 208 Percent 0.15 Sample Size 1 Mean Length 442 Std. Error Sample Size 1
Both Sexes 831 Percent 0.61 Sample Size 4 Mean Length 42 1 Std. Error 11 Sample Size 4
All Periods Combined:
Males 91 1 Percent 0.08 Sample Size 4 Mean Length 41 3 Std. Error 11 Sample Size 4
Females 1,145 Percent 0.10 Sample Size 3 Mean Length 443 Std. Error Sample Size 3
Both Sexes 2.056 Percent 0.17 Sample Size 7 Mean Length 430 Std. Error 11 Sample Size 7

Table 13. Age, sex, and size (length in mm and weight in kg) composition of sockeye salmon escapement, Igushik River, 1993.
Age Group
1.1 0.3 1.2 1.3 2.2 1.4 2.3 Total
Sample Period 1 : June 22 - July 2
Males Percent Sample Size Mean Length Std. Error Sample Size
Females Percent Sample Size Mean Length Std. Error Sample Size
Both Sexes Percent Sample Size Mean Length Std. Error Sample Size
Sample Period 2: July 3 -July 6
Males 194 194 Percent 0.16 0.16 Sample Size 1 1 Mean Length 640 Std. Error Sample Size 1
Females 388 Percent 0.31 Sample Size 2 Mean Length 559 Std. Error 1 Sample Size 2
Both Sexes 194 582 Percent 0.16 0.47 Sample Size 1 3 Mean Length 586 Std. Error 1 Sample Size 3
- Continued -
6 1

Table 13. (p 2 of 3)
Age Group
1.1 0.3 1.2 1.3 2.2 1.4 2.3 Total
Sample Period 3: July 7 - July 9
Males 277 Percent 0.41 sample-Size 2 Mean Length 564 Std. Error 10 Sample Size 2
Females Percent Sample Size Mean Length Std. Error Sample Size
Both Sexes Percent Sample Size Mean Length Std. Error Sample Size
Sample Period 4: July 10 -July 22
Males Percent Sample Size Mean Length Std. Error Sample Size
Females 373 Percent 0.40 Sample Size 2 Mean Length 536 Std. Error 6 Sample Size 2
Both Sexes Percent Sample Size Mean Length Std. Error Sample Size
- Continued -
62

Table 13. (p 3 of 3)
Age Group
1.1 0.3 1.2 1.3 2.2 1.4 2.3 Total
All Periods Combined:
Males 194 Percent 0.05 Sample Size 1 Mean Length Std. Error Sample Size
Females Percent Sample Size Mean Length Std. Error Sample Size
Both Sexes 194 Percent 0.05 Sample Size 1 Mean Length Std. Error Sample Size

Table 14. Age, sex, and size (length in mm and weight in kg) composition of sockeye salmon escapement, Nushagak River, 1993.
Age Group
0.2 0.3 1.2 0.4 1.3 2.2 1.4 2.3 2.4 Total
Sample Period 1: June 15 - June 27
Males Percent - Sample Size Mean Length Std. Error Sample Size
Females Percent Sample Size Mean Length Std. Error Sample Size
Both Sexes Percent Sample Size Mean Length Std. Error Sample Size
Sample Period 2: June 28 - June 29
Males Percent Sample Size Mean Length Std. Error Sample Size
Females Percent Sample Size Mean Length Std. Error Sample Size
Both Sexes Percent Sample Size Mean Length Std. Error Sample Size
- Continued -

Table 14. (p 2 of 3)
Age Group
0.2 0.3 1.2 0.4 1.3 2.2 1.4 2.3 2.4 Total
Sample Period 3: June 30 - July 3
Males Percent Sample Size Mean Length Std. Error Sample Size
Females Percent Sample S~ze Mean Length Std. Error Sample Size
Both Sexes Percent Sample Size Mean Length Std. Error Sample Size
Sample Period 4: July 4 -August 9
Males Percent Sample Size Mean Length Std. Error Sample Size
Females Percent Sample Size Mean Length Std. Error Sample Size
Both Sexes Percent Sample Size Mean Length Std. Error Sample Size
- Continued -
65

Table 14. (p 3 of 3)
Age Group
0.2 0.3 1.2 0.4 1.3 2.2 1.4 2.3 2.4 Total
All Periods Combined:
Males 35,687 Percent - 4.99 Sample Size 97 Mean Length 424 Std. Error 3 Sample Size 97
Females Percent Sample Size Mean Length Std. Error Sample Size
Both Sexes 35,687 Percent 4.99 Sample Size 97 Mean Length 424 Std. Error 3 Sample Size 97

Table 15. Age, sex, and size (length in mm aand weight in mm) composition of sockeye salmon commercial catch, Togiak River Section, 1993.
Age Group
0.2 0.3 1.2 0.4 1.3 2.2 1.4 2.3 Total
Sample Period
Males Percent Sample Size Mean Length Std. Error Sample Size Me3n Weight Std. Error Sample Size
Females Percent Sample Size Mean Length Std. Error Sample Size Mean Weight Std. Error Sample S~ze
Both Sexes Percent Sample Size Mean Length Std. Error Sample Size Mean Weight Std. Error Sample Size
Sample Period
Males Percent Sample Size Mean Length Std. Error Sample Size Mean Weight Std. Error Sample Size
Females Percent Sample Size Mean Length Std. Error Sample Size Mean Weight Std. Error Sample Size
Both Sexes Percent Sample Size Mean Length Std. Error Sample Size Mean Weight Std. Error Sample Size
1: June 8 -July 2
906 1.42
7 562
17 7
3.74 0.40
3
1,683 2.63
13 550
5 13
2.61 0.11
5
2,589 4.05
20 554
7 20
3.01 0.16
8
- -
- Continued -
67

Table 15. (p 2 of 3)
Age Group
0.2 0.3 1.2 0.4 1.3 2.2 1.4 2.3 Total
Sample Period 3: July 9 - July 12
Males Percent Sample Size Mean Length Std. Error Sample Size Mean Weight Std. Error Sample Size
Females Percent Sample Size Mean Length Std. Error Sample Size Mean Weight Std. Error Sample Size
Both Sexes Percent Sample Size Mean Length Std. Error Sample Size Mean Weight Std. Error Sample Size
Sample Period 4: July 13 -August 25
Males Percent Sample Size Mean Length Std. Error Sample Size Mean Weight Std. Error Sample Size
Females Percent Sample Size Mean Length Std. Error Sample Size Mean Weight Std. Error Sample Size
Both Sexes Percent Sample Size Mean Length Std. Error Sample Size Mean Weight Std. Error Sample Size
- Continued -

Table 15. (p 3 of 3)
Age Group
0.2 0.3 1.2 0.4 1.3 2.2 1.4 2.3 Total
All Periods Combined:
Males 283 Percent 0.06 Sample Size 1 Mean Length 516 Std. Error Sample Size 1 Mean Weight Std. Error Sample Size
Females 71 8 Percent 0.15 Sample Size 1 Mean Length 505 Std. Error Sample Size 1 Mean Weight Std. Error Sample Size
Both Sexes 1,001 Percent 0.21 Sample Size 2 Mean Length 508 Std. Error Sample Size 2 Mean Weight Std. Error Sample Size

Table 16. Age, sex, and size (length in rnm and weight in kg) composition of sockeye salmon escapement, Togiak River, 1993.
- -
Age Group
0.3 1.2 1.3 2.2 1.4 2.3 Total
Sample Period 1: June 29 - July 11
Males Percent Sample Size Mean Length Std. Error Sample Size
Females 185 2.307 Percent 0.37 4.65 Sample Size 2 25 Mean Length 576 514 Std. Error 10 6 Sample Size 2 25
Both Sexes 185 3,507 Percent 0.37 7.06 Sample Size 2 38 Mean Length 576 527 Std. Error 10 5 Sample Size 2 38
Sample Period 2: July 12 -July I 8
Males 122 3,296 Percent 0.18 4.99 Sample Size 1 27 Mean Length 570 534 Std. Error 5 Sample Size 1 27
Females 366 7.324 Percent 0.55 1 1 .09 Sample Size 3 60 Mean Length 542 510 Std. Error 11 3 Sample Size 3 60
Both Sexes 488 10,620 Percent 0.74 16.08 Sample Size 4 87 Mean Length 549 517 Std. Error 11 3 Sample Size 4 87
- Continued -
70

Table 16. (p 2 of 2 )
--
Age Group
- -
0.3 1.2 1.3 2.2 1.4 2.3 Total a
Sample Period 3: July 19 -August 5
Males 235 Percent 0.41 Sample Size 2 Mean Length 591 Std. Error 2 Sample Size 2
Females 117 Percent 0.21 Sample Size 1 Mean Length 555 Std. Error Sample Size 1
Both Sexes 352 Percent 0.62 Sample Size 3 Mean Length 579 Std. Error 2 Sample Size 3
All Periods Combined:
Males 357 Percent 0.21 Sample Size 3 Mean Length 584 Std. Error 2 Sample Size 3
Females 668 Percent 0.39 Sample Size 6 Mean Length 553 Std. Error 8 Sample Size 6
Both Sexes 1,025 Percent 0.59 Sample Size 9 Mean Length 564 Std. Error 6 Sample Size 9
' Total does not include 15,930 sockeye salmon counted, in the tributaries and mainstem Togiak River, below the counting towers.

Table 17. Age and size (length in mrn and weight in kg) composition of chinook salmon commercial catch, Nushagak District, 1993.
--
Age Group
1.4 1.5 Total
Sample Period 1: June 8 - June 16
Both Sexes Percent Sample Size Mean Length Std. Error Sample Size Mean Weight Std. Error Sample Size
Sample Period 2: June 17 - June 20
Both Sexes Percent Sample Size Mean Length Std. Error Sample Size Mean Weight Std. Error Sample Size
Sample Period 3: June 21 - June 30
Both Sexes Percent Sample Size Mean Length Std. Error Sample Size Mean Weight Std. Error Sample Size
Sample Period 4: July 1 - July 29
Both Sexes Percent Sample Size Mean Length Std. Error Sample Size Mean Weight Std. Error Sample Size
-- - --
- Continued -

Table 17. (p 2 of 2)
Age Group
1.2 1.3 1.4 1.5 Total
All Periods Combined:
Both Sexes Percent Sample Size Mean Length Std. Error Sample Size Mean Weight Std. Error Sample Size

Table 18. Age and size (length in rnrn and weight in kg) composition of chinook salmon escapement, Nushagak River, 1993.
Age Group
1.1 1.2 1.3 1.4 1.5 2.4 Total
Sample period: June 4 - August 9
~ o t h sexes- 587 16,909 34,993 43,915 1,291 117 97,812 Percent 0.60 17.29 35.78 44.90 1.32 0.12 100.00 Sample Size 5 1 44 298 374 11 1 833 Mean Length 394 562 764 868 932 874 776 Std. Error 43 5 5 4 24 3 Sample Size 5 144 298 374 11 1 833

Table 19. Age and size (length in rnm and weight in kg) composition of chinook salmon commercial catch, Togiak River Section, 1993.
--
Age Group
1.2 1.3 1.4 1.5 Total
Sample period: June 4 - August 23
Both Sexes Percent Sample Size Mean Length Std. Error Sample Size Mean Weight Std. Error Sample Size

Table 20. Age, sex, and size ( length in mm and weight in kg) composition of chum salmon commercial catch, Nushagak District, 1993.
Age Group
0.2 0.3 0.4 0.5 Total
Sample Period 1: June 8 - June 30
Males Percent Sample Size Mean Length Std. Error Sample Size Mean Weight Std. Error - Sample Size
Females Percent Sample Size Mean Length Std. Error Sample Size Mean Weight Std. Error Sample Size
Both Sexes Percent Sample Size Mean Length Std. Error Sample Size Mean Weight Std. Error Sample Size
Sample Period 2: July 1 - July 7
Males Percent Sample Size Mean Length Std. Error Sample Size Mean Weight Std. Error Sample Size
Females Percent Sample Size Mean Length Std. Error Sample Size Mean Weight Std. Error Sample Size
Both Sexes Percent Sample Size Mean Length Std. Error Sample Size Mean Weight Std. Error Sample Size
- Continued -
76

Table 20. (p 2 of 2)
Age Group
0.2 0.3 0.4 0.5 Total
Sample Period 3: July 8 -July 29
Males Percent Sample Size Mean Length Std. Error Sample Size Mean Weight Std. Error Sample Size
Females Percent Sample Size Mean Length Std. Error Sample Size Mean Weight Std. Error Sample Size
Both Sexes Percent Sample Size Mean Length Std. Error Sample Size Mean Weight Std. Error Sample Size
All Periods Combined:
Males Percent Sample Size Mean Length Std. Error Sample Size Mean Weight Std. Error Sample Size
Females Percent Sample Size Mean Length Std. Error Sample Size Mean Weight Std. Error Sample Size
Both Sexes Percent Sample Size Mean Length Std. Error Sample Size Mean Weight Std. Error Sample Size

Table 21. Age, sex, and size (length in mm and weight in kg) composition of chum salmon escapement, Nushagak River, 1993.
- -
Age Group
--
0.3 0.4 0.5 Total
Sample period: June 4 - August 25
Males 31,856 Percent 14.66 Sample Size 94 Mean Length 577 Std. Error 3 Sample Size 92
Females Percent Sample Size Mean Length Std. Error Sample Size
Both Sexes Percent Sample Size Mean Length Std. Error Sample Size

Table 22. Age, sex, and size (length in mm and weight in kg) composition of chum salmon commercial catch, Togiak River Section, 1993.
Age Group
Total
Sample Period 1: June 4 - July 3
Males Percent Sample Size Mean Length Std. Error Sample Size Me3n Weight Std. Error Sample Size
Females Percent Sample Size Mean Length Std. Error Sample Size Mean Weight Std. Error Sample Size
Both Sexes Percent Sample Size Mean Length Std. Error Sample Size Mean Weight Std. Error Sample Size
Sample Period 2: July 4 -July 7
Males Percent Sample Size Mean Length Std. Error Sample Size Mean Weight Std. Error Sample Size
Females Percent Sample Size Mean Length Std. Error Sample Size Mean We~ght Std. Error Sample Size
Both Sexes Percent Sample Size Mean Length Std. Error Sample Size Mean Weight Std. Error Sample Size
- Continued -
79

Table 22. (p 2 of 3)
Age Group
0.3 0.4 0.5 Total
Sample Period 3: July 8 - July 11
Males 387 Percent 7.23 Sample Size 27 Mean Length 557 Std. Error 5 Sample Size 27 Mean Weight 3.18 Std. Error 0.16 Sample Size ' 11
Females 488 Percent 9.12 Sample Size 34 Mean Length 543 Std. Error 3 Sample Size 34 Mean Weight 2.59 Std. Error 0.08 Sample Size 13
Both Sexes 875 Percent 16.35 Sample Size 6 1 Mean Length 549 Std. Error 3 Sample Size 61 Mean Weight 2.85 Std. Error 0.08 Sample Size 24
Sample Period 4: July 12 - August 24
Males Percent Sample Size Mean Length Std. Error Sample Size Mean Weight Std. Error Sample Size
Females Percent Sample Size Mean Length Std. Error Sample Size Mean Weight Std. Error Sample Size
Both Sexes Percent Sample Size Mean Length Std. Error Sample Size Mean Weight Std. Error Sample Size
- Continued -
80

Table 22. (p 3 of 3)
Age Group
0.3 0.4 0.5 Total
All Periods Combined:
Males Percent Sample Size Mean Length Std. Error Sample Size Mean Weight Std. Error Sample Size
Females Percent Sample Size Mean Length Std. Error Sample Size Mean Weight Std. Error Sample Size
Both Sexes Percent Sample Size Mean Length Std. Error Sample Size Mean Weight Std. Error Sample Size

Table 23. Age, sex, and size (length in rnm and weight in kg) composition of coho salmon escapement, Nushagak River, 1993.
Age Group
2.1 3.1 Total
Sample period: July 26 - August 25
Males Percent Sample Size Mean Length Std. Error Sample Size
Females Percent Sample Size Mean Length Std. Error Sample Size
Both Sexes Percent Sample Size Mean Length Std. Error Sample Size


Table 25. Age, sex, and size (length in mm and weight in kg) compostion of sockeye salmon commercial catch and escapement, Bristol Bay, 1994.
Age Group
Total
Males Percent Sample Size Mean Length Std. Error Sample Size Mean Weight Std. Error Sample Size
03 P Females
Percent Sample Size Mean Length Std. Error Sample Size Mean Weight Std. Error Sample Size
Both Sexes Percent Sample Size Mean Length Std. Error Sample Size Mean Weight Std. Error Sampk Siz?

Table 26. Age, sex, and size (length in mm and weight in kg) composition of sockeye salmon commercial catch, Naknek-Kvichak District, 1994.
Age Group
1.1 0.3 1.2 2.1 0.4 1.3 2.2 1.4 2.3 3.2 2.4 3.3 Total
Sample Period 1 :
Males Percent Sample Size Mean Length Std. Error Sample S-ize
Females Percent Sample Size Mean Length Std. Error Sample Size
Both Sexes Percent Sample Size Mean Length Std. Error Sample Size
June 9 -June 30
365 1,823 0.80 4.00
1 5 565 482
6 1 5
1,823 4.00
5 493
7 5
365 3,646 0.80 8.00
1 10 565 488
5 1 10
Sample Period 2: July 1 -July 2
Males 27.801 1.463 Percent 3.50 0.18 Sample Size 19 1 Mean Length 496 393 Std. Error 6 Sample Size 19 1 Mean Weight 1 .90 Std. Error 0.16 Sample Size 5
Females 1,463 19,021 Percent 0.18 2.39 Sample Size 1 13 Mean Length 577 481 Std. Error 9 Sample Size 1 13 Mean Weight 2.05 Std. Error 0.17 Sample Size 5
Both Sexes 1.463 46,822 1.463 Percent 0.18 5.89 0.18 Sample Size 1 32 1 Mean Length 577 490 393 Std. Error 5 Sample Size 1 32 1 Mean Weight 1.96 Std. Error 0.12 Sample Size 10
- --
- Continued -

Table 26. (p 2 of 8)
~
Age Group
1.1 0.3 1.2 2.1 0.4 1.3 2.2 1.4 2.3 3.2 2.4 3.3 Total
Sample Period 3: July 3
Males Percent Sample Size Mean Length Std. Error Sample Size Mean Weight Std. Error Sample Size - Females Percent Sample Size Mean Length Std. Error Sample Size Mean Weight Std. Error Sample Size
Both Sexes Percent Sample Size Mean Length Std. Error Sample Size Mean Weight Std. Error Sample Size
Sample Period 4: July 4
Males Percent Sample Size Mean Length Std. Error Sample Size Mean Weight Std. Error Sample Size
Females Percent Sample Size Mean Length Std. Error Sample Size Mean Weight Std. Error Sample Size
Both Sexes Percent Sample Size Mean Length Std. Error Sample Size Mean Weight Std. Error Sample Size
- - Continued -

Table 26. (p 3 of 8)
Age Group
1.1 0.3 1.2 2.1 0.4 1.3 2.2 1.4 2.3 3.2 2.4 3.3 Total
Sample Period 5: July 5
Males Percent Sample Size Mean Length Std. Error Sample Size Mean Weight Std. Error Sample Size
Females Percent Sample Size Mean Length Std. Error Sample Size Mean Weight Std. Error Sample Size
Both Sexes Percent Sample Size Mean Length Std. Error Sample Size Mean Weight Std. Error Sample Size
Sample Period 6: July 6 -July 7
Males Percent Sample Size Mean Length Std. Error Sample Size Mean Weight Std. Error Sample Size
Females Percent Sample Size Mean Length Std. Error Sample Size Mean Weight Std. Error Sample Size
Both Sexes Percent Sample Size Mean Length Std. Error Sample Size Mean Weight Std. Error Sample Size
- Continued -
8 7

Table 26 . (p 4 of 8)
Age Group
1.1 0.3 1.2 2.1 0.4 1.3 2.2 1.4 2.3 3.2 2.4 3.3 Total
Sample Period 7: July 8
Males Percent Sample Size Mean Length Std. Error Sample Size Mean Weight Std. Error Sample Size - Females Percent Sample Size Mean Length Std. Error Sample Size Mean Weight Std. Error Sample Size
Both Sexes Percent Sample Size Mean Length Std. Error Sample Size Mean Weight Std. Error Sample Size
Sample Period 8: July 9
Males Percent Sample Size Mean Length Std. Error Sample Size Mean Weight Std. Error Sample Size
Females Percent Sample Size Mean Length Std. Error Sample Size Mean Weight Std. Error Sample Size
Both Sexes Percent Sample Sue Mean Length Std. Error Sample Size Mean Weight Std. E m r Sample Size
- Continued -
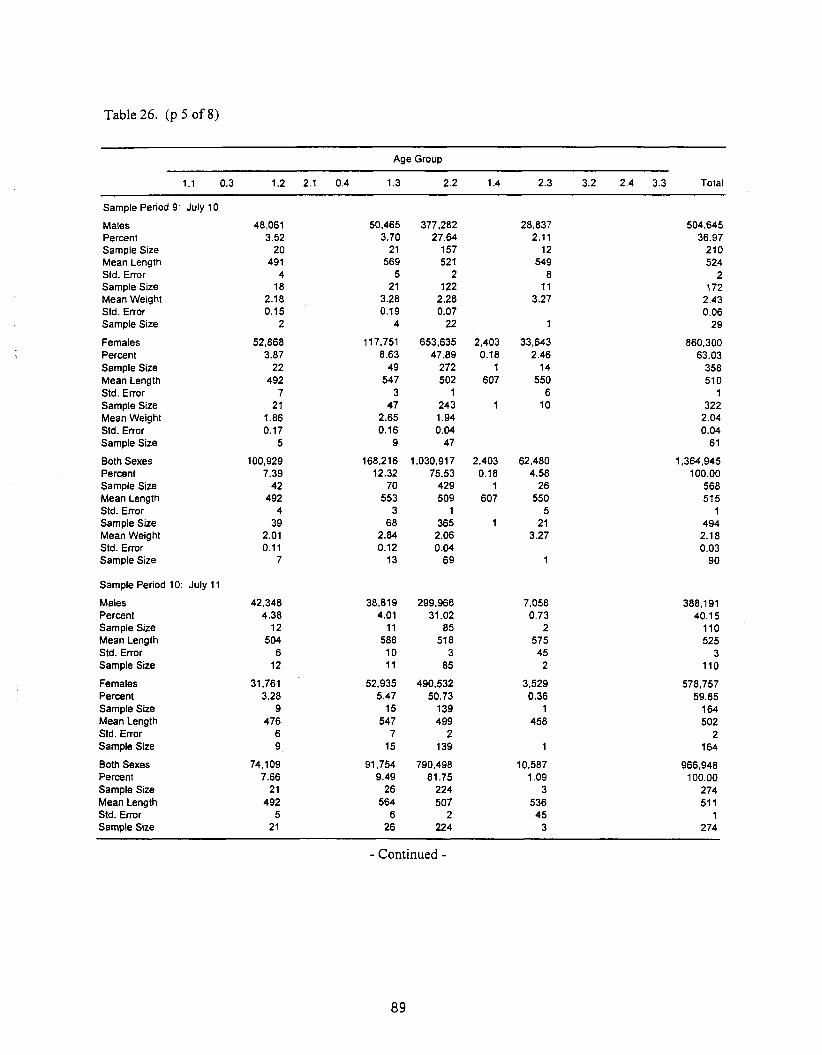
Table 26. (p 5 of 8)
Age Group
1.1 0.3 1.2 2.1 0.4 1.3 2.2 1.4 2.3 3.2 2.4 3.3 Total
Sample Period 9: July 10
Males Percent Sample Size Mean Length Std. Error Sample Size Mean Weight Std. Error Sample Size
Females Percent Sample Size Mean Length Std. Error Sample Size Mean Weight Std. Error Sample Size
Both Sexes Percent Sample Size Mean Length Std. Error Sample Sue Mean Weight Std. Error Sample Size
Sample Period 10: July 11
Males Percent Sample Size Mean Length Std. Error Sample Size
Females Percent Sample Size Mean Length Std. Error Sample Size
Both Sexes Percent Sample Size Mean Length Std. Error Sample Size
- Continued -

Table 26. (p 6 of 8)
Age Group
1.1 0.3 1.2 2.1 0.4 1.3 2.2 1.4 2.3 3.2 2.4 3.3 Total
Sample Period I 1 :
Males Percent Sample Size Mean Length Std. Error Sample Size Mean Weight Std. Error - Sample Size
Females Percent Sample Size Mean Length Std. Error Sample Size Mean Weight Sfd. Error Sample Size
Both Sexes Percent Sample Size Mean Length Std. Error Sample Size Mean Weight Std. Error Sample Size
Sample Period 12:
Males Percent Sample Size Mean Length Std. Error Sample Size Mean Weight Std. Error Sample Size
Females Percent Sample Size Mean Length Std. Error Sample Size Mean Weight Std. Error Sample Size
Both Sexes Percent Sample Size Mean Length Std. Error Sample Size Mean Weight Std. Error Sample Size
July 12 -
July 15
1,465 0.19
1 606
1
1,465 0.19
1 530
1
2.930 0.37
2 568
2
July 14
36.721 2.15
15 502
5 15
1.79
1
63.649 3.73
26 489
4 26
1.74 0.06
2
100.370 5.88
41 494
3 41
1.76 0.06
3
23,445 2.97
16 530
4 16
2.36 0.07
2
8.792 1.12
6 515
11 6
32.237 4.09
22 526
4 22
2.36 0.07
2
- Continued -

Table 26. (p 7 of 8)
Age Group
1.1 0.3 1.2 2.1 0.4 1.3 2.2 1.4 2.3 3.2 2.4 3.3 Total
Sample Period 13: July 16 - Males Percent Sample Size Mean Length Std. Error Sample Size Mean Weight Std. Error _ Sample Size
Females Percent Sample Size Mean Length Std. Error Sample Size Mean Weight Std. Error Sample Size
Both Sexes Percent Sample Size Mean Length Std. Error Sample Size Mean Weight Std. Error Sample Size
Sample Period 14: July 18 - Males Percent Sample Size Mean Length Std. Error Sample Size Mean Weight Std. Error Sample Size
Females Percent Sample Size Mean Length Std. Error Sample Size Mean Weight Std. Error Sample Size
Both Sexes Percent Sample Size Mean Length Std. Error Sample Size Mean Weight Std. Error Sample Size
July 17
44.208 1,842 1,842 2.99 0.12 0.12
24 1 1 491 382 602
5 24 1 1
2.46 0.29
3
July 19
14.985 2.43
13 496
8 13
1.95 0.1 1
4
- -- -
- Continued -

Table 26. (p 8 of 8)
Age Group
1.1 0.3 1.2 2.1 0.4 1.3 2.2 1.4 2.3 3.2 2.4 3.3 Total
Sample Period 15: July 20 - August 15
Males 49.410 Percent 6.03 Sample Size 17 Mean Length 500 Std. Error 6 Sample Size 17
Females Percent Sample Size Mean Length Ski. Error Sample Size
Both Sexes Percent Sample Size Mean Length Std. Error Sample Size
All Periods Combined:
Males Percent Sample Size Mean Length Std. Error Sample Size Mean Weight Std. Error Sample Size
Females 5.299 Percent 0.03 Sample Size 1 Mean Length 505 Std. Error Sample Size 1 Mean Weight Std. Error Sample Size
Both Sexes Percent Sample Size Mean Length Std. Error Sample Size Mean Weight Std. Error Sample Size

Table 27. Age, sex, and size (length in mm and weight in kg) composition of sockeye salmon escapement, Kvichak River, 1994.
Age Group
1.1 0.3 1.2 2.1 0.4 1.3 2.2 1.4 2.3 Total
Sample Period 1: June 23 - July 5
Males Percent Sample Size Mean Length Std. Error Sample Size
Females Percent Sample Size Mean Length Std. Error Sample Size
Both Sexes Percent Sample Size Mean Length Std. Error Sample Size
Sample Period 2: July 6 - July 8
Males Percent Sample Size Mean Length Std. Error Sample Size
Females Percent Sample Size Mean Length Std. Error Sample Size
Both Sexes Percent Sample Size Mean Length Std. Error Sample Size
- Continued -
9 3
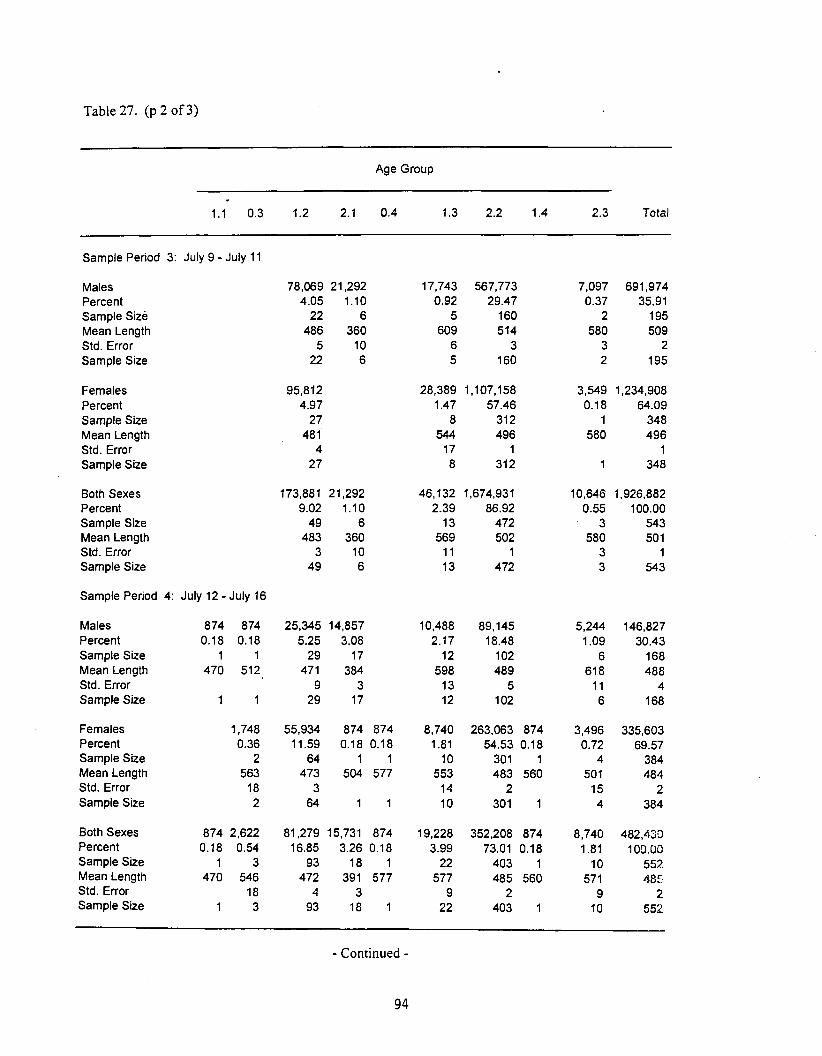
Table 27. (p 2 of 3)
Age Group
1.1 0.3 1.2 2.1 0.4 1.3 2.2 1.4 2.3 Total
Sample Period 3: July 9 - July 11
Males Percent Sample Size Mean Length Std. Error Sample Size
Females Percent Sample Size Mean Length Std. Error Sample Size
Both Sexes Percent Sample Size Mean Length Std. Error Sample Size
Sample Period 4: July 12 -July 16
Males 874 874 Percent 0.18 0.18 Sample Size 1 1 Mean Length 470 512 Std. Error Sample Size 1 1
Females 1.748 Percent 0.36 Sample Size 2 Mean Length 563 Std. Error 18 Sample Size 2
Both Sexes 874 2,622 Percent 0.18 0.54 Sample Sue 1 3 Mean Length 470 546 Std. Error 18 Sample Size 1 3
- Continued -
9 4

Table 27. (p 3 o f 3)
Age Group
1.1 0.3 1.2 2.1 0.4 1.3 2.2 1.4 2.3 Total
Sample Period 5: July 17 - July 23
Males Percent Sample Size Mean Length Std. Error Sample Size
Females Percent Sample Size Mean Length Std. Error Sample Size
Both Sexes Percent Sample Size Mean Length Std. Error Sample Size
All Periods Combined:
Males 87 Percent Sample Size Mean Length Std. Error Sample Size
Females Percent Sample Size Mean Length Std. Error Sample Size
Both Sexes Percent Sample Size Mean Length Std. Error Sample Size

Table 28. Age, sex, and size (length in m m and weight in kg) composition o f sockeye salmon escapement, Naknek River, 1994.
Age Group
0.2 1.1 1.2 2.1 1.3 2.2 1.4 2.3 2.4 Total
Sample Period 1: June 21 -July 3
Males Percent - Sample Size Mean Length Std. Error Sample Size
Females Percent Sample Size Mean Length Std. Error Sample Size
Both Sexes Percent Sample Size Mean Length Std. Error Sample Size
Sample Period 2: July 4 -July 8
Males Percent Sample Size Mean Length Std. Error Sample Size
Females Percent Sample Size Mean Length Std. Error Sample Size
Both Sexes Percent Sample Size Mean Length Std. Error Sample Size
- Continued -

Table 28. (p 2 of 2)
Age Group
Sample Period 3: July 9 - July 21
Males Percent SampleSize Mean Length Std. Error Sample Size
Females Percent Sample Size Mean Length Std. Error Sample Size
Both Sexes Percent Sample Size Mean Length Std. Error Sample Size
All Periods Combined:
Males Percent Sample Size Mean Length Std. Error Sample Size
Females Percent Sample Size Mean Length Std. Error Sample Size
Both Sexes Percent Sample Size Mean Length Std. Error Sample Size

Table 29. Age, sex, and size (length in mm and weight in kg) composition of sockeye salmon commercial catch, Egegik District, 1994.
Age Group
0.2 0.3 1.2 2.1 1.3 2.2 1.4 2.3 3.2 2.4 3.3 Total
Sample Penod 1: June 6 - June 23
Males 289 Percent 0.53 Sample Size 2 Mean Length 550 Std. Error 5 Sample Size 2
Females Percent Sample Size Mean Length Std. Error Sample Size
Both Sexes 289 Percent 0.53 Sample Size 2 Mean Length 550 Std. Error 5 Sample Size 2
Sample Period 2: June 24 - June 25
Males 317 Percent 0.26 Sample Size 1 Mean Length 427 Std. Error Sample Size 1 Mean Weight Std. Error Sample Size
Females 317 Percent 0.26 Sample Size 1 Mean Length 552 Std. Error Sample Size 1 Mean Weight 2.30 Std. Error Sample Size 1
Both Sexes 634 Percent 0.52 Sample Size 2 Mean Length 490 Std. Error Sample Size 2 Mean Weight 2.30 Std. Error Sample Size 1
- Continued -

Table 29. (p 2 of 8)
Age Group
0.2 0.3 1.2 2.1 1.3 2.2 1.4 2.3 3.2 2.4 3.3 Total
Sample Penod 3. June 26 - June 27
Males Percent Sample Size Mean Length Std. Error Sample Size Mean Weight Std. Error Sample Size
Females Percent Sample Size Mean Length Std. Error Sample Size Mean Weight Std. Error Sample Size
Both Sexes Percent Sample Size Mean Length Std. Error Sample Size Mean Weight Std. Error Sample Size
Sample Period 4: June 28 -June 29
Males Percent Sample Size Mean Length Std. Error Sample Size Mean Weight Std. Error Sample Size
Females Percent Sample Size Mean Length Std. Error Sample Size Mean Weight Std. Error Sample Size
Both Sexes Percent Sample Size Mean Length Std. Ermr Sample Size Mean Weight Std. Error Sample Size
- Continued -

Age Group
0.2 0.3 1.2 2.1 1.3 2.2 1.4 2.3 3.2 2.4 3.3 Total
Sample Period 5: June 30 -July 1
Males Percent Sample Size Mean Length Std. Error Sample Size Mean We~ght Std. Error Sample Size - Females Percent Sample Size Mean Length Std. Error Sample Size Mean Weight Std. Error Sample Size
Both Sexes Percent Sample Size Mean Length Std. Error Sample Size Mean Weight Std. Error Sample Size
Sample Period 6: July 2
Males Percent Sample Size Mean Length Std. Error Sample Size Mean We~ght Std. Error Sample Size
Females Percent Sample Size Mean Length Std. Error Sample Size Mean Weight Std. Error Sample Size
Both Sexes Percent Sample Size Mean Length Std. Error Sample Size Mean Weight Std. Ermr Sample Size
- Continued -

Table 29. (p 4 of 8)
Age Group
0.2 0.3 1.2 2.1 1.3 2.2 1 4 2.3 3.2 2 4 3.3 Total
Sample Period 7: July 3 -July 4
Males Percent Sample Size Mean Length Std. Error Sample Size Mean Weight Std. Error Sarnple Sue
Females Percent Sample Size Mean Length Std. Error Sample Size Mean Weight Std. Error Sample Size
Both Sexes Percent Sarnple Size Mean Length Std. Error Sample Size Mean We~ght Std. Error Sample Size
Sample Period 8: July 5
Males Percent Sample Size Mean Length Std. Error Sarnple Size Mean Weight Std. Error Sample Size
Females Percent Sample Size Mean Length Std. Error Sample Size Mean Weight Std. Error Sample Size
Both Sexes Percent Sample Size Mean Length Std. Error Sample Size Mean Weight Std. Error Sample Size
- Continued -

Table 29. (p 5 of 8)
Age Group
0.2 0.3 1.2 2.1 1.3 2.2 1.4 2.3 3.2 2.4 3.3 Total
Sample Penod 9: July 6 -July 7
Males Percent Sample Size Mean Length Std. Error Sample Size Mean Weight Std. Error Sample Size
Females Percent Sample Size Mean Length Std. Error Sample Size Mean Weight Std. Error Sample Size
Both Sexes Percent Sample Size Mean Length Std. Error Sample Size Mean Weight Std. Error Sample S~ze
Sample Period 10: July 8 -July 9
Males Percent Sample Size Mean Length Std. Error Sample Size Mean Weight Std. Error Sample Size
Females Percent Sample Size Mean Length Std. Error Sample Size Mean Weight Std. Error Sample Size
Both Sexes Percent Sample Size Mean Length Std. Error Sample Size Mean Weight Std. Error Sample Size
- - Continued -

Table 29. (p 6 of 8)
Age Group
0.2 0.3 1.2 2.1 1.3 2.2 1.4 2.3 3.2 2.4 3.3 Total
Sample Period 11: July 10 - July 11
Males Percent Sample Size Mean Length Std. Error Sample Size Mean Weight Std. Error Sample Size
Females Percent Sample Size Mean Length Std. Error Sample Size Mean Weight Std. Error Sample Size
Both Sexes Percent Sample Size Mean Length Std. Error Sample S~ze Mean Weight Std. Error Sample Size
Sample Period 12: July 12
Males Percent Sample Size Mean Length Std. Error Sample Size Mean Weight Std. Error Sample Size
Females Percent Sample Size Mean Length Std. Error Sample Size Mean Weight Std. Error Sample Size
Both Sexes Percent Sample Size Mean Length Std. Error Sample Size Mean Weight Std. Error Sample Size
- Continued -

Table 29. (p 7 of 8)
Age Group
0.2 0 3 1.2 2 1 1.3 2.2 1 4 2.3 3.2 2 4 3 3 Total
Sample Period 13: July 13 -July 14
Males Percent Sample Size Mean Length Std. Error Sample Size Mean Weight Std. Error Sample Size - Females 702 Percent 0.20 Sample Size 1 Mean Length 532 Std. Error Sample Size 1 Mean Weight 2.56 Std. Error Sample Size 1
Both Sexes 702 Percent 0.20 Sample Size 1 Mean Length 532 Std. Error Sample Size 1 Mean Weight 2.56 Std. Error Sample Size 1
Sample Period 14: July 15 - July 17
Males Percent Sample Size Mean Length Std. Error Sample Size Mean Weight Std. Error Sample Size
Females Percent Sample Size Mean Length Std. Error Sample Size Mean Weight Std. Error Sample Size
Both Sexes Percent Sample Size Mean Length Std. Error Sample Size Mean Weight Std. Error Sample Size
- - Continued -

Table 29. (p 8 of 8)
Age Group
0.2 0.3 1.2 2.1 1.3 2.2 1.4 2.3 3.2 2.4 3.3 Total
Sample Period 15: July 18 -August 26
Males Percent Sample Size Mean Length Std. Error Sample Size Mean We~ght Std. Error Sample Size
Females Percent Sample Size Mean Length Std. Error Sample Size Mean Weight Std. Error Sample Size
Both Sexes Percent Sample Size Mean Length Std. Error Sample Size Mean Weight Std. Error Sample Size
All Periods Combined:
Males Percent Sample Size Mean Length Std. Error Sample Size Mean Weight Std. Error Sample Size
Females Percent Sample Size Mean Length Std. Error Sample Size Mean Weight Std. Error Sample Size
Both Sexes Percent Sample Size Mean Length Std. Error Sample Size Mean Weight Std. Error Sample Size

Table 30. Age, sex and size (length in mm and weight in kg) composition of sockeye salmon escapement, Egegik River, 1994.
Age Group
0.2 1.1 1.2 2.1 1.3 2.2 3.1 1.4 2.3 3.2 2.4 3.3 Total
Sample Period 1: June 22 - June 27
Males Percent Sample Size Mean Length Std. Error Sample Size
Females Percent Sample Size Mean Length Std. Error Sample Size
Both Sexes Percent Sample Size Mean Length Std. Error Sample Size
Sample Period 2: June 28 - July 1
Males 296 3.844 7,985 739 Percent 0.36 4.63 9.61 0.89 Sample Size 2 26 54 5 Mean Length 323 478 358 567 Std. Error 15 9 4 13 Sample Size 2 26 54 5
Females Percent Sample Size Mean Length Std. Error Sample Size
Both Sexes 296 5.175 8,281 1,035 Percent 0.36 6.23 9.97 1.25 Sample Size ' 2 35 56 7 Mean Length 323 477 359 570 Std. Error 15 7 4 13 Sample Size 2 35 56 7
- Continued -

Table 30. (p 2 of 4)
Age Group
0.2 1.1 1.2 2.1 1.3 2.2 3.1 1.4 2.3 3.2 2.4 3.3 Total
Sample Period 3: July 2 - July 6
Males Percent Sample Size Mean Length Std. Error Sample Size
Females Percent Sample Size Mean Length Std. Error Sample Size
Both Sexes Percent Sample Size Mean Length Std. Error Sample Sire
Sample Period 4: July 7 -July 9
Males Percent Sample Size Mean Length Std. Error Sample Size
Females 795 Percent 0.16 Sample Size 1 Mean Length 474 Std. Error Sample Size 1
Both Sexes 795 Percent 0.16 Sample Size 1 Mean Length 474 Std. Error Sample Size 1
- Continued -

Table 30. (p 3 of 4)
Age Group
0.2 1.1 1.2 2.1 1.3 2.2 3.1 1.4 2.3 3.2 2.4 3.3 Total
Sample Period 5: July 10 - July 12
Males Percent Sample Size Mean Length Std. Error Sample Sue
Females Percent Sample Size Mean Length Std. Error Sample Size
Both Sexes Percent Sample Size Mean Length Std. Error Sample Size
Sample Period 6: July 13 -July 21
Males 742 2,227 8,538 Percent 0.27 0.81 3.11 Sample Size 2 6 23 Mean Length 336 455 403 Std. Error 10 15 23 Sample Size 2 6 23
Females Percent Sample Size Mean Length Std. Error Sample Size
Both Sexes 742 9.651 8.538 Percent 0.27 3.51 3.11 Sample Size 2 26 23 Mean Length 336 4'64 403 Std. Error 10 5 23 Sample Size 2 26 23
- Continued -

Table 30. (p 4 of 4)
Age Group
0.2 1.1 1.2 2.1 1.3 2.2 3.1 1.4 2.3 3.2 2.4 3.3 Total '
All Periods Combined:
Males 1,038 47,839 59.297 7.392 392,195 1,038 1,116 233,093 15,841 2,232 761,081 Percent 0.05 2.52 3.12 0.39 20.66 0.05 0.06 12.28 0.83 0.12 40.10 Sample Size 4 107 154 18 849 3 1 493 27 2 1,658 Mean Length 332 484 375 555 490 386 542 581 494 591 509 Std. Error 8 5 5 10 2 2 4 4 1 Sample Size 4 107 154 18 849 3 1 493 27 2 1,658
Females 795 58,380 3.540 7,667 794,602 238,708 28.002 1,827 3,330 1,136,851 Percent 0.04 3.08 0.19 0.40 41.87 12.58 1.48 0.10 0.18 59.90 Sample Size 1 100 8 16 1,420 491 56 4 5 2,101 Mean Length 474 476 486 550 487 558 485 585 573 502 Std. Error 2 39 3 1 2 2 25 1 Sample Size 1 100 8 16 1,419 491 56 4 5 2,100
Both Sexes 795 1,038 106,219 62,837 15,059 1,186,797 1,038 1,116 471,801 43.843 4,059 3,330 1,897,932 Percent 0.04 0.05 5.60 3.31 0.79 62.53 0.05 0.06 24.86 2.31 0.21 0.18 100.00 Sample Size 1 4 207 162 34 2,269 3 1 984 83 6 5 3,759 Mean Length 474 332 479 381 553 488 386 542 569 488 588 573 505 Std. Error 8 3 5 6 1 1 2 4 25 1 Sample Size 1 4 207 162 34 2,268 3 1 984 83 6 5 3,758
' Total does not include an estimated 66,132 sockeye salmon counted, from July 22 to September 11, during a USF8WS coho project, and escapement to Shosky Creek (15) and King Salmon River (30).

Table 3 1. Age, sex, and size (length in mm and weight in kg) composition of sockeye salmon commercial catch, Ugashik District, 1994.
Age Group
0.2 0.3 1.2 2.1 1.3 2.2 1.4 2.3 3.2 2.4 3.3 Total
Sample Period 1: June 6 -July 1
Males 201 Percent 0.18 Sample Sue 1 Mean Length 513 Std. Error Sample Size 1 Mean Weight 2.44 Std. Error Sample Size 1
Females Percent Sample Size Mean Length Std. Error Sample Sue Mean Weight Std. Error Sample Size
Both Sexes 201 Percent 0.18 Sample Size 1 Mean Length 513 Std. Error Sample Size 1 Mean Weight 2.44 Std. Error Sample Size 1
Sample Period 2:
Males Percent Sample Size
Females Percent Sample Size
Both Sexes Percent Sample Size
July 2 -July 3
901 1.38
5
541 0.83
3
1,442 2.21
8
- Continued -

Age Group
0.2 0.3 1.2 2.1 1.3 2.2 1.4 2.3 3.2 2.4 3.3 Total
Sample Period 3: July 4 -July 6
Males 1,850 17,572 Percent 0.54 5.16 Sample Size 2 19 Mean Length 516 Std. Error 7 Sample Size 9
Females 925 1,850 19,422 Percent 0.27 0.54 5.71 Sample Size 1 2 21 Mean Length 594 497 Std. Error 7 Sample Size 1 2
Both Sexes 925 3,700 36,994 Percent 0.27 1.09 10.87 Sample Size 4 40 Mean Length 594 506 Std. Error 5 Sample Size 1 11
Sample Period 4 : July 7 - July 9
Males Percent Sample Size Mean Length Std. Error Sample Size
Females 1,381 8,286 Percent 0.25 1.49 Sample Size 2 12 Mean Length 535 509 Std. Error 7 Sample Size 2 12
Both Sexes 1,381 40,047 Percent 0.25 7.18 Sample Size 2 58 Mean Length 535 513 Std. Error 4 Sample Size 2 58
- Continued -

Table 3 1. @ 3 of 5 )
Age Group
0.2 0.3 1.2 2.1 1.3 2.2 1.4 2.3 3.2 2.4 3.3 Total
Sample Period 5: July 10 -July 12
Males 1,471 Percent 0.31 Sample Size 1 Mean Length 554 Std. Error Sample Size 1
Females Percent Sample Size Mean Length Std. Error Sarnple Size
Both Sexes 1,471 Percent 0.31 Sample Size 1 Mean Length 554 Std. Error Sample Size 1
Sample Period 6: July 13
Males Percent Sample Size Mean Length Std. Error Sample Size
Females Percent Sarnple Size Mean Length Std. Error Sample Size
Both Sexes Percent Sarnple Size Mean Length Std. Error Sample Size
- Continued -

Table 3 1. (p 4 of 5 )
Age Group
2.2 1.4 2.3 3.2 2.4 3.3 Total
Sample Period 7: July 14
Males Percent Sample Size Mean Length Std. Error Sample Size
Females 1,322 13,220 Percent 0.22 2.24 Sample Size 1 10 Mean Length 517 487 Std. Error 4 Sample Size 1 10
Both Sexes 1.322 26,440 Percent 0.22 4.47 Sample Size 1 20 Mean Length 517 498 Std. Error 6 Sample Size 1 20
Sample Period 8: July 15 - September 2
Males 32,527 Percent 1.84 Sample Size 5 Mean Length 513 Std. Error 14 Sample Size 5
Females Percent Sample Size Mean Length Std. Error Sample Size
Both Sexes Percent Sample Size Mean Length Std. Error Sample Size
- Continued -

Table 3 1. @ 5 of 5 )
Age Group
All Periods Combined:
Males 201 Percent 0.00 Sample Size 1 Mean Length 513 Std. Error Sample Size 1 Mean Weight 244 Std. Error Sample Size 1
Females 925 Percent 0.02 Sample Size 1
1,651 0.04
2 ~ e a " Length 502 469 348 Std. Error 18 3 Sample Size 7 53 1 Mean Weight 2.82 2.20 Std. Error 0.18 Sample Size 1 2
Both Sexes Percent Sample Size Mean Length Std. Error Sample Size Mean Weight Std. Error Sample Size

Table 32. Age, sex, and size (length in mm and weight in kg) composition of sockeye salmon escapement, Ugashik River, 1994.
-- -
Age Group
-
1.1 1.2 2.1 1.3 2.2 2.3 3.2 2.4 Total
Sample Period 1 : July 8 - July 12
Sample Period 2: July 13 - July 16
Males Percent Sample Size Mean Length Std. Error Sample Size
Females Percent Sample Size Mean Length Std. Error Sample Size
Both Sexes Percent Sample Size Mean Length Std. Error Sample Size
Males Percent Sample Size Mean Length Std. Error Sample Size
Females Percent Sample Size Mean Length Std. Error Sample Size
Both Sexes Percent Sample Size Mean Length Std. Error Sample Size
- Continued -

Table 32. (p 2 of 3)
Age Group
1 .I 1.2 2.1 1.3 2.2 2.3 3.2 2.4 Total
Sample Period 3:
Males Percent Sample Size Mean Length Std. Error Sample Size
Females Percent Sample Size Mean Length Std. Error Sample Size
Both Sexes Percent Sample Size Mean Length Std. Error Sample Size
Sample Period 4:
Males Percent Sample Size Mean Length Std. Error Sample Size
Females Percent Sample Size Mean Length Std. Error Sample Size
Both Sexes Percent Sample Size Mean Length Std. Error Sample Size
- Continued -
11 6

Table 32. @ 3 o f 3)
Age Group
- -
1.1 1.2 2.1 1.3 2.2 2.3 3.2 2.4 Total a
All Periods Combined:
Males 6,132 Percent 0.57 Sample Size 8 Mean Length 332 Std. Error 8 Sample Size 8
Females 171 Percent 0.02 Sample Size 1 Mean Length 450 Std. Error Sample Size 1
Both Sexes 6,303 Percent 0.58 Sample Size 9 Mean Length 336 Std. Error 8 Sample Size 9
- -
a Total does not include escapement to King Salmon (8,885) and Dog Salmon (5,325) Rivers.

Table 33. Age, sex, and size (length in mm and weight in kg) composition of sockeye salmon commercial catch, Nushagak District, 1994.
Age Group
0.2 0.3 1.2 0.4 1.3 2.2 1.4 2.3 2.4 Total
Sample Period 1 :
Males Percent Sample Size Mean Length Std. Error Sample Size Mean Weight - Std. Error Sample Size
Females Percent Sample Size Mean Length Std. Error Sample Size Mean Weight Std. Error Sample Size
Both Sexes Percent Sample Size Mean Length Std. Error Sample Size Mean Weight Std. Error Sample Size
Sample Period 2:
Males Percent Sample Size Mean Length Std. Error Sample Size Mean Weight Std. Error Sample Size
Females Percent Sample Size Mean Length Std. Error Sample Size Mean Weight Std. Error Sample Size
Both Sexes Percent Sample Size Mean Length Std. Error Sample Size Mean Weight Std. Error Sample Size
June 8 -
June 25.
61 0.31
1 509
1
61 0.31
1 509
1
June 24
6,839 15.22
49 55 1
6 49
2.70 0.17
11
4,327 9.63
31 544
3 31
2.55 0.06
8
11,166 24.84
80 549
4 80
2.64 0.11
19
-June 28
2,623 13.19
43 563
7 43
2.96 0.33
7
2.440 12.27
40 540
5 40
2.38 0.13
8
5.063 25.46
83 552
4 83
2.68 0.18
15
- Continued -

Table 33. (p 2 of4)
Age Group
0.2 0.3 1.2 0.4 1.3 2.2 1.4 2.3 2.4 Total
Sample Period 3:
Males Percent Sample Size Mean Length Std. Error Sample Size Mean Weight Std. Error Sample Size
Females Percent Sample Size Mean Length Std. Error Sample Size Mean Weight Std. Error Sample Size
Both Sexes Percent Sample Size Mean Length Std. Error Sample Size Mean Weight Std. Error Sample Size
Sample Period 4:
Males Percent Sample Size Mean Length Std. Error Sample Size Mean Weight Std. Error Sample Size
Females Percent Sample Size Mean Length Std. Error Sample Size Mean Weight Std. Error Sample Size
Both Sexes Percent Sample Size Mean Length Std. Error Sample Size Mean Weight Std. Error Sample Size
June 29 - July 4
930 43,724 0.17 7.78
1 47 51 1 584
20 1 47
3.03 0.20
10
930 70,702 0.17 12.58
1 76 539 540
2 1 76
2.66 5.38 2.79
1 17
1.860 114,426 0.33 20.36
2 123 525 557
8 2 123
2.66 4.48 1.73
1 27
July 5 -July 9
57,655 4.93
26 554
6 26
3.09 0.21
7
-
- Continued -

Table 33. (p 3 of 4)
Age Group -
0.2 0.3 1.2 0.4 1.3 2.2 1.4 2.3 2.4 Total
Sample Period 5:
Males Percent Sample Size Mean Length Std. Error Sample Size Mean Weight Std. Error Sample Size - Females Percent Sample Size Mean Length Std. Error Sample Size Mean Weight Std. Error Sample Size
Both Sexes Percent Sample Size Mean Length Std. Error Sample Size Mean Weight Std. Error Sample Size
Sample Period 6: July 12 -July 28
Males Percent Sample Size Mean Length Std. Error Sample Size Mean Weight Std. Error Sample Size
Females Percent Sample Size Mean Length Std. Error Sample Size Mean Weight Std. Error Sample Size
Both Sexes Percent Sample Size Mean Length Std. Error Sample Size Mean Weight Std. Error Sample Size
- Continued -
120

Table 33. (p 4 of 4)
Age Group
0.2 0.3 1.2 0.4 1.3 2.2 1.4 2.3 2.4 Total '
All Periods Combined:
Males 991 Percent 0.03 Sample Size 2 Mean Length 51 1 Std. Error Sample Size 2 Mean Weight Std. Err01 Sample Size
Females 930 Percent 0.03 Sample Size 1 Mean Length 539 Std. Error Sample Size 1 Mean Weight 2.66 Std. Error Sample Size 1
Both Sexes 1.921 Percent 0.06 Sample Size 3 Mean Length 524 Std. Error Sample Size 3 Mean Weight 2.66 Std. Error Sample Size 1
' Nushagak District catch does not include lgushik Beach setnet catch (242,273) which was sampled separately.

Table 34. Age, sex, and size (length in mrn and weight in kg) composition of sockeye salmon commercial catch, Igushik Beach setnet fishery, 1994.
Age Group
0.3 1.2 1.3 2.2 1.4 2.3 Total
Sample period: June 17 - July 20
Males Percent Sample Size Mean Length Std. Error Sample Size Mean Weight Std. Error Sample Size
Females Percent Sample Size Mean Length Std. Error Sample Size Mean Weight Std. Error Sample Size
Both Sexes Percent Sample Size Mean Length Std. Error Sample Size Mean Weight Std. Error Sample Size

Table 35. Age, sex, and size (length in mrn and weight in kg) composition of sockeye salmon escapement, Wood River, 1994.
Age Group
1.1 0.3 1.2 2.1 1.3 2.2 1.4 2.3 Total
Females 2,140 Percent 1.15 Sample Size 6 Mean Length 352 Std. Error 5 Sample Sue 6
Both Sexes 2,140 Percent 1.15 Sample Sue 6 Mean Length 352 Std. Error 5 Sample Size 6
Sample Period 2: July 5 - July 9
Males 1,805 Percent 0.39 Sample Size 2 Mean Length 353 Std. Error 3 Sample Size 2
Males - Percent Sample Size Mean Length Std. Error Sample Size
Sample Period 1: June 22 - July 4
Females 2.708 Percent 0.58 Sample Size 3 Mean Length 379 Std. Error 18 Sample Sue 3
Both Sexes 4,513 Percent 0.97 Sample Sue 5 Mean Length 368 Std. Error 11 Sample Size 5
- -
- Continued -
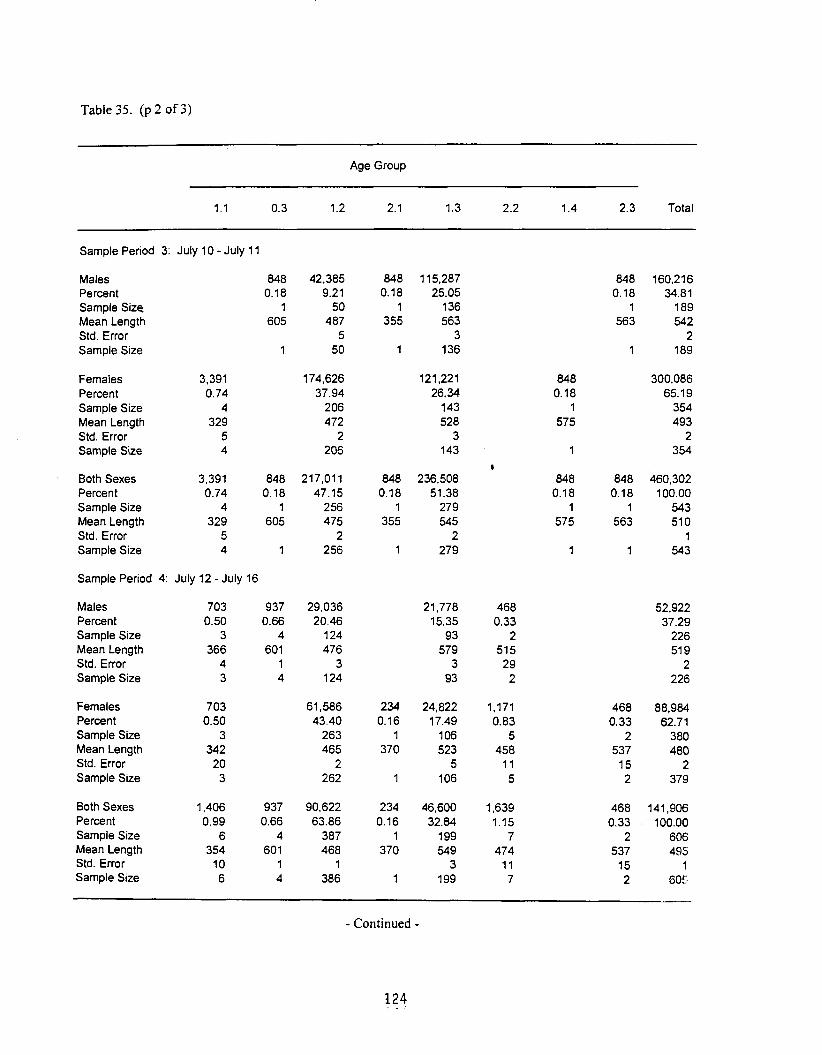
Table 35. (p 2 of 3)
Age Group
1.1 0.3 1.2 2.1 1.3 2.2 1.4 2.3 Total
Sample Period 3: July 10 - July 11
Males Percent Sample Size Mean Length Std. Error Sample Size
Females 3,391 Percent 0.74 Sample Size 4 Mean Length 329 Std. Error 5 Sample Size 4
Both Sexes 3.391 848 Percent 0.74 0.18 Sample Size 4 1 Mean Length 329 605 Std. Error 5 Sample Size 4 1
Sample Period 4: July 12 -July 16
Males 703 937 Percent 0.50 0.66 Sample Size 3 4 Mean Length 366 601 Std. Error 4 1 Sample Size 3 4
Females 703 Percent 0.50 Sample Size 3 Mean Length 342 Std. Error 20 Sample Size 3
Both Sexes 1,406 937 Percent 0.99 0.66 Sample Size 6 4 Mean Length 354 601 Std. Error 10 1 Sample Size 6 4
- Continued -

Table 35. (p 3 of 3)
--
Age Group
- --
1.1 0.3 1.2 2.1 1.3 2.2 1.4 2.3 Total
Sample Period 5: July 17 -July 24
Males 344 344 Percent 0.16 0.16 Sample Size 1 1 Mean Length 367 607 Std. Error Sample Size 1 1
Females Percent Sample Size Mean Length Std. Error Sample Size
Both Sexes 344 688 Percent 0.16 0.31 Sample Size 1 2 Mean Length 367 566 Std. Error Sample Size 1 2
All Periods Combined:
Males 2,852 2,129 Percent 0.19 0.14 Sample Size 6 6 Mean Length 358 604 Std. Error 2 1 Sample Size 6 6
Females 8,942 701 Percent 0.61 0.05 Sample Size 16 2 Mean Length 351 543 Std. Error 6 Sample. Size 16 2
Both Sexes 11,794 2,830 Percent 0.80 0.19 Sample Size 22 8 Mean Length 352 589 Std. Error 5 1 Sample Size 22 8

Table 36. Age, sex, and size (length in mm and weight in kg) composition of sockeye salmon escapement, Igushik River, 1994.
Age Group
- -- - -- -
0.3 1.2 1.3 2.2 1.4 2.3 Total
Sample Period 1 :
Males Percent - Sample Size Mean Length Std. Error Sample Size
Females Percent Sample Size Mean Length Std. Error Sample Size
Both Sexes Percent Sample Size Mean Length Std. Error Sample Size
Sample Period 2:
Males Percent Sample Size Mean Length Std. Error Sample Size
Females Percent Sample Size Mean Length Std. Error Sample Size
Both Sexes Percent Sample Size Mean Length Std. Error Sample Size
June 22 - July 6
- Continued -
126

Table 36. (p 2 of 3)
Age Group
0.3 1.2 1.3 2.2 1.4 2.3 Total
Sample Period 3: July 11 - July 14
Males Percent Sample Size Mean Length Std. Error Sample Size
Females Percent Sample Size Mean Length Std. Error Sample Size
Both Sexes Percent Sample Size Mean Length Std. Error Sample Size
Sample Period 4: July 15 - July 27
Males Percent Sarnple Size Mean Length Std. Error Sample Size
Females Percent Sample Size Mean Length Std. Error Sample Size
Both Sexes Percent Sample Size Mean Length Std. Error Sarnple Size
- Continued -

Table 36. (p 3 of 3)
Age Group
0.3 1.2 1.3 2.2 1.4 2.3 Total
All Periods Combined:
Males 198 Percent - 0.04 Sample Size 2 Mean Length 566 Std. Error 6 Sample Size 2
Females Percent Sample Size Mean Length Std. Error Sample Size
Both Sexes 198 Percent 0.04 Sample Size 2 Mean Length 566 Std. Error 6 Sample Size 2

Table 37. Age, sex, and size (length in mm and weight in kg) composition of sockeye salmon escapement, Nushagak River, 1994.
Age Group
0.2 1.1 0.3 1.2 0.4 1.3 2.2 1.4 2.3 2.4 Total
Sample Period 1 :
Males Percent Sample Size Mean Length Std. Error Sample Size
Females Percent Sample Size Mean Length Std. Error Sample Size
Both Sexes Percent Sample Size Mean Length Std. Error Sample Size
Sample Period 2:
Males Percent Sample Size Mean Length Std. Error Sample Size
Females Percent Sample Size Mean Length Std. Error Sample Size
June 9 - July 5
Both Sexes 5,723 120,197 Percent 1.64 34.54 Sample Size 10 21 0 Mean Length 433 549 Std. Error 15 2 Sample Size 10 210
- Continued -

Table 37. (p 2 of 2)
Age Group
0.2 1.1 0.3 1.2 0.4 1.3 2.2 1.4 2.3 2.4 Total
All Periods Combined:
Males 6,662 Percent 1.31 Sample Size 14 Mean Length 41 9 Std. Error 11 Sample Size 14
Females 1,478 Percent 0.29 Sample Size 4 Mean Length 502 Std. Error 39 Sample Size 4
Both Sexes 8,140 Percent 1.60 Sample Size 18 Mean Length 434 Std. Error 11 Sample Size 18

Table 38. Age, sex, and size (length in rnm and weight in kg) composition of sockeye salmon commercial catch, Togiak River Section, 1994.
Age Group
0.3 1.2 0.4 1.3 2.2 1.4 2.3 2.4 3.3 Total
Sample Period 1: June 8 - July 7
Males Percent Sample Size Mean Length Std. Error Sample Sue Mean Weight Std. Error Sample Size
Females Percent Sample Size Mean Length Std. Error Sample Size Mean Weight Std. Error Sample Size
Both Sexes Percent Sample Size Mean Length Std. Error Sample Size Mean Weight Std. Error Sample Size
Sample Period 2: July 8 -July 17
Males Percent Sample Size Mean Length Std. Error Sample Size Mean Weight Std. Error Sample Size
Females Percent Sample Size Mean Length Std. Error Sample Size Mean Weight Std. Error Sample Size
Both Sexes Percent Sample Size Mean Length Std. Error Sample Size Mean Weight Std. Error Sample Size
- Continued -

Table 38. (p 2 of 2)
Age Group
0.3 1.2 0.4 1.3 2.2 1.4 2.3 2.4 3.3 Total
Sample Period 3: July 18 - September 12
Males Percent Sample Size Mean Length Std. Error Sample Size Mean Weight Std. Error - Sample Size
Females Percent Sample Size Mean Length Std. Error Sample Size Mean Weight Std. Error Sample Size
Both Sexes Percent Sample Size Mean Length Std. Error Sample Size Mean Weight Std. Error Sample Size
All Periods Combined:
Males Percent Sample Size Mean Length Std. Error Sample Size Mean Weight Std. Error Sample Size
Females Percent Sample Size Mean Length Std. Error Sample Size Mean Weight Std. Error Sample Sue
Both Sexes Percent Sample Size Mean Length Std. Error Sample Sue Mean Weight Std. Error Sample Sue

Table 39. Age, sex, and size (length in mm and weight in kg) composition of sockeye salmon commercial catch, Kulukak Section, Togiak District, 1994.
Age Group
0.3 1.2 1.3 2.2 1.4 2.3 3.3 Total
Sample period: June 13 -August 4
Males Percent Sample Size Mean Length Std. Error Sample Size Mean Weight Std. Error Sample Size
Females Percent Sample Size Mean Length Std. Error Sample Size Mean Weight Std. Error Sample Size
Both Sexes Percent Sample Size Mean Length Std. Error Sample Size Mean Weight Std. Error Sample Size

Table 40. Age, sex, and size (length in mrn and weight in kg) composition of sockeye salmon escapement, Togiak River, 1994.
Age Group
0.2 1.1 0.3 1.2 1.3 2.2 1.4 2.3 Total
Sample Period 1: July 7 - July 24
Males Percent - Sample Size Mean Length Std. Error Sample Size
Females Percent Sample Size Mean Length Std. Error Sample Size
Both Sexes Percent Sample Size Mean Length Std. Error Sample Size
Sarnple Period 2: July 25 - August 9
Males 274 1,506 Percent 0.33 1.80 Sample Size 2 11 Mean Length 522 458 Std. Error 6 14 Sample Size 2 11
Females 411 1,096 Percent 0.49 1.31 Sample Size 3 8 Mean Length 467 472 Std. Error 17 6 Sample Size 3 8
Both Sexes 685 2,602 Percent 0.82 3.1 1 Sample Size 5 19 Mean Length 489 464 Std. Error 10 8 Sample Size . 5 19
- Continued -

Table 40. (p 2 o f 2)
Age Group
0.2 1.1 0.3 1.2 1.3 2.2 1.4 2.3 Total a
All Periods Combined:
Males 274 Percent- 0.18 Sample Size 2 Mean Length 522 Std. Error 6 Sample Size 2
Females 41 1 Percent 0.27 Sample Size 3 Mean Length 467 Std. Error 17 Sample Size 3
Both Sexes 685 Percent 0.44 Sample Size 5 Mean Length 489 Std. Error 10 Sample Size 5
a Total does not include 19,420 sockeye salmon counted, in the tributaries and mainstem Togiak River, below the counting towers.

Table 4 1. Age, sex, and size (length in mm and weight in kg) composition of sockeye salmon escapement, Kulukak River, 1994.
Age Group
0.2 1.1 0.3 1.2 1.3 2.2 2.3 Total a
Sample period:
Males Percent Sample Size Mean Length Std. Error Sample Size
Females Percent Sample Size Mean Length Std. Error Sample Size
Both Sexes Percent Sample Size Mean Length Std. Error Sample Size
a Total escapement count is from aerial survey. Scale samples were taken by USF&WS personnel.

Table 42. Age and size (length in mm and weight in kg) composition of chinook salmon commercial catch, Nushagak District, 1994.
Age Group
1 .l 1.2 1.3 1.4 1.5 2.4 Total
Sample Period 1: June 8 - June 18
Both Sexes Percent Sample Size Mean Length Std. Error Sample Size Mean Weight Std. Error Sample Size
Sample Period 2: June 19 - July 20
Both Sexes Percent Sample Size Mean Length Std. Error Sample Size Mean Weight Std. Error Sample Size
All Periods Combined:
Both Sexes Percent Sample Size Mean Length Std. Error Sample Size Mean Weight Std. Error Sample Size

Table 43. Age and size (length in mrn and weight in kg) composition of chinook salmon escapement, Nushagak River, 1994.
Age Group
- -- -
1.1 1.2 1.3 1.4 1.5 Total
Sample period: June 9 - August 4
Both Sexes 1,170 17,992 33,935 39,785 3,072 95,954 Percent 1.22 18.75 35.37 41.46 3.20 100.00 Sample Size 8 123 232 272 21 656 Mean Length 38 1 558 76 1 865 91 3 766 Std. Error 10 4 5 4 11 3 Sample Size 8 123 232 272 21 656

Table 44. Age and size (length in mm and weight in mm) composition of chinook salmon commercial catch, Togiak River Section, 1994.
Age Group
1.1 1.2 1.3 1.4 1.5 2.4 1.6 Total
Sample period:
Both Sexes Percent Sample Size Mean Length Std. Error Sample Size Mean Weight Std. Error Sample Size
June 3 - September 8

Table 45. Age, sex, and size (length in mrn and weight in kg) composition of chum salmon commercial catch, Nushagak District, 1994.
Age Group
0.2 0.3 0.4 0.5 Total
Sample Penod 1: June 8 - June 30
Males Percent Sample Size Mean Length Std. Error Sample Size Mean Weight Std. Error - Sample Size
Females Percent Sample Size Mean Length Std. Error Sample Size Mean Weight Std. Error Sample Size
Both Sexes Percent Sample Size Mean Length Std. Error Sample Size Mean Weight Std. Error Sample Size
Sample Penod 2: July 1 -July 7
Males Percent Sample Size Mean Length Std. Error Sample Size Mean Weight Std. Error Sample Size
Females Percent Sample Size Mean Length Std. Error Sample Size Mean Weight Std. Error Sample Size
Both Sexes Percent Sample Size Mean Length Std. Error Sample Size Mean Weight SM. Error Sample Size
- Continued -
140

Table 45. (p 2 of 2)
Age Group
0.2 0.3 0.4 0.5 Total
Sample Period 3: July 8 -July 20
Males Percent Sample Size Mean Length Std. Error Sample Size Mean Weight Std. Error Sample Size
Females Percent Sample Size Mean Length Std. Error Sample Size Mean Weight Std. Error Sample Size
Both Sexes Percent Sample Size Mean Length Std. Error Sample Size Mean Weight Std. Error Sample Size
All Periods Combined:
Males Percent Sample Size Mean Length Std. Error Sample Size Mean Weight Std. Error Sample Size
Females Percent Sample Size Mean Length Std. Error Sample Size Mean Weight Std. Error Sample Size
Both Sexes Percent Sarnple Size Mean Length Std. Error Sample Size Mean Weight Std. Error Sample Size

Table 46. Age, sex, and size (length in mrn and weight in kg) compostion of chum salmon escapement, Nushagak River, 1994.
-- Age Group
0.2 0.3 0.4 0.5 Total
Sample Period 1: June 9 - July 3
Males Percent Sample Size Mean Length Std. Error Sample Size
Females Percent Sample Size Mean Length Std. Error Sample Size
Both Sexes Percent Sample Size Mean Length Std. Error Sample Size
Sample Period 2: July 4 - August 25
Males Percent Sample Size Mean Length Std. Error Sample Size
Females Percent Sample Size Mean Length Std. Error Sample Size
Both Sexes Percent Sample Size Mean Length Std. Error Sample Size
- Continued -
142

Table 46. (p 2 of 2)
Age Group
0.2 0.3 0.4 0.5 Total
All Periods Combined:
Males Percent Sample Size Mean Length Std. Error Sample Size
T
Females Percent Sample Size Mean Length Std. Error Sample Size
Both Sexes Percent Sample Size Mean Length Std. Error Sample Size

Table 47. Age, sex, and size (length in mm and weight in kg) composition of chum salmon commercial catch, Togiak River Section, 1994.
Age Group
0.2 0.3 0.4 0.5 Total
Sample Period 1: June 3 -July 10
Males Percent Sample Size Mean Length Std. Error Sample Size Mean Weight Std. Error - Sample Size
Females Percent Sample Size Mean Length Std. Error Sample Size Mean Weight Std. Error Sample Size
Both Sexes Percent Sample Size Mean Length Std. Error Sample Size Mean Weight Std. Error Sample Size
Sample Period 2: July 11 -July 16
Males Percent Sample Size Mean Length Std. Error Sample Size Mean Weight Std. Error Sample Size
Females Percent Sample Size Mean Length Std. Error Sample Size Mean Weight Std. Error Sample Size
Both Sexes Percent Sample Size Mean Length Std. Error Sample Size Mean Weight Std. Error Sample Size
- Continued -
144

Table 47. (p 2 of 2)
Age Group
0.2 0.3 0.4 0.5 Total
Sample Period 3: July 17 - September 12
Males Percent Sample Size Mean Length Std. Error Sample Size Mean Weight Std. Error Sample Sue
Females Percent Sample Size Mean Length Std. Error Sample Size Mean Weight Std. Error Sample Size
Both Sexes Percent Sample Sue Mean Length Std. Error Sample Size Mean Weight Std. Error Sample Sue
All Periods Combined:
Males Percent Sample Size Mean Length Std. Error Sample Size Mean Weight Std. Error Sample Sue
Females Percent Sample Size Mean Length Std. Error Sample Size Mean Weight Std. Error Sample Size
Both Sexes Percent Sample Size Mean Length Std. Error Sample Sue Mean Weight Std. Error Sample Sue

Table 48. Age, sex, and size (length in mm and weight in kg) composition of chum salmon escapement, Kulukak River, 1994.
Age Group
0.3 0.4 0.5 Total a
Sample period: July 6 - July 31
Males Percent Sample Size Mean Length Std. Error Sample Size
Females Percent Sample Size Mean Length Std. Error Sample Size
Both Sexes Percent Sample Size Mean Length Std. Error Sample Size
a Total escapement count is from aerial survey. Scale samples were taken by USF&WS personnel.

Table 49. Age, sex, and size (length in rnm and weight in kg) composition of coho salmon escapement, Nushagak River, 1994.
Age Group
1.1 2.1 3.1 2.2 Total
Sample period:
Males Percent Sample Size Mean Length Std. Error Sample Size
Females Percent Sample Size Mean Length Std. Error Sample Size
Both Sexes Percent Sample Size Mean Length Std. Error Sample Size

Table 50. Bristol Bay sockeye salmon run, 1995.
Age Class
system' 0.2 1.1 0.3 1.2 2.1 0.4 1.3 2.2 3.1 1.4 2.3 3.2 2.4 3.3 3.4 Total
Kvichak C 0 0 0 1,786,075 0 110 869.174 12,498,420 0 2.341 2,221,809 8,149 0 5.828 0 17,391,906 E 1,673 0 3,744 798.583 1.673 0 265.955 7.956.929 0 0 1,006.024 4.139 0 0 0 10.038.720
1 1.673 0 3.744 2.584.658 1.673 110 1.135.129 20,455,349 0 2.341 3.227.833 12.288 0 5.828 0 27.430.626 S 66 0 342 103.462 31 1 56,757 649.824 0 149 88.361 466 0 153 0 899.612 T 1.739 0 4,086 2.688.120 1.704 il l 1,191,886 21.105.173 0 2.490 3.316.194 12.754 0 5.981 0 28.330.238
Branch C 0 0 0 134.547 0 3 91.352 198.243 0 60 10.888 0 0 148 0 435.241 E 0 1,682 0 57.404 3.503 0 26.484 121.734 0 0 4.906 0 0 0 0 215.713 I 0 1.682 0 191.951 3,503 3 117.836 319.977 0 60 15.794 0 0 148 0 650.954
S 0- 0 0 7.684 65 0 5.892 10.165 0 4 432 0 0 4 0 24.246 T 0 1.662 0 199.635 3.568 3 123.728 330.142 0 64 16.226 0 0 152 0 675.200
Naknek C 0 0 0 367.558 0 15 905.855 802.832 0 330 372,296 2,726 0 822 0 2.452.434 E 0 0 0 157.313 774 0 271.207 500.933 0 0 178,143 1.385 1,385 0 0 1.111.140
I 0 0 0 524,871 774 15 1.177.062 1,303,765 0 330 550.439 4.111 1,385 822 0 3363.574 S 0 0 0 21.010 14 0 58.853 41.418 0 21 15,068 156 124 22 0 136.686 T 0 0 0 545,881 788 15 1.235.915 1,345,183 0 351 565.507 4.267 1.509 844 0 3.700.260
Egegik C 5.197 0 2.419 1,225,732 1,306 0 782,064 8,476,325 0 5.235 3,636.297 144.818 2.130 144.454 0 14,425,979 E 0 125 0 117.924 18.549 0 43,914 826.605 628 125 236.287 18.661 304 3,570 0 1.266.692 1 5.197 125 2.419 1,343,656 19.857 0 825.978 9,302,930 628 5,360 3,872,584 163.479 2,434 148.024 0 15,692.671
S 206 0 221 53.786 370 0 41.299 295.535 0 341 106,010 6.196 217 3.893 0 508.073 T 5,403 125 2.640 1397.442 20.227 0 867.277 9,598,465 628 5.701 3,978,594 169.675 2.651 151.917 0 16.200.744
Ugashtk C 2.157 0 405 1,322.696 0 1.692 509,444 1,815,741 011.162 830,192 5.8532.864 7.240 0 4.509.446 E 3.485 2.916 0 632.858 1,330 0 166.048 414.902 0 0 99.569 0 0 0 0 1,321,108
1 5.642 2.916 405 1.955.554 1.330 1.692 675,492 2.230.643 0 11.162 929.761 5.853 2,864 7,240 0 5.830.554 S 224 0 37 78,279 25 12 33.775 70,863 0 710 25.452 222 256 190 0 210,044 T 5,8662,916 442 2.033.833 1.355 1.704 709.267 2,301,506 011.872 955.213 6,0753,120 7.430 0 6.040.598
- -
Wood C 4.366 0 5.226 1,538,594 0 2.210 759.769 198.856 0 478 30.151 0 0 0 0 2.539.650 E 5.2571.376 3,468 993,461 0 1.090 390.305 78.430 0 999 7.386 0 390 0 0 1.482.162
1 9,623 1.376 8.694 2,532.055 0 3.300 1.150.074 277.286 0 1.477 37.537 0 390 0 0 4,021.812 S 381 0 795 101,356 0 24 57.504 8,809 0 94 1.028 0 35 0 0 170.025 T 10.004 1.376 9.489 2.633.411 0 3.324 1.207.578 286.095 0 1.571 38.565 0 425 0 0 4,191.837
lgushik C 0 0 908 205.879 0 0 1,036,527 136.954 0 4,500 43,813 0 0 0 0 1.428.581 E 0 0 0 99.767 0 0 324.166 40.260 0 1.733 7.456 0 0 0 0 473.382 I 0 0 908 305.646 0 01.360.693 177.214 0 6.233 51.269 0 0 0 0 1,901,963
S 0 0 83 12.235 0 0 68.035 5,630 0 396 1.403 0 0 0 0 87.782 T 0 0 991 317.881 0 0 1,428.728 182.844 0 6.629 52.672 0 0 0 0 1.989.745
Nuyakuk E 3.205 0 1.736 28.308 0 1.736 32.180 935 0 801 801 0 0 0 0 69.702
Snake C 0 0 0 0 0 0 0 0 0 0 0 0 0 0 0 2.676 E 0 0 0 0 0 0 0 0 0 0 0 0 0 0 0 17.380 I 0 0 0 0 0 0 0 0 0 0 0 0 0 0 0 20.056
S 0 0 0 0 0 0 0 0 0 0 0 0 0 0 0 0 T 0 0 0 0 0 0 0 0 0 0 0 0 0 0 0 20.056
Nushagak C 28.771 0 77.457 111,608 0 71.977 159.258 13.068 0 9.845 3,009 0 0 0 0 474.993 E 52.558 0 48.454 54.009 0 31.730 81.977 4.444 0 7.201 747 187 0 0 0 281.307
1 81.329 0 125.911 165.617 0 103.707 241.235 17.512 0 17.046 3.756 187 0 0 0 756.300 S 3.223 0 11.513 6.630 0 751 12,062 556 0 1.084 103 7 0 0 0 35.929 T 84,552 0 137,424 172.247 0 104.458 253.297 18.068 0 18.130 3.859 194 0 0 0 792.229
Togiak C 714 0 1.552 115.714 0 1.366 311.970 62.505 0 977 32.344 0 0 0 0 527.142 E 434 0 904 85,628 0 0 126.215 10.190 0 120 7.735 0 0 0 0 211.226
1 1.148 0 2.456 181.342 0 1.366 438.185 72.695 0 1.097 40.079 0 0 0 0 738.368 S 45 0 225 7.259 0 10 21.909 2.309 0 70 1.097 0 0 0 0 32.925 T 1.193 0 2.681 188,601 0 1.376 460.094 75,004 0 1.167 41.176 0 0 0 0 771.293
Summ~ry C 41.205 0 87,967 6,808.403 1,308 77.373 5.425.413 24,202,944 0 34.928 7.180,799 161.546 4.994 158.492 0 44.185372 E 63.407 6.099 56.570 2.976.947 25.829 32.820 1.696.271 9.954.427 628 10.178 1.548.253 24.372 2.079 3.570 0 16.401.450
1 104.612 6,099 144.537 9.785.350 27.137 110,193 7.121.684 34.157.371 628 45.106 8,729.052 185.918 7.073 162.062 0 60,586,822 S 4.146 0 13.216 391.700 505 798 356.086 1.085.109 0 2.868 238.954 7,046 631 4.262 0 2.105.321 T 108.758 6.099 157.753 10,177,050 27.642 110.991 7.477.770 35.242.480 628 47.974 8,968,006 192.964 7.704 166,324 0 62.692.143
C = Catch, E = Escapement, I = Inshore Return, S = South Peninsula Catch, and T = Total. Egegik escapement includes King Salmon River; Ugashik escapement includes King Salmon and Dog Salmon Rivers; Togiak catch is Togiak River Section only and Togiak escapement includes the tower counts, and lower river and tributaries aerial survey estimate. Nuyukuk escapement is not totaled because it is a tributary of Nushagak.
148

Table 5 1 . Age, sex, and size (length in mm and weight in kg) compostion of sockeye salmon commercial catch and escapement, Bristol Bay, 1995.
Age Group
-
3.3 Total
Males
Percent Sample Size Mean Length Std. Error Sample Size Mean Weight
c.l Std. Error
P Sample Size \D
Females
Percent Sample Size Mean Length Std. Error Sample Size Mean Weight Std. Error Sample Size
Both Sexes
Percent Sample Size Mean Length Std. Error Sample Size Mean Weight Std. Error Sample Size

Table 52. Age, sex, and size (length in mrn and weight in kg) composition of sockeye salmon commercial catch, Naknek-Kvichak District, 1995.
-~ -
Age Group
1.2 0.4 1.3 2.2 1.4 2.3 3.2 3.3 Total
Sample Penod 1: June 6 - Males Percent Sample Size Mean Length Std. Error Sample Size Mean Weight Std. Error - Sample Size
Females Percent Sample Size Mean Length Std. Error Sample Size Mean Weight Std. Error Sample Size
Both Sexes Percent Sample Size Mean Length Std. Error Sample Size Mean Weight Std. Error Sample Size
Sample Period 2: June 22.
Males Percent Sample Size Mean Length Std. Error Sample Size Mean Weight Std. Error Sample Size
Females Percent Sample Size Mean Length Std. Error Sample Size Mean Weight Std. Error Sample Size
Both Sexes Percent Sample Size Mean Length Std. Error Sample Size Mean Weight Std. Error Sample Size
June 21
2,056 2.62
16 51 1
11 16
2.14 0.09
5
2.313 2.95
18 499
8 18
1 .go 0.13
10
4,369 5.57
34 504
7 34
2.01 0.08
15
June 24
4,692 4.30
13 488
9 13
1.84
1
4,331 3.97
12 496
7 12
2.18
1
9,023 8.28
25 492
6 25
2.00
2
- Continued -
150

Table 52. (p 2 of 8)
- -
Age Group
1.2 0.4 1.3 2.2 1.4 2.3 3.2 3.3 Total
Sample Period 3: June 25 - June 26
Males Percent Sample Size Mean Length Std. Error Sample Size Mean We~ght Std. Error Sample Size
Females Percent Sample Size Mean Length Std. Error Sample Size Mean Weight Std. Error Sample Size
Both Sexes Percent Sample Size Mean Length Std. Error Sample Size Mean Weight Std. Error Sample Size
Sample Period 4: June 27
Males Percent Sample Size Mean Length Std. Error Sample Size Mean Weight Std. Error Sample Size
Females Percent Sample Size Mean Length Std. Error Sample Size Mean Weight Std. Error Sample Size
Both Sexes Percent Sample Size Mean Length Std. Error Sample Size Mean Weight Std. Emr Sample Size
--
- Continued -

Table 52. (p 3 of 8)
Age Group
1.2 0.4 1.3 2.2 1.4 2.3 3.2 3.3 Total
Sample Period 5: June 28 -June 29
Males Percent Sample Size Mean Length Std. Error Sample Size Mean Weight Std. Error - Sample Size
Females Percent Sample Size Mean Length Std. Error Sample Size Mean Weight Std. Error Sample Size
Both Sexes Percent Sample Size Mean Length Std. Error Sample Size Mean Weight Std. Error Sample Size
Sarnple Period 6: June 30
Males Percent Sample Size Mean Length Std. Error Sample Size
Females Percent Sample Size Mean Length Std. Error Sample Size
Both Sexes Percent Sample Sue Mean Length Std. Error Sample Size
- p~
- Continued -

Table 52. (p 4 of 8)
Age Group
I .2 0.4 1.3 2.2 1.4 2.3 3.2 3.3 Total
Sample Penod 7: July 1 - July 2
Males Percent Sample Size Mean Length Std. Error Sample Size Mean Weight Std. Error Sample Size
Females Percent Sample Size Mean Length Std. Error Sample Size Mean Weight Std. Error Sample Size
Both Sexes Percent Sample Size Mean Length Std. Error Sample Size Mean Weight Std. Error Sample Size
Sample Period 8: July 3 -July 4
Males Percent Sample Size Mean Length Std. Error Sample Size Mean Weight Std. Error Sample Size
Females Percent Sample Sue Mean Length Std. Error Sample Size Mean Weight Std. Error Sample Size
Both Sexes Percent Sample Size Mean Length Std. Error Sample Size Mean Weight Std. Error Sample Size
- Continued -

Table 52. (p 5 of 8)
Age Group - -
1.2 0 4 1.3 2.2 1.4 2.3 3.2 3.3 Total
Sample Period 9: July 5 - Males Percent Sample Size Mean Length Std. Error Sample Size Mean Weight Std. Error Sample Size - Females Percent Sample Size Mean Length Std. Error Sample Size Mean Weight Std. Error Sample Size
Both Sexes Per&ent Sample Size Mean Length Std. Error Sample Size Mean Weight Std. Error Sample Size
Sample Period 10: July 7 - Males Percent Sample Size Mean Length Std. Error Sample Size Mean Weight Std. Error Sample Size
Females Percent Sample Size Mean Length Std. Error Sample Sue Mean Weight Std. Error Sample Size
Both Sexes Percent Sample Size Mean Length Std. Error Sample Size Mean Weight Std. Error Sample Size
July 6
166,613 5.75
6 1 516
3 60
2.24 0.25
5
109,254 3.77
40 505
4 40
1.81 0.02
3
275,867 9.53 101 512
3 100
2.07 0.15
8
July 8
113,454 6.65
51 514
4 5 1
2.16 0.1 1
7
135.700 7.95
61 499
3 61
1.98 0.17
9
249.154 14.60
112 506
2 112
2.06 0.1 1
16
- Continued -

Table 52. (p 6 of 8)
Age Group
1.2 0.4 1.3 2.2 1.4 2.3 3.2 3.3 Total
Sample Penod 11: July 9 -July 10
Males Percent Sample Size Mean Length Std. Error Sample Size Mean Weight Std. Error Sample Size
Females Percent Sample Size Mean Length Std. Error Sample Size Mean Weight Std. Error Sample Size
Both Sexes Percent Sample Size Mean Length Std. Error Sample Size Mean Weight Std. Error Sample Size
Sample Period 12: July 11
Males Percent Sample Size Mean Length Std. Error Sample Size Mean Weight Std. Error Sample Size
Females Percent Sample Sire Mean Length Std. Error Sample Size Mean Weight Std. Error Sample Sue
Both Sexes Percent Sample Size Mean Length Std. Error Sample Size Mean Weight Std. Emr Sample Size
- Continued -

Table 52. (p 7 of 8)
Age Group
1.2 0.4 1.3 2.2 1.4 2.3 3.2 3.3 Total
Sample Period 13: July 12 - Males Percent Sample Size Mean Length Std. Error Sample Size
Females - Percent Sample Size Mean Length Std. Error Sample Size
Both Sexes Percent Sample Size Mean Length Std. Error Sample Size
Sample Period 14: July 14 - Males Percent Sample Size Mean Length Std. Error Sample Size Mean Weight Std. Error Sample Size
Females Percent Sample Size Mean Length Std. Error Sample Size Mean Weight Std. Error Sample Sue
Both Sexes Percent Sample Size Mean Length Std. Error Sample Size Mean Weight Std. Error Sample Size
July 13
90,880 6.40
8 516
9 8
22,720 1.60
2 485
11 2
113,600 8.00
10 510
8 10
July 15
187,317 10.11
57 515
3 57
1.84 0.09
6
88,729 4.79
27 502
3 27
1.71 0.12
3
276,046 14.89
84 51 1
2 84
1.80 0.07
9
- Continued -

Table 52. (p 8 of 8)
Age Group
1.2 0.4 1.3 2.2 1.4 2.3 3.2 3.3 Total
Sample Period 15: July 16 -August 4
Males Percent Sample Size Mean Length Std. Error Sample Size Mean Weight Std. Error Sample Slze
Females Percent Sample Size Mean Length Std. Error Sample Size Mean Weight Std. Error Sample Size
Both Sexes Percent Sample Size Mean Length Std. Error Sample Size Mean Weight Std. Error Sample Size
All Periods Combined:
Males Percent Sample Size Mean Length Std. Error Sample Size Mean Weight Std. Error Sample Size
Females Percent Sample Size Mean Length Std. Error Sample Size Mean Weight Std. Error Sample Size
Both Sexes Percent Sample Size Mean Length Std. Error Sample Size Mean Weight Std. Error Sample Size

Table 53. Age, sex, and size (length in m m and weight in kg) composition o f sockeye salmon escapement, Kvichak River, 1995.
Age Group
0.2 0.3 1.2 2.1 1.3 2.2 2.3 3.2 Total
Sample Period 1 : June 25 - June 28
Males Percent - Sarnple Size Mean Length Std. Error Sample Size
Females Percent Sample Size Mean Length Std. Error Sample Size
Both Sexes Percent Sample Size Mean Length Std. Error Sample Size
Sample Period 2: June 29 - July 1
Males Percent Sarnple Size Mean Length Std. Error Sample Size
Females Percent Sample Size Mean Length Std. Error Sample Size
Both Sexes Percent Sample Size Mean Length Std. Error Sample Size
- Continued -

Table 53. (p 2 of 4)
Age Group
0.2 0.3 1.2 2.1 1.3 2.2 2.3 3.2 Total
Sample Period 3: July 2 - July 4
Males Percent Sample Size Mean Length Std. Error Sample Size
Females Percent Sample Size Mean Length Std. Error Sample Size
Both Sexes Percent Sample Size Mean Length Std. Error Sample Size
Sample Period 4: July 5 -July 8
Males Percent Sample Size Mean Length Std. Error Sample Size
Females Percent Sample Size Mean Length Std. Error Sample Size
Both Sexes Percent Sample Size Mean Length Std. Error Sample Size
- Continued -

Table 53. (p 3 of 4)
Age Group
0.2 0.3 1.2 2.1 1.3 2.2 2.3 3.2 Total
Sample Period 5: July 9 - July 12
Males Percent Sample Size- Mean Length Std. Error Sample Size
Females Percent Sample Size Mean Length Std. Error Sample Size
Both Sexes Percent Sample Size Mean Length Std. Error Sample Size
Sample Period 6: July 13 -July 16
Males 1,673 Percent 0.20 Sample Size 1 Mean Length 410 Std. Error Sample Size 1
Females Percent Sample Size Mean Length Std. Error Sample Size
Both Sexes 1,673 Percent 0.20 Sample Size 1 Mean Length 410 Std. Error Sample Size 1
- Continued -

Table 53. (p 4 of 4)
Age Group
0.2 0.3 1.2 2.1 1.3 2.2 2.3 3.2 Total
Sample Period 7: July 17 - July 26
Males Percent Sample Size Mean Length Std. Error Sample Size
Females Percent Sample Size Mean Length Std. Error Sample Size
Both Sexes Percent Sample Size Mean Length Std. Error Sample Size
All Periods Combined:
Males 1,673 Percent 0.02 Sample Size 1 Mean Length 410 Std. Error Sample Size 1
Females Percent Sample Size Mean Length Std. Error Sample Size
Both Sexes 1,673 3,744 Percent 0.02 0.04 Sample Size 1 1 Mean Length 41 0 534 Std. Error Sample Size 1 1

Table 54. Age, sex, and size (length in mm and weight in kg) composition of sockeye salmon escapement, Naknek River, 1995.
Age Group
1.2 2.1 1.3 2.2 2.3 3.2 2.4 Total
Sample Period 1: June 22 -June 27
Males 18,147 Percent - 8.03 Sample Size 3 1 Mean Length 470 Std. Error 6 Sample Size 30
Females 8,195 . Percent 3.63
Sample Size 14 Mean Length 483 Std. Error 8 Sample Size 14
Both Sexes 26,342 Percent 11.66 Sample Size 45 Mean Length 474 Std. Error 5 Sample Size 44
Sample Period 2: June 28 -July 6
Males 19,360 774 Percent 4.73 0.19 Sample Size 25 1 Mean Length 487 342 Std. Error 9 Sample Size 25 1
Females 34,074 Percent 8.33 Sample Size 44 Mean Length 490 Std. Error 5 Sample Size 44
Both Sexes 53,434 774 Percent 13.07 0.19 Sample Size 69 1 Mean Length 489 342 Std. Error 5 Sample Size 69 1
- Continued -
162

Table 54. (p 2 of 2)
Age Group
1.2 2.1 1.3 2.2 2.3 3.2 2.4 Total
Sample Period 3: July 7 - July 21
Males 40,153 Percent 8.43 Sample'Size 29 Mean Length 477 Std. Error 6 Sample Size 29
Females 37,384 Percent 7.85 Sample Size 27 Mean Length 491 Std. Error 5 Sample Size 27
Both Sexes 77,537 Percent 16.28 Sample Size 56 Mean Length 483 Std. Error 4 Sample Size 56
All Periods Combined:
Males 77.660 Percent 6.99 Sample Size 85 Mean Length 478 Std. Error 4 Sample Size 84
Females 79.653 Percent 7.17 Sample Size 85 Mean Length 490 Std. Error 3 Sample Size 85
Both Sexes 157,313 Percent 14.16 Sample Size 170 Mean Length 484 Std. Error 3 Sample Size 169

Table 55. Age, sex, and size (length in mm and weight in kg) composition of sockeye salmon commercial catch, Egegik District, 1995.
Age Group
0.2 0.3 1.2 2.1 1.3 2.2 1.4 2.3 3.2 2.4 3.3 Total
Sample Period 1 : June 6 - June 22
Males Percent Sample Size Mean Length Std. Error Sample Size Mean Weight Std. Error Sample Size
Females Percent Sample Size Mean Length Std. Error Sample Size Mean Weight Std. Error Sample Size
Both Sexes Percent Sample Size Mean Length Std. Error Sample Size Mean Weight Std. Error Sam~le Size
Sample Period 2: June 23 - June 26
Males Percent Sample Size Mean Length Std. Error Sample Size Mean Weight Std. Error Sample Size
Females Percent Sample Size Mean Length Std. Error Sample Size Mean Weight Std. Error Sample Size
Both Sexes Percent Sample Size Mean Length Std. Error Sample Size Mean Weight Std. Error Sample Sue
- Continued -
164

Table 55 . (p 2 of 7)
Age Group
0.2 0.3 1.2 2.1 1.3 2.2 1.4 2.3 3.2 2.4 3.3 Total
Sample Penod:
Males Percent Sample Size Mean Length Std. Error Sample S~ze Mean Weight Std. Error Sample Size
Females Percent Sample Size Mean Length Std. Error Sample Size Mean Weight Std. Error Sample Size
Both Sexes Percent Sample Size Mean Length Std. Error Sample Size Mean Weight Std. Error Sample Size
Sample Period:
Males Percent Sample Size Mean Length Std. Error Sample Size Mean Weight Std. Error Sample Size
Females Percent Sample Size Mean Length Std. Error Sample Size Mean Weight Std. Error Sample Size
Both Sexes Percent Sample Size Mean Length Std. Error Sample Size Mean Weight Std. Error Sample Size
June 27 - June 29
June 30
1.753 0.18
1 452
1
- Continued -

Table 55. (p 3 of 7)
Age Group
0.2 0.3 1.2 2.1 1.3 2.2 1.4 2.3 3.2 2.4 3.3 Total
Sample Period 5: July 1 -July 2
Males Percent Sample Size Mean Length Std. Error Sample Size Mean Weight Std. Error Sample Size - Females Percent Sample Size Mean Length Std. Error Sample Size Mean Weight Std. Error Sample Size
Both Sexes Percent Sample Size Mean Length Std. Error Sample Size Mean Weight Std. Error Sample Size
Sample Period 6: July 3 - July 4
Males Percent Sample Size Mean Length Std. Error Sample Size Mean Weight Std. Error Sample Sue
Females 3.444 Percent 0.20 Sample Size 1 Mean Length 475 Std. Error Sample Size 1 Mean Weight Std. Error Sample Size
Both Sexes 3,444 Percent 0.20 Sample Size 1 Mean Length 475 Std. Error Sample Sue 1 Mean Weight Std. Error Sample Size
- Continued -
166

Table 55. (p 4 of 7)
Age Group
0.2 0.3 1.2 2.1 1.3 2.2 1.4 2.3 3.2 2.4 3.3 Total
Sample Period 7: July 5 -July 6
Males Percent Sample Size Mean Length Std. Error Sample Size Mean We~ght Std. Error Sample Size
Females Percent Sample Size Mean Length Std. Error Sample Size Mean Weight Std. Error Sample Size
Both Sexes Percent Sample Size Mean Length Std. Error Sample Size Mean Weight Std. Error Sample Size
Sample Period 8: July 7
Males Percent Sample Size Mean Length Std. Error Sample Size Mean Weight Std. Error Sample Size
Females Percent Sample Size Mean Length Std. Error Sample Size Mean Weight Std. Error Sample Size
Both Sexes Percent Sample Size Mean Length Std. Error Sample Size Mean Weight Std. Error Sample Sue
- Continued -

Table 55 . (p 5 of 7)
Age Group
0.2 0.3 1.2 2.1 1.3 2.2 1.4 2.3 3.2 2.4 3.3 Total
Sample Period 9: July 8 - July 9
Males Percent Sample Size Mean Length Std. Error Sample Size Mean Weight Std. Error Sample Size . Females Percent Sample Size Mean Length Std. Error Sample Size Mean Weight Std. Error Sample Size
Both Sexes Percent Sample Size Mean Length Std. Error Sample Size Mean Weight Std. Error Sample Size
Sample Period 10: July 10 - July 11
Males Percent Sample Size Mean Length Std. Error Sample Size Mean Weight Std. Error Sample Size
Females Percent Sample Size Mean Length Std. Error Sample Size Mean Weight Std. Error Sample Size
Both Sexes Percent Sample Size Mean Length Std. Error Sample Size Mean Weight Std. Error Sample Size
- Continued -

Table 55. (p 6 of 7)
- -
Age Group
0.2 0.3 1.2 2.1 1.3 2.2 1.4 2.3 3.2 2.4 3.3 Total
Sample Period 11: July 12 - July 13
Males Percent Sample Size Mean Length Std. Error Sample Size Mean Weight Std. Error Sample Size
Females Percent Sample Size Mean Length Std. Error Sample Size Mean Weight Std. Error Sample Size
Both Sexes Percent Sample Size Mean Length Std. Error Sample Size Mean Weight Std. Error Sample Size
Sample Period 12: July 14 -July 16
Males Percent Sample Size Mean Length Std. Error Sample Size Mean Weight Std. Error Sample Size
Females Percent Sample Size Mean Length Std. Error Sample Size Mean Weight Std. Error Sample Size
Both Sexes Percent Sample Size Mean Length Std. Error Sample Size Mean Weight Std. Error Sample Size
- Continued -

Table 55 . (p 7 of 7)
Age Group
0.2 0.3 1.2 2.1 1.3 2.2 1.4 2.3 3.2 2.4 3.3 Total
Sample Period 13: July 17 -August 25
Males Percent Sample Size Mean Length Std. Error Sample Size Mean Weight Std. Error Sample Size
Females Percent Sample Size Mean Length Std. Error Sample Size Mean Weight Std. Error Sample Size
Both Sexes Percent Sample Size Mean Length Std. Error Sample Size Mean Weight Std. Error Sample Size
All Periods Combined:
Males 1.753 Percent 0.01 Sample Size 1 Mean Length 452 Std. Error Sample Size 1 Mean Weight Std. Error Sample Size
Females Percent Sample Size Mean Length Std. Error Sample Size Mean Weight Std. Error Sample Sue
Both Sexes Percent Sample Size Mean Length Std. Error Sample Sue Mean Weight Std. Error Sample Size

Table 56. Age, sex, and size (length in mm and weight in kg) composition of sockeye salmon escapement, Egegik River, 1995.
Age Group
1 .I 1.2 2.1 1.3 2.2 3.1 1.4 2.3 3.2 2.4 3.3 Total
Sample Period 1: June 19 - June 24
Males 1.356 522 Percent 5.14 1.98 Sample Size 26 10 Mean Length 497 340 Std. Error 7 3 Sample Size 26 10
Females 678 Percent 2.57 Sample Size 13 Mean Length 487 Std. Error 7 Sample Size 13
Both Sexes 2.034 522 Percent 7.71 1.98 Sample Size 39 10 Mean Length 494 340 Std. Error 5 3 Sample Size 39 10
Sample Period 2: June 25 -June 27
Males Percent Sample Size Mean Length Std. Error Sample Size
Females Percent Sample Size Mean Length Std. Error Sample Size
Both Sexes Percent Sample Size Mean Length Std. Error Sample Size
- Continued -

Table 56. (p 2 of 4)
Age Group
1.1 1.2 2.1 1.3 2.2 3.1 1.4 2.3 3.2 2.4 3.3 Total
Sample Period 3: June 28 - June 30
Males 26.715 3.929 Percent 6.26 0.92 Sample Size 34 5 Mean Length 507 365 Std. Error 5 17 Sample Size 34 5
Females 26.715 Percent 6.26 Sample Size 34 Mean Length . 506 Std. Error 3 Sample Size 34
Both Sexes 53,430 3,929 Percent 12.52 0.92 Sample Size 68 5 Mean Length 507 365 Std. Error 3 17 Sample Size 68 5
Sample Period 4: July 1 -July 6
Males 12.575 5,533 Percent 4.46 1.96 Sample Size 25 11 Mean Length 514 365 Std. Error 5 5 Sample Size 25 11
Females 14.084 Percent 5.00 Sample Size 28 Mean Length 490 Std. Error 3 Sample Size 28
Both Sexes 26.659 5,533 Percent 9.46 1.96 Sample Size 53 11 Mean Length 501 365 Std. Error 3 5 Sample Size 53 11
- Continued -

Table 56. (p 3 of 4)
Age Group
1.1 1.2 2.1 1.3 2.2 3.1 1.4 2.3 3.2 2.4 3.3 Total
Sample Period 5: July 7 -July 12
Males 4,862 Percent 2.69 Sample Size 16 Mean Length 520 Std. Error 8 Sample Size 16
Females 10,940 Percent 6.06 Sample Size 36 Mean Length 488 Std. Error 4 Sample Size 36
Sample Period 6: July 13 -July 18
Males 125 752 626 Percent 0.22 1.34 1.12 Sample Size 1 6 5 Mean Length 327 496 353 Std. Error 14 14 Sample Size 1 6 5
Females 3,633 Percent 6.49 Sample Size 29 Mean Length 487 Std. Error 5 Sample Size 29
Both Sexes 125 4.385 626 Percent 0.22 7.83 1.12 Sample Size 1 35 5 Mean Length 327 488 353 Std. Error 5 14 Sample Size 1 35 5
Both Sexes 15,802 Percent 8.75 Sample Size 52 Mean Length 498 Std. Error 4 Sample Size 52
- - -p
- Continued -

Table 56. (p 4 of 4)
Age Group
1.1 1.2 2.1 1.3 2.2 3.1 1.4 2.3 3.2 2.4 3.3 Total'
Sample Period 7: July 19 - July 25
Males 397 Percent 0.41 Sample Size 2 Mean Length 493 Std. Error - 1 Sample Size 2
Females 2,781 Percent 2.89 Sample Size 14 Mean Length 476 Std. Error 7 Sample Size 14
Both Sexes 3,178 Percent 3.31 Sample Size 16 Mean Length 478 Std. Error 6 Sample Size 16
All Periods Combined:
Males 125 51,900 Percent 0.01 4.10 Sample Size 1 123 Mean Length 327 508 Std. Error 3 Sample Size 1 . 123
Females 65,947 Percent 5.21 Sample Size 173 Mean Length 497 Std. Error 2 Sample Size 173
Both Sexes 125 117,847 Percent 0.01 9.31 Sample Size 1 296 Mean Length 327 502 Std. Error 2 Sample Sue 1 296
a Total does not include an eqtimated 15,816 sockeye salmon counted, from July 26 to August 30, during a USF&WS who project, and escapement to King Salmon River (830).

Table 57. Age, sex, and size (length in mrn and weight in kg) composition of sockeye salmon commercial catch, Ugashik District, 1995.
Age Group
0.2 0.3 1.2 0.4 1.3 2.2 1.4 2.3 3.2 2.4 3.3 Total
Sample Period 1 : June 12 - June 26
Males Percent Sample Size Mean Length Std. Error Sample Size
Females Percent Sample Size Mean Length Std. Error Sample Size
Both Sexes Percent Sample Size Mean Length Std. Error Sample Size
Sample Period 2: June 27 - June 29
Males Percent Sample S i e Mean Length Std. Error Sample Size Mean Weight Std. Error Sample Size
Females Percent Sample Size Mean Length Std. Error Sample Size Mean Weight Std. Error Sample Size
Both Sexes Percent Sample Size Mean Length Std. Error Sample Size Mean Weight Std. Error Sample Size
- Continued -

Table 57. (p 2 of 5)
Age Group
0.2 0.3 1.2 0.4 1.3 2.2 1.4 2.3 3.2 2.4 3.3 Total
Sample Period 3: June 30 - Males Percent Sample Size Mean Length Std. Error Sample Size Mean Weight Std. Error Sample Size
Females Percent Sample Sue Mean Length Std. Error Sample Size Mean Weight Std. Error Sample Sue
Both Sexes Percent Sample Sire Mean Length Std. Error Sample Size Mean Weight Std. Error Sample Size
Sample Period 4: July 4
Males Percent Sample Size Mean Length Std. Error Sample Size Mean Weight Std. Error Sample Size
Females Percent Sample Size Mean Length Std. Error Sample Size Mean Weight Std. Error Sample Size
Both Sexes Percent Sample Size Mean Length Std. Error Sample Size Mean Weight Std. Error Sample Size
--
- Continued -
176

Table 57. (p 3 of 5)
Age Group
0.2 0.3 1.2 0.4 1.3 2.2 1.4 2.3 3.2 2.4 3.3 Total
Sample Period 5: July 6 -July 8
Males Percent Sample Size Mean Length Std. Enor Sample Size
Females - Percent Sample Size Mean Length Std. Error Sample Size
Both Sexes Percent Sample Size Mean Length Std. Error Sample Size
Sample Period 6: July 9 -July 12
Males Percent Sample Size Mean Length Std. Error Sample Size Mean Weight Std. Error Sample Size
Females Percent Sample Size Mean Length Std. Error Sample Size Mean Weight Std. Error Sample Size
Both Sexes Percent Sample Size Mean Length Std. Error Sample Size Mean Weight Std. Error Sample Size
- Continued -

Table 57. (p 4 of 5)
Age Group
0.2 0.3 1.2 0.4 1.3 2.2 1.4 2.3 3.2 2.4 3.3 Total
Sample Period 7: July 13 - July 16
Males 1,570 188.400 Percent 0.19 22.51 Sample Size 1 120 Mean Length 434 528 Std. Error 2 Sample Size 1 120 Mean Weight 2.28 Std. Error 0.08 Sample Size ' 17
Females Percent Sample Size Mean Length Std. Error Sample Size Mean Weight Std. Error Sample Size
Both Sexes Percent Sample Size Mean Length Std. Error Sample Size Mean Weight Std. Error Sample Size
Sample Period 8: July 17 - July 18
Males 98,931 Percent 11.59 Sample Size 56 Mean Length 530 Std. Error 2 Sample Size 56 Mean Weight 2.32 Std. Error 0.08 Sample Size 14
Females 107,764 Percent 12.63 Sample Size 61 Mean Length 506 Std. Error 2 Sample Size 61 Mean Weight 1.84 Std. Error 0.05 Sample Size 8
Both Sexes 206,695 Percent 24.22 Sample Size 117 Mean Length 517 Std. Error 1 Sample Size 117 Mean Weight 2.07 Std. Error 0.04 Sample Size 22
- Continued -

Table 57. (p 5 of 5 )
Age Group --
0.2 0.3 1.2 0.4 1.3 2.2 1.4 2.3 3.2 2.4 3.3 Total
Sample Period 9:
Males Percent Sample Size Mean Length Std. Error Sample Size
Females - Percent Sample Size Mean Length Std. Error Sample Size
Both Sexes Percent Sample Size Mean Length Std. Error Sample Size
All Periods Combined:
July 19 - August 30
41.732 7.58
40 527
3 40
39,645 7.20
38 494
4 38
Males Percent Sample Size Mean Length Std. Error Sample Size Mean Weight Std. Error Sample Size
Females Percent Sample Size Mean Length Std. Error Sample Size Mean Weight Std. Error Sample Size
Both Sexes Percent Sample Size Mean Length Std. Error Sample Size Mean Weight Std. Error Sample Size

Table 58. Age, sex, and size (length in mm and weight in kg) composition of sockeye salmon escapement, Ugashik River, 1995.
Age Group
0.2 1 .I 1.2 2.1 1.3 2.2 2.3 Total
Sample Period 1 : July 3 - July 7
Males Percent Sample Size Mean Length Std. Error Sample Size
Females Percent Sample Size Mean Length Std. Error Sample Size
Both Sexes Percent Sample Size Mean Length Std. Error Sample Size
Sample Period 2: July 8 - July 18
Males Percent Sample Size Mean Length Std. Error Sample Size
Females Percent Sample Size Mean Length Std. Error Sample Size
Both Sexes Percent Sample Size Mean Length Std. Error Sample Size
- Continued -

Table 5 8 . (p 2 of 3)
Age Group
0.2 1.1 1.2 2.1 1.3 2.2 2.3 Total
Sample Period 3: July 19 - July 22
Males Percent Sample Size Mean Length Std. Error Sample Size
Females Percent Sample Size Mean Length Std. Error Sample Size
Both Sexes Percent Sample Size Mean Length Std. Error Sample Size
Sample Period 4: July 23 - July 27
Males 633 90 Percent 1.16 0.16 Sample Size 7 1 Mean Length 434 356 Std. Error 5 Sample Size 7 1
Females 181 Percent 0.33 Sample Size 2 Mean Length 421 Std. Error 4 Sample Size 2
Both Sexes 814 90 Percent 1.49 0.16 Sample Size 9 1 Mean Length 431 356 Std. Error 4 Sample Size 9 1
- Continued -
181

Table 58. (p 3 o f 3)
Age Group
0.2 1.1 1.2 2.1 1.3 2.2 2.3 Total a
All Periods Combined:
Males Percent Sample size Mean Length Std. Error Sample Size
Females Percent Sample Size Mean Length Std. Error Sample Size
Both Sexes Percent Sample Size Mean Length Std. Error Sample Size
a Total does not include escapement to King Salmon (7,650) and Dog Salmon (9,400) Rivers.

Table 59. Age, sex, and size (length in mm and weight in kg) composition of sockeye salmon commercial catch, Nushagak District, 1995.
Age Group
0.2 0.3 1.2 0.4 1.3 2.2 1.4 2.3 Total
Sample Period 1: June 13
Males Percent Sample Size Mean Length Std. Error Sample Size Mean Weight Std. Erroi Sample Size
Females Percent Sample Size Mean Length Std. Error Sample Size Mean Weight Std. Error Sample Size
Both Sexes Percent Sample Size Mean Length Std. Error Sample Size Mean Weight Std. Error Sample Size
Sample Period 2: June 28
Males Percent Sample Size Mean Length Std. Error Sample Size Mean Weight Std. Error Sample Size
Females Percent Sample Size Mean Length Std. Error Sample Size Mean We~ght Std. Error Sample Size
Both Sexes Percent Sample Size Mean Length Std. Error Sample Size Mean Weight Std. Error Sample Size
-June 27
943 0.37
2 493
23 2
943 0.37
2 493 23 2
- June 30
2,999 0.42
3 442
4 3
1.35
1
1.999 0.28
2 444
1 2
- Continued -

Table 59. (p 2 of 4)
Age Group
0.2 0.3 1.2 0.4 1.3 2.2 1.4 2.3 Total
Sample Period
Males Percent Sample Size Mean Length Std. Error Sample Size Mean Weight Std. Error Sample Size -
Females Percent Sample Size Mean Length Std. Error Sample Size Mean Weight Std. Error Sample Size
Both Sexes Percent Sample Size Mean Length Std. Error Sample Size Mean Weight Std. Error Sample Size
Sample Period
Males Percent Sample Size Mean Length Std. Error Sample Size Mean Weight Std. Error Sample Size
Females Percent Sample Size Mean Length Std. Error Sample Size Mean Weight Std. Error Sample Size
Both Sexes Percent Sample Size Mean Length Std. Error Sample Size Mean Weight Std. Error Sample Size
3: July 1 - July 3
- Continued -

Table 59. (p 3 o f 4)
Age Group
0.2 0.3 1.2 0.4 1.3 2.2 1.4 2.3 Total
Sample Period 5: July 7
Males Percent Sample Size Mean Length Std. Error Sample Size Mean Weight Std. Error Sample Size
Females Percent Sample Size Mean Length Std. Error Sample Size Mean Weight Std. Error Sample Size
Both Sexes Percent Sample Size Mean Length Std. Error Sample Size Mean Weight Std. Error Sample Size
Sample Penod 6: July 11
Males Percent Sample Size Mean Length Std. Error Sample Size Mean Weight Std. Error Sample Size
Females Percent Sample Size Mean Length Std. Error Sample Size Mean Weight Std. Error Sample Size
Both Sexes Percent Sample Size Mean Length Std. Error Sample Size Mean Weight Std. Error Sample Size
- Continued -
185

Table 59. (p 4 of 4)
Age Group
0.2 0.3 1.2 0.4 1.3 2.2 1.4 2.3 Total ' - --
All Periods Combined:
Males Percent Sample Sue Mean Length Std. Error Sample Size Mean Weight Std. Error - Sample Size
Females Percent Sample Size Mean Length Std. Error Sample Size Mean Weight Std. Error Sample Size
Both Sexes Percent Sample Size Mean Length Std. Error Sample Size Mean Weight Std. Error Sample Size
Nushagak District catch does not include lgushik Beach setnet catch (492,937) which was sampled separately

Table 60. Age, sex, and size (length in mm and weight in kg) composition o f sockeye salmon commercial catch, Igushik Beach setnet fishery, 1995.
Age Group
0.3 1.2 1.3 2.2 1.4 2.3 Total
Sarnple period:
Males Percent Sarnple Size Mean Length Std. Error Sample Size Mean Weight Std. Error Sample Size
Females Percent Sample Size Mean Length Std. Error Sample Size Mean Weight Std. Error Sample Size
Both Sexes Percent Sample Size Mean Length Std. Error Sample Size Mean Weight Std. Error Sample Size
June 13 - July 21
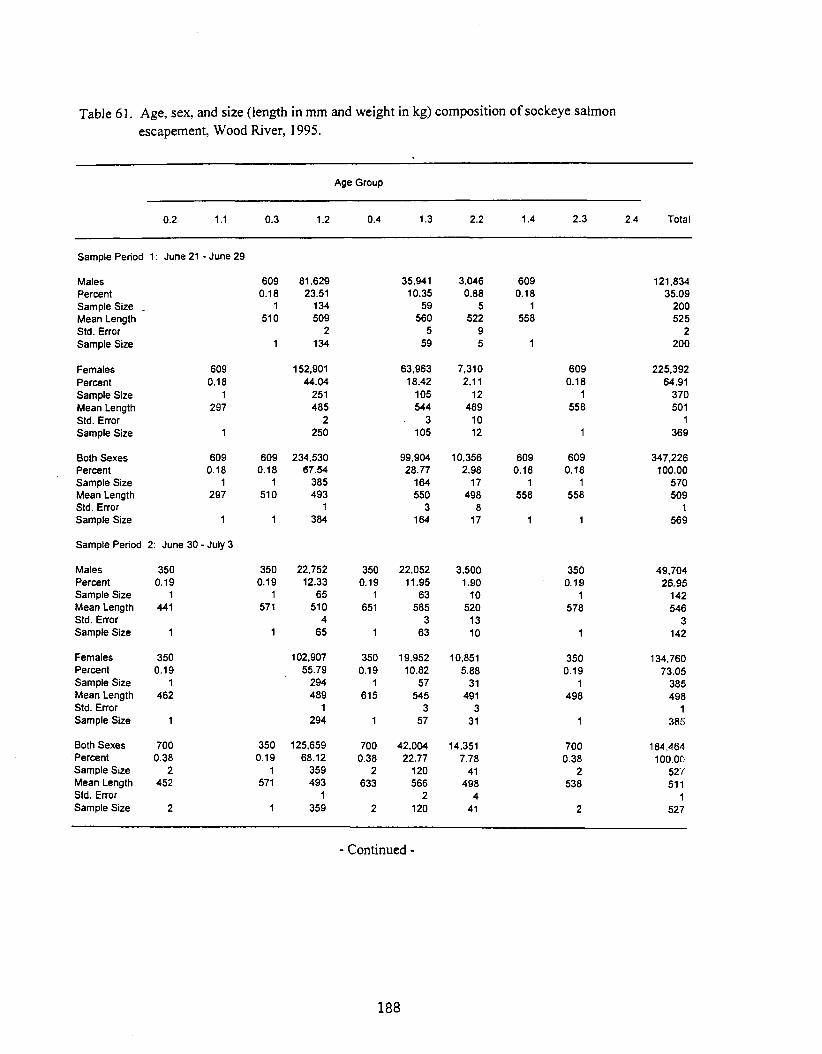
Table 6 1. Age, sex, and size (length in mm and weight in kg) composition of sockeye salmon escapement, Wood River, 1995.
Age Group
0.2 1 .I 0.3 1.2 0.4 1.3 2.2 1.4 2.3 2.4 Total
Sample Period 1 : June 21 - June 29
Males Percent Sample Size _ Mean Length Std. Error Sample Size
Females 609 Percent 0.18 Sample Size i Mean Length 297 Std. Error Sample Size 1
Both Sexes 609 Percent 0.18 Sample Size 1 Mean Length 297 Std. Error Sample Size 1
Sample Period 2: June 30 -July 3
Males 350 Percent 0.19 Sample Size 1 Mean Length 441 Std. Error Sample Size 1
Females 350 Percent 0.19 Sample Size 1 Mean Length 462 Std. Error Sample Size 1
Both Sexes 700 Percent 0.38 Sample Size 2 Mean Length 452 Std. Error Sample Size 2
- Continued -

Table 6 1. (p 2 of 3)
Age Group
0.2 1.1 0.3 1.2 0.4 1.3 2.2 1.4 2.3 2.4 Total
Sample Period 3: July 4 - July 7
Males 1.671 Percent 0.48 Sample Size 3 Mean Length 420 Std. Error- 8 Sample S~ze 3
Females 557 Percent 0.16 Sample Size 1 Mean Length 443 Std. Error Sample Size 1
Both Sexes 2.228 Percent 0.64 Sample Size 4 Mean Length 426 Std. Error 8 Sample Size 4
Sample Period 4: July 8 -July 9
Males 767 Percent 0.20 Sample Size 1 Mean Length 481 Std. Error Sample Size 1
Females 767 Percent 0.20 Sample Size 1 Mean Length 334 Std. Error Sample Size 1
Both Sexes 767 767 Percent 0.20 0.20 Sample Size 1 1 Mean Length 481 334 Std. Error Sample Size 1 I
- Continued -

Table 61. (p 3 of3)
Age Group
0.2 1.1 0.3 1.2 0.4 1.3 2.2 1.4 2.3 2.4 Total
Sample Period 5: July 10 -July 22
Males 781 Percent 0.36 Sample Size 2 Mean Length 458 Std. Error - 23 Sample Size 2
Females 78 1 Percent 0.36 Sample Sue 2 Mean Length 400 Std. Error 23 Sample Size 2
Both Sexes 1.562 Percent 0.72 Sample Size 4 Mean Length 429 Std. Error 16 Sample Size 4
All Periods Combined:
Males 3.569 Percent 0.24 Sample Size 7 Mean Length 443 Std. Error 9 Sample Size 7
Females 1,688 1,376 Percent 0.11 0.09 Sample Size 4 2 Mean Length 427 31 8 Std. Error 23 Sample Size 4 2
Both Sexes 5,257 1.376 Percent 0.35 0.09 Sample Size 11 2 Mean Length 438 31 8 Std. Error 9 Sample Size 11 2

Table 62. Age, sex, and size (length in mm and weight in kg) composition of sockeye salmon escapement, Igushik River, 1995.
Age Group
1.2 1.3 2.2 1.4 2.3 Total
Sample Period
Males Percent Sample Size Mean Length Std. Error Sample Size
Females Percent Sample Size Mean Length Std. Error Sample Size
Both Sexes Percent Sample Size Mean Length Std. Error Sample Size
1: June 23 - June 30
6,441 43,743 4.78 32.47
24 163 51 1 583
4 2 24 163
Sample Period 2: July 1 - July 5
Males Percent Sample Size Mean Length Std. Error Sample Size
Females Percent Sample Size Mean Length Std. Error Sample Size
Both Sexes Percent Sample Size Mean Length Std. Error Sample Size
- Continued -

Table 62. @ 2 of 3)
Age Group
1.2 1.3 2.2 1.4 2.3 Total
Sample Period 3: July 6 - July 11
Males Percent Sample Size Mean Length Std. Error Sample Size
Females Percent Sample Size Mean Length Std. Error Sample Size
Both Sexes Percent Sample Size Mean Length Std. Error Sample Size
Sample Period 4: July 12 - July 22
Males Percent Sample Size Mean Length Std. Error Sample Size
Females Percent Sample Size Mean Length Std. Error Sample Size
Both Sexes Percent Sample Size Mean Length Std. Error Sample Size
- Continued -
192

Table 62. (p 3 of 3)
- - -
Age Group
1.2 , 1.3 2.2 1.4 2.3 Total
All Periods Combined:
Males Percent Sample Size Mean Length Std. Error Sample Size
Females Percent Sample Size Mean Length Std. Error Sample Size
Both Sexes Percent Sample Size Mean Length Std. Error Sample Size

Table 63. Age, sex, and size (length in mm and weight in kg) composition of sockeye salmon escapement, Nushagak River, 1995.
Age Group
0.2 0.3 1.2 0.4 1.3 2.2 1.4 2.3 3.2 Total
Sample Period 1 : June 8 - July 4
Males Percent - Sample Size Mean Length Std. Error Sample Size
Females Percent Sample Size Mean Length Std. Error Sample Size
Both Sexes Percent Sample Size Mean Length Std. Error Sample Size
Sample Period 2: July 5 - August 19
Males Percent Sample Size Mean Length Std. Error Sample Size
Females Percent Sample Size Mean Length Std. Error Sample Size
Both Sexes Percent Sample Size Mean Length Std. Error Sample Size
- Continued -

Table 63. (p 2 of 2)
Age Group
0.2 0.3 1.2 0.4 1.3 2.2 1.4 2.3 3.2 Total
All Periods Combined:
Males 46,613 Percent 16.57 Sample Size 154 Mean Length 427 Std. Erroi 2 Sample Size 153
Females 5,945 Percent 2.1 1 Sample Size 26 Mean Length 456 Std. Error 10 Sample Size 25
Both Sexes 52.558 Percent 18.68 Sample Size 180 Mean Length 430 Std. Error 2 Sample Size 178

Table 64. Age, sex and size (length in mm and weight in kg) composition of sockeye salmon escapement, Nuyakuk River, 1995.
Age Group
-
0.2 0.3 1.2 0.4 1.3 2.2 1.4 2.3 Total a
Sample period: July 4 - July 20
Males - 2,804 935 Percent 4.02 1.34 Sample Size 2 1 7 Mean Length 444 591 Std. Error 7 17 Sample Size 2 1 7
Females 401 801 Percent 0.58 1.15 Sample Size 3 6 Mean Length 461 543 Std. Error 34 9 Sample Size 3 6
Both Sexes 3,205 1,736 Percent 4.60 2.49 Sample Size 24 13 Mean Length 446 569 Std. Error 8 10 Sample Size 24 13
a Enumeration and escapement sampling was done by Fisheries Research Institute personnel from University of Washington.

Table 65. Age, sex, and size (length in mm and weight in kg) composition of sockeye salmon commercial catch, Togiak River Section, 1995.
Age Group
0.2 0.3 1.2 0.4 1.3 2.2 1.4 2.3 Total
Sample Penod 1: June 12 -July 7
Males 76 Percent 0.20 Sample Size 1 Mean Length 574 Std. Error Sample S~ze 1 Mean We9ht 3.79 Std. Error Sample Size 1
Females Percent Sample Size Mean Length Std. Error Sample Size Mean Weight Std. Error Sample Size
Both Sexes Percent Sample Size Mean Length Std. Error Sample Size Mean Weight Std. Error Sample Size
Sample Period 2: July 8 -July 16
Males Percent Sample Size Mean Length Std. Error Sample Size Mean Weight Std. Error Sample Size
Females Percent Sample Size Mean Length Std. Error Sample Size Mean Weight Std. Emr Sample Size
Both Sexes Percent Sample Size Mean Length Std. Error Sample Size Mean Weight Std. Error Sample Size
- Continued -

Table 65. (p 2 of 2)
Age Group -- - - --
0.2 0.3 1.2 0.4 1.3 2.2 1.4 2.3 Total
Sample Period 3: July 17 - August 23
Males Percent Sample Size Mean Length Std. Error Sample Size Mean Weight Std. Error Sample Size'
Females Percent Sample Size Mean Length Std. Error Sample Size Mean Weight Std. Error Sample Size
Both Sexes Percent Sample Size Mean Length Std. Error Sample Size Mean Weight Std. Error Sample Size
All Periods Combined:
Males Percent Sample Size Mean Length Std. Error Sample Size Mean Weight Std. Error Sample Size
Females 714 Percent 0.1 Sample Size 1 Mean Length 524 Std. Error Sample Size 1 Mean Weight Std. Error Sample Size
Both Sexes 714 Percent 0.1 Sample Size 1 Mean Length 524 Std. Error Sample Size 1 Mean Weight Std. Error Sample Size
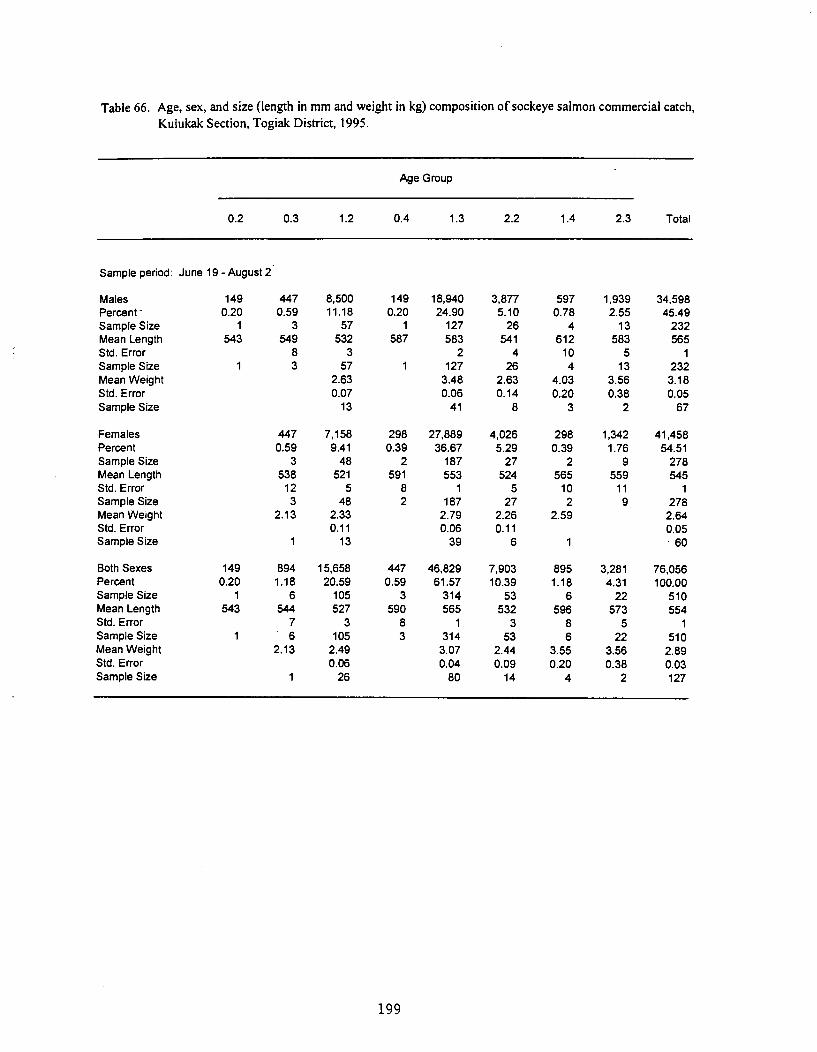
Table 66. Age, sex, and size (length in m m and weight in kg) composition o f sockeye salmon commercial catch, Kulukak Section, Togiak District, 1995.
Age Group
0.2 0.3 1.2 0.4 1.3 2.2 1.4 2.3 Total
Sample period: June 19 -August 2
Males 149 447 Percent - 0.20 0.59 Sample Size 1 3 Mean Length 543 549 Std. Error 8 Sample Size 1 3 Mean Weight Std. Error Sample Size
Females Percent Sample Size Mean Length Std. Error Sample Size Mean Weight Std. Error Sample Size
Both Sexes Percent Sample Size Mean Length Std. Error Sample Size Mean Weight Std. Error Sample Size

Table 67. Age, sex, and size (length in mrn and weight in kg) composition of sockeye salmon escapement, Togiak River, 1995.
--
Age Group - - - - -- - -- -
0.2 0.3 1.2 1.3 2.2 1.4 2.3 Total
Sample Period
Males Percent Sample Size Mean Length Std. Error Sample Size
Females Percent Sample Size Mean Length Std. Error Sample Size
Both Sexes Percent Sample Size Mean Length Std. Error Sample Size
1: July 3 - July 13
209 0.39
2 586
4 2
105 314 0.20 0.58
1 3 490 554
9 1 3
105 523 0.20 0.97
1 5 490 567
6 1 5
Sample Period 2: July 14 - July 21
Males Percent Sample Size Mean Length Std. Error Sample Size
Females Percent Sample Size Mean Length Std. Error Sample Size
Both Sexes Percent Sample Size Mean Length Std. Error Sample Size
- Continued -
200

Table 67. (p 2 of 2)
Age Group
0.2 0.3 1.2 1.3 2.2 1.4 2.3 Total a
Sample Period 3: July 22 - August 7
Males 133 6,924 Percent 0.26 13.61 Sample Size 1 52 Mean Length 590 52 3 Std. ~ h o r 4 Sample Size 1 52
Females Percent Sample Size Mean Length Std. Error Sample Size
Both Sexes Percent Sample Size Mean Length Std. Error Sample Size
All Periods Combined:
Males 139 481 26,853 Percent 0.07 0.26 14.46 Sample Size 1 4 218 Mean Length 540 593 529 Std. Error 4 2 Sample Size 1 4 21 8
Females 244 314 30,850 Percent 0.13 0.17 16.61 Sample Size 2 3 24 1 Mean Length 492 554 503 Std. Error 9 2 Sample Size 2 3 24 1
Both Sexes 383 795 57,703 Percent 0.21 0.43 31.07 Sample Size 3 7 459 Mean Length 509 578 51 5 Std. Error 6 1 Sample Size 3 7 459
a Total does not include 25,508 sockeye salmon counted, in the tributaries and mainstem Togiak River, below the counting towers.

Table 68. Age, sex, and size (length in mm and weight in kg) composition of sockeye salmon escapement, Kulukak River, 1995.
Age Group
0.2 1.1 0.3 1.2 0.4 1.3 2.2 1.4 2.3 3.3 Total a
Sample period: June 19 - August 22
Males 79 20 59 Percent 1.32 0.33 0.98 Sample Size 4 1 3 Mean Length 410 410 575 Std. Error 5 19 Sample Size 4 1 3
Females Percent Sample Size Mean Length Std. Error Sample Size
Both Sexes 79 20 138 Percent 1.32 0.33 2.30 Sample Size 4 1 7 Mean Length 410 410 549 Std. Error 5 9 Sample Size 4 1 7
a Total escapement count is from aerial survey. Scale samples were taken by USF&WS personnel.

Table 69. Age and size (length in mm and weight in kg) composition of chinook salmon commercial catch, Nushagak District, 1995.
Age Group
1.2 1.3 1.4 1.5 2.4 Total
Sample Period 1: June 9 - June 26
Both Sexes Percent Sample Size Mean Length Std. Error Sample Size Mean Weight Std. Error Sample Size
Sample Period 2: June 27 - July 21
Both Sexes Percent Sample Size Mean Length Std. Error Sample Size Mean Weight Std. Error Sample Size
All Periods Combined:
Both Sexes Percent Sample Size Mean Length Std. Error Sample Size Mean Weight Std. Error Sample Size

Table 70. Age and size (length in mm and weight in kg) composition of chinook salmon escapement, Nushagak River, 1995.
Age Group
1.1 0.3 1.2 1.3 1.4 1.5 Total
Sample period: June 8 - August 19
Both Sexes 904 226 34,112 13,555 35,921 904 85,622 Percent 1.06 0.26 39.84 15.83 41.95 1.06 100.00 Sample Size 4 1 151 60 159 4 379 Mean Length 366 81 0 564 71 1 869 944 71 8 Std. Error 7 5 12 6 25 4 Sample Size 4 1 151 60 159 4 379

Table 7 1. Age and size (length in mm and weight in kg) composition of chinoook salmon commercial catch, Togiak River Section, 1995.
Age Group
1.1 1.2 1.3 1.4 2.3 1.5 Total
Sample period: June 6 - August 17
Both Sexes Percent Sample Size Mean Length Std. Error Sample Size Mean Weight Std. Error Sample Size

Table 72. Age, sex, and size (length in mm and weight in kg) composition of chum salmon commercial catch, Nushagak District, 1995.
Age Group
0.2 0.3 0.4 0.5 Total
Sample Period
Males Percent Sample Size Mean Length Std. Error Sample Size Mean Weight _ Std. Error Sample Size
Females Percent Sample Size Mean Length Std. Error Sample Size Mean Weight Std. Error Sample Size
Both Sexes Percent Sample Size Mean Length Std. Error Sample Size Mean Weight Std. Error Sample Size
Sample Period
Males Percent Sample Size Mean Length Std. Error Sample Size Mean Weight Std. Error Sample Size
Females Percent Sample Size Mean Length Std. Error Sample Size Mean Weight Std. Error Sample Size
Both Sexes Percent Sample Size Mean Length Std. Error Sample Size Mean Weight Std. Error Sample Size
1: June 9 - June 26
2: June 27 - July 21
- Continued -

Table 72. (page 2 of 2)
Age Group
0.2 0.3 0.4 0.5 Total
All Periods Combined:
Males 9,758 69.938 50.919 4,975 135.590 Percent 2.50 17.93 13.05 1.28 34.75 Sample Size 35 253 179 17 484 Mean Length 545 570 590 595 576 Std. Error 4 2 2 9 1 Sample Size 35 252 179 17 483 Mean Weight 2.82 3.07 3.44 3.62 3.21 Std. Error 0.22 0.06 0.09 0.38 0.05 Sample Size 6 77 63 8 154
Females 17.941 132,159 94.971 9,497 254.568 Percent 4.60 33.87 24.34 2.43 65.25 Sample Size 65 483 340 34 922 Mean Length 528 546 561 562 551 Std. Error 3 1 1 4 1 Sample Size 65 483 340 34 922 Mean Weight 2.26 2.59 2.90 2.77 2.69 Std. Error 0.13 0.04 0.06 0.13 0.03 Sample Size 17 122 91 9 239
Both Sexes 27,699 202.097 145.890 14.472 390,158 Percent 7.10 51.80 37.39 3.71 100.00 Sample Size 100 736 519 51 1,406 Mean Length 534 554 571 573 560 Std. Error 3 1 1 4 1 Sample Size 100 735 519 51 1.405 Mean Weight 2.46 2.76 3.09 3.06 2.87 Std. Error 0.1 1 0.03 0.05 0.16 0.03 Sample Size 23 199 154 17 393

Table 73. Age, sex, and size (length in rnm and weight in kg) composition of chum salmon escapement, Nushagak River, 1995.
Age Group
- - --
0.2 0.3 0.4 0.5 Totai
Sample period: June 8 - August 19
Males 4,369 52,425 Percent 2.05 24.66 Sample Size 9 108 Mean Length 553 587 Std. Error 9 3 Sample Size 9 107
Females 5,340 41,745 Percent 2.51 19.63 Sample Size 11 86 Mean Length 509 546 Std. Error 8 2 Sample Size 11 86
Both Sexes 9,709 94,170 Percent 4.57 44.29 Sample Size 20 194 Mean Length 529 569 Std. Error 6 2 Sample Size 20 193

Table 74. Age, sex, and size (length in mrn and weight in kg) composition of chum salmon commercial catch, Togiak River Section, 1995.
Age Group
0.2 0.3 0.4 0.5 Total
Sample Period 1: June 12 -July 17
Males Percent Sample Size Mean Length Std. Error Sample Size Mean We~ght Std.€rror Sample Size
Females Percent Sample Size Mean Length Std. Error Sample Size Mean Weight Std. Error Sample Size
Both Sexes Percent Sample Size Mean Length Std. Error Sample Size Mean Weight Std. Error Sample Size
Sample Penod 2: July 18 -August 23
Males Percent Sample Size Mean Length Std. Error Sample Size Mean Weight Std. Error Sample Size
Females Percent Sample Size Mean Length Std. Error Sample Size Mean Weight Std. Error Sample Size
Both Sexes Percent Sample Size Mean Length Std. Error Sample Size Mean We~ght Std. Error Sample Size
- Continued -

Table 74. (p 2 of 2 )
Age Group
0.2 0.3 0.4 0.5 Total
All Periods Combined:
Males 5,510 23,780 29.632 2.229 61.151 Percent 2.78 12.00 14.96 1.12 30.86 Sample Size 22 88 112 9 231 Mean Length 561 580 596 595 587 Std. Error 5 3 3 10 2 Sample Size 22 88 112 9 231 Mean Weight 3.1 1 3.54 3.82 4.08 3.66 Std. Error 0.13 0.12 0.09 0.35 0.06 Sample Size 5 30 33 4 72
Females 10,678 58.050 61,276 6.986 136.990 Percent 5.39 29.30 30.93 3.53 69.14 Sample Size 42 226 232 25 525 Mean Length 543 56 1 569 567 564 Std. Error 4 2 2 4 1 Sample Size 42 226 232 25 525 Mean Weight 2.74 2.81 2.98 2.82 2.88 Std. Error 0.06 0.05 0.05 0.11 0.03 Sample Size 8 62 65 9 144
Both Sexes 16.188 81,830 90.908 9.215 198.141 Percent 8.17 41.30 45.88 4.65 100.00 Sample Size 64 314 344 34 756 Mean Length 549 567 578 574 57 1 Std. Error 3 2 1 4 1 Sample Size 64 314 344 34 756 Mean Weight 2.87 3.02 3.26 3.13 3.12 Std. Error 0.06 0.05 0.05 0.1 1 0.03 Sample Size 13 92 98 13 216

Table 75. Age, sex, and size (length in mm and weight in kg) composition of chum salmon escapement, Kulukak River, 1995.
Age Group
0.2 0.3 0.4 0.5 Total a
Sample period:
Males Percent Sample Size Mean Length Std. Error Sample Size
Females Percent Sample Size Mean Length Std. Error Sample Size
Both Sexes Percent Sample Size Mean Length Std. Error Sample Size
June 22 -August 31
" Total escapement count is fiom aerial survey. Scale samples were taken by USF&WS personnel.

Table 76. Age, sex, and size (length in rnm and weight in kg) composition of coho salmon escapement, Egegik River, 1995.
Age Group
1.1 2.1 3.1 Total
Sample period: July 30 - August 30
Males 1,332 Percent 17.83 Sample Size 69 Mean Length 513 Std. Error 7 Sample Size 69
Females 869 Percent 1 1.63 Sample Size 45 Mean Length 51 3 Std. Error 9 Sample Size 45
Both Sexes 2,201 Percent 29.46 Sample Size 114 Mean Length 51 3 Std. Error 6 Sample Size 114

Table 77. Age, sex, and size (length in mm and weight in kg) composition of coho salmon escapement, Nushagak River, 1995.
Age Group
1.1 2.1 3.1 Total
Sample period: July 8 - August 25
Males Percent Sample Size Mean Length Std. Error Sample Size
Females Percent Sample Size Mean Length Std. Error Sample Size
Both Sexes Percent Sample Size Mean Length Std. Error Sample Size

Table 78. Age, sex and size (length in mrn and weight in kg) composition of coho salmon escapement, Kulukak River, 1995.
Age Group
1.1 2.1 3.1 Total a
Sample period: August 5 - September 14
Males Percent - Sample Size Mean Length Std. Error Sample Size
Females Percent Sample Size Mean Length Std. Error Sample Size
Both Sexes Percent Sample Size Mean Length Std. Error Sample Size
" Escapement enumeration is fiom USF&WS counting tower


APPENDIX


Appendix A.1. Kvichak River sockeye salmon escapement and return by brood year including estimated interception catch (in thousands), 1950 - 1993.
Return by Age Group
Brood Year Escapement 0.2 1.1 0.3 1.2 2.1 0.4 1.3 2.2 3.1 1.4 2.3 3.2 2.4 3.3 3.4 Total
a Escapement not available.
Younger age groups not available.
Incomplete returns fiom brood year escapement.
Estimate fiom 1996 preliminary return numbers.

Appendix A.2. Branch River sockeye salmon escapement and return by brood year including estimated interception catch (in thousands), 1950 - 1993.
Return by Age Group
Brood Year Escapement 0.2 1.1 Total
Escapement not available.
Younger age groups not available.
Incomplete returns from brood year escapement.
* Estimate from 1996 preliminary return numbers.

Appendix A.3. Naknek River sockeye salmon escapement and return by brood year including estimated interception catch (in thousands), 1950 - 1992.
Return by Age Group
Brood Year Escapement 0.2 1.1 0.3 1.2 2.1 0.4 1.3 2.2 3.1 1.4 2.3 3.2 2.4 3.3 3.4 Total
"scapement not available.
Younger age groups not available.
Incomplete returns from brood year escapement. d Estimate from 1996 preliminary return numbers.

Appendix A.4. Egegik River sockeye salmon escapement and return by brood year including estimated interception catch (in thousands), 1949 - 1993.
Return by Age Group
Brood Year Escapement 0.2 1.1 0.3 1.2 2.1 0.4 1.3 2.2 3.1 1.4 2.3 3.2 2.4 3.3 3.4 Total
a Escapement not available.
Younger age groups not available.
Incomplete returns from brood year escapement. d Estimate from 1996 preliminary return numbers.

Appendix A.5. Ugashik River sockeye salmon escapement and return by brood year including estimated interception catch (in thousands), 1 949 - 1993.
Return by Age Group
Brood Year Escapement0.2 1.1 0.3 1.2 2.1 0.4 1.3 2.2 3.1 1.4 2.3 3.2 2.4 3.3 3.4 Total
"scapement not available.
Younger age groups not available.
Incomplete returns from brood year escapement.
Estimate from 1996 preliminary return numbers.

Appendix A.6. Wood River sockeye salmon escapement and return by brood year including estimated interception catch (in thousands), 1950 - 1993.
Return by Age Group
Brood Year Escapernent0.2 1.1 0.3 1.2 2.1 0.4 1.3 2.2 3.1 1.4 2.3 3.2 2.4 3.3 3.4 Total
" Escapement not available.
Younger age groups not available.
Incomplete returns from brood year escapement. d Estimate from 1996 preliminary return numbers.

Appendix A.7. Igushik River sockeye salmon escapement and return by brood year including estimated interception catch (in thousands), 1950 - 1992.
Return by Age Group
Brood Year Escapement0.2 1.1 0.3 1.2 2.1 0.4 1.3 2.2 3.1 1.4 2.3 3.2 2.4 3.3 3.4 Total
1950 o s o b O b O b O b O b O b O b O b O b 1 78 0 0 0 0 78 1951 0 ' O b O b O b O D O b 0 615 62 0 1 29 0 0 2 0 709' 1952 O a 0 0 0 b 0 1 4 7 0 0 303 9 0 5 73 0 0 0 0 538' 1953 O a 0 0 0 9 8 0 0 1 2 0 0 3 65 0 0 1 0 187 1954 - 0 ' 0 0 0 175 0 0 269 204 0 0 113 0 1 0 0 763 1955 O a 0 0 0 4 5 4 0 0 781 113 0 0 94 0 0 0 0 1,443 1956 400 0 0 0 1 6 9 0 0 523 12 0 3 36 0 0 0 0 743 1957 1 3 0 0 0 0 2 0 0 3 5 1 9 0 0 2 0 0 0 0 0 76 1958 107 0 0 0 14 0 0 71 20 0 0 28 0 0 0 0 133 1959 644 0 0 0 1 0 1 0 0 155 93 0 0 22 0 0 0 0 372 1960 495 0 0 1 61 0 0 310 44 0 0 57 0 0 0 0 474 1961 294 0 0 1 3 3 0 1 3 6 4 20 0 0 17 0 0 0 0 437 1962 16 0 0 8 2 0 0 0 2 8 0 9 0 0 9 0 0 0 0 327 1963 92 0 0 3 2 5 4 0 0 190 36 0 0 25 0 0 0 0 508 1964 129 0 0 1 1 6 2 0 0 585 133 0 0 49 0 0 0 0 930 1965 181 0 0 0 371 0 0 436 203 0 0 80 0 0 0 0 1,089 1966 206 0 0 0 66 0 0 383 6 0 0 15 0 0 0 0 470 1967 282 0 0 3 57 0 0 90 13 0 0 12 0 0 0 0 175 1968 195 0 0 0 43 0 0 120 0 0 2 10 0 0 0 0 176 1969 512 0 0 0 1 0 0 131 301 0 2 103 0 0 0 0 536 1970 371 0 0 1 2 6 0 0 170 41 0 0 71 0 0 0 0 309 1971 211 0 0 1 4 8 0 0 164 60 0 0 30 0 0 0 0 303 1972 60 0 0 4 8 9 0 0 1 0 9 6 0 8 1 3 0 0 0 0 229 1973 60 0 0 0 19 0 0 650 25 0 2 29 0 0 0 0 725 1974 359 0 0 7 441 1 0 750 346 0 4 25 0 0 0 0 1,574 1975 241 0 0 0 783 0 0 2.556 137 0 2 503 0 0 0 0 3,981 1976 186 0 0 0 551 3 0 1,411 194 0 20 215 0 0 0 0 2,394 1977 96 0 0 6 2 9 4 0 0 1 . 6 8 9 9 0 8 9 0 0 0 0 2,015 1978 536 0 0 0 96 0 0 330 84 0 1 15 0 0 0 0 527 1979 860 0 0 0 4 2 2 0 0 406 13 0 0 5 0 0 0 0 847 1980 1,988 0 0 0 20 0 0 271 25 0 0 56 0 0 0 0 373 1981 591 0 0 0 1 8 8 0 0 779 8 0 1 4 9 0 0 0 0 1,025 1982 424 0 0 7 5 7 0 0 4 3 4 9 0 2 1 0 0 0 0 0 518 1983 180 1 0 0 1 5 1 0 0 353 8 0 2 29 0 0 0 0 544 1984 185 0 0 0 41 0 0 641 56 0 5 36 0 1 0 0 781 1985 212 0 0 7 515 0 0 938 86 0 7 79 0 1 0 0 1,633 1986 308 3 0 14 236 0 1 2 , 2 3 1 27 0 15 30 0 0 0 0 2.557 1987 169 2 0 1 1 1 5 8 0 0 587 7 0 12 29 0 0 0 0 804 1988 170 0 0 1 1 8 9 0 1 1 , 0 5 6 41 0 3 36 0 0 0 0 ~ 1 , 3 2 7 ' 1989 462 0 0 1 5 5 0 8 0 0 1 , 1 1 9 59 0 7 53 0 o d o d O c 1 , 7 6 O C 1990 366 1 0 3 159 0 0 1,429 183 0 4 d 1 4 9 d o d O C O C O C 1,927' 1991 756 0 0 1 318 0 0 1,332~ 3 d o d O C O C O C O C O c O C 1,654' 1992 305 0 0 3 d 44d O d O C O C O C O C O C O C O C O C O C O C 47 '
" Escapement not available.
Younger age groups not available.
Incomplete returns from brood year escapement. d Estimate from 1996 preliminary return numbers.

Appendix A.8. Nushagak River sockeye salmon escapement and return by brood year including estimated interception catch (in thousands), 1983 - 1993.
Return by Age Group
Brood Year Escapernent0.2 1.1 0.3 1.2 2.1 0.4 1.3 2.2 3.1 1.4 2.3 3.2 2.4 3.3 3.4 Total
a Escapement not available.
Younger age groups not available.
Incomplete returns from brood year escapement.
* Estimate from 1996 preliminary return numbers.

Appendix A.9. Togiak River sockeye salmon escapement and return by brood year including estimated interception catch (in thousands), 1950 - 1993.
Return by Age Group
Brood Year Escapement 0.2 1.1 0.3 1.2 2.1 0.4 1.3 2.2 3.1 1.4 2.3 3.2 2.4 3.3 3.4 Total
1950 O a O b O b O b 0 ' O b O D O b O b O b 0 28 0 0 0 0 2 8 ' 1951 O a O b O D O b O b O b 0 98 53 0 0 9 0 0 0 0 160' 1952 0 ' o b 0 ' 0 152 O 0 58 9 0 0 6 0 0 0 0 225' 1953 0 s 0 0 1 3 1 0 0 8 4 8 0 0 1 6 0 0 0 0 1 4 1 1954 O a 0 0 0 20 0 0 1 4 6 12 0 0 17 2 0 0 0 196 1955 ' 0 ' 0 0 0 1 3 6 0 0 1 9 0 9 0 1 3 8 0 0 0 0 37: 1956 225 0 0 4 1 1 4 0 0 3 0 6 22 0 1 1 3 0 0 0 0 461 1957 25 2 0 5 4 8 0 0 7 0 2 0 0 0 3 6 1 0 0 0 1 8 2 1958 72 0 1 2 68 0 0 1 1 5 59 0 0 25 0 0 0 0 270 1959 210 0 0 0 141 0 0 92 56 0 0 7 0 0 0 0 296 1960 163 0 0 2 1 9 1 0 0 2 7 4 22 0 0 52 0 0 0 0 541 1961 122 1 0 3 85 0 0 216 15 0 1 19 0 0 0 0 340 1962 62 0 0 7 4 8 0 0 1 0 2 4 0 0 8 0 0 0 0 170 1963 116 0 0 2 43 0 0 65 18 0 0 24 0 0 0 0 152 1964 105 0 0 1 4 3 0 0 8 4 4 1 0 0 6 0 0 0 0 1 7 5 1965 96 0 0 2 1 5 4 0 0 1 8 1 31 0 0 37 0 0 0 0 406 1966 104 1 0 6 2 0 0 0 0 4 1 9 4 0 1 9 0 0 0 0 642 1967 81 1 0 6 1 8 0 0 9 9 1 6 0 1 4 0 0 0 0 0 1 8 1 1968 50 0 0 1 4 9 0 0 1 9 0 6 0 3 1 3 0 0 0 0 263 1969 117 0 0 5 28 0 0 142 25 0 3 13 0 0 0 0 216 1970 203 0 0 1 54 0 0 226 55 0 1 70 0 0 0 0 408 1971 200 0 0 4 106 0 0 317 62 0 1 68 0 0 0 0 558 1972 79 0 0 2 93 0 0 150 21 0 2 34 0 0 0 0 304 1973 107 1 0 10 151 0 0 442 18 0 1 31 0 0 0 0 654 1974 104 0 0 2 271 0 0 307 73 0 3 45 0 1 0 0 704 1975 181 1 0 7 1 9 5 0 0 8 4 8 87 0 2 59 0 0 0 0 1 . 2 0 0 1976 189 0 0 1 1 8 9 0 0 558 142 0 4 175 0 0 0 0 1.069 1977 163 0 0 5 232 0 0 617 14 0 4 14 0 0 0 0 884 1978 306 0 0 1 2 1 4 9 0 0 4 3 0 65 0 1 2 5 0 0 0 0 682 1979 198 1 0 1 2 7 0 0 0 2 9 3 12 0 2 5 0 0 0 0 583 1980 527 0 0 5 45 0 1 2 2 4 10 0 0 19 0 0 0 0 305 1981 307 2 0 11 53 0 0 245 15 0 1 16 0 0 0 0 345 1982 289 0 0 16 109 0 0 255 14 0 5 26 0 0 0 0 425 1983 213 1 0 3 2 8 5 0 2 9 2 4 9 0 2 21 0 0 0 0 1 , 2 4 6 1984 151 0 0 14 21 0 0 109 4 0 1 17 0 0 0 0 167 1985 153 0 0 7 35 0 0 1 9 4 35 0 1 7 7 0 1 0 0 351 1986 203 0 0 18 77 0 1 4 4 5 83 0 1 4 1 2 1 0 0 0 0 760 1987 278 0 0 7 1 9 0 0 1 5 7 5 31 0 7 81 0 0 0 0 892 1988 309 1 0 9 1 1 1 0 3 4 0 3 34 0 3 53 0 0 0 0 ~ 6 1 6 ' 1989 104 0 0 36 132 0 1 3 2 8 7 0 1 41 0 O d O d O C 548' 1990 166 1 0 23 101 0 1 4 6 0 75 0 5 d 3 6 d o d O C O C O C 704' 1991 254 1 3 3 189 0 1 ~ 4 2 7 ~ 2 8 d o d O C O C O C O c O C O C 651' 1992 210 1 0 3 s d 5 o d o d O C O C O C O c O c O c O c O c O c O c 86 ' 1993 189 O d O d O c O c O C O C O c O C O C O C O C O C O C O c O C lC
" Escapement not available.
Younger age groups not available.
' Incomplete returns from brood year escapement.
Estimate from 1996 preliminary return numbers.
The Alaska Department of Fish and Game administers all programs and activities free &om discrimination on the basis of sex, color, race, religion, national origin, age, marital status, pregnancy, parenthood or disability. For information on alternative formats available for this and other department publications, please contact the department ADA Coordinator at (voice) 907-465-4 120, or (TDD) 907-465-3646. Any person who believes she has been discriminated against should write to: ADF&G, P.O. Box 25526, Juneau, AK 99802-5526; or O.E.O., U.S. Department of the Interior, Washgton, D.C. 20240.