Abstracts of JSPS Core-to-Core Program “7th International ...
140
Abstracts of JSPS Core‐to‐Core Program “7th International Symposium of the Asian University Forest Consortium” Developing a network of long‐term research field stations to monitor environmental changes and ecosystem responses in Asian forests October 11‐14, 2016 Furano/ The University of Tokyo Hokkaido Forest, Hokkaido, Japan Organized by: The University of Tokyo Forests Graduate School of Agricultural and Life Sciences The University of Tokyo Under the project of: “Developing a network of long‐term research field stations to monitor environmental changes and ecosystem responses in Asian forests” JSPS Core‐to‐Core Program, B. Asia‐Africa Science Platforms The University of Tokyo Forests Graduate School of Agricultural and Life Sciences The University of Tokyo
-
Upload
khangminh22 -
Category
Documents
-
view
1 -
download
0
Transcript of Abstracts of JSPS Core-to-Core Program “7th International ...
Abstracts of
JSPS Core‐to‐Core Program
“7th International Symposium of the Asian University Forest Consortium”
Developing a network of long‐term research field stations
to monitor environmental changes and ecosystem responses in Asian forests
October 11‐14, 2016
Furano/ The University of Tokyo Hokkaido Forest, Hokkaido, Japan
Organized by:
The University of Tokyo Forests
Graduate School of Agricultural and Life SciencesThe University of Tokyo
Under the project of:“Developing a network of long‐term research field stations to monitor environmental changes and ecosystem responses in Asian forests” JSPS Core‐to‐Core Program, B. Asia‐Africa Science Platforms
The University of Tokyo ForestsGraduate School of Agricultural and Life SciencesThe University of Tokyo

Abstracts of
JSPS Core-to-Core Program
”7th International Symposium of the Asian University Forest Consortium”
Developing a network of long-term research field stations to monitor
environmental changes and ecosystem responses in Asian forests
October 11-14, 2016
Furano/The University of Tokyo Hokkaido Forest, Hokkaido, Japan
Organized by: The University of Tokyo Forests
Graduate School of Agricultural and Life Sciences The University of Tokyo
Co-sponsored by: Japan Society for the Promotion of Science
and Oji Forest & Products Co., Ltd.
Supported by: Furano City
Cover photograph: Maeyama LTER Plot, UTHF. Photographed by Nozomi OIKAWA.
Developing a network of long-term research field stations to monitor environmental changes and
ecosystem responses in Asian forests. Abstracts of JSPS Core-to-Core Program “7th Symposium of Asian
University Forest Consortium”, October 11-14 2016, Furano. Hokkaido, Japan
This Symposium is held under the project of:“Developing a network of long-term
research field stations to monitor environmental changes and ecosystem responses
in Asian forests” JSPS Core-to-Core Program, B. Asia-Africa Science Platforms
(Website; http://www.uf.a.u-tokyo.ac.jp/c2c/english/index.html)
Edited by Organizing Committee of the 7th International Symposium of the Asian University Forest
Consortium
Published in October 2016 by The University of Tokyo Forests, Graduate School of Agricultural and Life
Sciences, The University of Tokyo, Yayoi 1-1-1, Bunkyo, Tokyo 113-8657, JAPAN
Printed in Japan by Soubun Printing Co. Ltd., Tokyo
Chair
Naoto KAMATA, Professor, Director, The University of Tokyo Hokkaido Forest
Organizing Committee
Katsumi TOGASHI, Professor, Director, The University of Tokyo Forests
Toshiaki OWARI, Associate Professor, The University of Tokyo Hokkaido Forest
Dai FUKUI, Assistant Professor, The University of Tokyo Hokkaido Forest
Daisuke SAKAUE, Assistant Professor, The University of Tokyo Hokkaido Forest
Koichiro KURAJI, Associate Professor, The University of Tokyo Chiba Forest
Toshihide HIRAO, Lecturer, The University of Tokyo Chichibu Forest
Haruo SAITO, Assistant Professor, Fuji Iyashinomori Woodland Study Center
Shuhei TAKEMOTO, Assistant Professor, The University of Tokyo Tanashi Forest
Naoko MIURA, Assistant Professor, Education and Research Center
The 7th SAUFC, OCT 11-14, 2016 –The University of Tokyo Forests, Japan
1
Welcome from the Dean of Graduate School of Agricultural and Life Sciences, The University of Tokyo
It is my pleasure that I welcome you all to the 7th Symposium of Asian University
Forest Consortium.
The Graduate School of Agricultural and Life Sciences, the University of Tokyo has
led the research on agriculture, forestry and fisheries in Japan through 142 years of education.
Numerous research findings have been published and excellent graduates have been sent out in
the society. We are very proud of our contribution to the development of the fields of sciences
and industries, furthermore, to the improvement of human life in the world. Many of these
achievements have been produced in education and research fields of the Graduate School of
Agricultural and Life Sciences.
In recent years, climate change such as global warming has become increasingly
evident and observable, with extreme climatic events frequently threatening human life and
property. Global climate change is significantly affecting the primary industries, which depend
on the natural environment, and its impact is expected to increase in the future. Humankind is
facing the major challenges of securing stable food supplies and conserving the global
environment; agricultural science will play an increasingly important role in implementing
technical and social measures toward this end. Hence, there is a strong need to elucidate the
various functions of organisms, and to make the best use of the findings for society in the future.
International education and collaborative research is the key to promote the use of
agricultural science. I wish that all the participants spend enjoyable time in beautiful fall color
inside The University of Tokyo Hokkaido Forest and its surroundings, having fruitful
discussions on global issues and extending your knowledge on forest science.
Takeshi Tange
Dean of Graduate School of Agricultural and Life Sciences
The University of Tokyo
The 7th SAUFC, OCT 11-14, 2016 –The University of Tokyo Forests, Japan
2
Welcome from the Director of The University of Tokyo Forests
I have the honor to invite you all to attend the 7th Symposium of Asian University
Forest Consortium (SAUFC) held in Furano City, where The University of Tokyo Hokkaido
Forest (UTHF) locates. The SAUFC was first organized in 2002, Japan, for the purpose of
providing the opportunity to exchange experiences and to promote collaboration between
university forests in Asian countries. Since then, the symposium has been held in Taiwan and
Seoul building the international network between Asian university forests.
The University of Tokyo Forests have been used by a number of students and
researchers as education and research stations for 122 years since the establishment of the
University of Tokyo Chiba Forest in 1894. The UTHF where the excursion is programed in the
symposium was established in 1899. This university forest has nurtured the beautiful forest
located on the southwest of the Tokachidake mountain range and on the upper area of the
Sorachi River. The forest is well-known for the business-scale experiment of the stand-based
forest management system (‘Rinbun Segyo-Ho’ in Japanese), which has been continuously
conducted for over 50 years.
The UTHF is currently working on important objective ‘Sustainable and adaptive
management of forest ecosystems in the Pan-Mixed Forest Zone’ for education and research.
Sustainable forest management ensures that forest resources are preserved to meet the needs of
present and future generations. The practice of managing forest resources should be
environmentally appropriate as well as socially and economically beneficial. This is a universal
challenge given to university forests. I believe that all of us can share the knowledge and
experience to achieve sustainable forest management in our countries.
I am sure that two-day discussion and two-day excursion will bring us productive and
joyful time, and hope that this symposium provides a firm platform for further international
collaboration between our university forests in the future.
Katsumi Togashi
Director of the University of Tokyo Forests

The 7th SAUFC, OCT 11-14, 2016 –The University of Tokyo Forests, Japan
3
Welcome from Prof. Naoto KAMATA: a Project Leader of JSPS Core-To-Core Program
I am Naoto Kamata, a project leader of the Japan Society for the Promotion of Science
(JSPS) Core-to-core Program and a Director of The University of Tokyo Hokkaido Forest
(UTHF). As a Director of the UTHF, I welcome all of the participants to Hokkaido. This is a
great honor of mine to host the 7th International Symposium of Asian University Forest
Consortium here in Furano, Hokkaido, Japan under a support by Furano City and
co-sponsorship by the JSPS and Oji Forest & Products Co., Ltd. I would like to express my
sincere thanks to them.
I have been involved in international affairs of The University of Tokyo Forests (UTF)
since 2006. Fortunately, I myself had chances to attend the SAUFC four times. I also had
chances to do my own research in the Experiment Forest of National Taiwan University and Doi
Pui Research Station of Kasetsart University. Since 2008 when I was designated as a head of
the International Exchange Committee of the UTF, I have been seeking to strengthen our
relationship from a mild exchange via the SAUFC to research collaboration among the
universities. At the first time, I proposed our joint project to the JSPS Core-To-Core Program
in 2011 but unfortunately failed. At the second time, March 2016, I successfully got the fund
with a strong support by Dr. Owari.
Each university has long-term data on climate, hydrology, LTER study plots, and
plantations. These basic data are valuable treasures for a field of our science. In this project,
I would like encourage you and your students to expand your research and theirs internationally
by using these long-term data and research fields in abroad. This 7th SAUFC will act as a
kick-off meeting of the future international collaborative research among the five universities.
I hope your will have a fruitful time here in Hokkaido.
Naoto Kamata
Project Leader of the Japan Society for the Promotion of Science (JSPS) Core-to-core Program
Director, The University of Tokyo Hokkaido Forest
Chair of Organizing Committee, 7th International Symposium of Asian University Forest
Consortium

The 7th SAUFC, OCT 11-14, 2016 –The University of Tokyo Forests, Japan
5
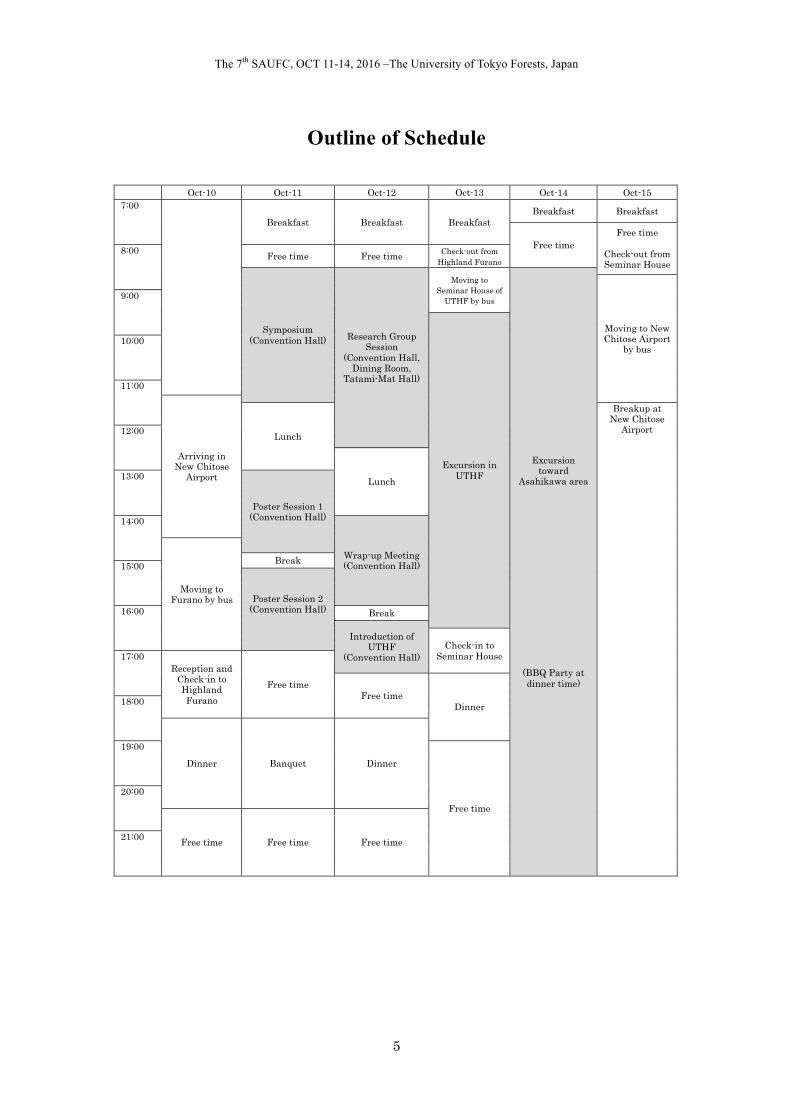
Outline of Schedule
Oct-10 Oct-11 Oct-12 Oct-13 Oct-14 Oct-15 7:00
Breakfast Breakfast Breakfast Breakfast Breakfast
Free time Free time
Check-out from Seminar House
8:00 Free time Free time Check-out from Highland Furano
Symposium (Convention Hall) Research Group
Session (Convention Hall,
Dining Room, Tatami-Mat Hall)
Moving to Seminar House of
UTHF by bus
Excursion toward
Asahikawa area
(BBQ Party at dinner time)
Moving to New Chitose Airport
by bus
9:00
Excursion in UTHF
10:00
11:00
Arriving in New Chitose
Airport
Lunch
Breakup at New Chitose
Airport
12:00
Lunch
13:00
Poster Session 1 (Convention Hall)
14:00
Wrap-up Meeting (Convention Hall)
Moving to Furano by bus
Break 15:00
Poster Session 2 (Convention Hall)
16:00 Break
Introduction of UTHF
(Convention Hall)
Check-in to Seminar House
17:00 Reception and
Check-in to Highland Furano
Free time
Free time Dinner
18:00
Dinner Banquet Dinner
19:00
Free time
20:00
Free time Free time Free time
21:00

The 7th SAUFC, OCT 11-14, 2016 –The University of Tokyo Forests, Japan
6
Program of Oral and Poster Presentation and Index of Abstracts
*Not all authors of papers, but only presenters are listed in the following tables.
*Please refer following abbreviated names of affiliation (in alphabetical order)
KU: Kasetsart University
NTU: National Taiwan University
SNU: Seoul National University
UMS: Universiti Malaysia Sabah
UT: The University of Tokyo
UTF: The University of Tokyo Forests
UTHF: The University of Tokyo Hokkaido Forest
October 11 (Tue) 8:30-11:30 Symposium Venue: Convention Hall 8:30-9:00 Opening Address and Introduction
KAMATA Naoto (UTHF) Introduction of the JSPS Core-to-Core Research Exchange Project
p.18-19
9:00-11:30 Keynote Presentations from each country 9:00-9:30 TOGASHI Katsumi (UTF) System for obtaining and
maintaining long-term fundamental data in the University of Tokyo Forests
p.20-21
9:30-10:00 KANG Kyu-Suk (SNU) Forest environment, research and education in Korea
p.22-23
10:00-10:30 TSAI Ming-Jer (NTU) Review and future perspective of long-term experimental plots of NTUEF
p.24-25
10:30-11:00 PHUA Mui How (UMS) Deforestation and Degradation of Tropical Forests in Sabah, Malaysia: The Role of Remote Sensing in REDD+
p.26-27
11:00-11:30 TEEJUNTUK Sakhan (KU) The management plan to do forward the research and demonstrate station in university forest of Faculty of Forestry, Kasetsart University Thailand
p.28-29
11:30-13:00 Lunch
October 11 (Tue) 13:00-17:00 Poster Sessions Venue: Convention Hall
The 7th SAUFC, OCT 11-14, 2016 –The University of Tokyo Forests, Japan
7
13:00-14:55 Poster Session 1 with short oral presentation (Odd ID numbers: PS1) 14:55-15:15 Coffee Break 15:15-17:10 Poster Session 2 with short oral presentation (Even ID Numbers: PS2) A list of posters
#01 (PS1)
CHU Fang-Hua (NTU) Gene Regulation Profile of Autumn Leaf Senescence and Coloration in Formosan sweet gum (Liquidambar formosana Hance.)
p.32-33
#02 (PS2)
LAI Yen-Jen (NTU) The Comparison of Long-term Temperature Trends between Subalpine and Alpine Areas of EXFO-NTU, Taiwan
p.34-35
#03 (PS1)
WEI Chiang (NTU) Long-term monitoring of forestland in NTUEF by Remote Sensing, GIS and GPS
p.36-37
#04 (PS2)
LI Chun-Lin (NTU) Unveiling the rare diversity of scarab beetles in Taiwan and neighboring areas
p.38-39
#05 (PS1)
LIN Chia-Min (NTU) Psychophysiological Healthy Benefits of Forest Bathing in Middle-aged and Elderly
p.40-41
#06 (PS2)
CHUNG Min-Hua (NTU) Inter-annual variation in soil respiration in a Moso bamboo forest
p.42-43
#07 (PS1)
WEN Chieh-Yu (NTU) Xylooligosaccharides and lactic acid production from pretreated Alnus formosana biomass
p.44-45
#08 (PS2)
CHIANG Wuan-Shuan (NTU) Lignin structure characterization of Dendrocalamus latiflorus culm
p.46-47
#09 (PS1)
HSU Chia-Wei (NTU) Nest site selection of Malayan Night Herons (Gorsachius melanophus) in urban area
p.48-49
#10 (PS2)
KIM Yang-Gil (SNU) Altitudinal variation of morphological traits of Acer pictum var. mono at Baekun mountain in SNU forests, Korea
p.50-51
#11 (PS1)
PARK Minjee (SNU) Analysis of growth trend changes for 51 temperate tree species using Korea national forest inventory data
p.52-53
#12 (PS2)
YANG Hyunje (SNU) Flow Measurement of Mountain Rivers Using Salt-dilution Method
p.54-55
#13 (PS1)
LI Qiwen (SNU) Experimental study of rainfall interception by conifer litters
p.56-57
#14 (PS2)
JUNG Jong Bin (SNU) Variation in the growth response of Pinus koraiensis along the altitudinal gradients in the southern region of Korea
p.58-59
The 7th SAUFC, OCT 11-14, 2016 –The University of Tokyo Forests, Japan
8
#15 (PS1)
LEE Woo-shin (SNU) The Long-term Nest Box Monitoring of Eastern Great Tits (Parus minor) and Varied Tits (Sittiparus varius) in Seoul National University’s Research Forest on Mt. Jiri, South Korea
p.60-61
#16 (PS2)
JEONG Min-Su (SNU) Use of temperature data logger to monitor the breeding phenology at nest boxes
p.62-63
#17 (PS1)
SATO Takanori (UTF) Effects of Quercus serrata trees killed by Japanese oak wilt disease on the spatial distribution of recruited trees in a warm-temperate secondary forest in the Tokai District of Japan
p.64-65
#18 (PS2)
CHANDRATHILAKE Thilakawansha (UTF) Transpiration response of neighboring trees to the wilting of oak individuals prone to Japanese oak wilt disease
p.66-67
#19 (PS1)
SARAGIH Syaiful Amri (UTF) Establishment of Quantitative real-time Polymerase Chain Reaction (qPCR) Technique for Detection and Quantification of Entomopathogenic Fungi in Soil
p.68-69
#20 (PS2)
JAYATHUNGA Sadeepa (UT) Forest biophysical parameter estimation using UAV imagery and airborne LiDAR data: A study in a mixed conifer-broadleaved forest
p.70-71
#21 (PS1)
PENG Yong (UTF) Soil biochemical responses to nitrogen addition in a secondary evergreen broad-leaved forest ecosystem
p.72-73
#22 (PS2)
SHIGYO Nobuhiko (UTF) Elevational diversity patterns of understory vegetation determined by soil properties and light conditions
p.74-75
#23 (PS1)
KAWASAKI Mitsuru (UTF) Inter- and intra-species resprouting patterns of undamaged trees in natural forests
p.76-77
#24 (PS2)
BURANAPANICHPAN Anut (UTF) Seasonal fluctuation of ambrosia beetles and species composition on Betula maximowicziana
p.78-79
#25 (PS1)
SAWADA Haruo (UTF) Annual increase of infestation by an ambrosia beetle Platypus quercivorus in a warm-temperate secondary forest in southern Izu Peninsula, Japan
p.80-81
#26 (PS2)
KARUKOME Tsutomu (UTF) Conservation activities and research of an endangered population of Pinus parviflora var. parviflora in the Boso Hills, Chiba, Japan
p.82-83
The 7th SAUFC, OCT 11-14, 2016 –The University of Tokyo Forests, Japan
9
#27 (PS1)
YOSHIDA Yumiko (UTF) Characteristic of flora in the University of Tokyo Chichibu Forest
p.84-85
#28 (PS2)
OIKAWA Nozomi (UTHF) Use of camera traps in wildlife survey in the UTHF
p.86-87
#29 (PS1)
FUKUOKA Satoshi (UTHF) Activities of bird research in University of Tokyo Forests
p.88-89
#30 (PS2)
KIMURA Noriyuki (UTHF) Long-term observation of phenology for forest tree species in UTHF
p.90-91
#31 (PS1)
TOYAMA Keisuke (UTF) Tree mortality of old even-aged coniferous plantation in long-term experimental plots in UTokyo Chiba Forest, eastern Japan
p.92-93
#32 (PS2)
TANAKA Nobuaki (UTF) Collaborative study on throughfall and stemflow in a teak plantation in Thailand
p.94-95
#33 (PS1)
GOTO Susumu (UTF) Response of sub-boreal conifers translocated in warm sites simulated global warming
p.96-97
#34 (PS2)
PARK So-Hee (SNU) Study on Compensating Villagers for Cost of Wildlife Conservation in Villages nearby Protected Areas
p.98-99
October 12 (Wed) Research Group Session 1: Water & Climate (RG1) Venue: Dining Room 8:30-12:00 8:30-10:10 Presentation from each country
RG1-1 IM Sangjun (SNU) Long-term Monitoring Program of Watershed Hydrology in the University Forests, SNU
p.102-103
RG1-2 KUME Tomonori (NTU) Characteristic of stand transpiration in Moso bamboo forests
p.104-105
RG1-3 KURAJI Koichiro (UTF) Long-term Forest Hydrology Research in Ananomiya Experimental Watershed, Ecohydrology Research Institute, The University of Tokyo Forests
p.106-107
RG1-4 MAHALI Maznah (UMS) Hydro-Meteorological Monitoring & Research in Crocker Range Park, Sabah Malaysia
p.108-109
The 7th SAUFC, OCT 11-14, 2016 –The University of Tokyo Forests, Japan
10
RG1-5 TANTASIRIN Chatchai (KU) Long term rainfall characteristic at a hill evergreen forest, Kog Ma Watershed, Chiang Mai Province, Northern Thailand
p.110-111
10:20-11:10 Introduction of long-term water and climate observations conducted in UTF; sharing of metadata for such observations in each university forest
11:10-12:00 Discussion for future collaborative researches October 12 (Wed) Research Group Session 2: Ecosystem (RG2) Venue: Convention Hall 8:30-12:30 8:30-10:30 Presentation from each country
RG2-1 GUAN Biing-Tzuang (NTU) Precipitation triggered landslides drive the stand dynamics of old-growth Taiwan spruce forests in central Taiwan
p.112-113
RG2-2 KAMATA Naoto (UTHF) Biological inventory monitoring methods and systems in The University of Tokyo Forests
p.114-115
RG2-3 LARDIZABAL Maria Lourdes T. (UMS) Black flies (Diptera: Simulidae) as biomonitoring agents in conservation areas of west coast Sabah, Malaysia
p.116-117
RG2-4 MAROD Dokrak (KU) Forest structure and species composition in 16-Ha LTER plot of Lower Montane Forest at Huai Kog Ma Biosphere Reserve, Chiang Mai province, northern Thailand
p.118-119
RG2-5 PARK Il-Kwon (SNU) (-)-α-Pinene and Ethanol: Attractants for Bark, ambrosia Beetles and weevils at Pinus koraiensis and Pinus densiflora stands in Korea
p.120-121
10:45-12:00 Introduction of LTER plots of each university forest
12:00-12:30 Discussion for future collaborative researches
October 12 (Wed) Research Group Session 3: Management (RG3) Venue: Tatami-Mat Hall 8:30-10:45 Presentation from each country
RG3-1 LIU Shing-Wang (NTU) Long-term monitoring of reforestation at cultivation abandoned forestland
p.122-123

The 7th SAUFC, OCT 11-14, 2016 –The University of Tokyo Forests, Japan
11
RG3-2 IOKI Keiko (UMS) Participatory Land Use Planning in Kinabalu Ecolinc Zone: The case of Wasai village
p.124-125
RG3-3 DUANGSATHAPORN Khwanchai (KU) Current status and causes of deforestation in Thailand
p.126-127
RG3-4 YOUN Yeo-Chang (SNU) Demand for Forest Ecosystem Services : case of SNU Forests
p.128-129
RG3-5 OWARI Toshiaki (UTHF) Creating a network of long-term experimental plots within Asian University Forests
p.130-131
RG3-6 FUJIWARA Akio (UTF) Metadata database for experimental permanent plots
p.132-133
10:45-11:00 Coffee Break
11:00-11:40 Research collaboration with a focus on long-term experimental plots
11:40-12:10 Potential research topics for further collaboration
12:10-12:30 RG3 action plan during the JSPS project period
12:30-14:00 Lunch
October 12 (Wed) 14:00-16:00 Wrap-up Meeting Venue: Convention Hall
October 12 (Wed) 16:20-17:30 Introduction of UTHF Venue: Convention Hall
The 7th SAUFC, OCT 11-14, 2016 –The University of Tokyo Forests, Japan
12
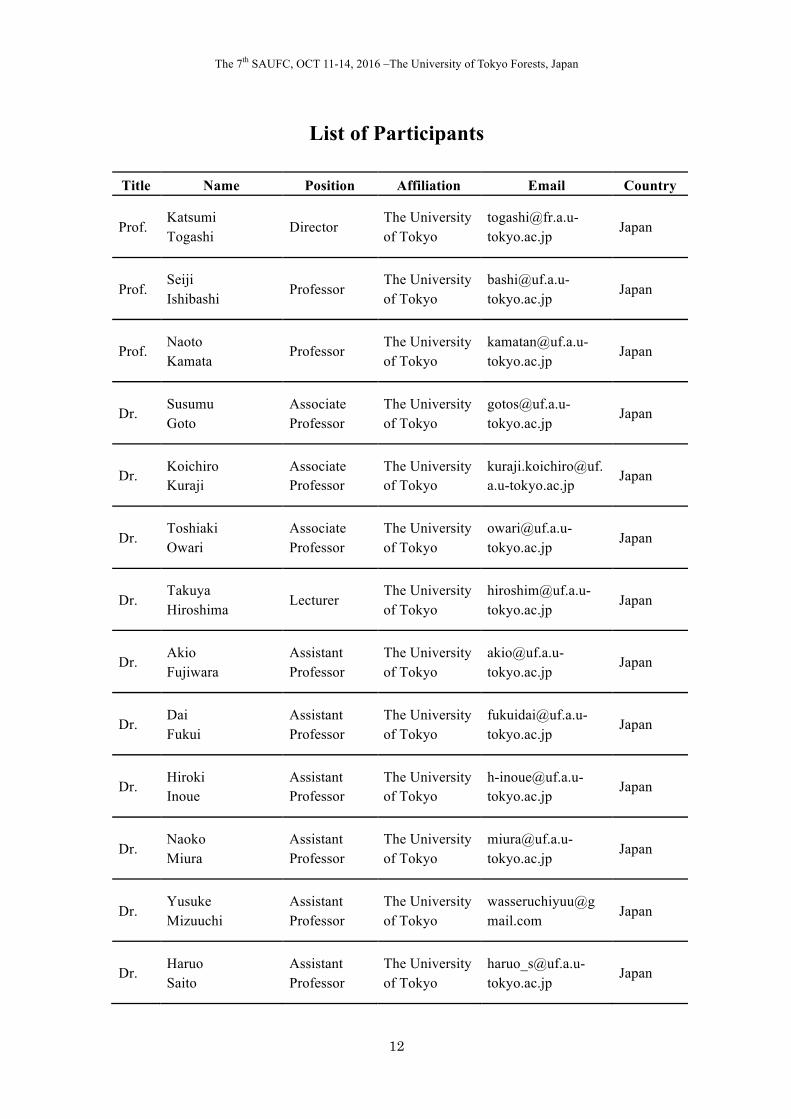
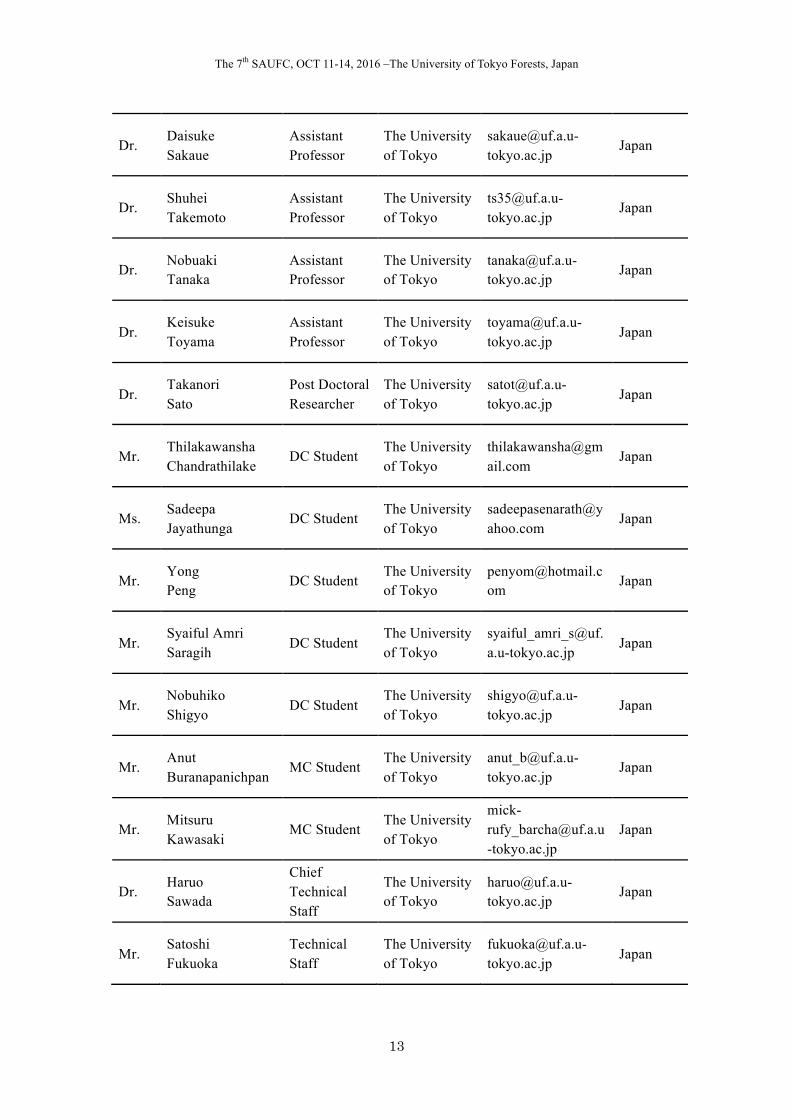
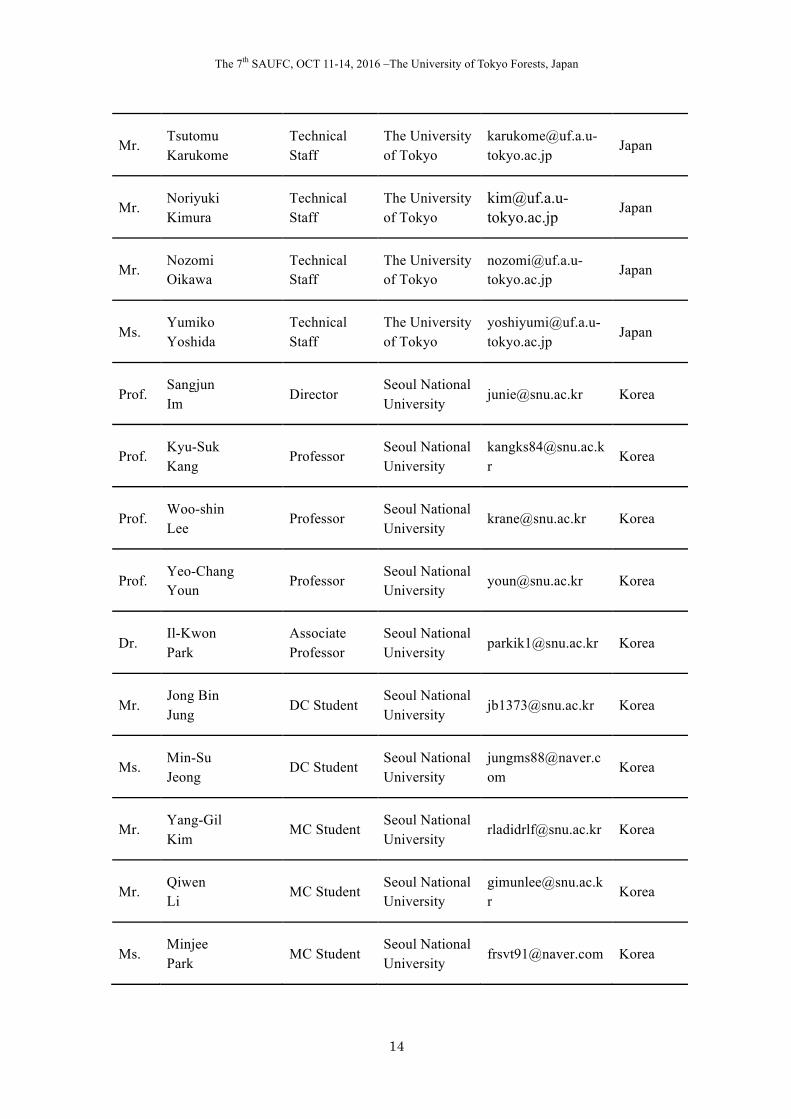
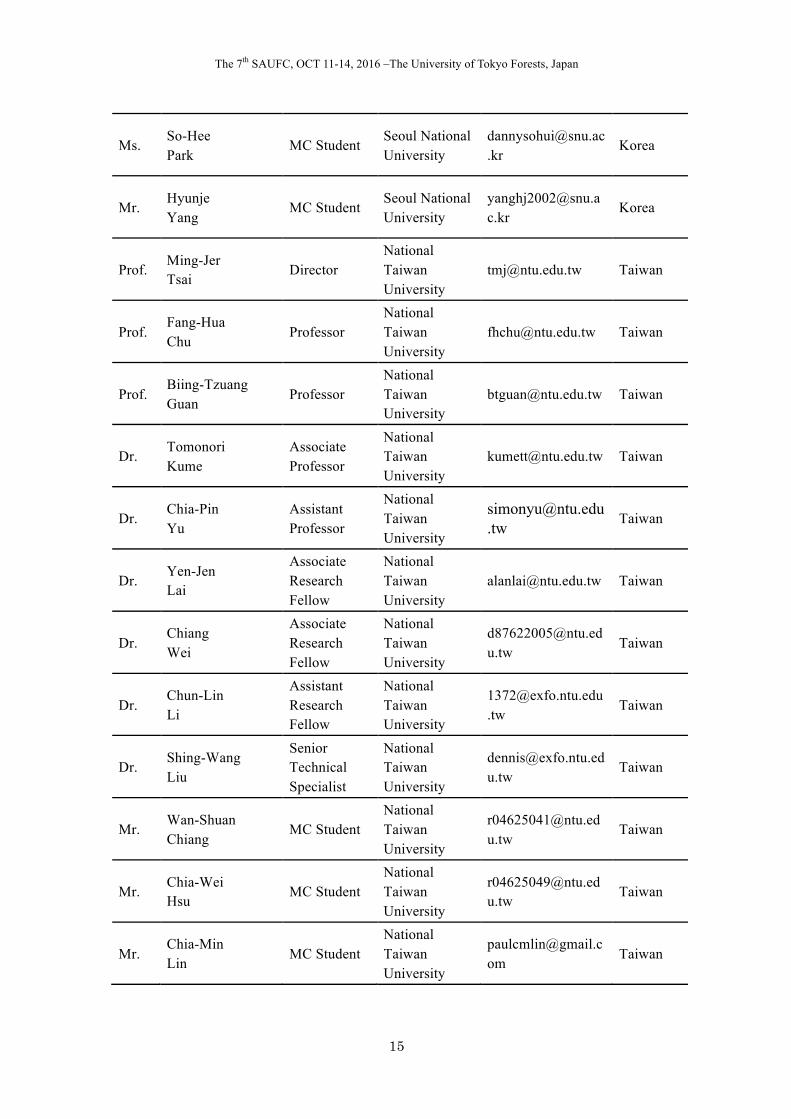
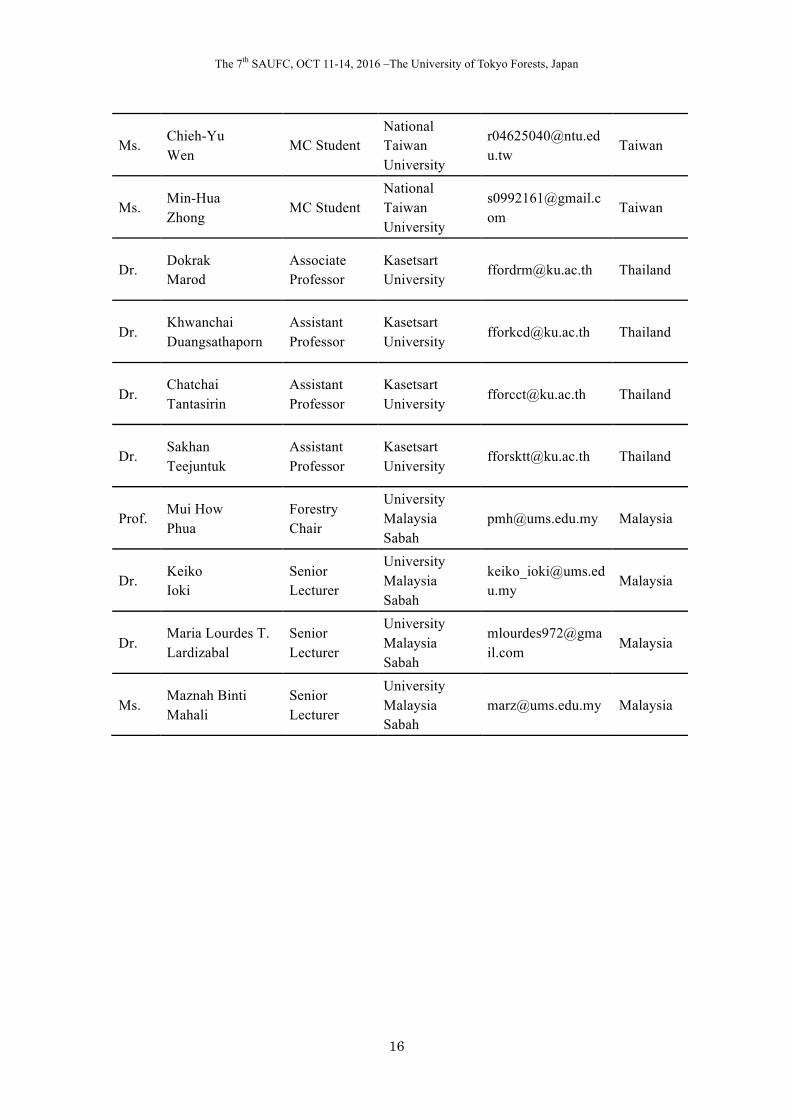
List of Participants
Title Name Position Affiliation Email Country
Prof. Katsumi Togashi
Director The University of Tokyo
Japan
Prof. Seiji Ishibashi
Professor The University of Tokyo
Japan
Prof. Naoto Kamata
Professor The University of Tokyo
Japan
Dr. Susumu Goto
Associate Professor
The University of Tokyo
Japan
Dr. Koichiro Kuraji
Associate Professor
The University of Tokyo
Japan
Dr. Toshiaki Owari
Associate Professor
The University of Tokyo
Japan
Dr. Takuya Hiroshima
Lecturer The University of Tokyo
Japan
Dr. Akio Fujiwara
Assistant Professor
The University of Tokyo
Japan
Dr. Dai Fukui
Assistant Professor
The University of Tokyo
Japan
Dr. Hiroki Inoue
Assistant Professor
The University of Tokyo
Japan
Dr. Naoko Miura
Assistant Professor
The University of Tokyo
Japan
Dr. Yusuke Mizuuchi
Assistant Professor
The University of Tokyo
Japan
Dr. Haruo Saito
Assistant Professor
The University of Tokyo
Japan
The 7th SAUFC, OCT 11-14, 2016 –The University of Tokyo Forests, Japan
13
Dr. Daisuke Sakaue
Assistant Professor
The University of Tokyo
Japan
Dr. Shuhei Takemoto
Assistant Professor
The University of Tokyo
Japan
Dr. Nobuaki Tanaka
Assistant Professor
The University of Tokyo
Japan
Dr. Keisuke Toyama
Assistant Professor
The University of Tokyo
Japan
Dr. Takanori Sato
Post Doctoral Researcher
The University of Tokyo
Japan
Mr. Thilakawansha Chandrathilake
DC Student The University of Tokyo
Japan
Ms. Sadeepa Jayathunga
DC Student The University of Tokyo
Japan
Mr. Yong Peng
DC Student The University of Tokyo
Japan
Mr. Syaiful Amri Saragih
DC Student The University of Tokyo
Japan
Mr. Nobuhiko Shigyo
DC Student The University of Tokyo
Japan
Mr. Anut Buranapanichpan
MC Student The University of Tokyo
Japan
Mr. Mitsuru Kawasaki
MC Student The University of Tokyo
Japan
Dr. Haruo Sawada
Chief Technical Staff
The University of Tokyo
Japan
Mr. Satoshi Fukuoka
Technical Staff
The University of Tokyo
Japan
The 7th SAUFC, OCT 11-14, 2016 –The University of Tokyo Forests, Japan
14
Mr. Tsutomu Karukome
Technical Staff
The University of Tokyo
Japan
Mr. Noriyuki Kimura
Technical Staff
The University of Tokyo
Japan
Mr. Nozomi Oikawa
Technical Staff
The University of Tokyo
Japan
Ms. Yumiko Yoshida
Technical Staff
The University of Tokyo
Japan
Prof. Sangjun Im
Director Seoul National University
[email protected] Korea
Prof. Kyu-Suk Kang
Professor Seoul National University
Korea
Prof. Woo-shin Lee
Professor Seoul National University
[email protected] Korea
Prof. Yeo-Chang Youn
Professor Seoul National University
[email protected] Korea
Dr. Il-Kwon Park
Associate Professor
Seoul National University
[email protected] Korea
Mr. Jong Bin Jung
DC Student Seoul National University
[email protected] Korea
Ms. Min-Su Jeong
DC Student Seoul National University
Korea
Mr. Yang-Gil Kim
MC Student Seoul National University
[email protected] Korea
Mr. Qiwen Li
MC Student Seoul National University
Korea
Ms. Minjee Park
MC Student Seoul National University
[email protected] Korea
The 7th SAUFC, OCT 11-14, 2016 –The University of Tokyo Forests, Japan
15
Ms. So-Hee Park
MC Student Seoul National University
Korea
Mr. Hyunje Yang
MC Student Seoul National University
Korea
Prof. Ming-Jer Tsai
Director National Taiwan University
[email protected] Taiwan
Prof. Fang-Hua Chu
Professor National Taiwan University
[email protected] Taiwan
Prof. Biing-Tzuang Guan
Professor National Taiwan University
[email protected] Taiwan
Dr. Tomonori Kume
Associate Professor
National Taiwan University
[email protected] Taiwan
Dr. Chia-Pin Yu
Assistant Professor
National Taiwan University
Taiwan
Dr. Yen-Jen Lai
Associate Research Fellow
National Taiwan University
[email protected] Taiwan
Dr. Chiang Wei
Associate Research Fellow
National Taiwan University
Taiwan
Dr. Chun-Lin Li
Assistant Research Fellow
National Taiwan University
Taiwan
Dr. Shing-Wang Liu
Senior Technical Specialist
National Taiwan University
Taiwan
Mr. Wan-Shuan Chiang
MC Student National Taiwan University
Taiwan
Mr. Chia-Wei Hsu
MC Student National Taiwan University
Taiwan
Mr. Chia-Min Lin
MC Student National Taiwan University
Taiwan
The 7th SAUFC, OCT 11-14, 2016 –The University of Tokyo Forests, Japan
16
Ms. Chieh-Yu Wen
MC Student National Taiwan University
Taiwan
Ms. Min-Hua Zhong
MC Student National Taiwan University
Taiwan
Dr. Dokrak Marod
Associate Professor
Kasetsart University
[email protected] Thailand
Dr. Khwanchai Duangsathaporn
Assistant Professor
Kasetsart University
[email protected] Thailand
Dr. Chatchai Tantasirin
Assistant Professor
Kasetsart University
[email protected] Thailand
Dr. Sakhan Teejuntuk
Assistant Professor
Kasetsart University
[email protected] Thailand
Prof. Mui How Phua
Forestry Chair
University Malaysia Sabah
[email protected] Malaysia
Dr. Keiko Ioki
Senior Lecturer
University Malaysia Sabah
Malaysia
Dr. Maria Lourdes T. Lardizabal
Senior Lecturer
University Malaysia Sabah
Malaysia
Ms. Maznah Binti Mahali
Senior Lecturer
University Malaysia Sabah
[email protected] Malaysia

Symposium
The 7th SAUFC, OCT 11-14, 2016 –The University of Tokyo Forests, Japan
18
Introduction of the JSPS Core-to-Core Research Exchange Project
Naoto KAMATA1, Toshiaki OWARI2 & Koichiro KURAJI3
1The University of Tokyo Hokkaido Forest, JAPAN, [email protected] 2The University of Tokyo Hokkaido Forest, JAPAN, [email protected]
3The University of Tokyo Chiba Forest, JAPAN, [email protected] Outline of the project 1. Title: Developing a network of long-term monitoring field stations to monitor environmental
changes and ecosystem responses in Asian forests 2. Term: FY2016-FY2018 (April 1, 2016 – March 31, 2019) 3. Members: Kasetsart University (Thailand), National Taiwan University (Taiwan), Seoul
National University (South Korea), The University of Tokyo (Japan, project leader), University Malaysia Sabah (Malaysia)
Purpose
The University of Tokyo Forests has adopted the research exchange project entitled “Developing a network of long-term research field stations to monitor environmental changes and ecosystem responses in Asian forests” (Project Coordinator: Prof. Naoto Kamata) for the Core-to-Core Program FY 2016 (B. Asia-Africa Science Platforms) by the Japan Society for the Promotion of Science (JSPS). This project is implemented in collaboration with core institutions in five countries (Japan, Korea, Taiwan, Thailand, and Malaysia) that hold or manage university forests and research sites in different climate and vegetation zones of the Asian monsoon region. It aims to promote the development of long-term research field stations for stable and continuous monitoring, and to establish a multilateral research cooperation network between core institutions through close collaboration. Research exchange activities 1. International collaborative research
We would like to incubate and expand collaboration for international joint research as follows: / Researches conducted by international researchers and students / Researches using university forests or research sites such as LTER plots in these five countries.
2. Symposia We will organize Symposia of Asian University Forest Consortium (SAUFC) or alternative
events every fiscal year from FY2016 to FY2018. Our tentative plan is as follows: FY2016, 7th SAUFC in The University of Tokyo Hokkaido Forest; FY2017, 8th SAUFC in Seoul National University; FY2018, 9th SAUFC in National Taiwan University and Wrap-up Seminar in Japan. The JSPS Core-to-Core Project will partially support travel expenses and registration fee for
participants from the five member universities to these symposia. 3. Research Exchange Program
(1) International workshop To share advanced techniques among the member universities, we will have a workshop in March 6-8, 2017 at University Malaysia Sabah, Kota Kinabalu, Sabah, Malaysia.
(2) Training program for young researchers We will invite young researchers and students to The University of Tokyo Forests,
The 7th SAUFC, OCT 11-14, 2016 –The University of Tokyo Forests, Japan
19
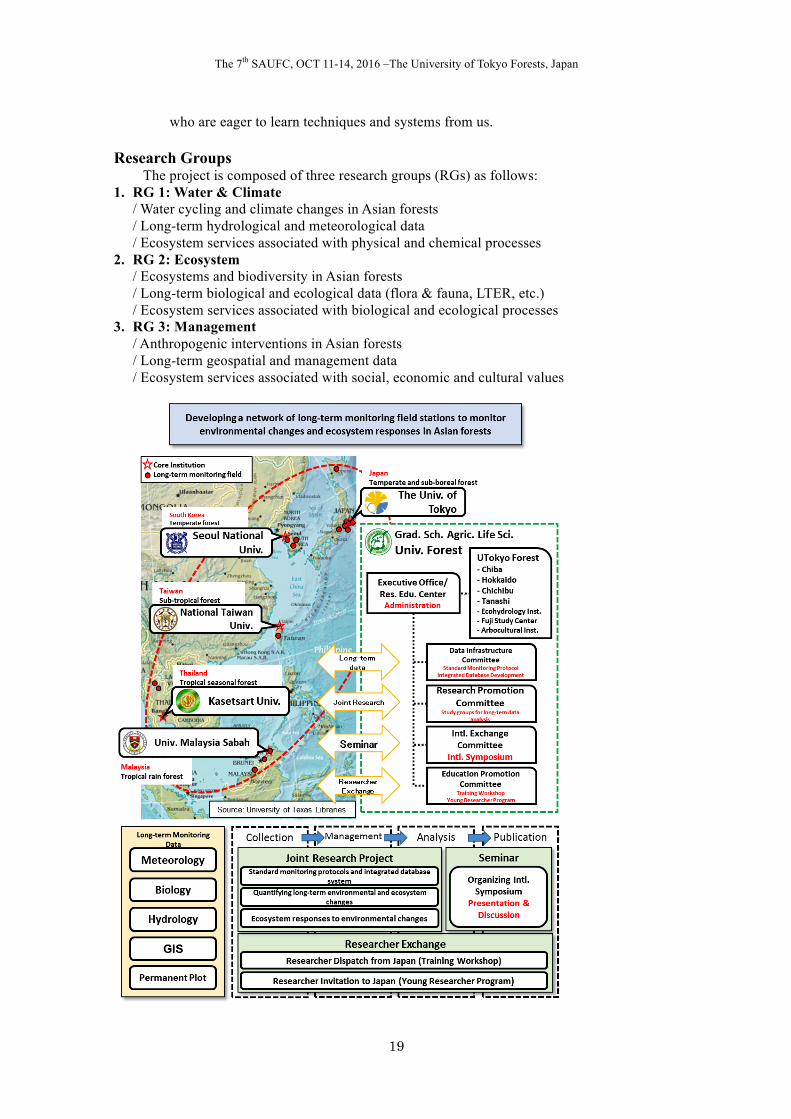
who are eager to learn techniques and systems from us. Research Groups
The project is composed of three research groups (RGs) as follows: 1. RG 1: Water & Climate
/ Water cycling and climate changes in Asian forests / Long-term hydrological and meteorological data / Ecosystem services associated with physical and chemical processes
2. RG 2: Ecosystem / Ecosystems and biodiversity in Asian forests / Long-term biological and ecological data (flora & fauna, LTER, etc.) / Ecosystem services associated with biological and ecological processes
3. RG 3: Management / Anthropogenic interventions in Asian forests / Long-term geospatial and management data / Ecosystem services associated with social, economic and cultural values
The 7th SAUFC, OCT 11-14, 2016 –The University of Tokyo Forests, Japan
20
System for obtaining and maintaining long-term fundamental data in the University of Tokyo Forests
Katsumi TOGASHI
The University of Tokyo Forests, JAPAN, [email protected]
Introduction
The University of Tokyo Forests (UTokyo Forests) was founded in 1894 at Chiba. Since then thirteen university forests had been established from Sakhalin through Hainan Island. Now, however, the UTokyo forests includes seven university forests. The UTokyo Forests have been taking various scientific data such as meteorology, biology and hydrology, and holding them. In 2011, we have established the Fundamental Data Development Committee to manage such data collection, hold the data collected so far, and promote the use of data. The committee comprises five sectors; meteorology, biology, hydrology water quality science, geographical information system GIS, and forests for long-term observation (Fig. 1). The committee manages data collection and support it financially. Here the details of each sector and some achievements using long-term data will be introduced. Meteorology sector
Air temperature, relative humidity, precipitation, solar radiation, rainfall, velocity and direction of wind are measured in five of the seven university forests. Japan Meteorological Agency measures meteorological data near the two remaining forests.
Ecohydrology Research Institute in Aichi compared the annual mean temperature between a forested area in the institute and an urban area of the big city, Nagoya during a long period of 76 years between 1935 and 2011. Both area show the global warming: an increase in temperature per year of 1.2 ˚C in the forested area and of 2.9 ˚C in the urban area. It also indicated the heat island phenomenon occurred in Nagoya as early as in 1935 based on the difference in temperature of ca 2 ˚C.
Biology sector
In botany, lists of plant species collected so far are completed. In addition, three herbarium specimens were made for each species and recorded as images digitally. Phenology has been investigated for some plant species.
Lists of vertebrates are finished. Now mammals have been taken by cameras equipped with infrared radiation sensor placed in forests. Census of the Sika deer are continued.
As for insects, the list is being compiled based on previous publications and survey in forests. Survey of carabids was started in 2008 using pitfall traps.
Avian list was published on our journal “Enshurin” in 2009. The list will be revised every 5 years. Line census of birds has been continued in reproductive seasons of each year.
Fundamental Data Development Committee MeteorologyBiology
BotanyVertebrate zoology EntomologyOrnithology
Hydrology and water quality scienceGeographical information system (GIS) Forests for long-term investigation
Fig. 1. Five sectors in Fundamental Data Development Committee

The 7th SAUFC, OCT 11-14, 2016 –The University of Tokyo Forests, Japan
21
Sector of hydrology and water quality science Daily flow rate of five streams has been determined by five university forests except
Tanashi Forest and Fuji Iyashinomori Woodland Study Center with no streams. Daily precipitation also has been measured. Water is taken from streams on specified day in each month and the contents are determined for Na+, K+, Mg2+, Ca2+, SO4
2−, NO3−, and Cl−. The
values of pH and EC are measured. As for rainfall, NH4+ is added to the measurements.
Previous data on paper has being recorded as digital data. GIS (Geographical information system) sector
To complete Geographical information in all university forests, the sector educates technical staffs, resulting in presence of GIS operators in each university. Professors and GIS operators have completed polygons of stands, 10 m meshed DEM, Orthographic aerial photograph, and ALOS satellite image. Sector of forests for long-term investigation
UTokyo forests has many stands for long-term investigation. We have been arranging data obtained from the stands for disclosing them.
The 7th SAUFC, OCT 11-14, 2016 –The University of Tokyo Forests, Japan
22
Forest environment, research and education in Korea
Dae-Young Kim1, Yang-Gil Kim2 & Kang Kyu-Suk3
1Dep. of Forest Sciences, Seoul National University, KOREA, [email protected] 2Dep. of Forest Sciences, Seoul National University, KOREA, [email protected]
3Dep. of Forest Sciences, Seoul National University, KOREA, [email protected] Introduction
Korea used to be a wealthy country of forest. Wise management of forest & water flow has been the most important agenda of Korea. The Korea Forest Service has the overall responsibility for establishment and implementation of forest policies and laws
The Korean Peninsula, surrounded by the sea on three sides (east, west, and south), is located on the eastern end of the Asian continent adjacent to the West Pacific. The Korean peninsula is located between 33°7′ and 43°1′ in northern latitude, and 124°11′ and 131°53′ in eastern longitude at the heart of the North Western Pacific, sharing a border with China and Russia to the north and lying near the Japanese archipelago to the south. It extends about 960 km southward and its width is about 170 km from east to west, surrounded by three oceans. Near 70% of the terrain is mostly mountainous so its terrestrial and marine ecosystems have a variety of species with high biodiversity.
Forest Environment
1. Forest distribution The Korean Peninsula belongs to the temperate zone with four distinct seasons, which are
largely controlled by the East Asian monsoon. During the winter, from December to February, it is cold and dry due to the establishment of the strong Siberian anticyclone on the Tibetan Plateau. Meanwhile, the summer, from June to August, is hot and wet, with frequent heavy rains. The modern climate of Korea is characterized by a mean annual temperature of 12.2℃, ranging from 5.1℃ to 13.6℃, with a monthly mean daily maximum temperature of up to 19.4℃ and a monthly mean daily minimum temperature of 0℃ over the past 30 years (1971–2000). Precipitation is relatively high (mean, 1299 mm), and about 70% of the annual precipitation falls in summer, especially from June to August (Korean Meteorological Administration, http://kma.go.kr).
There are mainly three forest zones in Korea. The sub-boreal forest zone has an average temperature of below 5°C and majot species are Abies, Picea, Larix, Juglans mandshurina and Betula platyphylla. The cool-temperate forest shows an average temperature ranged from 5 to 14°C and Quercus, Zelkova, Fraxinus, Pinus densiflora and Pinus koraiensis are dominant in this forest zone. The last one is the warm-temperate forest which has an average temperature above 14°C and dominant species are Quercus acuta, Castanopsis cuspidate and Camelia japonica.
2. Forest resources
The Korean peninsula encompasses 221,000 km2, 45% of which makes up the Republic of Korea (South Korea). About 20% of the total land area in South Korea is used for agriculture while forests cover 64%. The Korean peninsula lies in the east of the distinct seasonal temperature and precipitation. The main mountain range of the Korean peninsula is the Baekdu-daegan Mountains. It stretches 1,400 km from Mt. Baekdu in North Korea all the way down to Mt. Jiri in Republic of Korea, forming the great backbone of the Korean peninsula.
Forest area per capita is 0.2 ha that is 1/4 of World average. The average growing stock is 125.6 m3/ha which is equivalent to a total of 800 million m3. The growing stock of national forest (148.5m3/ha) is higher than that of private forest (117.7m3/ha). 59% of all trees is under
The 7th SAUFC, OCT 11-14, 2016 –The University of Tokyo Forests, Japan
23
the young age of 30 years. The timber self-sufficient rate is 84%, so 16% of the domestic timber is imported from abroad.
A total of 68% forest is owned by private and, among them, 82% of owner hold less than 50ha. National forest is followed by 24% and public forest is 8%. Forest products is 1.7 trillion KRW that is portioned by 0.1% of GDP. A total need of forest products is 27,819 thousand m3 and the self-supply of forest products is 4,506 thousand m3. Thus, the self-supply ratio is estimated as 16.2%. Forest Research
1. National Institute of Forest Science The National Institute of Forest Science (NIFoS) is the biggest governmental organization
on forest research in Korea. The NIFoS is the sole national institute in the field of forest, forestry and forest products and plays a leading role in developing forest-related science and technology. Mission is to promote and advance knowledge and technology focusing on sustainable management, and to contribute to strengthening the scientific competitiveness of Korea, improving the quality of life and creating wealth through the dissemination and application of developed technology.
2. Korea National Arboretum The Korea National Arboretum was established in 1987. They have 15 specialized plant
gardens, forest museum, wildlife conservatory, forest zoo, herbarium and seed bank. The KNA was designated as a UNESCO biosphere reserve in June 2010. Major activities of the KNA are forest resource survey and information research, forest bio-resources conservation and practical usage-base construction, research of blooming and fruition physiology of the forest plants, and forest relaxation and culture research.
3. National Forest Seed and Variety Centre
The National Seed and Variety Centre was established on August, 2008. Their main works are the management of seed orchard, the certification of seed and seedling, and the protection for forest varieties based on UPOV. Forest Education
1. Forest Education Promotion Act (Act 11690; 2013.3.23) The purpose of the act is to preserve forests in a sustainable manner and thereby contribute
to the development of the State and society and the improvement of the quality of life of citizens by providing for matters necessary for the promotion of forest education to ensure that citizens acquire correct knowledge about forests and development a proper sense of value thereof.
2. Forest University and Department
There are two forest colleges in Korea; College of Forest Environmental Science, Kangwon University and College of Forest Science, Kookmin University. Each provenance including the Seoul metropolitan has a national University (a total of eight) with Department of Forest Resources or Forest Environmental Sciences (variety names of Department). Besides there are ten more private Universities having Forest Department programs.
Recently characterization high schools for forestry have been open in 2012 (Korea Forest Science High School; http://korea-forest.school.gyo6.net/index/index.do), and some students are already graduated and working at the field of forestry.
3. University Forests A total of 19 Universities have the University Forest that is a sum of 34,941ha. Among
them, Seoul National University has the largest area with 17,200ha.
The 7th SAUFC, OCT 11-14, 2016 –The University of Tokyo Forests, Japan
24
Review and future perspective of permanent plots of NTUE
Ming-Jer TSAI1, 2
1 The Experimental Forest, National Taiwan University, TAIWAN, [email protected] 2 School of Forestry and Resource Conservation, National Taiwan University, TAIWAN Introduction
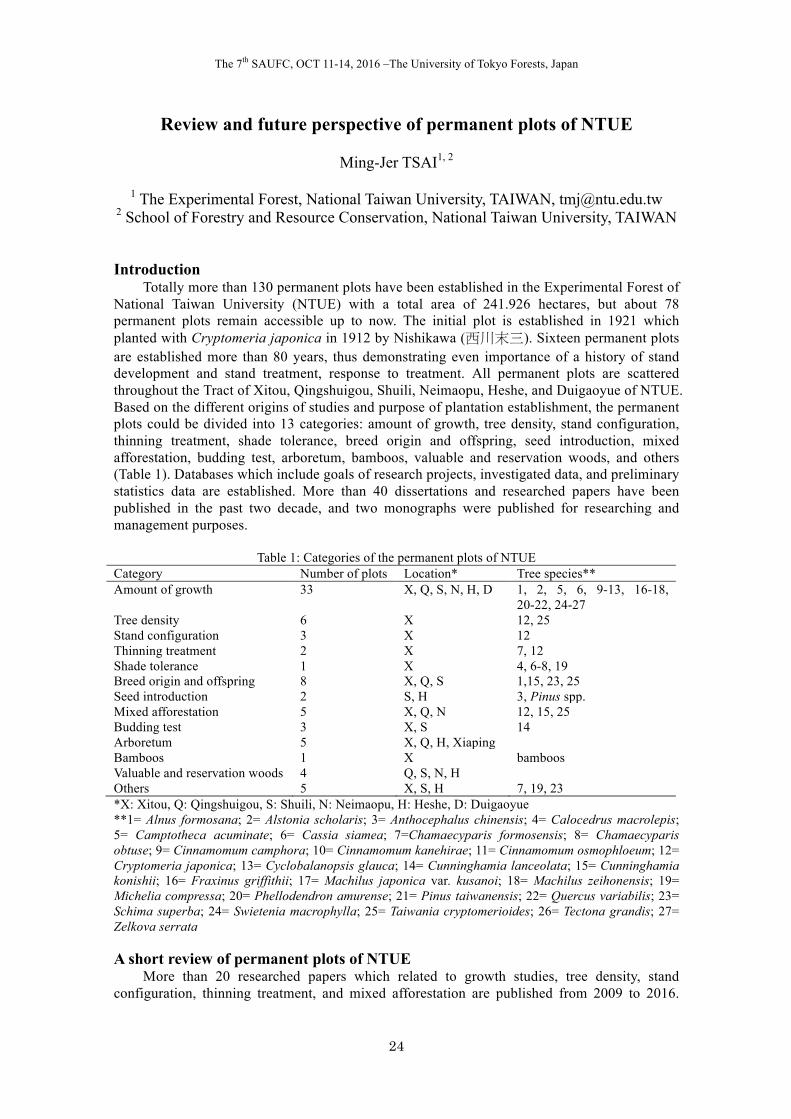
Totally more than 130 permanent plots have been established in the Experimental Forest of National Taiwan University (NTUE) with a total area of 241.926 hectares, but about 78 permanent plots remain accessible up to now. The initial plot is established in 1921 which planted with Cryptomeria japonica in 1912 by Nishikawa (西川末三). Sixteen permanent plots are established more than 80 years, thus demonstrating even importance of a history of stand development and stand treatment, response to treatment. All permanent plots are scattered throughout the Tract of Xitou, Qingshuigou, Shuili, Neimaopu, Heshe, and Duigaoyue of NTUE. Based on the different origins of studies and purpose of plantation establishment, the permanent plots could be divided into 13 categories: amount of growth, tree density, stand configuration, thinning treatment, shade tolerance, breed origin and offspring, seed introduction, mixed afforestation, budding test, arboretum, bamboos, valuable and reservation woods, and others (Table 1). Databases which include goals of research projects, investigated data, and preliminary statistics data are established. More than 40 dissertations and researched papers have been published in the past two decade, and two monographs were published for researching and management purposes.
Table 1: Categories of the permanent plots of NTUE Category Number of plots Location* Tree species** Amount of growth 33 X, Q, S, N, H, D 1, 2, 5, 6, 9-13, 16-18,
20-22, 24-27 Tree density 6 X 12, 25 Stand configuration 3 X 12 Thinning treatment 2 X 7, 12 Shade tolerance 1 X 4, 6-8, 19 Breed origin and offspring 8 X, Q, S 1,15, 23, 25 Seed introduction 2 S, H 3, Pinus spp. Mixed afforestation 5 X, Q, N 12, 15, 25 Budding test 3 X, S 14 Arboretum 5 X, Q, H, Xiaping Bamboos 1 X bamboos Valuable and reservation woods 4 Q, S, N, H Others 5 X, S, H 7, 19, 23 *X: Xitou, Q: Qingshuigou, S: Shuili, N: Neimaopu, H: Heshe, D: Duigaoyue **1= Alnus formosana; 2= Alstonia scholaris; 3= Anthocephalus chinensis; 4= Calocedrus macrolepis; 5= Camptotheca acuminate; 6= Cassia siamea; 7=Chamaecyparis formosensis; 8= Chamaecyparis obtuse; 9= Cinnamomum camphora; 10= Cinnamomum kanehirae; 11= Cinnamomum osmophloeum; 12= Cryptomeria japonica; 13= Cyclobalanopsis glauca; 14= Cunninghamia lanceolata; 15= Cunninghamia konishii; 16= Fraxinus griffithii; 17= Machilus japonica var. kusanoi; 18= Machilus zeihonensis; 19= Michelia compressa; 20= Phellodendron amurense; 21= Pinus taiwanensis; 22= Quercus variabilis; 23= Schima superba; 24= Swietenia macrophylla; 25= Taiwania cryptomerioides; 26= Tectona grandis; 27= Zelkova serrata A short review of permanent plots of NTUE
More than 20 researched papers which related to growth studies, tree density, stand configuration, thinning treatment, and mixed afforestation are published from 2009 to 2016.
The 7th SAUFC, OCT 11-14, 2016 –The University of Tokyo Forests, Japan
25
Most of researches concern with parameters of tree growth, rotation, volume stock of Japanese cedar (Cryptomeria japonica) in the different permanent plots. Some authors concentrated on aims to analyse trend growth of tree height and the relationship between DBH and H by apply Chapman-Richards growth model and simple empirical equation in Japanese cedar plantation of Xitou. One paper has discussed that influence of thinning on cutting grown tree and seedling grown tree of Japanese cedar, and it indicates that the survival rate of Japanese cedar planted by seed sapling is better than that planted by cutting sapling. In the study of effect of two different planting density (3000 and 4500 trees/ha), it shows that the early survival rate and tree height of Japanese cedar in two different planting densities have no difference, however, it shows that low planting densities with higher increase of DBH on initial growth. In the study of tree growth and stand structure of Japanese cedar, the result shows that when the stand reached its nine-year-old age, it started self-thinning phenomena and the number of trees within the stand gradually decreased, however, stand stocking kept increasing due to the growth of the tree left on the plot. Although some investigations into carbon sequestration in Japanese cedar, but it shows extremely difference in annual average storage of carbon dioxide from 16.3 to 1990.8 ton/ha in the investigations.
In the study of effects on growth by thinning between different stand densities (1300, 2600, 3200, and 5200 trees/ha) of Taiwania cryptomerioides plantations, the result shows that after treatment by lower thinned, 1300 trees/ha has the highest survival ratio, DBH growth, individual stand volume, and volume stock growth. In the growth and carbon sequestration study of Taiwania plantation, results show that stand volume stock and carbon sequestration varied with stand age
In order to establish height growth models for Taiwan red cypress (Chamaecyparis formosensis), the study was conducted on a long term study of Taiwan red cypress permanent plot at Xitou Tract. Maximum growth rate of Taiwan red cypress occurred in the juvenile period, the tree height growth equations of Taiwan red cypress was provided, additionally, it has been found that by adding tree age variables can further increase predictability.
The planted time of most of growth study of broad-leaf permanent plots (13/18) in NTUE are less than 30 years, and less researches concentrate on these issues. In the growth research at a 26-year stand of Anthocephalus chinensis permanent plot, the results show that all data were fitted with Weibull probility distribution function, and it found an obvious ingrowth, declined stocking and increased average basal area, indicating great potential of stand growth. In the study of analysing growth model and estimate the aboveground biomass and carbon storage at different stand age of Fraxinus griffithii permanent plot, it shows that at stand age of 10, 14, and 19, stand volumes were estimated to be 33.14, 63.10, and 113.89 m3/ha respectively, and average carbon storages were 1.87, 2.54, 3.38 ton/ha/yr respectively. Future works for permanent plots of NTUE
About 32.05% (25/78) permanent plots are related to tree species, Japanese cedar, it needs to collect new data to supplement those now existing and to extend work to less studied tree species which especially endemic species or conditions. Investigated data of permanent plots should be well analyzed not only to apply the volumes, growth trend of stands, but also to combine with environmental factors which have influence on tree growth. The issues on carbon sequestration of stand stock become more and more extensive; it needs more effort to cooperate with different disciplines. Owing to new technological advances, new facilities or computational programs for investigation become more popular, the methodologies for silviculture should keep abreast with times.
The 7th SAUFC, OCT 11-14, 2016 –The University of Tokyo Forests, Japan
26
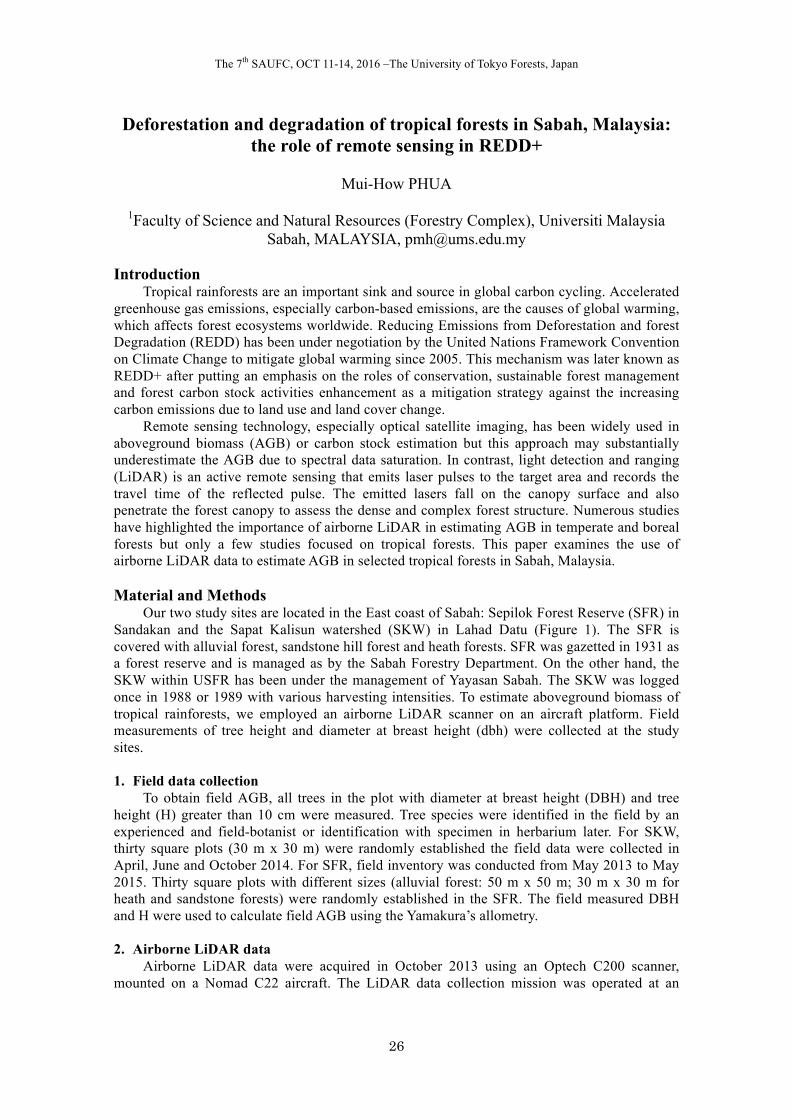
Deforestation and degradation of tropical forests in Sabah, Malaysia: the role of remote sensing in REDD+
Mui-How PHUA
1Faculty of Science and Natural Resources (Forestry Complex), Universiti Malaysia
Sabah, MALAYSIA, [email protected] Introduction
Tropical rainforests are an important sink and source in global carbon cycling. Accelerated greenhouse gas emissions, especially carbon-based emissions, are the causes of global warming, which affects forest ecosystems worldwide. Reducing Emissions from Deforestation and forest Degradation (REDD) has been under negotiation by the United Nations Framework Convention on Climate Change to mitigate global warming since 2005. This mechanism was later known as REDD+ after putting an emphasis on the roles of conservation, sustainable forest management and forest carbon stock activities enhancement as a mitigation strategy against the increasing carbon emissions due to land use and land cover change.
Remote sensing technology, especially optical satellite imaging, has been widely used in aboveground biomass (AGB) or carbon stock estimation but this approach may substantially underestimate the AGB due to spectral data saturation. In contrast, light detection and ranging (LiDAR) is an active remote sensing that emits laser pulses to the target area and records the travel time of the reflected pulse. The emitted lasers fall on the canopy surface and also penetrate the forest canopy to assess the dense and complex forest structure. Numerous studies have highlighted the importance of airborne LiDAR in estimating AGB in temperate and boreal forests but only a few studies focused on tropical forests. This paper examines the use of airborne LiDAR data to estimate AGB in selected tropical forests in Sabah, Malaysia. Material and Methods
Our two study sites are located in the East coast of Sabah: Sepilok Forest Reserve (SFR) in Sandakan and the Sapat Kalisun watershed (SKW) in Lahad Datu (Figure 1). The SFR is covered with alluvial forest, sandstone hill forest and heath forests. SFR was gazetted in 1931 as a forest reserve and is managed as by the Sabah Forestry Department. On the other hand, the SKW within USFR has been under the management of Yayasan Sabah. The SKW was logged once in 1988 or 1989 with various harvesting intensities. To estimate aboveground biomass of tropical rainforests, we employed an airborne LiDAR scanner on an aircraft platform. Field measurements of tree height and diameter at breast height (dbh) were collected at the study sites. 1. Field data collection
To obtain field AGB, all trees in the plot with diameter at breast height (DBH) and tree height (H) greater than 10 cm were measured. Tree species were identified in the field by an experienced and field-botanist or identification with specimen in herbarium later. For SKW, thirty square plots (30 m x 30 m) were randomly established the field data were collected in April, June and October 2014. For SFR, field inventory was conducted from May 2013 to May 2015. Thirty square plots with different sizes (alluvial forest: 50 m x 50 m; 30 m x 30 m for heath and sandstone forests) were randomly established in the SFR. The field measured DBH and H were used to calculate field AGB using the Yamakura’s allometry. 2. Airborne LiDAR data
Airborne LiDAR data were acquired in October 2013 using an Optech C200 scanner, mounted on a Nomad C22 aircraft. The LiDAR data collection mission was operated at an
The 7th SAUFC, OCT 11-14, 2016 –The University of Tokyo Forests, Japan
27
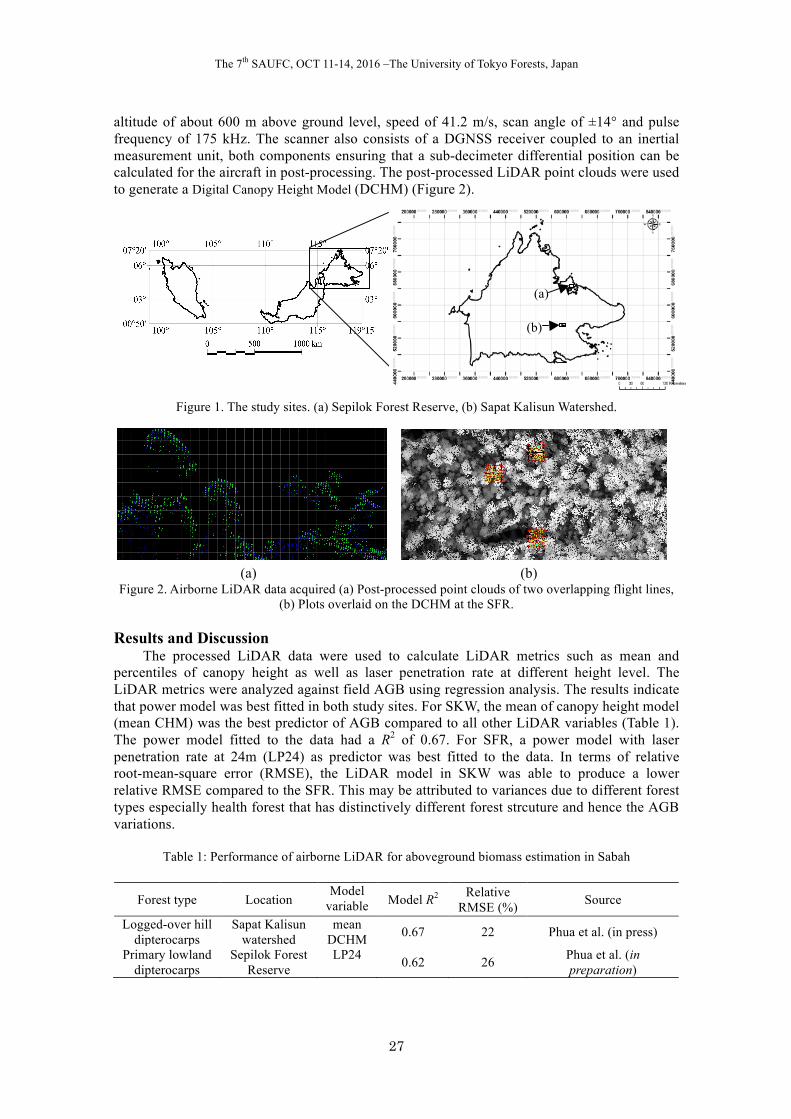
altitude of about 600 m above ground level, speed of 41.2 m/s, scan angle of ±14° and pulse frequency of 175 kHz. The scanner also consists of a DGNSS receiver coupled to an inertial measurement unit, both components ensuring that a sub-decimeter differential position can be calculated for the aircraft in post-processing. The post-processed LiDAR point clouds were used to generate a Digital Canopy Height Model (DCHM) (Figure 2).
Figure 1. The study sites. (a) Sepilok Forest Reserve, (b) Sapat Kalisun Watershed.
(a) (b) Figure 2. Airborne LiDAR data acquired (a) Post-processed point clouds of two overlapping flight lines,
(b) Plots overlaid on the DCHM at the SFR. Results and Discussion
The processed LiDAR data were used to calculate LiDAR metrics such as mean and percentiles of canopy height as well as laser penetration rate at different height level. The LiDAR metrics were analyzed against field AGB using regression analysis. The results indicate that power model was best fitted in both study sites. For SKW, the mean of canopy height model (mean CHM) was the best predictor of AGB compared to all other LiDAR variables (Table 1). The power model fitted to the data had a R2 of 0.67. For SFR, a power model with laser penetration rate at 24m (LP24) as predictor was best fitted to the data. In terms of relative root-mean-square error (RMSE), the LiDAR model in SKW was able to produce a lower relative RMSE compared to the SFR. This may be attributed to variances due to different forest types especially health forest that has distinctively different forest strcuture and hence the AGB variations.
Table 1: Performance of airborne LiDAR for aboveground biomass estimation in Sabah
Forest type Location Model
variable Model R2 Relative RMSE (%) Source
Logged-over hill dipterocarps
Sapat Kalisun watershed
mean DCHM 0.67 22 Phua et al. (in press)
Primary lowland dipterocarps
Sepilok Forest Reserve
LP24 0.62 26 Phua et al. (in preparation)
(a)
(b)
The 7th SAUFC, OCT 11-14, 2016 –The University of Tokyo Forests, Japan
28
The management plan to do forward the research and demonstrate station in university forest of Faculty of Forestry, Kasetsart University
Thailand Sakhan TEEJUNTUK
Faculty of Forestry, Kasetsart University Thailand [email protected]
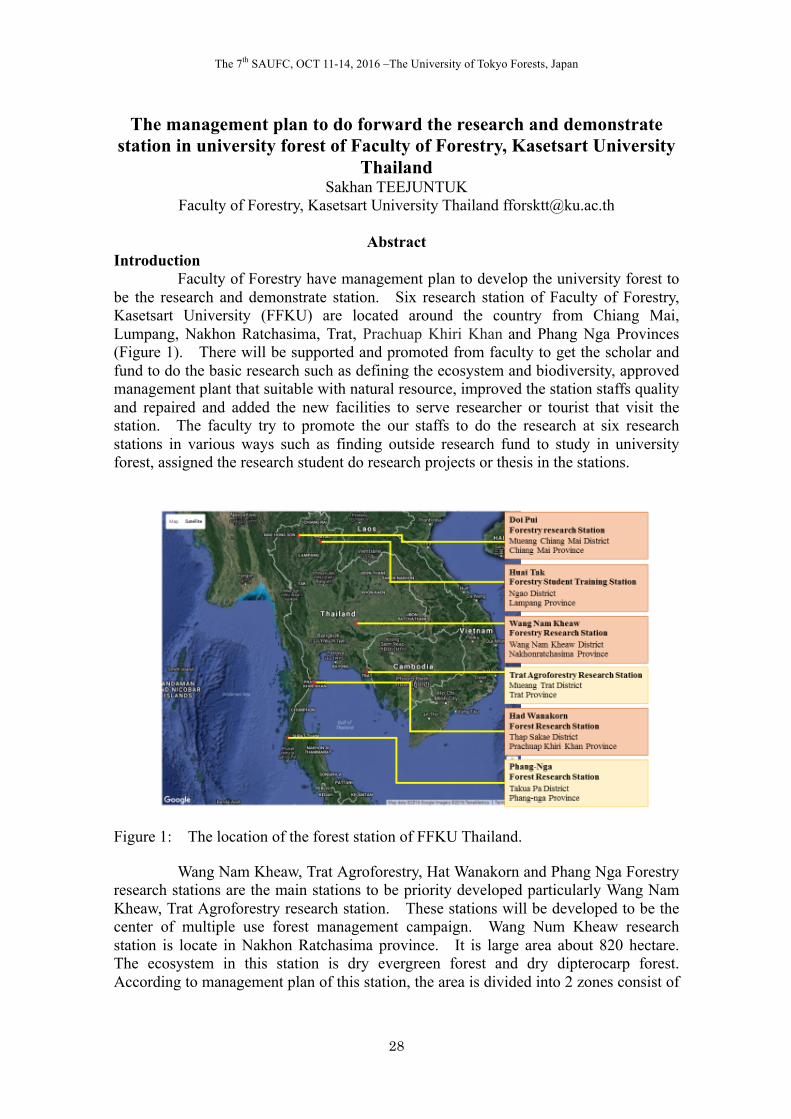
Abstract Introduction Faculty of Forestry have management plan to develop the university forest to be the research and demonstrate station. Six research station of Faculty of Forestry, Kasetsart University (FFKU) are located around the country from Chiang Mai, Lumpang, Nakhon Ratchasima, Trat, Prachuap Khiri Khan and Phang Nga Provinces (Figure 1). There will be supported and promoted from faculty to get the scholar and fund to do the basic research such as defining the ecosystem and biodiversity, approved management plant that suitable with natural resource, improved the station staffs quality and repaired and added the new facilities to serve researcher or tourist that visit the station. The faculty try to promote the our staffs to do the research at six research stations in various ways such as finding outside research fund to study in university forest, assigned the research student do research projects or thesis in the stations.
Figure 1: The location of the forest station of FFKU Thailand. Wang Nam Kheaw, Trat Agroforestry, Hat Wanakorn and Phang Nga Forestry research stations are the main stations to be priority developed particularly Wang Nam Kheaw, Trat Agroforestry research station. These stations will be developed to be the center of multiple use forest management campaign. Wang Num Kheaw research station is locate in Nakhon Ratchasima province. It is large area about 820 hectare. The ecosystem in this station is dry evergreen forest and dry dipterocarp forest. According to management plan of this station, the area is divided into 2 zones consist of
The 7th SAUFC, OCT 11-14, 2016 –The University of Tokyo Forests, Japan
29
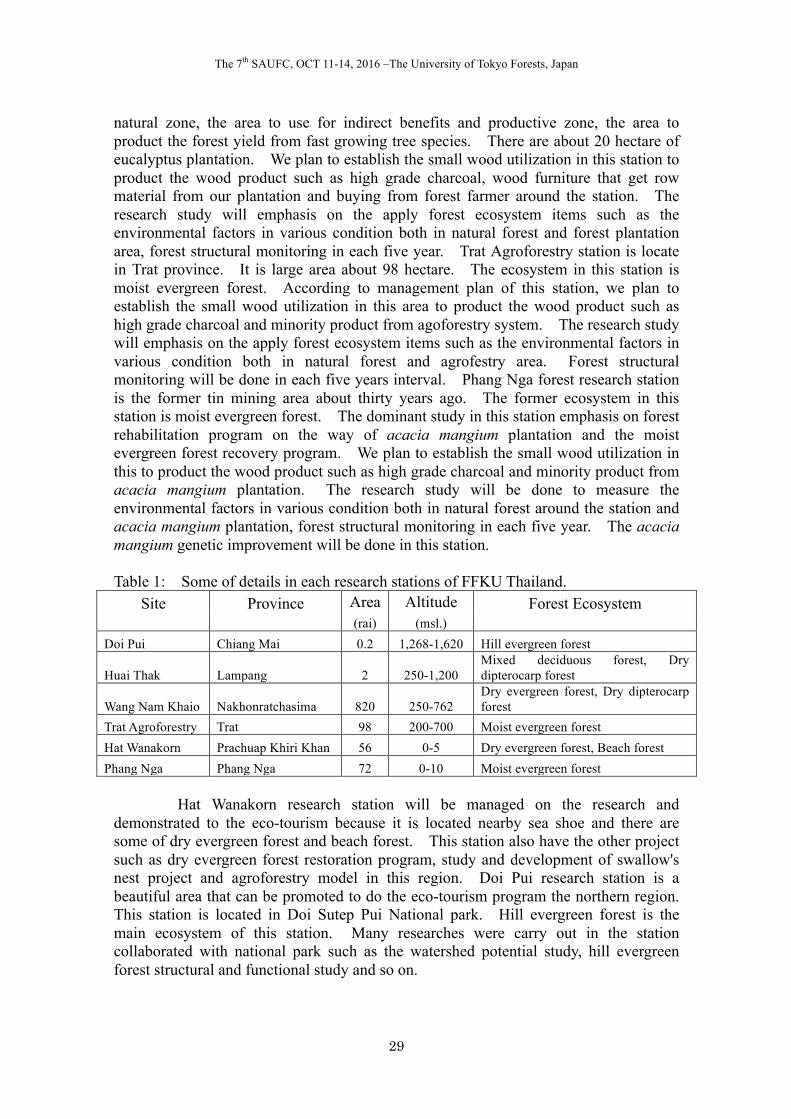
natural zone, the area to use for indirect benefits and productive zone, the area to product the forest yield from fast growing tree species. There are about 20 hectare of eucalyptus plantation. We plan to establish the small wood utilization in this station to product the wood product such as high grade charcoal, wood furniture that get row material from our plantation and buying from forest farmer around the station. The research study will emphasis on the apply forest ecosystem items such as the environmental factors in various condition both in natural forest and forest plantation area, forest structural monitoring in each five year. Trat Agroforestry station is locate in Trat province. It is large area about 98 hectare. The ecosystem in this station is moist evergreen forest. According to management plan of this station, we plan to establish the small wood utilization in this area to product the wood product such as high grade charcoal and minority product from agoforestry system. The research study will emphasis on the apply forest ecosystem items such as the environmental factors in various condition both in natural forest and agrofestry area. Forest structural monitoring will be done in each five years interval. Phang Nga forest research station is the former tin mining area about thirty years ago. The former ecosystem in this station is moist evergreen forest. The dominant study in this station emphasis on forest rehabilitation program on the way of acacia mangium plantation and the moist evergreen forest recovery program. We plan to establish the small wood utilization in this to product the wood product such as high grade charcoal and minority product from acacia mangium plantation. The research study will be done to measure the environmental factors in various condition both in natural forest around the station and acacia mangium plantation, forest structural monitoring in each five year. The acacia mangium genetic improvement will be done in this station. Table 1: Some of details in each research stations of FFKU Thailand.
Site
Province
Area Altitude Forest Ecosystem (rai) (msl.)
Doi Pui Chiang Mai 0.2 1,268-1,620 Hill evergreen forest
Huai Thak Lampang 2 250-1,200 Mixed deciduous forest, Dry dipterocarp forest
Wang Nam Khaio Nakhonratchasima 820 250-762 Dry evergreen forest, Dry dipterocarp forest
Trat Agroforestry Trat 98 200-700 Moist evergreen forest Hat Wanakorn Prachuap Khiri Khan 56 0-5 Dry evergreen forest, Beach forest Phang Nga Phang Nga 72 0-10 Moist evergreen forest
Hat Wanakorn research station will be managed on the research and demonstrated to the eco-tourism because it is located nearby sea shoe and there are some of dry evergreen forest and beach forest. This station also have the other project such as dry evergreen forest restoration program, study and development of swallow's nest project and agroforestry model in this region. Doi Pui research station is a beautiful area that can be promoted to do the eco-tourism program the northern region. This station is located in Doi Sutep Pui National park. Hill evergreen forest is the main ecosystem of this station. Many researches were carry out in the station collaborated with national park such as the watershed potential study, hill evergreen forest structural and functional study and so on.


Poster Presentation
The 7th SAUFC, OCT 11-14, 2016 –The University of Tokyo Forests, Japan
32
Gene regulation profile of autumn leaf senescence and coloration in Formosan sweet gum (Liquidambar formosana Hance.)
Chi-Hsiang WEN1 & Fang-Hua CHU1,2
1School of Forestry and Resource Conservation, National Taiwan University, Taiwan
2Experimental Forest, National Taiwan University, Taiwan, [email protected] Introduction
Autumn leaf coloration is one of the most attractive natural event and also the most obvious physiological sign in autumn leaf senescence. However, little is known about the regulation on colours and the link between leaf senescence and coloration has just begun to be investigated. Formosan sweet gum (Liquidambar formosana Hance.) is a subtropical deciduous native to Taiwan, the long coloration seasons make it suit for autumn leaf coloration studies. With the help of next-generation sequencing, transcriptome libraries from leaves collected in spring and winter were constructed and de novo assembled together. After customized microarray designed, gene expression in leaves through 2011-2013 were analysed, and finally the regulation network were illustrated. LfWRKY75, LfNAC1, LfNAC100 and LfMYB113 were shown as key regulators and the genes regulated by them were candidates play as the link between chlorophyll degradation and anthocyanin biosynthesis to senescence. Further gene function identification by tobacco infiltration and transformation showed LfMYB113 is a transcription factor positively regulate anthocyanin production and may accelerating or inducing leaf senescence. In summary, this is first subtropical deciduous tree whole year leaf development gene expression profile and revealed putative network regulation between autumn coloration and leaf senescence. Material and Methods 1. Plant material
Formosan sweet gum leaf sample were collected in the third or fourth week of each month during growing seasons on campus of National Taiwan University. Samples from “sample tree” collected in Apr. 2011 (green leaves, “G”) and Dec. 2010 (red leaves, “R”) were used in transcriptome sequencing. For microarray, samples collected from “sample tree” in Apr., Jun., Aug., Oct. and Dec. during year 2011-2013 were used, a time series through each year was defined as a biological repeat. For pigment measurements and LfMYB113 RT-PCR, samples collected from four individual trees during year 2012-2014 were used. 2. Next-generation, microarray and network analysis
Total RNA was extracted using Concert Plant RNA Reagent followed by DNase I treatment, purified by ethanol precipitation and quality controlled by Agilent 2100 Bioanalyzer. Library construction and sequencing was performed using Illumina HiSeq 2000 (Genomics BioSci & Tech Co.). The paired-end reads from ‘R’ and ‘G’ were assembled and pooled together using the de novo assembly program in CLC Genomics Workbench 5 (CLC bio). All the reads and contigs were analysed and a database was constructed in ContigViews web server (http://contigviews.csbb.ntu.edu.tw).
58,355 contigs successfully passed the probe design requirement and were synthesized as 60-mer oligonucleotides (Agilent Technologies). Total RNA was extracted using the Pine Tree method. The microarray experiments were performed by the Institute of Plant and Microbial Biology DNA Microarray Core Laboratory (Academia Sinica). The array image was analyzed by the Feature Extraction software version 10.7.1.1 using the default setting. The gene expression data used for network analysis were generated from microarray data using GeneSpring software version 11.5. The network analysis was conducted using algorithms based on the R program built into ContigViews. 3. LfMYB113 function identification
LfMYB113 sequence was acquired from Contigviews web server. The amino acid sequences
The 7th SAUFC, OCT 11-14, 2016 –The University of Tokyo Forests, Japan
33
of Arabidopsis MYB family genes were acquired from TAIR (https://www.arabidopsis.org/). Amino acid sequences were aligned and phylogenetic tree image were generate using MEGA 6. The neighbor-joining method was used and an unrooted tree was visualized. The alignment was visualized using GENEDOC software.
For agro-infiltration and transformation, binary vector pBI121 was used. After construction and sequencing, the plasmid was transform into Agrobacterium tumefaciens strain GV3101. Nicotiana benthamiana plant was used in infiltration experiments and Nicotiana tabacum plant was used in transformation experiment. 4. Pigment measurements
From April, 2012 to December, 2014, samples were collected each month in the growing seasons, two repeats were performed from the same month and values from the 3 years were averaged. Extracted materials (200 µl) were transferred to a quartz 96-well plate (Hellma) and the absorbance was measured on a µQuant Universal Microplate Spectrophotometer (BioTek). Results and Discussion
Formosan sweet gum start leaf senescence around summer as chlorophyll content reach maximum amount and start coloration around October every year as illustrated in A530 absorbance. The expression of genes on chlorophyll and anthocyanin metabolism pathways showed correlation with the pigment content, for example LfPPH, LfPaO, LfPAL1.3, LfPAL1.5 and LfDFR2.
The network analysis was focused on genes which up-regulated when leaf undergo senescence, and the outcome showed the conserved transcription factors LfWRKY70, LfWRKY75, LfWRKY65, LfNAC1, LfSPL14, LfNAC100 and LfMYB113 were putative key regulators in leaf senescence. In the present network the chlorophyll degradation gene LfPPH and LfSGR were linked to LfMYB113, otherwise anthocyanin biosynthetic gene LfPAL1.5 and LfDFR2 were link to LfWRKY75. Since LfMYB113 was identified by sequence alignment as a putative anthocyanin regulator, we next analysis the regulatory role of LfMYB113.
The expressions of LfMYB113 in different phenotypes were different, and the expression pattern correlated with anthocyanin content. In infiltration experiment, the inject site where LfMYB113 over expressed has obvious colour changing and later showed accelerated leaf senescence or necrosis. In the stable overexpression tobacco plant, the anthocyanin biosynthetic genes were significantly up-regulated compare to vector control plant. Besides, the anthocyanin content in transformed tobacco plants also correlated with gene expression level of LfMYB113.
In conclusion, in the present study a transcriptome database especially for autumn leaf senescence and coloration was constructed. The database can be also helpful in leaf development and other seasonal physiological studies. The equipment of three year gene expression data acquired by microarray make the database more reliable as leaf senescence gene illustrated in the present network show some conserve key regulators with current Arabidopsis leaf senescence gene regulation model. According to the infiltration and transformation experiments, we identified LfMYB113 as one of the key regulators in autumn leaf coloration, and which may be the link between leaf senescence and chlorophyll degradation.
The 7th SAUFC, OCT 11-14, 2016 –The University of Tokyo Forests, Japan
34
Compares ion of long-term temperature trends between subalpine and alpine area of EXFO-NTU, Taiwan
Yen-Jen LAI
Associate Researcher, Experimental Forest, National Taiwan University, alanlai@
ntu.edu.tw Introduction
IPCC’s AR5 indicated air temperature in 2000 was about 0.8°C warmer than that in 1950s in Asia regions. The global warming impact could be different from region to region and high mountain regions are some of the most sensitive areas where need to be monitored attentively due to bio-diversity impact issue. Moreover, the long-term temperature trends on the subalpine and alpine area in Taiwan are still open to question. Material and Methods
Moving average is currently one of the effective methods for trend analysis; however, except long-term trend, no more information could be obtained for further analysis from this method. This study tried to use a new algorithm, Ensemble Empirical Mode Decomposition (EEMD) (Huang et al., 1998; Wu and Huang 2005, 2008), to decompose climatic signal into number of components, which are collections of intrinsic mode functions (IMF) and each IMF stands for one impact factor/cycle (e.g. ENSO, PDO, Sunspot or lunar cycles). The last residue is the long-term trend of the signal. Based on IMFs and last residue, we would have a comprehensive grasp of the long-term climatic signal.
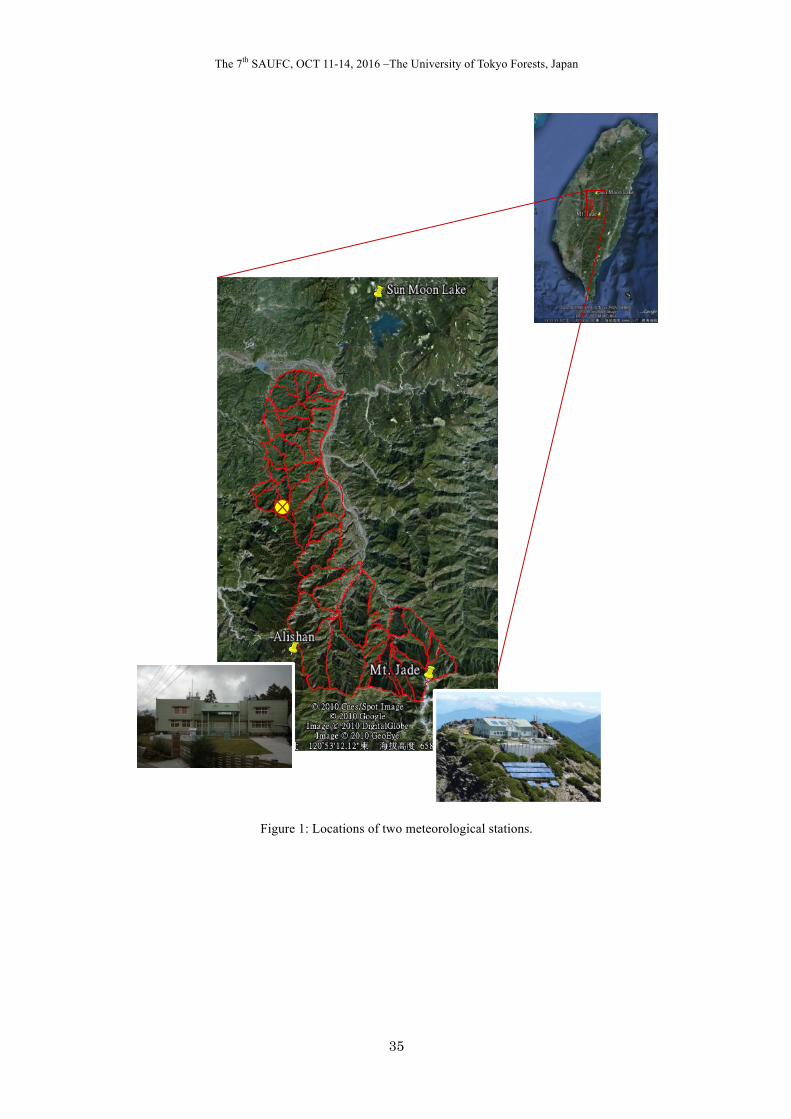
The last residues of climatic signals at two meteorological stations on the high mountain regions in central Taiwan are compared: alpine one is on Mt. Jade North Peak (Elev. 3845m), subalpine one is on Alishan (Elev. 2470m). More than 60 years’ data of both stations were analysed. These climatic signals include monthly-mean air temperature (MAT), monthly-mean maximum air temperature, monthly-mean minimum air temperature, and monthly-mean diurnal air temperature range(DTR) which are highly related to niche information and bio-climate envelope of native species. Results and Discussion
The distance between these two stations is only 15 km, but the results showed the long-term climatic trends were various on Alishan - Mt. Jade area. MAT rose quicker in winter than in summer from both sites, about 1°C higher than the baseline (1950s) in wintertime. Extreme temperature warmer/cooler speeds were different around these two sites. The trends of the monthly-mean DTR were smaller on Alishan but larger on Mt. Jade North Peak. The trends indicated changes of the niches were quick, complex and difficult to be adapted for some plants and animals. Moreover, these inconsistent trends between two sites could limit their migrant space and force some native species to face extinct threat faster than we expect because of global warming. The results also indicate EEMD is a good trend analytic method for most cases although in a few cases, it does get wrong results and have room to be improved. In addition, the IMFs of all analytic results were also worth to be further studied in the future.
The 7th SAUFC, OCT 11-14, 2016 –The University of Tokyo Forests, Japan
35
Figure 1: Locations of two meteorological stations.
The 7th SAUFC, OCT 11-14, 2016 –The University of Tokyo Forests, Japan
36
Long-term monitoring of forestland in NTUEF by remote sensing, GIS and GPS
Chiang WEI1, Raymond LEONG2 & Ming-Jer TSAI3
1,2Experimental Forest, National Taiwan University, Taiwan, ROC,
[email protected]; [email protected] 3 School of Forestry & Resource Conservation, National Taiwan University, Taiwan,
ROC, [email protected] Introduction
During the last decade, the forestland of National Taiwan University Experimental Forest (hereinafter referred as NTUEF) suffered natural disaster such as Chi-Chi Earthquake and subsequent typhoons which induced vast area of landside and debris flow that caused a lot of casualties. Besides, these natural disturbances severely hamper the growth of natural and plantation forest and wildlife within the forest ecosystem. In this study, remote sensing data including aerial photo, satellite imagery and GIS, GPS spatial information were used to detect and monitor the change of forestland. By computing and analyzing the vegetation index BR (Band Ratio) and NDVI (Normalized Difference Vegetation Index) derived from SPOT satellite imagery, the variation of ground vegetation was monitored. FORMOSAT-II satellite imagery was also collected to compute Landscape Pattern Metrics (LPM) in detail. In particular, part of the remotely sensed data in Xitou Tract was further analyzed with the LPM, flora and fauna to assess the impact of forestland change towards the biodiversity.
Material and Methods 1. Study site & remotely sensed data
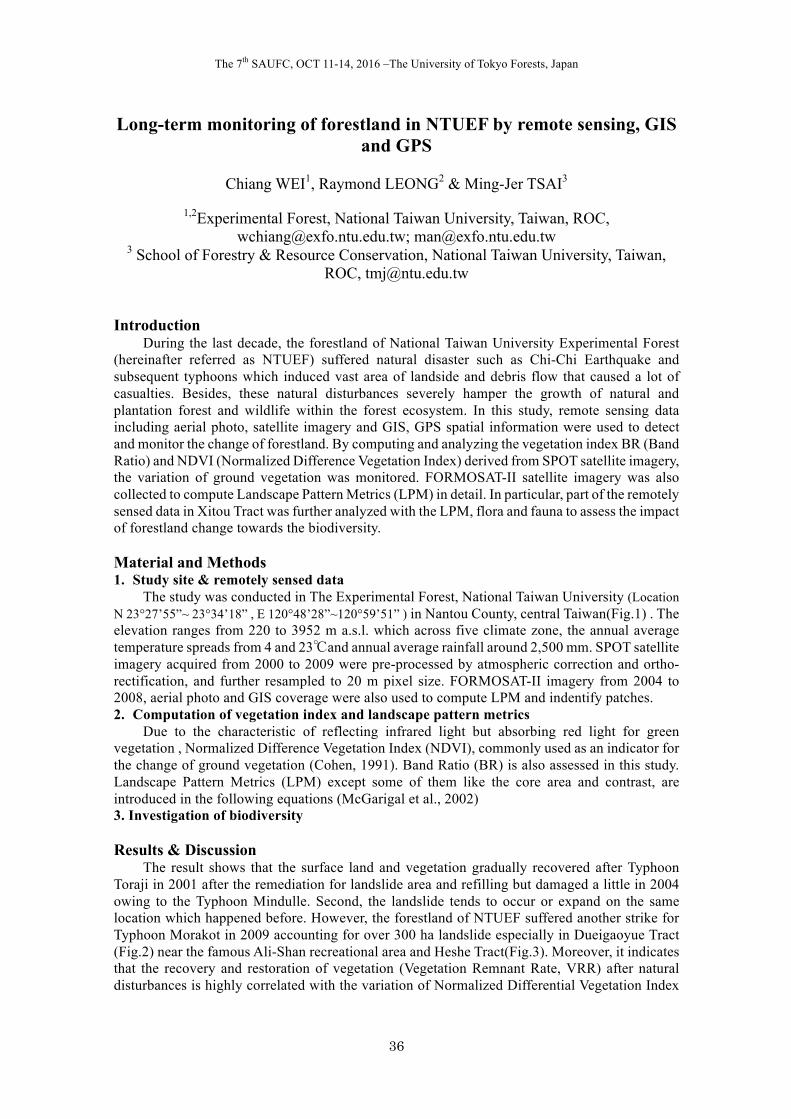
The study was conducted in The Experimental Forest, National Taiwan University (Location N 23°27’55”~ 23°34’18” , E 120°48’28”~120°59’51” ) in Nantou County, central Taiwan(Fig.1) . The elevation ranges from 220 to 3952 m a.s.l. which across five climate zone, the annual average temperature spreads from 4 and 23℃ and annual average rainfall around 2,500 mm. SPOT satellite imagery acquired from 2000 to 2009 were pre-processed by atmospheric correction and ortho-rectification, and further resampled to 20 m pixel size. FORMOSAT-II imagery from 2004 to 2008, aerial photo and GIS coverage were also used to compute LPM and indentify patches. 2. Computation of vegetation index and landscape pattern metrics
Due to the characteristic of reflecting infrared light but absorbing red light for green vegetation , Normalized Difference Vegetation Index (NDVI), commonly used as an indicator for the change of ground vegetation (Cohen, 1991). Band Ratio (BR) is also assessed in this study. Landscape Pattern Metrics (LPM) except some of them like the core area and contrast, are introduced in the following equations (McGarigal et al., 2002) 3. Investigation of biodiversity
Results & Discussion
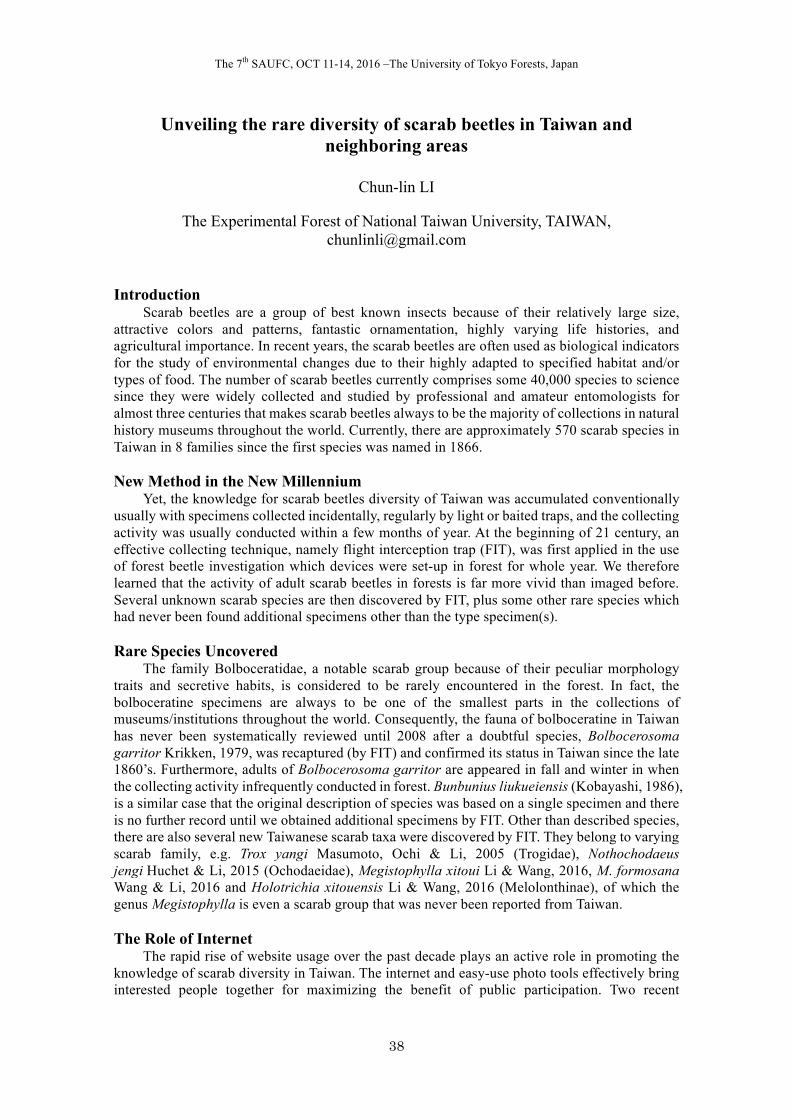
The result shows that the surface land and vegetation gradually recovered after Typhoon Toraji in 2001 after the remediation for landslide area and refilling but damaged a little in 2004 owing to the Typhoon Mindulle. Second, the landslide tends to occur or expand on the same location which happened before. However, the forestland of NTUEF suffered another strike for Typhoon Morakot in 2009 accounting for over 300 ha landslide especially in Dueigaoyue Tract (Fig.2) near the famous Ali-Shan recreational area and Heshe Tract(Fig.3). Moreover, it indicates that the recovery and restoration of vegetation (Vegetation Remnant Rate, VRR) after natural disturbances is highly correlated with the variation of Normalized Differential Vegetation Index
The 7th SAUFC, OCT 11-14, 2016 –The University of Tokyo Forests, Japan
37
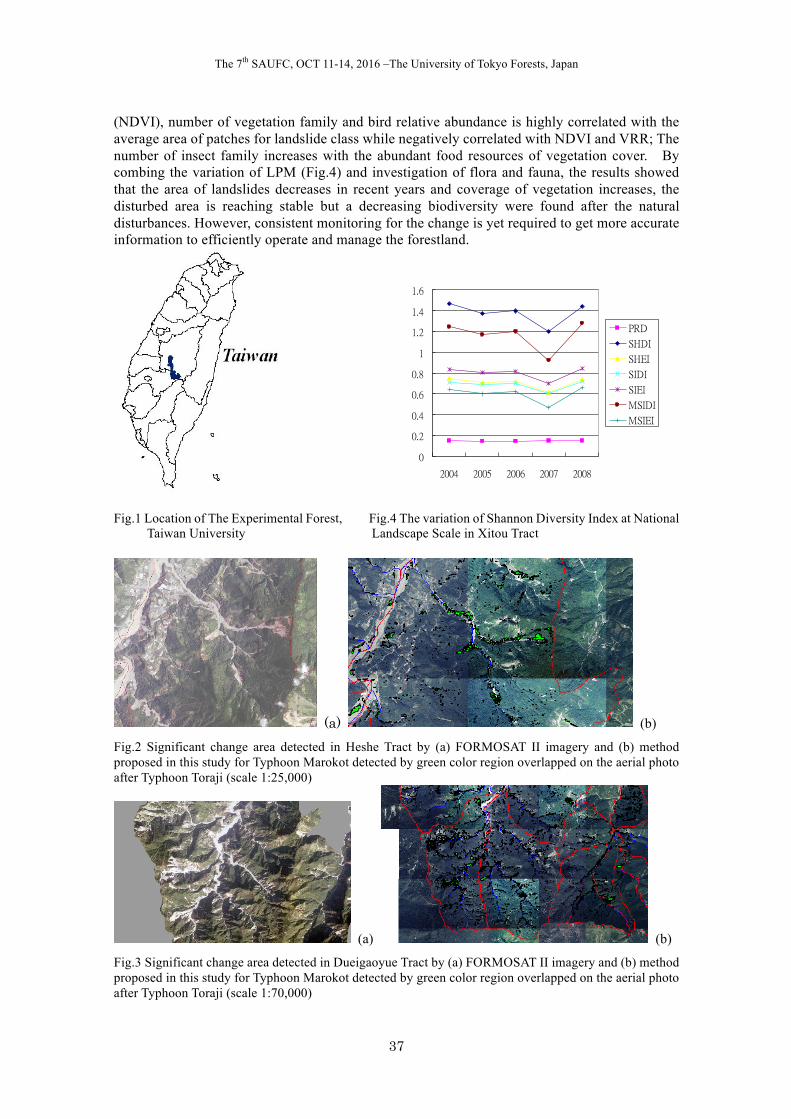
(NDVI), number of vegetation family and bird relative abundance is highly correlated with the average area of patches for landslide class while negatively correlated with NDVI and VRR; The number of insect family increases with the abundant food resources of vegetation cover. By combing the variation of LPM (Fig.4) and investigation of flora and fauna, the results showed that the area of landslides decreases in recent years and coverage of vegetation increases, the disturbed area is reaching stable but a decreasing biodiversity were found after the natural disturbances. However, consistent monitoring for the change is yet required to get more accurate information to efficiently operate and manage the forestland.
Fig.1 Location of The Experimental Forest, Fig.4 The variation of Shannon Diversity Index at National Taiwan University Landscape Scale in Xitou Tract
(a) (b)
Fig.2 Significant change area detected in Heshe Tract by (a) FORMOSAT II imagery and (b) method proposed in this study for Typhoon Marokot detected by green color region overlapped on the aerial photo after Typhoon Toraji (scale 1:25,000)
(a) (b)
Fig.3 Significant change area detected in Dueigaoyue Tract by (a) FORMOSAT II imagery and (b) method proposed in this study for Typhoon Marokot detected by green color region overlapped on the aerial photo after Typhoon Toraji (scale 1:70,000)
0
0.2
0.4
0.6
0.8
1
1.2
1.4
1.6
2004 2005 2006 2007 2008
PRD
SHDI
SHEI
SIDI
SIEI
MSIDI
MSIEI
The 7th SAUFC, OCT 11-14, 2016 –The University of Tokyo Forests, Japan
38
Unveiling the rare diversity of scarab beetles in Taiwan and neighboring areas
Chun-lin LI
The Experimental Forest of National Taiwan University, TAIWAN,
Introduction Scarab beetles are a group of best known insects because of their relatively large size,
attractive colors and patterns, fantastic ornamentation, highly varying life histories, and agricultural importance. In recent years, the scarab beetles are often used as biological indicators for the study of environmental changes due to their highly adapted to specified habitat and/or types of food. The number of scarab beetles currently comprises some 40,000 species to science since they were widely collected and studied by professional and amateur entomologists for almost three centuries that makes scarab beetles always to be the majority of collections in natural history museums throughout the world. Currently, there are approximately 570 scarab species in Taiwan in 8 families since the first species was named in 1866.
New Method in the New Millennium
Yet, the knowledge for scarab beetles diversity of Taiwan was accumulated conventionally usually with specimens collected incidentally, regularly by light or baited traps, and the collecting activity was usually conducted within a few months of year. At the beginning of 21 century, an effective collecting technique, namely flight interception trap (FIT), was first applied in the use of forest beetle investigation which devices were set-up in forest for whole year. We therefore learned that the activity of adult scarab beetles in forests is far more vivid than imaged before. Several unknown scarab species are then discovered by FIT, plus some other rare species which had never been found additional specimens other than the type specimen(s).
Rare Species Uncovered
The family Bolboceratidae, a notable scarab group because of their peculiar morphology traits and secretive habits, is considered to be rarely encountered in the forest. In fact, the bolboceratine specimens are always to be one of the smallest parts in the collections of museums/institutions throughout the world. Consequently, the fauna of bolboceratine in Taiwan has never been systematically reviewed until 2008 after a doubtful species, Bolbocerosoma garritor Krikken, 1979, was recaptured (by FIT) and confirmed its status in Taiwan since the late 1860’s. Furthermore, adults of Bolbocerosoma garritor are appeared in fall and winter in when the collecting activity infrequently conducted in forest. Bunbunius liukueiensis (Kobayashi, 1986), is a similar case that the original description of species was based on a single specimen and there is no further record until we obtained additional specimens by FIT. Other than described species, there are also several new Taiwanese scarab taxa were discovered by FIT. They belong to varying scarab family, e.g. Trox yangi Masumoto, Ochi & Li, 2005 (Trogidae), Nothochodaeus jengi Huchet & Li, 2015 (Ochodaeidae), Megistophylla xitoui Li & Wang, 2016, M. formosana Wang & Li, 2016 and Holotrichia xitouensis Li & Wang, 2016 (Melolonthinae), of which the genus Megistophylla is even a scarab group that was never been reported from Taiwan.
The Role of Internet
The rapid rise of website usage over the past decade plays an active role in promoting the knowledge of scarab diversity in Taiwan. The internet and easy-use photo tools effectively bring interested people together for maximizing the benefit of public participation. Two recent
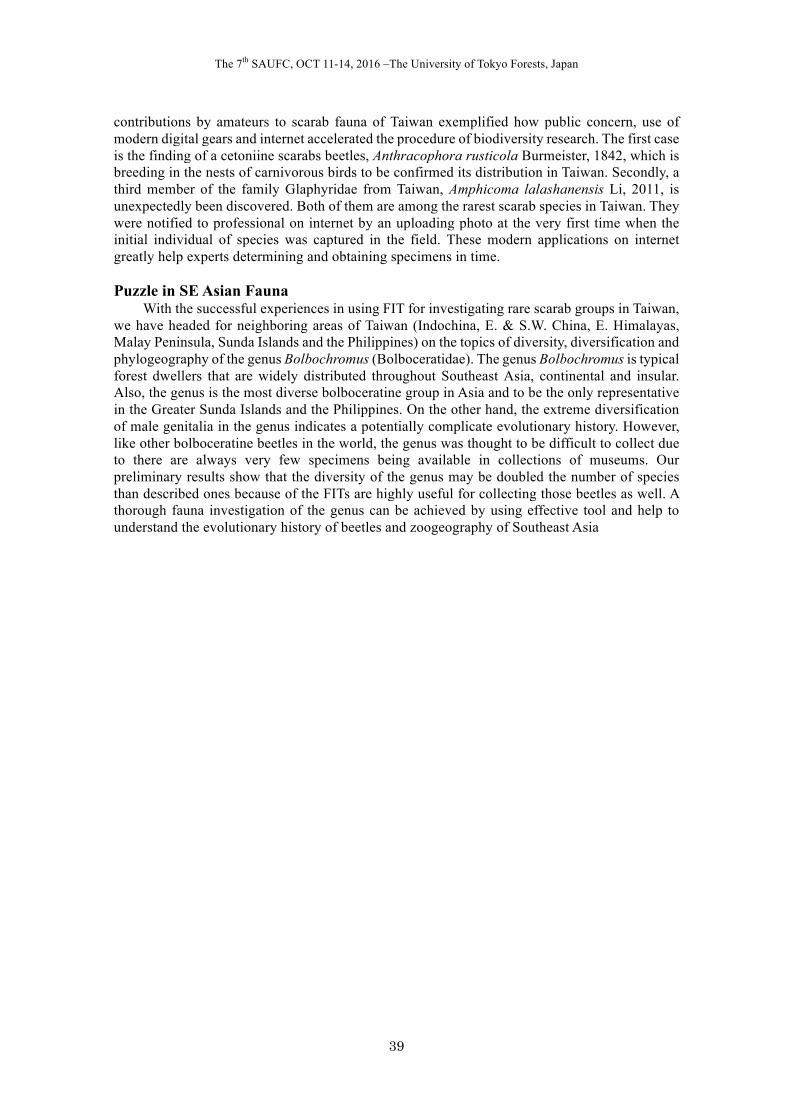
The 7th SAUFC, OCT 11-14, 2016 –The University of Tokyo Forests, Japan
39
contributions by amateurs to scarab fauna of Taiwan exemplified how public concern, use of modern digital gears and internet accelerated the procedure of biodiversity research. The first case is the finding of a cetoniine scarabs beetles, Anthracophora rusticola Burmeister, 1842, which is breeding in the nests of carnivorous birds to be confirmed its distribution in Taiwan. Secondly, a third member of the family Glaphyridae from Taiwan, Amphicoma lalashanensis Li, 2011, is unexpectedly been discovered. Both of them are among the rarest scarab species in Taiwan. They were notified to professional on internet by an uploading photo at the very first time when the initial individual of species was captured in the field. These modern applications on internet greatly help experts determining and obtaining specimens in time.
Puzzle in SE Asian Fauna
With the successful experiences in using FIT for investigating rare scarab groups in Taiwan, we have headed for neighboring areas of Taiwan (Indochina, E. & S.W. China, E. Himalayas, Malay Peninsula, Sunda Islands and the Philippines) on the topics of diversity, diversification and phylogeography of the genus Bolbochromus (Bolboceratidae). The genus Bolbochromus is typical forest dwellers that are widely distributed throughout Southeast Asia, continental and insular. Also, the genus is the most diverse bolboceratine group in Asia and to be the only representative in the Greater Sunda Islands and the Philippines. On the other hand, the extreme diversification of male genitalia in the genus indicates a potentially complicate evolutionary history. However, like other bolboceratine beetles in the world, the genus was thought to be difficult to collect due to there are always very few specimens being available in collections of museums. Our preliminary results show that the diversity of the genus may be doubled the number of species than described ones because of the FITs are highly useful for collecting those beetles as well. A thorough fauna investigation of the genus can be achieved by using effective tool and help to understand the evolutionary history of beetles and zoogeography of Southeast Asia
The 7th SAUFC, OCT 11-14, 2016 –The University of Tokyo Forests, Japan
40
Psychophysiological healthy benefits of forest bathing in middle-aged and elderly
Chia-Min LIN1 & Chia-Pin YU2
1National Taiwan University School of Forestry and Resource Conservation, TAIWAN,
[email protected] 2National Taiwan University School of Forestry and Resource Conservation, TAIWAN,
[email protected] Introduction
Taiwan has experienced significant economic growth and a rapid increase in senior population. Currently, the percentage of people who were 65 years of age and older has reached 12.83%. Taiwan is an aging society and we should pay more attention to healthy promotion in terms of wellbeing. Forest is been considered contribute to human health. Forests affect humans via their impacts on five human senses. Researchers found significant effects of forest bathing on physiological responses such as lower concentrations of cortisol, lower pulse rate, lower blood pressure, lower sympathetic nerve activity, greater parasympathetic nerve activity, and increasing NK activity. Additionally, immersed in forest environment further helps mood change and psychological stress relief. This type of research provides valuable insights in understanding the relationship between forests and human health. In order to better understand healthy effects of forest bathing, this study aims to provide scientific evidences by investigating psychophysiological responses in middle-aged and elderly. Material and Methods
The study area was located at Xitou Nature Education Area (XNEA) in Nantou County, Taiwan. The altitude of major area is 800-1000m. The average temperature of the month of Xitou is 11.0-28.0 C, and the average annual temperature is 16.6 C. The average annual rainfall is 2635 mm.
Authors have developed a two-hour forest bathing program which applies four senses (visual, hearing, smelling and touch) to all the subjects. The forest bathing program included walking and four human senses stimuli, i.e. visual (scenery), auditory (sound of running streams or bird singing), olfactory (the smell of wood), and tactile (feeling the surfaces of leaves and trees). Pretest and posttest were conducted between 9:00-9:30 and 11:30-12:00 am. In order to minimize variations of environmental factors, the investigation was conducted in the morning which temperature, humidity, wind speed and light would be constant. The study subjects were recruited randomly at the main entrance of XNEA during 2016/7/15-27. Participants had to meet three eligibility criteria: (1) aged ≥45 years, (2) capable of participating the full forest bathing program and (3) no drinking tea, coffee or any alcoholic drinks before the experiment. Physiological indicators include pulse rate, blood pressure, salivary alpha-amylase as well as psychological responses were measured using profile of mood states (POMS) and state-trait anxiety inventory state subscale (STAI-S) before and after the forest bathing program. The results of each indicator were analysis by paired t-test. Statistical analysis of data was processed using IBM SPSS Statistics 20.0. Results and Discussion
One hundred and twenty-eight subjects were recruited. The participants in this study were aged 45 to 86, with a mean age of 60.0 years (SD=7.44). This included 85 women (66.4%) and 43 men (33.6%).
Table 1 shows the changes in physiological indicators. The average pulse rate (3.34%
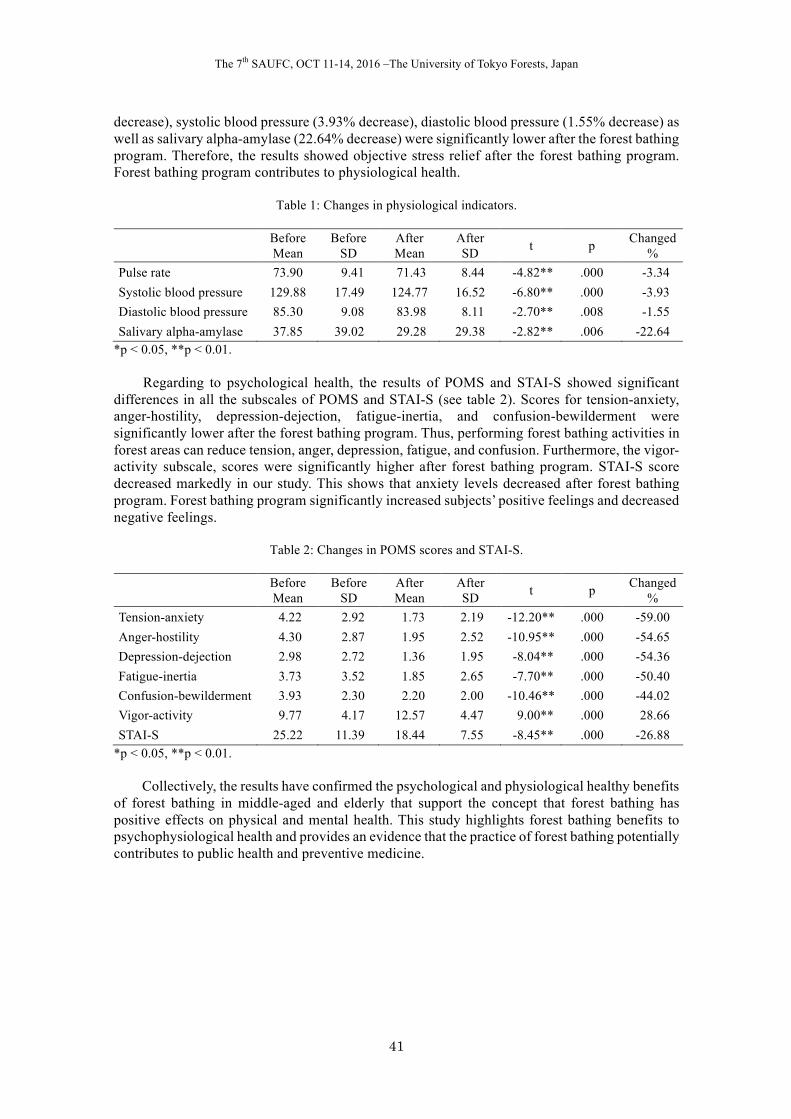
The 7th SAUFC, OCT 11-14, 2016 –The University of Tokyo Forests, Japan
41
decrease), systolic blood pressure (3.93% decrease), diastolic blood pressure (1.55% decrease) as well as salivary alpha-amylase (22.64% decrease) were significantly lower after the forest bathing program. Therefore, the results showed objective stress relief after the forest bathing program. Forest bathing program contributes to physiological health.
Table 1: Changes in physiological indicators.
Before Mean
Before SD
After Mean
After SD t p Changed
% Pulse rate 73.90 9.41 71.43 8.44 -4.82** .000 -3.34 Systolic blood pressure 129.88 17.49 124.77 16.52 -6.80** .000 -3.93 Diastolic blood pressure 85.30 9.08 83.98 8.11 -2.70** .008 -1.55 Salivary alpha-amylase 37.85 39.02 29.28 29.38 -2.82** .006 -22.64
*p < 0.05, **p < 0.01.
Regarding to psychological health, the results of POMS and STAI-S showed significant differences in all the subscales of POMS and STAI-S (see table 2). Scores for tension-anxiety, anger-hostility, depression-dejection, fatigue-inertia, and confusion-bewilderment were significantly lower after the forest bathing program. Thus, performing forest bathing activities in forest areas can reduce tension, anger, depression, fatigue, and confusion. Furthermore, the vigor-activity subscale, scores were significantly higher after forest bathing program. STAI-S score decreased markedly in our study. This shows that anxiety levels decreased after forest bathing program. Forest bathing program significantly increased subjects’ positive feelings and decreased negative feelings.
Table 2: Changes in POMS scores and STAI-S.
Before Mean
Before SD
After Mean
After SD t p Changed
% Tension-anxiety 4.22 2.92 1.73 2.19 -12.20** .000 -59.00 Anger-hostility 4.30 2.87 1.95 2.52 -10.95** .000 -54.65 Depression-dejection 2.98 2.72 1.36 1.95 -8.04** .000 -54.36 Fatigue-inertia 3.73 3.52 1.85 2.65 -7.70** .000 -50.40 Confusion-bewilderment 3.93 2.30 2.20 2.00 -10.46** .000 -44.02 Vigor-activity 9.77 4.17 12.57 4.47 9.00** .000 28.66 STAI-S 25.22 11.39 18.44 7.55 -8.45** .000 -26.88
*p < 0.05, **p < 0.01.
Collectively, the results have confirmed the psychological and physiological healthy benefits of forest bathing in middle-aged and elderly that support the concept that forest bathing has positive effects on physical and mental health. This study highlights forest bathing benefits to psychophysiological health and provides an evidence that the practice of forest bathing potentially contributes to public health and preventive medicine.
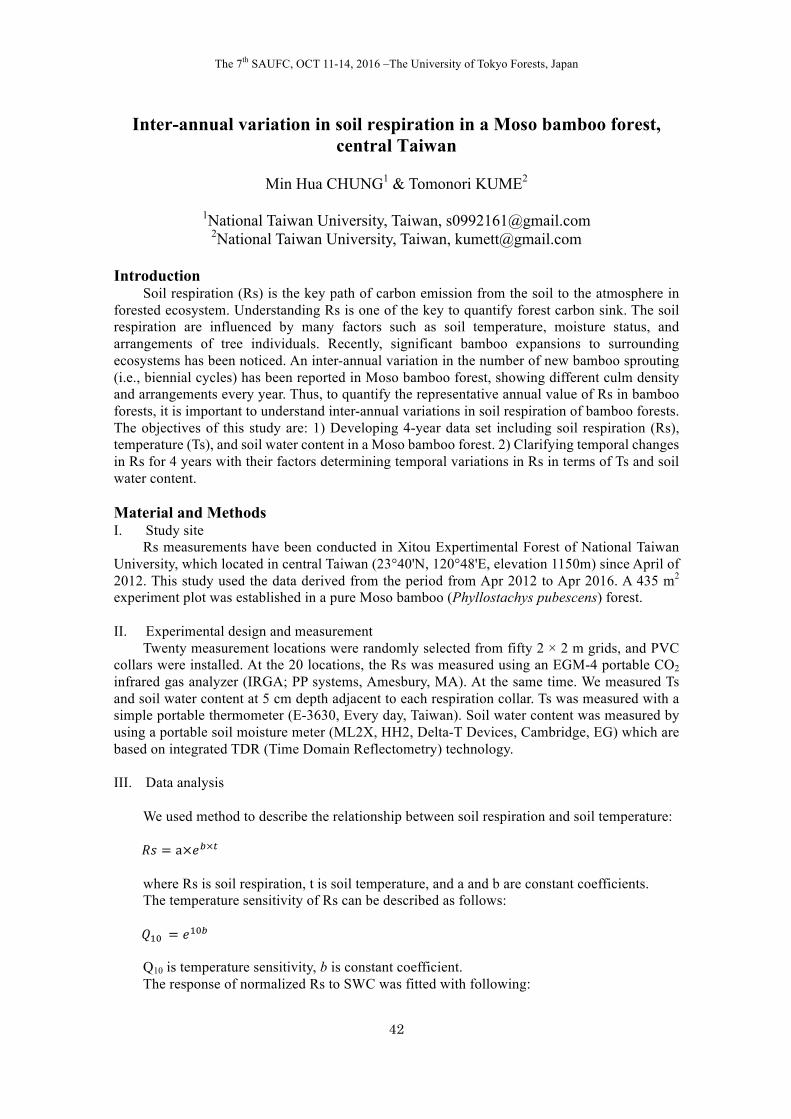
The 7th SAUFC, OCT 11-14, 2016 –The University of Tokyo Forests, Japan
42
Inter-annual variation in soil respiration in a Moso bamboo forest, central Taiwan
Min Hua CHUNG1 & Tomonori KUME2
1National Taiwan University, Taiwan, [email protected]
2National Taiwan University, Taiwan, [email protected]
Introduction Soil respiration (Rs) is the key path of carbon emission from the soil to the atmosphere in
forested ecosystem. Understanding Rs is one of the key to quantify forest carbon sink. The soil respiration are influenced by many factors such as soil temperature, moisture status, and arrangements of tree individuals. Recently, significant bamboo expansions to surrounding ecosystems has been noticed. An inter-annual variation in the number of new bamboo sprouting (i.e., biennial cycles) has been reported in Moso bamboo forest, showing different culm density and arrangements every year. Thus, to quantify the representative annual value of Rs in bamboo forests, it is important to understand inter-annual variations in soil respiration of bamboo forests. The objectives of this study are: 1) Developing 4-year data set including soil respiration (Rs), temperature (Ts), and soil water content in a Moso bamboo forest. 2) Clarifying temporal changes in Rs for 4 years with their factors determining temporal variations in Rs in terms of Ts and soil water content.
Material and Methods I. Study site
Rs measurements have been conducted in Xitou Expertimental Forest of National Taiwan University, which located in central Taiwan (23°40'N, 120°48'E, elevation 1150m) since April of 2012. This study used the data derived from the period from Apr 2012 to Apr 2016. A 435 m2
experiment plot was established in a pure Moso bamboo (Phyllostachys pubescens) forest. II. Experimental design and measurement
Twenty measurement locations were randomly selected from fifty 2 × 2 m grids, and PVC collars were installed. At the 20 locations, the Rs was measured using an EGM-4 portable CO2 infrared gas analyzer (IRGA; PP systems, Amesbury, MA). At the same time. We measured Ts and soil water content at 5 cm depth adjacent to each respiration collar. Ts was measured with a simple portable thermometer (E-3630, Every day, Taiwan). Soil water content was measured by using a portable soil moisture meter (ML2X, HH2, Delta-T Devices, Cambridge, EG) which are based on integrated TDR (Time Domain Reflectometry) technology.
III. Data analysis
We used method to describe the relationship between soil respiration and soil temperature: 𝑅𝑠 = a×𝑒'×( where Rs is soil respiration, t is soil temperature, and a and b are constant coefficients. The temperature sensitivity of Rs can be described as follows:
𝑄+, = 𝑒+,' Q10 is temperature sensitivity, b is constant coefficient. The response of normalized Rs to SWC was fitted with following:
The 7th SAUFC, OCT 11-14, 2016 –The University of Tokyo Forests, Japan
43
𝑅𝑠
𝑅𝑠 𝑇𝑠= c𝜃0 + 𝑑𝜃 + 𝑒
𝑅𝑠
𝑅𝑠 𝑇𝑠= 𝑐 + 𝑑𝜃
Where 𝜃 indicates volumetric SWC, and c, d and e are parameters to be fitted.
Results and Discussion I. Development of four year data base
This study successfully developed four years Rs data base with Ts and soil water content. Total measurement campaigns for Rs, Ts, and soil water content were 44 times in the four years. The data set showed obvious seasonal variations of Rs and Ts in the four years, being highest in summer and lowest in winter.
II. Temporal variation in Rs
(I). Soil respiration In first year, the annual mean Rs averaged over 20 locations was 2.92±1.16µmol CO2 m-2 s-
1, the Rs being highest in July-12(4.87µmol CO2 m-2 s-1) and lowest in Feb-13(1.53µmol CO2 m-
2 s-1). In second year, the annual mean Rs averaged over 20 locations was 2.98±1.4µmol CO2 m-
2 s-1, the Rs being highest in July-12 (4.98µmol CO2 m-2 s-1) and lowest in Jan-14 (0.93µmol CO2 m-2 s-1). In third year, the annual mean Rs averaged over 20 locations was 3.17±1.38µmol CO2 m-2 s-1, the Rs being highest (5.68µmol CO2 m-2 s-1) in Jun-14 and lowest in Jan-15(1.23µmol CO2 m-2 s-1). In fourth year, the Rs being highest in Apr-15(5.49µmol CO2 m-2 s-1) and lowest in Dec-13(1.61µmol CO2 m-2 s-1). The annual mean Rs (3.17±1.38µmol CO2 m-2 s-1) of fourth year was highest in the four years. The highest Rs of third year (5.68µmol CO2 m-2 s-1) was higher than the other years.
(II). Soil respiration response to soil temperature and soil water content The temporal variation in Rs averaged over 20 locations were strongly related to the Ts
(P<0.0001, R=0.5509) in the four years. Rs were related to the Ts in first year (P<0.0001, R=0.5503), second year (P<0.0001, R=0.6697), third year (P<0.0001, R=0.6156) and four year (P<0.0001, R=0.3569), respectively. The significant positive correlation between Rs and Ts indicated the seasonal variation of Ts was a main factor affecting the Rs for the four years. The temperature sensitivity (Q10 = e10*b) in first, second, third and fourth year was 4.04, 4.07, 5.87, 2.07 respectively. The weak relationship between Rs and SWC between four years. Conclusion
This study examined inter-annual variations in Rs, Ts, and soil water content in the Moso bamboo forest based on the four years dataset developed in this study. The annual mean Rs (3.17±1.38µmol CO2 m-2 s-1) of third year was highest in the four years because of temperature sensitivity. Ts was a main factor affecting the temporal variation of Rs for the four years. While, the weak relationship between Rs and SWC between four years.
The 7th SAUFC, OCT 11-14, 2016 –The University of Tokyo Forests, Japan
44
Xylooligosaccharides and lactic acid production from pretreated Alnus formosana biomass
Chun Han KO1, Guan Hong LIOU2 & Chieh Yu WEN3
1 School of Forestry and Resource Conservation, National Taiwan University, Taiwan,
[email protected] 2 School of Forestry and Resource Conservation, National Taiwan University, Taiwan,
[email protected] 3 School of Forestry and Resource Conservation, National Taiwan University, Taiwan,
[email protected] Introduction
Alnus formosana is a native species of central Taiwan. In order to take good use of the biomass, pretreatments including H2O steam explosion (HSE), 1.5% sulfuric acid steam explosion (ASE), RT-CaCCO (room temperature-calcium capturing by carbonation) and CaCCO (calcium capturing by carbonation) processes, and beating methods are conducted before production of xolooligosacchrides (XOs) and lactic acid production.
In XOs production, untreated and HSE A. formosana were mixed with 12% (w/v) NaOH solution with the liquid / solid ratio of 10. The mixtures were extracted at 150 rpm and 60oC for 16 hr. The mixtures were filtered and the filtrates were adjusted to pH 7 by HCl, and then they were mixed with EtOH and purified by ultrafiltration or nanofiltration. Then xylan was oven dried and conserved. 1% xylan was hydrolyzed by 10, 50, 100 IU/mL of enzymes to produce XOs. Results showed that xylan only conducted by EtOH treatment obtained the highest XOs, with 8.26 mg/mL. There were no significant differences between untreated and HSE A. formosana xylan on XOs production.
In lactic acid production, A. formosana pretreated by steam explosion, lime (RT-CaCCO and CaCCO), and beating methods were conducted by simultaneous hydrolysis and fermentation (SSF) to produce lactic acid. Results showed that A. formosana with 1.5% sulfuric acid steam explosion (ASE) pretreatment obtained the highest glucose concentration 4.00 g/L in enzyme hydrolysis at Day 4, and the efficiency was 53.35 %. And SSF of ASE also resulted in the highest lactic acid production, with 6.22 g/L at Day 4 and 11.51 g/L at Day 10, and the productivity was 0.048 gL-1h-1. The impacts of pretreatment efficiencies mentioned above were ASE > beating > lime.
Key word: Alnus formosana, steam explosion, beating, RT-CaCCO, lactic acid,
xlooligosaccharids

The 7th SAUFC, OCT 11-14, 2016 –The University of Tokyo Forests, Japan
45
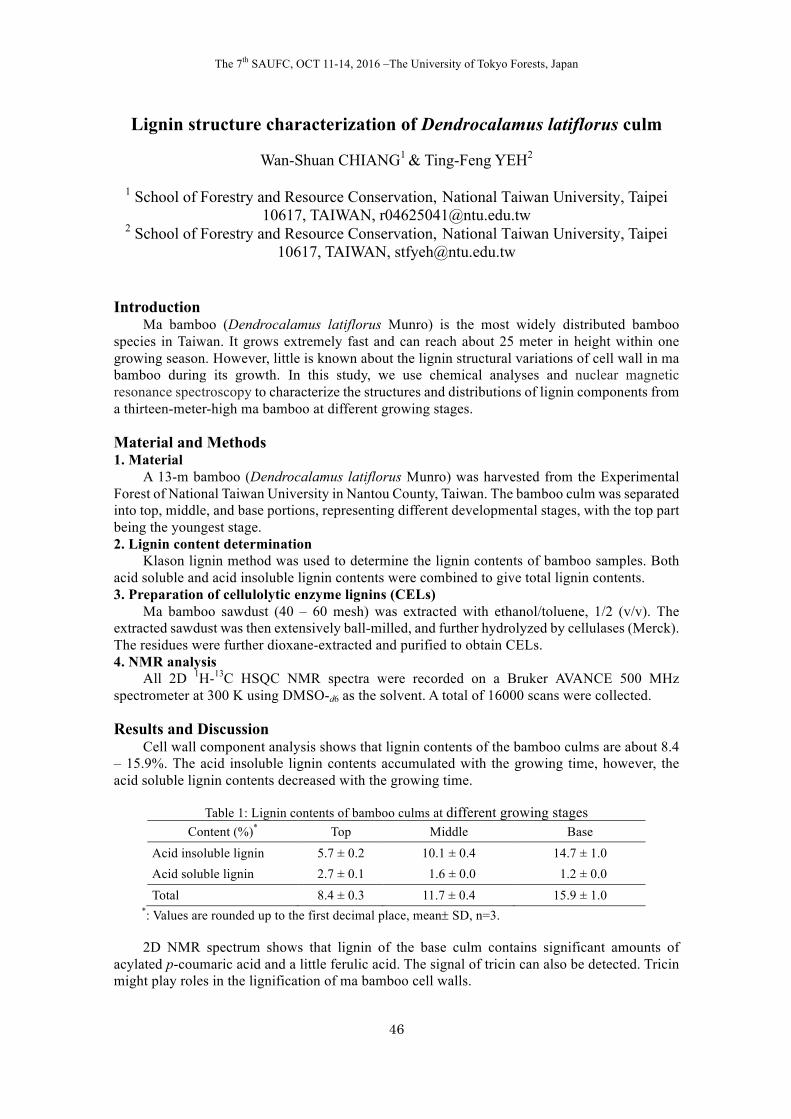
The 7th SAUFC, OCT 11-14, 2016 –The University of Tokyo Forests, Japan
46
Lignin structure characterization of Dendrocalamus latiflorus culm
Wan-Shuan CHIANG1 & Ting-Feng YEH2
1 School of Forestry and Resource Conservation, National Taiwan University, Taipei 10617, TAIWAN, [email protected]
2 School of Forestry and Resource Conservation, National Taiwan University, Taipei 10617, TAIWAN, [email protected]
Introduction
Ma bamboo (Dendrocalamus latiflorus Munro) is the most widely distributed bamboo species in Taiwan. It grows extremely fast and can reach about 25 meter in height within one growing season. However, little is known about the lignin structural variations of cell wall in ma bamboo during its growth. In this study, we use chemical analyses and nuclear magnetic resonance spectroscopy to characterize the structures and distributions of lignin components from a thirteen-meter-high ma bamboo at different growing stages. Material and Methods 1. Material
A 13-m bamboo (Dendrocalamus latiflorus Munro) was harvested from the Experimental Forest of National Taiwan University in Nantou County, Taiwan. The bamboo culm was separated into top, middle, and base portions, representing different developmental stages, with the top part being the youngest stage. 2. Lignin content determination
Klason lignin method was used to determine the lignin contents of bamboo samples. Both acid soluble and acid insoluble lignin contents were combined to give total lignin contents. 3. Preparation of cellulolytic enzyme lignins (CELs)
Ma bamboo sawdust (40 – 60 mesh) was extracted with ethanol/toluene, 1/2 (v/v). The extracted sawdust was then extensively ball-milled, and further hydrolyzed by cellulases (Merck). The residues were further dioxane-extracted and purified to obtain CELs. 4. NMR analysis
All 2D 1H-13C HSQC NMR spectra were recorded on a Bruker AVANCE 500 MHz spectrometer at 300 K using DMSO-d6 as the solvent. A total of 16000 scans were collected. Results and Discussion
Cell wall component analysis shows that lignin contents of the bamboo culms are about 8.4 – 15.9%. The acid insoluble lignin contents accumulated with the growing time, however, the acid soluble lignin contents decreased with the growing time.
Table 1: Lignin contents of bamboo culms at different growing stages
Content (%)* Top Middle Base Acid insoluble lignin 5.7 ± 0.2 10.1 ± 0.4 14.7 ± 1.0 Acid soluble lignin 2.7 ± 0.1 1.6 ± 0.0 1.2 ± 0.0 Total 8.4 ± 0.3 11.7 ± 0.4 15.9 ± 1.0
*: Values are rounded up to the first decimal place, mean± SD, n=3.
2D NMR spectrum shows that lignin of the base culm contains significant amounts of acylated p-coumaric acid and a little ferulic acid. The signal of tricin can also be detected. Tricin might play roles in the lignification of ma bamboo cell walls.
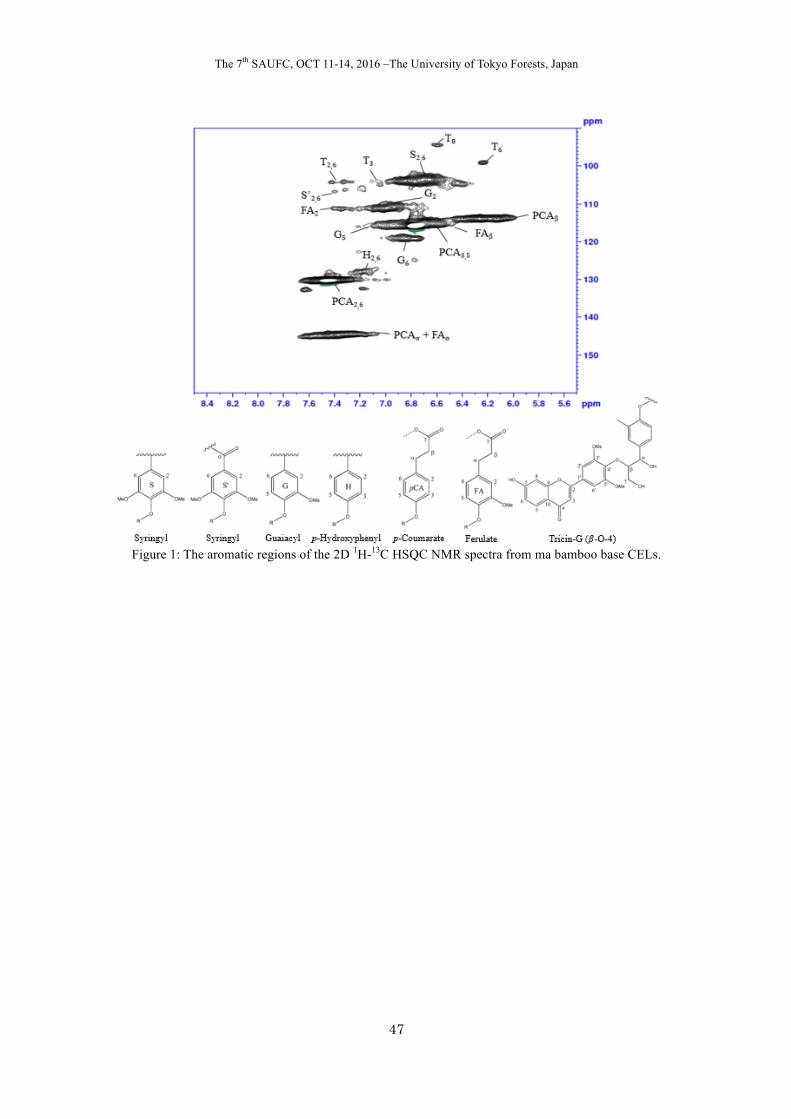
The 7th SAUFC, OCT 11-14, 2016 –The University of Tokyo Forests, Japan
47
Figure 1: The aromatic regions of the 2D 1H-13C HSQC NMR spectra from ma bamboo base CELs.
The 7th SAUFC, OCT 11-14, 2016 –The University of Tokyo Forests, Japan
48
Nest site selection of Malayan Night Herons (Gorsachius melanophus) in urban area
Chia-Wei HSH1 & Hsiao-Wei YUAN2
1 School of Forestry and Resource Conservation, National Taiwan University, Taipei,
Taiwan, R.O.C, [email protected] 2 School of Forestry and Resource Conservation, National Taiwan University, Taipei,
Taiwan, R.O.C, [email protected] Introduction
Urbanization is a global phenomenon that affects not only humans but also animals and plants, causing loss of natural habitats and decreasing biodiversity. However, urbanization can still provide new anthropogenic habitats for some adaptable wildlife. Malayan Night Herons (Gorsachius melanolophus) are good examples in urban areas. According to our survey, the amount of the Malayan Night Heron population in urban areas in Taiwan has risen in recent years. Material and Methods
The study was conducted in parks and green spaces in Taipei from May to June in 2016. We survey Malayan Night Heron population distribution and factors of nest site which including tree height, nest height, tree species, diameter at breast height (DBH), branch numbers under the nests, crown diameter, and nest sizes. It also contains Malayan Night Heron clutch size, the number of hatched offspring, and fledging number. We analyzed nest site habitat composition, containing the proportion of building areas, lawns and meadows, ponds, impervious surfaces, woodland, and roads. In breeding season, we tracked Malayan Night Heron, and marked the their rest spots and foraging ranges, dig and calculate earthworm biomass in soils, and compare with the random point to understand the food resources around. Finally, it surveys the proportion of tree species in the park and green spaces to understand the utilization of nest trees for Malayan Night Herons. Results
We found 41 Malayan Night Herons’ nests in the chosen 63 parks and green spaces, they distribute over 38 areas, we banded 147 individuals, including 85 adults, 40 subadults, and 22 juveniles. The average of nest height is 8.15 ± 2.11 m, the average of diameter at breast height is 0.58 ± 0.36 m, and the average of distance to trunk is 5.01 ± 2.48 m. As for the nest site environment, 25.93% of the nest sites are located on the edge of the woods, 33.33% on the roadside, 29.63% beside the open space, and 11.11% in the woods. Among the nest trees, the proportion of the Marabutan (Ficus spp.) is 63.41%, comphor tree (Cinnamomum camphora L. Presl.) and Taiwan acacia (Acacia confusa Merr.) are 9.76%, Taiwan Golden-rain Tree (Koelreuteria henryi Dummer) is 7.32%, Autummn Maple Tree (Bischofia jabanica Blume.) is 4.88%, Madagascar Almond (Terminalia muellerii Benth.), Formosan Sweet Gum (Liquidambar formosana Hance), Cajeuput-tree (Melaleuca leucadendra Linn.) and Palimara Alstonia (Alstonia scholaris L. R. Br.) are all 2.44%. Discussion 1. The amount of the population and breeding are increased for Malayan Night Herons in urban
areas. The past studies show that they were vulnerable species and nested by the riverbank in dense forests at lower altitudes (Wang et al., 1991). In the survey, we found they are common species in the urban parks in Taipei. According to the result of this study, we would like to set the Malayan Night Herons as an environmental indicator specie to help us understand the local environment.

The 7th SAUFC, OCT 11-14, 2016 –The University of Tokyo Forests, Japan
49
2. In Taipei, there are large areas of parks and green spaces, many trees had been grown for decades whose heights are suitable for Malayan Night Herons to nest. Moreover, there are many resources of nest trees for choosing, so Malayan Night Herons are able to breed to produce offspring.
3. The main kind of food for Malayan Night Herons are earthworms. There is not other large species are found to have earthworms as the staple in the urban parks and green spaces in Taipei, that makes the Malayan Night Herons can fit in this ecological niche and make use of the abundant food resources.
4. Currently, Malayan Night Herons mostly use Marabutan as nest trees, but the Marabutan in urban areas easily fall down when typhoon comes, and now Marabutan aren't planted as landscaping trees any more. However, the survey found that Malayan Night Herons would not only use Marabutan as nest trees. Therefore, it is predicted that in the future, depending on the proportion of the tree species in urban areas, Malayan Night Herons will change their choices of nesting.
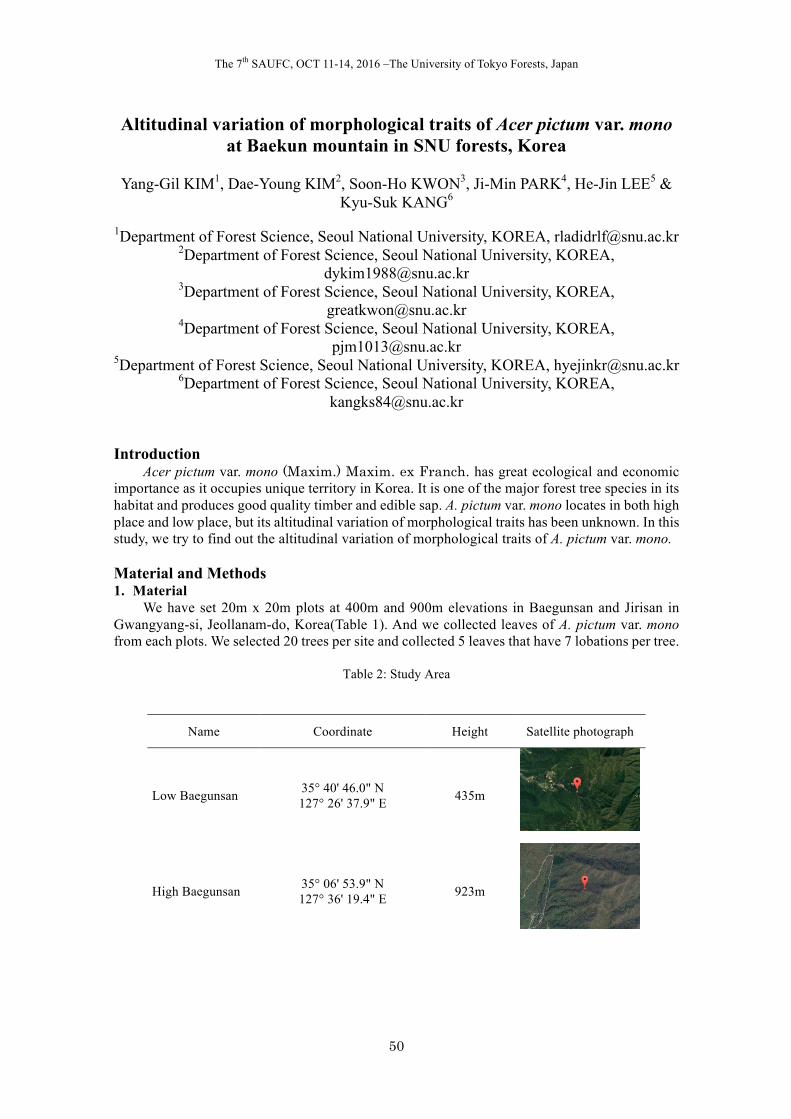
The 7th SAUFC, OCT 11-14, 2016 –The University of Tokyo Forests, Japan
50
Altitudinal variation of morphological traits of Acer pictum var. mono at Baekun mountain in SNU forests, Korea
Yang-Gil KIM1, Dae-Young KIM2, Soon-Ho KWON3, Ji-Min PARK4, He-Jin LEE5 &
Kyu-Suk KANG6
1Department of Forest Science, Seoul National University, KOREA, [email protected] 2Department of Forest Science, Seoul National University, KOREA,
[email protected] 3Department of Forest Science, Seoul National University, KOREA,
[email protected] 4Department of Forest Science, Seoul National University, KOREA,
[email protected] 5Department of Forest Science, Seoul National University, KOREA, [email protected]
6Department of Forest Science, Seoul National University, KOREA, [email protected]
Introduction
Acer pictum var. mono (Maxim.) Maxim. ex Franch. has great ecological and economic importance as it occupies unique territory in Korea. It is one of the major forest tree species in its habitat and produces good quality timber and edible sap. A. pictum var. mono locates in both high place and low place, but its altitudinal variation of morphological traits has been unknown. In this study, we try to find out the altitudinal variation of morphological traits of A. pictum var. mono. Material and Methods 1. Material
We have set 20m x 20m plots at 400m and 900m elevations in Baegunsan and Jirisan in Gwangyang-si, Jeollanam-do, Korea(Table 1). And we collected leaves of A. pictum var. mono from each plots. We selected 20 trees per site and collected 5 leaves that have 7 lobations per tree.
Table 2: Study Area
Name Coordinate Height Satellite photograph
Low Baegunsan 35° 40' 46.0" N 127° 26' 37.9" E 435m
High Baegunsan 35° 06' 53.9" N 127° 36' 19.4" E 923m
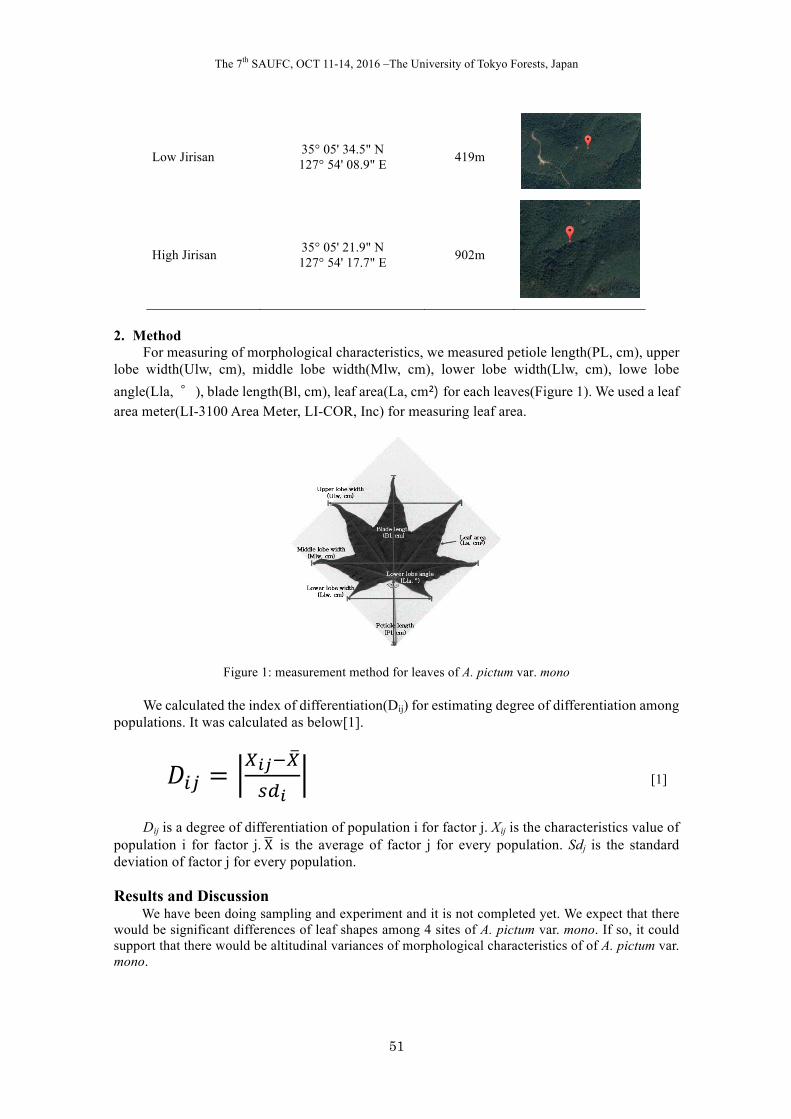
The 7th SAUFC, OCT 11-14, 2016 –The University of Tokyo Forests, Japan
51
Low Jirisan 35° 05' 34.5" N 127° 54' 08.9" E 419m
High Jirisan 35° 05' 21.9" N 127° 54' 17.7" E 902m
2. Method
For measuring of morphological characteristics, we measured petiole length(PL, cm), upper lobe width(Ulw, cm), middle lobe width(Mlw, cm), lower lobe width(Llw, cm), lowe lobe angle(Lla, °), blade length(Bl, cm), leaf area(La, cm²) for each leaves(Figure 1). We used a leaf area meter(LI-3100 Area Meter, LI-COR, Inc) for measuring leaf area.
Figure 1: measurement method for leaves of A. pictum var. mono We calculated the index of differentiation(Dij) for estimating degree of differentiation among
populations. It was calculated as below[1].
𝐷56 =789:7;<8
[1]
Dij is a degree of differentiation of population i for factor j. Xij is the characteristics value of
population i for factor j.X is the average of factor j for every population. Sdj is the standard deviation of factor j for every population. Results and Discussion
We have been doing sampling and experiment and it is not completed yet. We expect that there would be significant differences of leaf shapes among 4 sites of A. pictum var. mono. If so, it could support that there would be altitudinal variances of morphological characteristics of of A. pictum var. mono.
The 7th SAUFC, OCT 11-14, 2016 –The University of Tokyo Forests, Japan
52
Analysis of growth trend changes for 51 temperate tree species using Korea national forest inventory data
Minjee PARK1, Minkyu MOON2, Juhan PARK1, Sungsik CHO3 &
Hyun Seok KIM1,3,4,5
1Department of Forest Sciences, Seoul National University, Seoul, South Korea, [email protected], [email protected], [email protected]
2Department of Earth and Environment, Boston University, Boston, MA, United States, [email protected]
3Interdisciplinary Program in Agricultural and Forest Meteorology, Seoul National University, Seoul, South Korea, [email protected], [email protected]
4National Center for AgroMeteorology, Seoul, South Korea, [email protected] 5Department of Forest Sciences, Institute of Future Environmental and Forest
Resources, Research Institute for Agriculture and Life Sciences, Seoul National University, Seoul, South Korea, [email protected]
Introduction
Individual tree growth rates can be affected by various factors such as species, soil fertility, stand development stage, disturbance, and climate etc. To evaluate which trees are growing better or worse than their expected growth pattern in current, we can use tree ring samples and investigate long-term growth change by removing the internal age and size-related growth trends. However, tree ring core sampling costs much and is time-consuming. As a result, most previous studies have been limited by small number of samples and/or small area coverage. In Korea, a large data of tree ring samples on national level has been released from national forest inventory based on strictly statistical designs.
To estimate the effect of changes in tree growth rate on the structure and functionality of forest ecosystem in the future, we analyze the change of species-specific growth trends using the fifth Korea national forest inventory data, which was collected from 2006 to 2010. Material and Methods
The ring samples of average tree were collected from nationwide inventory plots and the total number of individual tree ring series was 69,128 covering 185 tree species. Among those, fifty one species with more than 100 tree ring series are used for our analysis. To remove trees that has eccentric growth from data set, we compare diameter of the tree and sum of tree ring series then exclude the tree with large differences. To examine natural effects only, we also exclude sampling plots known to have had anthropogenic disturbance. For growth-trend analysis, standardized regional curves of individual species growth are generated from three forest zone in South Korea; subarctic, cool temperate, warm temperate forest zone. Then individual tree ring series is indexed by dividing the growth of the tree by expected growth from standardized regional curves. Then the ratio of all tree ring series were aligned by year and the Spearman’s correlation coefficient of each species was calculated. Results and Discussion
The results show that most of species had increasing growth rates as forests developed after the Korean War. For the last thirty years, 67.3% of species including Quercus spp. and Zelkova serrata had positive growth trends, on the other hand, 11.5% of species including Pinus spp. showed negative growth trends probably due to the changes in successional stages in Korean forests and climate change (see Figure 1). These trends also vary with forest zone and species.
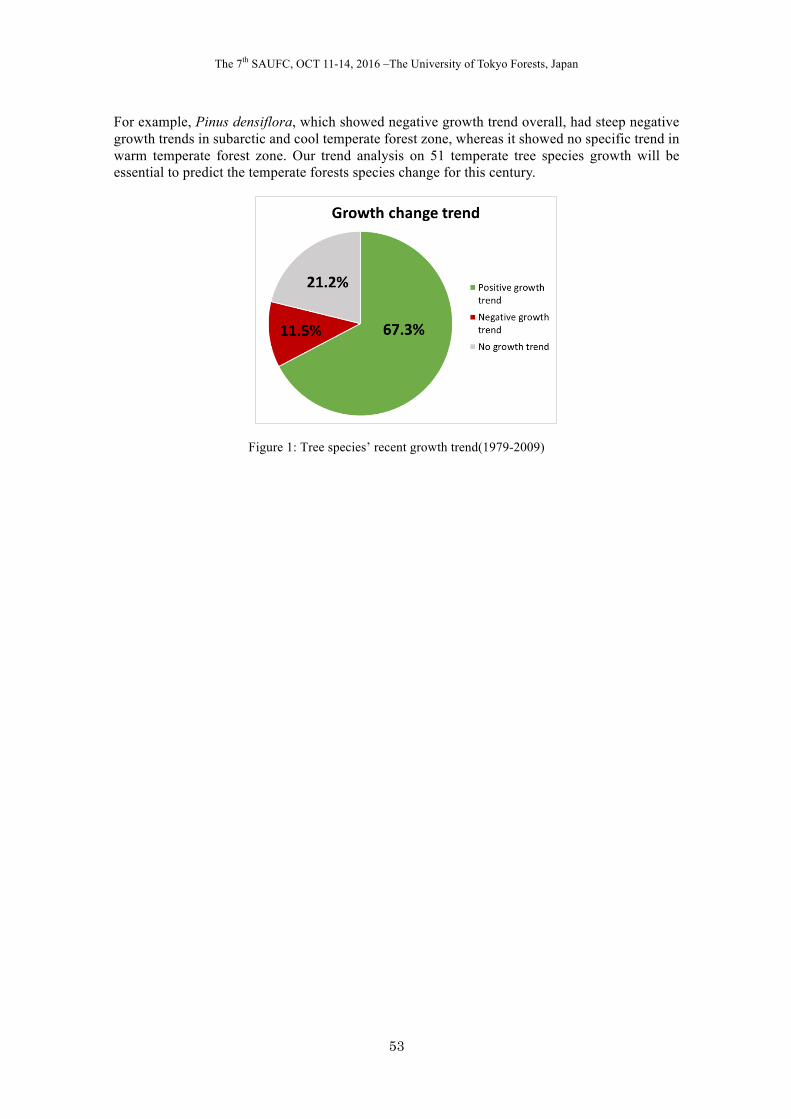
The 7th SAUFC, OCT 11-14, 2016 –The University of Tokyo Forests, Japan
53
For example, Pinus densiflora, which showed negative growth trend overall, had steep negative growth trends in subarctic and cool temperate forest zone, whereas it showed no specific trend in warm temperate forest zone. Our trend analysis on 51 temperate tree species growth will be essential to predict the temperate forests species change for this century.
Figure 1: Tree species’ recent growth trend(1979-2009)
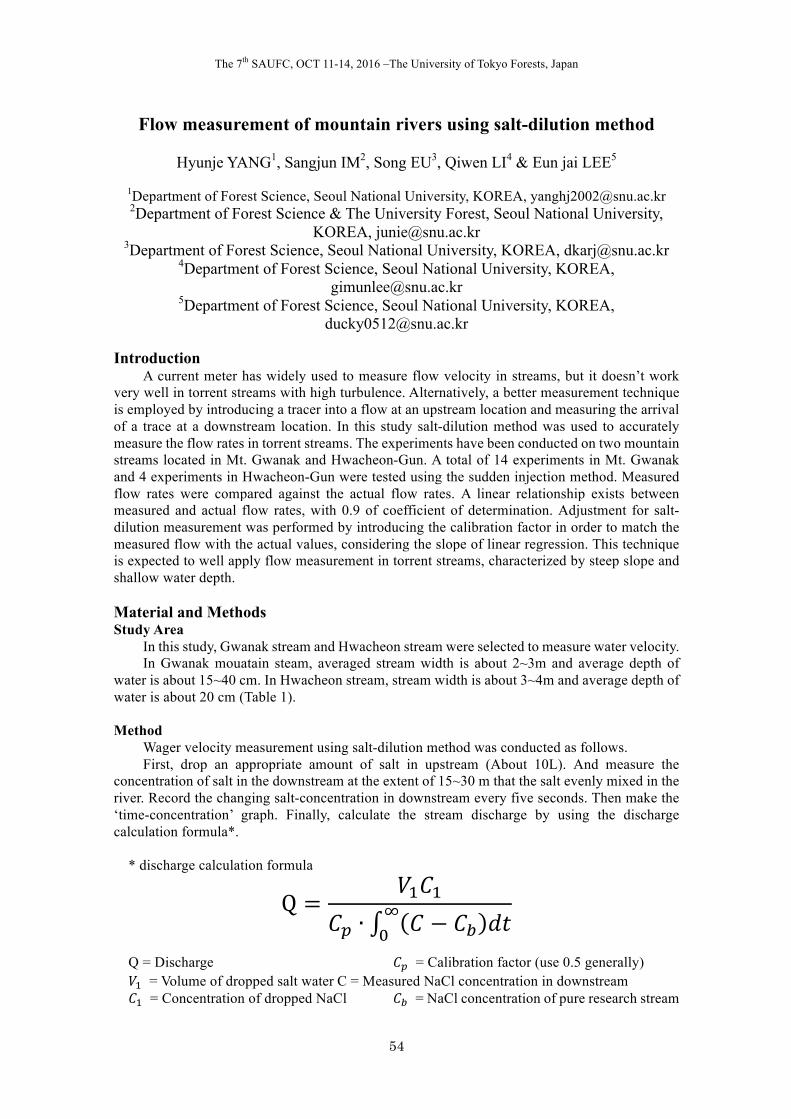
The 7th SAUFC, OCT 11-14, 2016 –The University of Tokyo Forests, Japan
54
Flow measurement of mountain rivers using salt-dilution method
Hyunje YANG1, Sangjun IM2, Song EU3, Qiwen LI4 & Eun jai LEE5
1Department of Forest Science, Seoul National University, KOREA, [email protected] 2Department of Forest Science & The University Forest, Seoul National University,
KOREA, [email protected] 3Department of Forest Science, Seoul National University, KOREA, [email protected]
4Department of Forest Science, Seoul National University, KOREA, [email protected]
5Department of Forest Science, Seoul National University, KOREA, [email protected]
Introduction
A current meter has widely used to measure flow velocity in streams, but it doesn’t work very well in torrent streams with high turbulence. Alternatively, a better measurement technique is employed by introducing a tracer into a flow at an upstream location and measuring the arrival of a trace at a downstream location. In this study salt-dilution method was used to accurately measure the flow rates in torrent streams. The experiments have been conducted on two mountain streams located in Mt. Gwanak and Hwacheon-Gun. A total of 14 experiments in Mt. Gwanak and 4 experiments in Hwacheon-Gun were tested using the sudden injection method. Measured flow rates were compared against the actual flow rates. A linear relationship exists between measured and actual flow rates, with 0.9 of coefficient of determination. Adjustment for salt-dilution measurement was performed by introducing the calibration factor in order to match the measured flow with the actual values, considering the slope of linear regression. This technique is expected to well apply flow measurement in torrent streams, characterized by steep slope and shallow water depth.
Material and Methods Study Area
In this study, Gwanak stream and Hwacheon stream were selected to measure water velocity. In Gwanak mouatain steam, averaged stream width is about 2~3m and average depth of
water is about 15~40 cm. In Hwacheon stream, stream width is about 3~4m and average depth of water is about 20 cm (Table 1). Method
Wager velocity measurement using salt-dilution method was conducted as follows. First, drop an appropriate amount of salt in upstream (About 10L). And measure the
concentration of salt in the downstream at the extent of 15~30 m that the salt evenly mixed in the river. Record the changing salt-concentration in downstream every five seconds. Then make the ‘time-concentration’ graph. Finally, calculate the stream discharge by using the discharge calculation formula*.
* discharge calculation formula
Q =𝑉+𝐶+
𝐶A ∙ 𝐶 − 𝐶' 𝑑𝑡E,
Q = Discharge 𝐶A = Calibration factor (use 0.5 generally) 𝑉+ = Volume of dropped salt water C = Measured NaCl concentration in downstream 𝐶+ = Concentration of dropped NaCl 𝐶' = NaCl concentration of pure research stream
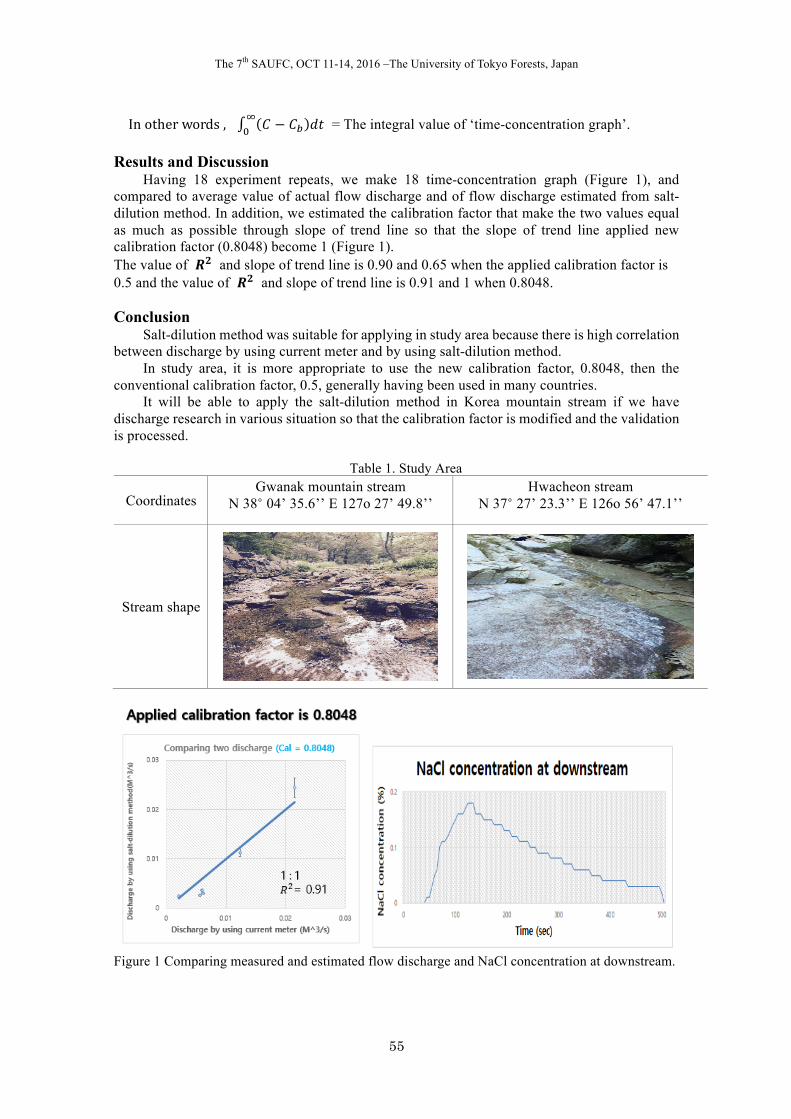
The 7th SAUFC, OCT 11-14, 2016 –The University of Tokyo Forests, Japan
55
Inotherwords, 𝐶 − 𝐶' 𝑑𝑡E, = The integral value of ‘time-concentration graph’.
Results and Discussion
Having 18 experiment repeats, we make 18 time-concentration graph (Figure 1), and compared to average value of actual flow discharge and of flow discharge estimated from salt-dilution method. In addition, we estimated the calibration factor that make the two values equal as much as possible through slope of trend line so that the slope of trend line applied new calibration factor (0.8048) become 1 (Figure 1). The value of 𝑹𝟐 and slope of trend line is 0.90 and 0.65 when the applied calibration factor is 0.5 and the value of 𝑹𝟐 and slope of trend line is 0.91 and 1 when 0.8048. Conclusion
Salt-dilution method was suitable for applying in study area because there is high correlation between discharge by using current meter and by using salt-dilution method.
In study area, it is more appropriate to use the new calibration factor, 0.8048, then the conventional calibration factor, 0.5, generally having been used in many countries.
It will be able to apply the salt-dilution method in Korea mountain stream if we have discharge research in various situation so that the calibration factor is modified and the validation is processed.
Table 1. Study Area
Coordinates Gwanak mountain stream
N 38° 04’ 35.6’’ E 127o 27’ 49.8’’ Hwacheon stream
N 37° 27’ 23.3’’ E 126o 56’ 47.1’’
Stream shape
Figure 1 Comparing measured and estimated flow discharge and NaCl concentration at downstream.
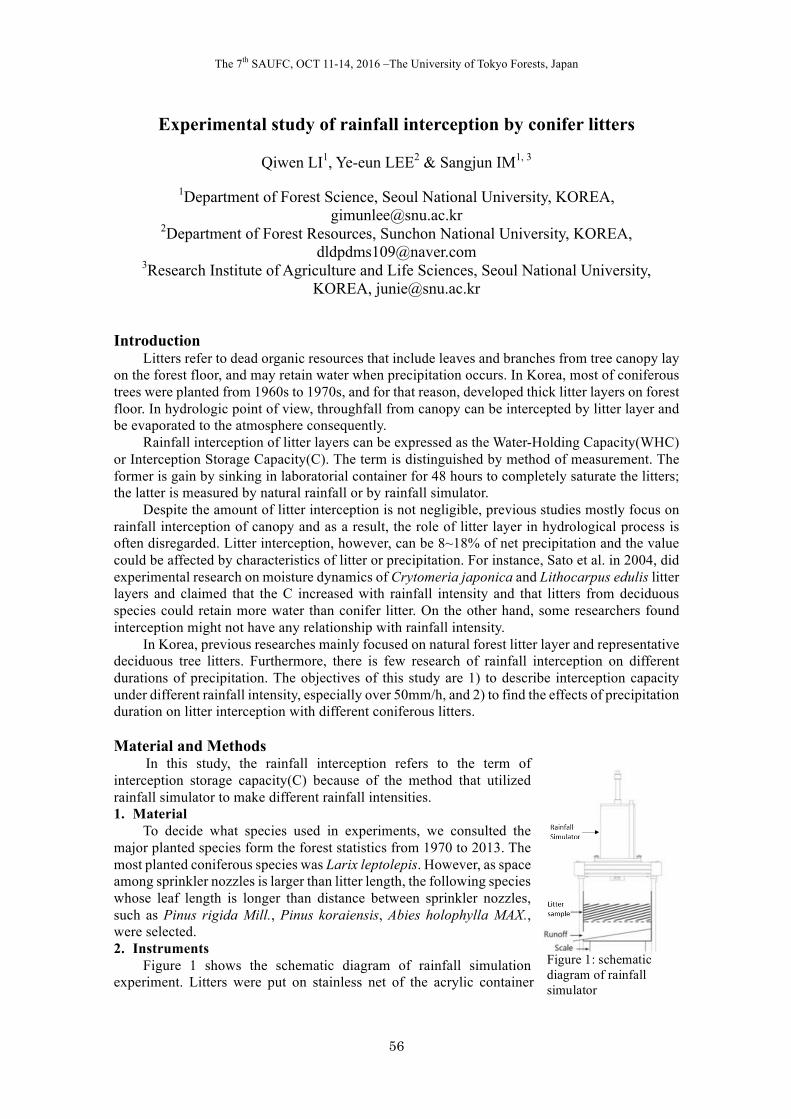
The 7th SAUFC, OCT 11-14, 2016 –The University of Tokyo Forests, Japan
56
Experimental study of rainfall interception by conifer litters
Qiwen LI1, Ye-eun LEE2 & Sangjun IM1, 3
1Department of Forest Science, Seoul National University, KOREA, [email protected]
2Department of Forest Resources, Sunchon National University, KOREA, [email protected]
3Research Institute of Agriculture and Life Sciences, Seoul National University, KOREA, [email protected]
Introduction
Litters refer to dead organic resources that include leaves and branches from tree canopy lay on the forest floor, and may retain water when precipitation occurs. In Korea, most of coniferous trees were planted from 1960s to 1970s, and for that reason, developed thick litter layers on forest floor. In hydrologic point of view, throughfall from canopy can be intercepted by litter layer and be evaporated to the atmosphere consequently.
Rainfall interception of litter layers can be expressed as the Water-Holding Capacity(WHC) or Interception Storage Capacity(C). The term is distinguished by method of measurement. The former is gain by sinking in laboratorial container for 48 hours to completely saturate the litters; the latter is measured by natural rainfall or by rainfall simulator.
Despite the amount of litter interception is not negligible, previous studies mostly focus on rainfall interception of canopy and as a result, the role of litter layer in hydrological process is often disregarded. Litter interception, however, can be 8~18% of net precipitation and the value could be affected by characteristics of litter or precipitation. For instance, Sato et al. in 2004, did experimental research on moisture dynamics of Crytomeria japonica and Lithocarpus edulis litter layers and claimed that the C increased with rainfall intensity and that litters from deciduous species could retain more water than conifer litter. On the other hand, some researchers found interception might not have any relationship with rainfall intensity.
In Korea, previous researches mainly focused on natural forest litter layer and representative deciduous tree litters. Furthermore, there is few research of rainfall interception on different durations of precipitation. The objectives of this study are 1) to describe interception capacity under different rainfall intensity, especially over 50mm/h, and 2) to find the effects of precipitation duration on litter interception with different coniferous litters. Material and Methods In this study, the rainfall interception refers to the term of interception storage capacity(C) because of the method that utilized rainfall simulator to make different rainfall intensities. 1. Material To decide what species used in experiments, we consulted the major planted species form the forest statistics from 1970 to 2013. The most planted coniferous species was Larix leptolepis. However, as space among sprinkler nozzles is larger than litter length, the following species whose leaf length is longer than distance between sprinkler nozzles, such as Pinus rigida Mill., Pinus koraiensis, Abies holophylla MAX., were selected. 2. Instruments
Figure 1 shows the schematic diagram of rainfall simulation experiment. Litters were put on stainless net of the acrylic container
Figure 1: schematic diagram of rainfall simulator
The 7th SAUFC, OCT 11-14, 2016 –The University of Tokyo Forests, Japan
57
which was on the electronic scale. The rainfall simulator from Eijkelkamp® was used to generate raindrops. This 09.06 version
simulator has 0.25m × 0.25m sprinkling area and it is able to generate 50~360mm/h rainfall intensity. To weigh the water on the litter samples, the CUX4200H scale from CAS® was connected with computer by communication cable. The scale can automatically send signals every 5 seconds.
The acrylic container was made to adjust the rainfall simulator. It has same size of 0.25m × 0.25m area and net hole size is 0.08mm. The grade of slope in lower part of container is 40% in order to drain water from it as soon as possible. 3. Measurements
Cmax(maximum interception storage capacity) and Cmin(minimum interception storage capacity) were calculated, respectively, under 10, 20, 30 and 40 minutes shower and under 50, 75, 100 mm/h rainfall intensities. Cmax refers to the water in litter layers including gravitational water which is drained in 30 minutes. Then Cmin that the water without gravitational water is estimated.
The experiments could be separated by two groups: 1) to describe the difference of C on three species when rainfall duration increased, each species was showered under 50mm/h; 2) to find the relationship between rainfall intensity and C, duration of precipitation was fixed at 20 minutes. All treatments were repeated 5 times and statistical analysis was done by SPSS 23.0 software.
Results and Discussion 1. Effect of rainfall intensity on Cmax and Cmin
The results of Cmax and Cmin under different rainfall intensities are shown in Table 1. All species did not show any increasing trend in Cmin under different three intensities.
Table 1 Results of rainfall interception of litter layer under different intensities
Intensity(mm/h) Pinus rigida Pinus koraiensis Abies holophylla Cmax(g) Cmin(g) Cmax(g) Cmin(g) Cmax(g) Cmin(g)
50 Mean 103.10 60.36 91.84 44.32 137.88 94.32 S.D. 4.42 3.22 3.72 3.96 13.21 7.80
75 Mean 108.06 61.84 101.20 41.34 148.32 103.48 S.D. 4.70 4.52 5.42 2.90 6.44 9.58
100 Mean 121.96 69.14 112.44 47.28 152.32 95.76 S.D. 8.12 8.04 12.86 6.85 21.28 18.12
2. Effect of rainfall duration on Cmax and Cmin
Table 2 shows results of Cmax and Cmin under different rainfall durations of precipitation. For P. koraiensis, both Cmax and Cmin did not have linear relationship with duration of precipitation.
Table 2 Results of rainfall interception of litter layer under different durations of precipitation
Duration(min.) Pinus rigida Pinus koraiensis Abies holophylla Cmax(g) Cmin(g) Cmax(g) Cmin(g) Cmax(g) Cmin(g)
10 Mean 83.90 53.90 87.00 43.02 104.38 79.56 S.D. 5.78 6.16 3.86 2.94 8.74 3.52
20 Mean 103.10 60.36 91.84 44.32 137.88 94.32 S.D. 4.42 3.22 3.72 3.96 13.21 7.80
30 Mean 106.74 63.38 93.00 40.12 151.12 102.04 S.D. 2.27 2.53 1.43 3.22 6.45 7.34
40 Mean 107.96 65.10 87.90 37.94 150.14 97.76 S.D. 5.07 3.39 7.31 8.62 11.01 10.13
The 7th SAUFC, OCT 11-14, 2016 –The University of Tokyo Forests, Japan
58
Variation in the growth response of Pinus koraiensis along the altitudinal gradients in the southern region of Korea
Jong Bin JUNG1, Hyun Jung KIM1, Dae Ho CHOI1, Hak Ki PARK2, Seon Hee CHO2 &
Pil Sun PARK1
1Seoul National University, REPUBLIC OF KOREA, [email protected] 2 Nambu University Forest, Seoul National University, REPUBLIC OF KOREA
Introduction
Korean pine (Pinus koraiensis Siebold & Zucc.) is native to Korea and is often mixed with broad-leaved species in subalpine forests. In Korea, they were widely planted in and outside of its native distributional range and showed the various growth patterns to environmental conditions
Recently, studies reporting that climate-growth relationship varies with elevation and species are increasing. However, the information on the climate-growth relationship of Korean pine is limited in despite that Korean pine was planted in various environmental conditions. This study aimed to compare the growth responses of P. koraiensis along the altitudinal gradients.
Material and Methods 1. Study site
The study was conducted in the Nambu University Forest in the southern part of Korea. Nambu University Forest was established in 1912. In the 1920s and 1930s, the province tests on diverse conifer species were conducted and many species were planted by Japanese researchers in this forest. Korean pine was planted in 92.5 ha in various altitudes. We selected three Korean pine stands along the three altitudinal range of 210, 660, 870 m a.s.l. on the northwest slope.
2. Meteorological data
For this study, we used meteorological data (temperature and precipitation data) from nearby chusan weather station (ca. 10 km).
3. Sample collection and ring width measurement
Cores were sampled in twenty dominant P. koraiensis trees in each site. Two cores per a tree were extracted at 30 cm above ground level using 5.15 mm increment borers. All samples were treated using standard dendrochronological methods. Ring widths were measured using WindendroTM at 0.001 mm precision. Accurate cross-dating were checked using COFECHA program. After cross-dating, we standardized all ring width measurement to tree ring index (TWI), then used bi-weight mean to calculate master chronologies using dplR package in R.
4. Statistical analysis
Relationship between tree ring growth and meteorological data were compared using correlation analysis.
Results and Discussion
Our study results will be presented in the symposium.

The 7th SAUFC, OCT 11-14, 2016 –The University of Tokyo Forests, Japan
59
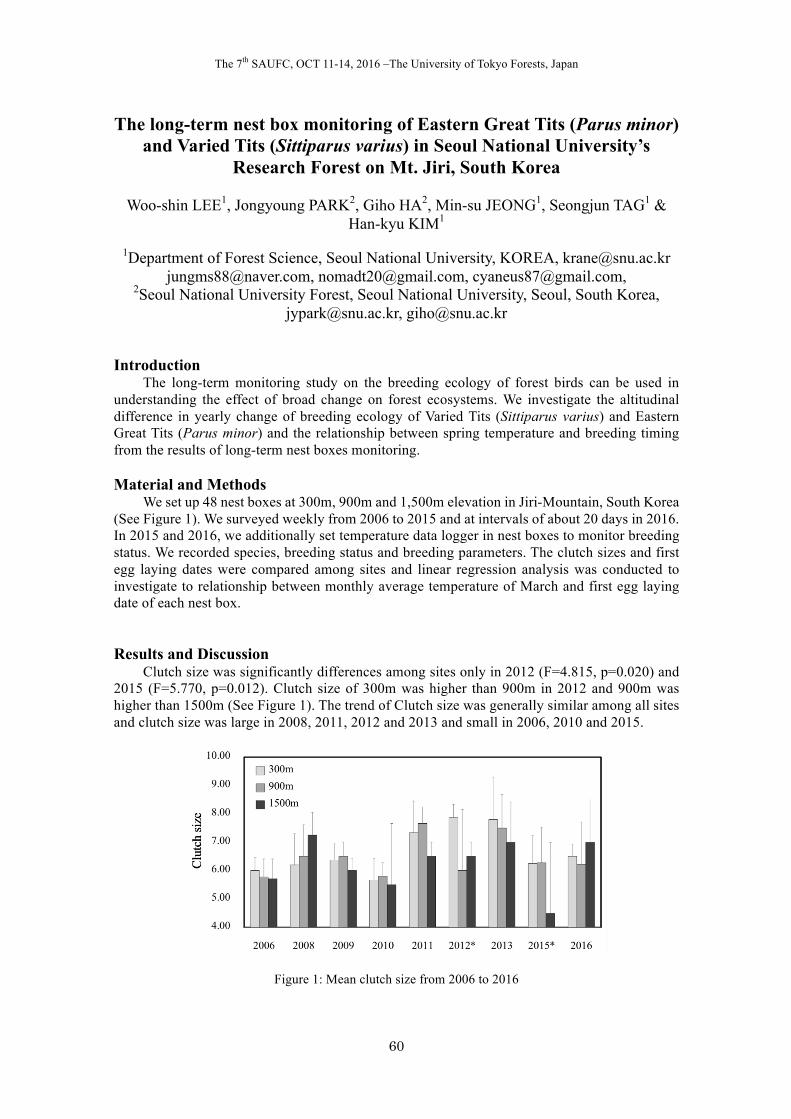
The 7th SAUFC, OCT 11-14, 2016 –The University of Tokyo Forests, Japan
60
The long-term nest box monitoring of Eastern Great Tits (Parus minor) and Varied Tits (Sittiparus varius) in Seoul National University’s
Research Forest on Mt. Jiri, South Korea
Woo-shin LEE1, Jongyoung PARK2, Giho HA2, Min-su JEONG1, Seongjun TAG1 & Han-kyu KIM1
1Department of Forest Science, Seoul National University, KOREA, [email protected]
[email protected], [email protected], [email protected], 2Seoul National University Forest, Seoul National University, Seoul, South Korea,
[email protected], [email protected] Introduction
The long-term monitoring study on the breeding ecology of forest birds can be used in understanding the effect of broad change on forest ecosystems. We investigate the altitudinal difference in yearly change of breeding ecology of Varied Tits (Sittiparus varius) and Eastern Great Tits (Parus minor) and the relationship between spring temperature and breeding timing from the results of long-term nest boxes monitoring. Material and Methods
We set up 48 nest boxes at 300m, 900m and 1,500m elevation in Jiri-Mountain, South Korea (See Figure 1). We surveyed weekly from 2006 to 2015 and at intervals of about 20 days in 2016. In 2015 and 2016, we additionally set temperature data logger in nest boxes to monitor breeding status. We recorded species, breeding status and breeding parameters. The clutch sizes and first egg laying dates were compared among sites and linear regression analysis was conducted to investigate to relationship between monthly average temperature of March and first egg laying date of each nest box.
Results and Discussion Clutch size was significantly differences among sites only in 2012 (F=4.815, p=0.020) and
2015 (F=5.770, p=0.012). Clutch size of 300m was higher than 900m in 2012 and 900m was higher than 1500m (See Figure 1). The trend of Clutch size was generally similar among all sites and clutch size was large in 2008, 2011, 2012 and 2013 and small in 2006, 2010 and 2015.
Figure 1: Mean clutch size from 2006 to 2016
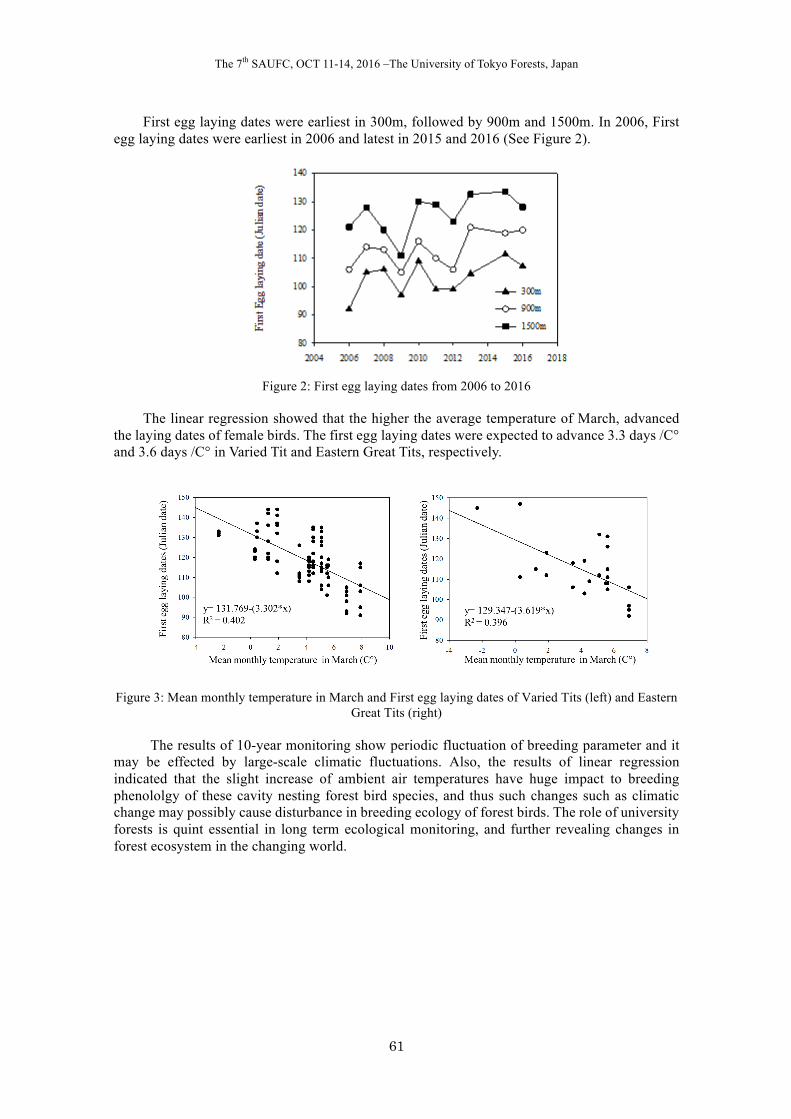
The 7th SAUFC, OCT 11-14, 2016 –The University of Tokyo Forests, Japan
61
First egg laying dates were earliest in 300m, followed by 900m and 1500m. In 2006, First egg laying dates were earliest in 2006 and latest in 2015 and 2016 (See Figure 2).
Figure 2: First egg laying dates from 2006 to 2016
The linear regression showed that the higher the average temperature of March, advanced
the laying dates of female birds. The first egg laying dates were expected to advance 3.3 days /C° and 3.6 days /C° in Varied Tit and Eastern Great Tits, respectively.
Figure 3: Mean monthly temperature in March and First egg laying dates of Varied Tits (left) and Eastern Great Tits (right)
The results of 10-year monitoring show periodic fluctuation of breeding parameter and it
may be effected by large-scale climatic fluctuations. Also, the results of linear regression indicated that the slight increase of ambient air temperatures have huge impact to breeding phenololgy of these cavity nesting forest bird species, and thus such changes such as climatic change may possibly cause disturbance in breeding ecology of forest birds. The role of university forests is quint essential in long term ecological monitoring, and further revealing changes in forest ecosystem in the changing world.
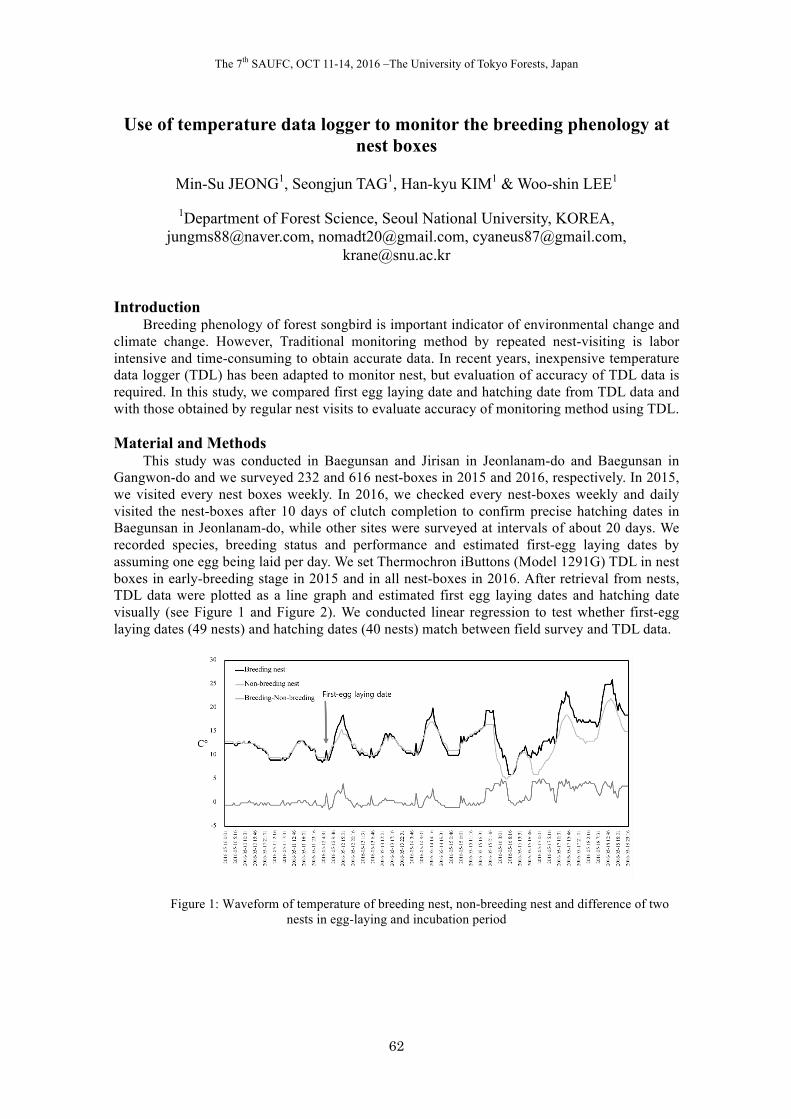
The 7th SAUFC, OCT 11-14, 2016 –The University of Tokyo Forests, Japan
62
Use of temperature data logger to monitor the breeding phenology at nest boxes
Min-Su JEONG1, Seongjun TAG1, Han-kyu KIM1 & Woo-shin LEE1
1Department of Forest Science, Seoul National University, KOREA,
[email protected], [email protected], [email protected], [email protected]
Introduction
Breeding phenology of forest songbird is important indicator of environmental change and climate change. However, Traditional monitoring method by repeated nest-visiting is labor intensive and time-consuming to obtain accurate data. In recent years, inexpensive temperature data logger (TDL) has been adapted to monitor nest, but evaluation of accuracy of TDL data is required. In this study, we compared first egg laying date and hatching date from TDL data and with those obtained by regular nest visits to evaluate accuracy of monitoring method using TDL. Material and Methods
This study was conducted in Baegunsan and Jirisan in Jeonlanam-do and Baegunsan in Gangwon-do and we surveyed 232 and 616 nest-boxes in 2015 and 2016, respectively. In 2015, we visited every nest boxes weekly. In 2016, we checked every nest-boxes weekly and daily visited the nest-boxes after 10 days of clutch completion to confirm precise hatching dates in Baegunsan in Jeonlanam-do, while other sites were surveyed at intervals of about 20 days. We recorded species, breeding status and performance and estimated first-egg laying dates by assuming one egg being laid per day. We set Thermochron iButtons (Model 1291G) TDL in nest boxes in early-breeding stage in 2015 and in all nest-boxes in 2016. After retrieval from nests, TDL data were plotted as a line graph and estimated first egg laying dates and hatching date visually (see Figure 1 and Figure 2). We conducted linear regression to test whether first-egg laying dates (49 nests) and hatching dates (40 nests) match between field survey and TDL data.
Figure 1: Waveform of temperature of breeding nest, non-breeding nest and difference of two nests in egg-laying and incubation period
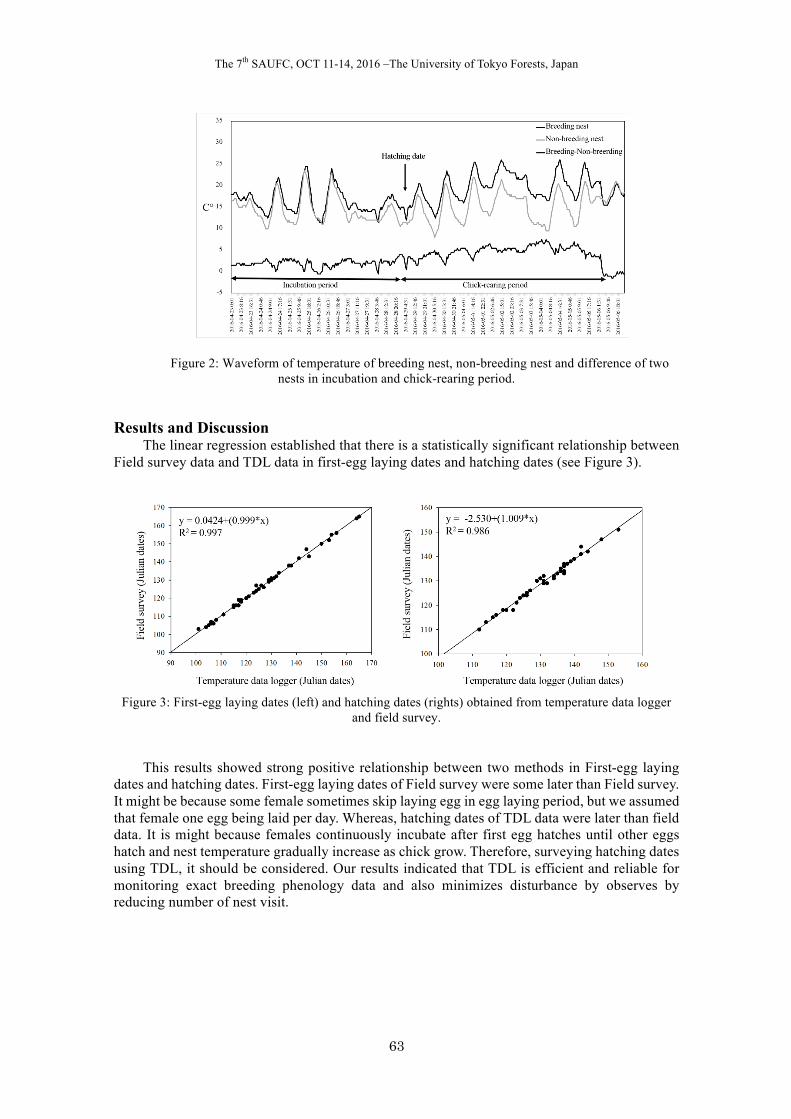
The 7th SAUFC, OCT 11-14, 2016 –The University of Tokyo Forests, Japan
63
Figure 2: Waveform of temperature of breeding nest, non-breeding nest and difference of two nests in incubation and chick-rearing period.
Results and Discussion
The linear regression established that there is a statistically significant relationship between Field survey data and TDL data in first-egg laying dates and hatching dates (see Figure 3).
Figure 3: First-egg laying dates (left) and hatching dates (rights) obtained from temperature data logger
and field survey.
This results showed strong positive relationship between two methods in First-egg laying dates and hatching dates. First-egg laying dates of Field survey were some later than Field survey. It might be because some female sometimes skip laying egg in egg laying period, but we assumed that female one egg being laid per day. Whereas, hatching dates of TDL data were later than field data. It is might because females continuously incubate after first egg hatches until other eggs hatch and nest temperature gradually increase as chick grow. Therefore, surveying hatching dates using TDL, it should be considered. Our results indicated that TDL is efficient and reliable for monitoring exact breeding phenology data and also minimizes disturbance by observes by reducing number of nest visit.
The 7th SAUFC, OCT 11-14, 2016 –The University of Tokyo Forests, Japan
64
Effects of Quercus serrata trees killed by Japanese oak wilt disease on the spatial distribution of recruited trees in a warm-temperate
secondary forest in the Tokai District of Japan
Takanori SATO1 & Nobuaki TANAKA2
1Ecohydrology Research Institute, The University of Tokyo Forests, Graduate School of
Agricultural and Life Sciences, The University of Tokyo, JAPAN, [email protected]
2 Ecohydrology Research Institute, The University of Tokyo Forests, Graduate School of Agricultural and Life Sciences, The University of Tokyo,
JAPAN, [email protected] Introduction
Japanese oak wilt (JOW) is caused by perforating into the oak tree by the oak platypodid beetle Platypus quercivorus. When that beetle perforate into the oak tree, the plant pathogenic fungus Raffaaelea quercivora was introduced. Oak trees infected by that fungus wilt them leaves and dead in some case. JOW kills a lot of oak trees and make gaps in the forest floor in a short time. Therefore it is possible that JOW has an influence of the distribution of recruited trees.
Our objective is to determine the effects of Quercus serrata trees killed by JOW on the spatial distribution of recruited trees in a warm-temperate secondary forest in the Tokai District of Japan. To determine the effects of Quercus serrata trees killed by JOW on the spatial distribution of recruited trees, the distributions of recruited Cleyera japonica and Eurya japonica trees were compared before and after a JOW outbreak. Material and Methods
Our study site is the Akazu Research Forest, Ecohydrology Research Institute, University of Tokyo, located in Seto, Aichi Prefecture, Japan (35°13’N, 137°10’E). In our research forest, a square 1 ha plot was established by support of the Monitoring Site 1000 Project of Ministry of the Environment, Japan. The annual mean temperature is 12.9 ℃, and the annual amount precipitation is 1,860 mm. In our study forest, Chamaecyparis obtusa, Q. serrata, Pinus densiflora, Acer sieboldianum and C. japonica dominated.
From 2004 to 2015, we measured the trunk girth at breast height of trees within our study plot. Trees with girths over 15 cm were defined as recruited trees each year. We also counted the Q. serrata trees perforated by the beetle and killed by JOW from 2007 to 2015 within the same plot.
We calculated the pair cross-correlation function gcross between killed Q. serrata trees and recruited C. japonica and E. japonica trees before and after the outbreak.
gcross(r) = ρ(r) / λ2 [1]
where r is the distance between killed Q. serrata and recruited tree, ρ(r) is the product density, and λ is the stand density. gcross(r) was calculated using the statistical software (R Ver. 2.15.2). Results and Discussion
Figure 1 showed the temporal variation of JOW from 2007 to 2015 in our study plot. There were 191 Q. serrata trees in 2007. Perforated Q. serrata trees were first found in 2009, and the maximum number of killed Q. serrata trees was 29 in 2011. In 2015, the total number of perforated Q. serrata was 159, and the number of killed Q. serrata trees within perforated trees was 58. The rate of perforated and killed by JOW were about 80 and 30 % respectively.
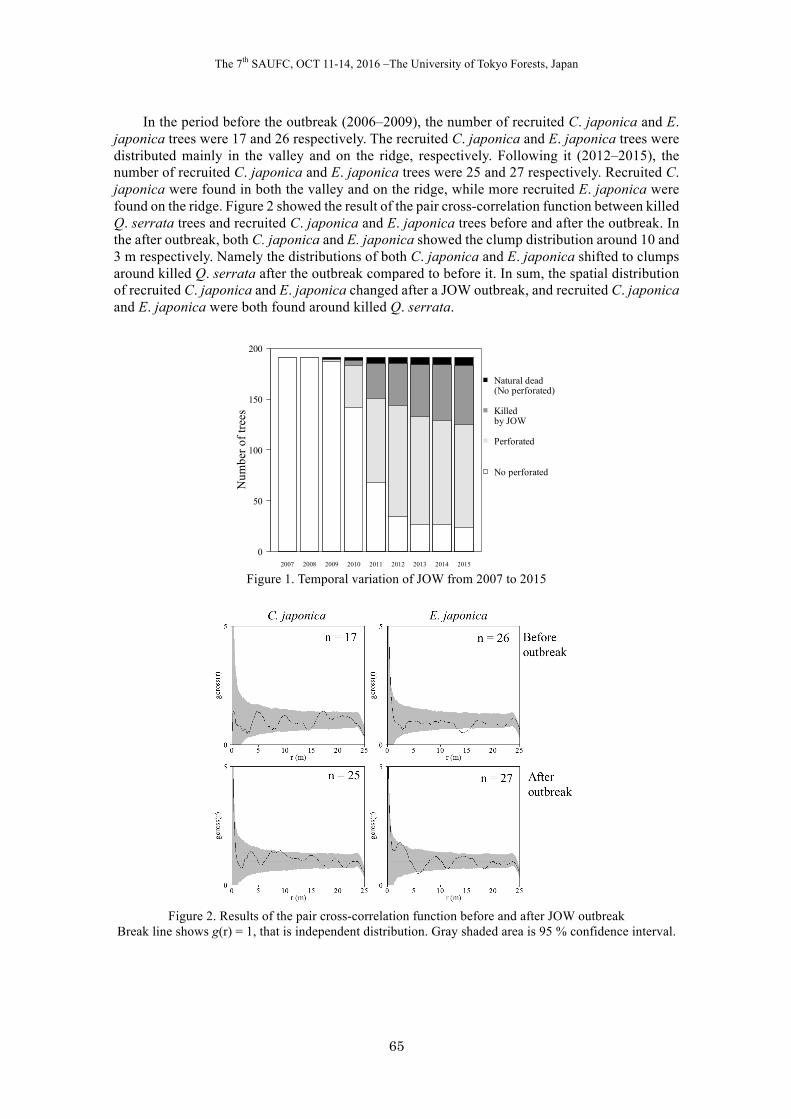
The 7th SAUFC, OCT 11-14, 2016 –The University of Tokyo Forests, Japan
65
In the period before the outbreak (2006–2009), the number of recruited C. japonica and E. japonica trees were 17 and 26 respectively. The recruited C. japonica and E. japonica trees were distributed mainly in the valley and on the ridge, respectively. Following it (2012–2015), the number of recruited C. japonica and E. japonica trees were 25 and 27 respectively. Recruited C. japonica were found in both the valley and on the ridge, while more recruited E. japonica were found on the ridge. Figure 2 showed the result of the pair cross-correlation function between killed Q. serrata trees and recruited C. japonica and E. japonica trees before and after the outbreak. In the after outbreak, both C. japonica and E. japonica showed the clump distribution around 10 and 3 m respectively. Namely the distributions of both C. japonica and E. japonica shifted to clumps around killed Q. serrata after the outbreak compared to before it. In sum, the spatial distribution of recruited C. japonica and E. japonica changed after a JOW outbreak, and recruited C. japonica and E. japonica were both found around killed Q. serrata.
Figure 1. Temporal variation of JOW from 2007 to 2015
Figure 2. Results of the pair cross-correlation function before and after JOW outbreak
Break line shows g(r) = 1, that is independent distribution. Gray shaded area is 95 % confidence interval.
2007 2008 2009 2010 2011 2012 2013 2014 2015
Num
ber o
f tre
es
0
50
100
150
200
Natural dead(No perforated)
Killedby JOW
Perforated
No perforated
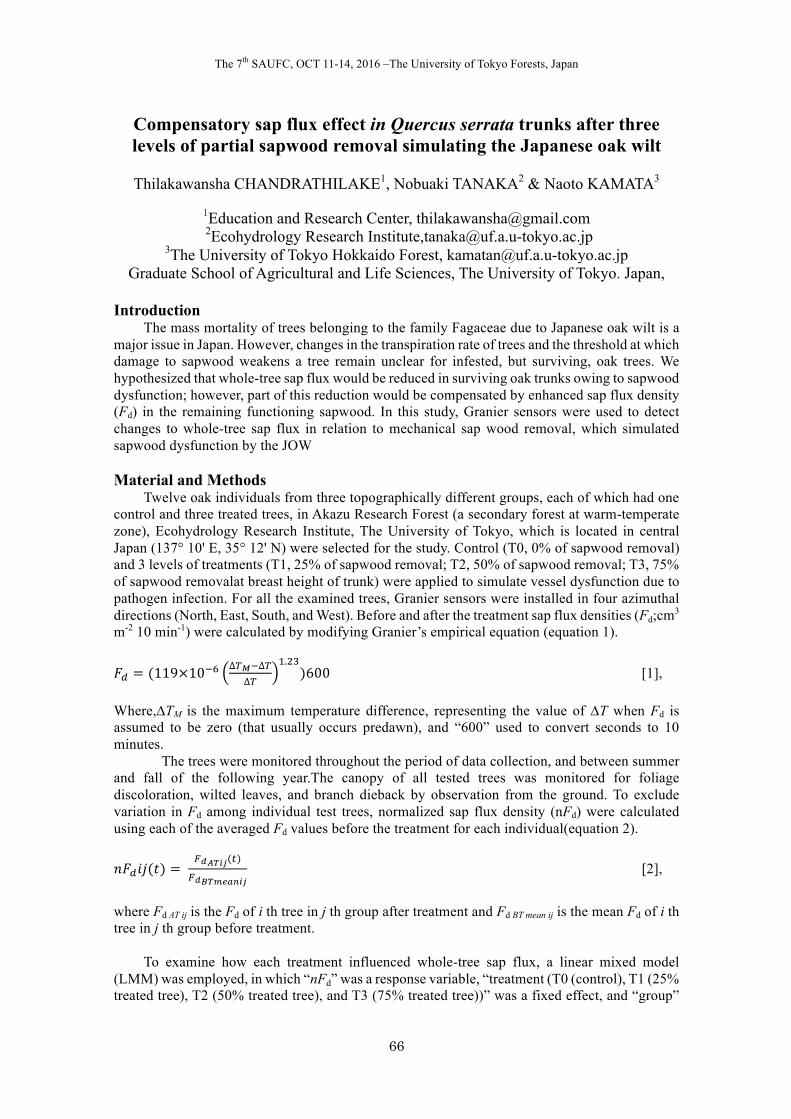
The 7th SAUFC, OCT 11-14, 2016 –The University of Tokyo Forests, Japan
66
Compensatory sap flux effect in Quercus serrata trunks after three levels of partial sapwood removal simulating the Japanese oak wilt
Thilakawansha CHANDRATHILAKE1, Nobuaki TANAKA2 & Naoto KAMATA3
1Education and Research Center, [email protected] 2Ecohydrology Research Institute,[email protected]
3The University of Tokyo Hokkaido Forest, [email protected] Graduate School of Agricultural and Life Sciences, The University of Tokyo. Japan,
Introduction
The mass mortality of trees belonging to the family Fagaceae due to Japanese oak wilt is a major issue in Japan. However, changes in the transpiration rate of trees and the threshold at which damage to sapwood weakens a tree remain unclear for infested, but surviving, oak trees. We hypothesized that whole-tree sap flux would be reduced in surviving oak trunks owing to sapwood dysfunction; however, part of this reduction would be compensated by enhanced sap flux density (Fd) in the remaining functioning sapwood. In this study, Granier sensors were used to detect changes to whole-tree sap flux in relation to mechanical sap wood removal, which simulated sapwood dysfunction by the JOW Material and Methods
Twelve oak individuals from three topographically different groups, each of which had one control and three treated trees, in Akazu Research Forest (a secondary forest at warm-temperate zone), Ecohydrology Research Institute, The University of Tokyo, which is located in central Japan (137° 10' E, 35° 12' N) were selected for the study. Control (T0, 0% of sapwood removal) and 3 levels of treatments (T1, 25% of sapwood removal; T2, 50% of sapwood removal; T3, 75% of sapwood removalat breast height of trunk) were applied to simulate vessel dysfunction due to pathogen infection. For all the examined trees, Granier sensors were installed in four azimuthal directions (North, East, South, and West). Before and after the treatment sap flux densities (Fd;cm3 m-2 10 min-1) were calculated by modifying Granier’s empirical equation (equation 1).
𝐹< = (119×10:X ∆Z[:∆Z∆Z
+.0])600 [1],
Where,∆TM is the maximum temperature difference, representing the value of ∆T when Fd is assumed to be zero (that usually occurs predawn), and “600” used to convert seconds to 10 minutes.
The trees were monitored throughout the period of data collection, and between summer and fall of the following year.The canopy of all tested trees was monitored for foliage discoloration, wilted leaves, and branch dieback by observation from the ground. To exclude variation in Fd among individual test trees, normalized sap flux density (nFd) were calculated using each of the averaged Fd values before the treatment for each individual(equation 2).
𝑛𝐹<𝑖𝑗(𝑡) = cdef89(()
cdgfhijk89 [2],
where Fd AT ij is the Fd of i th tree in j th group after treatment and Fd BT mean ij is the mean Fd of i th tree in j th group before treatment.
To examine how each treatment influenced whole-tree sap flux, a linear mixed model
(LMM) was employed, in which “nFd” was a response variable, “treatment (T0 (control), T1 (25% treated tree), T2 (50% treated tree), and T3 (75% treated tree))” was a fixed effect, and “group”
The 7th SAUFC, OCT 11-14, 2016 –The University of Tokyo Forests, Japan
67
and “date and time” were random effects. Before investigating whether Fd had a compensatory effect in the healthy part of sapwood,
we calculated an Fd index (osFd) that would have been observed if the treatment had not been implemented. For each treatment tree, we first derived the proportion of the sum of Fd in the treated direction(s) in relation to the sum of Fd in the four directions using directional Fd data before the treatment (p). Then, the offset Fd indices at the time/date t for i th tree in j th group were calculated by the following equation:
𝑜𝑠𝐹<𝑖𝑗(𝑡) =
mcd56(()A89
[3].
The calculated offset values (osFd) of treated trees were compared with the nFd values of control trees by LMM, in which “10-min or daily osFd” was a response variable, “treatment” was a fixed effect, and “group” and “date and time” were random effects. If the osFd of each treatment was positive and significantly greater than 0, it was judged that a compensatory effect of Fd in the untreated portions of treated trees was present. In contrast, if the osFd of each treatment was negative and significantly lower than 0, the treated trees were judged to be weakened. Further, we hypothesized that compensatory radial growth in treated trees was one of cause for compensatory sap flux in the untreated direction, thus radial growth of trees were measured end of the second growing season treatment
Results and Discussion
Even though tested trees were still alive until at least the end of the second growing season, external symptoms of weakening were detected in 75% treated trees. Analysis using a linear mixed model showed that whole-tree sap flux was significantly reduced in all treatments. However, 25% and 50% treated trees showed significant Fd compensation, whereas 75% treated trees showed significantly smaller whole-tree sap flux than the value expected from the treatment. The radial movement of sap in the stem is significant with intervessel pits in between early wood vessels and late wood vessels. Therefore, horizontal water movement in the stem may cause foliage to survive in the treated directions. The Fd compensation occurred in the remaining sapwood of treated trees, making up for reduced sap flow by sapwood removal. However, whole-tree sap flux in T3 was smaller than expected, probably because the trees in T3 were highly stressed by a greater proportion of sapwood removal and had begun to weaken.
Compensatory radial growth observed in the untreated direction of T1 trees, supporting our hypothesis that higher radial growth may cause compensatory sap flux in the treatment group. However, compensatory radial growth was not the only cause of compensatory sap flux. Previous studies showed that; (1) even though, water conductance is mostly restricted to the outermost annual growth ring of ring porous trees, there is considerable sap flow movement in the old inner xylem, and (2) the ability of sap flow movement in the inner rings increases significantly, after decreasing in the outermost rings. Therefore, the enhanced sap flow movement in inner xylem may also have contributed to the compensatory effect detected in this experiment.
These results suggest that the threshold of tree weakening lies between 50% and 75% of sapwood removal, above which the Fd compensation cannot be attained. Therefore, whole-tree sap flux in infested but surviving trees varies with respect to the intensity of sapwood damage. Compensatory radial growth in the untreated direction was detected in 25% treated trees, which caused the compensation in whole-tree sap flux. Increased sap flow ascent in the remaining xylem and the activation of inactive vessels in the older xylem may also contribute to this phenomenon. The physiological mechanisms supporting the compensatory effect could not be fully assessed; however, the present study reveals how infested, but surviving, Q. serrata trees control the magnitude of whole-tree transpiration; this information will be useful in better understanding watershed-scale hydrology in forests disturbed by JOW.
The 7th SAUFC, OCT 11-14, 2016 –The University of Tokyo Forests, Japan
68
Establishment of quantitative real-time polymerase chain reaction (qPCR) technique for detection and quantification of
entomopathogenic fungi in soil
Syaiful Amri SARAGIH1 & Naoto KAMATA2
1The University of Tokyo Education and Research Center, JAPAN, [email protected]
2The University of Tokyo Chichibu Forests, JAPAN, [email protected] Introduction
In forest ecosystems, population densities of forest defoliators sometimes reach outbreak level and cause conspicuous defoliation. The densities usually start to decrease within a few years by means of functions of natural enemies and induced defense of plants without causing devastating damage to the ecosystem. Entomopathogenic fungi sometimes play an important role in regulating the population outbreaks. However, knowledge on epizootiology of entomopathogenic fungi especially during latent periods is limited. Traditional methodology for studying epizootiology of entomopathogenic fungi includes bait methods using lab-reared insects with incubation and cultivation of isolated fungi from the baits, which is time consuming and provides only binomial data. Quantitative real-time PCR (qPCR) is considered as a rapid, sensitive, accurate, and culture-independent method, which is widely used to detect and quantify microorganism directly from environmental DNA extract. This study was conducted with following objectives: (1) To develop specific primer for each of six species of entomopathogenic fungi (Cordyceps militaris, Beauveria bassiana, Isaria fumosorosea, Metarhizium anisopliae, Isaria farinosa, and Beauveria brongniartii) and establish the qPCR as an effective method to detect and quantify genomic DNA of entomopathogenic fungi; (2) To check sensitivity of the qPCR by applying for soil DNA extracts and DNA extracts of fungi collected from the larch sawfly cocoons. Material and Methods
Several primer pairs for each of the entomopathogenic fungi were designed using software MEGA 6, which targeted the internal transcribed spacer (ITS) region and translation elongation factor 1 (TEF 1) alpha gene region, and tested for their specificity using BLAST similarity searches. To obtain two standard curves, the qPCR was conducted for 10 levels of concentration (101 to 1010) of both genomic DNA and a standard soil DNA (DNA extracts from autoclaved soil with 10 levels of fungal suspension). Amplification efficiency (E) from the slope of the linear plot was calculated for the standard quantification curve. In 2013, fifteen soil samples were collected from one site in the Japanese larch plantation in Furano (FU), Hokkaido, Japan during the larch sawfly (Pristiphora erichsonii) outbreaks, and from two sites in a natural beech forest in Hachimantai, Iwate, Japan (Hachimantai A (HA) and Hachimantai B (HB)) during the beech caterpillar (Syntypistis punctatella) outbreaks. The DNA was extracted from these soil samples and from fungi that emerged from incubated cocoons of the larch sawfly. The qPCR was applied to the extracted DNA from the soil and the cocoons. Results and Discussion
(1) A primer pair CM2946F/CM3160R was proved as the best primer pair for C. militaris, while for B. bassiana was BB1962F/BB2156R, for I. fumosorosea was IFU5821F/IFU6061R, and for M. anisopliae was MA6071F/MA6218R. Developing specific primer pair was still unsuccessful for I. farinosa and B. brongniartii. Standard curves were obtained for genomic DNA with strong relationship and good fitting (R2 > 0.980) for all fungus. Seven levels was obtained to
The 7th SAUFC, OCT 11-14, 2016 –The University of Tokyo Forests, Japan
69
generate standard genomic DNA for C. militaris with R2 = 0.9984 and amplification efficiency (E) = 0.86, while for B. bassiana was five levels (R2 = 0.9931, E = 0.89), for I. fumosorosea was five levels (R2 = 0.9866, E = 0.76), and for M. anisopliae was six levels (R2 = 0.98, E = 1.05). Standard soil DNA for C. militaris was generated using five levels with R2 = 0.9937, and E = 0.74, while for B. bassiana was seven levels (R2 = 0.9802, E = 0.97), for I. fumosorosea was four five levels (R2 = 0.989, E = 0.58), and for M. anisopliae was eight levels (R2 = 0.9854, E = 0.91). (2) Soil standard curves were created for the four species. However, amplification efficiency of soil DNA (an inverse of the standard curve slope) was smaller than genomic DNA. As a result, effective range of the standard curve of the soil DNA was smaller than genomic DNA. C. militaris was detected in three of five soil samples from Hachimantai A, and four samples from Hachimantai B by using qPCR, whereas most of obtained Ct values were out of range to evaluate C. militaris density. On the other hand, B. bassiana, I. fumosorosea, and M. anisopliae were not detected from all samples. Detection from dead cocoon samples showed positive for B. bassiana and M. anisopliae in several locations in Furano.
In this study, a specific primer pair was successfully designed for four entomopathogenic fungi among six. Standard curves with good fitting were obtained for both standard genomic DNA and standard soil DNA so that a mass of each of the fungi in soil will be determined by qPCR using specific primer pair (R2 > 0.980). A slope of standard soil DNA was greater than genomic DNA indicating that soil significantly inhibited amplification and decreased sensitivity of qPCR at each dilution step. C. militaris was detected from soil DNA of HA and HB and B. bassiana and M. anisopliae from dead larch sawfly cocoons in Furano. However, the Ct values were around or larger than an upper limit of an effective range of the soil standard curves (detection limit).
In future studies, some ideas for increasing detection level should be tried for successful detection and quantification of fungus from soil, such as increasing mass of soil samples in DNA extraction process or modifying soil sampling method. In the end, from this study can be concluded that culture-independent detection using qPCR using specific primer pair seemed effective, rapid, sensitive and specific in detection of entomopathogenic fungi in the soil, and can be used for rapid and reliable quantification in different ecosystem. The methodology to quantify fungi in soil using qPCR will contribute great progress of researches on fungi in soil. It will provide more comprehensive information to explain dynamic of entomopathogenic fungi in relation to insect outbreak and determinant factors by improving DNA extraction process from soil.
The 7th SAUFC, OCT 11-14, 2016 –The University of Tokyo Forests, Japan
70
Forest biophysical parameter estimation using UAV imagery and airborne LiDAR data: a study in a mixed conifer-broadleaved forest
Sadeepa JAYATHUNGA1, Toshiaki OWARI2 & Satoshi TSUYUKI3
1Graduate School of Agricultural and Life Sciences, The University of Tokyo, JAPAN,
[email protected] 2The University of Tokyo Hokkaido Forest, JAPAN, [email protected]
3 Graduate School of Agricultural and Life Sciences, The University of Tokyo, JAPAN, [email protected]
Introduction
Compared to other remote sensing techniques, light detection and ranging (LiDAR) measurements have been shown to predict more accurate estimates of forest structural attributes. However, high acquisition cost and data processing requirements of LiDAR limit its applicability in the practice of forest management. On the other hand, unmanned aerial vehicle (UAV) system which is a newly emerging method for fine-scale remote sensing, has several key advantages in forest management. These include but not limited to; (1) Flexibility in data acquisition (control over the number of repeat flights over a designated site), (2) Potential for high spatial and temporal resolution, (3) Insensitivity to cloud cover, (4) Decentralization of data acquisition, and (5) Low operational costs. Therefore, by addressing the limitations of conventional remote sensing approaches, UAV platforms may bridge the gap between the need for an effective method for data acquisition, and the considerable efforts and/or costs associated with field surveys. Although, this recent yet low-cost remote sensing technology holds promise as an effective tool for forest management, it remains underdeveloped. In this study, the main aim is to explore the applicability of low-cost, high resolution UAV imagery in forest biophysical parameter estimation. Airborne LiDAR derived parameters were used as a reference. Material and Methods
The study site (Forest management compartment No. 43) is located in the University of Tokyo (UTokyo) Hokkaido forest (43° 10′-20′N, 142° 18′-40′E). UTokyo Hokkaido forest is a Pan-mixed conifer-broadleaved forest where forest management activities including selection cutting and enrichment planting are being practiced. Most of the forest area in Compartment No. 43 is considered as secondary forest recovering after the heavy typhoon damage in 1981.
Field data were collected from 60 fixed-area plots (0.25 ha) during March, 2016. These include the DBH for all trees with DBH > 5 cm and height for sample trees. The remotely sensed data consisted airborne LiDAR data and UAV imagery that were acquired in September, 2015 (Figure 1).
We used Agisoft Photoscan Professional Edition 1.2.5 to build dense point cloud from the UAV images. Structure from motion (SfM) derived point cloud, airborne LiDAR point cloud and LiDAR derived digital terrain model (DTM that was provided by the LiDAR data provider) were used to compute a total of 24 structural variables for each field plot. These included height percentiles (h10, ..., h95), height standard deviation hsd, maximum canopy height (hmax), mean canopy height (hmean), and density variables. The densities were computed as the proportion of points above the 1st, …, 9th (d1, …, d9) fraction to the total number of points. A 2-m height threshold was applied to filter out the canopy component from the floor vegetation.
Dependent variables were related to field data using multiple regression analysis and the estimated parameters were used to predict the biophysical properties of interest i.e. dominant height (hdom), Lorey’s mean height (hL), mean diameter (D), basal area (G) and tree density (N). Logarithmic transformations of the dependent variables were used as this has previously been shown to be suitable for the modeling of these properties. To reduce the dimensionality of the
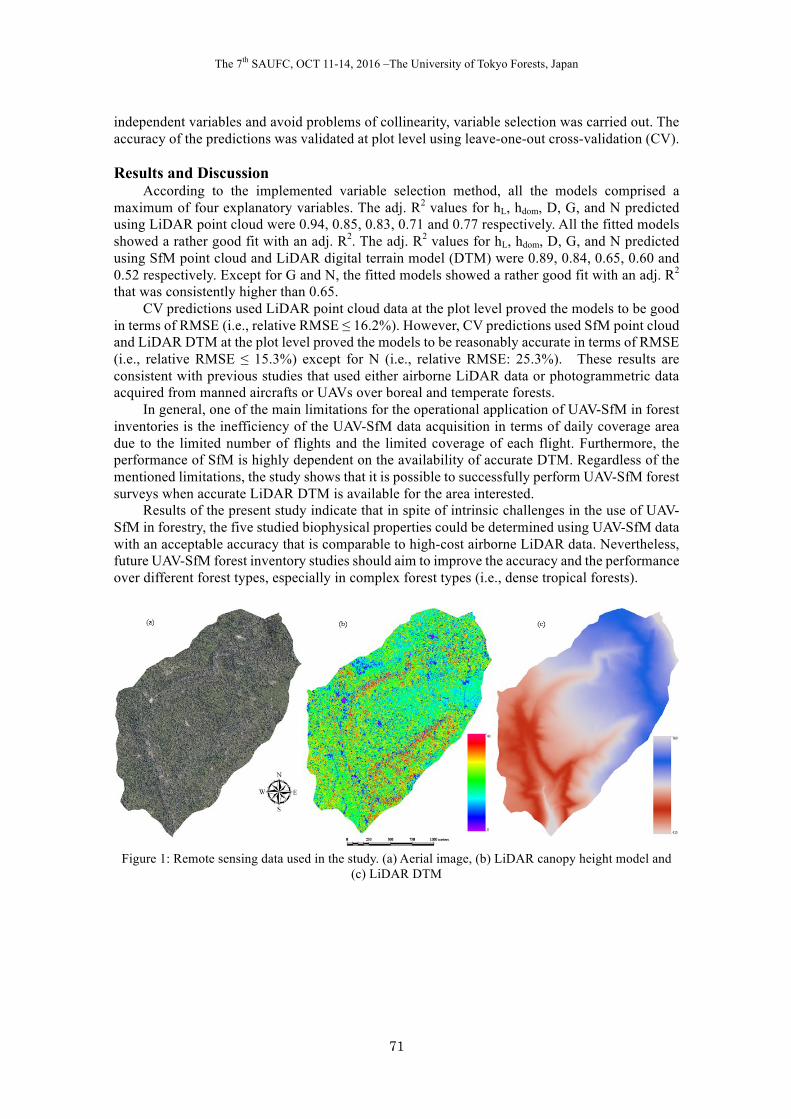
The 7th SAUFC, OCT 11-14, 2016 –The University of Tokyo Forests, Japan
71
independent variables and avoid problems of collinearity, variable selection was carried out. The accuracy of the predictions was validated at plot level using leave-one-out cross-validation (CV). Results and Discussion
According to the implemented variable selection method, all the models comprised a maximum of four explanatory variables. The adj. R2 values for hL, hdom, D, G, and N predicted using LiDAR point cloud were 0.94, 0.85, 0.83, 0.71 and 0.77 respectively. All the fitted models showed a rather good fit with an adj. R2. The adj. R2 values for hL, hdom, D, G, and N predicted using SfM point cloud and LiDAR digital terrain model (DTM) were 0.89, 0.84, 0.65, 0.60 and 0.52 respectively. Except for G and N, the fitted models showed a rather good fit with an adj. R2 that was consistently higher than 0.65.
CV predictions used LiDAR point cloud data at the plot level proved the models to be good in terms of RMSE (i.e., relative RMSE ≤ 16.2%). However, CV predictions used SfM point cloud and LiDAR DTM at the plot level proved the models to be reasonably accurate in terms of RMSE (i.e., relative RMSE ≤ 15.3%) except for N (i.e., relative RMSE: 25.3%). These results are consistent with previous studies that used either airborne LiDAR data or photogrammetric data acquired from manned aircrafts or UAVs over boreal and temperate forests.
In general, one of the main limitations for the operational application of UAV-SfM in forest inventories is the inefficiency of the UAV-SfM data acquisition in terms of daily coverage area due to the limited number of flights and the limited coverage of each flight. Furthermore, the performance of SfM is highly dependent on the availability of accurate DTM. Regardless of the mentioned limitations, the study shows that it is possible to successfully perform UAV-SfM forest surveys when accurate LiDAR DTM is available for the area interested.
Results of the present study indicate that in spite of intrinsic challenges in the use of UAV-SfM in forestry, the five studied biophysical properties could be determined using UAV-SfM data with an acceptable accuracy that is comparable to high-cost airborne LiDAR data. Nevertheless, future UAV-SfM forest inventory studies should aim to improve the accuracy and the performance over different forest types, especially in complex forest types (i.e., dense tropical forests).
Figure 1: Remote sensing data used in the study. (a) Aerial image, (b) LiDAR canopy height model and (c) LiDAR DTM
The 7th SAUFC, OCT 11-14, 2016 –The University of Tokyo Forests, Japan
72
Soil biochemical responses to nitrogen addition in a secondary evergreen broad-leaved forest ecosystem
Yong PENG1, Naoto KAMATA2 & Li-hua TU3
1Sichuan Agriculture University, CHINA, [email protected]
2The University of Tokyo Chichibu Forests, JAPAN, [email protected] 3Sichuan Agriculture University, CHINA, [email protected]
Introduction
Increased N deposition showed substantial impacts on terrestrial ecosystems. Secondary forests could contribute 0.35-0.6 Gt C yr−1 to terrestrial C sinks in 1990s, and N deposition contributes about 0.13 Gt C yr−1 to it. On western edge of the Szechwan Basin, China, there are large areas of secondary forests. The average wet N deposition in this region was 95 kg N ha−1 year−1 which is surprisingly much higher than the mean estimates of other areas of the world.
Material and Methods
Nine 20 m × 20 m plots were established in October 2012. Since April 2013, plots have been randomly divided into three treatments, i.e., control (CK, no N addition), low-N (LN, 50 kgN·hm−2·a−1) and high-N (HN, 150 kgN·hm−2·a−1). Then, litter fall, root biomass, soil respiration, and soil total organic C (TOC), total N (TN), ammonium N (NH4
+), nitrate N (NO3−), microbial
biomass C (MBC), microbial biomass N (MBN) and pH were measured.
Results and Discussion 1. Litter fall and root biomass
Added N had no significant effect on the accumulative litter fall (see Figure 1A). While the root biomass reduced significantly under N treatment (see Figure 1B). The reason may be that relatively less C was distributed to belowground when soil resource availability was enriched. Another potential reason is soil acidification and Al toxicity.
Figure 1: Litterfall mass and root biomass under different nitrogen treatments
2. Soil nutrient availability
Added N had not significant effect on the concentrations of soil TOC, TN, AP and AK (see Figure 2 and Table 1). However, the soil NO3
− and NH4+ concentrations significantly increased
under HN (see Figure 2 and Table 1), which could be attributed to the increases of gross N mineralization rates and the decreases of NO3
− and NH4+ immobilization.
Figure 2: Soil nutrient availability under different nitrogen treatments
The 7th SAUFC, OCT 11-14, 2016 –The University of Tokyo Forests, Japan
73
3. Soil microbial properties and pH The concentration of MBC decreased significantly under N treatments (see Figure 3 and
Table 1). It may because the root biomass and metabolism were inhibited by added N. However, N additions showed no significant influence on the MBN concentration. The ratio of MBC to MBN decreased significantly compared with control, which indicated that N fertilization had possibly altered the microbial community composition of this secondary forest.
Simulated N additions extremely significantly decreased the pH value of soil. It may because added N increased NH4
+ concentration, causing an accelerated nitrification and plant N uptake which could release H+ into soil.
Figure 3: Soil microbial properties and pH value under different nitrogen treatments
Table 1 Results of repeated measures ANOVA of soil nutrient availability, microbial properties and pH Treatments TOC(g kg−1) TN (g kg−1) NO3
−(mg kg−1) NH4+(mg kg−1) AP (mg kg−1)
CK 107.06±6.63a 5.93±0.36a 31.67±4.29a 20.41±4.00a 2.04±0.07a LN 119.43±6.64a 6.55±0.34a 34.50±1.01a 18.57±3.60a 2.47±0.20a HN 122.00±4.92a 6.76±0.25a 44.16±5.02b 36.82±7.83b 2.44±0.20a
Treatments AK(mg kg−1) MBC(g kg−1) MBN(g kg−1) MBC/MBN pH CK 142.16±8.70a 5.40±0.97a 0.23±0.00a 25.57±3.95a 3.91±0.01a LN 136.23±5.77a 2.62±0.13b 0.22±0.02a 12.40±1.16b 3.78±0.02b HN 153.21±10.59a 3.40±0.33b 0.22±0.01a 15.12±0.83b 3.73±0.03b
Different letters indicate significant difference among different treatments (a=0.05) 4. Soil respiration
Compared with the control, the average respiration rates in the HN significantly dropped ~30% (see Figure 4). The correlation analysis indicated that soil respiration rate showed a significant positive correlation with root biomass and soil MBC (see Figure 4), which well explanted that the root biomass and soil microbial biomass reductions are the main reasons for the decrease of soil respiration under N additions.
Figure 4: Annual mean soil respiration rate under different nitrogen treatments, and relationship
between soil respiration rate and root biomass or soil MBC 5. Conclusion
In this secondary forest, added N decreased root biomass and soil microbial biomass, thus slowing the soil C emissions. The inhibitory effects of N addition on soil pH and MBC/MBN indicted that increased N deposition leaded to soil acidification and changed soil microbial community composition.
The 7th SAUFC, OCT 11-14, 2016 –The University of Tokyo Forests, Japan
74
Elevational diversity patterns of understory vegetation determined by soil properties and light conditions
Nobuhiko SHIGYO1, Kiyoshi UMEKI2 & Toshihide HIRAO3
1Education and Research Center, The University of Tokyo Forests, JAPAN,
[email protected] 2Graduate School of Horticulture, Chiba University, JAPAN
3The University of Tokyo Chichibu Forest, JAPAN Introduction
Understory vegetation in mountainous regions is strongly affected by environmental conditions and evolutionary histories, shaping elevational diversity patterns. However, few studies have focused on how complicated interactions among environmental factors determine elevational diversity patterns. Therefore, this study aimed to examine the direct and indirect effects of environmental factors in regulating the taxonomic and phylogenetic diversity of understory vegetation along elevational gradients. Material and Methods
The study site was conducted in cool-temperate and sub-alpine forests at the University of Tokyo Chichibu Forest (35°56′ N, 138°52′ E) in the central Japan. 1. Data collection
60 plots (each 30 × 30 m2 in area) were established along elevational gradients. Each of 60 plots was divided into nine 10 × 10 m subplots, and then cross-shaped five subplots were selected. One sampling quadrats (1 × 1 m) for understory vegetation was set up at near the upper-right corner of each subplot. All vascular plants less than 0.3 m in height were identified and counted. Elevation and slope were calculated from airborne-LiDAR point cloud data. Soil temperature was measured for each plot using temperature data loggers. Topsoil samples were collected in each subplot, and soil pH and CN ratio were measured. All trees > 10 cm gbh (girth at breast height) were measured in each plot, and basal area per plot was calculated. Furthermore, canopy openness was calculated from hemispherical photographs that were taken with a fisheye camera in each quadrat at the height of 1.3 m above the ground. 2. Statistical analyses
To test phylogenetic signals in habitat requirements, Blomberg’s K was calculated for the mean values of environmental ranges with which each species was observed across the study sites. Values of K closer to 0 correspond to convergent patterns of trait evolution while K = 1 arises when trait values evolve by the Brownian motion, and K > 1 indicates conserved patterns of trait evolution. Phylogenetic species variability (PSV) was also calculated for tree seedlings and herbs. PSV ranges between 0 and 1, where phylogenetically clustered communities have a value close to 0 while phylogenetically overdispersed communities have a value close to 1. For tree seedlings and herbs, structural equation modeling (SEM) was used for considering the complicated causal relationships between environmental variables. For each of model, response variables were species richness and PSV. Results and Discussion
K values of all habitat requirements were lower than those expected under a Brownian-motion model (Fig. 1), where soil properties and basal area for tree seedlings showed significant phylogenetic signal (Fig. 1a). For herbs, the phylogenetic signal of canopy openness was reliable trend (P < 0.1; Fig. 1b). These phylogenetic patterns imply that elevational diversity gradients have been constrained by evolutionary histories of plant species.
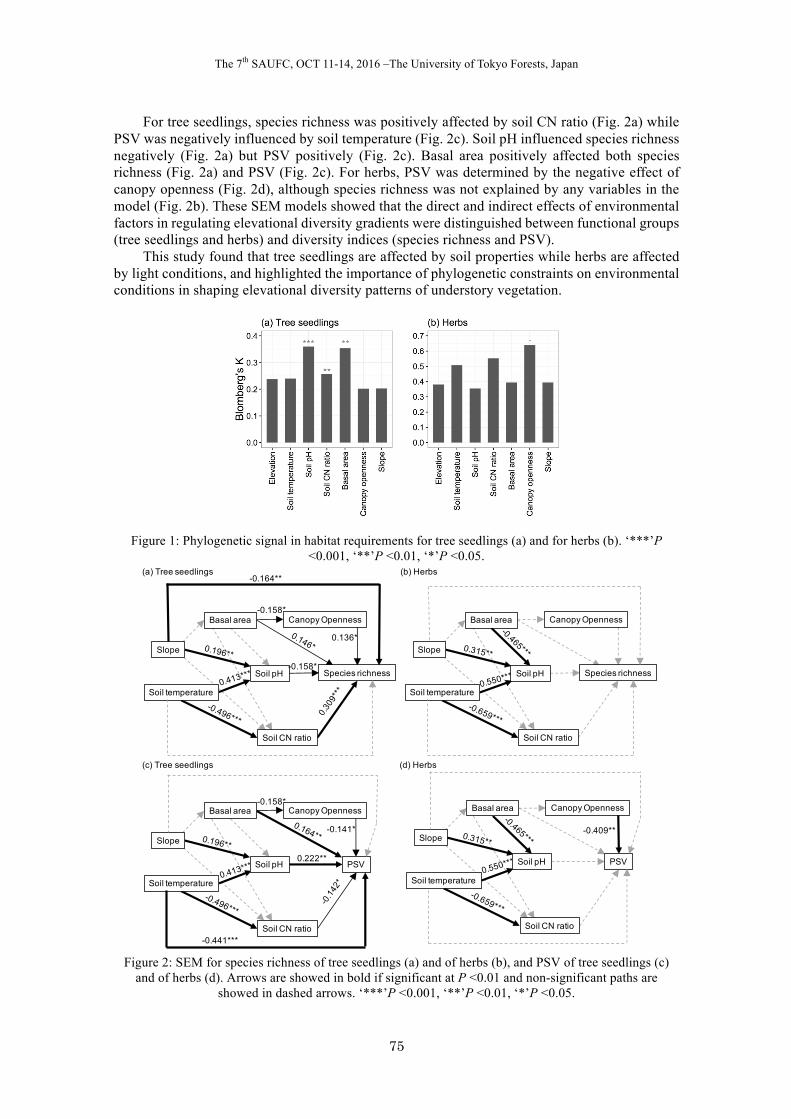
The 7th SAUFC, OCT 11-14, 2016 –The University of Tokyo Forests, Japan
75
For tree seedlings, species richness was positively affected by soil CN ratio (Fig. 2a) while PSV was negatively influenced by soil temperature (Fig. 2c). Soil pH influenced species richness negatively (Fig. 2a) but PSV positively (Fig. 2c). Basal area positively affected both species richness (Fig. 2a) and PSV (Fig. 2c). For herbs, PSV was determined by the negative effect of canopy openness (Fig. 2d), although species richness was not explained by any variables in the model (Fig. 2b). These SEM models showed that the direct and indirect effects of environmental factors in regulating elevational diversity gradients were distinguished between functional groups (tree seedlings and herbs) and diversity indices (species richness and PSV).
This study found that tree seedlings are affected by soil properties while herbs are affected by light conditions, and highlighted the importance of phylogenetic constraints on environmental conditions in shaping elevational diversity patterns of understory vegetation.
Figure 1: Phylogenetic signal in habitat requirements for tree seedlings (a) and for herbs (b). ‘***’P
<0.001, ‘**’P <0.01, ‘*’P <0.05.
Figure 2: SEM for species richness of tree seedlings (a) and of herbs (b), and PSV of tree seedlings (c)
and of herbs (d). Arrows are showed in bold if significant at P <0.01 and non-significant paths are showed in dashed arrows. ‘***’P <0.001, ‘**’P <0.01, ‘*’P <0.05.
Soil pH
Canopy OpennessBasal area
Soil CN ratio
Species richness
(a) Tree seedlings
Slope
-0.164**
0.136*
-0.158*
Soil temperature
-0.158*
(b) Herbs
(c) Tree seedlings
-0.141*
0.222**
-0.441***
-0.158*
(d) Herbs
-0.409**
Soil pH
Canopy OpennessBasal area
Soil CN ratio
PSV
Slope
Soil temperature
Soil pH
Canopy OpennessBasal area
Soil CN ratio
Species richness
Slope
Soil temperature
Soil pH
Canopy OpennessBasal area
Soil CN ratio
PSV
Slope
Soil temperature
The 7th SAUFC, OCT 11-14, 2016 –The University of Tokyo Forests, Japan
76
Inter- and intra-species resprouting patterns of undamaged trees in natural forests
Mitsuru KAWASAKI1 & Kiyoshi UMEKI2
1Education and Research Center, The University of Tokyo Forests, JAPAN, mick-
[email protected] 2Graduate School of Horticulture, Chiba University, JAPAN
Introduction
Although less attention has been traditionally paid to resprouting of woody species than to regeneration via seedlings, resprouting is an important demographic process influencing various aspects of community dynamics and evolution of species. In general, resprouting of many woody species living in various types of forests helps damaged individuals survive, regrowth, and persist. It has been widely recognized that there is considerable among- and within-species variability in resprouting behavior. Trade-offs in resource allocation (e.g. allocations to resprout production vs. to parent stem growth) may underlie this variability. In addition, physiological responses to parent and environmental conditions may cause the within-species variation.
Despite the increasing interest in resprouting of woody species, most researches have concentrated on resprouting of damaged individuals and researches on resprouting of undamaged individuals were rather scarce. Moreover, a few study of resprouting of undamaged individuals has been focused on some target species. Therefore, community-wide studies of resprouting of undamaged individuals are required for better understanding this demographic process.
In this study, we addressed the following questions: 1) How did species mean relative dbh growth rate and mean relative basal area affect species resprouting ability? and 2) How did parental and environmental factors affect resprout number per stem within each resprouting species?
Material and Methods
This study was conducted in natural forests along an elevational gradient (900 - 1,851 m above sea level) in the University of Tokyo Chichibu forest, central Japan. Forest types of this study area varied from cool-temperate deciduous broad-leaved forests at lower elevations to sub-alpine evergreen coniferous forests at higher elevations. In 2013, we chose 28 research sites in the study forests and set two 30m × 30m plots in each site: one with a deer exclosure and another without a deer exclosure, and measured all stems (> 3.18 cm in dbh) for their dbh. No recent major disturbances were evident in the research site. In 2015, we counted the number of resprouts (> 15 cm long and within 30 cm from the ground) emerging from parent stems without signs of major damages in the center 10 m × 10 m subplot in each plot, and re-measured dbh of all parent stems. The total number of the observed parent stems was 853. We also measured several environmental factors that might influence resprouting (soil temperature, soil nitrogen content, soil pH, and slope inclination).
Firstly, we analyzed the probability for an individual to have resprouts (Pr_s) using a simple logistic regression with two explanatory variables (mean relative dbh growth rate and mean relative basal area of species). Secondly, for nine resprouting species (Acer micranthum, A. rufinerve, A. ukurunduense, Clethra barbinervis, Fagus japonica, Fraxinus lanuginosa, Meliosma myriantha, Quercus crispula, and Sorbus commixta), we analyzed the effects of parental and environmental conditions on the number of resprouts per parent stem (N) using the hierarchical Bayesian method with the zero-inflated Poisson distribution (ZIP). The two parameters in ZIP, the mean of Poisson distribution (λ) and the probability of inflated zeros (p), were assumed to be determined by parental and environmental conditions:
The 7th SAUFC, OCT 11-14, 2016 –The University of Tokyo Forests, Japan
77
( ) xa+0apLogit = [1] ( ) xb+0bλLog = [2]
where a0 and b0 are intercepts; a and b are vectors of parameters relating explanatory variables and λ or p; and x is the column vector of explanatory variables. The priors of a0, b0, and elements of a and b were assumed to follow a normal distribution with hyper-species parameters, which were assumed to have non-informative priors. The posterior distributions of all parameters were determined by Markov chain Monte Carlo method. We conducted model selection to obtain a model that included only important predictors by using the “widely applicable information criterion” values. Results and Discussion
Species mean relative basal area had a negative effect of Pr_s but mean relative growth rate did not have a significant effect (Fig.1). The negative effect of mean relative basal area may support the argument that resprouting species cannot dominate forest communities because resprouting species must allocate resources to storage or multiple stems at the expense of height growth of single stems. However, it would be premature to draw a conclusion because mean relative dbh growth rate of parent stems did not affect the resprouting ability.
The model including dbh, dbh growth rate, soil temperature, slope inclination, total basal
area, the existence/absence of a deer exclosure was selected as the best-supported model predicting sprout number per stem for nine sprouting species. Consistent positive effects of deer exclosures on sprout number were found. This indicates that the browsing pressure by sika deer on resprouts was considerable. The effect of dbh of parent stems on resprout number was weaker than those of other selected factors. The effect of dbh growth on the resprout number was generally negative but not very strong. The effect of mean soil temperature was generally strong and positive, but negative for C. barbinervis. High temperature seems to have enhanced resprouting activity in our research sites. Slope inclination and stand basal area had various effects on resprout number. Previous studies often examined the effects of parental conditions on sprouting but rarely examined the effects of environmental conditions, which appeared to have relatively strong effects in this study. This may imply that important factors influencing resprouting activity have been overlooked while the effects of easily measured factors have often been examined.
Fig. 1
The 7th SAUFC, OCT 11-14, 2016 –The University of Tokyo Forests, Japan
78
Seasonal fluctuation of ambrosia beetles and species composition on Betula maximowicziana
Anut BURANAPANICHPAN1 & Naoto KAMATA2
1Graduate student of The University of Tokyo, JAPAN, [email protected] 2The University of Tokyo Hokkaido Forest, JAPAN, [email protected]
Introduction
Ambrosia beetles are known as an ecological guild that construct and live a gallery in sapwood. They have symbiotic relationship with ambrosia that is a mixture of fungi, yeasts, and bacteria. Ambrosia beetles carry, cultivate, and feed on the ambrosia. Ambrosia beetles are found in two subfamilies belonging to the family Curculionidae: the subfamily Scolytinae and Platypodinae. Most ambrosia beetles are known as secondary attackers that attack unhealthy, stressed, or dead trees. In The University of Tokyo Hokkaido Forest (UTHF), Betula maximowicziana is one of the most valuable timber species. There are large areas of young stands dominated by B. maximowicziana. However, since 2009, population outbreaks of saturniidae moth Caligula japonica (Lepidoptera: Saturniidae) has reached outbreak level and caused severe defoliation to B. maximowicziana. After consecutive years of the insect defoliation, ambrosia beetles started to attack some of these trees. The purpose of this study is to determine seasonal fluctuation of ambrosia beetles flying in B. maximowicziana stand using ethanol baited traps. Materials and Methods
The research was conducted from June to October, 2015 in The University of Tokyo Hokkaido Forest. Three study sites were selected in three secondary forest stands that have established after forest fire c. 100 years ago and dominated by B. maximowicziana; Loc-1, Nishinosawa; Loc-2, Rokugo; and Loc-3, Nunobe. Ethanol baited traps were used in this study. The trap was upside down hanging type modified from a soda bottle. A plastic tube (15 ml.) with 95% ethanol was hung inside the soda bottle. Propylene glycol was put into the soda bottle in order to kill and preserve insects attracted to the ethanol. Four traps were set at each location. Captured insects were collected every two weeks. The attractant and the preserve liquid were also replaced at the same time. Insects were brought back to the laboratory of UTHF and sorted into morphospecies for further identification. The number of the morphospecies belonging to the subfamily Scolytinae and Platypodinae were identified into species level and recorded. Results
In total, c. 14,000 individuals of ambrosia beetles were captured. The percentage of ambrosia beetles to coleopteran insects was 82.3%, 86.3% and 93.4% in Loc-1, Loc-2, and Loc-3, respectively. The number of ambrosia beetles peaked at June, 29 for all three locations, then started to decrease, and collapsed at August, 12 (Figure 1). The number of ambrosia beetles in Loc-3 was greatest followed by Loc-2 and significantly greater than the others (P <0.05).
Eight morphospecies of ambrosia beetles were collected, which belonged to the subfamily Scolytinae: Anisandrus hirtus, Scolytoplatypus blandfordi, Scolytoplatypus mikado, Scolytoplatypus tycon, Xyleborus seriatus, Xylosandrus germanus, and two unidentified species belonging to the genus Cryphalus (Cryphalus sp1 and Cryphalus sp2). No individuals belonging to the subfamily Platypodinae were captured. The total number of captures in the three locations was greatest in S. tycon followed by X. germanus, S. mikado, A. hirtus, S. blandfordi, Cryphalus sp1, and Cryphalus sp2 and X. seriatus. Proportion of S. tycon was greatest followed by X. germanus in all the three locations (Figure 2).
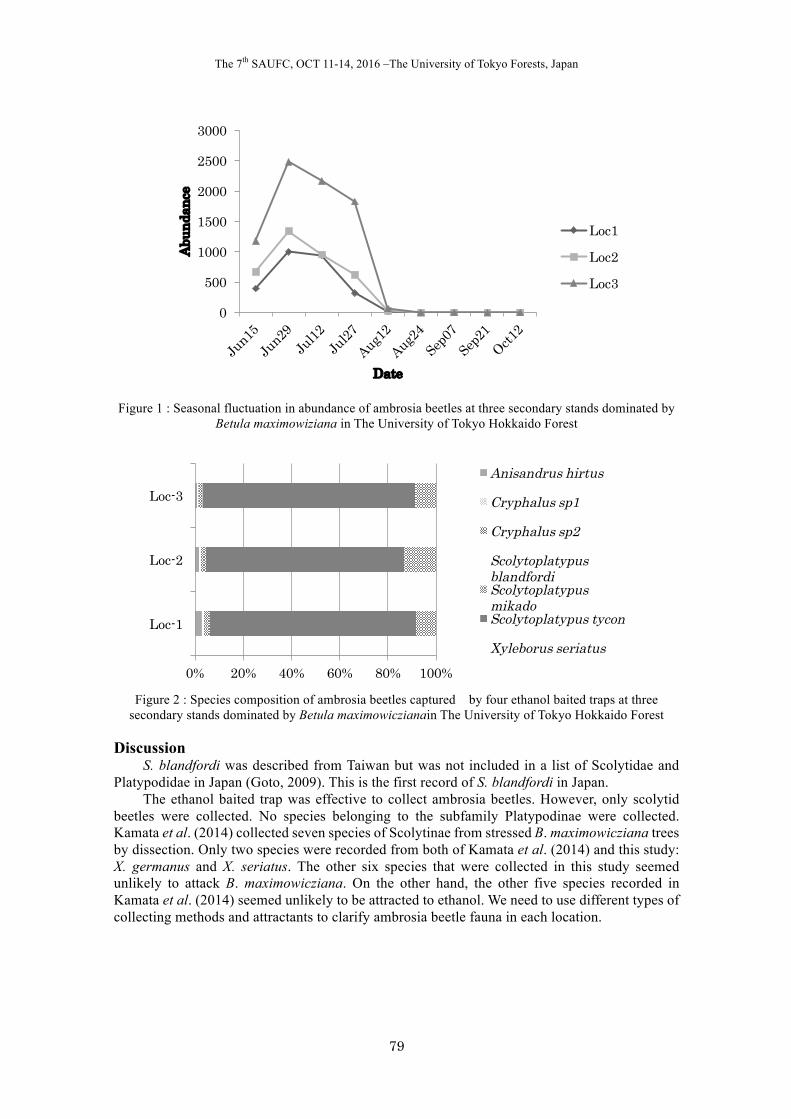
The 7th SAUFC, OCT 11-14, 2016 –The University of Tokyo Forests, Japan
79
Figure 1 : Seasonal fluctuation in abundance of ambrosia beetles at three secondary stands dominated by
Betula maximowiziana in The University of Tokyo Hokkaido Forest
Figure 2 : Species composition of ambrosia beetles captured by four ethanol baited traps at three
secondary stands dominated by Betula maximowiczianain The University of Tokyo Hokkaido Forest
Discussion S. blandfordi was described from Taiwan but was not included in a list of Scolytidae and
Platypodidae in Japan (Goto, 2009). This is the first record of S. blandfordi in Japan. The ethanol baited trap was effective to collect ambrosia beetles. However, only scolytid
beetles were collected. No species belonging to the subfamily Platypodinae were collected. Kamata et al. (2014) collected seven species of Scolytinae from stressed B. maximowicziana trees by dissection. Only two species were recorded from both of Kamata et al. (2014) and this study: X. germanus and X. seriatus. The other six species that were collected in this study seemed unlikely to attack B. maximowicziana. On the other hand, the other five species recorded in Kamata et al. (2014) seemed unlikely to be attracted to ethanol. We need to use different types of collecting methods and attractants to clarify ambrosia beetle fauna in each location.
0
500
1000
1500
2000
2500
3000
Abun
danc
e
Date
Loc1
Loc2
Loc3
0% 20% 40% 60% 80% 100%
Loc-1
Loc-2
Loc-3Anisandrus hirtus
Cryphalus sp1
Cryphalus sp2
Scolytoplatypus blandfordiScolytoplatypus mikadoScolytoplatypus tycon
Xyleborus seriatus
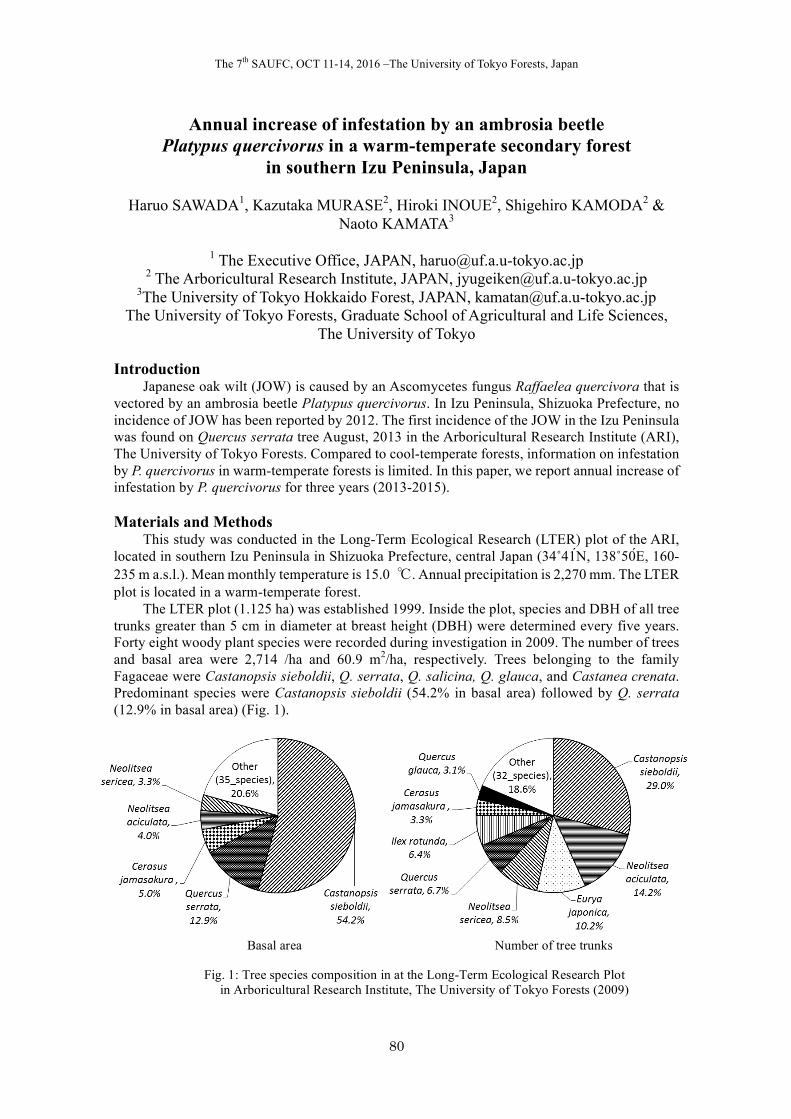
The 7th SAUFC, OCT 11-14, 2016 –The University of Tokyo Forests, Japan
80
Annual increase of infestation by an ambrosia beetle Platypus quercivorus in a warm-temperate secondary forest
in southern Izu Peninsula, Japan
Haruo SAWADA1, Kazutaka MURASE2, Hiroki INOUE2, Shigehiro KAMODA2 & Naoto KAMATA3
1 The Executive Office, JAPAN, [email protected]
2 The Arboricultural Research Institute, JAPAN, [email protected] 3The University of Tokyo Hokkaido Forest, JAPAN, [email protected]
The University of Tokyo Forests, Graduate School of Agricultural and Life Sciences, The University of Tokyo
Introduction
Japanese oak wilt (JOW) is caused by an Ascomycetes fungus Raffaelea quercivora that is vectored by an ambrosia beetle Platypus quercivorus. In Izu Peninsula, Shizuoka Prefecture, no incidence of JOW has been reported by 2012. The first incidence of the JOW in the Izu Peninsula was found on Quercus serrata tree August, 2013 in the Arboricultural Research Institute (ARI), The University of Tokyo Forests. Compared to cool-temperate forests, information on infestation by P. quercivorus in warm-temperate forests is limited. In this paper, we report annual increase of infestation by P. quercivorus for three years (2013-2015).
Materials and Methods
This study was conducted in the Long-Term Ecological Research (LTER) plot of the ARI, located in southern Izu Peninsula in Shizuoka Prefecture, central Japan (34˚41 ́N, 138˚50 ́E, 160-235 m a.s.l.). Mean monthly temperature is 15.0 ℃. Annual precipitation is 2,270 mm. The LTER plot is located in a warm-temperate forest.
The LTER plot (1.125 ha) was established 1999. Inside the plot, species and DBH of all tree trunks greater than 5 cm in diameter at breast height (DBH) were determined every five years. Forty eight woody plant species were recorded during investigation in 2009. The number of trees and basal area were 2,714 /ha and 60.9 m2/ha, respectively. Trees belonging to the family Fagaceae were Castanopsis sieboldii, Q. serrata, Q. salicina, Q. glauca, and Castanea crenata. Predominant species were Castanopsis sieboldii (54.2% in basal area) followed by Q. serrata (12.9% in basal area) (Fig. 1).
Basal area Number of tree trunks
Fig. 1: Tree species composition in at the Long-Term Ecological Research Plot in Arboricultural Research Institute, The University of Tokyo Forests (2009)
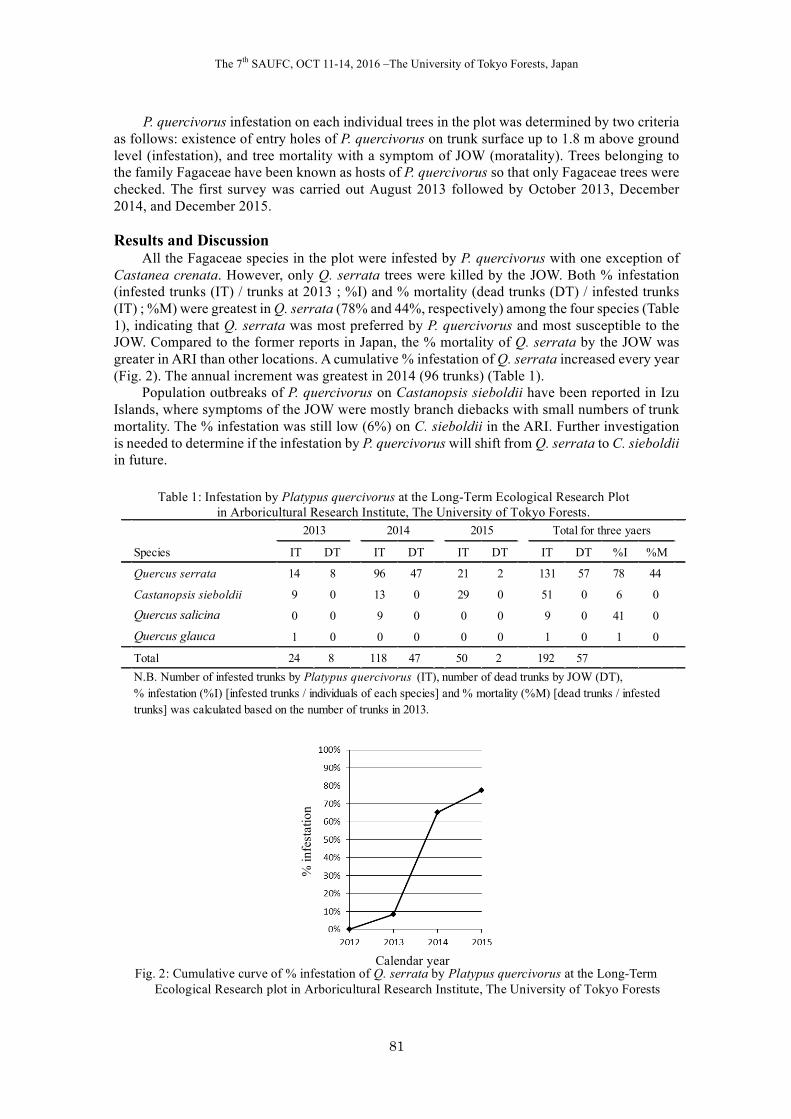
The 7th SAUFC, OCT 11-14, 2016 –The University of Tokyo Forests, Japan
81
Table 1: Infestation by Platypus quercivorus at the Long-Term Ecological Research Plot in Arboricultural Research Institute, The University of Tokyo Forests.
P. quercivorus infestation on each individual trees in the plot was determined by two criteria as follows: existence of entry holes of P. quercivorus on trunk surface up to 1.8 m above ground level (infestation), and tree mortality with a symptom of JOW (moratality). Trees belonging to the family Fagaceae have been known as hosts of P. quercivorus so that only Fagaceae trees were checked. The first survey was carried out August 2013 followed by October 2013, December 2014, and December 2015. Results and Discussion
All the Fagaceae species in the plot were infested by P. quercivorus with one exception of Castanea crenata. However, only Q. serrata trees were killed by the JOW. Both % infestation (infested trunks (IT) / trunks at 2013 ; %I) and % mortality (dead trunks (DT) / infested trunks (IT) ; %M) were greatest in Q. serrata (78% and 44%, respectively) among the four species (Table 1), indicating that Q. serrata was most preferred by P. quercivorus and most susceptible to the JOW. Compared to the former reports in Japan, the % mortality of Q. serrata by the JOW was greater in ARI than other locations. A cumulative % infestation of Q. serrata increased every year (Fig. 2). The annual increment was greatest in 2014 (96 trunks) (Table 1).
Population outbreaks of P. quercivorus on Castanopsis sieboldii have been reported in Izu Islands, where symptoms of the JOW were mostly branch diebacks with small numbers of trunk mortality. The % infestation was still low (6%) on C. sieboldii in the ARI. Further investigation is needed to determine if the infestation by P. quercivorus will shift from Q. serrata to C. sieboldii in future.
% in
fest
atio
n
Fig. 2: Cumulative curve of % infestation of Q. serrata by Platypus quercivorus at the Long-Term Ecological Research plot in Arboricultural Research Institute, The University of Tokyo Forests
Calendar year
Species IT DT IT DT IT DT IT DT %I %M
Quercus serrata 14 8 96 47 21 2 131 57 78 44
Castanopsis sieboldii 9 0 13 0 29 0 51 0 6 0
Quercus salicina 0 0 9 0 0 0 9 0 41 0
Quercus glauca 1 0 0 0 0 0 1 0 1 0
Total 24 8 118 47 50 2 192 57
2013 2014 Total for three yaers
N.B. Number of infested trunks by Platypus quercivorus (IT), number of dead trunks by JOW (DT),% infestation (%I) [infested trunks / individuals of each species] and % mortality (%M) [dead trunks / infestedtrunks] was calculated based on the number of trunks in 2013.
2015
The 7th SAUFC, OCT 11-14, 2016 –The University of Tokyo Forests, Japan
82
Conservation activities and research of an endangered population of Pinus parviflora var. parviflora in the Boso Hills, Chiba, Japan
Tsutomu KARUKOME1, Takashi YONEMICHI2, Shigenahi SATOMI3,
Kiriko YANASE4 & Yoko HISAMOTO5
1 The University of Tokyo Chiba Forest, JAPAN, [email protected] 2 The University of Tokyo Chiba Forest, JAPAN, [email protected]
3 The University of Tokyo Chiba Forest, JAPAN, [email protected] 4Ecohydrology Research Institute The Universty of Tokyo Forest, JAPAN,
[email protected] 5 The University of Tokyo Chiba Forest, JAPAN, [email protected]
Introduction
Pinus parviflora var. parviflora is disjunctively distributed on Boso Hills, Chiba prefecture, where the University of Tokyo Chiba Forest, the University of Tokyo (UTCBF) is located. This species is important from the point of view of geologic history and phytogeography of Chiba prefecture because it is a local relict species of the last glacial period (approximately 10,000 years ago). However, the population has recently diminished rapidly because of the pine wilt disease etc.. Therefore, the government of the Chiba prefecture registered P. parviflora var. parviflora as the most important conservation species in Chiba and "the recovering plan for the population of P. parviflora var. parviflora in Chiba prefecture" was formulated. The UTCBF has performed several conservation activities and research based on this recovering plan. We introduce about activities of the UTCBF in this report. Overview of Pinus parviflora var. parviflora in the Boso Hills
Pinus parviflora var. parviflora (Photo 1), which is a mountainous conifer, is also called a five-leaf pine and distributes from the southern Tohoku district to Kyushu district in Japanese temperate zones. In the Kanto district, they distribute mostly in more than 500 m above sea level, but they specifically distribute in low mountain areas which are less than 400 m above sea level on the Boso Hills, Chiba prefecture. It was said that there were several thousand trees in the 1960s but they diminished rapidly and approximately 80 individuals remained in 2014 and distributed among 7 local patches (Fig. 1). Among them, about 20 individuals grow in UTCBF.
The death caused by pine wood nematodes and the illegal dig of the seedlings as the gardening use are considered as the causes of the population decrease. In addition, natural regeneration is difficult due to a change of the growth environment and the isolation of individuals. Conservation activities by UTCBF
The prefectural government of the Chiba aimed to the conservation of P. parviflora var. parviflora and "the conservation meeting for P. parviflora var. parviflora" that consisted of the public sector, private sector, and academia was established in 2009 and "the recovering plan" was formulated. The UTCBF also participated as a member of the meeting. We produced seedling and performed clonal propagation for lineage preservation and maintained approximately 90 families and more than 1,000 trees consisted of the artificial mating, natural mating, grafted clones in 2014. We investigate the breeding quantity on the tree by using the traditional climbing technique ‘Burinawa'.
In addition, we act on awareness campaign for the local governments and the local high school students in order to let them know the issues of P. parviflora var. parviflora.
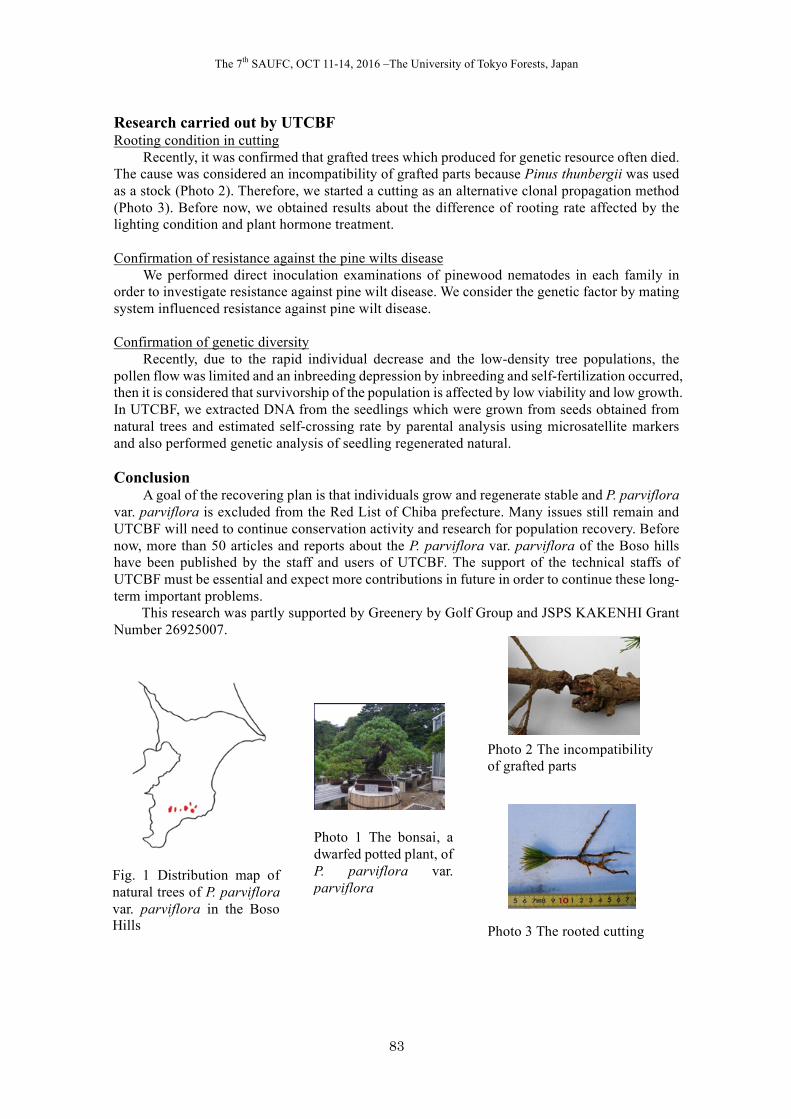
The 7th SAUFC, OCT 11-14, 2016 –The University of Tokyo Forests, Japan
83
Research carried out by UTCBF Rooting condition in cutting
Recently, it was confirmed that grafted trees which produced for genetic resource often died. The cause was considered an incompatibility of grafted parts because Pinus thunbergii was used as a stock (Photo 2). Therefore, we started a cutting as an alternative clonal propagation method (Photo 3). Before now, we obtained results about the difference of rooting rate affected by the lighting condition and plant hormone treatment. Confirmation of resistance against the pine wilts disease
We performed direct inoculation examinations of pinewood nematodes in each family in order to investigate resistance against pine wilt disease. We consider the genetic factor by mating system influenced resistance against pine wilt disease. Confirmation of genetic diversity
Recently, due to the rapid individual decrease and the low-density tree populations, the pollen flow was limited and an inbreeding depression by inbreeding and self-fertilization occurred, then it is considered that survivorship of the population is affected by low viability and low growth. In UTCBF, we extracted DNA from the seedlings which were grown from seeds obtained from natural trees and estimated self-crossing rate by parental analysis using microsatellite markers and also performed genetic analysis of seedling regenerated natural. Conclusion
A goal of the recovering plan is that individuals grow and regenerate stable and P. parviflora var. parviflora is excluded from the Red List of Chiba prefecture. Many issues still remain and UTCBF will need to continue conservation activity and research for population recovery. Before now, more than 50 articles and reports about the P. parviflora var. parviflora of the Boso hills have been published by the staff and users of UTCBF. The support of the technical staffs of UTCBF must be essential and expect more contributions in future in order to continue these long-term important problems.
This research was partly supported by Greenery by Golf Group and JSPS KAKENHI Grant Number 26925007.
Fig. 1 Distribution map of natural trees of P. parviflora var. parviflora in the Boso Hills
Photo 1 The bonsai, a dwarfed potted plant, of P. parviflora var. parviflora
Photo 2 The incompatibility of grafted parts
Photo 3 The rooted cutting
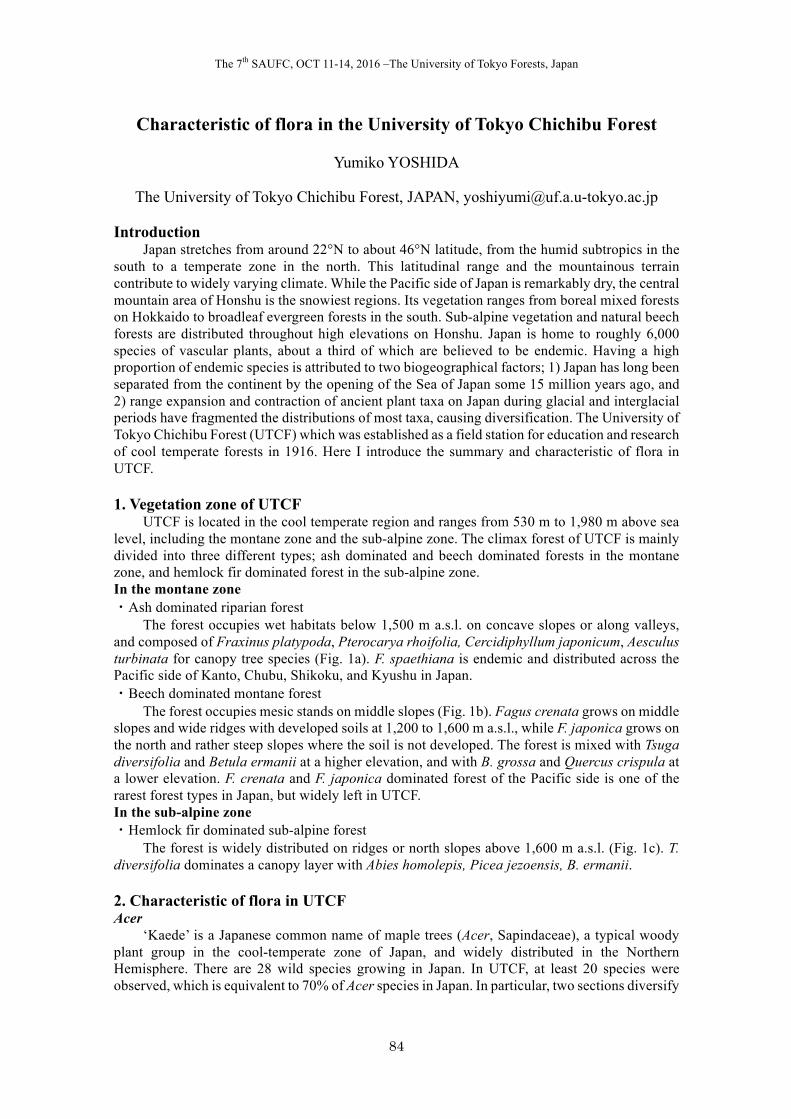
The 7th SAUFC, OCT 11-14, 2016 –The University of Tokyo Forests, Japan
84
Characteristic of flora in the University of Tokyo Chichibu Forest
Yumiko YOSHIDA
The University of Tokyo Chichibu Forest, JAPAN, [email protected] Introduction
Japan stretches from around 22°N to about 46°N latitude, from the humid subtropics in the south to a temperate zone in the north. This latitudinal range and the mountainous terrain contribute to widely varying climate. While the Pacific side of Japan is remarkably dry, the central mountain area of Honshu is the snowiest regions. Its vegetation ranges from boreal mixed forests on Hokkaido to broadleaf evergreen forests in the south. Sub-alpine vegetation and natural beech forests are distributed throughout high elevations on Honshu. Japan is home to roughly 6,000 species of vascular plants, about a third of which are believed to be endemic. Having a high proportion of endemic species is attributed to two biogeographical factors; 1) Japan has long been separated from the continent by the opening of the Sea of Japan some 15 million years ago, and 2) range expansion and contraction of ancient plant taxa on Japan during glacial and interglacial periods have fragmented the distributions of most taxa, causing diversification. The University of Tokyo Chichibu Forest (UTCF) which was established as a field station for education and research of cool temperate forests in 1916. Here I introduce the summary and characteristic of flora in UTCF. 1. Vegetation zone of UTCF
UTCF is located in the cool temperate region and ranges from 530 m to 1,980 m above sea level, including the montane zone and the sub-alpine zone. The climax forest of UTCF is mainly divided into three different types; ash dominated and beech dominated forests in the montane zone, and hemlock fir dominated forest in the sub-alpine zone. In the montane zone ・Ash dominated riparian forest
The forest occupies wet habitats below 1,500 m a.s.l. on concave slopes or along valleys, and composed of Fraxinus platypoda, Pterocarya rhoifolia, Cercidiphyllum japonicum, Aesculus turbinata for canopy tree species (Fig. 1a). F. spaethiana is endemic and distributed across the Pacific side of Kanto, Chubu, Shikoku, and Kyushu in Japan. ・Beech dominated montane forest
The forest occupies mesic stands on middle slopes (Fig. 1b). Fagus crenata grows on middle slopes and wide ridges with developed soils at 1,200 to 1,600 m a.s.l., while F. japonica grows on the north and rather steep slopes where the soil is not developed. The forest is mixed with Tsuga diversifolia and Betula ermanii at a higher elevation, and with B. grossa and Quercus crispula at a lower elevation. F. crenata and F. japonica dominated forest of the Pacific side is one of the rarest forest types in Japan, but widely left in UTCF. In the sub-alpine zone ・Hemlock fir dominated sub-alpine forest
The forest is widely distributed on ridges or north slopes above 1,600 m a.s.l. (Fig. 1c). T. diversifolia dominates a canopy layer with Abies homolepis, Picea jezoensis, B. ermanii. 2. Characteristic of flora in UTCF Acer
‘Kaede’ is a Japanese common name of maple trees (Acer, Sapindaceae), a typical woody plant group in the cool-temperate zone of Japan, and widely distributed in the Northern Hemisphere. There are 28 wild species growing in Japan. In UTCF, at least 20 species were observed, which is equivalent to 70% of Acer species in Japan. In particular, two sections diversify
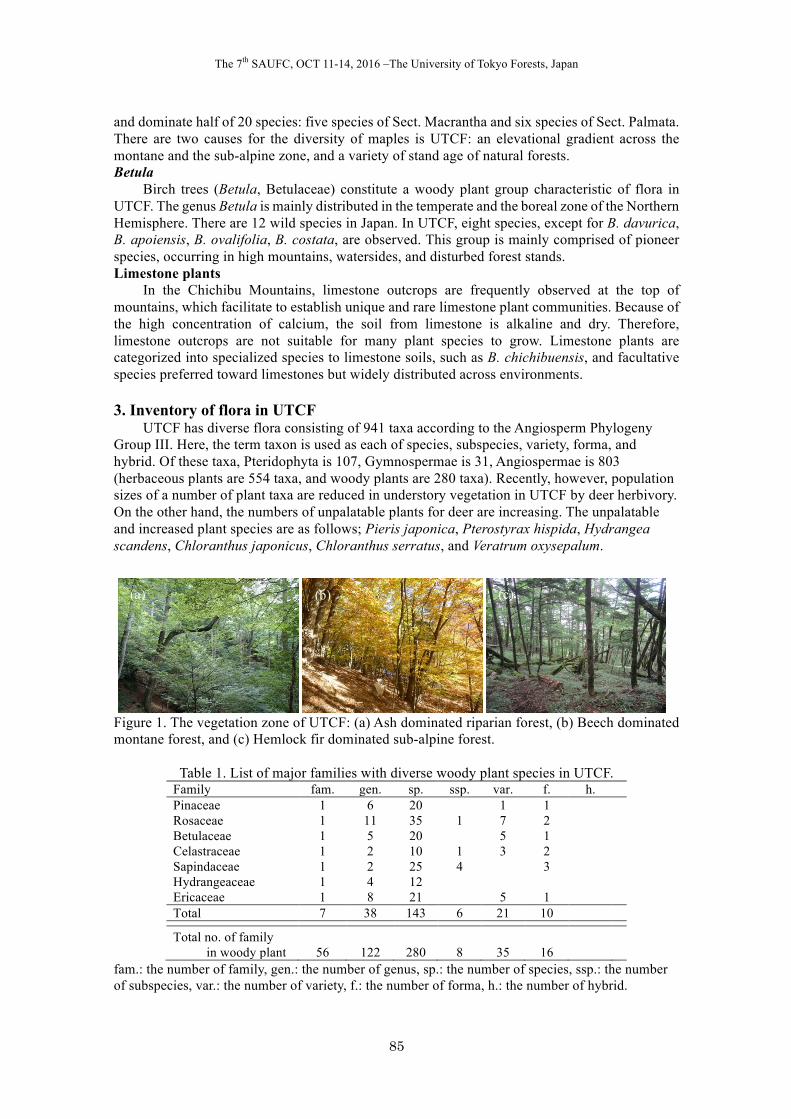
The 7th SAUFC, OCT 11-14, 2016 –The University of Tokyo Forests, Japan
85
and dominate half of 20 species: five species of Sect. Macrantha and six species of Sect. Palmata. There are two causes for the diversity of maples is UTCF: an elevational gradient across the montane and the sub-alpine zone, and a variety of stand age of natural forests. Betula
Birch trees (Betula, Betulaceae) constitute a woody plant group characteristic of flora in UTCF. The genus Betula is mainly distributed in the temperate and the boreal zone of the Northern Hemisphere. There are 12 wild species in Japan. In UTCF, eight species, except for B. davurica, B. apoiensis, B. ovalifolia, B. costata, are observed. This group is mainly comprised of pioneer species, occurring in high mountains, watersides, and disturbed forest stands. Limestone plants
In the Chichibu Mountains, limestone outcrops are frequently observed at the top of mountains, which facilitate to establish unique and rare limestone plant communities. Because of the high concentration of calcium, the soil from limestone is alkaline and dry. Therefore, limestone outcrops are not suitable for many plant species to grow. Limestone plants are categorized into specialized species to limestone soils, such as B. chichibuensis, and facultative species preferred toward limestones but widely distributed across environments. 3. Inventory of flora in UTCF
UTCF has diverse flora consisting of 941 taxa according to the Angiosperm Phylogeny Group III. Here, the term taxon is used as each of species, subspecies, variety, forma, and hybrid. Of these taxa, Pteridophyta is 107, Gymnospermae is 31, Angiospermae is 803 (herbaceous plants are 554 taxa, and woody plants are 280 taxa). Recently, however, population sizes of a number of plant taxa are reduced in understory vegetation in UTCF by deer herbivory. On the other hand, the numbers of unpalatable plants for deer are increasing. The unpalatable and increased plant species are as follows; Pieris japonica, Pterostyrax hispida, Hydrangea scandens, Chloranthus japonicus, Chloranthus serratus, and Veratrum oxysepalum.
Figure 1. The vegetation zone of UTCF: (a) Ash dominated riparian forest, (b) Beech dominated montane forest, and (c) Hemlock fir dominated sub-alpine forest.
Table 1. List of major families with diverse woody plant species in UTCF. Family fam. gen. sp. ssp. var. f. h. Pinaceae 1 6 20 1 1 Rosaceae 1 11 35 1 7 2 Betulaceae 1 5 20 5 1 Celastraceae 1 2 10 1 3 2 Sapindaceae 1 2 25 4 3 Hydrangeaceae 1 4 12 Ericaceae 1 8 21 5 1 Total 7 38 143 6 21 10
Total no. of family in woody plant 56 122 280 8 35 16
fam.: the number of family, gen.: the number of genus, sp.: the number of species, ssp.: the number of subspecies, var.: the number of variety, f.: the number of forma, h.: the number of hybrid.
(a) (b) (c)
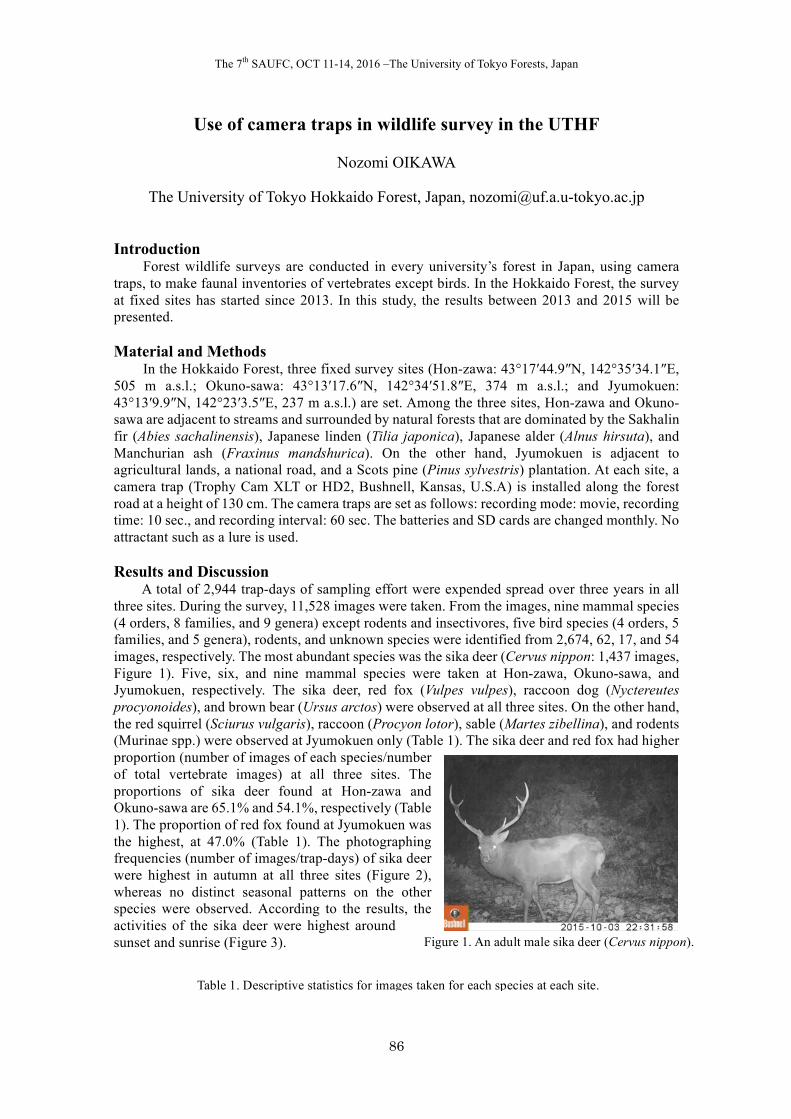
The 7th SAUFC, OCT 11-14, 2016 –The University of Tokyo Forests, Japan
86
Use of camera traps in wildlife survey in the UTHF
Nozomi OIKAWA
The University of Tokyo Hokkaido Forest, Japan, [email protected] Introduction
Forest wildlife surveys are conducted in every university’s forest in Japan, using camera traps, to make faunal inventories of vertebrates except birds. In the Hokkaido Forest, the survey at fixed sites has started since 2013. In this study, the results between 2013 and 2015 will be presented. Material and Methods
In the Hokkaido Forest, three fixed survey sites (Hon-zawa: 43°17′44.9″N, 142°35′34.1″E, 505 m a.s.l.; Okuno-sawa: 43°13′17.6″N, 142°34′51.8″E, 374 m a.s.l.; and Jyumokuen: 43°13′9.9″N, 142°23′3.5″E, 237 m a.s.l.) are set. Among the three sites, Hon-zawa and Okuno-sawa are adjacent to streams and surrounded by natural forests that are dominated by the Sakhalin fir (Abies sachalinensis), Japanese linden (Tilia japonica), Japanese alder (Alnus hirsuta), and Manchurian ash (Fraxinus mandshurica). On the other hand, Jyumokuen is adjacent to agricultural lands, a national road, and a Scots pine (Pinus sylvestris) plantation. At each site, a camera trap (Trophy Cam XLT or HD2, Bushnell, Kansas, U.S.A) is installed along the forest road at a height of 130 cm. The camera traps are set as follows: recording mode: movie, recording time: 10 sec., and recording interval: 60 sec. The batteries and SD cards are changed monthly. No attractant such as a lure is used. Results and Discussion
A total of 2,944 trap-days of sampling effort were expended spread over three years in all three sites. During the survey, 11,528 images were taken. From the images, nine mammal species (4 orders, 8 families, and 9 genera) except rodents and insectivores, five bird species (4 orders, 5 families, and 5 genera), rodents, and unknown species were identified from 2,674, 62, 17, and 54 images, respectively. The most abundant species was the sika deer (Cervus nippon: 1,437 images, Figure 1). Five, six, and nine mammal species were taken at Hon-zawa, Okuno-sawa, and Jyumokuen, respectively. The sika deer, red fox (Vulpes vulpes), raccoon dog (Nyctereutes procyonoides), and brown bear (Ursus arctos) were observed at all three sites. On the other hand, the red squirrel (Sciurus vulgaris), raccoon (Procyon lotor), sable (Martes zibellina), and rodents (Murinae spp.) were observed at Jyumokuen only (Table 1). The sika deer and red fox had higher proportion (number of images of each species/number of total vertebrate images) at all three sites. The proportions of sika deer found at Hon-zawa and Okuno-sawa are 65.1% and 54.1%, respectively (Table 1). The proportion of red fox found at Jyumokuen was the highest, at 47.0% (Table 1). The photographing frequencies (number of images/trap-days) of sika deer were highest in autumn at all three sites (Figure 2), whereas no distinct seasonal patterns on the other species were observed. According to the results, the activities of the sika deer were highest around sunset and sunrise (Figure 3).
Figure 1. An adult male sika deer (Cervus nippon).
Table 1. Descriptive statistics for images taken for each species at each site.
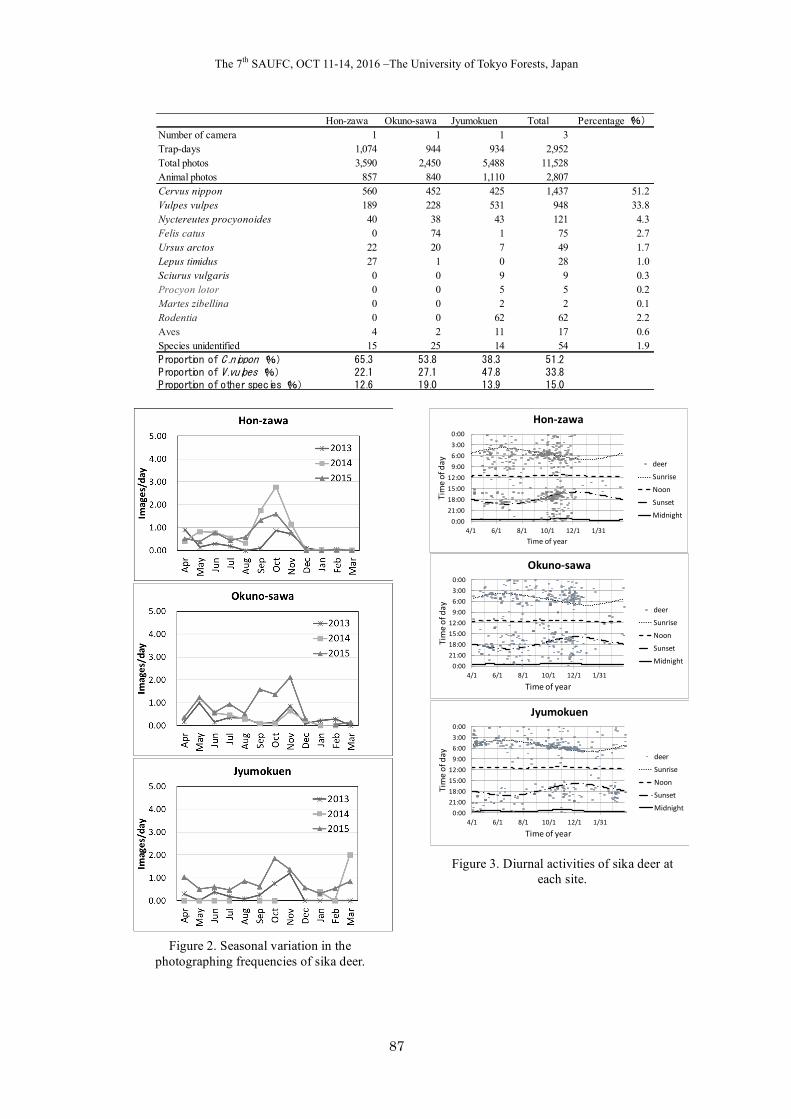
The 7th SAUFC, OCT 11-14, 2016 –The University of Tokyo Forests, Japan
87
Hon-zawa Okuno-sawa Jyumokuen Total Percentage(%)
Number of camera 1 1 1 3Trap-days 1,074 944 934 2,952Total photos 3,590 2,450 5,488 11,528Animal photos 857 840 1,110 2,807Cervus nippon 560 452 425 1,437 51.2Vulpes vulpes 189 228 531 948 33.8Nyctereutes procyonoides 40 38 43 121 4.3Felis catus 0 74 1 75 2.7Ursus arctos 22 20 7 49 1.7Lepus timidus 27 1 0 28 1.0Sciurus vulgaris 0 0 9 9 0.3Procyon lotor 0 0 5 5 0.2Martes zibellina 0 0 2 2 0.1Rodentia 0 0 62 62 2.2Aves 4 2 11 17 0.6Species unidentified 15 25 14 54 1.9Proportion of C .nippon(%) 65.3 53.8 38.3 51.2Proportion of V.vulpes(%) 22.1 27.1 47.8 33.8Proportion of other species(%) 12.6 19.0 13.9 15.0
0:003:006:009:00
12:0015:0018:0021:000:00
4/1 6/1 8/1 10/1 12/1 1/31
Timeofday
Timeofyear
Jyumokuen
deerSunrise
NoonSunsetMidnight
0:003:006:009:00
12:0015:0018:0021:000:00
4/1 6/1 8/1 10/1 12/1 1/31
Timeofday
Timeofyear
Okuno-sawa
deerSunrise
NoonSunsetMidnight
0:003:006:009:00
12:0015:0018:0021:000:00
4/1 6/1 8/1 10/1 12/1 1/31
Timeofday
Timeofyear
Hon-zawa
deerSunrise
Noon
SunsetMidnight
Figure 2. Seasonal variation in the photographing frequencies of sika deer.
Figure 3. Diurnal activities of sika deer at each site.
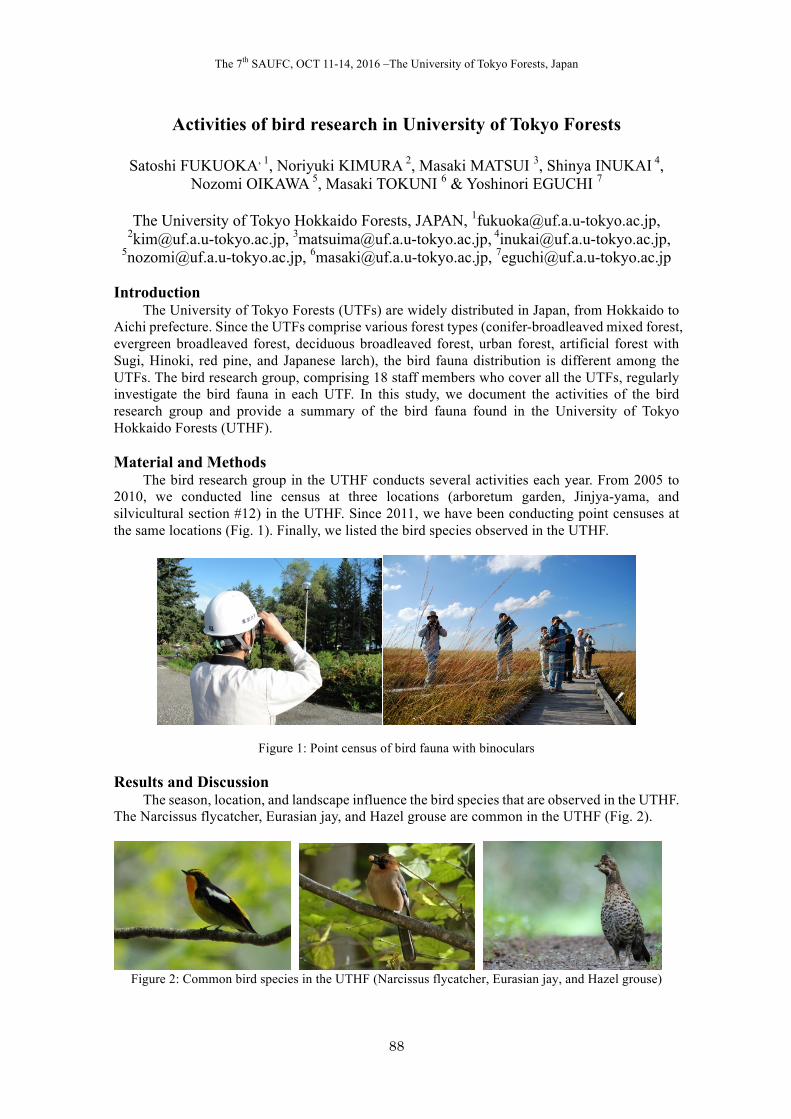
The 7th SAUFC, OCT 11-14, 2016 –The University of Tokyo Forests, Japan
88
Activities of bird research in University of Tokyo Forests
Satoshi FUKUOKA, 1, Noriyuki KIMURA 2, Masaki MATSUI 3, Shinya INUKAI 4, Nozomi OIKAWA 5, Masaki TOKUNI 6 & Yoshinori EGUCHI 7
The University of Tokyo Hokkaido Forests, JAPAN, [email protected],
[email protected], [email protected], [email protected], [email protected], [email protected], [email protected]
Introduction
The University of Tokyo Forests (UTFs) are widely distributed in Japan, from Hokkaido to Aichi prefecture. Since the UTFs comprise various forest types (conifer-broadleaved mixed forest, evergreen broadleaved forest, deciduous broadleaved forest, urban forest, artificial forest with Sugi, Hinoki, red pine, and Japanese larch), the bird fauna distribution is different among the UTFs. The bird research group, comprising 18 staff members who cover all the UTFs, regularly investigate the bird fauna in each UTF. In this study, we document the activities of the bird research group and provide a summary of the bird fauna found in the University of Tokyo Hokkaido Forests (UTHF).
Material and Methods
The bird research group in the UTHF conducts several activities each year. From 2005 to 2010, we conducted line census at three locations (arboretum garden, Jinjya-yama, and silvicultural section #12) in the UTHF. Since 2011, we have been conducting point censuses at the same locations (Fig. 1). Finally, we listed the bird species observed in the UTHF.
Figure 1: Point census of bird fauna with binoculars Results and Discussion
The season, location, and landscape influence the bird species that are observed in the UTHF. The Narcissus flycatcher, Eurasian jay, and Hazel grouse are common in the UTHF (Fig. 2).
Figure 2: Common bird species in the UTHF (Narcissus flycatcher, Eurasian jay, and Hazel grouse)
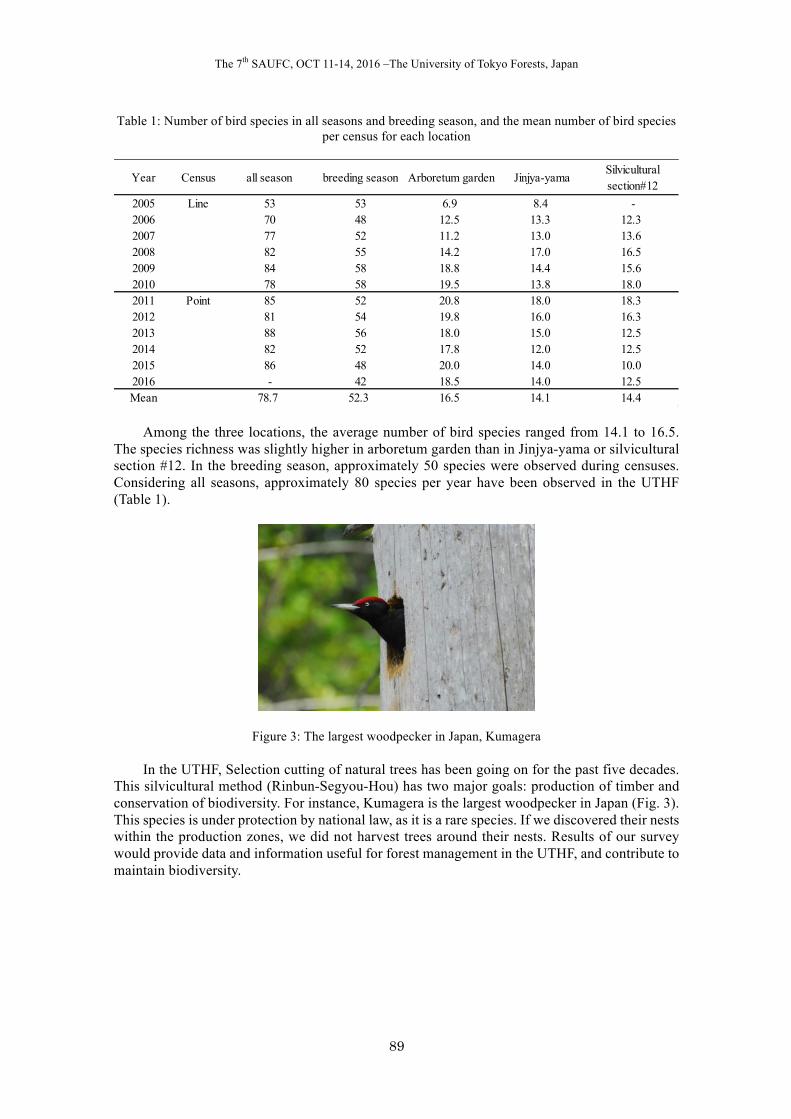
The 7th SAUFC, OCT 11-14, 2016 –The University of Tokyo Forests, Japan
89
Table 1: Number of bird species in all seasons and breeding season, and the mean number of bird species per census for each location
Among the three locations, the average number of bird species ranged from 14.1 to 16.5. The species richness was slightly higher in arboretum garden than in Jinjya-yama or silvicultural section #12. In the breeding season, approximately 50 species were observed during censuses. Considering all seasons, approximately 80 species per year have been observed in the UTHF (Table 1).
Figure 3: The largest woodpecker in Japan, Kumagera
In the UTHF, Selection cutting of natural trees has been going on for the past five decades. This silvicultural method (Rinbun-Segyou-Hou) has two major goals: production of timber and conservation of biodiversity. For instance, Kumagera is the largest woodpecker in Japan (Fig. 3). This species is under protection by national law, as it is a rare species. If we discovered their nests within the production zones, we did not harvest trees around their nests. Results of our survey would provide data and information useful for forest management in the UTHF, and contribute to maintain biodiversity.
Year Census all season breeding season Arboretum garden Jinjya-yamaSilviculturalsection#12
2005 Line 53 53 6.9 8.4 -2006 70 48 12.5 13.3 12.32007 77 52 11.2 13.0 13.62008 82 55 14.2 17.0 16.52009 84 58 18.8 14.4 15.62010 78 58 19.5 13.8 18.02011 Point 85 52 20.8 18.0 18.32012 81 54 19.8 16.0 16.32013 88 56 18.0 15.0 12.52014 82 52 17.8 12.0 12.52015 86 48 20.0 14.0 10.02016 - 42 18.5 14.0 12.5Mean 78.7 52.3 16.5 14.1 14.4
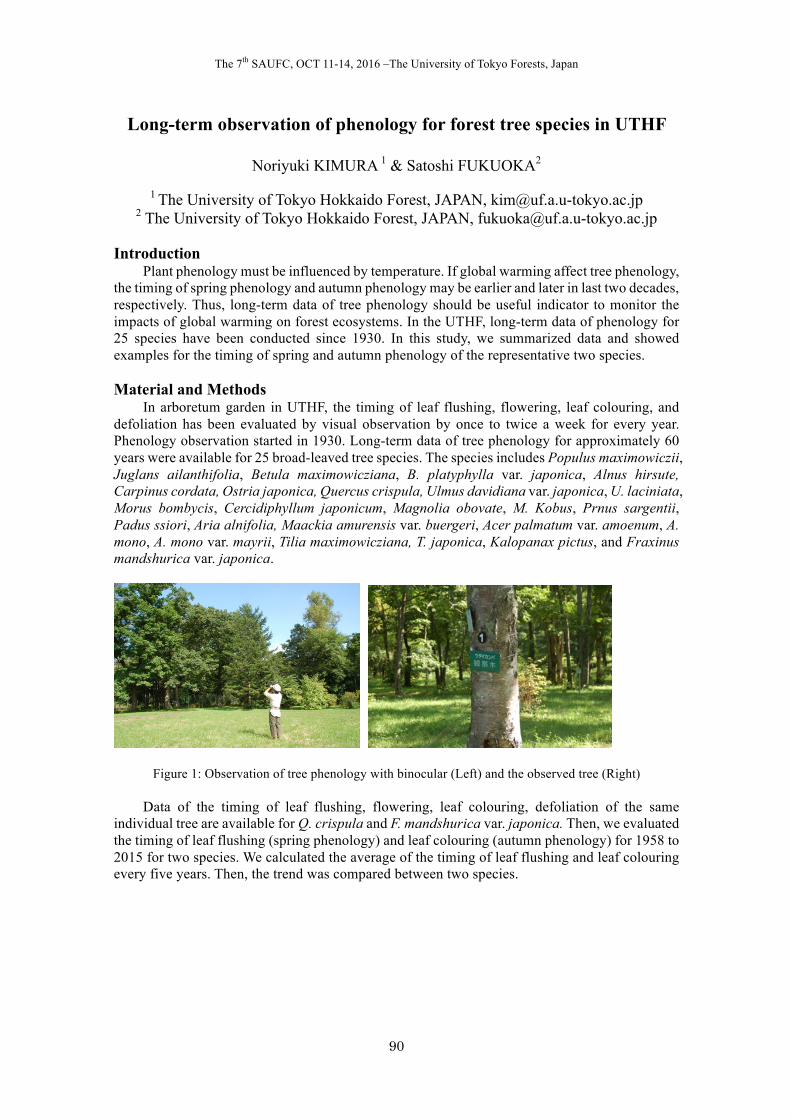
The 7th SAUFC, OCT 11-14, 2016 –The University of Tokyo Forests, Japan
90
Long-term observation of phenology for forest tree species in UTHF
Noriyuki KIMURA 1 & Satoshi FUKUOKA2
1 The University of Tokyo Hokkaido Forest, JAPAN, [email protected] 2 The University of Tokyo Hokkaido Forest, JAPAN, [email protected]
Introduction
Plant phenology must be influenced by temperature. If global warming affect tree phenology, the timing of spring phenology and autumn phenology may be earlier and later in last two decades, respectively. Thus, long-term data of tree phenology should be useful indicator to monitor the impacts of global warming on forest ecosystems. In the UTHF, long-term data of phenology for 25 species have been conducted since 1930. In this study, we summarized data and showed examples for the timing of spring and autumn phenology of the representative two species. Material and Methods
In arboretum garden in UTHF, the timing of leaf flushing, flowering, leaf colouring, and defoliation has been evaluated by visual observation by once to twice a week for every year. Phenology observation started in 1930. Long-term data of tree phenology for approximately 60 years were available for 25 broad-leaved tree species. The species includes Populus maximowiczii, Juglans ailanthifolia, Betula maximowicziana, B. platyphylla var. japonica, Alnus hirsute, Carpinus cordata, Ostria japonica, Quercus crispula, Ulmus davidiana var. japonica, U. laciniata, Morus bombycis, Cercidiphyllum japonicum, Magnolia obovate, M. Kobus, Prnus sargentii, Padus ssiori, Aria alnifolia, Maackia amurensis var. buergeri, Acer palmatum var. amoenum, A. mono, A. mono var. mayrii, Tilia maximowicziana, T. japonica, Kalopanax pictus, and Fraxinus mandshurica var. japonica.
Figure 1: Observation of tree phenology with binocular (Left) and the observed tree (Right)
Data of the timing of leaf flushing, flowering, leaf colouring, defoliation of the same individual tree are available for Q. crispula and F. mandshurica var. japonica. Then, we evaluated the timing of leaf flushing (spring phenology) and leaf colouring (autumn phenology) for 1958 to 2015 for two species. We calculated the average of the timing of leaf flushing and leaf colouring every five years. Then, the trend was compared between two species.
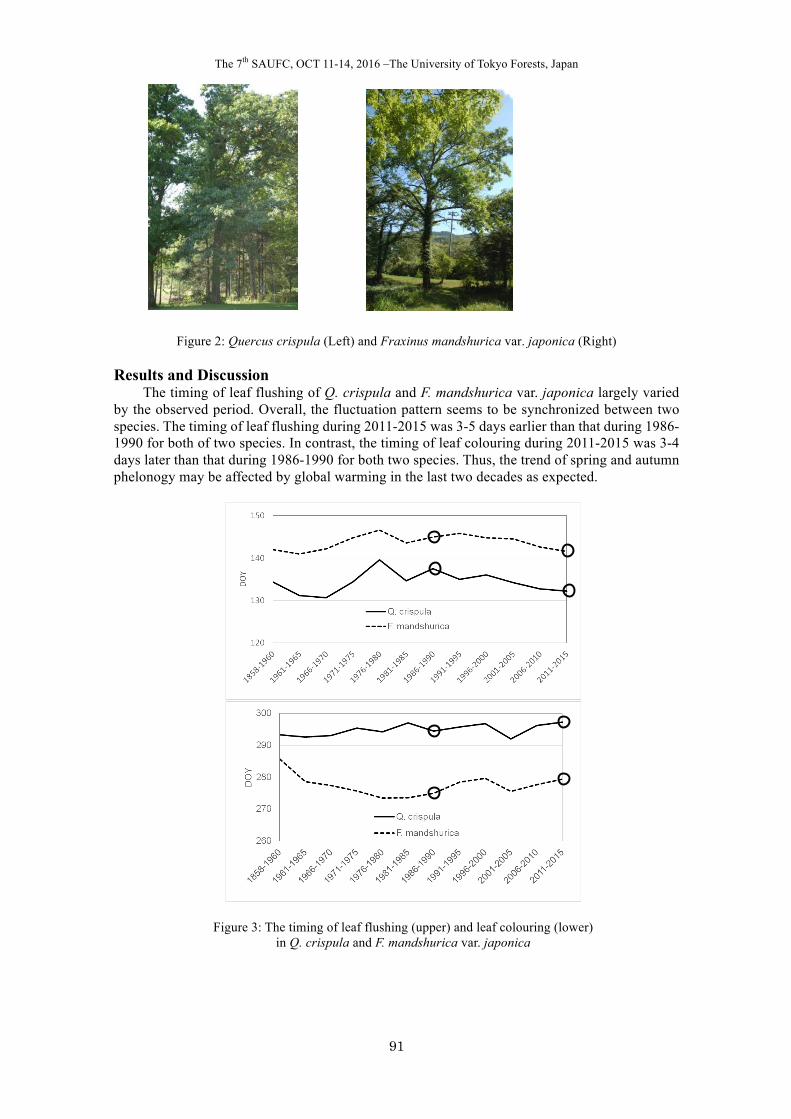
The 7th SAUFC, OCT 11-14, 2016 –The University of Tokyo Forests, Japan
91
Figure 2: Quercus crispula (Left) and Fraxinus mandshurica var. japonica (Right) Results and Discussion
The timing of leaf flushing of Q. crispula and F. mandshurica var. japonica largely varied by the observed period. Overall, the fluctuation pattern seems to be synchronized between two species. The timing of leaf flushing during 2011-2015 was 3-5 days earlier than that during 1986-1990 for both of two species. In contrast, the timing of leaf colouring during 2011-2015 was 3-4 days later than that during 1986-1990 for both two species. Thus, the trend of spring and autumn phelonogy may be affected by global warming in the last two decades as expected.
Figure 3: The timing of leaf flushing (upper) and leaf colouring (lower) in Q. crispula and F. mandshurica var. japonica
The 7th SAUFC, OCT 11-14, 2016 –The University of Tokyo Forests, Japan
92
Tree mortality of old even-aged coniferous plantation in long-term experimental plots in UTokyo Chiba Forest, eastern Japan
Keisuke TOYAMA1 & Takuya HIROSHIMA2
1 The University of Tokyo Chiba Forest, JAPAN, [email protected] 2Ecohydrology Research Institute, The University of Tokyo Forests, JAPAN,
[email protected] Introduction
The UTokyo Chiba Forest (35°8−12′ N, 140°5−10′ E) has 10 experimental plots of coniferous plantations planted between 1900−1905, where long-term growth of standing trees have been monitored. Among the data collected there, mainly standing tree growth has been published and analysed. This study focuses on the shift of tree mortality in old coniferous plantations, which provides for important information to estimate future condition of Japanese coniferous plantations that mainly consist of around 50-year-old stands.
In the standing tree density control theory used in Japanese coniferous plantation management, density decrease is estimated, relating to the growth of average height of dominant standing trees in stands. Density decrease in old stands where tree height growth has slowed down should be validated in detail. Materials
The 10 experimental plots are located in even-aged Sugi (Cryptomeria japonica) and Hinoki (Chamaecyparis obtusa) stands, 8 of which were established in 1916 (Fig.1, table 1).
The plot size is 0.02−0.54 ha. In each plot, the diameter at breast height (dbh) for all trees and the height for sample trees have been measured every 5 years.
It should be reminded that there were another three experimental plots of Sugi and Hinoki which were established in 1916 together with existing 8 plots. Measurements had become discontinued because of harvest in one plot, and because of typhoon damage in two plots. The tree mortality data shown in this study is that of stands without severe natural damages.
Table 1. Basic information of 10 experimental plots of old coniferous plantation in UTCBF
Plot name Species Area Planted Standing tree density (/ha)
year in Feb. 2016 Gobouzawa Sugi 0.540 1905 357
Goudai 1 Sugi 0.141 1905 489 Goudai 2 Sugi 0.034 1902 500 Oobera 2 Hinoki 0.020 1900 2200 Anno 1 Sugi 0.109 1903 945 Anno 2 Sugi 0.073 1902 904
Metaki 1 Hinoki 0.042 1903 1071 Metaki 2 Hinoki 0.021 1903 1381 Metaki 3 Sugi 0.037 1903 622 Ninodai Sugi 0.057 1900 737
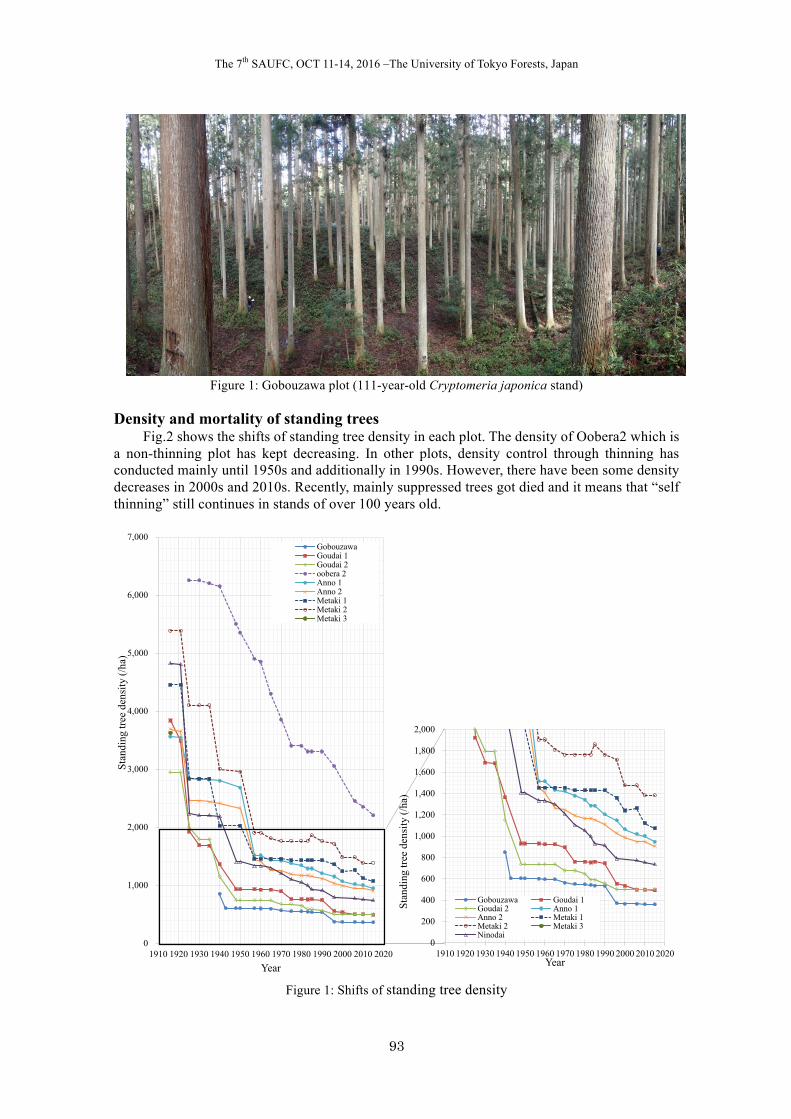
The 7th SAUFC, OCT 11-14, 2016 –The University of Tokyo Forests, Japan
93
Figure 1: Gobouzawa plot (111-year-old Cryptomeria japonica stand)
Density and mortality of standing trees Fig.2 shows the shifts of standing tree density in each plot. The density of Oobera2 which is
a non-thinning plot has kept decreasing. In other plots, density control through thinning has conducted mainly until 1950s and additionally in 1990s. However, there have been some density decreases in 2000s and 2010s. Recently, mainly suppressed trees got died and it means that “self thinning” still continues in stands of over 100 years old.
Figure 1: Shifts of standing tree density
0
200
400
600
800
1,000
1,200
1,400
1,600
1,800
2,000
1910 1920 1930 1940 1950 1960 1970 1980 1990 2000 2010 2020
Stan
ding
tree
den
sity
(/ha
)
Year
Gobouzawa Goudai 1Goudai 2 Anno 1Anno 2 Metaki 1Metaki 2 Metaki 3Ninodai
0
1,000
2,000
3,000
4,000
5,000
6,000
7,000
1910 1920 1930 1940 1950 1960 1970 1980 1990 2000 2010 2020
Stan
ding
tree
den
sity
(/ha
)
Year
GobouzawaGoudai 1Goudai 2oobera 2Anno 1Anno 2Metaki 1Metaki 2Metaki 3
The 7th SAUFC, OCT 11-14, 2016 –The University of Tokyo Forests, Japan
94
Collaborative study on throughfall and stemflow in a teak plantation in Thailand
Nobuaki TANAKA1 & Chatchai TANTASIRIN2
1 Ecohydrology Research Institute, The University of Tokyo Forests, Graduate School of Agricultural and Life Sciences, The University of Tokyo, JAPAN, [email protected]
tokyo.ac.jp 2 Faculty of Forestry, Kasetsart University, THAILAND, [email protected]
Introduction
Thoughfall and stemflow are recognized as a key hydrological processes in wooded ecosystems, delivering water and solute inputs to the soil. Both of the flowpaths are known to be influenced by a variety of biotic and abiotic factors and to exhibit heterogeneous spatial patterns within the canopy. Teak (Tectona grandis Linn. f.) is a commercially valuable tropical deciduous hardwood, often grown in plantations throughout southeastern Asia. As part of our collaborative research project ‘Water and carbon dioxide exchanges between teak plantation and the atmosphere’ based on measurements using flux towers, we conducted a study on throughfall and stemflow in a teak stand nearby the flux tower. By leveraging detailed above-canopy meteorological data as well as daily leaf area index (LAI) data, we analysed influential variables governing throughfall and stemflow in the teak plantation. Material and Methods 1. Study site
This study was conducted in an even-aged teak plantation in Mae Mo district, Lampang province, northern Thailand (18o25’N, 99o43’E; 380 m asl). Investigated teak stand was established in 1968, with a stand density of 440 trees ha−1 as of November 2005. Mean stem diameter at breast height (dbh, cm) and height of trees were 22.4 cm and 19.9 m, respectively (as of November 2005). The climate is dominated by the Asian Monsoon, with two distinct seasons: a wet season occurring from May to October and a dry season spanning from November to April. Mean annual rainfall and mean annual temperature was 1230.9 mm and 25.4°C, respectively. 2. Measurements and analyses
Throughfall (TF) was measured daily throughout the year of 2006 in four plots with different stand densities, using ninety collectors in total. Stemflow (SF) was also measured daily for the period from 2000 to 2006, for nine teak individuals with varying dbh. For each of the nine individuals, stemflow generated by the teak trees was collected using collar type gauges, approximately 1.2 m above the ground. Above-canopy meteorological conditions were monitored using a 40-m scaffolding tower and/or a 26-m triangular tower. LAI was estimated from seasonal changes in radiative transmittance through the canopy, i.e. the ratio of beneath-canopy solar radiation to above-canopy solar radiation. All the TF, SF, meteorological factors and LAI data was aggregated on a daily basis.
In order to seek influential variables governing TF and SF in the teak plantation, daily TF ratio to daily rainfall (TF ratio) and daily SF funnelling ratio (SFFR) were analysed with boosted regression tree (BRT) analysis, setting rainfall characteristics, the above-canopy meteorological factors and LAI as predictor variables. Results and discussions 1. Throughfall
Total rainfall during leafless, leafing, and leafed phenophases of the canopy were 359 mm, 239 mm, and 1,143 mm, respectively. The study period total TF ratio for each plot ranged from
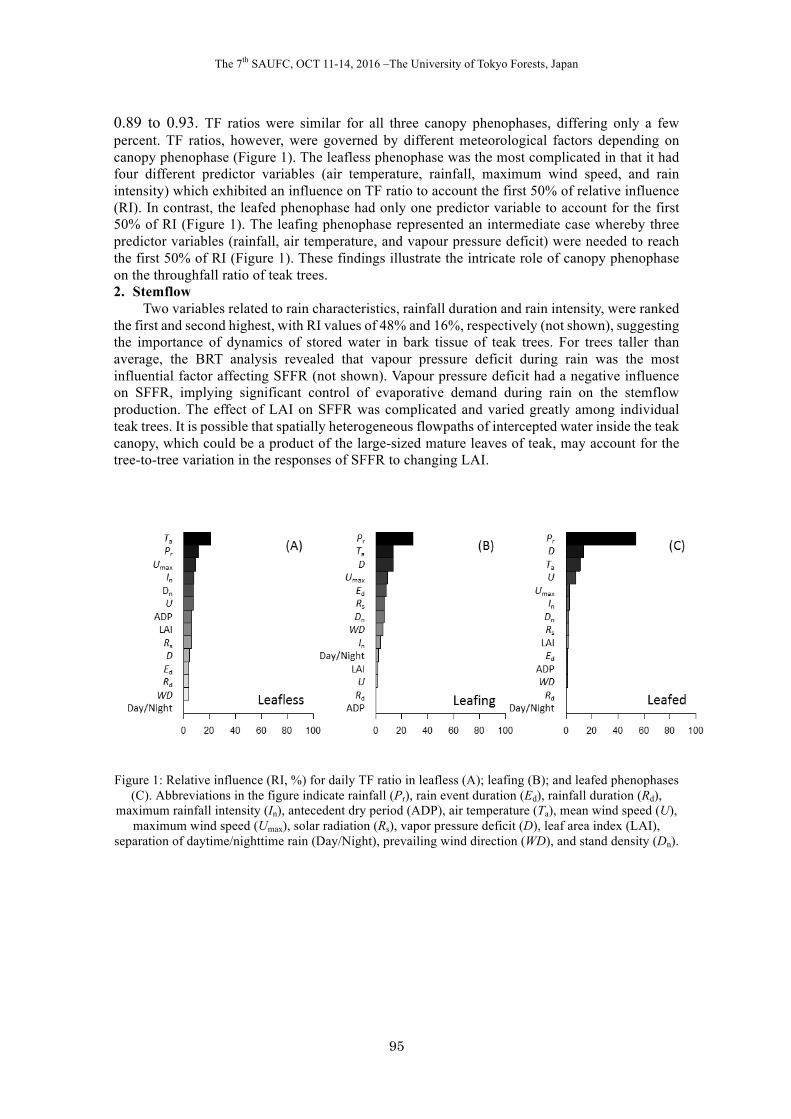
The 7th SAUFC, OCT 11-14, 2016 –The University of Tokyo Forests, Japan
95
0.89 to 0.93. TF ratios were similar for all three canopy phenophases, differing only a few percent. TF ratios, however, were governed by different meteorological factors depending on canopy phenophase (Figure 1). The leafless phenophase was the most complicated in that it had four different predictor variables (air temperature, rainfall, maximum wind speed, and rain intensity) which exhibited an influence on TF ratio to account the first 50% of relative influence (RI). In contrast, the leafed phenophase had only one predictor variable to account for the first 50% of RI (Figure 1). The leafing phenophase represented an intermediate case whereby three predictor variables (rainfall, air temperature, and vapour pressure deficit) were needed to reach the first 50% of RI (Figure 1). These findings illustrate the intricate role of canopy phenophase on the throughfall ratio of teak trees. 2. Stemflow
Two variables related to rain characteristics, rainfall duration and rain intensity, were ranked the first and second highest, with RI values of 48% and 16%, respectively (not shown), suggesting the importance of dynamics of stored water in bark tissue of teak trees. For trees taller than average, the BRT analysis revealed that vapour pressure deficit during rain was the most influential factor affecting SFFR (not shown). Vapour pressure deficit had a negative influence on SFFR, implying significant control of evaporative demand during rain on the stemflow production. The effect of LAI on SFFR was complicated and varied greatly among individual teak trees. It is possible that spatially heterogeneous flowpaths of intercepted water inside the teak canopy, which could be a product of the large-sized mature leaves of teak, may account for the tree-to-tree variation in the responses of SFFR to changing LAI.
Figure 1: Relative influence (RI, %) for daily TF ratio in leafless (A); leafing (B); and leafed phenophases
(C). Abbreviations in the figure indicate rainfall (Pr), rain event duration (Ed), rainfall duration (Rd), maximum rainfall intensity (In), antecedent dry period (ADP), air temperature (Ta), mean wind speed (U),
maximum wind speed (Umax), solar radiation (Rs), vapor pressure deficit (D), leaf area index (LAI), separation of daytime/nighttime rain (Day/Night), prevailing wind direction (WD), and stand density (Dn).
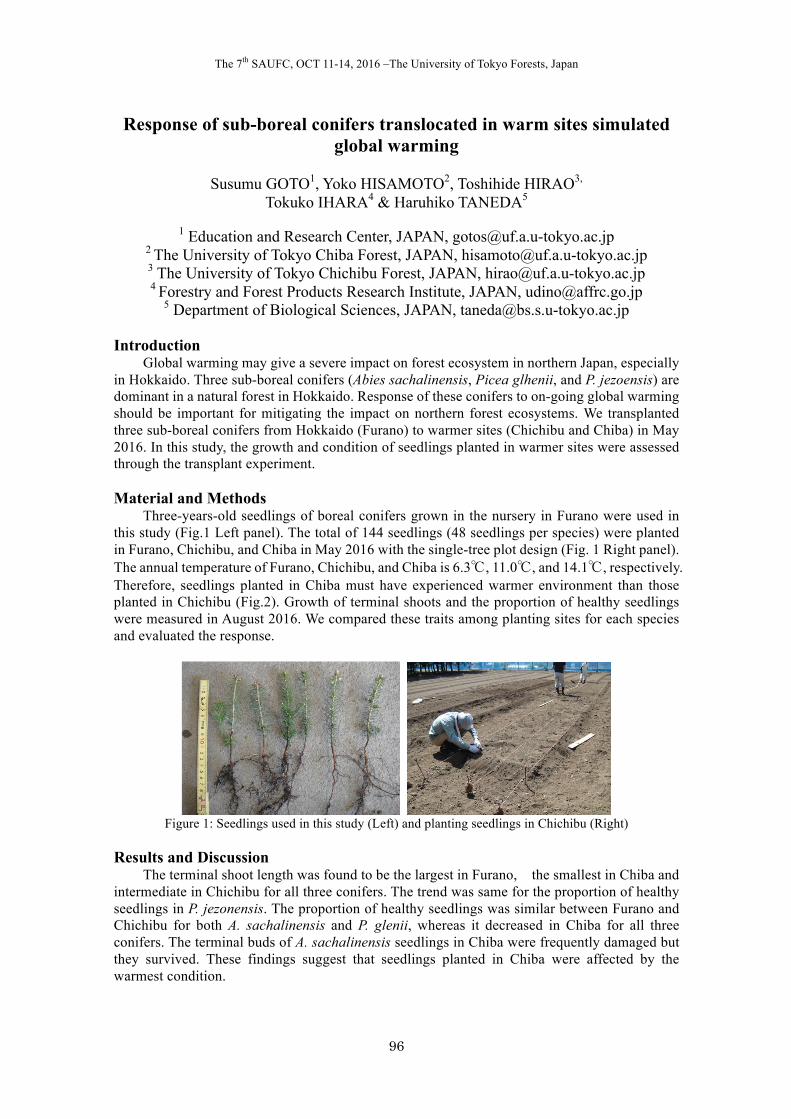
The 7th SAUFC, OCT 11-14, 2016 –The University of Tokyo Forests, Japan
96
Response of sub-boreal conifers translocated in warm sites simulated global warming
Susumu GOTO1, Yoko HISAMOTO2, Toshihide HIRAO3,
Tokuko IHARA4 & Haruhiko TANEDA5
1 Education and Research Center, JAPAN, [email protected] 2 The University of Tokyo Chiba Forest, JAPAN, [email protected] 3 The University of Tokyo Chichibu Forest, JAPAN, [email protected] 4 Forestry and Forest Products Research Institute, JAPAN, [email protected]
5 Department of Biological Sciences, JAPAN, [email protected] Introduction
Global warming may give a severe impact on forest ecosystem in northern Japan, especially in Hokkaido. Three sub-boreal conifers (Abies sachalinensis, Picea glhenii, and P. jezoensis) are dominant in a natural forest in Hokkaido. Response of these conifers to on-going global warming should be important for mitigating the impact on northern forest ecosystems. We transplanted three sub-boreal conifers from Hokkaido (Furano) to warmer sites (Chichibu and Chiba) in May 2016. In this study, the growth and condition of seedlings planted in warmer sites were assessed through the transplant experiment. Material and Methods
Three-years-old seedlings of boreal conifers grown in the nursery in Furano were used in this study (Fig.1 Left panel). The total of 144 seedlings (48 seedlings per species) were planted in Furano, Chichibu, and Chiba in May 2016 with the single-tree plot design (Fig. 1 Right panel). The annual temperature of Furano, Chichibu, and Chiba is 6.3℃, 11.0℃, and 14.1℃, respectively. Therefore, seedlings planted in Chiba must have experienced warmer environment than those planted in Chichibu (Fig.2). Growth of terminal shoots and the proportion of healthy seedlings were measured in August 2016. We compared these traits among planting sites for each species and evaluated the response.
Figure 1: Seedlings used in this study (Left) and planting seedlings in Chichibu (Right)
Results and Discussion
The terminal shoot length was found to be the largest in Furano, the smallest in Chiba and intermediate in Chichibu for all three conifers. The trend was same for the proportion of healthy seedlings in P. jezonensis. The proportion of healthy seedlings was similar between Furano and Chichibu for both A. sachalinensis and P. glenii, whereas it decreased in Chiba for all three conifers. The terminal buds of A. sachalinensis seedlings in Chiba were frequently damaged but they survived. These findings suggest that seedlings planted in Chiba were affected by the warmest condition.
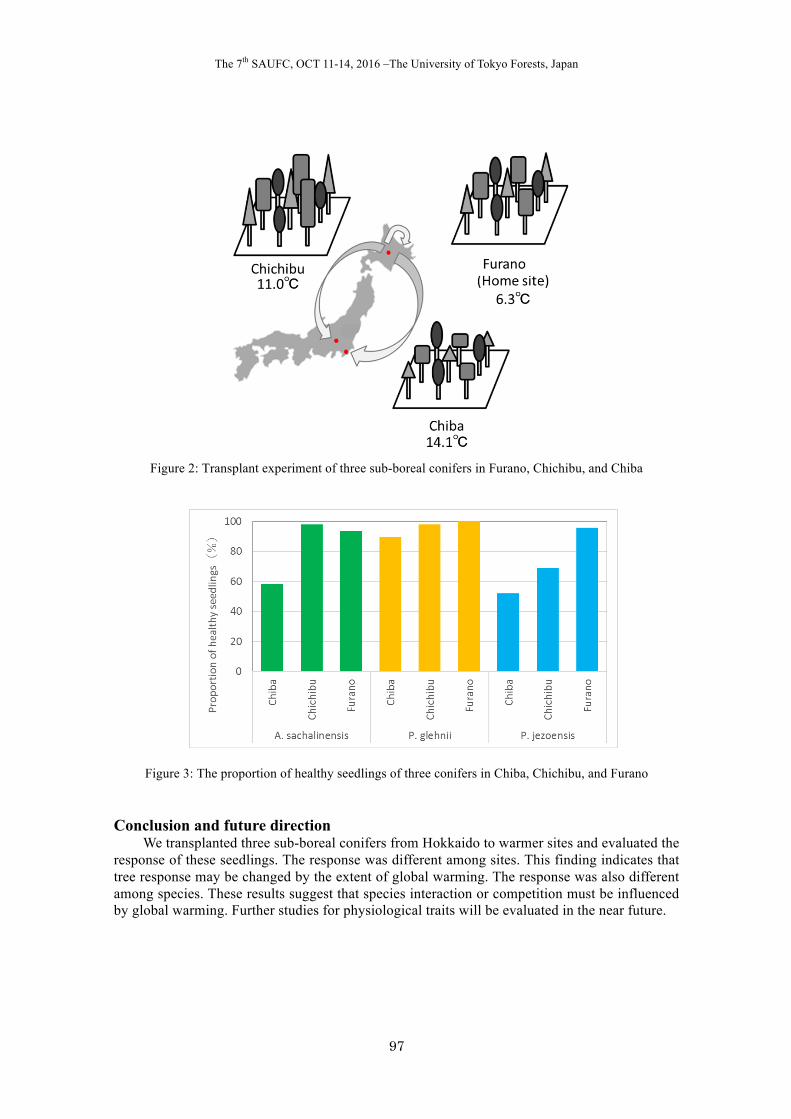
The 7th SAUFC, OCT 11-14, 2016 –The University of Tokyo Forests, Japan
97
Figure 2: Transplant experiment of three sub-boreal conifers in Furano, Chichibu, and Chiba
Figure 3: The proportion of healthy seedlings of three conifers in Chiba, Chichibu, and Furano Conclusion and future direction
We transplanted three sub-boreal conifers from Hokkaido to warmer sites and evaluated the response of these seedlings. The response was different among sites. This finding indicates that tree response may be changed by the extent of global warming. The response was also different among species. These results suggest that species interaction or competition must be influenced by global warming. Further studies for physiological traits will be evaluated in the near future.
The 7th SAUFC, OCT 11-14, 2016 –The University of Tokyo Forests, Japan
98
Study on compensating villagers for cost of wildlife conservation in villages nearby protected areas
So-Hee PARK
Seoul National University, Republic of Korea, [email protected]
Introduction
Wildlife damages production losses caused by wildlife in agriculture, forestry and fisheries sector. As wildlife populations increase with the establishment and expansion of protected areas, mountain villagers experience substantial economic losses and safety risks due to wildlife damage. Certain rules and regulations targeted at the implementation of wildlife protection schemes in protected areas threaten the livelihood of mountain villagers and cause conflicts between humans and wildlife. To mitigate these human-wildlife conflicts, governments have implemented programs targeted at reduction of wildlife damage, as well as compensating villagers for the damage by wildlife. However, the compensation program implemented is not practical because of the drawback of biodiversity conservation law. It is important to compensate mountain villagers for damages done by wildlife in order to protect the livelihoods of villagers living nearby protected areas and to manage wildlife in a sustainable manner. This study aims to estimate the amount of damage to agriculture crops and non-timber forest products by wildlife, and the necessary amount of compensation for villagers who are suffered from wildlife damage. This study also analyzed factors affecting the costs of installation of facilities for prevention and control wildlife damage, as well as the willingness to pay(WTP) for installation of such facilities.
Material and Methods 1. Data collection
The author interviewed with a questionaire 84 residents of 6 villages located in the vicinity of the Jirisan National Park nearby Southern SNU forests from April to June 2016. 2. Data analysis
We estimated wildlife damage to agriculture and forestry production and the annual payments made for the installation of prevention and control facilities to protect agricultural and forest products in the villages. WTP for the prevention facilities was also estimated using tobit model. We postulated that socio-economic characteristics such as respondent’s size of land area, amount of agriculture and forestry production per land area, rate of agriculture and forestry income, total income, rate of self consumption of agricultural and forest products, and awareness of wildlife damage compensation schemes could influence the local people’s the annual payments and WTP for the prevention facilities. Results and Discussion 1. Estimation of cost of wildlife conservation
The result of analysis indicates that estimated wildlife damage to agriculture and forestry production incurred to 84 households is 101 million won per annum, on average 1,210,000 won per household per year or 500,000 won per year per ha of cultivated area used for agricultural and forest production. In addition, the annual payments made for the installation of prevention and control facilities was estimated to be 1.37 million won per ha per year, and the amount of payments made was found to increase in proportion to the rate of self-consumption of agricultural and forest products. In terms of agricultural land area, WTP for the prevention facilities was estimated to be 17.86 million won per ha per year. Males and people who own smaller plots of agricultural land have a tendency to have a higher WTP for the installation of prevention and
The 7th SAUFC, OCT 11-14, 2016 –The University of Tokyo Forests, Japan
99
control facilities. In terms of total land area, which includes both agricultural and forest land, WTP for prevention and control facilities was estimated to be 13.23 million won per ha per year. People who have higher rate of self consumption of agricultural and forest products and who also believe that prevention and control facilities are effective, are likely to have higher WTP. 2. Policy implication
This study highlights several policy implications of wildlife damage compensation schemes. As aged people and small-scale farmers with high rates of self-consumption of agricultural and forest products highly value agricultural and forest products cultivated by themselves, the decrease in production of these products can cause serious livelihood problems for them. Hence, the government should consider small-scale farmers as beneficiaries of compensation schemes. Moreover, it is impractical to install prevention and control facilities all over the agricultural and forest lands adjacent to the protected area, and such facilities are ineffective against wildlife damage by animals such as wild boars. Thus, we need to explore other practical alternatives such as subsidies to encourage conversion production of agricultural and forest products that are not prone to wildlife damage, insurance schemes to compensate for damage caused by wildlife, payments for ecosystem services(PES) schemes to protect wildlife habitat and increasing the number of hunting groups to minimize wildlife damage.


Research Group Session
The 7th SAUFC, OCT 11-14, 2016 –The University of Tokyo Forests, Japan
102
Long-term monitoring programs of watershed hydrology in the University Forests, SNU
Sangjun IM1, Hyunje YANG2, Song EU3 & Qiwen LI4
1Department of Forest Science & The University Forest, Seoul National University,
KOREA, [email protected] 2Department of Forest Science, Seoul National University, KOREA,
[email protected] 3Department of Forest Science, Seoul National University, KOREA, [email protected]
4Department of Forest Science, Seoul National University, KOREA, [email protected]
Introduction
Forests play an important role in water cycle that is a complex system occurred in vegetation, soil, and water environments. Hydrological process in forests can be understood by either direct or indirect measurements. Measuring hydrology provides insight into the process that may vary over time and space.
Watershed monitoring is an evaluation program on hydrology over a period of time in a watershed. It is a labour and cost intensive method that provides a direct measurement of meteorological and hydrological attributes.
Hydrology monitoring program has executed since the year 1930 on the Choosan Experimental Forest of Seoul National University (CEF-SNU) for collecting meteorological data and stream discharge. In this study, historical perspective of watershed monitoring program on the CEF-SNU was introduced. Watershed Monitoring Program 1. Site description
The CEF-SNU is located in the southern part of Korea, lying at latitudes 35o01’30’’-35o03’00” N and longitudes 127o36’00”-127o37’30 E (Figure 1). It also belongs to the southern University Forest of Seoul National University.
As shown in Figure 1, monitoring program consists of three surface water monitoring sites, such as Bukmoongol and Baramgol. Bukmoongol watershed is divided into the upper sub-watershed (Bukmoongol-A) and the entire watershed (Bukmoongol-B).
The watershed is a temperate mixture forest of pine and deciduous trees consisting mostly of Pinus koraiensis, Pinus rigida and Fraxinus rhynchophylla with an average age of about 40 years old. Soils are mostly loam to clay loam in texture. The climate is characterized by monsoon, in which the highest monthly temperature was -5.3oC in winter and 30.7oC during summer. Annual precipitation is estimated to be 1.374 mm and most of its amounts concentrated in the warm summer season from June to August. 2. Historical review of monitoring program
Watershed monitoring program has established in 1929 by the Aichi University Forest of the University of Tokyo for examining watershed hydrology in a small mountainous forest (Figure 2(a)). Surface water monitoring has conducted in the CEF since 1930. However, the monitoring sites have partly destroyed during the Korean War. In 1991, Department of Forestry, Seoul National University, recovered the surface water monitoring weirs to collect stream discharge from the same watersheds (Figure 2(b)).
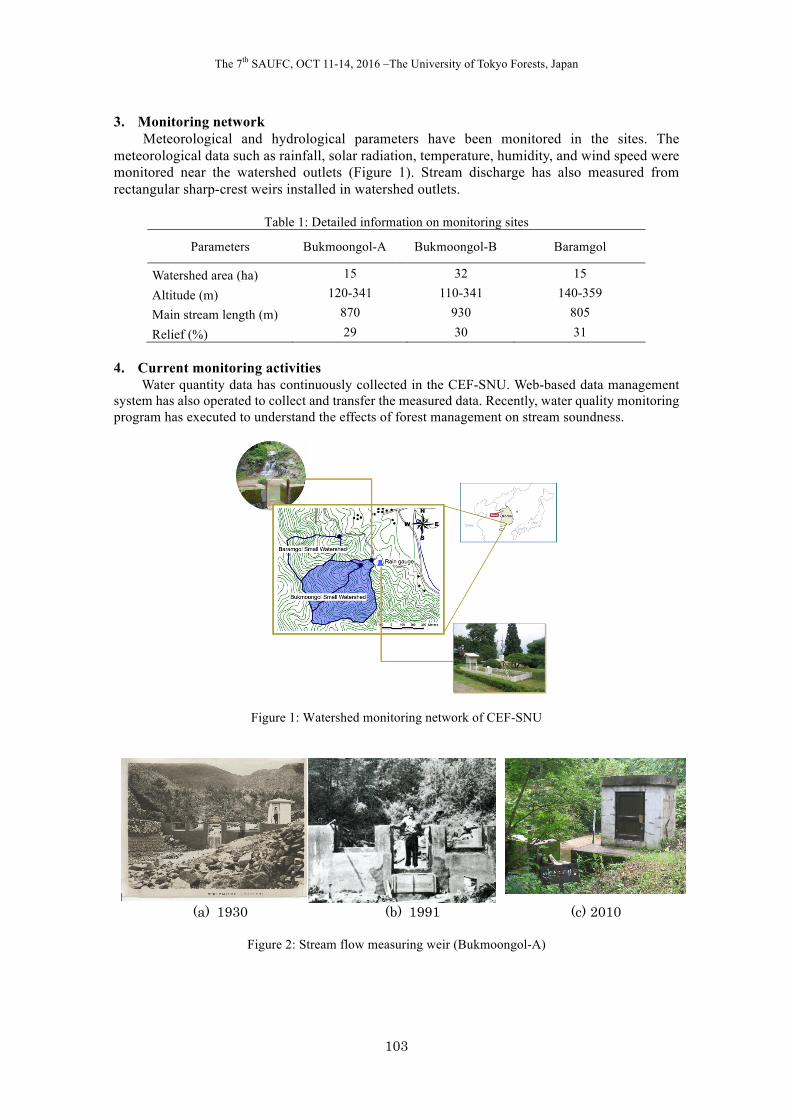
The 7th SAUFC, OCT 11-14, 2016 –The University of Tokyo Forests, Japan
103
3. Monitoring network Meteorological and hydrological parameters have been monitored in the sites. The
meteorological data such as rainfall, solar radiation, temperature, humidity, and wind speed were monitored near the watershed outlets (Figure 1). Stream discharge has also measured from rectangular sharp-crest weirs installed in watershed outlets.
Table 1: Detailed information on monitoring sites
Parameters Bukmoongol-A Bukmoongol-B Baramgol
Watershed area (ha) 15 32 15
Altitude (m) 120-341 110-341 140-359
Main stream length (m) 870 930 805
Relief (%) 29 30 31 4. Current monitoring activities
Water quantity data has continuously collected in the CEF-SNU. Web-based data management system has also operated to collect and transfer the measured data. Recently, water quality monitoring program has executed to understand the effects of forest management on stream soundness.
Figure 1: Watershed monitoring network of CEF-SNU
(a) 1930 (b) 1991 (c) 2010
Figure 2: Stream flow measuring weir (Bukmoongol-A)
The 7th SAUFC, OCT 11-14, 2016 –The University of Tokyo Forests, Japan
104
Characteristic of stand transpiration in Moso bamboo forests
Tomonori KUME
National Taiwan University, School of Forestry and Resource Management, Taiwan, [email protected]
Introduction
Some species of bamboos (eg,Moso bamboo; Phyllostachys pubescens) are useful plants in terms of providing food and materials. Bamboo forests had been developed and managed in Asian countries. However, these forests are now being abandoned because of the decline of bamboo industry in some countries. Bamboo forests have been expanded by replacing surrounding vegetation such as coniferous plantations and natural broad leaved forests. Significant increases in bamboo forested area have been reported in Asian countries such as Taiwan and Japan. It is possible that the bamboo expansion could change local water and carbon cyclins there.
Evapotranspiration is one of important water cycling components. The main components of forest evapotranspiration are canopy transpiration, rainfall interception, and forest floor evaporation. Several studies have examined the rainfall interception of bamboo forests on the basis of throughfall and stem flow measurements. They reported lower rainfall interception for bamboo forests than for coniferous and broadleaved forests. While, there have been a few studies examining transpiration in bamboo forests. The sap-flux method is one of the most common methods of measuring forest transpiration. Applicability of the method to transpiration estimates for bamboo forests was examined recently. The method was a valid means of detecting trends in transpiration despite the specific culm structure of bamboos, and an optimal scaling-up strategy was proposed for stand-scale transpiration estimates.
Using the methods, we clarified larger stand transpiration in a Moso bamboo forest than surrounding coniferous forests in Kyushu, Japan. On the other hand, the generality of the results was still unknown, as the conditions of Moso bamboo forests such as stand density and climate conditions are different between places. Further efforts confirming the large transpiration of Moso bamboo forests are needed to develop a general model for assessing potential impacts of bamboo expansion on water cyclins. Recently, our successive studies have been conducted to clarify stand transpiration in Moso bamboo forests covering different stem density and climate conditions. In this report, I introduce the year-round stand transpiration estimates based on sap flux measurements conducted in four Moso bamboo forests, such as Kyoto, Fukuoka, and Taiwan. This study examined the spatial variations in the stand transpiration in the four stands with different stem density and climate conditions. Material and Methods
The year-round sap flux measurements were conducted in four Moso bamboo forests. First, our measurements were performed in a Moso bamoo forest (culm density; 5500 stems/ha) in the Xitou Experimental Forest of National Taiwan University, Taiwan (23° 39’ N, 120° 20’ E, 1150 m a.s.l.) (XTB). Second, our measurements were made at the Kaguya site (culm density; 4000 stems/ha) located 12km east of Fukuoka city, Japan (33°37’N, 130°31’E, 50m a.s.l.) (FKL). Third, the sap flux measurements were conducted in a Moso bamboo stand (culm density; 11000 stems/ha) the Kasuya Research Forest (33°38′N, 130°33′E) of Kyushu University, Fukuoka, Japan (FKH). Fourth, our measurements were conducted in a Moso bamboo forest (culm density; 6800 stems/ha) at Kameoka City, Kyoto Prefecture, Japan (34.99°N, 135.61°E, 150 m a.s.l.) (KMO). In each site, more than 10 individuals were selected for sap flux based stand transpiration estimates.
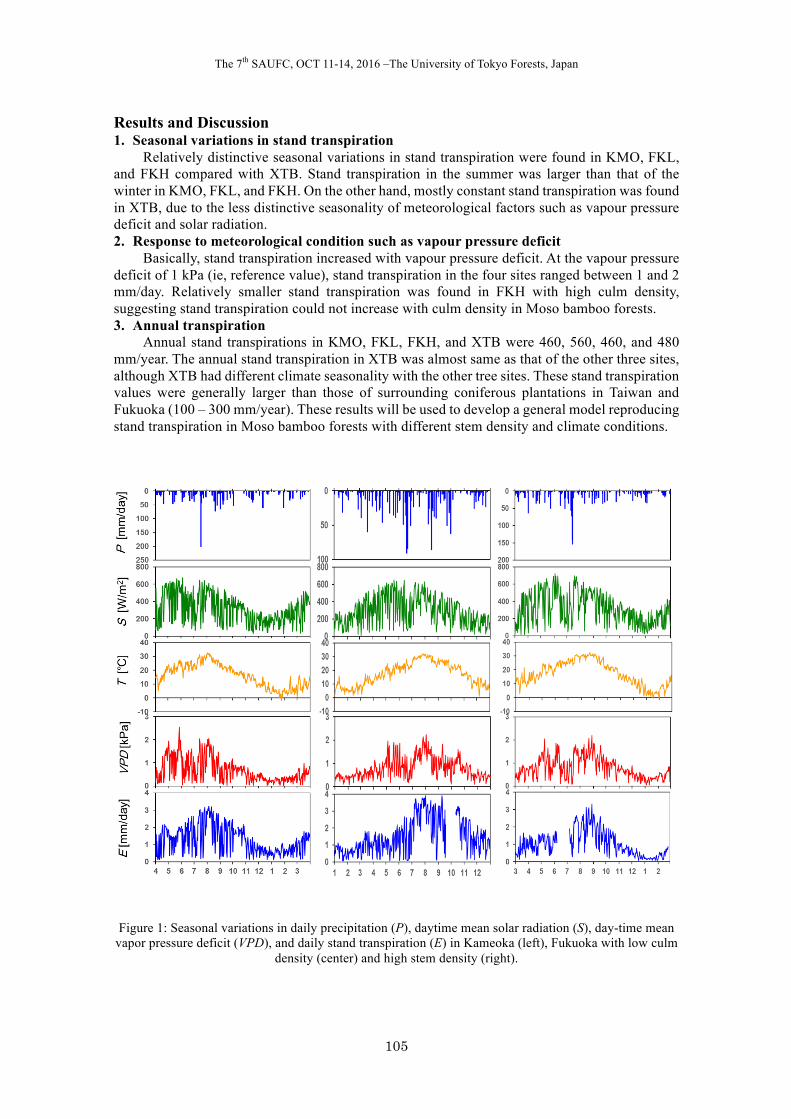
The 7th SAUFC, OCT 11-14, 2016 –The University of Tokyo Forests, Japan
105
Results and Discussion 1. Seasonal variations in stand transpiration
Relatively distinctive seasonal variations in stand transpiration were found in KMO, FKL, and FKH compared with XTB. Stand transpiration in the summer was larger than that of the winter in KMO, FKL, and FKH. On the other hand, mostly constant stand transpiration was found in XTB, due to the less distinctive seasonality of meteorological factors such as vapour pressure deficit and solar radiation. 2. Response to meteorological condition such as vapour pressure deficit
Basically, stand transpiration increased with vapour pressure deficit. At the vapour pressure deficit of 1 kPa (ie, reference value), stand transpiration in the four sites ranged between 1 and 2 mm/day. Relatively smaller stand transpiration was found in FKH with high culm density, suggesting stand transpiration could not increase with culm density in Moso bamboo forests. 3. Annual transpiration
Annual stand transpirations in KMO, FKL, FKH, and XTB were 460, 560, 460, and 480 mm/year. The annual stand transpiration in XTB was almost same as that of the other three sites, although XTB had different climate seasonality with the other tree sites. These stand transpiration values were generally larger than those of surrounding coniferous plantations in Taiwan and Fukuoka (100 – 300 mm/year). These results will be used to develop a general model reproducing stand transpiration in Moso bamboo forests with different stem density and climate conditions.
Figure 1: Seasonal variations in daily precipitation (P), daytime mean solar radiation (S), day-time mean
vapor pressure deficit (VPD), and daily stand transpiration (E) in Kameoka (left), Fukuoka with low culm density (center) and high stem density (right).
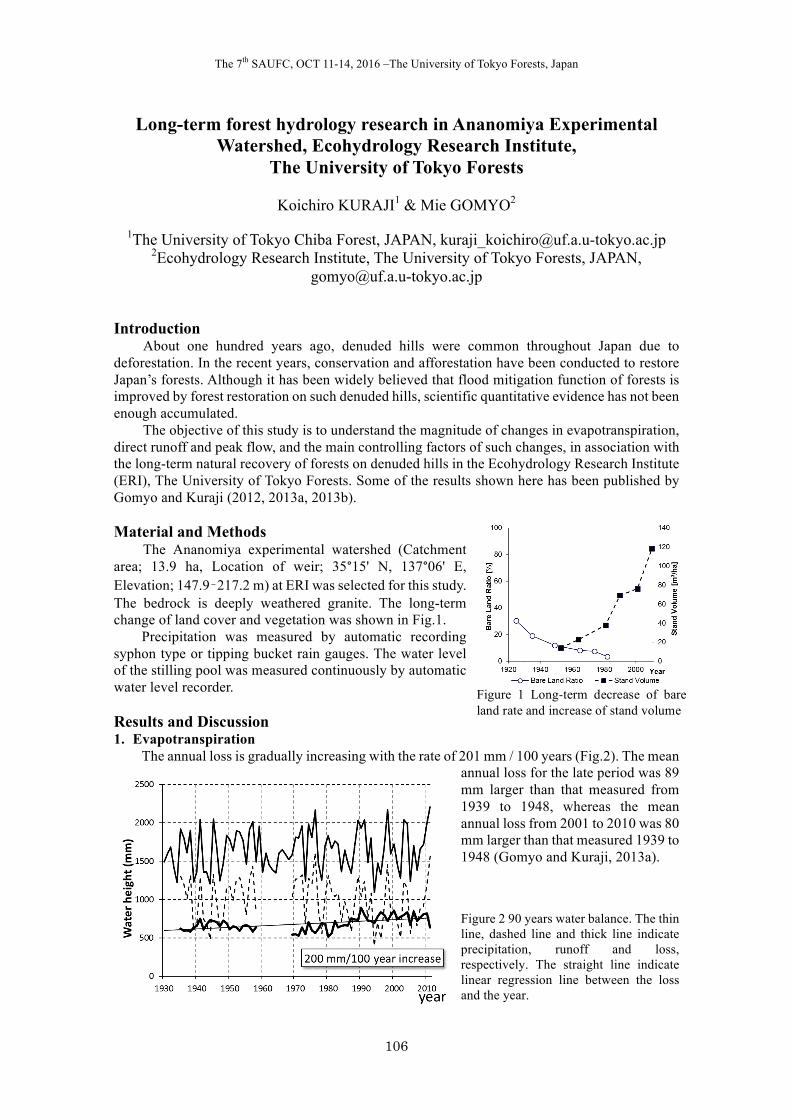
The 7th SAUFC, OCT 11-14, 2016 –The University of Tokyo Forests, Japan
106
Long-term forest hydrology research in Ananomiya Experimental Watershed, Ecohydrology Research Institute,
The University of Tokyo Forests
Koichiro KURAJI1 & Mie GOMYO2
1The University of Tokyo Chiba Forest, JAPAN, [email protected] 2Ecohydrology Research Institute, The University of Tokyo Forests, JAPAN,
[email protected] Introduction
About one hundred years ago, denuded hills were common throughout Japan due to deforestation. In the recent years, conservation and afforestation have been conducted to restore Japan’s forests. Although it has been widely believed that flood mitigation function of forests is improved by forest restoration on such denuded hills, scientific quantitative evidence has not been enough accumulated.
The objective of this study is to understand the magnitude of changes in evapotranspiration, direct runoff and peak flow, and the main controlling factors of such changes, in association with the long-term natural recovery of forests on denuded hills in the Ecohydrology Research Institute (ERI), The University of Tokyo Forests. Some of the results shown here has been published by Gomyo and Kuraji (2012, 2013a, 2013b). Material and Methods
The Ananomiya experimental watershed (Catchment area; 13.9 ha, Location of weir; 35°15' N, 137°06' E, Elevation; 147.9–217.2 m) at ERI was selected for this study. The bedrock is deeply weathered granite. The long-term change of land cover and vegetation was shown in Fig.1.
Precipitation was measured by automatic recording syphon type or tipping bucket rain gauges. The water level of the stilling pool was measured continuously by automatic water level recorder. Results and Discussion 1. Evapotranspiration
The annual loss is gradually increasing with the rate of 201 mm / 100 years (Fig.2). The mean annual loss for the late period was 89 mm larger than that measured from 1939 to 1948, whereas the mean annual loss from 2001 to 2010 was 80 mm larger than that measured 1939 to 1948 (Gomyo and Kuraji, 2013a).
Figure 2 90 years water balance. The thin line, dashed line and thick line indicate precipitation, runoff and loss, respectively. The straight line indicate linear regression line between the loss and the year.
Figure 1 Long-term decrease of bare land rate and increase of stand volume
Precipitation
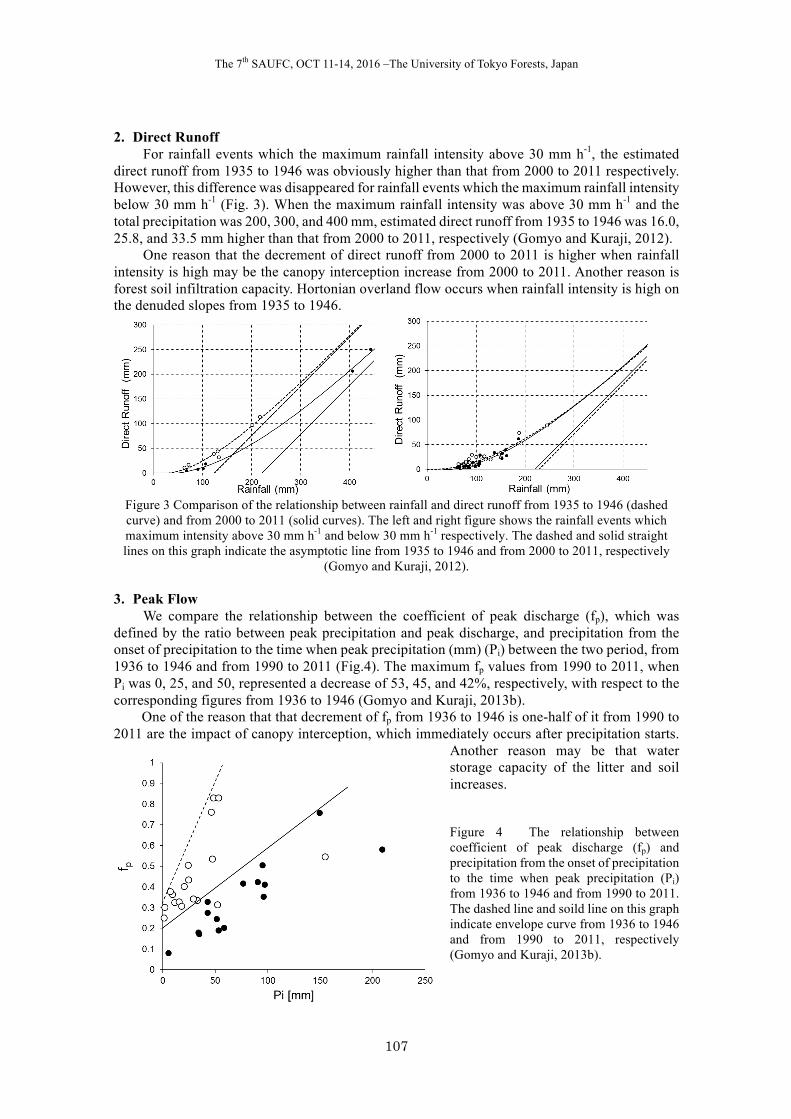
The 7th SAUFC, OCT 11-14, 2016 –The University of Tokyo Forests, Japan
107
2. Direct Runoff
For rainfall events which the maximum rainfall intensity above 30 mm h-1, the estimated direct runoff from 1935 to 1946 was obviously higher than that from 2000 to 2011 respectively. However, this difference was disappeared for rainfall events which the maximum rainfall intensity below 30 mm h-1 (Fig. 3). When the maximum rainfall intensity was above 30 mm h-1 and the total precipitation was 200, 300, and 400 mm, estimated direct runoff from 1935 to 1946 was 16.0, 25.8, and 33.5 mm higher than that from 2000 to 2011, respectively (Gomyo and Kuraji, 2012).
One reason that the decrement of direct runoff from 2000 to 2011 is higher when rainfall intensity is high may be the canopy interception increase from 2000 to 2011. Another reason is forest soil infiltration capacity. Hortonian overland flow occurs when rainfall intensity is high on the denuded slopes from 1935 to 1946.
Figure 3 Comparison of the relationship between rainfall and direct runoff from 1935 to 1946 (dashed curve) and from 2000 to 2011 (solid curves). The left and right figure shows the rainfall events which maximum intensity above 30 mm h-1 and below 30 mm h-1 respectively. The dashed and solid straight lines on this graph indicate the asymptotic line from 1935 to 1946 and from 2000 to 2011, respectively
(Gomyo and Kuraji, 2012). 3. Peak Flow
We compare the relationship between the coefficient of peak discharge (fp), which was defined by the ratio between peak precipitation and peak discharge, and precipitation from the onset of precipitation to the time when peak precipitation (mm) (Pi) between the two period, from 1936 to 1946 and from 1990 to 2011 (Fig.4). The maximum fp values from 1990 to 2011, when Pi was 0, 25, and 50, represented a decrease of 53, 45, and 42%, respectively, with respect to the corresponding figures from 1936 to 1946 (Gomyo and Kuraji, 2013b).
One of the reason that that decrement of fp from 1936 to 1946 is one-half of it from 1990 to 2011 are the impact of canopy interception, which immediately occurs after precipitation starts.
Another reason may be that water storage capacity of the litter and soil increases. Figure 4 The relationship between coefficient of peak discharge (fp) and precipitation from the onset of precipitation to the time when peak precipitation (Pi) from 1936 to 1946 and from 1990 to 2011. The dashed line and soild line on this graph indicate envelope curve from 1936 to 1946 and from 1990 to 2011, respectively (Gomyo and Kuraji, 2013b).
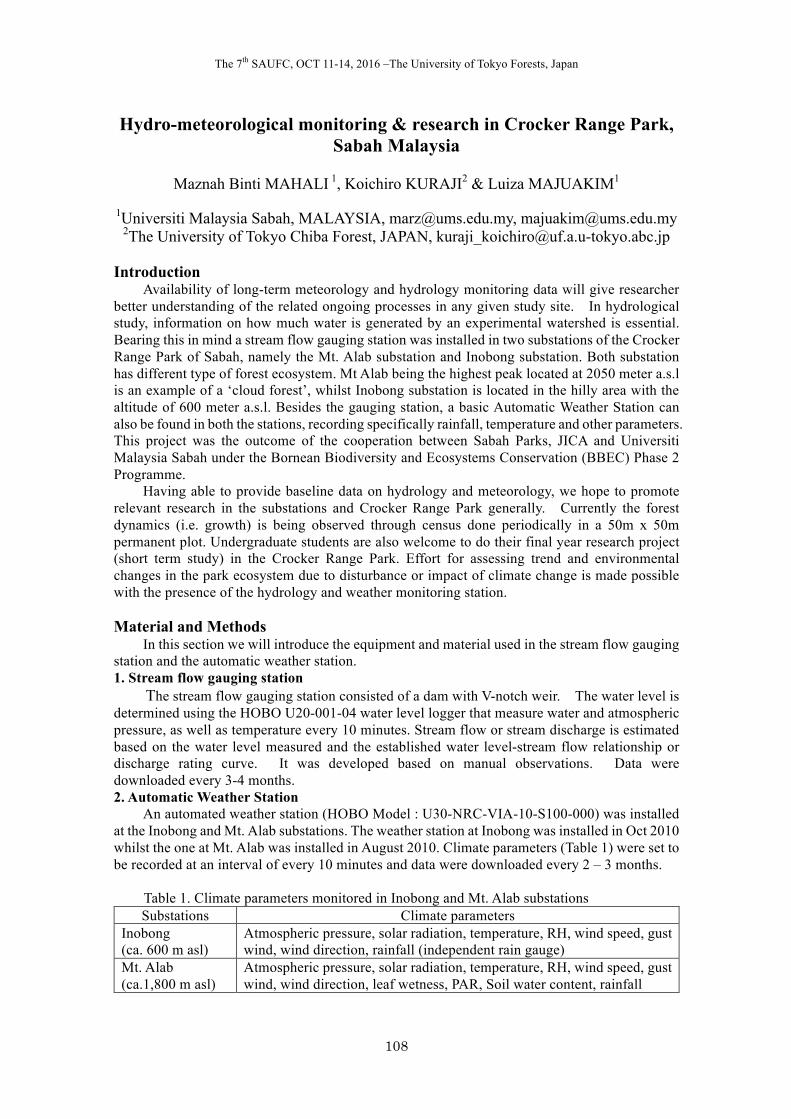
The 7th SAUFC, OCT 11-14, 2016 –The University of Tokyo Forests, Japan
108
Hydro-meteorological monitoring & research in Crocker Range Park, Sabah Malaysia
Maznah Binti MAHALI 1, Koichiro KURAJI2 & Luiza MAJUAKIM1
1Universiti Malaysia Sabah, MALAYSIA, [email protected], [email protected]
2The University of Tokyo Chiba Forest, JAPAN, [email protected] Introduction
Availability of long-term meteorology and hydrology monitoring data will give researcher better understanding of the related ongoing processes in any given study site. In hydrological study, information on how much water is generated by an experimental watershed is essential. Bearing this in mind a stream flow gauging station was installed in two substations of the Crocker Range Park of Sabah, namely the Mt. Alab substation and Inobong substation. Both substation has different type of forest ecosystem. Mt Alab being the highest peak located at 2050 meter a.s.l is an example of a ‘cloud forest’, whilst Inobong substation is located in the hilly area with the altitude of 600 meter a.s.l. Besides the gauging station, a basic Automatic Weather Station can also be found in both the stations, recording specifically rainfall, temperature and other parameters. This project was the outcome of the cooperation between Sabah Parks, JICA and Universiti Malaysia Sabah under the Bornean Biodiversity and Ecosystems Conservation (BBEC) Phase 2 Programme.
Having able to provide baseline data on hydrology and meteorology, we hope to promote relevant research in the substations and Crocker Range Park generally. Currently the forest dynamics (i.e. growth) is being observed through census done periodically in a 50m x 50m permanent plot. Undergraduate students are also welcome to do their final year research project (short term study) in the Crocker Range Park. Effort for assessing trend and environmental changes in the park ecosystem due to disturbance or impact of climate change is made possible with the presence of the hydrology and weather monitoring station.
Material and Methods
In this section we will introduce the equipment and material used in the stream flow gauging station and the automatic weather station. 1. Stream flow gauging station
The stream flow gauging station consisted of a dam with V-notch weir. The water level is determined using the HOBO U20-001-04 water level logger that measure water and atmospheric pressure, as well as temperature every 10 minutes. Stream flow or stream discharge is estimated based on the water level measured and the established water level-stream flow relationship or discharge rating curve. It was developed based on manual observations. Data were downloaded every 3-4 months. 2. Automatic Weather Station
An automated weather station (HOBO Model : U30-NRC-VIA-10-S100-000) was installed at the Inobong and Mt. Alab substations. The weather station at Inobong was installed in Oct 2010 whilst the one at Mt. Alab was installed in August 2010. Climate parameters (Table 1) were set to be recorded at an interval of every 10 minutes and data were downloaded every 2 – 3 months.
Table 1. Climate parameters monitored in Inobong and Mt. Alab substations Substations Climate parameters
Inobong (ca. 600 m asl)
Atmospheric pressure, solar radiation, temperature, RH, wind speed, gust wind, wind direction, rainfall (independent rain gauge)
Mt. Alab (ca.1,800 m asl)
Atmospheric pressure, solar radiation, temperature, RH, wind speed, gust wind, wind direction, leaf wetness, PAR, Soil water content, rainfall
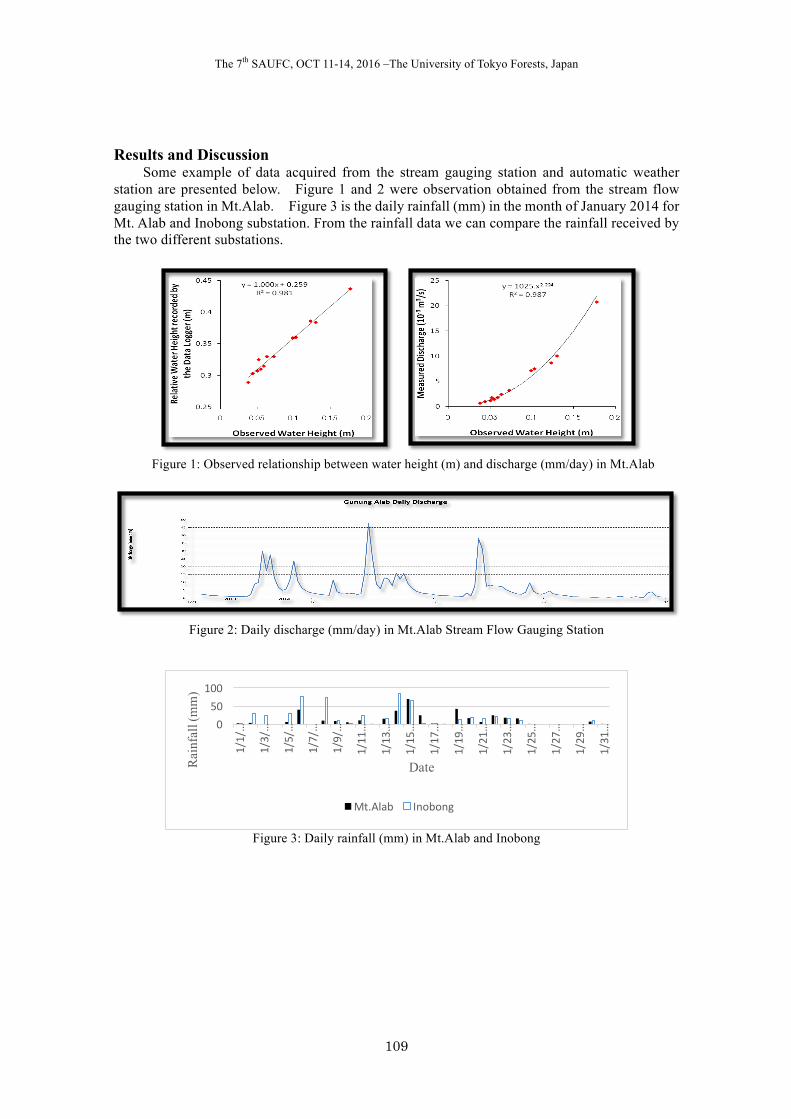
The 7th SAUFC, OCT 11-14, 2016 –The University of Tokyo Forests, Japan
109
Results and Discussion Some example of data acquired from the stream gauging station and automatic weather
station are presented below. Figure 1 and 2 were observation obtained from the stream flow gauging station in Mt.Alab. Figure 3 is the daily rainfall (mm) in the month of January 2014 for Mt. Alab and Inobong substation. From the rainfall data we can compare the rainfall received by the two different substations.
Figure 1: Observed relationship between water height (m) and discharge (mm/day) in Mt.Alab
Figure 2: Daily discharge (mm/day) in Mt.Alab Stream Flow Gauging Station
Figure 3: Daily rainfall (mm) in Mt.Alab and Inobong
050
100
1/1/…
1/3/…
1/5/…
1/7/…
1/9/…
1/11…
1/13…
1/15…
1/17…
1/19…
1/21…
1/23…
1/25…
1/27…
1/29…
1/31…
Rai
nfal
l (m
m)
Date
Mt.Alab Inobong
The 7th SAUFC, OCT 11-14, 2016 –The University of Tokyo Forests, Japan
110
Long term rainfall characteristic at a hill evergreen forest, Kog Ma Watershed, Chiang Mai Province, Northern Thailand
Chatchai Tantasirin1, Nobuaki Tanaka2, Mazakazu Suzuki3, Nipon Tangtham1
1Faculty of Forestry, Kasetsart University, THAILAND, [email protected]
2The University of Tokyo Chichibu Forests, JAPAN, [email protected] 2The University of Tokyo Chichibu Forests, JAPAN, [email protected]
Introduction Rainfall data is essential in the climate variability study and risk assessment. Rainfall data
on mountainous area is lack in Thailand. Result on long term data analysis from this study will enhance understanding of hydrological engineer and head water resources management policy maker.
Material and Methods A tipping bucket automatic recording rain gauges has been installed at D-weir, Kog-Ma
Watershed Chiang Mai Province, Northern Thailand since 1997. Data was collected from the logger every 3 – 4 months. In case of data missing, near by rain gauges installed on the 50 m meteorological tower located at 200 m far from the D-weir was employed. Storm rainfall characteristic including time of rain, amount, duration, average intensity and moving mean intensity during 5, 10 and 30 minute was investigated during 1997 – 2015. Rainfall event was separated using duration of 1 hour of no rain shower. Daily, monthly and annually characteristic was calculated from the storm data. Regression and frequency analysis were used to analyse changing of rainfall characteristics.
Results and Discussion 1. Number of Storm
Number of rain storm in a year during the study period ranges from 125 to 244 storms. Average number of annual rain storm is 181 storms. Average number of storm during monsoon season (May to October) is 18 to 34 storms while it is 2 – 9 storms in dry season. August is the month of the highest number of rain storm. Maximum number of rain event of 54 storms was occurred in this month on 2010 and average number of rain storm is 34 storms. 2. Duration
Frequency analysis of storm rainfall duration found that approximately 35% of all rainfall events are not longer than 30 minute and about 24% is rainfall duration lasted from 30 to 60 minute. During monsoon season average rainfall duration is longer than 60 minute. Maximum rainfall duration occurred in this area is 1,405 minute. 3. Intensity
Approximately 66%, 41%, 47% and 59% of all rainfall events, rainfall event which fell longer than 5, 10 and 30 minute has intensity lower than 10 mm/hr respectively. Average rainfall intensity and intensity of rain event longer than 5, 10 and 30 minute is 10.7, 23.3, 18.6 and 8.7 mm/hr respectively while the maximum value is 282.6, 216.0, 183.0 and 150.0 mm/hr respectively. High rainfall intensity over 50 mm/hr was found most frequent in September. 4. Number of Rainy day
Number of rainy day varies from 77 to 145 days/year and average is 111 days. Maximum number of rainy day in a month is 25 days in August and September. Average number of rainy day in wet and dry season is 16 and 4 days respectively.

The 7th SAUFC, OCT 11-14, 2016 –The University of Tokyo Forests, Japan
111
5. Amount Rainfall amount of each storm is not high in this area. It was found that rain fell lower than
5 mm and 5-10 mm is about 57% and 18% of all rainfall events respectively. Maximum mean monthly rainfall was found in August which is about 320 mm and minimum in February of 10 mm. Annual rainfall range from a high of 1,174 to 2,340 mm and mean annual rainfall is 1,659 mm. Rainfall amount over 50 mm was found most frequent in May. 6. Trend in rainfall characteristic
Regression analysis shown that rainfall duration, rainfall intensity of storm duration longer than 5, 10 and 30 minute of May decrease significantly.
The 7th SAUFC, OCT 11-14, 2016 –The University of Tokyo Forests, Japan
112
Precipitation triggered landslides drive the stand dynamics of old-growth Taiwan spruce forests in central Taiwan
Sheng-Kun HUANG1, Biing T. GUAN1 & Willam E. WRIGHT2
1School of Forestry & Resource Conservation, National Taiwan University, Taiwan,
ROC, [email protected]; [email protected] 2Laboratory of Tree-Ring Research, University of Arizona, USA, [email protected] Introduction
In August 2009, typhoon Morakot released more than 3,000 mm of precipitation over a 6-day period in Taiwan’s central alpine areas and severely damaged the upper Shalixian watershed, home of one of the largest Taiwan spruce forests. Large patches of the forest were destroyed as slopes collapsed. After the typhoon, two questions were immediately raised: (1) whether typhoon related disturbances are the main driver of dynamics for natural Taiwan spruce forests, and (2) whether similarly devastating events had occurred before. Despite more than a century of meteorological recording in Taiwan, the event was unprecedented. Thus, the answers to these questions could not be found by analysing historical weather data only. However, because Taiwan spruce is a shade-intolerant species that requires relatively large openings to establish, examining the structures and spatiotemporal dynamics of Taiwan spruce stands may help to answer the questions.
Material and Methods 1. Study site & Meteorological data
The study was conducted in a 1.44-ha (120 × 120-m) Taiwan spruce forest permanent plot located in the Tatachia area of the upper Shalixian watershed in central Taiwan (23°29′ N, 120°53′ E, ca. 2500-2700 m amsl; Fig. 1). The permanent plot was dominated by Taiwan spruce; co-dominant species included Taiwan hemlock and Taiwan armand pine. In addition, a small number of Taiwan fir were identified. The meteorological data were from Alishan Weather Station of the Taiwan Central Weather Bureau. Based on the records from 1934 to 2008, the mean annual temperature of the station was approximately 10.8 °C (5.8 °C in January and 14.3 °C in July). Due to orographic lifting and typhoons, the mean annual precipitation was approximately 4,000 mm with distinct wet (from April to September, average total precipitation ≈ 3,400 mm) and dry (from October to March, average total precipitation ≈ 600 mm) seasons. 2. Tree-ring data& analyses
In 2008 and early 2009, the spatial positions of all dominant and co-dominant trees within the plot taller than breast height (275 Taiwan spruces, 77 Taiwan hemlocks, and 25 Taiwan pines) were mapped, and those with a diameter at breast height (DBH) ≥ 15 cm were cored at breast height. We considered a tree to be successfully established when its DBH ≥ 15 cm. The cores were prepared following the standard tree ring analysis protocols, visually crossdated first, and then quality checked using the COFECHA program. After the cores were crossdated, the establishment age (EA, age at breast height) was determined for each tree. 3. Disturbance identifications and analyses
We adopted two frequently used and related methods to detect growth releases, namely, the percent growth change (PGC) and boundary line (BL) methods. The PGC for a given year is calculated as [(M2 ‒ M1) / M1] × 100%, where M1 is the preceding 10-year mean ring width including the focal year, and M2 is the subsequent 10-year mean ring width excluding the focal year. In this study, considering the shade-intolerant nature of the three dominant species, we
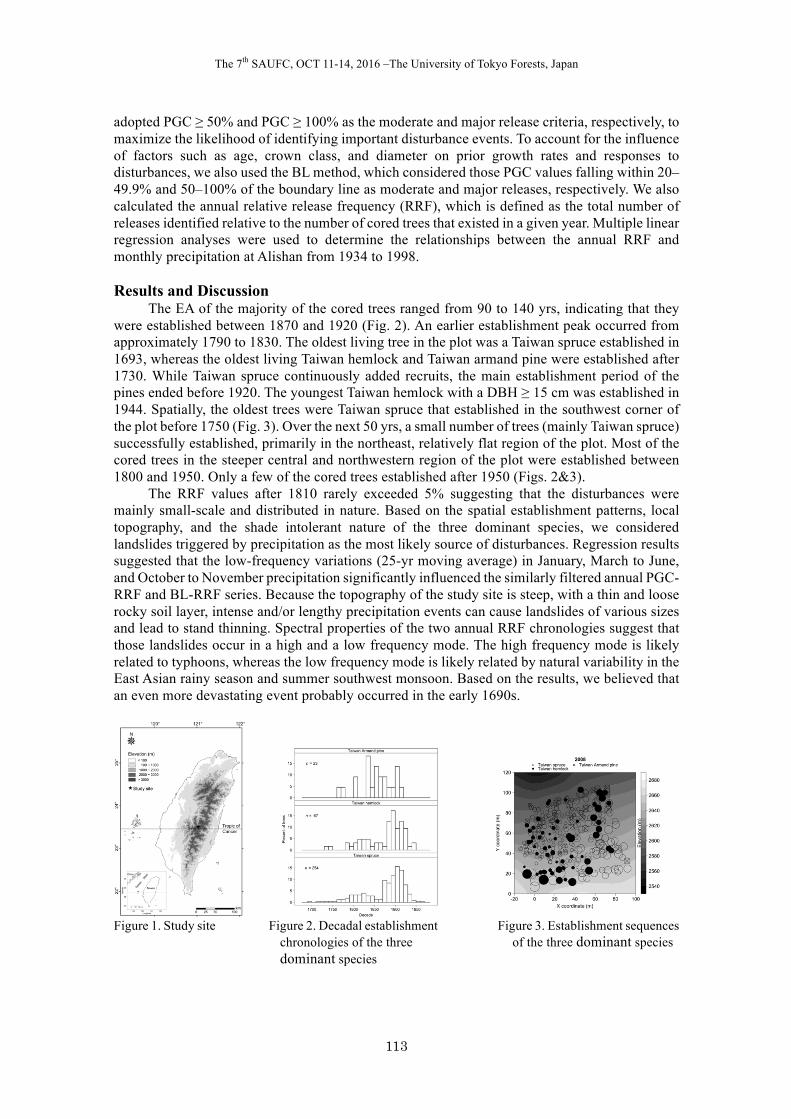
The 7th SAUFC, OCT 11-14, 2016 –The University of Tokyo Forests, Japan
113
adopted PGC ≥ 50% and PGC ≥ 100% as the moderate and major release criteria, respectively, to maximize the likelihood of identifying important disturbance events. To account for the influence of factors such as age, crown class, and diameter on prior growth rates and responses to disturbances, we also used the BL method, which considered those PGC values falling within 20–49.9% and 50–100% of the boundary line as moderate and major releases, respectively. We also calculated the annual relative release frequency (RRF), which is defined as the total number of releases identified relative to the number of cored trees that existed in a given year. Multiple linear regression analyses were used to determine the relationships between the annual RRF and monthly precipitation at Alishan from 1934 to 1998. Results and Discussion
The EA of the majority of the cored trees ranged from 90 to 140 yrs, indicating that they were established between 1870 and 1920 (Fig. 2). An earlier establishment peak occurred from approximately 1790 to 1830. The oldest living tree in the plot was a Taiwan spruce established in 1693, whereas the oldest living Taiwan hemlock and Taiwan armand pine were established after 1730. While Taiwan spruce continuously added recruits, the main establishment period of the pines ended before 1920. The youngest Taiwan hemlock with a DBH ≥ 15 cm was established in 1944. Spatially, the oldest trees were Taiwan spruce that established in the southwest corner of the plot before 1750 (Fig. 3). Over the next 50 yrs, a small number of trees (mainly Taiwan spruce) successfully established, primarily in the northeast, relatively flat region of the plot. Most of the cored trees in the steeper central and northwestern region of the plot were established between 1800 and 1950. Only a few of the cored trees established after 1950 (Figs. 2&3).
The RRF values after 1810 rarely exceeded 5% suggesting that the disturbances were mainly small-scale and distributed in nature. Based on the spatial establishment patterns, local topography, and the shade intolerant nature of the three dominant species, we considered landslides triggered by precipitation as the most likely source of disturbances. Regression results suggested that the low-frequency variations (25-yr moving average) in January, March to June, and October to November precipitation significantly influenced the similarly filtered annual PGC-RRF and BL-RRF series. Because the topography of the study site is steep, with a thin and loose rocky soil layer, intense and/or lengthy precipitation events can cause landslides of various sizes and lead to stand thinning. Spectral properties of the two annual RRF chronologies suggest that those landslides occur in a high and a low frequency mode. The high frequency mode is likely related to typhoons, whereas the low frequency mode is likely related by natural variability in the East Asian rainy season and summer southwest monsoon. Based on the results, we believed that an even more devastating event probably occurred in the early 1690s.
Figure 1. Study site Figure 2. Decadal establishment Figure 3. Establishment sequences chronologies of the three of the three dominant species dominant species
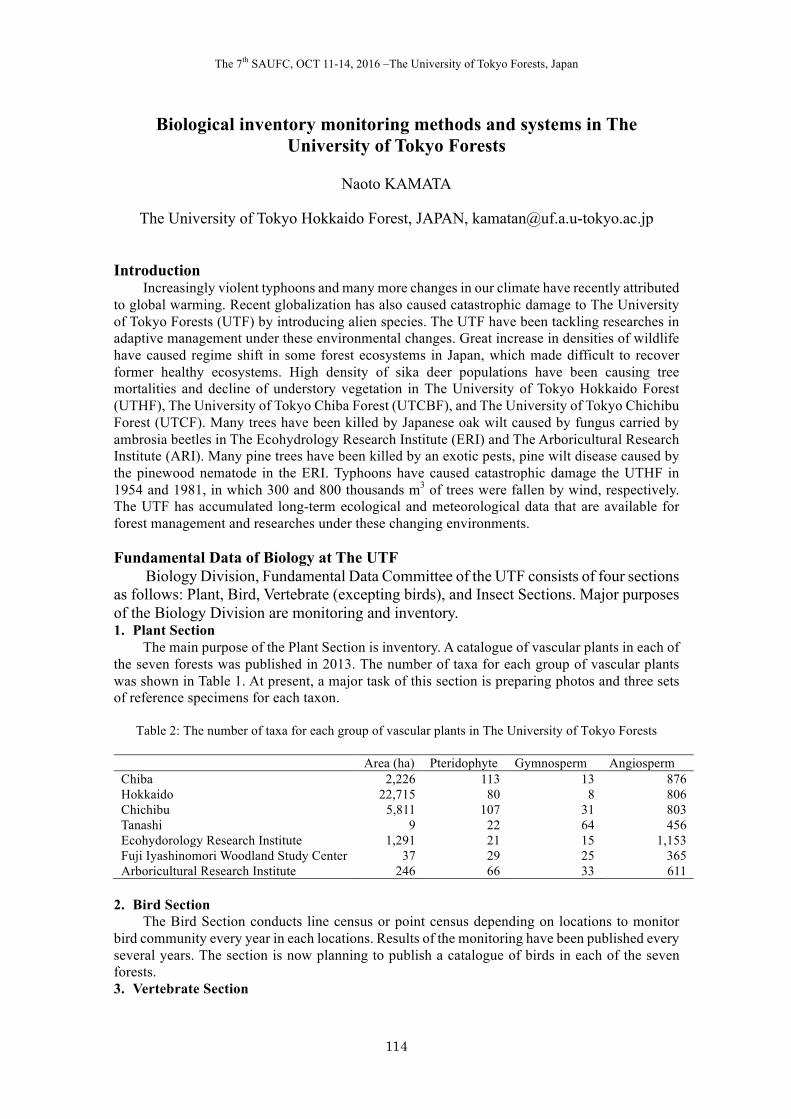
The 7th SAUFC, OCT 11-14, 2016 –The University of Tokyo Forests, Japan
114
Biological inventory monitoring methods and systems in The University of Tokyo Forests
Naoto KAMATA
The University of Tokyo Hokkaido Forest, JAPAN, [email protected]
Introduction
Increasingly violent typhoons and many more changes in our climate have recently attributed to global warming. Recent globalization has also caused catastrophic damage to The University of Tokyo Forests (UTF) by introducing alien species. The UTF have been tackling researches in adaptive management under these environmental changes. Great increase in densities of wildlife have caused regime shift in some forest ecosystems in Japan, which made difficult to recover former healthy ecosystems. High density of sika deer populations have been causing tree mortalities and decline of understory vegetation in The University of Tokyo Hokkaido Forest (UTHF), The University of Tokyo Chiba Forest (UTCBF), and The University of Tokyo Chichibu Forest (UTCF). Many trees have been killed by Japanese oak wilt caused by fungus carried by ambrosia beetles in The Ecohydrology Research Institute (ERI) and The Arboricultural Research Institute (ARI). Many pine trees have been killed by an exotic pests, pine wilt disease caused by the pinewood nematode in the ERI. Typhoons have caused catastrophic damage the UTHF in 1954 and 1981, in which 300 and 800 thousands m3 of trees were fallen by wind, respectively. The UTF has accumulated long-term ecological and meteorological data that are available for forest management and researches under these changing environments. Fundamental Data of Biology at The UTF
Biology Division, Fundamental Data Committee of the UTF consists of four sections as follows: Plant, Bird, Vertebrate (excepting birds), and Insect Sections. Major purposes of the Biology Division are monitoring and inventory. 1. Plant Section
The main purpose of the Plant Section is inventory. A catalogue of vascular plants in each of the seven forests was published in 2013. The number of taxa for each group of vascular plants was shown in Table 1. At present, a major task of this section is preparing photos and three sets of reference specimens for each taxon.
Table 2: The number of taxa for each group of vascular plants in The University of Tokyo Forests
Area (ha) Pteridophyte Gymnosperm Angiosperm Chiba 2,226 113 13 876 Hokkaido 22,715 80 8 806 Chichibu 5,811 107 31 803 Tanashi 9 22 64 456 Ecohydorology Research Institute 1,291 21 15 1,153 Fuji Iyashinomori Woodland Study Center 37 29 25 365 Arboricultural Research Institute 246 66 33 611
2. Bird Section
The Bird Section conducts line census or point census depending on locations to monitor bird community every year in each locations. Results of the monitoring have been published every several years. The section is now planning to publish a catalogue of birds in each of the seven forests. 3. Vertebrate Section
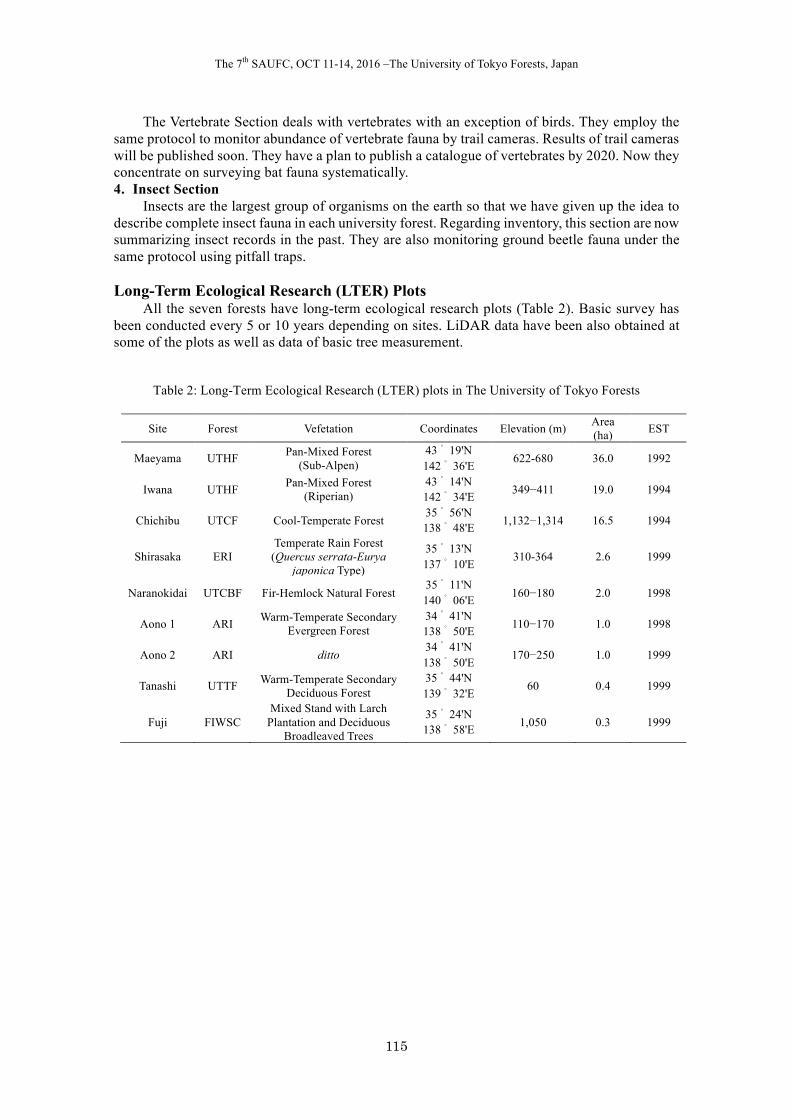
The 7th SAUFC, OCT 11-14, 2016 –The University of Tokyo Forests, Japan
115
The Vertebrate Section deals with vertebrates with an exception of birds. They employ the same protocol to monitor abundance of vertebrate fauna by trail cameras. Results of trail cameras will be published soon. They have a plan to publish a catalogue of vertebrates by 2020. Now they concentrate on surveying bat fauna systematically. 4. Insect Section
Insects are the largest group of organisms on the earth so that we have given up the idea to describe complete insect fauna in each university forest. Regarding inventory, this section are now summarizing insect records in the past. They are also monitoring ground beetle fauna under the same protocol using pitfall traps. Long-Term Ecological Research (LTER) Plots
All the seven forests have long-term ecological research plots (Table 2). Basic survey has been conducted every 5 or 10 years depending on sites. LiDAR data have been also obtained at some of the plots as well as data of basic tree measurement.
Table 2: Long-Term Ecological Research (LTER) plots in The University of Tokyo Forests
Site Forest Vefetation Coordinates Elevation (m) Area (ha) EST
Maeyama UTHF Pan-Mixed Forest (Sub-Alpen)
43 ゚ 19'N 142 ゚ 36'E 622-680 36.0 1992
Iwana UTHF Pan-Mixed Forest (Riperian)
43 ゚ 14'N 142 ゚ 34'E 349−411 19.0 1994
Chichibu UTCF Cool-Temperate Forest 35 ゚ 56'N 138 ゚ 48'E 1,132−1,314 16.5 1994
Shirasaka ERI Temperate Rain Forest
(Quercus serrata-Eurya japonica Type)
35 ゚ 13'N 137 ゚ 10'E 310-364 2.6 1999
Naranokidai UTCBF Fir-Hemlock Natural Forest 35 ゚ 11'N 140 ゚ 06'E 160−180 2.0 1998
Aono 1 ARI Warm-Temperate Secondary Evergreen Forest
34 ゚ 41'N 138 ゚ 50'E 110−170 1.0 1998
Aono 2 ARI ditto 34 ゚ 41'N 138 ゚ 50'E 170−250 1.0 1999
Tanashi UTTF Warm-Temperate Secondary Deciduous Forest
35 ゚ 44'N 139 ゚ 32'E 60 0.4 1999
Fuji FIWSC Mixed Stand with Larch
Plantation and Deciduous Broadleaved Trees
35 ゚ 24'N 138 ゚ 58'E 1,050 0.3 1999
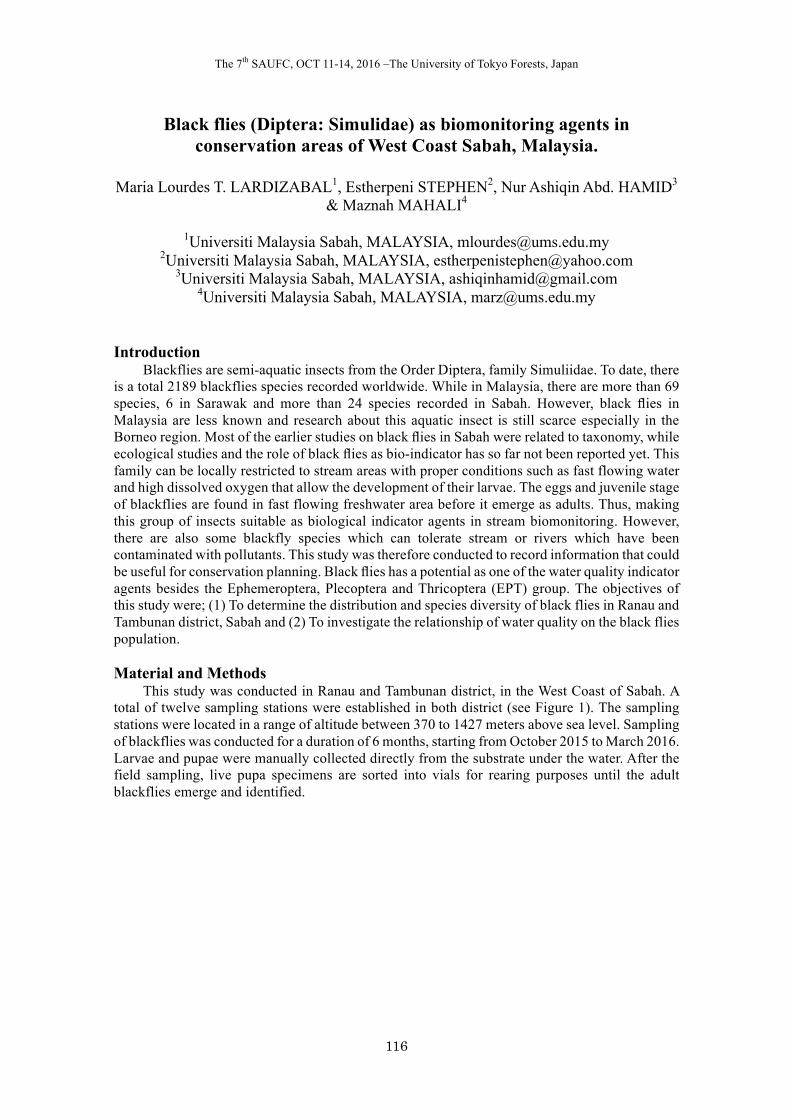
The 7th SAUFC, OCT 11-14, 2016 –The University of Tokyo Forests, Japan
116
Black flies (Diptera: Simulidae) as biomonitoring agents in conservation areas of West Coast Sabah, Malaysia.
Maria Lourdes T. LARDIZABAL1, Estherpeni STEPHEN2, Nur Ashiqin Abd. HAMID3
& Maznah MAHALI4
1Universiti Malaysia Sabah, MALAYSIA, [email protected]
2Universiti Malaysia Sabah, MALAYSIA, [email protected] 3Universiti Malaysia Sabah, MALAYSIA, [email protected]
4Universiti Malaysia Sabah, MALAYSIA, [email protected] Introduction
Blackflies are semi-aquatic insects from the Order Diptera, family Simuliidae. To date, there is a total 2189 blackflies species recorded worldwide. While in Malaysia, there are more than 69 species, 6 in Sarawak and more than 24 species recorded in Sabah. However, black flies in Malaysia are less known and research about this aquatic insect is still scarce especially in the Borneo region. Most of the earlier studies on black flies in Sabah were related to taxonomy, while ecological studies and the role of black flies as bio-indicator has so far not been reported yet. This family can be locally restricted to stream areas with proper conditions such as fast flowing water and high dissolved oxygen that allow the development of their larvae. The eggs and juvenile stage of blackflies are found in fast flowing freshwater area before it emerge as adults. Thus, making this group of insects suitable as biological indicator agents in stream biomonitoring. However, there are also some blackfly species which can tolerate stream or rivers which have been contaminated with pollutants. This study was therefore conducted to record information that could be useful for conservation planning. Black flies has a potential as one of the water quality indicator agents besides the Ephemeroptera, Plecoptera and Thricoptera (EPT) group. The objectives of this study were; (1) To determine the distribution and species diversity of black flies in Ranau and Tambunan district, Sabah and (2) To investigate the relationship of water quality on the black flies population. Material and Methods
This study was conducted in Ranau and Tambunan district, in the West Coast of Sabah. A total of twelve sampling stations were established in both district (see Figure 1). The sampling stations were located in a range of altitude between 370 to 1427 meters above sea level. Sampling of blackflies was conducted for a duration of 6 months, starting from October 2015 to March 2016. Larvae and pupae were manually collected directly from the substrate under the water. After the field sampling, live pupa specimens are sorted into vials for rearing purposes until the adult blackflies emerge and identified.
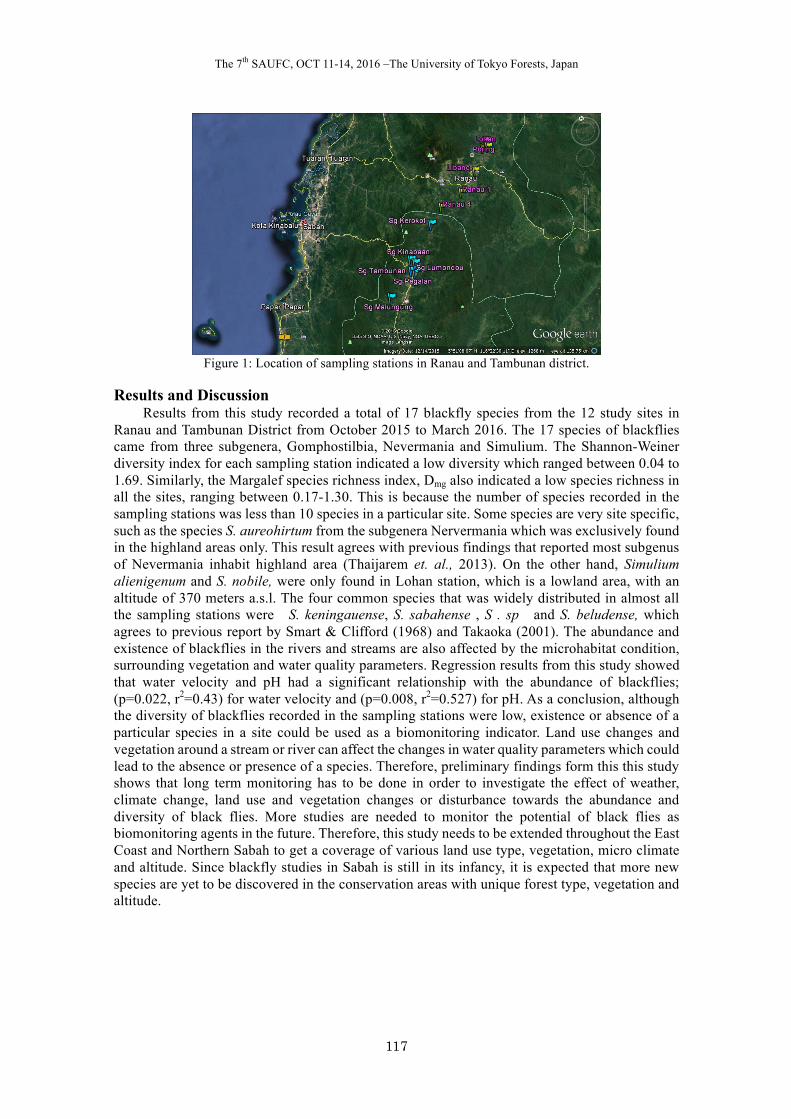
The 7th SAUFC, OCT 11-14, 2016 –The University of Tokyo Forests, Japan
117
Figure 1: Location of sampling stations in Ranau and Tambunan district.
Results and Discussion
Results from this study recorded a total of 17 blackfly species from the 12 study sites in Ranau and Tambunan District from October 2015 to March 2016. The 17 species of blackflies came from three subgenera, Gomphostilbia, Nevermania and Simulium. The Shannon-Weiner diversity index for each sampling station indicated a low diversity which ranged between 0.04 to 1.69. Similarly, the Margalef species richness index, Dmg also indicated a low species richness in all the sites, ranging between 0.17-1.30. This is because the number of species recorded in the sampling stations was less than 10 species in a particular site. Some species are very site specific, such as the species S. aureohirtum from the subgenera Nervermania which was exclusively found in the highland areas only. This result agrees with previous findings that reported most subgenus of Nevermania inhabit highland area (Thaijarem et. al., 2013). On the other hand, Simulium alienigenum and S. nobile, were only found in Lohan station, which is a lowland area, with an altitude of 370 meters a.s.l. The four common species that was widely distributed in almost all the sampling stations were S. keningauense, S. sabahense , S . sp and S. beludense, which agrees to previous report by Smart & Clifford (1968) and Takaoka (2001). The abundance and existence of blackflies in the rivers and streams are also affected by the microhabitat condition, surrounding vegetation and water quality parameters. Regression results from this study showed that water velocity and pH had a significant relationship with the abundance of blackflies; (p=0.022, r2=0.43) for water velocity and (p=0.008, r2=0.527) for pH. As a conclusion, although the diversity of blackflies recorded in the sampling stations were low, existence or absence of a particular species in a site could be used as a biomonitoring indicator. Land use changes and vegetation around a stream or river can affect the changes in water quality parameters which could lead to the absence or presence of a species. Therefore, preliminary findings form this this study shows that long term monitoring has to be done in order to investigate the effect of weather, climate change, land use and vegetation changes or disturbance towards the abundance and diversity of black flies. More studies are needed to monitor the potential of black flies as biomonitoring agents in the future. Therefore, this study needs to be extended throughout the East Coast and Northern Sabah to get a coverage of various land use type, vegetation, micro climate and altitude. Since blackfly studies in Sabah is still in its infancy, it is expected that more new species are yet to be discovered in the conservation areas with unique forest type, vegetation and altitude.
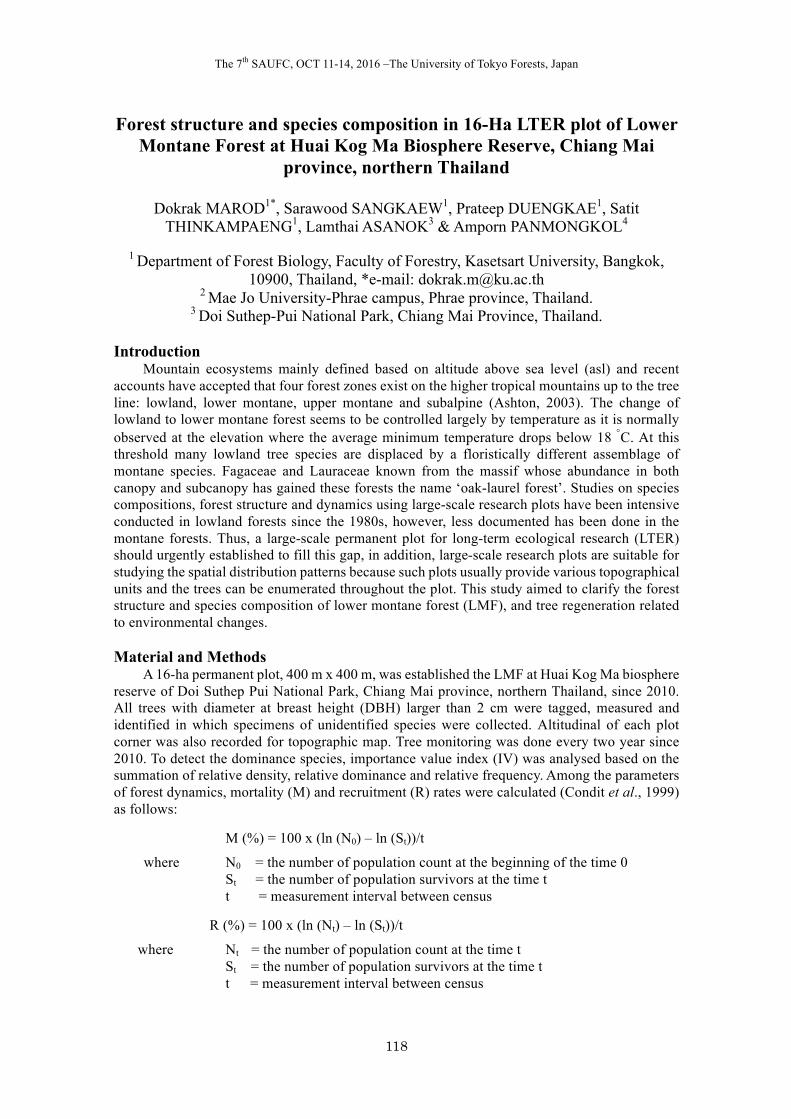
The 7th SAUFC, OCT 11-14, 2016 –The University of Tokyo Forests, Japan
118
Forest structure and species composition in 16-Ha LTER plot of Lower Montane Forest at Huai Kog Ma Biosphere Reserve, Chiang Mai
province, northern Thailand
Dokrak MAROD1*, Sarawood SANGKAEW1, Prateep DUENGKAE1, Satit THINKAMPAENG1, Lamthai ASANOK3 & Amporn PANMONGKOL4
1 Department of Forest Biology, Faculty of Forestry, Kasetsart University, Bangkok,
10900, Thailand, *e-mail: [email protected] 2 Mae Jo University-Phrae campus, Phrae province, Thailand.
3 Doi Suthep-Pui National Park, Chiang Mai Province, Thailand. Introduction
Mountain ecosystems mainly defined based on altitude above sea level (asl) and recent accounts have accepted that four forest zones exist on the higher tropical mountains up to the tree line: lowland, lower montane, upper montane and subalpine (Ashton, 2003). The change of lowland to lower montane forest seems to be controlled largely by temperature as it is normally observed at the elevation where the average minimum temperature drops below 18 °C. At this threshold many lowland tree species are displaced by a floristically different assemblage of montane species. Fagaceae and Lauraceae known from the massif whose abundance in both canopy and subcanopy has gained these forests the name ‘oak-laurel forest’. Studies on species compositions, forest structure and dynamics using large-scale research plots have been intensive conducted in lowland forests since the 1980s, however, less documented has been done in the montane forests. Thus, a large-scale permanent plot for long-term ecological research (LTER) should urgently established to fill this gap, in addition, large-scale research plots are suitable for studying the spatial distribution patterns because such plots usually provide various topographical units and the trees can be enumerated throughout the plot. This study aimed to clarify the forest structure and species composition of lower montane forest (LMF), and tree regeneration related to environmental changes.
Material and Methods
A 16-ha permanent plot, 400 m x 400 m, was established the LMF at Huai Kog Ma biosphere reserve of Doi Suthep Pui National Park, Chiang Mai province, northern Thailand, since 2010. All trees with diameter at breast height (DBH) larger than 2 cm were tagged, measured and identified in which specimens of unidentified species were collected. Altitudinal of each plot corner was also recorded for topographic map. Tree monitoring was done every two year since 2010. To detect the dominance species, importance value index (IV) was analysed based on the summation of relative density, relative dominance and relative frequency. Among the parameters of forest dynamics, mortality (M) and recruitment (R) rates were calculated (Condit et al., 1999) as follows:
M (%) = 100 x (ln (N0) – ln (St))/t
where N0 = the number of population count at the beginning of the time 0 St = the number of population survivors at the time t t = measurement interval between census
R (%) = 100 x (ln (Nt) – ln (St))/t
where Nt = the number of population count at the time t St = the number of population survivors at the time t t = measurement interval between census
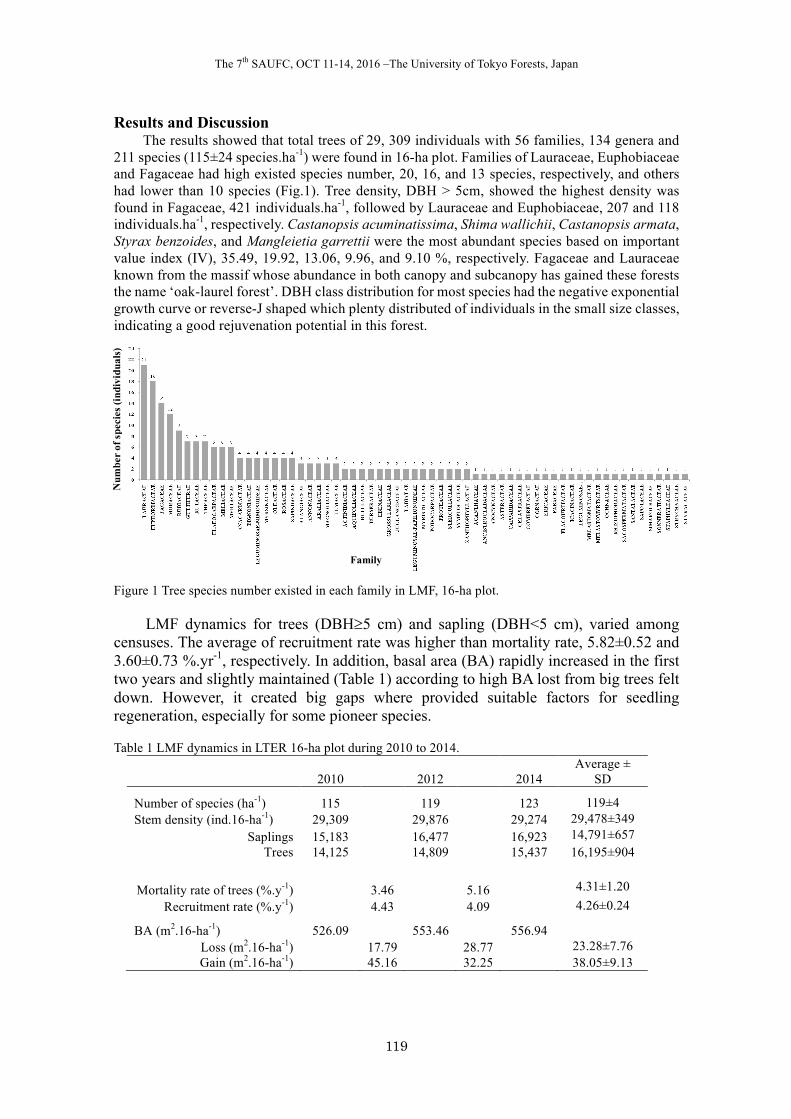
The 7th SAUFC, OCT 11-14, 2016 –The University of Tokyo Forests, Japan
119
Num
ber
of s
peci
es (i
ndiv
idua
ls)
Results and Discussion The results showed that total trees of 29, 309 individuals with 56 families, 134 genera and
211 species (115±24 species.ha-1) were found in 16-ha plot. Families of Lauraceae, Euphobiaceae and Fagaceae had high existed species number, 20, 16, and 13 species, respectively, and others had lower than 10 species (Fig.1). Tree density, DBH > 5cm, showed the highest density was found in Fagaceae, 421 individuals.ha-1, followed by Lauraceae and Euphobiaceae, 207 and 118 individuals.ha-1, respectively. Castanopsis acuminatissima, Shima wallichii, Castanopsis armata, Styrax benzoides, and Mangleietia garrettii were the most abundant species based on important value index (IV), 35.49, 19.92, 13.06, 9.96, and 9.10 %, respectively. Fagaceae and Lauraceae known from the massif whose abundance in both canopy and subcanopy has gained these forests the name ‘oak-laurel forest’. DBH class distribution for most species had the negative exponential growth curve or reverse-J shaped which plenty distributed of individuals in the small size classes, indicating a good rejuvenation potential in this forest. Figure 1 Tree species number existed in each family in LMF, 16-ha plot.
LMF dynamics for trees (DBH³5 cm) and sapling (DBH<5 cm), varied among censuses. The average of recruitment rate was higher than mortality rate, 5.82±0.52 and 3.60±0.73 %.yr-1, respectively. In addition, basal area (BA) rapidly increased in the first two years and slightly maintained (Table 1) according to high BA lost from big trees felt down. However, it created big gaps where provided suitable factors for seedling regeneration, especially for some pioneer species.
Table 1 LMF dynamics in LTER 16-ha plot during 2010 to 2014.
2010 2012 2014 Average ±
SD
Number of species (ha-1) 115 119 123 119±4 Stem density (ind.16-ha-1) 29,309 29,876 29,274 29,478±349
Saplings 15,183 16,477 16,923 14,791±657 Trees 14,125 14,809 15,437 16,195±904
Mortality rate of trees (%.y-1) 3.46 5.16 4.31±1.20 Recruitment rate (%.y-1) 4.43 4.09 4.26±0.24
BA (m2.16-ha-1) 526.09 553.46 556.94 Loss (m2.16-ha-1) 17.79 28.77 23.28±7.76 Gain (m2.16-ha-1) 45.16 32.25 38.05±9.13
Family
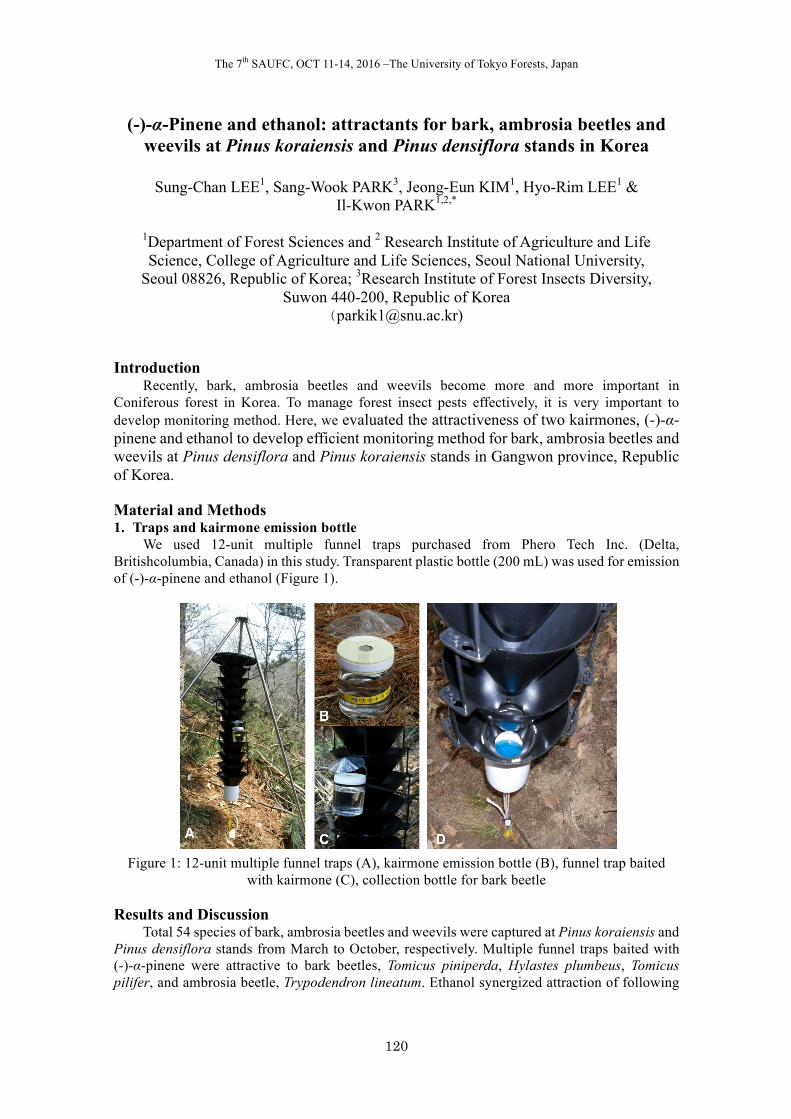
The 7th SAUFC, OCT 11-14, 2016 –The University of Tokyo Forests, Japan
120
(-)-α-Pinene and ethanol: attractants for bark, ambrosia beetles and weevils at Pinus koraiensis and Pinus densiflora stands in Korea
Sung-Chan LEE1, Sang-Wook PARK3, Jeong-Eun KIM1, Hyo-Rim LEE1 &
Il-Kwon PARK1,2,*
1Department of Forest Sciences and 2 Research Institute of Agriculture and Life Science, College of Agriculture and Life Sciences, Seoul National University,
Seoul 08826, Republic of Korea; 3Research Institute of Forest Insects Diversity, Suwon 440-200, Republic of Korea
([email protected]) Introduction
Recently, bark, ambrosia beetles and weevils become more and more important in Coniferous forest in Korea. To manage forest insect pests effectively, it is very important to develop monitoring method. Here, we evaluated the attractiveness of two kairmones, (-)-α-pinene and ethanol to develop efficient monitoring method for bark, ambrosia beetles and weevils at Pinus densiflora and Pinus koraiensis stands in Gangwon province, Republic of Korea.
Material and Methods 1. Traps and kairmone emission bottle
We used 12-unit multiple funnel traps purchased from Phero Tech Inc. (Delta, Britishcolumbia, Canada) in this study. Transparent plastic bottle (200 mL) was used for emission of (-)-α-pinene and ethanol (Figure 1).
Figure 1: 12-unit multiple funnel traps (A), kairmone emission bottle (B), funnel trap baited
with kairmone (C), collection bottle for bark beetle Results and Discussion
Total 54 species of bark, ambrosia beetles and weevils were captured at Pinus koraiensis and Pinus densiflora stands from March to October, respectively. Multiple funnel traps baited with (-)-α-pinene were attractive to bark beetles, Tomicus piniperda, Hylastes plumbeus, Tomicus pilifer, and ambrosia beetle, Trypodendron lineatum. Ethanol synergized attraction of following
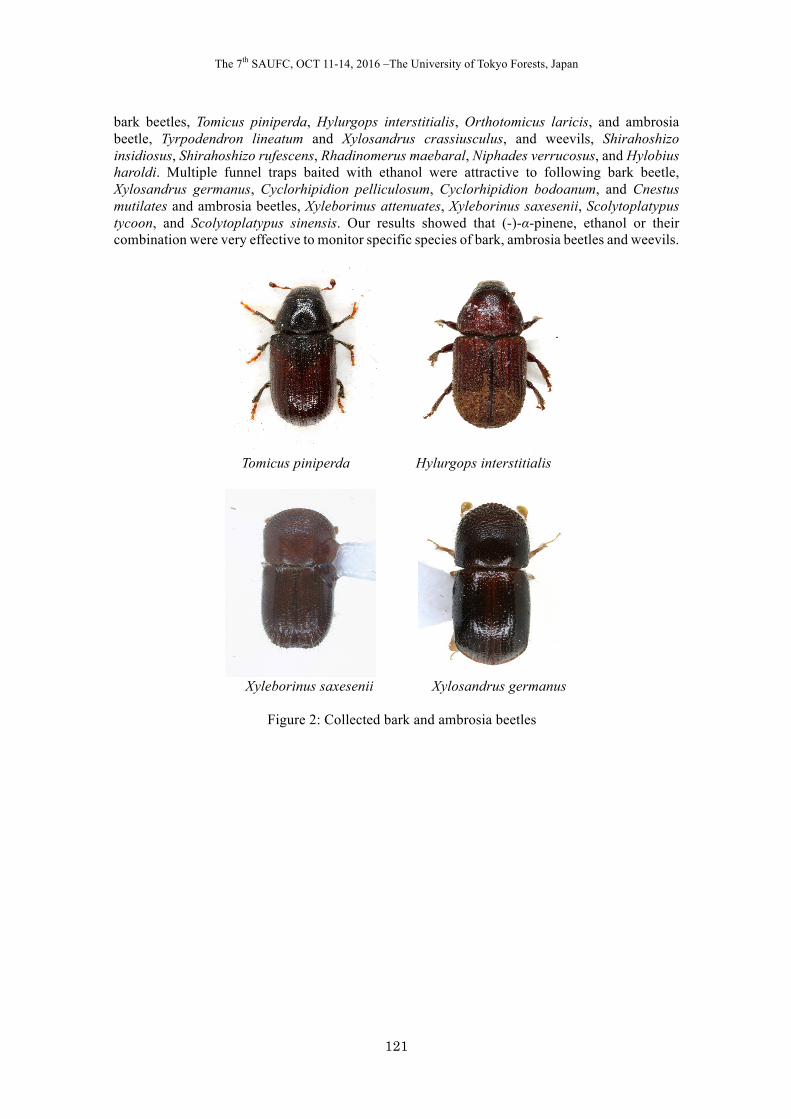
The 7th SAUFC, OCT 11-14, 2016 –The University of Tokyo Forests, Japan
121
bark beetles, Tomicus piniperda, Hylurgops interstitialis, Orthotomicus laricis, and ambrosia beetle, Tyrpodendron lineatum and Xylosandrus crassiusculus, and weevils, Shirahoshizo insidiosus, Shirahoshizo rufescens, Rhadinomerus maebaral, Niphades verrucosus, and Hylobius haroldi. Multiple funnel traps baited with ethanol were attractive to following bark beetle, Xylosandrus germanus, Cyclorhipidion pelliculosum, Cyclorhipidion bodoanum, and Cnestus mutilates and ambrosia beetles, Xyleborinus attenuates, Xyleborinus saxesenii, Scolytoplatypus tycoon, and Scolytoplatypus sinensis. Our results showed that (-)-α-pinene, ethanol or their combination were very effective to monitor specific species of bark, ambrosia beetles and weevils.
Tomicus piniperda Hylurgops interstitialis
Xyleborinus saxesenii Xylosandrus germanus
Figure 2: Collected bark and ambrosia beetles
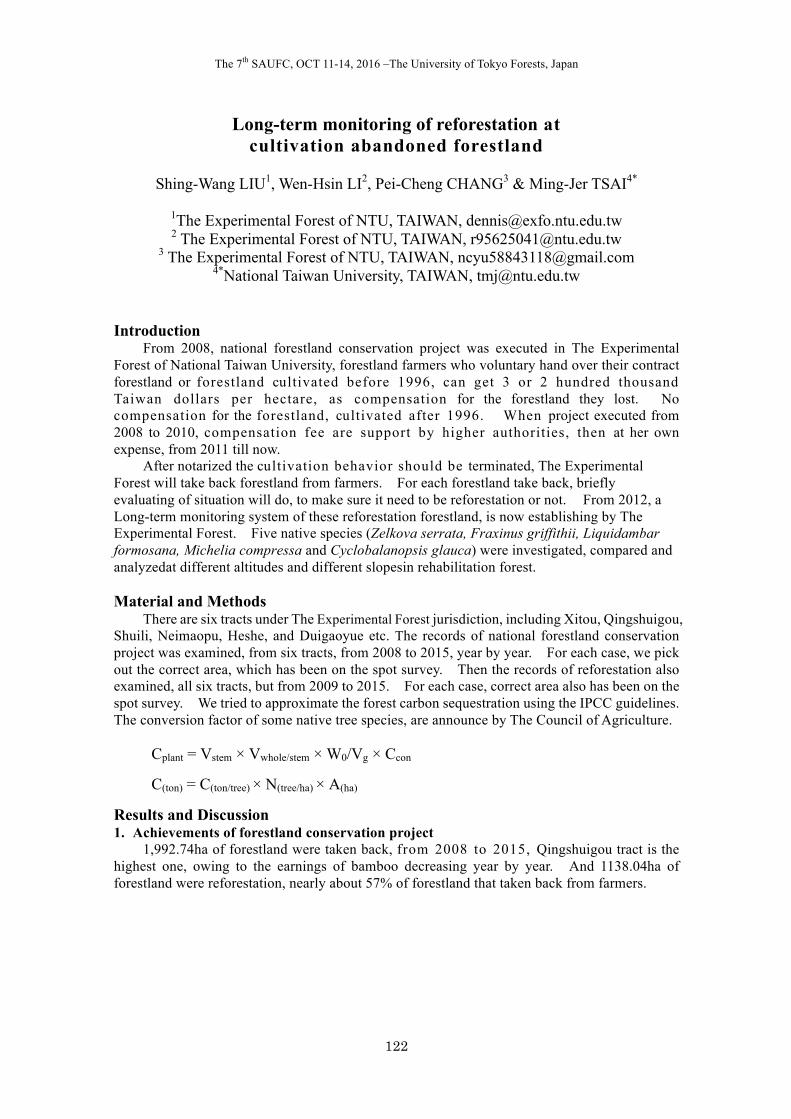
The 7th SAUFC, OCT 11-14, 2016 –The University of Tokyo Forests, Japan
122
Long-term monitoring of reforestation at cultivation abandoned forestland
Shing-Wang LIU1, Wen-Hsin LI2, Pei-Cheng CHANG3 & Ming-Jer TSAI4*
1The Experimental Forest of NTU, TAIWAN, [email protected] 2 The Experimental Forest of NTU, TAIWAN, [email protected]
3 The Experimental Forest of NTU, TAIWAN, [email protected] 4*National Taiwan University, TAIWAN, [email protected]
Introduction
From 2008, national forestland conservation project was executed in The Experimental Forest of National Taiwan University, forestland farmers who voluntary hand over their contract forestland or forestland cultivated before 1996, can get 3 or 2 hundred thousand Taiwan dollars per hectare, as compensation for the forestland they lost. No compensation for the forestland, cultivated after 1996. When project executed from 2008 to 2010, compensation fee are support by higher authorities, then at her own expense, from 2011 till now.
After notarized the cultivation behavior should be terminated, The Experimental Forest will take back forestland from farmers. For each forestland take back, briefly evaluating of situation will do, to make sure it need to be reforestation or not. From 2012, a Long-term monitoring system of these reforestation forestland, is now establishing by The Experimental Forest. Five native species (Zelkova serrata, Fraxinus griffithii, Liquidambar formosana, Michelia compressa and Cyclobalanopsis glauca) were investigated, compared and analyzedat different altitudes and different slopesin rehabilitation forest. Material and Methods
There are six tracts under The Experimental Forest jurisdiction, including Xitou, Qingshuigou, Shuili, Neimaopu, Heshe, and Duigaoyue etc. The records of national forestland conservation project was examined, from six tracts, from 2008 to 2015, year by year. For each case, we pick out the correct area, which has been on the spot survey. Then the records of reforestation also examined, all six tracts, but from 2009 to 2015. For each case, correct area also has been on the spot survey. We tried to approximate the forest carbon sequestration using the IPCC guidelines. The conversion factor of some native tree species, are announce by The Council of Agriculture.
Cplant = Vstem × Vwhole/stem × W0/Vg × Ccon
C(ton) = C(ton/tree) × N(tree/ha) × A(ha)
Results and Discussion 1. Achievements of forestland conservation project
1,992.74ha of forestland were taken back, from 2008 to 2015, Qingshuigou tract is the highest one, owing to the earnings of bamboo decreasing year by year. And 1138.04ha of forestland were reforestation, nearly about 57% of forestland that taken back from farmers.
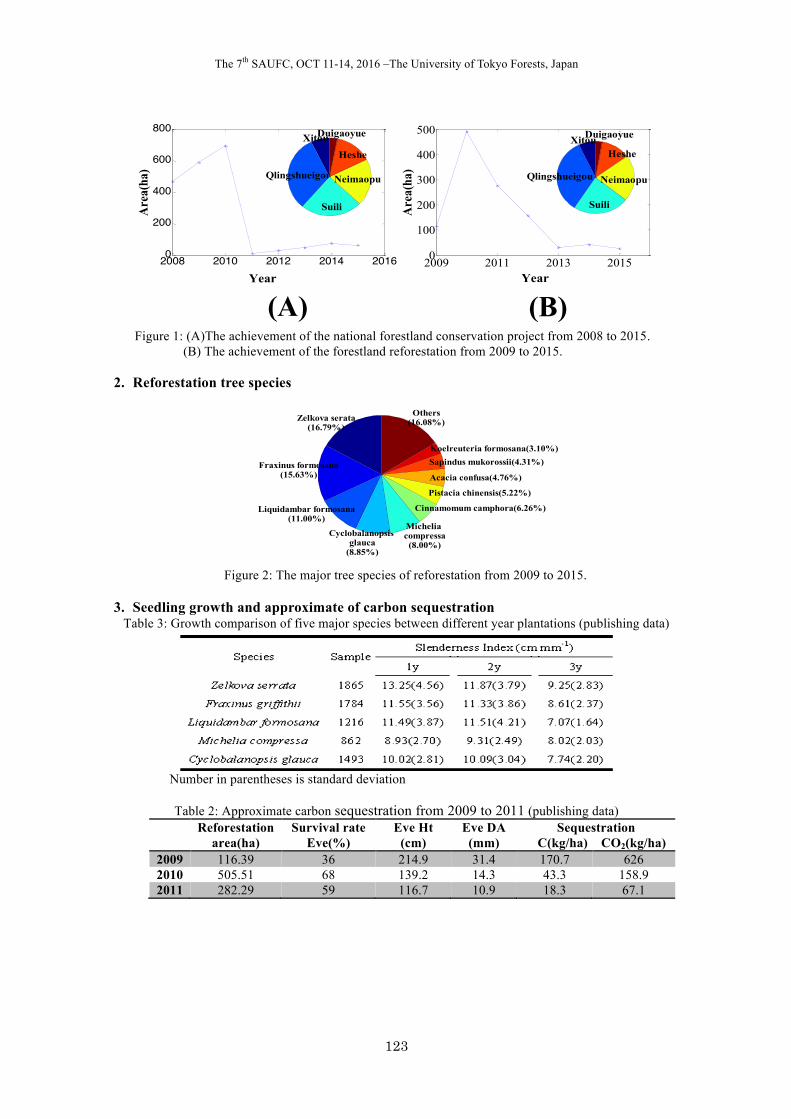
The 7th SAUFC, OCT 11-14, 2016 –The University of Tokyo Forests, Japan
123
Figure 1: (A)The achievement of the national forestland conservation project from 2008 to 2015.
(B) The achievement of the forestland reforestation from 2009 to 2015.
2. Reforestation tree species
Figure 2: The major tree species of reforestation from 2009 to 2015.
3. Seedling growth and approximate of carbon sequestration
Table 3: Growth comparison of five major species between different year plantations (publishing data)
Number in parentheses is standard deviation
Table 2: Approximate carbon sequestration from 2009 to 2011 (publishing data) Reforestation
area(ha) Survival rate
Eve(%) Eve Ht
(cm) Eve DA (mm)
Sequestration C(kg/ha) CO2(kg/ha)
2009 116.39 36 214.9 31.4 170.7 626 2010 505.51 68 139.2 14.3 43.3 158.9 2011 282.29 59 116.7 10.9 18.3 67.1
Zelkova serata(16.79%)
Fraxinus formosana(15.63%)
Liquidambar formosana(11.00%)
Cyclobalanopsis glauca
(8.85%)
Michelia compressa(8.00%)
Cinnamomum camphora(6.26%)
Pistacia chinensis(5.22%)
Acacia confusa(4.76%)
Sapindus mukorossii(4.31%)Koelreuteria formosana(3.10%)
Others(16.08%)
2008 2010 2012 2014 20160
200
400
600
800
Year
Area(ha)
2009 2011 2013 20150
100
200
300
400
500
Year
Area(ha)
Xitou
Qlingshueigou
Suili
Neimaopu
Heshe
Duigaoyue
(A) (B)
Xitou
Qlingshueigou
Suili
Neimaopu
Heshe
Duigaoyue
The 7th SAUFC, OCT 11-14, 2016 –The University of Tokyo Forests, Japan
124
Participatory Land Use Planning in Kinabalu Ecolinc Zone: The case of Wasai village
Keiko IOKI1 & Mui-How PHUA1
1Faculty of Science and Natural Resources (Forestry Complex),
Universiti Malaysia Sabah, MALAYSIA, [email protected], [email protected] Introduction
The Kinabalu Ecolinc Project is a connectivity conservation efforts initiated by Sabah Parks to improve ecological connectivity between Kinabalu Park, a World Heritage Site, and Crocker Range Park, a Biosphehere Reserve. Both parks are separated 10 km at the closest points and could become completely isolated from each other with the ongoing deforestation. The Ecolinc project attempts to address this issue by creating a more harmonized habitat corridor for people, plants and wildlife living in between these two Parks. Instead of seeing local people as the agent of deforestation, they are being considered as the guardians of their natural environments and heritages. The objective of this study was to undertake a comprehensive design process of the Participatory Land Use Planning (PLUP) procedure at Wasai village, part of the Kinabalu Ecolinc Project area. Material and Methods 1. Study area
Wasai village is located adjacent to the Crocker Range Park (N 5° 56’4.85’’, E 116°26’ 2.79’’). The estimated village area was 880.31 ha. The topography of the area is hilly with most of the area steeper than 25 degrees. It was estimated that the population of the village was less than 500 people in which majority are the Dusun ethnic group. The villagers depend mainly on agriculture activities as their source of living. 2. Planning approach
We employed the GIS-based multi-criteria analysis as the main method with a selection of implementation activities and tools such as workshops, key informant interview, transect walk and resource mapping. We established the framework of three criteria, 1) safety, 2) environment, 3) resources and three land use activities, 1) tourism and recreation, 2) agriculture and 3) restoration. Each criterion includes indicators such as landslide risk (safety), water pollution risk (safety and environment), biodiversity (environment), forest products (resources), and water sources (resources). In GIS database construction, existing agriculture areas and rubber plantation areas were digitized based on the paper map information constructed by community researchers and provided by Sabah Parks. Other basic information, e.g., rivers, roads and the location of the settlement area were digitized based on the recent Google Earth images. Additionally, a contour map was prepared using the digital elevation model from the freely-available Shuttle Radar Topography Mission (SRTM) data.
Implementation of activities included a preliminary survey with an on-site walk and key informant interviews with the head of the village, village committee members and Sabah Parks officials to understand the environmental setting of the target area. Two PLUP workshops were organized. The first workshop involved villagers, village committee members, neighbouring village representatives, the district office, relevant government departments and Sabah Parks. It was carried out with guided group-based activities such as intensive group discussion and presentation on each indicator and land use activities using the prepared base maps. Consequently, GIS analysis to generate indicator maps were carried out and a preliminary land use zoning was produced using the indicator maps. It was presented and explained in a follow-up workshop to the local villagers. The land use plan was evaluated and finalized based on the responses in the
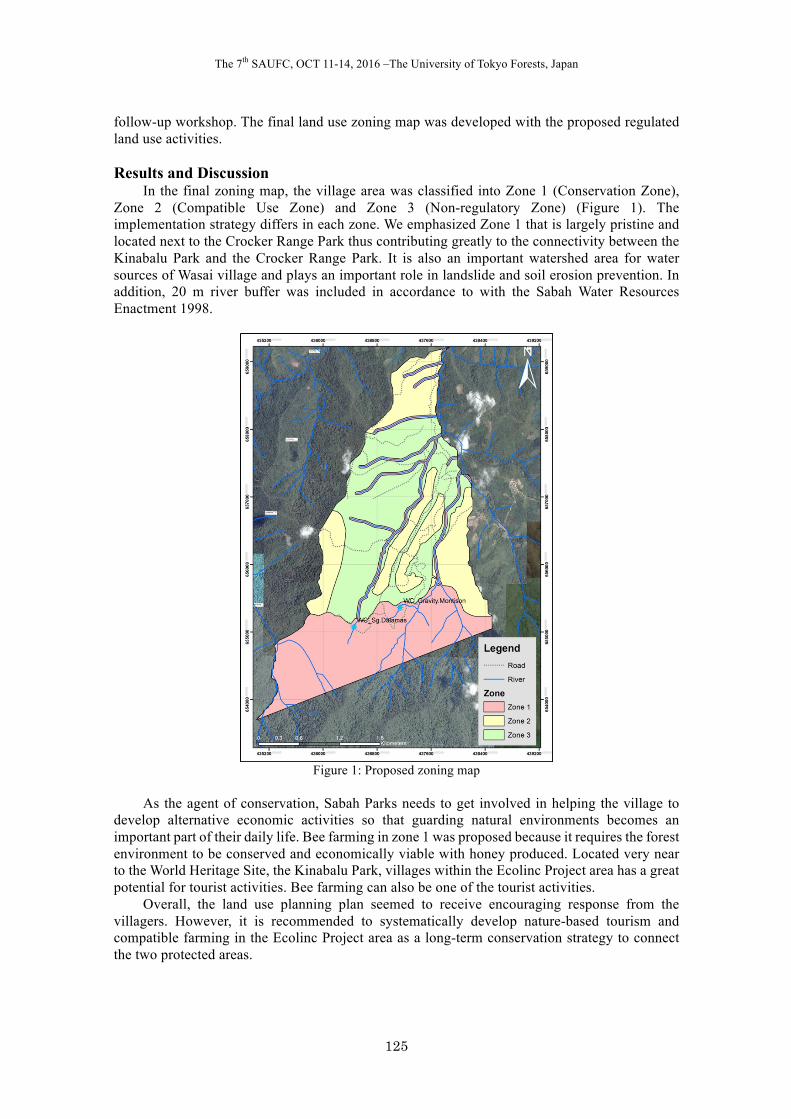
The 7th SAUFC, OCT 11-14, 2016 –The University of Tokyo Forests, Japan
125
follow-up workshop. The final land use zoning map was developed with the proposed regulated land use activities. Results and Discussion
In the final zoning map, the village area was classified into Zone 1 (Conservation Zone), Zone 2 (Compatible Use Zone) and Zone 3 (Non-regulatory Zone) (Figure 1). The implementation strategy differs in each zone. We emphasized Zone 1 that is largely pristine and located next to the Crocker Range Park thus contributing greatly to the connectivity between the Kinabalu Park and the Crocker Range Park. It is also an important watershed area for water sources of Wasai village and plays an important role in landslide and soil erosion prevention. In addition, 20 m river buffer was included in accordance to with the Sabah Water Resources Enactment 1998.
Figure 1: Proposed zoning map
As the agent of conservation, Sabah Parks needs to get involved in helping the village to
develop alternative economic activities so that guarding natural environments becomes an important part of their daily life. Bee farming in zone 1 was proposed because it requires the forest environment to be conserved and economically viable with honey produced. Located very near to the World Heritage Site, the Kinabalu Park, villages within the Ecolinc Project area has a great potential for tourist activities. Bee farming can also be one of the tourist activities.
Overall, the land use planning plan seemed to receive encouraging response from the villagers. However, it is recommended to systematically develop nature-based tourism and compatible farming in the Ecolinc Project area as a long-term conservation strategy to connect the two protected areas.
The 7th SAUFC, OCT 11-14, 2016 –The University of Tokyo Forests, Japan
126
Current status and causes of deforestation in Thailand
Khwanchai Duangsathaporn1
1Faculty of Forestry, Kasetsart University, THAILAND, [email protected] Introduction
The objectives of this research were to assess the status of forest areas, and to identify key drivers of deforestation and forest degradation, in Thailand. Thailand is located in south-east Asia, and borders Myanmar, Lao PDR, Cambodia and Malaysia. It has a land area of approximately 51.3 million ha. Estimate of forest cover in 2015 was about 16.4 million hectares, with the main forest types being evergreen forest (49.1%) and mixed deciduous forest (7.6%). The country’s 12th National Economic and Social Development Plan (NESDP) (2017-2021) has set up a target of protected forest area (nature conservation, recreation and environmental quality) of at least 25 percent, and production forest area (timber and other forest products) of at least 15 percent of total area, for a total forest area of at least 40 percent of the total land area. Thus, Thailand has to increase its forest area by at least 4.1 million hectares – a big challenge given other socio-economic pressures on the land base.
Material and Methods This research involved mainly in a review of the literature and discussions with various agencies involved in forest management in Thailand. This included a review of past national trends and rates of forest area decline, drivers of deforestation and degradation, the legal framework and institutions involved in forest conservation and management, and national efforts to combat deforestation and degradation. In this review, the following definitions of deforestation, encroachment and degradation were assumed. Deforestation referred to a situation where forest is cleared and the land-use changed more or less permanently to some other use. Degradation referred to a situation where the land remains as forest but the density and quality of the forest is decreased. Results and Discussion 1. Status of Forest Area
Thailand’s forest area has been declining in the past from about 53.3 percent of the total land area in 1961 to about 31.6 percent in 2015. The most rapid deforestation occurring during the period 1975 – 1977, and the annual rate of deforestation reached 144,000 ha between 1973 and 2013. This deforestation has damaged the forest ecosystem and biodiversity, on which community livelihoods rely and is the foundation for the country’s future economic development. This decline could be the result of several correlated factors including accessibility to market-based economics, improvement of infrastructure facilities (e.g., road, electricity and communication), and improvement of forest management. In practice, policies for conservation of natural resources and environmental protection are in conflict with policies for economic development. In particular, promotion of industrial policies that welcomes offshore industries that pollute heavily, have resulted in natural resource depletion and environmental degradation. 2. Drivers of Deforestation
Deforestation in Thailand is caused mainly by encroachment, infrastructure development, and mining. Encroachment is the conversion of natural forest area to agriculture and other uses, e.g., food and energy crops (corn, rubber tree, palm oil, cassava and sugar can) and tourism resorts. It affects all forest areas, including protected areas and national forest reserves. Moreover, monocrop farming has led to overuse of chemicals both fertilizers and herbicides and has destroyed soil fertility and biodiversity. Infrastructure development is required for Thailand to be able to keep developing. The top eight infrastructure construction projects that are most
The 7th SAUFC, OCT 11-14, 2016 –The University of Tokyo Forests, Japan
127
responsible for taking away forest land in the period 1973-2012 in total 615,287 ha were construction of irrigation projects (348,911 ha), road and highway construction (124,542 ha), mining activities (77,129 ha), power lines right-of-way (59,398 ha), telecommunication (3,502 ha), soil excavation and sand dredging (1609 ha), rock blasting (145 ha) and petrochemical operations (52 ha).
Forest degradation is caused mainly by illegal logging and uncontrolled forest fires. Illegal logging includes timber harvesting mainly by organized criminal gangs, as well as timber harvesting by rural households for domestic consumption. Illegal logging and the timber trade are extremely profitable due to strong timber demand in East and Southeast Asia, high prices and the existence of high value species, such as Dalbergia cochinchinensis. Forest fires are an important cause of forest degradation. Forest fires in Thailand are mainly surface fires, and burn seedlings, saplings, some trees and some NTFPs. They originate mainly from burning of forest to produce NTPFs, such as mushrooms, and grass for cattle grazing, and hunting. The areas burnt are quite significant. 3. Conservation Efforts
The Government of Thailand has established eight main acts aimed towards the protection, conservation and increase of forest areas. These include Forest, National Park, National Forest Reserve, Wildlife Preservation and Protection, Forest Plantation, Chain Saw, Plant, Plant Protection acts; and a new Community Forest Act that is to be enacted soon. These acts are administered by three government agencies. The Royal Forest Department (RFD), founded in 1896, is responsible for forests outside protected areas, which are the responsibility of the National Parks, Wildlife and Plant Conservation Department (DNP). The Department of Marine and Coastal Resources (DMC) has the authority over the mangrove and other coastal forests. All these departments are under the supervision of the Ministry of Natural Resources and Environment (MONRE). Several other agencies in the country are also dealing with forests. These include i) the Forest Industry Organization (FIO), which is the state enterprise involved in reforestation, teak plantations, and sawmilling; ii) several universities that offer various courses related to forest and natural resources management; iii) companies concerned with forest plantations and wood industry operators; and iii) civic organizations whose activities include environmental and local development matters. Thailand has in the past introduced several government policies to combat deforestation and forest degradation. These include the Cabinet’s National Forest Policy (December 1985), the 1st – 11th NESDPs, and Thai Forestry Sector Master Plan (TFSMP) of 1993. The TFSMP emphasized policy, legal and institutional reform; participation of rural people in managing forests; conservation and multiple use of the remaining natural forests; and a ban on logging concessions. Cabinet Resolution 10 (17 March 1992) classified three categories of reserve forest: conservation forest zone (C), commercial forest zone (E), and agriculture zone (A). This was another attempt to stop deforestation and degradation in the high conservation value (HCV) areas (Zone C) and other areas. Cabinet Resolution (30 June 1998) on resolving land issues in forest areas was intended to stop the expansion of agricultural land into protected forest areas. A ministerial regulation in 1989 imposed a national logging ban in the country, to protect and rehabilitate natural forest, improve degraded forestland, and conserve soil, water and biodiversity, by expanding conservation forest area. The logging ban has helped to slow down the rate of forest destruction, but it has not stopped it. The government also recognizes that traditional practices on natural resources and forest management are potential means to combat deforestation and forest degradation
The 7th SAUFC, OCT 11-14, 2016 –The University of Tokyo Forests, Japan
128
Demand for forest ecosystem services - The case of Southern SNU Forest
Yeo-Chang YOUN1 & So-Hee PARK2
1Seoul National University, Republic of Korea, [email protected]
2 Seoul National University, Republic of Korea, [email protected]
Introduction
Ecosystem service is generally defined as the benefits people obtain from ecosystems or the aspects of ecosystems used for improving quality of human life. It is classified as four services including provisioning, regulating, supporting and cultural services. Southern University Forest of Seoul National University (SNU) located in Gwangyang-si and Gurye-gun has been closely connected to local community as it is an important element of local resources providing local people with ecosystem services. However, unbalanced demand and supply of ecosystem services lead to the conflicts between the SNU and local community. For example, local people want to get more non-timber forest products (NTFPs) and make use of recreational services from forests for their livelihood, while the SNU has been more focusing on forest conservation for academic and educational services. This study aims to survey local people’s demand for ecosystem services of SNU forest and identify the factors affecting the demand. Material and Methods 1. Data collection
Household-level surveys were administered to 79 households of 3 villages (A=17, B=41, C=21) nearby Southern SNU forests in August 2015. 2. Data analysis
To figure out local people’s demand for ecosystem services of SNU forests, we classified forest ecosystem services as 7 services including provisioning, regulating (watershed conservation, noise regulation, climate regulation, and disaster regulation), supporting (biodiversity conservation) and cultural services and evaluated a priority of them.
To identify the factors affecting the local people’s demand for ecosystem services of SNU forests, we used the deductive method which establishes and verifies hypotheses. We postulated that socio-economic characteristics such as respondent’s length of residence, number of family members, income from sap production, participation in eco-tourism business, damage experience by wildlife and special characteristics of the village could influence the local people’s demand of SNU forests services. We analysed the factors affecting the local people’s demand for forest ecosystem services using ordered logit model.
Results and Discussion 1. Respondent’s characteristics
Table 1 shows the mean and standard deviation of respondents’ demographic and socio-economics characteristics by village. Respondents of village A are older and earn a low income from sap production than village B and C. They also have a low level of participation in in eco-tourism business, while village C have a high level of that.
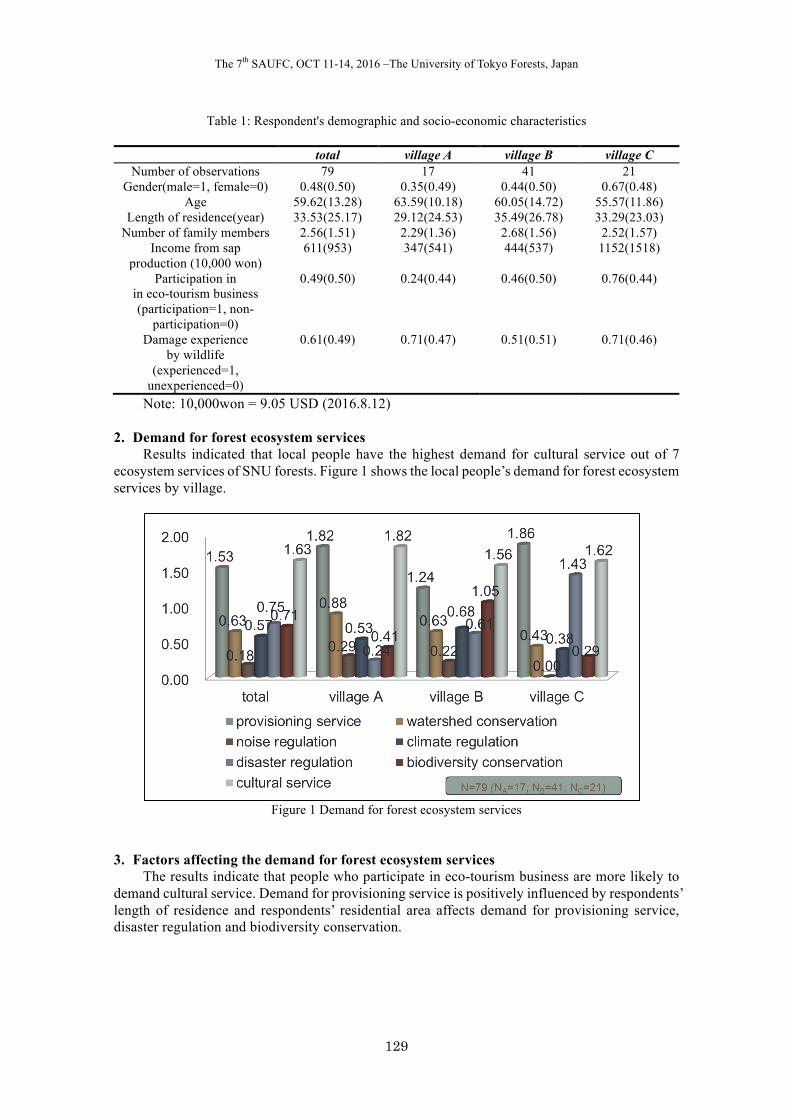
The 7th SAUFC, OCT 11-14, 2016 –The University of Tokyo Forests, Japan
129
Table 1: Respondent's demographic and socio-economic characteristics
total village A village B village C Number of observations 79 17 41 21
Gender(male=1, female=0) 0.48(0.50) 0.35(0.49) 0.44(0.50) 0.67(0.48) Age 59.62(13.28) 63.59(10.18) 60.05(14.72) 55.57(11.86)
Length of residence(year) 33.53(25.17) 29.12(24.53) 35.49(26.78) 33.29(23.03) Number of family members 2.56(1.51) 2.29(1.36) 2.68(1.56) 2.52(1.57)
Income from sap production (10,000 won)
611(953) 347(541) 444(537) 1152(1518)
Participation in in eco-tourism business (participation=1, non-
participation=0)
0.49(0.50) 0.24(0.44) 0.46(0.50) 0.76(0.44)
Damage experience by wildlife
(experienced=1, unexperienced=0)
0.61(0.49) 0.71(0.47) 0.51(0.51) 0.71(0.46)
Note: 10,000won = 9.05 USD (2016.8.12)
2. Demand for forest ecosystem services Results indicated that local people have the highest demand for cultural service out of 7
ecosystem services of SNU forests. Figure 1 shows the local people’s demand for forest ecosystem services by village.
Figure 1 Demand for forest ecosystem services
3. Factors affecting the demand for forest ecosystem services
The results indicate that people who participate in eco-tourism business are more likely to demand cultural service. Demand for provisioning service is positively influenced by respondents’ length of residence and respondents’ residential area affects demand for provisioning service, disaster regulation and biodiversity conservation.
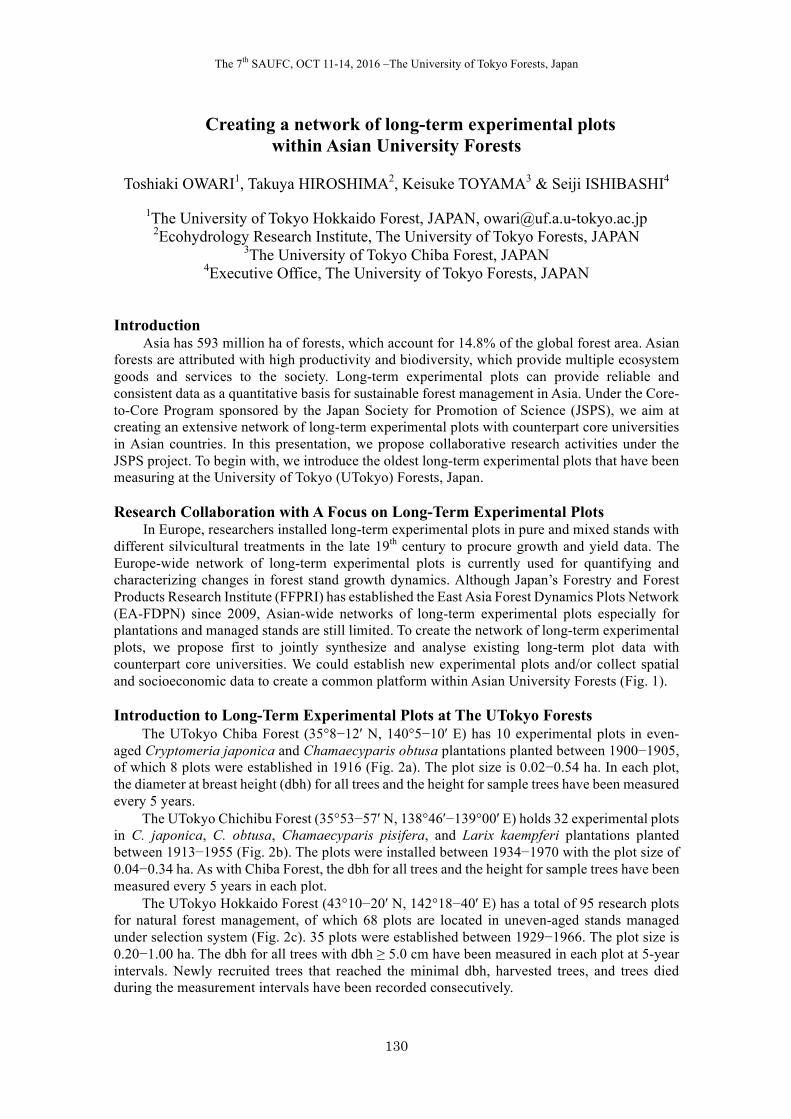
The 7th SAUFC, OCT 11-14, 2016 –The University of Tokyo Forests, Japan
130
Creating a network of long-term experimental plots within Asian University Forests
Toshiaki OWARI1, Takuya HIROSHIMA2, Keisuke TOYAMA3 & Seiji ISHIBASHI4
1The University of Tokyo Hokkaido Forest, JAPAN, [email protected]
2Ecohydrology Research Institute, The University of Tokyo Forests, JAPAN 3The University of Tokyo Chiba Forest, JAPAN
4Executive Office, The University of Tokyo Forests, JAPAN Introduction
Asia has 593 million ha of forests, which account for 14.8% of the global forest area. Asian forests are attributed with high productivity and biodiversity, which provide multiple ecosystem goods and services to the society. Long-term experimental plots can provide reliable and consistent data as a quantitative basis for sustainable forest management in Asia. Under the Core-to-Core Program sponsored by the Japan Society for Promotion of Science (JSPS), we aim at creating an extensive network of long-term experimental plots with counterpart core universities in Asian countries. In this presentation, we propose collaborative research activities under the JSPS project. To begin with, we introduce the oldest long-term experimental plots that have been measuring at the University of Tokyo (UTokyo) Forests, Japan. Research Collaboration with A Focus on Long-Term Experimental Plots
In Europe, researchers installed long-term experimental plots in pure and mixed stands with different silvicultural treatments in the late 19th century to procure growth and yield data. The Europe-wide network of long-term experimental plots is currently used for quantifying and characterizing changes in forest stand growth dynamics. Although Japan’s Forestry and Forest Products Research Institute (FFPRI) has established the East Asia Forest Dynamics Plots Network (EA-FDPN) since 2009, Asian-wide networks of long-term experimental plots especially for plantations and managed stands are still limited. To create the network of long-term experimental plots, we propose first to jointly synthesize and analyse existing long-term plot data with counterpart core universities. We could establish new experimental plots and/or collect spatial and socioeconomic data to create a common platform within Asian University Forests (Fig. 1). Introduction to Long-Term Experimental Plots at The UTokyo Forests
The UTokyo Chiba Forest (35°8−12′ N, 140°5−10′ E) has 10 experimental plots in even-aged Cryptomeria japonica and Chamaecyparis obtusa plantations planted between 1900−1905, of which 8 plots were established in 1916 (Fig. 2a). The plot size is 0.02−0.54 ha. In each plot, the diameter at breast height (dbh) for all trees and the height for sample trees have been measured every 5 years.
The UTokyo Chichibu Forest (35°53−57′ N, 138°46′−139°00′ E) holds 32 experimental plots in C. japonica, C. obtusa, Chamaecyparis pisifera, and Larix kaempferi plantations planted between 1913−1955 (Fig. 2b). The plots were installed between 1934−1970 with the plot size of 0.04−0.34 ha. As with Chiba Forest, the dbh for all trees and the height for sample trees have been measured every 5 years in each plot.
The UTokyo Hokkaido Forest (43°10−20′ N, 142°18−40′ E) has a total of 95 research plots for natural forest management, of which 68 plots are located in uneven-aged stands managed under selection system (Fig. 2c). 35 plots were established between 1929−1966. The plot size is 0.20−1.00 ha. The dbh for all trees with dbh ≥ 5.0 cm have been measured in each plot at 5-year intervals. Newly recruited trees that reached the minimal dbh, harvested trees, and trees died during the measurement intervals have been recorded consecutively.
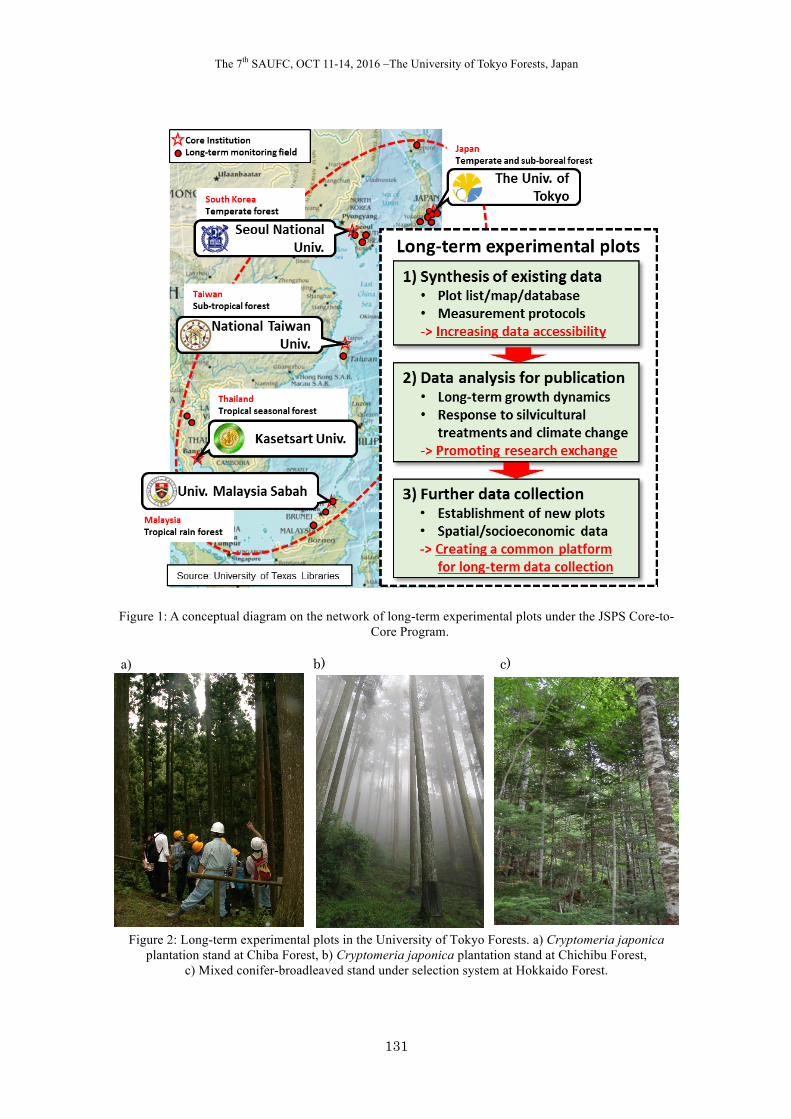
The 7th SAUFC, OCT 11-14, 2016 –The University of Tokyo Forests, Japan
131
Figure 1: A conceptual diagram on the network of long-term experimental plots under the JSPS Core-to-
Core Program.
a) b) c)
Figure 2: Long-term experimental plots in the University of Tokyo Forests. a) Cryptomeria japonica plantation stand at Chiba Forest, b) Cryptomeria japonica plantation stand at Chichibu Forest,
c) Mixed conifer-broadleaved stand under selection system at Hokkaido Forest.
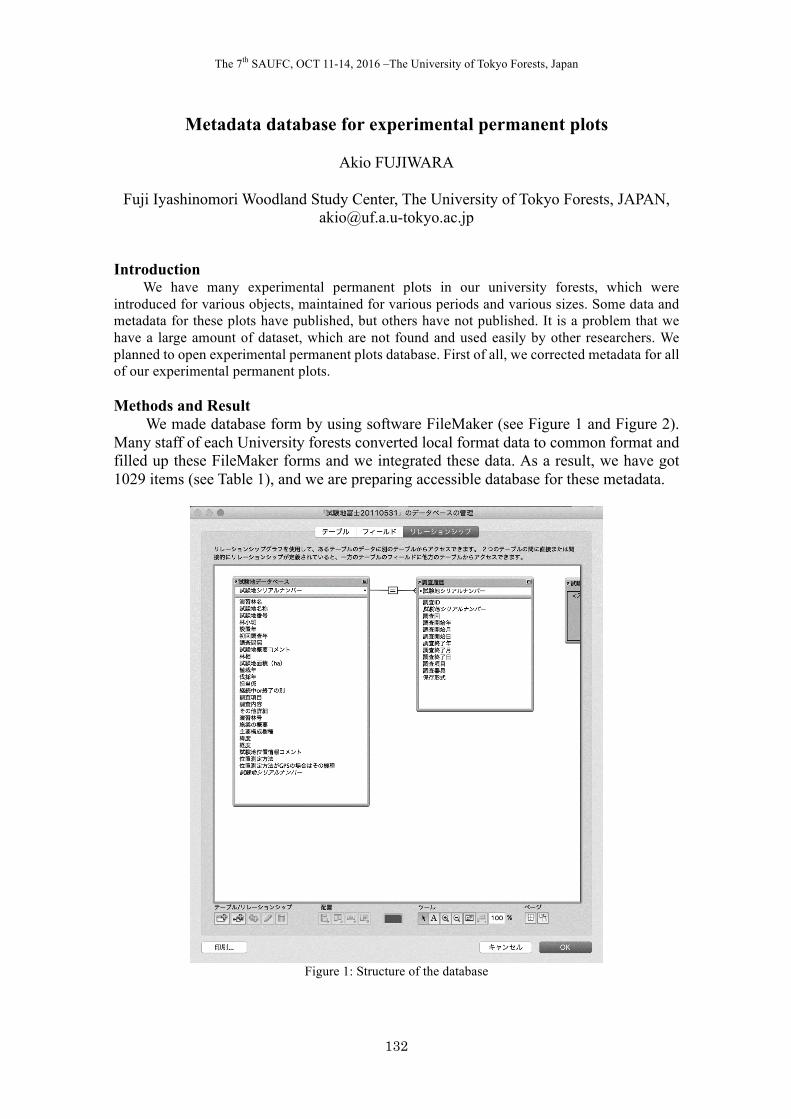
The 7th SAUFC, OCT 11-14, 2016 –The University of Tokyo Forests, Japan
132
Metadata database for experimental permanent plots
Akio FUJIWARA
Fuji Iyashinomori Woodland Study Center, The University of Tokyo Forests, JAPAN, [email protected]
Introduction
We have many experimental permanent plots in our university forests, which were introduced for various objects, maintained for various periods and various sizes. Some data and metadata for these plots have published, but others have not published. It is a problem that we have a large amount of dataset, which are not found and used easily by other researchers. We planned to open experimental permanent plots database. First of all, we corrected metadata for all of our experimental permanent plots. Methods and Result
We made database form by using software FileMaker (see Figure 1 and Figure 2). Many staff of each University forests converted local format data to common format and filled up these FileMaker forms and we integrated these data. As a result, we have got 1029 items (see Table 1), and we are preparing accessible database for these metadata.
Figure 1: Structure of the database
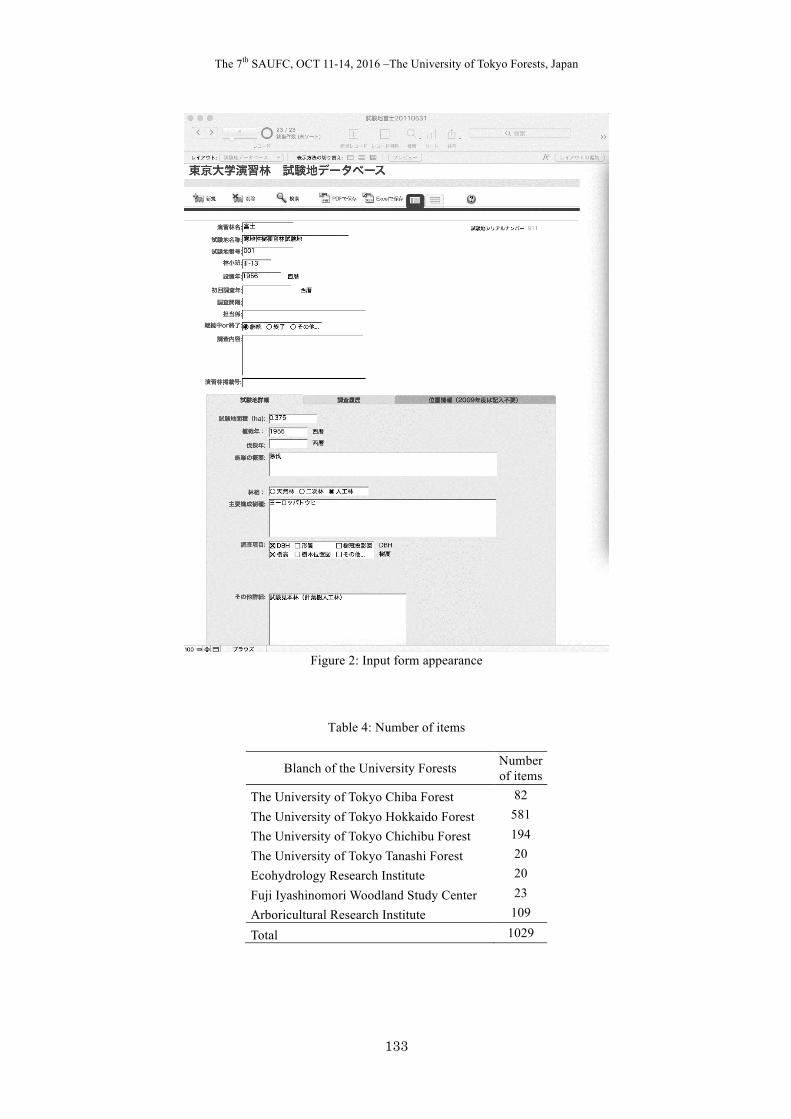
The 7th SAUFC, OCT 11-14, 2016 –The University of Tokyo Forests, Japan
133
Figure 2: Input form appearance
Table 4: Number of items
Blanch of the University Forests Number of items
The University of Tokyo Chiba Forest 82
The University of Tokyo Hokkaido Forest 581
The University of Tokyo Chichibu Forest 194
The University of Tokyo Tanashi Forest 20
Ecohydrology Research Institute 20
Fuji Iyashinomori Woodland Study Center 23
Arboricultural Research Institute 109
Total 1029


Co-Sponsored by:
Supported by:
Furano City