ABSTRACT PRADEEP, SHRAVAN. Towards Designing Flow ...
181
ABSTRACT PRADEEP, SHRAVAN. Towards Designing Flow Mechanics in Dense Suspensions of Smooth and Rough Colloids. (Under the supervision of Dr. Lilian C. Hsiao). Colloidal suspensions are ubiquitous in everyday life with applications ranging from pharmaceutical formulations to construction materials. Despite this, little is known concerning the design of suspensions from a ow perspective to avoid the problems that arise during their processing stage. Colloidal suspensions used in industrial applications are often complex in nature and are characterized by their size polydispersity, particle surface roughness, complex interactions, and inherent material softness. Furthermore, simulations and experimental studies implemented in academic settings use model particles and tend to ignore the diverse nature of industrial suspensions. In this thesis, we attempt to answer fundamental questions on how one of the complexities listed above, the constitutive particle surface roughness, affects the packing and ow behavior of dense colloidal suspensions. We seek primarily to decouple the effects of particle surface roughness on the bulk suspension behavior by probing their contact microstructure. Throughout the work we use poly(methylmethacrylate) microspheres suspended in refractive index matched solvent squalene. In the first part of the thesis (Chapter 2), we study the quiescent suspension microstructure of smooth and rough colloids. The mechanical properties of dense suspensions are related to their ability to transmit stress through the fluid. The suspension stress at the quiescent state, evident from the non-zero linear viscoelastic modulus, is directly correlated to the transient “contacts” that are formed due to the Brownian fluctuations in the system. Using 3D confocal microscopy of the equilibrium suspensions at various concentrations, we estimate the nearest neighbors, and extrapolate them to their respective isostatic conditions at the maximum possible packing, also called the jamming point. Apart from average particle diameter, the estimated “contact”
-
Upload
khangminh22 -
Category
Documents
-
view
1 -
download
0
Transcript of ABSTRACT PRADEEP, SHRAVAN. Towards Designing Flow ...
ABSTRACT
PRADEEP, SHRAVAN. Towards Designing Flow Mechanics in Dense Suspensions of Smooth
and Rough Colloids. (Under the supervision of Dr. Lilian C. Hsiao).
Colloidal suspensions are ubiquitous in everyday life with applications ranging from
pharmaceutical formulations to construction materials. Despite this, little is known concerning the
design of suspensions from a ow perspective to avoid the problems that arise during their
processing stage. Colloidal suspensions used in industrial applications are often complex in nature
and are characterized by their size polydispersity, particle surface roughness, complex interactions,
and inherent material softness. Furthermore, simulations and experimental studies implemented in
academic settings use model particles and tend to ignore the diverse nature of industrial
suspensions. In this thesis, we attempt to answer fundamental questions on how one of the
complexities listed above, the constitutive particle surface roughness, affects the packing and ow
behavior of dense colloidal suspensions. We seek primarily to decouple the effects of particle
surface roughness on the bulk suspension behavior by probing their contact microstructure.
Throughout the work we use poly(methylmethacrylate) microspheres suspended in refractive
index matched solvent squalene.
In the first part of the thesis (Chapter 2), we study the quiescent suspension microstructure
of smooth and rough colloids. The mechanical properties of dense suspensions are related to their
ability to transmit stress through the fluid. The suspension stress at the quiescent state, evident
from the non-zero linear viscoelastic modulus, is directly correlated to the transient “contacts” that
are formed due to the Brownian fluctuations in the system. Using 3D confocal microscopy of the
equilibrium suspensions at various concentrations, we estimate the nearest neighbors, and
extrapolate them to their respective isostatic conditions at the maximum possible packing, also
called the jamming point. Apart from average particle diameter, the estimated “contact”

lengthscale included other spatial parameters such as the polymer brush length, size polydispersity,
and surface roughness.
The next chapter (Chapter 3) focuses on an issue common in industrial suspensions: shear
thickening. Shear thickening occurs when there is an increase in viscosity with increasing applied
stress and the phenomena is responsible for issues such as pipe clogs and mixer blade damage
during high shear industrial processing of dense colloidal suspensions. Steady shear rheological
experiments show that the rate at which suspensions shear thicken is a direct function of the
suspension concentration and its respective jamming point. We combine the two parameters into
a single parameter called the jamming distance, which is defined as the scaled spatial difference
of each suspension with respect to its respective jamming point. Using the contact microstructural
analysis of these suspensions using an in-house built confocal rheometer, we determine that the
available free volume for suspensions containing particles of different roughness is related to the
deficiency from the maximum nearest neighbors at a given stress.
The results from Chapter 2 and 3 have two key takeaways: (a) the microstructures between
suspensions of smooth and rough particles, in both quiescent and ow state, are dependent on the
constitutive colloidal particle roughness and (b) the rheological properties between suspensions of
various colloidal types can be described using the jamming distance. The work in Chapter 4
explores the linear viscoelastic behavior i.e., rheological behavior in near-equilibrium conditions,
of dense suspensions containing smooth and rough colloids as a function of their scaled jamming
distance. We found that the elastic modulus of rough colloidal suspensions is 103 times more than
that of smooth colloidal suspensions at the same concentration. The drastic increase in the modulus
is attributed to the reduced dynamics of suspensions containing rough particles due to the

additional geometric frustration induced by the restricted rotational degrees of freedom in
individual rough particles.
Through results in Chapter 2, 3, and 4, we provide an engineering framework to design
colloidal suspensions for desired applications.

© Copyright 2021 by Shravan Pradeep
All Rights Reserved
Towards designing flow mechanics in dense suspensions of smooth and rough colloids
by
Shravan Pradeep
A dissertation submitted to the Graduate Faculty of
North Carolina State University
in partial fulfillment of the
requirements for the degree of
Doctor of Philosophy
Chemical Engineering
Raleigh, North Carolina
2021
APPROVED BY:
_______________________________ _______________________________
Dr. Lilian C Hsiao Dr. Orlin D. Velev
Committee Chair
_______________________________ _______________________________
Dr. Jan Genzer Dr. Joseph B. Tracy

ii
DEDICATION
Dedicated to my parents for their unconditional love, support, and sacrifices throughout my life.
iii
BIOGRAPHY
Shravan Pradeep was born in Thrissur, Kerala. Early in his school years, he found a basic
interest in STEM subjects, especially chemistry and computer science. Upon completion of
secondary schooling, he decided to pursue an undergraduate degree in Chemical Engineering at
Amrita Vishwa Vidyapeetham University. He was a recipient of the Prime Minister’s Scholarship
during all four years of his undergraduate studies. Shravan graduated First Class with Distinction
and secured the 3rd rank in the chemical engineering program.
After graduating, Shravan joined Mangalore Chemicals and Fertilizers Ltd. as a Production
Engineering Trainee. He worked in the ammonia and urea plant as shift engineer for a year before
deciding to pursue a master's degree. Shravan enrolled in the M.E. Chemical Engineering program
in one of the premier institutes in India, Birla Institute of Technology and Science (BITS) Pilani.
At BITS, he worked under the supervision of Dr. Sonal Mazumder. His focus was on synthesizing
quantum dots for two different applications: (a) bioimaging and (b) organic dye degradation. His
master’s thesis focused on how capping agents can be used to tune quantum dots for various
applications. After graduating from BITS, Shravan worked as research assistant for a year with
Prof. Shalini Gupta, alumnus of the NC State’s Chemical Engineering Ph.D. program, at Indian
Institute of Technology (IIT) Delhi. He worked on designing millifluidic devices to capture
pathogens using an immunomagnetic capture technique pioneered by the lab. While there, he
developed an interest in colloidal and soft materials engineering and decided to pursue doctoral
studies in this field.
In 2016, Shravan chose to pursue a Ph.D. in Chemical Engineering at NC State University
under the supervision of Dr. Lilian Hsiao. For the past five years he has been working in the Hsiao
Lab focusing on colloidal synthesis, suspension rheology, and confocal microscopy experiments.
iv
Apart from research-related activities, Shravan was heavily involved in the intradepartmental
activities with his roles in organizing the graduate admission recruitment event, “Future Leaders
in Chemical Engineering”, and as the Vice President for the Graduate Student Association. He was
also involved in the American Physical Society as their Student Affairs Committee member in the
Division of Soft Matter (DSOFT).
After completing his Ph.D., Shravan will be joining the University of Pennsylvania as a
Postdoctoral Research Associate. He will work with professors Douglas Jerolmack, Paulo Arratia,
and Daniella Bassett on a joint research project probing the yield and fluidization behavior of wet
granular materials.

v
ACKNOWLEDGEMENTS
My graduate school experience can be well described using the opening lines from the
Charles Dickens novel “The Tale of Two Cities” - It was best of the times, it was worse of the
times, it was age of wisdom, it was age of foolishness. Being fully independent for the first time,
both in a professional and personal context, I made mistakes and learnt lessons the hard way. But
along the way there were important moments when I was proud of my academic achievements.
None of this would have been possible without the help and encouragement of colleagues, friends,
and family.
First, I was fortunate to work with my advisor, Dr. Lilian Hsiao, who has all the traits you
want in a research advisor. She taught me how to write, present, and communicate my research. I
have always found Lilian’s way to approach science quite refreshing. She always encouraged us
to think about research problems, forge collaborations, and mentor undergraduate students. Above
all, Lilian has taught me to how be a good scientist. Even if given an option today, I will not trade
anyone else for my research advisor. Thanks for being a wonderful human and looking out for me.
I would also like to thank my doctoral committee members: Jan Genzer, Orlin Velev, and
Joe Tracy. Dr. Genzer, I really appreciate your willingness and generosity in finding time to talk
whenever I needed to. I thank Dr. Velev for designing one of the best courses for soft matter
fundamentals (I learnt a lot in those lectures) and the constant research support during my grad
school. Thanks to Dr. Tracy, who provided valuable suggestions during the preliminary exam
which helped me better navigate my work. Special thanks to Dr. Saad Khan, who made sure that
I got an advisor who fits my research interests, allowed me to participate in the graduate application
evaluation process, and over the years looked out to make sure that I never fell out of the GSSP.

vi
Professionally, I have had the opportunity to work with extraordinary people during my
doctoral studies. I am grateful to my peers in the Hsiao Soft Matter at Research Triangle (SMART)
group. Dr. Alan Jacob, Dr. Yunhu Peng, Daniel Cardenas, and I were the first group of cohorts to
join the lab. We had interesting experiences building the lab from scratch and learnt lots of painful
lessons along the way. I would like to thank Alan, who generously taught me valuable
experimental skills and shared his prior scientific knowledge concerning suspension rheology. I
am so happy to see the position you have reached today. I would like to thank Mike Mantini for
help with the initial laboratory set up and for being an extra hand in assembling our confocal
rheometer. I was also fortunate enough to learn from Dr. Karen Daniels. Her introductory course
on granular physics helped me understand the field better and her comments on my manuscripts
were extremely helpful.
I next thank Dr. Safa Jamali and Nabi Mohamad, our collaborators at Northeastern University,
for helping with the simulations in the colloidal shear thickening project. I learnt a lot working
with you guys, especially on the theoretical aspects of shear thickening mechanisms. Special
thanks to Chuck Mooney (Analytical Instrumentation Facility) on helping me with training on
electron microcopy instruments. I would like to express my acknowledgement to Dr. Jennifer Sun
and Dr. Petr Novotny who helped me with the NMR training and sample analysis, respectively.
Special thanks to Rakshit Jain, who helped me with VMD simulation data at short notice.
Additional thanks to Prof. Corey O’Hern (Yale University) and Dr. Arman Boromand (Facebook
Reality Labs) for discussions on jamming literature.
Good undergraduates are hard to come by, but I was lucky I got to work with a few of you,
namely, Alex Kramer, Colin Donaldson, Sara Wozniak, Christine Dang, and Alan Wessel. Special
thanks to Alan who helped me with the story in the fourth chapter of this dissertation. To Alex,

vii
Colin, and Alan: I have seen you develop into individual thinkers over the years, and I am quite
proud of where you guys have landed after graduation. Throughout my stay in the department, the
staff were of immense help. Specifically, I would like to thank Sandra Bailey for being the nicest
administrator I have ever known. Special thanks to Michelle Bunce, Joan O’Sullivan, Paola
Cavaliere, Angela Efimenko, and Nancy Dear for making the CBE department environment an
approachable workplace. I have included project-specific acknowledgements towards the end of
each chapter.
I would also like to thank my amazing roommates, Ryan and Robbie. I could not ask for
any other souls to share our “PET” townhouse with. The movie nights, pre-gaming, Halloween
costume hunts, and the “Super Smash Bros.” evenings were just a few good memorable moments
from the past four years. I am going to miss that place when I leave Raleigh. I would also like to
thank Camden for making me feel welcome to a new country and culture during my first year. I
enjoyed our group homework sessions, driving lessons, lunchtime political discussions, and TV
show binges. Special thanks to Leah for being a good listener and assisting with MSE homework.
My good friend, Arnab: I cherish our weekend hikes, midnight philosophy chats, and keeping me
on tracks. Thanks for being there!
I would like to acknowledge the remaining members in the Hsiao Lab, Chris and Kristine.
Chris, thank you for all the wisdom you have imparted even when I was not interested in listening
to it. Also, thanks for proofreading the documents I sent you at short notice. To Kristine, thanks
for being there as one of my best cheerleaders. I am excited to meet you in Philly in less than six
months! I wanted to acknowledge few in others who made my life in Raleigh better - Hen, Wardo,
and Alex. You guys made my life in grad school more palatable than I wish to admit. To Zijian
and Jiaqi, thanks for all the hotpot dinners. I enjoyed collaborating with you guys on a personal

viii
and professional level. To Sneha, thanks for all the desi food you have served me. You are an
amazing cook and an amazing friend. To Sahand, Tommy, Danny, Javier (and Ryan): I have
cherished our summer trips to Charleston, Portland, and Asheville. I hope we can keep the tradition
alive.
Lastly, I would like to thank the most important people in my life: my family. My parents:
Baby Pradeep and Pradeep Nair, I have no words to express for the love, support, and countless
sacrifices you have given. My brother, Sidhu, and sister-in-law, Hamna: you guys were constant
pillars of support throughout my graduate school life.

ix
TABLE OF CONTENTS
LIST OF TABLES………………………………………………………………………………………………………….xii
LIST OF FIGURES………………………………………….……………………………………………………………xiii
Chapter 1: Introduction - Synthesis and characterization of rough particles for colloidal
and granular rheology………………………………………………………………………………………..…1
Chapter 2: Contact criterion in dense suspensions of rough and smooth colloids……….…. 53
1.1 Rheological significance of particle roughness ........................................................................ 2
1.2 Synthesis of smooth spherical particles .................................................................................... 4
1.2.1 Silica colloidal spheres ....................................................................................................... 6
1.2.2 PMMA and PS spheres ...................................................................................................... 7
1.2.3 Other colloidal particles ..................................................................................................... 8
1.3. Synthesis of rough particles ..................................................................................................... 9
1.3.1 Grinding and milling ........................................................................................................ 10
1.3.2 Surface heterocoagulation and seeded growth polymerization ........................................ 11
1.3.3 Confinement templating ................................................................................................... 12
1.3.4 In-situ mechanical stresses ............................................................................................... 13
1.3.5 Crosslinker-aided polymerization .................................................................................... 13
1.3.6 Other wet chemistries ....................................................................................................... 14
1.3.7 Etching and 3D printing ................................................................................................... 15
1.4 Quantifying roughness and friction ........................................................................................ 16
1.4.1 Atomic force microscopy and roughness parameters ...................................................... 18
1.4.2 Lateral force microscopy .................................................................................................. 20
1.4.3 Angle of repose ................................................................................................................ 21
1.4.4 Rheometry and cyclic shear cells ..................................................................................... 21
1.4.5 In-situ force visualization ................................................................................................. 22
1.5 Rheological phenomena .......................................................................................................... 23
1.5.1 Onset of shear thickening and dilatancy .......................................................................... 24
1.5.2 Hydrodynamics and granular friction .............................................................................. 26
1.5.3 Bridging rheology at macroscale...................................................................................... 28
1.5.4 Bridging rheology at the microscale ................................................................................ 29
1.6 Conclusion .............................................................................................................................. 31
1.7 Dissertation outline ................................................................................................................. 32
References ..................................................................................................................................... 38
Abstract ......................................................................................................................................... 54
2.1 Introduction ............................................................................................................................. 55
2.2 Materials and Methods ............................................................................................................ 59
2.2.1 Synthesis and characterization of PHSA comb copolymer as the steric stabilizer .......... 59
2.2.2 Synthesis and characterization of smooth and rough colloids ......................................... 61
2.2.3 Preparation of colloidal suspensions ................................................................................ 62
2.2.4 CLSM imaging and image processing ............................................................................. 63
2.3 Results and Discussion ........................................................................................................... 65
2.3.1 Radial distribution function .............................................................................................. 65
2.3.2 Physical rationale of the contact cutoff distance and verification with simulations ........ 67
2.3.3 Sensitivity analysis of contact distance criterion ............................................................. 69
2.4 Conclusions ............................................................................................................................. 71
References ..................................................................................................................................... 83
x
Chapter 3: Jamming distance dictates colloidal shear thickening…………………………….…..89
Chapter 4: Linear viscoelasticity in dense suspensions of smooth and rough colloids…... 112
Chapter 5: Conclusions and future work………………………………………………………........... 137
Abstract ......................................................................................................................................... 54
2.1 Introduction ............................................................................................................................. 55
2.2 Materials and Methods ............................................................................................................ 59
2.2.1 Synthesis and characterization of PHSA comb copolymer as the steric stabilizer .......... 59
2.2.2 Synthesis and characterization of smooth and rough colloids ......................................... 61
2.2.3 Preparation of colloidal suspensions ................................................................................ 62
2.2.4 CLSM imaging and image processing ............................................................................. 63
2.3 Results and Discussion ........................................................................................................... 65
2.3.1 Radial distribution function .............................................................................................. 65
2.3.2 Physical rationale of the contact cutoff distance and verification with simulations ........ 67
2.3.3 Sensitivity analysis of contact distance criterion ............................................................. 69
2.4 Conclusions ............................................................................................................................. 71
References ..................................................................................................................................... 83
Abstract ......................................................................................................................................... 90
3.1 Introduction ............................................................................................................................. 91
3.2. Materials and methods ........................................................................................................... 93
3.3 Results ..................................................................................................................................... 95
3.3.1 Steady shear rheology ...................................................................................................... 95
3.3.2 Universal correlation in shear thickening behavior ......................................................... 96
3.3.3 Confocal rheometry experiments ..................................................................................... 97
3.3.4 Dissipative particle dynamic (DPD) simulations ............................................................. 98
3.3.5 Visualizing contact networks ........................................................................................... 99
3.3.6 Contact deficiency at local jamming.............................................................................. 100
3.4. Discussions .......................................................................................................................... 101
3.5 Conclusions ........................................................................................................................... 102
References ................................................................................................................................... 108
Abstract ....................................................................................................................................... 113
4.1. Introduction .......................................................................................................................... 114
4.2. Materials and Methods ......................................................................................................... 116
4.2.1 Colloidal Synthesis and Characterization ...................................................................... 116
4.2.2 Rheological Measurements ............................................................................................ 118
4.3 Results and Discussions ........................................................................................................ 118
4.3.1. Linear viscoelastic measurements ................................................................................. 118
4.3.2 Viscoelastic spectrum for colloidal suspensions ............................................................ 120
4.3.3 Decoupling the effects of geometric frustration in the linear viscoelastic regime ......... 122
4.3.4 Effective suspension temperature and associated moduli scaling .................................. 124
4.4 Conclusions ........................................................................................................................... 125
References ................................................................................................................................... 135
5.1 Concluding remarks .............................................................................................................. 137
5.2 Future work ........................................................................................................................... 139
5.2.1 Contact networks in shear thickening ............................................................................ 140
5.2.2 Phase-behavior of rough colloidal suspensions ............................................................. 140
References ................................................................................................................................... 141

xi
Appendix – Supplementary Information for Chapter 3……………………………………...…… 142
A.1 Flow fit curves from mean-field theory ............................................................................... 143 A.2 Estimating jamming points (ϕmax) for colloidal suspensions ............................................... 144 A.3 Sample immobilization and visualization with confocal microscopy ................................. 144 A.4. Details of the DPD simulations ........................................................................................... 145 A.5 Statistical testing .................................................................................................................. 147 A.6. Contact criterion model for shear thickening suspensions.................................................. 147 A.8. Axial forces in shear thickening suspensions ..................................................................... 151 References ................................................................................................................................... 159

xii
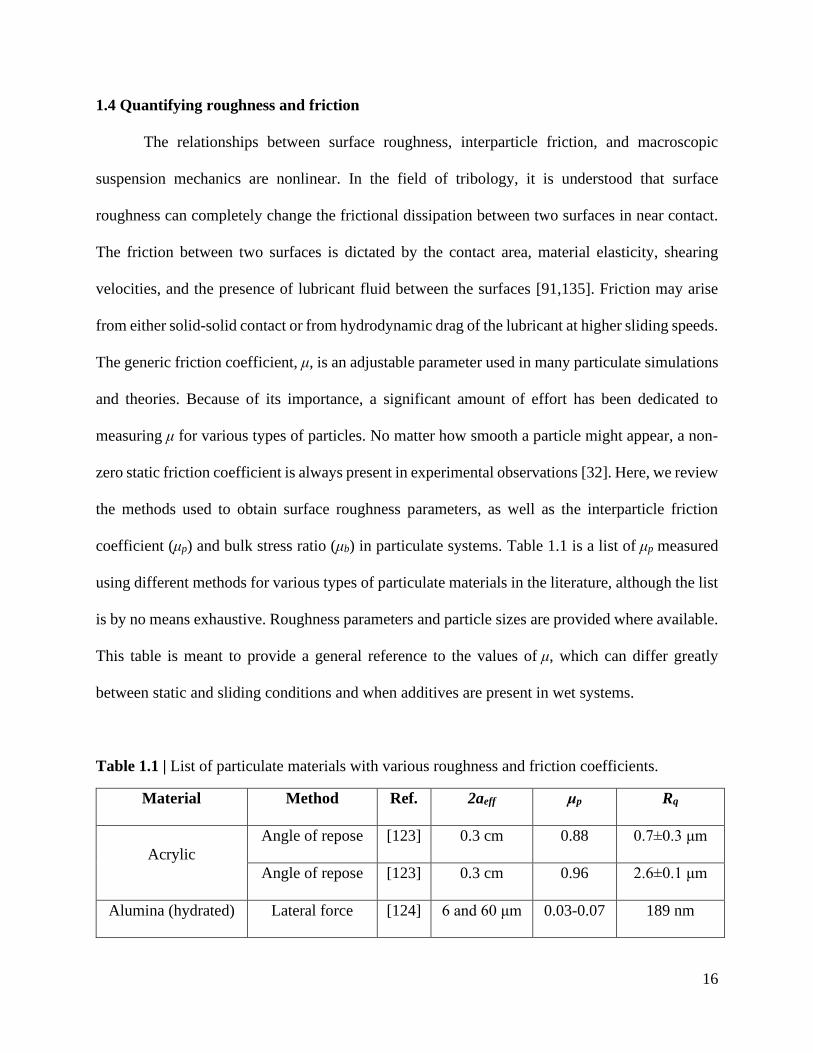
LIST OF TABLES
Table 1.1 List of particulate materials with various roughness and friction coefficients……….16
Table A.1 Input parameters for the contact criterion model…………………………………....150

xiii
LIST OF FIGURES
Figure 1.1 Surface morphologies accessible for symmetric rough particles and their
synthesis methods. Most of these micron-sized colloidal particles are
synthesized by wet chemistry methods, although 3D printing is also able to
fabricate large quantities of granular particles with arbitrary shapes ....................... 34
Figure 1.2 Atomic force microscopy (AFM) is one of the most viable methods of probing
surface roughness, as long as the particles are fixed on a flat substrate. The
surface morphology of (a) sterically stabilized PMMA colloids and (b)
raspberry-like silica colloids has been successfully quantified using AFM. (c)
The root-mean-squared roughness values for smooth (left) and rough (right)
PMMA colloids are calculated by fitting an effective sphere of radius aeff to the
raw data, then minimizing the deviation (red arrows) between the measured
profiles and the fitted sphere. Because the AFM tip is likely to produce imaging
artifacts near the edge of the particles, regions below a certain height z (indicated
by gray areas) should not be considered for analysis ............................................... 35
Figure 1.3 (a) Experiments by Boyer et al. in a pressure controlled Couette shear cell
showed that the bulk stress ratio plotted against the viscous number for a dense
suspension of millimeter-sized beads (ϕ = 0.565) collapse on a master curve. The
solvent is a Newtonian fluid. (b) Brownian Dynamics simulations by Wang and
Brady using a pressure-controlled simulation box, enabled by a compressible
solvent, showed that hard-sphere colloidal suspensions without friction or
lubrication hydrodynamics exhibit qualitatively similar rheology........................... 36
Figure 1.4 Experiments and simulations of shear thickening suspensions agree when
interparticle tangential friction is considered along with lubrication hydrodyna-
mics. Dense suspensions of silica and poly(methyl methacrylate) (PMMA)
colloids exhibited larger increases in the measured viscosities as ϕ and σ
increase, representing a transition from weak to strong shear thickening. The first
normal stress differences transitioned from negative to positive signs,
reminiscent of granular dilatancy in which particles push against their confining
boundaries to maintain flowing states. Surface roughness shifts these transition
points to lower values of ϕ and σ. When interparticle friction was explicitly
entered into the equations of motion in dissipative particle dynamics simulations,
they captured a qualitatively similar trend as the experiments. ............................... 37
Figure 2.1 Differences in the pairwise interaction potential between theoretical and
experimental hard-sphere systems. The experimental system consists of
poly(methyl methacrylate) colloids sterically stabilized with a thin layer of
poly(12-hydroxystearic acid). .................................................................................. 73
Figure 2.2 (a) Chemical reaction scheme for the PHSA stabilizer. (b) 1H-NMR spectra for
12-HSA (bold line) and PHS-GMA (dashed line) with chemical shift as a
function of normalized intensity with respect to the reference standard, d-CHCl3.

xiv
(c) Overview of the synthesis protocol for PHSA-g-PMMA smooth and rough
colloids. .................................................................................................................... 74
Figure 2.3 (a) SEM micrographs and (b) 2D AFM surface profiles for smooth (left) and
rough (right) colloids. The profiles are taken at close to the center plane of the
colloids.
(b) z* refers to regions that are not limited by the AFM cantilever geometry. ........ 75
Figure 2.4 (a,b) Representative raw CLSM images and (c,d) processed images where black
dots indicate centroid positions in a fixed plane. (a, c) Dense suspension of
smooth colloids at ϕ = 0.61, (b, d) dense suspension of rough colloids at ϕ = 0.54.
Scales bars = 5 μm. ................................................................................................... 76
Figure 2.5 (a) Comparison of the colloid volume fraction using two methods: high speed
centrifugation to a shear jammed packing followed by subsequent dilutions, and
directly counting number of particles from CLSM. (b) Method to extract the
effective diameter and volume fraction of rough colloids ....................................... 77
Figure 2.6 Radial distribution functions of (a) smooth and (b) rough colloids. Filled circles
represent experimental values and solid black lines represent the theoretical fits
from the Ornstein-Zernicke solutions. In (a), the g(r) data set are plotted for
smooth colloids at ϕ = 0.35 (yellow), ϕ = 0.47 (red), ϕ = 0.52 (green), ϕ = 0.57
(blue), and ϕ = 0.60 (pink). In (b), the g(r) data set are plotted for rough colloids
at ϕ = 0.32 (yellow), ϕ = 0.36 (red), ϕ = 0.45 (blue), ϕ = 0.51 (red), and ϕ = 0.55
(pink) ........................................................................................................................ 78
Figure 2.7 The contact number at jamming plotted against the volume fraction at jamming,
which is a function of the interparticle friction. Filled squares are data adapted
from simulations of Silbert. A dotted line is drawn to guide the eye. Open
symbols represent experimental data for smooth (circle) and rough (diamond)
colloids. The experimental zJ values are obtained by using r’ = 1.04 for smooth
colloids and r’ = 1.05 for rough colloids. Color gradient indicates transition from
frictionless (red) to infinite friction (blue) regime. Inset: Sketch of smooth and
rough PMMA particles with PHSA brushes for illustration purposes ..................... 79
Figure 2.8 Plot of the mean contact number as a function of ϕ for (a) smooth and (b) rough
colloids. Shaded regions indicate a range of <z> values for different search
distances used. The upper limit is for r’ = 1.1 and the lower limit is for r’ = 1.0.
Dashed lines indicate predictions for isostatic packings of (a) frictionless and (b)
frictional particles adapted from ref. 46. (Silbert, 2010) .......................................... 80
Figure 2.9 (a, c) Contact number distributions for smooth colloids obtained by setting (a) r’
= 1.04 and (c) r’ = 1.06. (b, d) Contact number distributions for rough colloids
obtained by setting (b) r’ = 1.05 and (d) r’ = 1.07. For smooth colloids, the data
sets consist of suspensions at ϕ = 0.20 (red), ϕ = 0.35 (dark blue), ϕ = 0.50
(green), ϕ = 0.55 (pink), and ϕ = 0.60 (aqua). For rough colloids, the data sets
xv
consist of suspensions at ϕ = 0.20 (red), ϕ = 0.40 (dark blue), ϕ = 0.47 (green),
ϕ = 0.52 (pink), and ϕ = 0.55 (aqua). Insets: Mean contact number of smooth
colloids with (a) r’ = 1.04 and (c) r’ = 1.06 and rough colloids with (b) r’ = 1.05
and (d) r’ = 1.07 ....................................................................................................... 81
Figure 2.10 Sensitivity analysis plot shows how zJ varies as a function of r’ for smooth (red
circles) and rough (blue diamonds) colloids at their respective extrapolated
values of ϕJ. Dotted lines represent isostatic conditions for frictionless (zJ = 6, μp
= 0) and frictional (zJ = 4, μp → ∞) particles. ........................................................... 82
Figure 3.1 Experimental rheology for suspensions of (a) smooth and (b) rough colloids.
Flow curves represent ηr plotted against σ scaled by the effective particle radii
and temperature. Numerical values next to each curve indicate respective ϕ
(filled). Solids lines are fit with Wyart-Cates mathematical model. Vertical
dashed lines represent stresses below and above the onset stress (vertical dotted
line) where we obtain the average contact number. Representative scanning
electron micrographs and confocal micrographs of colloids are shown to the
right side of respective flow curves. Scale = 5 μm. ............................................... 104
Figure 3.2 Data from this work are shown for S (magenta circles), SR (red upper triangles),
VR (coral lower triangles), and RK (cyan squares) colloids. Solid line indicates
an emperical fit of the form: β= β0exp(-Δ ϕ/ϕmaxk) with β0 = 1.61±0.05 and k = -
4.18±0.32. Literature values from experimental colloidal studies are indicated
by green symbols: smooth PMMA (circle), rough PMMA (upper triangle),
smooth silica (square and hexagon), and rough silica (lower triangle and
diamond). Literature values from simulations are indicated by grey symbols:
colloids with surface asperities interacting via lubrication (square), spheres with
sliding friction (upper triangle), spheres with sliding and rolling friction (circle),
and colloids interacting via sliding friction (lower triangle). Inset shows the
fitting to the form: ηr = (1-ϕ/ϕmax)-2 normalized for each particle ϕmax values.
Solid line represents the universal low-shear viscosity divergence. ...................... 105
Figure 3.3 (a) Confocal rheometer setup for imaging shear-induced contact networks during
the flow measurements. (b) Contact criterion for interparticle contact in smooth
(top row) and rough (bottom row) colloids. The light blue circle represents
additional experimental length scales. (c,d) Contact networks of shear thickening
suspensions at Δϕ/ϕmax = 0.075 and β = 0.85 as shown in VMD reconstructions
of the (c) experimental microstructures and (d) snapshots from simulations. For
(c) and (d), the top panel are for the suspensions with smooth particles and the
bottom panels are for rough colloidal suspensions. Side insets show color panel
for the respective contact numbers of the particles shown in (c,d). ....................... 106
Figure 3.4 (a) The change in <z>β of smooth (circles) and rough (squares) colloids from
experiments (filled) and simulations (unfilled) as a function of Δϕ/ϕmax. Inset
shows the β as a function of <z>β. Dashed lines in the main figure and the inset
corresponds to the suspensions at Δϕ/ϕmax ≈ 0.075 and β ≈ 0.85 (b) The scaling

xvi
z* ~ (Δϕ/ϕmax)α. Dashed line indicates the power law fit. Inset shows the scaling
relation between the relative viscosity and unscaled jamming distance to test the
fit, ηr ~ (ϕJ-ϕ)-2. Two additional types of rough particles: SR (upper triangles)
and VR (lower triangles) are included here ............................................................ 107
Figure 4.1 Scanning electron micrographs of (a) smooth and (b) rough particles. Scale = 5
μm ........................................................................................................................... 127
Figure 4.2 The elastic (G’, filled) and viscous (G’’, unfilled) moduli of suspensions
containing (a) smooth and (b) rough particles as a function of applied strain. The
experiments are performed at a constant frequency of 1 rad/s. (a) In smooth
particle suspensions, the ϕ values are 0.62 (pink), 0.59 (red), 0.58 (green), 0.50
(blue), and 0.45 (grey). (b) The data set are plotted for rough colloidal
suspensions of ϕ values: 0.56 (pink), 0.55 (red), 0.54 (green), 0.50 (blue), and
0.45 (grey) .............................................................................................................. 128
Figure 4.3 The dependence of (a) elastic (G’, filled) and (b) viscous (G’’, unfilled) for
suspensions of smooth colloids on applied frequency. The x-axis is normalized
by the applied oscillatory shear, particle radius, and thermal energy. The y-axis
is normalized by particle radius and thermal energy. The All experiments are
performed in the linear regime at strain ~ 0.05%. The suspension ϕ values are
0.62 (pink), 0.59 (red), 0.58 (green), 0.50 (blue), and 0.45 (grey). ........................ 129
Figure 4.4 The dependence of (a) elastic (G’, filled) and (b) viscous (G’’, unfilled) for
suspensions of rough colloids on applied frequency. The x-axis is normalized by
the applied oscillatory shear, particle radius, and thermal energy, and the y-axis
is normalized by particle radius and thermal energy. The All experiments are
performed in the linear regime at strain ~ 0.05%. The suspension ϕ values are
0.56 (pink), 0.55 (red), 0.54 (green), 0.50 (blue), and 0.45 (grey) ......................... 130
Figure 4.5 The master viscoelastic spectrum (elastic, filled and viscous, unfilled) for
suspensions of smooth (circles) and rough (square) colloids. The x-axis is
normalized frequency shifted by a factor α and the y-axis is normalized shear
moduli shifted by a factor β. The dark line indicates the Maxwell model fit at
lower frequencies. The smooth colloidal suspension ϕ values are 0.62 (pink),
0.59 (red), 0.58 (green), 0.50 (blue), and 0.45 (grey). The rough particle
suspension ϕ values are 0.56 (pink), 0.55 (red), 0.54 (green), 0.50 (blue), and
0.45 (grey) .............................................................................................................. 131
Figure 4.6 The shift factors (a) α and (b) β plotted against the volume fraction ϕ for
suspensions of smooth (circles) and rough (square) colloids. ................................ 132
Figure 4.7 The ratio of shift factors α/β as a function of (a) ϕ and (b) distance from
maximum packing for suspensions of smooth (circles) and rough (square)
colloids. The dashed lines in (b) denotes jamming distance of 0.1 as a guide to
the reader’s eyes. .................................................................................................... 133

xvii
Figure 4.8 The dependence of elastic modulus scaled with respect to effective particle radii
and temperature on jamming distance for suspensions of smooth (circles) and
rough (square) colloids. The colors indicate G’ values at various Peclet (Peω)
values: Peω = 10 (pink), Peω = 102 (green), and Peω = 103 (blue). The horizontal
dashed line indicates a jamming distance of 0.1. ................................................... 134
Figure A.1 Viscosity-stress curves for suspensions of (a) SR and (b) VR colloids. Solid lines
are fits with the Wyart-Cates model. The numbers on the side of each curve
represent the average estimated ϕ of the respective suspension. Inset:
Representative scanning electron micrographs and confocal laser scanning
micrographs of colloids. Scale bars = 5 μm ........................................................... 152
Figure A.2 Experimental contact number <z> for different suspensions plotted against ϕ.
Data are shown for S (magenta circles), SR (orange diamonds), VR (coral
squares), and RK colloids (cyan triangles). Simulation data from particles
interacting via short-range hydrodynamics, repulsion, and sliding/rolling friction
are overlaid in the plot (μs = sliding friction, μr = rolling friction). ....................... 153
Figure A.3 (a) The filled circles represent the radial distribution of the smooth colloidal
suspension at ϕ = 0.56. The dark line corresponds to the radial distribution
function from classical fluid theory with Percus-Yevick closure that mimics
hard-sphere microstructure. The matching of peaks in experimental and
theoretical radial distributions show that suspensions retain overall hard-sphere
like behavior. (b) Mean-squared displacement of a photopolymerized sample to
indicate the noise floor of the confocal rheometer setup ........................................ 154
Figure A.4 The z projection of the arrested dynamic microstructure in suspensions of (a)
smooth and (b) rough colloids at Δϕ/ϕmax ≈ 0.08 and β ≈ 0.95. Shear direction is
shown in the inset and the contact networks are aligned in the compressive axis
of the shear. Scale = 5 μm ...................................................................................... 155
Figure A.5 The dynamic contact number distribution for suspensions of (a, b) smooth and
(c, d) rough colloids in (a, c) experiments and (b, d) simulations .......................... 156
Figure A.6 The change in stress-dependent contact distribution for suspensions of (a, b)
smooth and (c, d) rough colloids in (a, c) experiments and (b, d) simulations. ..... 157
Figure A.7 Axial force measurements for all colloidal suspensions tested in this study: (a)
S, (b) SR, (c) VR, and (d) RK as a function of shear stress and ϕ ......................... 158

1
CHAPTER 1
Introduction: Experimental synthesis and characterization of rough particles for colloidal
and granular rheology†
†Lilian C. Hsiao and Shravan Pradeep, Curr. Opin. Colloid Interface Sci, 43, 94-112 (2019)
Department of Chemical and Biomolecular Engineering, North Carolina State University,
Raleigh, NC – 27695, United States.
2
This chapter aims to provide necessary background information for understanding the
experimental synthesis of smooth and rough particles, characterization of surface roughness,
quantification of the pairwise and bulk friction coefficients, and their effect on the rheology of wet
particulate flows. Even in the absence of interparticle attraction or cohesion, such types of flows
are broadly ubiquitous, spanning enormous length scales ranging from consumer and food
products to earth movements. The increasing availability of model frictional particles is useful to
advancing new understanding of particulate rheology. Although hard-sphere particles remain the
most widely studied system due to their simplicity, their rigid and frictionless nature cannot predict
many of the complex flow phenomena in colloidal and granular suspensions. Besides a myriad of
interparticle forces, the presence of tangential interparticle friction arising from either
hydrodynamics or solid contacts of asperities is now thought to be responsible for commonalities
in shear thickening and jamming phenomena at high volume fractions and shear stresses. The
overall richness of the suspension mechanics landscape points to the reunification of colloidal and
granular physics where one may apply a universal set of physical frameworks to understand the
flows of model rough particles across multiple spatiotemporal scales. This can only be
accomplished by properly distinguishing between microscopic and bulk friction and by decoupling
hydrodynamics and contact contributions within the context of experimental observations.
1.1 Rheological significance of particle roughness
The flow of particulate suspensions plays an important role in a broad variety of
geophysical phenomena and engineering applications. These suspensions typically consist of
rough or faceted microparticles packed in a continuum fluid in the absence of attractive interactions
where the particle type may span colloids, grains, bubbles, and emulsions. Collective mesoscale
3
rearrangements of the particles under applied stresses often cause enormous rheological changes
in the bulk material, ranging from the sudden clogging of pipes [1,2], liquefaction and landscape
evolution [3-5], to creative applications such as robotic grippers [6] and liquid body armor [7].
Despite the importance of suspension rheology and its investigation since Reynolds and Einstein
[8,9], there is still a persistent gap between the behavior of industrially relevant particulate systems
and the results obtained from academic model systems. Flows are especially challenging to predict
for dense suspensions (volume fraction ϕ > 0.40) of colloidal (typically with particle diameters 2a
≤ 2 μm) and granular (typically 2a > 2 μm) particles. This is because textbook treatments for low
Reynolds number suspension flows are traditionally developed through three simplifications [10]:
(1) particles are perfectly spherical in shape; (2) interparticle collisions are frictionless and
overdamped in the case of colloids or inelastic in the case of larger particles; (3) solvent molecules
are much smaller than the particle size, such that continuum approximations can be used to model
fluid drag between idealized spherical particles.
These assumptions have made theoretical developments from the Navier-Stokes equations
tractable and reduced computational demands but have also resulted in a major discrepancy
between experimental observations and predictions. A notable example is found in many recent
investigations of discontinuous thickening and shear jamming suspensions [11-19], in which rough
particles generated jumps in energy dissipation at reduced values of ϕ and shear stresses σ when
compared to smooth, spherical particles [12,14,20,21]. The prevailing thought is that contact
mechanics become important as lubrication films break down at large σ [22-24], although there is
a severe lack of in situ experimental evidence to directly support this statement.
The rheology of particulate suspensions was historically investigated by a combination of
fluid mechanics experts and granular physicists [25-27]. Although the two fields diverged in the
4
1950s, they are now beginning to reconvene due to the need to consider both solid and fluid
mechanics in dense suspension flows. The convergence of these two fields is found in a number
of reviews on granular physics and suspension mechanics [28-31]. In addition, we recommend a
comprehensive review by Morris [32] on the computer simulations of lubricated-to-frictional shear
thickening as parallel reading material, which will prove useful as we discuss the experimental
results here in light of theoretical findings.
This chapter summarizes recent experimental methods that are used to break new ground
in suspension rheology. First, we list a number of academic and industrial particulate materials in
which the surface roughness can be controlled and quantified. Second, we describe experimental
parameters used to characterize the frictional properties of various particulates based on their
surface morphologies. Finally, we describe the effects of surface anisotropy on macroscopic
rheological properties as seen in dense suspensions of rough or frictional particles, with an
emphasis on how interparticle friction impacts their microstructure and mechanics. The conclusion
provides an outlook on the field of dense suspension rheology based on past work, present
observations, and future strategies.
1.2 Synthesis of smooth spherical particles
A hard-sphere particle is assumed to be non-deformable and impenetrable and interacts
with other particles solely through contact. In experimental systems, particles possess a finite
elastic modulus and can become deformed by strong flows [33]. The collisions between particles
are inelastic in the case of wet and dry granular materials where inertia dominates because of large
particle sizes [34] or are overdamped in the case of colloidal suspensions where viscous dissipation
by the solvent is significant [35]. Perfectly smooth hard spheres have represented the ideal model
5
system for many years, allowing researchers to validate simulations and theories of suspension
phase behavior and rheology [36-41]. They also provide a benchmarking tool for experimental
studies involving rough particles of similar sizes made from the same material. It is worth
remembering that many interparticle forces (electrostatics, solvophilicity, van der Waals,
depletion, hydrogen bonding, and so forth) are in play during the shear flow of particulate
suspensions [42] and that variations in synthesis techniques can produce similar looking particles
with various types of pairwise interactions that generate completely different rheological
phenomena.
Currently, two common ways to generate such particles are through microfluidics and wet
chemistry synthesis. Reviews of microfluidic and lithographic tools used to synthesize particles
are found elsewhere [43]. While these methods are capable of producing particles from ~101 - 102
μm with intricate surface anisotropy and nearly zero size polydispersity, they are challenging to
scale up to the sheer number of particles required for bulk rheology measurements. As a point for
comparison, it takes ~1010 hard-sphere particles (2a = 2 μm) to completely fill a small parallel
plate rheometer geometry (diameter = 20 mm, gap height = 500 μm), with a suspension of ϕ =
0.50. Bulk chemical synthesis is therefore a much more viable method for producing the large
number of particles used in the investigation of dense suspension rheology. Owing to their well
characterized and highly tunable interaction potentials, sterically stabilized silica, polystyrene
(PS), and poly(methyl methacrylate) (PMMA) colloids remain three of the most popular systems
used in academic studies of suspension rheology. Each system poses unique advantages and
disadvantages. All three types of particles can be chemically or physically tagged with conjugated
fluorescent dyes for microscopy imaging.

6
1.2.1 Silica colloidal spheres
Monodisperse silica colloids are synthesized using the Stober process [44,45] in which the
precursor, typically tetraethyl orthosilicate, is hydrolyzed in alcohols and grown into colloidal
particles through a one-step sol-gel process. An octadecyl aliphatic chain is then grafted to the bare
surface of the silica particles through high temperature silanol esterification [46,47]. This method
readily produces hard-sphere particles with diameters between 20 nm [48] and 1000 nm [49]. If
larger particles are desired, additional layers of silica or other materials such as PS can be grown
as shells on seed cores, in a method known as seeded growth polymerization [50]. Depending on
the solvent quality, the octadecyl-grafted chains may undergo a lower critical solution temperature
crystalline transition that leads to thermoreversible flocculation from a hard-sphere suspension.
This tendency to flocculate at reduced temperatures leads to the term “adhesive hard spheres” for
octadecyl-grafted silica colloids, which are used in multiple gelation and self-assembly studies.
Small-angle neutron scattering is typically used to obtain the Baxter temperature, which quantifies
the attraction strength through a square well potential [51-54]. A key benefit of silica colloids is
that they do not swell or plasticize in most solvents, which can impact measurements of ϕ, as well
as hard-sphere properties. The refractive index mismatch of silica (n = 1.459) with common
solvents (n = 1.33 for water, n = 1.429 for tetradecane) is not too large, which does not significantly
hinder their imaging resolution in confocal microscopy or introduce significant van der Waals
forces. However, since silica colloids have a high density (ρp = 1.7-2.0 g/ml) compared with that
of most polar and nonpolar solvents (ρf = 1 g/ml for water, ρf = 0.76 g/ml for tetradecane), the
density mismatch poses issues due to sedimentation and detachment from rheometer geometries.
This issue is somewhat mitigated if the sedimentation velocities are reduced by decreasing the
particle size or increasing the solvent viscosity.
7
1.2.2 PMMA and PS spheres
Polymeric hard spheres form another class of model systems in studies of suspension
rheology, with benefits and drawbacks that are almost completely opposite to those of silica
colloids. PS and PMMA colloids are generally prepared by emulsion polymerization [55], in which
conjugated polymer brushes such as poly(vinyl pyrrolidone) [56], poly(dimethyl siloxane) [57,58],
fluorinated copolymer blends [59], or poly(12-hydroxystearic acid) (PHSA) [60-64] are covalently
attached to sterically stabilize a particle. Other stabilizers include electrostatic groups that become
charged in specific pH conditions, such as poly(acrylic acid) and aliphatic amines on PS
microspheres. The brushes can be grafted through a one-pot synthesis as in free radical
polymerization, with or without the addition of reversible addition fragmentation chain transfer
agents [65], or they can be grafted after synthesis through atom radical transfer polymerization.
Given the suspending fluid, proper choice of the polymer brush is key as a fully solvated brush
provides the largest range of steric repulsion compared with a collapsed brush. PHSA grafted
PMMA colloids in nonpolar solvents are widely considered to be the model of hard-sphere systems
and have been extensively used since the pioneering studies of Pusey and van Megen [36,66,67].
Direct and indirect measures of the hard-sphere properties of PHSA-PMMA colloids are widely
available in the literature. The standard PHSA brush length on these PMMA colloids is estimated
to bez10 nm, although longer chain lengths of up to 22.4 nm are possible by varying the
polycondensation time. The commonly-cited brush length of 10 nm was measured using a surface
force apparatus to obtain the interaction energy as a function of the surface separation for two flat
mica surfaces grafted with PHSA brushes [68]. Because this study was conducted in dry
conditions, the solvated PHSA brush length may be different with varying solvent quality.
8
The basic principle of emulsion polymerization reactions in the formation of polymer
lattices is as follows: a monomer, such as styrene or methyl methacrylate, is dissolved in a solvent
mixture in which it is barely soluble. Heat-activated initiators such as potassium persulfate and
azobisisobutyronitrile, or ultraviolet light-activated photoinitiators such as
hydroxymethylpropiophenone (Darocur), are triggered to release free radicals that initiate and
propagate the polymerization reaction. When the oligomers grow to a certain size, they become
insoluble in the solvent and phase separate out of the solution as nuclei for further colloidal growth.
A thorough review of the mechanisms involved in emulsion polymerization is given by Thickett
and Gilbert [55]. The major benefits of using most polymeric colloids are that benign solvents can
be used for complete density and refractive index matching and that the stabilizer brushes could
potentially be functionalized to introduce stimuli-responsiveness into particles [69]. Some
disadvantages include problematic charge screening in nonpolar solvents [70], particle
plasticization and swelling in organic solvents [71], and the added complexity that comes with the
synthesis of conjugated comb copolymer brushes such as PHSA-g-PMMA.
1.2.3 Other colloidal particles
A few other materials are used in the formation of spherical particles. Poly(N-
isopropylacrylamide) (PNIPAM) microgels have highly tunable Young’s moduli depending on the
concentration of the added cross-linker (102 Pa ≤ E ≤ 104 Pa) and can be synthesized by one-pot
emulsion polymerization. They are used to understand the flow and self-assembly physics of soft,
deformable particles above the random closed packing volume fraction of hard spheres (ϕrcp =
0.64) because they expand at temperatures below the lower critical solution temperature [72-74].
The applications of PNIPAM are especially promising in biomedical engineering. Owing to their

9
softness, microgels with binding motifs have been used as platelet-like particles to induce blood
clotting rapidly under physiological flow conditions [75], and composite nanostructures have been
added to PNIPAM to generate stimuli-responsive hydrogels that are highly stretchable [76].
Another highly versatile colloidal system is trimethoxysilyl propyl methacrylate (TPM), which has
been used to create polyhedral clusters [77], light-activated colloidal surfers [78], colloidal alloys
[79], and lock-and-key particles [80]. Non-polymeric materials such as fatty acid-coated
superparamagnetic iron oxide colloids are prepared by alkali-mediated precipitation and used in
magnetic field-driven assembly studies [81-83].
Because of the bottoms-up nature of these synthesis methods, in reality, even so-called
smooth particles are never completely smooth at length scales close to that of the homopolymer
constituents. Smith et al. [84] found that PHSA-PMMA colloids are slightly porous, with the
density of the PMMA cores being slightly lower than that of the homopolymers. Silica and PS
colloids are also subject to fluctuations in the particle porosity. This may shift the phase behavior
of hard-sphere suspensions, which is a function of the osmotic pressure of the solvent. It could
also affect the attraction potential in specific colloidal gel investigations where the interactions are
generated by excluded volumes of small depletant molecules.
1.3. Synthesis of rough particles
Rough particles were traditionally considered to be unsuitable as model systems due to
their nonuniform surfaces and challenges in simulating such morphologies. They are widely found
in industrial formulations due to the use of milling as a common technique to grind up solids, for
example in foods, paints, and coatings [85,86]. Fortunately, recent developments in chemical and
physical methods to synthesize bulk quantities of rough or bumpy particles have made it possible
10
to investigate the effects of roughness on suspension rheology (Figure 1.1). We provide an
overview of industrial and academic methods used to create geometrically symmetric, yet surface
anisotropic, particles spanning the colloidal to granular length scales. An in-depth review of the
synthesis of porous polymeric particles is given by Gokmen and Du Prez [87] and will not be
discussed here. Although there is a nontrivial relationship between roughness and friction [88,89],
in general, surface roughness increases the interparticle friction coefficient.
In this section, we discuss various physical and chemical routes to the formation of rough
particles in quantities large enough for bulk rheological characterization. The physical methods
include milling and grinding processes, self-assembly of smaller particles on larger ones through
interparticle forces, in situ templating methods, and external application of mechanical stresses.
The chemical methods include the seeded growth of small particles on larger cores, acid or base
etching, linker chemistry and charge compensation, and the addition of cross-linkers during
emulsion polymerization. The advent of 3D printing has also made it possible to create granular
particles with highly complex geometries.
1.3.1 Grinding and milling
A mill applies kinetic energy to solid materials to break them up via friction and attrition.
Grains formed by milling are typically very polydisperse in their size distributions (>10%) and
may contain sharp and irregular facets. In fact, it is not unusual to obtain polydispersity values
ranging from 100% to 300%. A few articles on the effect of breakage mechanisms on particulate
sizes are available [90,91], but ultimately, it is an engineering process in which the large number
of process parameters makes predictive capabilities difficult. Nevertheless, because a mill is easy
to use and can handle large quantities of wet or dry material, milling remains one of the most
11
common manufacturing techniques to grind materials such as organic crystals in pharmaceuticals
[92], calcite powders [93], nanocrystalline metals [86], pigments [85], and various other
particulates down to the desired size range. Cornstarch, a popular particulate used to study the
physics of shear thickening [94,95], is formed by the wet milling of corn kernels and is therefore
highly subject to size polydispersity and shape irregularities.
1.3.2 Surface heterocoagulation and seeded growth polymerization
Electrostatic forces are commonly leveraged to decorate large core particles with smaller,
oppositely charged particles, forming composite raspberry-like particles with a bumpy exterior.
This so-called heterocoagulation mechanism was first used by Ottewill et al. [96] in which
negatively charged PS particles are coated with smaller, positively charged poly(butyl
methacrylate) (PBMA) particles at reaction temperatures greater than the glass transition
temperature of the PBMA. The authors proposed a simple theory to explain this process by
considering the interfacial energy of the two polymers. The most important parameter is the ratio
of interfacial energies, as found in the Young-Dupre equation, which should be kept at an
intermediate value to avoid complete wetting or dewetting. A mass balance can be used to deduce
the proper ratio of particle radii and particle numbers for hexagonal close packing of the PS
particles on the PBMA cores. Various electrostatic stabilization and energy minimization methods
were used successfully by a number of research groups to fabricate a dizzying array of Pickering
emulsions and colloidosomes [97], surface-modified PS particles [98,99], and raspberry like silica
particles [2,100]. Other types of particle interactions, such as hydrogen bonding and π-π bonding,
can also result in the same type of raspberry like morphology [2,100]. Removal of the bumps
by chemical etching is also possible if golf ball-like morphologies are desired [101].

12
A variant of heterocoagulation coupled with seeded growth polymerization can be used to
synthesize larger raspberry-like particles, in which a core polymeric particle is coated with a solid
shell [102-106]. A secondary coating step is used to grow the shell covalently on top of the
composite bumpy particle. This step is thought to provide improved mechanical stability to the
asperities during shear such that they do not detach easily [107]. Although the particle morphology
obtained with heterocoagulation methods is desirable due to their ease of reproducibility in
simulation studies, a major issue is that each chemical synthesis and cleaning step reduces the
overall yield of particles.
1.3.3 Confinement templating
Raspberry-like particles with multiple bump functionalities are also obtainable through a
microstructural confinement templating method, in which a small number of large particles are
dispersed in a concentrated bath of smaller particles. This method was used by Gaulding et al.
[108] to deposit functionalized PNIPAM microparticles onto PS spheres, where the surface
bumpiness could be precisely tuned. However, this method suffers from two drawbacks, in that
the yield of the composite particles is limited and that the unused PNIPAM microparticles would
go to waste if not recycled. A similar method was used to confine TPM droplets by co-
sedimentation with a dense suspension of PS spheres. The deformed TPM droplets are then
polymerized by heat into polyhedral shapes [109]. The yield of particles obtained through
templating is likely to be much lower than that obtained through other types of bulk synthesis
methods.

13
1.3.4 In-situ mechanical stresses
Other researchers leveraged methods to generate internal mechanical stresses within
particles to create macroporous microstructures. Peterson et al. describe an internal templating
method in which the precipitation of low-melting-point salts together with silica nanoparticles
using high-temperature aerosol spraying generated various types of macroporous silica colloids
[110]. Degassing of PS and PMMA spheres in a polyelectrolyte solvent was also used to create
nanometer scale roughness on their surfaces due to changes in the charge density on the polymer
surface [111]. A similar gas-producing mechanism was used to create raspberry-like protrusions
on silica particles as they passed through a flow-focusing microfluidic channel [112]. The surface
morphology is thought to result from the addition of hydrochloric acid and sodium bicarbonate,
which participate in the Stober sol-gel process and produce carbon dioxide gas at the silica-water
interfacial subphase. Finally, PS dimers and triangles were made by swelling of PS seed particles
in the presence of a crosslinker [113]. The concentration gradient of the crosslinker is proposed to
mechanically control the directionality of the phase separations during the seeded growth
polymerization step. These methods are more likely able to produce the quantities of particles
needed for rheological testing, although the maximum roughness achievable may be limited to the
nanometer or submicron range.
1.3.5 Crosslinker-aided polymerization
The addition of cross-linking monomers during the early nucleation step of emulsion
polymerization can be used to generate surface morphologies that range from slight dimpling to
that reminiscent of crumpled paper and golf balls [114]. By increasing the concentration of the
crosslinker (ethylene glycol methacrylate) up to 2 wt% of the monomer, our group has fabricated

14
sterically stabilized PHSA-PMMA colloids that have root-mean squared (RMS) roughness values
up to 20% of the mean particle radius. Increasing the cross-linker concentration further tends to
result in gelation of the entire polymer network, causing a failed synthesis. This wet chemistry
method is likely to be applicable for any polymeric materials, such as PS and PNIPAM particles,
that are formed by one-pot free radical polymerization reactions. The size and polydispersity of
the particles can be tuned somewhat independently of the roughness, although care should be taken
such that the elastic modulus of the particles does not increase significantly due to the addition of
the cross-linker [115]. The thermodynamic mechanism for the formation of the rough features is
currently unknown, primarily due to the innate complexity of emulsion polymerization. We
speculate that changes to the oligomer solubility and nuclei shape during microphase separation
could be the possible reasons for the formation of rough particles. One of the biggest benefits of
this method is that the entire particle is made out of the same material, which simplifies the linking
of particle interactions and elasticity to bulk suspension mechanics.
1.3.6 Other wet chemistries
If metallic oxide particles with high surface areas are desired, one-pot and template-free
hydrothermal synthesis can be used to prepare copper oxide colloids coated with a layer of cerium
oxide. The particle morphology resembles the type created by internal mechanical stresses, and
the available surface area for catalysis can be dramatically increased by up to five times by this
technique [116]. Hydrolytic polycondensation of poly(methyl silsesquioxane) with inorganic
calcium carbonate particles produced composite and roughened colloids with increased
hydrophobicity [117]. Photoresponsive raspberry-like colloids were synthesized by covalently
attaching iron oxide nanoparticles to silica cores using cucurbituril and azobenzene linkers, which
15
generated reversible changes in particle morphology from rough to smooth upon illumination with
ultraviolet light [118]. The authors show that the particle shape can be controlled to switch between
shear thinning and shear thickening behavior. These examples illustrate the large variety of wet
chemistries that can be used to tailor particle shapes in an equally large variety of particulate
materials.
1.3.7 Etching and 3D printing
Chemical etching is a simple method to generate rough surfaces on almost all types of
material, whether they are inorganic or organic in nature. By immersing particles in a strong acid
or base for a sufficiently long period of time, the solvent will etch away parts of the surface, leaving
behind a slightly roughened exterior. Silica and soda-lime glass beads can be etched using
concentrated sodium hydroxide and salt derivatives of hydrofluoric acid [119,120]. The RMS
roughness can be tuned by controlling the immersion time of the particles [119], although the
roughness achievable may be limited to the nanometer range. On the other hand, it is possible for
metallic particles with high purity to become smoother after etching.
Finally, 3D printing has emerged as a powerful way to fabricate reusable granular building
blocks with highly complex geometries. Engineering software programs such as AutoCAD are
typically used to design the particle shape. Many types of 3D shapes, such as polyhedral and stars,
can be generated with polymer resins that have different elastic moduli values [121,122]. Acrylic,
nylon, ceramics, and hydrogel particles can all be printed this way. The particle size and shape
details are limited by the resolution of current 3D printers (~100 μm). A disadvantage with 3D
printing is that particles with very thin, interlocking features may break easily during packing or
shear due to the low fracture strength of commercial resins.
16
1.4 Quantifying roughness and friction
The relationships between surface roughness, interparticle friction, and macroscopic
suspension mechanics are nonlinear. In the field of tribology, it is understood that surface
roughness can completely change the frictional dissipation between two surfaces in near contact.
The friction between two surfaces is dictated by the contact area, material elasticity, shearing
velocities, and the presence of lubricant fluid between the surfaces [91,135]. Friction may arise
from either solid-solid contact or from hydrodynamic drag of the lubricant at higher sliding speeds.
The generic friction coefficient, μ, is an adjustable parameter used in many particulate simulations
and theories. Because of its importance, a significant amount of effort has been dedicated to
measuring μ for various types of particles. No matter how smooth a particle might appear, a non-
zero static friction coefficient is always present in experimental observations [32]. Here, we review
the methods used to obtain surface roughness parameters, as well as the interparticle friction
coefficient (μp) and bulk stress ratio (μb) in particulate systems. Table 1.1 is a list of μp measured
using different methods for various types of particulate materials in the literature, although the list
is by no means exhaustive. Roughness parameters and particle sizes are provided where available.
This table is meant to provide a general reference to the values of μ, which can differ greatly
between static and sliding conditions and when additives are present in wet systems.
Table 1.1 | List of particulate materials with various roughness and friction coefficients.
Material Method Ref. 2aeff μp Rq
Acrylic
Angle of repose [123] 0.3 cm 0.88 0.7±0.3 μm
Angle of repose [123] 0.3 cm 0.96 2.6±0.1 μm
Alumina (hydrated) Lateral force [124] 6 and 60 μm 0.03-0.07 189 nm

17
Table 1.1 (continued).
Aluminium Angle of repose [123] 0.3 cm 0.62 0.32±0.14 μm
Cellulose
Lateral force [125] 16 μm 0.22-0.64 13 nm
Lateral force [126] 25 μm 0.35 -
Cornstarch Lateral force [127] 8 μm 0.02 14 nm
Glass
Lateral force [15] 9.78 μm 0.9 12.4 nm
Lateral force [15] 9.78 μm 0.02 12.4 nm
Lateral force [124] 6 and 35 μm 0.18-0.60 12-19 nm
Sliding [128] 70-110 μm 0.25-0.65 -
Angle of repose [119] 140-240 μm 0.42-0.52 -
Angle of repose [129] 3.5 mm 0.20 -
Angle of repose [130] 0.5-10 mm 0-1 -
Sliding [131] 6 mm 0.13 -
Limestone Lateral force [124] 4 μm 0.67 102 nm
Ottawa sand Cyclic shear [132] 0.35 mm 0.40 -
Pea gravel Cyclic shear [132] 9 mm 0.42 -
PMMA
Simulations [12] 1.6-2.3 μm 0 20 nm
AFM [12] 1.9-2.8 μm 0.30-1.00 50-110 nm
Polystyrene Angle of repose [133] 520 nm 0-0.12 -
PTFE Angle of repose [123] 0.3 cm 0.54 1.1±0.6 μm
PVC Lateral force [127] 1 μm 0.45 2.2 nm
Salmeterol Angle of repose [134] 15-36 μm 0.25-0.87 -

18
Table 1.1 (continued).
Silica
Lateral force [14] 550-700 nm 0.13 0.53
Lateral force [135] 3.4-4.0 μm 0.34-1.04 -
Lateral force [136] 5 μm 0.08 -
Lateral force [136] 5 μm 0.39 -
Lateral force [14] 678 nm 0.03 -
Steel Angle of repose [123] 0.3 cm 0.66 0.10±0.02 μm
Titanium Lateral force [124] 0.2 μm 0.04-1.50 131-147 nm
Zeolite Lateral force [124] 2 μm 0.69 148 nm
1.4.1 Atomic force microscopy and roughness parameters
Atomic force microscopy (AFM) is the leading experimental technique to measure surface
roughness at nanometer resolutions. It involves the use of a cantilever and tip with known spring
constants to directly probe the topography of a surface in wet or dry conditions. As an extension
to the surface force apparatus [68,137], AFM can also be used to obtain the pairwise interactions
of surfaces and particles through approach-retraction measurements [138,139]. In this section, we
focus on the use of AFM for topographical characterization of surface roughness. Contact mode
involves moving the AFM tip up and down as the instrument scans the surface but is typically
avoided because the presence of liquids and adhesive interactions between the tip and the surface
may erroneously influence topography measurements. A more convenient way to avoid the pitfalls
encountered in contact mode is to use tapping mode, which involves oscillating the tip up and
down at its resonance frequency using piezoelectric elements in the cantilever holder. To obtain
3D surface topography measurements for particles, the particles must be fixed such that the AFM
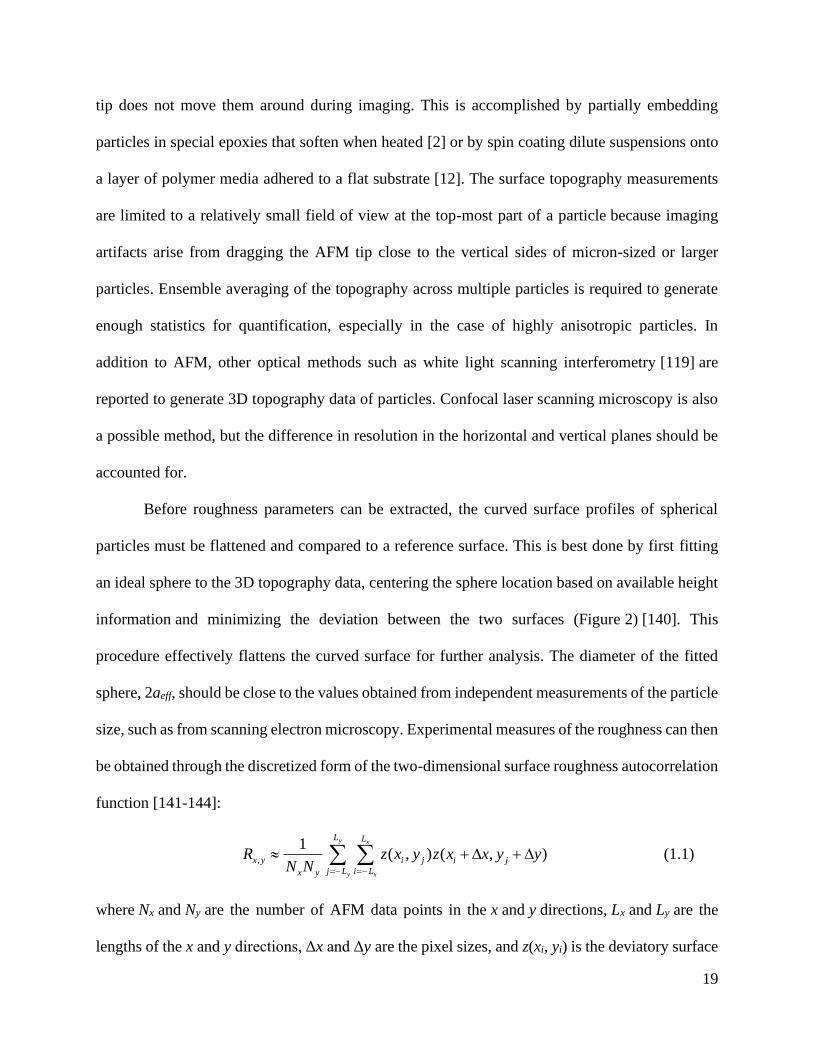
19
tip does not move them around during imaging. This is accomplished by partially embedding
particles in special epoxies that soften when heated [2] or by spin coating dilute suspensions onto
a layer of polymer media adhered to a flat substrate [12]. The surface topography measurements
are limited to a relatively small field of view at the top-most part of a particle because imaging
artifacts arise from dragging the AFM tip close to the vertical sides of micron-sized or larger
particles. Ensemble averaging of the topography across multiple particles is required to generate
enough statistics for quantification, especially in the case of highly anisotropic particles. In
addition to AFM, other optical methods such as white light scanning interferometry [119] are
reported to generate 3D topography data of particles. Confocal laser scanning microscopy is also
a possible method, but the difference in resolution in the horizontal and vertical planes should be
accounted for.
Before roughness parameters can be extracted, the curved surface profiles of spherical
particles must be flattened and compared to a reference surface. This is best done by first fitting
an ideal sphere to the 3D topography data, centering the sphere location based on available height
information and minimizing the deviation between the two surfaces (Figure 2) [140]. This
procedure effectively flattens the curved surface for further analysis. The diameter of the fitted
sphere, 2aeff, should be close to the values obtained from independent measurements of the particle
size, such as from scanning electron microscopy. Experimental measures of the roughness can then
be obtained through the discretized form of the two-dimensional surface roughness autocorrelation
function [141-144]:
,
1( , ) ( , )
y x
y x
L L
x y i j i j
j L i Lx y
R z x y z x x y yN N =− =−
+ + (1.1)
where Nx and Ny are the number of AFM data points in the x and y directions, Lx and Ly are the
lengths of the x and y directions, Δx and Δy are the pixel sizes, and z(xi, yi) is the deviatory surface
20
height at a position (xi, yi). It is also possible to compute a 1D form of the function in each direction
and simply average them if Nx = Ny. From this function, a variety of surface statistical parameters
such as the spatial distribution of heights, the mean surface gradient, and the RMS roughness can
be obtained. All these parameters are known to affect μp, with the RMS roughness Rq =
(R2)1/2 being a popular parameter used in the engineering literature [145]. To account for different
particle sizes, the value of Rq can be normalized by the particle radius. We emphasize that even
nominally smooth particles will have some level of roughness at the nanoscale. For
example, Rq was found to be 0.01% for smooth silica colloids [21] and 2.6% for smooth PMMA
colloids [12].
1.4.2 Lateral force microscopy
Lateral force microscopy (LFM) is a specialized operating mode of AFM, in which the
AFM tip is dragged horizontally across a substrate at a fixed normal force (FN) and at finite sliding
speeds [15,126,135,136,146,147]. The horizontal deflection of the cantilever is used to generate
the frictional shear force (FS) according to Hooke's law. The attachment of a colloidal particle onto
the AFM tip is termed colloidal probe microscopy. Many researchers have used LFM with
colloidal particles to either measure the value of μp for a particle sliding on a surface (which may
or may not be coated with particles) or to obtain μp for two nonrotational particles. Again, we
emphasize that even though LFM provides a measure of the frictional dissipation between two
particles, it is not representative of the multibody and multiscale physics found in flowing
particulate suspensions.

21
1.4.3 Angle of repose
Consider building a sand pile on a beach: continue to pour dry sand in one spot and a pile
of sand with a constant angle of repose, θ, forms. Adding water to the interstitial spaces reduces θ,
whereas the use of coarser grains might increase θ. The angle of repose for a particulate material
is defined as the steepest angle to which the granular pile can be built without failure. Two types
of experimental setups are used to obtain the angle of repose: The first involves a quasi-2D rotating
drum, which spins at a fixed speed and provides the dynamic angle of repose for a particulate
material [31,148,149], and the second involves a funnel setup where grains are continuously built
into a pile [123,133,134]. The stress ratio can be estimated from the angle of repose through
Coulomb's criterion, tanb S NF F = = , for a solid block sliding down an inclined plane. This
ratio is commonly understood as the macroscopic friction coefficient of a material [130]. More
sophisticated theoretical treatments of the angle of repose involve using a granular temperature to
explain the local rearrangement events of grains [150,151]. This so-called shear transformation
zone theory uses statistical mechanics principles [152], reminiscent of the type found in soft glassy
rheology [153,154], and was able to explain experimental measurements and computational
simulations of specific granular flows down an inclined plane [155,156].
1.4.4 Rheometry and cyclic shear cells
A rotational rheometer is a standard experimental tool used to quantify the relationship
between the bulk deformation and bulk stresses of particulate suspensions. When the normal force
is fixed and the shear force is measured, a measure of the bulk friction coefficient μb can be
obtained with various sliding speeds and lubricating solvents. The constant-volume cyclic shear
cells used in granular and soil mechanics testing are simply a larger version of the rheometer,
22
capable of plane shearing a packed bed of grains that have diameters on the order of
millimeters [4,131,132,157]. These instruments belong to a general class of rheometry techniques
that provide bulk material properties that are useful in modeling industrial and geophysical
rheological phenomena. Simple shear and oscillatory shear are two operating modes that are
widely used in the understanding of suspension rheology. They simulate the type of flows
encountered in realistic scenarios and provide useful dynamical information about the bulk
material through macroscopic parameters such as the yield stress, shear strength, viscoelastic
moduli, and relaxation spectra. Most instruments are either strain rate-controlled or shear stress-
controlled, with the cone-and-plate, parallel plate, and annular Couette cells being some of the
most common geometries. Recently, Boyer et al. [158] designed a specialized porous annular cell
to maintain a constant particle pressure Pp for dense granular suspensions.
1.4.5 In-situ force visualization
The methods described in previous sections provide measures of μb and μp, but these two
parameters may not be representative of the multibody interparticle friction coefficient when a
dense suspension is undergoing deformation. Currently, the best-known method to directly
visualize grain-scale forces in situ is through the use of photoelastic disks made out of
commercially available birefringent polymers. A detailed review of photoelastic force
measurements in granular packings is provided by Daniels et al. [159]. Briefly, this technique was
pioneered by the Behringer group to display contact force networks created by dense packing of
2D disks in a biaxial shear cell [160,161]. Noncircular shapes are also possible. When each
photoelastic disk is subjected to external normal stresses from its neighbors, local regions of the
material rotates the polarization of light in accordance with the stress–optic coefficient of the

23
polymer. This change in the polarization angle is observable as bright and dark fringe patterns
when viewed with a circular polarizer. Photoelastic force measurements were used to characterize
both the spatial and temporal distributions of the microscopic force network for various 2D
granular packings under linear and nonlinear impact [162]. The photoelastic quantification of force
chains in 3D packings has yet not been accomplished due to challenges in analyzing the
polarization angle and in fully solving the photoelasticity problem for 3D structures.
1.5 Rheological phenomena
A reason for the recent surge of interest in synthesizing and characterizing rough particles
is the attribution of shear thickening and jamming to interparticle friction. These flow scenarios
are associated with large increases in the dissipative energy of a dense suspension under applied
shear stresses [163-165]. In dense suspensions of colloidal and non-Brownian hard spheres, when
ϕ and σ are both sufficiently large, there is a gradual transition from Newtonian flow to mild
continuous shear thickening or to discontinuous shear thickening (DST) where s jumps
discontinuously as a function of the shear rate [166-168]. Both experiments and simulations
found that the suspension viscosity for hard spheres diverges as max( )s
−= − where max ≈ 0.58-
0.60 and α ≈ 2.2-2.6 for colloidal glasses [169-171] and max ≈ 0.59-0.64 and α ≈ 2.0 for athermal
suspensions [158,172]. Other particle shapes such as fibrous rods and ellipsoids with high aspect
ratios are known to decrease the value of fmax even further [173,174].
Colloidal suspensions behave in an overdamped fashion due to viscous dissipation from
the solvent while inertia becomes important for granular flows involving very large particles. A
few dimensionless numbers are useful in conceptualizing the relative importance of inertial and
viscous forces, with subtle differences between each number. The Stokes number
24
2
p eff fSt a = provides a measure of the inertial and viscous forces experienced by a particle
while the Reynolds number 2Re p f eff fa = describes the competing forces experienced by the
fluid around the particle. These two dimensionless numbers are different from the conventional
Reynolds number for a continuum fluid in a parallel-plate rheometer geometry,
Re (2 )f f fRH = , where H is the gap height and R is the radius of the geometry. It is well
known in the fluid mechanics community that pure fluids and dilute suspensions undergo inertial
or turbulent flows when Ref > 1. These types of inertial flows exhibit a shear stress to shear rate
scaling of 3/2~ and should be differentiated from the Bagnoldian scaling ( 2~ ) in dense
granular flows, which is observed even at low Rep values depending on ϕ [175].
1.5.1 Onset of shear thickening and dilatancy
At extremely large values of ϕ and σ, both colloidal and granular suspensions may
experience an expansion in volume and dilate against its confining boundaries [175] or even stop
flowing altogether [176,177]. Although dilatancy is thought to be related to shear thickening
[178,179], recent data on silica and PMMA colloids show that their onset stresses and volume
fractions do not always coincide [180]. Further investigation is necessary to comprehensively
probe the role of surface roughness on the onset conditions of dilatancy and shear thickening.
The critical stress of thickening, σ*, scales inversely as the particle radius squared (
2* ~ 1effa ) for spherical PHSA-PMMA and silica colloids with or without electrostatic repulsion
[181,182]. This scaling can be interpreted as a force balance between two particles at “contact”
where the hydrodynamic force acting on a particle pair is equivalent to the derivative of the
interparticle potential that prevents them from overlapping. If other types of interparticle forces
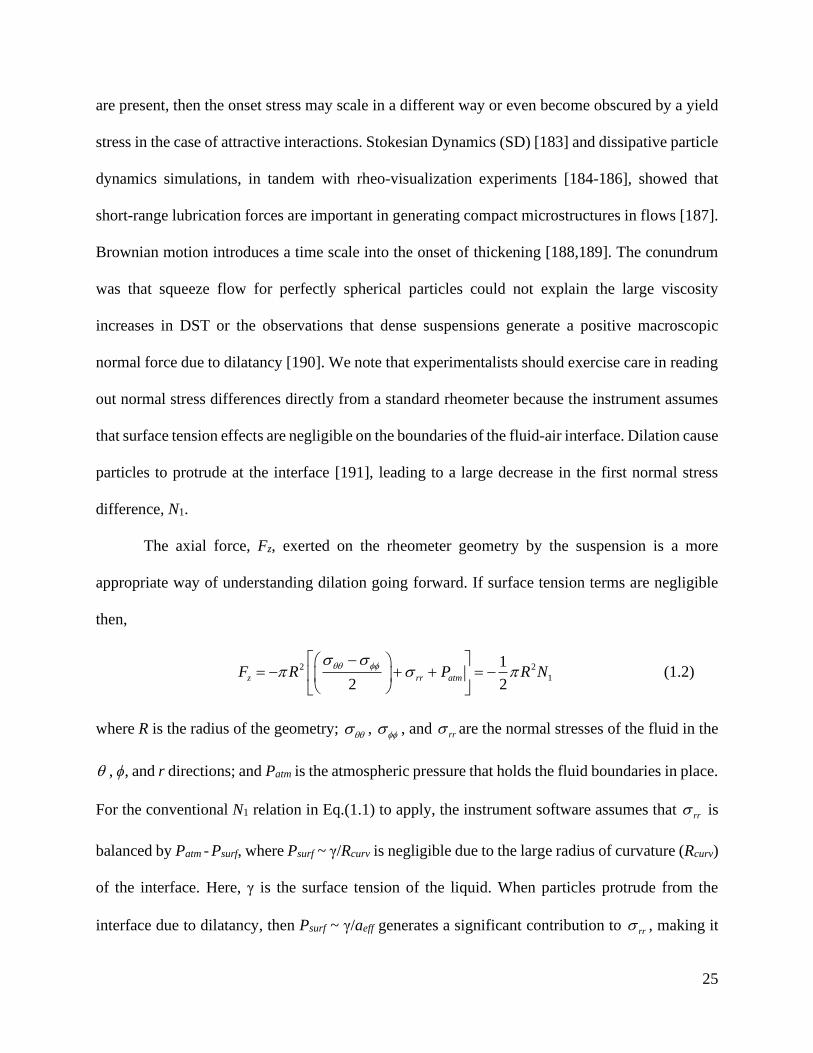
25
are present, then the onset stress may scale in a different way or even become obscured by a yield
stress in the case of attractive interactions. Stokesian Dynamics (SD) [183] and dissipative particle
dynamics simulations, in tandem with rheo-visualization experiments [184-186], showed that
short-range lubrication forces are important in generating compact microstructures in flows [187].
Brownian motion introduces a time scale into the onset of thickening [188,189]. The conundrum
was that squeeze flow for perfectly spherical particles could not explain the large viscosity
increases in DST or the observations that dense suspensions generate a positive macroscopic
normal force due to dilatancy [190]. We note that experimentalists should exercise care in reading
out normal stress differences directly from a standard rheometer because the instrument assumes
that surface tension effects are negligible on the boundaries of the fluid-air interface. Dilation cause
particles to protrude at the interface [191], leading to a large decrease in the first normal stress
difference, N1.
The axial force, Fz, exerted on the rheometer geometry by the suspension is a more
appropriate way of understanding dilation going forward. If surface tension terms are negligible
then,
2 2
1
1
2 2z rr atmF R P R N
− = − + + = −
(1.2)
where R is the radius of the geometry; , , and rr are the normal stresses of the fluid in the
, ϕ, and r directions; and Patm is the atmospheric pressure that holds the fluid boundaries in place.
For the conventional N1 relation in Eq.(1.1) to apply, the instrument software assumes that rr is
balanced by Patm - Psurf, where Psurf ~ γ/Rcurv is negligible due to the large radius of curvature (Rcurv)
of the interface. Here, γ is the surface tension of the liquid. When particles protrude from the
interface due to dilatancy, then Psurf ~ γ/aeff generates a significant contribution to rr , making it

26
difficult to define the first normal stress difference N1 as read out by the rheometer. Particle
imaging experiments have shown that it takes a finite amount of time for the particles to protrude
from the surface of the suspension and to generate a large negative N1 value. These considerations
suggest that it is more appropriate to use Fz instead of N1 to characterize a dilating suspension and
that confinement from boundaries plays an important role in measuring dilation.
1.5.2 Hydrodynamics and granular friction
The term “hydrodynamics” in suspension rheology refers to the stresses borne by the fluid
phase in which particles are suspended, which are strong functions of the particle concentration ϕ.
Einstein famously derived the relation between the viscosity of a dilute suspension and its volume
fraction, 1 2.5s
= + , by considering the mechanical work done on a continuum fluid by the
presence of a rigid sphere. This was accomplished through a surface integral for the expanding
spheres. The Stokes-Einstein-Sutherland relations for dilute suspensions (translational diffusivity
6T BD k T a= , rotational diffusivity 8R BD k T a= ) were obtained by considering the Stokes
drag around a sphere, the osmotic pressure exerted by a particle, and Fick’s first law of diffusion.
As the volume fraction increases beyond ϕ > 0.05, the Einstein relation for viscosity no longer
holds because multibody interactions cause the fluid stresses to become a function of the sheared
microstructure of the particles [192]. After Einstein, it took nearly 70 years before an analytical
form of the relative viscosity that includes higher order terms of ϕ2 was obtained [193], but the
Batchelor-Green relation is still unable to predict the viscosity when ϕ > 0.20. In fact, most
experimental studies of smooth hard-sphere suspensions still rely on empirical correlations and
benchmarking against previous studies to verify the validity of their measured suspension
viscosities at ϕ ≥ 0.50.
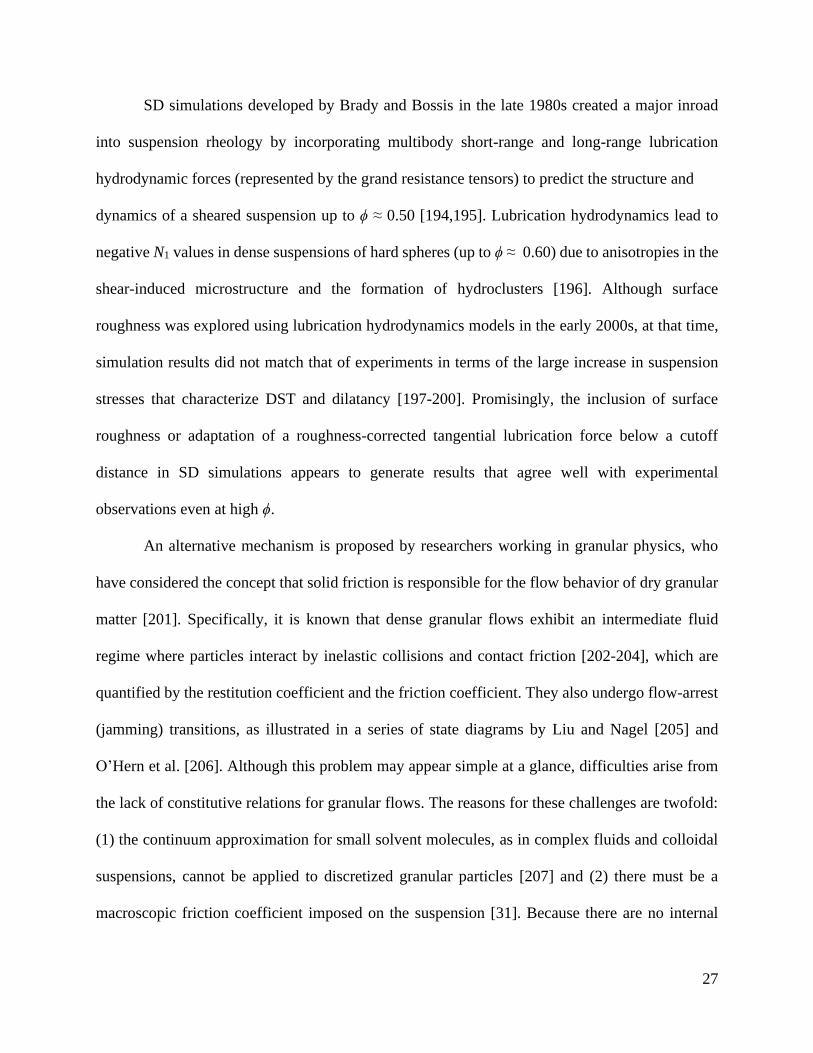
27
SD simulations developed by Brady and Bossis in the late 1980s created a major inroad
into suspension rheology by incorporating multibody short-range and long-range lubrication
hydrodynamic forces (represented by the grand resistance tensors) to predict the structure and
dynamics of a sheared suspension up to ϕ ≈ 0.50 [194,195]. Lubrication hydrodynamics lead to
negative N1 values in dense suspensions of hard spheres (up to ϕ ≈ 0.60) due to anisotropies in the
shear-induced microstructure and the formation of hydroclusters [196]. Although surface
roughness was explored using lubrication hydrodynamics models in the early 2000s, at that time,
simulation results did not match that of experiments in terms of the large increase in suspension
stresses that characterize DST and dilatancy [197-200]. Promisingly, the inclusion of surface
roughness or adaptation of a roughness-corrected tangential lubrication force below a cutoff
distance in SD simulations appears to generate results that agree well with experimental
observations even at high ϕ.
An alternative mechanism is proposed by researchers working in granular physics, who
have considered the concept that solid friction is responsible for the flow behavior of dry granular
matter [201]. Specifically, it is known that dense granular flows exhibit an intermediate fluid
regime where particles interact by inelastic collisions and contact friction [202-204], which are
quantified by the restitution coefficient and the friction coefficient. They also undergo flow-arrest
(jamming) transitions, as illustrated in a series of state diagrams by Liu and Nagel [205] and
O’Hern et al. [206]. Although this problem may appear simple at a glance, difficulties arise from
the lack of constitutive relations for granular flows. The reasons for these challenges are twofold:
(1) the continuum approximation for small solvent molecules, as in complex fluids and colloidal
suspensions, cannot be applied to discretized granular particles [207] and (2) there must be a
macroscopic friction coefficient imposed on the suspension [31]. Because there are no internal

28
stress scales in perfectly frictionless and rigid spheres, the lack of a macroscopic frictional criterion
means that they would not be able to form any solid-like structures such as a granular pile.
The introduction of this macroscopic friction coefficient (μb) is the origin of the growing
interest in bridging suspension and granular mechanics. Cates et al. [208] first proposed shearing
concentrated colloids as a specific example of inducing fragility in soft matter, in which force
chains are formed to support compressive load without plastic rearrangement. This concept was
further developed to explain S-shaped flow curves [209] and to derive local constitutive relations,
in which granular ideas such as jamming and friction were introduced into shear thickening
[210].When incorporated into simulations, a frictional criterion generally does well in predicting
the long-range velocity correlations and force networks displayed by granular flows [211,212]. In
particular, the relationship between the bulk stress ratio and the viscous number above the material
yield stress, or so-called μ(I) rheology, is used to generate predictive models for the nonlocal
rheology of granular flows [213-215].
Currently, most researchers agree that both hydrodynamic and contact forces are important
in sheared suspensions, with a joint effort directed at decoupling the fluid and solid contact
contributions to the overall dissipation [216-218].
1.5.3 Bridging rheology at macroscale
Recent efforts at bridging colloidal suspensions with granular matter have suggested bulk
μ(I) rheology as a possible unifying framework. At the macroscopic level, dimensional analysis
on frictional granular flows generates the Bagnoldian relations in which the shear stress scales as
2 2
1( )pa f = and the normal stress scales as 2 2
2 ( )pa f = , where f1 and f2 are functions
of packing density [219]. The stresses for a flowing colloidal suspension without frictional

29
interactions scale as ~ ~ sP , with thermal motion generating a dynamic yield stress at low
. Boyer et al. used a constant pressure shear cell to develop a general constitutive framework for
millimeter-sized PS and PMMA granules, in which the suspension viscosity (ηs) and μb are
measured as a function of the viscous number /v sI P = , where is the applied shear rate and ηs
is the solvent viscosity (Figure 12a). The measured rheology of the granular suspensions obeys the
frictional framework of granular matter and the viscous framework of colloidal suspensions.
Confined pressure Brownian Dynamics simulations of hard-sphere colloidal suspensions by Wang
and Brady [220] showed a similar μ(I) scaling, although the yield point is slightly lower than
experimental measurements (Figure 1.2b). Because hydrodynamic and frictional interactions were
not imposed in the simulations, the authors showed that excluded volume alone in colloidal
suspensions can generate similar types of bulk rheological behavior as the kind seen with frictional
granular flows.
1.5.4 Bridging rheology at the microscale
The pairwise friction coefficient μp offers a more intuitive way of thinking about frictional
effects on dense suspension rheology. Simulation studies explicitly impose Coulomb’s friction
criterion for the particle tangential and normal contact forces, by applying the relation
, ,S p p N pF F= when neighboring particles make contact or overlap with one another [221]. This
contact load model was developed as an attempt to overcome the breakdown in continuum
approximations as particles approach within nanometers of one another in strongly sheared flows.
Its success in capturing the viscosity increases in DST, and a positive first normal stress difference
representative of dilatancy, led to a subsequent influx of granular concepts into suspension
rheology, including theoretical predictions of S-shaped flow curves based on a phenomenological
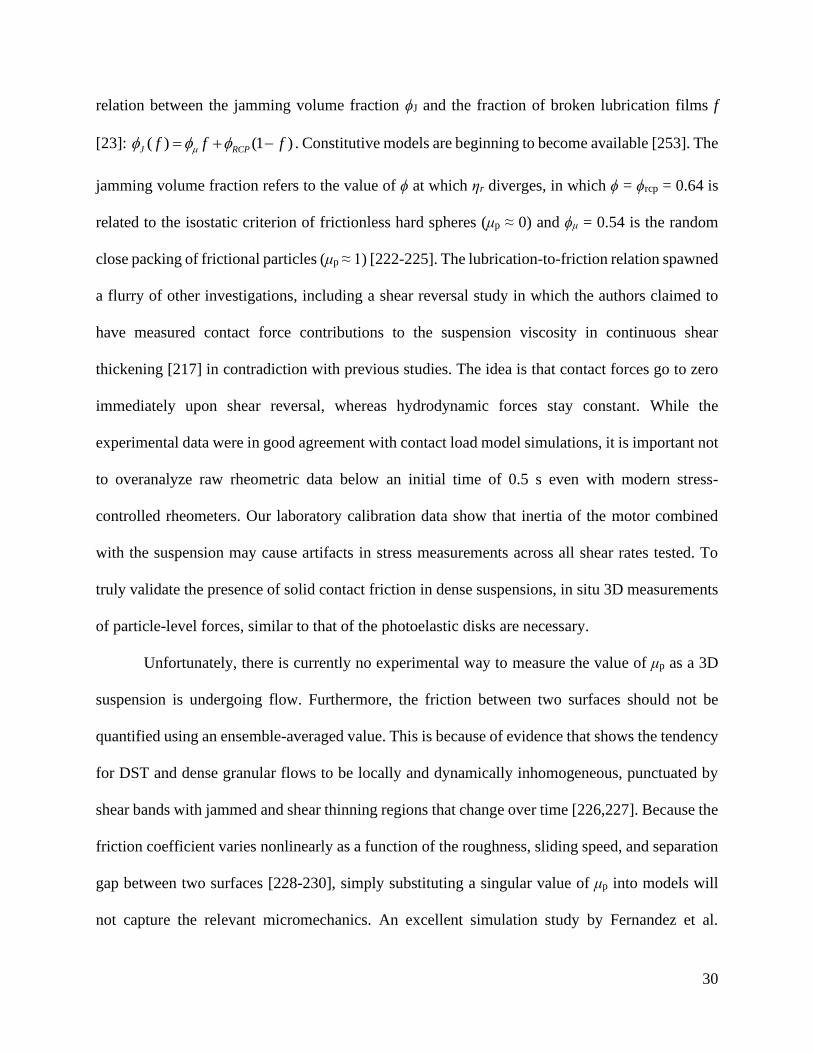
30
relation between the jamming volume fraction ϕJ and the fraction of broken lubrication films f
[23]: ( ) (1 )J RCPf f f = + − . Constitutive models are beginning to become available [253]. The
jamming volume fraction refers to the value of ϕ at which ηr diverges, in which ϕ = ϕrcp = 0.64 is
related to the isostatic criterion of frictionless hard spheres (μp ≈ 0) and ϕμ = 0.54 is the random
close packing of frictional particles (μp ≈ 1) [222-225]. The lubrication-to-friction relation spawned
a flurry of other investigations, including a shear reversal study in which the authors claimed to
have measured contact force contributions to the suspension viscosity in continuous shear
thickening [217] in contradiction with previous studies. The idea is that contact forces go to zero
immediately upon shear reversal, whereas hydrodynamic forces stay constant. While the
experimental data were in good agreement with contact load model simulations, it is important not
to overanalyze raw rheometric data below an initial time of 0.5 s even with modern stress-
controlled rheometers. Our laboratory calibration data show that inertia of the motor combined
with the suspension may cause artifacts in stress measurements across all shear rates tested. To
truly validate the presence of solid contact friction in dense suspensions, in situ 3D measurements
of particle-level forces, similar to that of the photoelastic disks are necessary.
Unfortunately, there is currently no experimental way to measure the value of μp as a 3D
suspension is undergoing flow. Furthermore, the friction between two surfaces should not be
quantified using an ensemble-averaged value. This is because of evidence that shows the tendency
for DST and dense granular flows to be locally and dynamically inhomogeneous, punctuated by
shear bands with jammed and shear thinning regions that change over time [226,227]. Because the
friction coefficient varies nonlinearly as a function of the roughness, sliding speed, and separation
gap between two surfaces [228-230], simply substituting a singular value of μp into models will
not capture the relevant micromechanics. An excellent simulation study by Fernandez et al.
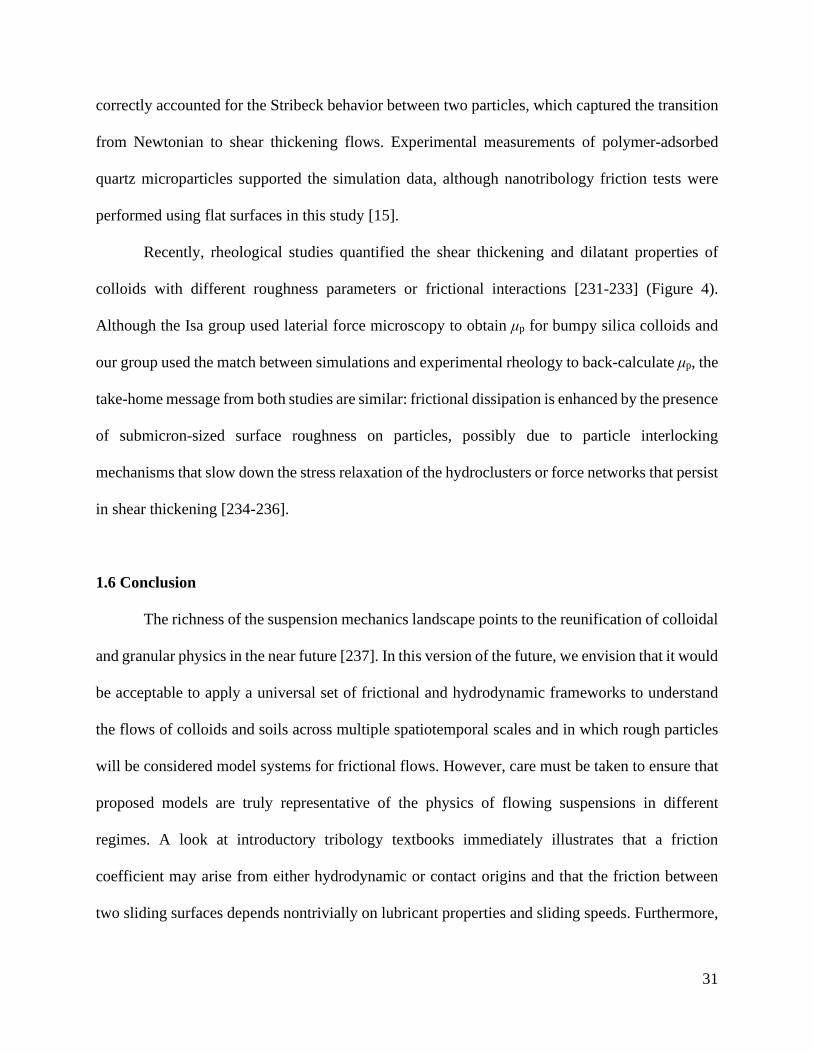
31
correctly accounted for the Stribeck behavior between two particles, which captured the transition
from Newtonian to shear thickening flows. Experimental measurements of polymer-adsorbed
quartz microparticles supported the simulation data, although nanotribology friction tests were
performed using flat surfaces in this study [15].
Recently, rheological studies quantified the shear thickening and dilatant properties of
colloids with different roughness parameters or frictional interactions [231-233] (Figure 4).
Although the Isa group used laterial force microscopy to obtain μp for bumpy silica colloids and
our group used the match between simulations and experimental rheology to back-calculate μp, the
take-home message from both studies are similar: frictional dissipation is enhanced by the presence
of submicron-sized surface roughness on particles, possibly due to particle interlocking
mechanisms that slow down the stress relaxation of the hydroclusters or force networks that persist
in shear thickening [234-236].
1.6 Conclusion
The richness of the suspension mechanics landscape points to the reunification of colloidal
and granular physics in the near future [237]. In this version of the future, we envision that it would
be acceptable to apply a universal set of frictional and hydrodynamic frameworks to understand
the flows of colloids and soils across multiple spatiotemporal scales and in which rough particles
will be considered model systems for frictional flows. However, care must be taken to ensure that
proposed models are truly representative of the physics of flowing suspensions in different
regimes. A look at introductory tribology textbooks immediately illustrates that a friction
coefficient may arise from either hydrodynamic or contact origins and that the friction between
two sliding surfaces depends nontrivially on lubricant properties and sliding speeds. Furthermore,

32
a force chain of fixed length can bear the same amount of load regardless of whether the particles
are held together by lubrication forces, electrostatic repulsion, or attractive interactions. The
current pool of evidence suggests that particle micromechanics contribute in a seemingly
nonunique way to the bulk rheological phenomena. Therefore, physicists and engineers must
continue to work together within the broader framework of experimental observations if we are to
truly understand and design the contributions of interparticle forces and friction in the complex
flows of dense suspensions.
1.7 Dissertation outline
This dissertation provides a guiding framework to design dense colloidal suspensions that
contain smooth and rough colloids for linear and nonlinear rheological applications. In Chapter 2,
we define a “contact” lengthscale in suspensions of smooth and rough colloids using arguments
from jamming granular literature. Since the suspensions exhibit a shear modulus at the equilibrium
states the lengthscale provides an estimate for average nearest neighbors that are involved in stress-
transmission through these suspensions, even in a non-flowing state. In Chapter 3, we observe a
universal correlation between the shear thickening strength and the jamming distance in all types
of colloidal suspensions with particles maintaining spherical symmetry. Characterizing the
microstructure in dynamic states in these suspensions enabled us to visualize contact networks,
similar to that observed in sheared photoelastic granular materials. In Chapter 4, we probe the
linear viscoelastic region in dense suspensions of smooth and rough particles and observed that
rough colloidal suspension moduli values are thousand times higher than that of suspensions with
smooth colloids. Using time-concentration superposition, we explained the difference in cage

33
dynamics between the two types of suspensions in the vicinity of glass transition. In Chapter 5, we
describe the summarizing remarks and outline future prospects in this research field.
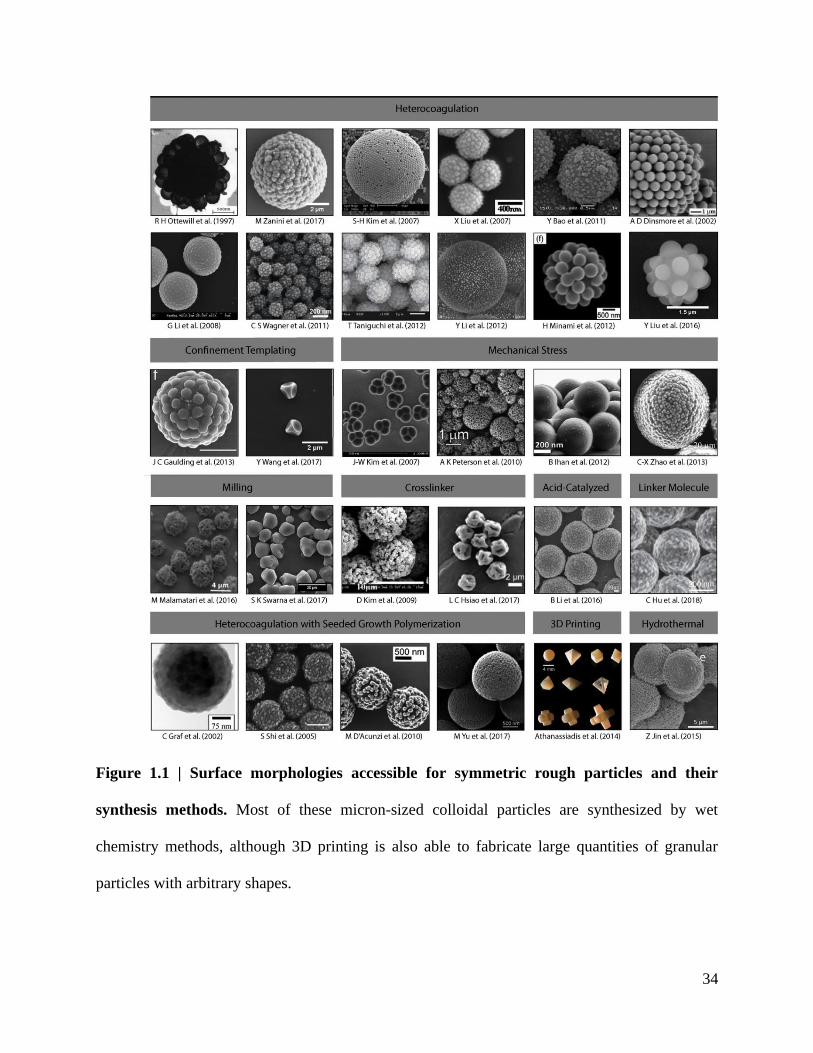
34
Figure 1.1 | Surface morphologies accessible for symmetric rough particles and their
synthesis methods. Most of these micron-sized colloidal particles are synthesized by wet
chemistry methods, although 3D printing is also able to fabricate large quantities of granular
particles with arbitrary shapes.

35
Figure 1.2 | Measurements and quantification of surface roughness for particles. Atomic
force microscopy (AFM) is one of the most viable methods of probing surface roughness, as long
as the particles are fixed on a flat substrate. The surface morphology of (a) sterically stabilized
PMMA colloids and (b) raspberry-like silica colloids has been successfully quantified using
AFM. (c) The root-mean-squared roughness values for smooth (left) and rough (right) PMMA
colloids are calculated by fitting an effective sphere of radius aeff to the raw data, then minimizing
the deviation (red arrows) between the measured profiles and the fitted sphere. Because the AFM
tip is likely to produce imaging artifacts near the edge of the particles, regions below a certain
height z (indicated by gray areas) should not be considered for analysis.

36
Figure 1.3 | Macroscopic μ(I) rheology show commonalities in dense granular and colloidal
suspensions. (a) Experiments by Boyer et al. in a pressure controlled Couette shear cell showed
that the bulk stress ratio plotted against the viscous number for a dense suspension of millimeter-
sized beads (ϕ = 0.565) collapse on a master curve. The solvent is a Newtonian fluid. (b) Brownian
Dynamics simulations by Wang and Brady using a pressure-controlled simulation box, enabled by
a compressible solvent, showed that hard-sphere colloidal suspensions without friction or
lubrication hydrodynamics exhibit qualitatively similar rheology.
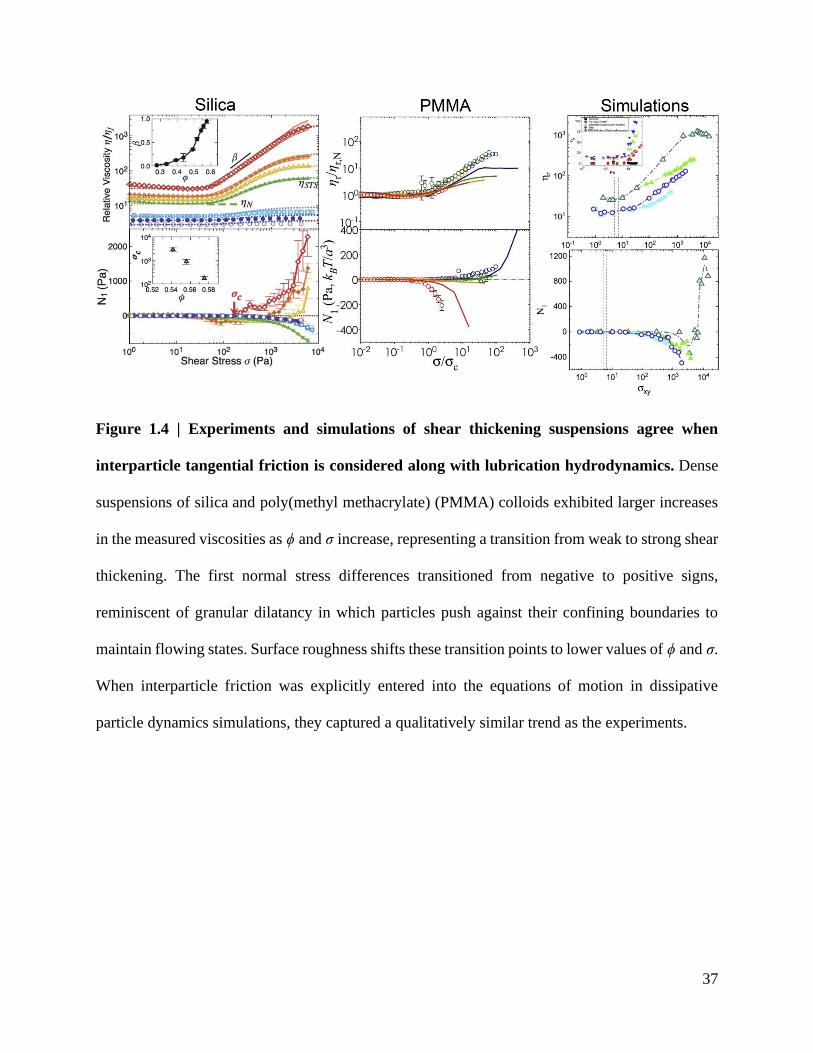
37
Figure 1.4 | Experiments and simulations of shear thickening suspensions agree when
interparticle tangential friction is considered along with lubrication hydrodynamics. Dense
suspensions of silica and poly(methyl methacrylate) (PMMA) colloids exhibited larger increases
in the measured viscosities as ϕ and σ increase, representing a transition from weak to strong shear
thickening. The first normal stress differences transitioned from negative to positive signs,
reminiscent of granular dilatancy in which particles push against their confining boundaries to
maintain flowing states. Surface roughness shifts these transition points to lower values of ϕ and σ.
When interparticle friction was explicitly entered into the equations of motion in dissipative
particle dynamics simulations, they captured a qualitatively similar trend as the experiments.
38
References
[1] C. Ness, R. Mari, and M. E. Cates, Science Advances 4, eaar3296 (2018).
[2] M. Zanini, C. Marschelke, S. E. Anachkov, E. Marini, A. Synytska, and L. Isa, Nature
Communications 8, 15701 (2017).
[3] M. Houssais, C. P. Ortiz, D. J. Durian, and D. J. Jerolmack, Nature Communications 6,
6527 (2015).
[4] A. Athanasopoulos-Zekkos and R. B. Seed, Journal of Geotechnical and Geoenvironmental
Engineering 139, 1911 (2013).
[5] B. Ferdowsi, C. P. Ortiz, and D. J. Jerolmack, Proceedings of the National Academy of
Sciences 115, 4827 (2018).
[6] E. Brown, N. Rodenberg, J. Amend, A. Mozeika, E. Steltz, M. R. Zakin, H. Lipson, and
H. M. Jaeger, Proceedings of the National Academy of Sciences (2010).
[7] Y. S. Lee and N. Wagner, Rheologica Acta 42, 199 (2003).
[8] A. Einstein, Annalen der Physik 324, 371 (1906).
[9] O. Reynolds, The London, Edinburgh, and Dublin Philosophical Magazine and Journal of
Science 20, 469 (1885).
[10] J. Mewis and N. J. Wagner, Colloidal Suspension Rheology (Cambridge University Press,
Cambridge, 2011), Cambridge Series in Chemical Engineering.
[11] N. J. Wagner and J. F. Brady, Physics Today 62, 27 (2009).
[12] L. C. Hsiao, S. Jamali, E. Glynos, P. F. Green, R. G. Larson, and M. J. Solomon, Physical
Review Letters 119, 158001 (2017).
[13] E. Brown and H. M. Jaeger, Reports on Progress in Physics 77, 046602 (2014).
39
[14] C.-P. Hsu, S. N. Ramakrishna, M. Zanini, N. D. Spencer, and L. Isa, Proceedings of the
National Academy of Sciences 115, 5117 (2018).
[15] N. Fernandez et al., Physical Review Letters 111, 108301 (2013).
[16] Y. Madraki, S. Hormozi, G. Ovarlez, É. Guazzelli, and O. Pouliquen, Physical Review
Fluids 2, 033301 (2017).
[17] D. Bi, J. Zhang, B. Chakraborty, and R. P. Behringer, Nature 480, 355 (2011).
[18] N. M. James, E. Han, R. A. L. de la Cruz, J. Jureller, and H. M. Jaeger, Nature Materials
17, 965 (2018).
[19] D. Lootens, H. Van Damme, and P. Hébraud, Physical Review Letters 90, 178301 (2003).
[20] S. Gallier, E. Lemaire, F. Peters, and L. Lobry, Journal of Fluid Mechanics 757, 514 (2014).
[21] D. Lootens, H. van Damme, Y. Hémar, and P. Hébraud, Physical Review Letters 95,
268302 (2005).
[22] R. Seto, R. Mari, J. F. Morris, and M. M. Denn, Physical Review Letters 111, 218301
(2013).
[23] M. Wyart and M. E. Cates, Physical Review Letters 112, 098302 (2014).
[24] R. C. Ball and J. R. Melrose, Advances in Colloid and Interface Science 59, 19 (1995).
[25] P. W. Rowe and G. I. Taylor, Proceedings of the Royal Society of London. Series A.
Mathematical and Physical Sciences 269, 500 (1962).
[26] M. von Smoluchowski, Annalen der Physik 326, 756 (1906).
[27] G. I. Taylor, Proceedings of the Royal Society of London. Series A, Containing Papers of
a Mathematical and Physical Character 138, 41 (1932).
[28] J. J. Stickel and R. L. Powell, Annual Review of Fluid Mechanics 37, 129 (2005).
[29] J. Mewis and N. J. Wagner, Journal of Non-Newtonian Fluid Mechanics 157, 147 (2009).
40
[30] J. F. Morris, Rheologica Acta 48, 909 (2009).
[31] Y. Forterre and O. Pouliquen, Annual Review of Fluid Mechanics 40, 1 (2008).
[32] J. F. Morris, Physical Review Fluids 3, 110508 (2018).
[33] S. Jamali, A. Boromand, N. Wagner, and J. Maia, Journal of Rheology 59, 1377 (2015).
[34] J. T. Jenkins and S. B. Savage, Journal of Fluid Mechanics 130, 187 (1983).
[35] B. Kaffashi, V. T. O'Brien, M. E. Mackay, and S. M. Underwood, Journal of Colloid and
Interface Science 187, 22 (1997).
[36] P. N. Pusey and W. van Megen, Nature 320, 340 (1986).
[37] G. K. Batchelor, Journal of Fluid Mechanics 83, 97 (1977).
[38] R. A. Lionberger and W. B. Russel, Journal of Rheology 38, 1885 (1994).
[39] S.-E. Phan, W. B. Russel, Z. Cheng, J. Zhu, P. M. Chaikin, J. H. Dunsmuir, and R. H.
Ottewill, Physical Review E 54, 6633 (1996).
[40] L. E. Silbert, J. R. Melrose, and R. C. Ball, Journal of Rheology 43, 673 (1999).
[41] W. Schaertl and H. Sillescu, Journal of Statistical Physics 77, 1007 (1994).
[42] W. B. Russel, D. A. Saville, and W. R. Schowalter, Colloidal Dispersions (Cambridge
University Press, Cambridge, 1989), Cambridge Monographs on Mechanics.
[43] D. Dendukuri and P. S. Doyle, Advanced Materials 21, 4071 (2009).
[44] W. Stöber, A. Fink, and E. Bohn, Journal of Colloid and Interface Science 26, 62 (1968).
[45] Y. J. Wong, L. Zhu, W. S. Teo, Y. W. Tan, Y. Yang, C. Wang, and H. Chen, Journal of
the American Chemical Society 133, 11422 (2011).
[46] A. K. Van Helden, J. W. Jansen, and A. Vrij, Journal of Colloid and Interface Science 81,
354 (1981).
41
[47] A. T. J. M. Woutersen, R. P. May, and C. G. de Kruif, Journal of Colloid and Interface
Science 151, 410 (1992).
[48] A. P. R. Eberle, R. Castañeda-Priego, J. M. Kim, and N. J. Wagner, Langmuir 28, 1866
(2012).
[49] P. Varadan and M. J. Solomon, Journal of Rheology 47, 943 (2003).
[50] K. A. Whitaker and E. M. Furst, Langmuir 30, 584 (2014).
[51] A. P. R. Eberle, N. J. Wagner, and R. Castañeda-Priego, Physical Review Letters 106,
105704 (2011).
[52] J. M. Kim, J. Fang, A. P. R. Eberle, R. Castañeda-Priego, and N. J. Wagner, Physical
Review Letters 110, 208302 (2013).
[53] M. Chen and W. B. Russel, Journal of Colloid and Interface Science 141, 564 (1991).
[54] M. A. Miller and D. Frenkel, The Journal of Chemical Physics 121, 535 (2004).
[55] S. C. Thickett and R. G. Gilbert, Polymer 48, 6965 (2007).
[56] H. Pertoft, T. C. Laurent, T. Låås, and L. Kågedal, Analytical Biochemistry 88, 271 (1978).
[57] L. C. Hsiao, R. S. Newman, S. C. Glotzer, and M. J. Solomon, Proceedings of the National
Academy of Sciences 109, 16029 (2012).
[58] H. Tsurusawa, J. Russo, M. Leocmach, and H. Tanaka, Nature Materials 16, 1022 (2017).
[59] T. E. Kodger, R. E. Guerra, and J. Sprakel, Scientific Reports 5, 14635 (2015).
[60] L. Antl, J. W. Goodwin, R. D. Hill, R. H. Ottewill, S. M. Owens, S. Papworth, and J. A.
Waters, Colloids and Surfaces 17, 67 (1986).
[61] G. Bryant, S. R. Williams, L. Qian, I. K. Snook, E. Perez, and F. Pincet, Physical Review
E 66, 060501 (2002).
[62] M. T. Elsesser and A. D. Hollingsworth, Langmuir 26, 17989 (2010).

42
[63] G. Bosma, C. Pathmamanoharan, E. H. A. de Hoog, W. K. Kegel, A. van Blaaderen, and
H. N. W. Lekkerkerker, Journal of Colloid and Interface Science 245, 292 (2002).
[64] L. Palangetic, K. Feldman, R. Schaller, R. Kalt, W. R. Caseri, and J. Vermant, Faraday
Discussions 191, 325 (2016).
[65] U. Capasso Palmiero, A. Agostini, E. Lattuada, S. Gatti, J. Singh, C. T. Canova, S.
Buzzaccaro, and D. Moscatelli, Soft Matter 13, 6439 (2017).
[66] S. Auer, W. C. K. Poon, and D. Frenkel, Physical Review E 67, 020401 (2003).
[67] B. M. Guy, M. Hermes, and W. C. K. Poon, Physical Review Letters 115, 088304 (2015).
[68] B. A. L. Costello, P. F. Luckham, and T. F. Tadros, Langmuir 8, 464 (1992).
[69] M. J. Solomon, Langmuir 34, 11205 (2018).
[70] N. Park and J. C. Conrad, Soft Matter 13, 2781 (2017).
[71] W. C. K. Poon, E. R. Weeks, and C. P. Royall, Soft Matter 8, 21 (2012).
[72] G. M. Conley, P. Aebischer, S. Nöjd, P. Schurtenberger, and F. Scheffold, Science
Advances 3, e1700969 (2017).
[73] L. Mohan, R. T. Bonnecaze, and M. Cloitre, Physical Review Letters 111, 268301 (2013).
[74] Y. Peng, F. Wang, Z. Wang, A. M. Alsayed, Z. Zhang, A. G. Yodh, and Y. Han, Nature
Materials 14, 101 (2015).
[75] A. C. Brown et al., Nature Materials 13, 1108 (2014).
[76] L.-W. Xia, R. Xie, X.-J. Ju, W. Wang, Q. Chen, and L.-Y. Chu, Nature Communications
4, 2226 (2013).
[77] K. V. Edmond, M. T. Elsesser, G. L. Hunter, D. J. Pine, and E. R. Weeks, Proceedings of
the National Academy of Sciences 109, 17891 (2012).
43
[78] J. Palacci, S. Sacanna, A. P. Steinberg, D. J. Pine, and P. M. Chaikin, Science 339, 936
(2013).
[79] É. Ducrot, M. He, G.-R. Yi, and D. J. Pine, Nature Materials 16, 652 (2017).
[80] S. Sacanna, W. T. M. Irvine, P. M. Chaikin, and D. J. Pine, Nature 464, 575 (2010).
[81] D. K. Kim, Y. Zhang, W. Voit, K. V. Rao, and M. Muhammed, Journal of Magnetism and
Magnetic Materials 225, 30 (2001).
[82] B. Bharti, A.-L. Fameau, M. Rubinstein, and O. D. Velev, Nature Materials 14, 1104
(2015).
[83] J. W. Swan, J. L. Bauer, Y. Liu, and E. M. Furst, Soft Matter 10, 1102 (2014).
[84] G. N. Smith et al., Journal of Colloid and Interface Science 479, 234 (2016).
[85] E. Bilgili, R. Hamey, and B. Scarlett, Chemical Engineering Science 61, 149 (2006).
[86] H. J. Fecht, E. Hellstern, Z. Fu, and W. L. Johnson, Metallurgical Transactions A 21, 2333
(1990).
[87] M. T. Gokmen and F. E. Du Prez, Progress in Polymer Science 37, 365 (2012).
[88] G. E. Yakubov, T. E. Branfield, J. H. H. Bongaerts, and J. R. Stokes, Biotribology 3, 1
(2015).
[89] in Engineering Tribology (Fourth Edition), edited by G. W. Stachowiak, and A. W.
Batchelor (Butterworth-Heinemann, Boston, 2014), pp. 105.
[90] Y. Altintaş and E. Budak, CIRP Annals 44, 357 (1995).
[91] D. Montgomery and Y. Altintas, Journal of Engineering for Industry 113, 160 (1991).
[92] S. P. Chamarthy and R. Pinal, Colloids and Surfaces A: Physicochemical and Engineering
Aspects 331, 68 (2008).
[93] E. Yoğurtcuoğlu and M. Uçurum, Powder Technology 214, 47 (2011).

44
[94] A. Fall, N. Huang, F. Bertrand, G. Ovarlez, and D. Bonn, Physical Review Letters 100,
018301 (2008).
[95] B. Saint-Michel, T. Gibaud, and S. Manneville, Physical Review X 8, 031006 (2018).
[96] R. H. Ottewill, A. B. Schofield, J. A. Waters, and N. S. J. Williams, Colloid and Polymer
Science 275, 274 (1997).
[97] A. D. Dinsmore, M. F. Hsu, M. G. Nikolaides, M. Marquez, A. R. Bausch, and D. A. Weitz,
Science 298, 1006 (2002).
[98] T. Taniguchi, S. Obi, Y. Kamata, T. Kashiwakura, M. Kasuya, T. Ogawa, M. Kohri, and
T. Nakahira, Journal of Colloid and Interface Science 368, 107 (2012).
[99] G. Li, X. Yang, F. Bai, and W. Huang, Journal of Colloid and Interface Science 297, 705
(2006).
[100] M. Zanini, C.-P. Hsu, T. Magrini, E. Marini, and L. Isa, Colloids and Surfaces A:
Physicochemical and Engineering Aspects 532, 116 (2017).
[101] D. Kim, D. Y. Lee, K. Lee, and S. Choe, Macromolecular Research 17, 250 (2009).
[102] M. Yu, Q. Wang, M. Zhang, Q. Deng, and D. Chen, RSC Advances 7, 39471 (2017).
[103] G. Li, X. Yang, and J. Wang, Colloids and Surfaces A: Physicochemical and Engineering
Aspects 322, 192 (2008).
[104] Y. Liu, K. V. Edmond, A. Curran, C. Bryant, B. Peng, D. G. A. L. Aarts, S. Sacanna, and
R. P. A. Dullens, Advanced Materials 28, 8001 (2016).
[105] S. Shi, S. Kuroda, K. Hosoi, and H. Kubota, Polymer 46, 3567 (2005).
[106] C. Graf, D. L. J. Vossen, A. Imhof, and A. van Blaaderen, Langmuir 19, 6693 (2003).
[107] M. D'Acunzi, L. Mammen, M. Singh, X. Deng, M. Roth, G. K. Auernhammer, H.-J. Butt,
and D. Vollmer, Faraday Discussions 146, 35 (2010).

45
[108] J. C. Gaulding, S. Saxena, D. E. Montanari, and L. A. Lyon, ACS Macro Letters 2, 337
(2013).
[109] Y. Wang, J. T. McGinley, and J. C. Crocker, Langmuir 33, 3080 (2017).
[110] A. K. Peterson, D. G. Morgan, and S. E. Skrabalak, Langmuir 26, 8804 (2010).
[111] B. İlhan, C. Annink, D. V. Nguyen, F. Mugele, I. Siretanu, and M. H. G. Duits, Colloids
and Surfaces A: Physicochemical and Engineering Aspects 560, 50 (2019).
[112] C.-X. Zhao and A. P. J. Middelberg, RSC Advances 3, 21227 (2013).
[113] J.-W. Kim, R. J. Larsen, and D. A. Weitz, Advanced Materials 19, 2005 (2007).
[114] R. Rice, R. Roth, and C. P. Royall, Soft Matter 8, 1163 (2012).
[115] K. Tamareselvy and F. A. Rueggeberg, Dental Materials 10, 290 (1994).
[116] Z. Jin, J. Li, L. Shi, Y. Ji, Z. Zhong, and F. Su, Applied Surface Science 359, 120 (2015).
[117] B. Li, X. Gao, J. Zhang, Y. Sun, and Z. Liu, Powder Technology 292, 80 (2016).
[118] C. Hu, J. Liu, Y. Wu, K. R. West, and O. A. Scherman, Small 14, 1703352 (2018).
[119] S. Utermann, P. Aurin, M. Benderoth, C. Fischer, and M. Schröter, Physical Review E 84,
031306 (2011).
[120] F. Tapia, O. Pouliquen, and É. Guazzelli, Physical Review Fluids 4, 104302 (2019).
[121] J. Zhao, M. Jiang, K. Soga, and S. Luding, Granular Matter 18, 59 (2016).
[122] A. G. Athanassiadis et al., Soft Matter 10, 48 (2014).
[123] G. R. Farrell, K. M. Martini, and N. Menon, Soft Matter 6, 2925 (2010).
[124] R. Jones, H. M. Pollock, D. Geldart, and A. Verlinden-Luts, Ultramicroscopy 100, 59
(2004).
[125] A. A. Feiler, J. Stiernstedt, K. Theander, P. Jenkins, and M. W. Rutland, Langmuir 23, 517
(2007).
46
[126] S. Zauscher and D. J. Klingenberg, Colloids and Surfaces A: Physicochemical and
Engineering Aspects 178, 213 (2001).
[127] J. Comtet, G. Chatté, A. Niguès, L. Bocquet, A. Siria, and A. Colin, Nature
Communications 8, 15633 (2017).
[128] S. Nasuno, A. Kudrolli, A. Bak, and J. P. Gollub, Physical Review E 58, 2161 (1998).
[129] D. M. Mueth, H. M. Jaeger, and S. R. Nagel, Physical Review E 57, 3164 (1998).
[130] Y. C. Zhou, B. H. Xu, A. B. Yu, and P. Zulli, Powder Technology 125, 45 (2002).
[131] J. Härtl and J. Y. Ooi, Granular Matter 10, 263 (2008).
[132] J. F. Hubler, A. Athanasopoulos-Zekkos, and D. Zekkos, Journal of Geotechnical and
Geoenvironmental Engineering 143, 04017043 (2017).
[133] C. P. Ortiz, R. Riehn, and K. E. Daniels, Soft Matter 9, 543 (2013).
[134] F. Podczeck, J. M. Newton, and M. B. James, Journal of Materials Science 31, 2213 (1996).
[135] X. Ling, H.-J. Butt, and M. Kappl, Langmuir 23, 8392 (2007).
[136] S. Ecke and H.-J. Butt, Journal of Colloid and Interface Science 244, 432 (2001).
[137] J. N. Israelachvili and D. Tabor, Proceedings of the Royal Society of London. A.
Mathematical and Physical Sciences 331, 19 (1972).
[138] S. Biggs, Langmuir 11, 156 (1995).
[139] L.-O. Heim, J. Blum, M. Preuss, and H.-J. Butt, Physical Review Letters 83, 3328 (1999).
[140] J. M. Bennett, Appl. Opt. 15, 2705 (1976).
[141] B. N. J. Persson, O. Albohr, U. Tartaglino, A. I. Volokitin, and E. Tosatti, Journal of
Physics: Condensed Matter 17, R1 (2004).
[142] R. S. Sayles and T. R. Thomas, Nature 271, 431 (1978).
47
[143] J. A. Greenwood and K. L. Johnson, Proceedings of the Royal Society of London. A.
Mathematical and Physical Sciences 393, 133 (1984).
[144] E. Sidick, Power spectral density specification and analysis of large optical surfaces
(SPIE, 2009), Vol. 7390, SPIE Europe Optical Metrology, p.^pp. EOM.
[145] A. J. McGhee et al., Tribology Letters 65, 157 (2017).
[146] S. Ecke, R. Raiteri, E. Bonaccurso, C. Reiner, H.-J. Deiseroth, and H.-J. Butt, Review of
Scientific Instruments 72, 4164 (2001).
[147] H.-J. Butt, B. Cappella, and M. Kappl, Surface Science Reports 59, 1 (2005).
[148] S. C. d. Pont, P. Gondret, B. Perrin, and M. Rabaud, Europhysics Letters (EPL) 61, 492
(2003).
[149] N. A. Pohlman, B. L. Severson, J. M. Ottino, and R. M. Lueptow, Physical Review E 73,
031304 (2006).
[150] A. Lemaître, Physical Review Letters 89, 195503 (2002).
[151] O. R. Walton and R. L. Braun, Journal of Rheology 30, 949 (1986).
[152] D. Fenistein, J. W. van de Meent, and M. van Hecke, Physical Review Letters 92, 094301
(2004).
[153] P. Sollich, F. Lequeux, P. Hébraud, and M. E. Cates, Physical Review Letters 78, 2020
(1997).
[154] G. Ovarlez, Q. Barral, and P. Coussot, Nature Materials 9, 115 (2010).
[155] L. E. Silbert, D. Ertaş, G. S. Grest, T. C. Halsey, D. Levine, and S. J. Plimpton, Physical
Review E 64, 051302 (2001).
[156] O. Pouliquen, Physics of Fluids 11, 542 (1999).

48
[157] K. H. Zehtab, S. Gokyer, A. Apostolov, W. A. Marr, and S. K. Werden, in Geotechnical
Earthquake Engineering and Soil Dynamics V2018), pp. 257.
[158] F. Boyer, É. Guazzelli, and O. Pouliquen, Physical Review Letters 107, 188301 (2011).
[159] K. E. Daniels, J. E. Kollmer, and J. G. Puckett, Review of Scientific Instruments 88,
051808 (2017).
[160] D. S. Bassett, E. T. Owens, M. A. Porter, M. L. Manning, and K. E. Daniels, Soft Matter
11, 2731 (2015).
[161] T. S. Majmudar and R. P. Behringer, Nature 435, 1079 (2005).
[162] L. Papadopoulos, M. A. Porter, K. E. Daniels, and D. S. Bassett, Journal of Complex
Networks 6, 485 (2018).
[163] J. Bender and N. J. Wagner, Journal of Rheology 40, 899 (1996).
[164] C. D. Cwalina and N. J. Wagner, Journal of Rheology 58, 949 (2014).
[165] L.-N. Krishnamurthy, N. J. Wagner, and J. Mewis, Journal of Rheology 49, 1347 (2005).
[166] R. Mari, R. Seto, J. F. Morris, and M. M. Denn, Journal of Rheology 58, 1693 (2014).
[167] R. Mari, R. Seto, J. F. Morris, and M. M. Denn, Physical Review E 91, 052302 (2015).
[168] Y. Madraki, G. Ovarlez, and S. Hormozi, Physical Review Letters 121, 108001 (2018).
[169] W. B. Russel, N. J. Wagner, and J. Mewis, Journal of Rheology 57, 1555 (2013).
[170] A. Ikeda, L. Berthier, and P. Sollich, Physical Review Letters 109, 018301 (2012).
[171] G. Brambilla, D. El Masri, M. Pierno, L. Berthier, L. Cipelletti, G. Petekidis, and A. B.
Schofield, Physical Review Letters 102, 085703 (2009).
[172] A. Ikeda, L. Berthier, and P. Sollich, Soft Matter 9, 7669 (2013).
[173] R. G. Egres, F. Nettesheim, and N. J. Wagner, Journal of Rheology 50, 685 (2006).
49
[174] E. Brown, N. A. Forman, C. S. Orellana, H. Zhang, B. W. Maynor, D. E. Betts, J. M.
DeSimone, and H. M. Jaeger, Nature Materials 9, 220 (2010).
[175] E. Brown and H. M. Jaeger, Journal of Rheology 56, 875 (2012).
[176] I. R. Peters, S. Majumdar, and H. M. Jaeger, Nature 532, 214 (2016).
[177] S. R. Waitukaitis and H. M. Jaeger, Nature 487, 205 (2012).
[178] H. M. Laun, Journal of Non-Newtonian Fluid Mechanics 54, 87 (1994).
[179] A. B. Metzner and M. Whitlock, Transactions of the Society of Rheology 2, 239 (1958).
[180] J. R. Royer, D. L. Blair, and S. D. Hudson, Physical Review Letters 116, 188301 (2016).
[181] B. J. Maranzano and N. J. Wagner, The Journal of Chemical Physics 114, 10514 (2001).
[182] R. Mari, R. Seto, J. F. Morris, and M. M. Denn, Proceedings of the National Academy of
Sciences 112, 15326 (2015).
[183] J F Brady and G. Bossis, Annual Review of Fluid Mechanics 20, 111 (1988).
[184] D. P. Kalman and N. J. Wagner, Rheologica Acta 48, 897 (2009).
[185] A. K. Gurnon and N. J. Wagner, Journal of Fluid Mechanics 769, 242 (2015).
[186] X. Cheng, J. H. McCoy, J. N. Israelachvili, and I. Cohen, Science 333, 1276 (2011).
[187] J. R. Melrose and R. C. Ball, Journal of Rheology 48, 937 (2004).
[188] D. R. Foss and J. F. Brady, Journal of Fluid Mechanics 407, 167 (2000).
[189] J. F. Brady, The Journal of Chemical Physics 98, 3335 (1993).
[190] A. Sierou and J. F. Brady, Journal of Rheology 46, 1031 (2002).
[191] M. E. Cates, M. D. Haw, and C. B. Holmes, Journal of Physics: Condensed Matter 17,
S2517 (2005).
[192] F. Gadala‐Maria and A. Acrivos, Journal of Rheology 24, 799 (1980).
[193] G. K. Batchelor and J. T. Green, Journal of Fluid Mechanics 56, 375 (1972).

50
[194] J. F. Brady, R. J. Phillips, J. C. Lester, and G. Bossis, Journal of Fluid Mechanics 195, 257
(1988).
[195] J. F. Brady, Journal of Fluid Mechanics 272, 109 (1994).
[196] J. Bergenholtz, J. F. Brady, and M. Vicic, Journal of Fluid Mechanics 456, 239 (2002).
[197] R. T. Bonnecaze, G. J. Rodin, R. H. Davis, Y. Zhao, K. P. Galvin, and H. J. Wilson,
Philosophical Transactions of the Royal Society of London. Series A: Mathematical,
Physical and Engineering Sciences 361, 871 (2003).
[198] H. J. Wilson and R. H. Davis, Journal of Fluid Mechanics 452, 425 (2002).
[199] J. R. Smart, S. Beimfohr, and D. T. L. Jr., Physics of Fluids A: Fluid Dynamics 5, 13
(1993).
[200] F. R. Da Cunha and E. J. Hinch, Journal of Fluid Mechanics 309, 211 (1996).
[201] R. P. Behringer and B. Chakraborty, Reports on Progress in Physics 82, 012601 (2018).
[202] O. Pouliquen and F. Chevoir, Comptes Rendus Physique 3, 163 (2002).
[203] C. K. K. Lun and S. B. Savage, Journal of Applied Mechanics 54, 47 (1987).
[204] G. D. R. MiDi, The European Physical Journal E 14, 341 (2004).
[205] A. J. Liu and S. R. Nagel, Nature 396, 21 (1998).
[206] C. S. O’Hern, L. E. Silbert, A. J. Liu, and S. R. Nagel, Physical Review E 68, 011306
(2003).
[207] B. Luan and M. O. Robbins, Nature 435, 929 (2005).
[208] M. E. Cates, J. P. Wittmer, J. P. Bouchaud, and P. Claudin, Physical Review Letters 81,
1841 (1998).
[209] Z. Pan, H. de Cagny, B. Weber, and D. Bonn, Physical Review E 92, 032202 (2015).
[210] H. d. Cagny, A. Fall, M. M. Denn, and D. Bonn, Journal of Rheology 59, 957 (2015).
51
[211] J. E. Thomas, K. Ramola, A. Singh, R. Mari, J. F. Morris, and B. Chakraborty, Physical
Review Letters 121, 128002 (2018)..
[212] H. A. Vinutha and S. Sastry, Nature Physics 12, 578 (2016).
[213] K. Kamrin and G. Koval, Physical Review Letters 108, 178301 (2012).
[214] M. Bouzid, M. Trulsson, P. Claudin, E. Clément, and B. Andreotti, Physical Review Letters
111, 238301 (2013).
[215] Z. Tang, T. A. Brzinski, M. Shearer, and K. E. Daniels, Soft Matter 14, 3040 (2018).
[216] A. Boromand, S. Jamali, B. Grove, and J. M. Maia, Journal of Rheology 62, 905 (2018).
[217] N. Y. C. Lin, B. M. Guy, M. Hermes, C. Ness, J. Sun, W. C. K. Poon, and I. Cohen, Physical
Review Letters 115, 228304 (2015).
[218] C. Clavaud, A. Bérut, B. Metzger, and Y. Forterre, Proceedings of the National Academy
of Sciences 114, 5147 (2017).
[219] R. A. Bagnold, Proceedings of the Royal Society of London. Series A. Mathematical and
Physical Sciences 225, 49 (1954).
[220] M. Wang and J. F. Brady, Physical Review Letters 115, 158301 (2015).
[221] T. Kawasaki, D. Coslovich, A. Ikeda, and L. Berthier, Physical Review E 91, 012203
(2015).
[222] M. van Hecke, Journal of Physics: Condensed Matter 22, 033101 (2009).
[223] S. Papanikolaou, C. S. O’Hern, and M. D. Shattuck, Physical Review Letters 110, 198002
(2013).
[224] L. E. Silbert, Soft Matter 6, 2918 (2010).
[225] M. P. Ciamarra, R. Pastore, M. Nicodemi, and A. Coniglio, Physical Review E 84, 041308
(2011).
52
[226] A. Fall, G. Ovarlez, D. Hautemayou, C. Mézière, J.-N. Roux, and F. Chevoir, Journal of
Rheology 59, 1065 (2015).
[227] R. N. Chacko, R. Mari, M. E. Cates, and S. M. Fielding, Physical Review Letters 121,
108003 (2018).
[228] G. He, M. H. Müser, and M. O. Robbins, Science 284, 1650 (1999).
[229] C. Marone, Annual Review of Earth and Planetary Sciences 26, 643 (1998).
[230] A. Fall, B. Weber, M. Pakpour, N. Lenoir, N. Shahidzadeh, J. Fiscina, C. Wagner, and D.
Bonn, Physical Review Letters 112, 175502 (2014).
[231] R. I. Tanner and S. Dai, Journal of Rheology 60, 809 (2016).
[232] J. E. Thomas, K. Ramola, A. Singh, R. Mari, J. F. Morris, and B. Chakraborty, Physical
Review Letters 121, 128002 (2018).
[233] Z. Pan, H. de Cagny, M. Habibi, and D. Bonn, Soft Matter 13, 3734 (2017).
[234] F. Ianni, D. Lasne, R. Sarcia, and P. Hébraud, Physical Review E 74, 011401 (2006).
[235] L. C. Hsiao, I. Saha-Dalal, R. G. Larson, and M. J. Solomon, Soft Matter 13, 9229 (2017).
[236] B. M. Guy, J. A. Richards, D. J. M. Hodgson, E. Blanco, and W. C. K. Poon, Physical
Review Letters 121, 128001 (2018).
[237] E. DeGiuli, G. Düring, E. Lerner, and M. Wyart, Physical Review E 91, 062206 (2015).

53
CHAPTER 2
Contact criterion for suspensions of smooth and rough colloids†
†Shravan Pradeep and Lilian C. Hsiao, Soft Matter, 16, 4980-4989 (2020)
Department of Chemical and Biomolecular Engineering, North Carolina State University,
Raleigh, NC 27695, USA
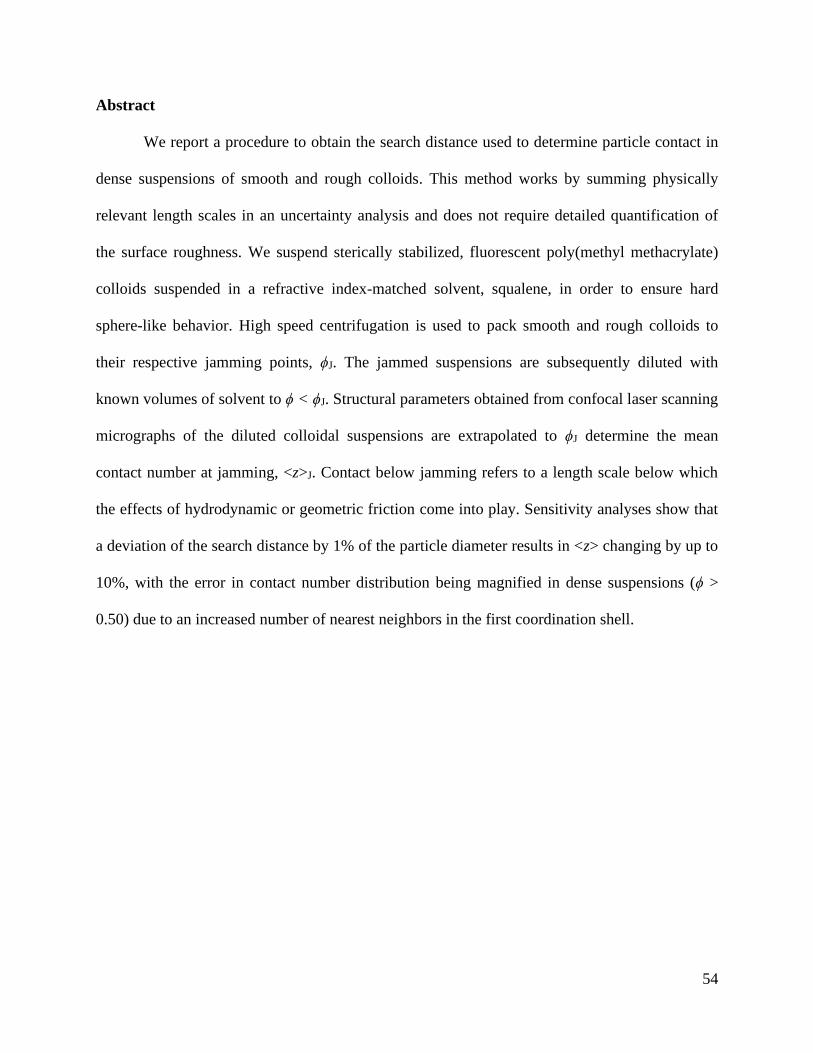
54
Abstract
We report a procedure to obtain the search distance used to determine particle contact in
dense suspensions of smooth and rough colloids. This method works by summing physically
relevant length scales in an uncertainty analysis and does not require detailed quantification of
the surface roughness. We suspend sterically stabilized, fluorescent poly(methyl methacrylate)
colloids suspended in a refractive index-matched solvent, squalene, in order to ensure hard
sphere-like behavior. High speed centrifugation is used to pack smooth and rough colloids to
their respective jamming points, ϕJ. The jammed suspensions are subsequently diluted with
known volumes of solvent to ϕ < ϕJ. Structural parameters obtained from confocal laser scanning
micrographs of the diluted colloidal suspensions are extrapolated to ϕJ determine the mean
contact number at jamming, <z>J. Contact below jamming refers to a length scale below which
the effects of hydrodynamic or geometric friction come into play. Sensitivity analyses show that
a deviation of the search distance by 1% of the particle diameter results in <z> changing by up to
10%, with the error in contact number distribution being magnified in dense suspensions (ϕ >
0.50) due to an increased number of nearest neighbors in the first coordination shell.
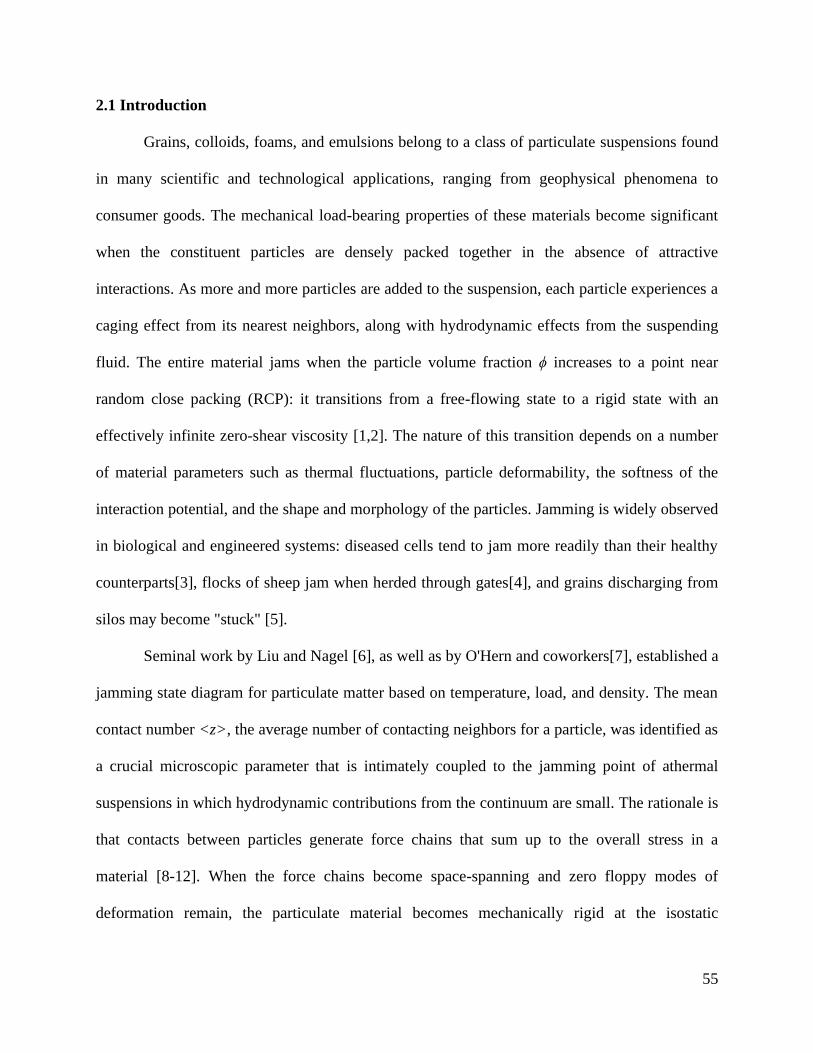
55
2.1 Introduction
Grains, colloids, foams, and emulsions belong to a class of particulate suspensions found
in many scientific and technological applications, ranging from geophysical phenomena to
consumer goods. The mechanical load-bearing properties of these materials become significant
when the constituent particles are densely packed together in the absence of attractive
interactions. As more and more particles are added to the suspension, each particle experiences a
caging effect from its nearest neighbors, along with hydrodynamic effects from the suspending
fluid. The entire material jams when the particle volume fraction ϕ increases to a point near
random close packing (RCP): it transitions from a free-flowing state to a rigid state with an
effectively infinite zero-shear viscosity [1,2]. The nature of this transition depends on a number
of material parameters such as thermal fluctuations, particle deformability, the softness of the
interaction potential, and the shape and morphology of the particles. Jamming is widely observed
in biological and engineered systems: diseased cells tend to jam more readily than their healthy
counterparts[3], flocks of sheep jam when herded through gates[4], and grains discharging from
silos may become "stuck" [5].
Seminal work by Liu and Nagel [6], as well as by O'Hern and coworkers[7], established a
jamming state diagram for particulate matter based on temperature, load, and density. The mean
contact number <z>, the average number of contacting neighbors for a particle, was identified as
a crucial microscopic parameter that is intimately coupled to the jamming point of athermal
suspensions in which hydrodynamic contributions from the continuum are small. The rationale is
that contacts between particles generate force chains that sum up to the overall stress in a
material [8-12]. When the force chains become space-spanning and zero floppy modes of
deformation remain, the particulate material becomes mechanically rigid at the isostatic
56
condition, where the contact number is ziso = 6 for frictionless spheres [2]. Follow-on
experiments and simulations have since confirmed the strong connection between <z> and the
bulk modulus of various materials with and without interparticle attraction. The viscoelasticity of
attractive colloidal gels is attributed to the contact number distribution within strands that contain
particles at volume fractions ϕ near random close packing (ϕRCP), which in turn affects their
structural and dynamical evolution [13-18]. Simulations of soft repulsive spheres interacting
through Hertzian contacts and an interparticle friction µp show that the shear modulus scaled
with bulk modulus or material stiffness exhibits a linear power-law scaling with respect to the
excess contact number, Δz = <z> - ziso [19-22]. When prolate and oblate spheroids of different
aspect ratios are used, ϕRCP increases, with a corresponding increase in <z> at RCP [23,24]. More
recently, the deformable particle model enables arbitrary particle shapes to be described by an
energy function that captures the onset of jamming for 2D deformable polygons [25].
Experimental approaches have utilized granocentric models to capture the jammed
microstructure of polydisperse emulsion packings [26,27]. Importantly, the correlation between
mechanics and contact microstructure scales as the distance to jamming <z> - zJ and ϕ - ϕJ,
where the subscript J refers to the jamming point. This correlation uses the excess parameters
instead of the absolute value of ϕ or <z>, because zJ and ϕJ change depending on particle
properties and how the packing is generated. As an example, the scaling behavior of properties
such as elastic modulus, external osmotic pressure, and low-frequency modulus had been
correlated with the distance from the RCP structure in compressed emulsions [28,29]. The idea
of scaling with the distance to jamming is widely accepted in the granular matter literature but
has not yet been experimentally validated in the field of colloidal suspensions.
57
The key difference between the two types of particulates is that colloidal suspensions
exhibit thermal fluctuations over experimental time scales, while granular media are athermal in
nature. The diffusive motion of the colloids generates a hydrodynamic resistance that contributes
to the suspension stress in dilute conditions [30]. As ϕ increases beyond ≈ 0.50, calculations of
suspension stress based solely on near- and far-field hydrodynamics begin to perform poorly
[31,32], likely because the contact stresses between particles become more granular-like [33].
However, unlike the case of athermal grains where a pile will not support any stress unless it is at
ϕ ≥ ϕRLP, where RLP is the random loose packing state,[34] stochastic Brownian fluctuations in
colloidal suspensions give rise to transient clusters that support a finite viscoelasticity below
ϕRCP. The viscoelasticity and rheology of the hard-sphere colloidal suspensions close to RCP is
very well established [35-37]. Experimentally, a connection between colloidal and granular shear
thickening was made using hard sphere particles of moderate sizes (1 µm ≤ 2a ≤ 50 µm) [38].
Additionally, particles with surface asperities possess greater interparticle friction than their
smooth counterparts [39,40] and this results in flow with greater hydrodynamic and contact
resistance under applied stress, especially at higher ϕ [33,41]. Soft particles, such as microgels
[42-44] and colloidal star polymers [45], do not jam unless packed to much higher volume
fractions (ϕJ → 1) because of their ability to deform or interpenetrate. Just as in the case of hard
spheres, their dynamical arrest and rheological properties are highly dependent on the distance of
ϕ from ϕJ.
A number of experimental challenges persist in obtaining a physically accurate value of
<z> even with hard sphere-like colloids. Conventionally, the contact distance is approximated as
the primary minimum in the radial distribution function, g(r) [46]. This is done to account for
uncertainties in the average particle-to-particle separation distance, which come from a few
58
sources: (a) sterically-stabilized particles tend to have surface-grafted polymer brushes, which
can adopt different conformations depending on the grafting density and the polymer-solvent
interactions [47] (Figure 2.1), (b) incomplete screening of the electrostatic repulsion gives rise to
a finite Debye screening length, and (c) most particles are polydisperse in size and surface
roughness. The effect of the contact distance in characterizing load-bearing colloidal packings
has been previously discussed in literature [48,49]. Due to the importance of contact
microstructure in particulate micromechanics, setting a contact criterion to establish an accurate
value of <z> near jamming is critical. Some of the earlier works to establish a contact criterion in
experimental systems include the use of black japan paint marks for packing of ball bearings [50]
and interfacial fluorescent dyes in an emulsion system [51]. These methods tend to be time
consuming and possess challenging surface chemistry modification in the case of experimental
hard sphere colloids, which are used as model systems for studying colloidal phase behavior and
rheology.
We report a method to extract the contact criterion from microscopy images of hard
sphere-like smooth and rough colloids suspended in a refractive index-matched solvent at ϕ >
0.10. The poly(methyl methacrylate) (PMMA) colloids are fluorescent and sterically stabilized
with a grafted layer of poly(12-hydroxystearic acid) (PHSA).[52,53] They are packed to a
jammed state, ϕJ, by high speed centrifugation, then diluted subsequently and imaged with a
confocal laser scanning microscope (CLSM). The resultant suspension microstructures are
compared to liquid state theory. Finally, we obtain the contact search distance by considering the
physical length scales between two neighboring particles and comparing our results with the
simulation data of Silbert for particles with varying pairwise friction coefficient, μp [54].
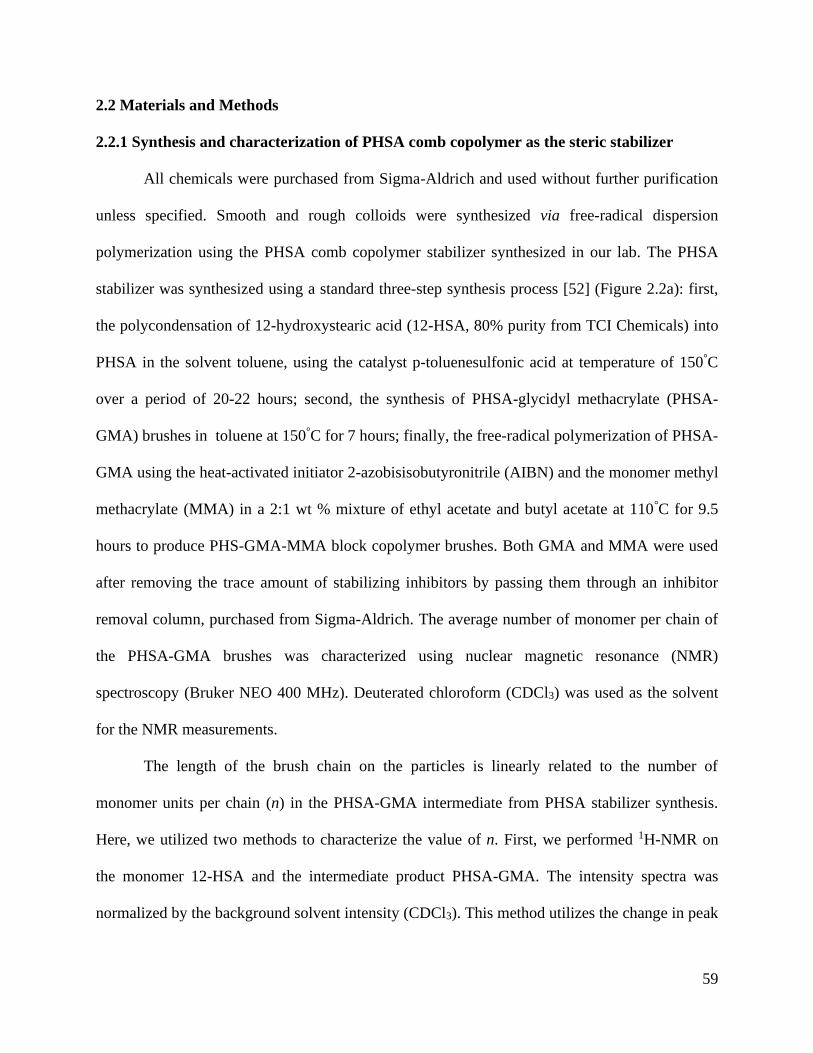
59
2.2 Materials and Methods
2.2.1 Synthesis and characterization of PHSA comb copolymer as the steric stabilizer
All chemicals were purchased from Sigma-Aldrich and used without further purification
unless specified. Smooth and rough colloids were synthesized via free-radical dispersion
polymerization using the PHSA comb copolymer stabilizer synthesized in our lab. The PHSA
stabilizer was synthesized using a standard three-step synthesis process [52] (Figure 2.2a): first,
the polycondensation of 12-hydroxystearic acid (12-HSA, 80% purity from TCI Chemicals) into
PHSA in the solvent toluene, using the catalyst p-toluenesulfonic acid at temperature of 150°C
over a period of 20-22 hours; second, the synthesis of PHSA-glycidyl methacrylate (PHSA-
GMA) brushes in toluene at 150°C for 7 hours; finally, the free-radical polymerization of PHSA-
GMA using the heat-activated initiator 2-azobisisobutyronitrile (AIBN) and the monomer methyl
methacrylate (MMA) in a 2:1 wt % mixture of ethyl acetate and butyl acetate at 110°C for 9.5
hours to produce PHS-GMA-MMA block copolymer brushes. Both GMA and MMA were used
after removing the trace amount of stabilizing inhibitors by passing them through an inhibitor
removal column, purchased from Sigma-Aldrich. The average number of monomer per chain of
the PHSA-GMA brushes was characterized using nuclear magnetic resonance (NMR)
spectroscopy (Bruker NEO 400 MHz). Deuterated chloroform (CDCl3) was used as the solvent
for the NMR measurements.
The length of the brush chain on the particles is linearly related to the number of
monomer units per chain (n) in the PHSA-GMA intermediate from PHSA stabilizer synthesis.
Here, we utilized two methods to characterize the value of n. First, we performed 1H-NMR on
the monomer 12-HSA and the intermediate product PHSA-GMA. The intensity spectra was
normalized by the background solvent intensity (CDCl3). This method utilizes the change in peak

60
signals for corresponding chemical shifts (δ) of the respective proton. In our case, these are
hydrogen atoms in the unreacted carbon atom (δ ~ 3.6 ppm) and the newly formed ester (δ ~ 4.8
ppm) in the 12-HSA and PHSA-GMA. As the polycondensation reaction proceeds, the former
peak decreases while the later peak increases, as shown in Figure 2.2b. The average number of
monomer units per chain ( ) was computed by integration of the peaks corresponding to the
ester and alcohol groups using the formula [53]:
1
11
1n
OH
ester
xn
n r
= +
+ −
(2.1)
Here, nOH and nester correspond to the number of alcohol and ester groups present in the
PHSA-GMA adduct. We obtained the ratio nester/nOH = 10.73 by integrating the intensities at
their peaks, and estimated the initial monomer purity, r, as 0.8975. Value of r for 80% pure 12-
HSA used in our synthesis was linearly interpolated from r-monomer purity data reported in
Palangetic et al. Substituting nester/nOH and r into equation (1) shows that = 5.586. To
independently verify the number of monomer units per PHSA copolymer chain, we estimated the
number of acid groups by titrating the PHSA adduct against 0.01 M potassium hydroxide (KOH)
solution, and found that the average number average molecular weight was = 1668 g/mol
and = 5.551. Previous studies reported that a length of 5-6 monomer units in PHSA is
equivalent to a stabilizer brush length of 10-15 nm [55]. Unlike the previous work (95%
purity)[53], we showed that PHSA stabilizer can be synthesized from a lower grade (80% purity)
12-HSA monomer.
nx
nx
nM
nx
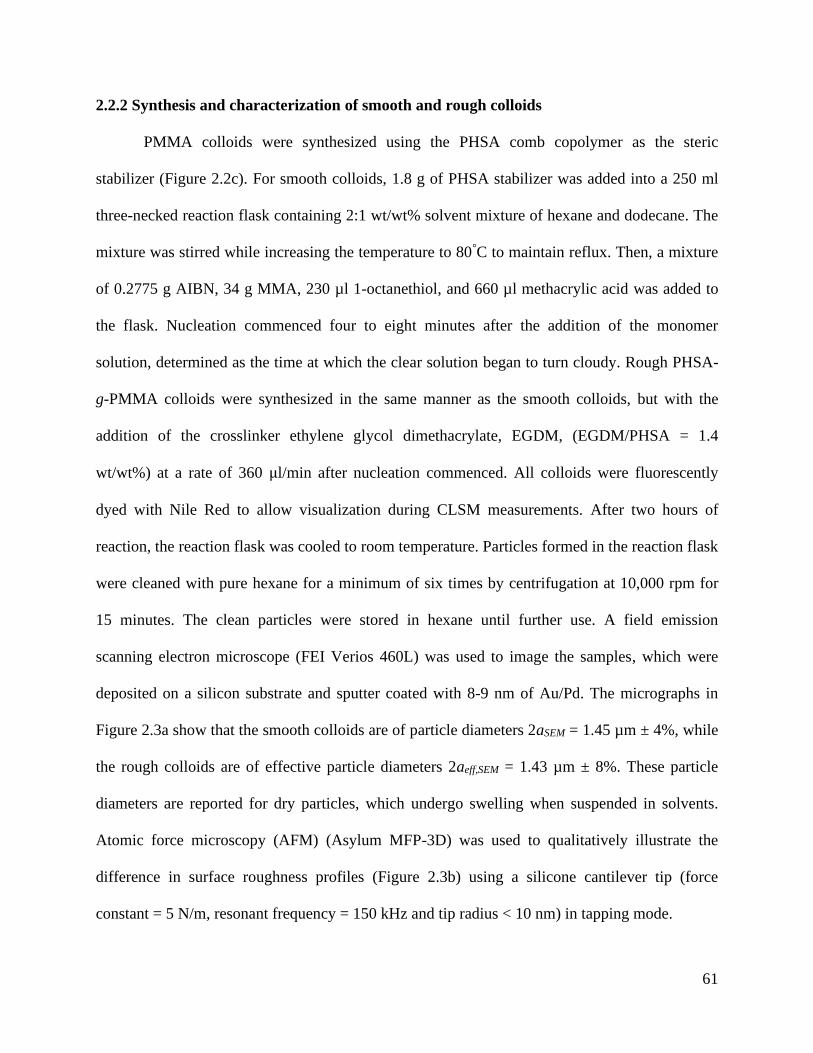
61
2.2.2 Synthesis and characterization of smooth and rough colloids
PMMA colloids were synthesized using the PHSA comb copolymer as the steric
stabilizer (Figure 2.2c). For smooth colloids, 1.8 g of PHSA stabilizer was added into a 250 ml
three-necked reaction flask containing 2:1 wt/wt% solvent mixture of hexane and dodecane. The
mixture was stirred while increasing the temperature to 80°C to maintain reflux. Then, a mixture
of 0.2775 g AIBN, 34 g MMA, 230 µl 1-octanethiol, and 660 µl methacrylic acid was added to
the flask. Nucleation commenced four to eight minutes after the addition of the monomer
solution, determined as the time at which the clear solution began to turn cloudy. Rough PHSA-
g-PMMA colloids were synthesized in the same manner as the smooth colloids, but with the
addition of the crosslinker ethylene glycol dimethacrylate, EGDM, (EGDM/PHSA = 1.4
wt/wt%) at a rate of 360 μl/min after nucleation commenced. All colloids were fluorescently
dyed with Nile Red to allow visualization during CLSM measurements. After two hours of
reaction, the reaction flask was cooled to room temperature. Particles formed in the reaction flask
were cleaned with pure hexane for a minimum of six times by centrifugation at 10,000 rpm for
15 minutes. The clean particles were stored in hexane until further use. A field emission
scanning electron microscope (FEI Verios 460L) was used to image the samples, which were
deposited on a silicon substrate and sputter coated with 8-9 nm of Au/Pd. The micrographs in
Figure 2.3a show that the smooth colloids are of particle diameters 2aSEM = 1.45 µm ± 4%, while
the rough colloids are of effective particle diameters 2aeff,SEM = 1.43 µm ± 8%. These particle
diameters are reported for dry particles, which undergo swelling when suspended in solvents.
Atomic force microscopy (AFM) (Asylum MFP-3D) was used to qualitatively illustrate the
difference in surface roughness profiles (Figure 2.3b) using a silicone cantilever tip (force
constant = 5 N/m, resonant frequency = 150 kHz and tip radius < 10 nm) in tapping mode.

62
2.2.3 Preparation of colloidal suspensions
Dense colloidal suspensions were prepared by performing a solvent transfer of the
PMMA particles into squalene (viscosity η = 12 cP at 25°C). Particles are charge neutral in this
solvent and exhibit hard sphere-like behavior. The solvent is refractive index-matched with the
particles (refractive index nPMMA = 1.49 and nsqualene = 1.49), which reduces scattering in 3D
CLSM and minimizes the van der Waals attractions between the colloids. There is a density
mismatch of Δρ = 0.322 g/cm3 between the particles and the solvent (density ρPMMA = 1.18 g/cm3
and ρsqualene = 0.858 g/cm3). The density mismatch was used to generate colloidal suspensions at
maximum packing by centrifuging the suspensions at high speeds until the particles completely
settled to the bottom of the centrifuge tubes [56]. It should be noted that our protocol shifts the
maximum random close packing (ϕRCP) to a lower shear-jammed value (ϕJ), which is process-
and µp-dependent [57-59]. The Péclet number for sedimentation, Peg = 4πa4Δρg/3kBT, is a
dimensionless number that defines the ratio of the sedimentation rate to the rate of Brownian
motion. Centrifugation was performed at Peg = 1400 to avoid crystallization of the monodisperse
colloids.[60] After removal of excess solvent, the compacted samples were diluted from ϕJ by
gradual addition of known small volumes of squalene. Diluted suspensions were tumbled in vials
at 3 rpm for a minimum of one week to achieve even re-dispersion. For smooth colloids, the
volume fraction ϕdilution was computed from the ratio of ϕdilution = Vp/(Vp+Vs’), where Vs’ = Vs+V’.
Here, VP and VS are the volume of particles and solvent at known ϕJ calculated from mass
balance, and V’ is the additional volume of solvent added for dilution from ϕJ.. This method was
used to generate suspensions of smooth and rough colloids with 0.1 ≤ ϕ ≤ ϕJ.
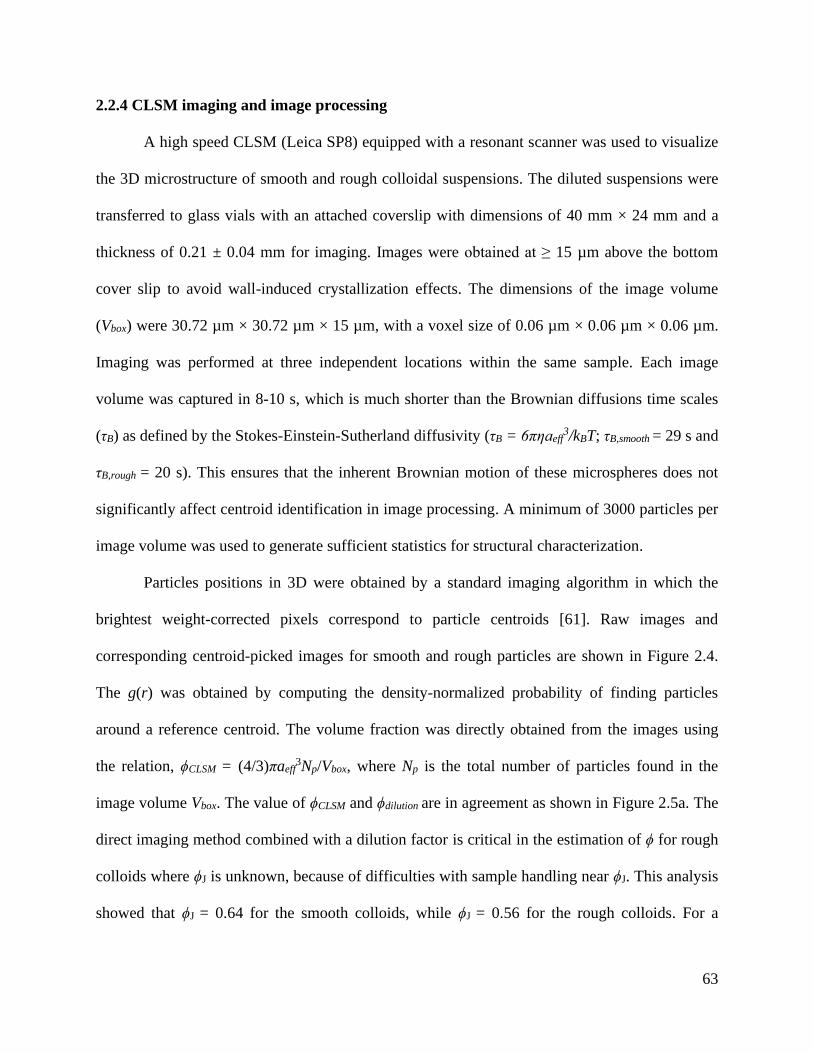
63
2.2.4 CLSM imaging and image processing
A high speed CLSM (Leica SP8) equipped with a resonant scanner was used to visualize
the 3D microstructure of smooth and rough colloidal suspensions. The diluted suspensions were
transferred to glass vials with an attached coverslip with dimensions of 40 mm × 24 mm and a
thickness of 0.21 ± 0.04 mm for imaging. Images were obtained at ≥ 15 µm above the bottom
cover slip to avoid wall-induced crystallization effects. The dimensions of the image volume
(Vbox) were 30.72 µm × 30.72 µm × 15 µm, with a voxel size of 0.06 µm × 0.06 µm × 0.06 µm.
Imaging was performed at three independent locations within the same sample. Each image
volume was captured in 8-10 s, which is much shorter than the Brownian diffusions time scales
(τB) as defined by the Stokes-Einstein-Sutherland diffusivity (τB = 6πƞaeff3/kBT; τB,smooth = 29 s and
τB,rough = 20 s). This ensures that the inherent Brownian motion of these microspheres does not
significantly affect centroid identification in image processing. A minimum of 3000 particles per
image volume was used to generate sufficient statistics for structural characterization.
Particles positions in 3D were obtained by a standard imaging algorithm in which the
brightest weight-corrected pixels correspond to particle centroids [61]. Raw images and
corresponding centroid-picked images for smooth and rough particles are shown in Figure 2.4.
The g(r) was obtained by computing the density-normalized probability of finding particles
around a reference centroid. The volume fraction was directly obtained from the images using
the relation, ϕCLSM = (4/3)πaeff3Np/Vbox, where Np is the total number of particles found in the
image volume Vbox. The value of ϕCLSM and ϕdilution are in agreement as shown in Figure 2.5a. The
direct imaging method combined with a dilution factor is critical in the estimation of ϕ for rough
colloids where ϕJ is unknown, because of difficulties with sample handling near ϕJ. This analysis
showed that ϕJ = 0.64 for the smooth colloids, while ϕJ = 0.56 for the rough colloids. For a
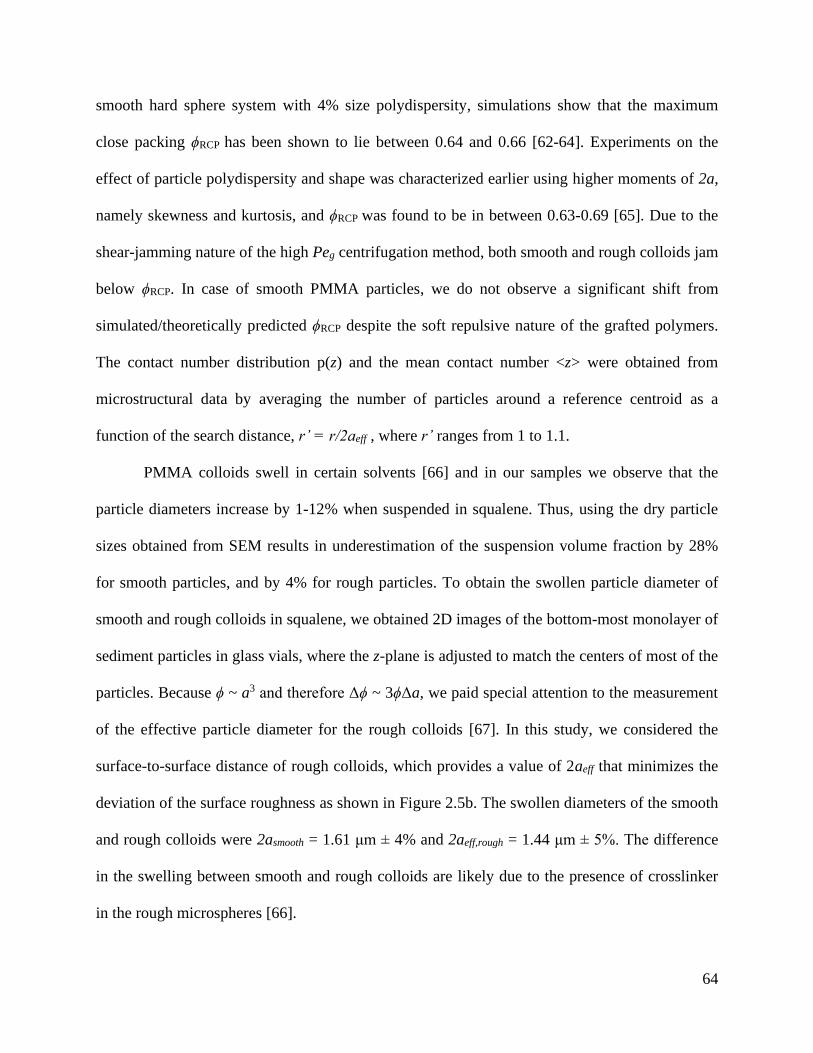
64
smooth hard sphere system with 4% size polydispersity, simulations show that the maximum
close packing ϕRCP has been shown to lie between 0.64 and 0.66 [62-64]. Experiments on the
effect of particle polydispersity and shape was characterized earlier using higher moments of 2a,
namely skewness and kurtosis, and ϕRCP was found to be in between 0.63-0.69 [65]. Due to the
shear-jamming nature of the high Peg centrifugation method, both smooth and rough colloids jam
below ϕRCP. In case of smooth PMMA particles, we do not observe a significant shift from
simulated/theoretically predicted ϕRCP despite the soft repulsive nature of the grafted polymers.
The contact number distribution p(z) and the mean contact number <z> were obtained from
microstructural data by averaging the number of particles around a reference centroid as a
function of the search distance, r’ = r/2aeff , where r’ ranges from 1 to 1.1.
PMMA colloids swell in certain solvents [66] and in our samples we observe that the
particle diameters increase by 1-12% when suspended in squalene. Thus, using the dry particle
sizes obtained from SEM results in underestimation of the suspension volume fraction by 28%
for smooth particles, and by 4% for rough particles. To obtain the swollen particle diameter of
smooth and rough colloids in squalene, we obtained 2D images of the bottom-most monolayer of
sediment particles in glass vials, where the z-plane is adjusted to match the centers of most of the
particles. Because ϕ ~ a3 and therefore Δϕ ~ 3ϕΔa, we paid special attention to the measurement
of the effective particle diameter for the rough colloids [67]. In this study, we considered the
surface-to-surface distance of rough colloids, which provides a value of 2aeff that minimizes the
deviation of the surface roughness as shown in Figure 2.5b. The swollen diameters of the smooth
and rough colloids were 2asmooth = 1.61 μm ± 4% and 2aeff,rough = 1.44 μm ± 5%. The difference
in the swelling between smooth and rough colloids are likely due to the presence of crosslinker
in the rough microspheres [66].
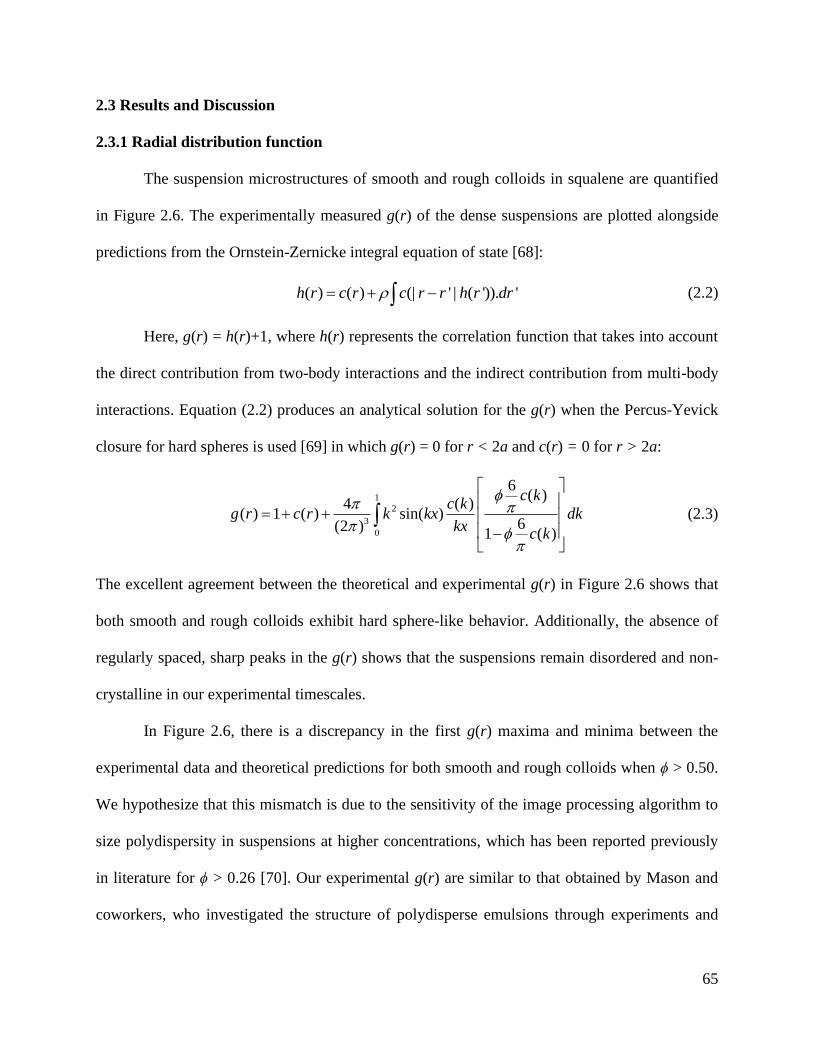
65
2.3 Results and Discussion
2.3.1 Radial distribution function
The suspension microstructures of smooth and rough colloids in squalene are quantified
in Figure 2.6. The experimentally measured g(r) of the dense suspensions are plotted alongside
predictions from the Ornstein-Zernicke integral equation of state [68]:
( ) ( ) (| ' | ( ')). 'h r c r c r r h r dr= + − (2.2)
Here, g(r) = h(r)+1, where h(r) represents the correlation function that takes into account
the direct contribution from two-body interactions and the indirect contribution from multi-body
interactions. Equation (2.2) produces an analytical solution for the g(r) when the Percus-Yevick
closure for hard spheres is used [69] in which g(r) = 0 for r < 2a and c(r) = 0 for r > 2a:
1
2
3
0
6( )
4 ( )( ) 1 ( ) sin( )
6(2 )1 ( )
c kc k
g r c r k kx dkkx
c k
= + + −
(2.3)
The excellent agreement between the theoretical and experimental g(r) in Figure 2.6 shows that
both smooth and rough colloids exhibit hard sphere-like behavior. Additionally, the absence of
regularly spaced, sharp peaks in the g(r) shows that the suspensions remain disordered and non-
crystalline in our experimental timescales.
In Figure 2.6, there is a discrepancy in the first g(r) maxima and minima between the
experimental data and theoretical predictions for both smooth and rough colloids when ϕ > 0.50.
We hypothesize that this mismatch is due to the sensitivity of the image processing algorithm to
size polydispersity in suspensions at higher concentrations, which has been reported previously
in literature for ϕ > 0.26 [70]. Our experimental g(r) are similar to that obtained by Mason and
coworkers, who investigated the structure of polydisperse emulsions through experiments and
66
Brownian Dynamics simulations [71]. To verify that the variation in our case does not
undercount Np and the mean contacts, we apply a similar concept from atomic liquids where the
the total number of particles in the first coordination shell, N, is computed using the integral,
where ρ is the number density of particles. Specifically, N particles fill the
volume around the first coordination shell as defined by the primary minimum (rmin) of g(r).
Since colloids are thought to be "model atoms", N was conventionally used to obtain the mean
contact number [72-75]. While the concept of coordination number is useful in describing the
structure of dense liquid phase [76], it is not the same as the number of direct particle-particle
contacts, which is required to establish the contact criterion required for mechanical stability.
Nonetheless, we know that N from both experimental and theoretical g(r) for the same ϕ should
match. We use this idea to comment on the accuracy of our experimental g(r). We estimate N by
discretizing the above integral as , where Δr is the binned intervals of the discretized
g(r). For a smooth suspension of ϕ = 0.57, we obtain N as 10.8 and 11.9, from experimental and
theoretical g(r), respectively. The small differences may be due to bin-size sensitivity in
discretizing the integration and approximation of the integral as . We
conclude that even though our image processing is sensitive to polydispersity at higher ϕ, the
algorithm does not undercount Np in the 3D image volumes.
2
0
4 ( )r g r dr N
min
2
0
( )r
i i
r
g r r r=
min
2
0
4 ( ) 1
r
r g r dr N N = −
67
2.3.2 Physical rationale of the contact cutoff distance and verification with simulations
We define r' as the additional length scale beyond that of the swollen particle diameter
that determines contact between two particles. It is obtained by propagating the uncertainties
introduced by size polydispersity, the length of the PHSA steric layer on particle surfaces, and
the average length scale of the asperities present on the rough colloids. We first discuss the
results obtained from using this contact criterion on dense suspensions of smooth colloids. The
true swollen particle diameter is given as 2atrue = 2(a+l), where l is the length of PHSA brush.
Uncertainty propagation in particle size estimation is given by Δ2atrue = [(Δ2a)2+(Δl)2]1/2. Since
2a = 1.62 µm for the smooth colloids, combining the uncertainty from particle polydispersity (±
0.06 µm) and the uncertainty from PHSA brush length measurements from the literature for 5-6
monomer units (± 6 nm) [55,77-79] yields a total uncertainty of 4%. This method suggests that a
value of r' = 1.04 defines contact between smooth colloids. The uncertainty in 2aeff for rough
colloids includes the added length scale from the surface bumps, which is also inherent in the
size polydispersity due to the method with which we obtained particle diameters. The rough
colloids have a size polydispersity of ± 0.07 µm. Here, we do not use the roughness length scale
or the interparticle friction for this set of particles. As in the case of smooth colloids, addition of
the uncertainty from PHSA brush length yields an overall size uncertainty of 5%. This
establishes the contact criterion as r’ = 1.05 for the rough colloids.
To verify that these values of r' represent the correct contact physics found in dense
colloidal suspensions, we first obtain <z> of all suspensions generated with different r' values.
Then, we extrapolate <z>to ϕJ using and empirical fit and compare the mean contact numner at
the shear jammed condition with simulated <z>J values for frictionless and frictional spheres in
the absence of solvent hydrodynamics [54]. Mechanical isostaticity, which controls the jammed
68
state at RCP, dictates that <z>RCP = 6 for smooth or frictionless particles. Our smooth particles
can be assumed as frictionless because we showed earlier that the experimentally calculated ϕJ
and the theoretically established ϕRCP are very close to each other. The concept of isostaticity at
RCP justifies extrapolation of the data for smooth colloids to ϕJ, where the experimental value of
<z>J is expected to be six. The benchmarking against predicted values of <z>J for smooth
(frictionless) and rough (frictional) colloids is used to generate an independent validation of the
experimental contact criterion r'.
Surface anisotropy in the form of microscale bumps is thought to cause interlocking
hindrance, which is a form of geometric friction caused by the inability of rough colloids to
rotate freely in the solvent. This concept is supported by our earlier experimental observations
that the rotational dynamics of rough colloids was far slower than that predicted by Stokesian
Dynamics simulations [40]. We used this idea to determine if the physical rationale behind the
value of of r' is correct by comparing the value of <z>J obtained with different r' for smooth and
rough colloids with the results from friction-dependent simulations of monodisperse granular
spheres. The computer simulations of Silbert [54] probed the packing microstructure and force
chains of a 3D packing of inelastic soft spheres that was first quenched by overcompression
beyond jamming point, then brought back to the point of isostaticity by expanding the box and
allowing ϕ → ϕJ. The protocol was repeated with the addition of a Coulomb friction criterion
between spheres. Silbert described two interesting observations: first, the value of ϕJ decreased
from 0.64 to 0.55 when the interparticle friction µp increased from 0.001 to 10; second, the
distribution of contact stresses depended on µp and the history of the packing. Furthermore, the
reduction in ϕJ with the increased frictional constraint between particles was accompanied by a
corresponding reduction in <z>J from six to four, which we reproduce in Figure 2.7 for
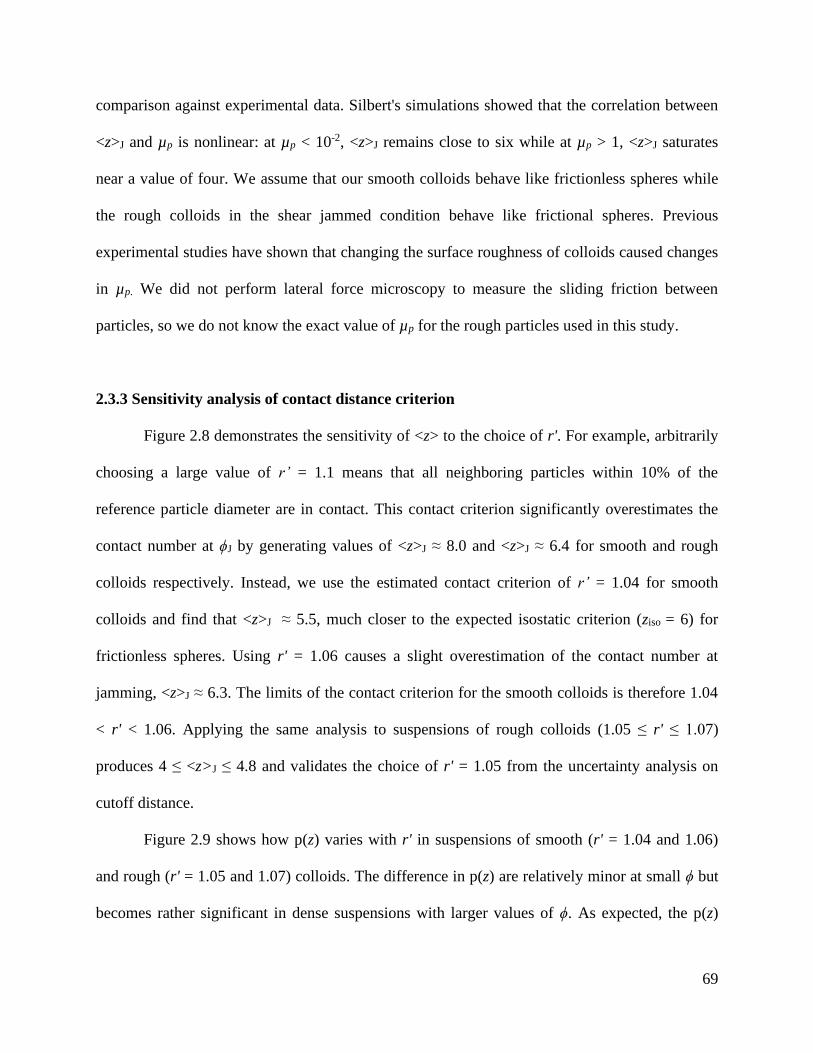
69
comparison against experimental data. Silbert's simulations showed that the correlation between
<z>J and µp is nonlinear: at µp < 10-2, <z>J remains close to six while at µp > 1, <z>J saturates
near a value of four. We assume that our smooth colloids behave like frictionless spheres while
the rough colloids in the shear jammed condition behave like frictional spheres. Previous
experimental studies have shown that changing the surface roughness of colloids caused changes
in µp. We did not perform lateral force microscopy to measure the sliding friction between
particles, so we do not know the exact value of µp for the rough particles used in this study.
2.3.3 Sensitivity analysis of contact distance criterion
Figure 2.8 demonstrates the sensitivity of <z> to the choice of r'. For example, arbitrarily
choosing a large value of r’ = 1.1 means that all neighboring particles within 10% of the
reference particle diameter are in contact. This contact criterion significantly overestimates the
contact number at ϕJ by generating values of <z>J ≈ 8.0 and <z>J ≈ 6.4 for smooth and rough
colloids respectively. Instead, we use the estimated contact criterion of r’ = 1.04 for smooth
colloids and find that <z>J ≈ 5.5, much closer to the expected isostatic criterion (ziso = 6) for
frictionless spheres. Using r' = 1.06 causes a slight overestimation of the contact number at
jamming, <z>J ≈ 6.3. The limits of the contact criterion for the smooth colloids is therefore 1.04
< r' < 1.06. Applying the same analysis to suspensions of rough colloids (1.05 ≤ r' ≤ 1.07)
produces 4 ≤ <z>J ≤ 4.8 and validates the choice of r' = 1.05 from the uncertainty analysis on
cutoff distance.
Figure 2.9 shows how p(z) varies with r' in suspensions of smooth (r' = 1.04 and 1.06)
and rough (r' = 1.05 and 1.07) colloids. The difference in p(z) are relatively minor at small ϕ but
becomes rather significant in dense suspensions with larger values of ϕ. As expected, the p(z)
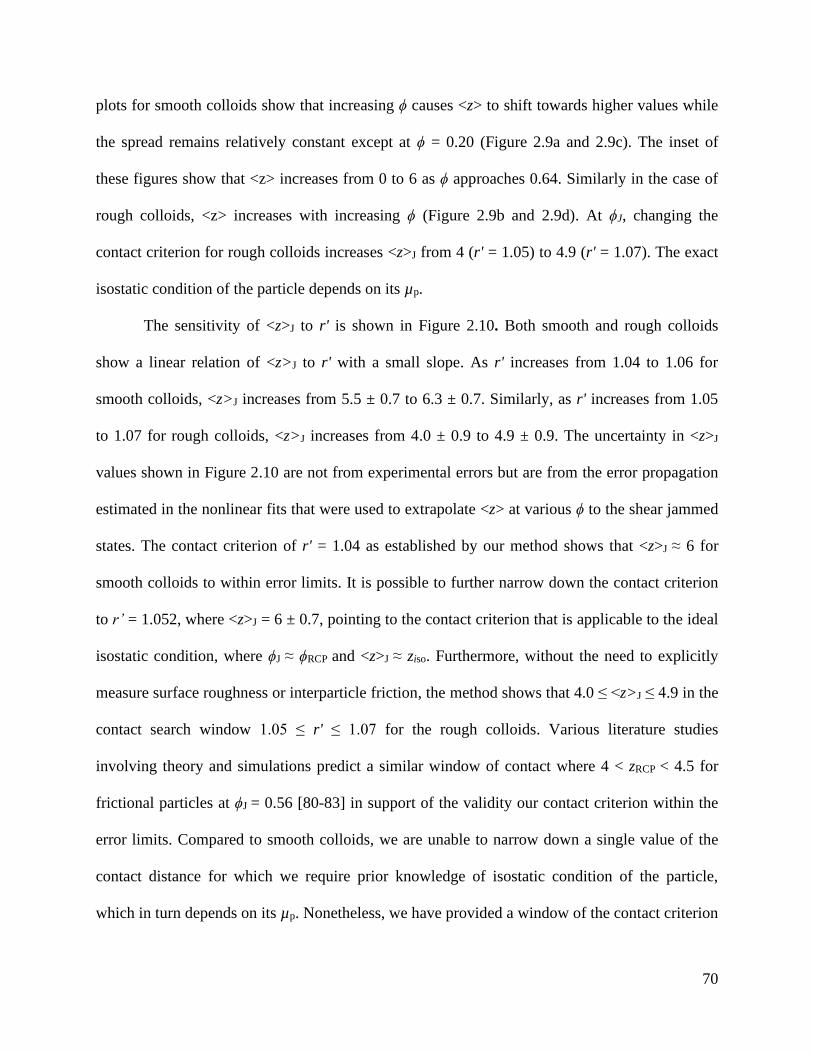
70
plots for smooth colloids show that increasing ϕ causes <z> to shift towards higher values while
the spread remains relatively constant except at ϕ = 0.20 (Figure 2.9a and 2.9c). The inset of
these figures show that <z> increases from 0 to 6 as ϕ approaches 0.64. Similarly in the case of
rough colloids, <z> increases with increasing ϕ (Figure 2.9b and 2.9d). At ϕJ, changing the
contact criterion for rough colloids increases <z>J from 4 (r' = 1.05) to 4.9 (r' = 1.07). The exact
isostatic condition of the particle depends on its µp.
The sensitivity of <z>J to r' is shown in Figure 2.10. Both smooth and rough colloids
show a linear relation of <z>J to r' with a small slope. As r' increases from 1.04 to 1.06 for
smooth colloids, <z>J increases from 5.5 ± 0.7 to 6.3 ± 0.7. Similarly, as r' increases from 1.05
to 1.07 for rough colloids, <z>J increases from 4.0 ± 0.9 to 4.9 ± 0.9. The uncertainty in <z>J
values shown in Figure 2.10 are not from experimental errors but are from the error propagation
estimated in the nonlinear fits that were used to extrapolate <z> at various ϕ to the shear jammed
states. The contact criterion of r' = 1.04 as established by our method shows that <z>J ≈ 6 for
smooth colloids to within error limits. It is possible to further narrow down the contact criterion
to r’ = 1.052, where <z>J = 6 ± 0.7, pointing to the contact criterion that is applicable to the ideal
isostatic condition, where ϕJ ≈ ϕRCP and <z>J ≈ ziso. Furthermore, without the need to explicitly
measure surface roughness or interparticle friction, the method shows that 4.0 ≤ <z>J ≤ 4.9 in the
contact search window 1.05 ≤ r' ≤ 1.07 for the rough colloids. Various literature studies
involving theory and simulations predict a similar window of contact where 4 < zRCP < 4.5 for
frictional particles at ϕJ = 0.56 [80-83] in support of the validity our contact criterion within the
error limits. Compared to smooth colloids, we are unable to narrow down a single value of the
contact distance for which we require prior knowledge of isostatic condition of the particle,
which in turn depends on its µp. Nonetheless, we have provided a window of the contact criterion
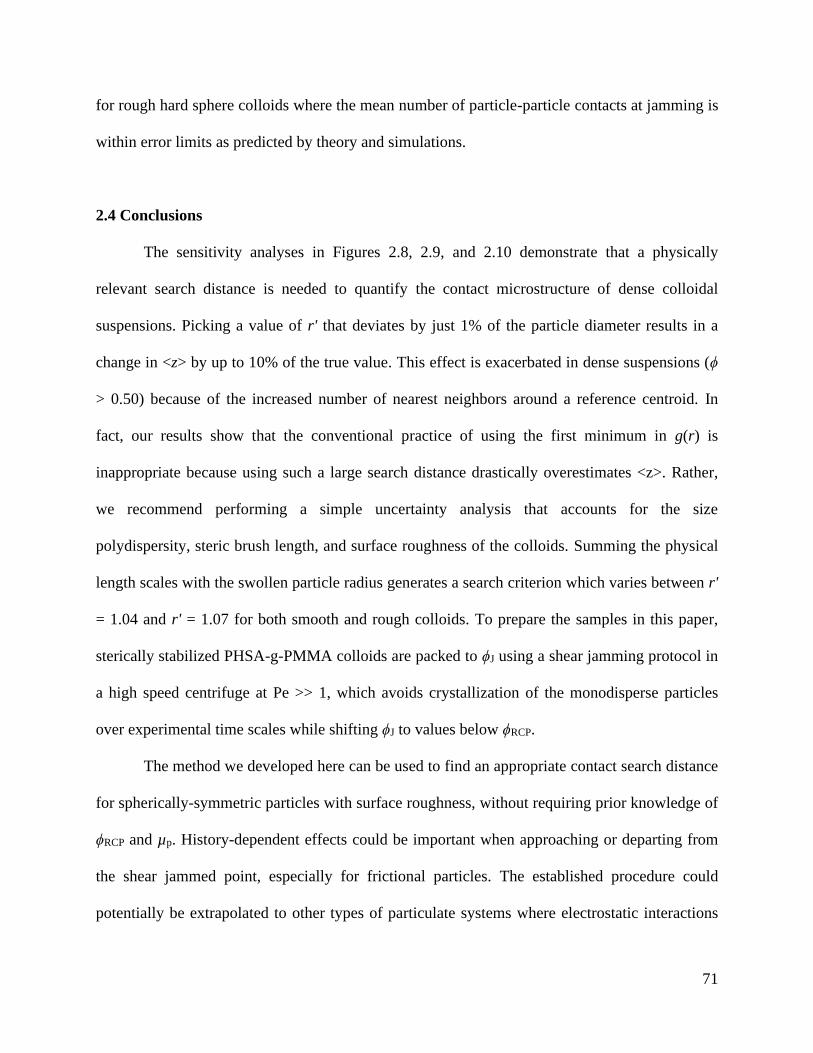
71
for rough hard sphere colloids where the mean number of particle-particle contacts at jamming is
within error limits as predicted by theory and simulations.
2.4 Conclusions
The sensitivity analyses in Figures 2.8, 2.9, and 2.10 demonstrate that a physically
relevant search distance is needed to quantify the contact microstructure of dense colloidal
suspensions. Picking a value of r' that deviates by just 1% of the particle diameter results in a
change in <z> by up to 10% of the true value. This effect is exacerbated in dense suspensions (ϕ
> 0.50) because of the increased number of nearest neighbors around a reference centroid. In
fact, our results show that the conventional practice of using the first minimum in g(r) is
inappropriate because using such a large search distance drastically overestimates <z>. Rather,
we recommend performing a simple uncertainty analysis that accounts for the size
polydispersity, steric brush length, and surface roughness of the colloids. Summing the physical
length scales with the swollen particle radius generates a search criterion which varies between r'
= 1.04 and r' = 1.07 for both smooth and rough colloids. To prepare the samples in this paper,
sterically stabilized PHSA-g-PMMA colloids are packed to ϕJ using a shear jamming protocol in
a high speed centrifuge at Pe >> 1, which avoids crystallization of the monodisperse particles
over experimental time scales while shifting ϕJ to values below ϕRCP.
The method we developed here can be used to find an appropriate contact search distance
for spherically-symmetric particles with surface roughness, without requiring prior knowledge of
ϕRCP and µp. History-dependent effects could be important when approaching or departing from
the shear jammed point, especially for frictional particles. The established procedure could
potentially be extrapolated to other types of particulate systems where electrostatic interactions
72
play a role, or in predicting the jamming threshold for biological systems and geological soils
[84,85].
Acknowledgements. The authors thank Dr. Alan Jacob, Prof. Karen Daniels, and Prof. Eric
Weeks for advice and discussion. We acknowledge the Analytical Instrumentation Facility (AIF)
at NC State University for SEM and AFM facilities. This work is supported in part by the
National Science Foundation (NSF CBET-1804462), the American Chemical Society Petroleum
Research Fund (#59208-DNI9), and North Carolina State University startup funds.

73
Figure 2.1 | When do experimental colloidal systems contact? Differences in the pairwise
interaction potential between theoretical and experimental hard-sphere systems. The
experimental system consists of poly(methyl methacrylate) colloids sterically stabilized with a
thin layer of poly(12-hydroxystearic acid).
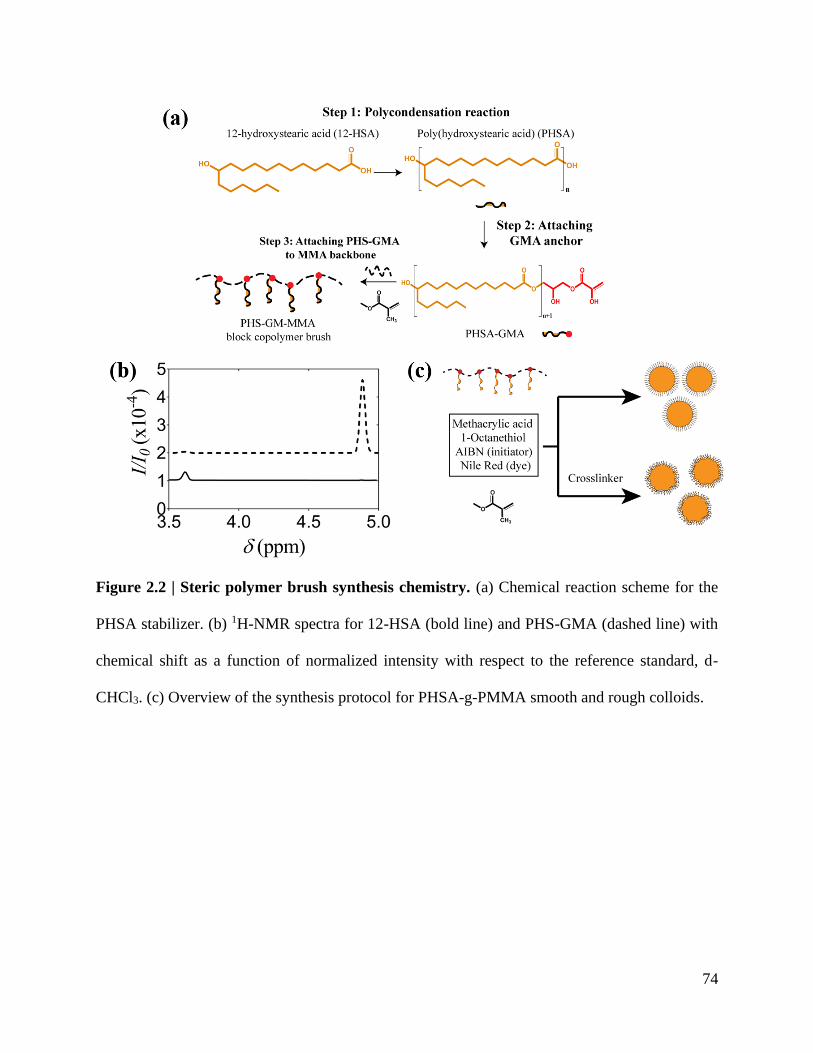
74
Figure 2.2 | Steric polymer brush synthesis chemistry. (a) Chemical reaction scheme for the
PHSA stabilizer. (b) 1H-NMR spectra for 12-HSA (bold line) and PHS-GMA (dashed line) with
chemical shift as a function of normalized intensity with respect to the reference standard, d-
CHCl3. (c) Overview of the synthesis protocol for PHSA-g-PMMA smooth and rough colloids.
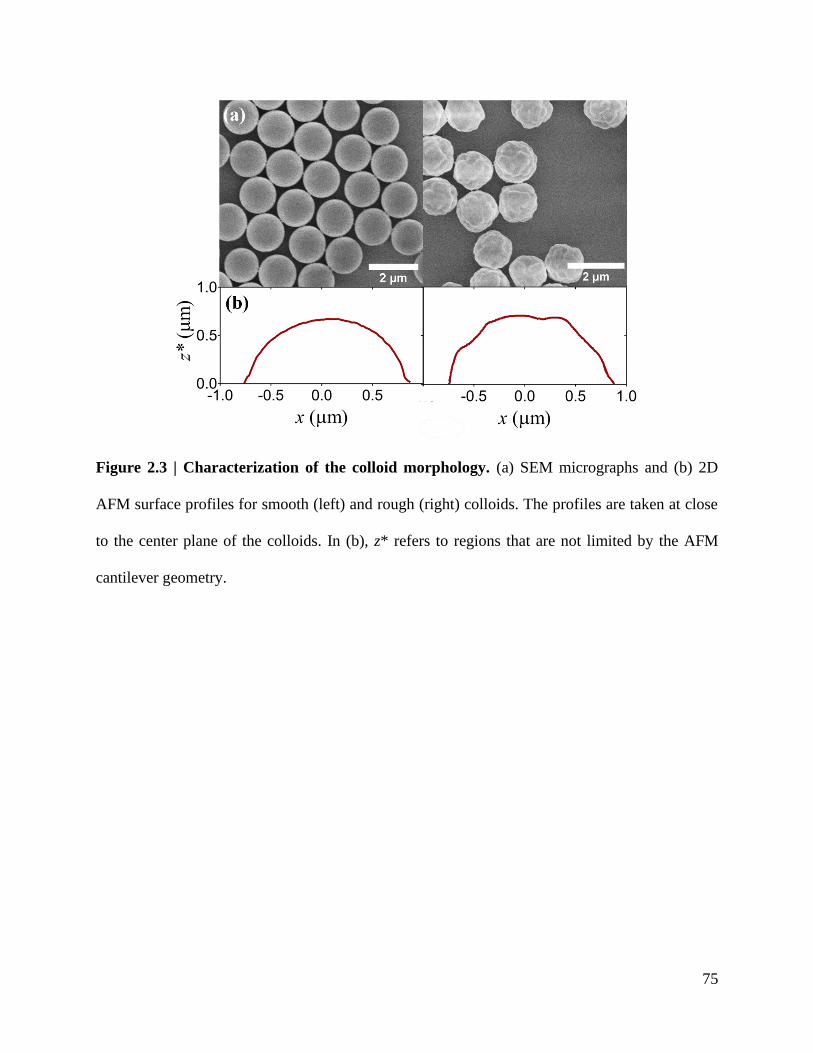
75
Figure 2.3 | Characterization of the colloid morphology. (a) SEM micrographs and (b) 2D
AFM surface profiles for smooth (left) and rough (right) colloids. The profiles are taken at close
to the center plane of the colloids. In (b), z* refers to regions that are not limited by the AFM
cantilever geometry.
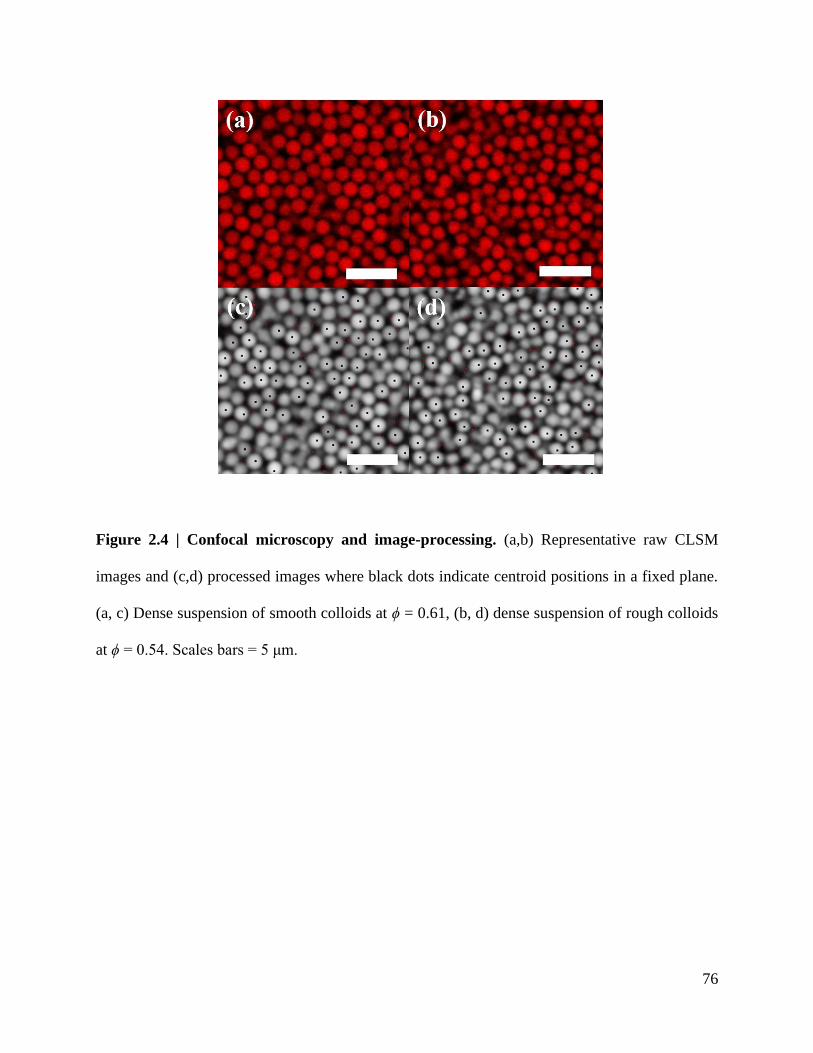
76
Figure 2.4 | Confocal microscopy and image-processing. (a,b) Representative raw CLSM
images and (c,d) processed images where black dots indicate centroid positions in a fixed plane.
(a, c) Dense suspension of smooth colloids at ϕ = 0.61, (b, d) dense suspension of rough colloids
at ϕ = 0.54. Scales bars = 5 μm.
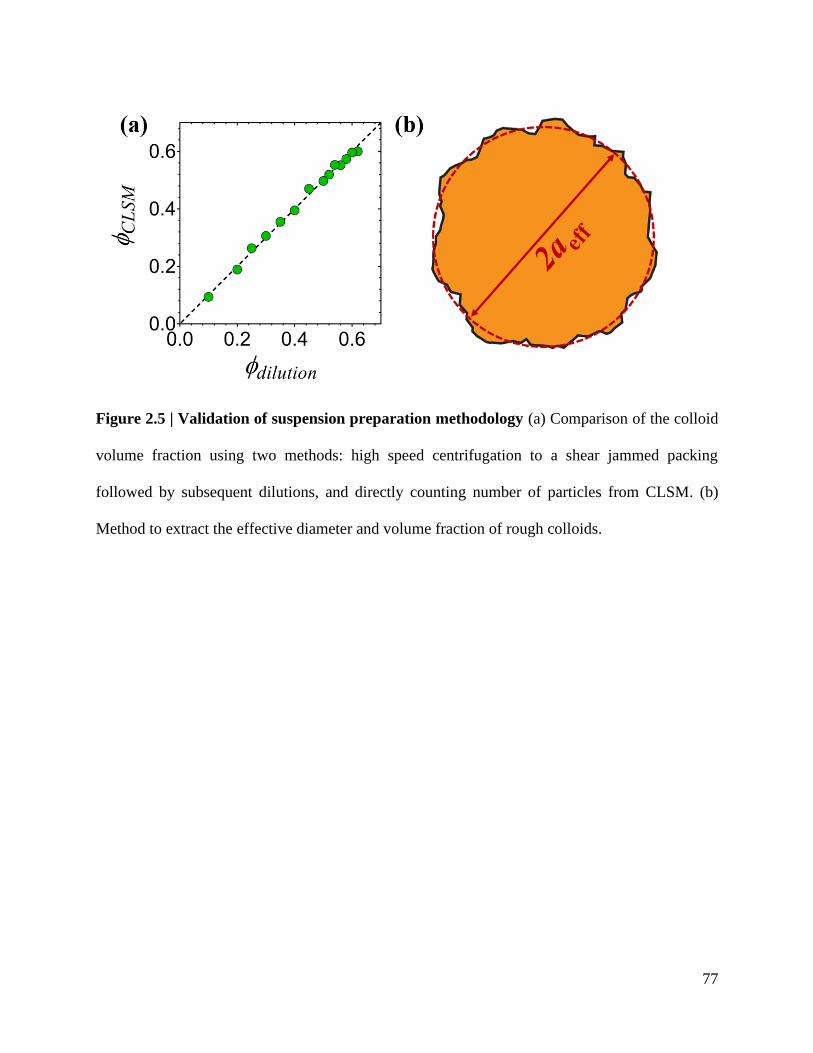
77
Figure 2.5 | Validation of suspension preparation methodology (a) Comparison of the colloid
volume fraction using two methods: high speed centrifugation to a shear jammed packing
followed by subsequent dilutions, and directly counting number of particles from CLSM. (b)
Method to extract the effective diameter and volume fraction of rough colloids.
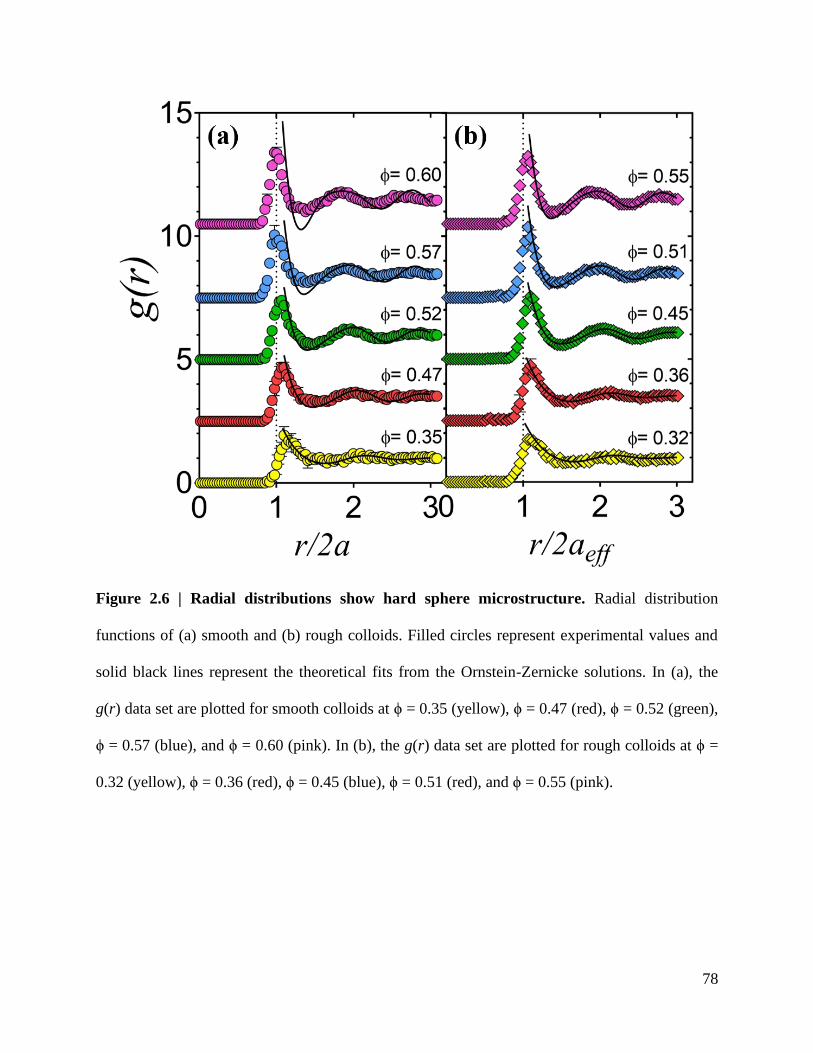
78
Figure 2.6 | Radial distributions show hard sphere microstructure. Radial distribution
functions of (a) smooth and (b) rough colloids. Filled circles represent experimental values and
solid black lines represent the theoretical fits from the Ornstein-Zernicke solutions. In (a), the
g(r) data set are plotted for smooth colloids at ϕ = 0.35 (yellow), ϕ = 0.47 (red), ϕ = 0.52 (green),
ϕ = 0.57 (blue), and ϕ = 0.60 (pink). In (b), the g(r) data set are plotted for rough colloids at ϕ =
0.32 (yellow), ϕ = 0.36 (red), ϕ = 0.45 (blue), ϕ = 0.51 (red), and ϕ = 0.55 (pink).

79
Figure 2.7 | Comparing experimental jamming contact with simulation data. The contact
number at jamming plotted against the volume fraction at jamming, which is a function of the
interparticle friction. Filled squares are data adapted from simulations of Silbert.[54] A dotted
line is drawn to guide the eye. Open symbols represent experimental data for smooth (circle) and
rough (diamond) colloids. The experimental zJ values are obtained by using r’ = 1.04 for smooth
colloids and r’ = 1.05 for rough colloids. Color gradient indicates transition from frictionless
(red) to infinite friction (blue) regime. Inset: Sketch of smooth and rough PMMA particles with
PHSA brushes for illustration purposes.

80
Figure 2.8 | Mean contact number as a function of contact search distances. Plot of the mean
contact number as a function of ϕ for (a) smooth and (b) rough colloids. Shaded regions indicate
a range of <z> values for different search distances used. The upper limit is for r’ = 1.1 and the
lower limit is for r’ = 1.0. Dashed lines indicate predictions for isostatic packings of (a)
frictionless and (b) frictional particles adapted from ref. 46. (Silbert, 2010).

81
Figure 2.9 | Contact number distributions for dense suspensions. (a, c) Contact number
distributions for smooth colloids obtained by setting (a) r’ = 1.04 and (c) r’ = 1.06. (b, d) Contact
number distributions for rough colloids obtained by setting (b) r’ = 1.05 and (d) r’ = 1.07. For
smooth colloids, the data sets consist of suspensions at ϕ = 0.20 (red), ϕ = 0.35 (dark blue), ϕ =
0.50 (green), ϕ = 0.55 (pink), and ϕ = 0.60 (aqua). For rough colloids, the data sets consist of
suspensions at ϕ = 0.20 (red), ϕ = 0.40 (dark blue), ϕ = 0.47 (green), ϕ = 0.52 (pink), and ϕ =
0.55 (aqua). Insets: Mean contact number of smooth colloids with (a) r’ = 1.04 and (c) r’ = 1.06
and rough colloids with (b) r’ = 1.05 and (d) r’ = 1.07.

82
Figure 2.10 | Sensitivity analysis for contact criterion. Sensitivity analysis plot shows how zJ
varies as a function of r’ for smooth (red circles) and rough (blue diamonds) colloids at their
respective extrapolated values of ϕJ. Dotted lines represent isostatic conditions for frictionless (zJ
= 6, μp = 0) and frictional (zJ = 4, μp → ∞) particles.
83
References
[1] J. J. Stickel and R. L. Powell, Annual Review of Fluid Mechanics 37, 129 (2005).
[2] M. van Hecke, Journal of Physics: Condensed Matter 22, 033101 (2009).
[3] J.-A. Park et al., Nat Mater 14, 1040 (2015).
[4] J. M. Pastor et al., Phys Rev E 92, 062817 (2015).
[5] I. Zuriguel, A. Garcimartín, D. Maza, L. A. Pugnaloni, and J. M. Pastor, Phys Rev E 71,
051303 (2005).
[6] A. J. Liu and S. R. Nagel, Nature 396, 21 (1998).
[7] C. S. O’Hern, L. E. Silbert, A. J. Liu, and S. R. Nagel, Physical Review E 68, 011306
(2003).
[8] M. E. Cates, J. P. Wittmer, J. P. Bouchaud, and P. Claudin, Physical Review Letters 81,
1841 (1998).
[9] T. S. Majmudar and R. P. Behringer, Nature 435, 1079 (2005).
[10] S. Henkes and B. Chakraborty, Phys Rev E 79, 061301 (2009).
[11] J. E. Thomas, K. Ramola, A. Singh, R. Mari, J. F. Morris, and B. Chakraborty, Physical
Review Letters 121, 128002 (2018).
[12] R. Radhakrishnan, J. R. Royer, W. C. K. Poon, and J. Sun, Granular Matter 22, 29
(2020).
[13] K. A. Whitaker, Z. Varga, L. C. Hsiao, M. J. Solomon, J. W. Swan, and E. M. Furst,
Nature Communications 10, 2237 (2019).
[14] R. N. Zia, B. J. Landrum, and W. B. Russel, Journal of Rheology 58, 1121 (2014).
[15] S. Jamali, G. H. McKinley, and R. C. Armstrong, Phys Rev Lett 118, 048003 (2017).
[16] A. Zaccone, H. Wu, and E. Del Gado, Phys Rev Lett 103, 208301 (2009).
84
[17] L. C. Hsiao, H. Kang, K. H. Ahn, and M. J. Solomon, Soft Matter 10, 9254 (2014).
[18] E. Moghimi, A. R. Jacob, and G. Petekidis, Soft Matter 13, 7824 (2017).
[19] W. G. Ellenbroek, M. van Hecke, and W. van Saarloos, Phys Rev E 80, 061307 (2009).
[20] E. Somfai, M. van Hecke, W. G. Ellenbroek, K. Shundyak, and W. van Saarloos, Phys
Rev E 75, 020301 (2007).
[21] M. Otsuki and H. Hayakawa, Phys Rev E 95, 062902 (2017).
[22] F. Scheffold, F. Cardinaux, and T. G. Mason, Journal of Physics: Condensed Matter 25,
502101 (2013).
[23] A. Donev, I. Cisse, D. Sachs, E. A. Variano, F. H. Stillinger, R. Connelly, S. Torquato,
and P. M. Chaikin, Science 303, 990 (2004).
[24] A. Baule and H. A. Makse, Soft Matter 10, 4423 (2014).
[25] A. Boromand, A. Signoriello, F. Ye, C. S. O’Hern, and M. D. Shattuck, Phys Rev Lett
121, 248003 (2018).
[26] M. Clusel, E. I. Corwin, A. O. N. Siemens, and J. Brujić, Nature 460, 611 (2009).
[27] C. Zhang, C. B. O'Donovan, E. I. Corwin, F. Cardinaux, T. G. Mason, M. E. Möbius, and
F. Scheffold, Physical Review E 91, 032302 (2015).
[28] T. G. Mason, J. Bibette, and D. A. Weitz, Physical Review Letters 75, 2051 (1995).
[29] T. G. Mason, M.-D. Lacasse, G. S. Grest, D. Levine, J. Bibette, and D. A. Weitz,
Physical Review E 56, 3150 (1997).
[30] J. Mewis and N. J. Wagner, Colloidal Suspension Rheology (Cambridge University Press,
Cambridge, 2011), Cambridge Series in Chemical Engineering.
[31] J. F. Brady, Journal of Fluid Mechanics 272, 109 (1994).
[32] R. J. Phillips, J. F. Brady, and G. Bossis, The Physics of Fluids 31, 3473 (1988).
85
[33] L. C. Hsiao and S. Pradeep, Current Opinion in Colloid & Interface Science 43, 94
(2019).
[34] M. Jerkins, M. Schröter, H. L. Swinney, T. J. Senden, M. Saadatfar, and T. Aste, Physical
Review Letters 101, 018301 (2008).
[35] R. A. Lionberger and W. B. Russel, Journal of Rheology 38, 1885 (1994).
[36] T. Shikata and D. S. Pearson, Journal of Rheology 38, 601 (1994).
[37] J. F. Brady, The Journal of Chemical Physics 99, 567 (1993).
[38] B. M. Guy, M. Hermes, and W. C. K. Poon, Physical Review Letters 115, 088304 (2015).
[39] C. P. Hsu, S. N. Ramakrishna, M. Zanini, N. D. Spencer, and L. Isa, P Natl Acad Sci
USA 115, 5117 (2018).
[40] L. C. Hsiao, I. Saha-Dalal, R. G. Larson, and M. J. Solomon, Soft Matter 13, 9229
(2017).
[41] B. Schroyen, C.-P. Hsu, L. Isa, P. Van Puyvelde, and J. Vermant, Phys Rev Lett 122,
218001 (2019).
[42] G. M. Conley, P. Aebischer, S. Nöjd, P. Schurtenberger, and F. Scheffold, Science
Advances 3, e1700969 (2017).
[43] L. Mohan, R. T. Bonnecaze, and M. Cloitre, Physical Review Letters 111, 268301
(2013).
[44] Z. Zhou, J. V. Hollingsworth, S. Hong, H. Cheng, and C. C. Han, Langmuir 30, 5739
(2014).
[45] D. Vlassopoulos and M. Cloitre, Current Opinion in Colloid & Interface Science 19, 561
(2014).
[46] C. J. Dibble, M. Kogan, and M. J. Solomon, Phys Rev E 74 (2006).
86
[47] P. G. De Gennes, J. Physique Lett. 37, 1 (1976).
[48] M. C. Jenkins, M. D. Haw, G. C. Barker, W. C. K. Poon, and S. U. Egelhaaf, Soft Matter
7, 684 (2011).
[49] M. C. Jenkins, M. D. Haw, G. C. Barker, W. C. K. Poon, and S. U. Egelhaaf, Phys Rev
Lett 107 (2011).
[50] J. D. Bernal and J. Mason, Nature 188, 910 (1960).
[51] J. Brujić, C. Song, P. Wang, C. Briscoe, G. Marty, and H. A. Makse, Physical Review
Letters 98, 248001 (2007).
[52] L. Antl, J. W. Goodwin, R. D. Hill, R. H. Ottewill, S. M. Owens, S. Papworth, and J. A.
Waters, Colloid Surface 17, 67 (1986).
[53] L. Palangetic, K. Feldman, R. Schaller, R. Kalt, W. R. Caseri, and J. Vermant, Faraday
Discuss 191, 325 (2016).
[54] L. E. Silbert, Soft Matter 6, 2918 (2010).
[55] B. A. D. Costello, P. F. Luckham, and T. F. Tadros, Langmuir 8, 464 (1992).
[56] P. N. Pusey and W. Vanmegen, Nature 320, 340 (1986).
[57] N. M. James, H. Xue, M. Goyal, and H. M. Jaeger, Soft Matter 15, 3649 (2019).
[58] I. R. Peters, S. Majumdar, and H. M. Jaeger, Nature 532, 214 (2016).
[59] D. Bi, J. Zhang, B. Chakraborty, and R. P. Behringer, Nature 480, 355 (2011).
[60] G. L. Hunter and E. R. Weeks, Reports on Progress in Physics 75, 066501 (2012).
[61] J. C. Crocker and D. G. Grier, J Colloid Interf Sci 179, 298 (1996).
[62] R. S. Farr and R. D. Groot, The Journal of Chemical Physics 131, 244104 (2009).
[63] S.-E. Phan, W. B. Russel, J. Zhu, and P. M. Chaikin, The Journal of Chemical Physics
108, 9789 (1998).
87
[64] W. Schaertl and H. Sillescu, Journal of Statistical Physics 77, 1007 (1994).
[65] K. W. Desmond and E. R. Weeks, Physical Review E 90, 022204 (2014).
[66] R. P. A. Dullens, Soft Matter 2, 805 (2006).
[67] W. C. K. Poon, E. R. Weeks, and C. P. Royall, Soft Matter 8, 21 (2012).
[68] L. S. Ornstein and F. Zernike, P K Akad Wet-Amsterd 17, 793 (1914).
[69] J. K. Percus and G. J. Yevick, Phys Rev 110, 1 (1958).
[70] P. Varadan and M. J. Solomon, Langmuir 19, 509 (2003).
[71] C. Zhang, N. Gnan, T. G. Mason, E. Zaccarelli, and F. Scheffold, Journal of Statistical
Mechanics: Theory and Experiment 2016, 094003 (2016).
[72] L. C. Hsiao, R. S. Newman, S. C. Glotzer, and M. J. Solomon, P Natl Acad Sci USA 109,
16029 (2012).
[73] L. C. Hsiao, M. J. Solomon, K. A. Whitaker, and E. M. Furst, Journal of Rheology 58,
1485 (2014).
[74] P. Varadan and M. J. Solomon, Journal of Rheology 47, 943 (2003).
[75] A. I. Campbell, V. J. Anderson, J. S. van Duijneveldt, and P. Bartlett, Phys Rev Lett 94,
208301 (2005).
[76] J.-P. Hansen and I. R. McDonald, in Theory of Simple Liquids (Fourth Edition), edited by
J.-P. Hansen, and I. R. McDonald (Academic Press, Oxford, 2013), pp. 13.
[77] A. Doroszkowski and R. Lambourne, Journal of Colloid and Interface Science 26, 214
(1968).
[78] R. J. R. Cainrs, R. H. Ottewill, D. W. J. Osmond, and I. Wagstraff, Journal of Colloid and
Interface Science 54, 45 (1976).

88
[79] G. Bryant, S. R. Williams, L. Qian, I. K. Snook, E. Perez, and F. Pincet, Physical Review
E 66, 060501 (2002).
[80] J. I. N. Sun and S. Sundaresan, Journal of Fluid Mechanics 682, 590 (2011).
[81] R. R. Radhakrishnan, John R.; Poon, Wilson C. K.; Sun, Jin, eprint arXiv:1904.03144
(2019).
[82] H. A. Vinutha and S. Sastry, Nature Physics 12, 578 (2016).
[83] C. Song, P. Wang, and H. A. Makse, Nature 453, 629 (2008).
[84] M. Delarue, J. Hartung, C. Schreck, P. Gniewek, L. Hu, S. Herminghaus, and O.
Hallatschek, Nature Physics 12, 762 (2016).
[85] B. Ferdowsi, C. P. Ortiz, and D. J. Jerolmack, P Natl Acad Sci USA 115, 4827 (2018).
89
CHAPTER 3
Jamming Distance Dictates Colloidal Shear Thickening†
†Shravan Pradeep1, Mohamad Nabizadeh2, Alan R. Jacob1, Safa Jamali2, and Lilian C. Hsiao1,
Preprint available, arXiv:2007.01825 (2021)
1 Department of Chemical and Biomolecular Engineering, North Carolina State University,
Raleigh, North Carolina – 27695, USA
2Mechanical and Industrial Engineering Department, Northeastern University, Boston,
Massachusetts – 02115, USA
90
Abstract
We report experimental and computational observations of dynamic contact networks for
colloidal suspensions undergoing shear thickening. The sterically stabilized poly(methyl
methacrylate) hard colloids are spherically symmetric and possess different surface roughness.
Confocal rheometry and dissipative particle dynamics simulations show that the shear thickening
strength β scales exponentially with the deficit contact number z* and the jamming distance
Δϕ/ϕmax. Rough colloids, which experience additional tangential and rolling constraints, require
an average of 1.5 - 2 fewer particle contacts as compared to smooth colloids to generate the same
β. Rough colloids with enhanced geometric friction do not experience a large change in the free
volume near the jamming point, while smooth colloids must undergo significant reduction in the
free volume to support an equivalent shear viscosity. The available free volume for different
colloid roughness is related to the deficiency from the maximum number of nearest neighbors at
jamming under shear. Our results further suggest that the force per contact is different for
particles with different morphologies.
91
3.1 Introduction
Dense suspensions of colloidal particles with stochastic Brownian motion exhibit shear
thickening under flow, a non-Newtonian behavior where the suspension viscosity η increases
mildly or strongly depending on the applied shear stresses σ and particle volume fraction ϕ. The
ability to design the onset of shear thickening provides a unique advantage in the reversible
tuning of material mechanics, which is of great interest in fields such as soft robotics, impact and
tear resistant fabrics, and liquid manufacturing [1-3]. However, the tunability in these systems
currently remains at a rudimentary level of "on" or "off". For dense suspensions to truly advance
technology, the level of control over the shear thickening needs to become more deliberate and
refined [4,5]. In this manuscript, we show that designing shear thickening strength is possible for
a broad class of colloidal suspensions through a singular parameter: the distance to jamming.
A jammed material at ϕJ is conventionally defined as a disordered particulate system that
has developed a yield stress [6]. Practically, this means that a sufficiently large, applied stress is
required to generate a measurable flow rate in the densely packed material. Shear thickening
shares similarities to jamming in that the particles in a flowing suspension become so impeded
by nearest neighbors that they require an increasing amount of stress to continue flowing [1,7].
The microstructural origin of shear thickening was first attributed to the formation of
hydroclusters in the Stokesian Dynamics simulations developed by Brady and Bossis [8], where
clusters of particles oriented along the compressional axis of shear cause a modest increase in the
suspension viscosity. Experiments later corroborated this observation [9], suggesting that the
onset of shear-thickening can be discussed through a single dimensionless parameter, Peclet
number, that represents the strength of hydrodynamic forces to thermal ones acting on colloids.
The hydroclusters persist because the short-range lubrication forces, which are dissipative in

92
nature, scale inversely as the particles’ separation distance. More recently, simulations that
incorporate explicit interparticle friction or particle roughness plus lubrication hydrodynamics
were able to fully capture the large increase in viscosity that is characteristic of strong shear
thickening [10]. An important result from these simulations is the appearance of space-spanning
force chains and velocity correlations in shear thickened suspensions [11]. These force chains
arise from any combination of σ- and ϕ-based constraints including hydrodynamics, repulsion,
adhesion, and solid contact friction [12-14]. Above the onset stress, where the Peclet number
(Pesh = 6πηaeff3 /kBT ) >> 1, the force networks constantly break and reform but these network
structures persist throughout the flow. Beyond a critical Pesh, the force chains proliferate and
grow stronger as a system approaches shear jamming, leading to stronger shear thickening [15].
Interestingly, conventional microstructural characterization techniques such as the radial
distribution function [14] or scattering patterns in the velocity-gradient-vorticity planes [16] are
not sensitive to differences between shear thickened states. This observation implies that the
distance between particle surfaces, rather than the center-to-center distance, is related to the force
chains. As ϕ → ϕJ and σ increases, conservation laws state that the contact distance between
particles in a constant-volume suspension must decrease, leading to a greater number of contacts,
except for volume expansion at the free boundary for a few DST dominated flows. To address a
lack of experimental evidence of force chains in the literature, we focus on the details of the
dynamic contact networks formed by dense colloidal suspensions in shear thickening flows.
We use the mean contact number <z>, a measure for the number of contacting nearest
neighbors around particles, to quantify the suspensions because of the strong correlation of <z>
with bulk mechanics [17]. Near the jamming point, the contact number at jamming, zJ, and ϕJ are
inextricably linked to the interparticle friction in dense packings. For instance, application of
93
Maxwell's isostatic criterion to a frictionless hard sphere system at ϕJ = 0.64 reveals that zJ = 6.
Incorporating an infinitely large sliding friction coefficient between colloids, μs → ∞, leads to zJ
→ 4, and ϕJ → 0.54 [18], while adding a rolling friction coefficient μr further reduces zJ → 2.4,
ϕJ → 0.36 for (μr, μs) → ∞ [19]. The sliding constraint μs is featured in several constitutive
equations, particle simulations, and phenomenological models that describe shear thickening as
due to particles undergoing a stress-induced lubricated-to-frictional transition beyond an onset
stress σ* [20-22]. Both μs and μr are thought to generate long-lasting force chains by reducing the
rotational degree of freedom of particles in flow. Experimental measurements support this idea
by demonstrating that the rotational dynamics of shape-symmetric particles with protrusions
deviate significantly from simulations of hard sphere suspensions [23-25]. While the interparticle
friction may not always track with surface roughness because of complex tribological factors
(e.g.: elastohydrodynamics [26,27]), in general, rougher particles have larger values of μs and μr.
In this manuscript, we focus on characterizing the contact microstructure of shear thickening
suspensions comprising of smooth and rough colloids.
3.2. Materials and Methods
To investigate the role of friction on the contact microstructure of shear thickening
colloidal suspensions, we use confocal rheometry experiments and dissipative particle dynamics
(DPD) simulations to identify a quantitative link between the strength of thickening β =
log(Δη)/log(Δσ) and the distance from jamming (ϕmax - ϕ)/ϕmax = Δϕ/ϕmax for smooth and rough
colloids. Here, ϕmax refers to the maximum jamming fraction for a disordered packing, where
ϕmax = ϕJ (σ = 0 Pa) is obtained from confocal microscopy performed on colloids that have
undergone unperturbed sedimentation under gravitational stress for three months. We obtain β

94
using the average slope at the inflection points above σ* and before the high shear plateau. At
ϕmax, the suspension is considered mechanically rigid, where forces on the individual particles are
fully balanced with respect to total torque and stresses such that the suspension is not flowable at
or beyond this volume fraction. The value of ϕmax is verified independently within an
experimental uncertainty of ± 5% by fitting the relative low-shear viscosity (ηr,low-shear)
divergence to the form ηr,low-shear = (1 - ϕ/ϕmax)-2. The value of ϕmax is a key parameter in
normalizing the jamming distance because it varies for colloids with different surface
morphologies.
Earlier treatise on suspension rheology have seen the prolific use of smooth hard spheres,
and only recently have poly(methyl methacrylate) (PMMA) and silica colloids with controlled
surface roughness become widely available [28]. We hypothesize that there is a universal
correlation between Δϕ/ϕmax, β, and <z> for all suspensions exhibiting shear thickening. To
reveal this relationship, we synthesize spherically symmetric and size-monodisperse PMMA
microspheres with different levels of surface roughness [29]. These particles are sterically
stabilized with poly(12-hydroxystearic acid) (PHSA) brushes of lengths 10 – 15 nm [30]. We
prepare suspensions at ϕ < ϕmax by first centrifuging the stock suspension at gravitation Peclet
number, Peg = 1500 (Peg = 4πaeff4Δρg/3kBT), and subsequently diluting the shear jammed
sediments with known volumes of solvent. We obtain ϕ by imaging the fluorescent colloids with
confocal laser scanning microscopy (CLSM, Leica SP8) and processing the 3D image volumes
using a brightness-weighted centroid-based algorithm [31]. We obtain particle diameters 2a and
2aeff, respectively, from the 2D images of the sedimented layer using confocal microscopy. For
rough particles, 2aeff is estimated as an effective particle diameter between the opposite end of
surfaces that minimizes the roughness. Separately, steady shear rheological measurements are
95
performed using a stress-controlled rheometer (TA Instruments DHR-2) fitted with a 50-mm
sandblasted cone-and-plate geometry. To capture the transient contact microstructure during
flow, we use a custom confocal rheometer and arrest the suspension samples at two applied
stresses: one in the low-shear regime and one in the shear thickening regime.
3.3 Results
3.3.1 Steady shear rheology
Figure 3.1 shows different rheological behavior of PMMA hard colloids with two types
of morphology and similar effective swollen diameters 2aeff, smooth (S, 2a = 1.65 μm ± 4%,
Figure 3.1a) and rocky (RK, 2aeff = 1.49 μm ± 6%, Figure 3.1b). Two other morphologies are
also studied: slightly rough (SR, 2aeff = 1.82 μm ± 5%), very rough (VR, 2aeff = 1.47 μm ± 6%).
These steady shear flow curves describe the relative suspension viscosity (ηr = η/ηs, solvent
viscosity ηs = 0.012 Pa·s) as a function of scaled σ. The dotted lines represent the two stress
points at which we obtain <z> values from dynamic packings: one at = 0 = < * and the
second at = > * , where the overhead represents the stress values scaled with a factor of
aeff3/kBT. In our flow curves, we choose 0 = ≈ 200 at the low-shear viscosity plateau and ≈
104 at the shear thickening regime for contact microstructure studies, as shown in Figure 3.1. As
increases beyond * , the steric and lubrication layers between the colloids gives way to the
solid-solid proliferation of interparticle contacts [21,32]. Moreover, experiments with rough
colloids and granular materials have shown that rough particles exhibit higher β and lower *
[33-35] at lower ϕ than smooth particles.
Regardless of the surface morphology, the suspensions transition from fully Newtonian
flow at low σ and ϕ, to continuous shear thickening (CST, β < 1) at intermediate σ and ϕ, and
96
finally to discontinuous shear thickening (DST, β ≥ 1) at high σ and when ϕ is close to ϕmax.
There is no clear demarcation between CST and DST in many practical scenarios, but in general
DST occurs when the value of β ≈ 1. Suspensions also exhibit a secondary plateau at the highest
values of σ, commonly observed in shear thickened states in which the particles’ motion is
hindered by either frictional or hydrodynamic forces [13,14,19,21,36]. The onset of DST for
smooth particle suspensions occurs at ϕ = 0.55 (Figure 3.1a), which is similar to the values
reported earlier in the literature for colloids interacting with a short-range repulsive potential
[37,38]. Suspensions of smooth colloids continue to exhibit DST until ϕmax,S = 0.64 ± 0.01 where
the samples reach ϕmax and become difficult to handle experimentally.
3.3.2 Universal correlation in shear thickening behavior
Our data show that Δϕ/ϕmax predicts β for different types of colloidal suspensions
containing spherically symmetric particles. Figure 3.2 shows that all colloidal suspensions obey
the general scaling of the form, β ~ exp(-Δϕ/ϕmax), where DST (β ≈ 1) is present at Δϕ/ϕmax ≤ 0.1
and CST (β < 1) is found at Δϕ/ϕmax > 0.1. The value of β rapidly decreases at increasing Δϕ/ϕmax.
Additional support for this correlation comes from β and Δϕ/ϕmax values extracted from a number
of literature studies in which both η-σ data and ϕmax are available, including: (1) smooth and
rough PMMA colloids with charged interactions [33,37], (2) smooth and rough silica colloids
with near-hard sphere and charge-screened interactions [34,36,39,40], (3) computer simulations
that incorporate particle-level sliding [22,32] and rolling friction [19], and one in which the
colloids have explicitly defined surface asperities [13]. This scaling has significant impact in the
academic and industrial communities because it enables the a priori estimation of shear
thickening strength (a non-equilibrium parameter) using the distance to jamming point (an
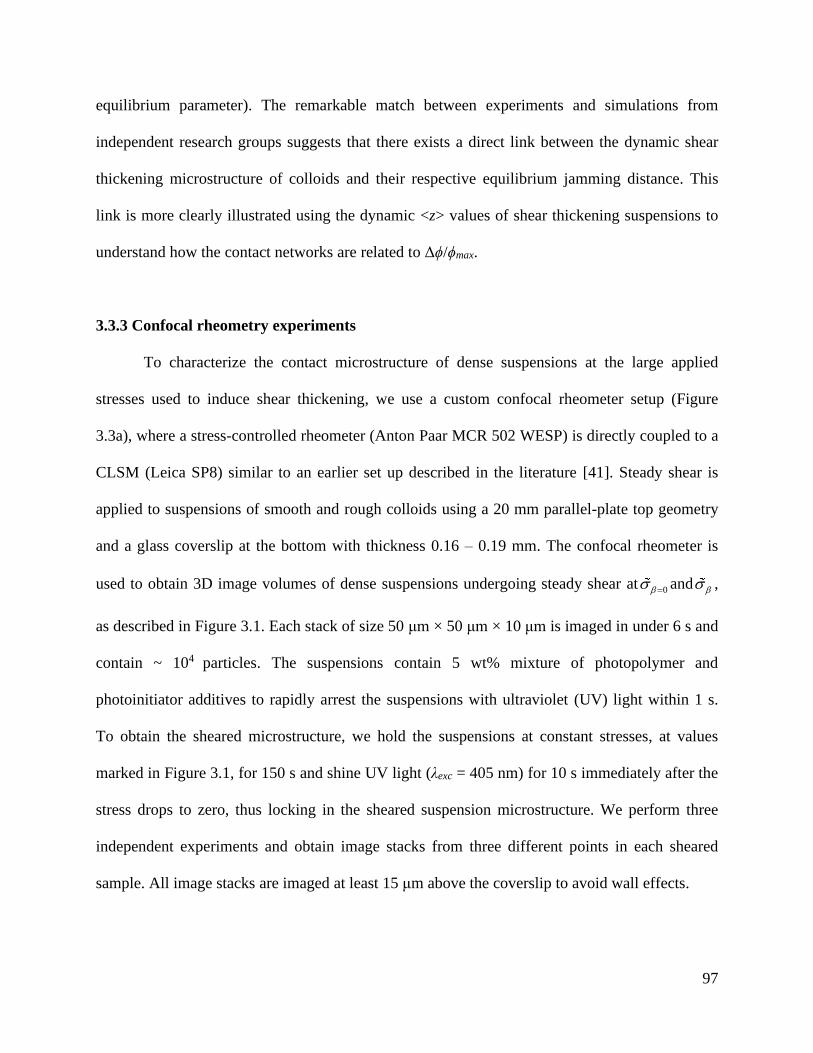
97
equilibrium parameter). The remarkable match between experiments and simulations from
independent research groups suggests that there exists a direct link between the dynamic shear
thickening microstructure of colloids and their respective equilibrium jamming distance. This
link is more clearly illustrated using the dynamic <z> values of shear thickening suspensions to
understand how the contact networks are related to Δϕ/ϕmax.
3.3.3 Confocal rheometry experiments
To characterize the contact microstructure of dense suspensions at the large applied
stresses used to induce shear thickening, we use a custom confocal rheometer setup (Figure
3.3a), where a stress-controlled rheometer (Anton Paar MCR 502 WESP) is directly coupled to a
CLSM (Leica SP8) similar to an earlier set up described in the literature [41]. Steady shear is
applied to suspensions of smooth and rough colloids using a 20 mm parallel-plate top geometry
and a glass coverslip at the bottom with thickness 0.16 – 0.19 mm. The confocal rheometer is
used to obtain 3D image volumes of dense suspensions undergoing steady shear at 0 = and ,
as described in Figure 3.1. Each stack of size 50 μm × 50 μm × 10 μm is imaged in under 6 s and
contain ~ 104 particles. The suspensions contain 5 wt% mixture of photopolymer and
photoinitiator additives to rapidly arrest the suspensions with ultraviolet (UV) light within 1 s.
To obtain the sheared microstructure, we hold the suspensions at constant stresses, at values
marked in Figure 3.1, for 150 s and shine UV light (λexc = 405 nm) for 10 s immediately after the
stress drops to zero, thus locking in the sheared suspension microstructure. We perform three
independent experiments and obtain image stacks from three different points in each sheared
sample. All image stacks are imaged at least 15 μm above the coverslip to avoid wall effects.
98
3.3.4 Dissipative Particle Dynamic (DPD) simulations
The images obtained from the confocal rheometer experiments are supported using
dissipative particle dynamics (DPD) simulations of bidisperse suspensions (a and 1.1a in an
equal volume ratio with total number of particles N = 1000) containing smooth and rough
colloids closely representing the experimental system. The particle roughness is modeled by
distributing asperities of lengthscale 0.1a on the surface of the smooth base spheres, using a
scheme similar to simulations in [13,14]. The solvent is modeled through explicit soft particles
and interact through conservative, dissipative, and random Brownian forces. We have shown
previously that this modified DPD scheme recovers a full representation of hydrodynamics in the
system, similar to a fully resolved Stokesian Dynamics formalism. To compare the data from
simulations and experiments, we use the suspension systems with smooth and rough particles in
simulations match the ϕmax to suspensions with S and RK systems from the experiments,
respectively. The goal is to link β to <z> to capture the contact networks responsible for the shear
thickening phenomena.
Defining interparticle contact during shear thickening requires the use of two different
contact criteria at σ < σ* and at σ ≥ σ*, because the particles undergo a transition from lubricated
to frictional flow and the soft PHSA brush becomes compressed by the large applied stresses
[33]. At σ < σ*, two particles are defined to be in hydrodynamic contact if the interparticle
separation is equal or less than the uncertainties that include the PHSA brush length, size
polydispersity, and surface roughness [29]. At σ ≥ σ*, a frictional contact is defined by the
average center-to-center distance between particles, 2aeff as shown in Figure 3.3b. In DPD
simulations, interparticle contacts are defined similarly for all particles and their interactions
with other asperities and base particles. Experimental results are in excellent agreement with the

99
contact microstructure obtained from DPD simulations for smooth and rough particles: the <z>
values obtained from DPD simulations fall within the error limits of the <z> values obtained
from our experimental packings, as shown in Figure 3.4a.
3.3.5 Visualizing contact networks
Visual Molecular Dynamics (VMD) renderings of the dynamic packings, at , from the
experiments and simulations for suspensions containing smooth and rough particles at Δϕ/ϕmax =
0.08 and β ≈ 0.85 are shown in Figure 3.3c-d. The renderings show the presence of space-
spanning contact networks in both experiments and simulations of shear thickening flows and
provide a statistical view of how smooth and rough pack differently in non-equilibrium shear
thickening flows. Particles are concentrated in the compressive flow axis, in agreement with
previous neutron scattering studies on shear thickening suspensions [16]. The observed contact
networks are also qualitatively similar to the percolations in strained systems of 2D photoelastic
disks [42,43]. A first step towards constructing a statistical mean-field description parameter of
the contact microstructure formed in such networks would be possible by evaluating the
relationship between the dynamic contact number at ,<z>β, and β for suspensions at various ϕ.
Figure 3.4a shows the dynamic contact number, <z>β, as a function of Δϕ/ϕmax for sheared
suspensions of smooth and rough colloids. The dashed lines in Figure 3.4a indicate that the
smooth colloids, on average, requires an additional of 1.5 – 2 contacts to maintain the same β as
compared to the rough colloids. This could be a consequence of a larger change in free volume
for smooth particles in shear flow. In other words, smooth colloids must become more
compacted by the applied stress before <z>β reaches the jammed state, in which the entire
suspension becomes mechanically rigid and therefore no longer flowable. For rough colloids,
100
geometric hindrance and an effective rolling friction reduces the change in free volume such that
<z>β does not need to be as large to cause jamming. The difference in available free volume for
different types of colloid roughness is related to the deficiency from the maximum number of
nearest neighbors at jamming under shear. The value of <z>β is a function of because the
external deformation imparts an additional non-equilibrium free energy that must be minimized
for steady flow [44]. To normalize the spatial effect of interparticle contacts that stem from free
volume differences, we define a parameter z* that captures the scaled contact deficit, where z* =
(zJ,β - <z>β)/zJ,β. Here, zJ,β is the maximum possible contacts available at ϕJ,β, which is defined as
the divergence of the viscosity at and indicate the maximum flowable volume fraction at .
3.3.6 Contact deficiency at local jamming
To estimate the shear-induced jamming point ϕJ,β for suspensions of smooth and rough
colloids, we invoke an argument that relates the divergence of ηr to (ϕJ - ϕ) at a given σ, where ϕJ
= ϕJ (σ). Specifically, the low-shear and high-shear viscosities are expected to diverge at ϕmax and
a σ dependent ϕJ, respectively, with an exponent of -2 [45]. By extension, this suggests that ηr at
intermediate σ should also diverge to a corresponding stress-dependent quasi-jamming point, ϕJ,β
= ϕJ,β ( ) with the same exponent of -2. The inset in Figure 3.4b. shows the scaling of the form
ηr ~ (ϕJ,β-ϕ)-2 where ϕJ,β = 0.61 and 0.51 for smooth and rough colloids, respectively. The value
of zJ,β is then obtained by extrapolating <z>β at various ϕ to the respective quasi-jamming points
ϕJ,β, where zJ,β as 4.95 ± 0.02 and 3.25 ± 0.01 for smooth and rough colloids. Figure 3.4b shows
that the dynamic contact scaling takes the form z* ~ (Δϕ/ϕmax)α with α = 0.98±0.01. A similar
scaling (α = 1.08) had been observed in 2D simulations of soft frictionless particles that are

101
repulsive [46]. The observed power-law correlation in Figure 3.4b is statistically significant with
a normalized chi-squared parameter 2
0 = 6.33.
3.4. Discussions
Normalizing the contact number deficit in this manner collapses the data for all particle
roughness and support our argument that the contact number at shear-induced jamming is a
measure of the free volume available for particles with specific morphologies, or interparticle
friction, to rearrange in a way to allow the suspension to flow at steady state. In Figure 3.1,
following the dashed lines corresponding to vertically, increase in ϕ is associated with an
increase in β as more contacts are made. Corresponding values of Δϕ/ϕmax and z* decreases
forming more space-spanning contacts and force networks. For a given shear thickening σ, for
each particle system, there exists a ϕJ and corresponding zJ beyond which there is no steady state
flow. Thus, smooth and rough colloids with similar 2aeff are characterized with different ϕJ,β and
zJ,β at the same applied . In a constant volume rheological experiment restricted by the
dimensions of experimental and simulation setup, the free volume available to rearrange under
shear is greater for smooth colloids than that of the rough colloids, because smooth colloids can
rotate freely with little hydrodynamic resistance. There are more spatial constraints imposed by
the restricted rotational degree of freedom of rough colloids, and this is in turn captured by the
deficiency of nearest neighbors to the shear-jamming contact number, zJ,β. The universality in
Figure 3.4b shows that this physical mechanism for shear thickening holds for all types of
suspensions and thus the parameter z*, which is a contact network parameter that captures the
distance to zJ,β, can be used as the manifestation of the modes of particle motion under shear.
102
The dynamic contact scaling z*~ Δϕ/ϕmax (Figure 3.4b) and the static packing correlation
β ~ exp(-Δϕ/ϕmax) (Figure 3.2) can be combined to relate the sheared contact microstructure and
the shear thickening strength as β ~ exp(-z*). This key relation implies that the onset of shear
thickening occurs when a minimally rigid network is formed, and the strength of the shear
thickening depends on the way in which σ pushes particles to their dynamic jamming contacts.
The power-law correlation in Figure 3.4b is likely related to the force per contact of these
suspensions under shear. The results suggest that at a given β, because <z> is different for
suspensions of particles with different asperities, the force carried by each contact is different for
particles of different morphologies.
Force networks in jammed granular particles interacting through hard-sphere potential are
described by two quantities: the particle positions and the contact networks [47]. Earlier work on
compressed hydrogel beads found that the average macroscopic force, F, scales with average
dynamic contacts as F ~ <z> [48]. To obtain same change in suspension stress (or β), rough
particles suspensions required, on average, fewer contacts compared to suspensions with
smoother particles. In other words, for the same F in our systems, F/<z> for rough particle
suspensions must be greater than that of smooth counterpart. We indirectly capture the force per
contact through parameter z*, which factors in the contact deficit for various type of particle
suspensions. Note that the contact networks found in this work would likely have different
morphologies and properties from the force chains observed in previous studies [11].
3.5 Conclusions
As a suspension shear thickens, clusters and percolated networks of particle contacts
break and reform, but our study has shown that a mean-field description using dynamic <z> can
103
connect β and Δϕ/ϕmax. The dynamic contact scaling may break down at ϕ values close to ϕmax
(Δϕ/ϕmax ≤ 10-2) due to pronounced flow instabilities such as localized stress fluctuations,
periodic density fluctuations in flow direction, large transient clusters in compressive direction,
and stress bands along the dilatational direction [49-51]. The increase in uncertainty in z* close
to the jamming point could be due to these flow instabilities. Nonetheless, our study shows that
the scaled jamming distance is a strong predictor for the shear thickening behavior of a broad
class of suspensions.
Because force networks are likely coupled to the contact network and particle positions,
future studies that analyze the transient network anisotropy could provide new insight as to how
different types of frictionless and frictional particles carry load in flowing systems. Athermal
suspensions [52] and shape-anisotropic colloids [53] have not been tested in this study, and it
would be interesting to see if the proposed scaling between β, Δϕ/ϕmax, and z* hold for these
materials.
Acknowledgements. We thank John Brady, Ronald Larson, Jeffrey Morris, and Abhinendra
Singh for discussions. This work is supported in part by the National Science Foundation (NSF
CBET-1804462), the American Chemical Society Petroleum Research Fund (ACS-PRF #59208-
DNI9), and North Carolina State University start-up funds.
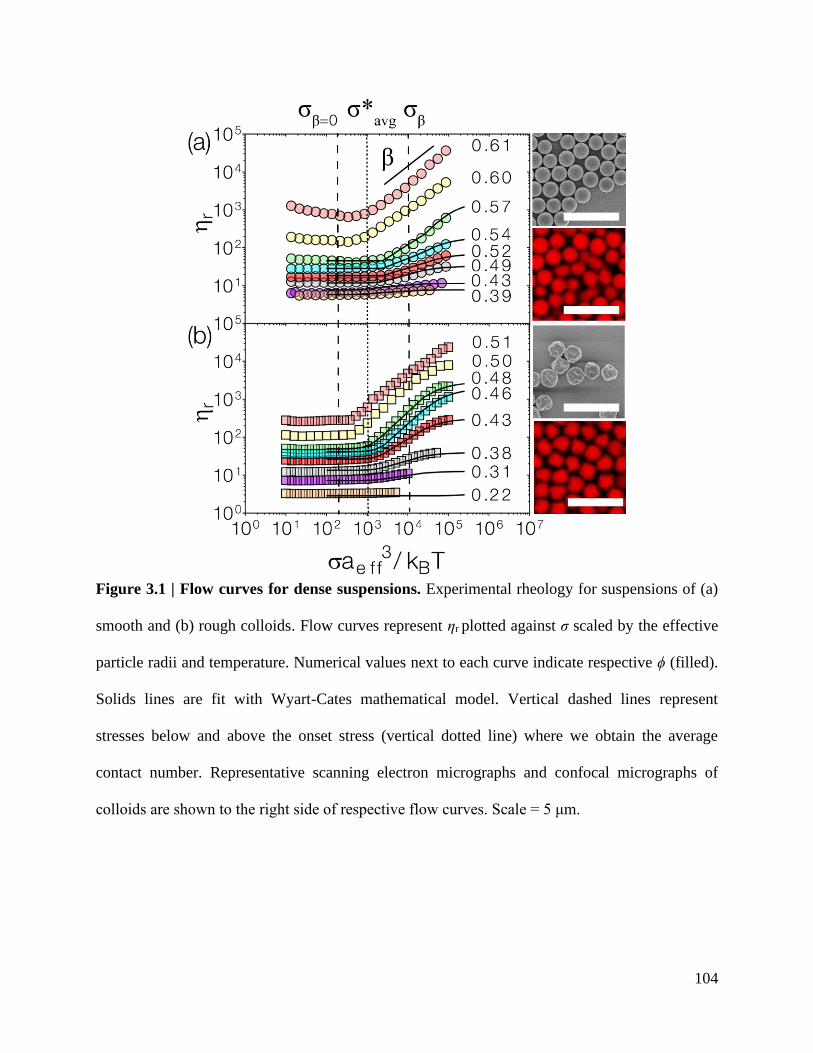
104
Figure 3.1 | Flow curves for dense suspensions. Experimental rheology for suspensions of (a)
smooth and (b) rough colloids. Flow curves represent ηr plotted against σ scaled by the effective
particle radii and temperature. Numerical values next to each curve indicate respective ϕ (filled).
Solids lines are fit with Wyart-Cates mathematical model. Vertical dashed lines represent
stresses below and above the onset stress (vertical dotted line) where we obtain the average
contact number. Representative scanning electron micrographs and confocal micrographs of
colloids are shown to the right side of respective flow curves. Scale = 5 μm.
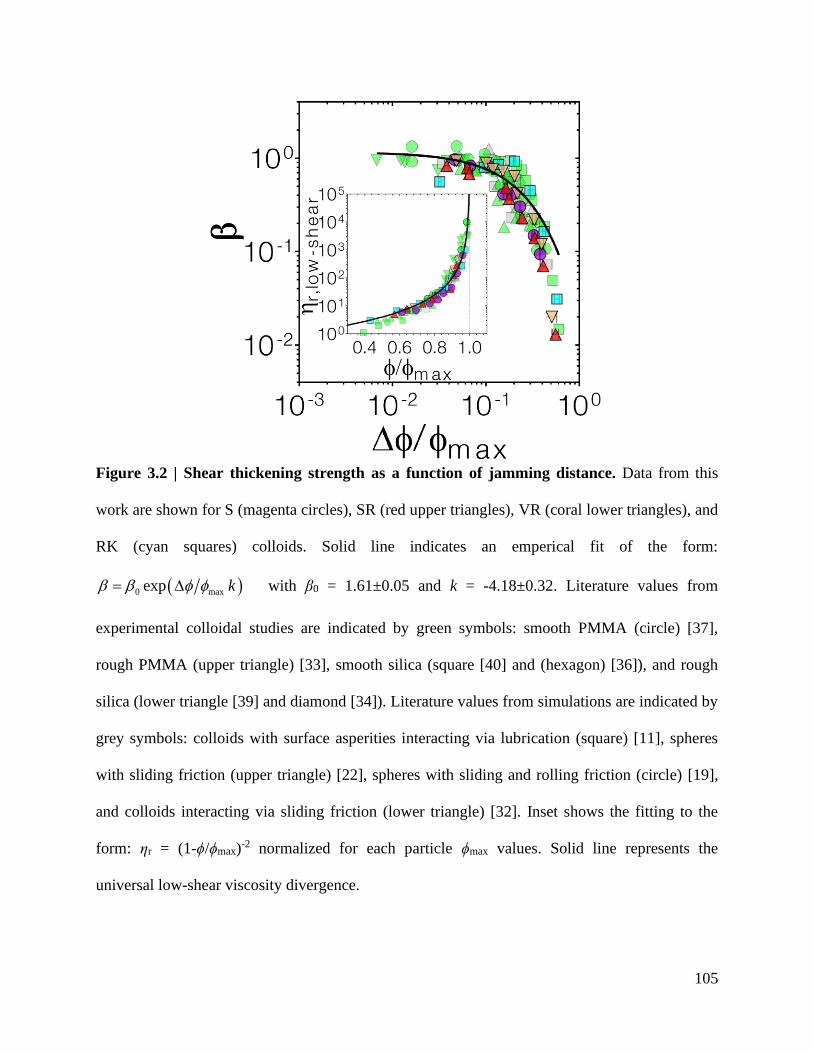
105
Figure 3.2 | Shear thickening strength as a function of jamming distance. Data from this
work are shown for S (magenta circles), SR (red upper triangles), VR (coral lower triangles), and
RK (cyan squares) colloids. Solid line indicates an emperical fit of the form:
( )0 maxexp k = with β0 = 1.61±0.05 and k = -4.18±0.32. Literature values from
experimental colloidal studies are indicated by green symbols: smooth PMMA (circle) [37],
rough PMMA (upper triangle) [33], smooth silica (square [40] and (hexagon) [36]), and rough
silica (lower triangle [39] and diamond [34]). Literature values from simulations are indicated by
grey symbols: colloids with surface asperities interacting via lubrication (square) [11], spheres
with sliding friction (upper triangle) [22], spheres with sliding and rolling friction (circle) [19],
and colloids interacting via sliding friction (lower triangle) [32]. Inset shows the fitting to the
form: ηr = (1-ϕ/ϕmax)-2 normalized for each particle ϕmax values. Solid line represents the
universal low-shear viscosity divergence.

106
Figure 3.3 | Confocal rheometry and force network visualization. (a) Confocal rheometer
setup for imaging shear-induced contact networks during the flow measurements. (b) Contact
criterion for interparticle contact in smooth (top row) and rough (bottom row) colloids. The light
blue circle represents additional experimental length scales. (c,d) Contact networks of shear
thickening suspensions at Δϕ/ϕmax = 0.075 and β = 0.85 as shown in VMD reconstructions of the
(c) experimental microstructures and (d) snapshots from simulations. For (c) and (d), the top
panel are for the suspensions with smooth particles and the bottom panels are for rough colloidal
suspensions. Side insets show color panel for the respective contact numbers of the particles
shown in (c,d).
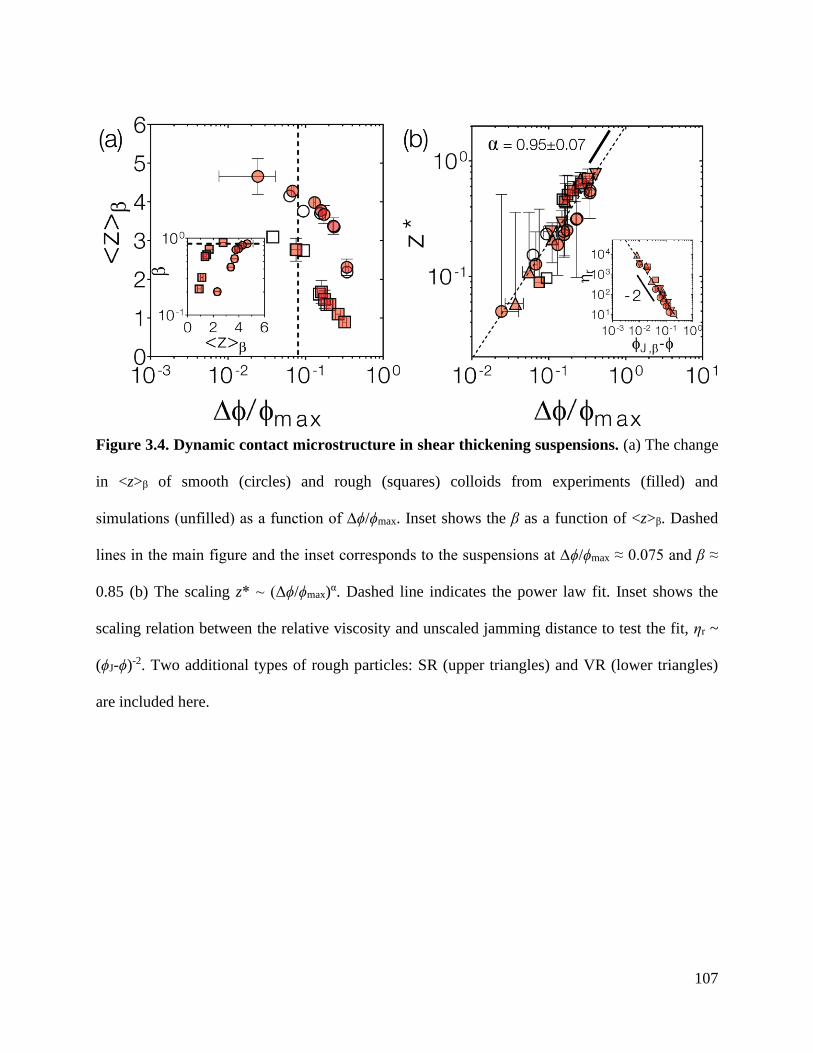
107
Figure 3.4. Dynamic contact microstructure in shear thickening suspensions. (a) The change
in <z>β of smooth (circles) and rough (squares) colloids from experiments (filled) and
simulations (unfilled) as a function of ∆ϕ/ϕmax. Inset shows the β as a function of <z>β. Dashed
lines in the main figure and the inset corresponds to the suspensions at ∆ϕ/ϕmax ≈ 0.075 and β ≈
0.85 (b) The scaling z* ~ (Δϕ/ϕmax)α. Dashed line indicates the power law fit. Inset shows the
scaling relation between the relative viscosity and unscaled jamming distance to test the fit, ηr ~
(ϕJ-ϕ)-2. Two additional types of rough particles: SR (upper triangles) and VR (lower triangles)
are included here.
108
References
[1] E. Blanco, D. J. M. Hodgson, M. Hermes, R. Besseling, G. L. Hunter, P. M. Chaikin, M.
E. Cates, I. Van Damme, and W. C. K. Poon, Proceedings of the National Academy of
Sciences 116, 10303 (2019).
[2] E. Brown, N. Rodenberg, J. Amend, A. Mozeika, E. Steltz, M. R. Zakin, H. Lipson, and
H. M. Jaeger, Proceedings of the National Academy of Sciences 107, 18809 (2010).
[3] Y. S. Lee, E. D. Wetzel, and N. J. Wagner, Journal of Materials Science 38, 2825 (2003).
[4] Y. Madraki, G. Ovarlez, and S. Hormozi, Physical Review Letters 121, 108001 (2018).
[5] N. Y. C. Lin, C. Ness, M. E. Cates, J. Sun, and I. Cohen, Proceedings of the National
Academy of Sciences 113, 10774 (2016).
[6] C. S. O’Hern, L. E. Silbert, A. J. Liu, and S. R. Nagel, Physical Review E 68, 011306
(2003).
[7] I. R. Peters, S. Majumdar, and H. M. Jaeger, Nature 532, 214 (2016).
[8] J. F. Brady and G. Bossis, Annual Review of Fluid Mechanics 20, 111 (1988).
[9] J. Bender and N. J. Wagner, Journal of Rheology 40, 899 (1996).
[10] J. F. Morris, Physical Review Fluids 3, 110508 (2018).
[11] J. E. Thomas, K. Ramola, A. Singh, R. Mari, J. F. Morris, and B. Chakraborty, Physical
Review Letters 121, 128002 (2018).
[12] E. Brown and H. M. Jaeger, Reports on Progress in Physics 77, 046602 (2014).
[13] S. Jamali and J. F. Brady, Physical Review Letters 123, 138002 (2019).
[14] M. Wang, S. Jamali, and J. F. Brady, Journal of Rheology 64, 379 (2020).
[15] R. J. E. Andrade, A. R. Jacob, F. J. Galindo-Rosales, L. Campo-Deaño, Q. Huang, O.
Hassager, and G. Petekidis, Journal of Rheology 64, 1179 (2020).
109
[16] A. K. Gurnon and N. J. Wagner, Journal of Fluid Mechanics 769, 242 (2015).
[17] E. Somfai, M. van Hecke, W. G. Ellenbroek, K. Shundyak, and W. van Saarloos,
Physical Review E 75, 020301 (2007).
[18] L. E. Silbert, Soft Matter 6, 2918 (2010).
[19] A. Singh, C. Ness, R. Seto, J. J. de Pablo, and H. M. Jaeger, Physical Review Letters 124,
248005 (2020).
[20] M. Wyart and M. E. Cates, Physical Review Letters 112, 098302 (2014).
[21] R. Seto, R. Mari, J. F. Morris, and M. M. Denn, Physical Review Letters 111, 218301
(2013).
[22] A. Singh, R. Mari, M. M. Denn, and J. F. Morris, Journal of Rheology 62, 457 (2018).
[23] L. C. Hsiao, I. Saha-Dalal, R. G. Larson, and M. J. Solomon, Soft Matter 13, 9229
(2017).
[24] S. Jiang, J. Yan, J. K. Whitmer, S. M. Anthony, E. Luijten, and S. Granick, Physical
Review Letters 112, 218301 (2014).
[25] K. V. Edmond, M. T. Elsesser, G. L. Hunter, D. J. Pine, and E. R. Weeks, Proceedings of
the National Academy of Sciences 109, 17891 (2012).
[26] Y. Peng, C. M. Serfass, C. N. Hill, and L. C. Hsiao, Experimental Mechanics (2021).
[27] Y. Peng, C. M. Serfass, A. Kawazoe, Y. Shao, K. Gutierrez, C. N. Hill, V. J. Santos, Y.
Visell, and L. C. Hsiao, Nature Materials (2021).
[28] L. C. Hsiao and S. Pradeep, Current Opinion in Colloid & Interface Science 43, 94
(2019).
[29] S. Pradeep and L. C. Hsiao, Soft Matter 16, 4980 (2020).
[30] M. T. Elsesser and A. D. Hollingsworth, Langmuir 26, 17989 (2010).

110
[31] J. C. Crocker and D. G. Grier, Journal of Colloid and Interface Science 179, 298 (1996).
[32] R. Mari, R. Seto, J. F. Morris, and M. M. Denn, Proceedings of the National Academy of
Sciences 112, 15326 (2015).
[33] L. C. Hsiao, S. Jamali, E. Glynos, P. F. Green, R. G. Larson, and M. J. Solomon, Physical
Review Letters 119, 158001 (2017).
[34] D. Lootens, H. van Damme, Y. Hémar, and P. Hébraud, Physical Review Letters 95,
268302 (2005).
[35] C.-P. Hsu, S. N. Ramakrishna, M. Zanini, N. D. Spencer, and L. Isa, Proceedings of the
National Academy of Sciences 115, 5117 (2018).
[36] C. D. Cwalina and N. J. Wagner, Journal of Rheology 58, 949 (2014).
[37] B. M. Guy, M. Hermes, and W. C. K. Poon, Physical Review Letters 115, 088304 (2015).
[38] O. Sedes, A. Singh, and J. F. Morris, Journal of Rheology 64, 309 (2020).
[39] C. P. Hsu, S. N. Ramakrishna, M. Zanini, N. D. Spencer, and L. Isa, Proceedings of the
National Academy of Sciences of the United States of America 115, 5117 (2018).
[40] J. R. Royer, D. L. Blair, and S. D. Hudson, Physical Review Letters 116, 188301 (2016).
[41] S. K. Dutta, A. Mbi, R. C. Arevalo, and D. L. Blair, Review of Scientific Instruments 84,
063702 (2013).
[42] D. Bi, J. Zhang, B. Chakraborty, and R. P. Behringer, Nature 480, 355 (2011).
[43] T. S. Majmudar and R. P. Behringer, Nature 435, 1079 (2005).
[44] V. Kobelev and K. S. Schweizer, Physical Review E 71, 021401 (2005).
[45] M. Wang and J. F. Brady, Physical Review Letters 115, 158301 (2015).
[46] M. Maiti, H. A. Vinutha, S. Sastry, and C. Heussinger, The Journal of Chemical Physics
143, 144502 (2015).
111
[47] R. P. Behringer and B. Chakraborty, Reports on Progress in Physics 82, 012601 (2018).
[48] N. Brodu, J. A. Dijksman, and R. P. Behringer, Nature Communications 6, 6361 (2015).
[49] G. Ovarlez, A. Vu Nguyen Le, W. J. Smit, A. Fall, R. Mari, G. Chatté, and A. Colin,
Science Advances 6, eaay5589 (2020).
[50] S. Saw, M. Grob, A. Zippelius, and C. Heussinger, Physical Review E 101, 012602
(2020).
[51] V. Rathee, D. L. Blair, and J. S. Urbach, Proceedings of the National Academy of
Sciences 114, 8740 (2017).
[52] A. Fall, N. Huang, F. Bertrand, G. Ovarlez, and D. Bonn, Physical Review Letters 100,
018301 (2008).
[53] L. Palangetic, K. Feldman, R. Schaller, R. Kalt, W. R. Caseri, and J. Vermant, Faraday
Discussions 191, 325 (2016).
112
CHAPTER 4
Linear viscoelasticity in dense suspensions of smooth and rough colloids
Shravan Pradeep, Alan Wessel, and Lilian C Hsiao
Department of Chemical and Biomolecular Engineering, North Carolina State University,
Raleigh, NC 27695, USA

113
Abstract
In dense suspensions that comprise of colloids which interact via a hard sphere potential,
the viscoelastic components of the stress response are determined by the excluded volume effects
and the hydrodynamics. The near-equilibrium structure of suspensions with smooth and rough
colloids is probed to decouple the effect of surface roughness-induced effects on the elastic and
the viscous moduli. Changes in the scaled moduli on suspensions containing smooth and rough
poly(methylmethacrylate) colloids are studied as a function of the distance to the maximum
packing or the jamming distance. At ϕ > 0.50 the frequency-sweep rheometry show that smooth
particle suspensions exhibit a scaled modulus ~10 Pa while rough particle suspensions exhibit a
modulus ~ 105 Pa. We generate a master Maxwell curve by performing frequency-ϕ superposition
for our colloidal suspensions. Furthermore, we capture the effect of surface roughness on local
microstructure response through a functional form of jamming distance.
114
4.1. Introduction
The rheological properties of colloidal suspensions are a consequence of complex interplay
between the Brownian and hydrodynamic forces between particles in the system. In colloidal
suspensions where particles interact through near hard sphere potential the rheological properties
are dictated by the excluded volume effects, which is a function of the suspension volume fraction
(ϕ) and the hydrodynamic contribution from the suspended solvent [1]. Even in a fluid state (at ϕ
< 0.40), such suspensions are characterized by a shear modulus due to the transient contacts or
bonds formed as a consequence of the close proximity of particles and the Brownian fluctuations
in the suspension system [2]. As the suspension ϕ increases, the environment around particles
become crowded, arresting the Brownian motion resulting in contribution to the dynamics and
rheological properties from additional parameters such as particle geometry. Understanding the
effect of crowding-induced parameters to predict the suspension elasticity is important in fields
ranging from detecting cancer cell dynamics [3] to predicting geological phenomena in advance
[4].
Stokes-Einstein-Sutherland diffusivity predicts the diffusion coefficient (D0) in dilute
suspensions (ϕ < 0.05) as D0 = kBT/6πηa, where kBT is the thermal energy, a is the particle radius,
and η is the suspended solvent viscosity. As ϕ increases, the dynamics in concentrated colloidal
suspensions are characterized by two relaxation modes: short time and long time. The former is
governed by the hydrodynamic interactions while the latter is a consequence of cage rearrangement
mechanism at longer timescales. Short time relaxation in colloidal dynamics is characterized by
short time translational (Dst) and rotational diffusion coefficients (Ds
r). Stokesian Dynamic
simulations, incorporating hydrodynamic interactions, and experiments on smooth colloidal
particles concluded that both Dst and Ds
r remain uncoupled up to ϕ ≤ 0.50 [5,6]. At ϕ > 0.50,
115
experiments on suspensions containing smooth colloidal particles are able to decouple Dst and Ds
r
using estimations of mean-square displacement (MSD) and mean-square angular displacement
(MSAD), respectively [5].
Long time relaxation in colloidal dynamics is characterized by the respective diffusion
coefficients for translational ( tD) and rotational ( rD
) modes. The long-time diffusivity
parameters characterizes the ability of a particle to escape out of the cage formed by its own
neighbors as the colloids experience crowding with increasing ϕ. Through scaling arguments,
simulations were able to predict tD as a product of Ds
t and the effect of change in microstructure
due to long-time diffusion, up to ϕ ≤ 0.50 [7]. For smooth spheres, t rD D due to minimal effect
of hydrodynamics on rotational motion. The effect may not be same in the spherically symmetric
colloids with surface roughness because in dense suspensions with geometric asperities create
hydrodynamic resistance for free rotation. The slowdown of the short-time rotational diffusion
coefficients in suspensions of rough colloids of poly(methyl methacrylate) (PMMA) colloids in
index and density matched solvent mixture at ϕ ≥ 0.35 was reported by Hsiao et al. [8]. Since the
suspension elasticity is inextricably linked to the dynamics [9], linear viscoelasticity measurements
of suspensions containing smooth and rough colloids may decouple the effects of roughness on
dynamics and thus the rheological properties.
Recent studies with experimental systems with rough colloids have shown to modify shear
thickening behavior [10,11], form low-dimensional fractals and suppress crystallization [12]. The
surface asperities in rough colloids exhibit different lubrication interaction due to additional
tangential interaction component [10,13]. Total suspension stress is characterized by additive
contributions from suspending fluid and colloidal particle. The particle contributions come from
hydrodynamics and interparticle stresses. In dense suspensions, the rough particles modify the

116
near-field hydrodynamic interactions and thus exhibit different cage dynamics at high ϕ values
compared to suspensions with smooth colloids. Thus, it is important to understand the effects of
surface roughness as suspension ϕ on the dynamics and elasticity of the suspensions.
In this work, we investigate the effects of surface roughness on the linear viscoelastic
properties of dense colloidal suspensions. Simulations in the high frequency regime suggests that
colloidal particles with surface modification can decouple the effects from lubrication “contacts”
that reduce the particle mobility and the diffusional boundary layer formed in pure hard sphere
interactions [14]. Using sterically stabilized PMMA smooth and rough colloids suspended in index
matched solvent squalene, that exhibit hard sphere interactions, we decouple the sole contribution
of the constitutive particle roughness to suspension elasticity. We use the small amplitude
oscillatory measurements to perturb the near-equilibrium microstructures of suspensions
containing smooth and rough colloids at various ϕ values.
4.2. Materials and Methods
4.2.1 Colloidal Synthesis and Characterization
We use in-house synthesized poly(hydroxystearic acid)-grafted-poly(methylmethacyrylate)
(PHSA-g-PMMA) colloids for our linear viscoelastic studies reported here. Smooth PHSA-g-
PMMA microspheres were synthesized using dispersion polymerization of PHSA-gycidyl
methacrylate-methyl methacrylate (PHSA-GMA-MMA) co-block polymer with 2-
azobisisobutyronitrile (AIBN) as the free radical initiator and MMA as the monomer. We add
fluorescent molecule, Nile Red, to visualize the suspension samples using confocal microscopy.
Additionally, the rough colloids are synthesized by adding crosslinker, ethylene glycol
dimethacrylate (EGDMA), during the dispersion polymerization reaction. Our earlier study

117
indicates that the steric polymer brush (PHSA) is of 10-15 nm in length [15]. The synthesized
particles are stored in stock solution and is further solvent transferred to an index-matching solvent
squalene (nsq = nPMMA = 1.49). Index matching serves two purposes: (a) minimizes the van der
Waals attraction between the microspheres thus by ensuring hard sphere interactions and (b)
reduces the background scattering during fluorescent imaging.
Since the particle swell in solvent squalene, we estimate the particle diameter from confocal
images. Due to swelling issues, we do not estimate the roughness via atomic force microscopy
(AFM) since the 3D structure does not reflect in the suspension squalene. Instead, we estimate a
2D circularity parameter (ψ) and average them for 100 independent 2D images from confocal
microscopy for each particle type. The parameter ψ is defined as 24 p pA P = where Ap is the
maximum 2D area of the particle and Pp is the perimeter corresponding to Ap. We obtain ψ for
smooth and rough particles as 0.99±0.01 and 0.87±0.03. Effective particle diameter for rough
particle is then calculated using the expression eff pa A = . In this study we use smooth particles
of 2a = 1.50 μm ± 4% and rough particles of 2aeff = 1.55 μm ± 5%. Scanning electron micrographs
of the particles are provided in Fig. 1.
Squalene and PMMA particles are not density matched (Δρ ≈ 0.322 kg/m3) and this enables
centrifugation of suspensions to form random packing. Centrifugation at 1500g eliminates
crystallization and for smooth particles suspensions we have shown that PHSA-g-PMMA are
nearly frictionless and where they pack maximum ≈ 0.64 [15]. We dilute the suspensions from the
centrifuged sediment to required ϕ. We image the quiescent suspensions under confocal
microscope, and we estimate the diluted ϕ using the formula,
34 3 eff p
box
a N
V
= , where Np is the
118
number of particle centroids obtained via image-processing of a 3D box of volume Vbox [16]. A
similar procedure is adopted for rough particle suspensions.
4.2.2 Rheological Measurements
We perform all our experiments on a stress-controlled rheometer (TA Instruments, DHR-
2) using a 50mm serrated cone and plate geometry. We perform strain sweep experiments by
varying γ from 0.01% to 100%, holding the frequency at 1 rad/s. The frequency sweep experiments
are conducted in the linear viscoelastic regime after identifying the linear regime in each case of
smooth and rough colloidal suspensions.
After loading and prior to every experiment set, all the suspensions are conditioned at
room temperature for 60 s to remove any prior shear-induced microstructural changes. Suspensions
of smooth and rough particles are prone to shear thickening readily during the protocol of lowering
the top geometry. To avoid such issues, for geometry heights < 1cm, we lower the top geometry
10 μm per step while monitoring the normal force at the same time.
4.3 Results and Discussions
4.3.1. Linear viscoelastic measurements
The linear regimes for the suspensions of both smooth and rough particles are identified by
performing strain amplitude sweeps at an oscillation frequency at a constant amplitude of 1 rad/s.
The strain sweep experiments were performed at a frequency of 1 rad/s on suspensions of ϕ ranging
from 0.45 – 0.62 in the case of smooth particle suspensions and 0.45 – 0.56 in the case of rough
particle suspensions. The results for the dependence of viscous (G’(ω)) and elastic moduli (G’’(ω))
as a function of applied strain for suspensions of smooth and rough particles are shown in Fig. 2(a)
119
and 2(b), respectively. In both the cases, we observe that G’(ω) and G’’(ω) values remain
independent of the applied strains at low to moderate values. For smooth colloidal suspensions,
the highest possible value of strain at the onset of nonlinearity reduces with increasing ϕ, which
corroborates earlier result [17]. In contrast, this distinction is not clear in suspensions with rough
colloids. One plausible explanation is the similar scale of local dissipation at ϕ > 0.53 for rough
due to the rotational constraints exhibited by the rough particles in the suspension.
At low strains, suspensions exhibit elastic behavior and at higher strains the response is
dominated by viscous dissipation. We observe that, in general, for ϕ ≤ 0.50, the G’(ω) values are
lower than the G’’(ω) values. This result parallels the data reported earlier in the literature for
silica colloids dispersed in ethylene glycol [17]. In smooth colloidal suspensions, for ϕ ≤ 0.50, the
dissipation is primarily viscous in nature and similar trend is observed in suspensions containing
rough colloids. By contrast smooth particle suspensions at ϕ > 0.57 is predominantly elastic and
the result is qualitatively similar in rough colloidal systems. Quantitatively, the elastic response of
rough particle suspensions is observed to be 103 times that observed in the suspensions containing
smooth colloids. In both types of suspensions, we identify the strain value, where suspensions lie
in their respective linear regime, to be at γ ≈ 0.5 %.
The frequency dependence of the viscoelastic moduli on the suspensions of smooth and
rough particles are shown in Figure 4.3 and Figure 4.4, respectively. To compare the results
between two types of particle suspensions, both axes are normalized. The frequency is non-
dimensionalized using the oscillatory shear Peclet number (Peω) defined as 2
0effPe a D = where
aeff is the effective particle radius, is the shear rate ( 2 = ) and D0 is the short-time diffusion
coefficient which is ϕ-independent. The value of D0 is obtained using the expression D0 =
kBT/6πηsaeff , where ηs is the solvent viscosity (0.012 Pa.s) and other terms are defined earlier in the

120
paragraph. The moduli, G’(ω) and G’’(ω) scales with the thermal energy in the suspension system
set by kBT and aeff.
The change in G’(ω) and G’’(ω) on the applied frequency in smooth colloidal suspensions
is shown in Figure 4.3(a) and 4.3(b), respectively. At ϕ = 0.45 and 0.50 and Peω ≥ 103, the
suspensions behave as model Maxwell fluids with G’ ~ ω2 and G’’ ~ ω. For ϕ ≥ 0.58 the
suspensions display G’(ω) > G’’(ω) at lower ω. At moderate ω, there is a high frequency crossover
point beyond which both G’(ω) and G’’(ω) rise sharply. The frequency dependence of G’(ω) and
G’’(ω) on suspensions of rough colloidal suspensions is shown in Figure 4.4(a) and 4.4(b),
respectively. Similar Maxwellian scaling, as reported earlier in smooth colloidal suspensions, is
observed in rough particle systems at ϕ = 0.45 and 0.50. The most interesting observation is the
increase in G’(ω) and G’’(ω) at ϕ ≥ 0.54. The G’(ω) value is frequency independent, reminiscent
of a high-frequency plateau modulus observed in compressed emulsions [18], and the magnitude
is ~103 higher than that reported for smooth particle suspensions. We observe the order of
magnitude increase in G’’(ω) is same as that of the G’(ω). In contrast to smooth particle
suspensions, G’’(ω) in suspensions containing rough colloids exhibit a reproducible minimum and
then slowly increases. This behavior of dramatic jump in G’(ω) and G’’(ω) is a novel observation
in colloidal rheology behavior in the linear regime.
4.3.2 Viscoelastic spectrum for colloidal suspensions
To further understand the unusual observation in the frequency dependence of G’(ω) and
G’’(ω) on the type of particle suspension and decouple the effect of surface roughness on linear
viscoelastic properties, we construct a master viscoelastic spectrum combining our data of smooth
and rough colloidal suspensions. The method employed here is the time-ϕ superposition principle
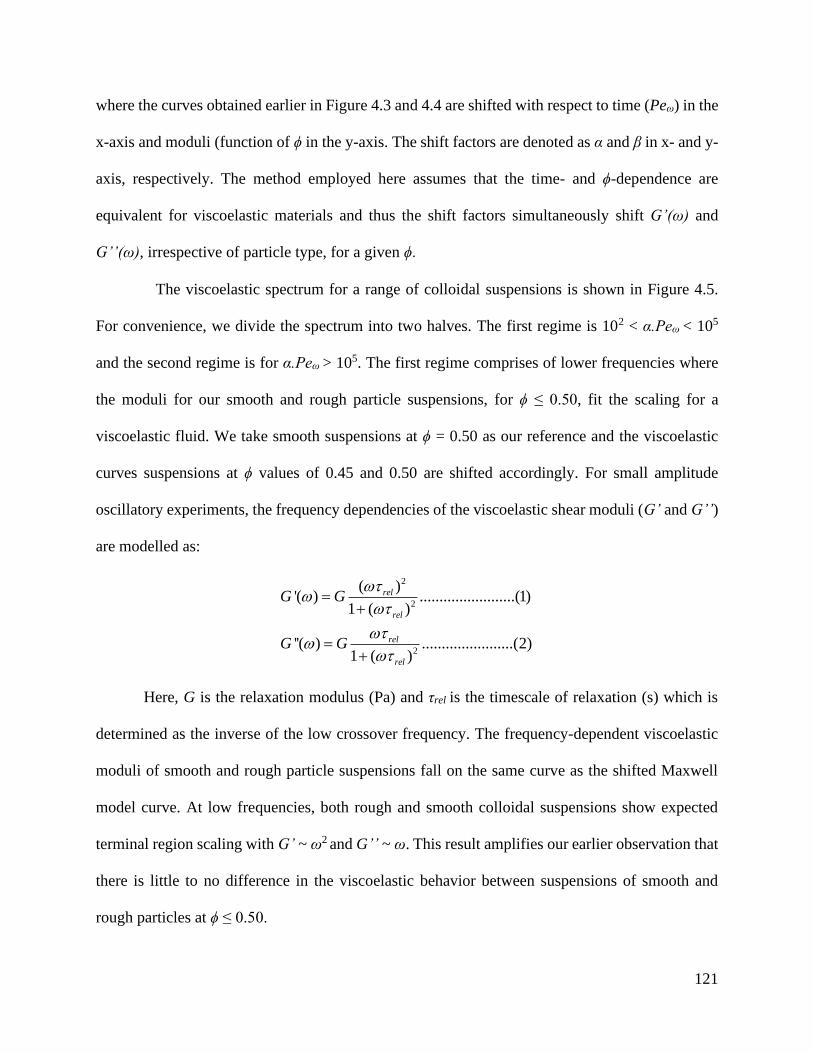
121
where the curves obtained earlier in Figure 4.3 and 4.4 are shifted with respect to time (Peω) in the
x-axis and moduli (function of ϕ in the y-axis. The shift factors are denoted as α and β in x- and y-
axis, respectively. The method employed here assumes that the time- and ϕ-dependence are
equivalent for viscoelastic materials and thus the shift factors simultaneously shift G’(ω) and
G’’(ω), irrespective of particle type, for a given ϕ.
The viscoelastic spectrum for a range of colloidal suspensions is shown in Figure 4.5.
For convenience, we divide the spectrum into two halves. The first regime is 102 < α.Peω < 105
and the second regime is for α.Peω > 105. The first regime comprises of lower frequencies where
the moduli for our smooth and rough particle suspensions, for ϕ ≤ 0.50, fit the scaling for a
viscoelastic fluid. We take smooth suspensions at ϕ = 0.50 as our reference and the viscoelastic
curves suspensions at ϕ values of 0.45 and 0.50 are shifted accordingly. For small amplitude
oscillatory experiments, the frequency dependencies of the viscoelastic shear moduli (G’ and G’’)
are modelled as:
2
2
2
( )'( ) ........................(1)
1 ( )
''( ) .......................(2)1 ( )
rel
rel
rel
rel
G G
G G
=+
=+
Here, G is the relaxation modulus (Pa) and τrel is the timescale of relaxation (s) which is
determined as the inverse of the low crossover frequency. The frequency-dependent viscoelastic
moduli of smooth and rough particle suspensions fall on the same curve as the shifted Maxwell
model curve. At low frequencies, both rough and smooth colloidal suspensions show expected
terminal region scaling with G’ ~ ω2 and G’’ ~ ω. This result amplifies our earlier observation that
there is little to no difference in the viscoelastic behavior between suspensions of smooth and
rough particles at ϕ ≤ 0.50.

122
The second regime consists of moderate and high frequency behavior, which are not
described in the Maxwell fluid formalism. In general, this regime is characterized with higher
elastic component, which changes at very high frequencies. We observe that with suitable shift
factors the viscoelastic behavior of dense suspensions that comprise of rough and smooth colloids
forms a master curve as shown in Figure 4.5. Since no continuous data from low-frequency to
medium-frequency regime was available, the reference for the second regime started where the
data matched with the high-frequency Maxwell model regime. This may introduce error in shift
factor α of magnitude ±2, which is much smaller considering the orders of magnitude of α in the
spectrum.
4.3.3 Decoupling the effects of geometric frustration in the linear viscoelastic regime
Further analysis of the shift factors is necessary to understand the effect of surface
roughness on the viscoelastic properties on the dense colloidal suspensions. We plot the shift
factors α and β as a function of ϕ, as shown in Figure 4.6a and 4.6b, respectively. The data show
that for ϕ ≤ 0.50 the shift factors for both type of suspensions are similar in magnitude and they
are around unity. This might be an artefact of choosing the reference as smooth suspension at ϕ =
0.50. For ϕ > 0.50, the shift factors vary in magnitude between suspensions of smooth and rough
colloids. To further understand the effect of the shift factors we investigate the effect of the ratio
of the shift factors α/β with the suspension ϕ.
The variation of shift factor ratio, α/β with respect to ϕ is shown in Figure 4.7(a). At ϕ ≤
0.50, α/β is in the order of 1 but at higher ϕ values the ratio is the order of ~106. This behavior is
seen in both smooth and rough particle suspensions. We extend the recent work in exploring
jamming distance as a design parameter in suspension flow to investigate this behavior. Figure
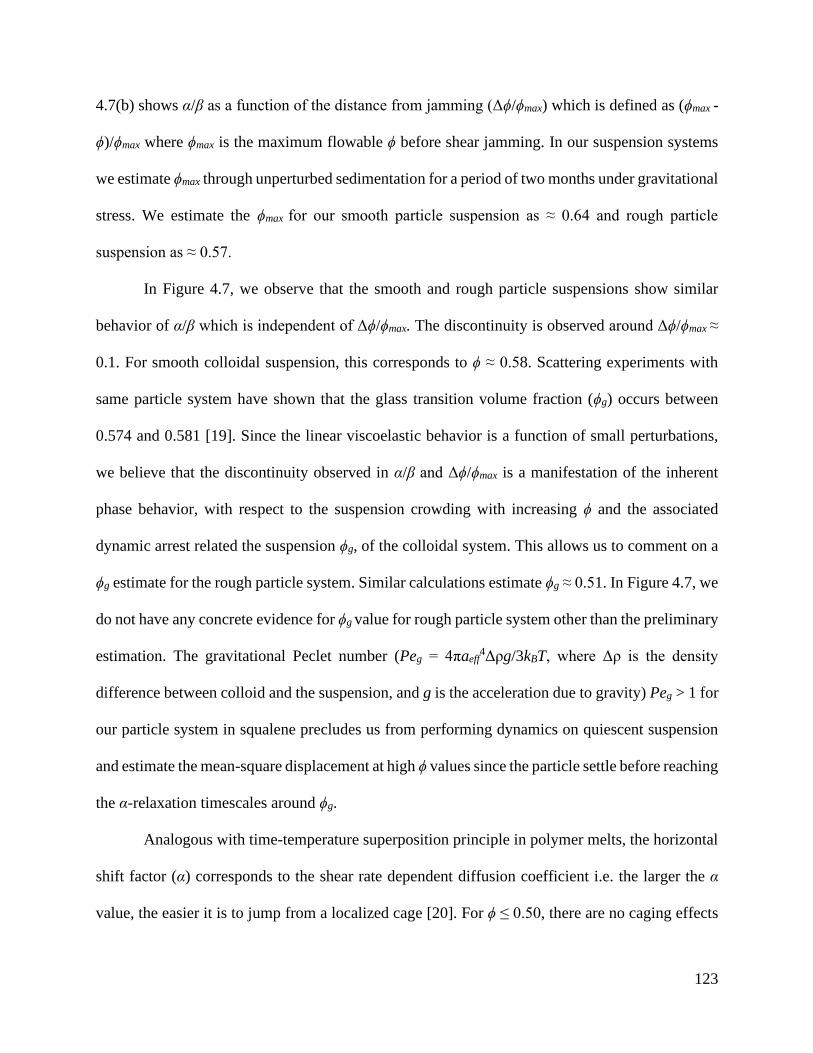
123
4.7(b) shows α/β as a function of the distance from jamming (Δϕ/ϕmax) which is defined as (ϕmax -
ϕ)/ϕmax where ϕmax is the maximum flowable ϕ before shear jamming. In our suspension systems
we estimate ϕmax through unperturbed sedimentation for a period of two months under gravitational
stress. We estimate the ϕmax for our smooth particle suspension as ≈ 0.64 and rough particle
suspension as ≈ 0.57.
In Figure 4.7, we observe that the smooth and rough particle suspensions show similar
behavior of α/β which is independent of Δϕ/ϕmax. The discontinuity is observed around Δϕ/ϕmax ≈
0.1. For smooth colloidal suspension, this corresponds to ϕ ≈ 0.58. Scattering experiments with
same particle system have shown that the glass transition volume fraction (ϕg) occurs between
0.574 and 0.581 [19]. Since the linear viscoelastic behavior is a function of small perturbations,
we believe that the discontinuity observed in α/β and Δϕ/ϕmax is a manifestation of the inherent
phase behavior, with respect to the suspension crowding with increasing ϕ and the associated
dynamic arrest related the suspension ϕg, of the colloidal system. This allows us to comment on a
ϕg estimate for the rough particle system. Similar calculations estimate ϕg ≈ 0.51. In Figure 4.7, we
do not have any concrete evidence for ϕg value for rough particle system other than the preliminary
estimation. The gravitational Peclet number (Peg = 4πaeff4Δρg/3kBT, where Δρ is the density
difference between colloid and the suspension, and g is the acceleration due to gravity) Peg > 1 for
our particle system in squalene precludes us from performing dynamics on quiescent suspension
and estimate the mean-square displacement at high ϕ values since the particle settle before reaching
the α-relaxation timescales around ϕg.
Analogous with time-temperature superposition principle in polymer melts, the horizontal
shift factor (α) corresponds to the shear rate dependent diffusion coefficient i.e. the larger the α
value, the easier it is to jump from a localized cage [20]. For ϕ ≤ 0.50, there are no caging effects
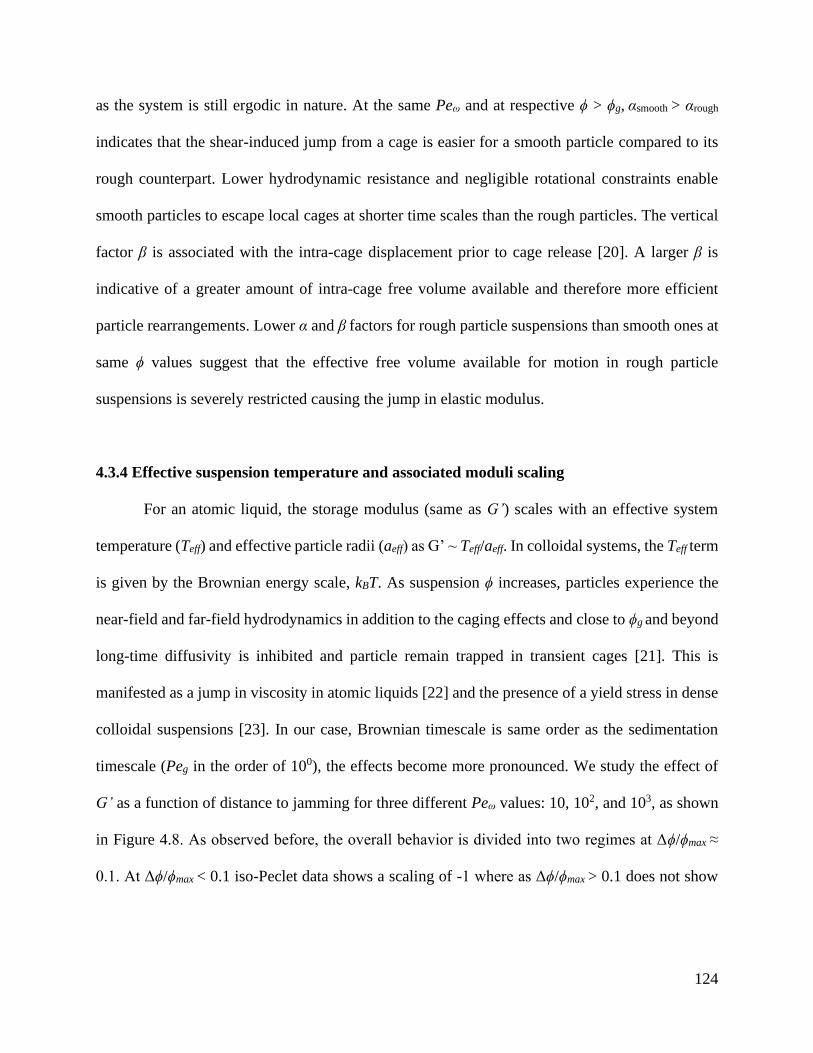
124
as the system is still ergodic in nature. At the same Peω and at respective ϕ > ϕg, αsmooth > αrough
indicates that the shear-induced jump from a cage is easier for a smooth particle compared to its
rough counterpart. Lower hydrodynamic resistance and negligible rotational constraints enable
smooth particles to escape local cages at shorter time scales than the rough particles. The vertical
factor β is associated with the intra-cage displacement prior to cage release [20]. A larger β is
indicative of a greater amount of intra-cage free volume available and therefore more efficient
particle rearrangements. Lower α and β factors for rough particle suspensions than smooth ones at
same ϕ values suggest that the effective free volume available for motion in rough particle
suspensions is severely restricted causing the jump in elastic modulus.
4.3.4 Effective suspension temperature and associated moduli scaling
For an atomic liquid, the storage modulus (same as G’) scales with an effective system
temperature (Teff) and effective particle radii (aeff) as G’ ~ Teff/aeff. In colloidal systems, the Teff term
is given by the Brownian energy scale, kBT. As suspension ϕ increases, particles experience the
near-field and far-field hydrodynamics in addition to the caging effects and close to ϕg and beyond
long-time diffusivity is inhibited and particle remain trapped in transient cages [21]. This is
manifested as a jump in viscosity in atomic liquids [22] and the presence of a yield stress in dense
colloidal suspensions [23]. In our case, Brownian timescale is same order as the sedimentation
timescale (Peg in the order of 100), the effects become more pronounced. We study the effect of
G’ as a function of distance to jamming for three different Peω values: 10, 102, and 103, as shown
in Figure 4.8. As observed before, the overall behavior is divided into two regimes at Δϕ/ϕmax ≈
0.1. At Δϕ/ϕmax < 0.1 iso-Peclet data shows a scaling of -1 where as Δϕ/ϕmax > 0.1 does not show
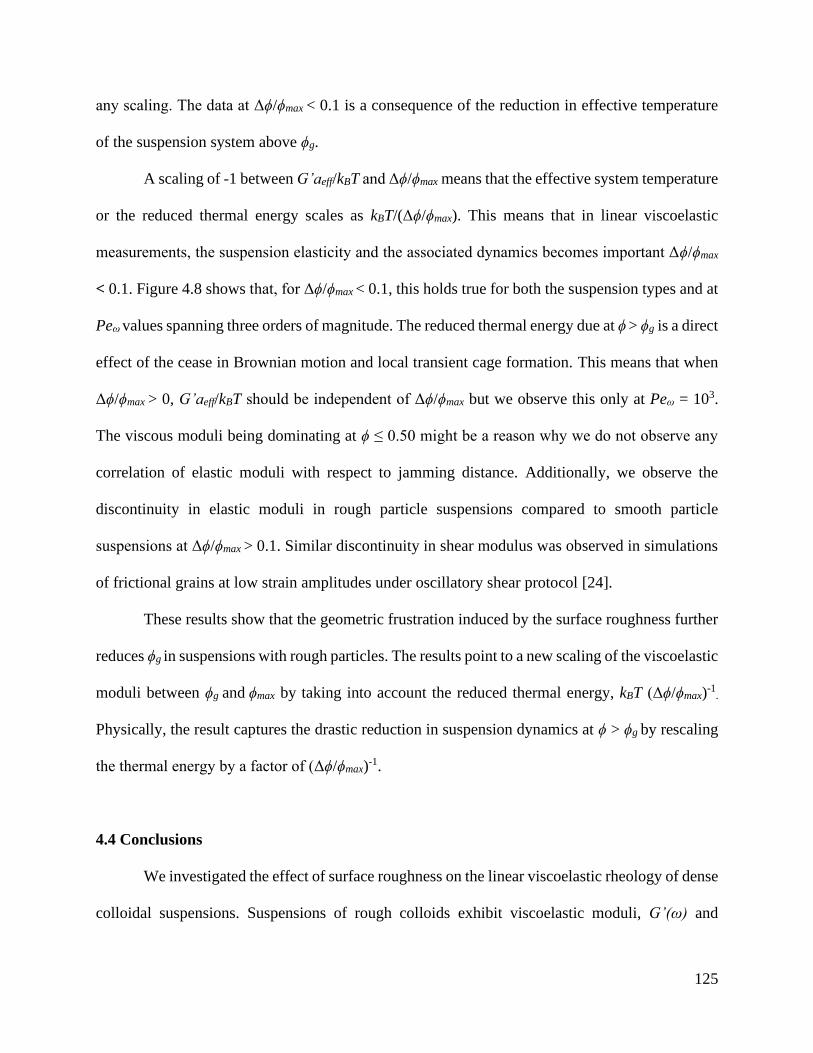
125
any scaling. The data at Δϕ/ϕmax < 0.1 is a consequence of the reduction in effective temperature
of the suspension system above ϕg.
A scaling of -1 between G’aeff/kBT and Δϕ/ϕmax means that the effective system temperature
or the reduced thermal energy scales as kBT/(Δϕ/ϕmax). This means that in linear viscoelastic
measurements, the suspension elasticity and the associated dynamics becomes important Δϕ/ϕmax
< 0.1. Figure 4.8 shows that, for Δϕ/ϕmax < 0.1, this holds true for both the suspension types and at
Peω values spanning three orders of magnitude. The reduced thermal energy due at ϕ > ϕg is a direct
effect of the cease in Brownian motion and local transient cage formation. This means that when
Δϕ/ϕmax > 0, G’aeff/kBT should be independent of Δϕ/ϕmax but we observe this only at Peω = 103.
The viscous moduli being dominating at ϕ ≤ 0.50 might be a reason why we do not observe any
correlation of elastic moduli with respect to jamming distance. Additionally, we observe the
discontinuity in elastic moduli in rough particle suspensions compared to smooth particle
suspensions at Δϕ/ϕmax > 0.1. Similar discontinuity in shear modulus was observed in simulations
of frictional grains at low strain amplitudes under oscillatory shear protocol [24].
These results show that the geometric frustration induced by the surface roughness further
reduces ϕg in suspensions with rough particles. The results point to a new scaling of the viscoelastic
moduli between ϕg and ϕmax by taking into account the reduced thermal energy, kBT (Δϕ/ϕmax)-1
.
Physically, the result captures the drastic reduction in suspension dynamics at ϕ > ϕg by rescaling
the thermal energy by a factor of (Δϕ/ϕmax)-1.
4.4 Conclusions
We investigated the effect of surface roughness on the linear viscoelastic rheology of dense
colloidal suspensions. Suspensions of rough colloids exhibit viscoelastic moduli, G’(ω) and

126
G’’(ω), orders of magnitude higher than the suspensions of smooth colloidal particles. The
microstructural explanation for this phenomenon is that the surface anisotropy constraints the
rotational motion in rough colloids, modifies the near-field hydrodynamics, and reduces the
effective free volume available in the suspension, particularly close to jamming at Δϕ/ϕmax < 0.1.
We quantify this reduction in free volume through the shift factors α and β used in frequency-ϕ
superposition. Furthermore, the scaling of elastic moduli over three orders of Peω proves that, for
Δϕ/ϕmax < 0.1, the elastic modulus should be scaled with a factor that takes into account the
reduction in thermal energy of suspensions.
Earlier work indicates that slow clusters contribute to the bulk elasticity in dense colloidal
glasses [25]. Visualizing single particle dynamics using a confocal rheometer may point to similar
correlated clusters in rough suspensions that form percolations with minimum contacts that impart
bulk elasticity orders of magnitude higher than smooth colloidal suspensions. This would enable
understanding phenomena that require low perturbation to respond, especially in cases of
geological flow phenomena where the frictional materials that inherently creep exhibit glassy
behavior [4].

127
Figure 4.1 | Particle images. Scanning electron micrographs of (a) smooth and (b) rough
particles. Scale = 5 μm.
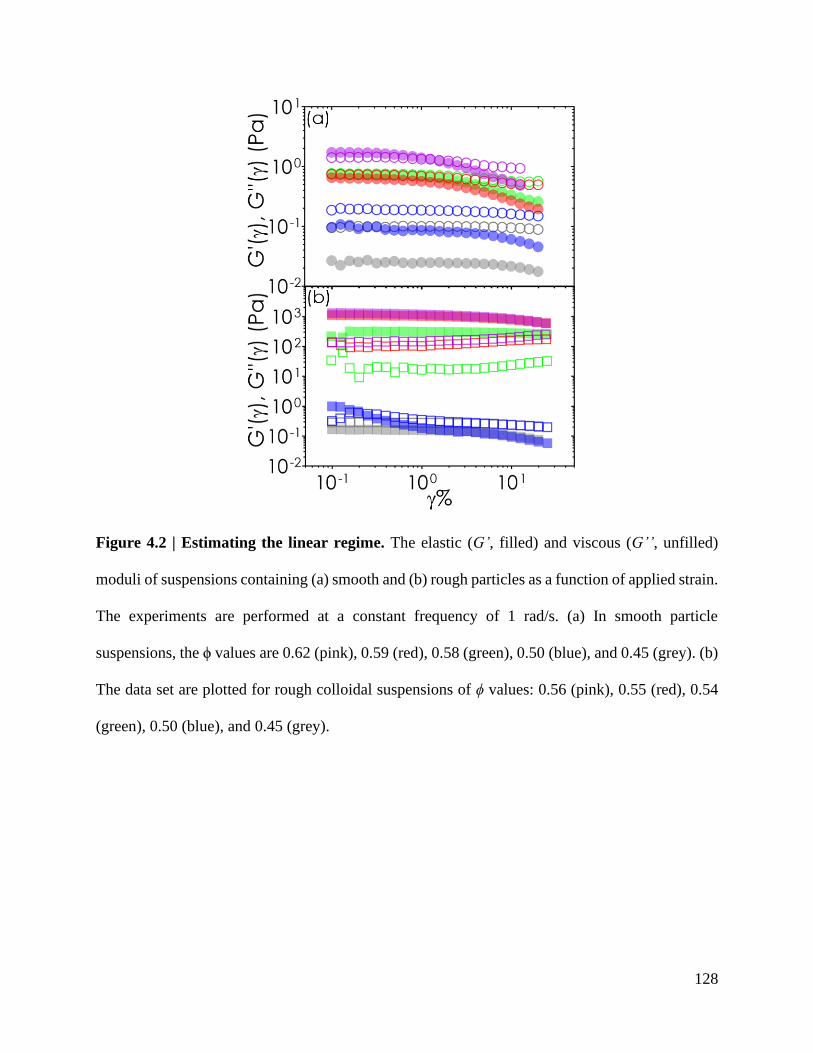
128
Figure 4.2 | Estimating the linear regime. The elastic (G’, filled) and viscous (G’’, unfilled)
moduli of suspensions containing (a) smooth and (b) rough particles as a function of applied strain.
The experiments are performed at a constant frequency of 1 rad/s. (a) In smooth particle
suspensions, the ϕ values are 0.62 (pink), 0.59 (red), 0.58 (green), 0.50 (blue), and 0.45 (grey). (b)
The data set are plotted for rough colloidal suspensions of ϕ values: 0.56 (pink), 0.55 (red), 0.54
(green), 0.50 (blue), and 0.45 (grey).

129
Figure 4.3 | Viscoelastic moduli in suspensions of smooth colloids. The dependence of (a) elastic
(G’, filled) and (b) viscous (G’’, unfilled) for suspensions of smooth colloids on applied frequency.
The x-axis is normalized by the applied oscillatory shear, particle radius, and thermal energy. The
y-axis is normalized by particle radius and thermal energy. The All experiments are performed in
the linear regime at strain ~ 0.05%. The suspension ϕ values are 0.62 (pink), 0.59 (red), 0.58
(green), 0.50 (blue), and 0.45 (grey).
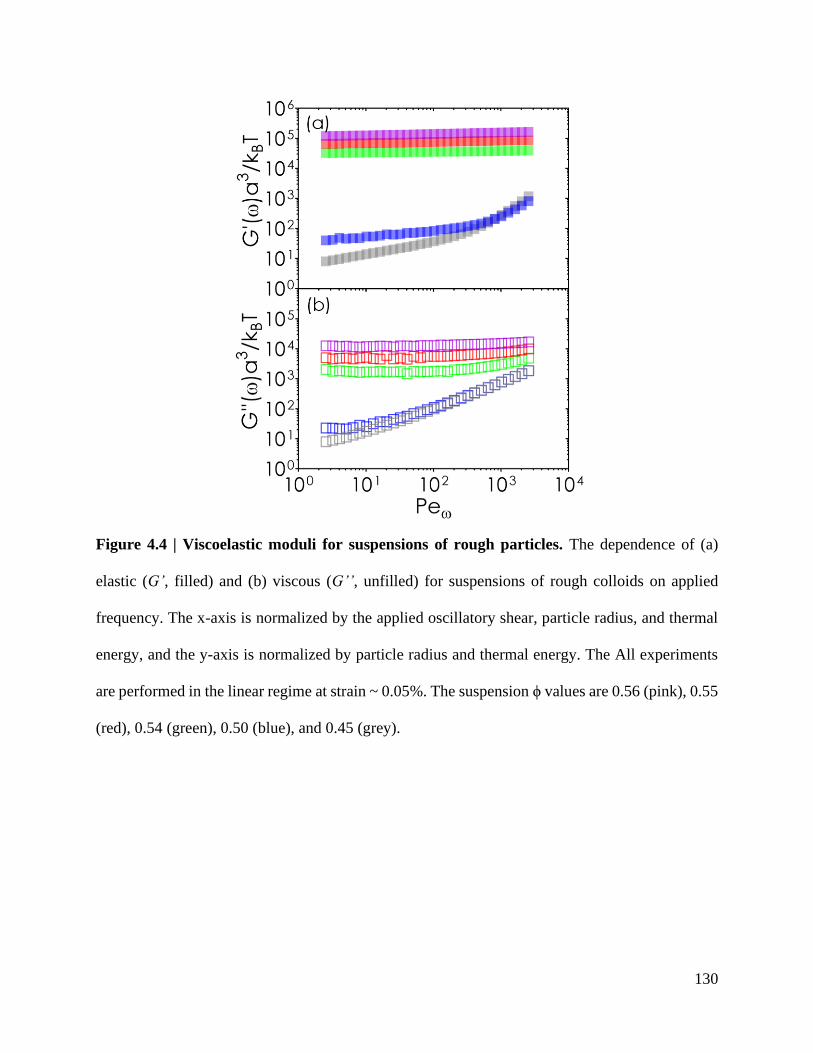
130
Figure 4.4 | Viscoelastic moduli for suspensions of rough particles. The dependence of (a)
elastic (G’, filled) and (b) viscous (G’’, unfilled) for suspensions of rough colloids on applied
frequency. The x-axis is normalized by the applied oscillatory shear, particle radius, and thermal
energy, and the y-axis is normalized by particle radius and thermal energy. The All experiments
are performed in the linear regime at strain ~ 0.05%. The suspension ϕ values are 0.56 (pink), 0.55
(red), 0.54 (green), 0.50 (blue), and 0.45 (grey).
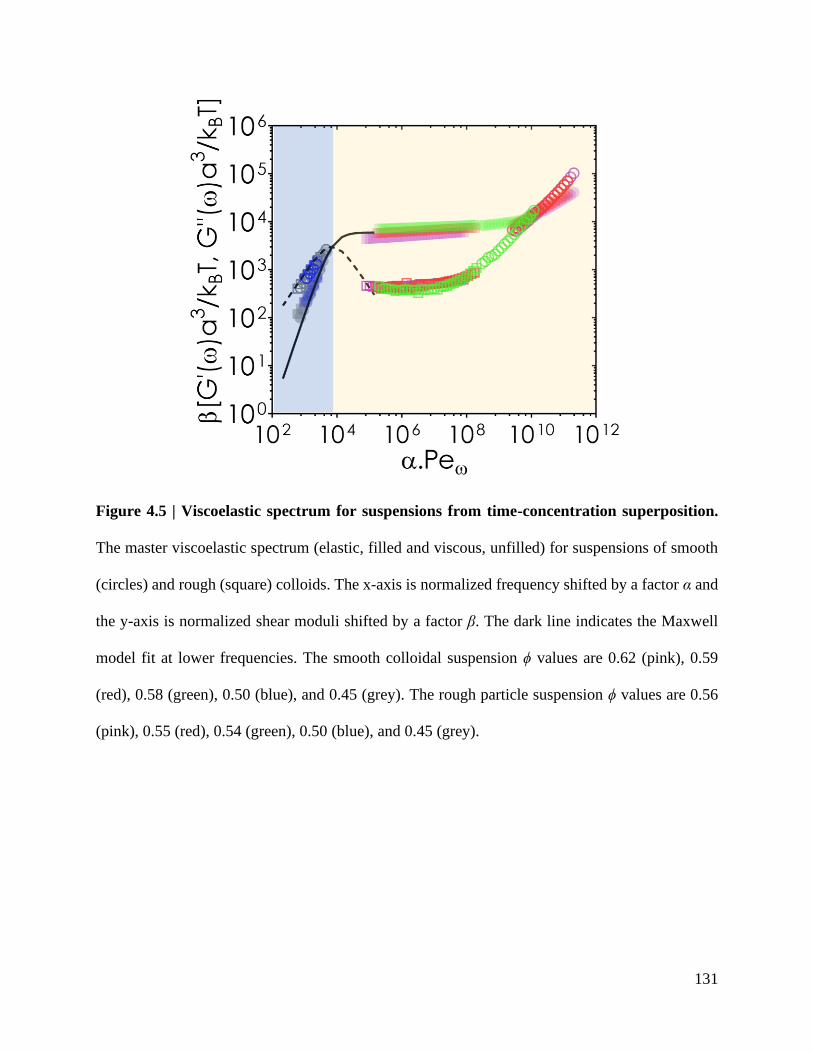
131
Figure 4.5 | Viscoelastic spectrum for suspensions from time-concentration superposition.
The master viscoelastic spectrum (elastic, filled and viscous, unfilled) for suspensions of smooth
(circles) and rough (square) colloids. The x-axis is normalized frequency shifted by a factor α and
the y-axis is normalized shear moduli shifted by a factor β. The dark line indicates the Maxwell
model fit at lower frequencies. The smooth colloidal suspension ϕ values are 0.62 (pink), 0.59
(red), 0.58 (green), 0.50 (blue), and 0.45 (grey). The rough particle suspension ϕ values are 0.56
(pink), 0.55 (red), 0.54 (green), 0.50 (blue), and 0.45 (grey).
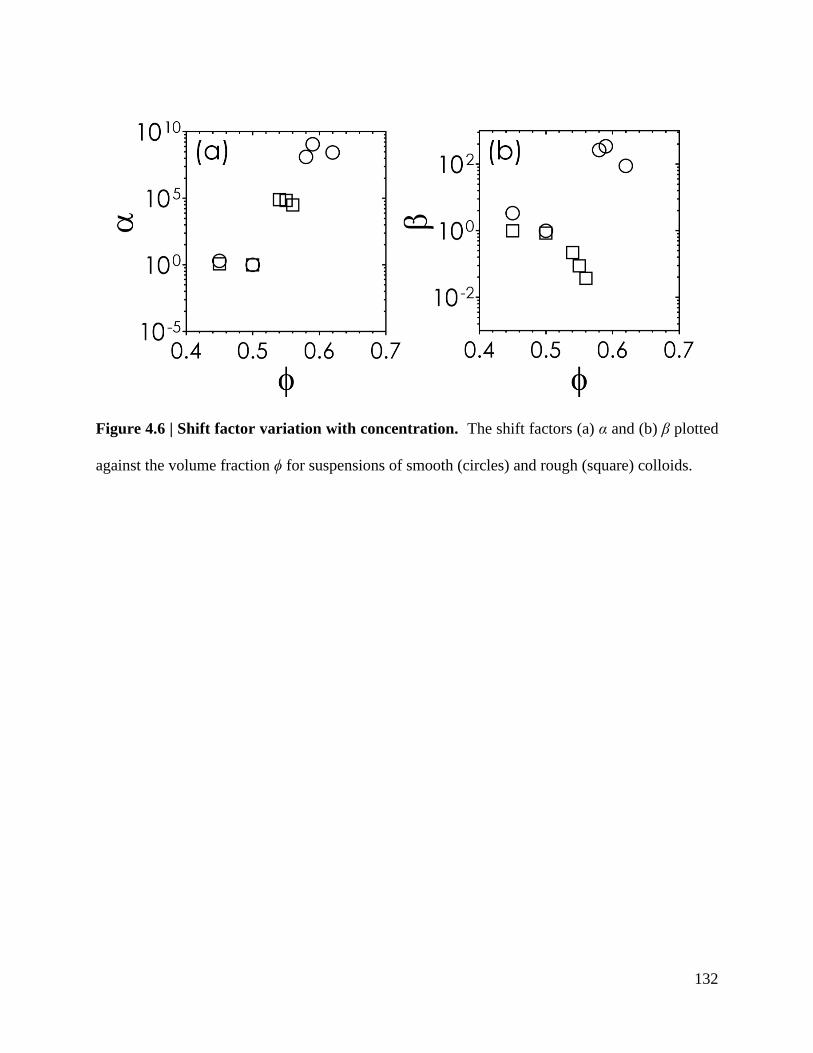
132
Figure 4.6 | Shift factor variation with concentration. The shift factors (a) α and (b) β plotted
against the volume fraction ϕ for suspensions of smooth (circles) and rough (square) colloids.
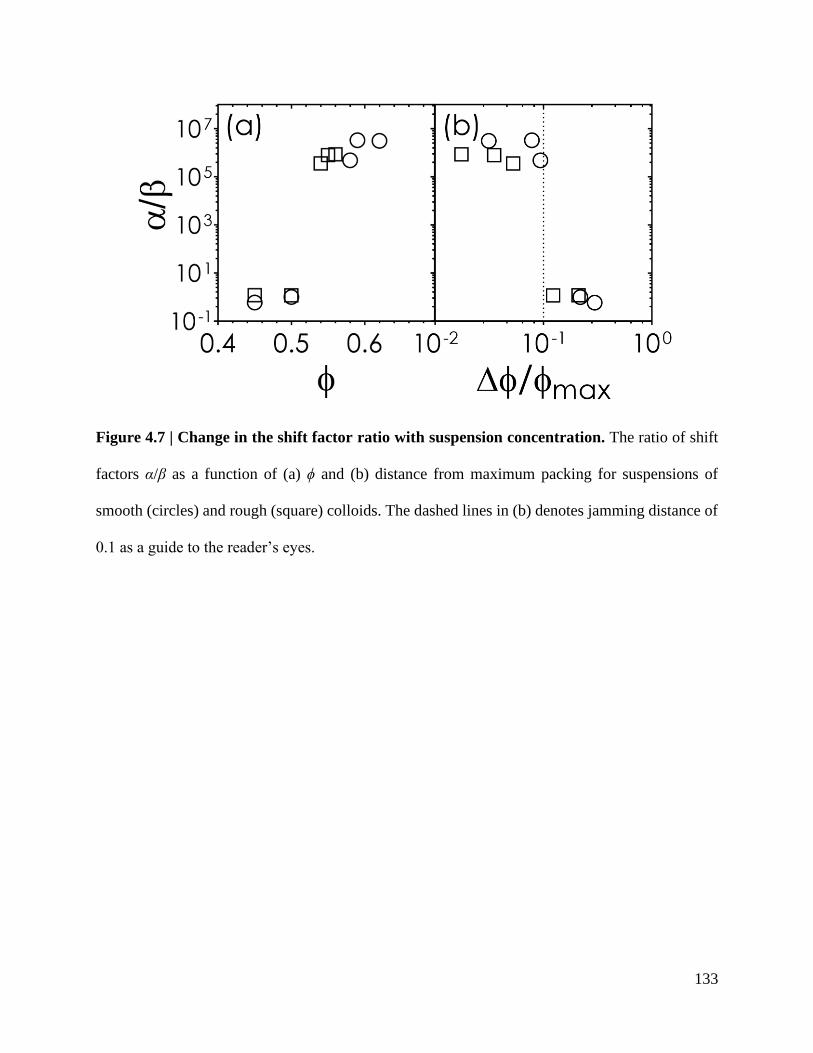
133
Figure 4.7 | Change in the shift factor ratio with suspension concentration. The ratio of shift
factors α/β as a function of (a) ϕ and (b) distance from maximum packing for suspensions of
smooth (circles) and rough (square) colloids. The dashed lines in (b) denotes jamming distance of
0.1 as a guide to the reader’s eyes.
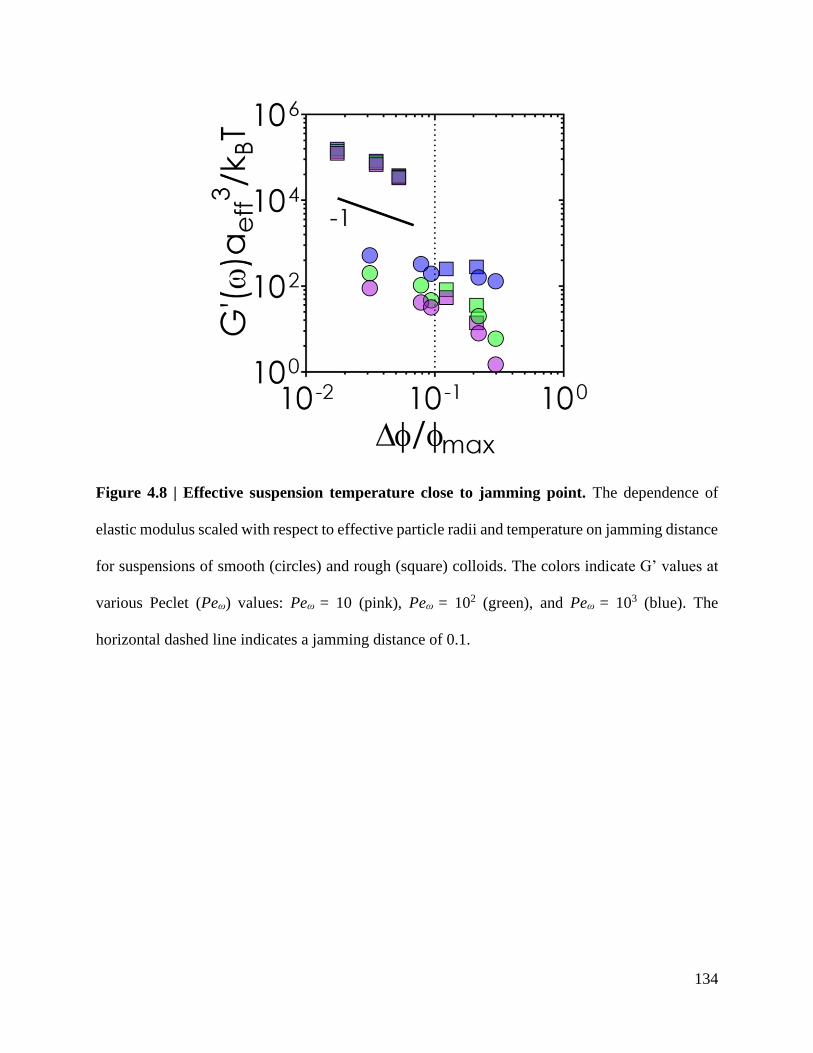
134
Figure 4.8 | Effective suspension temperature close to jamming point. The dependence of
elastic modulus scaled with respect to effective particle radii and temperature on jamming distance
for suspensions of smooth (circles) and rough (square) colloids. The colors indicate G’ values at
various Peclet (Peω) values: Peω = 10 (pink), Peω = 102 (green), and Peω = 103 (blue). The
horizontal dashed line indicates a jamming distance of 0.1.

135
References
[1] B. Schroyen, C.-P. Hsu, L. Isa, P. Van Puyvelde, and J. Vermant, Physical Review Letters
122, 218001 (2019).
[2] W. B. Russel, D. A. Saville, and W. R. Schowalter, Colloidal Dispersions (Cambridge
University Press, Cambridge, 1989), Cambridge Monographs on Mechanics.
[3] D. Bi, X. Yang, M. C. Marchetti, and M. L. Manning, Physical Review X 6, 021011 (2016).
[4] B. Ferdowsi, C. P. Ortiz, and D. J. Jerolmack, Proceedings of the National Academy of
Sciences 115, 4827 (2018).
[5] K. V. Edmond, M. T. Elsesser, G. L. Hunter, D. J. Pine, and E. R. Weeks, Proceedings of
the National Academy of Sciences 109, 17891 (2012).
[6] R. J. Phillips, J. F. Brady, and G. Bossis, The Physics of Fluids 31, 3462 (1988).
[7] J. F. Brady, Journal of Fluid Mechanics 272, 109 (1994).
[8] L. C. Hsiao, I. Saha-Dalal, R. G. Larson, and M. J. Solomon, Soft Matter 13, 9229 (2017).
[9] T. G. Mason and D. A. Weitz, Physical Review Letters 74, 1250 (1995).
[10] L. C. Hsiao, S. Jamali, E. Glynos, P. F. Green, R. G. Larson, and M. J. Solomon, Physical
Review Letters 119, 158001 (2017).
[11] C.-P. Hsu, S. N. Ramakrishna, M. Zanini, N. D. Spencer, and L. Isa, Proceedings of the
National Academy of Sciences 115, 5117 (2018).
[12] R. Rice, R. Roth, and C. P. Royall, Soft Matter 8, 1163 (2012).
[13] S. Jamali and J. F. Brady, Physical Review Letters 123, 138002 (2019).
[14] R. A. Lionberger and W. B. Russel, Journal of Rheology 38, 1885 (1994).
[15] S. Pradeep and L. C. Hsiao, Soft Matter 16, 4980 (2020).
[16] J. C. Crocker and D. G. Grier, Journal of Colloid and Interface Science 179, 298 (1996).
136
[17] T. G. Mason and D. A. Weitz, Physical Review Letters 75, 2770 (1995).
[18] T. G. Mason, J. Bibette, and D. A. Weitz, Physical Review Letters 75, 2051 (1995).
[19] W. van Megen and S. M. Underwood, Nature 362, 616 (1993).
[20] A. R. Jacob, A. S. Poulos, S. Kim, J. Vermant, and G. Petekidis, Physical Review Letters
115, 218301 (2015).
[21] E. R. Weeks and D. A. Weitz, Physical Review Letters 89, 095704 (2002).
[22] A. Ikeda, L. Berthier, and P. Sollich, Soft Matter 9, 7669 (2013).
[23] M. Dinkgreve, M. A. J. Michels, T. G. Mason, and D. Bonn, Physical Review Letters 121,
228001 (2018).
[24] M. Otsuki and H. Hayakawa, Physical Review E 95, 062902 (2017).
[25] J. C. Conrad, P. P. Dhillon, E. R. Weeks, D. R. Reichman, and D. A. Weitz, Physical
Review Letters 97, 265701 (2006).
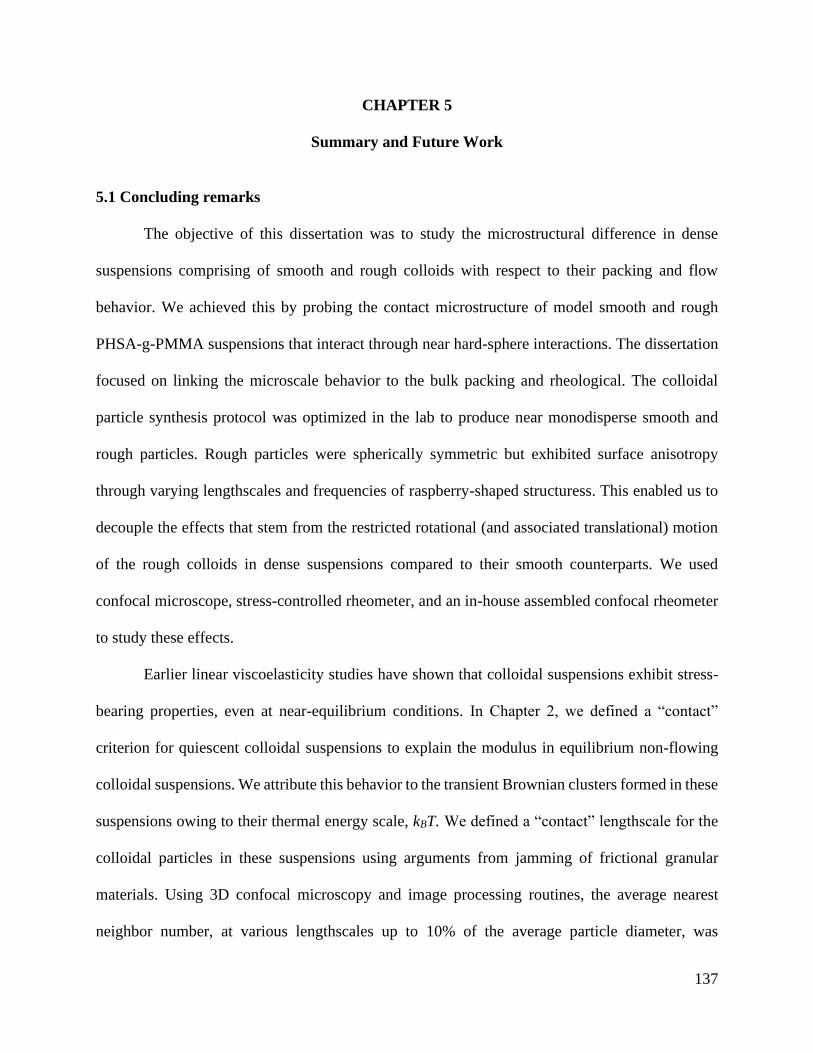
137
CHAPTER 5
Summary and Future Work
5.1 Concluding remarks
The objective of this dissertation was to study the microstructural difference in dense
suspensions comprising of smooth and rough colloids with respect to their packing and flow
behavior. We achieved this by probing the contact microstructure of model smooth and rough
PHSA-g-PMMA suspensions that interact through near hard-sphere interactions. The dissertation
focused on linking the microscale behavior to the bulk packing and rheological. The colloidal
particle synthesis protocol was optimized in the lab to produce near monodisperse smooth and
rough particles. Rough particles were spherically symmetric but exhibited surface anisotropy
through varying lengthscales and frequencies of raspberry-shaped structuress. This enabled us to
decouple the effects that stem from the restricted rotational (and associated translational) motion
of the rough colloids in dense suspensions compared to their smooth counterparts. We used
confocal microscope, stress-controlled rheometer, and an in-house assembled confocal rheometer
to study these effects.
Earlier linear viscoelasticity studies have shown that colloidal suspensions exhibit stress-
bearing properties, even at near-equilibrium conditions. In Chapter 2, we defined a “contact”
criterion for quiescent colloidal suspensions to explain the modulus in equilibrium non-flowing
colloidal suspensions. We attribute this behavior to the transient Brownian clusters formed in these
suspensions owing to their thermal energy scale, kBT. We defined a “contact” lengthscale for the
colloidal particles in these suspensions using arguments from jamming of frictional granular
materials. Using 3D confocal microscopy and image processing routines, the average nearest
neighbor number, at various lengthscales up to 10% of the average particle diameter, was

138
extrapolated to respective isostatic conditions of the suspensions. The optimized contact criterion
was found to include lengthscales involving average particle diameter, steric polymer brushes,
roughness scale, and associated polydispersity.
Chapter 3 was focused on designing shear thickening suspensions using a single parameter,
the jamming distance. Using suspensions of colloids that exhibited varying surface roughness, we
produced steady shear flow curves and observed that there is a universal behavior in the shear
thickening strength (defined by the rate of increase of suspension viscosity with increasing applied
stress) in these suspensions and their respective jamming distance. We assembled a confocal
rheometer in-house and arrested the suspension during shear thickening stress to study the 3D
contact microstructure. We found that the “contact” lengthscale obtained from our earlier analysis
of quiescent suspensions did not explain the physics behind shear thickening mechanics. At high
stresses, colloidal particles in shear thickening suspensions make closer “contacts” than when they
are at quiescent states due to the lubrication to frictional transition i.e., high stresses push particles
together squeezing the steric brushes and forming lock-and-key structures between rough
asperities. To take this into account, we redefined the “contact” lengthscale to the average particle
diameter and were able to capture the underlying physics in universal shear thickening behavior
of dense colloidal suspensions. Using the redefined frictional “contacts”, we estimated the scaled
contact deficiency of each suspension type to its respective jamming point. The scaled contact
deficit explains a normalized spatial variable that take to account the differences in free volume
available for different types of particles under shear. Thus, using arrested 3D contact
microstructure we explained the universal correlation between shear thickening strength and
jamming distance.
139
Results from the abovementioned works suggested that the contact microstructure of
suspensions with smooth colloids are different from rough colloids, in their quiescent state. This
comes from the fact that the isostatic condition, which dictates minimum neighbors for mechanical
stability, for the rough particle suspension is lower than suspensions with smooth colloids. Thus,
the Brownian suspension stress and associated hydrodynamics differ between these suspensions,
especially close to their respective jamming points. We probe this difference using linear
viscoelastic experiments which focuses on distorting near-equilibrium microstructures. In linear
regime, our small amplitude oscillatory experiments revealed the viscoelastic moduli of rough
particle suspensions is 103 times higher than that of the smooth colloidal suspensions for the
particle same concentration. We owe this difference to the restricted rotational motion of the rough
colloids below the jamming distance of 0.1 where we suspect that the cage rearrangement
dynamics was not possible in our experimental window. Additionally, we found that rescaling the
moduli by the jamming distance at jamming distance values less than 0.1 takes to account the
reduced Brownian energy due to suspension vitrification.
5.2 Future work
There is still a significant gap in understanding the effect of surface roughness on
dynamics, phase behavior, and viscoelastic properties. Probing real-time microstructure in the
suspension is an important step to understand the underlying physics for effective suspension
design for desired applications. Experiments exploring fragility of rough glasses, creep studies,
depleted gel microstructures etc. will reveal unexplored physics in these systems.
140
5.2.1 Contact networks in shear thickening
Recently there has been a great interest in understanding the networks formed during shear
thickening mechanism [1]. Scattering experiments were able to decouple the effects of surface
contact friction by analyzing the change in microstructure anisotropy in the shear plane [2]. During
shear thickening, networks break and reform continuously. Our arrested suspension
microstructures capture a statistical ensemble of such contact networks formed. Using particle
positions obtained using our image-processing algorithms, structural signatures related to shear
thickening suspensions can be further probed.
5.2.2 Phase-behavior of rough colloidal suspensions
We have observed that surface roughness modifies the the scaling of contact deficient with
respect to the jamming distance. Surface roughness was also shown to suppress crystallization in
dense suspensions [3]. Whether rough particle suspensions that interact via pure hard-sphere
potential ever crystallize? Further studies of the rough particle systems characterizing the change
in bond order parameters with time is required to answer few of these questions [4]. Can we say
that the suspension preparation protocol decides random close packing in rough particle
suspensions? The maximum packing formed by the suspensions of smooth and rough particles can
be probed using contact fabrics [5]. What happens if the suspensions are electrostatically
stabilized? Will the effects of surface roughness get masked? Many unanswered questions remain
with respect to the phase behavior of rough colloidal suspensions. Spherically symmetric but
surface anisotropic colloidal particles, that interact via hard sphere potential, form a model
experimental colloidal system to investigate the emerging interest in amorphous system behavior,
which is currently limited to computer simulations [6].

141
References
[1] M. Gameiro, A. Singh, L. Kondic, K. Mischaikow, and J. F. Morris, Physical Review
Fluids 5, 034307 (2020).
[2] Yu-FanLee, YiminLuo, TianyiBai, C. Velez, S. C. Brown, and N. J. Wagner, Physics of
Fluids 33, 033316 (2021).
[3] R. Rice, R. Roth, and C. P. Royall, Soft Matter 8, 1163 (2012).
[4] D. Ganapathi, D. Chakrabarti, A. K. Sood, and R. Ganapathy, Nature Physics 17, 114
(2021).
[5] J. Liu, W. Zhou, G. Ma, S. Yang, and X. Chang, Powder Technology 366, 747 (2020).
[6] J. N. Nampoothiri, Y. Wang, K. Ramola, J. Zhang, S. Bhattacharjee, and B. Chakraborty,
Physical Review Letters 125, 118002 (2020).
142
APPENDIX
Supplementary Information for Chapter 3 “Jamming distance dictates colloidal shear
thickening.”
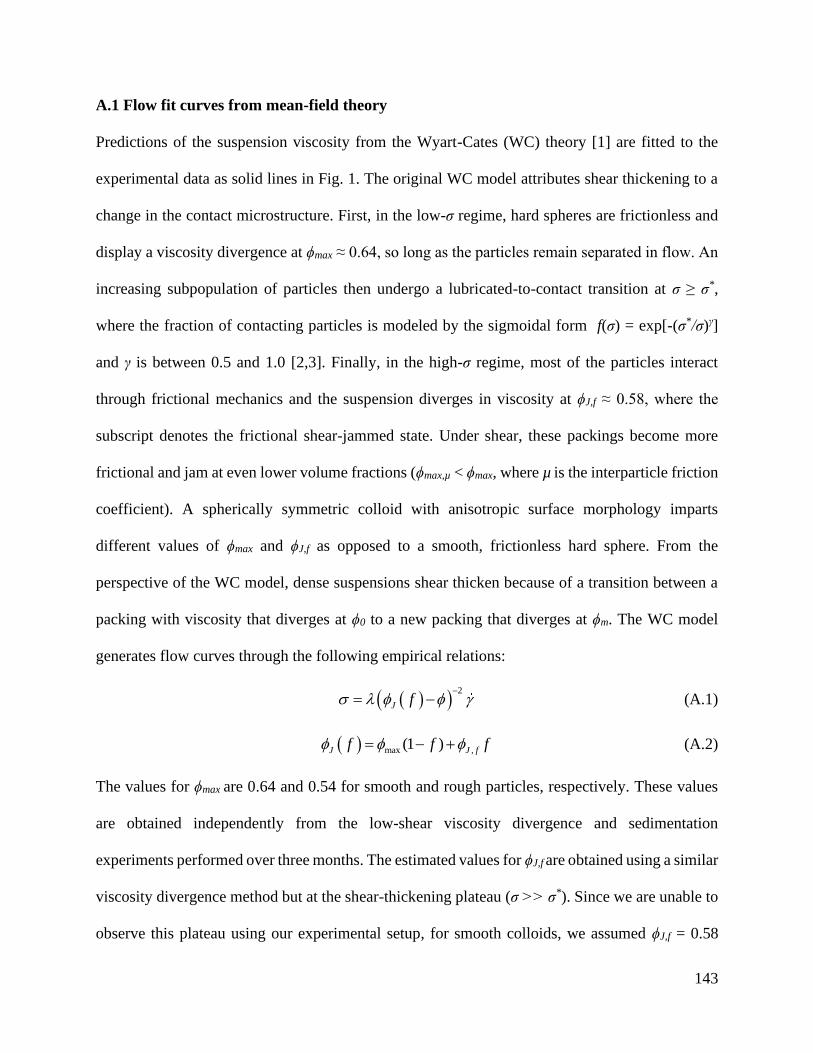
143
A.1 Flow fit curves from mean-field theory
Predictions of the suspension viscosity from the Wyart-Cates (WC) theory [1] are fitted to the
experimental data as solid lines in Fig. 1. The original WC model attributes shear thickening to a
change in the contact microstructure. First, in the low-σ regime, hard spheres are frictionless and
display a viscosity divergence at ϕmax ≈ 0.64, so long as the particles remain separated in flow. An
increasing subpopulation of particles then undergo a lubricated-to-contact transition at σ ≥ σ*,
where the fraction of contacting particles is modeled by the sigmoidal form f(σ) = exp[-(σ*/σ)γ]
and γ is between 0.5 and 1.0 [2,3]. Finally, in the high-σ regime, most of the particles interact
through frictional mechanics and the suspension diverges in viscosity at ϕJ,f ≈ 0.58, where the
subscript denotes the frictional shear-jammed state. Under shear, these packings become more
frictional and jam at even lower volume fractions (ϕmax,µ < ϕmax, where µ is the interparticle friction
coefficient). A spherically symmetric colloid with anisotropic surface morphology imparts
different values of ϕmax and ϕJ,f as opposed to a smooth, frictionless hard sphere. From the
perspective of the WC model, dense suspensions shear thicken because of a transition between a
packing with viscosity that diverges at ϕ0 to a new packing that diverges at ϕm. The WC model
generates flow curves through the following empirical relations:
( )( )2
J f −
= − (A.1)
( ) max ,(1 )J J ff f f = − + (A.2)
The values for ϕmax are 0.64 and 0.54 for smooth and rough particles, respectively. These values
are obtained independently from the low-shear viscosity divergence and sedimentation
experiments performed over three months. The estimated values for ϕJ,f are obtained using a similar
viscosity divergence method but at the shear-thickening plateau (σ >> σ*). Since we are unable to
observe this plateau using our experimental setup, for smooth colloids, we assumed ϕJ,f = 0.58
144
following the original model. Our system gives the high-shear viscosity divergence at ϕJ,f = 0.49.
The values of f are varied from 0 to 1 as described by sigmoidal model above. The value of λ in
the above equation is an empirical fitting parameter which we assume to be unity. The WC model
does not fit the experimental flow curves at ϕ > ϕJ,f because it predicts S-shaped flow curves (β >
1), which we do not observe in experimental systems. This is likely due to the overdamped motion
of the colloids used in this study, which precludes the presence of inertial flows even at the highest
applied shear stresses.
A.2 Estimating jamming points (ϕmax) for colloidal suspensions
Superimposing our experimental values of ϕmax and the corresponding <z> onto the
simulation data of Singh et al. [4] suggests that our rough colloids can be modeled as particles
with significant sliding constraints, quantified using μs and μr values (Figure A.2).
.
A.3 Sample immobilization and visualization with confocal microscopy
Rheology is performed using a 20 mm parallel-plate geometry and cover slip with thickness #1.5.
Suspension samples are incorporated with 5 wt% photocrosslinker mixture (2 wt% photoinitiator
phosphine oxide, 8 wt% photopolymer trimethylolpropane triacrylate-TMPTA, and solvent
diisooctyl phthalate). Good agreement in the radial distribution function, g(r), for suspension with
and without the photocrosslinker (Figure A.3(a)) shows that suspension doped with
photocrosslinker mixture retain their hard sphere behavior. We estimate the mean-squared
displacement 2( )r t of a representative photopolymerized suspension. As shown in Figure
A.3(b), the noise floor is estimated to be 0.0012 µm2 which is ≈ 0.1% of (2a)2. This shows that the
vibrations of the confocal rheometer is not significant enough to affect the particle centroid

145
identification in the photopolymerized sample and the <z> obtained from image processing
routine. Sample z-projections of the dynamic microstructure in suspensions of smooth and rough
colloids is shown in Figure A.4. Centroid identification from similar arrested 3D image stacks
enable us generate the respective dynamic contact networks by defining the contact criterion as
2aeff.
A.4. Details of the DPD simulations
Simulations are done via the HOOMD-Blue simulation toolkit where the roughness of different
particles is modeled by randomly placing asperities with their centers located on the periphery of
the base particle. The base particles are modeled as near hard spheres covered by these smaller
patchy asperities, and in our setting we choose the asperity radius to be 0.1a, where a is the radii
of the base particles [5]. The main simulations are based upon a core-modified Dissipative Particle
Dynamics (DPD) algorithm [6,7], previously shown to preserve the essential hydrodynamics in
dense suspension systems. Over the past two decades, there has been a plethora of research topics
that employ DPD as the primary simulation tool [8-10]. DPD is a discrete fluid model, where all
particles including the background fluid particles are modeled explicitly and through pairwise
interactions. We write the equations of motion for DPD as:
( )'
,
pN
C D R R Hii ij ij ij ij ij
i i j
dvm F F F F F
dt
= + + + + (A.3)
(1 / )ij ij cr r = − (A.4)
0.5( )R
ij ij ij ij ij ijF r t e −= (A.5)
2 ( )( . )D
ij ij ij ij ij ij ijF r v e e = (A.6)
( )C
ij ij ij ij ijF r e = (A.7)

146
' '
0
R R
ij ijF F e= (A.8)
( . )H
ij ij ij ij ijF v e e= (A.9)
The solvent particles in DPD are modeled as soft particles and interact through the first three terms
on the RHS of Eq. 3. In equation C
ijF , D
ijF and R
ijF are the pairwise conservative, dissipative,
random forces, respectively. Random and dissipative forces together form the canonical ensemble
and satisfy the fluctuation-dissipation requirements [11,12]. The random force introduces thermal
fluctuations via a random function, ij . This heat is dissipated by the dissipative force acting
against the relative motion of particles ij i j = − and ij is the strength of dissipation, which is
coupled with the thermal noise, ij . Together these parameters define the dimensionless
temperature as 2
B ij ijk T = and ije is the unit vector. Conservative force, defines the chemical
identity of a particle based on its chemical potential/solubility in the system, through a parameter,
ij . '
0
RF is the repulsive force that prevents the colloidal particles to overlap where '
0
RF is the
repulsion constant and '
0 500 /R
BF k T a= is used for the base-base interactions. Finally, ij
HF is the
short-range lubrication force that dissipates the motion of particles through a pair drag term,
0 1 23 2ij ija a h = based on normal squeezing mode of lubrication. This force enables us to
capture the short-range hydrodynamics between the particles, where 1a and 2a are the radii of the
interacting colloids and 0 is the viscosity of the suspending fluid, and ijh is the surface-surface
distance between two interacting colloids. Melrose and Ball [13] have shown previously that the
tangential mode of lubrication scaling as ~ log(1 )ijh can be ignored compared to the normal mode
of lubrication where stresses scale inversely with the separation distance between the particles.

147
Thus, in this platform, we only consider this normal model of lubrication, squeeze mode, and the
tangential motion and hindrance to it naturally comes from the normal interactions between the
asperities. We have shown previously that this scheme recovers the same hydrodynamics as a fully
resolved Stokesian Dynamics with a complete solution of hydrodynamics for the asperities
[14,15]. The hydrodynamic interactions are solved on the asperity-asperity and base-base
interactions and not on the asperity-base interaction, because the lubrication forces of high particle
size ratio are much weaker than the same size ones [15].
A.5 Statistical testing
Statistical significance of the contact scaling model fit, 0.95 0.07~z , is conducted using
reduced chi-squared parameter ( 2
0 ) defined as:
( )
2
2
0 21
( )1 Ni i
i i
y f x
N
=
−= (A.10)
Here, iy denotes the experimental data, ( )if x corresponds to the linear fit model, and i is the
standard deviation of the respective iy values. For Fig. 4b, the number of data points is N = 32 and
we obtain a 2
0 value of 2.12, with the corresponding P value less than 0.005 which indicates that
the agreement between experimental observations and corresponding power-law is statistically
significant. The error bars in Fig. 4b become increasingly large near jamming, because of the
magnified relative uncertainty with respect to ,J and ,Jz .
A.6. Contact criterion model for shear thickening suspensions
A prevailing theory that explains shear thickening mechanics is the transition of particle
interaction form a lubrication to a frictional flow above the onset stress, σ*, although the origins
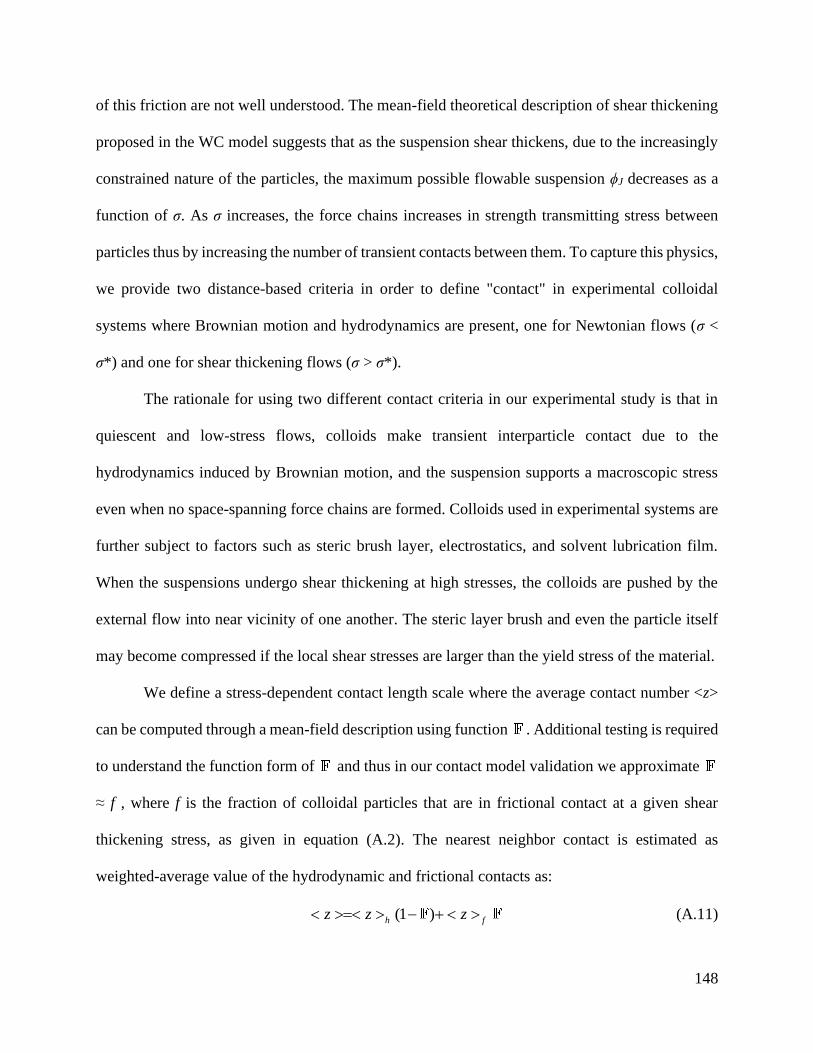
148
of this friction are not well understood. The mean-field theoretical description of shear thickening
proposed in the WC model suggests that as the suspension shear thickens, due to the increasingly
constrained nature of the particles, the maximum possible flowable suspension ϕJ decreases as a
function of σ. As σ increases, the force chains increases in strength transmitting stress between
particles thus by increasing the number of transient contacts between them. To capture this physics,
we provide two distance-based criteria in order to define "contact" in experimental colloidal
systems where Brownian motion and hydrodynamics are present, one for Newtonian flows (σ <
σ*) and one for shear thickening flows (σ > σ*).
The rationale for using two different contact criteria in our experimental study is that in
quiescent and low-stress flows, colloids make transient interparticle contact due to the
hydrodynamics induced by Brownian motion, and the suspension supports a macroscopic stress
even when no space-spanning force chains are formed. Colloids used in experimental systems are
further subject to factors such as steric brush layer, electrostatics, and solvent lubrication film.
When the suspensions undergo shear thickening at high stresses, the colloids are pushed by the
external flow into near vicinity of one another. The steric layer brush and even the particle itself
may become compressed if the local shear stresses are larger than the yield stress of the material.
We define a stress-dependent contact length scale where the average contact number <z>
can be computed through a mean-field description using function . Additional testing is required
to understand the function form of and thus in our contact model validation we approximate
≈ f , where f is the fraction of colloidal particles that are in frictional contact at a given shear
thickening stress, as given in equation (A.2). The nearest neighbor contact is estimated as
weighted-average value of the hydrodynamic and frictional contacts as:
(1 )h fz z z = − + (A.11)
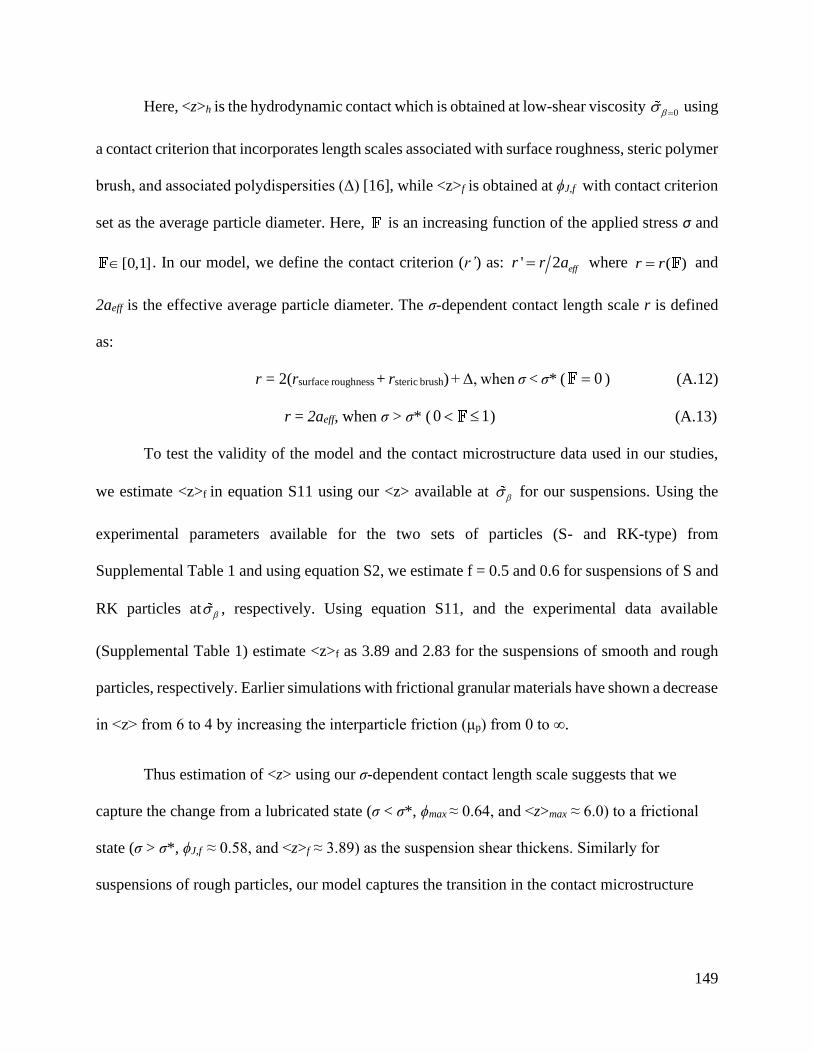
149
Here, <z>h is the hydrodynamic contact which is obtained at low-shear viscosity 0 = using
a contact criterion that incorporates length scales associated with surface roughness, steric polymer
brush, and associated polydispersities (Δ) [16], while <z>f is obtained at ϕJ,f with contact criterion
set as the average particle diameter. Here, is an increasing function of the applied stress σ and
[0,1] . In our model, we define the contact criterion (r’) as: ' 2 effr r a= where ( )r r= and
2aeff is the effective average particle diameter. The σ-dependent contact length scale r is defined
as:
r = 2(rsurface roughness + rsteric brush) + Δ, when σ < σ* ( 0= ) (A.12)
r = 2aeff, when σ > σ* ( 0 1 ) (A.13)
To test the validity of the model and the contact microstructure data used in our studies,
we estimate <z>f in equation S11 using our <z> available at for our suspensions. Using the
experimental parameters available for the two sets of particles (S- and RK-type) from
Supplemental Table 1 and using equation S2, we estimate f = 0.5 and 0.6 for suspensions of S and
RK particles at , respectively. Using equation S11, and the experimental data available
(Supplemental Table 1) estimate <z>f as 3.89 and 2.83 for the suspensions of smooth and rough
particles, respectively. Earlier simulations with frictional granular materials have shown a decrease
in <z> from 6 to 4 by increasing the interparticle friction (μp) from 0 to ∞.
Thus estimation of <z> using our σ-dependent contact length scale suggests that we
capture the change from a lubricated state (σ < σ*, ϕmax ≈ 0.64, and <z>max ≈ 6.0) to a frictional
state (σ > σ*, ϕJ,f ≈ 0.58, and <z>f ≈ 3.89) as the suspension shear thickens. Similarly for
suspensions of rough particles, our model captures the transition in the contact microstructure
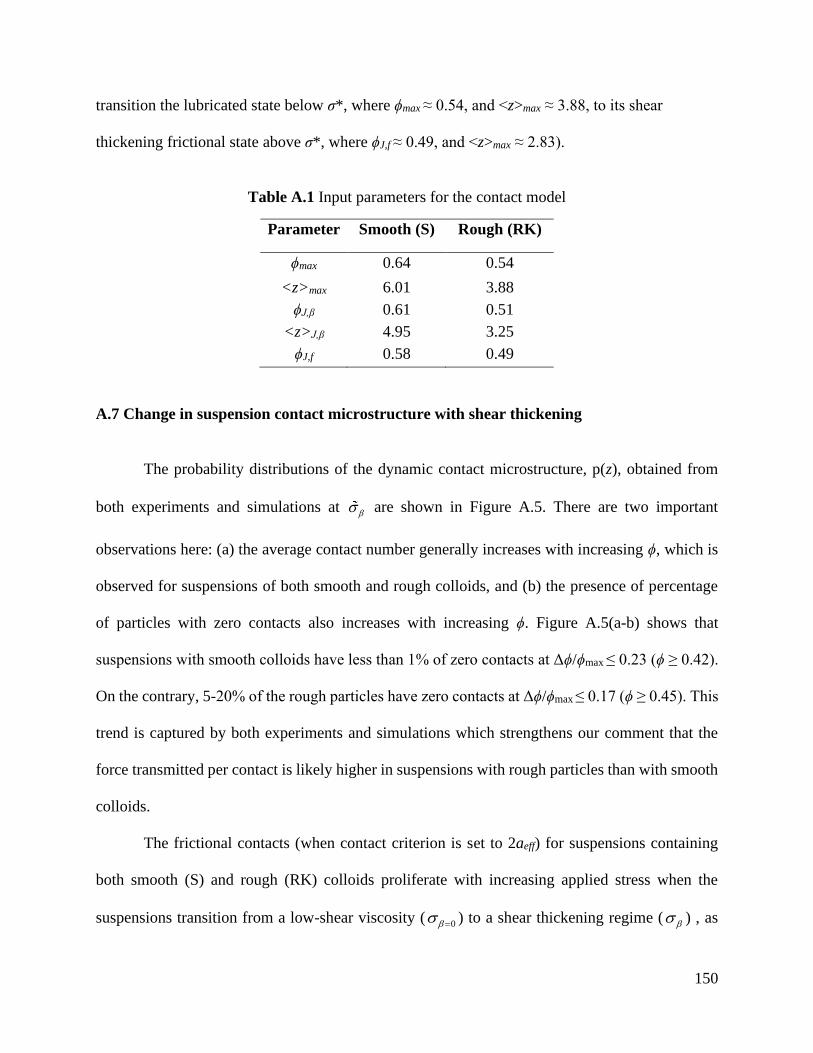
150
transition the lubricated state below σ*, where ϕmax ≈ 0.54, and <z>max ≈ 3.88, to its shear
thickening frictional state above σ*, where ϕJ,f ≈ 0.49, and <z>max ≈ 2.83).
Table A.1 Input parameters for the contact model
Parameter Smooth (S) Rough (RK)
ϕmax 0.64 0.54
<z>max 6.01 3.88
ϕJ,β 0.61 0.51
<z>J,β 4.95 3.25
ϕJ,f 0.58 0.49
A.7 Change in suspension contact microstructure with shear thickening
The probability distributions of the dynamic contact microstructure, p(z), obtained from
both experiments and simulations at are shown in Figure A.5. There are two important
observations here: (a) the average contact number generally increases with increasing ϕ, which is
observed for suspensions of both smooth and rough colloids, and (b) the presence of percentage
of particles with zero contacts also increases with increasing ϕ. Figure A.5(a-b) shows that
suspensions with smooth colloids have less than 1% of zero contacts at Δϕ/ϕmax ≤ 0.23 (ϕ ≥ 0.42).
On the contrary, 5-20% of the rough particles have zero contacts at Δϕ/ϕmax ≤ 0.17 (ϕ ≥ 0.45). This
trend is captured by both experiments and simulations which strengthens our comment that the
force transmitted per contact is likely higher in suspensions with rough particles than with smooth
colloids.
The frictional contacts (when contact criterion is set to 2aeff) for suspensions containing
both smooth (S) and rough (RK) colloids proliferate with increasing applied stress when the
suspensions transition from a low-shear viscosity ( 0 = ) to a shear thickening regime ( ) , as
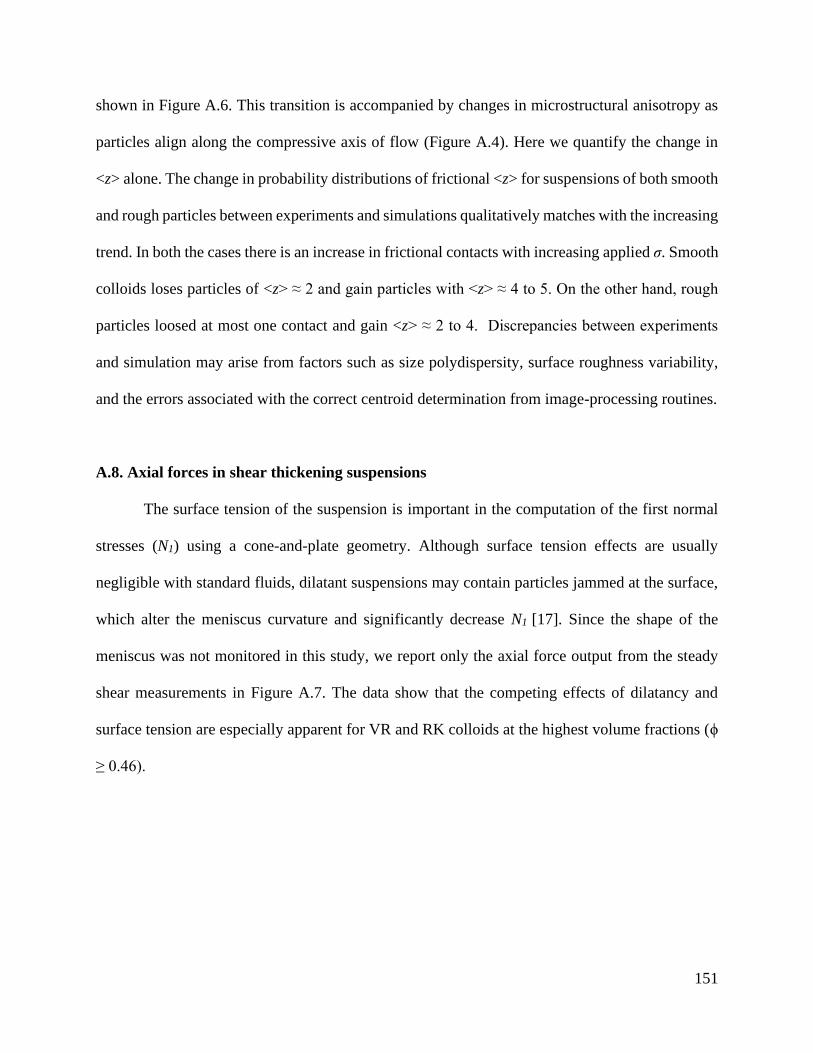
151
shown in Figure A.6. This transition is accompanied by changes in microstructural anisotropy as
particles align along the compressive axis of flow (Figure A.4). Here we quantify the change in
<z> alone. The change in probability distributions of frictional <z> for suspensions of both smooth
and rough particles between experiments and simulations qualitatively matches with the increasing
trend. In both the cases there is an increase in frictional contacts with increasing applied σ. Smooth
colloids loses particles of <z> ≈ 2 and gain particles with <z> ≈ 4 to 5. On the other hand, rough
particles loosed at most one contact and gain <z> ≈ 2 to 4. Discrepancies between experiments
and simulation may arise from factors such as size polydispersity, surface roughness variability,
and the errors associated with the correct centroid determination from image-processing routines.
A.8. Axial forces in shear thickening suspensions
The surface tension of the suspension is important in the computation of the first normal
stresses (N1) using a cone-and-plate geometry. Although surface tension effects are usually
negligible with standard fluids, dilatant suspensions may contain particles jammed at the surface,
which alter the meniscus curvature and significantly decrease N1 [17]. Since the shape of the
meniscus was not monitored in this study, we report only the axial force output from the steady
shear measurements in Figure A.7. The data show that the competing effects of dilatancy and
surface tension are especially apparent for VR and RK colloids at the highest volume fractions (ϕ
≥ 0.46).
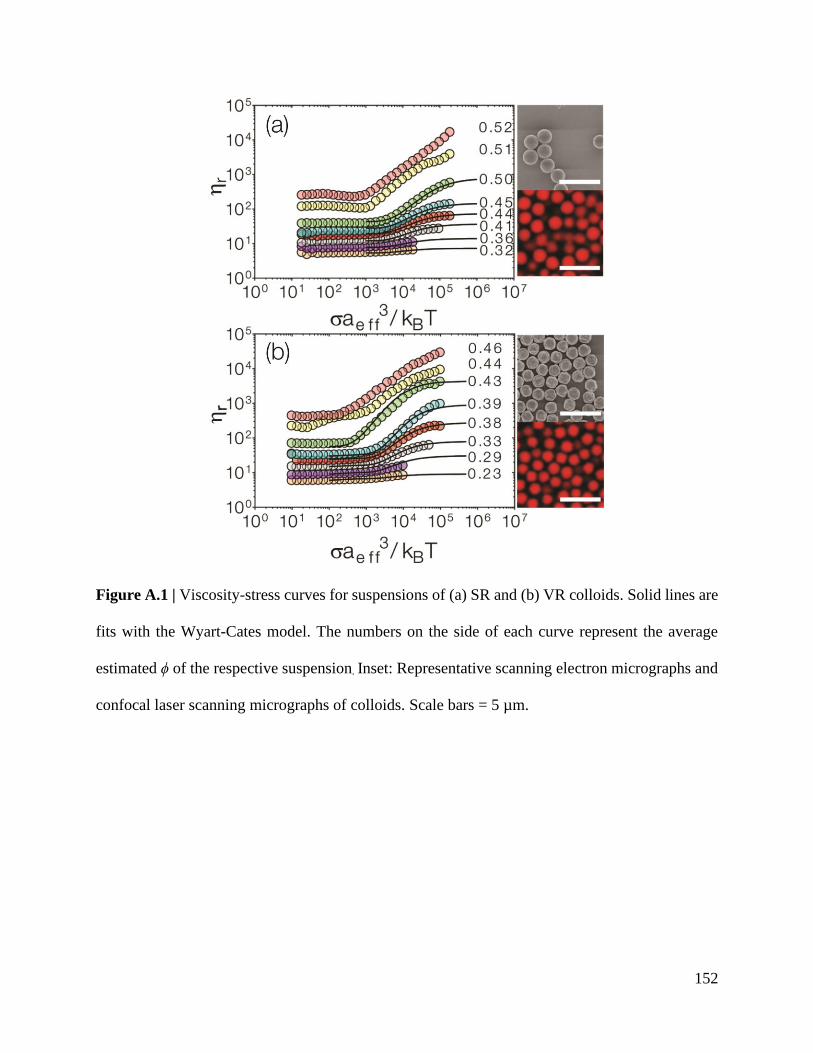
152
Figure A.1 | Viscosity-stress curves for suspensions of (a) SR and (b) VR colloids. Solid lines are
fits with the Wyart-Cates model. The numbers on the side of each curve represent the average
estimated ϕ of the respective suspension. Inset: Representative scanning electron micrographs and
confocal laser scanning micrographs of colloids. Scale bars = 5 µm.
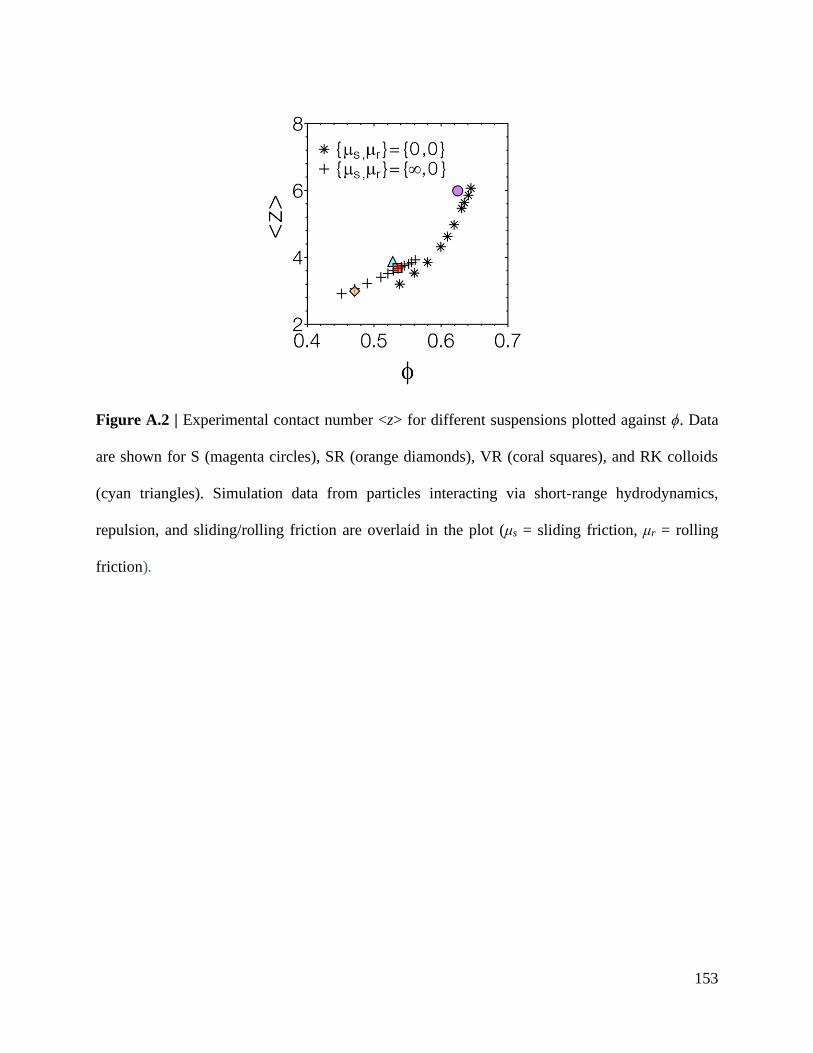
153
Figure A.2 | Experimental contact number <z> for different suspensions plotted against ϕ. Data
are shown for S (magenta circles), SR (orange diamonds), VR (coral squares), and RK colloids
(cyan triangles). Simulation data from particles interacting via short-range hydrodynamics,
repulsion, and sliding/rolling friction are overlaid in the plot (μs = sliding friction, μr = rolling
friction).
154
Figure A.3 | (a) The filled circles represent the radial distribution of the smooth colloidal
suspension at ϕ = 0.56. The dark line corresponds to the radial distribution function from classical
fluid theory with Percus-Yevick closure that mimics hard-sphere microstructure. The matching of
peaks in experimental and theoretical radial distributions show that suspensions retain overall
hard-sphere like behavior. (b) Mean-squared displacement of a photopolymerized sample to
indicate the noise floor of the confocal rheometer setup.

155
Figure A.4 | The z projection of the arrested dynamic microstructure in suspensions of (a) smooth
and (b) rough colloids at Δϕ/ϕmax ≈ 0.08 and β ≈ 0.95. Shear direction is shown in the inset and the
contact networks are aligned in the compressive axis of the shear. Scale = 5 µm.
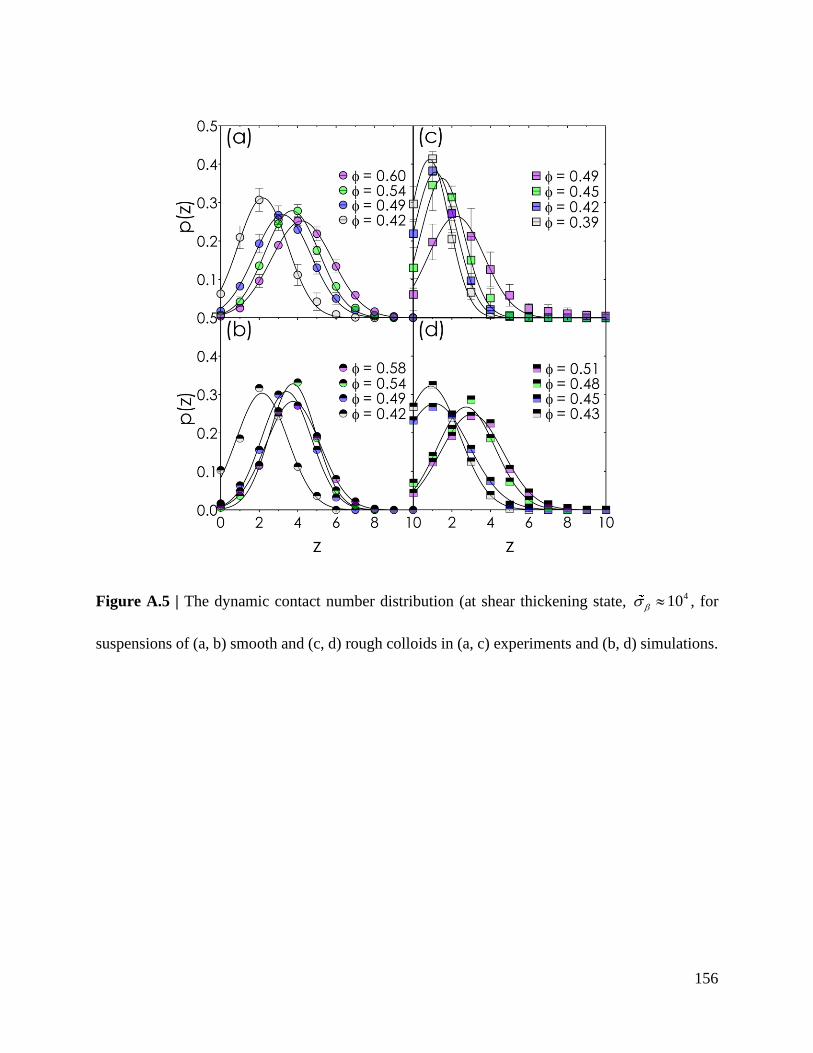
156
Figure A.5 | The dynamic contact number distribution (at shear thickening state, 410 , for
suspensions of (a, b) smooth and (c, d) rough colloids in (a, c) experiments and (b, d) simulations.
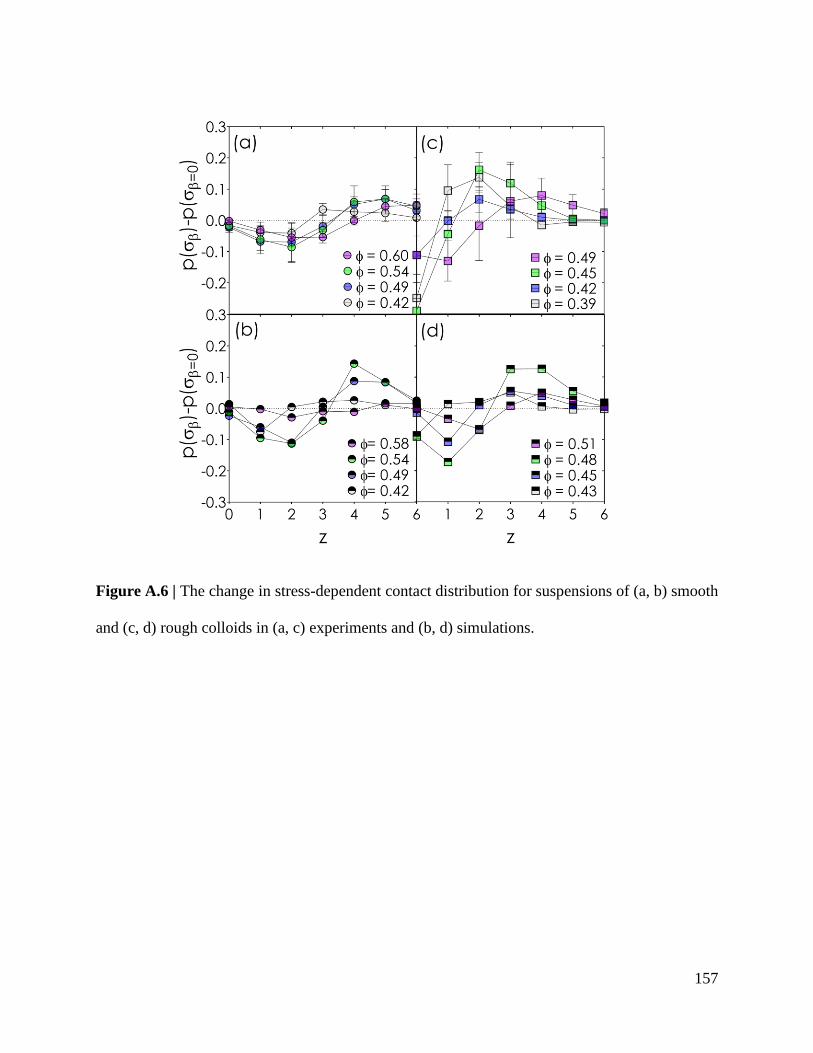
157
Figure A.6 | The change in stress-dependent contact distribution for suspensions of (a, b) smooth
and (c, d) rough colloids in (a, c) experiments and (b, d) simulations.
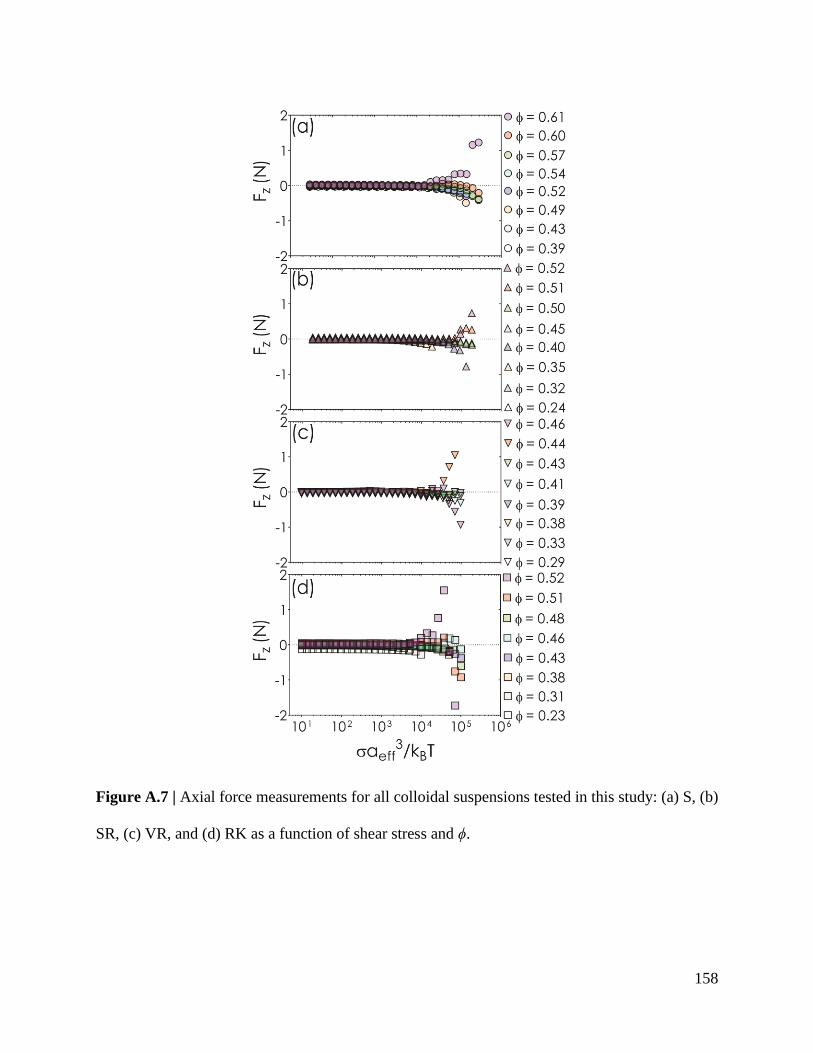
158
Figure A.7 | Axial force measurements for all colloidal suspensions tested in this study: (a) S, (b)
SR, (c) VR, and (d) RK as a function of shear stress and ϕ.

159
References:
[1] M. Wyart and M. E. Cates, Physical Review Letters 112, 098302 (2014).
[2] B. M. Guy, J. A. Richards, D. J. M. Hodgson, E. Blanco, and W. C. K. Poon, Physical
Review Letters 121, 128001 (2018).
[3] B. M. Guy, C. Ness, M. Hermes, L. J. Sawiak, J. Sun, and W. C. K. Poon, Soft Matter 16,
229 (2020).
[4] A. Singh, C. Ness, R. Seto, J. J. de Pablo, and H. M. Jaeger, Physical Review Letters 124,
248005 (2020).
[5] J. A. Anderson, J. Glaser, and S. C. Glotzer, Computational Materials Science 173, 109363
(2020).
[6] A. Boromand, S. Jamali, B. Grove, and J. M. Maia, Journal of Rheology 62, 905 (2018).
[7] S. Jamali, A. Boromand, N. Wagner, and J. Maia, Journal of Rheology 59, 1377 (2015).
[8] P. Español, Physical Review E 52, 1734 (1995).
[9] R. D. Groot and P. B. Warren, The Journal of Chemical Physics 107, 4423 (1997).
[10] D. A. Fedosov, W. Pan, B. Caswell, G. Gompper, and G. E. Karniadakis, Proceedings of
the National Academy of Sciences 108, 11772 (2011).
[11] R. Kubo, Reports on Progress in Physics 29, 255 (1966).
[12] A. Boromand, S. Jamali, and J. M. Maia, Computer Physics Communications 196, 149
(2015).
[13] J. R. Melrose and R. C. Ball, EPL (Europhysics Letters) 32, 535 (1995).
[14] M. Wang, S. Jamali, and J. F. Brady, Journal of Rheology 64, 379 (2020).
[15] S. Jamali and J. F. Brady, Physical Review Letters 123, 138002 (2019).
[16] S. Pradeep and L. C. Hsiao, Soft Matter 16, 4980 (2020).

160
[17] E. Brown and H. M. Jaeger, Reports on Progress in Physics 77, 046602 (2014).