Abstract 1 Introduction - CORE
23
1 A parametric study of CO 2 capture from gas-fired power plants using monoethanolamine (MEA) Salman Masoudi Soltani a,b , Paul S. Fennell a and Niall Mac Dowell c,d, * a Department of Chemical Engineering, Imperial College London, South Kensington Campus, London SW7 2AZ, United Kingdom b Department of Mechanical, Aerospace and Civil Engineering, Brunel University London, Uxbridge UB8 3PH, United Kingdom c Centre for Environmental Policy, Imperial College London, South Kensington Campus, London SW7 1NA, United Kingdom d Centre for Process Systems Engineering, Imperial College London, South Kensington Campus, London SW7 2AZ, United Kingdom *Corresponding author‘s Tel: +44 (0)20 7594 9298 Abstract The value of dispatchable, low carbon thermal power plants as a complement to intermittent renewable energy sources is becoming increasingly recognised. In this study, we evaluate the performance of post-combustion CO 2 capture using monoethanolamine (MEA) retrofitted to a 600 MW CCGT, with and without exhaust gas recycle (EGR). Our results suggest that the EGR ratio plays a primary role in the regeneration energy penalty of the process. We contrast a gas-CCS process with its coal counterpart and show that whilst CCGTs have a greater energy penalty per tonne of CO 2 captured than coal (i.e., 2 � > 2 � ), owing to the high thermal efficiencies of CCGTs relative to coal-fired power plants, the energy penalty per MWh of low carbon energy generated is lower for gas than it is for coal (i.e., ℎ � < ℎ � ), making CCGT-CCS an attractive choice for low carbon electricity generation. Keywords CO 2 Capture, post-combustion capture, Aspen Plus, CCGT, Gas CCS, gas-fired power plant 1 Introduction A significant reduction in total CO 2 emissions is essential to limit the average global temperature rise to 2 °C by the end of this century (Luo, et al., 2015). In December 2015, the so-called “COP21” agreement has identified the highly ambitious aspiration of limiting temperature rise to 1.5 °C (United Nations, 2015). Fossil fuels including coal and gas are brought to you by CORE View metadata, citation and similar papers at core.ac.uk provided by Brunel University Research Archive
-
Upload
khangminh22 -
Category
Documents
-
view
0 -
download
0
Transcript of Abstract 1 Introduction - CORE
1
A parametric study of CO2 capture from gas-fired power plants using monoethanolamine (MEA)
Salman Masoudi Soltania,b, Paul S. Fennella and Niall Mac Dowellc,d,*
aDepartment of Chemical Engineering, Imperial College London, South Kensington Campus, London SW7 2AZ, United Kingdom
bDepartment of Mechanical, Aerospace and Civil Engineering, Brunel University London, Uxbridge UB8 3PH, United Kingdom
cCentre for Environmental Policy, Imperial College London, South Kensington Campus, London SW7 1NA, United Kingdom
dCentre for Process Systems Engineering, Imperial College London, South Kensington Campus, London SW7 2AZ, United Kingdom
*Corresponding author‘s Tel: +44 (0)20 7594 9298
Abstract
The value of dispatchable, low carbon thermal power plants as a complement to
intermittent renewable energy sources is becoming increasingly recognised. In this study,
we evaluate the performance of post-combustion CO2 capture using monoethanolamine
(MEA) retrofitted to a 600 MW CCGT, with and without exhaust gas recycle (EGR). Our
results suggest that the EGR ratio plays a primary role in the regeneration energy penalty
of the process. We contrast a gas-CCS process with its coal counterpart and show that
whilst CCGTs have a greater energy penalty per tonne of CO2 captured than coal (i.e.,
𝐺𝐺𝐺𝐺𝑡𝑡𝐶𝐶𝐶𝐶2𝐺𝐺𝐺𝐺𝐺𝐺� > 𝐺𝐺𝐺𝐺
𝑡𝑡𝐶𝐶𝐶𝐶2𝐶𝐶𝐶𝐶𝐺𝐺𝐶𝐶� ), owing to the high thermal efficiencies of CCGTs relative to coal-fired
power plants, the energy penalty per MWh of low carbon energy generated is lower for
gas than it is for coal (i.e., 𝐺𝐺𝐺𝐺 𝑀𝑀𝑀𝑀ℎ𝐺𝐺𝐺𝐺𝐺𝐺� < 𝐺𝐺𝐺𝐺 𝑀𝑀𝑀𝑀ℎ𝐶𝐶𝐶𝐶𝐺𝐺𝐶𝐶� ), making CCGT-CCS an attractive
choice for low carbon electricity generation.
Keywords
CO2 Capture, post-combustion capture, Aspen Plus, CCGT, Gas CCS, gas-fired power plant
1 Introduction
A significant reduction in total CO2 emissions is essential to limit the average global
temperature rise to 2 °C by the end of this century (Luo, et al., 2015). In December 2015, the
so-called “COP21” agreement has identified the highly ambitious aspiration of limiting
temperature rise to 1.5 °C (United Nations, 2015). Fossil fuels including coal and gas are
brought to you by COREView metadata, citation and similar papers at core.ac.uk
provided by Brunel University Research Archive
2
currently primary sources of CO2 emissions to the atmosphere and thus, a key contributor to
anthropogenic climate change. Power generation using fossil fuels dominates the world’s
energy landscape and currently contributes approximately 25% of total global greenhouse
gas emissions (US Environmental Protection Agency, 2016), and despite a rapid expansion of
the role of renewable power, fossil energy is likely to play a dominant role in the world’s
energy landscape for some time to come.
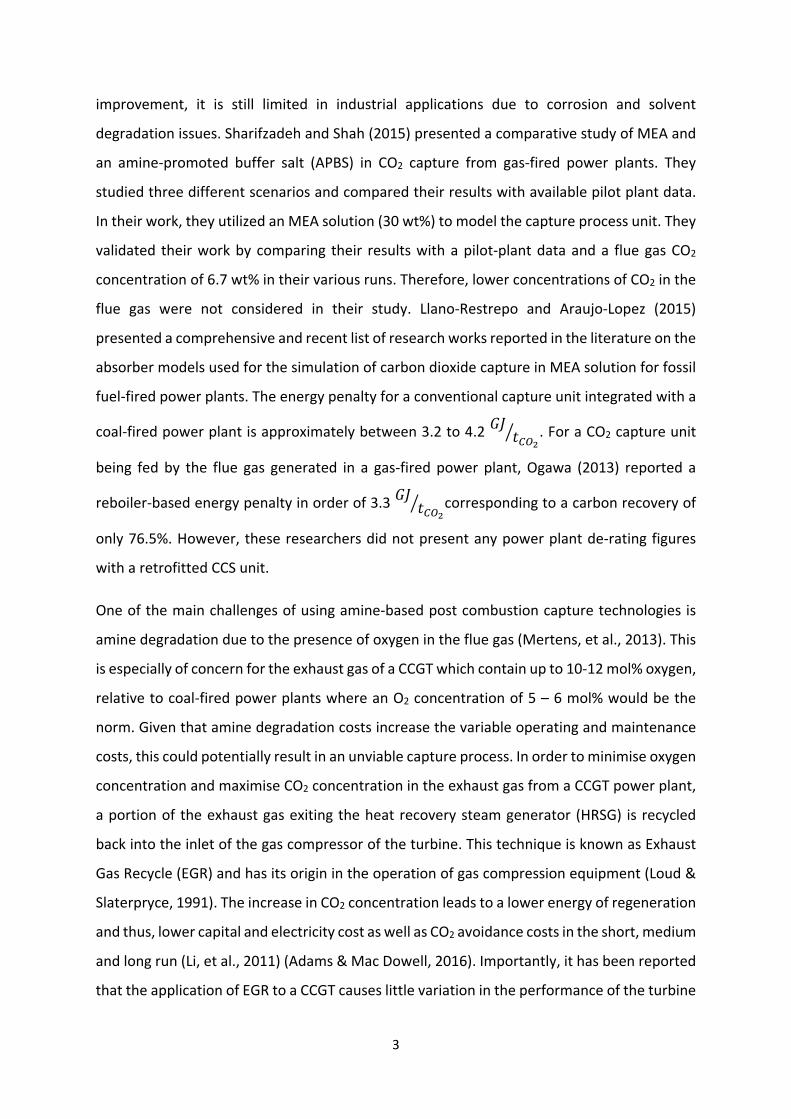
In this context, the role of natural gas as part of a transition to a low carbon energy system is
becoming increasingly important1, as presented in Table 1, compared to coal-fired power
generation, natural gas-fired power plants emit 50 to 60% less CO2 on a per MWh basis
(National Energy Technology Laboratory (NETL), 2013).
Table 1: The average kg of CO2 emitted per MWh of energy for various fuels from 2007 to 2014 (U.S. Energy Information Administration, 2015)
Fuel Type kgCO2/MWhth kgCO2/MWhe Coal (bituminous) 318.34 938.93
Coal (lignite) 333.36 984.29
Coal (subbituminous) 331.66 979.76
Natural gas 250.72 553.38
However, combined cycle gas turbines (CCGT) are not themselves low carbon – they’re just
lower carbon than coal, and in a low carbon world, they will also need to be decarbonised via
CCS (Heuberger, et al., 2016). In the context of decarbonising CCGTs, post-combustion
capture processes are generally considered the most appropriate for this purpose (Boot-
Handford, et al., 2014), although chemical looping combustion technologies are also
especially promising (Hassan, et al., 2017). Other recent studies also consider the oxy-combustion
of natural gas in CCGTs (Climent Barba, et al., 2016).
Abu-Zahra et al. (2007b) performed a detailed evaluation of amine-based post-combustion
CO2 capture applied to a 600 MW bituminous coal fired power plant using monoethanolamine
(MEA) as the working solvent. They achieved a reduction in energy consumption from 3.9 to
3.0 GJ/tCO2 by using a higher concentrations of MEA (i.e. 40 wt%). Although this is a significant
1 Such as in the UK, where, at the time of writing, there is the ambition to close all unabated coal-fired power stations and replace this capacity with gas-fired capacity (Department of Energy & Climate Change, 2015).
3
improvement, it is still limited in industrial applications due to corrosion and solvent
degradation issues. Sharifzadeh and Shah (2015) presented a comparative study of MEA and
an amine-promoted buffer salt (APBS) in CO2 capture from gas-fired power plants. They
studied three different scenarios and compared their results with available pilot plant data.
In their work, they utilized an MEA solution (30 wt%) to model the capture process unit. They
validated their work by comparing their results with a pilot-plant data and a flue gas CO2
concentration of 6.7 wt% in their various runs. Therefore, lower concentrations of CO2 in the
flue gas were not considered in their study. Llano-Restrepo and Araujo-Lopez (2015)
presented a comprehensive and recent list of research works reported in the literature on the
absorber models used for the simulation of carbon dioxide capture in MEA solution for fossil
fuel-fired power plants. The energy penalty for a conventional capture unit integrated with a
coal-fired power plant is approximately between 3.2 to 4.2 𝐺𝐺𝐺𝐺 𝑡𝑡𝐶𝐶𝐶𝐶2� . For a CO2 capture unit
being fed by the flue gas generated in a gas-fired power plant, Ogawa (2013) reported a
reboiler-based energy penalty in order of 3.3 𝐺𝐺𝐺𝐺 𝑡𝑡𝐶𝐶𝐶𝐶2� corresponding to a carbon recovery of
only 76.5%. However, these researchers did not present any power plant de-rating figures
with a retrofitted CCS unit.
One of the main challenges of using amine-based post combustion capture technologies is
amine degradation due to the presence of oxygen in the flue gas (Mertens, et al., 2013). This
is especially of concern for the exhaust gas of a CCGT which contain up to 10-12 mol% oxygen,
relative to coal-fired power plants where an O2 concentration of 5 – 6 mol% would be the
norm. Given that amine degradation costs increase the variable operating and maintenance
costs, this could potentially result in an unviable capture process. In order to minimise oxygen
concentration and maximise CO2 concentration in the exhaust gas from a CCGT power plant,
a portion of the exhaust gas exiting the heat recovery steam generator (HRSG) is recycled
back into the inlet of the gas compressor of the turbine. This technique is known as Exhaust
Gas Recycle (EGR) and has its origin in the operation of gas compression equipment (Loud &
Slaterpryce, 1991). The increase in CO2 concentration leads to a lower energy of regeneration
and thus, lower capital and electricity cost as well as CO2 avoidance costs in the short, medium
and long run (Li, et al., 2011) (Adams & Mac Dowell, 2016). Importantly, it has been reported
that the application of EGR to a CCGT causes little variation in the performance of the turbine

4
(Canepa, et al., 2013). This implies that the EGR strategy is potentially applicable to CCS
retrofit scenarios. However, it is worth noting that due to the change in the thermodynamic
properties of the gas as a result of the change in CO2 concentration, the output power from
the gas turbine can be adversely affected. This owes to the lower heat capacity of CO2
compared to air which consequently, lowers the outlet temperature of the combustor
(Akram, et al., 2013). These issues must be addressed for large-scale applications. In a recent
study, Ali et al. (2016), carried out a techno-economic analysis of a CCGT with various EGR
percentages (i.e. 20%, 35% and 50%) in a pilot-scale capture unit (30 wt% MEA, a lean loading
of 0.2 and a 90% capture rate). They investigated the effect of various EGR ratios on the liquid-
to-gas ratios and the subsequent effect on the CO2 concentration in the inlet flue gas to the
absorber. Akram et al. (2016) also investigated the effect of EGR ratio on the performance of
a pilot-scale capture unit. They considered flue gas CO2 concentrations in the range of 5.5 to
9.9 vol%. These researchers observed an increase in CO2 concentration in the flue gas with
an increase in the EGR ratio leading to a reduction in the specific reboiler duty by 7.1% per unit
percentage increase in CO2 concentration.
Post-combustion CO2 capture will impose a well-known energy penalty upon the power plant
with which it is integrated (Hanak, et al., 2015). This leads to a net efficiency reduction on the
power plant on the order of 10–12%-pts, primarily due to the energy required for solvent
regeneration, followed by CO2 compression and other auxiliary energy consumption, i.e.,
solvent and cooling water pumps together with the blower (Linnenberg, et al., 2012). Solvent
regeneration accounts for approximately 60% of the energy penalty associated with the
operation of a post-combustion CO2 capture process (Kothandaraman, et al., 2009). For MEA-
based CO2 capture applied to a CCGT, depending on the capture rate, solvent flow rate and
reboiler duty, the energy of regeneration is typically on the order of 4 to 5 GJ/tCO2, i.e.,
somewhat greater than might be expected for an equivalent coal-fired power station
(Kehlhofer, et al., 2009). The utilisation of advanced amines, such as piperazine, has the
potential to reduce this cost (Kvamsdal, et al., 2014) with recent pilot plant data reporting an
energy cost in the range 2.1-2.9 GJ/tCO2 (Lin, et al., 2016).
There have been several efforts to describe the chemical absorption of post combustion CO2
from the flue gases of both coal- and gas-fired power plants. These models have either been
developed on the assumption of equilibrium or rate-based mass transfer with some having
5
been validated on pilot-scale plants (Mac Dowell, et al., 2013; Dutta, et al., 2017; (Sherman,
et al., 2016; Norouzbahari, et al., 2016; Oko, et al., 2015). Although rate-based process
simulation is well-known to provide more insight into the absorption process enabling the
engineers to size the equipment and evaluate the process operating conditions more
accurately (Sharifzadeh & Shah, 2015; Mac Dowell, et al., 2013; Krishnamurthy & Taylor,
1985b; Krishnamurthy & Taylor, 1985a), equilibrium simulation, owing to its relative
simplicity, provides useful insight on the viability of the process if used astutely. Therefore,
we have adopted an equilibrium-based modelling approach in order to simulate our process.
Among various modelling approaches, the parametric method has been adopted by many
researchers. For example, Qi (2007) carried out a parametric study in order to simulate an
MEA-based CO2 absorption plant for a CCGT (3.73 mol% CO2 in the inlet flue gas). He
considered total CO2 capture and the reboiler energy consumption as the key performance
indicators (KPIs). He reported that the efficiency of the CCGT would drop by 8 pt-% from 58%
to 50% by retrofitting a post-combustion capture unit. It was shown that an 85% capture rate
was associated with an energy consumption of 3.7 GJ/tCO2.
In this study, we evaluate the performance of a post combustion CO2 capture plant applied
to the exhaust gas of a 600 MW CCGT power plant using a range of EGR ratios with concurrent
consideration of other operational parameters. The remainder of this paper is set out as
follows; we first describe our modelling approach in detail, and then present the results of
our parametric analysis. We conclude with some discussion and a comparison of coal- and
gas-CCS processes.
2 Model Development
Throughout this work, we have employed the electrolyte NRTL (electrolyte non-random-two
liquid) (Chen & Evans, 1986) to model the liquid phase and the SRK equation of state (EoS)
(Soave, 1972) to describe the vapour phase.
The following section briefly outlines the methods used in order to integrate the absorption,
aqueous-phase reactions and thermodynamic mechanisms involved in the MEA-CO2-H2O
systems into the model. In the following sections we concisely review the fundamentals
behind the thermodynamic framework employed in this study.
6
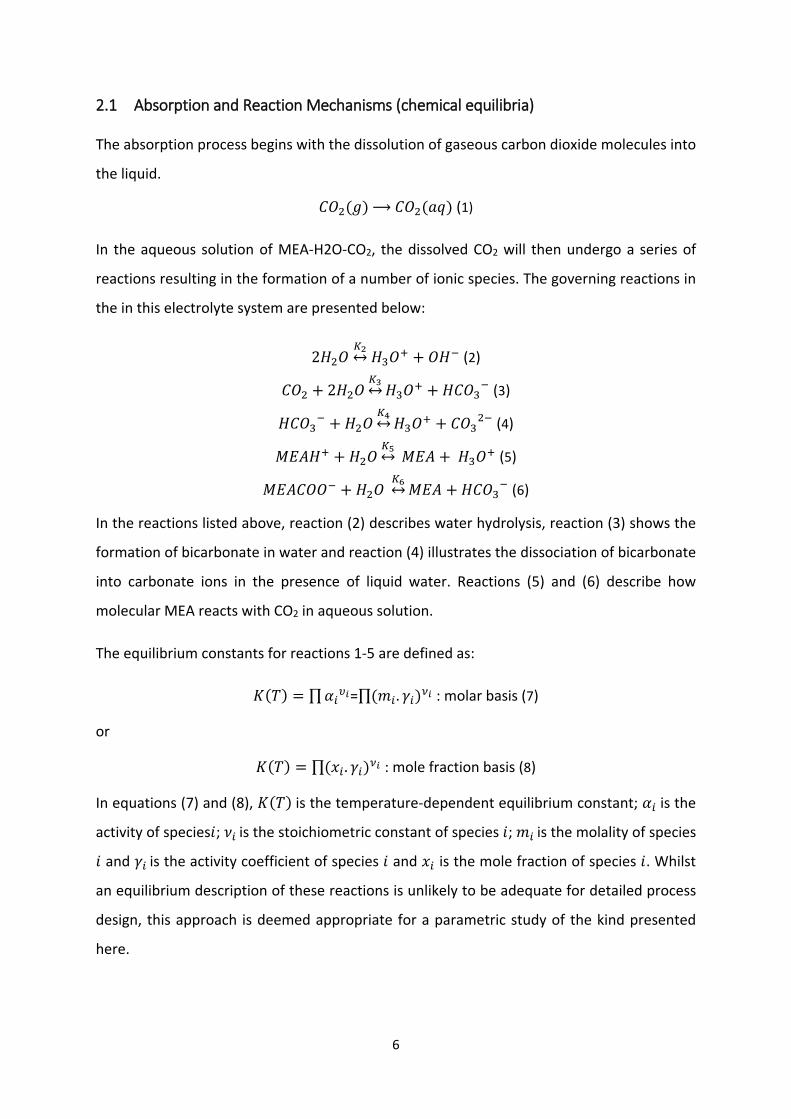
2.1 Absorption and Reaction Mechanisms (chemical equilibria)
The absorption process begins with the dissolution of gaseous carbon dioxide molecules into
the liquid.
𝐶𝐶𝐶𝐶2(𝑔𝑔) ⟶𝐶𝐶𝐶𝐶2(𝑎𝑎𝑎𝑎) (1)
In the aqueous solution of MEA-H2O-CO2, the dissolved CO2 will then undergo a series of
reactions resulting in the formation of a number of ionic species. The governing reactions in
the in this electrolyte system are presented below:
2𝐻𝐻2𝐶𝐶𝐾𝐾2↔ 𝐻𝐻3𝐶𝐶+ + 𝐶𝐶𝐻𝐻− (2)
𝐶𝐶𝐶𝐶2 + 2𝐻𝐻2𝐶𝐶𝐾𝐾3↔𝐻𝐻3𝐶𝐶+ + 𝐻𝐻𝐶𝐶𝐶𝐶3− (3)
𝐻𝐻𝐶𝐶𝐶𝐶3− + 𝐻𝐻2𝐶𝐶𝐾𝐾4↔𝐻𝐻3𝐶𝐶+ + 𝐶𝐶𝐶𝐶32− (4)
𝑀𝑀𝑀𝑀𝑀𝑀𝐻𝐻+ + 𝐻𝐻2𝐶𝐶𝐾𝐾5↔ 𝑀𝑀𝑀𝑀𝑀𝑀 + 𝐻𝐻3𝐶𝐶+ (5)
𝑀𝑀𝑀𝑀𝑀𝑀𝐶𝐶𝐶𝐶𝐶𝐶− + 𝐻𝐻2𝐶𝐶 𝐾𝐾6↔𝑀𝑀𝑀𝑀𝑀𝑀 + 𝐻𝐻𝐶𝐶𝐶𝐶3− (6)
In the reactions listed above, reaction (2) describes water hydrolysis, reaction (3) shows the
formation of bicarbonate in water and reaction (4) illustrates the dissociation of bicarbonate
into carbonate ions in the presence of liquid water. Reactions (5) and (6) describe how
molecular MEA reacts with CO2 in aqueous solution.
The equilibrium constants for reactions 1-5 are defined as:
𝐾𝐾(𝑇𝑇) = ∏𝛼𝛼𝑖𝑖𝜐𝜐𝑖𝑖=∏(𝑚𝑚𝑖𝑖 . 𝛾𝛾𝑖𝑖)𝜈𝜈𝑖𝑖 : molar basis (7)
or
𝐾𝐾(𝑇𝑇) = ∏(𝑥𝑥𝑖𝑖 . 𝛾𝛾𝑖𝑖)𝜈𝜈𝑖𝑖 : mole fraction basis (8)
In equations (7) and (8), 𝐾𝐾(𝑇𝑇) is the temperature-dependent equilibrium constant; 𝛼𝛼𝑖𝑖 is the
activity of species𝑖𝑖; 𝜈𝜈𝑖𝑖 is the stoichiometric constant of species 𝑖𝑖; 𝑚𝑚𝑖𝑖 is the molality of species
𝑖𝑖 and 𝛾𝛾𝑖𝑖 is the activity coefficient of species 𝑖𝑖 and 𝑥𝑥𝑖𝑖 is the mole fraction of species 𝑖𝑖. Whilst
an equilibrium description of these reactions is unlikely to be adequate for detailed process
design, this approach is deemed appropriate for a parametric study of the kind presented
here.
7
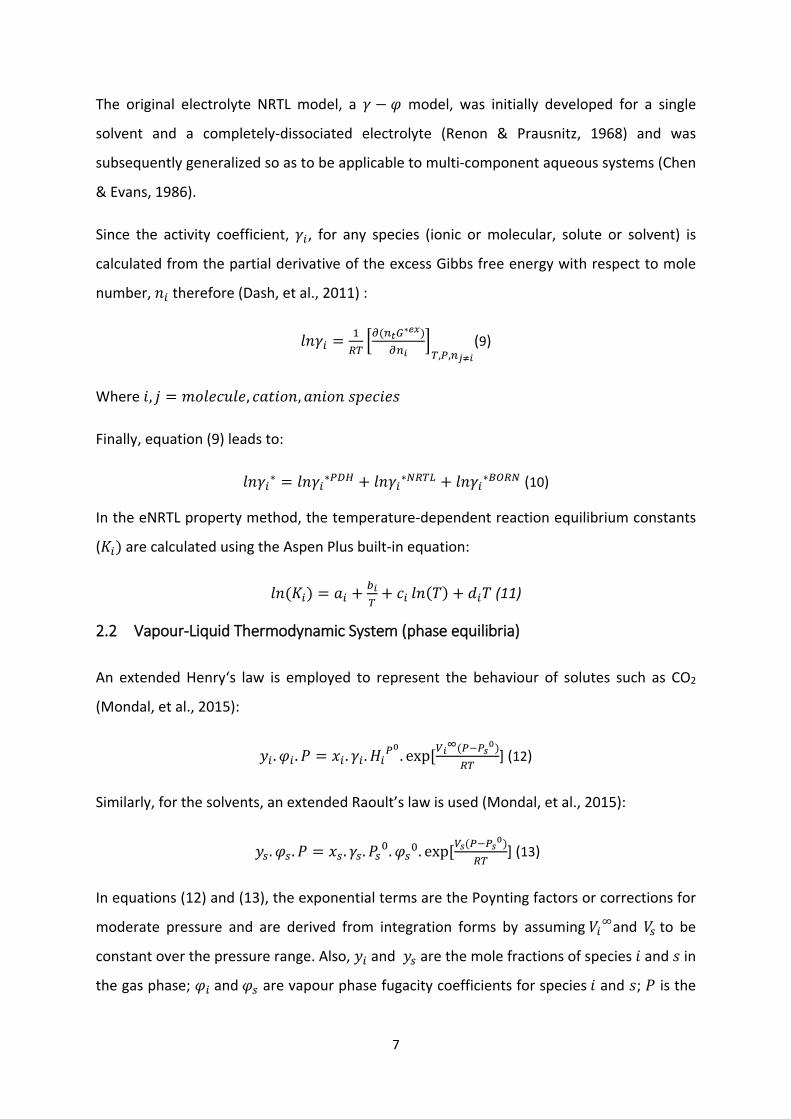
The original electrolyte NRTL model, a 𝛾𝛾 − 𝜑𝜑 model, was initially developed for a single
solvent and a completely-dissociated electrolyte (Renon & Prausnitz, 1968) and was
subsequently generalized so as to be applicable to multi-component aqueous systems (Chen
& Evans, 1986).
Since the activity coefficient, 𝛾𝛾𝑖𝑖, for any species (ionic or molecular, solute or solvent) is
calculated from the partial derivative of the excess Gibbs free energy with respect to mole
number, 𝑛𝑛𝑖𝑖 therefore (Dash, et al., 2011) :
𝑙𝑙𝑛𝑛𝛾𝛾𝑖𝑖 = 1𝑅𝑅𝑅𝑅�𝜕𝜕(𝑛𝑛𝑡𝑡𝐺𝐺∗𝑒𝑒𝑒𝑒)
𝜕𝜕𝑛𝑛𝑖𝑖�𝑅𝑅,𝑃𝑃,𝑛𝑛𝑗𝑗≠𝑖𝑖
(9)
Where 𝑖𝑖, 𝑗𝑗 = 𝑚𝑚𝑚𝑚𝑙𝑙𝑚𝑚𝑚𝑚𝑚𝑚𝑙𝑙𝑚𝑚, 𝑚𝑚𝑎𝑎𝑡𝑡𝑖𝑖𝑚𝑚𝑛𝑛,𝑎𝑎𝑛𝑛𝑖𝑖𝑚𝑚𝑛𝑛 𝑠𝑠𝑠𝑠𝑚𝑚𝑚𝑚𝑖𝑖𝑚𝑚𝑠𝑠
Finally, equation (9) leads to:
𝑙𝑙𝑛𝑛𝛾𝛾𝑖𝑖∗ = 𝑙𝑙𝑛𝑛𝛾𝛾𝑖𝑖∗𝑃𝑃𝑃𝑃𝑃𝑃 + 𝑙𝑙𝑛𝑛𝛾𝛾𝑖𝑖∗𝑁𝑁𝑅𝑅𝑅𝑅𝑁𝑁 + 𝑙𝑙𝑛𝑛𝛾𝛾𝑖𝑖∗𝐵𝐵𝐶𝐶𝑅𝑅𝑁𝑁 (10)
In the eNRTL property method, the temperature-dependent reaction equilibrium constants
(𝐾𝐾𝑖𝑖) are calculated using the Aspen Plus built-in equation:
𝑙𝑙𝑛𝑛(𝐾𝐾𝑖𝑖) = 𝑎𝑎𝑖𝑖 + 𝑏𝑏𝑖𝑖𝑅𝑅
+ 𝑚𝑚𝑖𝑖 𝑙𝑙𝑛𝑛(𝑇𝑇) + 𝑑𝑑𝑖𝑖𝑇𝑇 (11)
2.2 Vapour-Liquid Thermodynamic System (phase equilibria)
An extended Henry‘s law is employed to represent the behaviour of solutes such as CO2
(Mondal, et al., 2015):
𝑦𝑦𝑖𝑖 .𝜑𝜑𝑖𝑖 .𝑃𝑃 = 𝑥𝑥𝑖𝑖 . 𝛾𝛾𝑖𝑖 .𝐻𝐻𝑖𝑖𝑃𝑃0. exp [𝑉𝑉𝑖𝑖
∞(𝑃𝑃−𝑃𝑃𝑠𝑠0)𝑅𝑅𝑅𝑅
] (12)
Similarly, for the solvents, an extended Raoult’s law is used (Mondal, et al., 2015):
𝑦𝑦𝐺𝐺.𝜑𝜑𝐺𝐺.𝑃𝑃 = 𝑥𝑥𝐺𝐺. 𝛾𝛾𝐺𝐺.𝑃𝑃𝐺𝐺0.𝜑𝜑𝐺𝐺0. exp [𝑉𝑉𝑠𝑠(𝑃𝑃−𝑃𝑃𝑠𝑠0)𝑅𝑅𝑅𝑅
] (13)
In equations (12) and (13), the exponential terms are the Poynting factors or corrections for
moderate pressure and are derived from integration forms by assuming 𝑉𝑉𝑖𝑖∞and 𝑉𝑉𝐺𝐺 to be
constant over the pressure range. Also, 𝑦𝑦𝑖𝑖 and 𝑦𝑦𝐺𝐺 are the mole fractions of species 𝑖𝑖 and 𝑠𝑠 in
the gas phase; 𝜑𝜑𝑖𝑖 and 𝜑𝜑𝐺𝐺 are vapour phase fugacity coefficients for species 𝑖𝑖 and 𝑠𝑠; 𝑃𝑃 is the
8
total pressure; 𝑥𝑥𝑖𝑖 and 𝑥𝑥𝐺𝐺 are the mole fractions of species and in the liquid phase; 𝛾𝛾𝑖𝑖 and 𝛾𝛾𝐺𝐺 are
the liquid phase activity coefficients for species 𝑖𝑖 and 𝑠𝑠; 𝐻𝐻𝑖𝑖𝑃𝑃0and 𝑃𝑃𝐺𝐺0are respectively the
Henry‘s constant of 𝑖𝑖 in the amine solution and saturation pressure of component 𝑠𝑠; 𝜑𝜑𝐺𝐺0 is
the fugacity coefficient of 𝑠𝑠 under saturation condition; 𝑉𝑉𝑖𝑖∞and 𝑉𝑉𝐺𝐺 are the partial molar
volume of solute at infinite dilution and the molar volume of the solvent 𝑠𝑠; 𝑃𝑃𝐺𝐺0 is the vapour
pressure of solvent at saturated conditions.
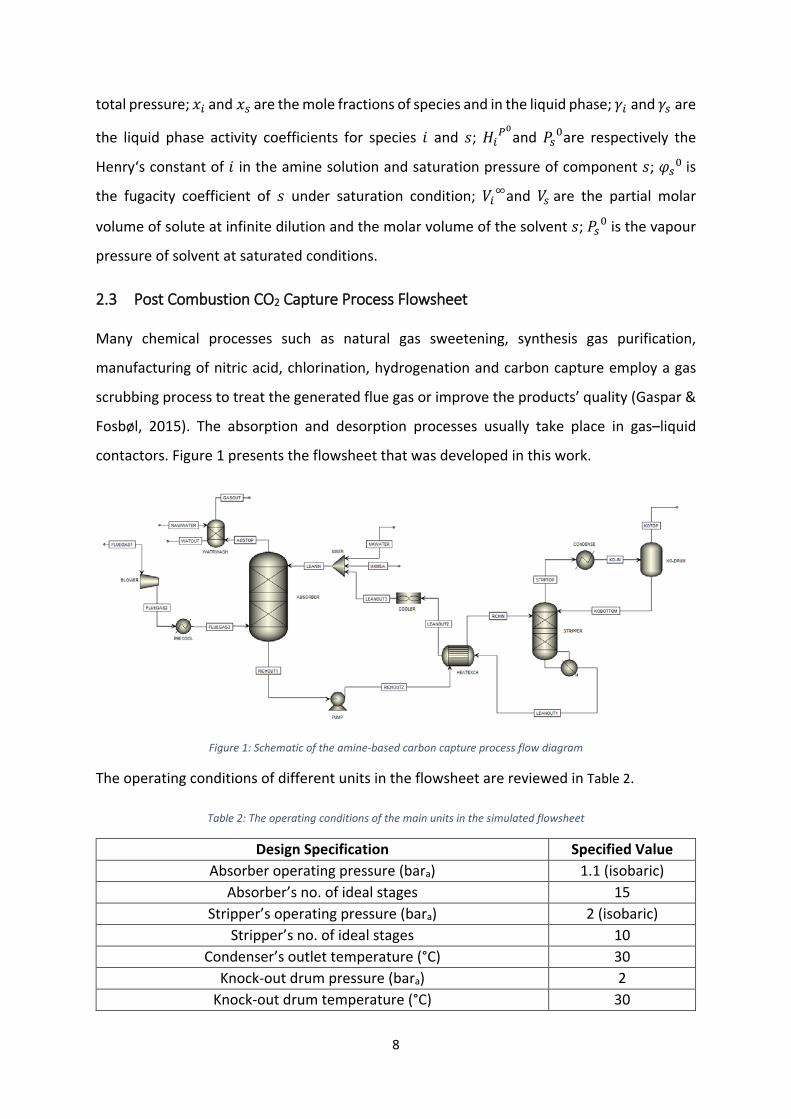
2.3 Post Combustion CO2 Capture Process Flowsheet
Many chemical processes such as natural gas sweetening, synthesis gas purification,
manufacturing of nitric acid, chlorination, hydrogenation and carbon capture employ a gas
scrubbing process to treat the generated flue gas or improve the products’ quality (Gaspar &
Fosbøl, 2015). The absorption and desorption processes usually take place in gas–liquid
contactors. Figure 1 presents the flowsheet that was developed in this work.
Figure 1: Schematic of the amine-based carbon capture process flow diagram
The operating conditions of different units in the flowsheet are reviewed in Table 2.
Table 2: The operating conditions of the main units in the simulated flowsheet
Design Specification Specified Value Absorber operating pressure (bara) 1.1 (isobaric)
Absorber’s no. of ideal stages 15 Stripper’s operating pressure (bara) 2 (isobaric)
Stripper’s no. of ideal stages 10 Condenser’s outlet temperature (°C) 30
Knock-out drum pressure (bara) 2 Knock-out drum temperature (°C) 30

9
Water-wash column pressure (bara) 1.1 Blower ∆𝑃𝑃 (bara) 0.1
Precooler’s outlet temperature (°C) 40 Assumption for pressure drop in pipes and equipment (bara) 0
In addition to the above, the key process specifications for the inlet streams are presented in
Table 3.
Table 3: The main stream values in the base-case flowsheet
Parameter Inlet Flue Gas Inlet Lean Solvent CO2 content (mol %) 4, 6, 8 N/A CO2 Loading Range N/A 0.15 - 0.35
Lean Solvent Concentration (wt %) N/A 15, 20, 25, 30 Temperature (°C) 120 40
Pressure (bara) 1.05 1.1
The concentration of CO2 (and other species) in the flue gas are modelled to represent various EGR
ratios (Adams & Mac Dowell, 2016) in a gas-fired power plant. The compositional analysis of the inlet
flue gas used in this simulation is given in Table 4.
Table 4: Inlet flue gas compositions studied in this work (Adams & Mac Dowell, 2016)
Inlet Flue Gas Composition (mol%) EGR Ratio% = 0 EGR Ratio% = 20 EGR Ratio% = 40 CO2 4 6 8 O2 12 9 5
H2O 7 7 7 N2 77 78 80
3 Results and Discussions
3.1 Effect of Lean Loading on CO2 Capture Energy Efficiency
The effect of lean loading on reboiler-based energy consumption for various EGR ratios and
amine concentrations is illustrated in Figure 2. It is evident that for all combinations of MEA
concentration and exhaust gas CO2 concentration there is a pronounced minimum in the
energy of regeneration.
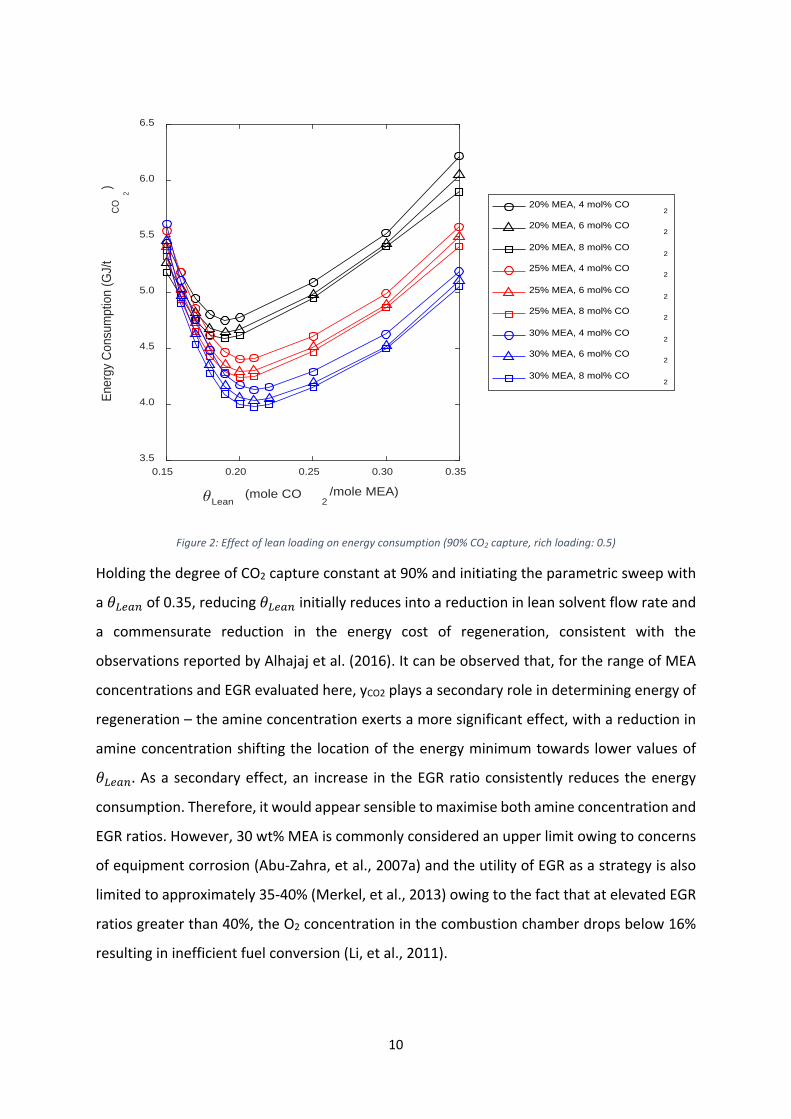
10
Figure 2: Effect of lean loading on energy consumption (90% CO2 capture, rich loading: 0.5)
Holding the degree of CO2 capture constant at 90% and initiating the parametric sweep with
a 𝜃𝜃𝑁𝑁𝐿𝐿𝐺𝐺𝑛𝑛 of 0.35, reducing 𝜃𝜃𝑁𝑁𝐿𝐿𝐺𝐺𝑛𝑛 initially reduces into a reduction in lean solvent flow rate and
a commensurate reduction in the energy cost of regeneration, consistent with the
observations reported by Alhajaj et al. (2016). It can be observed that, for the range of MEA
concentrations and EGR evaluated here, yCO2 plays a secondary role in determining energy of
regeneration – the amine concentration exerts a more significant effect, with a reduction in
amine concentration shifting the location of the energy minimum towards lower values of
𝜃𝜃𝑁𝑁𝐿𝐿𝐺𝐺𝑛𝑛. As a secondary effect, an increase in the EGR ratio consistently reduces the energy
consumption. Therefore, it would appear sensible to maximise both amine concentration and
EGR ratios. However, 30 wt% MEA is commonly considered an upper limit owing to concerns
of equipment corrosion (Abu-Zahra, et al., 2007a) and the utility of EGR as a strategy is also
limited to approximately 35-40% (Merkel, et al., 2013) owing to the fact that at elevated EGR
ratios greater than 40%, the O2 concentration in the combustion chamber drops below 16%
resulting in inefficient fuel conversion (Li, et al., 2011).
0.15 0.20 0.25 0.30 0.35
Lean (mole CO
2/mole MEA)
3.5
4.0
4.5
5.0
5.5
6.0
6.5En
ergy
Con
sum
ptio
n (G
J/t
CO2
)
20% MEA, 4 mol% CO2
20% MEA, 6 mol% CO2
20% MEA, 8 mol% CO2
25% MEA, 4 mol% CO2
25% MEA, 6 mol% CO2
25% MEA, 8 mol% CO2
30% MEA, 4 mol% CO2
30% MEA, 6 mol% CO2
30% MEA, 8 mol% CO2

11
The energy for solvent regeneration can be decomposed to three primary contributing factors
(Oexmann & Kather, 2010):
1. The energy required for the vaporisation of water and thus, the generation of steam (i.e.
latent heat) – which is dependent on CO2 and water partial pressures in equilibrium with
the liquid phase
2. The sensible heat of the solvent which is required to be supplied in order to increase the
liquid temperature to that of the reboiler. This is linked to the solvent flow rate.
3. The heat of desorption of CO2 from the rich solvent. This primarily depends on the type
of solvent used. Also, it is directly affected by the CO2 loading of the desired lean solvent.
Thus, the total reboiler heat duty is not simply a function of CO2 desorption energy but
comprises two other very important terms, namely the sensible heat and heat of water
evaporation. Therefore the total required regeneration energy in the stripper can be shown
as (Mac Dowell & Shah, 2013; Young, et al., 2012; Oexmann & Kather, 2010):
𝑎𝑎𝑟𝑟𝐿𝐿𝑟𝑟 = 𝑃𝑃𝑟𝑟𝑒𝑒𝑟𝑟𝑟𝑟𝑖𝑖𝑟𝑟𝑒𝑒𝑟𝑟�̇�𝑚𝐶𝐶𝐶𝐶2
= 𝑎𝑎𝐺𝐺𝐿𝐿𝑛𝑛 + 𝑎𝑎𝑣𝑣𝐺𝐺𝑣𝑣,𝑃𝑃2𝐶𝐶 + 𝑎𝑎𝐺𝐺𝑏𝑏𝐺𝐺,𝐶𝐶𝐶𝐶2 (14)
Where 𝑎𝑎𝑟𝑟𝐿𝐿𝑟𝑟 is the sensible energy, 𝑎𝑎𝑣𝑣𝐺𝐺𝑣𝑣,𝑃𝑃2𝐶𝐶 is water evaporation energy, 𝑎𝑎𝐺𝐺𝑏𝑏𝐺𝐺,𝐶𝐶𝐶𝐶2 is the CO2
absorption energy, 𝐻𝐻𝑟𝑟𝐿𝐿𝑏𝑏𝐶𝐶𝑖𝑖𝐶𝐶𝐿𝐿𝑟𝑟 is the heat duty of the reboiler and �̇�𝑚𝐶𝐶𝐶𝐶2is the mass flow rate of
CO2. The CO2 heat of absorption comprises three parts (Oexmann & Kather, 2010): non-ideal
mixing; dissolution of gas into the liquid and chemical reaction.
In order to provide some insight into the physical factors which drive the shape of the curves
presented in Figure 2, the contribution of each energy term to the stripper’s total heat duty
is presented in Figure 3 .

12
Figure 3: Reboiler energy breakdown for various amine concentrations and EGR ratios
As can be observed, the amount of energy required to actually recover the CO2 remains
approximately constant – which makes intuitive sense. At higher values of lean loading, more
energy is required for sensible heating owing to increased quantity of solvent required to
maintain a constant degree of capture. However, at lower values of lean loading, the vapour
liquid equilibrium conditions shift, and an increased amount of energy is spent producing
water vapour, consistent with previous observations in the literature (Oexmann & Kather,
2010). These trends were also observed by Abu-Zahra et al. (2007b) for a corresponding coal-
fired power plant.
The variation of solvent flow rate for various lean loadings is shown in Figure 4.
0.15 0.16 0.17 0.18 0.21 0.22 0.25 0.30 0.35
Lean (mole CO
2/mole MEA)
0
100
200
300
400
500
600
Reb
oile
r Ene
rgy
Con
tribu
tion
(MW
)
30 wt% MEA, 8 mol% CO2
CO2
Desorprtion Energy
Sensible Heat
Water Evaporation Energy

13
Figure 4: Effect of lean loading on lean solvent flow rate (90% CO2 capture)
It can be observed that with an increase in loan loading, an increased solvent is required to
achieve the constant CO2 capture of 90%, as there is a reduced carrying capacity in the
working solvent. This is similar to what has been observed in previous work (Alhajaj, et al.,
2016; Adams & Mac Dowell, 2016).
3.2 Effect of MEA Concentration on CO2 Capture Energy
In Figure 5, the effect of MEA concentration in the lean solvent on the reboiler-based energy
efficiency of the process has been illustrated for various lean loadings and EGR ratios.
0.15 0.16 0.17 0.18 0.19 0.20 0.25 0.30 0.35
(mole CO2
/mole MEA)
0.0
0.5
1.0
1.5
2.0
2.5
3.0
3.5
4.0So
lvent
Flow
Rat
e (to
nne/
s)30 wt% MEA
4 mol% CO2
6 mol% CO2
8 mol% CO2

14
Figure 5: Effect of MEA concentration in lean solvent on the reboiler energy efficiency (90% CO2 capture, rich loading: 0.5, 0.20 lean loading)
Figure 5 shows that with an increase in MEA concentration, leading to a reduction in solvent
flow rates, the reboiler energy consumption is reduced. This trend is consistent across all
values of yCO2. It may also be observed from Figure 5 that at a constant MEA concentration,
an increase in gas phase CO2 concentration leads to a second order reduction in energy
consumption. The minimum is achieved with an MEA concentration of 30 wt%, a lean loading
of 0.20 and an EGR of 40% (i.e. 8 mol% CO2 in the flue gas) - here the energy of regeneration
is 3.98 GJ/tCO2.
3.3 Effect of CO2 Capture Rate on Reboiler Duty
The basic operating conditions of the process (Table 3) were kept constant during the
simulation. In order to be able to perform a parametric study on the effect of reboiler heating
duty on CO2 capture, the inlet flue gas composition, lean loading and the MEA concentration
in lean loading were kept constant. However, the capture was manipulated by a varying lean
solvent flow rate. The effect of the reboiler duty and its corresponding steam consumption
on the total carbon dioxide capture percentage from the flue gas is illustrated in Figure 6.
15% 20% 25% 30%
MEA Concentration (wt%)
4.0
4.5
5.0
5.5
Ener
gy C
onsu
mpt
ion (G
J/tCO
2)
4 mol% CO2
6 mol% CO2
8 mol% CO2
15
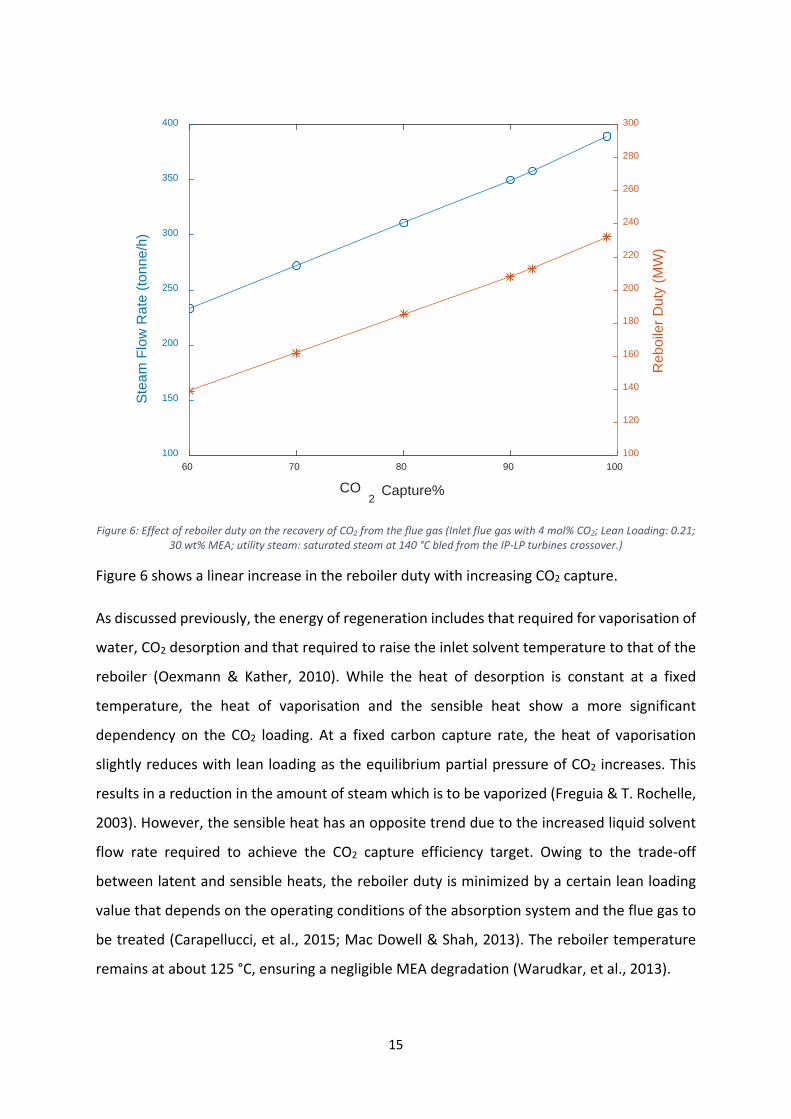
Figure 6: Effect of reboiler duty on the recovery of CO2 from the flue gas (Inlet flue gas with 4 mol% CO2; Lean Loading: 0.21;
30 wt% MEA; utility steam: saturated steam at 140 °C bled from the IP-LP turbines crossover.)
Figure 6 shows a linear increase in the reboiler duty with increasing CO2 capture.
As discussed previously, the energy of regeneration includes that required for vaporisation of
water, CO2 desorption and that required to raise the inlet solvent temperature to that of the
reboiler (Oexmann & Kather, 2010). While the heat of desorption is constant at a fixed
temperature, the heat of vaporisation and the sensible heat show a more significant
dependency on the CO2 loading. At a fixed carbon capture rate, the heat of vaporisation
slightly reduces with lean loading as the equilibrium partial pressure of CO2 increases. This
results in a reduction in the amount of steam which is to be vaporized (Freguia & T. Rochelle,
2003). However, the sensible heat has an opposite trend due to the increased liquid solvent
flow rate required to achieve the CO2 capture efficiency target. Owing to the trade-off
between latent and sensible heats, the reboiler duty is minimized by a certain lean loading
value that depends on the operating conditions of the absorption system and the flue gas to
be treated (Carapellucci, et al., 2015; Mac Dowell & Shah, 2013). The reboiler temperature
remains at about 125 °C, ensuring a negligible MEA degradation (Warudkar, et al., 2013).
60 70 80 90 100
CO2 Capture%
100
150
200
250
300
350
400
Stea
m F
low
Rat
e (to
nne/
h)
100
120
140
160
180
200
220
240
260
280
300
Reb
oile
r Dut
y (M
W)

16
Various CO2 capture efficiencies are achieved by manipulating the lean solvent flow rate in
the absorber. This will consequently affect the total rich solvent flow rate into the stripper
and thus, the reboiler heating load. The effect of lean solvent flow rate on CO2 capture
efficiency is depicted in Figure 8. An increase in solvent flow rate will result in an improved
capture efficiency; however, more dissolved CO2 will, in return, be needed to be stripped off
of the rich solvent, leading to an increase in reboiler duty.
Figure 7: Effect CO2 capture on required lean solvent flow rate and rich loading (Inlet flue gas with 4 mol% CO2; 0.21 Lean
Loading; 30 wt% MEA)
The heating supply to the reboiler is typically obtained by bleeding steam from between the
intermediate and low pressure turbines in the Rankine cycle within the CCGT plant. In our
simulation, a saturated steam at 140 - 160 °C is used to model the reboiler heating duty
requirements (assuming total condensation and no further sub-cooling) and was therefore,
integrated as the utility stream into our simulated process. This is equivalent to a ratio of 1.93
– 1.98 𝑘𝑘𝑟𝑟 𝐺𝐺𝑠𝑠𝐿𝐿𝐺𝐺𝑚𝑚𝑘𝑘𝑟𝑟 𝐶𝐶𝐶𝐶2𝑟𝑟𝐿𝐿𝑚𝑚𝐶𝐶𝑣𝑣𝐿𝐿𝑟𝑟
for 90% CO2 capture, within the range of 1.9 - 2.5 𝑘𝑘𝑟𝑟 𝐺𝐺𝑠𝑠𝐿𝐿𝐺𝐺𝑚𝑚𝑘𝑘𝑟𝑟 𝐶𝐶𝐶𝐶2𝑟𝑟𝐿𝐿𝑚𝑚𝐶𝐶𝑣𝑣𝐿𝐿𝑟𝑟
(Idem, et
al., 2009) reported in the literature. Obviously the conditions at which the steam is available
effects the quantity required; Table 5 presents the impact of varying extraction conditions on
the quantity of steam required.
60 70 80 90 100
CO2
Capture%
2000
2500
3000
3500
4000
4500
5000
Lean
Sol
vent
Flo
w R
ate
(tonn
e/h)
0.35
0.40
0.45
0.50
Ric
h Lo
adin
g (m
ole
CO
2/m
ole
MEA
)

17
Table 5: Required saturated steam flow rate to heat the reboiler supplied from some IP-LP crossover steam (4 mol% CO2, 30 wt% MEA, 0.21 lean loading, 90% Capture).
Pressure (bar) Temperature (°C) Required Steam Flow Rate (kg/s)
𝒌𝒌𝒌𝒌 𝒔𝒔𝒔𝒔𝒔𝒔𝒔𝒔𝒔𝒔 𝒖𝒖𝒔𝒔𝒔𝒔𝒖𝒖𝒌𝒌𝒌𝒌 𝒓𝒓𝒔𝒔𝒓𝒓𝒓𝒓𝒓𝒓𝒔𝒔𝒓𝒓𝒔𝒔𝒖𝒖 𝑪𝑪𝑪𝑪𝟐𝟐
3.615 140 97.12 1.93 4.761 150 98.54 1.95 6.182 160 100.05 1.98
3.4 Parasitic Power Loss and Power Plant De-rating
Whilst the 𝑘𝑘𝑔𝑔𝐺𝐺𝑠𝑠𝐿𝐿𝐺𝐺𝑚𝑚 𝑘𝑘𝑔𝑔𝐶𝐶𝐶𝐶2� is an accessible measure of cost of CCS, expressing this in terms of
the reduction in electricity generated is a much more meaningful measure of cost. This is the
purpose of this section, and the parameters used to evaluate the power plant de-rating are
compiled in Table 6.
Table 6: Parameters used in order to evaluate the parasitic power loss (Zhou & Turnbull, 2002)
Parameter Inlet to the LP turbine Outlet of the LP turbine Steam pressure (bara) 3.615 (saturated) 0.05
Steam temperature (°C) 140 32.8991 (calculated)
Considering an isentropic expansion of steam within the turbine, the quantity of steam
required to generate one unit of electricity depends on the inlet and outlet conditions of
steam as well as the efficiency of the turbine. This relationship is formulated as (Warudkar, et
al., 2013; Ganapathy, 1994):
𝑄𝑄𝐺𝐺𝐿𝐿𝑛𝑛(𝑘𝑘𝑀𝑀) = ∆𝐻𝐻 �𝑘𝑘𝑘𝑘𝑘𝑘𝑟𝑟� . �̇�𝑚𝐺𝐺 �
𝑘𝑘𝑟𝑟𝐺𝐺� . 𝜂𝜂𝑠𝑠 (16)
Where ∆𝐻𝐻 is the enthalpy drop across the turbine, �̇�𝑚𝐺𝐺 is the steam flow rate, 𝜂𝜂𝑠𝑠 is the turbine
efficiency. The power loss of the power plant is illustrated in Figure 9. There is a 5.2%
reduction in net power output for a 90% capture rate, assuming an advanced CCGT with an
HHV efficiency of 52% (Won, et al., 2015; Adams & Mac Dowell, 2016). Assuming that this
constitutes approximately 60% of total energy penalty (Kothandaraman, et al., 2009), the
total reduction in electricity generated by the power plant would be approximately 8-7%-pts,
in line with previous estimates (Wang, et al., 2016).

18
A final measure for evaluating the impact of CCS on a power plant is the energy penalty per
MWh of low carbon energy produced. A comparison between the energy efficiency of gas-
and coal-fired power plants with CCS is provided here by considering the regeneration energy
consumption by the CCS plant per tonne of captured CO2. This can also be converted into the
regeneration energy consumption per unit of electricity produced in the power plant:
𝐵𝐵 � 𝐺𝐺𝑘𝑘𝑀𝑀𝑀𝑀ℎ
� = 𝑀𝑀 ( 𝐺𝐺𝑘𝑘𝑠𝑠𝐶𝐶𝐶𝐶2
) ×𝐹𝐹�
𝑡𝑡𝐶𝐶𝐶𝐶2𝑀𝑀𝑀𝑀ℎ�
𝜂𝜂× 𝐶𝐶
100 (17)
Where, A is the regeneration energy consumed by the stripper’s reboiler, C is the CO2 capture
rate, F is the amount of CO2 produced in order to generate one MWh of thermal energy and
𝜂𝜂 is the power plant’s efficiency. Table 7 shows the regeneration energy demand for a CCGT
and coal-fired power plant.
Table 7: Comparison of regeneration energy consumption: 600 MW coal and CCGT plants with 90% CO2 capture (no EGR)
CCGT Power Plant Coal (bituminous)- fired Power Plant GJ/tCO2 GJ/MWh GJ/tCO2 GJ/MWh
3.98 1.50 3.90 2.33
Assuming a modern CCGT (60% HHV efficiency) and an advanced ultra-supercritical coal-fired
plant (48% HHV efficiency) of the same capacity (i.e., 600 MW), these results show that whilst
gas CCS (3.98 GJ/tCO2) incurs a greater energy penalty per tonne of CO2 captured than coal
CCS (3.9 GJ/tCO2), the energy penalty per unit of low carbon power generated is significantly
lower for gas-CCS (1.5 GJ/MWh) than for coal (2.33 GJ/MWh).
4 Conclusions
In this study, we have simulated an MEA-based post-combustion CO2 capture process applied
to a 600 MW natural gas-fired power plant with exhaust gas recycle. We found that using a
30 wt% MEA solution and an EGR of 40% to capture 90% of the CO2 incurred an energy penalty
of 3.98 𝐺𝐺𝑘𝑘 𝑟𝑟𝐿𝐿𝑏𝑏𝐶𝐶𝑖𝑖𝐶𝐶𝐿𝐿𝑟𝑟 𝐿𝐿𝑛𝑛𝐿𝐿𝑟𝑟𝑟𝑟𝑒𝑒𝑠𝑠𝐶𝐶𝑛𝑛𝑛𝑛𝐿𝐿 𝐶𝐶𝐶𝐶2 𝑐𝑐𝐺𝐺𝑣𝑣𝑠𝑠𝑐𝑐𝑟𝑟𝐿𝐿𝑟𝑟
. A flow of saturated LP steam at 140 - 160 °C was used to supply the
reboiler duty, and therefore required 1.93 – 1.98 𝑘𝑘𝑟𝑟 𝐺𝐺𝑠𝑠𝐿𝐿𝐺𝐺𝑚𝑚𝑘𝑘𝑟𝑟 𝑐𝑐𝐺𝐺𝑣𝑣𝑠𝑠𝑐𝑐𝑟𝑟𝐿𝐿𝑟𝑟 𝐶𝐶𝐶𝐶2
. It was observed that there
is a well-defined optimum value in the lean loading in the range 0.19 – 0.21, varying primarily
as a function of amine concentration and secondly as a function of EGR (i.e., gas-phase CO2
19
concentration). Our results also indicate that whilst gas CCS will require more energy, or will
be more costly, per tonne of CO2 captured, than coal CCS, it will require appreciably less
energy, or be much less costly, per MWh of low carbon power produced, which is after all,
the point.
Acknowledgement
This work was funded by Gas-FACTS EPSRC project grant EP/J020788/1, CO2QUEST EU FP7 Grant agreement 309102 and MESMERISE-CCS EPSRC EP/M001369/1.
References
Llano-Restrepo, M. & Araujo-Lopez, E., 2015. Modeling and simulation of packed-bed absorbers for post-combustion capture of carbon dioxide by reactive absorption in aqueous monoethanolamine solutions. International Journal of Greenhouse Gas Control, Volume 42, p. 258–287.
Abu-Zahra, M., Niederer, J., Feron, P. & Versteeg, G., 2007b. CO2 capture from power plants: Part II. A parametric study of the economical performance based on mono-ethanolamine. International Journal of Greenhouse Gas Control, Volume 1, pp. 135-142.
Abu-Zahra, M. R. et al., 2007a. CO2 capture from power plants Part I. A parametric study of the technical performance based on monoethanolamine. International journal of greenhouse gas control, Volume 1, pp. 37-46.
Adams, T. & Mac Dowell, N., 2016. Off-design point modelling of a 420 MW CCGT power plant integrated with an amine-based post-combustion CO2 capture and compression process. Applied Energy, Volume 178, pp. 681-702.
Akram, M. et al., 2016. Performance evaluation of PACT Pilot-plant for CO2 capture from gas turbines with Exhaust Gas Recycle. International Journal of Greenhouse Gas Control, Volume 47, p. 137–150.
Akram, M., Khandelwal, B., Blakey, S. & Wilson, C. W., 2013. Preliminary calculations on post combustion carbon capture from gas turbines with flue gas recycle. San Antonio, ASME Proceedings, p. V01BT04A004.
Alhajaj, A., Mac Dowell, N. & Shah, N., 2016. A techno-economic analysis of post-combustion CO2capture andcompression applied to a combined cycle gas turbine: Part I. Aparametric study of the key technical performance indicators. International Journal of Greenhouse Gas Control, Volume 44, pp. 26-41.
Ali, U. et al., 2016. Techno-economic process design of a commercial-scale amine-based CO2 capture system for natural gas combined cycle power plant with exhaust gas recirculation. Applied Thermal Engineering, Volume 103, pp. 747-758.
Boot-Handford, M. E. et al., 2014. Carbon capture and storage update. Energy & Environmental Science, 7(1), pp. 130 - 189.
20
Canepa, R., Wang, M., Biliyok, C. & Satta, A., 2013. Thermodynamic analysis of combined cycle gas turbine power plant with post-combustion CO2 capture and exhaust gas recirculation. Journal of Process Mechanical Engineering, 227(2), pp. 89-105.
Carapellucci, R., Giordano, L. & Vaccarelli, M., 2015. Studying heat integration options for steam-gas power plants retrofitted with CO2 post-combustion capture. Energy, Volume 85, p. 594–608.
Chen , C. C. & Evans, L. N., 1986. A local composition model for the excess gibbs energy of aqueous electrolyte systems. AIChE Journal, Volume 32, pp. 444-454.
Climent Barba, F. et al., 2016. A technical evaluation, performance analysis and risk assessment of multiple novel oxy-turbine power cycles with complete CO2 capture. Journal of Cleaner Production, Volume 133, pp. 971-985.
Dash, S. K., Samanta, A. N. & Bandyopadhyay, S. S., 2011. (Vapour + liquid) equilibria (VLE) of CO2 in aqueous solutions of 2-amino-2-methyl-1-propanol: New data and modelling using eNRTL-equation. J. Chem. Thermodynamics, 43(8), p. 1278–1285.
Department of Energy & Climate Change, 2015. GOV.UK. [Online] Available at: https://www.gov.uk/government/news/new-direction-for-uk-energy-policy [Accessed 22 8 2016].
Dutta, R., O. Nord, L. & Bolland, O., 2017. Prospects of using equilibrium-based column models in dynamic process simulation of post-combustion CO2 capture for coal-fired power plant. Fuel, Volume 15, p. 85–97.
Freguia, S. & T. Rochelle, G., 2003. Modeling of CO2 capture by aqueous monoethanolamine. AIChE Journal, 49(7), p. 1676–1686.
Ganapathy, V., 1994. Steam plant calculations manual. New York: CRC Press.
Gaspar, J. & Fosbøl, P. L., 2015. A general enhancement factor model for absorption and desorption systems: A CO2 capture case-study. Chemical Engineering Science, Volume 138, pp. 203-215.
Hanak, D. P., Biliyok, C. & Manovic, V., 2015. Efficiency improvements for the coal-fired power plant retrofit with CO2 capture plant using chilled ammonia process. Applied Energy, Volume 151, pp. 258-272.
Hassan, B., Ogidiama, O. V., Khan, M. N. & Shamim, T., 2017. Energy and exergy analyses of a power plant with carbon dioxide capture using multistage chemical looping combustion. Journal of Energy Resources Technology, 139(3), pp. 032002(1)-32002(9).
Heuberger, C. F., Staffell, I., Shah, N. & Mac Dowell, N., 2016. Quantifying the value of CCS for the future electricity system. Energy & Environmental Science, Volume 9, pp. 2497-2510.
Idem, R., Gelowitz, D. & Tontiwachwuthikul, P., 2009. Evaluation of the performance of various amine based solvents in an optimized multipurpose technology development pilot plant. Energy Procedia, Volume 1, pp. 1543-1548.
21
Kehlhofer, R., Hannemann, F., Stirnimann, F. & Rukes, B., 2009. Combined-cycle gas & steam turbine power plants. 3rd ed. Tulsa: PennWell.
Kothandaraman, A. et al., 2009. Comparison of solvents for post-combustion capture of CO2 by chemical absorption. Energy Procedia, 1(1), pp. 1373-1380.
Krishnamurthy, R. & Taylor, R., 1985a. A nonequilibrium stage model of multicomponent separation processes. Part I: Model description and method of solution. AIChE Journal, 31(3), p. 449–456.
Krishnamurthy, R. & Taylor, R., 1985b. A nonequilibrium stage model of multicomponent separation processes. Part II: Comparison with experiment. AIChE Journal, 31(3), p. 456–465.
Kvamsdal, H. M. et al., 2014. Energetic evaluation of a power plant integrated with a piperazine-based CO2 capture process. International Journal of Greenhouse Gas Control, Volume 28, pp. 343-355.
Li, H. et al., 2011. Impacts of exhaust gas recirculation (EGR) on the natural gas combined cycle integrated with chemical absorption CO2 capture technology. Energy Procedia, Volume 4, pp. 1411-1418.
Linnenberg, S. et al., 2012. Evaluating the impact of an ammonia-based post-combustion CO2 capture process on a steam power plant with different cooling water temperatures. International Journal of Greenhouse Gas Control, Volume 10, pp. 1-14.
Lin, Y.-J., Chen, E. & Rochelle, G., 2016. Pilot plant test of the advanced flash stripper for CO2 capture. Faraday Discussions, Volume DOI: 10.1039/c6fd00029k.
Loud, R. & Slaterpryce, A., 1991. Gas Turbine Inlet Air Treatment, New York: GE Company - GER-3419A.
Luo, X., Wang, M. & Chen, J., 2015. Heat integration of natural gas combined cycle power plant integrated with post-combustion CO2 capture and compression. Fuel, Volume 151, p. 110–117.
Mac Dowell, N., Samsatli, N. J. & Shah, N., 2013. Dynamic modelling and analysis of an amine-based post-combustion CO2 capture absorption column. International Journal of Greenhouse Gas Control, Volume 12, p. 247–258.
Mac Dowell, N. & Shah, N., 2013. Identification of the cost-optimal degree of CO2 capture: An optimisation study using dynamic process models. International Journal of Greenhouse Gas Control, Volume 13, pp. 44-58.
Mac Dowell, N. & Shah, N., 2014. Dynamic modelling and analysis of a coal-fired power plant integrated with a novel split-flow configuration post-combustion CO2 capture process. International Journal of Greenhouse Gas Control, Volume 27, p. 103–119.
Mac Dowell, N. & Shah, N., 2015. The multi-period optimisation of an amine-based CO2 capture process integrated with a super-critical coal-fired power station for flexible operation. Computers & Chemical Engineering, Volume 74, p. 169–183.
22
Merkel, T. C. et al., 2013. Selective exhaust gas recycle with membranes for CO2 capture from natural gas combined cycle power plants. Industrial and Engineering Chemistry Research, 52(3), p. 1150–1159.
Mertens, J., Helene , L., Dominique , D. & Thielens, M.-L., 2013. Understanding ethanolamine (MEA) and ammonia emissions from amine based post combustion carbon capture: Lessons learned from field tests. International Journal of Greenhouse Gas Control, Volume 13, pp. 72-77.
Mondal, B. K., Bandyopadhyay, S. S. & Samanta, A. N., 2015. Vapor–liquid equilibrium measurement and ENRTL modeling of CO2 absorption in aqueous hexamethylenediamine. Fluid Phase Equilibria, Volume 402, pp. 102-112.
National Energy Technology Laboratory (NETL), 2013. Cost and performance baseline for fossil energy plants volume 1: bituminous coal and natural gas to electricity, s.l.: United States Department of Energy.
Norouzbahari, S., Shahhosseini, S. & Ghaemi, A., 2016. Chemical absorption of CO2 into an aqueous piperazine (PZ) solution: Development and validation of a rigorous dynamic rate-based model. RSC Advances, 6(46), pp. 40017-40032.
Oexmann, J. & Kather, A., 2010. Minimising the regeneration heat duty of post-combustion CO2 capture by wet chemical absorption: The misguided focus on low heat of absorption solvents. International Journal of Greenhouse Gas Control, 4(1), p. 36–43.
Ogawa, T., 2013. Carbon dioxide capture and utilization for gas engine. Energy and Power Engineering, Volume 5, pp. 587-590.
Oko, E., Wang, M. & Olaleye, A. K., 2015. Simplification of detailed rate-based model of post-combustion CO2 capture for full chain CCS integration studies. Fuel, Volume 142, p. 87–93.
Qi, L. E., 2007. Aspen HYSYS simulation of CO2 removal by amine absorption from a gas based power plant. Gøteborg, SIMS2007 Conference.
Renon, H. & Prausnitz, . J. M., 1968. Local composition on thermodynamic excess functions for liquid mixtures. AIChE Journal, 14(1), pp. 135-144.
Rochelle, G. T., 2007. CO2 capture by aqueous absorption and stripping.. ABMA Annual Meeting, s.n.
Sharifzadeh, M. & Shah, N., 2015. Comparative studies of CO2 capture solvents for gas-fired power plants: Integrated modelling and pilot plant assessments. International Journal of Greenhouse Gas Control, Volume 43, p. 124–132.
Sherman, B. J., Ciftja, A. F. & Rochelle, G. T., 2016. Thermodynamic and mass transfer modeling of carbon dioxide absorption into aqueous 2-piperidineethanol. Chemical Engineering Science, Volume 153, p. 295–307.
Soave, G., 1972. Equilibrium constants from a modified Redkh-Kwong equation of state. Chemical Engineering Science, Volume 27, pp. 1197-1203.

23
U.S. Energy Information Administration, 2015. US Energy Information Administration. [Online] Available at: https://www.eia.gov [Accessed May 2016].
United Nations, F. C. o. c. C., 2015. Adoption of the Paris agreement. [Online] Available at: https://unfccc.int/resource/docs/2015/cop21/eng/l09r01.pdf [Accessed 07 04 2016].
US Environmental Protection Agency, 2016. EPA. [Online] Available at: https://www.epa.gov/ghgemissions/global-greenhouse-gas-emissions-data [Accessed 13 09 2016].
Wang, T. et al., 2016. Enhanced CO2 absorption and desorption by monoethanolamine (MEA)-based nanoparticle suspensions. Industrial & Engineering Chemistry Research, Volume 55, p. 7830−7838.
Warudkar, S. S., Cox, K. R., Wong, M. S. & Hirasaki, G. J., 2013. Influence of stripper operating parameters on the performance of amine absorption systems for post-combustion carbon capture: Part I. High pressure strippers. International Journal of Greenhouse Gas Control.
Won, J., Son, C. & Kim, C., 2015. The performance analysis of a combined power plant implementing technologies for enhancing power and efficiency. Montreal, Proceedings of ASME Turbo Expo 2015: Turbine Technical Conference and Exposition.
Young, E. K. et al., 2012. Comparison of carbon dioxide absorption in aqueous MEA, DEA, TEA, and AMP solutions. Bulletin of the Korean Chemical Society, 34(3), p. 783.
Zhou, S. & Turnbull, A., 2002. Steam turbine operating conditions, chemistry of condensates, and environment assisted cracking – A critical review, s.l.: National Physical Laboratory (NPL).