A Brief Introduction to Nomography - CORE
20
This is an Accepted Manuscript of an article published by Taylor & Francis in International Journal of Mathematical Education in Science and Technology on 26/09/2018 available online at: https://www.tandfonline.com/doi/full/10.1080/0020739X.2018.1527406 1 A Brief Introduction to Nomography: Graphical Representation of Mathematical Relationships Leslie Glasser* Nanochemistry Research Institute, Department of Chemistry Curtin University, GPO Box U1987, Perth, WA 6845, Australia and Ron Doerfler Advisory Systems Engineer, Naperville, Illinois, 60565 USA 6 Figures 1 Table 3 Online Resource Files ~3 000 words Keywords: Graduate Education/Research, Continuing Education, Interdisciplinary / Multidisciplinary, Mathematics / Symbolic Mathematics, Nomograph, Nomogram, Alignment Chart, Graphic Aids * Corresponding author L. Glasser: Telephone: + 61 8 9848-3334 E-mail: [email protected] ORCiD : 0000-0002-8883-0564 brought to you by CORE View metadata, citation and similar papers at core.ac.uk provided by espace@Curtin
-
Upload
khangminh22 -
Category
Documents
-
view
8 -
download
0
Transcript of A Brief Introduction to Nomography - CORE

This is an Accepted Manuscript of an article published by Taylor & Francis in International Journal of Mathematical Education in Science and Technology on 26/09/2018 available online at: https://www.tandfonline.com/doi/full/10.1080/0020739X.2018.1527406
1
A Brief Introduction to Nomography:
Graphical Representation of Mathematical Relationships
Leslie Glasser*
Nanochemistry Research Institute, Department of Chemistry
Curtin University, GPO Box U1987, Perth, WA 6845, Australia
and
Ron Doerfler
Advisory Systems Engineer, Naperville, Illinois, 60565 USA
6 Figures 1 Table 3 Online Resource Files ~3 000 words
Keywords:
Graduate Education/Research, Continuing Education, Interdisciplinary / Multidisciplinary,
Mathematics / Symbolic Mathematics, Nomograph, Nomogram, Alignment Chart, Graphic
Aids
*Corresponding author
L. Glasser: Telephone: + 61 8 9848-3334
E-mail: [email protected]
ORCiD : 0000-0002-8883-0564
brought to you by COREView metadata, citation and similar papers at core.ac.uk
provided by espace@Curtin

This is an Accepted Manuscript of an article published by Taylor & Francis in International Journal of Mathematical Education in Science and Technology on 26/09/2018 available online at: https://www.tandfonline.com/doi/full/10.1080/0020739X.2018.1527406
2
Abstract
Nomographs (or nomograms, or alignment charts) are graphical representations of
mathematical relationships (extending to empirical relationships of data) which are used by
simply applying a straightedge across the plot through points on scales representing
independent variables, which then crosses the corresponding datum point for the dependent
variable; the choice among independent and dependent variable is arbitrary so that each
variable may be determined in terms of the others. Examples of nomographs in common
current use compute the lift available for a hot-air balloon, the boiling points of solvents
under reduced pressure in the chemistry laboratory, and the relative forces in a centrifuge in a
biochemical laboratory. Sundials represent another ancient yet widely-familiar example. The
origins and geometry of the nomograph are seldom currently understood or taught.
With the advent and ready accessibility of the computer, printed mathematical tables, slide
rules and nomographs became generally redundant. However, there remains even today a
place for nomographs since they provide insight into mathematical relationships, are useful
for rapid and repeated application (as illustrated by the examples listed above), even in the
absence of calculational facilities, and can reliably be used in the field even by non-
specialists. Many nomographs for various purposes may be found online.
This paper describes the origins and development of nomographs, and illustrates their use
with some relevant examples. A supplementary interactive Excel file demonstrates their
application for some simple mathematical operations.

This is an Accepted Manuscript of an article published by Taylor & Francis in International Journal of Mathematical Education in Science and Technology on 26/09/2018 available online at: https://www.tandfonline.com/doi/full/10.1080/0020739X.2018.1527406
3
Introduction
In the years BC – “Before Computers”, that is – the principal modes of calculation were by
use of printed mathematical tables[1, 2] such as for logarithms and trigonometric functions,
or by use of slide-rules, or by graphical means in the form of pre-prepared nomographs.[3, 4,
5] With the advent of computers, printed tables often became redundant – although the NIST
Digital Library of Mathematical Functions[6] and its printed companion still remains as a
fundamental source of reference, together with such esoteric resources as the “Online
Encyclopedia of Integer Sequences”[7] – while slide-rules have generally disappeared.
Nomographs (from the Greek “nomo” = “law”), or nomograms, or alignment charts –
although the latter terms have become widely subverted to other applications - appeared to
become obsolescent in the 1950s, but have remained available, generally in specialist fields,
and may even be undergoing a partial renaissance for their speed of use, ready accessibility
and reliability, even if their construction is seldom currently discussed or understood. It is
the purpose of this paper to introduce the reader to nomography, to the construction of
nomographs, and to some of their applications.
Nomography[8] was developed in 1884 by Philbert Maurice d’Ocagne (in dealing with cut-
and-fill problems in the construction of French railways) as a graphic solution for
multivariable functions, being an extension of two-variable Cartesian graphs, with the
orthogonal axes transformed into separated parallel axes, as seen in Fig. 1. Based on the
principles of projective geometry:
“d'Ocagne showed that a point on a graph with Cartesian coordinates transformed into
a line on [a nomogram], that a line transformed into a point, and, finally, that a family
of lines or a surface transformed into a single line. … The nomogram has several great
advantages. First, it allows for great economy of expression: the diagram is much less

This is an Accepted Manuscript of an article published by Taylor & Francis in International Journal of Mathematical Education in Science and Technology on 26/09/2018 available online at: https://www.tandfonline.com/doi/full/10.1080/0020739X.2018.1527406
4
cluttered than a graph with Cartesian coordinates. Second, the same nomogram can
express all the parameters of a formula and can handle many more variables. And third,
one reads off the values on a nomogram by … laying a straightedge across the scales
and noting where it intercepts a third scale, thereby greatly increasing the speed and
accuracy of reading the graph. There is no need to follow a line from the abscissa to the
curve to the ordinate, as is the case with Cartesian coordinates.”[9]
Figure 1: A linear parallel 3-axes nomograph for addition (u1 + u2 + u3 = 0), prepared using the
nomograph-generating program PyNomo[10] based on Python program text. The broken
straight line joining the data points (u1 = 7, u3 = -9, with resultant negated sum u2 = 2) is an
instance of an isopleth.[11] Reprinted with permission from Doerfler, R.
http://www.myreckonings.com/pynomo/CreatingNomogramsWithPynomo.pdf.

This is an Accepted Manuscript of an article published by Taylor & Francis in International Journal of Mathematical Education in Science and Technology on 26/09/2018 available online at: https://www.tandfonline.com/doi/full/10.1080/0020739X.2018.1527406
5
While the simple form of a nomograph for addition, such as Fig. 1, seems trivial, it becomes
more useful when it is recalled than many multiplicative functions can be converted into
additions by taking logarithms of the functions. An example of a practical application (Fig.
2) is in calculating the relative force in a rotating centrifuge[12] where
5 2RCF / 1.118 10g rN (RCF Relative Centrifugal Force)
with radius, r, in centimeters, and rotational velocity, N, in revolutions per minute, so that
log(RCF) 5 log(1.118) log( ) 2log( )r N
A much elaborated nomograph, which also takes into account the time of centrifugation for
consideration of the processes of sedimentation, has been published by Rasmussen.[13]

This is an Accepted Manuscript of an article published by Taylor & Francis in International Journal of Mathematical Education in Science and Technology on 26/09/2018 available online at: https://www.tandfonline.com/doi/full/10.1080/0020739X.2018.1527406
6
Figure 2: A three parallel-scale nomograph for determining the relative force in a rotating
centrifuge with 5 2RCF / 1.118 10g rN (RCF Relative Centrifugal Force), created using
PyNomo.[10, 11]
This is an Accepted Manuscript of an article published by Taylor & Francis in International Journal of Mathematical Education in Science and Technology on 26/09/2018 available online at: https://www.tandfonline.com/doi/full/10.1080/0020739X.2018.1527406
7
Hot-Air Balloon Load Chart
Hot-air balloonists must take appropriate care that their balloons can successfully lift their
payload. The necessary basic information is provided by a loading chart nomograph (also
known as a network chart)[14] based on the ideal gas formula, a balloon envelope
temperature of 100C, and the atmospheric pressure at various altitudes (Fig. 3). An online
calculator version is also available, but does not currently respond![15] This emphasises an
important issue with regard to online facilities, which may not always be available[16] for a
variety of reasons or which become obsolete through software changes, unlike a printed
nomograph.

This is an Accepted Manuscript of an article published by Taylor & Francis in International Journal of Mathematical Education in Science and Technology on 26/09/2018 available online at: https://www.tandfonline.com/doi/full/10.1080/0020739X.2018.1527406
8
Figure 3: A loading chart for hot-air balloonists, showing the lift generated at ground level
for a balloon envelope temperature of 100C at various altitudes from sea level to 7 000m
ASL (Above Sea Level), for various values of the International Standard Atmosphere ( ISA)
of 15 °C and 1013.2 millibars (mb, or hPa). In use, select the ambient temperature (abscissa),
follow vertically to the current altitude, then follow parallel to the ISA temperature line to the
desired maximum altitude and, finally, look horizontally to the available lift (lines added by
authors). Published with the permission of Ultramagic Balloons,
http://ultramagic.com/openfiles/Manuals04/LoadChart.Pdf.
This is an Accepted Manuscript of an article published by Taylor & Francis in International Journal of Mathematical Education in Science and Technology on 26/09/2018 available online at: https://www.tandfonline.com/doi/full/10.1080/0020739X.2018.1527406
9
An Updated Vapour Pressure Nomograph
A vapour pressure nomograph is in common use in chemical laboratories, based on two
parallel temperature axes and a third curved pressure axis.[17, 18] The basic nomograph is
calculated using the thermodynamic Clausius-Clapeyron equation although this is seldom
mentioned in the resources. Of course this equation has limitations, including assumptions of
temperature-independent enthalpy of vaporisation, negligible liquid volume, ideal behaviour
of the vapour and inapplicability to associating materials, and so the nomograph is further
modified for greater accuracy[19] (see Fig. 4). Assessment is rapidly made without the
necessity of any computing device.

This is an Accepted Manuscript of an article published by Taylor & Francis in International Journal of Mathematical Education in Science and Technology on 26/09/2018 available online at: https://www.tandfonline.com/doi/full/10.1080/0020739X.2018.1527406
10
Figure 4: Pressure-Temperature nomograph[18] adapted from
http://www.tcichemicals.com/pdf/pressure-temperature-nomograph.pdf. Published with the
kind permission of TCI (Tokyo Chemical Industry) www.TCIchemicals.com

This is an Accepted Manuscript of an article published by Taylor & Francis in International Journal of Mathematical Education in Science and Technology on 26/09/2018 available online at: https://www.tandfonline.com/doi/full/10.1080/0020739X.2018.1527406
11
Geometry and Types of Nomographs[3, 20, 21]
Figure 5 shows the most basic parallel-scale nomograph, for addition.
Figure 5: The basic parallel-scale nomograph[20] for the calculation of a sum: m3f3(W) =
m1f1(U) + m2f2(V), with scale factors m1, m2, and m3.
By similar triangles, we have the relations among the scale factors which satisfy the sum
m3f3(W) = m1f1(U) + m2f2(V):
1 1 3 3 3 3 2 2
1 1 23
2 1 2
( ) ( ) ( ) ( )
Thus and
m f U m f W m f W m f V
a b
m m mam
m b m m

This is an Accepted Manuscript of an article published by Taylor & Francis in International Journal of Mathematical Education in Science and Technology on 26/09/2018 available online at: https://www.tandfonline.com/doi/full/10.1080/0020739X.2018.1527406
12
Using this information, a parallel-scale nomograph may be set up. If the range of W is very
small, its scale may be expanded by moving it outside the outer scales.
In general, nomographs may be prepared using determinants, provided that the determinant
can be set up in the generic Massau form:[22, 23]
1 1
2 2 2
1 1
2
3 3 3 3
( ) ( ) 1
( ) ( ) 1 0
( ) ( ) 1
f x g y
f x g y
f x g y
This determinant yields the area of a triangle in the xy-plane. When the area is zero, the
triangle corresponds to the straight-line isopleth with coordinates 1 1 2 2 3 3( , ), ( , ) and ( , )x y x y x y ,
independent of the actual values of x and y, and so can be arbitrarily placed across the
nomograph to yield the desired result.
These principles may be used to establish nomographs of various kinds. The generic
PyNomo software[10] is programmed to be able to prepare 10 different kinds of nomograph,
as listed in Table 1.
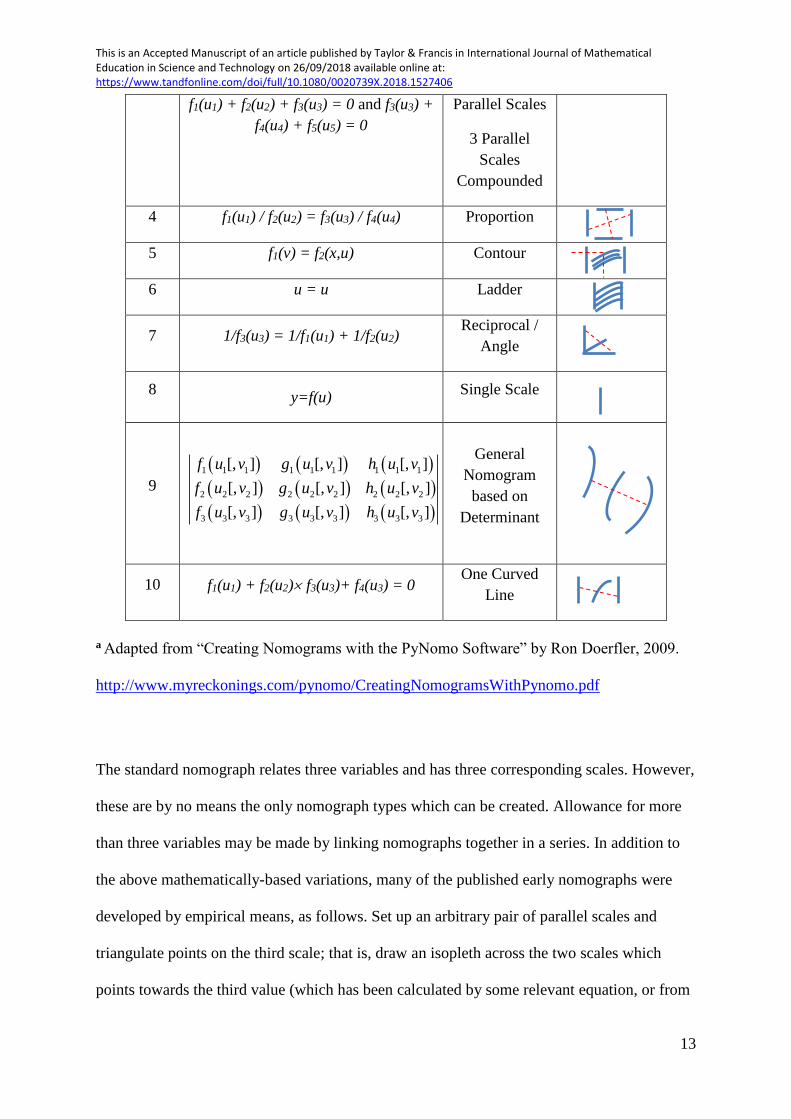
Table 1: Nomograph types available for construction by PyNomo:[10] equation form,
nomograph form, rough sketch.a
Type Form of Equation Form of
Nomograph Sketch
1 f1(u1) + f2(u2) + f3(u3) = 0 Three Parallel
Scales
2 f1(u1) =f2(u2) f3(u3)
or f1(u1) =f2(u2) / f3(u3) Z or N Chart
3 f1(u1) + f2(u2) + … + fn(un) = 0 Compound
This is an Accepted Manuscript of an article published by Taylor & Francis in International Journal of Mathematical Education in Science and Technology on 26/09/2018 available online at: https://www.tandfonline.com/doi/full/10.1080/0020739X.2018.1527406
13
f1(u1) + f2(u2) + f3(u3) = 0 and f3(u3) +
f4(u4) + f5(u5) = 0
Parallel Scales
3 Parallel
Scales
Compounded
4 f1(u1) / f2(u2) = f3(u3) / f4(u4) Proportion
5 f1(v) = f2(x,u) Contour
6 u = u Ladder
7 1/f3(u3) = 1/f1(u1) + 1/f2(u2) Reciprocal /
Angle
8 y=f(u)
Single Scale
9
1 1 1 1 1 1 1 1 1
2 2 2 2 2 2 2 2
3 3 3
2
3 3 3 33 3
[, ] [, ] [, ]
[, ] [, ] [, ]
[, ] [, ] [, ]
f u v g u v h u v
u v g u v h u v
u v g u v h u v
f
f
General
Nomogram
based on
Determinant
10 f1(u1) + f2(u2) f3(u3)+ f4(u3) = 0 One Curved
Line
a Adapted from “Creating Nomograms with the PyNomo Software” by Ron Doerfler, 2009.
http://www.myreckonings.com/pynomo/CreatingNomogramsWithPynomo.pdf
The standard nomograph relates three variables and has three corresponding scales. However,
these are by no means the only nomograph types which can be created. Allowance for more
than three variables may be made by linking nomographs together in a series. In addition to
the above mathematically-based variations, many of the published early nomographs were
developed by empirical means, as follows. Set up an arbitrary pair of parallel scales and
triangulate points on the third scale; that is, draw an isopleth across the two scales which
points towards the third value (which has been calculated by some relevant equation, or from

This is an Accepted Manuscript of an article published by Taylor & Francis in International Journal of Mathematical Education in Science and Technology on 26/09/2018 available online at: https://www.tandfonline.com/doi/full/10.1080/0020739X.2018.1527406
14
an experimental datum), then draw a second isopleth pointing to the same third value (for
example: 6 = 2 + 4 and 6 = 3 + 3 may be the values on the two original scales for an
addition). Where the two isopleths cross is the coordinate for the desired third point; this
procedure is repeated to generate a range of third-value coordinates through which a smooth
curve may be drawn to complete the nomograph. Since the crossing may occur at slightly
different points for various choices of isopleth pairs, one may choose a centre of a set of
crossing points and adjust the position of one of the original scales. This is done iteratively to
establish an optimum nomograph.
Comparison of Surface Plots, Contour Plots and Nomographs
Graphic representations of data provide insight into the relative influences of the variables in
a functional relationship which are obscured in tables of data. Surface and contour plots
provide such information for three-variable systems in a readily assimilable form
(supplementary Fig. S1 and S2 are surface and contour plots of the Body Mass Index, BMI).
However, attempting to obtain numeric values from such plots is awkward, and
nomographs[24] provide a convenient alternative view (Fig. 6).

This is an Accepted Manuscript of an article published by Taylor & Francis in International Journal of Mathematical Education in Science and Technology on 26/09/2018 available online at: https://www.tandfonline.com/doi/full/10.1080/0020739X.2018.1527406
15
Figure 6: A Body Mass Index Nomograph, BMI / kg m-2 = 10 000 (M/H2), created using
PyNomo. [10, 11]
Examination of the nomograph, by considering isopleths radiating from, say, a given weight
shows how height enters into the relation, and vice versa, while also providing numeric data.
While it might be considered that the BMI is a relatively trivial nomographic application, a
recent extended BMI nomograph provides corrections to the possibility of drug overdose for
obese children.[25] Indeed, the problems of incorrect dosage in hospitals are matters of great
concern,[26, 27] with nomographs providing a reliable means for dosage calculation in a
clinical situation.

This is an Accepted Manuscript of an article published by Taylor & Francis in International Journal of Mathematical Education in Science and Technology on 26/09/2018 available online at: https://www.tandfonline.com/doi/full/10.1080/0020739X.2018.1527406
16
Other Application Areas
One significant nomographic application is the elaborate (and, indeed, beautiful) Smith
chart,[28, 29, 30] which continues to be used by electrical engineers for calculations relating
to transmission lines and impedance matching. An ancient application of nomography (even
if not generally recognised as such) is on sundials,[31] where the upright gnomon (note the
presence of ‘nomo’) casts a moving shadow, which thus acts as the isopleth, on the face of
the sundial. A set of nomographs for predicting fire behaviour in vegetation[32] demonstrates
an application which would likely prove helpful in emergency situations.
A recent phenomenon has been the appearance in medical practice of nomograms (the
favoured term in this area) for prognosis, on a statistical basis using Bayes’s Theorem, of
disease outcomes following a series of clinical tests. Many of these graphical tools do not
use true nomographs,[33] but true nomographs for these purposes have recently been
developed.[3, 34]
This is an Accepted Manuscript of an article published by Taylor & Francis in International Journal of Mathematical Education in Science and Technology on 26/09/2018 available online at: https://www.tandfonline.com/doi/full/10.1080/0020739X.2018.1527406
17
Nomography Generation Programs and Sources
Simple nomographs may be prepared by hand,[35, 36] as was necessarily done by the
pioneers of nomography, by plotting on coordinate graph paper and with a calculator to hand;
however, this can be a somewhat difficult and time-consuming task. PyNomo[10] has been
mentioned here as the most sophisticated program available for the preparation of
nomographs, but requires some expertise for a successful outcome. Project RHO[37] has
elaborate instructions for preparing nomographs (generic, but directed towards use in war
gaming!). While many of the early texts on nomography are now out of print, one collection
for chemical processing[38] is available, while many hundreds for a variety of purposes can
be found by online search.
Summary and Conclusions
We have here introduced nomographs as convenient and rapid graphical means of performing
calculations, even of some complexity. Although nomographs are generally regarded as
obsolete, they can be of considerable service in situations requiring reliable results with
urgency, as in clinical situations, or for repeated survey over a range. They are not subject to
misplacement of decimal points in a calculator, mistaken application of formulae, software
obsolescence, poor or absent electronic communication access, temporary loss of power, or
absence of power in remote locations. For these and similar reasons, nomographs should be
carefully considered as practical tools in appropriate circumstances.

This is an Accepted Manuscript of an article published by Taylor & Francis in International Journal of Mathematical Education in Science and Technology on 26/09/2018 available online at: https://www.tandfonline.com/doi/full/10.1080/0020739X.2018.1527406
18
Online Resource Files
Online Resource 1 is an Excel file which demonstrates interactive nomograph use in the
calculation of arithmetic means, geometric means, harmonic means, and Z charts for
graphical division. Online Resource 2 is a Python file (in standard text format) which is used
with PyNomo to generate Figure 6. Online Resource 3 contains surface and contour plots of a
BMI chart, complementing the BMI nomograph of Fig. 6.

This is an Accepted Manuscript of an article published by Taylor & Francis in International Journal of Mathematical Education in Science and Technology on 26/09/2018 available online at: https://www.tandfonline.com/doi/full/10.1080/0020739X.2018.1527406
19
Bibliography
1. Moler C. "Jahnke and Emde, Revisited" 2014 [August, 2018]. Available from:
http://blogs.mathworks.com/cleve/2014/12/15/jahnke-and-emde-revisited/
2. Jahnke E, Emde F. Tables of Functions With Formulas and Curves [Funktionentafeln
mit Formeln und Kurven]. 4th ed. New York: Dover; 1945.
3. Marasco J, Doerfler R, Roschier L. Modern Nomograms 2012 [August, 2018].
Available from: http://www.myreckonings.com/modernnomograms/
4. Chung WD, Jr., PROJECT RHO. Nomography Introduction 2008 [August, 2018].
Available from: http://www.projectrho.com/nomogram/intro.html
5. Wikipedia. Nomogram [August, 2018]. Available from:
https://en.wikipedia.org/wiki/Nomogram
6. National Institute for Standards and Technology. NIST Digital Library of
Mathematical Functions 2016 [August, 2018]. Available from: http://dlmf.nist.gov/
7. OEIS Foundation. The On-Line Encyclopedia of Integer Sequences™ (OEIS™)
[August, 2018]. Available from: http://oeis.org/
8. Evesham HA. Origins and Development of Nomography. Annals of the History of
Computing. 1986;8(4):324-333. doi: 10.1109/MAHC.1986.10059.
9. Hankins T, L. Blood, Dirt, and Nomograms: A Particular History of Graphs. Isis.
1999;90(1):50-80.
10. Roschier L. PyNomo - Nomographs with Python [August, 2018]. Available from:
http://pynomo.org/wiki/index.php?title=Main_Page
11. Doerfler R. Creating Nomograms with the PyNomo Software 2009 [August, 2018].
Available from:
http://www.myreckonings.com/pynomo/CreatingNomogramsWithPynomo.pdf
12. Wikipedia. Centrifuge [August, 2018]. Available from:
https://en.wikipedia.org/wiki/Centrifuge
13. Rasmussen HN. Nomogram for Calculation of Centrifugal Data. Eur J Biochem.
1973;34(3):502-505. doi: 10.1111/j.1432-1033.1973.tb02786.x.
14. Ultramagic Balloons. Load Chart [August, 2018]. Available from:
http://ultramagic.com/ openfiles/Manuals04/LoadChart. pdf
15. Griffin S. Hot Air Balloon Lift Calculator [(not currently operational)]. Available
from: http://www.brisbanehotairballooning.com.au/hot-air-balloon-lift-calculator/
16. Quora. Why won't Java Applets run in my web browser? - see Richard Morris
response [August, 2018]. Available from: https://www.quora.com/Why-wont-Java-
Applets-run-in-my-web-browser
17. Sigma-Aldrich. Pressure-Temperature Nomograph [August, 2018]. Available from:
http://www.sigmaaldrich.com/chemistry/solvents/learning-center/nomograph.html
18. Beale ESL. Conversion of boiling-points of petroleum fractions. In: Dunstan AE,
Nash AW, Brooks BT, et al., editors. The science of petroleum. A Comprehensive
treatise of the principles and practice of the production, refining, transport and
distribution of Mineral Oil. Vol. II. London , New York, Toronto: Oxford University
Press; 1938. p. 1280-1286.
19. Nelson KL. Correcting observed boiling points to standard pressure. Am Lab.
1984;16(8):14-27. PubMed PMID: WOS:A1984TD32900002.
20. Doerfler R. The Art of Nomography I, II, and III 2008 [August, 2018]. Available
from: http://myreckonings.com/wordpress/2008/01/09/the-art-of-nomography-i-
geometric-design/

This is an Accepted Manuscript of an article published by Taylor & Francis in International Journal of Mathematical Education in Science and Technology on 26/09/2018 available online at: https://www.tandfonline.com/doi/full/10.1080/0020739X.2018.1527406
20
21. Doerfler R. The Lost Art of Nomography: UMAP Journal; 2009 [August, 2018].
Available from: http://www.myreckonings.com/wordpress/2010/04/18/nomography-
article-in-the-umap-journal/
22. Tournès D. Mathematics of nomography [August, 2018]. Available from:
https://www.academia.edu/30868186/Mathematics_of_Nomography
23. Menzel DH. Nomograms. Fundamental Formulas of Physics, Volume 1. 2nd
corrected ed: Dover Publications; 2011.
24. University of Texas Health Science Center. Nomogram for body mass index San
Antonio, TX[August, 2018]. Available from: http://teachhealthk-
12.uthscsa.edu/sites/teachhealthk-
12/files/activity/downloads/Nomogram%20for%20Body%20Mass%20Index%20Stud
ent%20Handout%20%204B.pdf
25. Callaghan LC, Walker JD. An aid to drug dosing safety in obese children:
development of a new nomogram and comparison with existing methods for
estimation of ideal body weight and lean body mass. Anaesthesia. 2015;70(2):176-
182. doi: 10.1111/anae.12860.
26. Thimbleby H, Williams D, editors. Using Nomograms to Reduce Harm from Clinical
Calculations. 2013 IEEE International Conference on Healthcare Informatics; 2013 9-
11 Sept. 2013.
27. Chemistry World. University fined in caffeine overdose case: Royal Society of
Chemistry; [August, 2018]. Available from:
https://www.chemistryworld.com/news/university-fined-in-caffeine-overdose-
case/2500343.article
28. Wikipedia. Philip Hagar Smith [August, 2018]. Available from:
https://en.wikipedia.org/wiki/Phillip_Hagar_Smith
29. Ferry D. Smith Chart 2010 [August, 2018]. Available from:
http://www.excelhero.com/blog/2010/08/excel-high-precision-engineering-chart-
1.html
30. Antenna-Theory.com. The Smith Chart [August, 2018]. Available from:
http://www.antenna-theory.com/tutorial/smith/chart.php
31. Hart G. Sundials: University of Cambridge; 1999 [August, 2018]. Available from:
http://www.sites.hps.cam.ac.uk/starry/ptolsund.html
32. Dimitrakopoulos AP, Dritsa S. Novel nomographs for fire behaviour prediction in
Mediterranean and submediterranean vegetation types. Forestry. 2003 January 1,
2003;76(5):479-490. doi: 10.1093/forestry/76.5.479.
33. Kattan MW, Marasco J. What Is a Real Nomogram? Seminars in Oncology.
2010;37(1):23-26. doi: 10.1053/j.seminoncol.2009.12.003.
34. Marasco J, Doerfler R, Roschier L. Doc, What Are My Chances? The UMAP Journal
2011;32(4):279-298.
35. Winchell H. Alignment chart for calculation of specific gravity Am Miner.
1948;33:353-359.
36. Rybner J. Nomograms. General Electric Review. 1930;3(3):164-179.
37. PROJECT RHO. Computerized Nomogram Plotting 2008 [August, 2018]. Available
from: http://www.projectrho.com/nomogram/cad.html
38. Kulwiec RA. Chemical Processing Nomographs. 2nd ed. New York: Chemical Pub.
Co.; 1969. (Davis DS, editor.).