
Abnormal white matter structural networks characterize heroin-dependent individuals: a network...
12
Abnormal white matter structural networks characterize heroin-dependent individuals: a network analysis Ruibin Zhang 1 * † , Guihua Jiang 2 *, Junzhang Tian 2 *, Yingwei Qiu 2 *, Xue Wen 1 , Andrew Zalesky 3 , Meng Li 2 , Xiaofen Ma 2 , Junjing Wang 1 , Shumei Li 2 , Tianyue Wang 2 , Changhong Li 1 & Ruiwang Huang 1 Centre for the Study of Applied Psychology, Guangdong Key Laboratory of Mental Healthy and Cognitive Science of Guangdong Province, School of Psychology, South China Normal University, China 1 , Department of Medical Imaging, Guangdong No. 2 Provincial People’s Hospital, China 2 and Melbourne Neuropsychiatry Centre, University of Melbourne and Melbourne Health, Australia 3 ABSTRACT Neuroimaging studies suggested that drug addiction is linked to abnormal brain functional connectivity. However, little is known about the alteration of brain white matter (WM) connectivity in addictive drug users and nearly no study has been performed to examine the alterations of brain WM connectivity in heroin-dependent individuals (HDIs). Diffusion tensor imaging (DTI) offers a comprehensive technique to map the whole brain WM connectivity in vivo. In this study, we acquired DTI datasets from 20 HDIs and 18 healthy controls and constructed their brain WM structural networks using a deterministic fibre tracking approach. Using graph theoretical analysis, we explored the global and nodal topological parameters of brain network for both groups and adopted a network-based statistic (NBS) approach to assess between-group differences in inter-regional WM connections. Statistical analysis indicated the global efficiency and network strength were significantly increased, but the characteristic path length was significantly decreased in the HDIs compared with the controls. We also found that in the HDIs, the nodal efficiency was significantly increased in the left prefrontal cortex, bilateral orbital frontal cortices and left anterior cingulate gyrus. Moreover, the NBS analysis revealed that in the HDIs, the significant increased connections were located in the paralimbic, orbitofrontal, prefrontal and temporal regions. Our results may reflect the disruption of whole brain WM structural networks in the HDIs. Our findings suggest that mapping brain WM structural network may be helpful for better understanding the neuromechanism of heroin addiction. Keywords Addiction, diffusion tensor imaging, graph theory, network-based statistic. Correspondence to: Ruiwang Huang, Center for the Study of Applied Psychology, Key Laboratory of Mental Healthy and Cognitive Science of Guangdong Province, School of Psychology, South China Normal University, Guangzhou 510631, China. E-mail: [email protected] INTRODUCTION Drug addiction, a major health problem in modern society, is characterized by the failure to resist one’s impulses to obtain and to take certain types of addictive drugs in spite of serious negative consequences (Volkow & Li 2004; Holmes 2012). Out of all drug abuses, heroin addiction is a major threat to the public health and social security in China because of its devastating medical effects, its impact on criminal behaviours and its low rates of recovery but high rates of relapse (Tang et al. 2006). It was because of the negative impacts of heroin addiction that many studies try to uncover the mecha- nisms of addiction from different fields (Koob 2002; Levran et al. 2008; Goldstein & Volkow 2011). With the neuroimaging technology, a growing number of studies suggested aberrant brain functional connectivity on the basis of resting-state functional magnetic resonance imaging (fMRI) data (Ma et al. 2010) and task-state fMRI data acquired in different stimulus paradigms, such as *Ruibin Zhang, Guihua Jiang, Junzhang Tian andYingwei Qiu contributed equally to this work. † Present address: Department of Psychology, The University of Hong Kong, Pokfulam, Hong Kong. ORIGINAL ARTICLE Addiction Biology doi:10.1111/adb.12234 © 2015 Society for the Study of Addiction Addiction Biology
Transcript of Abnormal white matter structural networks characterize heroin-dependent individuals: a network...

Abnormal white matter structural networkscharacterize heroin-dependent individuals:a network analysis
Ruibin Zhang1*†, Guihua Jiang2*, Junzhang Tian2*, Yingwei Qiu2*, Xue Wen1, Andrew Zalesky3,Meng Li2, Xiaofen Ma2, Junjing Wang1, Shumei Li2, Tianyue Wang2, Changhong Li1
& Ruiwang Huang1
Centre for the Study of Applied Psychology, Guangdong Key Laboratory of Mental Healthy and Cognitive Science of Guangdong Province, School of Psychology,South China Normal University, China1, Department of Medical Imaging, Guangdong No. 2 Provincial People’s Hospital, China2 and Melbourne NeuropsychiatryCentre, University of Melbourne and Melbourne Health, Australia3
ABSTRACT
Neuroimaging studies suggested that drug addiction is linked to abnormal brain functional connectivity. However, littleis known about the alteration of brain white matter (WM) connectivity in addictive drug users and nearly no study hasbeen performed to examine the alterations of brain WM connectivity in heroin-dependent individuals (HDIs). Diffusiontensor imaging (DTI) offers a comprehensive technique to map the whole brain WM connectivity in vivo. In this study,we acquired DTI datasets from 20 HDIs and 18 healthy controls and constructed their brain WM structural networksusing a deterministic fibre tracking approach. Using graph theoretical analysis, we explored the global and nodaltopological parameters of brain network for both groups and adopted a network-based statistic (NBS) approach toassess between-group differences in inter-regional WM connections. Statistical analysis indicated the global efficiencyand network strength were significantly increased, but the characteristic path length was significantly decreased in theHDIs compared with the controls. We also found that in the HDIs, the nodal efficiency was significantly increased in theleft prefrontal cortex, bilateral orbital frontal cortices and left anterior cingulate gyrus. Moreover, the NBS analysisrevealed that in the HDIs, the significant increased connections were located in the paralimbic, orbitofrontal, prefrontaland temporal regions. Our results may reflect the disruption of whole brain WM structural networks in the HDIs. Ourfindings suggest that mapping brain WM structural network may be helpful for better understanding theneuromechanism of heroin addiction.
Keywords Addiction, diffusion tensor imaging, graph theory, network-based statistic.
Correspondence to: Ruiwang Huang, Center for the Study of Applied Psychology, Key Laboratory of Mental Healthy and Cognitive Science of GuangdongProvince, School of Psychology, South China Normal University, Guangzhou 510631, China. E-mail: [email protected]
INTRODUCTION
Drug addiction, a major health problem in modernsociety, is characterized by the failure to resist one’simpulses to obtain and to take certain types of addictivedrugs in spite of serious negative consequences (Volkow &Li 2004; Holmes 2012). Out of all drug abuses, heroinaddiction is a major threat to the public health and socialsecurity in China because of its devastating medicaleffects, its impact on criminal behaviours and its low rates
of recovery but high rates of relapse (Tang et al. 2006).It was because of the negative impacts of heroinaddiction that many studies try to uncover the mecha-nisms of addiction from different fields (Koob 2002;Levran et al. 2008; Goldstein & Volkow 2011). With theneuroimaging technology, a growing number of studiessuggested aberrant brain functional connectivity on thebasis of resting-state functional magnetic resonanceimaging (fMRI) data (Ma et al. 2010) and task-state fMRIdata acquired in different stimulus paradigms, such as
*Ruibin Zhang, Guihua Jiang, Junzhang Tian and Yingwei Qiu contributed equally to this work.†Present address: Department of Psychology, The University of Hong Kong, Pokfulam, Hong Kong.
ORIGINAL ARTICLE
bs_bs_bannerAddiction Biologydoi:10.1111/adb.12234
© 2015 Society for the Study of Addiction Addiction Biology

drug craving (Xiao et al. 2006; Li et al. 2012), decisionmaking (Walter et al. 2014) and inhibitory control(Schmidt et al. 2013), in heroin-dependent individuals(HDIs). Given that aberrant functional connectivity maybe a result of the pathology of brain white mater (WM)connectivity, the next logical step is to understand theunderlying structural architecture of brain WM in HDIs.
Diffusion tensor imaging (DTI) is a non-invasive tech-nique to detect human brain tissue microstructure and toassess distribution of axonal fibre bundles in vivo (Mori &Zhang 2006). Several previous studies (Supporting Infor-mation Table S1) have reported the alterations of brainWM patterns related to heroin addiction on the basis ofdiffusive metrics (e.g. fractional anisotropy, FA). Forexample, Liu et al. (2009) analysed DTI datasets from 16HDIs and 16 controls and found significantly decreasedFA in HDIs in the bilateral frontal sub-gyral, rightprecentral and left cingulate regions compared with con-trols. Li et al. (2013) revealed decreased FA value in brainWM of the bilateral frontal lobes, cingulate gyri, medialfrontal gyri and right superior frontal gyrus in HDIs.Notably, although most of previous studies analysed themyelin axonal distribution according to the hypothesis ofWM disruption or inter-regional ‘dysconnection’ (Volkowet al. 2013), nearly no study has directly investigatedaxonal connectivity in HDIs per se.
Growing number of studies (Hagmann et al. 2010;Griffa et al. 2013; He & Evans 2014) have adopted anetwork model to characterize human brain cortical-cortical WM connectivity and suggested that the integ-rity of brain connectivity can be tested at the macroscaleor at the scale of brain axonal fibre bundles in drugpatients. For example, Zalesky et al. (2012b) found thatthe impaired WM fibre connectivity existed in the fornix,splenium of corpus callosum and commissural fibres inlong-term cannabis users. As the brain WM connectivityreflects the integration of brain WM structure, manystudies (Fornito et al. 2012; Griffa et al. 2013) have usedthe topology of brain networks to infer the integrityof brain network organization in different types ofneuropsychiatry patients. A previous study (Kim et al.2011) acquired DTI data from 12 cannabis users, ana-lysed their brain WM structural networks and suggestedless efficient integrated and altered regional connectivityin their brain WM structural networks. We have also seenthat several studies (Liu et al. 2009; Yuan et al. 2010;Jiang et al. 2013) reported aberrant brain functional con-nectivity and disrupted topological organization in HDIsbased on the resting-state fMRI data. However, the heroinaddiction-related changes of brain WM connectivity andtopological organization of the brain WM structural net-works are still unknown.
The aim of this study was to detect the topologicalchanges of brain WM structural networks related to
heroin addiction at a macroscale (i.e. at the scale of WMfibre bundles). In the calculations, we constructed wholebrain WM structural networks for both the HDIs andhealthy controls based on the DTI data, evaluated theirnetwork metrics using graph theory and determinedbetween-group differences in network topological param-eters. In addition, we also used a network-based statistic(NBS) approach (Zalesky et al. 2012a) to identify the dis-rupted WM structural connections in the HDIs.
MATERIALS AND METHODS
Subjects
We recruited 20 HDIs (18 males, two females; aged26–50 years, age = 35.0 ± 6.3 years) from the AddictionMedicine Division of Guangdong No. 2 Provincial Peo-ple’s Hospital. Among them, four inhaled the vapourfrom heated heroin, while 16 used intravenous andvapour from heated heroin. These HDIs were screenedusing the Structured Clinical Interview for the Diagnosticand Statistical Manual of Mental Disorders, FourthEdition to confirm the diagnosis of heroin dependence.Urine tests with a positive finding for heroin users wererequested before enrolling in the treatment programme.According to a laboratory report and an interview con-ducted in the hospital, none of the controls or HDIs had ahistory of excessive alcohol consumption. All of the HDIswere under daily methadone maintenance treatment atthe time of the study and were hospitalized for 6–7 daysbefore the MRI scanning took place. None of them usedheroin during their stay in the hospital as confirmedby the medical personnel responsible for their care(Supporting Information Table S2). In addition, werecruited 18 age- and gender-matched healthy subjectsas the controls (16 males, two females; aged 23–45 years,age = 33.1 ± 7.2 years). Table 1 lists the demographicdetails of all the volunteers in this study. None of the HDIsand the controls had history of neurological illness orhead injury, or was diagnosed with schizophrenia or anaffective disorder, according to their past medical history.All of the subjects were right-handed according to theirself-report. This study was approved by the ResearchEthics Review Board of the Southern Medical Universityin Guangzhou of China. Informed written consent wasobtained from each subject prior to the MRI scanning.
Data acquisition
All MR scans were performed on a 1.5T Philip MRIscanner (Philip, Amsterdam, the Netherlands) equippedwith an 8-channel head coil. To diminish motion arte-facts, we immobilized each individual’s head with cush-ions inside the coil after the alignment during the scan.The parameters of DTI sequence, signal-to-noise ratio
2 Ruibin Zhang et al.
© 2015 Society for the Study of Addiction Addiction Biology
(SNR) estimation of DTI data and estimates of headmotion are provided in the Supporting InformationAppendix S1.
Data pre-processing
The effects of head motion and image distortion causedby eddy current were corrected by applying an affinealignment to register all other diffusion volumes to theoriginal b0 volume using the Functional MagneticResonance Imaging of the Brain Software Library (FSL4.1: http://www.fmrib.ox.ac.uk/fsl). Rotation correctionswere applied to the corresponding diffusion-sensitive gra-dient directions (Leemans & Jones 2009). The correctedDTI data were then processed using Trackvis (http://trackvis.org/) to draw whole brain streamline countsbased on the fibre assignment by continuous trackingalgorithm, a deterministic fibre tracking approach.Fibre tracking was stopped when FA <0.2 or the anglebetween the eigenvectors of two consecutive voxels wasless than 45°.
Network construction
We first co-registered T1-weighted three-dimensionalvolume to the original b0 volume resulting in theco-registered T1 volume for each individual usingSPM8 (www.fil.ion.ucl.ac.uk/spm). The co-registered T1volumes were then non-linearly transformed to theICBM-152 T1-weighted template in the standard Mon-treal Neurological Institute (MNI) space. The inversetransformations were used to warp the automated ana-tomical labelling template with 90 regions (AAL-90)from the standard MNI space to the individual native DTIspace using a nearest-neighbour interpolation approach.The names and the abbreviations for these 90 regions arelisted in Supporting Information Table S3.
We used an abstract model of brain network to repre-sent the brain systems at the macroscale, each node cor-responding to a brain region and each edge to an inter-nodal connection. Given two regions of AAL-90, theywere considered structurally connected if there were atleast three streamline counts (counts ≥ 3) locatedbetween these two regions. In this way, we obtained asymmetric 90 × 90 connectivity matrix to represent thebrain WM structural network for each subject. The work-flow of the brain WM structural network construction isillustrated in Fig. 1.
Network analysis
We characterized the global topological properties of thebrain WM structural networks using six parameters:network strength (Sp), global efficiency (Eglob), character-istic path length (Lp), clustering coefficient (Cp) and small-worldness (δ). A network is said to be small-world if γ >>1and λ ≈ 1 or δ >> 1 (Watts & Strogatz 1998). The defini-tions and interpretations of these topological parametersare listed inTable 2.The mean Sp is a measure of density orthe total ‘wiring cost’ of the network. The larger of thenetwork strength, the more expensive of the wiring cost ofthis network.The average shortest path length between allpairs of nodes in the network gives the Lp, which is ameasure of WM connectivity integration. The averageinverse shortest path length relates to the Eglob. If twonodes were disconnected, the path between these two dis-connected nodes is assumed to have an infinite lengthand Eglob corresponds to zero (Achard & Bullmore 2007).The mean Cp for the network reflects, on average, theprevalence of clustered connectivity around individualnodes.
For the nodal topology, we focused on the nodal effi-ciency (Enod). Its definition and interpretation can be seenin Table 2 and Rubinov & Sporns (2010).
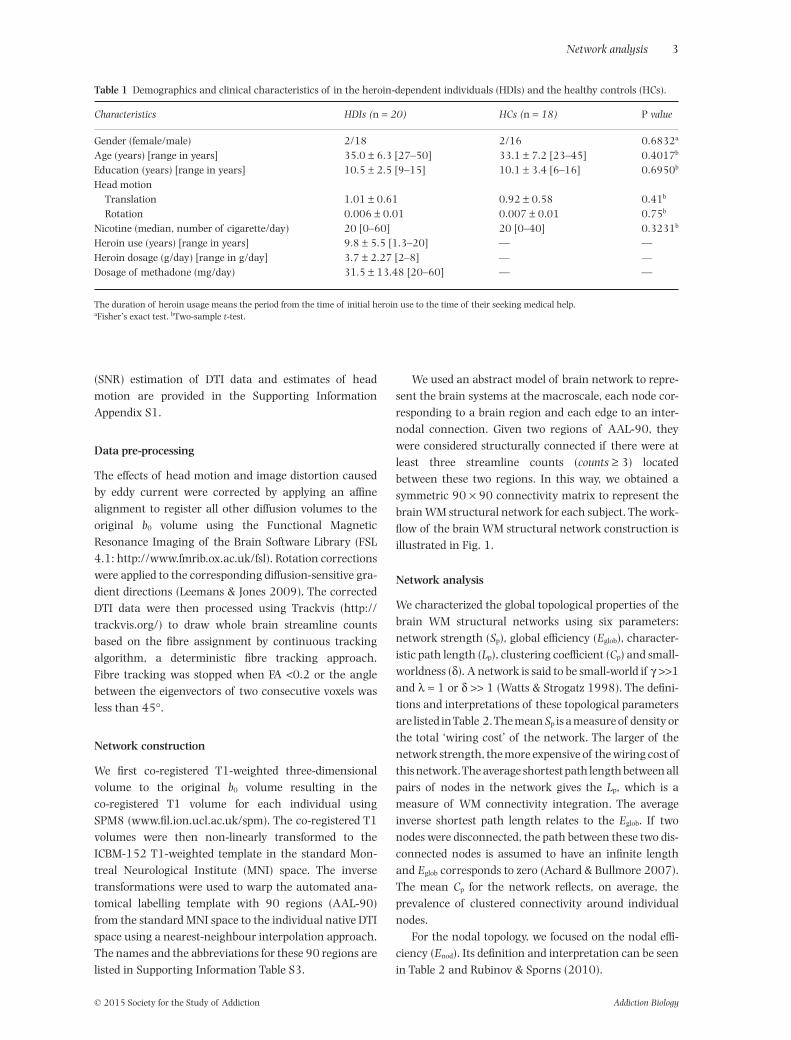
Table 1 Demographics and clinical characteristics of in the heroin-dependent individuals (HDIs) and the healthy controls (HCs).
Characteristics HDIs (n = 20) HCs (n = 18) P value
Gender (female/male) 2/18 2/16 0.6832a
Age (years) [range in years] 35.0 ± 6.3 [27–50] 33.1 ± 7.2 [23–45] 0.4017b
Education (years) [range in years] 10.5 ± 2.5 [9–15] 10.1 ± 3.4 [6–16] 0.6950b
Head motionTranslation 1.01 ± 0.61 0.92 ± 0.58 0.41b
Rotation 0.006 ± 0.01 0.007 ± 0.01 0.75b
Nicotine (median, number of cigarette/day) 20 [0–60] 20 [0–40] 0.3231b
Heroin use (years) [range in years] 9.8 ± 5.5 [1.3–20] — —Heroin dosage (g/day) [range in g/day] 3.7 ± 2.27 [2–8] — —Dosage of methadone (mg/day) 31.5 ± 13.48 [20–60] — —
The duration of heroin usage means the period from the time of initial heroin use to the time of their seeking medical help.aFisher’s exact test. bTwo-sample t-test.
Network analysis 3
© 2015 Society for the Study of Addiction Addiction Biology

Connectivity analysis
A NBS approach (Zalesky et al. 2012a) was used to deter-mine the specific altered WM connections related toheroin addiction. We first used two-sample t-test at eachedge to determine significant between-group difference inthe connection. A primary component-forming thresh-old (P < 0.01, uncorrected) was applied to derive a set ofsuprathreshold edges. By this step, we can identify all thepossible connected components or subnetworks showingaltered inter-regional connectivity. The statistical signifi-cance of the size for each observed component wasobtained using an empirical null distribution of maximalcomponent sizes under the null hypothesis of randomgroup membership (5000 permutations). The subnet-works that were significant at a level of P < 0.05 werereported in the current study.
Statistic analysis
Heroin addiction-related network parameters alteration
A non-parametric permutation test was used to assess thestatistical significance of between-group difference ineach of the global and nodal parameters. This rando-mization procedure was repeated 5000 times for a given
network parameter and the corresponding distribution oft-value was obtained. We set the critical value at 95% ofthe distribution for each of the global and nodal param-eters to test the null hypothesis. The age, gender and anage–gender interaction were entered as covariates of nointerest before permutation tests.
Correlations between network parameters andclinical variables
With respect to network parameters showing significantbetween-group differences, we performed multiple linearregression analysis to estimate the relationship betweeneach of the parameters and each of the clinical variablesin the HDIs. The age, gender and the age–gender interac-tion were regressed out. The clinical variables include theage onset of addiction and the duration of addiction.
Robustness analysis
Cross-validation of the main results
Using a bootstrap approach, we estimated the confidenceinterval for each of the topological parameters, Sp, Lp, Kp,Eglob, Eloc, γ, δ and λ, in the HDIs and the controls. Specifi-cally, we randomly draw an individual from the original
Connectivity matrixNode in native spaceT1-weighted image
Tensor estimation DTI tractography
Graph theory analysis
i
j
Network-based statistic
Data processing and connectome mapping HDIs versus Controls
0806040200
0
20
40
60
80
50
100
150
200
250
300
350
400
Figure 1 The workflow of constructing brain white matter (WM) structural networks for the heroin-dependent individuals (HDIs) andhealthy controls (HCs) using the diffusion tensor imaging (DTI) data
4 Ruibin Zhang et al.
© 2015 Society for the Study of Addiction Addiction Biology
sample, put the individual back before drawing the nextone and resample the subjects with replacement. Thus,each resample had the same size as the original sample.Based on the 1000 randomizations, we determined theconfidence intervals for each of these parameters.
Effect of threshold in streamline counts onnetwork parameters
Because false-positive or false-negative connections couldbe resulted from the selection of fibre connection thresh-old (Bassett et al. 2011; Zhang et al. 2014), we utilizedtwo additional thresholds of streamline counts > 0 (i.e.including all non-zero entries in the connectivity matri-ces) and streamline counts ≥ 5. To this end, we con-structed symmetric connectivity matrices based onAAL-90 template for each of the three different connect-ing thresholds (counts > 0, counts ≥ 3 and counts ≥ 5).
Effect of parcellation schemes on network parameters
To estimate the stability of our main findings corre-sponding to AAL-90 template, we repeated the network
analysis by selecting the AAL-1024, a high-resolutiontemplate randomly parcellating whole brain into 1024regions of equal volume (http://andrewzalesky.com/software.html). We selected each region in AAL-1024template as a node and obtained a symmetric1024 × 1024 connectivity matrix to represent the brainWM structural network for each subject.
Effect of the choice of significance level
The statistical results certainly depend on the choice ofsignificance level. Besides of the threshold P < 0.05 beingselected, we also adopted a much conservative thresholdP < 0.01 to determine between-group differences in thenetwork parameters. The aim was to test the robustnessof the main results.
Head motion effects
Several recent studies (Tijssen, Jansen & Backes 2009;Kong 2014; Yendiki et al. 2014) demonstrated that thehead motion may induce spurious group differences inDTI measures. To determine that the between-group
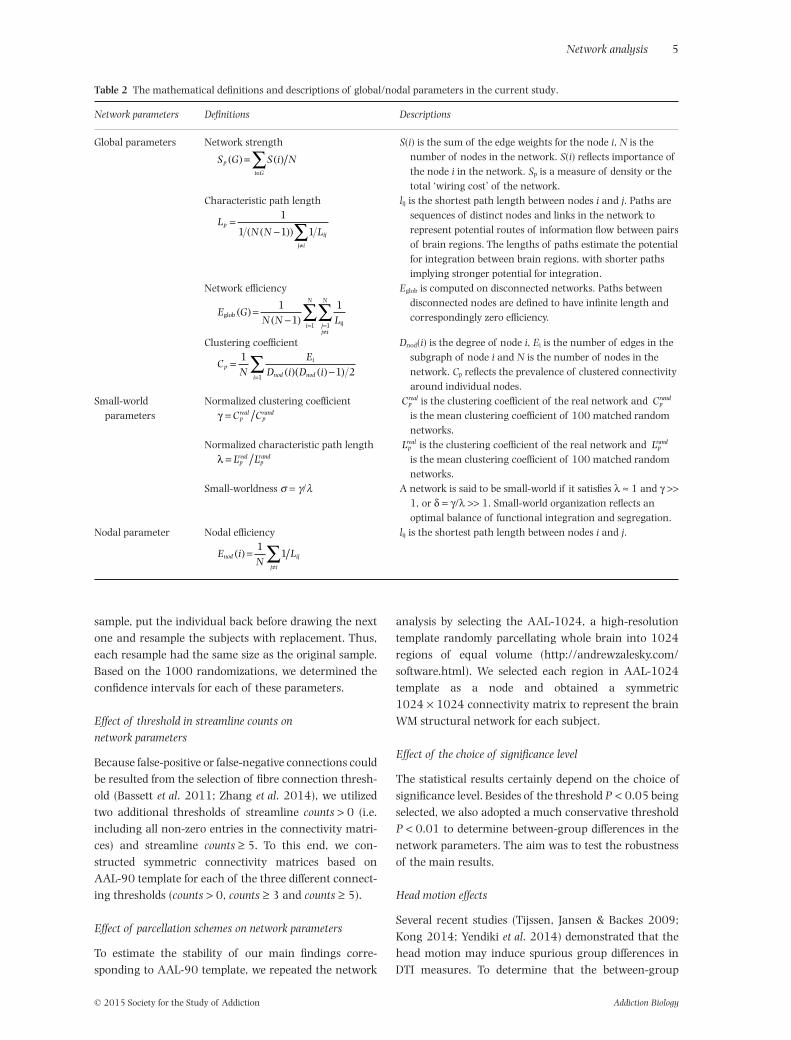
Table 2 The mathematical definitions and descriptions of global/nodal parameters in the current study.
Network parameters Definitions Descriptions
Global parameters Network strength
S G S i Np
i G
( ) = ( )∈∑
S(i) is the sum of the edge weights for the node i, N is thenumber of nodes in the network. S(i) reflects importance ofthe node i in the network. Sp is a measure of density or thetotal ‘wiring cost’ of the network.
Characteristic path length
LN N L
p
ij
j i
=−( )( )
≠∑
1
1 1 1
lij is the shortest path length between nodes i and j. Paths aresequences of distinct nodes and links in the network torepresent potential routes of information flow between pairsof brain regions. The lengths of paths estimate the potentialfor integration between brain regions, with shorter pathsimplying stronger potential for integration.
Network efficiency
E GN N L
jj i
N
i
N
globij
( ) =−( )
=≠
=∑∑1
11
11
Eglob is computed on disconnected networks. Paths betweendisconnected nodes are defined to have infinite length andcorrespondingly zero efficiency.
Clustering coefficient
CN
ED i D i
pi
nod nodi
=( ) ( ) −( )=
∑11 2
1
Dnod(i) is the degree of node i, Ei is the number of edges in thesubgraph of node i and N is the number of nodes in thenetwork. Cp reflects the prevalence of clustered connectivityaround individual nodes.
Small-worldparameters
Normalized clustering coefficientγ = C Cp
realprand
C preal is the clustering coefficient of the real network and C p
rand
is the mean clustering coefficient of 100 matched randomnetworks.
Normalized characteristic path lengthλ = L Lp
realp
rand
Lpreal is the clustering coefficient of the real network and Lp
rand
is the mean clustering coefficient of 100 matched randomnetworks.
Small-worldness σ = γ/λ A network is said to be small-world if it satisfies λ ≈ 1 and γ >>1, or δ = γ/λ >> 1. Small-world organization reflects anoptimal balance of functional integration and segregation.
Nodal parameter Nodal efficiency
E iN
Lnod ij
j i
( ) =≠
∑11
lij is the shortest path length between nodes i and j.
Network analysis 5
© 2015 Society for the Study of Addiction Addiction Biology

difference in network topology originated from the naïvebetween-group difference rather than from the headmotion nuisance noise, we estimated the intra-acquisition head movement using an affine transforma-tion approach (FSL). No significant difference was foundeither in any of the three displacement parameters or inany of the three rotation parameters between HDIs andcontrols. Even so, we still took these six head motionparameters as nuisance regressors into statistical analy-sis by following Yendiki et al. (2014).
RESULTS
Demographic and behavioural measures
Table 1 lists the demographic and behavioural measuresfor the HDIs. No significant between-group difference wasdetected in age, years of education, cigarette smokingand gender (P > 0.05). In the calculations, two-samplet-test were adopted for the age, years of education andcigarette smoking, while Fisher’s exact test was adoptedfor the gender (SPSS, version 17.0, IBM, Armonk, NY,USA).
Network analysis
Global parameters
Table 3 lists the global parameters for both the HDIs andcontrols. We found that the brain WM structural net-works for both groups satisfy the criteria of small-worldorganization, γ >>1 and λ ≈ 1, and δ >>1. Compared withthe controls, the HDIs showed significantly increasedEglob (P = 2.8e-3) and Sp, (P = 6.0e-4), but decreased Lp
(P = 1.6e-3). Whereas no significant between-group dif-ference was detected in the Cp (P = 0.4002) and in anyof small-world metrics (P = 0.9294 for γ, P = 0.2258 forλ and P = 0.9690 for σ).
Nodal parameter
Statistical analysis revealed uniformly significantlyincreased nodal efficiency in several regions in the HDIscompared with the controls (P < 0.05, Bonferroni’s cor-rection). According to addiction model proposed by Baler& Volkow (2006), we classified regions showing signifi-cant between-group difference into three addition-relatedfunctional systems: (1) the motivation and salienceevaluation system in the orbital cortex (ORB), includingthe bilateral orbital superior frontal gyri (ORBsup.L/R), bilateral orbital middle frontal gyri (ORBmid.L/R),left orbital inferior frontal gyrus (ORBinf.L) and leftmedial orbital of superior frontal gyrus (ORBsupmed.L);(2) the cognitive control and restraining cravingsystem in the prefrontal cortex (PFC), such as the leftrectus gyrus (REC.L); and (3) the inhibition control andconflict monitoring system in the anterior cingulategyrus (ACG), such as the left ACG. The mean values ofEnod and effect size (Cohen’s d) are presented in Table 4(Fig. 2).
Disrupted connectivity in HDIs
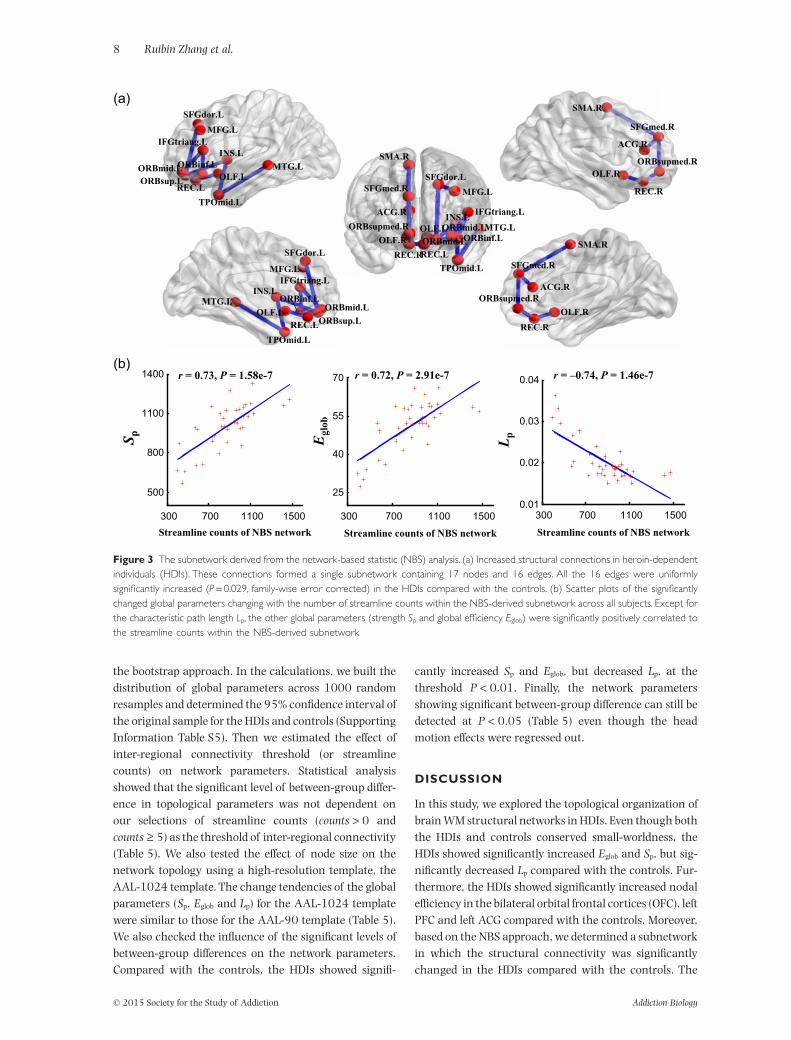
Using the NBS analysis, we identified a single subnet-work with significantly altered WM connections in theHDIs compared with the controls (P < 0.05, family-wiseerror corrected). This subnetwork was composed of 16links and 17 brain regions, including the left orbitalsuperior frontal gyrus (ORBsup.L), left insula (INS.L),left ACG, left middle frontal gyrus (MFG.L), left trianglepart of inferior frontal gyrus (IFGtriang.L), bilateralrectus (REC), bilateral olfactory (OLF), bilateral supple-mentary motor area (SMA) and the left middle temporalgyrus (MTG.L) (Fig. 3a). Notably, all of inter-regionalconnections within the NBS-derived subnetwork weresignificantly increased in the HDIs compared with the
Table 3 Global parameters of brain WMstructural networks in the heroin-dependent individuals (HDIs) and thehealthy controls (HCs).
Networkparameters
Mean ± standard deviation
P valueCohen’sdHDIs (n = 20) HCs (n = 18)
γ 3.607 ± 0.300 3.587 ± 0.706 0.9294 0.07λ 1.214 ± 0.031 1.202 ± 0.030 0.2258 0.33δ 2.972 ± 0.258 2.980 ± 0.581 0.9690 0.03Cp 0.031 ± 0.004 0.032 ± 0.005 0.4002 0.08Lp 0.018 ± 0.002 0.023 ± 0.006 1.6e-3* 1.12Eglob 57.87 ± 4.998 46.27 ± 11.346 2.8e-3* 1.12Sp 1090.6 ± 112.3 902.7 ± 183.2 6.0e-4* 1.25
The asterisk ‘*’ indicates significant between-group difference at P < 0.05 (5000 permutations).Cohen’s d indicates the value of effect size. The small, medium and large levels of the effect size are0.2, 0.5 and 0.8, respectively, according to Cohen’s definition (Cohen 1992).γ = normalized clustering; λ = normalized path length; δ = γ/λ; Cp = cluster coefficient; Lp = char-acteristic path length; Eglob = global efficiency; Sp = network strength.
6 Ruibin Zhang et al.
© 2015 Society for the Study of Addiction Addiction Biology

controls. The detailed mean weights and t-values of sta-tistic between-group comparison in the connections arelisted in Supporting Information Table S4.
For each of the global parameters showing significantbetween-group difference (Eglob, Sp and Lp), we calculatedits correlation with the edge weights or with the stream-line counts of the NBS-derived subnetwork. Figure 3bshows that the edge weight in the subnetwork was signifi-cantly positively correlated with the Sp (r = 0.73,P = 1.58e-7) and Eglob (r = 0.72, P = 2.91e-7), but nega-tively correlated with the Lp (r = −0.74, P = 1.46e-7),across all subjects.
Correlation between network parameters andclinical variables
Neither of the inter-nodal connections of NBS-derivedsubnetwork nor of the significant changed topologicalparameters (global and nodal) was significantly corre-lated with the age onset of addiction or with the durationof addiction in the HDIs (P > 0.05).
Robustness of our findings
We first obtained the confidence interval for each ofglobal parameters based on the AAL-90 template using
Table 4 Brain regions with significantdifference in nodal efficiency (Enod)between the heroin-dependent individuals(HDIs) and the healthy controls (HCs)(5000 permutations, P < 0.05, Bonferronicorrected).
Regions Category
Enod (mean ± standard deviation)
P valueCohen’sdHDIs (n = 20) HCs (n = 18)
ORBsup.L ORB 40.86 ± 5.56 30.91 ± 8.11 2.0e-4 1.45ORBsup.R ORB 41.57 ± 7.07 30.12 ± 9.73 <1.0e-4 1.36ORBmid.L ORB 43.47 ± 5.98 31.83 ± 12.19 2.0e-4 1.23ORBmid.R ORB 46.73 ± 8.16 34.26 ± 12.39 <1.0e-4 1.20ORBinf.L ORB 59.89 ± 6.75 49.15 ± 10.68 4.0e-4 1.22ORBsupmed.L ORB 43.04 ± 5.40 33.88 ± 7.64 <1.0e-4 1.40REC.L PFC 36.46 ± 3.89 28.11 ± 6.45 <1.0e-4 1.59ACG.L ACG 62.42 ± 7.89 50.47 ± 9.79 2.0e-4 1.35CAL.L Occipital 70.36 ± 10.32 55.17 ± 15.17 4.0e-4 1.18STG.L Temporal 69.54 ± 8.29 55.97 ± 14.76 4.0e-4 1.15
Enod was uniformly increased in the HDIs compared with the HCs.Cohen’s d indicates the value of effect size. The small, medium and large levels of the effect size are0.2, 0.5 and 0.8, respectively, according to Cohen’s definition (Cohen 1992).ACG = anterior cingulate gyrus; ORB = orbital frontal cortex; PFC = prefrontal cortex.
Figure 2 Rendering plot of the brain regions showing significantly increased nodal efficiency (Enod) in the heroin-dependent individualscompared with the healthy controls (P < 0.05, Bonferroni corrected).The images were plotted with the BrainNet Viewer (http://www.nitrc.org/projects/bnv/) (Xia, Wang & He 2013). Abbreviations: ACG, anterior cingulate gyrus (yellow); CAL, calcarine cortex (green); ORB, orbitalfrontal cortex (red); PFC, prefrontal cortex (blue); STG, superior temporal gyrus (cyan)
Network analysis 7
© 2015 Society for the Study of Addiction Addiction Biology
the bootstrap approach. In the calculations, we built thedistribution of global parameters across 1000 randomresamples and determined the 95% confidence interval ofthe original sample for the HDIs and controls (SupportingInformation Table S5). Then we estimated the effect ofinter-regional connectivity threshold (or streamlinecounts) on network parameters. Statistical analysisshowed that the significant level of between-group differ-ence in topological parameters was not dependent onour selections of streamline counts (counts > 0 andcounts ≥ 5) as the threshold of inter-regional connectivity(Table 5). We also tested the effect of node size on thenetwork topology using a high-resolution template, theAAL-1024 template. The change tendencies of the globalparameters (Sp, Eglob and Lp) for the AAL-1024 templatewere similar to those for the AAL-90 template (Table 5).We also checked the influence of the significant levels ofbetween-group differences on the network parameters.Compared with the controls, the HDIs showed signifi-
cantly increased Sp and Eglob, but decreased Lp, at thethreshold P < 0.01. Finally, the network parametersshowing significant between-group difference can still bedetected at P < 0.05 (Table 5) even though the headmotion effects were regressed out.
DISCUSSION
In this study, we explored the topological organization ofbrain WM structural networks in HDIs. Even though boththe HDIs and controls conserved small-worldness, theHDIs showed significantly increased Eglob and Sp, but sig-nificantly decreased Lp compared with the controls. Fur-thermore, the HDIs showed significantly increased nodalefficiency in the bilateral orbital frontal cortices (OFC), leftPFC and left ACG compared with the controls. Moreover,based on the NBS approach, we determined a subnetworkin which the structural connectivity was significantlychanged in the HDIs compared with the controls. The
SMA.R
SFGmed.R
ACG.R
ORBsupmed.R
REC.R
OLF.R
REC.R
OLF.R
SMA.R
SFGmed.R
ACG.RORBsupmed.R
SFGdor.L
MFG.L
MTG.L
TPOmid.L
INS.LIFGtriang.L
OLF.LORBmid.L
REC.L
ORBinf.L
ORBsup.L
SFGdor.L
MFG.L
TPOmid.L
REC.L
MTG.L ORBinf.LINS.L
IFGtriang.L
OLF.LORBsup.L
ORBmid.L
SMA.R
SFGmed.R
ACG.R
REC.R
OLF.R
ORBsupmed.R
TPOmid.L
MTG.L
SFGdor.L
MFG.L
IFGtriang.LINS.L
REC.L
OLF.LORBmid.LORBinf.LORBmid.L
300 700 1100 1500
500
800
1100
1400
300 700 1100 15000.01
0.02
0.03
0.04
300 700 1100 1500
25
40
55
70
Sp
Egl
ob
Streamline counts of NBS network Streamline counts of NBS network Streamline counts of NBS network
Lp
r = 0.73, P = 1.58e-7 r = 0.72, P = 2.91e-7 r = –0.74, P = 1.46e-7 (b)
(a)
Figure 3 The subnetwork derived from the network-based statistic (NBS) analysis. (a) Increased structural connections in heroin-dependentindividuals (HDIs). These connections formed a single subnetwork containing 17 nodes and 16 edges. All the 16 edges were uniformlysignificantly increased (P = 0.029, family-wise error corrected) in the HDIs compared with the controls. (b) Scatter plots of the significantlychanged global parameters changing with the number of streamline counts within the NBS-derived subnetwork across all subjects. Except forthe characteristic path length Lp, the other global parameters (strength Sp and global efficiency Eglob) were significantly positively correlated tothe streamline counts within the NBS-derived subnetwork
8 Ruibin Zhang et al.
© 2015 Society for the Study of Addiction Addiction Biology

number of streamline counts for all WM connectionsin this subnetwork was significantly increased in theHDIs.
Although the brain WM structural networks for boththe HDIs and the controls hold small-worldness (γ >>1and δ >>1, λ ≈ 1), we found the HDIs showed signifi-cantly increased Eglob, but decreased Lp compared with thecontrols (Table 3). Similarly, the HDIs also showed signifi-cantly increased Sp compared with the controls. Theseresults were consistent with a previous study (Yuan et al.2010) in which the topology of brain functional networkwas derived from resting-state fMRI data in heroin users.As small-world properties reflect an optimal balancebetween local specialization and global integration(Sporns 2011), our finding of the increased global inte-gration (increased Eglob and Sp, decreased Lp) andunchanged Cp in the HDIs indicate that the brain WMstructural networks in HDIs may keep high wiring cost orbreak up the trade-off between the efficiency and cost andmay shift towards a random network (Latora & Marchiori2001).
With respect to nodal parameters, we found that theHDIs showed significantly increased Enod in the bilateralOFC, left PFC and left ACG compared with the controls(Fig. 2 and Table 4). Previous studies (Kalivas & Volkow2005; Baler & Volkow 2006) suggested that the OFC ismainly involved in motivation and salience evaluation,the PFC is responsible for craving and cognitive controland the ACG is involved in the inhibition controlling andconflict monitoring. In heroin users, the typical cognitiveimpairment includes poor cognitive processing, decision-making deficit, uninhibited behaviour and loss of self-control (Vassileva et al. 2007; Dissabandara et al. 2014;Yan et al. 2014). The disrupted WM connectivity in thePFC or in the ACG may cause impairment of cognitivecontrol function across multiple domains, including
attention, inhibition, decision and working memory,which lead to the reduced cognitive control on cravingand motivation in heroin users (Ma et al. 2010;Moreno-Lopez et al. 2012; Jasinska et al. 2014). Notably,the NBS analysis suggested that the inter-regional con-nections among the paralimbic, OFC, PFC and temporalregions were significantly changed (Fig. 3a). Thus, ourfindings of the aberrant nodal efficiency in the bilateralOFC, left PFC and left ACG may provide evidence to someextent that heroin users have a weak cognitive controland conflict monitoring ability. When exposed to heroin-related cues, heroin users easily ignore the negativeresults of the addiction and turn to drug-taking behav-iours (Koob & Volkow 2009).
For the changes of WM connectivity in the HDIs, theirorigins might be traced back to the increased number ofstreamlines interconnecting different gray matter nodes.Within the NBS-derived subnetwork, we detected that thenumber of streamline counts was significantly correlatedwith the changed global network metrics (Lp, Sp and Eglob)in the HDIs (Fig. 3b). Although we are not sure whetheran increased streamline counts in this study can beascribed to an increased number, density or coherence ofaxonal fibres, it is clear that the axonal fibres providespathways for the information transferring between brainregions. The increased axonal fibres or density may implythat over-speed nerve pulses are transferred (Rushton1951; Budd & Kisvárday 2012; Hofman 2014). Theover-speed information flow may prompt HDIs to make apat-on-the-head decision ignoring the consequences(Forstmann et al. 2010; Cavanagh et al. 2011). In addi-tion, we found that the HDIs showed significantlyincreased FA and axial diffusivity (λ//) in several tractsusing the tract-based spatial statistic approach, includingthe right anterior corona radiate, right posterior limb ofinternal capsule, bilateral posterior thalamic radiation
Table 5 Robustness analysis to show thestability of our findings in brain topologybetween the heroin-dependent individuals(HDIs) and the healthy controls (HCs).
Analysis strategy
Between-group difference in network parameters(HDIs versus HCs)
δ λ γ Cp Sp Eglob Lp
counts > 0 in AAL-90 n.s. n.s. n.s. n.s. 5.0e-4 ↑ 1.5e-3 ↑ 1.4e-3 ↓counts ≥ 5 in AAL-90 n.s. n.s. n.s. n.s. 4.0e-4 ↑ 1.5e-3 ↑ 1.4e-3 ↓AAL-1024 template 4.2e-2 ↑ n.s. n.s. n.s. 9.0e-4 ↑ 6.0e-4 ↑ 5.0e-4 ↓P < 0.01 n.s. n.s. n.s. n.s. 6.0e-4 ↑ 2.8e-3 ↑ 1.6e-3 ↓Head motion effects n.s. n.s. n.s. n.s. 6.6e-3 ↑ 2.0e-2 ↑ 1.0e-2 ↓
We listed the results obtained from selecting different brain parcellation schemes (AAL-90 andAAL-1024) and a conservative threshold (P < 0.01) and regressing out head motion parameters.The threshold ‘counts > 0’ indicates that the two regions were connected if at least one streamlineexisted between a pair of brain regions. The AAL-1024 template contains 1024 regions with equalvolume size.↑ = HDIs > HCs; ↓ = HDIs < HCs; n.s. = non-significant; γ = normalized clustering; λ = normalizedpath length; δ = γ/λ; Cp = cluster coefficient; Eglob = global efficiency; Lp = characteristic pathlength; Sp = network strength.
Network analysis 9
© 2015 Society for the Study of Addiction Addiction Biology

and left exterior capsule (Supporting InformationFig. S1). Thus, we may infer that the increased WM con-nections provide a potential explanation of heroin addic-tion related to neuronal basis from the perspective ofneural pulse transferring.
Several potential limitations exist in this study. First,the DTI data with non-isotropic voxel size and low SNR(acquired from a 1.5T MRI scanner) may bias the cal-culation result. To address the potential impacts of lowSNR, we repeated the network analysis using differentinter-regional connectivity threshold and different brainparcellation schemes and found that the results showeda high robustness across subjects (Table 5). This sug-gests that our findings are reliable and stable, althoughsome suboptimal scanning parameters have been used.Second, the sources of miscalibration of hardware com-ponents may have a combined effect on fibre tracking.Gradient calibration is an important step for acquiringhigh-quality diffusion-weighed images and for obtainingaccurate brain WM tracks (Posnansky, Kupriyanova &Shah 2011). To calibrate gradient and reduce the gra-dient errors, such as gradient amplitude scaling errorsand background gradients, we used an affine alignmentto correct the eddy current and rotated gradient direc-tion corresponding diffusion-sensitive directions(Leemans & Jones 2009). Besides of the gradient correc-tion, the signal dropout or the interaction betweenmotion and field inhomogeneity should also be consid-ered in the future study. Third, the influence of metha-done on brain WM was not considered, although aprevious study (Wang et al. 2011) suggested that themethadone treatment may affect diffusivity of braintissues in HDIs. In this study, we analysed the correla-tions between the significant changed network param-eters and the age onset of addiction or the duration ofaddiction in the HDIs. We found that the duration ofaddiction in the HDIs was positively correlated with Sp
(r = 0.21, P = 0.37) and Eglob (r = 0.22, P = 0.34), butnegatively with the Lp (r = −0.21, P = 0.37). Similarly,we also detected that the age onset of addiction waspositively correlated with Sp (r = 0.02, P = 0.93) andEglob (r = 0.02, P = 0.93), but negatively with Lp
(r = −0.04, P = 0.86). However, none of these correla-tions reached the significant level (P < 0.05). To uncoverthe brain WM structural network alteration in HDIs, weshould collect more detailed clinical variables and con-sider the effect of methadone on the topology of brainnetworks in the future study. Finally, as this is a cross-sectional study, we cannot make sure whether the topo-logical differences are a consequence of heroin exposureor they existed before addiction and served as predispos-ing factors to the development of addiction. Genetic andlongitudinal imaging studies are required to resolvethis issue.
CONCLUSION
In summary, we constructed brain WM structural net-works, analysed the topological properties according tograph theory and detected abnormal axonal fibre connec-tivity and topological organization in the HDIs. The HDIsshowed increased global integration (increased Eglob andSp, decreased Lp) along with increased nodal efficiency inthe bilateral OFC, left PFC and left ACG. We also detectedincreased WM connections in the OFC, PFC and ACG inthe HDIs. These results may suggest the disruption ofbrain WM structural network in heroin-dependent users.
Acknowledgements
This work was partially supported by the Guangdong No.2 Provincial People’s Hospital, the funding of NationalNatural Science Foundation of China (Grant numbers:81271548, 81371535, 81428013, 81471654 and81471639) and the Science and Technology Plan-ning Project of Guangdong Province, China (Grantnumbers: 2011B031800044, 2012A030400019 and2013B021800172). We also thank the three anony-mous reviewers for their constructive suggestions andthanks to all individuals who served as the researchparticipants.
Authors Contribution
RZ, GJ, JT and RH designed the study. RZ and GJ under-took the data analyses. YQ, XM, SL and TW collected theclinical and MRI data. XW, AZ, ML, JW and CL contrib-uted to the data analyses. RZ and RH wrote the manu-script. All authors contributed to and approved the finalmanuscript.
References
Achard S, Bullmore E (2007) Efficiency and cost of economicalbrain functional networks. PLoS Comput Biol 3:e17.
Baler RD, Volkow ND (2006) Drug addiction: the neurobiologyof disrupted self-control. Trends Mol Med 12:559–566.
Bassett DS, Brown JA, Deshpande V, Carlson JM, Grafton ST(2011) Conserved and variable architecture of human whitematter connectivity. Neuroimage 54:1262–1279.
Budd JM, Kisvárday ZF (2012) Communication and wiring in thecortical connectome. Front Neuroanat 6:42. doi: 10.3389/fnana. 2012.00042
Cavanagh JF, Wiecki TV, Cohen MX, Figueroa CM, Samanta J,Sherman SJ, Frank MJ (2011) Subthalamic nucleus stimula-tion reverses mediofrontal influence over decision threshold.Nat Neurosci 14:1462–1467.
Cohen J (1992) A power primer. Psychol Bull 112:155–159.Dissabandara LO, Loxton NJ, Dias SR, Dodd PR, Daglish M,
Stadlin A (2014) Dependent heroin use and associated riskybehaviour: the role of rash impulsiveness and reward sensitiv-ity. Addict Behav 39:71–76.
Fornito A, Zalesky A, Pantelis C, Bullmore ET (2012) Schizo-phrenia, neuroimaging and connectomics. Neuroimage62:2296–2314.
10 Ruibin Zhang et al.
© 2015 Society for the Study of Addiction Addiction Biology

Forstmann BU, Anwander A, Schäfer A, Neumann J, Brown S,Wagenmakers E-J, Bogacz R, Turner R (2010) Cortico-striatalconnections predict control over speed and accuracy in per-ceptual decision making. Proc Natl Acad Sci U S A 107:15916–15920.
Goldstein RZ, Volkow ND (2011) Dysfunction of the prefrontalcortex in addiction: neuroimaging findings and clinical impli-cations. Nat Rev Neurosci 12:652–669.
Griffa A, Baumann PS, Thiran J-P, Hagmann P (2013) Structuralconnectomics in brain diseases. Neuroimage 80:515–526.
Hagmann P, Cammoun L, Gigandet X, Gerhard S, Ellen Grant P,Wedeen V, Meuli R, Thiran J-P, Honey CJ, Sporns O (2010)MR connectomics: principles and challenges. J NeurosciMethods 194:34–45.
He Y, Evans A (2014) Magnetic resonance imaging of healthyand diseased brain networks. Front Hum Neurosci 8:890.
Hofman MA (2014) Evolution of the human brain: when biggeris better. Front Neuroanat 8:15. doi: 10.3389/fnana.2014.00015
Holmes D (2012) Prescription drug addiction: the treatmentchallenge. Lancet 379:17–18.
Jasinska AJ, Stein EA, Kaiser J, Naumer MJ, Yalachkov Y (2014)Factors modulating neural reactivity to drug cues in addic-tion: a survey of human neuroimaging studies. NeurosciBiobehav Rev 38:1–16.
Jiang G, Wen X, Qiu Y, Zhang R, Wang J, Li M, Ma X, Tian J,Huang R (2013) Disrupted topological organization in whole-brain functional networks of heroin-dependent individuals:a resting-state fMRI study. PLoS ONE 8:e82715.
Kalivas PW, Volkow ND (2005) The neural basis of addiction:a pathology of motivation and choice. Am J Psychiatry162:1403–1413.
Kim D-J, Skosnik PD, Cheng H, Pruce BJ, Brumbaugh MS,Vollmer JM, Hetrick WP, O’Donnell BF, Sporns O, Puce A(2011) Structural network topology revealed by white mattertractography in cannabis users: a graph theoretical analysis.Brain Connect 1:473–483.
Kong X-Z (2014) Association between in-scanner head motionwith cerebral white matter microstructure: a multibanddiffusion-weighted MRI study. PeerJ 2:e366.
Koob GF (2002) Neurobiology of drug addiction. In: Kandel DB,ed. Stages and Pathways of Drug Involvement: Examining theGateway Hypothesis, pp. 337–361. New York, NY: CambridgeUniversity Press.
Koob GF, Volkow ND (2009) Neurocircuitry of addiction.Neuropsychopharmacology 35:217–238.
Latora V, Marchiori M (2001) Efficient behavior of small-worldnetworks. Phys Rev Lett 87:198701.
Leemans A, Jones DK (2009) The B-matrix must be rotated whencorrecting for subject motion in DTI data. Magn Reson Med61:1336–1349.
Levran O, Londono D, O’hara K, Nielsen D, Peles E, Rotrosen J,Casadonte P, Linzy S, Randesi M, Ott J (2008) Genetic suscep-tibility to heroin addiction: a candidate gene associationstudy. Genes Brain Behav 7:720–729.
Li Q, Wang Y, Zhang Y, Li W, Yang W, Zhu J, Wu N, Chang H,Zheng Y, Qin W, Zhao L, Yuan K, Liu J, Wang W, Tian J (2012)Craving correlates with mesolimbic responses to heroin-related cues in short-term abstinence from heroin: an event-related fMRI study. Brain Res 1469:63–72.
Li W, Li Q, Zhu J, Qin Y, Zheng Y, Chang H, Zhang D, Wang H,Wang L, Wang Y, Wang W (2013) White matter impairmentin chronic heroin dependence: a quantitative DTI study. BrainRes 1531:58–64.
Liu J, Liang J, Qin W, Tian J, Yuan K, Bai L, Zhang Y, Wang W,Wang Y, Li Q (2009) Dysfunctional connectivity patterns inchronic heroin users: an fMRI study. Neurosci Lett 460:72–77.
Ma N, Liu Y, Li N, Wang C-X, Zhang H, Jiang X-F, Xu H-S, FuX-M, Hu X, Zhang D-R (2010) Addiction related alteration inresting-state brain connectivity. Neuroimage 49:738–744.
Moreno-Lopez L, Stamatakis EA, Fernandez-Serrano MJ,Gomez-Rio M, Rodriguez-Fernandez A, Perez-Garcia M,Verdejo-Garcia A (2012) Neural correlates of hot and coldexecutive functions in polysubstance addiction: associationbetween neuropsychological performance and resting brainmetabolism as measured by positron emission tomography.Psychiatry Res 203:214–221.
Mori S, Zhang J (2006) Principles of diffusion tensor imagingand its applications to basic neuroscience research. Neuron51:527–539.
Posnansky O, Kupriyanova Y, Shah NJ (2011) On the problem ofgradient calibration in diffusion weighted imaging. Int J ImagSyst Tech 21:271–279.
Rubinov M, Sporns O (2010) Complex network measures ofbrain connectivity: uses and interpretations. Neuroimage52:1059–1069.
Rushton WA (1951) A theory of the effects of fibre size inmedullated nerve. J Physiol 115:101–122.
Schmidt A, Walter M, Gerber H, Schmid O, Smieskova R,Bendfeldt K, Wiesbeck GA, Riecher-Rossler A, Lang UE, RubiaK, McGuire P, Borgwardt S (2013) Inferior frontal cortexmodulation with an acute dose of heroin during cognitivecontrol. Neuropsychopharmacology 38:2231–2239.
Sporns O (2011) The human connectome: a complex network.Ann N Y Acad Sci 1224:109–125.
Tang YL, Zhao D, Zhao C, Cubells JF (2006) Opiate addiction inChina: current situation and treatments. Addiction 101:657–665.
Tijssen R, Jansen JF, Backes WH (2009) Assessing and minimiz-ing the effects of noise and motion in clinical DTI at 3T. HumBrain Mapp 30:2641–2655.
Vassileva J, Petkova P, Georgiev S, Martin EM, Tersiyski R,Raycheva M, Velinov V, Marinov P (2007) Impaired decision-making in psychopathic heroin addicts. Drug Alcohol Depend86:287–289.
Volkow ND, Li T-K (2004) Drug addiction: the neurobiology ofbehaviour gone awry. Nat Rev Neurosci 5:963–970.
Volkow ND, Wang G-J, Fowler JS, Tomasi D, Baler R (2013)Neuroimaging of addiction. In: Seeman P, Madras B eds.Imaging of the Human Brain in Health and Disease, 1st edn,pp. 1–26. Oxford: Elsevier Int.
Walter M, Denier N, Gerber H, Schmid O, Lanz C, Brenneisen R,Riecher-Rossler A, Wiesbeck GA, Scheffler K, Seifritz E,McGuire P, Fusar-Poli P, Borgwardt S (2014) Orbitofrontalresponse to drug-related stimuli after heroin administration.Addict Biol. doi: 10.1111/adb.12145. [Epub ahead ofprint].
Wang Y, Li W, Li Q, Yang W, Zhu J, Wang W (2011) Whitematter impairment in heroin addicts undergoing methadonemaintenance treatment and prolonged abstinence: a prelimi-nary DTI study. Neurosci Lett 494:49–53.
Watts DJ, Strogatz SH (1998) Collective dynamics of ‘small-world’ networks. Nature 393:440–442.
Xia M, Wang J, He Y (2013) BrainNet Viewer: a networkvisualization tool for human brain connectomics. PLoS ONE8:e68910.
Xiao Z, Lee T, Zhang JX, Wu Q, Wu R, Weng X, Hu X (2006)Thirsty heroin addicts show different fMRI activations when
Network analysis 11
© 2015 Society for the Study of Addiction Addiction Biology
exposed to water-related and drug-related cues. Drug AlcoholDepend 83:157–162.
Yan W-S, Li Y-H, Xiao L, Zhu N, Bechara A, Sui N (2014)Working memory and affective decision-making in addiction:a neurocognitive comparison between heroin addicts, patho-logical gamblers and healthy controls. Drug Alcohol Depend134:194–200.
Yendiki A, Koldewyn K, Kakunoori S, Kanwisher N, Fischl B(2014) Spurious group differences due to head motion in adiffusion MRI study. Neuroimage 88:79–90.
Yuan K, Qin W, Liu J, Guo Q, Dong M, Sun J, Zhang Y, Liu P,Wang W, Wang Y (2010) Altered small-world brain func-tional networks and duration of heroin use in male abstinentheroin-dependent individuals. Neurosci Lett 477:37–42.
Zalesky A, Cocchi L, Fornito A, Murray MM, Bullmore E (2012a)Connectivity differences in brain networks. Neuroimage60:1055–1062.
Zalesky A, Solowij N, Yücel M, Lubman DI, Takagi M, HardingIH, Lorenzetti V, Wang R, Searle K, Pantelis C (2012b) Effect oflong-term cannabis use on axonal fibre connectivity. Brain135:2245–2255.
Zhang R, Wei Q, Kang Z, Zalesky A, Li M, Xu Y, Li L, Wang J,Zheng L, Wang B (2014) Disrupted brain anatomicalconnectivity in medication-naïve patients with first-episodeschizophrenia. Brain Struct Funct. doi: 10.1007/s00429-014-0706-z. [Epub ahead of print].
SUPPORTING INFORMATION
Additional Supporting Information may be found in theonline version of this article at the publisher’s web-site:
Appendix S1 Data aquisition.Figure S1 Brain white matter with the significant altereddiffusion metrics in the heroin-dependent individuals(HDIs) compared with the healthy controls. (a) Fractionalanisotropy (FA); (b) Axial diffusivity (λ//); (c) overlap brainwhite matter tracts derived from both FA and λ// analyses,coloured by blue.Table S1 Summary of diffusion magnetic resonanceimaging studies about heroin-dependent individuals(HDIs) compared with healthy controls (HCs).Table S2 The detailed clinical description for eachheroin-dependent individual (HDIs).Table S3 Names and abbreviations of the regions ofinterest (ROIs) defined in the AAL-90 template (45regions for each hemisphere).Table S4 Inter-nodal connections with significant differ-ence between the heroin-dependent individuals (HDIs)and the healthy controls (HCs) derived from the network-based statistic (NBS) analysis. Compared with the con-trols, the HDIs showed significantly increased streamlinecounts in each of the inter-nodal connections (P = 0.029,FWE correction).Table S5 Confidence interval of global parameters in thebrain networks of the heroin-dependent individuals(HDIs) and the healthy controls (HCs).
12 Ruibin Zhang et al.
© 2015 Society for the Study of Addiction Addiction Biology