A quantitative FRET approach to characterize protein-protein ...
Upload
khangminh22Category
view
1download
0
applied sciences
Article
Experimental Evaluation of a Spectral Index to CharacterizeTemporal Variations in the Direct Normal Irradiance Spectrum
Gustavo Nofuentes 1,2,* , Christian A. Gueymard 3 , José A. Caballero 4, Guilherme Marques-Neves 5,6 andJorge Aguilera 1
�����������������
Citation: Nofuentes, G.;
Gueymard, C.A.; Caballero, J.A.;
Marques-Neves, G.; Aguilera, J.
Experimental Evaluation of a Spectral
Index to Characterize Temporal
Variations in the Direct Normal
Irradiance Spectrum. Appl. Sci. 2021,
11, 897. https://doi.org/10.3390/
app11030897
Academic Editor:
Alejandro Pérez-Rodróhiez
Received: 23 December 2020
Accepted: 18 January 2021
Published: 20 January 2021
Publisher’s Note: MDPI stays neutral
with regard to jurisdictional claims in
published maps and institutional affil-
iations.
Copyright: © 2021 by the authors.
Licensee MDPI, Basel, Switzerland.
This article is an open access article
distributed under the terms and
conditions of the Creative Commons
Attribution (CC BY) license (https://
creativecommons.org/licenses/by/
4.0/).
1 IDEA Research Group, University of Jaén, Campus de Las Lagunillas, 23071-Jaén, Spain; [email protected] Center for Advanced Studies in Earth Science, Energy and Environment (CEACTEMA), University of Jaén,
Campus Las Lagunillas, 23071 Jaén, Spain3 Solar Consulting Services, Colebrook, NH 03576, USA; [email protected] PVhardware Solutions S.L. Polígono Industrial Castilla, Vial I, 13. 46380 Cheste, Spain; [email protected] GDF Research Group, Brazilian National Institute for Space Research, Av. Dos Astronautas,
1758 São José dos Campos, Brazil; [email protected] Labren Research Group, Brazilian National Institute for Space Research, Av. Dos Astronautas,
1758 São José dos Campos, Brazil* Correspondence: [email protected]
Featured Application: The conclusions of this work may prove highly useful in developing easiermodels to capture the spectral impact on CPV devices.
Abstract: A simple index is desirable to assess the effects on both flat-plate and concentratingphotovoltaics of natural changes in the solar spectrum. Some studies have suggested that therelationship between the Average Photon Energy (APE) and the shape of individual global tiltedirradiance, global horizontal irradiance, or direct normal irradiance (DNI) spectra is bijective andcan therefore be used as a single number to unequivocally replace a complete spectral distribution.This paper reevaluates these studies with a modified methodology to assess whether a one-to-onerelationship really exists between APE and spectral DNI. A 12-month dataset collected in Jaén (Spain)using a sun-tracking spectroradiometer provides the necessary spectral DNI data between 350 and1050 nm. After quality control and filtering, 78,772 valid spectra were analyzed. The methodologyis based on a statistical analysis of the spectral distributions binned in 0.02-eV APE intervals, from1.74 to 1.90 eV. For each interval, both the standard deviation and coefficient of variation (CV) aredetermined across all 50-nm bands into which the 350–1050-nm waveband is divided. CV staysbelow 3.5% within the 450–900-nm interval but rises up to 13% outside of it. It is concluded that APEmay be approximately assumed to uniquely characterize the DNI spectrum distribution for Jaén (andpresumably for locations with similar climates) only over the limited 450–900-nm waveband.
Keywords: spectral irradiance; direct solar spectrum; spectroradiometer; average photon energy;effective wavelength
1. Introduction
The accurate estimation of both the expected and predicted electricity yields of photo-voltaic (PV) systems is normally carried out by following a standard procedure [1]. Thisstep is crucial to ascertain the production of electricity that such systems may deliver, thusenabling both the bankability of PV projects [2] and the quality assurance for PV plants [3],among other desirable outcomes. After the two quantities (incident broadband irradianceand temperature) that have the most impact on power output, the spectral distribution ofthe irradiance (spectral irradiance, in short) is generally considered the largest influenceto natural variations in the output of clean PV devices [4,5]. It is worth noting that con-ventional flat-plate PV are less sensitive to varying spectral irradiance than Concentrating
Appl. Sci. 2021, 11, 897. https://doi.org/10.3390/app11030897 https://www.mdpi.com/journal/applsci

Appl. Sci. 2021, 11, 897 2 of 15
Photovoltaics (CPV). Such a higher sensitivity of the latter technology to spectral effectsis especially noticeable when concentrated sunlight of 1000 suns or more is used in HighConcentrating Photovoltaics (HCPV) [6], where multi-junction solar cells based on series-connected subcells with different bands of absorption are used in conjunction with opticalelements [7,8]. The present contribution is mostly related to the latter type of application.
Spectral effects may be quantified using two methods aimed at estimating a spectralmismatch (MM) factor [9]. The first is based on measurements of the outdoor short-circuitcurrent of the PV device under investigation. The second is based on combining its spectralresponse with spectra recorded with spectroradiometers—although synthetic or modeledspectra may also be used. One hindrance in the first method is that spectral effects mightbe difficult to isolate the impacts of device temperature, soiling, or degradation and, inthe case of flat-plate PV, angular losses. Hence, the second method is often preferred butrequires knowledge of (i) the actual spectrum under the atmospheric conditions at anyspecific moment (in the case of outdoor exposure) and (ii) the actual spectral responseof the PV device under test. The procedure also implies numerical integrations in a 2Ddomain (wavelength and time). This can become cumbersome if this needs to be repeatedat high frequency and can be inexact if the spectral response of the PV device is not knownprecisely, which is often the case.
To overcome the above difficulties, a simplifying approach—recourse to 1D (timeonly) spectral indexes that would be independent of the cell’s spectral response—has beenproposed in the literature. Indeed, such kinds of indexes are often preferred to the inte-grated useful fraction [10], the spectrally weighted ratio [11], the spectrally corrected globalirradiance [12], or other metrics used in non-concentrating PV that depend on the specificdevice under scrutiny. The same preference holds for some other PV device-dependentindexes used in CPV characterization, such as the Z-parameter [13], the spectrally correcteddirect normal irradiance [14], etc. A comprehensive review of spectral indexes has beenrecently presented [8].
In view of the above, finding a PV device-independent spectral index that coulduniquely characterize individual spectra would be most useful for both PV science andengineering. A review of the literature shows that only two such indexes have beeninvestigated and proposed as possible candidates to meet this requirement: the blue fraction(BF) and the average photon energy (APE). BF has been introduced to assess the ratio ofspectral irradiance integrated below 650 nm to the total irradiance [15], whereas APE is themean energy of all the photons that impinge on a given surface [16].
Despite some early promising results presented by Louwen et al. [17] and later limitedresults reported by Paudyal and Imenes [18], the possible one-to-one relationship betweenBF and spectral irradiance still remains highly unexplored. Indeed, this issue has beenscarcely addressed thus far [8,18], therefore justifying further investigation. In contrast,APE is an older and more popular index amongst the PV community. It has been widelyused to provide a readily qualitative assessment on whether a specific spectrum is shiftedto shorter or longer wavelengths relative to the standard spectrum. Thus, a more in-depthanalysis of this parameter, including its physical significance, is provided hereafter.
Minemoto et al. [19] first analyzed the relationship between APE and the spectrumshape of global tilted irradiance (GTI). Their experimental campaign was conducted inKusatsu City, Japan (latitude 34◦58′ N) over a period of three years. Spectral irradiance wasmonitored on a 15.3◦-tilted surface facing the equator and led the authors to the conclusionthat the relationship between APE and the GTI spectrum was bijective. Their methodologywas based on an International Electrotechnical Commission (IEC) standard [20], whichstates by how much the output of a solar simulator can deviate from the AM1.5G referencespectrum. Their reasoning was basically that, if spectral distributions grouped in verynarrow APE intervals have a very small standard deviation (SD) in all considered 50-nmbands, such distributions may be considered equal. A closer insight to that methodology isprovided in what follows. Subsequent work assumed this one-to-one relationship between
Appl. Sci. 2021, 11, 897 3 of 15
APE and GTI [21–30], although further investigation at other sites was encouraged toconfirm the possible universality of such a relationship.
Norton et al. [31] carried out a statistical analysis very similar to that of Minemotoet al. [19], using measurements of spectral global horizontal irradiance (GHI) collected attwo sites with different climates: Ispra, Italy (latitude 45◦49′ N, longitude 8◦36′ E) andGolden, CO, USA (latitude 39◦45′ N, longitude 105◦13′ W). Measurements were recordedfor 16 months at the latter location and over two years at the former, using dissimilarinstruments and experimental protocols at each site. Norton and coworkers concluded thatthe relationship between APE and the GHI spectrum shape was bijective. However, theseauthors also raised the need for further collection and analysis of spectral irradiance dataat other sites because firm conclusions could not be drawn from measurements at onlytwo sites.
In contrast, the relationship between the spectral distribution of GTI and APE wasfound not bijective by Dirnberger et al. [12]. They noted that spectral distributions with thesame value of APE might yield different values of MM for the same PV material. Theirconclusion was based on the analysis of spectral GTI data collected on a 35◦-tilt equator-facing surface over a 3.5-year experimental campaign conducted in Freiburg im Breisgau,Germany (latitude 47◦59′ N).
A later study presented by Nofuentes et al. [32] applied the same methodology asproposed by Minemoto et al. [19] to two spectral datasets collected on a 30◦-tilt equator-facing surface during a two-year experimental campaign conducted in two Spanish citieswith nearly the same Mediterranean-Continental climate: Jaén (latitude 37◦49′ N) andMadrid (latitude 40◦24′ N). These authors underlined that the coefficient of variation (CV)was more appropriate in evaluating the dispersion around the mean than SD alone. Hence,they postulated that spectral distributions with nearly the same APE value should havea small value of CV across all considered 50-nm bands to be considered equivalent. Theresults obtained for the two Spanish sites under scrutiny showed that bijectivity betweenAPE and GTI spectrum shape could be assumed only from a pragmatic point of viewand only over the 450–900-nm waveband, where CV stays below 3.3%. The reasons whynoticeable dispersion occurred below 450 nm or above 900 nm were deeply analyzed fromboth an instrumental standpoint and atmospheric physics principles.
Tsuji et al. [33] carried out a similar statistical analysis to that of Minemoto et al. [19]with spectral GTI data collected on equator-facing surfaces at three Japanese sites for oneor two years: Kusatsu (15.3◦ tilt, as in the study discussed above [19]), Tsukuba (latitude36◦04′ N, 20◦ tilt), and Miyazaki (latitude 31◦49′ N, 35◦ tilt). They concluded that APEuniquely represented the spectral distribution of GTI, even though CV values in excess of30% were found within the 900–950 nm waveband for the three sites under scrutiny.
The literature reviewed above targets flat-plate PV applications only and thus focuseson the global spectrum (on either horizontal or tilted surfaces). The bijectivity betweenAPE and spectral direct normal irradiance (DNI) has not received much attention so far,which is a justification for the present investigation. Apparently, Chantana et al. [34] arethe only authors who have explored the APE–DNI relationship experimentally and onlyat a single site. They applied the same general methodology as Minemoto et al. [19] tospectral DNI measurements collected over a one-year experimental campaign conductedin Kusatsu. Chantana and coworkers concluded that a one-to-one relationship did existbetween APE and the DNI spectral shape. Unfortunately, they did not analyze the variationof CV across all the studied 10-nm wavebands. It is worth mentioning, though, that aprevious theoretical study presented by Gueymard [35] and based on simulations of thecloudless direct spectrum by means of the Simple Model of the Atmospheric RadiativeTransfer of Sunshine (SMARTS) l [36] had disproved the bijectivity between APE and theDNI spectral shape. That study showed that different combinations of air mass (AM),aerosol optical depth (AOD), and precipitable water (PW) could result in significantlydifferent DNI spectral distributions with however the same resulting APE value.

Appl. Sci. 2021, 11, 897 4 of 15
The present work aims at exploring whether the APE uniquely characterizes thevarying DNI spectrum—at least in practical terms—from an experimental standpoint. Inview of the above literature review, this study is the second known attempt to elucidate suchan issue by analyzing measured DNI spectra. The present 12-month experimental studyis based on spectroradiometric measurements at Jaén, Spain. The general methodologyof Nofuentes et al. [32] is followed to perform an appropriate statistical analysis of thespectral data.
2. Materials and Methods2.1. Experimental Setup
The experimental campaign was conducted at the University of Jaén (Spain, witha Mediterranean-Continental climate), a small-size city (113,000 inhabitants) where periodicSaharan dust episodes occur in summer, together with high levels of olive-tree pollenduring May. A comprehensive description of this site in atmospheric terms was carried outin a previous work [32].
The empirical data used in this paper was collected at the outdoor research facilitieslocated on the flat roof of one of the buildings of the High Technical School of the Engi-neering and Technology campus, located within the city. These facilities were described indetail in previous studies [37,38].
The direct spectrum was measured by an EKOTM MS700 spectroradiometer equippedwith a collimator tube and fixed to a two-axis BSQTM D1506 solar tracker for concentratingPV applications, as shown in Figure 1. The collimator tube was made of black PVC andwas devised according to the values of the slope angle (1◦) and aperture angle (5◦) specifiedin the MS700 spectroradiometer datasheet. This experimental setup has been successfullyused in earlier work [39].
Appl. Sci. 2021, 11, x FOR PEER REVIEW 4 of 14
DNI spectral shape. That study showed that different combinations of air mass (AM), aer-osol optical depth (AOD), and precipitable water (PW) could result in significantly differ-ent DNI spectral distributions with however the same resulting APE value.
The present work aims at exploring whether the APE uniquely characterizes the var-ying DNI spectrum—at least in practical terms—from an experimental standpoint. In view of the above literature review, this study is the second known attempt to elucidate such an issue by analyzing measured DNI spectra. The present 12-month experimental study is based on spectroradiometric measurements at Jaén, Spain. The general method-ology of Nofuentes et al. [32] is followed to perform an appropriate statistical analysis of the spectral data.
2. Materials and Methods 2.1. Experimental Setup
The experimental campaign was conducted at the University of Jaén (Spain, with a Mediterranean-Continental climate), a small-size city (113,000 inhabitants) where periodic Saharan dust episodes occur in summer, together with high levels of olive-tree pollen dur-ing May. A comprehensive description of this site in atmospheric terms was carried out in a previous work [32].
The empirical data used in this paper was collected at the outdoor research facilities located on the flat roof of one of the buildings of the High Technical School of the Engi-neering and Technology campus, located within the city. These facilities were described in detail in previous studies [37,38].
The direct spectrum was measured by an EKOTM MS700 spectroradiometer equipped with a collimator tube and fixed to a two-axis BSQTM D1506 solar tracker for concentrating PV applications, as shown in Figure 1. The collimator tube was made of black PVC and was devised according to the values of the slope angle (1°) and aperture angle (5°) speci-fied in the MS700 spectroradiometer datasheet. This experimental setup has been success-fully used in earlier work [39].
Figure 1. Pyrheliometer (a) and spectroradiometer with collimator tube (b) used in this work.
The specifications of the above instrumentation include a 10-nm spectral resolution, a wavelength interval of ≈3.3 nm between 350 and 1050 nm, and a temperature depend-ency of ±1% between −20 and +50 °C. The 12-month monitoring period extended from
Figure 1. Pyrheliometer (a) and spectroradiometer with collimator tube (b) used in this work.
The specifications of the above instrumentation include a 10-nm spectral resolution,a wavelength interval of≈3.3 nm between 350 and 1050 nm, and a temperature dependencyof ±1% between −20 and +50 ◦C. The 12-month monitoring period extended from March2013 to February 2014 at different time intervals. Observations were normally done every20 s, but the interval had to be relaxed to 5 min during a few periods; this did not influencethe results, as discussed in Section 2. The instruments were calibrated by the manufacturer

Appl. Sci. 2021, 11, 897 5 of 15
just before the experimental campaign and after it, in October 2014, with no significantchange in sensitivity. Additionally, the broadband DNI was measured with a first-classKipp & Zonen CHP 1 pyrheliometer. Spectral instances recorded while the broadbandDNI was below 50 W·m−2 were excluded to avoid the noise introduced by a low signal.Neglecting these measured spectra does not affect the calculations to be presented in whatfollows because the annual DNI fraction collected below this threshold only accounts for≈1% in Jaén [38]. After filtering of the data, 78,772 valid DNI spectra were available forfurther analysis.
As discussed earlier, the possible bijectivity between APE and spectral DNI for a givensite was apparently investigated in only one study so far [34]. Thus, it is worth mentioningthat the same spectroradiometer brand and model that was used in their work is also usedhere, thus making any comparison of results impervious to experimental differences. Theirdata filtering and its subsequent processing do not differ substantially from that presentedin this paper either, except in a few aspects that will be described hereafter.
2.2. Average Photon Energy
Originally proposed by Jardine et al. [16] to qualitatively assess the shape of thespectral irradiance, APE is the average energy of the photons over a specific spectrumdistribution. It may be expressed as follows:
APE =
∫ ba E(λ)dλ∫ b
a Φph(λ)dλ(1)
where E(λ) in W·m−2·nm−1 is the spectral irradiance, Φph(λ) in m−2·nm−1·s−1 is thespectral photon flux density, and a in nm and b in nm are the lower and upper limits,respectively, of the considered waveband of the solar spectrum. Solar spectra rich inphotons with shorter wavelengths yield higher values of APE, whereas solar spectra richin photons with longer wavelengths yield lower values of APE.
An equivalent definition was proposed later [35]:
APE = hc(kqλeff)−1, (2)
where
λeff =
∫ ba λE(λ)dλ∫ ba E(λ)dλ
(3)
and where λeff is the “effective wavelength” in nm, h is the Planck constant, c is the speedof light in vacuum, q is the electronic charge, and k is a constant to reconcile units, equalhere to 1 × 10⁻⁹ for λeff expressed in nm. By using Equation (2), possible variations in APEare intuitively linked to varying incident irradiance spectral balances. Thus, blue-biasedspectra are conducive to shorter effective wavelengths, which in turn lead to higher valuesof APE. Conversely, red-biased spectra—conducive to larger values of λeff—lead to lowervalues of APE.
Obviously, the value of APE also depends on the considered spectral range. In thissense, the 350–1050 nm waveband (typically sensed by the silicon-based detectors used inmany commercial spectroradiometers) has been used to calculate APE in many previousstudies [16,19,32,34,40–44]. For that specific waveband, the values of APE for the AM1.5Gand AM1.5D reference spectra equal 1.878 and 1.846 eV, respectively. The correspondingeffective wavelengths are 662.6 and 671.7 nm, respectively. The slight red shift in theDNI spectrum compared to the GTI spectrum results from the latter’s inclusion of diffuseirradiance, which is rich in blue wavelengths.

Appl. Sci. 2021, 11, 897 6 of 15
2.3. Methodology
As commented on in Section 1, the methodology initially proposed by Minemotoet al. [19] and followed by Chantana et al. [34], is applied as closely as possible in thisinvestigation to assess whether a given APE value is uniquely linked to a specific DNIspectrum shape. However, as discussed in Section 1, such a methodology is improved hereby adding a detailed analysis of variance, as argued by Nofuentes et al. [32]. In that study,the coefficient of variation (CV)—defined as the percentage ratio of the standard deviation(SD) to the mean—was shown to provide a better insight into the scatter around the meanthan SD alone.
Based on previous experience, the design of the APE analysis procedure used in thiswork was articulated with the steps described below:
(1) The trapezoidal rule was used to calculate the broadband DNI between 350 and1050 nm for each experimental direct spectrum. (That calculated DNI value wasobviously smaller than the reading from the pyrheliometer, for which the spectralrange was ≈290–4000 nm.)
(2) Equation (1) was used to calculate the APE for each DNI spectrum.(3) The wavelength range was divided into fourteen 50-nm bands—from 350 to 1050 nm—
for each spectral instance. The fractional contribution of each 50-nm spectral band tothe broadband irradiance (Rc) calculated in step 1 was obtained.
(4) All the DNI spectral measurements were grouped into APE intervals of 0.02-eV width.More specifically, eight intervals ranging from 1.74–1.76 eV to 1.88–1.90 eV wereconsidered. Spectral measurements having an APE within ±0.01 eV of the centralvalue of each of these intervals were binned inside them.
(5) For every APE interval and within each 50-nm band, spectral measurements withRc values below the 10th percentile or above the 90th percentile were eliminated tominimize the influence of outliers.
(6) For every APE interval defined in step 4, mean values of Rc (denoted <Rc>) werecalculated in each 50-nm band. Values of SD and CV were also obtained for each ofthese bands to determine the dispersion of the values of Rc around its mean value forevery APE interval.
As mentioned in Section 1, it should be kept in mind that the analysis carried out byChantana et al. [34] considered seventy-one 10-nm spectral bands into which the 350–1050 nmwaveband was divided instead of the fourteen 50-nm bands considered here (step 3, above).
3. Results and Discussion
The recorded spectral instances that are outside the eight APE intervals stated in step4 and removed according to step 5 of Section 2.2 account for less than 17% of the whole12-month experimental database. After filtration, 65,881 spectral instances remained.
It is worth investigating to what extent the local spectral distribution for values ofAPE close to its standard value (1.846 eV) align with that of the standard spectrum whenAM values are close to 1.5. Figure 2 shows the mean percentage contributions of every50-nm band considered in this work relative to the integrated DNI for measured spectra inwhich APE and AM are within 1.84–1.86 eV and 1.45–1.55, respectively. The values of Rc foreach of the fourteen bands are shown for the reference spectrum as well. The latter seemsto coincide reasonably well with local AM1.5D distributions. The fact that spectral DNImeasurements with APE values in the vicinity of 1.85 eV closely resemble the distributionof the reference spectrum is according to expectations and confirms what was alreadynoted by Chantana et al. [34] based on experimental measurements at Kusatsu, Japan.Nevertheless, a careful analysis shows that, despite being apparently small, the SD valuesobtained at both Jaén and Kusatsu are not negligible when compared to the <Rc> valuesacross the 50-nm band intervals used here—or 10-nm bands for the Japanese site—thatlie outside the central wavelength range (450–900 nm). This dispersion of percentagecontributions within the 350–450 nm and 900–1050 nm wavebands was also noted inlocal GTI spectral distributions for APE and AM around 1.88 eV and 1.5, respectively

Appl. Sci. 2021, 11, 897 7 of 15
(corresponding to the AM1.5G spectrum) for Jaén [32]. These two results are mutuallyconsistent because the AM1.5G spectrum is essentially composed of direct irradiance (see,e.g., Figure 10 of [45]).
Appl. Sci. 2021, 11, x FOR PEER REVIEW 7 of 14
values obtained at both Jaén and Kusatsu are not negligible when compared to the <Rc> values across the 50-nm band intervals used here—or 10-nm bands for the Japanese site—that lie outside the central wavelength range (450–900 nm). This dispersion of percentage contributions within the 350–450 nm and 900–1050 nm wavebands was also noted in local GTI spectral distributions for APE and AM around 1.88 eV and 1.5, respectively (corre-sponding to the AM1.5G spectrum) for Jaén [32]. These two results are mutually consistent because the AM1.5G spectrum is essentially composed of direct irradiance (see, e.g., Fig-ure 10 of [45]).
Figure 2. Mean percentage contributions to direct normal irradiance (DNI)—integrated from 350 to 1050 nm—across all 50-nm bands for spectral measurements with Average Photon Energy (APE) and air mass (AM) values of 1.85 ± 0.01 eV and 1.5 ± 0.05, respectively, recorded at Jaén (blue line): error bars indicate the standard deviation (SD) values related to each of these bands. The “reference” Rc values calculated for each of these bands from the standard AM1.5D spectrum are also shown (green line).
The AM values corresponding to the spectral measurements recorded over the course of the 12-month experimental campaign spread over a large interval, 1.03–16.00; the calculated average AM is 2.19 and, hence, significantly above the standard 1.5 value. In parallel, the broadband DNI values obtained from the pyrheliometer range from 50 to 1047 W·m−2 and average 715 W·m−2, far lower than the 900 W·m−2 standard value. This could be expected because DNI decreases rapidly when AM increases or when thin clouds partly obscure the sun’s disc.
Figure 3 shows the values of <Rc> for every 50-nm band according to each APE bin into which the spectral measurements have been grouped. Higher values of APE imply shorter values of λeff and, thus, higher relative contributions of shorter wavelengths rela-tive to the integrated DNI within 50-nm bands. Conversely, values of <Rc> corresponding to 50-nm bands with longer wavelengths are enhanced as APE decreases (and λeff in-creases). Interestingly, note that <Rc> tends to remain constant in the 600–650-nm spectral band, possibly because it corresponds to the “balance” wavelength for the 350–1050-nm spectrum, close to the effective wavelength of the AM1.5D standard spectrum. It is also worth noting that the results shown in Figure 3 are quite well aligned with those obtained
Figure 2. Mean percentage contributions to direct normal irradiance (DNI)—integrated from 350to 1050 nm—across all 50-nm bands for spectral measurements with Average Photon Energy (APE)and air mass (AM) values of 1.85 ± 0.01 eV and 1.5 ± 0.05, respectively, recorded at Jaén (blue line):error bars indicate the standard deviation (SD) values related to each of these bands. The “reference”Rc values calculated for each of these bands from the standard AM1.5D spectrum are also shown(green line).
The AM values corresponding to the spectral measurements recorded over the courseof the 12-month experimental campaign spread over a large interval, 1.03–16.00; thecalculated average AM is 2.19 and, hence, significantly above the standard 1.5 value. Inparallel, the broadband DNI values obtained from the pyrheliometer range from 50 to1047 W·m−2 and average 715 W·m−2, far lower than the 900 W·m−2 standard value. Thiscould be expected because DNI decreases rapidly when AM increases or when thin cloudspartly obscure the sun’s disc.
Figure 3 shows the values of <Rc> for every 50-nm band according to each APE bininto which the spectral measurements have been grouped. Higher values of APE implyshorter values of λeff and, thus, higher relative contributions of shorter wavelengths relativeto the integrated DNI within 50-nm bands. Conversely, values of <Rc> corresponding to50-nm bands with longer wavelengths are enhanced as APE decreases (and λeff increases).Interestingly, note that <Rc> tends to remain constant in the 600–650-nm spectral band,possibly because it corresponds to the “balance” wavelength for the 350–1050-nm spectrum,close to the effective wavelength of the AM1.5D standard spectrum. It is also worth notingthat the results shown in Figure 3 are quite well aligned with those obtained by Chantanaet al. [34] in their investigation of the purported one-to-one relationship between APE andthe DNI spectrum in Kusatsu (see their Figure 5a).

Appl. Sci. 2021, 11, 897 8 of 15
Appl. Sci. 2021, 11, x FOR PEER REVIEW 8 of 14
by Chantana et al. [34] in their investigation of the purported one-to-one relationship be-tween APE and the DNI spectrum in Kusatsu (see their Figure 5a).
Figure 3. Mean values of relative contributions to DNI—integrated from 350 to 1050 nm—across all 50-nm bands for spectral measurements binned in 0.02-eV-width APE intervals over the range 1.75–1.89 eV (central values), using direct irradiance spectra recorded at Jaén.
Moreover, the results depicted in Figure 3 appear to be a good match for those ob-tained by Minemoto et al. [19] (also for Kusatsu), Norton et al. [31] (for Ispra and Golden, Colorado), Nofuentes et al.[32] (for Jaén and Madrid), and Tsuji et al. [33] for three Japa-nese cities: Kusatsu, Tsukuba, and Miyazaki. It should be kept in mind, though, that the work presented here is not strictly comparable with these studies, as they were carried out to elucidate the possible bijectivity between APE and either the GTI or GHI spectral distribution.
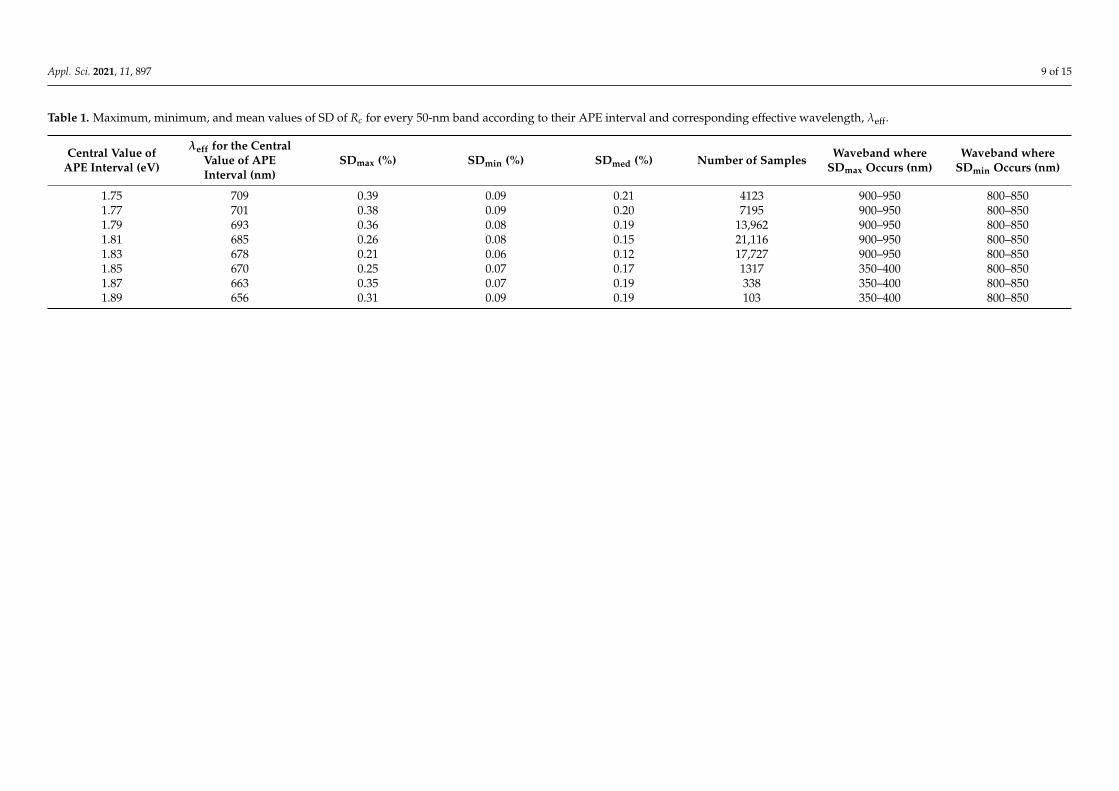
Table 1 provides details about the distribution of the spectral measurements binned by their corresponding APE interval. For each of these APE intervals, Table 1 also indi-cates the corresponding effective wavelength, in conjunction with the maximum, mini-mum, and mean SD values related to the relative contribution to the integrated 350–1050-nm DNI across the fourteen 50-nm bands under scrutiny. Note that only three APE bands (1.79 ± 0.01 eV, 1.81 ± 0.01 eV, and 1.83 ± 0.01 eV) account for 80% of the spectral instances recorded. Moreover, only less than 1% of the spectral measurements are grouped in bins with APE greater than 1.85 eV, which indicates prevailing red-shifted spectra for the site under investigation. As expected from fundamentals of statistics, the scatter around the mean is larger in APE intervals with fewer samples. In spite of this, the maximum values of SD stay below 0.40%. In comparison, the SD values obtained by Chantana et al. [34] at Kusatsu across all the seventy-one 10-nm bands within the 350–1050 nm spectral range do not exceed 0.20%. Remarkably, SD peaks in the same wavebands (350–400 nm and 900–950 nm) at Kusatsu and Jaén, which deserves scrutiny.
Figure 3. Mean values of relative contributions to DNI—integrated from 350 to 1050 nm—acrossall 50-nm bands for spectral measurements binned in 0.02-eV-width APE intervals over the range1.75–1.89 eV (central values), using direct irradiance spectra recorded at Jaén.
Moreover, the results depicted in Figure 3 appear to be a good match for thoseobtained by Minemoto et al. [19] (also for Kusatsu), Norton et al. [31] (for Ispra andGolden, Colorado), Nofuentes et al. [32] (for Jaén and Madrid), and Tsuji et al. [33] forthree Japanese cities: Kusatsu, Tsukuba, and Miyazaki. It should be kept in mind, though,that the work presented here is not strictly comparable with these studies, as they werecarried out to elucidate the possible bijectivity between APE and either the GTI or GHIspectral distribution.
Table 1 provides details about the distribution of the spectral measurements binnedby their corresponding APE interval. For each of these APE intervals, Table 1 also indicatesthe corresponding effective wavelength, in conjunction with the maximum, minimum,and mean SD values related to the relative contribution to the integrated 350–1050-nmDNI across the fourteen 50-nm bands under scrutiny. Note that only three APE bands(1.79 ± 0.01 eV, 1.81 ± 0.01 eV, and 1.83 ± 0.01 eV) account for 80% of the spectral instancesrecorded. Moreover, only less than 1% of the spectral measurements are grouped in binswith APE greater than 1.85 eV, which indicates prevailing red-shifted spectra for the siteunder investigation. As expected from fundamentals of statistics, the scatter around themean is larger in APE intervals with fewer samples. In spite of this, the maximum valuesof SD stay below 0.40%. In comparison, the SD values obtained by Chantana et al. [34] atKusatsu across all the seventy-one 10-nm bands within the 350–1050 nm spectral rangedo not exceed 0.20%. Remarkably, SD peaks in the same wavebands (350–400 nm and900–950 nm) at Kusatsu and Jaén, which deserves scrutiny.
As discussed before [32], SD alone is not enough to suitably assess the dispersion ofRc around its mean for each APE interval across the 350–1050 nm range. Instead, CV is amore meaningful parameter intended for such purpose.
Figure 4 shows the CV values obtained for each 50-nm band grouping defined above.Within the 450–900-nm waveband, CV stays below≈3.5% in contrast with the 900–1050-nmwaveband, where CV is found to reach much larger values, close to 10%. Higher spikeseven occur in the 350–450-nm waveband, where CV reaches up to 13%.
Appl. Sci. 2021, 11, 897 9 of 15
Table 1. Maximum, minimum, and mean values of SD of Rc for every 50-nm band according to their APE interval and corresponding effective wavelength, λeff.
Central Value ofAPE Interval (eV)
λeff for the CentralValue of APEInterval (nm)
SDmax (%) SDmin (%) SDmed (%) Number of Samples Waveband whereSDmax Occurs (nm)
Waveband whereSDmin Occurs (nm)
1.75 709 0.39 0.09 0.21 4123 900–950 800–8501.77 701 0.38 0.09 0.20 7195 900–950 800–8501.79 693 0.36 0.08 0.19 13,962 900–950 800–8501.81 685 0.26 0.08 0.15 21,116 900–950 800–8501.83 678 0.21 0.06 0.12 17,727 900–950 800–8501.85 670 0.25 0.07 0.17 1317 350–400 800–8501.87 663 0.35 0.07 0.19 338 350–400 800–8501.89 656 0.31 0.09 0.19 103 350–400 800–850

Appl. Sci. 2021, 11, 897 10 of 15
Appl. Sci. 2021, 11, x FOR PEER REVIEW 9 of 14
Table 1. Maximum, minimum, and mean values of SD of Rc for every 50-nm band according to their APE interval and corresponding effective wavelength, λeff.
Central Value of APE Interval (eV)
λeff for the Central Value of APE Interval
(nm)
SDmax (%)
SDmin (%)
SDmed (%)
Number of Samples
Waveband where SDmax occurs
(nm)
Waveband where SDmin occurs
(nm) 1.75 709 0.39 0.09 0.21 4123 900–950 800–8501.77 701 0.38 0.09 0.20 7195 900–950 800–8501.79 693 0.36 0.08 0.19 13,962 900–950 800–8501.81 685 0.26 0.08 0.15 21,116 900–950 800–8501.83 678 0.21 0.06 0.12 17,727 900–950 800–8501.85 670 0.25 0.07 0.17 1317 350–400 800–8501.87 663 0.35 0.07 0.19 338 350–400 800–8501.89 656 0.31 0.09 0.19 103 350–400 800–850
As discussed before [32], SD alone is not enough to suitably assess the dispersion of Rc around its mean for each APE interval across the 350–1050 nm range. Instead, CV is a more meaningful parameter intended for such purpose.
Figure 4 shows the CV values obtained for each 50-nm band grouping defined above. Within the 450–900-nm waveband, CV stays below ≈3.5% in contrast with the 900–1050-nm waveband, where CV is found to reach much larger values, close to 10%. Higher spikes even occur in the 350–450-nm waveband, where CV reaches up to 13%.
Figure 4. Coefficient of variation of Rc across all 50-nm bands for spectral measurements binned in 0.02-eV width APE intervals over the range 1.75–1.89 eV (central values), using experimental spec-tral measurements at Jaén.
In practical terms, such results suggest that APE can be assumed to uniquely represent the shape of the direct spectrum within the central 450–900-nm wavelength range only. Following an identical procedure to that described in Section 2.2, Nofuentes et al. [32] came to the same conclusion for Jaén and Madrid regarding the purported one-to-one relationship between APE and spectral GTI. The present confirmation of the findings in [32] is likely related to the similarity between the GTI and DNI spectra under cloudless
Figure 4. Coefficient of variation of Rc across all 50-nm bands for spectral measurements binned in0.02-eV width APE intervals over the range 1.75–1.89 eV (central values), using experimental spectralmeasurements at Jaén.
In practical terms, such results suggest that APE can be assumed to uniquely representthe shape of the direct spectrum within the central 450–900-nm wavelength range only.Following an identical procedure to that described in Section 2.2, Nofuentes et al. [32]came to the same conclusion for Jaén and Madrid regarding the purported one-to-onerelationship between APE and spectral GTI. The present confirmation of the findingsin [32] is likely related to the similarity between the GTI and DNI spectra under cloudlessconditions, as mentioned above. Interestingly, CV values up to 6% and over 30% within the350–400 nm and 900–1050 nm wavebands, respectively, were found in Japan [33]. However,despite the fact that such high CV values indicate a large scatter of Rc around its mean,Tsuji et al. [33] claimed that APE is a unique characteristic of the GTI spectrum distribution.In any case, the results depicted in Figure 4 deserve some further discussion from both theexperimental and theoretical standpoints.
The expanded uncertainties (U95) for the spectral measurements obtained with thepresent spectroradiometer used are ±10.89%, ±4.13%, and ±4.06% for the 350–450 nm,450–900 nm, and 900–1050 nm wavebands, respectively, according to the certificate ofcalibration issued by the manufacturer. No significant additional uncertainty resultingfrom actual outdoor laboratory measurement conditions is likely because the instrumentwas cleaned each working day. It was, however, not cleaned during a week in March2013 and another week in August 2013. Given the relative short periods of time duringwhich the instrument remained uncleaned, no significant differences were found betweenspectral data collected in such periods relative to those gleaned over the course of the entireexperimental campaign.
The dispersion noticed for Rc below 450 nm and the resulting higher values of CV maybe explained in part by the higher values of U95 at these shorter wavelengths. As discussedpreviously [32], however, another contribution is likely related to the substantial dailyvariance in AOD, which has a large impact on the direct spectrum at short wavelengths [46].In contrast, the lowest U95 values occur above 900 nm, where CV also peaks. This wouldseem paradoxical if U95 was the only driver of CV variations along the spectrum, whichthus requires scrutiny. As mentioned by Nofuentes et al. [32], it should be borne in mindthat the instrument undergoes calibration indoors in a laboratory at a constant ambienttemperature (25 ◦C), thus avoiding the potential impact of large temperature excursions

Appl. Sci. 2021, 11, 897 11 of 15
during sunny days. Those field conditions could influence the reading accuracy in the NIRpart of the spectrum much more than at shorter wavelengths [47,48]. This temperatureeffect should be small here, however, because the detector core of this specific instrumentis temperature controlled and has a specified temperature range of −10 to 50 ◦C. A morelikely explanation for the high CV in the NIR is that the spectral irradiance is weak theredue to water vapor absorption. Therefore, measurements in that band are more vulnerableto the influence of noise, which increases the actual measurement uncertainty. Moreover,water vapor conditions (characterized by PW) are variable on a daily basis over Jaén, whichcreates strong variance in the 900–950 nm waveband, where water vapor absorption is thestrongest relative to the whole 350–1050 nm range.
The results shown in Figure 4 confirm previous theoretical findings obtained by meansof synthetic spectra generated by the SMARTS radiation model for various ideal atmo-spheric conditions [35]. Both modeled and experimental spectra obtained under variableconditions show that AM and AOD influence APE in a way that longer wavelengths areenhanced when they increase (red shift). On the other hand, PW has a more limited but an-tagonistic effect (blue shift). Hence, different sets of conditions (AM, AOD, and PW) couldlead to dissimilar spectral distributions of DNI that would exhibit the same value of APE.As a result, Gueymard [35] concluded that APE was not appropriate to characterize theDNI spectral shape with a single number. The present results tend to confirm that finding.
4. Conclusions
This study investigated whether the average photon energy (APE) uniquely representsthe direct normal irradiance (DNI) spectrum over the 350–1050 nm band at Jaén, a Spanishsunny site with Mediterranean-Continental climate. No previous study focusing on theapplication of APE to the direct spectrum is known except at a Japanese location in adifferent climate.
The methodology used here is based on a procedure that was previously applied toassess the possible bijectivity between APE and the global tilted irradiance (GTI) spectrumat both Jaén and Madrid. This procedure centers on the analysis of the coefficient ofvariation (CV) of the relative importance of contributions of 50-nm bands compared tothe integrated DNI (from 350 to 1050 nm) of the spectral distributions binned in specificAPE intervals.
DNI spectra from 350 to 1050 nm were collected over the course of a 12-month ex-perimental campaign. Over the range 450–900 nm, spectral distributions obtained for anAPE of ≈1.85 eV and air mass (AM) of ≈1.5 match quite well that of the standard AM1.5Dspectrum used as reference in concentrating photovoltaic applications. Nevertheless, somescatter is noticed outside of this central band. Likewise, spectral distributions correspond-ing to measurements binned in the same APE interval are well aligned within 450–900 nm,where CV remains below ≈3.5%. In contrast, this concordance does not hold outside ofthat spectral range, considering that CV reaches values of up to ≈10% and 13% within350–450 nm and 900–1050 nm, respectively. This significant scatter at shorter wavelengthsis only partially ascribed to the measurement uncertainty of the spectroradiometer reportedby the manufacturer, which is relatively large below 450 nm. Theoretical considerationsreveal that another explanation for the high CV there is related to the temporal variance inaerosol optical depth, which is significant at Jaen, and results in a more or less pronouncedred shift in the spectrum. In contrast, the measuring uncertainty is far smaller beyond900 nm, but steep temperature excursions during the day may influence measurements.Additionally, weak signal levels around the water vapor absorption band (940 nm) areespecially vulnerable to noise, thus conducing an increased uncertainty related to themeasurements in such band. Temporal variance in atmospheric precipitable water alsoinduces a more or less significant blue shift of the spectrum.
From a theoretical standpoint, the results presented here confirm previous radiativetransfer simulations that rejected the APE bijectivity by showing how a single APE value

Appl. Sci. 2021, 11, 897 12 of 15
could be obtained by combining different values of air mass, aerosol optical depth, andprecipitable water, thus shaping significantly different DNI spectral distributions.
To summarize, the results presented in this study disprove the currently assumedone-to-one relationship between APE and the spectral DNI within the whole 350–1050 nmwaveband. Rather, APE may only be assumed to uniquely characterize the DNI spectrumdistribution only from ≈450 to 900 nm for Jaén in practical terms. Hence, this limitedband is recommended when using APE to model the spectral impact on concentratingPV devices. The present findings confirm those from a previous work that focused ratheron the GTI spectrum, which is the reference for flat-plate PV applications. The presentconclusion that bijectivity is valid over only a part of the DNI spectrum presumably holdsfor sites with a similar climate as Jaén, although further verification is needed. Hence,further collection and analysis of spectrally resolved DNI data are desirable at more sitesworldwide to better evaluate the impact of local climate, since this type of experimentalmethodology has been done so far at only two sites in relatively temperate climates, whichdo not allow drawing general conclusions on a worldwide basis.
Author Contributions: Conceptualization, methodology, and writing—review and editing, G.N.;conceptualization, methodology, supervision, and writing—review and editing, C.A.G.; software anddata curation, J.A.C.; software, G.M.-N.; funding acquisition, project administration, and supervision,J.A. All authors have read and agreed to the published version of the manuscript.
Funding: This research was funded by the Spanish Science and Innovation Ministry (Ministerio deCiencia e Innovación de España) and the ERDF, grant number ENE2009-08302, within the frame of theProject “Analysis and characterization of a concentrated PV system under natural sunlight. Compari-son with other PV technologies” (Análisis y caracterización de un sistema fotovoltaico de concentración asol real. Comparativa con otras tecnologías fotovoltaicas). This work was also funded by the Departmentof Science and Innovation of the Regional Government of Andalucía (Consejería de Innovación, Cienciay Empresa de la Junta de Andalucía), grant number P09-TEP-5045, within the frame of the Project“Analysis and characterization of a concentrated PV system under natural sunlight. Comparisonwith other PV technologies” (“Análisis y caracterización de un sistema fotovoltaico de concentración a solreal. Comparativa con otras tecnologías fotovoltaicas”).
Institutional Review Board Statement: Not applicable.
Informed Consent Statement: Not applicable.
Data Availability Statement: Not applicable.
Acknowledgments: Guilherme Marques-Neves acknowledges the Brazilian National Council forScientific and Technological Development (CNPq) for granting a scholarship to support his stay at theUniversity of Jaén. The authors greatly acknowledge the technical support of Beatriz García-Domingoand Miguel Torres Ramírez during the experimental campaign.
Conflicts of Interest: The authors declare no conflict of interest. The funders had no role in the designof the study; in the collection, analyses, or interpretation of data; in the writing of the manuscript; orin the decision to publish the results.
Abbreviations
TerminologyDNI Direct normal irradianceGHI Global horizontal irradianceGTI Global tilted irradianceIEC International Electrotechnical CommissionPV Photovoltaic(s)SMARTS Simple Model of the Atmospheric Radiative Transfer of Sunshine

Appl. Sci. 2021, 11, 897 13 of 15
Symbolsa Lower wavelength limit of an interval of the spectrum (nm)AM Air massAPE Average photon energy (eV)AOD Aerosol optical depth at any wavelengthb Upper wavelength limit of an interval of the spectrum (nm)BF Blue fractionCV Coefficient of variation (%)E(λ) Spectral Irradiance of the actual solar spectrum (W·m−2·nm−1)MM Spectral mismatch factorPW Precipitable water (cm)Rc Percentage contribution of a spectral band of a recorded spectral (%)
measurement to the broadband irradianceSD Standard deviation of Rc for every 50-nm band and the same APE interval (%)SDmax Maximum value of standard deviation of Rc for every 50-nm band and the
same APE interval (%)SDmean Average value of standard deviation of Rc for every 50-nm band and
the same APE interval (%)SDmin Minimum value of standard deviation of Rc for every 50-nm band and (%)
the same APE intervalU95 Expanded uncertainty related to spectral measurements (%)UF Useful fractionΦph(λ) Spectral Photon Flux Density (m−2·nm−1·s−1)λeff Effective wavelength (nm)
References1. IEC 61724-1. Photovoltaic System Performance—Part 1: Monitoring; International Electrotechnical Commission (IEC): Geneva,
Switzerland, 2017.2. Leloux, J.; Lorenzo, E.; García-Domingo, B.; Aguilera, J.; Gueymard, C.A. A Bankable Method of Assessing the Performance of a
CPV Plant. Appl. Energy 2014, 118, 1–11. [CrossRef]3. De la Parra, I.; Muñoz, M.; Lorenzo, E.; García, M.; Marcos, J.; Martínez-Moreno, F. PV Performance Modelling: A Review in the
Light of Quality Assurance for Large PV Plants. Renew. Sustain. Energy Rev. 2017, 78, 780–797. [CrossRef]4. Duck, B.C.; Fell, C.J. Improving the Spectral Correction Function. In Proceedings of the 43rd IEEE Photovoltaic Specialists
Conference (PVSC), Portland, OR, USA, 5–10 June 2016; pp. 2647–2652. [CrossRef]5. Pierro, M.; Bucci, F.; Cornaro, C. Full Characterization of Photovoltaic Modules in Real Operating Conditions: Theoretical Model,
Measurement Method and Results. Prog. Photovolt. Res. Appl. 2015, 23, 443–461. [CrossRef]6. Shanks, K.; Senthilarasu, S.; Mallick, T.K. High-Concentration Optics for Photovoltaic Applications. In High Concentrator
Photovoltaics. Fundamentals, Engineering and Power Plants; Pérez-Higueras, P.J., Fernández, E.F., Eds.; Springer InternationalPublishing: Geneva, Switzerland, 2015; pp. 85–114. [CrossRef]
7. Fernández, E.F.; Soria-Moya, A.; Almonacid, F.; Aguilera, J. Comparative Assessment of the Spectral Impact on the Energy Yieldof High Concentrator and Conventional Photovoltaic Technology. Sol. Energy Mater. Sol. Cells 2016, 147, 185–197. [CrossRef]
8. Rodrigo, P.M.; Fernández, E.F.; Almonacid, F.M.; Pérez-Higueras, P.J. Quantification of the Spectral Coupling of Atmosphere andPhotovoltaic System Performance: Indexes, Methods and Impact on Energy Harvesting. Sol. Energy Mater. Sol. Cells 2017, 163,73–90. [CrossRef]
9. IEC 60904-7. Photovoltaic Devices—Part 7: Computation of the Spectral Mismatch Correction for Measurements of Photovoltaic Devices;International Electrotechnical Commission (IEC): Geneva, Switzerland, 2008.
10. Betts, T.R.; Infield, D.G.; Gottschalg, R. Spectral Irradiance Correction for PV System Yield Calculations. In Proceedings of the19th European Photovoltaic Solar Energy Conference, Paris, France, 7–11 June 2004; pp. 2533–2536.
11. Hofmann, M.; Vanicek, P.; Haselbuhn, R. Is the Average Photon Energy (APE) a Suitable Measure to Describe the Uniquenessof Solar Spectra? In Proceedings of the 29th European Photovoltaic Solar Energy Conference and Exhibition, Paris, France,22–26 September 2014; pp. 3461–3466.
12. Dirnberger, D.; Blackburn, G.; Müller, B.; Reise, C. On the Impact of Solar Spectral Irradiance on the Yield of Different PVTechnologies. Sol. Energy Mater. Sol. Cells 2015, 132, 431–442. [CrossRef]
13. Peharz, G.; Siefer, G.; Bett, A.W. A Simple Method for Quantifying Spectral Impacts on Multi-Junction Solar Cells. Sol. Energy2009, 83, 1588–1598. [CrossRef]
14. Fernández, E.F.; Almonacid, F. Spectrally Corrected Direct Normal Irradiance Based on Artificial Neural Networks for HighConcentrator Photovoltaic Applications. Energy 2014, 74, 941–949. [CrossRef]
Appl. Sci. 2021, 11, 897 14 of 15
15. Sutterlueti, J.; Ransome, S.; Kravets, R.; Schreier, L. Characterising PV Modules under Outdoor Conditions: What’s MostImportant for Energy Yield. In Proceedings of the 26th European Photovoltaic Solar Energy Conference and Exhibition, Hamburg,Germany, 5–11 September 2011.
16. Jardine, C.N.; Betts, T.R.; Gottschalg, R.; Infield, D.G.; Lane, K. Influence of Spectral Effects on the Performance of Multi-junction Amorphous. In Proceedings of the Photovoltaic in Europe—From PV Technology to Energy Solutions, Rome, Italy,7–11 October 2002.
17. Louwen, A.; de Waal, A.C.; van Sark, W.G. Evaluation of Different Indicators for Representing Solar Spectral Variation. InProceedings of the 43rd IEEE Photovoltaic Specialists Conference (PVSC), Portland, OR, USA, 5–10 June 2016; pp. 133–137.[CrossRef]
18. Paudyal, B.R.; Imenes, A.G. Analysis of Spectral Irradiance Distribution for PV Applications at High Latitude. In Proceedingsof the 47th IEEE Photovoltaic Specialists Conference (PVSC), Calgary, OR, Canada, 15 June–21 August 2020; pp. 1834–1841.[CrossRef]
19. Minemoto, T.; Nakada, Y.; Takahashi, H.; Takakura, H. Uniqueness Verification of Solar Spectrum Index of Average PhotonEnergy for Evaluating Outdoor Performance of Photovoltaic Modules. Sol. Energy 2009, 83, 1294–1299. [CrossRef]
20. IEC 60904-9. Photovoltaic Devices—Part 9: Solar Simulator Performance Requirements; International Electrotechnical Commission(IEC): Geneva, Switzerland, 2007.
21. Gottschalg, R.; Betts, T.R.; Infield, D.G.; Kearney, M.J. Experimental Investigation of Spectral Effects on Amorphous Silicon SolarCells in Outdoor Operation. In Proceedings of the Conference Record of the 29th IEEE Photovoltaic Specialists Conference, NewOrleans, LA, USA, 19–24 May 2002; pp. 1138–1141. [CrossRef]
22. Gottschalg, R.; Betts, T.R.; Infield, D.G.; Kearney, M.J. On the Importance of Considering the Incident Spectrum When Measuringthe Outdoor Performance of Amorphous Silicon Photovoltaic Devices. Meas. Sci. Technol. 2004, 15, 460. [CrossRef]
23. Gottschalg, R.; Betts, T.R.; Infield, D.G.; Kearney, M.J. The Effect of Spectral Variations on the Performance Parameters of Singleand Double Junction Amorphous Silicon Solar Cells. Sol. Energy Mater. Sol. Cells 2005, 85, 415–428. [CrossRef]
24. Takahashi, H.; Fukushige, S.; Minemoto, T.; Takakura, H. Output Estimation of Si-Based Photovoltaic Modules with OutdoorEnvironment and Output Map. J. Cryst. Growth 2009, 311, 749–752. [CrossRef]
25. Minemoto, T.; Takahashi, H.; Nakada, Y.; Takakura, H. Outdoor Performance Evaluation of Photovoltaic Modules Using ContourPlots. Curr. Appl. Phys. 2010, 10, S257–S260. [CrossRef]
26. Nofuentes, G.; de la Casa, J.; Torres-Ramírez, M.; Alonso-Abella, M. Solar Spectral and Module Temperature Influence on theOutdoor Performance of Thin Film PV Modules Deployed on a Sunny Inland Site. Int. J. Photoenergy 2013, 2013. [CrossRef]
27. Yoshida, S.; Ueno, S.; Kataoka, N.; Takakura, H.; Minemoto, T. Estimation of Global Tilted Irradiance and Output Energy UsingMeteorological Data and Performance of Photovoltaic Modules. Sol. Energy 2013, 93, 90–99. [CrossRef]
28. Cornaro, C.; Andreotti, A. Influence of Average Photon Energy Index on Solar Irradiance Characteristics and Outdoor Performanceof Photovoltaic Modules. Prog. Photovolt. Res. Appl. 2013, 21, 996–1003. [CrossRef]
29. Sirisamphanwong, C.; Sirisamphanwong, C.; Ketjoy, N. The Effect of Average Photon Energy and Module Temperature onPerformance of Photovoltaic Module under Thailand’s Climate Condition. Energy Procedia 2014, 56, 359–366. [CrossRef]
30. Chantana, J.; Imai, Y.; Kawano, Y.; Hishikawa, Y.; Nishioka, K.; Minemoto, T. Impact of Average Photon Energy on Spectral Gainand Loss of Various-Type PV Technologies at Different Locations. Renew. Energy 2020, 145, 1317–1324. [CrossRef]
31. Norton, M.; Amillo, A.M.G.; Galleano, R. Comparison of Solar Spectral Irradiance Measurements Using the Average PhotonEnergy Parameter. Sol. Energy 2015, 120, 337–344. [CrossRef]
32. Nofuentes, G.; Gueymard, C.A.; Aguilera, J.; Pérez-Godoy, M.D.; Charte, F. Is the Average Photon Energy a Unique Characteristicof the Spectral Distribution of Global Irradiance? Sol. Energy 2017, 149, 32–43. [CrossRef]
33. Tsuji, M.; Rahman, M.M.; Hishikawa, Y.; Nishioka, K.; Minemoto, T. Uniqueness Verification of Solar Spectrum Obtained fromThree Sites in Japan Based on Similar Index of Average Photon Energy. Sol. Energy 2018, 173, 89–96. [CrossRef]
34. Chantana, J.; Ueno, S.; Ota, Y.; Nishioka, K.; Minemoto, T. Uniqueness Verification of Direct Solar Spectral Index for EstimatingOutdoor Performance of Concentrator Photovoltaic Systems. Renew. Energy 2015, 75, 762–766. [CrossRef]
35. Gueymard, C.A. Daily Spectral Effects on Concentrating PV Solar Cells as Affected by Realistic Aerosol Optical Depth and OtherAtmospheric Conditions. In Proceedings of the SPIE Optical Modeling and Measurements for Solar Energy Systems III, SanDiego, CA, USA, 2–4 August 2009. [CrossRef]
36. Gueymard, C.A. The SMARTS Spectral Irradiance Model after 25 Years: New Developments and Validation of Reference Spectra.Sol. Energy 2019, 187, 233–253. [CrossRef]
37. Alonso-Abella, M.; Chenlo, F.; Nofuentes, G.; Torres-Ramírez, M. Analysis of Spectral Effects on the Energy Yield of Different PV(Photovoltaic) Technologies: The Case of Four Specific Sites. Energy 2014, 67, 435–443. [CrossRef]
38. García-Domingo, B.; Aguilera, J.; de la Casa, J.; Fuentes, M. Modelling the Influence of Atmospheric Conditions on the OutdoorReal Performance of a CPV (Concentrated Photovoltaic) Module. Energy 2014, 70, 239–250. [CrossRef]
39. García, R.; Torres-Ramírez, M.; Muñoz-Cerón, E.; de la Casa, J.; Aguilera, J. Spectral Characterization of the Solar Resource of aSunny Inland Site for Flat Plate and Concentrating PV Systems. Renew. Energy 2017, 101, 1169–1179. [CrossRef]
40. Nofuentes, G.; García-Domingo, B.; Muñoz, J.V.; Chenlo, F. Analysis of the Dependence of the Spectral Factor of Some PVTechnologies on the Solar Spectrum Distribution. Appl. Energy 2014, 113, 302–309. [CrossRef]

Appl. Sci. 2021, 11, 897 15 of 15
41. Ye, J.Y.; Reindl, T.; Aberle, A.G.; Walsh, T.M. Effect of Solar Spectrum on the Performance of Various Thin-Film PV ModuleTechnologies in Tropical Singapore. IEEE J. Photovolt. 2014, 4, 1268–1274. [CrossRef]
42. Nofuentes, G.; de la Casa, J.; Solís-Alemán, E.M.; Fernández, E.F. Spectral Impact on PV Performance in Mid-Latitude SunnyInland Sites: Experimental vs. Modelled Results. Energy 2017, 141, 1857–1868. [CrossRef]
43. Neves, G.; Vilela, W.; Pereira, E.; Yamasoe, M.; Nofuentes, G. Spectral Impact on PV in Low-Latitude Sites: The Case ofSoutheastern Brazil. Renew. Energy 2021, 164, 1306–1319. [CrossRef]
44. Polo, J.; Alonso-Abella, M.; Ruiz-Arias, J.A.; Balenzategui, J.L. Worldwide Analysis of Spectral Factors for Seven PhotovoltaicTechnologies. Sol. Energy 2017, 142, 194–203. [CrossRef]
45. Gueymard, C.A.; Myers, D.; Emery, K. Proposed Reference Irradiance Spectra for Solar Energy Systems Testing. Sol. Energy 2002,73, 443–467. [CrossRef]
46. Gueymard, C.A. Interdisciplinary Applications of a Versatile Spectral Solar Irradiance Model: A Review. Energy 2005, 30,1551–1576. [CrossRef]
47. Myers, D.R. Estimates of Uncertainty for Measured Spectra in the SERI Spectral Solar Radiation Data Base. Sol. Energy 1989, 43,347–353. [CrossRef]
48. Schubert, F.; Klameth, K.; Darou, S.; Spinner, D. Measurement Uncertainties of a Compact Array Spectrometer. Energy Procedia2015, 77, 179–186. [CrossRef]
Copyright © 2022 FDOKUMEN