Ab initio many-body calculations on infinite carbon and boron-nitrogen chains
Upload
khangminh22Category
view
0download
0
Ab initio study of free and depositedtransition metal clusters
Dissertation
zur Erlangung des Grades
Doktor der Naturwissenschaften
an der Fakultät für Physik
der Universität Duisburg-Essen
von
Frau Sanjubala Sahoo
aus Odisha, Indien
Referent: Prof. Dr. Peter Entel
Korreferent: Prof. Dr. Hubert Ebert
Tag der mündlichen Prüfung: 15.08.2011

Contents
Abstract 11
Zusammenfassung 13
1 Introduction 151.1 Magnetism in low dimensional systems . . . . . . . . . . . . . . . .. . . . . . . . 15
1.2 Origin of magnetism in atoms: Hund’s rules . . . . . . . . . . . .. . . . . . . . . . 17
1.3 Cluster magnetism . . . . . . . . . . . . . . . . . . . . . . . . . . . . . . . .. . . 17
1.4 Magnetism in bulk . . . . . . . . . . . . . . . . . . . . . . . . . . . . . . . . .. . 18
1.5 Jahn-Teller effect . . . . . . . . . . . . . . . . . . . . . . . . . . . . . . .. . . . . 19
1.6 Other general aspects of clusters . . . . . . . . . . . . . . . . . . .. . . . . . . . . 20
1.7 Experimental techniques for synthesis of clusters . . . .. . . . . . . . . . . . . . . 21
1.8 Experimental characterization of clusters . . . . . . . . . .. . . . . . . . . . . . . . 22
1.9 Outline of thesis . . . . . . . . . . . . . . . . . . . . . . . . . . . . . . . . .. . . . 23
2 Density functional theory 252.1 Thomas-Fermi-Dirac model . . . . . . . . . . . . . . . . . . . . . . . . .. . . . . 25
2.2 The Hohenberg-Kohn theorems . . . . . . . . . . . . . . . . . . . . . . .. . . . . . 26
2.3 The Kohn-Sham approach . . . . . . . . . . . . . . . . . . . . . . . . . . . .. . . 27
2.4 Exchange correlation functionals . . . . . . . . . . . . . . . . . .. . . . . . . . . . 28
2.4.1 Local density approximation (LDA) . . . . . . . . . . . . . . . .. . . . . . 28
2.4.2 Generalized-gradient approximation (GGA) . . . . . . . .. . . . . . . . . . 29
2.5 Basis sets . . . . . . . . . . . . . . . . . . . . . . . . . . . . . . . . . . . . . . .. 29
2.5.1 Localized basis sets . . . . . . . . . . . . . . . . . . . . . . . . . . . .. . . 29
2.5.2 Plane wave basis sets . . . . . . . . . . . . . . . . . . . . . . . . . . . .. . 30
2.6 Pseudopotentials . . . . . . . . . . . . . . . . . . . . . . . . . . . . . . . .. . . . 31
2.6.1 Norm-conserving pseudopotentials . . . . . . . . . . . . . . .. . . . . . . 31
2.7 Projector augmented wave (PAW) method . . . . . . . . . . . . . . .. . . . . . . . 32
2.8 Noncollinear magnetism . . . . . . . . . . . . . . . . . . . . . . . . . . .. . . . . 33
2.9 Spin-orbit coupling . . . . . . . . . . . . . . . . . . . . . . . . . . . . . .. . . . . 33
2.10 Methods for the determination of magnetocrystalline anisotropy . . . . . . . . . . . 34
2.11 Electronic structure calculations . . . . . . . . . . . . . . . .. . . . . . . . . . . . 34
3

Contents
2.11.1 Single point energy calculations . . . . . . . . . . . . . . . .. . . . . . . . 34
2.11.2 Geometry optimization . . . . . . . . . . . . . . . . . . . . . . . . .. . . . 36
3 Structure and magnetism in transition metal clusters 38
3.1 Introduction . . . . . . . . . . . . . . . . . . . . . . . . . . . . . . . . . . . .. . . 38
3.2 Elemental clusters . . . . . . . . . . . . . . . . . . . . . . . . . . . . . . .. . . . . 39
3.2.1 NiN clusters . . . . . . . . . . . . . . . . . . . . . . . . . . . . . . . . . . . 40
3.2.2 FeN clusters . . . . . . . . . . . . . . . . . . . . . . . . . . . . . . . . . . . 42
3.3 Size dependence of the magnetic moments . . . . . . . . . . . . . .. . . . . . . . . 47
3.4 Binary clusters: Segregation and mixing . . . . . . . . . . . . .. . . . . . . . . . . 48
3.4.1 Fe-Ni . . . . . . . . . . . . . . . . . . . . . . . . . . . . . . . . . . . . . . 52
3.4.2 Fe-Co . . . . . . . . . . . . . . . . . . . . . . . . . . . . . . . . . . . . . . 55
3.4.3 Fe-Pt . . . . . . . . . . . . . . . . . . . . . . . . . . . . . . . . . . . . . . 58
3.4.4 Co-Pt . . . . . . . . . . . . . . . . . . . . . . . . . . . . . . . . . . . . . . 63
3.4.5 Co-Mn . . . . . . . . . . . . . . . . . . . . . . . . . . . . . . . . . . . . . 63
4 Magnetic anisotropy of clusters 69
4.1 Introduction . . . . . . . . . . . . . . . . . . . . . . . . . . . . . . . . . . . .. . . 69
4.1.1 Magnetoelasticity . . . . . . . . . . . . . . . . . . . . . . . . . . . . .. . . 70
4.1.2 Magnetic anisotropy in thin films and wires . . . . . . . . . .. . . . . . . . 70
4.2 Spin moments, orbital moments and magnetic anisotropy for clusters . . . . . . . . . 72
4.3 Computational details . . . . . . . . . . . . . . . . . . . . . . . . . . . .. . . . . . 73
4.4 Elemental clusters . . . . . . . . . . . . . . . . . . . . . . . . . . . . . . .. . . . . 74
4.4.1 MAE of perfect clusters . . . . . . . . . . . . . . . . . . . . . . . . . .. . 75
4.4.2 Structural distortion of relaxed clusters . . . . . . . . .. . . . . . . . . . . 76
4.4.3 Spin and orbital magnetic moments of relaxed clusters. . . . . . . . . . . . 78
4.4.4 MAE of relaxed clusters . . . . . . . . . . . . . . . . . . . . . . . . . .. . 79
4.4.5 Pt capped clusters: (Fe, Co, Ni)13Ptn . . . . . . . . . . . . . . . . . . . . . . 80
4.4.6 Fe13Ptn . . . . . . . . . . . . . . . . . . . . . . . . . . . . . . . . . . . . . 84
4.4.7 Co13Ptn . . . . . . . . . . . . . . . . . . . . . . . . . . . . . . . . . . . . . 84
4.4.8 Ni13Ptn . . . . . . . . . . . . . . . . . . . . . . . . . . . . . . . . . . . . . 84
5 Structure and magnetism of clusters on Pt surfaces 88
5.1 Introduction . . . . . . . . . . . . . . . . . . . . . . . . . . . . . . . . . . . .. . . 88
5.2 Deposited elemental clusters . . . . . . . . . . . . . . . . . . . . . .. . . . . . . . 89
5.2.1 Structural stability of M13 and M55 clusters on Pt(001) and Pt(111) . . . . . 89
5.2.2 Spin and orbital moments of deposited elemental clusters . . . . . . . . . . . 91
5.3 Deposited binary clusters: L10 (FePt)55 on Pt surfaces . . . . . . . . . . . . . . . . . 93
4
Contents
6 Transition metal clusters on graphene 99
6.1 Introduction . . . . . . . . . . . . . . . . . . . . . . . . . . . . . . . . . . . .. . . 99
6.2 Computational details . . . . . . . . . . . . . . . . . . . . . . . . . . . .. . . . . . 100
6.3 Clusters on defect free graphene sheet . . . . . . . . . . . . . . .. . . . . . . . . . 100
6.4 Clusters on five-member ring graphene . . . . . . . . . . . . . . . .. . . . . . . . . 103
6.5 CO adsorption on clusters deposited on five member ring graphene . . . . . . . . . . 106
6.6 CO oxidation on pristine graphene . . . . . . . . . . . . . . . . . . .. . . . . . . . 108
7 Exact diagonalization and thermodynamics of clusters 1117.1 Introduction . . . . . . . . . . . . . . . . . . . . . . . . . . . . . . . . . . . .. . . 111
7.2 Theoretical method . . . . . . . . . . . . . . . . . . . . . . . . . . . . . . .. . . . 112
7.3 13-atom clusters with spin-12 . . . . . . . . . . . . . . . . . . . . . . . . . . . . . . 114
7.4 4-atom cluster: Tetrahedron and square . . . . . . . . . . . . . .. . . . . . . . . . 123
7.4.1 Square (s =12 ) . . . . . . . . . . . . . . . . . . . . . . . . . . . . . . . . . . 123
7.4.2 Tetrahedron and square with s = 1 . . . . . . . . . . . . . . . . . . .. . . . 124
7.5 13-atom icosahedron with spin-1 . . . . . . . . . . . . . . . . . . . .. . . . . . . . 128
8 Summary and outlook 1318.1 Summary . . . . . . . . . . . . . . . . . . . . . . . . . . . . . . . . . . . . . . . . 131
8.2 Outlook . . . . . . . . . . . . . . . . . . . . . . . . . . . . . . . . . . . . . . . . .134
Appendix 137
Acknowledgments 161
5
List of Figures
1.1 Energy differences between icosahedra and cuboctahedra for TM clusters . . . . . . 16
1.2 Example of Jahn-Teller effect . . . . . . . . . . . . . . . . . . . . . .. . . . . . . . 19
3.1 The energetically favorable structures of NiN clusters . . . . . . . . . . . . . . . . . 42
3.2 Comparison of magnetic moments for NiN clusters between theory and experiment . 43
3.3 The fixed spin moment studies for Fe13 obtained from the fixed spin moment method 45
3.4 The variation of binding energy with respect to cluster size for NiN and FeN . . . . . 45
3.5 The average magnetic moment as a function of cluster sizefor NiN and FeN . . . . . 46
3.6 The variation of HOMO-LUMO gap as a function of cluster size for NiN and FeN . . 46
3.7 Magnetic moments per atom for FeN, CoN and NiN clusters obtained from experimen-
tal results . . . . . . . . . . . . . . . . . . . . . . . . . . . . . . . . . . . . . . . . 49
3.8 The variation of energies and magnetic moments as a function of cluster size for FeNclusters . . . . . . . . . . . . . . . . . . . . . . . . . . . . . . . . . . . . . . . . . 50
3.9 Surface distributions of each species of binary 13-atomicosahedral clusters . . . . . 51
3.10 The lowest energy structures for Fe13−nNin clusters . . . . . . . . . . . . . . . . . . 54
3.11 Possible distributions of two Ni atoms on the surface ofFe13 clusters and the energetics 55
3.12 The nearest neighbour bonds for Fe13Ni13−n cluster . . . . . . . . . . . . . . . . . . 55
3.13 Comparison of mixing energy for Fe13Ni13−n clusters with bulk alloy as a function of
Ni concentration . . . . . . . . . . . . . . . . . . . . . . . . . . . . . . . . . . . .. 56
3.14 The composition-dependent mixing energy of (Fe-Ni)3,4,5 clusters . . . . . . . . . . 56
3.15 The composition-dependent mixing energy for Fe6−nNin octahedron . . . . . . . . . 57
3.16 Energetically favorable structures for Fe43Ni12 and Fe12Ni43 clusters . . . . . . . . . 57
3.17 Low energy structures of Fe13−nCon clusters . . . . . . . . . . . . . . . . . . . . . . 60
3.18 The variation of nearest neighbour bonds with respect to the number of Co atoms for
Fe13−nCon clusters . . . . . . . . . . . . . . . . . . . . . . . . . . . . . . . . . . . 60
3.19 The energetically favorable structures of Fe13−nPtn clusters . . . . . . . . . . . . . . 61
3.20 The number of nearest-neighbor bonds and mixing energies of Fe13−nPtn clusters . . 62
3.21 Composition-dependent mixing energies for Co13−nPtn clusters . . . . . . . . . . . . 64
3.22 Composition-dependent mixing energies for Co13−nMnn clusters . . . . . . . . . . . 65
3.23 The magnetic moments for Co13−nMnn clusters . . . . . . . . . . . . . . . . . . . . 65
3.24 Electronic density of states for Co13−nMnn clusters . . . . . . . . . . . . . . . . . . 66
6
List of Figures
3.25 Magnetic moments for (Co-Mn)55 clusters . . . . . . . . . . . . . . . . . . . . . . . 67
3.26 Mixing energy and magnetic moments for 13-atom binary systems . . . . . . . . . . 68
4.1 The phase diagram of a free standing 10-atom chain . . . . . .. . . . . . . . . . . . 71
4.2 Tight binding studies for magnetic anisotropy of Co clusters . . . . . . . . . . . . . 73
4.3 The perfect icosahedron showing thex-z plane, used for the calculation of MAE . . . 75
4.4 Magnetic anisotropy of perfect cluster . . . . . . . . . . . . . .. . . . . . . . . . . 76
4.5 The Jahn-Teller and Mackay distorted Fe13 clusters . . . . . . . . . . . . . . . . . . 77
4.6 The energetics for Fe13 clusters . . . . . . . . . . . . . . . . . . . . . . . . . . . . . 78
4.7 The magnetic anisotropy for relaxed Fe13, Co13 and Ni13 . . . . . . . . . . . . . . . 81
4.8 Low energy isomers of Co13Pt3 and Co13Pt5 . . . . . . . . . . . . . . . . . . . . . . 81
4.9 The comparison of spin and orbital moments for Ni13Pt3 obtained by VASP and FPLO 82
4.10 Orbital magnetic moments for (Fe, Co and Ni)-Pt clusters . . . . . . . . . . . . . . . 82
4.11 Spin magnetic moments for (Fe, Co and Ni)-Pt clusters . .. . . . . . . . . . . . . . 83
4.12 Magnetic anisotropy for Fe13Pt4 cluster . . . . . . . . . . . . . . . . . . . . . . . . 85
5.1 The optimized structure of Co13 on Pt(001) surface . . . . . . . . . . . . . . . . . . 90
5.2 Optimized structures of Fe55 and Co55 on Pt(001) substrate . . . . . . . . . . . . . . 91
5.3 A comparison of density of states for free and clusters supported on Pt(001) and Pt(111) 92
5.4 The magnetic anisotropy for a Ni(111) monolayer . . . . . . .. . . . . . . . . . . . 93
5.5 Magnetic anisotropy of Fe13 on Pt(111) . . . . . . . . . . . . . . . . . . . . . . . . 94
5.6 The perfect icosahedral and L10 structures for Fe5Pt8 and Fe24Pt31 clusters . . . . . . 95
5.7 Magnetic moments for free and supported Fe5Pt8 and Fe24Pt31 clusters . . . . . . . . 96
5.8 The induced magnetic moments on Pt(001) and Pt(111) surfaces . . . . . . . . . . . 97
5.9 Magnetic anisotropy of Fe5Pt8 cluster on Pt(001) . . . . . . . . . . . . . . . . . . . 97
6.1 The band dispersions of graphene . . . . . . . . . . . . . . . . . . . .. . . . . . . 99
6.2 Optimized structure of Co13 on graphene . . . . . . . . . . . . . . . . . . . . . . . . 101
6.3 The optimized geometry of Pt13 clusters on graphene . . . . . . . . . . . . . . . . . 102
6.4 The density of states for graphene-supported Fe13, Co13 and Ni13 clusters . . . . . . 105
6.5 Relaxed structures of 13-atom clusters on five-member ring graphene . . . . . . . . 106
6.6 The favorable adsorption sites of CO molecule on 13-atomFe, Co, Ni and Pt clusters 107
6.7 The energy profile for CO oxidation on graphene supportedPt cluster . . . . . . . . 109
6.8 The energy profile for CO oxidation on Pt(111) . . . . . . . . . .. . . . . . . . . . 109
6.9 The energy profile for CO oxidation on pristine graphene .. . . . . . . . . . . . . . 110
7.1 Skematic picture of 13-atom icosahedron and cuboctahedron . . . . . . . . . . . . . 115
7.2 Whole eigenvalue spectrum for FM and AFM interactions oficosahedron and cuboc-
tahedron . . . . . . . . . . . . . . . . . . . . . . . . . . . . . . . . . . . . . . . . . 117
7.3 The Field-dependent magnetization for icosahedron andcuboctahedron . . . . . . . 118
7
List of Figures
7.4 The magnetic field dependence of minimum eigenenergy foricosahedron and cuboc-
tahedron . . . . . . . . . . . . . . . . . . . . . . . . . . . . . . . . . . . . . . . . . 119
7.5 The field-dependent magnetization for antiferromagnetic case of icosahedron at sev-
eral dipole coupling strengths . . . . . . . . . . . . . . . . . . . . . . . .. . . . . . 121
7.6 The field-dependent entropy for the antiferromagnetic case of icosahedron . . . . . . 122
7.7 The field-dependent specific heat and susceptibility forthe antiferromagnetic case of
icosahedron and cuboctahedron . . . . . . . . . . . . . . . . . . . . . . . .. . . . . 123
7.8 The field-dependent entropy, specific heat and susceptibility for the ferromagnetic
case of icosahedron and cuboctahedron . . . . . . . . . . . . . . . . . .. . . . . . 124
7.9 Temperature-dependent entropy and specific heat for theantiferromagnetic case of
icosahedron and cuboctahedron . . . . . . . . . . . . . . . . . . . . . . . .. . . . . 125
7.10 temperature-dependent Entropy, specific heat and susceptibility for the ferromagnetic
case of icosahedron and cuboctahedron . . . . . . . . . . . . . . . . . .. . . . . . 126
7.11 Field-dependent magnetization for the antiferromagnetic case of icosahedron . . . . 126
7.12 Skematic picture of a square and a tetrahedron . . . . . . . .. . . . . . . . . . . . . 127
7.13 Field-dependent magnetization for a square geometry for ferro and antiferromagnetic
cases . . . . . . . . . . . . . . . . . . . . . . . . . . . . . . . . . . . . . . . . . . . 127
7.14 Effect of anisotropy constants on the field-dependent magnetization of four atom clusters128
7.15 The temperature-dependent spin-spin correlation function for four atom clusters . . . 129
7.16 Magnetization as a function of magnetic field for the spin-1 AFM icosahedron . . . . 129
8.1 Phase diagram of bulk Fe1−x-Nix alloy . . . . . . . . . . . . . . . . . . . . . . . . . 134
8.2 Cluster to bulk phase diagram for Fe . . . . . . . . . . . . . . . . . .. . . . . . . . 135
8.3 Reaction paths for CO oxidation reaction on Fe55 cluster . . . . . . . . . . . . . . . 135
8.4 The magnetic exchange parameters for Fe59 and Fe89 clusters . . . . . . . . . . . . . 138
8.5 Temperature-dependent magnetization for Fe59 and Fe89 clusters . . . . . . . . . . . 138
8
List of Tables
3.1 Number of nearest neighbour bonds for Fe13−nNin clusters . . . . . . . . . . . . . . 54
3.2 The number of nearest neighbour bonds for Fe13−nCon clusters . . . . . . . . . . . . 58
3.3 The average magnetic moments for Fe13−nCon clusters . . . . . . . . . . . . . . . . 59
3.4 The nearest neighbour bonds for Fe13−nPtn clusters . . . . . . . . . . . . . . . . . . 59
3.5 The average magnetic moments for the lowest energy structures of Fe13−nPtn clusters 62
3.6 Average magnetic moments for the lowest energy structures of Co13−nPtn clusters . . 64
4.1 The bond lengths for the Jahn-Teller and Mackay-distorted Fe13 cluster . . . . . . . 78
4.2 The average orbital and spin moment for 13-atom Fe, Co andNi clusters . . . . . . . 78
4.3 A comparison of magnetic moments for Fe13, Co13 and Ni13 clusters obtained by
VASP and SIESTA . . . . . . . . . . . . . . . . . . . . . . . . . . . . . . . . . . . 86
4.4 Anisotropy constantsDn for the perfect and relaxed 13-atom Fe, Co and Ni clusters . 87
4.5 The orbital and spin moments for Pt-capped 13-atom clusters . . . . . . . . . . . . . 87
5.1 The average spin and orbital moments for M13 and M55 clusters on Pt(001) and
Pt(111) surfaces . . . . . . . . . . . . . . . . . . . . . . . . . . . . . . . . . . . .. 92
5.2 The energetics for the Pt-supported and free Fe-Pt13,55 clusters . . . . . . . . . . . . 95
5.3 The magnetic moments for free and Pt-supported Fe5Pt8 and Fe24Pt31 . . . . . . . . 96
6.1 The average bond lengths for 13-atom Fe, Co, Ni and Pt clusters . . . . . . . . . . . 102
6.2 Adsorption energy of (in eV) 13-atom clusters on pristine and defective graphene . . 103
6.3 The magnetic moments of clusters on pristine and defective graphene . . . . . . . . 103
6.4 The onsite magnetic moments for 13-atom Fe, Co and Ni clusters on graphene . . . . 104
6.5 Adsorption energy (in units of eV) of CO for 13-atom free and graphene supported
Fe, Co, Ni and Pt clusters . . . . . . . . . . . . . . . . . . . . . . . . . . . . . .. 107
7.1 Minimum energy eigenvalues for 13-atom icosahedron andcuboctahedron for AFM
interaction . . . . . . . . . . . . . . . . . . . . . . . . . . . . . . . . . . . . . . . .116
7.2 The ground state expectation values of center and surface spins for antiferromagnetic
case of icosahedron . . . . . . . . . . . . . . . . . . . . . . . . . . . . . . . . . .. 119
7.3 The spin correlation functions for icosahedron with ferromagnetic and antiferromag-
netic interactions . . . . . . . . . . . . . . . . . . . . . . . . . . . . . . . . . .. . 120
9
List of Tables
7.4 The spin-spin correlation functions for cuboctahedronfor the ferromagnetic and anti-
ferromagnetic interactions . . . . . . . . . . . . . . . . . . . . . . . . . .. . . . . 120
7.5 The dimension of matrices, lowest energy eigenvalues and degeneracy for the antifer-
romagnetic case of spin-1 icosahedron . . . . . . . . . . . . . . . . . .. . . . . . . 130
7.6 The spin-spin correlation functions for spin-1 icosahedron with ferro and antiferro-
magnetic interaction . . . . . . . . . . . . . . . . . . . . . . . . . . . . . . . .. . . 130
10
Abstract
Transition metal (TM) clusters occupy an important role in the class of materials projected for nano
applications. In addition to the unusual properties due to their cluster form, TM clusters have the
advantage of developing magnetic moments. The goal of this thesis is to study the properties of
clusters and cluster related phenomena. Physical properties of clusters are suitable platform to study
quantum effects, which becomes prominent at such low dimensions. Thus, it is essential to study
the properties of clusters using first-principles methods because they cannot be easily handeled by
empirical approaches. The present thesis deals with the density functional theory total energy for-
malism through the Kohn-Sham approach. The many-body correlation effects are accounted for the
generalized gradient approximation (GGA) which has been successful in describing the properties of
materials, especially metals.
The ground state structure of various sizes of elemental andbinary TM clusters is studied. One of the
main observation is that the icosahedron is one of the most stable geometries for 13-atom elemental
(Fe, Co, Ni) clusters. For large Fe clusters with regular icosahedron geometry, the core of the cluster
relaxes towards the cuboctahedral geometry. For all sizes,after geometrical optimization, we find
slight structural distortions. This is associated with thephysics of Jahn-Teller effect. We observe
that the Jahn-Teller effect is more prominent in Fe clustersas compared to Ni and Co clusters. Also,
the evolution of magnetic moment with cluster size is studied. The clusters show enhanced magnetic
moment which is inversely related to the cluster size. The magnetic moment versus cluster size
obtained from calculations match very well with the experimental results.
One of the main goals of studying binary cluster is to understand the site-specific occupation of atomic
species in a multi-component (here binary) cluster. This isachieved this by studying the competition
between chemical ordering and segregation for binary Fe-(Co, Ni, Pt) and Co-(Pt, Mn) icosahedral
clusters. The energetically favorable distribution of constituent elements in binary cluster is examined
for different compositions. Using the lowest energy structure so obtained, the composition-dependent
mixing energy is studied. It is observed that the qualitative behavior of mixing energy with respect
to composition for 13-atom Fe-Ni clusters is very similar tothat of the bulk alloy. It is found that
Ni atoms tend to occupy the surface sites on a cluster (segregation tendency) for Fe-rich and Ni-rich
compositions. This appears to be a common trend which has been verified for both 13- and 55-
atom clusters. Owing to heavy computational demand, we haveverified the trend at some specific
compositions for 55-atom clusters.
Magnetic properties like the orbital magnetic moment and the magnetic anisotropy are studied for free
11

List of Tables
and deposited clusters. 13- and 55-atom icosahedral clusters of Fe, Ni and Co are deposited on the
substrates like Pt(111) and Pt(001) for these studies. Boththe free clusters and the deposited clusters
are observed to exhibit large magnetic anisotropy as compared to that of the respective bulk metals.
The angle (angle between magnetization and the spin-quantization axis) dependent anisotropy energy
is calculated from DFT and then fitted to the classical Heisenberg model containing an anisotropy
term. Large values of magnetic anisotropy energy are found for relaxed clusters as compared to
perfect clusters because of the structural symmetry-breaking.
In addition to its structural and magnetic properties, transition metal clusters are attractive candidates
for catalysis. In principle, the catalysis can be studied byestimating the activation energy barrier
of various paths of a reaction by nudged elastic band method.There are studies in literature of the
catalytic properties of TM clusters (for example Fe and Pt) for the oxidation of carbon monoxide to
carbon-dioxide on graphene surface. We have attempted to study the oxidation of carbon monoxide
on graphene surface. The goal is to understand the role of TM clusters in reducing the activation
barrier of the chemical reaction and to derive the possible reaction paths. Presently, the proper site
for adsorption of CO molecule on free and graphene-supported TM clusters are identified within the
accuracy of GGA.
From another aspect, we tried to extrapolate the magnetic properties of clusters to finite temperature
using the exact diagonalization technique. We have only studied the magnetic properties of 4- and 13-
atom clusters. The exact diagonalization method is appliedto the quantum Heisenberg Hamiltonian
with nearest-neighbor spin-interactions. The role of dipolar interaction and local uniaxial anisotropy
terms in the Heisenberg Hamiltonian are taken into account which has non-negligible contribution
for clusters. We observe discontinuities in the magnetization with change in external magnetic field
for clusters with antiferromagnetic interactions, which is unlike for clusters with ferromagnetic in-
teraction. The ground state and the temperature-dependentspin-spin correlation functions are also
studied.
The findings of these studies for elemental and binary clusters like the size-dependent structural
and magnetic properties, the composition-dependent atomic distributions of multi-component clus-
ters (segregation), magnetic anisotropy of free and supported TM clusters are expected to shed light
on the understanding of physics of clusters in general and may be helpful for experimentalists.
12
Zusammenfassung
Übergangsmetallcluster nehmen einen wichtigen Platz in der Klasse der Materialien für Anwendun-
gen im Nanobereich ein. Übergangsmetallcluster besitzen,zusätzlich zu weiteren ungewöhnlichen
Eigenschaften aufgrund ihrer Cluster-Form, den Vorteil magnetische Momente zu entwickeln. Das
Ziel dieser Arbeit ist die Eigenschaften von Clustern und der damit zusammenhängenden Phänomene
zu untersuchen. Die physikalischen Eigenschaften von Clustern sind eine geeignete Grundlage um
Quanteneffekte zu studieren, die in niedrigen Dimensionendominieren. Da sich die Eigenschaften der
Cluster nicht mit empirischen Ansätzen einfach beschreiben lassen ist es notwendig, parameterfreie
first-principlesMethoden zu verwenden. In dieser Arbeit kommt der Dichtefunktional Gesamten-
ergieformalismus im Rahmen des Kohn-Sham-Ansatzes zum Einsatz. Die Vielteilchen-Korrelations-
effekte werden im Rahmen der verallgemeinerten GradientenApproximation (GGA) behandelt, die
sehr erfolgreich für die Beschreibung von Materialien, insbesondere Metalle, eingesetzt wird.
Im Rahmen dieser Arbeit wurden die Grundzustandsstrukturen von elementaren und binären Über-
gangsmetallclustern verschiedener Größen untersucht. Eine der wichtigsten Beobachtungen ist hier-
bei, dass die ikosaedrische Geometrie eine der stabilsten Formen für elementare 13-Atom (Fe, Co,
Ni) Cluster ist. Für alle untersuchten Größen sind leichte strukturelle Verzerrungen präsent, die auf
dem Jahn-Teller-Effekt beruhen. Dieser tritt stärker in Fe-Clustern als in Ni- und Co-Clustern auf.
Für größere Fe-Cluster mit regelmäßiger ikosaedrischer Geometrie relaxiert der Kern des Clusters in
Richtung einer kuboktaedrischen Geometrie. Ebenfalls untersucht wurde die Entwicklung des mag-
netischen Momentes mit der Clustergröße. Die Cluster besitzen ein erhöhtes magnetisches Moment,
dessen Größe sich umgekehrt zur Clustergröße verhält. Der berechnete Zusammenhang stimmt gut
mit experimentellen Resultaten überein.
Ein weiteres wichtiges Ziel der Untersuchung binärer Cluster ist das Verständnis der gitterplatzspezi-
fischen Besetzung der atomaren Spezies in mehrkomponentigen (hier binären) Clustern. Dazu wurde
die Konkurrenz zwischen chemischer Ordnung und Segregation in binären Fe-(Co, Ni, Pt) und Co-
(Pt, Mn) Clustern mit ikosaedrischer Struktur untersucht.Für verschiedene Zusammensetzungen
wurde die energetisch günstigste Verteilung der konstituierenden Elemente berechnet. Aufbauend
auf der so bestimmten Struktur mit der niedrigsten Energie,wurde das zusammensetzungsabhängige
Mischungsverhalten der Elemente untersucht. Das qualitative Verhalten der Mischungsenergie eines
13-Atom Fe-Ni-Clusters stellt sich in Bezug auf die Zusammensetzung als sehr ähnlich zu dem des
Festkörpers heraus. Dabei zeigt sich, dass Ni zur Besetzungder Oberflächenplätze (Segregationsten-
denz) im Fe-reichen wie auch im Ni-reichen Zusammensetzungsbereich tendiert. Das erscheint als
13

List of Tables
allgemeiner Trend, der in dieser Arbeit für 13- und 55-Atom-Cluster verifiziert werden konnte.
Ebenfalls untersucht wurden magnetische Eigenschaften wie das Bahnmoment und die magnetische
Anisotropie für freie und deponierte Cluster. Hierzu wurden, ikosaedrische Cluster mit 13 und 55
Atomen bestehend aus Fe, Ni und Co auf Pt(111) und Pt(001) Substraten deponiert. Sowohl die freien,
wie auch die deponierten Cluster zeichnen sich durch eine große magnetische Anisotropie im Vergle-
ich zu den entsprechenden Festkörper-Materialien aus. Diewinkelaufgelöste Anisotropie-Energie
(gemeint ist der Winkel zwischen Magnetisierung und Spin-Quantisierungsachse) wurde im Rahmen
der DFT berechnet. An diese Ergebnisse wurden die Parametereines klassischen Heisenberg-Modells
mit Anisotropieterm gefittet. Für relaxierte Cluster werden im Vergleich zu perfekten Strukturen auf-
grund der strukturellen Symmetriebrechung große Anisotropie-Energien gefunden.
Abgesehen von ihren strukturellen und magnetischen Eigenschaften sind Übergangsmetallcluster at-
traktive Kandidaten für katalytische Anwendungen. Im Prinzip können die katalytischen Eigen-
schaften durch Bestimmung der Aktivierungsbarriere für verschiedene Reaktionspfade im Rahmen
der Nugded-elastic-band-Method untersucht werden. In derLiteratur existieren Studien der katalytis-
chen Eigenschaften von Übergangsmetallclustern (z.B. Fe oder Pt) im Bezug auf die Oxidation von
Kohlenmonoxid zu Kohlendioxid. Im Rahmen dieser Arbeit wird die Oxidation von Kohlenmonoxid
auf Graphen mit dem Ziel untersucht, die Rolle der Übergangsmetallcluster im Hinblick auf eine Re-
duzierung der Aktivierungsbarriere der chemischen Reaktion zu verstehen und mögliche Reaktion-
spfade abzuleiten. Bislang konnte der Adsoptionsplatz eines CO-Moleküls auf freien und Graphen-
unterstützten Clustern im Rahmen der Genauigkeit der GGA bestimmt werden.
Um die magnetischen Eigenschaften bei endlichen Temperaturen besser zu verstehen, wurden vier
bis 13-Atom Cluster im Rahmen des quantenmechanischen Heisenbergmodells mit nächster-Nachbar-
Spin-Wechselwirkung exakt diagonalisiert. Die Rolle der Dipolwechselwirkung und radialer Anisotro-
pieterme, die nicht vernachlässigbare Beiträge für Cluster haben, wurden im Heisenberg-Hamiltonian
berücksichtigt. Für antiferromagnetische Cluster wurden- im Gegensatz zu ferromagnetische wech-
selwirkenden Clustern - Unstetigkeiten in der Magnetisierung als Funktion des externen Magnetfeldes
gefunden. Zusätzlich wurden für diese Cluster Grundzustand und temperaturabhängige Spin-Spin-
Korrelationsfunktionen berechnet.
Die Ergebnisse dieser Arbeit für elementare und binäre Cluster, wie die Größenabhängigkeit struk-
tureller und magnetischer Eigenschaften, die zusammensetzungsabhängige Verteilung der Atome
in mehrkomponentigen Clustern (Segregation), magnetische Anisotropie freischwebender und de-
ponierter Übergangsmetallcluster können beitragen, das Verständnis der Clusterphysik im Allge-
meinen voranzubringen und Hilfestellungen für experimentelle Arbeiten bieten.
14
1 Introduction
1.1 Magnetism in low dimensional systems
Magnetism is a relatively old topic, but still attracts lot of scientific attention. Phenomenas associated
with magnetism can be classified as many-body problems and quantum mechanics has been successful
in interpreting them [1]. The scope of the present thesis is understanding the structure and magnetism
of some pure and mixed transition metal clusters. Clusters provide the unique opportunity to study the
development of a physical property from the atom towards thesolid, i.e., from a “zero”-dimensional
to a three-dimensional system. This concerns the formationof an electronic band structure or the
development of many-electron phenomena, such as solid state magnetism or superconductivity. Like
the corresponding atoms these small particles have significant spin and orbital contributions to their
magnetic moment. This is in contrast to the respective solids, where the orbital moment is almost com-
pletely quenched by crystal fields and where in most cases theexchange energy that could be gained
by spin alignment is exceeded by the increase in kinetic energy that according to the Pauli principle
is required to promote the electrons to empty orbitals. Mostsolids therefore are non-magnetic. When
the energy band width is small and correspondingly the density of statesD(EF) is large at the Fermi
energy, like in somed- and f - metals, there is a gain in exchange energy at the expense of kinetic
energy and then magnetism survives. This corresponds to theStoner criterion, which states that for a
material to be magnetic the product of the exchange integralI andD(EF) needs to be larger than one.
Experimentally, the magnetic moments of metal clusters areusually studies by in-flight molecular
beam Stern-Gerlach experiment. In the experiment, a magnetic field gradient induces small deflec-
tions of a beam of magnetic clusters traveling through a highvacuum channel. The tiny deflections
are only a fraction of millimeters in magnitude, but can be measured with very accurate precision by
a position-sensitive time of flight (TOF) technique [2]. From the magnitude of these deflections the
magnetic moments of the clusters can be determined. Anotheradvanced method for characterization
of magnetic moments is the technique of X-ray magnetic circular dichroism (XMCD). The advantage
of XMCD is that one can make a distinction between spin and orbital contributions to the magnetic
moment when clusters are soft landed on the substrate [3].
The following is a short recapitulation of the basic properties of clusters [4]. Clusters have very differ-
ent and often very individual physical and chemical properties. For example, the chemical reactivity
can change by orders of magnitude from one cluster size to thenext. Therefore, clusters may form
specific material selective catalysts. Clusters have structures with five-fold symmetry (possibly also
15
1 Introduction
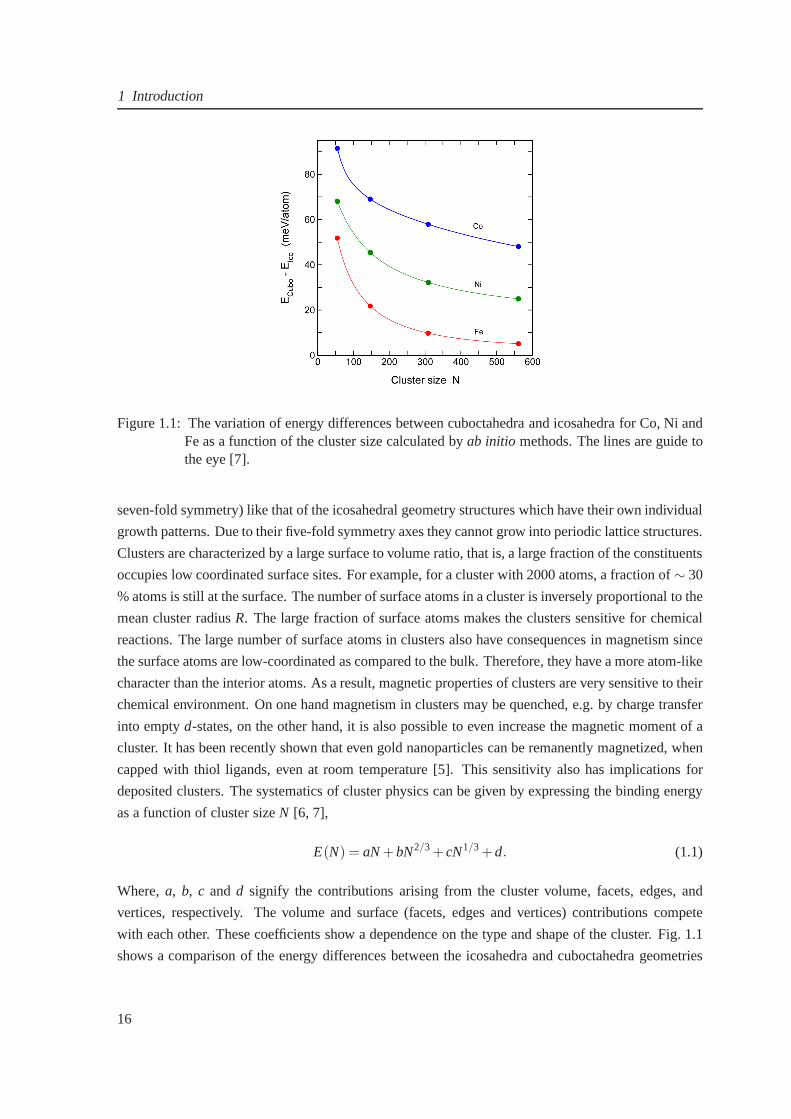
Figure 1.1: The variation of energy differences between cuboctahedra and icosahedra for Co, Ni andFe as a function of the cluster size calculated byab initio methods. The lines are guide tothe eye [7].
seven-fold symmetry) like that of the icosahedral geometrystructures which have their own individual
growth patterns. Due to their five-fold symmetry axes they cannot grow into periodic lattice structures.
Clusters are characterized by a large surface to volume ratio, that is, a large fraction of the constituents
occupies low coordinated surface sites. For example, for a cluster with 2000 atoms, a fraction of∼ 30
% atoms is still at the surface. The number of surface atoms ina cluster is inversely proportional to the
mean cluster radiusR. The large fraction of surface atoms makes the clusters sensitive for chemical
reactions. The large number of surface atoms in clusters also have consequences in magnetism since
the surface atoms are low-coordinated as compared to the bulk. Therefore, they have a more atom-like
character than the interior atoms. As a result, magnetic properties of clusters are very sensitive to their
chemical environment. On one hand magnetism in clusters maybe quenched, e.g. by charge transfer
into emptyd-states, on the other hand, it is also possible to even increase the magnetic moment of a
cluster. It has been recently shown that even gold nanoparticles can be remanently magnetized, when
capped with thiol ligands, even at room temperature [5]. This sensitivity also has implications for
deposited clusters. The systematics of cluster physics canbe given by expressing the binding energy
as a function of cluster sizeN [6, 7],
E(N) = aN+bN2/3 +cN1/3+d. (1.1)
Where,a, b, c and d signify the contributions arising from the cluster volume,facets, edges, and
vertices, respectively. The volume and surface (facets, edges and vertices) contributions compete
with each other. These coefficients show a dependence on the type and shape of the cluster. Fig. 1.1
shows a comparison of the energy differences between the icosahedra and cuboctahedra geometries
16
1.2 Origin of magnetism in atoms: Hund’s rules
of Fe, Co and Ni clusters [7], which shows that the icosahedral structures are more favorable for Co
and Ni with larger energy difference in contrast to Fe.
1.2 Origin of magnetism in atoms: Hund’s rules
There exists a close relationship between angular momentumand magnetism [8]. Each electron in an
atomic orbital contributes to spin and orbital magnetic moment. The addition of these contributions is
within the scope of the vector model of atomic magnetism. In theLS coupling, also known as Russell-
Saunders coupling scheme, the total orbital momentumL = Σili and the total spin momentumS = Σisi
combine to yield the total momentumJ = L+S. The moments obey the matrix-operator rules, such as
S2 = S(S+1), L2 = L(L+1), andJ2 = J(J+1). In heavy elements, due to the large nuclear charges,
spin-orbit interactions are larger than spin-spin interactions or orbit-orbit interactions. This situation
is described by thejj coupling, where,J = ΣiJi = Σi (Li + Si) .
Hund’s rules can be summarized by three rules.
• For an electronic configuration, the spin configuration with maximum multiplicity has the low-
est energy. The multiplicity is given by 2S+1, which is maximum whenS is maximum. This is
possible because of the Pauli exclusion principle which states that two electrons cannot share
the same set of quantum numbers.
• For a given multiplicity, the configuration with the largest value ofL has the lowest energy. This
rule deals with reducing the repulsion between electrons.
• For a given atom with the outermost subshell half-filled or less, the configuration with the lowest
value ofJ is the lowest in energy. If the outermost shell is more than half-filled, the configura-
tion with the highest value ofJ is the lowest in energy. This rule takes into consideration the
energy shifts due to spin-orbit coupling, and is valid for the case where the spin-orbit coupling
is weak compared to the residual electrostatic interaction.
Any degeneracy beyond the Hund’s rules is removed by interactions such as Zeeman coupling and
interatomic exchange. This is of importance for the temperature dependence of magnetic anisotropy.
1.3 Cluster magnetism
Magnetism is sensitive to many factors such as the symmetry,atomic coordination and interatomic
distances in the cluster. These characteristics are interrelated [9]. Let us consider the case of free
atoms. Fe, Co and Ni have eight, nine and ten valence electrons, respectively and are distributed
in the 3d and 4s shells. Hund’s rules require the spin to be a maximum and thisleads to electronic
configurations 3d↑5 3d↓1 4s2 for Fe, 3d↑5 3d↓24s2 for Co, and 3d↑5 3d↓34s2 for Ni, where the 3d↑and 3d↓ subshells are separated by the exchange interaction. Sincethe spin magnetic moment of an
17
1 Introduction
electron is 1µB, and these atoms have non-zero spins, the atoms possess substantial moments. The
magnetic moment is given by the difference in the number of spin ↑ and spin↓ 3d electrons per atom,
which is nd(↑)− nd(↓) = 4,3,2 for Fe, Co and Ni, respectively. When the atoms come together in
a cluster, the overlap between the atomic orbitals of neighbor atoms gives rise to energy bands. The
levels corresponding to 4s electrons produce a free electron-like band, while thed electrons stay lo-
calized on the atomic sites. The crystal potential stabilizes thed ands states by different amounts.
Together with the crystal potential,spdhybridization leads to charge transfer froms to d states, and
the number ofs electrons for systems other than the atom is close to 1. Assuming that the 3d orbitals
are atomic-like, the Hund’s rules require the majority 3d↑ sub-band to be fully occupied with five
electrons per atom while the minority 3d↓ sub-band has two, three and four electrons per atom in Fe,
Co and Ni respectively. The difference in the number of spin↑ and spin↓ 3d electrons per atom is
nd(↑)−nd(↓) = 3,2,1 for Fe, Co and Ni respectively, and the magnetic moments peratom are 3µB,
2 µB and 1µB for Fe, Co and Ni, respectively. These values are quite closeto the magnetic moments
of very small clusters. The bulk moments per atom for Fe (2.2µB), Co (1.7µB) and Ni (0.6µB) are
smaller, and their noninteger values originate because of the partial delocalization of the 3d electrons.
This also leads to the mutual alignment of the moments, whichis known as itinerant exchange.
1.4 Magnetism in bulk
The main characteristic of bulk is that the energy levels areclassified as energy bands which can be
delocalized [9]. In a one-electron picture, the electrons fill the available delocalized states up to the
Fermi level. This explains the occurrence of noninteger magnetic moments in bulk transition metals.
Nonmagnetic metals have two equally populated↑ and↓ spin subbands. With application of magnetic
field, some electrons are transferred from the↓ to the ↑ band. This type of behaviour of metals
are characteristically known as Pauli paramagnetism. The corresponding spin polarization is small,
usually less than 0.1%. In itinerant ferromagnets the corresponding one-electron energies of the bands,
as represented by the band width, compete against intra-atomic exchange. As a result ferromagnetism
is realized in narrow bands. The simplest model of itinerantferromagnetism is the Bloch model, where
the intra-atomic exchange is evaluated for the free electrons. A more sophisticated model is the Stoner
model, which relates the onset of ferromagnetism with that of the DOS at the Fermi level. The density
of states strongly depend on the crystal structure. This makes it difficult to predict the ferromagnetic
moment of solids from their atomic composition. Itinerant magnets with approximately half-filled
bands exhibit a strong tendency towards antiferromagnetism because the hybridization energy of half-
filled ↑ and↓ spin bands is lower than that of completely-filled↑ bands. Magnetism in the iron-series
transition metal elements is because of the itinerant electrons. The itinerant character is represented
by the non-integer spin moments per atom, such as the 2.2µB for Fe, 1.7µB for Co, and 0.6µB for
Ni, as already discussed. The origin of non-integer values of magnetic moment cannot be accounted
18
1.5 Jahn-Teller effect
Tetragonal
g
2g
d
t
e
Octahedral
xz yz
xy
3z2
2
d
d
d d
x − y2
TetragonalOctahedral
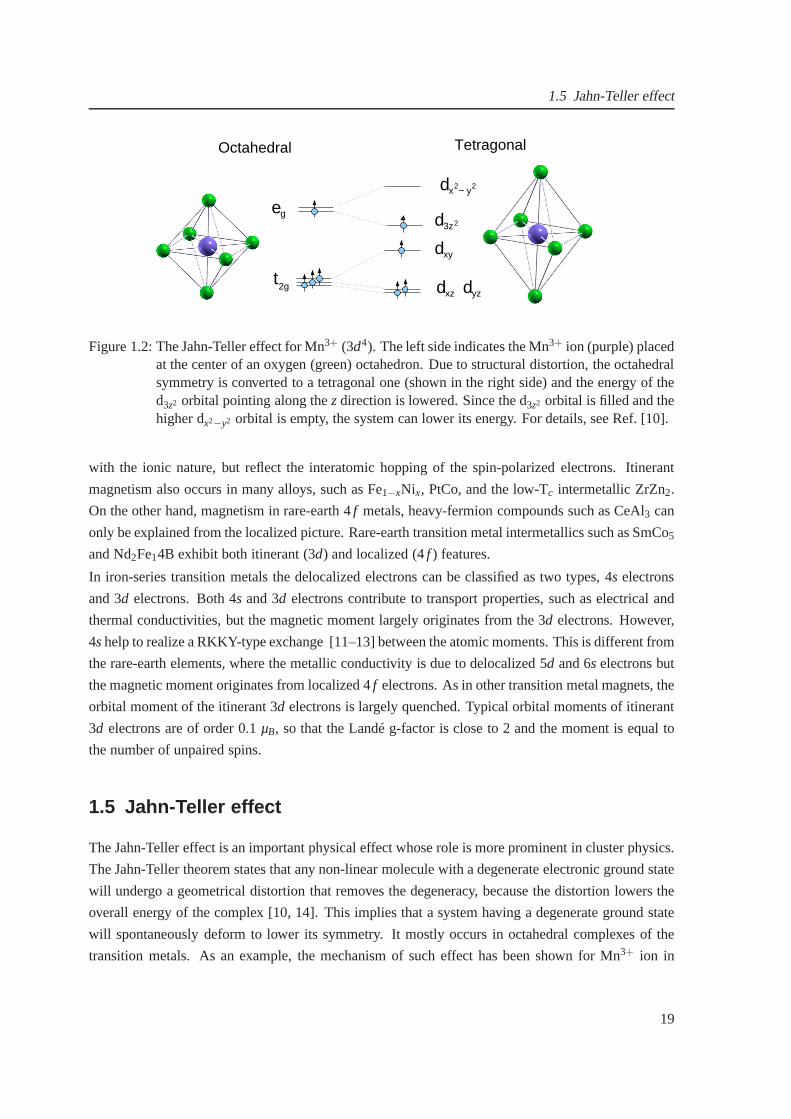
Figure 1.2: The Jahn-Teller effect for Mn3+ (3d4). The left side indicates the Mn3+ ion (purple) placedat the center of an oxygen (green) octahedron. Due to structural distortion, the octahedralsymmetry is converted to a tetragonal one (shown in the rightside) and the energy of thed3z2 orbital pointing along thezdirection is lowered. Since the d3z2 orbital is filled and thehigher dx2−y2 orbital is empty, the system can lower its energy. For details, see Ref. [10].
with the ionic nature, but reflect the interatomic hopping ofthe spin-polarized electrons. Itinerant
magnetism also occurs in many alloys, such as Fe1−xNix, PtCo, and the low-Tc intermetallic ZrZn2.
On the other hand, magnetism in rare-earth 4f metals, heavy-fermion compounds such as CeAl3 can
only be explained from the localized picture. Rare-earth transition metal intermetallics such as SmCo5
and Nd2Fe14B exhibit both itinerant (3d) and localized (4f ) features.
In iron-series transition metals the delocalized electrons can be classified as two types, 4s electrons
and 3d electrons. Both 4s and 3d electrons contribute to transport properties, such as electrical and
thermal conductivities, but the magnetic moment largely originates from the 3d electrons. However,
4shelp to realize a RKKY-type exchange [11–13] between the atomic moments. This is different from
the rare-earth elements, where the metallic conductivity is due to delocalized 5d and 6s electrons but
the magnetic moment originates from localized 4f electrons. As in other transition metal magnets, the
orbital moment of the itinerant 3d electrons is largely quenched. Typical orbital moments of itinerant
3d electrons are of order 0.1µB, so that the Landé g-factor is close to 2 and the moment is equal to
the number of unpaired spins.
1.5 Jahn-Teller effect
The Jahn-Teller effect is an important physical effect whose role is more prominent in cluster physics.
The Jahn-Teller theorem states that any non-linear molecule with a degenerate electronic ground state
will undergo a geometrical distortion that removes the degeneracy, because the distortion lowers the
overall energy of the complex [10, 14]. This implies that a system having a degenerate ground state
will spontaneously deform to lower its symmetry. It mostly occurs in octahedral complexes of the
transition metals. As an example, the mechanism of such effect has been shown for Mn3+ ion in
19
1 Introduction
Fig 1.2. When the Mn3+ in high spin configuration is placed in the octahedral ligandfield, it contains
a single electron in the uppereg state. The system lowers its energy by a tetragonal distortion, thereby
causing a splitting in the energy levels. The total energy islowered due to the lowering of the one of
theeg orbitals (d3z2) marked by the increased bond length along thez axis. This causes the filled d3z2
orbital to drop in energy below the empty dx2−y2 orbital. On the other hand, since both of the split
t2g states are filled and the center of gravity is preserved, the t2g states donot contribute to the overall
energy saving.
1.6 Other general aspects of clusters
The difference between cluster and bulk are manyfold. One ofthem is the number of surface atoms,
which are significantly larger in the cluster. Another aspect of the difference is that the electrons are
confined in a small volume of the potential well in clusters. As a result the electrons are filled in
discrete levels instead of the band which is characteristicof bulk. Clusters provide the bridge be-
tween atoms, molecules and bulk. One of the important questions which is still lacking convincing
answer is how many number of atoms are required for a cluster to mimic the bulk behaviour. Al-
though the jellium model sucessfully explains the stability of clusters of nearly free electron metals,
it has limitations in describing the structural propertiesof clusters, such as their geometry and atomic
arrangements (for many elements in clusters). There are ample research going on studying clusters
by rigorous molecular orbital calculations based on density-functional theory.
Clusters can be broadly classified into following categories based on the type of chemical bonding [4].
Accordingly, needs different experimental setups for synthesis and also different level of theory are
necessary for studying the system.
• Van der Waals clusters
The clusters are characterized by the weak van der Waals interaction. Due to the central force,
the most stable clusters have a closed-packing of atoms. Theweak binding leads to low melting
and boiling points. Molecular clusters like (I2)N, (N2)N, (CO2)N, (SF6)N belong to this class.
• Metal clusters
One can sub-classify the metals clusters based on constituent like, simple metals (Na or Al with
sp-valence electrons) and transition metals (Fe or Co, where the localizedd electrons play an
important role). Some polyvalent non-transition elementslike Pb form a group in between.
The clusters reflect these characteristics. The strength ofthe binding in metallic clusters ranges
from moderate to strong (0.5 to 3 eV per atom). The main property of the clusters of the simple
sp elements is the existence of electronic shell effects [15].The delocalized character of the
electronic states inspelements allows for the occurence of collective electronicexcitations at
low energies. The presence ofd electrons in transition metals make it more complex than the
20

1.7 Experimental techniques for synthesis of clusters
clusters ofspelements. One of the interesting effects of these clusters is their role in catalysis.
Another interesting effect is the evolution of magnetic properties with the cluster size.
• Clusters of ionic materials
The cohesion of such clusters can be described by potentialswith an attractive part due to
electrostatic monopole forces and a repulsive part from theoverlap of the electronic clouds of
ions with filled electronic shells. The structures of these clusters can have a rectangular shape
cut from the solid.
• Network clusters
In this case, the covalent bonding leads to the formation of atomic networks in clusters. Mate-
rials like Si, Ge and C belong to this catagory. The binding energy in network clusters is strong
(1 to 4 eV per atom). Some of the example are the fullereneC60, and water clusters.
1.7 Experimental techniques for synthesis of clusters
Depending on the physical or chemical properties of the clusters, different methods of synthesis tech-
niques are used [16].
Clusters having low melting points can be produced through liquid metal ion source, where the metal
cluster is heated in an oven and then distilled into a tungsten capillary needle. By applying high
electric field between the tip of the capillary needle and an extraction electrode to the field emission
of cluster ions of different size can be synthesized.
Ion bombardment is another method of generating clusters. Here a beam of inert gas ions with a high
kinetic energy is directed towards the sample to produce thecluster ions. Charged cluster of noble
metals and the Zn group elements have been obtained in this way. This method is applied to produce
clusters with high boiling point like alkali halides.
Clusters have been synthesized using techniques like supersonic nozzle sources. The basic idea behind
this method is the formation of clusters by condensation of an expanding gas of atoms. A highly
compressed gas (typically under pressure of around 10 bar) with atoms of the material to be aggregated
is allowed to expand through a small nozzle. The adiabatic expansion slows down the atoms up to
a point at which binding between neighboring atoms becomes energetically favorable. This leads
to a successive aggregation of the atoms to form clusters. Supersonic sources are often used for
producing clusters of low melting metals like alkali metals. A furnace containing molten metal is
heated to produce the metal vapor of pressure around 10-100 mbar. This vapor is mixed with a rare
gas introduced into the source at a pressure of several bar. The hot mixture of metal vapor and rare gas
is driven through the nozzle which expands after coming out of the nozzle. This pure vapor source is
efficient to produce van der Waals clusters. In the case of metallic clusters it produces mainly small
clusters, and some medium size clusters but with low abundances. This source is not suitable for the
21
1 Introduction
formation of large metallic clusters because the process ofatom aggregation leaves the cluster in an
excited state and the metal vapor must act also as a heat bath to cool the clusters.
Metal clusters can also be produced using gas aggregation sources, where the metal vapor exists in a
supersaturated state for a short time. This leads to the formation of small clusters. But large clusters
are formed with the increase of corresponding times in gas aggregation sources. In a gas aggregation
source the metal vapor from the oven enters a condensation chamber, where it mixes with a stream
of inert gas at pressure about 1 Torr. Cluster growth continues in the condensation chamber until the
mixture of gas and clusters is discharged through an orifice into a sourrounding vacuum chamber. The
distribution of cluster sizes is controlled by the temperatures of the oven and condensation chamber
and by the gas flow rate. Experimental parameters can be adjusted to produce clusters up to sizes of
105 atoms.
Laser vaporization is another method of producing clusters. It can produce aggregates with up to
100 atoms or more of any substance which exists in the solid state. In this method of production
of clusters, a pulsed laser beam is allowed to hit a metallic rod or disk placed in a tube. The laser
pulse evaporates atoms producing an extremely hot plasma. This vapor is cooled by a stream of
inert gas flowing through the tube and condensation of the vapor produces clusters of different sizes.
The flowing inert gas carries the clusters to a vacuum chamberwhere the pressure difference induces
a supersonic expansion of the beam. Collisions ocurring during the expansion cool the aggregates
down to a low temperature. Both neutral and ionized clustershas been produced by this method.
1.8 Experimental characterization of clusters
After the production of clusters, it is analyzed to estimatethe size distributions and varios other cluster
properties. The size distribution is estimated with mass spectrometers. There are two main classes
of experimental setups involving either time-dependent ortime-independent electromagnetic fields.
Typical devices with time-dependent fields are quadrupolessetup, ion cyclotron resonance systems
and the widely used time of flight (TOF) set-up. TOF mass spectrometry [2] is a method of mass
spectrometry in which ions are accelerated by an electric field of known strength. The velocity of the
ion depends on the mass-to-charge ratio. The time that it subsequently takes for the particle to reach
a detector at a known distance is measured. From this time andthe known experimental parameters
one can find the charge to mass ratio of the ion. The characterization discussed is valid for gas-phase
synthesis of clusters as discussed above.
X-ray diffraction (XRD) and transmission electron microscopy (TEM) are often used for structure
analysis. X-ray photoelectron spectroscopy (XPS) is useful for anlysing the chemical composition
of the clusters. Magnetic characterization is commonly done using the superconducting quantum in-
terference device (SQUID). The system is designed to measure the magnetic moment of a sample,
from which the magnetization and magnetic susceptibility can be obtained. Temperature dependent
magnetic properties can also be studied. X-ray absorption spectroscopy (XAS), which essentially
22
1.9 Outline of thesis
measures the atomic composition of the material by analysing the element specific X-ray absorption
process. This is complementary to XPS, which probes the emission spectra. One of the improtant
experimental characterization techniques for measuring the spin and orbital magnetic moments sep-
arately is XMCD. In this case circularly polarized X-ray from a synchrotron source (which contains
an angular momentum - the helicity) is incident on a sample. The XMCD is yielded by the difference
of the absorption curves for both the helicities of X-ray. The XMCD effect is commonly described
by a two step model [10], which distinguishes the generationof a spin and/or orbitally polarized
photoelectron and the transfer of this photoelectron to free electron state of higher energy.
1.9 Outline of thesis
This thesis addresses mainly the structural and magnetic properties of TM clusters based on DFT. As
TM clusters, Fe, Co, Ni, Pt and their combinations are mostlystudied. TM clusters show enhanced
stability at some particular sizes, known as magic numbers (13, 55, 147, 309, 561, 923,· · · ). Clusters
with magic number of atoms usually have the geometry of a closed shell icosahedron, cuboctahedron
and decahedron. As a result, the main focus is on 13 and 55 atomicosahedron and cuboctahedron.
The structural stability and magnetic properties of isolated and deposited closed shell transition metal
clusters are studied with much focus. Along with the elemental clusters, some of the binary clusters
of (Fe-Co, Ni, Pt) are studied. The motivation for studying binary clusters is that the intermixing of
different atomic species in clusters gives rise to more parameters to control the physical and chemical
properties, those are different from the corresponding elemental clusters. After a short description
of the DFT and specific settings used for the calculations in the second chapter, the elementary and
binary clusters are discussed with emphasis on properties like segregation and mixing in clusters in
the third chapter.
The magnetic clusters are projected as possible candidatesfor future recording media [17], where hy-
pothetically, each cluster can store one bit of informationby means of the magnetic configuration. For
this purpose, magnetic anisotropy is a primary requirement. Since magnetism of small clusters is not
stable due to superparamagnetism and thermal fluctuation isa major menace as size reduction of the
storage devices, therefore, materials with large magneticanisotropy are needed to block the thermal
fluctuations. In chapter four, the magnetic anisotropy, spin moment and orbital moments of elemental
and binary clusters are discussed. The studies on orbital magnetism and magnetic anisotropy needs the
incorporation of spin-orbit interaction in the DFT Hamiltonian. The spin-orbit coupling in the present
case is treated as a perturbation term in the scalar-relativistic Hamiltonian. Theoretical determination
of magnetic anisotropy based on DFT is challenging, becauseof the very small energy differences.
For example, the value of magnetocrystalline anisotropy inbulk is of the order of 10−6 eV. Thus, to
determine the magnetic anisotropy for clusters, the energytolerance to 10−10 eV is necessary which
is a sensitive task [18]. Therefore, calculation of MAE requires much careful attention towards some
facts like the proper convergence of energy and accuracy of the results.
23
1 Introduction
Physical phenomena associated with surfaces and its interaction with molecules and clusters are cur-
rently much aspired research problems [19]. Chapter five discusses the structural stability and mag-
netic properties of clusters deposited on Pt surfaces. The magnetic anisotropy of deposited clusters
are also discussed.
The use of TM clusters as catalysts is well known [20, 21]. Some studies on the catalytic activity of
metal clusters are attempted and reported in the literature[23, 24]. (Fe, Co, Ni and Pt)13,55 clusters
on a pristine (defect free) and a five-member ring graphene (with defect) sheet are used as substrate
to study the stability of clusters and the cluster-grapheneinterface. This topic is discussed in chapter
six.
The cluster calculations have mostly been perfomed with a quantum mechanical package named as
Vienna Ab initio simulation package (VASP) [25, 26]. It solves the Kohn-Sham equations of local
density or spin-density functional theory, iteratively within a plane-wave basis-set. The interaction
between ions and electrons is described by the projector-augmented wave (PAW) [27] method. In
addition to the VASP calculations, we have used the SIESTA code [28] for a comparative study in
chapter four. In a few case, the cluster calculations have been performed with the full potential FPLO
code of the Dresden group [29], see chapter four. The consideration of catalytic reaction (oxidation
of CO in different environments) in chapter six represents the first step in this important of research.
Here, further calculations are needed, which are beyond thescope of the present thesis.
Thermodynamics of the cluster magnetism is done by the exactdiagonalization method. In chapter
seven, we discuss the Heisenberg spin Hamiltonian to which our cluster can be modeled and then
study the thermodynamic properties by the exact diagonalization technique. We have treated the case
of 13- and 4-atom clusters with spin-1/2 and spin-1 particles [30, 31].
24
2 Density functional theory
The DFT is a theory where the many-body problem is treated by the single-particle density through
the Kohn-Sham equations. This was proposed by P. Hohenberg and W. Kohn in 1964 [32]. The
total energy is a functional of the density. Thus all properties of the system can be considered to be
unique functionals of the ground state density. The number of degrees of freedom is now significantly
reduced allowing for quick computations in comparison to other quantum chemical methods. As a
result DFT has become a primary tool for calculation of electronic structure in condensed matter and is
increasingly important for quantitative studies of molecules and other finite systems. The formulation
of DFT as we use today, comes from the classic work of W. Kohn and L. J. Sham [33] and has
become the basis of much of present-day methods for treatingelectrons in atoms, molecules, clusters,
surfaces, adsorbates and bulk. One of the landmark achievement of the DFT is the local-density
approximation (LDA) as the exchange-correlation functional which is very successful in describing
the material properties. Improvements over LDA, like generalized gradient approximation (GGA) is
also mostly recommended in many cases. Below we present a brief theoretical description of the DFT
following the description of Ref. [34]. For more detailed description one must refer to standard books
and review articles.
2.1 Thomas-Fermi-Dirac model
The original DFT of quantum systems was proposed by Thomas [35] and Fermi [36] in 1927. Al-
though their approximation is not accurate enough for present-day electronic structure calculations,
the approach illustrates the way DFT works. In the original Thomas-Fermi method the kinetic en-
ergy of the system of electrons is approximated as an explicit functional of the density, idealized as
non-interacting electrons in a homogeneous gas with density equal to the local density at any given
point. However, in this case the exchange-correlation among the electrons is neglected. Later on in
1930, Dirac formulated the local approximation for exchange. This leads to the energy functional for
electrons in an external potentialVext(r)
ETF[n] = C1
Z
d3r n(r)5/3 +
Z
d3r Vext(r)n(r)+C2
Z
d3r n(r)4/3
+12
Z
d3rd3r′ n(r)n(r)′
| r− r′ |(2.1)
where the first term is the local approximation to kinetic energy withC1 = 310(3π2)2/3 The ground state
25
2 Density functional theory
density and energy can be found by minimizing the functionalETF[n] in Eq. (2.1) and the number of
electronsn(r)
Z
d3r n(r) = N. (2.2)
Using the Lagrange method, the solution can be found by an unconstrained minimization of the func-
tional
ΩTF[n] = ETF[n]−µ∫ d3r n(r)−N (2.3)
where the Lagrange multiplierµ is the Fermi energy. For small variations of the densityδn(r), the
condition for a stationary point is
Z
d3r ΩTF[n(r)+ δn(r)]−ΩTF[n(r)] →Z
d3r
53
C1n(r)2/3 +V(r)−µ
δn(r) = 0, (2.4)
whereV(r) = Vext(r)+VHartree(r)+Vx(r) is the total potential. Since Eq. 2.4 must be satisfied for
any functionδn(r), it follows that the functional is stationary if and only if the density and potential
satisfy the relation
12(3π2)2/3n(r)2/3 +V(r)−µ= 0. (2.5)
DFT is attractive because in this case the equation for density is more simpler compared to the many-
body Schrödinger equation that involves 3N degrees of freedom forN electrons. Thomas-Fermi
approach has very crude approximations, which lacks the essential physics, unable to provide a useful
description of electrons in matter.
2.2 The Hohenberg-Kohn theorems
The formulation of DFT by Hohenberg and Kohn applies to any system of interacting particles in an
external potentialVext(r), with the electrons and fixed nuclei. In this case, the Hamiltonian can be
written as
H = − h2
2me∑
i∇2
i +∑i
Vext(ri)+12 ∑
i 6= j
e2
| ri − r j |. (2.6)
DFT is based on two theorems proved by Hohenberg and Kohn [32], which is as follows.
• TheoremI: For any system of interacting particles in an external potential Vext(r), the potential
Vext(r) is uniquely determined, except for a constant, by the groundstate particle densityn0(r).
26
2.3 The Kohn-Sham approach
• TheoremII: A universal functional for the energyE[n] in terms of the densityn(r) can be defined,
which is valid for any external potentialVext(r). For any particularVext(r), the exact ground state of
the system is the global minimum value of this functional, and the densityn(r) which minimizes the
functional is the exact ground state densityn0(r).
2.3 The Kohn-Sham approach
The assumption made behind this approach is that the ground state density of the original interacting
system is equal to that of a non-interacting system, which leads to independent particle equations of
the non-interacting system that can be considered exactly soluble with all many-body terms incorpo-
rated into an exchange-correlation functional of the density. By solving the equations one finds the
ground state density and energy of the original interactingsystem with the accuracy limited by the
approximations in the exchange-correlation functional.
The Hamiltonian for the independent particle system has form
Hσ = −12
∇2 +Vσ(r) (2.7)
For a system ofN independent electrons withN = N↑ + N↓ obeying this, the ground state has one
electron in each of theNσ orbitalsψσi with the lowest eigen valuesεσ
i of the Hamiltonian (Eq. 2.7).
The density of the auxiliary system is given by sums of squares of the orbitals for each spin
n(r) = ∑σ
n(r,σ) = ∑σ
Nσ
∑i=1
| ψσi (r) |2 (2.8)
the independent-particle kinetic energyTs is given by
Ts = −12∑
σ
Nσ
∑i=1
〈ψσi | ∇2 | ψσ
i 〉 =12∑
σ
Nσ
∑i=1
| ∇ψσi |2, (2.9)
and the classical Coulomb energy of the electron densityn(r) is defined as
EHartree[n] =12
Z
d3rd3r ′n(r)n(r′)| r− r′ | . (2.10)
The Kohn-Sham approach to the full interacting many-body problem is to rewrite the Hohenberg-
Kohn expression of ground state energy functional in the form
EKS = Ts[n]+Z
drVext(r)n(r)+EHartree[n]+EH +Exc[n]. (2.11)
Where,Vext(r) is the external potential due to the nuclei and other external fields (assumed to be
independent of spin),EH : the interaction among the nuclei.
27
2 Density functional theory
Using expressions fornσ(r) andTs from Eqs. 2.8 and 2.9 and the Lagrange multiplier method for the
constraints, the Kohn-Sham Schrödinger-like equation is obtained. this has a form
(HσKS− εσ
i )ψσi (r) = 0, (2.12)
whereεi are the eigenvalues, andHKS is the effective Hamiltonian
HσKS(r) = −1
2∇2 +Vσ
KS(r), (2.13)
whereVσKS(r) consists of three terms, i.e.,
VσKS(r) = Vext(r)+
δEHartree
δn(r,σ)+
δExc
δn(r,σ)= Vext(r)+VHartree(r)+Vσ
xc(r). (2.14)
The last three equations are the Kohn-Sham equations, with the electron densityn(r,σ) and total
energyEKS given in Eqs. 2.8 and 2.11. If the exactExc[n] functional is known, then the exact ground
state density and energy can be calculated for the interacting system.
2.4 Exchange correlation functionals
2.4.1 Local density approximation (LDA)
In local density approximation (LDA) or more generally the local spin density approximation (LSDA),
the exchange- correlation energy is an integral over all space with the exchange-correlation energy
density at each point assumed to be the same as in a homogeneous electron gas with that density,
ELSDAxc [n↑,n↓] =
Z
d3rn(r)εhomxc (n↑(r),n↓(r)) (2.15)
Here, the spin quantization axis is assumed to be the same at all points in space. The LSDA is the
most common local approximation for exchange and correlation . In the case of unpolarized systems,
the LDA is found by settingn↑(r)=n↓(r)=n(r)/2. In LDA,
δExc[n] = ∑σ
Z
dr[
εhomxc +n
∂εhomxc
∂nσ
]
r,σδn(r,σ) (2.16)
Hence the exchange-correlation potentialVσxc can be expressed as
Vσxc(r) =
[
εhomxc +n
∂εhomxc
∂nσ
]
r,σ, (2.17)
Sinceεhomx (nσ) scales(nσ)−1/3, the LDA exchange terms are
Vσxc(r) =
43
εhomx (n(r,σ)). (2.18)
28
2.5 Basis sets
2.4.2 Generalized-gradient approximation (GGA)
In generalized gradient approximation (GGA), the exchange-correlation potential is treated as a func-
tion of both electron density as well as the gradient of the density. The exchange-correlation functional
in GGA has the form
δExc[n] = ∑σ
Z
dr[
εxc +n∂εxc
∂nσ +n∂εxc
∂∇nσ ∇]
r,σδn(r,σ). (2.19)
where, the term in the square brackets is the exchange-correlation potential.
δVσxc(r) =
[
εxc +n∂εxc
∂nσ +n∂εxc
∂∇nσ ∇]
r,σ. (2.20)
2.5 Basis sets
A basis set is a set of unknown functions through which the wavefunction is expanded. For a single
electron, the wavefunction can be written as
ψi(r) =∞
∑j=1
c jφ j(r) (2.21)
whereφ j(r) are a complete set of functions. Any set of functions could beused as basis functions.
In principle, the basis functions should have the same limiting behavior as the real wavefunction, for
isolated atom or molecules they should decay to zero, and they should be computationally inexpensive.
2.5.1 Localized basis sets
The wavefunction exponentially decays to zero at large distances for isolated atoms and molecules.
This means that the basis functions also should behave in a similar way. Atomic orbitals are the basis
functions possessing this property and have two forms: Slater type orbitals (STO) and Gaussian type
orbitals (GTO).
STOs have the following form in spherical coordinates [37]
φnlmζSTO(r,θ,φ) = αYlm(θ,φ)rn−1e−ζr
whereα is a normalization constant,Ylm(θ,φ) is the spherical harmonic.l , m, andn are quantum
numbers, andζ determines the radius of the orbit. The exponential dependence on distance is the
same as for the hydrogen atom.
GTOs in spherical coordinates have a form
φnlmζGTO(r,θφ) = αYlm(θ,φ)r(2n−2−l)e−ζr2
.
29
2 Density functional theory
In both cases the angular dependence of the wavefunction is contained in the spherical harmonics,
where thel ,mvalues determine the type of orbital (e.g.l = 0 is as type orbital,l = 1 a p orbital, etc).
The main difference between STO and GTO is the power ofr in the exponent. GTOs have a zero
slope at the nucleus (r = 0) whereas STOs have a cusp. GTOs also fall off more rapidly with distance
than STOs. These factors suggest that more GTOs are needed toform a suitable basis set than STOs,
roughly three times as many are needed to achieve the same accuracy [37]. However, GTOs are
computationally more efficient than STOs: the factorr in the exponent requires taking a square root
( r =√
x2 +y2 +z2) which is computationally very slow. This computational efficiency compensates
for the additional number of functions needed, hence GTOs are more commonly used in calculations.
The size of the basis set has a large effect on the accuracy of the calculation. The smallest basis set
possible is the minimum basis set which contains only enoughfunctions to contain all the electrons in
the neutral atoms. Increasing the number of basis functionsimproves the accuracy of the calculation.
2.5.2 Plane wave basis sets
The potential for a periodic system has the property
V(r+na) = V(r) (2.22)
wherea is a lattice vector andn is an integer. From Bloch’s theorem [38], the wavefunction can be
written as a product of a periodic and a wave-like part, i.e.,
ψi(r) = eik·rφi(r) (2.23)
Because of periodicity,f (r) can be expanded as a set of plane waves
φi(r) = ∑G
ci ,GeiG·r (2.24)
whereG are the reciprocal lattice vectors. Substituting Eq. 2.24 in Eq. 2.23, the wave function can be
written as
ψi(r) = ∑G
ci,Gei(k+G)·r (2.25)
The number of wavefunctions used is controlled by the largest wave vector in the expansion in
Eq. 2.24. This is equivalent to a cut-off on the kinetic energy since the kinetic energy of an elec-
tron with wave vectork is given by
Ek =h2|k|2
2m. (2.26)
Using the plane waves, the Kohn-Sham equations can be written as [39]
30
2.6 Pseudopotentials
[
∑G′
h2
2m|k + G|2δGG′ +Ven(G −G′)+Vee(G−G′)+VXC(G−G′)
]
ci,k+G′ = ci,k+Gεi, (2.27)
whereVen(G − G′), Vee(G − G′) and VXC(G − G′) are the Fourier transforms of electron-nuclei,
electron-electron, and exchange-correlation potentials.
The major advantages of using plane wave basis sets:
• it is very easy to calculate all kinds of matrix elements, where the fast-Fourier-transform techniques
are of great help.
• the size of basis set can be increased systematically in a simple way.
• the same basis set can be used for all atomic species,
• convergence towards completeness can easily be tested,
• plane waves do not depend on nuclear positions so, unlike localized basis sets, correction terms are
not needed for the calculation of forces.
The main disadvantage is that the basis sets become large very easily. For finite systems such as clus-
ters and molecules in a plane wave approach, it is essential to construct a supercell in each dimension
in which the system is localized. In order to neglect any interactions with the images, the supercell
should be large enough. This means that a large number of plane waves should be used; nevertheless,
this may be an effective way of solving the problem.
2.6 Pseudopotentials
The application of pseudopotentials in electronic structure is to replace the strong Coulomb potential
on the nucleus and the effects of tightly bound core electrons by an effective ionic potential acting on
the valence electrons. Since the core states remain unchanged, a pseudopotential can be generated and
used to compute properties of valence electrons in the system. The advantage of ultrasoft or norm-
conserving pseudopotentials has led to accurate calculations which are the basis for the development
of new methods in electronic structure.
2.6.1 Norm-conserving pseudopotentials
The norm-conserving pseudo functionsψPS are normalized and are solutions of a model potential
chosen to reproduce the valence properties of all-electroncalculation. In the application of pseudopo-
tential to molecules, clusters or solids, the valence pseudo functions must satisfy the orthonormality
conditions, i.e.,
〈ψσ,PSi | ψσ′,PS
j 〉 = δi, jδσ,σ′ (2.28)
31
2 Density functional theory
so that the Kohn-Sham equations can be written as,
(
Hσ,PSKS − εσ
i
)
Ψσ,PSi (r) = 0, (2.29)
with the external potential given by the pseudopotentials.
The norm-conserving pseudopotentials must satisfy the following conditions, namely,
1. All-electron and pseudo valence eigenvalues must agree for the atomic reference configuration.
2. All-electron and pseudo valence wavefunctions must agree beyond the core radiusRc.
3. The logarithmic derivatives of the all-electron and pseudo wavefunctions must agree atRc.
4. The integrated charge insideRc for each wavefunction must agree (norm-conservation).
5. The energy derivative of the logarithmic derivatives of the all-electron and pseudo wavefunc-
tions must agree atRc.
Generation of a pseudopotential starts with the usual all-electron atomic calculation with eachl , m
states treated independently. The total potential is calculated self-consistently for the given approxi-
mation for exchange and correlation and for the given configuration of the atom.
Relativistic effects can be incorporated into the pseudopotentials, since they lead to finite effects in
the interior of the atom very close to the nucleus. The relativistic effects incorporated in the valence
electrons, like shifts due to scalar relativistic effects and spin-orbit interactions, could be easily carried
into the molecular or solid-state calculations.
2.7 Projector augmented wave (PAW) method
The projector augmented wave (PAW) method [27], developed by Blöchl (1994) is a powerful method
for performing pseudopotential electronic structure calculations within DFT. It retains the information
about the correct nodal behavior of the valence electron wave functions and includes the upper core
states in addition to valence states in the self-consistentiterations without significant additional com-
putation. The problem of constructing the projector and basis functions needed for PAW technique
is very similar to the problem of constructing local and nonlocal pseudopotentials. The PAW method
starts with a self-consistent all-electron atomic structure calculation within the framework of DFT.
The projector and basis functions are derived from the eigenstates of the all-electron atomic Hamilto-
nian. They are determined iteratively solving radial differential equations. A detailed description of
the PAW method can be found in Ref [40].
32
2.8 Noncollinear magnetism
2.8 Noncollinear magnetism
In the collinear case of a spin polarized system, for spin up and spin down there are always two
densities[n↑(r),n↓(r)] and potentials[V↑xc(r),V
↓xc(r)]. Since the spin axis can vary in space, i.e., the
non-collinear case [41], the electron density at every point is represented by a vector giving the direc-
tion.
The local spin density matrix has a form
ραβ(r) = ∑i
φiψα⋆i (r)ψβ
i (r), (2.30)
The Kohn-Sham Hamiltonian becomes a 2×2 matrix
HαβKS(r) = − h2
2me∇2+Vαβ
KS(r), (2.31)
where the only part ofVαβKS that is non-diagonal inαβ isVαβ
xc .
Although this looks like a major complication, the real difficulty is in the nature of the functionalεαβxc .
In LDA it is given by finding the local axis of spin quantization and using the same functional form
εhomxc (n↑(r),n↓(r)), whereas the gradient of spin axis is taken into account for the modifications of
GGA expressions.
2.9 Spin-orbit coupling
The spin-orbit coupling involves the interaction between electron spin with its orbital motion. It plays
an significant role in determining the magnetic properties such as the magnetocrystalline anisotropy,
magnetostriction and magneto-optical effects. The spin-orbit coupling can be included as a perturba-
tion in the scalar relativistic LSDA Hamiltonian (Eq. 2.13)with a self-consistent treatment of spin-
orbit contribution at each variational step.
H = H0 + HSO (2.32)
where,H0 is the scalar relativistic Hamiltonian andHSO is the spin-orbit Hamiltonian, which has a
form
HSO=h2
2M2c2
1r
dVdr
L ·σ = ξL ·σ, (2.33)
ξ = h2
2M2c21r
dVdr and is the spin-orbit coupling strength.
For 3d transition metals, theHSO alters charge density, spin density, and spin moment negligibly [42].
While for heavy elements like 4d or 5d elements,HSO has to be included in the self-consistence loop
for the solution of the Kohn-Sham equations.
33

2 Density functional theory
2.10 Methods for the determination of magnetocrystalline
anisotropy
The determination of magnetocrystalline anisotropy energy (EMAE) form first-principles is a great
challenge. It is known that spin-orbit coupling is the origin of magnetocrystalline anisotropy, which is
the fully relativistic total energy difference between twoseparate magnetization directions. There are
three different methods to calculate the MAE; (i) the force theorem [43–45], (ii) the total energy [46],
(iii) the torque method [45, 47]. There are evidences of achieving similar results for most of the 3d
systems.
The calculation of MAE through force theorem includes the difference in the band energies of the
two different magnetization directions with spin-orbit coupling included in the Kohn-Sham equation
in the presence of the same self-consistent scalar-relativistic potential [43, 44]. It has a the following
form
EMAE = E(90)−E(0) ≈ ∑occ′
εi(90)− ∑occ′
εi(0). (2.34)
Where,εi are the band energies which are summed up to the occupied bands. In order to restrain the
numerical fluctuations, a large number ofk points are required.
On the other hand, the calculation of MAE from total energiesnot only deals with large number ofk
points but also a well-converged charge density or potential.
The torque method [47] involves the calculation of the expectation values of the angular derivative of
HSOC(spin-orbit coupling term) at some particular angle (θm andφm). The prime in the wave function
denotes the consideration of SOC.
EMAE = ∑iεocc
〈Ψ′i(θm,φm) | ∂HSOC
∂θ| Ψ′(θm,φm)〉. (2.35)
θm andφm can be found from the symmetry of the crystal lattice. However, it gives reliable results
with few k-points.
2.11 Electronic structure calculations
2.11.1 Single point energy calculations
In a single point energy (SPE) calculation, the wavefunction and charge density, and hence the energy
of an arrangement of nuclei is calculated self-consistently. The total energy functional of a system of
electrons and nuclei can be written as
E[ρ(ri),RI ] = Te[ρ(ri)]+Tn+Een[ρ(ri),RI]+Eee[ρ(ri)]+Enn(RI) (2.36)
34
2.11 Electronic structure calculations
whereTe[ρ(ri)] is the electronic kinetic energy,Tn is the nuclear kinetic energy,Een is the electron-
nuclei interaction,Eee is the electron-electron interaction andEnn is the nuclei-nuclei interaction.Ene
is described using pseudopotentials, while for a fixed set ofnuclear positionsTn is zero andEnn is
a constant. Therefore, a SPE calculation is reduced to finding the charge density that minimizes the
total energy functional by solving the Kohn-Sham equations.
The total energy minimization can be done in several ways. One method is through direct diagonal-
ization of the matrix equation 2.27. Starting from an initial trial densityEee is calculated and inserted
into 2.27. A new density is then calculated by inverting the matrix equation 2.27. If the change in
energy between iterations is smaller than a given tolerance, it is then inserted into the total energy
functional and the energy calculated. Otherwise this new density is used to calculate a newEee. This
is repeated until the density and potential are consistent with each other within a given tolerance.
The matrix diagonalization method has the disadvantage that the computational cost of matrix diag-
onalization scales as the cube of number of plane waves. An alternative method is to minimize the
energy functional directly [48], where the energy is a functional of the density, which is determined
by the expansion coefficientsci,k+G. The ground state density is found from the set ofci,k+G that min-
imize the energy functional. Several standard functional optimization methods [49] can then be used
to find the minima of the total energy functional. One of such techniques is the method of Steepest
Descents (SD) [49]. The SD method produces a series of pointsPi
Pi+1 = Pi + λihi (2.37)
where
hi = −∇ f (Pi).
Here,Pi are sets of plane wave expansion coefficients andf (P) is the energy functional.λi (a scalar)
is the distance along the directionhi from Pi that a minima is located. The SD method proceeds
by moving in the steepest downhill direction from a pointPi until a minima along that direction is
located at pointPi+1. The steepest downhill direction fromPi+1 is then determined (−∇ f (Pi+1)) and
the minima located along that direction is found. This is repeated until the change in the function is
lower than a preset tolerance. The speed at which the SD method will find a minima is limited as at
each step only the information at that point is taken into account. It is easy to think of examples where
this will lead to slow convergence. A better method is the Conjugate Gradients (CG) method [48, 49]].
It differs from the SD method in that each search direction isconjugate to the last one. In CG method
the function has a quadratic form
f (x) ≈ 12
x.A.x (2.38)
whereA is the Hessian and is given by
35
2 Density functional theory
Ai j =∂2 f
∂xi∂x j
∣
∣
∣
∣
x=x0
. (2.39)
Using the quadratic form Eq. 2.38 the step needed to get to theminima in the directionhi is given
by [49]
λi =hi.gi
hi .A.hi. (2.40)
This however can be found from a one-dimensional minimization alonghi, i.e. without explicitly
calculating the Hessian. As the Hessian is anN×N matrix, for DFT calculations withN = 105−106
plane waves the CG method has a large advantage over methods that explicitly use the Hessian. The
CG method will find a minimum of anN dimensional function inN iterations. For CG and SD
methods to minimize the total energy functional, the wavefunctions have to be orthonormal which is
an additional constraint on the minimization. The number ofiterations required can be substantially
reduced by preconditioning the function [48].
2.11.2 Geometry optimization
The aim of geometry optimization is to generate the lowest energy structure of a molecule or cluster
from any arbitrary starting state. Since using the Born-Oppenheimer approximation, the motion of the
nuclei and the electrons can be separated, hence a geometry optimization consists of a set of single
point energy calculations. For the initial starting geometry, a SPE calculation is performed. The forces
on the nuclei are calculated from the wavefunction using theHellmann-Feynman theorem [50]. The
force in this case is given by
FI = −⟨
∂E∂RI
⟩
(2.41)
whereE is the energy,RI is the position of the nucleus. This force can be used to find the ground
state positions of the atoms. As the forces point towards a local minimum in the energy integrating
the equations of motion for the nuclei will move the nuclei towards an equilibrium structure. Alterna-
tively, functional optimization techniques like SD or CG methods may be used. However the Hessian
based methods [49] may also be used for this purpose.
Two points should be made about the above method. Firstly, ifthe basis set is incomplete, an error
is introduced into the Hellman-Feynman forces, known as thePulay force [51]. However, for a plane
wave basis set the wavefunctions do not depend on the nuclearpositions, hence this error is zero, as
long as the electronic system has converged to the ground state. For situations where the cell shape
changes analogous Pulay stresses arise. Secondly, the above procedure will find the nearest point in
the configuration space at which the forces are zero. Hence, if a poor starting point is chosen it may
find a local rather than a global minimum in the potential energy surface or if the starting point is an
energy maximum it may stay there. This procedure can also be rather time consuming with many SPE
36

2.11 Electronic structure calculations
calculations needed to find the minima. Thus it is common to perform an initial energy minimization
using molecular mechanics calculations to get to the vicinity of a minima and then perform a fullab
initio geometry optimization.
37
3 Structure and magnetism in transitionmetal clusters
3.1 Introduction
One of the important quest in the physics of transition metalclusters is to understand how the prop-
erties of clusters vary with change in morphology and size. The physical and chemical properties of
clusters, such as magnetic properties and chemical reactivity can be determined by analyzing their
geometry and electronic structures. For instance, the magnetic properties of TM clusters depend
on various parameters like bond lengths, structural geometry, cluster size,d-band filling (TM type),
atomic distributions (for binary clusters) and surrounding environment (deposited clusters). Therefore
it is essential to study the physics of clusters by anab initio approach, where all type of interactions
are modeled through more fundamental electron-electron interactions and correlations.
Transition metal clusters of Fe, Co and Ni have been the main topic of research both experimen-
tally [52–55] and theoretically [56, 57]. Experimental studies based on Stern-Gerlach setup [52] for
magnetic properties of FeN, CoN and NiN clusters show enhancement of the average magnetic mo-
ment for small clusters relative to bulk. With increase in cluster size, upto few hundreds of atoms, the
average magnetic moment are still higher but slowly approaches towards the corresponding bulk value
in a non monotonous way. The convergence of magnetic moment towards the bulk limit are faster for
Ni and Co in comparison to Fe. There exist various experimental [52, 53] and theoretical [56, 58–60]
studies for the structure and magnetism of Ni and Fe clusters. For example, the geometry of small NiN,
3≤N≤28, clusters have been studied by Parkset al. [61, 62] through molecular adsorption and have
reported different atomic packings with respect to clustersizes. Using the classical molecular dynam-
ics and molecular orbital theory, Reddy et al. [63] have studied the morphology, energetics, electronic
structure and vertical ionization potential and magnetic properties of Ni clusters up to 21 atoms (N
= 21). Through the self-consistent tight-binding model, Aguilera-Granjaet al. [64] have studied the
variation of the magnetic moments of nickel clusters for 5≤ N ≤ 60. Reuse and Khanna [65] have
performed studies on the geometry, electronic and magneticproperties of nickel clusters using the
linear combination of atomic orbitals. They have found a number geometries and spin multiplicities
for NiN (N = 2-6, 8, 13) clusters. A study of the electronic structure and magnetic properties of NiN
(N= 2-39 and 55) clusters was also performed by Duanet al. [58] using LSDA. Futscheket al. [66]
have studied the structural and magnetic properties of Ni clusters through the fixed spin moment cal-
38
3.2 Elemental clusters
culations within the GGA based on DFT. Experimental studiesrelated to structure of Fe clusters are
still limited [67–69]. The bond lengths for Fe dimer on neon [67] and argon matrix [68] are pre-
dicted to be 2.02± 0.02 Å and 1.87± 0.13 Å, respectively, through extended X-ray absorption fine
structure (EXAFS) analysis. For a Fe trimer (N = 3), Raman spectroscopy measurements by Haslett
et al. [70] have proved a Jahn-Teller distorted ground state. For Fe clusters larger than three atoms,
no direct experimental results are available regarding thestructural stability. However, experimen-
tally, there exists results for electron affinity and ionization potential [71–74] of Fe clusters up to 100
atoms. Theoretical studies on structure and magnetism of Feclusters are many, which are mainly
based on tight-binding techniques [60, 75] or first-principles approach [76–79]. LSDA calculations
for small Fe clusters containing up to 5 atoms have shown enhanced stabilities for higher-dimensional
clusters [76, 77]. For instance, among several isomers for Fe4, the tetrahedral geometry is more prefer-
able over the square and linear geometry. Using density functional tight binding and DFT, Bobadova
et al. [80] have evaluated the potential energy surface as well as the magnetic properties of Fe clusters
up to 19 atoms. Diéguezet al. [79] have performed LSDA calculations to study the structures and
magnetic moments of Fe clusters up to 17 atoms. There have been studies on the optimal geometries,
binding energies, bond dissociation energies, ionizationpotentials and electron affinities of neutral
and charged iron clusters up to 5 atoms using the nonlocal spin density method [81].
The literature survey discussed above mainly deals with theproperties of clusters based on collinear
treatment of spins, where a global spin quantization axis isassumed for the whole system. One must
note that spin spiral states exist in bulk fcc Fe [82]. On the other hand, triangular lattice structures of
bulk Mn and Cr leads to the spin frustration. This shows the importance of non-collinear magnetism
occurring in clusters. There are already reports for the noncollinear magnetic configurations for small
clusters of Fe, Cr and Mn studied within the LSDA [83–85].
3.2 Elemental clusters
In order to determine the equilibrium geometries, we have considered several isomers (same cluster
size but different structural geometry) for each cluster size. Since the number of isomers increase
rapidly with cluster size, it is nearly impossible to scan all the isomers in the potential energy surface
of each cluster. Therefore, the starting geometry is constructed according to certain educated geuss
backed from literature. After structural optimization, all isomers of NiN and FeN are found to be
distorted from their regular geometries. These structuraldeformations can be attributed to Jahn-
Teller (JT) [14] distortions. Jahn-Teller distortions arecharacterized by structural distortions in finite
systems like molecules and clusters, which is accompanind by removal of any degeneracy of electronic
energy levels near the Fermi level by breaking the symmetry and there by lowering the energy of the
system.
39

3 Structure and magnetism in transition metal clusters
3.2.1 NiN clusters
Using the linear combination of atomic and molecular orbitals Reuseet al. [65] have reported a bond
length of 1.76 Å and corresponding binding energy of 1.61 eV/atom for Ni-dimer. Our studies based
on GGA for Ni2 also gives a ferromagnetic ground state, however we obtain slightly larger bond
length of 2.08 Å. We have obtained the binding energy as 1.41 eV/atom, which is slightly smaller.
This difference is due to the degree of approximations used in the calculations. We believe that GGA
gives a much better value and our obtained results also agreevery well with other calculations done
in GGA [56, 66]. Badenet al. [86] have presented results on binding energy calculated using various
functionals and the binding energy is shown to vary from 1.15to 1.25 eV/atom. The experimentally
obtained bond length and binding energy of Ni2 is reported to be 2.15 Å and 1.02 eV/atom, respec-
tively [87]. One observes that the bond length of Ni2 is shorter than the nearest-neighbour distance of
bulk fcc Ni (2.49 Å). We have obtained a magnetic moment of 1.0µB/atom for Ni2.
The equilibrium geometry for Ni3 is a distorted triangle with an average bond length of 2.20 Å.The
total magnetic moment is found to be 0.733µB/atom and a binding energy is 1.84 eV/atom. It must
be compared with results obtained by Castroet al [56], where they have obtained a regular equilateral
triangle as the ground state structure. The value of bond length, magnetic moment and the binding
energy are howerver comparable to the values obtained from our calculations, on the other hand the
binding energy reported by Futscheket al. [66] is slightly lower. The reason for obtaining a low
binding energy can be accounted from the structural optimization which they have performed within
fixed-spin constraints. Our calculations, however, are done with fully unconstrained relaxation also
allowing for noncollinear magnetic moments. LSDA values ofbond length, magnetic moment and
binding energy reported by Reuseet al. [65] agrees very well with our results obtained from GGA.
For Ni4, a JT distorted tetrahedron is found to be the minimum energystructure. The average bond
length is 2.28 Å (the exreme values of bond length are 2.20 and2.33 Å), total magnetic moment
is 0.86µB/atom and the binding energy is 2.14 eV/atom. The above results match well with those
obtained by Bienatiet al. [88]. Castroet al. have also predicted a Jahn-Teller distorted structure with
a large variation of bond length (from 2.21 Å to 2.41 Å). The value of binding energy reported is 2.33
eV/atom, which is larger as compared to ours. It must be notedthat unlike Ni3, they obtain distorted
structure for Ni4. Reuseet al. [65] on the other hand, have obtained the distorted tetrahedron and
square as structures with degenerate energies for Ni4 cluster. This is unlike the energy trend obtianed
by us for the two structures.
A JT-distorted trigonal bipyramid with three atoms in a triangular ring and two atoms occupying the
apex sites is found to be the stable structure for Ni5 with variation in bond length between 2.25 Å to
2.34 Å. The total magnetic moment and binding energy are calculated to be 0.77µB/atom and 2.39
eV/atom, respectively. The obtained minimum energy structure is in agreement with Castroet al [56],
Reuseet al [65] and Micheliniet al. [89]. LSDA calculations [65, 89] predict a larger binding energy
for Ni5 compared to the present GGA calculations. The calculated total spin moment, howevr, agrees
well with the LSDA calculations.
40
3.2 Elemental clusters
For Ni6 cluster, a Jahn-Teller distorted octahedral cluster is obtained as the ground state structure with
a bond length range between 2.29 Å-2.35 Å. Similar structureis predicted as the lower in energy by
Reuseet al. [65] and Micheliniet al. [89]. The calculated values of bond length variations, magnetic
moment (1.1µB/atom) and binding energy (2.61 eV/atom) agree with those ofMichelini et al.[89]. On
the other hand, Reuseet al. have obtained a relatively large value of binding energy∼ 3.30 eV/atom,
which might be due to the small variation of bond lengths in their results. They have obtained a
distorted octahedral Ni6 cluster with bond length variation (2.32-2.35 Å) as low energy strcuture.
The total mangnetic moment obtained in our calculations forNi6(1.10µB/atom) agrees well with the
experimental obtained values of 1.33µB/atom [54].
A distorted pentagonal bipyramidal structure is determined as the stable structure for Ni7 obtained
from our calculations. Using embeded atoms potentials, Böyükataet al. [90] have obtained a similar
structure as the minimum energy structure. The emperical many body potential and molecular dy-
namics simulations by Nayaket al. [91] have also shown such a structure having the lowest energy.
However, LSDA calculations by Desmaraiset al. shows a capped octahedron as the stable structure
for Ni7 [92]. They have also predicted a distorted pentagonal bipyramid structure as energetically
close to the ground state structure. The calculated value ofbinding energy (2.71 eV/atom) is almost
comparable to the corresponding result in Ref. [90].
We have found the lowest energy structure for Ni8 as a distorted bidisphenoid structure with the bond
lengths varying from 2.27 to 2.39 Å. Such a structure is also predicted by Desmaraiset al. [92]. Our
calculated binding energy, 2.84 eV/atom is slightly less ascompared to their values, this is because
of the different exchange-correlation functional used in the calculations. They have used LSDA,
while our calculations are in GGA. The energetically favorable structures for Ni9-Ni11 are observed
to be of polytetrahedral geometry. The binding energies forNi9, Ni10 and Ni11 are calculated to be
2.95, 2.98 and 3.05 eV/atom, respectively, and their magnetic moments are 0.86 (Ni9), 0.8 (Ni10) and
0.75µB/atom (Ni11). The equilibrium geometries and binding energies obtained in our calculations
agree with the results Refs. [90, 91]. Form Ni12 onwards, the icosahedral-like geometry is more
favorable. For instance, the Ni13 cluster is a JT-distorted icosahedron, with average centerto shell
distance of 2.32 Å and a total spin moment of 0.61µB/atom, which is close to the corresponding bulk
value of fcc Ni (0.6µB/atom).
The equilibrium geometries obtained for NiN clusters are illustrated in Fig 3.1. The calculated value
of magnetic moments for NiN clusters are compared with the available theoretical and experimental
results in Fig 3.2. It shows that theoretically obtained values of magnetic moments are lower compared
to that of the experimental ones. Our calculations show a good qualitative agreement with Ref. [63].
The strong fluctuations in the moments of small cluster sizesmay be due to the different equilibrium
structures predicted from various approximations. FromN = 6 onwards, almost a linear decrease in
the magnetic moment is observed untilN = 14. This trend is supported by other theoretical results [58,
63, 64] and also from experiment [54]. There is a discrepancyin the theoretical results for clusters
larger thanN = 14. We must stress that the present calculation is consistent with the experimental
41
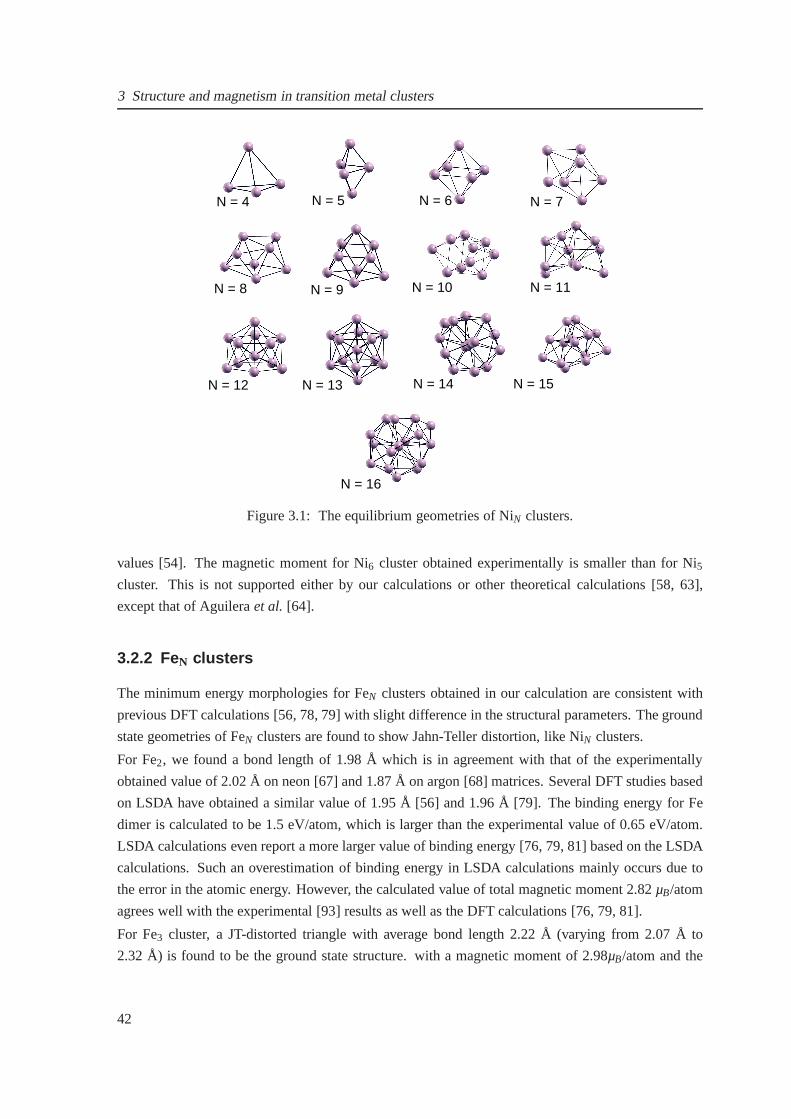
3 Structure and magnetism in transition metal clusters
N = 4
N = 8
N = 5 N = 7
N = 9 N = 10 N = 11
N = 12 N = 13 N = 14 N = 15
N = 6
N = 16
Figure 3.1: The equilibrium geometries of NiN clusters.
values [54]. The magnetic moment for Ni6 cluster obtained experimentally is smaller than for Ni5
cluster. This is not supported either by our calculations orother theoretical calculations [58, 63],
except that of Aguileraet al. [64].
3.2.2 FeN clusters
The minimum energy morphologies for FeN clusters obtained in our calculation are consistent with
previous DFT calculations [56, 78, 79] with slight difference in the structural parameters. The ground
state geometries of FeN clusters are found to show Jahn-Teller distortion, like NiN clusters.
For Fe2, we found a bond length of 1.98 Å which is in agreement with that of the experimentally
obtained value of 2.02 Å on neon [67] and 1.87 Å on argon [68] matrices. Several DFT studies based
on LSDA have obtained a similar value of 1.95 Å [56] and 1.96 Å [79]. The binding energy for Fe
dimer is calculated to be 1.5 eV/atom, which is larger than the experimental value of 0.65 eV/atom.
LSDA calculations even report a more larger value of bindingenergy [76, 79, 81] based on the LSDA
calculations. Such an overestimation of binding energy in LSDA calculations mainly occurs due to
the error in the atomic energy. However, the calculated value of total magnetic moment 2.82µB/atom
agrees well with the experimental [93] results as well as theDFT calculations [76, 79, 81].
For Fe3 cluster, a JT-distorted triangle with average bond length 2.22 Å (varying from 2.07 Å to
2.32 Å) is found to be the ground state structure. with a magnetic moment of 2.98µB/atom and the
42
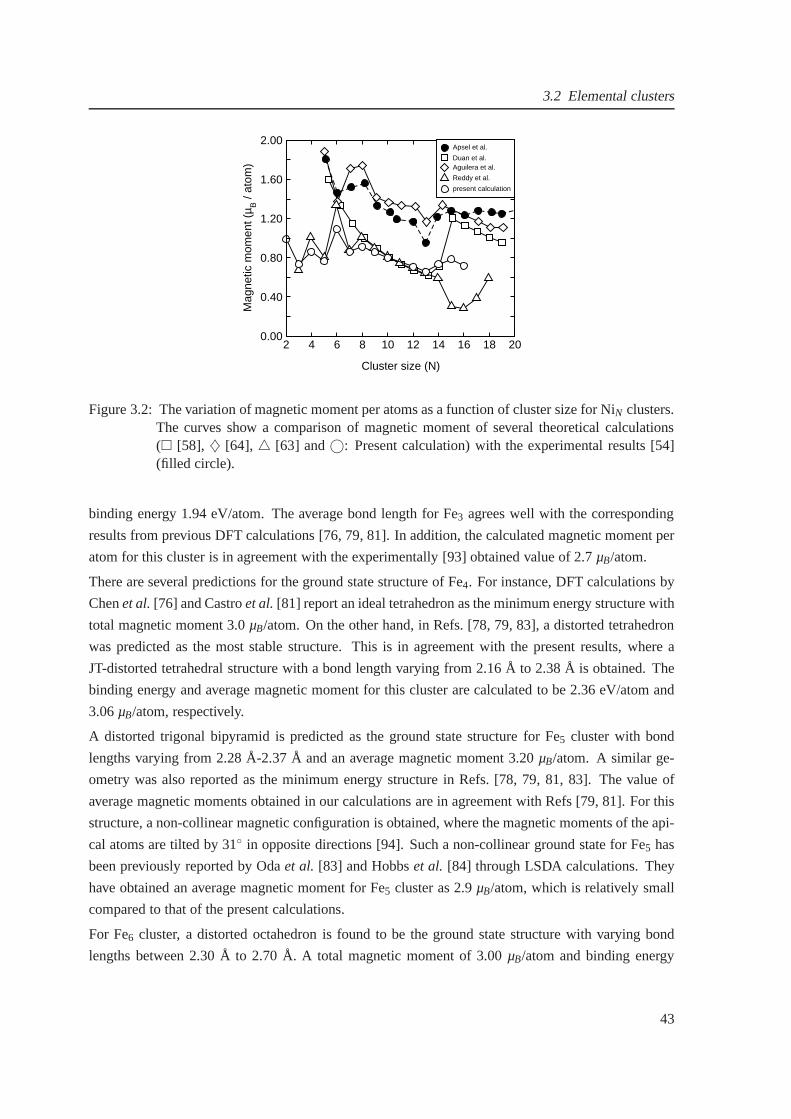
3.2 Elemental clusters
2 4 6 8 10 12 14 16 18 20
Cluster size (N)
0.00
0.40
0.80
1.20
1.60
2.00
Mag
netic
mom
ent (
µ B /
atom
)
Apsel et al.
Duan et al.Aguilera et al.
Reddy et al.
present calculation
Figure 3.2: The variation of magnetic moment per atoms as a function of cluster size for NiN clusters.The curves show a comparison of magnetic moment of several theoretical calculations( [58], ♦ [64], [63] and©: Present calculation) with the experimental results [54](filled circle).
binding energy 1.94 eV/atom. The average bond length for Fe3 agrees well with the corresponding
results from previous DFT calculations [76, 79, 81]. In addition, the calculated magnetic moment per
atom for this cluster is in agreement with the experimentally [93] obtained value of 2.7µB/atom.
There are several predictions for the ground state structure of Fe4. For instance, DFT calculations by
Chenet al.[76] and Castroet al.[81] report an ideal tetrahedron as the minimum energy structure with
total magnetic moment 3.0µB/atom. On the other hand, in Refs. [78, 79, 83], a distorted tetrahedron
was predicted as the most stable structure. This is in agreement with the present results, where a
JT-distorted tetrahedral structure with a bond length varying from 2.16 Å to 2.38 Å is obtained. The
binding energy and average magnetic moment for this clusterare calculated to be 2.36 eV/atom and
3.06µB/atom, respectively.
A distorted trigonal bipyramid is predicted as the ground state structure for Fe5 cluster with bond
lengths varying from 2.28 Å-2.37 Å and an average magnetic moment 3.20µB/atom. A similar ge-
ometry was also reported as the minimum energy structure in Refs. [78, 79, 81, 83]. The value of
average magnetic moments obtained in our calculations are in agreement with Refs [79, 81]. For this
structure, a non-collinear magnetic configuration is obtained, where the magnetic moments of the api-
cal atoms are tilted by 31 in opposite directions [94]. Such a non-collinear ground state for Fe5 has
been previously reported by Odaet al. [83] and Hobbset al. [84] through LSDA calculations. They
have obtained an average magnetic moment for Fe5 cluster as 2.9µB/atom, which is relatively small
compared to that of the present calculations.
For Fe6 cluster, a distorted octahedron is found to be the ground state structure with varying bond
lengths between 2.30 Å to 2.70 Å. A total magnetic moment of 3.00 µB/atom and binding energy
43

3 Structure and magnetism in transition metal clusters
2.85 eV/atom. LSDA calculations by Diéguezet al. [78, 79] have predicted such a structure to be
more favorable for Fe6. Our calculated value of magnetic moment for the octahedronis slightly less
than that of Diéguezet al., who have obtained 3.33µB/atom. The ground state structure for Fe7 is a
distorted pentagonal bipyramid with a bond length range between 2.28 Å-2.56 Å, which agrees with
the results in Refs. [78, 79]. The calculated value of magnetic moment 2.88µB/atom is lowered by
0.26µB compared to Ref. [79].
The ground state structures obtained for Fe8, Fe9 and Fe10 are similar to the corresponding findings
of Diéguezet al. [79], who have found a bidispenoid for Fe8, a tricapped trigonal prism for Fe9 and
a bicapped square anti prism for Fe10 with relatively larger value of binding energies (4.12 eV/atom,
4.19 eV/atom and 4.27 eV/atom for Fe8, Fe9 and Fe10, respectively). The binding energy obtained
from our calculations are 3.17, 3.21 and 3.27 eV/atom which have a lower value compared to those
obtained in LSDA calculations. The average magnetic moments obtained in our calculations are 2.77,
2.69 and 2.63µB/atom for Fe8, Fe9 and Fe10 clusters, respectively.
From N = 11 onwards, the stable structures exhibit icosahedral-like strucutres. In particular, for
Fe13 cluster we obtain a JT-distorted closed shell icosahedron [18, 95] with everage center to shell
distance of 2.39 Å and an average magnetic moment 3.02µB/atom with binding energy 3.45 eV/atom.
LSDA studies also predict a distorted icosahedron as the ground state structure for Fe13 [96, 97]. The
calculated value of average magnetic moment for this cluster is comparable with the experimental
value of 2.6±0.4 µB as obtained from the cluster beam deflection experiments [98]. The collinear
fixed spin moment calculations for Fe13 suggest the existence of two spin states. The high spin state
with total magnetic moment 44µB (all spins parrell) is lower in energy compared to the low spin state
of 34µB where the central spin is reversed with respect to the surrounding atoms. Figure 3.3 shows the
total energies obtained for each spin moment of Fe13 icosahedral cluster using the fixed spin moment
method [99], where the total energy is calculated by fixing the total magnetic moment of the cluster.
It shows that both LDA and GGA yield the same result with the high spin state as the more favorable
in energy as compared to the low spin state. Our findings for GGA calculation of Fe13 agrees with
Ref. [97].
Figures 3.4, 3.5 and 3.6 shows a comparison of the evolution of cluster properties with respect to
cluster size for the minimum energy structures of NiN and FeN clusters. The variation of binding
energy as a function of cluster size for both cluster speciesare illustrated in Fig. 3.4. The variation
of binding energies for NiN and FeN clusters show monotonically increasing trends with increasing
cluster size. However, no anomalous feature is observed towards the existence of magic numbers
previously reported for alkali metal clusters.
In Fig. 3.5, the total magnetic moment per atom as a function of cluster size are plotted for FeN and
NiN clusters, which shows oscillatory behavior for both clusters with increase in the number of atoms
in a cluster. Both clusters show magnetic moment enhancements relative to the corresponding values
of bulk bcc Fe (2.22µB/atom) and fcc Ni (0.6µB/atom). However, such an enhancement for NiN is
found to be weak compared to FeN. It is observed that the magnetic moment in Fe clusters increases
44
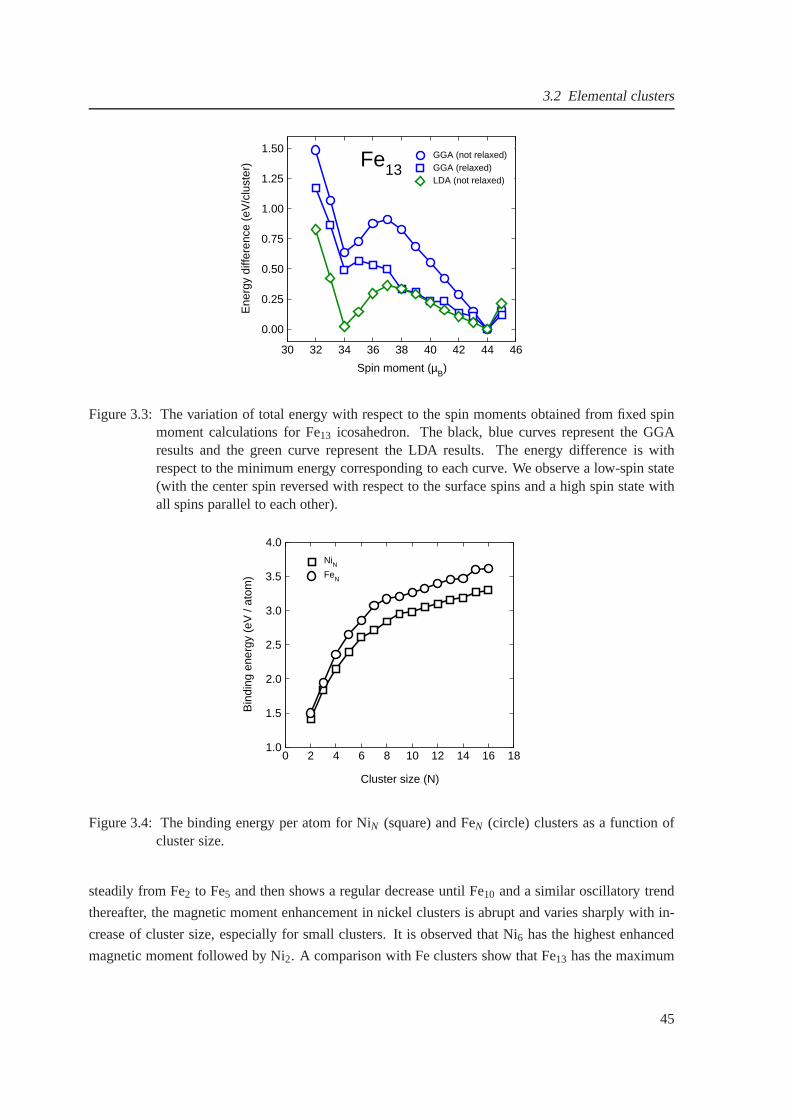
3.2 Elemental clusters
30 32 34 36 38 40 42 44 46
Spin moment (µB)
0.00
0.25
0.50
0.75
1.00
1.25
1.50
Ene
rgy
diffe
renc
e (e
V/c
lust
er)
GGA (not relaxed)GGA (relaxed)LDA (not relaxed)
Fe13
Figure 3.3: The variation of total energy with respect to thespin moments obtained from fixed spinmoment calculations for Fe13 icosahedron. The black, blue curves represent the GGAresults and the green curve represent the LDA results. The energy difference is withrespect to the minimum energy corresponding to each curve. We observe a low-spin state(with the center spin reversed with respect to the surface spins and a high spin state withall spins parallel to each other).
0 2 4 6 8 10 12 14 16 18
Cluster size (N)
1.0
1.5
2.0
2.5
3.0
3.5
4.0
Bin
ding
ene
rgy
(eV
/ at
om)
NiNFeN
Figure 3.4: The binding energy per atom for NiN (square) and FeN (circle) clusters as a function ofcluster size.
steadily from Fe2 to Fe5 and then shows a regular decrease until Fe10 and a similar oscillatory trend
thereafter, the magnetic moment enhancement in nickel clusters is abrupt and varies sharply with in-
crease of cluster size, especially for small clusters. It isobserved that Ni6 has the highest enhanced
magnetic moment followed by Ni2. A comparison with Fe clusters show that Fe13 has the maximum
45
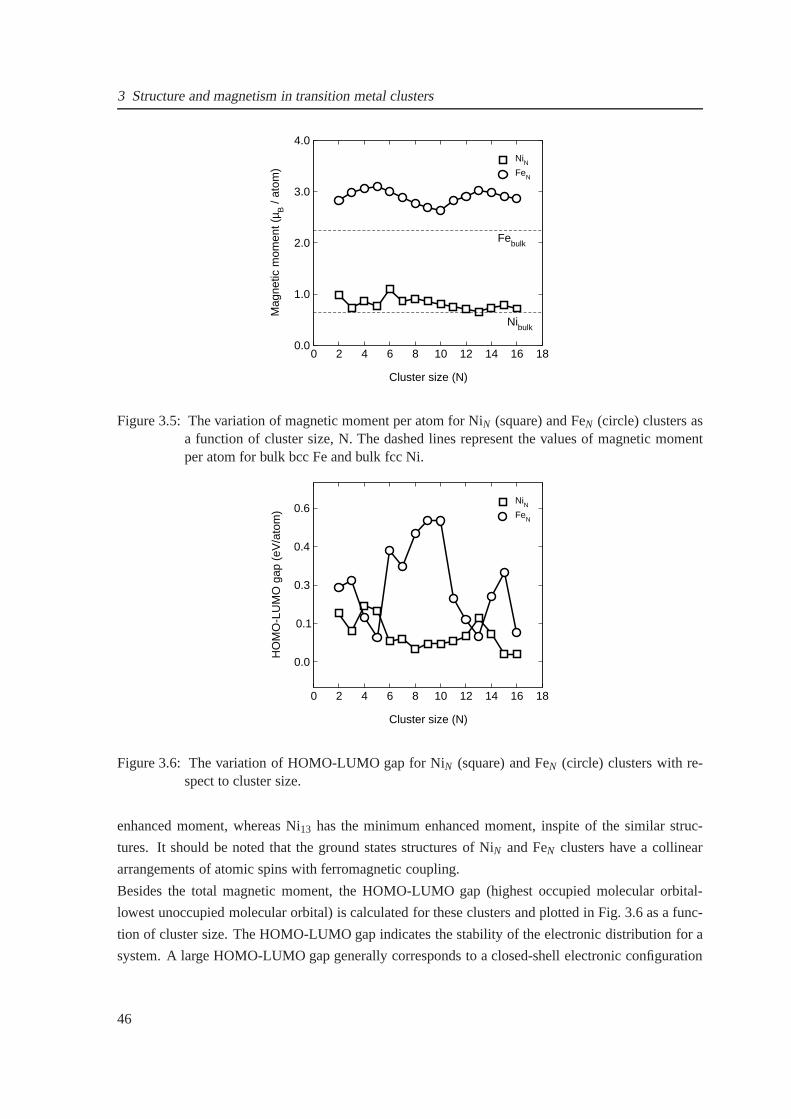
3 Structure and magnetism in transition metal clusters
0 2 4 6 8 10 12 14 16 18
Cluster size (N)
0.0
1.0
2.0
3.0
4.0
Mag
netic
mom
ent (
µ B /
atom
)
NiNFeN
Febulk
Nibulk
Figure 3.5: The variation of magnetic moment per atom for NiN (square) and FeN (circle) clusters asa function of cluster size, N. The dashed lines represent thevalues of magnetic momentper atom for bulk bcc Fe and bulk fcc Ni.
0 2 4 6 8 10 12 14 16 18
Cluster size (N)
0.0
0.1
0.3
0.4
0.6
HO
MO
-LU
MO
gap
(eV
/ato
m)
NiNFeN
Figure 3.6: The variation of HOMO-LUMO gap for NiN (square) and FeN (circle) clusters with re-spect to cluster size.
enhanced moment, whereas Ni13 has the minimum enhanced moment, inspite of the similar struc-
tures. It should be noted that the ground states structures of NiN and FeN clusters have a collinear
arrangements of atomic spins with ferromagnetic coupling.
Besides the total magnetic moment, the HOMO-LUMO gap (highest occupied molecular orbital-
lowest unoccupied molecular orbital) is calculated for these clusters and plotted in Fig. 3.6 as a func-
tion of cluster size. The HOMO-LUMO gap indicates the stability of the electronic distribution for a
system. A large HOMO-LUMO gap generally corresponds to a closed-shell electronic configuration
46

3.3 Size dependence of the magnetic moments
which indicates the absence of low-energy excitations in the system. In the present calculations, a
large energy gap is obtained for Ni4, Ni5 and Ni13 clusters with 0.22 eV, 0.19 eV and 0.17 eV, re-
spectively, which indicates an enhanced stability for these clusters. On the other hand, the energy
gap for Fe5 clusters show large fluctuations in particular, for Fe5 and Fe13, a lower gap is observed.
Our calculations of HOMO-LUMO gap for Ni clusters (marked bysquares in Fig. 3.6) show a good
agreement with Ref. [63] from N≥7. Some discrepancies appear for small clusters. The originof
such discrepancies can be due to the different treatment of the electronic structure as well as the use
of model potentials to optimize the geometries. However, our results are more reliable because of
the high-precision calculations performed with the PAW method and a large basis set with an energy
cut-off of 270 eV.
3.3 Size dependence of the magnetic moments
The variation of the average magnetic moment as a function ofthe cluster size is not smooth in general.
The overal decay is due to the increasing number of nearest neighbors, an effect that enhances the
itinerant character of thed electrons. On the surface of the clusters the number of neighbors is still
low compared to the bulk, so only when the number of surface atoms becomes small compared to the
total number of atoms in the cluster, then the cluster magnetic moment converges towards the bulk
moment. Furthermore, small clusters have structures that are not simple fragments of the crystal. All
these ingredients affect the detailed broadening of the electronic levels to form thed bands. So the
exchange splitting between↑ and↓ d sub-bands, the charge transfer from thes to thed band and the
sdhybridization depend on the cluster sizeN, and control the evolution of magnetic moments.
The magnetic moments of Fe, Co and Ni clusters with sizes up to700 atoms have been measured [52,
54, 55] under conditions where the clusters follow superparamagnetic behavior, for low cluster tem-
peratures (vibrational temperatureTvib = 120K for Fe clusters and 78 K for Ni and Co clusters). The
results are shown in Fig. 3.7. The magnetic moment per atom decreases with increasing cluster size
and converges to the bulk value for a few hundred atoms; this convergence is faster for the Ni clus-
ters. However, in the three cases weak oscillations are superimposed to the global decrease of average
magnetic moments. The size dependent magnetic moments has been studied for Fe clusters up to 641
atoms using DFT [100]. Figure 3.8 shows the energetics (leftpanel) and the corresponding magnetic
moments (right panel) for Fe clusters (for details, see Ref.[100]). For each cluster size, the Fe clusters
with bcc, fcc, and Mackay transformed (discussed in Section4.4.2) geometries are structurally opti-
mized. It shows that the for small clusters of 13 atoms, the Jahn-Teller distorted Fe13 cluster shows
enhanced stability, whereas with increase in cluster size (clusters containing more than 100 atoms), the
Fe clusters with bcc symmetry are found to show more stability compared to the Jahn-Teller distorted
or Mackay transformed ones. Concerning the magnetic moments for all clusters (shown in the right
panel of Fig. 3.8), it slowly approaches towards the bulk limit with increase in cluster size, the Mackay
transformed and bcc Fe clusters show a better agreement withthe experimental results [53, 55].
47
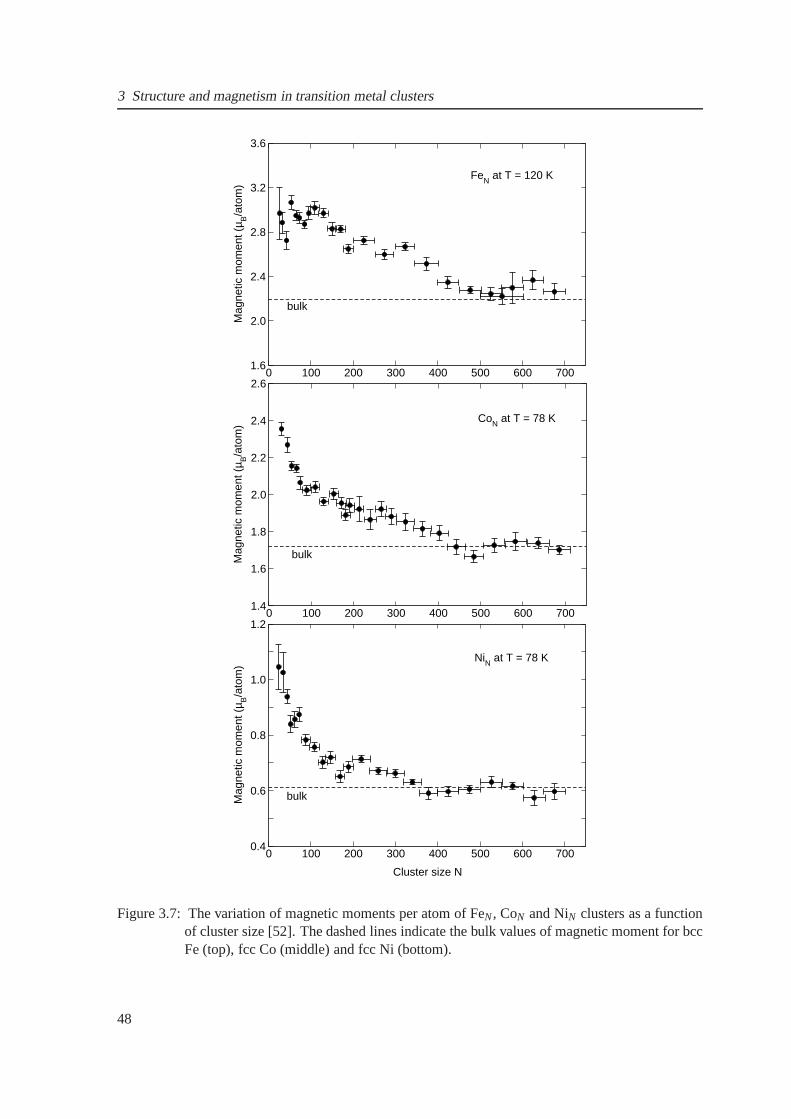
3 Structure and magnetism in transition metal clusters
0 100 200 300 400 500 600 7001.6
2.0
2.4
2.8
3.2
3.6
Mag
netic
mom
ent (
µ B/a
tom
)
bulk
FeN at T = 120 K
0 100 200 300 400 500 600 7001.4
1.6
1.8
2.0
2.2
2.4
2.6
Mag
netic
mom
ent (
µ B/a
tom
)
bulk
CoN at T = 78 K
0 100 200 300 400 500 600 700
Cluster size N
0.4
0.6
0.8
1.0
1.2
Mag
netic
mom
ent (
µ B/a
tom
)
bulk
NiN at T = 78 K
Figure 3.7: The variation of magnetic moments per atom of FeN, CoN and NiN clusters as a functionof cluster size [52]. The dashed lines indicate the bulk values of magnetic moment for bccFe (top), fcc Co (middle) and fcc Ni (bottom).
48
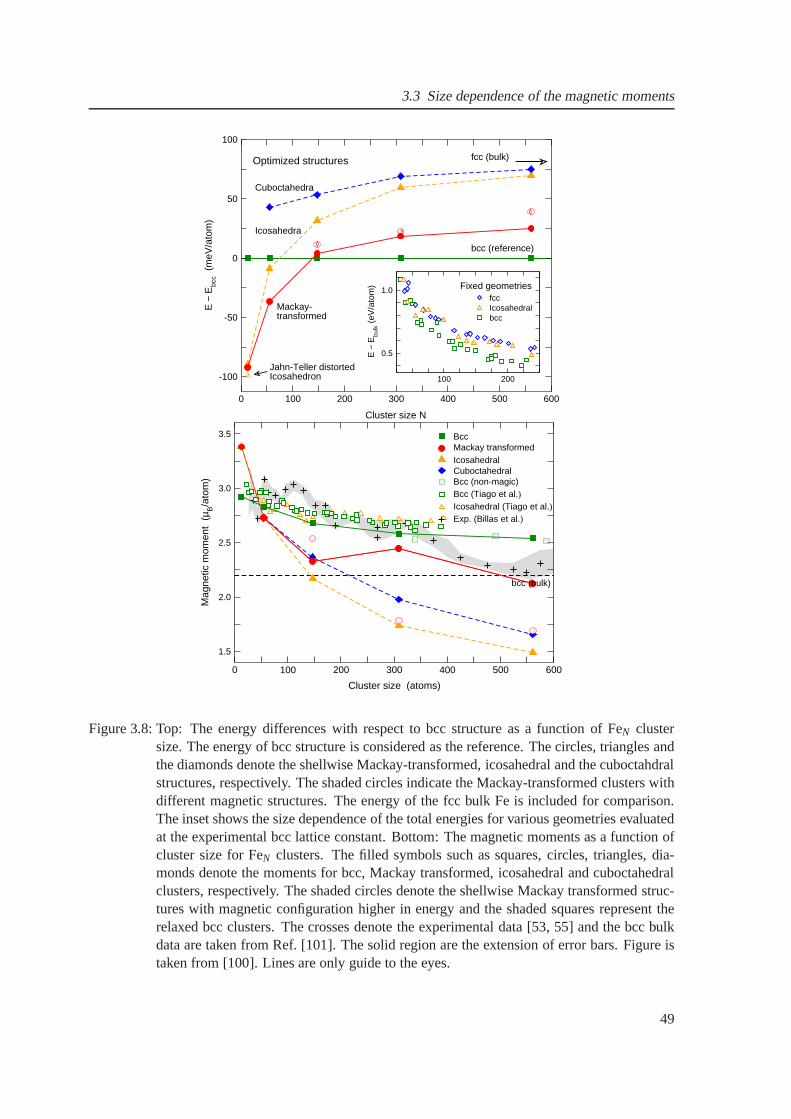
3.3 Size dependence of the magnetic moments
0 100 200 300 400 500 600
Cluster size N
-100
-50
0
50
100
E −
Ebc
c (m
eV/a
tom
)
bcc (reference)
Icosahedra
Mackay-transformed
Cuboctahedra
fcc (bulk)
Jahn-Teller distortedIcosahedron 100 200
0.5
1.0
E −
Ebu
lk (
eV/a
tom
)
Optimized structures
Fixed geometriesfccIcosahedralbcc
0 100 200 300 400 500 600
Cluster size (atoms)
1.5
2.0
2.5
3.0
3.5
Mag
netic
mom
ent
(µB/a
tom
)
BccMackay transformedIcosahedralCuboctahedralBcc (non-magic)Bcc (Tiago et al.)Icosahedral (Tiago et al.)Exp. (Billas et al.)
bcc (bulk)
Figure 3.8: Top: The energy differences with respect to bcc structure as a function of FeN clustersize. The energy of bcc structure is considered as the reference. The circles, triangles andthe diamonds denote the shellwise Mackay-transformed, icosahedral and the cuboctahdralstructures, respectively. The shaded circles indicate theMackay-transformed clusters withdifferent magnetic structures. The energy of the fcc bulk Feis included for comparison.The inset shows the size dependence of the total energies forvarious geometries evaluatedat the experimental bcc lattice constant. Bottom: The magnetic moments as a function ofcluster size for FeN clusters. The filled symbols such as squares, circles, triangles, dia-monds denote the moments for bcc, Mackay transformed, icosahedral and cuboctahedralclusters, respectively. The shaded circles denote the shellwise Mackay transformed struc-tures with magnetic configuration higher in energy and the shaded squares represent therelaxed bcc clusters. The crosses denote the experimental data [53, 55] and the bcc bulkdata are taken from Ref. [101]. The solid region are the extension of error bars. Figure istaken from [100]. Lines are only guide to the eyes.
49
3 Structure and magnetism in transition metal clusters
Experiments performed on 4d and 5d transition metal clusters show that clusters develop a magnetic
moment unlike bulk which is nonmagnetic. Rh clusters with less than 60 atoms show magnetic
moments, but larger clusters are nonmagnetic. Clusters with about ten atoms have magnetic moments
µ ≈ 0.8µB, and µ decays quickly betweenN=10 and 20, showing, oscillations that produce large
moments for Rh15, Rh16 and Rh19. Rhodium was the first case in which magnetism was observed
in clusters of a nonmagnetic metal. This behavior is different from that shown by clusters of the 3d
elements Fe, Co and Ni, where the variation of average magnetic moment extends over a much wider
range of cluster sizes. In contrast to Rh, Ruthenium and Palladium clusters with 12 to more than 100
atoms are reported nonmagnetic.
3.4 Binary clusters: Segregation and mixing
In addition to elemental clusters, we have studied the ground state properties of multi-component
clusters. One of the main features of the multi-component clusters is that their properties can be tuned
by changing the chemical ordering and composition [102–108]. As a result, they show physical and
chemical properties different from their constituent elemental clusters as well as bulk. Several stud-
ies have been carried out on the structure and chemical ordering as well as magnetic properties of
bimetallic transition metal clusters [109–114]. Experimentally, Roussetet al. have performed TOF
mass spectrometry and photo fragmentation techniques for free and supported Pd-Pt bimetallic clus-
ters, where they observed the segregation tendency of Pd forboth free and supported cases [115].
Yasudaetal. [116] have studied the alloying and phase stability for Au-Sn binary clusters using trans-
mission electron microscopy and have observed an enhanced solubility of Sn atoms into Au clusters.
Theoretical studies based on EAM method for Cu-Ni and Cu-Pd bimetallic clusters have shown the
surface segregation of Cu atoms for Cu-Ni clusters, and the coexistance of both segregation and or-
dering for the Cu-Pd clusters [117]. The studies on the growth of for Ag-Pd and Ag-Cu core-shell
clusters by Balettoet al. [118] have shown well-defined single-layer shells of Ag atoms on Pd at low
temperatures and on Cu at high temperatures.
Another aspect is to study the magnetism in binary clusters,which is one of our prime interest. It
has been observed that alloying among 3d elements as well as 3d with 4d or 5d element gives rise
to novel magnetic properties. For instance, enhancements of magnetic moments have been observed
experimentally for binary clusters such as Fe-(Co, Ni) [119], Co-Rh [120], Ni-Pd [121] and Fe-
Pt [122]. The enhancements of of magnetic moments for these systems [123–127] are also confirmed
by theoretical calculations.
In this chapter, the segregation and magnetic properties ofbinary Fe-Ni, Fe-Co, Fe-Pt, Co-Pt and
Co-Mn clusters are discussed for closed-shell icosahedra consisting of 13 atoms in the whole con-
centration range. In order to check wheather the propertiesobserved in small clusters still persist for
larger clusters, the binary clusters consisting of 55 atomsare studied. Unlike the case of 13-atom
binary clusters, few compositions for 55-atom binary clusters are considered due to the existence of
50
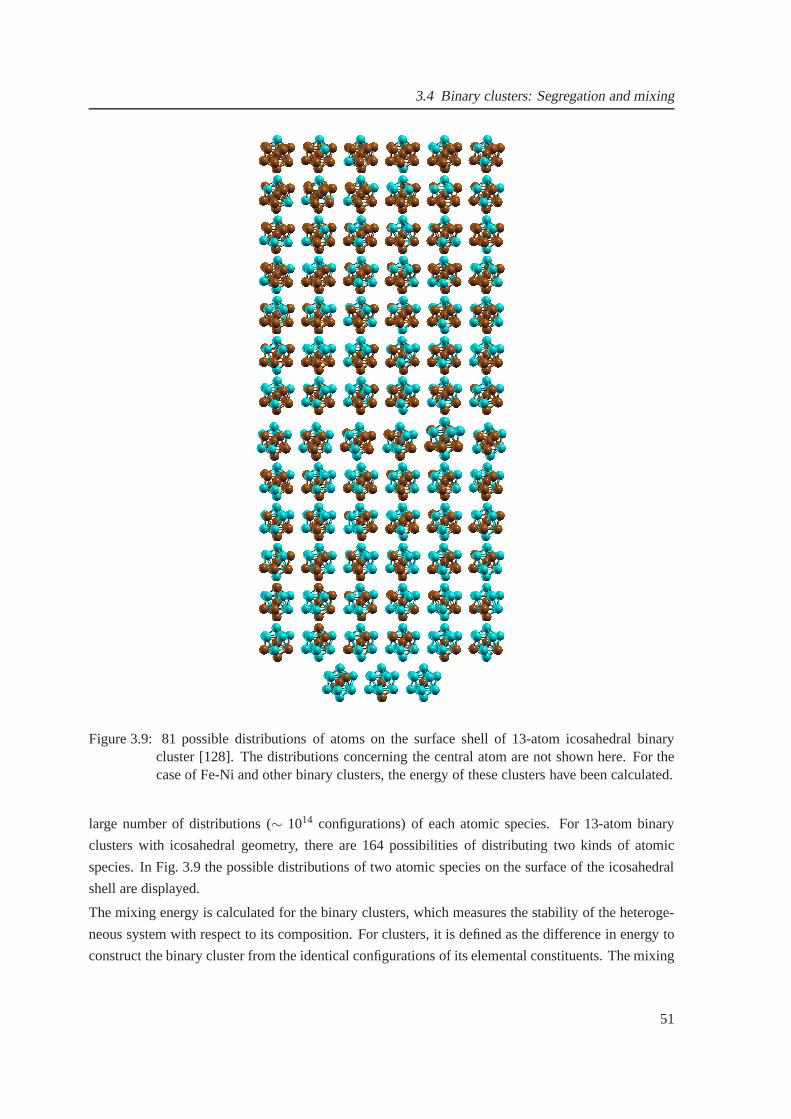
3.4 Binary clusters: Segregation and mixing
Figure 3.9: 81 possible distributions of atoms on the surface shell of 13-atom icosahedral binarycluster [128]. The distributions concerning the central atom are not shown here. For thecase of Fe-Ni and other binary clusters, the energy of these clusters have been calculated.
large number of distributions (∼ 1014 configurations) of each atomic species. For 13-atom binary
clusters with icosahedral geometry, there are 164 possibilities of distributing two kinds of atomic
species. In Fig. 3.9 the possible distributions of two atomic species on the surface of the icosahedral
shell are displayed.
The mixing energy is calculated for the binary clusters, which measures the stability of the heteroge-
neous system with respect to its composition. For clusters,it is defined as the difference in energy to
construct the binary cluster from the identical configurations of its elemental constituents. The mixing
51
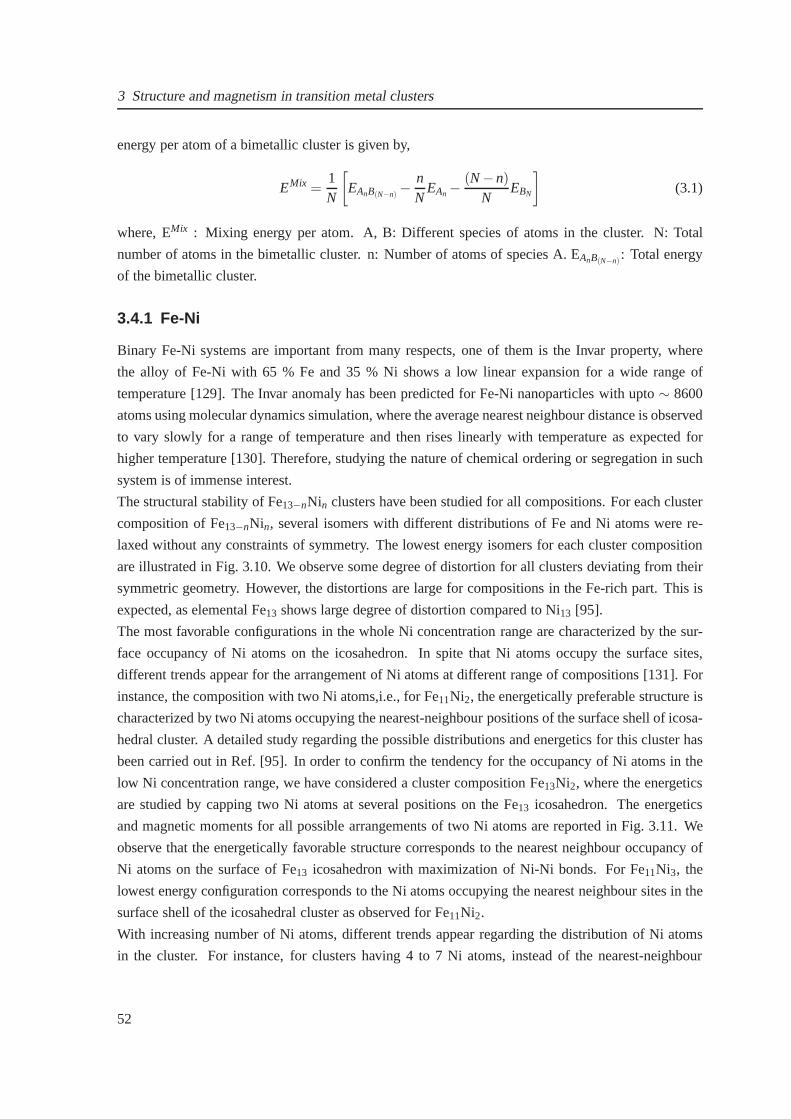
3 Structure and magnetism in transition metal clusters
energy per atom of a bimetallic cluster is given by,
EMix =1N
[
EAnB(N−n)− n
NEAn −
(N−n)
NEBN
]
(3.1)
where, EMix : Mixing energy per atom. A, B: Different species of atoms in the cluster. N: Total
number of atoms in the bimetallic cluster. n: Number of atomsof species A. EAnB(N−n): Total energy
of the bimetallic cluster.
3.4.1 Fe-Ni
Binary Fe-Ni systems are important from many respects, one of them is the Invar property, where
the alloy of Fe-Ni with 65 % Fe and 35 % Ni shows a low linear expansion for a wide range of
temperature [129]. The Invar anomaly has been predicted forFe-Ni nanoparticles with upto∼ 8600
atoms using molecular dynamics simulation, where the average nearest neighbour distance is observed
to vary slowly for a range of temperature and then rises linearly with temperature as expected for
higher temperature [130]. Therefore, studying the nature of chemical ordering or segregation in such
system is of immense interest.
The structural stability of Fe13−nNin clusters have been studied for all compositions. For each cluster
composition of Fe13−nNin, several isomers with different distributions of Fe and Ni atoms were re-
laxed without any constraints of symmetry. The lowest energy isomers for each cluster composition
are illustrated in Fig. 3.10. We observe some degree of distortion for all clusters deviating from their
symmetric geometry. However, the distortions are large forcompositions in the Fe-rich part. This is
expected, as elemental Fe13 shows large degree of distortion compared to Ni13 [95].
The most favorable configurations in the whole Ni concentration range are characterized by the sur-
face occupancy of Ni atoms on the icosahedron. In spite that Ni atoms occupy the surface sites,
different trends appear for the arrangement of Ni atoms at different range of compositions [131]. For
instance, the composition with two Ni atoms,i.e., for Fe11Ni2, the energetically preferable structure is
characterized by two Ni atoms occupying the nearest-neighbour positions of the surface shell of icosa-
hedral cluster. A detailed study regarding the possible distributions and energetics for this cluster has
been carried out in Ref. [95]. In order to confirm the tendencyfor the occupancy of Ni atoms in the
low Ni concentration range, we have considered a cluster composition Fe13Ni2, where the energetics
are studied by capping two Ni atoms at several positions on the Fe13 icosahedron. The energetics
and magnetic moments for all possible arrangements of two Niatoms are reported in Fig. 3.11. We
observe that the energetically favorable structure corresponds to the nearest neighbour occupancy of
Ni atoms on the surface of Fe13 icosahedron with maximization of Ni-Ni bonds. For Fe11Ni3, the
lowest energy configuration corresponds to the Ni atoms occupying the nearest neighbour sites in the
surface shell of the icosahedral cluster as observed for Fe11Ni2.
With increasing number of Ni atoms, different trends appearregarding the distribution of Ni atoms
in the cluster. For instance, for clusters having 4 to 7 Ni atoms, instead of the nearest-neighbour
52
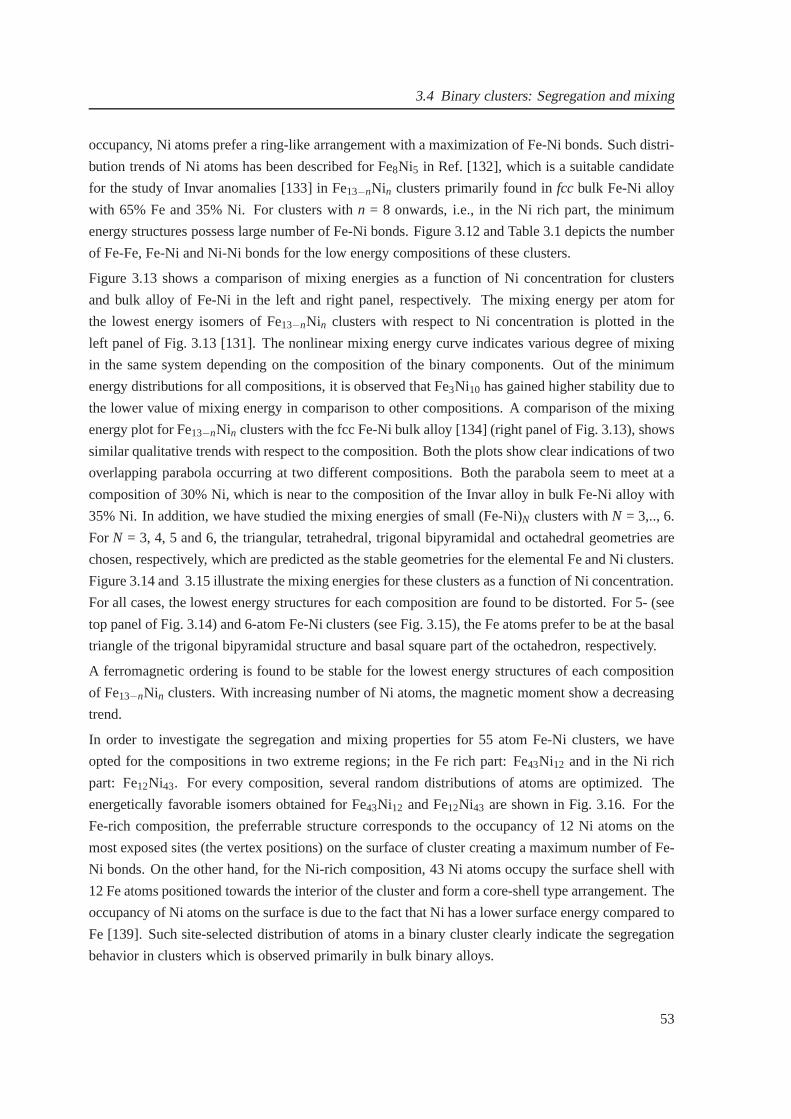
3.4 Binary clusters: Segregation and mixing
occupancy, Ni atoms prefer a ring-like arrangement with a maximization of Fe-Ni bonds. Such distri-
bution trends of Ni atoms has been described for Fe8Ni5 in Ref. [132], which is a suitable candidate
for the study of Invar anomalies [133] in Fe13−nNin clusters primarily found infcc bulk Fe-Ni alloy
with 65% Fe and 35% Ni. For clusters withn = 8 onwards, i.e., in the Ni rich part, the minimum
energy structures possess large number of Fe-Ni bonds. Figure 3.12 and Table 3.1 depicts the number
of Fe-Fe, Fe-Ni and Ni-Ni bonds for the low energy compositions of these clusters.
Figure 3.13 shows a comparison of mixing energies as a function of Ni concentration for clusters
and bulk alloy of Fe-Ni in the left and right panel, respectively. The mixing energy per atom for
the lowest energy isomers of Fe13−nNin clusters with respect to Ni concentration is plotted in the
left panel of Fig. 3.13 [131]. The nonlinear mixing energy curve indicates various degree of mixing
in the same system depending on the composition of the binarycomponents. Out of the minimum
energy distributions for all compositions, it is observed that Fe3Ni10 has gained higher stability due to
the lower value of mixing energy in comparison to other compositions. A comparison of the mixing
energy plot for Fe13−nNin clusters with the fcc Fe-Ni bulk alloy [134] (right panel of Fig. 3.13), shows
similar qualitative trends with respect to the composition. Both the plots show clear indications of two
overlapping parabola occurring at two different compositions. Both the parabola seem to meet at a
composition of 30% Ni, which is near to the composition of theInvar alloy in bulk Fe-Ni alloy with
35% Ni. In addition, we have studied the mixing energies of small (Fe-Ni)N clusters withN = 3,.., 6.
For N = 3, 4, 5 and 6, the triangular, tetrahedral, trigonal bipyramidal and octahedral geometries are
chosen, respectively, which are predicted as the stable geometries for the elemental Fe and Ni clusters.
Figure 3.14 and 3.15 illustrate the mixing energies for these clusters as a function of Ni concentration.
For all cases, the lowest energy structures for each composition are found to be distorted. For 5- (see
top panel of Fig. 3.14) and 6-atom Fe-Ni clusters (see Fig. 3.15), the Fe atoms prefer to be at the basal
triangle of the trigonal bipyramidal structure and basal square part of the octahedron, respectively.
A ferromagnetic ordering is found to be stable for the lowestenergy structures of each composition
of Fe13−nNin clusters. With increasing number of Ni atoms, the magnetic moment show a decreasing
trend.
In order to investigate the segregation and mixing properties for 55 atom Fe-Ni clusters, we have
opted for the compositions in two extreme regions; in the Fe rich part: Fe43Ni12 and in the Ni rich
part: Fe12Ni43. For every composition, several random distributions of atoms are optimized. The
energetically favorable isomers obtained for Fe43Ni12 and Fe12Ni43 are shown in Fig. 3.16. For the
Fe-rich composition, the preferrable structure corresponds to the occupancy of 12 Ni atoms on the
most exposed sites (the vertex positions) on the surface of cluster creating a maximum number of Fe-
Ni bonds. On the other hand, for the Ni-rich composition, 43 Ni atoms occupy the surface shell with
12 Fe atoms positioned towards the interior of the cluster and form a core-shell type arrangement. The
occupancy of Ni atoms on the surface is due to the fact that Ni has a lower surface energy compared to
Fe [139]. Such site-selected distribution of atoms in a binary cluster clearly indicate the segregation
behavior in clusters which is observed primarily in bulk binary alloys.
53
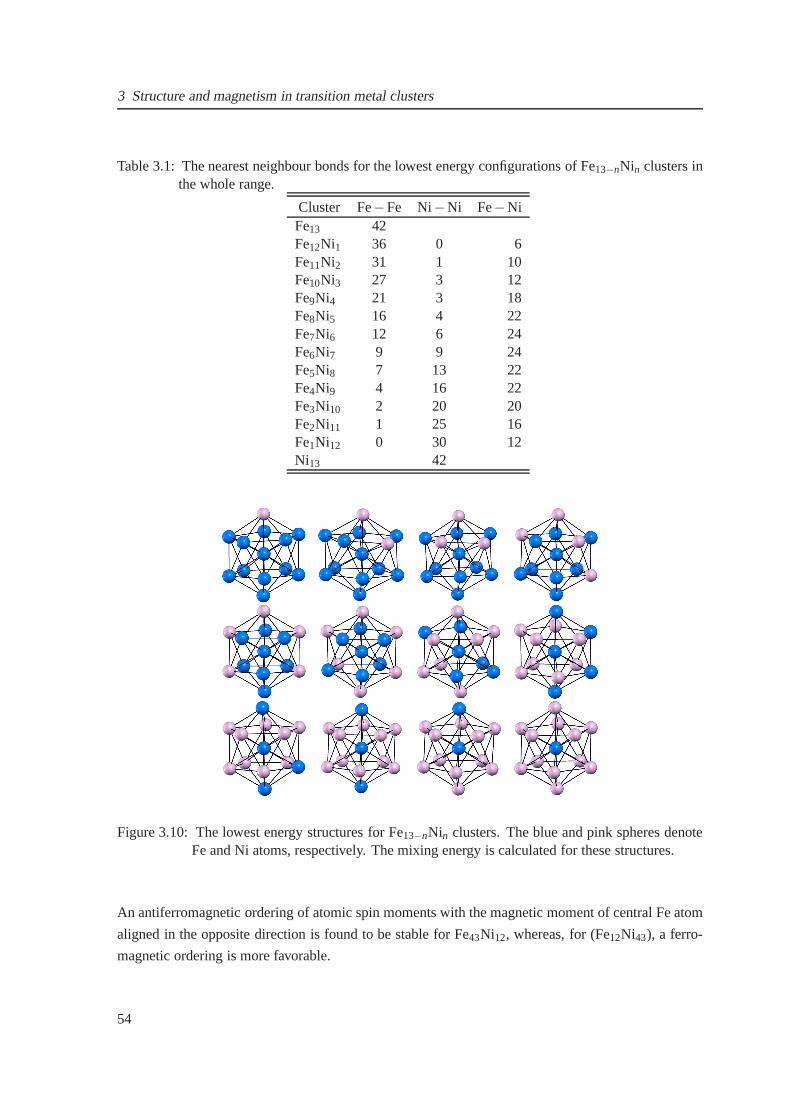
3 Structure and magnetism in transition metal clusters
Table 3.1: The nearest neighbour bonds for the lowest energyconfigurations of Fe13−nNin clusters inthe whole range.
Cluster Fe−Fe Ni−Ni Fe−NiFe13 42Fe12Ni1 36 0 6Fe11Ni2 31 1 10Fe10Ni3 27 3 12Fe9Ni4 21 3 18Fe8Ni5 16 4 22Fe7Ni6 12 6 24Fe6Ni7 9 9 24Fe5Ni8 7 13 22Fe4Ni9 4 16 22Fe3Ni10 2 20 20Fe2Ni11 1 25 16Fe1Ni12 0 30 12Ni13 42
Figure 3.10: The lowest energy structures for Fe13−nNin clusters. The blue and pink spheres denoteFe and Ni atoms, respectively. The mixing energy is calculated for these structures.
An antiferromagnetic ordering of atomic spin moments with the magnetic moment of central Fe atom
aligned in the opposite direction is found to be stable for Fe43Ni12, whereas, for (Fe12Ni43), a ferro-
magnetic ordering is more favorable.
54
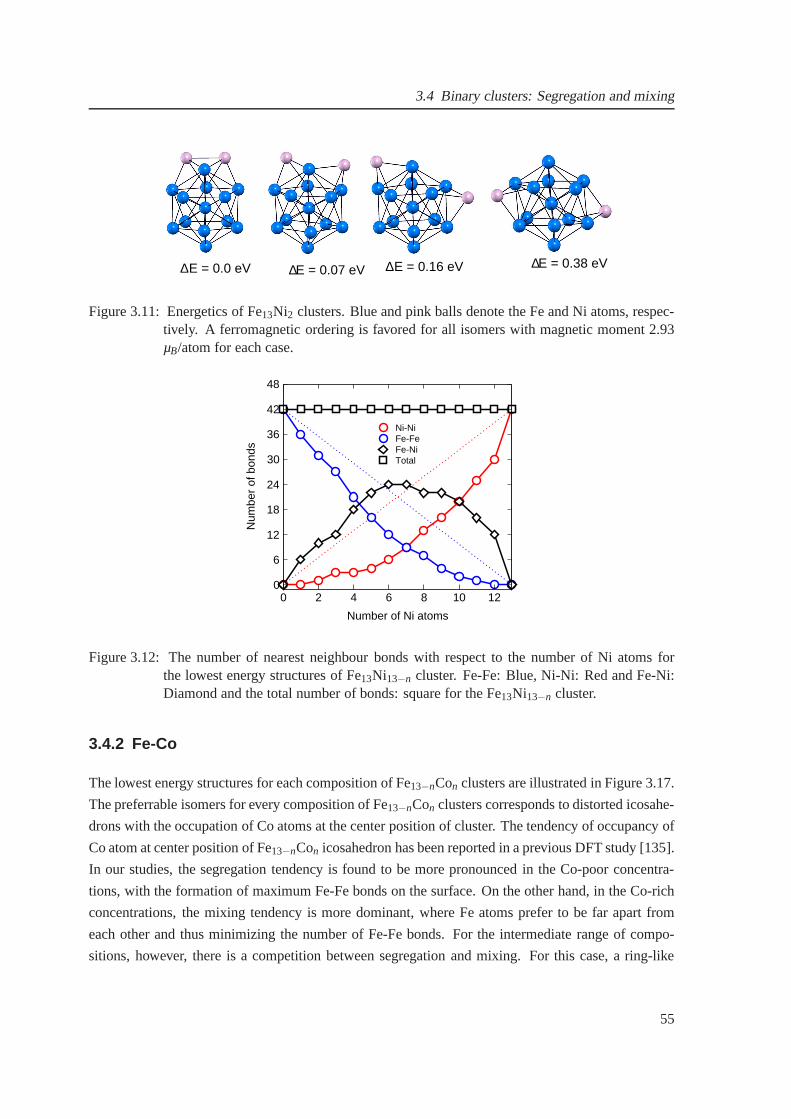
3.4 Binary clusters: Segregation and mixing
∆E = 0.0 eV E = 0.07 eV E = 0.38 eVE = 0.16 eV∆ ∆ ∆
Figure 3.11: Energetics of Fe13Ni2 clusters. Blue and pink balls denote the Fe and Ni atoms, respec-tively. A ferromagnetic ordering is favored for all isomerswith magnetic moment 2.93µB/atom for each case.
0 2 4 6 8 10 12
Number of Ni atoms
0
6
12
18
24
30
36
42
48
Num
ber
of b
onds
Ni-NiFe-FeFe-NiTotal
Figure 3.12: The number of nearest neighbour bonds with respect to the number of Ni atoms forthe lowest energy structures of Fe13Ni13−n cluster. Fe-Fe: Blue, Ni-Ni: Red and Fe-Ni:Diamond and the total number of bonds: square for the Fe13Ni13−n cluster.
3.4.2 Fe-Co
The lowest energy structures for each composition of Fe13−nCon clusters are illustrated in Figure 3.17.
The preferrable isomers for every composition of Fe13−nCon clusters corresponds to distorted icosahe-
drons with the occupation of Co atoms at the center position of cluster. The tendency of occupancy of
Co atom at center position of Fe13−nCon icosahedron has been reported in a previous DFT study [135].
In our studies, the segregation tendency is found to be more pronounced in the Co-poor concentra-
tions, with the formation of maximum Fe-Fe bonds on the surface. On the other hand, in the Co-rich
concentrations, the mixing tendency is more dominant, where Fe atoms prefer to be far apart from
each other and thus minimizing the number of Fe-Fe bonds. Forthe intermediate range of compo-
sitions, however, there is a competition between segregation and mixing. For this case, a ring-like
55
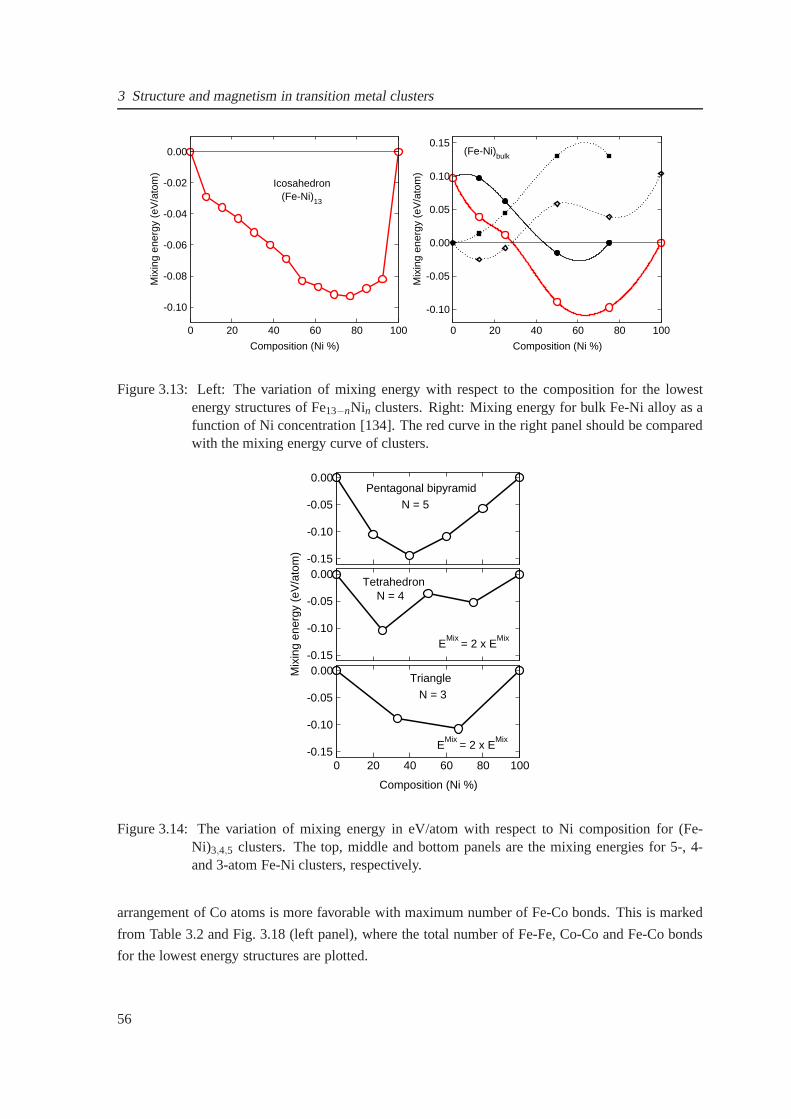
3 Structure and magnetism in transition metal clusters
0 20 40 60 80 100
Composition (Ni %)
-0.10
-0.08
-0.06
-0.04
-0.02
0.00M
ixin
g en
ergy
(eV
/ato
m)
(Fe-Ni)13
Icosahedron
0 20 40 60 80 100
Composition (Ni %)
-0.10
-0.05
0.00
0.05
0.10
0.15
Mix
ing
ener
gy (
eV/a
tom
)
(Fe-Ni)bulk
Figure 3.13: Left: The variation of mixing energy with respect to the composition for the lowestenergy structures of Fe13−nNin clusters. Right: Mixing energy for bulk Fe-Ni alloy as afunction of Ni concentration [134]. The red curve in the right panel should be comparedwith the mixing energy curve of clusters.
-0.15
-0.10
-0.05
0.00
-0.15
-0.10
-0.05
0.00
Mix
ing
ener
gy (
eV/a
tom
)
0 20 40 60 80 100
Composition (Ni %)
-0.15
-0.10
-0.05
0.00
Pentagonal bipyramid
N = 5
EMix
= 2 x EMix
EMix
= 2 x EMix
N = 3
Triangle
TetrahedronN = 4
Figure 3.14: The variation of mixing energy in eV/atom with respect to Ni composition for (Fe-Ni)3,4,5 clusters. The top, middle and bottom panels are the mixing energies for 5-, 4-and 3-atom Fe-Ni clusters, respectively.
arrangement of Co atoms is more favorable with maximum number of Fe-Co bonds. This is marked
from Table 3.2 and Fig. 3.18 (left panel), where the total number of Fe-Fe, Co-Co and Fe-Co bonds
for the lowest energy structures are plotted.
56
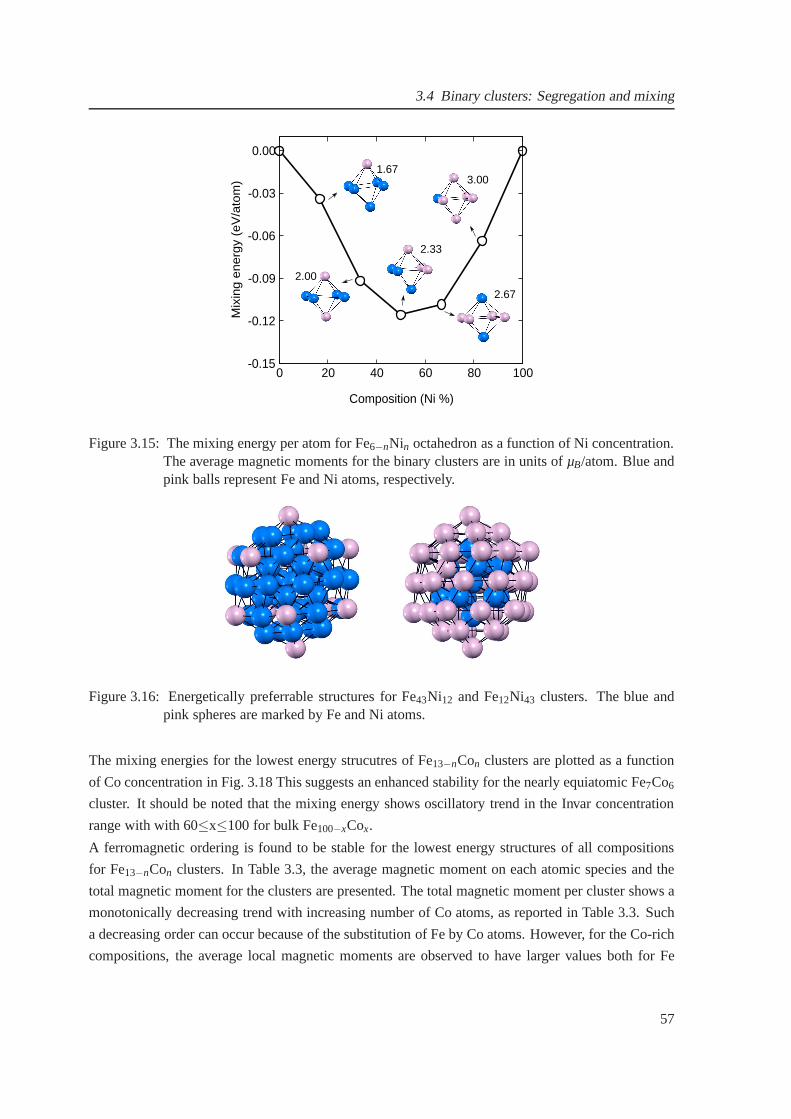
3.4 Binary clusters: Segregation and mixing
0 20 40 60 80 100
Composition (Ni %)
-0.15
-0.12
-0.09
-0.06
-0.03
0.00
Mix
ing
en
erg
y (e
V/a
tom
)
OctahedronN = 6
2.00
2.33
2.67
1.673.00
Figure 3.15: The mixing energy per atom for Fe6−nNin octahedron as a function of Ni concentration.The average magnetic moments for the binary clusters are in units of µB/atom. Blue andpink balls represent Fe and Ni atoms, respectively.
Figure 3.16: Energetically preferrable structures for Fe43Ni12 and Fe12Ni43 clusters. The blue andpink spheres are marked by Fe and Ni atoms.
The mixing energies for the lowest energy strucutres of Fe13−nCon clusters are plotted as a function
of Co concentration in Fig. 3.18 This suggests an enhanced stability for the nearly equiatomic Fe7Co6
cluster. It should be noted that the mixing energy shows oscillatory trend in the Invar concentration
range with with 60≤x≤100 for bulk Fe100−xCox.
A ferromagnetic ordering is found to be stable for the lowestenergy structures of all compositions
for Fe13−nCon clusters. In Table 3.3, the average magnetic moment on each atomic species and the
total magnetic moment for the clusters are presented. The total magnetic moment per cluster shows a
monotonically decreasing trend with increasing number of Co atoms, as reported in Table 3.3. Such
a decreasing order can occur because of the substitution of Fe by Co atoms. However, for the Co-rich
compositions, the average local magnetic moments are observed to have larger values both for Fe
57
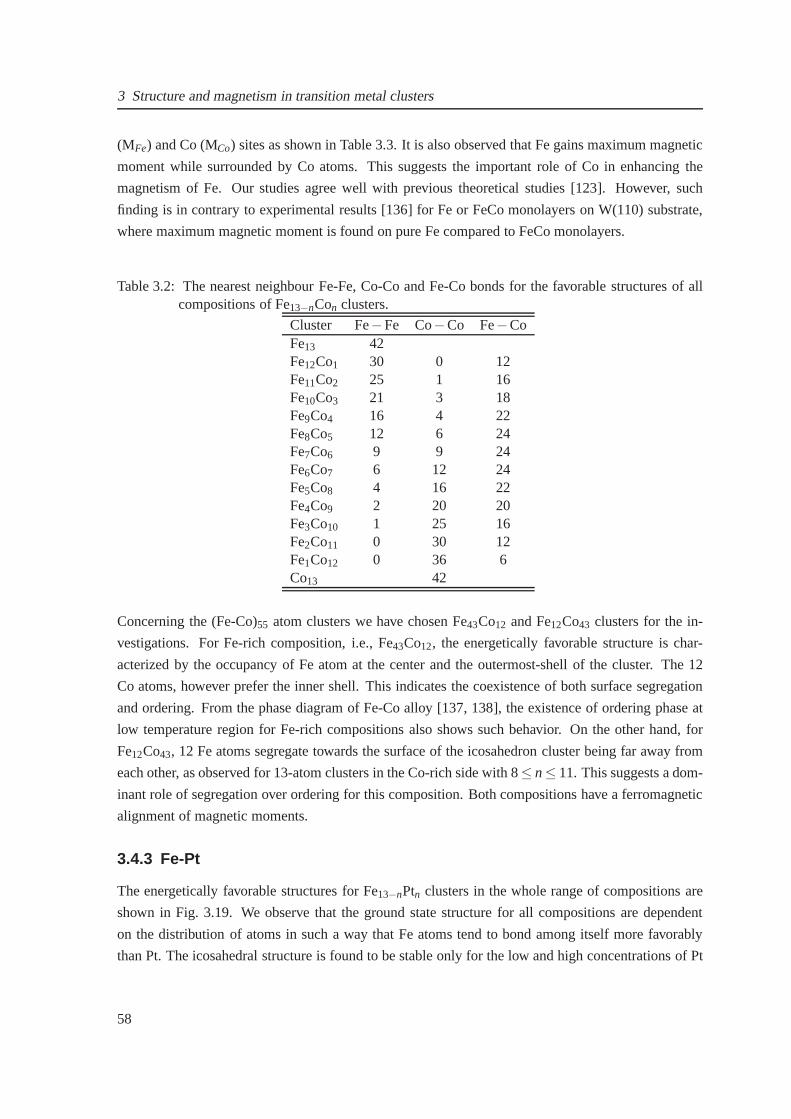
3 Structure and magnetism in transition metal clusters
(MFe) and Co (MCo) sites as shown in Table 3.3. It is also observed that Fe gainsmaximum magnetic
moment while surrounded by Co atoms. This suggests the important role of Co in enhancing the
magnetism of Fe. Our studies agree well with previous theoretical studies [123]. However, such
finding is in contrary to experimental results [136] for Fe orFeCo monolayers on W(110) substrate,
where maximum magnetic moment is found on pure Fe compared toFeCo monolayers.
Table 3.2: The nearest neighbour Fe-Fe, Co-Co and Fe-Co bonds for the favorable structures of allcompositions of Fe13−nCon clusters.
Cluster Fe−Fe Co−Co Fe−CoFe13 42Fe12Co1 30 0 12Fe11Co2 25 1 16Fe10Co3 21 3 18Fe9Co4 16 4 22Fe8Co5 12 6 24Fe7Co6 9 9 24Fe6Co7 6 12 24Fe5Co8 4 16 22Fe4Co9 2 20 20Fe3Co10 1 25 16Fe2Co11 0 30 12Fe1Co12 0 36 6Co13 42
Concerning the (Fe-Co)55 atom clusters we have chosen Fe43Co12 and Fe12Co43 clusters for the in-
vestigations. For Fe-rich composition, i.e., Fe43Co12, the energetically favorable structure is char-
acterized by the occupancy of Fe atom at the center and the outermost-shell of the cluster. The 12
Co atoms, however prefer the inner shell. This indicates thecoexistence of both surface segregation
and ordering. From the phase diagram of Fe-Co alloy [137, 138], the existence of ordering phase at
low temperature region for Fe-rich compositions also showssuch behavior. On the other hand, for
Fe12Co43, 12 Fe atoms segregate towards the surface of the icosahedron cluster being far away from
each other, as observed for 13-atom clusters in the Co-rich side with 8≤ n≤ 11. This suggests a dom-
inant role of segregation over ordering for this composition. Both compositions have a ferromagnetic
alignment of magnetic moments.
3.4.3 Fe-Pt
The energetically favorable structures for Fe13−nPtn clusters in the whole range of compositions are
shown in Fig. 3.19. We observe that the ground state structure for all compositions are dependent
on the distribution of atoms in such a way that Fe atoms tend tobond among itself more favorably
than Pt. The icosahedral structure is found to be stable onlyfor the low and high concentrations of Pt
58
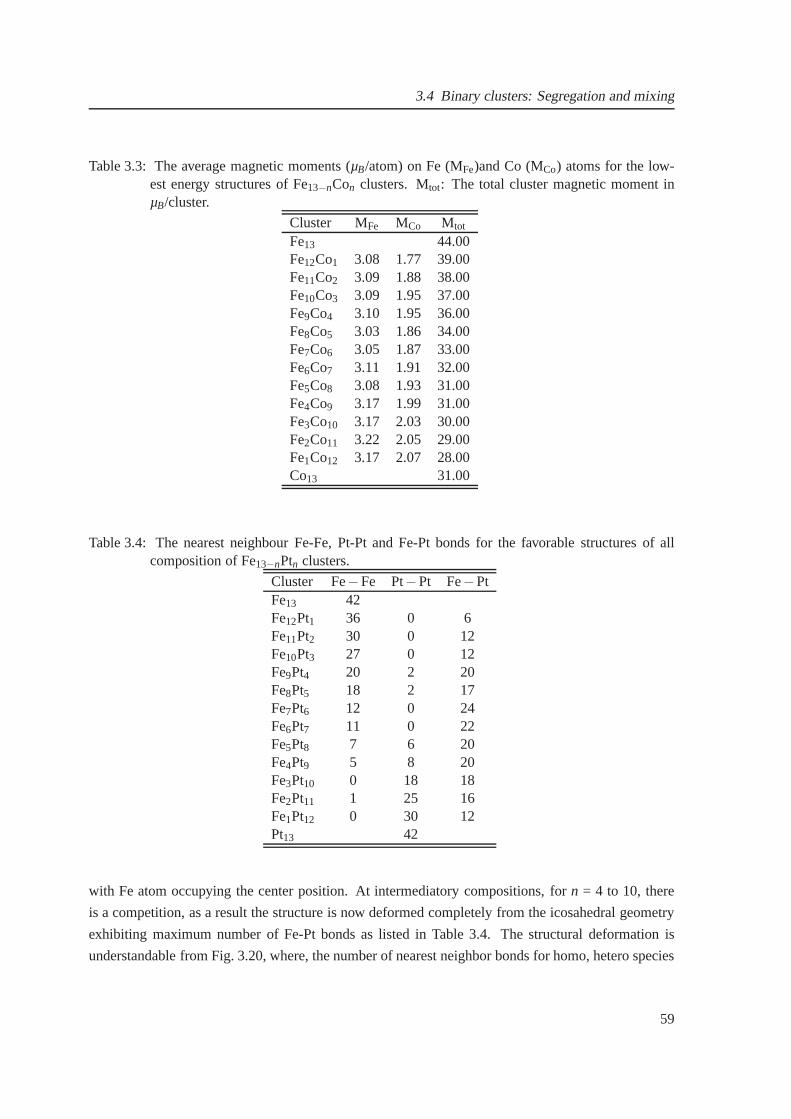
3.4 Binary clusters: Segregation and mixing
Table 3.3: The average magnetic moments (µB/atom) on Fe (MFe)and Co (MCo) atoms for the low-est energy structures of Fe13−nCon clusters. Mtot: The total cluster magnetic moment inµB/cluster.
Cluster MFe MCo Mtot
Fe13 44.00Fe12Co1 3.08 1.77 39.00Fe11Co2 3.09 1.88 38.00Fe10Co3 3.09 1.95 37.00Fe9Co4 3.10 1.95 36.00Fe8Co5 3.03 1.86 34.00Fe7Co6 3.05 1.87 33.00Fe6Co7 3.11 1.91 32.00Fe5Co8 3.08 1.93 31.00Fe4Co9 3.17 1.99 31.00Fe3Co10 3.17 2.03 30.00Fe2Co11 3.22 2.05 29.00Fe1Co12 3.17 2.07 28.00Co13 31.00
Table 3.4: The nearest neighbour Fe-Fe, Pt-Pt and Fe-Pt bonds for the favorable structures of allcomposition of Fe13−nPtn clusters.
Cluster Fe−Fe Pt−Pt Fe−PtFe13 42Fe12Pt1 36 0 6Fe11Pt2 30 0 12Fe10Pt3 27 0 12Fe9Pt4 20 2 20Fe8Pt5 18 2 17Fe7Pt6 12 0 24Fe6Pt7 11 0 22Fe5Pt8 7 6 20Fe4Pt9 5 8 20Fe3Pt10 0 18 18Fe2Pt11 1 25 16Fe1Pt12 0 30 12Pt13 42
with Fe atom occupying the center position. At intermediatory compositions, forn = 4 to 10, there
is a competition, as a result the structure is now deformed completely from the icosahedral geometry
exhibiting maximum number of Fe-Pt bonds as listed in Table 3.4. The structural deformation is
understandable from Fig. 3.20, where, the number of nearestneighbor bonds for homo, hetero species
59
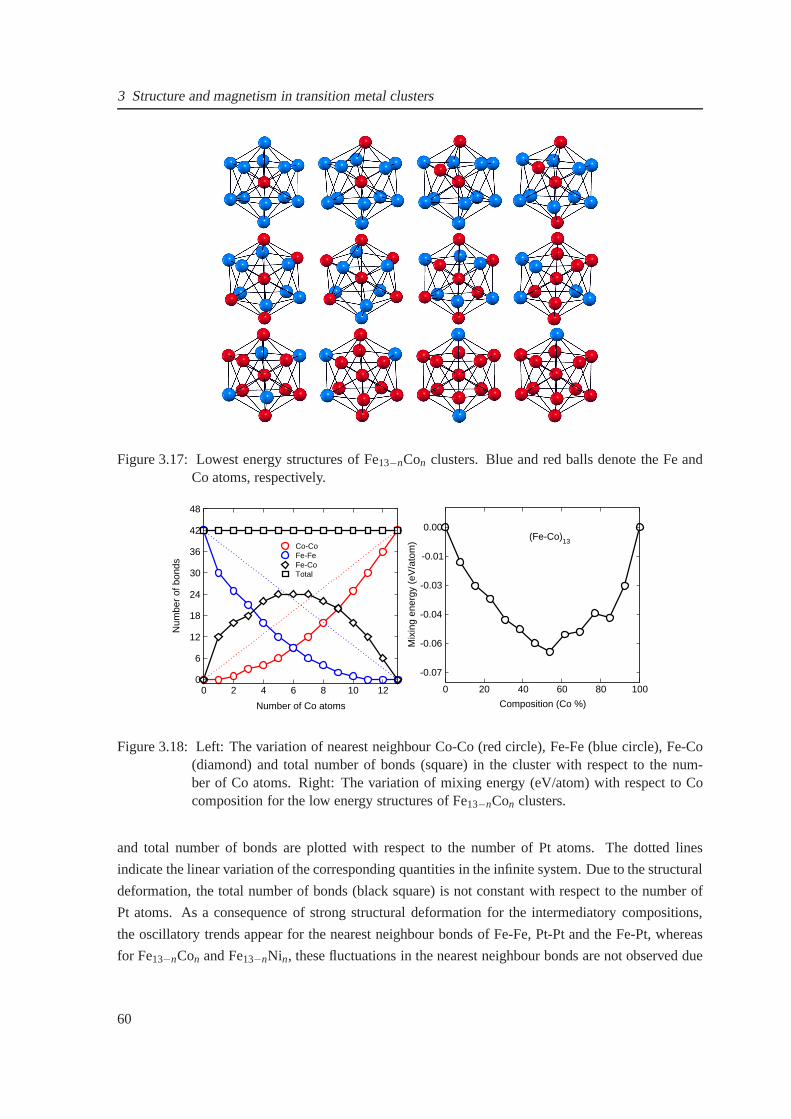
3 Structure and magnetism in transition metal clusters
Figure 3.17: Lowest energy structures of Fe13−nCon clusters. Blue and red balls denote the Fe andCo atoms, respectively.
0 2 4 6 8 10 12
Number of Co atoms
0
6
12
18
24
30
36
42
48
Num
ber
of b
onds
Co-CoFe-FeFe-Co Total
0 20 40 60 80 100
Composition (Co %)
-0.07
-0.06
-0.04
-0.03
-0.01
0.00
Mix
ing
ener
gy (
eV/a
tom
) (Fe-Co)13
Figure 3.18: Left: The variation of nearest neighbour Co-Co(red circle), Fe-Fe (blue circle), Fe-Co(diamond) and total number of bonds (square) in the cluster with respect to the num-ber of Co atoms. Right: The variation of mixing energy (eV/atom) with respect to Cocomposition for the low energy structures of Fe13−nCon clusters.
and total number of bonds are plotted with respect to the number of Pt atoms. The dotted lines
indicate the linear variation of the corresponding quantities in the infinite system. Due to the structural
deformation, the total number of bonds (black square) is notconstant with respect to the number of
Pt atoms. As a consequence of strong structural deformationfor the intermediatory compositions,
the oscillatory trends appear for the nearest neighbour bonds of Fe-Fe, Pt-Pt and the Fe-Pt, whereas
for Fe13−nCon and Fe13−nNin, these fluctuations in the nearest neighbour bonds are not observed due
60
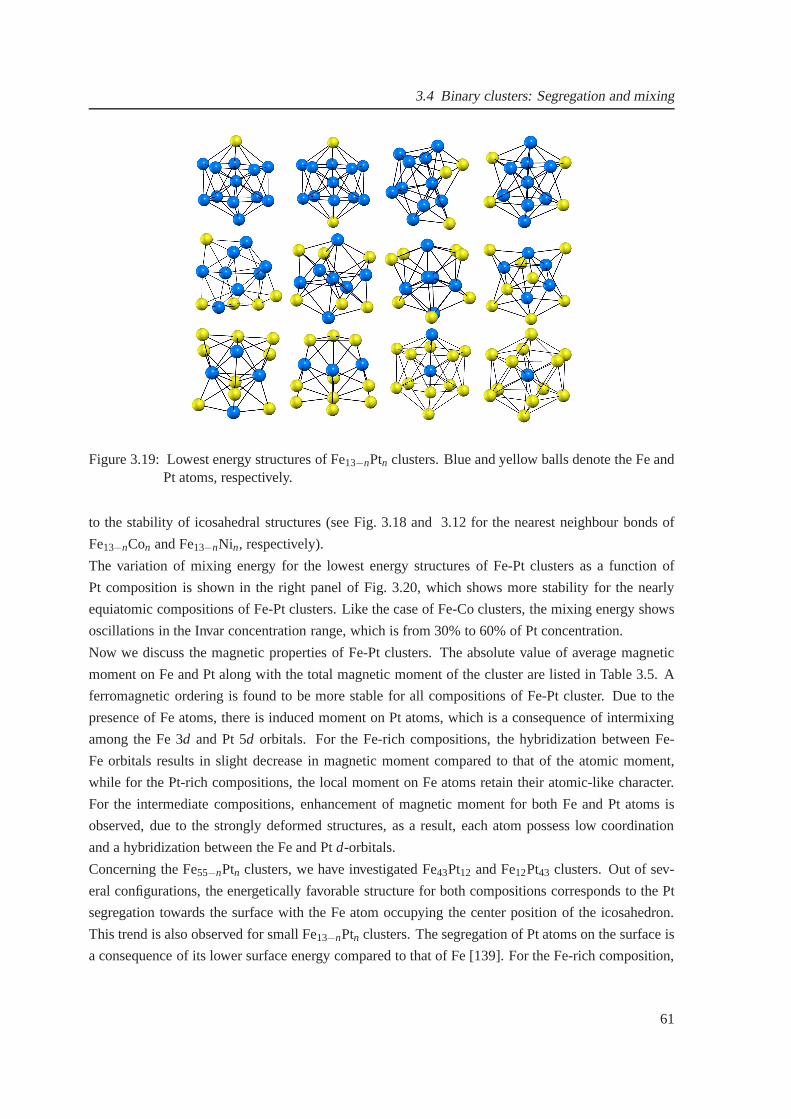
3.4 Binary clusters: Segregation and mixing
Figure 3.19: Lowest energy structures of Fe13−nPtn clusters. Blue and yellow balls denote the Fe andPt atoms, respectively.
to the stability of icosahedral structures (see Fig. 3.18 and 3.12 for the nearest neighbour bonds of
Fe13−nCon and Fe13−nNin, respectively).
The variation of mixing energy for the lowest energy structures of Fe-Pt clusters as a function of
Pt composition is shown in the right panel of Fig. 3.20, whichshows more stability for the nearly
equiatomic compositions of Fe-Pt clusters. Like the case ofFe-Co clusters, the mixing energy shows
oscillations in the Invar concentration range, which is from 30% to 60% of Pt concentration.
Now we discuss the magnetic properties of Fe-Pt clusters. The absolute value of average magnetic
moment on Fe and Pt along with the total magnetic moment of thecluster are listed in Table 3.5. A
ferromagnetic ordering is found to be more stable for all compositions of Fe-Pt cluster. Due to the
presence of Fe atoms, there is induced moment on Pt atoms, which is a consequence of intermixing
among the Fe 3d and Pt 5d orbitals. For the Fe-rich compositions, the hybridizationbetween Fe-
Fe orbitals results in slight decrease in magnetic moment compared to that of the atomic moment,
while for the Pt-rich compositions, the local moment on Fe atoms retain their atomic-like character.
For the intermediate compositions, enhancement of magnetic moment for both Fe and Pt atoms is
observed, due to the strongly deformed structures, as a result, each atom possess low coordination
and a hybridization between the Fe and Ptd-orbitals.
Concerning the Fe55−nPtn clusters, we have investigated Fe43Pt12 and Fe12Pt43 clusters. Out of sev-
eral configurations, the energetically favorable structure for both compositions corresponds to the Pt
segregation towards the surface with the Fe atom occupying the center position of the icosahedron.
This trend is also observed for small Fe13−nPtn clusters. The segregation of Pt atoms on the surface is
a consequence of its lower surface energy compared to that ofFe [139]. For the Fe-rich composition,
61

3 Structure and magnetism in transition metal clusters
Table 3.5: The average magnetic moments (µB/atom) on Fe MFe and Pt MPt sites for the lowest en-ergy structures of Fe13−nPtn clusters. Mtot: The total cluster magnetic moment in units ofµB/cluster.
Cluster MFe MPt Mtot
Fe13 44.00Fe12Pt1 2.86 0.39 34.70Fe11Pt2 2.82 0.37 31.70Fe10Pt3 2.95 0.56 31.14Fe9Pt4 2.89 0.42 27.62Fe8Pt5 3.01 0.41 26.15Fe7Pt6 3.09 0.50 24.60Fe6Pt7 3.17 0.52 22.64Fe5Pt8 3.21 0.57 20.62Fe4Pt9 3.30 0.41 16.90Fe3Pt10 3.34 0.33 13.32Fe2Pt11 3.10 0.31 9.62Fe1Pt12 3.15 0.54 9.70Pt13 0.15 1.93
0 2 4 6 8 10 12
Number of Pt atoms
0
6
12
18
24
30
36
42
48
Num
ber
of b
onds
Pt-PtFe-FeFe-PtTotal
0 20 40 60 80 100
Composition (Pt %)
-0.5
-0.4
-0.3
-0.2
-0.1
0.0
Mix
ing
ener
gy (
eV/a
tom
) (Fe-Pt)13
Figure 3.20: Left: The variation of nearest neighbour Pt-Pt(red circle), Fe-Fe (blue circle), Fe-Pt (di-amond) and total number of bonds (square) in the cluster withrespect to the number of Ptatoms. Right: The variation of mixing energy (eV/atom) withrespect to Pt compositionfor the low energy structures of Fe13−nPtn clusters.
12 Pt atoms prefer the six-coordinated vertex sites with a minimization of Pt-Pt bonds, while in the Pt-
rich composition, a core-shell structure is more favorablewith Fe as the core and Pt as the outer-shell.
Experimental observations through high resolution transmission electron micrographs (HRTEM) have
confirmed the existence of such core-shell structures for icosahedral Fe-Pt nanoparticles with Pt seg-
regation on the surface [140].
Different magnetic orderings are observed at two extreme compositions of Fe55Ptn clusters in contrary
62
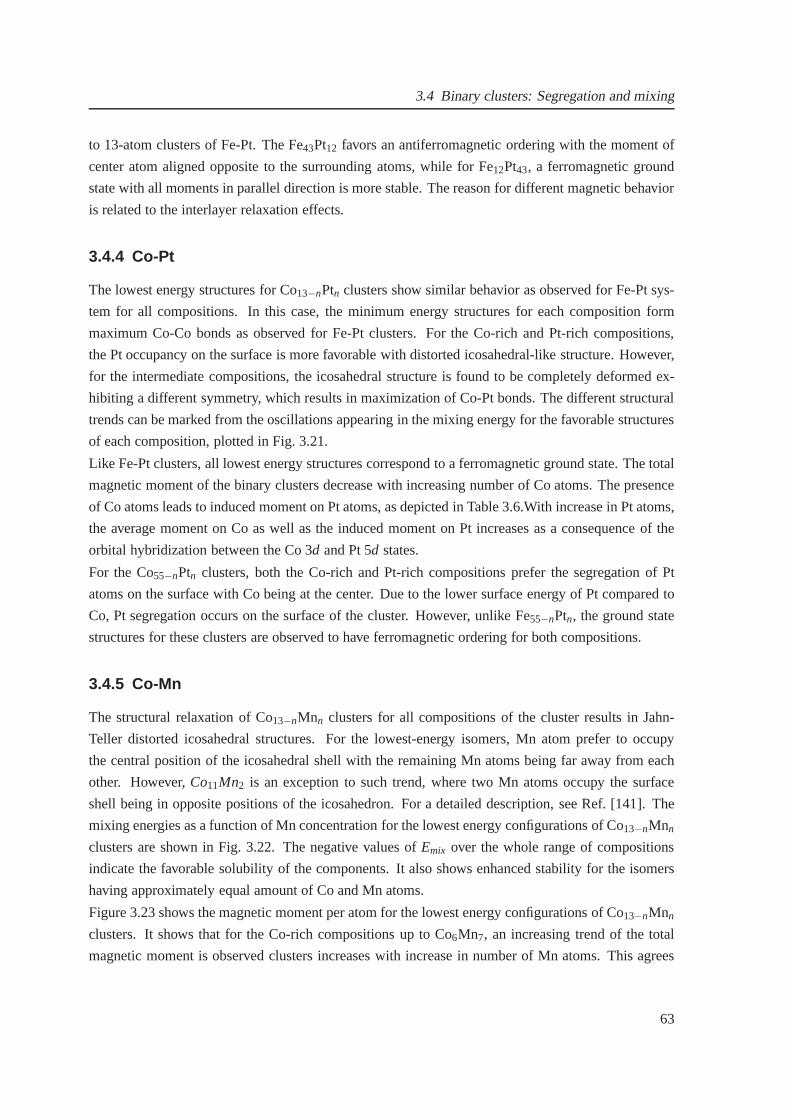
3.4 Binary clusters: Segregation and mixing
to 13-atom clusters of Fe-Pt. The Fe43Pt12 favors an antiferromagnetic ordering with the moment of
center atom aligned opposite to the surrounding atoms, while for Fe12Pt43, a ferromagnetic ground
state with all moments in parallel direction is more stable.The reason for different magnetic behavior
is related to the interlayer relaxation effects.
3.4.4 Co-Pt
The lowest energy structures for Co13−nPtn clusters show similar behavior as observed for Fe-Pt sys-
tem for all compositions. In this case, the minimum energy structures for each composition form
maximum Co-Co bonds as observed for Fe-Pt clusters. For the Co-rich and Pt-rich compositions,
the Pt occupancy on the surface is more favorable with distorted icosahedral-like structure. However,
for the intermediate compositions, the icosahedral structure is found to be completely deformed ex-
hibiting a different symmetry, which results in maximization of Co-Pt bonds. The different structural
trends can be marked from the oscillations appearing in the mixing energy for the favorable structures
of each composition, plotted in Fig. 3.21.
Like Fe-Pt clusters, all lowest energy structures correspond to a ferromagnetic ground state. The total
magnetic moment of the binary clusters decrease with increasing number of Co atoms. The presence
of Co atoms leads to induced moment on Pt atoms, as depicted inTable 3.6.With increase in Pt atoms,
the average moment on Co as well as the induced moment on Pt increases as a consequence of the
orbital hybridization between the Co 3d and Pt 5d states.
For the Co55−nPtn clusters, both the Co-rich and Pt-rich compositions preferthe segregation of Pt
atoms on the surface with Co being at the center. Due to the lower surface energy of Pt compared to
Co, Pt segregation occurs on the surface of the cluster. However, unlike Fe55−nPtn, the ground state
structures for these clusters are observed to have ferromagnetic ordering for both compositions.
3.4.5 Co-Mn
The structural relaxation of Co13−nMnn clusters for all compositions of the cluster results in Jahn-
Teller distorted icosahedral structures. For the lowest-energy isomers, Mn atom prefer to occupy
the central position of the icosahedral shell with the remaining Mn atoms being far away from each
other. However,Co11Mn2 is an exception to such trend, where two Mn atoms occupy the surface
shell being in opposite positions of the icosahedron. For a detailed description, see Ref. [141]. The
mixing energies as a function of Mn concentration for the lowest energy configurations of Co13−nMnn
clusters are shown in Fig. 3.22. The negative values ofEmix over the whole range of compositions
indicate the favorable solubility of the components. It also shows enhanced stability for the isomers
having approximately equal amount of Co and Mn atoms.
Figure 3.23 shows the magnetic moment per atom for the lowestenergy configurations of Co13−nMnn
clusters. It shows that for the Co-rich compositions up to Co6Mn7, an increasing trend of the total
magnetic moment is observed clusters increases with increase in number of Mn atoms. This agrees
63
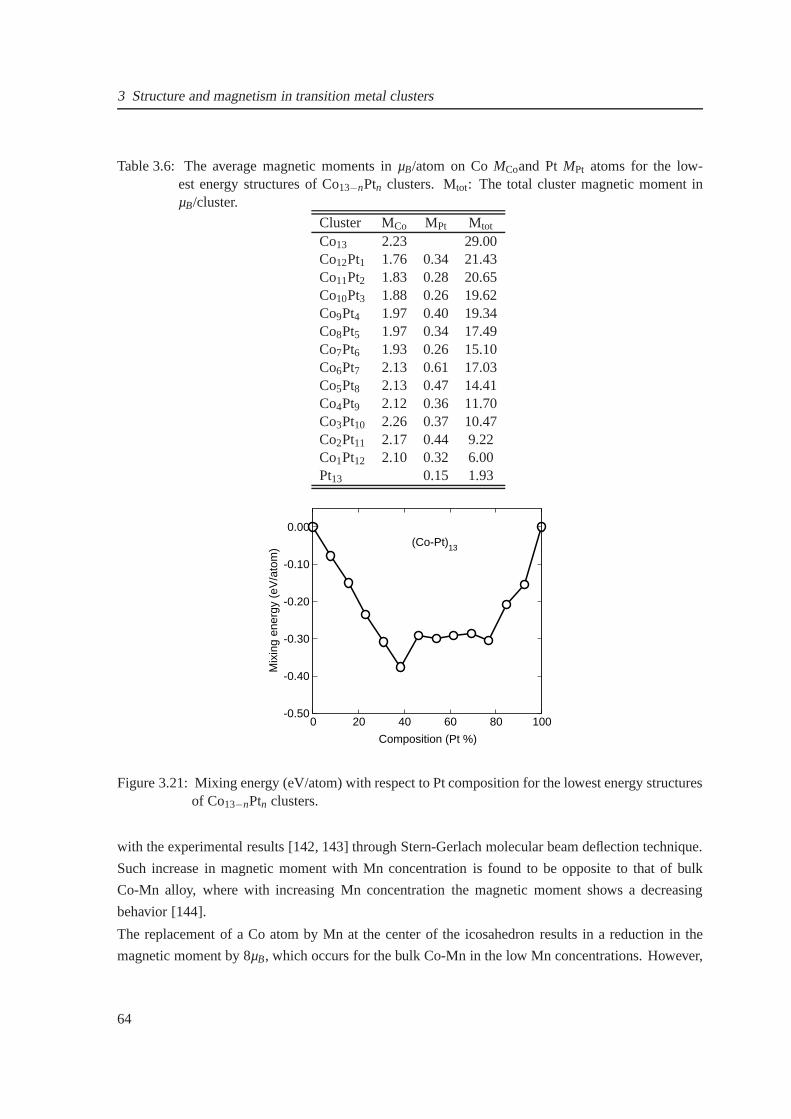
3 Structure and magnetism in transition metal clusters
Table 3.6: The average magnetic moments inµB/atom on CoMCoand PtMPt atoms for the low-est energy structures of Co13−nPtn clusters. Mtot: The total cluster magnetic moment inµB/cluster.
Cluster MCo MPt Mtot
Co13 2.23 29.00Co12Pt1 1.76 0.34 21.43Co11Pt2 1.83 0.28 20.65Co10Pt3 1.88 0.26 19.62Co9Pt4 1.97 0.40 19.34Co8Pt5 1.97 0.34 17.49Co7Pt6 1.93 0.26 15.10Co6Pt7 2.13 0.61 17.03Co5Pt8 2.13 0.47 14.41Co4Pt9 2.12 0.36 11.70Co3Pt10 2.26 0.37 10.47Co2Pt11 2.17 0.44 9.22Co1Pt12 2.10 0.32 6.00Pt13 0.15 1.93
0 20 40 60 80 100
Composition (Pt %)
-0.50
-0.40
-0.30
-0.20
-0.10
0.00
Mix
ing
ener
gy (
eV/a
tom
) (Co-Pt)13
Figure 3.21: Mixing energy (eV/atom) with respect to Pt composition for the lowest energy structuresof Co13−nPtn clusters.
with the experimental results [142, 143] through Stern-Gerlach molecular beam deflection technique.
Such increase in magnetic moment with Mn concentration is found to be opposite to that of bulk
Co-Mn alloy, where with increasing Mn concentration the magnetic moment shows a decreasing
behavior [144].
The replacement of a Co atom by Mn at the center of the icosahedron results in a reduction in the
magnetic moment by 8µB, which occurs for the bulk Co-Mn in the low Mn concentrations. However,
64
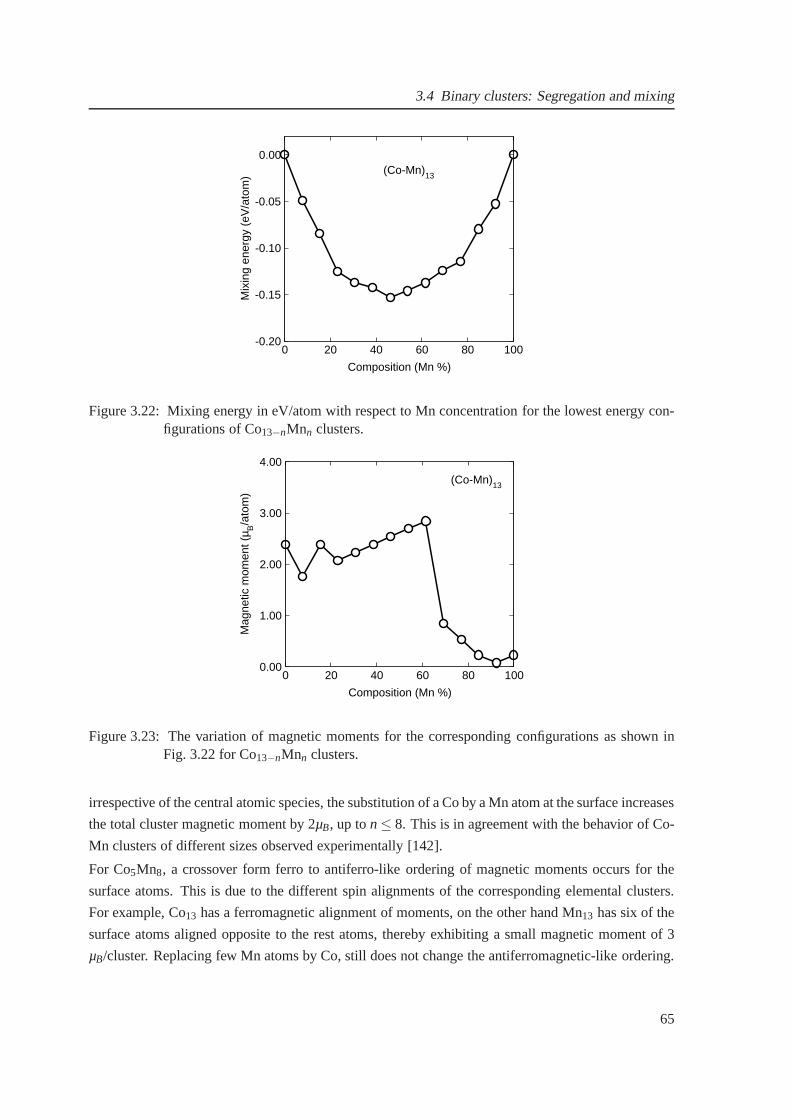
3.4 Binary clusters: Segregation and mixing
0 20 40 60 80 100
Composition (Mn %)
-0.20
-0.15
-0.10
-0.05
0.00
Mix
ing
ener
gy (
eV/a
tom
) (Co-Mn)13
Figure 3.22: Mixing energy in eV/atom with respect to Mn concentration for the lowest energy con-figurations of Co13−nMnn clusters.
0 20 40 60 80 100
Composition (Mn %)
0.00
1.00
2.00
3.00
4.00
Mag
netic
mom
ent (
µ B/a
tom
)
(Co-Mn)13
Figure 3.23: The variation of magnetic moments for the corresponding configurations as shown inFig. 3.22 for Co13−nMnn clusters.
irrespective of the central atomic species, the substitution of a Co by a Mn atom at the surface increases
the total cluster magnetic moment by 2µB, up ton≤ 8. This is in agreement with the behavior of Co-
Mn clusters of different sizes observed experimentally [142].
For Co5Mn8, a crossover form ferro to antiferro-like ordering of magnetic moments occurs for the
surface atoms. This is due to the different spin alignments of the corresponding elemental clusters.
For example, Co13 has a ferromagnetic alignment of moments, on the other hand Mn13 has six of the
surface atoms aligned opposite to the rest atoms, thereby exhibiting a small magnetic moment of 3
µB/cluster. Replacing few Mn atoms by Co, still does not changethe antiferromagnetic-like ordering.
65
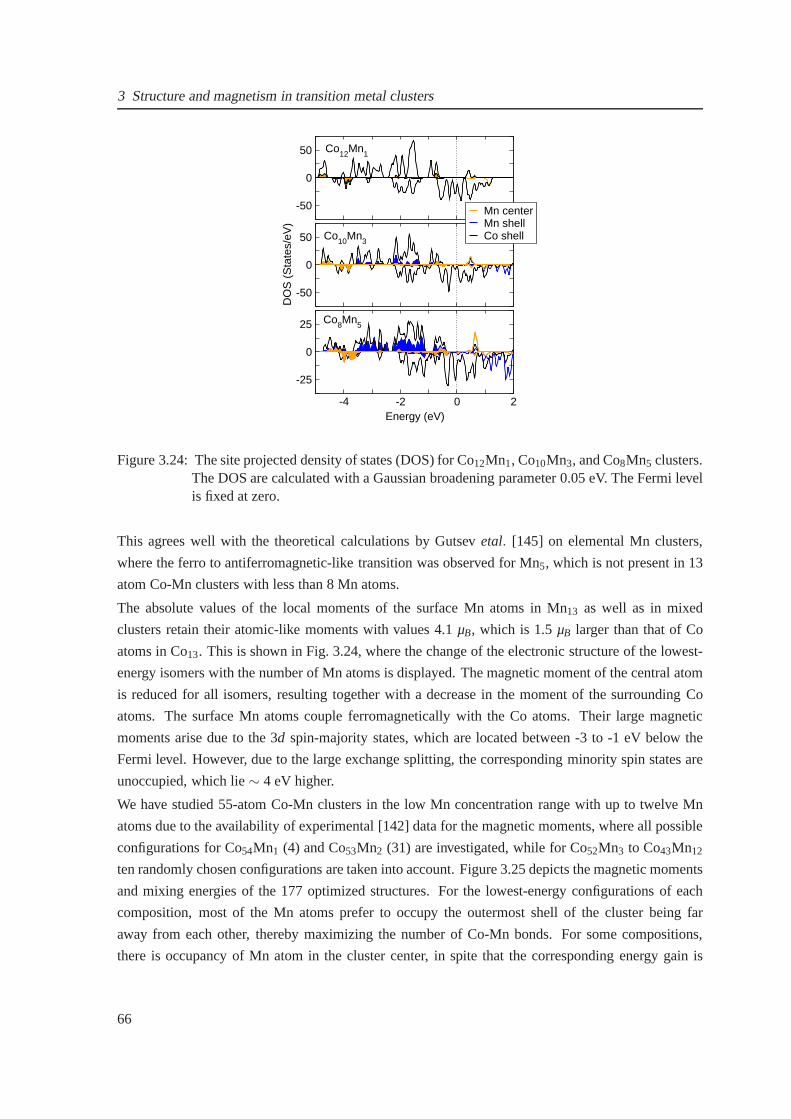
3 Structure and magnetism in transition metal clusters
-50
0
50 Co12Mn1
-50
0
50
DO
S (
Sta
tes/
eV)
Co10Mn3
-4 -2 0 2Energy (eV)
-25
0
25 Co8Mn5
Mn centerMn shellCo shell
Figure 3.24: The site projected density of states (DOS) for Co12Mn1, Co10Mn3, and Co8Mn5 clusters.The DOS are calculated with a Gaussian broadening parameter0.05 eV. The Fermi levelis fixed at zero.
This agrees well with the theoretical calculations by Gutsev etal. [145] on elemental Mn clusters,
where the ferro to antiferromagnetic-like transition was observed for Mn5, which is not present in 13
atom Co-Mn clusters with less than 8 Mn atoms.
The absolute values of the local moments of the surface Mn atoms in Mn13 as well as in mixed
clusters retain their atomic-like moments with values 4.1µB, which is 1.5µB larger than that of Co
atoms in Co13. This is shown in Fig. 3.24, where the change of the electronic structure of the lowest-
energy isomers with the number of Mn atoms is displayed. The magnetic moment of the central atom
is reduced for all isomers, resulting together with a decrease in the moment of the surrounding Co
atoms. The surface Mn atoms couple ferromagnetically with the Co atoms. Their large magnetic
moments arise due to the 3d spin-majority states, which are located between -3 to -1 eV below the
Fermi level. However, due to the large exchange splitting, the corresponding minority spin states are
unoccupied, which lie∼ 4 eV higher.
We have studied 55-atom Co-Mn clusters in the low Mn concentration range with up to twelve Mn
atoms due to the availability of experimental [142] data forthe magnetic moments, where all possible
configurations for Co54Mn1 (4) and Co53Mn2 (31) are investigated, while for Co52Mn3 to Co43Mn12
ten randomly chosen configurations are taken into account. Figure 3.25 depicts the magnetic moments
and mixing energies of the 177 optimized structures. For thelowest-energy configurations of each
composition, most of the Mn atoms prefer to occupy the outermost shell of the cluster being far
away from each other, thereby maximizing the number of Co-Mnbonds. For some compositions,
there is occupancy of Mn atom in the cluster center, in spite that the corresponding energy gain is
66
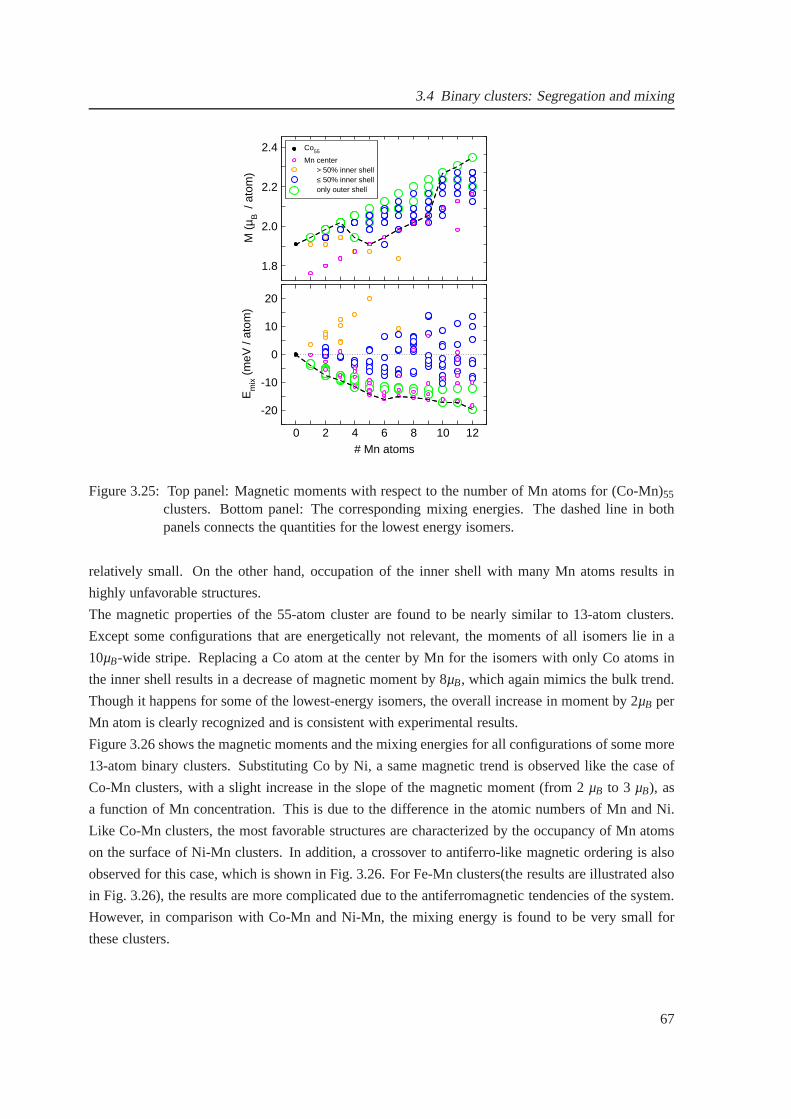
3.4 Binary clusters: Segregation and mixing
1.8
2.0
2.2
2.4
M (
µ B /
atom
)100
110
120
130
M (
µ B )
0 2 4 6 8 10 12# Mn atoms
-20
-10
0
10
20
Em
ix (
meV
/ at
om)
Co55
Mn center> 50% inner shell≤ 50% inner shell
only outer shell
Figure 3.25: Top panel: Magnetic moments with respect to thenumber of Mn atoms for (Co-Mn)55
clusters. Bottom panel: The corresponding mixing energies. The dashed line in bothpanels connects the quantities for the lowest energy isomers.
relatively small. On the other hand, occupation of the innershell with many Mn atoms results in
highly unfavorable structures.
The magnetic properties of the 55-atom cluster are found to be nearly similar to 13-atom clusters.
Except some configurations that are energetically not relevant, the moments of all isomers lie in a
10µB-wide stripe. Replacing a Co atom at the center by Mn for the isomers with only Co atoms in
the inner shell results in a decrease of magnetic moment by 8µB, which again mimics the bulk trend.
Though it happens for some of the lowest-energy isomers, theoverall increase in moment by 2µB per
Mn atom is clearly recognized and is consistent with experimental results.
Figure 3.26 shows the magnetic moments and the mixing energies for all configurations of some more
13-atom binary clusters. Substituting Co by Ni, a same magnetic trend is observed like the case of
Co-Mn clusters, with a slight increase in the slope of the magnetic moment (from 2µB to 3 µB), as
a function of Mn concentration. This is due to the differencein the atomic numbers of Mn and Ni.
Like Co-Mn clusters, the most favorable structures are characterized by the occupancy of Mn atoms
on the surface of Ni-Mn clusters. In addition, a crossover toantiferro-like magnetic ordering is also
observed for this case, which is shown in Fig. 3.26. For Fe-Mnclusters(the results are illustrated also
in Fig. 3.26), the results are more complicated due to the antiferromagnetic tendencies of the system.
However, in comparison with Co-Mn and Ni-Mn, the mixing energy is found to be very small for
these clusters.
67
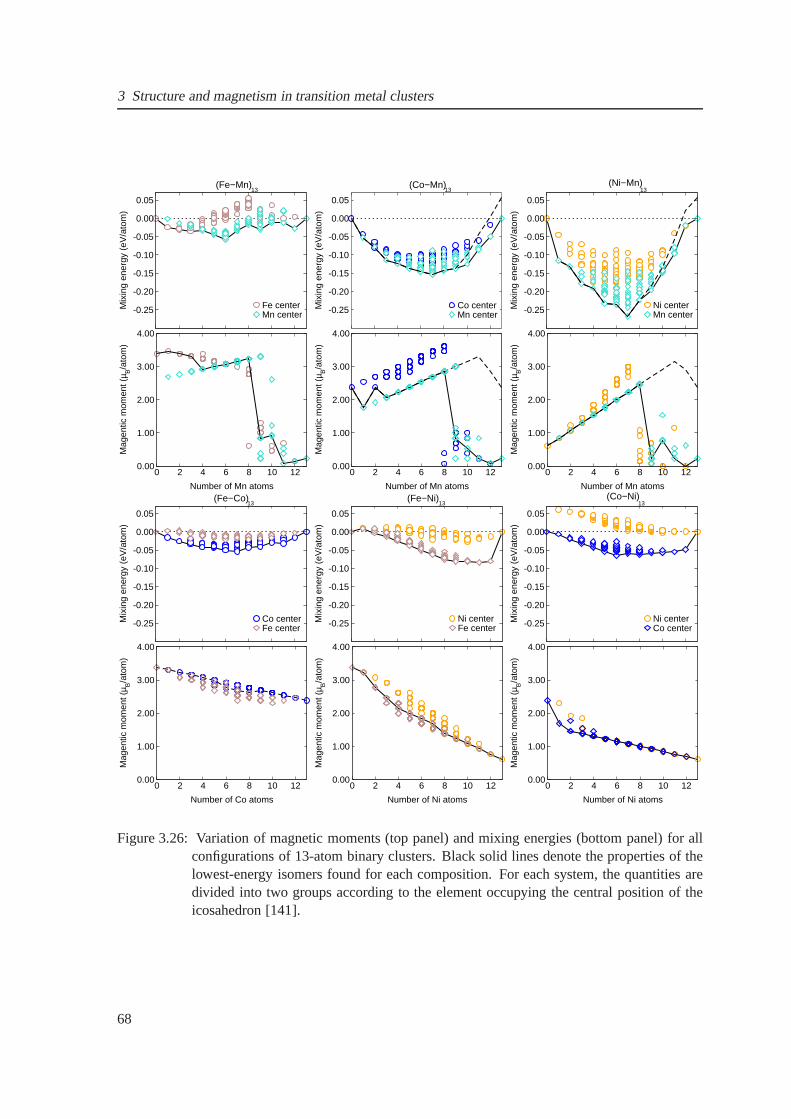
3 Structure and magnetism in transition metal clusters
0 2 4 6 8 10 12
Number of Mn atoms
-0.25
-0.20
-0.15
-0.10
-0.05
0.00
0.05
Mix
ing
ener
gy (
eV/a
tom
)
Fe centerMn center
0 2 4 6 8 10 12
Number of Mn atoms
0.00
1.00
2.00
3.00
4.00
Mag
entic
mom
ent (
µ B/a
tom
)
Fe centerMn center
(Fe−Mn)13
0 2 4 6 8 10 12
Number of Mn atoms
-0.25
-0.20
-0.15
-0.10
-0.05
0.00
0.05
Mix
ing
ener
gy (
eV/a
tom
)Co centerMn center
0 2 4 6 8 10 12
Number of Mn atoms
0.00
1.00
2.00
3.00
4.00
Mag
entic
mom
ent (
µ B/a
tom
)
Co centerMn center
(Co−Mn)13
0 2 4 6 8 10 12
Number of Mn atoms
-0.25
-0.20
-0.15
-0.10
-0.05
0.00
0.05
Mix
ing
ener
gy (
eV/a
tom
)
Ni centerMn center
0 2 4 6 8 10 12
Number of Mn atoms
0.00
1.00
2.00
3.00
4.00
Mag
entic
mom
ent (
µ B/a
tom
)
Ni centerMn center
(Ni−Mn)13
0 2 4 6 8 10 12
Number of Co atoms
-0.25
-0.20
-0.15
-0.10
-0.05
0.00
0.05
Mix
ing
ener
gy (
eV/a
tom
)
Co centerFe center
0 2 4 6 8 10 12
Number of Co atoms
0.00
1.00
2.00
3.00
4.00
Mag
entic
mom
ent (
µ B/a
tom
)
Co centerFe center
(Fe−Co)13
0 2 4 6 8 10 12
Number of Ni atoms
-0.25
-0.20
-0.15
-0.10
-0.05
0.00
0.05
Mix
ing
ener
gy (
eV/a
tom
)
Ni centerFe center
0 2 4 6 8 10 12
Number of Ni atoms
0.00
1.00
2.00
3.00
4.00
Mag
entic
mom
ent (
µ B/a
tom
)
Ni centerFe center
(Fe−Ni)13
0 2 4 6 8 10 12
Number of Ni atoms
-0.25
-0.20
-0.15
-0.10
-0.05
0.00
0.05M
ixin
g en
ergy
(eV
/ato
m)
Ni centerCo center
0 2 4 6 8 10 12
Number of Ni atoms
0.00
1.00
2.00
3.00
4.00
Mag
entic
mom
ent (
µ B/a
tom
)
Ni centerCo center
13(Co−Ni)
Figure 3.26: Variation of magnetic moments (top panel) and mixing energies (bottom panel) for allconfigurations of 13-atom binary clusters. Black solid lines denote the properties of thelowest-energy isomers found for each composition. For eachsystem, the quantities aredivided into two groups according to the element occupying the central position of theicosahedron [141].
68
4 Magnetic anisotropy of clusters
4.1 Introduction
One of the major obstacle in the miniaturization of magneticstorage devices is to overcome the
thermal fluctuation of magnetic information which has attracted much attention in current research.
Out of various factors that can help to overcome the obstacle, one of the main strategies is to enhance
the magnetic anisotropy by artificial material manipulation. As an example, for a disk shaped sample,
one can identify two main anisotropy directions: External field acting in the plane of the disk and
external field acting perpendicular to the plane of the disk.This type of anisotropy is popularly called
the shape anisotropy. For a ferromagnetic material the direction of the magnetization depends on the
shape of the material due to the shape anisotropy. Besides shape of the material, the non-isotropic
environment of atoms (in multi-component alloys, for example) in a crystal is another source of
magneto-crystalline anisotropy.
Experimentally, there has been many ways to tailor magneticanisotropies of nanostructured materi-
als especially by manipulating lattice strains, compositions, capping layers, growth procedures, and
surface adsorbates etc. [146–148]). Density-functional calculations have been extensively used to
explore and understand the underlying mechanism at the electronic structure level [42, 149, 150].
The reliable determination of MAE for any material requiresvery accurate electronic structures cal-
culations and proper treatment of the spin-orbit coupling because the energy we are dealing with are
sometimes several orders ofµeV, which can very easily superimpose with the numerical noise. The
spin-orbit coupling term is usually omitted in most of the DFT calculations with the assumption that it
does not play a major role in the chemical bonding and also forquick computations. In DFT the spin-
orbit interaction is treated through the scalar-relativistic or semi-relativistic [151] approaches. The
magnetic anisotropy is studied using the force theorem (fordetails, see Sec. 3.10). Such calculations
involve a large number ofk points to deal with the numerical fluctuation [43]. Several improvements
are proposed, like broadening techniques [152], and the state-tracking and the torque schemes, to
overcome this problem. The evaluation ofEMAE can also be done through the torque method. For a
detail description, see Sec. 3.10. In all our studies on MAE we have adopted the former method, i.e.
calculating the magnetic anisotropy energy using the magnetic force theorem method.
69
4 Magnetic anisotropy of clusters
4.1.1 Magnetoelasticity
There exists a different magnetic phenomena, due to the strain dependence of the MAE, known as
magnetostriction or magnetoelastic anisotropy, which is the deformation of the material in response
to a change in its direction of magnetization through the application of a magnetic field [9]. Magnetoe-
lastic anisotropy is caused by the mechanical strain which yields substantial anisotropy contributions
in a material. It has long been exploited in iron-based magnets, such as carbon steels and related
alloys (Fe-Cr, Fe-Co). It is also important in soft magnets,for example in permalloy-type magnets
(Fe100−xNix), where the cubic anisotropy is small and the magnetoelastic contribution easily dom-
inates the total anisotropy. The main source of magnetoelasticity is magnetocrystalline anisotropy.
Magnetoelasticity is closely related to magnetostriction, where the mechanical strain is created by the
rotation of the magnetization direction. Subjecting cubicmagnets to uniaxial mechanical strain yields
a uniaxial anisotropy contribution. Uniaxial magnetoelasticity is defined as
EME
V= −λsE
2(3cos2θ−1)ε+
E2
ε2− εσ (4.1)
whereσ is the uniaxial stress,ε is the elongation along the stress axis and is equal to∆l/l , E is the
Young’s modulus andθ is the angle between the magnetization and strain axes.λs is the saturation
magnetostriction that describes the strength of magnetoelastic coupling. Puttingσ and θ = 0 and
minimizing the magnetoelastic energy with respect toε in Eq. 4.1 yields the elongationε = λs, which
means thatλs is the spontaneous magnetostriction in the magnetization direction. A magnet that has
a spherical shape in the paramagnetic state becomes a prolate ferromagnet forλs > 0 and an oblate
ferromagnet forλs < 0. Sinceλs is very small in most compounds, moderate stressσ = Eε outweighs
the spontaneous magnetostriction, which yields the magnetoelastic anisotropy energy density
EME
V= −λsσ
2(3cos2θ−1) (4.2)
and the magnetoelastic contributionK1= 3λsσ/2. A crystal-field phenomenon occurring in highly
symmetric crystals and requiring a degenerate ground stateis the Jahn-Teller effect. Jahn-Teller ions
can lower their energy by spontaneously distorting the surrounding lattice. This energy gain is small
but proportional toε, as compared to the elastic energy, which is proportional toε2. Minimizing the
total energy results in a finite lattice distortion [8]. However, besides the crystal-field analogy, the
Jahn-Teller effect is not related to magnetocrystalline anisotropy.
4.1.2 Magnetic anisotropy in thin films and wires
The origin of large uniaxial magnetic anisotropies in thin films are the surface interface effects and
lattice strains arising because of lattice mismatches and presence of step edges [147, 153]. The con-
tributions from surface and interface strongly depend on the atomic relaxations, chemisorptions, and
growth morphologies. Therefore, the calculation ofEMAE through DFT requires geometrically op-
70

4.1 Introduction
Figure 4.1: The phase diagram for a free-standing chain of 10-atoms using classical Monte Carlosimulations [45].
timized structures. Though GGA improves the results of atomic structures for 3d transition metals
over LSDA, it overestimates the volume of 4d and 5d elements as well as oxides. A complete under-
standing of complex magnetic films requires the analysis of the electronic origin of theEMAE for a
free-standing magnetic monolayer.
There have been many calculations to study the effects of metal substrates or capping layers on the
EMAE of ultrathin magnetic thin films [42, 150]. The values ofK for magnetic films can be deter-
mined through DFT calculations with suitable accuracy. Interestingly,EMAE of Fe, Co and Ni films
can be tuned by surface chemisorptions of O, CO, and H [154–158], and the underlying electronic
mechanism has been actively explored through theory and experiment interplays.
The smallest possible magnetic recording units, such as monoatomic chains, are grown on sub-
strates [159] or built by Scanning Tunneling Microscope (STM) tip manipulation [160] for 100-1000
TB in.−2. The major problem of nanomagnets is the thermal fluctuation, which produces superpara-
magnetism [161] at finite temperature. Therefore, a high anisotropy energy barrier is required in
order to maintain the ferromagnetic ordering. Experimentally, Jametet al. have studied the mag-
netic anisotropy in a 3-nm Co cluster embedded in a niobium matrix and found the dominating role
of atoms on the cluster surface [162–164]. Giant MAEs of Co particles on Pt(111) [3, 165] was
found by Gambardellaet al.. They have also found an oscillation of MAE and the coercive field as a
function of the transverse width of the Co wires on Pt(997). The experimental studies by Rusponiet
al. [166] for Co patches deposited on Pt(111) has predicted the dominant role of edge Co atoms in the
perpendicular uniaxial anisotropy. Pratzeret al. have studied the Fe stripes on stepped W(110) and
found an extremely narrow domain wall, (≈ 6 Å), which might be due to large MAE [167, 168]. Fig-
ure 4.1 shows the magnetic phase diagram for a 10-atom monatomic chain, obtained through classical
Monte Carlo simulations. In order to achieve a high blockingtemperature (300K), below which the
71
4 Magnetic anisotropy of clusters
magnetization of each atom aligns along the easy axis and thereby forming a ferromagnetic structure,
stringent conditions are required, such as,J= 320-420 meV andK= 30-50 meV/atom. Such a large
EMAE cannot be achieved in nano-entities only with 3d elements. For the free-standing or supported
Co monatomic chains,EMCA is still a few tenths meV/atom [169]. For Co chains depositedon Pt(111),
Lazarovitset al. have found the easy axis to be perpendicular to the surface and independent of the
length of the chains [170]. There are also studies on the growth of Fen chains on Cu(001), Cu(111)
as well as embedded in the bulk Cu [169]. Shicket al. found that a quasi-one-dimensional Co chain
at the Pt(111) step edge has an easy axis at an odd angle of 20 toward the Pt step [171, 172]. In
addition, the spin and orbital magnetic moments are noncollinear. The relationship between MAE
and the anisotropy of the orbital moment, that is adopted formeasuring theEMAE through the X-ray
magnetic circular dichroism technique, was also examined for several systems [149, 173]. LargeK
values upto 30-50 meV have been found through DFT calculations. Model calculations for 3d-5d
trimers (FeOsFe and FeIrFe) showed a large value ofEMAE up to 108 meV, which is due to the high
spin polarization of Fe and the strong SOC from the 5d atoms. Giant values of 30-60 meV/atom were
also reported for Ru or Rh wires by Mokrousovet al. through FLAPW calculations [174].
4.2 Spin moments, orbital moments and magnetic anisotropy f or
clusters
DFT successfully calculates several physical and chemicalproperties of clusters. While calculat-
ing the magnetic properties such as spin and orbital momentsas well as the MAE of small clusters,
from computational point of view, two cases should be taken into account, namely, the non-collinear
magnetization density (the magnetization vector varies smoothly with respect to the position) and the
spin-orbit coupling (the interaction between electron spin and its orbital motion). For Both cases, the
spin-up and spin-down states are mixed together [175, 176].It has been observed that TM clusters
give rise to novel magnetic anisotropic properties compared to the bulk. For example, XMCD studies
by Gambardellaet al. [3] predict a large MAE of a single Co atom (9.0 meV/atom) deposited on
Pt(111) surface. Experimentally, Balashovet al. [177] through inelastic tunnelling spectroscopy have
found very large value of MAE for Fe and Co clusters up to 3 atoms compared to bulk. Theoretically
there exists abundant studies for MAE of clusters depositedon substrates [178–184], however studies
related to MAE of gas phase clusters are still limited [185–188]. Most of them are based on semiem-
pirical techniques. For example, using tight binding technique, Pastoret al. [185] have calculated the
MAE of small Fe clusters up to 7 atoms, where they have found large MAEs for clusters relative to the
corresponding bulk as well as thin films. Using the same method, Xie et al. [189] and Guirado-Lopez
et al. [186] have calculated the MAE for Co nanoparticles. They have also obtained large MAEs for
Co clusters relative to bulk. As an example, Figure 4.2 showsthe MAE of Co clusters obtained from
tight binding calculations [189]. Calculation of MAE for isolated clusters based onab initio methods
are mostly for TM dimers [188, 190, 191]. For larger clusters, there exists very few reports [192, 193].
72
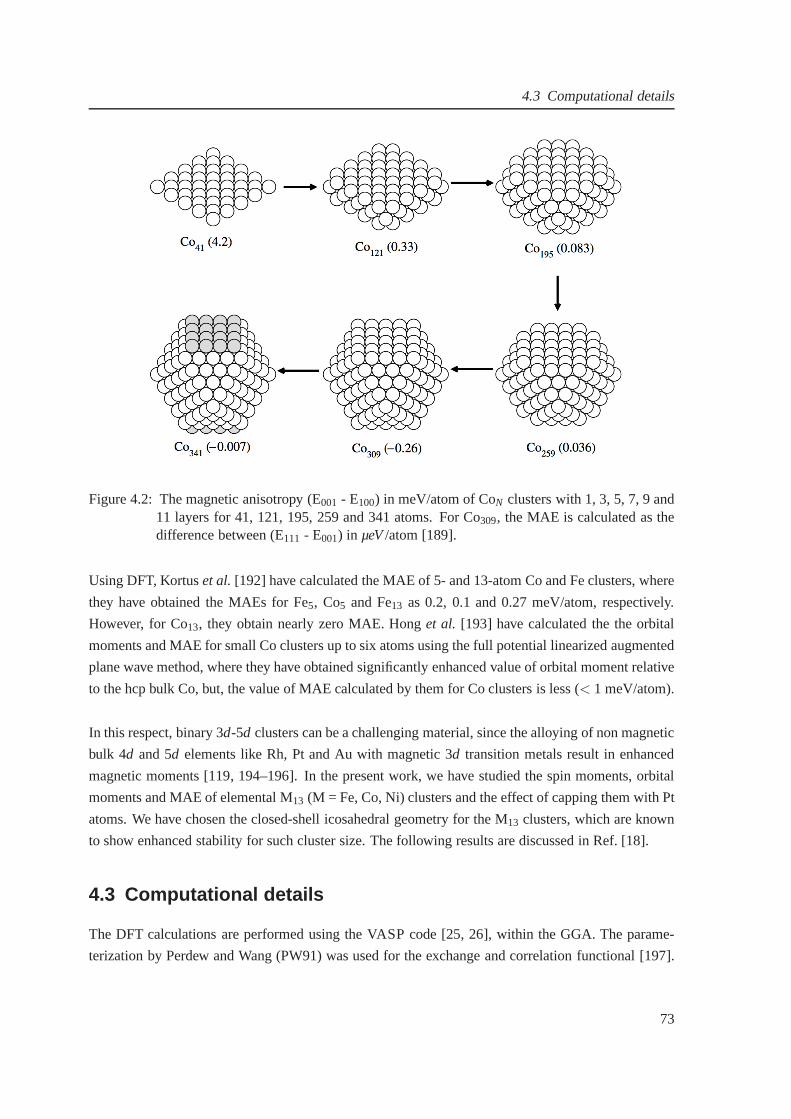
4.3 Computational details
Figure 4.2: The magnetic anisotropy (E001 - E100) in meV/atom of CoN clusters with 1, 3, 5, 7, 9 and11 layers for 41, 121, 195, 259 and 341 atoms. For Co309, the MAE is calculated as thedifference between (E111 - E001) in µeV/atom [189].
Using DFT, Kortuset al. [192] have calculated the MAE of 5- and 13-atom Co and Fe clusters, where
they have obtained the MAEs for Fe5, Co5 and Fe13 as 0.2, 0.1 and 0.27 meV/atom, respectively.
However, for Co13, they obtain nearly zero MAE. Honget al. [193] have calculated the the orbital
moments and MAE for small Co clusters up to six atoms using thefull potential linearized augmented
plane wave method, where they have obtained significantly enhanced value of orbital moment relative
to the hcp bulk Co, but, the value of MAE calculated by them forCo clusters is less (< 1 meV/atom).
In this respect, binary 3d-5d clusters can be a challenging material, since the alloying of non magnetic
bulk 4d and 5d elements like Rh, Pt and Au with magnetic 3d transition metals result in enhanced
magnetic moments [119, 194–196]. In the present work, we have studied the spin moments, orbital
moments and MAE of elemental M13 (M = Fe, Co, Ni) clusters and the effect of capping them with Pt
atoms. We have chosen the closed-shell icosahedral geometry for the M13 clusters, which are known
to show enhanced stability for such cluster size. The following results are discussed in Ref. [18].
4.3 Computational details
The DFT calculations are performed using the VASP code [25, 26], within the GGA. The parame-
terization by Perdew and Wang (PW91) was used for the exchange and correlation functional [197].
73
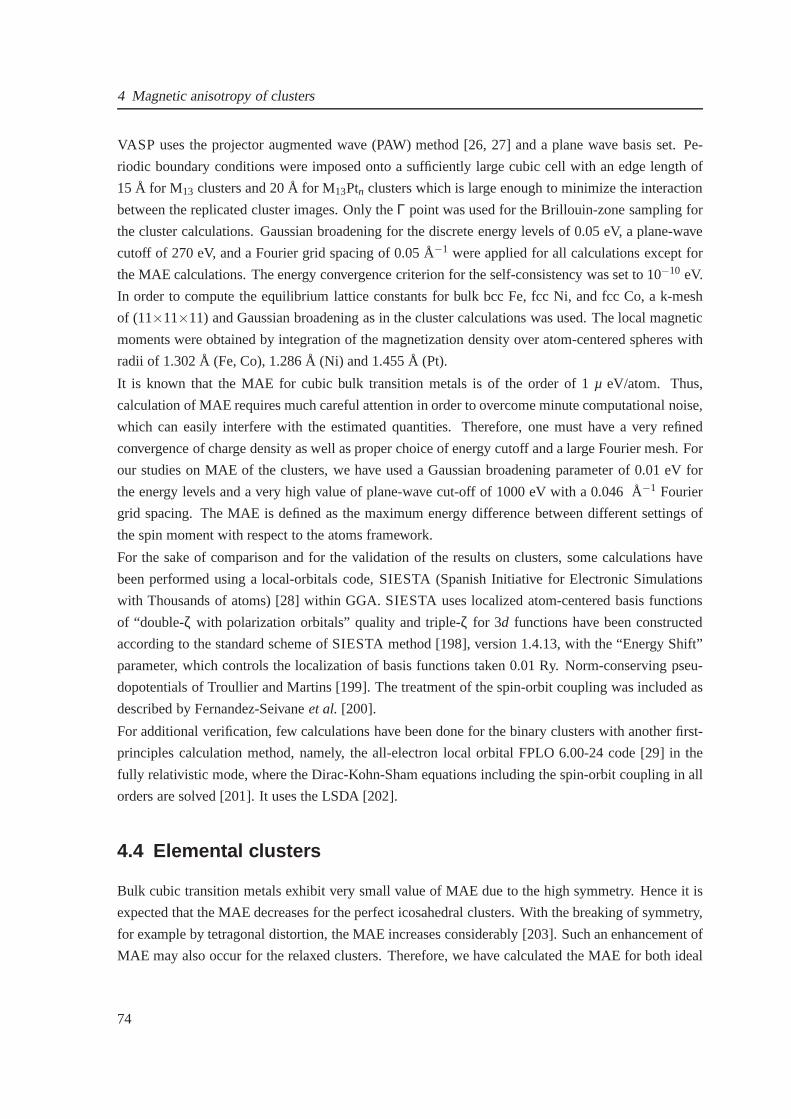
4 Magnetic anisotropy of clusters
VASP uses the projector augmented wave (PAW) method [26, 27]and a plane wave basis set. Pe-
riodic boundary conditions were imposed onto a sufficientlylarge cubic cell with an edge length of
15 Å for M13 clusters and 20 Å for M13Ptn clusters which is large enough to minimize the interaction
between the replicated cluster images. Only theΓ point was used for the Brillouin-zone sampling for
the cluster calculations. Gaussian broadening for the discrete energy levels of 0.05 eV, a plane-wave
cutoff of 270 eV, and a Fourier grid spacing of 0.05 Å−1 were applied for all calculations except for
the MAE calculations. The energy convergence criterion forthe self-consistency was set to 10−10 eV.
In order to compute the equilibrium lattice constants for bulk bcc Fe, fcc Ni, and fcc Co, a k-mesh
of (11×11×11) and Gaussian broadening as in the cluster calculations was used. The local magnetic
moments were obtained by integration of the magnetization density over atom-centered spheres with
radii of 1.302 Å (Fe, Co), 1.286 Å (Ni) and 1.455 Å (Pt).
It is known that the MAE for cubic bulk transition metals is ofthe order of 1µ eV/atom. Thus,
calculation of MAE requires much careful attention in orderto overcome minute computational noise,
which can easily interfere with the estimated quantities. Therefore, one must have a very refined
convergence of charge density as well as proper choice of energy cutoff and a large Fourier mesh. For
our studies on MAE of the clusters, we have used a Gaussian broadening parameter of 0.01 eV for
the energy levels and a very high value of plane-wave cut-offof 1000 eV with a 0.046 Å−1 Fourier
grid spacing. The MAE is defined as the maximum energy difference between different settings of
the spin moment with respect to the atoms framework.
For the sake of comparison and for the validation of the results on clusters, some calculations have
been performed using a local-orbitals code, SIESTA (Spanish Initiative for Electronic Simulations
with Thousands of atoms) [28] within GGA. SIESTA uses localized atom-centered basis functions
of “double-ζ with polarization orbitals” quality and triple-ζ for 3d functions have been constructed
according to the standard scheme of SIESTA method [198], version 1.4.13, with the “Energy Shift”
parameter, which controls the localization of basis functions taken 0.01 Ry. Norm-conserving pseu-
dopotentials of Troullier and Martins [199]. The treatmentof the spin-orbit coupling was included as
described by Fernandez-Seivaneet al. [200].
For additional verification, few calculations have been done for the binary clusters with another first-
principles calculation method, namely, the all-electron local orbital FPLO 6.00-24 code [29] in the
fully relativistic mode, where the Dirac-Kohn-Sham equations including the spin-orbit coupling in all
orders are solved [201]. It uses the LSDA [202].
4.4 Elemental clusters
Bulk cubic transition metals exhibit very small value of MAEdue to the high symmetry. Hence it is
expected that the MAE decreases for the perfect icosahedralclusters. With the breaking of symmetry,
for example by tetragonal distortion, the MAE increases considerably [203]. Such an enhancement of
MAE may also occur for the relaxed clusters. Therefore, we have calculated the MAE for both ideal
74
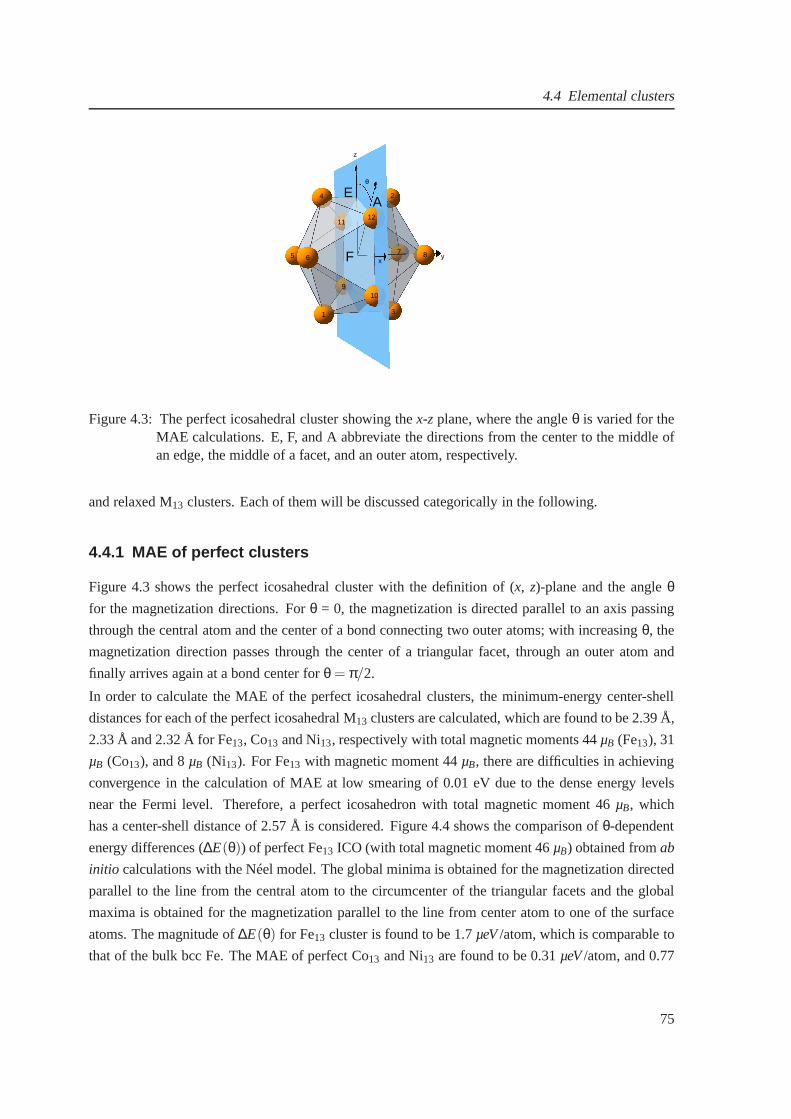
4.4 Elemental clusters
1 3
2
1211
8765
910
z
yx
4
θ
EA
F
Figure 4.3: The perfect icosahedral cluster showing thex-z plane, where the angleθ is varied for theMAE calculations. E, F, and A abbreviate the directions fromthe center to the middle ofan edge, the middle of a facet, and an outer atom, respectively.
and relaxed M13 clusters. Each of them will be discussed categorically in the following.
4.4.1 MAE of perfect clusters
Figure 4.3 shows the perfect icosahedral cluster with the definition of (x, z)-plane and the angleθfor the magnetization directions. Forθ = 0, the magnetization is directed parallel to an axis passing
through the central atom and the center of a bond connecting two outer atoms; with increasingθ, the
magnetization direction passes through the center of a triangular facet, through an outer atom and
finally arrives again at a bond center forθ = π/2.
In order to calculate the MAE of the perfect icosahedral clusters, the minimum-energy center-shell
distances for each of the perfect icosahedral M13 clusters are calculated, which are found to be 2.39 Å,
2.33 Å and 2.32 Å for Fe13, Co13 and Ni13, respectively with total magnetic moments 44µB (Fe13), 31
µB (Co13), and 8µB (Ni13). For Fe13 with magnetic moment 44µB, there are difficulties in achieving
convergence in the calculation of MAE at low smearing of 0.01eV due to the dense energy levels
near the Fermi level. Therefore, a perfect icosahedron withtotal magnetic moment 46µB, which
has a center-shell distance of 2.57 Å is considered. Figure 4.4 shows the comparison ofθ-dependent
energy differences (∆E(θ)) of perfect Fe13 ICO (with total magnetic moment 46µB) obtained fromab
initio calculations with the Néel model. The global minima is obtained for the magnetization directed
parallel to the line from the central atom to the circumcenter of the triangular facets and the global
maxima is obtained for the magnetization parallel to the line from center atom to one of the surface
atoms. The magnitude of∆E(θ) for Fe13 cluster is found to be 1.7µeV/atom, which is comparable to
that of the bulk bcc Fe. The MAE of perfect Co13 and Ni13 are found to be 0.31µeV/atom, and 0.77
75
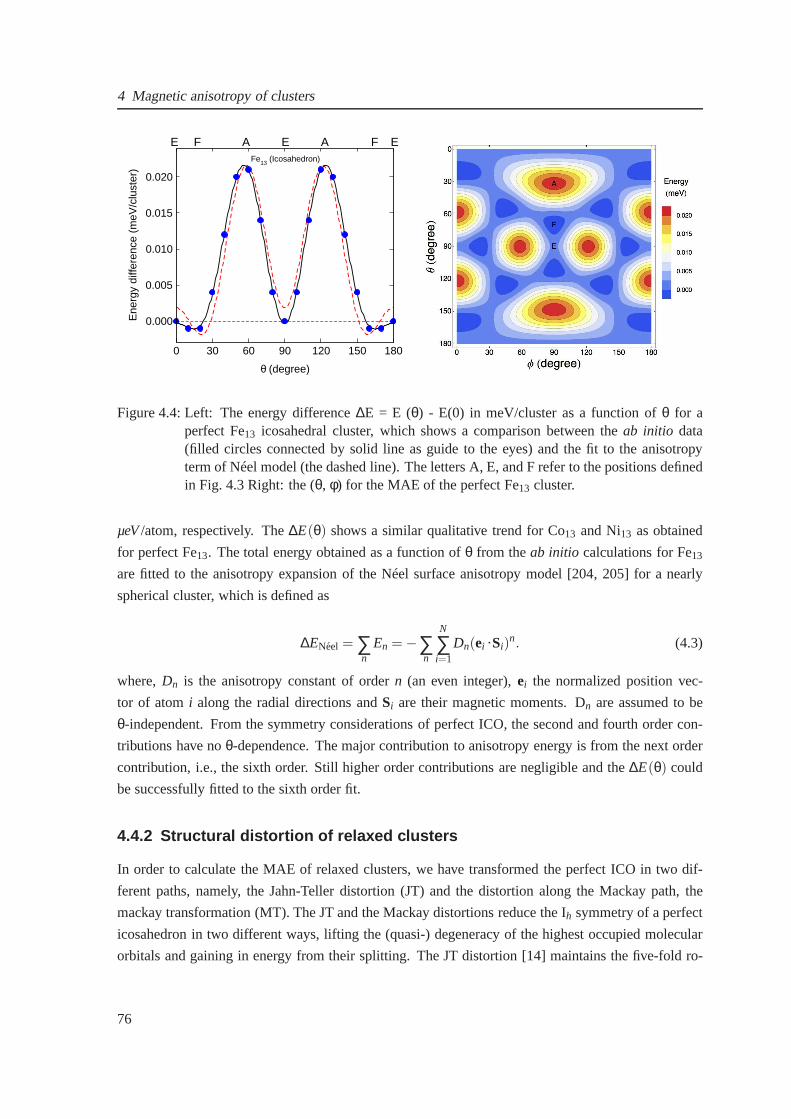
4 Magnetic anisotropy of clusters
0 30 60 90 120 150 180
θ (degree)
0.000
0.005
0.010
0.015
0.020
Ene
rgy
diffe
renc
e (m
eV/c
lust
er)
Fe13 (Icosahedron)
F A E A F EE
Figure 4.4: Left: The energy difference∆E = E (θ) - E(0) in meV/cluster as a function ofθ for aperfect Fe13 icosahedral cluster, which shows a comparison between theab initio data(filled circles connected by solid line as guide to the eyes) and the fit to the anisotropyterm of Néel model (the dashed line). The letters A, E, and F refer to the positions definedin Fig. 4.3 Right: the (θ, φ) for the MAE of the perfect Fe13 cluster.
µeV/atom, respectively. The∆E(θ) shows a similar qualitative trend for Co13 and Ni13 as obtained
for perfect Fe13. The total energy obtained as a function ofθ from theab initio calculations for Fe13
are fitted to the anisotropy expansion of the Néel surface anisotropy model [204, 205] for a nearly
spherical cluster, which is defined as
∆ENeel = ∑n
En = −∑n
N
∑i=1
Dn(ei ·Si)n. (4.3)
where,Dn is the anisotropy constant of ordern (an even integer),ei the normalized position vec-
tor of atomi along the radial directions andSi are their magnetic moments. Dn are assumed to be
θ-independent. From the symmetry considerations of perfectICO, the second and fourth order con-
tributions have noθ-dependence. The major contribution to anisotropy energy is from the next order
contribution, i.e., the sixth order. Still higher order contributions are negligible and the∆E(θ) could
be successfully fitted to the sixth order fit.
4.4.2 Structural distortion of relaxed clusters
In order to calculate the MAE of relaxed clusters, we have transformed the perfect ICO in two dif-
ferent paths, namely, the Jahn-Teller distortion (JT) and the distortion along the Mackay path, the
mackay transformation (MT). The JT and the Mackay distortions reduce the Ih symmetry of a perfect
icosahedron in two different ways, lifting the (quasi-) degeneracy of the highest occupied molecular
orbitals and gaining in energy from their splitting. The JT distortion [14] maintains the five-fold ro-
76

4.4 Elemental clusters
13
65
1
212
4
11
7
8
3
9
10
1
4
3
136
57
8
2
11
12
9
10
Figure 4.5: The JT-distorted and MT Fe13 clusters in the left and right panels, respectively. Arrowsindicate the direction of relative shift of atoms with respect to the ideal positions. Thearrows have been scaled up by a factor of 20 and 30 for the JT andMT Fe13 cluster. Thebox is only guide to the eyes. The actual simulation box size is 153 Å3 [18].
tational symmetry, with a compression of the cluster along the corresponding axis. It also involves
a mutual opposite rotation of the two pentagonal rings pierced by the axis in consideration. The JT
distortion can be characterized by parameterr, defined asr = |rrr3 − rrr4|/|rrr1 − rrr2| (see left panel of
Fig. 4.5 for the labeling of atoms). The MT can be characterized by parameters, which is the square
of the ratio of the stretched to the unstretched edges (see Fig. 4.5, right panel) being equal to 1 and 2
for the perfect icosahedron and cuboctahedron, respectively [206]. That is,s= |rrr4− rrr2|2/|rrr4− rrr12|2.
Figure 4.6 shows the variation of energy as a function of the JT-parameterr and of the Mackay
parameters for M13 clusters. As the starting geometries, the minimum energy center-shell distances
for the perfect ICO of Fe13, Co13 and Ni13 are considered, which are 2.39 Å, 2.33 Åand 2.32 Å,
respectively. The minimum energy structural parameters are reported in Table 4.1. It should be
noted that for the JT-distorted clusters, two of the axial atoms have different center-shell distances
compared to the other atoms, while for the Mackay transformed clusters, the center-shell distances
remains independent ofs.
For Fe13 cluster, the JT-distorted structure is by 125 meV/cluster,the MT cluster by 61 meV/cluster
lower in energy compared to the energy of perfect ICO. For Co13, the JT relaxation is by 7 meV/cluster
and the MT relaxation is by 27 meV lower in energy with respectto the perfect ICO, whereas for Ni13
the energy differences are nearly the same (16 meV/cluster)for both JT and MT clusters, respectively.
77
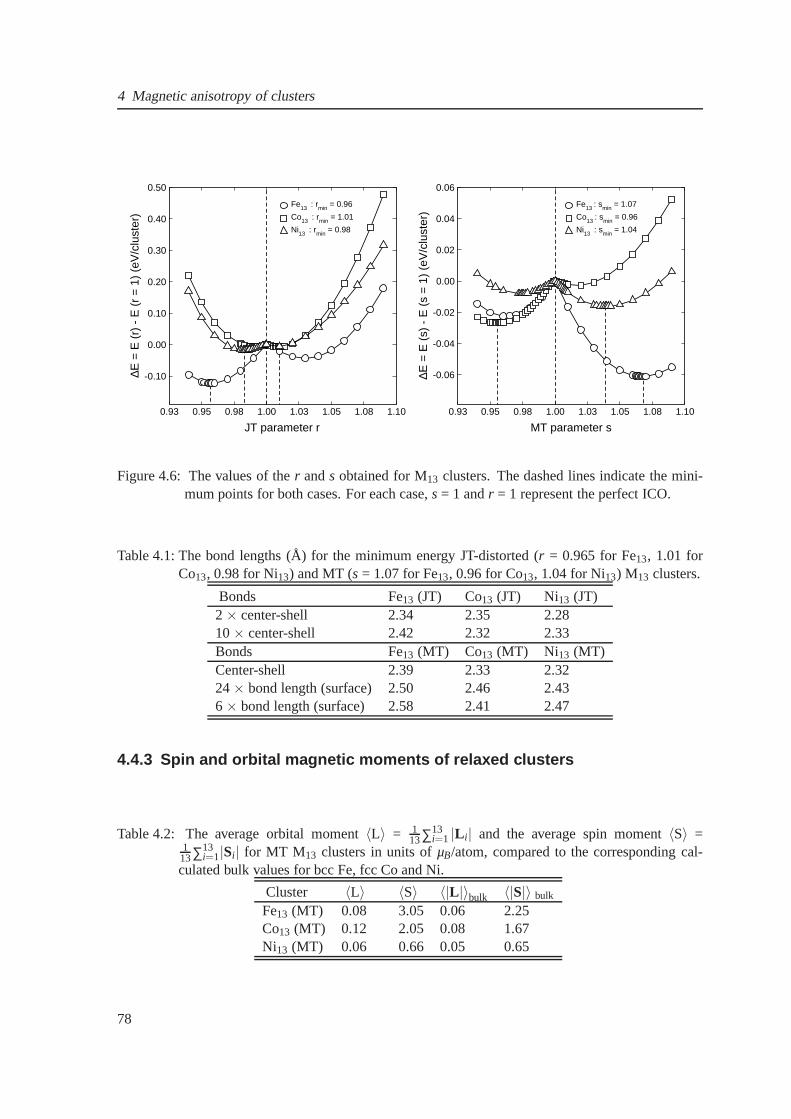
4 Magnetic anisotropy of clusters
0.93 0.95 0.98 1.00 1.03 1.05 1.08 1.10
JT parameter r
-0.10
0.00
0.10
0.20
0.30
0.40
0.50
∆E =
E (
r) -
E (
r =
1)
(eV
/clu
ster
)
Fe13 : rmin = 0.96
Co13 : rmin = 1.01
Ni13 : rmin = 0.98
0.93 0.95 0.98 1.00 1.03 1.05 1.08 1.10
MT parameter s
-0.06
-0.04
-0.02
0.00
0.02
0.04
0.06
∆E =
E (
s) -
E (
s =
1)
(eV
/clu
ster
)
Fe13 : smin = 1.07
Co13 : smin = 0.96
Ni13 : smin = 1.04
Figure 4.6: The values of ther ands obtained for M13 clusters. The dashed lines indicate the mini-mum points for both cases. For each case,s= 1 andr = 1 represent the perfect ICO.
Table 4.1: The bond lengths (Å) for the minimum energy JT-distorted (r = 0.965 for Fe13, 1.01 forCo13, 0.98 for Ni13) and MT (s = 1.07 for Fe13, 0.96 for Co13, 1.04 for Ni13) M13 clusters.
Bonds Fe13 (JT) Co13 (JT) Ni13 (JT)2× center-shell 2.34 2.35 2.2810× center-shell 2.42 2.32 2.33Bonds Fe13 (MT) Co13 (MT) Ni13 (MT)Center-shell 2.39 2.33 2.3224× bond length (surface) 2.50 2.46 2.436× bond length (surface) 2.58 2.41 2.47
4.4.3 Spin and orbital magnetic moments of relaxed clusters
Table 4.2: The average orbital moment〈L〉 = 113∑13
i=1 |Li| and the average spin moment〈S〉 =113∑13
i=1|Si| for MT M13 clusters in units ofµB/atom, compared to the corresponding cal-culated bulk values for bcc Fe, fcc Co and Ni.
Cluster 〈L〉 〈S〉 〈|L|〉bulk 〈|S|〉 bulk
Fe13 (MT) 0.08 3.05 0.06 2.25Co13 (MT) 0.12 2.05 0.08 1.67Ni13 (MT) 0.06 0.66 0.05 0.65
78
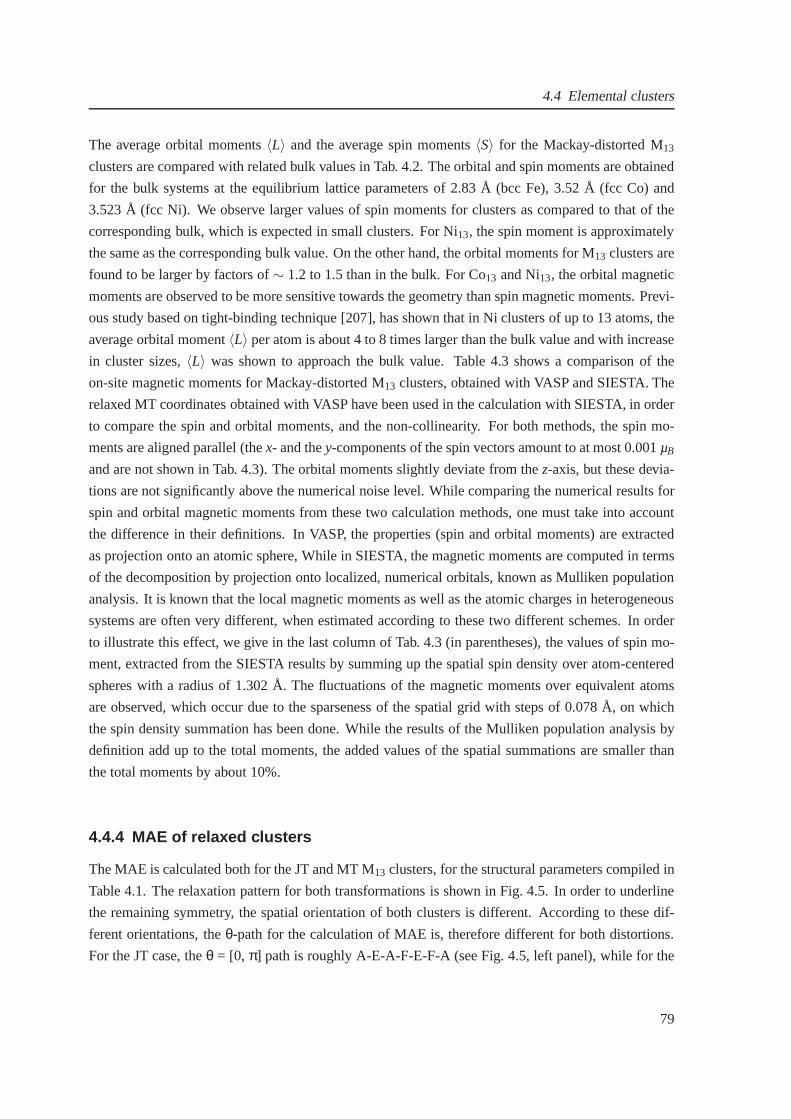
4.4 Elemental clusters
The average orbital moments〈L〉 and the average spin moments〈S〉 for the Mackay-distorted M13
clusters are compared with related bulk values in Tab. 4.2. The orbital and spin moments are obtained
for the bulk systems at the equilibrium lattice parameters of 2.83 Å (bcc Fe), 3.52 Å (fcc Co) and
3.523 Å (fcc Ni). We observe larger values of spin moments forclusters as compared to that of the
corresponding bulk, which is expected in small clusters. For Ni13, the spin moment is approximately
the same as the corresponding bulk value. On the other hand, the orbital moments for M13 clusters are
found to be larger by factors of∼ 1.2 to 1.5 than in the bulk. For Co13 and Ni13, the orbital magnetic
moments are observed to be more sensitive towards the geometry than spin magnetic moments. Previ-
ous study based on tight-binding technique [207], has shownthat in Ni clusters of up to 13 atoms, the
average orbital moment〈L〉 per atom is about 4 to 8 times larger than the bulk value and with increase
in cluster sizes,〈L〉 was shown to approach the bulk value. Table 4.3 shows a comparison of the
on-site magnetic moments for Mackay-distorted M13 clusters, obtained with VASP and SIESTA. The
relaxed MT coordinates obtained with VASP have been used in the calculation with SIESTA, in order
to compare the spin and orbital moments, and the non-collinearity. For both methods, the spin mo-
ments are aligned parallel (thex- and they-components of the spin vectors amount to at most 0.001µB
and are not shown in Tab. 4.3). The orbital moments slightly deviate from thez-axis, but these devia-
tions are not significantly above the numerical noise level.While comparing the numerical results for
spin and orbital magnetic moments from these two calculation methods, one must take into account
the difference in their definitions. In VASP, the properties(spin and orbital moments) are extracted
as projection onto an atomic sphere, While in SIESTA, the magnetic moments are computed in terms
of the decomposition by projection onto localized, numerical orbitals, known as Mulliken population
analysis. It is known that the local magnetic moments as wellas the atomic charges in heterogeneous
systems are often very different, when estimated accordingto these two different schemes. In order
to illustrate this effect, we give in the last column of Tab. 4.3 (in parentheses), the values of spin mo-
ment, extracted from the SIESTA results by summing up the spatial spin density over atom-centered
spheres with a radius of 1.302 Å. The fluctuations of the magnetic moments over equivalent atoms
are observed, which occur due to the sparseness of the spatial grid with steps of 0.078 Å, on which
the spin density summation has been done. While the results of the Mulliken population analysis by
definition add up to the total moments, the added values of thespatial summations are smaller than
the total moments by about 10%.
4.4.4 MAE of relaxed clusters
The MAE is calculated both for the JT and MT M13 clusters, for the structural parameters compiled in
Table 4.1. The relaxation pattern for both transformationsis shown in Fig. 4.5. In order to underline
the remaining symmetry, the spatial orientation of both clusters is different. According to these dif-
ferent orientations, theθ-path for the calculation of MAE is, therefore different forboth distortions.
For the JT case, theθ = [0, π] path is roughly A-E-A-F-E-F-A (see Fig. 4.5, left panel), while for the
79
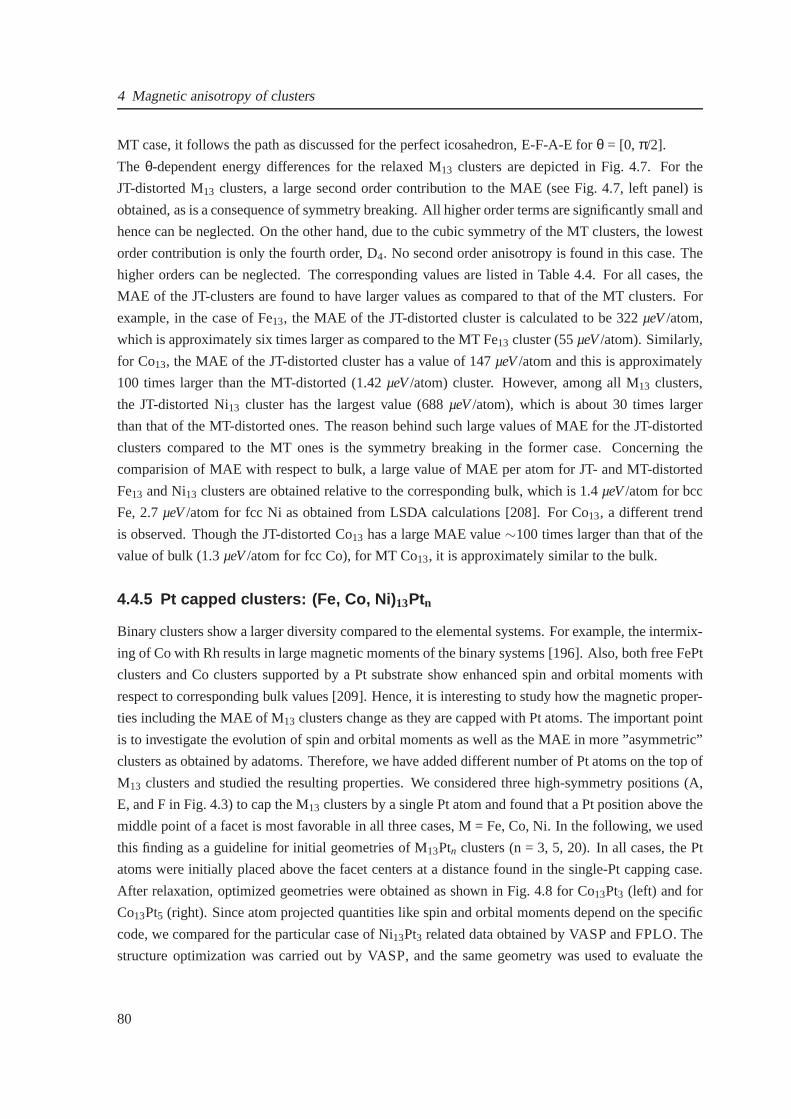
4 Magnetic anisotropy of clusters
MT case, it follows the path as discussed for the perfect icosahedron, E-F-A-E forθ = [0, π/2].
The θ-dependent energy differences for the relaxed M13 clusters are depicted in Fig. 4.7. For the
JT-distorted M13 clusters, a large second order contribution to the MAE (see Fig. 4.7, left panel) is
obtained, as is a consequence of symmetry breaking. All higher order terms are significantly small and
hence can be neglected. On the other hand, due to the cubic symmetry of the MT clusters, the lowest
order contribution is only the fourth order, D4. No second order anisotropy is found in this case. The
higher orders can be neglected. The corresponding values are listed in Table 4.4. For all cases, the
MAE of the JT-clusters are found to have larger values as compared to that of the MT clusters. For
example, in the case of Fe13, the MAE of the JT-distorted cluster is calculated to be 322µeV/atom,
which is approximately six times larger as compared to the MTFe13 cluster (55µeV/atom). Similarly,
for Co13, the MAE of the JT-distorted cluster has a value of 147µeV/atom and this is approximately
100 times larger than the MT-distorted (1.42µeV/atom) cluster. However, among all M13 clusters,
the JT-distorted Ni13 cluster has the largest value (688µeV/atom), which is about 30 times larger
than that of the MT-distorted ones. The reason behind such large values of MAE for the JT-distorted
clusters compared to the MT ones is the symmetry breaking in the former case. Concerning the
comparision of MAE with respect to bulk, a large value of MAE per atom for JT- and MT-distorted
Fe13 and Ni13 clusters are obtained relative to the corresponding bulk, which is 1.4µeV/atom for bcc
Fe, 2.7µeV/atom for fcc Ni as obtained from LSDA calculations [208]. For Co13, a different trend
is observed. Though the JT-distorted Co13 has a large MAE value∼100 times larger than that of the
value of bulk (1.3µeV/atom for fcc Co), for MT Co13, it is approximately similar to the bulk.
4.4.5 Pt capped clusters: (Fe, Co, Ni) 13Ptn
Binary clusters show a larger diversity compared to the elemental systems. For example, the intermix-
ing of Co with Rh results in large magnetic moments of the binary systems [196]. Also, both free FePt
clusters and Co clusters supported by a Pt substrate show enhanced spin and orbital moments with
respect to corresponding bulk values [209]. Hence, it is interesting to study how the magnetic proper-
ties including the MAE of M13 clusters change as they are capped with Pt atoms. The important point
is to investigate the evolution of spin and orbital moments as well as the MAE in more ”asymmetric”
clusters as obtained by adatoms. Therefore, we have added different number of Pt atoms on the top of
M13 clusters and studied the resulting properties. We considered three high-symmetry positions (A,
E, and F in Fig. 4.3) to cap the M13 clusters by a single Pt atom and found that a Pt position abovethe
middle point of a facet is most favorable in all three cases, M= Fe, Co, Ni. In the following, we used
this finding as a guideline for initial geometries of M13Ptn clusters (n = 3, 5, 20). In all cases, the Pt
atoms were initially placed above the facet centers at a distance found in the single-Pt capping case.
After relaxation, optimized geometries were obtained as shown in Fig. 4.8 for Co13Pt3 (left) and for
Co13Pt5 (right). Since atom projected quantities like spin and orbital moments depend on the specific
code, we compared for the particular case of Ni13Pt3 related data obtained by VASP and FPLO. The
structure optimization was carried out by VASP, and the samegeometry was used to evaluate the
80
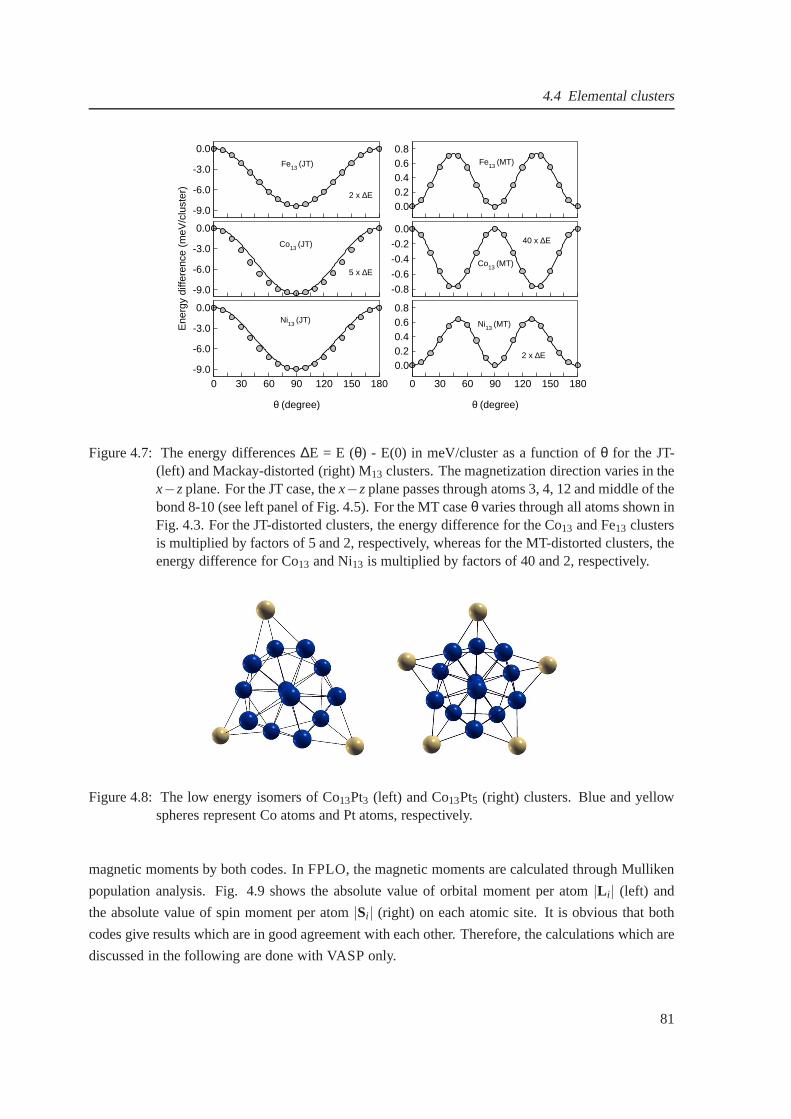
4.4 Elemental clusters
-9.0
-6.0
-3.0
0.0
0.00.20.40.60.8
-9.0
-6.0
-3.0
0.0
Ene
rgy
diffe
renc
e (m
eV/c
lust
er)
-0.8
-0.6
-0.4
-0.2
0.0
0 30 60 90 120 150 180
θ (degree)
-9.0
-6.0
-3.0
0.0
0 30 60 90 120 150 180
θ (degree)
0.00.20.40.60.8
5 x ∆E
2 x ∆E
40 x ∆E
2 x ∆E
Fe13 (JT)
Co13 (JT)
Ni13 (JT)
Fe13 (MT)
Co13 (MT)
Ni13 (MT)
Figure 4.7: The energy differences∆E = E (θ) - E(0) in meV/cluster as a function ofθ for the JT-(left) and Mackay-distorted (right) M13 clusters. The magnetization direction varies in thex−zplane. For the JT case, thex−zplane passes through atoms 3, 4, 12 and middle of thebond 8-10 (see left panel of Fig. 4.5). For the MT caseθ varies through all atoms shown inFig. 4.3. For the JT-distorted clusters, the energy difference for the Co13 and Fe13 clustersis multiplied by factors of 5 and 2, respectively, whereas for the MT-distorted clusters, theenergy difference for Co13 and Ni13 is multiplied by factors of 40 and 2, respectively.
Figure 4.8: The low energy isomers of Co13Pt3 (left) and Co13Pt5 (right) clusters. Blue and yellowspheres represent Co atoms and Pt atoms, respectively.
magnetic moments by both codes. In FPLO, the magnetic moments are calculated through Mulliken
population analysis. Fig. 4.9 shows the absolute value of orbital moment per atom|Li| (left) and
the absolute value of spin moment per atom|Si | (right) on each atomic site. It is obvious that both
codes give results which are in good agreement with each other. Therefore, the calculations which are
discussed in the following are done with VASP only.
81
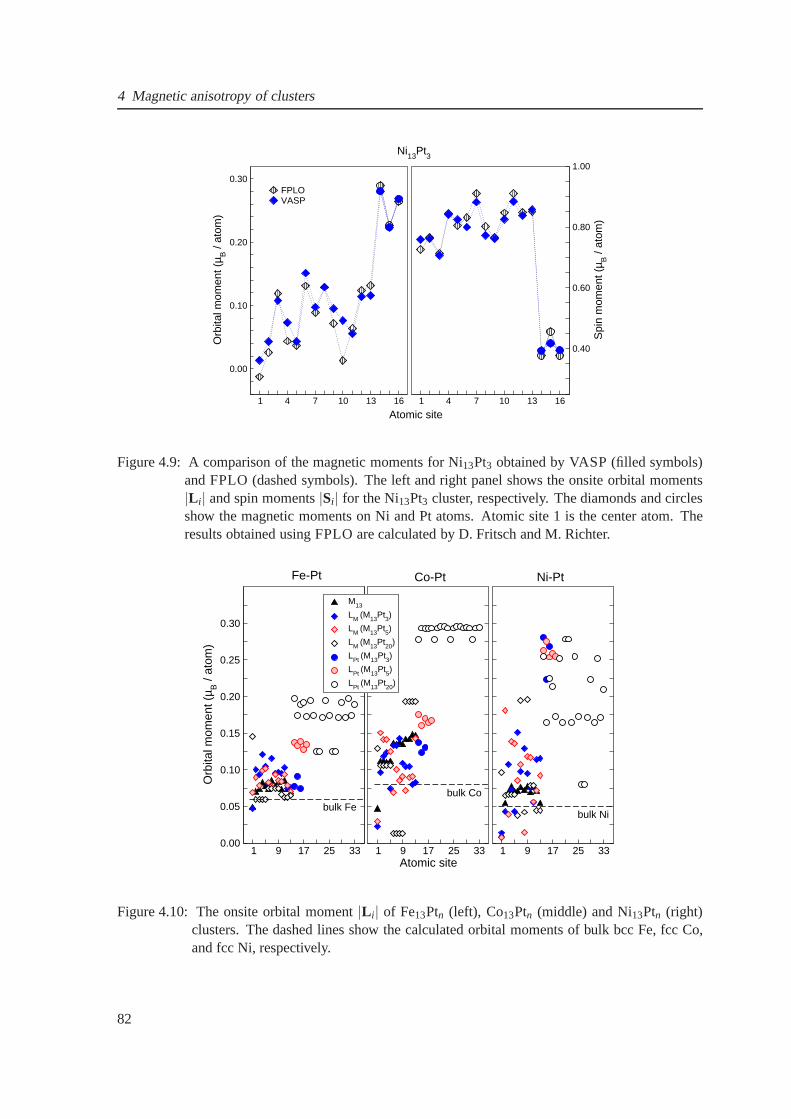
4 Magnetic anisotropy of clusters
1 4 7 10 13 16
0.00
0.10
0.20
0.30
Orb
ital m
omen
t (µ B
/ at
om)
FPLOVASP
1 4 7 10 13 16
0.40
0.60
0.80
1.00
Spi
n m
omen
t (µ B
/ at
om)
Ni13Pt3
Atomic site
Figure 4.9: A comparison of the magnetic moments for Ni13Pt3 obtained by VASP (filled symbols)and FPLO (dashed symbols). The left and right panel shows theonsite orbital moments|Li| and spin moments|Si| for the Ni13Pt3 cluster, respectively. The diamonds and circlesshow the magnetic moments on Ni and Pt atoms. Atomic site 1 is the center atom. Theresults obtained using FPLO are calculated by D. Fritsch andM. Richter.
1 9 17 25 330.00
0.05
0.10
0.15
0.20
0.25
0.30
Orb
ital m
omen
t (µ B
/ at
om)
1 9 17 25 33Atomic site
M13
LM (M13Pt3)
LM (M13Pt5)
LM (M13Pt20)
LPt (M13Pt3)
LPt (M13Pt5)
LPt (M13Pt20)
1 9 17 25 33
Fe-Pt Co-Pt Ni-Pt
bulk Febulk Co
bulk Ni
Figure 4.10: The onsite orbital moment|Li| of Fe13Ptn (left), Co13Ptn (middle) and Ni13Ptn (right)clusters. The dashed lines show the calculated orbital moments of bulk bcc Fe, fcc Co,and fcc Ni, respectively.
82

4.4 Elemental clusters
1 9 17 25 330.0
0.5
1.0
1.5
2.0
2.5
3.0
Spi
n m
omen
t (µ B
/ at
om)
1 9 17 25 33Atomic site
0.0
0.5
1.0
1.5
2.0
2.5
3.0
1 9 17 25 330.0
0.3
0.6
0.9
1.2
1.5
M13
SM(M13Pt3)
SM(M13Pt5)
SM(M13Pt20)
SPt (M13Pt3)
SPt (M13Pt5)
SPt (M13Pt20)
Fe-Pt
bulk Fe
Fe-Pt Co-Pt Ni-Pt
bulk Co
bulk Ni
Figure 4.11: The onsite spin moment|Si| of Fe13Ptn (left), Co13Ptn (middle) and Ni13Ptn (right)clusters. The dashed lines show the calculated spin momentsof bulk bcc Fe, fcc Co, andfcc Ni, respectively The same symbols as in Fig. 4.10 are used.
Figures 4.10 and 4.11 show the variation of|Li | and the variation of|Si| on each atomic site of M13Ptnclusters are shown, respectively (the symbols are kept consistent for both figures and the center atom
is placed at 1). Fig. 4.10 shows that the orbital moments of such few-atom systems, which in general
depend sensitively on the particular chemical compositionand geometry. The resulting electronic
structure can be very individual (e.g., the nature of the highest occupied level depends on the electron
number and on the spin moment), and is hard to be predicted without a detailed calculation. It is found
that the|Li| of Fe13 clusters approach the corresponding bulk value of bcc Fe (see Table 4.5), with
increasing number of Pt atoms. This trend is absent in the related Co and Ni systems (see Table 4.5).
The orbital moment on Pt atoms is found to be very sensitive with respect to the core atomic species.
For Fe and Co cores, it grows with the numbern of Pt atoms, but for Ni cores it slightly decreases
with growingn.
In Fig. 4.11, the site-specific spin moments of the capped clusters are shown. Different trends are
found for the core atoms: While the Fe and the Co spin moments are reduced by the capping, the
Ni moments are relatively enhanced. The spin moment on Pt atoms does not show any clear trend.
One intriguing point is the difference between the trends ofPt orbital and spin moments for the
M13Pt3/M13Pt5 clusters, as M varies from Fe to Ni. Here, the Pt orbital moments increase by a factor
of two, while the Pt spin moments are merely unchanged. We assume that the hybridization between
Ni and Pt is weaker than between Fe and Pt due to the different extension of the atomic orbitals.
83
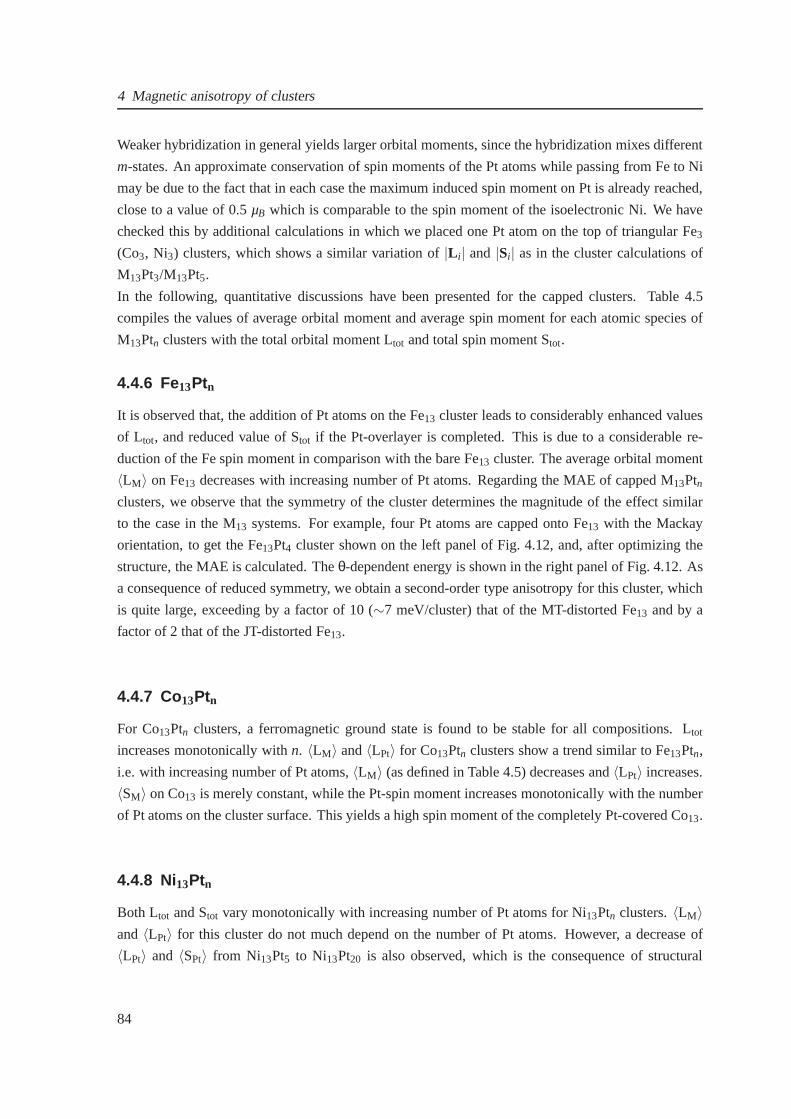
4 Magnetic anisotropy of clusters
Weaker hybridization in general yields larger orbital moments, since the hybridization mixes different
m-states. An approximate conservation of spin moments of thePt atoms while passing from Fe to Ni
may be due to the fact that in each case the maximum induced spin moment on Pt is already reached,
close to a value of 0.5µB which is comparable to the spin moment of the isoelectronic Ni. We have
checked this by additional calculations in which we placed one Pt atom on the top of triangular Fe3
(Co3, Ni3) clusters, which shows a similar variation of|Li| and |Si| as in the cluster calculations of
M13Pt3/M13Pt5.
In the following, quantitative discussions have been presented for the capped clusters. Table 4.5
compiles the values of average orbital moment and average spin moment for each atomic species of
M13Ptn clusters with the total orbital moment Ltot and total spin moment Stot.
4.4.6 Fe13Ptn
It is observed that, the addition of Pt atoms on the Fe13 cluster leads to considerably enhanced values
of Ltot, and reduced value of Stot if the Pt-overlayer is completed. This is due to a considerable re-
duction of the Fe spin moment in comparison with the bare Fe13 cluster. The average orbital moment
〈LM〉 on Fe13 decreases with increasing number of Pt atoms. Regarding theMAE of capped M13Ptnclusters, we observe that the symmetry of the cluster determines the magnitude of the effect similar
to the case in the M13 systems. For example, four Pt atoms are capped onto Fe13 with the Mackay
orientation, to get the Fe13Pt4 cluster shown on the left panel of Fig. 4.12, and, after optimizing the
structure, the MAE is calculated. Theθ-dependent energy is shown in the right panel of Fig. 4.12. As
a consequence of reduced symmetry, we obtain a second-ordertype anisotropy for this cluster, which
is quite large, exceeding by a factor of 10 (∼7 meV/cluster) that of the MT-distorted Fe13 and by a
factor of 2 that of the JT-distorted Fe13.
4.4.7 Co13Ptn
For Co13Ptn clusters, a ferromagnetic ground state is found to be stablefor all compositions. Ltot
increases monotonically withn. 〈LM〉 and〈LPt〉 for Co13Ptn clusters show a trend similar to Fe13Ptn,
i.e. with increasing number of Pt atoms,〈LM〉 (as defined in Table 4.5) decreases and〈LPt〉 increases.
〈SM〉 on Co13 is merely constant, while the Pt-spin moment increases monotonically with the number
of Pt atoms on the cluster surface. This yields a high spin moment of the completely Pt-covered Co13.
4.4.8 Ni13Ptn
Both Ltot and Stot vary monotonically with increasing number of Pt atoms for Ni13Ptn clusters.〈LM〉and〈LPt〉 for this cluster do not much depend on the number of Pt atoms. However, a decrease of
〈LPt〉 and 〈SPt〉 from Ni13Pt5 to Ni13Pt20 is also observed, which is the consequence of structural
84
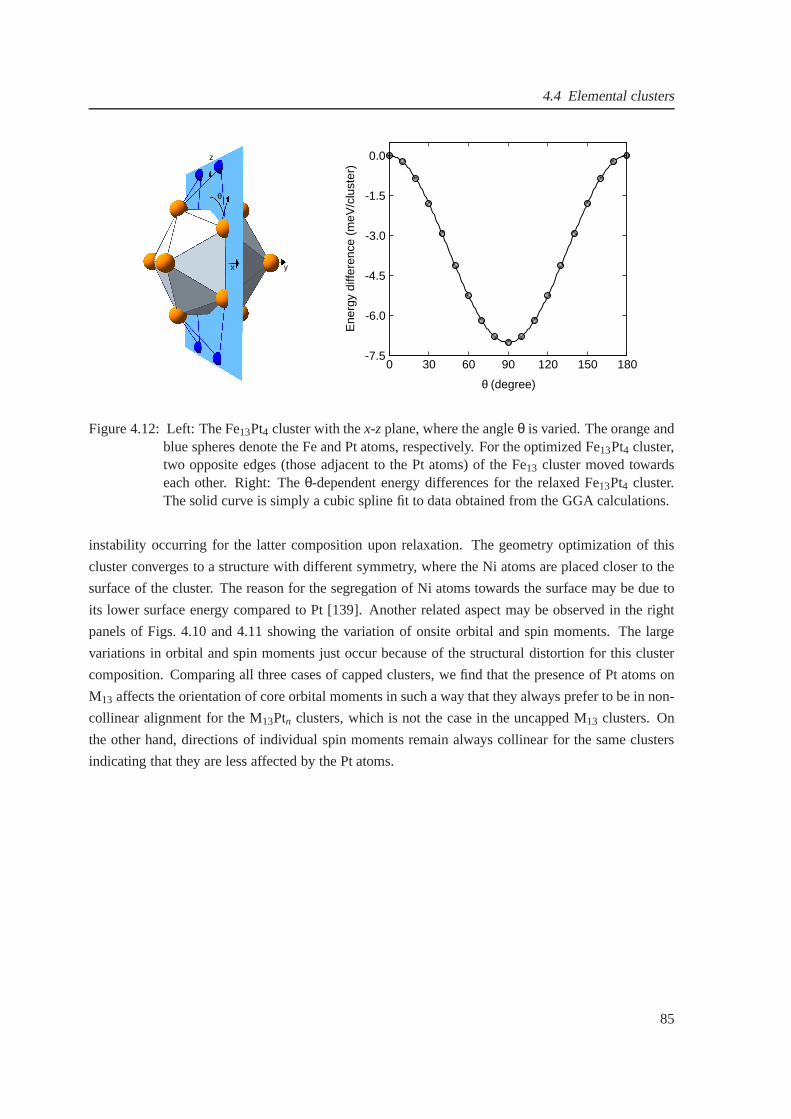
4.4 Elemental clusters
yx
θ
z
0 30 60 90 120 150 180
θ (degree)
-7.5
-6.0
-4.5
-3.0
-1.5
0.0
Ene
rgy
diffe
renc
e (m
eV/c
lust
er)
Figure 4.12: Left: The Fe13Pt4 cluster with thex-zplane, where the angleθ is varied. The orange andblue spheres denote the Fe and Pt atoms, respectively. For the optimized Fe13Pt4 cluster,two opposite edges (those adjacent to the Pt atoms) of the Fe13 cluster moved towardseach other. Right: Theθ-dependent energy differences for the relaxed Fe13Pt4 cluster.The solid curve is simply a cubic spline fit to data obtained from the GGA calculations.
instability occurring for the latter composition upon relaxation. The geometry optimization of this
cluster converges to a structure with different symmetry, where the Ni atoms are placed closer to the
surface of the cluster. The reason for the segregation of Ni atoms towards the surface may be due to
its lower surface energy compared to Pt [139]. Another related aspect may be observed in the right
panels of Figs. 4.10 and 4.11 showing the variation of onsiteorbital and spin moments. The large
variations in orbital and spin moments just occur because ofthe structural distortion for this cluster
composition. Comparing all three cases of capped clusters,we find that the presence of Pt atoms on
M13 affects the orientation of core orbital moments in such a waythat they always prefer to be in non-
collinear alignment for the M13Ptn clusters, which is not the case in the uncapped M13 clusters. On
the other hand, directions of individual spin moments remain always collinear for the same clusters
indicating that they are less affected by the Pt atoms.
85
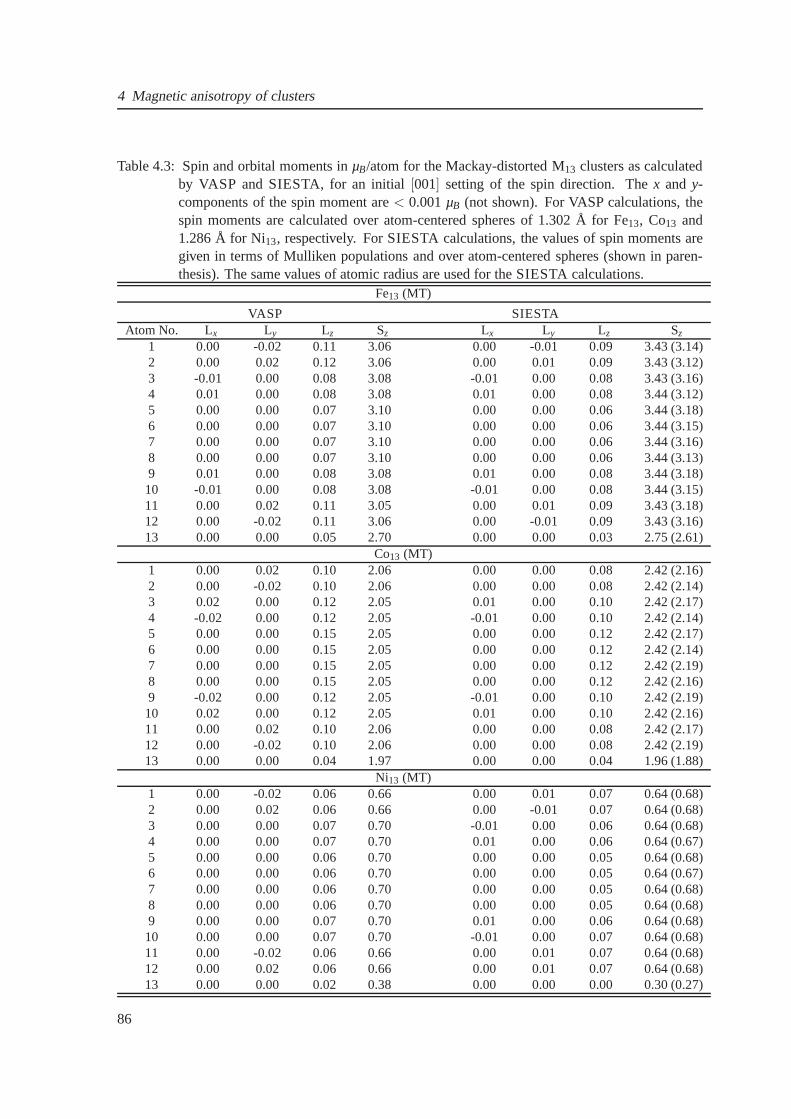
4 Magnetic anisotropy of clusters
Table 4.3: Spin and orbital moments inµB/atom for the Mackay-distorted M13 clusters as calculatedby VASP and SIESTA, for an initial[001] setting of the spin direction. Thex and y-components of the spin moment are< 0.001µB (not shown). For VASP calculations, thespin moments are calculated over atom-centered spheres of 1.302 Å for Fe13, Co13 and1.286 Å for Ni13, respectively. For SIESTA calculations, the values of spinmoments aregiven in terms of Mulliken populations and over atom-centered spheres (shown in paren-thesis). The same values of atomic radius are used for the SIESTA calculations.
Fe13 (MT)
VASP SIESTAAtom No. Lx Ly Lz Sz Lx Ly Lz Sz
1 0.00 -0.02 0.11 3.06 0.00 -0.01 0.09 3.43 (3.14)2 0.00 0.02 0.12 3.06 0.00 0.01 0.09 3.43 (3.12)3 -0.01 0.00 0.08 3.08 -0.01 0.00 0.08 3.43 (3.16)4 0.01 0.00 0.08 3.08 0.01 0.00 0.08 3.44 (3.12)5 0.00 0.00 0.07 3.10 0.00 0.00 0.06 3.44 (3.18)6 0.00 0.00 0.07 3.10 0.00 0.00 0.06 3.44 (3.15)7 0.00 0.00 0.07 3.10 0.00 0.00 0.06 3.44 (3.16)8 0.00 0.00 0.07 3.10 0.00 0.00 0.06 3.44 (3.13)9 0.01 0.00 0.08 3.08 0.01 0.00 0.08 3.44 (3.18)10 -0.01 0.00 0.08 3.08 -0.01 0.00 0.08 3.44 (3.15)11 0.00 0.02 0.11 3.05 0.00 0.01 0.09 3.43 (3.18)12 0.00 -0.02 0.11 3.06 0.00 -0.01 0.09 3.43 (3.16)13 0.00 0.00 0.05 2.70 0.00 0.00 0.03 2.75 (2.61)
Co13 (MT)1 0.00 0.02 0.10 2.06 0.00 0.00 0.08 2.42 (2.16)2 0.00 -0.02 0.10 2.06 0.00 0.00 0.08 2.42 (2.14)3 0.02 0.00 0.12 2.05 0.01 0.00 0.10 2.42 (2.17)4 -0.02 0.00 0.12 2.05 -0.01 0.00 0.10 2.42 (2.14)5 0.00 0.00 0.15 2.05 0.00 0.00 0.12 2.42 (2.17)6 0.00 0.00 0.15 2.05 0.00 0.00 0.12 2.42 (2.14)7 0.00 0.00 0.15 2.05 0.00 0.00 0.12 2.42 (2.19)8 0.00 0.00 0.15 2.05 0.00 0.00 0.12 2.42 (2.16)9 -0.02 0.00 0.12 2.05 -0.01 0.00 0.10 2.42 (2.19)10 0.02 0.00 0.12 2.05 0.01 0.00 0.10 2.42 (2.16)11 0.00 0.02 0.10 2.06 0.00 0.00 0.08 2.42 (2.17)12 0.00 -0.02 0.10 2.06 0.00 0.00 0.08 2.42 (2.19)13 0.00 0.00 0.04 1.97 0.00 0.00 0.04 1.96 (1.88)
Ni13 (MT)1 0.00 -0.02 0.06 0.66 0.00 0.01 0.07 0.64 (0.68)2 0.00 0.02 0.06 0.66 0.00 -0.01 0.07 0.64 (0.68)3 0.00 0.00 0.07 0.70 -0.01 0.00 0.06 0.64 (0.68)4 0.00 0.00 0.07 0.70 0.01 0.00 0.06 0.64 (0.67)5 0.00 0.00 0.06 0.70 0.00 0.00 0.05 0.64 (0.68)6 0.00 0.00 0.06 0.70 0.00 0.00 0.05 0.64 (0.67)7 0.00 0.00 0.06 0.70 0.00 0.00 0.05 0.64 (0.68)8 0.00 0.00 0.06 0.70 0.00 0.00 0.05 0.64 (0.68)9 0.00 0.00 0.07 0.70 0.01 0.00 0.06 0.64 (0.68)10 0.00 0.00 0.07 0.70 -0.01 0.00 0.07 0.64 (0.68)11 0.00 -0.02 0.06 0.66 0.00 0.01 0.07 0.64 (0.68)12 0.00 0.02 0.06 0.66 0.00 0.01 0.07 0.64 (0.68)13 0.00 0.00 0.02 0.38 0.00 0.00 0.00 0.30 (0.27)
86
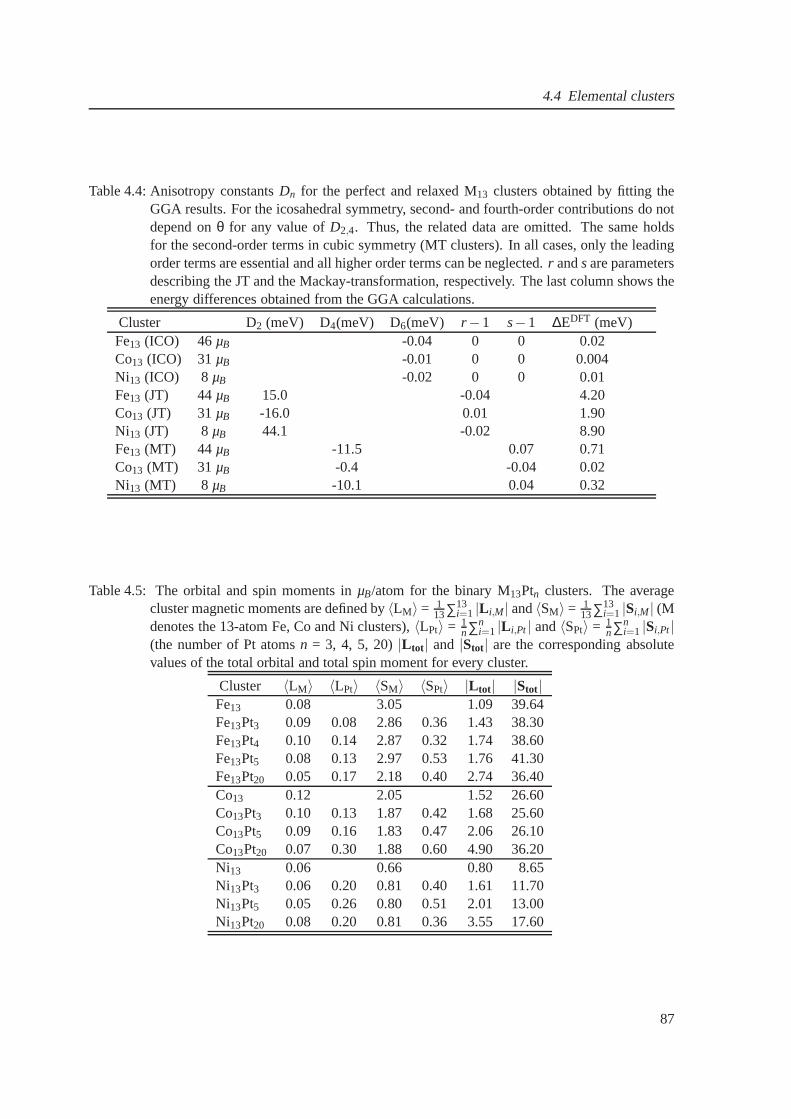
4.4 Elemental clusters
Table 4.4: Anisotropy constantsDn for the perfect and relaxed M13 clusters obtained by fitting theGGA results. For the icosahedral symmetry, second- and fourth-order contributions do notdepend onθ for any value ofD2,4. Thus, the related data are omitted. The same holdsfor the second-order terms in cubic symmetry (MT clusters).In all cases, only the leadingorder terms are essential and all higher order terms can be neglected.r andsare parametersdescribing the JT and the Mackay-transformation, respectively. The last column shows theenergy differences obtained from the GGA calculations.
Cluster D2 (meV) D4(meV) D6(meV) r −1 s−1 ∆EDFT (meV)Fe13 (ICO) 46µB -0.04 0 0 0.02Co13 (ICO) 31µB -0.01 0 0 0.004Ni13 (ICO) 8µB -0.02 0 0 0.01Fe13 (JT) 44µB 15.0 -0.04 4.20Co13 (JT) 31µB -16.0 0.01 1.90Ni13 (JT) 8µB 44.1 -0.02 8.90Fe13 (MT) 44 µB -11.5 0.07 0.71Co13 (MT) 31 µB -0.4 -0.04 0.02Ni13 (MT) 8 µB -10.1 0.04 0.32
Table 4.5: The orbital and spin moments inµB/atom for the binary M13Ptn clusters. The averagecluster magnetic moments are defined by〈LM〉 = 1
13∑13i=1 |Li,M | and〈SM〉 = 1
13∑13i=1 |Si,M | (M
denotes the 13-atom Fe, Co and Ni clusters),〈LPt〉 = 1n∑n
i=1 |Li,Pt| and〈SPt〉 = 1n∑n
i=1 |Si,Pt|(the number of Pt atomsn = 3, 4, 5, 20)|Ltot| and |Stot| are the corresponding absolutevalues of the total orbital and total spin moment for every cluster.
Cluster 〈LM〉 〈LPt〉 〈SM〉 〈SPt〉 |Ltot| |Stot|Fe13 0.08 3.05 1.09 39.64Fe13Pt3 0.09 0.08 2.86 0.36 1.43 38.30Fe13Pt4 0.10 0.14 2.87 0.32 1.74 38.60Fe13Pt5 0.08 0.13 2.97 0.53 1.76 41.30Fe13Pt20 0.05 0.17 2.18 0.40 2.74 36.40Co13 0.12 2.05 1.52 26.60Co13Pt3 0.10 0.13 1.87 0.42 1.68 25.60Co13Pt5 0.09 0.16 1.83 0.47 2.06 26.10Co13Pt20 0.07 0.30 1.88 0.60 4.90 36.20Ni13 0.06 0.66 0.80 8.65Ni13Pt3 0.06 0.20 0.81 0.40 1.61 11.70Ni13Pt5 0.05 0.26 0.80 0.51 2.01 13.00Ni13Pt20 0.08 0.20 0.81 0.36 3.55 17.60
87
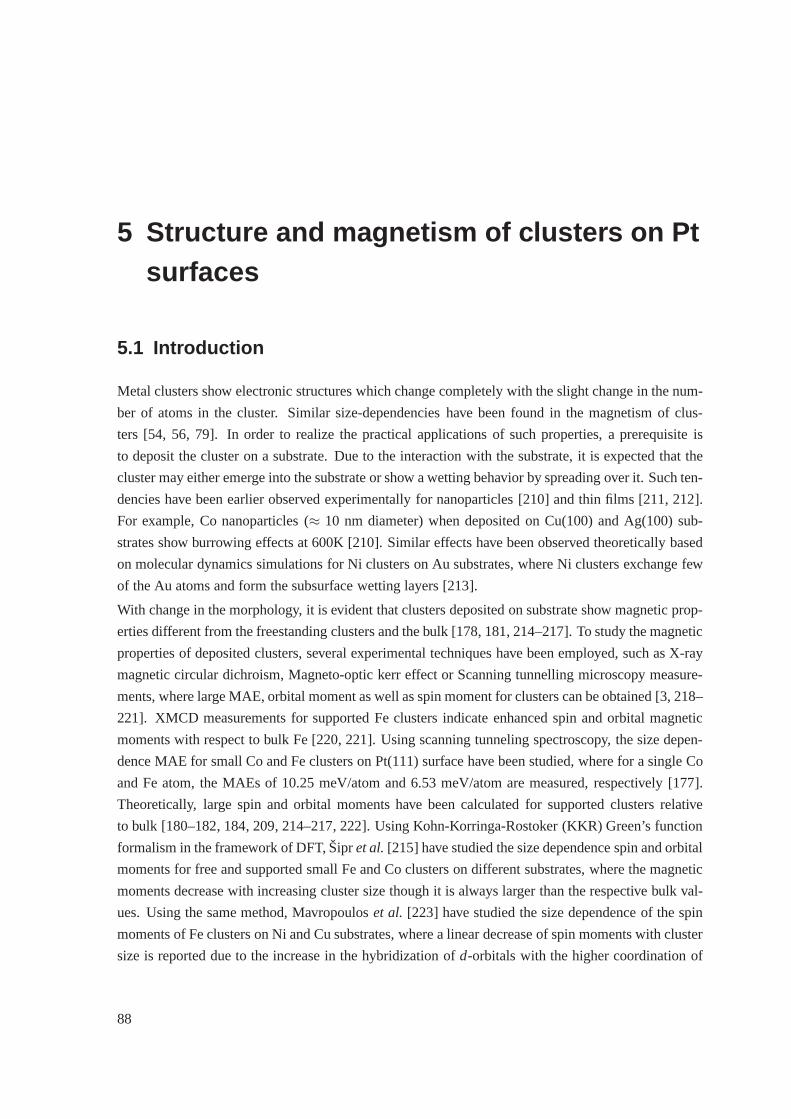
5 Structure and magnetism of clusters on Ptsurfaces
5.1 Introduction
Metal clusters show electronic structures which change completely with the slight change in the num-
ber of atoms in the cluster. Similar size-dependencies havebeen found in the magnetism of clus-
ters [54, 56, 79]. In order to realize the practical applications of such properties, a prerequisite is
to deposit the cluster on a substrate. Due to the interactionwith the substrate, it is expected that the
cluster may either emerge into the substrate or show a wetting behavior by spreading over it. Such ten-
dencies have been earlier observed experimentally for nanoparticles [210] and thin films [211, 212].
For example, Co nanoparticles (≈ 10 nm diameter) when deposited on Cu(100) and Ag(100) sub-
strates show burrowing effects at 600K [210]. Similar effects have been observed theoretically based
on molecular dynamics simulations for Ni clusters on Au substrates, where Ni clusters exchange few
of the Au atoms and form the subsurface wetting layers [213].
With change in the morphology, it is evident that clusters deposited on substrate show magnetic prop-
erties different from the freestanding clusters and the bulk [178, 181, 214–217]. To study the magnetic
properties of deposited clusters, several experimental techniques have been employed, such as X-ray
magnetic circular dichroism, Magneto-optic kerr effect orScanning tunnelling microscopy measure-
ments, where large MAE, orbital moment as well as spin momentfor clusters can be obtained [3, 218–
221]. XMCD measurements for supported Fe clusters indicateenhanced spin and orbital magnetic
moments with respect to bulk Fe [220, 221]. Using scanning tunneling spectroscopy, the size depen-
dence MAE for small Co and Fe clusters on Pt(111) surface havebeen studied, where for a single Co
and Fe atom, the MAEs of 10.25 meV/atom and 6.53 meV/atom are measured, respectively [177].
Theoretically, large spin and orbital moments have been calculated for supported clusters relative
to bulk [180–182, 184, 209, 214–217, 222]. Using Kohn-Korringa-Rostoker (KKR) Green’s function
formalism in the framework of DFT, Šipret al.[215] have studied the size dependence spin and orbital
moments for free and supported small Fe and Co clusters on different substrates, where the magnetic
moments decrease with increasing cluster size though it is always larger than the respective bulk val-
ues. Using the same method, Mavropouloset al. [223] have studied the size dependence of the spin
moments of Fe clusters on Ni and Cu substrates, where a lineardecrease of spin moments with cluster
size is reported due to the increase in the hybridization ofd-orbitals with the higher coordination of
88

5.2 Deposited elemental clusters
Fe atoms. Studies based on tight-binding technique [178] for Co clusters on Pd(111) surface have
reported large spin and orbital moments as well as MAE for Co clusters where the significant role
of substrate behind the enhanced the magnetic properties has been reported. The above theoretical
studies have neglected the effect of structural optimization of clusters. It is evident that relaxation
effects play an important part in determining the properties of deposited clusters [181, 182, 216].
For example, as a consequence of atomic relaxation, it has been observed that Ni dimers on Cu(001)
surface lead to vanishing magnetic moments [216]. For Fe clusters on Pd(001), the relaxation ef-
fects lead to reduced magnetic moments for Fe clusters and enhanced induced magnetization on the
Pd substrate [182]. Studies of deposited clusters considering the effects of atomic relaxation are still
limited.
In the present chapter, we have studied the structural stability and magnetic properties such as spin
moments, orbital moments and MAE of closed shell M13,55 (M = Fe, Co, Ni) clusters supported
on Pt(001) and Pt(111) surfaces considering the effects of structural relaxation of both clusters and
substrates. Pt is considered as a substrate due to its large spin-orbit coupling. Though the orbital
moment is quenched in 3d TM systems, still they are magnetic. Therefore, the combined effect of
large spin-orbit coupling strength of Pt and 3d TM may give rise novel magnetic properties. This has
been observed for free standing Pt-capped Fe13 clusters, where a large second order MAE has been
obtained [18]. Along with the elemental clusters, the structural and magnetic properties of binary
(Fe-Pt)13,55 clusters on Pt(001) and Pt(111) will be discussed.
To deposit the clusters on Pt surfaces, three and four substrate layers are considered for Pt(001) and
Pt(111), respectively. The periodic boundary condition isimposed along the directions parallel to the
surfaces. The structural relaxation for the cluster/substrate complex is performed using the conjugate
gradient algorithm. In order to mimic the bulk behavior, only the bottom layer is kept fixed for Pt(001)
and for Pt(111) the bottom two layers are kept fixed. Sufficiently extended surface layer and large
vacuum space is created along the perpendicular direction to the substrate to minimize the interaction
between the periodic images of cluster. The integration over the Brillouin-zone is performed at the
Γ point. The Pt(001) surface is constructed with the experimental value of lattice constant 3.92 Å,
while for Pt(111), the equilibrium value of lattice constant 3.99 Å calculated from GGA are taken into
account.
5.2 Deposited elemental clusters
5.2.1 Structural stability of M 13 and M55 clusters on Pt(001) and Pt(111)
The perfect icosahedrons [18] with equilibrium center-shell distances 2.39 Å, 2.33 Å and 2.32 Å
are considered as the starting geometries for Fe13, Co13 and Ni13, respectively for deposition on
Pt surfaces. The structural relaxation of M13 clusters on Pt(001) surface shows a deformation of
icosahedral geometry, where the M13 clusters emerge into the Pt(001) substrate by substitutingfew of
the Pt atoms. Fig. 5.1 for instance, illustrates the starting (top panel) and the optimized (bottom panel)
89

5 Structure and magnetism of clusters on Pt surfaces
Figure 5.1: The initial and relaxed structures of Co13 on Pt(001) surface are shown in the top andbottom panel, respectively with different side views. The red and yellow balls are markedby Co and Pt atoms, respectively. The optimized structure for Co13 on Pt(001) shows thesubstitution of Pt atoms by few Co atoms.
structure of Co13 on Pt(001). For the optimized structure, the Co atoms substitute few Pt atoms in
the substrate and occupy exactly the lattice sites in the substrate indicating a hint for the surface alloy
formation. The reason behind the cluster deformation and emergence of cluster into substrate is be
due to the large mismatch of nearest neighbour bond lengths in bulk Pt and the cluster species, which
is ∼ 28%. The intermixing tendency of M13 clusters on Pt(001) substrate is confirmed by molecular
dynamics simulations at 300K for supported Fe13 and Co13. Experimentally, such tendency has been
observed for Fe and Co thin films on Pt surfaces [211, 212, 224]. In addition to Co thin films,
Zimmermannet al. [210] have observed such effect for supported Co nanoparticles with diameter∼10nm, where the Co atoms burrow into the Ag(100) and Cu(100) at finite temperature, which they
attribute is due to the large capillary forces on the nanoparticles and the low surface energy of the
substrate. With increase in cluster size, for M55 on Pt(001), the intermixing tendency persists for
Co55 and Ni55, while for Fe55, the cluster spreads over the substrate. To see this effect,the optimized
structures of Fe55 and Co55 clusters on Pt(001) are displayed in Fig. 5.2 in the left and right panel,
respectively. Like M13/Pt(001), all supported clusters are geometrically deformed.
Deposition of M13 and M55 clusters on Pt(111) substrate shows structural trends different from those
on Pt(001). Due to the closed packing, the clusters on Pt(111) do not show any sign of surface
alloying, rather they spread over the surface showing a strong deviation from icosahedron geometry.
However, Fe13 on Pt(111) does not fall in the same trend. For this system, the icosahedral structure is
90
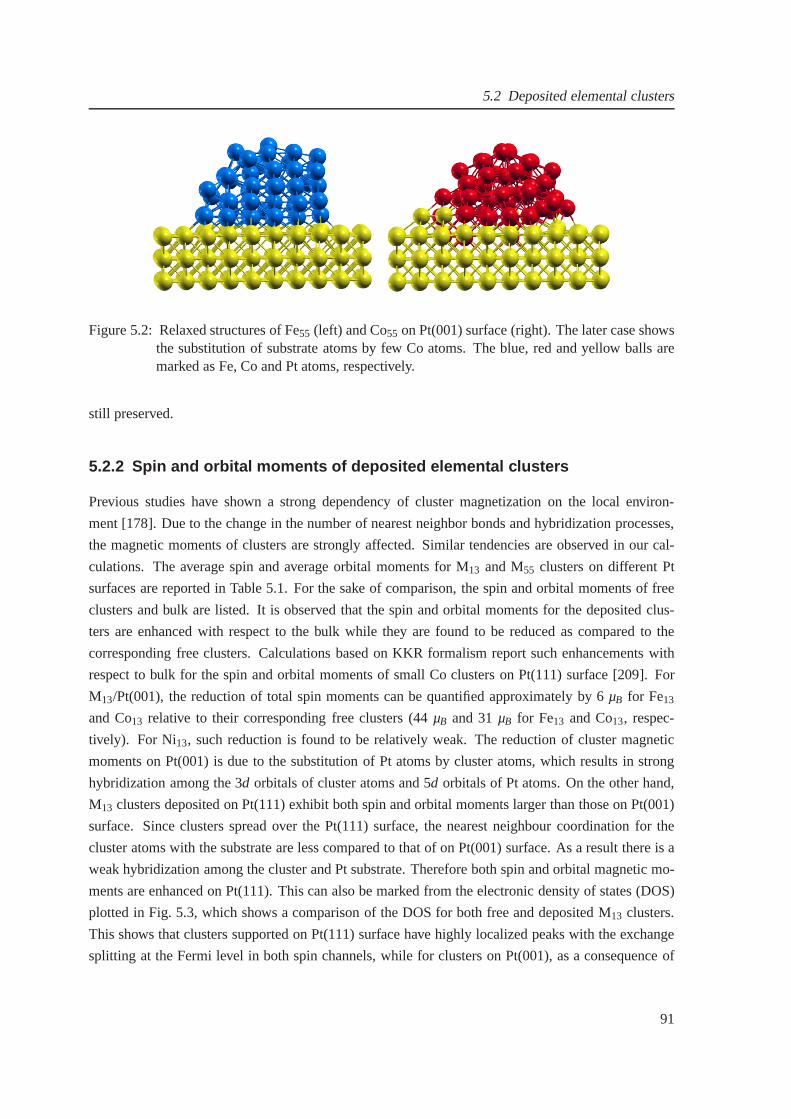
5.2 Deposited elemental clusters
Figure 5.2: Relaxed structures of Fe55 (left) and Co55 on Pt(001) surface (right). The later case showsthe substitution of substrate atoms by few Co atoms. The blue, red and yellow balls aremarked as Fe, Co and Pt atoms, respectively.
still preserved.
5.2.2 Spin and orbital moments of deposited elemental clust ers
Previous studies have shown a strong dependency of cluster magnetization on the local environ-
ment [178]. Due to the change in the number of nearest neighbor bonds and hybridization processes,
the magnetic moments of clusters are strongly affected. Similar tendencies are observed in our cal-
culations. The average spin and average orbital moments forM13 and M55 clusters on different Pt
surfaces are reported in Table 5.1. For the sake of comparison, the spin and orbital moments of free
clusters and bulk are listed. It is observed that the spin andorbital moments for the deposited clus-
ters are enhanced with respect to the bulk while they are found to be reduced as compared to the
corresponding free clusters. Calculations based on KKR formalism report such enhancements with
respect to bulk for the spin and orbital moments of small Co clusters on Pt(111) surface [209]. For
M13/Pt(001), the reduction of total spin moments can be quantified approximately by 6µB for Fe13
and Co13 relative to their corresponding free clusters (44µB and 31µB for Fe13 and Co13, respec-
tively). For Ni13, such reduction is found to be relatively weak. The reduction of cluster magnetic
moments on Pt(001) is due to the substitution of Pt atoms by cluster atoms, which results in strong
hybridization among the 3d orbitals of cluster atoms and 5d orbitals of Pt atoms. On the other hand,
M13 clusters deposited on Pt(111) exhibit both spin and orbitalmoments larger than those on Pt(001)
surface. Since clusters spread over the Pt(111) surface, the nearest neighbour coordination for the
cluster atoms with the substrate are less compared to that ofon Pt(001) surface. As a result there is a
weak hybridization among the cluster and Pt substrate. Therefore both spin and orbital magnetic mo-
ments are enhanced on Pt(111). This can also be marked from the electronic density of states (DOS)
plotted in Fig. 5.3, which shows a comparison of the DOS for both free and deposited M13 clusters.
This shows that clusters supported on Pt(111) surface have highly localized peaks with the exchange
splitting at the Fermi level in both spin channels, while forclusters on Pt(001), as a consequence of
91

5 Structure and magnetism of clusters on Pt surfaces
-2
0
2
-2
0
2
DO
S (
Sta
tes/
eV)
-4 -2 0 2
-2
0
2
-4 -2 0 2Energy (eV)
-4 -2 0 2
M13 on Pt(001) M13 on Pt(111)Free M13
Co13
Fe13
Ni13
Fe13
Co13
Ni13Ni13
Co13
Fe13
Figure 5.3: Left: The DOS of free standing M13 clusters. Middle and right panel indicates DOS ofM13 clusters on Pt(001) and Pt(111) surfaces. The vertical dashed line indicates the Fermilevel fixed at zero.
strong hybridization with Pt, the broadened peaks show the exchange splitting only in the minority
spin channel at the Fermi level. With increase in cluster size, i.e., for deposited M55 clusters, the
spin and orbital moment does not show any significant change for both surfaces of Pt, in spite of the
fact that the relaxation patterns are different, which is due to the fact that with increasing number of
atoms in the cluster, the number of nearest-neighbour bondsbetween the cluster and substrate in the
interface decreases. Thus the clusters almost retain the magnetic moments like the corresponding free
ones. The deposition of clusters leads to some induced magnetic moments on Pt surfaces.
Table 5.1: The average spin moment per atom〈S〉= 1N ∑N
i=1 |Si| (where N = 13, 55)and average orbitalmoment per atom〈L〉 = 1
N ∑Ni=1 |Li| for deposited M(13,55) clusters inµB/atom, compared
to that of the corresponding unsupported clusters and for bulk bcc Fe, fcc Co and Ni asobtained from our calculations.
Cluster 〈S〉M/Pt(001) 〈S〉M/Pt(111) 〈|S|〉free 〈|S|〉bulk 〈L〉M/Pt(001) 〈L〉M/Pt(111) 〈|L|〉free 〈|L|〉bulk
Fe13 2.88 2.74 3.05 2.25 0.07 0.08 0.08 0.06Co13 1.81 3.18 2.05 1.67 0.08 0.12 0.12 0.08Ni13 0.62 0.64 0.66 0.65 0.06 0.07 0.06 0.05Fe55 2.72 2.62 2.65 2.25 0.07 0.08 0.08 0.06Co55 1.78 1.75 1.87 1.67 0.09 0.10 0.10 0.08Ni55 0.63 0.62 0.74 0.65 0.06 0.06 0.09 0.05
In addition to spin and orbital moments, the magnetic anisotropy is calculated for the optimized
92
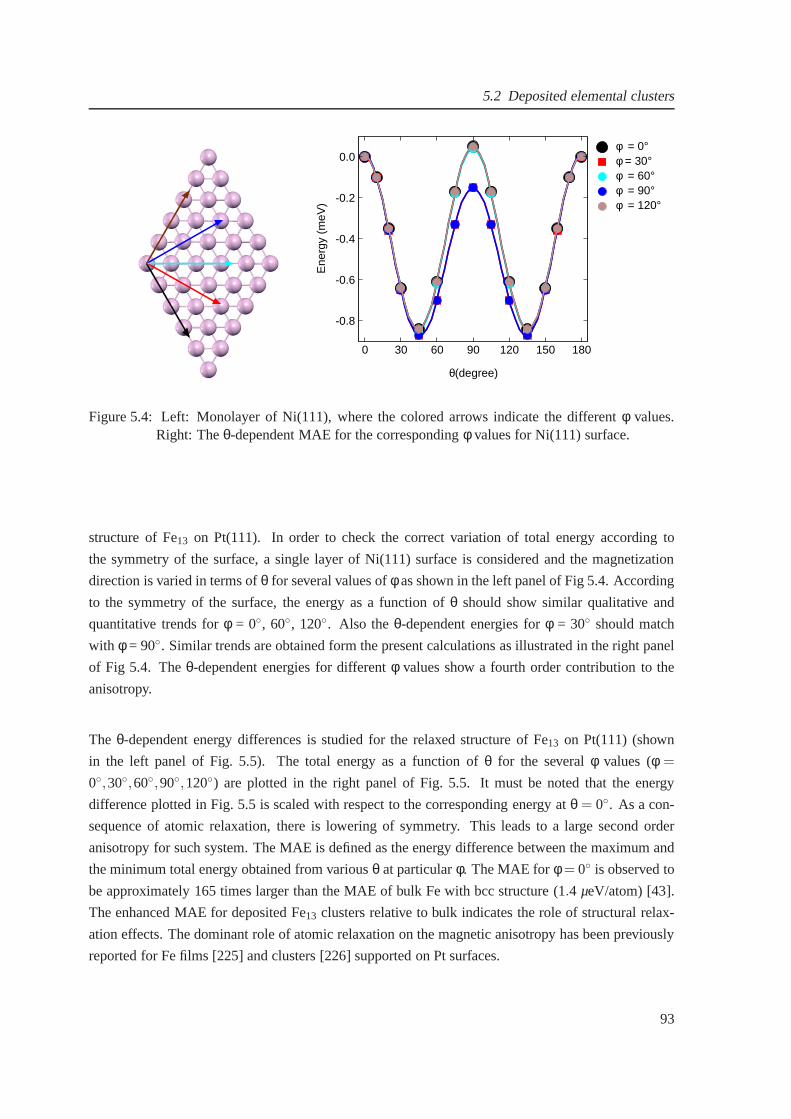
5.2 Deposited elemental clusters
0 30 60 90 120 150 180
θ(degree)
-0.8
-0.6
-0.4
-0.2
0.0
Ene
rgy
(meV
)
φ = 0°φ = 30°φ = 60°φ = 90°φ = 120°
Figure 5.4: Left: Monolayer of Ni(111), where the colored arrows indicate the differentφ values.Right: Theθ-dependent MAE for the correspondingφ values for Ni(111) surface.
structure of Fe13 on Pt(111). In order to check the correct variation of total energy according to
the symmetry of the surface, a single layer of Ni(111) surface is considered and the magnetization
direction is varied in terms ofθ for several values ofφ as shown in the left panel of Fig 5.4. According
to the symmetry of the surface, the energy as a function ofθ should show similar qualitative and
quantitative trends forφ = 0, 60, 120. Also theθ-dependent energies forφ = 30 should match
with φ = 90. Similar trends are obtained form the present calculationsas illustrated in the right panel
of Fig 5.4. Theθ-dependent energies for differentφ values show a fourth order contribution to the
anisotropy.
The θ-dependent energy differences is studied for the relaxed structure of Fe13 on Pt(111) (shown
in the left panel of Fig. 5.5). The total energy as a function of θ for the severalφ values (φ =
0,30,60,90,120) are plotted in the right panel of Fig. 5.5. It must be noted that the energy
difference plotted in Fig. 5.5 is scaled with respect to the corresponding energy atθ = 0. As a con-
sequence of atomic relaxation, there is lowering of symmetry. This leads to a large second order
anisotropy for such system. The MAE is defined as the energy difference between the maximum and
the minimum total energy obtained from variousθ at particularφ. The MAE forφ = 0 is observed to
be approximately 165 times larger than the MAE of bulk Fe withbcc structure (1.4 µeV/atom) [43].
The enhanced MAE for deposited Fe13 clusters relative to bulk indicates the role of structural relax-
ation effects. The dominant role of atomic relaxation on themagnetic anisotropy has been previously
reported for Fe films [225] and clusters [226] supported on Ptsurfaces.
93
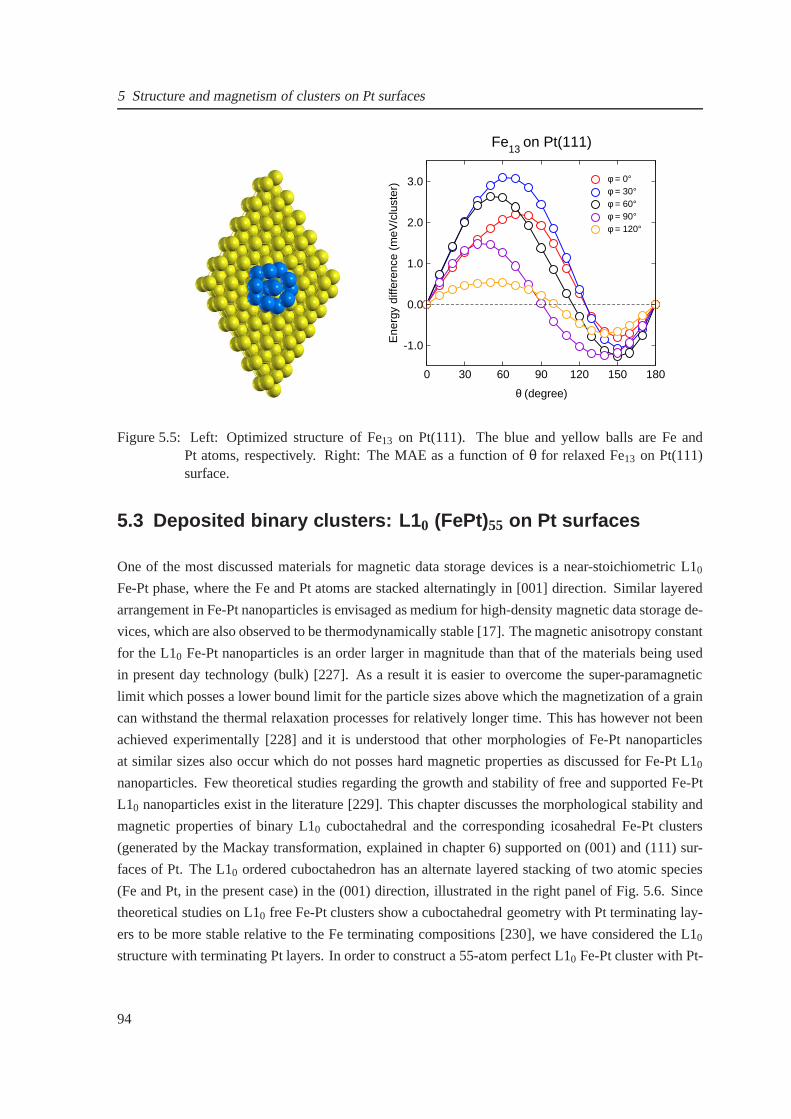
5 Structure and magnetism of clusters on Pt surfaces
0 30 60 90 120 150 180
θ (degree)
-1.0
0.0
1.0
2.0
3.0
Ene
rgy
diffe
renc
e (m
eV/c
lust
er) φ = 0°
φ = 30°φ = 60°φ = 90°φ = 120°
Fe13 on Pt(111)
Figure 5.5: Left: Optimized structure of Fe13 on Pt(111). The blue and yellow balls are Fe andPt atoms, respectively. Right: The MAE as a function ofθ for relaxed Fe13 on Pt(111)surface.
5.3 Deposited binary clusters: L1 0 (FePt)55 on Pt surfaces
One of the most discussed materials for magnetic data storage devices is a near-stoichiometric L10
Fe-Pt phase, where the Fe and Pt atoms are stacked alternatingly in [001] direction. Similar layered
arrangement in Fe-Pt nanoparticles is envisaged as medium for high-density magnetic data storage de-
vices, which are also observed to be thermodynamically stable [17]. The magnetic anisotropy constant
for the L10 Fe-Pt nanoparticles is an order larger in magnitude than that of the materials being used
in present day technology (bulk) [227]. As a result it is easier to overcome the super-paramagnetic
limit which posses a lower bound limit for the particle sizesabove which the magnetization of a grain
can withstand the thermal relaxation processes for relatively longer time. This has however not been
achieved experimentally [228] and it is understood that other morphologies of Fe-Pt nanoparticles
at similar sizes also occur which do not posses hard magneticproperties as discussed for Fe-Pt L10
nanoparticles. Few theoretical studies regarding the growth and stability of free and supported Fe-Pt
L10 nanoparticles exist in the literature [229]. This chapter discusses the morphological stability and
magnetic properties of binary L10 cuboctahedral and the corresponding icosahedral Fe-Pt clusters
(generated by the Mackay transformation, explained in chapter 6) supported on (001) and (111) sur-
faces of Pt. The L10 ordered cuboctahedron has an alternate layered stacking oftwo atomic species
(Fe and Pt, in the present case) in the (001) direction, illustrated in the right panel of Fig. 5.6. Since
theoretical studies on L10 free Fe-Pt clusters show a cuboctahedral geometry with Pt terminating lay-
ers to be more stable relative to the Fe terminating compositions [230], we have considered the L10
structure with terminating Pt layers. In order to constructa 55-atom perfect L10 Fe-Pt cluster with Pt-
94
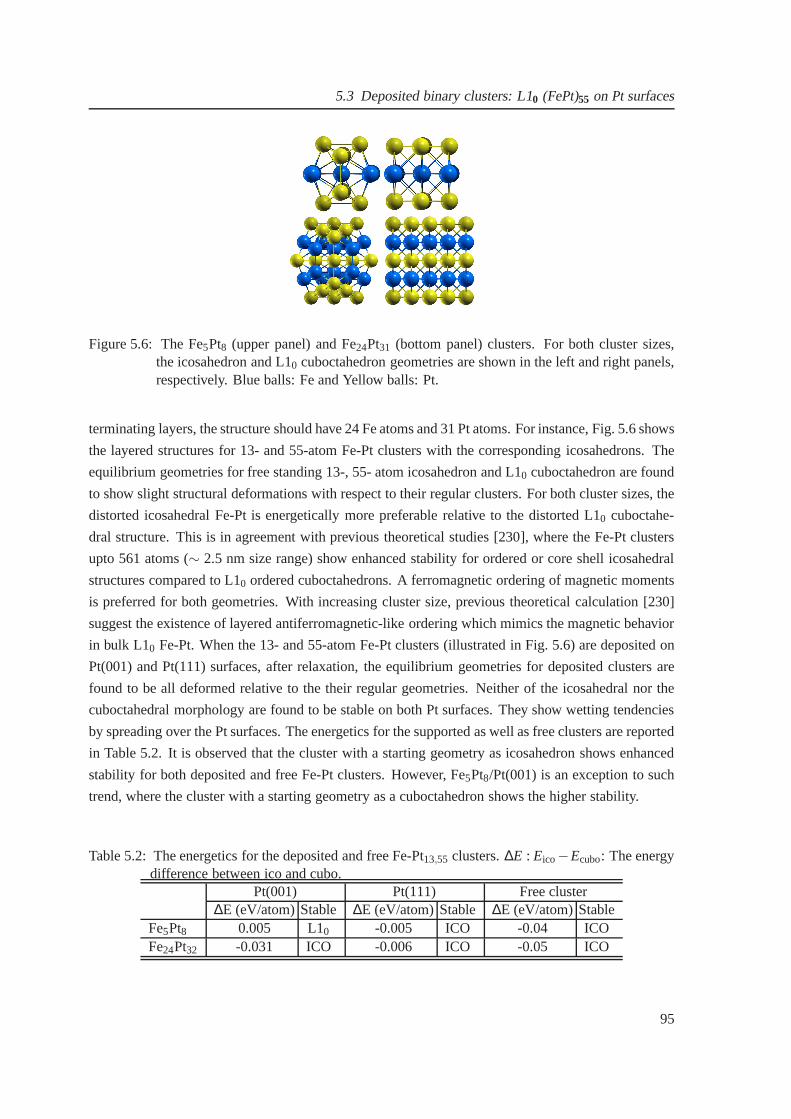
5.3 Deposited binary clusters: L10 (FePt)55 on Pt surfaces
Figure 5.6: The Fe5Pt8 (upper panel) and Fe24Pt31 (bottom panel) clusters. For both cluster sizes,the icosahedron and L10 cuboctahedron geometries are shown in the left and right panels,respectively. Blue balls: Fe and Yellow balls: Pt.
terminating layers, the structure should have 24 Fe atoms and 31 Pt atoms. For instance, Fig. 5.6 shows
the layered structures for 13- and 55-atom Fe-Pt clusters with the corresponding icosahedrons. The
equilibrium geometries for free standing 13-, 55- atom icosahedron and L10 cuboctahedron are found
to show slight structural deformations with respect to their regular clusters. For both cluster sizes, the
distorted icosahedral Fe-Pt is energetically more preferable relative to the distorted L10 cuboctahe-
dral structure. This is in agreement with previous theoretical studies [230], where the Fe-Pt clusters
upto 561 atoms (∼ 2.5 nm size range) show enhanced stability for ordered or core shell icosahedral
structures compared to L10 ordered cuboctahedrons. A ferromagnetic ordering of magnetic moments
is preferred for both geometries. With increasing cluster size, previous theoretical calculation [230]
suggest the existence of layered antiferromagnetic-like ordering which mimics the magnetic behavior
in bulk L10 Fe-Pt. When the 13- and 55-atom Fe-Pt clusters (illustratedin Fig. 5.6) are deposited on
Pt(001) and Pt(111) surfaces, after relaxation, the equilibrium geometries for deposited clusters are
found to be all deformed relative to the their regular geometries. Neither of the icosahedral nor the
cuboctahedral morphology are found to be stable on both Pt surfaces. They show wetting tendencies
by spreading over the Pt surfaces. The energetics for the supported as well as free clusters are reported
in Table 5.2. It is observed that the cluster with a starting geometry as icosahedron shows enhanced
stability for both deposited and free Fe-Pt clusters. However, Fe5Pt8/Pt(001) is an exception to such
trend, where the cluster with a starting geometry as a cuboctahedron shows the higher stability.
Table 5.2: The energetics for the deposited and free Fe-Pt13,55 clusters.∆E : Eico−Ecubo: The energydifference between ico and cubo.
Pt(001) Pt(111) Free cluster∆E (eV/atom)Stable ∆E (eV/atom)Stable ∆E (eV/atom)Stable
Fe5Pt8 0.005 L10 -0.005 ICO -0.04 ICOFe24Pt32 -0.031 ICO -0.006 ICO -0.05 ICO
95
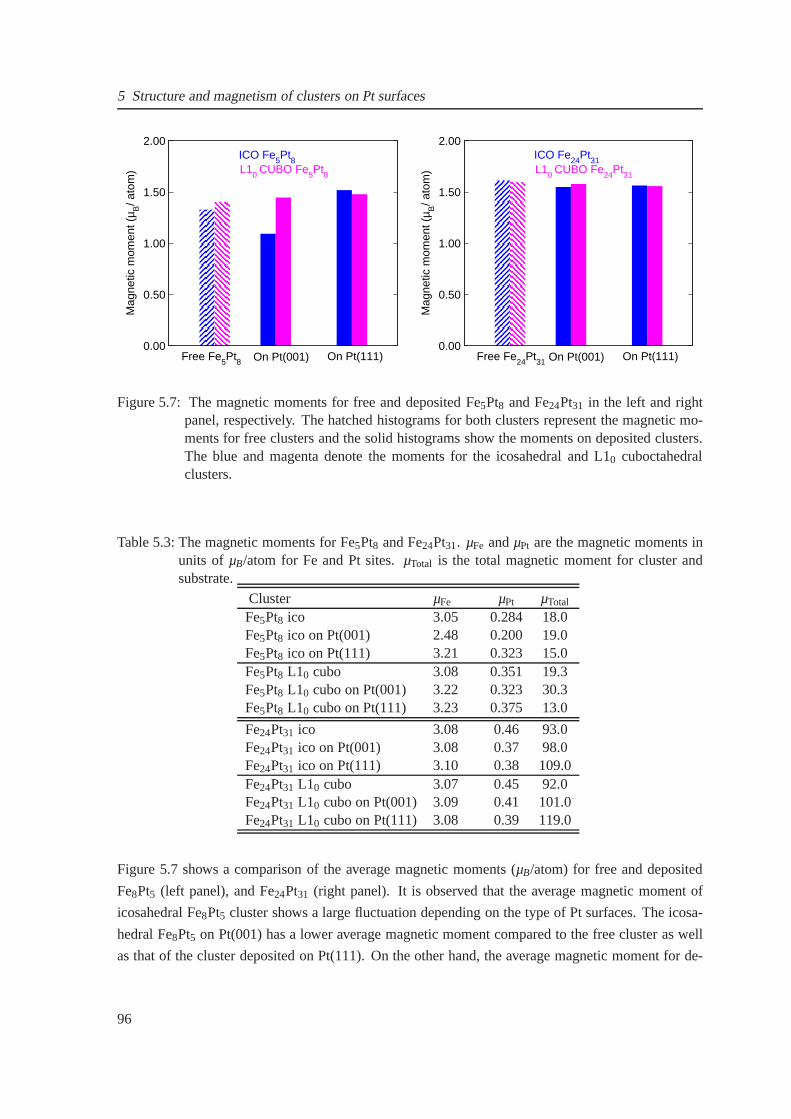
5 Structure and magnetism of clusters on Pt surfaces
0.00
0.50
1.00
1.50
2.00M
agne
tic m
omen
t (µ B
/ ato
m)
Free Fe5Pt8 On Pt(111)
ICO Fe5Pt8L10 CUBO Fe5Pt8
On Pt(001)0.00
0.50
1.00
1.50
2.00
Mag
netic
mom
ent (
µ B/ a
tom
)
Free Fe24Pt31 On Pt(111)
ICO Fe24Pt31L10 CUBO Fe24Pt31
On Pt(001)
Figure 5.7: The magnetic moments for free and deposited Fe5Pt8 and Fe24Pt31 in the left and rightpanel, respectively. The hatched histograms for both clusters represent the magnetic mo-ments for free clusters and the solid histograms show the moments on deposited clusters.The blue and magenta denote the moments for the icosahedral and L10 cuboctahedralclusters.
Table 5.3: The magnetic moments for Fe5Pt8 and Fe24Pt31. µFe andµPt are the magnetic moments inunits of µB/atom for Fe and Pt sites.µTotal is the total magnetic moment for cluster andsubstrate.
Cluster µFe µPt µTotal
Fe5Pt8 ico 3.05 0.284 18.0Fe5Pt8 ico on Pt(001) 2.48 0.200 19.0Fe5Pt8 ico on Pt(111) 3.21 0.323 15.0Fe5Pt8 L10 cubo 3.08 0.351 19.3Fe5Pt8 L10 cubo on Pt(001) 3.22 0.323 30.3Fe5Pt8 L10 cubo on Pt(111) 3.23 0.375 13.0
Fe24Pt31 ico 3.08 0.46 93.0Fe24Pt31 ico on Pt(001) 3.08 0.37 98.0Fe24Pt31 ico on Pt(111) 3.10 0.38 109.0Fe24Pt31 L10 cubo 3.07 0.45 92.0Fe24Pt31 L10 cubo on Pt(001) 3.09 0.41 101.0Fe24Pt31 L10 cubo on Pt(111) 3.08 0.39 119.0
Figure 5.7 shows a comparison of the average magnetic moments (µB/atom) for free and deposited
Fe8Pt5 (left panel), and Fe24Pt31 (right panel). It is observed that the average magnetic moment of
icosahedral Fe8Pt5 cluster shows a large fluctuation depending on the type of Pt surfaces. The icosa-
hedral Fe8Pt5 on Pt(001) has a lower average magnetic moment compared to the free cluster as well
as that of the cluster deposited on Pt(111). On the other hand, the average magnetic moment for de-
96
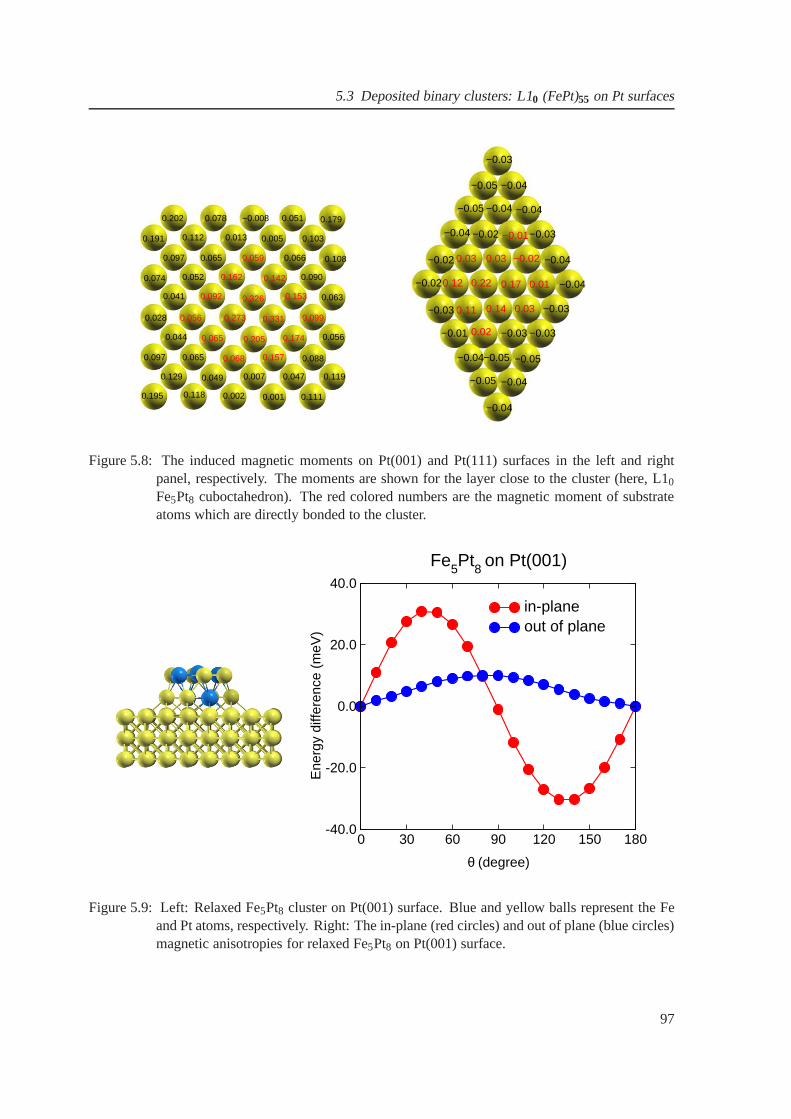
5.3 Deposited binary clusters: L10 (FePt)55 on Pt surfaces
0.195 0.118 0.002 0.001 0.111
0.1190.0470.0070.0490.129
0.097 0.065 0.088
0.0560.0650.044
0.068 0.157
0.174
0.028
0.0630.041
0.074 0.052 0.090
0.108
0.202 0.078 −0.008 0.051 0.179
0.191 0.112 0.013 0.005 0.103
0.097 0.065 0.0660.059
0.162
0.092
0.056 0.273
0.326
0.142
0.153
0.0990.331
0.205
−0.03
−0.04−0.05
−0.05 −0.04 −0.04
−0.04 −0.02 −0.01−0.03
−0.04−0.020.030.03−0.02
−0.020.12 0.22 0.17 0.01 −0.04
−0.03 0.11 0.14 0.03 −0.03
−0.03−0.030.02−0.01
−0.04−0.05 −0.05
−0.04−0.05
−0.04
Figure 5.8: The induced magnetic moments on Pt(001) and Pt(111) surfaces in the left and rightpanel, respectively. The moments are shown for the layer close to the cluster (here, L10
Fe5Pt8 cuboctahedron). The red colored numbers are the magnetic moment of substrateatoms which are directly bonded to the cluster.
0 30 60 90 120 150 180
θ (degree)
-40.0
-20.0
0.0
20.0
40.0
Ene
rgy
diffe
renc
e (m
eV)
in-planeout of plane
Fe5Pt8 on Pt(001)
Figure 5.9: Left: Relaxed Fe5Pt8 cluster on Pt(001) surface. Blue and yellow balls representthe Feand Pt atoms, respectively. Right: The in-plane (red circles) and out of plane (blue circles)magnetic anisotropies for relaxed Fe5Pt8 on Pt(001) surface.
97
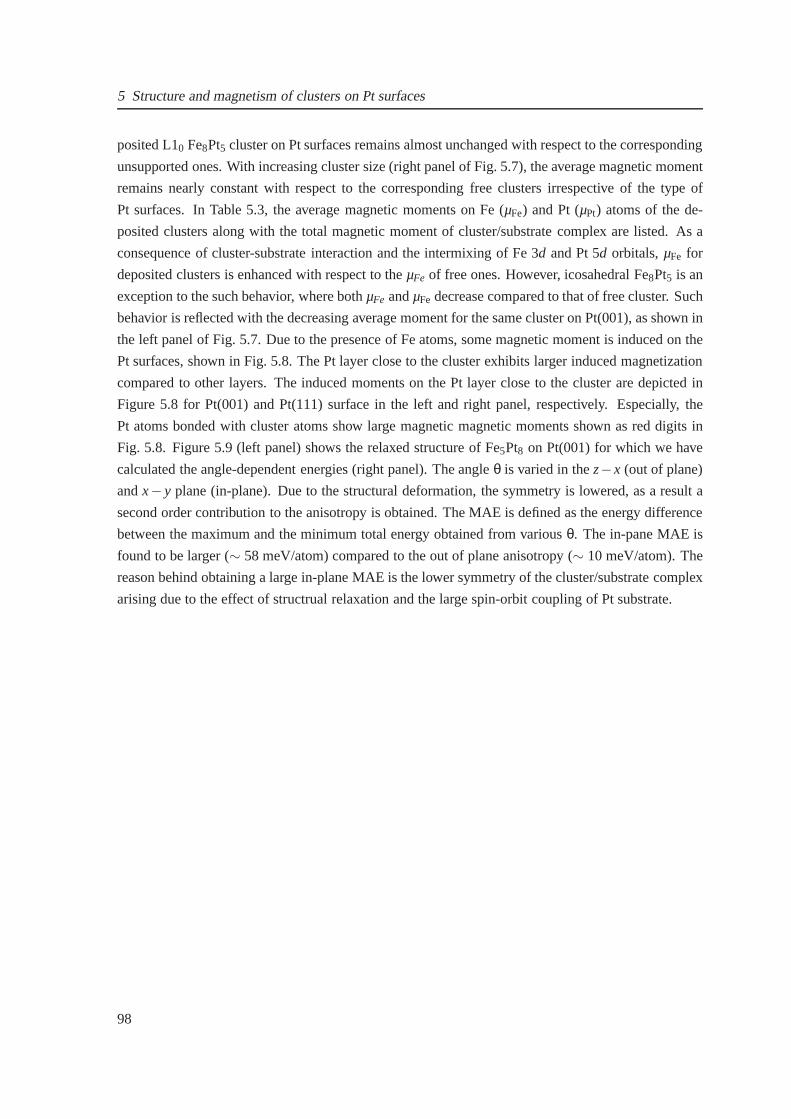
5 Structure and magnetism of clusters on Pt surfaces
posited L10 Fe8Pt5 cluster on Pt surfaces remains almost unchanged with respect to the corresponding
unsupported ones. With increasing cluster size (right panel of Fig. 5.7), the average magnetic moment
remains nearly constant with respect to the corresponding free clusters irrespective of the type of
Pt surfaces. In Table 5.3, the average magnetic moments on Fe(µFe) and Pt (µPt) atoms of the de-
posited clusters along with the total magnetic moment of cluster/substrate complex are listed. As a
consequence of cluster-substrate interaction and the intermixing of Fe 3d and Pt 5d orbitals,µFe for
deposited clusters is enhanced with respect to theµFe of free ones. However, icosahedral Fe8Pt5 is an
exception to the such behavior, where bothµFe andµFe decrease compared to that of free cluster. Such
behavior is reflected with the decreasing average moment forthe same cluster on Pt(001), as shown in
the left panel of Fig. 5.7. Due to the presence of Fe atoms, some magnetic moment is induced on the
Pt surfaces, shown in Fig. 5.8. The Pt layer close to the cluster exhibits larger induced magnetization
compared to other layers. The induced moments on the Pt layerclose to the cluster are depicted in
Figure 5.8 for Pt(001) and Pt(111) surface in the left and right panel, respectively. Especially, the
Pt atoms bonded with cluster atoms show large magnetic magnetic moments shown as red digits in
Fig. 5.8. Figure 5.9 (left panel) shows the relaxed structure of Fe5Pt8 on Pt(001) for which we have
calculated the angle-dependent energies (right panel). The angleθ is varied in thez−x (out of plane)
andx− y plane (in-plane). Due to the structural deformation, the symmetry is lowered, as a result a
second order contribution to the anisotropy is obtained. The MAE is defined as the energy difference
between the maximum and the minimum total energy obtained from variousθ. The in-pane MAE is
found to be larger (∼ 58 meV/atom) compared to the out of plane anisotropy (∼ 10 meV/atom). The
reason behind obtaining a large in-plane MAE is the lower symmetry of the cluster/substrate complex
arising due to the effect of structrual relaxation and the large spin-orbit coupling of Pt substrate.
98
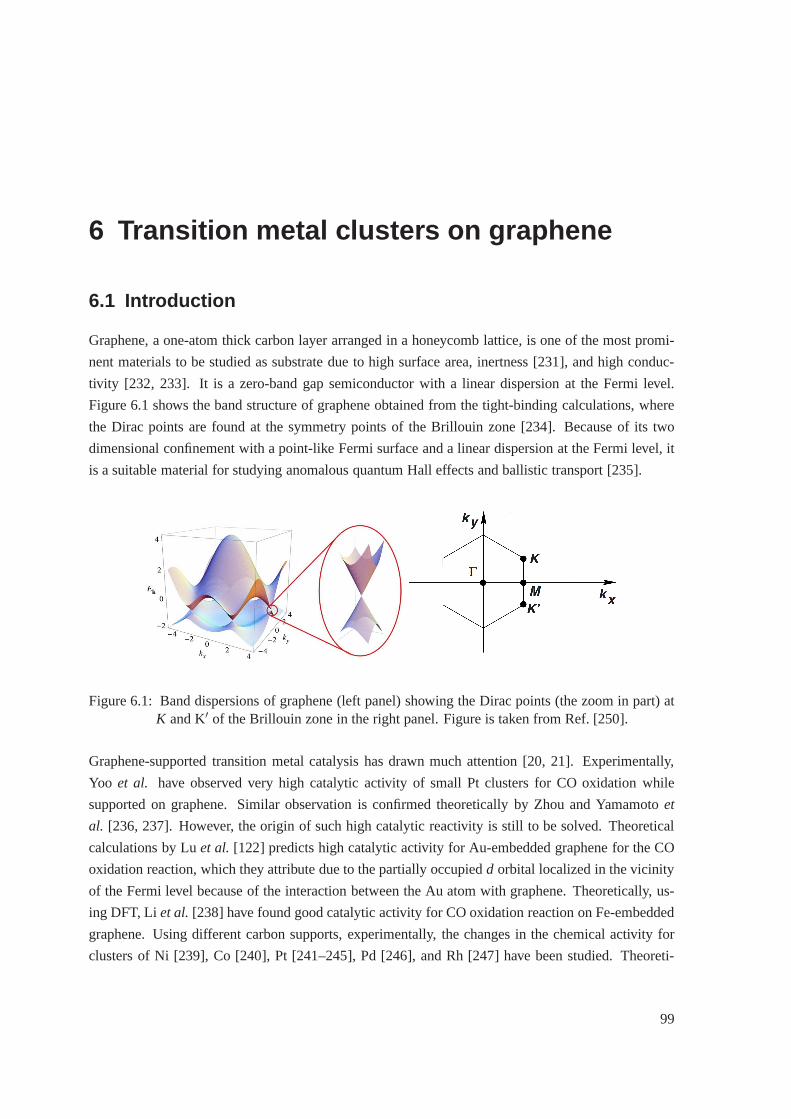
6 Transition metal clusters on graphene
6.1 Introduction
Graphene, a one-atom thick carbon layer arranged in a honeycomb lattice, is one of the most promi-
nent materials to be studied as substrate due to high surfacearea, inertness [231], and high conduc-
tivity [232, 233]. It is a zero-band gap semiconductor with alinear dispersion at the Fermi level.
Figure 6.1 shows the band structure of graphene obtained from the tight-binding calculations, where
the Dirac points are found at the symmetry points of the Brillouin zone [234]. Because of its two
dimensional confinement with a point-like Fermi surface anda linear dispersion at the Fermi level, it
is a suitable material for studying anomalous quantum Hall effects and ballistic transport [235].
Figure 6.1: Band dispersions of graphene (left panel) showing the Dirac points (the zoom in part) atK and K′ of the Brillouin zone in the right panel. Figure is taken fromRef. [250].
Graphene-supported transition metal catalysis has drawn much attention [20, 21]. Experimentally,
Yoo et al. have observed very high catalytic activity of small Pt clusters for CO oxidation while
supported on graphene. Similar observation is confirmed theoretically by Zhou and Yamamotoet
al. [236, 237]. However, the origin of such high catalytic reactivity is still to be solved. Theoretical
calculations by Luet al. [122] predicts high catalytic activity for Au-embedded graphene for the CO
oxidation reaction, which they attribute due to the partially occupiedd orbital localized in the vicinity
of the Fermi level because of the interaction between the Au atom with graphene. Theoretically, us-
ing DFT, Li et al. [238] have found good catalytic activity for CO oxidation reaction on Fe-embedded
graphene. Using different carbon supports, experimentally, the changes in the chemical activity for
clusters of Ni [239], Co [240], Pt [241–245], Pd [246], and Rh[247] have been studied. Theoreti-
99
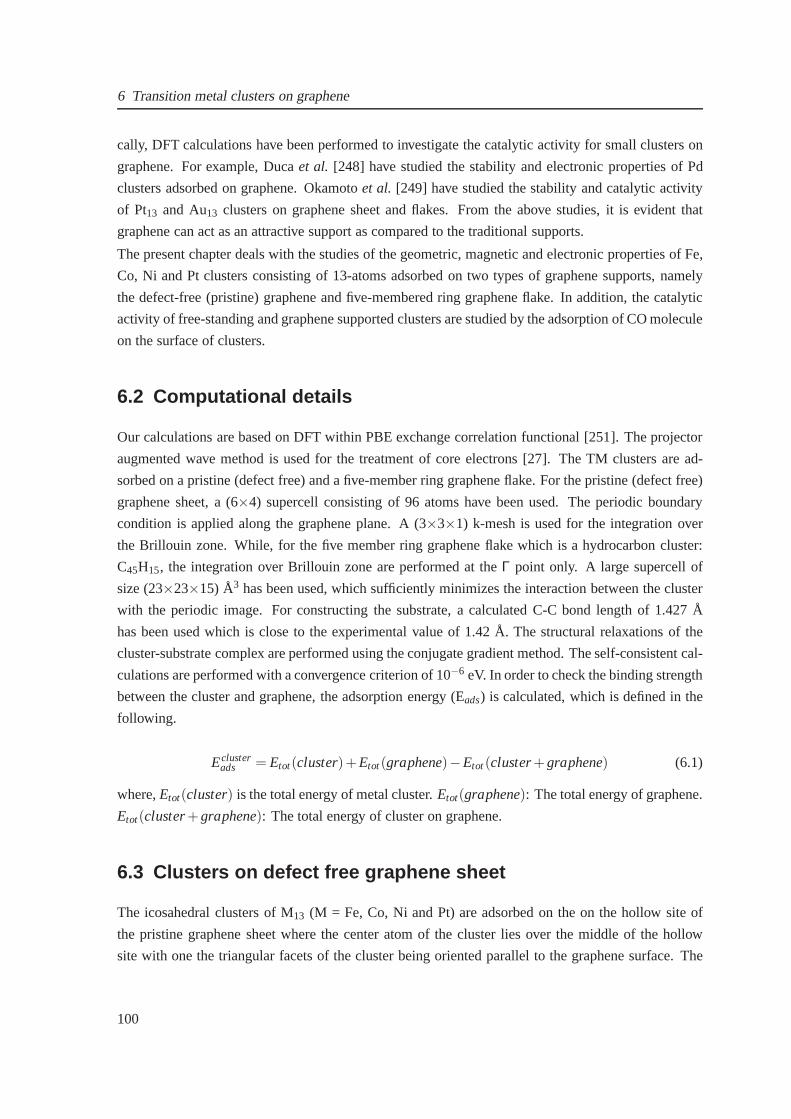
6 Transition metal clusters on graphene
cally, DFT calculations have been performed to investigatethe catalytic activity for small clusters on
graphene. For example, Ducaet al. [248] have studied the stability and electronic propertiesof Pd
clusters adsorbed on graphene. Okamotoet al. [249] have studied the stability and catalytic activity
of Pt13 and Au13 clusters on graphene sheet and flakes. From the above studies, it is evident that
graphene can act as an attractive support as compared to the traditional supports.
The present chapter deals with the studies of the geometric,magnetic and electronic properties of Fe,
Co, Ni and Pt clusters consisting of 13-atoms adsorbed on twotypes of graphene supports, namely
the defect-free (pristine) graphene and five-membered ringgraphene flake. In addition, the catalytic
activity of free-standing and graphene supported clustersare studied by the adsorption of CO molecule
on the surface of clusters.
6.2 Computational details
Our calculations are based on DFT within PBE exchange correlation functional [251]. The projector
augmented wave method is used for the treatment of core electrons [27]. The TM clusters are ad-
sorbed on a pristine (defect free) and a five-member ring graphene flake. For the pristine (defect free)
graphene sheet, a (6×4) supercell consisting of 96 atoms have been used. The periodic boundary
condition is applied along the graphene plane. A (3×3×1) k-mesh is used for the integration over
the Brillouin zone. While, for the five member ring graphene flake which is a hydrocarbon cluster:
C45H15, the integration over Brillouin zone are performed at theΓ point only. A large supercell of
size (23×23×15) Å3 has been used, which sufficiently minimizes the interactionbetween the cluster
with the periodic image. For constructing the substrate, a calculated C-C bond length of 1.427 Å
has been used which is close to the experimental value of 1.42Å. The structural relaxations of the
cluster-substrate complex are performed using the conjugate gradient method. The self-consistent cal-
culations are performed with a convergence criterion of 10−6 eV. In order to check the binding strength
between the cluster and graphene, the adsorption energy (Eads) is calculated, which is defined in the
following.
Eclusterads = Etot(cluster)+Etot(graphene)−Etot(cluster+graphene) (6.1)
where,Etot(cluster) is the total energy of metal cluster.Etot(graphene): The total energy of graphene.
Etot(cluster+graphene): The total energy of cluster on graphene.
6.3 Clusters on defect free graphene sheet
The icosahedral clusters of M13 (M = Fe, Co, Ni and Pt) are adsorbed on the on the hollow site of
the pristine graphene sheet where the center atom of the cluster lies over the middle of the hollow
site with one the triangular facets of the cluster being oriented parallel to the graphene surface. The
100
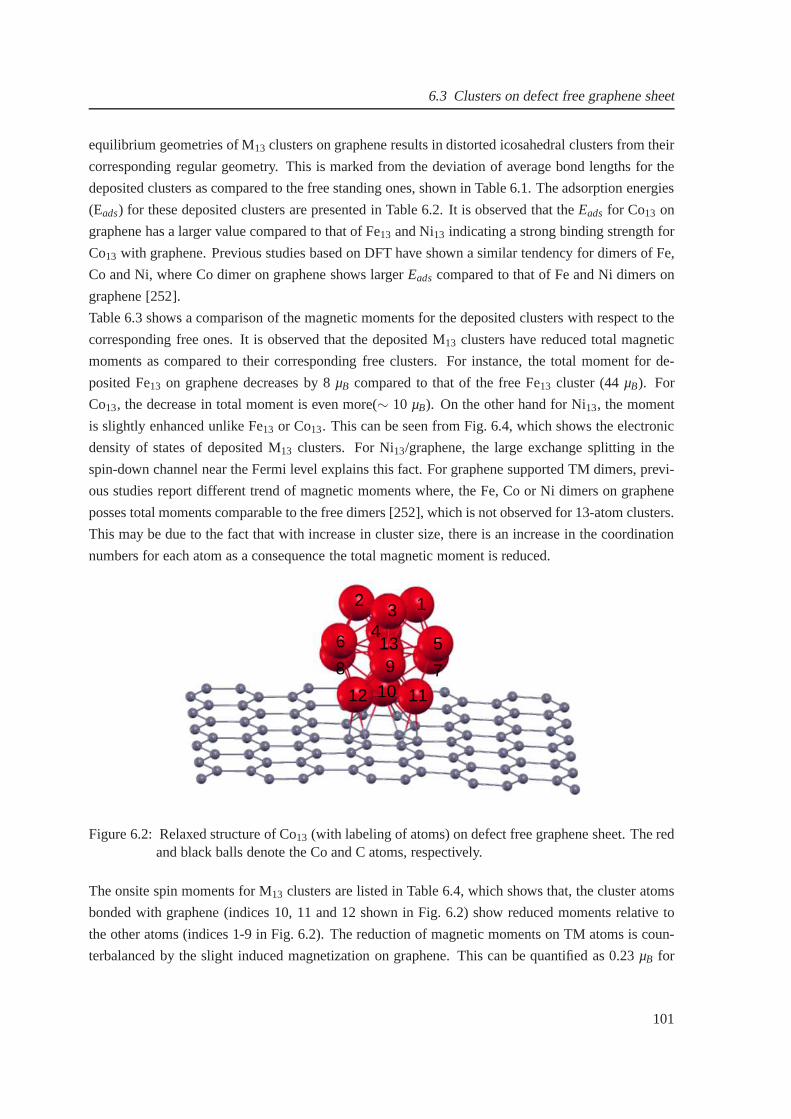
6.3 Clusters on defect free graphene sheet
equilibrium geometries of M13 clusters on graphene results in distorted icosahedral clusters from their
corresponding regular geometry. This is marked from the deviation of average bond lengths for the
deposited clusters as compared to the free standing ones, shown in Table 6.1. The adsorption energies
(Eads) for these deposited clusters are presented in Table 6.2. Itis observed that theEads for Co13 on
graphene has a larger value compared to that of Fe13 and Ni13 indicating a strong binding strength for
Co13 with graphene. Previous studies based on DFT have shown a similar tendency for dimers of Fe,
Co and Ni, where Co dimer on graphene shows largerEads compared to that of Fe and Ni dimers on
graphene [252].
Table 6.3 shows a comparison of the magnetic moments for the deposited clusters with respect to the
corresponding free ones. It is observed that the deposited M13 clusters have reduced total magnetic
moments as compared to their corresponding free clusters. For instance, the total moment for de-
posited Fe13 on graphene decreases by 8µB compared to that of the free Fe13 cluster (44µB). For
Co13, the decrease in total moment is even more(∼ 10 µB). On the other hand for Ni13, the moment
is slightly enhanced unlike Fe13 or Co13. This can be seen from Fig. 6.4, which shows the electronic
density of states of deposited M13 clusters. For Ni13/graphene, the large exchange splitting in the
spin-down channel near the Fermi level explains this fact. For graphene supported TM dimers, previ-
ous studies report different trend of magnetic moments where, the Fe, Co or Ni dimers on graphene
posses total moments comparable to the free dimers [252], which is not observed for 13-atom clusters.
This may be due to the fact that with increase in cluster size,there is an increase in the coordination
numbers for each atom as a consequence the total magnetic moment is reduced.
2
6
3
139
12
8
11107
5
1
4
Figure 6.2: Relaxed structure of Co13 (with labeling of atoms) on defect free graphene sheet. The redand black balls denote the Co and C atoms, respectively.
The onsite spin moments for M13 clusters are listed in Table 6.4, which shows that, the cluster atoms
bonded with graphene (indices 10, 11 and 12 shown in Fig. 6.2)show reduced moments relative to
the other atoms (indices 1-9 in Fig. 6.2). The reduction of magnetic moments on TM atoms is coun-
terbalanced by the slight induced magnetization on graphene. This can be quantified as 0.23µB for
101
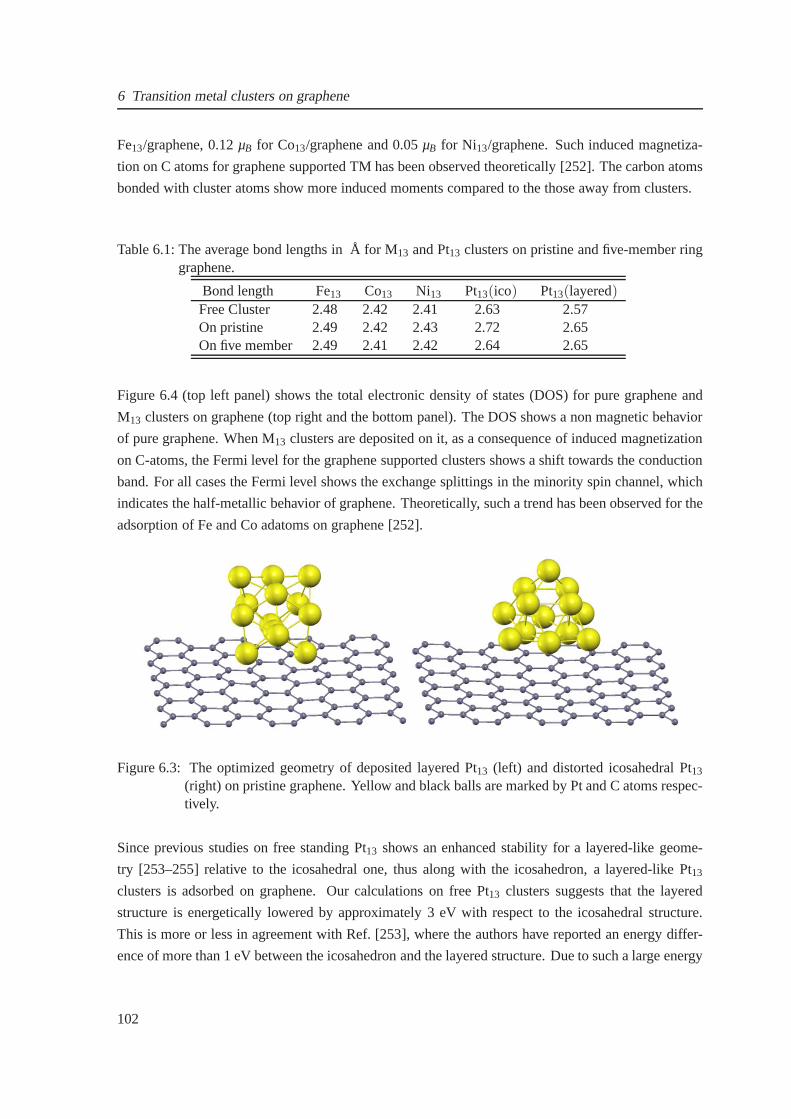
6 Transition metal clusters on graphene
Fe13/graphene, 0.12µB for Co13/graphene and 0.05µB for Ni13/graphene. Such induced magnetiza-
tion on C atoms for graphene supported TM has been observed theoretically [252]. The carbon atoms
bonded with cluster atoms show more induced moments compared to the those away from clusters.
Table 6.1: The average bond lengths in Å for M13 and Pt13 clusters on pristine and five-member ringgraphene.
Bond length Fe13 Co13 Ni13 Pt13(ico) Pt13(layered)Free Cluster 2.48 2.42 2.41 2.63 2.57On pristine 2.49 2.42 2.43 2.72 2.65On five member 2.49 2.41 2.42 2.64 2.65
Figure 6.4 (top left panel) shows the total electronic density of states (DOS) for pure graphene and
M13 clusters on graphene (top right and the bottom panel). The DOS shows a non magnetic behavior
of pure graphene. When M13 clusters are deposited on it, as a consequence of induced magnetization
on C-atoms, the Fermi level for the graphene supported clusters shows a shift towards the conduction
band. For all cases the Fermi level shows the exchange splittings in the minority spin channel, which
indicates the half-metallic behavior of graphene. Theoretically, such a trend has been observed for the
adsorption of Fe and Co adatoms on graphene [252].
Figure 6.3: The optimized geometry of deposited layered Pt13 (left) and distorted icosahedral Pt13
(right) on pristine graphene. Yellow and black balls are marked by Pt and C atoms respec-tively.
Since previous studies on free standing Pt13 shows an enhanced stability for a layered-like geome-
try [253–255] relative to the icosahedral one, thus along with the icosahedron, a layered-like Pt13
clusters is adsorbed on graphene. Our calculations on free Pt13 clusters suggests that the layered
structure is energetically lowered by approximately 3 eV with respect to the icosahedral structure.
This is more or less in agreement with Ref. [253], where the authors have reported an energy differ-
ence of more than 1 eV between the icosahedron and the layeredstructure. Due to such a large energy
102
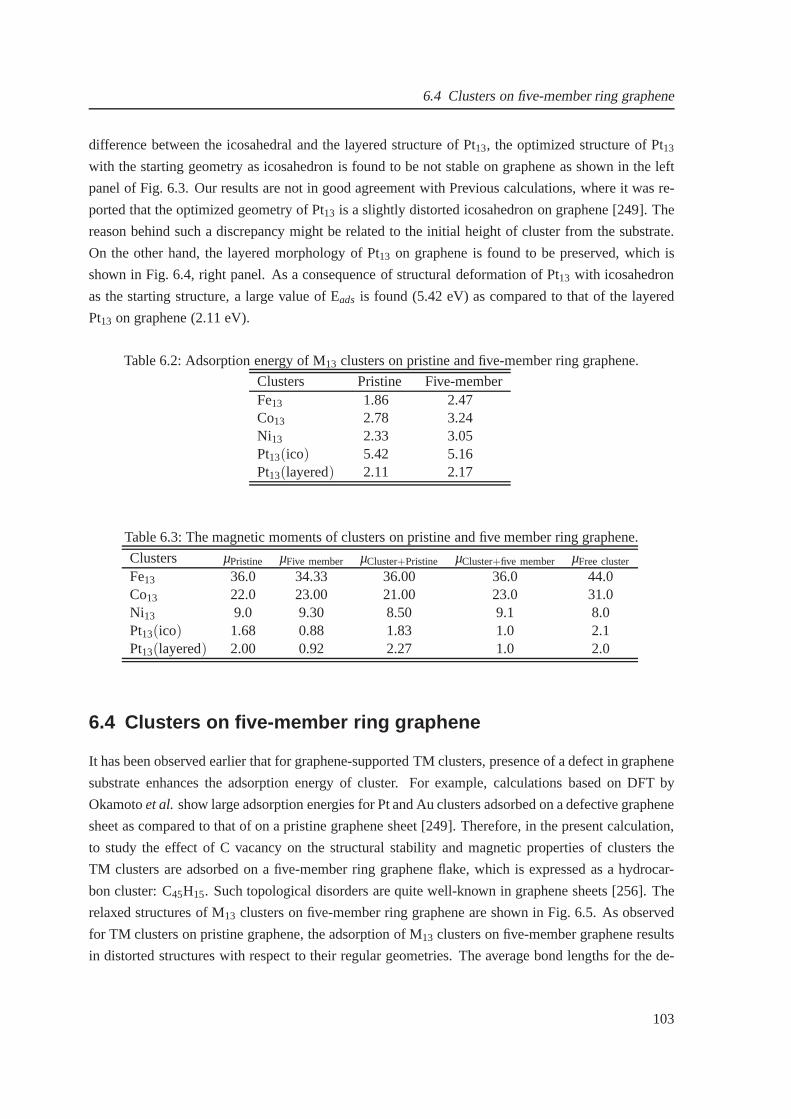
6.4 Clusters on five-member ring graphene
difference between the icosahedral and the layered structure of Pt13, the optimized structure of Pt13
with the starting geometry as icosahedron is found to be not stable on graphene as shown in the left
panel of Fig. 6.3. Our results are not in good agreement with Previous calculations, where it was re-
ported that the optimized geometry of Pt13 is a slightly distorted icosahedron on graphene [249]. The
reason behind such a discrepancy might be related to the initial height of cluster from the substrate.
On the other hand, the layered morphology of Pt13 on graphene is found to be preserved, which is
shown in Fig. 6.4, right panel. As a consequence of structural deformation of Pt13 with icosahedron
as the starting structure, a large value of Eads is found (5.42 eV) as compared to that of the layered
Pt13 on graphene (2.11 eV).
Table 6.2: Adsorption energy of M13 clusters on pristine and five-member ring graphene.
Clusters Pristine Five-memberFe13 1.86 2.47Co13 2.78 3.24Ni13 2.33 3.05Pt13(ico) 5.42 5.16Pt13(layered) 2.11 2.17
Table 6.3: The magnetic moments of clusters on pristine and five member ring graphene.
Clusters µPristine µFive member µCluster+Pristine µCluster+five member µFree cluster
Fe13 36.0 34.33 36.00 36.0 44.0Co13 22.0 23.00 21.00 23.0 31.0Ni13 9.0 9.30 8.50 9.1 8.0Pt13(ico) 1.68 0.88 1.83 1.0 2.1Pt13(layered) 2.00 0.92 2.27 1.0 2.0
6.4 Clusters on five-member ring graphene
It has been observed earlier that for graphene-supported TMclusters, presence of a defect in graphene
substrate enhances the adsorption energy of cluster. For example, calculations based on DFT by
Okamotoet al. show large adsorption energies for Pt and Au clusters adsorbed on a defective graphene
sheet as compared to that of on a pristine graphene sheet [249]. Therefore, in the present calculation,
to study the effect of C vacancy on the structural stability and magnetic properties of clusters the
TM clusters are adsorbed on a five-member ring graphene flake,which is expressed as a hydrocar-
bon cluster: C45H15. Such topological disorders are quite well-known in graphene sheets [256]. The
relaxed structures of M13 clusters on five-member ring graphene are shown in Fig. 6.5. As observed
for TM clusters on pristine graphene, the adsorption of M13 clusters on five-member graphene results
in distorted structures with respect to their regular geometries. The average bond lengths for the de-
103
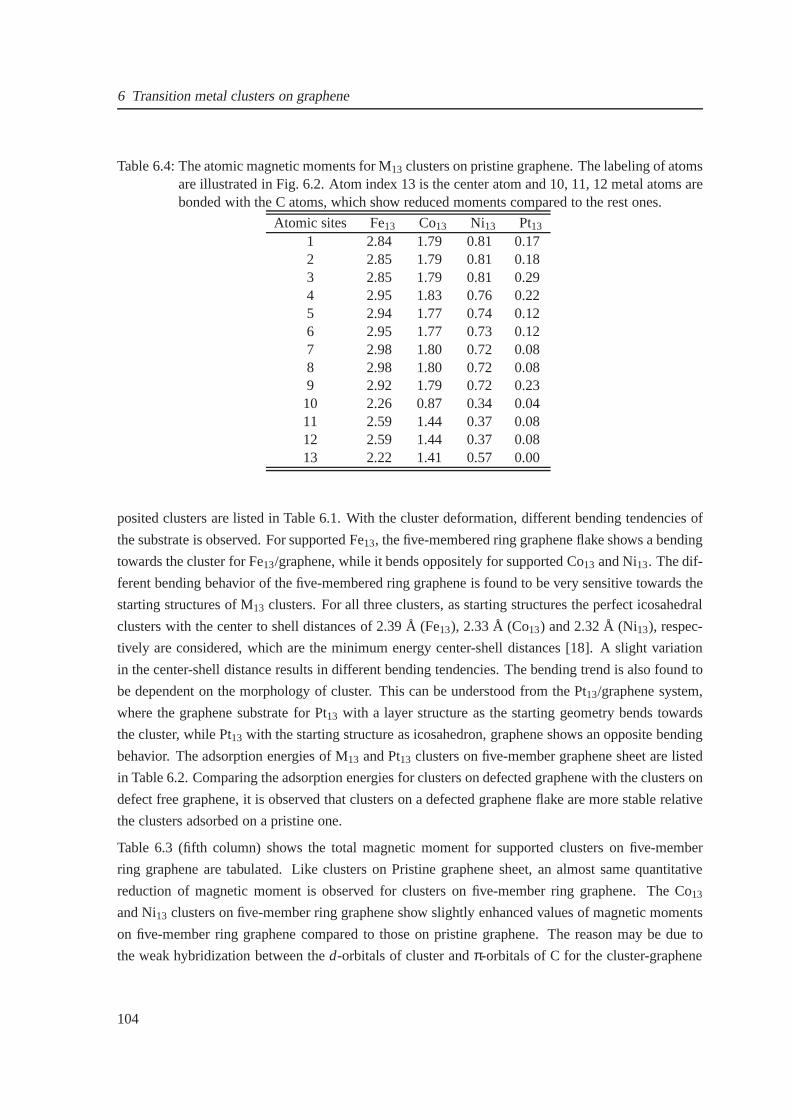
6 Transition metal clusters on graphene
Table 6.4: The atomic magnetic moments for M13 clusters on pristine graphene. The labeling of atomsare illustrated in Fig. 6.2. Atom index 13 is the center atom and 10, 11, 12 metal atoms arebonded with the C atoms, which show reduced moments comparedto the rest ones.
Atomic sites Fe13 Co13 Ni13 Pt13
1 2.84 1.79 0.81 0.172 2.85 1.79 0.81 0.183 2.85 1.79 0.81 0.294 2.95 1.83 0.76 0.225 2.94 1.77 0.74 0.126 2.95 1.77 0.73 0.127 2.98 1.80 0.72 0.088 2.98 1.80 0.72 0.089 2.92 1.79 0.72 0.2310 2.26 0.87 0.34 0.0411 2.59 1.44 0.37 0.0812 2.59 1.44 0.37 0.0813 2.22 1.41 0.57 0.00
posited clusters are listed in Table 6.1. With the cluster deformation, different bending tendencies of
the substrate is observed. For supported Fe13, the five-membered ring graphene flake shows a bending
towards the cluster for Fe13/graphene, while it bends oppositely for supported Co13 and Ni13. The dif-
ferent bending behavior of the five-membered ring graphene is found to be very sensitive towards the
starting structures of M13 clusters. For all three clusters, as starting structures the perfect icosahedral
clusters with the center to shell distances of 2.39 Å (Fe13), 2.33 Å (Co13) and 2.32 Å (Ni13), respec-
tively are considered, which are the minimum energy center-shell distances [18]. A slight variation
in the center-shell distance results in different bending tendencies. The bending trend is also found to
be dependent on the morphology of cluster. This can be understood from the Pt13/graphene system,
where the graphene substrate for Pt13 with a layer structure as the starting geometry bends towards
the cluster, while Pt13 with the starting structure as icosahedron, graphene showsan opposite bending
behavior. The adsorption energies of M13 and Pt13 clusters on five-member graphene sheet are listed
in Table 6.2. Comparing the adsorption energies for clusters on defected graphene with the clusters on
defect free graphene, it is observed that clusters on a defected graphene flake are more stable relative
the clusters adsorbed on a pristine one.
Table 6.3 (fifth column) shows the total magnetic moment for supported clusters on five-member
ring graphene are tabulated. Like clusters on Pristine graphene sheet, an almost same quantitative
reduction of magnetic moment is observed for clusters on five-member ring graphene. The Co13
and Ni13 clusters on five-member ring graphene show slightly enhanced values of magnetic moments
on five-member ring graphene compared to those on pristine graphene. The reason may be due to
the weak hybridization between thed-orbitals of cluster andπ-orbitals of C for the cluster-graphene
104
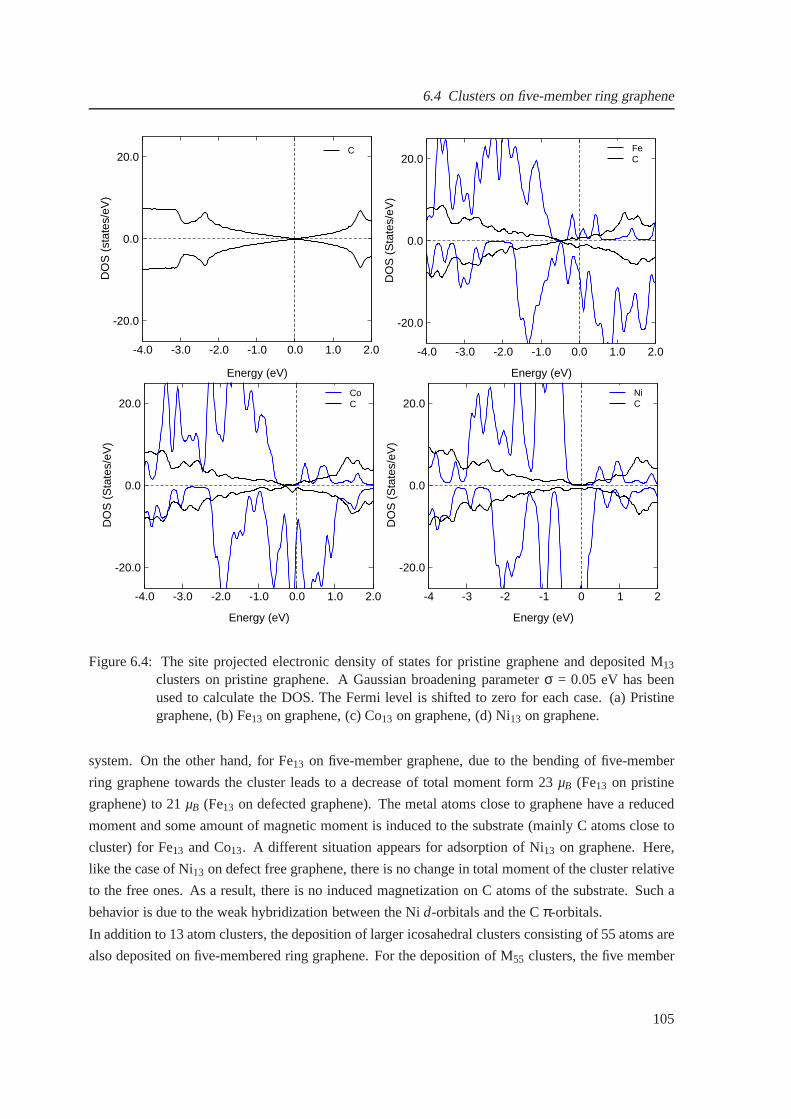
6.4 Clusters on five-member ring graphene
-4.0 -3.0 -2.0 -1.0 0.0 1.0 2.0
Energy (eV)
-20.0
0.0
20.0
DO
S (
stat
es/e
V)
C
-4.0 -3.0 -2.0 -1.0 0.0 1.0 2.0
Energy (eV)
-20.0
0.0
20.0
DO
S (
Sta
tes/
eV)
FeC
-4.0 -3.0 -2.0 -1.0 0.0 1.0 2.0
Energy (eV)
-20.0
0.0
20.0
DO
S (
Sta
tes/
eV)
CoC
-4 -3 -2 -1 0 1 2
Energy (eV)
-20.0
0.0
20.0D
OS
(S
tate
s/eV
)NiC
Figure 6.4: The site projected electronic density of statesfor pristine graphene and deposited M13
clusters on pristine graphene. A Gaussian broadening parameterσ = 0.05 eV has beenused to calculate the DOS. The Fermi level is shifted to zero for each case. (a) Pristinegraphene, (b) Fe13 on graphene, (c) Co13 on graphene, (d) Ni13 on graphene.
system. On the other hand, for Fe13 on five-member graphene, due to the bending of five-member
ring graphene towards the cluster leads to a decrease of total moment form 23µB (Fe13 on pristine
graphene) to 21µB (Fe13 on defected graphene). The metal atoms close to graphene have a reduced
moment and some amount of magnetic moment is induced to the substrate (mainly C atoms close to
cluster) for Fe13 and Co13. A different situation appears for adsorption of Ni13 on graphene. Here,
like the case of Ni13 on defect free graphene, there is no change in total moment ofthe cluster relative
to the free ones. As a result, there is no induced magnetization on C atoms of the substrate. Such a
behavior is due to the weak hybridization between the Nid-orbitals and the Cπ-orbitals.
In addition to 13 atom clusters, the deposition of larger icosahedral clusters consisting of 55 atoms are
also deposited on five-membered ring graphene. For the deposition of M55 clusters, the five member
105
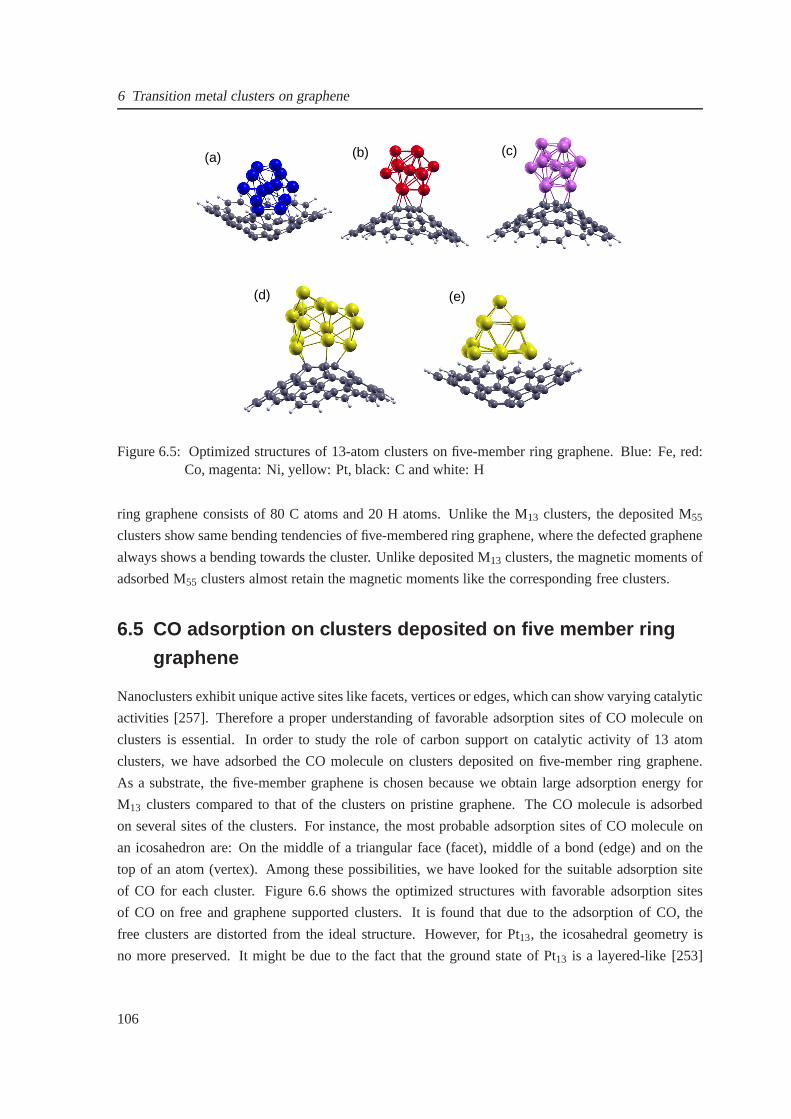
6 Transition metal clusters on graphene
(a) (b)
(d) (e)
(c)
Figure 6.5: Optimized structures of 13-atom clusters on five-member ring graphene. Blue: Fe, red:Co, magenta: Ni, yellow: Pt, black: C and white: H
ring graphene consists of 80 C atoms and 20 H atoms. Unlike theM13 clusters, the deposited M55
clusters show same bending tendencies of five-membered ringgraphene, where the defected graphene
always shows a bending towards the cluster. Unlike deposited M13 clusters, the magnetic moments of
adsorbed M55 clusters almost retain the magnetic moments like the corresponding free clusters.
6.5 CO adsorption on clusters deposited on five member ring
graphene
Nanoclusters exhibit unique active sites like facets, vertices or edges, which can show varying catalytic
activities [257]. Therefore a proper understanding of favorable adsorption sites of CO molecule on
clusters is essential. In order to study the role of carbon support on catalytic activity of 13 atom
clusters, we have adsorbed the CO molecule on clusters deposited on five-member ring graphene.
As a substrate, the five-member graphene is chosen because weobtain large adsorption energy for
M13 clusters compared to that of the clusters on pristine graphene. The CO molecule is adsorbed
on several sites of the clusters. For instance, the most probable adsorption sites of CO molecule on
an icosahedron are: On the middle of a triangular face (facet), middle of a bond (edge) and on the
top of an atom (vertex). Among these possibilities, we have looked for the suitable adsorption site
of CO for each cluster. Figure 6.6 shows the optimized structures with favorable adsorption sites
of CO on free and graphene supported clusters. It is found that due to the adsorption of CO, the
free clusters are distorted from the ideal structure. However, for Pt13, the icosahedral geometry is
no more preserved. It might be due to the fact that the ground state of Pt13 is a layered-like [253]
106
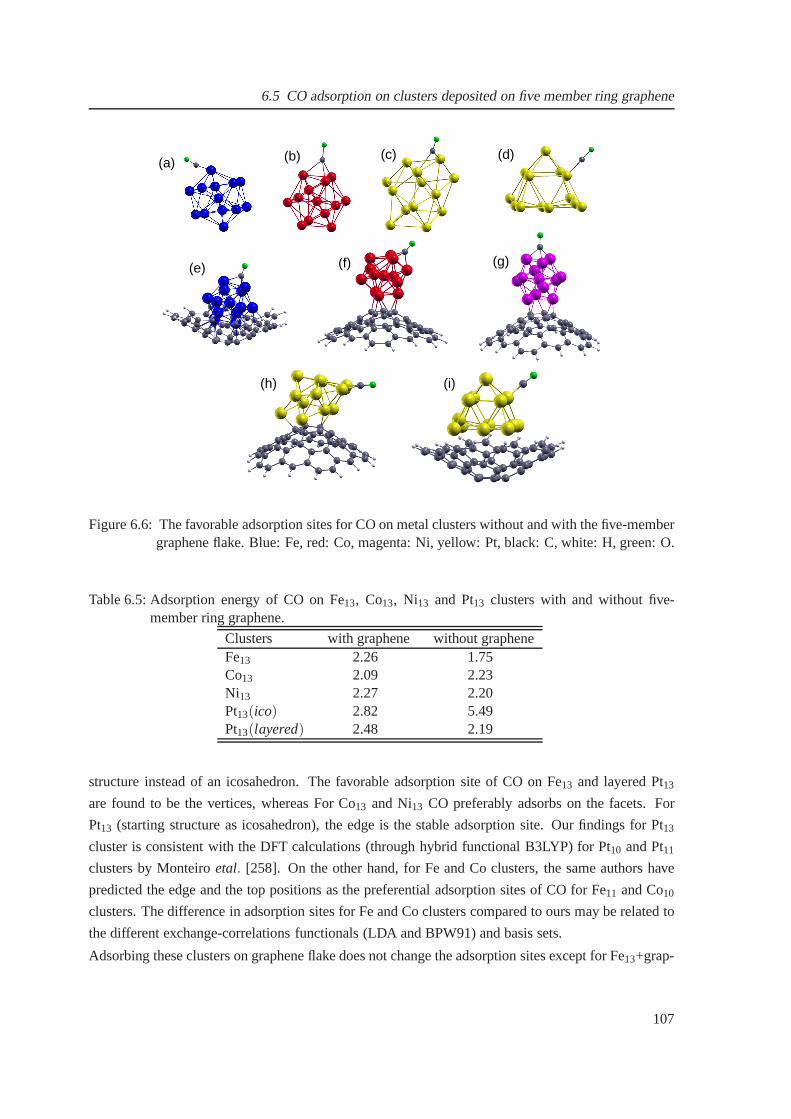
6.5 CO adsorption on clusters deposited on five member ring graphene
(b) (c) (d)
(e) (f) (g)
(h) (i)
(a)
Figure 6.6: The favorable adsorption sites for CO on metal clusters without and with the five-membergraphene flake. Blue: Fe, red: Co, magenta: Ni, yellow: Pt, black: C, white: H, green: O.
Table 6.5: Adsorption energy of CO on Fe13, Co13, Ni13 and Pt13 clusters with and without five-member ring graphene.
Clusters with graphene without grapheneFe13 2.26 1.75Co13 2.09 2.23Ni13 2.27 2.20Pt13(ico) 2.82 5.49Pt13(layered) 2.48 2.19
structure instead of an icosahedron. The favorable adsorption site of CO on Fe13 and layered Pt13
are found to be the vertices, whereas For Co13 and Ni13 CO preferably adsorbs on the facets. For
Pt13 (starting structure as icosahedron), the edge is the stableadsorption site. Our findings for Pt13
cluster is consistent with the DFT calculations (through hybrid functional B3LYP) for Pt10 and Pt11
clusters by Monteiroetal. [258]. On the other hand, for Fe and Co clusters, the same authors have
predicted the edge and the top positions as the preferentialadsorption sites of CO for Fe11 and Co10
clusters. The difference in adsorption sites for Fe and Co clusters compared to ours may be related to
the different exchange-correlations functionals (LDA andBPW91) and basis sets.
Adsorbing these clusters on graphene flake does not change the adsorption sites except for Fe13+grap-
107
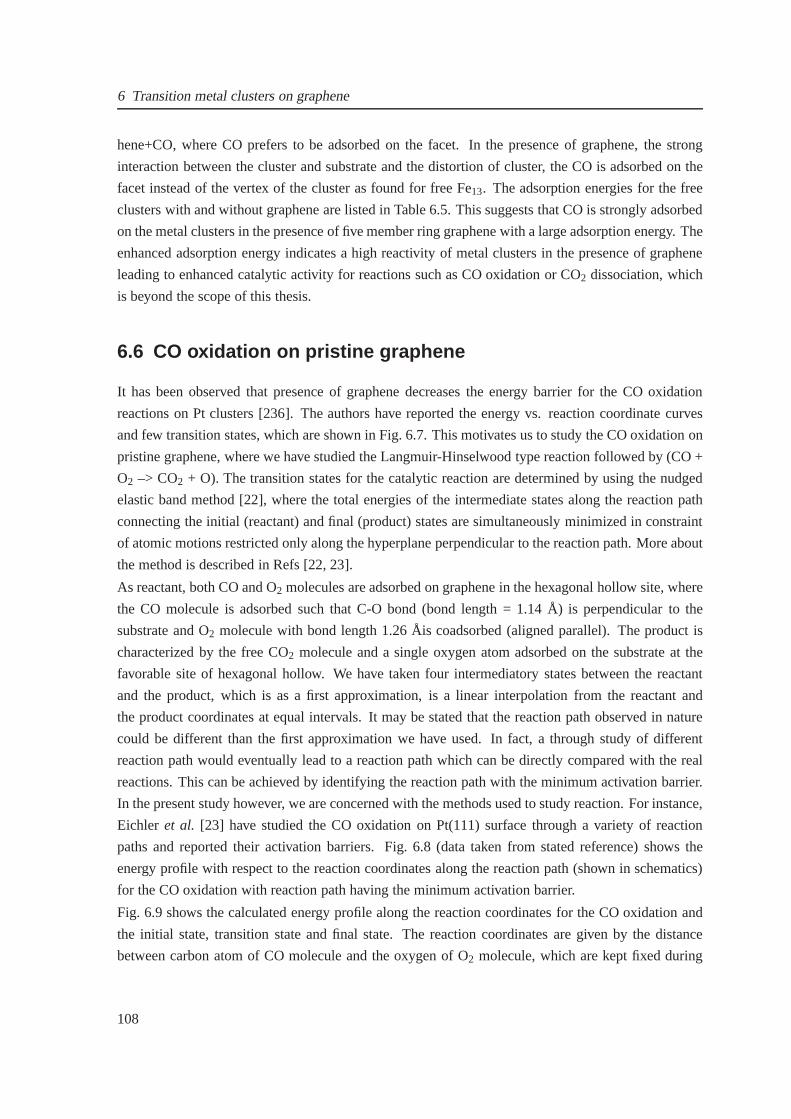
6 Transition metal clusters on graphene
hene+CO, where CO prefers to be adsorbed on the facet. In the presence of graphene, the strong
interaction between the cluster and substrate and the distortion of cluster, the CO is adsorbed on the
facet instead of the vertex of the cluster as found for free Fe13. The adsorption energies for the free
clusters with and without graphene are listed in Table 6.5. This suggests that CO is strongly adsorbed
on the metal clusters in the presence of five member ring graphene with a large adsorption energy. The
enhanced adsorption energy indicates a high reactivity of metal clusters in the presence of graphene
leading to enhanced catalytic activity for reactions such as CO oxidation or CO2 dissociation, which
is beyond the scope of this thesis.
6.6 CO oxidation on pristine graphene
It has been observed that presence of graphene decreases theenergy barrier for the CO oxidation
reactions on Pt clusters [236]. The authors have reported the energy vs. reaction coordinate curves
and few transition states, which are shown in Fig. 6.7. This motivates us to study the CO oxidation on
pristine graphene, where we have studied the Langmuir-Hinselwood type reaction followed by (CO +
O2 –> CO2 + O). The transition states for the catalytic reaction are determined by using the nudged
elastic band method [22], where the total energies of the intermediate states along the reaction path
connecting the initial (reactant) and final (product) states are simultaneously minimized in constraint
of atomic motions restricted only along the hyperplane perpendicular to the reaction path. More about
the method is described in Refs [22, 23].
As reactant, both CO and O2 molecules are adsorbed on graphene in the hexagonal hollow site, where
the CO molecule is adsorbed such that C-O bond (bond length = 1.14 Å) is perpendicular to the
substrate and O2 molecule with bond length 1.26 Åis coadsorbed (aligned parallel). The product is
characterized by the free CO2 molecule and a single oxygen atom adsorbed on the substrate at the
favorable site of hexagonal hollow. We have taken four intermediatory states between the reactant
and the product, which is as a first approximation, is a linearinterpolation from the reactant and
the product coordinates at equal intervals. It may be statedthat the reaction path observed in nature
could be different than the first approximation we have used.In fact, a through study of different
reaction path would eventually lead to a reaction path whichcan be directly compared with the real
reactions. This can be achieved by identifying the reactionpath with the minimum activation barrier.
In the present study however, we are concerned with the methods used to study reaction. For instance,
Eichler et al. [23] have studied the CO oxidation on Pt(111) surface through a variety of reaction
paths and reported their activation barriers. Fig. 6.8 (data taken from stated reference) shows the
energy profile with respect to the reaction coordinates along the reaction path (shown in schematics)
for the CO oxidation with reaction path having the minimum activation barrier.
Fig. 6.9 shows the calculated energy profile along the reaction coordinates for the CO oxidation and
the initial state, transition state and final state. The reaction coordinates are given by the distance
between carbon atom of CO molecule and the oxygen of O2 molecule, which are kept fixed during
108
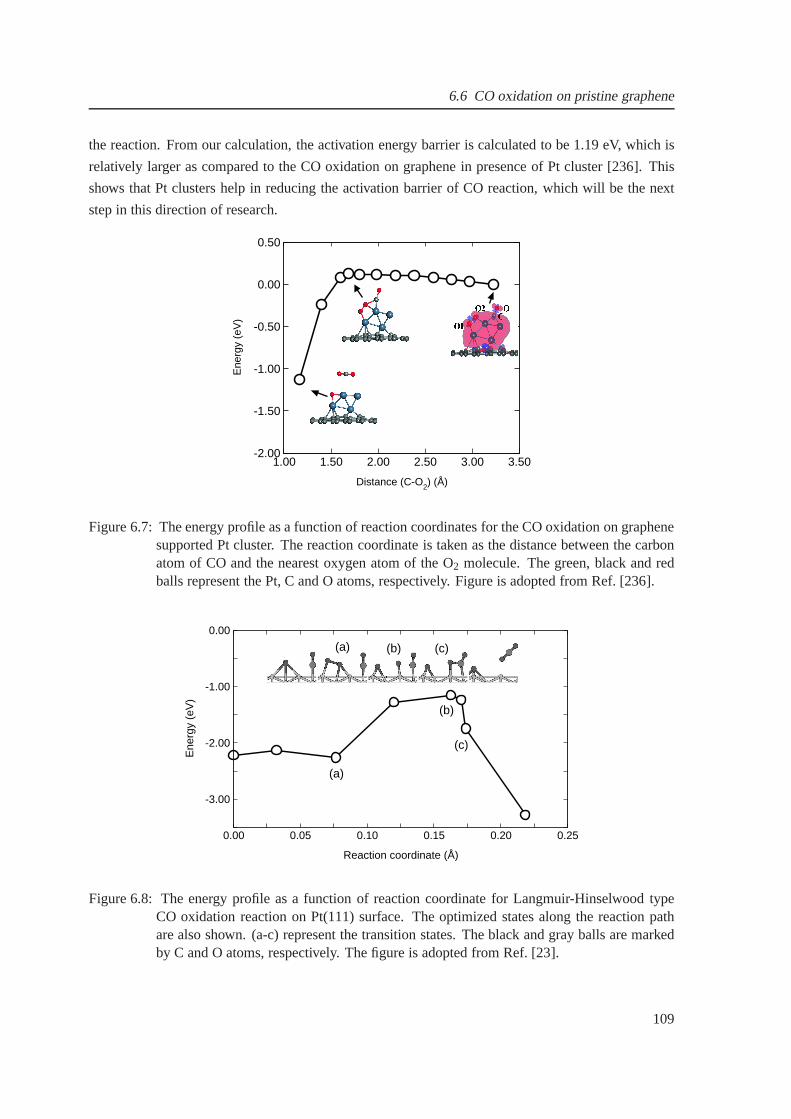
6.6 CO oxidation on pristine graphene
the reaction. From our calculation, the activation energy barrier is calculated to be 1.19 eV, which is
relatively larger as compared to the CO oxidation on graphene in presence of Pt cluster [236]. This
shows that Pt clusters help in reducing the activation barrier of CO reaction, which will be the next
step in this direction of research.
1.00 1.50 2.00 2.50 3.00 3.50
Distance (C-O2) (Å)
-2.00
-1.50
-1.00
-0.50
0.00
0.50E
nerg
y (e
V)
Figure 6.7: The energy profile as a function of reaction coordinates for the CO oxidation on graphenesupported Pt cluster. The reaction coordinate is taken as the distance between the carbonatom of CO and the nearest oxygen atom of the O2 molecule. The green, black and redballs represent the Pt, C and O atoms, respectively. Figure is adopted from Ref. [236].
0.00 0.05 0.10 0.15 0.20 0.25
Reaction coordinate (Å)
-3.00
-2.00
-1.00
0.00
Ene
rgy
(eV
)
(a)
(b)
(c)
(a) (b) (c)
Figure 6.8: The energy profile as a function of reaction coordinate for Langmuir-Hinselwood typeCO oxidation reaction on Pt(111) surface. The optimized states along the reaction pathare also shown. (a-c) represent the transition states. The black and gray balls are markedby C and O atoms, respectively. The figure is adopted from Ref.[23].
109
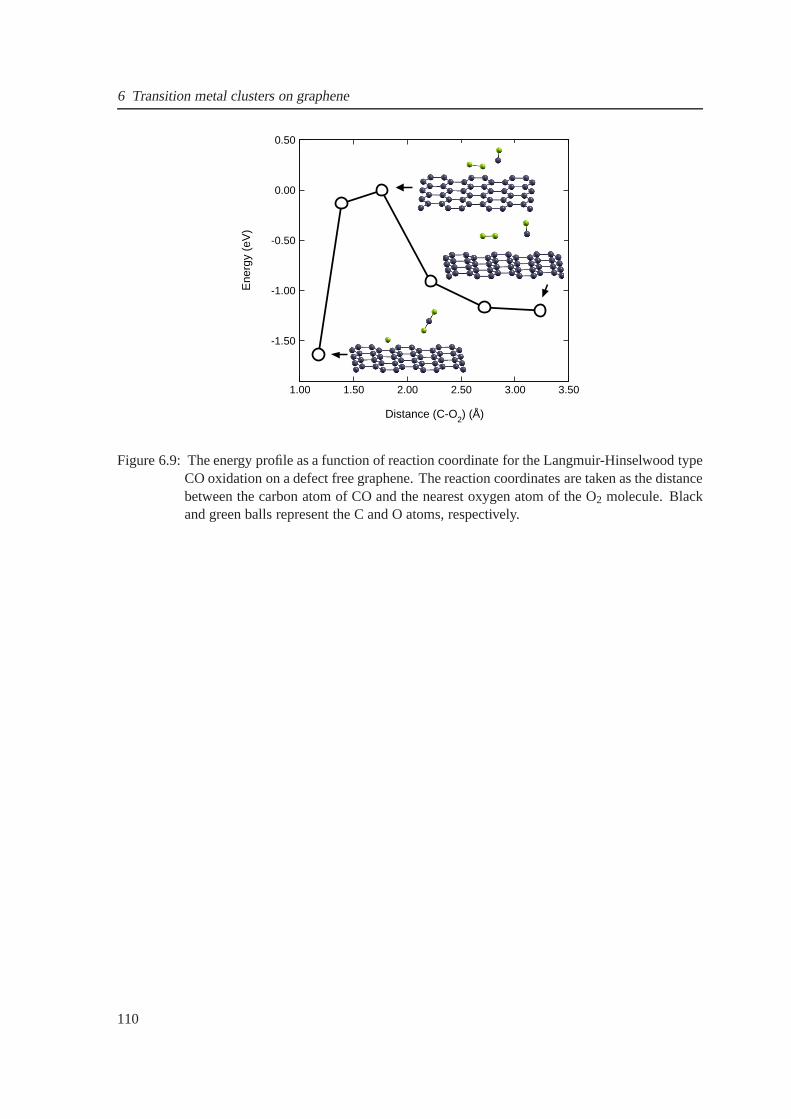
6 Transition metal clusters on graphene
1.00 1.50 2.00 2.50 3.00 3.50
Distance (C-O2) (Å)
-1.50
-1.00
-0.50
0.00
0.50
Ene
rgy
(eV
)
Figure 6.9: The energy profile as a function of reaction coordinate for the Langmuir-Hinselwood typeCO oxidation on a defect free graphene. The reaction coordinates are taken as the distancebetween the carbon atom of CO and the nearest oxygen atom of the O2 molecule. Blackand green balls represent the C and O atoms, respectively.
110
7 Exact diagonalization andthermodynamics of clusters
7.1 Introduction
In the previous, the ground state properties of TM clusters are exclusively discussed using DFT, which
is based on variational principle, i.e., a system has a lowerbound in energy, known as the ground
state energy, which can be obtained by minimizing the total energy of a system. However, such a
treatment completely barrs from estimating any propertiesat non-zero temperature. Thermodynamics
of some of the exactly solvable models are already well established [259]. In this chapter, the nearest-
neighbour Heisenberg spin model is adopted to study the magnetic and thermodynamic properties
of finite systems through exact diagonalization technique [31]. Besides the exact diagonalization
method, several other techniques such as the density matrixrenormalization group [260], cluster
expansions [261], spin-wave expansions [262–264] and quantum Monte Carlo techniques [265–267],
which can be used to study the magnetic systems. However, some of these techniques have limitations,
for instance quantum Monte Carlo technique has limitationsin describing the systems with geometric
frustration. In this regard, exact diagonalization methodhas the advantage, where it is possible to
obtain all energy levels with their spectroscopic classification (useful for the electron paramagnetic
resonance or nuclear magnetic resonance spectra).
It is well known that frustration in low dimensional magnetic systems leads to many nontrivial fea-
tures, like plateaus and jumps in magnetization with the variation of external magnetic field and
occurrence of low-lying singlets [30, 268–277] in the energy spectra. For example, through exact
diagonalization of the antiferromagnetic Heisenberg model, Konstantinidiset al. [268] have calcu-
lated the ground state magnetization for a dodecahedron andicosahedron symmetry fors = 12 and 1,
where they have found discontinuity in the field-dependent magnetization and double peaks in the
temperature-dependent specific heat arising due to the frustrations. The same authors have applied
the full diagonalization technique to a series of clusters with size ranging from 24 to 32, where they
have shown the effect of frustration and connectivity on thelow lying energy spectrum. For a 28-site
cluster, they obtain the most pronounced plateaus in the field-dependent magnetization compared to
other cluster sizes [278]. Using perturbation theory, Coffey et al. [269] have studied the effect of
frustration and connectivity on the magnetic properties ofa 60-site cluster [279]. Schnalleet al. [270]
have applied an approximation of diagonalization scheme toa cuboctahedron fors= 1 and32 in order
111
7 Exact diagonalization and thermodynamics of clusters
to obtain the energy spectra. In addition to ground state magnetic properties, several studies also exist
for the thermodynamical properties. Honeckeret al. [280] have computed several magneto-thermal
properties such as the magnetic susceptibility, specific heat and magnetic cooling rate for a cubocta-
hedron with different spin quantum numbers using the antiferromagnetic Heisenberg model, where
they have observed significant deviations from the classical behavior for the corresponding properties
of the cuboctahedron withs≤ 5. Studies on the effect of dipolar interaction and radial anisotropy
on properties of nano clusters is still limited [238, 281, 282]. In the present chapter, the exact diag-
onalization method is applied to small clusters consistingof 13 and 4-atoms with spin-12 and 1 and a
systematic study of the magnetic and thermodynamic properties has been performed. The main focus
is showing the effect of dipolar interaction and uniaxial anisotropy on the magnetization behavior in
the presence of magnetic field. The ground state and the temperature-dependent spin-spin correlation
functions are also calculated for these clusters.
7.2 Theoretical method
The Heisenberg spin Hamiltonian for a set of nearest neighbour interacting spinssssi has the following
form,
H = −∑i< j
Ji j sssi ·sssj , (7.1)
where, the sum is over all pairs.sssi is the spin operator on sitei having total spins and szi =
−s,−s+ 1, . . . ,s; Ji j is the exchange coupling. For a ferromagnetic and antiferromagnetic interac-
tion, Ji j > 0 andJi j < 0, respectively. Though, for one dimensional nearest-neighbour couplings
Ji j = J, the Heisenberg model has been solved analytically by meansof the Bethe-Ansatz [283], for
higher dimensions, other approximation methods are highlyrequired. However, for small spin sys-
tems, the problem is solved by employing the exact diagonalization technique [284]. In order to study
the model Hamiltonian numerically (defined in Eq. 7.1), the straightforward way is to obtain the ma-
trix elements ofH in a basis of|sz1,s
z2, . . . ,s
zn〉, with thez-axis taken as quantization direction, wheren
is the total number of spins in the system, and then diagonalize the Hamiltonian matrix. For instance,
for thes= 12 Heisenberg model, we can construct the basis states,
|1〉 = |↑↑ . . . ↑↑〉,|2〉 = |↑↑ . . . ↑↓〉,|3〉 = |↑↑ . . . ↓↑〉,
...
|2n〉 = |↓↓ . . . ↓↓〉,
where↑ and↓ representsszi = 1
2 and -12 state, respectively. In terms of these basis states, the dimension
of the Hamiltonian matrix will be 2n×2n. Fors= 1 systems,sz has three basis states (-1, 0, 1) leading
112
7.2 Theoretical method
to the dimension of Hamiltonian matrix 3n×3n. In general for a spin system of sizen, the number
of basis states to represent the Hilbert space is(2s+ 1)n. Therefore, with increase of the system
size, the dimension of the matrix grows exponentially and becomes intractable. There are conserved
quantities corresponding to the symmetry of the systems. Insuch cases, the basis states with different
eigenvalues of the symmetry operators do not mix together onthe application of Hamiltonian on the
basis. Then, the Hamiltonian matrix can be expressed as a direct product of several small matrices.
It has been observed that the Heisenberg Hamiltonian commutes with the square of the total spin of
the systemSSS2 and thez component of the total spinSz. Though it is straightforward to work in anSz
subspace, there is no efficient method to construct symmetryadopted eigenstates ofSSS2. In addition,
the Hamiltonian is symmetric under combination of permutation of spins that respect the connectivity
of the small size cluster considered in the present case. Furthermore, the model also possesses time
reversal symmetry in the absence of external magnetic field.While the symmetries of the system is
taken into account,Sz basis states can be projected into states that transform under specific irreducible
representation of the symmetry group. In this way, the Hamiltonian is block diagonalized into small
matrices and the maximum dimension is dramatically reducedcompared to full Hilbert space size.
In the presence of an external magnetic field the Heisenberg Hamiltonian is modified to the following
form,
H = −∑i< j
Ji j sssi ·sssj −BzSz, (7.2)
whereBz is the external magnetic field alongz-direction, andSz = ∑i szi is thez-component of the total
spin. The value ofSz can vary from−S to +S in unit steps, withS being the maximum total spin
of the system. Note thatBz measures the field energy, i.e., the factorµB is absorbed intoBz. In the
presence of a magnetic field, the time reversal symmetry is broken, as a result, the eigenvalues of the
Hamiltonian within the positiveSz sector and negativeSz sector will be different. However, one can
obtain the eigenvalues of the system in the presence of magnetic field directly from the eigenvalues of
the pure Heisenberg model forBz = 0, Eq. (7.1), by shifting the eigenvalues byBzSz, asSz commutes
with H.
Now the Hamiltonian matrix is constructed in terms of eigenstates of the totalSz operator by express-
ing the Hamiltonian in the form
H = −∑i< j
Ji j
[
12
(
s+i s−j +s−i s+
j
)
+szi s
zj
]
−BzSz, (7.3)
wheres±i = sxi ± isy
i are the raising and lowering operators. Whens+i ands−i operates on the eigenstates
of szi , we have
s±i |szi 〉 =
√
s(s+1)−szi (s
zi ±1) |sz
i±1〉. (7.4)
113
7 Exact diagonalization and thermodynamics of clusters
For example, for a spin-12 particle,
s+i |↑i〉 = 0,
s+i |↓i〉 = |↑i〉,
s−i |↑i〉 = |↓i〉,s−i |↓i〉 = 0,
and for a spin-1 particle,
s+i |↑i〉 = 0,
s+i |0i〉 =
√2|↑i〉,
s+i |↓i〉 =
√2|0i〉,
s−i |↑i〉 =√
2|0i〉,s−i |0i〉 =
√2|↓i〉,
s−i |↓i〉 = 0,
where in the latter case↓,0,↑ denote the three possible values ofszi = −1,0,1. We have adopted the
block diagonalization procedure in order to obtain the eigenvalue spectra of 13- and 4-atom clusters,
where the total Hamiltonian matrix is written in terms of smaller matrices with the zero off diagonal
elements. For instance, in case of a 13-atom cluster withs = 12, the dimension of the Hamiltonian
matrix is 213×213. Because of the block diagonalization, the whole matrix is divided into blocks with
dimension(13
k
)
×(13
k
)
, with k = 0, . . . ,13. 14 such block matrices have to be solved and the largest
block matrix has(13
6
)
= 1716 rows. In addition, the effect of uniaxial anisotropy for 13- and 4-atom
clusters withs= 1 has been studied, as the anisotropy does not have any contribution fors= 12. For a
spin-1 system, the total Hamiltonian in the presence of local uniaxial anisotropy axeseeei can be written
as
H = −∑i< j
Ji j sssi ·sssj −BzSz−∑i
Di (eieiei ·sisisi)2, (7.5)
whereDi are the local uniaxial anisotropy constants andeieiei are the easy axes compatible with the
symmetry of the system [18]. The results obtained for 13- and4-atom clusters are discussed in the
following sections.
7.3 13-atom clusters with spin- 12
In order to study the properties of 13-atom clusters, we haveconsidered two geometries: The icosahe-
dron (ICO) and the cuboctahedron (CUBO). Both geometries are shown in Fig. 7.1. The ICO having
a connectivity like fullerene [285, 286], exhibits 12 vertices, 20 triangular facets and 30 edges with a
114

7.3 13-atom clusters with spin-12
symmetry groupIh. The CUBO has 12 vertices with 8 triangular and 6 square faces, 24 edges, which
belongs to a symmetry groupOh. In spite of same number of vertices (12), both geometries exhibit
different number of nearest neighbors, i.e., the ICO and CUBO posses 5 and 4 nearest neighbors,
respectively.
The total Hamiltonian for a 13-atom cluster has the following form
H = −J ∑i, j>0〈i j 〉
sssi ·sssj −J′ ∑i>0
sss0 ·sssi −Bz∑i
szi , (7.6)
wheresss0 is the spin of the center atom, and the first sum runs over nearest-neighbor pairs〈i j 〉 in the
surface shell.J is the exchange coupling between atoms in the surface shell and J′ is the exchange
coupling between central and surface spins.
The Hamiltonian matrix of dimension 8192×8192 has to be diagonalized for 13-atom spin-12 cluster.
Because of symmetries of the system, the Hamiltonian matrixis divided into 14 sub-matrices with
block diagonalization dimensions(13
k
)
with k = 0,1, . . . ,6 for the positive and negativeSz sectors.
The block diagonalization of the total Hamiltonian matrix leads to the eigenvalues of the system.
The ground state energy is obtained by taking the minimum of the energy eigenvalues from each
magnetization sector. We have obtained the energies for four different exchange couplings defined by
(i) all spins ferromagnetic (J = J′ = 1); (ii) all spins antiferromagnetic (J = J′ =−1); (iii) central spin
is reversed with respect to the ferromagnetic surface spins(J = 1 andJ′ =−1), (iv) antiferromagnetic
surface spins with ferromagnetic central spin (J =−1 andJ′ = 1). Note that all energies are measured
in units of|J|, where|J| is fixed to the one.
1
2
11
9 53
6
74
812
10
6
10
7
11
129
8
2
41
5
3
Figure 7.1: Skematic picture of 13-atom ICO (left) and CUBO (right) with labeling of each atomicsite. Both structures have 12 vertices with one atom at center. The center atom for bothcases are not shown here.
The minimum energies for AFM case of 13-atom clusters (ICO and CUBO) corresponding to eachSz
sector are listed in Tab. 7.1, which suggests a two-fold degeneracy for AFM case i.e., the minimum
energy for each positiveSz sector has similar value like that of the corresponding negative Sz sector.
115
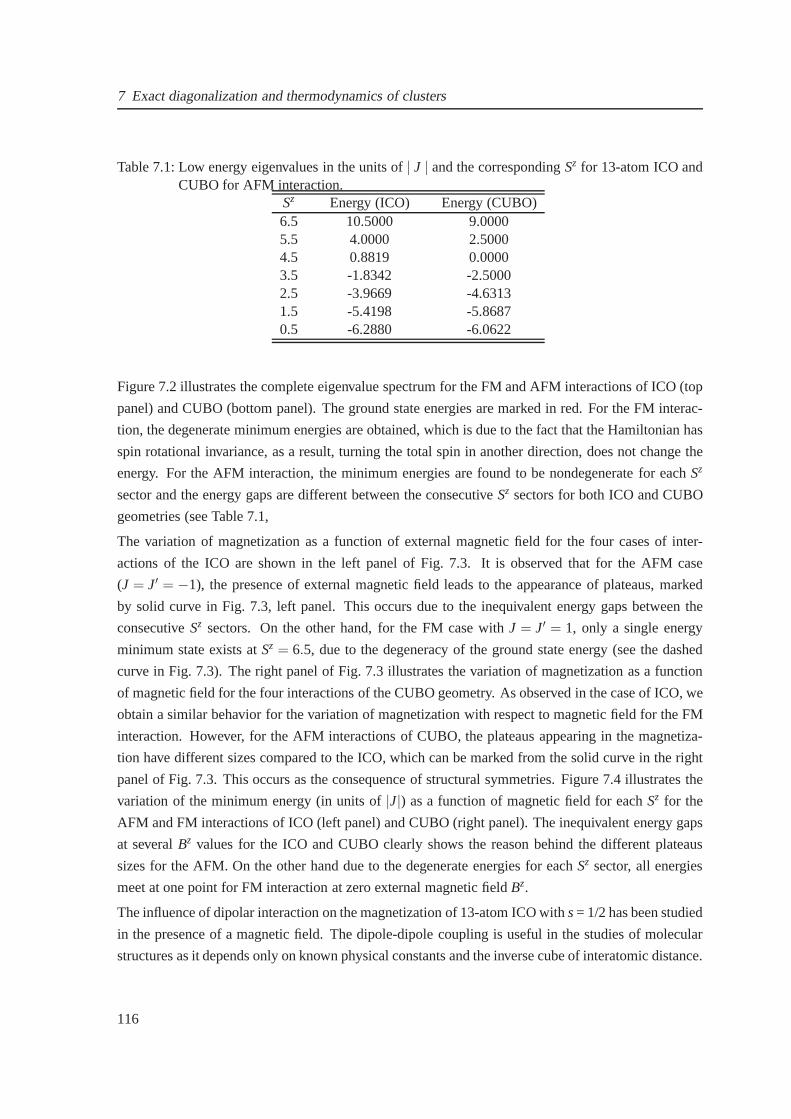
7 Exact diagonalization and thermodynamics of clusters
Table 7.1: Low energy eigenvalues in the units of| J | and the correspondingSz for 13-atom ICO andCUBO for AFM interaction.
Sz Energy (ICO) Energy (CUBO)6.5 10.5000 9.00005.5 4.0000 2.50004.5 0.8819 0.00003.5 -1.8342 -2.50002.5 -3.9669 -4.63131.5 -5.4198 -5.86870.5 -6.2880 -6.0622
Figure 7.2 illustrates the complete eigenvalue spectrum for the FM and AFM interactions of ICO (top
panel) and CUBO (bottom panel). The ground state energies are marked in red. For the FM interac-
tion, the degenerate minimum energies are obtained, which is due to the fact that the Hamiltonian has
spin rotational invariance, as a result, turning the total spin in another direction, does not change the
energy. For the AFM interaction, the minimum energies are found to be nondegenerate for eachSz
sector and the energy gaps are different between the consecutive Sz sectors for both ICO and CUBO
geometries (see Table 7.1,
The variation of magnetization as a function of external magnetic field for the four cases of inter-
actions of the ICO are shown in the left panel of Fig. 7.3. It isobserved that for the AFM case
(J = J′ = −1), the presence of external magnetic field leads to the appearance of plateaus, marked
by solid curve in Fig. 7.3, left panel. This occurs due to the inequivalent energy gaps between the
consecutiveSz sectors. On the other hand, for the FM case withJ = J′ = 1, only a single energy
minimum state exists atSz = 6.5, due to the degeneracy of the ground state energy (see the dashed
curve in Fig. 7.3). The right panel of Fig. 7.3 illustrates the variation of magnetization as a function
of magnetic field for the four interactions of the CUBO geometry. As observed in the case of ICO, we
obtain a similar behavior for the variation of magnetization with respect to magnetic field for the FM
interaction. However, for the AFM interactions of CUBO, theplateaus appearing in the magnetiza-
tion have different sizes compared to the ICO, which can be marked from the solid curve in the right
panel of Fig. 7.3. This occurs as the consequence of structural symmetries. Figure 7.4 illustrates the
variation of the minimum energy (in units of|J|) as a function of magnetic field for eachSz for the
AFM and FM interactions of ICO (left panel) and CUBO (right panel). The inequivalent energy gaps
at severalBz values for the ICO and CUBO clearly shows the reason behind the different plateaus
sizes for the AFM. On the other hand due to the degenerate energies for eachSz sector, all energies
meet at one point for FM interaction at zero external magnetic fieldBz.
The influence of dipolar interaction on the magnetization of13-atom ICO withs= 1/2 has been studied
in the presence of a magnetic field. The dipole-dipole coupling is useful in the studies of molecular
structures as it depends only on known physical constants and the inverse cube of interatomic distance.
116
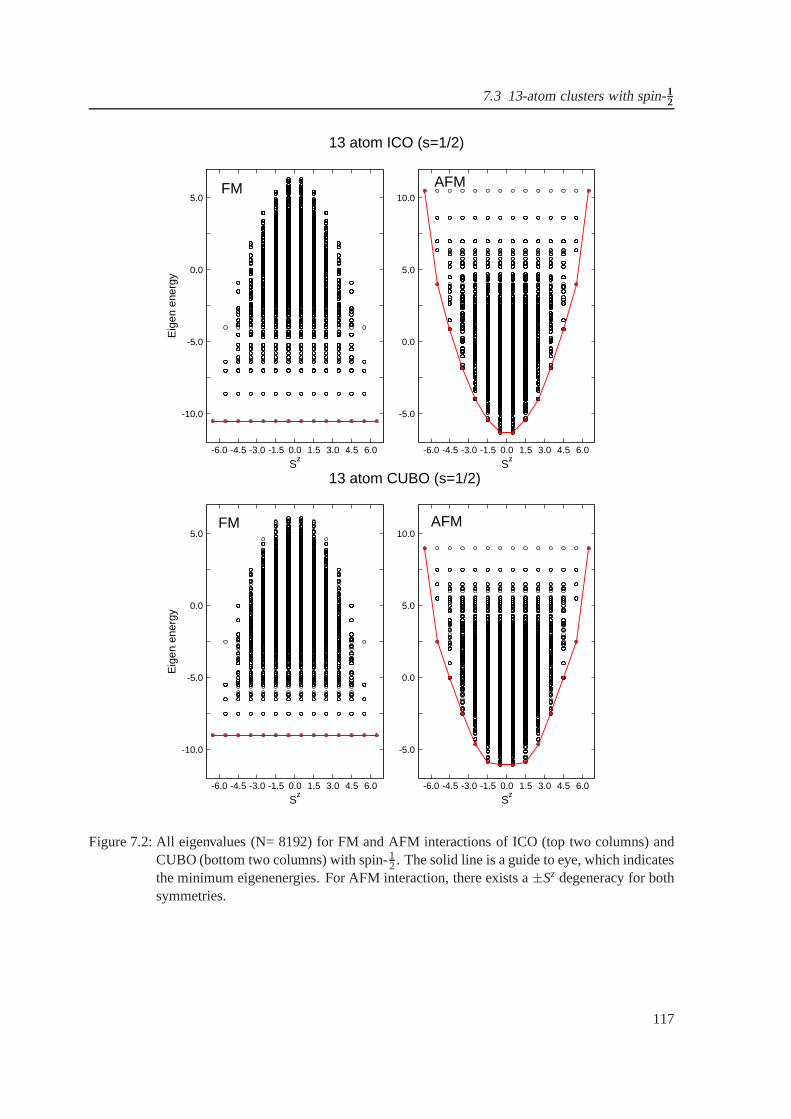
7.3 13-atom clusters with spin-12
-6.0 -4.5 -3.0 -1.5 0.0 1.5 3.0 4.5 6.0
Sz
-10.0
-5.0
0.0
5.0
Eig
en e
nerg
y
-6.0 -4.5 -3.0 -1.5 0.0 1.5 3.0 4.5 6.0
Sz
-5.0
0.0
5.0
10.0FM AFM
13 atom ICO (s=1/2)
-6.0 -4.5 -3.0 -1.5 0.0 1.5 3.0 4.5 6.0
Sz
-10.0
-5.0
0.0
5.0
Eig
en e
nerg
y
-6.0 -4.5 -3.0 -1.5 0.0 1.5 3.0 4.5 6.0
Sz
-5.0
0.0
5.0
10.0FM AFM
13 atom CUBO (s=1/2)
Figure 7.2: All eigenvalues (N= 8192) for FM and AFM interactions of ICO (top two columns) andCUBO (bottom two columns) with spin-1
2 . The solid line is a guide to eye, which indicatesthe minimum eigenenergies. For AFM interaction, there exists a±Sz degeneracy for bothsymmetries.
117
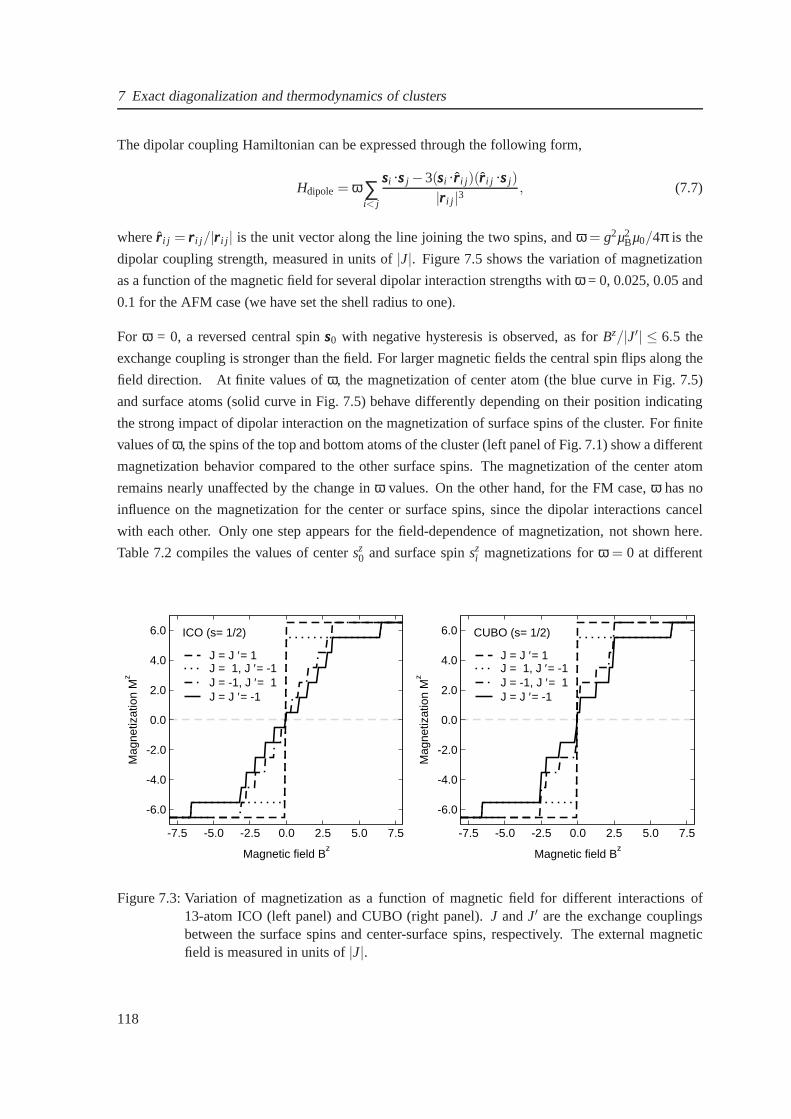
7 Exact diagonalization and thermodynamics of clusters
The dipolar coupling Hamiltonian can be expressed through the following form,
Hdipole = ω∑i< j
sssi ·sssj −3(sssi ·rrr i j )(rrr i j ·sssj)
|rrr i j |3, (7.7)
whererrr i j = rrr i j /|rrr i j | is the unit vector along the line joining the two spins, andω = g2µ2Bµ0/4π is the
dipolar coupling strength, measured in units of|J|. Figure 7.5 shows the variation of magnetization
as a function of the magnetic field for several dipolar interaction strengths withω = 0, 0.025, 0.05 and
0.1 for the AFM case (we have set the shell radius to one).
For ω = 0, a reversed central spinsss0 with negative hysteresis is observed, as forBz/|J′| ≤ 6.5 the
exchange coupling is stronger than the field. For larger magnetic fields the central spin flips along the
field direction. At finite values ofω, the magnetization of center atom (the blue curve in Fig. 7.5)
and surface atoms (solid curve in Fig. 7.5) behave differently depending on their position indicating
the strong impact of dipolar interaction on the magnetization of surface spins of the cluster. For finite
values ofω, the spins of the top and bottom atoms of the cluster (left panel of Fig. 7.1) show a different
magnetization behavior compared to the other surface spins. The magnetization of the center atom
remains nearly unaffected by the change inω values. On the other hand, for the FM case,ω has no
influence on the magnetization for the center or surface spins, since the dipolar interactions cancel
with each other. Only one step appears for the field-dependence of magnetization, not shown here.
Table 7.2 compiles the values of centersz0 and surface spinsz
i magnetizations forω = 0 at different
-7.5 -5.0 -2.5 0.0 2.5 5.0 7.5
Magnetic field Bz
-6.0
-4.0
-2.0
0.0
2.0
4.0
6.0
Mag
netiz
atio
n M
z
J = J ′= 1J = 1, J ′= -1J = -1, J ′= 1J = J ′= -1
ICO (s= 1/2)
-7.5 -5.0 -2.5 0.0 2.5 5.0 7.5
Magnetic field Bz
-6.0
-4.0
-2.0
0.0
2.0
4.0
6.0
Mag
netiz
atio
n M
z
J = J ′= 1J = 1, J ′= -1J = -1, J ′= 1J = J ′= -1
CUBO (s= 1/2)
Figure 7.3: Variation of magnetization as a function of magnetic field for different interactions of13-atom ICO (left panel) and CUBO (right panel).J andJ′ are the exchange couplingsbetween the surface spins and center-surface spins, respectively. The external magneticfield is measured in units of|J|.
118
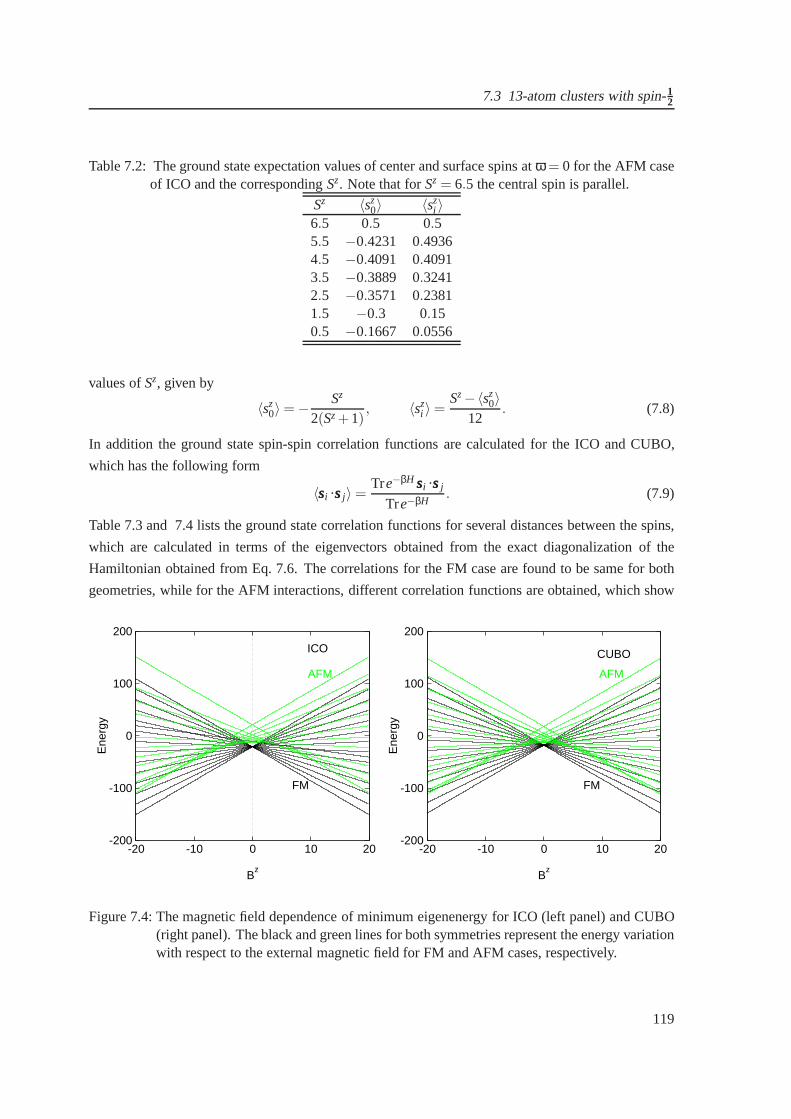
7.3 13-atom clusters with spin-12
Table 7.2: The ground state expectation values of center andsurface spins atω = 0 for the AFM caseof ICO and the correspondingSz. Note that forSz = 6.5 the central spin is parallel.
Sz 〈sz0〉 〈sz
i 〉6.5 0.5 0.55.5 −0.4231 0.49364.5 −0.4091 0.40913.5 −0.3889 0.32412.5 −0.3571 0.23811.5 −0.3 0.150.5 −0.1667 0.0556
values ofSz, given by
〈sz0〉 = − Sz
2(Sz+1), 〈sz
i 〉 =Sz−〈sz
0〉12
. (7.8)
In addition the ground state spin-spin correlation functions are calculated for the ICO and CUBO,
which has the following form
〈sssi ·sssj〉 =Tre−βH sssi ·sssj
Tre−βH. (7.9)
Table 7.3 and 7.4 lists the ground state correlation functions for several distances between the spins,
which are calculated in terms of the eigenvectors obtained from the exact diagonalization of the
Hamiltonian obtained from Eq. 7.6. The correlations for theFM case are found to be same for both
geometries, while for the AFM interactions, different correlation functions are obtained, which show
-20 -10 0 10 20
Bz
-200
-100
0
100
200
Ene
rgy
FM
AFM
ICO
-20 -10 0 10 20
Bz
-200
-100
0
100
200
Ene
rgy
FM
AFM
CUBO
Figure 7.4: The magnetic field dependence of minimum eigenenergy for ICO (left panel) and CUBO(right panel). The black and green lines for both symmetriesrepresent the energy variationwith respect to the external magnetic field for FM and AFM cases, respectively.
119
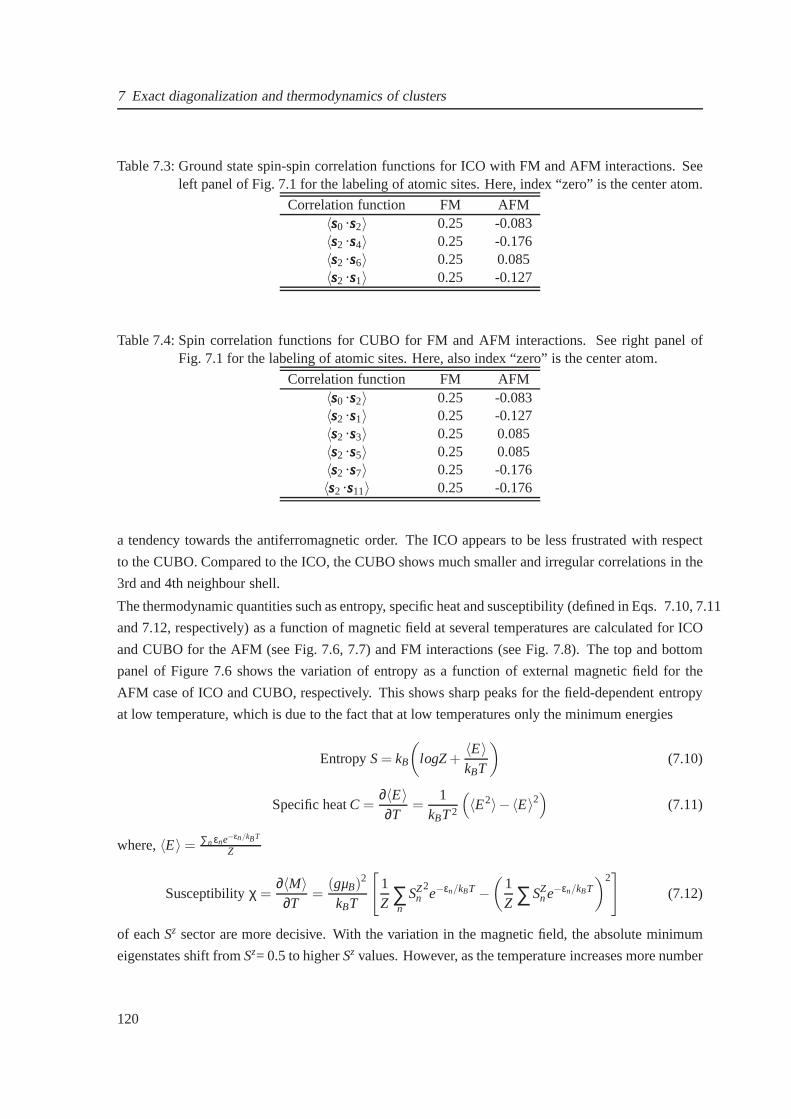
7 Exact diagonalization and thermodynamics of clusters
Table 7.3: Ground state spin-spin correlation functions for ICO with FM and AFM interactions. Seeleft panel of Fig. 7.1 for the labeling of atomic sites. Here,index “zero” is the center atom.
Correlation function FM AFM〈sss0 ·sss2〉 0.25 -0.083〈sss2 ·sss4〉 0.25 -0.176〈sss2 ·sss6〉 0.25 0.085〈sss2 ·sss1〉 0.25 -0.127
Table 7.4: Spin correlation functions for CUBO for FM and AFMinteractions. See right panel ofFig. 7.1 for the labeling of atomic sites. Here, also index “zero” is the center atom.
Correlation function FM AFM〈sss0 ·sss2〉 0.25 -0.083〈sss2 ·sss1〉 0.25 -0.127〈sss2 ·sss3〉 0.25 0.085〈sss2 ·sss5〉 0.25 0.085〈sss2 ·sss7〉 0.25 -0.176〈sss2 ·sss11〉 0.25 -0.176
a tendency towards the antiferromagnetic order. The ICO appears to be less frustrated with respect
to the CUBO. Compared to the ICO, the CUBO shows much smaller and irregular correlations in the
3rd and 4th neighbour shell.
The thermodynamic quantities such as entropy, specific heatand susceptibility (defined in Eqs. 7.10, 7.11
and 7.12, respectively) as a function of magnetic field at several temperatures are calculated for ICO
and CUBO for the AFM (see Fig. 7.6, 7.7) and FM interactions (see Fig. 7.8). The top and bottom
panel of Figure 7.6 shows the variation of entropy as a function of external magnetic field for the
AFM case of ICO and CUBO, respectively. This shows sharp peaks for the field-dependent entropy
at low temperature, which is due to the fact that at low temperatures only the minimum energies
EntropyS= kB
(
logZ+〈E〉kBT
)
(7.10)
Specific heatC =∂〈E〉∂T
=1
kBT2
(
〈E2〉− 〈E〉2)
(7.11)
where,〈E〉 = ∑n εne−εn/kBT
Z
Susceptibilityχ =∂〈M〉∂T
=(gµB)2
kBT
[
1Z ∑
nSZ
n2e−εn/kBT −
(
1Z ∑SZ
ne−εn/kBT)2
]
(7.12)
of eachSz sector are more decisive. With the variation in the magneticfield, the absolute minimum
eigenstates shift fromSz= 0.5 to higherSz values. However, as the temperature increases more number
120
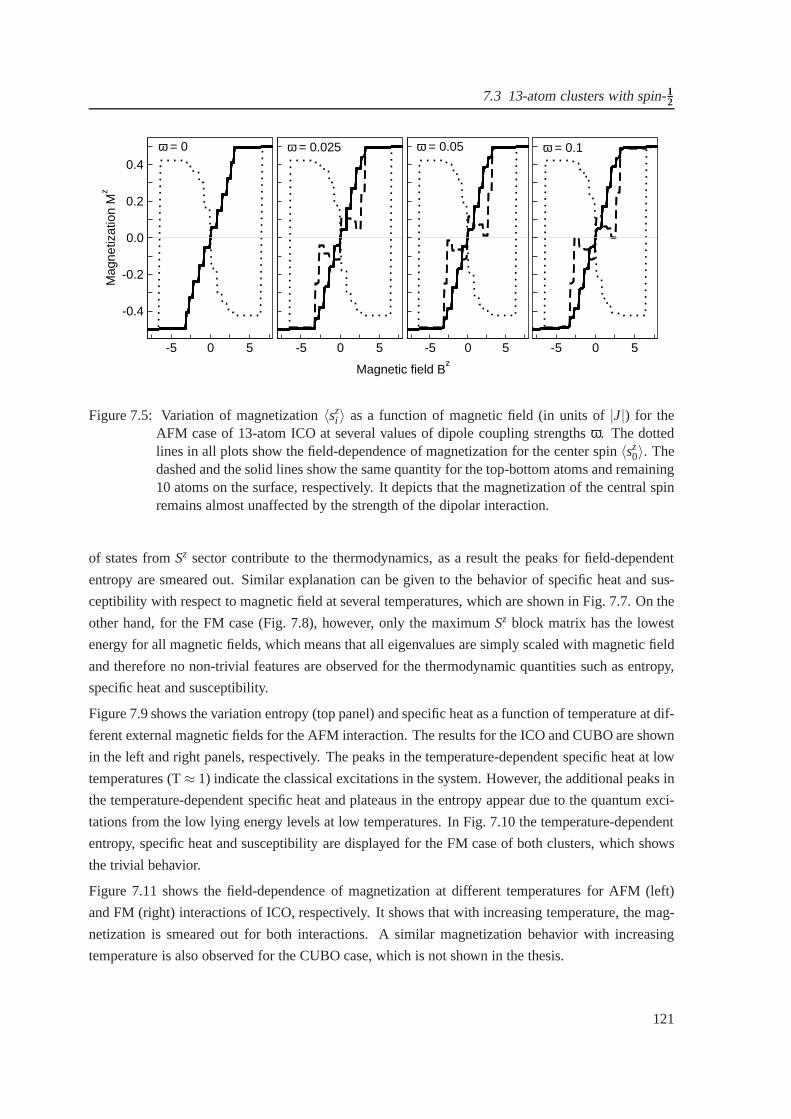
7.3 13-atom clusters with spin-12
-5 0 5
-0.4
-0.2
0.0
0.2
0.4
Mag
netiz
atio
n M
z
-5 0 5 -5 0 5 -5 0 5
Magnetic field Bz
ω = 0 ω = 0.025 ω = 0.05 ω = 0.1
Figure 7.5: Variation of magnetization〈szi 〉 as a function of magnetic field (in units of|J|) for the
AFM case of 13-atom ICO at several values of dipole coupling strengthsω. The dottedlines in all plots show the field-dependence of magnetization for the center spin〈sz
0〉. Thedashed and the solid lines show the same quantity for the top-bottom atoms and remaining10 atoms on the surface, respectively. It depicts that the magnetization of the central spinremains almost unaffected by the strength of the dipolar interaction.
of states fromSz sector contribute to the thermodynamics, as a result the peaks for field-dependent
entropy are smeared out. Similar explanation can be given tothe behavior of specific heat and sus-
ceptibility with respect to magnetic field at several temperatures, which are shown in Fig. 7.7. On the
other hand, for the FM case (Fig. 7.8), however, only the maximum Sz block matrix has the lowest
energy for all magnetic fields, which means that all eigenvalues are simply scaled with magnetic field
and therefore no non-trivial features are observed for the thermodynamic quantities such as entropy,
specific heat and susceptibility.
Figure 7.9 shows the variation entropy (top panel) and specific heat as a function of temperature at dif-
ferent external magnetic fields for the AFM interaction. Theresults for the ICO and CUBO are shown
in the left and right panels, respectively. The peaks in the temperature-dependent specific heat at low
temperatures (T≈ 1) indicate the classical excitations in the system. However, the additional peaks in
the temperature-dependent specific heat and plateaus in theentropy appear due to the quantum exci-
tations from the low lying energy levels at low temperatures. In Fig. 7.10 the temperature-dependent
entropy, specific heat and susceptibility are displayed forthe FM case of both clusters, which shows
the trivial behavior.
Figure 7.11 shows the field-dependence of magnetization at different temperatures for AFM (left)
and FM (right) interactions of ICO, respectively. It shows that with increasing temperature, the mag-
netization is smeared out for both interactions. A similar magnetization behavior with increasing
temperature is also observed for the CUBO case, which is not shown in the thesis.
121
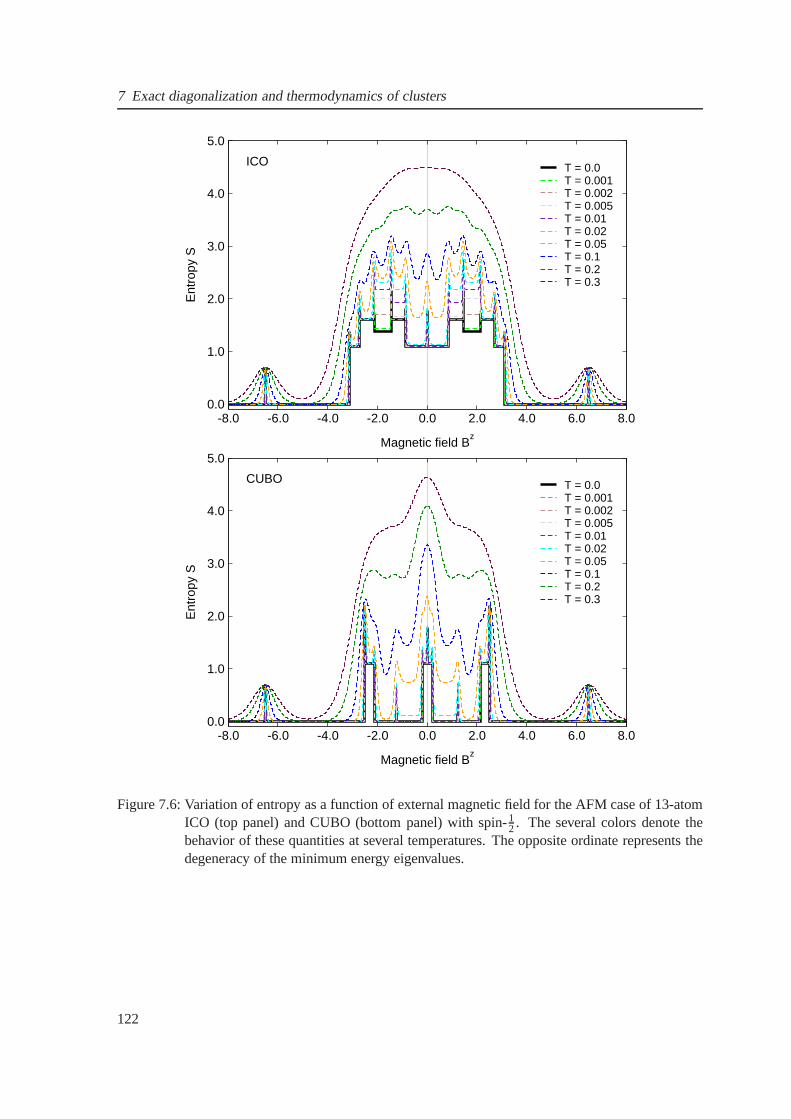
7 Exact diagonalization and thermodynamics of clusters
-8.0 -6.0 -4.0 -2.0 0.0 2.0 4.0 6.0 8.0
Magnetic field Bz
0.0
1.0
2.0
3.0
4.0
5.0
Ent
ropy
S
T = 0.0T = 0.001T = 0.002T = 0.005T = 0.01T = 0.02T = 0.05T = 0.1T = 0.2T = 0.3
ICO
-8.0 -6.0 -4.0 -2.0 0.0 2.0 4.0 6.0 8.0
Magnetic field Bz
0.0
1.0
2.0
3.0
4.0
5.0
Ent
ropy
S
T = 0.0T = 0.001T = 0.002T = 0.005T = 0.01T = 0.02T = 0.05T = 0.1T = 0.2T = 0.3
CUBO
Figure 7.6: Variation of entropy as a function of external magnetic field for the AFM case of 13-atomICO (top panel) and CUBO (bottom panel) with spin-1
2 . The several colors denote thebehavior of these quantities at several temperatures. The opposite ordinate represents thedegeneracy of the minimum energy eigenvalues.
122
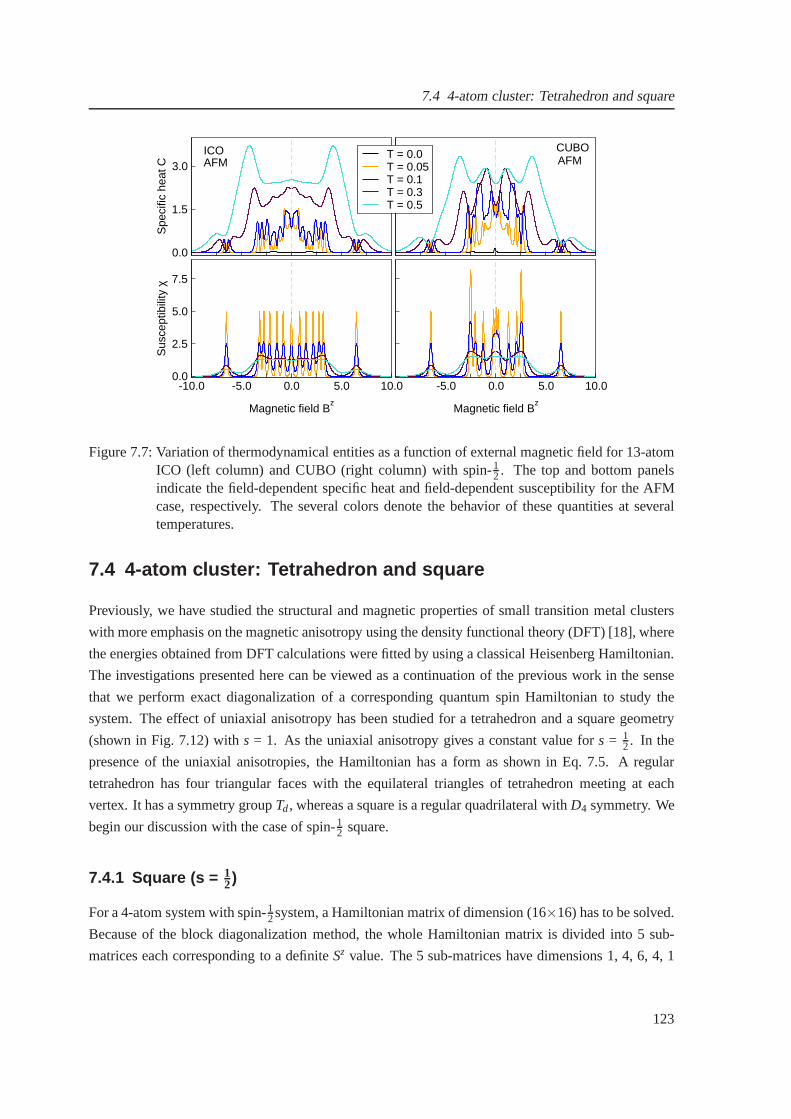
7.4 4-atom cluster: Tetrahedron and square
0.0
1.5
3.0S
peci
fic h
eat C
T = 0.0T = 0.05T = 0.1T = 0.3T = 0.5
-10.0 -5.0 0.0 5.0 10.0
Magnetic field Bz
0.0
2.5
5.0
7.5
Sus
cept
ibili
ty χ
-5.0 0.0 5.0 10.0
Magnetic field Bz
CUBOICOAFM AFM
Figure 7.7: Variation of thermodynamical entities as a function of external magnetic field for 13-atomICO (left column) and CUBO (right column) with spin-1
2 . The top and bottom panelsindicate the field-dependent specific heat and field-dependent susceptibility for the AFMcase, respectively. The several colors denote the behaviorof these quantities at severaltemperatures.
7.4 4-atom cluster: Tetrahedron and square
Previously, we have studied the structural and magnetic properties of small transition metal clusters
with more emphasis on the magnetic anisotropy using the density functional theory (DFT) [18], where
the energies obtained from DFT calculations were fitted by using a classical Heisenberg Hamiltonian.
The investigations presented here can be viewed as a continuation of the previous work in the sense
that we perform exact diagonalization of a corresponding quantum spin Hamiltonian to study the
system. The effect of uniaxial anisotropy has been studied for a tetrahedron and a square geometry
(shown in Fig. 7.12) withs = 1. As the uniaxial anisotropy gives a constant value fors = 12. In the
presence of the uniaxial anisotropies, the Hamiltonian hasa form as shown in Eq. 7.5. A regular
tetrahedron has four triangular faces with the equilateraltriangles of tetrahedron meeting at each
vertex. It has a symmetry groupTd, whereas a square is a regular quadrilateral withD4 symmetry. We
begin our discussion with the case of spin-12 square.
7.4.1 Square (s = 12)
For a 4-atom system with spin-12system, a Hamiltonian matrix of dimension (16×16) has to be solved.
Because of the block diagonalization method, the whole Hamiltonian matrix is divided into 5 sub-
matrices each corresponding to a definiteSz value. The 5 sub-matrices have dimensions 1, 4, 6, 4, 1
123
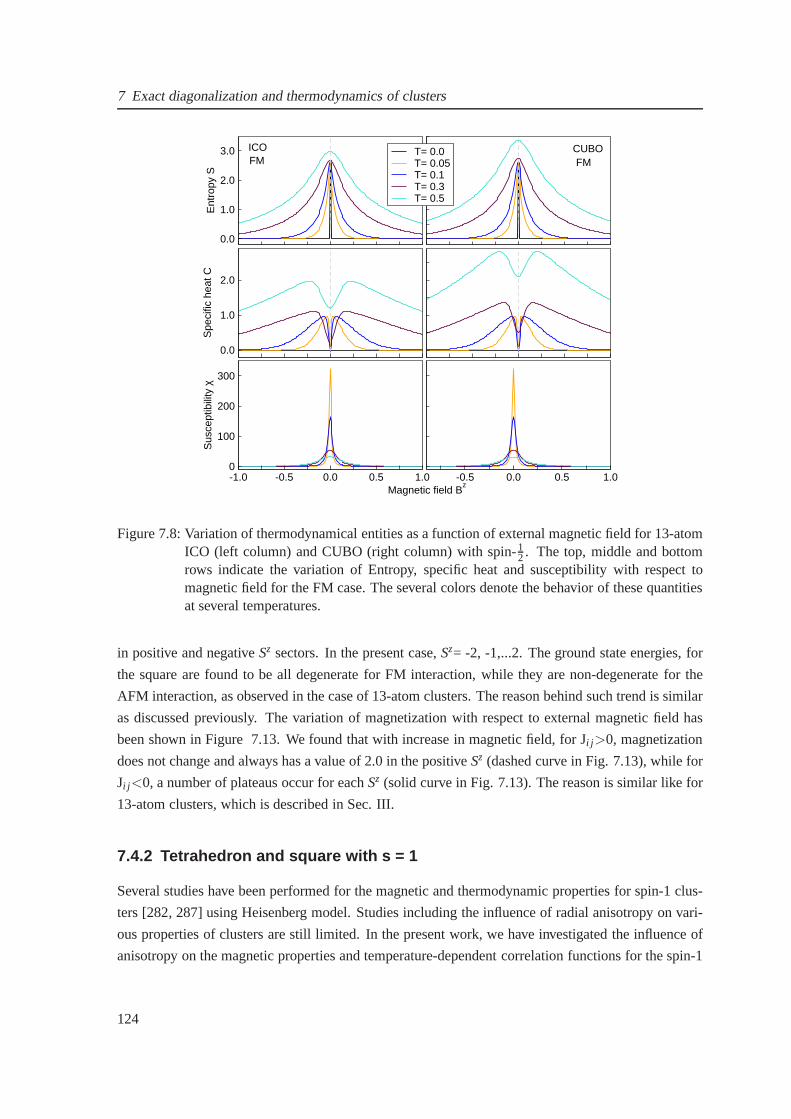
7 Exact diagonalization and thermodynamics of clusters
0.0
1.0
2.0
3.0
Ent
ropy
S
T= 0.0T= 0.05T= 0.1T= 0.3T= 0.5
0.0
1.0
2.0
Spe
cific
hea
t C
-1.0 -0.5 0.0 0.5 1.00
100
200
300
Sus
cept
ibili
ty χ
-0.5 0.0 0.5 1.0Magnetic field B
z
CUBOICO
FMFM
Figure 7.8: Variation of thermodynamical entities as a function of external magnetic field for 13-atomICO (left column) and CUBO (right column) with spin-1
2 . The top, middle and bottomrows indicate the variation of Entropy, specific heat and susceptibility with respect tomagnetic field for the FM case. The several colors denote the behavior of these quantitiesat several temperatures.
in positive and negativeSz sectors. In the present case,Sz= -2, -1,...2. The ground state energies, for
the square are found to be all degenerate for FM interaction,while they are non-degenerate for the
AFM interaction, as observed in the case of 13-atom clusters. The reason behind such trend is similar
as discussed previously. The variation of magnetization with respect to external magnetic field has
been shown in Figure 7.13. We found that with increase in magnetic field, for Ji j >0, magnetization
does not change and always has a value of 2.0 in the positiveSz (dashed curve in Fig. 7.13), while for
Ji j <0, a number of plateaus occur for eachSz (solid curve in Fig. 7.13). The reason is similar like for
13-atom clusters, which is described in Sec. III.
7.4.2 Tetrahedron and square with s = 1
Several studies have been performed for the magnetic and thermodynamic properties for spin-1 clus-
ters [282, 287] using Heisenberg model. Studies including the influence of radial anisotropy on vari-
ous properties of clusters are still limited. In the presentwork, we have investigated the influence of
anisotropy on the magnetic properties and temperature-dependent correlation functions for the spin-1
124
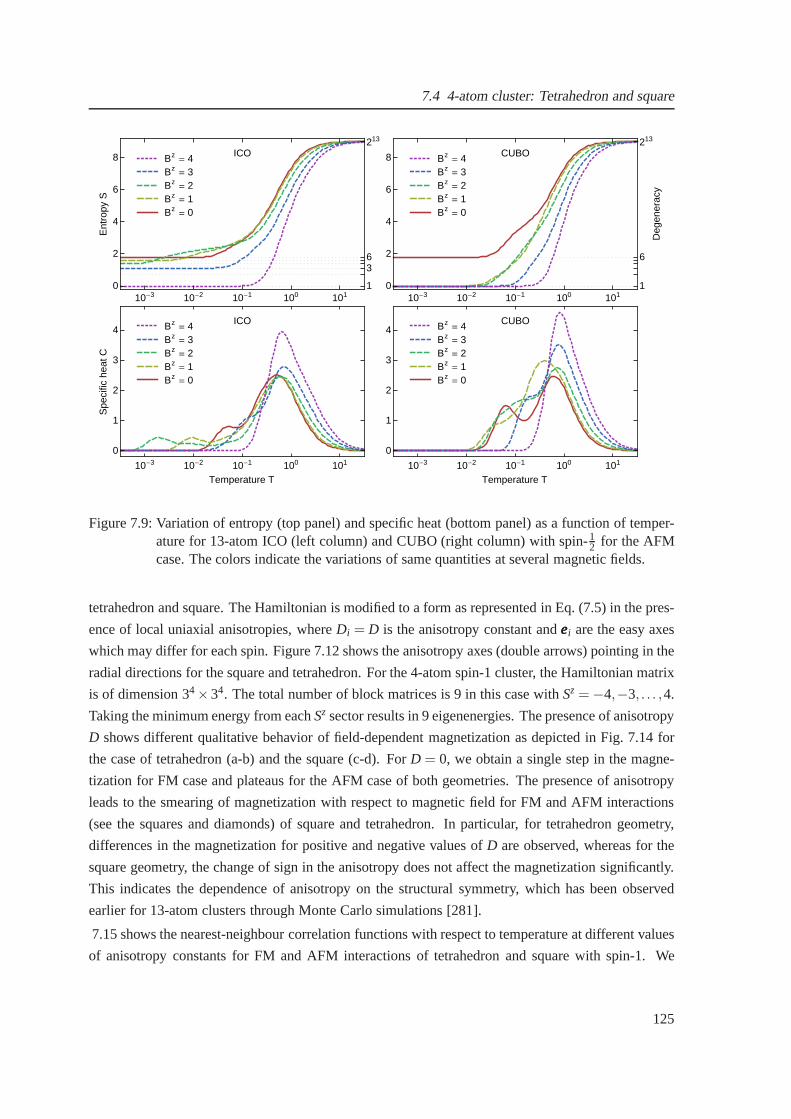
7.4 4-atom cluster: Tetrahedron and square
10-3 10-2 10-1 100 1010
2
4
6
8
1
36
213
Ent
ropy
S
ICO
Bz= 0
Bz= 1
Bz= 2
Bz= 3
Bz= 4
10-3 10-2 10-1 100 1010
2
4
6
8
1
6
213
CUBO
Deg
ener
acy
Bz= 0
Bz= 1
Bz= 2
Bz= 3
Bz= 4
10-3 10-2 10-1 100 101
0
1
2
3
4
Temperature T
Spe
cific
heat
C
ICO
Bz= 0
Bz= 1
Bz= 2
Bz= 3
Bz= 4
10-3 10-2 10-1 100 101
0
1
2
3
4
Temperature T
CUBO
Bz= 0
Bz= 1
Bz= 2
Bz= 3
Bz= 4
Figure 7.9: Variation of entropy (top panel) and specific heat (bottom panel) as a function of temper-ature for 13-atom ICO (left column) and CUBO (right column) with spin-12 for the AFMcase. The colors indicate the variations of same quantitiesat several magnetic fields.
tetrahedron and square. The Hamiltonian is modified to a formas represented in Eq. (7.5) in the pres-
ence of local uniaxial anisotropies, whereDi = D is the anisotropy constant andeeei are the easy axes
which may differ for each spin. Figure 7.12 shows the anisotropy axes (double arrows) pointing in the
radial directions for the square and tetrahedron. For the 4-atom spin-1 cluster, the Hamiltonian matrix
is of dimension 34×34. The total number of block matrices is 9 in this case withSz = −4,−3, . . . ,4.
Taking the minimum energy from eachSz sector results in 9 eigenenergies. The presence of anisotropy
D shows different qualitative behavior of field-dependent magnetization as depicted in Fig. 7.14 for
the case of tetrahedron (a-b) and the square (c-d). ForD = 0, we obtain a single step in the magne-
tization for FM case and plateaus for the AFM case of both geometries. The presence of anisotropy
leads to the smearing of magnetization with respect to magnetic field for FM and AFM interactions
(see the squares and diamonds) of square and tetrahedron. Inparticular, for tetrahedron geometry,
differences in the magnetization for positive and negativevalues ofD are observed, whereas for the
square geometry, the change of sign in the anisotropy does not affect the magnetization significantly.
This indicates the dependence of anisotropy on the structural symmetry, which has been observed
earlier for 13-atom clusters through Monte Carlo simulations [281].
7.15 shows the nearest-neighbour correlation functions with respect to temperature at different values
of anisotropy constants for FM and AFM interactions of tetrahedron and square with spin-1. We
125
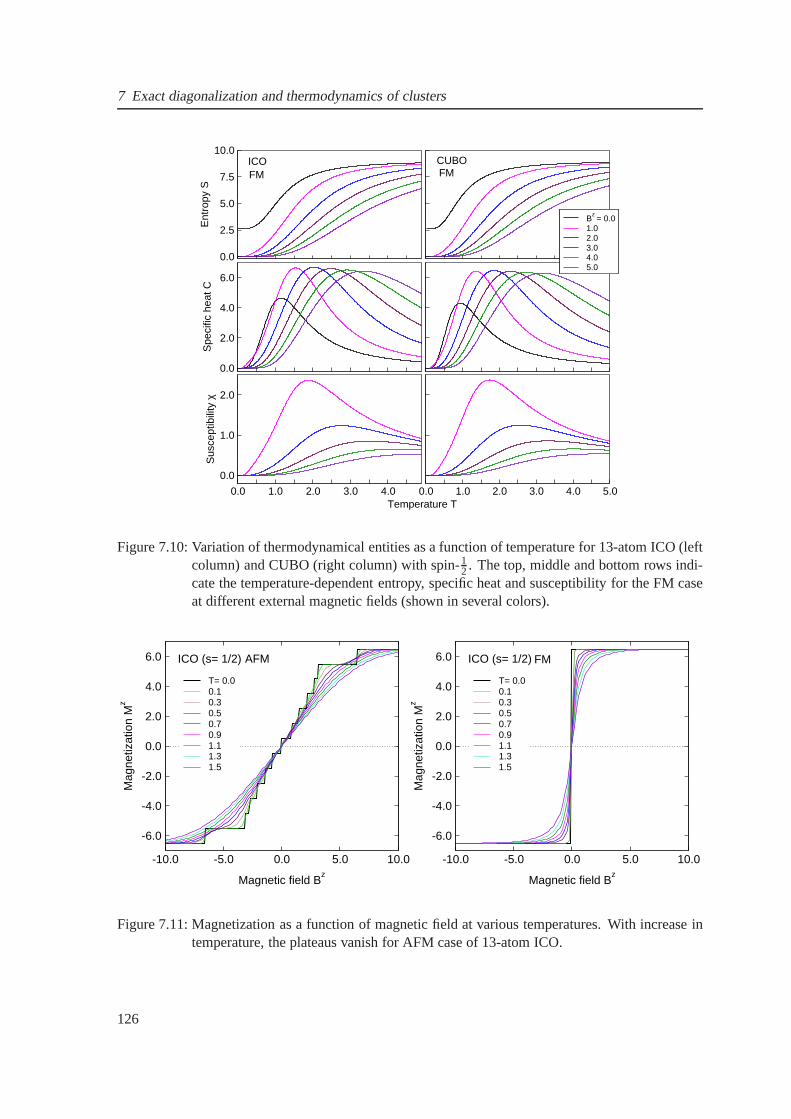
7 Exact diagonalization and thermodynamics of clusters
0.0
2.5
5.0
7.5
10.0
Ent
ropy
SB
z = 0.0
1.02.03.04.05.0
0.0
2.0
4.0
6.0
Spe
cific
hea
t CB
z = 0.0
1.02.03.04.05.0
0.0 1.0 2.0 3.0 4.0
0.0
1.0
2.0
Sus
cept
ibili
ty χ
0.0 1.0 2.0 3.0 4.0 5.0Temperature T
CUBOICOFMFM
Figure 7.10: Variation of thermodynamical entities as a function of temperature for 13-atom ICO (leftcolumn) and CUBO (right column) with spin-1
2 . The top, middle and bottom rows indi-cate the temperature-dependent entropy, specific heat and susceptibility for the FM caseat different external magnetic fields (shown in several colors).
-10.0 -5.0 0.0 5.0 10.0
Magnetic field Bz
-6.0
-4.0
-2.0
0.0
2.0
4.0
6.0
Mag
netiz
atio
n M
z
T= 0.00.10.30.50.70.91.11.31.5
ICO (s= 1/2) AFM
-10.0 -5.0 0.0 5.0 10.0
Magnetic field Bz
-6.0
-4.0
-2.0
0.0
2.0
4.0
6.0
Mag
netiz
atio
n M
z
T= 0.00.10.30.50.70.91.11.31.5
ICO (s= 1/2) FM
Figure 7.11: Magnetization as a function of magnetic field atvarious temperatures. With increase intemperature, the plateaus vanish for AFM case of 13-atom ICO.
126
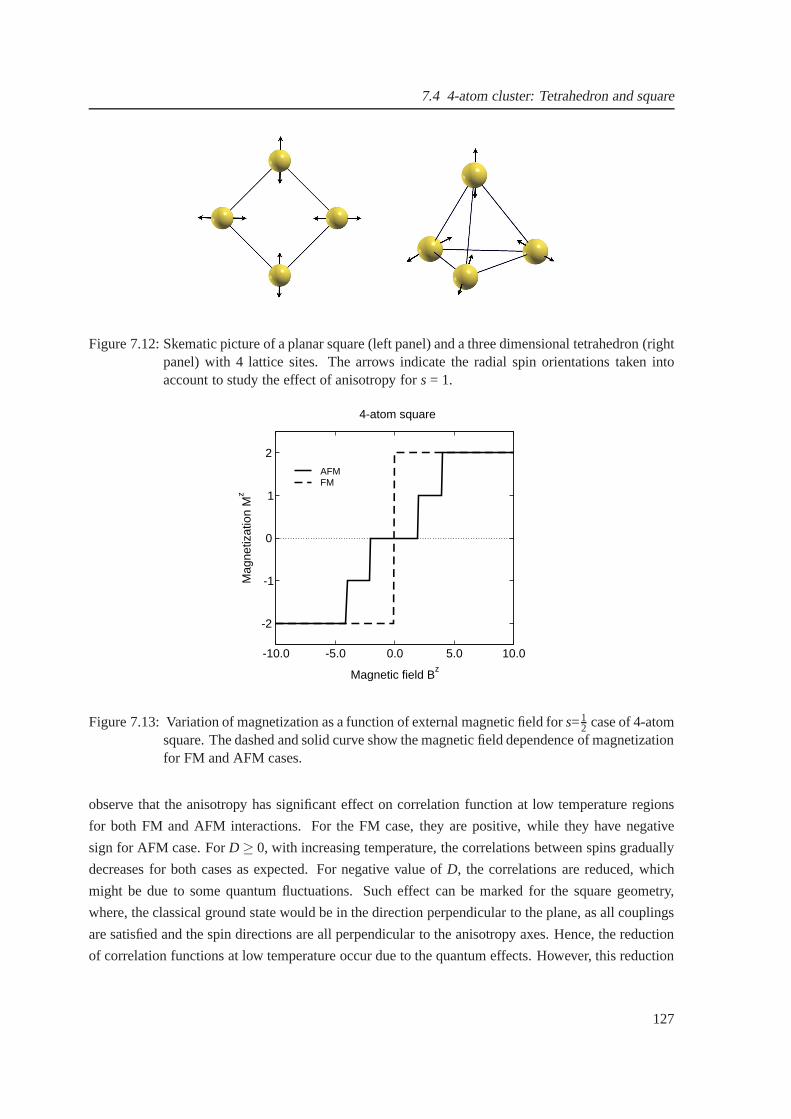
7.4 4-atom cluster: Tetrahedron and square
Figure 7.12: Skematic picture of a planar square (left panel) and a three dimensional tetrahedron (rightpanel) with 4 lattice sites. The arrows indicate the radial spin orientations taken intoaccount to study the effect of anisotropy fors= 1.
-10.0 -5.0 0.0 5.0 10.0
Magnetic field Bz
-2
-1
0
1
2
Mag
netiz
atio
n M
z
AFMFM
4-atom square
Figure 7.13: Variation of magnetization as a function of external magnetic field fors=12 case of 4-atom
square. The dashed and solid curve show the magnetic field dependence of magnetizationfor FM and AFM cases.
observe that the anisotropy has significant effect on correlation function at low temperature regions
for both FM and AFM interactions. For the FM case, they are positive, while they have negative
sign for AFM case. ForD ≥ 0, with increasing temperature, the correlations between spins gradually
decreases for both cases as expected. For negative value ofD, the correlations are reduced, which
might be due to some quantum fluctuations. Such effect can be marked for the square geometry,
where, the classical ground state would be in the direction perpendicular to the plane, as all couplings
are satisfied and the spin directions are all perpendicular to the anisotropy axes. Hence, the reduction
of correlation functions at low temperature occur due to thequantum effects. However, this reduction
127
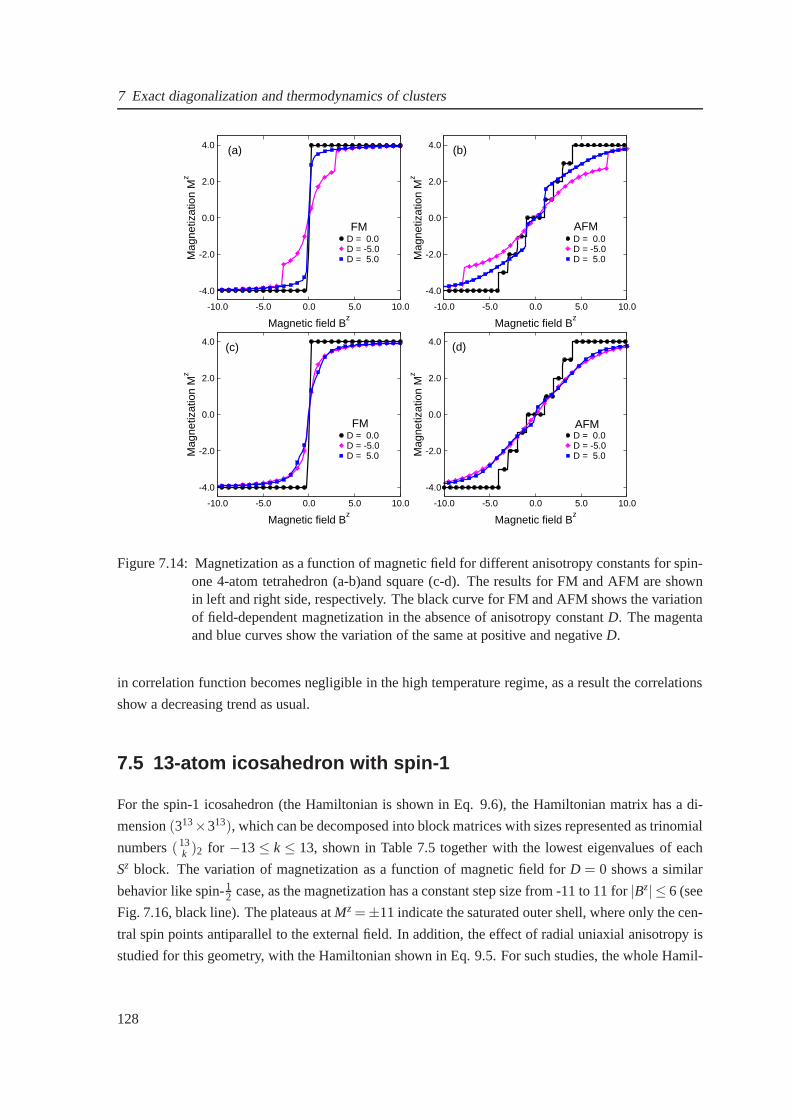
7 Exact diagonalization and thermodynamics of clusters
-10.0 -5.0 0.0 5.0 10.0
Magnetic field Bz
-4.0
-2.0
0.0
2.0
4.0
Mag
netiz
atio
n M
z
D = 0.0D = -5.0D = 5.0
FM
(a)
-10.0 -5.0 0.0 5.0 10.0
Magnetic field Bz
-4.0
-2.0
0.0
2.0
4.0
Mag
netiz
atio
n M
z
D = 0.0D = -5.0D = 5.0
AFM
(b)
-10.0 -5.0 0.0 5.0 10.0
Magnetic field Bz
-4.0
-2.0
0.0
2.0
4.0
Mag
netiz
atio
n M
z
D = 0.0D = -5.0D = 5.0
FM
(c)
-10.0 -5.0 0.0 5.0 10.0
Magnetic field Bz
-4.0
-2.0
0.0
2.0
4.0
Mag
netiz
atio
n M
z
D = 0.0D = -5.0D = 5.0
AFM
(d)
Figure 7.14: Magnetization as a function of magnetic field for different anisotropy constants for spin-one 4-atom tetrahedron (a-b)and square (c-d). The results for FM and AFM are shownin left and right side, respectively. The black curve for FM and AFM shows the variationof field-dependent magnetization in the absence of anisotropy constantD. The magentaand blue curves show the variation of the same at positive andnegativeD.
in correlation function becomes negligible in the high temperature regime, as a result the correlations
show a decreasing trend as usual.
7.5 13-atom icosahedron with spin-1
For the spin-1 icosahedron (the Hamiltonian is shown in Eq. 9.6), the Hamiltonian matrix has a di-
mension(313×313), which can be decomposed into block matrices with sizes represented as trinomial
numbers(13k )2 for −13≤ k ≤ 13, shown in Table 7.5 together with the lowest eigenvalues of each
Sz block. The variation of magnetization as a function of magnetic field for D = 0 shows a similar
behavior like spin-12 case, as the magnetization has a constant step size from -11 to 11 for|Bz| ≤ 6 (see
Fig. 7.16, black line). The plateaus atMz =±11 indicate the saturated outer shell, where only the cen-
tral spin points antiparallel to the external field. In addition, the effect of radial uniaxial anisotropy is
studied for this geometry, with the Hamiltonian shown in Eq.9.5. For such studies, the whole Hamil-
128

7.5 13-atom icosahedron with spin-1
0.0
0.3
0.6
0.9
D = -5.0D = -2.5D = 0.0D = 2.5D = 5.0
-0.6
-0.4
-0.2
0.0
0.0 1.0 2.0 3.0 4.0
Temperature T
0.0
0.3
0.6
0.9
0.0 1.0 2.0 3.0 4.0
Temperature T
-1.5
-1.0
-0.5
0.0Square
AFMFM
Tetrahedron⟨ s
i.sj⟩
Figure 7.15: The variation of spin-spin correlation function with respect to temperature for spin-1tetrahedron (top) and square (bottom) for several anisotropy constants.
-15.0 -10.0 -5.0 0.0 5.0 10.0 15.0
Magnetic field Bz
-10.0
-5.0
0.0
5.0
10.0
Mag
netiz
atio
n M
z
D = 0.0D = -5.0D = 5.0
AFM
Figure 7.16: Variation of magnetization as a function of theexternal magnetic field (measured in unitsof |J|) for the spin-1 AFM icosahedron.
tonian matrix is considered, since the anisotropy term doesnot commute with the interaction term
and hence destroys the block structure of theH. In the present case, we have calculated the minimum
eigenvalues and eigenvectors using the Lanczos scheme. Theresulting field-dependent magnetiza-
129
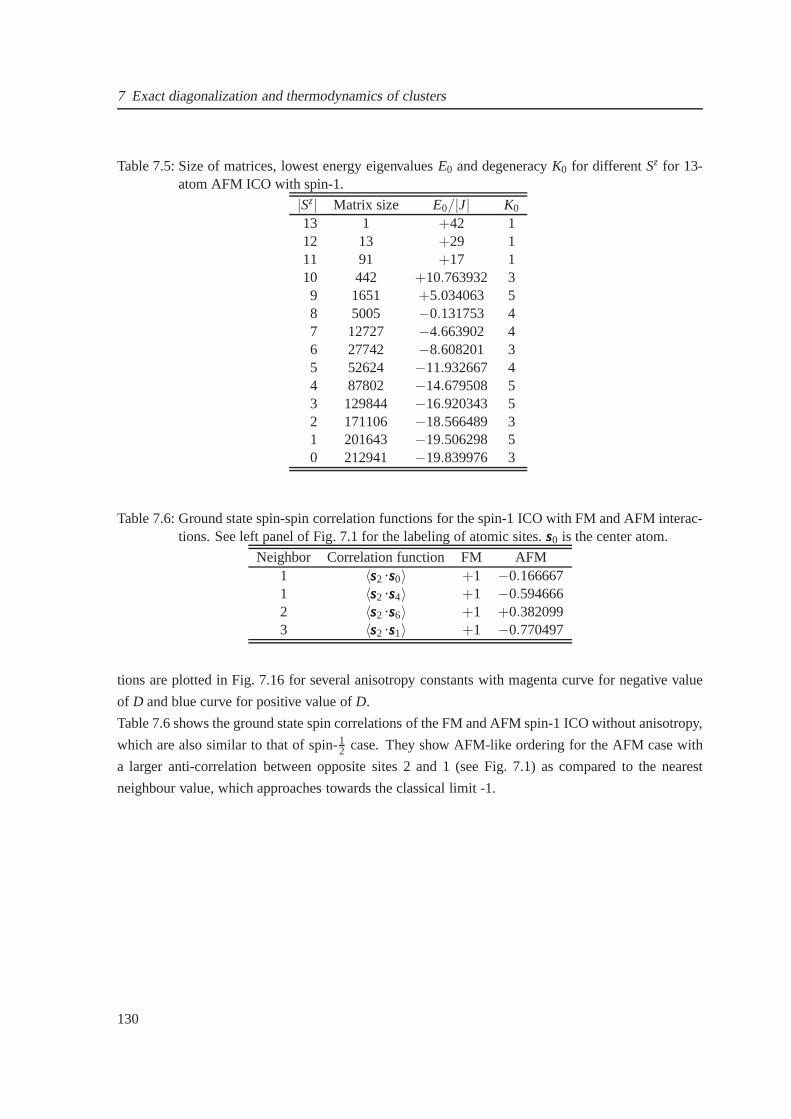
7 Exact diagonalization and thermodynamics of clusters
Table 7.5: Size of matrices, lowest energy eigenvaluesE0 and degeneracyK0 for different Sz for 13-atom AFM ICO with spin-1.
|Sz| Matrix size E0/|J| K0
13 1 +42 112 13 +29 111 91 +17 110 442 +10.763932 39 1651 +5.034063 58 5005 −0.131753 47 12727 −4.663902 46 27742 −8.608201 35 52624 −11.932667 44 87802 −14.679508 53 129844 −16.920343 52 171106 −18.566489 31 201643 −19.506298 50 212941 −19.839976 3
Table 7.6: Ground state spin-spin correlation functions for the spin-1 ICO with FM and AFM interac-tions. See left panel of Fig. 7.1 for the labeling of atomic sites.sss0 is the center atom.
Neighbor Correlation function FM AFM1 〈sss2 ·sss0〉 +1 −0.1666671 〈sss2 ·sss4〉 +1 −0.5946662 〈sss2 ·sss6〉 +1 +0.3820993 〈sss2 ·sss1〉 +1 −0.770497
tions are plotted in Fig. 7.16 for several anisotropy constants with magenta curve for negative value
of D and blue curve for positive value ofD.
Table 7.6 shows the ground state spin correlations of the FM and AFM spin-1 ICO without anisotropy,
which are also similar to that of spin-12 case. They show AFM-like ordering for the AFM case with
a larger anti-correlation between opposite sites 2 and 1 (see Fig. 7.1) as compared to the nearest
neighbour value, which approaches towards the classical limit -1.
130
8 Summary and outlook
8.1 Summary
This thesis deals with the study of structural, magnetic andelectronic properties of elemental and
binary transition metal clusters. We have considered especially the closed shell clusters of Fe, Co,
Ni and Pt. We have used the density functional theory for studying the electronic structure and the
total energy. As the exchange-correlation potential we have adopted the generalized gradient ap-
proximation, which is successful in describing the properties of metals. The cluster geometries are
structurally optimized by applying the conjugate gradientenergy minimization procedure. We have
explored various essential properties of clusters like theground-state structure, structure dependent
magnetic moment, possible distribution of atoms in binary clusters through segregation and mixing.
Magnetic anisotropy properties has been studied for various free and supported clusters. We have
used the exact-diagonalization procedure to study the thermodynamics of clusters.
The studies of the ground-state structural properties of small elemental clusters of Ni and Fe with upto
16 atoms suggest that the small clusters are slightly distorted from perfect geometry. The distortion
is identified as the Jahn-Teller distortion which arises because of the inherent property of a system
to avoid degeneracy of states at the Fermi level. The magnetic moments of clusters are larger than
bulk due to the uncompensated bonding of atoms. The magneticmoment as a function of cluster size
shows an oscillatory (non-monotonous) behavior. The convergence of magnetic moment towards the
corresponding bulk value is much faster for Ni clusters thanthat of Fe, which is in agreement with
experimental results. We observe existence of two spin states for the icosahedral Fe13 from the fixed
spin moment calculations The two spin states are: (i) the high-spin state with magnetic moment 44µB,
where all spins are parallel to each other, (ii) the low spin state with magnetic moment 34µB, where
the central spin is aligned oppositely with respect to the surrounding surface atoms. We find that the
high-spin state has a lower energy than the low-spin state.
Our studies on binary icosahedral Fe-(Co, Ni, Pt) and Co-(Pt, Mn) clusters show a competition be-
tween the alloy components which finally leads to chemical ordering and segregation. In order to
achieve this, the energetically preferable configuration of the binary clusters are found for several
compositions. Using the lowest energy structure of the compositions, the mixing energy is calcu-
lated. We observe a qualitative resemblance for composition-dependent mixing energy for Fe13−nNinclusters as compared to that of the bulk alloy. For Fe-Ni clusters, it is found that Ni atoms show the
occupancy at the surface of the icosahedron for all compositions studied. For 55-atom binary clusters,
131
8 Summary and outlook
however, owing to the large number of configurations that canbe possible, we have studied selective
compositions in the extreme composition regions to comparethe trends of 13-atom cluster. Our stud-
ies on 55-atom binary clusters showed similar tendencies asthat of the 13-atom binary clusters. From
the segregation properties as observed for Fe-Ni, Fe-Pt andCo-Pt, we could generalize the trend that
in a binary cluster the component with larger atomic number segregate towards the surface of the clus-
ter. In the TM-Pt binary clusters we find induced magnetic moment on Pt due to the TM component,
which is otherwise non magnetic in bulk.
Our studies on 13- and 55-atom icosahedral binary Fe, Co, Ni and Pt clusters show that there is a
competition between the alloy components which finally leads to chemical ordering and segregation.
We have calculated the mixing energy at all compositions forthe energetically most favorable config-
uration of component atoms in the cluster. The trend in the mixing energy gives the chemical ordering
and the corresponding cluster configuration is used to studythe segregation property. We observe a
qualitative resemblance of composition-dependent mixingenergy for Fe13−nNin clusters as compared
to that of the bulk alloy. For 55-atom binary clusters, however, owing to the large number of con-
figurations that can be possible, we have studied selective compositions in the extreme composition
regions to compare the trends of 13-atom cluster. Our studies on 55-atom binary clusters showed
similar tendencies as that of the 13-atom binary cluster. From the segregation properties as observed
for Fe-Ni, Fe-Pt and Co-Pt, we could generalize the trend that in a binary cluster the component with
larger atomic number segregate towards the surface of the cluster. In the TM-Pt binary clusters we
find induced magnetic moment on Pt due to the TM component, which is otherwise non magnetic in
bulk.
One of the main part of the thesis is the magnetic anisotropy studies of clusters. Usually the compu-
tational demand for magnetic anisotropy studies is more because of inclusion of spin-orbit part into
the Hamiltonian. Since the energy differences we are dealing with magnetic anisotropy studies are
relatively smaller, this needs more accurate calculationswith large energy cut-off and Fourier transfor-
mation grids. Our studies show that both spin and orbital moments of clusters are larger compared to
the corresponding bulk values. The MAE for perfect icosahedral clusters has been obtained from our
calculations and compared with the Néel anisotropy model, which are in good qualitative agreement.
We have studied the MAE of relaxed Fe13, Co13 and Ni13 clusters through two competing structural
transformation paths, namely, the Jahn Teller and the Mackay transformation. As already mentioned,
JT-distortion in clusters is a natural way to structural deviations. In the present controlled structural
transformation with separate transformations paths show that Fe13 prefers JT-distortion, while Co13
prefers MT-distortion. For Ni13 we find that both JT- and MT- distortions are almost degenerate. It
is found that the MAE of clusters is larger as compared to their bulk values. Since MAE is related
to the structure through the position vectors of all the atoms, symmetry of clusters play an important
role. The relaxed clusters have a large MAE than the perfect clusters as a consequence of symmetry
lowering for the relaxed clusters. It is peculiar that this trend was not observed for Co13 cluster, where
the MAE values were similar to that of bulk values. Our studies on Pt-capped Fe13 cluster (Fe13Pt4)
132
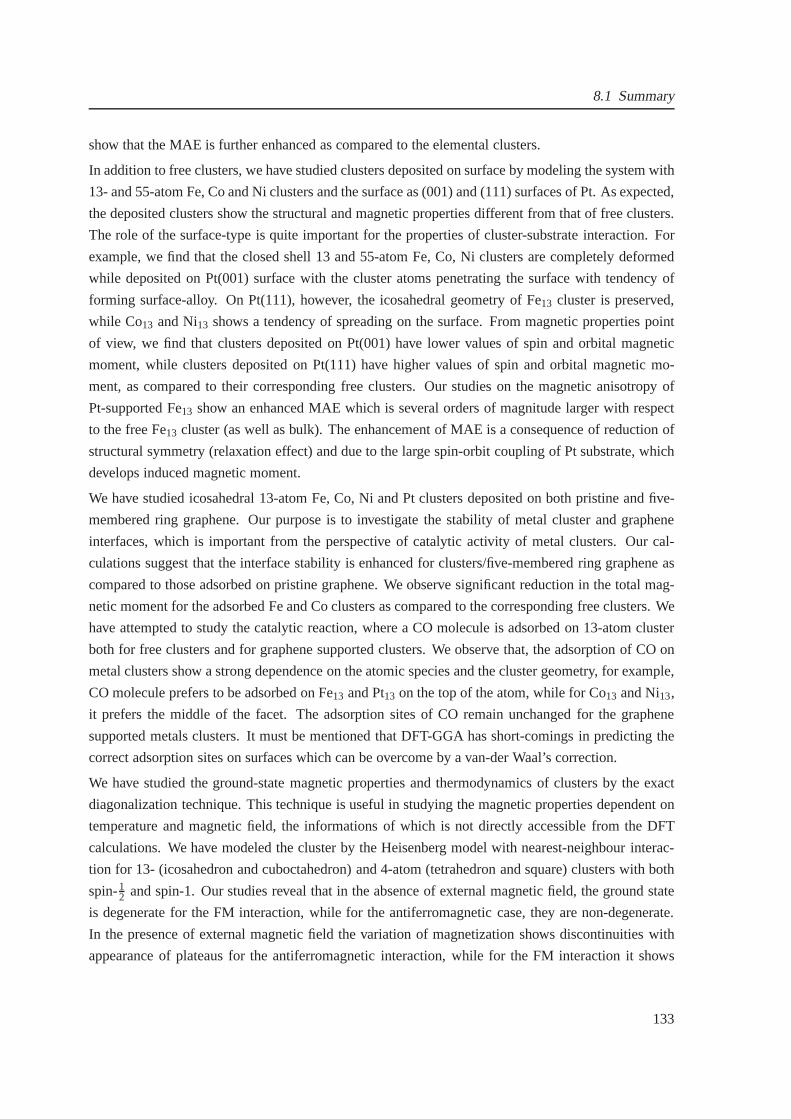
8.1 Summary
show that the MAE is further enhanced as compared to the elemental clusters.
In addition to free clusters, we have studied clusters deposited on surface by modeling the system with
13- and 55-atom Fe, Co and Ni clusters and the surface as (001)and (111) surfaces of Pt. As expected,
the deposited clusters show the structural and magnetic properties different from that of free clusters.
The role of the surface-type is quite important for the properties of cluster-substrate interaction. For
example, we find that the closed shell 13 and 55-atom Fe, Co, Niclusters are completely deformed
while deposited on Pt(001) surface with the cluster atoms penetrating the surface with tendency of
forming surface-alloy. On Pt(111), however, the icosahedral geometry of Fe13 cluster is preserved,
while Co13 and Ni13 shows a tendency of spreading on the surface. From magnetic properties point
of view, we find that clusters deposited on Pt(001) have lowervalues of spin and orbital magnetic
moment, while clusters deposited on Pt(111) have higher values of spin and orbital magnetic mo-
ment, as compared to their corresponding free clusters. Ourstudies on the magnetic anisotropy of
Pt-supported Fe13 show an enhanced MAE which is several orders of magnitude larger with respect
to the free Fe13 cluster (as well as bulk). The enhancement of MAE is a consequence of reduction of
structural symmetry (relaxation effect) and due to the large spin-orbit coupling of Pt substrate, which
develops induced magnetic moment.
We have studied icosahedral 13-atom Fe, Co, Ni and Pt clusters deposited on both pristine and five-
membered ring graphene. Our purpose is to investigate the stability of metal cluster and graphene
interfaces, which is important from the perspective of catalytic activity of metal clusters. Our cal-
culations suggest that the interface stability is enhancedfor clusters/five-membered ring graphene as
compared to those adsorbed on pristine graphene. We observesignificant reduction in the total mag-
netic moment for the adsorbed Fe and Co clusters as compared to the corresponding free clusters. We
have attempted to study the catalytic reaction, where a CO molecule is adsorbed on 13-atom cluster
both for free clusters and for graphene supported clusters.We observe that, the adsorption of CO on
metal clusters show a strong dependence on the atomic species and the cluster geometry, for example,
CO molecule prefers to be adsorbed on Fe13 and Pt13 on the top of the atom, while for Co13 and Ni13,
it prefers the middle of the facet. The adsorption sites of COremain unchanged for the graphene
supported metals clusters. It must be mentioned that DFT-GGA has short-comings in predicting the
correct adsorption sites on surfaces which can be overcome by a van-der Waal’s correction.
We have studied the ground-state magnetic properties and thermodynamics of clusters by the exact
diagonalization technique. This technique is useful in studying the magnetic properties dependent on
temperature and magnetic field, the informations of which isnot directly accessible from the DFT
calculations. We have modeled the cluster by the Heisenbergmodel with nearest-neighbour interac-
tion for 13- (icosahedron and cuboctahedron) and 4-atom (tetrahedron and square) clusters with both
spin-12 and spin-1. Our studies reveal that in the absence of external magnetic field, the ground state
is degenerate for the FM interaction, while for the antiferromagnetic case, they are non-degenerate.
In the presence of external magnetic field the variation of magnetization shows discontinuities with
appearance of plateaus for the antiferromagnetic interaction, while for the FM interaction it shows
133
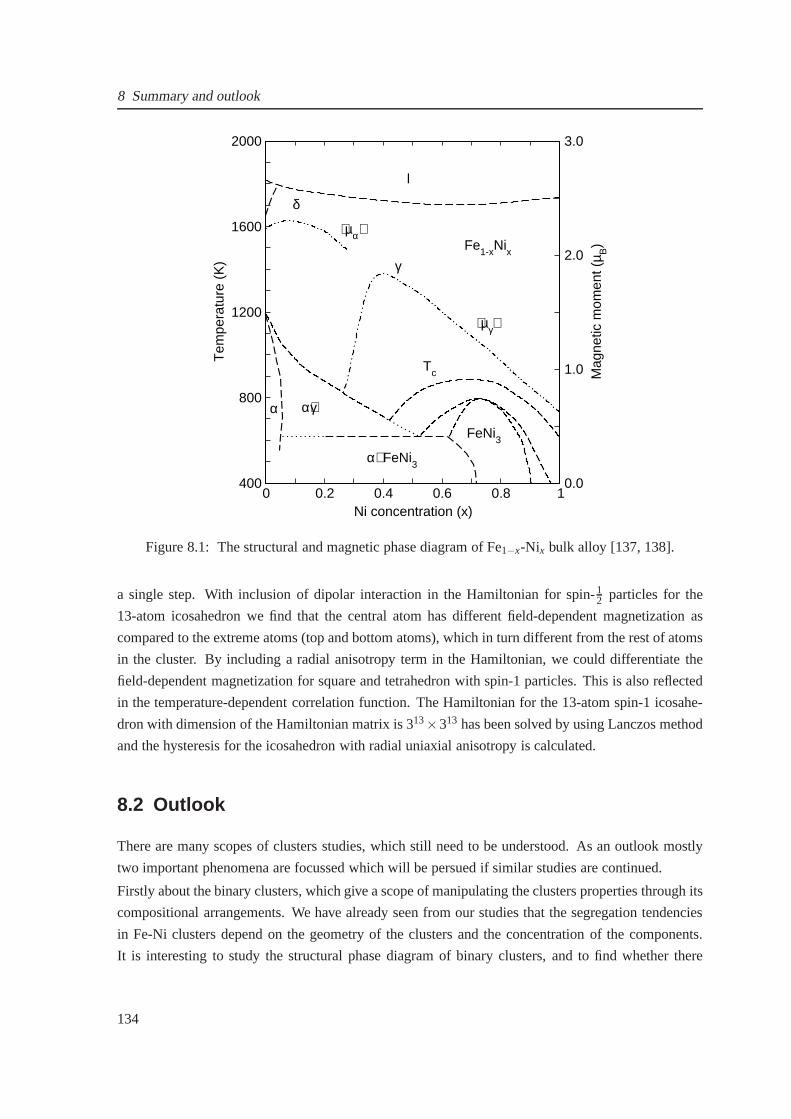
8 Summary and outlook
0 0.2 0.4 0.6 0.8 1Ni concentration (x)
400
800
1200
1600
2000
Tem
pera
ture
(K
)
0.0
1.0
2.0
3.0
Mag
netic
mom
ent (
µ B)
δ
α α+γ
γ
α+FeNi3
FeNi3
Tc
l
Fe1-xNix
⟨µα⟩
⟨µγ⟩
Figure 8.1: The structural and magnetic phase diagram of Fe1−x-Nix bulk alloy [137, 138].
a single step. With inclusion of dipolar interaction in the Hamiltonian for spin-12 particles for the
13-atom icosahedron we find that the central atom has different field-dependent magnetization as
compared to the extreme atoms (top and bottom atoms), which in turn different from the rest of atoms
in the cluster. By including a radial anisotropy term in the Hamiltonian, we could differentiate the
field-dependent magnetization for square and tetrahedron with spin-1 particles. This is also reflected
in the temperature-dependent correlation function. The Hamiltonian for the 13-atom spin-1 icosahe-
dron with dimension of the Hamiltonian matrix is 313×313 has been solved by using Lanczos method
and the hysteresis for the icosahedron with radial uniaxialanisotropy is calculated.
8.2 Outlook
There are many scopes of clusters studies, which still need to be understood. As an outlook mostly
two important phenomena are focussed which will be persued if similar studies are continued.
Firstly about the binary clusters, which give a scope of manipulating the clusters properties through its
compositional arrangements. We have already seen from our studies that the segregation tendencies
in Fe-Ni clusters depend on the geometry of the clusters and the concentration of the components.
It is interesting to study the structural phase diagram of binary clusters, and to find whether there
134
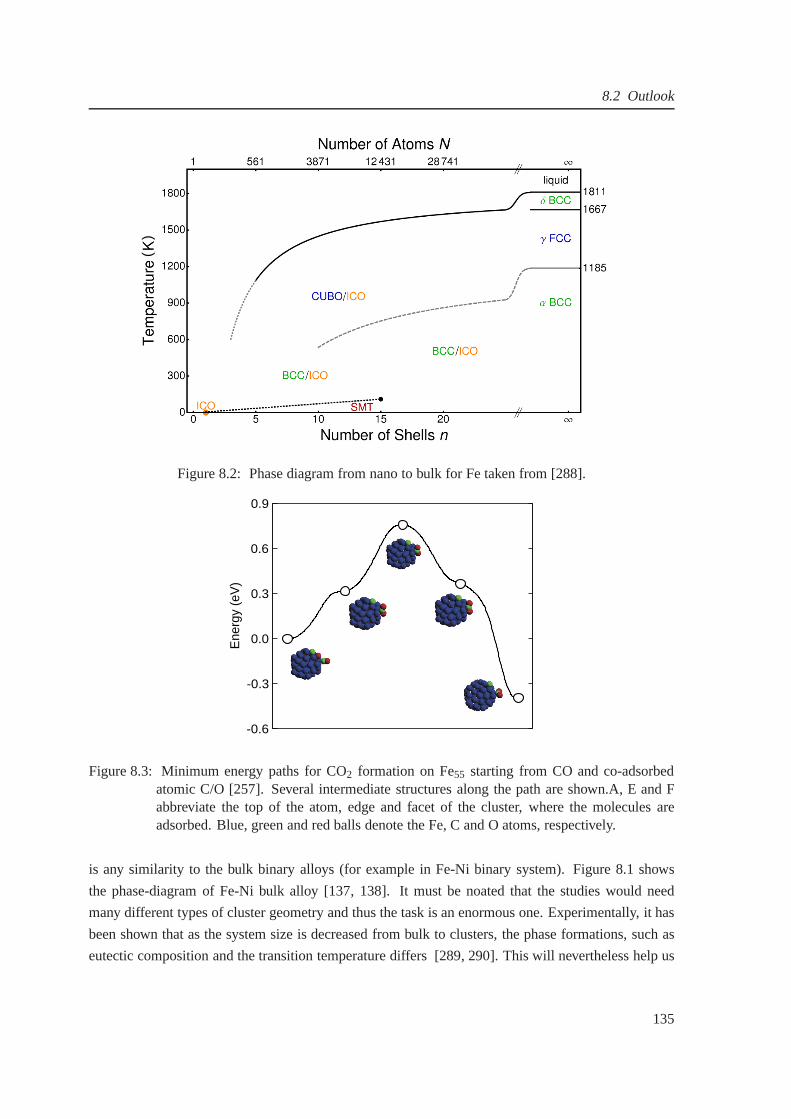
8.2 Outlook
(
(
Figure 8.2: Phase diagram from nano to bulk for Fe taken from [288].
-0.6
-0.3
0.0
0.3
0.6
0.9
Ene
rgy
(eV
)
Figure 8.3: Minimum energy paths for CO2 formation on Fe55 starting from CO and co-adsorbedatomic C/O [257]. Several intermediate structures along the path are shown.A, E and Fabbreviate the top of the atom, edge and facet of the cluster,where the molecules areadsorbed. Blue, green and red balls denote the Fe, C and O atoms, respectively.
is any similarity to the bulk binary alloys (for example in Fe-Ni binary system). Figure 8.1 shows
the phase-diagram of Fe-Ni bulk alloy [137, 138]. It must be noated that the studies would need
many different types of cluster geometry and thus the task isan enormous one. Experimentally, it has
been shown that as the system size is decreased from bulk to clusters, the phase formations, such as
eutectic composition and the transition temperature differs [289, 290]. This will nevertheless help us
135
8 Summary and outlook
to address questions like, what are the properties of a desired configuration of clusters and how they
can be synthesized by understanding the stability of the desired configuration from the phase diagram.
The studies will lead the scope of extending the traditionalphase transition theories to low dimensions.
Since experimentally the studies on nano-phases can be a challenge, so theoretical studies based on
DFT may provide the right insight into the problem. Fig. 8.2 shows the cluster to bulk phase diagram
for Fe [288] (studied through molecular dynamics simulations using embedded atom potentials) which
predicts a stability for the icosahedral and shell wise Mackay transformed structures up to cluster sizes
with 15 closed atomic shells. Wanget al. have studied the size-dependent surface reconstruction and
layerwise relasation of icosahedron FePt nanoparticles and propose that the structural results can
be understood if the atomic distribution in the nanoparticle is assumed to have radial composition
gradient with a Pt-rich shell and a Fe-rich core [140]. It is understood that empirical studies can be
quick from computational aspects, but approaching the problem in fundamental way throughab initio
formalism will be useful for building better empirical potantials and directly approaching the problem
from ab initio will lead to unchallenged results.
A second scope of the outlook is the studies on catalysis properties of transition metal clusters. While
catalysis is an active technological application of transition metal nanoparticles, there are relatively
few theoretical studies attempted to understand how transition metal atom act as a catalyst for chemi-
cal reaction. Catalytic reactions can be studied by comparing the energy-barrier of reaction paths thus
predicting the most favourable reaction path. Figure 8.3 shows the several states of CO2 formation on
Fe55 cluster [257]. The energy barrier is comparable to the experimental values. Treating this problem
may sound easy, but comparing to the number of configurationsof reactants and products, the task is
challenging. These studies will contribute to desigining catalysts for efficient reactions, for example,
for efficient combustion of hydrogarbons or gasolins in industries and automobiles.
136
Appendix
Extension of cluster magnetism to finite temperatures
DFT being a variational theory has shortcoming in predicting the excited state properties of materials.
A direct extention to temperature dependence of propertiesis not straightforward. One of the ways to
deal with finite temperature properties especially for the magnetic properties can be easily conceiv-
able. It is a rather indirect method of calculating the distance-dependent exchange integralsJi j (r) of
magnetic atoms byab initio methods and thereby simulating the thermodynamics by the Monte Carlo
approach through the construction of classical HeisenbergHamiltonian,
He f f = −∑i 6= j
Ji j sssi ·sssj (8.1)
where,sssi is the spin magnetic moment on the atomic site.
We have attempted to extent the zero-temperatureab initio calculations of the magnetic properties
of small clusters to finite temperatures. The exchange integrals can be calculated from the Green’s
function formalism adopted in the SPR-KKR code [291] from the group of Prof. Ebert at LMU-
Munich. The essential theory behind the method is derived byLichtensteinet al. [292] through
frozen-magnon approximation. The exchange integral is thus given by the energy integration of the
imaginary part of combination oft-matrix andτ-matrix integrated from the bottom of the valency
band (theoretically−∞) up to the Fermi-energy [293].
Ji j = − 14π
ImZ EF
dE Tr[
δi(E)G↑↑i j (E)δ j(E)G↓↓
ji (E)]
(8.2)
where,Gσσi j is the propagator of electrons with spinσ between sitesi and j in the ferromagnetic
configuration. The quantityδi(E) is the energy-dependent local exchange splitting at sitei. The trace
is over the orbital index.
It must be stressed that the mean-field estimation of the magnetic transition temperature from theJi j s
itself is overestimated. This is already well known for the bulk magnetic materials. Especially in
clusters, because of the large number of surface atoms whichare under-coordinated, the mean-field
prediction can be still misleading. Thus Monte-Carlo simulations are must. One must be aware that
for finite systems the statistics has to be closely monitored, and the transition point can be estimated by
suitably scaling the physical quantities (magnetization for example) by appropriate critical exponents.
There has already been some attempts of studies in literature. For example, the left panel of Fig 8.4
137
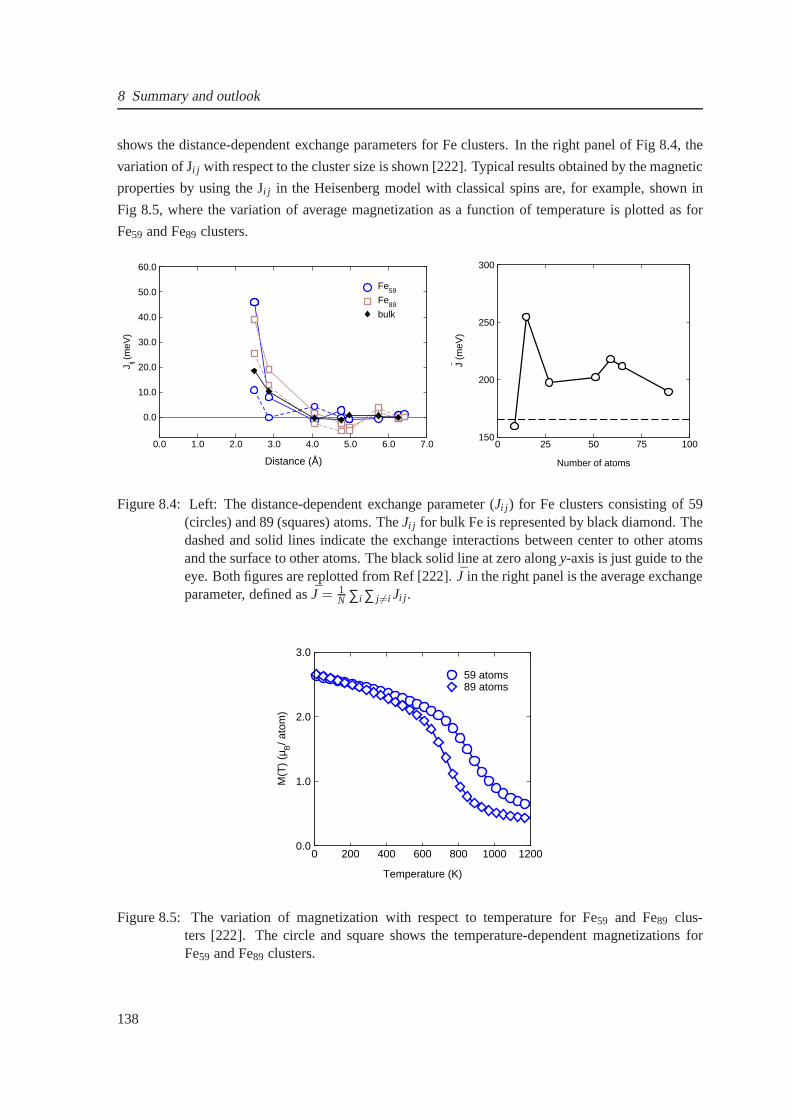
8 Summary and outlook
shows the distance-dependent exchange parameters for Fe clusters. In the right panel of Fig 8.4, the
variation of Ji j with respect to the cluster size is shown [222]. Typical results obtained by the magnetic
properties by using the Ji j in the Heisenberg model with classical spins are, for example, shown in
Fig 8.5, where the variation of average magnetization as a function of temperature is plotted as for
Fe59 and Fe89 clusters.
0.0 1.0 2.0 3.0 4.0 5.0 6.0 7.0
Distance (Å)
0.0
10.0
20.0
30.0
40.0
50.0
60.0
J ij (m
eV)
Fe59
Fe89
bulk
0 25 50 75 100
Number of atoms
150
200
250
300
J (m
eV)
Figure 8.4: Left: The distance-dependent exchange parameter (Ji j ) for Fe clusters consisting of 59(circles) and 89 (squares) atoms. TheJi j for bulk Fe is represented by black diamond. Thedashed and solid lines indicate the exchange interactions between center to other atomsand the surface to other atoms. The black solid line at zero alongy-axis is just guide to theeye. Both figures are replotted from Ref [222].J in the right panel is the average exchangeparameter, defined asJ = 1
N ∑i ∑ j 6=i Ji j .
0 200 400 600 800 1000 1200
Temperature (K)
0.0
1.0
2.0
3.0
M(T
) (µ
B/ a
tom
)
59 atoms 89 atoms
Figure 8.5: The variation of magnetization with respect to temperature for Fe59 and Fe89 clus-ters [222]. The circle and square shows the temperature-dependent magnetizations forFe59 and Fe89 clusters.
138

8.2 Outlook
We have, so far, carried out few calculations of Ji j for small clusters of Fe2 and Fe13 using the Juelich
SKKR code [294, 295]. But since the cluster calculations have already been published mainly by
the group of Prof. Hubert Ebert (LMU Munich) for tiny Fe and Fe-Pt clusters, we discuss here the
published results.
139
Bibliography
[1] J. Kübler,Theory of Itinerant Electron Magnetism, (Oxford University Press, Oxford, 2000).
[2] W. E. Stephens,A pulsed mass spectrometer with time dispersion, Phys. Rev.69, 691 (1964).
[3] P. Gambardella, S. Rusponi, M. Veronese, S. S. Dhesi, C. Grazioli, A. Dallmeyer, I. Cabria,
R. Zeller, P. H. Dederichs, K. Kern, C. Carbone, and H. Brune,Giant magnetic anisotropy of
single cobalt atoms, Science300, 1130 (2003).
[4] J. A. Alonso,Structure and properties of atomic nanoclusters, Imperial college press, London
(2005).
[5] P. Crespo, R. Litrán, T. C. Rojas, M. Multigner, J. M. de laFuente, J. C. Sánchez-López,
M. A. García, A. Hernando, S. Penadés, and A. Fernández,Permanent magnetism, magnetic
anisotropy, and hysteresis of thiol-capped gold nanoparticles, Phys. Rev. Lett.93, 087204
(2004).
[6] F. Baletto and R. Ferrando,Structural properties of nanoclusters: Energetic, thermodynamic,
and kinetic effects, Rev. Mod. Phys.77, 371 (2005).
[7] M. E. Gruner and P. Entel,Simulating functional magnetic materials on supercomputers, J.
Phys.: Condens. Matter,21, 293201 (2009).
[8] S. Blundell,Magnetism in Condensed Matter, (Oxford University Press, Oxford, 2001).
[9] R. Skomski,Simple Models of Magnetism, (Oxford University Press, Oxford, 2008).
[10] J. Stöhr and H. C. Siegmann,Magnetism from Fundamentals to Nanoscale Dynamics,
(Springer, Berlin, 2006).
[11] M. A. Ruderman and C. Kittel,Indirect exchange coupling of nuclear magnetic moments by
conduction electrons, Phys. Rev.96, 99 (1954).
[12] T. Kasuya,A theory of metallic ferro- and antiferromagnetism on Zener’s model, Prog. Theor.
Phys.16, 45 (1956).
[13] K. Yoshida,Magnetic Properties of Cu-Mn Alloys, Phys. Rev.106, 893 (1957).
140
Bibliography
[14] H. A. Jahn and E. Teller,Stability of polyatomic molecules in degenerate electronic states. I.
Orbital degeneracy, Proc. R. Soc. London A161, 220 (1937).
[15] W. D. Knight, K. Clemenger, W. A. de Heer, W. A. Saunders,M. Y. Chou, and M. L. Cohen,
Electronic shell structure and abundances of sodium clusters, Phys. Rev. Lett.52, 2141 (1984).
[16] F.E. Kruis, H. Fissan, and A. Peled,Synthesis of nanoparticles in the gas phase for electronic,
optical and magnetic applications-a review, J. Aerosol Sci.29, 511 (1998).
[17] M. L. Plumer, E. J. Van, and D. Weller,The Physics of Ultra-high-density Magnetic Recording,
(Springer, Berlin, 2001)
[18] S. Sahoo, A. Hucht, M. E. Gruner, G. Rollmann, and P. Entel, A. Postnikov, J. Ferrer, L.
Fernández-Seivane, M. Richter, D. Fritsch, and S. Sil,Magnetic properties of small Pt-capped
Fe, Co, and Ni clusters: A density functional theory study, Phys. Rev. B82, 054418 (2010).
[19] A. Zangwill, Physics at Surfaces, (Cambridge University Press, Cambridge, 1988).
[20] E. Yoo, T. Okata, T. Akita, M. Kohyama, J. Nakamura, and I. Honma,Enhanced electrocat-
alytic activity of Pt subnanoclusters on graphene nanosheet surface, Nano Lett.9, 2255 (2009).
[21] G. M. Scheuermann, L. Rumi, P. Steurer, W. Bannwarth, and R. Mulhaupt,Palladium nanopar-
ticles on graphite oxide and its functionalized graphene derivatives as highly active catalysts
for the Suzuki-Miyaura coupling reaction, J. Am. Chem. Soc.131, 8262 (2009).
[22] H. Jonsson, G. Mills, and K. W. Jacobsen,Classical and Quantum Dynamics in Condensed
Phase Simulations, edited by B. J. Berne, G. Ciccotti, and D. F. Coker (World Scientific, 1998).
[23] A. Eichler and J. Hafner,Reaction channels for the catalytic oxidation of CO on Pt(111), Phys.
Rev. B59, 5960 (1999).
[24] P. Lazic, M. Alaei, N. Atodiresei, V. Caciuc, R. Brako, and S .Blügel, Density functional theory
with nonlocal correlation: A key to the solution of the CO adsorption puzzle, Phys. Rev. B,81
045401 (2010).
[25] G. Kresse and J. Furthmüller,Efficiency of ab initio total energy calculations for metalsand
semiconductors using a plane-wave basis set, Comput. Mater. Sci.6, 15 (1996).
[26] G. Kresse and D. Joubert,From ultrasoft pseudopotentials to the projector augmented-wave
method, Phys. Rev. B59, 1758 (1999).
[27] P. E. Blöchl,Projector augmented-wave method, Phys. Rev. B50, 17953 (1994).
[28] J. M. Soler, E. Artacho, J. D. Gale, A. Gracía, J. Junquera, P. Ordejón, and D. Sánchez-Portal,
The SIESTA method for ab initio order-N materials simulation, J. Phys.: Condens. Matter14,
2745 (2002).
141

Bibliography
[29] K. Koepernik and H. Eschrig,Full-potential nonorthogonal local-orbital minimum-basis band-
structure scheme, Phys. Rev. B59, 1743 (1999).
[30] J. Schnack,Effects of frustration on magnetic molecules: a survey fromOlivier Kahn until
today, Dalton Trans.39, 4677 (2010).
[31] A. Hucht, S, Sahoo, S. Sil, and P. Entel,Effect of anisotropy on small magnetic clusters, Ac-
cepted in Phys. Rev. B. (2011).
[32] P. Hohenberg and W. Kohn,Inhomogeneous electron gas, Phys. Rev.136, B864 (1964).
[33] W. Kohn and L. J. Sham,Self-Consistent equations including exchange and correlation effects,
Phys. Rev.140, A1133 (1965).
[34] R. M. Martin,Electronic Structure: Basic Theory and Practical Methods, (Cambridge Univer-
sity Press, Cambridge, 2004).
[35] L. H. Thomas,The calculation of atomic fields, Proc. Cambridge Phil. Roy. Soc.23, 542 (1927).
[36] E. Fermi,Un metodo statistico per la determinazione di alcune priorieta dell atome, Rend.
Accad. Naz. Lincei26, 376 (1930).
[37] F. J. Jensen,Introduction to Computational Chemistry, Wiley, Chichester (1999).
[38] J. S. Blakemore,Solid State Physics, (Cambrige University Press, Cambridge, 1985).
[39] M. C. Payne, M. P. Teter, D. C. Allan, T. A. Arias, and J. D.Joannopoulos,Iterative minimiza-
tion techniques for ab initio total-energy calculations: Molecular dynamics and conjugate
gradients, Rev. Mod. Phys64, 1045 (1992).
[40] Per Söderlind, J. M. Wills, B. Johansson, and O. Eriksson, Structural properties of plutonium
from first-principles theory, Phys. Rev. B55, 1997 (1997).
[41] U. von Barth and L. Hedin,A local exchange-correlation potential for the spin polarized case:I,
J. Phys. C5, 1629 (1972).
[42] R. Q. Wu and A. J. Freeman,Spin-orbit induced magnetic phenomena in bulk metals and their
surfaces and interfaces., J. Magn. Mag. mater.200, 498 (1999).
[43] G.H.O. Daalderop, P. J. Kelly, and M. F. H. Schuurman,First-principles calculation of the
magnetocrystalline anisotropy energy of iron, cobalt and nickel, Phys. Rev. B42, 11919 (1990).
[44] X. D. Wang, D. S. Wang, R. Q. Wu and A. J. Freeman,Validity of the force theorem for
magnetocrystalline anisotropy, J. Magn. Mag. mater.159, 337 (1996).
142
Bibliography
[45] Handbook of Magnetism and Advanced Magnetic Materials, Vol. 1 edited by H. Kronmüller
and S. Parkin (Wiley, 2007).
[46] O. Eriksson,Band-Ferromagnetism, edited by K. Baberschke, M. Donath and W. Nolting,
(Springer, Berlin, 2001).
[47] X. Wang, R. Wu, D. Wang, and A. J. Freeman,Torque method for the theoretical determination
of magnetocrystalline anisotropy, Phys. Rev. B54, 61 (1996).
[48] M. P. Teter, M. C. Payne, and D. C. Allan,Solution of Schrödinger’s equation for large systems
Phys. Rev. B40, 12255 (1989).
[49] W. H. Press, B. P. Flannery, S. A. Teukolsky, and W. T. Vetterling,Numerical Recipies, (Cam-
bridge University Press, 1992).
[50] R. P. Feynman,Forces in molecules, Phys. Rev.56, 340 (1939).
[51] P. Pulay,Ab initio calculation of force constants and equilibrium geometries. I. theory, Mol.
Phys.17, 197 (1969).
[52] I. M. L. Billas, A. Châtelain, and W. A. de Heer,Magnetism of Fe, Co and Ni clusters in
molecular beams, JMMM 168, 64 (1997).
[53] I. M. L. Billas, A. Châtelain, and W. A. de Heer,Magnetism from the Atom to the Bulk in iron,
cobalt, and nickel clusters, Science265, 1682 (1994).
[54] S. E. Apsel, J. W. Emmert, J. Deng, and L. A. Bloomfield,Surface-enhanced magnetism in
nickel clusters, Phys. Rev. Lett.,76 1441 (1996).
[55] Isabelle M. L. Billas, J. A. Becker, A. Châtelain, and Walt A. de Heer,Magnetic moments of
iron clusters with 25 to 700 atoms and their dependence on temperature, Phys. Rev. Lett.71,
4067 (1993).
[56] M. Castro, C. Jamorski, and D. R. Salahub,Structure, bonding, and magnetism of small Fen,
Con and Nin clusters, n≤5, Chem. Phys. Lett.271 133 (1997).
[57] R. Singh and P. Kroll,Structural, electronic, and magnetic properties of 13-, 55-, and 147-atom
clusters of Fe, Co, and Ni: A spin-polarized density functional study, Phys. Rev. B78, 245404
(2008).
[58] H. M. Duan, X. G. Gong, Q. Q. Zheng, and H. Q. Lin,Electronic and magnetic properties of
Ni clusters, J. Appl. Phys.89 7308 (2001).
[59] J. Guevara, F. Parisi, A. M. Llois, and M. Weissmann,Electronic properties of transition-metal
clusters: Consideration of the spillover in a bulk parametrization, Phys. Rev. B55 13283
(1997).
143
Bibliography
[60] G. M. Pastor, J. Dorantes-Dávila, and K. H. Bennemann,Size and structural dependence of the
magnetic properties of small 3d-transition-metal clusters, Phys. Rev. B40 7642 (1989).
[61] E. K. Parks, L. Zhu, J. Ho and S.J. Riley,The structure of small nickel clusters. I. Ni3-Ni15, J.
Chem. Phys.100 7206 (1994).
[62] E. K. Parks, L. Zhu, J. Ho and S. J. Riley,The structure of small nickel clusters. II. Ni16-Ni28,
J. Chem. Phys.100 7377 (1995).
[63] B. V. Reddy, S. K. Nayak, S. N. Khanna, B. K. Rao, and P. Jena, Physics of nickel clusters,
electronic structure and magnetic properties, J. Phys. Chem. A102, 1748 (1998).
[64] F. Aguilera-Granja, S. Bouarab, M. J. López, A. Vega, J.M. Montejano-Carrizales, M. P.
Iniguez, and J. A. Alonso,Magnetic moments of Ni clusters, Phys. Rev. B57 12469 (1998).
[65] F. A. Reuse, and S. N. Khanna,Geometry, electronic structure, and magnetism of small Nin
(n=2-6,8,13)clusters, Chem. Phys. Lett.234 77 (1995).
[66] T. Futschek, J. Hafner, and M. Marsman,Stable structural and magnetic isomers of small
transition-metal clusters from the Ni group: an ab initio density-functional study, J. Phys.:
Condens. Matter,18, 9703 (2006).
[67] H. Purdum, P. A. Montano, G. K. Shenoy, and T. Morrison,Extended-x-ray-absorption-fine-
structure study of small Fe molecules isolated in solid neon, Phys. Rev. B25, 4412 (1982).
[68] P. A. Montano, and G. K. Shenoy,EXAFS study of iron monomers and dimers isolated in solid
argon, Solid state Commun.35, 53 (1980).
[69] E. K. Parks, B. H. Weiller, P. S. Bechthold, W. F. Hoffman, G. C. Nieman, L. G. Pobo, and S.
J. Riley,Chemical probes of metal cluster structure: Reactions of iron clusters with hydrogen,
ammonia, and water, J. Chem. Phys.88, 1622 (1988).
[70] T. L. Haslett, K. A. Bosnick, S. Fedrigo, and M. Moskovits, Resonance Raman spectroscopy
of matrix-isolated mass-selected Fe3 and Ag3, J. Chem. Phys.111, 6456 (1999).
[71] E. A. Rohlfing, D. M. Cox, A. Kaldor, and K. H. Johnson,Photoionization spectra and elec-
tronic structure of small iron clusters, J. Chem. Phys.81, 3846 (1984).
[72] S. Yang and M. B. Knickelbein,Photoionization studies of transition metal clusters: Ionization
potentials for Fen and Con, J. Chem. Phys.93, 1533 (1990).
[73] L. Wang, H. Cheng, and J. Fan,Photoelectron spectroscopy of size-selected transition metal
clusters: Fe−n , n=3-24, J. Chem. Phys.102, 9480 (1995).
144

Bibliography
[74] L. Wang, X. Li, and H. Zhang,Probing the electronic structure of iron clusters using photo-
electron spectroscopy, Chem. Phys.262, 53 (2000).
[75] A. Andriotis and M. Menon,Tight-binding molecular-dynamics study of ferromagneticclus-
ters, Phys. Rev. B57, 10069 (1998).
[76] J. L. Chen, C. S. Wang, K. A. Jackson, and M. R. Pederson,Theory of magnetic and structural
ordering in iron clusters, Phys. Rev. B44, 6558 (1991).
[77] M. Castro and D. R. Salahub,Theoretical study of the structure and binding of iron clusters:
Fen n≤5, Phys. Rev. B47 10955 (1993).
[78] P. Ballone and R. O. Jones,Structure and spin in small iron clusters, Chem. Phys. Lett.233,
632 (1995).
[79] O. Diéguez, M. M. G. Alemany, C. Rey, P. Ordejón, and L. J.Gallego,Density-functional
calculations of the structures, binding energies, and magnetic moments of Fe clusters with 2 to
17 atoms, Phys. Rev. B63, 205407 (2001).
[80] P. Bobadova-Parvanova, K. A. Jackson, S. Srinivas, M. Horoi, C. Köhler and G. Seifert,Scan-
ning the potential energy surface of iron clusters: A novel search strategy, J. Chem. Phys.116,
3576 (2002).
[81] M. Castro and D. R. Salahub,Density-functional calculations for small iron clusters:Fen, Fe+n ,
and Fe−n for n≤ 5, Phys. Rev. B49 11842 (1994).
[82] O N Mryasov, A I Liechtenstein, L M Sandratskii and V A Gubanov,Magnetic structure of
FCC iron, J. Phys.: Condens. Matter3, 7683 (1991).
[83] T. Oda, A. Pasquarello, and R. Car,Fully unconstrained approach to noncollinear magnetism:
Application to small Fe clusters, Phys. Rev. Lett.80, 3622 (1998).
[84] D. Hobbs, G. Kresse, and J. Hafner,Fully unconstrained noncollinear magnetism within the
projector augmented-wave method, Phys. Rev. B62 11556 (2000).
[85] M. Zelený, M. Sob and J. Hafner,Noncollinear magnetism in manganese nanostructures, Phys.
Rev. B80 144414 (2009).
[86] C. J. Barden, J. C. Rienstra-Kiracofe, and H. F. Schaefer III Homonuclear 3d transition-metal
diatomics: A systematic density functional theory study, J. Chem. Phys.113 690 (2000).
[87] J. C. Pinegar, J. D. Langenberg, C. A. Arrington, E. M. Spain, and M. D. Morse,Ni2 revisited:
Reassignment of the ground electronic state, J. Chem. Phys.102 666 (1994).
145
Bibliography
[88] M. Bienati, V. Bonacic-Koutecky, and P. Fantucci,The electronic structre and magnetic prop-
erties of the nickel tetramer and its partially carbonylated forms, Eur. Phys. J. D9 467 (1999).
[89] M. C. Michelini, R. P. Diez, and A. H. Joubert,Density functional calculations of Ni5 and Ni6clusters, Journal of Molecular Structure,490 181 (1999).
[90] M. Böyükata, Z. B. Güvenc, S. Özcelik, P. Durmus, and J. Jillinek, Structure and reactivity of
Nin (n = 7-14, 19) clusters, Int. J. Quant. Chem.84, 208 (2001).
[91] S. K. Nayak, S. N. Khanna, B. K. Rao, and P. Jena,Physics of Nickel Clusters: Energetics and
Equilibrium Geometries, J. Phys. Chem. A101, 1072 (1997).
[92] N. Desmarais, C. Jamorski, F. A. Reuse, and S. N. Khanna,Atomic arrangements in Ni7 and
Ni8 clusters, Chem. Phys. Lett.294, 480 (1998).
[93] D. M. Cox, D. J. Trevor, R. L. Whetten, E. A. Rohlfing, and A. Kaldor,Magnetic behavior of
free-iron and iron oxide clusters, Phys. Rev. B32 7290 (1985).
[94] G. Rollmann, P. Entel, and S. Sahoo,Competing structural and magnetic effects in small iron
clusters, Comput. Matter. Sci.35, 275 (2006).
[95] G. Rollmann, S. Sahoo, and P. Entel,Structural and magnetic properties of Fe-Ni clusters,
Phys. Status Solidi A,201 3263 (2004).
[96] B. I. Dunlap,Symmetry and cluster magnetism, Phys. Rev. A41, 5691 (1990).
[97] P. Bobadova-Parvanova, K. A. Jackson, S. Srinivas, andM. Horoi, Density-functional investi-
gations of the spin ordering in Fe13 clusters, Phys. Rev. B66 195402 (2002).
[98] M. B. Knickelbein,Adsorbate-induced enhancement of the magnetic moments of iron clusters,
Chem. Phys. Lett.353, 221 (2002).
[99] V. L. Moruzzi, P. M. Marcus, K. Schwarz, and P. Mohn,Ferromagnetic phases of bcc and fcc
Fe, Co, and Ni, Phys. Rev. B34, 1784 (1986).
[100] G. Rollmann, M. E. Gruner, A. Hucht, R. Meyer, P. Entel,M. L. Tiago, and J. R. Chelikowsky,
Shellwise Mackay Transformation in Iron Nanoclusters, Phys. Rev. Lett. bf 99, 083402 (2007).
[101] H. C. Herper, E. Hoffmann, and P. Entel,Ab initio full-potential study of the structural and
magnetic phase stability of iron, Phys. Rev. B,60, 3839 (1999).
[102] L. Favre, V. Dupuis, E. Bernstein, P. Mélinon, A. Pérez, S. Stanescu, T. Epicier, J. -P. Simon,
D. Babonneau, J. -M. Tonnerre, and J. -L. Hodeau,Structural and magnetic properties of CoPt
mixed clusters, Phys. Rev. B74, 014439 (2006).
146
Bibliography
[103] R. Ferrando A. Fortunelli, and G. Rossi,Quantum effects on the structure of pure and binary
metallic nanoclusters, Phys. Rev. B.72, 085449 (2005).
[104] J. Vrijen and S. Radelaar,Sigmalike phase and nanoscale segregation in polycrystalline
FexCr1−x films: An element-resolved magnetic and structural study, Phys. Rev. B61 64 (2000).
[105] S. Heinrichs, W. Dieterich, and P. MaassModeling epitaxial growth of binary alloy nanostruc-
tures on a weakly interacting substrate, Phys. Rev. B.75, 085437 (2007).
[106] F. R. Negreiros, Z. Kuntová, G. Barcaro, G. Rossi, R. Ferrando, and A. Fortunelli,Structures
of gas-phase Ag-Pd nanoclusters: A computational study, J. Chem. Phys.132, 234703 (2010).
[107] G. Rossi, R. Ferrando and C. Mottet,Structure and chemical ordering in CoPt nanoalloys,
Faraday Discuss.138, 193 (2008).
[108] M. Gruner and P. Entel,Structural and magnetic properties of ternary Fe1−xMnxPt nanoalloys
from first principles, Bailstein J. Nanotechnol.2, 162 (2011).
[109] N. T. Wilson and R. L. Johnston,A theoretical study of atom ordering in copper-gold nanoalloy
clusters, J. Mater. Chem.12 2913 (2002).
[110] L. D. Lloyd, R. L. Johnston, S. Salhi, and N. T. Wilson,Theoretical investigation of isomer
stability in platinum-palladium nanoalloy clusters, J. Mater. Chem.14 1691 (2004).
[111] C. Mottet, G. Tréglia and B. Legrand,Theoretical investigation of chemical and morphological
ordering in PdcCu1−c clusters, Phys. Rev. B66 045413 (2002).
[112] S. Darby, T. V. Mortimer-Jones, R. L. Johnston, C. Roberts,Theoretical study of Cu-Au nanoal-
loy clusters using a genetic algorithm, J. Chem. Phys.116 1536 (2002).
[113] M.S. Bailey, N.T. Wilson, C. Roberts, and R. L. Johnston, Structures, stabilities and ordering
in Ni-Al nanoalloy clusters, Eur. Phys. J. D25 41 (2003).
[114] E.B. Krissinel and J. Jellinek,13-atom Ni-Al alloy clusters: Structures and dynamics, Int. J.
Quant. Chem.62 185 (1996).
[115] J. L. Rousset, A. M. Cadrot, F. J. Cadete Santos Aires, A. Renouprez, P. Mélinon, A. Perez,
M. Pellarin, J. L. Vialle, and M. Broyer,Study of bimetallic Pd-Pt clusters in both free and
supported phases, J. Chem. Phys.102 8574 (1995).
[116] H. Yasuda and K. Furuya,Spontaneous alloying of tin atoms into nanometer-sized gold clusters
and phase stability in the resultant alloy clustersEur. Phys. J. D10 279 (2000).
[117] J.M. Montejano-Carrizales, M. P. Iñiguez, and J. A. Alonso,Embedded-atom method applied
to bimetallic clusters: The Cu-Ni and Cu-Pd systems, Phys. Rev. B49 16649 (1994).
147
Bibliography
[118] F. Baletto, C. Mottet and R. Ferrando,Growth simulations of silver shells on copper and pal-
ladium nanoclusters, Phys. Rev. B66 155420 (2002).
[119] J. Bansmann, S. H. Baker, C. Binns, J. A. Blackman, J.-P. Bucher, J. Dorantes-Dávila, V.
Dupuis, L. Favre, D. Kechrakos, A. Kleibert, K.-H. Meiwes-Broer, G. M. Pastor, A. Perez, O.
Toulemonde, K. N. Trohidou, J. Tuaillon, and Y. Xie,Magnetic and structural properties of
isolated and assembled clusters, Surf. Sci. Rep.56, 189 (2005).
[120] D. Zitoun, M. Respaud, M. Fromen, M. J. Casanove, P. Lecante, C. Amiens, and B. Chaudret,
Magnetic enhancement in nanoscale CoRh particles, Phys. Rev. Lett.89, 037203 (2002).
[121] N. Nunomura, H. Hori, T. Teranish, M. Miyake, and S. Yamada, Magnetic properties of
nanoparticles in Pd/Ni alloys, Phys. Lett. A249 524 (1998).
[122] Y. H. Lu, M. Zhou, C. Zhang, Y. P. Feng,Metal-embedded Graphene: A possible catalyst with
high activity, J. Phys. Chem. C113 20156 (2009).
[123] G. Mpourmpakis, G. E. Froudakis, A. N. Andriotis, and A. Menon,Role of Co in enhancing
the magnetism of small Fe clusters, Phys. Rev. B72 104417 (2005).
[124] B.K. Rao, S.R. de Debiaggi and P. Jena,Structure and magnetic properties of Fe-Ni clusters,
Phys. Rev. B64 024418 (2001).
[125] N. Nunomura, H. Hori, T. Teranish, M. Miyake, and S. Yamada,Structural and magnetic
properties of CoRh nanoparticles, Phys. Rev. B70 014410 (2004).
[126] S. Dennler, J. L. Ricardo-Chavez, J. Morillo, and G. M.Pastor,Density functional calculations
on small bimetallic magnetic clusters, Eur. Phys. J. D24 237 (2003).
[127] T. Sondón, J. Guevara, and A. Saúl,Study of the structure, segregation, and magnetic properties
of Ni-Rh clusters, Phys. Rev. B75 104426 (2007).
[128] G. Rollmann,Ab initio simulationen eisenhaltiger systeme: vom Festkörper zum cluster, PhD
Thesis, University of Duisburg-Essen (2007).
[129] V. Crisan, P. Entel, H. Ebert, H. Akai, D. D. Johnson, and J. B. Staunton,Magnetochemical
origin for Invar anomalies in iron-nickel alloys, Phys. Rev. B66 014416 (2002).
[130] K. Kadau, M. E. Gruner, P. Entel, and M. Kreth,Modeling structural and magnetic phase
transitions in iron-nickel nanoparticles, Phase Trans.76 355 (2003).
[131] S. Sahoo, G. Rollmann and P. Entel,Segregation and ordering in binary transition metal clus-
ters, Phase Trans.79 693 (2006).
148
Bibliography
[132] S. Sahoo, G. Rollmann and P. Entel,First-principles calculation of cluster geometries and
magnetization of pure Ni and Fe-Ni clusters, Phase Trans.78 723 (2005).
[133] J. Kaspar, and D. R. Salahub,Explanation of the Invar Anomalies from Molecular-Orbital
Cluster Calculations, Phys. Rev. Lett.47 54 (1981).
[134] H.C. Herper,Ab initio untersuchung magnetischer und struktureller Eigenschaften von 3d-
Übergangsmetallen und ihren Legierungen, PhD thesis, University of Duisburg-Essen (2000).
[135] F. Aguilera-Granja and A. Vega,Stability, magnetic behavior, and chemical order of(CoxFe1-
x)N (N = 5, 13) nanoalloys, Phys. Rev. B79, 144423 (2009).
[136] M. Pratzer and H. J. Elmers,Magnetic and electronic properties of binary alloy monolayers:
FexMn1−x and Co1−xFex on W(110), Phys. Rev. B69, 134418 (2004).
[137] W. Pepperhoff, M. Acet,Constitution and Magnetism of Iron and its Alloys, Engineering Ma-
terials Vol. III, (Springer, Berlin, 2001).
[138] O. Kubaschewski,Iron Binary Phase Diagrams(Springer, Berlin, 1982). H. Masumoto, K.
Watanabe, Japan Inst. Met.42, 256 (1978). J. Crangle, G. C. Hallam, Proc. Roy. Soc. London
A272, 119 (1963).
[139] J. A. Alonso and N. H. March,Electrons in Metals and Alloys(Academic, London, 1989).
[140] R. M. Wang, O. Dmitrieva, M. Farle, G. Dumpich, H. Q. Ye,H. Poppa, R. Kilaas, and C.
Kisielowski, Layer resolved structural relaxation at the surface of magnetic FePt icosahedral
nanoparticles, Phys. Rev. Lett.,100 017205 (2008).
[141] G. Rollmann, S. Sahoo, A. Hucht, and P. Entel,Magnetism and chemical ordering in binary
transition metal clusters, Phys. Rev. B78, 134404 (2008).
[142] S. Yin, R. Moro, X. Xu, and W. A. de Heer,Magnetic enhancement in cobalt-manganese alloy
clusters, Phys. Rev. Lett.98, 113401 (2007).
[143] M. B. Knickelbein,Magnetic moments of small bimetallic clusters: ConMnm, Phys. Rev. B75,
014401 (2007).
[144] J. Crangle,The magnetization of cobalt-manganese and cobalt-chromium alloys, Philos. Mag.
2, 659 (1957).
[145] G. L. Gutsev, M. D. Mochena, and C. W. Bauschlicher,Structure and Properties of Mnn, Mn−n ,
and Mn+n Clusters (n = 3-10), J. Phys. Chem. A110, 9758 (2006).
[146] Z. Q. Qiu, J. Pearson, and S. D. Bader,Asymmetry of the spin reorientation transition in ultra-
thin Fe films and wedges grown on Ag(100), Phys. Rev. Lett.70, 1006 (1993).
149
Bibliography
[147] R. K. Kawakami, E. J. Escorcia-Aparicio, and Z. Q. Qiu,Symmetry-induced magnetic
anisotropy in Fe films grown on stepped Ag(001), Phys. Rev. Lett.77, 2570 (1996).
[148] M. Farle, B. Mirwald-Schulz, A. N. Anisimov, W. Platow, and K. Baberschke,Higher-order
magnetic anisotropies and the nature of the spin-reorientation transition in face-centered
tetragonal Ni(001)/Cu(001), Phys. Rev. B,55, 3708 (1997).
[149] J. S. Hong and R. Q. Wu,Magnetic properties of Co nanochains, Phys. Rev. B70, 060406
(2004).
[150] P. Weinberger and L. Szunyogh,Perpendicular magnetism in magnetic multilayer systems,
Comp. Mater. Sci.17, 414 (2000).
[151] D. D. Koelling and B. N. Harmon,A technique for relativistic spin-polarised calculations, J.
Phys. C: Solid State Phys.10, 3107 (1977).
[152] O. Hjortstam, K. Baberschke, J. M. Wills, B. Johanssonand O. Eriksson,Magnetic anisotropy
and magnetostriction in tetragonal and cubic Ni, Phys. Rev. B.,55, 15026 (1997).
[153] K. Baberschke,The magnetism of nickel monolayers, Appl. Phys. A62, 417 (1996).
[154] I. G. Baek, H. G. Lee, H. K. Kim, and E. Vescovo,Spin reorientation transition in Fe(110) thin
films: the role of surface anisotropy, Phys. Rev. B67, 075401 (2003).
[155] R. Vollmer, and J. Kirschner,Influence of H2 adsorption on magnetic properties of Fe films on
Cu(001)., Phys. Rev. B,61, 4146 (2000).
[156] R. Vollmer, Th. Gutjahr-Löser and J. Kirschner, S. vanDijken, and B. Poelsema,Spin-
reorientation transition in Ni films on Cu(001): the influence of H2 adsorption., Phys. Rev.
B, 60, 6277 (1999)
[157] D. Matsumura, T. Yokoyama, K. Amemiya, S. Kitagawa, and T. Ohta,X-ray magnetic circular
dichroism study of spin reorientation transitions of magnetic thin films induced by surface
chemisorption, Phys. Rev. B,66, 024402 (2002).
[158] D. Sander, W. Pan, S. Ouazi, J. Kirschner, W. Meyer, M. Krause, S. MÃŒller, L. Hammer, and
K. Hein, Reversible H-induced switching of the magnetic easy axis inNi=Cu(001) thin films.,
Phys. Rev. Lett.,93, 247203 (2004).
[159] P. Gambardella, A. Dallmeyer, K. Maiti, M. C. Malagoli, W. Eberhardt, K. Kern, and C. Car-
bone,Ferromagnetism in one-dimensional monatomic metal chains, Nature416, 301 (2002).
[160] N. Nilius, T. N. Wallis, and W. Ho,Development of one-dimensional band structure in artificial
gold chains, Science297, 1853 (2002).
150
Bibliography
[161] S. Bedanta and W. Kleemann,Superparamagnetism, J. Phys. D: Appl. Phys.,42, 013001
(2009).
[162] A. L. Barra,Single-molecule magnet behavior of a tetranuclear iron(III) complex. The origin
of slow magnetic relaxation in iron(III) clusters, Journal of the American Chemical Society
121, 5302 (1999).
[163] M. Jamet, W. Wernsdorfer, C. Thirion, D. Mailly, V. Dupuis, P. Mélinon, and A. Pérez,Mag-
netic anisotropy of a single cobalt nanocluster, Phys. Rev. Lett.86, 4676 (2001).
[164] M. Jamet, W. Wernsdorfer, C. Thirion, V. Dupuis, P. Mélinon, and A. Pérez,Magnetic
anisotropy in single clusters, Phys. Rev. B69, 024401 (2004).
[165] P. Gambardella, A. Dallmeyer, K. Maiti, M. C. Malagoli, S. Rusponi, P. Ohresser, W. Eberhardt,
C. Carbon, and K. Kern,Oscillatory magnetic anisotropy in one-dimensional atomic wires,
Phys. Rev. Lett.93, 077203 (2004).
[166] S. Rusponi, T. Cren, N. Weiss, M. Epple, P. Buluschek, L. Claude, and H. Brune,The remark-
able difference between surface and step atoms in the magnetic anisotropy of two-dimensional
nanostructures, Nat. Mat.2, 546 (2003).
[167] M. Pratzer, H. J. Elmers, M. Bode, O. Pietzsch, A. Kubetzka, and R. Wiesendanger,Atomic-
scale magnetic domain walls in quasi-one-dimensional Fe nanostripes, Phys. Rev. Lett.87,
127201 (2001).
[168] M. Pratzer and H. J. Elmers,Domain wall energy in quasi-one dimensional Fe/W(110) nanos-
tripes, Phys. Rev. B67, 094416 (2003).
[169] J. S. Hong and R. Q. Wu,First principles calculations of magnetic anisotropy energy of Co
monatomic wires, Phys. Rev. B67, 020406 (2003).
[170] B. Lazarovits, L. Szunyogh, and P. Weinberger,Magnetic properties of finite Co chains on
Pt(111), Phys. Rev. B67, 024415 (2003).
[171] A. B Shick, Y. N. Gornostyrev, and A. J. Freeman,Magnetoelastic mechanism of spin reorien-
tation transitions at step edges, Phys. Rev. B60, 3029 (1999).
[172] A. B Shick, F. Maca, and P. M. Oppeneer,Anomalous ferromagnetism of a monatomic Co wire
at the Pt(111) surface step edge, Phys. Rev. B69, 212410 (2004).
[173] C. Ederer, M. Komelj, and M. Fahnle,Magnetism in systems with various dimensionalities: a
comparison between Fe and Co, Phys. Rev. B68, 052402 (2003).
[174] Y. Mokrousov, G. Bihlmayer, S. Heinze, and S. Blügel,Giant magnetocrystalline anisotropies
of 4d transition-metal monowires, Phys. Rev. Lett.96, 147201 (2006).
151
Bibliography
[175] L. M. Sandratskii,Noncollinear magnetism in itinerant-electron systems: Theory and applica-
tionsAdv. Phys.47, 91 (1998).
[176] L. M. Sandratskii and J. Kübler,Noncollinear magnetism: Effects of symmetry and relativity,
Mod. Phys. Lett. B10, 189 (1996).
[177] T. Balashov, T. Schuh, A. F. Takács, A. Ernst, S. Ostanin, J. Henk, I. Mertig, P. Bruno, T.
Miyamachi, S. Suga, and W. Wulfhekel,Magnetic anisotropy and magnetization dynamics of
individual atoms and clusters of Fe and Co on Pt(111), Phys. Rev. Lett.102, 257203 (2009).
[178] R. Félix-Medina, J. Dorantes-Dávila, and G. M. Pastor, Ground-state magnetic properties of
CoN clusters on Pd(111): Spin moments, orbital moments, and magnetic anisotropy, Phys.
Rev. B67, 094430 (2003).
[179] S. Rohart, C. Raufast, L. Favre, E. Bernstein, E. Bonet, and V. Dupuis,Magnetic anisotropy of
CoxPt1−x clusters embedded in a matrix: Influences of the cluster chemical composition and
the matrix nature, Phys. Rev. B74, 104408 (2006).
[180] A. N. Andriotis and M. Menon,Orbital Magnetism: Pros and Cons for Enhancing the Cluster
Magnetism, Phys. Rev. Lett.93, 026402 (2004).
[181] Š. Pick, V. S. Stepanyuk, A. L. Klavsyuk, L. Niebergall, W. Hergert, J. Kirschner, and P. Bruno,
Magnetism and structure on the atomic scale: Small cobalt clusters in Cu(001), Phys. Rev. B
70, 224419 (2004).
[182] J. Hafner and D. Spišák,Morphology and magnetism of Fen clusters(n = 1−9) supported on
a Pd(001) substrate, Phys. Rev. B76, 094420 (2007).
[183] S. Bornemann, J. Minár, J. B. Staunton, J. Honolka, A. Enders, K. Kern, and H. Ebert,Magnetic
anisotropy of deposited transition metal clusters, Eur. Phys. J. D45, 529 (2007).
[184] B. Nonas, I. Cabria, R. Zeller, P. H. Dederichs, T. Huhne and H. Ebert,Strongly enhanced
orbital moments and anisotropies of adatoms on the Ag(001) surface, Phys. Rev. Lett.86, 2146
(2001).
[185] G. M. Pastor, J. Dorantes-Dávila, S. Pick, and H. Dreyssé, Magnetic anisotropy of 3d
transition-metal clusters, Phys. Rev. Lett.75, 326 (1995).
[186] R. A. Guirado-López and J. M. Montejano-Carrizales,Orbital magnetism and magnetic
anisotropy energy of Co nanoparticles: Role of polytetrahedral packing, polycrystallinity, and
internal defects, Phys. Rev. B75, 184435 (2007).
[187] L. Fernández-Seivane and J. Ferrer,Magnetic anisotropies of late transition metal atomic clus-
ters, Phys. Rev. Lett.99, 183401 (2007).
152
Bibliography
[188] P. Błonski and J. Hafner,Magnetic anisotropy of transition-metal dimers: Density functional
calculations, Phys. Rev. B79, 224418 (2009).
[189] Y. Xie and J. A. Blackman,Magnetic anisotropy of nanoscale cobalt particles, J. Phys.: Con-
dens. Matter16, 3163 (2004).
[190] T. O. Strandberg, C. M. Canali, and A. H. MacDonald,Transition-metal dimers and physical
limits on magnetic anisotropy, Nature Mater.6, 648 (2007).
[191] D. Fritsch, K. Koepernik, M. Richter, and H. Eschrig,Transition metal dimers as potential
molecular magnets: A challenge to computational chemistry, J. Comp. Chem.29, 2210 (2008).
[192] J. Kortus, T. Baruah, and M. R. Pederson,Magnetic moment and anisotropy in FenCom clusters,
Appl. Phys. Lett.80, 4193 (2002).
[193] J. Hong, and R. Q. Wu,First principles determinations of magnetic anisotropy energy of Co
nanoclusters, J. Appl. Phys.93, 8764 (2003).
[194] F. Luis, J. Bartolomé, F. Bartolomé, M. J. Martínez, L.M. García, F. Petroff, C. Deranlot,
F. Wilhelm, and A. Rogalev,Enhancement of the magnetic anisotropy of Co clusters by Au
capping, J. Appl. Phys.99, 08G705 (2006).
[195] S. Dennler, J. Morillo, and G. M. Pastor,First-principles study of binary transition-metal clus-
ters and alloys, J. Phys.: Condens. Matter.16, S2263 (2004).
[196] M. Muñoz-Navia, J. Dorantes-Dávila, and G. M. Pastor,Calculation of the orbital magnetic
moments in fcc 3d-4d binary clusters: Co-Rh and Co-Pd, J. Phys.: Condens. Matter.16, S2251
(2004).
[197] J. P. Perdew, inElectronic Structure of Solids’91,edited by P. Ziesche and H. Eschrig (Berlin,
Akademie Verlag, 1991), pp. 11-20.
[198] J. Junquera, Ó. Paz, D. Sánchez-Portal, and E. Artacho, Numerical atomic orbitals for linear-
scaling calculations, Phys. Rev. B64, 235111 (2001).
[199] N. Troullier and J. L. Martins,Efficient pseudopotentials for plane-wave calculations, Phys.
Rev. B43, 1993 (1991).
[200] L Fernández-Seivane, M. A. Oliveira, S. Sanvito, and J. Ferrer,On-site approximation for spin-
orbit coupling in linear combination of atomic orbitals density functional methods, J. Phys.:
Condens. Matter18, 7999 (2006).
[201] H. Eschrig, M. Richter, and I. Opahle, in:Relativistic Solid State Calculations. Relativistic
Electronic Structure Theory – Part II: Applications, edited by P. Schwerdtfeger (Amsterdam:
Elsevier, 2004), pp. 723-776.
153
Bibliography
[202] J. P. Perdew and Y. Wang,Accurate and simple analytic representation of the electron-gas
correlation energy, Phys. Rev. B45, 13244 (1992).
[203] M. E. Gruner, P. Entel, I. Opahle, and M. Richter,Ab initio investigation of twin boundary
motion in the magnetic shape memory Heusler alloy Ni2MnGa, J. Mater. Sci.43, 3825 (2008).
[204] L. Néel, C. R. Acad. Sci. Paris237, 1468 (1953).
[205] L. Néel,Anisotropie magnétique superficielle et surstructures d’orientation, J. Phys. Radium.
15, 225 (1954).
[206] A. L. Mackay, A dense non-crystallographic packing of equal spheres, Acta Cryst.15, 916
(1962).
[207] R. A. Guirado-López, J. Dorantes-Dávila, and G. M. Pastor, Orbital Magnetism in Transition-
Metal Clusters: From Hund’s Rules to Bulk quenching, Phys. Rev. Lett.90, 226402 (2003).
[208] S. V. Halilov, A. Ya. Perlov, P. M. Oppeneer, A. N. Yaresko, and V. N. Antonov,Magnetocrys-
talline anisotropy energy in cubic Fe, Co, and Ni: Applicability of local-spin-density theory
reexamined, Phys. Rev. B57, 9557 (1998).
[209] H. Ebert, S. Bornemann, J. Minár, P. H. Dederichs, R. Zeller, and I. Cabria,Magnetic properties
of Co- and FePt-clusters, Comput. Mater. Sci.35, 279 (2006).
[210] C. G. Zimmermann, M. Yeadon, K. Nordlund, J. M. Gibson,and R. S. Averback,Burrowing of
Co nanoparticles on clean Cu and Ag surfaces, Phys. Rev. Lett.83, 1163 (1999).
[211] J. Honolka, T. Y. Lee, K. Kuhnke, A. Enders, R. Skomski,S. Bornemann, S. Mankovsky, and
J. MinárMagnetism of FePt Surface Alloys, Phys. Rev. Lett.,92, 147202 (2004).
[212] J. S. Tsay and C. S. Shern,Diffusion and alloy formation of Co ultrathin films on Pt(111), J.
Appl. Phys.,80, 3777 (1996).
[213] D. N. Tafen and L. J. Lewis,Structure and energetics of Ni and Au nanoclusters deposited on
the (001), (110), and (111) surfaces of Au and Ni: A moleculardynamics study, Phys. Rev. B
77, 075429 (2008).
[214] Y. Xie and J. A. Blackman,Theory of enhanced magnetic anisotropy induced by Pt adatoms on
two-dimensional Co clusters supported on a Pt(111) substrate, Phys. Rev. B74 054401 (2006).
[215] O. Šipr, J. Minár and H. Ebert,Magnetism of free and supported clusters: a comparative study,
Cent. Eur. J. Phys.7 257 (2009).
[216] S. K. Nayak, P. Jena, V. S. Stepanyuk and W. Hergert,Effect of atomic relaxation on the mag-
netic moment of Fe, Co and Ni dimers supported on Cu(001), Surf. Sci.,491 219 (2001).
154
Bibliography
[217] L. Tang, X. Zhang, and Q. Guo,Organizing C60 molecules on a nanostructured Au(111) sur-
face, surf. Sci.604 1310 (2010).
[218] J. Chen, M. Drakaki, C. A. Ballentine, and J. L. Erskine, Bull. Am. Phys. Soc.35, 199 (1989).
[219] K. von Bergmann, M. Bode, and R. WiesendangerMagnetism of iron on tungsten (001) studied
by spin-resolved scanning tunneling microscopy and spectroscopy, Phys. Rev. B70, 174455
(2004).
[220] J. T. Lau, A. Föhlisch, M. Martins, R. Nietubyc, M. Reifand W. Wurth,Spin and orbital
magnetic moments of deposited small iron clusters studied by x-ray magnetic circular dichroism
spectroscopy, New J. Phys.4, 98 (2002).
[221] K. W. Edmonds, C. Binns, S. H. Baker, S. C. Thornton, C. Norris, J. B. Goedkoop, M. Finazzi,
and N. B. Brookes,Doubling of the orbital magnetic moment in nanoscale Fe clusters, Phys.
Rev. B60, 472 (1999).
[222] S. Polesya, O. Šipr, S. Bornemann, J. Minár, and H. Ebert, Magnetic properties of free Fe
clusters at finite temperatures from first principles, Europhys. Lett.74, 1074 (2006).
[223] P. Mavropoulos, S. Lounis, R. Zeller and S. BlügelFe clusters on Ni and Cu: size and shape
dependence of the spin moment, Appl. Phys. A82 103 (2006).
[224] T. I. Fu, P. C. Liao, and C. S. Shern,Growth mechanism and surface alloy formation of Ni on
Pt(110) surface, J. Vac. Sci. Technol. A,11, 2407 (1993).
[225] M. Tsujikawa, A. Hosokawa, and T. Oda,Magnetic anisotropy of Fe/Pt(001) and Pt/Fe/Pt(001)
using a first-principles approach, Phys. Rev. B77, 054413 (2008).
[226] M. Tsujikawa, A. Hosokawa, and T. Oda,Magnetism of free Fe clusters and islands on Pt
surfaces, Appl. Phys. A82, 109 (2006).
[227] D. Weller and A. Moser,Thermal effect limits in ultrahigh-density magnetic recording, IEEE
Trans. Magn,35 4423 (1999).
[228] U. Wiedwald, L. Han, J. Biskupek, U. Kaiser, P. Ziemann, Preparation and characterization
of supported magnetic nanoparticles prepared by reverse micelles, Beilstein J. Nanotechnol.1,
24 (2010).
[229] M. Müller and K. Albe,Kinetic Monte-Carlo simulations on the ordering kinetics of free and
supported FePt L10-nanoparticles, Bailstein J. Nanotechnol.2, 40 (2011).
[230] M. E. Gruner, G. Rollmann, P. Entel, and M. Farle,Multiply twinned morphologies of FePt and
CoPt nanoparticles, Phys. Rev. Lett.100, 087203 (2008).
155
Bibliography
[231] A. B. Stiles,Catalysts Supports and Supported Catalysts, Butter-worths: Boston, MA, (1987).
[232] A. V. Melechko, V. I. Merkulov, T. E. McKnight, M. A. Guillorn, K. L. Klein, D. H. Lowndes,
and M. L. Simpson,Vertically aligned carbon nanofibers and related structures: Controlled
synthesis and directed assembly, J. Appl. Phys.97 041301 (2005).
[233] E. Auer, A. Freund, J. Pietsch, and T. Tacke,Carbons as supports for industrial precious metal
catalysts, Appl. Catal. A173 259 (1998).
[234] P. R. Wallace,The band theory of graphite, Phys. Rev.71 622 (1947).
[235] A. K. Geim and K. S. Novoselov,The rise of graphene, Nat. Mater.6, 183 (2007).
[236] M. Zhou, A. Zhang, Z. Dai, C. Zhang, and Y. P. Feng,Greatly enhanced adsorption and cat-
alytic activity of Au and Pt clusters on defective grapheneJ. Chem. Phys.132, 194704 (2010).
[237] K. Yamamoto, T. Imaoka, W-J Chun, O. Enoki, H. Katoh, M.Takenaga, and A. Sonoi,Size-
specific catalytic activity of platinum clusters enhances oxygen reduction reactionsNat. Chem.
1, 397 (2009).
[238] Y. Li, T. Wang, and Y. X. Li,The influence of dipolar interaction on magnetic propertiesin
nanomagnets with different shapes, Phys. Status Solidi,247 1237 (2010).
[239] E. Ochoa-Fernández, D. Chen, Z. Yu, B. Totdal, M. Ronning, and A. Holmen,Effect of carbon
nanofiber-induced microstrain on the catalytic activity ofNi crystals, Surf. Sci.554, L107
(2004)
[240] Z. J. Liu, Z. Xu, Z. Y. Yuan, D. Y. Lu, W. X. Chen, and W. Z. Zhou, Cyclohexanol dehy-
drogenation over Co/carbon nanotube catalysts and the effect of promoter K on performance,
Chem. Lett.72, 203 (2001).
[241] H. Kim, W. Lee, D. Yoo,Functionalized carbon support with sulfonated polymer fordirect
methanol fuel cells, Electrochim. Acta52, 2620 (2007).
[242] C. Bessel, K. Laubernds, N. M. Rodriguez, R. T. K. J. Baker, Graphite nanofibers as an elec-
trode for fuel cell applications, J. Phys. Chem. B105 1115 (2001).
[243] Z. L. Liu, X. Y. L. XY, B. Guo, L. Hong, J. Y. Lee,Pt and PtRu nanoparticles deposited
on single-wall carbon nanotubes for methanol electro-oxidation, J. Power sources167, 272,
(2007).
[244] V. Selvaraj, and M. Alagar,Pt and Pt-Ru nanoparticles decorated polypyrrole/multiwalled car-
bon nanotubes and their catalytic activity towards methanol oxidation,Electrochem. Commun.
9, 1145, (2009).
156
Bibliography
[245] S. Kim, and S. J. Park,Preparation and electrochemical behaviors of platinum nanoparticles
impregnated on binary carbon supports as catalyst electrodes of direct methanol fuel cells, J.
Solid State Electrochem.11, 821, (2007).
[246] J. -S. Zhenga, X. -S. Zhang, P. Lia, J. Zhua, X. -G. Zhoua, W. -K. Yuana,Effect of carbon
nanofiber microstructure on oxygen reduction activity of supported palladium electrocatalyst,
Electrochem. Commun.9, 895 (2007).
[247] R. Giordano, P. Serp, P. Kalck, Y. Kihn, J. Schreiber, C. Marhic, and J. -L. Duvail,Preparation
of Rh catalysts supported on carbon nanotubes by a surface mediated organometallic reaction,
Eur. J. Inorg. Chem. 610, (2003).
[248] D. Duca, F. Ferrante, and G. L. Manna,Theoretical study of palladium cluster structures on
carbonaceous supports, J. Phys. Chem. C111, 5402 (2007).
[249] Y. Okamoto,Density-functional calculations of icosahedral M13 (M = Ptand Au) clusters on
graphene sheets and flakes, Chem. Phys. Lett.420, 382 (2006).
[250] A. H. Castro Neto, F. Guinea, N. M. R. Peres, K. S. Novoselov, and A. K. Geim,The electronic
properties of graphene, Rev. Mod. Phys.81 109 (2009).
[251] J. P. Perdew, K. Burke, and M. Ernzerhof,Generalized gradient approximation made simple,
Phys. Rev. Lett.77, 3865 (1996).
[252] C. Cao, M. Wu, J. Jiang, and H. Cheng,Transition metal adatom and dimer adsorbed on
graphene: Induced magnetization and electronic structures, Phys. Rev. B81 205424 (2010).
[253] M. Zhang and R. Fournier,Density-functional-theory study of 13-atom metal clusters M13, M
= Ta - Pt, Phys. Rev. A,79 043203 (2009).
[254] L. Xiao and L. Wang,Structure of platinum clusters: Planar or spherical?, J. Phys. Chem. A,
108 8605 (2004).
[255] L-L. Wang and D. D. Johnson,Density functional study of structural trends for late-transition-
metal 13-atom clusters, Phys. Rev. B75 235405 (2007).
[256] P. Kim,Graphene: Across the border, Nat. Mat.9 792 (2010).
[257] G. Lanzani, A. G. Nasibulin, K. Laasonen, and E. I. Kauppinen,CO dissociation and CO + O
reactions on a nanosized iron cluster, Nano Res.,2, 660 (2009).
[258] R. S. Monteiro, L. W. C. Paes, J. W. M. Carneiro, and D. A.G. Aranda,Modeling the adsorption
of CO on small Pt, Fe and Co clusters for the Fischer-Tropsch synthesis, J. clust. Sci.19 601
(2008).
157
Bibliography
[259] P. Fazekas,Lecture Notes on Electron Correlation and Magnetism, World scientific, Singapore
(1999).
[260] S. R. White,Density-matrix algorithms for quantum renormalization groups, Phys. Rev. B48,
10345 (1993).
[261] M. P. Gelfand, R. R. P. Singh, and D. A. Huse,Perturbation expansions for quantum many-body
systems, J. Stat. Phys.59, 1093 (1990).
[262] D. C. Mattis,The Theory of Magnetism I: Statics and Dynamics(Springer, New York, 1988).
[263] Q. F. Zhong and S. Sorella,Spin-wave theory on finite lattices: Application to the J1-J2 Heisen-
berg model, Europhys. Lett.21, 629 (1993).
[264] A. E. Trumper, L. Capriotti, and S. Sorella,Finite-size spin-wave theory of the triangular
Heisenberg model, Phys. Rev. B61, 11529 (2000).
[265] A. W. Sandvik and J. Kurkijärvi,Quantum Monte Carlo simulation method for spin systems,
Phys. Rev. B43, 5950 (1991).
[266] A. W. Sandvik,Stochastic series expansion method with operator-loop update, Phys. Rev. B
59, R14157 (1999).
[267] L. Engelhardt and M. Luban,Low-temperature magnetization and the excitation spectrum of
antiferromagnetic Heisenberg spin rings, Phys. Rev. B73, 054430 (2006).
[268] N. P. Konstantinidis,Antiferromagnetic Heisenberg model on clusters with icosahedral sym-
metry, Phys. Rev. B72, 064453 (2005).
[269] D. Coffey, and S. A. Trugman,Correlations for the S = 1/2 antiferromagnet on a truncated
tetrahedronPhys. Rev. B46, 12717 (1992).
[270] R. Schnalle, A. Laeuchli, and J. Schnack,Approximate eigenvalue determination of geometri-
cally frustrated magnetic molecules, Condens. Matter Phys.12, 331 (2009).
[271] N. P. Konstantinidis, and D. Coffey,Accurate results from perturbation theory for strongly
frustrated S = 1/2 Heisenberg spin clusters, Phys. Rev. B63, 184436 (2001).
[272] I. Rousochatzakis, A. M. Läuchli, and F. Mila,Highly frustrated magnetic clusters: The
kagomé on a sphere, Phys. Rev. B77, 094420 (2008).
[273] N. P. Konstantinidis,Unconventional magnetic properties of the icosahedral symmetry antifer-
romagnetic Heisenberg model, Phys. Rev. B76, 104434 (2007).
158
Bibliography
[274] J. Schulenburg, A. Honecker, J. Schnack, and H.-J. Schmidt, Macroscopic magnetization jumps
due to independent magnons in frustrated quantum spin latticesPhys. Rev. Lett.88, 167207
(2002).
[275] C. Schröder, H.-J. Schmidt, J. Schnack, and M. Luban,Metamagnetic phase transition of the
antiferromagnetic heisenberg icosahedronPhys. Rev. Lett.94, 207203 (2005).
[276] J. Schnack, R. Schmidt, and J. Richter,Enhanced magnetocaloric effect in frustrated magnetic
molecules with icosahedral symmetry, Phys. Rev. B76, 054413 (2007).
[277] J. Schnack,Properties of highly frustrated magnetic molecules studied by the finite-temperature
Lanczos method, Eur. Phys. J. B78, 535 (2010).
[278] N. P. Konstantinidis,s = 1/2 antiferromagnetic Heisenberg model on fullerene-type symmetry
clusters, Phys. Rev. B80, 134427 (2009).
[279] D. Coffey, and S. A. Trugman,Magnetic properties of undoped C60, Phys. Rev. Lett.69, 176
(1992).
[280] A. Honecker and M. E. Zhitomirsky,Magneto-thermal properties of the spin-s Heisenberg
antiferromagnet on the cuboctahedron, J. Phys. Conference series145, 012082 (2009).
[281] L. Hernández and C. Pinettes,Study of the influence of surface anisotropy and lattice structure
on the behaviour of a small magnetic cluster, J. Magn. Magn. Mater.295, 82 (2005).
[282] Z. B. Li, K. L. Yao, and Z. L. Liu,Thermodynamic properties of a spin-1 tetrahedron as a
model for a molecule-based compound [Mo12O30(µ2-OH)10H2Ni(H2O)34]·14H2O J. Magn.
Magn. Mater.320, 1759 (2008).
[283] F. Bonechi, E. Celeghini, R. Giachetti, E. Sorace, andM. Tarlini, Heisenberg XXZ model and
quantum Galilei groupJ. Phys. A: Math. Gen.25, L939-L943 (1992).
[284] H. Q. Lin and J. E. Gubernatis,Exact diagonalization methods for quantum systems, Computers
in Physics7, 400 (1993).
[285] H. W. Kroto, J. R. Heath, S. C. OBrien, R. F. Curl, and R. E. Smalley,C60: Buckminster-
fullerene, Nature318, 162 (1985).
[286] P. W. Fowler and D. E. Manolopoulos,An Atlas of Fullerenes, (Oxford University Press, Lon-
don, 1995).
[287] G. Kamieniarz, R. W. Gerling, L. S. Campana, A. C. DÁuria, F. Esposito, and U. Esposito,
Thermodynamic properties of some S = 1 soliton-bearing and Haldane-like systemsJ. Magn.
Magn. Mater.104, 865 (1992).
159
Bibliography
[288] D. Comtesse, A. Hucht, R. Meyer, and P. Entel, unpublished.
[289] W. A. Jesser, G. L. Shiflet, G. L. Allen, and J. L. Crawford, Equilibrium phase diagrams of
isolated nano-phases, Mat. Res. Innovat.2, 211 (1999).
[290] H. Mori and H. Yasuda,Alloy phase formation in nanometer-sized particles, Mater. Sci. Eng.
A 312, 99 (2001).
[291] Electronic Structure and Physical Properties of Solids, edited by H. Dreyssé (Springer, Berlin,
2000).
[292] A. I. Liechtenstein, M. I. Katsnelson, V. P. Antropov,and A. V. GubanovLocal spin density
functional approach to the theory of exchange interactionsin ferromagnetic metals and alloys,
J. Magn. Mag. Mater.67, 65 (1987).
[293] S. Frota-Pessôa, R. B. Muniz, and J. Kudrnovský,Exchange coupling in transition-metal fer-
romagnets, Phys. Rev. B62, 5293 (2000).
[294] N. Papanikolaou, R. Zeller and P. H. Dederichs,Conceptual improvements of the KKR method,
J. Phys.: Condens. Matter14 2799 (2002).
[295] N. Papanikolaou, R. Zeller and P. H. Dederichs,Computational Nanoscience: Do it Yourself,
edited by J. Grotendorst, S. Blügel, and D. Marx, NIC Series31, Jülich (2006).
160
Acknowledgments
This thesis has been possible out of the active and passive contributions from colleagues and col-
laborators. I would extend my heartly thanks to all the people who have been very cooperative and
participated with patience all throughout my PhD work.
My ernest thanks to Prof. Dr. Peter Entel for his supervisionas a guide and his constant concern and
encouragement during my work that has helped me in many ways.I specially thank my colleagues
Dr. Alfred Hucht, Dr. Markus E. Gruner, Dr. Georg Rollmann and Dr. Heike Herper who have
been cooperative and from whom I learnt a lot. I additionallythank Dr. Gruner for suggesting im-
provements and translating the abstract of this thesis formEnglish to German. I extend my thanks
to all present colleagues, Anna Grünebohm, Mario Siewert, Denis Comtesse, Antje Dannenberg, and
ex-colleagues Dr. Ralf Meyer, Dr. Alexei Zayak, Dr. Waheed A. Adeagbo, Sergej Schmidt, Stephan
Buschmann and the group members of Prof. Jürgen König, whosewelcoming gestures and helpful
attitude certainly helped me in having a pleasant time.
I also extend my thanks to collaborators, Dr. Manuel Richter, IFW Dresden, Germany and Dr.
Sreekantha Sil, Viswabharati University, India and Dr. Andrei Postnikov, University of Metz, France,
with whom I had very fruitful discussions. Especially, Dr. Richter and Dr. Postnikov has helped
me in magnetic anisotropy studies and Dr. Sil and Dr. Hucht have helped me for studies in exact-
diagonalization techniques. I also thank collaborators Dr. Phivos Mavropoulos, Forschungszentrum
Jülich and Prof. Stefan Müller, University of Hamburg, for my studies on exchange integrals of tran-
sition metal clusters and cluster expansion methods (studies not included in this thesis), respectively.
I would also like to thank our experimental colleague Dr. Marina Spasova for helpful discussions.
I express my gratitude to Prof. Surjo N. Behera, ex-directorof the Institute of Physics, Bhubaneswar,
India and Prof. Gouri S. Tripathi, Berhampur University, India for their constant encouragement
throughout my research work. I thank Prof. Behera for going through my thesis and suggesting
improvements.
I would like to express my thanks to Ms. Dagmar Thiele, our secretary, and the university adminis-
tration in general which has been impressive in managing students of foreign origin, like me, to have
a pleasant working atmosphere.
Some efforts from everybody in my family and my friends have collectively played a positive role in
my work and credit of my success also goes to all my family members and friends.
161
List of own publications
1. G. Rollmann, S. Sahoo, and P. Entel,Structural and magnetic properties of Fe-Ni clusters,
Phys. Status Solidi A,201 3263 (2004).
2. S. Sahoo, G. Rollmann and P. Entel,First-principles calculation of cluster geometries and
magnetization of pure Ni and Fe-Ni clusters, Phase Transitions78, 723 (2005).
3. S. Sahoo, G. Rollmann, and P. Entel,Segregation and ordering in binary transition metal clus-
ters, Phase Transitions79, 693 (2006).
4. G. Rollmann, P. Entel, and S. Sahoo,Competing structural and magnetic effects in small iron
clusters, Comput. Matter. Sci.35, 275 (2006).
5. G. Rollmann, S. Sahoo, and P. Entel,Structure and magnetism in iron clusters, in: Nanoscale
Materials: From Science to Technology, edited by S. N. Sahu,R. K. Choudhury, and P. Jena
(Nova Science, New York, 2006).
6. M. E. Gruner, G. Rollmann, S. Sahoo, and P. Entel,Magnetism of close packed Fe147 clusters,
Phase Transitions79, 701 (2006).
7. P. Entel, M. E. Gruner, A. Hucht, R. Meyer, G. Rollmann, S. Sahoo, and S. K. Nayak,Sim-
ulating structure, magnetism and electronic properties ofmonoatomic, binary and ternary
transition metal nanoclustersin: Proceedings of the International Workshop on Mesoscopic,
Nanoscopic and Macroscopic Materials (IWMNMM-2008), edited by S. M. Bose, S. N. Be-
hera and B. K. Roul, AIP Conference Proceedings1063, 3 (2008).
8. P. Entel, M. E. Gruner, G. Rollmann, A. Hucht, S. Sahoo, A. T. Zayak, H. C. Herper, and
A. Dannenberg,First-principles investigations of multimetallic transition metal clusters, Phil.
Mag. 88, 2725 (2008).
9. G. Rollmann, S. Sahoo, A. Hucht, and P. Entel,Magnetism and chemical ordering in binary
transition metal clusters, Phys. Rev. B78, 134404 (2008).
10. S. Sahoo, A. Hucht, M. E. Gruner, G. Rollmann, and P. Entel, A. Postnikov, J. Ferrer, L.
Fernández-Seivane, M. Richter and D. Fritsch and S. Sil,Magnetic properties of small Pt-
capped Fe, Co, and Ni clusters: A density functional theory study, Phys. Rev. B82, 054418
(2010).
162
Bibliography
11. P. Entel, S. Sahoo, A. Hucht, and M. E. Gruner,From tiny magnetic clusters to functional ma-
terials, Proceedings of the Internal Conference on Advances in Condensed and Nano Materials
(ICACNM), February 22-26, Chandigarh, India, AIP Conference Proceedings, edited by S. K.
Tripathi (2011), in print.
12. A. Hucht, S, Sahoo, S. Sil, and P. Entel,Effect of anisotropy on small magnetic clusters, ac-
cepted in Phys. Rev. B (2011).
163
Copyright © 2022 FDOKUMEN