13C-18O Bonds in Precipitated Calcite and Aragonite: An ab Initio Study
46
Open Journal of Geology, 2014, 4, 436-480 Published Online September 2014 in SciRes. http://www.scirp.org/journal/ojg http://dx.doi.org/10.4236/ojg.2014.49034 How to cite this paper: Yuan, J., Zhang, Z.G. and Zhang, Y.G. (2014) 13 C- 18 O Bonds in Precipitated Calcite and Aragonite: An ab Initio Study. Open Journal of Geology, 4, 436-480. http://dx.doi.org/10.4236/ojg.2014.49034 13 C- 18 O Bonds in Precipitated Calcite and Aragonite: An ab Initio Study Jie Yuan * , Zhigang Zhang, Yigang Zhang Key Laboratory of Earth and Planetary Physics, Institute of Geology and Geophysics, Chinese Academy of Science, Beijing, China Email: * [email protected] Received 26 July 2014; revised 20 August 2014; accepted 13 September 2014 Copyright © 2014 by authors and Scientific Research Publishing Inc. This work is licensed under the Creative Commons Attribution International License (CC BY). http://creativecommons.org/licenses/by/4.0/ Abstract The 13 C- 18 O bonds in carbonates are potential single-phase geo-thermometers. However, their theoretical distributions (noted as ∆ 47 s) in CO 2 degassed from calcite and aragonite with phospho- ric acid are unclear. Thus, the isotope reactions of 13 C- 18 O bonds on the growing surfaces of calcite (0001) and aragonite (001) planes were investigated using ab initio techniques. It was found that these reactions determined 13 C- 18 O clumped isotope signatures in bulk calcite and aragonite min- erals with novel ∆ 47 polynomials: - 8 6 5 2 2 47 calcite 4 3 2 8.14673 10 9.31441 10 1.42742 10 1.64905 10 = + + 5.65986 10 − × × × × ∆ − − − × T T T T and - 8 7 5 2 2 47 aragonite 4 3 2 5.81530 10 1.18267 10 1.50830 10 1.71999 10 = + + 5.86981 10 − × × × × ∆ − − − × T T T T for temperatures T ranging from 260 to 1500 K. These theoretical results were in good agree- ment with the experimental data. In addition, the influence of phosphoric acid on these polynomi- als was at the level of 0.01‰. Keywords 13 C- 18 O Bonds, Clumped Isotope, Calcite and Aragonite, Ab Initio Calculation 1. Introduction Since first catching the attention of geochemists in 2004, the 13 C- 18 O bonds in carbonates have become new geo-thermometers. It is first noted that the isotope reaction: * Corresponding author.
-
Upload
independent -
Category
Documents
-
view
1 -
download
0
Transcript of 13C-18O Bonds in Precipitated Calcite and Aragonite: An ab Initio Study

Open Journal of Geology, 2014, 4, 436-480 Published Online September 2014 in SciRes. http://www.scirp.org/journal/ojg http://dx.doi.org/10.4236/ojg.2014.49034
How to cite this paper: Yuan, J., Zhang, Z.G. and Zhang, Y.G. (2014) 13C-18O Bonds in Precipitated Calcite and Aragonite: An ab Initio Study. Open Journal of Geology, 4, 436-480. http://dx.doi.org/10.4236/ojg.2014.49034
13C-18O Bonds in Precipitated Calcite and Aragonite: An ab Initio Study Jie Yuan*, Zhigang Zhang, Yigang Zhang Key Laboratory of Earth and Planetary Physics, Institute of Geology and Geophysics, Chinese Academy of Science, Beijing, China Email: *[email protected] Received 26 July 2014; revised 20 August 2014; accepted 13 September 2014
Copyright © 2014 by authors and Scientific Research Publishing Inc. This work is licensed under the Creative Commons Attribution International License (CC BY). http://creativecommons.org/licenses/by/4.0/
Abstract The 13C-18O bonds in carbonates are potential single-phase geo-thermometers. However, their theoretical distributions (noted as ∆47s) in CO2 degassed from calcite and aragonite with phospho-ric acid are unclear. Thus, the isotope reactions of 13C-18O bonds on the growing surfaces of calcite (0001) and aragonite (001) planes were investigated using ab initio techniques. It was found that these reactions determined 13C-18O clumped isotope signatures in bulk calcite and aragonite min-erals with novel ∆47 polynomials:
-
8 6 5 22
47 calcite 4 3 2
8.14673 10 9.31441 10 1.42742 10 1.64905 10= + + 5.65986 10−× × × ×∆ − − − ×
TT T T and
-
8 7 5 22
47 aragonite 4 3 2
5.81530 10 1.18267 10 1.50830 10 1.71999 10= + + 5.86981 10−× × × ×∆ − − − ×
TT T T
for temperatures T ranging from 260 to 1500 K. These theoretical results were in good agree-ment with the experimental data. In addition, the influence of phosphoric acid on these polynomi-als was at the level of 0.01‰.
Keywords 13C-18O Bonds, Clumped Isotope, Calcite and Aragonite, Ab Initio Calculation
1. Introduction Since first catching the attention of geochemists in 2004, the 13C-18O bonds in carbonates have become new geo-thermometers. It is first noted that the isotope reaction:
*Corresponding author.
J. Yuan et al.
437
12 18 16 13 16 13 18 16 12 162 2C O O C O C O O C O+ = + (1)
is a geo-thermometer if the relative concentration of 13C18O16O in the CO2 (i.e. 47∆ (CO2), see definition in the Methods section) is determined via mass spectrometry (MS) [1] [2]. Ghosh et al. (2006) [3] and (2007) [4] then studied multiply substituted carbonate isotopologues in calcite and aragonite minerals:
12 18 16 13 16 13 18 16 12 162 3 2 3Ca C O O Ca C O Ca C O O Ca C O+ = + (2)
by dissolving carbonates with phosphoric acid [5]-[8] and obtaining different 47∆ (CO2) values at specific tem-peratures. The authors suggested that the 47∆ value reflected the formation temperature T of carbonates and developed polynomials (e.g. 6 2
47 0.0592 10 0.02T∆ = × × − in [3]) by fitting their experimental data. The relationship of the associated variables in the experiment is:
47 63 y∆ = ∆ + , (3)
where y represents the phosphoric acid fractionation factor and 63∆ represents the relative concentration of Mass63 in carbonate Mass60 isotopologues (see definition in the Methods section) [9]. The theoretical explana-tion for observed 47∆ values depends on the ability to define 63∆ and y ; however, the appropriate approach is under debate. Schauble and Eiler (2004) [10], Schauble et al. (2006) [11] and Hill et al. (2014) [9] (SSH) performed theoretical calculations of 63-SSHs∆ (approximately 0.40‰ for calcite and aragonite at 25˚C) and suggested the phosphoric acid digestion fractionation factor -SSH 0.20y = ‰ at 25˚C. The theoretical analy- sis by Guo et al. (2009) [12] provided a value of ( )- Guo 0.22 3y − = ‰ (25˚C) for these two minerals. The com- bination 63-SSH -SSHy∆ + (or - Guoy − ) agrees with the observed 47∆ (=0.6460‰ (25˚C) [3]); however, both
- SSHy − and - Guoy − are inconsistent with y ≤ 0.14‰, which was recommended by Ghosh et al. (2006). There- fore, new strategies for understanding observed values for 47∆ are required.
Herein, we described the results of our investigation of the equilibrium reaction (2) at the interfaces between calcite/aragonite crystals and water using ab initio techniques. Notably, new 47∆ results for 13C-18O bonds in these minerals were obtained. In addition, the influence of the phosphoric acid digestion process on the 47∆ signals was discussed.
2. Method 2.1. Carbonate Isotopologues Reacting on Calcite and Aragonite Surfaces The 13C-18O bonds in carbonates are isotope signals on growing surfaces during precipitation from solution. As shown by crystal growth models (e.g. the “growth entrapment model” [13]-[15] and the “surface kinetic model” [16]), the bulk carbonate crystal records the isotopic information on its growing surface during precipitation from solution. Natural carbonate samples include stalactites and otoliths [4] [17], teeth and bones [18], corals [3], foraminifera and coccoliths, etc. [3] [4] [11] [17]-[22], which are made up of calcite and aragonite.
For clumped 13C-18O isotopes reacted on calcite and aragonite surfaces (Figure 1(a) and Figure 1(b), respectively): 12 18 16 13 16 13 18 16 12 16
2 3 2 3Ca C O O Ca C O Ca C O O Ca C O+ = + , (4)
for which the equilibrium constant is noted as K3866| (illustrating the doubly substituted isotopologues 13 18 16 2
2C O O − in the reaction): 13 18 16 12 16
2 3
12 18 16 13 162 3
Ca C O O Ca C OK3866
Ca C O O Ca C O
=
, (5)
where the brackets indicate the concentrations of matter [10] [11], “|” represents the surface, and the 13C-18O clumped bonds in this reaction remain in the calcite or aragonite [13]-[16].
For the isotopologues in the 23CO − groups of the carbonate minerals:
( ) [ ][ ]
Sample263 3
stochastic random
Mass63 Mass60CO 1 1000
Mass63 Mass60−
∆ = − ×
, (6)
J. Yuan et al.
438
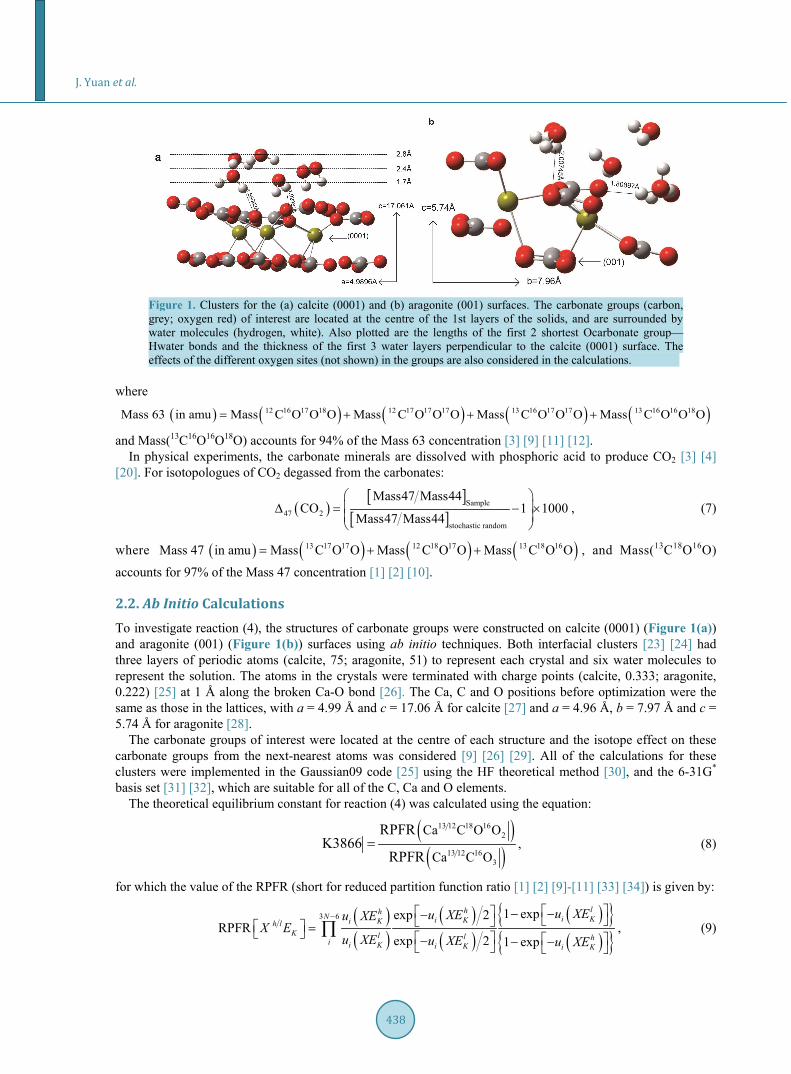
Figure 1. Clusters for the (a) calcite (0001) and (b) aragonite (001) surfaces. The carbonate groups (carbon, grey; oxygen red) of interest are located at the centre of the 1st layers of the solids, and are surrounded by water molecules (hydrogen, white). Also plotted are the lengths of the first 2 shortest Ocarbonate group— Hwater bonds and the thickness of the first 3 water layers perpendicular to the calcite (0001) surface. The effects of the different oxygen sites (not shown) in the groups are also considered in the calculations.
where
( ) ( ) ( ) ( ) ( )12 16 17 18 12 17 17 17 13 16 17 17 13 16 16 18Mass 63 in amu Mass C O O O Mass C O O O Mass C O O O Mass C O O O= + + +
and Mass(13C16O16O18O) accounts for 94% of the Mass 63 concentration [3] [9] [11] [12]. In physical experiments, the carbonate minerals are dissolved with phosphoric acid to produce CO2 [3] [4]
[20]. For isotopologues of CO2 degassed from the carbonates:
( )[ ]
[ ]Sample
47 2stochastic random
Mass47 Mass44CO 1 1000
Mass47 Mass44
∆ = − ×
, (7)
where ( ) ( ) ( ) ( )13 17 17 12 18 17 13 18 16Mass 47 in amu Mass C O O Mass C O O Mass C O O= + + , and Mass(13C18O16O)
accounts for 97% of the Mass 47 concentration [1] [2] [10].
2.2. Ab Initio Calculations To investigate reaction (4), the structures of carbonate groups were constructed on calcite (0001) (Figure 1(a)) and aragonite (001) (Figure 1(b)) surfaces using ab initio techniques. Both interfacial clusters [23] [24] had three layers of periodic atoms (calcite, 75; aragonite, 51) to represent each crystal and six water molecules to represent the solution. The atoms in the crystals were terminated with charge points (calcite, 0.333; aragonite, 0.222) [25] at 1 Å along the broken Ca-O bond [26]. The Ca, C and O positions before optimization were the same as those in the lattices, with a = 4.99 Å and c = 17.06 Å for calcite [27] and a = 4.96 Å, b = 7.97 Å and c = 5.74 Å for aragonite [28].
The carbonate groups of interest were located at the centre of each structure and the isotope effect on these carbonate groups from the next-nearest atoms was considered [9] [26] [29]. All of the calculations for these clusters were implemented in the Gaussian09 code [25] using the HF theoretical method [30], and the 6-31G* basis set [31] [32], which are suitable for all of the C, Ca and O elements.
The theoretical equilibrium constant for reaction (4) was calculated using the equation:
( )( )
13 12 18 162
13 12 163
Ca C O O
Ca C O
RPFRK3866
RPFR= , (8)
for which the value of the RPFR (short for reduced partition function ratio [1] [2] [9]-[11] [33] [34]) is given by:
( )( )
( )( )
( ){ }( ){ }
3 6 1 expexp 2RPFR
exp 2 1 exp
lhhN i Ki Ki Kh lK l l hi i K i K i K
u XEu XEu XEX E
u XE u XE u XE
− − −− = − − − ∏ , (9)
J. Yuan et al.
439
where KXE is the molecule, h and l represent the heavy (13C, 18O) and light (12C, 16O) isotopes for element E and iu hv kT= , with h representing Planck’s constant, iv the thi frequency of the clusters (see Sup-plementary Materials) calculated using the Gaussian09 code [25], k is the Boltzmann’s constant and T is the temperature (in the range from 260 to 1500 K) (Guo et al., 2009; Schauble et al., 2006). This temperature range is sufficient for studying the precipitation of calcite and aragonite near 0˚C (the freezing point of water [17]) and 1200˚C (for metamorphic rocks [3]). Note that the symmetry numbers were 1 for both optimized clusters be-cause of their C1 symmetry (see Supplementary Materials).
For calculation of the RPFR, a scaling factor (SF) should be used [11] [29] [35] and is predicted by:
( )all all 2theor exp theor
i iSF t
i i iv v v= ∑ ∑ , (10)
with the values for iv for the carbonate groups on the calcite (0001) surface presented in Table 1. By compar-ing the listed experimentally observed and theoretically calculated harmonic frequencies obtained using this equation, the value of the SF was determined to be 1.0613 for the HF/6-31G* level in the present study.
The theoretical values for 63∆ were then calculated using the equation:
( )63 1000 K3866 1∆ ≅ × − , (11)
which provides results with an accuracy of 94% [3] [9] [11] [12]. All of the 63∆ values for calcite and aragonite were obtained by averaging the values for three different oxygen sites (O1, O2 and O3) [9] [11] [12] on each of the two surfaces (see Supplementary Materials).
Re-writing Equation (3) gives the present phosphoric acid fractionation factor:
47 63y = ∆ −∆ , (12)
where 47∆ represents the fitted polynomials from [3] [4] [20] and 63∆ represents the values obtained using Equation (11).
3. Results 3.1. Optimized Structures and Harmonic Frequencies The optimized structures for the calcite and aragonite interfaces are in agreement with experimental observa-tions. In the calcite structure, the O atoms in the water molecules were located at 1.70 - 2.80 Å from and per-pendicular to the (0001) surface (Figure 1(a)); such values agree well with the vertical data for a (10 - 14) sur-face: 2.2 - 3.2 Å according to a molecular simulation (MD) study [36] and 2.29 - 3.45 Å as determined via X-ray scattering observations [37].
These structures are also consistent with basic theories on crystal surface chemistry. Both the orientation of the atoms and the bond lengths in the clusters (see Supplementary Materials) slightly deviate from the pure crystal lattice positions [27] [28]; this variation is reasonable [38] due to the termination of the periodic atom layers that are connected to molecules [39].
The ab initio harmonic vibrational frequencies (in cm−1), and standard C and O elemental masses for the car-bonate groups on the calcite (0001) surface are listed in Table 1, which also includes experimental vibrational data for carbonate groups on a calcite surface determined via laser Raman spectroscopy and infrared analysis [40]. The calculated vibrations for the symmetric stretch ( )1v and asymmetric stretching ( )3v bands of the carbonate groups are 1211, 1212 and 1213 cm−1 ( )3bv and are less than the observed values. On the other hand, the calculated out-of-plane bending ( )2v and in-plane-bending ( )4v bands at 988, 779 and 799 cm−1 ( )4bv are greater than the observed values.
The harmonic frequencies for the 23CO − groups with different isotopic masses on the calcite surface are pre-
sented in Table 2. It can be seen from this data that when the heavier 13C substitutes the lighter 12C isotope in xC16O16O16O2−|, 1v does not change; however, 2v , 4v and 4bv decrease by 29, 2 and 2 cm−1, respectively. These trends are in agreement with the corresponding vibrations in bulk calcite [26]. In addition, when heavier (13C, 18O) isotopes substitute lighter (12C, 16O, respectively) isotopes, the asymmetric stretching ( 3v and 3bv ) bands under interfacial conditions do not change, which is different from the decreasing trends of 3v and 3bv in bulk calcite [26].

J. Yuan et al.
440
Table 1. Vibrational bands (in cm−1) of carbonate groups on the (0001) surface of calcite and the scaling factor (Scott and Radom, 1996).
Source v1 v2 v3 v3b v4 v4b S.F. Experimenta 1266 901 1438 1438 713 713 -- This study 1211 988 1212 1213 779 799 1.0613
aFrom Forbes et al. (2011) Table 2. Comparison of the frequencies (in cm−1) of carbonate groups on the calcite surface (this study) and in bulk calcite (Rustad et al. (2008)) and their ratios (vi/v1, in unit 1).
Species v1 v2 v3 v3b v4 v4b Vi/v1 v2/v1 v3/v1 v3b/v1 v4/v1 v4b/v1 Source/Level 12C16O16O16O2−|a 1211 988 1212 1213 779 799 1.000 0.816 1.001 1.001 0.643 0.660
This Study HF/6-31G*
12C18O16O16O2−| 1207 984 1212 1213 773 788 1.000 0.815 1.004 1.005 0.640 0.653 13C16O16O16O2−| 1211 959 1212 1213 777 797 1.000 0.792 1.001 1.001 0.642 0.658 13C18O16O16O2−| 1207 955 1212 1213 773 786 1.000 0.792 1.004 1.005 0.640 0.651
12C16O16O16O2−-icceb 1078 823 1478 1478 685 684 1.000 0.763 1.371 1.371 0.635 0.635 Rustad et al. (2008) PBE/6-31G*/3-21G 13C16O16O16O2−-icce 1078 798 1436 1436 683 682 1.000 0.740 1.332 1.332 0.634 0.633
a| stands for the surface of the crystal; b“icce” stands for inner-crystal-chemical environments.
3.2. Values for 63∆ , y and 47∆ for Both Calcite and Aragonite
The calculated 63∆ values are presented in Figure 2 and Figure 3 and Tables 3-6. In Table 4, it can be seen that for calcite at 25˚C, the 63∆ values for O2 and O3 are slightly lower (−0.02‰) and higher (0.02‰), respec-tively, than the mean value (0.65‰), while that of O1 equals the mean value (Figure 2(a)). In contrast, for ara-gonite at 25˚C, the 63∆ values for O2 and O3 are slightly higher (0.01‰ and 0.03‰, respectively) than the mean value (0.66‰), whereas that of O3 is lower (−0.04‰) than the mean value (Figure 2(b)). The variations in the 63∆ values for the different sites are partly due to the varying lengths of the O(in carbonate group)-H(in water)
bonds, which range from 1.88 to 1.92 Å in calcite (Figure 1(a)) and from 1.81 to 2.01 Å in aragonite (Figure 1(b)).
The values for the phosphoric acid fractionation factor y (Equation (12)) are shown in Figure 4 and Table 5. For temperatures ranging from 0˚C to 50˚C, the values in the present study were found to be
6 2-G-T-calcite 0.0067 10 0.0829y T= × − ( )2 0.0106R = , 6 2
-D-T-calcite 0.0187 10 0.1841y T= − × +
( )2 0.0106R = , 6 2-G-T-aragonite 0.0068 10 0.094y T= × − ( )2 0.0109R = and
6 2-G-T-aragonite 0.0187 10 0.1732y T= − × + ( )2 0.0109R = (Figure 4). These y values were thus on the order
of 0.01‰ in this temperature range, which is in good agreement with the value suggested by Ghosh et al. (2006) ( 0.14y ≤ ‰). In addition, the G-Ty polynomials determined for both minerals decreased extremely slowly with increasing temperature (approximately −0.0002‰/˚C), which is consistent with the trend reported by Ghosh et al. (2006) (−0.016‰/˚C). Note that the slope calculated in the present study for D-Ty was 0.0005‰/˚C.
Because the values for y calculated in the present study are so small:
47 63∆ ≅ ∆ , (13)
where 63∆ is given by Equation (11). Equation (13) provides results with an accuracy of 98%-G (=(abs (0.658 − 0.01)/0.658)) × 100% for calcite at 25˚C in Table 5) and 95%-D (=(abs(0.658 − 0.032)/0.658)) × 100% for cal-cite at 25˚C in Table 5). This equation also demonstrates why both the 47∆ and 63∆ values calculated in the present study can be placed on the ordinate in Figure 2. Furthermore, the 47∆ values calculated in this study agreed well with the experimentally determined values for both minerals (Figure 2).
3.3. Uncertainty of the Present Predictions Possible errors in the ab initio calculations were first considered. A series of factors influence the accuracy of the calculated K3866| values, including the quality of the exchange density functional and the level of the basis

J. Yuan et al.
441
(a) (b)
Figure 2. Values for ∆47 and ∆63 as a function of temperature (K) for (a) calcite and (b) aragonite. The theoretical (this study TS O1, red solid line; TS O2, blue solid line; TS O3, cyan solid line; TS mean, black solid line) and experimental (Ghosh et al. (2006), black crosses; Ghosh et al. (2007), black dots; Dennis and Schrag (2010), black diamonds; Eagle et al. (2010), black circles; Tripati et al. (2010), black squares) data are illustrated. The best polynomial fittings for the means of the ∆47 and ∆63 values for both calcite and aragonite obtained in the present study are shown in Table 3.
Figure 3. Comparison of this results of the present study (TS, black solid) obtained at the HF/6-31G*/1.0613(SF) level to other theoretical and experimental results for calcite ∆47 values from 0˚C to 100˚C. Data points for the data taken from Ghosh et al. (2006) (black dashed), Dennis and Schrag (2010) (blue dashed), and combined Guo et al. (2009) (cyan dashed) were calculated using their fitted polynomials. The data points for Hill et al. (2014) at the B3LYP/6-311++G(2d,dp)(un-scaled) level were illustrated by adding the experimental y (0.232 ± 0.015‰) (cross solid) and theoretical y (0.220‰, Guo et al., 2009) (cross dashed) values. Also shown are the results for ∆47-aragonite obtained in the present study (red solid line).
set; thus, the harmonic frequencies, as well as the error of the scaling factor and the Teller-Redlich product rule [41] [42] used in Equation (9). The use of the Teller-Redlich product rule simplifies the calculation of the RPFR [33] [34] with an uncertainty of less than 10−5, as shown in previous theoretical calculations [11] [26] [29] [43]. The standard error for the SF = 1.0613 was not determined because only one experimental vibrational spectrum [40] has been published. The quality of the theoretical method and the level of the basis set consist of systemic errors in the harmonic frequencies; however, it is clear that the systemic errors are partially cancelled out due to the division of the two RPFRs during calculation of the K3866| values [11].
The uncertainties in the calculated y values derive from the accuracies of both the calculated 63∆ s values and the experimentally fitted 47∆ polynomials. As shown above for Equation (11), the 63∆ values obtained using

J. Yuan et al.
442
Table 3. Parameters for the polynomial fitting to calculated best-estimate ∆63 and ∆47 values (Equation (13)) from different studies and the corresponding temperature ranges (K).
Items A B C D E Temperature range (K) Reference
Calcite
∆47 ≅ ∆63 −8.14673 × 10⁸ −9.31441 × 10⁶ 1.42742 × 10⁵ −1.64905 × 10² 5.65986 × 10⁻² 260 - 1500 This study
∆63 −3.40752 × 10⁹ 2.36545 × 10⁷ −2.63167 × 10³ −5.85372 0.00000 260 - 1500 Schauble et al. (2006)
∆47 −1.67298 × 10⁹ 6.81374 × 10⁶ 5.13850 × 10⁴ −7.78016 × 101 3.18281 × 10⁻² 273.15 - 1373.15 Hill et al. (2014) ∆47 −3.33040 × 10⁹ 2.32415 × 10⁷ −2.91282 × 10³ −5.54043 2.32520 × 10⁻¹ 260 - 1500 Guo et al. (2009)
Aragonite
∆47 ≅ ∆63 −5.81530 × 10⁸ −1.18267 × 10⁷ 1.50830 × 10⁵ −1.71999 × 10² 5.86981 × 10⁻² 260 - 1500 This study
∆63 −3.51109 × 10⁹ 2.40017 × 10⁷ −4.62181 × 10² −7.25553 0.00000 260 - 1500 Schauble et al. (2006)
∆47 −1.57483 × 10⁹ 5.29223 × 10⁶ 5.85736 × 10⁴ −8.57804 × 101 3.46876 × 10⁻² 273.15 - 1373.15 Hill et al. (2014) ∆47 −3.43068 × 10⁹ 2.35766 × 10⁷ −8.06003 × 10² −6.90300 2.28930 × 10⁻¹ 260 - 1500 Guo et al. (2009)
The form of each fit is ∆47/63 (T) = A/T4 + B/T3 + C/T2 +D/T + E. Our polynomials reproduce ∆63 within 0.26% for both calcite and aragonite from 260 to 1500 K. Present ∆47 ≅ ∆63 is given by Equation (13) within 0.01‰. Table 4. Site-specific effects of ∆63 in the present study.
Mineral Site 0˚C 25˚C 50˚C 75˚C 100˚C
Calcite
O1 0.76 0.65 0.56 0.48 0.42 O2 0.74 0.63 0.54 0.47 0.41 O3 0.79 0.67 0.58 0.50 0.44
Mean 0.76 0.65 0.56 0.48 0.42
Aragonite
O1 0.72 0.62 0.53 0.45 0.39 O2 0.78 0.67 0.58 0.50 0.43 O3 0.80 0.69 0.59 0.52 0.45
Mean 0.77 0.66 0.57 0.49 0.42
the calculated K3866| values have an accuracy within 0.03‰. The external precision of the 47-G∆ values is 0.01‰ - 0.02‰, with a related temperature precision of ±2˚C [3], and the run-to-run reproducibility and internal count-ing statistics in [20] were 0.029‰ and 0.012‰, respectively. That is, the accuracies of the experimental 47∆
values are at the level of 0.01‰. Therefore, the errors in the y values determined in the present study are on the order of 0.01‰, and the precision of the temperature is ±2˚C [3] [4] [9] [12] [20].
3.4. Fractionations for 13/12C, 18/16O and 14/12C The accuracy of the calculated results obtained in the present study was then evaluated by comparing the calcu-lated and experimentally obtained 13/12C and 18/16O fractionations for calcite and aragonite. For RPFR(13/12C-calcite) at 25˚C (Table 6 and Table 7), the estimated value of 1.2761 was greater than previously reported results (e.g. 1.2037 [44], 1.1973 [45], 1.20430 [11], 1.1994 [26] and 1.2078 [9]). The calculated value of 1.2785 for RPFR(13/12C-aragonite) at 25˚C, was also greater than previously reported results (e.g. 1.20669 [11], 1.2014 [26] and 1.2110 [9]). In contrast, the calculated value of −1.9‰ for ∆13CCalcite-Aragonite = 1000 × ln (RPFR (13/12C-calcite)/RPFR(13/12C-aragontie)) was in good agreement with the value reported previously for low-temperature equilibrium experiments (−1.7 ± 0.4‰, 25˚C) [46] [47].
For RPFR(18/16O-calcite) at 25˚C, is the calculated value of 1.1355 was again larger than previously reported re-sults (e.g. 1.1018 [48], 1.1040 [44], 1.10328 [11] and 1.1060 [9]). The calculated value of 1.1394 for RPFR(18/16O-aragonite) at 25˚C was also larger than previously reported results (e.g. 1.098 [48], 1.10319 [11], 1.0737 [49] and 1.1075 [9]). On the other hand, the calculated value for ∆18OCalcite-Aragonite of −3.4‰ at 25˚C, was less than the experimentally obtained results (−0.6‰ [31] [50] and −1.4‰ at 25˚C, [49]). The difference in the magnitudes of the ∆18O valued may be due to the influence of the acid fractionation factor (1.01107 and 1.01049 for calcite and aragonite, respectively) [11] [51].
The present results may be applied to the study of the climate history of the Paleozoic, Precambrian and Ce-
J. Yuan et al.
443
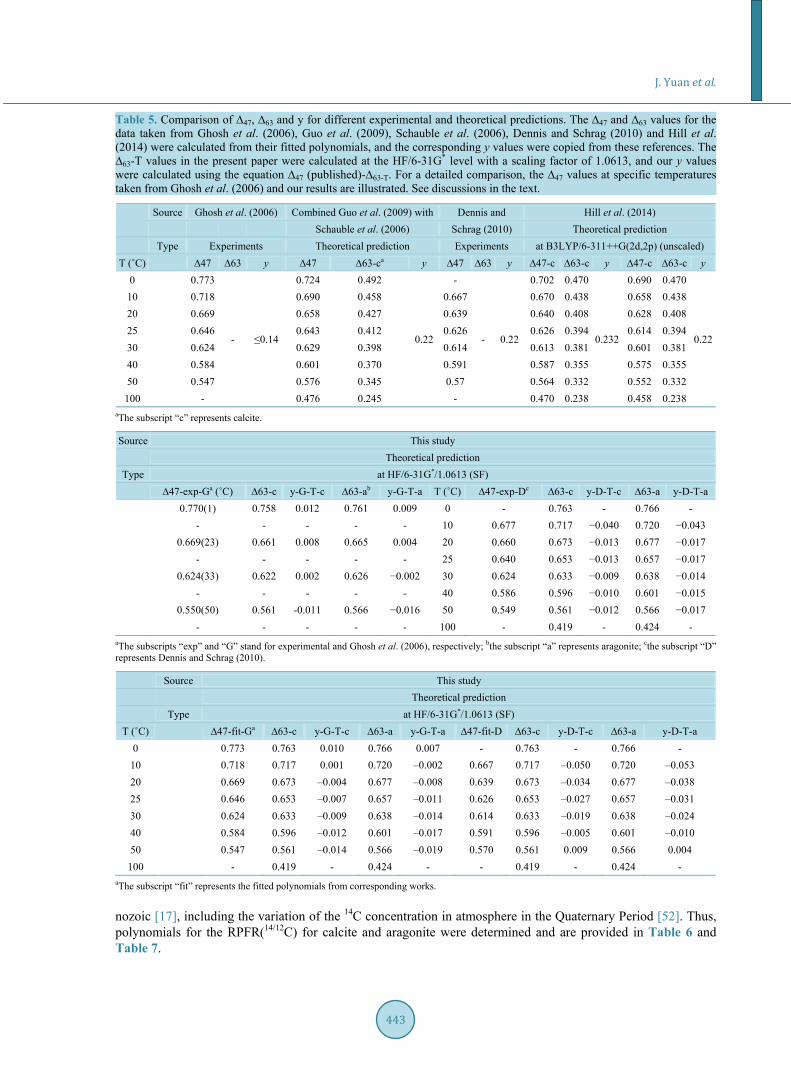
Table 5. Comparison of ∆47, ∆63 and y for different experimental and theoretical predictions. The ∆47 and ∆63 values for the data taken from Ghosh et al. (2006), Guo et al. (2009), Schauble et al. (2006), Dennis and Schrag (2010) and Hill et al. (2014) were calculated from their fitted polynomials, and the corresponding y values were copied from these references. The ∆63-T values in the present paper were calculated at the HF/6-31G* level with a scaling factor of 1.0613, and our y values were calculated using the equation ∆47 (published)-∆63-T. For a detailed comparison, the ∆47 values at specific temperatures taken from Ghosh et al. (2006) and our results are illustrated. See discussions in the text.
Source Ghosh et al. (2006) Combined Guo et al. (2009) with Dennis and Hill et al. (2014)
Schauble et al. (2006) Schrag (2010) Theoretical prediction
Type Experiments Theoretical prediction Experiments at B3LYP/6-311++G(2d,2p) (unscaled) T (˚C) ∆47 ∆63 y ∆47 ∆63-ca y ∆47 ∆63 y ∆47-c ∆63-c y ∆47-c ∆63-c y
0 0.773
- ≤0.14
0.724 0.492
0.22
-
- 0.22
0.702 0.470
0.232
0.690 0.470
0.22
10 0.718 0.690 0.458 0.667 0.670 0.438 0.658 0.438 20 0.669 0.658 0.427 0.639 0.640 0.408 0.628 0.408 25 0.646 0.643 0.412 0.626 0.626 0.394 0.614 0.394 30 0.624 0.629 0.398 0.614 0.613 0.381 0.601 0.381 40 0.584 0.601 0.370 0.591 0.587 0.355 0.575 0.355 50 0.547 0.576 0.345 0.57 0.564 0.332 0.552 0.332 100 - 0.476 0.245 - 0.470 0.238 0.458 0.238
aThe subscript “c” represents calcite. Source This study
Theoretical prediction Type at HF/6-31G*/1.0613 (SF)
∆47-exp-Ga (˚C) ∆63-c y-G-T-c ∆63-ab y-G-T-a T (˚C) ∆47-exp-Dc ∆63-c y-D-T-c ∆63-a y-D-T-a
0.770(1) 0.758 0.012 0.761 0.009 0 - 0.763 - 0.766 -
- - - - - 10 0.677 0.717 −0.040 0.720 −0.043
0.669(23) 0.661 0.008 0.665 0.004 20 0.660 0.673 −0.013 0.677 −0.017
- - - - - 25 0.640 0.653 −0.013 0.657 −0.017
0.624(33) 0.622 0.002 0.626 −0.002 30 0.624 0.633 −0.009 0.638 −0.014
- - - - - 40 0.586 0.596 −0.010 0.601 −0.015
0.550(50) 0.561 -0.011 0.566 −0.016 50 0.549 0.561 −0.012 0.566 −0.017
- - - - - 100 - 0.419 - 0.424 - aThe subscripts “exp” and “G” stand for experimental and Ghosh et al. (2006), respectively; bthe subscript “a” represents aragonite; cthe subscript “D” represents Dennis and Schrag (2010).
Source This study
Theoretical prediction
Type at HF/6-31G*/1.0613 (SF) T (˚C) ∆47-fit-Ga ∆63-c y-G-T-c ∆63-a y-G-T-a ∆47-fit-D ∆63-c y-D-T-c ∆63-a y-D-T-a
0 0.773 0.763 0.010 0.766 0.007 - 0.763 - 0.766 - 10 0.718 0.717 0.001 0.720 –0.002 0.667 0.717 –0.050 0.720 –0.053 20 0.669 0.673 –0.004 0.677 –0.008 0.639 0.673 –0.034 0.677 –0.038 25 0.646 0.653 –0.007 0.657 –0.011 0.626 0.653 –0.027 0.657 –0.031 30 0.624 0.633 –0.009 0.638 –0.014 0.614 0.633 –0.019 0.638 –0.024 40 0.584 0.596 –0.012 0.601 –0.017 0.591 0.596 –0.005 0.601 –0.010 50 0.547 0.561 –0.014 0.566 –0.019 0.570 0.561 0.009 0.566 0.004
100 - 0.419 - 0.424 - - 0.419 - 0.424 - aThe subscript “fit” represents the fitted polynomials from corresponding works. nozoic [17], including the variation of the 14C concentration in atmosphere in the Quaternary Period [52]. Thus, polynomials for the RPFR(14/12C) for calcite and aragonite were determined and are provided in Table 6 and Table 7.
J. Yuan et al.
444
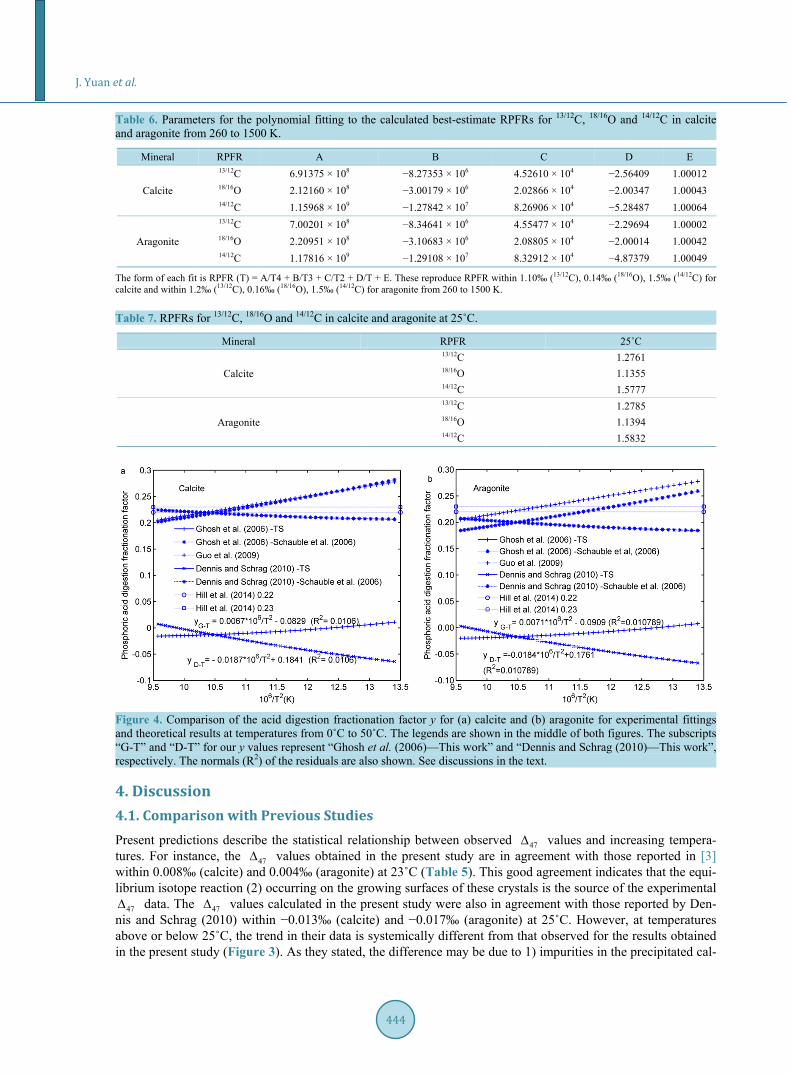
Table 6. Parameters for the polynomial fitting to the calculated best-estimate RPFRs for 13/12C, 18/16O and 14/12C in calcite and aragonite from 260 to 1500 K.
Mineral RPFR A B C D E
Calcite
13/12C 6.91375 × 10⁸ −8.27353 × 10⁶ 4.52610 × 10⁴ −2.56409 1.00012 18/16O 2.12160 × 10⁸ −3.00179 × 10⁶ 2.02866 × 10⁴ −2.00347 1.00043 14/12C 1.15968 × 10⁹ −1.27842 × 10⁷ 8.26906 × 10⁴ −5.28487 1.00064
Aragonite
13/12C 7.00201 × 10⁸ −8.34641 × 10⁶ 4.55477 × 10⁴ −2.29694 1.00002 18/16O 2.20951 × 10⁸ −3.10683 × 10⁶ 2.08805 × 10⁴ −2.00014 1.00042 14/12C 1.17816 × 10⁹ −1.29108 × 10⁷ 8.32912 × 10⁴ −4.87379 1.00049
The form of each fit is RPFR (T) = A/T4 + B/T3 + C/T2 + D/T + E. These reproduce RPFR within 1.10‰ (13/12C), 0.14‰ (18/16O), 1.5‰ (14/12C) for calcite and within 1.2‰ (13/12C), 0.16‰ (18/16O), 1.5‰ (14/12C) for aragonite from 260 to 1500 K. Table 7. RPFRs for 13/12C, 18/16O and 14/12C in calcite and aragonite at 25˚C.
Mineral RPFR 25˚C
Calcite
13/12C 1.2761 18/16O 1.1355 14/12C 1.5777
Aragonite
13/12C 1.2785 18/16O 1.1394 14/12C 1.5832
Figure 4. Comparison of the acid digestion fractionation factor y for (a) calcite and (b) aragonite for experimental fittings and theoretical results at temperatures from 0˚C to 50˚C. The legends are shown in the middle of both figures. The subscripts “G-T” and “D-T” for our y values represent “Ghosh et al. (2006)—This work” and “Dennis and Schrag (2010)—This work”, respectively. The normals (R2) of the residuals are also shown. See discussions in the text.
4. Discussion 4.1. Comparison with Previous Studies Present predictions describe the statistical relationship between observed 47∆ values and increasing tempera-tures. For instance, the 47∆ values obtained in the present study are in agreement with those reported in [3] within 0.008‰ (calcite) and 0.004‰ (aragonite) at 23˚C (Table 5). This good agreement indicates that the equi-librium isotope reaction (2) occurring on the growing surfaces of these crystals is the source of the experimental
47∆ data. The 47∆ values calculated in the present study were also in agreement with those reported by Den-nis and Schrag (2010) within −0.013‰ (calcite) and −0.017‰ (aragonite) at 25˚C. However, at temperatures above or below 25˚C, the trend in their data is systemically different from that observed for the results obtained in the present study (Figure 3). As they stated, the difference may be due to 1) impurities in the precipitated cal-

J. Yuan et al.
445
cite, 2) non-equilibrium isotope fractionation with water, and 3) “inter-lab differences in sample preparation and IRMS analysis”. If these factors were to be considered, it is possible that the data would be in better agreement.
The calculated results obtained in the present study were also compared to previously reported theoretical re-sults (Figure 3, Table 3 and Table 5). At 25˚C, the present calculated 63∆ values of 0.653‰ (calcite) and 0.657‰ (aragonite) were greater than the 63-icce∆ value (approximately 0.40‰ for both minerals) obtained us-ing lattice dynamics [11] and cluster models [9]. In addition, the calculated 47∆ values for calcite systemically deviated from those reported by Guo et al. (2009) (Figure 3). Furthermore, the y values obtained in the pre-sent study were in agreement with [3] but far lower than the conventionally accepted value of 0.22(3)‰ ([9] [12] [20]), regardless of whether 47-fit-G∆ or 47-fit-D∆ was used in Equation (12) (Figure 4 and Table 5). This difference is due to different interpretations of the recrystallization process for carbonate samples (see Section 4.2).
Notably, all of the theoretical results obtained in the present study (RPFR(13/12C), RPFR(18/16O), K3866|, 63∆ and 47∆ values) differed from previously reported results. The difference is in part due to the dissimilarity of vibrations (as required in Equation (9)) for carbonate groups at the crystal-water interface (Figure 1) and in the inner crystal environment [9] [11] [26]. Examples can be seen in Table 2, including the frequencies on the cal-cite surface at the HF/6-31G* level (this work) and in bulk calcite at the PBE/6-31G*/3-21G level [26]. Note that the frequencies are compared using the ( )1iv v ratio, because the differences in the magnitudes due to the dif-ferent calculation levels are cancelled out using this approach, which indicates the property of the ith vibration in corresponding clusters. This comparison revealed that: 1) 1v , 2v , 4v and 4bv on the surface are similar to those in the bulk crystal, whereas the C-O asymmetric stretching vibrations 3v and 3bv are very close to 1v on the calcite surface, but approximately 1.3 times greater than 1v in bulk calcite. As a result, the differences in the results obtained in the present and previous studies are mainly due to the C-O asymmetric stretching vibra-tions 3v and 3bv at the calcite interface.
In addition, the different coordinate atoms (CAs) of the O atoms in the carbonate group in the two different environments also contribute to the difference in the results obtained in the present and previous studies. The CAs of the O atoms include hydrogen, carbon and calcium atoms for both the calcite and aragonite surfaces (Figure 1), whereas the CAs for the O atoms in inner crystal environment consist of only carbon and calcium atoms [9]-[11] [26].
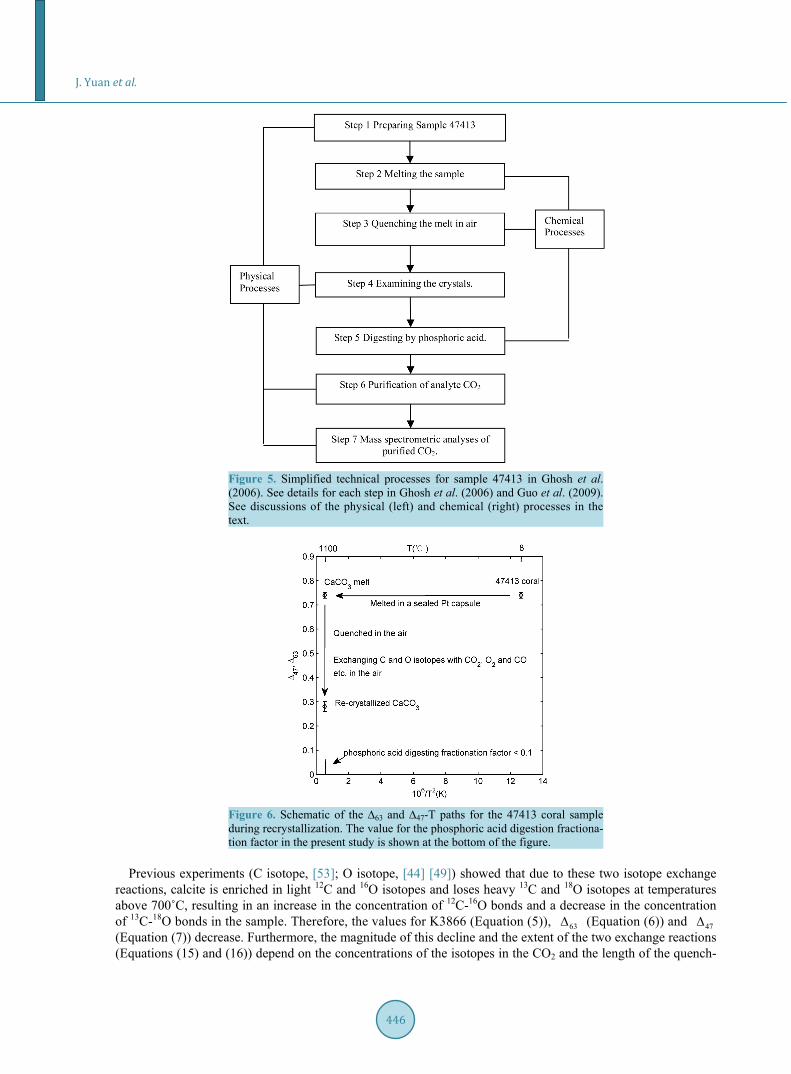
4.2. Information behind the Conventional 0.22(3)‰ Value for y In Ghosh et al.’s (2006) study, the technical process for analysing the recrystallized CaCO3 from, for example, sample 47413 is shown in Figure 5. This process involved seven steps that can be classified as physical or chemical processes. Steps 1, 4 and 6 were physical processes and did not involve chemical reactions and thus were assumed to have little or no influence on the final 63∆ and 47∆ values.
The remaining four chemical processes play key roles in determining the 0.22(3)‰ value for y. Step 2, which corresponds to the horizontal left arrow in Figure 6, includes the reaction:
( ) ( )heat3 3CaCO solid CaCO liquid→ , (14)
which produces a uniform distribution of different isotopes in the system, but does not change the total chemical composition, including the isotopic 63∆ of the system, if a “sealed Pt capsule (ideally without air in it)” is used [3] [4] [12].
In reality, air would be present in the Pt capsules if step 2 in both Ghosh et al.’s (2006) and Guo et al.’s (2009) experiments was performed in air rather than under a vacuum or atmosphere of a noble gas. In this con-dition, reactions (15) and (16) below occur during the melting process and contribute to a decrease in the K3866 value.
Steps 3 and 5 involve significant isotopic reactions. Step 3 corresponds to the vertical-down arrow in Figure 6. When quenched in air, isotopes in the melted CaCO3 sample (including CO2, CO and O2 gases) exchange with gases in the air. Take CO2 as an example:
13 12 12 133 2 3 2Ca CO CO Ca CO CO+ ⇔ + (15)
and 18 16 16 18
2 2CaC OO C OO CaC OO C OO+ ⇔ + . (16)
J. Yuan et al.
446
Figure 5. Simplified technical processes for sample 47413 in Ghosh et al. (2006). See details for each step in Ghosh et al. (2006) and Guo et al. (2009). See discussions of the physical (left) and chemical (right) processes in the text.
Figure 6. Schematic of the ∆63 and ∆47-T paths for the 47413 coral sample during recrystallization. The value for the phosphoric acid digestion fractiona- tion factor in the present study is shown at the bottom of the figure.
Previous experiments (C isotope, [53]; O isotope, [44] [49]) showed that due to these two isotope exchange
reactions, calcite is enriched in light 12C and 16O isotopes and loses heavy 13C and 18O isotopes at temperatures above 700˚C, resulting in an increase in the concentration of 12C-16O bonds and a decrease in the concentration of 13C-18O bonds in the sample. Therefore, the values for K3866 (Equation (5)), 63∆ (Equation (6)) and 47∆ (Equation (7)) decrease. Furthermore, the magnitude of this decline and the extent of the two exchange reactions (Equations (15) and (16)) depend on the concentrations of the isotopes in the CO2 and the length of the quench-
J. Yuan et al.
447
ing time [54]. When digesting CO2 from a sample (step 5), phosphoric acid reacts with recrystallized carbonates [5] [8]) and
the phosphoric acid fractionation factor is at the level of 0.01‰ according to our calculations. Thus, we suggest that the intercepts (0.28‰, 47413 aragonite coral; 0.22‰, MZ carbonate; 0.14‰, Sigma carb in Ghosh et al. (2006) and 0.234, re-crystallized MZ; 0.210, NBS19 standard; 0.243, Sigma carbonate in Guo et al. (2009)) represent residual isotope information for the corresponding original CaCO3 samples after reaction with air.
5. Conclusions Ab initio calculations of 13C-18O clumped isotope reactions on growing surfaces of calcite (0001) and aragonite (001) planes were performed. On the basis of the calculated results, the following conclusions can be drawn:
1) These reactions determine the clumped isotope signatures in bulk carbonate crystals and the corresponding 47∆ information after dissolution using phosphoric acid. Over the temperature range from 260 to 1500 K, the
calculated 47∆ polynomial for calcite was found to be: 8 6 5 2
247-calcite 4 3 2
8.14673 10 9.31441 10 1.42742 10 1.64905 10 5.65986 10TT T T
−× × × ×∆ = − − + − + ×
and that for aragonite: 8 7 5 2
247-aragonite 4 3 2
5.81530 10 1.18267 10 1.50830 10 1.71999 10 5.86981 10TT T T
−× × × ×∆ = − − + − + × .
2) A comparison of the present results with previously reported experimental data suggests that the phospho-ric acid influences the degassing of CO2 from the carbonates at a level of just 0.01‰. It is therefore thought that the conventional intercept of 0.22(3)‰ is due to C and O isotope reactions between CaCO3 and air.
Acknowledgements We would like to thank Dr Wang Xu in IGGCAS for helpful discussions on the process of phosphoric acid digestion. All of the calculations were performed at the IGGCAS computer simulation lab. This work was supported by the National Natural Science Foundation of China (Grant No. 90914010, 41020134003 and 41303047). The authors would like to thank Enago (www.enago.cn) for the English language review.
References [1] Wang, Z.G., Schauble, E.A. and Eiler, J.M. (2004) Equilibrium Thermodynamics of Multiply Substituted Isoto-
pologues of Molecular Gases. Geochimica et Cosmochimica Acta, 68, 4779-4797. http://dx.doi.org/10.1016/j.gca.2004.05.039
[2] Eiler, J.M. and Schauble, E. (2004) (OCO)-O-18-C-13-O-16 in Earth’s Atmosphere. Geochimica et Cosmochimica Acta, 68, 4767-4777.
[3] Ghosh, P., Adkins, J., Affek, H., Balta, B., Guo, W.F., Schauble, E.A., Schrag, D. and Eller, J.M. (2006) 13C-18O Bonds in Carbonate Minerals: A New Kind of Paleothermometer. Geochimica et Cosmochimica Acta, 70, 1439-1456. http://dx.doi.org/10.1016/j.gca.2005.11.014
[4] Ghosh, P., Eiler, J., Campana, S.E. and Feeney, R.F. (2007) Calibration of the Carbonate “Clumped Isotope” Paleo-thermometer for Otoliths. Geochimica et Cosmochimica Acta, 71, 2736-2744. http://dx.doi.org/10.1016/j.gca.2007.03.015
[5] Mccrea, J.M. (1950) On the Isotopic Chemistry of Carbonates and a Paleotemperature Scale. The Journal of Chemical Physics, 18, 849.
[6] Swart, P.K. (1991) The Oxygen and Hydrogen Isotopic Composition of the Black Sea. Deep Sea Research Part A. Oceanographic Research Papers, 38, S761-S772.
[7] Swart, P.K. (1991) Factors Affecting the Oxygen Isotopic Composition of the Black Sea. Black Sea Oceanography, 351, 75-88.
[8] Swart, P.K., Burns, S.J. and Leder, J.J. (1991) Fractionation of the Stable Isotopes of Oxygen and Carbon in Car-bon-Dioxide during the Reaction of Calcite with Phosphoric-Acid as a Function of Temperature and Technique. Che- mical Geology: Isotope Geoscience Section, 86, 89-96.

J. Yuan et al.
448
[9] Hill, P.S., Tripati, A.K. and Schauble, E.A. (2014) Theoretical Constraints on the Effects of pH, Salinity, and Tem-perature on Clumped Isotope Signatures of Dissolved Inorganic carbon Species and Precipitating Carbonate Minerals. Geochimica et Cosmochimica Acta, 125, 610-652.
[10] Schauble, E.A. and Eiler, J.M. (2004) Theoretical Estimates of Equilibrium 13C-18O Clumping in Carbonates and Or-ganic Acids. Eos, Transactions American Geophysical Union, 85, 11A-0552.
[11] Schauble, E.A., Ghosh, P. and Eiler, J.M. (2006) Preferential Formation of 13C-18O Bonds in Carbonate Minerals, Es-timated Using First-Principles Lattice Dynamics. Geochimica et Cosmochimica Acta, 70, 2510-2529. http://dx.doi.org/10.1016/j.gca.2006.02.011
[12] Guo, W.F., Mosenfelder, J.L., Goddard, W.A. and Eiler, J.M. (2009) Isotopic Fractionations Associated with Phospho-ric Acid Digestion of Carbonate Minerals: Insights from First-Principles Theoretical Modeling and Clumped Isotope Measurements. Geochimica et Cosmochimica Acta, 73, 7203-7225. http://dx.doi.org/10.1016/j.gca.2009.05.071
[13] Watson, E.B. and Liang, Y. (1995) A Simple Model for Sector Zoning in Slowly Grown Crystals: Implications for Growth Rate and Lattice Diffusion, with Emphasis on Accessory Minerals in Crustal Rocks. American Mineralogist, 80, 1179-1187.
[14] Watson, E.B. (2004) A Conceptual Model for Near-Surface Kinetic Controls on the Trace-Element and Stable Isotope Composition of Abiogenic Calcite Crystals. Geochimica et Cosmochimica Acta, 68, 1473-1488. http://dx.doi.org/10.1016/j.gca.2003.10.003
[15] Watson, E.B. (1996) Surface Enrichment and Trace-Element Uptake during Crystal Growth. Geochimica et Cosmo-chimica Acta, 60, 5013-5020. http://dx.doi.org/10.1016/S0016-7037(96)00299-2
[16] DePaolo, D.J. (2011) Surface Kinetic Model for Isotopic and Trace Element Fractionation during Precipitation of Cal-cite from Aqueous Solutions. Geochimica et Cosmochimica Acta, 75, 1039-1056. http://dx.doi.org/10.1016/j.gca.2010.11.020
[17] Eiler, J.M. (2011) Paleoclimate Reconstruction Using Carbonate Clumped Isotope Thermometry. Quaternary Science Reviews, 30, 3575-3588. http://dx.doi.org/10.1016/j.quascirev.2011.09.001
[18] Eagle, R.A., Schauble, E.A., Tripati, A.K., Tuetken, T., Hulbert, R.C. and Eiler, J.M. (2010) Body Temperatures of Modern and Extinct Vertebrates from 13C-18O Bond Abundances in Bioapatite. Proceedings of the National Academy of Sciences of the United States of America, 107, 10377-10382. http://dx.doi.org/10.1073/pnas.0911115107
[19] Came, R.E., Eiler, J.M., Veizer, J., Azmy, K., Brand, U. and Weidman, C.R. (2007) Coupling of Surface Temperatures and Atmospheric CO2 Concentrations during the Palaeozoic Era. Nature, 449, 198-201. http://dx.doi.org/10.1038/nature06085
[20] Dennis, K.J. and Schrag, D.P. (2010) Clumped Isotope Thermometry of Carbonatites as an Indicator of Diagenetic Al-teration. Geochimica et Cosmochimica Acta, 74, 4110-4122. http://dx.doi.org/10.1016/j.gca.2010.04.005
[21] Saenger, C., Affek, H.P., Felis, T., Thiagarajan, N., Lough, J.M. and Holcomb, M. (2012) Carbonate Clumped Isotope Variability in Shallow Water Corals: Temperature Dependence and Growth-Related Vital Effects. Geochimica et Cos- mochimica Acta, 99, 224-242.
[22] Tripati, A.K., Eagle, R.A., Thiagarajan, N., Gagnon, A.C., Bauch, H., Halloran, P.R. and Eiler, J.M. (2010) 13C-18O Isotope Signatures and “Clumped Isotope” Thermometry in Foraminifera and Coccoliths. Geochimica et Cosmo-chimica Acta, 74, 5697-5717. http://dx.doi.org/10.1016/j.gca.2010.07.006
[23] Hammer, B., Morikawa, Y. and Norskov, J.K. (1996) CO Chemisorption at Metal Surfaces and Overlayers. Physical Review Letters, 76, 2141-2144. http://dx.doi.org/10.1103/PhysRevLett.76.2141
[24] Xu, Y., Ruban, A.V. and Mavrikakis, M. (2004) Adsorption and Dissociation of O-2 on Pt-Co and Pt-Fe Alloys. Jour-nal of the American Chemical Society, 126, 4717-4725. http://dx.doi.org/10.1021/ja031701+
[25] Frisch, M.J., Trucks, G.W., Schlegel, H.B., Scuseria, G.E., Robb, M.A., Cheeseman, J.R., Montgomery, J.J.A., Vreven, T., Kudin, K.N., Burant, J.C., Millam, J.M., Iyengar, S.S., Tomasi, J., Barone, V., Mennucci, B., Cossi, M., Scalmani, G., Rega, N., Petersson, G.A., Nakatsuji, H., Hada, M., Ehara, M., Toyota, K., Fukuda, R., Hasegawa, J., Ishida, M., Nakajima, T., Honda, Y., Kitao, O., Nakai, H., Klene, M., Li, X., Knox, J.E., Hratchian, H.P., Cross, J.B., Adamo, C., Jaramillo, J., Gomperts, R., Stratmann, R.E., Yazyev, O., Austin, A.J., Cammi, R., Pomelli, C., Ochterski, J.W., Ayala, P.Y., Morokuma, K., Voth, G.A., Salvador, P., Dannenberg, J.J., Zakrzewski, V.G., Dapprich, S., Daniels, A.D., Strain, M.C., Farkas, O., Malick, D.K., Rabuck, A.D., Raghavachari, K., Foresman, J.B., Ortiz, J.V., Cui, Q., Baboul, A.G., Clifford, S., Cioslowski, J., Stefanov, B.B., Liu, G., Liashenko, A., Piskorz, P., Komaromi, I., Martin, R.L., Fox, D.J., Keith, T., Al-Laham, M.A., Peng, C.Y., Nanayakkara, A., Challacombe, M., Gill, P.M.W., Johnson, B., Chen, W., Wong, M.W., Gonzalez, C. and Pople, J.A. (2009) Gaussian 09, Revision A.01. Gaussian, Inc., Wallingford.
[26] Rustad, J.R., Nelmes, S.L., Jackson, V.E. and Dixon, D.A. (2008) Quantum-Chemical Calculations of Carbon-Isotope Fractionation in CO2 (g), Aqueous Carbonate Species, and Carbonate Minerals. Journal of Physical Chemistry A, 112, 542-555. http://dx.doi.org/10.1021/jp076103m
J. Yuan et al.
449
[27] Maslen, E.N., Streltsov, V.A. and Streltsova, N.R. (1993) X-Ray Study of the Electron-Density in Calcite, CaCo3. Acta Crystallographica Section B-Structural Science, 49, 636-641.
[28] Jarosch, D. and Heger, G. (1986) Neutron-Diffraction Refinement of the Crystal-Structure of Aragonite. Tschermaks mineralogische und petrographische Mitteilungen, 35, 127-131.
[29] Liu, Y. and Tossell, J.A. (2005) Ab Initio Molecular Orbital Calculations for Boron Isotope Fractionations on Boric Acids and Borates. Geochimica et Cosmochimica Acta, 69, 3995-4006. http://dx.doi.org/10.1016/j.gca.2005.04.009
[30] Kohn, W. and Sham, L.J. (1965) Self-Consistent Equations Including Exchange and Correlation Effects. Physical Re-view, 140, A1133-A1138. http://dx.doi.org/10.1103/PhysRev.140.A1133
[31] Patterson, W.P., Smith, G.R. and Lohmann, K.C. (1993) Continental Paleothermometry and Seasonality Using the Iso- topic Composition of Aragonitic Otoliths of Freshwater Fishes. In: Climate Change in Continental Isotopic Records, American Geophysical Union, Washington DC, 191-202. http://dx.doi.org/10.1029/GM078p0191
[32] Petersen, J., Kieffer, M., Lilic, D., Rathlev, N. and Andersen, V. (1982) Influence of Autologous Monocytes on the Pokeweed Mitogen-Induced Generation of Immunoglobulin-Secreting Cells in Man. Scandinavian Journal of Haema-tology, 29, 273-282.
[33] Bigeleisen, J. and Mayer, M.G. (1947) Calculation of Equilibrium Constants for Isotopic Exchange Reactions. Journal of Chemical Physics, 15, 261. http://dx.doi.org/10.1063/1.1746492
[34] Urey, H.C. (1947) The Thermodynamic Properties of Isotopic Substances. Journal of the Chemical Society, 562-581. [35] Scott, A.P. and Radom, L. (1996) Harmonic Vibrational Frequencies: An Evaluation of Hartree-Fock, Moller-Plesset,
Quadratic Configuration Interaction, Density Functional Theory, and Semiempirical Scale Factors. Journal of Physical Chemistry, 100, 16502-16513. http://dx.doi.org/10.1021/jp960976r
[36] Kerisit, S. and Parker, S.C. (2004) Free Energy of Adsorption of Water and Calcium on the {10(1)over-bar-4} Calcite Surface. Chemical Communications, 1, 52-53.
[37] Geissbuhler, P., Fenter, P., DiMasi, E., Srajer, G., Sorensen, L.B. and Sturchio, N.C. (2004) Three-Dimensional Struc-ture of the Calcite-Water Interface by Surface X-Ray Scattering. Surface Science, 573, 191-203. http://dx.doi.org/10.1016/j.susc.2004.09.036
[38] Fenter, P., Geissbuhler, P., DiMasi, E., Srajer, G., Sorensen, L.B. and Sturchio, N.C. (2000) Surface Speciation of Cal-cite Observed in Situ by High-Resolution X-Ray Reflectivity. Geochimica et Cosmochimica Acta, 64, 1221-1228. http://dx.doi.org/10.1016/S0016-7037(99)00403-2
[39] Myers, D. (1999) Surfaces, Interfaces, and Colloids: Principles and Applications. 2nd Edition, John Wiley & Sons, Inc., New York.
[40] Forbes, T.Z., Radha, A.V. and Navrotsky, A. (2011) The Energetics of Nanophase Calcite. Geochimica et Cosmo-chimica Acta, 75, 7893-7905. http://dx.doi.org/10.1016/j.gca.2011.09.034
[41] Angus, W.R., Bailey, C.R., Ingold, C.K., Leckie, A.H., Raisin, C.G., Thompson, J.W. and Wilson, C.L. (1935) Infra- Red Spectrum of Hexadeuterobenzene and the Structure of Benzene. Nature, 136, 680.
[42] Wilson, E.B.J., Decius, J.C. and Cross, P.C. (1955) Molecular Vibrations: The Theory of Infrared and Raman Spectra. Dover, New York.
[43] Zeebe, R.E., Sanyal, A., Ortiz, J.D. and Wolf-Gladrow, D.A. (2001) A Theoretical Study of the Kinetics of the Boric Acid-Borate Equilibrium in Seawater. Marine Chemistry, 73, 113-124. http://dx.doi.org/10.1016/S0304-4203(00)00100-6
[44] Chacko, T., Mayeda, T.K., Clayton, R.N. and Goldsmith, J.R. (1991) Oxygen and Carbon Isotope Fractionations be-tween CO2 and Calcite. Geochimica et Cosmochimica Acta, 55, 2867-2882.
[45] Deines, P. (2004) Carbon Isotope Effects in Carbonate Systems. Geochimica et Cosmochimica Acta, 68, 2659-2679. http://dx.doi.org/10.1016/j.gca.2003.12.002
[46] Romanek, C.S., Grossman, E.L. and Morse, J.W. (1992) Carbon Isotopic Fractionation in Synthetic Aragonite and Calcite: Effects of Temperature and Precipitation Rate. Geochimica et Cosmochimica Acta, 56, 419-430.
[47] Rubinson, M. and Clayton, R.N. (1969) Carbon-13 Fractionation between Aragonite and Calcite. Geochimica et Cos-mochimica Acta, 33, 997-1002.
[48] Kieffer, S.W. (1982) Thermodynamics and Lattice-Vibrations of Minerals: 5. Applications to Phase-Equilibria, Iso-topic Fractionation, and High-Pressure Thermodynamic Properties. Reviews of Geophysics, 20, 827. http://dx.doi.org/10.1029/RG020i004p00827
[49] Chacko, T. and Deines, P. (2008) Theoretical Calculation of Oxygen Isotope Fractionation Factors in Carbonate Sys-tems. Geochimica et Cosmochimica Acta, 72, 3642-3660. http://dx.doi.org/10.1016/j.gca.2008.06.001
[50] Tarutani, T., Clayton, R.N. and Mayeda, T.K. (1969) Effect of Polymorphism and Magnesium Substitution on Oxygen
J. Yuan et al.
450
Isotope Fractionation between Calcium Carbonate and Water. Geochimica et Cosmochimica Acta, 33, 987-996. [51] Kim, S.T. and Oneil, J.R. (1997) Equilibrium and Nonequilibrium Oxygen Isotope Effects in Synthetic Carbonates.
Geochimica et Cosmochimica Acta, 61, 3461-3475. http://dx.doi.org/10.1016/S0016-7037(97)00169-5 [52] Yuan, J. and Liu, Y. (2012) Quantum-Mechanical Equilibrium Isotopic Fractionation Correction to Radiocarbon Dat-
ing: A Theory Study. Journal of Radioanalytical and Nuclear Chemistry, 292, 335-338. http://dx.doi.org/10.1007/s10967-011-1563-3
[53] Scheele, N. and Hoefs, J. (1992) Carbon Isotope Fractionation between Calcite, Graphite and CO2: An Experimental- Study. Contributions to Mineralogy and Petrology, 112, 35-45. http://dx.doi.org/10.1007/BF00310954
[54] Levine, I.N. (1995) Physical Chemistry. 4th Edition, McGraw-Hill, Inc., New York.
J. Yuan et al.
451
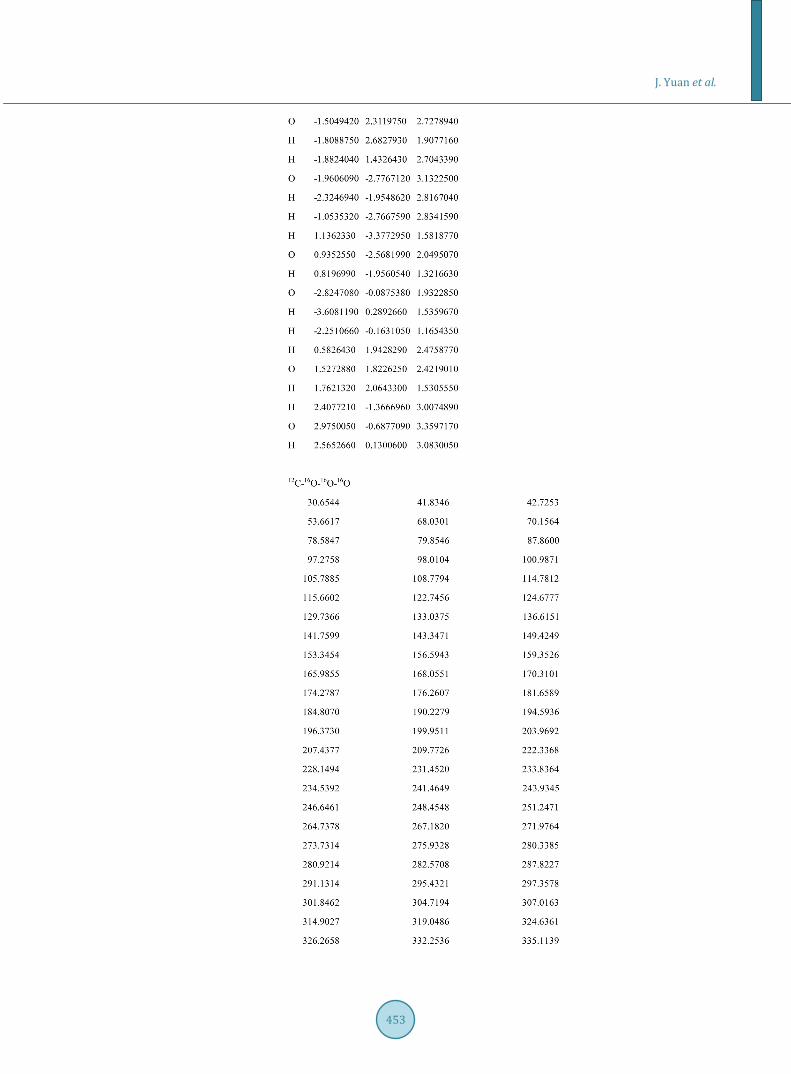
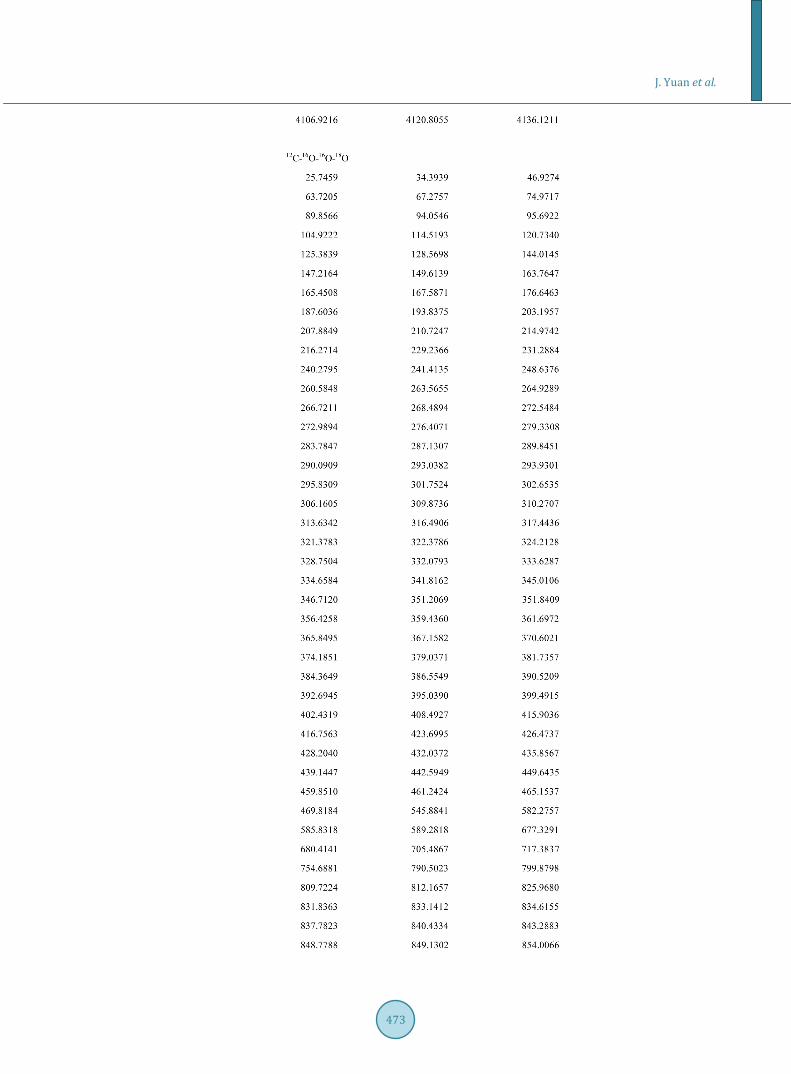
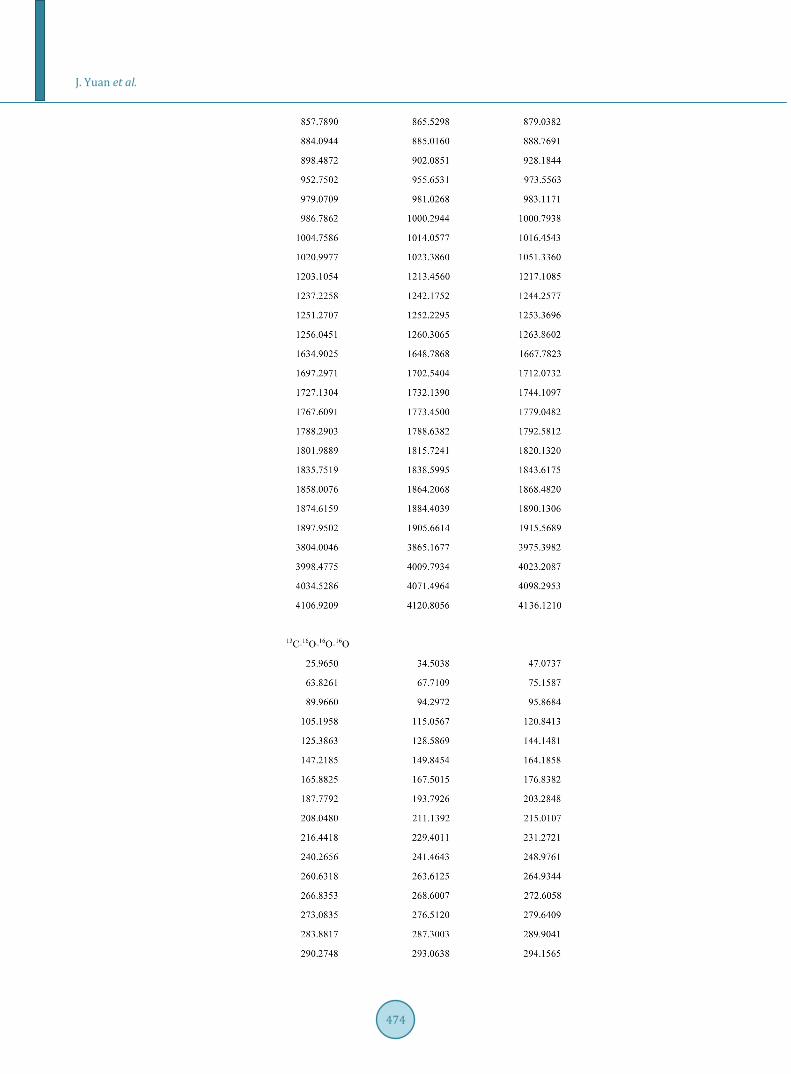
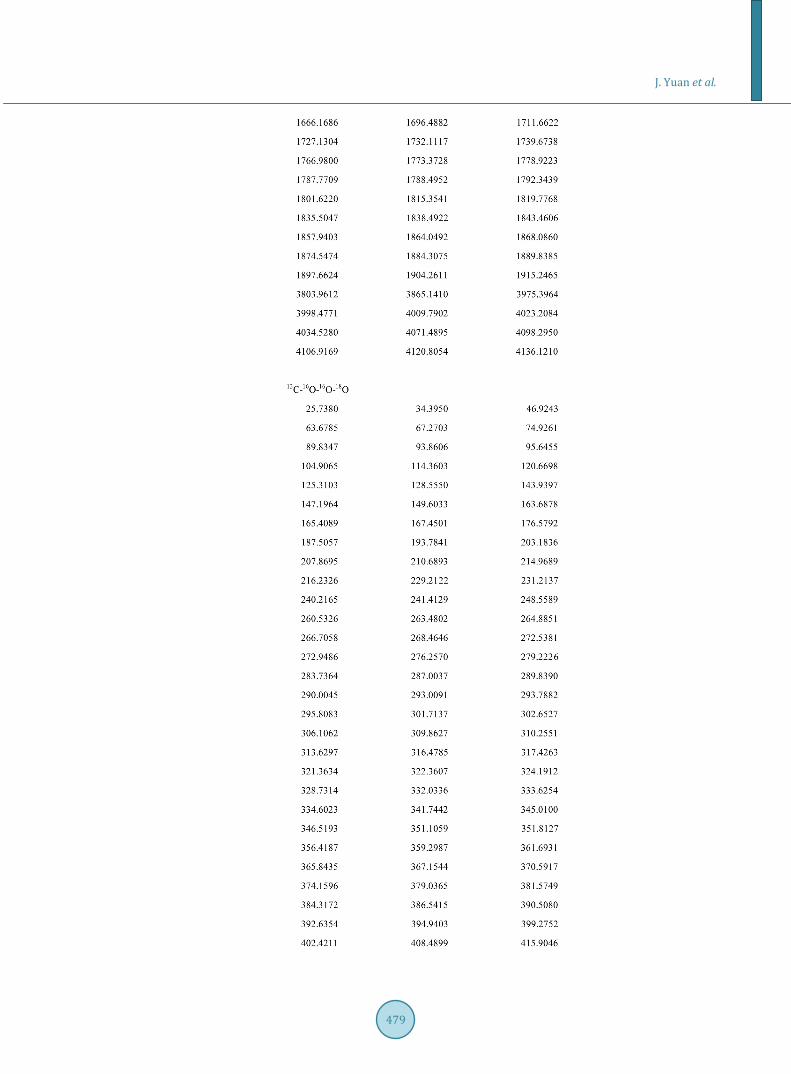
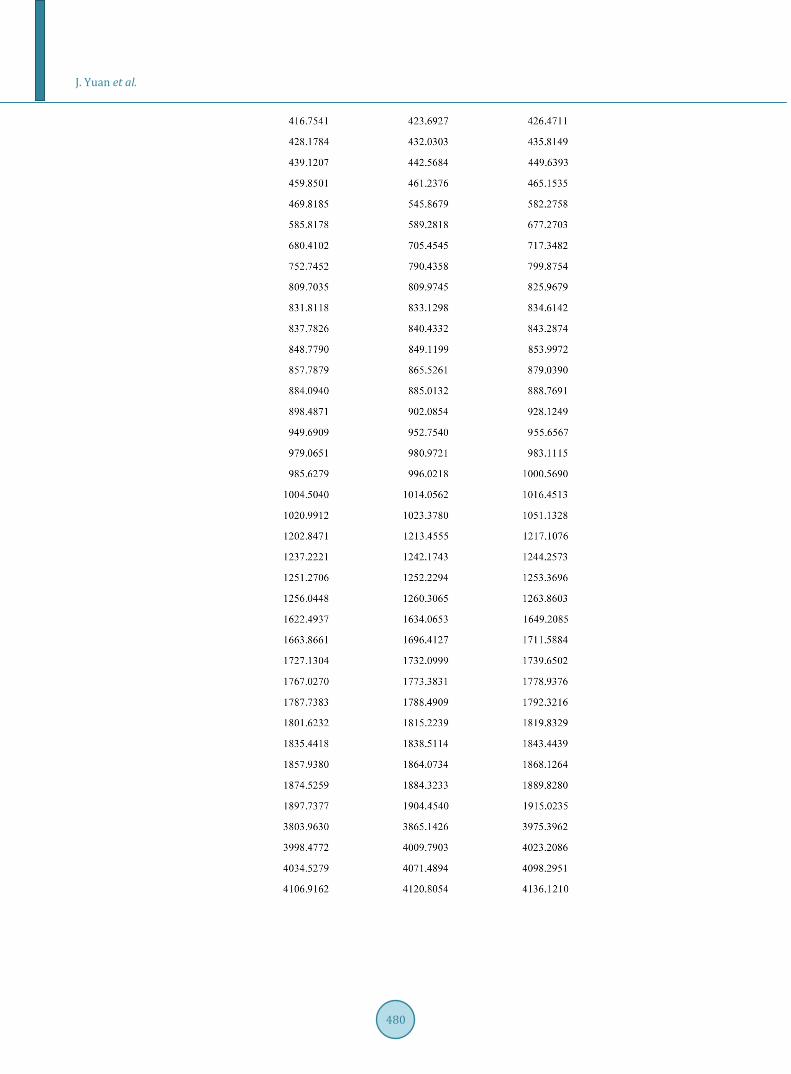
Appendix A. Supplementary Materials Supplementary Materials can be found in the online version.
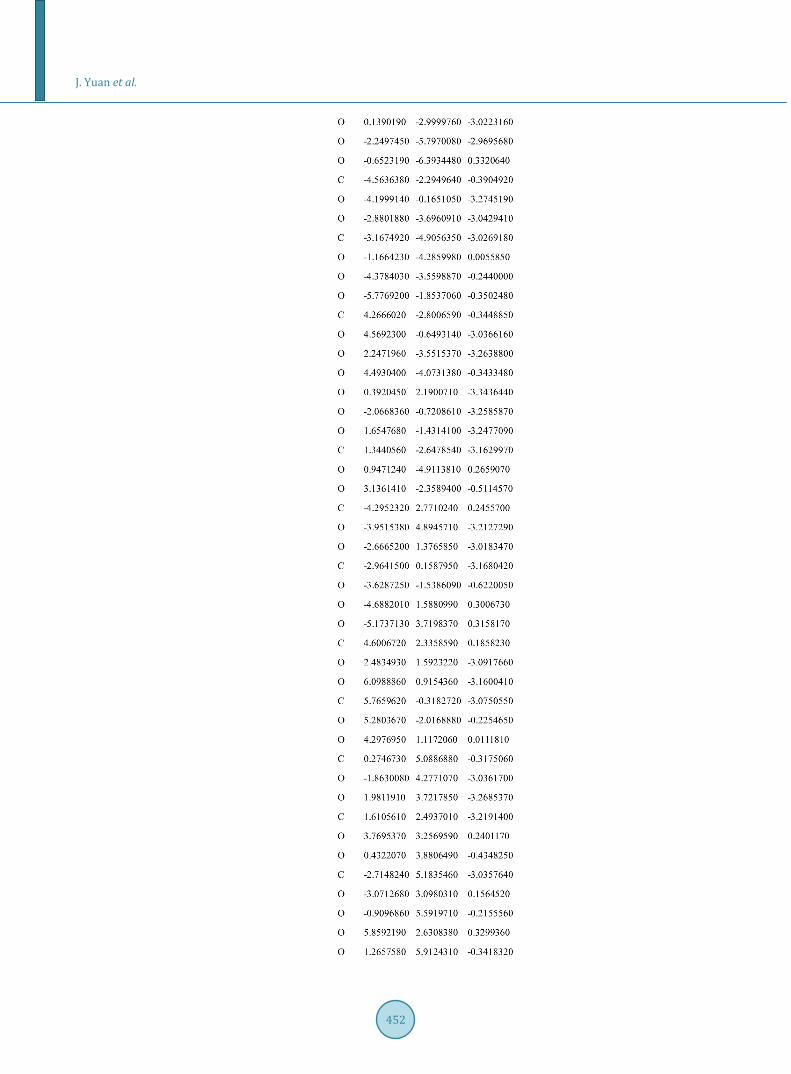
This file includes the optimized structures and frequencies for different isotopes of calcite and aragonite at HF/6-31g(d).
Note: the frequencies for calcite in Table 1 are calculated using the standard masses of the C and O elements, as is required by Scott and Radom, 1996. See details in the reference.
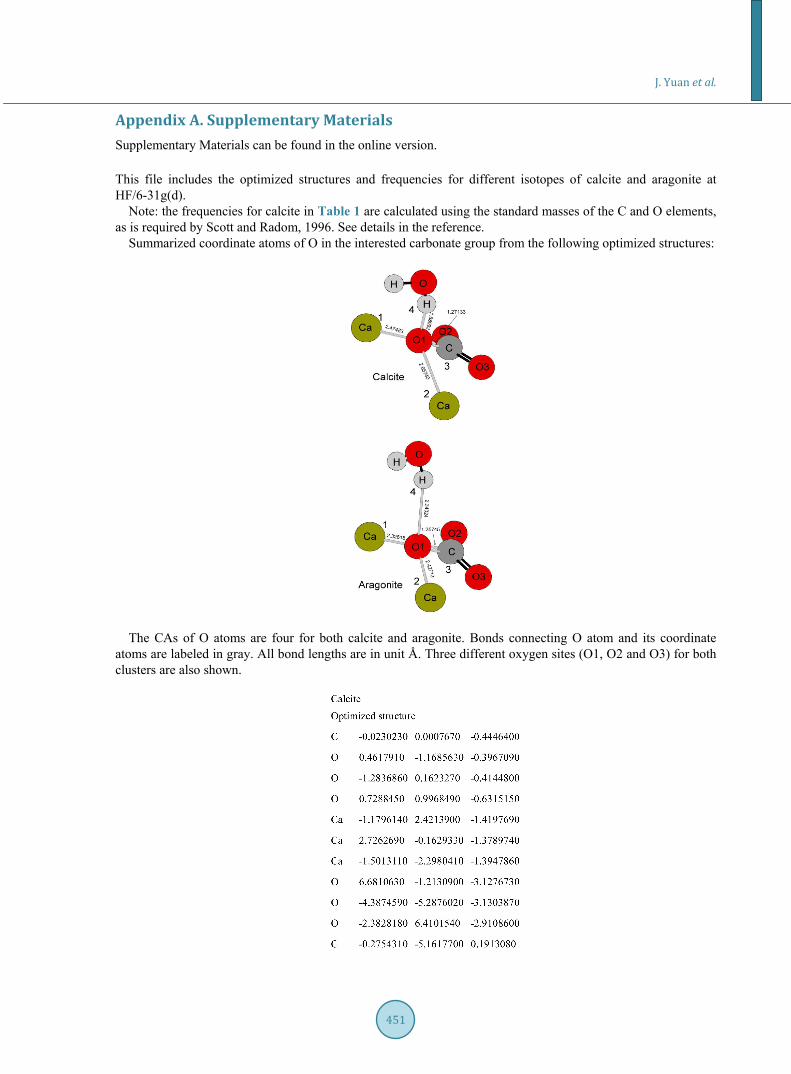
Summarized coordinate atoms of O in the interested carbonate group from the following optimized structures:
The CAs of O atoms are four for both calcite and aragonite. Bonds connecting O atom and its coordinate
atoms are labeled in gray. All bond lengths are in unit Å. Three different oxygen sites (O1, O2 and O3) for both clusters are also shown.
J. Yuan et al.
452
J. Yuan et al.
453

J. Yuan et al.
454
J. Yuan et al.
455

J. Yuan et al.
456
J. Yuan et al.
457
J. Yuan et al.
458

J. Yuan et al.
459

J. Yuan et al.
460
J. Yuan et al.
461
J. Yuan et al.
462

J. Yuan et al.
463
J. Yuan et al.
464

J. Yuan et al.
465

J. Yuan et al.
466

J. Yuan et al.
467
J. Yuan et al.
468
J. Yuan et al.
469
J. Yuan et al.
470
J. Yuan et al.
471
J. Yuan et al.
472
J. Yuan et al.
473
J. Yuan et al.
474

J. Yuan et al.
475

J. Yuan et al.
476

J. Yuan et al.
477

J. Yuan et al.
478
J. Yuan et al.
479
J. Yuan et al.
480