AARTI INDUSTRIES LTD. METROPOLIS HEALTHCARE LTD.
80
Market Overview Prominent Headlines Testimonials Q&A with CIO Mutual Fund Overview Stock Picks Monthly Insight Performance Management Meet Note Economy Review Startup Corner Sector Outlook: Chemical Q3FY20 Result Analysis Technical View Commodity Monthly Round up Book Review World Economic Event Calendar March 2020 BRITANNIA INDUSTRIES LTD. | AARTI INDUSTRIES LTD. METROPOLIS HEALTHCARE LTD. IN SIGHT Q&A WITH CIO Mr. Saurabh Mukherjea, Founder and Chief Investment Officer - Marcellus Investment Managers Viral Markets
-
Upload
khangminh22 -
Category
Documents
-
view
8 -
download
0
Transcript of AARTI INDUSTRIES LTD. METROPOLIS HEALTHCARE LTD.

Market Overview Prominent Headlines Testimonials Q&A with CIO
Mutual Fund Overview Stock Picks Monthly Insight Performance Management Meet Note
Economy Review Startup Corner Sector Outlook: Chemical Q3FY20 Result Analysis
Technical View Commodity Monthly Round up Book Review World Economic Event Calendar
March 2020
BRITANNIA INDUSTRIES LTD. | AARTI INDUSTRIES LTD. METROPOLIS HEALTHCARE LTD.
INSIGHTQ&A WITH CIO Mr. Saurabh Mukherjea, Founder and Chief Investment Officer - Marcellus Investment Managers
ViralMarkets

2March 2020 INSIGHT
INSIDE THIS ISSUE
Marketoverview1 34 Economy
Review
6 Testimo-nials 40 Sector -
Chemical
11 Mutualfund overview
24 Monthlyinsight Recommendation performance
64 Technicalview
69 Book review Value Investing and Behavioral Finance by Parag Parekh
Startupcorner 39
Q&A with CIO- Mr. Saurabh Mukherjea, Founderand Chief Investment Officer - MarcellusInvestment Managers
7 Q3FY20 Result Analysis 46
Stock picks• Britannia Industries
Ltd.• Aarti Industries Ltd.• Metropolis Healthcare
Ltd.
15
Managementmeet note• Phillips Carbon Black
Ltd. 30
Commoditymonthly round up 68
Worldeconomic calendar 72
Testimonial
Prominent headlines February 2020 4PROMINENT

1 March 2020INSIGHT
MarketOVERVIEW
The coronavirus code named as COVID-19 has turned out to be a new scare for the world markets and have beaten previous records of notorious SARS though the positive thing is the mortality rate which is around 2% in comparison to earlier epidemic outbreaks.
2March 2020 INSIGHT
As the number of death toll has already crossed 2,762 worldwide while the total number of infected
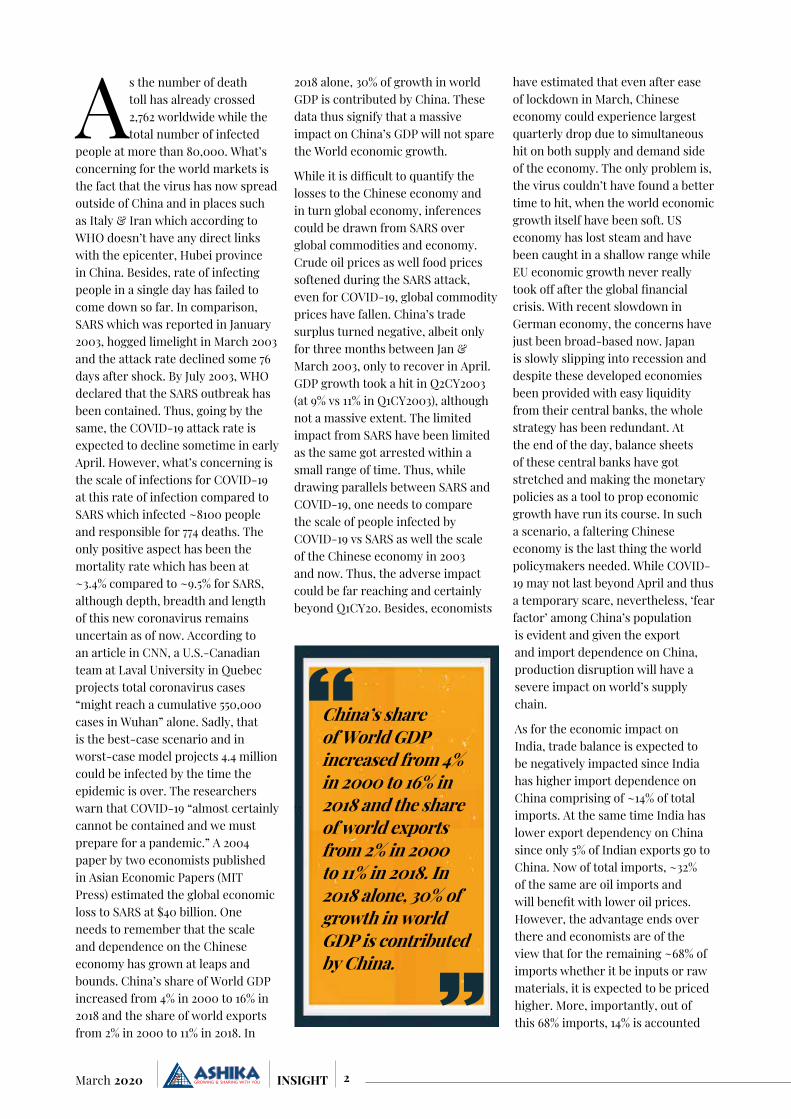
people at more than 80,000. What’s concerning for the world markets is the fact that the virus has now spread outside of China and in places such as Italy & Iran which according to WHO doesn’t have any direct links with the epicenter, Hubei province in China. Besides, rate of infecting people in a single day has failed to come down so far. In comparison, SARS which was reported in January 2003, hogged limelight in March 2003 and the attack rate declined some 76 days after shock. By July 2003, WHO declared that the SARS outbreak has been contained. Thus, going by the same, the COVID-19 attack rate is expected to decline sometime in early April. However, what’s concerning is the scale of infections for COVID-19 at this rate of infection compared to SARS which infected ~8100 people and responsible for 774 deaths. The only positive aspect has been the mortality rate which has been at ~3.4% compared to ~9.5% for SARS, although depth, breadth and length of this new coronavirus remains uncertain as of now. According to an article in CNN, a U.S.-Canadian team at Laval University in Quebec projects total coronavirus cases “might reach a cumulative 550,000 cases in Wuhan” alone. Sadly, that is the best-case scenario and in worst-case model projects 4.4 million could be infected by the time the epidemic is over. The researchers warn that COVID-19 “almost certainly cannot be contained and we must prepare for a pandemic.” A 2004 paper by two economists published in Asian Economic Papers (MIT Press) estimated the global economic loss to SARS at $40 billion. One needs to remember that the scale and dependence on the Chinese economy has grown at leaps and bounds. China’s share of World GDP increased from 4% in 2000 to 16% in 2018 and the share of world exports from 2% in 2000 to 11% in 2018. In
2018 alone, 30% of growth in world GDP is contributed by China. These data thus signify that a massive impact on China’s GDP will not spare the World economic growth.
While it is difficult to quantify the losses to the Chinese economy and in turn global economy, inferences could be drawn from SARS over global commodities and economy. Crude oil prices as well food prices softened during the SARS attack, even for COVID-19, global commodity prices have fallen. China’s trade surplus turned negative, albeit only for three months between Jan & March 2003, only to recover in April. GDP growth took a hit in Q2CY2003 (at 9% vs 11% in Q1CY2003), although not a massive extent. The limited impact from SARS have been limited as the same got arrested within a small range of time. Thus, while drawing parallels between SARS and COVID-19, one needs to compare the scale of people infected by COVID-19 vs SARS as well the scale of the Chinese economy in 2003 and now. Thus, the adverse impact could be far reaching and certainly beyond Q1CY20. Besides, economists
have estimated that even after ease of lockdown in March, Chinese economy could experience largest quarterly drop due to simultaneous hit on both supply and demand side of the economy. The only problem is, the virus couldn’t have found a better time to hit, when the world economic growth itself have been soft. US economy has lost steam and have been caught in a shallow range while EU economic growth never really took off after the global financial crisis. With recent slowdown in German economy, the concerns have just been broad-based now. Japan is slowly slipping into recession and despite these developed economies been provided with easy liquidity from their central banks, the whole strategy has been redundant. At the end of the day, balance sheets of these central banks have got stretched and making the monetary policies as a tool to prop economic growth have run its course. In such a scenario, a faltering Chinese economy is the last thing the world policymakers needed. While COVID-19 may not last beyond April and thus a temporary scare, nevertheless, ‘fear factor’ among China’s population is evident and given the export and import dependence on China, production disruption will have a severe impact on world’s supply chain.
As for the economic impact on India, trade balance is expected to be negatively impacted since India has higher import dependence on China comprising of ~14% of total imports. At the same time India has lower export dependency on China since only 5% of Indian exports go to China. Now of total imports, ~32% of the same are oil imports and will benefit with lower oil prices. However, the advantage ends over there and economists are of the view that for the remaining ~68% of imports whether it be inputs or raw materials, it is expected to be priced higher. More, importantly, out of this 68% imports, 14% is accounted
China’s share of World GDP increased from 4% in 2000 to 16% in 2018 and the share of world exports from 2% in 2000 to 11% in 2018. In 2018 alone, 30% of growth in world GDP is contributed by China.

3 March 2020INSIGHT
from china alone and is expected to witness higher prices. Thus, considering that the import volumes are not significantly hampered, trade balance is expected to worsen since the benefits of lower oil & related prices will be overshadowed by inflationary impact on 68% of imports. Similarly, for inflation, 35% of the CPI basket will be moved by the global commodity prices, particularly food articles. In fact, international food prices are also on an uptrend and global food inflation stood at 6.99% in Dec 2019, after 5.97% clocked in November 2019. Thus, either way the trend will be the same. However, categories like Household goods and services & Personal care and effects together accounting for ~8% weight in CPI index would be affected by COVID-19 induced increase in prices of articles. Thus, in a way, core inflation could be impacted more than the general price levels as the prices of electronics and consumer durables could increase.
The Confederation of Indian Industry (CII) estimates that shipping,
pharmaceuticals, automobiles, mobiles, electronics, textiles etc. could be impacted due to prolonged impact. Although there are hopes of factories resuming production, 10% production cut by Hero MotoCorp shows the way things can turn in event of delay in recovery as Indian manufacturing industries will exhaust raw material inventory by
middle of March. The next set of quarterly results for India Inc. could be impacted severely if production doesn’t start as early as March. As for Q3FY20 earnings season, results were broadly in line with expectations. Excluding Tata Motors (due to exceptional loss in Q3FY19), topline growth for Nifty 50 has remained muted (down 0.2% yoy) while EBITDA grew by 5% driven by margin expansion on lower commodity costs and cost cutting exercise by India Inc. Net profit has been higher by 4.7% yoy, lower tax expenses. While the consumer sector has exceeded expectations, automobiles, capital goods and metals have missed expectations, and private banks, NBFC and healthcare have met consensus estimates. All eyes are now on rural recovery post Rabi harvest season to uplift the economic growth engine as higher crop prices and 9.5% increase in Rabi cultivation will result in higher incomes. In a global supply disruption, the inward looking sectors will provide necessary support to the ailing economic growth.
Growing dependence on China
Source: World Bank, Ashika Research
15%
30%
4%
16%
2%
11%
2000 2018 Contribution to GDP growth Share in World GDP China share in world exports
Daily new cases
Source: www.worldometers.info
0
2000
4000
6000
8000
10000
12000
14000
16000
23-J
an
25-J
an
27-J
an
29-J
an
31-J
an
02-F
eb
04-F
eb
06-F
eb
08-F
eb
10-F
eb
12-F
eb
14-F
eb
16-F
eb
18-F
eb
20-F
eb
22-F
eb
24-F
eb
The Confederation of Indian Industry (CII) estimates that shipping, pharmaceuticals, automobiles, mobiles, electronics, textiles etc. could be impacted if the COVID-19 virus scare is prolonged.
Paras BothraPresident - Equity ResearchEmail - [email protected]: +91 22 6611 1700Direct: +91 22 6611 1786Mobile: +91 98203 97061
Reaching for
yield is really
stupid, but it’s
very human, People are
reaching for yield, there’s
no question about that.
And that’s stupid and it
has consequences over
time, but it’s very human
- WARREN BUFFETT, chairman and chief exec-
utive officer of Berkshire
Hathaway Inc
I don’t think in the next few months, you will hear of any structural
reforms. We have to realise that the fiscal room available to the government is not very high. It really becomes very difficult to give eco-nomic stimulus - PAWAN GOENKA, Mahindra & Mahindra managing director
India needs pro-busi-ness, not pro-crony policies to take the
country to the goal of USD 5 trillion GDP. Pro-business policies are those that enable fair competition in the coun-try while Pro-crony pol-icies on the other hand just help incumbents and that is something that we have to stay away from in enabling the invisible hands of the market - KRISHNAMURTHY SUBRAMANIAN, Chief Economic Adviser
The economy is heading towards a recovery in the
next fiscal, adding good auto-plays and good private sector banks are a sensible way to play it. Would advise people to leave the high beta names from real estate, steel, construction aside, where there are broader challenges around the balance sheet and governance - SAURABH MUKHERJEA, founder of Marcellus Investment Managers
The government welcomes e-com-merce companies
to work within the framework and laws of the land, promises of a certain number of people benefiting from such companies can’t be at the expense of suffering of many others - PIYUSH GOYAL, Commerce and Industry Minister
Despite near-term challenges, equities are
expected to deliver a return of 10-12 percent CAGR over the next 5-10 years however economic growth could remain muted, impacting topline growth of corporate India. But, weaker crude and continuous inflows from both domestic and foreign investors could provide good support to equity markets - SRINI-VAS RAO RAVURI, PGIM MF
India Inc.’s most important investments in the current decade
would be on skilling soft-ware engineers. “Around 72 percent of new jobs for software engineers are outside the tech industry as the crossover happened in 2017 and forever it’s going to be true - SATYA NADELLA, Microsoft Corp.’s Chief Executive Officer
The impact of
Coronavirus
outbreak will
be felt on global steel
industry for at least two
to three years, as China
is the largest producer
of the alloy. Indian steel
companies should
enhance output, partic-
ularly special steel, to
grab larger global market
share - DHARMENDRA PRADHAN, Union
Minister
The four quarters of 2020 may bring some
gradual improvement in company earnings will be based on four reasons—favourable base, directed measure by the government to iron out sector specific challenges, likelihood of decent rabi season, and full impact of low interest cost… NEELESH SURANA, Mirae Asset Mutual Fund’s Chief Investment Officer
PROMINENT HEADLINES FEBRUARY 2020
4March 2020 INSIGHT

PSUs as a pack look
attractive, dividend
yields of some of
these companies are very
attractive. Price-to-book
multiples have fallen below
one time, in some cases
at 0.5-0.6 times, look very
attractive from buyers’
point of view, but there is
a bit of fear of the supply
overhang - A BALASUBRA-MANIAN, Aditya Birla SL
AMC
India is quite an expen-
sive market now. In the
past, people have been
willing to pay a higher cost
because the economy was
simply one of the fastest
growing in the world and
that has probably slowed
down quite a bit. India
appears to have one of
the strongest prospects
for earnings growth, but
Indian companies tend
to disappoint every year
for the last five years - JIM MCCAFFERTY, joint head
of Asia-Pacific equity
research at Nomura
Value is out of fashion
right now, deeply
out of fashion. Even
Warren Buffett is having
a tough time. Earlier you
used to buy cheap. If you
end up buying cheap,
you were guaranteed to
make money. That’s not
the scene now - RAAM-DEO AGARWAL, MD &
Co-founder, Motilal Oswal
The markets, on an
overall basis look
reasonable right
now. The broader markets
have not done well for
the past two years, but it
seems that the markets
are expanding in terms of
stocks that are now doing
well as compared to very
few movers in recent years
- SAMIR ARORA, founder
and fund manager Helios
Capital
We have seen
NBFCs are get-
ting funded in a
big way, banks have also
started to give them credit.
Hence there is a push
for growth which is very
important for the economy.
So, availability of funds,
lower cost of funds are two
prime drivers of why we
are believing that we are
the cusp for recovery. The
only negative point India’s
growth rate can go off track
if Corona Virus outbreak is
sustained for a longer-term
- S KRISHNAKUMAR, Sundaram Mutual Fund’s
Chief Investment Officer
Coronavirus out-
break in China
provides a good
opportunity to India to
expand trade and follow
an export-driven model -
KRISHNAMURTHY SUBRA-MANIAN, Chief Economic
Advisor
Banks of the future would be extremely different from now, and regulating the distinct segments of these banks would be a chal-lenging task, therefore, an integrated framework for resolution of financial firms operating in India could be expected in the near future as that would add to the resilience of the financial system - SHAKTIKANTA DAS, RBI Governor
Every small business owner has potential in India to become Dhirub-hai Ambani or Bill Gates; entrepreneurial power at grassroots is enormous - MUKESH AMBANI CHAIRMAN, Reliance Industries
5 March 2020INSIGHT

6March 2020 INSIGHT
TESTIMONIALS“INSIGHT” is a absolutely exhaustive and your one-stop-shop for credible public market ideas. The content is thorough, well-researched and action-oriented…
SAKET TODI, Director, Lux Industries
Ashika monthly “INSIGHT” is quite insightful with loads of data and useful information on stocks and mutual funds. I particularly look forward to reading the monthly insight magazine specially the Q&A section with an expert. Keep up the good work…
CHANDRAPRAKASH PADIYAR, Senior Fund Manager, Tata Mutual Fund
I have been reading monthly issue of “INSIGHT”. Good presentation of market statistics and very good list of companies that have been covered…
RAJEEV AGARWAL, Rare Enterprise
Ashika’s monthly “INSIGHT” newsletter is one of the sharpest summaries of financial industry in India with a strong set of industry experts giving their views along with well thought through investment recommendations…
PARAG MEHTA, Director, Edelweiss Alts Investments
Ashika monthly “INSIGHT” is a great research publication with lot of insights on financial market. I always look forward to it and specifically the stock recommendations in it is found worthy of investment.…
Great work!
MAHESH SINGHI, Founder & MD, Singhi Advisors
Ashika monthly “INSIGHT” magazine gives in depth analysis and reasoning of stocks it is recommending to buy. The interviews of various Fund Manager provide their rational of sector and stock selections and broader view of market. It is a must read for all investors…
RAJENDRA KUMAR PARAKH, CFO, Vikram Solar Ltd.
I must that I find “INSIGHT” has good content, is highly informative and nice stock ideas on monthly basis. I am quite impressed with the idea of sharing views of fund manager and management note. I can imagine the hard word behind the output. Keep sending and all the best…
PREM RAJANI, Managing Partner, Rajani Associates
True to its name, “INSIGHT” provides focused, relevant and topical insight into companies, sectors and evolving trends. The easy to read and interesting layout of the content makes it easy to absorb and less mundane. I personally look forward to each publication…
MURZASH MANEKSHANA, Dy Managing Director, MEP Infrastructure Developers Ltd.
I have been reading “INSIGHT” for quite some time and the coverage, analysis and calls made therein have been extremely good. A well-balanced mix of industry knowledge, company research and actionable insights, makes it a great read…
AMOL MIRCHANDANI, Head Business Development, Aries Agro Ltd.

7 March 2020INSIGHT
Q: Do you see any green shoots in our economy at present and whether the economy is going to broad base from here on?
A: There are two different narratives playing out today and these can play out over the next 10 years. The first narrative is companies which have a strong financial position, strong balance sheets & free cashflow generation. These companies are growing at a rapid rate and should be able to continue doing so eg. Titan, Dr. Pathlabs, Asian paints or HDFC Bank, etc,. Across sectors, companies with
a strong financial position, strong balance sheet & strong cash flow generation are not facing significant problems with respect to generating growth. These companies will continue going from strength to strength.
The second parallel narrative is that there are two types of companies which are struggling today and could struggle for the next 10 years. The first type are companies with broken balance sheets, and they could be steel companies, infrastructure companies, NBFCs or manufacturing
companies. Companies with broken balance sheets are now going to struggle in India, with no lenders willing to support the companies. Once upon a time, these companies secured loans with the help of errant politicians. That era is gone and with little or no likelihood of an economic recovery in the horizon, these companies will have a tough time. Second type of companies which are screwed are the ones which are not industry/market leaders. For instance, for a footwear company with ROCE at 15%, there is very little chance of being able to compete with a Relaxo or Bata whose ROCEs are significantly north of their cost of capital. Similarly, for an adhesive company with ROCE of 13-15%, it has very little chance of competing with Pidilite whose ROCE is close to 40%. Second rung or third rung players are typically SMEs whose ROCEs are not above their cost of capital and such firms are going to struggle and gradually they are going to die over the next 10 years. Either they have to sell themselves to the market leader or they have to become outsourcing suppliers to the market leader. This point also pertains to high street retail where on the high street, the kirana stores will gradually die out, the independent restaurants will die out and we will witness the highstreet being dominated by chains whether they are supermarket chains or restaurant chains.
So, what we are going to witness in India over the next 10 years is twin narratives: one of dominance and growth and lasting success of market leading franchises with strong financial strength, balance sheets and strong cash flows. Alongside that we will have the death or demise and bankruptcy of the poorly run entities with weak balance sheets, weak cashflows and subpar ROCEs. These two narratives will play out in parallel and hence at any point of time it will look as if India is booming and at the same point of time it would look like India is bust.
Mr. Saurabh Mukherjea - Founder and Chief Investment Officer - Marcellus Investment Managers
Q&A WITH CIO

8March 2020 INSIGHT
In the next 10 years, the country will end up consolidating in the hands of 50 large, well run companies while everybody else will have a struggle. So, the notion of a broad-based recovery will remain a fantasy. These sorts of socialist notions of broad-based recovery were applicable upto year 2015. Once, the black economy got squeezed out and the ability of the second, third grade franchises to borrow money from the financial system got compromised, broad based recovery became a thing of the past. We will remember this notion of broad-based recovery like we remember the Ambassador car or Fiat car, as relics of a bygone era.
Q: Can you give any kind of anecdotes about the fact that capitalist countries like U.S. might have faced something similar to what we are witnessing at present here in India?
A: We have got in front of us three economic transitions from which we can learn from. For U.S., it will be period between 1880 & 1930s, secondly Japan post world war & thirdly Korea post 1970. Basically, the U.S. economy formalized in the fifty years between 1880 to 1930. The Japanese economy formalized roughly in the forty years after the second world war. The Korean economy formalized in the 22-25 years after 1970. All of these formalizations have been very similar, and India have also entered the same journey. Taking the U.S. as example, there were no supermarkets in America in 1880s at all. By 1930, U.S. had 500,000 supermarkets. As a result, the kirana stores were a thing of the past in USA by 1930.
How did America formalize between 1880-1930? First came the railroads, then came the Telegraph, then came the road network, then came the motor car. These various things networked the U.S. economy and created an integrated whole. We are going through a very similar process
in India. 10 years ago, we had barely 4-5 million broadband users and now we have 100 times that number. Airline traffic grows at 20% per annum in our country. Road network has more than doubled in the last 15 years. The number of mobile phone voice users actually exceeds the population. We are thus linking up what was either to a fragmented economy and on top of that we have now full throttle GST implementation by Govt. which clearly needs the tax revenues which GST can bring. When you integrate a fragmented economy, you create national giants. In the American context, all the famous FMCG brands that we know about in the likes of Heinz, Kellogg’s, Coca Cola, Wrigley’s, Pillsbury were born in 1880-1930 era. Till 1880, there were lot of ketchup makers in U.S., however in the next 50 years, Heinz captured the sauce & ketchup industry and the smaller players either shut down or sold themselves to Heinz
or became outsourced suppliers to Heinz and Heinz ended up on all the supermarket shelves by 1930.
Basically, in a non-networked economy, every village by itself is a mini economy and thus every village has a cereal maker or ketchup maker or a biscuit maker. However, once the economy is well linked/networked, those local cereal makers, biscuit makers or ketchup makers end up consolidating. In the process of consolidation, the most efficient company with the best cashflows, best return on capital ends up dominating. We are going through that identical process in India. The story of development in any country is the rise of around 50 really well-run high-quality corporates who pull towards themselves the country’s cashflow into their balance sheets and then use it to fuel development. That is the story of economic growth the world over and we have to live with that regardless of the fact whether anybody likes it or not.
Q: Are the moats getting broadened for companies such as Pidilite, Britannia or Hindustan Unilever? For an investor how do they see that these changes are taking place.
A: The Govt. has expedited two sets of legal changes, two sets of tax changes which are allowing dominant cash generating market leaders to pull away from the rest. First change was the announcement back in September 2019 of a 15% tax rate if you set up a new subsidiary and a new plant inside the subsidiary. In our country, we have 25 monopolists whose return on capital is ~45%. Assuming that cost of capital is 15% it means that every year these companies are throwing out 30% of capital employed as free cashflow. This in turn means that every three years, these companies are returning to their investors the entire capital invested in the business. We are talking about giant companies here - the likes of Britannia, ITC, Nestle, Marico, Pidilite. If the same free
The U.S. economy formalized in the fifty years between 1880 to 1930. The Japanese economy formalized roughly in the forty years after the second world war. The Korean economy formalized in the 22-25 years after 1970. All of these formalizations have been very similar, and India have also entered the same journey.
9 March 2020INSIGHT
cashflow is reinvested back into the business, every three to five years, the size of the franchise doubles. Now, if we consider the Finance Minister’s new tax regime, the market leaders which doubles their franchise sizes in every three years or more conservatively even five years, will end up paying lower effective tax rate as its doubles capacity. However, this is not possible for competitors who do not generate enough free cashflow to grow their capacity. And given the state of the country, banks are not going to finance doubling of capacity. Hence, five years down the line, market leaders’ effective tax rate will be much lower at 17-18% compared to 25% for inefficient competitors. This 7% tax rate differential is huge. The laggard competitor will either get sold to the market leader or become an outsourced manufacturer to the market leader or might wind up. This lower tax rate of 15% for setting up new manufacturing facilities is a potent weapon in the hands of market leaders.
Next is GST, which is also a very powerful weapon for the market leading franchises. Based on rough estimates, ~30 crore Indians – i.e. around half of our workforce - work in retail/logistics sector. Most of these people haven’t paid tax before and now they are forced to pay GST, which has squeezed their profit margins from 12-14% earlier to ~3%. Thus, these shops are facing a working capital crunch to buy the next consignment of manufactured products from the wholesaler. These retailers will also not get easy finance from high street banks since most of them don’t possess three years of financial statements. The easy option to get finance earlier was through NBFC channel, which is also running dry. Thus, the only option left for the retailers is to get financing from manufacturers. Here again there would be two possibilities, one, where the market leader given its financial strength and firepower will find it easy to convince banks to finance its
channels at ~8% with no-recourse to market leader’s balance sheet while the laggard competitor which doesn’t have the financial strength & stature can only manage financing of its dealers at ~12-15% with recourse to its balance sheet. Thus, on the high street there are two types of retailers, one that of market leaders with low cost, abundant financing and other one of the laggard with high cost, limited financing. The high street will thus polarize in favour of market leader and its products have better chances of sitting on shelves of supermarket stores due to its competitive deals which are unlikely to be provided by laggards.
This process of manufacturing consolidation and retail consolidation is already happening in India and at bewildering speed. This process will result in economic polarizing in the hands of 50 market leading franchises who will end up becoming giants over the next 10 years and the moats around these are also very powerful – one is GST and the other is the lower corporate tax rate. These two are the irreversible government
created moats for market leading franchises. The only thing that is pending is land law reforms sine the 2013 land acquisition Act has resulted in acquisition of land at four times of market price. If the Govt. liberalizes the Act, there will be frenzy of land acquisition by the market leaders. This could speed up the formalization process in India and what America achieved in 50 years (1880-1930) could arguably be achieved by India in 15 years.
Q: These businesses with strong brands, moats and high return of capital, these are consistent businesses which are also not hit hard by recessions, there are however businesses which are cyclical in nature, like for e.g. metals or chemicals or agribusinesses. How do an investor deal with these kinds of businesses?
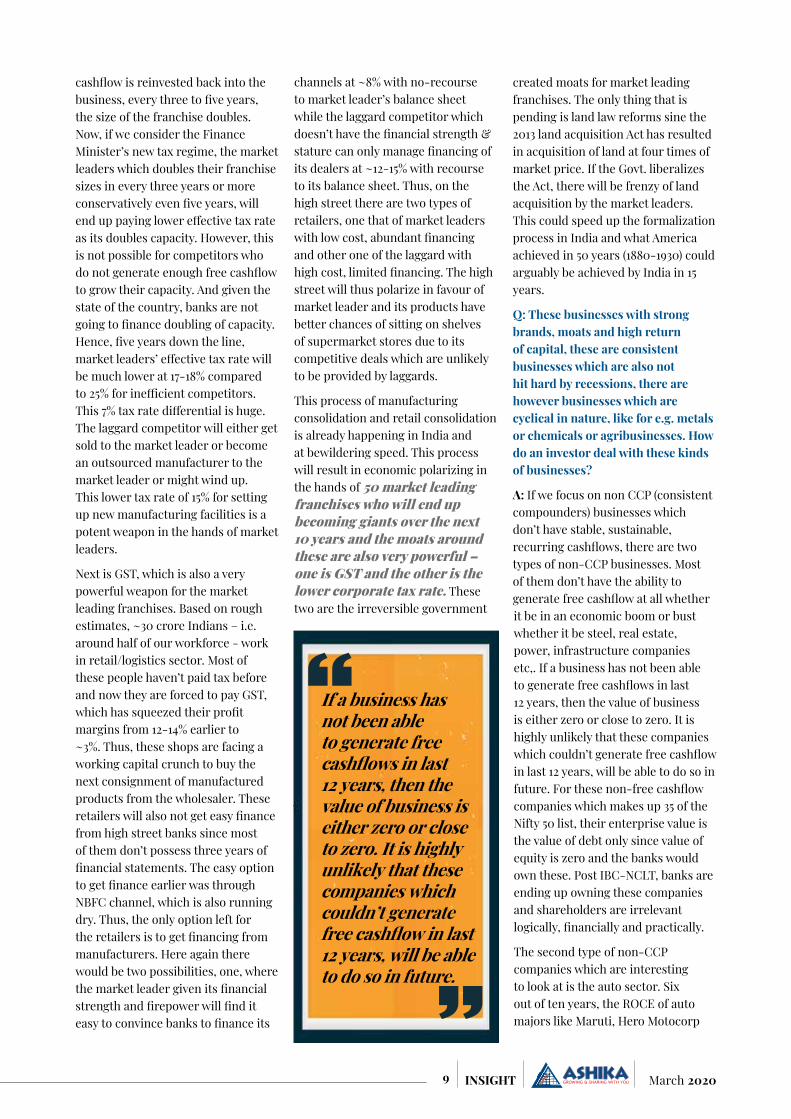
A: If we focus on non CCP (consistent compounders) businesses which don’t have stable, sustainable, recurring cashflows, there are two types of non-CCP businesses. Most of them don’t have the ability to generate free cashflow at all whether it be in an economic boom or bust whether it be steel, real estate, power, infrastructure companies etc,. If a business has not been able to generate free cashflows in last 12 years, then the value of business is either zero or close to zero. It is highly unlikely that these companies which couldn’t generate free cashflow in last 12 years, will be able to do so in future. For these non-free cashflow companies which makes up 35 of the Nifty 50 list, their enterprise value is the value of debt only since value of equity is zero and the banks would own these. Post IBC-NCLT, banks are ending up owning these companies and shareholders are irrelevant logically, financially and practically.
The second type of non-CCP companies which are interesting to look at is the auto sector. Six out of ten years, the ROCE of auto majors like Maruti, Hero Motocorp
If a business has not been able to generate free cashflows in last 12 years, then the value of business is either zero or close to zero. It is highly unlikely that these companies which couldn’t generate free cashflow in last 12 years, will be able to do so in future.
10March 2020 INSIGHT
will be 25% plus, well above the cost of capital and generating free cashflow. They will re-invest that free cashflow in new plants, new models and over 10 years may clock ~12-13% EPS growth. With these sorts of companies where there are genuine moats, there is genuine ability to create free cashflow, but the problem is they can’t do it every single year. They do it in 6-7 years out of 10 and 3-4 years they won’t be able to generate free cashflow. For these sorts of companies, there is a style of cyclical investing which might work. There is merit in saying that once an economic downturn has progressed for 2-3 years; one should look at buying best of these sort of franchises. Auto companies, Genset manufacturers, T&D companies would fall into this bracket. Note however, that CCP is barely 1% of the Indian stock market, and out of the remaining 99%, only 1/10th falls into this sort of non-CCP companies (i.e. cyclical companies) and hence are worth considering. 90% of Indian stock market falls into the category of non-CCP, non-free cash flow generating franchices (regardless of the state of the economy) and hence are inherently worthless and to be avoided at all cost. Unfortunately, the majority of Indian large cap portfolios are made up of such companies where there is no underlying free cashflow generation whatsoever.
Q: Where do you see the real tailwinds in years to come. Sectors or themes worth considering?
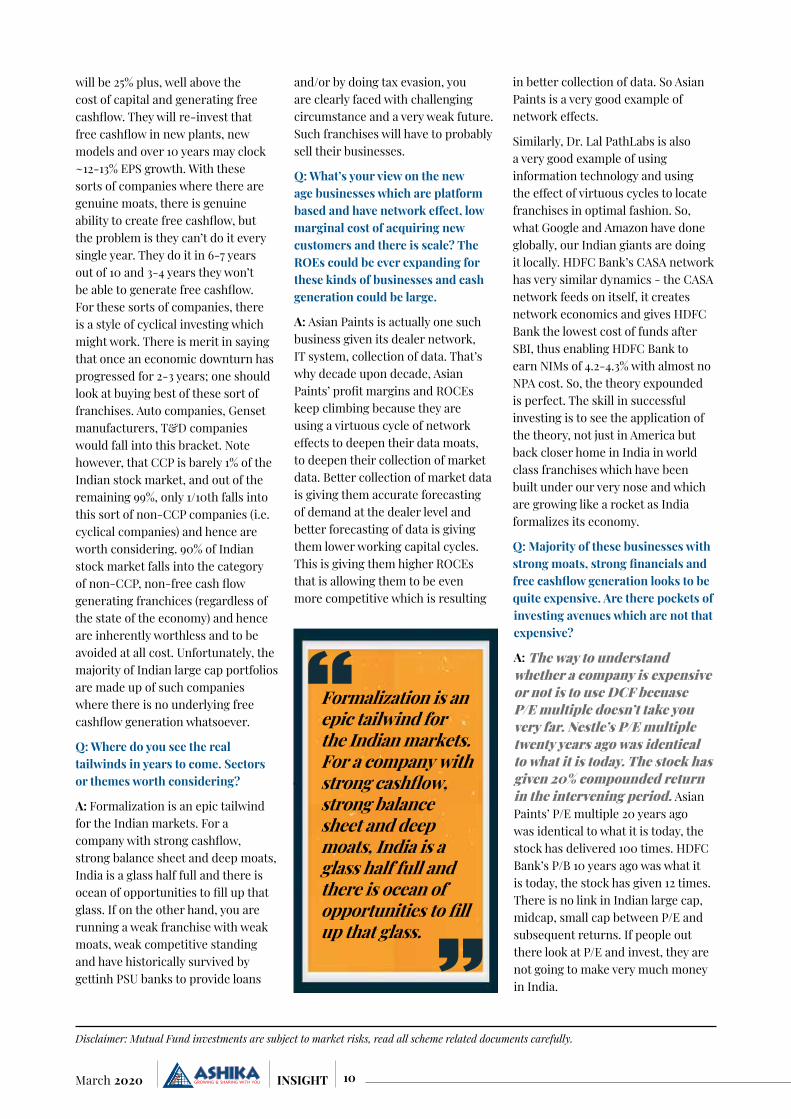
A: Formalization is an epic tailwind for the Indian markets. For a company with strong cashflow, strong balance sheet and deep moats, India is a glass half full and there is ocean of opportunities to fill up that glass. If on the other hand, you are running a weak franchise with weak moats, weak competitive standing and have historically survived by gettinh PSU banks to provide loans
and/or by doing tax evasion, you are clearly faced with challenging circumstance and a very weak future. Such franchises will have to probably sell their businesses.
Q: What’s your view on the new age businesses which are platform based and have network effect, low marginal cost of acquiring new customers and there is scale? The ROEs could be ever expanding for these kinds of businesses and cash generation could be large.
A: Asian Paints is actually one such business given its dealer network, IT system, collection of data. That’s why decade upon decade, Asian Paints’ profit margins and ROCEs keep climbing because they are using a virtuous cycle of network effects to deepen their data moats, to deepen their collection of market data. Better collection of market data is giving them accurate forecasting of demand at the dealer level and better forecasting of data is giving them lower working capital cycles. This is giving them higher ROCEs that is allowing them to be even more competitive which is resulting
in better collection of data. So Asian Paints is a very good example of network effects.
Similarly, Dr. Lal PathLabs is also a very good example of using information technology and using the effect of virtuous cycles to locate franchises in optimal fashion. So, what Google and Amazon have done globally, our Indian giants are doing it locally. HDFC Bank’s CASA network has very similar dynamics - the CASA network feeds on itself, it creates network economics and gives HDFC Bank the lowest cost of funds after SBI, thus enabling HDFC Bank to earn NIMs of 4.2-4.3% with almost no NPA cost. So, the theory expounded is perfect. The skill in successful investing is to see the application of the theory, not just in America but back closer home in India in world class franchises which have been built under our very nose and which are growing like a rocket as India formalizes its economy.
Q: Majority of these businesses with strong moats, strong financials and free cashflow generation looks to be quite expensive. Are there pockets of investing avenues which are not that expensive?
A: The way to understand whether a company is expensive or not is to use DCF becuase P/E multiple doesn’t take you very far. Nestle’s P/E multiple twenty years ago was identical to what it is today. The stock has given 20% compounded return in the intervening period. Asian Paints’ P/E multiple 20 years ago was identical to what it is today, the stock has delivered 100 times. HDFC Bank’s P/B 10 years ago was what it is today, the stock has given 12 times. There is no link in Indian large cap, midcap, small cap between P/E and subsequent returns. If people out there look at P/E and invest, they are not going to make very much money in India.
Disclaimer: Mutual Fund investments are subject to market risks, read all scheme related documents carefully.
Formalization is an epic tailwind for the Indian markets. For a company with strong cashflow, strong balance sheet and deep moats, India is a glass half full and there is ocean of opportunities to fill up that glass.

11 March 2020INSIGHT
Consistent Compounders is a PMS strategy launched by Marcellus Investment Managers in December 2018 to invest in a concentrated portfolio of heavily moated companies which can drive healthy earnings growth over long periods of time.
The Portfolio construction involves two stage process: 1) a filter based approach to create an investible universe of 30-35 stocks; 2) in-depth bottom-up research of such companies in the universe to assess sustainable competitive moats to build a portfolio of 10-20 stocks that deliver healthy compounded earnings growth over long periods of time.
Such a portfolio is monitored for sustainability of moats on a continuous basis through extensive primary research. Repeating the filters annually helps keep the investible universe updated and also such a universe is continuously researched for developing or strengthening of moats to augment the portfolio.
Strategy:The Filter Based Approach creates a list of stocks using a twin-filter criterion of double-digit YoY revenue growth and return on capital being in excess of cost of capital, each year for 10 years in a row. Next a portfolio of such stocks each year are created and taken each of these annual iterations of portfolios for the subsequent 10 years (without any churn).
Unique DNA of these companies: By “filtering in” companies with a history of very consistent fundamentals over very long time periods, the portfolio is skewed towards companies with a DNA built around relentlessly
deepening their competitive moats despite disruptive changes taking place both inside as well as outside the organization. More often than not, such DNA sustains over the subsequent 5-10 years investment horizon of the filter-based approach.
Power of compounding: Holding a portfolio of stocks untouched for 10 years allows the power of compounding to play out, such that the portfolio becomes dominated by the winning stocks while losing stocks keep declining to eventually become inconsequential.
Avoiding the pitfalls of psychology and reducing transaction costs: Being patient with a portfolio helps cut out ‘noise’ of trying to time entry / exit decisions. With no churn, this filter-based approach also reduces transaction costs. Consider two data points: (a) In a portfolio with 70% churn (average churn of large cap mutual funds), 20bps broking cost and 30bps impact cost, churn reduces the terminal value of the portfolio (after 10 years) by 10% (i.e. a drag of 120bps on the 10-year CAGR); and (b) deferring the 10% long term capital gains tax payable on the portfolio by 10 years enhances the terminal value of the portfolio by 8% (i.e. 100bps increase in the 10-year CAGR) vs a portfolio where capital gains are paid each year.
The above deep-dive stock-specific research help generate outperformance of 4-5% per annum over and above these filter-based portfolios which is achieved via 3 factors:
1. Portfolio concentration:
2. Ignorable consistency in historical fundamentals
3. Excusable blips in historical fundamentals are forgiven
Mutual Fund Overview MARCELLUS PMS STRATEGY - CONSISTENT COMPOUNDERS

12March 2020 INSIGHT
Ashika Mutual Fund Recommendation Alpha GenerationMonth of Recom
Fund Name Benchmark NAV as on 24.02.2020
1 Year Return
(%)
3 Year Return
(%)
5 Year Return
(%)
Mar-19 Mirae Asset Large Cap Fund NIFTY 200 53.4 12.78 11.41 10.24
Apr-19 SBI Focused Equity Fund S&P BSE 500 160.72 24.95 15.87 11.8
May-19 Invesco India Small Cap Fund S&P BSE 250 SmallCap TRI 12.12 27.41 - -
Jun-19 ICICI Prudential Multi Asset Fund Nifty 50 Total Return (70) 268.29 7.17 5.92 6.72
Jul-19 ICICI Prudential Asset Allocator Fund CRISIL Hybrid 50+50 Moderate Index
58.78 9.54 9.47 8.73
Aug-19 Reliance MultiCap Fund S&P BSE 500 98.36 7.94 8.94 5
Sep-19 Canara Robeco Emerging Equities Fund Nifty Large midcap 250 TRI 103.5 18.64 12.44 12.27
Oct-19 LIC MF large & Mid Cap Fund Nifty Large midcap 250 TRI 16.73 21.59 11.72
Nov-19 ITI Multi Cap Fund Nifty 500 TRI 11.13 - - -
Dec-19 Parag parikh Long Term Equity Fund Nifty 500 TRI 28.81 16.66 13.69 12.2
Jan-20 DSP Dynamic Asset Allocation Fund CRISIL Hybrid 35+65 Aggressive 16.48 11.41 7.47 7.4
Feb-20 Invesco India Growth opportunities Fund S&P BSE 250 Large Midcap 65:35 TRI
36.99 16.41 12.65 9.37
Note: All data are as on Jan 31, 2020; NAV are as on Feb 24, 2020, Source: Factsheet, Value Research
ALL DATA BELONGS TO 02/24/2020NAV AUM
(Rs Cr)3 M 6 M 1 Yr 3 Yr 5 Yr Since
Inception Return
Sharpe Ratio
Exp. Ratio
SBI - Large & Midcap Fund Reg (G) 239.17 2978 6.62 17.96 16.42 10.30 8.97 13.92 0.53 2.2Invesco - India Growth Opportunities Fund (G) 36.99 2447 3.30 14.38 16.50 12.65 9.37 10.99 0.66 2.04Kotak - Equity Opportunities Fund (G) 131.75 3188 5.82 17.35 19.47 10.29 9.65 18.11 0.54 2.02LIC - Large & Mid Cap Fund - Reg (G) 16.74 639 6.44 18.10 21.72 11.72 0.00 10.85 0.51 2.5Sundaram - Large and Mid Cap Fund (G) 37.57 1110 2.75 16.82 17.66 12.02 10.57 10.73 0.61 2.19
Large & Mid Cap Fund
Performance: The filter-based portfolio delivers returns of 20-30%
p.a. and 8-12% outperformance relative to the Sensex.
The volatility of returns of such portfolios, for holding periods longer than 3 years, is similar to that of a Government Bond
Returns here (both for our portfolio and for the Sensex) are on a Total Shareholder Return basis i.e. all dividends are included in the returns.
Fee Structure:Marcellus offers Consistent Compounders Portfolio with zero fixed fees
The Consistent Compounders PMS comes with ZERO entry load/exit load and with no lock-in. Clients can choose any of the following fee structures:
1. a fixed fees model (2% p.a. fixed fees + zero performance fees) or
2. a variable fees model (zero fixed fees + performance fees of 20% profit share above a hurdle of 8%, no catch-up)
3. a hybrid model (1% p.a. fixed fees + performance fees of 15% profit share above a hurdle of 12%, no catch-up).
Minimum investment: Rs. 50 lakhs
Source: Bloomberg. Note: Only the Consistent Compounder Portfolios which have finished their 10 year run have been shown. Note: These are total shareholder returns.

13 March 2020INSIGHT
Value FundALL DATA BELONGS TO 02/24/2020
NAV AUM (Rs Cr)
3 M 6 M 1 Yr 3 Yr 5 Yr Since Inception
Return
Sharpe Ratio
Exp. Ratio
SBI - Contra Fund Reg (G) 103.12 1367 0.76 9.32 2.11 2.37 2.66 17.06 0.02 2.34UTI - Value Opportunities Fund (G) 65.71 4634 4.86 16.69 15.44 9.12 5.47 13.70 0.45 1.78Nippon India - Value Fund (G) 75.51 3114 2.07 12.98 12.16 8.89 7.23 14.70 0.35 2Kotak - India EQ Contra Fund (G) 55.55 900 2.53 12.36 12.52 11.96 8.60 12.47 0.69 2.32Invesco - India Contra Fund (G) 50.95 4751 5.57 16.46 14.86 12.20 10.05 13.48 0.56 1.93
Focus Fund
Axis - Focused 25 Fund Reg (G) 31.7 9627 5.28 17.84 25.20 15.93 11.89 16.14 0.83 1.85
Mirae - Asset Focused Fund Reg (G) 11.77 2701 1.03 15.28 0.00 0.00 0.00 21.32 - 1.97
SBI - Focused Equity Fund Reg (G) 160.73 7694 6.52 20.56 25.11 15.87 11.80 19.62 0.82 2.03
Motilal Oswal - Focused 25 Reg (G) 24.4 1220 3.55 17.61 22.49 10.38 8.35 13.92 0.49 2.22
Sundaram - Select Focus Reg (G) 194.75 1074 2.50 12.57 18.04 13.21 8.18 18.36 0.76 2.18
ELSS Fund
Mirae - Asset Tax Saver Fund Reg (G) 18.98 3293 1.62 13.47 16.61 13.70 0.00 16.65 0.8 2.05
Kotak - Tax Saver Scheme (G) 48 1155 5.06 15.61 18.31 9.93 8.74 11.62 0.53 2.49
Motilal Oswal - Long Term Equity Fund Reg (G) 19.2 1725 5.09 19.41 21.02 10.70 12.96 13.66 0.56 2.12
DSP - Tax Saver Fund Reg Fund (G) 51.59 6381 1.63 12.59 17.68 9.33 9.91 13.34 0.41 1.96
SBI - Long Term Equity Fund Reg (G) 143.69 7582 0.50 11.25 6.89 5.49 4.62 15.20 0.2 1.97
Multi Cap Fund
Parag Parikh - Long Term Equity Fund Reg (G) 27.71 2784 5.25 13.61 15.83 12.94 11.51 16.20 0.85 2.02
SBI - M Multicap Fund Reg (G) 51.49 8760 2.09 11.35 14.82 9.33 9.96 12.07 0.5 2.01
Kotak - Standard Multicap Fund (G) 37.57 30546 2.16 12.82 15.82 10.49 9.96 13.30 0.56 1.63
ICICI Pru - Multicap Fund Reg (G) 291.26 5197 (0.39) 8.32 7.09 6.60 7.65 14.19 0.33 2.24
DSP - Equity Fund Reg (G) 45.28 3502 8.35 20.96 27.62 12.90 9.72 12.60 0.54 2.07
Small Cap Fund
Invesco - India Smallcap Fund Reg (G) 12.12 522 14.77 31.17 27.58 0.00 0.00 15.00 - 2.54
SBI - Small Cap Fund Reg (G) 57.05 3493 6.10 19.66 19.40 13.30 13.95 18.10 0.54 2.26
Axis - Small Cap Fund Reg (G) 34.97 2084 11.51 24.05 35.07 14.82 12.56 22.21 0.75 2.04
Kotak - Smallcap Fund (G) 79.15 1592 11.31 24.89 22.22 6.42 8.93 14.78 0.23 2.15
ICICI Pru - Smallcap Fund Reg (G) 27.33 1030 9.23 19.50 25.83 5.61 5.61 8.47 0.16 2.43
Thematic/Sectoral Fund
Franklin - Build India Fund (G) 40.13 1208 (3.03) 7.01 6.31 4.48 6.82 13.96 0.19 2.51
ICICI Pru - Banking & Financial Services Fund Reg (G)
68.14 3615 0.71 15.00 17.69 11.29 12.49 18.13 0.54 2.12
Kotak - Pioneer Fund (G) 10.41 717 3.55 0.00 0.00 0.00 0.00 11.21 - 2.73
Sundaram - Services Fund (G) 13.5 1304 10.58 27.19 31.65 0.00 0.00 22.28 - 2.37
Aditya Birla SL - Digital India Fund Reg (G) 58.63 440 9.59 10.98 11.13 17.94 9.88 6.95 1.04 2.52
Blance/BAF Fund
SBI - Equity Hybrid Fund Reg (G) 148.92 32585 3.87 12.84 18.50 11.78 9.40 15.32 0.71 1.72
Sundaram - Equity Hybrid Fund Reg (G) 98.83 1876 3.77 12.91 15.86 10.58 8.28 12.64 0.61 2.21
ICICI Pru - Balanced Advantage Fund Reg (G) 37.98 28853 1.31 8.95 12.00 8.57 8.42 10.55 0.71 1.75
Kotak - Balanced Advantage Fund Reg (G) 11.29 3719 1.69 8.55 12.77 0.00 0.00 7.79 - 2.15
Aditya Birla SL - Balanced Advantage Fund (G)
55.43 2736 0.69 7.86 10.13 5.94 8.07 9.00 0.25 2.04

14March 2020 INSIGHT
Arbitrage Fund
Aditya Birla SL - Arbitrage Fund Reg (G) 20 5769 1.27 2.73 6.28 5.98 6.27 6.76 0.4 0.85
ICICI Pru - Equity Arbitrage Fund Reg (G) 25.73 13739 1.22 2.59 6.05 5.95 6.30 7.45 0.29 0.93
Kotak - Equity Arbitrage Fund (G) 27.85 17856 1.25 2.68 6.20 6.15 6.39 7.37 0.66 0.98
Nippon India - Arbitrage Fund (G) 19.99 10497 1.23 2.64 6.20 6.23 6.49 7.63 0.69 1.08
SBI - Arbitrage Opp Fund Reg (G) 25.38 5253 1.29 2.60 6.28 6.01 6.18 7.25 0.31 0.91
Index Fund
HDFC - Index Fund-NIFTY 50 Plan - (G) 108.03 1064 (0.76) 9.20 10.42 10.73 7.13 14.20 0.58 0.3
ICICI Pru - Nifty Next 50 Index Fund Reg (G) 24.88 618 0.01 10.64 7.67 5.13 7.74 9.83 0.15 0.85
HDFC - Index Fund - Sensex Plan 358.66 722 (0.14) 9.81 13.17 12.57 7.87 14.67 0.71 0.3
SBI - Nifty Index Fund Reg (G) 101.64 514 (0.91) 8.96 9.94 10.29 6.59 14.25 0.55 0.69
ICICI Pru - Nifty Index Fund Reg (G) 114.65 517 (0.77) 9.24 10.30 10.14 6.63 14.61 0.54 0.45
Dynamic/Multi Assets
Invesco - India Dynamic Equity Fund (G) 30.58 870 0.57 27.44 (28/02/2019)
1.97 8.52 11.36 4.39 0.34 2.16
ICICI Pru - Asset Allocator Fund (FOF) (G) 58.79 6941 1.47 53.6284 (27/02/2019)
1.23 6.51 9.60 9.46 0.91 1.36
DSP - Dynamic Asset Allocation Reg (G) 16.49 1224 1.23 14.813 (28/02/2019)
2.97 9.04 11.48 7.72 0.51 2.41
SBI - Dynamic Asset Allocation Fund (G) 13.55 664 0.90 13.0557 (22/08/2019)
(0.67) 3.54 3.44 3.49 0.51 2.02
Disclaimer: Mutual Fund investments are subject to market risks, read all scheme related documents carefully.
SolutionsNAV AUM Mod
Duration (in Yrs)
AMP (IN Yrs )
3 M 6 M 1 Yr 2 Yr Sharpe Ratio
Exp. Ratio
ICICI Pru - Retirement Fund Pure Debt Plan (G)
11.18 370 - 10 (27/02/2019)
3.01 5.07 11.79 0.00 - 2.07
Aditya Birla SL - Retirement Fund 30s Plan (G)
10.42 129 - 9.061 (22/08/2019)
1.96 14.33 4.18 0.00 - 2.65
HDFC - Retirement Savings Fund Hybrid Equity Reg (G)
17.39 387 0.68 15.736 (26/02/2019)
2.74 9.86 10.72 4.67 0.45 2.73
Aditya Birla SL - Bal Bhavishya Yojna Wealth Plan (G)
10.82 230 - 9.45 (22/08/2019)
1.88 13.89 8.20 0.00 - 2.6
Axis - Childrens Gift Fund Reg (G) 14.56 470 0.63 12.4304 (25/02/2019)
3.37 12.30 18.08 7.98 0.55 2.44
Equity Savings FundALL DATA BELONGS TO 02/24/2020
NAV AUM (Rs Cr)
3 M 6 M 1 Yr 3 Yr 5 Yr Since Inception
Return
Sharpe Ratio
Exp. Ratio
HDFC - Equity Savings Fund (G) 37.33 4168 (0.07) 3.90 5.67 5.59 7.58 8.92 0.14 1.97
ICICI Pru - Equity Savings Fund (G) 14.78 1553 1.86 6.79 11.21 7.19 7.59 7.82 0.6 1.39
Kotak - Equity Savings Fund Reg (G) 15.03 1804 1.56 6.27 8.67 7.74 7.39 7.78 0.59 2.1
Axis - Equity Saver Fund Reg (G) 13.65 820 2.25 6.81 10.35 8.68 0.00 7.02 0.51 2.32
SBI - Equity Savings Fund Reg (G) 13.75 1567 1.88 7.82 10.04 6.45 0.00 6.86 0.23 1.7

15 March 2020INSIGHT
STOCK PICKS
Britannia Industries Ltd.CMP: Rs 2,962 Rating: BUY Target: Rs 3,400
Company InformationBSE Code 500825NSE Code BRITANNIABloomberg Code BRIT INISIN INE216A01030Market Cap (Rs. Cr) 71,455Outstanding shares(Cr) 24.052-wk Hi/Lo (Rs.) 3583.75 / 2300Avg. daily volume (1yr. on NSE) 4,83,971Face Value(Rs.) 1Book Value 165.8
Investment RationaleNew product launchesBritannia Industries Ltd. (BIL) continues to remain committed in launching new products which are futuristic and highly differentiated in nature, targeting various markets at the same time. The recent new launches (contribute ~3% to overall revenue) performed well, finding strong acceptance in most markets. The company is also focusing on fine tuning the existing brands and then scaling its launches. As is evident from the cake business which saw a relaunch of bar, veg and tiffin cakes and introduction of new formats like swiss rolls, layer cakes, brownies and muffils. During Q4, the company is expected to come up with four new launches – Treat Burst, Treat Stars, Whole Wheat Marie and Milk Bikis Choco Cream. Further, BIL plans to fine tune its products in new cate-gories like Croissants (national roll out in next 3-4 months), Salty Snacks (national roll out in 6 months) once demand pick up is visible. Wafers is doing well and BIL is already a No. 3 brand with a 10% market share.
However, the wafers market segment is highly fragmented and largely operates in trade promotions, but BIL has differentiated by giving freebies to ensure it creates a Pull brand than being a Push brand. In bread, the company continued its focus toward driving profitable growth while dairy business profitability was impacted due to significant upsurge in milk prices. Several additional investments led growth initiatives such as investments in the value added dairy segment, Chitpita JV (Greek company) for manufacturing and selling long life filled croissants has been gaining result. Hence some new launches have already started to yield result (~2.5% of revenue) and for some category extension will help the company to increase its market share going ahead.
Distribution reach to drive growthBritannia Industries is one of the companies with the lowest depen-dency on the wholesale channel for its domestic business. Increased direct reach and lower dependence
on wholesale channels have benefited BIL in last three years. Britan-nia’s direct distribution reach increased by 2.9x to 21.7 lakh outlets in last 5 years and total distribution reach currently stands at 55 lakh outlet increased from 36 lakh outlets 5 years ago. Hence the gap with market leader has narrowed down to 8 lacs during the quarter. Rural distribution (preferred dealers) has grown to 21,000 villages at end of Dec-2019 compared to 18,000 in Mar-2019. Company wit-nessed unprecedented gain in market share in all rural states, especially the Hindi belt, as it continues to strengthen its distribution network. Management targets to cross 6 mn outlets mark over the next three years to expand its distribution network.
Prudent cost management helps margin expansionBritannia has taken various cost saving measures in the past few years which help the company to considerably improve the margin from 11.0% in FY15 to 15.9% in 9MFY20. The margin expansion was primarily
Promoters 50.6%
DII 13.6%
FII 15.8%Others 20.0%
Share holding pattern as on Dec 2019

16March 2020 INSIGHT
attributable to cost efficiencies achieved through management initiatives such as use of renewable energy, rainwater harvesting and commodity hedging. Recent food inflation shot up cost of raw mate-rials (mainly dairy up 42% YoY), but company’s contract of raw materials, strong cost cutting measures and waste deduction techniques pro-pelled EBITDA margins. Management is also eyeing vertical integration such as in-house sourcing of whey for biscuit. Moreover, the company plans to reduce its dependency on third-party manufacturers and wants to focus on in-house capacity. Right now, the in-house to outsourced offerings ratio stands at 55:45, which will be 65:35 by FY20, as envisaged by the company. Further, the manage-ment indicated that the focus is going to be on driving revenue growth rather than volume growth and that it would go for a price hike to offset the inflation in raw material prices. Management expects to implement price increases selectively and con-tinues to target cost savings at 2.1% of revenue. Company is confident to expand margins moderately led by its relentless focus on cost saving initiatives, premiumization drive and scale benefits
Venture into new geographyManagement has plans to enter one new geography every year. It entered Nepal in FY19 and has ~17-18% market share. With in-house manufacturing, management expects Britannia’s Nepal business is likely to see margin expansion of ~600bps owing to no import duty. The company is expected to increase capacity in
Nepal form current capacity of 600tonnes to 1,200 tonnes with small investment. Overall capex in Nepal is pegged at ~Rs. 55 cr, which management estimates to yield ~Rs. 100- 150 cr revenue in three years on p.a. basis. The company has large part of its international business in the Middle East, where it has two overseas manufacturing units in Dubai and Oman. It is looking to create a hub-and-spoke model to get into more and more markets like Myanmar and the African continent. The company is presently considering entry in tougher market like Bangla-desh which is characterized by many players.
Q3FY20 Result AnalysisCompany continued to report decent
growth in all front in Q3FY20. Consolidated revenues grew by 3.8% YoY at Rs. 2936 cr marked by volume growth of 3% YoY on the back of domestic slump in urban and rural demand. According to management, about half of growth was contributed by
its base business, with new innova-tion and new categories contributing 1% each to the topline. Its increased efforts on reducing trade inventory and rising freshness alsohad some impact on volumes. The Company has shown increase in its operating profits by 11.1% YoY to Rs. 502 cr while Operating Profit margin increased by 94 bps on YoY basis to 16.8%. Opera-tional margins surprised positively on back of moderate RM inflation (due to forward cover on key RMs) and enhanced focus on cost saving initiatives (partly aided by flat A&P spends). PBT stood at Rs. 497 crore, up by 6.8% YoY. Net Profit of the company has increased by 22.9% YoY to Rs. 370 cr while Net Profit margin increased by 181 basis points for Q3 on YoY basis to 12.4%. Net Profit growth aided by corporate tax rate reduction as tax decline by 23.2% to Rs. 127 cr.
Key Risks Rising competitive intensity
especially from large organized / unorganised regional players can potentially result in volume pressures Rise in the raw material prices
like wheat, flour, RPO, milk without commensurate hike in product prices can lead to pressure on the gross margins. Prolonged slowdown particularly in
rural areas, will lead to slowing of the category growth rates.
ValuationBritannia is the leader in the biscuit category in terms of value. Despite the challenging environment the company managed to continuously improve its market share. Major pos-itive for Q3FY20 was EBITDA margin expansion in spite of inflation in key raw materials prices. Cover on input prices and company’s cost saving initiatives with flat advertisement expenses helped in expansion in EBITDA margin. BIL initiatives of new launches and innovations, distribu-tion expansion (reducing gap with market leader) and judicious pricing (to be competitive in the market) will lead to better growth than peers. Improving product mix (premium growing faster than value category), moderate competitive intensity, modest price hike (to offset raw material inflation) and sharp focus
Britannia Industries Ltd. Price Chart
0 200 400 600 800 1,000 1,200 1,400 1,600 1,800 2,000
2200
2400
2600
2800
3000
3200
3400
3600
Feb-
18
Apr-
18
Jun-
18
Aug-
18
Oct
-18
Dec
-18
Feb-
19
Apr-
19
Jun-
19
Aug-
19
Oct
-19
Dec
-19
Total Traded Quantity Britannia
Despite the challenging environment the company managed to continuously improve its market share. Major positive for Q3FY20 was EBITDA margin expansion in spite of inflation in key raw materials prices.

17 March 2020INSIGHT
on cost optimization (cost savings target for the current year is 2.1% of revenue) should continue to support operating margin trend. Recovery in the biscuit category’s growth and a scale-up in performances of new products and adjacencies (including dairy and bakery businesses) would help Britannia record better earnings
in the near to medium term. Going forward, it is expected that company’s thrust on distribution expansion and category expansion with pre-miumization to drive growth. While judicious pricing and strategic input buying with cost saving measures will help in better margins. Considering government rural initiatives, we
are optimistic of bouncing back of demand in few quarters time. Hence, we hold positive view on the scrip and recommend BUY with a target price of Rs. 3400 from 12 - 18 months investment perspective. Currently, the scrip is valued at P/E multiple of 44x on FY21E Bloomberg consensus EPS of Rs 67.3.
Valuation charts
Particulars (in Rs Cr) FY19 FY20E FY21E FY22ENet Sales 11054.7 11784.3 13045.2 14519.3Growth (%) 11.5 6.6 10.7 11.3EBITDA 1733.4 1873.7 2126.4 2424.7EBITDA Margin (%) 15.7 15.9 16.3 16.7Net profit 1156.4 1402.3 1617.6 1858.5Net Profit Margin (%) 10.5 11.9 12.4 12.8EPS (Rs) 48.2 58.3 67.3 77.3
Consensus Estimate: Bloomberg, Ashika Research
PE Band
Source: Bloomberg & ACE Equity
0
1000
2000
3000
4000
5000
Apr-1
5 Au
g-15
De
c-15
Ap
r-16
Aug-
16
Dec-
16
Apr-1
7 Au
g-17
De
c-17
Ap
r-18
Aug-
18
Dec-
18
Apr-1
9 Au
g-19
De
c-19
Ap
r-20
Aug-
20
Dec-
20
Price 35x 40x 45x 50x 55x
Revenue, EBITDA & PAT CAGR (%)
Source: Bloomberg & ACE Equity
10.5 8.9
12.7
16.5 19.0
30.1
14.4 13.8
30.8
0.0
5.0
10.0
15.0
20.0
25.0
30.0
35.0
3 year 5 years 10 years
Revenue CAGR EBITDA CAGR PAT CAGR
P/E Median
Source: Bloomberg & ACE Equity0x 10x 20x 30x 40x 50x 60x
8 Years
5 Years
3 Years
PE Ratio SD 5 yr
Source: Bloomberg & ACE Equity
30
40
50
60
70
80
90
Jan-
15
May-
15
Sep-
15
Jan-
16
May-
16
Sep-
16
Jan-
17
May-
17
Sep-
17
Jan-
18
May-
18
Sep-
18
Jan-
19
May-
19
Sep-
19
Jan-
20
PE Ratio Mean 1 SD+ 2 SD+ 1 SD- 2 SD-
Revenue, EBITDA & PAT Trend (Rs. Cr.)
Source: Bloomberg & ACE Equity
10%
11%
12%
13%
14%
15%
16%
0
2,000
4,000
6,000
8,000
10,000
12,000
FY15 FY16 FY17 FY18 FY19
Revenue EBITDA PAT EBITDA Margin

18March 2020 INSIGHT
STOCK PICKS
Aarti Industries Ltd.CMP: Rs 980 Rating: BUY Target: Rs 1,177
Company InformationBSE Code 524208NSE Code AARTIINDBloomberg Code ARTO INISIN INE769A01020Market Cap (Rs. Cr) 17,041Outstanding shares (Cr) 17.42 52-wk Hi/Lo (Rs.) 1071.0/676.8Avg. daily volume (1yr. on NSE) 128,260 Face Value (Rs.) 5Book Value (Rs) 169.0
Company profileIncorporated in 1984, Aarti Industries ltd. is a leading specialty chemicals company in Benzene based deriva-tives with integrated operations and high level of cost optimization. Aarti operates in two division, specialty chemical account 84% of total revenue and pharma contributes 16% of turnover. Company’s pharma operations include APIs, intermedi-ates and Xanthene derivatives. It has 11 plants for specialty chemicals and 4 for pharma (2 USFDA and 2 WHO/GMP). Further, another 2 projects are coming at Dahej SEZ and setting up 4th R&D center at Navi Mumbai.
Investment RationaleLargest benzene derivatives producerAarti Industries is the largest pro-ducer of benzene derivatives in India and leading manufacturer globally. Globally, it has strong market share with most of its products having market share in the range of 25-40%. Further, 75% of its specialty chemical products are commanding a position in Top-4 in their respective catego-ries. Aarti is the third largest player globally in chlorination, fourth in the world in nitration, globally second in ammonolysis, second largest in the world in hydrogenation, and is the first and only player in India
to commercialize manufacturing of flouro compounds via Halex chemistry. It has a diversified product portfolio with relative low dependency on individual products. Company’s top 5 products contrib-ute nearly 39% of the consolidated revenue, while the top 10 products contribute 58% of revenue. It has also a diversified customer base across North America, Europe, Japan, China and RoW and no single company/customer accounts for more than 5% of consolidated revenue. Aarti’s top 10 customers contribute 27% of consolidated revenue while top 20 contribute 38% of revenue. Company is also focusing on innova-tion in order to effectively utilize its
Promoters 48.3%
FIIs 7.5%
DII 16.7%Others 27.6%
Share holding pattern as on Dec 2019

19 March 2020INSIGHT
by-products and generate additional revenue. Diversified product portfo-lio and customers help the company to mitigate the concentration risk from business model.
Focus on moving up the value chainAarti industries has a integrated business model and management continued its focus in moving up the value chain yielded positively for the company. Company has presence in both the chains (Simple & Advance) and sells 30% commoditized and 70% in the complex. Advanced products have higher gross margins (USD 800-1000 per tonne vs USD 400-600 per tonne) compared to simple products which help the company to sustain healthy margins. However, in simple product division the market size is much bigger than advanced. Aarti has strong market share of around 50-70% in complex segment, while 30-40% market share in simple category. First mover advantage and scale benefits help the company to be the low cost of producer compared to standalone players. Aarti’s presence across the value chain with scale is a key moat for the company.
Coronavirus epidemic throws opportunity for chemical sectorThe recent outbreak of coronavirus in China which infected around 77,000 people and death toll of around 2,500, lockdown the manufacturing activities in the mainland. China is one of the largest chemical manufac-turers globally, shutting down their plants amid threat of coronavirus and that benefit the Indian integrated
chemical companies like Aarti indus-tries. For integrated chemical man-ufacturers such as Aarti Industries, it could mean new opportunities because of the growing preference for India as an alternative reliable supplier of chemicals. Over the years, supply chain disruptions in China due to operational hazards, environ-mental compliance issues and higher cost of operations have made the case for this likely shift. A 5-10% business shift to India can actually more than double the opportunity size for many chemical companies. As per man-agement, its chemical business is not dependent on imports from China as its operation is fully backward integrated. Overall, coronavirus outbreak in China is a positive for its specialty chemical business as far as demand and prices are concerned. As per the management, due to corona-
virus company’s market share will improve as it has been getting more orders from their existing custom-ers. Management also conveyed that more impact would start coming in from March onwards and company will have carry-for-ward orders
for a month or so. Thus, most of the impact will come from March onwards. Due to ongoing supply disruption from China led by environmental issues and followed by coronavirus epidemic, global innovators and generic companies are establishing alternative source for a steady and assured supply of intermediates. India on the other hand is a known alternative hub for chemicals and stands to bag a multi-year exports opportunity. Against this backdrop, Aarti Indus-tries is well-poised to cash out the growing opportunities because of its market leadership and strong global presence.
Growth backed by strong capexAarti industries growth story has been backed by capacity expansions and introduction of value-added products. Company embarked an ambitious capex plan to the tune of Rs 2100-2400 over FY19-21 compared to Rs 2740 over FY09-18. Company’s capex including investments towards long-term multi year deals, capacity expansions in hydrogenation and NCB, de-bottlenecking and expan-sions in various specialty chemicals, API and pharma intermediates and setting up new R&D center in Navi Mumbai. Management have positive visibility of long-term demand for their products, as a result they have continued to drive capital expenditure as per plan, spending Rs 830 crore in the first 9MFY20 and expects to close FY20 within guided range of Rs 1,000-2,000 crore. As per management, all its key projects including the expansion of chlorina-tion capacity, investments underlying various long-term contracts, etc. are on track and will be commissioned as per scheduled timelines. Timely, commissioning of all the capacities will support the long-term growth of the company.
Key Risks Any unfavorable movement in raw
material prices and resultant spike in working capital could adversely impact the margins of the company Any delay in commissioning
the new capacities and lower than expected offtake could hurt
Aarti Industries ltd 3 Year Price Chart
100 200 300 400 500 600 700 800 900
1000 1100
Feb-
17
Apr
-17
Jun-
17
Aug
-17
Oct
-17
Dec
-17
Feb-
18
Apr
-18
Jun-
18
Aug
-18
Oct
-18
Dec
-18
Feb-
19
Apr
-19
Jun-
19
Aug
-19
Oct
-19
Dec
-19
Aarti industries has a integrated business model and management continued its focus in moving up the value chain yielded positively for the company.

20March 2020 INSIGHT
company’s long-term revenue growth.
ValuationAarti is leading integrated specialty chemical manufacturer globally with strong product pipeline. Manage-ment’s continuous focus on increas-ing contribution from downstream products of chemical business and scaling presence in non-commod-itized segments at 75% are the most encouraging developments from business perspective. Further, com-pany’s diversified product portfolio and low dependency on single clients mitigate the concentration risks.
The coronavirus epidemic in China disrupted the supply chain of global chemical sector, resulting in shortage of raw materials. Aarti being an integrated specialty chemical and API manufacturer is going to benefit from acute supply shortage of key chemical ingredients on wake of coronavirus epidemic in China as far as demand and prices are con-cerned. Management have positive view on the long-term demand for their products, thus will continue to drive capex plan which will further underpin its long-term revenue growth visibility. In pharma business, margins are expanding as company
started to derive higher contribution from supplies to regulated markets and improve the product mix to more value addition. Also, Pharma capacity expansions are continuing which will drive deeper penetration in some key therapies such as antihypertensive, cardiovascular, oncology, corticoste-riods, etc. Overall, we believe, Aarti is on right track to achieve humongous growth in coming 2 to 3 years. Thus, we recommend our investors to BUY the scrip with target of Rs 1,177 from 12 months investment perspective. At current price, the scrip is valued at P/E multiple of 24.5 on Bloomberg consensus EPS of Rs 39.9.
Valuation charts
Particulars (in Rs Cr) FY18 FY19 FY20E FY21E
Revenue 3,759.3 4,659.5 4,629.0 5,602.7
Growth (%) 20.7% 23.9% -0.7% 21.0%
EBITDA 691.4 963.0 1,016.8 1,243.1
EBITDA Margin (%) 18.4% 20.7% 22.0% 22.2%
Net profit 328.6 490.6 561.1 694.4
Net Profit Margin (%) 8.7% 10.5% 12.1% 12.4%
EPS (Rs) 20.2 28.3 32.3 39.9
Source: Bloomberg consensus
PE Band - Aarti Industries Ltd.
Source: Bloomberg & ACE Equity
0.00
200.00
400.00
600.00
800.00
1000.00
1200.00
1400.00
01-Apr-15 01-Apr-16 01-Apr-17 01-Apr-18 01-Apr-19
Price 10x 15x 20x 25x 30x
Revenue, EBITDA & PAT CAGR
Source: Bloomberg & ACE Equity
12% 12%
16% 15%
19% 19% 18%
25% 24%
10 Years 5 Years 3 Years
Revenue CAGR (%) EBITDA CAGR PAT CAGR
Revenue, EBITDA & PAT trend
Source: Bloomberg & ACE Equity
2,908
2,956
3,115
3,759
4,659
466
566
652
691 96
3
206
256
315
329 491
0%
5%
10%
15%
20%
0
1,000
2,000
3,000
4,000
5,000
FY15 FY16 FY17 FY18 FY19
Revenue (Rs crs) EBITDA (Rs crs)
PAT (Rs crs) EBITDA Margins (%)
P/E Median
Source: Bloomberg & ACE Equity
29.5x
25.0x
17.4x
0.0x 5.0x 10.0x 15.0x 20.0x 25.0x 30.0x 35.0x
3 Years
5 Years
8 Years

21 March 2020INSIGHT
STOCK PICKS
Metropolis Healthcare Ltd.CMP: Rs 1,880 Rating: BUY Target: Rs 2,200
Company InformationBSE Code 542650NSE Code METROPOLISBloomberg Code METROHL INISIN INE112L01020Market Cap (Rs. Cr) 9,341Outstanding shares (Cr) 5.0252-wk Hi/Lo (Rs.) 1950/907Avg. daily volume (1yr. on NSE) 82,040Face Value(Rs.) 2Book Value (Rs) 97.98
Investment RationaleFormalization driven industry growthThe industry is expected to grow at 15% p.a. between FY19 & FY22, driven by population above 60 years old accounting for majority of healthcare spend. Besides, rising awareness, rising income and urbanization leads to preference for shifting trend from unorganized pro-viders to organized providers in the diagnostics market. There is
plenty of room for growth of orga-nized players since 80% of the market is catered by un-organized players. Favorable government incentives like tax breaks towards preventive testing could further add to volume growth. Besides, organized players could easily pass on price hikes of ~0.5% p.a to cover medical cost inflation despite increasing scrutiny from the regulators and government. In short, formalization in the industry will lead to market share gains of 5-7 major diagnostic chains at the cost of small
regional players or standalone labs.
Volume driven growth on increased B2C focusMETROHL organic growth strategy has been driven by consolidating its position in its 5 focus cities (Mumbai, Bengaluru, Chennai, Surat and Pune), accounting for 54% of revenue. It is focusing on increasing its sales contribution from the B2C channel (currently 43%) through increase in its collection centers and lab net-works. The B2C contribution in focus
Promoters 57.41%
DIIs 5.85%
FIIs 16.58%Others 34.98%
Share holding pattern as on Dec 2019

22March 2020 INSIGHT
cities of METROHL has increased from 43% in FY16 to 55% by 9MFY20 and is further targeted to reach 65%. The company’s patient service network has grown 6.6x between FY16 and 9MFY20 and its lab network grew at 8.7% CAGR between FY17 and 9MFY20. This growth in B2C network has enabled the company to clock 12.8% CAGR in number of patient vis-its and 9% CAGR in number of tests between FY17 & FY19. For 9MFY20, number of patients has grown at 15.5% yoy (after 15.6% yoy growth in FY19) and no. of tests at 19.3% yoy. Earlier, growth for tests as well as patient visits for METROHL used to lag peers. The growth in FY19 & FY20 have been after company invested heavily in infrastructure together with expansion of test offerings which is paying off. METROHL’s B2C segment has thus registered 22% sales CAGR over FY16-19 and the company is focusing on increasing its B2C contribution further through (a) aggressive network expansion (b) strengthen Metropolis brand (c) building awareness amongst doctors for quality & service differentiators (d) focus on customer experience & improvement. Besides, since 79% of the existing Individual patients touch points added during FY2017-19, it is a young network. According to the company, average retail centre matures in five years thus enabling short and midterm future growth as the young network matures.
Premium realization compared to peersMETROHL’s realizations are at premium compared to peers due to its evolving mix of B2C segment and higher contribution of specialized tests (41%) to revenue. According to the company, there are few players in the specialized test segment as market demands high accuracy and quality parameters, thus leading to lower competition and high margins on low volumes. This is in contrast to semi-specialized tests where there is intense competition. Revenue per patient has grown at a CAGR of 7.3% and revenue per test at a CAGR of 7.9% between FY16 and FY19, while realization has remained
flat for peers. Government’s intention to lower healthcare costs could be a major deterrent for METROHL to increase reali-zation further, however increas-ing contribution of international business could support the cause.
Asset-light business modelMETROHL works on an asset-light model and 90.68% of the centre network and 16.8% lab network is asset light. Major addition in the labs in FY19 and 9MFY20 is through lab on lease model which is asset light with no capital requirement. It is working on the hub & spoke model and expanding its third-party collection centers (currently 66% of its collec-tion centers are third party). The company aims to establish strategic partnerships with 3rd Party Patient Service Centers in India, Africa and Middle East to boost geographic reach. Thus, leveraging on the existing infrastructure, METROHL will expand customer base as well as profitability matrix. Being asset-light, has helped the company to generate ROCE of more than 45% in last three years.
Key Risks Government putting a cap on prices
of medical tests
Intensifying competition in orga-nized space
Decline in realizations.
ValuationMetropolis Healthcare (METROHL) is a dominant player in West India providing extensive coverage of tests and quality services. The industry is expected to grow at 15% p.a. between FY19 & FY22 driven by senior citizens, urbanization, growing awareness & rising income to bring a shift in preference towards organized play-ers from inorganized players. The industry is highly fragmented thus leading to bountiful opportunities for growth for organized players and thus gain market share. METROHL has successfully increased its presence in B2C channel thus raising its contribution in total sales through consolidating its presence in focused cities. This has resulted in nearly 16% growth in number of patients in FY19 as well as in 9MFY20, against 8-9% CAGR earlier. Besides, the company earns strong realizations
Metropolis Healthcare share price chart
800
1000
1200
1400
1600
1800
2000
Apr
-19
May
-19
May
-19
Jun-
19
Jul-
19
Jul-
19
Aug
-19
Sep
-19
Sep
-19
Oct
-19
Nov
-19
Dec
-19
Dec
-19
Jan-
20
Feb-
20
Feb-
20
The Company’s realizations are at premium compared to peers due to its evolving mix of B2C segment and higher contribution of specialized tests (41%) to revenue.
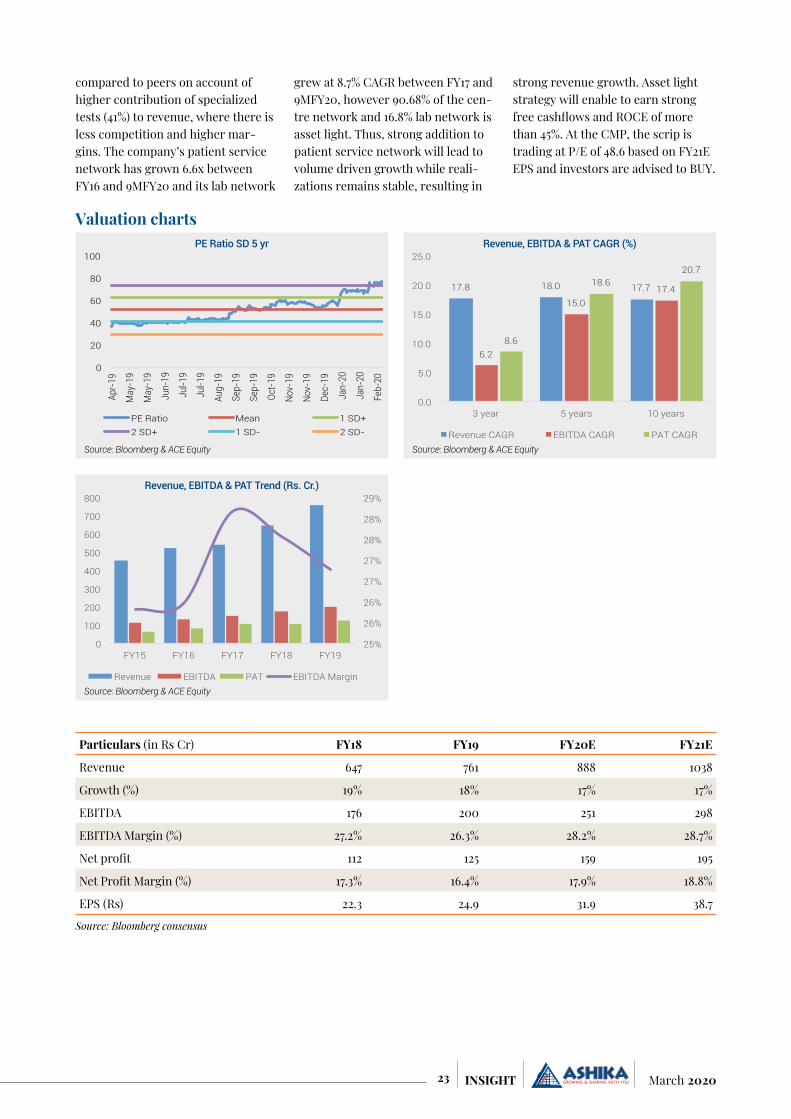
23 March 2020INSIGHT
compared to peers on account of higher contribution of specialized tests (41%) to revenue, where there is less competition and higher mar-gins. The company’s patient service network has grown 6.6x between FY16 and 9MFY20 and its lab network
grew at 8.7% CAGR between FY17 and 9MFY20, however 90.68% of the cen-tre network and 16.8% lab network is asset light. Thus, strong addition to patient service network will lead to volume driven growth while reali-zations remains stable, resulting in
strong revenue growth. Asset light strategy will enable to earn strong free cashflows and ROCE of more than 45%. At the CMP, the scrip is trading at P/E of 48.6 based on FY21E EPS and investors are advised to BUY.
Valuation charts
Particulars (in Rs Cr) FY18 FY19 FY20E FY21E
Revenue 647 761 888 1038
Growth (%) 19% 18% 17% 17%
EBITDA 176 200 251 298
EBITDA Margin (%) 27.2% 26.3% 28.2% 28.7%
Net profit 112 125 159 195
Net Profit Margin (%) 17.3% 16.4% 17.9% 18.8%
EPS (Rs) 22.3 24.9 31.9 38.7
Source: Bloomberg consensus
Revenue, EBITDA & PAT CAGR (%)
Source: Bloomberg & ACE Equity
17.8 18.0 17.7
6.2
15.0 17.4
8.6
18.6 20.7
0.0
5.0
10.0
15.0
20.0
25.0
3 year 5 years 10 years
Revenue CAGR EBITDA CAGR PAT CAGR
PE Ratio SD 5 yr
Source: Bloomberg & ACE Equity
0
20
40
60
80
100
Apr-
19
May
-19
May
-19
Jun-
19
Jul-1
9
Jul-1
9
Aug-
19
Sep-
19
Sep-
19
Oct-1
9
Nov-
19
Nov-
19
Dec-
19
Jan-
20
Jan-
20
Feb-
20
PE Ratio Mean 1 SD+ 2 SD+ 1 SD- 2 SD-
Revenue, EBITDA & PAT Trend (Rs. Cr.)
Source: Bloomberg & ACE Equity
25%
26%
26%
27%
27%
28%
28%
29%
0
100
200
300
400
500
600
700
800
FY15 FY16 FY17 FY18 FY19
Revenue EBITDA PAT EBITDA Margin

24March 2020 INSIGHT
Monthly Insight Performance Since Jan-2015... Return @CAGR 21.1%
* All Figures quoted in Rs. Calculated as on February 25, 2020
-40,00,000
-20,00,000
0
20,00,000
40,00,000
60,00,000
80,00,000
1,00,00,000
1,20,00,000
1,40,00,000
1,60,00,000
Jan-
15
Apr-
15
Jul-1
5 Oc
t-15
Ja
n-16
Ap
r-16
Ju
l-16
Oct-
16
Jan-
17
Apr-
17
Jul-1
7 Oc
t-17
Ja
n-18
Ap
r-18
Ju
l-18
Oct-
18
Jan-
19
Apr-
19
Jul-1
9 Oc
t-19
Ja
n-20
Net Profit Invested Capital Booked Profit M2M
92,28,623 71,298
1,00,10,615 -7,81,983
-7,80,679
-1,62,882
-23,89,498
3,60,317
-9,72,137
1,37,380
-10,22,194 -781983
6000
7000
8000
9000
10000
11000
12000
13000
-30,00,000
-25,00,000
-20,00,000
-15,00,000
-10,00,000
-5,00,000
0
5,00,000
10,00,000
Jan-
15
May
-15
Sep-
15
Jan-
16
May
-16
Sep-
16
Jan-
17
May
-17
Sep-
17
Jan-
18
May
-18
Sep-
18
Jan-
19
May
-19
Sep-
19
Jan-
20
M2M Nifty (RHS)
70,
35,8
65
77,
86,0
07
79,
73,3
68
83,
27,0
45
94,
27,7
36
94,
27,7
36
1,00
,10,
615
1,3
7,38
0
-5,3
1,88
3
-3,4
3,11
8
-4,7
8,49
2
-6,3
1,80
1
-487
803
-781
983 71,
73,2
44
72,
54,1
25
76,
30,2
50
78,
48,5
53
87,
95,9
35
89,
39,9
33
92,
28,6
32
-20,00,000
0
20,00,000
40,00,000
60,00,000
80,00,000
1,00,00,000
1,20,00,000
Dec-
17
Jun-
18
Dec-
18
Jun-
19
Oct-
19
Dec-
19
Feb-
20
Booked Profit M2M Net Profit
56,68,062
1,36,07,205
99,32,126
32,88,584
-22,76,367
10,30,564
56,67,598
-24,32,209
71,298
15,65,492
-6,61,124
46,91,240
74,58,360 76,30,250 92,28,632
-40,00,000
-20,00,000
0
20,00,000
40,00,000
60,00,000
80,00,000
1,00,00,000
1,20,00,000
1,40,00,000
1,60,00,000
Jan-
15
Apr-
15
Jul-1
5 Oc
t-15
Ja
n-16
Ap
r-16
Ju
l-16
Oct-
16
Jan-
17
Apr-
17
Jul-1
7 Oc
t-17
Ja
n-18
Ap
r-18
Ju
l-18
Oct-
18
Jan-
19
Apr-
19
Jul-1
9 Oc
t-19
Ja
n-20
Invested Capital Net Profit
56,68,062
1,36,07,205
99,32,126
32,88,584
-22,76,367
10,30,564
56,67,598
-24,32,209
71,298
15,65,492
-6,61,124
46,91,240
74,58,360 92,28,632
0
2000
4000
6000
8000
10000
12000
14000
-40,00,000
-20,00,000
0
20,00,000
40,00,000
60,00,000
80,00,000
1,00,00,000
1,20,00,000
1,40,00,000
1,60,00,000
Jan-
15
May
-15
Sep-
15
Jan-
16
May
-16
Sep-
16
Jan-
17
May
-17
Sep-
17
Jan-
18
May
-18
Sep-
18
Jan-
19
May
-19
Sep-
19
Jan-
20
Invested Capital Net Profit Nifty (RHS)
6000
7000
8000
9000
10000
11000
12000
13000
-20,00,000
0
20,00,000
40,00,000
60,00,000
80,00,000
1,00,00,000
Jan-
15
May
-15
Sep-
15
Jan-
16
May
-16
Sep-
16
Jan-
17
May
-17
Sep-
17
Jan-
18
May
-18
Sep-
18
Jan-
19
May
-19
Sep-
19
Jan-
20
Net Profit Nifty (RHS)
Ashika Insight Reco CAGR: 21.1%
Nifty CAGR: 7.6%
Date Cumm. Purchase Cumm. Sell Invested Capital Booked Profit M2M Net Profit31-Jan-15 14,99,743 11,94,534 3,05,209 1,94,567 1,687 1,96,25428-Feb-15 35,00,104 19,82,519 15,17,585 4,82,540 -84,363 3,98,17731-Mar-15 50,00,125 26,06,961 23,93,164 6,06,713 2,153 6,08,86630-Apr-15 64,98,467 32,20,161 32,78,306 7,20,155 -305,719 4,14,43631-May-15 85,00,103 32,20,161 52,79,942 7,20,155 -186,615 5,33,54030-Jun-15 94,98,351 38,30,289 56,68,062 8,30,507 -522,724 3,07,78331-Jul-15 1,04,98,441 49,94,743 55,03,698 9,95,421 -264,246 7,31,17531-Aug-15 1,24,98,538 73,20,667 51,77,871 13,24,055 -773,213 5,50,84230-Sep-15 1,34,98,520 78,97,102 56,01,418 14,00,450 -780,679 6,19,771
Monthly Profit & Loss Fact Sheet (Rs.)
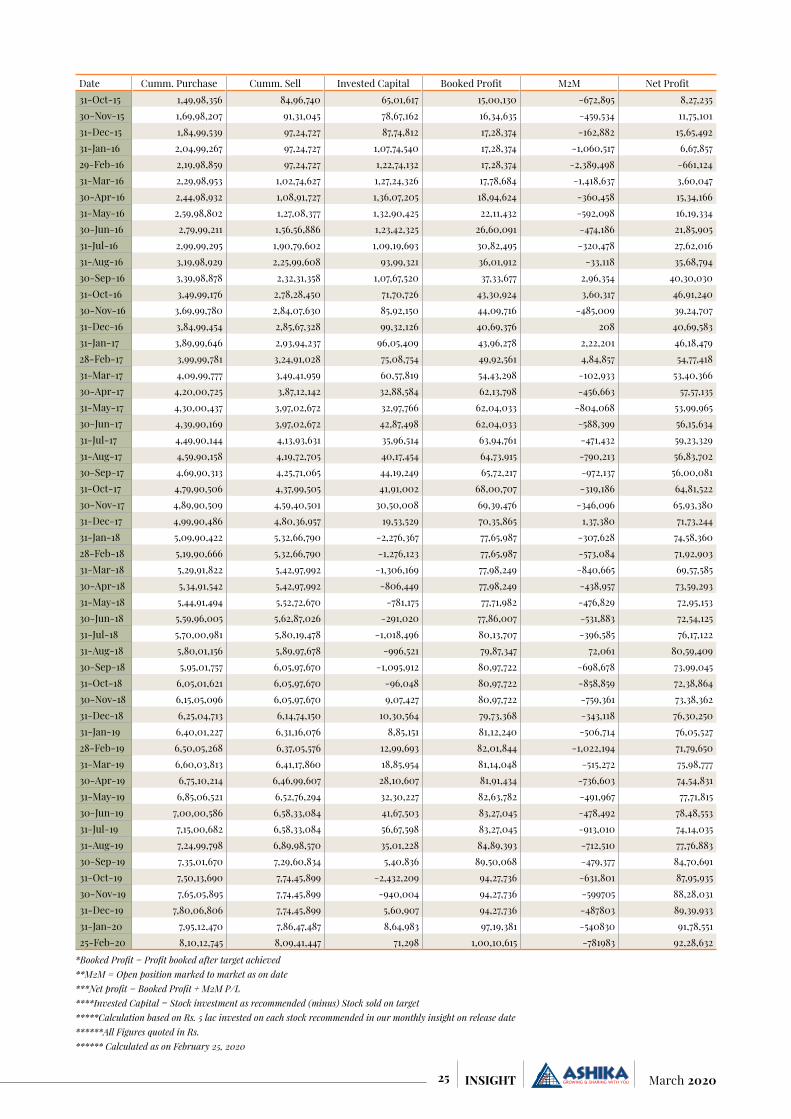
25 March 2020INSIGHT
Date Cumm. Purchase Cumm. Sell Invested Capital Booked Profit M2M Net Profit31-Oct-15 1,49,98,356 84,96,740 65,01,617 15,00,130 -672,895 8,27,23530-Nov-15 1,69,98,207 91,31,045 78,67,162 16,34,635 -459,534 11,75,10131-Dec-15 1,84,99,539 97,24,727 87,74,812 17,28,374 -162,882 15,65,49231-Jan-16 2,04,99,267 97,24,727 1,07,74,540 17,28,374 -1,060,517 6,67,85729-Feb-16 2,19,98,859 97,24,727 1,22,74,132 17,28,374 -2,389,498 -661,12431-Mar-16 2,29,98,953 1,02,74,627 1,27,24,326 17,78,684 -1,418,637 3,60,04730-Apr-16 2,44,98,932 1,08,91,727 1,36,07,205 18,94,624 -360,458 15,34,16631-May-16 2,59,98,802 1,27,08,377 1,32,90,425 22,11,432 -592,098 16,19,33430-Jun-16 2,79,99,211 1,56,56,886 1,23,42,325 26,60,091 -474,186 21,85,90531-Jul-16 2,99,99,295 1,90,79,602 1,09,19,693 30,82,495 -320,478 27,62,01631-Aug-16 3,19,98,929 2,25,99,608 93,99,321 36,01,912 -33,118 35,68,79430-Sep-16 3,39,98,878 2,32,31,358 1,07,67,520 37,33,677 2,96,354 40,30,03031-Oct-16 3,49,99,176 2,78,28,450 71,70,726 43,30,924 3,60,317 46,91,24030-Nov-16 3,69,99,780 2,84,07,630 85,92,150 44,09,716 -485,009 39,24,70731-Dec-16 3,84,99,454 2,85,67,328 99,32,126 40,69,376 208 40,69,58331-Jan-17 3,89,99,646 2,93,94,237 96,05,409 43,96,278 2,22,201 46,18,47928-Feb-17 3,99,99,781 3,24,91,028 75,08,754 49,92,561 4,84,857 54,77,41831-Mar-17 4,09,99,777 3,49,41,959 60,57,819 54,43,298 -102,933 53,40,36630-Apr-17 4,20,00,725 3,87,12,142 32,88,584 62,13,798 -456,663 57,57,13531-May-17 4,30,00,437 3,97,02,672 32,97,766 62,04,033 -804,068 53,99,96530-Jun-17 4,39,90,169 3,97,02,672 42,87,498 62,04,033 -588,399 56,15,63431-Jul-17 4,49,90,144 4,13,93,631 35,96,514 63,94,761 -471,432 59,23,32931-Aug-17 4,59,90,158 4,19,72,705 40,17,454 64,73,915 -790,213 56,83,70230-Sep-17 4,69,90,313 4,25,71,065 44,19,249 65,72,217 -972,137 56,00,08131-Oct-17 4,79,90,506 4,37,99,505 41,91,002 68,00,707 -319,186 64,81,52230-Nov-17 4,89,90,509 4,59,40,501 30,50,008 69,39,476 -346,096 65,93,38031-Dec-17 4,99,90,486 4,80,36,957 19,53,529 70,35,865 1,37,380 71,73,24431-Jan-18 5,09,90,422 5,32,66,790 -2,276,367 77,65,987 -307,628 74,58,36028-Feb-18 5,19,90,666 5,32,66,790 -1,276,123 77,65,987 -573,084 71,92,90331-Mar-18 5,29,91,822 5,42,97,992 -1,306,169 77,98,249 -840,665 69,57,58530-Apr-18 5,34,91,542 5,42,97,992 -806,449 77,98,249 -438,957 73,59,29331-May-18 5,44,91,494 5,52,72,670 -781,175 77,71,982 -476,829 72,95,15330-Jun-18 5,59,96,005 5,62,87,026 -291,020 77,86,007 -531,883 72,54,12531-Jul-18 5,70,00,981 5,80,19,478 -1,018,496 80,13,707 -396,585 76,17,12231-Aug-18 5,80,01,156 5,89,97,678 -996,521 79,87,347 72,061 80,59,40930-Sep-18 5,95,01,757 6,05,97,670 -1,095,912 80,97,722 -698,678 73,99,04531-Oct-18 6,05,01,621 6,05,97,670 -96,048 80,97,722 -858,859 72,38,86430-Nov-18 6,15,05,096 6,05,97,670 9,07,427 80,97,722 -759,361 73,38,36231-Dec-18 6,25,04,713 6,14,74,150 10,30,564 79,73,368 -343,118 76,30,25031-Jan-19 6,40,01,227 6,31,16,076 8,85,151 81,12,240 -506,714 76,05,52728-Feb-19 6,50,05,268 6,37,05,576 12,99,693 82,01,844 -1,022,194 71,79,65031-Mar-19 6,60,03,813 6,41,17,860 18,85,954 81,14,048 -515,272 75,98,77730-Apr-19 6,75,10,214 6,46,99,607 28,10,607 81,91,434 -736,603 74,54,83131-May-19 6,85,06,521 6,52,76,294 32,30,227 82,63,782 -491,967 77,71,81530-Jun-19 7,00,00,586 6,58,33,084 41,67,503 83,27,045 -478,492 78,48,55331-Jul-19 7,15,00,682 6,58,33,084 56,67,598 83,27,045 -913,010 74,14,03531-Aug-19 7,24,99,798 6,89,98,570 35,01,228 84,89,393 -712,510 77,76,88330-Sep-19 7,35,01,670 7,29,60,834 5,40,836 89,50,068 -479,377 84,70,69131-Oct-19 7,50,13,690 7,74,45,899 -2,432,209 94,27,736 -631,801 87,95,93530-Nov-19 7,65,05,895 7,74,45,899 -940,004 94,27,736 -599705 88,28,03131-Dec-19 7,80,06,806 7,74,45,899 5,60,907 94,27,736 -487803 89,39,93331-Jan-20 7,95,12,470 7,86,47,487 8,64,983 97,19,381 -540830 91,78,55125-Feb-20 8,10,12,745 8,09,41,447 71,298 1,00,10,615 -781983 92,28,632
*Booked Profit = Profit booked after target achieved**M2M = Open position marked to market as on date***Net profit = Booked Profit + M2M P/L****Invested Capital = Stock investment as recommended (minus) Stock sold on target *****Calculation based on Rs. 5 lac invested on each stock recommended in our monthly insight on release date******All Figures quoted in Rs.****** Calculated as on February 25, 2020
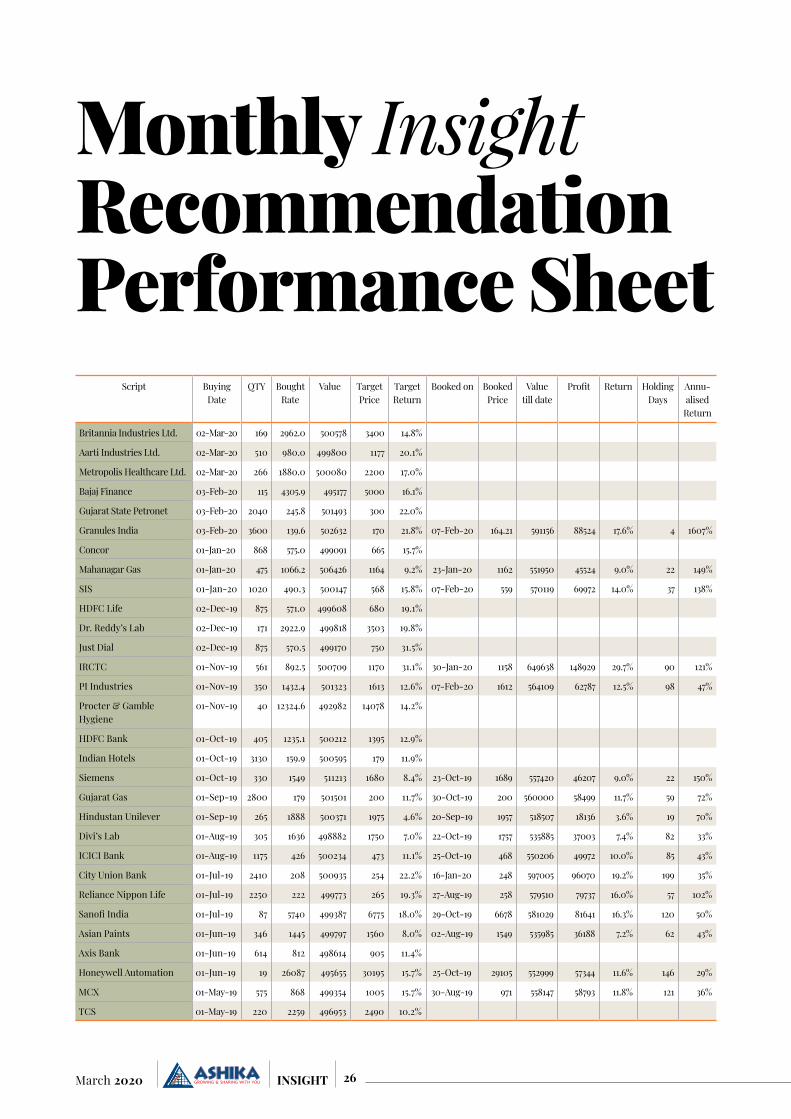
26March 2020 INSIGHT
Script Buying Date
QTY BoughtRate
Value TargetPrice
TargetReturn
Booked on BookedPrice
Value till date
Profit Return Holding Days
Annu-alised
Return
Britannia Industries Ltd. 02-Mar-20 169 2962.0 500578 3400 14.8%
Aarti Industries Ltd. 02-Mar-20 510 980.0 499800 1177 20.1%
Metropolis Healthcare Ltd. 02-Mar-20 266 1880.0 500080 2200 17.0%
Bajaj Finance 03-Feb-20 115 4305.9 495177 5000 16.1%
Gujarat State Petronet 03-Feb-20 2040 245.8 501493 300 22.0%
Granules India 03-Feb-20 3600 139.6 502632 170 21.8% 07-Feb-20 164.21 591156 88524 17.6% 4 1607%
Concor 01-Jan-20 868 575.0 499091 665 15.7%
Mahanagar Gas 01-Jan-20 475 1066.2 506426 1164 9.2% 23-Jan-20 1162 551950 45524 9.0% 22 149%
SIS 01-Jan-20 1020 490.3 500147 568 15.8% 07-Feb-20 559 570119 69972 14.0% 37 138%
HDFC Life 02-Dec-19 875 571.0 499608 680 19.1%
Dr. Reddy’s Lab 02-Dec-19 171 2922.9 499818 3503 19.8%
Just Dial 02-Dec-19 875 570.5 499170 750 31.5%
IRCTC 01-Nov-19 561 892.5 500709 1170 31.1% 30-Jan-20 1158 649638 148929 29.7% 90 121%
PI Industries 01-Nov-19 350 1432.4 501323 1613 12.6% 07-Feb-20 1612 564109 62787 12.5% 98 47%
Procter & Gamble Hygiene
01-Nov-19 40 12324.6 492982 14078 14.2%
HDFC Bank 01-Oct-19 405 1235.1 500212 1395 12.9%
Indian Hotels 01-Oct-19 3130 159.9 500595 179 11.9%
Siemens 01-Oct-19 330 1549 511213 1680 8.4% 23-Oct-19 1689 557420 46207 9.0% 22 150%
Gujarat Gas 01-Sep-19 2800 179 501501 200 11.7% 30-Oct-19 200 560000 58499 11.7% 59 72%
Hindustan Unilever 01-Sep-19 265 1888 500371 1975 4.6% 20-Sep-19 1957 518507 18136 3.6% 19 70%
Divi’s Lab 01-Aug-19 305 1636 498882 1750 7.0% 22-Oct-19 1757 535885 37003 7.4% 82 33%
ICICI Bank 01-Aug-19 1175 426 500234 473 11.1% 25-Oct-19 468 550206 49972 10.0% 85 43%
City Union Bank 01-Jul-19 2410 208 500935 254 22.2% 16-Jan-20 248 597005 96070 19.2% 199 35%
Reliance Nippon Life 01-Jul-19 2250 222 499773 265 19.3% 27-Aug-19 258 579510 79737 16.0% 57 102%
Sanofi India 01-Jul-19 87 5740 499387 6775 18.0% 29-Oct-19 6678 581029 81641 16.3% 120 50%
Asian Paints 01-Jun-19 346 1445 499797 1560 8.0% 02-Aug-19 1549 535985 36188 7.2% 62 43%
Axis Bank 01-Jun-19 614 812 498614 905 11.4%
Honeywell Automation 01-Jun-19 19 26087 495655 30195 15.7% 25-Oct-19 29105 552999 57344 11.6% 146 29%
MCX 01-May-19 575 868 499354 1005 15.7% 30-Aug-19 971 558147 58793 11.8% 121 36%
TCS 01-May-19 220 2259 496953 2490 10.2%
Monthly Insight Recommendation Performance Sheet

27 March 2020INSIGHT
Script Buying Date
QTY BoughtRate
Value TargetPrice
TargetReturn
Booked on BookedPrice
Value till date
Profit Return Holding Days
Annu-alised
Return
Crompton Greaves Cons. 01-Apr-19 2138 234 501153 256 9.2% 20-Sep-19 251 536681 35528 7.1% 172 15%
Equitas Holdings 01-Apr-19 3637 138 500875 191 38.7%
Page Industries 01-Apr-19 20 25219 504373 29080 15.3% 14-Aug-19 17525 350506 -153867 -30.5% 135 -82%
ITC 01-Mar-19 1800 278 500089 319 14.8%
Tech Mahindra 01-Mar-19 605 824 498456 960 16.5%
HDFC Bank 01-Feb-19 240 2101 504338 1204 -42.7% 20-May-19 2403 576686 72348 14.3% 108 48%
Pfizer 01-Feb-19 163 3066 499703 3490 13.8% 20-Sep-19 3389 552433 52730 10.6% 231 17%
Abbott India 01-Jan-19 65 7593 493527 8580 13.0% 11-Jun-19 8566 556790 63263 12.8% 161 29%
Indraprastha Gas 01-Jan-19 1850 273 504362 315 15.5% 08-Apr-19 314 581748 77386 15.3% 97 58%
United Spirits 01-Jan-19 800 623 498624 735 17.9% 14-Feb-20 711 568576 69952 14.0% 409 13%
Berger Paints 01-Dec-18 1567 319 499873 369 15.7% 29-Aug-19 369 578223 78350 15.7% 271 21%
Cummins India 01-Dec-18 644 776 499744 889 14.6% 16-Jan-19 889 572516 72772 14.6% 46 116%
Dabur India 01-Nov-18 1299 385 500115 470 22.1% 20-Sep-19 470 610530 110415 22.1% 323 25%
Nestlé India 01-Nov-18 52 9680 503360 11370 17.5% 10-Jan-19 11370 591240 87880 17.5% 70 91%
Dr. Lal PathLabs 01-Oct-18 524 954 499896 1125 17.9% 06-Feb-19 1125 589500 89604 17.9% 128 51%
Godrej Consumer 01-Oct-18 651 768 499968 910 18.5%
ABB India 01-Sep-18 378 1322 499716 1510 14.2% 14-Sep-18 1510 570780 71064 14.2% 13 399%
Bharat Forge 01-Sep-18 752 665 500080 752 13.1% 15-Mar-19 548 412284 -87796 -17.6% 195 -33%
Whirlpool of India 01-Sep-18 279 1795 500805 2033 13.3% 09-Oct-19 2033 567207 66402 13.3% 403 12%
Cipla 01-Aug-18 800 625 500000 715 14.4%
Marico 01-Aug-18 1425 351 500175 408 16.2% 25-Sep-19 404 575700 75525 15.1% 420 13%
Dishman Carbogen 01-Jul-18 1916 261 500076 307 17.6% 03-Sep-18 307 588212 88136 17.6% 64 101%
Procter & Gamble Hygiene
01-Jul-18 51 9900 504900 11100 12.1% 17-Jul-18 11100 566100 61200 12.1% 16 277%
Bata India 01-Jun-18 654 764 499656 890 16.5% 23-Jul-18 890 582060 82404 16.5% 52 116%
CESC 01-Jun-18 624 802 500348 1020 27.2%
Nestle India 01-Jun-18 53 9519 504507 10900 14.5% 01-Aug-18 10900 577700 73193 14.5% 61 87%
ITC 01-May-18 1786 280 500080 324 15.7% 03-Sep-19 323 576789 76709 15.3% 490 11%
Tata Chemical 01-May-18 656 762 499872 890 16.8%
Voltas 01-Apr-18 806 620 499720 720 16.1% 24-Oct-19 720 580320 80600 16.1% 571 10%
Britannia Industries 01-Mar-18 202 2480 500960 2845 14.7% 23-May-18 2845 574690 73730 14.7% 83 65%
Infosys 01-Mar-18 876 571 500196 667 16.8% 03-Jul-18 667 584292 84096 16.8% 124 49%
Godrej Consumer 01-Feb-18 714 701 500276 804 14.7% 27-Jun-18 804 574056 73780 14.7% 146 37%
Power Grid 01-Feb-18 2604 192 499968 223 16.1% 01-Aug-19 216 563115 63147 12.6% 546 8%
Maharshtra Seamless 01-Jan-18 990 505 499950 585 15.8% 09-Jan-19 483 478170 -21780 -4.4% 373 -4%
Solar Industries 01-Jan-18 423 1182 499986 1480 25.2%
Hindustan Copper 01-Dec-17 5263 95 499985 116 22.1% 30-May-18 76 399988 -99997 -20.0% 180 -41%
Petronet LNG 01-Dec-17 1992 251 499992 297 18.3% 23-Sep-19 297 591624 91632 18.3% 661 10%
Indian Hotels Co. 01-Nov-17 4673 107 500011 127 18.7% 04-Jan-18 127 593471 93460 18.7% 64 107%
KNR Constructions 01-Nov-17 2008 249 499992 297 19.3% 21-Dec-17 297 596376 96384 19.3% 50 141%
CDSL 01-Oct-17 1471 340 500140 424 24.7% 16-Mar-18 302 444242 -55898 -11.2% 166 -25%
Karur Vysya 01-Oct-17 4005 125 500053 145 15.8% 17-Aug-18 100 400500 -99553 -19.9% 320 -23%
Hindustan Unilever 01-Sep-17 411 1217 500187 1379 13.3% 18-Jan-18 1379 566769 66582 13.3% 139 35%
NMDC 01-Sep-17 3968 126 499968 142 12.7% 01-Jan-18 142 563456 63488 12.7% 122 38%
Indraprastha Gas 01-Aug-17 2137 234 500058 280 19.7% 11-Sep-17 280 598360 98302 19.7% 41 175%
Kaveri Seed 01-Aug-17 732 683 499956 790 15.7% 24-Dec-18 580 424560 -75396 -15.1% 510 -11%
Apollo Tyres 01-Jul-17 2083 240 499920 278 15.8% 07-Aug-17 278 579074 79154 15.8% 37 156%

28March 2020 INSIGHT
Script Buying Date
QTY BoughtRate
Value TargetPrice
TargetReturn
Booked on BookedPrice
Value till date
Profit Return Holding Days
Annu-alised
Return
Greaves Cotton 01-Jul-17 3145 159 500055 193 21.4% 26-Jun-18 140 440300 -59755 -11.9% 360 -12%
Bosch 01-Jun-17 21 23325 489825 27442 17.7% 18-Sep-18 21000 441000 -48825 -10.0% 474 -8%
Relaxo Footwears 01-Jun-17 2183 229 499907 286 24.7% 01-Nov-17 286 623247 123340 24.7% 153 59%
PI Industries 01-May-17 577 866 499682 1028 18.7% 09-Jan-18 1028 593156 93474 18.7% 253 27%
PNC Infratech 01-May-17 3226 155 500030 200 29.0% 26-Oct-17 200 645200 145170 29.0% 178 60%
Akzo Nobel 01-Apr-17 269 1862 500878 2135 14.7% 28-Dec-18 1680 451920 -48958 -9.8% 636 -6%
Crompton Greaves 01-Apr-17 2370 211 500070 244 15.6% 16-May-17 244 578280 78210 15.6% 45 127%
Deepak Nitrite 01-Mar-17 4673 107 500011 124 15.9% 02-Mar-17 124 579452 79441 15.9% 1 5799%
Manappuram Finance 01-Mar-17 5263 95 499985 120 26.3% 22-Dec-17 120 631560 131575 26.3% 296 32%
CESC 01-Feb-17 855 585 500175 671 14.7% 13-Feb-17 671 573534 73359 14.7% 12 446%
Dewan Housing 01-Feb-17 1724 290 499960 341 17.6% 14-Mar-17 341 587884 87924 17.6% 41 157%
Persistent Systems 01-Jan-17 812 616 500192 741 20.3% 09-Jan-18 741 601692 101500 20.3% 373 20%
Berger Paints 01-Dec-16 2083 240 499920 280 16.7% 25-Oct-17 280 583240 83320 16.7% 328 19%
Britannia Industries 01-Dec-16 332 1505 499660 1761 17.0% 26-Apr-17 1761 584652 84992 17.0% 146 43%
Dishman Pharma 01-Dec-16 2058 243 500094 300 23.5% 29-Mar-17 300 617400 117306 23.5% 118 73%
Max Financial Services 01-Nov-16 909 550 499950 650 18.2% 07-Apr-17 650 590850 90900 18.2% 157 42%
Minda Industries 01-Nov-16 4274 117 500058 151 29.1% 21-Apr-17 151 645374 145316 29.1% 171 62%
Natco Pharma 01-Nov-16 870 575 500250 737 28.2% 06-Feb-17 737 641190 140940 28.2% 97 106%
Vindhya Telelinks 01-Nov-16 693 722 500346 900 24.7% 05-Jul-17 900 623700 123354 24.7% 246 37%
Credit Analysis 01-Oct-16 381 1314 500634 1543 17.4% 10-Oct-16 1543 587883 87249 17.4% 9 707%
Nilkamal 01-Oct-16 374 1336 499664 1700 27.2% 17-Oct-16 1700 635800 136136 27.2% 16 622%
IDFC Bank 01-Sep-16 9025 55 499985 70 26.4% 22-Sep-16 70 631750 131765 26.4% 21 458%
Kirloskar Ferrous 01-Sep-16 5814 86 500004 113 31.4% 10-Apr-17 113 656982 156978 31.4% 221 52%
Mahanagar Gas 01-Sep-16 780 641 499980 748 16.7% 17-Oct-16 748 583440 83460 16.7% 46 132%
Mercator 01-Sep-16 9615 52 499980 71 36.5% 05-Jan-18 44 418253 -81728 -16.3% 491 -12%
Federal Bank 01-Aug-16 7692 65 499980 78 20.0% 25-Oct-16 78 599976 99996 20.0% 85 86%
Indian Oil Corp. 01-Aug-16 3683 136 499967 155 14.2% 05-Oct-16 155 570865 70898 14.2% 65 80%
LIC Housing Finance 01-Aug-16 963 519 499797 608 17.1% 19-Oct-16 608 585504 85707 17.1% 79 79%
Unichem Lab 01-Aug-16 1754 285 499890 360 26.3% 09-Jan-18 360 631440 131550 26.3% 526 18%
Aarti Industries 01-Jul-16 962 520 500240 620 19.2% 30-Aug-16 620 596440 96200 19.2% 60 117%
Capital First 01-Jul-16 12478 40 500018 47 16.7% 20-Jul-16 47 583504 83486 16.7% 19 321%
Godrej Properties 01-Jul-16 1370 365 500050 415 13.7% 05-Apr-17 415 568550 68500 13.7% 278 18%
Steel Strips Wheels 01-Jul-16 1096 456 499776 578 26.8% 25-Aug-16 578 633488 133712 26.8% 55 178%
Dabur India 01-Jun-16 1724 290 499960 335 15.5% 01-Nov-17 335 577540 77580 15.5% 518 11%
Glenmark Pharma 01-Jun-16 588 851 500388 985 15.7% 01-Nov-16 985 579180 78792 15.7% 153 38%
Godrej Consumer 01-Jun-16 1013 494 500084 583 18.2% 22-Feb-17 583 590917 90832 18.2% 266 25%
Tata Power Co 01-Jun-16 6849 73 499977 85 16.4% 17-Feb-17 85 582165 82188 16.4% 261 23%
DCM Shriram 01-May-16 3185 157 500045 195 24.2% 27-May-16 195 621075 121030 24.2% 26 340%
Mahindra & Mahindra 01-May-16 752 665 500080 775 16.5% 20-Dec-17 775 582800 82720 16.5% 598 10%
PI Industries 01-May-16 787 635 499745 760 19.7% 27-Jul-16 760 598120 98375 19.7% 87 83%
ACC 01-Apr-16 365 1370 500050 1580 15.3% 27-Jun-16 1580 576700 76650 15.3% 87 64%
VA Tech Wabag 01-Apr-16 1931 259 500129 345 33.2% 24-Mar-17 345 666195 166066 33.2% 357 34%
Whirlpool India 01-Apr-16 735 680 499800 810 19.1% 07-Jun-16 810 595350 95550 19.1% 67 104%
Marico 01-Mar-16 2119 236 500084 280 18.6% 15-Jul-16 280 593320 93236 18.6% 136 50%
NTPC 01-Mar-16 4762 105 500010 123 17.5% 03-Jun-16 123 587313 87303 17.5% 94 68%
HCL Tech 01-Feb-16 577 866 499682 1020 17.8% 25-Jan-18 1020 588540 88858 17.8% 724 9%

29 March 2020INSIGHT
Script Buying Date
QTY BoughtRate
Value TargetPrice
TargetReturn
Booked on BookedPrice
Value till date
Profit Return Holding Days
Annu-alised
Return
HDFC 01-Feb-16 424 1180 500320 1400 18.6% 29-Jul-16 1400 593600 93280 18.6% 179 38%
Hero MotoCorp 01-Feb-16 195 2562 499590 2820 10.1% 02-Mar-16 2820 549900 50310 10.1% 30 123%
Indraprastha Gas 01-Jan-16 4762 105 500010 125 18.9% 29-Jun-16 125 594298 94288 18.9% 180 38%
Pidilite Ind. 01-Jan-16 907 551 499757 656 19.1% 20-May-16 656 594992 95235 19.1% 140 50%
SH Kelkar 01-Jan-16 2000 250 500000 310 24.0% 22-Aug-16 310 620000 120000 24.0% 234 37%
Texmaco Rail 01-Jan-16 3311 151 499961 183 21.2% 23-Nov-17 110 364210 -135751 -27.2% 692 -14%
Garware Wall Ropes 01-Dec-15 1289 388 500132 488 25.8% 09-Aug-16 488 629032 128900 25.8% 252 37%
Sanofi India 01-Dec-15 116 4300 498800 5060 17.7% 01-Mar-18 5060 586960 88160 17.7% 821 8%
Wabco India 01-Dec-15 80 6280 502400 7200 14.6% 28-Nov-17 7200 576000 73600 14.6% 728 7%
GP Petroleums 01-Nov-15 7463 67 500021 156 132.8% 07-Feb-17 95 708985 208964 41.8% 464 33%
HCC 01-Nov-15 28652 17 500007 29 65.4% 03-Jan-17 29 826909 326902 65.4% 429 56%
Inox Wind 01-Nov-15 1259 397 499823 500 25.9% 19-Oct-16 225 283275 -216548 -43.3% 353 -45%
Sterlite Tech 01-Nov-15 6993 72 500000 107 50.1% 20-Oct-16 107 750349 250349 50.1% 354 52%
Castrol India 01-Oct-15 2309 217 499899 255 17.8% 10-Jul-17 195 450255 -49644 -9.9% 648 -6%
Syngene Int 01-Oct-15 3115 161 499958 193 19.9% 21-Oct-15 193 599638 99680 19.9% 20 364%
Zee Ent. 01-Oct-15 1282 390 499980 464 19.0% 07-Jun-16 464 594848 94868 19.0% 250 28%
Berger Paints 01-Sep-15 3365 149 499943 176 18.8% 22-Dec-15 176 593682 93739 18.8% 112 61%
Ceat 01-Sep-15 463 1080 500040 1245 15.3% 10-Sep-15 1245 576435 76395 15.3% 9 620%
Cummins India 01-Aug-15 520 962 500240 1130 17.5% 06-Aug-15 1130 587600 87360 17.5% 5 1275%
Greenply Ind. 01-Aug-15 3281 152 500041 183 20.1% 12-May-16 183 600584 100543 20.1% 285 26%
SQS India BFSI 01-Aug-15 735 680 499800 863 26.9% 23-Nov-15 863 634305 134505 26.9% 114 86%
TIME Technoplast 01-Aug-15 7576 66 500016 81 22.7% 22-Aug-16 81 613656 113640 22.7% 387 21%
Asian Paints 01-Jul-15 658 760 500080 883 16.2% 31-Jul-15 883 581014 80934 16.2% 30 197%
Idea Cellular 01-Jul-15 4762 105 500010 122 16.2% 20-Dec-17 60 285720 -214290 -42.9% 903 -17%
Maruti Suzuki 01-Jun-15 132 3774 498168 4367 15.7% 04-Aug-15 4367 576444 78276 15.7% 64 90%
Whirlpool India 01-Jun-15 658 760 500080 879 15.7% 13-Jul-16 879 578382 78302 15.7% 408 14%
Sun pharma 01-May-15 541 925 500425 1220 31.9% 19-Aug-16 790 427390 -73035 -14.6% 476 -11%
Tata Global 01-May-15 3546 141 499986 174 23.4% 12-Jul-17 174 617004 117018 23.4% 803 11%
Tata Motors 01-May-15 971 515 500065 615 19.4% 20-Jul-16 490 475790 -24275 -4.9% 446 -4%
Ultratech 01-May-15 187 2680 501160 3300 23.1% 13-Apr-16 3300 617100 115940 23.1% 348 24%
Abbott India 01-Apr-15 124 4020 498480 4680 16.4% 04-Aug-15 4680 580320 81840 16.4% 125 48%
Elantas Beck India 01-Apr-15 442 1130 499460 1320 16.8% 29-Jul-15 1320 583440 83980 16.8% 119 52%
Strides Arcolab 01-Apr-15 434 1153 500402 1340 16.2% 10-Aug-15 1340 581560 81158 16.2% 131 45%
BEML 01-Mar-15 511 978 499758 1200 22.7% 09-Apr-15 1200 613200 113442 22.7% 39 212%
MCX 01-Mar-15 425 1177 500225 1552 31.9% 22-May-17 970 412250 -87975 -17.6% 813 -8%
Rolta 01-Mar-15 2618 191 500038 250 30.9% 26-Dec-16 61 159698 -340340 -68.1% 666 -37%
Amrutanjan Health 01-Feb-15 2227 225 499962 325 44.8% 17-Apr-17 325 723775 223814 44.8% 806 20%
HBL Power 01-Feb-15 14327 35 500012 55 57.6% 20-Feb-15 55 787985 287973 57.6% 19 1106%
Mangalam Cement 01-Feb-15 1558 321 500118 432 34.6% 16-Jan-18 432 673056 172938 34.6% 1080 12%
SML Isuzu 01-Feb-15 511 979 500269 1222 24.8% 10-Mar-15 1222 624442 124173 24.8% 37 245%
Dewan Housing 01-Jan-15 2519 199 500022 240 20.9% 15-Jan-15 240 604560 104539 20.9% 14 545%
Emami 01-Jan-15 1277 392 499946 462 18.0% 28-Jan-15 462 589974 90029 18.0% 27 243%
Torrent Pharm 01-Jan-15 456 1096 499776 1338 22.1% 18-Jun-15 1338 610128 110352 22.1% 168 48%

30March 2020 INSIGHT
Phillips Carbon Black Ltd.
MANAGEMENT MEET NOTE
Meeting pointers Phillips Carbon Black ltd (PCBL) is a part of RPG Group
and largest carbon black manufacturers in India by capacity and 7th largest carbon black company globally.
Company aims to be 6th largest in the World by 2023 after commissioning of its upcoming projects (32,000 mtpa of specialty carbon black and 1,50,000 mtpa of Carbon black).
Revenue mix: Domestic accounts 70% of total revenue and export contributes 30%.
PCBL is the largest carbon black exporter from India with presence in 37 countries.
Industry application1. 73% of carbon black globally is used in tyres.
2. 20% is used in other rubber products
3. Remaining 7% is specialty carbon black used in non-rubber applications such as automotive, plastics, inks dyes, pigments etc.
Company has 60+ grades of carbon black products in its portfolio.
It operates through 4 manufacturing plants in India and each plant has captive power plant.
Of the total power generated, company used 40% captive and 60% it sales to external. In West Bengal it sells power to its group company CESC.
Power accounts nearly 5% of total turnover, while rest 95% come from Carbon black segment.
Profit from power segment is tax exempted, thus PCBL’s total tax rate is lower at 24-25%.
Its power units will enjoy 3 more years of tax holidays.
Its existing carbon black capacity of 5.71 lakh tone is running at 85% utilization rate.
3 years back company has done debottlenecking their existing plants, then went for brownfield expansion, and are now planning on greenfield expansion.
In Palej, Gujarat, company has set up 32,000 mtpa specialty carbon black facility which will be commissioned on Q2FY21.
PCBL is also planning for greenfield expansions of 150,000 mtpa of carbon black plant in other parts of coun-try which is expected to be commercialized by 2022-23.
Company InformationBSE Code 506590NSE Code PHILIPCARBBloomberg Code PHCB INISIN INE602A01023Market Cap (Rs. Cr) 1,963.8 Sector Carbon BlackPromoter Holding 53.56%Outstanding shares (Cr) 17.23 52-wk Hi/Lo (Rs.) 184.4/105.8Avg. daily volume (1yr. on NSE) 854,400 Face Value (Rs.) 2Book Value (Rs) 106.9

31 March 2020INSIGHT
Company will incur a capital outlay of Rs 600 crore for new projects of which Rs 500 crore will be invested in first 2 years and balance in 3rd year.
For FY19 total gross debt in balance sheet was Rs 790 crore and for FY20, company will end up with total gross debt in range between Rs 500-600 crore.
Company has the ability to generate adequate cash flows which help it in keeping gearing ratio at very comfort level at 0.3x - 0.4x.
In order to insulate from domestic auto slowdown, company is focusing on export market and increasing its market share in existing market. Company’s long-term plan for geographical revenue mix to be 60% domestic and 40% export (existing 70% domestic and 30% export).
Ongoing auto slowdown impact the overall demand of carbon black. The impact is visible from slowdown and management is moderating the strategies according to the situation. Thus, to mitigate the risk company is focusing on export market and intent to increase market share in other markets.
As per management, domestic auto sector is already bottomed out and not much decline in demand is expected from current level. Time should be given to economy to stabilize after massive disruption from demonetization and GST roll out.
Company’s group company Ceat ltd accounts nearly 10-12% of its total production. PCBL maintains arm’s length distance with Ceat tyre.
Anti-dumping duty on carbon black from China will expire on November 2020. Company will approach to the administration for the extension of anti-dumping duty so to avoid unfair trade and very much optimistic that concerned department is likely to impose the duty again on imports from China and Russia.
As per management, company doesn’t depend on anti-dumping duty as they need to be efficient so that company can compete with other players globally.
Currently the anti-dumping duty is USD 400 per tonne.
Company is focusing on moving up to the value chain and producing more value-added products where the margins are comparatively higher and also to mitigate the competition from China & Russia.
Current carbon black demand in domestic market is nearly 1.1 million tonne and other players like Himadri Chemicals are adding capacity to meet up the demand.
In domestic market, MRF, JK Tyre, Apollo tyre, Ceat, etc are the key clients for PCBL.
Globally auto is a large-scale industry with market size of around USD 2 trillion dollar. Tyre industry demand is mainly coming from replacement market which is very huge.
Auto manufacturers are now shifting their manufactur-ing facilities to Asian countries and Eastern Europe.
PCBL is now totally focused on domestic operations and as per management, if the opportunity comes company will do the acquisition abroad.
Roll out of Electric vehicles will not have much impact on Auto sector. In manufacturing of battery for EV there is a requirement of specialty carbon black as raw mate-rials. PCBL is working to produce that grade of specialty carbon black and is partially achieved.
Tata chemicals recently brought the Silica business from Allied Silica for Rs 123 crore. Silica is a versatile product which find applications in many industries including rubber, oral care, coatings and agrochemicals.
Carbon black and Silica has differ-ent chemical properties & appli-cations and silica will not replace carbon black in their respective industries. Both Silica and Carbon black uses will grow.
China’s Coronavirus impact on business performance China coronavirus impact is big
affecting PCBLs customers. Wuhan in China has the largest carbon black capacity. Toyota has the largest facility in Wuhan.
Hubei in China is the largest prov-ince for manufacturing companies.
China coronavirus issue is hurting
Existing Installed capacity (tonne)
Expansion (tonne) Date of Commercialization
Total installed capacity after expansion (tonne)
Carbon black 571,000 150,000 2022-23 721,000
Specialty Carbon black 40,000 32,000 2QFY21 72,000
China coronavirus impact is big affecting PCBLs customers. Wuhan in China has the largest carbon black capacity. Toyota has the largest facility in Wuhan.

32March 2020 INSIGHT
the supply of other raw materials required for manufac-turing tyres, thereby indirectly affecting PCBL’s demand.
Prolonged plant shutdown in China on wake of coronavirus threat which will disrupt raw mate-rials supply might force tyre makers to undertake production cut in coming months. Thus, it can turn out to be negative for PCBL’s carbon black demand.
Raw materials & Pricing Carbon black feed stock is the main raw material for
manufacturing carbon black and PCBL imports nearly 80-85% of raw material from US.
In past company used Carbon black oil as raw materials and used to import from China when the price was com-mercially viable. Currently the spread between the price of carbon black oil & carbon black feed stock has widened with carbon black feed stock become cheaper.
For tyre manufacturers, carbon black as raw material accounts nearly 13-15% of total raw material costs.
On pricing front, company does the formula-based pricing where any raw materials volatility or higher over-head costs are passed on to its end customers. Pricing is done on quarterly basis and any price change is passed to customer with 1 quarter lag.
So, any benefit received from lower crude oil prices (as its raw material is crude derivatives) is passed on to customers with 1 quarter lag.
Formula based pricing are based on 4 variables
• Raw materials
• Labour cost
• Freight
• Currency fluctuations
Management clarified that there is wrong perception that carbon black is a polluted industry, whereas com-pany is not getting any complain from any plant related to pollution. As per management, there will be no pollution if the plant run efficiently and adhere to the stipulated environmental norms.
Company is successfully running the plant in Kochi which is known to be most sensitive to environmental pollution.
Company is using the waste gas produce in the plant to generate power, which company use it for captive purpose and rest sell to external.
Research & Development In last 2 years company has been investing in R&D cen-
ters and a new R&D center to be ready in next 6 months.
On the research centers, PCBL is focusing on improve-ment of Process and Machine Technology, Yield Improve-ment, Feedstock Efficiency, Customization of Grades and New Product Development.
A new R&D center is opening up in Vadodara, Gujarat with manpower of 25 scientists.
2nd R&D center is coming up in Belgium in next 2 months, with manpower strength of 25 foreign scientists.
Outlook Globally, the demand for carbon black is growing at
4-5% annually.
Management is expecting volume CAGR of 7-8% in next 5 years.
Current Gross margin is around 25-30% which is improving every year.
Management is expecting EBITDA per tonne from Rs 12,000 to improve by 15-20% in next 5 years.
As per management, EBITDA margin is not the right parameter to look into as the margin was never stable due to volatility in raw materials, currency fluctuations and overhead costs.
EBITDA performance is depending on below four variables
• Manufacturing efficiencies
• Input/output ratio
• Widening of product portfolio (60+ grades of product), moving up the value chain and customized products
• Operating leverage.
Company has the ability to generate adequate cash flows and company is utilizing the cash flows in reducing the debt or capital expenditure or either paying dividends to shareholders.
Company is generating RoCE of 17-20%.
FY20 has not been a good year for the company amid slowdown in auto sector and weak demand from other industries.
PCBL is increasing its presence in international market in order to circumvent the domestic auto slowdown. As per management, globally the growth potential for carbon black is immense.
Company’s current cash conversion cycle is around 100 days.
Of total gross debt, Rs 270 crore is long term debt and rest Rs 330 crore is working capital loan.

33 March 2020INSIGHT
Particulars 201903 201803 201703 201603 201503 201403Inc / Exp Performance Gross Sales 3,528.6 2,611.3 2,131.3 2,115.5 2,711.4 2,530.5 Total Income 3,550.5 2,590.7 1,964.6 1,932.0 2,484.4 2,300.0 Total Expenditure 2,914.4 2,185.1 1,687.8 1,750.3 2,319.2 2,253.2 PBIDT 636.1 405.6 276.8 181.7 165.2 46.8 PBT 532.9 303.6 164.7 47.4 12.1 (88.0)PAT 382.7 229.6 68.7 15.9 10.4 (86.9)Cash Profit 449.1 290.1 129.3 78.1 68.7 (32.3)Sources of Funds Equity Paid Up 34.5 34.5 34.5 34.5 34.5 34.5 Net Worth 1,649.9 1,377.6 1,130.7 1,044.8 507.2 501.3 Total Debt 793.4 717.3 758.2 1,021.7 1,219.7 1,086.6 Capital Employed 2,443.3 2,094.9 1,888.9 2,066.6 1,726.9 1,587.9 Application of FundsGross Block 1,742.0 1,575.0 1,505.8 1,478.0 1,325.7 1,306.1 Investments 366.6 320.2 295.3 228.1 85.6 38.2 Cash and Bank balance 115.5 172.6 24.5 51.9 12.9 10.9 Net Current Assets 212.0 (67.2) (183.1) (265.5) (220.2) (142.2)Total Current Liabilities 1,562.8 1,327.0 1,211.5 1,311.9 1,255.1 1,299.2 Total Assets 3,747.2 3,103.4 2,743.5 2,719.9 2,128.7 2,241.6 Cash Flow Cash Flow from Operations 289.9 292.6 346.4 422.0 35.3 (149.5)Cash Flow from Investing activities (277.5) (34.3) (35.9) (121.5) (67.9) (36.3)Cash Flow from Finance activities (70.4) (109.9) (337.1) (261.6) 33.6 122.0 Free Cash flow (4.5) 87.0 198.0 313.0 (98.0) (248.3)Key RatiosDebt to Equity(x) 0.5 0.5 0.7 1.0 2.4 2.2 Current Ratio(x) 1.1 0.9 0.8 0.8 0.8 0.9 ROCE(%) 25.1 17.3 10.9 6.3 6.4 (0.5)RONW(%) 25.3 18.3 6.3 2.1 2.1 (16.0)PBIDTM(%) 18.0 15.5 13.0 8.6 6.1 1.8 PATM(%) 10.8 8.8 3.2 0.8 0.4 (3.4)Market Cues Close Price (Unit Curr.) 176.7 217.5 66.0 19.1 26.2 11.3 Market Capitalization 3,044.4 3,747.7 1,137.4 329.0 451.9 195.3 Adjusted EPS 22.3 13.3 4.0 0.9 0.6 (5.0)CEPS 26.1 16.8 7.5 4.5 4.0 (1.9)Enterprise Value 3,722.3 4,292.4 1,871.1 1,298.9 1,658.8 1,271.0 Valuation Ratios Adjusted PE (x) 7.9 16.4 16.4 20.2 42.4 - PCE(x) 6.8 12.9 8.8 4.2 6.6 (6.0)Price / Book Value(x) 1.8 2.7 1.0 0.3 0.9 0.4 Dividend Yield(%) 2.0 1.1 1.8 2.6 0.8 - EV/Net Sales(x) 1.1 1.7 1.0 0.7 0.7 0.6 EV/EBITDA(x) 5.9 10.6 6.8 7.1 10.0 27.2 M Cap / Sales 0.9 1.5 0.6 0.2 0.2 0.1
Source: ACE Equity
Fiscal Year to 31 March

34March 2020 INSIGHT
The deadly novel coronavirus (COVID-19) epidemic which has claimed more than 2,762 lives and infected more than 80,000 people worldwide has brought key industries globally to a grinding halt.
Economy review
China, the epicenter of the outbreak, is a major player in the global supply chain accounting for ~11% share of glob-al imports, ~13% in global exports and
accounting for ~20% of global GDP at purchasing power parity. The disruption in global supply chain is inevitable considering that China accounts for 28% of global manufacturing output and is currently the top sup-plier of goods for over 100 countries. For the time being it is widely expected that China’s GDP could decelerate by 1-1.25 percentage point over 2020 due to halting of economic activities in key production centers. In fact, the Chinese authorities have also eased lockdown conditions in Wuhan, the epicenter of the virus in China which alone accounted for 95% of global deaths. However, majority of economists opine that global markets are so far pricing in a scenario which is rather ‘good’ or which is expected to see a quick stabilization of the situation in China with
minimal cases of spreading internationally, particularly in Asian region. However, new reports of escalation in num-ber of cases in South Korea, Italy and Iran are bad news and more importantly the World Health Organization (WHO) is worried with growing number of cases outside China without any clear link to the epicentre of the out-break in China. Besides, the new cases reported in single day in China refuses to stay low and keeps cropping up despite change in counting methodology. Unless the rate of infections slowdown somewhere within this month, the slowdown in China could linger for more than one quarter. To support economy, China will have to provide support through both fiscal and monetary policies. People’s Bank of China (PBOC) has already injected through various chan-nels together with lowering interest rates. The economists also expect the government to open fiscal taps as well and accelerate issuance of local government special bonds, and the central government fiscal deficit will also widen as
ECONOMY REVIEW

35 March 2020INSIGHT
needed to ensure the economy gets back on track. This exercise however comes at a cost and will raise debt ratios of Chinese firms and detrimen-tal to the asset quality for Chinese banks as well. The global economic growth is hampered as well since China has become a critical driver of global economic growth. According to Rabobank research, sensitivity of the world economy to China’s growth rate was 0.17 between the 1980s and 2000, which has almost tripled to 0.47 in the last 15 years. As for India is concerned, it certainly cannot escape unscathed, however so far has been largely immune to the partial shutdown in China. Although, in the event of a pro-longed shutdown it would have signif-icant impact on sectors ranging from automobiles, pharmaceuticals, chemi-cals, consumer durables, metals, oil & gas, solar power and IT sector as well. India has a higher import dependence on China since 14% of India’s total imports are from China. Industries such as Electrical machinery, Organic chemicals, machinery & mechanical appliances, plastics, optical & surgical instruments have heavy dependence on Chinese imports. At the same time India has lower export dependency on China since only 5% of Indian exports go to China.
Krishnamurthy Subramanian, the chief economic adviser of India in an interview has opined that the virus poses risks to a nascent recovery in India. According to him “There are some green shoots, but I would be cautious-ly optimistic.” He further added that “There are known unknowns and unknown unknowns. It’s hard to model unknown unknowns.” The Finance Minister has also con-veyed that steps would be taken to address the shortage of raw materials for the affected sectors which sources raw materials from China. According to an analysis by
the Confederation of Indian Industry (CII), submitted to the Centre, China supplies 43% of India’s imports of the top 20 goods, that India buys from the coronavirus-affected country, in-cluding mobile handsets ($7.2 billion import from China), computers ($3 billion), integrated circuits, and other inputs ($7.5 billion), fertilisers ($1.5 billion), APIs ($1.4 billion) and antibi-otics ($1.1 billion). Industry represen-tatives have requested to the finance minister for reduction in customs duties if raw materials like active pharmaceutical ingredients (APIs) were to be airlifted to India. How-ever, Finance minister has assured that measures would be announced “soon”, after consultations with the Prime Minister’s Office. Question remains as how big an impact would the COVID-19 have on the already ailing economic growth and on the rising inflation levels in India? The Monetary Policy Committee (MPC) of RBI on 6th February 2020 kept the policy repo rate under the liquidity adjustment facility (LAF) unchanged
at 5.15% and also decided to continue with the accommo-dative stance as long as it is necessary to revive growth, while ensuring that inflation remains within the target. GDP growth for H1FY21 has been trimmed and expected to be in the range of 5.5-6% from 5.9-6.3% from December 2019 policy. Although, the RBI has mentioned of negative implications from tourist arrivals and global trade from breakout of the coronavirus, nothing adverse has been mentioned in the RBI MPC minutes whether be it to-wards economic growth or inflation. The IMF has however stated its view that the coronavirus poses risks to a fragile global economic recovery. RBI has mentioned in its MPC minutes that “on the verge of the coronavirus outbreak, growth in the Economic Cycle Research Institute’s (ECRI’s) 21-Country Long Leading Index, a harbinger of global economic activity, entered a mild cyclical upturn consistent with global growth prospects posting patchy progress”. This confirms for a nascent recovery in global industrial growth. RBI further stated that “it is notable that the coronavirus epidemic is not yet tipping global industrial growth into a fresh cyclical downturn. Howev-er, this has to be monitored closely to gauge the possible impact of the epidemic on global growth”. Dr. Janak Raj, one of the members of MPC is of the view that rising input costs has led to higher output prices, despite limited pass-through from corporates. However, global com-modity prices, especially of crude oil and metals declined sharply towards end-January in anticipation of slowdown in global demand due to the outbreak of coronavirus. This may help mitigate some of the input price pressures wit-
Top five imports from China (%) for FY19
Note: as % of India’s imports from ChinaSource: Department of Commerce
3%
4%
12%
19%
29%
Fertilizers
Plastics
Organic chemicals
Machginery & mechanical appliances
Electrical machinery
India has a higher import dependence on China since 14% of India’s total imports are from China. Industries such as Electrical machinery, Organic chemicals, machinery & mechanical appliances, plastics, optical & surgical instruments have heavy dependence on Chinese imports.

36March 2020 INSIGHT
nessed in the recent period, feels Dr. Raj. However, he also feels that if the epidemic prolongs itself and spreads, there will be ramifications for the global economy and its net impact on the Indian economy might be negative even if oil and other global commodity prices decline. Thus, in the interim, India has limited risks from COVID-19 unless contagion spreads to other Asian nations in the form of global pandemic and unless rate of infections fails to decline.
The adverse effect on the Indian economic growth will thus only be quantifiable if the virus persists at this rate of infection for very long. On the current account and particularly on trade front, the reactions will be mixed. For instance, 14% of India’s exports are mineral fuels, mineral oils and products of their distillation together with another ~5% for iron & steel & related articles and 1.6% for aluminium & related articles. Since commodity prices are down since January 2020 particularly for crude related items and metals - aluminium, zinc, steel etc and hence more than 20% of Indian exports will be impacted. Gold prices are however up ~8.6% month on month and will provide some cush-ion to ~12% of Indian exports. Now, for the imports, ~32% of the same are oil imports and will benefit with lower oil prices. However, the advantage ends over there and economists are of the view that for the remaining ~68% of imports whether it be inputs or raw materials, it is ex-pected to be priced higher. More, importantly, out of this 68% imports, 14% is accounted from china alone and is expected to witness higher prices. Thus, considering that the import volumes are not significantly hampered, trade balance is expected to worsen since the benefits of lower oil & related prices will be overshadowed by inflationary impact on 68% of imports.
The CPI inflation in India has recently been led by vegeta-ble inflation and more particularly blamed on to onions, however significant growth can be visible in cereals, puls-es, milk, sugar too. While vegetable prices may be cyclical and may come off, the inflation in other non-vegetable food items is likely to taper-off with a lag. CPI for January 20 stood at 7.6%, impacted by low base and core inflation which also inched higher to 4.1% (due to telecom tariff hike and higher prices in personal care). RBI in its MPC howev-er expects food inflation to soften from the high levels of December 2019 and more pronounced by Q4FY20 as onion prices fall rapidly in response to arrivals of late kharif and rabi harvests. However, expects the recent pick-up in prices of non-vegetable food items, (specifically in milk due to a rise in input costs, and in pulses due to a short-fall in kharif production), to sustain. Overall, RBI expects CPI inflation to scale ~6.5% in Q4FY20, 5.4-5% for H1FY21
and eventually tapering off to 3.2% by Q3FY21, within RBI’s comfort level of 4%. Nearly 35% of the CPI basket will be moved by the global commodity prices, particularly food articles. In fact, international food prices are also on an uptrend and global food inflation stood at 6.99% in Dec 2019, after 5.97% clocked in November 2019. Thus, either way the trend will be the same. However, categories like Household goods and services & Personal care and effects together accounting for ~8% weight in CPI index would be affected by COVID-19 induced increase in prices of articles. Thus, in a way, core inflation could be impacted more than the general price levels as the prices of electronics and consumer durables could increase.
Weights in combined CPI Index (%)Food and beverages 45.86
Pan, tobacco and intoxicants 2.38
Clothing and footwear 6.53
Housing 10.07
Fuel and light 6.84
Miscellaneous 28.31
Household goods and services 3.80
Health 5.89
Transport and communication 8.59
Recreation and amusement 1.68
Education 4.46
Personal care and effects 3.89Source: MOSPI
Price levels in India
Source: RBI, Ashika Research
4.1
7.6
0
2
4
6
8
10 Ja
n-14
Jul-
14
Jan-
15
Jul-
15
Jan-
16
Jul-
16
Jan-
17
Jul-
17
Jan-
18
Jul-
18
Jan-
19
Jul-
19
Jan-
20
Core Inflation (%) CPI Inflation (%)
Overall, RBI expects CPI inflation to scale ~6.5% in Q4FY20, 5.4-5% for H1FY21 and eventually tapering off to 3.2% by Q3FY21, within RBI’s comfort level of 4%.

37 March 2020INSIGHT
While experts are trying to draw references from the SARS-Coronavirus which lasted from November 2002 to July 2003, it would be inadequate since death toll of the COVID-19 has exceeded that of SARS and more importantly uncertainty on its containment prevails. By the time it had run its course, SARS infected 8,098 people and claimed 774 lives in total, a 9.6% mortality rate. In contrast, the coronavirus epidemic isn’t over yet and is expected to have low mortality rate. According to an article in CNN, a U.S.-Canadian team at Laval University in Quebec projects total coronavirus cases “might reach a cumulative 550,000 cases in Wuhan” alone. Sadly, that is the best-case scenario and in worst-case model projects 4.4 million could be infected by the time the epidemic is over. The researchers warn that COVID-19 “almost certainly cannot be contained and we must prepare for a pandemic.” A 2004 paper by two economists published in Asian Economic Papers (MIT Press) estimated the global economic loss to SARS was $40 billion. The article questions if 8,098 SARS infections caused $40 billion in economic losses, how much damage would 550,000 – 4.4 million coronavirus infections cause? Extrapolating with the SARS cases, economic loss for Coronavirus could be $2.7 trillion. Thus, in all probabilities, the economic loss could be higher than ~40 billion and economic impact could be devastating on the Chinese economy. During SARS, PBOC urged banks to guarantee loans to businesses manufacturing and selling equipment and medicines used in the fight against the virus. Besides, funds were made available to sectors such as aviation, retail and tourism, companies and towards healthcare. The PBOC would probably have to prepare for an even bigger scale. Although, the world is unsure whether fresh doses of liquidity from central banks would be adequate anymore.
An article by economists C.P. Chandrasekhar and Jayati Ghosh titled “No Escape from Low Growth” has stressed on the fact that the world economy is already trapped in a low rate of growth particularly for the developed nations. In the European Union, crisis intensified with a delay, taking the form of a sovereign debt crisis and with Germany also now on a decelerated path, the sustenance of an economic revival if at all is questionable. Japan is probably the one developed nation where growth rates have been dismal and close to ‘zero’ levels, all through out after the global financial crisis. After intervention by the Treasury and the Federal Reserve stimulus packages, the U.S economy visibly recovered but only to fall back and stuck in a slow lane in the more recent quarters. And lastly, the global growth concerns have been compounded after the engines of growth, China and India failed to deliver miserably. The authors state that “The perception that these economies were decoupled from the rest of world and would compensate for poor or indifferent performance elsewhere, has turned out to be wrong.” However, it needs to be remembered that China
planned for it when it announced for transition from manufacturing-driven economy to one that is services and consumption-led. In fact, the plans for China have been coming off very well. The slowdown was thus supposed to be smooth and calculated one, however, in between the trade war between US & China just made the smooth path uneven. For India, however, brakes on growth rates have been applied with the implementation of demonetization, followed up by GST. Thus, the formalization of the economy is bound to pass through low rates of growth.
The developed nations in a bid to prop up growth has relied heavily on monetary policy and lowering
Year-on-Year global inflation for major groups/sub-groups (%)Dec-18 Jan-19 Feb-19 Mar-19 Apr-19 May-19 Jun-19 Jul-19 Aug-19 Sep-19 Oct-19 Nov-19 Dec-19
Energy -7.0 -13.2 -3.9 -1.2 -2.0 -10.9 -19.6 -18.4 -22.1 -23.0 -26.8 -8.9 5.9
Non-energy -4.1 -6.7 -6.4 -6.0 -7.5 -9.6 -5.7 -1.6 -4.1 -1.8 -2.4 1.4 3.8
Agriculture -2.6 -3.9 -5.5 -7.6 -9.1 -10.5 -4.7 -3.3 -4.8 -2.0 -1.3 4.2 6.0
Beverages -3.6 -3.7 -6.2 -11.9 -11.4 -12.6 -5.1 -1.7 -2.2 1.6 -1.8 3.6 10.0
Food -2.4 -4.0 -5.9 -8.3 -10.5 -12.3 -5.6 -3.6 -4.5 -1.7 -0.1 6.0 7.0
Raw Materials -2.7 -3.7 -4.3 -3.7 -4.1 -4.4 -1.8 -3.3 -6.7 -4.5 -4.4 -0.3 1.5
Fertilizers 20.6 15.1 9.2 7.7 7.8 9.1 11.1 1.6 -3.4 -10.2 -11.8 -19.4 -18.8
Metals & Minerals -9.6 -14.4 -9.6 -4.0 -5.6 -9.4 -9.7 1.6 -2.7 -0.2 -3.7 -1.7 1.8
Precious Metals -2.5 -4.2 -1.7 -2.8 -4.6 -3.1 3.4 11.8 23.0 26.1 22.4 20.1 17.9Source: Monthly Economic report
By the time it had run its course, SARS infected 8,098 people and claimed 774 lives in total, a 9.6% mortality rate. In contrast, the coronavirus epidemic isn’t over yet and is expected to have low mortality rate.

38March 2020 INSIGHT
interest rates down to near zero and in some cases even negative levels. In addition, developed country central banks opted for “quantitative easing” or large and regular bond purchases that infused liquidity into the economy. The authors argue that surge in easy money and cheap credit would spur debt-financed investment and consumption and raise the rate of growth, although not sustainable for long. That is the case broadly now, as the global growth rates were already weakening before the onset of COVID-19. If the assumptions of researchers come true, then world’s policy makers are in for a monumental challenge. However, reliance on monetary policy has run its course due to mammoth central bank balance sheets and thus revise their policy stance and think out of the blue.
US Quarterly GDP growth (% yoy)
Source: tradingeconomics.com
Quarterly GDP growth (% yoy)
Source: Bloomberg
4
5
6
7
8
9
10
Mar
-14
Jul-1
4
Nov
-14
Mar
-15
Jul-1
5
Nov
-15
Mar
-16
Jul-1
6
Nov
-16
Mar
-17
Jul-1
7
Nov
-17
Mar
-18
Jul-1
8
Nov
-18
Mar
-19
Jul-1
9
China India
EU GDP growth (% yoy)
Source: tradingeconomics.com
0.0% 0.1% 0.2% 0.3% 0.4% 0.5% 0.6% 0.7% 0.8% 0.9%
Mar
-14
Jul-
14
Nov
-14
Mar
-15
Jul-
15
Nov
-15
Mar
-16
Jul-
16
Nov
-16
Mar
-17
Jul-
17
Nov
-17
Mar
-18
Jul-
18
Nov
-18
Mar
-19
Jul-
19
Nov
-19
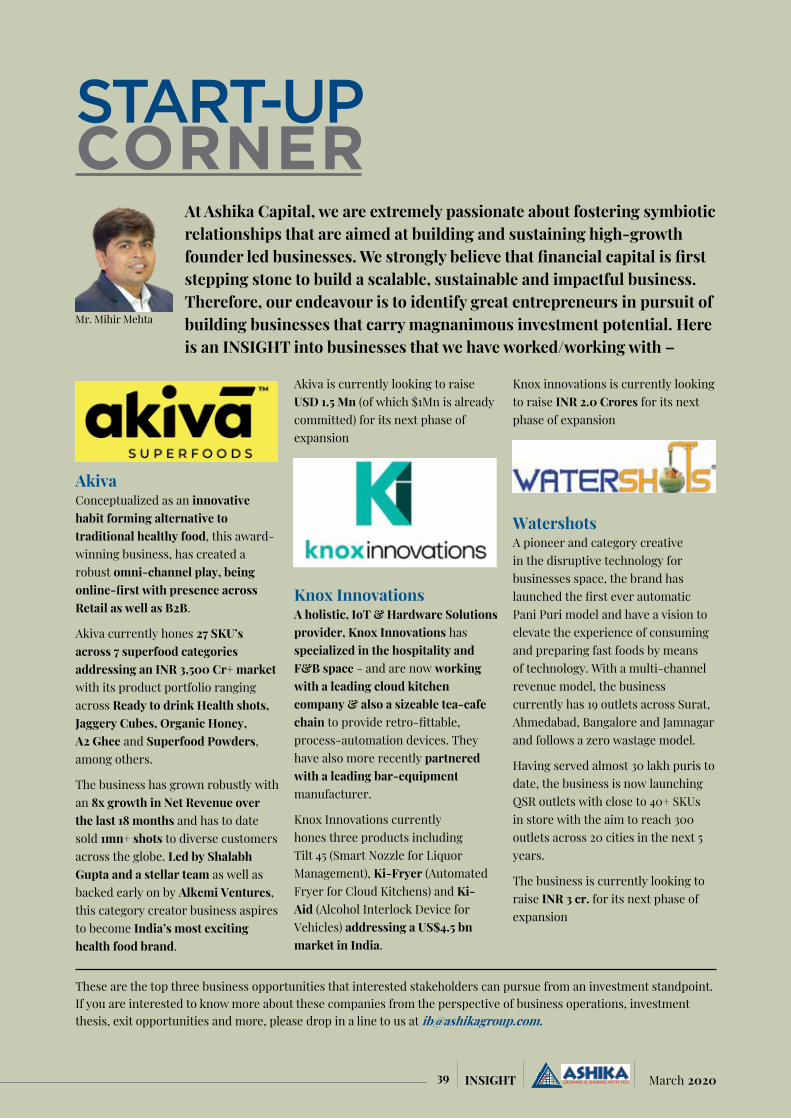
39 March 2020INSIGHT
At Ashika Capital, we are extremely passionate about fostering symbiotic relationships that are aimed at building and sustaining high-growth founder led businesses. We strongly believe that financial capital is first stepping stone to build a scalable, sustainable and impactful business. Therefore, our endeavour is to identify great entrepreneurs in pursuit of building businesses that carry magnanimous investment potential. Here is an INSIGHT into businesses that we have worked/working with –
START-UP CORNER
AkivaConceptualized as an innovative habit forming alternative to traditional healthy food, this award-winning business, has created a robust omni-channel play, being online-first with presence across Retail as well as B2B.
Akiva currently hones 27 SKU’s across 7 superfood categories addressing an INR 3,500 Cr+ market with its product portfolio ranging across Ready to drink Health shots, Jaggery Cubes, Organic Honey, A2 Ghee and Superfood Powders, among others.
The business has grown robustly with an 8x growth in Net Revenue over the last 18 months and has to date sold 1mn+ shots to diverse customers across the globe. Led by Shalabh Gupta and a stellar team as well as backed early on by Alkemi Ventures, this category creator business aspires to become India’s most exciting health food brand.
Akiva is currently looking to raise USD 1.5 Mn (of which $1Mn is already committed) for its next phase of expansion
Knox InnovationsA holistic, IoT & Hardware Solutions provider, Knox Innovations has specialized in the hospitality and F&B space - and are now working with a leading cloud kitchen company & also a sizeable tea-cafe chain to provide retro-fittable, process-automation devices. They have also more recently partnered with a leading bar-equipment manufacturer.
Knox Innovations currently hones three products including Tilt 45 (Smart Nozzle for Liquor Management), Ki-Fryer (Automated Fryer for Cloud Kitchens) and Ki-Aid (Alcohol Interlock Device for Vehicles) addressing a US$4.5 bn market in India.
Knox innovations is currently looking to raise INR 2.0 Crores for its next phase of expansion
WatershotsA pioneer and category creative in the disruptive technology for businesses space, the brand has launched the first ever automatic Pani Puri model and have a vision to elevate the experience of consuming and preparing fast foods by means of technology. With a multi-channel revenue model, the business currently has 19 outlets across Surat, Ahmedabad, Bangalore and Jamnagar and follows a zero wastage model.
Having served almost 30 lakh puris to date, the business is now launching QSR outlets with close to 40+ SKUs in store with the aim to reach 300 outlets across 20 cities in the next 5 years.
The business is currently looking to raise INR 3 cr. for its next phase of expansion
These are the top three business opportunities that interested stakeholders can pursue from an investment standpoint. If you are interested to know more about these companies from the perspective of business operations, investment thesis, exit opportunities and more, please drop in a line to us at [email protected].
Mr. Mihir Mehta

40March 2020 INSIGHT
ChemicalThe coronavirus outbreak in China took a toll on Chinese economy as well as Global economy. The deadly virus surfaced from a fish market of Wuhan city of Hubei province and spread across China and outside the country.
TIME TO GAIN MARKET SHARE ON ACCOUNT OF CORONAVIRUS EPIDEMIC IN CHINA
SECTOR OUTLOOK
Around 77,000 people are infected with death toll of around 2500 people which outpaced total people died in China from the SARS virus in 2003. With this escalating infections, city shutdowns and nationwide transporta-tion halts, the coronavirus epidemic is starting to strain China’s chemical industry. In 2003, China accounted for less than 10% of the global chemical market while in 2018, the share was 36%. Thus, anything happening in China`s chemical industry will have a much bigger impact on global customers and suppliers of Chinese producers of chemicals. The ongoing shutdowns of chemical plants in China, could be an opportunity for Indian chemical play-ers, because of the growing preferences for India as an
alternative reliable supplier of chemicals. Over the years, supply chain disruptions in China due to operational hazards, environmental compliance issues and higher cost of operations have made the case for this likely shift. Around 5-10% business shift to India can actually more than double the opportunity size for many chemical companies. Currently, India’s share in global chemical trade is still around 3%, which is about one fourth the share of China in global trade. The impact of the coronavirus epidemic in China on the chemicals sector could be far reaching, depending on the extent of epidemic reach, the period of plant shutdown in China and restrictions on shipments/logistics.
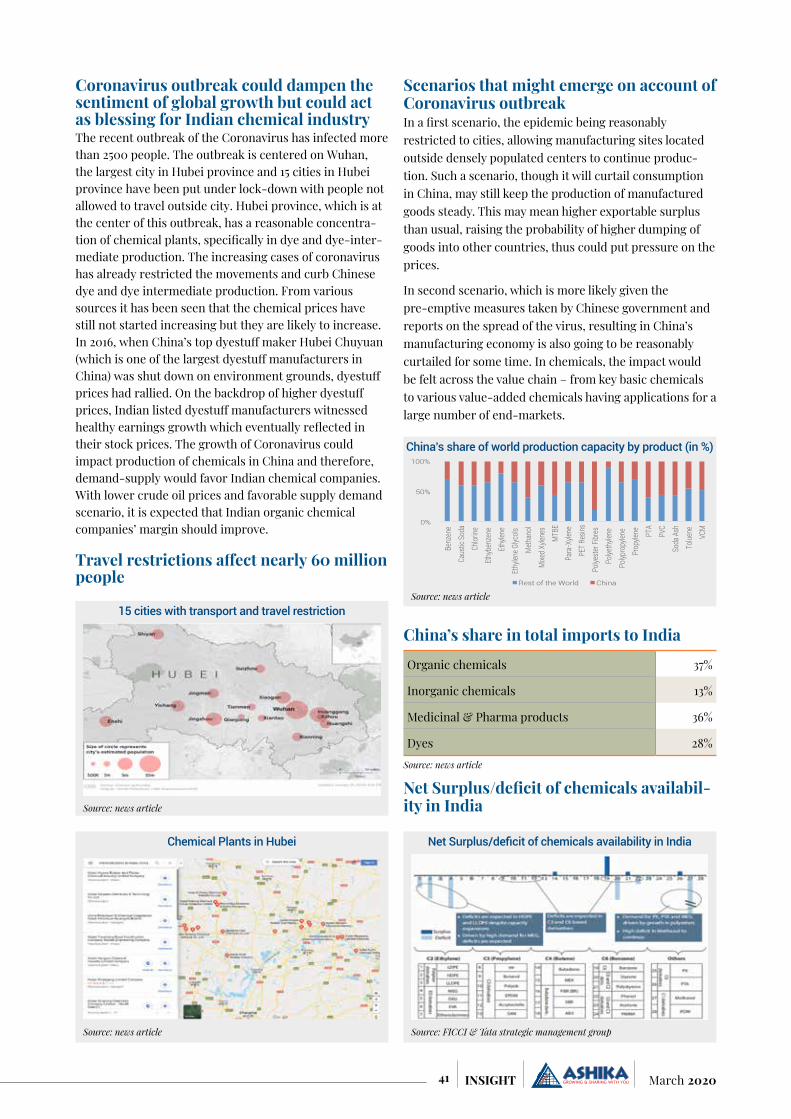
41 March 2020INSIGHT
Coronavirus outbreak could dampen the sentiment of global growth but could act as blessing for Indian chemical industryThe recent outbreak of the Coronavirus has infected more than 2500 people. The outbreak is centered on Wuhan, the largest city in Hubei province and 15 cities in Hubei province have been put under lock-down with people not allowed to travel outside city. Hubei province, which is at the center of this outbreak, has a reasonable concentra-tion of chemical plants, specifically in dye and dye-inter-mediate production. The increasing cases of coronavirus has already restricted the movements and curb Chinese dye and dye intermediate production. From various sources it has been seen that the chemical prices have still not started increasing but they are likely to increase. In 2016, when China’s top dyestuff maker Hubei Chuyuan (which is one of the largest dyestuff manufacturers in China) was shut down on environment grounds, dyestuff prices had rallied. On the backdrop of higher dyestuff prices, Indian listed dyestuff manufacturers witnessed healthy earnings growth which eventually reflected in their stock prices. The growth of Coronavirus could impact production of chemicals in China and therefore, demand-supply would favor Indian chemical companies. With lower crude oil prices and favorable supply demand scenario, it is expected that Indian organic chemical companies’ margin should improve.
Travel restrictions affect nearly 60 million people
Scenarios that might emerge on account of Coronavirus outbreakIn a first scenario, the epidemic being reasonably restricted to cities, allowing manufacturing sites located outside densely populated centers to continue produc-tion. Such a scenario, though it will curtail consumption in China, may still keep the production of manufactured goods steady. This may mean higher exportable surplus than usual, raising the probability of higher dumping of goods into other countries, thus could put pressure on the prices.
In second scenario, which is more likely given the pre-emptive measures taken by Chinese government and reports on the spread of the virus, resulting in China’s manufacturing economy is also going to be reasonably curtailed for some time. In chemicals, the impact would be felt across the value chain – from key basic chemicals to various value-added chemicals having applications for a large number of end-markets.
China’s share in total imports to India
Organic chemicals 37%
Inorganic chemicals 13%
Medicinal & Pharma products 36%
Dyes 28%Source: news article
Net Surplus/deficit of chemicals availabil-ity in India
China’s share of world production capacity by product (in %)
Source: news article
0%
50%
100%
Benz
ene
Caus
tic S
oda
Chlor
ine
Ethy
benz
ene
Ethy
lene
Ethy
lene G
lycols
Met
hano
l
Mixe
d Xyle
nes
MTB
E
Para
-Xyle
ne
PET
Resin
s
Polye
ster
Fibr
es
Polye
thyle
ne
Polyp
ropy
lene
Prop
ylene
PTA
PVC
Soda
Ash
Tolue
ne
VCM
Rest of the World China
15 cities with transport and travel restriction
Source: news article
Chemical Plants in Hubei
Source: news article
Net Surplus/deficit of chemicals availability in India
Source: FICCI & Tata strategic management group

42March 2020 INSIGHT
Below are the few chemical value chains which are likely to be impacted by the Coronavirus epidemicDyes and pigmentsThe dyes and pigments manufacturers in the last few years have been benefitting from the China opportunity as increased compliance norms had led to closure of various chemical manufacturing facilities in China. The current coronavirus problem is likely to have more pronounced effect than the situation few years back when due to environment compliance large players such as Hubei Chuyuan had to shut down facilities. Prices of key dye intermediates H-Acid and Vinyl Sulphone have already increased in the range of 35-50% from average price in Q3FY20. The epicenter of the epidemic Hubei province along with adjacent Henan province contribute 90% of China’s production of Vinyl Sulphone. Most of the plants in these provinces including that of Hubei Chuyuan are already closed. Since globally, India and China are the major suppliers of dye intermediates, some demand may shift from China to India. Most of the Indian dye inter-mediate players such as Bodal Chemicals, Shree Pushkar, Bhageria Industries, Kiri Industries, can benefit from the situation on both the volume and pricing fronts. However, Indian dye manufacturers might not run their capacity at 100% due to shortage of raw materials. About 20-30% of raw materials are sourced from China at the industry level and recent coronavirus epidemic make the prices of key raw materials such as sulphur, aniline, caustic soda and naphthalene volatile, thus posing a sourcing challenge for manufacturers. Indian dye manufacturers which are not backward integrated would find it difficult to survive due to a spike in dye intermediate prices. In India, smaller dye intermediate manufacturers which depend on supply of raw materials from China are likely to close down in case of extended shutdown in China.
Rubber chemicalsChina accounts nearly 70% of the global rubber chemical production, while it only consumes about 33-35% of total produce and rest it exports. Hence, exports are likely to increase as the epidemic curbs consumption in China. Higher imports from China, particularly after discontinuation of antidumping duty on rubber chemi-cals in July 2019 along with the weak domestic end market (Autos, Tyres) in India, impacted both product price realization and volume growth in recent quarters for domestic rubber chemical companies. NOCIL is a company which can be impacted due to coronavirus epidemic. In a scenario of lower imports of rubber chemicals from China in future, can help NOCIL to ramp up its production.
Carbon blackCarbon black which is used as black pigment and rein-forcer for tyres, paints and plastics, imports from China constitute about 10% of domestic demand. Two Indian companies like Himadri Speciality and Phillips Carbon have been undergoing capacity expansion in order to cater to the undersupplied domestic market. However, the recent slowdown in the automobile end market has weighed on volumes sold and realizations. Thus, lower imports from China could provide much needed fillip to domestic carbon black manufacturers.
Graphite electrodesGraphite electrode, particularly non-Ultra High-Power grade, supply from China has been a big concern for Indian electrode companies in FY20. This had led to an adverse supply-demand situation for the domestic industry. China is on course towards a significant ramp up in steel production through the EAF (Electric Arc Furnace) route. To facilitate this, China is reportedly expanding its graphite electrode capacity to 1.5 million tonnes by 2020 compared to 0.9 million tonnes in 2017. The current epidemic in China is likely to lower the dumping of electrodes in India, thus benefiting the domestic graphite electrode manufacturers like HEG & Graphite India. China accounts nearly 50% of total global steel production and exports nearly 10% of its production. Production halt for steel plants in China will result in higher production in other countries which means higher throughput through EAF route, thereby creating incremental demand for graphite electrode. However, persistence weakness in global economy due to epidemic in China could result in lower demand for steel as well as graphite electrodes.
SurfactantsSurfactants companies are relatively immune to imports from China on raw material front. China is the second largest palm oil importing nation in the world importing over 70 lakh tonnes annually. A sudden drop in demand of palm oil has pulled down its prices, which translates into lower prices for palm oil derivative such as lauryl alcohol,
which is utilized by the surfactant industry as a key raw material that makes up 50% of the input cost. This could be a positive catalyst for Galaxy Surfactants.
AminesFor amine manufacturers like Balaji Amines and Alkyl Amines, the China situation can pose a daunting challenge as both the players have a significant exposure to end markets like APIs and agri-chemicals, which are in middle of significant supply chain disruption. Any extension of production shutdown in China to March and beyond may spell trouble for the availability of matching ingre-dients required for the production of
Prices of key dye intermediates H-Acid and Vinyl Sulphone have already increased in the range of 35-50% from average price in Q3FY20.

43 March 2020INSIGHT
respective pharma drug and agri-chemicals.
Some of the chemicals where India’s dependence on China is higher are titanium di-oxide, acetic acid, citric acid, aniline and calcium carbide. Chemicals where total imports are quite substantial compared to domestic production are caustic soda, acetone, phenol, aniline, isopropanol, PVC and nylon.
Raw materials like Vinyl Acetate Monomer, which is key
inputs for adhesives, is mainly imported from China. Thus, companies like Pidilite Industries & Astral Poly are also exposed to raw material price volatility on backdrop of supply disruption in China due to coronavirus out-break. Though, most of the Indian chemical companies have their raw materials inventory requirements covered till April 2020, any shutdown beyond that time could sig-nificantly push up the raw material costs of the company.
Capacity difference between India & ChinaCapacity (mt) India China Times
Phenol 76,750 2,423,000 32
Styrene - 8,265,000 NA
TDI 14,000 870,000 62
Methanol 260,490 76,740,000 295
Acetic Acid 159,620 8,310,000 52
Benzene 1,318,030 16,980,000 13
Cumene 260,000 2,933,000 11
Vinyl acetate monomer - 3,040,000 NA
MDI - 2,970,000 NA
Ethylene oxide 291,300 8,030,000 28
Propylene oxide 36,000 3,042,000 85 Source: news article
Raw material sourcing could be a concernIndia depends on China for chemicals across the value chain with import dependency on China in the range between 10-40%. Due to China lockdown on account of coronavirus outbreak, supply chains are drying up which could have an impact in the next few months. A wide vari-ety of raw material is imported from China and it is not possible to quickly switch around for alternative sources. On cost front, China is also one of the most cost competi-tive, thus there are possibilities of escalating costs. India’s share in global chemical trade by value is 3%. Chemicals form a significant part of the overall trade flow in India and ranks fourth in imports, after mineral fuels and oils, precious stones and metals, and electrical machinery. India imports key raw materials from China for manufac-turing chemicals like deystuff, petrochemical intermedi-aries (Intermediaries like ethylene oxide, propylene oxide, polyols, phenol, acrylic acid, and styrene), etc. Falling shortage of raw materials for manufacturing specialty
Dependence on China for select chemicalsChemicals Installed
capacity (mt)
Domestic production
(mt)
Total net imports
(mt)
Import from
China (mt)
Import from China as a % share
in net imports
Total imports as a % of domestic
production
Caustic Soda 333,594 274,231 261,668 42,357 16% 95%
Calcium Carbide 112,000 87,300 55,187 20,838 38% 63%
Carbon Black 640,000 530,360 63,937 62,465 98% 12%
Titanium di oxide 82,500 57,820 4,141 5,632 136% 7%
Acetic Acid 159,620 157,070 872,295 360,214 41% 555%
Acetone 47,140 32,870 141,824 21,775 15% 431%
Phenol 76,750 53,450 283,822 33,742 12% 531%
Citric Acid NA NA 81,869 83,936 103% NA
Male ic Anhydride NA NA 52,394 4,950 9% NA
Aniline 54,100 41,880 65,254 48,917 75% 156%
Vinyl Acetate Monomer 30,000 - 163,703 30,379 19% NA
Isopropanol 70,000 71,830 99,460 19,320 19% 138%
Polyol 141,630 79,430 195,114 55,190 28% 246%
Nylon-6 28,200 20,560 154,592 15,972 10% 752%
PVC 1,493,000 1,466,080 1,839,634 231,315 13% 125%Source: news article

44March 2020 INSIGHT
chemicals could adversely impact the production of the plants. However, this supply shortage could act as an opportunity to boost manufacturing and increase prices. Many integrated chemical players have already started to witness increased demand from users and simultaneously sharp jump in product prices. Government has also assured to provide all type of supports to boost the domestic manufacturing output in order to overcome the challenges on raw material supply front.
Government interven-tion to deal with supply shortageThe lockdown in parts of China in the wake of the coronavirus outbreak has disrupted the supply of Active Pharmaceutical Ingredients (APIs) for most pharma companies and that is an alarming for domestic drugs manufacturers. Indian pharmaceutical companies import almost 70% of pharmaceutical ingre-dients from China. Domestic pharma industry may still be able to manoeuvre around the supply chain issues if the situation turns more acute. Given the importance of the sector for the society, the government is also expected to provide all kind of support. The government is con-templating ways to encourage domestic manufacturing of APIs to counter a potential shortage of bulk drugs and intermediates amid coronavirus outbreak. A suitable ecosystem with focus on fiscal and procedural support to
pharma companies is being consid-ered by the government. Recently, Niti Aayog Chief executive Amitabh Kant chaired a meeting with the representatives of top drug makers where the point of discussion was to find the ways to reduce imports dependence on China for bulk drugs or intermediates. The idea is to build API production capacity for 58 APIs, for which India is sig-nificantly dependent on China. The list of drugs which were compiled by the drug regulatory authority are antibiotics like azithromycin, amoxicillin, ofloxacin, metronidazole, vitamins such as B12, B1, B6 and E, female hormone progesterone and anti-cardiac arrest drug atorvastatin, among others. As per the industry experts, it is a good development that government is willing to support the
API industry. Indian API industry was ahead of China in the 1990s, but the advantages of free land, low cost utilities such as water, steam, power and negligible financing costs in China changed the dynamics, resulting in China is now way ahead of India. However, domestic APIs manufac-turers are benefiting from supply chain disruption with higher demand and increased prices. Domestic API play-ers like Granules India, Shilpa Medicare, IOL Chemicals & Pharmaceuticals ltd. and Lasa Supergenerics seen their stock prices rallied on the expectation of higher demand owing to coronavirus triggered lockdown in China.
Various Chemical Prices movementChemicals Region Metric CMP* 1 Month 3 Month 1 Year
Acetic Acid Kandla Rs/Kg 30 -11% -16% -17%
Acetone China $/MT 615 3% 21% 40%
Acetone Kandla Rs/Kg 59 17% 52% 39%
Acetonitrile Mumbai Rs/Kg 290 -6% -6% 100%
Acrylic Acid USA USD/MT 1,433 -6% -3% -12%
Acrylonitrile SE Asia $/MT 1,435 -2% -7% -7%
Acrylonitrile Mumbai Rs/Kg 112 7% -7% -7%
Acrylonitrile Butadiene Styrene (ABS) USA cents/Lb 91 0% -4% -1%
Ammonia India USD/MT 300 3% 5% -11%
Benzene China $/MT 745 1% 12% 30%
Benzene Vizag Rs/Kg 53 2% 35% 22%
Bromine China Yuan/MT 30,444 0% 0% -12%
Butadiene (C4H6) SE Asia USD/MT 925 3% -23% -19%
Caprolactam China USD/MT 11,350 4% -9% -16%
Caustic Soda India INR/50 Kgs 1,600 -11% 7% -22%
The government is contemplating ways to encourage domestic manufacturing of APIs to counter a potential shortage of bulk drugs and intermediates amid coronavirus outbreak.

45 March 2020INSIGHT
Chemicals Region Metric CMP* 1 Month 3 Month 1 Year
Caustic Soda Flake Mumbai Rs/Kg 31 -3% -18% -30%
Caustic Soda Lye SE Asia $/MT 300 -4% -5% -9%
Caustic Soda Lye Mumbai Rs/Kg 22 -45% -44% -47%
Chlorine USA USD/MT 231 0% -5% -1%
Chloroform Delhi Rs/Kg 34 -3% -17% -26%
Cumene USA USD/MT 772 0% 1% -16%
DMF (Dimethyleformamide) Mumbai Rs/Kg 62 0% -5% -17%
EDC (Ethylene Dichloride) SE Asia USD/MT 330 10% 16% -24%
Ethanol Mumbai Rs/Kg 54 0% 0% 2%
Ethylene (C2H4) Korea USD/MT 805 11% 1% -24%
Ferro Silicon China USD/MT 1,095 2% 2% -9%
Fluorspar China INR/MT 29,692 -1% -2% -14%
High-Density Polyethylene (HDPE) India USD/MT 880 10% -10% -22%
Low-Density Polyethylene (LDPE) India USD/MT 945 4% -1% -11%
MDI USA USD/MT 4,343 -3% -1% -5%
MEG (Mono Ethyl Glycol) China $/MT 590 3% 9% -5%
MEG (Mono Ethyl Glycol) Mumbai Rs/Kg 47 4% 4% -16%
Methanol China $/MT 254 16% 11% -13%
Methanol Kandla Rs/Kg 22 17% 26% -15%
MMA (Methyl Methacrylate) Kandla Rs/Kg 111 -3% -2% -31%
MTBE (methyl tertiary butyl ether) USA Cents/Gallon
199 -20% 12% 31%
PET (Polyethylene Terephtalate) China Yuan/MT 6,800 4% -5% -21%
Phenol China $/MT 895 10% -1% -14%
Phenol Kandla Rs/Kg 74 0% 6% -24%
Polypropylene (PP) India USD/MT 1,010 3% -8% -11%
Polystyrene India USD/MT 1,210 5% 0% -15%
Propylene (C3H6) China USD/MT 890 10% -9% -11%
PTA (Purified Teraphthalic Acid) Mumbai Rs/Kg 60 -2% 0% -10%
PVC China Yuan/MT 6,825 -1% 2% 7%
Soda Ash Mumbai INR/50 Kgs 1,140 -1% -4% -8%
Styrene India USD/MT 885 1% -10% -15%
Styrene-Butadiene Rubber (SBR) China Yuan/MT 11,440 0% 3% -6%
TDI China Yuan/MT 11,700 4% -9% -21%
Toluene China $/MT 650 -4% 0% 4%
Toluene Kandla Rs/Kg 58 -6% 7% 9%Source: Industry reports; Note: CMP as on end of January 2020
It is believed that India could stand to benefit over the lon-ger term due to the spreading of coronavirus across the world, faltering the global economy, as foreign companies are looking to set up alternative manufacturing base from China to India. However, in short-term, there could be some supply-chain disruptions which the government is expected to provide full support. Over the years, supply chain disruptions in China due to operational hazards, environmental compliance issues and higher cost of operations forced many multinational companies to think about shifting their manufacturing base or sourcing
destinations. Thus, it is expected that a 5-10% business shift to India can actually more than double the oppor-tunity size for many chemical companies. Further, as per Indian Chemical Council (ICC), domestic chemical industry is expected to double its turnover from the cur-rent USD 150 billion to USD 300 billion by 2025, provided the government extends its support to the proposed infrastructure and policy changes. Thus, the domestic chemical companies have immense growth prospects in future to amplify its earnings.

46March 2020 INSIGHT
Q3FY20 turned out to be a moderate quarter for India Inc. on the operational front even as tax cuts aided profit growth. India Inc. earnings have witnessed headwinds given the domestic economic slowdown, liquidity tightness, weak consumer sentiment, slowdown in government spending and lukewarm volume growth across the sectors.
Q3FY20 Result Analysis
RESULT ANALYSIS

47 March 2020INSIGHT
Weakness was seen in auto, metals & energy sector, whereas sectors like
financials, information technology, pharmaceuticals and select consumer companies reported healthy performance. At the aggregate level, large caps continued to outperform midcap and small caps in these challenging times. Despite tax rate benefits, profitability was still muted in the midcap and small cap space. For the listed universe (~3,000 companies), topline de-grew 2.4% YoY while bottomline climbed 36.2% YoY. However, the expectations continues for a strong revival in FY21 given rising farm incomes and lower commodity prices, but headline inflation and uneven growth in industrial output remain a challenge to economic expansion. In the long term, the government’s focus to maintain fiscal prudence (and thereby attract foreign capital to at least partially fund the huge infrastructure development projects) is commendable and would likely result in better times for industrials and building material companies. This would have a positive spill-over effect on the economy and corporate sector. Further, Q1FY21 is expected to see impact of Corona Virus on Indian companies. Indian economy will have far reaching implications of Corona virus as China is India’s largest import partner and accounts for 45% of electronics, 40% chemicals, 33%
machinery and 65-70% API’s and 90% of mobile components. CII estimates that shipping, pharmaceuticals, automobiles, mobiles, electronics, textiles etc. could be impacted if the virus impact is prolonged.
Most Nifty 50 companies either met or surpassed estimates in the October-December earnings
season. Operating income of nearly half of the Nifty 50 constituents met estimates and around a third surpassed analyst expectations, data compiled by Bloomberg showed. Only 12 companies missed the consensus forecast. (Yes Bank Ltd. put off its third-quarter earnings till March 14) Metals, industrials and oil marketing companies performed the worst in Q3FY20 while Sectors such as agrochemicals, fast-moving consumer goods, retail, information technology and pharmaceuticals beat estimates. Among the Nifty 50 companies (Ex Tata Motors) the aggregate revenue decline by 5% while EBITDA shows a growth of 5% and net profit grew by 4.7%, but ex BFSI and Tata Motors net profit shows a degrowth of 5.4%. Corporate tax rate cuts continued supporting earnings growth. The blended tax rate for Nifty50 was 27.4% compared with 30.1% in the year-ago quarter.
Nifty 50 Companies – Beat or Miss
Source: Bloomberg
0
5
10
15
20
25
30
Q3F
Y18
Q4F
Y18
Q1F
Y19
Q2F
Y19
Q3F
Y19
Q4F
Y19
Q1F
Y20
Q2F
Y20
Q3F
Y20
Beat Estimate In Line With Estimate Missed Estimate
Q3 Earnings Heat Map
Nifty 50 Companies
Bajaj Auto Bajaj Finance
Bharti Airtel
Dr. Reddy's
GAIL HCL Tech Hero MotoCorp
Tech Mahindra
UPL Vedanta
Asian Paints
Axis Bank Bajaj Finserv
BPCL Bharti Infratel
Britannia Cipla Coal India Eicher Motors
HDFC Bank
HUL HDFC ITC ICICI Bank
Indian Oil IndusInd Bank
Infosys Nestle NTPC Ltd. ONGC
Power Grid
SBI Sun Pharma
TCS Titan UltraTech Cement
Wipro Adani Ports
Grasim Hindalco
JSW Steel Kotak Bank
L&T M&M Maruti Suzuki
RIL Tata Motors
Tata Steel Zee Ent. Yes Bank
Beat Estimate In Line With Estimate Missed EstimateSource: Bloomberg
Most Nifty 50 companies either met or surpassed estimates in the October-December earnings season. Operating income of nearly half of the Nifty 50 constituents met estimates and around a third surpassed analyst expectations.

48March 2020 INSIGHT
On the sectoral front, in the auto space, lower volumes, weak consumer sentiment and negative operating leverage impacted margins for the sector. In the banking space, the operating performance was healthy amid improving asset quality and recovery of stressed loan accounts. In the cement space, profitability was supported by a rise in realisations and lower costs (power & fuel, freight) even as volume growth remained
subdued. In the FMCG space, volume growth came in lower at ~5-6% YoY due to weak rural demand, most input costs have witnessed escalation, which kept margins under pressure. In IT space companies reported better than expected results, indicating an improving demand environment. Q3FY20 performance and management commentaries by IT companies indicate signs of improving demand
environment and healthy deal pipelines. In metal & mining space, operational performance was marked by subdued realisations both in ferrous and non-ferrous sector driven by lower prices amid global uncertainty. In the pharma space, companies demonstrated consistent performance in the US, double-digit growth in the domestic market, improving margins and continual balance sheet improvement
Sectoral performance reviewAuto & Auto ancillary SectorAs expected, Q3FY20 was a hard quarter for automobile companies with decline in performance on all front. October festive period resulting in healthy retail sales and consequent destocking at dealer end but November and December, however, saw the return of poor
demand offtake amid continued weakness in consumer sentiment as structural and cyclical factors hurting the industry volume growth across automotive categories (2W, PV and CV) due to weak retail demand and high channel inventory along with slowing economic growth. While companies across the board suffered revenue declines, softer raw material prices (lagged pass through of steel,
lead, crude derivatives) provided relief to gross margins in most cases, although negative operating leverage pinched. Management commentary clearly highlighted the benefit of low commodity prices during the quarter; however, the benefits of lower costs couldn’t be translated into a bottom-line improvement due to operating deleverage. Q3FY20 total industry volumes at 65.9 lakh units
CNX 500 (Excluding Banks, NBFC & Oil Companies)(In Rs. Cr.) Q3FY18 Q4FY18 Q1FY19 Q2FY19 Q3FY19 Q4FY19 Q1FY20 Q2FY20 Q3FY20
Net Sales 848420 923903 962631 1018531 1032889 1072642 1023416 1033537 1033770
Growth (YoY) 5% 7% 17% 23% 22% 16% 6% 1% 0%
Growth (QoQ) 3% 9% 4% 6% 1% 4% -5% 1% 0%
Operating Expenses 692614 757217 785069 836252 846495 879409 831111 856789 849616
Growth (YoY) 3% 5% 14% 23% 22% 16% 6% 2% 0%
Growth (QoQ) 2% 9% 4% 7% 1% 4% -5% 3% -1%
% of Sales 82% 82% 82% 82% 82% 82% 81% 83% 82%
Operating Profit 155806 166686 177562 182278 186395 193232 192305 176748 184154
Growth (YoY) 14% 14% 31% 24% 20% 16% 8% -3% -1%
Growth (QoQ) 6% 7% 7% 3% 2% 4% 0% -8% 4%
OPM 18% 18% 18% 18% 18% 18% 19% 17% 18%
Depreciation 16747 22204 17441 21502 20539 26002 20651 23427 20507
Growth (YoY) -6% 5% -9% 11% 23% 17% 18% 9% 0%
Growth (QoQ) -14% 33% -21% 23% -4% 27% -21% 13% -12%
Interest 34299 35701 37883 39321 40913 43331 46817 48904 50296
Growth (YoY) 8% 3% 19% 19% 19% 21% 24% 24% 23%
Growth (QoQ) 4% 4% 6% 4% 4% 6% 8% 4% 3%
Other Income 28859 31059 33708 35555 36315 38014 40277 40690 41035
Growth (YoY) 4% 13% 21% 20% 26% 22% 19% 14% 13%
Growth (QoQ) -2% 8% 9% 5% 2% 5% 6% 1% 1%
Adj Profit 79613 79297 88893 87317 91288 89959 86942 96873 82795
Growth (YoY) 13% 12% 38% 15% 15% 13% -2% 11% -9%
Growth (QoQ) 5% 0% 12% -2% 5% -1% -3% 11% -15%
NPM 9% 9% 9% 9% 9% 8% 8% 9% 8%Source: AceEquity, PL-Profit to Loss and LP=Loss to Profit

49 March 2020INSIGHT
represented a yearly and sequential decline of 9.2% and 4.5%, respectively, dragged by the domestic space which is down 12.6% YoY to 53.7 lakh units while exports performance was better with growth of 9.5% YoY to 12.2 lakh units. Domestic PV volumes in Q3FY20 were flattish YoY at 7.8 lakh units, amid UV segment growth of 27.9% counteracting 8.5% and 41.3% decline in passenger cars and vans respectively. The 2-Ws declined 14.9% YoY domestically to 42.2 lakh units with motorcycles down 14.6%, scooters down 14.3% & mopeds down 13.8%. Domestic CV segment was down 21.4% YoY to 1.98 lakh units (M&HCV came off by 39.0%, LCV declined by 10.0%). 3-W segment improve marginally by 2% YoY domestically.
In the OEM space, Eicher Motors, M&M and Bajaj Auto were positive surprises declaring strong performances at operating level. PV market leader Maruti’s net sales were up 5.3% YoY amid 2% volume increase to 4.4 lakh units and EBITDA margins disappointed. M&M reported 5.5% YoY standalone revenue decline (auto volumes down 7.6%, tractor volumes down 7%) with margins up 80 bps QoQ & consolidated PAT hurt by write downs in subsidiary SsangYong Motor. Tata Motors’ results were muted driven by disappointment on the JLR margins front. Consolidated sales were impacted by dip in ASPs and high marketplace discounts amid 24.6% fall in standalone volume
while JLR volumes rose 2.7% YoY. Escorts posted sales dip as tractor volumes down 2.5% to 25,109 units with margins at a multi-year high. Market leader in 2-W segment, Hero MotoCorp, total volumes fell 14.3% YoY to 15.4 lakh units, with limited topline decline, healthy margins while PAT was aided by low tax outgo. Bajaj Auto’s volumes were down 4.6% YoY to 12 lakh units, with net sales and margins improvement due to savings realised in other expenses and flowed into PAT performance.
Going forward, Q4FY20 is expected to witness continuance of soft demand prospects due to weak economic growth and transition to BS6 emission norms w.e.f. April 1, 2020. Industry margin profiles are seen remaining under strain owing to limited operating leverage, firming up of commodity prices along
with an uncertain BS-VI pricing environment. Most automotive OEM’s (except Tata Motors) have not felt the impact of the fallout of coronavirus in China on their production so far. OEM’s have inventory for about a month and have stated that they need to monitor the situation in China for the next 10-15 days. If production in China is impacted beyond the next two weeks, the production of automotive companies in India could also be impacted. Tata Motors which has manufacturing presence in China has stated that JLR volumes would be impacted in Q4FY20. Hero Motocorp also get warning signal.
Trend in Volumes (Units)Q3FY20 YoY
(%)QoQ (%)
Hero MotoCorp
1,540,868 -14.3% -8.9%
Bajaj Auto 1,202,486 -4.6% 2.5%TVS Motors 821,521 -17.0% -7.3%Maruti Suzuki
437,361 2.0% 29.3%
Mahindra & Mahindra
216,816 -7.3% 13.3%
Eicher Motors
182,791 -6.0% 9.7%
Tata Motors ( JLR)
141,222 -2% 10%
Tata Motors (S/A)
129,381 -24.7% 23.4%
Ashok Leyland
31,200 -28.7% 7.8%
Escorts 25,109 -2.5% 27.1%Source: Company, Ashika Research
Aggregate EBITDA Margin (%)
Source: Company, Industry Report
8
9
10
11
12
13
14
15
16
Q3F
Y16
Q4F
Y16
Q1F
Y17
Q2F
Y17
Q3F
Y17
Q4F
Y17
Q1F
Y18
Q2F
Y18
Q3F
Y18
Q4F
Y18
Q1F
Y19
Q2F
Y19
Q3F
Y19
Q4F
Y19
Q1F
Y20
Q2F
Y20
Q3F
Y20
Aggregate (excl JLR) Aggregate (incl JLR)
Segment-wise Margin (%)
Source: Company, Industry Report
0
2
4
6
8
10
12
14
16
2W PVs CVs
Q3FY19 Q4FY19 Q1FY20 Q2FY20 Q3FY20
Eicher Motors, M&M and Bajaj Auto were positive surprises declaring strong performances at operating level.

50March 2020 INSIGHT
Auto & Auto ancillary CompaniesCompany (Rs Cr) Net
SalesYoY %
QoQ %
OperatingProfit
YoY %
QoQ %
OPM %
Net Profit
YoY %
QoQ %
NPM %
Tata Motors Ltd. 71676 -7% 10% 7197 21% 2% 10% 1955 107% LP 3%
Mahindra & Mahindra Ltd. 25020 -4% 5% 3405 -8% 3% 14% -170 PL PL -1%
Maruti Suzuki India Ltd. 20722 5% 22% 2105 9% 31% 10% 1569 5% 16% 8%
Motherson Sumi Systems Ltd. 15661 -5% -2% 1148 -11% -7% 7% 319 -39% -27% 2%
Bajaj Auto Ltd. 7640 3% -1% 1367 13% 7% 18% 1262 15% -10% 17%
Hero MotoCorp Ltd. 7075 -11% -8% 1058 -5% -8% 15% 880 16% 1% 12%
Ashok Leyland Ltd. 5189 -31% 32% 752 -34% 229% 14% 57 -87% 46% 1%
TVS Motor Company Ltd. 4766 -7% -4% 613 7% 6% 13% 158 -20% -39% 3%
Apollo Tyres Ltd. 4400 -7% 10% 534 1% 24% 12% 174 -12% 109% 4%
MRF Ltd. 4076 0% 2% 622 9% 12% 15% 241 -17% 5% 6%
Exide Industries Ltd. 3554 8% -6% 294 -13% -29% 8% 118 -17% -52% 3%
Bosch Ltd. 2537 -16% 10% 320 -22% -5% 13% 190 -43% -22% 8%
Eicher Motors Ltd. 2371 1% 8% 592 -13% 9% 25% 482 -2% -15% 20%
Bharat Forge Ltd. 1831 -26% -15% 222 -47% -33% 12% 49 -78% -77% 3%
Amara Raja Batteries Ltd. 1748 3% 3% 284 12% -3% 16% 164 25% -25% 9%
Cummins India Ltd. 1456 -4% 10% 216 -5% 41% 15% 170 0% 14% 12%
Balkrishna Industries Ltd. 1156 -4% 7% 346 27% 27% 30% 224 48% -24% 19%
Total 180875 -6% 7% 21074 2% 7% 12% 7841 LP 15% 4%Source: AceEquity, PL-Profit to Loss and LP=Loss to Profit
Banking SectorDuring Q3FY20, improved operating performance of corporate-focused banks and healthy growth trends in retail loan growth were key positives. Banks operating performance was stable in spite of slower NII growth on higher other-income partially from recoveries and better opex control. Higher provisions on either fresh NPAs or downgrades continue to adversely impact bottom-line. Banks continue to provide writeoffs to maintain asset quality, though PCR has been maintained on higher provisioning. Focus on term deposits, especially retail term deposits continues to prevail. Banks loan growth came in at 3.6% YoY but certain private banks like HDFC bank/ICICI bank/Axis bank (supported by retail) saw stable growth, although Kotak Mahindra Bank maintained a cautious stance with loan growth slowing to low double digit. PSBs continue to
degrow at ~1% YoY as corporate book saw flattish to negative growth, whereas retail continued to do well. Corporate-focused private banks’
earnings were aided by recoveries from few large NCLT accounts, which resulted in strong operating performance while retail banks reported stable profitability. Most PSU banks (PSBs) reported modest operating performance helped by recoveries from few large NCLT accounts but weak capitalisation and muted loan growth outlook (partly due to impending mergers) are dampeners for most PSBs., On the asset quality front, headline asset quality has improved although it balanced from higher slippages from corporate book (mainly a HFC), retail and Agri, while witnessing higher recoveries in the quarter from a few account mainly from large Steel companies. Going ahead, banks are expecting lower corporate slippages and smaller recoveries. On liabilities & funding cost, retail term deposits accretion continues but CASA growth was slightly better for industry which pushed the cost of
Corporate-focused private banks’ earnings were aided by recoveries from few large NCLT accounts, which resulted in strong operating performance while retail banks reported stable profitability.
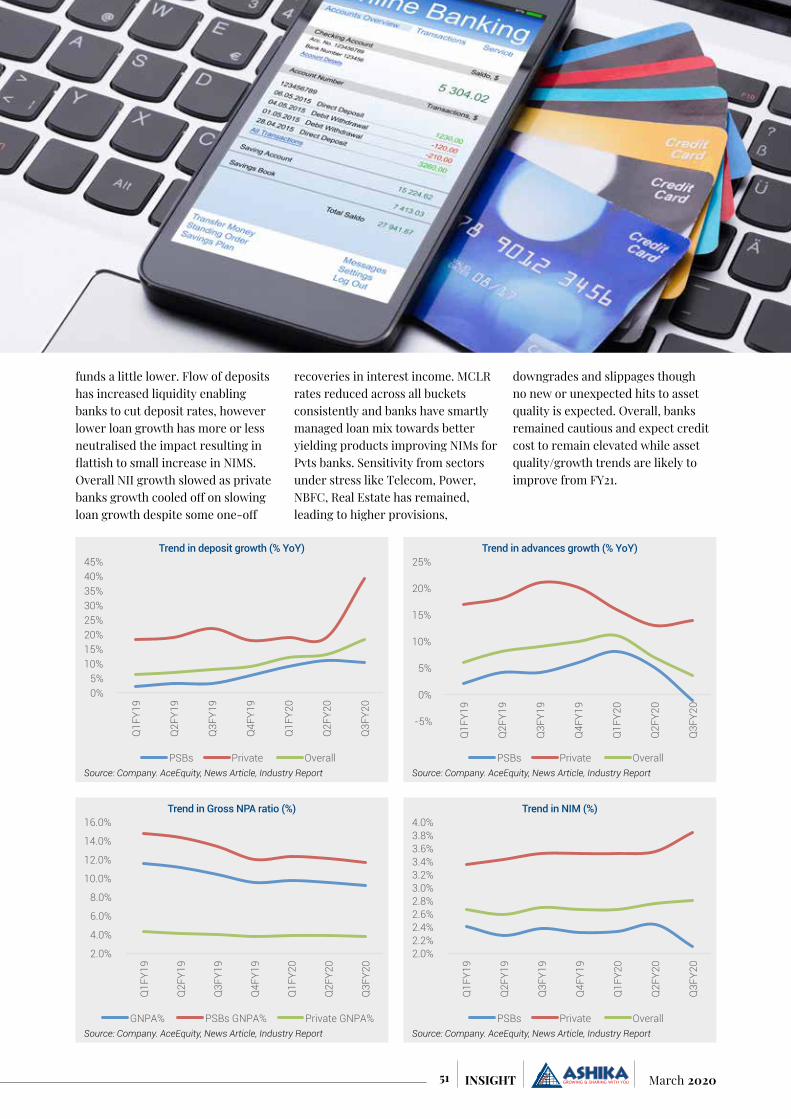
51 March 2020INSIGHT
funds a little lower. Flow of deposits has increased liquidity enabling banks to cut deposit rates, however lower loan growth has more or less neutralised the impact resulting in flattish to small increase in NIMS. Overall NII growth slowed as private banks growth cooled off on slowing loan growth despite some one-off
recoveries in interest income. MCLR rates reduced across all buckets consistently and banks have smartly managed loan mix towards better yielding products improving NIMs for Pvts banks. Sensitivity from sectors under stress like Telecom, Power, NBFC, Real Estate has remained, leading to higher provisions,
downgrades and slippages though no new or unexpected hits to asset quality is expected. Overall, banks remained cautious and expect credit cost to remain elevated while asset quality/growth trends are likely to improve from FY21.
Trend in deposit growth (% YoY)
Source: Company. AceEquity, News Article, Industry Report
0% 5%
10% 15% 20% 25% 30% 35% 40% 45%
Q1F
Y19
Q2F
Y19
Q3F
Y19
Q4F
Y19
Q1F
Y20
Q2F
Y20
Q3F
Y20
PSBs Private Overall
Trend in Gross NPA ratio (%)
Source: Company. AceEquity, News Article, Industry Report
2.0%
4.0%
6.0%
8.0%
10.0%
12.0%
14.0%
16.0%
Q1F
Y19
Q2F
Y19
Q3F
Y19
Q4F
Y19
Q1F
Y20
Q2F
Y20
Q3F
Y20
GNPA% PSBs GNPA% Private GNPA%
Trend in advances growth (% YoY)
Source: Company. AceEquity, News Article, Industry Report
-5%
0%
5%
10%
15%
20%
25%
Q1F
Y19
Q2F
Y19
Q3F
Y19
Q4F
Y19
Q1F
Y20
Q2F
Y20
Q3F
Y20
PSBs Private Overall
Trend in NIM (%)
Source: Company. AceEquity, News Article, Industry Report
2.0% 2.2% 2.4% 2.6% 2.8% 3.0% 3.2% 3.4% 3.6% 3.8% 4.0%
Q1F
Y19
Q2F
Y19
Q3F
Y19
Q4F
Y19
Q1F
Y20
Q2F
Y20
Q3F
Y20
PSBs Private Overall
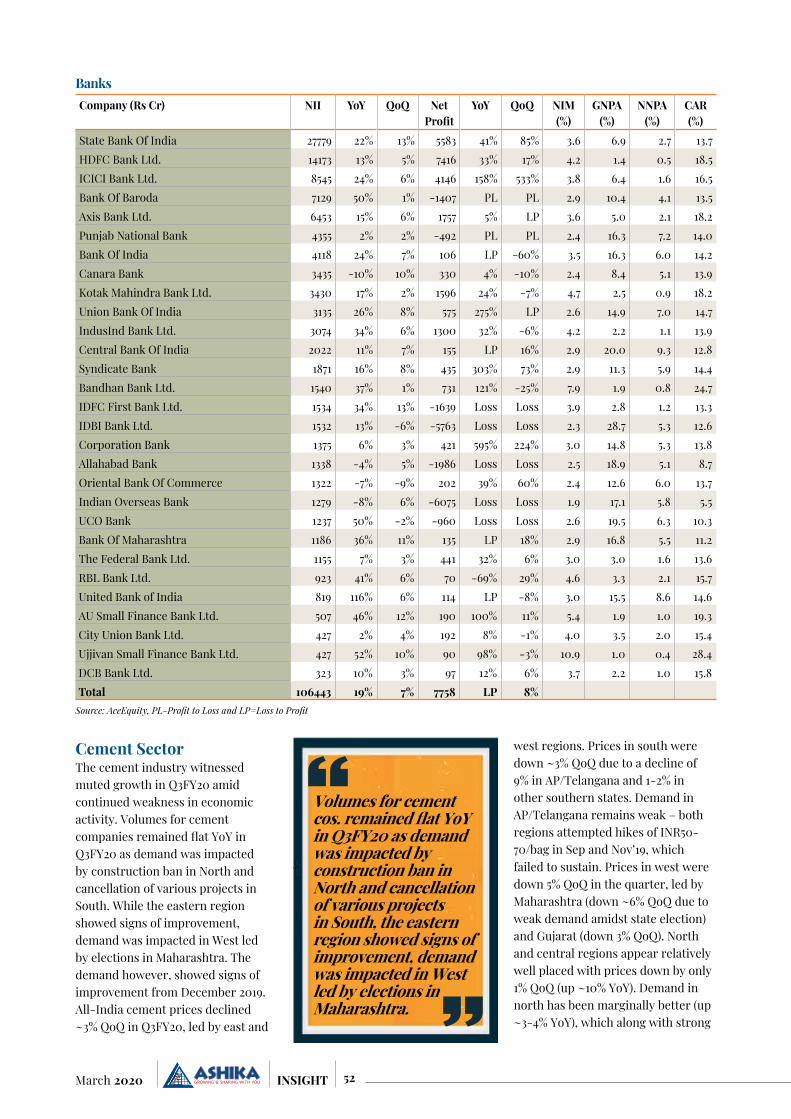
52March 2020 INSIGHT
BanksCompany (Rs Cr) NII YoY QoQ Net
ProfitYoY QoQ NIM
(%)GNPA
(%)NNPA
(%)CAR (%)
State Bank Of India 27779 22% 13% 5583 41% 85% 3.6 6.9 2.7 13.7HDFC Bank Ltd. 14173 13% 5% 7416 33% 17% 4.2 1.4 0.5 18.5ICICI Bank Ltd. 8545 24% 6% 4146 158% 533% 3.8 6.4 1.6 16.5Bank Of Baroda 7129 50% 1% -1407 PL PL 2.9 10.4 4.1 13.5Axis Bank Ltd. 6453 15% 6% 1757 5% LP 3.6 5.0 2.1 18.2Punjab National Bank 4355 2% 2% -492 PL PL 2.4 16.3 7.2 14.0Bank Of India 4118 24% 7% 106 LP -60% 3.5 16.3 6.0 14.2Canara Bank 3435 -10% 10% 330 4% -10% 2.4 8.4 5.1 13.9Kotak Mahindra Bank Ltd. 3430 17% 2% 1596 24% -7% 4.7 2.5 0.9 18.2Union Bank Of India 3135 26% 8% 575 275% LP 2.6 14.9 7.0 14.7IndusInd Bank Ltd. 3074 34% 6% 1300 32% -6% 4.2 2.2 1.1 13.9Central Bank Of India 2022 11% 7% 155 LP 16% 2.9 20.0 9.3 12.8Syndicate Bank 1871 16% 8% 435 303% 73% 2.9 11.3 5.9 14.4Bandhan Bank Ltd. 1540 37% 1% 731 121% -25% 7.9 1.9 0.8 24.7IDFC First Bank Ltd. 1534 34% 13% -1639 Loss Loss 3.9 2.8 1.2 13.3IDBI Bank Ltd. 1532 13% -6% -5763 Loss Loss 2.3 28.7 5.3 12.6Corporation Bank 1375 6% 3% 421 595% 224% 3.0 14.8 5.3 13.8Allahabad Bank 1338 -4% 5% -1986 Loss Loss 2.5 18.9 5.1 8.7Oriental Bank Of Commerce 1322 -7% -9% 202 39% 60% 2.4 12.6 6.0 13.7Indian Overseas Bank 1279 -8% 6% -6075 Loss Loss 1.9 17.1 5.8 5.5UCO Bank 1237 50% -2% -960 Loss Loss 2.6 19.5 6.3 10.3Bank Of Maharashtra 1186 36% 11% 135 LP 18% 2.9 16.8 5.5 11.2The Federal Bank Ltd. 1155 7% 3% 441 32% 6% 3.0 3.0 1.6 13.6RBL Bank Ltd. 923 41% 6% 70 -69% 29% 4.6 3.3 2.1 15.7United Bank of India 819 116% 6% 114 LP -8% 3.0 15.5 8.6 14.6AU Small Finance Bank Ltd. 507 46% 12% 190 100% 11% 5.4 1.9 1.0 19.3City Union Bank Ltd. 427 2% 4% 192 8% -1% 4.0 3.5 2.0 15.4Ujjivan Small Finance Bank Ltd. 427 52% 10% 90 98% -3% 10.9 1.0 0.4 28.4DCB Bank Ltd. 323 10% 3% 97 12% 6% 3.7 2.2 1.0 15.8Total 106443 19% 7% 7758 LP 8%
Source: AceEquity, PL-Profit to Loss and LP=Loss to Profit
Cement SectorThe cement industry witnessed muted growth in Q3FY20 amid continued weakness in economic activity. Volumes for cement companies remained flat YoY in Q3FY20 as demand was impacted by construction ban in North and cancellation of various projects in South. While the eastern region showed signs of improvement, demand was impacted in West led by elections in Maharashtra. The demand however, showed signs of improvement from December 2019. All-India cement prices declined ~3% QoQ in Q3FY20, led by east and
west regions. Prices in south were down ~3% QoQ due to a decline of 9% in AP/Telangana and 1-2% in other southern states. Demand in AP/Telangana remains weak – both regions attempted hikes of INR50-70/bag in Sep and Nov’19, which failed to sustain. Prices in west were down 5% QoQ in the quarter, led by Maharashtra (down ~6% QoQ due to weak demand amidst state election) and Gujarat (down 3% QoQ). North and central regions appear relatively well placed with prices down by only 1% QoQ (up ~10% YoY). Demand in north has been marginally better (up ~3-4% YoY), which along with strong
Volumes for cement cos. remained flat YoY in Q3FY20 as demand was impacted by construction ban in North and cancellation of various projects in South, the eastern region showed signs of improvement, demand was impacted in West led by elections in Maharashtra.
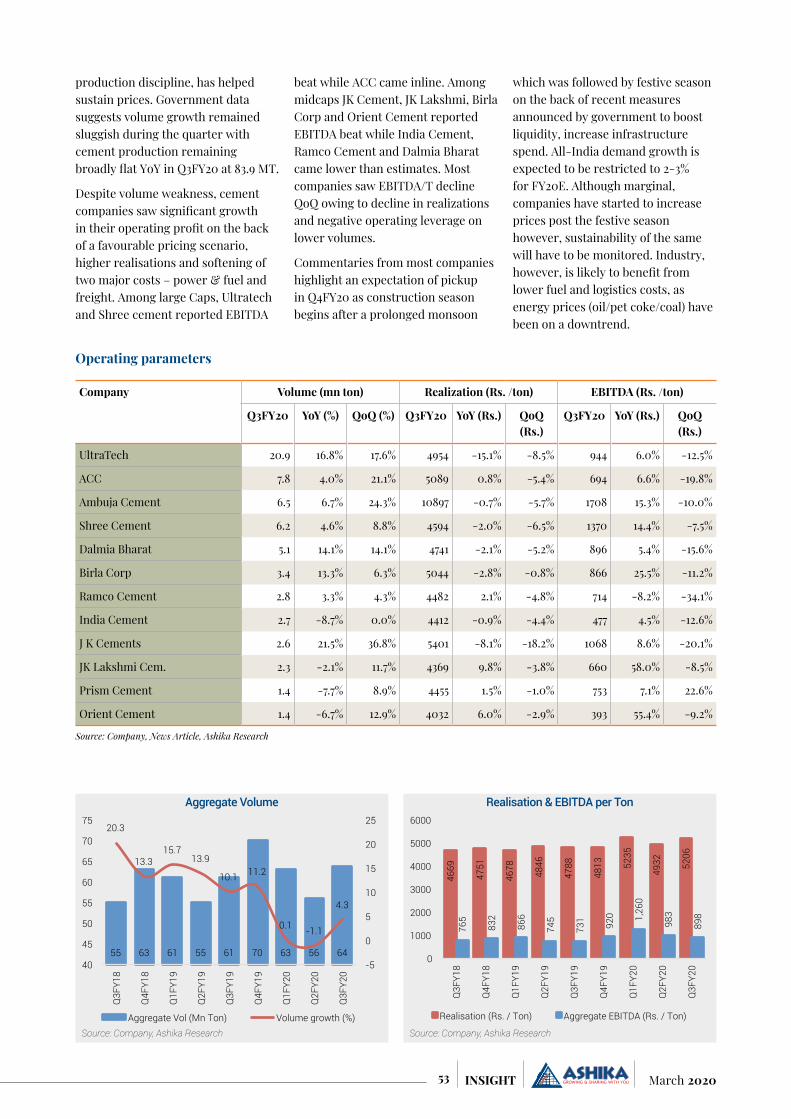
53 March 2020INSIGHT
production discipline, has helped sustain prices. Government data suggests volume growth remained sluggish during the quarter with cement production remaining broadly flat YoY in Q3FY20 at 83.9 MT.
Despite volume weakness, cement companies saw significant growth in their operating profit on the back of a favourable pricing scenario, higher realisations and softening of two major costs – power & fuel and freight. Among large Caps, Ultratech and Shree cement reported EBITDA
beat while ACC came inline. Among midcaps JK Cement, JK Lakshmi, Birla Corp and Orient Cement reported EBITDA beat while India Cement, Ramco Cement and Dalmia Bharat came lower than estimates. Most companies saw EBITDA/T decline QoQ owing to decline in realizations and negative operating leverage on lower volumes.
Commentaries from most companies highlight an expectation of pickup in Q4FY20 as construction season begins after a prolonged monsoon
which was followed by festive season on the back of recent measures announced by government to boost liquidity, increase infrastructure spend. All-India demand growth is expected to be restricted to 2-3% for FY20E. Although marginal, companies have started to increase prices post the festive season however, sustainability of the same will have to be monitored. Industry, however, is likely to benefit from lower fuel and logistics costs, as energy prices (oil/pet coke/coal) have been on a downtrend.
Company Volume (mn ton) Realization (Rs. /ton) EBITDA (Rs. /ton)
Q3FY20 YoY (%) QoQ (%) Q3FY20 YoY (Rs.) QoQ (Rs.)
Q3FY20 YoY (Rs.) QoQ (Rs.)
UltraTech 20.9 16.8% 17.6% 4954 -15.1% -8.5% 944 6.0% -12.5%
ACC 7.8 4.0% 21.1% 5089 0.8% -5.4% 694 6.6% -19.8%
Ambuja Cement 6.5 6.7% 24.3% 10897 -0.7% -5.7% 1708 15.3% -10.0%
Shree Cement 6.2 4.6% 8.8% 4594 -2.0% -6.5% 1370 14.4% -7.5%
Dalmia Bharat 5.1 14.1% 14.1% 4741 -2.1% -5.2% 896 5.4% -15.6%
Birla Corp 3.4 13.3% 6.3% 5044 -2.8% -0.8% 866 25.5% -11.2%
Ramco Cement 2.8 3.3% 4.3% 4482 2.1% -4.8% 714 -8.2% -34.1%
India Cement 2.7 -8.7% 0.0% 4412 -0.9% -4.4% 477 4.5% -12.6%
J K Cements 2.6 21.5% 36.8% 5401 -8.1% -18.2% 1068 8.6% -20.1%
JK Lakshmi Cem. 2.3 -2.1% 11.7% 4369 9.8% -3.8% 660 58.0% -8.5%
Prism Cement 1.4 -7.7% 8.9% 4455 1.5% -1.0% 753 7.1% 22.6%
Orient Cement 1.4 -6.7% 12.9% 4032 6.0% -2.9% 393 55.4% -9.2%
Source: Company, News Article, Ashika Research
Operating parameters
Aggregate Volume
Source: Company, Ashika Research
55 63 61 55 61 70 63 56 64
20.3
13.3 15.7
13.9
10.1 11.2
0.1 -1.1
4.3
-5
0
5
10
15
20
25
40
45
50
55
60
65
70
75
Q3F
Y18
Q4F
Y18
Q1F
Y19
Q2F
Y19
Q3F
Y19
Q4F
Y19
Q1F
Y20
Q2F
Y20
Q3F
Y20
Aggregate Vol (Mn Ton) Volume growth (%)
Realisation & EBITDA per Ton
Source: Company, Ashika Research
4669
4751
4678
4846
4788
4813
5235
4932
5206
765
832
866
745
731 920 1,26
0
983
898
0
1000
2000
3000
4000
5000
6000
Q3F
Y18
Q4F
Y18
Q1F
Y19
Q2F
Y19
Q3F
Y19
Q4F
Y19
Q1F
Y20
Q2F
Y20
Q3F
Y20
Realisation (Rs. / Ton) Aggregate EBITDA (Rs. / Ton)

54March 2020 INSIGHT
FMCG SectorThe festive season didn’t bring much cheer for consumer goods companies as volume growth of most companies remained under pressure in Q3FY20. The industry’s growth which was stable at high single-digits in Q2FY20, moderated to low single digits in Q3FY20. Consumer staples’ volume growth dented in Q3FY20 on account of overall consumption slowdown (average volume growth down to 1.4% YoY from 4.7% YoY in Q2FY20). Rural growth continues to lag urban growth, staying at 0.5x urban growth however bigger companies continue to do well on the back of their distribution strength. One classic sign of slowdown is number of new launches going down which is playing out in the current environment. Additionally, liquidity crisis continues to dent liquidity with wholesalers and retailers, thereby exerting pressure on the trade pipeline. On the international front, companies having large presence in geographies such as Africa and Middle East have witnessed lower
growth, while companies having presence in South East Asian countries did well during the quarter. Most input costs have witnessed escalation, which kept margins under
pressure. Milk, palm oil, wheat and sugar prices have been on a rising trend, which impacted operating margins. However, a softening in crude led derivatives provide cushion to companies. Wheat and Barley prices are up by 9.3% and 10.7% YoY respectively. SMP prices are up 47% YoY while Palm oil prices are up 35% YoY (31.6% QoQ). Mentha prices are soft and are down 23.4% YoY. Gold prices are higher by 21.9% YoY and 4.4% QoQ. However crude based inputs like VAM, Packaging, LLP, LAB, Pigments etc. have been moving up steadily.
During Q3FY20, sales performance of majority of the FMCG companies was broadly in line with expectations. Within consumer companies, Asian Paints and Nestle were one of the better performers in a challenging environment, primarily in terms of volume growth. HUL positively surprised with a consistent 5% volume growth. ITC continued to record modest volume growth (2% YoY). Marico, GCPL, Emami, Kansai, Jyothy Labs, Bajaj Consumer Care
Cement CompaniesCompany (Rs Cr) Net
SalesYoY%
QoQ%
OperatingProfit
YoY%
QoQ%
OPM%
Net Profit
YoY%
QoQ%
NPM%
Ultratech Cement Ltd. 10354 -1% 8% 1973 24% 3% 19% 711 90% 23% 7%
Ambuja Cements Ltd. 7126 6% 17% 1117 23% 12% 16% 722 -47% 37% 10%
ACC Ltd. 4060 4% 15% 541 11% -3% 13% 268 -63% -10% 7%
Shree Cement Ltd. 3146 0% 5% 880 15% 0% 28% 312 -5% 0% 10%
Dalmia Bharat Ltd. 2418 12% 8% 455 7% -3% 19% 26 -16% -28% 1%
JK Cement Ltd. 1472 11% 12% 290 39% 13% 20% 124 218% 56% 8%
The Ramco Cements Ltd. 1282 6% -3% 205 -4% -32% 16% 95 -5% -44% 7%
The India Cements Ltd. 1244 -8% -2% 130 -4% -13% 10% -9 Loss PL -1%
JK Lakshmi Cement Ltd. 1078 4% 6% 177 67% -1% 16% 51 1479% 2% 5%
Orient Cement Ltd. 564 -1% 10% 55 45% 2% 10% -6 Loss Loss -1%
Heidelberg Cement India Ltd. 548 -3% 5% 120 -2% -2% 22% 65 10% 11% 12%
Star Cement Ltd. 451 8% 18% 94 -23% 46% 21% 71 -15% 57% 16%
Sagar Cements Ltd. 262 -18% -1% 20 -34% -53% 8% -9 Loss PL -3%
Ramco Industries Ltd. 199 -7% -10% 19 -9% -17% 9% 4 -30% -86% 2%
Total 34206 2% 9% 6075 17% 1% 18% 2426 -22% 11% 7%Source: AceEquity, PL-Profit to Loss and LP=Loss to Profit
Most input costs have witnessed escalation, which kept margins under pressure. Milk, palm oil, wheat and sugar prices have been on a rising trend, which impacted operating margins. However, a softening in crude led derivatives provide cushion to companies.

55 March 2020INSIGHT
continue to deliver muted to negative growth primarily due to demand slow down, delayed winters and liquidity issues in the channel. Majority of the companies, primarily HPC (home and personal care) and paint based companies witnessed gross margin expansion due to benign raw material cost. Food & Beverages companies like Nestle however witnessed pressure on margins as milk and its derivatives saw sharp increase in prices. Consumer companies indicated continued demand moderation particularly in the rural markets due to unfavorable
sentiment and liquidity issues in the trade channel.
Managements of consumer goods companies are building hopes on demand revival in another two to three quarters banking on some of the initiatives undertaken by the government to improve the liquidity environment in domestic markets and better rabi crop production. Further, the timely on-set of summers will fuel the demand for summer products in Q4FY20. With prices of crude oil and other key inputs such as palm oil remaining
stable, it expects a limited stress on gross margins in the near term. However, higher milk & milk product prices would put stress on the profitability of food companies in the near term. Although rural sales growth has been tepid over the last year, companies would witness a strong volume led growth in Q1FY21 driven by companies’ increased focus on increasing direct reach (thereby reducing dependency on wholesalers), favourable base and government’s greater thrust on improving rural income levels.
FMCG Players Quarterly Volume Growth (%)Companies Q3FY18 Q4FY18 Q1FY19 Q2FY19 Q3FY19 Q4FY19 Q1FY20 Q2FY20 Q3FY20
Asian Paints 7.5 10.5 12.0 11.0 24.0 10.0 20.0 16.0 11.0
Bajaj Consumer 5.2 5.9 8.7 0.1 7.0 5.5 4.7 1.3 (8.6)
Berger Paints 8.0 13.0 15.0 15.0 19.0 10.5 12.0 13.0 10.0
Big Bazaar 13.1 11.0 10.1 9.4 10.1 13.6 8.1 4.6 2.1
Britannia 13.0 13.0 13.0 12.0 7.0 7.0 3.0 3.0 3.0
Colgate 12.0 4.0 3.0 5.5 7.0 5.0 6.0 4.0 2.3
Dabur 13.0 7.7 21.0 8.1 12.4 4.3 9.6 4.8 5.6
Emami (Domestic) 6.0 9.0 18.0 (4.0) 3.5 2.0 0.1 1.0 (2.0)
FRL 10.4 6.0 3.6 5.9 5.9 11.2 8.3 4.6 2.1
Godrej Consumer (Domestic) 18.0 6.0 14.0 5.0 1.0 1.0 5.0 7.0 7.0
GSK Consumer 17.0 8.0 12.8 13.7 9.6 6.5 5.4 3.6 (1.0)
Hindustan Unilever 11.0 11.0 12.0 10.0 10.0 7.0 5.0 5.0 5.0
ITC (Cigarettes) (5.0) (2.5) 1.5 6.0 7.5 7.5 3.0 2.5 2.0
Jubilant (Dominos) 17.8 26.5 26.5 20.5 14.6 6.0 4.1 4.9 5.9
Jyothy Labs 11.5 11.4 18.5 4.4 6.1 6.0 5.6 8.3 (5.6)
Kansai Nerolac 14.5 14.5 15.0 9.0 15.0 4.0 10.0 1.0 (2.5)
Marico - Domestic 9.4 1.0 12.4 6.0 5.0 8.0 6.0 1.0 (1.0)
Marico - Parachute 15.0 (5.0) 9.0 8.0 9.0 6.0 9.0 (1.0) (2.0)
Marico - Saffola 0.1 (1.0) 10.0 5.0 2.0 18.0 3.0 1.0 11.0
Marico - Value added hair oils 8.0 11.0 15.0 5.0 7.0 1.0 7.0 0.0 (7.0)
Nestle India 18.0 6.9 11.5 15.3 11.5 9.3 12.3 9.0 5.5
Pidilite 23.0 14.0 20.2 11.0 13.0 4.0 6.3 0.6 3.0
Titan: Tanishq 6.0 6.0 (3.0) 24.0 34.0 15.0 6.0 (14.0) (5.0)
United breweries 12.0 24.0 12.0 17.0 16.0 7.5 5.0 6.0 (7.0)
United Spirits - P&A (3.0) 15.0 13.0 15.0 12.1 7.0 8.4 3.0 2.0
United Spirits - volume growth (14.2) (1.4) 1.1 - 3.8 1.0 6.0 1.0 (1.8)Source: Company, News Article, Industry Report

56March 2020 INSIGHT
Information Technology Sector3QFY20 IT companies reported mixed performance on revenue front (Infosys was better than expected, Wipro was in-line and TCS was tad below expectations). Top tier IT companies reported average growth of mere 1.1% sequentially compared to average 1.8% QoQ growth in the third quarter of the last four years. The top five IT players reported revenue growth of 1.0-5.1% QoQ in USD terms, with tech mahindra reporting the highest growth driven by robust growth in the communications vertical. Infosys, Wipro and HCL Tech reported broadly in-line results, while TCS missed estimates. Tier-I IT pack delivered reported CC revenue
growth of 0.4-4.3% QoQ. Amongst tier one players Infosys/TCS/Wipro/HCL reported constant currency revenue growth of 1.0/0.3/1.8/2.1% respectively. The lower growth can mainly be attributed to the pressure in legacy business, though growth in digital business (~40% of revenue) partially countered this decline. TCS discontinued giving a break-up between digital and non-digital segments citing blurring lines between the two parts of businesses. This may hint at other companies following in the same footsteps. Among mid-tier companies, L&T Infotech and Tata Elxsi surprised positively with strong revenue growth, led by recovery in top accounts and broad-based growth across many verticals.
On the margins front, impact of furloughs mildly offset a benign forex environment, leading to margin expansion for most top five players except TechM (owing to rampups in large deal wins). Tier-1 IT companies witnessed an average margin expansion of 40 bps QoQ mainly led by 100 bps QoQ expansion in TCS. The primary factor in driving margin expansion in TCS was cost optimisation and currency benefit. While higher utilisation, stabilisation of subcontracting expenses and currency tailwinds helped companies to report better margin performance, transition of large deals impacted the margin performance of Tech M. Total TCVs of large deals remained slightly weak in a seasonally soft quarter, with the exception of Tech M which
FMCG CompaniesCompany (Rs Cr) Net
SalesYoY%
QoQ%
OperatingProfit
YoY%
QoQ%
OPM%
Net Profit
YoY%
QoQ%
NPM%
ITC Ltd. 13308 6% 3% 4977 8% 3% 37% 4048 29% -3% 30%Hindustan Unilever Ltd. 10103 3% 0% 2529 21% 1% 25% 1631 13% -10% 16%United Spirits Ltd. 7812 0% 7% 426 19% 4% 5% 233 15% 47% 3%United Breweries Ltd. 3254 2% -9% 222 -11% 15% 7% 107 -2% -7% 3%Nestle India Ltd. 3149 9% -2% 678 23% -10% 22% 473 38% -21% 15%Britannia Industries Ltd. 2983 5% -2% 502 11% 2% 17% 370 23% -8% 12%Godrej Consumer Products Ltd. 2778 2% 6% 631 4% 10% 23% 445 5% 8% 16%Godrej Industries Ltd. 2696 12% 3% 159 125% 5% 6% 78 LP -74% 3%Dabur India Ltd. 2353 7% 6% 493 11% 1% 21% 399 9% -1% 17%Radico Khaitan Ltd. 2012 -2% -20% 103 7% 18% 5% 56 7% -29% 3%Tata Consumer Products Ltd. 1962 3% 7% 240 22% 2% 12% 140 16% -2% 7%Marico Ltd. 1824 -2% 0% 373 4% 6% 20% 276 10% 10% 15%Godrej Agrovet Ltd. 1783 23% -4% 101 0% -16% 6% 45 0% -56% 3%KRBL Ltd. 1329 42% 49% 239 17% 44% 18% 159 48% 40% 12%Glaxosmithkline Consumer Healthcare Ltd.
1159 4% -14% 272 14% -31% 23% 277 25% -20% 24%
Colgate-Palmolive (India) Ltd. 1147 4% -6% 316 1% -2% 28% 199 4% -18% 17%Jubilant FoodWorks Ltd. 1071 14% 7% 254 51% 9% 24% 102 10% 39% 10%Avanti Feeds Ltd. 923 10% -13% 63 -42% -51% 7% 59 -31% -53% 6%Procter & Gamble Hygiene & Health Care Ltd.
859 5% 1% 187 -2% 2% 22% 136 10% -1% 16%
Emami Ltd. 813 0% 23% 264 0% 37% 32% 146 6% 50% 18%Godfrey Phillips India Ltd. 797 14% 6% 167 38% 18% 21% 114 39% 0% 14%Gillette India Ltd. 459 -3% -1% 100 2% 2% 22% 71 32% 15% 15%Jyothy Labs Ltd. 421 -6% -11% 66 -8% -16% 16% 45 -12% -16% 11%VST Industries Ltd. 368 17% 14% 108 24% 12% 29% 81 47% 7% 22%Zydus Wellness Ltd. 333 129% 2% 33 -13% 60% 10% 4 -90% LP 1%Total 68746 5% 1% 13961 12% 2% 20% 9943 21% -7% 14%
Source: AceEquity, PL-Profit to Loss and LP=Loss to Profit

57 March 2020INSIGHT
signed strong deal TCVs of USD 1.23 billion (2x YoY), which is also higher than its usual quarterly run-rate. Despite headwinds in select verticals, deal wins continue to be strong as evidenced by order bookings of USD 6.0bn by TCS and USD 1.8bn by Infosys. Digital deals continued to form a major part of companies’ deal pipeline and strong growth in digital business aided the overall growth rate of companies.
Improvement in US BFS revenue environment and stable commentary on IT spends may provide a sustainable setup for Indian IT companies in CY20. US banks commentary seemed more optimistic as compared to last 3 quarters. US banks had a good quarter & are more optimistic on revenue environment due to improvement of US-China trade discussions & uptick in consumer spending. Commentary of major banks like Citi, JP Morgan, BoA and Wells Fargo on technology spending remained stable. JP Morgan and Goldman Sachs provided healthy
outlook on technology spending & Citi indicated higher productivity
savings to outpace incremental investments in 2020. Though the recent coronavirus impact is still not accessed in its entirety.
In terms of verticals, most managements continued to provide cautious commentary on retail segment and banking & financial services (specifically capital markets and European banking), though some companies witnessed a revival in the latter segment on the back of up-tick in spending by a few banking clients and vendor consolidation. Q3 being a quarter with high furloughs, there were some delays in deal closure. Hence, few companies witnessed quarterly volatility in deal TCV (Total Contract Value) this quarter. However, the outlook on this front remained positive. Hence, revenue growth could remain healthy in coming quarters. Further, margins could witness expansion led by pyramid rationalisation, although investments in deals and pricing pressure could keep near term margins in check.
Quarterly Revenue of Tier-1 Companies (USD Mn.)Q3FY18 Q4FY18 Q1FY19 Q2FY19 Q3FY19 Q4FY19 Q1FY20 Q2FY20 Q3FY20
Infosys 2,755.0 2,805.0 2,831.0 2,921.0 2,987.0 3,060.0 3,131.0 3,210.0 3,243.0
QoQ (%) 1.0 1.8 0.9 3.2 2.3 2.4 2.3 2.5 1.0
TCS 4,787.0 4,972.0 5,051.0 5,215.0 5,250.0 5,397.0 5,485.0 5,517.0 5,586.0
QoQ (%) 1.0 3.9 1.6 3.2 0.7 2.8 1.6 0.6 1.3
Wipro 2,013.0 2,062.0 2,026.5 2,041.2 2,046.5 2,075.5 2,038.8 2,048.9 2,094.8
QoQ (%) - 2.4 -1.7 0.7 0.3 1.4 -1.8 0.5 2.2
HCL Tech 1,987.5 2,038.0 2,054.5 2,098.6 2,201.5 2,277.8 2,363.6 2,485.6 2,543.4
QoQ (%) 3.1 2.5 0.8 2.1 4.9 3.5 3.8 5.2 2.3
Tech M 1,209.1 1,244.3 1,224.1 1,218.2 1,260.8 1,267.5 1,247.1 1,287.2 1,353.0
QoQ (%) 2.5 2.9 -1.6 -0.5 3.5 0.5 -1.6 3.2 5.1
Total 12,751.6 13,121.3 13,187.1 13,494.0 13,745.8 14,077.8 14,265.5 14,548.7 14,820.2QoQ (%) 1.3 2.9 0.5 2.3 1.9 2.4 1.3 2.0 1.9
Source: Company, News Article, Industry Report
Digital revenue (as a % of total revenue)Company Q3FY18 Q4FY18 Q1FY19 Q2FY19 Q3FY19 Q4FY19 Q1FY20 Q2FY20 Q3FY20Infosys 26.1 26.8 28.4 31.0 31.5 33.8 35.7 38.3 40.6
TCS 22.1 23.8 25.0 28.1 30.1 31.0 32.2 33.2 NA
Wipro 25.1 26.7 28.0 31.3 33.2 35.0 37.4 39.6 39.8
HCL Tech NA NA 26.6 27.9 29.0 29.5 29.7 33.0 34.0
Tech M NA 27.0 27.0 31.0 33.0 34.1 36.0 39.0 41.0
L&T Infotech 33.0 33.0 34.0 37.0 37.0 38.0 38.9 40.3 41.0Source: Company, News Article, Industry Report
Revenue growth could remain healthy in coming quarters. Further, margins could witness expansion led by pyramid rationalisation, although investments in deals and pricing pressure could keep near term margins in check.

58March 2020 INSIGHT
Company Q3FY19 Q4FY19 Q1FY20 Q2FY20 Q3FY20TCS 5,100 6,200 5,700 6400.0 6000.0Infosys 1,570 1,568 2,714 2847.0 1813.0Tech M 440 408 475 1490.0 1230.0
Source: Company, News Article, Industry Report
Deal Wins (USD Mn.)
Revenue Growth (%)
Source: Company, Industry Report, Ashika Research
1.0 0.3
1.8 2.1
4.1
1.0 0.6
2.2 2.3
5.1
0.0
1.0
2.0
3.0
4.0
5.0
6.0
Info
sys
TCS
Wip
ro
HCL
Tec
h
Tech
M
CC QoQ (%) $ revenue QoQ (%)
Net Addition &Attrition Rates
Source: Company, Industry Report, Ashika Research
6,96
8
-4,0
63
5,86
5
2,05
0
-683
17.6%
12.2%
15.7% 16.8%
20.0%
0%
5%
10%
15%
20%
25%
-6,000
-4,000
-2,000
0
2,000
4,000
6,000
8,000
Info
sys
TCS
Wip
ro
HCL
Tech
Tech
M
Net Addition (LHS) Attrition (RHS)
Information Technology CompaniesCompany (Rs Cr) Net
SalesYoY%
QoQ%
OperatingProfit
YoY%
QoQ%
OPM%
Net Profit
YoY%
QoQ%
NPM%
Tata Consultancy Services Ltd. 39854 7% 2% 10871 8% 6% 27% 8143 0% 1% 20%Infosys Ltd. 23092 8% 2% 5801 17% 3% 25% 4466 24% 11% 19%HCL Technologies Ltd. 18135 16% 3% 4629 27% 9% 26% 2944 13% 9% 16%Wipro Ltd. 15471 3% 2% 3180 -3% 3% 21% 2460 -3% -4% 16%Tech Mahindra Ltd. 9655 8% 6% 1563 -9% 4% 16% 1110 -9% 0% 11%Larsen & Toubro Infotech Ltd. 2811 14% 9% 528 4% 13% 19% 377 0% 5% 13%Mphasis Ltd. 2277 16% 5% 427 29% 5% 19% 294 6% 7% 13%Mindtree Ltd. 1965 10% 3% 306 8% 23% 16% 197 3% 46% 10%Hexaware Technologies Ltd. 1529 22% 3% 240 44% 1% 16% 168 36% -9% 11%L&T Technology Services Ltd. 1423 8% 1% 286 18% 1% 20% 206 11% 0% 14%Sonata Software Ltd. 1237 47% 76% 110 10% 21% 9% 76 19% 5% 6%Oracle Financial Services Software Ltd.
1160 -2% 0% 526 5% 2% 45% 457 49% 27% 39%
Cyient Ltd. 1106 -7% -5% 152 9% -5% 14% 110 19% 13% 10%NIIT Technologies Ltd. 1073 10% 3% 195 7% 2% 18% 129 22% 3% 12%Firstsource Solutions Ltd. 1053 7% 7% 167 22% 26% 16% 90 -9% 33% 8%Zensar Technologies Ltd. 1021 -1% -5% 70 -26% -54% 7% 41 -27% -50% 4%Persistent Systems Ltd. 923 7% 4% 124 -16% 2% 13% 88 -4% 2% 10%Birlasoft Ltd. 833 48% 8% 107 65% 26% 13% 73 12% 78% 9%Tata Elxsi Ltd. 423 4% 10% 94 3% 34% 22% 75 14% 51% 18%Just Dial Ltd. 235 4% -3% 67 21% 0% 28% 62 8% -19% 26%Infibeam Avenues Ltd. 158 -51% -6% 41 -30% 2% 26% 13 -58% 8% 8%Total 125435 8% 3% 29484 10% 5% 24% 21576 6% 4% 17%
Source: AceEquity, PL-Profit to Loss and LP=Loss to Profit
Metal & Mining SectorOverall for Q3FY20, the metal sector’s operational performance was marked by subdued realisations both in ferrous and non-ferrous sector.
The subdued offtake from key user industries were driven by global uncertainty and weak demand in India. Steel volumes were strong in the quarter, rising 19% YoY and 19%
QoQ led by sharply higher exports to get rid of high-cost inventory, which impacted margins. All companies reported higher steel volumes in the quarter. Extended monsoon,

59 March 2020INSIGHT
liquidity issues and the weakness in the automobile sector impacted domestic steel demand registering a flat growth in Q3FY20 compared to demand growth of 3.8% in Q2FY20 thereby impacting realisations. This led EBITDA/tonne of domestic steel companies to slide to multi-quarter lows. Blended steel realizations declined sequentially impacted by weaker steel prices, re-set of half yearly automotive contracts at lower levels and higher export volumes. Spreads in the domestic operations of major steel players declined sequentially for all companies partly offset by lower input costs and lower other expenditure. Amid weak demand and lower global commodity prices, margins for steel companies were lower QoQ. Tata Steel, JSW Steel, Jindal Steel and SAIL reported ~Rs. 500-1,200/t contraction in margins in 3QFY20, with SAIL reporting the highest contraction. EBITDA/t at Tata Steel Europe was dismal with a loss of USD 57/t due to a fall in steel spreads, weak demand and purchase of carbon credits.
Most non-ferrous prices remained subdued during Q2FY20 with the average price of zinc at US$2387/tonne, down 9.2% YoY & up 1.4% QoQ. Average price of copper was at US$5891/tonne, down 3.7% YoY, up 1.4% QoQ. Average aluminium prices were at US$1765/tonne, down 10.7% YoY, 0.5% QoQ. Lead was an exception in metals as it reported average prices at US$2042/tonne, a increase of 0.6% QoQ and 3.9% YoY.
Tata Steel reported a subdued performance, with European realisations (down £75/tonne QoQ) a particular disappointment. Sales volumes for standalone business, Bhushan Steel and Europe business were at 3.4 MT, 1.26 MT and 2.35 MT, respectively. JSW Steel earnings below estimates due to weaker margins in domestic operations and disappointing earnings in overseas ops. Domestic unitary EBITDA/tonne fell at Rs. 5,998, down 7.3% QoQ (down 51% YoY). JSPL reported lower margins in domestic steel operations made up by higher earnings in Jindal Power (JPL) and Shadeed. Maintained quarterly run-rate of 3% debt reduction. EBITDA/t came tad below at Rs. 7,914, down 9.8% QoQ/32.7% YoY, due to higher than expected fall in realisation. Impacted by weak realisations and higher costs, SAIL’s
earning came in below estimates. EBITDA/t came in at Rs. 115, down 92% QoQ/98% YoY. In non-ferrous space, Hindalco reported aluminium and copper volumes were at 3.28 lakh tonnes & 86,000 tonnes, respectively. Its subsidiary - Novelis delivered strong quarter with EBITDA margin at US$430/t and flat volumes impacted by temporary destocking. Awaiting approval from European Commission to divest Aleris’s automotive asset in Duffel (Belgium) to Liberty House, a precondition for European asset acquisition. NMDC reported steady Q3FY20 numbers. Iron ore volumes at 8.4 MT were down 3% YoY & 45% QoQ. Hindustan Zinc’s earnings were below estimates due to lower than expected Lead/Silver volumes.
Q4FY20 is expected to be better for ferrous as spreads have moved sharply up following 9.4% QoQ uptick in domestic HRC prices and much better export realisations. On the mining front as well, an improvement can be seen led by higher iron ore prices and shipments. However, performance of non-ferrous stocks is expected to stay subdued owing to LME prices remaining under pressure. Spreads are expected to recover with a recovery in steel prices and lower coking coal costs partly offset by higher iron ore costs for non-integrated steel players. Slowdown in Chinese economic growth due to the corona virus and domestic liquidity concerns remain an overhang on metal prices rendering us neutral on the sector.
Volume trendQ3FY20 Q3FY19 YoY % Q2FY20 QoQ %
Tata Steel 3.4 3.0 15.4% 3.1 11.0%
Tata Steel BSL 1.3 0.9 36.3% 1.0 20.3%
JSPL 1.6 1.2 34.2% 1.3 21.1%
JSW Steel 4.0 3.7 9.5% 3.6 11.9%
SAIL 4.1 3.2 26.4% 3.1 29.9%
Jindal Stainless (kt) 239.3 204.1 17.2% 233.3 2.6%
Coal India 142.0 154.0 -8.1% 122.0 15.6%
NMDC 8.5 8.7 -2.8% 5.8 45.6%Source: Company, News Article, Industry Report, Ashika Research
Slowdown in Chinese economic growth due to the corona virus and domestic liquidity concerns remain an overhang on metal prices.

60March 2020 INSIGHT
Base metal price movement on LME (USD/tonne)Q3FY20 Q3FY19 YoY % Q2FY20 QoQ %
Zinc 2,387 2,630 -9.2% 2,353 1.4%
Lead 2,042 1,966 3.9% 2,029 0.6%
Alum. 1,756 1,966 -10.7% 1,765 -0.5%
Copper 5,891 6,120 -3.7% 5,808 1.4%
Source: Company, News Article, Industry Report, Ashika Research
EBITDA/ton trendQ3FY20 Q3FY19 YoY % Q2FY20 QoQ %
Tata Steel- standalone 9,638 15,318 -37.1% 11,264 -14.4%
Tata Steel BSL 2,194 10,954 -80.0% 4,988 -56.0%
JSPL- (Steel only) 7,914 11,754 -32.7% 8,769 -9.8%
JSW Steel- standalone 5,998 12,220 -50.9% 6,472 -7.3%
SAIL 115 7,965 -98.6% 1,374 -91.6%
Jindal Stainless 12,640 11,149 13.4% 13,590 -7.0%
Source: Company, News Article, Industry Report, Ashika Research
Metal & Mining CompaniesCompany (Rs Cr) Net
SalesYoY%
QoQ%
OperatingProfit
YoY%
QoQ%
OPM%
Net Profit
YoY%
QoQ%
NPM%
Tata Steel Ltd. 35520 -9% 3% 3620 -46% -5% 10% -1249 PL -138% -4%
Hindalco Industries Ltd. 29197 -12% -2% 3364 -12% -7% 12% 1060 -24% 9% 4%
Coal India Ltd. 23190 -7% 14% 4968 -27% 38% 21% 3921 -14% 11% 17%
Vedanta Ltd. 21360 -10% -3% 6514 15% 47% 30% 2665 14% -2% 12%
JSW Steel Ltd. 18055 -11% 3% 2451 -46% -10% 14% 214 -87% -92% 1%
Steel Authority Of India Ltd. 16542 4% 17% 1006 -61% -14% 6% -442 PL Loss -3%
Jindal Steel & Power Ltd. 9300 -3% 4% 1820 -12% 11% 20% -219 Loss Loss -2%
Hindustan Zinc Ltd. 4672 -16% 4% 2289 -19% 8% 49% 1620 -27% -22% 35%
NMDC Ltd. 3006 -18% 34% 1590 -26% 50% 53% 1375 -13% 96% 46%
Welspun Corp Ltd. 2888 20% 28% 367 93% 26% 13% 186 261% 80% 6%
APL Apollo Tubes Ltd. 2116 25% 28% 161 171% 123% 8% 83 547% 39% 4%
National Aluminium Company Ltd.
2088 -23% -12% 34 -93% 7% 2% -34 PL Loss -2%
Ratnamani Metals & Tubes Ltd. 756 4% 24% 108 7% -7% 14% 101 61% 32% 13%
MOIL Ltd. 256 -23% 1% 55 -64% -34% 22% 55 -54% -37% 22%
Hindustan Copper Ltd. 93 -80% -68% -41 PL PL -44% -96 PL PL NM
Total 169041 -8% 5% 28305 -26% 14% 17% 9240 -44% -40% 5%
Source: AceEquity, PL-Profit to Loss and LP=Loss to Profit
Pharmaceuticals SectorIndian Pharma reported one of its best quarters in recent years
driven by a consistent performance in the US, double-digit growth in the domestic market, improving
margins and continual balance sheet improvement. After an in-line 1H, Q3FY20 further lent a degree

61 March 2020INSIGHT
of stability as results were largely in-line on the revenue front and margins were ahead of expectations for most companies. Decent growth in the domestic formulations (up 9.2% YoY) was partially offset by muted US growth, flat YoY / up 3% QoQ. Domestic business was strong for both acute and chronic therapies mainly due to seasonality benefit and price hikes across portfolios while US business was also stable as the benefit from lower price erosion and stable-to-increasing market share was set off by disappointing new launch performance. Price erosion in the US market has stabilized in the mid-single digits. API segment reported sequential strong growth mainly due to product related opportunities. Most of the other geographies have reported decent growth on the back of volume gains and new launches. The U.S. business of pharma companies is expected to be under pressure, attributable to sustained regulatory hurdles from the USFDA as increased inspections are ending up with a number of observations/warning letters being issued. Moreover, rise in Official Action Initiated (OAI) status has been observed, which could further delay the approval process. Pressures are likely to be elevated as the average approvals for U.S. markets have declined to around 30 per quarter from around 65 per quarter over the
previous 2-3 quarters.
The outbreak of Corona Virus in China had resulted in a lockdown of industrial activity. This has raised concerns in terms of sourcing of input materials for pharma industry, as China is the largest source of intermediates and APIs. In the event of extended shutdown, the industry faces risk of supply disruption and increased input cost. Most companies have inventory of 3-4 months and are closely monitoring the situation. It is difficult to ascertain specific impact at this stage but a prolonged shutdown will impact the entire supply chain which could
have knock on effect on the cost of goods produced globally. It is expected that over a longer term the Indian API industry would stand to benefit as regulators encourage investments and incentivise the API industry to reduce dependence on China. Also, the cost arbitrage has narrowed between Indian and Chinese manufacturers given stricter environmental and compliance regulations.
Despite a visibly strong FY20, especially in the domestic space, there is likely to be a bit of uncertainty in the near-term. While the AIOCD data on MAT basis shows a balanced growth, companies have indicated that there are challenges from Jan-Aushadi programme of the govt. that is likely to impact volume uptake. In addition, though the US market has broadly stabilized in terms of price erosions, compliance issues and a lack of meaningful launches should moderate overall growth. In addition, given increased focus on specialty portfolio, companies are inching up R&D spend in the forthcoming quarters. In contrary to this, domestic markets have reported healthy growth and the same is expected to sustain going ahead, thus partially offsetting the impact of weakness in the U.S. business.
Domestic Formulation Business Growth (%)
Source: Company, Ashika Research
12.6
13.3
9.0
12.0
7.6 18
.0
15.2
4.3
-25.
9
-30.0 -25.0 -20.0 -15.0 -10.0
-5.0 0.0 5.0
10.0 15.0 20.0 25.0
Sun
Phar
ma
Dr R
eddy
's
Lupi
n
Cip
la
Cad
ila
Gle
nmar
k
Ipca
Torr
ent
Bioc
on
US Business Growth (%)
Source: Company, Ashika Research
-4.4
7.9
-2.9
18.0
-13.
4
16.0
-22.
2
22.0
-25 -20 -15 -10
-5 0 5
10 15 20 25
Sun
Phar
ma
Dr R
eddy
's
Lupi
n
Cipl
a
Cadi
la
Gle
nmar
k
Torr
ent
Auro
bind
o
US market has broadly stabilized in terms of price erosions, compliance issues and a lack of meaningful launches should moderate overall growth.

62March 2020 INSIGHT
ANDA Approved/Pending
Source: Company, Industry Report
32 24 22 20 17 14 15 7
103
52
154 152
63
96
49 42
0 20 40 60 80
100 120 140 160 180
Sun
Phar
ma
Cadi
la
Auro
bind
o
Lupi
n
Cipl
a
Dr R
eddy
's
Gle
nmar
k
Torr
ent
ANDA Approval in CY19 Pending ANDA approval
Company-wise revenue break-up (Rs. Bn.)
Source: Company, Industry Report, Ashika Research
25 30 9 14 16
25 0
18 13 8
14
15 2 3 3
0 10 20 30 40 50 60 70 80 90
Sun
Phar
ma
Auro
bind
o
Cipl
a
Lupi
n
Dr R
eddy
's
US India Europe ROW API + Others
Pharmaceuticals CompaniesCompany (Rs Cr) Net
SalesYoY%
QoQ%
OperatingProfit
YoY%
QoQ%
OPM%
Net Profit
YoY%
QoQ%
NPM%
Sun Pharmaceutical Industries Ltd. 8155 5% 0% 1760 -9% -2% 22% 1024 -30% -12% 13%
Aurobindo Pharma Ltd. 5895 12% 5% 1208 11% 6% 20% 706 -1% 10% 12%
Dr. Reddys Laboratories Ltd. 4397 14% -9% -289 PL PL -7% -556 PL PL -13%
Cipla Ltd. 4371 9% -1% 758 7% -17% 17% 354 9% -26% 8%
Piramal Enterprises Ltd. 3806 9% 6% 2296 13% 2% 60% 598 12% 31% 16%
Lupin Ltd. 3769 -5% -14% 429 -37% -41% 11% -841 Loss Loss -22%
Cadila Healthcare Ltd. 3638 2% 8% 693 -17% 11% 19% 364 -29% 340% 10%
Glenmark Pharmaceuticals Ltd. 2736 7% -3% 440 1% -2% 16% 191 64% -25% 7%
Alkem Laboratories Ltd. 2182 13% -4% 453 45% 0% 21% 390 90% 2% 18%
Torrent Pharmaceuticals Ltd. 1966 -4% -2% 540 -4% 0% 27% 251 2% 3% 13%
Biocon Ltd. 1748 13% 11% 444 17% 10% 25% 234 1% -11% 13%
Divis Laboratories Ltd. 1396 3% -3% 494 -7% 1% 35% 359 -8% 1% 26%
Ipca Laboratories Ltd. 1213 21% -6% 274 17% 3% 23% 200 25% 3% 16%
Alembic Pharmaceuticals Ltd. 1209 19% -3% 325 34% -6% 27% 228 33% -9% 19%
Abbott India Ltd. 1078 14% 2% 240 64% 17% 22% 187 59% 5% 17%
Glaxosmithkline Pharmaceuticals Ltd. 779 -6% -12% 124 -9% -36% 16% -661 PL PL -85%
Laurus Labs Ltd. 730 38% 2% 148 69% 8% 20% 73 312% 30% 10%
Granules India Ltd. 704 11% 1% 163 44% 14% 23% 64 10% -33% 9%
Ajanta Pharma Ltd. 651 34% 1% 186 73% 5% 29% 108 61% -8% 17%
Pfizer Ltd. 538 5% -5% 133 -14% -19% 25% 139 5% -10% 26%
Natco Pharma Ltd. 482 -13% -1% 129 -38% -4% 27% 104 -34% -11% 22%
Eris Lifesciences Ltd. 266 6% -6% 77 -18% -30% 29% 63 -21% -32% 24%
Procter & Gamble Health Ltd. 237 16% 5% 49 219% -2% 21% 38 -95% 7% 16%
Astrazeneca Pharma India Ltd. 224 4% 7% 37 -10% 10% 16% 27 -8% 85% 12%
Total 52170 8% -1% 11112 -6% -13% 21% 3643 -47% -49% 7%Source: AceEquity, PL-Profit to Loss and LP=Loss to Profit

63 March 2020INSIGHT
Operator-wise ARPU (Rs.)
Source: Company, News Article, Industry Report
80
90
100
110
120
130
140
Q2FY
19
Q3FY
19
Q4FY
19
Q1FY
20
Q2FY
20
Q3FY
20
Bharti Airtel Vodafone Idea Reliance Jio
Jun-19 Market Share (%)
Sep-19 Market Share (%)
Dec-19 Market Share (%)
Bharti 32.0 27.5 32.6 27.7 32.7 28.4
Vodafone Idea 38.3 32.9 37.3 31.7 33.3 28.9
RJIO 33.1 28.4 35.5 30.3 37.0 32.1
Industry 116.5 117.4 115.1 Source: TRAI
Total subscribers (crore)
Company (Rs Cr) Net Sales
YoY%
QoQ%
OperatingProfit
YoY%
QoQ%
OPM%
Net Profit
YoY%
QoQ%
NPM%
Bharti Airtel Ltd. 21947 8% 4% 9246 51% 5% 42% -617 PL Loss -3%
Vodafone Idea Ltd. 11089 -6% 2% 3421 194% 2% 31% -6539 Loss Loss -59%
Total 33037 3% 3% 12666 74% 4% 38% -7156 -54% 90% -22%Source: AceEquity, PL-Profit to Loss and LP=Loss to Profit
Telecom Companies
Telecom SectorAfter facing a blow from the Supreme Court’s unfavorable ruling on AGR liability in Oct’19 and the TRAI’s consultation process on IUC charge, telecom operators had undertaken tariff hike in December 2019. Telecom operators witnessed improved sequential performance in Q3FY20 as some benefits of tariff hike flowed through in terms of ARPU increase. Even on subscriber base, pressure was largely seen in Vodafone Idea while new operators continued to lead the pack. Vodafone Idea continued to lose subscriber with net loss of 4 crore customers during the quarter and resultant overall subscriber base at 33.3 crore while ARPU at Rs. 109 up 1.9% QoQ. Bharti Airtel subscriber base was largely stable with net addition of 13 lakh subscribers and subscriber base
of the company now stands at 32.7 crore with ARPU of Rs. 135, up 5.5% QoQ. Jio’s subscriber base was at 37.0 crore and net subscriber addition was
at 1.5 crore while ARPU remain flat at Rs. 128 QoQ. The mobile broadband addition continues to remain strong for RJIO and Bharti Airtel, while Vodafone Idea still lags behind due to the ongoing network integration and the lag with respect to 4G capacity addition and expansion vis-à-vis peers.
Going ahead, the investors are keenly awaiting the outcome of the adjusted gross revenue (AGR) liabilities saga. The Supreme Court dismissed telcos’ modification petition with respect to the AGR liabilities while asking them to pay before the next hearing on March 17. It is expected that this makes duopoly almost certain in the absence of government intervention. Chances of government intervention are slim, but it cannot be ruled out considering the judgment’s potential impact on PSUs with AGR liabilities.
Telecom operators witnessed improved sequential performance in Q3FY20 as some benefits of tariff hike flowed through in terms of ARPU increase.

64March 2020 INSIGHT
Technical view Key takeaways from February 2020 Coronavirus virus sweeps the globe, with cases in at
least 48 countries.
China cut the benchmark lending rate, the one-year loan prime rate (LPR) by 10 basis points to 4.05% from 4.15% and the five-year rate from 4.80% to 4.75%.
India became the world’s fifth largest economy last year, according to IMF’s October World Economic Outlook
Ratings agency Moody’s has slashed its 2020 growth projection for India to 5.4% from 6.6%
RBI maintained status quo in its latest policy announce-ment and kept the repo rate unchanged at 5.15%
Supreme Court refused relief and asked telecom opera-tors to pay adjusted gross revenue (AGR) dues by 17 March
Arvind Kejriwal-led Aam Aadmi Party (AAP) registered thumping victory in Delhi polls by winning 62 seats out of 70 seats.
India’s trade deficit rose 0.9% to $15.17 billion in January 2020 from $14.73 billion in January 2019.
Index of industrial production (IIP) shrank 0.3% in December from a 1.8% expansion a month ago.
IHS Markit India Manufacturing Purchasing Managers’ Index (PMI) jumped from 52.7 in December to 55.3 in January
Wholesale Price Index (WPI)-based inflation continued to accelerate higher to 3.1% in January 2020
CPI inched upwards to 7.59% during January against 7.35% in December.
SIAM announced the sales figures for January 2020 where domestic passenger vehicle sales declined 6.2%, total two-wheeler sales fell 16.06% and commercial vehicles sales were down 14.04% YoY.
Nifty vulnerable at higher levelsVolatility ruled the market in the month of February 2020 with a ‘V’ shaped recovery came post the Budget however was unable to sustain higher levels and soon entered negative territory. During the month Nifty ended with a decline of 3.34%. The Mid-cap Index was up by 4.18% and Small-Cap was down by 5.05%. Nifty midcap and small cap indices have retraced 61.8%. Faster pace of retracement signifies negative structural buildup. The market breadth stayed negative with A/D ratio of 1:3.1. Barring Telecom and Consumer Durables, all other indices ended in the red weighed by Realty, Auto, Infra and Capital Goods. The Telecom sector rose by 3.60% followed by Consumer

65 March 2020INSIGHT
Durable registering a growth of 2.94%. On the contrary Realty declined by 12% followed by Auto, Infra and Capital Goods registered degrowth of more than 9.5%. Trading data for FIIs and DIIs showed that during the month FIIs were net sellers to the tune of Rs.11255 Cr and DIIs were net buyers to the tune of Rs. 9311 Cr.
Nifty formed a bearish ‘Marubozu’ candle in weekly time frame, such pattern has a bearish implication as it paired most of the gains post the budget day. Marubozu Pattern means that bears have completely reverse the gains hence more bearish movement is still. Volume too were stron-ger to term that the downtrend has began.
Nifty witnessed selling pressure from its crucial hurdle of a Rising Trendline on monthly chart, it also witnessed break-down from the Broadening Formation on daily scale. However, the rising channel formation since last 5 years still remains in place and lower end of the channel at 11150-11200 would curb downside potential for Nifty.
In Elliott wave analysis currently, Nifty has been sliding to its IV wave. Price are falling in wave (i) of wave “(c)” of IV wave. In short term perspective 11100-11200 should pro-vide strong support as it further coincides with the 50% retracement and the 100WMA. Hence as per the present setup any rally towards 11800-11900 will provide a good shorting opportunity for a downside target of 11100-11200.
On the Oscillator front MACD histogram is in the negative zone on a weekly chart and oversold territory on a daily chart, indicating a possible positive move if Index is able to clear the resistance zone of 12270-12300. Daily 13 period ADX also indicates of a further trended downmove in Nifty as ADX is placed at 14 levels, the weekly stochastic oscillator has found support at key support area of its intermediate correction around the 40 mark. Hence, there is a higher possibility of a resumption of sharp trended movement in the market soon.
-40000
-30000
-20000
-10000
0
10000
20000
30000
40000
Feb-
18
Apr-
18
Jun-
18
Aug-
18
Oct-
18
Dec-
18
Feb-
19
Apr-
19
Jun-
19
Aug-
19
Oct-
19
Dec-
19
Feb-
20
FII
-14.00% -12.00% -10.00%
-8.00% -6.00% -4.00% -2.00% 0.00% 2.00% 4.00% 6.00%
Rea
lty
Infr
a Oil
Met
al
Util
ities
Ener
gy
Larg
eCap
Mid
cap
Fin
ance
Hea
lthca
re
Teck
Tele
com
Sector & Industry

66March 2020 INSIGHT
Other correlated asset classes like Gold is on the higher path as a mounting coronavirus death toll supported safe-haven buying in yellow metal amidst PBoC’s injec-tion of 1.7 trillion Yuan ($242.74 billion) via reverse repos in an efforts to support the jolted economy from the outbreak that is expected to have a devastating impact on its first quarter growth. Not only are the Chinese factories affected by lockdowns and quarantines, production sites in other countries are also running low due to supply disruption. While oil prices may remain on weaker path as energy demand globally would take long-term hit
from growing coronavirus outbreak outweighing the efforts by OPEC to stabilize prices. Until the fear of the contagion virus diminishes downtrend in oil is unlikely to be reversed. The domestic currency USDINR continues its losing streak after the outbreak of coronavirus. RBI too in its recently held credit policy meet extended the decision to keep interest rates unchanged as surging inflation kept policy makers from easing again to support economic growth, Indian rupee reacted negative and is likely to have bearish outlook.
Crystal Gazing the Derivative Data
Nifty rollovers on expiry day stood at 77% on provisional basis, higher than the February series figure of 66% while market wide rollover stood at 85% v/s 88% in the previous month. Short positions created by FIIs during the series have been rolled over to the next month and fresh short positions have been added in the new series. India VIX — which measures market’s perception of risk in near-term, moved up by 5.7% in the February series. Put writers are holding positions which indicates that there is possibility of a bounce-back to 11,750, but it will remain a ‘sell on rise’ situation. The 11800 strike holds the highest open interest among Nifty put options, followed by the 11700 strike. The 12000 strike holds the highest number of open positions among Nifty call options expiring March 26.
60
62
64
66
68
70
72
74
76
Jan-
17
Apr-
17
Jul-1
7
Oct-
17
Jan-
18
Apr-
18
Jul-1
8
Oct-
18
Jan-
19
Apr-
19
Jul-1
9
Oct-
19
Jan-
20
USD-INR
1000
1100
1200
1300
1400
1500
1600
1700
Jan-
17
Apr-
17
Jul-1
7
Oct-
17
Jan-
18
Apr-
18
Jul-1
8
Oct-
18
Jan-
19
Apr-
19
Jul-1
9
Oct-
19
Jan-
20
Gold USD per Oz
25
35
45
55
65
75
85
95
Jan-
17
Apr-
17
Jul-1
7
Oct-
17
Jan-
18
Apr-
18
Jul-1
8
Oct-
18
Jan-
19
Apr-
19
Jul-1
9
Oct-
19
Jan-
20
Brent Crude (USD per Barrel)
9075
9225
5175
5432
25
3360
0
5002
5
3675
0
6330
0
4844
25
6834
75
8010
75
1150
500
8819
25 18
5655
0
7620
00
1070
175
7148
25
4459
50
1287
375
3540
75
1233
75
1701
75
6412
50
1618
200
5496
75
7643
25
1330
050
9768
75
1655
925
1039
200
1895
325
2395
350
6453
75
1874
475
4387
50
4902
75
1236
75
1654
50
7640
25
2542
5
0
500000
1000000
1500000
2000000
2500000
3000000
1070
0
1080
0
1090
0
1100
0
1110
0
1120
0
1130
0
1140
0
1150
0
1160
0
1170
0
1180
0
1190
0
1200
0
1210
0
1220
0
1230
0
1240
0
1250
0
1260
0
Call
Put
Call -Put Options Open Interests Distributions for Mar’20 Contract

67 March 2020INSIGHT
Summing it up In the month of February Index started on a positive note gained sharply at the beginning but failed to sustain above crucial resistance zone 12250-12300, consolidated for a brief period and then registered downtrend. The sharp surge or the ‘V’ shaped recovery traditionally leads to a consolidation for a certain period before the sharp downtrend started. However in the present scenario bias would remain corrective as long as index maintains lower high-low formation. Hence, to pause the ongoing correc-tive decline, index need to decisively close above previous swing high of 12250-12300. Strong support for Nifty exist in the range of 11100 11300- as s it is confluence of 61.8% retracement of last major up move (10637-12430) at 11322, Long term upward sloping trend line at 11000. Hence structurally, over past six weeks index has corrected by over 7% that hauled weekly stochastic oscillator to cool off the overbought condition (currently placed at 45). Hence, we believe that the ongoing secondary corrective decline in a major up move will make market healthy with stock specific action and pave way to challenge the upper band of consolidation at 12300 and beyond.
Other Indices to watch forNifty Media: The down trend in the sector since 2018 onward seems to be reversing with of the sector since 2015 onward seems to have been reversing with positive divergence in oscillator and breach of downward sloping trendline. Prices sustaining above the recent congestion zone of 1920-1930 can be earmarked as a clear emergence of uptrend and projects price target from 23.6% retrace-ment at 2070-2130.
Nifty MNC: The sector has been making a sequence of higher high and higher low since August 2018 onward. Historically a bullish Flag formation was also initiated, and target is still awaited. The sector has been facing resistance around 14400-14420 for multiple number of time. Sustaining decisively above the said resistance with
volume projects an upside target developing from the ‘Flag’ formation at 15100 and beyond.
Activity in broader SpaceNSE 500 Stocks at 52 Week High
Sl No. Stocks Close Price
1 Biocon 314.3
2 CDSL 289.3
3 Essel Propack 190.7
4 FDC 256.6
5 GMR Infrastructure 25.5
6 Indian Energy Exchange 193.6
7 JK Cement 1494.1
8 Shilpa Medicare 489.5
9 Tasty Bite Eatables 12605.1
10 Tube Investments of India 544.5
NSE 500 Stocks with highest delivery position
Sl No. Stocks Close Price
1 UltraTech Cement 4395.0
2 Zee Entertainment 249.1
3 Bata India 1759.4
4 NIIT Technologies 1838.8
5 Adani Gas 164.7
6 Can Fin Homes 510.4
7 Berger Paints India 568.3
8 Divi's Laboratories 2160.5
9 Grasim Industries 724.9
10 Swan Energy 136.8
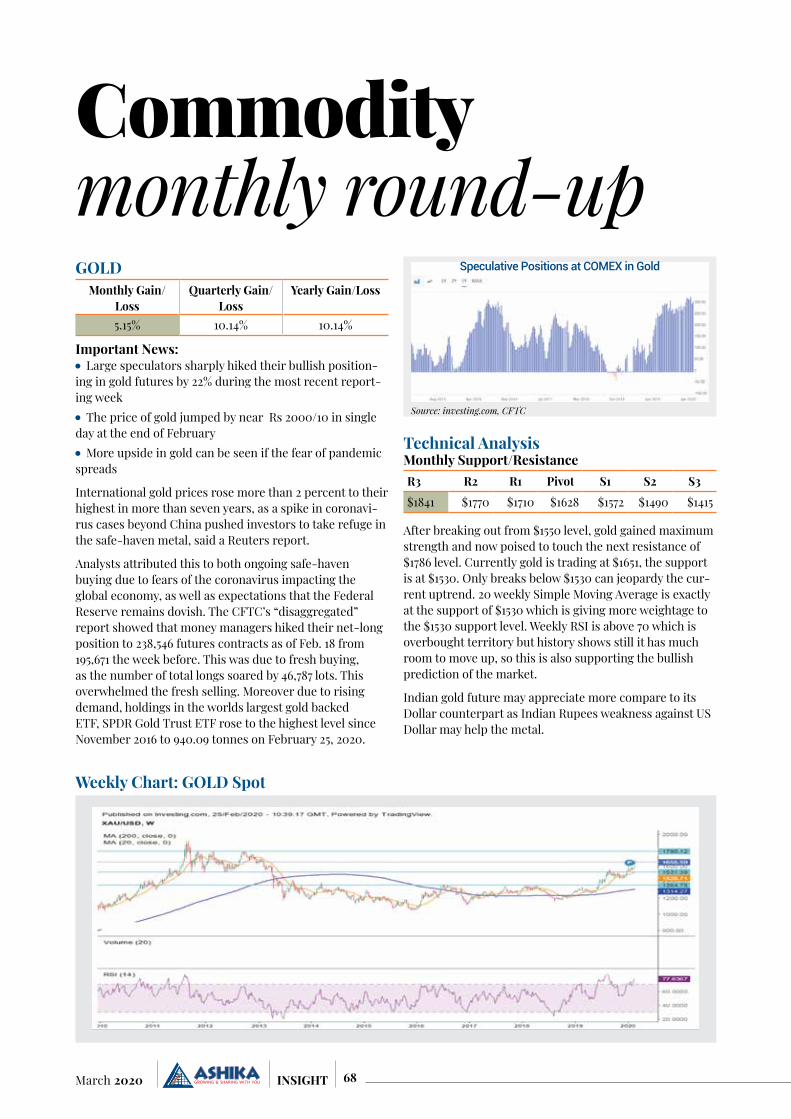
68March 2020 INSIGHT
GOLDMonthly Gain/
LossQuarterly Gain/
LossYearly Gain/Loss
5.15% 10.14% 10.14%
Important News: Large speculators sharply hiked their bullish position-
ing in gold futures by 22% during the most recent report-ing week The price of gold jumped by near Rs 2000/10 in single
day at the end of February More upside in gold can be seen if the fear of pandemic
spreads
International gold prices rose more than 2 percent to their highest in more than seven years, as a spike in coronavi-rus cases beyond China pushed investors to take refuge in the safe-haven metal, said a Reuters report.
Analysts attributed this to both ongoing safe-haven buying due to fears of the coronavirus impacting the global economy, as well as expectations that the Federal Reserve remains dovish. The CFTC’s “disaggregated” report showed that money managers hiked their net-long position to 238,546 futures contracts as of Feb. 18 from 195,671 the week before. This was due to fresh buying, as the number of total longs soared by 46,787 lots. This overwhelmed the fresh selling. Moreover due to rising demand, holdings in the worlds largest gold backed ETF, SPDR Gold Trust ETF rose to the highest level since November 2016 to 940.09 tonnes on February 25, 2020.
Technical AnalysisMonthly Support/ResistanceR3 R2 R1 Pivot S1 S2 S3$1841 $1770 $1710 $1628 $1572 $1490 $1415
After breaking out from $1550 level, gold gained maximum strength and now poised to touch the next resistance of $1786 level. Currently gold is trading at $1651, the support is at $1530. Only breaks below $1530 can jeopardy the cur-rent uptrend. 20 weekly Simple Moving Average is exactly at the support of $1530 which is giving more weightage to the $1530 support level. Weekly RSI is above 70 which is overbought territory but history shows still it has much room to move up, so this is also supporting the bullish prediction of the market.
Indian gold future may appreciate more compare to its Dollar counterpart as Indian Rupees weakness against US Dollar may help the metal.
Commodity monthly round-up
Weekly Chart: GOLD Spot
Source: investing.com, CFTC
Speculative Positions at COMEX in Gold

69 March 2020INSIGHT
Value Investing and Behavioral Finance by Parag Parekh
BOOK REVIEW
This month the book review chosen is Value Investing and Behavioral Finance by Parag Parikh. This book
talks about value investing and the behavioral traits required to be successful in equity markets. He touches upon the mental strength and models required for being a successful investor and to ward of the basic instinct of greed and fear which leads to sub-par decision making in investing. What an investor requires in terms of the emotional quotient (EQ) and the intelligent quotient (IQ) and the importance of EQ over IQ is very well laid out.
The first chapter discussed is about the reasons for success and failure of an investor. The basic characteristics of human nature of laziness, greedy, ambition, self-interest, ignorance and vanity are a deterrent in taking sound decision making and clouds our rational mind to look through a given situation with clarity. More
importantly, unwillingness to delay gratification and the inherent
nature of human being to seek the fastest and the easiest way to get the things they want and want it right now. The pull of the expediency factor is so strong that the long-term consequences are highly compromised. Hence the “law of the farm” which says that you cannot sow a seed today and reap tomorrow is ignored. It takes time for the seed to grow into a tree. It has to go through different seasons. Self-discipline in a sense is overlooked and processes and hard work is compromised because of the heuristic biases.
In the second chapter he talks about the market returns and the actual returns based on fundamentals and the speculative returns built into the price is gauged to understand how much fundamental is factored into the markets and how much is speculative in nature.
The table below is reflective of his way of thinking of various factors embedded in the market returns.
The basic characteristics of human nature of laziness, greedy, ambition, self-interest, ignorance and vanity are a deterrent in taking sound decision making and clouds our rational mind to look through a given situation with clarity.

70March 2020 INSIGHT
Date Sensex PE Ratio Normal Return
Total Return
Fundamental Return Specula-tive Return
Dvd. Yld.EPS Return
Dec-10 20509 20.4 17.4% 18.9% 993.6 38.6% -20.9% 1.2%
Dec-11 15455 14.8 -24.6% -18.8% 1083.5 9.1% -29.7% 1.8%
Dec-12 19427 16.7 25.7% 23.7% 1163.4 7.4% 14.7% 1.6%
Dec-13 21171 16.7 9.0% 8.5% 1247.3 7.2% -0.3% 1.6%
Dec-14 27499 19.4 29.9% 32.4% 1409.0 13.0% 17.9% 1.5%
Dec-15 26118 19.3 -5.0% -5.1% 1321.3 -6.2% -0.5% 1.6%
Dec-16 26626 19.9 1.9% 3.6% 1307.2 -1.1% 3.0% 1.7%
Dec-17 34057 23.3 27.9% 31.6% 1459.9 11.7% 18.6% 1.3%
Dec-18 36068 26.9 5.9% 7.4% 1336.3 -8.5% 14.4% 1.5%
Dec-19 41254 25.0 14.4% 12.2% 1594.7 19.3% -8.5% 1.4%Total Return = Fundamental Return + Speculative Return + DividendFundamental Return = % change in EPS YoYSpeculative Return = EPS * Change in PE ratio/Price Paid
He talks about PE contractions and expansion and the long-term fundamental returns is equal to the growth in earnings whereas the PE contraction and expansion in the short term leads to speculative returns built into the price because of various forces coming to play along with the fundamentals. Hence the oscillation of Mr. Market between greed and fear.
Also, corporate performance and shareholders performance can be diagonally opposite. It is the behavioral traits of the investor in particular and the crowd behavior of the markets in general which makes equity investing appear a risky proposition. Real discipline and courage is: you buy when you emotionally do not feel like buying, and sell when your heart says no but the mind and the logic say yes.
In this book he exhaustively talks about behavioral finance which is a subject that combines the understanding of behavioral and cognitive psychology with financial decision-making processes. As Warren Buffet says, “It is only when you combine sound intellect with emotional discipline that you get rational behavior.”
Then he talks about different style of investing and the distinction between value investing and growth investing. The three integral sources of value are assets, earnings and growth.
Also, the role of process versus outcome, as process is important in defining the success in the long run. Chance plays a crucial role in determination of an outcome in a singular event. But in a sequence of event, the role of chance diminishes, and it is the process that plays the
crucial role.
Value investing: When one buys a stock, one is buying a business. It is necessary to understand that the business is good and sustainable. Its earnings stream is also predictable. The price the investor pays for this business is important. A value investor will buy this business at a much lower value than the fundamentals justify. One major distinction on value one should bear in mind is between “value in use” and “value in exchange”. Water has good value in use and gold has good value in exchange.
He talks about behavioral obstacles for pursuing value strategies, like error of judgement, well-run companies= good companies, instant gratification, loss aversion and valuation heuristics as an impediment for it. Interesting in it is the loss aversion where people generally tend to take more risks simply to avoid acknowledging a certain loss and avoid taking extra risk even if it entails a higher profit potential. Also, with regards to valuation heuristics (Heuristics are the short cut the brain takes when processing information. It does not process full information. This leads
When one buys a stock, one is buying a business. It is necessary to understand that the business is good and sustainable. Its earnings stream is also predictable.

71 March 2020INSIGHT
to cognitive biases) or the rules of the thumb in valuing companies which becomes the innovations of the valuation game and hence become the distorted benchmark for the industry so as to do a swift valuation for earning quick bucks. Some of the valuation heuristics are P/E, P/B, P/Sales etc.
For growth investing he sums up well by saying that for any stock to be a growth stock it has first to be a value stock. Value and growth are inseparable. The concept of growth stock is a product of a bull market. It dies when the bear market sets in. Bear market create values.
Behavioral traits pursing growth strategies which one needs to be vigilant of are availability heuristics, follow the herd, chasing fads and fancies, novelty over familiarity, instant gratification, rationalization trap and expectation investing.
Important to highlight is that growth of a company doesn’t translates to return of stocks. A company’s value is a function of market expectations for its growth rate and its economic return (i.e., return of capital higher than its cost of capital consistently).
In the fourth chapter he talks about Contrarian Investor as the one who attempts to profit by betting against conventional wisdom, but only when consensual opinion appears to be wrong. What really differs a contrarian investor is his emphasis on looking for opportunities where the sensual opinion has led to mispricing. And the difficulties following a contrarian investing is psychological constraints, group thinking, false consensus effect, buyers remorse, ambiguity effect, illusion of control, herd mentality, myopic loss aversion, recency
effect, confirmation trap and also organizational constraints.
In the fifth chapter he talks about growth traps and real behavioral biases for it are availability heuristic, go with the herd, overconfidence bias, bystander effect, peer pressure effect, information cascades and halo effects. Also, the earlier talked about growth investing and its behavioral traits also to be looked at in contrast.
Investment opportunities don’t come daily. However, the noise of the markets offers mispriced securities from time to time. All information on companies is always readily available. This can never be an edge in investing. Being in control of one’s impulses and keeping the urges in control will help one to spot mispriced opportunities and avoid the growth trap.
For commodities the valuation in the short term is dependent on r/m prices, product price change, debt level, low cost producers etc. Volatility in the short term with
regards to various factors leads to intense speculative activity and the thrill of momentum investing in the stock. Whereas in the long run, it is the net cash generated by the business that determines the returns for the shareholders and needs to look in perspective of how competent the business is in generating free cash flow in the long-term. Commodity cycle plays a key role and replacement value and its discount and premium to it is the key to spot any opportunity in it. More importantly when a rise in the price of a commodity occurs, there will ordinarily be a larger advance, percentage-wise, in the shares of high-cost producers than in the share of low-cost producers, contrary to the general perception. Hence high-cost producers are more logical commitments that those of low-cost producers when the buyer is convinced that a rise in the price of a commodity is imminent.
Then he goes on to talk about PSU sector and Sector investing. In sector investing top-down approach, high-growth sector is looked at and the behavioral traits in it are the representativeness bias, availability, herd mentality, anchoring, winner’s curse ad confirmation bias. Companies in out-of-favor sectors can result in healthy investor returns.
For IPOs the author has a firm belief that IPO’s generally are richly priced because of the behavioral biases of the promoters, merchant bankers, venture capitalist, private equity investors and the likes. IPO during bear phase is the one to be closely looked at, because of the low expectation and less aggressiveness in pricing the IPO in bad markets for fear of undersubscription.
A company’s value is a function of market expectations for its growth rate and its economic return (i.e., return of capital higher than its cost of capital consistently).

72March 2020 INSIGHT
Mon
day
Tues
day
Wed
nesd
ayTh
ursd
ayFr
iday
23
45
6
IN: M
arki
t Ind
ia P
MI M
fgIN
: Eig
ht In
fras
truc
ture
Indu
stri
esUS
: ISM
Man
ufac
turi
ngCH
: Cai
xin
Chin
a PM
I Mfg
JN: J
ibun
Ban
k Ja
pan
PMI M
fg
EC: C
PI M
oMUK
: Mar
kit/
CIPS
UK
Cons
truc
tion
PMI
EC: U
nem
ploy
men
t Rat
eEC
: PPI
YoY
IN: M
arki
t Ind
ia P
MI C
ompo
site
IN: M
arki
t Ind
ia P
MI S
ervi
ces
US: A
DP
Empl
oym
ent C
hang
eUS
: ISM
Non
-Man
ufac
turi
ng In
dex
CH: C
aixi
n Ch
ina
PMI C
ompo
site
US: I
nitia
l Job
less
Cla
ims
US: D
urab
le G
oods
Ord
ers
US: F
acto
ry O
rder
sUS
: Blo
ombe
rg C
onsu
mer
Com
fort
US: C
ap G
oods
Ord
ers N
onde
f Ex
Air
US: C
hang
e in
Non
farm
Pay
rolls
US: U
nem
ploy
men
t Rat
eUS
: Tra
de B
alan
ceUS
: Who
lesa
le In
vent
orie
s MoM
JN: L
eadi
ng In
dex
CI
910
1112
13
CH: T
rade
Bal
ance
JN: G
DP
SA Q
oQJN
: Tra
de B
alan
ce B
oP B
asis
IN: M
anpo
wer
Sur
vey
CH: C
PI Y
oYEC
: GD
P SA
QoQ
CH: P
PI Y
oYJN
: Mac
hine
Too
l Ord
ers Y
oY
US: C
PI M
oMUS
: MBA
Mor
tgag
e Ap
plic
atio
nsUK
: Ind
ustr
ial P
rodu
ctio
n M
oMUS
: Mon
thly
Bud
get S
tate
men
tUK
: Tra
de B
alan
ce G
BP/M
n
IN: I
ndus
tria
l Pro
duct
ion
YoY
IN: E
xpor
ts Y
oYIN
: CPI
YoY
US: I
nitia
l Job
less
Cla
ims
EC: E
CB M
ain
Refin
anci
ng R
ate
US: U
. of M
ich.
Sen
timen
tJN
: Ter
tiary
Indu
stry
Inde
x M
oMUS
: Im
port
Pri
ce In
dex
MoM
1617
1819
20
IN: W
hole
sale
Pri
ces Y
oYJN
: Cor
e M
achi
ne O
rder
s MoM
US: E
mpi
re M
anuf
actu
ring
CH: I
ndus
tria
l Pro
duct
ion
YTD
YoY
UK: R
ight
mov
e H
ouse
Pri
ces M
oM
JN: I
ndus
tria
l Pro
duct
ion
MoM
UK: J
oble
ss C
laim
s Cha
nge
US: R
etai
l Sal
es A
dvan
ce M
oMUK
: ILO
Une
mpl
oym
ent R
ate
3Mth
sUS
: Ind
ustr
ial P
rodu
ctio
n M
oM
US: F
OM
C Ra
te D
ecis
ion
(Upp
er B
ound
)EC
: CPI
YoY
US: H
ousi
ng S
tart
sJN
: Tra
de B
alan
ceUS
: Bui
ldin
g Pe
rmits
US: I
nitia
l Job
less
Cla
ims
JN: N
atl C
PI Y
oYJN
: All
Indu
stry
Act
ivity
Inde
x M
oMUS
: Lea
ding
Inde
xUS
: Phi
lade
lphi
a Fe
d Bu
sine
ss O
utlo
ok
US: E
xist
ing
Hom
e Sa
les
UK: P
SNB
ex B
anki
ng G
roup
s
2324
2526
27
EC: C
onsu
mer
Con
fiden
ceUS
: Chi
cago
Fed
Nat
Act
ivity
Inde
xUS
: New
Hom
e Sa
les
JN: J
ibun
Ban
k Ja
pan
PMI M
fgEC
: Mar
kit E
uroz
one
Man
ufac
turi
ng P
MI
US: R
ichm
ond
Fed
Man
ufac
t. In
dex
JN: M
achi
ne T
ool O
rder
s YoY
UK: C
PI Y
oYUS
: Dur
able
Goo
ds O
rder
sUK
: PPI
Out
put N
SA M
oMUS
: FH
FA H
ouse
Pri
ce In
dex
MoM
UK: R
PI M
oM
UK: B
ank
of E
ngla
nd B
ank
Rate
US: I
nitia
l Job
less
Cla
ims
US: G
DP
Annu
aliz
ed Q
oQUS
: Who
lesa
le In
vent
orie
s MoM
UK: R
etai
l Sal
es In
c Au
to F
uel M
oM
US: U
. of M
ich.
Sen
timen
tJN
: Tok
yo C
PI E
x-Fr
esh
Food
YoY
US: P
erso
nal I
ncom
eUS
: Per
sona
l Spe
ndin
gUS
: PCE
Cor
e D
eflat
or M
oM
3031
UK: N
atio
nwid
e H
ouse
PX
MoM
UK: M
ortg
age
Appr
oval
sUS
: Pen
ding
Hom
e Sa
les M
oMEC
: Con
sum
er C
onfid
ence
US: D
alla
s Fed
Man
f. Ac
tivity
IN: E
ight
Infr
astr
uctu
re In
dust
ries
JN: I
ndus
tria
l Pro
duct
ion
MoM
JN: J
oble
ss R
ate
UK: G
DP
QoQ
EC: C
PI M
oM
IN: I
ndia
, US:
Uni
ted
Stat
es, E
C: E
urop
ean
Unio
n, U
K: U
nite
d Ki
ngdo
m, C
H: C
hina
, JN
: Jap
an
Wor
ld ec
onom
ic ca
lend
ar
Mar
ch 2
020
73 March 2020INSIGHT
For institution business please contactMr. Dilip Minny (Co-founder- Institution); Mobile: +91 90070 66096; Email: [email protected]
Products Products Contact
• TradeX (Mobile App & Web base)
• Online Equity, Derivative, Currency and Commodity Trading Facility
• InvestX (Mobile App & Web base) • A One Stop Solution to all
your Mutual Funds needs online.
• Back Office Reports on WhatsApp. Ashika BOT on
Whatsapp / Telegram.
• Ask ACIRA - • Online Customer service
for clients on our website.
• Margin Trading Facility (MTF)
• With this MTF facility client can trade inspite of debits beyond T+7.
• EKYC • it now takes just 30 mins to open an
Account.
• ReKYC • hassle-free & paperless modification
without stepping out.
• Research Services• A galaxy of potential research team
to provide the best equity research reports, ideas, solving queries and many more.
• Online Fund Transfer Facility
• Securities Lending and Borrowing (SLB) • Provide securities lending and
borrowing at a market competitive rates
• Depository Services (CDSL/NSDL) • Provide one roof solution wherein
seamless trading could be ensured through DP maintained with Ashika
For Business Opportunity please contact
Mr. Amit Jain (CEO – Retail)Mobile: +91 90070 66000E-mail: [email protected]
Mr. Niraj Sarawgi (CEO - PCG)Mobile: +91 91676 16989Email: [email protected]
For Services please contact
Mr. Ashwini Kumar Gautam (COO)Mobile: +91 90070 66097Email: [email protected]
Services at Ashika Stock Broking Limited
For start-up investing please contact Mr. Chirag Jain (CEO); Contact: +91 22 66111700; E-mail: [email protected]
Capital Markets Fund Raising Advisory Contact
• Issue Management • IPO / FPO • Right Issue • Qualified
Institutional Placement
• Open Offer • Takeover • Buyback • Delisting
• Overseaslisting
• Underwriting
• Private Equity• Venture /
Growth Capital • Pipe
• Debt Syndication• Project Finance• Team Loan• Working Capital
Loan • Acquisition
Funding • Construction
Finance
• M &A• Merger / Acquisition /
Disposal• Management Buy-outs /
Buy-ins• Leveraged Buy-outs • Joint Ventures• Strategic Partnership • Spin-Offs• Divestment
• Corporate restructuring• Capital Restructuring • Finance Restructuring
• Business Valuation• ESOP Valuation • Fairness Opinion
For Debt Fund Raising / Mergers & Acquisition / Business Opportunity please contact
Mr. Mihir MehtaContact: +91 22 6611 1770Email: [email protected]
Mr. Yogesh ShetyeContact: + 91 22 6611 1770E-mail: [email protected]
Services at Ashika Capital Limited

74March 2020 INSIGHT
Ashika Global Securities Pvt. Ltd is the holding company of Ashika Group, an RBI-registered non-deposit taking NBFC engaged in providing long term and short term loans & advances to individual & body corporate and Invest-ment in shares and securities. It has 6 wholly owned subsidiaries including Ashika Stock Broking Ltd.
Ashika Global Securities Pvt. Ltd.
It is the Flagship company of the group and incorporated in the year 1994. A RBI registered Non-Banking Financial Company carrying on NBFI Activities i.e. investment in shares an securities and providing Loan to Individuals, corporates HNI etc. The company floated its shares to public in 2000 and got listed with CSE. Thereafter, in 2011 , the shares were traded on BSE under permitted category and in 2014 got listed with MSEI. It has a registered FII as one of its investor.
Ashika Credit Capital Ltd.
Registered under ROC, Mumbai on 13 WJuly 2017. It is a wholly owned subsidiary of Ashika Global Securities Pvt Ltd. The company has created a trust named Ashika Alternative Investment and has applied to SEBI for registration under Category 3, AIF.
Ashika Investment Managers Pvt. Ltd.
Contact
Ashika Wealth Advisors is a boutique Wealth management firm offering personalized investment management solutions to high net-worth indi-viduals, families, businesses, trusts, private foundations, and non-profit organizations. Our aim is to grow Wealth by selecting the right balance of asset classes and product categories with timely switches and periodical rebalancing.
For Wealth Advisory please contact
Mr. Amit Jain (Co-Founder & CEO)Mobile: +91 93134 89991Email: [email protected]
Services at Ashika Wealth Advisory Private Limited

75 March 2020INSIGHT
AWARDS
Helping Clients Reach for Better Via SIP – National from Franklin Templeton Investments, 2018NSDL STAR PERFORMANCE AWARD 2018
NSE Market Achievers Award 2018REGEIONAL RETAIL MEMBER OF THE YEAR 2018 -
EASTERN INDIA
NSE Market Achievers Award 2017REGEIONAL RETAIL MEMBER OF THE YEAR 2017 -
EASTERN INDIA
NSDL Stock Performer Awards of the Year 2019
BTVI Emerging Company of the Year 2019
CDSL Excellent Performer in Depository Services
BTVI Young Business Leader of the Year 2019

76March 2020 INSIGHT
Ashika Stock Broking Ltd.Ashika Stock Broking Limited (“ASBL”) started its journey in the year 1994 and is presently offering a wide bouquet of services to its valued clients including broking services, depository services and distributorship of financial prod-ucts (Mutual funds, IPO & Bonds). It became a “Research Entity” under SEBI (Research Analyst) Regulations 2014 in the year of 2015 (Reg No. INH000000206).
ASBL is a wholly owned subsidiary of Ashika Global Securities (P) Ltd., a RBI registered non-deposit taking NBFC Company. ASHIKA GROUP (details enumerated on our website www.ashikagroup.com) is an integrated financial service provider inter alia engaged in the business of Investment Banking, Corporate Lending, Com-modity Broking, Debt Syndication & Other Advisory Services.
There were no significant and mate-rial disciplinary actions against ASBL taken by any regulatory authority during last three years except routine matters.
DISCLOSUREResearch reports are being prepared and distributed by ASBL in the sole capacity of being a Research Analyst under SEBI (Research Analyst) Regu-lations 2014. The following disclosures and disclaimer are an essential part of any Research Report so being distributed.
1) ASBL or its associates, its Research
Analysts (including their relatives) may have financial interest in the subject company(ies). And, the said financial interest is not limited to having an open stock market position in /acting as advisor to /having a loan transaction with the subject com-pany(ies) apart from registration as clients.
2) ASBL or its Research Analysts (including their relatives) do not have any actual / beneficial ownership of 1% or more of securities of the subject company(ies) at the end of the month immediately preceding the date of publication of the source research report or date of the concerned public appearance. However, ASBL’s associates may have actual / beneficial ownership of 1% or more of securities of the subject company(ies).
3) ASBL or its Research Analysts (including their relatives) do not have any other material conflict of interest at the time of publication of the source research report or date of the concerned public appearance. However, ASBL’s associates might have an actual / potential conflict of interest (other than ownership).
4) ASBL or its associates may have received compensation for investment banking, merchant banking, broker-age services and for other products and services from the subject compa-nies during the preceding 12 months. However, ASBL or its associates or its
Research analysts (forming part of Research Desk) have not received any compensation or other benefits from the subject companies or third parties in connection with the research report/ research recommendation. Moreover, Research Analysts have not received any compensation from the companies mentioned in the research report/ recommendation in the past twelve months.
5) The subject companies in the research report/ recommendation may be a client of or may have been a client of ASBL during the twelve months preceding the date of con-cerned public appearance for invest-ment banking/ merchant banking / brokerage services.
6) ASBL or their Research Analysts have not managed or co–managed public offering of securities for the subject company(ies) in the past twelve months. However, ASBL’s associates may have managed or co–managed public offering of securities for the subject company(ies) in the past twelve months.
7) Research Analysts have not served as an officer, director or employee of the companies mentioned in the report/ recommendation.
8) Neither ASBL nor its Research Analysts have been engaged in market making activity for the companies mentioned in the report / recommendation.
DISCLAIMERThe research recommendations and information are solely for the personal information of the authorized recipient and does not con-strue to be an offer document or any investment, legal or taxation advice or solicitation of any action based upon it. This report is not for public distribution or use by any person or entity, where such distribution, publication, availability or use would be contrary to law, regulation or subject to any registration or licensing requirement. We will not treat recipients as customer by virtue of their receiving this report. The report is based upon the information obtained from public sources that we consider reliable, but we do not guarantee its accuracy or completeness. ASBL shall not be in anyways responsible for any loss or damage that may arise to any such person from any inadvertent error in the information contained in this report. The recipients of this report should rely on their own investigations.

77 March 2020INSIGHT
Donate here: https://rzp.io/i/eqMEM6I
Gyanada Foundation Details 12A:M.No.DIT(E)/8E/472/2013-14/14-15/T-94/1672-7480G: No.DIT (E)/8E/472/2013-14/14-15/G-187/1675-77PAN: AABTG9774GTrust Registration No: IV 06246 of 2013Facebook: @gyanadafoundation, Twitter: @Gyanada_Fdn, Instagram: gyanada_fdn, Website: gyanada.org
Gyanada FoundationAshika Group supports charitable foundation to fuel the aspirations of young girls in India.The new year has brought in new aspirations for Gyanada Foundation. With goals set and a lot of events lined up for the coming year, we’ve started strong in the month of January. Here are a couple of highlights of our head start.
FELLOWSHIP WITH GYANADA FOUNDATIONWe’re happy to share that our fellowship enrolment will soon open by the first week of March. Fellowship with Gyanada Foundation is a two-year program for students or IT professionals, designed at and deployed in under-resourced schools to introduce school children to Computer Programming (CS) and Physical Computing. It is a wonderful opportunity for fellows to design the learning content of the classes they lead. By teaching children of grade 7th to 9th, they have the chance to shape an alternative way of learning and education. In this process, our fellows in turn become life long learners. To know more about our fellowships, visit: https://www.gyanada.org/fellowship.html
FUNDRAISING FOR GYANADA LABSAffordable Gyanada labs have been our way to provide kids with hands on experience with technology. With Raspberry pi and Arduino, we have been able to establish low cost labs. We wish to open up new ones to further expand their reach to children. For this, we’ll soon be hosting a crowd funding campaign for fundraising for eight new Gyanada Labs we wish to establish across Mumbai.
CEL HACKATHONThe CEL Hackathon, a national level event, was held on the 9th of February with preparations having begun since January. It was a platform of wide exposure, were children had their unique takes on the four major sustainable development goals- (i) zero hunger, (ii) good heath and well being, (iii) quality education and (iv) peace justice and strong institution. They had to understand these goals and relate them with their surroundings and use Scratch to code projects which would spread awareness about them and help people take action to progress towards the goal.
The planned journey of the hackathon began with the school communicating the problem statement to kids one week before Hackathon week i.e. on 27 January 2020. Students then took time to understand the problem statement and discussed various solutions with their partner. They had feedbacks from their teacher and prepared on the project that they wish to create on the Hackathon day. On Hackathon Day, each pair got 90 minutes to create the project on Scratch and another 30 minutes to make a concept note and 3 mins to present the project in front of other kids and guests. The event was a great success to bring forward the kids’ creativity, understanding and their ability to express their idea. The links for these innovative projects can be found on our website: www.gyanada.org

A
PR
OD
UCT
| in
fo@
tris
ysco
m.c
omRegistered OfficeTrinity226/1, A.J.C. Bose Road7th Floor, Kolkata-700020Phone: 033-4010 2500Fax No: 033-4010 2543
Toll Free No.: 1800 212 2525For any research related query: [email protected]
Corporate Office1008, Raheja Centre,214, Nariman Point, 10th FloorMumbai-400021Phone: 022-6611 1700Fax No: 022-6611 1710
Group CompaniesAshika Stock Broking Ltd.
(Member : NSE, BSE, MSE, MCX, ICEX Depository participant of CDSL / NSDL, AMFI Mutual Fund Advisor, Research Analyst)
CIN No. U65921WB1994PL217071SEBI Registration No : INZ000169130
SEBI Regsitration No : INH00000006 (RA)
Ashika Credit Capital Ltd.(RBI Registered NBFC)
CIN No. L67120WB1994PLC062159
Ashika Global Securities Pvt. Ltd.(RBI Registered NBFC)
CIN No. U65929WB1995PTC069046
Ashika Capital Ltd.(SEBI Authorised Merchant Banker)
CIN No. U30009WB2000PLC091674
Ashika Wealth Advisors Pvt Ltd.CIN number – U65999WB2018PTC227019
SEBI Registered Investment Adviser
SEBI Registration number – INA300013759
Ashika Investment Managers Pvt. Ltd.CIN number – U65929MH2017PTC297291
www.ashikagroup.com