Particle Metropolis–Hastings using gradient and Hessian information
Upload
khangminh22Category
view
1download
0
•
•
•
•
•
MONITORING SPATIAL'P ATTERNS OF AIR POLLUTION IN KARACHI
•
METROPOLIS: A GIS AND REMOTE SENSING PERSPECTIVE
•
• • • • •
•
MUDASSAR HASSAN ARSALAN
•
•
DEPARTMENT OF GEOGRAPHY UNIV·ERSITY OF KARACHI
KARACHI - P AKIST Ai"!
2002

•
/
,
,
• •
\
,
CERTIFICATE
,
•
This is to certify that Mr. Mtidassar Hassan Arsalan, has 'well completed his dissertation
for the degree of Doctor of Philosophy, under my supervision on
,
"Monitoring Spatial Patterns of Air Pollution in Karachi Metropolis: A GIS and
Remote Sensing Perspective."
The completed work is valuable and distinct for the disciplines of Geography and allied
Environmental Sciences. It is hoped that in future, more analogous multi-disciplinary
researches would be conducted on the cities of developing countries . .
I wish him success in his future endeavours.
) • -- . . r . Mn Kazw,lj
t Prof ... ~sotr
J)epartment or Geography . Olllvcraity or
, 15~70.
. , , , '" , ,
Dr. S. Jamil H. Kazmi
. .
..
• ,
•
,
,
• •
•

• •
DEDICATED To:
•
/
•
•
•
•
---".---
•
•
•
,
•
•
•
,
•
•
•
•
•
. •

,
•
•
ABST
The growing environmental degradation has exerted desperate burden on resources,
therefore, environmental monitoring has become imperative. There is a serious need to •
evaluate the quality regularly. Remote Sensing technology has been providing multi
dimensional information, which is utilized in lots of environmental investigations.
Geographical Infonnation Systems (GIS) have been accepted as a tumkey solution for the
complex world due to its magnanimous breath of functionalities and cost effectiveness.
Karachi is one of the worst effected cities of the world due to unchecked and still •
uncontrolled air pollution. Spatial variation within metropolis have been largely ignored
mainly due to less comprehension, under estimation of spatial techniques as well as
difficulties in collecting, processing and analysing the data at micro geographic scales.
The main goals of this study are to modulate the infom1ation pertains to air quality and its •
adverse effects on human health and find out their spatial pattems all over Karachi. The
research has covered different parameters: assessment of land cover / land use classes, .
human settlement growth, temporal traffic patterns, population distributions, current level
of air pollutants, health implications and public perceptions .
.
The developed GIS evaluation combined the data sets, various analyses and the resultant
maps with the capability to integrate further parameters for future risk assessments.
Multi-criteria decision analysis was successfully employed. Micro-geographic appraisals .
of the metropolis were perf0l111ed by· considering 58 zones outlined by the local •
development authority. Each zonal assessment included area, popUlation density, •
distribution of land cover classes,. split of land use categories, frequency of airborne
diseases, their prevalence scenario and temporal variations in CO concentrations within
the zone. MUltiple regression models for predicting carbon monoxide (CO) enrichment at
the olden region of Karachi metropolis have been formulated in which traffic and land use
parameters act as independent variables.
,
•
• lV
•
• "" ,,¥"J""""' j4\1 '" , .
. .'
•
,

, ',
J
, "
•
,
,
•
• • ,
/
l.q'f-~)I,;f.~~~b~~{JL--,Jy IJ1 l,':;% ~J.Y~
-,,-"'L:!I...fI( GIS)(IJliJL}vJ~0 c.,}ifL'f-ci. H :;t>~7.l:.Jj~u!,,:, .~ J~.Y L
,
,
,
J.: il/jl(....j/",;~, -.~?jv~lJ0if.1 ,~A·~0'.t!fjli.--~
-v.7,-j)/,-·~Jf0=:ih.:?;.J
J~&'~J.. :?I;j~,~ j;iu!/.;~jJI.-.ljl,?"'£l{d ji,Jl"-JL}v0.-,IJ J:.vJL:Ju!J'VIJ)h·V' ~~~;( j
JL:J'?J J)~lc, -,lj'ijL)L~ )c';Jv?-ji,Jl'4-'/JLJ~IJ ~,J?/J :/.-1 Jh(..l(;h·, g[:!~ -v.7 ,
- w ,41 -.:;# _4 .:f- - - ? (" J~lc .~\(~=f.i.I- - ·1A-u!V- VL1 { .. -,~3 (;;,iJh1f~,-,L}v'I:iI~U)hl??-JjLGISJ"'V
t~u!dL £.V:;~..£ J:L" -'L}vJ~0Jur (M\:)Jl¢'le)//-L ~I;;LJ.!~' -"q /vl)1 - VV'
:; Lt{i...IC)pj ~J'yILIJLJ1I~c "~XI JuJC~JJ{/J :/.c' . ...-'~tr.-'~J)LJ~'J ;'(" -:,tr J J)kic,.;;)jJ).t1 ,
.....iIL-liJ ),I,fJ~IJ :/.dL--dvLvf _1.17' jjJG",-A;! J, -.lj'ijL)L;lSJ-JILYL,fi,'YI,;f.)!{;,'J(...-,)""'J .... '. - -
• ,
v
.~- ~ .. M, '.'""""'"''"'F''?'"'' , , , , , ,
, .'
•
,

•
, •
ACKNOWLEDGMENTS
It is my pleasure to present my deep gratitude to Dr. S. JamB H. Kazmi, for his energetic ,
valuable guidance in completion of this dissertation. Without his scientific zeal, ever
willing, and detemlined assistance, his kind solicitude for my tribulations and amiable
appreciations of my limitations, it \vould have never been viable to bring these pages to
the light of the day. I will remain grateful to him ever for his valuable guidance and
intellectual competence. My profound appreciations are to an important member of my
supervisor's research team, Engineer Mohammed Raza Mehdi for his continued help in
data collection, analysis and shaping up of this thesis.
I extend my continuing indebtedness to th~ Chairperson of the Department of Geography
University of Karachi, Professor Mrs. Birjies Talat. Her continuous instructions and •
support have been illuminable through out my studentship .
•
Gratefully I acknowledge my personal obligation to Ms. Sheeba Afsar for her valuable
cooperation for shaping up of the dissertation. I extend my indebtednesses for my
colleagues and respectable educationalists Mrs. Khalida Mahmood, Dr. Farkhunda Burke, ,
Mrs. Azra Parveen Azad, Mr. S. Shahid Ali, Mr. Shamshad Akhtar, Department of
Geography; and Mr. Muhammad Shahid, Department of Social Work, provided their
support and assistance.
I will remain ever thankful to Dr. Badar Ghauri, Dr. Ishaq Mirza and Mr. Shafiq Ahmed,
SUPARCO; Prof. Dr. Waseem Akhtar and Prof. Engr. Zia ur Rehman, Department of
Environmental Engineering - NEDUET; Prof. Dr. Mohsin Raza, HEJ Institute; Prof. Dr.
Ahsanullah, Mr. Jamil Ahmed Khan, and Dr. Farooq Ahmed, Department of Geography,
. University of Karachi to provide their precious ideas and suggestions for the work
My thanks to Mr. Mohammad Taufiq and Mr. Mujahid Raza Hameedi, Blue Chip ,
International; Mr. Asif Kazmi and Tahir Munir, Population Census of Pakistan; Mr.
Akhtar, Statistical Division - JPMC; Mr. Muhammad Ayoub, Statistical Division
Karachi Civil Hospital; Mr. Shahab Afrooz Alvi, Master Plan Department - KDA;
• VI
, ..
,
,
,

•
,
--,
,
, ,
"
,
Engr. Hyder Ali, Traffic Engineering Bureau - KDA, Mr. Arif Mahmood, Meteorological
Department; Mr. Tahir Abbas and Ms. Durdana Rais, PCSIR; Mr. Ishtiaq Ali Mehkri and
Ms. Sabahat Sherwani, daily Dawn, to provide their indispensable resources and
information.
•
With pleasure I acknowledge the debt of affection to my parents, sisters and brother, for
their various considerations and generous encouragement during the preparation of this
work.' ,
In the end it would not be justified if I do not acknowledge my friends Mr. Faraz Ahmed ,
Khan, Ms. Maria Qadri, Mr. Razzaq Ahmed, S. Saulat R. Zaidi, Mr. Hasan Askari, Mr. ,
M. Javed Mahmood, Mohammad Rashid, Mr. Ali Naqi and Mr. Masood Farooqi; my
supporting staff supporting staff especially, Mr. Arif Masieh, Mr. Murtaza Khan, Mr.
Murtaza Gabol, Mr. Tariq Najamuddin, Mr. Nasar Alam and Mr. Mohammad Atiq; and ,
,
my students on their heartfelt cooperation.
,
,
,
,
•
,
, .. VB
,
• •
,
-. --
•

•
•
..
•
•
TABLE OF CONTENTS
1.
1.1 1.2 1.3 1.4 I .4. 1 1.4.2 1.4.3 1.4.4 1.4.5 1.5
•
2.
2. I 2. 1 . 1 2.1.2 2.1.2.1 2.1.2.2 2.1.2.3 2.1.2.4 2.1.2.5 2.1.2.6 2.2 2.2.1 2.2.2 2.2.2.1 2.2.2.2 2.3
3.
3.1 3.1.1 3.1.2 3.1.2.1
,
ABSTRACTS
ACK1'IJOWLEDGEMENTS
INTRODUCTION
Background The Problem The Study •
Study Area Physiography Climate Socio - Economic Structure Urban Settings
•
Historical Sprawl Significance of the Study
•
REVIEW OF LITERATURE
Air Pollution: Effects, Sources and Spatial Disseminations Global and Regional Scenarios Biotic Upshots Sulphur Dioxide (S02) Nitrogen Oxides (NOx)
Carbon Monoxide (CO) Ozone (03) Suspended Particulate Matters (SPM) Lead (Pb)
•
Development of Teclmologies Remote Sensing (RS) Geographic Information Systems (GIS)
• Air Pollution Dispersion Modelling Multi Criteria Evaluation Literature Synopsis
•
METHODOLOGICAL CONSTITUTION
•
Remote Sensing Techniques .. Data Acquisition . Satellite Image Processing Environmental Attenuation Corrections
.. . Vlll
•
1- 23
2 4 5 7 10 12 14 15 20 21
24-91
25 32 44 44 48 53 57 64 70 77 77 83 85 88 91
92 -142
96 96 97 97
• • •
•
•
•
3.1.2.1.1 3.1.2.1.2 3.1.2.2 3.1.2.2.1 3.1.3 3.1.4 3.1.4.1 3.1.4.2 3.1.5 3.1.6 3.1.6.1 3.1.6.2 3.1.6.3 3.1.6.4 3.1.6.5 3.1.6.6 3.2 3.2.1 3.2.2 -3.2.3 3.2.3.1 3.2.3.2 3.2.3.2.1 3.2.4 3.2.5 3.3 3.3.1 3.3.1.1 3.3.1.2 3.3.1.3 3.3.1.4 3.3.2 3.3.3 3.3.3.1 3.3.3.2 3.3.3.2.1 3.3.3.3 3.3.3.3.1 3.3.3.4 3.3.3.5 3.3.3.6 3.3.3.6.1 3.3.3.6.2 3.3.3.6.3 3.3.3.6.4 3.3.3.7 3.4 3.5 3.5.1 3.6
•
Compensation for Seasonal Differences Haze Compensation Instrumental Error Correction . Line Drop Noise Correction Image Geometric Correction Image Enhancement Direct Application Indirect Application Study Area Development (Mosaicking/Subsetting) Land Cover Classification Land Cover Classification Scheme Supervised Classification Method Mining of Training Sites Classification Algorithm Classification Result Editing and Aggregation Accuracy Assessment Ground Realities Traffic Flow Information Land Use Infonnation Air Pollution Concentrations S02. NOx, 0 3, and Particulate Matters Carbon Monoxide Levels Monitoring Sites Demographic Information Epidemiological Infonnation Geographic Information Systems Cartographic Techniques Base Map Development
•
Mapping of Monitoring Stations Analysis Zones' Map Cartographic Layouts Development Database Integration Analyses
•
Change Detection: Growth of Settlements Air Pollution Spatial Variations Development of Spatially Continuous Patterns Air Pollution Temporal Variations Statistical Deviations Road Density Index: Massiveness Measure Population Disfributions Epidemiological Investigations Morbidity Treated by Physicians Disease Grading by Professionals Morbidity and Mortality: Vital Indices Airborne Diseases Prevalence Public Perception Evaluation Zonal Appraisals Multi Criteria Evaluation of Risk Neighbourhoods Weights Reckoning
•
•
Predictive ModelliIlg: Estimation of Carbon Monoxide (CO) •
• IX
97 98 99 99 99 101 101 101 101 102 104 106 106 106 107 107 107 108 110 113 113 114 116 117 117 119 121 121 124 125 127 127 128 128 129 129 130 130 130 131 132 132 133 133 134 134 136 137 138 140
•
•
•

-"" '. '.
•
•
•
4 .
4.1
RESULTS AND DISCUSSION
4.2 4.3 4.4 4.5 4.6 4.7 4.8 4.8.1 4.8.2 4.8.3 4.8.4 4.8.5
4.9
4.10 4.10.1 4.10.2 4.10.3 4.10.4 4. 1 I 4.12 4.12.1 4.12.2 4.12.3 4.12.4 4.12.5 4.12.6 4.12.7 4.12.8 4.12.9
,
4.12.10 4.12.11 4.12.12 4.12.13 4.12.14 4.12.15 4.12.16 4.12.17 4.12.18 4.12.19 4.12.20 4.12.21 4.12.22 4.12.23 4.l2.24 4.12.25
•
•
Rectified Satellite Product Land Cover Change Detection: Settlem«nts Growth Land Use . Population Distribution Roads Network Widespread Assessment of Traffic Patterns Spatial Patterns of Air Pollutants
•
Suspended Particulate Matter (SPM) Sulphur Dioxide (S02) Nitrogen Oxides (NOx)
Surface Ozone (03)
Carbon Monoxide (CO) Temporal Variations in Carbon Monoxide (CO) Enrichment Patterns Airborne Epidemics Disease Grading by Professionals Morbidity Treated by Physicians Morbidity and Mortality: Vital Indices Spatial Distribution' of Airborne Diseases Perception Critique Zonal Appraisal Zone # 1: luna Market, Old Town area Zone # 2: Ranchore Line & Ramsawami Zone # 3: Saddar & Artillery Maidan Zone # 4: Civil Lines Area Zone # 5: 1.1. Chundrigar Road & New Queens Road Zone # 6: Port Area Zone # 7: Nawabad, Baghdadi Lane, Kharadar Zone # 8: Agra Taj, Bihar Colony Zone # 9: Lea Market, Gul Mohammad Lane Zone # 10: Chakiwara, Kalakot Zone # 11: Garden, Soldier Bazaar, lamshed Quarters Zone # 12: Lines Area & Khudadad Colony
•
Zone # 13: Naval H.ospital, lPMC and Liaquat Barracks Zone # 14: Bath Island, Frere Town, Defense Society (Part) Zone # 15: Gizri Area, Delhi Colony Zone # 16: Clifton Zone # 17: Baba Bhit Islands Zone # 18: Shetshah, S.I.T.E. (Part) Zone # 19: S.I.T.E. (Sindh Industrial Trading Estate) Zone # 20: Asif, Pak Colony & T.P.T. Zone # 21: Rizvia, Firdous Colony, Golimar Zone # 22: Liaquatabad ' Zone # 23: Gulshan-e-Iqbal (Part), P.LB. Colony Zone # 24: Gulshan~e-Iqbal, Chandni Chowk, Society Area Zone # 25: Akhtar & Baloch Colony, Chanesar Goth
x •
143 - 315
144 148 152 152 158 165 168 176 176 179 182 186 189
218
219 219 220 227 228 234 239 239 239 240 241 241 242 243 243 244 245 245 246 247 247 248 249 249 250 250 251 252 252 253 254 254
, ..
,
,

• -
•
4.12.26 4.12.27 4.12.28 4.12.29 4.12.30 4.12.31 4.12.32 4.12.33 4.12.34 4.12.35 4.12.36 4.12.31 4.12.38 4.12.39 4.12.40 4.12.41 4.12.42 4.12.43 4.12.44 4.12.45 4.12.46 4.12.47 4.12.48 4.12.49 4.12.50 4.12.51 4.12.52 4.12.53 4.12.54 4.12.55 4.12.56 4.12.57 4.12.58 4.13 4.13.1 4.13.2 4.13.3 4.13.4 4.13.5 4.13.6 4.14 4.14.1 4.14.2 4.14.3 4.14.4
5.
5. 1 5.2
•
Zone # 26: Drigh Cantonment, 9th Mile Zone # 27: Gulshan-e-Iqbal, National Cement Factory Zone # 28: F.e. Area and Mansoora Zone # 29: Nazimabad, Paposhnagar Zone # 30: North Nazimabad Zone # 31: North Karachi Zone # 32: Qasba, Manghopir Area Zone # 33: Orangi, Metroville-I Zone # 34: Baldia Zone # 35: Masroor (Mauripur) Zone # 36: Hawkesbay and Adjoining Area Zone # 37: Deh Moach, Naval Depot Zone # 38: Deh Lal Bhakhar& Hawkesbay Scheme Zone # 39: Korangi (Part) Zone # 40: Landhi Colony Zone # 41: Landhi Industrial, Scheme 3 & 4 Zone # 42: Shah Latif, Deh Khanto Zone # 43: Model and Malir Colonies Zone # 44: Karachi Airport Zone # 45: Drigh Colony & Malir Zone # 46: Korangi Industrial Area - East Zone # 47: Korangi Industrial Area - West Zone # 48: Korangi Creek and Refinery Zone # 49: Steel Mill and Port Qasim Zone # 50: Deh in the East Zone # 51: Malir Cantonment Zone # 52: Scheme 33 Zone # 53: Defence Society Zone # 54:Surjani Town Zone # 55: Taisar Town Zone # 56: Halkani Scheme Zone # 57: Dehs in the West along Hub Rivet Zone # 58: Dehs along Super Highway Multi Criteria Risk Weight Extraction . Very High Risk High Risk Moderate Risk Low Risk Safe Zone
•
•
Carbon Monoxide (CO) Prediction Prediction Models Evaluation of Models Applications of Models Constraints of Models
•
.
CONCLUSIONS AND RECOMMENDATIONS
Conclusions •
Further Research A venues • •
• Xl
•
•
255 256 256 257 258 258 259 259 260 260 260 261 261 261 262 263 263 264 265 265 266 267 267 268 268 268 269 270 270 271 271 271 271 295 298 303 304 306 307 308 309 310 313 314 314
316 - 323
317 320
• •
•
•

•
,
, ,
5.3 Recommendations ,
REFERENCES
Annexure A
Annexure B
Annexure C
Almexure D Annexure E Annexure F Annexure G
Almexure H
Annexure I
Annexure J
•
.
Monitoring Sample Locations around Karachi Metropolis Carbop Monoxide Concentrations at Monitoring Sample Locations around Karachi Observed Traffic Load at Monitoring Sample Locations around Karachi Metropolis Specifications of Carbon Monoxide Analyser Health Statistics
, .
QuestiOlmaires (English Translation) Zone-wise Land Use and Land Cover Appraisals' Land Use and Traffic Statistics around Monitoring Stations in Old City Area within 100-Meter Diameter Pictorial Illustrations of the Problem Plume Dispersion from Industry in Karachi: Monitoring through Optical Imageries .
,
,
,
,
,
,
• •
xu
,
322
324 - 371
,
372
379
386
394 395 400 404
423
426
428
, .
,
,

•
•
-- •
•
•
LIST OF TABLES
1.I
2.1
2.2
2.3
2.4 2.5 2.6
2.7 2.8
2.9
2.10
2.11
2.12· 3.1
3.2
3.3
3.4
3.5
3.6
3.7
3.8
4. I
4.2 4.3
4.4
4.5 4.6 4.7
4.8
4.9
Population of Karachi: 1931 - 2002 .
Hazardous Air Pollutants
Particulate Matters: Sizes and Identifications
Summary of Key Greenhouse Gases Affected by Human Activities
Estimated CO2 from Various Economic Sectors in Pakistan
Human Response to Different levels of S02 for Different Period
Estimated S02 from Various Economic Sectors in Pakistan
Human Response to Different Levels ofN02 for 2 Hours
N02 Exposure Effects on Human Health
Predicted Carboxyhaemoglobin in Levels for People Engaged in Different Types of Work in Different Concentrations of Carbon Monoxide Effects of CO on Humans and the Accompanying Carboxyhaemoglobin Blood (COHb) Concentrations
Methods for Integration of Air Pollution Dispersion Models with GIS
GIS Integrated Air Pollution Dispersion Models •
Satellite Imageries: Sensors, Resolution and Acquisition
Daily Traffic of Sixteen Hours at Major Intersections of Karachi
Categorization of Observed Average Hourly Traffic at Monitoring Stations
Air Pollution Assessment in Karachi Metropolis
Metadata of Base Map
Analysis Zones •
Input Data Tables Integrated with Map Objects
Target Groups, Criteria and Description Of Questionnaires
KDA Land Use 2000
Land Use Groups ofKDA Defined Categories
Zone-wise Population Distribution of Karachi Metropolis
Population Density: Descriptive Statistics
Indoor Morbidity and Mortality Statistics 2001
Indoor Morbidity and Mortality Statistics of Airborne Diseases 2000 and 2001
Disease Occurrence: Descriptive Statistics
Disease Prevalence: Descriptive Statistics
CO Concentrations across the Juna Market, Old Town area
4.10 CO Concentrations across the Ranchore Line & Ramsawami
. 4.11 CO Concentrations across the Saddar & Artillery Maidan
4.12 CO Concentrations aeross the Civil Lines Area
4.13 CO Concentrations across the I.I. Chundrigar Road & New Queens Road
4.14 CO Concentrations across the Port Area
4.15 CO Concentrations across the Nawabad, Baghdadi Lane, Kharadar .
4.16 CO Concentrations across the Agra Taj, Bihar Colony
4.17 CO Concentrations across the Lea Market, Gul Mohammad Lane
4.18 CO Concentrations across the Chakiwara, Kalakot
• •
... Xlll
•
14 27 29
34
37
45 48 51
52
54
55
86
88
97
109
110
114
124 125
128 136
154 156 161
163
227 228 229 229 239
240 240
241 242 242 243
244
244
245
• •
•
•

•
4.19
4.20 4.21
4.22
CO Concentrations across the Garden, Soldier Bazaar, lamshed Quarters
CO Concentrations across the Lines Area & Khudadad Colony
CO Concentrations across the Naval Hospital, JPMC and Liaquat Barracks
CO Concentrations across the Bath Island, Frere Town, Defense Society (part)
4.23 CO Concentrations across Gizri Area, Delhi Colony
4.24 CO Concentrations across the Clifton
4.25 CO Concentrations acrpss the Shershah, S.LT.E. (part)
4.26 CO Concentrations across the S.I.T.E. (Sindh Industrial Trading Estate)
4.27
4.28
4.29
4.30 4.31
4.32
4.33 4.34
4.35
4.36 4.37
4.38
4.39
4.40 4.41
4.42
4.43
4.44
4.45
4.46
4.47
4.48
4.49
4.50
4.51
4.52 4.53
4.54 4.55
4.56
4.57 4.58
4.59
CO Concentrations across the Asif, Pak Colony & T.P.1.
CO Concentrations across the Rizvia, Firdous Colony, Golimar
CO Concentrations across the Liaquatabad
CO Concentrations across the Gulshan-e-Iqbal (part), P.I.B. Colony
CO Concentrations across the Gulshan-e-Iqbal, Chandni Chowk, Society Area
CO Concentrations across the Akhtar & Baloch Colony, Chanesar Goth
CO Concentrations across the Drigh Cantonment, 9th Mile
CO Concentrations across the Gulshan-e-Iqbal, National Cement Factory
CO Concentrations across the F.C. Area and Mansoora
CO Concentrations across the Nazimabad, Paposhnagar
CO Concentrations across the North Nazimabad
CO Concentrations across the North Karachi
CO Concentrations across the Orangi, Metroville-I
CO Concentrations across the Korangi (Part)
CO Concentrations across the Landhi Colony
CO Concentrations across the Landhi Industrial, Scheme 3 & 4
CO Concentrations across the Shah Latif; Deh Khanto
CO Concentrations across the Model and Malir Colonies
CO Concentrations across the Karachi Airport
CO Concentrations across the Drigh Colony & Malir
CO Concentrations across the Korangi Industrial Area - East
CO Concentrations across the Korangi Industrial Area - West •
CO Concentrations across the Malir Cantonment
CO Concentrations across the Scheme 33
CO Concentrations across the Defence Society
Factor Analysis Communalities •
Factor Analysis Total Variance Explained
Factor Analysis Component Matrix
Correlation Matrix
Correlation Matrix (Modulus)
Extracted Weights for Variables
Multi-Criteria Overlay Template
•
Constants and Coefficients of Predictive Models
• •
• XIV
246
246
247
248
248
249
250
251
251
252
253
253 254
255 255
256
257
257
258
259 260 262 262
263 264
264
265 266
266 267
269 269 270 296
296
297
298 298
299
300 312
•
• ••
•
•

•
,
---" . -
A.I
B.l
C.I
C.2
E.l
E.2
E.3
H.I
,
.'
Monitoring Sample Locations around Karachi Metropolis
Carbon Monoxide Concentrations at Monitoring Sample Locations around Karachi
Criterion of Traffic Flow Observation
Observed Traffic Load at Monitoring Sample Locations around Karachi Metropolis Indoor Morbidity and Mortality Statistics 2001, Medical Records and Statistical Office, civil Hospital, Karachi .
•
Indoor Morbidity and Mortality Statistics of Airborne Diseases, Statistical Records, Jinnah Postgraduate Medical Centre, Karachi: 2000 and 2001 Zone Wise Epidemiological Statistics (Questionnaire Based)
Land Use and Traffic Statistics around Monitoring Stations in Old City Area within 100-Meter Diameter
,
•
•
,
,
•
, .
xv
, ,
372 378 386
386
395
397
398
423
,
, ' ,
,
. ' . . • . '. . '. ,
", --
•
•
•
•
LIST OF FIGURES
1.1
1.2
1.3
1.4
1.5
1.6
1.7
1.8
1.9
3.1
3.2
3.3
3.4
3.5
3.6
3.7
3.8
3.9
3.10 .
3.11
3.12
3.13
3.14
4.1
4.2
4.3
4.4
4.5
4.6
4.7
4.8
4.9
4.10
4.11
4.12
4.13
4.14 •
•
Karachi Metropolis: Study Area
Karachi Metropolis: Administrative
Physiography of Karachi Metropolis
Meteorological Characteristics of Karachi Metropolis
Urban Land Cover of Karachi
Conceptual Geometrical Shape of Karachi Division
Karachi Urban Sprawl (1947 - 2002) •
Karachi Road Network
Succession of Environmental Studies
Methodological Framework: Flow diagram ·
Variations in Solar Elevation Angle
Image / Map Geometric Correction Model
Karachi Landsat 5 - TM Subset
Land Cover Classification Model
Land Cover Classification Scheme
Conceptual Diagram of MDC Algorithm
Old City Area of Karachi
Distribution of Monitoring Stations
GIS Organizational Diagranl ,
·
Detailed Base Map of Karachi Metropolis •
Base Map Development Procedure Diagram
Karachi Metropolis: Analysis Zones
Weight Extraction Model ·
Karachi and Its Environs from Space (Landsat TM FCC)
Karachi and Its Environs: Geometrically Corrected Image
Selected Subsets of Pre and Post Enhanced Imageries
Classified Land Cover of Karachi Metropolis
Appraisal of Land Cover .
Growth of Settlements in Karachi Metropolis
Projected Land Use 2000 of Karachi Metropolis
Housing Distribution in Karachi
Karachi Population Distribution ·
Population Densities in Analysis Zones •
Karachi Population Density Gradient
Road Density Index
Road Proximity Buffers , ·
Karachi Traffic Concentrations Weekend Mornings
• •
XVI •
•
-
•
8
9
1 1
13
16
17
18
19
22
95
98
100
103
104
105
106
112
115
120
122
123
126
139
145
146
147
149
151
153
155
158
160
162
164
166
167
169
• •
•
•
4.15
4.16
4.17
4.18
4.19
4.20
4.21
4.22
4.23
4.24
4.25
4.26
4.27
4.28
4.29
4.30 •
4.31
4.32
4.33
4.34
4.35
4.36
4.37
4.38 4.39
4.40
4.41
4.42
4.43
4.44
4.45
4.46
4.47
4.48
4.49
4.50
4.51
4.52
4.53
4.54
Karachi Traffic Concentrations Weekend Afternoons
Karachi Traffic Concentrations Weekend Evenings
Karachi Traffic Concentrations Working Day Mornings
Karachi Traffic Concentrations Working Day Afternoons
Karachi Traffic Concentrations Working Day Evenings
Spatial Patterns of SPM Emission
Spatial Patterns ofPM IO Emission
Spatial Patterns of S02 Emission Maximums
Spatial Patterns of S02 Emission Averages
Spatial Patterns of NO x Emission Maximums
Spatial Patterns of NO x Emission Averages
Spatial Patterns of 0 3 Emission Maximums
Spatial Patterns of 0 3 Emission Averages
Spatial Patterns of CO Emission Weekend Mornings (3')
Spatial Patterns of CO Emission Weekend Mornings (4 Y])
Spatial Patterns of CO Emission Weekend Afternoons (3')
Spatial Patterns of CO Emission Weekend Afternoons (4 Y])
Spatial Patterns of CO Emission Weekend Evenings (3')
Spatial Patterns of CO Emission Weekend Evenings (4 Y])
Spatial Patterns of CO Emission Working Day Mornings (3') •
Spatial Patterns of CO Emission Working Day Mornings (4 Y])
Spatial Patterns of CO Emission Working Day Afternoons (3')
Spatial Patterns of CO Emission Working Day Afternoons (4 Y])
Spatial Patterns of CO Emission Working Day Evenings (3')
Spatial Patterns of CO Emission Working Day Evenings (4 Y])
Spatial Patterns of CO Emission Diurnal Average (3')
Spatial Patterns of CO Emission Diurnal Average (4 Y])
Spatial Patterns of CO Emission Diurnal Average
Spatial Patterns of CO Emission Diurnal Deviation (3 ')
Spatial Patterns of CO Em'ission Diurnal Deviation (4 Y])
Spatial Patterns of CO Emission Diurnal Deviation
Epidemics of Diseases in Karachi, 200 1
•
Comparison of Prevailing Diseases between General Public and Population at Risk
Occurrence of Airborne Diseases in Analysis Zones
Point Prevalence of Airborne Diseases in Analysis Zones
Perceived Rush Hours in Karachi •
Comparison between Level of Education and Perceived Effects of Air Pollution on Human Health
Zonal Aggregates of CO Emission Weekend Mornings 3 feet
Zonal Aggregates of CO Emission Weekend Afternoons 3 feet
Zonal Aggregates of CO Emission Weekend Evenings 3 feet
•
• • XVll
170
171
173
174
175
177
178
180
181
184
185
187
188
191
192
194
195
197
198
200
201
203
204
206
207
210
211
212
215
216
217
221
230
232
233
235
237
272
273
274
•
•
•

•
4.55
4.56
4.57
4.58
4.59
4,60
4.61 '
4.62
4.63 ,
4.64
4.65
4,66
4,67
4,68
4.69
4.70
4.71
4.72
4.73
4.74
4.75
D,l
Gx.l
Gy.1
Gx.2
Gy.2
Gx.3
Gy.3
Gx.4
Gy.4
Gx.5
Gy.5
Gx.6
Gy.6
Gx.7
Gy.7
Gx.8
Gy.8
Gx.9
Gy.9
Gx.l0
Gy.lO
,
,
Zonal Aggregates of CO Emission Weekend Mornings 4 Y:! feet
Zonal Aggregates of CO Emission Weekend Afternoons 4 Y:! feet
Zonal Aggregates of CO Emission Weekend Evenings 4 Y:! feet
•
Zonal Aggregates of CO Emission Working Day Mornings 3 feet
Zonal Aggregates of CO Emission Working Day Afternoons 3 feet
Zonal Aggregates of CO Emission Working Day Evenings 3 feet
Zonal Aggregates of CO Emission Working Day Mornings 4 Y2 feet
Zonal Aggregates of CO Emission Working Day Afternoons 4 Y:! feet
Zonal Aggregates of CO Emission Working Day Evenings 4 Yfeet
Zonal Aggregates of CO Emission 3 feet Averages ,
Zonal Aggregates of CO Emission 4 Y2 feet Averages
Zonal Aggregates of CO Emission Total Averages
Zonal Aggregates of SPM Emission
Zonal Aggregates ofPM IO Emission
Zonal Aggregates of S02 Emission Averages
Zonal Aggregates of S02 Emission Maximums •
Zonal Aggregates of NO x Emission Averages
Zonal Aggregates of NO x Emission Maximums
Zonal Aggregates of 0 3 Emission Averages
Zonal Aggregates of 0 3 Emission Maximums
Karachi: Multi Criteria Risk
Carbon Monoxide Analyser
Analysis Zone 1: Land Use ,
Analysis Zone 1: Land Cover
Analysis Zone 2: Land Use
Analysis Zone 2: Land Cover
Analysis Zone 3: Land Use
Analysis Zone 3: Land Cover
Analysis Zone 4: Land Use
Analysis Zone 4: Land Cover
Analysis Zone 5: Land Use
Analysis Zone 5: Land Cover
Analysis Zone 6: Land Use '
Analysis Zone 6: Land Cover
Analysis Zone 7: Land Use
Analysis Zone 7: Land Cover ,
Analysis Zone 8: Land Use
Analysis Zone 8: Land Cover
Analysis Zone 9: Land Use
Analysis Zone 9: Land Cover
Analysis Zone 10: Land Use
Analysis Zone 10: Land Cover •
•
•
,
,
,
• •• XVlll
•
275
276
277
278 279
280
281
282
283 284
285
286 287
288
289
290
291
292
293
294
305
394
404
404 404
404
404 404
405
405
405
405
405
405
406
406
406 406
406
406
407
407
, "
•
,

.'
Gx.ll Analysis Zone 11: Land Use 407 Gy.ll Analysis Zone II: Land Cover 407
• Gx.l2 Analysis Zone 12: Land Use 407
Gy.l2 Analysis Zone 12: Land C~)Ver 407 Gx.13 Analysis Zone 13: Land Use 408
Gy.l3 Analysis Zone 13: Land Cover 408
Gx.14 Analysis Zone 14: Land Use 408
Gy.14 Analysis Zone 14: Land Cover 408
Gx.15 Analysis Zone 15: Land Use 408
Gy.15 Analysis Zone 15: Land Cover 408
Gx.16 Analysis Zone 16: Land Use 409
Analysis Zone 16: Land Cover • Gy.16 . 409
Gx.17 Analysis Zone 17: Land Use 409
Gy.17 Analysis Zone 17: Land Cover 409
Gx.18 Analysis Zone 18: Land Use 409
Gy.18 Analysis Zone 18: Land Cover 409 •
Gx.19 Analysis Zone 19: Land U.se 410
Gy.19 Analysis Zone 19: Land Cover 410
Gx.20 Analysis Zone 20: Land Use 410
.. Gy.20 Analysis Zone 20: Land Cover 410
Gx.21 Analysis Zone 21: Land Use 410
Gy.21 Analysis Zone 21: Land Cover 410
Gx.22 Analysis Zone 22: Land Use 411
Gy.22 Analysis Zone 22: Land Cover , 411 •
Gx.23 Analysis Zone 23: Land Use 411
Gy.23 Analysis Zone 23: Land Cover 411
Gx.24 Analysis Zone 24: Land Use 411
Gy.24 Analysis Zone 24: Land Cover 411 •
Gx.25 Analysis Zone 25: Land Use 412
Gy.25 Analysis Zone 25: Land Cover 412
Gx.26 Analysis Zone 26: Land Use 412
Gy.26 Analysis Zone 26: Land Cover 412
Gx.27 Analysis Zone 27: Land Use' 412 --•
• ~-.
Gy.27 Analysis Zone 27: Land Cover 412
Gx.28 Analysis Zone 28: Land Use 413
Gy.28 Analysis Zone 28: Land Cover 413
Gx.29 Analysis Zone 29: Land Use 413 ,
Gy.29 Analysis Zone 29: Land Cover 413
Gx.30 Analysis Zone 30: Land Use 413
Gy.30 Analysis Zone 30: Land Cover 413
Gx.31 Analysis Zone 31: Land US,e 414
Gy.31 Analysis Zone 31: Land Cover 414 •
,
• XIX

• • •
• •
Gx.32 Analysis Zone 32: Land Use 414
Gy.32 Analysis Zone 32: Land Cover 414 • Gx.33 Analysis Zone 33: Land Use 414
Gy.33 Analysis Zone 33: Land Cover 414
Gx.34 Analysis Zone 34: Land Use 415
Gy.34 Analysis Zone 34: Land Cover 415
Gx.35 Analysis Zone 35: Land Use 415
Gy.35 Analysis Zone 35: Land Cover 415
Gx.36 Analysis Zone 36: Land Use 415
Gy.36 Analysis Zone 36: Land Cover 415 •
Gx.37 Analysis Zone 37: Land Use 416
Gy.37 Analysis Zone 37: Land Cover 416
Gx.38 Analysis Zone 38: Land Use 416
Gy.38 Analysis Zone 38: Land Cover 416
Gx.39 Analysis Zone 39: Land Use 416
Gy.39 Analysis Zone 39: Land Cover 416
Gx.40 Analysis Zone 40: Land Use 417
Gy.40 Analysis Zone 40: Land Cover 417 •
Gx.41 Analysis Zone 41: Land Use • 417 .. Gy.41 Analysis Zone 41: Land Cover 417
Gx.42 Analysis Zone 42: Land Use 417
Gy.42 Analysis Zone 42: Land Cover 417
Gx.43 Analysis Zone 43: Land Use 418
Gy.43 Analysis Zone 43: Land Cover • 418
Gx.44 Analysis Zone 44: Land Use 418
Gy.44 Analysis Zone 44: Land Cover 418
Gx.45 Analysis Zone 45: Land Use 418
Gy.45 Analysis Zone 45: Land Cover 418
Gx.46 Analysis Zone 46: Land Use 419
Gy.46 Analysis Zone 46: Land Cover 419
Gx.47 Analysis Zone 47: Land Use 419 •
Gy.47 Analysis Zone 47: Land Cover 419 =rt Gx.48 Analysis Zone 48: Land Use' 419 -'- .. ~
Gy.48 Analysis Zone 48: Land Cover 419
Gx.49 Analysis Zone 49: Land Use 420 •
Gy.49 Analysis Zone 49: Land Cover 420
Gx.50 Analysis Zone 50: Land Use 420
Gy.50 Analysis Zone 50: Land Cover 420 • •
Gx.51 Analysis Zone 51: Land Use • 420
Gy.51 Analysis Zone 51: Land Cover 420
GX.52 Analysis Zone 52: Land Use 421
Gy.52 Analysis Zone 52: Land Cover • 421
•
xx

•
Gx.53
Gy.53
Gx.54
Gy.S4
Gx.55
Gy.55
Gx.56
Gy.56
Gy.57
Gy.58
l.l
1.2
1.3
1.4
1.1
1.2
1.3
•
Analysis Zone 53: Land Use
Analysis Zone 53: Land Cover
Analysis Zone 54: Land Use
Analysis Zone 54: Land Cover
Analysis Zone 55: Land Use
Analysis Zone 55: Land Cover
Analysis Zone 56: Land Use
Analysis Zone 56: Land Cover
Analysis Zone 57: Land Cover
Analysis Zone 58: Land Cover
Traffic Congestion Forming Very High Risk
"
Visibility Problem nearby Empress Market (Very High Risk Zone) ,
Typical Old City Housing (Very High Risk Zone)
Black Smoke Emission in Congested Streets of Very High Risk Zone
Landsat 5 - TM, 1992, Bands 2, 5, 7
Landsat 5 - TM, 1998, Bands 2, 3, 4 •
KVR, 1998, Very High Spatial Resolution (2 meter)
,
,
,
•
,
,
• • XXI
•
•
,
421 421
421
421
422
422
422 422 422
422
426
426
427 427
428 428
429
,
, '.'
•

•
_ _ Ie . ~, ~
•
•
ACRONYMS AND LOCAL TE S
ACRONYMS
3-S ADB APP ATSDR BERG CBD
. CDIAC DHA EC EPA EPW ESRl GIS GOP EUAD GOP GPS HE! HRV ICA IEEE IPCC IUCN JPMC KCHS KCR KDA KESC KITE KMC KMTP KPT LBA LDCs LIDAR MAGIS MBBS MDCs MIC MSS NAS NASA NIPA NOAA NSIEM OECD PCI PCSIR PC YO PECHS
•
Three integrated technologies, i.e. RS, GIS and GPS· Asian Development Bank Associated Press of Pakistan' Agency for Toxic Substances and Diseases Registry Buildings Effects Review Group Central Business District Carbon Dioxide Information Analysis Centre of ORNL Defence Housing Authority, Karachi - Pakistan European Commission Environmental Prot.ection Agency Environment Protection Wing of PC YO Environmental Systems Research Institute, Inc. Geographic Information Systems Environment & Urban Affairs Division, Government of Pakistan Government of Pakistan Global Positioning System •
Health Effect Institute, United States High Resolution Visible scanner Instituto Geografico Nacional, Spain Institute of Electrical and Electronics Engineers Intergovernmental Panel on Climate Change World Conservation Union Jinnah Post Graduate Medical Centre Karachi Cooperative Housing Society Karachi Circular Railway Karachi Development Authority . Karachi Electric Supply Corporation Korangi Industrial Trade Estate Karachi Metropolitan Corporation Karachi Mass Transit Programme Karachi Port Trust Large Scale Biosphere-Atmosphere Experiment in Amazonia Less Develop Countries Laser Radar Metropolitan Area Geographic Information Systems Bachelor of Medicine I Bachelor of Surgery Most Develop CountrJes . Map Info Corporation Multi-Spectral Scanner National Academy of Science National Aeronautics and Space Administration, United States National Institute of Public Administration, Karachi - Pakistan National Oceanic and Atmospheric Administration, United States National Swedish Institute of Environmental Medicine Organization for Economic Co-operation and Development PCI Geomatics Canada Pakistan Council for Science and Industrial Research Pakistan Crescent Youth Organization Pakistan Employees Cooperative Housing Society
• • XXll
•
•
•

•
PEPA PRB PSI RCD RS SEPA SITE SPOT SRS SUPARCO TEB TM UID UNCHS UNDP UNEP URe USEPA WB WHO WMO WRI
•
Pakistan Environmental Protection Agency •
Population Reference Bureau, United States Pakistan Standards Institution Regional Cooperation for Development Remote Sensing Sindh Environmental Protection Agency Sindh· Industrial Trade Estate Satellite Probattoire de l'Observation de la Terre (French Satellite) Satellite Remote Sensing Pakistan Space and Upper Atmosphere Research Commission Traffic Engineering Bureau, Karachi - Pakistan Thematic Mapper Urban Heat Island United Nations Centre for Human Settlements (Habitat) United Nation Development Programme United Nation Environment Programme Urban Resource Center, Karachi - Pakistan United States Environmental Protection Agency
,
World Bank World Health Organization World Meteorological Organization World Resources Institute, United States
•
LOCAL TERMS
Bagh Bazaar Chawrangi Chowk Chowki Dakkhana Dawakhana Deh Goth Gully Hakim Jhuggi Kachra Kundi Katchi Abadi Kuh Mazar Morre Patharay walas Pu/ Purana
'Qabristan Rickshaw Sarafa Bazaar Shahrah Subzi Mandi Thana
•
Garden Market Roundabout Intersection Check Post
•
Post Office Clinic
,
Rural administrative entity Village Minor Street Physician practicing with herbal medicines Temporary Settlement Neighbourhood garbage dump Squatter settlement " Village , Mausoleum Intersections Temporary slllali cabins Bridge Old Cemetery, Graveyard 2-stroke, 3-wheeled para-transit vehicle
•
Gold Market Major Arterial Vegetable Market Police Statioll
,
, • • •
XXlll
, .
•
,
•

•
•
•
• - •
from
"The Principles of Human Knowledge ", by Bishop Berkeley (1685 -1753)
,
•
•
•
•
• ,
, •
"'9 3 ,
•
•
•
•
, •
• • XXIV
•

1. INTRODUCTION

1.1 BACKGROUND
Every component of man's environment has its own significance whereas atmosphere 'as
a whole' has the greatest imponance. This significance can be appraised from the fact that
on average each person breathes 14 to 1 g Kg of air from atmosphere and man cannot
survive for more than a few minutes without air but can live for days without drinking
water and for weeks without food .
Atmosphere is very dynamic and this dynamism is changing at an alarming rate since the
advent of industrial revolution. As a result some harmful chemicals were deliberately
introduced in the environment. These substances in such quantities and of such duration
are liable to cause harm to human, plant or animal life, or damage human made materials
and structures, or bring changes in the weather / climate, or interfere with the comfons of
life or propeny or effect other human activities.
Nowadays atmospheric pollution is a major environmental health problem, affecting
developed as well as developing countries around the world. Continuous growth of
human induced unchecked sources of pollution is the pivotal point of this burgeoning
problem. Besides increasing pollution there is an increasing demand for the early and
reliable detection of adverse effects caused by this pollution so that effective monitoring
and control measures could be introduced.
Environmental monitoring enables us to identify pollutant sources, their nature and
concentrations, patterns, trends and their harmful effects. Therefore, environmental
monitoring is now recognized at global as well as national and regional levels .
Environmental modelling technique is one of the recognized tools of monitoring. Some
times these techniques determine the appropriate mean to monitor the environmental
problem. Almost all of the environmental problems possess spatial dimension. Within the
domain of environmental modelling this is addressed by spatially distributed models that
describe environmental phenomena in one, two, three or even four dimensions. The
increasing development and use of spatially distributed models replacing simple spatially
2
----------- -

aggregated or lumped parameter models is, at least in part, driven by the availability of
more and more powerful and affordable computers (Fedra, 1993).
With the changing technological paradigms some other advance tools are also coming in
the field of environment health monitoring. Remote Sensing techniques are not new as
such but development of innovative sensors and modified applications of multispectral
data is now being used in this context. Especially meso and macro scale real time smoke
plume diffusion, trends, patterns detection and its under influence fauna and flora
estimation are very common remote sensing applications of atmospheric environmental
change. Remotely sensed data is not only directly used but also it facilitates
environmental models indirectly, which may provide us spatially continuous data.
On the other hand, Geographic Information System (GIS) is a set of tools to capture,
manipulate, process and display spatial or geo-referenced data (Gatrell, 1998). They
contain both geometry (coordinates and topological information) and attributes, i.e.
information describing the properties of geometrical spatial objects such as points, lines
and area. In GIS the basic· concept is location, spatial distribution and its relationship
whereas basic elements are spatial objects. In environmental modelling, by contrast, the
essence is state, expressed in terms of numbers, mass, or energy, of interaction and
dynamics; the basic elements are "species", which may be biological, chemical, and
environmental media such as air, water or sediment.
The harmony in these techniques is proved to be very powerful and thus the integration of
these fields of research technologies, or sets of methods, that is promising us some
integrated data, the data which is essentially needed to evaluate such a pressing human
issue. Unification of fields of researches, or adding a new technology to an established
and mature field, usually leads to new and exciting developments. Air pollution IS a
multi-dimensional problem and should be tackled with multi-disciplinary approach.
There has been a growing awareness on environmental issues in the developing world
after the United Nations "Earth Summit" held in 1992 at Rio de Janeiro. In Pakistan, this
wave of awareness has been further boasted by the promulgation of "Environmental
Protection Act of 1997." However, air quality remained a low priority area both for
decision-makers and common public. Nevertheless, some agencies and individuals
3

contributed considerably on air quality studies. But most of these studies are without
spatial dimensions, in spite of the fact that air pollution by all means a spatial problem
and have spatial repercussions both at local and regional scale. Karachi in this context
ranks very high among the Mega cities and contains highest concentrations of some
pollutants like lead (Pb), carbon monoxide (CO), carbon dioxide (C<h) etc. In this study,
an attempt has been made to study air pollution geography with the most effective
monitoring tools of our times, i.e. GIS and RS.
1.2 THE PROBLEM
Sandstorms and the emission of dust and gases from volcanoes pollute the earth's
atmosphere naturally but the most serious kind of air pollution comes from human
activity, . factories, power stations and vehicular exhausts. Atmospheric Pollution IS
considered as threat for human life and well being. Urban areas of the world in
developing as well as developed countries are badly under influence of harmful effects of
air pollution.
The gravity of the situation could be realized by the fact that in the early morning, there
are no clouds in the sky but the sun does not shine until it is well above the horizon. The
sun never comes out to its full strength in the city of more than 10 million people (i.e.
Karachi Metropolis) because the atmospheric pollution (Brown, 1998).
Urbanization in the modem sens'e of the term is the embodiment of blocks of flats, traffic
jams, air pollution, noise nuisance, growth of slums and avalanches of refuse (Scholz,
1983). These environmental degradation processes continue in Karachi in which air
pollution is the major concern that is dangerously affecting the urban and rural areas of
the metropolis. Karachi is one of the leading polluted cities in the world.
Atmospheric pollution in Karachi is 40 percent higher than other cities of Pakistan that is
on alarming stage. As a colossal urban and industrial area there are three human induced
dominating air pollution sources, vehicular traffic, Industrial manufacturing units and
open air garbage burning. These sources release thousands of tons of toxic gases and
particulate matters into atmosphere of Karachi (Qureshi, 1997)
4

1.3 THE STUDY
Increasing environmental pollution is a systematic change, which starts from human
perception and behaviour; varies from nation to nation at various levels of development,
passes through the civilization, and effected by the enhancement and introduction of new
technologies, side effects, monitoring and control etc. Continued growth in industrial
sectors, number of vehicles and in the wastage from an ever-increasing number of
sources, together with the need to preserve nature, have found worldwide attention
focused on the burgeoning problems of environmental pollution. Therefore, there is an
increasing demand for the early and reliable detection of adverse effects caused by
pollution so that effective monitoring and control measures could be introduced. As
people has become more aware of the hazards associated with the pollutants that are
emitted into the atmosphere as gases or particles, interest has grown in measuring
concentration in air both in polluted environments and in 'clean' environments
(Campbell, 1995). Human beings have reached to this concept of better environment after
centuries of thought. The management of environmental pollution is a key element in
achieving sustainable development that meets the needs of the present without
compromising the ability of future generations to meet their own needs. Besides
developed countries, Third world developing nations are more affected and paymg
against pollution, much greater share of income.
Karachi is one of the worst effected cities of the world due to unchecked and still
uncontrolled air pollution. Although few governmental and private organizations have
been working on this issue but spatial variation within metropolis have been largely
ignored mainly due to less comprehension, under estimation of spalial techniques as well
as difficulties in collecting, processing and analysing the data at micro geographic scales.
The primary objective of this study is to modulate the spatial information pertains to air
quality and to visualize its adverse effects on human health ina GIS matrix . The research
is intended to cover different basic parameters of air quality. The salient objectives of this
research are envisaged as described herein:
5
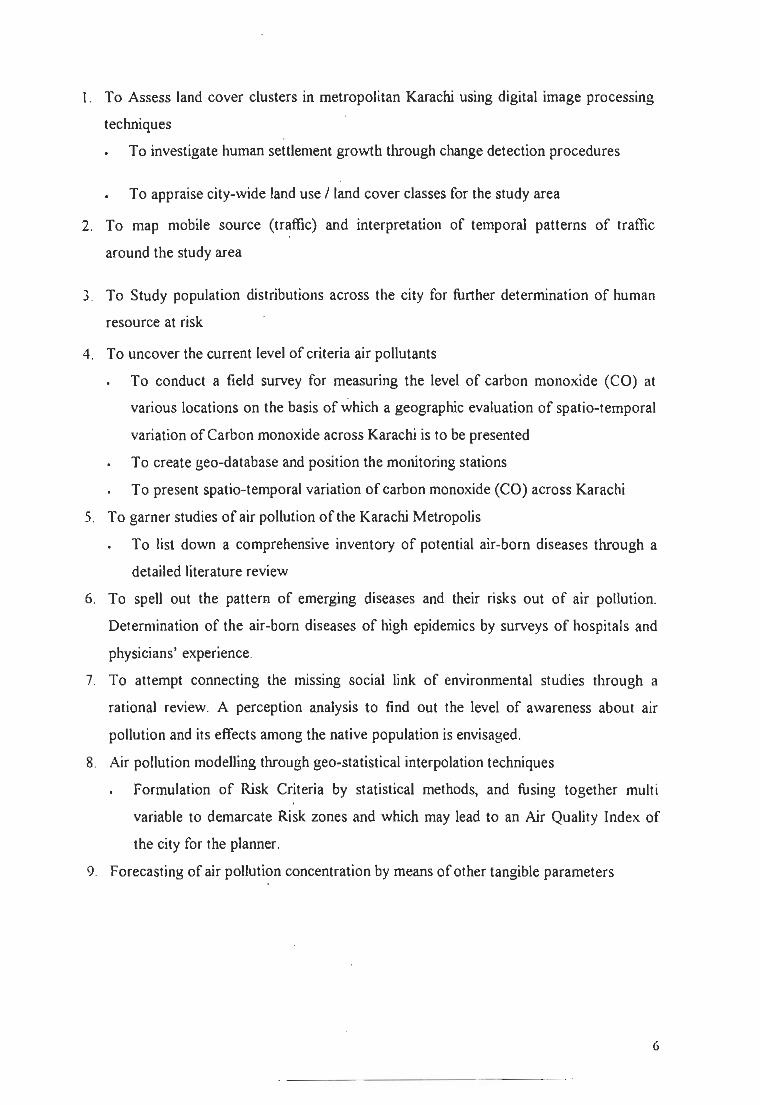
I. To Assess land cover clusters in metropolitan Karachi using digital image processing
techniques
To investigate human settlement growth through change detection procedures
To appraise city-wide land use / land cover classes for the study area
2. To map mobile source (traffic) and interpretation of temporal patterns of tramc
around the study area
3. To Study population distributions across the city for further determination of human
resource at risk
4. To uncover the current level of criteria air pollutants
To conduct a field survey for measuring the level of carbon monoxide (CO) at
various locations on the basis of which a geographic evaluation of spatio-temporal
variation of Carbon monoxide across Karachi is to be presented
To create geo-database and position the monitoring stations
To present spatio-temporal variation of carbon monoxide (CO) across Karachi
5. To garner studies of air pollution of the Karachi Metropolis
To list down a comprehensive inventory of potential air-born diseases through a
detailed literature review
6. To spell out the pattern of emerging diseases and their risks out of air pollution.
Determination of the air-born diseases of high epidemics by surveys of hospitals and
physicians' experience.
7. To attempt connecting the mlssmg social link of environmental studies through a
rational review. A perception analysis to find out the level of awareness about air
pollution and its effects among the native population is envisaged.
8. Air pollution modelling through geo-statistical interpolation techniques
Formulation of Risk Criteria by statistical methods, and fusing together multi
variable to demarcate Risk zones and which may lead to an Air Quality Index of
the city for the planner.
9. Forecasting of air pollution concentration by means of other tangible parameters
6

The work would be summarized under the following hypothesis:
"The higher concentrations and spatial patterns of air pollution are in conformity with the
geographical distributions of land cover / land use, traffic and population, which resulted
in high incidence of airborne diseases and the human resource near those areas, are on
vulnerable risk ."
The results of above-mentioned objectives are subjected to the availability of data and its
quality. In third world countries like Pakistan, data resources are limited and even
available data are not continuous both temporally and spatially. Methodology IS
meticulously chosen to overcome the data errors and flaws as much as possible In
indigenous environment.
1.4 STUDY AREA
Karachi metropolis is the largest city of Pakistan, the capital of Sindh Province and
former Federal Capital. Karachi Division a larger administrative unit lying geographically
in between 24° 45' N to 25° 37' Nand 66° 42' E to 67° 34' E, comprises of five districts
Karachi East, Karachi West, Karachi South, Karachi Central and Malir Figure I. I. In
August 200 I, the Sindh Local Government Ordinance was promulgated and accordingly
Karachi City District Government was established to look after the whole Karachi
Division under the single administrative authority. Instead of former five districts Karachi
Division was divided into eighteen towns (Mahmood el al., 2001). Administratively it lies
in Sindh Province and surrounded by Lasbela District in the West (Baluchistan Province),
Dadu District in the North and North East and Thatta District in the East Figure 1.2. The
whole administrative area occupies about 3600 Sq. Km in which more than half is under
urban land use. Some businessmen and fishermen along the sea founded this city in 18th
century. At that time it was called as Kalachi-lo-Goth or Kalachi-lo-Kuh (i. e. Village of
Kalachi) and then to its present name of Karachi (GOP, 1984).
7
--------- --- - -

".'0 ' ....
8

DIVISION
KARACHI Towns
Figure 1.2
KARACHI METROPOLIS Administrative
DISTRICTS \
t
l
' //~
9

1.4.1 Physiography
This region of the world has been developed under subtropical semi arid conditions. In
Karachi basin three anticlines and three synclines, known as Malir, Layari and Hub, mark
the physical characteristics. The Malir flows in the east of Karachi, the Layari flows
through the heart of City and Hub lies 30 km to the west and flows along Karachi Lasbela
boundary. The alluvial plains of the river Layari and Malir, salty and polluted where the
sea is near at hand and now these channels, are being used as sewage water channels
especially in the urban area. Jutting from these plains are barren rocky outcrops from
ridges and low hills. In the vicinity of the coast, sea creeks and mangrove swamps are met
with. Gullying is prominent in the softer rocks of uninhabited area. North-western portion
is skirted by the Kirthar Range, which lies north-and-south as related members of the
Pabb Range, which extends northward parallel to the Kirthar Range. Extending from
Cape Monze (Extreme South west of Karachi Division) to the Manghopir area (Centre of
Karachi Division) is a series of hills and ridges, known as Jhil Range. Most of hills of this
range from 400 feet to SOO feet in height. From South east of the city to North there is
another series of low hills, which is extending north-westward. These hills are 96 feet to
200 feet high.
Distinct from the alluvial plains of the · non-perennial Malir and Layari rivers are the
planes of marine denudation. South of the city is totally connected with Arabian sea
whereas the east-south-east lies a vast expanse of mud-flats, sandbanks and mangrove
swamps, intersected by a complicated system of ramifying creeks and inlets (Pithawalla,
1946) Figure 1.3. Range, which extends northward parallel to the Kirthar Range.
Extending from Cape Monze (Extreme South west of Karachi Division) to the Manghopir
area (Centre of Karachi Division) is a series of hills and ridges, known as Jhil Range. ·
Most hills of this range are from 400 feet to SOO feet in height. From South east of the city
to North there is another series of low hills, which is extending north-westward . These
hills are 96 feet to 200 feet high. Distinct from the alluvial plains of the non-perennial
Malir and Layari rivers are the planes of marine denudation. South of the city is totally
connected with Arabian sea whereas the east-south-east lies a vast expanse of mud-flats,
sandbanks and mangrove swamps, intersected by a complicated system of ramifying
creeks and inlets (Pithawalla, 1946) Figure 1.3.
10

P HYSIOGRAPHY OF
KARACHI METROPOLIS
~ , \'.
--
. ' .--' .(
/~'£-~J,':' .) -, I
C ,
fj~n:: 1.3
11

1.4.2 Climate
Latitudinal position and Physiography of an area together determine the regional as well
as local climate. In general Karachi is a subtropical coastal lowland area. Its geographical
location is not favourable to receive even sufficient seasonal monsoonal rainfall. It is Hot
Desert Rainfall Summer Concentration i.e. BWhb region by Koppen Geiger, Arid
Megathermal- little or no surplus moisture and summer Concentration heat index < 48 .0
cm i.e. EA'da' Region by Thornthwaite whereas Tropical coast lands with low rainfall
high humidity- low diurnal and annual range of temperature and sea breeze dominant in
summer when mean maximum is 35° C while winter mean daily temperatures is 20° C i.e.
I (iii) a region by Ahmad's classification (Ahmed, 1952; Khan, 1993).
Karachi endures a long hot season from March to October. In July and August
Temperatures are moderate because of monsoon winds. Sea breeze controls the severity
of temperature but in the areas away from the coast temperatures are higher. In May and
June low pressure in interior Sindh Province the north eastern winds increase the
temperature and it soars up to 43° C or a little higher. Monthly variations in climatic
elements are shown in Figure 1.4.
Humidity in this area particularly near shore is about 50% at least through out the year.
Annual range is from 50% (December, driest month) to 85% (August, moistest month) .
Average wind velocity in winter is 6.5 miles per hours, which is overall considered as low
wind. By the end of June or in July, monsoonal winds pass through the study area and its
surroundings. These seasonal winds are strong and increase speed in local wind system up
to 11.7 miles per hours. Rainfall in Karachi is meagre as well as very variable. Average
rainfall is about 197.85 mm. Maximum is received in July and August but irregular.
There are some local afternoon disturbances due to conventional currents and contrasts of
weather conditions, such s high temperatures, diurnal ranges and differences in humidity,
which cause thunderstorms, dust storms ' and squally weather during the transition stage
between the two seasons, viz. March to May and September to November (Pithawalla,
1946).
12

1ilOnm
""" 1001\ SIl
s "" ..
Meteor.ological Characteristics of Karachi Metropolis
-
~ ~! "-
"Or <
F "
, ;,
':' -, - ,. -
I
~ t l . • • -r f • 1
~ • 1 • -- • ...... - • ~ - --0 0 0
,,., feb r: " A,. ~:~ "" .... .... S .. Oct """ Dec
- - - - -L ..... •
Figure 1,4
1
'O"e
30
20 BCoI.}tml ,Om
, . ."" ,
• 0 0
13

In addition to these there are local land and sea breezes near the coast. These sea breezes
are accompanied by fall of temperature (from about 50 F to 3.50 F), rise of humidity
(from 5% to 30% and above), shift of wind direction to west, south or southwest and an
increase of wind velocity. The transition from land breeze to sea breeze is more marked,
as the latter proceeds inland. The sea-breeze front appears to be somewhat diffuse near
the coast but by the time it reaches far inside the land it becomes quite sharp owing to
increased contrast with the land breeze.
1.4.3 Socio-Economic Status
Total population of Karachi division was 9856318 persons in 1998 with over 3 percent
annual growth rate (GOP, 2000a) that estimates 11.3647 million in 2002. Almost 94.S
percent population lives in urban area, which indicates about 17334.8 people per square
kilometre population density on an average (GOP, 2000b). Table 1.1 indicates the
population growth from 1931 to 2002.
Table 1.1: Population of Karachi
1931-2002
Karachi's population is deconcentrating from its core because of better residential and
availability of basic goods and services. Environment and urban sprawl are also major
contributors to this deconcentration. In 1972 almost sixty three percent of the population
lived with in ten kilometres of the city. By 1981 this had declined fifty two percent. as
population growth shifted to the ring located between eleven and twenty kilometres from
the centre. At present over one half of Karachi population lives more than 10 kilometre
from the city centre.
14
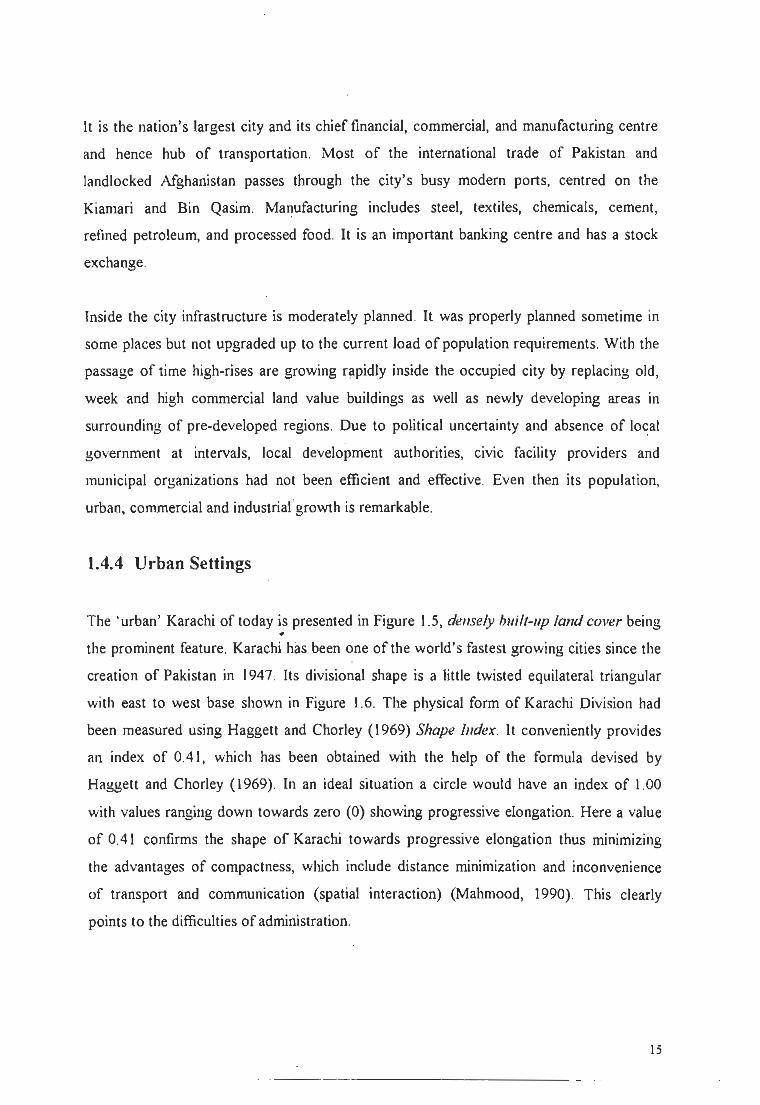
It is the nation's largest city its chief financial, commercial, manufacturing centre
and hence hub of transportation. Most of the international trade of Pakistan and
landlocked Afghanistan passes through the city's busy modern ports, centred on the
Kiamari and Bin Qasim. Manufacturing includes steel, textiles, chemicals, cement,
refined petroleum, and food. It is an important banking centre and has a stock
exchange.
Inside the city infrastructure is moderately planned. It was properly planned sometime in
some places but not upgraded up to the current load of population requirements. With the
pa!;sa!~e of time high-rises are growing rapidly the occupied city by replacing old,
week and high commercial land value buildings as well as newly developing areas in
surrounding of pre-developed regions. Due to political uncertainty and absence of local
government at intervals, local development authorities, civic facility providers and
municipal organizations had not been efficient and effective.
urban, commercial and industriafgrowth is remarkable.
1.4.4 Urban Settings
its population,
'urban' Karachi of today is presented in Figure 1.5, dellsely huill-lip land cover •
the prominent feature. Karachi has been one of the world's fastest growing cities the
creation of Pakistan in 1947. Its divisional shape is a little twisted equilateral triangular
with east to west base shown in Figure 1.6. The physical form of Karachi Division had
been measured using Haggett and Chorley (1969) Shape Illdex. It conveniently provides
an index of 0.41, which has been obtained with the help of the formula by
Haggett and Chorley (1969). In an ideal situation a circle would have an index of 1.00
with values ranging down towards zero (0) showing progressive elongation. Here a value
of 0.41 confirms the shape of Karachi towards progressive elongation thus minimizing
advantages of compactness, which include distance minimization and inconvenience
of transport and communication (spatial interaction) (Mahmood, 1990). dearly
points to the difficulties of administration.
15

•• '1 .. i <. • • t ",wart "' '''JlS'1 ..
~C_C -- --- • --- .... ... - --- --, • , .-- • -, - --- • --

Conceptual Ceometrical Shape of Karachi Division
E<jui1aten1 TriansJc Con<q>tual Ov<rlapped
Figure 1.6
This city has grown nearly 25 times in the last 45 years and is growing at the rate of about
6% per annwn, making Karachi one of the tastest growing cities in the world. This
situation is mainly due to the rapid industrialization process, which has caused continues
influx of people from up-country areas to Karachi.
Its Core lies near to left-base comer geometrically that is southwest geographically, near
the coast. This core is the gravitational focus of the city because of commercial centre
(Saddar). It is difficult to define it as Central Business District (CBD), owing to sufficient
night time and residential population, but that is the kernel of metropolis.
Analyses of past growth trends in Karachi suggest that the city has expended primarily
along growth corridors to the South, North, East and Northwest. Between 1931 and 2002,
growth in these places was on the order of5.4 percent per year (KDA, 1991) Figure 1.7.
Karachi is considered as transportation hub of Pakistan. It contains many of the nation's
major transport networks. Two major ports of the country: the port of Karachi and port
Qasim (container terminal) and Pakistan's largest international airport are situated in this
metropolis. The functional area or area of influence of these ports are extended upto the
neighbouring land locked states.
Karachi is the terminus of major road and rail networks, which link it to the interior of the
country. This transport infrastructure has transformed it into a cardinal national and
international commerce and banking centre and thus serves as lifeline for the whole
country.
17

KARACHI Urban Sprawl
(1947 -- 2002)
N
o &-.... l _· :;. I \~~
1"..!4,~u..-L ... .......,n..--I ......... I~
101:. .... IAIIII
--.-".. - _oJ'
Ara ian Sea
So.,.c~: A fter A fsar. 200 I
/
/'
/
/
./
/ _ t ,
Figure 1.7
18

19

Karachi metropolis has a major road network (Figure 1.8) of more than 7,400 kilometres
(KDA, 1991). In Planned and restructured areas, roads are wide and well carpeted as
compared to unplanned areas where such development is almost impossible. Generally
the road width is insufficient for great route flow especially in commercial and industrial
areas, which creates traffic jams, dead slow speed and choking points during rush hours.
1.4.5 Historical Sprawl
Karachi, the capital of Sindh, had a population of about 450,000 with small extensions in
1947 (GOP, 1951). [n physical terms, the city was clearly divided into two: the European
city and the native city The European City consisted of the Cantonment, Civil Lines and
the Saddar Bazaar. The native city was near the port and consisted of the old pre-British
town and its suburbs. The area between the two parts of the city consisted of Bunder
Road, McLeod Road, and Katchehry Road triangle and extended south to the port. That
area contained the Karachi PorI' Trust (KPT) warehouses and railway yard; port related
business, commercial and financial concerns; civic and municipal functions; the major
institutions of higher education, high court and provincial assembly secretariat. [n
addition to the city itself, the Karachi district also contained over 1,200 gOlhs or villages.
Fishermen, peasants and herders inhabited the coastal and inland goths.
Major changes took place in Karachi wiihin a few months after independence. Within a
few months after it became the capital of the country, Karachi received 600,000 refi.lgees
from India. [n addition, it received a large number of government servants a~d support
stalT from other provinces of Pakistan. This massive demographic change was also
accompanied by physical and cultural changes.
The major problem that Karachi faced after the refugee influx was of housing the
migrants, developing infrastructure for water and sewage, and creating space for the
further development of the capital city. Housing was developed for government servants
in or around the periphery of the city and between 1949 - 1953 over 14,000 plots were
developed by promoting cooperative housing societies. These colonies were located at
considerable distance from the city centre and transport, though inadequate, was
developed to service them (Hasan el a/., 1999).
20

Most of the industrialization took place in Karachi and hence people, displaced by the
green revolution, migrated to the city in search of jobs. As a result to accommodate the
incoming population, new townships have been established from fifteen to twenty miles
to the east and west of Karachi in Korangi and New Karachi . In the vicinity of these
townships, large industrial areas were also planned and incentives provided to the
industrialists to develop these areas. Squatter settlements were also developed along the
roads linking the city to New Karachi and Korangi . Located on or along natural drainage
channels.
In the decade of the seventies the state encouraged the construction of medium-rise and
high-rise apartment buildings. Consequently, Karachi's skyline started to change and a
nat-culture, which has now become an integral part of Karachi's sociology, began to
develop. Building bylaws were changed so as to increase building heights and covered
areas. These policies also densified the old city and overloaded its already fragile
infrastructure, and created .vertical slums in the middle and lower middle-income suburbs.
It also led to the creation of a flat culture (Meyerink, 1983). The growth of ka/chi abadies
increased and suburbs to the .north and north east of the city are densifying rapidly.
For Karachi Development Plan 2000, the monitoring and related planning exercises could
not be carried out due to scarcity of data. for which no system was proposed by the Plan.
Resultantly, fragmented development takes place, as there is no coordination among the
agencies making and implementing these development proposals (Khoro and Mooraj,
1997). The growth is still continuing but the most perilous is that, these developments
often involving high-rises commercial development, which are made without any urban
design exercise. Much of Karachi's environmental degradation is a result of atrocities.
1.5 SIGNIFICANCE OF THE STUDY
Air quality is proving detrimental to human health in many parts of the region. These
trends are likely to continue. World Health Organization reported that air pollution is a
threat to the health and well being of peoples throughout the world (WHO, 1958).
21

The uhimate purpose of air pollution monitoring is not merely to present data, but to
provide the information necessary for scientists, policy makers and planners to make
informed decisions on managing and improving the enviromnent. Monitoring fulfils a
central role in this process, providing the necessary sound scientific basis for policy and
strategy development objective setting, compliance measurement against targets and
enforcement action thus enhancing administrative output Figure 1.9.
Control and M.n8!!!l!!!!'1!t Scenarios for decision makers
Source: After WHO, 2000
Problem Idrtrtifintion MDDiloring, inventories,
sources.
PijplrCl .9:S,·_of __
Formulate Policy Modeling, Scenario evaluation
Karachi metropolis is one of the badly poUuted cities in the world. Some private as weU
as governmental organizations have tried to monitor air pollution but spatial dimensions
of air pollution and its impacts particularly on human health have been ignored. This
ignorance by aU means is not deliberate, what we believe is an under estimation of spatial
dimension by our planners. As a result any monitoring management tool has never been
used in this area, which is being conceived in a spatial matter. The spatial dimension
might store muhi-type data, query with multi-spatial criteria, analyse impacts, estimate
population at risk precisely and interpret effects visually, within one integrated system.
The essence of this study is to investigate how to monitor air pollution and to endeavour
for protecting public health from the adverse effects of air pollution thus improving
quality of life of people. Another purpose is to make recommendations to reduce to a
minimum, those air contaminants that are known to be or are likely to be, hazardous to
the health of the inhabitants residing in this biggest metropolis of Pakistan.
"Is air pollution a threat for human life" and qualitatively "How much is it dangerous" are
not questionable except quantitatively how much is it harmful for dwellers of Karachi
22

metropolis and Why? Only spatial pattern monitoring can answer this question even on
micro scale. Spatial pattern monitoring is not essential as prerequisite internationally but
it is in the local and national interest for sustainable development and welfare of
indigenous population.
Remote Sensing is a helping and data providing tool, which provides useful relevant
information related to environmental problems and their impacts. It also supplements to
comprehend the analysed results . In this work besides data collection and representation
of air pollutants, health and diseases, socio-economic and demographic structure variables
and their association were to be integrated and analysed by GIS. Geographic Information
Systems has explored and depicted spatial patterns of atmospheric pollution and spatial
epidemiology of airborne diseases and established cause and effect relationship between
pollutants and diseases respectively.
This systematic research has academic emmence of using Geographic Information
Systems and Remote Sensing tools to examine atmospheric pollution and its aftermath
monitoring. This monitoring would lead towards a cost effectual and efficient planning
and development. Geographers, environmentalists, epidemiologists, planners, decision
makers and other professionals and researchers would not only be interested in the
findings of this study but also in the research methodology.
23

2. REVIEW OF LITERATURE
2.1 AIR POLLUTION: EFFECTS, SOURCES AND SPATIAL
DISSEMINATIONS
Earth's atmosphere is a complex phenomenon formed with the interaction of
hydrosphere, lithosphere and biosphere. It is composed primarily of the gases Nitrogen
(N2) (78 % dry), Oxygen (02) (21%) and Argon (Ar) (1%), whose quantity are controlled
over geologic time-scales by uptake and release from crustal material, by degassing of the
interior and by the biosphere (Prather e/ al., 1995). Water vapour (H20) is the next
largest, though highly variable, constituent present mainly in the lower atmosphere at
concentrations as high as 3%, where evaporation and precipitation control its abundance.
The remaining gaseous constituents are considered trace gases, comprising less than I %
of the atmosphere, yet playing a disproportionately important role in the Earth's radiative
balance and these are extremely important meteorologically (Tarbuck and Lutgens, J 992).
The budget ofa trace gas is defined by its sources and sinks (Akimoto e/ al., 1994), these
chemical species are governed by the rates of production and removal (Bouwman, J 993).
A chemical that is in the wrong place at the wrong concentration is either a pollutant or a
contaminant. The distinction resides in the ability of a pollutant to damage human beings
or parts of the biosphere upon which they depend. These pollutants are emitted into the
atmosphere as gases or particulate which then, directly or indirectly, degrade or adversely
affect physical and biological sy.stems (Elsom, 1987). In the atmosphere, pollutants may
move from a dry, gaseous phase into a liquid phase before falling to the surface (e.g.
Wine and Chameides, 1990). Damage by air pollutants to metals, fabrics and materials
used by humans is very evident but the biological effects of air pollutants directly upon
humans or upon the living systems that surround them are often subtle and far more
significant (Weber, 1982).
There is growing understanding of the links between atmospheric problems such as local
air pollution, acid rain, global climate change and stratospheric ozone depletion. Isolated
25

responses to one environmental problem may in fact worsen another. For example
catalytic converters on cars decrease nitric oxide emissions and help to reduce acid rain
and urban smog but they release higher levels of nitrous oxide, which is a potent
greenhouse gas and a contributor to stratospheric ozone depletion (IPCC, I 996a).
Every year over a thousand people die from the direct affects of air pollution in Pakistan
(Waqas and Dar, 1997; Correspondent Frontier Post, 1999) and 20 to 30 percent diseases
in Pakistan result from pollution and degradation (APP, 2000a). The tremendous increase
in the use of petroleum products, particularly in motor vehicles, introduced several new
pollutants (WHO, 1972). Atmospheric pollution in Karachi, 40 percent higher than other
cities of Pakistan, was on alarming stage. Thousands of tons of toxic gases and particulate
matters were present in the atmosphere in Karachi produced by industrial activity and
traffic vehicles at large (Qureshi, 1997).
Air pollutants are usually classifIed into two broadly categories i.e. Criteria Air Pollutants
and Hazardous air pollutants (USEPA, 1985) USEPA defined Environmental Quality
Standards on the basis of six pollutants' threshold and criteria in Clean Air Act, I 970s.
Since 1970, these have been known as Criteria air pollutants.
I. Carbon Monoxide (CO)
2. Nitrogen Dioxide (N02)
3. Ozone (03)
4. Lead (Pb)
5. Particulate Matter
6. Sulphur Dioxide (S02)
Hazardous air pollutants, also known as toxic air pollutants or air toxics, are those
pollutants that cause or may cause cancer or other serious health effects, such as
reproductive effects or birth defects, or adverse environmental and ecological effects.
Table 2. I presents a list of hazardous air pollutants known:
26

Table 2.1: Hazardous Air Pollulanls
2 3 4
5 6 7 8 9 10 II 12 13 14 15 16 17 18
)9 20 21 22 23 24 25 26 27 28 29 30 31 32 13 34 35 36
Ie
2
AC!),lic acid
Ally
Aniline
lellZyl
C
Captan C.,h.rvl Carbon ' Carbon
1 sullide
Chlorine " : acid
37 ( 38 ( 39 40 ( 1 methyl other 41 C 42 :rc,ylic acid ' 43 <14 45 46 47 48 49
2.4-0, salts and esters DOE
50 C'
,Irom
,
, and ,
52 53 54 55 56 57 58 59 60 61 62 63 64 65 66 67 68 69 70 71 72 73 74 75 76 77 78 79 80 81 82 83 84 85 86 87 88 89 90 91 92 93 94 95 96 97 98 99 100
I ethor C
N. I aniline n Diethyl sulfate 3,3-1
[);melhvi
,1-1 '
I sulfate . and salts
1 : (1 4-C'
I (I
Ethyl ae!),late Ethyl Ethyl Elll/l
Hexane
, :(C~ 'de (Dibromo,
:(1
:.lwol : imine " : oxide
, :(1.1-['
-1
H ',acid I fluoride I sullide
l'I<thor)
: acid)
27

~. f'1oi". 102 Lindane(aJl 152 ~ , 103 Maleic ' 153 104 154 2.4-Toluene 10; 155 2, 106 Methvl bromide ill!: 156 107 Methyl ,(Ch 157 108 Methyl \0,1,1-: 158 1,I,2-TI \09 Methyl c~ 1'1 Kelonc I 159 110 Methyl ' 160 :,4,5-TI III Methvl iodid., 161 112 Melllyl,sobut\'1 ketone 162
3 Methyl 163 _4 MethYl 164 ; Metltyl terl butyl ether 16;
116 ,bis{ 166 117 , chloride ') 167
2,2.4-T: Vinyl n«\ate Viny Viny
II S ,(MDI) 168 , chloride 0, 119 169 Xylenes (isomers and ,
123 124 125 126 127 128 129 130 131 132 133 134 J:
3'
13! 139 140 141
142
N-
Phenol p-I
Phthalic
, sultone
143 : oxide
, (
, 0,2-
144 I ,c 14; 146 147 ,tyrene 148 Styrene oxide 149 2.3,7,8-T' 1;0 1.1.2,2-T,
Source: u~~. ~. 2002. Web:
170 0-) enes 171 172 173
174 175 176 177 \'
, I'
I: 181 182 183 184 1~5
186 187 188 189
Arsenic , \ (
~( Cobalt Coke Oven Cyanide G Ivcol eth.rs2 LcadC
Fine mincrallibcrs3 N :ke1
, Organic Mattcr4 :eadon)5
,AuguSI I
: orsine)
28

Apart from the USEPA classification of crileria and hazardous pollulan/s, they are
generally classified in the literature according to their physical state. These pollutants are
found in atmosphere in various states of matter. Therefore, these are usually classified
into suspended particulate matter, gaseous pollutants (gases and vapours), odours and
heat (WHO, 2000).
The term Suspended Particulate Matter refers to the wide range of finely divided solids
or liquids dispersed into the air and have a number of different names. In common
lerminology particulate matter consists of dust, aerosols, fly ash, fog, fume, mist,
particles, smoke, soot, and sprays (Parker, 1978). Some common types of particulate
matter are indicated in Table 2.2.
Table 2.2: Particulate Malter: Sizes and Identifications
Dlisl consists of solid larger particles, capable of temporary suspension in air and other
gases (Buat-Menard el al., 1983; Dulac el al., 1989, 1992). Ail aerosol consists of
dispersion in a gaseous media of solid or liquid particles of microscopic size, such as
smoke, fog or mist. In some definitions aerosols are considered to include anything from
particles of 100 !lm to 0.1 ~lm or less. Particles 5 !lm or smaller tend to form stable
suspensions. Particles larger than 5 !lm tends to settle out as dust fall. Fly ash consists of
fmely divided particles of ash entrained in flue gases arising from the combustion of fuel.
The particles of ash may contain unburned fuel and minerals. Fog consists of visible
29
.. _ - -- -----
aerosols in which the dispersed phase is liquid (Andreae, 1995). In meteorology, fog is a
dispersion of water or ice (Tarbuck and Lutgens, 1992, 1994).
Fllllle consists of particles formed by condensation, sublimation, or chemical reaction, of
which predominate part. by weight, consists of particles smaller than I J.llll. Tobacco
sllloke and condensed metal oxides are examples of fume. Fume may flocculate or
coalesce. Misl is a low concentration dispersion of relatively small liquid droplets. In
meteorology, the term mist applies to a light dispersion of water droplets(Tarbuck and
Lutgens, 1992, 1994). In enough amounts to fall from the air, Mists may result from the
condensation of gases or vapours to the liquid state. Breaking up a liquid through
splashing, or foaming can also generate mists. Sprays are liquid droplets formed by
mechanical action (Durkee el al., 1991; Stull, 2000).
The World Health Organization (1976) recolllmends the suspended particulate matter
sample to be referred to as 'smoke' (or sometimes 'soot') and latter as 'total suspended
particulate' (TSP). Each of them has a specific meaning despite being popularly used in
an interchangeable manner, and Table 2.2 distinguishes them by nature and size. In the
case of grits and most coarse dusts, only particles greater than 50 J.lm across remain
suspended for some time and, if very small (0.1-2 J.lm), act as nuclei for the condensation
of water during cloud formation. They are only removed as rain or when hit by falling
rain (washout). If they escape from the lower troposphere to upper altitudes, however,
they remain there for months or even years (Commins and Waller, 1967; Lee el at., 1972;
Ball and Hume, 1977; Parker, 1978; Pashel and Egner, 1981; Elsom, 1987). Effects of
SPM in humans depend on particle size and concentration, and can fluctuate with
tluctuations in PMIO (Concentration of particles with aerodynamic particle diameters of
less then 10 micrometers) or PM2.5 (Concentration of particles with aerodynamic particle
diameters ofless then 2.5 micrometers, respirable Particulates) levels.
VajJours include gases and compounds that in general have a boiling point below 2000 C .
. The terms vapour and gas are often used interchangeably. In a strict sense a vapour is a
substance, which, though present in the gaseous phase, generally exists as a liquid or solid
at room temperature and sea level barometric pressure such as Acetone, Benzene,
Hydrogen Sulphide, Formaldehyde etc. A gas normally exists in the gaseous phase at
30

room temperature. Gaseous pollutants include sulphur compounds (e.g. Sulphur dioxide
and Sulphur trioxide), Carbon monoxide, nitrogen compounds (e.g. Nitrogen oxide,
Nitrogen dioxide, ammonia), Organic compound (e.g. hydrocarbons, volatile organic
compounds, Polycyclic aromatic hydrocarbons and halogen derivative aldehydes etc.),
halogen compounds (HF and HCI), Ozone and etc. (Logan, 1983: Laxen, 1985: and
Novelli et al., 1992). Many industrial processes as well as the operation of machines such
as engines may either raise temperatures or lower the barometric pressure, causing a
substance to convert to the gaseous phase (Lawther, 1970).
Some odours may be dangerous for human health, these are considered as air pollutant.
During the travel on public transport, crossing the industrial odorous areas, near the
kllchra kill/dies of solid waste and near the sewage sludge many people feel Nausea and
Nasal bleeding. While some odours are known to be caused by specific chemical agents
such as hydrogen sulphide (H2S), Carbon disulphide (CS2) and mercaptans (R-SH, Rl S
R2), others are difficult t. define chemically (WHO, 2000)
The energy released by man 111 the form of "eat, called a type of air pollution
(Padmanabhamurty and Hirt, 1974). This energy causes a significant climate change in
our cities and in global climate effects. Cities are warmer than their rural surroundings
because of energy dissipation and the thermal capacitance of streets and buildings for
solar input. This concept is known as Urban Heat Island (UHI) (Quattrochi and Ridd,
1994, Lo et ai, 1997).
Transportation contributes the largest share of air pollutants to the urban environment.
The total number of registered vehicles in Asia-Pacific region in 1996 was about 127
million, 4.24 percent more than in the previous year (International Road Federation,
1997). In Seoul, car ownership doubled in a single year between 199 I and 1992 (Ministry
of Environment, Republic of Korea, 1990 and 1995). Lead pollution is a particular
problem in megacities of South and Southeast Asia. The introduction of unleaded fuels is
reducing average lead levels, although the rate of decline is slower in Asian than
elsewhere.
Pakistan has fortunately switched to unleaded gasoline. Vehicular emissions are only just
one big source of air pollution in the cities of Pakistan besides industrial emISSIons,
31
burning of solid waste and natural dust (Correspondent the Nation, 2000). Nairn (1998)
Jlcrceived that the major contributors as a source of air pollution in Karachi were tirstly
the oil tired thermal power stations, secondly the factories and thirdly the road vehicles.
Pakistani petroleum marketing and blending companies were supplying fuel to industries
and powerhouses with over 3.5 percent sulphur content. While the standard of one
pcrcent sulphur content in high-speed diesel in furnace oil by the Pakistan Standards
Institution (PSI) is very high as compare to less than 0.5 percent sulphur allowed in India
(Qureshi, 2000).
Karachi is the most populated city of Pakistan having very high traffic density. These
vehicles emit 1,813 tons of smoke daily (Khalil, 1996). Major proportion of that pollution
is caused by 15,000 rickshaws, which create multidimensional environmental problems in
which air pollution was leading (Editorial daily News, 1996; APP, 2000b). The two
stroke rickshaws are a major cause of air and noise pollution (APP, 1999). Main causes of
vehicular emitted air pollution in Karachi were supply of adulterated diesel, petrol and
engine oil, road traffic jams due to illegal encroachments at numerous places,
mismanagement of civil administration (Correspondent daily Dawn, 1997), traffic
congestion, insufficient urban road space, ineffective traffic management, low average
vehicle speed, lack of enforcement of vehicle emission standards and poorly maintained
older vehicles (Mughal, 1998).
2.1.1 Global and Regional Scenarios
Air Pollution adds harmful substances to the atmosphere resulting in damage to the
environment, human health, and quality of life. Some air pollutants return to Earth in the
form of acid rain and snow, which corrode buildings, damage crops and forests, and make
lakes and streams unsuitable for fish and other plant and animal life (Manins, 1995).
Pollution is changing Earth's atmosphere so that it lets in more harmful radiation from the
Sun. At the same time. our polluted atmosphere is becoming a better insulator, preveflting
heat from escaping back into space and leading to a rise in global average temperatures
that further affect world food supply, alter sea level, make weather more extreme, and
increase the spread of tropical disease (WHO, 1992).
32

Air pollution expands beyond a regional area to cause global effects. It is rich in ozone,
the same molecule that acts as a pollutant when found at lower levels of the atmosphere in
urban smog. Up at the stratospheric level, however, Ozone forms a protective layer that
serves a vital function: It absorbs the wavelength of solar radiation known as ultraviolet-B
(UV-B). UV-B damages deoxyribonucleic acid (DNA), the genetic molecule found in
every living cell, increasing the risk of such problems as cancer in humans (Elsom, 1987).
Several pollutants attack the ozone layer. Chief among them is the class of chemicals
known as chlorot1uorocarbons (CFCs). In these compounds the chlorine acts as a catalyst.
A single chlorine atom can destroy up to 100,000 ozone molecules in the stratosphere
(Miller, (999). Other pollutants, including nitrous oxide from fertilizers and the pesticide
methyl bromide, also attack atmospheric ozone (Keller el al., 1993; Keller and Matson,
1994). In the Antarctic region, it vanishes almost entirely for a few weeks every year
(Bowman et aI., 1995). Although eFe use has been greatly reduced in recent years and
will soon be prohibited worldwide (Montzka et al., 1993), eFe molecules already
released into the lower atmosphere are making their way to the stratosphere for decades,
and further ozone loss is expected. As a result in anticipation, an increase in the incidence
of skin cancers, more eye cataracts (clouding of the lens of the eye), and reduced yields of
some food crops are considerable effects (Liu and Trainer, 1988; Liu el al., (991).
The driving energy for weather and climate comes from the Sun. There are several
natural factors, which can change the balance between the energy, absorbed by the Earth
and that exited by it in the form of long wave infrared radiation; these factors cause the
radiative forcing on climate. One of the most important factors is the greenhouse effect
that furthers affects on human beings directly as well as indirectly. The main greenhouse
gases are water vapour {the biggest contributor (!Pee, (995)}, carbon dioxide, methane,
nitrous oxide and ozone in the troposphere and stratosphere (IPee, 1990). Aerosols in the
atmosphere can also affect climate because they can rellect and absorb radiation. The
most important natural perturbations result from explosive volcanic eruptions, which
affect concentrations in the lower stratosphere. Table 2.3 is a summarized key greenhouse
gases aft'ected by human activities and their future trends around the globe.
33

Table 2.3: Summary of Key Greenhouse Gases Affected by Human Activities
Vr.:·induslrial (11 $0 - I ~OO) 2>0 0.> 0 0 2~~
1990 333 1.72 2~0 4~4 )IU
CUINtll r;II .. · or ~h'lIIg.: I)o,:r Y":OIr I . t( (O. j ~ u) O.UIS (0.')" ,,) ').5 (4", .. ) 17 (4~,,) O.X (0.25"u)
All\1U),(JINri~ lili.:tim.: (y.:ars) 30 ·· 200 IU 63 Ilu IlO
Source: !PCC. 1 ~91l
Globally, future levels of atmospheric pollution will be governed largely by the use of
energy from fossil fuels . The Intergovernmental Panel on Climate Change (IPCC) (1995)
has predicted that global economic output may double between now and 2050, with
energy demand reaching nearly three times that in 1990. If the developing countries
tollow the conventional development path, there would be a massive increase in the
emission of atmospheric pollutants. However. this need not be the case as has been
proved by some developed countries. For example, in Europe. sulphur emissions peaked
in the 1970s and subsequently declined steadily, despite increasing energy consumption.
Similarly, the mechanisms developed fur the Kyuto Protocol could help developing
countries restrict their emissions .of greenhouse gases.
Naturally occurring greenhouse gases keep the Earth warm enough to be habitable. By
increasing their concentrations and by adding new pollutant (so called greenhouse gases)
like chlorofluorocarbons (CFCs), humankind is capable of raising the annual global mean
surface-air temperature. This is enhanced greenhouse effect as compared to that occurring
due to natural greenhouse gas concentrations. Other changes in climate are expected to
result, for example changes in precipitation, and a giobaiwllrmillg would cause sea levels
10 rise. Human made aerosols, from sulphur emitted largely in fossil fuel combustion, can
modify clouds and this may act to lower temperatures. Changes in ozone in the
stratosphere due to CFCs may also influence climate. The total release of carbon to the
atmosphere from changes in lane use, primarily deforestation, between 1850 and 1985 has
been estimated to be about 115 GtC (Houghton and Skole, 1990).
Annual global emissions of carbon dioxide from the burning of fossil fuels cement
manufacture and gas flaring reached at a peak of nearly 23,900 million tonnes in 1996
(CDIAC, 1999). This was some 400 million tonnes more than in 1995 and nearly four
times the 1950 total . Only in some countries in Europe and Central Asia has there been a
34

significant drop in emissions during the past decade, mainly a result of the economic
crises in Eastern and Central Europe. Atmospheric concentrations of COl in 1997 reached
more than 360 parts per million (ppm), the highest ever level (Keeling and Whorf 1998).
In assessing the possible impact of rising atmospheric concentrations of COl and other
grccnhouse gases (GHGs), the WMO/UNEP Intergovernmental Panel on Climate Change
(lPCC) concluded in its 1995 report that 'the balance of evidence suggests that there is a
discernible human influence on global climate' (IPCC 1996a). Recent research suggests
that climate change would have ' complex impacts on the global environment. The IPCC
mid range scenario projects an . increase in global mean temperature of 2.0 C, within a
range of 1.0 to 3.5 C by the year 2100, the largest warming in the past 10,000 years.
Average sea level is projected to rise by about 50 cm, within a range of 15 to 95 cm, by
the 2100. A 50 cm rise in sea level would lead to the displacement of million of people in
low lying delta areas and a number of small island states could be wiped out (IPCC
I 996b).
In a warmer world there would be higher agricultural production in the high latitudes of
the northern and southern hemispheres but reduced production in the tropics and sub
tropics where there is already food deficiency. The species composition of forests and
other terrestrial ecosystems is. likely to change, entire forest types may disappear .
Although forest productivity could increase, the standing biomass of forests may not
increase because of more frequent outbreaks and extended ranges of pests and pathogens,
and increasing frequency and intensity of fires. Climate change could influence lakes,
streams and wetlands through altered water temperatures, flow regimes and water levels.
Increases in the variability of water flow, particularly the frequency and duration of large
floods, and droughts, would tend to reduce water quality and biological productivity and
habitat in freshwater ecosystems (JPCC 1998).
In addition to these environmental effects, climate change may have direct and indirect
health impacts. Greater frequency and severity of heat waves, and changes in agriculture
and food production, could affect nutritional status and vector distributions (Lindsey and
Birley, 1996). Two anthropogenic processes primarily affect the concentration of COl in
the atmosphere: release of COl from fossil fuel combustion; and changes in land use such
as deforestation. The global input of COl to the atmosphere from fossil fuel combustion,
35
------ ------------.

plus minor industrial sources like cement production, has shown an exponential increase
since 1860 (about 4% per year) (Marland, 1989). The components of the flux to the
atmosphere have been: burning associated with land use change; and decay of biomass on
site (roots, stumps, slash, twigs etc.); oxidation of wood products removed from site
(paper, lumber. waste etc.); oxidation of soil carbon.
Ninety five percent of the industrial C02 emissions are from the Nonhern Hemisphere,
dominated by countries, where annual releases reach up to about 5 tC per capita (Rotty
and Marland, 1986). In contrast CO2 emission rates in most developing countries lie
between 0.2 and 0.6 tC per capita per year. However, the relative rate of increase of the
CO2 emissions is much larger in the developing countries (-6% per year), showing almost
no slowing down after 1973 in contrast to Western Europe and Nonh America where the
rate of increase decreased from about 3% per year (1945 - 72) to less than 1% per year
(1973 - 84) (lPCC, 1990).
Future GHG emissions will be a function of global energy demand, and the rate of
development and introduction of carbon-free and low carbon energy technologies.
Several variables make predictions of future emissions uncenain: economic growth rates.
energy prices, the adoption of effective energy policies and the development of efficient
industrial technologies. Meeting the targets for emission reductions agreed at Kyoto, itself
a formidable challenge for some countries, is only a first step in bringing under control
what is generally agreed to be the most critical environmental problem that the world
faces . But even meeting all the targets agreed at Kyoto will have an insignificant etTed on
the stabilization levels of carbon dioxide in the atmosphere.
With the increase in the use of relatively high carbon content fuels such as coal and oil,
emissions of C02 also increased fast at twice the average world rate of 2.6 percent a year
during 1975-95 (CDIAC, 1998). Since the 1970s, industrial emissions of CO2 have grown
60 percent faster in Asia than anywhere else (ADB, (997). China and Japan are the first
and second largest CO2 emitters respectively in the region (WRl, UNEP, UNDP, and
WB, 1998). However, CO2 emissions per capita are low, little more than half the world
average and only 11 .2 percent of the level in North America in 1995. Past land clearing
has also contributed a signifIcant proportion of C02 emissions in some countries.
36
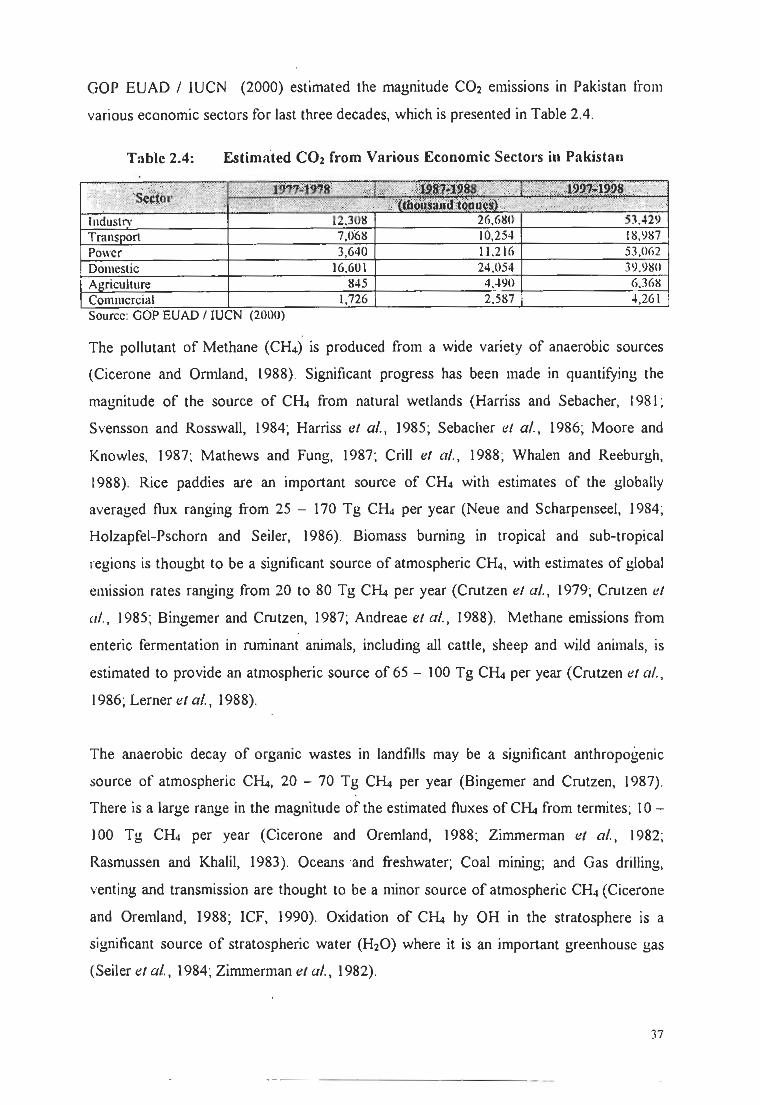
GOP EUAD / IUCN (2000) estimated the magnitude CO2 emissions in Pakistan Irom
various economic sectors for last three decades, which is presented in Table 2.4.
Table 2.4: Estima·ted CO2 from Various Economic Sectors in Pakistan
The pollutant of Methane (CH4) is produced from a wide variety of anaerobic sources
(Cicerone and Ormland, 1988) Significant progress has been made in quantifying the
magnitude of the source of CH4 from natural wetlands (Harriss and Sebacher, 1981;
Svensson and Rosswall, 1984; Harriss e! af., 1985; Sebacher e! af., 1986; Moore and
Knowles, 1987; Mathews and Fung, 1987; Crill e! af. , 1988; Whalen and Reeburgh,
1988). Rice paddies are an important source of CH4 with estimates of the globally
averaged flux ranging from 25 - 170 Tg CH4 per year (Neue and Scharpenseel, 1984;
Holzapfel-Pschorn and Seiler, 1986). Biomass burning in tropical and sub-tropical
regions is thought to be a significant source of atmospheric CH4, with estimates of global
emission rates ranging from 20 to 80 Tg CH. per year (Crutzen e! af., 1979; Crutzen e!
a/., 1985; Bingemer and Crutzen, 1987; Andreae e! af., 1988). Methane emissions from
enteric fermentation in ruminant animals, including all cattle, sheep and wild animals, is
estimated to provide an atmospheric source of 65 - 100 Tg CH4 per year (Crutzen e! af.,
1986; Lerner e! af., 1988).
The anaerobic decay of organic wastes in landfills may be a significant anthropogenic
source of atmospheric CH., 20 - 70 Tg CH. per year (Bingemer and Crutzen, 1987).
There is a large range in the magnitude of the estimated fluxes of CH. from termites; 10-
) 00 Tg CH4 per year (Cicerone and Oremland, 1988; Zimmerman e! af., ) 982;
Rasmussen and Khalil, 198) . Oceans and freshwater; Coal mining; and Gas drilling,
venting and transmission are thought to be a minor source of atmospheric CH4 (Cicerone
and Oremland, 1988; ICF, 1990). Oxidation of CH. hy OH in the stratosphere is a
significant source of stratospheric water (H20) where it is an important greenhouse gas
(Seiler e! at., 1984; Zimmerman e! af., 1982).
J7

Halocarbons containing chlorine and bromine have been shown to deplete 0 3 in the
stratosphere. In addition, it has been recognized that they are important greenhouse gases.
Their role in perturbing stratospheric 0) and the Earth's radiative balance has been
considered significantly (WMO 1985, 1989a, 1989b). Most halo carbons, with the notable
exception of Methyl Chloride CH)Cl, are exclusively of industrial origin. Halocarbons are
used as aerosol propellants, refrigerants, foam blowing agents, solvents, and fire
retardants. The atmospheric concentration of methyl chloride is about 0.6 ppb, and is
primarily released from the oceans and during biomass burning. Methyl Bromide CH,Br
is produced by oceanic algae, and there is evidence that its atmospheric concentration has
been increasing in recent times due to a significant anthropogenic source (Wofsy ~I al.,
1975; Penkett el al., 1985).
Nitrous oxide is a chemically and radiatively active trace gas that is produced from a wide
variety of biological sources in soils and water and is primarily removed in the
stratosphere by photolysis and reaction with electronically excited oxygen atoms. The
oceans are a signifIcant, but not dominant source of N20 (McElroy and Wofsy, 1986).
Based on measurements of the concentration gradients between the atmosphere and
surface waters (Butler el al., 1990), and on estimates of the gas exchange coefficient, the
current estimate of the magnitude of the ocean source ranges from 1.4 - 2.6 Tg N peryear
(Elkins ~I al., 1978; Cohen and Gordon, 1979; Cline el al., 1987) . Denitrification in
aerobic soils is thought to be a dominant source of atmospheric N20 (Slemr ~I al., 1984;
Keller el al., 1986; Matson and Vitousek, 1987). The combustion of fossil fuels has been
thought to be an important source of atmospheric N20 (Pierotti and Rasmussen, 1976;
Weiss and Carig, 1976; Hao ~I al., 1987). Biomass burning and the use of ammonium
fertilizers are now thought to be minor but significant sources of N20 emission in
atmosphere (Muzio and Kramlich, 1988; Cmtzen 1989; Elkins ~I al., 1990; Winstead ~I
((/., 1990; Griffith el a/., 1990)
Tropospheric 0) is a greenhouse gas, of particular importance in the upper troposphere in
the tropics and sub-tropics. Its distribution is controlled by a complex interplay between
chemical, radiative, and dynamical processes. Ozone is produced by the photo-oxidation
of CO, CH4 and NMHC in the presence of reactive nitrogen oxides (NO,) and destroyed
by vegetative surfaces, uv-photolysis and by reaction with hydrogen oxide radicals (HOl )
38

(Danielsen, 1968; Crutzen, 1974; Mahlman and Moxim, 1978; Isaksen e/ al., 1978 and
GalbaJly and Roy, 1980).
Global consumption of chlorofluorocarbons (CFCs), the most prevalent ozone-depleting
substances (ODS), fell from 1.1 million tonnes in 1986 to 160,000 tonnes in 1996, thanks
10 an almost complete phase out by industrialized countries (UNEP, I 998a, 1999).
Several factors contributed to the success of policies directed at reducing the consumption
of ODS : damage to the ozone layer could be ascribed to a single group of substances,
alternative substances and processes were developed at acceptable costs, a scientific
assessment was introduced to make adjustments to the Montreal Protocol as required, the
Protocol contained flexible implementation schemes and evaluation procedures, and the
principle of 'common but differentiated' responsibilities was recognized for the
developed and developing countries.
One measure of the Protocol's success is that the ozone layer is now expected recover to
pre 1980 levels by the year 2050. Without the Protocol, levels of ODS would have been
tive times hither then than they are today, and surface UV-B radiation levels would have
doubled at mid latitudes in the northern hemisphere (UNEP 1999).
The total combined abundance of ODS in the lower atmosphere peaked in about 1994 and
is now slowly declining (WMO, UNEP, NOAA, NASA and EC 1998). While total
chlorine is declining, total bromine is still increasing, as is the abundance of CFC
substitutes. If reductions in the use of ODS continue as envisaged in the Montreal
Protocol, then concentrations of these substances in the stratosphere should gave peaked
between 1997 and 1999, and should begin to decline during the next century. The rate of
decline in stratospheric ozone levels at mid latitudes has already started to slow. The
unusually low ozone values above the Arctic in late winter/spring observed in six out of
the past nine years could have ' been accentuated by the unusually cold and prolonged
stratospheric winters experienced during those six years (WMO, UNEP, NOAA, NASA
and EC, 1998).
Despite significant progress in bringing the problem of ozone layer depletion under
control, a number of outstanding challenges remain. Past (and continuing) emissions of
ODS will result in increases in UV -8 radiation that are likely to lead to increases in the
incidence and severity of a variety of short and long term human health effects,
-----_ . . _-- -_ . . --- - - .. _ .

particularly on the eyes, the immune system and the skin. Recent evaluations of UV
related excess skin cancer risks in Europe caused by ozone depletion suggest that, even
though stratospheric ozone concentrations should reach a minimum around the year 2000
(which assumes that the measures in force are fully implemented) m excess skin cancer
incidence is not expected to begin to fall until about 2060, because of the time lags
involved .
The response of terrestrial ecosystems to increase UV -8 is evident primarily in
interactions among species rather than in the performance of individual organisms.
Recent studies indicate that increased UV-8 affects the balance of competition among
higher plants, the degree to which higher plants are consumed by insects and the
susceptibility of plants to pathogens (UNEP 1998b). Increased UV -8 can be damaging
for crop varieties but this may be offset by protective and repair processes.
In terms of overall impact, ozone depletion interacts with the climate change process.
Stratospheric loss of ozone has caused a cooling of the global lower stratosphere: changes
in stratospheric ozone since the late 1970s may have offset about 30 percent of the
warming efrect of other greenhouse gases over the same period (WMO, UNEP, NOAA,
NASA, and EC 1998). There are also complex interactions between ozone depletion,
climate change and the abundance of methane, nitrous oxide, water vapour and sulphate
aerosols in the atmosphere. For example, carbon is an important element in the absorption
of UV radiation. Climate change and acid rain have led to decreases in the dissolved
organic carbon concentration in many North American lakes (Schindler 1:1 at., \996) . As
organic carbon levels have decreased, UV radiation has been able to penetrate much more
deeply into surface waters, resulting in greater UV -8 exposure of fish and aquatic plants.
While the potential impact of stratospheric ozone depletion means there is no room for
complacency, the cooperative measures that followed the identification of the problem
remain an outstanding and encouraging example of the ability of the international
community to act in unison in protecting the global environment.
The atmospheric concentration of CO exhibits significant spatial and temporal variability
because of its short atmospheric lifetime (Heidt 1:1 at., 1980; Dianov-Klokov and
Yurganov, 1981; Seiler and Fishman, 1981; Seiler el al., 1984; Khalil and Rasmussen
40
---- -------------

1984, 1988a: Fraser el al., I 986a, 1986b: Newell el al., 1989: Zander el al., 1989;
Kirchhoff and Marinoho, 1989; Kirchhoff el aI., 1989). The total annual source of CO is
about 2400 Tg (!PCC, 1995): CO, being about equally divided between direct
anthropogenic (incomplete combustion of fossil fuels and biomass) and atmospheric
(oxidation of natural and anthropogenic CH. and NMHC) sources (Logan el aI., 1981;
Cicerone. 1988). Atmospheric concentrations of CO may have increased in the Northern
Hemisphere because of the fossil fuel source, and because of changes in the rate of
oxidation of CH., whose atmospheric concentration has increased since pre-industrial
times (USEPA. 1989).
In Latin America, the mam . anthropogenic source of atmospheric emlsstons IS
deforestation. Biomass burning and the establishment of new types of vegetation cover in
the Amazon basin have significant ecological implications for the region. the continent
and the globe (LBA. 1996). Some parts of the region also suffer from air pollution from
industry and from large cities. The situation may worsen as result of the deregulation and
privatisation of the energy sector in, for example, Argentina, Brazil and Colombia where
there may be a trend away from biomass and hydropower to more use of fossil fuels
(Rosa el al., 1996). In Japan, some pollutants were decreased nearly 40 percent between
1974 and 1987 (WRl, UNEP and UNOP, 1992). Similar air pollution problems in the
Republic of Korea have been reduced since the 1980s by increasing the use of liquefied
natural gas (Government of Republic of Korea 1998).
Non-Methane Hydrocarbons (NMHC) are also considerable pollutant for broad scale
effects. The oceans are a major source of NMHC, mainly alkenes. Estimates of the source
strength of ethane and propene range from 26 Tg C per year (Bonsang el al., 1988) to as
high as 100 Tg C per year (Penkett, 1982). Emissions of NMHC from terrestrial
vegetation are mostly dependent upon environmental factors as well as the type of
vegetation (Rasmussen and Khalil, 1988). The source strength of NMHC from
anthropogenic activities such as biomass burning, solvents and fossil fuel combustion has
been estimated to be about 100 Tg per year (Rasmussen and Khalil, 1988).
Global warming has different effects in different regions. A warmed world is expected to
have more extreme weather, with more rain during wet periods, longer droughts and more
powerful storms (Schimel and Sulzman, 1994). Although the effects of future climate
41
change are unknown, some predict that exaggerated weather conditions may translate into
better agricultural yields in areas such as the western United States where temperature
and rainfall are expected to increase. While dramatic decreases in rainfall may lead to
severe drought and plunging agricultural yields in parts of Africa (Parther, 1994).
Local and regional pollution takes place in the lowest layer of the atmosphere. the
troposphere in which most weather occur (Tarbuck and Lutgens, 1994; Christopherson,
1997). In the weather phenomenon known as thermal inversion. a layer of cooler air is
trapped near the ground by a layer of warmer air above and makes occluded front. When
this occurs, normal air mixing almost ceases and pollutants are trapped in the lower layer.
Local topography, or the shape of the land, can worsen this effect (Lyons and Scott.
1992).
Smug is intense local pollution usually trapped by a thermal inversion (Cope and
Ischtwan 1995; Cope and Hess, 1997). Before the advent of the automobile, most smog
came from burning coal. Burning gasoline in motor vehicles is the main source of smog
in most regions today. Powered by sunlight, oxides of nitrogen and volatile organic
compounds react in the atmosphere to produce photochemical smog (Lin, 1981). Smog
contains ozone in the lower atmosphere that damages vegetation, kills trees. irritates lung
tissues, and attacks rubber (Harrison, 1996). Environmentalists measure ozone to
determine the severity of smog .. When the ozone level is high, other pollutants, including
carbon monoxide, are usually present at high levels as well (Kagawa and Toyama, 1975;
Lin and Bland, 1980).
Pakistan Environment Protection Agency (PEP A) carried out air quality study during
high smog time in winter 1999, which recorded SPM in the range of 800 to 900 Mglm3
with considerable contents of soot in the air. Pakistan environmental protection agency
(PEPA) also estimated that 40 percent of the total urban population, a counting for about
16.28 million people are exposed to the risk of air pollution. Accordingly, non
compliance of World Health Organization's (WHO) air quality standards was costing
Pakistan rupees (Rs.) 25.7 billion on health accounts (Correspondent daily Dawn, 2000).
In the presence of atmospheric moisture, sulphur dioxide and oxides of nitrogen turn into
droplets of pure acid floating in smog. These airborne acids are bad for the lungs and
42

attack anything made of limestone, marble, or metal (BERG, 1989; Lal and Pati!, 2001).
III cities around the world, smog acids are eroding precious artefact, including the
Parthenon temple tn Athens, Greece, and the Taj Mahal in Agra, India (Brydges and
Wilson, 1991). by winds in the troposphere, Oxides of nitrogen and sutphur
dioxide reach distant regions where they descend in acid form, usually as rain or snow
(Cape, 1987), Such acid precipitation can burn the leaves of plants and make lakes too
acidic to support fish and other living things (Hutchinson and Havas, 1980; HoweHs,
1983, Heck 11/ aI., 1988; Last and Watling, 1991; Jager e/ ai" 1993). Because of
acidification,
many lakes
,~,.,nH" species such as the popular brook trout can 110 longer survive in
streams in the eastern States (Howells, I Wellburn, (994),
Rainwater once was the purest form of water available but now is often contaminated by
pollutants in the air (Galloway e/ ai" 1979; Legge and Krupa, 1986), Acid rain is caused
when industrial emissions mix with atmospheric moisture (Legge and Kurpa, 1986,
1990), Pollutants may be carried in clouds for long distances before falling, which mean
that and far away from factories may be damaged acid raill (Lollghurst,
1989),
Strenuous efforts have begun 10 abate atmospheric pollution in many industrialized
countries but urban air pollution problems are reaching crisis dimensions in most cities of
the developing world. Acid rain remains a problem with critical loads (the threshold at
which deposition causes frequently over large parts of North
America, Europe and South Southeast Asia (Kuylenstierna e/ aI" 1998),
precipitation of atmospheric pollutants at sea is the major source of open ocean pollution,
and the identification of processes that transport toxic chemicals from warm regions into
the Arctic shows how the atmosphere links the global environment into Ii single
integrated system,
The Korean peninsula will be seriously affected by cross border acid rain, Mongolia may
receive acid rain form its, north-western border with Russia, In addition, increasing
emissions from transport will aggravate urban pollution, A study of Nepal, for
instance, estimates that total emissions will increase fivefold by 20! 3, about two thirds of
which are likely to come from the transport sector (Shrestha and Malia, 1996),
43
Beg was cited in a news (APP, ! 997) item regarding acid in which it was stated that
massive invasion of the power plants, using sulphur containing heavy fuel, has largely
exposed Karachi to the hazards of acid rains and relevant environmental risks, Shams
(19973) the attention of towards the threat of Acid rain in Karachi. He
estimated that the use of furnace oil with very high content in power
acidity the whole environment the city would experience the same fate, which
European cities had experienced during the 1960s and 19705,
A team of Pakistan Youth Organization, Environment Protection Wing
EPW} the imminent hazard of acid in Karachi metropolis to
thousands of tons of sulphur dioxide daily emission (APP, 1998), the
corrosive effects of sulphuric acid in Karachi, Furnace oil, contains approximately 3,5
percent sulphur, was used as a fuel in thermal power plants in Pakistan, This sulphur in
form of sulphur dioxide forms sulphuric acid with combination of atmospheric moisture,
I Biotic Upshots
This review cannot encompass the entire spectrum of more than 190 known air pollutants
Nonetheless, it is endeavoured here to elaborate the effects on life due to the
pollutants,
L2.l Sulphur Dioxide (S02)
crilf!ria
Sulphur dioxide (S02) is a colourless pungent, irritating, water-soluble reactive gas. It
may react catalytically or photo-chemically with other pollutants to form sulphur trioxide,
sulphuric acid and sulphates (Hameed, 1991; WHO, 2000), Tills pollutant has great
impacts on plants (Mansfield, 1976). It the size of stomatal aperture in leaves,
which provide a plant with mechanisms to control the movement of CO2 into leaves and
H20 out wards, S02 injures the plasma membranes of guard cells and transport cells
loading the vascular elements of leaves (Winner el aI., 1985), The prominent effects of
SOlon plants are necrosis, chloroplastidic damage, early leaf fall, and increases in
numbers of dead leaves (Wellburn, 1994) whereas, invisible injury associated with
relative changes in growth and yield (Unsworth and Omrod, 1982)
44

Sulphur dioxide is the oldest recognized harmful air pollutant-affecting human (Clean Air
Year Book, 1975), recently other priorities (e.g. photochemical oxidant damage) have
tended to disguise the harmful consequences to human health of this acidic gas (Pikhart e/
al., 200 I; Harman el aI. , 200 I; Pande el al., 2002). Human studies have shown acute
ctTccts of S02 on pulmonary functions among asthmatics as well as an increase in
symptoms, such as wheezing and shortness of breath (WHO, 1995a). Petroeschevsky e/
al. (200 I), Polat e/ al. (2002) have discussed the effects of Sulphur dioxide and its
derivatives that produce strong irritation upon the eyes and also within the nasal
passageways.
Particles smaller than I lAm are the most irritating but larger particles, as well as high
concentrations of gaseous S02, also induce an involuntary coughing reflex (Pope e/ al.,
1995; WHO, 1995a; Hajat el al., 2002). Braga el al., (2001) mentioned that the eye
irritation combined with choking cough draws the attention of those affected to the
hazards of the surrounding atmosphere. Linn el al. (1987) report a 10 percent decrease in
FEY I after 15 minutes exposure to 1,144 lAg mol (0 .4 ppm), and a reduction of IS percent
after exposure to 1,716 lAg mol (0 .6 ppm) among moderate and severe asthmatics.
However, very high concentrations of S02 paralysed the sense of smell quickly (Smith
Sivertsen el al., 2001). Horstman el al. (1988), Herbarth el al., (2001), and Trenga e/ al.
(2001) have shown in their studies that when asthmatic subjects exercise in air containing
S02, symptomatic broncho-constriction and dryness can develop, which may induce
chronic bronchitis in some individuals. S02 causes local release of histamine, which then
acts as a local modulator to · cause constriction of the airways and initiates local
inflammation (Lippmann el al., 2000). Wellburn (1994) summarize the human response
to S02 for various dose levels Table 2.5.
Table 2.5: Human response to different levels of S02 for diffe.'ent period
Source: Welburn. 1994
45

During accidental non-fatal exposures, victims expenence inflammation of the eyes,
nausea, vomiting, abdominal pain, a sore throat, bronchitis, and often pneumonia (Buseck
and Poslili, 1999). Lippmann (1989c) reviewed the state of knowledge on these ell'ects.
Alteration of lung functions, particularly increase in pulmonary flow resistance due to
acculllulations in the epithelial tissues of the lungs or nasal regions, adverse localized
damage, occurs after acute exposure. As well as changes in levels of enzymes, the
properties of the surrounding cell membranes may also be altered by SOl, bisulphite or
sulphite.
Sti~b /11 al., (2002) have discussed the effects of gases and panicles and the influence of
cause of death, age, and season and mentioned that SOl reduce immune surveillance then
gives rise to the bronchitic and respiratory problems. Ballester el al. (2002) have shown
the long-term respiratory problems of humans caused by atmospheric SOl with
combination of particulates in the atmosphere such as Emphysema. The literature, which
deals with and confirms the correlation between chronic chest disease and levels of S02
in urban air is vast, but the evidence suggesting that chronic exposure to SOl and
particulate matter plays a part in the cause and development of chronic respiratory disease
has been established (e.g. Zeghnoun el al., 200 I; Tunnicliffe el al., 200 I; Wong, 2002) .
The Convention on Long Range Transboundary Air pollution has resulted in significant
reductions in emissions of acidifying gases in Developed world of Europe and North
America, between 1985 and 1994, SOl emissions in Western, Central and Eastern Europe
fell by 50 percent in line with the Convention on Long Range Transboundary Air
Pollution protocols (Olendrzynski, 1997). However, emissions in other regions, especially
in developing nations such as parts of Asia, are a major and growing problem. If current
trends continue, emissions of sulphur dioxide from coal burning in Asia has been surpass
emissions form North America and Europe combined by the year 2000 and continue to
grow thereafter, unlike emissions in North America and Europe which are expected to
tall. Impacts have already been observed (WB, 1997a). In Japan, many monitoring sites
recorded annual sulphur dioxide deposition at levels equal to or greater than those in
Europe or North America; and in the Republic of Korea winter rain acidity has been
nearly as high as pH 4 (Shrestha and Iyngararasan 1998). On global scale there is a main
problem of unchecked growing air pollution in developing nations, such as India,
Pakistan and Central Asian countries (WHO and UNEP. 1992). The Asian and Pacific
46

region has experienced significant growth in atmospheric pollution, resulting from the
heavy use of coal and high sulphur fuels, traffic growth and forest fires . The most serious
problems are in urban areas and the developing countries in the region. Japan, however,
has reduced sulphur emissions through gains in efficiency, heavier reliance on oil imd
lIuclear power. and stringent pollutioll control laws.
I n the past quarter of a century, atmospheric pollution increased significantly in much of
the region, largely as a result of escalating energy consumption due to economic growth
and greater use of motor vehicles. The use of poor quality fuels with high sulphur content
such as coal, inefficient methods of energy production and use, traffic congestion, poor
automobile and road conditions, leaded fuel and inappropriate mining methods have
exacerbated the situation. Forest fires are also contributing significantly to air pollution.
Significant health threats also exist from the use of low quality traditional solid fuels ,
such as wood, crop residues and dung, for cooking and heating in lower income urban
households and rural areas. Sulphur dioxide emissions in Asia increased from I 1.2
million tones of sulphur equivalent in 1970 to 20 million tones in 1986 at least four times
the rate of many other regions (Hameed and Dignon 1992).
Two of Asia ' s giant economies, China and India, rely heavily on coal. Ninety percent of
China's 18 million tones of SOl emitted into the atmosphere annually come from coal
burning (State Planning Commission, 1997). Overall, Asian emissions of SOl are at least
50 percent higher than those of North America, Africa and Latin America (ADB, 1997).
Three of Asia ' s II megacities exceed WHO guidelines for acceptable SOl levels (WHO
and UNEP, 1992).
With increasing SOl emissions, acidification IS an emergmg Issue. The most sensitive
areas are in south China, the southeast of Thailand, Cambodia and south Viet Nam
(Hettelingh e/ al. 1995). On the other hand, there is no evidence of significant acid
deposition in Australia, which in not subjected to emissions from neighbouring countries
and where fossil fuels have a low sulphur content (Commonwealth of Australia, 1996).
GOP EUAD / IUCN (2000) estimated the magnitude SOl emissions in Pakistan from
various economic sectors for last three decades, which is presented in Table 2.6.
47

Table 2.6: Estimated SOl from Various Economic Sectors in Pakistan
Thermal power stations m Pakistan had been a major source of atmospheric pollution
especially SOl (Correspondent the Muslim, 1996). In Karachi, oil-fired thermal power
plants of KESC burned 80 percent of the total furnace oil used in the city (Nairn, (996).
Furnace oil, contains approximately 3.5 percent sulphur, has been commonly using in
Karachi . Only Bin Qasim thermal power plant unit burns more than fifty percent of the
furnace oil consumed in the city, to produce 100 MW. It was observed that the unit
generates some 400 tones of sulphur dioxide and 450 kg of toxic metals gravely polluting
the local environments on daily basis. Massive invasion of the sulphur containing heavy
fuel has largely exposed Karachi to the hazards of acid rains and relevant environmental
risks (APP, 1997) and the city would experience the same fate, which European cities had
experienced during the I 960s and 1970s (Shams, 1997b).
2.1.2.2 Nitrogen Oxides (NO,)
Nitrogen dioxide (NOl) and nitric oxide (NO) are not the predominant nitrogen oxides of
the atmosphere but they are the ones, which appear to give most problems in the
troposphere (Grosjean, 1979). Generally, nitrogen oxides reduce rather than enhance
growth~ plants also fail to take advantage of the extra nitrogen (N) in nitrogen oxides.
Collapsed and bleached tissues increase mostly at the apex of the leaves and along the
margins due to increasing concentrations of nitrogen oxides in troposphere (Lee and
Stewart, 1978~ Rowland el al.,. 1985). Certain plants (e.g. grasses) grown on nitrogen
deficient soils and exposed to nitrogen oxides show a slight improvement in yield
(MAFF, 1969), whereas plants from the same stock but grown with an adequate supply of
N fertilizer have decreased yield and sometimes show evidence of visible damage
(Marietta, 1989~ Herman el al., 200 I) such as increased 'Ieafiness' and poorer root
development (Wellburn, 1990).
48
Nitrogen dioxide is an irritating gas and its toxicity is generally attributed to its oxidative
capabilities (Glass, 1979). It penetrates the lung periphery and is primarily deposited in
the centriacinar region. It is also absorbed into the mucosa of the respiratory tract (Vogel,
\ 984: Schwela and Zali. \(99).
Upon inhalation 80-90 percent of N02 can be absorbed, although this proportion varies
according to nasal or oral breathing (Polat el al., 2002). The maximal dose to the lung
tissue occurs at the junction of the conducting airway and the gas exchange region
(Hazucha <11 al., 1994). Because N02 is not very soluble in aqueous surfaces, the upper
airways retain only small amounts of inhaled nitrogen oxides. Nitric and nitrous acids or
their salts can be observed in the blood and urine after exposure to N02 (WHO, 1987a).
Nitrogen dioxide is a widespread contaminant of indoor as well as outdoor air, and indoor
levels can exceed those found outdoors ' (Anyanwu, 1999; Junker el al., 2000). Indoor
levels of N02 are determined by the infiltration of NOl from outdoor air and by the
presence and strength of indoor sources, such as gas cooking stoves and kerosene space
heaters, and by air exchange (Bascom el al., 1996).
Some workers associated with certain occupations, are intermittently laid open to high
concentrations of oxides of nitrogen, particularly NO and NOl (England e/ al., 200 I). The
spectrum of pathological effects in the lung resulting from occupational exposure to
nitrogen oxides range from mild inflammatory response in the mucosa of the
tracheobronchial tree at low concentrations, to bronchitis, to bronchopneumonia, and to
acute pulmonary oedema at high concentrations (WHO, 1977). In a similar fashion
cough, headaches, chest tightness, circulatory collapse or congestion and reduce blood
pressure are some of the acute symptoms of nitrogen oxides dose (Hatta el al., 2002;
Vaziri el al .. 1999). Continuous exposure increases the chronic pulmonary disorders such
as asthma and emphysema (Saldiva e/ al., 1994; Hazucha e/ aI., 1994; Leduc e/ al., 1995,
Koren, 1995; Yamamoto, 2001: Qian e/ al., 200 I). In Karachi, asthma becoming quite
common because of alarming increase in level of pollution, industrialization, unhygienic
living conditions and growing stress. During 1995 to 2000, there had been a notable
yearly increase in the incidence of asthma patients (Shahzad, 2000).
49

Some epidemiological research endeavours have emphasised on the acute effects of shon
term exposure to high levels of NO, and there are few data on long-term effects of low
level or repeated exposure at peak levels (e.g. Hyden and Varhelyi, 2000; Akimoto e/ aI.,
2000; Dzik Itl aI., 2002). Damji and Richters (1989) have shown a reduction of T
lymphocyte subpopulations following acute exposure to NO"
and this may reflect a
functional impairment of the immune response. Morrow (1984) has reported that N02 can
be toxic in cenain biological systems, and acute exposure to NO, has been accounted to
affect both the cellular and humoral immune systems. Devlin e/ al. (1992) described an
impaired phagocytic activity in human alveolar macrophages after exposure to 3,760 Ilg
m') (2.0 ppm) for 4 hour, with intermittent exercise.
Several studies revealed the effect of nitrogen dioxide on the lung functions of healthy
individuals, asthmatics and subjects with chronic bronchitis (USEPA, 1982a). Shon
exposure (10-15 minutes) to concentrations of N02 exceeding 1,300 Ilg m') (0.7ppm)
caused functional changes in healthy subjects, particularly an increased airway resistance.
Studies show conflicting results concerning respiratory effects in asthmatics and healthy
individuals at NO, concentrations in the r~nge of 190 -7,250 Ilg m') (0.1 - 4.0 ppm). The
lowest observed level to affect lung function consistently was a 30-minute exposure, with
intermittent exercise, to a N02 concentration of 380 - 560 Ilg m') (0.2 - 0.3 ppm).
Asthmatics appear to be more responsive to NO" and their lung functions may be
alfected by a concentration of ·560 - 940 Ilg m') (0.3 - 0.5 ppm) with an enhanced
reactivity to pharmacological bronchoconstrictor agents (Mohsenin, 1987a; WHO,
1995a). Wellburn (1994) has given an account on likely effects of nitrogen dioxide upon
human (Table 2.7) for a 2-hours exposure time and suggested much lower values for
asthmatics.
Neve'1heless, several studies have failed to demonstrate an adverse effect of N02 on the
respiratory health of asthmatics (Morrow and Utell, 1989; Roger el al., 1990).
Inconsistencies in the results could be due to the lack of comparability in experimental
studies and a difference in susceptibility among asthmatics.
50

Table 2.7: Human response to different levels of N02 for 2-hours
11-0.21 NoeJJects 11.11 - 0.21 SliKht odour detected 0.22 - t.1 Some metabolic effecl.\· associated with either toxicity. adaptatiun or
rC!pnir of fum! tls:,'uC!s (c. C'. in"ihi/ed melaholi .... m of prosloj!,lolldin I~'y I . I - 2 ~'·ignijicalll changcs 10 respiralU/:v rale lIud lung volume, coliallced
susceptibility /0 i~fection anel evidence of tissue repair 2.1 - 5.3 Deterioration of lung /issue (e.g. loss of cilia) not balanced by repair
mechanisms Above 5.3 Gross distortioN oj lung lissties and emphysema. possibl4t death ~r
prolofl~ed
Suurl.:C : Wdbuflt. l'.)')~
Some reviews (Dijkstra el al., 1990; Neas el al., 1991; Samet el aI., 1993) have
concentrated on indoor air pollution through N02. These studies could not establish a
consistent trend in incidence or duration of illness due to NOz exposure. In addition no
consistent effect of N02 on pulmonary function could be confirmed, and no association
was observed between symptoms such as chronic cough, persistent wheeze and shortness
of breath, with N02 concentrations. As reponed by Braun-Fahrlander el al. (1992) Ihe
duration of episodes with symptoms was associated with outdoor, but not indoor, N02
concentrations. The inconsistency in the results of epidemiological studies has 'been
commented on by Samet and Utell (1990) who pointed out the potential for
misclassification, confounding and lack of statistical power among the investigations.
Also, some factors such as exposure pattern, age, nutritional status, and interaction with
other pollutants or allergen~ may panly explain the variability observed in response to
N02 exposure.
Some studies of outdoor NO, exposure have recognized an association between ambient
air levels of NO, compounds and measurable health effects (e.g. Bobak and Leon, 1992;
Tornqvist and Ehrenben, 1992; Leikauf el al., 1995, Carna el al., 1998; Anstey el aI.,
1999; Bobak and Leon, 1999; D' Amato el aI., 2000). However, methodological
problems, such as the presence of a mixture of pollutants and a lack of control due to
parental smoking or indoor sources of N02 (Speizer el af, 1980), in these studies
preclude acceptance of any of the results as clear evidence for an increase in acute
respiratory illness due to NO} exposures. Some endeavours have been extensively,
reviewed by the United Stines Environmental Protection Agency (USEP A) (USEPA,
51

1982a). To summarise the results of studies reponed up until 1990, a meta analysis of II
epidemiological studies showed (Schwela and Zali, 1999) an increase in respiratory
illness in children of less than 12 years of age. associated with long term exposure to high
concentrations of N02, compared with children exposed to low concentrations of this
pollutant (Table 2.8). A difference in exposure of28.5 fig m-l (0.015 ppm) N02 (2-week
average) resulted in an increase of about 20 percent in the odds ratio of respiratory illness.
In these studies, the weekly N02 average ranged from 15 to 128 fig m-l (8 - 65 ppb) or
possibly higher. There was, however, insufficient epidemiological evidence to draw any
conclusions regarding the shon or long-term effects of N02 on pulmonary function
(Hasselblad e/ al., 1992).
In summary we could conclude that in spite of decades of untiring laboratory, clinical and
epidemiological research. the human health effects of N02 exposure have not been fully
documented. The toxicological evidence has indicated hypotheses to be tested in human
populations but limitations in the clinical and epidemiological studies have precluded
such definitive testing of these hypotheses. Therefore, there is an emergent need to
characterise factors that may modulate response to N02 exposure.
Table 2.8: N02 Exposure Effects on Human Health
;' ;i'~~~«~ , ~ . ' ~ -r· I~"; :{;'~;';;
,.1 ' ,. ' /" . ... -F" , I , " '":": ' 1i "';~'111;,:"' ,~ ,, " ,,', , ;,i:" ': ,," " M~_ol"", "" . ;e;t<~ .. ..
"- . .' f ;f J - ... ~ .j. .' ~ " . :I ..,:.: :-;;.' .' ~ • Il/!> ~,'!
Increased i,tlensity of rcspimtory infections Reduced cfficaC}'. of lungdefenccs Increased severity of respiratorv infections Reduced efficacy of lung defences Respiratorv sYmptoms Airways injury Reduced lung function Airways and alveolar injury Worsening of the clinical Slatus of persons wiUl Airways injury asthma. chronic obstructive pulmonary disease or other chronic rcspiratorv conditions Source: Samet and Utell . 1990
From 1970 to 1986. Nitrogen oxide (NO.) emissions from fossil fuel combustion in Asia
increased by about 70 percent (Hameed and Dignon 1992). However, total emissions
were significantly less than those of Nonh America and Europe during the same period.
Critical loads for acid deposition were still being exceeded for more than 25 percent of
ecosystems in Western and Central Europe, and emissions of nitrogen oxides in Nonh
America increased by about' 10 percent from the 1980s to the 1990s (International Joint
Commission. 1997). The situation was likely to worsen as the economics in Eastern
52

Europe and Central Asia grow stronger, and with the continuing increase in car use in
these regions in the rest of Europe and in North America.
2.1.2.3 Carbon Monoxide (CO)
Carbon monoxide is a sneaky poison, approaches without warnlllg because it is
colourless, non-irritating and without any odour. It is rapidly absorbed in the lungs and is
taken up in the blood where 80 - 90 percent of CO binds to haemoglobin (Hb) with the
formation of carboxy haemoglobin (COHb) (WHO, 2000), which impairs the oxygen
carrying capacity of blood, which may result as fatal (Seinfeld, 1986). It is formed when
carbon in fuels is not burned completely (Nadakavukaren, 1990; IPCC, 1992; Schwela
and Zali, 1999). It is a by-product of highway vehicle exhaust, which contributes about 60
percent of all CO emissions in USA (MacEachern, 1990; Seitz, 1995). In urban areas,
automobile exhaust can cause as much as 95 percent of all CO emissions (Harrison,
\996). These emissions can result in high concentrations of CO, particularly in local areas
with heavy traffic congestion (Calabrese, 199\; Coburn, 1970). Other sources of CO
emissions include industrial processes and fuel combustion in sources such as boilers and
incinerators. Despite an overall downward trend in concentrations and emissions of CO,
some metropolitan areas still experience high levels of CO (Schwela and Zali, 1999;
Miller, \999).
This criteria pollutant results from incomplete combustion of fuel and is emitted directly
from vehicle tailpipes. Incomplete combustion is most likely to occur at low air to fuel
rations in the engine. These conditions are common during vehicle starting when air
supply is restricted, when cars are not tuned properly, and at altitude, where 'thin' air
effectively reduces the amourit oxygen available for combustion (Harrison, 1996;
Seinfeld, 1986). Carbon monoxide (CO) emissions form automobiles increase
dramatically in cold weather. This is because cars need more fuel to start at cold
temperatures, and because some emission control devices operate less efficiently when
they are cold (Marsh and Grossa, 1996; Lyons and Scott, 1992).
The resultant carboxyhaemoglobin is extremely stable. CO at very low concentrations in
the blood (i.e. 0.1%) will combine with over half of the haemoglobin and immediately
reduce the O2 carrying capacity by a similar proponion. The affinity of CO for human
53

foetal haemoglobin is higher than that for normal haemoglobin, This means that unborn
babies in the womb are especially susceptible to CO poisoning (Guo el ai" 200 I;
Piantadosi, 2002), In ambient air CO rapidly diffused but its concentration approaches to
an alarming stage at proximity of source, especially, in open window low height vehicles
(Flachsbart, 1999; Alm el ai" 1999; Atimtay el ai" 2000; Mukherjee and Viswanathan,
2001),
The dissociation of oxyhaemoglobin is also altered due to the presence of COHb in the
blood thereby further impairing the oxygen supply to body tissues (Choi, 200 I), Carbon
monoxide is also bound to myoglobin (MbCO) in cardiac and skeletal muscle, which will
limit the rate of 0 1 uptake by , these tissues and impair 0 1 delivery to intercellular
contractile processes (Agostoni el al., 1980; Westphal, 2002). The main factors
conditioning the uptake of CO are its concentration in tbe inhaled air, the endogenous
production of CO, the intensity of physical effort, body size, the condition of the lungs,
and the barometric pressure whereas alcoholism, obesity, old age, heart conditions, and
lung diseases exacerbate the intensity of effect (Uasuf el aI., 1999; Antuni el al., 2000;
Easley, 2000), Table 2,9 presents the expected COHb levels after exposure to CO
concentrations between 11.5 and liS mg m') during different types of physical activity.
In absence of CO exposure, COHb concentrations are approximately 0,5 per cent; one
peak per day cigarette smokers may achieve COHb saturation of 4 - 7 percent (WHO,
1979), Wellburn (1994) haS an attempted to develop a relationship between 2 hours
exposure (CO concentrations) and effects of carbon monoxide on humans Table 2,10,
Table 2.9:
100
50
25
to
Predicted carboxyhaemoglobin in levels for people engaged in different types of work in different concentrations of carbon monoxide
tt5 15 min t.2 2.0 2,8
57 30 min l.l 1.9 2,6
29 01 h 1.1 1.7 2,2
ItS 08 II 1.5 1.7 1.7
54

Table 2.10: ElTects of CO on bumans and tbe accompanying carboxyhaemoglobill blood (COBb) concentrations
ExPl»iur;e". '.J:};;; .j;~~::,f~~€>1);>-~~~t~e~~:#~k~~~:lihl-i?;~~'!; ': (llp~i,V ' .: 01' >-. " :":~:~~~:; :tOO~ :~~mb:: ,~ .; . . .... . _ .~ .. .... t 1')
.. " h. • •
0 - 10 Nu discomfort or effect 0-2 10 - 50 Some tiredness. impaired vigilance and reduction in manual 2- 10
dexteritv 50 - 100 Sli~ht headache. tiredness and irritability to 20 100 - 200 Mild headache 20 - 30 200 - 400 Severe headache. visual impOirment, nausea, general weakness and 30-40
vomitinK ~OO - 600 As above, but with greater possibility of col/apse 40 - 50 (.UO - HOO Fn;l1l;n'lo!, increased pulse rale and convulsions 50 -60 SilO - lGOU Comu, weak pul.,e and possibility of death 60-70 1600 + Death within a short period 70 + Source. Wellburn, 1994
The major consequence of CO is to reduce the oxygen transport to the tissues (Mehta,
200 I; Aneja el a/. , 200 I). Organs, which are dependent on a large oxygen supply, are the
most vulnerable, particularly the. heart and the central nervous system, as well as the
foetus (Raub eJ al., 2000; scharte eJ al., 2000; Jaeger eJ al., 2000). Four types of health
effects are described to be associated with CO exposure: neurobehavioral effects,
cardiovascular effects, fibrnolysis effects and peri'llatal effects (Nicholls, 200 I; Zevin eJ
ul., 200 I; Motterlini el al., 2002). Carbon monoxide leads to a decreased oxygen uptake
capacity with a resultant decreased work capacity under maximum exercise conditions.
According to available data, the COHb level required to induce these effects is
approximately 5 percent (WHO,' 1979). Some authors (Beard and Wertheim, 1967) have
reported impairment ill the ability to judge correctly slight differences in given tasks in
successive short-time intervals at lower COHb levels of 3.2 to 4.2 percent. At this level,
subjects may miss signals the'y would not have missed when starting a task.
Subjects with previous cardiovascular disease (chronic angina patients) seem to be the
group most sensitive to CO exposure (Koehler and Traystman, 2002). Similarly, Allred el
al. (1989) investigated the effects of CO exposure 011 myocardial ischaemia during
exercise in 63 men with documented coronary artery disease. Results showed a decr.ease
in dose-response relationship between the length of time to the onset of angilla and COHb
level. This study shows that CO.Hb levels as low as 2 percent can exacerbate myocardial
ischemia during exercise ill subjects with coronary artery disease. Similar effects have
been demonstrated ill patients with intermittent c1audicatioll from peripheral vascular
disease (Aronow el al., 1974) .
5;

Carbon monoxide exposure may also affect the foetus directly though oxygen deficit
without elevation of COHb level in the foetal blood. During exposure to high CO levels.
the mother's Hb gives up its oxygen, less readily with a consequent lowering of the
oxygen pressure in the placenta, and hence also in the foetal blood . Research has mainly
focused on they eflects of cigarette smoking during pregnancy. The main eflects are
reduced birth weight (Hebel el al., 1988; Ash el aI., 1989; Mathai el al., 1990; Maisonet
<:1 (II., 200 I; Chen el aI., 2002) and retarded postnatal development (Campbell 1:1 01..
1988). Impairment of neurobehavioral development has also been related to maternal
smoking during pregnancy (US EPA, 1983) Ambient CO exposure has been related to
low birth weight in a study conducted in Denver, USA (Alderman .:1 al .. 1987) Mothers
who lived in neighbourhoods with a mean CO concentration below 3.4 mg m-J (3 ppm)
during the last trimester of their pregnancy had a 50 percent increase in the risk of having
an infant with low birth weight when compared with a group unexposed to CO
A cohort study conducted among bridge and tunnel officers (5,529 persons) exposed to
CO showed a 35 percent excess risk of arteriosclerotic heart disease mortality among
tunnel officers when compared with the New York City Population. Two factors
contributed to this excess risk : the exposure to CO of tunnel officers and the movement
into a critical higher age group. There was a reduction in mortality signifying a decrease
in exposure (more ventilation in the tunnel) (Stern d al., 1988). The classic symptoms of
CO poisoning are headache and dizziness at COHb levels between 10 and 30 percent and
severe headache, cardiovascular 'symptoms and malaise at above about 30 percent. Above
about 40 percent there is considerable risk of coma and death.
In summary, average COHb levels in the general population are around 1.2 - 1.5 percent
(in cigarette smokers around 3 - 4 percent). Below 10 percent COHb, it is mainly
cardiovascular and neurobehavioral effects that have been evaluated. The aggravation of
symptoms in angina pectoris patients, which is a major public health concern, may occur
at levels as low as 2 percent COHb. Decreased work capacity and neurobehavioral
function have mostly been observed at around 5 percent COHb (Schwela and Zali, 1999)
Severe hypoxia due to acute CO pOisomng may cause both reversible, short-lasting,
neurological deficits and sever, often delayed, neurological damage The neurobehavioral
56

include as low as 5. I - percent (WHO; 2000; Kourembanas, 2002)
Andersson el al., (2002) has reported Increased carbon monodixe levels in the nasal
airway of subjects with a history of seasonal allergic rhinitis and in patients with upper
respiratory tract.
A study on air pollution reported that in Karachi alone. annually about 2.705.000 tons
carbon monoxide (CO) was emitted into the air from garbage burning and traffic vehicles.
The report said that a survey as early as 1988 showed that average CO concentrations
from 8 am to 6pm in various parts of Karachi managed from 2 to mglm' The highest
levels were found at Tibet Centre, Plaza and Nagan Chowrangi in North
Karachi In these congested sites the CO concentration was as high as 107 mg/m). This is
more than 10 times the WHO limit of 10 mg/mJ (Qureshi, 1996).
GOP ECAD I IUCN (2000) furnished annual emissions of carbon monoxide (CO) for
1985 as 96 percent (123,054 tonnes) from motor vehicles and 4 percent (4,622
tonnes) wood, coal and waste. Carbon monoxide (CO) levels in the range of S
- 30 parts per millions (ppm) and 6 - 40 parts per million (ppm) have been recorded for
Lahore and Karachi respectively. Metropolitan reliance on buses and light commercial
vehicles also has various air pollution consequences. Old vehicles stay on the roads
because of the absence of emission regulations, lack of enforcement motor vehicle
fllness regulations. and the owner·s· lack of capital to purchase replacements. Thus the
average Pakistani vehicle emits 25·times as much carbon monoxide (CO) as the average
vehicle in the Cniled Slates (Haider, 1996).
2.1.2.4
Ozone is such a reactive gas towards organic molecules that it is worth examining the
consequences in detail. In plants plasma or cell membranes of plant cells (sometimes
called the plasmalemma) suffer the most injury due to surplus of surface ozone (Lawson
e/ al., 2001) damage due to oxidants arising from 0 3 lS heralded by losses of
chlorophyll, in leaf fluorescence (indicative wasted light energy), and
changes in adenylale (ATP) levels. It produces irreversible pathological damage of
sensitive cells in leaves and roots (Wellburn, 1994) Many researches have reported the
57

decreased yield of crops where the ozone (0-,) level has been high (Saitanis ef <II .. 2001 .
Gntnhage ef al., 200 I).
The observed health effects of photochemical oxidant exposure cannot be attributed
uniquely to oxidants because photochemical smog typically consists of 02, N02, acid
sulphate and other reactive agents. These pollutants may have additive or synergistic
etlects on human health, but 0, appears to be the most biologically active (WHO, 1978.
1987b).
In human, the primary target organ for OJ is the lung. High-risk groups include children,
the aged, individuals with pre-existing respiratory or immune-related diseases, and those
with coronary heart diseases (Polat ef aI., 2002). This photochemical product causes
irritation to the eyes, nose, throat, and chest. Ozone exposure produces cellular and
structural changes, the overall effect of which is a decrease in the ability of the lung to
perform normal functions. Cilaiated and Type I cells are the most sensitive to 0 .1
exposure (Gornicki and Gutsze, 2000) . Proliferation of non-ciliated bronchiolar and Type
2 alveolar cells occurs as a result of damage and death of ciliated and Type I cells (Luster,
200 I) Ozone exposure causes major lesions in the centriacinar area of the lung that
includes the end of the terminal bronchioles and the first few generations of either
rElspiratory bronchioles or alveolar ducts (Lippmann, I 989a).
Experimental studies have shown that OJ increases alJ'Way permeability and particle
clearance, causes airway inflammation and a decrease in bactericidal capacity, and causes
structural alterations in the lung (Dye ef 01., 1999). The acute morphologic response to 0 .1
involves epithelial cell injury along the entire respiratory tract, resulting in cell loss and
replacement (Gosepath ef aI., 2000; Desqueyroux and Momas, 2001; Cohen ef al., 2001)
In the lower airway, the proximal regions are most affected. In the alveolus, Type I cells
are highly sensitive to OJ while Type \I cells are resistant and appear to serve as a stem
cell for Type I cell replacement (Limppmann, I 989b). Studies have reported an increase
in numbers of neutrophils (Schelegle ef aI., 1991; Koren ef aI., 1991) and in cytokine
chemotactic for neutrophils (LDH and IL-8) (Aris ef al., 1993) Ozone induced increases
in constituents of BAL fluid such as lactate dehyudrogenase, prostaglandine E1,
interleukin-6, flbronectin and albumin, have been observed in humans (Devlin ef al. ,
1991). The increase in the content of neutrophils in nasal lavage fluid has also been
----- --- -- -- _. __ .

observed in humans after exposure to 03 (Graham and Koren, 1990; Smith et at, 1993)
It is not yet known whether repetitive inflammation has long-term consequences.
Ozone can induce increased non-specific airway sensitivity to inhalation challenge testing
with bronchoconstrictive agents (HEI, 1988) In several human studies, reductions in lung
nmction have been observed among voluntary subjects exposed to 03 concentrations
ranging from 012 ppm to 0.40 ppm (Avol el al, 1984; McDonnell el at"~ 1985; Linn eI
aI" 1986; Paige el aI., 2000; Mortimer el at"~ 2000; Declercq and iV!acquet, 2000). Recell!
research has shown that effects can be produced by exposures as short as 5 minutes, and
that various effects become progressively worse as exposures at a given concentration are
extended in time up to 6.6 hours. Exposure to 160 ~lg m'] (0.08 ppm) for 6.6 hours in a
group of healthy exercising adults led to a decrease in lung functions of more than 10
percent in the most sensitive individuals, However, repeated exposures to a given
concentration (60.6 hours to 0.08, 0 10 and 0 12 ppm) on several consecutive days
resulted in attenuation of functional changes but persistence of ainv!!y hyper
responsiveness. This suggests an ongoing action 0) on the lung (Folinsbee 1.'1 (II,
1994). Although smokers and subjects with pre-existing pulmonary disease do not appear
to be more sensitive than others to O}, within the apparently normal population there is a
range of responsiveness to O} Ihat is reproducible (VtHO, 1987b)
Most studies of the health effects of have focused on short-term (1-2 hour) exposure
and have indicated a number of acute effects of 0] and other major photochemical
oxidants (USEPA, 1986). Some studies have linked acute daily mortality with 0,
exposure in Los Angeles County and New York City (Kinney and Ozkaynat, 1991, 1992),
bllt data from a study conducted in Mexico City do 110t confirm these results (Borja
Aburto el at"~ 1995; Loomis 111 a/., 1996) Studies of hospital admissions in relation to 0)
exposure reported an increase in hospital admission rales for respiratory diseases (Tenias
el a/., 2002; Petroeschevsky el al., 20001; Burnett el aI" 2001; Bates and Sizto, 1983,
1987) and asthma attacks (Whittemore and Korn, 1980; White and Etzel, 1991; White el
at"~ 1994: Romieu el a/., 1995), Summer haze pollutants (including 0) have also been
related to hospitalisation and emergency roOIl) visits for respiratory diseases (Cody el at"~
1992; Thurston el a/., 1992, -1994),

Many endeavours have examined symptoms related to 0.1 exposure. In a clinical study,
Avol et al. (1987) studied the occurrence of symptoms in subjects to 0 ..
concentrations of 0 640 (lg mol (0 .- ppm). Symptoms were classified as upper
(nasal congestion or discharge and throat irritation), lower respiratory
(substernal irritation, cough, sputum production, dyspnea, wheeze and chest tightness)
and non-respiratory (headache, fatigue and eye irritation). SO.flfes were calculated, based
on the intensity of the symptoms presented. The results showed a
relationship between effective dose (01 concentration x time x ventilation rate)
and symptom scores. Imai e/ al (1985) reported significant increases in the symptoms or
adults during periods of increased ambient 0.1 exposure in Japan Ostro (1989) analysed
data collected for 6 1976- 81, and showed that ambient 0-, levels were associated
with days of activity due to respiratory illness in the working population, Seal e/
a/. (1996) have correlated the effects of socio-economic status and menstrual cycle
on pulmonary response to ozone. According to these analyses, the change in the number
of days of minor or restricted activity of an individual on a given day in a given
population; the proportionality factor is 0.077 (Kleinman et ai"~ 1989a)
The inhalation of 0, causes concentration-dependent decreases in average lung volumes
and flow rates during expiration; the mean value of the decrease increases with increasing
depth of breathing (Lippmann, 1989a; Aris Itf aI" 1993; Frischer 1:/ aI" 1993; Hoek e/ "I.,
1993; Putman Itt al., 1997; Bouthillier ef al.. I Chen et al., I Chistakos and
Kolovos, 1999). Decreases in the lung functions of healthy children and young adults
have been reported at hourly average OJ concentrations in the range of 160 - 300 ,lg n(1
(0.08 - O. J 50 ppm).
Though has been shown to alter macrophage function, \vhich could lead to an
increased susceptibility to respiratory infection. there is little data on the relation
exposure to 03 to acute respiratory infection in humans. In a stud\" conducted ill Mexico
among preschool children, investigators reported a 14 percent increase in school
absenteeism for respiratory infection related to an 0,1 ambiellt concentration (I hour
maximum) > 240 ).lg m-3 (0 12 ppm) 011 Ihe preceding day (lag of I day). When 0,
concentrations (I hour maximum) were high (> 240 ).lg mol) on two consecutive days a
percent was observed. interactive was between low
(,(1

temperature and high 03 exposure (Sartor el al., 1995; Romieu el al .. 1992, Cody III af,
1992)
Based on estimates from Spekror el af. (i 988), moderate physical activity for a range of
exposure between 38 and 226 llg m') (0.019 10 0.113 ppm) for I hour could lead to a
decrease of 0.5 ml per J,lg for FVC (Forced Vilal Capacity) and 0.7 ml per J,lg nfl for
FEV, (Forced Expiratory Volume in I second); this would result in a decrease in FVe,
FEV, and (Peak Expiratory Flow Rate) of 4.9 percent, 7.7 percent and 17 percent
respectively were predicted for the current USEPA standard of 240 m'l (0 12 ppm).
Further studies conducted among children have shown similar decrease in function
and have reported the persistence of a measurable functional deficit mto the following
day, even for peak concentrations below or equal to 300 /lg m" on the day before (0.15
ppm) (Lippmann, 1993, ; Friedman el aI., 1992; Lippmann el at. 1983).
A study conducted in Mexico City among school children, Castillejos el al. (1992)
reported acute and sub-acute elIects of 03 on tung functions. However, the decreases in
function were smaller than was to be expected from the regressIOn slop of Spektor .:1 01.
(1988) (08 percent for FVe and 0.8 percent for FEV l at a maximum 0) concentration of
240 ~lg (0.12 ppm) h prior to testing). Mean exposures of 48 hand 168 h (7
days) were more significant in predicting FEV, and FEF2P5 (Forced Expiratory Flow
from 2S percent to percelltof the Forced Vital Capacity). These authors suggested that
children chronically exposed to OJ might present a phenomenon of "tolerance" This
fmding supports the observation that repetitive exposures tend to produce less of a
response (Folinsbee Itt al., 1994) The potential adverse effect of such "tolerance" is not
known. Avol el al. (1998) studied asthmatic, wheezy and healthy children in Southern
California during periods of varying 03 levels in spring and late Sl.lmmeL The study fbund
that asthmatic children had the most trouble breathing, the most wheezing and the most
use of inhalers during high 0, days in the spring. Wheezy children had the most trouble
breathing and wheezed more during low 0 3 days in summer.
Susceptibility to OJ exposure does not appear to vary by ethic (Seal el al., 1993) or
demographic characteristics (Messineo and Adams, 1990). Dietary antioxidant levels
have been shown to modulate the response to 03 exposure ill animals (Slade "I af., 1985,
61

Eisayed ef al., 1988), but data for humans are still sparse. In controlled clinical studies,
asthmalics do not appear to be more sensitive 10 OJ as shown by their FEV I response
(Koenig e/ al., 1989). However. short-term follow up of asthmatic subjects (panel sllldy)
exposed to 0., have shown a decrease in lung fullction and an increase in respiratory
symploms among adults (Lebowitz el ai., 1987; Holguin el al., 199.:1) and children
(Krzyzanowski el al., 1992; Hoek 1:1 aI., 1993; Neas el aI., 1995; OSlro el aI., 1995;
Romieu 1:1 al, 1996). Other studies were unable 10 find any adnlrse effect on respiratory
health (Vedal el aI., 1987; Roemer ell/I., 1993). However, ill these studies, ambient 0,
concentrations were low and tllis could partly explain tile results Ozone may exacerbate
asthma by facilitating the entry of allergens or because of the inflammation it induces.
There is some evidence that may act synergistically with other pollutants, slich as
sulphate and NO, (Kleinman el ClI., 1989b). Koenig eI ClI. (1989) showed that inhaling 10\\
concentrations of 0, might potentiate the bronchial hyper-responsiveness of people with
asthma to SOl exposure. A similar potentiating effect has been observed wilh exposures
to OJ and sensitivity to NOz (Hazucha el al., 1994)
The chronic effects of OJ are still blurred, but there are ample evidences to believe tilal
repeated exposure could lead to persistent impairment of lung development and
malfunctioning. Animal studies have demonstrated progressive epithelial damage and
inflammatory changes that appear to cumulative and persistent, even in animals that
adapted to exposure by modifying their respiratory mechanisms (Tepper e/ ai,
1989) at 0, concentrations slightly higher than those that produce effects in humans.
Furthermore, for some chronic effects, intermittent exposures can produce greater effects
than continuous exposure regimes Ihat result in a higher cumulative exposure. These
results suggest that disease pathogenesis depends on the elTec!s produced by
defensive responses to the direct selves (Lippmann, 1989a).
Few studies Southern California suggest that chronic oxidant exposures affect baseline
respiratory function. Comparing two communities from this area, Detels el al. (1987)
found thaI baseline lung functions were lower and that here was a greater rate of decline
ltl function in the high oxidant community over 5 years. However. this study has
been criticised for reasons (poor exposure measurements, of adjustment for
potential confounding factors such as indoor air pollution, and occupational exposure)
Kilburn el al. (1992), comparing the lung functions of school children from Los Angeles

and Houston. observed that children from Los Angeles had 6 percent lower baseline \'aluc
for FEY I and 15 percent lower values for FEF2l,n than children from Houston Aerosol
administration of metaproterenol to Los Angeles (USA) children improved FEY 1 by I
percent and FEF2l,71 by 6.6 percent, but expiratory flows were still below the values of
Houston children, suggesting that impairment was not reversible . Repeated measurements
of lung functions among 106 Mexican-American children from Los Angeles showed that
FEY I and FEF2l,71 were respectively 2 percent and 7 percent lo\\'er than the predicted
value in 1987 compared with 1984. The FYC remained unchanged. The authors
concluded that the worsening of airway obstruction in these children was probably due (0
air pollution (Kilburn el at.. 1992) Schwartz. (1989) indicated that ambient OJ
concentrations were associated with a loss of lung function when the annual a\'erage
concentration was above 80 /lg rtt'.l (0.04 ppm).
Euler el al. (1988) assessed the risk of chronic obslnlctive pulmonary disease due to long
term exposure to ambient levels of total oxidants and N02 in a cohort of 7,445 Se\'enth
Day Adventists non-smokers. who had resided in California for at least II year and were
also aged at least 25 years. The results suggested a significant association between
chronic symptoms and total oxidants exceeding 200 ~tg m,J (0 10 ppm). However. when
cumulative exposure to SPM was considered as confounding variable in the model. only
SPM was considered as confounding variable in the model, only SPM exposure above
200 ~Ig m,3 showed statistical significance. Other studies conducted among Seventh Day
Adventists suggested that OJ exposure could lead to an increase in respiratory cancer
(Abbey e/ al .. 1993). This result should be interpreted with caution because of small
number of cases studied. Sherwin and Richter (1990) conducted an autopsy study among
107 young non-smoker adults aged between 14 - 25 years. and who died of non
respiratory traumatic causes in Los Angeles County. They found that 29 of them had
lungs with severe respiratory bronchiolitis of the kind first described in young smokers.
Moderate changes were present in a further 5 I cases.
In summary. effects which have been associated with hourly average oxidant
concentrations beginning at about 200 /lg m,J (0 . 10 ppm), include eye, nose and throat
irritation, cough, throat dryness. thoracic pain, increased mucous production, rales. chest
tightness, substernal pain, lassitude, malaise and nausea. The transient effects of 0, seem
(,J
to be more closely related to cumulative daily exposure than to I-hour peak
concentrations (Henderson el al., 1993; Ueno el aI., 1998; Gong el al., 1998; Bermudez el
al., 1999; Yalacchi and Bocci, 2000) Several studies provide sufficient information to
allow a quantitative evaluation of the potential impact of short-term exposure to 0) on
population subgroups (WHO, 1995a). Kleinman el al. (1989a). summarising data from
different studies, derived a dose-response relationship between change in FEY I and
effective dose of 0) (product of concentration of OJ x time x ventilation rate). These
authors also calculated dose-response nlnctions to determine the change in the percentage
of the population affected by specific symptoms according to 0) ambient level. The
model fitted well data derived from clinical studies. Finally, the work of Ostro (1989) can
be used to determine the change in restricted activity days associated with changes in
ambient OJ Many health outcoines associated with the change in peak daily ambient 0)
concentrations observed in epidemiological studies (WHO, 1995a). However, these
models can only provide an approximation to the health outcomes because the effects of
OJ may be enhanced by the presence of other environmental variables such as acid
aerosols. The effects of long-term chronic exposure to 0) remain poorly defl11ed , but
recent epidemiological and animal inhalation studies suggest that current ambient levels
(240 Ilg m') or a 12 ppm) are sufficient to cause premature lung ageing (Lippmann,
1989b, 1993).
A study of the Punjab University, Lahore, showed the rice yield that found to be reduced
by more than 27 percent due to high ozone level near Lahore (Nairn, 1996). Surface
Ozone is ooe of the pollutants, which is leading to respiratory, eye and skin diseases and
also affecting the crop outputs. Average surface ozone level in Karachi is 50 ppb and in
Lahore 40 ppb which is very .high from permissible limit of30 ppb (Rashid, 1996)
2.1.2 .5 Suspended Particulate Matters (SPM)
Particulate matter suspended in air includes total suspended particles (TSP), PM IO , PM21,
fine and ultra-fine particles, diesel exhaust, coal fly-ash, mineral dusts, metal dusts and
fumes, acid mists, fluoride particles, paint pigments, pesticide mists, carbon black, oil
smoke and many others (Roosli el al., 2000). Suspended particulate pollutants provoke
respiratory diseases, and can cause cancers, corrosion, deslruclion 10 plant life, elC. They
(,.)

can also constitute a nuisance, interfere with sunlight and also act as catalytic surfaces for
reaction of adsorbed chemicals (WHO, 2000)
Several studies have used time-series analysis to look at the relative change in the rate of
monality associated with changes in air quality variables (e,g. USEPA, 1982b; Abbey el
aI., 1993, 1995; Broja-Abuno el af" 1997; Goldberg e/ aI., 2001a, 2001b), In these
studies weather conditions and other potential confounding factors were accounted for
Although various measurements of paniculate pollution were used, the result of most
studies suggested that a 10 ~lg m'l increase in PM IO was associated with an increase in
daily monality equal to 05 - l.S percent (Pope el af" 1995) and the absence of a
threshold level.
Many endeavours provide a split of monality by causes of death. A review estimate of
these studies suggested that an increase of I O-~g m') in PM IO (24-hours average) was
related to a 3.4 percent increase in respiratory monality (range 2 - 8 percent) and a 1.4
percent increase in cardiovascular monality (range 0.8 - 1.8 percent) (Dockery and Pope,
1994), A detailed examination of cause of deaths showed the relative increase was higher
for chronic obstructive lung diseases and pneumonia. Also, almost all-cardiovascular
deaths on days with high paniculate air pollination have a respiratory cause as a
contributing factor (Schwanz, 1994),
Comparable results have been described in several European countries (Katsouyanni d
af" 1995; TouIoumi and Katsouyanni, 1995; Zmirou e/ af" 1995; Nowak el af" 1996;
Schindler e/ af" 200 I; Ebelt e/ af" 200 I) as well as in Latin American countries (Romieu
and Borja-Abuno, 1997). Peaks of acid aerosols observed in Canada during the sUlllmer
could have been responsible for the association observed between sulphate concentrations
and hospital admissions, to the .extent that sulphate constitutes a surrogate variable for
sulphuric acid aerosols (Bates and Sizto, 1987) Similar results have been observed in
USA. (Dockery and Pope, 1994). Taken together, these studies found an increase of
hospital admissions for all respiratory diagnoses ranging from 0.8 percent to 3.4 percent
(weighted mean, 0.8 percent) for each 10 ~g m') in PM IO has been reponed; (Samet e/ aI.,
1981; Schwanz e/ aI., 1993; Sunyer el af" 1993).

Asthmatic subjects seem to be more susceptible to particle pollution, and several studies
have examined the impact of PM IO on the occurrence of asthma attacks and on the
frequency of use of bronchodilators. The incidence of asthma attacks increased for I. I to
11.5 percent (weighted mean, 3 percent) with an increase of 10 ~g m') in PM", daily
average, and bronchodilator use increased from 2.3 percent to 12 percent (weighted mean,
2.9 percent) (Dockery and Pope, 1994). Ostro (1989) calculated that an increase in the
annual mean of 1 fig m') in fine particulate mater (2.5 flm) could be associated with a 3.2
percent increase in acute respiratory diseases in adults aged 18 - 65 years . In some
studies, observed deviations in the lung function of children hale been associated with
short-term fluctuations in particulate concentration (WHO, 1987c). From data collected
by Dockery el aI, (1982) during air pollution episodes it can be calculated that in the most
sensitive children (approximately 25 percent of the study population), a deficit in lung
function at least four times greater than in hose of average sensitivity was observed,
corresponding to a decrease in FEV 1 of 0.39 ml per each increase of I ~lg m'J of exposure
to SPM . However, more recent panel studies have suggested the absence of a threshold
value in the adverse health effect of particulate matter (WHO, 1995a). In a study about
the population of Utah Valley (USA), PMIO concentrations were associated with
reductions in PEFR and increased symptoms and medication use (Pope el al., 1991).
Aerosol acidity was the below detection limit. Decreases in lung function parameters
related to particle exposure have also been observed in studies conducted in the
Netherlands (Hoek and Brunekreef, 1993; Roemer el al., 1993). Germany (Peters e/ "I.,
1995) and Mexico (Romieu el at:, 1996).
Some studies showed a decrease in lung function associated with aerosol acidity as well
as with PM 10 (Neas el al., 1992, (995). Raizenne el al., (1989) reported a 3.5 - 7 percent
decrease for FEV 1 and PEFR associated with air pollution episodes with maximum OJ
concentrations of 286 fig m') (0. 143 ppm) and 47.7 fig m') ofH,S04. Most of the studies
suggested that a 10 fig m') increase in reparable particles resulted in less than 1 percent
decline in lung function (Pope el aI., (995). In addition to declines in lung function, many
of these studies observed increases in respiratory symptoms. A 10 fig m') increase in
PM 10 was typically associated with a 1 - 10 percent increase in respiratory symptoms
such as cough, combined lower. respiratory symptoms and asthma attacks. These etl'ects
66

were also observed at comparable PMlo concentrations near, or even below, 150 ilg Ill'"
(Pope el aI" 1995)
Dockery and Pope (1994) and Pope el al. (1995) have determined cross-sectional
differences in mortality among cohorts of adults in the USA The results from the study of
Dockery and Pope (1994) suggested that a \ 0 ilg m') increase in average PM II) exposure
was associated with an increase in chronic mortality equal to 9 percent (odds ratio of 1.09
with 95 percent conftdence interval between 1.03 and 1.15). This estimate reached 13
percent for fine particles (PM2l), with a 95 percent confidence interval between 1.04 and
1.23, and 36 percent for sulphates with a 95 percent confidence interval between 1.10 and
1.62. In the second study (Pope el al., 1995) an increase of 7 percent was observed for
total mortality for each 10 ilg m') increase in PM2,S , The strongest association was
observed with cardiopulmonary disease and lung cancer deaths (Pope el al., 1995),
In a prospective study conducted in the Netherlands (Van de Lande el aI., 1981) in two
communities over a 12-year period, residents of the community with higher pollution
levels had higher rates of lung function decline, implying that exposure to high ambient
pollution during adulthood may be a risk for COPD. In a study conducted among a
preadolescent population aged 6 - 9 years living in six USA cities (Ware el aI., 1986).
frequency of chronic cough was significantly associated with the annual average
concentration of these air pollutants (SPM, total sulphates (TSO.) and S02) during the
year preceding the examination, The maximum concentrations observed were 114 ilg 01' )
for SPM, 68 ilg m') for S02 and 18 ilg m') for TSO •. The rates of bronchitis and
composite measure of respiratory illness were significantly associated with average
particulate concentration. Similar results have been confirmed in a second cross-sectional
survey of the same population (Dockery e/ aI" \989) A subject with asthma and
permanent wheeze experienced a higher rate of pulmonary symptoms in relation to
increased pollutants. There was no evidence of impaired lung function associated with
pollutant levels,
There is some growing evidence that chronic exposure to smoke may play an important
role in the genesis of chronic lung disease . In developing countries, prevalence rates of
chronic bronchitis often appear to be much higher than in industrialized countries, and
with sex ratio tending to \, which cannot be explained solely by cigarette smoking

(Bumgartner and Speizer, 199 J). Although exposure to multiple risk in developing
countries may much higher than in developed countries, these results thaI
exposure to indoor smoke pollution which is much more common among women, may
largely accounl for the differences.
Non-neoplastic and neoplastic effects on the lung from exposure 10 diesel engine exhaust
have recently been reviewed by a VolHO Task Group on Environmental Health Criteria for
diesel fuel and exhaust emissions (WHO, 1996a). Non-neoplastic effects of diesel exhaust
include mucous membrane irritation, headache and light-headedness. Diesel-bus garage
workers reported signiftcantly more incidents of cough, itchy or burning headache
and wheezing. Several cases of persistent asthma and asthma attacks have also been
reported after acute exposure. Many studies of occupationally exposed individuals with
long, well-defmed exposure and follow-up (> 20 years) investigated the prevalence of
lung cancer (Grashick el aI., 1987, 1988; Gustavsson e/ al., 1990; Emmelin el aI., 1993).
Most of studies showed an increased risk of lung cancer with exposure to diesel
exhaust. The relative risks reported ranged between 1.3 and The point estimates were,
however, imprecise and had wide confidence intervals including a relative risk of I. 0 as a
lower limit of the 90 percent confidence intervals. Other studies supported these results
with relative risks in the range 1.2 - I but did not always achieve statistical significance
(WHO, 1 996b).
Some important fmdings suggest that there is no threshold for the adverse health effects
of SPM Ihat may occur when ambient levels are lower than the older WHO guideline for
respirable particles (WHO, 1987c) or the current USEPA standard for PM JO (USEPA
1982b) It seems that the role of secondary products as acid sulphate is strongly
involved in the effects of the Sh - particulate matter complex (Spengler el "I"
1990) Findings of several studies have been for quantitative evaluations of the
health impact of particulate matter and have also been llsed for risk assessment (Kleinman
e/ aI., \989a; Ostro, 1990; Romieu e/ al., 1990) Fmdings prQ\'ide more insight into the
amplitude of the effect and have suggested that at low concentrations of 24-hours
exposure (defmed as 0 - 200 jlg m') PM w), the exposure-response curve probably fits a
straight lille reasonably well. However, some studies conducted ill an area with a higher
level of air pollution (several hundreds of jlg m'} PM IO) suggest a curvilinear relationship
with the slope becoming shallower at higher ambient concentrations. Estimates of the

magnitude of effect occurring at low levels of exposure should, therefore not be used to
extrapolate to higher concentrations outside the range of exposures that existed in most of
the recent acute studies (WHO, 1995a). Particle composition and size distribution within
PM IU fraction, as well as synergy with other pollutants, are important factors to produce
variety of disorders (e.g. Perry e/ aI., 1983; Xu e/ al., 1995; Peters e/ (II., 1997; Ormstad
e/ (II., 1998; Neukirch e/ aI., 1998; Peters e/ al., 1999; Rogers e/ aI., 2000; Ibald-Mulli el
aI., 2001; Hameed and Khodr, 2001; Borai and Soliman, 2001: Muramoto e/ ai., 2001;
Ng and Lam, 200 I; Fan e/ aI., 2002; Triantafyllou e/ al., 2002)
In many developing countries, people are exposed to PMIO levels that are greatly in
excess of USEPA standards and there is great concern for the impact of these levels on
the health of population exposed (Naeher e/ aI., 2000; Chhabra e/ lIl., 2001, Kumar e/ ai.,
2001; Aneja e/ al., 2001; Ravindra e/ aI., 2001) . Ten of Asia's II mega cities exceed
WHO guidelines for particulate matter by a factor of at least three (WHO and UNEP,
1992) Levels of smoke and dust, a major cause of respiratory diseases, are generally
twice the world average and more than five times as high as in industrial countries and
Latin America (ADB, 1997). Recent forest fires in Indonesia are further, notorious source
of air particulates.
Some studies show that smoke and dust particles can significantly damage human health.
According to WHO estimates, Bangladesh, India, Nepal and Indonesia together account
for about 40 percent of the global mortality in young children caused by pneumonia
(WHO 1993). In China, smoke and small particles from burning coal cause more than
50,000 premature deaths and 400,000 new cases of chronic bronchitis a year in II of its
large cities (WB, I 997b). The negative impacts of domestic burning of solid fuels are not
confined to developing countries. Winter air pollution, mostly from coal and wood
burning fires in private homes, is a persistent problem in New Zealand (New Zealand
Ministry for the Environment, 1997).
In Karachi where a large number of people are crammed, noxious gases and dust in cities
air are at choking levels (Awan, 1997a) Surveys conducted as early as 1988 found that
SITE and Saddar had levels of dust and suspended particles 0.000459 and 0.000397 g/m'
respectively, between two and three times higher than the WHO guideline of 0000 15 to
0.00023 g m'] Levels in the SITE area at 0.000788 g m·3 were the highest and were

sometimes five times higher than the recommended WHO guidelines (Qureshi, 1996)
Y ousufzai el al. (2001), monitored major ambient aIr pollutants in Sindh Industrial
Trading Estate (SITE), Karachi and revealed that the time weighted average
concentrations of PMIO were 2 'I, times higher than WHO guidelines.
2.1.2.6 Lead (Pb)
Lead may cause both acute and chronic effects, which usually result from the
accumulation of. lead in the body over a certain period of time. Aboul 10 % of the
ingested lead is absorbed in the gastrointestinal tract. This proportion may be higher for
infant and children. The degree of pollution differs from country to country, depending on
motor vehicle density and efficiency of efforts to reduce the Pb content of petrol (WHO,
1987e; Mortada el aI., 2001). Concentrations oftetraalkyl Pb amounting to more than 10
percent of the total Pb content of ambient air have been measured in the immediate
vicinity of service station (Petrol pumps) (NSIEM, 1983).
Most of the Pb in ambient air occurs as fme particles (10 ~m). For adults, the retention
rate of airborne particulate matter ranges from 20 - 60 percent. Young children inhale a
proportionately higher daily air volume per unit measure (weight , body area) than adults
(Barltrop, 1972). It was estimated that children have a lung deposition rate of Pb that can
be up to 2 .7 times higher than that of adults.
The proportion of Pb absorbed from the gastrointestinal tract is about 0-15 percent
(Rabinowitz el aI. , 1980). Absorption is influenced by dietary intake; fasting and diets
with low levels of Ca, vitamin D, Fe and Zn have been shown to increase Pb absorption
(Mahaffey, 1990). The un-excreted fraction of absorbed Pb is distributed among three
bodily components: blood, soft .tissues and mineralised tissues (bones, teeth). About 9S
percent of the body burden of Pb in adults is located in the bones, compared with about
70 percent in children. Non-absorbed Pb is excreted in the faeces. Of the absorbed
fraction, 50 - 60 percent is removed by renal and bilary excretion (Sanchez-Fructuoso el
al., 2002; Olivi el al., 2002). The concentration of Pb in "milk" (baby) teeth provides a
lIsefullong-term record of Pb exposure in growing children.
7(J

the gondal and reproductive systems (Rohn el a/., 1982), It also depresses thyroid
function (Tuppurainen el a/., 1988) and impairs hepatic metabolism of cortisol (Saenger
el a/., 1984), In young children, Pb exposure is also associated with a decrease in the
biosynthesis of 1.2S-dihydroxyviamin D, an important metabolite of vitamin D (Angle
and McIntire, 1979; Taskinen el aI" 1981 ; Mahaffey el a/., 1982; Gan el aI" 1982;
Williams el aI" 1983).
The central nervous system is the primary target organ for Pb toxicity In children.
Exposure to high concentrations of Pb can result in an encephalopathy, which is more
frequent in childhood Pb poisoning than in adult poisoning, The reason may be due to the
ease with which Pb crosses the blood-brain barrier in children. Encephlopathy has
occurred in children with blood Pb concentrations in excess of 800 - 1,000 ~g 1'1 (NAS.
1972) , The brain seems more sensitive to alkyl Pb exposure (NSlEM, 1983), Exposure of
children to lower concentrations of Pb may produce neurophysiological disorders,
including impairment of learning ability, behaviour, intelligence and fine motor
coordination, Evidence for such disorders has been reviewed recently by (Davis and
Svendsgaard, 1987; ATSDR, 1988; Grant and Davis, 1990), Needleman el a/. (1979), in a
community-based study of children in Boston in whom previous exposure to Pb was
estimated by examination of shed teeth. reported evidence of Pb-related
neuropsychological deficits, This negative association between Pb concentration in teeth
and mental development was also reported in subsequent studies (Winneke el al,. 1983.
1985), However, in other studies (Smith el a/., 1983 ; Harvey el aI" 1984). correcting for
social environment greatly attenuated this inverse association.
Some researchers (Hawk el a/.. 1986; Fulton el al., 1987) have reported a significant
inverse linear association between cognitive ability and concentration of the group with
the highest concentration in the study by Fulton el a/. (1987) was 221 ~g 1'1, suggesting
that lQ (intelligence quotient) deficits are related to Pb exposure below 250 ~g 1"1 In
agreement with these findings, a recent study conducted in Mexico City among school
children. from low to medium social status and aged 9 - 12 years, showed a strong
negative correlation between blood Pb concentration and intellectual coefficients and
71
------_._-- -

teacher grading, without evidence of threshold concentration (Monz el al., 1993).
Although above studies cannot provide definite evidence that low-level Pb exposure is
linked to reduced cognitive performance in children, the overall pattern of fmdings
supports the conclusion that low-level Pb exposure is related to neurobehavioral
dysfunction in children. In a meta analysis using data from 12 cross sectional
epidemiological studies, Needleman and Gastsonis (1990) concluded that blood Pb
concentrations as low as 100 - ISO Ilg r' are associated with IQ impairment in children.
Based on this body of data the lowest-observed adverse effect level has been defined as
possibly < 100 Ilg r' (ATSDR, 1990).
Lead (Pb) is transported to the foetus across the placenta because there is no metabolic
barrier to foetal Pb uptake Furthermore, the amount of Pb available for foetal uptake may
actually be increased because part of the Pb stored in bone is released into the blood
during pregnancy. Prenatal exposure to Pb produces toxic effects on the human foetus
including reductions in gestational age, birth weight and mental development. These
effects occur at relatively low blood Pb concentrations. An inverse association between
maternal (or cord) blood Pb concentrations and gestational age has been reported by
different authors (Okamoto and Kawai, 1984; Wilkins and Sinks, 1984; Alfano and Petit,
1985; McMichael el al., 1986; Dietrich ef aI., 1986, 1987b). Based on risk estimates made
by McMichael ef al. (1986), the risk of premature delivery increases approximately four
fold as cord or maternal blood Pb concentration increase from 80 Ilg r' to greater than
140 ~lg ,.'. Data from a Cincinnati study suggest an inverse relationship between prenatal
maternal blood Pb concentration and birth weight and postnatal growth rates (Dietrich el
aI., 1987a; Shulka el al., 1987). Other studies also support this inverse association
(Bellinger el aI., 1984; Ward el dl., 1987; Audrey el al., 2002).
A senes of long-term studies have investigated the effect of early Pb exposure and
developmental effects. Bellinger el al. (J 987, 1989) in Boston, USA studied the
relationship between umbilical cord blood Pb and early cognitive development over 6 and
24 months of age. Lead (Pb) concentrations were measured in 249 umbilical cord blood
samples of infants born to middle and upper middle class parents. Cord blood Pb
concentrations were categorised as low (mean = 18 Ilg r'), mid (mean = 65 Ilg r') and
high (mean = 146 Ilg r') After accounting for factors related to infant development, such
as mother's age, race, IQ, education, care-giving environment, social class, and infant 's
72

sex, birth weight, birth order and gestational age, there was a significant inverse relation
between performance on the Baylet Mental Development Index (MDl) at 6, 12 and 24
months and cord blood Pb concentrations (McMichael el al., (988).
The MDI is a composite scale to assess sensory-perceptual acuity, memory, learning
ability, verbal communication and other cognitive functions (Shy, 1990) The difference
in MDI between the low and high exposure groups was between 4 and 7 points. Postnatal
blood Pb concentration showed no association with MDI deficit Children in the lower
socio-economic stratum were adversely affected at lower levels of prenatal exposure
(Needleman, (989). These findings are supported by other studies (Petit and Alfano,
1979; Dietrich I!I aI., 1987a; Emhart el al., 1987; Haraguchi el al., 2001; Morgan III aI.,
200 I; Counter and Buchanan, 2002).
Another prospective study was conducted in Port-Pirie, South Australia among a cohort
of 537 children born during 1979 to 1982 to women living near a Pb smelter (McMichael
el al., (988). Blood samples were collected from the mother, before and at delivery from
the umbilical cord, and at ages 6, 15, 24 months and every year thereafter from the
infants. At the age of two, the mean blood Lead (Pb) concentration was 212 J,lg rl with a
range of 49 - 566 J,lg rl. The developmental status of each child was tested using the
McCarthy Scale of Children's Abilities (MSCA). Maternal intelligence and care-giving
environment were also evaluated. The blood Pb concentration at each age, particularly at
2 and 3 years and integrated postnatal average concentration were inversely related to
development at the age of 4 years. independently from other factors that may affect child
development, subjects with an average postnatal blood Pb concentration of309 J,lg rl had
a cognitive score seven points lower than those with an average concentration of I 03 ~lg r I (McMichael el aI. , 1988, (994) .
Although the cognitive and neurosensory efiects of low-level blood Pb are particularly
difficult to study mainly because of the variety of tests used and the number of different
factors that may affect child development, there is an impressive convergence of animal
and human studies (Shy, 1990; Bunn el al., 2001; Dietrich el aI., 2001). Grant and Davis
(1990) concluded that neurobehavioral deflcits and reduction in gestational age and birth
weight are associated with prenatal internal exposure levels, indexed by maternal or cord
73
--------

blood Pb concentration of 100-150 Ilg rl and possibly lower. In addition a follow-up
investigation of the children whose dentine concentrations of Pb had been measured in
primary school showed that, II years later, children with high Pb level (dentine
concentrations ~ 20 ppm) were significantly more likely to drop out of high school and to
have a reading disability (Needleman el aI., 1992). This study has been criticised because
of potential bias (Good, 1991); nevertheless the results suggest that early Pb exposure
may result in long-term neurobehavioral impairment.
In addition to the assessments discussed above, other aspects of Pb-associated
neurotoxicity have also been examined. Hearing thresholds in children appear to be
adversely affected by Pb. Schwartz and Otto (1987) reported the probability of Pb
induced hearing loss increased with increasing blood levels across the entire range of
concentrations studied (between about 40 and 500 Ilg 1'1). Exposure to high
concentrations of Pb may lead to functional disorders of the gastrointestianl tract; a
common sigh of acute poisoning is colic. Lead may also produce damage in the kidneys,
which leads to increased urinary excretion of amino acids, glucose and enter a chronic
stage with fibrosis and arteriosclerotic changes in the kidney (Choie and Richter, 1980;
L10bet til a/., 2002).
Epidemiological information indicates that Pb increases blood pressure. In a study
conducted in the USA, systolic and diastolic blood . pressure were significantly related to
blood Pb in white males aged 20 - 47 years, after adjusting for potential confounding
variables (Pirkle el al., 1985). These findings have been confirmed by another study
(Pocock e/ al., 1988). In a Danish follow-up study, Moller and Kristensen (1992) reported
a decrease in blood pressure associated with a decrease in blood Pb concentrations over a
five year period. However, the causal relationship between blood Pb concentrations and
blood pressure is still unclear. The mechanism of toxicity could involve the Ca-mediated
control of vascular smooth muscle contraction (Chai and Webb, 1988), and the renin
angiotensine system (Vander, 1988).
In summary, the adverse effects 'of Pb exposure in early neurobehavioral development are
of primary concern. It occurs at levels well below those considered "safe" in recent years
There can be little doubt that exposure to Pb, even at blood concentrations as low as 100-
7~

150 >Ig rl and possibly lower, is linked to undesirable developmental outcomes in human
foetuses and children (Davis and Svendsgaard, 1987). The most clearly identified effect
has been lower scores on the MDI of the Baylet Scale of Infant Development, poor school
attainment and lower intellectual coefficients, reduced gestational age, and lower binh
weight. In different studies, a dose-response curve for blood Pb concentration and
neurobehavioral impact has been derived (McMichael el al., 1986, 1988; Bellinger el al.,
1987), and can be used to estimate the health impact of Pb exposure at the population
leveL In terms of implications for public health, an overall four point downward shift in a
normal distribution of Baylet MDI scores would result in 50 percent more children
scoring below 80 in this test.
It is also imponant to mention that lead (Pb) absorption may be modulated by nutritional
status. Nutrient deficiencies such as Ca, Fe and Zn have been associated with high blood
Pb concentrations (Mahaffey and Michelson, 1980; Mahaffey, 1990; Wang el al., 2001;
Domingo el al., 2001) and, in some studies, Ca intake was inversely related 10 blood Pb
concentrations (Mahaffey, 1990; Hernandez-Avil el aI., 1996). Some epidemiological
studies in Pb exposed populations are in progress to determine the impact of Ca
supplementation on Pb absorption and mobilisation.
The use of Pb in petrol has been declining in various countries in the world and this has
been responsible for a substantial decrease in blood Pb concentrations in the general
population (Annest el al., 1983) such as alopecia, diarrhoea, headache, irritability,
Jaundice, Sleeplessness, Fume fever, Reproductive problems elc. (Yokoyama el al., 1985;
Behringer el aI., 1986; Wagnerova el al., 1986; Wibow el aI., 1986). A similar impact has
been observed in Mexico among residents of Mexico City (Hernandez-Avila el al., 1996).
Pakistan in mid 90s was nearing the top of the list for lead content in both premium and
regular grades of gasoline available in the market. (Editorial daily Dawn, 1996). Over 12
million tons of leaded petrol used to be burnt in Pakistan every year, emitting
approximately 550 tons of lead into the atmosphere. Because of the small traces in
furnace oil, oil-fired thermal power stations add another 190 tons of lead to the air . That
lead damages the brain, blood-forming organs and the kidneys (Naveed, 2000). A study
conducted by the Quaid-e-Azam University, ISlamabad, where milk from many dairy
75

forms along the Grand Trunk road, Rawalpindi, had two to three times more lead than the
'safe' level recommended by WHO. Another study depicted high level of lead in the
blood of school children. It was, in fact, double the WHO limits (I\aim, 1995).
According to UNEPfWHO (1992), Awan (l997b) and Shams (I 997b) Karachi ranked as
one of the worst third world city even among top ten with very high air born lead levels.
A study was conducted to investigate lead level around the city. Data collected from three
spots in Karachi indicated prevalence of an average 5.8 milligrams of lead per cubic
meter. In that study at Tibet Centre on M A Jinnah road in commercial district of Karachi
the lead level was as high as 9.60 mg per cubic meter. Interestingly more than 90 percent
of about 0.86 million vehicles playing on the Karachi roads do not correspond to fitness
standards, thus emit lead in raw shape (Qureshi, 2000). A survey repol1 reveal that in
Karachi, lead content was up to 10 Mg 1m3. That is very high as compared to the WHO
recommended maximum range of 0.5 to 1.0 Mg 1m3 (Ikram. 1996) Traffic police in
Karachi had levels of 46 mg/dl and school children in Saddar, Karachi had 36 mgldl
against the permissible lead limit of 20 mg/dl (Husain, 1997b).
7(,

2.2 DEVELOPMENT OF TECHNOLOGIES
2.2.1 Remote Sensing (RS)
The launching of the first artificial satellite. Sputnik I, on 04 October 1957 ushered in an
era of unprecedented technological development and scientific progress. The
development of space technology in 'the past four decades has indeed been an
unparalleled event in human experience in terms of technological innovations. which
characterized it. and in its impact on the human life. It provided a remarkable boost to
increased efficiencies and miniaturization III Imaglllg devices. (Drury. 1990)
microcomputers. data storage/transmission systems, conversion of solar energy into
electrical energy elc. These advances in space technology, besides making it possible to
carry out research in terrestrial. (Jensen. 1986; Foody, 2002) interplanetary and deep
space. permit applications . in a variety of areas such as meteorology (Hubert and
Timchalk. 1969; Battan, 1973; Spalding. 1974; Witter and Chelton. 1991). natural
resource monitoring & mapping such as agriculture, soils, Landuse/land-cover, ecology.
forestry, geology/geophysics(mineral exploration),water resources (Stancioff el al.. 1986;
Niemi. 1975; McRoberts el al .. 2002; Chang and Islam. 2000). environment (Komjathy el
al .. 2000; Miller and Yool, 2002; Friedl. 2002), communication (Wilke. 1990). search
(Slavecki . 1964; Alpers el aI., 1981; Prakash el al .. 1995; Corbley. 1997; Zhang el al..
1997) and rescue (Vekerdy and Genderen, 1999; Williamson and Baker. 2002) elc. The
advances in space technology have amply demonstrated their potential both for developed
as well as developing countries (Verbyla, 1995). In fact, space activities have become one
of the major generators and stimulators of scientific, technical, industrial. economic and
all-round progress of societies and the lack of such activity leads to a widening of the gap
between the developed and developing countries (Colwell, 1967; Meyer and Werth.
1990).
Over the years capabilities for remote sensing have been much extended by the invention
and steady improvements of a variety of specialized instruments. This field has grown up
with right from pigeon photography to the Satellite Remote Sensing (SRS). Aerial
photography has long been employed as a tool in urban analysis (Jensen 1983). Indeed.
this form of remote sensing is still extensively used today and can now benefit from
77

digital image-processing techniques, provided of course that the photographs are digitized
first (Futz 1996), Aerial photography has been used in various applications of earth
resources monitoring, management and exploration (Collins, 1978; Kupfer el al. 1987,
Long el aI., 1989; Lo and Noble, 1990; Fent el aI., 1995; Baker el al., 1995; Mack el al.,
1995; Tomer el aI. , 1997; Ramsey el al., 2002)
Satellite Remote Sensing (SRS) has accommodated vanous technologies such as
photographic camera, Vidicon camera, Infrared radiometers, Microwave radiometers,
micrometer radar, Laser radar (Lidar) elc. (Barrett and Curtis, 1976; Curran, 1988;
Lillesand & Keifer, 1994; Rango, 2000; Blackburn, 2002; Drake, 2002) , Remote Sensing
promises to have several advantages over the conventional methods (Chouhan, 1992),
The major socio-economic and developmental factors like population, production and
pollution exert strain on earth's resources due to which depletion or degradation of
environment results and the world starts facing crisis (Nadakavukaren, 1990), In a
scenario of dynamic changes taking place on land, water and atmospheric environment,
the resources have to be periodically mapped and monitored (Nielsen el al., 1998; Elmore
el aI., 2000; Rogan el al., 2002) To help in this stupendous task, the comparatively new
technique of remote sensing provides an effective tool to the present day scientists and
environmentalists (Faruqi, 1992). Comprehensive approach has great importance to study
the interactions among biotic and abiotic creatures (Gates, 1967; Greegor, 1986) where
remote evaluation empowers the environmentalist and decision-makers for better
governance at affordable cos't
The trend of urban studies via remotely sensed data, was initiated with the advent of 'fIrst
generation' satellite sensors, notably the Landsat MSS, and was given further impetus by
a number of second-generation devices, such as SPOT HRV. Data from the former were
initially used to analyse regional urban systems and for exploratory investigations of
some of the larger cities in North America (Forster 1983; Jensen 1983; Stow and Chen,
2002), The availability of still higher spatial resolution images from the latter enabled
more detailed studies of the older, more compact urban areas characteristic (Forster,
1983) The advent of a third generation of very high spatial resolution satellite sensors is
likely to stimulate the development of urban remote sensing still further (Aplin el al..
1997; Fritz, 1999). The data they produce facilitates improved discrimination of the dense
and heterogeneous milieu of the old urban cores (Ridley el al., 1997), and will also help
78
- --------_ . - - --

to disentangle the urban fabric in the rapidly expanding agglomerations and 'edge cities'
of many developing countries (Ganas e/ al., 2002).
Silva (1996) accounted for Remote Sensing as a powerful technique for surveying,
mapping and monitoring earth resources and environment. This techn ique has become
indispensable and increasingly more meaningful because of the synoptic coverage of
satellites over large areas rendering its cost and times effectiveness. Furthermore, in areas
that are difftcult to access, this technique is perhaps the only method of obtaining the
required data more effectively and speedily. Shukla and Suchandra (1996) considered
satellite remote sensing technology that provide an effective system of temporal
monitoring of urbanization with consequent depletion of other natural resources in the
immediate environs of big cities and metropolis. These easily available sources of
information provide inputs in the urban Landuse planning of large cities and metropolis
with a futuristic trend based on the past dynamic observation. Sutanto (1991) suggested
remotely sensed data for urban problem evaluation and planning studies owing to fast
growth of urban areas whereas ·the continuous provision of updated huge city maps on
such a large scale is difftcult for city officials. Conversely, acquisition of updated and
highly detailed (with higher resolution) information is easy and cheaper.
Several studies have been conducted with the use of moderate resolution satellite data
such as NOV AA, Landsat and SPOT both panchromatic and multi spectral analysis. Gao
and Skilleorn (1998) described the capability of SPOT -XS data in producing land cover
maps at the urban-rural periphery. On similar lines Toll (1984): Gupta and Munshi
(1985); Misra (1989); Doi (1990); Forghani (1994); Shukla and Suchandra (1996);
Coppin and Bauer (1996); Kwarteng and Chavez (1998); and Gao and Skilleorn (1998)
have attempted to study urban environment and land cover by using remotely sensed
imageries. Brouwer (1990) used remote sensing techniques to rapid assessment of urban
growth. Quattrochi and Luvall (1999) studied the growth of Atlanta (USA) city vis-a-vis
meteorology and air quality using remote sensing. Anthony and Xia (1996) studied urban
growth management in the Pearl River delta (USA) by using remotely sensed
information.
Haack e/ al. (1987) found that in some cases Landsat TM data might not always lead to
required results than Landsat MSS in mapping urban and near-urban land covers if they
are less homogenous. Landsat TM data allowed many classes such as densely built-up
79

(settlements) . sparsely buill-up (settlements). Rangeland. irrigated crops. and irrigated
pasture in suburban region of Denver (USA). However. the improvement was minimal for
spectrally heterogeneous classes such as urban residential areas. From Landsat TM
imagery. Harris and Ventura (1995) performed a five-category (residential. commercial.
industrial. open spaces and freeways) classification for the small urban areas of Beaver
Dam. Wisconsin (USA). The accuracy was improved after such ancillary spatial
information as zoning and housing density was incorporated in the classification.
Therefore, in spite of its being a primary data source, TM imagery functions better in a
complementary role in mapping land covers at the urban periphery (Milazzo, 1980).
With the growing technology, several new techniques have been introduced to monitor
changes in the land cover I lana use. Some of these include image difference, ratioing.
principal component analysis (PCA), and selective principal component analysis (e.g
Chavez el al., 1977; Jensen and Toll, 1982; Gunther, 1982; Singh 1989; Chavez and
Kwarteng, 1989; Chavez and MacKinnon, 1994).
Remote Sensing techniques has also been used to monitor some constituents of
atmospheric pollution (Barrett and Curtis. 1976; Deeter el al .. 200 I ;) . However, in an
indirect approach air pollution could be estimated by way of the monitoring of the relative
parameters such as landuse, traffic count and speed elc. (Ulshafer and Rosner , 200 I)
Ulshafer and Rosner (2001) used Lichens on apple trees as bio-indicators of air pollution
in the region of Reutlingen (Germany). Remote Sensing could help to map the road
network, geometry of choking regions, expansion of plume including its concentration,
under threat popUlation elc. (Gonzalez and Wintz., 1987, Lillesand and Keifer. 1987) .
These parameters have strong relationship with the generation. distribution, effects and
control of air pollution (Hayes, 1979; Stern el a1., I 984;Collins ~I al., 1995; Weide el al.,
1999). Beside these, there are some direct pollutant-monitoring techniques also being
used, through remote sensing (Hayes, 1979). Some adaptive instruments I devices use the
same concept of remote sensing but their platforms are on ground rather satellites (Bilbro
el al., 1986; McCaul el al., 1987; Rothermel el al., 1997).
The integration of GIS and remote sensing has justifiably received widespread and
extensive mention in recent literature (e.g. Aronoff, 1989; Korte, 1992; Denegre, 1994;
Verbyla, 2000; Steede-Terry, 2000;) . According to Fedra (1993); and Lillesand and
8U

Keifer (1994), the interface between GIS and remote senlsing can be envisaged in one of
different ways
a ) Remote sensing can as a tool 10 gather sets for use in GIS;
b.) GIS data sets can be used as ancillary information with which to improve the
products derived from remote sensing and;
c.) Remote sensing data and GIS data can be used together tor modelling and
analysis.
Some important satellites' payloads been sent into orbit to monitor atmospheric
parameters like carbon methane (C~). A the Measurement
Pollutants In The Troposphere (MOPITT) was launched on the Terra platform
and tropospheric carbon monoxide (CO) profiles and methane (CH4) columns
(Drummond e/ at, 200 I). Gas filter correlation radiometry with pressure modulation and
length modulation techniques are used in MOPITT The same methodology has been IIsed
for MA TR but with the different objectives. MATR has two fUllctions. The first function
is to collect data to test ability to <I"I,,,p,,,,, correct atmospheric CO or
from MOPITT-like filter radiometer data. The second function is to
MOPITT data (McKernan el al., 2001).
amounts
validate
The MOPITT Airborne Test Radiometer (MATR) uses gas filter correlation radiometry to
measure troposphere carbon monoxide (CO) with three optical channels or methane
(CH.) with one channel. MATR data serves to test retrieval techniques for converting
infrared radiometric data into atmospheric CO or CH4, amounts. MATR is also applied to
MOPITT data validation (Tohon el aI., 1999; Gillea et aI., 2001)
In Pakistan, Space and Upper Atmosphere Commission, Pakistan (SUPARCO), is the
governmental organization involved in space technology development, claims to its credit
a host of studies addressing diverse resource, mapping and environmental problems
covering various disciplines such as hydrology, agriculture, forestry, geology, geography,
oceanography, etc. (Mehmud, 19&8; SUP ARCO, 2000). Out of these projects, chief
studies includes LanduselLandcover Studies of Karachi, Lahore, Islamabad,
Peshawar e/c. with integration of GIS; Monitoring of Cholistan al
Dingarh, Fort Abbas and lslamgarh; Land Degradation Monitoring of Hyderabad District:
81
Mapping Biomass and other Terrain Units around Chotiari in Sanghar District; Pakistan
Coastal Mangrove Degradation: a temporal variation from 1973 - 1998; Land Suitability
around Moen jo Daro Area; Water logging and Salinity Mapping -WAPDA (SCARP VI
Project); 1 Km Landcover Database ' of Asia; Mapping of Forests in Northern
Mountainous Regions of Pakistan; Landuse!Landcover Estimation of Karachi Region and
Urban Sprawl Studies of Karachi and other major cities of Pakistan (SUP ARCO, 2000) .
Zareen e/ al. (1995) performed statistical analysis of wind speed and direction obtained
through satellite based TCP network in Pakistan. Baig e/ al. (1995) processed satellite
based data of Bannu basin, Pakistan to enhance the geological features. Siddiqui (1995a),
elaborated the diversifIed applications of satellite imageries in exploration / development
of oil and gas fIeld in Pakistan. Rangoonwala and Ahmed (1995a), wrote a review article
on integrated use of optical and Radar sensors for resource development. Khan and
Siddiqui (1986) used Landsat data for urban growth monitoring in Karachi metropolitan
area. Bertaud, Marie-Agnes (1989) used aerial photograph at scale I :40,000, SPOT PAN
image at scale I :40,000 and SPOT XS image at scale I :24,000 to identification of
different patterns of development and with the help of AutoCAD and GIS software PC
ARC/INFO produced the land use and road network maps of Karachi . Siddiqui (1991)
merged high-resolution SPOT-pAN data with SPOT XS and Landsat TM data for urban
land use application. Kazmi (1991) applied SPOT HRV-2 data to identiftcation and
mapping of types of land use classes and with the help of ground truth information
Landuse classes were checked. It was suggested that SPOT images could effectively be
used for the identification and interpretation of land use.
Rangoonwala e/ at. (1991) used satellite remote sensing data for identifying residential
units for change detection in Karachi. A follow-up study by Rangoonwala and Ahmed
(1995b) described the urban growth monitoring and development planning using remote
sensing and GIS technologies. Siddiqui e/ at. (1995) have undertaken an urban land
use/land cover study through satellite remote sensing techniques by classifying Landsat
and SPOT imageries. It was concluded that the systematic monitoring of urban growth,
proper management of the city and planned future expansion would lead to improvement
in the living standards and environmental conditions of the city as a whole. Siddiqui e/ al.
(1996) used satellite remote sensing data for mapping and monitoring temporal changes
in Larkana district and presented the application of satellite remote sensing data to urban
land use c1assiftcation studies. Siddiqui (1993 and 1995b) looked at the possibility of SRS

technology in monitoring deforestation and land degradation in Pakistan. Malik and
Majeed (1995) threw light on RS application in water resources research in Pakistan.
Nasir and Raouf (1995) wrote a review article on remote sensing for coastal resources and
marine pollution.
Kazmi (1995, and 2001b) utilized SPOT HRV and Landsat 5, imageries to monitor land
degradation and crop assessment in the rural vicinity of Karachi . Afsar (2001) and Mehdi
el al. (200 I) contributed their work related to the signifIcance of satellite remote sensing
in the fIeld of urban studies of Karachi metropolis. Afsar (200 I) has estimated 500
square kilometres, built-up urban area with rapid growing rate. Mehdi el al. (200 I)
indicated that the major portion of urban built-up in 1998 was covered by medium density
of selliements. But the major concentration of population and selliement was in core
Karachi .
2.2.2 Geographic Information Systems (GIS)
GIS technology provides an excellent platform upon which different types of spatially
referenced data can be united for analysis and display purposes. Prior to the advent of GIS
technology, many operations that involved the concerted utilization of datasets derived
from different sources and in different formats used to be carried out using a " push-pin"
approach in which hard copy. maps were generated and overlaid upon one another. The
approach was both costly and time-consuming and often yielded substandard results
(Dent el al .• 1998)
It has been estimated that over eighty percent of the world's data have a spatial
component (Worrall, 1991; MIC, 1999). These spatial components could include an
address in a database or coordinates in sampling data. GIS has been used to manage
natural resources, utility networks, government activities such as revenue management,
crime analysis, crime monitoring and environmental degradaiion monitoring elc. GIS has
evolved to provide solutions in three areas: GIS as an information database, GIS as an
analytical tool, and GIS as a decision support system (Bellman and Zadeh, 1970; Bodily,
1985; Banai-Kashani, ) 989; Armstrong, el al., ) 991; Huizing and Bronsveld, 1994;
Eastman, ) 995). A trend affecting the GIS application is the result of recent advances of
Xl

computer technology and graphic user interface operating systems. In particular, desktop
GIS have emerged, capitalizing on the advancement of direct manipulation (Theobald.
1998; MIC, 1999; PCI, 2002).
There are many prominent trends in the GIS-industry (Theobald, \ 998) . More
sophisticated GIS are being used to address a broader range of problems and in a wider
variety of situations. For example, GIS is being applied to problems that require coupling
of simulation models with GIS (Goodchild, 1993); the visualization of spatial data
(MacEachren and Taylor 1994; Buttenfleld 1996) the development of spatial decision
support systems (e.g. Faber e/ al. 1998); and to support public policy and decision
making (e.g., Hobbs e/ al. 1997).
Environmental management, decision-making. and planning require a large and diverse
ensemble of data that includes time series of monitored environmental variables and
geographical datasets. Most environmental phenomena show five different dimensions of
data: the location in space, (set. of 3 coordinates - latitude, longitude and altitude), the
position in time and the particular phenomenon (variable/theme being analyzed)
(Langram, 1993; Waters, 1995; Hibbard e/ aI. , 1995; Oracle, 1995). The goals of an
environmental monitoring and information system is thus to collect data in this five
dimensional world , store it and promote its use in the most efficient possible way (Raper
and Livingstone, 1995; Oliveira and Ribeiro da Costa, 2000; McConnell e/ al. 2000)
Some of the pnor environmental cartographic visualizations (Pape, 1980), where
analytical and composite maps of urban air pollution are proposed, together with temporal
(static) displays of changes. Hayes (1979) has given an example of more specific
demands for environmental visualizations. Since the ICA cartographic conference ill
Tokyo in 1980, which was dedicated to environmental cartography, environmental
mapping and visualization work has increased (lCA, 1980; Pape, 1980; Grot jan, 1982;
Kadmon, \983; Lavin and CelVeny, 1987; EuroCarto 7, 1988). By the late 1980s
environmental cartography was also concerned with environmental data integration, the
spatial characteristics of the data to be mapped and environmental databases (Ormeling,
1989). Computer capabilities have, in the meantime, promoted the development of
systems for efficient environmental monitoring and impact studies and more realistic
visualizations (IEEE 1984, Papathomas e/ ((I. 1988; Wolfe and Liu 1988; DiBiase e/ a l.

1991; Abel el al. 1 992a, 1 992b; Emmell 1992; Gantz 1992; Lang. 1992; Lang and Speed
1992; Kruse el at. 1993; Stenberg 1993). However, apart from the visualization need, the
various thematic variables related to the air pollution phenomenon introduce more
possibilities and demands for data analysis and mapping (Koussoulakou, 1994) .
2 .2.2.1 . Air Pollution Dispersion Modelling
Air dispersion modelling is a well-established discipline that can produce results in a
spatial context. Integration of this discipline \Vith GIS technology is optimal because it
leverages the predictive capacity of modelling with the data management, analysis, and
display capabilities of GIS. The utilization of air emission data and air dispersion
modelling with GIS enable public health .professionals to identify and define a potentially
exposed population, estimate the health risk burden of that population, and determine
correlations between point-based health outcome results and estimated health risk (Stern
el al. 1984; Dent el al., 1998). Geographic Information Systems (GIS) make the
atmospheric quality measures more comprehendible with the help of inherent digital
Cartographic Visualization Functions.
Models of Air dispersion estimate the concentrations of pollutants in the atmosphere
resulting from point or non-point atmospheric emissions. They take into account variolls
factors that can affect a substance's concentration in a plume as it migrates through the
air . These influential factors include gravity, meteorological conditions, and chemical
reactions (Fedra, 1994; Folgert, 1997).
Geographic Information System and air dispersion modelling algorithms are separately
designed . Three well known methods exist, which could be adopted to empower GIS with
dispersion modelling abilities. Strong comparisons of procedures for linking of GIS with
models are provided by Haining el al. (1992) Able (1994), and Fedra (1994) . Table 2 .1 I,
reveals possible methods of integration.

Table 2.11: Methods for Integration of Air Pollution Dispersion Models with GIS
'~ '. .. . -,~,:s.'~.:~-i~ ... :. .~( .'
r.1elb:o.di~lnic:gtjdii5jl . .. . EXllinple Application , . .." . .. ' : '. . ..
Full Inte.l(ration Bishoo and Robev (1994) Loose Couolin" Collins (1995) Tight Couoling Buckley (1993)
Source: Folgen . 1997
In the filII ill/egrfl/ioll approach, a programming language such as Maplnfo's MapBasic
or Arclnfo® Arc Macro Language (AML) is used to create and implement the model and
the model becomes one of the analytical functions of GIS . This method is adequate for
modelling simple processes where computational requirements are not extremely great,
and may be utilized if a phenomenon to be modelled is very specialized (Foigert, 1997).
Bishop and Robey (1994) created a model to run within the GIS, written as a series of
A.J\1L commands, that used the GRID module' s capacity to undertake visibility, proximity
and overlay analysis. They suggested work is made easier if models use data from or are
implement within a GIS. assessed and compared the accuracy and efficiency of a
Arclnfo® GIS-only model with the coupling of a model with Arc lnfo® GIS . In her study,
she quantified the advantages and disadvantages of these two approaches (Chou and
Ding, 1992). As suggested by Goodchild (1992) although GIS supports a broad range of
data models, the ability to wdte the environmental model directly in the command
language of the GIS is being researched (Steyaert and Goodchild, 1994; Parks, 1993).
Nyerges (1992) and Fedra (1993) and others argue that the best approach is to link GIS
and other systems, resulting in more efiicient modelling tools.
Zack and Minnich (1991) applied a diagnostic wind field model for forest fire
management. In this loose coupling approach, a GIS was used to help prepare model
input data, and display model analysis . Collins e/ aI., (\995) estimated pollutant
concentrations using a stand-alone dispersion model then used the GIS to visualize the
model's numerical output, without directly linking the two systems. The advantage of this
method is that each system complements each other; the model provides potentially
valuable information to the GIS for further spatial analysis and the GIS can be used to
prepare input files and allows model output to be visualized in map form.

Tight coupling involves full integration of an existing model with GIS, uSing one
common graphical user interface (GUI) to facilitate the modelling process. The GUI
provides a veneer, which assists and guides the user through the modelling process while
hiding the processing intricacies. Such systems offer a virtual environment within which
decision-makers and scientists can explore theory and evaluate competing management
strategies (Bennett, 1997). One advantage of this method over the full integration
approach is that the speed of model calculations is a function of the computer ' s
processing speed, not the speed in which the GIS interpret command-macros.
Buckley (1993) integrated atmospheric dispersion modelling with GIS technology to
produce the Computer-Assisted Protective Action Recommendation System (CAP ARS),
which provides plume and health impact predictions from toxic chemical emergencie$. In
this integration, a sophisticated and fault tolerant system was designed to produce plume
paths and predict plume spread over complex terrain. Novak and Dennis (1993) provide a
synopsis of a regional air quality and 'acid deposition model. and provide a plan to
develop an integrated modelling and analysis framework to ensure that GIS functionality
is directly accessible by the researchers. Lathrop el al. (1994), have applied a tight
coupling approach in modelling the impact of atmospheric deposition and climate change
on northeastern USA forest ecosystems.
As stated by Goodchild (1993), the computational power of computers and GIS make it
easier to integrate models, to disaggl'egale them to greater levels of spatial detail and to
reaggregale results over relevant areas. The GIS function of visualization can be used to
make powerful products that carry far more weight than tables of numbers . The
interactive nature of many current GIS allows the decision-makers to work with complex
models in a comfortable, reassuring environment. Table 2.12, shows the dispersion
models integrated with GIS.
87
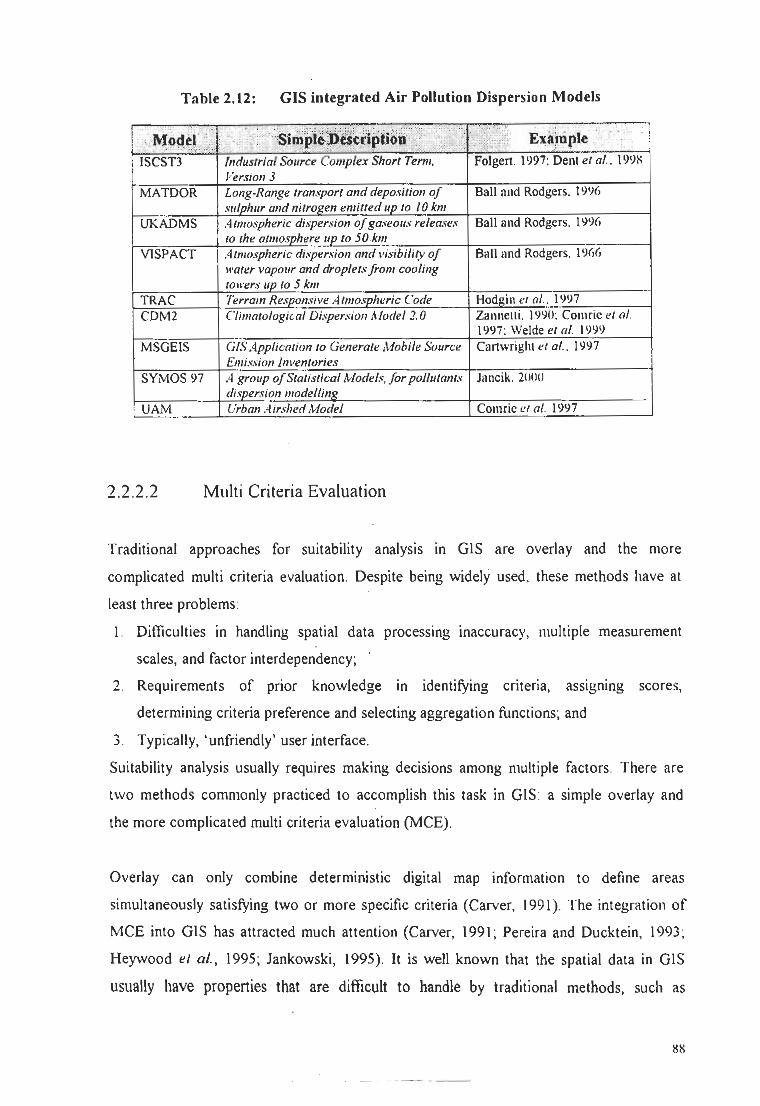
Table 2.12: GIS integrated Air Pollution Dispersion Models
'. M;o~~t ::.: . ~Si~Pl~D~~i.iptiOif" ''',", .. . ;/,> .;,:,.' Ex~niple
ISCST3 Induslrlal Source Complex Shorl Term. Folgen. 1997, Delli <I al .. 1 ~~X Version 3
MATDOR Long~Range transport and deposition 0/ Ball nnd Rodgers. t ~% ,,"Iohur and nilro~en emilled up 10 10 km
UKADMS Atmospheric dispersion oJ gaseous releases Ball and Rodgers. t ~% 10 Ihe almosohere liP 10 50.km
V1SPACT A rmospheric dispersion Gnd vis;bility of Ball nnd Rodgers. 1%(, water vapour and droplels from cooling towers up 10 5 km
TRAC Terrain Responsive A lmosoheric Code Hodgin <I al.. 19~7 CDM2 Climalolagiwl Di.'persian Aladel 2.0 Zalluclli . 1990: Comrie el 01.
1997: Weide el {Ii. 1~9~
MSGEIS GIS Application 10 Generale Mobile Source Canwriglll <I al .. 1997 Emission inventories
SYMOS 97 A group oj Sialisl/cal Models, Jor po/Julallls Jancik. 21100 disoersion mode/linF
UAt"l Urban A irslred Model Comrie (!{ al. t~97
2.2.2.2 Multi Criteria Evaluation
Traditional approaches for suitability analysis in GIS are overlay and the more
complicated multi criteria evaluation. Despite being widely used, these methods have al
least three problems:
I. Difficulties in handling spatial data processlllg inaccuracy, multiple measurement
scales, and factor interdependency; .
2. Requirements of prior knowledge III identifying criteria, assigning scores,
determining criteria preference and selecting aggregation functions; and
3. Typically, 'unfriendly' user interface.
Suitability analysis usually requires making decisions among multiple factors . There are
two methods commonly practiced to accomplish this task in GIS , a simple overlay and
the more complicated multi criteria evaluation (MCE).
Overlay can only combine deterministic digital map information to define areas
simultaneously satisfying two or more specifiC criteria (Carver, 1991). The integration of
MCE into GIS has attracted much attention (Carver, 1991; Pereira and Ducktein, 1993;
Heywood el at., 1995; Jankowski, 1995). It is well known that the spatial data in GIS
usually have properties that are difficult to handle by traditional methods, such as

inaccuracy, multiple measurc;ment scales, and interdependency among factors . Traditional
methods require prior knowledge to identifY all relevant criteria, assign scores, determine
the criterion preference, and select the aggregation function. Methodological uncertainty
and error may appear in these procedures. For example, a user may be asked to provide a
set of values, such as criteria weights. These questions are usually cognitively demanding
and far beyond his or her intuition.
The application of digital map overlay for the purpose of identifying suitable areas is a
classic application of GIS. In raster GIS, for example in IDRISI or in ArcYiew (Eastman,
1995; Lee and Wang, 2001), a suitability map is produced from a series of Boolean
images, where each image represents all areas meeting the criterion being depicted. These
images are then combined using the overlay combination procedure to yield a final map
that shows the sites meeting all the specified criteria. However, overlays have limitations
when dealing with information of a non-deterministic nature (Carver, 1991). Heywood
(1995) considered four factors - school location, roads, urban areas and insurance. After
the identification of relevant criteria, the scores, which indicate the impacts of alternatives
on each criterion, were determined. There existed many methods for this task (Hepner,
1984; Pereira and Ducktein, 1993).
The methods for criterion importance determination and aggregation can be classified
into compensatory and non-compensatory (Hwang and Yoon, 1981; Minch and Sanders,
1986; Jankowski, 1995). In a compensatory method, the high performance of an
alternative achieved on one or more criteria can compensate for the weak performance of
the same alternative on other criteria. Weighted summation is such a method. Other
compensatory methods include concordance analysis, analytical hierarchy process, and
ideal point. Non-compensatory techniques are the stepwise reduction of the set of
alternatives without trading off their deficiencies along some evaluation criteria for their
strengths along other criteria. Another promising method for suitability analysis and
mapping is based on the Dempster-Schaefer's theory of evidence and fuzzy logic
(Boham-Carter, 1994).
The ultimate rum of GIS is to support spatial decision-making (Malczewski, 1999).
Today, available GI-Systems offer unique opportunities to tackle mOre efficiently and
effectively problems traditionally associated with data handling and analysis (Belton and
89

Gear, 1997). They playa vital role of spatial decision-making by sloring and managing a
large amount of spatial data and information.
The hypothesis formulated earlier in this study falls within the broad class of MAD\1
(multi-attribute decision making). Conventional multi-criteria technique largely assumes
90

2.3 LITERATURE SYNOPSIS
The global air pollution problem was explored and studied from a number of different
perspectives with emphasis on developing countries. The literature on this subject was
largely for the developed parts of the world . However. there is now a more refmed
understanding on the number of issues such as land use / land cover, population,
epidemiology etc., as compared to fifteen years ago . There has emerged a literature
consensus that the locus classicus ideas and solutions suitable for developed countries are
not viable in the indigenous environment for the developing countries. The areas, which
need further attention, are around understanding the diverse' perceptions on
environment', and utilization of modern tools in an integrated approach.
The basic literature searched was based on the nature, sources, and effects of criteria air
poI/II/allis. It is felt that the whole set of literature developed worldwide in this field was
so enormous in magnitude that the author had to go for precise abridgments. A major
concern experienced during this review was the dearth of indigenous literature.
The later part of this chapter dealt with the evolution of remote sensing and geographic
information systems. These notes have convinced the author of the tremendous potential,
which these technologies could put forth in the analyses of geographic inquiries, with
special reference to environmental simulation and management. In the upcoming sections
of this thesis, the conceptual framework is developed for monitoring spatial patterns of air
pollution in Karachi metropolis through the '3-S' technologies .
~I
---.---------

3. METHODOLOGICAL CONSTITUTION

Most of the urban areas in the world have high concentrations of air pollution sources
resulting from human activities; sources such as motor vehicle traffic, power generation,
residential heating and industry. Urban air pollution not only represents a threat to human
health and the urban environment, but it can also contribute to serious regional and global
atmospheric pollution problems. Air pollution is experienced in most urban areas and is
therefore a worldwide problem and an issue of global concern, it has been estimated that
globally about 500,000 people die prematurely each year as a consequence of exposure to
ambient pollution of suspended particulate matter. Increases in morbidity from respiratory
diseases due to air pollution are estimated to occur in about 40 million people; several
million infants die each year from acute respiratory infections exacerbated by air
pollutants (Murray and Lopez, 1996; Schwela, 1996; WHO 1997).
Pakistan covers 0.7 percent of the world's land area, but accounts for a little over 2
percent of the world's population (McDevitt, 1999). With a per capita annual income of
hardly US$ 450 (WB, 1998), a fast depleting natural resource base, inadequate social
service, and an arid or semi-arid climate where health issues remain a predominant
concern. The countIy is particularly vulnerable to the negative impacts of environmental
degradation. Inefficient use of existing resources, particularly energ\' resources, has added
to the country's susceptibility.
Air pollution is considered to be primarily, an urban problem in Pakistan. As the rate of
urbanization increases air pollution levels are expected to increase significantly. Karachi
is the biggest and the highly polluted city of Pakistan. Population growth rate according
to population census 1998 is more than 3.0 that depict the annual growth of population at
risk while pollution growth is also considerable. There has been no seriolls study of the
impacts of air pollution in Karachi (UNEP, 1999), although its most obvious expected
effects are those related to human health (Pipe, 1995; WHO, 2000) Air pollutants are a
major cause of respiratory and ocular diseases (Ware el aI., 1986; Schwartz, 1989;
Dockery el al., 1989; Pope and Dockery, 1992; Hoek el al., 1992; Donaldson el aI.,
2002), which are highly prevalent in almost all over the urban area . Although some
individuals and some organizations like SUPARCO, PCSIR and AKU have worked on
93
the problem of air pollution and its impacts on dwellers of Karachi Metropolis (e.g.
Manser el al., 1990; Yousufzai, 1991; Yousufzai el al., 1994; Ghauri el al., 1999;)
However, certain important aspects could not be addressed by them. For example, spatial
patterns within a city on micro scale, epidemiological indicators, socio-economical
aspects of residents, perception and awareness about pollution among the community elC.
This study strives to overcome these shortcomings and to present a cause-effect
relationship based on logical and factual spatial dimensions of burgeoning human induced
environmental hazard . These aims reveal that there is a need for carefully designed
research on spatial pattern of air pollution and impacts within Karachi metropolis, In
order to provide deep insight . The study is important for environmental protection of
urban areas of developing countries. Conceptually a systematic approach is required to
cope this manner that not only accompanies the discipline but also encompasses all
aspects of study Figure 3. 1.

Ii
I t ! j ~ l' J i i ~ (I
I! r ! 1 ~ ! « ; ~ ]
j Ii
j 1 B ] ~j ~ ~ j ~ 1 OJ
j ..
i g
j • j ~
~
M
!;! b1, on
a-iL:

3.1 REMOTE SENSING TECHNIQUES
Remote Sensing is the technology to acquire and measure the facts of some property of an
object by a recording device that is not in physical or intimate contact with that under
study phenomenon. These facts can be processed to make particular organized
information. Diversity in the applications of the remotely sensed information now ranges
from the detection of very tiny objects in geo-spheres (i. e. lithosphere, hydrosphere,
atmosphere and biosphere), to the precise quantification of huge surface and subsurface
resources through its direct, .indirect and multi·dimensional integrated observation
methods.
Remote sensing has become an organized tool to provide from raw to processed
information for various environmental applications. This technology greatly enhances
abilities to analyse landscape level relationship of environmental factors and impacts . As
a result, nowadays in many places scientist have been monitoring various environmental
impacts by focusing on their factors with the help of Remote Sensing and GIS tools
(Kazmi, 2001a)
3.1.1 Data Acquisition
The use of satellite imageries for mapping appears to be one of the most straightforward
applications of remote sensing. Multi-spectral images are being used for land cover
elassijicaliolls. Landsat spacecraft provide images of global coverage every 16 days for
down·to·earth projects such as land-cover inventories, natural resource mapping, water
quality assessment, and flood control.
In this study Landsat TM (1998), SPOT Pan (1992) and SPOT XS (1992) multispectral
data has been used to classity Karachi's Land cover and its distribution Table J. I. The
density of land utilization with respect to individual elI/sIers of the images has been
determined. The quality of the' images was found satisfactory however, reclijicalioll,
correeliolJs and euhaneemem was conducted as per protocols.

Table 3.1: Satellite Imageries: Sensors, Resolution and Acquisition
SPOT Pan 10 x 10 m March. 1992 SPOTXS 20 x 20 m March. 1992 Landsat TM :\0 x 30 III Febmar\'. 1998 KVR 2x2m 1998
Source: cQUnes) KaZllll . J.H .. UnI\Crsl~' afKarachl
For targeting the congestion locations due to heavy traffic and dense land use (resulting in
unbearable air pollution). use of high-resolution imagery i.e. KVR (2m resolution) of
Sovinform Sputnik. Russia has been employed. Unfortunately it was not containing the
whole of the metropolitan Karachi but had the coverage of about two larger districts . The
author utilized this high-resolution imagery and his life time exposure of the city in
deciding the list of more than 300 locations for the ground data collection.
3.1.2 Satellite Image Processing
The remotely sensed image is processed in various steps according with the needs and
objectives. Broadly speaking, the major steps in satellite images processing are image
Rectiftcation, Enhancement, Stitching/Sub-setting and Classification. These procedures
are applied through high-speed computers using pertinent software
3.1.2.1 Environmental Attenuation Corrections
Atmospheric error creeps into the data acquisition process and may degrade the quality.
This in turn may have an impact on the accuracy of subsequent human or machine
assisted image analysis (Meyer ef at.. 1993). Therefore, it is usually necessary to pre
process the remotely sensed data prior to actually analysing it (Teillet, 1986).
Rectification. a pre-processing step, involves application of some correction factors on
the remotely sensed imagery acquired from the source.
3.1.2 .1.1 Compensation for seasonal Differences
Angle of incidence imparts great influence on radiant flux from the surface objects. It
changes digital numbers (DNs) during variations especially in temporal studies involving

time spans of less than a year. It is important to compensate for the difference in sun
elevation angle throughout the year (Figure 3.2).
;;I- Sate ll ite
Zenith
Sun Position
~S:::::------ Summer
Spring/Fa ll
Wi nter
Tangen t Plane
Figure 3.2: Variations ill Solar Elevation Angle
The above-mentioned correction was accomplished uSlDg program available In
Geomatica 8.x Algorithm library:
This MODEL algorithm nonnalizes the sun's elevation angle to that of its zenith position.
This is achieved by dividing each image by the sine of the solar elevation angle for the
scene (PCI, 2002). Solar elevation angles were provided as ancillary data in the header of
the acquired imagery.
3.1.2.1.2 Haze Compensation
Particulate matter in the atmosphere is responsible for the scatter of electromagnet ic
energy. This scattered component (known as "haze") increases the overall radiance
thereby reducing tbe contrast in an image. A quick and simple method to compensate for
haze is to estimate the additive haze factor independently for each channel. These values
were obtained by observing the Grey level for scene features for which the reflectance
should be known.
9S

Having determined a quantitative measure for haze, compensation for this effect by
subtracting the haze factor value · from every pixel in the image has been adopted .
Subtraction of an image by a constant grey level of above-mentioned additive haze was
achieved using Image Database Arithmetic algorithm:
3.1 .2.2 Instnlmental Error Correction
Noise is the result of sensor malfunctions during the recording or transmission of
information. Noise in a digital image can manifest itself as either inaccurate grey level
readings or missing data altogether. Unlike geometric distortions and other radiometric
degradations, Noise is readily identiflable, even to those unfamiliar with the scene of the
image. Satellite Image Processing software offers correction algorithms for the most
commonly encountered types of Noise such as Line Drop, Regular Stripping elc.
3.1.2.2.1 Line Drop Noise Correction
To make proper image data sei Line Drop Replacement algorithm has been applied on
imperfect images, which were used in this study. This function fdled the several adjacent
pixels or entire missing lines or noticeably different to each other.
3,1.3 Image Geometric Correction
Raw digital images contain geometric distortions, which make them not viable as maps.
Map is a flat representation ofa part of the earth's spheroidal surface. To be useful, a map
should conform to an internationally accepted type of cartographic projection, so that any
measurements made on the map will be accurate with those made on the ground.
The steps to correct the satellite images as well as scanned maps geometrically, are shown
in the flow chart as follows Figure 3.3 :
99
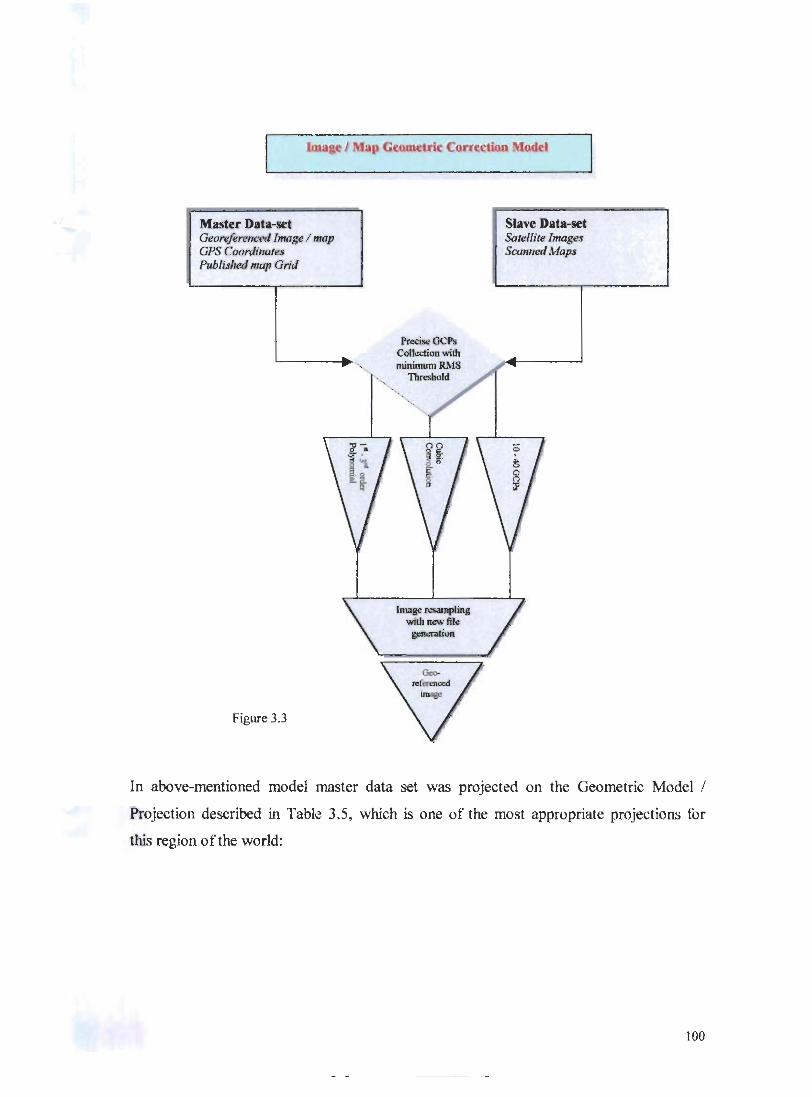
Ma.ter Data-sc:t Georefo~"ce(/ Jmag~ I map GPS C oominote. Pub/i .• lled RlUP Grid
Figure 3.3
~"'iwOCh Col1 .. -ctiOQ \\;lh nuntnmm R.\IS Thr~old
1n1Ol~ l'CWI1IpIiA. wiD JIC'N til.:
p.-ratiIM.
Slave Data-set Satellite Images Scanned }',fap3
In above-mentioned model master data set was projected on the Geometric Model !
Projection described in Table 3.5, which is one of the most appropriate projections tor
this region of the world:
100

3.1.4 Image Enhancement
Image Enhancement techniques are used to remotely sensed data to improve the
appearance of an image for human visual analysis or occasionally for subsequent machine
analysis. There is no such thing as the ideal or best image enhancement because the
results are ultimately evaluated by humans, who make subjective judgments as to whether
a given image enhancement is useful (Jensen, 1996). In this study, various enhancement
algorithms have been used to improve the quality of images through world-renowned
software: ERDAS Imagine version S.3 .1 and PCI Geomatica S.x.
The algorithms employed are: Contrast Enhancement (Linear, Root, Frequency,
Adaptive), Band Ratioing, Spatial Filtering (Low Pass filters including, Average (mean),
Median, Mode, Gamma) and High Pass Filters (Gaussian Filter, Laplacian, Sobel, Prewitt
Edge Detector and Edge Sharpening etc.) (PCI, 2002).
Procedure for saving the implemented enhancement is as follows:
3.1.4.1 Direct Application
for machine analysis, enhancement algorithm was permanently applied on the Image
bands and saved afterward in the same file.
3.1.4.2 Indirect Application
The enhanced values have been saved as Look Up Tables (LUT) files separately. These
LUTs were applied at the time of Visual Interpretation over loaded image bands in RGB
channels.
3.1.5 Study Area Development (Mosaicking/Subsetting)
Mosaicking is the blending together of several arbitrarily shaped images, to form one
large radiometrically balanced image such that the boundaries between the original
images are not easily seen. This allows creating a complete study area as a single image,
which could be consisted of several images before. At times, area under study is not
III 1

wider than the image. Instead of mosaicking of several images, sub selling of image is
done .
For the convenience of processing, it was necessary to study the metropolitan Karachi
only and image of adjoining areas was overlooked. This process of focusing the study
area and clipping the image of irrelevant locations is known as Subselling. Here the
Karachi metropolis in Landsat synoptic coverage is extracted from the image through
subselling. Landsat TM image covers 185 x 185 km (34225 Sq. km) synoptic view .
Karachi Division occupies 10.2 percent of the total TM scene. In this study, Area of
Interest (AOI) has been developed in form of georeferenced vector data. Subset has been
taken out from image on the basis of AOI. The total Karachi Division is covered in the
same image illustrated in Figure 3.4.
3.1.6 Land-cover Classification
Remotely sensed data of the earth surface may be analysed to extract useful thematic
information. This raw data are then transformed into information. Multispectral
classification is one of the most· practicing methods for the information extraction. This
information is the best source of available, updated and synoptic Land-cover extraction.
The scale of details and accuracy depend upon the image resolution, accuracy of
algorithms along with their limits and expertise of users.
The land cover classification procedures used are illustrated In the form of a Flow
diagram Figure 3.5:
For the achievement of maxImum land cover accuracy several supervised and
unsupervised classifIcation algorithms has been applied with different classification
schemes on exercise level. This exercise gave very profound observation on the study
area's land cover.
102

Figllrc 3.4
11
.~ . -
KARACHI Landsat 5 - TM
Subset
, W{¢}E
S 0 II ZI
Xilflwwtrr
{
"
(
103

Obtaining initial grollnd referenced Selection of Appropriate Remotely database a priori Sensed Application D<lla
I I
I Illlage Rectification
r I Tntilling Siles I
sUpcl'\'is.:d C'1:lssilil',llil/lt ,\I;uric]I"1 l ' lI':;u ,WI'" J.~~.I CI:I:<osilil';&(il1l1 ,\I!.I.U !'ithm j'(lf fT ltelr;ptpcd ISOl.klT.-l ,\111111'111 111 dl~rU/ln: ,:'; ·t!I~lIIl \
,\hIXlm,'tm I!l.:idlhood FIt=>
I
I A.: .. ·ur.u.:y [yahlitlilln
Figure 1,5 ,- --..
SourCfJ: After Jenscn. 1996 Digital ThcJn"uic
Map' ~
3.1.0.1 Land cover Classification Scheme
With the detailed spectral examination of images, the following scheme of land cover
classes has been designed, ·each of which has it s own significance for this study Tlt e
classes studied were basically live and flll1her classified depending upon the sparseness
and density of that particular land cover illustrated as under Figure 3.6 :
Iii.!

Land Coyer Classification Scheme
Urban
Densely BlIilt-up
:'vIedium Built-up
LolV Built-up
Mixed Landcoyer
Urban-Vegetatiol/
Vegetation
Dense
Sparse
Mangroves
Unused Land
-.J Open Plain -.J Sandstune Reflectiun -=.J Rock Shaduw
"'ate.·
/-Vater Bodies
F~lln.; 3.6
105

3.1.6.2 Supervised Classification Method
After going through in details of spectral distribution with individual bands and several
combinations, criteria land-covers have been explored. After detection of proper land
cover sites classification has been performed under the supervision of training areas.
3.1.6.2.1 Mining a/Training Sites
An analyst may select training sites within the image that are representative of the classes
of his/her interest. For each class 3 to 5 sample training sites has been marked.
Complexity and overlapping was avoided and the sites were kept straightforward . Class
homogeneity has been given the highest priority in the overall mining of training sites.
3.1.6.2.2 Classification Algorithm
Various available supervised classification algorithms have been tested. Eventually,
Minimum distance classifier (MDC) was used with explicit training areas over the
images. This classifier assigns each unknown pixel to the closest category mean Figure
3.7. This algorithm is computationally simple and commonly used . When used properly it
can result in classification accuracy comparable to other more computationally intensive
techniques. The author was satisfied with the analysis results of this exercise.
** *~* *1' ... ... , ... ...
i .*'1 • ! ... ,),
. . . . ,. ~ ••• • ,,,,,.,A , " t';~'. '~e ...• ~.
. e' • • •• Channel A
Figur\! 3.7, ConceptWlI diagram of MDC algorilrun: A simpk MDC shows tho Class of Pixel, -A" which is on lh~ ba:;is of iB distanCt! from the! nt!ighbourlng. c1a~s: .
1U6

3.1,63 Classification Result Editing and Aggregation
In lilly interactive (supervised or unsupervised) classification result, it is very rare that
classification results are lOO% accurate. One of the post-classification processes, "elms
Ediling and Aggregalion" is one of the essential steps to enhance the accuracy. When
classification results are analysed, it might be realized that the classifier had difliculty
distinguishing two classes. These classes may be relatively similar land-covers, In this
regard merging of two same land-cover classes completely or under the selected mask
covered area is II common one, Similarly, during the class editing results can be stored in
II new class as welL In this study these facilities of today's powerful available toolboxes,
has been used almost after all classification schemes,
3.1,6.4 Accuracy Assessment
The purpose of the accuracy assessment is to create a report, which indicates the accuracy
of classification results compared to the raw image data. It compares what is assumed to
correct with an image classification based on pixel groupings, The results of the
accuracy assessment are shown in the form of Error (confusion) matrix and as an
accuracy statistic. The Error (Confusion) Matrix is II method for displaying the results of
the accuracy assessment process. Reference data are listed in the columns of the matrix
represents the number of correctly classified samples,
3.2 GROUND REALITIES
In all empirical studies, most important considerations are that whether the data collected
is on suftlcient spatial scale or not Another consideration is regarding the coltection
procedure and the presentation of data< Lastly the credibility of the source is
important.
The urban variables that play an important role with respect to pollution were
identified and the scope of work was extended beyond the approved title of the project It
is often very difficult that all types of information would be provided by the remote
sensing techniques. Remote sensing is one of the premium technologies to acquire
107

information but within its limitations. For air pollution shaping, there are many dynamic
urban variables, information on which had to be acquired, in situ via non-image sources.
The types of information collected and analysed for this study could be broadly outlined
as under :
• Air Pollution Information
• Traffic Flow Information
• Land use Information
• Demographic Information
• Epidemiological Information
• Perception Information
3.2.1 Traffic Flow Information
Being a non-funded research work, it was initially decided that the source of traffic data
would be secondary i.e. the Traffic Engineering Bureau (TEB) of Karachi Development
Authority (KDA), which was the department responsible to design, plan and implement
traffic improvements in the Karachi metropolis.
It was found that the data collection efforts by the TEB were carried out way back in
1982 and 1994.These counts were available as hard copies. These counts were
categorized as technical papers having discrete numbers and are termed as Classified
Turning Movements of a particular intersection or a mid block location on a major
roadway. These surveys by the TEB were conducted normally for sixteen hours . Table
3.2, presents the flgures of daily traffic (I6-hours) for the locations surveyed by TEB,
KDA. These were obviously, high volume locations in 1982 and 1994. Updated figures
were direly required for this study but unfortunately were not available from the
concerned bureau, TEB.
IUS

Table 3.2: Daily Traffic of Sixteen 'Hours at Major Intersections of Karachi
S. NO: '~., '. ". . ",' . in~netticiru
Gurumandir 2 Nazimabad Chowranei No. 2 3 Old Exhibition 4 Gora Oabrislan 5 Civic Centre SQuare 6 Liaauatabad No. JO 7 Nazimabad Chowrari2i No, I 8 Shaheed-E-MillatJUniversilV Rd 9 A. Haraon Rd.lMcre Weather Rd. 10 Musical Fountain II Mansfield Street / M,A. Jinnah Rd 12 NewTown 13 Board Officc 14 Club Road / Abdullah Haroon Rd 15 Dakhana (Liaauatabadl 16 Dr. Dawood Pola Rd / MA Jinnah Rd 17 Karimabad 18 Aisha Manzil 19 Nishter Rdl Love Lane Rd 20 Tin Halti 21 Nazimabad No. 7 22 Shaheen Complex, 23 Sharea Faisal / Rashid Minhas Rd 24 Abdullah Haraon Rd / Hoshin2 Rd 25 Britto Rd / Nishter Rd 26 Kda Chowrari2i / North Karachi 27 Water Purno (North Nazimabadl 28 Lea Market 29 Mere Weather Tower 30 Pidc House 31 Fatima Jinnah Rd / Sharea Faisal
'." ... .. Daily Trame '. '(16 bours)
H1317 318438 302318 270133 2560411 252624 243765 220831 216498 210741 205510 197007 191522 191184 189804 189083 181593 174093 163685 162082 156132 145340 144144 143598 142677 131583 130015 125185 118653 111 689 105384
Source: Traffic Engmccnng Bureau, Karachi Development Aulhonty (KDA), 1991
At this juncture, it was realized that efforts should be made to collect current statistics.
The reason of this decision was the obsoleteness of sufficient traffic data available at the
traffic-engineering bureau. Hence, hourly traffiC volumes at selected 90 locations of
Karachi were manually recorded, Annexure H presents the traffic volumes for 90
locations of old city (core). This special case study is being presented separately as
predictive modelling.
The said case study was limited to 90 locations, whereas, the sample size for current
carbon monoxide concentration level in metropolitan Karachi was greater than 300 . For a
meaningful appraisal of air pollution vis-a-vis traffic volume, the researcher had no other
J09

option than to rely on his exposure during the survey for categorizing the locations
qualitatively at different times of the day.
Table 3.3 from the secondary (TEB) and Annexure C & H from the pnmary data
collection exercise helped in conceptualising the traffic volumes and formulation of a
denomination criterion. The criteria formulated for the traffic volumes at study spots is as
under:
Table 3.3: Categorization of Observed Average Hourly Traffic at Monitoring Stations
..
brieliolY "):'." ".< .' "'. " :e,tt*ilrj>" " " " 1;/,; Aver~:,e~~q~~:~ !r~fic "
<>f ,.':: "+:~' Not.Hill!' ,; :,..~. ~ " , .' ", ,' ) f "" . ... '7' : ," } AHT·: : ... . VeryLow VL Less than 200 Low L 200 - 400 Moderate M 400 - 2,000 High H 2000 - 10,000 Verv High YH 10,0011 and above • All modes and Ihelr turfllng movements. al Ihe locallon, summed up
I
Annexure C tabulates the six temporal variations of traffic at 308 locations all across
Karachi. Based on the above stated traffic criterion, qualitative thematic maps illustrate
the state of traffic affairs for the metropolis, Karachi.
3.2.2 Land use Information
Urban land use studies are designed to provide basic data on land characteristics and the
various activities that occupy land in the urban area. These data are used in analysing the
current patterns of urban land use to ascertain the character and quality of environment.
Land use surveys furnish information on the use, misuse and non-use of urban land. In
planning and zoning studies, it i.s essential to know the amounl of land use for different
purposes.
The available records from the Master Plan and Environmental control department of
Karachi Development Authority were studied and considered as the only basis of land use
information regarding the metropolis. These documents include:
l. Land use analysis (MP- RP/37) March 1972, KDA
110

2, The Karachi Development Plan 1974
I. Land use Map 1972
II, Land use Map 1985
3, The Karachi Development Plan 2000
I. Land use Map 1987
II. Land use Map 2000
The land use map 2000 was scanned from the published document into a digital form and
later geo-referenced, This ' maps was then digitised (vectorised) and finally these
vectorised maps were converted into grid form for further analysis , It was found that the
land use zoning maps developed by the Karachi Development Authority (KDA) were
more towards aggregation and understanding on a macro scale , A geographic inquiry
searching the micro patterns and the changes thereof, within the metropolitan city, needs
an intensive and extensive information gathering effort requiring human and financial
resources,
Due to the unavailability of land use data on micro-geographic scale in Karachi, the study
region was chosen as old Karachi (core) (Figure 3,8), thus Primary data generated on land
use for zonal appraisals and predictive modelling has a unique distribution of various
combinations of land use mixes. spread over the entire area In old Karachi (core) it has
been very difficult to find areas, which have a single land use category because
businesses are usually found linked with residential areas, Being unplanned
neighbourhoods, complex situations exist, which presents the old city area as a case to
investigate, To proceed further into the study, a comprehensive data set was needed,
Annexure H shows the list of selected locations for the collection of land use and air
pollution data , A sample size of 90 locations was considered to be large enough for
statistical analysis, Attempts were made to maintain uniform data acquisition procedures ,
It was initially decided to acquire the details of land use for each location within a vicinity
of 100-meter diameter. Physical measurements and distribution of floor space were
carried out. Site-specific maps (condition diagrams) were drawn for each location, They
contained land use information for the vicinity (all sides) of the location,
III

OLD CITY AREA OF
KARACHI
o i .
N
1
Kilometer
Sample Localionl
Figutc 3.8
112

A radius of 50 meter was superimposed on that vectorised maps. Site-wise, computation
of areas was done through Arc View and MS Excel.
3.2.3 Air Pollution Concentration
Karachi is the biggest metropolis in Pakistan and one of the worst effected cities of the
world due to unchecked air pollution. A few organizations have been 'working on this
issue but spatial dimensions within metropolis have been largely ignored mainly due to
less comprehension and underestimation of spatial techniques as well as the difficulty in
collecting. processing. and analysing the data at micro geographic scales. Some studies
have evaluated Karachi with a little geographical sample size; however. their studies are
milestones in the field of investigation of hazardous air pollution. Significant among these
is a study conducted by SUPARCO (Ghauri el al.. 1999). This study is discussed here. as
it was recent and monitored criteria pollutants. Moreover. the author on the data
furnished. which is discussed elsewhere in the thesis. does some analyses .
3.2.3.1 S02, NO" 0 3, and Particulate Matters
The publication "assessmeni of air quality in the metropolitan Karachi" (Ghauri el al.
1999) was collaborative project of SUP ARCO and KESC. The collaborative program
included air pollution monitoring on round the clock basis using the KESC Mobile
Laboratory. The air quality measurements were taken at eleven different sites of the city
(Table 3.4).
Total suspended particulate were collected through the high volume air sampler. The
appraisal of the most harmful inhalable particulate was conducted through PM IO sampler.
It separates particles smaller than 10 microns (aerodynamic diameter) from the larger
particles (Ghauri el al., 1999). Nitrogen Oxides (NOx), Sulphur dioxide (S02) and Ozone
(03) were conducted through their specifically designed analysers.
113
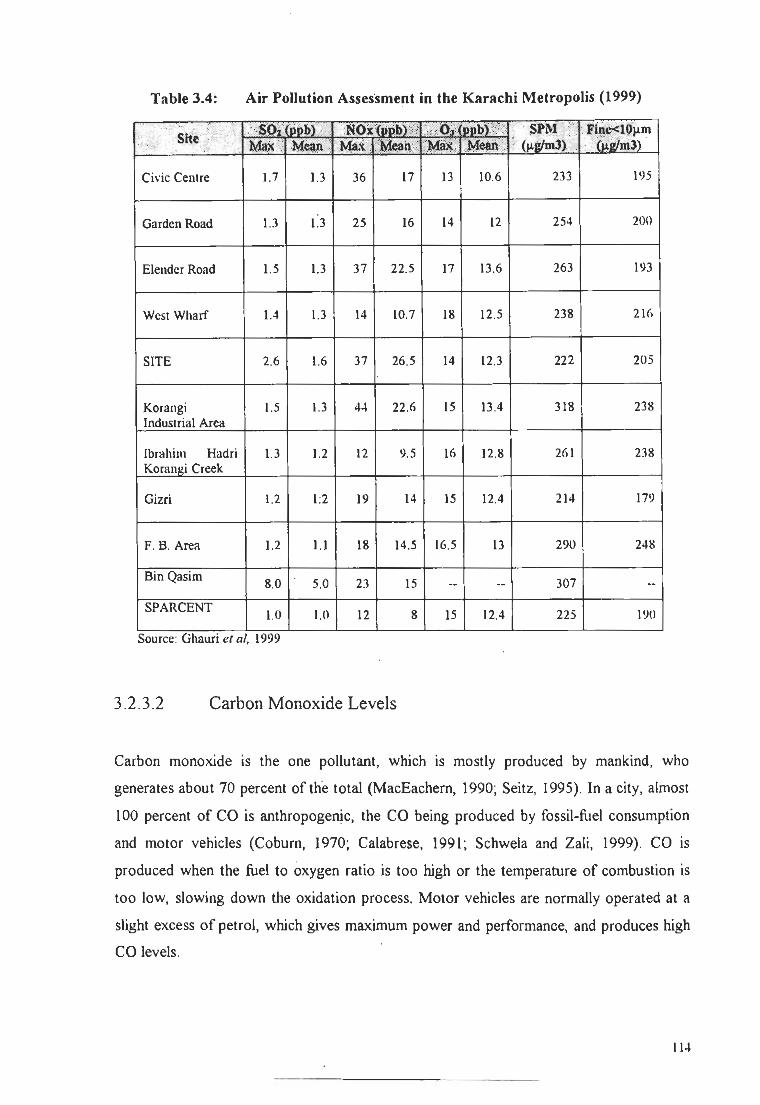
Table 3.4: Air Pollution Assessment in the Karachi Metropolis (1999)
~~(DDb\ . . ~PM. " • t~.~liivm Site · •. ~ .Ma.i ' ;MiiX: """""n.· '00 .>010..:', .
Civic Centre L7 U 36 17 13 10.6 233 195
Garden Road 1.3 L3 25 16 14 12 254 201l
Elendcr Road L5 U 37 22.5 17 13.6 263 193
West Wharf 1.4 U 14 10.7 IS 12.5 23S 21(,
SITE 2.6 1.6 37 26.5 14 12.3 222 205
Korangi 1.5 U 44 22 .6 15 13.4 31S 238 Industrial Area
lbrahim Hadri L3 L2 12 9.5 16 12.S 261 238 v_ .. : Creek
Gizri L2 1:2 19 14 15 12.4 214 179
F. B. Area L2 1.1 IS 14.5 16.5 13 290 248
Bin Qasim S.O 5.0 23 15 -- -- 307 --
~ H 1.0 1.0 12 S 15 12.4 225 1911
Source:Gi\llilri el ai, 1999
3.2.3.2 Carbon Monoxide Levels
Carbon monoxide is the one pollutant. which is mostly produced by mankind. who
generates about 70 percent of the total (MacEachern. 1990; Seitz. 1995). In a city. almost
100 percent of CO is anthropogenic. the CO being produced by fossil-fuel consumption
and motor vehicles (Coburn. 1970; Calabrese. 1991; Schwela and Zali. 1999). CO is
produced when the fuel to oxygen ratio is too high or the temperature of combustion is
too low. slowing down the oxidation process. Motor vehicles are normally operated at a
slight excess of petrol. which gives maximum power and performance. and produces high
CO levels .
114

S t t
." ~' ? v,
'" • :;:: " " >. 2 .
I ;; :I,
" "" '" ~I c
"
-t2 \\.
" "
"
, • ,
/ . ~ '. • '. 'K:i\' I ,;:-.r
.j • '~" '. . ; • " , , .;\&. .. '. .. ~ ' .., " , •• ' eo. .'. • . ~ .. -.-.-., , "
'. ?\ ' .. \.... "-'-' , .., • ' : I '\ • ./ ,', " • • . • ... \ f iI:~ , • • ""' .
l .••.• ' , '. \ . ............... ' '" , " ',
.. ' .,.". ~ • r "', • "" . • __ . _ ~ , .. ',.' \ ...... " . ,'-' - . • l . ' i ' .... \ .'", . '"
' ;. • \ • ," • ; " i'· •••• ( " "" • k ... ' : \ ', . " ' " '. " . ~ " \ .' "\ ' . \.
/ " ', ". ,\ ,." . '\.
/,/,/: \ '\ " "\ " '" \ \ • I' • -"
" . \ . l \
•
"
\ • • \ \ • , , /' • • • ' . ../ i (
\ "
• I ,. . ;l
• •
• • ' I
• a,_
! •
\ ,/
/\'~ ! \. I
,,' '"" . / )
I . I •

However, CO concentrations are highly variable in cities, with maximum occurring at the
peak traffic times. When measurements are made immediately down wind of a road, it is
possible to obseIVe plume from individual vehicles. Effects of Carbon monoxide vary
from discomfort to death within a short period. Whereas intensity of effects deviate
according to the dose level (i.e. CO concentration and exposure time). CO is a definite
pOison for the people travelling in open-air vehicles or pedestrians walking along the
road .
The author used his scarce resources to monitor this pollutant (which is harmful human
induced and prominent in urban environment) on micro geographic scale. The monitoring
criterion selected was based on the quest of spatial and vertical diffusion patterns of CO
concentration.
I. Average values of ten minutes at 1 - 2 meter from the source about 3 - 3Y, feet
above the surface
2. Average values of ten minutes at 2 - 3 meter from the source about 4Y, - 5 feet
above the surface
Most of the population travelling through Cars, Rickshaws, and Motorbikes are at the
highest dosage level in Karachi metropolis. The pedestrian especially young children
owing to their lower height are at much vulnerable risk . Nevertheless, average CO
concentration from the source about 4Y, - 5 feet above the surface depicts the CO levels
in ambient air, harming the neighbouring population Annexure B.
3.2.3 .2.1 Monitoring Sites
Settlements of Karachi metropolis occupy more than 500 sq. km area . (Mehdi el 01. ,
200 I) Coverage of Karachi on micro scale was a difficult task especially owing to
number of financial and human resource constraints. Nevertheless sample-size of more
than 300 sites was targeted and successfully covered, Figure 3.9, Annexure A . Sampling
was conducted on logical and practical criteria :
116

• Carbon monoxide (CO) potential
• Spatial coverage
• Target neighbouring parameter such as near source, not in open grounds etc.
3.2.4 Demographic Information
The source for obtaining the demographic data of Karachi metropolis is the Bureau of
Census, Statistics Division, Government of Pakistan. Fortunately the data on population
and its attributes have. been managed comprehensively in the form of District Census
Reports (DCRs) for the five districts (Central, East, South, West and Malir) of Karachi
along with the maps that shows the boundaries of circles and charges. These circles and
charges are the subdivisions in various localities. Charge being the larger entity while
circle smaller. The Census maps are to be read in conjunction with the District Census
Reports (DCRs) to extract the information on micro geographic scale. These reports
portray detailed account on the circles and charges regarding the age and gender
distribution of their respective populations.
Since various inquiries of this study are done taking each of the' Analysis Zones' defined
by the KDA, as an entity. Hence, it was mandatory to reconstruct the population
contained by 'Charges' and 'Circles' into the respective zones. It was a painstaking and
laborious task .
The transformed information was converted into a digital database compatible for
geographic information system. GIS data sets are finally developed for the whole of the
metropolitan city incorporating the demographic information as fields and their records .
3.2.5 Epidemiological Information
Although relating disease causes with environment is dated back to Greek period, but it
took a proper shape in the last century when disciplines like Medical Geography, Disease
Ecology and Epidemiology developed. Epidemiology is concerned with the distribution
and determinants of health and disease, morbidity, injury, disability and mortality in
populations.
117

Epidemiological analyses determine why certain diseases concentrate among particular
population group (Learmonth, 1972). The discipline of Environmental Epidemiology
focuses on the environmental health, monitoring the levels of diseases (in the dwellers)
and looks for causal relationships between exposure and a subsequent disease
(McGlashan, 1972; Barker, 1987; Bentham, 1994). In the environmental framework,
epidemiological studies with geographical dimensions are at large used to assess the
impacts on human health .
In terms of prevalence and incidence of diseases, there is an extensive variation in
developed and developing countries. Pakistan being a developing nation is no exception
as incessant environmental degradation especially in urban areas, inadequate health-care
services and its inaccessibility are making it an ideal breeding ground for environmental
diseases. Unfortunately, there is a very little information available on such environmental
diseases. As a result, the prevalence and frequency of "air pollution based diseases" and
their variations on landscape in Karachi, is an area yet to be discovered . To study these
phenomena, two sources were identified as primary and secondary.
The secondary source was the records of the major public sector's hospitals, while the
quest to explore from primary sources resulted in the formulation of a questionnaire for
the citizens and the physicians practicing in the different neighbourhoods of Karachi .
Annexure E (E. I & E.2), which provides the recent disease data, acquired from two major
hospitals of Karachi. The absence of recording and compiling the patient's detailed
address has created several deficiencies in the indigenous data provided by the hospitals.
Elsewhere in world , both in developing and developing countries, linking of postal I zip
codes (Banta el al., 200 I; Stone, 2001) with disease occurrence has provided the basis for
spatial analysis .
To generate primary disease data a rigorous literature search was conducted to identify
diseases, whose relationship vis-a-vis air pollution has been established (Waldbott,
1978; Wellburn, 1994; Peters el aI. , 1997, 1999; Rogers el aI., 2000; Schindler el al.,
2001; Chhabra el al., 2001, Ibald-Mulli el al., 2001; Goldberg el al., 2001a, 2001b,
Ravindra el al., 2001). To make this search more meaningful, a critique by physicians
was obtained . The instrument employed was a questionnaire. QualifIed Physicians were
decisively asked some questions such as: .
118

• What do you think about air pollution as a contributing factor among the listed
diseases?
• Mark the diseases frequent'in your practicing area from the given list.
Basing on the physicians experience at various localities of Karachi. diseases having
significant relationship with air pollution were ranked. The names of diseases are highly
technical and could not be asked to a common man. It was necessary to rephrase the
diseases with their symptoms to make the list understandable. Thus a list of air-borne
diseases was incorporated in the questiomiaires Annexure F (F.Q I & F. Q2) presented to:
a. Dwellers of air pollution risk zones (core city area)
b. General Public across the. metropolis
The questionnaires provided the data on the occurrence of each of these symptoms /
diseases on a micro geographic scale i.e. for various areas in Karachi. Later, the data on
the frequency of air pollution based diseases in various regions of Karachi was integrated
with the GIS database to discover the prevalence in each zone.
3.3 GEOGRAPHIC INFORMATION SYSTEMS
Geographic Information Systems (GIS) is automated set of functions that provides
professionals with advanced capabilities for the storage, retrieval, manipulation and
display of geographically located multidimensional data . It is a decision support system
involving the integration of spatially referenced data in a problem-solving environment.
GIS technology provides an excellent platform upon which different types of spatially
referenced data can be united for analysis and display purposes.
119

Geographic Information Systems was the main investigative tool for this 'iudy. Remote
Sensing and In situ (Ground Realities Collection) techniques to provide and process the
inputs for GIS. Here GIS has been implemented according to elemental requirements. A
general conceived GIS model for this study is shown below:
11 ...... 1)' s..-4 ... _ Carh)gJ:aphic Ptodud I.I!. o..wcf~ SubocII M ... ickod and da:~ilicd digital-r pril1ll:d iRJOl~$ , .. 'c.
I
Elements or GIS
\ ,
l 07 '
~ \
¥un~tion.. or GJ
bI.hu ..... On'nlidon
Such IS co concenlntioR. ()"'1I"Vaph)', Land Uk, Tr.lffic. cliscur:Ilnfonnatiod etc.
I
Data Storage I Data Retrie-ing I
_________ D_a_ta_Eru __ ·_ting I Data Manipulating .J
_____ D_a_ta Analysing J Infonnation Publishing I
Figure 3.10: G!S Organizationa! Diagram
120

3.3.1 Cartographic Techniques
Cartography is the making and study of maps in all their aspects (Robinson, 1990). Just as
spoken and written languages allow us to express ourselves without having to point to
everything, a map extends out ·normal range of vision. A map lets us see the broader
spatial relations that exist over large areas or the details of microscopic particles. It is
carefully designed instrument for recording, calculating, displaying, analysing, and
understanding the interrelation of things. Nevertheless, its most fundamental function is
to bring things into view.
The increased flexibility and capabilities bf the new technology has enabled from manual
cartography to Computer Assisted Cartography (CAC). Now the jargon of the electronic
age has become part of the cartographer's language. Numerous techniques, which were
only dream in past without digital cartography now has become practical and advances
are coming more instantly. Cartography is one of the fundamental elements of
Geographic Information System that provide spatial canvas on which ancillary
infornlation are analysed. For the purpose of study following maps were developed by
using digital cartographic techniques.
3.3.1.1 Base Map Development
Remote Sensing quickly replaced laborious and inexact data collection by plane table
surveying and field sketching (Robinson, 1990). PlanimetricaJly corrected ortho-rectified
digital images of high spatial resolution are being used all over the world for cartographic
map preparation. Applying image-processing techniques has developed base map, which
has been described earlier Figure·3.1!.
Base map for every GIS based research is essential because it is the only thing that directs
the data to the clear spatial dimension. Survey of Pakistan is the sole authority of mapping
and surveying in Pakistan but beside that different other governmental organizations
(KDA, municipal corporations) also develop their own maps.
121

DETAILED BASE MAP
of KARACHI METROPOLIS
'i .... .. . .
..... - . .... ~ ' .. ~ ... . ;-~ . , -~
. ~~, .... ....,.r--. +
• • ---
600
,.. ., ....
[B]
• --.
+ 0 600 1200
Meters
5bopplaIC e rnl.n
Pllbllc P"k..,
Mo~"",
1101."
IIppilllh
I'boY,rG .... t1 ...
G"'\~ .. rd ..
'Ii"lin), Ro.6.\
M-Jor A03d.\
Sno..t • .,· M03t1 ...
~Ir«'"
figure 3. 11
122

l Published maps OJ I Satellite Image J I
I Enhancement 1
I Geo·Referencing I Orthorectificahon ~
I I Digilizalion !
Base Map (
J, 12: Base Map Development Procedure Diagram
Source: After Kazmi, 1999
To develop any GIS model it is essential to make a suitable base map in vector format so
that there can be attached attribute data to the geographical entities such as Polygon
(Regional Feature). Polyline (Linear feature) or Point (Exact object location),
Taking
elsewhere
Karachi metropolis guide map (on appropriate scale) and discussed
the enclosed map for Karachi has been produced, This map is
cOllsiliting of the major infrastructure of the city urban area such as main roads, lU~'UI\I""'.
railway-line, administrative divisional boundaries and Sample points, The base
map has the Metadata (Table 3.5):
123

Table 3.5: Metadata of Base Map
,- ' '; "'. . ~ -,' . . '
Name ' -~:jI{ •• , · f.;a~d. ·~s~ Category . Topology -.. Districts Administrative Polygon Hotels Commercial Point Shopping Centres -do- Point Hospitals Health Point Industrial Estates Industrial Polygon Grounds Recreational Point Parks -do- Point Mosques Religious Point Bridges Transportation Line Major Roads -do- Line Primary Roads -do- Line Roundabouts -do- Polygon Secondary Roads -do- Line Streets -do- Line Features Miscellaneous Point Grdveyard -do- Point
Projection Zone Unit Ellipsoid
Universal Transverse Mercator (UTM) 42 Meter Everest (Pakistan)
3.3.1.2 Mapping of Monitoring Stations
During the Carbon Monoxide (CO) sample collection throughout Karachi metropolis for
more than 300 locations, latitudeJJongitude coordinates has been taken for each sampling
site. Magellan GPS tracker, USA has been used which is hand held and very easy to use
in the field during sampling, That tracker provided x, y coordinates on preset Projection
system Table 3.5. That tracker has ilO-meter planimetric accuracy. After that the
collected x, y coordinates were plotted in GIS software through add event theme in
ArcView GIS environment.
Owing to the maxImum available accuracy error points may deviate from its original
locations on map, But all these more than 300 samples were located near by or exactly on
the same location within the same described error. To overcome that problem interactive
geocoding has been used to locate those sample point exact and accurately on the map.
With the help of same geocoding method previously surveyed sample points were
mapped as accurate as possible within available information.
124
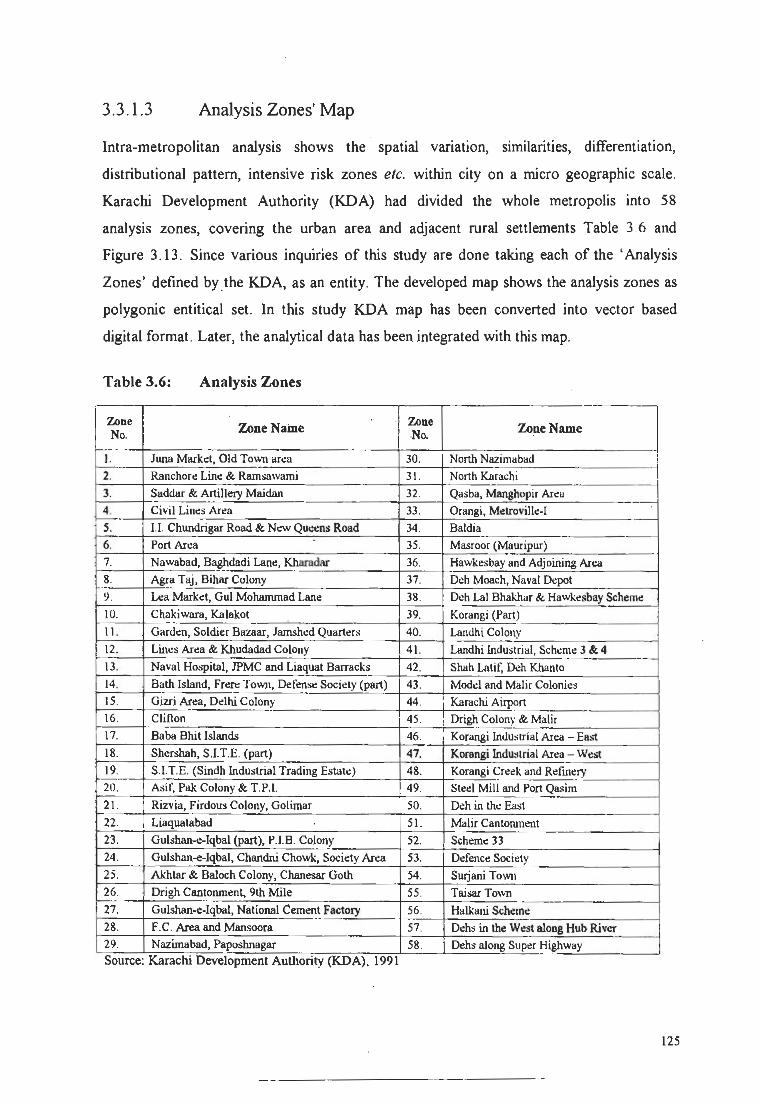
3.3 .1.3 Analysis Zones' Map
Intra-metropolitan analysis shows the spatial variation, similarities, differentiation,
distributional pattern, intensive risk zones etc. within city on a micro geographic scale.
Karachi Development Authority (KDA) had divided the whole metropolis into 58
analysis zones, covering the urban area and adjacent rural settlements Table 3.6 and
Figure 3. \3 . Since various inquiries of this study are done taking each of the • Analysis
Zones' defined by.the KDA, as an entity. The developed map shows the analysis zones as
polygonic entitical set. In this study KDA map has been converted into vector based
digital format. Later, the analytical data has been integrated with this map.
Table 3.6: Analysis Zones
Zone Zooe Naine . ' Zone
ZooeNamc No. ·No.
I. JlUU1 Milfkc:t. Old Town ar~a 30. North Nnimabad 2. Ranchon: Lin~ &. Ramsawami 31. North Karal:hi
3. S.dd.r & Artillery Maidan 32 . Qasba. Manghopir An:u
4. Civil Lines Area 33. Orangi. Metroyille·1 .-S. I.L Chundrigar Road & New Queens Road 34 . Baldi.
6. Port Area 35. Masroor (Mauripur) 7. Nawabad, Baghdadi Lane, Khanular 36. Hawk«bay and Adjoining Ar""
8. AS'a Taj , Bihar Colony 37. Doh Mooch, Nay.1 Depot
9. U:a Market, Gul Mohammad Lane 38. Doh Lal Bhakhar & Hawke.bay $oheme
ID. Chakiwara, Kalakot 39. Korangi (Part)
II. Garden, Soldier Bazaar, lamshcd Quartc:rs 40. Landhi Colony
12. Lilies Area & Khudadad Colony 41. Landhi Indu,t rial , Schome J &. 4
13. NaYal Hospital, JPMC and Liaquat Barracks 42. Shah Latil: Doh Khanto
14 . Bath Island, Fro« Town, Defens< Society (part) 43. Mood and Malic Colonies 15. Gmi Area, Ddhi Colony 44 . ; Kamchi AiIjXlrt
16. Clifton 45. : Drigh Colony & Malir
17. Baba Bhit Islands 46. Korangi Induslrial Area - East 18. Shcr.shah, S.I.T.E . (part) 47. Korangi Industrial Area - Wc:S( 19. S .I.T.E. (Sindh Industrial Trading Estate) 48. Korangi Creek and Rcfml!f'j 20. Asil: Pak Colony & T.P.1. 49. Steel Mill and Port Qa<im
2 1. Rizvia, Firdous Colony. Golimar 50. Doh in the East
22 Liaquatabad 51. Malir Cantorunt!tlt 23. Gulshan...,·lqbal (part), P.I.B. Colony 52. $oheme JJ
24 . Gulshan-e-Iqbal, Chandni Chow!:, Society Area 53. lkfenC4! Socil!ty 2;. Akhtar & Baloch Colony, Chane<ar Goth 54. Swjani Town
26. Drigh Canlonment, 9th Mile 55. T aisar T o\\-n 27. Gulshan.e.lqbal, National Cement Factory 56. Hall.:ani StheIne! 28. F. C. Area and Mansoora 57. Dehs in the West a100g Hub River
29. NszUn.bad,Paposhnagar 58 . Deh. along Supor Highway
Source. Karachi Development Authonty (KDA), 199 I
125

rv 0\
KARACHI METROPOLIS Analysis Zones
55
56
57 37
38
42
+ 41
7 ~ 1 I~
Kilomc,"h:t
Source: Karachi Development Authority (KDA). 1991 Figure 3.13
.IS
49.

3.3.1.4 Cartographic Layouts Development
Without applying advance digital cartographic techniques it may not be possible to
comprehend the digital thematic results . Presentation and interpretation of maps are
impractical without the following ingredients :
Projection, Symbols, Scale,Colour Scheme, Legend, Title, North Arrow, Grid, Border,
Neat Line e/c.
After facilitating these requirements maps are aesthetically and logically legible for users.
To fmalize layouts almost all GIS, Remote Sensing and Cartographic software have their
toolboxes and editors. But advance graphics packages such as Adobe® lIIlIs/ra/o,.,
Adobe;g· Ph%Shop, macromedia:g1 FREEHAND, Map Pllblisher, PCI -Advallce
Car/ographic Ellvirollmell/ e/c. have very special tools such as graphic filters, effects e/c.
During the study some of the tools have been used to produce better results.
3.3.2 Database Integration
GIS data comes from many sources, such as maps, remote-sensing imagery, and Ground
information collections. These diverse se.ts of data are not always easily integrated The
central data integrator for GIS is the database that accepts and merges diverse data sets
and different types of data, giving the user flexible and powerful sets of data for analyses .
Another major strength of GIS is the interactive link between the database and the map.
Using parameters has been set out in form of tables normally separately but some time
within map-linked tables. The following Table 3.7 is showing the inputs of data tables
and relational map objects.
127

Table 3.7: Input Data Tables Integrated with Map Objects
bi~, l~r~iiii~tlQ~Qiatat~l~i ", .. , :';i,j,;. ". li\lg"i:leci widl " , , "
) y, " ' •.• " iMiu',Obil :si ' . ~ > " '.', 1. ' . .' $~·~;~ . , .. < •••. ,., •• ;.1- ' -; ." '. a , edJ . ""' . " Air oollutant Data Monitored sites' Doint Air pollutant Data AnalYsis Zones Traffic Data Monitored sites' paint Demowiohic Data AnalYsis Zones Disease Data AnalVsis Zones Imaee classified Land cover AnalVsis Zones KDA Land use Data Analysis Zones
3.3.3 Analyses
The analytical processes of this research composed of three kinds of works, which were
carried out simultaneously, The first was related to the creation of themes of data and its
integration, generation of surfaces and interpretations, Secondly statistical analysis for
forecasting of air pollution was carried out. Thirdly all of these outcomes had to be
qualitatively examined based on the knowledge of the metropolitan Karachi.
3 ,3,3 , I Change Detection: Growth of Settlements
Advantage of image-based analysis could be extended to monitor the urban growth of the
metropolis over a period of time, This co'uld be done using two or more classified images
of different dates of the study area to demarcate the new settlements, This is particularly
useful for highlighting changes that have occurred over time such as in urban analysis,
Change detection technique has been applied to see the changes in human settlement
patterns across the metropolitan from 1986 to 1998.
SPOT -xs October 1986 and March 1998 had been processed and classified by Afsar
(2001) , The digital versions . of both the classified images were acquired and then change
detection was conducted in SPANS, The change detection procedure overlays two grids
and determines the areas of change from the first grid to the second grid , An overlay of
two identical Land-cover classes indicates an area of no change and it is therefore
assigned a class value of zero (0),
128

On the other hand, where there are changes, a new grid is created using the new classes.
The cell size of the new grid is same as the lower of the maximum cell size of two input
grids . The results of the overlay are organized into a table as well as map result (Stevens,
1999). The results would be pres·ented in the later chapters.
3.3.3.2 Air Pollution Spatial Variation
According to an estimate more than eighty- percent organizational and non-organizational
datasets have some sort of geographical matters (MIC, 1999). Ajr pollution is amongst
them containing rigorous relationship with geo-spheres. Spatial analyses of this kind of
variables do not only show the distribution, pattern and variation but also assert to find
out the reasons of these variations. Every phenomenon that have relation with earth, are
spatially organized and be full of interaction with other spatially distributed objects I
factors, Some times the study , of those factors provide clues about the main studied
objective owing to their spatial associations,
3,3,3,2,1 Development of Continuous Spatial Pal/ems
In GIS analysis, 'Interpolation' is the procedure of predicting the value of attributes at
unsampled sites from measurements made at point locations within the same area or
region (Journel and Huijbregts, 1978; Clark, 1979; Mousset-Jones, 1980; Brooker, 1991;
Geron e/ aI" I 994), Interpolation is used to convert data from point observations to
continuous fields so that the spatial patterns sampled by these measurements can be
compared with the patterns of other spatial entities, Spatially monitored data do not cover
the domain of interest continuously (i,e, they are samples). Interpolation can be
performed through miscellaneous statistical techniques in which Inverse distance
interpolation is commonly used in environmental GIS modelling (Isaaks and Srivastava,
1989; Deutsch and Journel, 1992) to create raster I grid overlays from point data.
Grid themes have been constructed for each set of samples in ftrst step by completing
appropriate values of required parameters under the ArcView Spatial Analyst
Environment. In second step interpolated grid has been reclassified according to definite
criterion,
119

3.3.3.3 Air Pollution Temporal Variations
Time is one of the controlling factors of every dynamic phenomenon in this world . Air
pollution emitted and diffused with variety of speed depending upon the nature of the
pollutant . That speed reveals the rate of dynamism with respect to time. On micro scale
CO concentration may change with in millisecond with the availability of favourable
reaction environment. It is difficult to monitor continuously to some extent especially
when spatial canvas is huge and with quite enough details. On such, scale time-to-time
variation may be recommended to scrutinize with respect to morning, afternoon, evening
or low to high peak times. GIS may provide spatio-temporal analysis functions that depict
temporal variations as well as spatial variations at a time through different modes. One of
the methods have been utilised to analyse collected data temporally is elaborated here
under.
3.3.3.3 .1 Statistical Deviations
One of the themes, which have been developed for temporal variation, is the use of
algebraic grid. Map algebra is a high-level computational language for performing
cartographic spatial analysis using girded (raster) data. It provides a way to create
mathematical and statistical operations that compare grid themes. In this regard collected
data has been converted into interpolated grids for mornings, afternoons and evenings of
working and off days. Finally standard deviation has been calculated for each grid to
identify the variation of air pollution during these times' sessions and days.
3.3 .3.4 Road Density Index: massiveness measure
Congested road network is assumed to be a fundamental source of Carbon monoxide
concentration. It was observed that road intersections are more vulnerable as compared to
smooth traffic streets due to choking in congested areas during peak hours. The postulate
further revealed a relationship between choking point's density and broadness of pollution
concentration zones (a continuous area having similar hazardous pollution concentration) .
Nevertheless, demarcation of precise pollution concentration zones on micro geographic
scale is a tedious task.
130

After generation of equidistance points along the roads, these have been categorised
according to the road classification of the Traffic Engineering Bureau (TEB). Weights
were assigned to the points with respect to the functional importance of associated origin
roads . Converted into the point geometry and have been given high value of pollution
concentration weights. That is also a fact that traffic on straight smooth running roads
also carries pollution, therefore, sample points has been extracted with low weight.
The density function generated a surface by applying a sampling radius to each point in
the data layer. No output values were calculated for areas lying outside of any sampling
radius. This technique generated output in the grid data format. The value for each cell in
the output grid is calculated based on the value of each point whose sampling radius
overlaps the centre of that quad cell. Therefore,
Where:
Point Density = " ~ L..." d-
z ~ Pollution weighl
d ~ dislance from Ihe cenlre of the quad cell 10 Ule dala poinl
i r cHeh point ollhe centre of the sampling radii that overlap the grid cell
3.3.3 .5 Population Distribution
Human activity produced polluti.on and human population is the ultimate victim itself. An
envirorunental study has to quantify the impacts of specific pollution on population.
Therefore, the initially formulated hypothesis of this research was revolving around the
concept of risks and the population under risk . The assumption of the analysis is that
higher the population concentration at a location would generate more vehicular travel
yielding higher air pollution and obviously affecting larger segments of population.
Popllialion density is considered to be a better measure as compared to population
numbers merely. Densities reflect the concentration and distribution patterns much better
than the absolute figures. At large they are obtained arithmetically by dividing the
131

numbers to the entity areas (Rehman, 1983). As the entities for this study are the fifty
eight analysis zones of Karachi metropolis, areas of these zones had to be computed
through GIS.
Dot maps are often used to represent the distribution of spatially distributed phenomenon.
The result of differences in dot density is a visual impression of the distribution pattern of
actual population (Campbell, 1984). The location of these dots on the map was governed
by the sources that finally yielded the base map; classified satellite imagery, population
census maps and knowledge about study area .
GIS can present the population density with its gradient trends through population density
gradient map. The density function generated a surface by applying a sampling radius to
each point in the data layer. That function generated output in the grid data format. The
value for each cell in the output grid is calculated based on the value of each point whose
sampling radius overlaps the centre of that quad cell (PCI, 2000).
3.3.3.6 Epidemiological Investigations
Qualified and unqualified medical practitioners, Homeopaths and Hakims treat the vast
majority of Karachiites. There is also a strong tradition of self-medication in this part of
the world , where every medicine is available over the counter, without any prescription.
Patienis are carelessly handled in private and public sector hospitals of populous Karachi .
Lack of proper record keeping of these service providers convinced the author that most
of these sources, could not furnish statistics on scientific premise. Therefore some
quantitative and qualitative epidemiological analysis has been performed on the data
generated primarily by one thousand and one hundred (1100) questionnaires.
3.3.3 .6.1 Morbidity treated by Physicians
To inquire more about the frequency of air pollution based diseases, the seventy five (75)
practicing physicians were explicitly asked to mark the diseases frequent in their
practicing areas. These public health statistics can be invaluable in understanding local
patterns of diseases in Karachi .
132

practicing areas. These public health statistics can be invaluable in understanding local
patterns of diseases in Karachi.
3.3 .3.6.2 Disease Grading by Professionals
After establishing the contribution of air pollution in the occurrence and prevalence of
some diseases in Karachi through scientific studies and morbidity data of hospitals and
practitioners, there appears an obligation to find what do the professionals think about it.
There was a specific question:
• What do you think about air pollution as a contributing factor among the listed
diseases?
To seek not only their perception but also empirically deduce a link between spread of
disease and air pollution in Karachi. Assigning of weights to predetermined responses is a
familiar approach in such inquiries (Manheim, 1979). The arithmetic summation ranks
the diseases (symptoms) as Highly associated, Fairly associated or Less associated with
air pollution in Karachi.
3.3 .3.6.3 Morbidity and Mor/aliiy: Vital Indices
The number of Yearly Indoor Patients (YIP) treated at the two teaching hospitals
(Disease-wise and Institution-wise was annexed as Annexure E (E. I & E.2). This data
gives an overall picture of various diseases prevalent in the metropolis. Some of the
diseases have a significant linkage with air pollution. The share of patients affected by
air-induced diseases from the total number of patients is an interesting dimension to be
looked at.
Annexure E (E. I ) presents the indoor morbidity and mortality statistics for 200 I at the
Civil Hospital Karachi. Similarly Annexure E (E.2) gives figures for the Jinnah Post
graduate Medical Centre (JPMC). Viewing the morbidity, moreover the mortality (if any)
due to the diseases having linkage with air pollution was considered worthwhile for this
study.
133

3.3.3.6.4 Airborne Diseases Prevalence
The prevalence of air pollution induced diseases indicates the effected population during
a certain time period. This measure provides weight to the trends of environmental
impacts (Woodward and Francis, 1988). The following relation calculates prevalence
Prevalence of air-borne diseases =
(Moon el al., 2()OO)
l\(1 ofoormlalion fltte..100 b\ iiir wl!ulion
A'!'~.: ,IlOPUIShOf(
Available hospital records were nol able to relate the disease information with location.
Elsewhere in world. both in developing and developing countries. linking of postal I zip
codes (Banta el al., 2001; Stone. 2001) with disease occurrence has provided the basis for
spatial analysis.
To the results of diseases prevalence on micro geographic scale, the instrument of
questionnaire has been used. With the combination of three queries the relevant
information has been extracted to achieve the objective:
L Address
2. Household size
3. Diseases
Address helped to geocode the extracted results 011 zonal basis; sample zone wise
population was obtained through aggregate zonal households whereas numbers of
diseases events were the representatives of affected population cases.
3.3.3.7 Public Perception Evaluation
Air pollution could be found everywhere especially in the urban environment both in the
form of indoor and outdoor pollutants. As a result, these pollutants being inhaled by the
people from the direct sources and ambient air as well. Urban dwellers effected mostly by
industrial and traffic induced poJlulants while rural inhabitant harmed by agronomic
contaminants, However, in a developing country like Pakistan, acceptance of a
134

constituent as pollutant and to perceive its harmful effects is very difficult for public.
Nevertheless, perception of the people is a key-player around the world to control the air
pollution. Perception is based on the knowledge and experience of a person (Bernstein e/
al., 1988). Knowledge creates awareness whereas experience strengthens the learning
(Dember and Warm, 1979). Missing either vague the depth of reality and make the things
fantasy.
Most of the research processes assume that some form of basic knowledge is already
available on the subject. Such basic data is normally available in most of the established
research topics (Ali, 1997). However, in unexplored research in developing countries,
official records and other basic research are usually not available (Bulmer and Warwick,
1983). In a developing nation where the literacy rate (and its definition) is awful, carrying
out a meaningful perception survey becomes more difficult. In Pakistan, the socio
economic information on micro scale may not be always available. Public health data is
not spatially managed. Living conditions of urban (and rural) localities are not
scientifically documented. All these factors contribute in awareness building of
individuals.
In the wake of scarcity and paucity of published data on environmental awareness,
questionnaire survey is the best alternate to gauge the extent of pollution (Ali, 1997; De
Souza, \999) . Therefore, it was indispensable to conduct the awareness/perception
analysis through interviews and questionnaires. Three following focus groups were
identified to achieve this task:
1. General Public of metropolitan Karachi
2. Competent Physicians practising in different localities
3. Inhabitants of Air pollution Risk zones
Subject receptive questionnaires were developed to accomplish the following targeted
objectives:
1. Understanding the disease patterns on micro scale
2. Perception analysis of Health professionals
3. Awareness appraisal of the society
135

To overcome the local data acquisition problems and to collect relevant information in
depth, special questionnaires were designed. These questionnaire surveys were carried out
around the metropolitan city (referred Table 3.8).
Table 3.8: Target Groups, Criteria and Description of Questionnaires
. : . . ' ... " . :~ } ... ~. ~
';"
. ,~~~',~~~;~~~ .. i~<~~.:-:' . ' ,' ' : ' :~'dpti,~ .. ..
. . ,Targe! ,G,r~\I:p "'~> .. . ' ~et~:reDce : ' , ' , .. ~~ ,', , ' . " ..... .: .. , .. : .. '; .... , . , '.'
Health Professionals Spatial co,'eragc of the Linkage belween pollulion Annexure F (F-melropolis and disease Prevalence QI)
General Public Spalial coycrage of Ihe Socio-economic and Annexure F > 18 years Age melropolis environment relaled (F-Q2)
queslions
The results of these surveys would be a handful of significant information, which will be
helpful in developing a cognition scenario of the problem and its intensity.
3.4 ZONAL APPRAISALS
The air pollution concentration samples were discretely distributed all over the Karachi
metropolis according to sampling criterion. Geographic Information System has the
strong topological intelligence such as adjacent I neighbouring, containing, and
intersecting features information. That topological intelligence has been used to select
spatial objects (i.e. underling grid cells) within each individual KDA zone. The territorial
air pollution surfaces (i.e. portion of underlying surface) were aggregated for that
particular territory (KDA zone). This analysis would provide the data behaviour in terms
of minimum, maximum, mean, range and standard deviation (ESRI, 1998; MIC, 1999)
The zonal analysis map was overlaid on the classified land cover and year- 2000 land use
map for the quantification of each category per zone. SPANS PCI, Canada was used for
this analysis. This software terms such analysis as area cross tabulation analysis. The
information collected on population and diseases in terms of different parameters was
transformed to the grass root level i.e, the 58 analysis zones of this study. Tabulations in
Microsoft Excel, and data integration into a GIS in ArcView facilitated to map these
phenomena. Classed Choro'pleth maps (Campbell, 200 \) of disease occurrence, point
prevalence and population densities are used to show the zonal variation in
epidemiological and demographical studies (Aral el al., 1994; Jacquez el al., \996;
136
----------------------. . -- - -

Goodchild, 1998; Jacquez, 1998; Haining, 1998; Kulldorff, 1998) Similar methodology
has been adopted here in this study.
3.5 MULTI CRITERIA EV AL UATION OF RISK Il"
NEIGHBOURHOODS
GIS furnishes advance statistical and mathematical modelling techniques. It supports a
wide range of advanced functions, such as auto-correlation, spatial interactions, location
allocation, simulation, and decision analysis (Cliff and Ord, 1973 ; Amrhein, 1985;
Anselin and Getis, 1992; Fotheringham and Rogers, 1994; Altman, 1994). Multi criteria
analysis is one of those advance and complex spatial statistical models . It is a type of
analysis performed through maps when analysing data; some factors may weigh more
heavily in the decision-making process than others. For risk evaluation the factors, which
could be causes or effects, were analysed under this study has been taken as overlays with
their precedence. Multi criteria analysis is a modelling technique that allows discovering
patterns and associations in data . The understanding of these relationships increases the
interpretability of spatial information and provides the basis for making accurate
predictions. The input overlays (maps) are listed below:
• Land Cover Classification Grid (LCCG)
• Population Density Grid (PDG)
• Averages of CO a t3 Feet Grid (AC3FG)
• Averages of co at 4 Feet Grid (A C4FG)
• Averages of CO Total Grid (ACTG)
• Disease Prevalence Grid (DPG)
• Disease Occurrence Grid (DOG)
• Roads Buffers Grid (RBG)
• Road Density Index Grid (RI;JIG)
• Standard Deviation of co at 3 Feet Grid (SDC3FG)
• Standard Deviation of CO at4 Feet Grid (SDC4FG)
• Standard Deviation of co at Total Grid (SDCTG)
137
. . -- _._----_. ---

There were some other maps (overlays) that could have been also used as input maps for
this multi-criteria analysis (such as the overlays of other pollutants from secondary
sources) . The author restricted his selection of input maps based on the sources and
quality of information. 11 was tried utmost that maps generated from primary sources be
selected. Secondly, this study had already been confined to Carbon monoxide (CO)
pollutant and since other pollutants have different sources of generation so their overlays
were avoided.
The land cover classification gird had been generated through the imagery; population
density overlay was produced by incorporating the census data into a GIS. Grids
penaining to CO were basically interpolated surfaces of the primary pollutant data
collected in the field, both disease maps were obtained through the instrument of
'questionnaire' filled by city dwellers while the grids related to road network were in fact
the products of GIS based analytical techniques.
The modus operandi of multi criteria analysis can be described as under:
.. A blank overlay template is created which incorporates all of the grids, which are used in
this study as components. This template is edited to assign weights and scores. Weights
were assigned to each grid (layer) as an indication of the intended contribution of that
grid . The scores were assigned to each class in every grid (layer) to define its suitability"
(Stevens, 1999).
3.5.1 Weights Reckoning
Principal component analysis is a transformation procedure used as a preliminary search
procedure to identify variables for funher monitoring and analysis (Daultrey, 1976) In
this study, Principal Component Analysis (PCA) using SPSS 10.0 was applied to check
the significance of the twelve above-mentioned parameters (Refer Section of Results and
Discussions) and thereof weights for each layer were calculated through Weight
Extraction Method . The flow of weight extraction is illustrated as follows Figure 3.14.
The results of above described weight extraction method are presented in the fonh
coming section (Refer the section in Result and discussion) .
138

Map Composition (All Layers)
Random sample points
o.~t.&.d La~ 1 "Illue o.uWd ~ 2 vdw Ox:rl.ud l...IIy'cI" ) Y.l.l\Jel OverlAid u~ -4 \o',due O\.aJ.lId 1Ay!::I" S \IlUut, ~1Md Uy!:t 6 v.iliJ.e: Ovdt.ud I.Ayu 7 vlI.hll:
Figure 3. 14
Weight Edradloll Model
1 2 3
•
21 17 80 2i
15
" 31 7\
o
,. 56 14 00
Random Point Generation
Correlation Matrix j (by SPSS)
Weight for each
variable
L X; ·Su"~~LC~ot.~~ .. iUa 1II04bcf
......... L x, -Sumo/Sum alaJfT'd.lir.:Jasaflill \..,...
139

3.6 PREDICTIVE MODELLING: ASSESSMENT OF CARBO:"l MONOXIDE (CO)
One of the most fundamental problems of science and engineering is to predict and
forecast future phenomena. Using existing theories and then extending such theories by
means of experimental results frequently accomplish this. The basic problem is to
develop models analytic form so those future real world situations can be predicted
with a reliable degree of accuracy. Likewise in transportation and environmental
engineering. analytical models are needed to forecast urban traffic pollution that is
reliable. It is the one of the objectives of this research to develop II prediction
methodology for use in land use planning, which is II major component of urban
transponation planning.
Methodology has been developed to estimate CO pollution at intersections by generating
estimates from various types of adjacent land uses, traffic volumes, road geometry etc. in
order to provide traffic engineers and urban planners a less expensive and fairly accurate
means 10 facilitate critical decision making regarding pollution. The methodology could
also be adopted elsewhere as well by incorporating indigenous patterns.
After a thorough investigation, the of Predictive Modelling was limited to core
areas (Old City) in Karachi. Since this study is unfunded research and constrained by the
limited time and manpower available, the magnitude was kept I(} a reasonable level.
The old city (core) areas of Karachi are quite unique in nature as far as land use is
concerned. Simultaneous mixed activities at different floors of a single building in core
Karachi calls for a model study that could provide insight on these unique situations.
Photographs revealing these chaotic circumstances are illustrated as Annexure r
The existing secondary data from the Master Plan and Environmental Control Depanment
of the Karachi Development Authority (KDA) is although helpful but does not go far into
looking at the micro geographic patterns of land use in various regions of Karachi. The
appraisal of land use patterns for an environmental study on metropolitan Karachi
required more effort. Hence, a field study was conducted to address this issue. Owing to
14!l

the financial, human resource and time constraints, a total of 90 locations were identified
in old Karachi for understanding the ground realities.
Stepwise Regression Analysis is a statistical technique, which is considered to be very
effective in identifying relations between various independem and dependent variables
(McCuen 1985; Gujarali, 1995). The objective of stepwise regression is to develop a
prediction equation relating a criterion (dependent) variable to one or more predictor
variables. Stepwise regression,' in addition to calibrating a prediction equation, uses
statistical criteria for selecting which of the available predictor variables will be included
in the final regression equation; the multiple regression technique includes all available
variables in the equation and is often plagued by irrational regression coefficients.
Stepwise regression usually avoids the irrational coefficients because tbe statistical
criteria of F-statistics that are used in selecting the predictor variables usually eliminate
predictor variables that have high inter-cotrelation (Theil, 1978; Gujarati, 1995).
The multivariate linear model structure with p independent explanatory variables, the
regression equation is (Fomby, 1984; McCuen \985; Rogerson, 2001):
(2.1 )
Hameed (1990) and Ali (2000) have utilized Stepwise linear multiple regression for rural
and urban transportation research. Ali (2000) in attempting to model rural travel
behaviour, developed probabilistic models for individual activity choice and the resulting
travel Hameed (1990) produced three pedestrian volume prediction models using
adjacent land use data at intersection through stepwise regression analysis. Both had used
SPSS for their statistical calculations.
Due to the inherent characteristics of land use variables, they were aggregated into major
categories to keep the classification of land use GIS and Statistical modelling to a
reasonable number. The variables is shown in list and a brief description of each variable
is given as follows:
141

I. Residential Space (XI) : indicates all space utilized for residential purposes, which
includes, single family, multifamily, flats, hostels etc.
2 . Commercial Space (Xz): refers to the space used for bazaar, petrol pumps, retail
stores, shopping areas, warehouses, cottage industries, restaurants, governmental and
private offices, banks, courts, etc.
3. Special Purpose Space (X.J): this category refers to religious institutions, medical
facilities, educational instiiutions, social, cultural Institutions, Parks, Cinemas,
playgrounds, zoo, picnic resorts etc.
4. Transportation Right of Way (X.) : consist of all space used for Roadway pavement,
sidewalks, all sorts of parking space, median etc.
5. Vacant space (X5): designated to show all space allocated for some activity that is not
utilised presently. This includes vacant lots found in different study locations.
6. Hourly traffic count (X6) •
7. Roadway width (X7)
8 . Built-up Space (Xs): consist of all space utilized for whether residential, commercial
or special purpose summed together. This clearly excludes the space for Vacant and
Transportation right of way.
142

4. RESULTS & DISCUSSION
- - ---~------~~- -

4.1 RECTIFIED SATELLITE PRODUCT
The section on methodological framework has thrown light on the pre-processing techniques
often referred to as Rectification. adapted in this research. The most comprehensible
approach towards the presentation of results on remote sensing products is to provide the
visual comparisons, "Before and After" each step of processing. The software applied was
Geomatica of PCI Geomatics (Canada). Figure 4.1 is the raw image acquired for analysis.
Figure 4.2 is the georeferenced version of the raw image. This exercise of georeferencing has
made the image of Karachi more geometrically familiar for the users in the form of having
geographical coordinates for 'manoeuvring' and 'environmental attenuation' and ' noise
correction' .
In Figure 4.3, 'a', 'c', 'd ' are the set of selected pre-enhanced subsets whereas 'b', 'd ', and
or are the enhanced outputs through Linear distribution, Root distriblJtion alld Adaptive
distriblJtion of spectral values respectively. These enhanced images would help in the
upcoming classification process for the assessment of land cover clusters for metropolitan
Karachi.
Figure 4.1, and Figure 3.3 are the before and after renditions of the image 'Subsetting'
technique. As already discussed in the methodology, it is evident here that the subsetting
techniques have successfully narrowed down the depiction of the developed study area .
However, the land beyond inhibited areas was included in the picture as the administrative
boundaries of the then districts that had to be accounted for. Secondly, the author wished to
render a pictorial overview of the physiographic features surrounding the study area.
144

Figure 4.1
KARACHI AND ITS ENVIRONS FROM SPACE
(Landsat TM FCC)
Satellite
Sensor Bands
: Landsat 5
:TM : 2,3, 4
Date of Acquisition : Feb 1998
Resolution : 30 x 30 m

KARACHI AND ITS ENVIRONS GEOMETRICALLY CORRECTED IMAGE
( ( :,
Projection UTM Zone UTM ROW Ellipsoid UTM 42 R Everes'
t'igurc 4.2
145

SELECTED SUBSETS OF PRE AND POST ENHANCED
Imageries (Pre - Enhanced) (Post-Enhanced)
(a)
c
(e)
~~.....,..
, ,
(i • . 1,
" ,
(Linear Distribution o.fSpectral Values)
(Root Distriblltion
(Adaptive Distribution of Spectral Vallles) l·i.",[I: 4.3
(0

4.2 LAND COVER
The land cover classification scheme adopted in this study has been presented in the chapter
of Methodology (Figure 3.4). Image classification of Landsat-5 1998, produced a value
added digital thematic map (Figure 4.4) that contains itemized account of eleven land cover
classes as illustrated in Figures 4.5. This itemized account was for the subsetted version
(Figure 3.3) of acquired imagery (Figure 4.1).
To make the query more meaningful, the area occupied by the 'landmass' was detached for
further scrutiny. The appraised land cover of Karachi division indicated that the major share
by area is comprised Mountains I barren land (8/.5%), Urban Land use (15 .3%) and
Vegetation canopy (3.2%) however, the urban land cover is sprawling day by day.
The classified thematic map could be interpreted on the basis of physiography and historical
expansion of urban land, which is mainly due to the human activities (as dwelling, transport
and business).
Classified results indicate the existence of three distinct widely spread physiographic
features . Karachi has plain land, coastal zone and hilly ranges. The processed image has
yielded the acreage of plain land of Karachi division to be around 2000 square kilometre.
Out of which about 25 percent is covered by urban settlement, whereas the rest is either too
far from the settlements or isolated pockets surrounded by hills. The planned development of
the metropolitan has been mostly on the plain land. The likelihood of future expansion of
urban cover lies around the plains near Hawks bay, Pipri, and Gadap. The coastline shown on
the image has occupied more than 75 percent by the built environment. It has expanded due
to reclamation of shore around Clifton and Defence Housing Authority (DHA). over the
period of time. This reclamation process is on going ever since the date of image acquisition.
The southern part of the city is cOnnected with the Arabian Sea. On the south and southeast
corridors lie a widespread extent of mud flats, sandbanks and mangrove swamps, crossed by
a complex system of branching creeks and inlets.
148

~ -,~. =-~ --50.
Figur~ 4 A
CLASSJFIED LAND COVER OF
KARACHI METROPOLIS
------• l_ ......
-~, --.-------~_'--
" •. ---."""""-~ . -'- . --- .
149
The Kirthar Range can be seen on the northwestern portion of the classified image near the
prominent Hub dam. The Pabb Range, south of Kirthar is manifested in the cluster of rock
shadow and sand stone reflection. In the extreme Southwest to the centre of Karachi
Division, Jhil Range is dominating, a series of hills and ridges, extending from Cap Monze to
the Manghopir area. These features are quite obvious to pinpoint on the classified image.
The human settlements are portrayed in four clusters on the classified image. The most
prominent cluster on the image is of densely built up land cover. The areas inscribed in this
class are Nazimabad, Liaqatabad, Lasbela, old city areas (from south of Layari river to Club
road), Shreen Jinnah Colony ·and Shah Faisal Colony. The localities falling under densely
built-up class are congested because the residential and economic activities that take place
around them, have expended over time. The dense road network and high rises have occupied
all open spaces and amenities. Population densities at some of these neighbourhoods are as
high as 1,800 persons per acre (URC, 2002). In these areas concentration of commercial
activities are very high resulting in mixed land uses all over.
As evident on the classifled thematic map, the class of low built-up area shows actually the
suburban areas, urban outskirts and peripheries. This class includes Surjani Town, Gulshan
e-Maymar, Gulshan-e-Hadeed, Northwest of Orangi Town, Phase VI and VII of Defence
Housing Authority (DHA).
A very interesting phenomenon is observed while examining the medium built up cluster of
the classified output. The author observed that vegetation is almost non-existent in the
densely built up class since most of it is historically pre-independence Karachi .. Whereas,
greenery can be seen in the medium built up class on the image and these are mostly the post
independence planned localities developed by KDA and Cooperative Societies. The medium
built up class encompasses the vicinities of North Nazimabad, PECHS, Co-operative
Societies, Cantonment areas around Shahrah-e-Faisal, Clifton and Defence Housing
Authority.
150

Appraisals of Land Cover
Figure 4.5
Me. ". ' .... -t~ - .. ... B~II up Land covel
If.''''''' . '-1501. 14 Km' J Open Land I
943.11 Km' I Sand Stone Reflection I Unused Land
/ IJ 220.78 Km' I Rock Sbadow
2%
22.1 %
40 60 so
151

4.3 CHANGE DETECTION: SETTLEMENTS GROWTH
It has been found that pinpointing of growth corridors is quite difficult. During the analysis
period of twelve years (1986 - 1998) the city has grown literally in all land available
directions as shown in Figure 1.4 and Figure 4.6. It was also deduced that the human
settlements around Karachi during the analysis period, were the by·products of infrastructure
development. Major growth has been observed along National highway, Super highway,
University road and RCD highway. Similar results were obtained by Afsar (2001), when
Karachi's urban sprawl was studied. KDA (1991) had identified future growth corridor
directions. Figure 4.6 presents the updated reality.
There are three major highway projects in the pipeline viz. the Northern bypass, the Layari
Expressway and the Southern bypass (Correspondent daily Dawn, 2002). It is envisaged that
the Northern bypass has acquired a priority among these projects. Its construction (Super
highway to Karachi port) is expected to provide another corridor for future settlements.
Decision-makers should start visualizing the future scenario of the metropolitan growth when
all these highway projects would be materialized.
Concluding the findings of classification exercise, it is suggested that the problem be viewed
ill a broader perspective. In Karachi metropolis, enormous traRic and land use problems are
degrading the environment as a whole. Analogous ·to the formulated hypothesis, the
functional agglomerations of landuse attract the population and traffic that give rise to air
pollution. Therefore, after land cover, of the city's land use was scrutinised in depth.
4.4 LAND USE
Rapid urban growth generally means that little land is reserved for public space and amenity.
Lack of recreational space is yet another cause of deteriorating urban quality of life in DCs
and LDCs and contributes to increasing social instability (Barrow, 1995). Allied to low
quality housing, poverty, disruption of community cohesion, and other declining urban
conditions are public health threats.
152

-, -
GROWTH OF SETTLEMENTS IN
KARACHI METROPOLIS (1986 - 98)
,
"
' . .... ~ . .: ...
.; .. "r ' -
- . ; ", ,~
. "l' "
, " ';r '~ .:"", ' .
Arabian Sea
Sourc.: SPOT xs, Ocloher 1986 and March 1998
,
+ ., ______ O~----~6 ____ ~12
Kilomdl'r
Figun: 4.6
· - :~:··fr " :\!W*!.~'f. !fI"'lI-
t ' ';'' • :: . ,.- J
, ,
153

Drawing the analysis towards land use from land cover, it could be well said that Karachi is a
cosmopolitan city and having multi-faceted urban functions . As described in the section 3.2.2
on land use / Ground Realities; year 2000 land use plan of Karachi Development Authority
(KDA, 1991) was the source of information whose further analysis yielded the following
categorized information illustrated in Figure 4 .7 and Table 4.1. The categories spelled out in
the document were not altered due to logical reasons. Primarily it was to maintain the
relevance of analysis with the 'original document and to facilitate in comprehension.
However, it should be noted that the boundaries of the metropolis are not the ones as the
author had demarcated in the previous analysis of land cover. In fact this land use map of
KDA had considered only the urban limits of Karachi. Another limitation of the source map
was that the KDA had marked the classes / areas based on dominant land use of localities.
These tabular and geographically mapped outcome can well be considered as value added
products benefiting the planners and administrators of the city.
Table 4.1: KDA Land Use 2000
:.·;~·:·;~i~\1:~f:!~~~~~'~~1~~t~i~~~~'1 P~~~"a' :7~~; 4li~rceiiF f~)(§qJliiii)f ;;;,s.bare\ , ~; . ' . ' '~ "
Planned Residential 163.7 18.12 Military Arel!s 121.3 13.43 Schemes 10 infill 98.8 10.94 Low Income Senlements 82.7 9.15 Unplanned Residential 70.1 7.76 Industrial 67 7.42 Agriculture 50.9 5.63 New InduslfV 48 5.31 Densification Areas 47.8 5.29 Flood Plain 47.1 5.21 Vacanl Undeveloped 16.7 1.85 Buffer Areas 14.3 1.58 Recreational 14 1.55 Transport Facilities 13.5 1.49 Urban Renewal 11.2 1.24 Commercial 10.7 1.18 Utilities 8 0.89 Education 7.7 0.85 New Commercial Cenlres 4.9 0.54 Burial Ground 3.2 0.35 Vacanl Developed 1.9 0.21
Total 903.~ 99.99
154

1 .... 'lry' /'IiC'Wo 1.41u.~11"}
c-. .. .....n.I N ... C:-....bl
,\&nn.ttt.R' u ..... ~ .. C ................ nl.' ...... ~ .. I
I ... ,.,.... Srt.'mll:n'
~~IOI.1lI
DnbiIiati.n .\~
B .... . \ne
Mi .. ".,4 ( -",,",C'nl
\'IQIII On:c-........
\'.u.'I~d .,...I'ta .. _ 811';"1(; ......
_ £d .. -...o..,. kt~tilulioll HI'C ...... "r_ l.'Imdn
_ Tnllt';r-,lr1 h ,dlilw"
" "'i.St C
, Ii
KUOIath'r
--
P f{OJECTED L AND U SE 2000 OF
KARACHI METROPOLIS
I
,'" ~
•
~ • ,
I ~: • • • ~ ,
•
Source: Ka rachi Development Authority 1 ... 1P & ECD, 1991 Fi,gurc 4.7
I

There are actually the first ever development of a statistical and georeferenced database on
actual land use and functions for the metropolitan city of Karachi . This digital database has
opened avenues for looking at the land use scenario. For instance, if these twenty-one land
use classes outlined by the KDA are grouped together broadly on the basis of their functions,
interesting figures are derived, which are tabulated as under:
Table 4.2: Land .use Groups of KDA Defined Categories
. ~~:~ .. ~·~ff~~.~~ ~$trl~)~:i1,J:~i{~~}~tri~i¥ti~~~ p~~~:ml~!ljH~<~~i ~ ;' :: :':~t;~~~: .. ":' -'1ucenV " .,' .:~ -:~::-:;~?
ndustrial 61 7.41
Agriculture 50.S 5.63 Economic New Indusm 41 5.31
ommercial 10.7 LIS
New Commercial Centres 4.9 0.54
Total 181.5 20.08 ;Recreational 14 L5 II'ransport Facilities 13.5 1.49
Infrastructure ~lilities S O.S'
~ducation 7 . 0 .S5
iBurial Grounds 3.2 0.35
Total 46.4 5.1 Planned Residential 163. IS.I
~ehemes to infill 9S.S 10.94
Housing "",,w Income Settlements 82.7 9." Unplanned Residential 70.1 7.71
iDensification Areas 47.8 5.2\
Urban Renewal 11.2 1.24
rrotal 474.3 52.S:
MilitaI)' Areas 121.3 13 .43
Vacant Undeveloped 16. 1.8 Special Purpose Buffer Areas 14.3 l.51
Vacant Developed U 0.21
Flood Plain 47.1 5.21
[rotal 201.3 22.28
These appraisals of land use in metropolitan Karachi provide legitimate ideas of urban and
environmental inquiries. Amongst them, some are presented here, when the whole city is
looked at macro level.
I . It would be very unfair with the metropolis if it were not denominated according to
conventional functional classification theories (e.g. Harris, 1943). In fact it has
156
----------------_. -_ ._--

emerged as a "diversified city" with multi-faceted activities. Karachi cannot be
viewed on the basis of functional specialization only.
2. In the context of Pakistan, Karachi metropolis may qualify to be placed under the
"Central Place Theory" (Christaller, 1933) The groups of economic and
infrastructure land use themselves indicate that the centrality that is crucial to the
development of urban phices, does exist in the light of a very large hinterland and
sufficient potential for basic and non-basic goods (e.g. Myrdal, 1967; Friedmann and
Weaver, 1979)
While introducing Karachi earlier, the two Seaporls, an Inlemalional Ai/porI and
rail/highway linkages were earlier discussed. Being a trall.lporlaliol/ Hllb comprising
of around 47 sq. kms. of infrastructure land use (Table 4.2), Karachi's hinterland
goes beyond Afghanistan up to Central Asia (MS Encarta, 2002; Correspondent
Dawn, 2002). Therefore, the city has a multiplier effect due to the economic
expansion of its own kind (e.g. Friedmann and Weaver, 1979).
3. Looking at urban morphology, it is observed that the metropolis understudy is
different than the theoretical 'Concentric zone' model (Burgess, 1925), Sector model
(Hoyt, 1939) and Multiple nuclei model (Harris and Ulllman, 1945). Reasons for this
are deep rooted in its history and evolution, as touched upon in the first chapter.
Unprecedented huge migration is partially responsible for the mixed and chaotic
land use. Secondly, there has been no institutional control of land use due to weak
governance. Moreover, the socio-economic eccentricity of the "urban poor" of
Karachi has contributed to the emergence of many squatter settlements kalchi
abadies.
Over crowded and poor quality housing may aid the transmission of diseases and
pollution (Barrow, 1995). In Karachi city, at prima facia, for the housing sector,
(Table 4.2 and Figure 4 .8) the area occupied jointly by Low Income Selliemenfs and
Unplanned Residenlial comes out to be about 150 sq. km (17% of total urban land
157

use). If these two poor residential categories are summed up and their share out of
the total land for the housing group is assessed, it is 32 percent. A7ad eloJ. (200 I) has
discussed the continually changing urban structure, peculiar to Karachi through 8 case
study of residential neighbourhoods being transformed slowly into commercial
markets.
4. It is to be emphasized that the functional aggIomecation has put tremendous stress on
housing and settlement. The western concept of 8 classical CBO is nonexistent due
to mixed Ianduse all around the metropolis. This has obviously resulted into a host of
manifestations of urban environmental degradation: air quality being one of them
Housing Distribution In Karachi
• Planned Residenlal IaSchemes to 1""11 o lDw lnoome SeIIIeI i oelts o lJI1lIanned ResIcIentIaI I!I DenslfIcaIIon ~
1:1 UrbIn Renewal
Figun:4.8
4.5 POPULATION DISTRIBUTION
The source of the population data has been descnDed in the previous chapter; the pertinent
analysis done on this data has also been discussed. The results of demographic analyses are
presented in Table 4.3 and Figures 4.9, 4.10 and 4.11. Deliberations on the spatial
demographic patterns of present-day Karachi could be given by taking into BCCOWlt the
historical. cuhural and socio-economic filctors. Karachi city has gone through phenomenal
158

changes since the creation of Pakistan (Rehman, 1983). This is also reflected in the intra
urban distribution of its population.
The pre-independence population of Karachi i.e. 386655 in 1941 (GOP, 1985) was attributed
to its port and strategic activities limiting its boundaries up to Soldier Bazaar. The population
around 1068459 in 1951 was because of the first migration of Muslim refugees from India .
This influx was accommodated in the Jhuggies around Numaish to Jamshed Road and via
vertical expansion in the form of flats / apartments all across the old city. The population of
3515402 in 1971 could be explained by factors as natural growth, migration from up country,
development of industry (SITE, KITE etc.) and trade (wholesale and distribution) across the
then metropolis. The city had grown to include F.B. Area, Nazimabad, North Nazimabad,
Liaquatabad, Landhi, Korangi, Malir Extension, PECHS and other societies. The population
of 5437984 in 1981 (GOP, 1985) includes the second migration from eastern parts of the
Indian sub-continent, perpetual migration from up country (especially rural to urban) and
natural increase. The city frontiers had been extended to Orangi Town, Gulshan-e-Iqba1.
North Karachi, New Karachi, Kehkshan, and Defence Housing Authority. The latest
published figures of exceeding 9 millions in 1998 (GOP, 2000b; MS Encarta, 2002) are for
the times when Karachi has broadened to the present limits Figure I. 4.
The above discussion could · be enhanced by indicating the need for a comprehensive
demographic / spatial distribution study for Karachi in the light of relevant variables . Jafri
(1973) and Husain (1992) worked on these lines but time has outpaced their endeavours since
Karachi is now considered to be one of the top fifteen populous cities on the globe (PRB,
2001).
Remaining within the constraints of this study, the author has contributed towards the micro
geographic understanding of population distribution within the metropolis by presenting the
following Figures 4.9,4.10 and 4.11 and Table 4.3.
159

em
•• +.~q'~f~------~--------------------------~'J--~~~'~'~'~" ~~~~----------------------------I\----~~~.~ ••• ' ~ I ~-.~_ i • 5 .,
----0-.
~ Anlbian Sea ~ ~
,~~------------------------------------~~~---------------------------------------+~ .,..or! t I' rf!¥DKf.
• • •• -

Table 4.3: Zone-wise Population Distribution of Karachi MetropoliS
I 4
218041 59726 86247 31771
194399
86790.25
4 094.4' !45.6'
20196.63 1.1999
~--~---+------~111971 1'6.01
10 II
I. !819 :096
2, )48 1,
12
!l08.28 Il88. !l
.4 23 13
~ __ ~5~ __ ~ ____ ~~~~~:~ ________ ~~:~~~~~:
17 10008 5234.33
20 119256 18l84.10
!l 26
132688 6l 10 1.)4 267477 7l968.01
78720 30<1 .79 210752 Il497.09
71833 10909.4l 201984 8l84.26 236319 l3620 239l0l 291078 819981
r-~1~2 __ ~ __ ~~~~02ll~)1~2 ________ ~'6~9.~i2~ 33 67s99O 1414 .. 34 371343269U. 3l 1792l 19J2.' 36 19043 Il1.4' 37 2099l 286.89
6010 68.28 ,9 580115 10 227837 128l9.02
284710 10201.69 16040 3716.93
43 398289 32 ' .46 44 8601 .l2 4l 3272 21 . 11 46 383, 47 624' 39l2.77 48 : 14l 914.:
96036 41l.1O 9OIl8 466.79 44464 1111.16
160278 1868.21 6471. 12.61 74126
5l 8628 '08 l6 12420 78: l7 . 6711 l8 11833 81.8'
161

54
POPULATION DENSITIES IN
ANALYSIS ZONES
S4. 55
Persons ! Km2 56
143588
57 .14 t. 52
37 19 ~ U •
~6
~ ~ II.FII:IIIItr -.,.
+' _,. rrl- ~-.i' 47 4. ~ 42 \ 4g
\JILl- I~'-' ct> ,..li.... 15 r ,~~ 411 41
tv I 7 0 11 411 r 7 U D
i ----,
Kilometer
Figure 4_10
58

The lowest density of population (about 54 persons per square kilometre) occurred at zone 57
(Dehs in the west along Hub River), which is essentially a rural fringe of Karachi. While the
highest population density (143588 persons per square kilometre) was found in zone 10
(Chakiwara, Kalakot etc.), which is an old neighbourhood of Karachi often referred as a
portion of 'core of the city' . Out of fifty-eight, nineteen (19) zones exceed the popUlation
density of 25,000 persons per square kilometre. There are only five (05) zones in Karachi
that are having a population density of less than 100 persons per square kilometre and
incidentally these are all rural-urban fringe or rural areas. The following statistics (Table 4.4)
are self-explanatory.
Table 4.4: Population Density: Descriptive Statistics
:·m~~i~:- C· : :1'd~S'bid;:~,~}~'t:}: ::~ • :;;Y<YlIiiia:;4· .",. Mean 23217.94 Slandard Error 3861.08 Median 12349 Slandard Devialion 29405. )(l Sample Variance 864660300 Kurtosis 4.69 Skewness 2.03 Range 143534 Minimum 54 Maximum 143588 Sum 1346641
COUll I 58 Largesl(2) 103108 Smallesl(2) 68 Confidence Level(95.0%) 7731.68
The population density map (Figure 4.10) for Karachi illustrates noticeable distribution
patterns. An elongated pattern of population concentration is clearly visible encompassing
analysis Zones # 1,2,7,8,9, 10, II, 12,21,22,23,28,29,30 and 31. The author is of the
opinion that cheaper land vallie is the chief explanation for this elongated spatial pattern.
Rehman (1983) had partially attributed the population agglomeration (at that time) to 'land
value'. Zones # I, 2, 7, 8, 9, 10, II and 12 are parts of Old City inhibited by initial settlers.
Zones # 21, 22, 23, 28, 29, 30 and 31 comprise 'several subsidised schemes' furnished to the
public by the government for settling the upper and
163

KARACHI Popul tion Density Gradient
;W~. _~Q='~E~ ____________________________________ ~~~W~t~'~ ____________________________________ ~~~W~"t .. , ~1I.a)-n-.. ..
I
......
( )
i Arabian Sea ~ • ,~~--~~------------------~--------------,-----~==~====~~==~====~==~--~-------+~
". ~r( tp"jIS"[ .1' " ' !Jr! _ ..... ,u.
: " :t • •

lower middle social classes. For instance the scheme of North Nazimabad was advertised at
the rate of Rs. 07 per sq. yards (to be paid in easy instalments) in 1960s by Karachi
Development Authority. The two exceptions, zone 33 (Orangi Town) and zone 43 (Malir and
Model colonies) can also be credited to the author's raison d'etre of cheap rather almost free
land. Orangi the largest 'Katchi Ahadi' of Asia was founded for the refugees from East
Pakistan in early 1970s. Malir and Model colonies were established in 1950s for socially
lower segment of population.
Another presentation of population distribution is portrayed in the form of 'Dot Map' Figure
4.9 in which each dot represented 200 persons. This gives a better picture of population
distribution and its concentrations within study area. Through this map analysis of affected
popUlation (under risk) has been facilitated. Further, cartographic output in the form of map
Figure 4 . 11 depicting population density gradient was derived. Density gradient map shows
the ascending and descending gradual changes across the metropolis (Rehman, 1983).
As discussed in the context of land use, there are several factors responsible for the spatial
concentrations of this kind in Karachi . Keeping the historical factors aside, the economic
conditions of the urban inhabitant are also the cause of densely crowded neighbourhoods
Like many third world countries, in urban areas of Pakistan, 25 percent of the population
lives below poverty line (UNCHS, 1996; Drakakis-Smith, 2000). Karachi's urban poor
does not have the commercial worthiness to move home from where he/she was born. In the
olden parts of Karachi, third generation of initial post independence dwellers is being
witnessed residing.
4.6 ROAD NETWORK
The base map had the road network of Karachi updated until 1998 Figures 3.1 I and 1.8 .
There was a need to examine its relevance within the framework of this study. Therefore,
widespread traffic assessment was performed at a later stage. Momentarily the graphical
presentation of this densely distributed aspect is illustrated in Figure 4 .12.
165
-

ROADD INDEX .·t'W~a~7'~ __________________________________________ -=~~W~'~I~ __________________________________________ ~V~W~"=t., !. o.w.-l ia)-.r I ~
~TCM'II h
f
"
''''''-
I ~ Arabian Sea ~
~±-=----------------=----=~--~-------------------------+~ w.,. ~t ..,."t! '·l
.. , 41l
• J • •

ROAD PROXIMITY BUFFERS ':t~~C~."~~ ______________________________________ ~~~~~r~'~ __ ~ ____________________________________ ~v~·~·t,'
• - - $ ,. ~
Arabian
PI'''''''
Sel
,. "
~ " ~ ~t.~,OK~'----------------------------------~~~---W~.~~--------------------------------------------~~
r 1 [ ~ I • " ,,-1 . " .. ~r l
•
1 • + 1 • •
~ II - 511
50 - 100 100 - SOH '> !'ilK) lIIeler
167

This map was produced through GIS technology and the task IS commonly referred as
density mapping in the texts (Demers, 1999).
The core city areas (Old Karachi) again emerged as a case to study at its own merit. Some
other neighbourhoods developed afterwards by the cooperative housing societies. These also
have some dense and narrow gaped roads such as PECHS, KCHS efC. The city developed by
the Karachi Development Authority (KDA) can be appreciated as a spacious, aesthetically
pleasant and well-planned. The neighbourhoods of Clifton, North Nazimabad, Federal 'B'
Area, Gulshan-e-Iqbal and Gulistan-e-lohar can be seen on this map as good examples of
fairly apart roads. Noticeably, North Nazimabad can be taken as a model neighbourhood
where planning has contributed in reducing the future environmental degradations.
Figure 4.13 is another endeavour usmg modern cartography where roads' proximity IS
magnified through a technique known as 'linear buffering' (Lang, 1999; Audet and Ludwing,
2000; Steede-Terry, 2000). This map could be considered complementing the (previoLls)
Figure 4.10 of density mapping. The legend shows the lateral distances marked on both sides
of the roads. Although, a different exercise in approach, it produced quite identical results to
understand this scenario of road density variations from place to place.
4.7 WIDESPREAD ASSESSMENT OF TRAFFIC PATTERNS
Traffic congestion is a common occurrence and fairly widespread over the metropolitan
Karachi. In this section, it has been attempted to give a general outlook of traffic conditions
for the three daily variations and two-week wise variations. Figures 414, 4.15, 4.16, 4.17,
4.18 and 4.19, were produced as GIS themes indicating these six variations respectively.
These maps represented the development of gravitational centres (Active Zone) in Karachi
from time to time and place to place.
Figure 4. 14 shows the 'Morning' session on Friday I Saturday I Sunday. It is observed that
high traffic at this juncture is along the major arterial road (TEB classification). The localities
do not encounter congestion very often during this segment of time. The neighbourhoods of
168
-
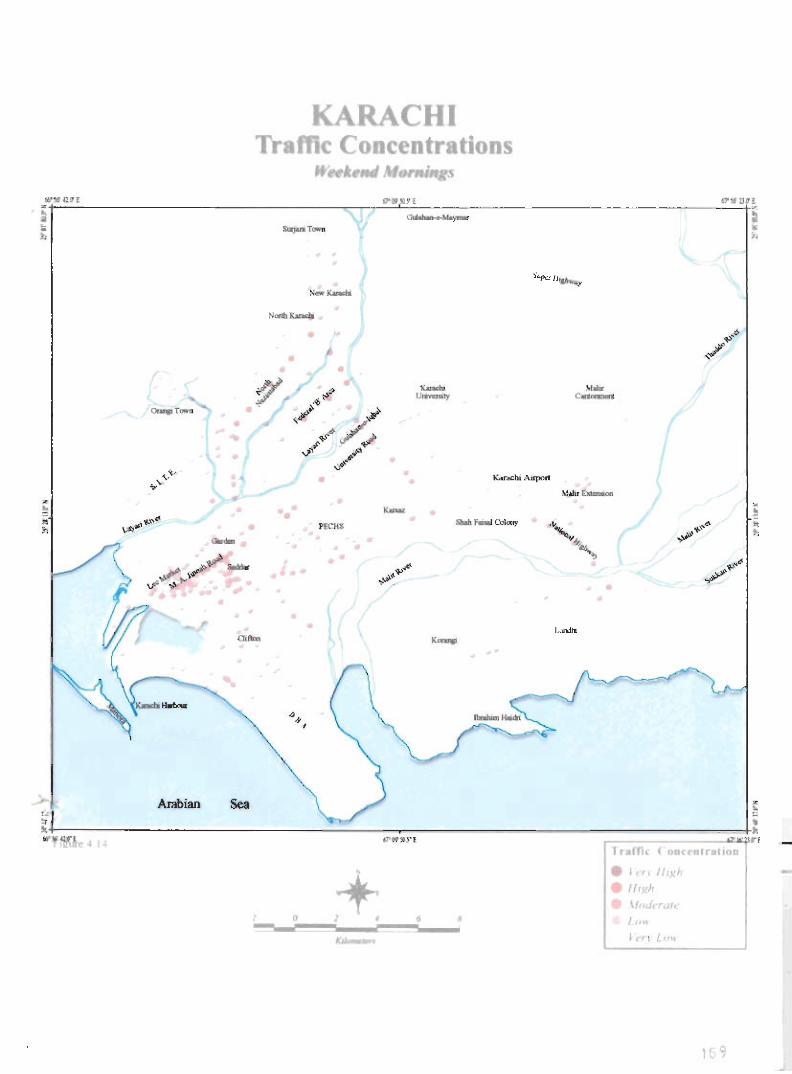
KARACHI Tr c Concentr tions
WAr
.~t~~O~'~'~ ______________________________________________ ~~~'~'~ __________ ~ __________________________________ -=O~-~D" ~ ~~ S L ~T""," II: ~ ~
. Arabian
•
... • •
Sea
•
• •
• •
K,,,,," Unr.a.ty
. .....
L
'" I~ ~
~ . ~.~~----:-----------..:::~----;;;;;:;---------;::=---=~~. 1IIf'f'l.,r1 Q'O 'II'I'1I.n ., r f
,
+ ~~ .. ~'~' .... ~J ...... '~ .... ~.~ .. ~.
Jr.rr, (ODe' Ir IIOll
• I 'l Js ~I'l
• 1/{V.1r
'f'JJt ~11/1 10"
I . , f L 'It
" <..
,

KARACHI Traffic Concentrations
rn a !tI' " 12(t'i f7' Qi' q ". .. n!11 .~~~--------------------------------------,--~~~----------------------------------------~~~, ~ ~_ :a . >;
• "
•
• ••
~ Arabian Sea ~ ~ ~
l~~~~~---=~------------------------------~;;~--------------------------~::~::::~:::-~~~ 111' ." f"[ur "''' '' .$'~ ~
If.nil (nn(l.fr linb
'J • •
• r In J( 1):1t
• II 'Xi, \I, .. , I
I .

• •
•
Arabian
KARACHI Traffic Concentrations
W~kt d ,v I.
•
-. I •. •
• • • • • • • • • • •
• t..noh
i • "
z
" ~ • • %,+-;;~-:=------------;;;;;;:;---------;::::-::::::::::::::::::::::=~~' Il"' .. JlY[ w'{ur l " I" t
l~ I " h.ffir 'nncrnlr nn
0 :t • • --el'''lti· • 1/, ,I:
"('I I t , . ,r , ..
7 •

Orangi Town, Clifton, DHA and Landhi posses low traffic volume while the radial roads
from Lasbela / Teenhatti via Grumandir up to Tibet centre remain the two busiest arterials of
Karachi.
Slight changes occur in the patterns of traffic concentration in the' Afternoons' owing to the
citywide activities, Figure 4.15. Major roads remain same in their business but the arterial,
which passes through industrial and residential zones in the city, shows comparative calm.
'Evenings' in Karachi, either during the business or during holidays, are the peak hours of
traffic activity across the whole metropolis. However, congestion is often experienced around
Karachi District Central and the core city area. The roads that contain several choking points
are Shahrah-e-Pakistan, Shahrah-e-Faisal, M . A Jinnah Road, S M. Taufiq Road, Nawab
Siddique Ali Khan Road, Rashid Minhas Road, and Abdullah Haroon Road . These roadways
on the evenings of Friday / Saturday / Sunday carry high volume of vehicular traffic (Figure
4. 16)
The morning scenario of traffic iri Karachi metropolitan (Figure 4.17) during working days
exhibits fairly widespread moderate to very high volumes. With the exception of reclaimed
DHA, nearly all-residential and business localities of districts South, Central and East remain
occupied.
Afternoons of Monday / Tuesday / Wednesday / Thursday become less busy than other two
time-segments of these days (Figure 4. 18) . . Slight low trends are found and the major arteries
are engaged with low, moderate and high volumes of traffic. The activity surrounds the
business centres and other trip generators in the city.
The thematic map Figure 4.19 portrays the appraisal of evening traffIC volume in metro
Karachi. This session happens to be the most congested of the six sessions studied. The
volumes remain in the range of high to very high at more than 75 % of308 intersections.
172
-

KAR CHI Tr c Co centratioD
WOrklDC
WJfQ.IiH :+-------------------------------------------.~ ., '" ..
. ~
• ~ •
AJabian Sea
•
e. PECHS
•
I •• •
•
)I\oralll
<1'WO , ~
~ ~
"
• •
• •
•• •
, ~
~.+---------------------------... WU'f' l
---~~O~------~====~' ~ "".,!'a,n ~~¥{
1 r.mc ( fin. en"
• I If" (/r1J,h
• II ~h
\I. II r "
• • I,no rOli
173

KARACHI Trame Concentrations
Work! 10 Y rraooas
Z~+~~~~7~' ______________________________________ ~~~~"~ ________________________________________ ~~~~~Ut.' ~ ~~~ ~ • ~ToWn ~
,.
•
• • ""' ... - •••
• . . ~
--~ Arabian Sea t
,+-------------------------------------------~r_------------------------------------------_+ ~ w. oil" ! UI"{ " jJ""' !il5~I
" -t • • ........
rufn, ( anu
• I tr /I,.:h
• 11 "~h
~'I dr' I •
I , M
t (ri I
[inn
• 4
•

KARACHI Tramc Concentrations
W rill
... !i,. ~ C7e! C"~ .rI fl"'1f ~ ~
. t-------------------------------------------~~~----------------------------------------~~ ~ ~.~ W
:5'II)a.,TOIIm !a b ~
~ , ,," .~
,.l " ~'"~~ ,~~
• • ", .1" v· , '" •
•
• • • • .....,
• • I .. •
• • • • • , ..... • • ••••
~ Arabian Sea ~ ~ . ~~~------------------------------------~----~~------~~----~~-----------------------------+~ iIP~· Q.I' t. II jl"'''''5'f r ...-r-¥. r f
" ,
1 r.rrh <. OD('rnlul~on
• ~I r l Ii:>.:" • /I ~h
'f'I,/I r "
J " ..
I ,''' I ",
17"

Nishtar road, M. A Jinnah Road, Shahrah-e-Faisal, Rashid Minhas Road, S. M. Tauflq,
Nawwab Siddique Ali Khan Road and Tariq Road have several choked up intersections.
Whereas, Shahid-e-Millat Road, Shahrah-e-Quaideen, and Abdullah Haroon Road give way
to thousands of vehicles during this time segment similar to the roads, previously mentioned .
The industrial areas of SITE, Landhi and Federal B. Area are also involved in traffic
congestion due to work to home trips.
4.8 SPATIAL PATTERNS OF AIR POLLUTANTS
4.8.1 Suspended Particulate Matter (SPM)
The aerosol contents of the atmosphere are sensitive to the location of local sources and
meteorological conditions. Human-induced particle emissions result from sources such as
cars. trucks, steel mills, cement plants, ceramic industries, construction dust and waste
incineration. The fme fraction of the suspended particles PM IO in an urban area is combustion
product of I-C engines (vehicles) .
1. Days: Time: Measure: Figure :
7'h .fuly 10 n"d .filly 1999 24 hours Suspended Particulate Matters (SPM) 4.20
Spa/irt! Patterns:
The interpolated surface shows total suspended particulate concentrations and their
spatial variations all over the sampling area. Regions had SPM concentration of the
order of 214 - 3 18 I-lg / m3. Higher values of SPM have spatial boundings with open
plain nearby industrial activity that attract the heavy traffic for transporting raw
materials and manufactured products.
176
-

SPATI L. PAlTERNS OF SPM EMI SION
•• t' ~~"~.'~------------------------------------~--~=c~----------------------------------------~~~W~"+ ' ~ i
KarM:hl A upon.
PECHli
AIabian Sea
, "
• "
~ ., • • ~~~----------------------------------~~----~~----------------------------------------------~:~ w ,,· 'U't -4 II "''' lI}'[ p',,' :].r t
+ ! • • •
SP\l onctntr n
, ...
•

SPATIAL PAlTERNS OF PMIO EMISSION
~"'UIH Q'~'lDyt ~ il lJtH
E~~------------------------------------~~~--------------------------------------~' .. ~~-n. ..:; ii ~TCIIm 5 ~ ~
:: =
--~ Arabian Sea :.: ~ ~
+-----------------------------~--------~--------------------------------------~: i7l., ".r [ tJ"'16'~ ... ,
I' 110 Conceolntlon
+ ~ . ..
• • .. -

2.
Ho/spots:
Landhi. Korangi industrial area. Sohrab goth. AI-Asif square
Days: Time: lv/easllre: Figure:
1h Jllly 10 22nd .lilly 1999 24 hours Inhalable Particles (PM 10) 4.21
Spatial Pal/ems:
On the average 10 to 20 % of the total suspended particulate were found to be PM to
in the sampling areas. High concentrations of PM JO are indicative of high density of
vehicular traffic . Throughout the sampling area. PM IO values were found exceeding
the prescribed USEP A standard of 150 ~g/m]
Ho/spo/s:
North Karachi, New Karachi, Buffer zone, North Nazimabad, Sohrab goth, Landhi,
Korangi, Harbour area
4.8.2 Sulphur Dioxide (S02)
Sulphur dioxide is mainly generated from the industrial sources , Considering the furnace oil
consumption in oil fired power plants at Port Qasim. an estimated amount of 40,000 ton per
annum of Sulphur dioxide is produced from power plants in Karachi , 80% of city's total
consumption is being used in power generation at Port Qasim, which is therefore, the main
source of S02 (Ghauri el at.. 1988)
I. Days: Time: Measure: Figure:
1h July to 22"d Jllly 1999 24 hours Sulphur dioxide (Sal), Maximums 4,22
179
-

SPATIAL PATTERNS OF S02 E J\IISSI 0,
Maximums
.~+.~'"'~'~ __________________________________ ~~~~~~'~'~ ______________________________________ ~~2W2"tf' ~ -- ~ :. ~ToJIIIIm ., ~ J I
I
(
....... U~ty
~ .,
'-~l'an Sea • ~ rudU ~
1.+---------------------------------~--------=__=~~==~==~--------~~ .,. ~ r. un. " tJ"""J"( ,'l"Wnr i
01 (ooceOlnlion
+ I.' .. • • • .. .- -

SPATI l PATTERNS Of S02 EMISSION
Averages
0" bn , r-tayvw _T~
t7' W ~ E
£ " ••
~ Arabian Sea I ~ i~~--~~--------------------~-------===------------------~=¥ .. "'¥ UI 1111 t" "'''.S''f ,1'1t'nn
+ I • , • •
SOz ('nol' nlr&llon
.. '" -

2
Spatial Patterns:
Map illustrating Sulphur dioxide (S02) maXImums of the location variation of
concentrations in ambient air with in the sampling area. Spatial patterns of S02 are
seem to be nucleated due to the industrial activity at Bin Qasim that has emerged out
as the prime contributor . of sulphur dioxide emissions in the metropolis . Sindh
Industrial Trading Estate (SITE) is arising as the second major risk zone in the
metropolis
Hotspots:
SITE. Bin Qasim Thermal Power Plant Area
Days: Time : Measure: Figure:
1h July 10 22"d July 1999 24 hours Sulphur dioxide (S02), Averages 4 .23
Spatial Patterns:
Since this pollutant is induced by the location of power plants. Spatial patterns in this
map once again are nucleated around Bin Qasim that has surfaced out as the major
contributor of sulphur dioxide emissions in the region.
Hotspots:
Bin Qasim Thermal Power Plant Area
4.8.3 Nitrogen Oxides (NO.)
Beside natural process NOx formed when combustion occurs at very high temperature. It
enters the atmosphere in approximately equal amounts from auto-emissions and power plants
(Nadakavukaren, 1990). These oxides of nitrogen are not only important as they effect
human respiratory system but they also have their significant role in promoting
photochemical pollution such 'as surface ozone (OJ). Nonetheless, in Karachi the prevalent
bronchitis and eye ailments are the manifestations of the presence of NO x in the atmosphere.
182
I.
2.
Days: Time: Measure: Figure:
1h July 1o 22nd July 1999 24 hours Nitrogen Oxides (NO.). Maximums 4.24
Spa/illT PilI/ems:
It is evident that regions where risk is higher are the vicinities of Korangi. SITE. and
Elender/l. I. Chundrigar Road. The reasons for higher concentration are industrial
activity especially the thermal power stations and the heavy traffic volume. The
residents and commuters of these regions are vulnerable to eye diseases. and
respiratory disorders.
Hotspots:
Landhi. Korangi
Days: Time: Measure: Figure:
1h July 1o 22nd July 1999 24 hours Nitrogen Oxides (NO.). Averages 4.25
Spatilll PilI/ems:
Similar spatial patterns of NOx (averages) presence in the atmosphere of
Karachi metropolis are portrayed. It is obvious to observe spatial interaction
between emission of NOx and human activities. NOx existed with higher
concentration where sources of emissions are present with their higher level of
intensity. SITE and Korangi industrial areas are rich in heavy cargo vehicle
movement. where as M. A. Jinnah road is one of the busiest roads of Karachi
due to offices and commercial neighbourhoods.
183

,. -.. ~ ...
I\T1AL PATTERNS OF NOx EMISSION
Maximums
-" ......
'EC~
• ArabiaJi Sea t 5 , . ,+-----------------------------------------,------------------------------------------+~ 0:#..- \U' I "''' .IW ~
NO (oDe Dtratlo
I + • • •
.. .. ..

ilU'W UI1 !
i ~ .. "' \j,· ~t ,
SPATIAL PATIERNS Of NOX EMISSIO
Aver ges
I
PECKS
Ambian
fi1'~.J-l
NO
• -+ ,. JO
• , • .. .- -
a • "
~
'" • .. .7'II'-:::JII'I
Concentration
~.dl.Z Ihl.

4.8.4 Surface Ozone (OJ)
In the turbulent troposphere below the stratosphere. the major source of 0) is the photolysis
of N01, which produces monatomic oxygen (0), which then forms 0) by reacting with
molecular oxygen. Hydrocarbons, aldehydes and CO accelerate this initial photolysis by
increasing the rate of (NO) oxidation. Surface ozone concentration relates directly to nitrogen
oxides and hydrocarbon, which means that it has some correlation with vehicular traffic,
refuse burning, sunshine and wind direction. In Karachi, high-risk groups of adverse affects
of 0 .. , include children, the aged, individuals with pre-existing respiratory of immune-related
diseases and those with coronary hear diseases.
I.
2.
Days: Time: Measure: Figure:
jh July /0 22"d July 1999 24 hours Ozone (0) , Maximums 4.26
Spatial Patterns:
This analysis is providing a new GIS based risk zone concept of interpolated ozone
surfaces. Spatial patterns of 0) are more or less on the same trends as the patterns of
NOx. The effected areas comprise of the core city centre. industrial areas and
residential areas . However, the cantonment areas are well safe of ozone. The regional
effects on the inhabitant population could in future be monitored if spatially
referenced epidemiological data on eye irritation and asthma cases be compared
simultaneously.
Ho/spots:
Korangi. Ibrahim hyderi, Sohrab goth, Kaemari
Days: Time: Measure: Figure:
jh July /0 22"d July 1999 24 hours Ozone (0),. Averages 4.27
Spa/ial Patterns:
Spatial dimensions of concentrations of average ozone (0) were indicating the same
diffusion and extensions of risk that was depicted by the maximum values of surface
ozone (0) .
186
------------------ --- -

SPA I l PATTERNS Of 03 E 11
Ma 1m ms
ION
!:'~+W~~='~! ________________________________ ~~~~~~~<~V'~~;;;-____________________________ ~~~.~"~ .. ~ _t ,_ 77 .... _ ....
if; ..... Tun ii
" ::/
-' ........ ---- .. ~ /'
(/ " .... ..... 1M......., r_ .... T_ . /4> ~
/..,. /.; , .......... , ~/ ............... --• ~
~ .. b "' .... --"""'"
~
"- ~. ~
" "",'" ~,
'"""" " .",v-> -. .,'" #" .,,~ .. ./
• 1: Arabian Sea ~
~--------------------------------~~-----.------------------------------------------+7.
'" " ,"' ... 'll .. ,
0, (onct'nlr.llon
•
+ • ] , •
..
.. k't'D JaIKtsJ..
" -- ~-' ... ,

.~ ,
• Arabian Sea. 1
t ~ • • !+~~<7~, ----------------------------------~~--~-~~.-r-t-----------------------------------------~-~+~~
.. ..

4.8.5 Carbon Monoxide (CO)
Carbon monoxide is a vehicular traffic induced air pollutant, which reacts with the oxygen in
the atmosphere yielding oxides of carbon. Before discussing the spatial patterns of this
contaminant, it would be quite appropriate to take a look at the existing roadway network of
the metropolis. In Figure 1.7 the extension and agglomeration of the roads is shown and quite
expectedly the carbon monoxide (CO) readings are higher along the road corridors.
Air pollution in Karachi metropolitan deserves research with several aspects of analyses.
Previous endeavours never provided a detailed coverage as compared to the city size of
Karachi. The foregoing endeavours on Karachi had generally been restricted to point based
observation. The reader is advised to refer the sections on Air pollulion cOllcenlratioll levels
(3.2.3.1) and Carbon Monoxide Levels (3.2.3.2) in the chapter of conceptual framework.
Being the major pollutant in urban environment, carbon monoxide has been selected to study,
the spatial variation and weekly changes in the patterns of air pollution. Primary field
observations are tabulated in Allne.xure A. The patterns developed and analysed through GIS
techniques provide entirely new understanding of the environmental scenario of the mega
city, Karachi .
'Interpolation' is used to convert data from point observations to continuous fields so that the
spatial patterns sampled by these measurements can be compared with the patterns of other
spatial entities. Spatially monitored data do not cover the domain of interest continuously
(i .e. they are samples). 'Interpolation' can be performed through miscellaneous statistical
techniques in which Inverse distance interpolation is commonly used (Arsalan, 2000; Mehdl
el aI., 2002) in environmental GIS modelling to create raster I grid overlays from point data
as discussed in section 3.3.3.2.
Grid themes have been constructed for each set of samples in first step by completing
appropriate values of required parameters under the ArcView Spatial Analyst environment
189

with cartographic limitations l. In the second step interpolated grid has been reclassified
according to definite criterion. For the purpose of demarcating the spatial patterns of
pollution, safe to very high-risk zones were spelled out for Karachi. WHO (1987) and WHO
(2000) guidelines have been used to fonnulate the following criterion:
CO Risk CriterioD ,---. · • · ~ • · » · · •
It • · • ... -
Sale Moderate Risk HigbRisk Very Higb Risk
The maps produced depicting the locational patterns are listed as under:
\. Days:
Time: Measure: Figure:
Weekend
Mornings 3 feet 4.28
Spatial Patients:
The pattern shows that some important business areas in the old city are under
tmderate risk. The scenario is influenced by the high-risk patterns, which covers a
large part of the city. Administratively speaking, the district Karachi West, Ma1ir and
a large portion of district Karachi East are well out of risk.
I II is worth mentioning al this poinl thai while Jld filIming the surface interpolalion in An:View, the boundaries of the maximum diffusion were inadvertenlly not taken care of:
190

J
_:'-cr l 11 ~ :J, ( ~~~~ ____________________________________________ ~=c~ ______________________________________________ ~~,
" CI
~ ~
; ;; "
..... -
~ Ar.hian Sea t ~ • • .+---------------------------------------~=------.------------------------------------------------+~ .... WU! --=."C""..::=-:.'t..--==-- 11' ~"J"J. "-.-:.11' (
f ,
19 1

. .. · U l
Sp TI L PA ER S OF CO E 11 SION
Weekend Mornin s (411]')
_ .....
..... .......
~ .. ,' [
;; Arabaao Sea i: ~ ~
• • .;+-------------------------------------~------------------------------------+~ w SClr I --=e-~..::..~ .. -- U-f'I'lU'! "'''!1I1
.. - , --
CO Ri k Crilerlon
~url:'
lodl!r Ie Ri k
High RI k
Vel) Hi h Risk

2.
3.
Hotspots:
Isolated crowded roundabouts / intersection such as Lasbela. Golimar. Empress Market and Tibet Centre
Days: Time: Measure: Figure:
Weekend Mornings 4 y, feet 4.29
Spatial Patterns:
The spatial patterns seem to have direct relationship with vehicular traffic and the
concentration of urban activities . . The planned neighbourhoods of Defence and
societies are under safe zone. While the older parts of the city are under moderate
risk. The inadequate roadway width has contributed for the sparse clusters of high
risk zones around Malir. Grumandir and Empress Market.
Days: Time : Measure: Figure:
Weekend Afternoons 3 feet 4.30
Spatial Patterns:
Apart from the cartographic limitations. this figure shows a spatial expansion in the
patterns formed as compared to the morning situation. The DHA and P AF Masroor
are the safe regions. while the major arterial roads in district Karachi-central are
under high risk of Carbon monoxide. The old city areas in district Karachi-south
show spatial similarity. The remaining metropolis falls under moderate risk
temporally
Hotspots:
Nagan Chowrangi. Scihrab Goth, Water Pump (F. B. Area) Karimabad, Empress
Market. Tibet Centre and Nigar Cinema.
193
- -- ------ - - - -- ._- ----- - --

~ Arabi.. Sea ~ k ~ . ~~w~o .. ,,-~, ~,~~~'~~r.==;i;:~;.~--------~~--~~~w~.;r.'---------------------------------;~;tw~~
CO HI k Criterion
.. -~ --
~art:
'\Ioder te RI k
High Ri\k
\ en High HI k
1'11.

Sp TI L P TIER \\' kend A
OF CO EMI
r oon (4'h') 10
":'- <O'!: irlllJ r " t-------------------:----"==-=---------------------"-:..:j-y ~ I .......... · .~ ~ If s.,.n. T__ IJ ~ .
Arobian ~
;+-----------------~~---r---------------------+;:. I*-,.-Ul I--.. =-~-~~~ "' ''''' f" ~ "')f.v"f
-- -
CO RI { rltenon
fc
lodcrate Ri k
High Ri k
en Uigh RI
1 'I"

4.
s.
Days: Time: Measure: Figure:
Weekend Afternoons 4 '12 feet 4.31
Spatial Palterns;
This figure could be discussed considering the diffusion property of carbon monoxide
gas and by comparing it with the spatial patterns for equal monitoring height in the
morning. The spatial elongation of clusters can be seen around the locations as
already discussed .
Hotspots;
Empress Market
Days: Time: MeaSllre: Figure:
Weekend Evenings 3 feet 4.32
Sp(l(ial Palterns;
Only the · undeveloped KDA scheme-33, is found safe and the rest of the metropolis
portrays a horrific picture. The metropolitan Karachi has enormous social activity
during the evenings owing to demographic characteristics. The congestion at the
roads is due to different trip purposes i. e. recreation and business. It can be noticed
here that the DHA has also fallen under the moderate risk zone and the entertainment
centres of Clifton and sea view are clearly under high risk .
Hotspots;
Aladdin and Sindbad . amusement parks, Garden east , 4-legged Intersections of
districts Karachi- central and Karachi-south
196
-- "
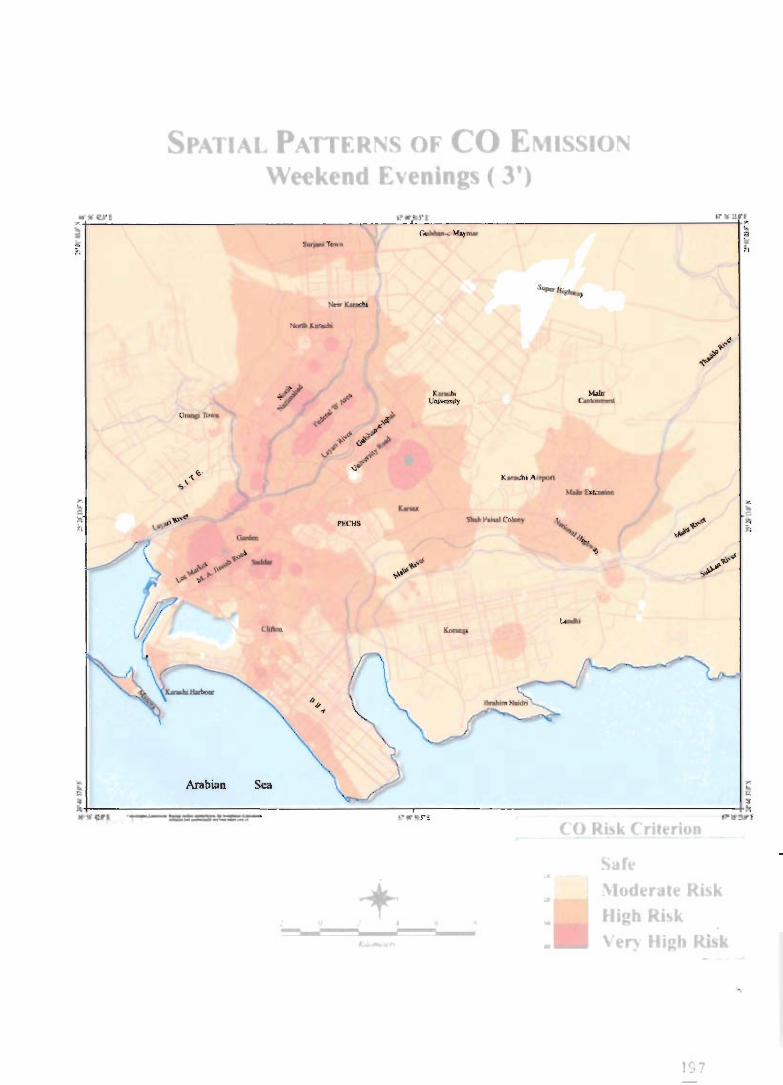
... ·Ul
P. TI L P F~R' OF CO EMI 10 W k nd Eveni g (3')
S Arabia. Sea ~
.~~--~~~~~~~~----------~=-----~--------------------------------------+~ !'vc..rt -::.~-=-_":..~ ~"III' S" ! ~WYI
-~ -
(0 Ri k ( rilerlon
<Ire
loder Ie Risk
High Ri k
"en fll" Ri ...
1 ~7

Sp 11 l. P ER Of CO E IS 10 \\" kend E\ enin (4 1h')
tII"Cj'~ ... ,." YI fI .. ' [ ,~~----------------------------------~~~--------------------------------~~~> }j r~~ a ~ -- ~ ,.
• .,-/
• >
~ ~
~,+---------------------------------------,,---------------------------------------+~ WWCFt -'-=--e::.='_':...,.-_"~ ~·.,. ... r~ ' ''!!':>IE
-- -
( 0 Ri.,k (rlter! 0
fl'
\Ioder Ie Ri k
High RI k
er IIlgh Ri k

6.
7.
Days: Time: Measure: Figure:
Weekend Evenings 4 \I, feet 4.33
Spatial Patterns:
The spatial contraction is quite visible but the affected localities are more or less the
same. This could be explained again due to the diffusion characteristics of the
pollutant itself The F. B. Area / North Nazimabad joining arterial, "Shahrah-e
lahangir" has emerged as a major carrier for late evening, social and shopping trips.
Hotspots:
Aisha Manzil to Babul Ilm, Sindbad to Aladdin park. Nagan Chowrangi and the
stretch of M. A. linnah Road from Civil hospital to Boultan Market
Days: Time: Measure: Figure:
Working Day Mornings 3 feet 4.34
Spatial Patterns:
This figure should be viewed with the already discussed cartographic limitations.
Morning trips in Karachi are mostly school and work related. DHA falls in safe zone;
Societies SITE and Korangi Industrial areas, Orangi Town and Gulistan-e-lohar are
in moderate risk zone; rest of the city is within the high risk , whereas the core old city
and major intersections of district Karachi -central are under very high risk . The
patterns formed in this figure would help the reader in discovering the spatial
variations and interactions for the upcoming themes.
199
-

I L P TIER' OF CO EMI Workin D y Mornin s ( 3')
10.
.~t.~" ~' r~' ______________________________ ~ __ ~~~~~,,~. ___________________________________ ~~"'~l ~£ Iil ~..".... ~ !I ~T__ l;: ~ J;J
.. on
- , --
( 0 RI~1o. (rll rtOI
10, rt lodtr Ie RI k
Jti"h RI .. k
\ er Iflgh RI

SPATIAL PATIERNS OF CO EM SSION Working 0 v Mornings (4 Ih')
II'M' Qr . P ' I ; ~' ( J1' lrDI'[ ~~--------------------------------~~~~-~----------------------------~~i
~ ~ r__ II; ~ b
."'''''
' .....
~ Arabian Sea ~
• • ~~~====~----~~----~~~~~,~ w~rllrt.· """""-=--=W:--"-- 1.1":IU. ~ '''Inl' (
.
+ , , • -- .-...
• • .. • --
CO Ri k (ruerlon
Safe !\Ioderate Risk
High Ri k Very High Risk

8.
9.
Hotspots:
Major wholesale and commercial area i.e. core of Karachi city, Lasbela, Grumandir,
NIPA, Hassan Square, Stadium, Qaidabd Malir, Liaquat market Malir, intersections
of Shahrah-e-Pakistan and Nagan Chowrangi.
Days: Time: Mecmlre: Figllre:
Working Day Mornings 4 'Iz feet 4.35
Spatial Pat/ems:
Unlike some western mega-city dwellers, the Karachiites are not early birds, which is
manifested in this figure . The undeveloped schemes and DHA is safe, most of the city
is under moderate risk , the core old city and vicinities of M. A. Jinnah road are under
high risk with a couple of hotspots in the very high risk zones.
Ho/spo/s:
Nagan Chowrangi, and Robson Road
Days: Time: Measlll'e: Figure:
Working Day Afternoons 3 feet 4.36
Spa/ial Palterns:
Monday to Thursday afternoons are occupied with work and other activity trips. The
traffic and narrow roadway width produce congestion . In this figure the hotspots are
surrounded by very high-risk zone, the city is divided into moderate and high-risk
zones. Only the DHA is shown in the safe zone.
202

SPATIAL PATTERNS OF CO EMISSION Working Day Afternoons (3')
:~'"~"'~" __________________________ ~~'~>'~"~ ____________________________ ~~~~U~" ~ ~~ S --
,-v .u-l!i .......
• "
~ Arabian Sea ~
• • ' .. :+:: .• ;:-~::--====:=-:==c==----------------~---------------------------------+" ... ...,-, .'-..,.......==-- ~~ ~ •• n n"tnJ, 1
CO RI k Criterion
• •
• • I • -- --'are Moderate Ri k
High Risk
Very Hi b Ri k
2 j

~ ~ ~
SPATI L PATIERNS OF CO EMISSION Workin D y Afternoons (4Ihl)
Pt",,,
'''"'"'
, :-" • • ~.~----,----------------.,--------------------+,..
'I oIM" -i-o-='~..t.. "- t1" •• ~·f
,.
• • • , ..
--
CO Risk Criterion
S fe
Moderate Ri k Hi h RI k
WW!l' t
Very High Ri k
~r~ f ....

10.
II .
r-,
The patterns formed help in understanding the traffic and trip trends of the city and
answer the inquiry at micro geographic scale. Once again the reader is reminded of
the cartographic limitations in the map.
Hotspots:
Major wholesale and commercial areas i. e. core of Karachi city; Lasbela, Grumandir.
NIP A, Hassan Square, Stadium, Qaidabd Malir, Liaquat market Malir, intersections
of Shahrah-e-Pakistan and Nagan Chowrangi .
Days: Time: Measure: Figure:
Working Day Afternoons 4 V, feet 4.37
Spatial Pattems:
This figure has to be understood vis-a-vis its counter part for mornings. There are
clear spatial contractions and the high risk zone has nucleated around the core old city
and stretched out to localities where traffic manoeuvring is difficult due to geometric
and space limitations. Overall the city remains under moderate risk.
Hotspots:
Robson Road, Empress market, 10har Morre (Rashid Minhas Road)
Days: 71me: Measure: Figure:
Working Day Evenings 3 feet 4.38
205
-

Spatial Patterns of CO Emission Worldn Oa Evenings ( 3')
.C'ft 1.1" , I"I"II!I" , '': 11'wa t .~~------------------------------~~------------------------------~~. II ~~ -a
~T___ ~ ~ r
..... ~
,--
I
Arabian Sea • }: ~
:+.---~~~~--~~------------------~----------------------------------+~ M'+4IIIr ~=:'-=--'--_':...~ .. - t-:--l'o'~ n .1"W Ifl
..
.. • J • • • - _ ..
CO Ri k CrIterion
Safe Moderate Risk
nigh RI k Very Hi h Ri k
-
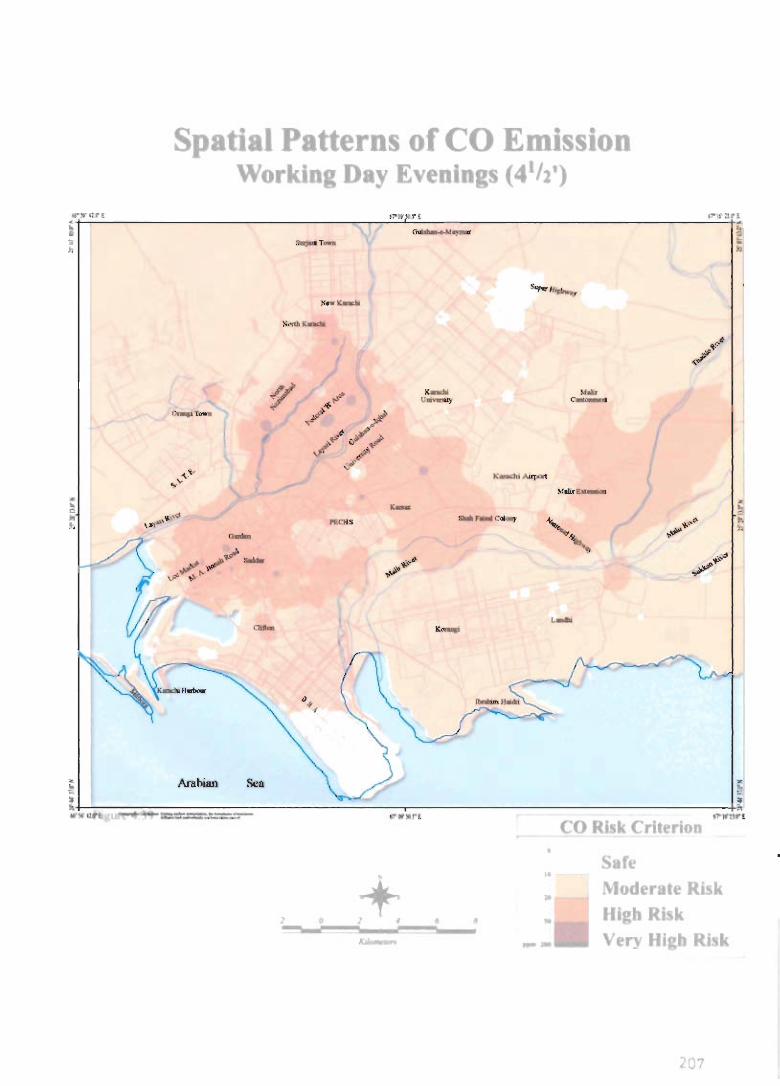
Spati I Patterns of CO Emission Working Da Evenln s (4 1/2')
W'.!f'l!ir[ , :''' If r~ ,"I lU'I <+-~------------------------------~~------------------------------~~. ~ ~~ ~ ~ i'iIIQM T,*", " · ~
• • o Arabian s. ...
,-P£CHS
..... u • ....,
. ~ t.
"
~ · ~ ~~~~~~,~~.~~~ __ =¢~~~:;:~;;~------------~~~w~.;,,--------------~==-=~~~--~--;~;.n!!'" co HI k Criterion
. , • ~ • -- ..........
..
.. • ..
--
Suft:
Moderate Ri k
IIIgh Ri k
Very Hlgb Ri k
2C7

12.
13 .
Spatial Patterns:
There is no part of the city, which is safe at this time. The scenario is overwhelmed
by the high and very high-risk zones comparable to its counter parts for weekends. As
the activities on Monday to Thursday are more than the three other days, the spatial
patterns show agglomeration of high and very high-risk clusters. The Landhi /
Korangi and Defence areas are under moderate risk. This figure and the upcoming
figure confirms that tbe peak hours of activities and traffic in Karachi Metropolis are
between 6:00 p.m. and 11.00 p.m.
Hotspots:
Shahrah-e-Pakistan (from Suhrab Goth to Liaquatabad 10), from Nagan Chowrangi to
Grumandir, Core of Karachi, Malir and Shahrah-e-Faisal, Core city of Karachi
Days: Time: Measure: Figure:
Working Day Evenings 4 y, feet 4.39
Spatial Patterns:
The trend of high-risk zone seems to be shifting in this figure from old city towards
district Karachi Central. The districts West, Malir, East and partially South are in the
moderate risk zone. The most populous district of Pakistan i.e. Karachi Central,
although a planned and relatively younger locality is under high risk due to high rate
of vehicle ownership and urbanization. Even at 4 y, feet, CO seems to be affecting the
population at this juncture.
Hotspots:
Intersections of district Karachi Central, lohar morre, National Stadium
Day & Time: Measure: Figwe:
Whole Week Diurnal Averages J feet 4.40
208
14.
Spatial Patterns:
This map is illustrative of the overall situation of carbon monoxide (CO)
concentration at 3 feet vertical distance from the fmished road surface on the arteries
of Karachi metropolis. There is hardly a single locality. which falls under the safe
zone. The majority of the city is under the high risk while about twenty-five major
intersections are constantly under extreme risk. Rest of the city is nevertheless under
moderate risk, A worthwhile outcome of this map is the formation of an "extremely
risk corridor" in the vicinity of Saddar and M, A Jinnah Road.
Hotspots:
Nagin Chowrangi, Sakhi Hasan, Teen Haiti, Lasbela, Sohrab Goth. Water Pump.
Aisha Manzil. NIPA Chowrangi. Johar Morre. Hasan Square. Empress Market. M. A
Jinnah Road and Nishtar Road,
Day & Time: Measure: Figure:
Whole Week Diurnal Averages 4 Y, feet
4.41
Spatial Plll/erns:
This figure portrays the cumulative carbon monoxide (CO) enrichment at 4 112 feet
high from the surface, on the roads of Karachi, There is only a single neighbourhood
i, e, DHA, which remains safe otherwise major regions of the city, comes under the
moderate risk,
209

SPATIAL PAlTERNS OF CO EMISSION Diurn I Aver e (3')
•~~W~"~.,~ ______ ==~ __ ~ ____________ ~~.,~_~,~.,. ______________________________ ~~ I ... \l"' ln , i
c G~.,....,.. } ~ s.t-. T~ to ~ .
P'lEC K3I
'. ,
• ..
1 " • • -- _ ..
CO RI k Crit ri
fe
loderate Risk High RI k
Very High Ri k
21
> ~ .. b

SPATIAL PATTERNS OF CO EMISSION Dluro lAver e (4 Ih')
!I'Wflrl .,. .. '" roll' . ~
_ .... ..-• ~ --
·~HI.~, s ... ~
~~~lI:~
(.",4 , ,./
?' "," "-" M'" u~ C_
",- T_ " ~ , ,..,,- < ~ ,.. ~
,"" ~ ... .. ,. ~tu. .o\up:rI
M.~
• . - ~ "" ~ PKII' :ar.IIf~ C~1Mf
"'-.. ...., .....
\ ",-fI,'
" " ~
.;"" - ...... .,.6 ~
_.I"',. ,,+'" ,; '" ~
~ AIllbian Sea • ~ t ~+¥-~~,--~ __ ~ __ ~~~~-=~.-=~.-=-----------------~-.~.-"-, ------------------------------------W-_4"~.,
I • - + , • • • • --
CO RI k Criterio
re :\Ioderate Risk High RI k
Very HI h Risk

SPATI L PA ERNS OF CO EMISSIO • Diurnal Aver ge
~t·~~"~"~ __________________________ ~ __ ~~~w~r~'~ ______________________________ ~~~".~" ~ ~.,.,... t
= -- =
"'~"'c.u.,
• ......bian Sea ~ ~ • • ~;t~::;"';;;\ __ ;:''""T"~.=-==~,,";:::;::,::.=::.....-=---------------: ... ~.r",-:-, ,------------------------------.,.-"-+;'f
.. + •
1 • • • • --
co R k Crit ri
ofe
Moderate Risk High RI k Vel") HI h RI k
212

15.
Although there are no extremely high-risk locations across the city due to the fast
dispersion property of Ihis unstable gas, however, a distinct boundary of "high risk
corridor" emerged prominently. This deserves serious contemplation of all the
stakeholders.
Hotspots:
Old city area, J\azimabad, B. Area and Liaquatabad
Day & Time: Measure: Figure:
Whole Week Diurnal Averages (Total) 4.42
Spntill/ Patterns:
This thematic map has been produced through the superimposition of twelve thematic
layers of field observation of CO concentration across the metropolis; at the two
specified monitoring heights, three predetermined times the day, and two week
wise \llIrlalions. The author regrets existence of unreal high-risk corridor in the
eastern portion of the map owing to extrapolated estimation. The other patterns
formed are in line with the real life observations. Here a relationship could be
explored between the road density, traffic volume and enrichment of the pollutant.
Hotspots:
Nagao Chowraogi, Aisha Manzil, Water pump, Empress market and area near the
zoological garden
213

16.
17.
IS.
Day & Time: Measure: Figllre:
Whole Week 3 feet Diurnal Deviations 4.43
This fIgure is the ancillary statistical analysis performed by GIS indicating the data
variations. It has to be studied along with Figure 4.38 to appreciate the spatial
proximity and the severity of risk itself. For instance, the locations under extremely
high-risk corridors are also depicting minimal standard deviation; manager and
stakeholders need to look into the spatial phenomenon with care.
Day & 71 me: Measure: Figure:
Whole Week 4 y, feet Diurnal Deviations 4.44
This map illustrates the deviations among the monitored values at 4 y, feet height
from the surface. It is a supponing theme of the Figure 4.39. Wherever the average
value is higher and the standard variation is low, the risk severity is enhanced.
Day & Time: Measure: Figure:
Whole Week 3 and 4 Y2 feet Diurnal Deviations 4.45
This figure qualifIes the pattern of risk overall in Karachi metropolis and suppons the
geographical distribution ofCa emissions across the city Figure 4.40.
214

SPATIAL PATTERNS OF CO EMISSIO Diurnal Devi lion ( 3')
.-
+ • •
.......
•
, .. '" ~
( )
~
J-d ~ - 16 16 - 24 24 - 32 32·40
"--~

SPATIAL PATTERNS OF CO EMISSION Diurnal Devi tion (41/2')
--
"<1"
.....
:; Arabian Sea ~ ~
• • -+---------------------------------~------------------------------~~~ WlfUlt ._-=;:- ~- t."":/t" Y ( "'tftl'l
Staedanl Don
-+ --:.' __ ~.--~::~'--~.--~.
21C

Sp IAL PAITERNS OF CO EMISSION Dlurn I Deviation
"·W.lrl :~~ ______________________________ ,-__ ~"~w~,. ,~ ________________________________ ~~~,,~"., : ~ 5 h ...- r".. :
"""'K_
.
• + 1 , • • .... _-'
u-tS Ii - 1G 16 - 24 24 - 32 32 - 40
217

4.9 TEMPORAL VARIATIONS IN CARBON MONOXIDE (CO)
ENRICHMENT PATTERNS
Carbon monoxide (CO), a criteria-pollutant has rapid diffusion property due to its light
density. The patterns shown in Figures 4.28 to 4.39 throughout the metropolis at the heights
of 3 feet (approx. 1 m) and 4 Y, feet (approx. \.5 m) illustrate this phenomenon. The
passengers inside the automobiles (i.e. Cars, Taxies etc.), low height pedestrian (mostly
children), and motorcycle riders are more vulnerable than the riders of large size vehicles
(Buses, Minibuses, Trucks, Coaches) and air-conditioned vehicles.
Temporally, on weekday mornings, carbon monoxide enrichment remains on lower sides as
compared to weekday afternoons and evenings. As the city activities increase during the later
parts of the day, the spread of carbon monoxide becomes broaden at large. Variations have
been found in this fashion due to the neighbourhood characteristics. Nevertheless, weekday
evenings have been discovered as busier than afternoons in the residential localities of
district Karachi Central and district Karachi East vis-a-vis the old city (core) areas of district
Karachi South.
Understandably, for the weekend mornings the concentrations of carbon monoxide (CO) is
less than any other time during the week refer Figures 4.28 and 4.39. The inference is
obviously found in the connection between the carbon monoxide concentration and the
vehicular tramc. Weekend afternoons are more polluted than the weekend mornings whereas
evenings are the most polluted times of the weekend. The temporal trends have been
observed as similar among the concentrations recorded at both monitoring heights.
High-risk (Figure 4.42) zones are invariably having lesser diurnal deviations (Figure 4.45)
indicating consistency in carbon monoxide enrichment throughout the week. Looking at
Figures 4.40, 4.41 and 4.42 along with Figure 4.43, 4.44 and 4.45 simultaneously, large parts
of the Karachi metropolis have been unearthed as under perpetual high risk with little
temporal relief. These include old city (core) area and almost all of the localities district
Karachi Central. However, some locations indicated the occasional very high-risk zone
21S

owing to higher temporal variations such as Rashid Minhas Road (near Aladdin Park) and
Nazimabad Chowrangi.
4.10 AIRBORNE EPIDEMICS
In many health applications, a crucial issue is data quality: the use of complete and reliable
data based on standard disease definition is prerequisite. In Pakistan, the quality of most
routine health data is often questionable (Kazmi and Pandit, 200 I) therefore, instead of
relying on the data from hospitals, most of the analysis presented hereunder is from the data
primarily generated through questionnaires. This practice data based on the Physicians'
experience has much higher quality than the conventional hospital statistics due to the
educational background of the health professionals.
Most of the respondents were belonging to the age group of 25 to 40 years. They were fresh
and recently graduated male and female doctors. They have been practicing their profession
in governmental and private hospitals and clinics. However about 30 percent, doctors who
were in the age group of fifties were well-experienced. Approximately 50 percent of the
respondents were MBSS and remaining had some additional qualification. ' Majority of
respondent ' s (65%) had more than five years experience. Whereas, 39 percent doctors had
more than IS years experience. About 37 percent had started their career recently and had
less than five years experience. Thirty five percent of doctors had diversified, spatially
distributed information of air-based epidemics because they practice more than one location
with in the city.
4.10.1 Disease Gradin~ by Professionals
To assess how much air pollution was considered as a contributing factor for the incidence of
specified diseases . The diseases that have known and established relationship with air
pollution were listed and the focus group (Physicians practicing in Karachi) was requested to
rank their perceived contribution for each of them, quantitatively. The epilogue of that
grading has been narrated under the titles of:
219

• Highly associated
• Fairly associated
• Less associated
The diseases that emerged as highly associated with air pollution were, in descending order
Asthma and Allergies (#7)2, Air way and Lung irritation (#1), Bronchitis (#10), Nasal
irritation (#30), Headache (#21), Eye irritation (#18), Lung silicosis (#27), Emphysema
(# 17), Asphyxiation (#6), Irritability (#22), Sleeplessness (#36), Fume fevers (1119) and
Gastroenteritis (#20).
The diseases perceived as fairly associated with air pollution, were Lung fibrosis (#26),
Diarrhea (#16), Dermatitis (#15), Sarcoidosis (#35), Brain impairments (#9), Visual
impairments (#38), Dental discoloration (#14), Anaemia (#3), Cancer (#11), Cyanosis (#12)
and Premature Aging (#33).
The diseases perceived as less associated by physicians with air pollution, in descending
order, were: Dental caries (#13), Melanosis (#28), Reproductive Problem (#34), Alopecia
(#2), Arteriosclerosis and coronary heart disease (#4), Nerve impairments and ataxia (#31),
Para thyroid disturbances (#32), Muscular impairments (#29), Jaundice (#23), Liver
malfunctions (#25), Thyroid disturbances (#37), Kidney malfunctions (#24), Arthritis (#5)
and Bone diseases (#8) .
4.10.2 Morbidity treated by Physicians
Through the same questionnaire, Physicians practicing across Karachi were asked to provide
information on the morbidity and frequency of air pollution induced diseases. Figure 4.46,
ranks symptoms and diseases frequent in Karachi metropolis. This review has consequently
categorised 38 Symptoms and diseases into three broader distinctions.
Frequent
Fairly Frequent
, Numbers in brackets arc serial numbers Allnexure 'F (F. Q I)
220

Puatllyroid dishllbw'll:'" Epidemics of Airborne Diseases (2001)
Nttl'C' iDIpairmtrf. and II ... (inq'" ..,,,, __ .)
Alapcdl Oon of_) ".=J Rep(od1X1~ ploblcml
...... -a Bone Diac .. e.
IUpbylQariol
,-""' ...... ~~~ u.. .i1ico .. )I
v ........ _"5[ Kidney ..u\n:tiCUII
....... DcItnI d-.eo~rahon
Tbyroid dill'lIrtI.-. ,. ••••• C===J .... ...,. '-__ -===::1
DcN~,~ ,. ••••• -====::1 ---"-=-==---Nualirritltion
-----,..,.
II Fre<p:DCY
~~... ~IIIIIIIIIIIIIIII~=====~
S",p'""-'e===~~~ E)'tm..liou
Bronclib
o ,. .. .. .. 50 .. Figure 4.46
221

The critique of Physicians has marked "Airway and Lung Irritation"(#I) as the most
frequent in their respective practising neighbourhoods. This is very much expected as the
pollutants such as CO, C, FeOl, SOl, N01, 0), Ch, NH), As, Pb, Asbestos, quartz and silica
dusts (Coburn, 1970; Waldbott, 1978) are considered as the causing factors for airway and
lung irritation. In fact this symptom could be the initial stage of few diseases such as
Tonsillitis, Influenza, Respiratory tract infections etc. The airway of people with Asthma (#7)
IS extra sensitive to irritating things m the air (called irritants)
(http ·lIwww.familydoctoLorglhealthfactslO 14D
Interestingly, the health professionals have marked Asthma and allergies (#7) as the second
most frequent disease in Karachi. Ca, Pollen, Fungi, Insect scales, House dust, isocyanates,
PVC, SOl, epoxy resins, 03, N01, HCHHO are the pollutants responsible for Asthma and
allergies (Waldbott, 1978; Calabrese, 1991). Basically Asthma is a disease of the Lungs.
Patients are extra sensitive to things that they are allergic too (called allergens)
(http://www.familydoctor.orglhealthfactslOI4D. Ansari (1998) declared uncontrollable and
growing pollution in metropolitan cities of Pakistan as a main radix of burgeoning Asthma.
Bronchitis (# I 0) ranked as the third highly morbid disease according to the appraisal
provided by Physicians. It is the inflammation of one or more bronchi
(IlIlp:llaliserv.rug.ac.beI- rvdslich/euglossIDIC/dictioI3.hlmlN0259). Girt (1972), attempted to model the
number of Bronchitics and air pollution variables mathematically . Mass Miniature
Radiography Committee of the Pakistan Anti-Tuberculoses Association presented some
study results. 121 children out of 851 were found suffering from different diseases; acute
bronchitis amongst one of them. Their investigation revealed that pollution was the leading
cause for chest diseases (The News, 1998). Literature on Epidemiology has widely reported
SOl, 0) and NOl being the pollutants in air causing Bronchitis (NAS, 1977; OECD, 1984).
Eye Irritation (# 18) was rated as the fourth highly frequent symptom across Karachi by the
professionals. SOl, NH3, H2S, HCHO, V, Peroxyacetyl nitrates (PAt "Is), Benzyl chloride and
Acrolein cause Eye irritation (Waldbott, 1978; Guderian, 1983). Here, it would be appealing
to look at the figures provided by the Civil hospital, Karachi for 200 I (Annexure E. I) Two
222

major eye ailments viz. Glaucoma and Cataract had indoor patient cumulative morbidity of
549 persons. Although eye irritation is merely a symptom but prolonged exposure to S02,
P AJ'\Is and other pollutants could lead to chronic eye diseases. Orakzai (1998) remarked that
the environmental pollution had taken a serious dimension in Pakistan and thus causing eye
diseases, which were affecting almost every second citizen of the country.
The account made through the Physicians' experiences rests 'Sleeplessness' (# 36) as on of
the major complaints by the patients in Karachi. Lead (Pb) causes sleeplessness (WHO,
1980, 1989). A study (Yousufzai, 1991) found a definite correlation between ambient mean
Lead (Pb) level and daily average traffic. In spite of the fact relatively very pure sea breeze
blow across the city, traffic jams, poor conditions of the engines and heavy traffic are the
major cause of high Lead pollution (2989 ppm) in the city centre of Karachi (Yousufzai,
1991). A World Bank news publication had included Karachi along with Cairo, Algiers,
Jakarta, Cape Town, Jeddah, Lim,!, Mexico City and Nairobi as the cities where people were
susceptible to develop certain diseases owing to increased lead levels in the environment
(APP, 1996). These flDdings are academically encouraging as they are in synthesis with the
assumptions of this study. Fortunately when these lines are written, Lead in Gasoline has
been eradicated in Pakistan by control measures.
Another health problem associated with Lead (Pb) and Fluoride (F.) (WHO, 1970, 1980,
1989), "Headache" (#21) was confirmed as frequent by the questionnaires' result. In a
separate inquiry of questionnaire responded by general public, Headache was the highest
complaint of Karachiites Annexure E. 3. This symptom is inherent with the urban life style.
The ache across the forehead or within the head could be induced due to tension, another
urban epidemic. Nairn (1995) reported an IUCN and Baqai University's study of 100 traffic
police personnel in Karachi indicated that about one·third of the healthy young men recruited
rrom the rural areas develop central nervous system problems, including vertigo, loss of
concentration and headaches, within two years of serving on the city's streets.
Diarrhea (# 16) is defined as abnormal frequency and liquidity of faecal discharges
(http://allser,,.mg.ac.beI-rvdstich/euglossIDIC/dictio25.htmlIlO487). Binder and Hohenegger (1982)
223

studied the human metabolism and held F- and HF responsible for this very common
disorder. Other studies (Walbott, 1978; Bruaux and Friberg 1985) have exposed the
contribution of As and Pb for causing Diarrhea. Pb was prevalent in Gasoline until recently
and much has been published OIi this episode. A study conducted by the University of
Karachi (Asadullah, 2000) authenticated significant correlation between the number of
passing petrol driven vehicles and the amount of lead in the pal1iculate deposits collected
from the plants growing along the road at different designated sites in Karachi (Asadullah,
2000)
Gastroenteritis (#20) was appraised as the next frequent disease in Karachi metropolis . It is
an acute inflammation of the lining of the stomach and intestine, characterized by Nausea
and Diarrhea, which has several causes including air pollution. This disease is also called as
, Enterogastritis' (hup:llallserv'. mg aC.beJ-rvdstich/euglossfDIC/dictio36. hllnl#()704 ). The biological
impacts of CO, HF, Pb, F-, ln, Hg, As and Se present in the air are supposed to be causing
this physiological disorder (Coburn, 1970, Tomatis, 1990). Interestingly, a study conducted
by University of Karachi examined Lead (Pb) content in numerous food items sold in
Karachi . They had considerable amount of lead, much greater than WHO's standards. The
researcher believed that the food items had absorbed Lead (Pb) from smoke exhausted by
heavy vehicles using low-grade petrol then (Husain, I 997a).
Nasal irritation (#30), a symptom leading the Physicians to many complicated diseases has
its roots in air pollution due to S02, HF, Ch, F-, As, Ni, Cr, Se, and V (Stern, 1977). The
pollutants that accumulate in the nose can cause problems locally, or be absorbed in the nasal
mucosa, resulting in a number of deleterious effects on the body. The air pollutants that are
absorbed also affect the nose in an immunologic way - allergic rhinosinusitis. Patients with
existing allergies become more allergic and less responsive to therapy. In Pakistan, according
to a news report (Correspondent the Muslim, 1998; Correspondent Frontier Post, 1998) about
60 percent of respiratory diseases are caused by unhygienic conditions and environmental
pollution.
224

Anaemia (#3) is deficiency in the amount or quality of red blood corpuscles or of
haemoglobin in the blood (Wagman, 1985). Pb, Mo, Se and V contribute towards Anaemia
(Waldbott, 1978; Wellburn 1994). Air pollution is the source of a wide variety of materials
that may enter the blood. Chemicals with known adverse effects, often or usually airborne,
include benzene. lead and other heavy metals, carbon monoxide. volatile nitrites, and
pesticides and herbicides. All of these have been found to lead to deleterious effects on the
blood and the hematopoietic system (http://www.napenet.org/apslidesi22blood.html). The
assessment of Physicians' ranked Anaemia at lOth position for Karachi. Yousufzai (1994) did
some work on Blood Pb levels in sample of Population of Karachi and reported Sixty-two
percent (62%) had blood lead level between 100 and 200 ~g 1'1. If it is compared to the
critical value of I OO~gIL (WHO, 2000), the risks are obvious. Another pertinent work done
at the University of Karachi studied the level of lead in fruits, vegetables, grains and pulses at
various locations in Karachi. Most of the analysed samples contained higher levels than the
maximum permissible limit of 0 I parts per million.
Jaundice (#23) essentially a liver disease is reported to be originated from the heavy metals
in the air such as Pb, Ti, Se and Nitrogen Oxides (NAS, 1977; Wellburn, 1994). Exploring
the relationship between Lead (Pb) in the ambient air and blood lead concentration, in the
general population of Karachi, Taqvi (1993) showed higher blood lead level in those person
e.g. policemen and drivers, who spend a good deal of their working hours outdoor.
Dental Carries (# 13) is the gradual decay of the white crown (hard tissues) of teeth , due to
the actions of micro organisms or chemicals such as Se (Waldbott, 1978; Wellburn 1994).
General Physicians (respondents). categorized it as a frequent anomaly in Karachi. It is
suggested that the frequency of this anomaly be explored further through a critique of Dental
Surgeons.
Dermatitis (# 15) i.e. inflammation of skin
(http://allserv.rugac.be!-rvdstichieuglossIDIC/dicti024.html#00471 ) IS also among the
frequent diseases in Karachi, according to the doctors. It is also one of the clinical symptoms
induced by large quantities of air-borne pollutants such as As, Cr, Ni, Se, V,
225
Organophosphate and HCHO. The skin is the body's external interface with the environment.
It is a target organ for pollution and also the site of significant absorption of environmental
pollutants. The atmospheric pollution of ozone-depleting chemicals such as
chlorofluorocarbons (CFCs) is a major concern because of its suspected relationship to the
development of skin cancer (http://www.napenet.orglapslidesl24skin.html).
The breadth of this study prevents from going into the further particulars of diseases related
to air pollution and their frequency in Karachi . However, it would be worthwhile to
enumerate the symptoms and diseases that were evaluated fairly freqllelll than the ones
discussed as highly frequent. In descending order they were : Irritability (#22), Thyroid
disturbances (#37), Dental discoloration (#14), Arthritis (#5), Kidney malfunction (#24),
Visual impairments (#38), Lung fibrosis (#26) , Arteriosclerosis and coronary Heart Disease
(#4) and Liver malfunctions (#25)
This revIew would remain incomplete if the diseases marked as leas/ frequent in the
practicing localities of the respondents are not mentioned. In descending order, they were:
Cancer (#11), Lung silicosis (#27), Premature ageing (#33), Asphyxiation (#6), Bone
diseases (#8), Emphysema (# 17), Brain impairments (#9), Reproductive problems (#34),
Alopecia (#2), Nerve impairments and ataxia (#31), Fume fevers (#19), Sarcoidosis (#35),
Cyanosis (# 12), Melanosis (#28) and Parathyroid disturbances (#32). Probably, these med ical
terminologies were intensive enough with respect to the limited and precious time available
to the respondents. Another learning from this task was that focusing on symptoms rather
than specific disease was more convenient for the respondents .
To discover the spatial distributions of air pollution induced diseases within Karachi, new
questions (Annexure F Q. 2) were developed for distribution among the general public
(residing across the metropolis) and amongst the people working in the old city core of
Karachi . Necessary modifications were made according to the experience from the
Physicians appraisal. The narne of diseases was mostly replaced with either symptoms or
easy to understand synonyms. The diseases, which were ranked Least Freqllelll by the
doctors' critiques, were either not included in these new questionnaires or the ailment was
226

clearly explained. For instance. Lung and Throat Cancers were specifically spelled out. Even
some of the diseases characterized as Fairly Freqllel1/ through the Physicians assessment
were also dropped from the list. The main reason of this short listing was the low awareness
and literacy level of the man out in the street.
4.10.3 Morbidity and Mortality: Vital Indices
On the basis of literature reviewed on clinical discoveries. the diseases that could be
categorized as • airborne' were extracted. Prominent among those were Bronchitis.
Emphysema. Asthma, Acute Bronchitis, Pulmonary & Respiratory Tuberculosis, disorders of
Peripheral Nervous System, Whooping cough, disorders of Thyroid Glands. Anaemia. Eye
ailments. Influenza and Skin diseases. The leading public sector hospitals records (where
reputed medical colleges are being run) were approached to find out the spread of pollution
based diseases over the metropolis.
Civil Hospital, Karachi located in the old city (core) Karachi caters thousands of patients
daily on the Out Patient and Emergency departments. There has been no disseminated data
for this huge influx of Out Patients at the busiest public sector hospital of Karachi .
Fortunately. the statistics for Indoor Morbidity and Mortality has been managed according to
the disease code number and detailed list number. Table 4.5, manifests the findings of twelve
months statistics of the largest hospital in Karachi . Analyses reveal Air-induced diseases
capture about one fifth of the morbidity . One in every four deaths in Civil Hospital Karachi
was on account of air pollution based diseases. This limited data exhibit that had there been
daily Out Patient figures publicly available, surprising findings could have been possible to
derive.
Table 4.5: Indoor Morbidity and Mortality Statistics 2001
227

The second major hospital managed by the government in Karachi is the Jinnah Post
Graduate Medical Centre, located near old city (core) of Karachi . Here too, thousands of
patients are daily catered at the Out Patient and Emergency depanments. The hospital has
several Indoor treatment sections. More than two thousands Indoor patients have been found
affected by air-induced disorders in last two years . Table 4.6, shows the Monality and
Morbidity statistics revealing very high ratio between both parameters. Again, the statistics
on Out Patient was not maintained at this imponant hospital. The numbers presented in Table
4.6, calls for the dire need of managing this vital public health data so that surprising results
could be explored .
Table 4.6: Indoor Morbidity and Mortality Statistics of Airborne Diseases 2000 and 2001
Air pollution contributes to monality and morbidity. Kunzli el at. (2000) estimated the
impact of outdoor (total) and Traffic-related on public health in Austria, France and
Switzerland. Attributable cases of morbidity and monality were estimated in this European
assessment. Air pollution caused 6% of total mortality or more than 40,000 attributable cases
per year. About half of this (all mortality caused by air pollution) was attributed to motorized
traffic, accounting also for more than 25,000 new cases of chronic Bronchitis (adults >= 25
years); more than 290,000 episodes of Bronchitis (children less than 15 years); more than 0.5
million asthma attacks; and more than 16 million person-days of restricted activities.
4.10.4 Spatial Distribution of Airborne Diseases
A comparison between the prevailing diseases among general public and population at risk
(working near the congested areas) is presented in Figure 4.47. The comparison appeared to
be pretty consistent within the framework of both of these focused groups. Figure 4.47, again
has pointed out that the public could identifY the common disorders more easily than the
228

once which were difficult to comprehend such as high cholesterol , efficiency loss, types of
cancers etc. The family members of the respondents were largely suffering from Headache,
Hypenension, Eye ailments, Chronic Influenza, Stress and Tonsillitis. While Nausea,
Chronic Cough, Hearing Loss, Learning Loss and Palpitation were prevalent disorders to a
lesser extent found in the respondents.
An interesting convergence could' be deduced if Figure 4.47 is studied along with Figure
4.46. Keeping the differences in technical and popular terminologies in mind, the highly
prevalent diseases (from the questionnaires) are also those categorized frequent by the
Physicians critique. The symptoms of Headache, Hypenension, Eye ailments, Chronic
Influenza, Stress and Tonsillitis were highly prevalent, according to the outcome of this
analysis. Moreover, the frequent diseases, according to the Physicians critique, were Airway
and lung irritation, Bronchitis, Eye Irritations, Sleeplessness and Headaches. This
coincidence was although unexpected but is much relevant from epidemiological viewpoint .
The disease data collected covered 55 out of 58 analysis zones. This data was penaining to
the occurrence and prevalence refers to Annexure E. 3. The characteristics of data are given in
Table 4.7 and Table 4.8.
Table 4,7: Disease Occurrence: Table 4.8: Disease Prevalence: Descriptive Statistics Descriptive Statistics
. ;' :: :.:MeilSlir'e. - '2;. -c. 'f'~7' v..aii.~"'-:;' .-,'j ' ~":2 MtaSlirer --; : , .,: ;::. _"Value . Mean 8.67 Mean I3 . 8~
Slandard Error 1.23 Slandard Error 1.96 Median 5 Median 9.33 Mode 4 Mode 9.09 Slandard Deviation 9.17 Slandard Deviation IU~
Samole Variance 84 .15 Samole Variance 211.42 Kurtosis 5.53 Kurtosis 5AS
Skewness 2. 19 Skewness 2.2(, Ran~e 46 Range (.6. 12
Minimum I Minimum 1.02 Maximum 47 Maximum 67 . 1~
Sum 477 Sum 763 .79 Counl 55 Count 55 Lar.est(2) 32 Largcst(2) 66.66 Smallesl(2) I Smallesl(2) 1.80
Confidence Level(95 .0%) 2.47 Confidence Lcvel(95 .0% 3_9.1
229
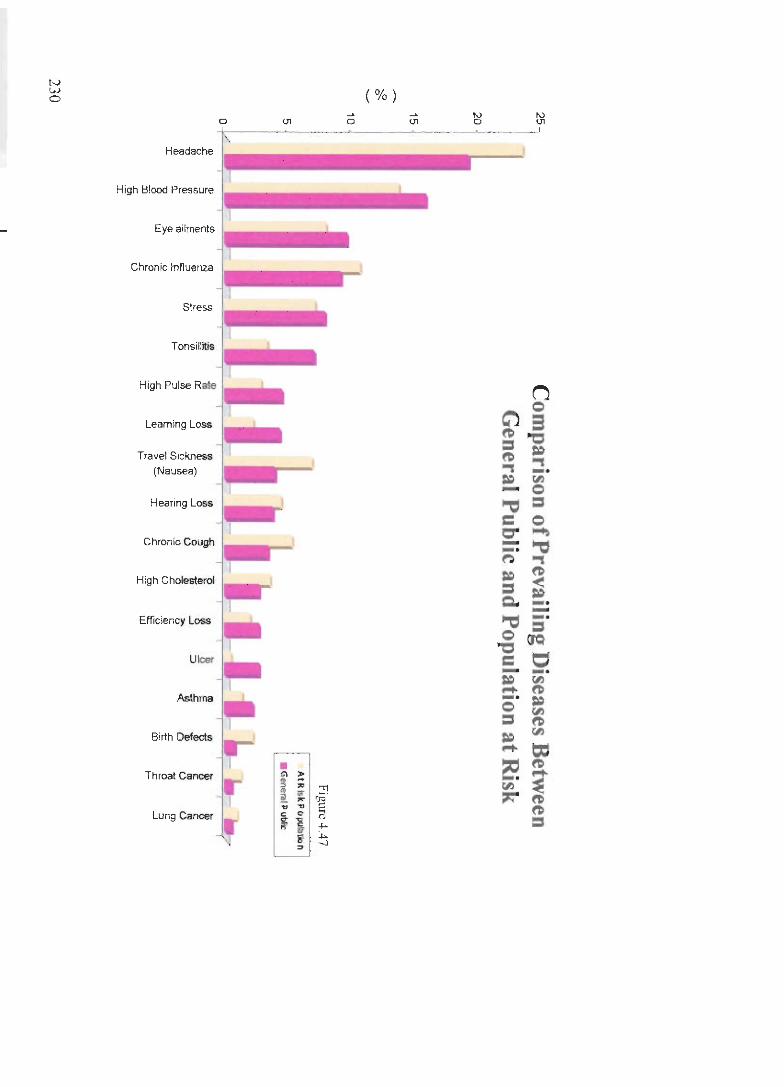
tv uJ 0
Headache
High Blood Pressure
Eye ailments
Chronic Infiuenza
Stress
Tonsillitis
High Pulse R<>I.
Leaming Loss
Travel Sickness
(Nausea)
Hearing Loss
Chronic Cough
H;gh Cholesterol
Efficiency Loss
Ulcer
Asthma
Birth Defects
Throat Cancer
Lung Cancer
(% ) ~ ~ ~ ~
a ~ 0 ~ 0 ~
k-----.---... --. .J ---<------- , I'
(j C")Q ~ 3 =~ ~ ~ ., ., ~ r;j . -Q "'tI= = Q r:r"'" =-= ~ ., ~ ~ = ~ Q. _ . -"'tI - . Q = ~(JQ
=.t:1 ~ _ . .... III _. "' Q ~ = ~
• ~ III
~ ! .... == ~ ~ ~ ~ ~ ;; ~ ". ~ i c o t; III "'i' " -"- ,, '" .... ~ ~ ~ "' ~ ~ =

The analysis zones determined by the then Karachi Development Authority serves as the
precinct of metropolitan Karachi for the purpose of this study. Figure 4.48 maps the disease
occurrence for Karachi. The higher occurrence of air pollution based diseases in the study
area was in the district Karachi Central, specifically, Nonh Karachi (Zone # 31), F. C Area
and Mansoora I F B Area (Zone #28) The affected zones of district Karachi East were
Garden, Soldier Bazaar, lamshed Quarters (Zone #11), Korangi (Zone#39), Landhi Colony
(Zone#40) and Akhtar and Baloch Colony, Chanesar Goth (Zone #25) . In district Karachi
South, which comprises of mostly the old city (core) localities of Karachi, Saddar and
Artillery maidan (Zone # 3) had the highest occurrence of airborne diseases. Orangi,
Metroville-I (Zone#30) of district Karachi West posses a significant disease problem.
Figure 4.49 map the normalised disease point prevalence for the metropolis of Karachi . The
wide coverage of metropolis was made possible via extensive questionnaire survey. The
outskins and relatively rural zones of Karachi having scattered population were fortunately
involved. The spatial patterns of disease point prevalence are diffused from the city centre
towards the peripheries. These results are apparent outcome of the existing demographic and
socio-economic behaviour of zonal regions, which may create the urban functional
agglomerations and accessibility to the health facilities
This assessment estimated the public-health impacts of current patterns of air pollution in
Karachi metropolis with the limited data available. Although, individual health risks of air
pollution are relatively small, the public-health consequences are considerable. Trafiic
related air pollution remains a key target for public-health action in European countries
(Kunzli, It! aI., 2000). The results presented in this chapter have attempted to provide the
decision makers, quantitative assessment of environmental health scenario for the
metropolitan city of Karachi.
231
-
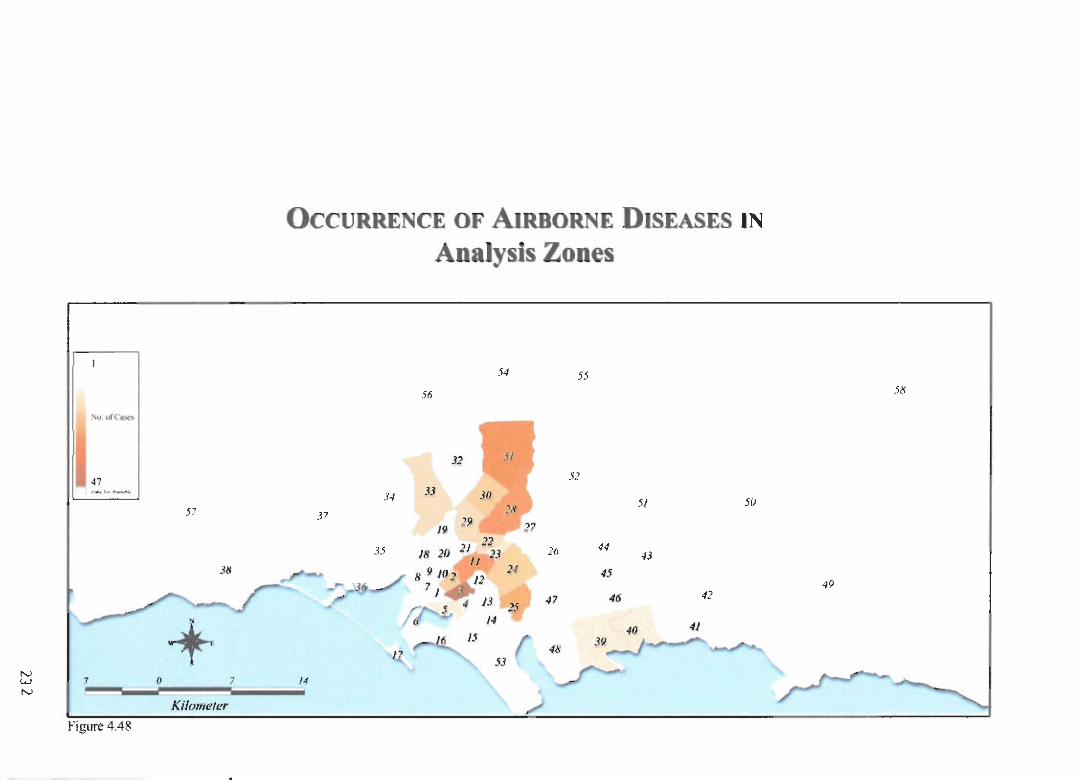
N (.oJ
N
1"-0. <) f ("1b('jo
'7
7
Figure 4.48
57
38
+ o 7
K ilonJf!Ier
OCCURRENCE OF AIRBORNE DISEASES IN
Analysis Zones
34
37
35
-,.... - -'
I.{
I<
.'4
56
32 31
.'-1 311 2X
J9 19
22 'I 21
J8 2(J • /I '}4
8 9 I(J~, i2 7 '
J 4 J3 2.' 5 . i4
~ 15 - "'-53
55
52
27
26
47
48
44
45
46
39
51
43
4Q
50
42
41
5~
49

N W W
\ .. _. , .. ' .. ,--
~
//
7
Figure 4.49
POINT PREVALENCE OF AIRBORNE DISEASES IN
Analysis Zones
~/-
r'~r'-.J \ / )./'-
/ . / / .// , $7 / \ , ,
\,
+ o 7 14
Kilometer
" --'-....... ~
1
I /
56
// ,
l... i' ·, _ .. , .....
i J4 \ ~j
( ~ ~ v"
'\
A-/·"'·' -, ,
I \ .1/ ),
I
I..,... - / / ~ 4y ]6
47 ~---.....
48 .13
"' 4~ --. \ \.
'-, ./
.--4]
41
) - - -"--'\ '. , i J8 I ,
~ ~ /<~ . '" , .. -v- .//
50
(' /'./ """'\
.r' ,/./
! "' \
'vI \ 49
-./'--""""----

4.11 PERCEPTION CRITIQUE
Focus group questionnaires supplemented the quantitative data and provided insights into the
perception dynamics of air pollution among various demographic and income groups. The
participants were selected and organised by age, gender, education, occupation and income
levels. The participants were also selected to ensure racial and ethnic diversity associated to
the cosmopolitan city of Karachi for ascertaining their attitudes and perception of the urban
air pollution problems.
The people working across the old city (core) area of Karachi were pre-dominantly (69%) .
• Patharay walas' vendors and small businessmen; the rest were office workers. The author
could reach 20% female respondents, which is a high break up in a pre-dominantly male
chauvinistic society. Having known the international debate about education and income (De
Souza, \999), the focus was to target urban poor (10%), working (lower middle) class (52%)
and middle class (24%). The definitions of literacy and social classes were according to
Pakistani standards. About 8% of participants were illiterate, 37% had gone up to secondary
school and the rest were higher (2J % higher secondary, 27 % University graduates and 7 %
Postgraduates).
The perceptions regarding the linkage among environmental problems and urban /
illfrastructure variables were uncovered through various queries. Most of the Karachi's
workers live in the peripheries (Surjani Town, New Karachi, Landhi, Korangi, Orangi, Malir
etc.) so they have to commute long distances everyday. About 3/4'h of the respondents have
daily work trip time exceeding 2 hours. The inhabitants at risk were asked to identify the
mode of transportation for their work-related trips. Most of the participants (51 %), owing to
their social status were compelled to use the cheep fared, low quality, over crowded and
diesel propelled transport modes. Motorcycle (20%), a two stroke engine vehicle, has
emerged as a symbol of middle and lower middle working class means of transport,
according to the findings of this survey. Some (12%) respondents appeared to be the
residents of adjacent neighbourhoods as they walk for their work trips, thus their
susceptibility to disease is higher and perpetual.
234

Drawing conclusions towards the environs. pertinent respondents were inquired about the
nearest road to their workplace/residence, its traffic conditions, operating speeds etc. The
participants perceived their proximity to the nearest main road within 100 feet (42%), within
300 feet (47%), and beyond (10"/1,). It appeared that habitants were too close to the source of
pollution i.e. Traffic. Traffic jams were perceived as a chronic problem throughout (85%) the
study area. The AM rush hours discovered were 07:00 - 09:00 (80"/1,) and 9:00 - 11:00
(92%). The PM peak hours were opined as 5:00 - 7:00 (93%) and 7:00 to 9:00 (81%) refer to
Figure 4.50. Three-fourth of the participants linked the congestion during rush hours with
medium and slow traffic operating speed, which is because of the narrow roadway width.
They were requested to furnish the reason for the slow operating speed at the nearest road.
Unmanaged high volumes (47%), roadway conditions (35%) and on-street parking and
encroadunents (18%) were seen as the chief reasons for congestion. Participants indicated
that the reckless attitude of drivers of heavy vehicles (Trucks, Mirubus and Buses) and lack
of enforcement of traffic rules made it difficult to expect any change. The roads in the old
city (Core) region of Karachi could not be widened due to the space restriction and built
environment.
Pauiuul R ..... HCU'S ... ... ... ... ... "" ... JOG
' -I • ~ f I I
.... ~. <-
• J I ~ ! I • I I • ~ ~ ! I ~
l i • ! ! ! i J ! ! l
Figun:4.S0 I
235

Understanding of problem, its insight, effects, personal impact and controlling measures are
all dependent upon the collective perception of the pertinent population. The most important
source of air pollution in Karachi City is the urban transport system. Opinions were gathered
about the adverse affects of the traffic present nearby. It was mainly an attempt to examilW
the quality of societal perception and to see if the population at risk could establish the link
between cause and effect themselves. The focus group was probed on the affects of the
prevailing conditions. The responses varied again, according to their levels of understanding.
77 % of the respondents could only perceive up to pollution, whereas 14 % of the responded
had the ability to think beyond. Some people (11%) had the approach to correlate these
conditions with health problems in an open-ended question. Similarly very few (3 %)
perceived that the traffic on road was the main problem of weathering and erosion of their
buildings. It cost a lot because they had to spend money again and again on to repairs their
buildings. Few (9 %) respondents were unable to perceive any problem whatsoever related to
nearest road and traffic.
In Karachi, another polluting object in the vicinity is often a Kaehl'll Kundi. One third of the
sample population was suffering from nearby Kachra Kllndi. Though, it is apparently an
issue of Solid Waste Management but it is linked with air pollution closely. The practice of
burning the waste at these locations is considered to be part of daily life in Karachi . 82% of
the participants reside / work within 100 feet of its location, which must be hurting their
health in a subtle manner. Majority (55%) believed location of a garbage dumping places are
adversely affecting human health and conditions of building. As the participants could be
denominated as 'layman' so about (38%) could not behold beyond ugly and obvious
pollution.
Industry, a source of pollution in the environment, was in the neighbourhood of some (23%)
partakers. Nearly half of them (49%) attributed air and noise pollution to the positioning of
nearby industry and a good number (39%) linked its impacts on their health and houses.
Overflowing of sewerage manholes is a great nuisance in the urban life of Karachi. Although
(311%) respondents reported this problem, however, only (13%) out of them complained
236

about bad smell (H2S gas odour), a large majority (78%) linked it with other harmful health
effects besides Malaria, few (5%) were unable to imagine it as a problem
Perception regarding air pollution around the neighbourhood varied according to the level of
education and economic status of the respondents. Inhabitants of the study area felt highly
concentrated air pollution (75%) in their neighbourhoods and this might be effecting their
quality of life. Nearly all participants (98",1,) clearly considered that air pollution was having
adverse effects on their health. However, when asked to rate the extent at which they
perceive air pollution effecting human health, the perceptions varied according to the
educational level of the respondents. A high correlation was found among educated
participants and problem intensity ratings Figure 4.51.
CompMtlon 8etVJeen ...... ~ EducZIDn and PerceIved Ef'Fecbi ~ Air Pollution 011 Human 1_1th
There bas arisen a dilemma of comprehending the complete dimensions of air pollution
problem among the Kara.chiites. After having an almost cent per cent affirmation on the
adverse affects of air pollution, the same percentage of people literally do not know about
any remedial measures. It is a typical third world citizen's pessimistic psychology and
irresponsible individual behaviour. Such perceptions about personal impact on air pollution
intensifY risk at community levels.
237

It is interesting to note that in a country of 140 million with an annual population growth rate
of 2.8 (PRB, 2001), (90%) of the urbanites thought that growing population was the primary
contributor to environmental degradation. Nearly all the governments in Pakistan have been
generous in advertising the slogans of family planning. Large-scale media campaigns have
influenced the citizens to start perceiving population as a problem than resource.
To explore the notion of 'safe haven', a deliberate question was coined . Substantial (41%)
number of people believed the Places of worship, approximately one third considered their
honies and some (23%) perceived recreational places as 'away from environmental stresses'.
Concluding the chapter on Perception analysis, the author would like to offer his own
perceptions about the issue. If the detrimental effects of air pollution on health were
widespread and more publicised in the Pakistani society, the public would have been more
willing to change their mind-set. In the efforts to reduce air pollution, initiatives and
incentives are needed. Legislation and enforcement could only produce results partially. The
bottom line lies in the poverty and socio-economic conditions of the citizens and the country.
The living conditions of the public go together with the financial health of the state. Owing to
uncertainty, dissension, regionalism, class disparities and lack of national interest; politics
and governance in developing nations as Pakistan manifest negative impressions on the
public psychology. Pessimism could be seen in the qualitative inferences of this Perception
Analysis.
238

4.12 ZONAL APPRAISAL
4.12.1 Zone # 1: Juna Market, Old Town area
Land cover (Figure ~v. I)
Land use (Figure Gr. I )
Populalioll Densily (Figure -1. 1 OJ
Disease Occurrence (jigure 4.48)
Frequenc airborne disease
Disease Prevalence (Figure -1.49)
Referred Figures of Zonal Aggregales
CO concentrations across the zone
.;-,/ '2';;< ';::'-:.\ ,.
Densely buih up (87%)
Urban RenewallRedeveloplllenl (7M%).
Commercial (22%)
46,610 persons per square km
Low
Hypenension. high choleslerol
High
Series of Figures from 4.52104.74
"" Z" " .:~., I <~'; . " .
. ,: :.' :' ~".:. ' .• ',(C .
. <;:: .' ,. ,>/ j] ., i'( ~ '. ': . Meal!' ..
3 "" 17 8 46
W.,k;n< Dav , Heel 17 49 W.,k;ng Day Ewn;n"" 3 "" 12 8 H Won.;ng Day ,4;''''' 12 6 26 IVork;n" D-av ,4b"" 26 IV«kday Even;n .. 4 Y, fee' 10 7 32 . ; , fccl 10 43 21
3 f," 10 7S 29 I Evenin .. 3 1.<1 10 104 47
,4 Y, ,,,., .10 36 14 ,4 Y, feet 10 42 19
, Even;n., 4 'h I,,, 10 90 30 ,3,«< 17 66 41
W«lJv Am.« 4 'f, ",' 40 25 Wukl, IS SJ 33
Tnhlr- 4.9 : CO cOllcrnlnlllo .. s across Ihe .Jw)a l\.liukrL. Old TOll'll ;Ire"
4.12.2 Zone # 2: Ranchore Line & Ramsawami
Land cover (Figure Gy.2)
Lllnd use (Figure Gr. 2):
PopulaIion Densit)· (Figure 4.10)
Disease OccuJfcncc (FIgure -1.48)
Frequenc airborne disease
Disease Prevalence (Figure 4.49)
Referred Figures of Zonal AggJegales
Densely buih'up (74%)
Urban fCnewal/redeveloplllenl (63%).
Commercial and planned Residencial
86790 persons per square kilomelre
Considerable
Headache. Chronic Cough. Chronic
Influenza
High
Series of Figures fro1114.5210 4.74
239
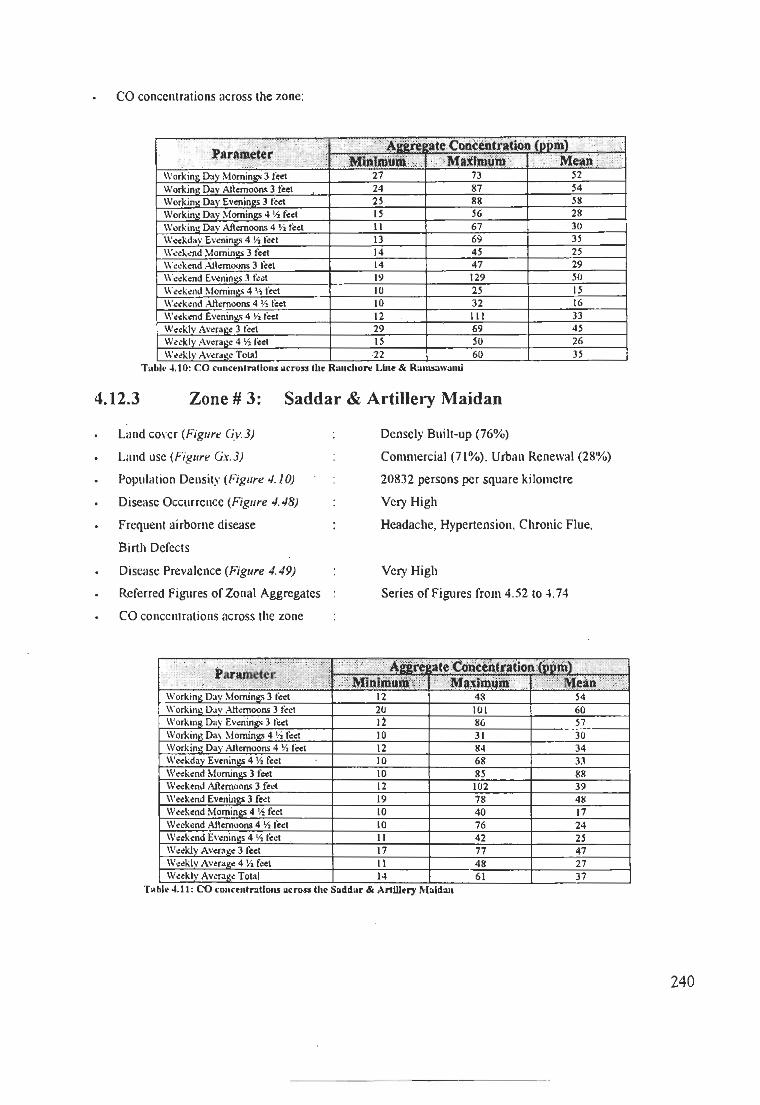
CO concentrations across the zone:
W"!!''''!l Dav ' 3 10., 24 87 l4 Workin, Day Evenin., 3 1«1 2l 88 S8 Work',," Day ,4 V, r,,, ~ S6 28 \\,<>!! ill" Dav ,4 V, I;'" 67 JU
, Ev,"in~' 4 Yd;''' 69 3S, ,If<<' 14 4S 2S
,If<<' 14 47 29 W"k,nd Evenin", 31'", 19 129 SU " '"k",,1 ,4 V, 1«1 '0 IS IS
,4 1', 1;''' 10 32 16 \\'"k",d Ev<nin~' 4 V, ,«I III ~3
\\'"klv.!\,,,.&<: 1«' 29 69 4S
Tublt, ",10: CO cunct'nlnallons u.l."roSlllh~ R: .... cllort' Lb,~ & R.unsaw:ulU
4.12.3 Zone # 3: Saddar & Artillery Maidan
Land cOl'cr (rlgure Gy,3) Densely Built-up (76%)
Land use (Figure Gx,3)
PopulllJion Densil)' (Figure -1,10)
Disease Occurrence (Figure -I, -18)
Frequenl airborne disease
Birth Defecls
DisC<lse Prevalence (Figure 4.49)
Referred Figures of Zonal Aggregales
CO conccnlrations across the zone
Commercial (71 %), Urban Renewal (28'Y.)
20832 persons per square kilomelre
Ver), High
Headache, Hypertension, Chronic Flue,
Very High
Series of Figures from 4,52 10 4,74
240

4.12.4 ZONE # 4: CIVIL LINES AREA
Land cover (Figure Gy. 4)
Land use (Figure Gx.4)
Population Density (Figure 4. /0)
Disease Occurrence (Figure -1.48)
: Densely Built-up (42%). Vegetation (3-1%)
: Commercial (58%). Planned Residential (40%)
: 41094 persons per square kilometre
: Low
Frequent airbome disease :Headache. Nausea
Disease Prevalence (Figure -1.49) : Considerable
Referred Figures of Zonal Aggregates :Series of Figures from 4.52 to 4.7-1
CO concentrations across the zone:
T~ble -',12: co cOlleenlruUons aeruss the ChU Lim,'s Are-.1
4.12.5 Zone # 5: 1.1. Chunddgar Road & New Queens Road
Land cover (Figure Gy.5)
Land use (Figure Gx.5)
Population Density (Figure -I. /0)
Disease Occurrence (Figure 4.-18)
Frequent airborne disease
Disease Prevalence (Figure 4.49)
Referred Figures of Zonal Aggregates
Densely Built-up (58%). Medium Built-up (2()'Y")
Planned Residential (45%). Tmnsport
Facilities (39%)
7245 persons per square kilometre
Low
Stress. Chronic Flue
High
Series of Figures from 4.52 to -1.74
.------ -
241

CO conccntrations across the lonc :
, . . :':" AUri: *;:e·Coiltelitriltioo.(ppm) .
," l>,~l'lIc~t~t . ; .. ... , . .
. ;': . i'Minbil.'uiil· ')janm\iJij . · '·'Mea" ,': .. Workinl! D.lV Momin.ltI) feet II 74 40 Working Da .. · Mernoons 3 feet II 64 36 Working Day Evenings 3 Ic.et II 8S 41 \VOrKin~ Day ~fomjn!l;S 4 v, ftel 10 42 22 Working Dav Aft~moons 4 J" feet 10 3S 20 Weekday Evc:nings. 4 %. fed to S3 2S W e~k¢f\d Momin~ 3 feet 10 40 17 W~~kl!nd Aft~moon<; J fe.e1. II 4S 23 Weekend Ewnin~ 3 ft¢t 10 62 27 W.:do;end ~{oming.~ 4 II I fed 10 26 13 W.:c:k.:nd Attc::moons 4 \ti reet \0 31 IS Weekend E\'cnin2S 4 ~/l f.ed 10 43 17 Wc::eklv Average 3 feci II S8 31 Wc::eklv Average 4 VI f~et 10 33 19 Wec::kl'l AvC'ra~c:: Total '1\ 46 21
Table -1.13, CO COIIC'cneraliun.s actuu eht' 1.1. ChWldricar Roud &. New Queen:'!! Road
4.12.6 Zone # 6:
Land cover (Figure Gv.6)
L,md usc (Figure Gr. 6)
Port Area
Population Density (Figure 4. 10)
Disease Occurrencc (jigure 4.48)
Freqnent airborne disease
Disease Prevalence (Figure 4.49)
Referred Figures of Zonal Aggregates
CO concentrations across the zone
T:lblt' ........ : CO ('onceneraUons IICruSS lit" Port Ana
Densely Built-up (76%). Medium Buill-up (11 %)
Transport Facilities (42%). Industrial (29%). Urball
Renewal (13%)
20996 persons per square kilometre
Low
Headache. Chronic Flue
Considerable
Series of Figures from 4.52 to 4.74
242

4.12.7 Zone # 7: Nawabad, Baghdadi Lane, Kharadar
Land cover (Figllre Gy.7)
Land use (Figure Gx.7)
Population Density (Figure 4.10)
Disease Occurrence (Figure 4.48)
Frequent airborne diSCllse
Disease Prevalence (Figure 4.49)
Referred Figures of Zonal Aggregates
CO concentrations across the zone
Densely Buill up (84%). Medium Built up (12%)
Urban RenewaVRedevelopmem (100%)
72396 persons pcr square kilometre
Low
Headache. Hypenension
Considemble
Series of Figures from ~ . 52 to ~ . 74
Tabl~ 4.15: CO conct'nlnltions across tht' NRwablld, BOlhdlldi L:mt',
4.12.8 Zone.# 8: Agra Taj, Bihar Colony
Land cover (Figllre Gy.8)
Land nse (Figure Gx.8)
Population Density (Flgllre 4.10)
Disease Occurrence (Figure 4.48)
Frequent airborne disease
Disease Prevalence (Figure 4.49)
Referred Figures of Zonal Aggregates
Densely Built-up (77%). Vegetation (11%)
Urban RenewaVRedevelopment (100%)
82054 persons per square kilometre
Low
Stress. Headache. Hypenension
Considerable
Series of Figures from 4.52 to ~.74
243

CO conccrorations across the zone
4.12.9 Zone # 9: Lea Market, Gul Mohammad Lane
Land cover (Figure Gy.9)
Land use (Figure Gx.9)
Popul",ion Density (Figure 4.10)
Disease Occurrence (Figure 4 . ./8)
Frequent airborne disease
Disease Prevalence (Figure 0/.49)
Referred Figures of Zonal Aggregates
CO concentralions across the zone
Densely Built-up (82%)
Uroan RencwallRedevelopment (99%)
103108 persons per square kilometre
Low
Stress, Headache and High cholesterol
Considcrable
Series of Figures from 4.52 to 4.74
Tablr 4.17: (oncrntrations ",cross .he Lt1I Markr~ G'" Moh.:uIUlI'3d Lanr
. :, .
244

4.10.10 Zone # 10: Cbakiwara, Kalakot
Land cover (Figure Gy.IO)
Land use (Figure Gx. 10)
Population Density (Figure -I. 10)
Disease Occurrence (Figure .J.48)
Frequent airborne disease
Disease Prevalence (Figure -1.-19)
Referred Figures of Zonal Aggregates
CO concentrations across Ihe zone
across
Densely Built-up (78%). Medium Built up (10%)
Urban Renewal (75%), Recreational (33%)
143588 persons per square Idlometre
Low
Tonsillitis
Low
Series of Figures from ~.52 to ~.74
4.12.11 Zone # 11: Garden, Soldier Bazaar, Jamsbed Quarters
Land cover (Figure Gy. I I)
Land use (Figure Gr. II)
Population Density (Figure 4. 10)
Disease Occurrence (Figure 4.48)
Frequent airborne disease
Disease Prevalence (Figure -1.49)
Referred Figures of Zonal Aggregates
Densely Built up (6 I %). Urban Vegetation Mi,
(17%), Medium Built up (13%)
Planned Residential (95%). Unplanned Residential
(3 %)
37523 persons per square kilometre
High
Headache, Hypertension. Chronic flue, Eye ailmenls
High
Series ofFigurcs from 4.52104.74
245

CO concentrations across the zone
TAble 4.19: CO COlleentnations across tile Jamshed Qu;u1en;
4.12.12 Zone # 12: Lines Area & Khudadad Colony
Land cover (Figure G y. /2)
Land use (Figure G x. /2)
Population Density (Figure 4. /0)
Disease Occurrence (Figure 4.48)
Frequent airbo(ne disease
Disease Prevalence (Figure 4.49)
Referred Figures of Zonal Aggregates
CO concentrations across the zone
Table . CO COllcentrutions
Densely Buill-Up (56%). Medium Built up (16%).
Urban Vegetation Mix (13%)
Planned Residential (82%), Recreational (8%)
37664 persons per square kilometre
Low
Headache, Stress
Considerable
Series of Figures from 4.52 to 4.74
246

4.12.13 Zone # 13: Naval Hospital, JPMC and Liaquat Barracks
Land cover (Figure Gy./3)
Land use (FIgure G.r. /3)
Population Density (Figure 4. /0)
Disease Occurrence (Figure 4.48)
Frequent airborne disease
Disease Prevalence (Figure 4.49)
Referred Figures of Zonal Aggregates
CO concentrations across the 20ne
Tnble 4.21: CO
Densely Built-up (38%). Medium Built up (23%) .
Urban Vegetation Mix (20%)
Planned Residential (60%), Education (18%).
Unplanned Residential (14%)
19205 persons per square kilometre
Low
Tonsillitis
Low
Series of Figures from 4.52 to 4,74
4.12.14 Zone # 14: Bath Island, Frere Town, Defense Society (part)
Land cover (Figure Gy. /4)
Land use (Figure G x, /4)
Population Density (Figure 4, /0)
Disease Occurrence (Figure 4.48)
Frequent airborne disease
Disease Prevalence (Figure 4.49)
Referred Figures of Zonal Aggregates
Urban Vegetation (36%), Densely Built-up (H%),
Mediwn Built-up (20%)
PlaMed Residential (78%), Densificalion Areas (9%)
41380 persons per square kilometre
Low
Headache
Considerable
Series of Figures from 4.52 to 4,74
247

CO concentrations across the zone
4.22: acruss
4.12.15 Zone # 15: Gizri Area, Delhi Colony
Land cover (Figure Gy. J 5)
Land use (Figure Gx. J 5)
Population Density (Figure 4. J 0)
Disease Occurrence (Figure 4.48)
Frequent airborne disease
Disease Prevalence (Figure 4.49)
Referred Figures of Zonal Aggregates
CO concentrations across the zone
across
Urban Vegetation (33%). Densely Built·up (25%).
Medium Built·up (22%)
Planned Residential (56%). Densifieation "reaS
(28%)
4092 persons per square kilometre
High
Headache, Hypertension
. High
Series of Figures from 4.52 to 4.74
248

4.12.16 Zone # 16: Clifton
Land cover (Figure Gy. J 6)
Land use (Figur. G x. J 6)
Population Density (Figure 4. J 0)
Disease Occurrence (Figure 4.48)
Frequent airborne disease
Disease Prevalence (Figure 4.49)
Referred Figures of Zonal Aggregates
CO concentrations across the zone
'., ,
4.24: CO conccntrations across the CUftun
Densely Built·up (51%), Medium Built·up (16%).
Water (16%)
Densification Areas (83%). Commercial (11%)
9890 persons per square kilometre
High
Headache, Chronic Cough
High
Series of Figures from 4.52 to 4.74
4.12.17 Zone # 17: Baba Bhit Islands
Land cover (Figure Gy. J 7)
Land usc (Figure Gx. J 7)
Population Density (Figure 4. J 0)
Disease Occurrence (Figure 4.48)
Frequent airborne disease
Disease Prevalence (Figure 4.49)
Open Land (31%), Sparsely Built-up (24%), Medium
(21%)
Military areas (98%), Recreational (2%)
5234 persons per square kilometre
High
Nausea. Birth defects
High
249

4.12.18 Zone # 18: Shershah, S.I.T.E. (part)
Land cover (Figure Gy.18)
Land use (Figure Gx.18)
Population Density (Figure 4.10)
Disease Occurrence (Figure 4.48)
Frequent airborne disease
Disease Prevalence (Figure 4.49)
Referred Figures of Zonal Aggregates
CO concentrations across the zone
Tahir 4.25: CO
Densely Built·up (41%). Medium Built·up (20%).
Sparsely Built·up (19%)
Unplanned Residential (32%), Industrial (30%).
Planned Residential (22%)
1200 I persons per square kilometre
High
Hypenension. Nausea
High
Series of Figures from 4.52 to 4.74
4.12.19 Zone # 19: S.1.T.E. (Sindh Industrial Trading Estate)
Land cover (Figure Gy.19)
Land use (Figure Gx.19)
Population Density (Figure 4.10)
Disease Occurrence (Figure 4.48)
Frequent airborne diseases
Disease Prevalence (Figure 4.49)
Referred Figures of Zonal Aggregates
Sparsely Built·up (33%). Medium Built·up (24%).
Densely Built·up (18%)
Industrial (62%), Unplanned Residential (31 %)
3489 persons per square kilometre
High
Headachc. Chronic Cough
Vcry High
Series of Figures from 4.52 to 4.74
250

CO concentrations across the zone
,.
4.12.20 Zone # 20: Asif, Pak Colony & T.P.I.
Land cover (Figure Gy.20)
L~nd lise (Figure Gx.20)
Population Density (Figure -1.10)
Disc"se Occurrence (Figure -1../8)
Frequent airborne discase
Disease Prevalence (Figure 4../9)
Referred Figures of Zonal Aggregates
CO concentrations across the zone
Densely Built-up (35%), Vegetation (27%), Urb~n
Vegetation (14%)
Unplanned Residential (33%), Agriculture (31 %),
Industrial (I 1%)
18584 persons per square kilometre
Low
Learning Loss
. Considerable
Series of Figures from 4.52 to 4.74
251

4.12.21 Zone # 21: Rizvia, Firdous Colony, Golimar
Land cover (Figure Gy.21)
Land usc (Figure Gr. 21)
Population Density (Figure 4. 10)
Disease Occurrence (Figure 4.48)
Frequent airborne disease
Disease Prevalence (Figure 4.49)
Referred Figures of Zonal Aggregates
CO conccntrations across the zone
Densely Built·up (73%), Medium Built·up (13%),
Urban Vegetation (9%)
UnplalUled Residential (76%), Planned Residential
(15%), COfIUIlercial (9%)
65101 persons per square kilometre
Low
Headache, Stress
Considerable
Series of Figures from 4.52 to 4.74
Tablr 4.28: CO concentNllon. ~cross the R!J.,'I:.. Firdous Colony, Golimar
4.12.22 Zone # 22: Liaquatabad
L<lIld cover (Figure Gy.22)
Land use (Figure Gr. 22)
Population Density (Figure 4.10)
Disease Occurrence (Figure 4.48)
Frequent airborne disease
Disease Prevalence (Figure 4.49)
Referred Figures of Zonal Aggregates
Densely Built-up (79%), Medium Built-up (7%).
Urban Vegetation (7%)
Planned Residential (61%). Unplanned Residential
(23%), Commercial (16%)
75968 persons per square kilometre
Considerable
Eye ailments, Chronic Flue
Considerable
Series of Figures from 4.52 to 4.74
252

CO concenlrations across the zone
4.12.23 Zone # 23: Gulshan-e-Iqbal (part), P.lB.Colony
Land cover (Figure Ov.23)
Land usc (Figure Gr. 23)
Population Density (Figure ~. J 0)
Disease Occurrence (Figure ~. ~8)
Frequent airborne disease
Disease Preyalenee (Figure ~A9)
Referred Figures of Zonal Aggregates
CO concentrations across the zone
Densely Built-up (54%), Medium Built-up (24%),
Urban Vegetation (9%)
Planned Residential (49%), Unplanned Residential
(23%), Commercial (20%)
30417 persons per square kilometre
Low
Headache, Hypertension
High
Series of Figurcs from 4.52 to 4.74
253

4.12.24 Zone # 24: Gulshan-e-Iqbal, Chandni Chowk, Society Area
Land cover (Figure Gy.24)
Land usc (Figure Gx.24)
Population Density (Figure 4. J 0)
Disease Occurrence (Figure 4,48)
Frequent airborne disease
Disease Prevalence (Figure 4,49)
Referred Figures of Zonal Aggregates
CO concentrations across the zone
('onC'C'nfrutions
Urban Vegetation (38%), Densely Built-up (26%),
Medium Built-up (17%)
Planned Residential (85%), Education (5%),
Conunercial (5%)
15497 persons per square kilomelre
Considerable
Headache, Eye ailments, Hypertension
High
Series of Figures fro11l4.52 to 4.74
4.12.25 Zone # 25: Akhtar & Baloch Colony, Chanesar Goth
Land cover (Figure Gy.25)
Land use (Figure Gx.25)
Population Density (Figure 4. J 0)
Disease Occurrence (Figure 4,48)
Frequent airborne disease
Disease Prevalence (Figure 4.49)
Referred Figures of Zonal Aggregates
Mediulll Built-up (52%), Densely Built-up (18%).
Sparsely Built-up (18%)
Unplanned Residential (58%), Densification areas
(17%), Planned Residential (15%)
10909 persons per square kilometre
High
. Headache, Hypertension, Slrcss
Very High
Series of Figures fro1ll4.52 to 4.74
254

CO concentralions across lhe zone
conc~ntrallon' across th~ Aldtbr"
4.12.26 Zone # 26: Drigh Cantonment, 9th Mile
Land cover (Figure Gy.26)
Land use (FIgure Gx.26)
Population Density (Figure 4. ) 0)
Disease Occurrence (Figure 4.48)
Frequent airborne disease
Disease Prevalence (Figure 4.49)
Referred Figures of Zonal Aggregates
CO concentrations across the zone:
Open Land (31%). Sparsely Built-up (24%). Urban
Vegetation (15%)
Military (71%). Recreational (6%) Planned
Residential (7%)
8584 persons per square kilometre
Low
Headache, Hypertension
Considerable.
Series of Figures from 4.52 to 4.74
~<TI~;;~~,'~2~,''B; : ; ,<,; t}\ .o.'!> ':; .. . · .... i,,:,~ ~" . . . ~ ,"
rut Working J).y , Ir..,
1 v, r«\ 1 v,r«.
E"," ng> 4 , ; ru' , H,"
11«1 I EHnillg> 3 ru' ~ !oming> 4.\iI ~
54' r.d E","in", 4 V, I ,..
w .. Jy A"".g. 3 rcc. W .. lly Am.go.' 'f, r.et W .. I.lv
12 13 13
.8
12 10
12 I 1
12 II 12
49 81 79 21 69 '1 2' 3' 119 J3 24 84 11 36 46
44 48 16 26 29
" 21 34 10 14
26
255

4.12.27 Zone # 27: Gulshan-e-Iqbal, National Cement Factory
Land cover (Figure Gy.27)
Land use (Figure Gx.27)
Population Density (Figure 4. 10)
Disease Occurrence (Figure 4.-/S)
Frequent airborne disease
Disease Prevalence (Figure 4.49)
Referred Figures of Zonal Aggregates
CO concentrations across the zone
.:', ",
Medium Built·up (32%), Sparsely Built-up (22%),
Urban Vegetation (22%)
Planned Residential (76%), Dcnsification areas (7%)
18466 persons per square kilometre
Low
Chronic Flue, Binh defects
Low
Series of Figures from 4.52 to 4.74
TllbI~ ~ .J~ : CO ('un('fnlr:allons across the GuIshan-f-lqlYoll, NaUon:ll CmwlIl Factory
4.12.28 Zone # 28: . F.e. Area and Mansoora
Land cover (Figure Gy.2S)
Land use (Figure Gx.28)
. Population Density (Figure 4.10)
Disease Occurrence (Figure 4.48)
Frequent airborne disease
Disease Prevalence (Figure 4,49)
Referred Figures of Zonal Aggregates
Medium Built-up (37%), Densely Built-up (19%),
Urban Vegetation (18%)
Planned Residential (68%), Unplanned Residential
(12%)
33866 persons per square kilometre
High
Headache, Chronic Flue, Hypertension
Considerable
Series of Figures from 4.52 to 4.74
256

CO concenlrll1ions across Ihe zone
Table·US: acron
4.12.29 Zone # 29: Nazimabad, Paposhnagar
Land cover (Figuu Gy.29)
Land use (Figure Gx.29)
Populalion Density (Figure.J. 10)
Disease Occurrence (Figure 4.018)
FrcqueIll airborne disease
Disease Prevalence (Figure 4.49)
Referred Figures of Zonal Aggregales
CO concentrations across Ihe zone
con(enlnlJull$ across
Densely Buill-up (40%). Medium Buill-up (26%).
Urban Vegelalion (22%)
Planned Residential (62%), Conunercial (18%),
Unplanned Residential (13%)
29322 persons per square kilomelre
Considerable
Chronic Cough and Chronic Cough
Considerable
Series of Figures from 4.5210 4.74
257

4.12.30 Zone # 30: North Nazimabad
Land cover (Figure Gy.30)
Land use (Figure Gr. 30)
Population Density (Figure 4. J 0)
Disease Occurrence (Figure 4.48)
Frequent ahOOrne disease
Disease Prevalence (Figure 4.49)
Referred Figures of Zonal Aggregates
CO concentrations across the 20ne
Table 4.37: across
Medium Built·up (31 %). Urban Vegetation (24%),
Sparsely Built·up (22%)
Planned Residential (70%), Unplanned Residential
(23%)
32822 persons per square kilometre
Considerable
Headache, Hypertension, Stress
Considerable.
Series of Figures from 4.52 to ~.74
: "
4.12.31 Zone # 31: North Karachi
Land cover (Figure Gy.3J)
LlIld use (Figure Gr. 3 J)
Populalion Density (Figure 4. JO)
Disease Occurrence (Figure 4..18)
Frequent airborne disease
Disease Prevalence (Figure 4.49)
Referred Figures of Zonal Aggregates
Sparsely Built·up (37%), Medium Built·up (34%).
Open Land (14%)
Planned Residential (82%). New Indust')' (7%)
30393 persons per square kilometre
High
Headache, Hypertension, Chronic Flue
Considcrdblc
. Series of Figures from 4.52 to 4.74
258

CO concenU3tions across the zone
TwblE' 4.38: co aero ..
4.12.32 Zone # 32: Qasba, Manghopir Area
Land cover (Figure Gy.32)
Land use (Figure Gx.32)
Population Density (Figure -I. J 0)
Disease Occurrence (Figure -1.48)
Frequent airborne disease
Disease Prevalence (FIgure 4.49)
CO concentrations across the zone
. Open Land (70%), Sparsely Built-up (10%), Medium
Built-up (7%)
Low Income Settlements (47%), Unplanned
Residential (45%)
9569 persolls per square kilometre
Low
Tonsillitis, Eye ailments, Chronic Flue, Chronic
Cough
Considerable
4.12.33 Zone # 33: Orangi, Metroville-I
Land cover (Figure Gy.33)
Land use (Figure Gx.33)
Population Densit)' (Figure -I. J 0)
Disease Occurrence (Figure -1.48)
Frequent airborne disease
Disease Prevalence (Figure 4.49)
Referred Figures of Zonal Aggregates
Sparsely Built-up (35%), Medium Built-up (35%).
Open Land (15%)
Unplanned Residential (62%), Planned Residential
(28%)
33414 persons per square kilometre
Considerable
Chronic Flue, Chronic Cough, Stress
Considerable
Series of Figures from 4.52 to 4.74
259

CO concenlrations across the zone
n~ro5S
4.12.34 Zone # 34: Baldia
Land cover (Figure Gy.34)
Uilld use (Figure Gx.34)
Population Density (Figure 4.10)
Disease Occurrence (Figure ,/.48)
Frequent airborne disease
Disease Prevalence (Figure ./ . ./9)
Open Land (53%). Sparsely Built-up (23%). Medium
Built-up (16%)
Unplanned Residential (53%). Low Income
Settlements (44%)
12695 persons per square kilometre
Low
High Cholesterol
Low
4.12.35 Zone # 35: Masroor (Mauripur)
Land cover (Figure Gy.35)
Land use (Figure Gx.35)
Population Density (Figure ,/. 10)
Disease Occurrence (Figure ./ . ./8)
Frequent airborne disease
Disease Pre,·alence (Figure 4 . ./9)
. Open Land (50%). Sparsely Built-up (24%)
Military areas (87%). Unplanned Residential (7%)
1932 persons per square kilometre
Low
Headache
Considerable
4.12.36 Zone # 36: Hawkesbay and Adjoining Area
Land cover (Figure Gy.36)
Land Use (Figure G:r.36)
Opcn Land (42%). Sparsely Built-up (20%). Medium
Built-up (11%). Urban Vegetation (10%)
Military (28%). Recreational (25%). Schemes to
infill
260

Population Density (Figure 4,10)
Disease Occurrence (Figure 4,48)
Frequent airborne disease
Disease Pre\'alence (Figure 4,49)
351 persons per square kilometre
Low
Headache
Considerable
4.12.37 Zone # 37: Deh Moach, Naval Depot
Land cover (Figure Gy.37)
Land use (Figure Gx, 3 7)
Population Density (Figure 4,10)
Disease Occurrence (Figure 4.48)
Frequent airborne disease
Disease Prevalence (Figure 4,49)
Open Land (95%)
Military (74%), Vacant Undeveloped (14%)
286 persons per square kilometre
Low
Headache
, Considerable
4.12.38 Zone # 38: Deh Lal Bhakhar & Hawkesbay Scheme
Land cover (Figure Gy.38)
Land use (Figure Gx,38)
Population Density (Figure 4,10)
Disease Occurrence (Figure 4,48)
Frequent airborne disease
Disease Prevalence (Figure 4..19)
Open Land (99%)
Schemes to infill (50%), Recreational (28%)
68 persons per square kilometre
Low
Chronic Flue, Chronic Cough, Eye ailments
Considerable
4.12.39 Zone # 39: Korangi (Part)
Land cowr (Figure Gy.39)
Land use (Figure Gx,39)
Population Density (Figure 4,10)
Disease Occurrence (Figure 4..18)
Frequent airborne disease
Disease Prevalence (Figure 4,49)
Referred Figures of Zonal Aggregates
Medium Built-up (36%), Sparsely Built-up (23%),
Open Land (16%), Urban Vegetation (16%)
Planned Residential (68%), Vacant Undeveloped
(10%), Vacant Developed (7%)
22723 persons per square kilometre
Considerable
Headache, Hypertension
Considerable
Series of Figures from 4,52 to 4,74
261

CO concentrations across the zone
T .. ble~AO: across
4.12.40 Zone # 40: Landhi Colony
Land cover (Figure Gy.40)
Land use (Figure Gx.40)
Population Density (Figure 4. /0)
Disease Occurrence (Figure 4.48)
Frequent airborne disease
Disease Prevalence (Figure 4.49)
Referred Figures of Zonal Aggregates
CO concentrations across the zone
T:Jble ~.~1: .erou dae LandW
Open Land (28%), Mediulll Built-up (19%), Urban
Vegetation (19%), Sparsely Built-up (17%)
Vacant Undeveloped (43%), PlarUled Residential
(40%), Military (13%)
12859 persons per square kilometre
Considerable
Headache, Eye ailments
Considerable
Series of Figures from 4.52 to 4.74
262

4.12.41 Zone # 41: Landhi Industrial, Scheme 3 & 4
Land cover (Figure Gy.4I)
Land use (Figure GxAI)
Population Density (Figure 4. 10)
Disease Occurrence (Figure 4.48)
Frequent airborne disease
Disease Prevalence (Figure 4.49)
Referred Figures of Zonal Aggregates
CO concentrations across the zone
CO con('ntrations auoss Ihe Landhl
Open Land (42%), Sparsely Buill-up (19%), Medium
Built-up (16%), Urban Vegetation (13%)
Low Income Settlements (63%), Industry (11%),
Vacant Undeveloped (11%)
1020 I persons per square kilometre
Low
Nausea, Eye ailments, Throat Cancer and Lung
Cancer
Considerable
Series of Figures from 4.52 to 4.74
4.12.42 Zone # 42: Shah Latif, Deh Khanto
Land cover (Figure Gy.42)
Land use (Figure Gx.42)
Population Density (Figure 4. 10)
Disease Occurrence (Figure 4A8)
Frequent airborne disease
Disease Prevalence (Figure 4.49)
Referred Figures of Zonal Aggregates
Open Land (71%), Sparsely Built-up (11%), Urban
Vegetalion (7%)
New Industrial (74%). Agricullure (14%)
3716 persons per square kilometre
Low
Nausea, Eye ailments, Learning Loss, Efficiency
Loss
Considerable
. Series of Figures from 4.52 to 4.74
263

CO concentrations across the zone
4.12.43 Zone # 43: Model and Malir Colonies
Land cover (Figure Gy. ~3)
Land use (Figure Gr . .J3)
Population Densit)' (Figure ~. J 0)
Disease Occurrence (Figure ~A8)
Frequent airborne disease
Disease Prevalence (Figure ~A9)
Referred Figures of Zonal Aggregates
CO concentrations across the zone
across
Medium Built-up (34%), Sparsely Built-up (23%),
Urban Vegetlltion (17%)
Planned Residential (93%), Military (7%)
32119 persons per square kilometre
Low
Stress, Eye ailments
Considerable
Series of Figures from 4.52 to 4.74
264
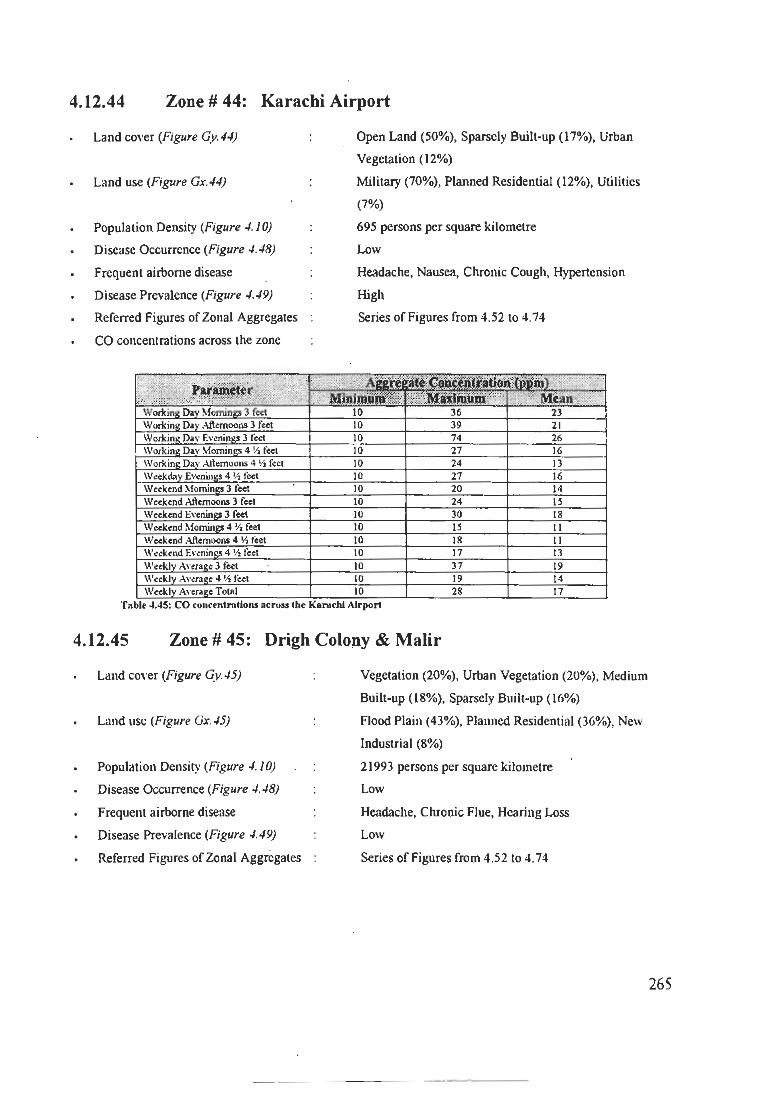
4.12.44 Zone # 44: Karacbi Airport
Land cover (Figure Gy.44)
Land use (Figure G:r.44)
Population Density (Figure ./. /0)
Disease Occurrence (Figure ./ . ./8)
Frequent airbome disease
Disease Prevalence (Figure ./../9)
Referred Figures of Zonal Aggregates
CO concentrations across the zone
Open Land (50%). Sparsely Built·up (17%). Urban
Vegetation (12%)
Military (70%), Planned Residential (12%), Utilities
(7%)
695 persons per square kilometre
Low
Headache, Nausea, Chronic Cough, Hypertension
High
Series of Figures from 4.52 to 4.74
4.12.45 Zone # 45: Drigb ColollY & Malir
Land coyer (Figure Gy../5)
Land lise (Figure G:r . ./5)
Population Densit)' (Figure ./. /0)
Disease Occurrence (Figure ./ . ./8)
Frequent airborne disease
Disease Prevalence (Figure ,/.49)
Referred Figures of Zonal Aggregates
Vegetation (20%), Urban Vegetation (20%), Medium
Built-up (18%), Sparsely Built-up (16%)
Flood Plain (43%), Planned Residential (36%), New
Industrial (8%)
21993 persons per square kilometre
Low
Headache, Chronic Flue, Hearing Loss
Low
Series of Figures from 4.52 to 4.74
265

CO concentrations across the zone
neron
4.12.46 Zone # 46: Korangi Industrial Area - East
Land cover (Figure Gy.46)
Land use (Figure Gx. -16)
Population Density (Figure 4. J 0)
Disease Occurrence (Figure -I. -18)
Frequent airborne disease
Disease Prevalence (Figure 4.49)
Referred Figures of Zonal Aggregates
CO concentrations across the zone
across
Urban Vegetation (24%), Vegetation (22%), Open
Land (14%), Sparsely Built·up (17%)
New Industrial (61%), Industrial (21%)
2359 persons per square kilometre
Low
Headache, Stress, Hypenension
Considerable
Series of Figures from 4.52 to 4.74
266

4.12.47 Zone # 47: Korangi Industrial Area - West
Land cover (Figure Gy.47)
Land use (Figure G:r:.47)
Population Density (Figure 4.10)
Disease Occurrence (Figure 4.48)
Frequent airborne disease
Disease Prevalence (Figure 4.49)
Referred Figures of Zonal Aggregates
CO concentrations across the zone
pen Land (30%), Sparsely Built-up (24%),
Vegetation (15%)
New Industrial (46%), Flood Plain (25%), Industrial
(22%)
3952 persons per square kilometre
Low
Stress, Nausea, Eye ailments, Palpitation
Considerable
Series of Figures from 4.52 to 4.74
4.12.48 Zone # 48: Korangi Creek and Refinery
Land cover (Figure ((y.48)
Land lise (Figure Gx.48)
Population Density (Figure 4.10)
Disease Occurrence (Figure 4.48)
Frequent airborne disease
Disease Prevalence (Figure 4..19)
Open Land (29%), Sparsely Built-up (29%), Medium
Built·up (17%), Urban Vegetation (12%)
New Industrial (48%), Military (20%), Recreational
(4%)
3914 persons per square kilometre
Low
Nausea
Considerable
267

4.12.49 Zone # 49: Steel Mill and Port Qasim
Land cover (Figure Gy.49)
Land use (Figure Gx.'9)
Population Density (Figure 4.10)
Disease Occurrence (Figure 4../8)
Frequent airborne disease
Disease Prevalence (Figure 4.49)
Open Land (77%), Vegetalion (7%), Urban
Vegetation (7%)
Industrial (43%), Densifieation (17%), Buffer Areas
(14%). Planned Residential (10%), Transport Facilities
(8%)
415 persons per square kilometre
Low
Nausea
Considerable
4.12.50 Zone # 50: Deh in the East
Land cover (Figure Gy.42)
Lnnd use (Figure Gx . .J2)
Population Density (Figure 4.10)
Disease Occurrence (Figure 4.48)
Frequent airborne disease
Disease Prevalence (Figure 4.49)
Open Land (80%), Vegetation (8%)
Agriculture (48%), Flood Plain (38%)
466 persons per square kilometre
Low
Throat Cancer
Considerable
4.12.51 Zone # 51: Malir Cantonment
Land cover (Figure Gy.51)
Land use (Figure Gx. 5 I)
Population Density (Figure 4.10)
Disease Occurrence (Figure 4 .• 9)
Frequent airborne disease
Disease Prevalence (Figure • .• 9)
Referred Figures of Zonal Aggregates
. Open Land (67%), Sparsely Built·up (17%). Urban
Vegetation (9%)
Military (74%), Schemes to Infill (25%)
1113 persons per square kilometre
Low
Hyperteusion
Considerable
Series of Figures from 4.52 to 4.74
268

CO concentrations across the zone
concrnllOltioM ucross Ihe
4.12.52 Zone # 52: Scheme 33
Land cover (Figure Gy.52)
Land use (Figure Gx.52)
Population Density (Figure 4. J 0)
Disease Occurrence (Figure .J../8)
Frequent airborne disease
Disease Prevalence (Figure .J.49)
Referred Figures of Zonal Aggregates
CO concentrations across the zone
Open Land (70%), Sparsely Built-up (15%)
Schemes to Infill (70%), New Indumial (11%), New
Commercial (6%)
1868 persons per square kilometre
Low
Headache, Nausea
Considerable
Series of Figures from 4.52 to 4.74
269

4.12.53 Zone # 53: Defence Society
Land cover (Figure Gy.53)
Land use (Figure Gx.53)
Population Density (Figure 4.10)
Disease Occurrence (Figure 4A8)
Frequent airborne disease
Disease Prevalence (Figure 4.49)
Referred Figures of Zonal Aggregates
CO concentrations across the zone
. i
actuss
Open Land (52%), Sparsely Built·up (22%), Medium
Built·up (12%)
Densifieation Areas (64%), Recreational (13%),
Planned Residential (12%), Military (9%)
2132 persons per square kilometre
Low
Headache, Hypertension
Considerable
Series of Figures from 4.52 to 4.74
4.12.54 Zone # 54: Surjani Town
Lmld cover (Figllre Gy.54)
Land use (Figure Gx.54)
Population Densit)' (Figure 4.10)
Disease Occurrence (Figure 4.48)
Frequent ~irbome disease
Disease Prevalence (Figure 4A9)
Open Land (85%), Sparsely Built·up (10%)
Low Income Senlement (76%), New Industrial
(II %), Planned Residential (7%)
2350 persons per square kilometre
Low
Nausea
Considerable
270

4.12.55 Zone # 55: Taisar Town
Land co\'er (Figure Gy.55)
Land usc (Figure GJd5)
Population Density (Figure 4. J 0)
Disease Occurrence (Figure 4.48)
Frequent airborne disease
Disease Prevalence (Figure 4.49)
Opcn Land (97%)
Low Income Settlements (62%), Flood Plain (38%)
94 pcrsons pcr square kilometre
Low
Hypcnension
Considerable
4.12.56 Zone # 56: Halkani Scheme
Land cover (Figure Gy.56)
Land usc (FIgure Gx.56)
Population Density (Figure 4. J 0)
Open Land (91%), Vegelation (5%)
Low Income Settlement (48%), Agriculture (41 %)
78 persons per square kilometre
4.12.57 Zone # 57: . Dehs in the West along Hub River
Land cover (Figure Gy. 5 7)
Population Density (Figure 4. J 0)
Open Land (97%), Vegetation (3%)
53 persons per square kilometre
4.12.58 Zone # 58: Dehs along Super Highway
Land cover (Figure Gy.58)
Population Density (Figure 4. J 0)
Open Land (96%), Vegetation (4%)
81 persons per square kilometre
271

IV
" IV
~?""1--
ZoNAL AGGREGATES OF CO EMISSION
Weekend Mornings 3 feet
, ~ ,
CORl.liCi"k.~ s.r. ~ u Mod~nlt' R~k
,
,-. " ~v--~ .~ Rb" HIgb Rbk
h , '~v--~
(Mi nimum) (Maximum)
.-
------,
~R.ng.' __ -1 I 0
..... ~ ~ "',~,
Sraad.rd Ol'l"I. lIo"
o
"~v--~ (Average) 75
POIrt:. f'~T ~Iillio"
Ippm) I 'i~ L - ! f rr ...... n_ ... "'J
, -- -. ----'. " ~ ,
N
W~E S ~?""}r-..
. "~~"::---~ 6 0 ti 12
Figure 4.52 ........... '\r-~
(Range) (Standud Deviation)

IV ....., w
~>
ZONAL AGGREGATES OF CO EMISSION
Weekend Afternoons 3 feet
./
, .-' .. -_...--
CO Rillk Cri.erloD
I:' s.rC'
~: ,
~~ Ii'- (' ~ ,----~ '~../',...r- .. -=- Mode.,,,. RbI> , r~HI.' Rbk ....... ~ V.I')' High Risk L _
,,~~~
(M inimum)
-' ~" ,
Ralnj.!l'
(I
I'mb P~'r .\1il lion (ppm)
~~;r'~\.r-~--...,
l)() '~I..,.t"n"'r (Average)
~ , N
:..-~ . . '. IT"-! ,~r\ ~
Figure 4.53 \..; \.,--- "'-~ '"""""""
W-\¢tE S
6 0 6 12
(Maximu m)
~r-
(Range) (Standard Deviation )
Studlird OnlaU1 oR
o
____ 1_4 ,~J...-rt .. II,
-'
~ ,

i~
ZONAL AGGREGATES OF CO EMISSION
Weekend Evenings 3 feet
-' r---"
/-----r~~v__~ I ,CORliiCCiiterloa
s.r~ I~ Mod.ro'. Risk HIl:b RIsk \lory H I,b Rhk
(Minimum)
'" --------'---
C --Rong<- I
o Parts Pt , MlIIion t_, • 120 114/'fI>II'-rn~
~ - ........F r/ I ~
_.-' .. ,,~ \..r - ~ (Averag~)
-' _---r-'"
, N
~-r--> .J \.'" I , ;;---,
.,~ ('~~ Figure 4.54 V ~
W-r¢tE S • 0 • 12
Kl~IOI1
(Maximum)
(Range) (Standard Deviation)
•
r-"'--~
~
Slnd.U1t Dn-i.rio.
o
___ 17"..,-I .... f~
-' ~--
,

'" '-' (J1
----. ~ ~ :rr-.
ZONAL AGGREGATES OF CO EMISSION
Weekend Mornings 4lh feet
" _/
co RilfCrii"ioa ,: ___ Slff' _-r-.~>
_ r--...t -...r " ,.... ,
"" ,--------,
'~~~,~~-.. _ _ Mod ...... Rlok
Hlgb Risk Very Hlgb Risk '~\,~~--
~n~l'~ o
(Minimum)
_"' __ r-~~ _____ ~ r , IT'-
(Maximum)
.--------'
!oi1udllf"d On"i_lio,.]
o
P.trt:. r(r "Iillilln I (ppml
, ,~\,,--.~--5 ,~ ___ J J I
I~/"",""
, ~--
,
, - ~~> ' ,~ r /f'r
r'igurc 4,55 "~\...r--.-.t--"'~ " •
(Range)
(Average)
N
W~E o S. 12
........... - ~~)
~--...r ,£ /.
" '.
.-/ ,
"~~~ (Staodard D~\iatioD)

'" ...., en
~-../i
ZONAL AGGREGATES OF CO EMISSION
Weekend Afternoons 41 /: feet
" ~.,
.-
CO Rilk Criteriou I
,it-Safe' , Mod~ro!. Risk
.. ~~> .. ... --' . /.
~. r-,
:-. .'~~~. r High Ri,k Vory "Ilb Rl,k '~~~----'
(Miaiml!m) (Maximum)
-- ~'
Fo R,nJ< ----=.:l
Par1s t'.:r Mill ion I IPpm)
.~~~ "~'V-............... ~~.-'"'-.
66 ~"". (i\nrage)
" -------,
N
s ~~f\, ~ ~~ W{¢}E
Figur" 4.56 ~~
a a e 12
"'-(Range) (Standard Deviation )
Sn""dlml D",-i ll riun
o
1$ Ir""'l~'
~. ~

IV -., -.,
Zonal Aggregates of CO Emission Weekend Evenings 4th feet
;' -~. .-- ,
~~ .. -,
"....,~
~ J" };--.,
'~\.r-~
CO Riol< Cril~r;".
I~ __ s.re . Mod.n,. Risk
Higb Rlik Vtry Higb Risl< I
~,
~ I . r: ......t-'~,,_. '-~- '~\r=
o
'l'I
RllnJ:.t." __
I'(1) rH Milliun (ppm)
1~1JIo,".1
(Min imum)
;'
... ~ ,
;~~;.,...., .
"~v--~~ (Average)
, ~
N
(Maximu m)
~.rd - [)n-i.tlvR
o
15 U f/aIf *,"fII,
'. ;' ,------'
,
" -~~"v-~ Figure 4.)7 (Range)
• W~E
o S a
"""""""' " ~p-"}-
,~,-,--.~ (Slandard Devi.'ion)

...., '-' CD
ZONAL AGGREGATES OF CO EMISSION
Working Day Mornings 3 feet
.. , -~'
co RIsk Criteriom
.=--- Sarr .',-,,~j
~~ /i'-t
, ,~~~~ ! Modeno •• Risk
Hlgb Rilk ..,; _ V.ry High Rl,k
~.n~<_~
J - l':Jrt!i j1cr Million (ppm)
75 lbiN( J/wTT..iI ;
(Mioimum)
~~~
, _ ..... r-
,~~)r...,
"~'.r-~. (A"frage)
~' -_.---' N
W-t¢1-E s
figure 4.58 ,~\,,....~
t! (I 6 12
"""""""
(Maximum)
"
,----' ,
St.lldlilrd Dn-lilfH:. ft
o
_ IJ II..,.." ... -.roJl
~ - ~
,.....--' ,
~~ (R~nge) (Slandard Devialion)

'N
'" '-D
ZONAL AGGREGATES OF CO EMISSION
Working Day Afternoons 3 feet
, " ~'
~)
___ ,~ .r '~\..-_~~
o
"'
Rliln:~<~ __
l~illt S Per ~1il!ion (rrml
(/~_IttI.Y"t .. j
(Minimum)
, ___ '".,-""----1
../ -_/'
,
.. ,-.-,~>.., - ..",- """' ,
Figure 4,59 .. !;: (' \./-~ ... .' ~ ,.r-~
. to Riok Criterion i
l~sart' . Mod.", te Ri'"
HI~b RIsk " el")' HIlh Rl>k
,,~
./T""I
-' ~ ,
~\...--. --~ .. ,~-,.-~ .. -. (AYcragc)
~.
N
W{¢tE S , 0 6 12 -""""""'"
---~
'----' ,
(Maximum)
S';.d.,. 1m''', ~-
o
1 51/~""""',m,
" .-.-'
"
(\.;-~
(Range) (Standard Deyiation)

'" CD o
- '-:-'~},..., : _..--"''--' . ~
ZONAL AGGREGATES OF CO EMISSION
Working Day Evenings 3 feet
.' ._./-'
,
(1 -r---~ . ~ V-~
~co Risk Criler~
s.r. Mod.no,. Rbk Higb Rhk Vcry H leh Rbk
(Minimum)
-' ...---,-' -
FoRlnJ:,C ~ P<lru I' c:r ~' ill i on
(ppm ) I - 113 Ir~"""'IJ
~ f\ ~-.. " V"-'"'- ~
(Ayuage)
~"'-" ,
N
Figure 4.60
W1.¢tE S , o ~ 12
K11Cmt~
~ '~~v--~
(Maximu m)
./
--,...---,
r---
Standli rd Dni.lioa
o
J 8 "--twl """"~
~ ,
f'\..,_~
(Range) (Standard Dnialioo)

N Q:l
/""'I~~ . "....,
ZoNAL AGGREGATES OF CO EMISSION
Working Day Mornings 4111 feet
'" --,. -' i CORkk Criteria. I
i ,~ ____ s.rt
. '~v--~ ____ , Mode"'l< RI.~
High RIsk W ry High R15k
~
Fo Ran9 Purl:> Per Million
(r"Pnt l
., ____ .:;.j..,-mn~
(Minimum)
'~ i
,
,. ,----r--'
.. ~~ ,,,",,, (' 'v~....I'--"~ ~,
\..; V-
(Average)
----_.; N
W~E s
---,-('\..r-~ _ ..... -
(Msximum)
Stli. lllhn'd D~i.fio.
o
, - 8 If"L~j",~
, ,------'
,
Figure 4.61 ,~,,---~
6 0 6 12
"","' ..... '~'v--~~~ (Range) (Standard Deviation)

N (l)
'"
~,
ZONAL AGGREGATES OF CO EMISSION
Working Day Afternoons 41h feet
-' -----' ;
CO-RlJ"-C" f';ri<>n s.r.
~ Mod .... '. Risk
~-'
-
r.r 'tr-- ~ I -""--- . ~ - ~ -...--- - ~ '..r- , Rbk
,~ __ • HIR~ Risk
-"'"'~ ...... ~ ,. ~ . " (\\J'- ~~.
.r-, (Minimum) (Maximum)
'" I
~
. ~~ ..-.~ ". "I , '
I~St'O d il ni D~' l.lio.1 RUI~",-< -----I o
P;m s PC-I :'I.lil liofl (ppm)
"~v--~-,._ ~ .. ~J " _____ ---'",~ IlIHfl"l
_ rC'.~> ~ --........J.,- ., 11"-
.- -./~-...
, ...... ~ f' '-'~~ , fig ure 4.62 \..; ~
(Range)
,
(Average)
N
W1¢tE S
0 , 12
"""""'"
~~ .!1'.
;' ~-_0''''-
...... ~'v-~ .. _ (SlndBrd Devialion)
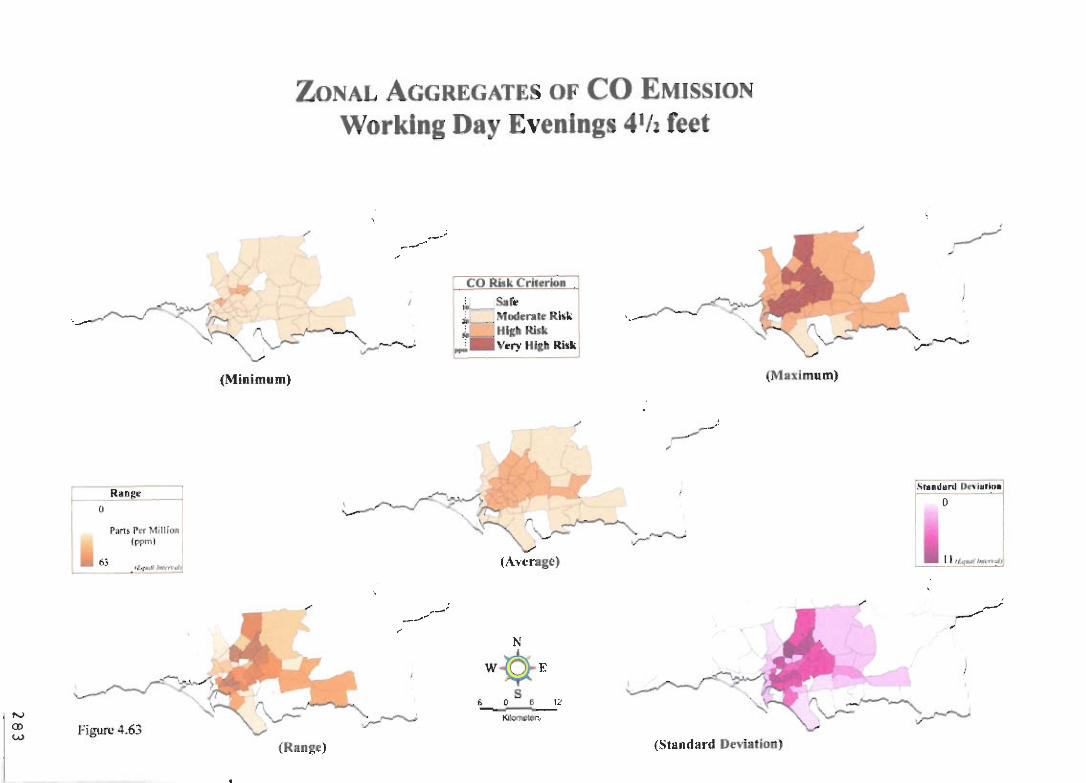
...., CD w
ZONAL AGGREGATES OF CO EMISSION
Working Day Evenings 4th feet
;' .----... __ .. .-
co RlIkCri.irlOn
.~~ .'~v-~~
S.rr Mode"'lo RI.~
Hi,~ Risk ~rry Hlgb Rid, J
--Rlloec =--l o
P"rh I' N Millioo ~
(ppm, J 6' • _ _ d<l"4IA j,*_~"1
~-'~-
figure 4.63
(Minimum)
--~ _ _ I.
,
~~> . /'!'-t
--
h
, ,/--"
-~
'~ rv-~ _____
'~ '--~~-.r-v (AYe rage)
N
W1¢tE S • o • Il -Ki~ItIr!>
(Maxi mum)
--
---~
~ ,~
,
---
StudamI D,.\ i.,io.
o
11"..,.....1 ........ ,
------~
(1v-~
(Range) (Standard Deviation)

N Q) &-
ZONAL AGGREGATES OF CO EMISSION 3 feet Averages
(
, ~ ..... ----
:~~~~v-~ CO Risk Cri,erio. ;
I~Sar~ +=---, Mod ...... Ri ... i. "l1tb Risk
,"':_ V.ry "11h Risk ,
(Minimum)
IoR.n~. ~ ,-~ ,I,
/ .------
P!ln:'i Per Million (ppm) '~~~-~
bI j>t"" '_~ .t:o
, .,...., . . " _.__-------r - ;,:'--> . ft
~ ..... ---
Figure 4,64 ,~ n~ ~ V ,/,*~
(Average)
N
W-r¢tE • o S ~ 12
KiIomt""
r~
(M8Iimum)
r--"'---'
-
v-~
Mu.d";n'-Dn.l-;rlOft o
~ '2 ., --,
,~ -
f\..r-~~ (Range) (Standard Deviation)

N
en ()'l
.....---""---. > ,7
ZONAL AGGREGATES OF CO EMISSION
41/2 feet Averages
;' ~-"
----,
CO-Risk Cri •• rioa
Sare ~..-.~ .."....,
, ~ ,
' ~ r, ...-t-""'..-.,. " "v 'v-- ~.
Mod.n". Rio .. H1Xb Risk Vt ry Hilb Risk
,~r~~~ "v v-
I----R-;nJ!~ o
..,
P ~ln li P~T .\1illion ({lflml
)1 '/ .... _n.
(Min imu m)
.~~~ " '~~'v
(Average)
;'
----~-, N
rr'~ ' .""-- ' ~I', ~~ '-""' - " \.,> .... ~ v--
Figure 4.65 (Rollge)
W~E s
fi 0 6 12
>Oicmo""
(Maximum)
;'
,.- -----"'-' ,
Sludllrd Dn'i.'IOII'
o
......I-"'~.~. - " /1 '1._ ... .. ..".;
" ,.---.--' ,
r\...-...-t-""'~
(Standard DC"ialioo )

N (J) (])
. .-, ....... -./)
ZONAL AGGREGATES OF CO EMISSION
Total Averages
-- -_/
CO RBI< Cri.erion ,
I~ __ s.r.
,-.....,.,.~-..
-
~.<' . . ~n.. ~~ .- " "v'\./'- v-I ~Mod~f1I le IUs" ~Higb RUk ~_V.ry High Ri," "~~~~---.
.-----R.n~c ~o
r~Ir1 S P~r :\'1il!ion (;.'1('11'11)
_ -1 7 1~/""m'"
(Minimum)
. ~~> -.- ~
.,.
-~.~ -
--.~>
,"'_ .. ,j .. K r, ~ '_,",-' --- "'\..r 'v"- ,r-
(Average)
~ . .......-" .,.
N
W~E S
"~\.r-~ , 0 6 12 .
K"we"'" Figure 4.66
(Maximum)
.----.---~
Stnd.rd Dn"j.tto.
o 1 9.,."".J
". .---.,.
8 ::!!I!!O
'~'v--~ (Range) (Standard Deviation)

'" CD .....,
ZONAL AGGREGATES OF SPM EMISSION
" -~ ~
" ~SPM CO.U.ll1Iliol1' ~
, - "'""'"""'""""'-""'> ~ --..r r ,/l"'-o ", '" "~'v---~ t:"
Lo .. Mod.ral. High VtJ)' HI~b
(Min imum)
" ,
~ ,)
~R.ne< , J ).t J; 1 m
70 IL<I'ttIIltrt.:TT
~P"o-/} '. ' ~ f\ '--""'--'"
~ '\., \..r= ~J--"'-' (Avcr~gc)
, ~
, N
(Maximum)
~}r-~-- "~'v-~
W~E S • 0 6 12
r-~-,) ".. 11"-> ~ ~
~
"'-Figure 4.67 (Range)
(Standud Deviatioo)
,-/--_. ,
~nd D(,"· I. tio" o
• I& '~ I" '~!
, --
... ---"'
~

tv m lb
ZONAL AGGREGATES OF PMJO EMISSION
#_...----.. --/-'
PMIU CODt'alr.lio •• 1 ,
~~>. .. Low
:~ U Mod.",«
'~----HIKh .- Vtry Hlg~
~.
(Minimum) (M.ximum)
-----_ . •
C-LR'.~< ~ Jl I m'
.. 61 /J~mJ J ... , .... ~ (Average)
Srudllrd Pn·i.fio.
r 0
-I611 ... ~/"'"Tr""
-' I~.-/ -' ~ , • N
~
Figure 4_68 ~
I ~..,.,.........> fl'-.
'~~\..r- ~
W-r¢tE S , o • 12 -, ~~'\.r-~
(Range) (Standard On-iafion)

tv CD <D
ZONAL AGGREGATES OF S02 EMISSION
Averages
.-' -.-.-/ ~
~ SOl COIIC. DIr-IIIo ..
,~~~ ~ ~~'. ~"""""""' - l:
thnl!c
o
'-' - _.-. -----.. . v I,..'
(Minimum)
~,r-~}r-
Low Modcra'c
Hlab ••.. I v.~
.-'
-.-_r
.-
- ...-<-~} ~'-V • /i'-
'~".-r- .::---.---. (Maximum)
--'" ~ ,
Patb P&:r Millilin (ppm)
. '~'v--------~ ·S!OOd;rd p;;j'til
1.0,,,,,,, .. ,,~.1 ,; rF..,MoII I'I/r ,..-uI, ! (Average)
.-'
~ .-' •
.-/-, ,
N
Figure 4.69
W~E S
""""""" ~?'-""'> • " /i'- I
'~ (Standard Deviation) ~ ~
\ ...-...._ ;-~-'"o,J...-/,,,, . '-- ~ .... 'i'r-
'~'v--(Ra nge)
6 0 5 '2

'" o.D o
ZONAL AGGREGATES OF S02 EMISSION
Maximums
" -' .-./
SQ.iTOD.enlrationl
". ~ ,
r~j,..., r -1'-'"'.-....... ~ ',~\/- ~ + Lo ...
.l. W Modenle Hilh Very HI,h _I
~-~
~v----,,r--r-...-
R.n~ l o
ParI) I~t:r Million <rpm )
- 5 rr..,Nl.llhtknv/1
~.
Figure 4.70
(Minimum) (Maximum)
" ...---.--J ,
~ r<-'~ ) ~~ ..r If"->
Mud .. ", D~i.tir~
o
" ~\-~~ C::.....:I.::.3'.!'" .. .., ..... .J (Average)
, --' , N
~ r\-~ __ ' \..... ,~
W{¢}E • oS , "
Kl_
(Raoge)
" ,
,--' ,
~ .~ >
""".m D~~V--~

N <D
ZONAL AGGREGATES OF NOx EMISSION
Averages
r" ,~ ,
NO;-CODcenfrartaDI
r" ,.-r-'
~~-../Jr-, . "~\..-~~
,. ~
Lo,,· Mod .... I. H1Xb
~~}r-.,
"~~~
~o RMn
2C
II Parh Pt"r Million
fppm )
~~. __ ! .. FI((,.A IIIl~r" lIh
Figure 4.71
(Minjm~m)
(Range)
'" ,-, Very Hixh
(Maximum)
---~' ,
(Average)
-.----. --, St..dud DevillclClo. I 0
1h '~IJ --~> ' .'
~ J: /f"-'> f\ ~~--..., ~-- ,,~ '\.r- V-
I
~ .-'
---" ,....---, /
N
W{¢}E ,r-,~,_ A. . ' I ~ :(--;,...;,. .
'''~~~ ~
80S
6 12
K,_
(Standard Deviation)
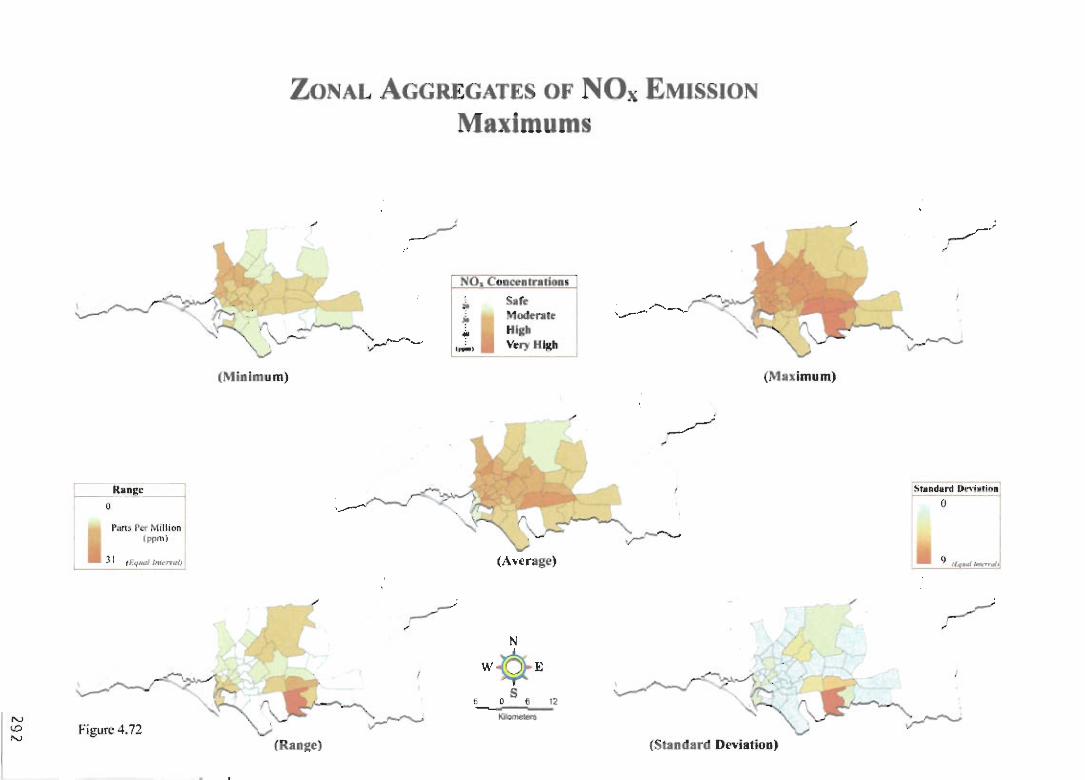
'" <D N
~~)" , I7'"-:l
ZONAL AGGREGATES OF NOx EMISSION
Maximums
,/
~
NO! Cooeenru.ittDi
Sore .. '~'v~~_~_, " ..
,-,
Moderal. High Very H igh
~o RUJl:c
r;ln~ r tf" I\t'illion (pprll)
J I r£"INUi JI11.'Tlulj
(Min imum)
~ ~ " ~\J Figure 4.72
./ ,...-/,..-/
,
. ~ .---~ . ..... Ii
' ''~I\.r-~~ (Average)
~-' , N
W-t¢tE S ~
'~ 6 0 6 " ~ --
(Maximum)
(Range) (Standard Deviation)
,/ ~---.-;
,
v-~
~t.lld.lilrd Dr'illllim,
o
9 11,,"'( I-.TTtiJ
". ,~ ,
~
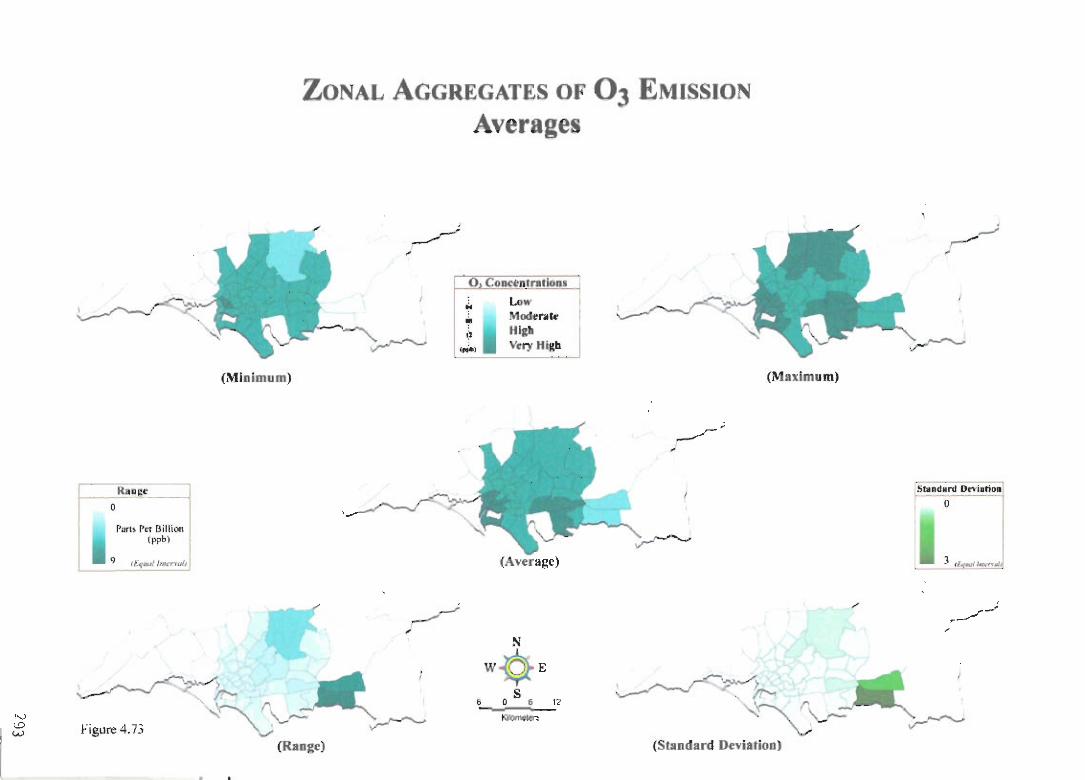
'" cD w
_ ~ Ill!t.'_ o
Pmh ['cr [J illioo I)'!pbl
t) t f.f(ta.lI /,Jtj,' nu!1
~ Figure 4.73
ZONAL AGGREGATES OF 03 EMISSION
Averages
~.-J ,
0, COD«nrr.riolll I ' Low : Modcn.rC' I ,) I I High I
,,;., III Vrry H I~
(Mi nimum) (M aximum)
.-/.r-
-
(Awrage)
~ , N
'~v-~ W~E
'L-? S fi 12
"- ,.,,
, _ ,...r-~) v-r '-". "......
'~ (Range) (Standud De~jation)
"
....J
-
LStlindalnJ ~~.
o
3 " <twII~
... ----~-.. ,
.,;-----

N -0 ...
ZONAL AGGREGATES OF 03 EMISSION
Maximums
1--0 RlIIl1j!l:.'_ ---I
P.:Jrh Pl." Uilli Drt Ipph)
L.....:_I ~ . f.'1Hi.ll/rrltnvl/
(Minimum)
----)
~ ,;, I~l
11";'1
~ ~
~-/> ' , .. 1'- ~.
Figure 4. 74 ~~ r\ '\.,>_r- v-~
(!tang~)
Conct"JIII"'I..ion.1
Low Modl'nte
Hil~ . I V<ryH IK~
(Average)
N
W{¢}E s
L 0 I) 12
-......
(Maximu m)
,...../""".,
- ~---i . ~ '-V -r /T'-<
"'~/~ (Slandard Devialion)
"
-..",.,-'/
,.
v----
St.ndud l>~
o
-==-';):..!.I~I ~tJJ.:
~
,I
.,....---"-
,_.

4.13 MUL Tl CRITERIA RISK
The analyses explained until now were conducted by taking up one variable at a time. The
success of GIS analysis is inherent in its capabilities of handling multivariate data (Zhou and
Civco, \996) and the same has been done in this study. The ultimate risk due to air pollution
in its present form is because of all other variables explained previously. In the chapter of
conceptual framework, the decision analysis tool of "Multi-criteria Analysis" has been
described .
Many studies of complex geographic phenomena begin with a set of data and notions of
hypotheses and theories that are vague at best. Factor analysis may be used as a data
reduction method, to reduce a dataset containing a large number of variables down to one of
more manageable size. When many of the original variables are highly correlated, it is
possible to reduce the original data from a large number of original variables to a small
number of underlying factors (Foster, 2000). Miles (I99S) annotated an example of factor
analysis using SPSS for a study in Human Psychology. Kazmi (i 996) performed factor
analysis (PCA) for investigation of the resurgence of Malaria in Pakistan.
Exploration of the significance of variables is done through Principal component analysis
(PCA). Tables 4.52, 4.53 and 4.54 are outcomes of PCA. Commonalities indicate the
amount of variance in each variable that is accounted for. Initial communalities are estimates
of the variance in each variable accounted for by all components or factors . For principal
components analysis, this is always equal to 1.0 or the variance of the variable. Extraction
communalities are estimates of the variance in each variable accounted for by the factors (or
components) in the factor solution. Very small values indicate variables that do not fit well
with the factor solution, and are usually dropped from the analysis. The variables based on
monitored pollutant data Table 4.52 shows highest extraction communalities (for averages
and standard deviations of CO). Factor analysis communalities indicate the amount of
variance in each variable that is accounted for by the factors in the factor solution (Foster,
2000). It was reasonable to get the low~st extraction communality for the grid of road
proximity since it was added as a layer in the multi criteria analysis purposely to account for
295

rapid chemical conversion (Seinfeld, 1986) of studied pollutant and to acquire justified
cartographic results. Further it could be observed from Table 4.53 that component one
explains greater than 55 % variance and one and two cumulatively explains greater than 68
% variance. An eigenvalue (sometimes called an eigenvactor) is a measure of how important
the factor is in accounting for the variance (Miles, 1998).
Table 4.52: Factor Analysis Communalities
l"~'l:: ':i:;Y:~~J~~}l~~-:~,~ i%'):; :\Y'6r~
:~i1t:~~~~~~~~r; :,f' Jj)mj~i¥A ,~_.'\i.?%'';'. '
I , RBG 1.000 0.299 , LCCG 1.000 0.424
I PDG 1.000 0.429 DOG 1.000 0.438 DPG 1.000 0.484 RDIG 1.000 0.574
I SDC3FG 1.000 0.849
I SDC4FG 1.000 0.879 AC3FG 1.000 0.939
I AC4FG 1.000 0 .943 I ACTG 1.000 0.950 , SDCTG 1.000 I Extraction Method: Principal Component Analysis.
0.955
Table 4.53: Factor Analysis Total Variance Explained
296

Table 4. S4 shows the component matrix canying correlations, which could help to formulate
an interpretation of the factors or components. Ten out of twelve variables load highly on this
component to include most of the health, environmental and demographic indicators.
Table 4.54: Factor Analysis Component Matrix
297

4.13.1 Weight Extraction
Table 4.55: Correlation Matrix HIJIG I'J>G 00C; LCCG Acre AC'.JI'C AC .... C socrc SIJCJFG SOC~FC OPC KBG
~IG I 0.39790 0 .344366 .0 .2380323 0.4~0791 0.479199 0.477\04 0,461002 0.415813 0.402162 0.3888~8 .0.2004
DC 0.39790 I 0 .4~2'"6 .0.2736311 0.575405 0.569296 0.l79466 0.l17l65 0.45540 0.5011013 .0.019421 .0.02613
DOG 0344366 0 .4~2786 1 .0 .2609571 0.4444 0.433322 0 .46059~ 0.38167 0.33064 0.3769794 0.3408649 .0.0622,
.£CC ..o.2.lK03 .0.27363 .0.26096 1 .o.246~ .0.25141 ..0.23454 .0.2542 .0.237 ·0.223)011 .0.1816015 .0.00452
~CTG O.4N0791 0.l75405 O.4444~ .(J.2469891 1 0.997646 0.99039. 0.941 O.t«44275 O.86503K4 0.184082 0.014501
~C3t'C 0.479199 0.l69296 0.433322 -0 .25140~2 0.997646 1 0.978588 0 .9434l2 0.8418l 0.M96669 O.I89000l 0.DI77l1
!,C4FC 0.47710 0,)79466 0.460598 .0.1345407 0.990398 0.978588 I 0.9243l 0.8370 0.883619 0.171l174 0.00773'
~ocrc 0.461002 0.517l65 0.3816' .o.2l41993 0.9416 0.9434l2 0.9243l7 I 0.9G8l41 0.9407419 0.2182993 0.00491
DC3FG 0.415813 . OAl540 0.330648 .0.237397 0.844275 . 0 .84185 D,RJ704 0.968541 1 0.93ll985 0.2269l76 .0.0027
'DC4FC 0.402163 0.lO1101 0.376979 .o.223l011 0.865038 0.849667 0.883619 0.940741 0.93ll99 I 0 . 14746~ .o.006?
PPC 0.388881 .0.01942 0.H086l .0.18 16015 0.184083 0. \89001 0.171527 0.118295 0.2269l 0.1474646 I .0.1163
~ .0.20049 .0.02613 .o.0622? .o.OO<ll73 0.0 14501 0.0177l2 0.007737 0.00491 .0 .002 .0.0066954 .0.1163408 I
.:. lfabsolute (modulus) values are not accounted for, the sum would not reflect the strength of variable hence, Table 4.56 are the absolute values of Table 4.55 .
RDIC POG DOC LCCG AcrC ACJFC AC4FC SDcrC SDOFC SOC4FC OPC RBC
~IG I 0.39790 0.344366 0.23110322 0 .48079) 0.479199 0.0477104 0.461002 0.41l813 0.402162 0.388888 0.200481
Poe 0.39790 I OA827~6 0.2736310 0.57l405 0.569296 0.l794Q1 0 .l17l65 0.4ll40 0.5011013 0.019421 0.02612. poe 0.344366 0.48278 I 0.2609l713 0.44448 0.433322 0.460598 0.nI6' 0.33064 0.376979 0.3408~ 0.06226.
~G 0.23803 0.273631 0 .260957 I 0.246989 0.251406 0.234l41 0.2l4199 0.23739 0.1235011 0.1816015 0.00451.
~~"G O.4tc079I 11.575405 0 .44441.: O.2JG9K9101 I U.9976016 0.99039X 0.9416 O.M4275 OJe6503t( 0 . 18408~21 0.014l01
'OPG 0.47919 0.lG929( 0 .433312 0.251406: 0.99164 I 0.978588 O .9434~2 0.8418l' 0.849666! 0.1890ool O .Oln~~
I-C4FC 0.4771<l< 0.l7946( 0.460l9" 0.234540: 0.99039 0 .97858' I 0.92435: 0.8370< 0.88361! 0.171527 O.OO713j
"Derc: 0.46100 0.!'11!i6!i 0.3"167 0.2l419933 0 .941( 0.943452 0.924357 I o 968S41 0.9407411 0.2181993 0.004911
ISDClFG O.oll5KIJ 0.4l540: O.J30641C 0.2373977' O.~44275 O.lC41K51 o.gno.; 0.968541 I 0.9355989 0 .2269l76 O.DOli
' OC4FC 0.402163 O.lOIIOI 0.376979 0 .223l0113 0.86l038 O .~49667 0.8836 1 0.94074 0.935591 I 0. 147464 0.00669l
pPG O.3888X8 0.019422 0.340865 0. 18160151 0.184083 0.189001 0.17\52 0.218299 0 .2269~ O. 1474~ I 0.116341
~BC 0.200481 (J.026 12 0.062267 0.004l l725 0.014501 0.0177l2 0 .007737 0 .004918 0.0021 0.006695' 0.1\6340 I
Table 4.56: Correlation Matrix (Modulus)
298

Following Table 4.57 provided the extracted 'weights' for each variable for multi criteria
GIS analysis.
Table 4.57: Extracted Weights for Variables
Weights Variables L:x, (L:lfx, , 100)
1 /?oads Buffers (REG) 1.464 2.15
2 Disease Prevalence (DPG) 3.184 4.67
3 and Cover Classification (LCCG) 3.406 5.01
4 pisease Occurrence (DOG) 4.918 7.22
5 '{load Density Index (RDIG) 5.285 7.76
6 'l'opulalion Density (PDG) 5.398 7.92 7 'Ptandard Deviation o/CO at3 Feet (SDC3FG 7.096 1M2 8 'Ptandard Deviation o/CO at4 (SDC4FG) 7.132 10.47
9 4verages a/CO at4 Feet (AC4FG) 7.544 11.08
10 4verages a/CO at 3 Feet (AC3FG) 7.551 11.08
11 ~Iandard Deviation a/CO at Total (SDCTG) 7.556 11.09
12 4verages a/CO Totaf (ACTG) 7.585 11.13
The disease data was not large enough but needed to be incorporated due to its environmental
and public health relevance. 'Similarly, The land-cover overlay got lower 'weight', as a
classified imagery it was quite different in nature than the other grids. Interestingly, the
highest weight statistically extracted happened to be for the overlay of CO overall average.
After elucidating the importance of 'weights' of the overlays, it must be remembered that
each overlay has multiple classes of data; therefore, the classes are also assigned 'scores'
depending upon their technical relevance and the author's professional judgement. • Scores'
are assigned on the scale of 0 to 10 where ' 0' qualitatively represents safe, and '10'
represents very high risk.
The following template depicts the assigned 'scores' and 'weights' of every overlay Table
4.58 :
299

Table 4.58: Multi~Criteria Overlay Template
New MaplD & Tille' MulliCri Air Rlsk Multi Criteria
No oflnput Maps: 12 Input Maps (Id Max Color)
LandCoverCiassijicalionl998 7 PopulalionDensi/y 10 AverrageCOa/3Fee/ 4 AverrageCOal4Feei 3 AverageCOToral .J Dis.asePrevalence 5 DiseaseOcclJrrence 5 RoadsBuJJers 5 RoadDensilyl",Jex 10 SldDevialianCOa13Feel 4 SrdDevialionCOal4Feei 4 SldDevialiollCOTola/4
Format ~ Weight Map ID
5,01 LnndCoverClassljicalian 1998 (LCCG)
Null • 0: (l
I Water • I: (l
2 Vegetation • 2: 01 3 Urban Veg. (Mix) • 4: 05 4 Medium Built up • 5: 08 5 Densely Built up • 6: 10 (, Low Bml! up • 7: 05 7 umd • 8: 0
7,92 Papu/alionDenslly (PDG)
Null · 0: 0 1 54 467 · L 01 2 467 liB · 2: 02 3 1113 2359 3: 03 4 2359 7246 • 4: 04 5 7246 12859 • 5: 05 6 12859 19205 • 6: 06 7 19205 22724 · 7: 07 II 22724 46610 • 8: 08 9 46610 W3I08 • 9: 09 10 HlJHlS 143588 . 10 10
BOS
Null · 0: 0 I 10 · I: 01 II· 20 · 2: 02 21- 50 · 3: 08
>50 • 4: \Q
300
.........• -, ......... --............. -~

1.08 AverrageCOal4Feel (AC4FG)
Null I 10 11 20 21 50
- 0: - I: - 2: - 3:
o 01 02 08
11.13 AverrageCOTolal (.4CTG)
Null - 0: 0 10 - I: 01
II 20 - 2: 02 21 50 - 3: 08 51 200 - 4: 10
~ . 67 DiseasePrevalence (DPG)
Null 1 - 14 14 - 27 27 - 41 ~1 54 5~ - 67
- 0: - 1: - 2: - 3: - ~ : - 5:
o 01 02 05 08 10
7.22 DiseaseOccurrence (DOG)
Null - 0: 3 - 1:
~ 8 - 2: 9 1~ - 3: 15 23 - ~ : 2~ 47 - 5:
2. 15 RoadsBufJers (RBG)
Null - 0: 50 - 1:
51 100 - 2: 101 500 - 3: 501 1000 - 4:
> 1001 - 5:
o 01 02 05 08 10
0 10 08 05 02 01
301

7.76 RoadDensitylnder (ROIG)
Null - 0: 0 1 86 - 1: 01 86 173 - 2: 02 173 259 - 3: 03 259 346 - 4: 04 346 ~32 - 5: OS ~32 519 - 6: 06 519 60S - 7: 07 60S 691 - 8: 08 691 778 - 9: 09 778 864 - 10: 10
10.42 SrdDel'iationCOar3Feer (SDC3FG)
Null 10
\0 20 20 30 30 40
- 0: - 1: - 2: - 3: - 4:
o 05 OS 03 03
10.47 SrdDeviarionCOar~Feer (SDC~FG)
Null 10
10 20 20 30 30 40
- 0: - 1: - 2: - 3: - ~ :
o OS 05 03 03
11 .09 SrdDel'iarronCOToral (SDCTG)
Null - 0: 0 1 10 - 1: OS 10 20 - 2: OS 20 30 - 3: 03 30 40 - ~ : 03
302
Figure 4.75 illustrates the final results of the whole endeavour in the form of thematic map. It
has been established that the exploration of spatial patterns of air pollution and its risk
evaluation over the whole metropolis was conducted through the integrated approach of Field
and Remote Sensing techniques along with Geographic Information System. This map is able
to clearly identify and demarcate the five classes of risk due to air pollution and the
popUlation at risk, under each zone. It is worth mentioning here that even the class of
. moderate risk' be not taken lightly since the outcome is involving twelve variables of
diverse nature.
4.13.2 Very High Risk
Area: 0.866 Km2
Population: 28,000 persons
On the digital format, there are two zones of very high-risk identified as heart of the Karachi
(i.e. Saddar / Empress Market) and section of M. A. Jinnah Road (from the intersection of
Garden road to Robson road known as Eidgah). These have emerged as very high-risk zone
based on the applied criteria counting on various parameters and not only the concentration
of CO. These parameters included high population density, dense road network, concentrated
habitation, higher disease prevalence, and hazardous observations of carbon monoxide with
low temporal variations.
The Saddar- Empress Market area comprises of several bus terminals/transfer station, dense
network of roads, crowded retail markets, thousands of commuters, a lot of pedestrians, long
queued vehicles, mixed land use and high-rise buildings all around. The commercial activity
of this old part of the city involves unavoidable trips, therefore, the actual human population
at risk is difficult to quantify. Appraisal of population at risk yields the figure of 18600
persons for this smaller area of 0.566 Krn2. There is no pedestrian data available and this
study possesses the census figures of the resident population only. Environmentalists are
called to recommend intervention measures for this peculiar very high-risk zone of Karachi .
303

The section of M. A. Jinnah road from the intersection of Garden Road up to Robson Road
known as Eidgah is a two way traffic, section with commercial vehicles such as buses,
minibuses, coaches, rickshaws etc., plying with countless number of two stroke motorcycles
and loading vehicles. This road is also a part of old Karachi with many factors common as in
the Saddar zone. The GIS analysis has figured out the population of this very high-risk zone
as 9,400 persons and the area as 0.30 Km2.
4.13.3 High Risk
Area: 16.941 Km2
Population: 792,600 persons
It is reiterated that the risk zones have been derived due to the effect of a combination of
urban and environmental factors endangering human potential. Reader would observe three
major high-risk zones with some hazardous islands. The first high risk zone covers the old
city areas, adjoining neighbourhoods of Nishtar road, the Katchi abadies besides Layari river
and borders the Karachi cantonment area. The popUlation at risk is computed to be 436,800
persons and the area is 9.28 KmZ, The open green space of Karachi zoological garden is
clearly out of high risk proving the ground reality.
Second high risk zone has the jurisdiction across Liaquatabad and Federal'S' Area. The
critical arterial of Shahrah-e-Pakistan, which later becomes S. M. Taufiq road, bears
thousands of vehicles and people daily. The software has calculated the area of this risk zone
as 4.945 Km2 and population as 250,200 persons. Six major junctions (earlier Roundabouts
now turned as signa Ii sed intersections) are the choking traffic points viz. Oak khana,
Liaquatabad No. 10, Karimabad, Aisha Manzil, Water Pump and Sohrab Goth. The transfer
of Subzi Mandi to its new location on Karachi-Hyderabad Super Highway has worsened the
traffic and environmental conditions of this risk zone.
304
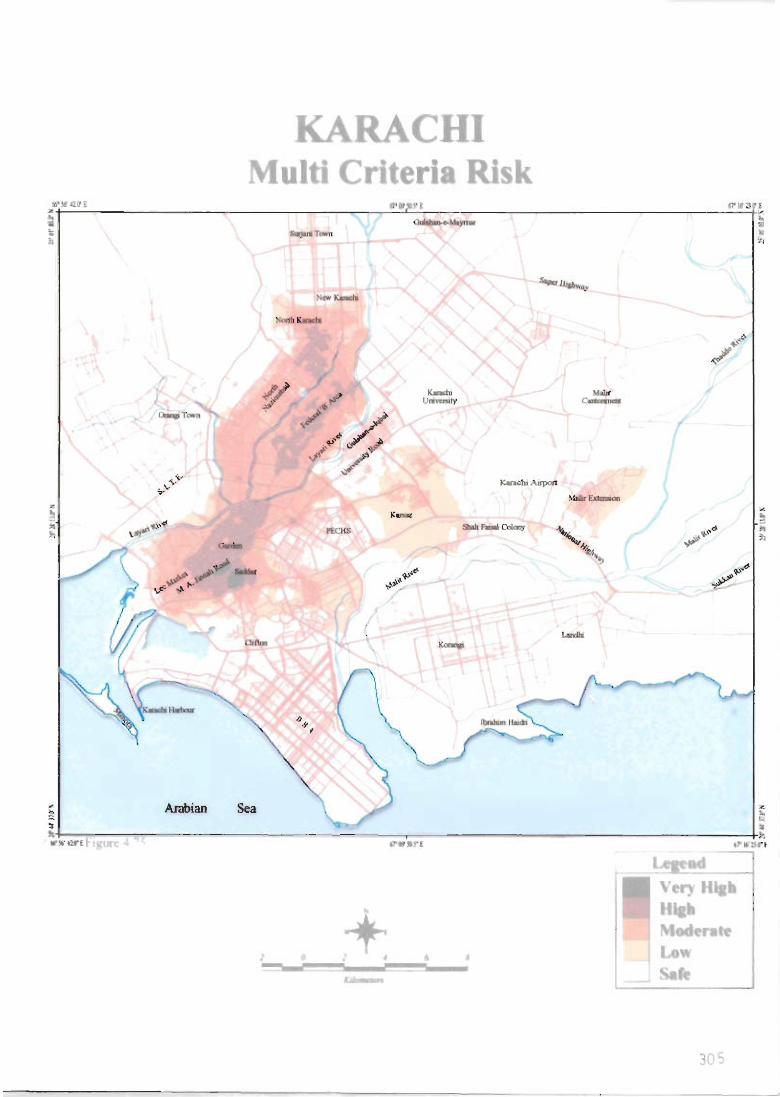
KARACHI ulti Cr· eri Risk
.~+~~Q~'~'~ __________________________________ ~~~~'~' ______________________________________ ~~~w~~~~
:! .-.. .... ,..., ~ • ,'j
Alabian Sea ~ , . .. +-------~~--------------------------~----~---------------------------------------------+~ lI" !fnl r n t1"WtW E ,)I' In~r t
I • • I
t'ntt'
Low Sa
3('

North Karachi risk zone although relatively smaller area i.e. Km2 carries 98,800
persons. The effect traffic and pollution at Nagan Chowrangi largely expanded the
boundaries this risk zone. The. population density here is quite high, which might have
contributed in the formation this multi criteria based risk zone.
On the map, there are two. distinct spots of high risk. One of them is Chowrangi of
Nazimabad at Nawab Siddique Ali Khan road. This high-risk spot covers an area of 0.06
Km! and has the population around 3000 persons. It is II location coming in the way for II
large number of commuter trips during the day. The second significant high-risk spot is seen
on the intersection of Shahied-e-Millat road and the University road (Jail Chowrangi)
Analogous to Nazimabad Chawrangi, this high-risk spot witnesses thousands of vehicles
and passengers daily due to its mainstream location. This spot shown on the map wrap an
area of 0.1 Km!, bears a population of3800 persons.
4.13.4 Moderate Risk
Area: 103 Km!
Population: 2,186,200 Persons
Administratively speaking, the two populous districts (Karachi Central and Karachi South)
are lying under moderate risk, Through GIS techniques, it has been possible to micro
geographic details of this risk zone as the count of polygons was thirty-five. For the sake of
brevity. the moderate risk zone could be discussed in two folds. The agglomerated moderate
risk zone largely spread out over the map and shows an elongated pattern towards the
northeast direction. This agglomerated zone encompasses an area of 50.96 Km! and a
population of 2,122,600 persons at risk. This particular risk zone covers a large portion of
urban land and imbibes several planned, unplanned neighbourhoods and squatter selllements.
The figure of greater than two million people under moderate risk, by itself are a legitimate
theme of environmental inquiry.
306

The scattered moderate risk spots spread on an area of 4.15 Km2 and have a population of
63,600 persons. The locations on map are identified as Liaquat Market Malir and Saudabad
No. 15 Malir Extension, which are densely, populated commercial areas. These locations
have narrow roadway widths and traffic congestion is reported during the off peak timings as
well. Other spots are the intersection of NIP A, the road section between Hassan Square and
National Stadium, which lies 'on route for many public transport trips. The last hotspot is
recognized as the intersection of Shahrah-e-Faisal and Shahrah-e-Quaideen.
4,13.5 Low Risk
Area: 56.36 Km2
Population: 1126400 Persons
As the Figure 4.75 and its legend shows that lastly but not the least, there exist some low risk
zones. Which are useful for spatial decision makers. The above described moderate risk zone
has adjoining regions which are under low risk . The pattern of this region is similar to the
agglomerated moderate risk zone. This particular risk zone travels similarly to its adjoining
moderate risk zone in elongated fashion from southwest to northeast. The GIS give the area
of this zone as 26.134 Km2 and covers poptllation of 646,800 persons.
The Rashid Minhas Road has a low risk zone corridor on its both sides, which further
stretches to main Shahrah-e-Faisal and Shah Faisal Colony. The T -intersection of lohar
Morre at this road is the root cause in the creation of this risk zone. Conflicting turning
movements at the lohar Morre are made without any traffic-control device (TCD) or even
without a policeman. This location has to be either grade separated through an Overpass or
Underpass or at least be signalised. The existence of recreational parks (Aladdin and
Sindbad) on left and right sides of Rashid Minhas road generates congestion. This low risk
zone comprises of an area of 19.044 Km2 and population of 23 6, 000 persons.
Malir extensions, Quaidabd area, and parts of Shah Faisal colony make the low risk zone on
the eastern outskirts of the metropolis. Population of 243,600 happens to be under low risk
307

and the area it surrounds is 8,145 Km2, The grids of population density and disease
prevalence might have played an important role in the formation of this low risk zone,
4.13.6 Safe Zone
The enclosed map illustrates rest of Karachi metropolis under the safe category, It is only a
pictorial representation of the present day situation, The rising population, in migration
(Khan e/ ai, 1998) registration of motor vehicles (especially two stroke engine), formation of
new Ka/chi A badies, decrease in vegetation canopy suggest that sitting idle without seeking
alternative solutions would turn this safe haven into risk zones in future,
308

4.14 CARBON MONOXIDE (CO) PREDICTION
In the section, the results of an intensive study of Old City (core) Karachi are presented. In
this study, primary data on land use (floor space), traffic and air pollution (CO concentration)
has been originally collected.
Carbon monoxide (CO) enrichment during specific time period was the dependent variable
whereas roadway traffic and landuse related parameters were independent variables
determined for the purpose of predicting air pollution in the old city centre of Karachi.
Prediction models for CO-concentration for the following time periods have been developed.
I. Working Day Mornings
2. Working Day Afternoons
3. Working Day Evenings
4. Weekend Mornings
5. Weekend Afternoons
6. Weekend Evenings
7. Working Day Averages
8. Weekend Averages
9. Weekly Averages
This was possible usmg the backward elimination procedure for estimation of linear
regression models in statistical analysis software (SPSS). This procedure eliminates all non
significant coefficients such that the final model contains statistically significant coefficients
only (McCuen 1985; Gujarati, 1995).
Model parameters were estimated for equation (2.1). Table 4.59, summarizes the model
selected on the basis of following statistical parameters:
I. The low value of intercept (constant) is statistically desirable (which is the case here)
because theoretically when there will be no traffic and land use (i. e. Xl, X2 .... ..... Xs all
309

tend towards zero) then CO concentration should also tend to zero. Therefore,
intercept value should be smaller (Hameed, 1990).
2. These models were found to be statistically significant on the basis of the F-statistic
(Gujarati, 1995).
3. The coefficient of multiple detenninations R 2 is the proportion of variation in the
dependent variable explained by the regression model (Ali, 2000). The values of R
squared range from 0 to 1. Small Vlllues indicate that the model does not fit the data
well. The sample R squared tends to optimistically estimate how well the models fit
the population (Christ, 1966). The values of R2 greater than 0.5 are considered to be
acceptable for engineering data (McCuen, 1985).
4. If the significance value of the F statistic is small (smaller than say 0.05) then the
independent variables do' a good job explaining the variation in the dependent
variable (Fomby et al., 1984).
4.14.1 Prediction Models
The best model developed for predicting the carbon monoxide (CO) concentrations in the
study area (under the experimental conditions) during the selected times of week are given as
follows:
Working Day Mornings
Y"" ....... __ = 2.161838 + 0.004801 X6 + 0.138413 X 7 - 0.00019 XI - 0.00013 XJ + 0.000177 X,
Working Day Afternoons
Y (W ..... D."'~~I= 6.138887 + 0.005743 X6 - 0.00016 XI - 0.00014 XJ+ 0.00019 X,
Working Day Evenings
Y""""D~'_I= 17.65964 + 0.005868X6-· 0.0002 XI - 0.00012XJ - 0.00014X4+ 0.000187 X,
Weekend Mornings
1.749067 + 0.004467 X 6- 0.0000591 XI + 6.03E-05 X,
310

Weekend Afternoons
4.169156 + 0.005001 X6 + 0.000114 Xa
Weekend Evenings
4.729716 + 0.007588 - 0.00011 X1 + Xa
Working Day Averages
3674709 + 0.017228 X 6 - 0.00054 X1 - 0.00036 Xj - 0.00022 Xs+ 0.00054 X,
Weekend Averages
Weekly Averages
9.957327 + 0.016575 X6 - 0,00024 X1 + 0.000264Xs
8.299302 + 00,,0, X 6 - 0.00013 Xr 0.00000656 Xr 0.0000513 0.000137 Xs
311

Tablc 4.59: Constllllis and Cocfficicnts of P"cdictivc Modcls
• Monday. Tu~y. W~y;and 11lU~y, Avcrasc v ... luc; oft.cn minulcs .1.1 1 - 2 meier Irom the $OU(~e about 3 - 3~ feet above !.he sutf~
1 Friday. SabJtday and Sunday. Average values often minutes "I I - 2 nwter from the 5OW\:C about) -)~ fect above the s.unitce
312

4.14.2 Evaluation of Models
Some important aspects of the formulated models are:
• The negative coefftcients for residential (XI) and special purpose (X) suggest their
cancelling affect on the dependent variable. In other words, greater the space utilized for
residential and special purposes, lower would be the concentration of CO in the vicinity
of that particular location. It happens to be a rational aspect.
• All coefftcients for traffic volume (~) bear positive sign. Higher the traffic volume,
higher would be the pollution (CO enrichment). These coefficients are higher in
magnitude as compared to all coefftcients of other variables. Surprisingly, these
coefftcients complement the hypothesis that high level of air pollution in an urban
environment is the by-product of vehicular traffic.
• The regression analysis for almost all the nine models eliminated the variable of
Commercial space (X2) in the first step.
• It was realized that the results could be improved to a good extent if all the built up
spaces added (Xs) as follows.
The relative accuracy of the models improved statistically after this modification.
• Vacant space (Xs) emerged as completely insignificant variable for all prediction models
developed. This is quite understandable, as zero activity on land would translate into no
pollution.
• Since transportation ROW (X4) consisis of Roadway pavement, sidewalks, aU sorts of
parking space, medians etc. , its impact on the dependent variable would be of cancelling
out. The negative coefftcients for this category of land use in all the models developed
supplement to this postulate.
313

4.14.3 Applications of Models
The air pol/ulanl dispersion models (e.g. Hatano el al., 1989; Zannetti, 1990; USEPA, 1995;
Folgert, 1997; Hodgin el al., 1997; Comrie el at., 1997; Cartwright el at., 1997; Coe el aI.,
1998; Dent el at., 1998) deal with the phenomenon of pollutant dispersion rather than its
generation. The predictive models developed in this study provide the basic input needed for
the various air pol/ulanl dispersion models found in the literature.
The models developed for predicting air pollution (CO) in this study head to tremendous
potential. These models have the capability of forecasting carbon monoxide (CO)
concentrations for different temporal (diurnal, weekly) phases in Karachi. These models have
practical applications in urban and transportation planning, land use control, traffic and
environmental engineering. The practicality of the prediction models lies as being tool in
saving time and effort compared to the cumbersome and expensive field sampling methods.
These models have another interesting application, when transportation engineers and
regional planners deal with future planning and design problems. Whenever a change in land
use might be anticipated, it would be desirable to study its impact on air pollution at nearby
intersections in order to implement modifications and improvements. These models could be
used for this purpose very efficiently.
4.14.4 Constraints of Models
Models developed in this study give a reasonable estimation of carbon monoxide
enrichments from traffic and land use variables. The limitations should also be clearly
recognized.
• The data for this study were obtained from Old City (core) of Karachi. The land use
patterns in the study area exempted an important class of • Industrial', which may be
characteristic of other cities. Therefore, keeping such indigenous factors, cities may
314

develop models for their use. Frankly, the models develop here should not be applied to
other cities.
• These models have been developed for primarily a dense network of roads . When
applying to sparse network of roads, caution should be exercised.
• The study area characterise a significant fraction of land use for 'Warehouses' (Hasan e/
al., 1999). The results may not be consistent at location where there is a drastic change in
land use concentration e.g. ' special purpose' is predominant.
• Lastly, the temporal nature of regression models should be understood. The variables
used in the development of these models may be changed periodically by urban renewal,
change in allocation of space for various activities, future changes in transit services of
Karachi such as Karachi Mass Transit Program (KMTP) and up-gradatipn of Karachi
Circular Railway (KCR). Catastrophic events changing landuse patterns can disturb the
predictability of the derived models.
• Therefore, the predictive modelling exerCise should be validated periodically and
modified in order to maintain stability in the process.
315

5. CONCLUSIONS AND RECOMMENDATIONS

This chapter summarizes the research and gtves some conclusions and suggestion for
possible improvements and extensions of the research.
5.1 CONCLUSIONS
It is really a thrilling experience to study air pollution in one of the badly affected cities
of the world with meagre field resources we have. Nevertheless, by any means it is
equally comparable with all such studies being conducted elsewhere in the world.
This study establishes that RS and GIS integrated techniques are the most reliable and
expeditious technologies in monitoring air pollution. Although RS/G1S seem expensive
in initial financial outlay, nevertheless, in the longer run, these are cost effective, lasting
aDd dynamically adaptable in any part of the world.
It is revealed through this study that human behaviour is the key in creating air pollution
and that it should not be combated only through technological solutions. Rather a
balanced modification in human perceptions would come up with more concrete remedial
measures. It is with this basic intention that parallel physical and perception studies have
been initiated to achieve the main objective of the study, which has been outlined in the
hypothesis:
"The higher concentrations and spatial patterns of air pollution are in conformity with the
geographical distributions of land cover I land use, traffic and population, which resulted
in high incidence of airborne diseases and the human resource near those areas, are on
vulnerable risk. "
The developed GIS evaluation combined the data sets, various analyses and the resultant
maps with the capability to integrate further parameters for future risk assessments.
317

Multi-criteria decision analysis in the GIS environment was successfully employed first
time in Pakistan.
Micro-geographic appraisals of the metropolis were performed by considering 58 zones
outlined by the local development authority. Each zonal assessment included area,
population density, distribution of land cover classes, split of land use categories, and
frequency of airborne diseases, their prevalence scenario and temporal variations in CO
concentrations within the zone,
Multiple regression models for predicting carbon monoxide (CO) enrichment at the olden
region of Karachi metropolis have been formulated in which traffic and land use
parameters act as independent variables.
Further conclusions and suggestions concerning the general flow of the study within
RS/GIS framework and the specific aspects of epidemiology and public perception in
Karachi are as follows:
• The research attempted to. explore the advanced capabilities of Remote Sensing (RS)
and Geographic Information Systems (GIS) for simulating the parameters and
variables that happened to be the causes and effects of air pollution generation
respectively.
• The satellite image processing has yielded the classified product that is able to give,
in quantitative terms, the geographical spread of major land covers throughout the
metropolis.
• Another RS/GIS integrated technique of change detection has illustrated the historical
growth of human settlements and the future expansion potentials available.
• The study investigated the land use scenario of this mega-city and has furnished the
first ever development of a statistical and geocoded database on explicit land use
318
-------------------------------

types and functions for Karachi, which has also raised some issues requiring further
studies.
patterns of population have been monitored on micro geographic scale
analysis zones. Computer Assisted Cartography provided a combination of
demographic themes on which aUlhor has briefly tried to reflect with a socio
economic viewpoint
.. II has been firmly established that GIS and GPS enabled the researcher to render
temporal assessment of traftie and spatial variations of the road network across the
city.
.. Criteria pollutants (as defined by USEPA) have been ventured for spatial patterns
monitoring. Recent published have been used for interpolation and
transformation of po in I observation into continuous sUrface.
However, Ground tmlhing was endeavoured for hazardous carbon monoxide (CO).
Out of 308 stations monitored, more Ihan 32 percent sites exceeded the WHO
guidelines (I-hour) Annexure B.
Techniques such as Map Algebra, Density computation, and Surface development
produced the outcomes of the previous chapter.
.. Effects of air pollution on the human health within the study area have been
investigated by means of conventional tools. The study has gone further to measure
the epidemiological indicators of dlsea5:e occurrence and point prevalence at the
micro scale of Analysis Zone.
line public health information pertaining to Morbidity, Morbidity-Mortality
Ratios, Airborne disease freq1lency and Intensity of Frequency has been computed.
319

The linkage between rur pollution and subsequent diseases has
through II critique of experiences of the physicians practising in Karachi.
evaluated
• The research focused on the understanding and awareness asp'''''' of the population at
risk. Pathetic community attitude towards an important societal problem was
concluded. Findings of perception survey on air pollution indicate jeopardy at
community level.
5.2 FURTHER RESEARCH AVENUES
The products of this study have created many possibilities for further research:
• Due to many constraints, this research monitored enrichments; predicted pollution
levels; assessed risks; and appraised regions on the basis of a single criteria pollutant
Carbon Monoxide (CO). It is recommended that further studies should be done by
taking into consideration the criteria pollu/anls.
• A number of air dispersion models, have been developed in western countries. There
exist a need for suitable Air Pollution Dispersion Models within GIS framework for
the state of affairs in the developing countries.
• Further comprehensive simulated models embedding meteorological parameters
(vertical and horizontal temperatures; moisture; Field, direction and velocity of wind),
which could evaluate I animate the changes in air quality seasonally and their effects
henceforth.
• Land:sat 5 image, which was processed in this research for the extraction of land
cover themes. had a spatial resolution of 30 meters that suits beller to large-scale
investigations. Today's world offers a host of high·resolution commercial satellite
imageries like Quick Bird, IKONOS, DKI and KVR, whose spatial resolution are in
the range of to 0.60 meters. Urban investigations require detailed topography for

modelling etc in fonn of Digital Elevation Model (OEM), Further research.
applications in Pakistan can be conducted on similar lines provided the availability of
stereo pairs of low altitude aerial photographs and/or high-resolution digital
imageries,
.. Satellite Remote Sensing has been employed worldwide for time-lapse monitoring of
land covers, Developing countries such as Pakistan could watch for specifics e,g,
vegetation, environmental quality, settlement patterns and desertification, This work
has provided a footing for building on these inquiries,
.. In the developing countries, urban parameters are drastically different from that of
developed countries that' has propounded environmental implications,
Interrelationships Ilmong categories of land use ill the metropolitan cities
developing countries in Asia are interesting research areas. Karachi in depth
autopsy in this regard,
Studies' identilYing gradual land use changes at the neighbourhood level and its
consequent impacts on environmental deterioration are an avenue of future
investigation for Karachi metropolis,
• Risk assessment studies incorporating gender information of the affected
population be carried out as outlined in this thesis,
.. Pakistan lacks in vivo as well in vitro epidemiological studies establishing indigenous
linkage between environmental pollution and subsequent effects on human health,
Correlation of diseases incidence and enrichment of a particular pollutant has to be
inferred through recurrent community based studies,
The suggested clinical studies should spatially widespread and imbibe socio-
economic and ethnic clues of the focus population,
321

• Cross-sectional studies should be taken to evaluate the perceptions about the
understanding of such an important environmental problem and psychological desires
to abate them. These studies may provide the perception variations among the various
socio-economic and ethnic target groups.
5.3 RECOMMENDATIONS
• The quality of data on land use in the study area had not been excellent as it consisted
many approximations. There is a dire need of developing a comprehensive
cadastral database in the GIS framework for the metropolitan city of Karachi. The
beneficiaries of such MAGIS (Metropolitan Area Geographic Information Systems)
would not only be planners and researchers but also utility and services providers;
law enforcement agencies and revenue departments of Federal. Provincial and Local
governments.
• It is suggested that a metropolis-wide traffic volume count program be launched to
ascertain the current magnitudes. The storing and computing power of GIS and its
analysis tools provide potential for· more detailed descriptions and analysis of
roadway and traffic data. There is no doubt that traffic management in Karachi could
greatly be enhanced by GIS technology due to its visuaJising. analyses, simulating
and modelling capacities.
• Although complete population data are spatially managed at the level of districts, it is
not to deliver goods at the micro levels. Detailed demographic and socio
economic households' information is required to be maintained on GIS at smaller
local entities.
• This study has exposed another requirement of this society. Vilal statistics are largely
managed on GIS worldwide. Steps towards this direction need initiation in Pakistan.
:122

• Satellite Remote Sensing (SRS) can demarcate the large Plume of air pollution
particularly, from industrial units (cement factory, thermal power plant, and smelter).
Two real life examples for Karachi are illustrated in Annexure J. It is highly
recommended that further work be carried out to quantifY the affected regions,
property and population due to cloud cover concentration of such disturbances.
• Air Quality Index (AQI), a dynamic phenomenon could only be investigated subject
to the availability of continuous, multi-variate monitoring. In a LDC e.g. Pakistan, no
local resources are yet available to examine it. It is hoped that time would come when
AQIs on spatial canvas be explored.
• Technological innovation, institutional development, and co-operation by all levels of
. government and industry have proven to be successful strategy for abating air
pollution in the Developed nations. Keeping in view the monetary constraints for
developing countries like· Pakistan, concurrent endeavours by all the stakeholders
incorporating educational (ethical), engineering and enforcement (legislation)
measures are recommended.
323

REFERENCES Abbey D.E., Hwang B.L., Burchette R.J., Vancuren T ., MiIIJ P.K., 1995, Estimated Leng-Tenn Ambient CODccnlralions of PM 10 and Development of Respiratory S}mptoms in a Nonsmoking Population, Archives of Environlllenial Heallh, 50(2), pp. 139-52
Abbey D.E., Pete.,en F., Mill. P.K., Beeson W.L., 1993, Long-Tenn Ambient Concentrations of Total Suspended Particulates, Ozone, and Sulfur Dioxide and Respiratory Symptoms in a Nonsmoking Populalion, Archi""s of Ellvironmellial Health. 48(1), pp. 33 -46
Abel D. J., Kilby, P.J., and Davis, J.R , 1992b, The Systems Integration Problem, Inlematiollal Journal of GIS, 8, Nl, 1-12
Abel D. J., Yap S. K., Ackland R., Cameron M. A., Smith F. D. and Walker G., 1992a, Environmental Decision Support System Project: an Exploration Of Alternative Architectures for Geographical lnfonnation Systoms,/lIlernaliollal Journal of GIS, 6(3), pp. 193-204
ADB, 1997, Emerg ing Asia: Changes and Challenges, Asian Ixvelopmt:nt Bnnk, Manila. Philippines
Af.ar S., 200 I, Application of Remole Sensing for Urban Growlh MOlliloring aud Land Cover/Land Use Mapping for Change Deleclion in Karachi, M Phil thesis, University of Karochi, Pakistan
Agostoni A., Stabilini R., Viggiano G., Luzzana M, and Samad. i\1., 1980, Influence of Capillary aod Tissue P02 on Carbon Onoxide Binding to Myoglobin: A Theoretical Evaluation. Aflcrovascular Research, 20, pp. 81 - 87
Ahmed K. S., 1952, Climotic Regions of West Pokistan, Pakislan Geographical Review
Akimoto H. Na)ume N. t and Matsumoto Y., 1994, Tht: Cht:mistry of Oxidant Gent:ration: Tropospht:ric Ozont: Incrt:a:-;t: in .Iap6n. in : Calvert J. G. (w .) .. The Chemistry of the Atmosphere: Its Impact on Global Change , BI. ckweli Sci . Publi ., pp. 261 - 273
Aklmoto M., Hashimoto H., Shigemolo M., Yama.hit. K., Yokoyama I., 2000, Clumg'" of Nitric Oxide ond Gro\\1h F .clors During Gastric Ulcer H""ling, Journal ofe ardiovascular Pharmacology, 36(5 Suppl 1), S282-5
Alderman B.W., Baron A. E and Savitz D. A., 1987, Malemal Erposure 10 Neighbourhood Carbon mOlloxide and Risk of Low Birlh-w~ighl Public Heallh Reporl, 102, pp. 410 - 414
Alfano D.P., Petil T.L. , 1985, Postnatal Lead Exposure And The Cholinergic System, Physiological Behaviour, 34(3), pp. 449-55
Ali M. S .• 2000, All .~cceS5ibilily-Aclivily Baset/ Approach for Modeling Rurol Travel Demand in Developing Countries, Ph. D. thesis , Tht: University of Binningham. UK
Ali S. M., 1997. lnlegralion oflhe Officiol and Privale Informal Practices in Solid Wasle Management, Ph. D Thesis , Loughborough University, UK
Allred E. N., Bleecker E. R., Chairman B. R., Dahm. T. E., Goltlleb S. 0., Haclmey J . D., Pangano M., Selvester R. H., Walden S. M. and Warren J ., 1989, Short Tenn ElIecl Of Carbon Monoxide Exposure On The Exe:rcise Perfomance Of Subject~ With Coronary Artery Disease, New England Journal a/Medicine, 321, pp. 426 -432
324

AIm S., Jantunen M.J., Vartiainen M., 1999, Urban Commuter Exposure to Particle MaUer and Carbon Monoxide (nside an Automobile, Journal of exposure analysis and environmental epidemiology, 9(3), pp. 237·44
Alpers W.R., RO>5 D.D., and Rurecach C.L., 1981, On the Delectability ofO"""n Surface Waves by Real and Synthetic Aperture Radar, Joumal ofGeoplrysical Researclr, 86, pp. 6481 - 6498
Altman D., 1994, F~' sL"11hcore"c approaches for handling imprecision in spatial analysis, in/emational Joumal of GIS, 8(3 ), pp. 271 - 289
Amrhein e.G.. 1985, An interactive multi-criteria decision model for spatial problems. East Lakes Geograpber, 20(1). pp. 20 - 28
Andersson J.A., Uddman R, Cardell L.O., 2002, Increased carbon monoxide levels in the nasal ainvays of subjecl .. \\ ith a histol)' of seasonal allergic rhinitis and in patients with upper respiratory tract infection, Clinical and Expenmelllal Allergy, 32(2), pp. 224·7
Andreae MO., 1995, Climate Effects of Changing Atmospheric Aeosol Level, . In: Henderson Selle" A. (ed.), World Survey ofClimalology, Vol. XVT Fulure Clilllale oflhe World" Else"ier, Amsterdam
Andreae M.D., Bron-ell E. V., Garsfang M., Gregory G.L., Harriss R.C, Hill G.F., Jacob D.J., Pereira M.C., Sach.e G.W., Setzer A.W., Silva Dia. P.L., Talb'ol R.W., Torres A. L., and wor.y S.C" 1988, Bioma;\$ buming emissions and 8ssocialt:d hitst! layers ov~ Amazonia, Journal o/Geophysical Research, 93, pp. 1509 - 1527
Aneja V.P., Agan"al A., RoeUe P.A., Phillips S.B., Tong Q., Watkins N., Yablonsky
R., 2001, Mcasun::ments and analysi~ of criteria polluwnts in New Delhi. India, Envj,.onmelllal Inlemational. 27(1), pp. 35·42
Angle c.R., McJnlire MS., 1979, Envirorunental lead and children: the Omaha study, Journal of Toxicology mId EI/\'iron/llenlal Health, 5(5), 855·70
Annest J. L., Pirkle J.L., Neese J.W., Bayse D.O., and KO"ar MG., 1983, Chronological trend in blood lead levels between 1976 and 1980, New Englond JOllnlal oflledicine, 308, pp. 1373 - 1377
Ansari, G, 1998. Astluna all risc dUt!: to uncontrollable pollution. The News, December 06, Karachi
Anselin L., and Gdis A., 1992, Spatial statjstical t:tMlysis and gt:ographic infonnation systems, Annals of Regional Sciellce. c6( I) , pp. 19 - 33
Anstey N.M., Granger D.L., Hassan.li M. Y., Mwaikambo E.D., Duffy P.E., Weinberg J.D., 1999, Nitric oxide.:, maluria , and ant:mia: inverse rdatiol1$hip bctwet!n nitric oxidt: production and haemoglobin conct:nlrulion in ~ symptomalic, malaria-expost:d children, American Journal uf Tropical AJedecine ond Hygine . 61(2), pp. c49 - 52
Anthony G. lind Xia, 1996, Urban Growth Managem<nt in the Pe.rl Rive"T Oo:lt. : An Intege-dted Remote Sensing alld GIS Approach, ITC JOl/17Ial, pp. 77 - 86.
Antuni J.D., Kharitonov S.A., Hughes D., Hodson M.E., Barnell P.J., 2000, Incrl!ast: in exhaled carbon monoxide during exacerbations of cystic librosis, Thorax , 55(2), pp. 138-42
Anyan\\'u E .. 1999. Complex intt:fConvertibility of nitrogen oxidt:s (NOX): impact on ocl;upational ~Jld environmental health, Review on Environmental Health, 14(3), pp. 169 - 85
Aplin, P., Alkinson, P. M., and Curran, P. J., 1997, Fine spatial resolution sHtellite sensors for the next decade, Internalional Journal of Remote Sensing, 18,3873-3882.
APP, 1996, Karachiites exposed to high lead levels: WB, daily Dawn, June 27, Karachi
APP, 1997, PO\,c:r plants using sulphur laden fuel thrcatt:n acid rains, Frontier Pmit, February 23 , Karachi
325

APP, 1998, Karachi facing imminent hozard, of.oid rains: Study, Frontier Post, April 26, Karachi
APP, 1999,42,644 vehicles challaned for polluling.atmosphere, the Nation, October 28, Lahore
APP, 2000., 30 percCllI dis"",",s resull from pollution in country, Bu,iness Recorder, April 09, Karachi
APP, 20oob, Rickshaw. mJijor couse of air, noise pollution in citie., Frontier Po,l, Febnmry 21, Karachi
Aral Jl.1.M., MasUa M.L .. Williams R.C., Su,le" A., IUld Heilgnd 1994, Exposure Assessment of Populalions Using En'1ronmenlal Modeling, Demographic analysis, and GIS. Water Resources Bul/elin 30(6), pp. 1025-4 L
Aris R.M., Chrisllan D" H""me P.Q., Kerry K., FInkbeiner W.E. and Bal",,,,, J,R.. 1993, OzoneInduc<:d Airway Inflammalion in Human Subjects as Delermined by Airway Lavage and American Review o/Respiralory Disease. 148, pp. 1363 - 1372
Arm.trong M.P., De .. ,ha .. P.J., and Lolonb P., 1991, Cartographic Visuallization and Users Interfaces in Sapoli.1 Decision SUppOlt SYSiems, in: procoedinss GISILlS, AIl.nta, GA, 1'1'.321-330
Aronoff 1989, Geographic Illformation Syslems: A Managemenl Perspective, WDL ?ublications. Otlliwa, Canada
Aronow W. 8., Slemmer E. A., and Isbell M. W., 1974, Elfecl of ClII'OOn Monoxide Exposure on Inlenniltent Claudication, Circulation, 49, pp. 415 - 417
Analll1l M. H'J
2000, Spatiall'altems of Air Pollution: A GIS 1'00·sp,:cIi,'e. in: proceedings, GIS in New MIII.nnl.m: ;r In/emalional GIS Year ]000, Pakistan of Geographic Inforamation System (I'SGIS), Islamabad, Web: Y!l.l'l!U!Q£,li!l;~!!£JIli:;§.!!l;ruJ;i!lJ!Ji!liJiOl!lUQQ.Q.bl!ll1
A •• dull.h K., 2000, Lead (Pb) Poisinins Retards Barin Development, Frontier Posl, Jan. I, Karachi
A,h 8., Fisher C. Trw;",ell", S., Allen J. Rand Irwlng L., 1989, Maternal Weigh! G.in, Smoking and other Faclor. 11'1 Pregnancy as Pn:dicalors Of Infant Birth-Weighl in Sydney Women, Australian and New Zealand Journal a/Obstetrics and Gynaec%gy. 29, PI'. 212 - 219
Athnlay Emr! S., Bage; T" Demir A.V., 2000, Urban CO Exposure and its Health Effects on Trnffic Policemen in Ankarn, i£nviTonme1lla/ Research, 82(3), pp. 222-30
ATSDR, 1988, The Nature and Exlem 0/ [ .• ad Poisoning In Children In Ihe Unlled Siales: A Report 10 Congress. Agency for Toxic Substances and Di_ •• Registry. U.S. Department of Health and Huma" Services
ATSDR, 1990, Toxicological Profile for Department of Health and Hum.1I Services
Agency for To~ic Substance3 and Disease Registry, US
Audet and Ludwig G. 2000, GIS in School, ESRl Pre .. , California, USA
Audrey S .• Takser L.. Andre M., Msl1in S. Donna M., Genevicce A.. Philipp" B., Georgelle H., Guy H., 2002, A Comparative StudY of Manganese and Lead Level. in Human UmbiliC<lI Cords and Malemal Blood from Two Urban Centers Exposed 10 Different a"soline Additives, Science o/Ihe Ta/al Environmem, 290(1-3). pp. 151-64
Avol Linn W,s" Sham •• D.A., Spier c.!:., Valencia L.M., Venel Trim S.c., ""d Ha.lmey J.D., 1987. Short-Term Respiratory Effects of Pholochemical Oxidant Exposure in Exercising Children, Journal oflhe Air Pol/ulion Control,lssociallOl1, 37, pp. 158 - 162
326

Avol E.L., Linn W.S., Venel T.G., Shamoo D. A., and Hadmey JD., 1984, Comparative Respiratory Eff""ts or Ozone And Ambient Oxidant Pollution Exposure During Heavy Exercise, Journal of the Air Pollution Control AJSociation, 31, pp. 666 - 668
Avol E.L., Navldl W.e., Rapparj.ort E.B., and Peters J.M., 1998, Acute Effect, of Ambient Ozone on Asthmatic, Wheezy and Healdry Children, Special Report 82, Health Effects Institute, Cambridge M.A
Awan A. 1997a, Pollution At Choking Level in Karachi, Lahore: experts, Frontier Post, January 20, Karachi
Awan A. I 997b, Karachi Among Top Ten High Lead Levt:1 Cities, Business Recorder, August 09, Karachi
Azad A. p, AnaJan M. H., Hameed A., Rasheed S" and Ahmed R., 2001, The Changing Commercial Structure in the Planned Neighborhoods of Nazimabod and North Nazimabad in GIS Perspective, T""hnical Report, University or Karachi, Pakistan, pp. 75·79
Baig M.A.S., Kltalid M. M., Hussain J., and Dar H.P., 1995, Use or Digital Image Processing Techniques to Enhance the Geological Features in Bannu Basin, Pakistan, In Proceedings, The Second Asia-Pacific Conference on Multilateral Cooperation. in Space Technology and Application>, pp. 285 - 293
Baker W.L., Honaker J.J., and Weisberg P.J., 1995, Using Aerial Photography and GIS to Map tl,e Forest· Tundra Ecotone in Rocky Mountain National Park, Colorado, ror Global Change Research, Phologrammelric Engineering & Remote Sensing, 3, pp. 3 J3 - 320
Ball J. and Rodgers I., 1996, Development and Use of an Environmental Information System for Powt!r Station Atmospheric Emissions. In Proceedings, 1996 ESRl European User Conference, btto:llgis. esri.comllibr.ry/userconf/eu[oproc961P APERSIPN 18/PN 1 8F.!fIM
Ball, D. J. and Hume, R., 1977, The Relative Importance or Vehicular and Damestic Emissions or Dark Smoke in Greater London in The Mid-1970s. the Significan~ of Smoke ShHode Measurements, and Hon Explanation of the Relationships of Smoke Shade to Gravimetric Measurements of Particulate, AtmospheriC Environment, II, pp. 1065 - 73
BaUe!ter Fo, Saez M., Perez.Hoyu! So, Iniguez. Co, GandarillAs A., Tobias A., Bellido J., TAraddo Mo, Arriba! F., Daponte A., Alonso Eo, Canada Ao, Guillen-Grima F. t eirera L.t Perez-BoUlos M.J., Saurina C" Gomez F., Tenias J,M .. , 2002, The EMECAM Project: Multicentrc Study on Air Pollution and Mortality in Spain: Combined Results for Particulates and ror Sulfur Dioxide, Occupational and Environmental Medecine, 59(5):300·8.
BRnai-Ka.hani R., 1989, A New Method for Site Suitability Anal)'sis: tbe Analytical bierarcchy process, Enviornmental,"'lanagelllent 13, (6), pp.685-693
Banta J., Bailey Co, Hartwick N., Mca"']ey 1<., Trevino E., 2001, Using AIcView and a Theory to Assess The N<ed or Pre·Scbool Children in San Bernardino County: A Newly Integrated C01U1ty Human Services System Looks at Unmet Needs or.young Children, In: Proceedings, ESRI Heatth User Conference, web: hllp://www.esri.comlljbrary/userconlibealthOl/paperslbcQI P03b1bCO! p03b btml, 0610612002
Barker D,J.P, 1987, Practical Epidemiology, Third Edition, Longman, Singnpore
B.rltrop D., 1972, Children and Environmental lead. In: Proceedings, Hepple P., (ed), Leod in the EnVironment, Institute of Petrolewn, LoDdo~ pp. 52 - 60
Barntt E.C. and Curtis LoF., 1976, Introduction to Environmental Remote Sensing, John Wiley & Sons Inc., New Yowk
Barrow C.J., 1995, Developing the Env;ronment: Problems and Jlanagemen,. Longman Scientific and Technical. Singnpore
327
Bascom R., Bromberg P. A., Coda D. A., Devlin R., DockeryD. W.) Frampton M. W., Lambert W., Samel J. M., Speizer F. E and men M. J ., 1996, A committee of the environmental and occupational health assembly of the American Thoracic Society, 1995 State of the art review: Health effects of outdoor air pollution, American Journal o/Respiratory and Critical Care Medicine, 153, pp. 3 - 150
Bal.,. D.V. and Sizto R., 1987, Air Pollution And Hospital Admissions In Souther Ontario: The Acid Summer Haze Eff«t, Environmental Research, 43, pp. 317 - 331
B.'es D. V., and Sizto R., 1983, Relationship Between Air Pollutant Levels And Hospital Admissions In Southern Ontario, Canadian Journal 0/ Public Health , 74, pp. 117-122
Batt.n L., 1973, Radar Observation o/the Atmosphere, Chicago University Press, Chicago
Beard R. R , and Wertheim G. A., 1967, Bchavrorallmpainnent Associated With Small Doses Of Carbon Monoxide, American Journal 0/ Public Health, 57, pp. 2012 - 2022
Behringer D., Cra",en P., Mohl C, Sloeppler M., Ritz E., 1986, Urinary Lead Excretion In Uremic Patients, Nephron, 42(4), pp. 323-9
Bellinger D. C., Needleman H.L., Levilion A., Watemaux C, Rabinowitz M.B ..... d Nichol! M.L., 1984, Early Sensory Motor Development And Prental Exposure To Lead, Neurobehavioral Toxicology and Teratology, 6, pp. 387 - 402
Bellinger D.C, Lev'ilon A., Watemaul C and Rabinowitz M., 1987, Longitudinal Analyses Of Prentai And Postnatal Lead Exposure And Early Cognitive Development, New Englalld Journal 0/ Medicine, 316, pp. 1037 - 1043
Bellinger D,C., Leviton A., Watemaul C, Needleman H., and Rabinowitz M., 1989, Low Level Lead Exposure, Social Cia", And Infant Development, Neurotoxicology and Teratology, 10, pp. 497 - 503
Bellman R.E., and Zadeh L.A., 1970, De<i,ion-M.king In A Fuzzy Envisorunent, Management science 17, (4), pp.141-164
Bennett, D, 1997, A framework for the integration of geographical infonnation systems and modelba;;e managemcnt. In : International Journal o/GIS, 11(4), pp. 337-357.
Bentham G., 1994, Global environmental change and health. In: Phillips D.R. and Verhasselt Y., (cds.), Heallh and Development, Routledge, London
BERG, 1989, The Effects 0/ Acid Deposition on Buildings and Bllilding Materials in the United Kingdom , HMSO, Buildings Effects Re'1cw Group, London
Bcnnudez E., Femg S.F., Castro CE., MustaCa M.G., 1999, DNA Strand Breaks Caused By Exposure To Ozone And Nitrogen Dioxide, Env;ronmental Research, 81(1), pp. 72-80
Bemstein D.A., Roy E.J., Srull T.K., and Wickens CD., 1988, Psychology, Houghton Milllin Company, Boston, USA pp. 162
Bilbro J .W., Dimanio CA., FitLjarrald D.E., Johnson S.C, and Jones W.D., 1986, Airborne Doppler Lidar Measurements, Appl/ied Opics, 25, pp. 3952-3960
Binder, K. Rnd Hohenegger, M., 1982, Fluoride Metabolism, Verlag Wilhelm Maudrich, Germany
Bingemer H. G. and CNtzen P. J., 1987, The Production Of Methane From Solid Wastes, Journal 0/ Geophysical Research, 92, pp. 2181 - 2187
328

Bishop I, and M Robey., 1994, Iml'lemeniing lin Environmental Impact Model Within A GeogrnplUc Inlormation System, in: Proceedings, 2lnd Annual Conference 0/ AURlSA, Sydney. ACT: AURISA, 1994. 1 :281-292.
Blackburn G. A., ZOOZ, Remote Sensing Of Fares! Pigments Using Airborne Imaging Spectrometer lind LIDAR Imagery, Remote Sensing o/Ihe £nvlronmenl, 82 (2·3), Pl'. 311·321
Bobak M, Lun DA, 1992. Air Pollution lind InfWlt Mortality In The Czech Republic 1986·88, Lancel. 340(8826), PI'. 1010 - 1014 .
B.bak M, Leon D,A., 1999, Pregnancy Outcomes lind Outdoor Air Pollution: lin Eoo·lnglC<lj Study In DistricL< Of The C=h RepUblic 1986-8, Occupational and Environmenlal Medecine. PI" 539 - 43
Bodily 1985, .Hoderan Decision Making: A Gllid. To Modeling Wilh Decision Support Systelll, McGraw·HiIl, NY, USA
Boham-Carlcr G.F., 1994, Geographic In/orll/alion Systems /01' Geosciemisls: Modeling with GIS, Pergamon, Oxford, New York
Bu"sRng, K ..... kidou B.M., L.mber' ."d M.nfray P., 1988, The Marine Sour"" OfC2-C6 Aliphatic Hydrocaroon.<, Joomal a/Allliospheric Chemislry, 6, PI'. 3 - 20
Bond SolIma" 2001, lind Sta!islical EVllluation Of HellV}' Metals In Airbome Particula!e$ In Cairo, Egypt, Journal a/Chromatography a/America, 920([-2), PI'. 261·269
B.rJa.Abul1o V,H., Loomis D.P., Shy C., and B.ngdiwala S.I., 1995, Air Pollution and Daily Mortali,y m Mexico City. Epidemi%gy, 4,pp. 864
Bouthillier L., Vincent R., Goegan P., Adamsun tV., Bjamason S.) Stewart M) Guenette J'l Po~in
M., Kum ..... ''' ••• " 1'., 1998, Acute effectll of inhaled urban particles and ozone: lung morphology, macrophage acti'1ty, and plasma endothelin·I., Amerlcal lournal 0/ Potitology, 153(6), pp. 1873·84
B"",,'man, A. F., 1993, Report o/Ihe lhird wor!whip a/the Global h'lli55,i.,,", Invenlory Aclivity (G£lA). RIVM Report 481507002, RIVM, Bilthovell, The Netherlands
&",man F.M., pllin;, C. and Soinf.ld J,H., 1995, Ozone and Aer!Jllol Productivity of Reactive Organics, ,~Imo.<p"el'lc Environmen/, 29, pp. 579 - 589
A.L., Sahlin p.R, p.""ira L.A., Mw",. J.J., Coneeicao Lin CA., Zanobelll A, Sc!h".rlt.J, Doekery D.W., 2001, Health effects of.ir pollulion exposure all childrc'fl and .dO\cSC<:l1L' in
Sao Paulo, Brazil, Pedlalr Pulmonolagy. 31(2): 106-13
Br.un-Fltbrl.nder C, AckermalU1-LI.htich U., Schwam: J., Gn.l1m H. Rulish.u ... ll>t, and Wanner H. U, 1992, Air Pollution And Respirntory Symptoms In Pr«chool Children, American Review 0/ RespiralolY Heal/h, 145, PI" 42 47
Bl'1lol<er 1'.1., 1991, A Geoslalisllml Prilner, World Scientific, Sirlgapo,:e
Brouwer, H.d •. , 1990, Rapid Assessment of Urban Growth Using GIS-RS T""h111qoles,l1C Journal, pp. 63-69
Brow" P. 1998, Karachi -The Poison City, dally Dawn. January Kamchi
Bruaux, and Friberg) 1985. Assessment of Human Exposure to Lead: Comparison between Belgium, Malta, Mexico and Sweden, Kru:olillska I, Sweden
Brydg.s T.e. and WiI •• n ltD., 1991, Acid Ruin Since 1985 -Times Are Changing, In: proceedillgs afthe Royal Society a/ Edillburgh, B97, pp. I - 16 .
329

Buat-Menard P., Ezal U., and Gaudichet A., 1983, Size Distribution And Minemlogy Of Alwniosilicate Dust Particles In Tropical Pacific Air And Rain, In: H. R. Pruppacher. Semonin R. G. and Slinn W. G. N. (eds). Precipitation Scavenging, Dry Deposition And Resuspension; Elsevier, pp. 1259 - 1269
Buckley, D., 1993, Integrating Atmospheric Dispersion Modeling With GIS TecMology, in: proceeding, GIS 93, Vancouver Be.
Bulmer M., and Wan\'ick D.P., 1983, Social Research in Developing Counlfie"" John Wiley and Sons, UK
Bumgartner J.R Rnd Speizer F., 1991. Chronic Obsl11Jc/;ve Pulmonary Disease, Population, Health and Nutrition Division, World Bank, W8:"hington D.C.
Bunn T.L., Parsons P.J., Kao E., Dietert RR., 2001, Exposure to lead during critical windows of ~mbryonic development: differential inununotoxic outcome based on stage of exposwe and gender. Toxicological Science, 64(1), pp. 57-66
Burge .. , E., 1925, The Growth of the City, In Park R., (00.) The City, University of Chicago Press, pp. 47-62
Burnett R.T., Smith-Doiron M., Stieb D., Raizenne M.E., Brook J.R., Dales R.E., Leech J.A., Cakmak S., Krewskj D., 2001, Association Between Ozone And Hospitalization For Acute Respiratory Diseases In Children Less Than 2 Years Of Age, Americal Journal of Epidemiology, 153(5), pp. 444-52
Busedt P. R. and Posfai M., 1999, Airbom~ Minerals And Related Aerosol Particles: E1Tt!Cts On Climate And 'The Environment, Procerdings of National Academy of Scienc<, USA, 96(7): 3372 - 3379
Butler J.H., Elkins J.W., Thompson T.M., and Egan I{.B., 1990, Tropospheric And Dissolved N,O Of The West Pac inc And East Indian Oceans During The EI Nino -Southern Oscillation Event Of 1987, Joumal o/Geophysical Research
Buctenfield, B. P., 1996. Scientific Visualization For Environmental Modeling: Interactive And Proat.:tive Graphics. GIS And Environmental Modeling: Progress And Research Issues, Goodchild, M.F., SteYfier1. L.T., find Park<, 8.0., (cds.). GIS World: Fort Collins, Colorado.
C.dabrese, E. J., and Kenyon, E. M., 1991,Air Toxics and Risk Assessment. Lewis, Michigan, US.
Campbell J., 1984, Introductory C'!rtography, Prentice Hall. NJ, USA, pp. 306
Campbell J., 2001 ,Map Use & Analysis, 4'" Edition, McGraw Hill, NY, USA pp. 169 -171
Campbell M. J., Lewf)' J., and Walloo M., 1988, Further Evidence For The EII;'ct Of Passive Smoking 01\ Neonates, Postgraduate Afedical Joul7lal. 64, pp. 663 665
Campbell S. G., Shimp, D. R., 1995, Using a Geographic in/onno/ion System to Evaluate PA1/o Area Source Emissions, California Air Resowce.~ Board, Sacramento, CA
Cape J., N., 1987, Non-Suppressed Ion Chromatography In Acid Rain Analysis, In Rowland A.P. (ed.), Chemical Analysis in Em"ironmental Research, In:;titute of Terrestrial Ecology, Grange-ovcr-Silnds, UK
Carh"rlght J., Barrett R., and MacRae B., 1997, MSGEIS-A GIS Application to GeneMe Mobile Source Emission Inventorit:s, Proceeding E::'lU User Conference web :;ite http://gis .• sri .com/libmry/userconflproc97/proc97/abstractla566.htm
Can'er S.J., 1991, Integrating Multi-Criteria Evaluation into Geographic lnfonnation Systems, IlIIernaiional Journal of GIS, 5(3), pp. 321 - 339
Costillejus M., Guld D., Dockery·D., To.te.on T., Baurn T., and Speizer F, 1992. EII""ts Of Ambient Ozone On Respir.tory Function And Symptoms In School Children In Mexico City, American Review of R<spiralolY Heallh, 145, pp. 276 - 282
330

CDIAC, 1998, Revised Regional C02 Emissions from Fossil·Fuel BUnliTlg, Cemen! Manu/acillre, and Gas Flaring: 1751.1995, Carbon Dioxide Information Analysis En,varonenlal Sciences Oak Ridge, Tennessee, United States, http://wmc,esd,om],govlcdiacihome,html
CDIAC, 1999, Revised Regional C02 Emissi""s from Fossil·Fuel BUnling, Cemenl MWlU/aclure, and Gas Flariag: 1751·1996, Carbon Dioxide Infomlation Analysis Cellter, EnviIonmenlal Sciences Division, Oak Ridge, T ennesse, United States, hl1p:llcdiac,esd,oml.gov/cdiacihome,html
Chai S, and Webb R. 1988, EIf""t. Of Lead On Vascular Reactivity, Envi"mmental Heal/It Perspectives, 78, pp, 53 - 56
Chang D,H, and Islam 8., 2000, Estimation of Soil Physical Properties Using Remo!e Sensing and Anilicial Neural Network, Remot. Sensing o/Ihe Environmenl, 74 (3), pp, 534·544
ChawL P.8. JR, and kwareng A,Y" 1989, Extracting Spectra! Centrd.l ill Londsal Thematic Mapper Image Data u:sing Sd~ctive Principal Component Analy~is, Ph%grmmnefric Engineering & Remote &",sin;~. 55, pp. 339·348
Ch.,. .. P$" JR., Berlin G.L" and MilchellmW,B, 1977, Computer Enhancement Techniques of Landsat MSS Digital Images for Land uselLandoov", Assessment, In: proceeding, Sixlir Remote Sellsillg 0/ t.arth Resources Symposium, The University of Tennessee spa"" Imti!ue, Tullahoma, Tenn.ss .. (Ann Aroor: Erim), pp, 259·215
Chanz, P,8" JR., and Mackinnon D, 1994, Automatic o."teclion of Vegetation Change, in lhe South'\,vt:slem United States Using Remotely Sensed Images, Ph%grammelric Engineering & Remote Smsillg, 60, 1'1',571·583
Chen L" Yang W" Jennison B.L., Goodrich A,. Om.y. S,T" 2002, Air pollution and birth weight in northern Nevada, 1991-1999,/lIholalioll Toxicology, 14(2), PI', 141·57
Cit"" p,c., L.I Y,M,. Chan ee, Hwang Yang Wang J,D" 1999, Short·term en""t of ozone un the pulmonary function of children in primary school, Ellvironmental Hoailll Perspective, 107(11), pp, 921·5
CIIDalrra S-K., CIIDab", p" Rajpal Guph. R.K., 200 I, Ambient Air Pollut,UIJ And Chrome RcsplTatory Morbldit)' In Delhi, Archives a/Environmental Health, 56(1), pp, 58,64
Cnol 1,5" 2001, Carbo" Monoxide Poisoning: Systemio Manifestations And Complieations, Journal 0/ Korean Medecal SCiellce, 16(3), pp. 253-61
Coole D,D" and Rlchler G,W, 1980, Effecls OfLeod In The Kidney, ~!: Singhal RL, and Thomas'!, A (cds.). Leod TOXicity, Urban and Schwanenbert, Baltimore, pp. 337 350
Chou, ,I, and Ding, Y, 1992, Methndology Of ~!I"gr.lin8 Spatial AnalysislModeling And GIS, In: Procceding,S; 51h Infernational Symposium em spalial Data Handling, Charlcston. South Carolinu, 3-7pp, 514,523
Chouhan, T. s.j 1992. Natural Resources and Monitoring Desertification Proct::s3, in: Readings bl Remote Sensing Applicatiolls, Scienlil1c Publishers, India
Christ C. F" 1%6, Ecollometric Models and ,\ie/hods, John Wiley & Sons, NY, USA
Chrislall., W" 1933, CenlDil Places in Southern Gcnrumy, trnnslated by Baskin C, 1966, Englewood CIiH's, N,J.; Prenlice Hall, (Originally published in 1933)
Christoph.non R. W" 1997, G_systems: An Inlroduction to Physical Geography, 3,d Edition, Pren!ice Hall, N1. USA
Cicerone R, and Orcmland R, 1988, Bios"",ehemical Aspects Of Atmospheric Methane, G/obl1/ Biogeocllemical Cycles. 1, pp. 199 - 327
331

Cicerone RJ .• 1988. How Has The Atmospheric Concentration of CO Changed? in: Rowland F.S. and Isaksen I.S.A. (eas .). The Changing Ahnosphere. Wiley Interscicnce. pp. 49 - 61
Clark r., 1979. Practical Geostalislics. Applied Science Publishers. London
Clean Air Year Book. 1975. History of air pal/Illion in Great Britain. National Society for Clean Air. UK
Cliff A., And Ord J.K., 1973, Spatial Autocorrelation. Pion. London
Cline J.D., Wi,egan'er D.P., and Kelly-Han,en K.. 1987. Nitrous O:<ide And Vertical Mixing in the Equatorial Pacific During the 1982 - 1983 EI Nino. Deep-&a Resear·ch. 34. pp. 857 - 873
CDbum, R. F., 1970, Biological ~flects of carbon monoxide, Annals of the New York Academy 0/ SCiences, 174. pp. 1-430 .
CDlIy R..P., Weisel c.P., Birnbaum G., and Lioy P.J., 1992, The Effect of Ozone Associated with Summertime Photochemical Smog on the Frequency of Astluna Visits to Hospitltl Emergency Departments, EnYironmenlal Research, 58, pp. 184 - 194
Coe D.L., Eisinger D.S., and Prouty J.D .• 1998. User's Guide for CL4: A Us", Friendly III/erface for the ClUNE 4 Model for Transportalion P/'Ojectlmpact Assessments. CalU'ans UC Davis Air Quality Project. CA. USA
Cohen M.D., Sisco M., Li Y., ZeUkoff J .T., Schlesinger RB .• 2001. Ozone·lnduced Modulation of Cell· Mediated Inunune Responses in O,e Lungs. Toxicology al/d Applied Pharmacology • . 171 (2). pp. 71-84
Cohen Y., and Gordon L.r .• 1979. Nitrous Oxide Production in the Ocean. Journal of Geophysical Research. 84(C I). pp. 347 - 353
Collin, S., Smallbone K., ond Brigg, D., 1995. A GIS Approach to Modeling Small Asea Variations in Air Pollution within a Compl.x Urban Environment. Innovations in GIS. 2. pp. 245-253
Collins W ., 1978. Remote Sensing of Crop Type' and Maturity, PhotogromJIIl1lric Engineering & Remote Sensing. 44 , pp. 43 - 55
Cohnll R. N., 1967, Remote Sc:nsing as a Means of Detcnnining Ecological Conditions., BioScience , 17, pp. 444 - 44~
Cummin~, B. T. and Waller, R. E., 1967, Observations from a ten year study of pollution at 8 ~ ite in the city of London, Ahl/Osp/reric Environmmt. I. pp. 49 - 68
Commonwealth of Australia, 1996, Australia: Slate of the Environment 1996, State of the Envjrorun~nt Ad" ,ory Council and Departrn.nt of the EnvirolUllcnt, Sport and Territories. CSIRO Publishing. Cullingwood, Australia
Comrie A. C., Diem J. E., and G!ltheim T. L .• 1997. Development ofa GIS-Based Air Quality Planning Model for Marginal Attainment Area,. SMOGMAP. Toronto. Ontario. Canada Web: hHp:llclinuttc. geog.arizona.edu/Vo 7Ecomirc/smogmap/sand-oap. htm, 5/24/00, 2:.:53 PM
Cope M. E. and He" D., 1997. The Application to an Integrated Meteorological Air Quality Modelling System for a Photochemical Smog Event in P<rth Australia. in: 12'" NATVICCMS Internaliol/al Technical A1eeling 0" .-lir Pollwion A.fodelling and ils Applicat;ons, Ckrmont Ferrand
Cope M. E. and Ischtwan J., 1995. Perth Photochemical Smog Study: AirShed Modelling C o/llponent. Final R~port. Emirorunental Protection Authority of Vicloria, Melbourne
Coppin P. R and Bauer M.E .• 1996. Digital Change Detection in Forest Ecosystem:! with Remote Sensing Imagery, Remote Sensing Reviews, 13 , pp. 207 - 243
332

Corbley K., 1997, Norway Enhance< Oil Spill Deleetion with RADARSAT, Earlh Observation Magazi"e, 6(5), pp. 22 - 26
Cor."podenl daily Dawn, 1997, Adulteraled Fuel Main Cause Of Poilu lion, daily Dawn, May 05, Karachi
Coreupodenl daily Dawn, 2000, 40 Percent Urbani Ie. Exposed to Air PoliUlion: Sludy, daily Dawn, July 13, Karachi
Cor.upodenl Frontier Po.~ 1999, Air Pollution Kills Over 1,000 in Pakistan Every Vear, Frontier Post, September 03, Karachi
Curesspodent the Muslim, /996, Therma] Power Stations a Major Sowce of Pollution, Tlte A1uslim, November 12, Islamabad
CUJ"e5spodent the Niltion, 2000, Deformaty Desieasc Due to Industrial Pullution, the Nation. July 28 '-"hore
Correspondenl dailY Dawn, 2002, Pakistan, Azerbaijan to boost erade lies, daily Dawn 3-9-2002, htlp:llwww.dawn.eoml2002l09/03/ebr9 htrn 5:21 pm
Correspondent Frontier Post, 1998, Pollution Causes Eye Diseases, Frontier Post, Aug. 15, Karachi
Correspundenl Ihe Muslim, 1998, Air Pollulion !neeerasing Eye Ailmenl" The Muslim, Feb. 12, Islamabad
Correspondent: the New!, 1998, Pollution Found Main Causes of Chest Disl!8ses, the All/slim, May 14, Karachi
Counter S.A., Buchanan L.H., 2002, Neuro-ototosicity in Andean Adults with Cruonic Lead and Noi:ie Exposurc, Joumal o/Occupational and Env;ronmenla/ lHedecine, 44(1), pp. 30-8
Crill P. M., Barllell K. B., Harriss R c., Gorham E., Verry E.S., Sebaeher D.I., Mad ... r L., and Sanner W .. 1988, Methane Flux from Minnesota Peallands, Global Biogeochemical Cye/es, 2, pp. 371 -384
Crutzen P.J., 1974, Pholochemical R<aclion, lnilialed by and Influencing OlOne m Unpolluted Tropospheric Air, Tel/us, 26, pp. 253 - 256
Crutzen P.J., 1989, Emissions of COl and Other Trace Ga:ies to the Atmosphere from Fires in the Tropic)!, 28" Liege Intenralional ASlrophysicalColloquium, University de Liege, Belgium
Crutzen P.J., Aselmann I., and Seiler W.S., 1986, Methane Produclion by Domeslic Animals, Wild Rumin.n", Other Herbivorous Fauna, & Humans, Tellus, 38B, pp. 271 - 284
CrutLM P.J., Delany A.C., Greenberg J., Haagensun P., Heidt L., Lueb Ho, PoUock W., Seiler W., Wartburg A., and Zimmermtm P. , 1985, Tropospheric Chemical Composition. Mcasuremt!11ts in Brazil During the Dry Season, JOIII'Tlol oJAtTllosplreric Clremistry, 2, pp. 233 - 256
Crotzen P.J., Heidt L.E., Xrasnec J,P., PoUock w.n., and Seiler W., 1979, Biomass Burning as 8 Source of Alrnospheric Gases CO, H2, N20, NO, CHlCl, .00 COS, NaluI'e, 282, pp. 253 - 256
Curran P. J., 1988, Priniciples o/Remote Sensing. Longman Scientific & Technical. Hong Kong
D'Amatu G .• Liccart11 G., D'Amato l\L, 2000, Environmental Ri~k Factors (Outdoor Air Pollution and Climalic Changes) .nd Increased Trend of Respiralory Allergy, Jounral oj Inwstigational Allergology and Clinical bmmmology, 10(3), 123 - 8 .
Damji K. S. and Riehlen A., 1989, Reduclion of T Lymphoc}1e Subpopulations Following Acute Exposure 10 4 ppm Nilrogen Dioxide, Envirolllllental Research, 49, pp. 217 - 224
333
Danielsen E.F., 1968, Stratosphere-Troposphere Exchange Base on Radioactivity, Ozone and Potential Vorticity, Journal of Atmospheric Science, 25, pp. 502 - 518
Daultrey S., 1976, Principal Componenl5 Ana/y.Ji.J, Insli/u/e of Brili.Jh Geographer.J, University of East Anglia, UK
Davis M. J., ond S,..ndsgaard D. J., 1987, Lead and Child Development, Nature, 329, pp. 297 - 300
De Souza R. M., 1999, Household Transportation Use and Urban Air Pollution: A Comparative Allalysis of Thailand, Nlexico, and Ihe United SID/e.J, Population Reference Bureau, Washington DC., USA
Declercq c., Mocquet V., 2000, Short-tenn Effects of Ozone on Respiratory Health of Children In
Armentier«, North of France, Rev Epidemiol Sante Pllblique. 48 Suppl2, pp. 2S37-43
Deotor M. N., Wang J., Gille J. c., and Bailey P. L., 2001, Retrieval of Tropospheric Methane from MOPITT Measurements: Algoritlun Description and Simulations, Na/ional Cenler for Atmo.Jpheric Research, Colorado, USA
Dembor W.N. ond Warm J .S., 1979, Psychology of Perception, 2'~ Edition, funchart & Wn.ton, NY, USA
Demers, M. N., 1999, Fundamenlals of Geographic Infannation SY.J/ems, Second Edition • .lohn Wiley & Sons, NY, US
Dencgre J ., 1994, Thematic Mapping From Satellite ImagelY a guidebook, Pergamon, UK
Dent, A. L., Fc,,'lor, D. A., Kaplon B. M., and Zarus G. M, 1998, Using GIS to Study the Health Impact of Air Emissions, in: ~edings, 1998 ESRl In/emotional U.Jer Conference, web http;l!www.atsdr.cdc.govIGISlconferen .... 98Iprocee<!ingslhtmVdent.html. 414nOO I
Desqueyrou1 H., Mom.s I., 200 I, Short Tenn EITcct of Urban Air Pollution on Respiratory Insufficiency Due to Chronic Obstructive Pulmonary Disease; Synthesis of Studies Published Irom 1962 to January 2000, Rev Epidemiol SWlle Publique, 49(1), pp: 61-76
De"lin R., Horslman D., Becker S., Gerrity T., Madden M. and Koren H. , 1992, lnflallUlllltocy Responst! in Humans Exposed to 2.0 ppm NO" American Review of Respirato/y Disease, 145, pp. A455
Dc"\'lin RB., McDonnell W.F., MRM R., Becker S., House D.E., Schreinemachers D. Rnd Kuren as., 1'J91, Exposure of Humuns to Ambient Levels of Ozone for 6.6 hours Caust!:s Cellular and Biocht..··miCl:t1 Changes in the LWl!! , American JOllmal of Respirato/y Cell and Molecular Biology, 4, pp. 72 - 81
Dianov-Klukuv V.I. and Yurgonov L.N., 1981, A Spectroscopic Study of the Global Spa",,-Time Distribution of Atmospheric CO" Tellus, 33, pp. 262 - 273
DiBiase D. A., MacEarhren A. M. t Krygier~J., Ree\'es C. And Brenner A., 1991 Animated Cartographic Visualiz.ution in Earth System Sci~n~, in: proceedings 15'11 ICA Conference, Boumemouth. pp. 223- 232.
Dietrich KN., Krafft KM. and B'ier M., 1986, Early Effects of Lead Expo.ure; Ncurobeh.vioral Findings at 6 Monts . intemationa/Joumal ofBiosocial Research, 8, pp. 151-168
Dietrich KN., Krafft KM., Bronschein R.L., Hammond P.B., Berger 0 ., Succop P.A. and Bier M., 1987b, Low Level Fetal Lead Exposure Effect on Neurobeh",oral Development in Early Infancy, Pediatrics, 80(5), pp, 721 -730
Dietrich KN., Krafft KM" Shukla R., Bomschein R.L., and Succop P.A., 1987a, The Neurobehavioral Elfects of Early E'posure. In; Schroeder S. R. (ed')' Toxic Substances and Mental Retardation: .Vellrobehavioral Toxicology and Terat%gy. Monographs of the Ameri~n A'isocilltion on Menhll Deliciency : No.8, Begab M, J. (ed ')' American As,oeiation on Mental Deficiencv, Washington D.C., pp. 71 - 95
334

Dietrich K.N., Rls M.D., Su"up P.A., Berger 0.0., Bum,.heln R.L., Juvenile Delinquency, .'feura/oxicalogy Tera/aiogy, 23(6), PI'. SII·g
Early Exposure 10 Lead and
Dijl'-'I'" Hauth .. lj. D., Bnmek.eer B., Akkermann I., and B.leij J.S.M .• 1990. Respiratory Health Effect, of the Indoor Environment in a Population of Dutch Children .• AmericaJl Review oj Respiratory Diseou, 142. pp. 1172 - 1178
D<><kery D.W. and Pope 1994. Acute Respiratory Effects of Particulate Air Pollution .• An""al Review oj Publle Heallil, 15. Pl" 107 - 132
Dockery D.W., Spelnr Stram D.O., Wore J.H., SpnglerJ.D.,lIlld Ferr!. B.G. Jr .• 1989. Effects of 1 .. IMlable Particles on Respiratory Health of Children. American Review oj Respiratory Disease. PI'. 587 - 594
Dockery D. W., W.'" J.l::L, Ferris G. Jr., Spci:te. F.E. and Caul N.R, ! 982, Change in Pulmonary Functions in Children Associated with Air PoHution Epi,ndes, Journal oj lile Air Palill/ion Conlrol Association. pp.937 942
Do; D. D. 1990, The Application of Remote Sen'ing in Currenl Land-Use Mapping in Vietnam, in: report, Jilt! Regional Seminar on fire Application of Re!l!ote Sensing TecJmiquf!s 10 Land Use Planning and linv/romllenlal Surveying. PI" 64-66, 21 to 27 October
Domingo J.L., Schuhm.cher M., Agramunl Muller L., Neugeb.uer 2001, Levels or Melal, and Organic Substances in Blood and Urine. of Workt!rs: at 8: New Hazardous Waste Incinerator, Internallanol Archives aJOccupalional Environmenlal Heallh. 74(4), pp. 263-9
Dunald,on K., Brown D., Cloute. A., Dum" R, MoeNee W,' Renwick Tnm L., and Slone Y., 2002. The pulmonary toxicolol!Y of ullrafino particles. J. Aerosol Medeclnc, 15(2). pp. 213 -120
Drag.,;'I" U .• 1994, .liooeling Acid Deposition: An Assessment oj the Accuracy and Efficiency oj a GIS and a TilirdG.nermian Lemguage Implemenlalioll. ~1.Sc thesis, University of Edinburgh. UK
Drnl<llki,·Smilh D., 2000. Third Warldeities, 2'" Edition, Routledge, London. UK
Drake J. B. 1002. Estlmation of Tropical Forest Structural Charactoristie, Remote SenJlng oJliI. Envinmment, 79 (2·3) pp. 305-319
Lerge.Footprint Liililr.
Drummond J. R. Boiley P.L.. B ....... r G., Davi, G.R, Gill. J.e., P""kell G.D., Reichle H,K., Ru,,1<! N., Mand e.s., and McCu.,.,ell J.e., 2001, Early Mission Planning for the MOPITf instrument, Na/iollal Center for Atmospheric Colorado, USA
01'111')' S.A .. 1990.A Gllide /0 Remole Sensing: Interpreling Image oJlhe Earth, Oxford UniVersity Press
Dulac F. Tam"e D. BergametU Buat .. Menard P., Desbois Afric~n du;;t mass over tht!: western ~Aeditcrranean Sea using Research, 97, PI" 2489 - 2506
and Sullon, 1992, A"",,sment of the Meteosat claw, Journal GeophYSical
Dula. F., Buol·Menord P., Ezal u., Melki S. and Bergamelli G., 1989. Aunaspheric Input of Trace Mewls to the Westem Medilemmcelm: Uncertainities iI, Modeling Dry Deposition from Cascade lmpaclor Data, Tel/liS. 4 lB. pp. 262 - 378
Durke. P. A .• preil Frost E. and Shein a R. 1991. Glob.1 Analysis of Aerosol Particle Charactcri,tb, .1011 mal oJAtmosplleric Ellvlronl1lelfl, pp. 2451- 2471
Dye J.A" Madden M.C., Rlch.rd. J.H., Lehmann J.R, D.,tin RB., C •• la D. L .• 1999. Ozone Effects on Airv/ay Responsiveness, Lung Injury, and lnnammation. Comparati\it! Rat Strain and in v1\'()Jin .. itro lllve'tigalions.lnhaiallol/ Toxlc%gy. Il(lll, pp. 10 15-40
Dzik J.M., Dobmuukll A., Gnu.reld D., Walajlj .. -Rode Eo. 2002. Nitric O,ide Metabelites in the Urine of Full·Tcm, and Pret""" Inflmts. Pedialrics Imernatiol/al, 44(4), pp. 368 -75
335

Eftsley R. B .• 2000, Open Air Carbon Monoxide Poiso";.'S in a Child Swimming Behind a Boat, South Medecal Journal, 93(4), pp. 430·2
Eastman J.R., 1995, Idrisifor Window~ Student Manual, Clark University. Worcester, Massachusetts
Ehell S., Brauer M., Cyrys J., Tueh T., KreyllngW.G., WiehmalU1 H.E., HeinriehJ., 2001, Air Quality in Postunification Erfurt, East Gennany: Associating Changes in Pollutant Concentrations with Changes in Emissions, Environmental Heallh Pel'spective , 109(4). pp. 325-33
Editorial daily Dawn, 1996, lead Pollution Threat. daily Dawn. April 04, Karachi
Editorial daily Ne"., 1996, Smoky Riskshaws and Buses, daliy News, June 3D, Karachi
Elkin. J.W., HaU B. D., Butler J.H., 1990, Laboratory and Field Investigations of the Emissions of Nitrous Oxide from Biomass Burning. in: proceedings, Levine 1.5. (ed.), Conference on Global Bloman Burning, Atmospheric. Climatic. and Biospheric Implications, Williamsburgh. Virginia
Elkin. J.W. , Wofsy S.c., MeElory M.B., Kolb C.E., and Kaplan W.A., 1978, Aquatic Sources and Sinks tOr Nitrous Oxide, Natllre. 275, pp. 602 - 606
Elmore A. J ., Mustard J . F. , Manning S. J ., and Lohell D. B., 2000, QuantifYing Vegetation Change in St:miarid Environrm:nts, Remote Sensing of/he Env;ronment, 73 (1) pp. 87-102
Ebayed N.M., Ka .. R., Mustafa M.G., Hacker A.D., O.pilal J.J., Chow c.K., and Cro .. C.E., 1988, Enect of Dietary Vitamin E Lev<l on the Biochemical Response of Rat loog to Ozone Inhalation, Drug Nutrient Interactions, 5, pp. 373 - 386
E"om D., 1987, Ahllosplreric Polllltion: Callses, Effects and COlltrol Policies, Ba. il Blackw<ll, NY, USA
Emmelin A., Ny,trom L., and Wal S., 1993, Diesd Exhaust Exposure and Smoking: A Ca,e Reference Study of lung Cancer among Swedish Workers, Epidemiology, 4(3), 237 - 244
Emmet! A., 1992, Scientific Visualization· a Masket Mosaic, Computer GraphiCS World, pp. 29·39
England G.c., McGrath T.P., Gilmer L., Seebold J.G., Lev·On M., Hoot T ., 2001, Hazardous Air Pollutant Emissions from Gas-Fired Combustion Sources: Emissions and the Effi:cts of Design and Fuel Typ", Chemosphere, 42(5-7) pp. 745 - 64
Emhart C.B., Morrow·Tlueak M., Marler M.R. and Wolf A.W., 1987, Low Level Lead Exposure in the Prenatal and Early Preschool Periods: Early Pre-school Dev<lopment, Neurotoxicology and Teratology, 9, pp. 259 - 270
ESRI, 1998, Working with Arc ~lelV Spatial Analyst, ESRl Educational Services. Envirorunental Systems Research Institu~ Inc., California, USA
Euler GL., Abbey D.E., Hodgkin J .E., and Magie A.R., 1988, Chronic Ob:;tructive Pulmonary Di, ,,"sc Symptom ElTects of Long-tenn CumulatiVt! Exposure to Ambient Levels of Total Oxidant..:: llnd NitIOgen Dioxide I Califomia Se\'enth-day Ad"entist Residents, Arc/rives 0/ Environmental Heal/h. 43 , pp. 279 - 285
Eurocarto 7,1988, En\lrorunental applications of digital mapping, in: Proceeding!'. Eurocor/o 7. En$chede
Faher, B. G., Wallace, W.W., and. Johnson, G. E., 1998. Activt: Re~ponse GIS: For Resour~ Management Spatial Decision Support Systems. Photogrammetric Engineering & Remote Sens;ng, 64( 1) 7 ~ 15
Fan G.c., Chang C.N., Wu Y.S., Lu S.C., Fu P.P., Chang s.c., Cheng C.D., Vuen W.H., 2002, Concentration of Atmospheric Particulates During a Dust Stonn Period in Central Taiwan, TaichWl8, Science Of the Total Envirollment, 287(1·2), pp. 141-5
Faruqi S. A" 1992, Remole St:nsing for Envirorunent: Some Basic Concepts, in: Readings in Remote St",Si"K Applicalions, Sci~ntific Publisht:rs, India
336
--- -.--.. -

Fed .... , 1(., 1993, Distributed Mooels and Embedded GIS: Stralegic .. and Case Studi"" Integtalion, in: pn:x.:eedingS'. Second International Con/ereru::eIWorkshop on Inlegraling Geographic Information Systems and Environmental Jlodeling, Br&k<nridgc
Fedra, 1(., 1994, GIS aru:l Environmenll11 Modeling in: Ed.: G<l<l<khild!vl, F" Envil'ollmentl1lModeling wilh GIS, Oxford Urnvm;t)' Pre ... pp 35 - 50
• Fenl L" Hall RJ" and Nesby 1995, Aeriall'ilms for Foresllnventory Optimizing Film Parameters. Phologrammetric E'llgineering & Remote Sensing, 3, pp. 281- 290
F1aehsbatl 1999. Mooels of Exposure 10 C."boo Monoxide Inside a Vehicle on a Honolulu Highway, .fournal of exposure (molysis and environmental epidemiology. 9(3), PI', 245-60
Fulgerti J, 1997/ An Inyestigation OJDJ11flflfiC Simulation.' Integration a/GIS and.-iir Dispersion Jfodeiing, T c'Chnical Report, Unh'ersity of Edinburgh, UK
Falin.bee L,J" Hariman D.H., Kehrl a.R., Harder S., Abd"l..saJan S., o"tll" •• P.J, 1994, Respiratory R<SjlOnses to Repeated Prolonged EXjlOsl!ll! to 0.12 ppm Ozone, American Journol of Resplralory and CrilicalCore A.fedicin'. 149, pp, 98 -105
Fu",by T.B., C.rter RH., and Stanley R.J" 1984, Advanced Economefric Melhods, Springers-Verl.g, NY, USA
Fuody G. M I 2002, St.'ltus of Land COY!!f CiassiHcation Accuracy As:,'cssmcnt, Remote Sensing of fhe [{ltV/rorllllenl, 80 (I), PI'. 185·201
Forghani A. 1994, A New Technique for Map Revision and Change Detection Using Merged Landsat TM and SPOT Data ",IS in an Urban Environmmt Asia-Pacific Remole Sensing JournaL. 7(1), pp. 119 - 129
Forster, B. 1983, Some Urban Measures From Landsat Data1 Phologrammelric Engineering & Remote Sensing, 49, PI', 693 - 707
Fusler J,J., 2000, Dota Analysis Using SPSS for Windows Versiolls 8·10: A beginner:, GI/ide, SAGE Publiciltion::i, London
Fotheringh.", S., and Toge .. p" 1 994:Spollol Analysis and GIS. Taylor & Fr."ci>, London
Fraser P.J., Hy,an p,. Cora", S,' R .. m" .. en R,A .• C",,,ford A.J., and Khalil MA" C.rooll Monoxide ill the Southern Hemisphere, in: prowedings. Sevenlh World Cfean AII' Congress, 2, pp, 341 -352
Fra.er P.J .• Hy'on P., R.s",,,,.en RA., Crowford A.J., ond Kholl! M,A" I 986a, Meth.ne dnd Metltylchloroform in the Southern HemISphere, .faun/af of Atmospheric ChemIStry, 4, PI', 3 - 24
Friedl 2002, Forward and [nrers. Modeling of Land Surface Energy Bal.ne<: Usi1l8 Surface 'fcmpemltlfC Measurements, Remole Sellsing of the Environment. 79 (2·3), pp, 344·354
Friedman M,. Madden S.",.t J.M., Koren H.S" 19n, Elfect< of Ozone Exposure on Metabolism in Human Alveolar Macmphages, Environmental Health Perspect, 97, pp. 95-101
Friedmann J. ond WOalcr C., 1979, Territory and Function. University "fC.lililm!. Press. H.:rkcley
Frisch« T.M., Kllohr J., Nlwill A., Meinert R, Fotster J., Studnicka M., Koren n. 1993, Ambit"'t Ozone C"uses Upper Airways Inflammation in Childrcn~ American Review of Respiratory Dist:ase, 148(4 PI I), PI'. 961-4
Fritl:, L.W" 1999, High Resolution Commercial Remote Sensing Satellite and ~'paliallnf()rmaticm, h!lp:II ... ww j'm' o!1!lpublicaliol)l!il1ighljgblsil1ighligh!s0402lmt;:.html
337

Fulton M., Roab G" Thoms.n G,. Loxen Hunter R, .nd Hepbllrn W" 1987, Influence of Blood Lead on the Ability and Allainrnent ofCruldrea in Edinburgh, Lancel, 1(8544), pp, 1221 - 1226
Futt, Re., 1996, Integration ofHardC<lpy and Sofloopy Exploration, Gevlnal/os Illfo Magozine, to, pp, 6-7
GalbaUy I.E" and Roy CR, 1980, Destruction of Ozone at the Earth's Surf a"", Journal 0/ Royal ,llel.orologlcal Society, 106, pp. 599 - 620
Gallo,.ay J,N" Co.by B.J •• nd Liken!! G.E., 1979, Acid Precipitation: Measurement of pH and Acidity, Limnology and Ocel11fograplry, 24, 1161 - 1165
Gan I., Schier G., Innis C, 1992, BlOOd Lead Levels in Schoolchildren in tho Port Kembla Journalo/Allslraila, 2(8), pp, 372-6
Medical
Gam" A., Lap. E. and T""l11:l.I •• N" 2002, An Investigation on the Spatial AlXuracy of the IKONOS 2 Orthoimagt!t)' within "n Urban Environment, PCl~Geomaiics Web, ht1p:IIv.'\\w.pcjscoml:ltic::u;om1tech~ l1!llJ"rsliirsl}lllJ!'rlin.1 I pdf, 1011012002
G.ntL, J., I ~92, SCierlli!ie Vi$lllilizahon: a Market Mosaic, Compuler Graphics World, pp. 27·28
G.o, J" ami Skilleorn D., 1998, Capability of SPOT xs Data: Producing Detailed Land COVcf Map' At TI,e Urban - Rural Perifery. ITC Joumal, 15, pp, 2877 - 2891
Gale, D, N<, 1967, Remote Sensing lor the Biologist, BioScience, 17, PP< 303 307
Galrell A. C .nd Senior M, L., 1998, GIS and Health, tn Longley P<, Maguire D., Goodchild M. F. and Illiilld D. w. (ed.), Geographical ["fo,.molion :'ySiems; Principles and Applicalions, Gooinfol111ation International, Camt~idige.
Geron C,' Gu.:nlher A., ""d Pierce T" 1994, An Improved Model for Estimating Emissions of Volatile Organic Compoonds from Foresta ill !he Eastern United States, Journal afGeophyslcal Research, 99(06), pp.12773·12791
Ghauri B., Ladhl A,. and Salam M<, 1999, Assessmeni of Air Qualily in Iile ?vielropo/iicm Karachi, p.ki$tan Spa"" and Upper Atmosphere Roseareh Commi8Sion with Collabor.tion arKarueh; Electric Supply Coorporation ·Thermal Power Plant, Bin Qasim, Karachi
Gimon B .• S.l.m M., Mi ..... M.l, 1988, SUP,4RCO; A Reporl on Assessmenl on Air Pol/ulioll ill Ihe J/efropolUcm Karachi, Pakistan Space and Upper Atmosphere Restmrch Commh;sion
Gi11ea J., Drummondb J,. Wan, .. J., Edwardsa D., Deeter:a M.) KhaHatOYH B., Lamarqui:$II J. F.'1 Warnel'lO J, and Zlsk!na D" 2001, The EOS MOpm Experunent Extracting (he InformatIOn from the Mea~uremt.'11ts, National Center Jor Atmospheric Research, C{)lomdo~ USA
GI.ss N,R, 1979, En'llOnmc'Iltal Elfects of Increllsoo Cool UliliZlltion: EC<liogicai Efli:<:ls of O.,.<Ju., Emi:;...;ions: from Coal C('Jmbustion, Environmental Health Perspective, 33, pp, 249~72.
Goldberg M,S., Burnett RT., B.lla, J,C .• Brook J., Bo",'alol Y., Tamblyn R, Singh R. Valois M,F., Vincenl R., 2001b, The Assodution between Daily Morllllity and Ambient Air Particle Pollution ill MOlllreal, 2. Cause-specific MQrllIlity, Env i ronmen ta 1 86(1), pp. 26·36
Goldberg M,S., Burnett R.T., B.iI"r J.C, Brook J" &n.alol Y., Tamblyn R., Singh R.. V.I.i, M.F<, 200 la, The Association betweell Mortality and Ambient air Particle Pollution in Montreal, Quebec. L Nml"Ccident.1 mortal it)', Environmental Research, 86(1), pp. 12·25
Gong H. Wong R., Sarma RJ., Linn W,S., Sullivan S,B, 1998, C.,dim·."ul.r Efreels of Oz.one EXp""ure in Respiralory alldCri/rcolCare Medeclne, 158(2), pp. 538-46
Sum"" D,A,. Ande .. o., K.R., Prasad Human Volufl~$, Americal Journal of
338

GOllZlilloz R. C., ""d Wintz P., ! 987, Digilllll'mage P,ocessing, Currenl Science Journal, IRS-IC
section on
Good M. I., 1991, The LOIIg-Term Effect:; of Exposure to Low Doses of Lead in Childhood, New England journal o/lefedlcille, 324,1'1'. 415 - 418
Goodchild M.F" 1998, The G.<>Him")', In: CO"", S, (cd.), Innovalions In GIS 5, Taylor and Francis, I.ondon PI'. 59-68,
Goodchild, M., 1993, EnvircmmmlalMadeling .... ilk Oxford University Press, UK
Goodchild, M., Haining, R., 1992; Integraling GIS and spalial data analysis,ln1emalionalJou171al o/GIS, 6,401-423
GOP EVAD IIVCN, 2000, The Pakistan Nalional Conservallon Strategy, Environment & Urban AllaiN Divl;.{ton, Govemm.enl of Pakistan and IUCN~Thc World Conservation Union
GOP, 1951, Paklslan Demographic Survey 1951, Federal 13um1u of StAlislics, Statislics Divi,ion, Oovernmenl of P.kisllln, Karachi
GOP, 1984, 1981 Censlls Report of Karachi Division, Fed.ral Bureau of Sla!;;tics, SIll!lsl;c. Division, Government oj" Pakistan, Islamabad
GOP, ! 985, Hondbook oj Populalio" Cmsus 1985, Federal Bureau or Slalislics, Statistics Division, Government or Pakistbn, blamabad
GOP, 1985, Handbook Poplila/ion Census DOIa, PopUlation Censw Organi"'tion Stblistical Division Gove'mment of Pakistan. Isjamabad pp, 1~3)
GOP, 2000., Dislr/ct Census Reporl oj Karachi Soulh, PakistAn Demographic Survey 1998, Federal Bure.u of Sllllistt«, Sllltistics Division, Government of PakislJrn, Islamabad
GOP, 2oo0b, Provi/lce Census Reporl 0/ Sindh, Pakisllln Dt,moll'aphic Survey 1998, Federal Bureau of StiJtist1c$, Stalistit;s Divislon, Government of Pakistan. Islamabad
Gornick! A., Gul". A" 2000, In vilro Effeclll of Ozone on Human Ery1hrocy1e Membranes: an EPR study, AClo BiochilN Pol" 47(4), pp, 963-11
Go .. palh J., Schaefer D., Brommer C, IOlmol, L" Amed"" R,C., Mann W'],. 2000, Suoocute Ell""ls of IJzone on Cul1ivaled Human Respiralory Mucosa., AlIIer/ea/Jal/mal ojllhinol0ID', 14(6),1'1'. 4 iiS
Go'remmenl of Republic of Korea, 1998. Environmental Protection in Korea 1997, ~1ini$try or Envlronm~nt, Kwacheon. Republic of Korea
Graham D.E. and Kore ... H.S., 1990, Biomarkers of Inflammalion in IJlOne·Exposed Humans, Americwl Review 0/ Respiratory Disease, 142, PI', 152 - 156
Gran' L. and Da"i, J, M" 1990, Efl"ts of Low l.ewl Lead Exposure on Pediatric Neurobeh""ol1ll and Physical Development: Curren! Findings and Future Directions, In: Smith Orant L D., and Son A (t:ds.) Lead Exposure and Child Development: Anintenlalional Assessment. MTP Press, Lancaster, UK
GN.gor D, H., 1986, Ecology from Space, 8ioScience, pp,429-432
Griffilh D.W.T., Mankin W.G" corr.y M.T., Ward D,E., a"d Rich ... A., 1990, FTJR R"""'te Sensing of Biomass Burning Emission, of Co" CO, CH" CIllO, NO, NO" NH, and N20, in: u,ville JS. (ed,). Chapman Conference, Global Biomass Bun1ing: Atmospheric, Climatic, and Biosphf!ric Implication.s, Williamsburgh, Virginia
339

Grosjean, D" 1979, Nitrogenous Air Pollu/emts,' Chemical and Biological lmplications, Ann Arbor Science, Ann Arbor. Michigan
GrIlljlUl R, 1982, Computer Animation of 1bre. DimensioruJl Time·Varying Meteorological Fields. Proce .. ing and Display orIhree Dimensional Data. SPlE. 367. Pl'. 107-IOS
G!"UI!Iutge L., Kraus" G.H .• Kollner B., Bender Weigel H.J., Jager H.J., Guderian R. 2001. A New Fhjx~Orientated Concept to Derive Critical Leveis for Ozone to Protect Vegetation, Environmental Pol/u/ion. 111(3). 1'1'.355·62
Guderian, R lUlU Rob., R. 1983. Pllolochemicollxidan/s·Fomalion. Conlrol Elfecls 011 MOll. AnimaiJ and Plants, Springer-Verlag, Berlin
Gujuali D.N., 1995, Basic Econometrics, Edilion. McGraw Hill, NY, USA
Gmtlh .. F.J., 1982. A New Principal Components Produces 10 Aid the Analysis of Land .. t MSS Digital Data. in: proceedings. l.E,EJS Computer Saetty Conference on pattern Recognition and image processing, Las Vegas. :-levada. Pl'. 38-43
Guo X., Shin V.Y., Clta C.H .• 2001. Modulation of Heme O,.ygellllse in Tissue Injury and Its Implication in Protection As.inst Gastrointestinal Life Science, 69(25.26}. PI'. 3113·9
Gupta n.M., and Munshi M.l(., 1985. Urban Change Detection and Land Use Mapping of Delhi. In/emational JOII",al of Remote Sensing, 6. pp. 116 - 180
Guslavssun P., Plalu N., Lid.lrom E.B. and Hog.ledl C. 1990, Lung Cancer ood Exposure to Diesel Exhaust.mong Bus Garage Work"",. Scanditll1VianJoumal of Work. Environmmt & Heallh. 16(5). 1'1'.348
354
Haack, B., Bryant, N., and Adoms, S .•. 1981. An assessment of Landsat MSS and 1M Data for Urban and Near-urhan Land-rowr Digital Classification, Environmental Remote Sensing. 21. Pl'. 201·2]3,
Haggetl and Chorley R..J., 1969, Network Analysis In Geography, London
H.inlng R.. 1998, Spatial Statistics and the Analysis of Health Deta. In; Gatrell A .. and LO]ionen M, (eds.). GIS alld healtl!. Taylor & London. PI', 29-48,
Hoining, R.., Wise, 8., Blake. M. 1992, Developing a GIS for Health Needs A"essment In Sheffield. In; Report, Annual ,'vIeeJing of the AssociatiON of American Geographer::., San Diego.
Hnj.1 Andersun H.R.., Alklnson R.W., Haines A., 2002. EffeclS of Air Pollution OIl General Praetitiont!f Consultations for Upper Respiratory Dist;8ses in London, Occupational and E"twironmento! Mod"cin •• 59(5): 294-9
Ham •• d and Dignan J .• 1992. Glob-al Emission. of Nitrogen and SullLlt Oxides in Fossil Fuel Combustion )970~R6, Journal of the Air Waste .iltinagemenl ASSOCiation, 42, ~j9-63
Hameod A.A., Khodr M.I.. 2001, Suspended Particulates and Bio.erosol. Emitted from an Agricultural Non-point Source. JOIln/al of Environmel'tal Mom/oring. 3(2). pp, 206-9
Hameed t. 1990, Eslimallng Pedestrian Volumes aJ /nlersecticm Using Adjacent Land Use, Master;:; thesIs;, Un;versity of Maryland. USA
Hame.d S. IUId Dignon J" 1991. Global Emissions of Nilrog.'ll and Sulphur Oxides in Fossil Fuel Combustion 1970-1986, Journal of tho Air Waste Mrmagemem ASSOciation, 42, 159-163
Hao W.M., Wofsy S.c., McEI .... y M.D., Beer J.M., .nd Tog.n M.A., 1987. Sou"",. of Atmospheric Nitrous Oxide from Combustion. Journal of Geophysical Researcll, n. pp, 3098 - 3104
340

HAraguchi T., Ishizu H., Takehila Y., Kawai K., Yokota 0., Terada 5., Tluchiya K., Ikeda K., Morita 1(., Horike T., !Gra S., Kuroda S •• 2001. Lead Content of Brain Tissue in Diffuse Neurofibrillary Tangles with Calcification (DNTC): The Possibility of Lead Neurotoxicity. Neuroreport .• 12(18). pp. 3887·90
Harris C. D. and Ullman E. L .• 1945. The Nature of Citie •• A.mall of the American Academy of Polirk'al WId Social Science, 242, pp, 7 - 17
HArris C. D .• 1943. A Functional Clas,itication o[Cities in the United States. Geographical Review. 33. pp. 88
Harrb P.M., and Venture S.J .• 1995. The Integration of Geographic Data with Remote Sensed Imagery 10 Improve Classification in an Urban Area, Photogrammetric Engineering & Remote Seusing, 61 pp. 993-998
Harrison, R.M., 1996, Air Pollution: Sources, Concenlrntion~ and MI:a~urement. In: Harrison, R.M. (ed.), Polllltion: Causes. Effects and Control. Third Edilion, The Royal Society uf Chemistry. University of Birmingham. UK
Harris. R.c., Gorham E., Sebacher D.I., Barilett I(.B., and Flebbe P.A., 1985. Methane Flux from Northern Peal·lands. Xature. 315. pp. 652 - 654
Harrbs Re., Sebacher D.I., 1981, Methane Flux. in Fote$tcd Freshwater Swamps of the Southca~tem United Slat<5, Geophysical Research Lellers. 8 .• pp. 1002 - 1004
Harvey P. G., Hamlin M.W., Kumar R. and Deh'" I. T., 1984. Blood Load, Beha,·jour and [nlelligcnet T e~l Pertonn.l:ln~ in Pre-:.;:chool Children,. Science of the Total EnVironment, 40, pp, 45 - 60
Hasan A., Younus M., and Zaidi S.A., 1999, Understanding Karachi: Planning and Refonllfor the Future, City Press, Karachi. Pakistan
Ha~.selblad V., Eddy D. M., and Kotchmar D. J., 1992, Syntht:sis of EnvirOlmlental Evidence: Nitrogen. Dioxide Epidemiology studies, Journal of the Air Waste Alal1agement Associalion, 42, pp. 662 - 671
H .. tanu M., Benson P., Pinkerman K., Bra,,'n G. Connally P., Cramer R, Edwards G., Quittmeyer J., Rnd Rubcrtson K. , 1989, C4L1NE4-A Dispersiotl Alodelfor Predicating Air Pollutant Concentration Near Roadway. R No. FHWNCAITL-lI4115. Department of Transportation. Californi., USA
Hatta T., Naka(a T., Harada S., Kiyama M., Moriguchi J., Morimoto 5., Itoh H., Sasaki S., Tai<eda K., Nal<agR\\'a M., 2002, Lo\\-'Cring of Blood Pr~surc Improves Endothelial Dysfunction by Increase of Nitric Oxide Produclion in H\'pcrtensive Ral!!. Hypertension Research. 25(3).455 - 60
Hawk B. A., Schroeder S. R., Robinson G., Otto D., Mushak P., !Geinbaum D. and Dawson G .• 1986. Relation of Load and Social Faclors to IQ of Low SES Children: A Partial Replicalion. American JOllrnal of .l1enlal Deficiency. 91, pp. 178 - 183
Hay .. S. R .• 1979. A Technique for Plume Visulizalion in Power Planl Siling. JOllrnal of the Air Polllliion Contl'OlASJociation. Vol. 29, No.8. pp 840·843
Hazuch~ M.J., Seal E., Folirubee L.J. and Bromberg P.A .• 1994. Lung Funelion Rdsponsc of He<lhhy Women C:iftcr Sequential exposur~ ... to N01 and O~. American Jot/mal of Respiratory and Critical Care .1/,dici"' , 150(3), pp. 642 - 647
Hebel J. R., Fox N. L.. and Sexton M .• 1988. Dose Re<ponse of Birth Weight 10 Various Measures uf Maternal Smoking During Pregnancy. JOllrnal of Clinic 01 Epidemiology. 41. pp. 483 - 489
Heck W.W., Taylor O.c. and Tingey D.T .• 1988. Asse,,",ent of Crop Lossfrum Air Pollu"mts. Elsevier. umdon
HEI. 1988, Air Polllltio". the Alltomobile and Public Health, Health Elfecl Instilule, National Academic Press, Wushington D.C.
341

Heidt L.E., Krasnec J.P., Lueb R.A., Pollack W.K, Henry B. E., and Crutzen P.J ., 1980, Latitudinal Distribution of CO and CH. Over Ute Pacific. Journal of Geophysical Research, 85, pp. 7329 - 7336
Henderson RF., Hotehkiu J.A., Chang I.Y., Scott B.R., Harkema J.R, 1993, Effect of Cumulative Exposure on Nasal Response to Ozone, Toxicology and Applied Phan"acology, 119(1), pp. 59~5
Hepner G.F" 1984, Use of Value Functions as a Possible Suitability Scaling Procedure in Automated Composite Mapping, Professional Geographer, 36(4), pp. 486 - 472
Herbarlh 0., FrItz G., Krumblegel P., DI .. U., Franck U., Richter M., 2001, Effect of Sulfur Dioxide and Paniculate Pollutants on Bronchitis in Children: II. risk analysis, Ellvironmellfnl Toxicology, 16(3); 269-76.
He:rman F., Stnilit S., Huber s., EngUsch M., KnoOacher M., 200}, Evalutltion of Pollution-Relatt:d Siress Factors for Fort:st Ecosystems in Central Em-ope, E1Jvironmenlal Science and Pol/utjorl Research International, 8(4), PP. 231-42.
Ht:mamlez-A\'ila M., Gonzales-Cosdo T., PalazueIos E., Romieu I., Aro A., Fishbtin E., Pch:rson K.. and Hu H., 1996, Dieta£)' and Enviroruno:ntal Detenninants of Blood and Bone Lead in Lactating Postpartum Women Linging in Mexico City, fnvironmental Health Perspectives. 104( 10). pp. 1076 - 1082
Hettelingh J. P. , Chadwlek M., Sverdrup H. and Zhao D .• 1995. RAINS-ASIA : An Assessment Modelfor Acid Depo.fition ill Asia. The World Bank. Washington DC , United States
HeywuolJ I., Olh'er J., and Tomlinson S., 1995, Buildillg all Explora{o~y l\1ulli·crileria ;\4odeling Environment/or Spolial Decision Support, Innovations in GIS, Taylor & Francis, pp. 127 - 136
Hibbard, W., Paul, B., Battaiola, A' I Santek, D., Martinez, M. and Dyer, c., 1995, Interactive Vi:malizalion ofEIlM and Space Science Computations, Computer, 7, pp.65·72
Huhbs, N.T., Thcubald, D.M., Zack, J., Bearly, T" W.E. Riebsame, T. Shenk 1997. Forecasting Impacts a/Land Uu Change on Wildlife Habitat: Collaborative DelJelopmen/ of an Interactive GIS/or Con.H!llIaUOn Plmming. htlP://W1A'w.nrd.colostate.cdulsc.oplSCop\\"\vw.htmt
Hodgin R ., Ciolek J., Buekley D. J., and Bouwman D., 1997, Integrating Atmuspheric Disptrrsion Mod~lins with ArcInfo: A Ca$e Study of the Regional Atmo$pheric Response Center, Den\'er Colorado, in: Procceding:s, 1997 £SRI User COllference. Web: http://gis.esri.comllibrary/usereonllproc97/proc97/abstractla344 .htm
Hock G. and Brunekred 8.. 1993. Acute Effects of a Winter Air Pollution Epi'ode on Pulmonary Function and R«pirntory Symptoms of Children. ArchNes of Environmental Health. 48, pp. 328 - 335
Hoek G .. Brunekr.ef B., and Roemer W .• 1992. Acute Eftects of Moderately Elevated Wintertime Air Pollution on Respiratory Health of Children, American Re1,liew o/Respiralory Disease, 142, pp. A88
Hock G., Fischer P., Brunekreef 8., Lebret E., Hofsehreuder P. t and Mennen M.G., 1993, Acute EflcclS of Ambient Ozone on Pulmonary Function on Children in the Netherlands. American Re1,l;ew 0/ Respiratory Disease. 147. pp. III - 117
Holguin A.H., Burner P.A., Conlant C.F., Stock T.lL, Kotchmar D., His B.P., Jenkings D.E., G.han B.M., Noel L.M., and Mel M., 1994. The Effects of Ozon. on Asthmatics in the Houston Area. In: Lee S. D. (00.). Evalttatioti o/the Scientific bosis/or OzonelOxidanls Standards, Houston, Texas
HolzRpfd-Pschom A' I and Seiler W., 1986, Mcthune Emission During u Culti\'ution Period from itn ltaliljn Rice Paddy. JOlll1lal of Geophysical Research, 91, pp. 803
Horstman D. H., Seal E. J., Folin,bee L. J., h .. P. and Roger L. H., 1988. The Relationship, bet"'""n Expo$ucc Duration and Sulphur Dioxide Induced Bronchoconstruction in Asthmatic SubJects, American Indus/rial and Hyg;ne AssocialionJolJntal, 49, 38 - 47
342

Houghton R.A. And Skole, D.L .• 1990, Changes in the Global Carbon Cycle between 1700·1985, In: Turner B.L., <eds.), The Earth as TransJom/ed by Human Action, Cambridge University Press, New York, pp. 393 -408
Howells G., 1983. Acid Waters: 'The Effects of Low pH and Acid Associated Factors on Fisheries, Advances in Applied Biology, 9, pp. 143 - 255
Hoyt, H .• 1939, The SlIuclllre and Glow/II of Residenlial Neighborhoods ill American eWes, Federal Housing AciminisLralion, Washington, D.C.
Hubert L.F., And Timchalk A ., 1969, Estimating Hurricane Wind Speeds from Satellite Pictures, Monthly Weather Review, 97, pp. 383
Huizing, H., and Bronneld K., 1994, lnteractive multiple-goal analysis for land use plaruling, lTC Journal, 4, pp. 366 - 373
Hu.aln S. 1997a, Lead Content in Food Products Found ' alarming' , Frontier Post. April 03, Karachi
Husain S. N. I 997b, TIlt: Air Pollution is Rise with Dangers, The News, September 14, Karachi
Hu •• 1n S. z., 1992, .~n Alternative Melhod in Delermination oj a CBD Hard Core: A Case oj Karachi CBD, The Kasachi Gecgrapbors Association, pp. 41
Hutchinson T.e. and HAVas M. (ell •. ), 19980, Effects of Acid Precipitation on Terrestrial Ecosystems, Plenum Prc~~ , New York
HWRng CL., ltnll Yoon K., 1981, Multiple Attribute Decision Nlaking lvfethods and Applications: A State of Ihe Art Survey, Springer' Verlag, Berlin
Hyden c., and Varhelyi A., 2000, The Effects on Sarety, Time Conswnption and EnviroJUnent or Large Scale Use of Roundabouts in an Urban Area: A Case Study, Accident: Analysis: and Prevention, 32(1), pp. 11 - 23
Ibald·Mulli A., Stieber J., Wichmann RE., Koenig W" Pe'ers A., 2001, Erfects or Air Pollution on Blood Pressure : a Population.based Approach, American JouTlfal oj Public Heallh, 91(4), pp. 571·7
ICA, 1980, E'(amples of Environmental A1aps . lnstituto Geogralico Nacional, Madrid.
leF, 1990, Technical Rq>ert, International Work.Jhop on Ivlethane Emissions from Natural Gas Systems, Coal MiHing and Waste lvfanagement Systems, lPCC Working Group 3, Washington D.C., USA
IEEE, 1984, System Monitors Ha7...ardous M6t~rials Dispersion, Computer GraphiCS and Applications , pp. 72·73.
lIu'am T. 1996, Pakistanis Choke on Uncontrolled Air Pollution, Frolltier Post, March 02, Kasachi
Imai M., yo,hid. K, Kotchmar D.J., and Lee S.D., 1985, A Survey of Health Studies of Photoch"mi",,1 Air Pollution in Japan, Journal of the Air Pol/ution Confrol Association, 35, pp. 103 - 108
Intem.tional Join! CommissIon, 1997, 771< IJC and the 21st CeI1/Ury. Response oJthe JJC to a Reqllesl by the Governments ofCamxla and the United States for Proposals on How to Best Assist Them to A1eellhe Environmental Challenges of lire 21st Century. International Joint Commission, Washington DC, United St(jlCS, and Ottawa, Canada
International Road Federation, 1997, World Road Statistics 1997 Edilion, IRF, GenevlI, Switzerland, and Washington DC, United SIB",s
IPCC, 1990. Climate Change: the IPCC SCielltific Assessment, Houghton J.T., Jenkins GJ. and Ephruunl< t!:ds.), lntt:rgovenunental Panel on Climate Change, Cambridge University Press, Cambridge, UK
343
IPCC, 1992, Climate Change 1992: The Supplemenlary Repart 10 Ihe IPCC Scienlific Assessmelll, Houghton J.T., Callande, B.A., and Varney S.K, (eds.), Intergovernmental Panel on Climate Change, Cambridge University Press, Cambridge, UK
1995, Climale Change 1994: Radlalive Forcing o/Cllmale Clu"'ge and An Evalualion o/the IPCC IS92 Emlssioll Scenarios, Houghton J.T., Meira Fillio L.G., Broe J., Leo H., Callander B.A., Haites Harris N., and Maskell K. (cds.), Intergovernmental Panel on Climate Change, Cambridge University Pres., Cambridge, UK
IPCC, 1995, Climale Change 1994. Radiolive Forc/ng o/Climale Change and all Evalualion o/Ihe !pec IS92 EmisSIIm Scenarios. Houghton, J., Meira Filho, L.G, Bruce, J., Leo., H., Callander, B.A., Haite" E., HarrIS, N., and Maskell, K. (eds.), UNEPIWMO. Cambridge University C.mbridge, UK
IPCC, 1996a, Climale Change 1995: Tile Science 0/ Climate Change, Houghton, .1., Moiro Filho, Callander, B.A., N., Kattenhers, A., and Maskell, K. UNEPIWMO, Cambridge University Prc%. Cambridge, UK
IPCC, 1998, The Region"llmpac/$ a/Climale Change: An Assessment a/Vulnerability, A special report of IPCC Working Group II. Cambridge University Press, Cambridge, UK
IPPC, 1996b, Climate Change 1995: Impacts, Adaplalions andMiligalion o/Climale Change: SclenlificTechnical <malyses, Contribution of Working Group U to !he Second As,;cssmcnt Report of the Intc'rgoverrullCIltal Pand on Climate Change. Watson, R.T., Zinyowera, M.C .. and Moss, RH. (eds), WMOIUNEP, Cambridge University Cambridge, UK
h.lnks E.H.} and STh'Stsll\va R.M., 1989, An Introduction to Applied Gcoslafistics. Oxtbrd University Press, N~w York
lsaluen I.S.A.\ Hov O.t and Hesstvedt E., 1978, Ozone generation over ruml areas. Environmental Science & Technology, 12, 1279 ~ 1284
Jacquez C.M., 1998, GIS as an Enabling Technology, In: Gattrell, A., and LO'r1rmc"Il M. (cds.), GIS and heallh, Taylor & Francis, london, pp. 17~21!.
Jacquez GrlmsfJn R., Waller L.A., and Warienberg D., 1996, The Amdysls of Di:;:elise Cluster:;, Plift II: Introduc.ion to Icclmiques, "ifeclioll C 01111'01 and Hospital Epidemiology, 17, pp. 3g5~97
Jaeger K. t Ruschulte H. t Heine. J., Piepenbrock S., 2000, Caroon l\.1ono:\ide Poisoning. Anaesthesial Rea,,;"', 25(3) pp. 74-7
Jarr! A, 1973, The Problems of Urooniza.ion in Pakistan: A Case for City and Regional Planning, in: Proceeding', Firsl All Pakistan Geography COII/.renc<, Th. Karachi Goographers Association, pp. 21-39
Jager H.J., Unsworth M.H., d. Temmerm.,.. L. and Mathy P, 1993, Effecls of Air /'o/lulioll 011 Agricultural Crops 111 Europe - Resulls of Ih. European Open-Top Chambers Projecl. Air Pollution R","Search Report 46, Commission of the Europ~n Communities, Brussels
Janel], P .. 2000, Dynamic Air Pollution Modeling and GIS, In proceeding;;, 2000 ESRJ User Con/ereIIC', hllp:ll si s . esri. comll ibra!), iuserconllproc{)Olproli;ss io .... IIp"l""siP AP89WpR 99. hI III
Janko".ld P., 1995, inlegrnling Geographical Information System, and Multiple Crileri. D""j,ion·Makjnl! Methods, Inlernalion,,1 Journal of GIS, 9(3), pp. 251 ~ 273
Jensen J. R, and Toll D,L., 1982, Dete<:tion of Residential Landuse Development at the Uroon P!/Olograllllllelric EngIneering & Remote Sensing, 19, pp. 629··643
Jensen J. R., 1986, InlrodliclOl'Y Dlgllallmage Processing, Prentice Hall" Englewood ClilIs, NJ
JelUcn, J.R. (ed.) 1983, Urbon!Subl1r/xlII LandliJe Analysis, Manual 0/ Remole Se"smg, American Society of phologramme!ry, Fall, church, Virginia, pp. 1571·1666
edition,
344

Jensen, J.R., 1996, Introductory Digital Image Processing: a Remote Seming perspeclive, 2~ Ed, Prenti~ Hall. NJ
Juurnel A.G. and Huijbreg'J C.J., 1978, Min;ng Geoslalislics. Academic Press, London
Junker M., KoUer T., Monn C., 2000, An Assessment of Indoor Air Contaminants in Buildings with Recreational Aetivil)·. Science of the Total' Environment. 246(2-3), pp. 139-52.
Kaumon, N., 1983. Photographic, Poly focal and Polar-Diagrammatic Mapping of Aunospheric Pollution, n .. CarlographicJoumal, 20(2). pp. 121-126.
K.gawa J. and Toyama T., 1975. Photochemical Air Pollution: Its Effects on Respiratory FUllctions of Elementary School Children, Archive, oj Environmental Heallh. 30. pp. 117 - 122
Katsouyanni K., Zmirou D., Spix C., Sunyer J., Schou.en J.P., PonlUl A., Anuerson H.R., LeMoullcc Y., Wojl)niak B., Vigoni M.A., and Bachorova L., 1995. Thc APHEA Project: Background, Objectives, Design. Short Tenn Effects of Air Pollution on Health. A European Approach Using Epidemiological Time Series Data, European ResplraloryJoumal, 8. pp. 1030 - 1038
Kazmi J.H, and Pandit K, 2001, Disease and Dislocation: The Impact of Refugee Movements on the Geography orM.loria in NWFP, Pakistan, Social Science alld Medicines. 52(7), pp. 1043-1055
Kazmi J.H.. 1991, The us< of SPOT Images in the Study of Land Use Patterns: A Case Study in a Suburban Arta of Kurachi, in: proceedings, Regional seminar on applications 0/ remole SenJing Techniques 10 Land Use Pla"ning and Environmental Surv~ing, pp. 26-29
Kaznli J.H., 1996,lnc;dence o/Afalaria in Pakislan: A Geographical Analysis, Ph. D. Th~is, Unh't:rsity of Karachi, Pakistan
Kazmi, J.H., 2001a, Application of Remote Sensing and GIS for the Monitoring of Disca~es : A Unique Research Agenda for Geographers, Rell/Ole Sensing Review, 20(1). pp. 45-70
K.umi, J.H., 200lb, Apprdisal Of Agricultral Land Use Thsough High-Re<olution Digital Imageries In Kurachi. in: proceedings. GIS - 2001 ConJerence & Expo,itio", Vancouver. BC. "p. II
K .. mi. J . H .. 1995, Application of Remotc Sensing Techniques for the Monitoring of Desertification: An appraisal of Malir Valley, in: proceeding$, The Second Asia-Pacific Conference on Afullilaleral Cooperation ill Space Technology a"d Applications. pp. 196 - 203
KDA, 1991, Ka,.achi Developmenl Plan 2000, Master Plan and environmental Control Departlllent. Karachi DeVelopment Authority. Kamchi
K«lIng C.D., and WhorfT.P., 1998, Almo'pheric CO, Concenlraliom -Malina LoaObservalo/y. Hawaii, 1958-/997. NDP-DOI, Carbon Dioxide Infonnation Analysis Center. Oak Ridge National Laboratory, Ouk Ridge, Tt!Ilness~. United States http://cdiac.csd.omt·. gov/cdiac/home.html
Kt:lIer M., and 1\1afson P., 1994, Biosphere- Atmosphere Exclumge of Tra~ Gases in the Tropics:: Evaluating the Effects of Land U.e Change., in: Prinn R. (ed.), Global AhnOsphe,.ic-Biospheric Chell/i,l/y. Plenum Preo<. New York and Lendon. pp. 103 - 118
Kellcr M., Kaplan W.A., and Wof.y S.C .• 1986. Emissions of N,O, CH.., and CO, from tropical 'oils, ./ollrnal oJGeophysical Research, 91, pp. 791 - 802
Keller M., VeldlUlmp E., Weltz A., and Reiner< W .• 1993, Efrect of Pasture Age on Soil TrlIte-Gas Emi«ion. from a Deforested Asea of Costa Rica, Nalure, 365. pp. 244 - 246
KhAlil M.A.K, and Rasmussen R.A .• 1984. Carbon Monoxide in the Earth·, Aunosph<re: Increasing trend, Science. 224. pp. 54 - 56
345
Khalil M.A.K., and Rasmussen RA., 19880, Carbon Monoxide in the Earth', Atmosphere: Indications ofa Global [ncrease, Natllre, 332, pp. 242 - 245
Khalil M.S., 1996, City Vehicles Emmits 1,8 \3 tons of Smok Daily, daily Star, July \3, Karachi
Khan F. K., Rehman S. A., Talat B., 1998, Rural-Urban Migration: A secondary Contributor to Urban GroMh in Pakistan, Pakistan Journal a/Geography, Vll & VlIl (1&2), pp. 147-156
Khan G, M, and Siddiqui 2. A., 1986, Usc of Landsat Data For Urban Growth Monitoring [n Karachi Metropolitan Area, Space Horizon, 4, SUPARCO, Karachi
Khan J. A., 1993, The Climate a/Pakistan, Rehber Publisher, Karachi. pp. 15·20
Khoro HOI and Mooraj A., 1997, Karachi J\4egacily of our Times, Oxford University Press, Karuchi. Pakistan
Kilburn K.H., WRrshaw RH. and Thornton J.e., 1992, Expiratory Flows Decreased in Los Angeles Children Irom 1984 to 1987: [s This Evidence for Efli:cts of Air Pollution, Environmental Research, 59, pp. 150 - 158
Kinney P.L. and Ozkaynak H., 1991, Associations of Daily Mortality and Air Polltion in Lo. Angel<s County, Environmelllal Research, 54, pp. 99 - 120
Kinney P.L. and Ozkaynak H., 1992, Associations between Ozone and Daily Mortality in Los Allgelc:S Imd New York City., American Review o/Respiratory Disease, 145(4 :2), pp. A95
Kirchhon' V.W.J.H. and Marlnho E.V.A., 1989, A Survey of Continental Concentrations of Atmospheric CO in the Southem Hemisphere, Atmospheric EnvirolUnent, 23, pp. 461 - 466
Kirchhoff V.W.J.H., s<:tzer A.W., and Pereira M.C., 1989, Biomass Burning in Amazonia: Sea,onal E1f""ls on Almospheric 0, and CO, Geophysical Re'earell Letters. 16, pp. 469 - 472
Kleinman M. T., Lurman F.W., Winer A. M., Colome S.D., Brajer V. and Hall J.V., 1989a, Effects on Hllman Heallh of Pol/u/ants in 'he Soulh CoasllHr Basin, Report for South Coast Air Quality Manugl:ITIcnt District, California Slate Uni\'er:;ity Fullerton Foundation
KleinmRn M.T., Phalen RF., Mautz W.J., Mannix RC., McLure T.R. and Croc\{er T.T., 1989b, Hcahh Effect of Acid Aerosols Formed in Atmospheric Mix-tures, Environmental Healih Perspectives, 79, pp. 137-145
Koehler R.C., and Traystman R.J., 2002. Cerebro\'8scular Etl'ecls of Carbon Monoxide, Anliaxid Redox Signal, 4(2), pp. 279·90
Koenig J.Q., CO\'ert D.S., Manh~U S.G., Van BeUe G. and Pierson W.E., 1989, The EJlccts OrOZOn!! and Nilrogc:n Dioxide on Pulmonary Function in Healthy and Asthmatic Adob'ct..'Tlts, American Review of Respiratory Disease, \36, pp. 1152 -1157
Komjathy A., Za,.orolny V. U., Axelrad P., Born G. H., and Garrison J. L., 2000, GPS Signal SCllllcring Irom Sea Surface, R,mole Sensing a/tire Environment, 73 (2), pp. 162-174
Koren H. S., 1995, Associations between Critc:ria Air Pollutants and AstJuna, Environ Health Perspect, 103-(6), pp. 235 - 42
Koren H.S., De,.lin RB., Becker S., Perez R. and MeDoruten W.F .• 1991. Time-Dependent Changes of MHrkc:rs Associated with Inflammation in the Lungs of Humans Exposr..:d to Ambient Levels of Ozone, Toxicologic Patlrology, 19, pp. 406 - 411
Korte G. B., 1992, Th, GIS Book: A Pracliliona 'J Handbook, 2'~ Edition, Onword P'c.<s, USA
346
--- -----_ .

Kourembanas S .• 2002. Hypoxia and Ouban Monoxide in the Vasculature .• Antioxid Redox Signal .• 4(2). pp. 291-9.
Koussoulal,ou A .• 1994. Spatial Temporal Analysis of Urban Air Pollution. In: Vis"aliration 0/ Geographic In/orlllation Systems, Wiley Publishing, pp. 243 - 265
Kruse, F. A., Lefkoff A. B., Boardman J. W., Heidebrecht K. B. Shapiro A. T., bar)oon P. J. ond Goetz A. F. H. , 1993, The Spectral Image Processing System (SIPS) . Interacti"" Visualization and Analysis of Imaging Spoctrometer Data, Remote Sensing o/the Environment. 44, pp. 145·163
Krzyzanowski M., Quackennbou .J.J., and lebowitz M.D., 1992. Relation of Peak Expiratory Flow Rates and Symptoms to Ambient Ozone,Archives o/Environmental Health, 47, pp. 102 -lIS
Kulldorff M., 1998, Selection of Statistical Methods for the Analysis of Spatial Health Data, In: Gatrell A.. and Loyton.n M. (eds.), GIS and Health, Taylor & Francis, London, pp. 49-62 .
Kum.r A .• Phallke K.M., Tajne D.S., H .. an M.Z., 2001, Increase in Inhalable Particulates' Concentration by Conunercial and Industrial Activities in the Ambicmt Air of Ii Select Indian M~tropoli3. Environmental Sciellce & Technology, 35(3), 487-92
KUJ12Ii, N. ot al., 2000. Public-Health Impact of Outdoor and Traffic-Related Air Pollution: A European Assessment, Pakistan Journal o/Chest Medicine. 6(4), pp. 33
Kupfer, G., Turl<strK J. and Hofstec P., 1987, Spalil:11 Growth of Unplanned Areas in Nairobi : Usc of Aerial Photography for Monitoring Urban Growth and Improvement PlalUling,lTC journal, 3, pp. 239-247
Kuylen.tierna J.C.I ., Clnderby S., and Cambridge 8., 1998, Risks from Future Air Pollution, In: Kuyl~ns'cma • .1 . and Hicks, K, (eds,), Reg;onol Air Pol/ulion in Developing Countries, Stockholm EnvirolUllcnt Institule, York. UK
Kwarteng A. Y., and Chavez Jr. P.S .• 1998, Change Delection Study of Kuwait City and Environs Using Multi-Temporal Landsat Thematic Mapper Data,lnternational Journal o/Remote Sensing, 19(9), pp. 165-166
Lal S., Pam RS., 2001, Monitoring of Atmospheric Behaviour of NOx from Vehicular Tr.Il',c, Environmenlal l\-loniloring and ASSe1Smenl, 68( 1), pp, 37-50
Lang L., 1992. GIS comes to life, CompliterGraphlcs World, October, pp. 27-36.
Lang L., 1999. Trallsportation GIS. ESRI Pres;. California, USA
Lang L., and ~peed V., 1992, Environmental Consciousness, Compuler Grophics World, August, pp. 57-70.
Langram G., 1993, Time in Geographic In/ormallon Syslems. Taylor and Fran(;is.
Last F.T. and Watling R. (cds.), 1991. Acidic Deposition: lis Nature and Impacts. Royal Society of Edinburgh, Edinburgh
Lathrop, R, Aber, J., Bognar J., Ollinger S., Cauet, S., EIU. J., 1994, GIS Development to Support Regional Simulation Modeling of North-Eastern (USA) Forest Ero.ystems. In: Michener W., Statlord S., Brunt, .I. (oos.), Ellvironmenialin/onnalion Managemenl and Analysi.r, Taylor ijlnd Francis. 432-451.
La,'In, S. J. and Cenny R S., 1987, Unit Vector Density Mapping, The Cartographic JOllmal, 24. pp. 131-141
Lawson T., Craigon J., Black C.R, CoU. J.J., TuUoch A.M., Landon G., 2001, Effects of Elevated Carbon Dioxide and Ozone on the Growth and Yield of Potatoes (Solanum Tuberoswn) Grown in Open-top Chambers, Environmental Pol/ution, 111(3), pp. 479-91
347

Lawther, P. J. and Commins B. T., 1970, Pollution/rom Road Vehicles and Health, Clean Air Confcrence, National Society for Clean Air
La.en D., 1985, Nitrogen Dioxide: an Air Quality Problem in London" umdon Environ. Bulletin, 3, pp. 10 - 12
LBA, 19%, The Large Scale Biosphere·Atmosphere Experiment in Amazonia,lNPE, sao Paulo, Brazil
Learmonth A.T.A., 1972, Medicine and Medical Geography, in: McGlashan N.D. (ed.l, Medical Geography: Techniques and Field Studies, Methuen & Co Ltd., London
Lebowitz M. D., Collins L., Holberg e.H., 1987, Time Series Analyses of Respiratol)' Responses to Indoor and Outdoor Environmental Phenomena, Environment, 43, pp. 332 - 341
Leduc D., De Vuy.t P., Yemault J.C., 1995, RespiratOl)' Toxicity Due to Atmospheric Pollutants. General Re"cw and a Study of the Relation to RcspiratOl)' Infections, Rev. Mal. Respir., 12(1) pp. 13 - 23
Lee J. A. Hnd Stewart G. R., 1978, Ecological Aspects of Nnitrogen Assimilation, Advances in Botunical Research. 6. pp. I - 43
LeeJ., and Wang D.W.S., 2001, Statisl/cal Analysis with Arcview GIs". Johan Wiley & Sons, NY, USA
Lee, R. E. Jr., Cald.,.eU, J. S. and Morgan, G. B .• 1972, The Evaluation of Methods for Measuring Suspended Particulates in Air. Atnfospheric EnVironment, 6, pp. 593 - 622
Legge A.H. and Krupa S. V. (ed'.l, 1986, Air Pol/ulants and their EJ/ecl.r on the Terrstrial Ecosystem., Wih:y In1erscience, New York
Legge A.H. and Krupa S. V. (ed'.l, 1990, Acidic Deposition: Sulphur and Nitrogen Oxides. Lewis Publishers, Michigan
LeilUluf G.D., Kline S., Albert R.E., Baxter e.S., Bernstein D.I., Buncher e.R., 1995, Ev.luation of a Possible Association of Urban Air Toxies and Asthrua, El1Vironmenlal Health PerJpeClive. 103 Suppl 6, pp. 253 - 71
Lerner J., Mathews G., and Fung I ., 1988, Methane Emi .. ions for Animals: A Global High-Resolution D .... bas, Global Biogeoc!,emicaICycles, 2, pp. 139 - 156
Llew, S.e., Lim, O.K., Kwoh, L.K., and Lim H,. 1998, Study of the 1997 For""t Fires in South East Asia Using SPOT Quicklook Mosaics. In: proceedings, /998 International Geosience and Remote Sensing Symposium, Seattle, Washington, US, pp. 879-881
Lillesan~ T. M. and Keifer R. W ., 1987, Remole Sensing and Image Interpretation, .Iohn Wiley & Sons Inc .. NY, USA
Lillesand T. 1\1. anll Keifer R.W., 1994, Remole Sensing and Image Interpretation, Jolm Wiley & Sons Inc., N~w Y ourk
Lin G. Y. and Bland W. R., 1980, Spatio-Tc'fTlporal V.ri.tions in Photochemical Smog Concentrations in Los Angeles Count)', California Geographer, 20, pp. 28 - 52
Lin G. Y, 1981 , Simple Markov Chain Model of Smog Probabilities in the South Coast Air Basin of C.lilorna, Po/essional Geographer, n. pp. 228 - 236
Lindny S., and Birley ~1 .• 1996, Climate Change and Malaria Transmission. Annals o/Tropical kledicinf! and Parasitology, 90(6), pp. I - to
348

Linn W. S, Avol E. L., Peng R. C., Shamoo D. A. and Hackney J. D. 1987, Rcplicat<d Dose·Respen,. Study of Sulphur Dioxide Effects in NonnaJ, Atopic and Asthmatic Volunteers, American Review of Respiratory Diseases, 136, 1127 - 1134
Linn W.S., Avol E.L., Shamoo D. A., Spier C.E., Valencia L.M., Venel T.G., Fischer D.E. and Hackney J.D., 1986. A Dose·Respense Sludy of Healthy, Heavily Exercising Men Exposed 10 Ozone at Concentralions Near the Ambient Air Quality Standard, Toxicology alld Industrial Health, 2, pp. 99 - 112
LippmlUlll M ., 1 989a, Effects of Ozone on Respiratory FWlction and Structure, Annual Review oj Public Health, 10, pp. 49 - 67
Lippmarm M., 1989b, Health Effects of Ozone: A Critical Review, Journal of the Air Pollution Control Association, 39. pp. 672 - 695
Lippmann M., 1989c, Background on Health Effect:) of Acid Sulphate Aerosols, Emlironmenlal Health PerJpec/jve.s, 79, 3 - 6
Lippmarm M .. 1993, Health Effects of Tropospheric Ozone, Review ofR=nl Research Findings and Their Implications to Ambient Air Quality Standards. Journal of Exposure Analy.r;j and Environmetnol Epidel/liology, 3, 103 - 129
Lippmann M., Ito K., Nadas A., Burnett R.T., 2000, Associalion of Particulate Alaller Components with Daily Mortality and J/orbidity in Urban Poplliations, Research Report, Health. Effecllnstilulc, 95, pp. 5·72
Llppmarm M., Lio)' P.J., Leihauf G., Green K.B. and Baxler D., 1983 . Effects of Ozone on Ihe Pulmonary FW1ction ofChildrcn. Enyironmental Toxicology, 5, 423 - 446
Liu S,C. and Trainer M., 1988, Respenses of TroPospheric Ozone and Odd Hydrogen Radicals 10 Column Ozone Change. Journal of AtmospheriC Chemistry, 6, pp. 221 - 233
Llu S.c., McKeen S.A., and Madronich S., 1991, Effecl of Anthropegenic Aerosols on Biologically ACli"e Ultra Violel Radialion, Geophysical Research utlers. 18, pp. 2265 - 2268
Llobel J.M., Schuhmacher M., Domingo J.L., 2002, Spalial Distribulion and Temporal Vari.tion of Metals in the Vicinity of a Municipal Solid· Waste Incinerator Siler a Mcxiemization of the Flue Gas Cleaning Syslem. of the Facility, Science of the To/al EnVironment, 284(1·3), pp. 205·14
Lv C. p" Quattrochi D. A" and LuvaU J, C., 1997, Application of High·Resolulion Thermal Infrared Rt:nlolc Sensing and GIS to Assess the Urba Heat Island Effect, InlemationalJollrnal of Remote Sensing, 18, pp. 287 - 304
Lu, C.P., and Noble, E. Jr., 1990, Detailed Urban Land""e and Landcover Mapping using Large format camt.:ra Photographs: an Evaluation, Photogrammefric Engineering & Remote Sensing, 56, pp.197 -206
Lugan J, A., 1983, Nitrogen Oxides in the Tropesph.re: Global and Regional Budgets, Journal of Geophysical Research. 88, pp. 10785 - 10807
Lugan J .A., Pralher M.H., Wofsy S.c., and McElroy M.B., 1981. Troposph«ic Chemistry: A Global Perspeclive. JOllnlal of Geophysical Research, 86. pp. 7210 - 7254
Lung D.S., Nielson G.A., and Carlson G.R., 1989, Us. of Aerial Pholograph< for Improving Layoul of Field Research Plols, ApplliedAgriculture Research, 4, pp. 96 - 100
Lvnghursl J.W.S., 1989, Acid Deposition: Sources, Effects Dnd Controls, Brilish Library, London
Luuml. D. P., Borja·Aburlo V.H., Bangdiwala S.I" and Shy C.M., 1996, Ozone Exposure (DId Dally Mortality in Ivlexico City: A Time Review Analysis, Research Repert Numb.:r 75. Health Effect Inslilul., CUlI1bridge, M.A.
Lu,ler M.I., 2001, Ozone·induced Mucous cell Metaplasia., Toxicol Sci .. 60(2), pp. 193
349
------------ ---.

Lyons T.J. and Scoll W.D., 1992, Prirlciples of Air Pol/utiOri Meteorology, CBS Publishers and Distributol1l, New Delhi, India
MacEachern D., 1990, Save Our Plarlet, 750 Everyday Ways You Can Help Clean Up the Earth, Dell Publi,hing, New York, USA
MacEachren, A. M. and Taylor, F. D. R., 1994. Visualization in ;Wader" Cartography, Pergammon. Oxlord, U.K.
Mack, C" Mar.h, E.S., and Hutehiruon, C.F., 1995, Application of A<rial Photography and GIS Techniques in the Development of a Historical Petspective of Environmental Hazards at the Rural-Urban Fringe, Photogranrmelric Engineering & Remote SenSing, 61, pp. 10 15-1020.
MAFF, 1969, Nih'ogen alld Soil Organic Maller, Technical Bulletin No. 15, Ministry of Agriculture, Fisheries and Food - USA
Mahaffey K. R, 1990, EnvirOlunental Lead Toxicity : Nutrition as a Compon.ent of Intervention, Environmental Health Perspeclive, 89, pp. 75 -78
Maharrey K.R. and Michelson I.A., 1980, The Interaction betwcen I.ead and Nutrition, In: Needleman H. L. (ed.), 11lt Clinicallmplicalions in Current Research, Raven Press, US
Mahaffey K.R., Annest J.L., Roberl. J. and Murphy R.S., 1982, National Estimates of Blood Lead Levels: United Stntes, 976 - 1980.: Association with Selected D~mographic and Soeioeconomjc Factors, New Englalld Joumal of Medicine, 307, pp. 573 - 579
Mahlman J.D. and Moxlm W.J., 1978, Tracer Simulation Using a Global General Circulation Mood: Rc:mlts from a Mid-Latitude Instantaneous Source Experiment. Journal 0/ Atmospheric Science, 35, pp. 1340 - 1374
Mahmood K., 1990, On the Functional Quality of the Districts of Sindh: A Geographical Evaluation, Geographical Papers, 0 I, pp. 25 - 33
Mahmood K., Kazmi J. H., Ahmad R., Ar,ar S., 2001, Local Bodies Electiuns in Karachi: A Study of Spalio-Temporal Relationship o/Voting Behaviiour. T~chnical Repor1 , University ofK..urachi pp. 26
MMisonet M., Bush T.J" Correa A., JaakkolA J .J., 2001, Relation between Ambient Air Pollution iJnd Low Binh Weight in the Northeaslern United States, Environmental Health Perspective, 109, pp. 351-{;
Malczewski J .• 1999, GIS and Multicriteria Decision Analysis, John Wiley & Sons, Inc., NY, USA
Ma.IiI{ Z. A., and MAjeed A., 1995, Remote Sensing Applications in ' Water Resources Research, m: procet:'dings. The Second Asia-Pacific Conference on Multilateral Cooperation in Space Technology and Applications, pp. 185 - 191 .
MMnhcirn M.L.L. t 1979, Fundamentals a/Transportation Systems Analysi.s: Basic Concepts, Vol. I. MIT Pre~s. USA
Manlnl P.e., 1995, Regional Air Pollution Modelling tor Planner:J, Terresuial, Atmospheric and Oceanic Sciences, 6(3), pp. 393 - 40 I
Manser W.W., Lalani R., Haider S., and Khan M.A ., 1990, Trace Element Sludie, on Karachi Populations. Part V: Blood Lead Levels in Nonnal Healthy Adults and Grammar School Children, JOllmal uf the Pakistan Medical Association, 40(7), pp. 150 - 154
MKn.fidd T . A., 1976, Effects of Air Pol/utants on Plants, SEB Seminar Smcs No. I., Cambridgo Univcr.>it)' Press, UK
Marie - Angos B., 1989, The Use of Satellite Images for Urball Planlling. Report No. 4Z
350
- - --- ---

MarllUld G., 1989, FOS$i/ fuels CO, emissions: Three Countries Account for 50% in 1988, CDIAC Communicafiofl5, Winter 1- 4, Carbon Dioxide Information Analysis Centre, Oak Ridge National Laboratory, USA
Marlella M. A., 1989, Nitric Oxide: Biosynthesis and Biological Significance, Trends in Biochemical Sciences, 14, pp. 488 - 492
MHrsh W. M., and Grona J. Jr., 1996, Environmental Geography: Science. Land Use. and Earth Systellls, John Wiley & Sons, New York, USA
Mathai M., Skinner A., Lawton K. and Weindling A. M., 1990, M.ternal Smoking, Urinary Continine Levels and Birth Weil!ht, Australian and New Zealand Journal of Obstetrics and Gynaecology, 30, pp. 33 -36
Mathews E. and Fung J., 1987, Mcthano Emissions from Natural Wetlands: Global Distribution, AIca and Environment of Characteristics of Sources, Global Biogeochem Cycles. I, pp. 61 - 86
Matson P.A., Rnd Vitousek P.M., 1987, Cross-system Comparisions of Soil Nitrogen Transfonnations tlnd Nitrous Oxide Flux in Tropical Forest Ecosystems, Global Biogeochelllical Cycles, I, pp. 163 - 170
McCaul E.W., Bluestein Jr., H.B. and Doviak R.J., 1987, Airborne Doppler Lidar Observations of Cunvective Phc"Tlomena in Oklahoma, Journal of Atmospheric and Oceanic Technology, 4, pp. 479-497
McConnell L. M., Vliet D. V., Cook T. J ., 2000, New Suite of User·Friendly GIS Tools for Accessing Enviroruncnlal Monitoring Dala.bas~:\. in: proceedings. 2000 ESRl User Conference. Web: http://.i.e.ri.comllibralV/userconflprocOO/profession.!lparersIPAP883/p883.htm
McCuen, R. H., 1985, Statistical Methods for Engineers, Prentice Hall, NJ, USA
McDevitt T.M., 1999, World Population Profile: 1998 with a Special Chapter Focusing on HIVIAIDS ill the O"velopillg World, Department of Commerce, USA
McDonnell W. F., Chapman R.S., Lci&h M.W., Strope G.L., and Collier A,M., 1985, R.,pir.tory Rl!sponst::I of Vigorously Exercising Children to 0.12 ppm Ozone E:O<PO!'UfI!, American Rev;ew of Respiratory Disease, 132(4), pp. 875 - 879
McElroy M.B. and Wofsy S.c., 1986, Tropical Forests: Interactions with the Atmosphere, Tropical Rain Furests and the World Atmosphere, in: Prance G.T. (ed.), Selected Symposium 101 , Westview Pres., pp. 33-60
McGIHJh~n N.D., 1972, Mc-dical Geography: an Introduction, In: McGlashan N.D. (ed.), Medical Geography: Techlliques and Field Studies, Methuen & Co Ltd., London
McKernan E., Yurganov L., Tolton B. T., and Drummond J. R., 2001, MOP/TT Validation Using Grolllld-B~sed IR Spectroscopy, Departmenl of Physics, University ofToronlo, Ontario, Canada
McMichael A.J., BHghUrst P. A-, Vimpanl G,V" Wigg N.R., Robertson E.F., and Tong S., 1994, Tooth Lead Levels and IQ in School-Age Children: The Port Pirie Cohort Study, American Joul7lal of Epidemiology, 140, pp. 489 - 499
McMich .. el A.J., Baghurst P. A., Wigg N.R., Vimpanl G,V., Robertson E.F., and Roberts R.J., 1988, Port Pirie Cohort Study: Environmental Exposure to Lead and Children', Abilities at tbe Age of Four Yea"" New England Journal of Medicine, 319, pp. 468 - 475
McMichael A.J., Vimpani G,V., Roberlson E.F., Ba&hurst P.A., and CllIrk P.D., 1986. The Port Pirie Cohort Study: Maternal Blood Lead and Pregnancy Outcome, Journal of Epidemiology alld Commullity Health, 40, pp. 18 - 25
351
- - - ---_._.

MeRobere. R. E., Nelson M. D. and · Wendl D. G., 2002, SlnItified Estimation of Forest Area Using Satellite Imagery, Im'entory Data, and the k·Nearest Neighbon< Technique, Remole Sensing 0/ Ii .. Environmenl, 82 (2·3) pp. 457-468
Mehdi R, Analan M.H. and Kazmi J.H .. 200 I, Assessment of Land Cover Cluster of Metropolitan Karachi though Remote Sensing Techniques, in: proceedings r International civil engineering Congress, hutitution of Enginl."Cr.l Pakistan, Karachi
Mchdl R, Arsalan M.H., and Kazmi J.H., 2002, Spotting Noise Risk Zone in Karachi , Pakistm, in: pr~edings, Govemance and Ihe Use o/G!S in DevelopingCounlries, lTC, the Netherland, May, pp. 23·1 to 23 -6
Mehmud, 5., 1988, Space Technology and Its Relevance to Man, in: Anlnlorduclion 10 SUPARCO, 2'" Ed, Dawn Printers, Karachi, pp. 52
Md,ta S.R, Niyogi M., Kaslhuri A.S., Dub.1 U., Bindr. S., Prasad D., Lalliri A.K., 2001. Carbon Monoxide Poisoning, J.-lssoc Physicians Ind;a, 49, pp. 622-5
M<s .• ineo T.D. and Adams W.C. , 1990, Ozone Inhalation Effects in Female. Varying Widely in Lung Size: Comparison with Mal.,. Journal of App!ied Physiology, 69, pp. 96 - 103
Mey« M. P., and Werth L.F., 1990, Satellite Data': Management Panacea or Potential Problem? Journal 0/ Foreslry, 88(9), pp. 10 - [3
Meyer P., Uten K.l., KcUenberger T., Sandmeier S., and Scanmcicr, 1993, Radiometric Corrections. of Topographi""lly Induced Ellccts on Landsat 1M Data in an Alpine Environment, !SPRS JOJlrnl of PhologrwlI1l11 .. "ry and Remote Sensing, 48(4), pp. 17 -28 T
Meycrlnl<, H., 1983 , Karachi's Grov,1h in the Historical Perspccth'C, in: Be/ween Basli Dwellers and Bureaucrats, Pergamon Press, Karachi .
MIC, 1999. Map!nfo Professional: User 's Guide Version 5.5, Maplnfo Corporation, New York, USA
Miluno V.A., 1980, .4 Review and Evaluation ofA.lternatives for Updalirlg us Geological Survey Landuse alld Land cover Maps . US Geological Survey circular 826
Miles J ., 1998, An Annolaled Exanlple of Faclor Analysis. Using SPSS, http://www.hc; .derby.ac.uk/psycholollY/agdaefa.htm. 03/19/1998, 06:06 PM (GMl)
Miller J. D. and Yool S. R., 2002, Mapping Forest Post·Fire Canopy Consumption in Several Overstory Type; U,ing Multi·Temporal Landsat TM and ETMData, Remole Sensing oflhe Enviranment, 82 (2·3), pp. 481 ·496
Miller, G. T. Jr., 1999, Living;rI the Environmenl: Principles, Connections and SoluOotu, 11th Edition, Thomson Leaming, US
Minch R,P' I and Sanders G.L., 1986, Computerized Information System" Supporting Multicriteria Decision Making, Decision &ience, 17(3), pp. 395 - 4[3
Ministry of [n"ironment, Republic of Korea, 1990, Environment Statistical Yearbooks 1990, Ministry of El'll1rorunenl, Kwacheon. Republic of Korea
Ministry of En"ironment, Republic of Korea, 1995, Environment SIaJis/ical Yearbooks 1995, Ministry of Environment, Kwacheon, Republic 9fKorea .
MOMcnin V., 1987, Airway Response< to Nitrogen Dioxide in Asthmatic subjects, JOlmlal of Toxicology and Envirol/lllelllol Heallh, 22, pp. 371·380
Moller L., and Kristensen T.S .. t 992. Blood Lead as a Cardiovascular Risk Factor., American Journal of Epidemiology. [36, pp. 1091 - 1100
352

MontzllK S.A., Myers Re., BUller J.H., And Elkin. J.W., 1993,G1obal Tropospheric Distribution and Calibrution Scale of HCFC-22, Geophysical Research Leiters, 20. pp. 703 -706
Moon G., Gould M., and colleagues. 2000, Epidemiology: An Inlroduc/;on. Open University Pre~s.
Philadelphi •• US, pp. 37 - 39
Moore T.R., and Knowles R ., 1987, Methane 'and Carbon Dioxide Evolution from Subarctic FI!11S, Canadian Journal of Soil Science. 67. pp. 77 - 81
Morgan RE., GArA.an R, Smith E.G., Dri,coU L.L., Levitsky D.A., Strupp B.J., 2002. Early Lead EXPOSlUC Produces Lasting Changes in Sustaincd .Attention. R(sponse Initiation, and Reactivity to Errors, .veuroloxicology Teralology, 23(6), pp. 519-31
Morrow P. E. and Utell M. J., 1989, Responses of Susceplible SlIbpoplllalions 10 Nilrogen DiOXide, Research Report, Health Effects Institute; 23, pp. 1 - 44
Morrow P. W ., 1984, Toxicological data on NOx an Ovef\;cw, Journal o/Toxicology and Env;ronme1llal Heallh. 13. pp. 25 - 227
Mortada W.I., Sobh M.A., EI-Defrawy M.M., FarahaC S.E., 2001. Study of Lead Exposuse trom Automobile Exhaust as a Risk for Nephrotoxicity among Traffic Policemen. Americal Journal of .Vephrology. 21(4), pp. 274-9
Mortimer K.M., Tager I.B., Docl<ery D.W., Nea, L.M., Redline S., 2000, The EfTect of Ozone on InnerCity Children with Asthma : Identification of Susceptible Subgroups, American JounJaJ oj Respiratory and Crilical Car. Medicine, 162(5). pp. 1838-45
Molterlini R, Clark J.E., ForesCi R., SaraChchandra P., Mann B.E., Green C.J., 2002, Carbon Monoxjde~Releasing Molecules: Characterization of Biochemical and Vascular Activities, Circulation Reswrch. 90(2), pp. E17-24
Muusset-Jones P. (ed.), 1980, Geoslalislies, McGraw Hill, London
MS EncHrla. 2002, Micro<oft Encacta Reference Library 2003, USA
Mughal F. H. 1998, Vehicles Main SOllrce of Air Pollution in Karachi, daily Dawn, December 02, Karachi
Mukherjee P., and Viswanathan S., 2001, Carbon Monoxide Modeling from Transportation Sources, Chell/osph"e. 45(6-7). 1071-83
MuramoCo S., Maitani T., Aoyama I., 2001, Distribution Charncterislics of Acid·Dissolvcd Trace Met<.lls of Su<pended Particulate MaUer (SPM) in Kurashiki, Japan, Journal of Envlromnenlal &ience and Heallh. Parl.-:l, Toxic/Hazardous Substallce.! & Environmen.lal Engineering, 36(5), pp. 611·88
MurrHY C. J. L., and Lopez A. D .• 1996, Tire Global Burden of Disea ... .4 Comprehensive AsseSSlnml of .Horlality and Disobility frolll Diseases. Injuries. and Risk FaCiors in 1990 and Projecled 10 2020, Harvard S<huol of Public Health. Harvard University Press.
Muziu L. J., ant! Kramlich J. C, 1988, An Artefact in the Measurement of N10, from Combustion Sources, Geophysical Research Ldlers, 15(12). pp. 1369 - 1372
Myrdal G, 1967, Econolllic Theory and Underdeveloped Regi01l5, Duckworth, London
NHdal(H,'ul(aren A., 1990, '\1nn and Environment: A Health Perspective, Third Edition, Waveland Prclis, Inc .. Ulinoii" USA
Naeher L.P., Leaderer B.P., Smith K.R., 2000, Particulate Malter and Carbon Monoxide in Highland Guatel1"U11a: Indoor and Outdoor LeVels from Traditiona! and Improved Wood Stovt!S and Gas Stoves, Jndoor Air. 10(3). pp. 200-5
353

Nairn P, 1995, Vehicular Lead Pollution: Fatal Consumption, Pakistan Times, November 16, Lahore
Nairn P., 1996, NEQS' Compliance: Practical Steps for a Cleaner Environment, daily Dawn, June OS, Karachi
Nairn P., 1998,In Search of Happiness, The News, November 23, Karachi
NAS, 1972. Lead: Airborne Lead in Perspective. Committee on biological effects of atmospheric pollutants. National Academy of Sciences, Washington DC
NAS, 1977, Nitrogen Oxides, Comminee on Medical and Biological Effects of Environmental Pollutants, National Academy of Sciences, Washington DC US
Nasir A., and Raouf A., 1995, Remote Sensing for Coastal Resources and Marine Pollution, in: proceedings, The Second ASia-Pacific Conference on .Uulii/a/eral Cooperation in Space Technology and Applications, pp. 204 - 207
Naveed R, 2000, Pakistan Importing Dirtiest of the Dirty Petroleum, Pakistan Times, July 20, Lahore
Ne •• L. M., Dockery D. W., Ware J. H., Spengler J. D., Speizer F. E. and Ferrie. B. G. Jr., 1991, Association of Indoor Nitrogen Dioxide with Respiratory Symptoms and Pulmonary FWlction in Children, American Jo,m,al oj Epidemiology, 134, pp. 204 - 219
Nea.!i L.M., Duel"cl'Y D.W., Koutrki.!i· P., ToUcrud D.J. and Speizer F.E., 1995, The Association of Ambient Air Pollution with Twice Daily Peak Expiratory Flow Rate Measurements in Children, American Journal oj Epidemiology, 141, pp. III - 122
Nease L.M., Dockery D.W., Spengler J.D., Spener F.E., and Tollerud D,J., 1992, The Association of Ambi~nt Air Pollution with Twice Daily Peak Expiratory Flow Measurements in Children, American Review o/Respiratory Disease, 145, pp. A429
Needleman H. L. and Gastsom.. C.A., 1990, Low Level Lead Exposure and the I.Q. of Children, A Meta Analysis of Modem Studies, Journal oJAlllerican Medical Association, 263, pp. 673 - 678
Needleman H.L., 1989, The persistent threat of lead: A Singular Opportunity, American Journal oj Public Health, 75, pp. 643 - 645
Needleman H.L., Gunnoe C., Leviton A., Reed R., Peresie H., Maher C., and BarreH P., 1979, Deficits in Psychological and Class.room Peiformance of Children with Elevated. Dentin~ Lead Levels, New England .foumal oj Medicine, 300, pp. 689 - 695
Needleman H.L., Schell A., Bellinger D., Levition A. and Allred E.N., 1992, The Long Tcnn Effects of ExposufO to Low Doses of Lead in Childhood. An II-Vear Follow up R<port, New England Journal oj Medicine, 322, pp. 83-88
Neue H.H., and Scharpenseel H. W., 1984, Gaseous Products of Eecompostion of Organic Maller in Submerged Soils, Int. Rice Res. Inst., Organic Matter and Rice, Los Banos, Philippines, pp. 311 - 328
Neulurch F., Segala c., Le Moullec Y., Korobi.eff M., Aubier M., 1998, Short-Tenn Effects of Low· Level Winter Pollution on Respiratory Health of Asthmatic Adults, Archives oj Errvironlllental Healtlr, 53(5), pp. 320-8
New Zealand Ministry for the Em'lronment, 1997, The State oj New Zealand's Environment J997, GP Publications, Wellington, New Zealand
Newell R.E., Reichle H.G., and Seiler W., 1989. Carbon Monoxide and the Burning Earth, Scientific American, October, pp. 82 - 88 .
354

Ng S.L., Lam K.e.. 2001, Respiratory Suspended Particulate (RSP) Concentration and Its Implication. to Roadside Workers: A Case Study of Hong Kong, Environmen tal Moni toring and Assessmen t, 72(3). pp. 235-47
Nicholls J.e., 2001. Carbon Monoxide: The Elusive Environmental Toxicant, Medical Hypotheses, 57(5), pp. 591-2
Nielsen A A., Conrad!len K., and Simpson J. J" 1998, Multivariate Alteration Detection (lv1.AD) and MAF Postprocessing in Multispectral, Bitemporal Image Data : New Approaches to Change Detection Studio., Remote Sensing of the Environment. 64 (I), pp. 1-19
Niemi A., 1975. Ecolo\!y of Phytoplankton in the Tvarmille Area, SW Coo,t of Finland .• II Primary production and environmental conditions in the Archipelago and the Sea zone. Acta Bolanica Fennica. 105, pp. 73
Novak, K. H. and Dennis, R. L., 1993, Regional Air Quality and Acid Deposition Modeling and the Role lor Vi.ualization, in: Goodchild, M.F., Parks. 8.0 and Steyaer1. L.T (eds.) Environmental Modelillg with GIS. pp. 142-6, New York: Oxford University Press
Novelli P. c., Sfeele L. P. and Tans P. P., 1992, Mixing Ratios of Carbon Monoxide in the Troposphere. Journal of Geophysical Research, 97, pp. 20731 - 20750
No\\',.,k D., Heinrlc:h J., Jorre~ R., Wassmer G., Berger J., Beck E., Boczor S., Claussen M., Wichmarm H.E., Magnwsen H., 19%, Prevalence of Respiratory Symptoms, Bronchial Hypcrresponsiveness and Atopy among Adults: West and East Germany, European RespirotoryJournal, 9( 12), pp. 2541-52
NSIEM, 1983, Health Risks Resulti"g from Exposure to IU%r Vehicle Exhaust. A report to the Swedish Government, CommWee on Automotive Air Pollution. National Swedish Institute of Environmental Medicine. Stockholm
Nyerges, T.L.. 1992, Coupling GIS and Spatial Analytical Models. in: proceedings, 5th International Symposium of Spalial Data Handling, Charleston. Sputh Carolina. 2. p. 534-543.
OECD, 1984, Air-home Sulphur Pollution, Air Pollutioll Study No. I., Economic Corrunission for Europe (OECD). United Nations, New York. US
OIGlmuto Y., Kawai M., 1984, An Association between Increased Porphyrin Precursors lmd Onsd of Abdominal Symptom. in Lead Poisoning. Toxicology Letters, 21 (2), pp. 219-23
Olendrz)nsld K, 1997, Emissions. In Transboundary Air Pollution in Europe, in: Berge E. (cd.). MSC-W S,alll.'i Report 1997, Norwegi.m Meteorological Institute. Oslo, Norway
Oliveira R., Ribeiro da Costa J., 2000, An Environmental Intormation System Linking Time Series with GIS. in: proceedings, 2000 £SRI User Conference, http ://gi~ . esrj .comflibrary/usercontlprocOO/professionaVoapcrsIPAP851/p851 . htm
Oli"i L., Cascio S., Wang S., Bressler J .• 2002, Mobilization ofIntracelluhu Calcium in Kidn~y Epithelial Cells i< Inhibited b)' Lead, Toxicology, I 76(1-2). pp. 1- 9
Oracle. 1995, Multi-dimension. ORACLE Working Paper
Orakzai M. Y., 1998. Air poIlution 8incro:asing eye ailments, The Muslim, FebrUltry 12,
Ormeling, F. J., \989, Environmental Mapping in Tntnsition. in: proceedings, Seminar TeacMng Cartography for Em'ironmental In/onnation Management. Ensch~de, pp. 11-26
Ormstall H., Johansen B,V'I Gaarder P.l, 1998, Airborne House Dust Particles and Diesel Exhl:HIsl Particles as Allo:rgen Carriers. Clinical and Experimental Allergy. 28(6). pp. 702-8
Osfro B.D .• 1989, E'timaling the Risk of Smoking, Air Polklution and Passive Smoke on Acute Re;piratol), Conditions. Risk Analysis, 9, pp. 189 -. 191
355
- - - - ---- - - - - -

O.'ro B.D, 1990, Transferring Air Pollution Health Effects Across European Bord.,,: Issues of Mca.surement and Efficiency. in; proc.ee<iings.lnlemaJional Conference on EnvironmenlalCo-operalian aud Policy in the Single European .\larke!} Venice, Italy
O.lro B,D., Lip,ell M.J., Mann J.K., Br .. xton-Oweno H., "fill White M.e., 1995, Air Pullul;on and Asthma Exacerbations among African-American Children in Los Angelis, in/wlallon Toxicology, 7, PI'. 711 -722
Padm."obhamurty B. and Hit! M. S., 1974, The Toronto Heat Island and Pollution Distribution, Water, ,111' and Soil Poliu., 3, pp. 81 - 89
Paige R.C., Wong V., Ploppn C.G., 2000, Long-Term Exposure 10 Ozone IMroases Acute Pulmonary Contriacinar Injury by I-Nilronaphlhalenc: n. QlUlntilAtive Histopllthology, Jo"",o/ 0/ PIII1I11/acology and E'q""imemal Therapeutics, 295(3), pp. 942-50
Pand. J.N" Bholl. N., B.,wIU D., Pandey 1tM., Ahluwalia G., Siddanmaiah N.H., KlriInani G.c., 2002, Outdoor Air Pollution and Emergency Room Visits at a Hospital in Delhi, Indian JOllmal 0/ Chesl Diseases Allied Sci,nces, 44(1), 13·9.
Pap.tbomas, T. J., Schiavon. J, A., and Jul ... B, 1988, Applications of Computer ('''''phies to the Visualization of Metoo,ological Data, Computer Graphics. 22(4). 1'1'.327-334
Pape H., 1980. Planning Restriction Area Maps in Town Pfanning, Nachrichlen aus clem Karlen lind Vermessungswt!sen. H(38). pp" 61 - 67
P.rl,er A (ed.), 1978.111duslrial Air Pol/Illion Handbook. McCrraw·HiII Book Company I.td., London, UK
Parl". B.O., 1993, The Need for ,lnlegration, in: Goodchild M. F., PllIks B. B. 0., 8toy.ert L. T. (eds.). Environmental Modeling wilh GIS. New York: Oxford Un;"""ity Press, 199), 31·34
P.rther M.J .• 1994, Lifetimes and Eignstates in Atmospheric Chemistry, Geophysical Researell Lellers. 21. P!'- 801 - 804
Pa.hel, G. E. and Egner, D. R., 1981. A Comparison of Ambient Suspended Particulate MaUer Concentrations as Mcasun:d by the Brilish Smoke Sampler and the High Volume Sampler at 16 siles in the United States, Atmospheric EnVironment, 15, pp. 919 - 27
PCI G •• malic., 2000. Using PC! Software, Vol •. [and 1I, Riclunond Hill, ON
PCI e.om.tlcs, 2002, e,ing PCI So/tware. Vois. I and 1I, Richmond Hill, ON
Pcnl .. 11 8.A., 1982, Non-Melhane Organic. in the Remore Troposphere. in: Goldberg E. D. (cd.). Ahllospheric Chemistry, Dahlem publicatiollS, Springer Verlag, Berlin, pp. 329 - 355
Pe"I,.1I S-A., JOlies B. t>lR., Rycroft M.J., and Simmons D.A., 1985, An Interhemispheric Comparison "r the Concentration of Bromine Compounds in the Almosphere. No/ure. 318, pp, 550 - 553
Pereira, J.M.c., and Duck/ein L., 1993, A Multiple Criteria Decision·Making Approach to GlS·Based Land Suitability Evaluation, Infemational JOII",a/ a/GIS. 7(5). pp. 4Q7 - 424
Perry G.B., Ch.i H., Dickey D. W., Janes R.H., Kinsmon itA., Morrill ce., Spec/or S-L., Weiser P.e.. 1983, EIl""ts of Particulate Air Pollution on Asthmatics, American JOII",ol 0/ Public Heaill,. 73( I). Pl'. 50 -6
Pelers A., Dockery D.W., Heinrich J., Wi.lun""" RE., 1997. Short·Term Effects of Particul.te Air Poliution on Respir.tory Morbidity in Asthmatic Children, European RespiraloryJoumal, 10(4), pp. 872·9
Pders A., Do.k.~· D.W., Heinrich J" Wicluna"" 1997. Short·Tem, Effects of Punlculutc Air 1'"lIurlo" on R •• piratol')' Morbidity in Asthmatic Children, European R~5pjro.loryJo/irnal. 10(4). pp. S72-~
356

Pcter3 A., Pen S., Doring A., Stieber J., Koenig W., Wichmann H.E., 1999, Increases in Heart Rate during an Air Pollution Episode. American Journal a/Epidemiology, pp. 150(10), pp. 1094-8
Pete" A., Tuch T., Heinrich J., Heyder J. and Wichmann H.E., 1995, Short-Tenn EfTects of PM I' Fin. and Ultra-Fine Particles, on Lung Function and Symptom." Epidemiology, 6(4), pp. S64
Petit T .L., and Alfano D.P., 1979, Differential Eexporicnce Following Developmental Lead Expcsure: EfTects on Brain and Behavior, Phannacology Biochemistry and Behaviour, II (2), pp. 165-71
Petroesche\'Sky A" Simpson R.W., Thallb L., RutherCord S., 2001, Associations between Outdoor Air Pollution and Hospital Admissions in Brisbane, Australia,Archives 0/ Environmental Health, 56(1):37-52.
Piantadosi C.A ., 2002, Biological Chemistry of Carbon Monoxide, Antioxid Redox Signal, 4(2), pp. 259-70
Plerotd D., and Rasmuuen R.A., 1976, Combustion as a Source of Nitrous Oxide in the Almosph~, Geophysical Research Letters, 3, pp. 265 - 267
Pit"'art H., Bobak M., Goryn.ki P., Wojtyniak B., DMov. J., CeUto M.A., Kriz B., Briggs D., Elliott P., 200 I, Outdoor Sulphur Dioxide and Respirntory Symptoms in Czech and Polish School Children: A Small-Arca Study (SAVIAH). Small-Asea Variation in Air Pollution and Health, International Archives 0/ Occupational Environmental Health. 74(8), PP. 574-8.
Pipe J. (ed.), 1995, Focus on Air, Aladdin Books .Ltd., Shooting Star Press Inc., NY, USA
Pirltle J.L., Schwartz J., Landis J.R., and Harlan W.R , 1985. The Relationship between Blood Leild Le\"ds and Blood Pressure and It.s Cardiovascular Risk Implications, American Journal 0/ Epidemiology. l21, pp. 246 - 258
Pithawalla M. B, Kaye, P. M., Wadia D. N., 1946, Geology and Geography 0/ Karachi and Its Neighborhood, Daily Gazette Press, Karachi pp. 18-30
Pocock S.J., Shaper A.G., Ashaby D., Delve. flT. and Clayton B.E., 1988, TheRelationship bet",,,,,n Blood Lead. Blood Pressure, Stroke, and Heart Attacks in Middle Aged British Men, Environmental Health Perspective, 78. pp. 23 - 30 .
Pol.t D., Eben\'ein G., Becker A., Weishaupt c., Schin. RP., Ranft U., Borm P.J ., 2002, Ambient Espcsure and Nasal Inflammation in Adults and Children: A Preliminary Analysis, Intemational Joumal 0/ Hygine and Environlllental Healtb, 205(3), pp. 229-34 .
Pope C. A., Bate. D. V. and Raizenne M. E., 1995, Health EfT«ts of Particulate Air Pollulion: Time for Reassessment? Environmental Health Perspective, 103. pp. 472 - 480
Pope C.A., and Dockery D.W., 1992, Acute Health E!l'ects of PM" Pollulion on Symptomatic and Asymptomttlic Children, American Review o/Respiratory Disease, 145, pp. 112., - 1128
Pope C.A., Dock.~· D.W., Spengler HJ.D. and Raizenne M.E., 1991, Respiratory Health and PM" Pollution: A Daily Time Series Analysis.Allleric,,,, Review a/Respiratory Disease, 144, pp. 668 - 674
Prakash A., Sast~· RG.S., Gupta RP. and Sara! A.K, 1995, Eslimating The Depth of Buried Hot Feature From Themal I.R. Remote Sensing data, A conceptual approach .• International Journal 0/ Remote Sensing. 16, pp. 2503 - 2510
Prather M., Dennn. R, Ehhalt D., Fraser P., Sanhue7A E. and lJ10u X., 1995. Other Trace Oases and Atmosph<ric Chemisuy. in: Houghton J T. et al. (eds.), Clilllate Change 1994: Radiative ForCing o/Clilllat. Change and An Evalflation o/the IPCC IS92 Emission ScenariOS, Cambridge Uni\'ersity Press, UK, pp. 76-126
357
- - - - ----

PRB, 200 I, World Dafa Sheel of flte Population Reference Burell, Demographic Dafa and Esfimales lor COlilllries alld Regions a/lhe World, Population Reference Bmeu, Washington, USA
Putman Lie,. W., V.orh."t W,F" van S,... 1., v." Golde L.M., HlUIgsma ... RP., 1997, Short-Term Ozone Exposure Affects the Surface Activity of Pulmonary Surf.ctant, Toxicology and Applied Pharmacology, 142(2), pp. 288-%
QJ." z., Zbang Wei r., Wilson W.E., Ch'pma ... R.S., 2001. Long-Term Ambient Air Pollution Levels In Four Chine« Cities: Inler-City and Intra-City Concentnltion Gr.dients for Epidemiological Sludies., Journal of Exposure Analysis and Ellvironmental Epidemiology. 11(5). pp. 34 I ··51
Q".ilrochi D. A., .... d Ridd H. K, 1994, Measurement and Analysis of Thennal Responses from Diere!. Urban Surface' Using Remote Sensing Data,lmemalional Journal o/Remole SeJ1S"1g, 15, pp. 1991 - 2022
Quallrochi, D. A., and Lu~.11 J. c., 1~99, As:IC"ing the of Atlanta'. Grovv1h on Meteorology and Air Qualiiy Using Remote and GIS, ato 111/0 Syslem. pp. 27 - 33
Qureshi N .• 1997, Atmospheric Pollution in Karachi 40 PerCl,'llt Higher than other June 07, Karachi
Frontier Post.
Qureshi O. R., 1996, Major threat to health, open air trash burning releasing large amount of toxic ga •• s, Daily Dawn • .Iune 22, Lahore
Qureshi D.R., 1997, Atmospheric Pollution in Klillldu 40 Percent Higher than Other June 07, Karachi
Frontier Post,
Qureshi S .• 2000. Earth Day: Dirty Fucl U"" Poses Threats \0 En\'rronment, Earth, Frontier Posl, April Karachi
Rabi.nowitl; M. B., Kopple J. D, and Wetherill G. W., 1980, fIT""t of Food Intake and Fasting on Guslrointestinal laRd Ab.sorption in American Joumal o/Clinlcol Nllirillan, 33, pp. 1784 - 1788
Ralunne M., Burnet! R. T., Stem B., Fnonklin C.A. a ... d Spengler J.D., 1989, Acute Lung Function Response to Ambic'l1t Acid Aerosol Exposuru in Children, Environ",."lol Heallh Perspectives, 79, pp. 179-185
Ramsey E, W., Nelson G.A., Sapkola Seeger E.B., .nd Marlellll KD., 2002, Mapping Chines. Tallow with Color-Int'ared Photography, PllOlograJIIlllelric Engineering & Remole Sensing, 68, Pl'. 251 256
Rango A .. 2000, Morphologi,,"1 Charnctenstie. of Shrub Coppice Dunes in Desert Grasslands of Southern New Mexico derived from Scanning LlDAR, Remole Sensing o/Ihe Environmenl. 74 (I J, Pl'. 2644
Rungoon",.I" A. ami Ahmed S., 1991. The U$tl of Satellite Remote Sellsing Data for Ideoti!'.·ing Residential Units for Change Dete<::t(on in Karachi. in: proceedings, Remole Sensing for Landuse and Environmental :,)udies, Karachi
Rang.onw"l. A., and Ahmed S. 1995., illtegratoo Use of Optical and Rudar Senso,", for Resource Development, in: proceedings, The Second Ajia~Pacific Conference on Mullila/eral Cooperation in Space rechnology and AppilcallOns, Pl'. 300 - )07
Rangoonwala A" and Ahmed S., 1995b, Urban gro,,;h Monitoring and De\'elopmOll' PI.nning U,ing Remote Sensing and OIS Technologies, in pr~ings, Tire Second ilsla-Paciflc Conference an Mlliliialeral CooperaUo" III Space Technology and Applicallons, Pl'. 326 - 329
Raper, J.& Lh'ing,lone, D., 1995, Develcpo_t of. Geomorphological Spatial Mode! Using ObjL'CtOriented Design, IlIIemalionaiJollrnal o/GlS, 9(4), pp. 359-383
358

Rashid H. 1996, High Ozone Level in Karachi, Lahore Leading to Respiratory Diseases, The News, August 26, Karachi
Rasmussen R.A., and Khalil M.A.K, 1983, Global Production of Mclhane by Termites, Nature, 301, pp 700 - 702
Rasmussen R.A., and Khalil M.A.K., 1988, Isoprene Over the Amazon Basin, Journal of Geophysical Research, 93, pp. 1417 - 1421
Raub J.A., Mathieu-Nolf M., Hampson N.B., Thom S.R., 2000, Carbon Monoxide Poisoning: A Public Health Per.;pcctive, Toxicolngy, 145(1), pp. 1-14
Ra,·indr., Mittal A.K, Van Grieken R., 2001, Health Risk Assessment of Urban Suspended Particulate Matter with Special R~f~r~nce to Polycyclic Aromat ic Hydrocarbons: A Review, Review on Environmental Healtil, 16(3), pp. 169·89
Rehman S., 1983, Population Densities within Karachi City, M. Phil thesis, University of Karachi . Pakistan
Ridley H-M., Atkison P.M., Aplin P., Muller J . P., and Downman I., 1997, Evaluating the Potential of Forthcoming Commercial U.S. High-Resolution Satellite Sensor Imagery at the Ordnance Survey, PI1ofogrammelric Eugineering & Remote Sensing. 63, pp. 997~l005
Rubinsun A.H., 1990, Elements afCartography, 5'" Edition, Wiley, John & Sons, NY. USA
Roemer W., Hoeck G. and Brunekre<f B., 1993, EfTects of Ambient Winter Air Pollution on Respiratory Hl!ahh of Children with Chronic RC$pirutory Symptom., American Review of Respiratory Disease. 147, pp. 118 - 124
Rog.n J., Frankiin J. and Roberls D. A .• 2002, A Comparison of Methods for Monitoring Multitemporal Vegetation Change Using Thematic Mapper Imagery, Remote Sensing of the Environment. 80 (1). pp. 143-156
Roger L. J" Horstman D. H., McDonnell W., Kehrl H., Ives P. J., Seal E., Chapman R., and Massaro E. J., 1990, Pulmonary Function. Airway Responsh'eness, and Respiratory Symptoms tn Asthmatics Following Exercise in NO,. Toxicology and InduS/rial Health , 6. pp. 155 - 171
Rogers J.F., Thompson S.J., Addy C.L., McKeown R.E., Cowen D.J., DecouOe P., 2000, Association of Very Low Sinh Weight with Exposures to Environmental Sulphur Dioxide and Total SuspL'l1ded Panicul"tes. Americal Jaurnal of Epidelliiology, 151(6). pp. 602-13
Rogerson P. A .• 2001. Statistical Methodsfor Geography, SAGE Publications, London. UK
Rohn R.D., Shelton J.E., RJ1d Hill J.R.. 1982, Somatomedin Activity before and after Chelation Therapy in l.c<Id Intoxicated Children. Archives of Environmental Health, 37, pp. 369 - 373
Rumi.u r., and BorJa-Aburto V.H., 1997, Pasticulate Air Pollution and Doil)' Mortality: can.Resuits be Generalized 10 Lotin American Countries? Salud PI/blica de ."-fexic. 39(5). pp. 403 - 411
Romieu I., Cortes Lugo M., Ruiz-Velasco S., Sanchez s., Meneses F. and Hernandez M., 1992, Air Pollution and School Absenteeism among Children in Mexico City, American JOl/mal of Epidemiology, 136. pp. 1524 - 1531
Romieu 1" Meneses F., Ruiz-Velasco S., Sienra-Monge J.J., Huerta J., White M.C., and Etzel R.A ., 1996. EII'ects of Air Pollution ou the Respiratory Health of Asthmatic Children Living in Mexico City, Am . ./. Respir. Crit. Care .lIed .• 154, pp. 300 307
Romieu I., Meneses F., Sienra-Moge J.J., Huerta J., Ruiz-Velasco S., White M.c., Etzel R.A., and Hernandez M .• 1995. EfTect:< of Urban Air Pollutant:< on Emergency Visits lor Childhood Asthma in Mexico Cit)', American JOl/rnal of Epidemiology. 141, pp. 546 - 553
Rumil:u I., Weittc:nfeld H. and Finkelman J ., 1990, Urban air Pollution in Latin America and the Caribbean: Health Perspectives, World Health Statistics Quarterly, 43, pp. 153 - 167
359

Roosli M., Bnoun-Fahrlander c., Kumli N., Ogl .. by L., Theis G., Camel12ind M., Malhys P., Siaehelin J., 2000. Spatial Variability of DilTerent Fractions of Particulate Matter within an Urban Environment and between Urban and Rural Sites,J Air Waste Manag Assoc. , 50(7), pp. 1115-24
Rosa L. P., Tolmasquim M. T, La Rovere, E. Legey L. F., MJguez J ., Schaeffer R., 1996. Carbon Dioxide (md MelhwJt Em;.s.r/ons: A Developing Country Per.rpec/ive, COPPElUFRJ, Rio de Janeiro, Brazil
ROlhermel, J., Cullen D.R., Hardesty R .M., HoweD J.N., Mel12le. R. T., Trail D.M., and Johnson S.c.. 1997. Application of Airborne Doppler Lascr Radar to Hurricane Research, in: proceedings. r' ConJerence on Hurricanes and Tropicol .Ueteorology. American Meteorological Society, pp. :57-58
ROily R.N., ond Marlond G .• 1986, Production oJC02JrolII Fossil Fuds Burring by Fu<i Type. 1860-1982. Report NDP 006, Carbon Dioxide Infonnation centre, Oak Ridge National Laboratory USA
Rowlond A., Murray A.J.S. ond Wellbum A. R. , 1985, Oxides of Nitrogen and TIteir Impact upon Vcgetation, Reviews oj Environmental Health , 5(4), pp. 295 - 342
Soenger P., Markowitz M.E. and Rosen J. F .• 1984, Depressed Excretion of 6B-Hyruo''Ycortisol in LeadToxic Child"", .• Joumal oJChin"e Endocrinology and Metabolism. 58. pp. 363 - 367
S"ilani. c.J., Riga-Karandinos A.N., Karandinos M.G .• 2001 . EIli:cts of Ozone on Chlorophyll and Quantum Yield ofTobacco Varieties, Ch~mosphere, 42(8), pp. 945-53
Saldh'a P.H., Lichtenfels A.J., Pah'a P.S., Barone I.A., Martins M.A., Mauad E., Pereira J.e., Xa\'icr V.P., Singer J.M., Bohm G.M., 1994, Association belwt:Cn Air Pollution and Morlality Due to Respiratory Diseases in Children in Sao Paulo, Brazil: A Pn:lirninary Rc:port, Environmental Research,65(2), pp.218-25
Samet J. M., ond Ulell M. J ., 1990. The Risk of Nitrogen Dioxide: Whot hove we Learned trolll Epidemiological and Clinical Studies, Toxicology and Industrial Health, 26, pp. 247 - 262
Samel J. M., Lamberl W. E., Skipper ·B. J., Cushing A. H., Hunl W. c., Young S. A., McLaren L. C., Schwab M., amI Spengler J. D., 1993, Nitrogen Dioxide and Respiratory Illness in Infants, American Review oJRespiratory Disease , 148. pp 1258 - 1265
Samel J.M-, Speiler F.E., Bishop Y., Spengler J.D., and Ferris B.G.Jr .• 1981. The Relationship b<lwL't:n Air Pollution and Emergency Room Visits in an Industrial Community, Journal oI/he Ai, Pol/II/ion Control Association. 31 , pp. 236 - 240
Sanchez-FruCNOSO A.I., Canu M., Arroyo M., Fernandez C., Prats D., Barrientos A., 2002, Lead Mobilization During Calcium Disodiwn Ethylencdiaminetctraacetate Chelation Therapy in Treatment of Chronic Lead Poisoning, American Journal oj Kidney Diseases, 40(1), pp. 51-8
Sartor F., Snacken R., Demuth C., Walclden D., J 995, Tt:mperature, Ambient Ozone Le\'els, and Mortality During Summer 1994, in Belgium. Environmental Research, 70(2). pp. 105-13
Scharle M., Bo"" H.G., Van Aken H., Meyer J ., 2000. Increased Carbon Monoxide in Exhaled Air of Critically III Patients. Biochemical and Biophysical Re.rearch Communications, 267(1). pp. 423-6
Scholegle E.S., Sielkln A.D. and MeDonald R.J., 1991. Time Course of Ozone-Induced Neutrophilia in Nomlal Humani, American Revie .... a/Respiralory Diseasr, 143, pp. 1353 - 1358
Schimd D.S. and Sulzman E. W., 1994. Variability in the Earth Climate System: Decadal and Longer Timescale'S. in: Nelson S.P. (ed.), The U. S. National Report (1991 - 1994) to Ih. International Union oj Geophysics and Geodessey, American Geophysical Union. Washington, DC
&hindi<r c., KunzU N., Bongard J.P., Leuenberger P., Karrer W., Rapp R., Monn C., Aek~rm.nnLiebrich u., 2001 , Short-T~rm Variation in Air PoUution and in Avt:rage Lung Function umong Never· Smokef:O:. The Swiss Study on Air Pollution nnd Lung Diseases in Adults . American Journal of RespiraJory and Critical Care Medicine. 163(2), pp. 356-61
360
--_._- -

Schindler D.W., Curti. J.P., Parker B.R. and Slainlon M.P., 1996. Consequences of Climate WaIming and Lake Acidification for UV·B Penetrntion in North American Boreal Lakes. Nahlre. 379, 705-708
Scholz F .• 1983. Urbanization in the Thrid World: Th< C.s< of Pakistan, Applied Geography and Dovelopment. 21. pp. 7 - 34
Schwartz J., 1989, LWlg Function and Chronic E,posure to Air Pollution: A Cross-Sectional Analysis of Nhanes ll. Environmental Research, 50, pp. 309 - 321
Schwartz J., 1994, '.Vhat Sf< People Dying of on High Air Pollution Days?, Envirolllneinal Research. 64, pp. 26 - 35
Schwartz J., and 0"0 D.A .• 1987. Blood load. Hearing Thr<shold, and Neurobch.,'ioral Development in Children and Youth. Arc/,iv" of Environmental HealtJr. 42. pp. 153 - 160
Schwartz J., SlAter D., Larson T.V., Pierson W.E., and Koenig J.Q., 1993. Particulate Air Pollution and Hospiwl Emcrg~ncy Room Visits for Asthma in Seattle., American Review of Respiratory Disease. 147, pp. 826 - 31
Sch .. ela D. and ZaU 0. (eth.), 1999. Urban Traffic Pal/ution, F & FN Spon, London, UK
Schwela D. H., 1996, Exposure to Environrnenwl. Chemicals Relevant for Rt:'spiratory Hypersensitivity: Global ASp<C1S, Toxicology Lellers, 86: pp. 131-142
S~al E. Jr., McDonnel \V.F., House D.K, Salaam S.A., DeWilt P.J., Butler S.O., Green J., and Raggio L., 1993, The Pulrnonsl}' Respon« of While and Black Men and Women to Si, Concentrations of Ozon<, American Review of Respiratory Disease, 147, pp. 804 - 810
Seal E. Jr., McDonneU W.F., Howe D.E., 1996, EII.cls of Age, Socioeconomic Status, and Menstrual Cycl< on Pulmonary Response to Ozone, Archives of Environmental Health, 51(2) pp. 132-7
S.bacher D.I., Harris. R. c., Banlelt KB., Sebacher S.M., and Grice S.S., 1986, Atmosph<ric Methane sources: Alaskan Tundra Bogs, an Alpin< Fro, and a Subarctic Boreal Marsh, Tel/us, 38B, pp. 1 - 10
Seiler W. and Fishman J ., 1981, The Distribution of Carbon Monoxid< and Ozone in the Fro< Troposphere., Jou/1Iol of Geophysical Research, 86, pp. 7255 - 7265
Stiltr W., Conrad R., Rnd Scharffe D., 1984. Field Studies of Methant: Emission from Termite Nests inlO
thl! Atmosphere and Mc:asurcmcnts of Methane Uptake.: by Tropical Soils, Joumol of Ah"osplreric Chomistry. 1. pp. 171 - 186
Seinfeld J. H., 1986. Atmospheric Chemistry and Physics of Air Pollution. John Wiley and Sons. USA
Scltz J. L., 1995, Global Issues: A" Introductian. Blackwell Publishers, Ma .. achusctts, USA
SIUtllZRd F., 2000, Business and Industry in the Pun.iab Pharmaceutical: Pollution Cause o/Asthma, daily DIIWII. May 29, Karachi
Sham. 1.. I., 1997a. Acid Rain Threalto Karachi, Daily Dawn, August 06, Lahore
Sham. 1.. I., 1997b, Lead pollution in Karachi is Serious Health Hazard. daily Dawn. April 16. Karachi
Shcmin R.P., and Richten V., 1990. Centriacinar Region (CAR) Disease in the Lung of Young Adull.,. A Prdiminary Report. ~'hlOuscrlpl from Air and Waste Management A,."soclation M~ting, lO$ Angeles
Shn:slha 5., and I~ngararasan. M" 1998, An Overnt:w cfor Acid Rain Impacts in the Asia and Pacific, In Kuylt:nsit:ma. J., and Hicks, K. (eds.). Regional Ai,. Pollulion ill Deve!0p;'Ig COlmlries, Stockholm EnviroMu:nt lnslitutt:. York, UK
361

Shre.tha R. M. and Malia S., 1996, Air pollution from Energy Use in a Developing Country City: the Case of Katlunandu Valley, Nepal Energy, Ihe InlernalionaiJournal, 21, 9, 785-794
Shukla, S. 1(., Suchandra Ray M.S., 1996, Monitoring Urban Sprawl in Kanpur Metropolis, India, using Multidate Satellite Data, Asian Pacific Remole Sensing Journal, 21, pp. I - 6
Shul"" R., Bom.chein R.L., and Dietrich I(. N., 1987, Effects of Fetal and Early Postnatal Lead Exposure on Child', Growth in Stature. The Cincinnati Lead Study, in: proceedings, Lindberg S.E. and Hutchimon T. c. (eds) , In/emational conference: Heavy Metais in Ihe Environment; New Orleans, LA. CEP Consultants Ltd., Edinburgh, pp. 210 - 221
Shy C.M., 1990, Lead in Petrol: the mistake O/Ihe XXlh cenhlry, World Health Statistics Quarterly, 43, pp. 168 - 176
Siddiqui M. N., 1991, Merging High R""olution SPOT pan data with SPOT XS and Landsat 1M data for Urban and Landuse Applications, Asian Pacific Remole Sensing Journal, 3(2), pp. 12-17
Siddiqui M. N., 1995b, Usc of SRS Technology in Monitoring Deforestation and Land Degradation in Pakistan. in: proceedings, The Second Asia-Pacific Conference on l\fulli/aleral Cooperation in Space Technology and Applicalions, pp. 176 - 184
Siddiqui M., Mirza M.J., Ahmed A., Hahib A., and Jamil z., 1996, Use Of Satellite Remote Sensing Duta For Mapping And Monitoring Temporal Changes In Larkana Distinct, AsilUJ Pacific Remote Sensing Journal. Vol. 8, No 2, January
Siddiqui M.N., 1993, Forest Change Detection in Margala Hills of Pakistan, Advances ill Space Researclr, 13(11), pp. 107 - 110
Siddiqui N. K., 1995a, Satellite Imagery: A Tool of Divcrsified Applications in Exploration I Development of Oil and Gas Fields in Pakistan, in: proceedings, The Second ASia-Pacific Conference on Multilaleral Cooperation in Space Technology and Applications. pp. 294 - 299
Siddiqui Z. A., Ahmad S., Mahar A. W., 1995, Application of Satellite Remote Sensing Dnta to Urban Landuse classification Studies, in Proceedings. The Second Asia~Pacific Conference on ,\,fuili/ateral Cooperalion in Space TechnologyandApplicalions, pp. 318 - 325
Silva R., 1996, Monitoring Of Landuse Changes, Asian Pacific Remole Sensing JOllrnal, H-4, I - 4
Singh A, 1989, Review Article: Digital Change Dcte<:tion To:cbniques Using Remotely-Sensed Data. Inlemaliollol Journal 0/ Remote Sensing, 10, pp. 989-1003
SlAde R., Stead A.G., Graham J.A., Hatch G.E., 1985, Compoarison of Lung Antioxidant Levels in Humans and Labo[lltory Animals, American Review 0/ Respiralory Disease, 131, pp. 742 - 6
Slavccki R.J., 1964, Detection Bnd Location of Su\>surfBce Coal Fires, in : proceedings, r'Symposium 011
Remole Sensing of Env;ronment, Ann Arbor, Michigan: University of Michigan, pp. 537 - 547
Slcmr F., Cunrad R., and Seiler W., 1984, Nitrous Oxide Emissions from Fertilized and Unfertilised Soils in a Subtropical Region (AndBlusia, Spain), Journal o/Almospheric Cllemi .• 'ry, 1, pp . 159 - 169
Smith C. E., Koren H. S., Graham D. g., and John,on D. A., 1993, Mast Cell Tryptasc is Increased ill Nasal and Bronchial Alvt!olar Lavage Fluids of Humans after Ozone Exposure,lnhaiation Toxicology,S, pp. 117-127
Smith M., Delv., T., Lansdown R.N., Clayton B and Graham P., 1983, The elrects of Lead exposure on urban children: The Institute of Child Health Southampton Study, Developments ill Medical Child Neurology, 47, pp. I-54
362

Smilh-Sivert.en T., Bykov V., Melbye ll, Tehaehlehlne V., Seine. A., Lund E., 2001 , Sulphur Dioxide Exposure and Lung Function in a Notwcgiao and Russian Population Living Close to a Nickel Smeller, Intemalional Journal afCircumpolar Health, 60(3) pp. 342·59.
Spalding T .R. , 1974, Satellile Data for Tropical Weather Forecasting, in: Barrett E. C. and Curti. L.F. (cds.), Environmental Remote Sensing Applications and Achievements, Edward Arnold, London, pp. 215 -240
Speizer F. E., Ferris B. Jr., Bishop Y. Mo, and Spengler J .D., 1980, Respiratory disease rates and pulmonary function I children associated with N01 'e>..'posure, American Review of Respira/ory Disease, 121, pp. 3 - \0
Speklor D.M., Lippman M., Lioy P.J" Thunton G.D., CiI.k K., James D.J., Bock N., Spolzcr F.E., and Haye. c., 1988, Effects of Ambient Ozone on Respiratory function in Active Normal Children. , American Review ofRespiralory Disease, 137, pp. 313 - 320
Spengler J.D., Brauer M., and Koutrakis P., 1990, Acid Air and Healtlt. Environmental Science and Technology. 24, pp. 946 - 956
Staneioff A., Slaljons,eru S. and Tappan G., 1986, Mapping and Remole Sensillg of the Resources oflhe Repllblic of Senegal: A Sflldy of Ihe Geology, Hydrology, Vegelalion and Land Uu Polenlial, Remote Sensing Institute, South Dakota State University, Brookings, South Dakota, SDSU-RSI·86'()I
Sh.fe PlalUling Commission, 1997, Chino's Energy Development Report. Economic Management Press, Beijing. China
Sleede-Terry K. , 2000. Inlegraling GIS and Ihe Global Posi/ioning Syslem, ESRl Press, California, USA
Slenberg, B., 1993, Military and Civilian GIS Work in Tandem, GIS Europe, April, pp. 16·\7
Stem A. c., Boubel R. W., Turner D. B. and Fox D. L. , 1984, Fundamenlals of Air Pol/ulion, 2"" Ed., Academic Press, NY, USA
Stem F B., Halperin W. E., Hornung R. W., Ringenburg V. L., and McCammon C. S., 1988, Heart Disf!asC Mortality among Bridge and Tunnel Officers Exposed to Carbon Monoxid~, American Journal of Epidemiology. \28. pp. 1276 - 1288
Stem, A. c., 1977, Air pollulioll, 3" Edition, Academic Press. NY. USA
Sleven. W ., 1999, Mmlllal of SPANS Explorer Version 7. 1, TYDAC Research Inc., Nepean, ON, Canada pp. 319·332
Sle),aerl, L. T and M. Goodchild. 1994. Integrating Geographic Information Systems and Environmental Simulation Models: A Status Review, In: Michen .. W., Brunt 1 and Stafford S. (cds.), Envirolllnellial flifol7llalion Managemenl and Analysis, pp. 333·355
Sti.h D.M., Judek S., Bumo .. R.T., 2002. Meta-Analysis of Time·Series Studies of Air Pollution and Mortality: Ellccts of Gases and Partick-s and the Influence of Cuusc: of Death. Age, lind Season, Journal of tire Air Wasle Managemenl Associailon, 52(4), pp. 470·84
Slone M.L. , 2001, The Utility of Geographical Information Systems (GIS) and Spatial Analysis in Tuberculosis Surveillance in Harri, Comlty, Texas , 1995 - 1998, In: proceedings. ESRI Conference GfS ill Heallheare. web: http://www.esricom/librarv/userconflhealthQl /paperslhcQlp02a1hc01p02 • . htm!. 0610612002
Stow D. A. and Chen D. M., 2002, Sensitivity of Multitemporal NOAA A VHRR Data of on Urbanizing Region to Land Use I Land Cover Changes and Misregistrdtion. Remote Sensing of the Environment, 80 (2), pp. 297·307
Stull R.. 2000, Meteorofogy for Scienlisls and Engineers, 2'~ Edition, BrolllS/Colc, USA
363

Sunyer J., Saez M., Murillo c., Caslelbague J., Martinez F. and Anlo J.M., 1993, Air Pollution and Emergency Room Admissions for Chronic Obstructive Pulmonary Disease: A 5-year Study. American )01117101 of Epidemiology. 137. pp. 701 -705
SUPARCO, 2000, Satellite Remote Sensing and GIS Applications, Space and Upper Atmosphere Research Commission, Pakistan, pp. 1-2
Sulanlo, 1991, Remote sensing for Land-Usc Mapping, in: report. Work.'hop all Remote Sellsing for Landlise Mapping and Planllillg, Gadjh Mada University, Bakosutand and lTC.
S,'cnsson D.H. and Ross\\'all T., 1984, In Situ Methane Production from Acid Peat in Plant COlTul1unitics with Different M_oisture Regimes in a Subarctic Mire, Oikos, 43, pp. 341 - 350
Taq"i, S. t. H., 1993. Comparative Study of heavy metal ions (Pb. Cd. Ni. Zn) present in Milk and vegetables in Polluted enid Non Polluted areas of Karachi, M. Phil. Thesis, Univer~ ity of Karachi. Pakistan
Tarbuck E. J .• ond Lutgens F. K, 1992, The Atmosphere, 5'" Edition. Prentie<:-Hall, Inc., NJ, USA
TarbucJ, E. J., and Lutgen! F. K, 1994, Earth Science, 7'" Edition, Macmillan College Publishing Company, Inc. , US
Tarbucl< E.J., and Lulgens F.A., 1992, The Atmosphere: An Introduction to Meteorology, 5th edition, Prentice Hall, NJ, USA
T.<ldnen H., Nordman H., Hemberg S., Engstrom K , 1981, 8100d Lead Levels in Finni. h Preschool Child«n. Sciellce ofth. Total Ellvirollment, 20(2). pp. 117-29
Teillet, P.M., 1986. Image Correction for Radiomc:lric Effects in Remote Sensing,lnternational Journal 0/ RellJoteSensing, 7(12), pp. 1637-1651
Tenias J.M., Ballester F., Perez-Hoyos 5., Rivera M.L., 2002, Air Pollution and Hospital Emergency Room Admissions for Chronic Obstructive Pulmonary Disease in Valmcia, Spain. Archives 0/ Environmental Heallh. 57, pp. 41-7
Tepper J .S., Co,ta D. L., Lehmann J.R., Weber M.F., and Hatch G.E., 1989, Unattelluated Structural and Biocht~mical Alterations in the Rat Lung During Functional Adaptation to Ozone, American Review 0/ Respiratory Disease, 140. pp. 493 - 501.
Theil, H., 1978, Introdllction 10 Econometrics , Prentice Hall, NJ, USA
Theobald D. M., 1998. A Visual Programming Envirorunent for Spatial Modeling: The ArcView Spatial Modt:lcr Extension. in : proceedings, 2000 ESRl User Con/enmce , http://Bjsosri .comlljbran'/userconf/proc98IPROCEEDaO 150IPAP I 0 lIP 1 0 1 JITM
Thunton G. D., Ito K, Hayes C.G., Bates D.V. and Lippman M .• 1994, Respiratory Hospital Admissiuns and Summertime Haze Air Pollution in Toronto, Ontario: Consideration of lhl! Role of Acid Aerosols, Environmental Researacl" 65. pp. 271 - 290
Thunton G.D., Ito K, Kinney P.L., and Lippman M., 1992. A Multi-year Study of Air Pollution and Rc'>piratory Hospital Admissions in lluee New York State Metropolitan Areas: Results for 1988 and 1989 Summers, Journal 0/ E'Cposrlre Analysis and Env;ronmental Epidemiology, 2. pp. 429 - 450
Toll, D.L. 1984. An Evaluation of Simulated Thematic Mapper data "nu Landsot MSS data tor discriminiSting suburbiSn and regional Landuse and LandcO\'er, Phologrammetric Engineering & Remote Swsillg, 50(12). pp. 1713-1742.
Tollon B. T., Yurgano\, L., McKernan· E., Prcdoi-Cross A., and Grechko E. T .• 1999, intercalibration of Mediumrosolulion Grating Spectrometers for MOPITI Validation, Optical Spectroscopic Techniques and In~trumcmtatio1.l for Atmo~pheric and Spuce Research III. SPIE Proceedings, Vol. 3756
Tomatl" L., 1990. Air Pol/lltion and Human Cancer. European School of Oncology. Monograph. SpringorVorioS. Germany
364

Tomer M. D., Andenon J.L., and Lamb J.A,. 1997, Assessing Com Yidd and Nitrogen Uptake Variability with Digitized Aerial Infrart:d Photographs. Phologrammelric Engineering & Remote Sensing, 3, pp, 299 - 235
Tornqvist M., and Ehrenberg L., 1992, Risk Assessment ofUrb.n Air Pollution, Pharmacogenetics, 2(6), pp. 297 - 303
Touloumi G. and Katsouyanni K, 1995. Short TenTI Effect of Air Pollution on Mortality: Result, of the APHEA Project for the Athens Popul.tion, Epidemiology, 6. pp. S59
Trenga C.A., Koenig J.Q., Williams P.V., 2001, Dietary Antioxidants: and Ozone-Induced Bronchial Hypmcsponsivencss in Adults with Asthma, Archive., of Environmenlal Heallh. 56(3): 242-9.
Trianlal)'lIou A.G., Kiro. E.S., Evagelopoulos V.G. 2002, Respirable Particulate MaUer at an Urban ond nearby Industrial Location: Concentrations and Variability and Synoptic Weather Conditions During High Pollution Episodes. JOllmal of Ihe Air Waste Management Association, 52(3), pp, 287-96
Tunnicliffe W,S., Hillon M.F" Harrison RoM., Ayres J.G .• 2001, The Eff""t of Sulphur Dioxide Expo,ur< on Indices of Heart Rate Variability in Nonn.land Asthmatic Adults, European Respiratory Journal, 17(4), pp,604-8.
Tuppurninen M., Wagar G., Kurppa 1(" Sakarl W., Wambugu A., Fr.seth 8., Alho J. and Nykyri E., 1988, Thyroid Function as Assessed by Routine Laboratory Tests of Workers with Long Term Exposures, Scandinavian Jou171a/ o/Work, Environment and Heallh, 14, pp. 175 - 180
Uasuf e.G., Jalakanon A., James A., Khorilonov S.A., Wilson N.M., Bam •• P.J., 1999, Exhaled Carbon Monoxide in Childhood Asthma, Joi/rnal of Pediatrics, 1]5(5), pp, 569-74
Ueno I., Hoshino 1\1., Miura T., Shinriki N., 1998, Ozone Exposure Generates Free Radicals in the Blood Sample, In Vitro, Detection by the ESR Spin·Trapping Technique, Free Radical Research, 29(2), pp, 127-35
UIshiifer, J. and Ro,ner H. J., 2001, GIS-Based Analysis of Lichen Mappings and Air Pollution in The Area of Reutling,,,, (Baden-Wuerttemberg, Germany). Meteor%gische Zeitschri/t, 10(4), pp. 261-265, http://www.uni~tuebinlZen.deJgeography/proieetlgi).talbl1ichenJJichen.htm
UNCHS, 1996, An ('"banizing World, Habitat, Oxford Univ""ity Press. Oxford. UK
UNEP, 1998a, Production and Consumpfion a/Ozone Depleting Substances 1986-1996, CT.lone Secretariat. United. Nations Environment Programmer Nairobi. Kenya
UNEP, 1999b, Environmental Effects of Ozone Depletion.' 1998 Assesslnenf, Ozone Secretariut, United Nations Environment Programme, Nairobi, Kenya,
UNEP, 1999, GEO 2000: Global Emironme"t Olltlook, United Nation Environment' Program, Earth,""n Pllblication~ London
UNEP. 1999. Synthesis of the Reports of the Scientific, Environmenta/ Effects. and Technology and Economic Assessment Panels of the [\Jontreal Protocol, A Decade of Assessments for Decision Alakers Regardillg the Protectioll Of the Ozolle Layer: 1988-99. Ozone Secretariat, UNEP, Nairobi, Kenya
Unsworth M. H. lind Ormrod D. p" 1982, Effe<:ts of Gaseous Air Pollution in Agriculture and Horticulture, Butlenmrfhs, London. UK
URC, 2002, Poor Civic Facilities Due to Lack of MOSier Plan. Facts and Figures, Urban Resource Cen!cr, 10(1), pp, I
USEPA, 1982., Air Quality Criteria for Oxides of Nitrogen, Report 600/11-82-026F, United Slates Environmental Protection Agency, Washington IJ.C
365
USEPA. 1982b. Air Quality Criteria for Parliculale Maller and SU/filf Oxides. Rep<lrl 600!8·82-026F, United States Environmental Protection Agency. Washington D,C,
USEPA, 1983, Revised Evaluallon 0/ Ileallh Effecls Associated wilh Carbon Monoxide Exposure: .4n Addendum 10 Ihe 1979 Air Quality Criteria Docamelll far Carbon Monoxide, Rep<lrt 60018 - 83 - 033, United States Environmental Pro""'tion Agency, Washington D. C,
USEPA. 1985, Compilalion 0/ Air Poliulanl Emission Faclors, Volume, I and II National Technical Illf""""tiofl Service, Sprmgfield, V A, USA
USEPA, 1986, Air Quailly CriterlaJor Ozone ond Olher Phaloehemical Oxidanls, Volume V, Reporl60018. 841()20eF, United Stat .. Environme~!al Protection Agency. Washington DC
USEPA. 1989, Nalional air pollulant emissioll estimoles i940 - US Environmental Proll:<:tion Board R"POrt EPAl450/41881022, United States Environmental Prolection Agency, North Carolirut, USA
USEPA. 1995. User's Guide jor the Indus/rial Source Complex (ISC3) Dispersion Models, Volume I & 2. users instructions. EPA 4541B·95'()03a & b, United States Envir01ll1Wntal Protection Agency, NC, USA
V.lac""i G" 80&<:1 V., 2000, Studies on the Biological Effects of Owne: I L Release of Factors from Human Endothelial Cells. Medlalors oJlnflammalion, 9(6). W' 271·6
V ... De Lande R.. Kok Relg R.P" QUlUljer Schorle" J,P •• "d Orie G" 1981, Decrea,es in VC lind FEV, wilh Time: Indicators lor Efti:cts of Smoking and Air Poltution. Bill Ellr Pity" Res!" pp, 775 -729
Vander A.J., 1988. Chronic Effects of lAad on lIle Rennin·Angiotensin Syslem, Environmen/aillealih Perspectives, Pl'. 85 - 89
Va.!r! N,D" Liang K, DIng y" 1999. Increased Nitric Oxide Inaeliv.tion by Rea",ive Oxygen Species in Lead·lnduced Hypertension, Kidney /memallonal, 56(4), w' 1492 - 8
Veda) Schenlter M.B., Munoz A., Samet J., B.lleroom and F.E., 1987, Daily Air Pollution on Children's Respiratory Symptoms and Peak Expiratory Flow. American Journal of Public Ileallh. 77, PI', 694 - 698
Vekerdy Z, and Grod«en J,L,. 1999, CooIM.n-Information System for Monitoring of Sub-Surface Coal Fire, and lIle Management of Fire Fighting in Cool Mining Ateas, in: proceedings, Gooin/armalies: Beyond 2000, ILRS, Indi. Pl'. l79 - 184
Verllyl. D, L" 1995, Solellile Remole Sensing aJ,vo/ural Resources. Lewis Publisher>, CRC Pres, US
Verbyl. D. L" 2000, Salellile Remole Sensing a/Natural Resources, CRC Pre". NY. USA
Vogel F., 1984. The Effecl of Air Pollution on Man, POrlSc/"Medlcal, 102(13), PI', 365 - 8
Wagman, R. J" 1985, The New Complete Medical and Heallh Encyclopedia. 1. J G. Fergus"n Publishing Company, USA PI'. 8
W'gnero"R M., Wagner V .• Madlo Z, Zavaul V., Wok.""",,, D" Krb; J., Mohyl" 0 .• 1986. Seasonal Var,alions ill lIle L.,d of lmmwroglobulins and Serwn Proteins of Children Differing by Exposure to Airoome Lead. Journal oj Hygine. Epidemiology, Microbiology and Immunology, 30(2), PI', 127-38
Waldlwlt, G, 1978, Health Effecls oj Environmemo[ Pollu/ioll. 2"" Edition, C. v, Mosby. Missouri. US
WlUlg c.x., Zhu W., Peng A., Gulch,dt R., 2001. Comparative Studies on the Concentration of Rare E"rth Elements and Melliis in tb. Atmospheric Particulate Maller in Beijing, Chino. and in Delft. lb. Netherl.nds, Envi!.onme .. lallnlemalional.26(5-6).PI.. 309·13
366

Waqa. K., and Dar Q., 1997, Air Pollution, /Jre Nation, May 04, Lahore
Ward N.J., Watson R. and Bryce-Smith D., 1987, Placenta Element Levels in Relation to Fetal Development for Obstetrically Normal Births: A Study of 37 Elements, Evidence for the Effects of Cadmium. Lead, and Zinc on Fetal Growth and for Smoking as a Source ofCadmiwn,lntematioflol Joumal of Biosocial Research, 9, pp. 63 - 61
Ware J .H., Ferri. B.G., Dockery D.W., and Spengler J.D., 1986, Effects of Ambient Sulfur Oxide, and Suspended Particles on Respiratory Health of Preadolescent Children, American Review of Resp;rn!OIY Di .. ase, 13 3, pp. 834 - 842
Waten, N., 1995, GIS Database Technology and Beautiful Formulae. In: GIS WORLD SOURCE BOOK, pp. J57-363.
WB, 1992. Development and Environment, World Development Report, The World Bank, Oxford Univl:rsity Press, Oxford, United Kingdom,
WB, 1997a. Clear lValer. Blue Skies: China's Environment in the New Century, China 2020 Series, The World Bank, Washington DC, United States
WB, 1997b, Environment ,..",fallers: Towards Environmentally and Socially Sustainable Development, The World Bank, Washington DC, United States .
WB, 1998, From the World Developmmtlndicators, 1998: World Bank Atlas, Map Design Unit of 'he World Bank, Washington DC and New York, USA
Weber, E., 1982, Air Pollution: Assessment Methodology andModeling, Vol. 2., New York: Plenum Press
Weiss R.F., anti Craig H., 1976, Production of Atmospheric Nitrous Oxide by Combustion, Geopbyslcal Research urlers, 3(12), pp. 75 1-753
Weide B., Kinman E., and Hailheoat T., 1999, Integrating GIS with Dispersion Solhvare to DdeI1l1in<: the Equity and Risk of Air Pollution in Ea,t SI. Louis, Illinois, in: proceeding, 1999 ESRl User Conference, Web: hi to: /I rz i s.esri. corru1 i bra ry/userconflproc 99/proceedlpa pefs/pa 1279 SIp 795 . htm
Wellbum A. R, 1990, Why arc Atmospheric Oxide. of NilIog<n Usually Ph}1otoxic and not Alternllti"e Fertilizers?, New Phytologist, 115, pp. 395 - 429
Wellbum, A., 1994, Air Pollution and Climatic Change: The Biologicalllllpact, 2"" Edition, Longman Scientil;c & Technical, NY, USA
Westphal M., Weber T.P., Meyer J., von Kegler.S., Van Akcn H., Booke M., 2002, Allinity of Carbon Monoxidt: to Hemoglobin Increast:s at low Oxygen Raclions, Biochemical alld Biophysical Research Comrmmicalions, 295, pp. 975·7.
WhAlen S.C,. anti Reeburgh W.S., 1988, A Methane Flux Time Serit:s for Tundra Environments, Glob,,' Biogeochemical Cycles, 2, pp. 399 - 410
White M.e., ond ElIeI R.A., 1991, Childhood Asthma and Ozone Pollution in Atlanta, m: Report, Socidty for Occupational alld Environmelnal Health meeting on HealtIr Effects of Air Pollution: IlIIpact of Clean Air Legislation, Crystal Cil)', VA, pp. 25 - 27
While M.C., ElIeI T.A., Wilcox W.D., and Lloyd C, 1994, Exacerbations of Childhood Asthma And Ozone Pollution in Atlanta, Environmenlal Research. 65, pp. 56 - 68
Whittemore A. and Kor. E.L., '1980, Asthma and Air Pollution in the Los Angele, Area, Americall Journal of Public Health , 70, pp. 687 - 696
WHO .nd UNEP, 1992, Urban Air Pollrltion in Megacilles of tire World, Blackwdl. Oxford, UK
367
-_. __ ._-..

WHO, 1958, Air Pollullon, Fifth Report of the Expert Commitl<e on environmental Sanitation, Technical Report Series No, 157, World Health Organization, Geneva,
WHO, 1970, Fluorides and Human Heal/h, World Health Organization, Genev.
WHO. 1972, Health Hazards oj Ihe HI/man Envlronmenl. World H""lth Organization, GC'lleva
WHO, 1976, SelecledAte/hods oJMeasrirhlg Air Pol/ulanls, 24, World Health Organization, Genova
WHO, 1977, Oxides oj Nilrogen, Envlronmemallfeallh Criteria No, 4, World Health Organization, Genev.
WHO, 1978, Ph%chemlcal Oxldanls, Ellvlronmenml Heallh Crileria No, 7; World Health Organisat!on, Gene\'H
WHO, 1979, Carbon Monoxide, Enviromnenlaf Heallh Crilerla No, 13, World Health Organization, Geneva
WHO, 1980, Recommended Heal/h Based Permissible Levels In Occupolianal Exposure 10 Heavy Me/aL" Reports ofSrudy Group, World Health OrganiZlltion
"VHO, 1987, Carbon Monoxide in: Air quality guidelines Jar Europe, WHO regional publications, European Series No, 23, World H""Uh Org'niZllllon, Regional office for Europe, Copenhagen. 210·220
WHO, 1987., Nitrogen Dioxide, in: Air Quality GUidelines Jor Europe, WHO Region.1 PublicatIOns, European Series No. 23, World Health OrganiIlItion Regional ani"" for Europe, Copenhagen, 297 - 314
WHO, 1987b, Ozone and olber photochemical oxidam.s, in: Air Quality Guidelines Jar Europe, WHO ReSioIlllI Publication. European Series No, 23, World He.lIb Organi,ation, Regiolllli ani"" for Europe, Copenhagen, pp, 3 15 - 326
WHO, 19870, Sulfur dioxide and particulate maUer, m: Air Qualily Guidelines Jor Europe, WHO Regional Publie,lllons, !lump""n Seri.s No, 23, World Health Organization, Regional Office for Europe, Copenhagen, pp, 338 - 360
WHO, 1987d, Carbon MOno,ida, in: Air Quality Grlidelmel Jar Europe, WHO Regio""l Publicalions, European Series No, 23, Wo.ld Health OrganizJ.tion, Regional Ofti"" for Europe, Copenhagen, PI', 210 -220
WHO, I 987e, Lead, in: Air QI/ality Guidelines/ar Europe, WHO Regional Publications, European Series No 23, World Health Organization, Regional Office lOr Europe, Copenhagen, pp 242- 261
WHO, 1989, Lead, Environmental aspects, EnvironmenJal Health Criteria 85. World Health OrganI7,ation, Genva
WHO, 1991, Accule J:.ffecls on Heal.h Organii'.1ition. Gl!neva
Smog Episodes, European Series No, 43, World Health
WHO, 1993, The Work oj WHO In Ihe SOllfh-EaslAslo Region, I July 199/-30 .June /993, World Health Organisation. New Delbi
WHO, 1995., Updl1llng alld Revision oj Ihe Air Quality Guidelines Jar Europe, Meeling O/Ine WHO Working Group "Clamcal" Air Pollulanls, EUR1ICPIEHAZ 94 051PB, World Heallh OrsaniZlllion, Regioru!\ Office for Europe, Copenhagen
WHO, 1996., Diesel Fuel and Exl","sl Emissions, Envlromnenlal Heallh Criteria No, 171, World Health Organization, Gene\"3.
WHO, 1996b, Updofing and Revisian oj Ihe Air Quality Grlidelines Jor Europe, Report On a WHO Working Group on VoMile Organic Compounds, EURllCPIEHAZ94051MT12, World Health Org_nil.lion, Region"1 om"" for Europe, Copenhagen
368

WHO, 1997, Health and EnvIronment in Sustainable Development. Five years after the Earth Summit, World Health Organization, Geneva
WHO, 2000, Guidelinesjor Air Quality, World Health Organization, Geneva
Wil!« D, S., 1990, GPS Location Data: An Aide to Satellite Image Analysis of Poorly Mapped Regions, International Jorlrnal o/Remote SenSing, II, pp. 638 - 653
Wilkins J.R., SinIu T.H.Jr., 198( Occupational Exposures among Fathers of Children with Wilms' tumor, Journal oj OCCllpational.Hedicine, 26(6), pp. 427-35
WiIIl"ms B.J., Hejtmancik M.R. Jr., Abreu M., 1983, Cardiac Effccts of Lead, Federation Proceediugs, 42(13), pp. 2989-93
Williamson R.A., an~ Baker J. c., 2002, Lending A Helping Hand: Using RenlOte Sensing to Support the Respon:re (Iud Recovery Operations at the World Trade Center, Photogrammefl'ic Engineering & Remote Sensing, 68(9), pp. 870 - 891
Wine P. H., and Chameides W. L., 1990, Ponible Atmospheric Lifetimes and Chemical Reaction Mechanismsjor Selected HCFCs, HFCs, CH,cCI, and Their Degradation Products Against Dissolution and ' or Degradation in Seawater ondClollciwater, WMO/UNEP report, 20(2), pp. 271 - 295
Winneke G., Beginn U., Ewert T., Havestadt C., Kramer V., Krause C., Thron H.L., and Waner H. M., 1985, Comparing the Effects of Perinat.1 Hnd Later Childhood Lead Expo",,,e on Neuropsychological Outcome, Environmental Research, 38, pp. 155 - 167
\Vinnc!(e G., Kramer u., Brockhaus A., Ewers V., Kujanek G., Lechner H., and JanJ(e W., 1983, Neuropsychological Studi"" in Children with Elevated Tooth-Lead Concentrution, Part 11 E.xtended study, International Arch;ves o/Occupational mrd Environmental Health, 51, pp. 231 - 252
Winner W. E., Mooney H. A. and Goldstein R. A., 1985, Sulphur Dioxide and Vegetation: Physiology, Ecology and Policy Issues, Stanford University Press, California, USA
\Vinstcad E.L., Hoffman K.G., Coffer W.R., and Levine, 19'X>, Nitrous Oxide Emissions from Biomass Burning, in: l&vine J.S. (ed.), Chapman Conference, Global Biomass Brlrning: Atmospheric. Climatic, and Biospheric Implications , Williamsburgh. Virginia
Willer D.L., and Chellon D.B., 1991, A GEOSAT Altimeter Wind Speed Algorithm and a Method for Wind Speed Algorithm De\'o!opment, Journal ojGeoplrysical Research, 96, pp. 18853 - 18860
WMO, 1985, Atmospheric Ozone 1985:.A.uenment o/Our Understanding o/the Processes Controlling Its Preunt Distribution and Change, Global G-lone Research and Monitoring Project, report 16, Gene"3
WMO, 1989., Report of the NASAIWMO Ozone Trends Panel, 1989, Global Ozone Research und Monitoring Project, Report 18, Geneva
WMO, 1989b. ScielJlific assessment o/stratospheric ozone: 1989, Global Ozone Research and Monitoring Project, Report 20, Gene,'.
WMO, UNEP, NOAA, NASA AND EC, 1998, Scientific Assessll/ent o/Ozon, Depletion: 1998, Volumes I and II , Global Ozone Research and Monitoring Project - Report No. 44. WMO, Geneva, Switzerland
Wufsy S.C., McElroy ~lB. snd Yung Y.L., 1975, The Chemistry of Atmosph.:ric Ozone, Geophysical Research Lellers, 2, pp. 215 - 218
Wolft:, R. 11. Jr, and Liu C. N., 1988, Interactive Visualizations of 3D Seismic Data: A Volumetric Method, IEEE COli/pliler Graphics and Applications, pp. 24-30.
369

Wong T.W., Tam W.S., Yu T.S., Wong A.H., 2002, Associations between Daily Mortaliti« from Respiratory and Cardiovascular Diseases and Air Pollution in Hong Kong. China, OccupalionaJ and E""ironme,,tal Medecille , 59(1), pp. 30·5
Woodward M., and Francis L., 1988, Statistics Jar Health Management and Research, Edward Arnold, London, UK, pp. 249 - 251
Worrall L., 1991, Spatial Analysis alld Spatial Policy Using Geographic InJonllatioll Systems, Belhaven Pre.';;::;, London
WRI, UNEP and UNDP, 1992, World Resources 1992·93: A Guide to the World Environment, Oxford University Press, New York. United States, and Oxford, UK
WRI, UNEP, UNDP and WD, 1998, World Resollrces 1998·99: A Guide to the Global Emironment (alld the World Resources Database diskette), Oxford University Pn:ss. New York, United States, and Oxford, UK
Xu X., Ding H., Wang X .• 1995, Acute Effects of Total Suspended Particles and Sulphur Dioxides on Preterm Delivery: A Community·Based Cohort Study, Arch'" .. oJEnvironmental Health, 50(6), pp. 407·15
Ya.mamoto Y., Nakano H., Ide H., Ogasa T., Takahashi T., Osanai S., Kikuchi K., Iwamoto J. , 2001, Role of Airway Nitric Oxide on the Regulalion of Pulmonary Circulation by Carbon Dioxide, Journal oj Appllied Physiology, 91(3), pp. 1121 - 30
Yol(oyama K., Araki 5., Yamamoto R., 1985. Renal Handling uf 'filterable' Plasma Metals and Organic Substances in Man., JOllntal oj AppJ/ied Toxicology. 5(2), pp. 94'()
Yousufzai A. H. K, 1991, Lead and the Heavy Metals in the Street Dust of Metropolitan City of Karachi, Pakistan JOllrnal oJScimce and Industri.al Research, 74(5), pp. 167 - 172
Yousufzai A. H. K., H .. hml D.R., SaJam A., Qaim Khani L, Rnd Khan Z. H., 2001, Measurement of Mator Arnbient Air Pollutants in Sindh Industrial Trading Estate (SITE), Karachi, Pakistan, En"iranmental Sdellces, 8(4), pp. 331 - 346
Yousuf.ai A. H. K., KIt.lid Q., and Sultana, 1.., 1994, Human Exposure to Pollutants : Part I. Blood Le<ld und Cadmium L:wl~ in 8 Sample of PopUlation of Karachi. Pakistan Journal of Science and Indus/rial Research, 37(6·7). pp. 241 · 244
Zatk, J .A. and Minnich, R.A., 1991, integration of Geographic Jnfonnation Systems with a Diagnostic Wind Field Model for Fire Manogement, Forest Sci~nce, 37(2), pp. 560·573
Zander R., Demoulin Ph., Ehhalt D.H., Schmidt U., and R1nsJand c.P., 1989, Secular Increase:; in the Towl Vertical Abundance of Carbon Monoxide Above Central Europa Since 1950, JOllrnal oJGeophysical Ruearch, 94, pp. 21 - 28
Zannelti P. , 1990, Air Polllltion Modeling, Van Norstrand Reinhold. NY, USA
Zareen R., Ghaur; D., and Mlna I., .I 995, Statistical Analysis of Wind Speed and Direction Obtained though Satellite Based OCP Network, in: proceedings, The Second Asia.Pacific ConJerelle< on Mllitilateral Cooperation In Space Technology and Applications, pp. 227 - 275
Zcghnoun A., Czemichow P., Beaudeau P., Hautemaniere A., Froment L., Le Tertre A., Quenel P., 2001, Short·Tenn En"cts of Air Pollution on Mortality in the Cities of Rauen "nd Lc H.'Te. France, 1990· 1995, .4rchiws oJEII"lronmental Health, 56(4), pp. 327·35
al'in S., Saunders S., Gourlay S.C., Jacob P., Benowitz N.L., 2001, Cardiovl:1scular Effects of Carbon Mono,ide and Cigarette Smoking, Journal oj American C olegel oJC ardialagy. 38(6), pp. 1633·8
370

Zhang X.M., Gonder ... J.L., and Kroonenberg S.B., 1997, A Method to Evaluate the Capability of umdsat·5 1M Band Ii Dalll for Sub·Pixel Cool Fire Detection, [nlemalional JOlll7l0l o/Remole SefIJing, 18 pp. 3279 - 3288
Zhou J, and Cive" D,L., 1996, Using Genetic Learning Neural Nctworks for Spalial Decision Making in GIS, Phologrammelric Engineering & Remole Sensing, II, pp. 1287 - 1295
Zimmerman P. C .... nberg J,P., Wandlga g,O" and Cn>rl<n p, 1982, A Potentially Source of Atmospheric Methane, Carbon Dim<ide and Molecular Hydrogen, SCience, 218, pp. 563 565
Zmi", .. D" Balducci F" B.mmandzRdeh T" Rille .. P., Laham G, and GldlardJI P. 1995, Daily Mortality and Yellr Pollution in Lyon, 1985·1990, A European Approach, Epidemiology, 6, pp. 361
(htlp:llal\,,,,,' !'llg.ac.beH'Vdstichleuglos.IDIC/dictiIl13html~0259). Hej'ffilln.s Institute of Pharmacology, University of Gent, Belgium, 20, Oct 200 I
(hll!l'llallserv.l1lg.ae.bel~rvdsliehleuglo<sIDIC/dictin24 hlm1N0047l), Heymans Institute of PhormacoloID" University ufGent, Belgium, 20, Oct 2001
(htlp'ilallscry.rug ae.bel==c:astich/euglossIDIC/dictio25.htmIN0487), H~J!Tllllns Institute of Phormacology, University urGent, Belgium, 20, Oct 2001
thttp://all,erv.rug.ac beI-rvdstichlcuglosi!IDIC/dictio36.ht,mIN07(4), Heyman; Institute of Phannacology, University of Gent, Belgium, 20, Oct 200 I
(hltp/l\nvw.('amilvdocior.org/hMlth!l!ctslOI4!), American Ac.d~my of Family Physicians: Family Health Facts, 10, Nov. 2001
(hllp:II"",,,, nanenct QrWapsl\des/22 blood.h!ml), Natio!1lll Institute of Environmental Health Science, Abstracts of Conference on "Air Pollution: Impact on Body Organs and Systems" held on 18 Nov. 19;14, Washington D.C, 11 July, 2001
(l1Ilpllv.",wnanenctorslapslidcsI24 sk!!l ht,ml), National Abstracts of Conference on "Air Pollution: Impact on Washington D.C, II July, 2001
Institute of Emironmental Health Organs and Systems" held on 18 Nov. 1994,
371

Annexure A
Monitoring Sample Locations around Karachi Metropolis A.l
m

373

J7~

375

376

377

378

Annexure B
Carbon Monoxide Concentrations at Monitoring Sample iAlcations around Karachi Metropolis
B.l
379

)80


382

J~J

384

3H5

Annexure C
Criterion of Traffic Flow Observation C.I
~~, ?~~},t~;dli~~~;;~tt ~-~~~,jf~:[~,.~ ~l~~~~~i!ii}~~~J.~~q~(~~~:~~ Very Low VL Less than 200 Low L 200 - 400 Moderate M 400 - 2 000 High H 2000 - 10.000 Very High VH 10,000 and above • All modes and their turning movements. at the location. summed up
Observed Traffic Load at Monitorillg Sample Locations around Karachi Metropolis.
C.l
~~~~~. : -" .. > , -' :-:: : ': . .: .. ," : ; : .' - ., ' "' -': . : : . . . : . - . - . :; . - :." . :':' : . "- ", : " ::'
t ~1 L H VH t>L Vii 2 M J,. H_ VH M VH ) M L H VH M VH
• H H H VH VH VH S L VL M M L ~
~ 1- Vlc M }1 L M 7 M H " VH VH VH VH
8 VL L M M L M
9 M M H H -"H YH 10 M M _H H VH VH
II M M H H VH VH 12 ~1 ~I H H VH ..\'H
13 M M H H VH vH I. M ~1 H H VH VH IS M M H H VH VH 16 M M H H VH VH 17 H H _VH \'H VH VH
I8 _M L H H M YH 19 H H VH VH VH VH 20 M L H H M VH 21 L M M ) I H H 22 L M M ¥ H H 2) M M " M H ~1 H 2. M M M H )1 H
2S H H VH VH VH VH
26 M H H M H H 27 M H H M H H 28 ~f H H M H H 29 M H VH VH VH VH )0 L M VH M H VH
386

32 I! I! VH VI! I! VI!
~ I! VH VI! I! VI!
I! ~ VI! VH I! 3~ L I! I! ~\ I!
36 I! VL 1 \'[ L
VL L VL L 39 VL VL M M ~\ I!
40 L ~ M M ~\ I!
4\ ~ ~ ~ VI! I! VI!
~ ~ ~I M M M I!
~ VI! VH VI! VI! 44 ~ I! VI! VI! VI! VI!
~ --.!i I! M VL VL M
48 -"l. ~ M VL \'1 M
s\ VL VL L YL L VL
~2 L 'I VL I! I! ~I n ~ 1 VI I! I! M
~ VL L L ~I ~ ~l I! I! VH VI! VI! VI!
~7 VL VL VL M L M
2! VL VL VL I! .~ t.I. ~ M I! I! ~I I! I!
60 M I! I! VH VI! VI!
! L ~I L I! \I I!
64 VL VL VL L VI 1
6S ~l I! I! M I! VI!
L L -,'.I ~ _" --.!i 66 M I! VI! VI! VI! --"-I!
-; M II VI! VI! VI! VI!
M 'I! VI! VI! vI! VI!
69 M I! -"1:1. VH VI! VH
70 M I! I! VI! I! '.III
..2l M II VH VH VI! VI!
72 ~l I! VI! VH VI! VI!
73 M I! VI! VH VH VII.
:: M I! VI! VI! \'I! VI!
387

~t~lft.m'~ ., " . ' 76 ~I M ~ H M VH
77 M H M VH
7H VL VL M M L M 79 VL VL VL L L L
SO VL VL VL l L L
SI VL VL , VL L L L
&2 VL VL M L H
~3 H H VH VH VH
S4 H VH VH VH
SS VL VL M L l H 86 VL VL L L VL L
87 VL VL M M L H
8S VL L VL L
&9 VL VL L L VL L
90 M M H H H VH
,91 M M H H
92 VL L L L ~I
93 VL VL VL L VL L
94 VL L L M H 9S VL VL VL M H 96 VL VL VL M H 97 VL VL L L L M 98 VL VL VL ~I H
99 VL VL VL M ~I H
100 VL VL VL M M H 101 VL VL VL L L L
102 _\lL VI. ..YL M ~I H
103 VL VL VI. M M H
104 VL VL VL M ~I H
lOS _\,L L VL VL
106 VL VL VL M M H 107 VL VL VL VL
lOS VI. VL L M ~I H
109 VL VL L M ~I H
110 VL VL L ~t H
III L VL ~I VL VL M
112 L VL M VL VL M
113 VL VL • VL L L L
114 VL VL VL L L J,.
liS VL VL VL L L I.
116 VL VL VI. VI. VL ' VI.
117 L M H VI.
H VH I. I. M 119 M H ~ I. M H 120 VL VI. M I. VL !I.
388
,~- , - --- ,--

,\;9 ~~:';'~ " ' " ' 1M ' ,' ,', : " '. ' , .... ,', , " ',", : ' 'if":, ," ,' ,' , " , ' ," ' " , ' :, , .. 121 _VL Vl ~ J. Vl M
122 VL VL M l Vl M
III VL VL M l \'L M
124 Vl VL VL VL \'L _VL 121 VL VL VL l \'l l
126 . "'L 11). VL l -''L L
127 VL Vl ' VL l \'l l
12' Vl l M l \'l H
129 VL L M l \'l H
130 VL l M l -"l. H
ill l l _VH M \1 VH
132 l l H \1 \1 H
133 Vl Vl l Vl L !-134 VL _VL V~ ..\Il. \'L VL
131 M H VH l \1 H
136 L l VH M \1 VH
137 l l H \I \1 H
138 l L H \! .\1 H
139 l. l H M \1 H
140 Vl VL VL Vl Yl L
141 VL Vl VL VL YL l
142 Vl VL l l J.. M
.!.Q M ]. , .M ~ \1 M
144 M L M \I \1 M
141 l l H H \1 YH
146. J.. L H H \1 VH
147 L l H H \1 VH
14' VL l l M l \1
149 VL Vl VL Vl -,:l VL
llO Vl ..1 L M L M
III VL L H H \1 VH
III l l M M l H
113 \I H H VH \'H VH
114 \1 H .1i Vii \ 'H VH
III M H H YH YH VH
116 L ' M M H \'H ,'IlL 117 l L L M \1 M
11. l M -'-- M \1 H
119 M H ' VH H H VH
160 M H VH H H VH
~1 Vl J.. M J.. \1 H
161 Vl M H \1 H VH
163 Vl \1 H \1 11 YH
164 \1 H -".I! .H H VH
161 L \I. L M \1 M
)89
-----~ ... " ,-", "

·~':'i}l'· .
166 VL VL VL VL L L
167 L M H H VH
168 H H H VH VH VH
M H VH H \ 'H VH 170 L
171 L 101 H H VI!
172 L M I! H VH
17) L M H M H
174 L H
17l M L H VH VI!
176 VL VL VL VL VL VL
177 VL VL VL VL VL VL
178 VL VL VL VL VL VL
VL VL VL VL _VL VL
180 VL VL VL VL VL VL
IKI VL L M L
. 182 M M
18) VL VL L ' VL L
184 M M H H VH VH
H VH VH VI! VH VH
186 M H H H VH VH 187 L L M M L ~I
188 L ,L M M L M
189 L L L
190 L L M L
191 L L L
192 L L M L H
19) L ' L M L
194_ L L M L H
19l VL VL M L M
196 VL VL M M L
197 VL VL M M L
198 -"L L L
199 VL L L M
200 VL L L
201 VL L L
202 VI, L M L
20) VL VL L L L M
204 VL VL L L VL L
20l VL VL L L L
206 VL VL L L
207 VL VL L M L M
208 VL VL L L
209 M M H H VH VH 210 M M H H VH VH
390
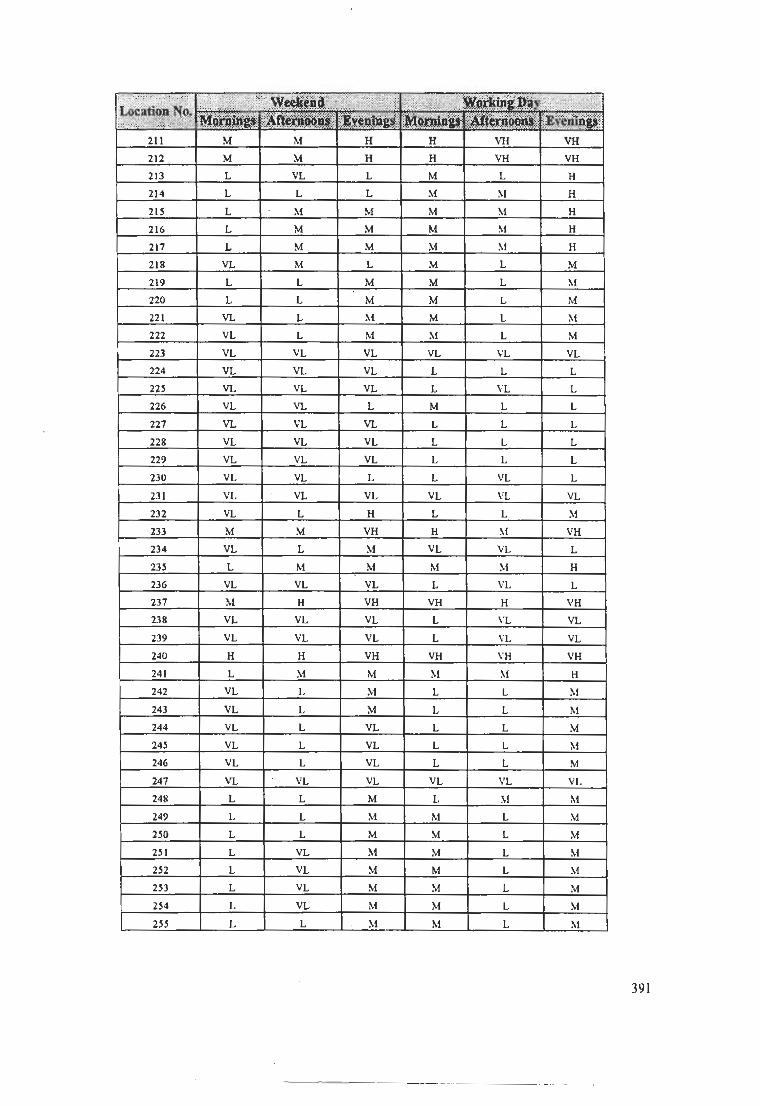
211 M M H H VH VH 212 M M H H VH VH 213 L VL L M L H 214 l l L ~! ~I H 211 L ~! M M ~I H 216 L M M M ~I H 217 L M M M ~I H 21~ VL_ M ~ M J, lot 219 L L M M L ~I
220 L L M M L M
221 VL L ~I M L M
222 VL L M ~I L M
223 VL VL VL Vj. \'L VL 224 VI. VL Vl L L L 22S VL VL VL L VL L 226 VL VL L M L L 227 VL VL VL L L L
,~ VL VL "'yL ~ L L 229 VL VL VL L L L 230 VL VL L L VL L 231 VL , VL VL VL VL VL
232 VL L H L L ~I
233 M M VH H ~I VH
23' VL L M VL VL L 23S, L M ..M. M ~I H 23G vl VL VL L VL L 237 M H VH VH H VH 238 VL VL VL L \'L VL
239 "'yL _VL VL .L VL VL 240 H H VH VH "H VH 241 L ~I M M ~I H
242 VL L .M. L L M
243 VL L M l l M
24. VL L VL L L M
24S VL L VL L L M
~ VL 1- --"k L l M
247 VL VL VL Vl Vl VL 24~ L L M L ~I M
249 L L M M L ~I
2S0 L , L M M L M
2S1 L VL ~I M L M
212 L VL ~! M L ~!
253 L VL M M L M
2S' L VL M M L M
2SS L L M M L ~I
391

~:~; ,.:~:~ '~, .. ' .. .•. .. .. ........ ..... . ......... ... ' .. .. .. ......... .
256 .L L M M L M
2S7 H M H H ~I H
258 H H VH VH VH VH
259 L L L ~f M M
260 VL VL VL M L M
261 . VL VL VL M L ~I
262 VL VL VL L L L
263 VL VL VL L L L
264 VL VL VL L L L
265 L L L M M ~I
266 L L L M ~I M
267 L L M M ~I H
268 L L M M \1 H
269 L . L M M L ~I
270 L L M M \1 H
271 ~I ~I H H ~I VH
272 VL L L L L M
273 L L M M \1 H
.~ M M H H ~l VII
275 II H VH VII VH VH
276 VL VL VL VL VI. VL
277 VL .VL VL VL VL VL
278 M M M M \1 ~I
279 L ~I H M H VH
..lli L M II M H VH
2H1 L L .1, ~I L \1
2~2 L L L M l. M
210 L L L M L M
2~4 L L L M L M
285 L . L L M L ~l
2.6 L L L M L ~I
2.7 M H VH H H VH
2"" M H VH H H VH
2M9 M. .li 'II! H H VH
290 M H . VH H H VH
291 L . \1 M H YH VH_
292 VL L L M !, \1
293 VL L L M L \1
294 VL L L \l L ~I
295 L M M \l H H
296 L M M M H H
297 L L L M L \1
298 M H VH H H VH
299 M H H .\1 H H
300 VL VL L VL VL L
392

393

AnnexureD
Specifications of ADalyser
Model GasAlm (CO) Pollutant Detector Carbon Monoxide
Units Parts Per Million (ppm) and Percent (%)
Part No. GA-M
Manufucturer BW Technologies
Origin Canada Power 3 V lithium CR2- series battery
Detection Range o ppm - 999 ppm Detection Increments I ppm SeosorType Plug-in electrochemical cells Operating Temperature _20°C to +50 °C
Operating Humidity 5 % to 95 % Relative Humidity
Figure D.I, CO analyser is also filcilitated with Audible alarm of 90 dB (A) at I ft (O.3m)
variable pulsed beeper and Visual aIann, which indicates the aIarming conditions, by Red
light -emitting diode (LED).
FIgure D.l
394
-----. -- ---

Annexure E
Health Statistics
Indoor Morbidity and Mortality Statistics 2001
Medical Records and Statistical Office, Civil Hospital, Karachi E.l
". . ~&~l ":~~~~~ 7. 'H· :;~Q. .< . . • • . . i i'i'':~5. ' ~ ;; •. , · .:;/:ir<~<~'"<'. ' . '. '. .' .' " . . ~.' . "'.' ...• '.~ .~ :W~t# ,; ' .. ' it!; r ~ :>. 'j , . , >~~. ?
. " . . .. ',. . ,. ' "'.";";'" )16 i . , .nd other lung di ...... due 10 «lorna! .......
l59 Other injuri ... urly, , oflr.um 381 3991 .7801 ill 113 28(
l29 Dums . 25, 61~ 861 .5 83 13 '
29. r di .. """ 339 164 503 63 21 9(
499 "1 mju ... In"'", 442 lSI 623 41 29 T
~23 "' 161 III 28l 21 2: 44
J5. Othudi ...... , 232 15E 381 3( 12 42
270 A""., . I in .... cti .. 63 41 IIC 2( _2.1 46 Vi .. 1 Hepa,itis 22 143 36< I: I· 2~
191 149 101 251 I' " 2(
J6 . I i'.'etien 9] .1' 161 I I: 2(
350 " .i·i ,n.plvo'i. \31 41 172 I I 2l
419 \3IC 88t 219t I I: 24
320 Acute ,,.d 8l 1\ 161 I 2(
'"' D,abe, .. mellnu. 211 151 422 I' I'
II M,I,,,i. 141 161 .}21 II I
.'" 131 114 3\2 " I,
.1.11 ilL"''''''' onh. jaw 163 104 261 I I,
300 I i, ot'pro",,', 191 12 319 6 I
.17 Tetanus II 59 173 1 I:
27. Otht.~ : heart disc"", 11 47 111 1 I:
47 Rabi .. 3' 2C 54 1 I:
20 59 52 II 13
101 Mali"" .. ,. , .~. lIun. 91 6' 15: 12
209 Iron ' anpmi", 161 112 33l 6 I
91 MIi"",n': 33 11 5e -~ 93 i lof,olon 49 31 8C
341 Ulcer, .. nd 739 21' 951
~21
~iC'· .etc. ) 81 31 II'
~2.
. pulmonary dis ...... and allied, 31 31 71
22' Other, , =",,1 nomou. ,,-.tern " 21 61 I other diorden od the " ..... 1 n''''ous
229.1 ,,,'«. 5' 41 9J
1K9, Simpleand I.w, 31 2' l! 251 elvoni, : heart dis""" 81 4\ 131
••• ; .p .. ins and ofio'" and M~I .. ) 61 4( 102
239. 1 Com"" op"ity and Olh<r di.order> of ""'" 3\ 31 T
395
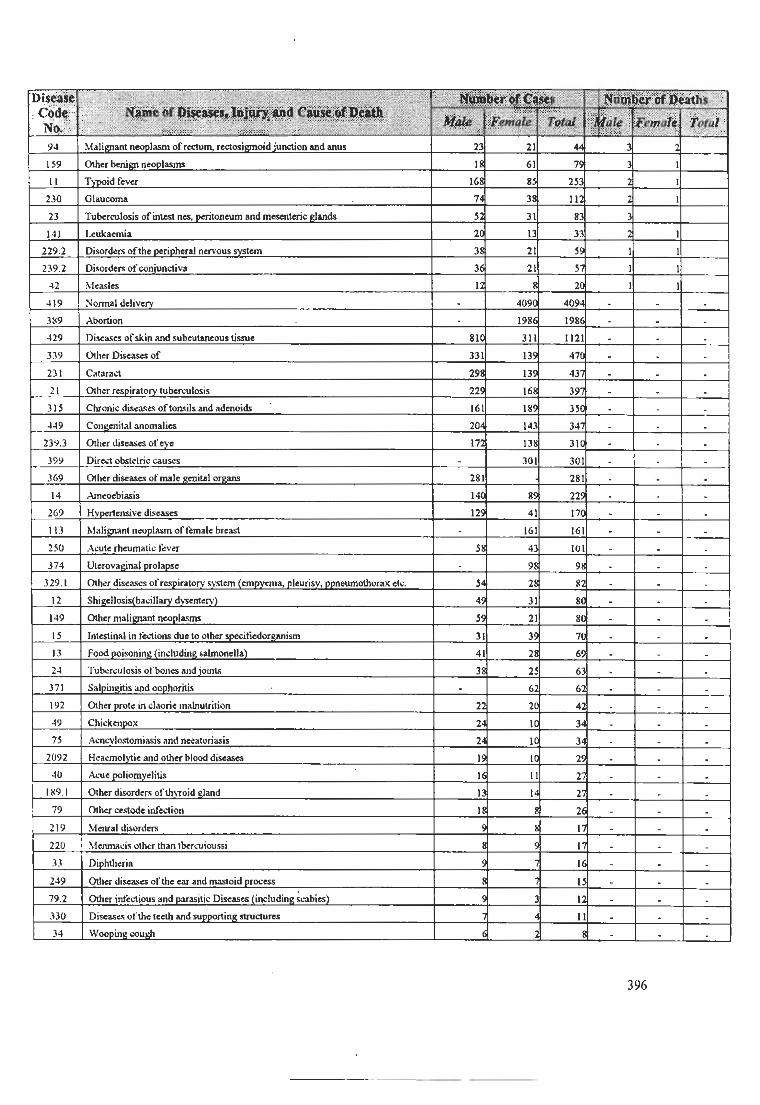
-r:;' I ~';';,<" ....... ' " .. '~~Jji~_ . .... .... .. ' .. " y . .. .•. _ ".';'''.'''c ..•.• ' .. _ •.. ~\1\~
. N~? I ;: :,~:l~, .: ' ., .! .' .,.' . • . • ..• . ~ . . . ~ f~t 94 ' I iunction and anus n 21 44 1
IS9 Othe, benj"" , 18 61 7~
II T\1,oid r,ver 168 S! 211
230 74 l! III
21 ,orintut nes. ,d ' : <lands l2 31 8J
141 I. 20 I 31
229 .2 i , orth' I n""ous svstom 31 21 l5
239.2 i 31 21 l~
., ~I<asles 11 8 21
419 No=.1 d.liv.ry 409a 409' - -3~9 Abortion 198! 1981 - - · 429 Di"' .... ofskin , ti",,, 811 31 1121 · · · 3J9 001", D~"'" or 331 m 471 · · · 231 C,,,,,,, 291 m 43~ · 21 Othe" 221 161 3~ · ·
31S Chronic d''''''''' oft .... il ..... adenoids 161 181 HO -'- · ·
4'9 20' 141 341 · · · 239.3 O\h" di ...... of ey. 17: Il! 310 · · · }99 Di,,,,,' cbs,,,,ic <a""" · 301 301 · · -
.169 Othe, di .. ue' of mal. Rmital 0",'" 281 281 · · · 14 140 81 225 · · ·
269 : di'eAses m 41 171 · · 11.1 : bro'" 161 161 ..:. · -
2)0 Acul" ; I,,,, li 4' 101 · · · )74 I p,ol.",. · 91 91 · · ·
329.1 "''''om , • pleu,isv, t elc . l' 2! 8, · · · 12 45 11 81 · · 149 Oth", I II 2, Sf · · Il I in '<-1ions due 10 other 31 39 71 -'- · · 13 Food I I 41 28 65 -'- · -,4 ,orbo""!a,,d joints 31 2: 6' · · · 311 "nd, " · 6J 6: · · ·
192 O\h" p,ol. in cl.ori. 2: 2e 4: · · -
4. 2' Ie 3' · 7l .. nd 2' Ie 3' ·
2092 : and othe, II Ie 2t · 40 A,,,. II I 21 '- · ·
1~9 . ' I<i",d 13 1, 21 '- · ·
79 : inf""ion 18 26 · · · 219 ~1 .. v.1 d~,dc .. 9 11 · · · 220 r th,n' 8 11 · · JJ 9 II · · 249 . • of the ear .nd """,'oid P'OC'" I .. · · · 79.2 Oth", ; D~, 5 1: · · · JJO Dise ..... or the l<eth and: 1 · · J4 . ,oou"" · ·
396

Indoor Morbidity and Mortality Statistics of Airborne Diseases Medical Records and Statistical Office
Jinnah Postgraduate Medical Centre, Karachi: 2000 and 200t
E.2
397

Zone Wise Epidemiological Statistics (Questionnaire Based)
Dl : HrlMbrh .. DOl : Hurine Lou DIS: Throat ClIJ1crr E.3 Dl: SlrrA D09 : Jlith Blood Preuurr DI6 : [..un, CJmur DJ : Tnnl Slrknrsa (NaUSC'a) DI0 : HJ&h C'1Iollrllrrol 017 : Birth Ddt"'" D'" : Eye a1lJmhta 011 : Hlp Puls, Rllit DI8 : Alttuna
D~ : TonalWI'- DIl: Ltamlnl Lou D19: Other 06 : alrON" AUf' Oil: Emdruc)' lAn D7 : ebron!" COUlh 01-1 : tJlur
. Sam~ " " . iDs ' .' . , . :",' . j. :\ ::
~l' .. '
"1114' '-: ' ~: Wj Q), ~~r~ ;rrnaH Zon. ·111 . D1 : 113 Dol ..
", . »1 :~< .,~ : DIO ;Il.1~ .. J)J~ .~ :b~' 0.11 . 'op. ';.; . ~ : . . ~ ... ;: ~ ;1
1 21 0 0 0 0 0 0 0 1 1 0 0 0 0 C 0 1 ., IZ.O<
2 " 3 1 0 4 1 1 2 1 0 1 0 1 1 0 0 0 • 1 17 20.91:
3 7. 11 1 1 3 I , I 4 , 1 2 0 0 I 0 I • 0 0 47 61.1'
• '0 1 0 1 C 0 0 0 0 1 1 0 0 0 0 0 0 0 4 ' .0( , 3S " 3 0 0 2 3 0 0 1 C 1 0 0 0 0 0 1 11 31,4;
• '" 3 " 0 " 0 1 " " 0 0 0 0 0 0 0 • 0 4 4.4t
7 •• 2 0 0 0 0 0 " 0 1 0 0 0 " 0 0 0 0 3 4 .3~
• 4' 1 2 0 0 0 0 0 0 1 0 0 0 0 " 0 0 I I 1O.2{
• 6. I 2 • • " 0 • 0 • 1 G 0 " " 0 " 1 I 1. Sf
10 " 0 C 2 • 0 0 0 0 0 0 0 0 • 0 • 2 J .lt
11 "' 1 1 3 1 , 0 ' 1 • 0 2 1 1 " 0 0 I 0 19 2U~
12 GO 1 " 1 0 0 0 1 • 0 0 • " " 0 2 7 I O. I~
13 3G " " " 0 I • 0 0 0 0 • 0 0 0 " " 1 2.1.
14 107 2 " " • " I 1 0 I 0 1 " • " 0 " • 5.61
Il 19 , 0 1 0 1 • 1 0 , " 0 0 0 " " 0 " 0 7 36.R.t.
1G 4G 4 1 1 0 0 0 J 1 0 • 0 0 " " " , 0 " '" 21.11
17 3l 1 0 , 1 " 0 " 0 " 0 0 I 1 2 " 0 , 22.1((
" J7 0 1 2 I " 0 0 1 , 1 • 0 " " 0 " 0 0 1 • 24 .]~
I. • 2 " 0 0 I 2 0 I " 0 0 0 " " 0 0 0 • GG .6~
20 II 0 I 1 " " 0 0 0 0 0 0 2 1 0 0 0 0 0 " l 9.~
21 " 1 1 0 " " 1 I 0 0 " 0 " " 0 " " " 0 4 6.4~
12 12. 2 0 4 ." J , I , 0 " 0 0 " " 0 0 2 IG 12.9<
23 37 J " " 1 2 0 0 0 J 0 0 0 0 0 " 0 0 J 12 )2.4:
24 .. • 0 1 2 I 1 " 1 2 0 0 0 " 0 0 0 " 2 .. un: 2l 41 • , 0 1 0 1 2 1 3 I 1 2 0 C " 1 1 I 23 !lUI
2. 91 3 0 0 1 1 1 0 0 2 C 1 0 0 " " " 0 • 0 • 9.4~
17 111 0 0 0 • 0 I 0 • " , 0 0 " " 0 1 0 " 2 !.fl(
" 249 11 I " " 0 7 0 1 • 2 0 1 " " 0 " 2 1 .11 11 . 4~
19 111 1 1 I 0 U 4 3 1 1 " 0 0 0 1 " " 0 1 1l \) . .51
3" IJ!I J J 0 2 " " 1 1 3 I " 0 , 0 " 0 U 1 2 17 IU~
.\1 372 • 1 " I 0 " , • , 1 I " 0 " " 1 " 3 12 W.6(
.n 14' " " I 1 1 I 1 " 0 0 1 0 " " " 0 0 0 • 4.0:
JJ JOG 1 , 1 1 " . J 2 0 0 I 1 0 2 " 0 " , 14 4 . .5f
H OK 0 " 0 " " " 0 0 0 1 0 0 " u 0 0 0 0 0 1 1.0:
II II 1 U 0 U " " 0 0 . 0 0 0 " " 0 " u 0 1 ·U!
398

:':':,"',: I ,~"; .. I '~'l :bi' . . ' ~I :~~ '~' ~f~;! ,!,#._ ." ,~~~~~~
" • • 0 '
l6 20 -" -" • • 0 • 0 • 0 0 0 0 C • 0 ..s .• l1 SS 0 0 • 0 0 C • -" -" 0 0 0 C -' 0 S 9 .•
II 44 • 0 I 0 0 0 0 0 0 C 0 0 C 0 C S Il.l
l\ 20S 4 0 0 C 0 C 2 C C C 0 0 ( 0 ( Il 6.2
4C 106 0 0 l 0 C 0 C C 0 C I C 12 ~ 41 III 0 C 0 ( 0 C ( C 0 0 C 0 l.O
42 54 0 ( 0 C 0 . 0 0 U C 0 U 4 7.4
4l ISl 0 I -' ( 0 0 C 0 C C 0 ( 0 C ( 0 U .2.,-
44 11 I C 0 ( 0 0 C 0 -" 0 0 0 ll .l
45 151 0 0 0 0 C C 0 0 0 C 0 1.9
46 \8 I 0 C 0 0 ( ( 0 0 0 ( 0 16.6
41 _29 ( 0, 0 C 0 0 0 0 0 0 0 0 -, l .7
41 Sl 0 0 0 ( -" -" U -" C 0 -" 0 0 5.6
4\ 7S U 6 ( 0 0 ( • 0 0 0 0 0 0 0 0 7 9.l
5C 62 U 0 0 0 0 I a a 0 0 0 a 7 11.2
51 21 0 a 0 0 U C ( a a 0 0 0 C ( 0 C 0 0 I 4.7
Sl 75 a 0 u c 0 a 0 0 0 0 0 0 0 C 0 0 1 ~ SJ 30 C C 0 0 0 _0 0 -" 0 0 C -" C 0 0 l 6.6
5' l4 0 ( I a 0 c 0 .0 C 0 a 0 0 C 0 0 C 0 ( 2.9
S! IC 0 C a a 0 0 0 a a ( ( 0 0 u C 10.0
399

Annexure F
Questionnaires (English Translation) F -Q I. Filled by Health Professionals F -Q2. Filled by General Poblic
Name:
Specialization:
.1 Age: L..I __ ...J
....... __ ......11 years
Practi~ing Lotality: 1...1 ______ ...J1 . IL-___ ....J
• Mark the diseases frequent la·.your practitiJ!& area (Air pollDtion bued):
2 3 4 5 6 7 8 9 10 II
12
13 14 15
16
19
• Lhf three mO!lt prevaleDt diacue. (nun tile ahove-meatioaed iA yow- praitice area (Air pollution based):
L 2. 3.
F-QI
. slin> _ .
400

• What do you think about air pollution as a contrlbuline factor In the given listed diseases:
Rallking Legend 100% Just only because of Air Pollution,' 50% Moderately Significant factor 75% Air Pollution is a Significant Factor 25% Less Significant Factor
o % Not Significant
D D D Irritability
D D D D D Arteriosclerosis and coronary D D D D Jaundice heart disease
D D 0 D D Arthritis D D D D 0 Kidney malfunctions
0 0 0 D D Asphyxiation D D D D 0 Liver malfunctions
0 0 0 D D Asthma and allergies D D D D D Lung fibrosis
D 0 0 0 0 Bone Diseases D D D D D Lung silicosis
D D 0 0 D Brain impainnents D D D D D Melanosis (darkened skin)
D D D D D Bronchitis D 0 D D D Muscular impairments D D 0 D 0 Cancer D 0 D D D Nasal irritalion
D D 0 D 0 Cyanosis (blue skin tint) D D D D 0 Nerve impairments and ataxia (irregular movements)
D D D D 0 Dental caries D D D D 0 Parathyroid disturbances
D D D D D Dental discoloration D D D D D Premature ageing D D D D D Dermatitis D D D D 0 Reproductive problems
D 0 D 0 D Diarrhea D D D D D Sarcoidosis (granuloma formation in lungs)
D 0 D 0 0 Emphysema D D D D 0 Sleeplessness
D D 0 0 0 Eye irritation D D D D 0 Thyroid disturbances
D D 0 D D Fume fevers D D D D D Visual impairment
D D 0 D 0 (Other)", ."", .. . , .. ". , .. , .. D D D D 0 (Other), .. , .. ",." . .. ,., ...
401
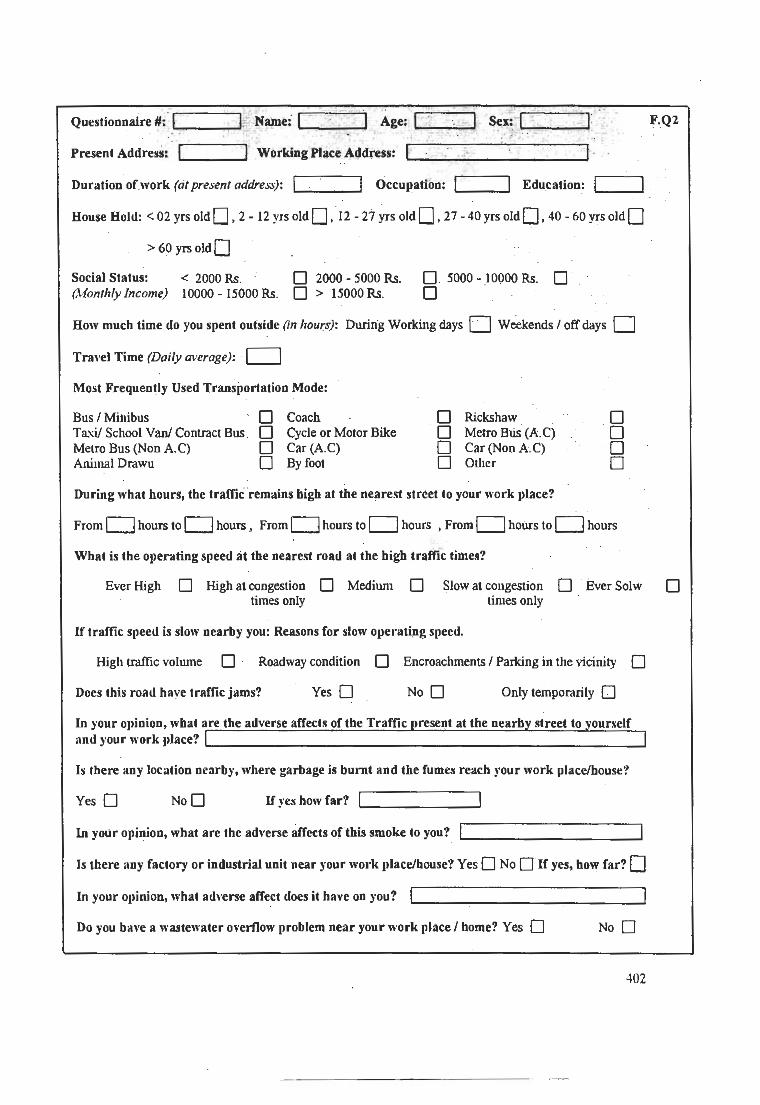
Questionnalrell: . I..., __ ...,......1; Name: ...,1 --,-_~I Age: I ... ~.,.;...;. ... ~~; 1 .... __ --11 F.Q2
Present Addresi:1 L. ___ ... 1 Working Place Address: rl..., -_"'-;,. -_-:-'0-_--'--_-_-_ -_ ~_ -_ -_ -_-_ -_ -_-_ -_ ' ... 1·
Duration of work (at present address): 1...1 -"-__ ... 1 Occupation: Education: 1...1 __ oJ 1 .
House Hold: < 02 yrs old 0 , 2 - 12 yrs old 0, 12 - 27 yrs old 0,27 - 40 yrs old 0, 40 - 60 yrs old 0 > 60 yrsoldO
Social Status: < 2000 Rs. D 2000 - 5000 Rs. r,.{onlhly Income) 10000 - 15000 Rs. D > 15000 Rs.
o 5000 - 10000 Rs. D D
How much time do you spent outside (in hOUrS): During Working days 0 W~kends! off days 0 Tra"ei Time (Daily average): 0 Most Frequently Used Transportation Mode:
Bus! Minibus D Coach Taxi! School Van! Contract Bus D Cycle or Motor Bike Metro Bus (Non AC) D Car (AC) Animal Drawu D By foot
D Rickshaw D Metro BUs (AC) D Car (Non A C) D Other
During what hourS, the traffic 'remains higb at the nearest street to your work place?
B D D
From D hours to D hours. From D hours to D hours ,From D hoUrs to D hours
What is the operating speed at tbe nearest road at the bigb traffic times?
Ever High D High al congestion D Medium D times only
Slow al congestion DEver Solw times only
If traffic speed is slow nearby you: Reasons for slow operaling speed.
High traffic volume D· Roadway condition D Encroachments! Parking in Ule vicinity D
Does this road have traffic jams? Yes D No D Only temporarily D
In your o)linion, wbat are the adverse affects of tbe Traffic resent at the nearb street to ~ourself llnd your work )llace? '--_________________________ --'
Is tbere any location n .... by. where garbage is burnt and the fumes reach your work placc/bou .. ?
Yes D NoD If )'es how far? .... 1 ______ --'
In yOllr opinion. wbat are the ad,'erse affects of tbis smoke to you?
Is Ibere any factory or industrial unit near your work place/house? Yes D No D If yes. bow far? 0 In your ollinion. what adyerse affect does it have on you? .... 1 ________ ---,. ____ --'
Do you b.,'e a wastewater overflow problem near your work place! home? Yes D No D
402
D

Despite Mosquitoes. What other problems do you haye due to this wastewater? 11... ______ -'
Is there another source of noise and smoke nearby your work place I house?
Yes 0 No 0 If yes how far? 1'---______ -'
Do you think Growing population is the main cause of enyironmental degradation? Yes 0 No 0
Do you think surrounding air is yulnerable? Yes 0 No
Has anyone from your ramily members. been affected by any of the following disorders:
How would you rate air pollution in your neighborhood?
Very High 0 High 0 Moderate 0 Low 0 Very Low 0
Do you consider that air pollution arfects human health? Yes 0 No 0 If yes. at what extent?
Very High 0 High 0 Moderate 0 Low 0 Very Low 0 Do you haye any remedial measures for the preYention or air pollution?
I. ,-I __ -,i.2. ,-I __ -,I . 3.1 '-__ ~I . 4.1 L-__ ..... 1 .5. L-I __ -'
Which place do you perceiYe to be clear of air pollution?
Home 0 Office 0 Educational Place 0 Place of worship 0 Recreational Place 0
403

Annexure G
Zone-wise Land Use and Land Cover appraisals
l"i~ul"C: Gx. I
AMlpsZ-Z LiHldU • .--~~
Anolysl. Zone 3 LandUoe ,% ,
c Plarnd RtSlderTiII
QC oofl'leJoal
DUI'b..n Renewai
DP~R~tm..11
IiiJUrb., A.cn:wtI
OCCfI"JlleJc.IIiI
tl%
404
AnoIp_ Zone 1 L_C_
PM. J"It ( q&qib
3% l "tb
Analysis Zone 3 Lande _
'''''
D O. 8 u;::t ~
oM . 0"* 141
OS. BLlt!: Lfl
DUrb.-, VCQ.
D '~ l!Qo!i.lIln
o~
F4;urt G)I.1
Q D. Bt<l.4l
OM .B~ ap
os. 8 ti!t up
O Urb., v eg.
DV!gd.1oo
0 0 ........
gO. eiJIt ~
C~. 8taklfl'
os.s .... 1.C)
OUtb.., Veg .
Fi~urt' Gy.3

Figure Gx4
Anal"';s Zclne 5 Land Use
0%
rigllrt Gx.5
Analysis Zclne II LWldU.
DU",1Mwed Rewdtt'IWl
o U rban Jl.crft'4111 tJ Der'I5lf1cmonAR115
gC_
."',.,rW tlT~rt F-=*1IiI!5
l-'igurt G:c.6
8%
45%
D P\IMed RsdstiIJ
Q Ul"fI\lmed R~ert. CU tbClRetlCWW
"Ccmneroll ICTf'lraport fdlle$
2"""
• %
." '"
405
gO.Bult~
oM . B.~
OS. Bult 14'
CUrb..,"~ .
CV~ct~
c Opttt.ard
12%
Ftl!ur~ Gy.4
'10 . 8!J!t 1.4)
c!r4 .8 1..1111,4)
as. 81J1t up
O Uri>Ir1 Veg .
O VtgdMlCiI
cOpert..-d
fo·i~u~Gy.5
00. Bldte>
C M. B tAll.4>
C S.8lJ.t\4>
OU TtlanVtJil .
Hgurt Gy.6

- Urb~R~
. 'i l!urt' Gx..7
Analpo Zone 7 LandU ...
""''It
, 00'lb
Anolps Zane 9
. UrtNnR~
L_Use ... ,%
• U III &IrrcId RewdAal
. BIS1I11GJotn!
O lll!il:ltOltJOnaI
Q Urb~lt~
406
AnalvolsZane 7 Land C...-
ANlpo Zone 9 LandC __
DO.Bqll""
QH .alllt~
as. Sult I.p
IJ UrbM VaJ·
t!I'VcgCIII-.Jcn
o Opo<Lwl
Fig u no Gy. 7
OO. BI.iltlC)
c ,lo4. 8UiltIC)
C S.B .... It~
FIRure Gy.&
C O. BlJllLP
OM . BI.IIII4I
OS.BlfIlt41
O Urblrlveg.
OV egel.-.on
c C......-

,,%
A .... y ... Z-U L_u.e
.,,.
.~~IIC"t' Gx./ I
'''''
1%
.. PIIrn!d RlllidtrUll C U If! IIrn:d R sidst'-l . 9 lIS. Grot.rd
Ii U "11\ RfnIWII OC~ o E\ecraLlonlf
IiJP1ncdR~
CtJ~ Ru8'tllll
. Ed\DbOn c RClCnlllJoniI
Analysis Zone 12 L .. du.e
oPWrlned Rewde1Jll
oC CltffT'aW'daI
.Ed~lC"
[J R«.rClltkl~1
407
A .... ,..da .... U ...... C_
Analysl. Zane 12 LandC _
".
D O. 81.tJt L4J
OM . BUlIt"",
os. Sult.up
1:10. 61.10-'(",
I:J M.BIAIt !4)
oS .6tw.t ~ CU f'bIl'l VfQ .
gO.e"" LfI
aM . BIAk~
O S, BWI. ~
QUrb"Ve:J .
D Ve;I!!I.ClO rl
F~tll"~ Gy.11

a PWn'ed RI!ildet1: '-I
c Uf!l1«Y'o1 RtsidO'f1111
C C 0ITY'IWdI1
. EdlGll!on
FiJ llrr Gx.11
DI'1iInd ReliUMY6
D UflIUIYIOJ Rl$idbf).JI
OC~I
O P'«rMlCM"li&
a l>tir6rfC:lhon A rt:<J$
A ..... y.I. Zone 15 LiUldU ..
a Ul1'i.m'If!d RCI&MicmQ4
O RecrM:lOlliJj
'D Oe1ilf~on Areil!li
Ficurc Gx. IS
, ...
408
...
"'.
Analysis Zone 14 LandC.,....
Analysl. Zone 15 LandC~
",
" ..
gO. BIJIt IC)
OM.Sli!;( I4J'
05. 8ult up
Q Urb.1n V t!IJ .
D '/tQtl.jgn
Fi~urt Gy.13
II!ID.S"Itf.4)
O M .8 Lo1l ...
os O-..ltup
ClU Jb .. Vcg .
ClV et;let .• IO~
0 0-.....
F.gul,t Gy./J
DO. e l.l Jt 1fI
eM . Buitt qI
oS. B "It~
[]UroanV~ .
Ii v eo«~hOfl 0 """'"",
F~urt G)'. IS

Analysis Zone 16 Land Use
"
flcurc Gx.16
Analysi. Zone lJ L_ u...
I'~u("c Gx.J 7
Fi~urr Gx.IS
."
C RfCf'lilltlONi
a DetlificMJQn Af t.:lS
o M IMtary A ratS
D'I..-..dll.~
IiiiI Vr'CII...-..<IR~1:iaI
. 11n.<a-1IU'ld Q uttltlu -......... • rduttllon
DLowh;~5erllll'lldt
409
Analysis Zone 16 Land C.--
Analysis Zone lJ LandC..-
Analysl. Zone 18 LandCCM!I"
''''
, ....
DO.8 tJ!J: If)
0"' . BlAt".,
D S. BtMUp
OU rblnveg.
C VCQf!I.1OIt
00_ . WATE R
51'"
F~un~ ~'y.16
,g O. 81.1ItLP
eM .BUI: I..CI
DS. B"'It~
CU rb., vcg
IIVegt(.akln
0 --....
"'.
ILIO. aLiI! "" OH . B ... 'P
a s. BIJIl4)
cU,*VCIIjI.
DVt:r.ld:.lon
ao_
Fi~ ul'"c G)'.18
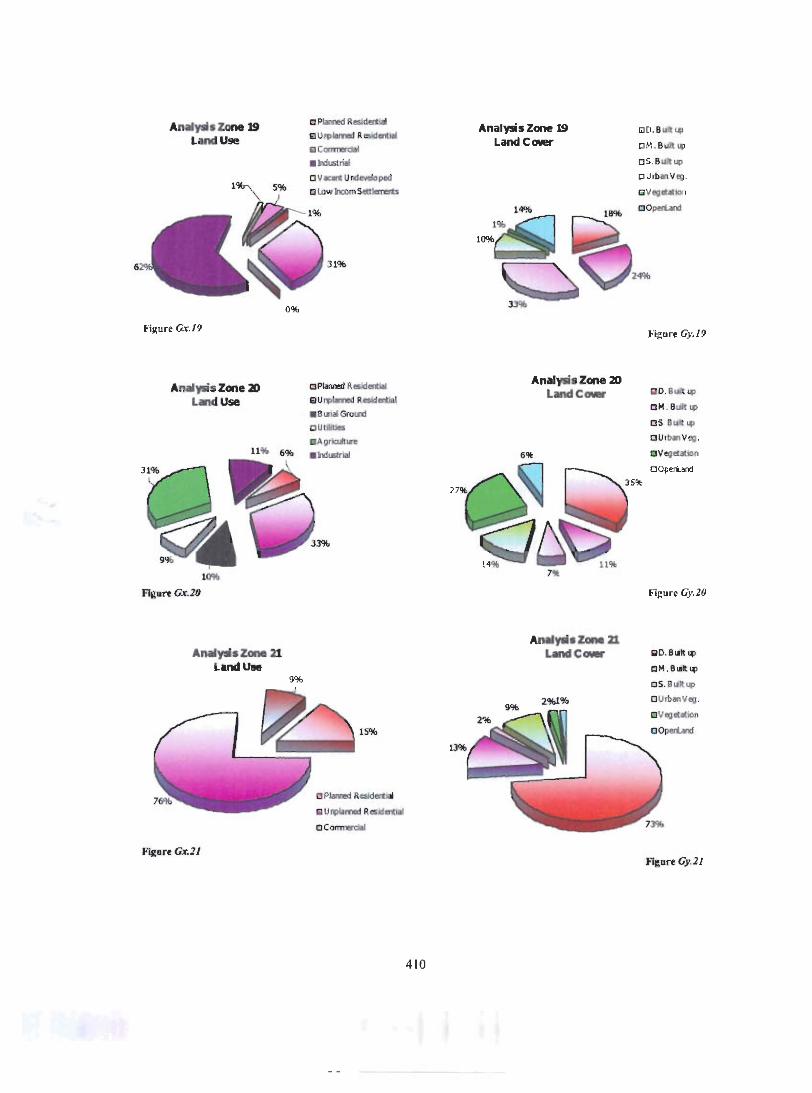
A"oIy,,;s Z ... e 1O Lind Use
0%
11l1'.:. 6%
10'10
F\:urt Gx.20
9%
FilUl"~ Gx.JJ
aP~ R~""
iJ UlfOl'aatnrrd R ~lderc~
O~Aelids&l
QU~ Resldet&l
. B 111111 GJotnl
C UtlliUes
s Agrlailwe
. h::liRr1a!
DP~ R~
&l Uf1)lttnlld RI5Jdetlill
o C """'"""
410
Analyois Zone 19 LandC.-,.
2%1%
~ D . 8 ~1t lCI
[JM . 8 1.ill~
[]S . 8 ~JtLC)
C Urb" v l!g.
Il Vegct"K30
cO........,
.·i~urt Gy.19
gD. B~""
OM . 8LA ~
OS_8 L11 ~
a urb4n Vcv.
DVeg t!lation
QOPM~
Fi~ure Gy.l{J
QO.Bult '41
OM . 8wt./.4I
OS.B IJJtI.4)
a Urb""'ea. CJ Veg,e(aflOtl
0 """"",,
t1t;Uf't Cy,lJ

O P\ll'r1ed RO$)(tm;14I
IilU flI'-nd RCAfcrWI
c C """""""
16%
Aznlysi. Zone 23 LandlJ5e
aP'-"'d R_~1aI iii U ",Mw:! RI!5id 8XIiIi
c c--"" • EdUCltlon
FiRllrr Gx.2J
AlYlpi. Zone 14 LandU..,
DPWn!d Rstdtmal 15:1 U",1Amed Reslamial 1 o C "'"'""'" . EdlOtion CM MKafyAr-. O RecrMlo,.t
Fi~tHT Gx.24
6 ' %
411
1% 1%
Analysis Zane 23 LandC __
c n.B uiitl..Jl
DM . 8 1Al ~
OS . [hi .• l.op
OUIb.,. Veg .
Fig ... G)'.12
0 0. BlIlt I.P
cM .a.L4I
OS. 8 U111: L4I
C Urb .. Veg.
II \I e;«:ilUIKI
Figure Gy,]]
QO. a .. l l4J
0;101 , Built ""
as . B"It~
OUrtlClVI!I9.

D PLnled A,ajdcrtW IQ Ul'l'lamed R~ild~ oUMtirs o M lilt.., Areu . Flood PIIm gDtnallt.tltlOf'l AIUI
Flr,unGx.26
CJ PIn'cd Raldftial IiiJUflItimed Res.dertl.)j
(] u tlt.ties • hll&tnli
• Education
OReaeUlMl
. SCh!IrntfI to HIli
o ee.llbtlon A/Or.>
s ...
Analysis Zone 215 L..sU.
''II>
a PI:rnd. Rcu::tertMI IiIUfJI'-mcd R-.id.ut c Utll.ie5 . h!IA1:rW DMawyAttu C Recl'elDONl . flOod...., OV IttrCD~ed DD~nA.~_
76%
412
, ....
,,..,
QO. 8 1J1k 14>
CM .SlAlt LP
CS. BI.I"l1.tJ
O UI'bIifl Veg .
C VI!9I!!.4_km
c~
Q Veg ___ lOn
OUfb., V'$.
OH ,e.LP
&l O. BIoi. I.P
0 5. 0 IJft up
Fi~uR Gy.26
DVeg •• )Orr
C Urbln\l fIJ •
OM . 9 1d: 141
go. 8111tf Lp
C S. BUlIt ~
[]~
to'i~urt: Gy.27

DP~R .. dcrtW
C COI'ITI'1!t'CIoIIJ
.h:lwtnal
. Edf.Dl1on
• Flood Pl4 0
.~t~ C(ll"rlref(:laI Cert~
CI~R~
ElUI1Iiath!d R.e:sldotJtI
O UblCJ!5
DC OII'ITWaM
C Va:at'I Un:lCYdoped
Fraurc G:c.l'
Anllysls Zone 3D ~_Use
CI B -.nil GrolJld
DC OfTm!tdil
OV4ICM Urdflll'dopcd
o Low tlrom SctiIrrwc..
F~urr Gx.JO
111%
2% 0%
1% S~ 1%
413
Analysis Zone 1II LandC.-.
.. --~)""'
Analysis Zone 19 LandCCMr
2%
11%
aVegdltlOn
O Urb",VIg.
I:H'LS I.i"If 14)
QO. Buft L4l
OS.S uitup
00_
a VQgef .. ll:ln
o U cb., V!!g.
OM .8.""
0 0 .81"14)
a s. S\lJt '41
c O ........
Fi~urt Gy.19
DVeg_OJI:;o.,
CUrbanveg .
a;'o1. sl.llh~
QO.8~ 14)
o s. BtJI L4I
C"""'-'''''

a P\b.t R ellidt:r1 'III o Uflll.i11"Cld R.c::WtrOII 13 9 \6111 GrolRf Dublrbel: ...... "" . FIood "'n DNtlHhl.LIIi~ry Qlow ftomSdllcm!m1
A"".,.. Zone 32 l_Use
Fla . ... G.dJ
6200:-_._" F~Urt Gr.))
8200
o P'W#'IDd A. ~cnMI DU l'1)btnd Realdertll.l IJ B II'W Gro.t.ni oUtJln5 DA~ o Real!lllicll1l! .NM h;lustTv aLowkDmSettI~
OU'll~ RellidftJII . NCllfrial Dl.nwkoms~t:
414
2%
Analysis Zone 32 l.ndCooer
7%
&:I I/ eo_titian
DU J!I."Vcg .
ClM .Stilt""
QO. Bu.k ~
Ds. e ~lt~
DOo«t-nI
f"i~urt GJ'.J I
~~" .. J I"""
7%
o 1/ eg elilllioo
C Urban Vc:g .
EJ M. 9li1t lCl
aO.au. t.p
O S.8ult1.P OOpcUnd
a VfIg«illOn
OUrbInVflIJ.
a M. BIMt t.p
QO.fh . lt lC)
OS.SUlk '-'
D OpoUd
Fij[urt Gy.JJ

0 ...
87%:-..... _ .. ~,...
Fijturt Gx.J.f
2 ....
lo1gyrt Gx.J6
QU~ Resld8tilll
.B";.G~
o lOw k-com 5a1l8lWts
, ...
IiI U~ R5.tt!l'tNtl
.Pf~q1
. £du3tlo n
OY &IIOI urwS~
o H tAJY MIllIS
o Low h:Dm SdtBn'!fts
o Plim!d Reslderfial I5 Uflllllrn:!d ~~enr:\aL .b1 __ 1'1aI
[] M _t1ry Af~
OR ecrutlOnll . Sdltr'nes; 10 Irfli
415
J%
...... ytlsZone 3S L_C.--
.""
2-<1%
, ... 10%
-_.""
eVegct..lltion
CU rt>IfIVI!Q.
DH . 8 Ui11~
8D. 8Li1up
OS.9 L1..~
0 0priAnl
Figurt: G'y.3.J
.VegetatiOn
O IJrbIl'l Yt.ll ·
DM . a ~14l
a D. oiMt IC)
as. alA I4J
o OpetUrd
Io'i"ur~ G)'.J5
VegtllUon
CUrb~ Veg.
II M. BuitlC!
iii D. fhJII: lC)
O S. fhd LCJ
00_ . wAl1:.R
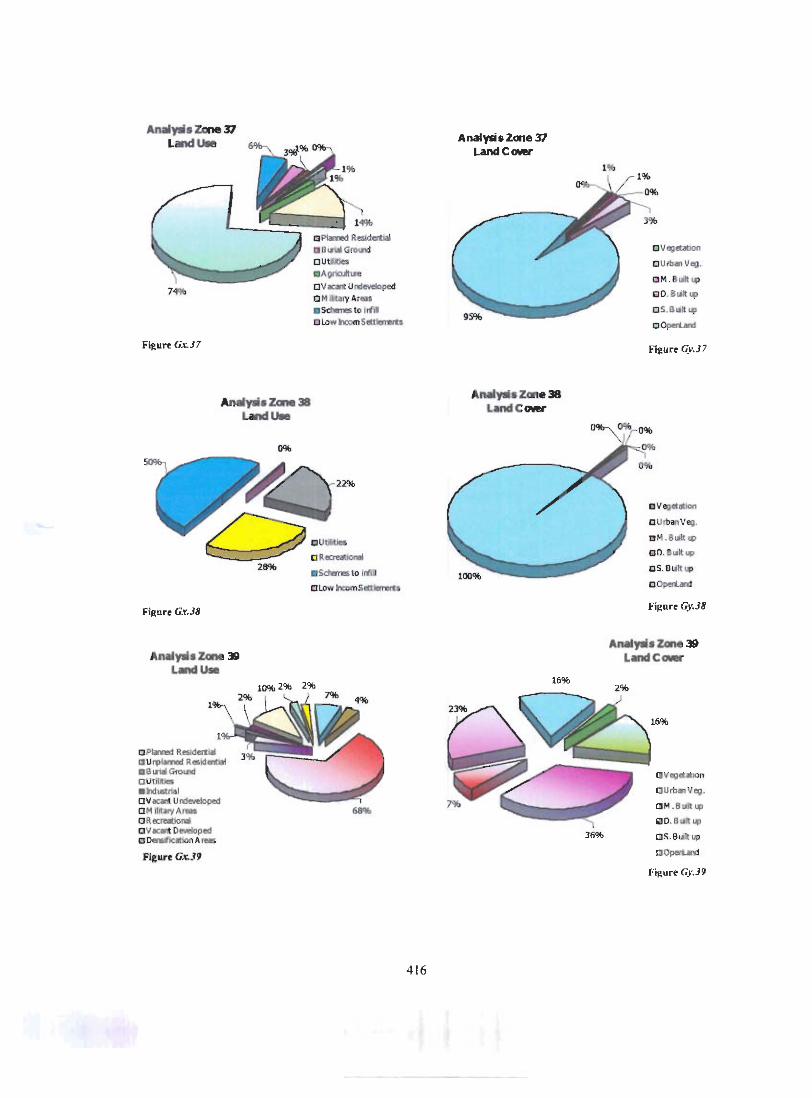
FiRurt Gx.J7
FiRur~ G.f.)8
DPYmect ReMdcttla IJBllraGroilld OUultSel
ClA~no.iIUfI
O V Ie.n U rclClYdcped
O M llicary Areu . Sct.nes to llii. OlDw h:Qm Stttkmrts
22%
. Sdwr& to IrtlJ
alDw h:cmSett~
416
A nalp • Zone 37 LandC.--
16%
)6%
)%
O lJllgtbbOn
O UfbMl Vf!g ,
O~ , 8 IiJ1:LP
QO. 81Mt~
O S, SII" L4'
c CocltR
~UI"C G. ... ,J7
a Vegetatlon
DU!b~V~ ,
a M,611ktl)
DO,BLlItL4)
oS, Bille Up
C O......,
I!I veo«aiOn
C Urb.,Veg.
~M ,BLAtI:~
.,0,8 lilt 141
C S.BI.lItI4l
00_
"'igul"c Gy.J9

[] p~ Reitdettlal
IJUIllIamad RoC$idatll;l 0% OUtiilles . N lA'lrIIIIi o Y en: U I"IIh:vd:I peel
OM~""NS
F~ure G:c..40
Analysis Zone 41 L_U.
a Pin1ed Resldl5fill I:I U~Wn!d R,.;dcrcial CU tiJhs • ftI."iQI'\AI aVaQI'Cund~
OT~f1Fdlt". 13 ScNn. 10 I rfil II NM" h:l1&try
Olcw kolflSl!ttm..tl[J.
.... a" Gx..fI
Analysi. Zcne 42 ~u.
a Pllr"I1!d R..r'lt~MII trUilly/ftld Rald~
l % CUUIUt:Ii DAgoaMtil:
1% .h1uarill • Edtatbn . Flood PlaIn WNcwhfusfry a Low h;otq Scttlern:1tJ. a8t.1f •. :ueM;
FiR""' G.t41
417
a V.gd.lDn
a Urb.,Veg.
aM . BLI/t 14>
IiIO. Bult lJI
oS. Bul'l: ""
17%
a Yeg-«on
aU rbVlveg •
oM . eutL4)
IiiID. fhd"P
o S. 8111" '4J
c"-
OUtb,-,V!9.
a M. 8\i1t I.4l
QD.SUllt I.P
oS. ew!t up
C O .......
Analysis Zcne 4D LondC.--
2 ...
19%
Analysi. Zone 41 L_C.--
1 ... 6%
Analysis Zone 42 ~_C_
1 ...
19%
FiKUrt Gy.JO
'I'll>
13%
Fi~urt Gy.41
4%
,%
2%
r;lRurf Gj'.-I1

Anal"';' Zone 00 LandUlle
Analyois ZDne 44 UndU..,
o PI«'w'cd R~drrI.O U~llkIeI
O M IlltllY ~roas o'r~ort faalrtid .~~o,fIlll
t1gun: Gx,U
FiJ!ure Gx..l5
AMp' ZontI4Ii LandUlle
D PIImed R.eMdedWIII
o MIII\alYArMS
.F~d PWn
S'lb
D PI ... dR ...... I ... au~ ....... I .. .1!I!81"~ O Ulillbti a l'lOfllll'1IiIn a,._ hUCrY
418
o VegctoHon
cU rtl., v~.
oll! . 8iJ1t ~ go.a..- up DS. B~ 4)
D Op.uro
DVeg_lIIion
Qu r1:lanVeg .
CM .SIiI",
QD.8I.1ll4l'
os. Dtill IQ
DOpcrhrd
.'/egSAlIOn
QUrtl,IVeg,
a foll .BIiIt\,p
n O. 91.t1t up
o S. BIAIt up
0 0_
15%
17%
3 .....
17'1b
FiJturc 0)<..15

(I i>IIrnd R elldertW gV11'1M\'Ied Ae£i:I'wtW .hd,*n.M a M \fit.., Arms CA~loNl
. FlQodPIIiII
.~to .rtlll
. NI&.III"G'lAt1V
aOffU~AI~"
Fla .... Gx.46
II P&nta::l A. nenlill QUl'lIiIm!d RI5ldeft)itJ
• h:lushi. O "I'IItwyA~
• Flood plArfl
.K~WLtl"" D OCin5f1"c:alO nAre.s
J.·if.!ure Gx.4 7
". ~ ~
: ' ,
Anal";. Zone 445 Landlloe
61%
'''' 8'"
An~";s Zone 47 Land Use
2%
IIPWed Relii:lf4t11 au!J:'~ AeJ):::Inlai .BwialGm~ ...... riaI o V.:" Und~pe:j O M ;ilrtl:lIyArmI
QRflI:~IO"'" • Flood P'-in o Va:n DewWoped • New Ir'I!h.lltJY
.. .. ~~,: I'. -' .. ~~ •• ,'
" '.
FiRure Gx.4S
419
aV~ttmon
c Urttn Veg.
0"' . 8 lilt...p
aO, 8 1jft~
os. 8Uft up
" ",..,.....,
DVfJget.-..on
CUrb¥t VC'fJ .
OM . 8 ~.,.
g O. Bult IC)
OS.BLm up
DOpcrtn
a l/tga.1Oft
OUrtl-lnV(Ig.
OM .S ~ t.IJ
gO 81il",
Analysis Zone 46 LandC.--
22%
F~urt' Gy.46
Analysis Zone 47 LandC""",
Il'IOo
13%
Fi~lIr(' Gy.47
.'"

F~l"t' Gx.<l9
I'~un' Gx.SO
m: P\irftd R..adeIIIII
OM IIit.ryArDIIS
IIFIood P~
OS~ to Irfift
10% 0 ...
II Piwftd RKh~eth" Cumlt~
. hlLMri4l
. Ftood PWI! O T1If'II4I olt Facials . Sdlemei to >rtlb o OcNfIatlon Arc. C Low b:omt'l lfmtru Q et/f8" Areal
C PIIINd RsJdD1l141 C 9r.6W Gro.....t D Agrci.lt:LI1I! o H IIby II reM.
• flood ~ 8 SdwNsto irftII . Ncw¥dU5try ODer&ifbtklnA remo
420
mV a;lo!I:&lon
C Urb.nVl'g.
O M .Bwil4J
oO.9 rJ. ""
av~~
OUrh nV CI!il •
ClM . B·Lfl
IiIO. BUlIt loCI
05. 8\111: ~
CO........,
a VevdCio\'l
D UrbM Veg .
DM .BUlt Io4)
"O. Buft~
OS. elJl~
D~""
•
t' iJ,!ul"t Gy.51

m"~.-d1! ... tt..cl1ll
Dlk1JI~R"""UIll a,~ .. ~o:x.nd QUla l)" • ....,1. . c...r.1orI [J"'Ji t.-., Ar ISM
O ll!«rwUJOMIi . floodPltIn
. Sd!ene to trJiU ..... -a \pw"'IIII'I.5~(I..,.., Ct
....... COllWllCrC'-fCcnc ....
Fi2ure Gx.S2
.....
mp~R~~~ ~ .......... ... a~tt.~o.,u., 64% C tolll t.-y Ar_
O R«NIIIItl
C o..nc.l(loroNMC
Fl&ure Gx..U
O'J...cd1l_~I '"
• f'tood PI.,
.It~hlatr(
Olowh:QII('I.$.~a
Ii'~urt Gx.S4
7% .%
70'1b
421
CJ V t.OeQll lO n
C UlhnVcv.
OM. BIiI!: \4l
Q O.B ~
5
ove;;«ltlOn
o Vrb-.Vcg.
ClM . 8 "'~
DO. BtMt'4'
os.S,,"'J.C:l o Opcrtand
OVegetoilion
OU fb .... Veg.
0"' . 9 111114)
OO. Bttlt L4'
Analysis Zone 52 LandC,,-
2 ....
AnMyois Z .... 54 L.r1dC .....
.%
=--::!4% _ 1%
2%
Figurr Gy.H
••• II1II "'%
ficure G}'. S4

AnoIYS;6 Zone 55 L:ondUoe
. floodPloilin
.H_~IY
O LON'k0l'!l5 effieDlftt
Filturr Gx.J5
Analysis Zone 56 Land Use
O~"":lR __ "o."l(l.
a AWi'IMw-t . fJGudPIAn .H~~ry O (.QII't"N0III5tttl4OMnlt
J.l gurr Gx.56
.""
-
• %
422
D lJl!qs.lcm
[JU rb"VflIJ·
OM . 8lllt l4l
gD.e~~
OS.Bt.t.~
0 0 ..........
aVegd.1l.1OO
OU rbWlVeoj .
DM .8~~
&1D. B'" ~
os. Bul lC) D Opert.ond
Q 'YegtlctQn
o Ufban 'lolt\1.
00""""'"
Analysis Zone 56 LandCCM!I"
.. 'It
FiRLlre Gy,5S
F~Llrr c.;:v. S6
fi2arr G},.J7

Annexure H
Land Use find Traffic Statistics arollnd Monitoring Stations in Old City Area within IOO-rneter Oi;mleter
HOUl'l)' Ro:.d,,":lY Conuncrdal Rtshl('nli;'l) S(l<'dill
V'h."~UlI Trans['I0I1:1
1"ame- of LoC:ltiuR 1~",ft1c w'dlh· SpACC·· Sp:u:~"·
Purp(JSC _pace· .. lion Riehl ('omlt !oiP;'Itt" • Qr"'a)'· •
}.; ild'llf C cntre: 288 G4.S-l 7J7X~ .O I .521:1 6. 00 1-19.00 16900 4914,00
),;1,11 1 e .1~1t )' Bridbe 10974 5S.S' 11 8224.87 0.00 0 00 II GI6.0U ' 3)18.00
Cll\' SI~\iol.l lhhJb B;U\k f'!Uo\ 3724 42.56 5287152 0.00 43-16 .00 000 13962.00
\1I1l'GI1$h. )\1 A Jllm:,h Koad 198" 3714 S 16JN. 5 174477 3357.93 651 .... 7 H9S11
. \s1I.\ t\h:1Il Rd kt)llI!d:jbQul 1482 42 . .56 500n 7S '2172,7.00 2706:1 00 ~9]O .OO 1 ;6~1 '"
H~'h f .. nHly BYJ Rd 3422 43 .11 1 9342 1 OS 216(,) 00 27-10H)O 0 00 161·('\ uO
)uc.:ns Rd II lji CIlmp 5922 86.62 20151 GA D 00 2)69 1 00 0.00 22J7.fJ.OO
rntcrt.. ... 1Ion n(~ [ A JLnfl;,h ;\OO llauddlll Kllh:ht.ry 3626 ~230 90N05.24 '27. % ,00 51 (>6.00 293.00 2'2-1 11 .00
Rd 1 ;,;1" 1 I""",
ArolU1 B.lsil POIrk SIde 6736 82.30 1 1 70 04 .9~ 6%".0' 1638.00 0.00 l173!UIO
r ,,'P(II.I~·t\.l.un ~ Iru.qw ... 1011 ;1 ~'k l , Ni.J\tlr R(I 5646 J ... . 5l:f 141 99f1.01 8] UJl:f.'14 17597.00 0.00 229-I~ 00
./..I.x\IQ'I~,, 1 Ga rden Gnte 50S, 11.91 lJ 741~ ,71 .\.!t7U_OU 3U I9.00 1J7000 2J 120.00
I ~~ .,11; Daw~kh~U1<1. Lmen;.:-.;tio\1 North :-""~pe <lr Rd 2854 5 1 .~7 X<C9 19.9'" 66~ IO.OU 26S94.00 O.Of 24341 0"
llll\'P<~hon ufBlJnVi Rd ;md D,-. ,\1. HlUhim (;I\on 8474 54.70 907)(5.56 Ii: 1:\40 .00 25947.00 0.00 27%0.00
~ d
Itlh.!r,\.!t..1 101 1 of Robson IMMJ 'BUI'n.'S Rd 3 21C 6'2.(ill 5744654 6K401.0U :lI.JSf}~ ,OO 1942 IJO 27')')().OO
h..unw t"il\cnt:ll :",;tpc:tr Rd 454' 64.R4 88486.54 0.0< 698?()( 0.00 298<100
Inl ... ~(iol\ or:"'orth N;t{l(:~1" Rd and !\l.,h'-1r Rd 518< 116.62 1 3 '250.~5 2).:}74.00 691.00 0.00 30·lJ6,Ob
:-'· t~.". Cmcm ... }
lI;ll~tru Clt.;:r.4" 113..V3l Moo.ilJU Rd 7324 ] 192 177557.96 152 12)( .00 2571),00 I OO~lf)O JI)46) .Otl
fSh,tlVOlh-<- u ;t'j;tl ~ ... '" Ch;tl i 880( S4.70 205936.78 191 092.00 0.00 1:;!.s7700 3156700
SlliX \lflri.: .:l :-.119.101' Rd 3824 59.52 774S6.42 J9'JIO 00 xn9.00 0 00 HI 7.1 0<
( ;,.:tt."IO Gull )' .\b1"1, K.il;n! RJ 710, ~7.(i2 2049 30' 91 1607"2.00 )J6YO.00 000 HJ57 0t
~ ;tr.l ... hi.-\ \II,J il0mJtll 489() ) 1.92 III J6UI L 29J~4 .00 JlJ5.00 63£10.00 3SO l< 00:
IIlnk"( Chl<"llla Round -aOOUI 3496 .s 1.1.' 90990.47 ~1)70 1.00 4077.00 0.00 " 973 ()t
Smdtt t ,\\lI o.;Jill) Soci..1y Signal 2124 ~.5.~1 1 LU~6.2 1 71<; 159.00 ~S 1.00 000 3622200
"l1y roo;l Otlk ..: 51' j l _~n 11 ~4N 3:\ 1l$).:7{j..OO 19)7 UO H70.oo 363" 1.00
IhIl .. hlwn-t LAne, :", i:,.JIIM Rd 7762 92 -1..( l1A l\OO 87 ' 271~O.J-1 490, 00 o UO ]6-4:';:000
nu.."'~nrtl 1244 50 UO 361 83.32 (J .OU O.OU 000 3G~0 jJ) U
F"'o:!\\ ~ktl~n l\1l»lIU":, ~t . \ Jill.fl;ih Ftd 1038 ~ l<. 52 246002.61 :l)-l G 7.00 2.1212.00 22-l~ 00 ]G98~ OU
~w( wi;: Blt4: .-\11 Rd 6974 53 .20 n.54 \2.>:9 0.00 0.00 OUO J7()94 ()II
~ RQ;ld \hi·l..;.olJ...:hi Ullt~L1 lOn 3446 49 21 91671.73 l Ufl7 ..t.()(I 23676 UO b.W 3770 1 aU
1)~~ ~1 ;l rIi..::\ In\CBti:lion Slumh-c:-liaq;lt 3410 37.24 6nS7.46 250Y4.00 U.OC 902600 3772 1 (j(j
'.1\ COlIn M, A J""o:lh RtJ 927 ] 724 15-l1Gl<.n 194:< X.OO 0.00: II 196 'X )~ l6G . ()(J
'\'::\\10 [XIUO Hilll SlOp I tJ\~;ud,; ~laman ~loSl~ ~I 5292 S9.H I ~O I1~ 7.s ~IJ.\OO.OO 0.0/. 212.1 UO 39~75 01'
\ Jilbl;o;h 1M
lnlCf"'<>."io" of Granumv 5.:hool and S.:.J~ r Rd 751 58.52 9"'172.611 62031(05 S5J80 .&9 14 11JS.71 ' UO(l(J ()lJ
!We: \I ill kd R.ound ol!x.\Ul lo.ot,ion 2 8584 58.52 2-4675 1. 26 -I 1<21 0.(J{l 89 11 UO (.1110 40000 OU
Int.'7'60.1 ion lIf\ tal\;hO PiJ Rd .. N i~l\ta Rd N~M 8378 60.02 2214"71.10 93 23 2. 00 )29 Ut 4613 !.lJO 400u0.OU
'bLU
~2J
Ii. 1
Un.l1t -up SpoICC ....
79'2'200)
1182248
5-TI175
567-112S
lO.5"')I.~ 79
)4'2491 rJ9
225201"'1;1:
12)09724
204J] I I},
2<1'2625 .5 1
209UJ17 1
1 78023.9~
1 98U71..~i-;1
1 5644~ :141 95473 $-4
]GJ I I.5.KS
332264.96
'l':liUl1( 7K
12~G9~ H
.. H 931(j .97
1"3 S~7 . .s1
1 8416~41
192396 21
14Jl~7 .J]
2.S6:-: 59 :U I 301>0 n
JUHltl61
135-l I 2..!\9
1~1 42J n 91S51 461
11JG56n
2.)94757S
; 11591 n
:W.J l' 7.2 16
J [ 5UJ2 JU

HOUl·l,. Roodwo)' Commt!rciul R~hlrntlftl
Spedal "a .. ·rml
'fr.mspo rta Dullt-up i'llIlK' u(LlK':lrion It,.mc
widlh· Spik"c·· SPQCe·-rurposf'
"l'lK'c·· tI(ln RJE'" Sp:. ... ·('· .. <_, SpIKe"· 0(\\':&),- •
K~lC WOrk:clulP XiJlhl;u RJ 2588 41.23 36733.90 1031 0 1.00 O .O~ 000 -10 160.00 I 39!34 00
l.:I,blmlllSol Slrtd nt:t( Pan:\f,)rolffil Ctl11r~ 4404 37.2. (19642.00 5Uli I 3.00 D.OC Xl4 14 BO 40'1 71.00 11045100
.U1g PrL!S."i I I Chllndr;";M" Rd 3484 65.00 390 15.97 S7oSI 00 o DC 7G05.00 4 1021 0U 961J%'~ R':~l1\1 Pb7~' 541 4 58.52 95235.0:) 4']01".00 D.DC 000 4 1OJO.00 1 ~231LU3
hriL\ c.: ht l ~·h. ~ i)jhl;1r Rd 60:10 SK. 52 126 247.81 1919 K{)(J 21 793 .00 0.00 .: I l n .OU 167~!O: :-:2
CriW.1\ Cino:.m,1 ~ !;!;.·hh,u· Colon~ 21~ 35.) 0 3giS I4 .0~ 7\)7.00 4%3.00 10932.00 4 1422.0u 44374.05
1\. 1:J11I)I" .M <l!o:mll), 11 0m..:: Ra.,hu~ CfOSSll1~ 271' SO.I' 72319.~8 6)(.36.00 '21 • . O( 0.00 .1 I 8"76..()u !-IU I U as
. \;u CUl.u.,.:i l 6678 SHO 1I190lAI .130 •. 00 ) 166 1-1.00 0 00 41 H94 .DO 2751:21-15
l..:hllr~~:r, h,lcn-c ... li QII orSh<lhj~1 L..'lhfBhill1 l l{d lI)(l. \ 1:1 ).J).m Rd 355~ 38.00 708·18.t( l~"16.00 1&41.UCJ '(.6 00 4lln oo lJl~11.$7 -10. \ C,ly Campus 22"' 34.S8 5OO5s'9. 0.00 11 $~73. UO 88 12 1 14 4H434 16SS'J I 94
1"'tDL .... 1lQ(l or b jb\\i'luisll .. nd Slllhr"h lr.4q 481' H ~S 224546 6.6 0.00 0 .00 1030 1.97 ·UHO.? l.24S",6.Gr.
~ll)oIj,l\h.r"~1 9764 -IS .22 234545.64 617'.39 0.00 ' 68Il .93 4299G .. P HOn' .tf2
' 1)\'m'Itlr Hous~ 3Oa' i5.00 l 1908. IO 0.00 0.00 000 4]SRO~1 5190 :" 10
lnt~~"''''1)()U M ,.\ Jinn:t h Rd :u~ :-; ... "P't;,c Rei ( Lkll\O
Bolli 1727 108.4 1(.D n .80 98773.00 12)1.00 0.00 441 !aUJo 26.5336 11:0
S.:n I~'~ J IQ,;,pitlil AI 1,lhwil l" .\1);'t (Inl ROh!-.otl Iln6 B22< 39 90 1 6~ -I 55 . 6 1...,7600 23842.00 0.00 45 11 6.00 2OG77J 64 \1. \ JII1Il;lh Rd)
r io! G,,1t Qil..Q.!l;1I1 ~fD S('I" r.::\I .-\ JlI\).h Rd 54:10 8662 1 3 "'~4G .60 41261 .00 1090600 0 .00 ·H705 .W:,.l mUIH!
PI (K' ROUHt.!;thool 9764 1O~ .4 U 133704.-14 61J73 .00 245 .00 1 29~') .On 45732,00 140DU .... 4
hlW·'~~'\: t,u'l 01 [)ill ~I WII(l\l llnd Kamal .·,.1 ;\ Turk Rd 6;38 13.10 2~ 1.31'2.02 26726.00 1.5!)92.00 U.OO 4GUSS 00 294040.02
l\tlld .\\ an T<\'\ cts' 2982 76.-18 017856 Gl 643J .00 193'00 240\ .UO 4GStN UO t..ol27.61
HI,IV'1 n.Il'~tM 8014 43.56 132" •. 5( 0.00 0.00 J~20 .2' 4676" 13 132446,50
Fr,.;:,. .. 'O n.1.l.. .:ry Bum ..... Rei 669. 39.90 15079·1 28 Fi9-1J7~ ,OO 0.01l 0 .00 4(.% 1 rJO 240771.2R
t-..h:.ddll .\ lark<!t 201 4 7 1.16 9~M l. 06 57-124.00 0.00 19 1,'1 00 47122.LJO 112065.061
;,Ir.1 Qaoo-';l4111 i60C GI<. OO ~607) . 17 "'60( ~ 4J1U O( U 011 47,'JI< 00 t'991v I
[(.Slur' . Cha.lld Bibt Rd nt'3I l!";m &nar 1Q64( 266U 176 149.69 IO.JIO.O( o Ot 25 2."\.00 4 7G~1.00 192-'5969
~I~h ... :r Hod . lh m S" 7IllIi 431 C 55.Xl ·,>nO( 5JS O( --
425S1.J 2 g<))J.\ .UO 471(41.00 13G7IG32
Sh,\hnh Im4. M.:hboob ~bfkrt 430, I!."' 15699. 2X 2169!C JS OOt II CI( 4~S24.6li 97197.66
Pnfh:c CUlI:'ln.l Si!>nal 2B86 75 If J6~ 19. JI 00( II:C4ilJ,54 2l >'99 (J( S029S.5 1 5:52$9 89
t-..h ,tr:l(br Vo lke l li tlwld :l<O( 5911 ~~749 . 55 130 7~4 00 :<SI\2.00 653 D( 5114'iC .(JU 12111 S..55
F mrro;. .. M;uk.:1 1184, 7S 9R 14!t<oIJ S.94 2161<1 ,9 64U1.71< 409 1 98 5141 71l 17G522:m
( ill l j~t"n SdlOO \ Q:lli l·tllI S\IS 34H 66.34 6.)020.90 19' 21.00 I 453 KOb O.UO 52562.0(.1 ~7J79.90
Sh.thecn Complex 671( ) 7 . 2 ·~ 137277..s8 ~7%OO 479U7.00 0 00 S2606 .0U 1909:<:QAl(
11>':1 t:.:mi~. ~ ' A Ji,\Il.lh Rd 126H ~1 . 12 191\0,).9.51 2640.3-.UO 9';~2.00 tJ . .uO 52n9 ,o(} 133914 S I
Sllr,~\\ il n ll ()l o:J 1OS7( 100.92 l iU863.61 9.H~9.00 oW I II X36.1)() 11419 .01 27612V))
.... r ;')'II~rt 5 71! l)0I 1(01 9"B~ .02 ,u) '''.00 1 1) ~-I ~ . U() 1,U~. OO lHJ2 U( 119U I" ./.I
~,,,,I 12061 43.16 20g-l61 .3M 42i~2 ,OO 000 000 SS (., I U( HI2IJ.l:C
hll,;!r .... · ... 1IOn oj ~ I. \ Jil\ ..... th .n"J Ga:JL'Il Rd 441! .3 7.24 149649.52 0.00 OUO 1 ~{,6i.UO S~694J':') 1oI9G49. 521
W.::o..t \1,l1;1r1' 132: 7S .Oi 343 16.J;;9 0.00 0.00 IU6KOO IIX1100 H3I G . .s9
~!lllutl:1 1 Bank ~I ;nn Br.tn..:h. II Chundri~ ... r Rd 249 14. 16 4I l 99.]( 2'14 I_liD 4~66 .00 36 1~.00 564'IKOO ..t x9QG.36 --'
R.ltho P:lkiS)an 1254l! 1l.2n 2 \Jl47.J5 65447.00 JOI9~ .OO O.()U 5?S4 1 ,00 j091"~ .35
lSold..'t B;llltotr 4S3( 6 H }9 112(,94.43 13799.(.10 17] 19 0{J fI .OtJ 511:31 4.011 143t>:J24)
sHe A.~CJ" h ly m< 70.66 847i1.29 0.00 96-1 7() 00 0.01 19473 no 1:<115029'
( ;IIn1ltLl ndir S23, 90 .70 125 797 62 6 22 1GOU (,]~ fH 0.0< S9967.00 1~1-:G46.G~

Itourly Rl\Dlhu)' Co.nmc:rcbl Rhld('tltlnl Spt'tl .. 1
V.wunt Trntl$p0r1 ..
Owlt-up N"U1C' O( IACtfloa l...me ,,·kllh· Spoct·· S,.,n-" • Purpon JipoK"C •• lion Righi
SpM('l!. · .. cOat\! . Spw..-II:- .. o(WOIy··
Inte~.:1. ion onlin;ll Ad.lln Ktull Rd ! \fMi POOf Rd 5210 59.52 1)06 15.55 0.00 320 n .OO 6589.00 6U9&9.OO 16262KSj
C~rri Cino: I'11.'1 SiCJ1.:l J 0042 10MAO 139797.67 II G74, l<2 564618 7982R .6~ 61967.3' 157119,21
Pil~IIt1Ml Cl}(l"'k 87311 1 7 '1.4 22~G3S .11 133570,00 0.00 £1 .00 6 191000 361205.32
r'y\;\!l Wa h ~I \l.~\[ u~ . :\i.~ h ( l"r Rd GMd]\1 Oard.:-n 2500 ·15 Il )4260». 50UJ5.00 734".00 0.00 62629.00 91635.69
J,: 1L"ri Grtlu(1d. ,-\.blliL 1\.h.1I1 Rd 6182 H 2O 8lOG3 H 39'),3.00 0.00 0.00 6496300 12~6 S4
LI' ~ll1I k":l Round abIJut L,o..;;"tiw I 13784 6".8-4 11 698S,,8 lH-l1.30 0,00 OW 65GJ9.(J/J 129531.89;
l..Ju;.hc la 8376 37.24 138526.1 3 4204.0. 1"2700.00 0.00 G795G.OO ! H ... 3U.48
.·\JI.:Jh Willi Cha\\r.tJ\bi. Sh.ll-II1lh-c·QuJ)iLi&"'11 16SS 8L\ 48 41 567,15 373170C 105.00 3332.00 6964400 79599."
Lu.J..y St:.r 493C 26.60 164395.80 10810.)7.3 1 0.00 24626. 23 6')736.7 /t 27319316
~11!f':\\"(:.l.\h(:('" O\\Cf" 1184' 4H9 154"'72.79 U.OO DUO 6 10900 F663 1.00 154"72 .79
11l1~1Ml1I of L"liuddin ("lIlt:h~hfl) Rd. :lI)d Shallf.lh· 1413C 53.10 27363182 1 6 ) ~"~ .Oll OW 0 00 1326 1900 "35479 f!2
Ic-Li"q"t Int~1ioo. or o . Allana At;h.l. }o.J\;1.1I. J .. m~1 J\J\.1 1"\:1 4058 6·1 .84 ' 55 11.60 109336.00 220223.00 0.00 114:-;52011 -'1507 • . GC
r:nJt Subtu.ni 4026 53.20 94G I 2.64 33·192 .. 33 tI.OO 2514.55 20'971.67 H 81U-I.9
• l"nU: r .. d •• \jult: Sqlmrc (1'('1

Annexure I
Pictorial mustrations of the Problem
Figure 1.1:
Traffic Congl.'Stiol1 fomllng Very High Ri:sk
Figure 1.2: Visibility Problem ncarby Emprc .. Market (Very High Risk Zone)
426

Figure I.J: Typical Old City llru:lin;J (Very Hi\1l Risk Zone)
Figure 1. 4: Slack SlK>lre e.u..s.Lor> in C'Dn:)ested Streets o f very High Risk Zone
427

Annexure J
Plume Dispenion from Industry, Karachi: Monitoring through OptiCllI Imageries
Fi gure J . l : Landsa t 5 - TM, 1992, Bands 2 , 5, 7
Figure J. 2: Landsat 5 - TN, 199B, Bands 2 , 3, 4
428

Figure J. 3: KVR, 1998, Very High Spatial Resolution (2 meter)
42~
Copyright © 2022 FDOKUMEN