A usability-driven approach to the development of a 3D web-GIS environment
35
Journal of Visual Languages & Computing Journal of Visual Languages and Computing 18 (2007) 280–314 A usability-driven approach to the development of a 3D web-GIS environment Vincenzo Del Fatto a , Luca Paolino a, , Fabio Pittarello b a Dipartimento di Matematica e Informatica, Universita` di Salerno 84084, Fisciano (SA), Italy b Dipartimento di Informatica, Universita` Ca’ Foscari 30172, Mestre (VE), Italy Abstract The main goal of this work is to provide an advanced visual environment where users that are not skilled for what concerns the computer science domain may compose queries related to those geographical phenomena for which the third dimension is a relevant feature. Visual queries are composed in a 3D environment accessible from the web where the users manipulate geographical objects, called 3D geometaphors. The geometaphors represent the operands of an underlying algebra characterized by a set of topological, directional and metrical operators; such operators are expressed in the query environment in terms of visual relationships between the geographical objects. The introduction of the third dimension for querying the geographical databases has challenged the authors with a number of important issues related to the area of visualization, navigation and object manipulation. According to the principles of usability engineering, the authors have built different prototypes based on a client-server architecture that have been iteratively evaluated by experts and final users in order to discover drawbacks and to improve the quality of the proposal. The result is a coordinated user-friendly 3D visual metaphor for querying GIS on the web, where all the elements needed for composing a query have a visual, easy to understand, counterpart. r 2007 Elsevier Ltd. All rights reserved. Keywords: Advanced visual interfaces; Geographical information systems; Visual environment; Visual query languages ARTICLE IN PRESS www.elsevier.com/locate/jvlc 1045-926X/$ - see front matter r 2007 Elsevier Ltd. All rights reserved. doi:10.1016/j.jvlc.2007.02.007 Corresponding author. E-mail addresses: [email protected] (V. Del Fatto), [email protected] (L. Paolino), [email protected] (F. Pittarello).
Transcript of A usability-driven approach to the development of a 3D web-GIS environment

ARTICLE IN PRESS
Journal ofVisual Languages & ComputingJournal of Visual Languages and Computing
18 (2007) 280–314
1045-926X/$
doi:10.1016/j
�CorrespoE-mail ad
(F. Pittarello
www.elsevier.com/locate/jvlc
A usability-driven approach to the development of a3D web-GIS environment
Vincenzo Del Fattoa, Luca Paolinoa,�, Fabio Pittarellob
aDipartimento di Matematica e Informatica, Universita di Salerno 84084, Fisciano (SA), ItalybDipartimento di Informatica, Universita Ca’ Foscari 30172, Mestre (VE), Italy
Abstract
The main goal of this work is to provide an advanced visual environment where users that are not
skilled for what concerns the computer science domain may compose queries related to those
geographical phenomena for which the third dimension is a relevant feature. Visual queries are
composed in a 3D environment accessible from the web where the users manipulate geographical
objects, called 3D geometaphors. The geometaphors represent the operands of an underlying algebra
characterized by a set of topological, directional and metrical operators; such operators are expressed
in the query environment in terms of visual relationships between the geographical objects. The
introduction of the third dimension for querying the geographical databases has challenged the
authors with a number of important issues related to the area of visualization, navigation and object
manipulation. According to the principles of usability engineering, the authors have built different
prototypes based on a client-server architecture that have been iteratively evaluated by experts and
final users in order to discover drawbacks and to improve the quality of the proposal. The result is a
coordinated user-friendly 3D visual metaphor for querying GIS on the web, where all the elements
needed for composing a query have a visual, easy to understand, counterpart.
r 2007 Elsevier Ltd. All rights reserved.
Keywords: Advanced visual interfaces; Geographical information systems; Visual environment; Visual query
languages
- see front matter r 2007 Elsevier Ltd. All rights reserved.
.jvlc.2007.02.007
nding author.
dresses: [email protected] (V. Del Fatto), [email protected] (L. Paolino), [email protected]
).

ARTICLE IN PRESSV. Del Fatto et al. / Journal of Visual Languages and Computing 18 (2007) 280–314 281
1. Introduction
Visual programming systems offer software engineering environments that enable bothvisual programming and program visualization to be undertaken [1]. Moreover, recentstudies have shown that visual languages represent a promising means for allowingunskilled users to query geographical databases, and to interpret and possibly reuserecorded queries [2,3].
Systems like Cigales [4], GISQL [5] and the GIS Wallboard [6] are mainly based on thedefinition of graphical representations for the spatial properties associated with thegeographical data manipulated, and for the involved spatial operators. Spatial propertiesare referred to the geometry of the geographical data and to their topology, whichdescribes the objects’ relative positions. When trying to add user-friendliness to GIS, theassociation of visual descriptions to such features seems to be quite a natural step. As amatter of fact, many systems have been primarily targeted at querying visually the spatialfeatures of GIS data (see also [7,8]).
The goal of the research that we have been carrying out in the last years has been toprovide users with further intuition about the data processed, by means of a visual querylanguage, which describes also the semantics of those data in the real world. A first step inthat direction was the development of a visual environment, the Metaphor GIS QueryLanguage (MGISQL), in which the concept of geometaphor was introduced tosimultaneously capture the topological and the thematic components of geographicaldata [9].
In this paper we propose an extension of MGISQL to the 3D domain and to the web,called WebMGISQL 3D. The key features which have been added include the possibility tomake queries about those phenomena where the third dimension is a relevant aspect andthe chance for the users to query and retrieve the spatial information by making remoterequests on the web.
The first feature extends the usefulness and intuitiveness of visual queries to all thephenomena for which the third dimension is relevant. During the design phase the authorsof this work have examined carefully the association of variables and relationships to theirvisual counterparts, for allowing the users to build more easily a mental model of the wholeprocess.
The latter feature is particularly important for enabling the users to access seamlesslyremote geographical databases using standard web technologies that require noconfiguration effort by the user. Besides, the client-server approach is useful also forusers that access information using systems with low computational performances (e.g.,old computers and mobile systems).
The design process has taken advantage of techniques related to the usabilityengineering [10,11], including iterative prototyping and a systemic approach to theevaluation of the different design artifacts in order to obtain a better result. In particular,the evaluation process has involved in the different stages of development both expertevaluators and final users.
The paper is organized as follows: Section 2 analyzes systems related to the proposal,dividing them into two categories, namely systems for making textual queries and systemsfor building visual queries. Section 3 gives the reader an overview of the designmethodology used for developing the visual query environment. Section 4 describes theuser profiles, activities and scenarios that represented the starting points for the interface

ARTICLE IN PRESSV. Del Fatto et al. / Journal of Visual Languages and Computing 18 (2007) 280–314282
design. Section 5 focuses on the definition of the visual counterparts for the operands (i.e.,the geometaphors) and for the spatial operators considered in this work. Section 6 presentsthe visual environment for composing queries: three different prototypes, iterativelydeveloped and followed by their evaluation, are described. Section 7 presents theunderlying system architecture, based on a client/server model. Section 8 draws the finalconclusions. Finally, Appendix A illustrates background information related to the formalmodel underlying WebMGISQL 3D.
2. Related work
The main research areas related to our work include textual languages and visual languagesfor GIS querying. Concerning textual languages, Section 2.1 will offer a description ofdifferent proposals and a justification for our choice of the OpenGIS SQL standard; the limitsof the textual approach will be discussed too, illustrating to the reader the reasons formigrating to a visual solution. Concerning visual languages, Section 2.2 will describe previousproposals of visual languages and environments for performing GIS queries.
2.1. Textual query languages
In literature among several existing approaches for extending SQL in order to managespatial data (see e.g. [12–17]), SQL3 [18] and OpenGIS SQL [16] are recognized asstandard.Both the SQL3 and OpenGIS SQL specifications have facilities for using abstract data
types (ADTs). In particular, OpenGIS SQL represents an extension to the SQL92specification for incorporating geo-spatial ADTs [19], enhancing the features alreadyavailable in the earlier Spatial SQL specification [12]. Currently it is considered as thestandard for the manipulation of spatial data. That is the reason why we chose it as thetarget language for our proposal.SpatialSQL syntax inherits the same problems associated to the textual query languages
for traditional databases: typing commands can be tiring and lead to errors [20]; the syntaxis tedious to use and to learn [21]; users may spend more time thinking about commandtools to use than thinking about the task at hand [20]. Besides, Kaushik and Rundensteiner[22] state that while spatial relationships are often thought by the users in terms of imagesthat depict the spatial positions, SQL translates them into a non-spatial language; suchtranslation represents therefore a further obstacle to the composition of the query.Mark and Gould [15] suggest that composing queries using the natural language
probably might be a significant opportunity for allowing the users to interact with a GIS;unfortunately this is not easy to achieve. Aufaure-Portier and Trepied [23] add thatalthough the natural language approach may appear as a better opportunity for the GISusers, query expressions can be verbose, difficult and characterized by unresolvedambiguities. That is the reason why we shifted towards a proposal including a visualtranslation of the operands and the operators that characterize the SQL syntax.
2.2. Visual querying languages
Visual languages are today being widely used as a means for reproducing the user’smental model of the data-manipulated content [9]. A great deal of work has already been

ARTICLE IN PRESSV. Del Fatto et al. / Journal of Visual Languages and Computing 18 (2007) 280–314 283
carried out to use such languages for traditional and object-oriented databases in order toaddress usability problems. Iconic, diagrammatic, graph-based and multimodal ap-proaches are available. Some approaches related to the spatial domain have consideredalso sketch-based interfaces for composing the query [21,24].
In 1995, Lee and Chin [7] proposed an iconic language where icons are used to representobjects and processes. Queries are expressed by building up iconic sentences using agraphical interface. The difficulties related to such approach arise from the fact that theobjects in the query expression need to be explicitly specified along with their associated classand attributes. Unfortunately such approach makes the language cumbersome for the casualuser. Besides, only a limited number of spatial relations can be used in the queries [21].
Jungert [25] proposed a query language named GRAQULA where simple queries arecarried out as the user selects the objects on a map and executes functions between theobjects themselves. In [26], he also proposed a spatial/temporal query language to supportthe retrieval, fusion and discovery of multimedia information. It is based on the SQLwhich is based upon the s-operator sequence and in practice expressible in an SQL-likesyntax. Another graph-based language was described by Traynor and Williams [27] andTraynor [28]. In their approach, users place panels representing categories in a graphicaldiagram. In spite of that, users must still use textual commands to compose the query.Kaushik and Rundensteiner [22] proposed a direct manipulation approach namedSVIQUEL (Spatial Visual Query and Exploration Language). Users can specifytopological and directional spatial relations between region objects using filters calledS-sliders. This approach is limited in that it allows the users to compose a query using onlyobjects belonging to the class region. Besides, although the interface is simple to use, thereare some ambiguities in the query interpretation [29]. The system was extended [30] forallowing to query non-spatial data, even though this had to be carried out in a separatewindow. Non-spatial queries were made using sliders, limiting the approach only to simplequeries.
Most sketch-based languages adopt a query-by-example approach [31] where userssketch an example of the results that they would like displayed. In spatial databasessketches are usually referred to spatial configurations [21]. Sketch! [24] was one of the firstsketch-based languages for spatial databases, that used a syntax directed editor forcomposing the queries. The non-spatial parts of the database were queried using diagramssimilar to the ER model. However, Haarslev and Wessel [32] observed that in spite of theformal semantics used in Sketch!, there are no mathematical foundations to the spatialrelations.
Cigales [4] is another example of a sketch-based query language for GIS. Users expressqueries by clicking on a set of buttons for selecting features and operations; the systemthen activates the drawing of the queries. The main drawback of Cigales comes from themultiple interpretations and visual representations of the queries and also from the lack oflogical operators [33].
LVIS [33] was defined as an extension to the Cigales language. The extension definedsome new operators, attempting to resolve the interpretation ambiguities, and wasintegrated into a customisable visual environment. However, the attempt to resolve theambiguities was limited [29].
In Spatial-Query-By-Sketch [21,34] users build up queries by drawing spatialconfigurations on a touch sensitive screen. Users can augment or reduce the accuracythreshold for the drawing, enabling the browsing of exact and similar matches.

ARTICLE IN PRESSV. Del Fatto et al. / Journal of Visual Languages and Computing 18 (2007) 280–314284
The Pictorial Query Language (PQL), proposed by Ferri et al. [35], includesgeographical features and it is characterized by an object-oriented environment. Usersformulate queries by placing together configurations using symbolic features. In Ferri et al.[29], a syntactic and semantic correctness method is defined, in order to reduce the multipleinterpretations of the queries.In general sketch and drawing-based approaches are suitable for expressing similarity-
based queries. Such methods can become complex in a general context characterized bycomposite queries. Users need to know the target of their search and they do not getbenefits when they only want to browse through the data sets [30]. Besides, sketch anddrawing-based approaches rely on the user’s ability to express spatial relationships in asketch. Even if some approaches offer support to the user during the drawing phase, exactqueries can be generally ambiguous due to the several possible interpretations of the visualconfigurations [33].VISCO is a multimodal query language for defining approximate spatial constellations
of objects [8,32]. VISCO uses a metaphor that is based on the semantics of everydayphysical objects. It uses a combination of an iconic library and command line operators;queries are built by drawing in the query pane. A drawback of this language is that it canonly query the spatial data in a GIS, and only simple thematic descriptors such as Lake orCity can be typed onto the objects.
3. Design methodology
As stated in the Introduction, the design methodology used for this work takesadvantage of the concepts and the techniques related to usability engineering [10,11] anduser-centred design [36] in order to obtain a visual environment compliant with the userneeds. As illustrated by Fig. 1, users are an important part of the design process, startingfrom the early stages of the requirements’ definition to the final validation stages; togetherwith the usability experts, they give an essential contribute both to the design and thevalidation of the different stages. Besides, the methodology takes advantage both ofiterative design and iterative evaluation techniques which characterize typical usabilityengineering processes with a design methodology that aims at obtaining significantimprovements of the final application through the systemic application and validation ofusability principles.Let us consider in detail the different steps of the design process: the process begins with
the definition of a set of users profiles corresponding to different groups of users that maybe interested in using the system; each profile is associated to a specific set of activities thatthe system should help to accomplish; finally, a set of scenarios 6 consistent with theprofiles and the tasks to be accomplished are designed. The user profiles, the related tasksand scenarios are the starting point for the design of the interface. In the final validationphase, representatives of the different user profiles will validate the design proposals,acting in the context of the scenarios designed in the initial phase.The second phase includes the definition of visual counterparts for the geographical
objects and their spatial relationships (i.e., topological, directional and metrical).While it is straightforward to find a good representation for the topological and the
metrical relationships, defining a visual counterpart for the topological relationships ismore complex. In our approach such definition is based on the 9-intersection model byEgenhofer and Herring, a comprehensive model for binary topological spatial relations

ARTICLE IN PRESS
definition of user profiles, tasks and scenarios
definition of visual counter parts for objects and spatial relations
definition of the visual environment for composing queries (1st prototype)
refinement of the visual environment for composing queries (II prototype)
validation of the visual environment (with final users)
definition of the final visual environment for composing queries
phase 1
phase 2
phase 3
validation of the visual counter parts (with final users)
validation of the visual environment (heuristic evaluation)
Fig. 1. A schematic representation of the design methodology.
V. Del Fatto et al. / Journal of Visual Languages and Computing 18 (2007) 280–314 285
that applies to objects of type region, line and point [37] (see Appendix A). The visualrepresentations derived from the 9-intersection model were submitted to a group of usersfor finding the best match between such visual objects and a set of textual labels related tothe topological relationships defined by the OpenGIS Consortium [16].
The third phase, related to the definition of the visual environment for composing thequeries, is the most complex and includes the iteration of the prototyping activity, coupledwith two different validation stages. A preliminary prototypical environment forcomposing the queries was defined; in such environment the visual elements validated inthe second design phase are visualized together with a set of supporting tools and aids thathelp the users to manipulate the spatial metaphors inside a 3D area called sensible board,receiving appropriate feedback. The prototypical environment was then validated by asmall group of usability experts that consider the different features in relation to the well-known 10 usability heuristics [10,11].
The results of such validation lead to design of a more advanced prototype taking intoaccount the reviewers’ suggestions; a final validation stage, performed by representatives of

ARTICLE IN PRESSV. Del Fatto et al. / Journal of Visual Languages and Computing 18 (2007) 280–314286
the user profiles defined in the first design phase, concludes the process and leads to thethird final prototype.
4. User profiles, requirements and scenarios
At the Computer Science Department of the University of Salerno we identified twodifferent profiles of users that may be interested in using our system: the student and thedatabase professor; such groups don’t include all the potential users of the system, but theyrepresent two interesting profiles offering the additional advantage of permitting us tovalidate the system thanks to the constant collaboration of their representatives. Most oftheir suggestions, collected in the validation phase, are general enough to be useful also forother profiles that may be considered as additional targets for our proposal.The traits of the different profiles were identified interviewing a number of people
belonging to such categories.The student profile characterizes young women and men aged from 19 to 25, studying
computer science. They like to travel and visit different places, including foreign countries.They would appreciate a web service accessible from the locations they visit to assist
them in collecting information about such places, in order to minimize the time to discovernew interesting sites. Such service should have an easy interface and should enable them toask information about locations of places (e.g., museums, restaurants, hotels, stations, etc.)or different associations (e.g., locations of hotels next to a certain museums, etc.); besidessuch service should enable them to print maps containing summaries of the search results.The database professor profile includes people aged from 35 and above, graduated in
computer science and teaching database management systems in the public Italianuniversity. The representatives of such profile are interested in exploring all the teachingopportunities to improve the knowledge of their students.In particular they are interested in exploring new methods to teach spatial SQL that
represents a challenge for educational activities: students have difficulties to understandthe concepts and the relations between the different spatial operators; therefore theintroduction of visual metaphors that represent textual queries may be useful to smooththe learning curve of their students.
4.1. User requirements
Table 1 summarizes the activities for which the different categories of users would needsupport; each activity is briefly described and it is followed by two short notes derived fromthe users’ interviews about the importance attributed to it and to the frequency of theactivity itself.
4.2. Scenarios
Two different scenarios, associated with the user profiles and consistent with therequirements defined above, were considered. Such scenarios were used in the validationphase where representatives of the two users groups were asked to test the system.In the first scenario the user plays the part of a student going abroad for vacancy; when
the student has arrived to her/his final destination, (s)he decides to take advantage of a

ARTICLE IN PRESS
Table 1
User profiles and associated activities
Activity Frequency Importance
Student profile
Access the service from any computer connected to the Internet, using
standard web technologies that require no software installation
Sometimes High
Locate easily single categories (or instances) of places Sometimes High
Locate easily places corresponding to spatial associations of different
categories of locations
Sometimes High
View maps describing the search results Sometimes High
Print maps Sometimes Medium
Database professor profile
Represent the visual counterparts of the operators and the spatial
operands that characterize a spatial SQL
Frequently High
Compose in an intuitive manner a spatial query using such visual
counterparts
Frequently High
Compare the visual query with the textual SQL query Frequently High
Show the query results to improve further the learning process Frequently Medium
V. Del Fatto et al. / Journal of Visual Languages and Computing 18 (2007) 280–314 287
web-based tourist information service, accessible from the hotel, in order to discoverquickly interesting locations.
The student learns how to use the system by herself/himself. After a brief exploration ofthe capabilities of the system, the student takes advantage of the WebMGISQL interfaceto compose spatial associations of operands’ pairs (e.g., churches located at the city’s northside, 1 km far from the hotel) in order to find the locations the best fit her/his interests. Thestudent visualizes the search results on a map and finally prints them for using them asnavigational aids in the exploration of the city.
In the second scenario the user plays the part of a database professor exploring theexpressivity of the WebMGISQL visual interface to represent operands and spatialoperators. The professor composes a number of queries selecting operand’ pairs andchoosing different spatial operators.
5. Defining the visual counterparts for the operands and the spatial operators
Following the traditional approach of visual languages, queries are expressed in terms ofspatial composition of visual elements representing objects, operators, and functions. Thissection will illustrate the association of visual counterparts to the geographical objects andto the related spatial relationships; such association represents the first important designchoice and is followed by the definition of the visual environment for selecting andmanipulating such objects (see Section 6).
Section 5.1 will describe the visual artefacts, named geometaphors, representing thegeographical objects that can be selected in a query.
Section 5.2, 5.3 and 5.4 will consider the topological, directional and metricalrelationships between the geometaphor pairs. As stated in the Introduction, while findingan appropriate visual association for the directional and metrical relationships was quiteeasy, associating textual labels identifying the topological relationships with the visual

ARTICLE IN PRESSV. Del Fatto et al. / Journal of Visual Languages and Computing 18 (2007) 280–314288
representations was more complex and required a further validation phase with the finalusers.The concluding Section 5.5 will face the issue of representing in parallel all the spatial
relationships described above.
5.1. Representing the operands: the 3D geometaphor
In our proposal, geographical objects are represented by a composite visual element,named 3D geometaphor, derived from previous research work [9] and represented in Fig. 2;such visual element has been extended in order to take into account the role of the thirddimension.Different categories of geographical objects may be represented using the geometaphors,
including Regions, Lines and Points.Geometaphors are characterized by iconic and property components, as shown in Fig. 2.The first component is characterized by the physical description of the object, a textured
3D cube, with an associated meaning. The presence of labeled textures is an importantfeature in order to stimulate the visual and textual cognitive styles of the end users. In sucha way, users understand the meaning at once and are immediately able to use them.While 2D icons are effective for the retrieval of objects inhabiting a 2D space, they do
not allow an exact definition of the spatial relationships where the third dimension is arelevant feature. That is the reason why we need to introduce 3D icons. Such introductionhas been necessarily coupled with the definition of a 3D environment where such objectscan be manipulated. In fact, as demonstrated by research in experimental and cognitivepsychology, the mental processes of human beings simulate physical world processes.Computer-generated line drawings representing 3D objects are regarded by human beingsas 3D structures and not as image features; as a consequence, humans imagine that spatialtransformations, such as rotations or shifting, happen in the 3D space.The second geometaphor’s component is divided into type, representing the object type
used to store the data (e.g., a REGION for squares or a LINE for rivers), and source,indicating where the data should be retrieved. The source field can contain a table, a view
Fig. 2. A schematic representation of the Geometaphor components.

ARTICLE IN PRESS
Fig. 3. DTD for representing the components of the geometaphor.
Fig. 4. XML code representing the Italian rivers geometaphor.
V. Del Fatto et al. / Journal of Visual Languages and Computing 18 (2007) 280–314 289
name, an SQL query or a function. For example, the geographical object ARCHAE-OLOGICAL_OBJECTS, may be characterized by a physical description expressed by a3D textured cube, a meaning defined by the words Archaeological Objects, a type Point anda source containing the query SELECT * FROM objects WHERE years ¼ ‘‘200 B.C.’’ (i.e.,such query would retrieve all the archaeological objects instances dated around 200 B.C.).
Information related to the 3D geometaphor is stored using an XML description,validated by the DTD illustrated in Fig. 3.
If we consider again the archaeological objects example, we can express the elements ofsuch geographical object with the XML code shown in Fig. 4, compliant with the DTDpreviously described.
The code is a fragment of an XML file that may contain more than one object, as declaredby the DTD definition. The tag object has an attribute type for declaring the type of theobject (i.e., Point) and contains all the other components: the tag name, for declaring thename of the element (i.e., archaeological objects), the tag description for declaring the sourceand the tag img for indicating the path to the image mapping the faces of the 3D icon.
After having defined the representation for the geographical objects, we will focus on thedefinition of visual counterparts for their relations. In particular, the following threesubsections will focus on the topological, directional and metrical relationships.A concluding subsection will focus on how to represent in parallel different categoriesof relations, giving to the user adequate feedback.
5.2. Modeling the topological relationships
The model for binding visual representations to topological relationships is derived froma survey we performed with a group of potential users. The subjects were twenty males andfemales between the ages of 20 and 50; all the participants were usual users of PCs andwere familiar with GIS technology and the notion of topological relationship. The test wasconducted in a quiet classroom after courses.

ARTICLE IN PRESS
Fig. 5. Visual compositions generated by the Egenhofer 9-intersection matrix.
V. Del Fatto et al. / Journal of Visual Languages and Computing 18 (2007) 280–314290
We asked the subjects to provide a resemblance value between pairs of geometaphorscomposed in a 3D abstract environment and textual labels expressing topologicalrelationships.Fig. 5 represents the pairs of geometaphor and the visual compositions taken into
account; each composition corresponds to a different valid Egenhofer 9—intersectionmatrix [37].As discussed in [38], the representation of 3D objects on a 2D plane benefits from the
implementation of a number of pictorial cues (e.g., perspective, shadow, etc.) that diminishthe ambiguity of the recognition by the user. Accordingly to that research, we used anumber of cues for easing the task of recognizing the spatial relations between thegeometaphor pairs. The cues used included color, semi-transparency and motion (i.e., theability for the user to change point of view in order to address occlusion issues). It isimportant to point out that the order the geometaphors are selected and composed wasmeaningful for the answer and that the subjects were enabled to distinguish the firstselection from the latter. In Fig. 5 the first selection is identified by the red color andlabeled as R while the latter selection is identified by the blue color and labeled as B.The topological relationships are defined according to the OpenGIS specification and
include: Equals, Disjoint, Touches, Within, Overlaps, Contains, Crosses and Intersects.The scale for the resemblance parameter was set from 0 to 10, where 0 was associated to
the value it does not correspond to the relationship and 10 was associated to the value it fully
corresponds to the relationship.The results we obtained from the interviews are summarized in Figs. 6–11. Each visual
composition is associated to a pie chart displaying the resemblance percentages resultingfrom the answers. The percentages are calculated by summing, for each relationship, theresemblance values assigned by all the subjects (Yj ¼ Sxi where xi is the value assigned bythe user i) and dividing the result by the overall sum of all the values assigned by the usersto all the available labels (Z ¼ SYj); then the results are normalized, assigning the value100% to Z.Therefore each pie chart represents, for a given visual composition, the relative
importance of the different user interpretations, evidencing if there is any convergence on aspecific textual label.The result implies that the subjects’ mental model does not univocally associate the Op1
operation with a specific relationship. Additional observations are needed in order to select

ARTICLE IN PRESS
Intersects
30%
Contains
6%
Equals
9%
Disjoint
0% Touches
9%
Within
3%
Overlaps
18%
Crosses
25%
Fig. 6. Subjects’ interpretation of the visual composition Op1.
Equals
12%
Contains
0%
Touches
0%Within
0%Overlaps
0%
Crosses
0%Intersects
0%
Disjoint
88%
Fig. 7. Subjects’ interpretation of the visual composition Op2.
Contains
3%
Equals
10%
Disjoint
0%
Touches
41%
Within
3%
Overlaps
9%
Crosses
12%
Intersects
22%
Fig. 8. Subjects’ interpretation of the visual composition Op3.
V. Del Fatto et al. / Journal of Visual Languages and Computing 18 (2007) 280–314 291
a single interpretation from the resulting set. For obtaining such result we take advantageof three remarks that reduce the most part of the ambiguity:
�
Remark 1: The order the geographical objects have been selected is relevant (e.g., for theOp4 composition only R Contains B is true and not B Within R.
ARTICLE IN PRESS
Equals
6%
Disjoint
0%
Touches
9%
Within
14%
Overlaps
7%
Crosses
6%
Intersects
22%
Contains
36%
Fig. 9. Subjects’ interpretation of the visual composition Op4.
Contains
20%
Equals
20%
Disjoint
0%
Touches
9%
Within
19%
Overlaps
12%
Crosses
4%
Intersects
16%
Fig. 10. Subjects’ interpretation of the visual composition Op5.
Equals
4%Disjoint
0%
Touches
8%
Within
35%
Overlaps
8%Crosses
4%
Intersects
18%
Contains
23%
Fig. 11. Subjects’ interpretation of the visual composition Op6.
V. Del Fatto et al. / Journal of Visual Languages and Computing 18 (2007) 280–314292
�
Remark 2: The Intersects relationship has a lower priority with respect to the otherrelationships; Intersects is a relaxed relationship that can be defined also as Not Disjoint;in other words, it can be associated to all those situations where all the otherrelationships defined above (with the exception of Disjoint) exist; in this work, whenambiguity situations exist, the higher priority relationship is applied.
ARTICLE IN PRESSV. Del Fatto et al. / Journal of Visual Languages and Computing 18 (2007) 280–314 293
�
Remark 3: Some topological relations make sense only for specific categories of objects(e.g., the Point–Point geometry pair accepts only the Disjoint, Equals, Intersects andOverlaps relations).Applying such remarks to the Op1 visual composition we obtain a reduction of theambiguity deriving from the subjects’ answers.
In the case of the Point–Point (P–P) and Region–Region (R–R) geometry pairsthen only the Overlaps and Intersects relationships belong both the Egenhofer’s set and tothe resemblance set (Overlaps, Crosses and Intersects). The Overlaps relationship has apriority higher than Intersects; therefore, applying Remark 2, the Overlaps relationship isselected.
In the case of the Line–Region (L–R), Point–Region (P–R) and Point–Line (P–L) pairs,only Crosses and Intersects belong both to the Egenhofer’s set and to the resemblance set.According to Remark 2, the Crosses relationship is representative of Op1 for suchgeometry pairs.
A more difficult case happens when the geometaphors represent two lines (L–L). In suchsituation both Crosses and Overlaps are admissible; the users, interacting with a systemimplementing our associations, will need to select the proper relationship at run-time,according to the specific situation.
As for the remaining geometry pairs, according to Remark 3, the Intersects relationshipis the only choice that may be applied. All the results related to Op1 are summarized inTable 4.
Fig. 7 shows the resemblance result obtained for the Op2 operation. The most significantpercentage is represented by the Disjoint relationship (88%); a much smaller value (12%) isassociated to the textual label identifying the Equals relationship. Users motivated thelatter association stating that the cubes had the same size and therefore could resemble theEquals relationship; such answer motivated us to adopt a perspective view, instead of anorthogonal one, for the visual query environment where geometaphors are put in relation.
Concluding, the Op2 operation has been associated to the Disjoint relationship for anypair built with the geometry types Point, Line and Region.
The results for the Op3 visual composition are summarized in Fig. 8. Two relation-ships are particularly important: Touches, which gains the 41% of the sample, andIntersects which is represented by the 22% of the sample. According to Remark 2,we 15 have associated the Touches relationship to any pair of geometries, with theexception of the Point–Point (P–P) pair; given that Touches is not defined for such categoryof objects (i.e. points), according to Remark 3 we have decided to apply the Intersects
relationship.As for the Op4 visual composition (Fig. 9), the most important relationship is Contains,
but significant results were obtained also for Intersects and Within. According to Remark2, we have associated the Contains relationship for any pair of geometries that permits thisrelationship (i.e. all pairs where the first geometry has a greater dimension than the secondone: (R–R), (R–L), (R–P), (L–L) and (L–P)). In the other cases we have applied theIntersects relationship that represents the second subjects’ choice. According to Remark 1,the Within relationship has not been considered; such relation seems to be related to awrong interpretation by the subjects of the geometaphors’ selection order.
Fig. 10 shows the results for the Op5 operation: the Equals, Within and Contains
relationships result as admissible hypotheses for the interpretation (i.e. their resemblance

ARTICLE IN PRESSV. Del Fatto et al. / Journal of Visual Languages and Computing 18 (2007) 280–314294
value varies from 19% to 20%). The interpretative model discriminates the proper relationon the basis of the geometry dimension (Remark 3). In particular:
�
Tab
Sum
Op
Op
Op
Op
Op
Op
if both the geometries have the same dimension (e.g., Point–Point) the model returns anEquals relationship;
� if the dimension of the first geometry is strictly bigger than the second one (e.g. Region-Line) the model returns a Contains relationship;
� if the dimension of the first geometry is strictly than the second one the model returns aWithin relationship.
The last visual composition considered is Op6 (Fig. 11). Such visual composition is verysimilar to Op4; the only difference is related to the selection order of the operands. Theconsequence is that the results obtained represent a mirror of those one obtained for Op6.In fact, we note a significant predominance of the Within relationship, followed byContains and Intersects.According to Remark 2, the Within relationship is applied when the first geometry has an
equal or smaller dimension than the second one. There is an exception to this remark whenboth the geometries belong to the type Points; in such situation Intersects is applied. Besides,Intersects is applied when the first geometry has a greater dimension than the second one.According to Remark 1, the Contains relationship has not been considered because it
seems related to a wrong interpretation by the subjects of the geometaphors’ selection order.In conclusion, Table 2 summarizes the bindings among the different geometry pairs,
visual compositions and labels describing spatial relationships.As stated at the beginning of the section, we mapped different categories of geometries
(i.e., Points, Lines and Regions) with a unified representation, a 3D textured and labeledcube. Some subjects told us that further information about the category of geometrieswould have been useful to assign more precise bindings between the visual compositionand the topological relationships. Because of that, we organized an additional test wherethe geometries were associated to three different representations (see Fig. 12).The results derived from the new test do not highlight significant improvements. In fact,
the resulting resemblance diagrams are similar to the previous ones deriving from theunified representation of the objects; besides, in some cases, the new diagrams have showna wider dispersion of data.Fig. 13 shows three distinct visual representations (Op4.1, Op4.2, Op4.3); in each
situation a blue object (i.e., respectively a Region, a Line or a Point) is represented within ared object representing a Region.
le 2
marization of the bindings deriving from the survey
R/R R/L R/P L/R L/L L/P P/R P/L P/P
1 Overlaps Intersects Intersects Crosses Overlaps/Crosses Intersects Crosses Crosses Overlaps
2 Disjoint Disjoint Disjoint Disjoint Disjoint Disjoint Disjoint Disjoint Disjoint
3 Touches Touches Touches Touches Touches Touches Touches Touches Intersects
4 Contains Contains Contains Intersects Contains Contains Intersects Intersects Intersects
5 Equals Contains Contains Within Equals Contains Within Within Equals
6 Within Intersects Intersects Within Within Intersects Within Within Intersects

ARTICLE IN PRESS
Fig. 12. An alternative approach for representing different geometries.
V. Del Fatto et al. / Journal of Visual Languages and Computing 18 (2007) 280–314 295
The different representations were shown in parallel to the subjects, asking them toassociate the visual compositions to the textual labels. The results show that the choice ofincreasing the number of representation augments the confusion of the users. In all thesituations, compared with the results obtained with the unified representation presented inFig. 9, there is a higher number of labels that have been associated to significant valueswith a lower variance among them.
We may infer from such results that a unified representation doesn’t vary significantly theusers’ interpretation of a certain visual composition and in some cases may lead to better resultsin terms of convergence towards a unique association between representation and labels.
5.3. Modeling the directional relationships
In this subsection we will focus on how to model the directional relationships forrepresenting them in a visual query language. There are several approaches to this issue:some works define directions approximating the objects in terms of their minimumbounding rectangles (MBRs) or as points; Goyal and Egenhofer [13] propose a model thatcan be used also for crisp objects and that makes use of a Boolean 3� 3 matrix forrepresenting the cardinal directions.
However, in order to represent the relationships in a 3D space we propose an extensionof the model based on the direction-relation matrix of [13] which takes into account twoadditional directions, defined by the Zenith and the Nadir relationships besides the existingNorth, South, East and West. The first one is the point on the celestial sphere intersected bya line drawn from the center of the Earth through the observer’s location on the Earth’ssurface (Fig. 14), while the latter is the point opposite to the zenith.
Consider the minimum bounding parallelepiped (MBP, for short) of a 3D object locatedin the center of the 3D space system: the infinite planes passing through the 6 faces of theMBP originate a 27-fold space partitioning (see Fig. 15a). Such 3D matrix (3� 3� 3, seeFig. 15b) can be used to represent the cardinal direction of a given object (the target object)with respect to the reference object placed into the center of the matrix.
5.4. Modeling the metrical relationships
The model for binding visual representations to metrical relationships is very simple anddoesn’t require sophisticated visual representations or complex interpretations of thecompositions of the visual elements. The value expressing the Euclidean distance, themetrical relationship considered for the operand pairs, is visualized on the 3D scenebetween the two geometaphors.

ARTICLE IN PRESS
6
0
9
14
7 6
22
36
13
11
22
1214
16
21
0
5
10
15
20
25
30
35
40
Touch
es
With
in
Ove
rlaps
Inte
rsect
s
Conta
ins
%
0
5
10
15
20
25
30
35
40%
op4 op4.2
6
0
9
14
7 6
22
36
8
3
1311
1311
16
25
0
5
10
15
20
25
30
35
40
%
op4 op4.3
Equals
Dis
join
t
Cro
sses
Touch
es
With
in
Ove
rlaps
Inte
rsect
s
Conta
ins
Equals
Dis
join
t
Cro
sses
Touch
es
With
in
Ove
rlaps
Inte
rsect
s
Conta
ins
Equals
Dis
join
t
Cro
sses
Op 4.2
Op 4.1
Op 4.3
6
0
9
14
7 6
22
36
1 2
8
20
10
1917
23
op4 op4.1
Fig. 13. Comparison of the subjects’ interpretation for the visual compositions Op4, Op4.1, Op4.2 and Op4.3.
V. Del Fatto et al. / Journal of Visual Languages and Computing 18 (2007) 280–314296
5.5. Visualizing topological, directional and metrical relationships in parallel
The opportunity to represent in parallel the different spatial relationships allows toincrease remarkably the visual language expressiveness.Without such capability, users could only describe queries referring to the single
categories of operators, such as: A disjoint B (i.e., topological relationship), A North B (i.e.,

ARTICLE IN PRESS
Fig. 14. Representation of the zenith in a 3D space system.
Fig. 15. (a) The space partitioning used for the directional relationships. (b) The representation of the
relationships in the 3D direction-relation matrix.
V. Del Fatto et al. / Journal of Visual Languages and Computing 18 (2007) 280–314 297
directional relationship) or A distance of Bp100 m (i.e., metrical relationship). It is evidentthat such samples represent only a part of all the sentences that can be generated usingcombinations of topological, directional and metrical operators.
The visual representations considered in the previous sections use the same artifacts (i.e.,the geometaphors) for displaying different spatial relationships; only the metricalrelationship adds an additional element to the representation (i.e., the numerical valuebetween the geometaphors). In this section we describe further elements which were addedto the already defined visual compositions for enabling the users to take advantage of aunified query environment where different relationships can be used in parallel. Suchelements help the users to distinguish clearly which operators they are currently using,avoiding ambiguity and errors in the query composition. The following mapping betweenthe spatial relationships selected by the users and the visualization on the 3D space wasadopted:
�
no selection of the spatial relationships: the cubes representing the geometaphors aredisplayed in an empty 3D space; � selection of the topological relationships: the visual composition is enhanced by a simpleplane textured with a grid; besides, a semi-transparent cube corresponding to thecurrent bounding box of the geometaphors is added for helping the users to understandthe relative positions of the geometaphors in the 3D space (see Fig. 16a);
ARTICLE IN PRESS
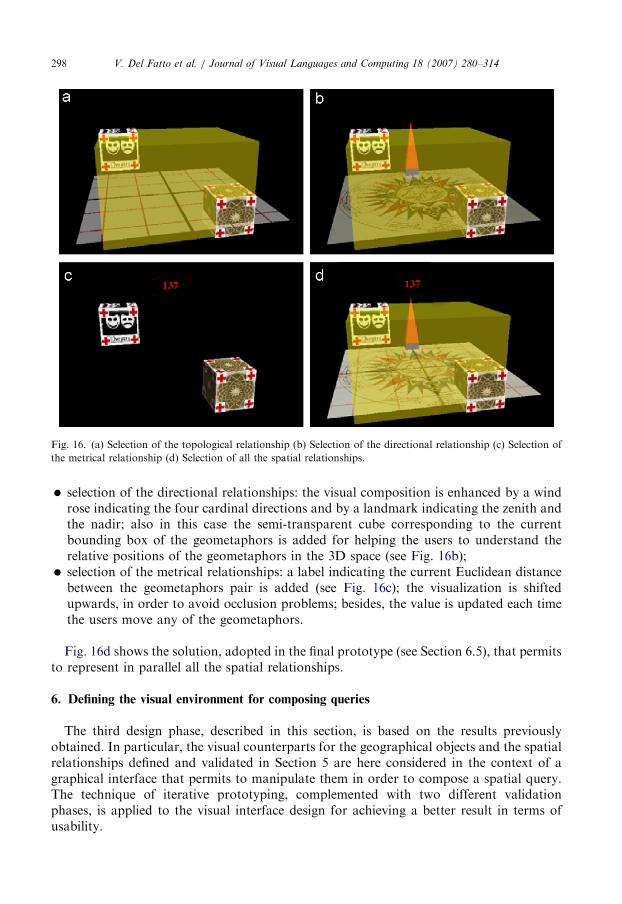
Fig. 16. (a) Selection of the topological relationship (b) Selection of the directional relationship (c) Selection of
the metrical relationship (d) Selection of all the spatial relationships.
V. Del Fatto et al. / Journal of Visual Languages and Computing 18 (2007) 280–314298
�
selection of the directional relationships: the visual composition is enhanced by a windrose indicating the four cardinal directions and by a landmark indicating the zenith andthe nadir; also in this case the semi-transparent cube corresponding to the currentbounding box of the geometaphors is added for helping the users to understand therelative positions of the geometaphors in the 3D space (see Fig. 16b); � selection of the metrical relationships: a label indicating the current Euclidean distancebetween the geometaphors pair is added (see Fig. 16c); the visualization is shiftedupwards, in order to avoid occlusion problems; besides, the value is updated each timethe users move any of the geometaphors.
Fig. 16d shows the solution, adopted in the final prototype (see Section 6.5), that permitsto represent in parallel all the spatial relationships.
6. Defining the visual environment for composing queries
The third design phase, described in this section, is based on the results previouslyobtained. In particular, the visual counterparts for the geographical objects and the spatialrelationships defined and validated in Section 5 are here considered in the context of agraphical interface that permits to manipulate them in order to compose a spatial query.The technique of iterative prototyping, complemented with two different validationphases, is applied to the visual interface design for achieving a better result in terms ofusability.

ARTICLE IN PRESS
Fig. 17. The first interface prototype.
V. Del Fatto et al. / Journal of Visual Languages and Computing 18 (2007) 280–314 299
The different phases, already summarized in Fig. 1, are discussed in detail in thefollowing subsections.
6.1. The first prototype
The first prototypical interface was designed on the basis of the visual representationsdiscussed in the previous sections and on a complementary brainstorming phase wheredifferent solutions for manipulating the geographical objects and selecting the spatialrelationships were discussed. A special attention was devoted to the design of a set of toolsfor changing the point of view on the scene, in order to diminish the occlusion problemsthat characterize all the 3D representations.
Fig. 17 shows the main five functional areas of the interface, evidenced also by differentcolors:
�
the most important area is located in the center of the user interface and contains the 3Dscene where the queries will be composed. Such area contains the geometaphors selected
ARTICLE IN PRESSV. Del Fatto et al. / Journal of Visual Languages and Computing 18 (2007) 280–314300
by the users and the other artifacts for giving appropriate feedback about the selectedspatial operations. Fig. 17 displays the content of the area after the selection of thedirectional relationships; according to Section 5.5 a wind rose and a landmark aredisplayed; the scene will be completed by a geometaphor pair after the user selection.The user interacting in this area can take advantage of direct manipulation techniquesboth for moving the geometaphors or for changing the point of view: in the first case theuser can drag the different faces of the geometaphors cubes in order to move them alongthe three Cartesian axes; in the latter case the user can drag the mouse over the rest ofthe 3D area in order to rotate her/his point of view around the objects that compose thescene;
� the area on the right of the 3D scene contains a repository of geometaphors namedgeometaphor dictionary; the user selects the geometaphor pair (s)he is interested in,dragging the icons and dropping them in the 3D scene in order to compose the visualquery;
� the top gray area allows the users to select the spatial relationships they want to applythrough a set of check boxes; the user can choose any combination of the availablerelationships (topological, directional and metrical); for each combination the systemgives an appropriate visual feedback, as discussed in Section 5.5; the user may also leaveall the three boxes unchecked; in this case the system will interpret such choice as asimple selection of the geographical elements involved;
� the light yellow area on the bottom contains a set of buttons that activate predefinedviewpoints related to the four cardinal directions and to the azimuth; besides the fit view
button allows to zoom in or zoom out the current viewpoint in order to visualize all theobjects that compose the scene; finally, the initial view button, allows the users to getback to the default viewpoint on the scene in case s/he get lost moving through thescene; the introduction of such predefined views is suggested by a number of usabilitystudies that show how the availability of guided navigation tools is a valuable supportfor users [39]; it offers to the users an alternative option for the direct manipulation ofthe viewpoint;
� the dark yellow area contains the Query button that triggers the execution of thealgorithm for interpreting the scene content as a spatial SQL query; the textual query isvisualized in the text area located below the button.
6.2. Heuristic evaluation
While the validation performed with a consistent group of subjects represents thebest methodology for discovering the usability problem related to a given interface,such technique can be very expensive and time consuming. That is the reason why wereserved such methodology for a more advanced stage of the interface implementation,considering an alternative technique for the early stage of the evaluation process.The heuristic evaluation is a technique that requires the involvement of a small groupof usability experts; while such technique doesn’t guarantee the same results of acontrolled experiment with a group of users, it can contribute greatly to discriminatethe main problems of a given application. According to Nielsen [10,11], a group offive expert evaluators can discover about the 75% of the usability problems in a givenapplication.

ARTICLE IN PRESSV. Del Fatto et al. / Journal of Visual Languages and Computing 18 (2007) 280–314 301
The experts have been supported in their work by Nielsen-Molich’s 10 usabilityheuristics [11], a set of general principles that can be used both as a guide for the design orfor the validation of a user interface.
The results of the heuristic evaluation are shown in Table 3: each guideline is followedby the list of the problems and of the solutions identified by the five evaluators; besides,each problem has been assigned a rating, according to the experience of the evaluators. Thescale for such ratings, presented in Table 4, corresponds to Nielsen’s proposal [10].
As shown by Table 3, the most important problems evidenced by the evaluators arerelated to heuristics number 1, 3, 5 and 10, referred respectively to the visibility of thesystem status, the user control, the error prevention and the documentation. The exam ofthe interface in relation to the other heuristics reveals only minor problems or the absenceof specific drawbacks.
The observations of the evaluators were considered for the second user interfaceimplementation, according to the following criteria: the problems associated to ratingsbetween 3 and 4 were resolved following the evaluators’ suggestions; the problemsassociated to lower ratings were resolved only if the solution didn’t require a highimplementation effort.
6.3. The second prototype
The second prototype, shown in Fig. 18, takes advantage of the suggestions derivedfrom the heuristic evaluation.
Concerning the catastrophic usability problems (i.e., rating value 4) the followingsolutions have been implemented:
�
Problem 3.1: A scissor icon has been added to allow the removal of the geometaphorsfrom the scene (Fig. 18, on the bottom). � Problem 5.1: The dictionary area is disabled after the second geometaphor has beendragged to the 3D scene.
� Problem 5.2: The editable text area where the SQL string appeared has been replaced bya not editable text area (Fig. 18, below the 3D scene); the content of such area appearswhen the second geometaphor is dragged into the 3D area and it is dynamically updatedeach time the user moves any geometaphor or changes the selection of any spatialrelationship; therefore such improvement represents a solution also to problems 1.1
and 1.4;Concerning the major usability problems (i.e., rating value 3), the prototype has beenimproved as follows:
� Problem 10.1: A set of links has been placed in the different areas of the interface inorder to give contextual help in relation to the terminology and to the differentfunctions of the prototype.
Concerning the remaining lower level usability problems, the following improvementshave been performed:
�
Problem 1.2: The visual feedback on the 3D scene has been improved in order to let theusers understand more clearly which spatial relationships are currently used; in order toreach such aim, some of the complementary artifacts that characterize the different
ARTICLE IN PRESS
Table 3
Results of the heuristic evaluation for the first prototype
Heuristic Problem Solution Rating
(1) Visibility of the system
status
1.1 The SQL string corresponding to
the visual composition is visualized
only at the end of the query
composition process
Display the SQL string since the
beginning of the composition phase
2
1.2 In some circumstances there is no
clear visual feed back in the 3D scene
about the set of spatial relationships
currently selected (topological,
directional, metrical)
Adopt more significant textures in
the 3D environment
2
1.3 There is no visual feedback when
the user drags a in the 3D scene
Display an image representing the
selected geometaphor geometaphor
under the mouse pointer during the
drag operation
2
1.4 The SQL query string displayed
to the users is not always consistent
with the visual composition
Update the SQL query string
displayed to the users after each
change in the 3D scene or a different
selection of the spatial relationships
3
(2) Match between the
system and the real world
2.1 Some interface labels do not
correspond to the users’ language
Use natural language terms 2
(3) User control and
freedom
3.1 It is not possible to delete the
geometaphors dragged in the 3D
scene
Add a trash metaphor to the
interface
4
3.2 After the scene deletion, it is not
possible to restore it
Add a function for saving the current
visual composition
2
(4) Consistency and
standards
No problem
(5) Error prevention 5.1 Even though the spatial
relationships are defined only
between geometaphors’ pairs, the
user can insert more than two
geometaphors into the scene
Disable the insertion mechanism
after the second geometaphor
4
5.2 The text field for showing the
SQL can be edited by the users
Disable textfield editing 4
(6) Recognition rather
than recall
No problem
(7) Flexibility and
efficiency of use
No problem
(8) Aesthetic and
minimalist design
No problem
(9) Help users recognize,
diagnose, and recover
from errors
No problem
(10) Help and
documentation
10.1 Some technical terms like drag,
scene, topological, metrical and
directional are not clear to users that
are not familiar with the GIS domain
Insert links to popup windows for
helping the users to understand the
meaning of the technical terms
3
V. Del Fatto et al. / Journal of Visual Languages and Computing 18 (2007) 280–314302

ARTICLE IN PRESS
Table 4
The rating scale for the heuristic evaluation
Rating Meaning
0 Not a usability problem
1 Cosmetic problem only: no need to fix it unless extra time is available for the project
2 Minor usability problem: low priority for fixing it
3 Major usability problem: high priority for fixing it
4 Usability catastrophe: highest priority for fixing the problem
Fig. 18. The second interface prototype.
V. Del Fatto et al. / Journal of Visual Languages and Computing 18 (2007) 280–314 303
spatial relationships (i.e. the grid plane and the rose wind) have been transformed intosemi-transparent surfaces for letting the users see when they are both present into thescene.
� Problem 2.1: Some interface labels have been changed for adhering to the users’language.
Finally, the second prototype includes two new features for improving its flexibility:
�
the possibility for the users to select the geometaphors representing specific instances ofgeographical objects instead of generic classes (e.g., the geometaphor Garda Lakeinstead of the generic Lake); the mouse-click on a generic geometaphor of the dictionary

ARTICLE IN PRESSV. Del Fatto et al. / Journal of Visual Languages and Computing 18 (2007) 280–314304
labeled as Layer activates a secondary dictionary labeled as Feature, related to theavailable instances for such class (see Fig. 18 on the left); the user can choose to dragclasses and/or instances into the 3D scene for composing the query;
� the possibility to save the results of the query in a new layer of the GIS, associating to itan identification icon and a set of user definable colors for representing the results onthe map (Fig. 18, on the right).
6.4. The usability test
The second prototype was presented for evaluation to a group of users, in orderto receive further feedback about the application. The users were representative ofthe profiles defined at the beginning of the design process and were asked to play thescenarios defined in Section 4.2; their contribution was very useful to lead to the finalrefined version of the interface. The test included both quantitative and qualitativemeasures, in order to get information both in terms of performance and subjectivesatisfaction.
6.4.1. Methodology
6.4.1.1. Participants. We selected 20 participants, divided into two groups composed by10 subjects, which were totally unfamiliar with our application.Group A was composed by people corresponding to the student profile: they were
males and females between the ages of 19 and 25, novices in relation to the GIS/DBMSdomain.Group B was composed by subjects belonging to the database professor profile; they
were between the ages of 35 and 50, skilled in the GIS/DBMS domain.
6.4.1.2. Apparatus. All the tests were organized at the Department of Matematica eInformatica of University of Salerno, in a quiet classroom after courses. A laptopcomputer working both as client and server was used. Full details about the client-server architecture can be found in Section 7. In order to record the interaction on thescreen and the users’ talking aloud we used the Camtasia StudioTM software byTechsmithTM.
6.4.2. Scenarios and tasks
Both the groups of the participants were asked to play scenarios compliant with thosedefined in Section 4.2, in order to allow the survey team to capture their performanceand subjective satisfaction. Each scenario was described by a script that was given to theusers:
Script 1 (Scenario A for the student profile): You play the part of a student going abroadfor holiday. You are fond of eighteenth century paintings and you know that Salerno’schurches are particularly full of that kind of pictures. You stay in a hotel located in theMercatello quarter which is quite far from the historical center of the city, where thechurches are concentrated. You have rented a car for parking it on the Concordia squarebecause the hotel’s receptionist told you that it is very near to the center. You have notmuch time for visiting and therefore you decide to take advantage of the WebMGISQL 3Dsystem, accessible from the hotel, for satisfying your information needs. After a brief self-training you have to solve two different tasks.

ARTICLE IN PRESSV. Del Fatto et al. / Journal of Visual Languages and Computing 18 (2007) 280–314 305
Script 2 (Scenario B for the database professor profile): You play the part of a databaseprofessor teaching information systems and you want to explain the SQL language takingadvantage of the visual metaphors offered by WebMGISQL 3D for permitting the users tounderstand more clearly the concepts of operands and spatial relationships. In particularyou have to compose visually two queries concerning the city of Salerno and involvingdifferent spatial operators; at the end you have to visualize the corresponding SQL codeand show the results on a map.
While the groups performed their work in the context of different scenarios, weassigned the same tasks to both of them, in order to make a comparison of the resultsobtained:
�
Task 1. Look for all the roads located at Northwest of Concordia square and distantless than 1000m from the square itself. � Task 2. Display the map showing all the churches within the historical center quarter.Both the tasks assigned allowed to test a number of significant functionalities of theprototype, including: selection and composition of geometaphors, selection of spatial 29relationships, SQL code generation and visualization of results.
6.4.3. Procedure
The survey team was present at the test and included a test assistant, an observer/note-taker and an observer/time-keeper.
At the beginning of the session, the test assistant read to each participant theappropriate script and illustrated the two tasks to be accomplished. Participants were nottrained, but each subject was allowed to explore the functionalities of the interface byherself/himself before beginning the tasks.
The observer/note-taker recorded the participants’ actions, the navigational errors, andthe verbal comments made during the task execution (i.e. talk aloud technique). Theobserver/time-keeper kept track of the time needed by each participant to complete thetask and of her/his ability to perform the task correctly.
After the completion of all the tasks, participants were asked to answer to a briefquestionnaire about the features of the interface, evidencing both the positive features andthe drawbacks.
6.4.4. Discussion of the results
The aim of our test was to verify the application potentialities on two main groupsprincipally composed by novice users (group A) and GIS/DBMS experts (group B) and tovalidate the design choices that characterize the user interface.
The results obtained, summarized in Tables 5–8, are encouraging. In particular:
�
Table 5 shows that all the GIS/DBMS experts were able to complete the assignedtasks using the visual interface. The percentage of success decreases for the noviceusers; such result can be explained with the basic knowledge related to the GIS domainthat characterized the subjects belonging to the group A; in spite of that the resultsobtained are encouraging and vary from 75% to 87.5% of completed tasks (i.e., due tothe higher difficulty of the task 2, a minor percentage of users were able to completethe task).
ARTICLE IN PRESS
Table 5
Percentage of participants who completed correctly the assigned tasks
Group A—novices (%) Group B—experts (%)
Task 1 87.5 100
Task 2 75 100
Table 6
Mean time for completing the assigned tasks (the reported value includes also the time spent by the users on
reading the task script, which is estimated in 3000 for each task)
Group A—novices Group B—experts
Task 1 130 0200 80 5600
Task 2 40 3500 40 0400
Table 7
Ease of use—Overall interface
Group A—novices 3.31
Group B—experts 2.93
(scale from 1 to 5, where 1 ¼ very difficult and 5 ¼ very easy)
Table 8
Ease of use—Visual query composition
Group A—novices 4
Group B—experts 3.79
(scale from 1 to 5, where 1 ¼ very difficult and 5 ¼ very easy)
V. Del Fatto et al. / Journal of Visual Languages and Computing 18 (2007) 280–314306
�
The influence of the knowledge of the domain is underlined also by Table 6 that showsthe time spent by the different groups for completing the tasks (i.e., only the completedtasks were considered). The difference is particularly relevant for the first task: thenovice users completed the task in 1300200 while the GIS/DBMS experts needed only805600. The table shows also that the experience acquired performing the first task was agreat help for diminishing the performance time during the execution of the second task;such result shows that the interface is not characterized by a steep learning curve andallows the users to perform significantly better even after the execution of a single task.In particular the results related to the task 2 show that the novice users obtain the bestreduction of the execution time; besides, the mean time of their performance is similar tothat one of the experts users (i.e., 403500 vs. 400400). � Tables 7 and 8, concerning the subjective satisfaction of users, confirm the appreciationfor the overall interface and the visual composition of the queries. The visual querycomposition got the highest satisfaction values, while the appreciation 30 for the overallinterface, although positive, was slightly lower due the identification of somedrawbacks; such drawbacks were taken into account for the development of the final

ARTICLE IN PRESSV. Del Fatto et al. / Journal of Visual Languages and Computing 18 (2007) 280–314 307
prototype (see Section 6.5). In both cases, novice users assigned higher satisfactionvalues, because the interface allowed them to overcome their inability to compose thequeries using alternative methods, such as the SQL string composition.
6.5. The final prototype
The analysis of the observations during the task execution and of the answers recordedafter the test completion led to develop the final refined version of the user interface, shownin Fig. 19. In particular the following improvements were introduced:
�
the map of the results is displayed on the right of the visual query environment on aunified interface panel and it is updated each time the user presses the Update Mapbutton;
� the set of widgets for saving the results of the query was moved to a pop-up windows thatcan be recalled after the visualization of the results; the user is no more obliged to specifythe parameters for saving the query (i.e. the name of the new GIS layer, the identificationicon and other options) before visualizing the results, speeding up the process;
� the top of the interface displays the sequence of steps for making a visual query; eachlabel appears on the top of the related interface widgets and it is associated to a shortexplanation; such adjustment was necessary because the correct step sequence was notalways intuitive for all the users;
� the text SQL string located on the bottom side of the interface was replaced by a naturallanguage query representation; the SQL representation is still visible clicking over theshow SQL code button, added on the top of the interface;
Fig. 19. The final interface prototype.

ARTICLE IN PRESSV. Del Fatto et al. / Journal of Visual Languages and Computing 18 (2007) 280–314308
�
the set of the checkboxes for choosing the spatial relationships was moved near to thenatural language query representation, in order to let the users understand better theinfluence of the spatial operators on the query composition; � a new link, named Get started, was added in order to help the users to get acquaintedwith the application; such link triggers a help page containing information about theapplication aims, the steps for composing the query and the meaning of the differentinterface objects;
� a Delete button was added to the interface for allowing the users to delete the 3D scene;a similar widget was already available in the previous interface, but its meaning was notunderstood by all the user because of its representation as a scissor;
� the labels associated to the selection of the classes and the instances of the geometaphors(layer and feature) were replaced by descriptions (category and object) more familiar tothe end users;
� the objects dictionary displays simultaneously all the instances; in the older prototypesuch repository displayed only the instances corresponding to the class selected by theuser in the category dictionary; such behavior was not understood by some users thatconsequently were not able to find the objects they needed; and
� finally, the supplementary textual labels associated to the geometaphors in the secondprototype were canceled because they generated occlusion problems when also themetrical relationships were selected (see Fig. 18); for avoiding additional occlusionproblems the metrical label was shifted upwards (see also Fig. 16d).
7. The architecture
The 3D WebMGISQL environment presented is based on the client-server architecturedescribed in Fig. 20.The client side is used for composing the queries and visualizing the corresponding
results whereas the server side consists of a GIS application server devoted to the queryprocessing.
Fig. 20. Software architecture underlying the WebMGISQL 3D system.

ARTICLE IN PRESSV. Del Fatto et al. / Journal of Visual Languages and Computing 18 (2007) 280–314 309
On the client side the Interaction Components, evidenced by the dotted line, receive theuser input and communicate the visual feedback during the query composition. The userchooses the appropriate geometaphors from the Dictionary and selects the spatialrelationships using the Interpretation Selector. The 3D Scene Component materializes thegeometaphors in the 3D environment and provides the user with visual feedback aboutthe selected spatial relationships. The user manipulates the chosen geometaphors in the3D space for completing the query; besides, the user is enabled to change the initialselection of the spatial relationships, receiving an appropriate visual feedback. The Visual
Query Translator component transforms the visual query into an SQL-like statementaccording to the model defined in Section 5. Finally, the SQL string is sent to the server tobe processed.
On the server side the SQL code is received by the Web MGISQL 3D server modulewhich triggers the Postgis and Mapserver servers in order to generate the results. Theresults are converted to a raster format and sent back for the visualization on the client.
The visual query system can be easily applied without any modification to existing GISdatabases compliant with Mapserver. The only part that needs to be generated for eachdatabase is the set of geometaphors, according to the available data.
All the technologies used for the implementation on the server side (i.e., Apache, PHP,Mapserver and Postgis) are open-source and freely distributable.
The client has been built using widely diffused web technologies. The visual queryenvironment can be accessed by any Windows XP computer connected to the Internet andrunning the Microsoft Internet Explorer web browser. All the environment components(i.e. the VRML ActiveX for the 3D scene and the XHTML/Javascript components for theother interaction widgets) can be accessed and automatically installed from the network,giving the system a significant flexibility and avoiding complex setup procedures for theusers.
8. Conclusion
In this paper we presented the design of WebMGISQL 3D, a visual spatial querylanguage for geographical information systems.
The design process took advantage of techniques related to usability engineering,including iterative prototyping and a systemic approach to the evaluation of the differentdesign phases in order to obtain a result compliant with the users’ needs. To obtain suchresult, the evaluation process involved in the different stages both expert evaluators andfinal users.
The first design phases considered, from a user centered perspective, the associationbetween visual representations (i.e., geometaphors) representing geographical objectsand a complete set of spatial relationships. The association between a set of topologicalrelationships compliant with the OpenGIS standard and visual counterparts was themost complex and included an experimental survey with a group of users. While the resultsof the survey often showed a convergence towards specific associations, in other casesusers indicated a set of associations complementary to the main choice. Therefore, inorder to reduce the ambiguity, the answers to the survey were filtered taking into accountthe priority of the relationships, the type of the geometaphors and the order they wereselected.

ARTICLE IN PRESSV. Del Fatto et al. / Journal of Visual Languages and Computing 18 (2007) 280–314310
The result was an interpretation model of the visual compositions representing thetopological relationships; such model was then complemented with the definition of visualcounterparts for the directional and metrical relationships.The visual mapping of the geometrical objects and of the spatial relationships
represented a primary element for the design of a visual environment for queryinggeographical information systems.Two different prototypes were iteratively developed and evaluated, leading to the
implementation of a final visual environment. Such environment is meant to providesupport to for the implementation of visual query systems taking into account, as aprimary requisite, the users’ mental model, with the goal of increasing the resultingusability of those systems.Compared with existing approaches four aspects of WebMGISQL 3D are worth
mentioning:
�
the ability to select in parallel all the categories of spatial relationships (i.e. topological,directional and metrical); � the extension of the directional relationships to the third dimension, which allows usersto build queries that include zenith and nadir clauses;
� the ability to query remote geographical databases accessible from the web; � the validation of the proposal, according to the techniques of the usability engineeringand the user-centered design.
Preliminary and partial versions of the themes discussed in this work are available in[40–43].In the future a deeper study about the usability of the environment has been designed.
We intend to increase the number of subjects as well as the typologies of users in order tounderstand how much the visual language is easy to use and which categories could/shoulduse the system.
Appendix A. The 9-intersection model
The formalism underlying MGISQL 3D is based on the 9-intersection model byEgenhofer and Herring [35]. It is a comprehensive model for binary topological spatialrelationships and applies to objects of type Region, Line and Point. It characterizes thetopological relation t between two point sets, A and B, by the set of intersections of A’sinterior (A1), boundary (qA), and exterior (A�) with the interior, boundary and exterior ofB. With each of these nine intersections being empty ({) or nonempty ({), the model has512 possible topological relationships between two point sets, some of which can neveroccur, depending on the dimensions of the objects, and the dimensions of their embeddingspace. For example, let us consider the topological relation adjacent (between two regionsA and B). It can be represented as follows.The spatial relationships are used as a basis for the definition of the MGISQL 3D spatial
operators. The Egenhofer’s model can used for describing the spatial compositionsbetween 3D objects. Fig. A1 shows all the possible combinations between two cubes (i.e.,in this paper cubes are used for representing different typologies of geographical objects)and the association with an Egenhofer’s matrix.

ARTICLE IN PRESS
Fig. A1. The Egenhofer’s 9-intersection model for pairs of cubes.
V. Del Fatto et al. / Journal of Visual Languages and Computing 18 (2007) 280–314 311
A.1. The openGIS relationships
In 1999, the group composed by Environmental Systems Research Institute, Inc., IBMCorporation, Informix Software, Inc., MapInfo Corporation and Oracle Corporationsubmitted an implementation specification [34] in response to a request for proposals bythe OpenGIS Consortium, Open Geodata Model Working Group (OpenGIS ProjectDocument Number 96-021).
This specification treats several aspects about geographical data, such as the DBMSarchitecture, data types, implementation, relationships, SQL according to SQL92specification, etc.
After 6 years, the OpenGIS specification has become the standard for all the companiesand research groups dealing with geographical data management.
In particular, the OpenGIS definition of spatial relationships has become a standard forevery tool or language which needs to query GIS. Basically, the definition includestopological and metrical relationships. The former expresses a qualitative propertybetween two geometric objects while the latter adds quantitative information.
Table A1 describes the topological and metrical relationships as defined by OpenGISconsortium for the geometries g1 and g2.

ARTICLE IN PRESS
Table A1
Description of the topological relationships defined in the OpenGIS SQL specification
Group Relationship Description
Topological Touches (g1, g2) Returns TRUE if the only points in common between g1 and g2 lie in
the union of the boundaries of g1 and g2
Crosses (g1, g2) Return TRUE if the intersection between g1 and g2 results in a value
whose dimension is less than the maximum dimension of g1 and g2 and
the intersection value includes points interior to both g1 and g2, and the
intersection value is not equal to either g1 or g2
Within (g1, g2) Returns TRUE if g1 is completely contained in g2
Contains (g1, g2) Returns TRUE if g1 totally contains g2
Overlaps (g1, g2) Returns TRUE if the intersection of g1 and g2 results in a value of the
same dimension as g1 and g2 that is different from both g1 and g2
Disjoint (g1, g2) Returns TRUE if the intersection between g1 and g2 corresponds to the
empty set
Equals (g1, g2) Returns TRUE if both Contains and Within are TRUE
Intersects (g1, g2) Return TRUE if one of the Crosses, Within, contains, Overlaps or
Equals relationships are TRUE.
Metric Distance (g1, g2) Returns the minimum Euclidean distance between g1 and g2
V. Del Fatto et al. / Journal of Visual Languages and Computing 18 (2007) 280–314312
References
[1] S.K. Chang, Principles of Visual Programming Systems, Prentice-Hall, Inc., Upper Saddle River, NJ, 1990.
[2] M.A. Aufaure-Portier, Definition of a visual language for GIS, in: T. Nyerges, D. Mark, R. Laurini, M.
Egenhofer (Eds.), Cognitive Aspects of Human-Computer Interaction for Geographic Information Systems,
Kluwer Academic Publisher, Dordrecht, The Netherlands, 1994, pp. 163–178.
[3] C. Traynor, M.G. Williams, Usability of Visual and Textual Representations for Geographic Information
Systems, in: Proceedings of the First International Conference on Geographic Information Science, Georgia,
USA, 2000.
[4] D. Calcinelli, M. Mainguenaud, Cigales, a visual query language for a geographical information system: the
user interface, Journal of Visual Languages and Computing 5 (2) (1994) 113–132.
[5] G. Costagliola, G. Tortora, M. Tucci, GISQL—A Query Language Interpreter for Geographic Information
Systems, in: Proceedings of the Third IFIP 2.6 Working Conference on Visual Database System, Lausanne,
Switzerland, 1995, pp. 275–286.
[6] J. Florence, K. Hornsby, M. Egenhofer, The GIS Wallboard: Interactions with Spatial Information on
Large-Scale Displays, in: Proceedings of the Sevnth International Symposium on Spatial Data Handling
(SDH’96), Delft, The Netherlands, 1996, pp. 1–15.
[7] Y.C. Lee, F.L. Chin, An iconic query language for topological relationships in GIS, International Journal of
GIS 9 (1) (1995) 25–46.
[8] M. Wessel, V. Haarslev, VISCO: Bringing Visual Spatial Querying to Reality, in: Proceedings of the IEEE
Symposium on Visual Languages, Nova Scotia, Canada, 1998, pp. 170–177.
[9] M. Sebillo, G. Tortora, G. Vitiello, The metaphor GIS query language, Journal of Visual Languages and
Computing 11 (4) (2000) 439–454.
[10] J. Nielsen, Jacob Nielsen Web Site, /http://www.useit.com/S.
[11] J. Nielsen, Usability Engineering, Morgan Kaufmann, San Francisco, 1994.
[12] M. Egenhofer, Spatial SQL: a query and presentation language, IEEE Transactions on Knowledge and Data
Engineering 6 (1) (1994) 86–95.
[13] R.K. Goyal, M. Egenhofer, Consistent Queries over Cardinal Directions Across Different Levels of Detail,
in: Proceedings of 11th International Workshop on Database and Expert Systems Applications (DEXA’00),
Greenwich, London, UK, 2000, pp. 876–880.

ARTICLE IN PRESSV. Del Fatto et al. / Journal of Visual Languages and Computing 18 (2007) 280–314 313
[14] K. Ingram, W. Phillips, Geographic information processing using a SQL based query language, in:
Proceedings of the Eighth International Symposium on Computer Assisted Cartography (AUTO-CARTO
8), Baltimore, Maryland, 1987, pp. 326–335.
[15] D. Mark, M. Gould, Interaction with geographic information: a commentary, Photogrammetric Engineering
and Remote Sensing 57 (11) (1991) 1427–1430.
[16] OpenGIS, Simple Features Specification for SQL—Revision 1.1, 1999, Open GIS Consortium Inc., /http://
www.opengis.org/techno/specs/99-049.pdfS.
[17] S. Ravada, J. Sharma, Oracle8i Spatial: Experiences with Extensible Database, in: Proceedings of the Sixth
International Symposium on Spatial Databases (SSD’ 99), Hong Kong, China, 1999, pp. 355–359.
[18] ISO/IEC JTC SC21 N10441, SQL Multimedia and Application Packages, Part 3: Spatial, 172pp.
[19] S. Shekhar, S. Chawla, S. Ravada, A. Fetterer, X. Liu, C.-T. Lu, Spatial databases—accomplishments and
research needs, IEEE Transactions on Knowledge and Data Engineering 11 (1) (1999) 45–55.
[20] M. Egenhofer, T. Bruns, Visual Map Algebra: a direct-manipulation user interface for GIS, in: Proceedings
of the third IFIP 2.6 Working Conference on Visual Database Systems, Lausanne, Switzerland, 1995,
pp. 235–253.
[21] M. Egenhofer, Query processing in spatial query by sketch, Journal of Visual Languages and Computing 8
(4) (1997) 403–424.
[22] S. Kaushik, E.A. Rundensteiner, SVIQUEL: A spatial visual query and exploration language, in:
Proceedings of the Ninth International Conference on Database and Expert Systems Applications
(DEXA’98), Vienna, Austria, 1998, pp. 290–299.
[23] M.-A. Aufaure-Portier, C. Trepied, What approach for searching spatial information?, Journal of Visual
Languages and Computing 12 (4) (2001) 351–373.
[24] B. Meyer, Beyond Icons: Towards new metaphors for visual query languages for spatial information systems,
in: Proceedings of International Workshop on Interfaces to Database Systems (IDS 92), Glasgow, UK, 1992,
pp. 113–135.
[25] E. Jungert, Graqula—a visual information-flow query language for a geographical information system,
Journal of Visual Languages and Computing 4 (4) (1993) 383–401.
[26] K. Chang, E. Jungert, A spatial/temporal query language for multiple data sources in a heterogeneous information
system environment, International Journal of Cooperative Information Systems 7 (2 & 3) (1998) 167–186.
[27] C. Traynor, M.G. Williams, A study of end-user programming for geographic information systems, in:
Proceedings of the Seventh Workshop on Empirical Studies of Programmers, Alexandria, Virginia, USA,
1997, pp. 140–156.
[28] C. Traynor, Putting power in the hands of end users: a study of programming by demonstration, with an
application to geographical information systems, in: Proceedings of Conference on Human Factors in
Computing Systems (CHI 98), Los Angeles, California, USA, 1998, pp. 68–69.
[29] F. Ferri, E. Pourabbas, M. Rafanelli, The syntactic and semantic correctness of pictorial configuration query
geographic databases by PQL, in: Proceedings of the 17th ACM Annual Symposium on Applied Computing
(ACM SAC2002), Madrid, Spain, 2002, pp. 432–437.
[30] S. Kaushik, E.A. Rundensteiner, SEE: a spatial exploration environment based on a direct-manipulation
paradigm, IEEE Transactions on Knowledge and Data Engineering 13 (4) (2001) 654–670.
[31] M.M. Zloof, Query-by-example: a database language, IBM Systems Journal 16 (4) (1977) 324–343.
[32] V. Haarslev, M. Wessel, Querying GIS with animated spatial sketches, in: Proceedings of IEEE Symposium
on Visual Languages, Capri, Italy, 1997, pp. 201–208.
[33] M.A.A. Portier, C. Bonhomme, A high level visual language for spatial data management, in: Proceedings of
Visual’99, Amsterdam, the Netherlands, 1999, pp. 325–332.
[34] A. Blaser, M. Egenhofer, A visual tool for querying geographic databases, in: Proceedings of the Advanced
Visual Interfaces Conference (AVI 2000), Palermo, Italy, 2000, pp. 211–216.
[35] F. Ferri, F. Massari, M. Rafanelli, A pictorial query language for geographic features in an object-oriented
environment, Journal of Visual Languages and Computing 10 (6) (1999) 641–671.
[36] D.A. Norman, S.W. Draper, User Centered System Design: New Perspectives on Human–Computer
Interaction, Lawrence Erlbaum Associates, Mahwah, NJ, USA, 1986.
[37] M. Egenhofer, J. Herring, Categorizing Binary Topological Relationships Between Regions, Lines and
Points in Geographic Databases, Technical Report, Department of Surveying Engineering, University of
Maine, Orono, ME, 1990.
[38] L.R. Wanger, J.A. Ferwerda, D.P. Greenberg, Perceiving spatial relationships in computer-generated images,
IEEE Computer Graphics and Applications 12 (3) (1992) 44–58.

ARTICLE IN PRESSV. Del Fatto et al. / Journal of Visual Languages and Computing 18 (2007) 280–314314
[39] E. Haik, T. Barker, J. Sapsford, S. Trainis, Investigation into effective navigation in desktop virtual
interfaces, in: Proceedings of the Seventh International Conference on 3DWeb Technology, Tempe, Arizona,
USA, 2002, pp. 59–66.
[40] V. Del Fatto, L. Paolino, F. Pittarello, Representing topological relatiohships by using 3D objects: an
empirical survey, in: Proceedings of the International Workshop on Visual Languages and Computing
(VLC’06), Grand Canyon, USA, August 30—September 1, 2006, pp. 199–204.
[41] V. Del Fatto, L. Paolino, F. Pittarello, M.Sebillo, G. Vitiello, WebMGISQL 3D—iterating the design
process passing through a usability study, in: Proceedings of the 20th Human-Computer Interaction—
HCI2006, Londra, September 11–15, 2006, pp. 69–73.
[42] L. Paolino, F. Pittarello, M. Sebillo, G. Tortora, G. Vitiello, Extending the metaphor GIS query language
and environment to 3D domains, in: Proceedings of Advanced Visual Interfaces Conference (AVI 2002),
Trento, Italy, 2002, pp. 144–147.
[43] L. Paolino, F. Pittarello, M. Sebillo, G. Tortora, G. Vitiello, WebMGISQL—A 3D Visual Environment for
GIS Querying, in: Proceedings of International Conference on Visual Languages and Computing (VLC’03),
Miami, Florida, USA, 2003, pp. 294–299.