A Tool for Design Decision Making - ORBi
298
A Tool for Design Decision Making Zero Energy Residential Buildings in Hot Humid Climates
-
Upload
khangminh22 -
Category
Documents
-
view
0 -
download
0
Transcript of A Tool for Design Decision Making - ORBi

A Tool for Design Decision Making Zero Energy Residential Buildings in Hot Humid Climates

This thesis was done in Louvain La Neuve with lead supervision provided by the promoter and doctoral committee at the Université catholique de louvain in Belgium. The case studies were performed in Cairo, Egypt. The work was supported by the following organisations: Architecture et climat Université catholique de louvain Faculté d'architecture, d'ingénierie architecturale, d'urbanisme, LOCI The studies were financed by Bourses de Coopération au développement ‐ UCL and the Louvain School of Engineering (EPL) Budget doctorats pays en voie de développement (PVD). Financial support for the publication of this thesis by Bourses de Coopération au développement ‐ UCL and Louvain School of Engineering (EPL) is gratefully acknowledged. Louvain La Neuve, 2012 © Presses universitaires de Louvain, 2012. © Diffusion universitaire Ciaco, 2012. Dépôt légal : D/2012/9964/15 ISBN 978‐2‐87558‐059‐7 Imprimé en Belgique Tous droits de reproduction, d’adaptation ou de traduction, par quelque procédé que ce soit, réservés pour tous pays, sauf autorisation de l’éditeur ou de ses ayants droit. Diffusion : www.i6doc.com, l’édition universitaire en ligne Sur commande en librairie ou à Diffusion universitaire CIACO Grand‐Place 7, 1348 Louvain‐la‐Neuve, Belgique Tél. 32 10 47 33 78 Fax 32 10 45 73 50 [email protected]

A Tool for Design Decision Making Zero Energy Residential Buildings in Hot Humid Climates
Thèse de doctorat soutenue par
Shady Attia en vue de l’obtention du diplôme de
Docteur en sciences appliquées Promoteur André DE HERDE Doctoral Committee Elisabeth Gratia (UCL, LOCI) Magali Bodart (UCL, LOCI) Jan Hensen (TU-Eindhoven) Membre extérieur de Jury: Koen Steemers (Cambridge University)
Faculté d'architecture, d'ingénierie architecturale, d'urbanisme, LOCI
Département AUCE – Unité ARCH Architecture & Climat, May 2012

To my family, and the Egyptian Revolution

Contents Chapter 1 .. Introduction 5
1.1 NZEB DESIGN 5
1.2 THEORETICAL AND CONCEPTUAL BACKGROUND 9
1.3 RESEARCH QUESTIONS OF THE THESIS 10
1.4 THESIS OUTLINE 12
Part I • Analysis of NZEB Design Problem 15
Chapter 2 ... Hot Humid Climate & Comfort 17 2.1 INTRODUCTION 17
2.2 HOT AND HUMID CLIMATES 17
2.3 RESIDENTIAL BUILDINGS ENERGY PERFORMANCE 22
2.4 THERMAL COMFORT IN HOT CLIMATES 25
2.5 BIOCLIMATIC ANALYSIS METHODS 32
2.6 EVALUATION CRITERIA OF THERMAL COMFORT 38
2.7 CONCLUSION 39
Chapter 3 .. Design & Practice of NZEB 41 3.1 INTRODUCTION 41
3.2 DEFINITION OF NZEB 41
3.3 DESIGN CONCEPTS OF NZEB FOR HOT CLIMATES 44
3.4 PASSIVE, LOW ENERGY AND HYBRID COOLING STRATEGIES 47
3.5 SCALE AND URBAN DENSITY 51
3.6 HIGH TECH OR LOW TECH NZEBS 53
3.7 DESIGN METHODOLOGY AND GUIDANCE 56
3.8 CONCLUSION 63
Chapter 4 .. Design & Technologies of NZEB 65 4.1 INTRODUCTION 66
4.2 ACTIVE VENTILATION TECHNOLOGIES 67
4.3 ACTIVE COOLING TECHNOLOGIES 70
4.4 SOLAR RENEWABLE TECHNOLOGIES 76
1

4.5 SOLAR COOLING TECHNOLOGIES 81
4.6 PARAMETRIC ANALYSIS AND A NZEB CASE STUDY 82
4.7 CONCLUSION 89
Chapter 5 .. Design & Modelling of NZEB 91 5.1 INTRODUCTION 91
5.2 BUILDING PERFORMANCE SIMULATION FOR NZEBS 92
5.3 DESIGN PROCESS AND TOOLS OF NZEB 94
5.4 NZEBS TOOLS REVIEW 98
5.5 BPS FOR ARCHITECTS’ DECISION SUPPORT 111
5.6 CONCLUSION 114
CONCLUSION OF PART I 115
Part II • Development of the Decision Aid 117
Chapter 6 .. Towards a NZEB Decision Support Tool 119 6.1 INTRODUCTION 119
6.2 BACKGROUND 120
6.3 STRUCTURE OF THE WORKSHOPS 121
6.4 RESULTS OF THE WORKSHOPS 123
6.5 DISCUSSION 132
6.6 CONCLUSION 136
Chapter 7 .. Development of Benchmark 139 7.1 INTRODUCTION 139
7.2 LITERATURE REVIEW 142
7.3 METHODOLOGY 145
7.4 SURVEY RESULTS 149
7.5 DISCUSSION 160
7.6 CONCLUSION 163
Chapter 8 .. Development of the Decision Support Tool 165 8.1 INTRODUCTION 166
8.2 TOOL DESCRIPTION 166
2

8.3 CASE STUDY 173
8.4 USABILITY TESTING 177
8.5 DISCUSSION AND CONCLUSION 182
CONCLUSION OF PART II 185
Part III • Evaluation of the Decision Aid 187
Chapter 9.. Design Case Studies 189 9.1 INTRODUCTION 189
9.2 CASE STUDY 1 189
9.3 CASE STUDY 2 192
9.4 CASE STUDY 3 197
9.5 CONCLUSION 201
Chapter 10 .. Usability Testing & Validation 203 10.1 INTRODUCTION 203
10.2 DESIGNING AND CONDUCTING THE STUDY 204
10.3 CASE STUDIES FRAMEWORK 207
10.4 RESULTS 207
10.5 DISCUSSION AND CONCLUSION 219
CONCLUSION OF PART III 221
Chapter 11 .. Conclusions 223 11.1 INTRODUCTION 223
11.2 PRINCIPAL FINDINGS 223
11.3 INTERPRETATION AND CRITIQUE OF THE FINDINGS 225
11.4 FUTURE WORK 230
11.5 CONCLUSION 231
References 233
Abbreviations and Acronyms 251
Appendix A 253
Appendix B 263
Appendix C 270
3

Appendix D 278
List of Figures 280
Summary 285
Acknowledgements 289
Bibliography 291
Selected Publications 292
4

Chapter 1 .. Introduction
The design and modelling of Net Zero Energy Buildings is a challenging and complex problem of increasing importance. Informing the uncertainty of architects during early design stages for decision making is very important. In this introductory chapter I will first expand on the basis of this uncertainty, examining the implications of NZEBs design in hot climates, the limitation of existing building performance simulation tools and the reasons against their integration in design. Then, in the second part, I will outline the concept of informed decision making, before discussing how simulation based decision making may be of benefit in addressing the design uncertainty of NZEBs. Thirdly, I will present the three research questions of this thesis, and in the final part I will consider how these four questions will be addressed in the thesis. The chapters of the thesis will be presented in three sections: analysis of the problem, development of the decision support tools and evaluation of the decision aid.
1.1 NZEB Design 1.1.1 NZEB Design and Modelling
The modelling of net zero-energy buildings (NZEBs) is a challenging problem of increasing importance. The NZEBs objective has raised the bar of building performance, and will change the way buildings are designed and constructed. During the coming years, the building design community at large will be galvanised by mandatory codes and standards that aim to reach neutral or zero-energy built environments (ASHRAE 2008, EU 2009, IEA 2011). At the same time, lessons from practice show that designing a robust NZEB is a complex, costly and tedious task. The uncertainty of decision making for NZEBs is high (Athienitis 2010, Kolokotsa 2010, Marszal 2011). Combining passive and active systems early on is a challenge, as is, more importantly, guiding designers towards the objective of energy and indoor comfort of NZEB. Table 1.1, shows the six main building design aspects that designers should address early on during the conceptual stage. The integration of such design aspects during the early design phases is extremely complex, time consuming and requires a high level of expertise, and software packages that are not available. At this stage, the architects are in a constant search for a design direction to make an informed decision. Decisions taken during this stage can determine the success or failure of the design. In order to design and construct such buildings it is important to assure informed decision making during the early design phases for NZEBs. This includes the integration of building performance simulation (BPS) tools early on in the design process (Shaviv 1999, Hayter 2001, Charron 2006).
5

1.1.2 Uncertainty of Decision Making
Architectural design is exploratory, ill-defined and uncertain by nature. The better the search in solution space, the better the outcome. Exploring design during early stages considering multi-disciplinary aspects constitutes the work process of an architect. Consequently, early design support has never been more important, especially for small projects lacking engineering support due to limited budgets. The architectural design process and more specifically early design stages, embrace major opportunities in achieving NZEB. During the early design stages important parameters affecting the building performance are addressed. During early design phases, 20% of the design decisions taken subsequently influence 80% of all design decisions (Bogenstätter 2000).
In the context of NZEB architects can no longer only depend on intuition and experience. However, the uncertainty regarding performance decisions of NZEB design is very high. Particular tasks such as form finding should include environmental performance and energy efficiency aspects beside space layout, aesthetics, circulation, etc.
Table 1.1 The six main building design aspects of NZEBs design 1. Metric: There are several definitions for NZEBs that are based on energy,
environmental or economic balance. Therefore, a NZEB simulation tool must allow the variation of the balance metric.
2. Comfort Level and Climate:
The net zero energy definition is very sensitive toward climate. Consequentially, designing NZEBs depends on the thermal comfort level. Different comfort models, e.g. static model and the adaptive model, can influence the ‘net zero’ objective.
3.Passive Strategies:
Passive strategies are very fundamental in the design of NZEB including daylighting, natural ventilation, thermal mass and shading.
4.Energy Efficiency:
By definition, a NZEB must be a very efficient building. This implies complying with energy efficiency codes and standards and considering the building envelope performance, low infiltration rates, and reduce artificial lighting and plug loads.
5.Renewable Energy Systems (RES):
RES are an integral part of NZEB that needs to be addressed early on in relation to building from addressing the panels’ area, mounting position, row spacing and inclination.
6. Innovative Solutions and Technologies:
The aggressive nature of ‘net zero’ objective requires always implementing innovative and new solutions and technologies.
6

1.1.3 Integration of BPS in Design
BPS is ideal to lower such barriers. BPS techniques can be supportive when integrated early on in the architectural design process. Simulation in theory handles dynamic and iterative design investigations, which makes it effective for enabling new knowledge, analytical processes, materials and component data, standards, design details, etc., to be incorporated and made accessible to practicing professionals. In the last ten years, the BPS discipline has reached a high level of maturation, offering a range of tools for building performance evaluation (Hensen et al 2002). Most importantly, they open the door to other mainstream specialism, including architects and smaller practices, during earlier design phases. In the past delegating BPS to domain experts at early design stages hindered the effective exploration of the solution space and the cognitive process. It is argued that architects’ access to simulation in the form of advanced decision making platform is essential for integration of simulation in design. However, despite the proliferation of BPS tools in the last decade, the barriers are still high. There are no ready-to-use applications that cater specifically for the hot climates and their comfort conditions. Current design and decision support tools are inadequate to support and inform the design of NZEBs, specifically during early design phases. The use of BPS tools in NZEB design is based on a post-decision trial and error approach, where the simulation results are compared to a desired value. If the results are not satisfactory the design is modified and the process is repeated. This approach is cumbersome, tedious, and costly and forces architects to rely on simulation experts during the early design stages.
Additionally, most simulation tools are not able to adequately provide feedback regarding the potential of passive and active design and technologies, nor the comfort used to accommodate these environmental conditions (Attia 2011a). Several studies show that current tools are inadequate, user hostile and too incomplete to be used by architects during the early phases to design NZEBs (Lam 2004, Riether et al. 2008, Attia et al., 2009b, Weytjens et al., 2010). Architects suffer from BPS tool barriers during this decisive phase that is more focused on addressing the building geometry and envelope. In fact, architects are not on board concerning the use of BPS tools for NZEB design. Out of the 392 BPS tool listed on the DOE website in 2011, less than 40 tools are targeting architects during the early design phases, as shown in Figures 1.1 and 1.2 (DOE 2011b).
7

Figure 1.1 BPS tools developed for architects and engineers between 1997 and 2010 (DOE 2011b)
Figure 1.2 BPS Classification of BPS Tools pre- and post-design decisions (DOE 2011b)
8

1.2 Theoretical and Conceptual Background 1.2.1 Informed Decision Making
Informed decision making, or informed design choice, forms an essential basis for the design of NZEBs. This concept is based on providing knowledge prior to the decision making to influence the decision attitude. To date, however, no such tools and validated measure of informed design choice has been developed for NZEB design.
1.2.2 Decision Aids
Decision aids have developed significantly in their sophistication, both in terms of their scope and the technologies used. They are tools developed to help designers make decisions, particularly in areas of performance uncertainty of NZEB design and the range of BPS tools now in existence reflects that there have been on the field. Early BPS aids were evaluative, based on post design evaluations, catering for HVAC engineers. Later BPS tools were more guiding the design and catering for architects but still evaluative. More recently, BPS decisions support tools have become more informative aiming to aid before making a decision. This includes parametric analysis automated optimisation techniques; however, this is mainly catering for engineers during later design stages.
1.2.3 Evaluation of Decision Aids
There are an extensive body of literature that examine the effects of BPS tools as informative decision aids, for example, the work of Christoph Morbitzer (2003) who examined the Integration of Simulation into the Building Design Process. The work of Donn (2004) investigated the influence of simulation based environmental design decision support tools in architecture. Mourshed’s (2006) work investigated the optimization of architectural design decision making. Hanne-Tine Hansen (2007) investigated the role of sensitivity analysis as a methodical approach to the development of design strategies for environmentally sustainable buildings. Finally, the work of Christina Hopfe (2009) examined the use of uncertainty and sensitivity analysis in BPS for decision support and design optimization.
By reviewing this work systematically we found that BPS improved the decision making in a number of ways:
• Increasing designers knowledge of the design problem and options • Reducing decisional uncertainty • Increasing the design robustness
9

It will be shown in this thesis that these quality domains are features of a NZEB decision support tool under development, ZEBO. In the development phase, a significant effort was undertaken to build a benchmark and embed it the tool. Furthermore, it will be shown that not only has the decision support tool been delivered, but also that this medium has been used to test the effectiveness of using BPS to achieve informed decision making.
1.2.4 Usability Testing of BPS Decision Support Tools
Despite the extensive body of academic literature that underpins the field of BPS supported decision making and aids, it is, at best, an open question whether most decision aids have been developed with reference to usability testing. As part of this thesis, out of 40 tool addressing architects 15 BPS tools were examined to identify if usability testing were used during their development. No tool reported conducting usability testing. Moreover, only three tools described the development process of the tool. At the end of this thesis I will examine the extent to which ZEBO was developed with reference to usability testing.
1.3 Research Questions of the Thesis
Four main questions are posed in this thesis: i) How to design NZEBs in hot climates? ii) What are the requirements of the BPS decision support tool to be developed? iii) What are the effects of a BPS and sensitivity analysis on decision support? iv) How to achieve and measure informed decision making for NZEB design?
1.3.1 How to Design NZEBs in Hot Climates?
The design and modelling of NZEB is a challenging and complex problem and is associated with uncertainty, and, as noted earlier one that requires designs to be given the opportunity to get informed prior to the decision making. However, little is known about the design of NZEBs in hot climates and experiences of architects who consider, or actually use, BPS to support design. Does the design of NZEBs in hot climates possible without the aid of BPS? What are the climatic and comfort implications on NZEBs design in hot climates? (Chapter 2) What are the design strategies for NZEBs design in hot climates? (Chapter 3) What are technologies used in NZEBs in hot climates? (Chapter 4) Finally, what do we know about existing BPS tools, and how they are used by architects? (Chapter 5)
10

1.3.2 What are the Requirements of the BPS Decision Support Tool to be Developed?
Before embarking on the development of a BPS decision support tool, it is important to focus on the needs and requirements of a decision support tool to be developed. (Chapter 6) What is the simulation model or benchmark like of a NZEB? (Chapter 7) Also, when developing the actual decision support tool, what are the responses of users to evolving prototypes, and what does this tell us about the best method of usability-testing of BPS decision support in general? (Chapter 8)
1.3.3. What are the Effects of a BPS and Sensitivity Analysis on Decision Support?
In line with the development of other decision aids, the effects of a BPS and sensitivity analysis on decision support needs to be evaluated. That evaluation, however, needs to take into account the aim of the decision support: the promotion of informed decision making of architects considering the NZEB design in hot climates. This was done through a series of cases studies aiming to measure this effect (Chapter 9 and 10).
1.3.4 How to Achieve and Measure Informed Decision Making for NZEB Design?
In order to achieve an informed decision making we would need to explore how design case studies could be developed to evaluate the effect of a decision support on informed decision making in NZEB design? (Chapter 9) Then, the informed decision making, needs to be measured through usability testing of the efficiency and effectiveness of the intervention. Finally, as a decision support tool under development, there is a potential for further, detailed analysis of the association between the usages of the BPS decision aid and informed decision making (chapter 10). Finally, the question of achieving the informed decision making to be discussed in conclusion in Chapter 11.
11

1.4 Thesis Outline 1.4.1 Section 1: Analysis of the Problem
After the introduction in this chapter, where the research questions and outlines of the chapters are presented, the next four chapters consider the problem of, and possible solutions to, the design of NZEBs in hot climates. Chapter 2 contains an extensive review on the implications of hot climates on comfort in NZEBs, which explored the climates, comfort, and residential buildings anatomy. From this review evaluation criteria of thermal comfort were identified and analysed. In Chapter 3, a general review, the status and definitions of NZEB design and practice in hot climates was explored. The role of passive cooling strategies and mixed mode cooling was discussed. From this review design methodologies and guidance were identified. Then, in Chapter 4, another general review, the technologies for active cooling and energy generation is examined. Finally, Chapter 5 reviews the modelling of NZEB and the integration of building performance simulation to support the design decisions. The review considers the most current simulation software and suggests possible future advances in the use of parametric analysis for decision support.
1.4.2 Section 2: Development of the Decision Aid
The second section considers the development of the simulation based decision aid, ZEBO. Chapter 6 contains the results of workshops undertaken to identify the needs for the decision support tool that can aid architects during early design stages. Then Chapter 7 contains a result of a field survey to create a benchmark representing the basecase for a NZEB in Egypt. A specific outcome from this chapter is a benchmark simulation model that will be the basis of decision support tool. In Chapter 8, the prototype of the decision support tool under development, ZEBO is presented. There are two main prototypes that are developed. The development embeds the evolving prototypes through usability testing. Participating architects, architectural engineer and architecture student tested the tool using the system usability scale method.
1.4.3 Section 3: Evaluation of the Decision Aid
The core of the evaluation section is three design case studies of the effect of BPS tools on informed decision making, and the protocol and results for those case studies are detailed in Chapter 9. The aim of the case studies, the findings of which are presented in Chapter 10, was to evaluate the effect of BPS tools on knowledge and decision making attitudes and behaviour, the components of informed decision making, defined as knowledge in the presence of attitudes that are congruent with subsequent decisions. The relationship between the usage of BPS tools including ZEBO and informed decision making is examined in greater detail in this chapter. Using a self
12

reported usability metrics we described patterns of usage from conducting simulation tasks, and analysed correlations with the design outcomes of informed decision making used in the case studies.
This thesis concludes with a discussion (Chapter 11) that presents and critiques the main results and conclusions from the studies. The implications of these findings are then considered in the context of other academic and professional disciplines, with suggestions made for the further research and development of BPS decision aids.
13

14

Part I • Analysis of NZEB Design Problem
15

16

Chapter 2 ... Hot Humid Climate & Comfort
2.1 Introduction
This chapter will identify and comment on the most significant published findings concerning climate data, hot and humid climates, energy performance of net zero energy buildings (NZEBs), thermal comfort models and standards, bioclimatic analysis methods, different performance indices for office and residential buildings.
2.2 Hot and Humid Climates
“People living in the hot, climates, are faced with a different problem: amplified ultraviolet rays that hit our concrete structures and rebound onto us in hot and humid weather conditions” (Fathy 1986).
2.2.1 Climate Classification Criteria
To define boundaries of climatic zones several methods have been developed according to prevailing climate conditions using monthly data. Wladimir Köppen suggested five main climatic zones –tropical (humid), arid, temperate, cold and polar –with further subdivisions (Peel et al. 2007), Table A.1 in Appendix (A). The ASHRAE standards 90.2 (2007) use eight main clusters of climate type –where cities of each cluster have similarities in their datasets between different climate indices such as heating and cooling degree-days, incident solar radiation, or average relative humidity– with marine, humid or dry subdivisions (Briggs et al. 2002), Table A.2 in Appendix (A). In 2007, Peel et al. summarized the work that has been bone in climate classification starting by Köppen’s first attempts in the 19th century until the latest update of Köppen world map presented by Kottek et al. in 2006, Figure 2.1, with 31 climatic zones (Peel et al. 2007).
In order to define classification criteria for arid climates, three main approaches exist. Firstly, the Köppen classification system, the most well known, introduced in 1936, categorises arid climatic zones according to Mean Annual Temperature (MAT, ºC) and the Mean Annual Precipitation (MAP, mm) (Lohrnann et al. 1993). The hot desert arid zone (with its three letters coding subdivisions, BWh) are formulated according to relatively high Mean Annual Temperatures MAT(°C) and relatively low Mean Annual Precipitation MAP(mm). These are defined as: (Peel et al. 2007)
• If 70% of rain fall in winter then MAT ≥ 18ºC and MAP < 10 x MAT • If 70% of rain fall in summer then MAT ≥ 18ºC and MAP < (10 x
MAT)+140 • Else then MAT ≥ 18ºC and MAP < (10 x MAT)+70
17

Secondly, in 1992, the United Nations Environment Programme UNEP developed the precipitation effectiveness method introduced by Thornwaite in 1948 and defined the aridity index –a numeric degree of climate dryness –as the mean annual precipitation over the potential evapotranspiration. Arid zones are identified with an aridity index below 0.2 (Darkoh and Rwomire 2003). This method is oriented to botany and is considered more complex to calculate.
Thirdly, due to the availability of recent climatic data and powerful computational capabilities, Hierarchical Cluster Analysis has been carried out for 16 U.S. climatic regions and has been developed for Canadian and International locations to derive climate classification criteria (Briggs et al. 2002). According to the ASHRAE standards 90.1 and 90.2, Table A.2 in Appendix (A), clusters 1B, 2B and Part of 3B and 4B are equivalent to the BWh of Köppen classification, but these standards don’t provide further subdivisions of the eight main clusters for Canadian and International locations (ASHRAE 2007). The ASHRAE classification criteria for arid zones are:
• For dry zones definition MAP < (20xMAT)+140 • For Cooling Degree Days (10ºC base) > 5000 (cluster1), 3500 (cluster2), • 2500 (cluster3) • For Heating Degree Days (18ºC base) ≤ 3000 (cluster4)
All these classification schemes identify each zone (or cluster of locations) according to mean annual climatic factors. Hot Desert Arid zones are mainly classified according to both temperature and precipitation. By comparing Köppen with the ASHRAE methods, it can be seen that the former uses a lower limit of mean annual precipitation and so could be more selective than the later. In this work, both methods have been used with the monthly climate data of several worldwide locations in order to identify some arid cities and to formulate a database of arid climates.
2.2.2 Hot Arid Desert Climate Classification
According to the Köppen method, arid climatic zones are dominant in the world with 30.2% of the land area (Peel et al. 2007), Figure 2.1. The most dominant arid subdivision is the hot desert arid, BWh, covering 14.2% of the total land area and lying within 35°N, 35°S of the equator. Arid zones cover 57.2% of Africa, 23.9% of Asia, 15.3% of North America, 15% of South America, 78% of Australia and 36.3% of the Europe –considering the Arabian Peninsula and the middle-eastern countries as part of Europe (Peel et al. 2007). The arid zone is considered the dominant in Africa and is the largest portion of Australia (Gratzfeld 2003). Due to global warming and climate change, the polar and the cold zones are shrinking and there has been an overall expansion of the arid zones in the last 50 years, the greatest
18

expansion of arid zones has been in Africa with 5% increase in area followed by Asia (Beck et al. 2006).
Figure 2.1 The world climate zones referred to Köppen-Geiger Classification Method (Kottek et al. 2006)
2.2.3 Climate Classification in Egypt
Egyptian Meteorological Authority (EMA 2010) classified the climate into eight regional climates. However, due to the similarity between some of the eight regional climates classified by the EMA, this study summed up and classified the climate of Egypt into three major climatic regions (Figure 2.2). The three major climatic regions can be classified into hot dry, hot mild and hot humid regions respectively.
19

Figure 2.2 The three regional climates of Egypt
2.2.4 Types of Climate Data
Processed weather data are available with different representations according to the purpose of use. These weather datasets include long-term average monthly values for a period of 10-30 years that are used as a benchmark for validating new datasets, near extreme datasets which represents hot weather for testing indoor thermal comfort and system performance during peak conditions (particularly natural and hybrid ventilation strategies), and typical year datasets with average conditions for predicting the overall building energy consumption and carbon emissions (Levermore and Parkinson 2006).
Although synoptic weather data can be used in building simulation at early design stages to reduce processing time, results may not be as accurate as using annual datasets, especially when simulating heavyweight buildings with high thermal inertia (Westphal and Lamberts 2004, Pedersen 2007).
20

Design Summer Year (DSY) datasets – only available for UK locations– represent the near-extreme representation by selecting the year with the third hottest summer within 20 years (90th percentile) using summer daily mean dry-bulb temperature (Levermore and Parkinson 2006).
Typical year datasets represent the average of preceding years are ideal for building energy simulation but need to be regularly updated (Levermore and Parkinson 2006). The production of these datasets has been developed over the past three decades. Commonly used datasets include:
• World Weather Information Service (WWI) • The North American Typical Meteorological Year 2 (TMY2) developed
from the original TMY by NREL in 1995 based on period 1961-1990 and its European equivalent Test Reference Year (TRY).
• The Weather Year for energy Calculations 2 (WYEC2) developed by NREL with coordination with ASHRAE from the original (WYEC) in 1998 and its European equivalent Design Reference Year (DRY).
• The Canadian Weather Year for Energy Calculation (CWEC). • The International Weather for Energy Calculations (IWEC).
The TMY and the TRY datasets are generated by selecting the most average months from 20-30 years period in order to derive a typical year with average conditions. An alternative typical year is produced with the WYEC, CWEC, IWEC and the DRY files by substituting days and hours of the same month over 30-years period (William and Urban 1995). In 1991, Lund presented the DRY generation process, site selection and its unique parameters which offer more accurate monthly mean values than TRY data. Although precipitation is considered a valuable parameter for classifying climatic zones, neither the TMY nor the WYEC data provide this (TenWolde and Colliver 2001).
2.2.3 Sources of Climate Data
Sources of weather data can be obtained through publications, national meteorological services, airports, airfields, universities or research organisations (CIBSE 2002, ASHRAE 2005, TenWolde and Colliver 2001). The US Department of Energy (DOE) provides typical year weather datasets for more than 2100 worldwide locations in more than 100 countries, some of these are hot humid and hot dry. In 2006, Forejt et al. presented a list of weather data sources sorted by type. Although they confirmed the absence of existing worldwide database offering typical years for most of the non-typical regions, including hot zones, they also discussed Meteonorm. This commercial software can generate weather data from recorded monthly means climatological data for the period 1961-1990 of about 7400 worldwide stations. Meteonorm also provides precipitation data that is lacking in other datasets (Meteotest 2003).
21

With regard to hot humid and hot drylocations, DOE’s weather datasets are considered more accurate than those generated by Meteonorm in representing typical climate conditions of a certain location. The DOE data uses hourly measurements extracted from the months closest to mean conditions within a 30-years period to form a typical year dataset while the latter interpolates monthly mean measurements for the same period from nearest weather stations and generates hourly measurements based on these monthly means. Meteonorm has the advantage that it can provide precipitation data and weather datasets for any hot/worldwide location not included in the DOE’s weather datasets
2.2.4 Conclusion
DOE’s weather datasets were used within this research to generate typical weather data provided by the US Department of Energy.
2.3 Residential Buildings Energy Performance
Economic changes in hot climate regions are occurring fast. In non-industrialized countries including Brazil, Mexico, China, Egypt and India residential energy consumption rises by 2 percent per year, compared with 0.4 percent per year for the OECD countries (Organisation for Economic Co-operation and Development). In those emerging countries, the patterns of residential energy use are well established and faster population growth and young populations translate to larger increases in energy demand (DOE 2010, Sivak 2009). In hot climates, air conditioning tends to be the single largest use of electricity. A number of studies have been carried out in developed countries to analyse total direct and indirect energy requirements in households. However, information about global energy use in the residential building sector in hot climates does not exist.
2.3.1 Energy Consumption by End Use in Egypt
In Egypt, the building sector is the second largest energy consumer by end use as shown in Figure 2.3. The demand in the building sector is constantly growing. The residential sector consumed in 2008 more than 47% of the total national generated electricity. According to the annual report of the Egyptian Ministry of Electricity and Energy (EMEE 2008), electricity consumption for acclimatization and lighting for residential buildings was 48%. Residential buildings include single-family detached and semi detached homes, apartment blocks and free standing housing units. Between 1998 and 2008, electricity consumption for residential purposes has been growing exceeding 7-10% a year. This is an important indicator of the importance of residential building energy in Egypt.
22

Figure 2.3 Primary energy consumption by end use in Egypt (EMEE 2010)
2.3.2 Residential Building Type
Residential buildings can be sub categorized into several building topologies or types according to their principal layout and functions (see Figure 2.4). The amount of energy consumed is greatly affected by the type, vintage of the building and occupant behaviour. No attempt has been conducted to classify residential buildings in Egypt according to their performance or typology. However, for this thesis two classifications have been proposed. The first is a performance classification dividing the residential building stock into five groups:
• Performance group I (Bearing walls system with thermal mass) • Performance group II (RC Skeleton with masonry and thermal mass) • Performance group III (RC Skeleton with masonry no thermal mass) • Performance group IV (RC Skeleton with masonry and wall air gap) • Performance group V (RC Skeleton with masonry and wall insulation)
This classification does not necessarily imply that all buildings shall fall into one of these groups. It might be particular cases where building might under another classification. Despite making use of several sources of data in order to infer a rational classification for the building stock, a field surveys for representative samples of the building population was conducted in three cities. At the outset of the survey it was essential to inspect the generic trend of buildings in Alexandria, Cairo and Asyut using satellite maps to ensure that the surveyed areas are representative of the prevailing conditions. In this process, a number of observations were made by the author, the most
32%
28%
5%
35% Buildings
Transport
Agriculture
Industry
23

important of which is the high proportion (88-95%) of Performance group III (Reinforced Skeleton with masonry no thermal mass) in all performance age groups.
The second proposed classification for the residential building stock is a topology classification aiming to investigate the urban and architectural home design. This classification took place during the performance groups’ classifications through field surveys of popular areas in Alexandria, Cairo and Asyut which are dominated by apartment buildings of various heights and structural systems. Despite the high proportion of informal (or slum) areas which usually comprise a considerable proportion of residential buildings, the most common building topology was narrow apartment blocks.
Figure 2.4 Examples of residential apartment blocks in density urbanised Nile Valley and Delta
The narrow-front apartments are dwellings whose street-facing exteriors measure 12 meters or less. They are constructed in detached, semidetached or attached form. They have been constructed throughout Egypt in compact configurations. Built in high densities improve energy efficiency once occupied. With the rapidly growing demographics narrow apartment blocks have been an efficient utilization of space providing affordable building prototype.
24

2.3.3 Anatomy of a Residential Households
It is important to present an anatomy of energy end-uses in the residential buildings, where such information is not available in Egypt. Therefore, this study evaluated a middle-income urban residential community in Cairo (Attia 2009c). Figure 2.5 presents a breakdown of energy end-use in the residential buildings for Cairo. The single largest user of energy in residential buildings is for cooling, followed by plug loads and other uses – primarily electric appliances. The order of the next largest uses is for heating and domestic hot water. Lighting and cooking are least consuming as the fifth and six largest users in residential buildings.
Figure 2.5 Energy consumption per household in Madinet Al-Mabussin, Cairo (Attia 2009c)
2.4 Thermal Comfort in Hot Climates
“The energy required to heat and cool our buildings, and the very way we define the “comfortable” thermal conditions we are trying to maintain, play significant roles in this environmental impact “(De Dear & Brager).
Recent studies have indicated that both thermal comfort and indoor air quality affect productivity (Oseland 1999). Accordingly, occupants are expected to be more productive when they are more satisfied with their physical environment including thermal comfort and indoor air quality. Thermal comfort in hot climates residential buildings is associated with early sleeping and better sleep quality. Therefore, attempts to reduce residential buildings’ energy consumption and carbon emissions should not be considered where occupant satisfaction is also compromised.
65%9%
6%
12%
5% 3%
Cooling
Heating
DHW
Plug Loads
Lighting
Cooking
25

Thermal comfort is viewed as a state of mind where occupants are satisfied with their surrounding thermal environment and desire neither a warmer nor a cooler condition (Fanger 1970). Six primary factors affecting thermal sensation are either environmental or personal parameters; these factors are air temperature, mean radiant temperature, air velocity, humidity, metabolic rate and clothing (ASHRAE 2007). Research has shown that other contributing parameters include climate change with time, building and its services, and occupants’ perception (Nicol and Humphreys 2002, Evans 2003 and Hellwig et al. 2006). Due to biological variance beyond occupants and psychological phenomena, neither perfect conditions nor well defined comfort boundary settings exist, but rather a comfort zone with a band of operative temperatures that satisfy the highest percentage of occupants (Nicol and Humphreys 2007).
Humphreys found the best representation to predict occupants’ thermal comfort, had to be derived from field studies (Nicol 1995). Using field survey questionnaires with synchronized records of parameters this was done while measuring personal thermal states or changes (Auliciems and Szokolay 1997). According to literature the evaluation of the personal thermal state is suggested through a series of guidelines with three scales (ASHRAE 2007):
• a scale of perception of the personal thermal state with seven degrees and two poles: from cold to hot with a central point of indifference that corresponds to the absence of hot and cold.
• an evaluative scale with four degrees and one pole: present affective assessment from comfort to discomfort
• a future thermal preference scale with seven degrees and two poles; from ‘cooler’ to ‘warmer’ with a central point of indecision that corresponds to the absence of change.
The evaluation of thermal surroundings or local climate can be made through two additional scales:
• a scale of personal acceptability of local climate with 2 degrees: from generally acceptable to generally unacceptable.
• a scale of tolerance of local climate with 2 degrees: from tolerable to intolerable.
On the other side, the strict reliance on laboratory-based comfort standards such as ASHRAE ignores important cultural and social differences in the need or desire for air-conditioning. A special issue of Energy and Buildings (Kempton and Lutzenhiser 1992) focused on these non-thermal issues, with a variety of papers examining how individuals and cultures vary in their perceived need for and expectations of air-conditioning.
26

2.4.1 Thermal Comfort Ranges
Comfort ranges are part of how design criteria are proposed for the evaluation of indoor environment and NZEB energy calculation. Comfort ranges are one of the basis inputs for the design and assessment of the comfort and energy performance of NZEBs. The following paragraph reviews the existing thermal comfort ranges for office buildings that can help the design of zero energy residential buildings in hot humid climates.
The comfort models in recent standards are based on defining the comfort into categories. For example, ISO-7730-2005 proposes three categories of comfort (A,B, C), only for the Fanger model, defined by the ranges of PMV, ±0.2, ±0.5, ±0.7, and leaves open the choice about which buildings fit into which category. EN 15251-2007 proposes three categories of comfort (I, II, III) for the Fanger model, defined by the same ranges of PMV, ±0.2, ±0.5, ±0.7; it also defines categories of comfort I, II, III for the adaptive model. ASHRAE 55 in the revision of 2004 maintains the previous definition of acceptable range defined by means of PMV ±0.5, without introducing categories. In EN 15251-2007, categories are meant to apply different types of buildings. Category I is suggested to be applied to buildings occupied by very sensitive and fragile persons, category II for new buildings, category III for existing buildings and category IV for buildings that fail to meet category III specifications.
However, a number of researchers have observed that building in hot climates do not fall exactly into the proposed categories. Some passive, low energy and hybrid cooling strategies (see Chapter 3, Section 4) are among those of uncertain classification both on the ground available data in the databases such as the ASHRAE, SCAT and Berkeley databases of field surveys. Therefore, it is important to distinguish NZEBs into two types: sealed air-conditioned buildings and passive and mixed-mode buildings. The thermal comfort of both types is described below.
2.4.1.1 Sealed Air-Conditioned Office Buildings
Following the development of air-conditioning, the business community has been more inclined towards artificial indoor environments and sealed buildings (CIBSE 2007). Based on climate chamber experiments, Fanger’s Predicted Mean Vote (PMV) model of thermal comfort, introduced in 1970 and developed by Fanger, first established a relation between six primary factors based on a thermal balance equation under steady-state conditions (Fanger 1970). The model has been incorporated into a number of standards and design codes (e.g. EN ISO7730:2005). The model is intended for application to situations similar to those of sealed air-conditioned buildings. In these types of buildings, the envelope is completely sealed with non-operable windows and occupants interact with an artificial indoor environment totally disconnected from the outside one.
27

Recent field measurements derived in hot regions (Pakistan and Kalgoorlie-Boulder) highlighted some inaccuracies when the model is applied to either air-conditioned or non air-conditioned buildings (Nicol 2004, Nicol et al. 1999, and Cena and de Dear 2001). The model was found to overestimate and underestimate occupant response in warm climates. Givoni suggests one important factor is the absence of sweat evaporation in the heat balance equation (Heidari and Sharples 2002). Researchers have suggested that the PMV-model should only be used for sealed air-conditioned buildings (Nicol 2004, Van der Linden et al. 2006). Nevertheless, the PMV-model is commonly applied in the design of air-conditioned office buildings in hot climate zones. Since there are no other models for net zero energy residential buildings, it has been applied in the analysis of fully air-conditioned NZEBs in this work.
2.4.1.2 Passive and Mixed-Mode Office Buildings
In order to find an alternative to the PMV-model, in 1995, ASHRAE sponsored a field survey project (RP-884) which focused on statistical analysis of high quality data from existing buildings rather than the heat balance approach derived from climate chamber data. The data was collected from 160 passive, active and mixed-mode office buildings in a number of climate zones, including those considered hot humid and hot dry (de Dear 1998). Occupants in naturally ventilated buildings were found to accept wider temperature variation and higher indoor temperatures than those in air-conditioned buildings (de Dear and Brager 2002, ASHRAE 2005). De Dear and Brager observed that occupants of office buildings showed a low sensitivity to indoor temperature changes. The gradient of their thermal sensation votes with respect to indoor operative temperature turned out to be 1 vote for every 3°C to 5 °C change in temperature. Values in the same range are encountered in work of Oseland and of Van der Linden et al.
The apparent acceptance of warmer temperatures is thought to be due to different psychological perceptions and adaptations (Haldi and Robinson 2008). This finding changed the idea that occupants can be considered as passive users (de Dear and Brager 2001), in contrast, occupants either adapt the surrounding environment to suit their expectations –using windows, blinds, fans (ceiling), and doors– or shift their comfort temperature by a number of physiological thermoregulatory mechanisms; changing metabolic rate (activity level and cold drinks), rate of heat loss (clothing) and thermal environment (controls) (Nicol and Raja 1996, de Dear 1999, Nicol and Humphreys 2002, and Pfafferott et al. 2007).
Across a number of adaptive comfort studies, outdoor temperature was proven to have the dominant effect on defining comfort conditions (Saberi et al. 2006, Nicol and Raja 1996). A number of adaptive models seek to correlate perceived comfort with some measure of recent external temperatures and the current internal temperature (Pfafferott et al. 2007)
28

through a two-step procedure. The first step has been to develop a linear correlation between the mean outdoor temperature (To) and the operative temperature (Tc) as Tc =a To + b, the second step has been to specify 90% and 80% ranges of acceptance (De Dear and Brager 2002). In this work, the operative temperature (Tc) is defined as the average of the indoor air and radiant temperatures. Different values of coefficients a and b were determined by Humpheys, Auliciems, Nicol, Brager and others. This indicates the lack of universal parameter values (a and b) (Bouden and Ghrab 2005).
Figure 2.6 Acceptable operative temperature ranges for naturally ventilated office spaces based on the ASHRAE Adaptive comfort model (De Dear and Brager 2002)
The ASHRAE adaptive comfort model, defined in ASHRAE standard 55-2004, is applicable for outdoor temperature ranges 10ºC - 33ºC (De Dear and Brager 2001) with constant comfort boundaries above and below these ranges as shown in Figure 2.6 The external temperature is expressed as the mean monthly outdoor temperature and can be easily determined from meteorological data (De Dear and Brager 2002) while Auliciems and Szokolay (1997) chose mean daily outdoor effective temperature to represent both temperature and humidity. Acceptable ranges of 10% and 20% predicted percentage dissatisfaction (PPD) with ±2.5ºC and ±3.5ºC as ranges of acceptance respectively, used in this model, and are equivalent to ±0.5 and ±0.8 predicted mean vote (PMV), Figure 2.6 (de Dear and Brager 2001).
Many researchers, however, challenge this assumption of universal applicability, arguing that it ignores important contextual differences that can
29

attenuate responses to a given set of thermal conditions. Fanger and Toftum (2002) disagree with the adaptive approach in concept since it only deals with outdoor temperature and neglect the other five primary factors they identified. The 6 parameters should be taken into consideration. We have to find an experiential law with indexes for all those six parameters. In hot climates we need at least air temperature, surface temperature and air velocity. This was also acknowledged by Givoni (1992), who revised his already notable work on the building bioclimatic chart. He expanded the boundaries of the comfort zone based on the expected indoor temperatures achievable with different passive design strategies, applying a “common sense” notion that people living in unconditioned buildings become accustomed to, and grow to accept higher temperature or humidity.
However, a proposed addendum in September 2008 suggested the use of the PMV model to air speeds below 0.20 m/s. Air speeds greater than this may be used to increase the upper operative temperature limits of the comfort zone in certain circumstances. This could be achieved by using fans (ceiling fan shown in Figure 2.7) to elevate air speed to offset increased air and radiant temperatures. As shown in Figure 2.7, elevated air speed is effective at increasing heat loss when the mean radiant temperature is high and the air temperature is low.
Figure 2.7 Air speed required to offset increased temperature [ASHRAE]
30

However, if the mean radiant temperature is low or humidity is high, elevated air speed is less effective. The required air speed for light, primarily sedentary activities may not be higher than 0.8 m/s. But the ceiling fans effect cannot control humidity and depends on clothing and activity. Figure 2.8 shows the acceptable range of operative temperature and air speed for a given clothing level.
Figure 2.8 Acceptable ranges of operative temperature and air speeds [ASHRAE]
2.4.2 Thermal Comfort Standards
Thermal comfort standards help designers to establish indoor conditions that suit occupants’ expectations. In Egypt, there are no current standards or models that define what those “comfortable” ranges or conditions that should be in residential buildings. At the same time, the available models worldwide are mainly focused on office buildings, partly because of the limited number of surveys in the area of residential buildings. Recent standards are based on Fanger’s PMV-model for sealed air-conditioned buildings and adaptive models for naturally ventilated buildings (Nicol 2004). The ASHRAE standard 55-2004 and the PrEN 15251 refer both to Bragger and de Dear’s studies. Parsons (1995) finds that western world standards aren’t appropriate for many countries, especially hot climate countries, and an updated international standard for thermal comfort is required (Nicol et al. 1995, Nicol 2004). Therefore, the largest issue in this discussion remains the applicability of those standards and models of none air-conditioned buildings in hot climate residential buildings.
31

2.5 Bioclimatic Analysis Methods
“The bioclimatic evaluations give a general picture of the relationship of comfort conditions and the weather situation” (Olgyay 1963).
This section focuses on preliminary analysis of the potential of passive approaches using bioclimatic analysis and design methods. Bioclimatic analysis methods aim to support climate responsive design decisions and are used to assess the climate-comfort-building relationship in the early stages of building design. They help designers to test the effectiveness of passive control strategies in relation to the surrounding environment (Szokolay 1995). They offer the designer a comfort metric to indicate where occupants are expected to be comfortable but also suggest boundaries/zones of effectiveness of several passive strategies such as natural ventilation and evaporative cooling. Efficient hybrid approaches aim to maximize the use of these passive strategies and minimize the dependence on conventional mechanical means of cooling. Accordingly, these bioclimatic design methods analyse climate data using charts, tables and spreadsheets, and can be used to find the percentages of time the passive strategies may work effectively.
An ideal bioclimatic analysis method would allow evaluation to be performed using hourly weather data and integrate the latest developments of thermal comfort modelling and give accurate indications of the limits between which passive strategies are effective (Saberi et al. 2006). These analyses could be used to offer guidelines to the designer and to allocate effective passive strategies (Labs and Watson 1981). Bioclimatic analysis findings have been reported for a wide range of hot humid and hot dry locations (Papparelli et al. 1996, Sayigh 1986, Sayigh and Marafia 1998, Farija and Sayigh 1993, Alajlan and Sayigh 1993).
These methods could be used in the evaluation of mixed-mode strategies in that the percentage of hours where heating/cooling is required, and where passive strategies can be used to maintain satisfactory comfort, can be quantified. Many methods for bioclimatic evaluations have been developed but only the most well known techniques will be discussed.
2.5.1 Olgyay’s Bioclimatic Chart
The Bioclimatic Chart introduced by Victor Olgyay in 1953 was the first bioclimatic analysis proposal that summarizes the relation between the four major environmental parameters of thermal comfort in addition to solar radiation and added moisture content based on clothing insulation 0.8 clo and an activity level of 1.3 met (Brown 2001). This chart has been developed by Arens et al. (1980) based on boundaries of passive strategies of Milne and Givoni.
32

The comfort zone is suggested to be shifted with latitude other than 40º (Olgyay 1963). Givoni proved the inaccuracy of the bioclimatic chart in hot dry climates with heavyweight buildings as it is based on outdoor rather than the expected indoor ambient conditions. Givoni, accordingly, limited its applicability to lightweight buildings in humid regions with little difference between indoor and outdoor conditions (Givoni 1969).
2.5.2 Givoni’s Building Bioclimatic Chart (BBCC)
In 1963, Baruch Givoni introduced the Building Bioclimatic Chart (BBCC) –developed by Milne and Givoni 1979 –based on expected indoor temperature rather than the outdoor conditions. The BBCC presents boundaries of comfort zone and passive strategies –derived from experiments of residential buildings –plotted on the psychrometric chart, Figure 2.7. The psychrometric chart is considered as the best representation of climatic variables (Szokolay 1986).
In 1992, Givoni proposed two sets of boundaries for developed and hot developing countries with a suggested elevation of 2K (Givoni 1992). Recent researches based on dynamic thermal simulation have indicated the inaccuracy of the boundaries (Lomas et al. 2004) and highlighted the lack of diurnal and seasonal variations that may impact the pattern use of the passive strategies (Visitsak and Haberl 2004). Moreover, at early stages of the design, indoor temperatures can hardly be identified since the design is still immature.
The climatic data has been incorporated into Givoni BBCC Diagram and adapted those specifically for the three major climates of Egypt. Also an average comfort zone was derived for application in the three climate regions. With the aid of a computer program (Climate Consultant 5) and the Department of Energy (DOE 2011d) weather files for Aswan, Cairo and Alexandria three psychrometric charts were produced. The weather pattern for the three cities was analyzed for a typical meteorological year. Figure 2.9, 2.10 and 2.11 are showing a primary climatic assessment and the suggested passive design guidelines in correspondence with the three climatic regions (Attia 2009a). More detailed weather data can be found in Appendix A (Figures AA1-AA4 and Tables A3-A6). Hourly dry-bulb temperatures are plotted in a form of dots representing 365 days. The comfort zone is defined on the chart and every possible passive design strategy is defined as percentages of hours that fall in each range of each strategy.
33

Figure 2.9 Psychrometric chart analysis and the corresponding passive design strategies for Alexandria (Climate Consultant 5 see Appendix A)
34

Figure 2.10 Psychrometric chart analysis and the corresponding passive design strategies for Cairo (Climate Consultant 5 see Appendix A)
35

Figure 2.11 Psychrometric chart analysis and the corresponding passive design strategies for Aswan (Climate Consultant 5 see Appendix A)
36

2.5.3 Szokolay’s CPZ Method
In 1970s, Mahoney derived a series of tables first published by the United Nations Centre for Housing, Building and Planning especially for hot regions. These tables deal with the effective climatic variables, subdivide climates into humidity groups, predict climatic indicators, and present a series of preliminary and detailed design recommendations. These recommendations are categorized into eight headings (layout, spacing, air movement, openings, walls, roofs, outdoor areas and rain protection) (Koenigsberger et al. 1974, and Upadhyay et al. 2006). The tables were the first method to consider a preliminary adaptive approach to thermal comfort evaluation in terms of mean annual temperature and mean monthly relative humidity (Saberi et al. 2006).
In 1986, referring to the latest development in the BBCC and Mahoney tables, Szokolay constructed the Control Potential Zone (CPZ) method that applies Auliciems’ outcomes for the adaptive thermal comfort approach. The CPZ method tests the different strategies with outdoor conditions to achieve indoor comfort (Rabah and Tamakam 2002). The adaptive comfort zone of the CPZ method refers to Auliciems’ equation (Tn = 17.6 + 0.31 To; where thermal neutrality (Tn) is a function of outdoor mean temperature (To)) with range of operative temperature between 17.8ºC and 29.5ºC. The control limits are linked to that comfort zone. Szokolay used the absolute humidity to reflect the evaporation potential of the skin, and the solar heating effect according to both solar radiation and building characteristics (Szokolay 1986 and 1995).
The CPZ method has been applied for 114 locations in Queensland by Szokolay in order to classify different climate zones. Yang et al. (2005), Zain-Ahmed et al. (1998) and Upadhyay et al. (2006) utilised it to determine appropriate cooling strategies for four climatic regions of Cyprus, the hot humid climate of Malaysia and warm desert climate of the Kathmandu Valley respectively.
37

2.6 Evaluation Criteria of Thermal Comfort
Mixed mode buildings are considered more similar in their operation to naturally ventilated buildings than to fully air-conditioned ones. Rijal et al. (2008, 2009) observed that operation of windows and fans in naturally ventilated and mixed mode buildings was almost identical. Furthermore, across a database of 370 mixed-mode and air-conditioned buildings, mixed-mode buildings were found to provide higher occupant satisfaction (Brager and Baker 2008).
The adaptive comfort model, with its wider range of acceptable conditions, could promote longer operation of natural ventilation; reduce the dependence on mechanical cooling and consequently save ventilation and cooling energy (Nicol et al. 1999). The thresholds that regulate the alteration between active and passive modes have to respect the adaptive comfort criteria especially when sizing equipment (De Dear and Brager 2001). Energy savings using this comfort model was estimated as 10% - 18% of the cooling load for temperate climate such as that of Europe (Nicol and Humphreys 2002). More energy savings can be expected for buildings in hot climates with greater cooling demands.
To put the available comfort models in perspective Figure 2.12 illustrates the application of three comfort models, namely ASHRAE 55, EN 15251, Fanger EN ISO 7730 and Givoni Model, using the climate data of Cairo. The variation in the comfort model is so huge and summarizes the previous discussion. For example, the Fanger model indicates that indoor thermal comfort is achieved with a very narrow (red line) temperature range. On the other range of the spectrum, the Givoni Model (black line) has a very wide temperature range of temperature reaching 30 oC. Generally the, application of the adaptive model (ASHRAE 55 and EN 15251) can be achieved with a wider range of temperatures than the Fanger model. In consequence, in some situations it is possible to maintain building interior conditions within the adaptive comfort limits entirely by natural means (Pagliano 2010). In these cases there is no energy use associated with achieving indoor summer comfort. Therefore, as the adaptive model of thermal comfort is thought to be more appropriate for mixed-mode buildings (Rijal et al. 2008, Pfafferott et al. 2007, De Dear 1999), it has been adopted for the residential benchmark developed in this thesis.
38

Figure 2.12 The application of three standards for Cairo (ASHRAE 55, EN 15251 and Givoni)
2.7 Conclusion
The literature review presented in this chapter covers selected major and fundamental topics related to the thesis. These major topics are climate data for different hot climates classifications and energy performance of Egyptian residential buildings. Also different thermal comfort models and standards for sealed and non sealed office buildings are explored because there are no comfort models for residential buildings in hot climates. Moreover, bioclimatic analysis methods and evaluation criteria of thermal comfort of residential NZEBS is reviewed. This review is fundamental because it has direct impact on defining NZEB in hot climates and the implications and requirements that influence the design. The next chapter describes in detail the impact of the contextualisation that has been presented in this chapter.
39

40

Chapter 3 .. Design & Practice of NZEB
The Net Zero Energy Buildings (NZEBs) objective has raised the bar for sustainable development among architects and developers in hot climates. The objective of this chapter is to review existing NZEBs definitions and to investigate the influence of setting a zero energy objective for residential buildings in hot climates. The chapter compares the impact of passive design strategies on energy consumption and comfort.
3.1 Introduction
The building design community at large is triggered by mandatory codes and standards that aim to reach zero energy built environment (IEA 2011, ASHRAE 2008). On the other hand, the design and implementation of NZEBs in hot climates has been scarcely studied. Most energy efficiency research is conducted with cold climate in mind. Perhaps because industrialised countries spend about twice as much energy for residential heating as they do for cooling (DOE 2010, Sivak 2009). Thus the body of knowledge for NZEBs is growing mainly there.
However, economic changes in hot climate regions are occurring fast. In non-industrialized countries including Brazil, China, Egypt and India residential energy consumption rises by 2 percent per year, compared with 0.4 percent per year for the OECD countries (Organisation for Economic Co-operation and Development). In those emerging countries the patterns of residential energy use are well established and faster population growth and young populations translate to larger increases in energy demand (DOE 2010, Sivak). Therefore, it is essential to address NZEBs design in hot climates.
3.2 Definition of NZEB
Determining if a building is truly zero-energy is a complex task. Definitions by default are an ambush because they are static while the reality of the world and practice are changing. Therefore, and as part of this chapter it is essential to explore the existing definitions and the stand points that initiate them.
3.2.1 Complexity of Definition
The term ‘net zero’ is used for calculating the annual energy use for the building operations including cooling, heating, ventilation, lighting and plug loads. The term ‘is based on using the electricity grid both as a source and a storage medium thus avoiding the onsite electricity storage. Since the revival of the ‘net zero’ concept in the 1970s in the field of the environment there has been an agreement to connect a domestic renewable system to the
41

electricity grid. This argument has been adopted widely due to the better life cycle performance of NZEBs versus autonomous buildings (Hernandez, P. Et al. 2010). The 1988 Chanelle zero energy house in Norway and the 1996 Freiburg self sufficient house in Germany were the earliest attempts in Europe. Since then several concrete classifications and calculation methodologies for zero energy building or net zero energy buildings (NZEB) unfolded (Marszal, A. et al. 2009).
One of the earliest classifications for four primary definitions found in literature was the study by Paul Torcellini, Shanty Pless and Michael Deru with the National Renewable Energy Laboratory (NREL) set one. The authors highlighted the influence of the definitions on project design and success in achieving the zero energy goal (Torcellini, P. Et al. 2006). The four definitions are based on the site energy, source energy, energy costs, or emissions. All four definitions assume a grid connected building where the annual export and import is equalized during the term of one year. The ‘net zero site energy’ definition assumes producing at least as much energy as used in a year, when accounted for at the site. The ‘net zero source energy’ assumes producing at least as much energy as used in a year when accounted for at the source, referring to the primary energy used, using site-to source conversion factors. The ‘net zero energy costs’ assumes that the money paid by the utility to the building owner for energy exported to the grid is at least equal to the amount the owner pays the utility over a year. Finally, the ‘net zero energy emissions’ assumes producing at least as much emissions-free renewable energy as used from emissions-producing energy sources. The authors suggest that buildings should first reduce energy use overall, and produce electricity within the building footprint.
Another study by Kilkis (2007) highlighted the importance of balancing the neutrality of energy regarding the quantity and quality (exergy) of energy. He stressed on the exergy as an optimal metric that can assess the complete impact of the building on the environment. Therefore, the author suggests a new definition for ZEB namely the Net Zero Exergy Building (NZXB) and defines it as: ‘’… a building, which has a total annual sum of zero exergy transfer across the building-district boundary in a district energy system, during all electric and any other transfer that is taking place in a certain period of time”. On the other hand, Mertz, et al. (2007) describes a method of performing and comparing lifecycle costs for standard, CO2-neutral buildings. The authors emphasize on the costs of source energy to be calculated based on the cost of photovoltaic systems, tradable renewable certificates, CO2 credits and conventional energy.
Moreover, a number of authors focused on finding a common definition for electricity dominated buildings. For example, Gilijamse (1995) defines a ZEB as building where no fossil fuels are consumed, and annual electricity consumption equals annual electricity production. The author considers the electrical grid as a storage buffer with annual imports and exports. Iqbal
42

(2002) defines ZEB as buildings that does not consume fossil fuels and produces an equal amount of electricity over the term of one year.
Since 2008, the IEA Task 40: Towards Net Zero Solar Energy Building has been working to establish an internationally agreed understanding on NZEBs based on a common methodology. The Task members published recently a comprehensive review and analysis of existing NZEB definitions (Marzal 2011). The definitions for achieving zero energy have been reviewed from a conceptual perspective. To a large extent most of these definitions aim to reach a balance by setting energy metrics (kWh or MJ), boundary balance (net zero) and balance period (monthly, seasonally or yearly). Also the joint team of the IEA SHC Task 40 developed criteria for NZEB definition (Marzal 2010, Sartori et al. 2010 and Sartori et al. 2012). Figure 3.1 illustrates a summary of the scope of questioned criteria among the task activities.
Figure 3.1 NZEB definition criteria after the IEA Task 40 (Sartori 2010) 3.2.2 NZEB Definition in this Study
Among the variety of definitions, in practice many practitioners have opted to meet the site ZEB goal, as with this approach there is no need to adjust for grid generation and transmission losses, utility emission rates, or utility cost structures. As these values can vary greatly by location, the site ZEB goal simplifies energy calculations and provides a more level playing field. Therefore for this thesis the NZEB definition is:
“A NZEB is a grid connected, energy efficient building that balances its total annual energy needs by on-site generation”
43

3.3 Design Concepts of NZEB for Hot Climates
By default NZEBs benefit from abundant renewable energy sources such as direct solar radiation, wind and the earth’s thermal storage capacity. Implementing of design strategies that takes advantage of these natural energy sources in building design contributes to lowering the energy consumption and generating its own energy needs (Torcellini et al. 2008). This section reviews design solutions for residential buildings in hot climates and list multiple passive and active climate-responsive strategies and solutions.
In hot climates, it is always necessary to avoid sensible and latent heat gains in every possible way and to achieve comfort conditions while minimizing energy consumption. Therefore, passive design solutions couple two major strategies, heat rejection and heat release (Givoni 1992 and Fathy 1986). The heat rejection strategies are environmentally protective and include solar and thermal control in addition to thermal zoning or buffering concepts (Harriman 2008). The heat release strategies are environmentally reversing the heat effect through cooling and include passive cooling techniques. Similarly, active design solutions aim to reject and release heat but mechanically. However, the difference between active and passive design strategies is not only the mechanical intervention, but it is also the generation of thermal and electric needs on site. These main differences are illustrated in Figure 3.2 and discussed in the following paragraphs.
3.3.1 Passive Design Strategies
Solar Control: The envelope is commonly the element of a building that is most exposed to the sun. Solar radiation absorbed by the envelope surfaces raises the surface temperatures, driving heat transfers toward the interior buildings, as well as the ambient air and sky. The peaks in surface temperatures are affected by solar radiation and thus the design of building envelope should seek to control the absorption of solar radiation and its effect indoors. This should be achieved by sun protection and shading of the envelope to reduce incidence of direct solar radiation. The optimal choice of orientation, building compactness, window to wall ratio (WWR) and form is important. Light coloured external finishes can also reduce absorptance of solar radiation. Landscape elements such as shade trees and ground cover can also help if properly placed to block the sun and reduce the reflectance (Koch-Nnielsen 2002, Attia 2006a & Attia 2006b).
Thermal Control: Thermal and humidity control are essential for the building skin in hot climates. The thermal exchanges between buildings and the outdoor micro-climate depend on the temperature difference between inside and outside, as well as on the exposure and thermal properties of external building elements. The use of wall cavities, thermal mass, thermal insulation,
44

and external reflective materials, can help prevent heat gains and suppresses these exchanges.
Thermal Zoning: The positioning of the building spaces with regard to the path of the sun, prevailing winds, openings locations and landscape design can lead to improved thermal comfort in relation to the functions and climatic requirements.
Figure 3.2 Inventory of passive and active solution sets for NZEB in hot-humid climates
45

In hot climates, the concept of thermal zoning or heat buffering entails creating intermediate semi-controlled outdoor zones that serve as an active double skin or even triple skin using bioclimatic landscape design strategies. These outdoor zones serve to block the heat in the mass of spaces and include courtyards, deep veranda, porches and earth sheltered partitions of buildings (Attia 2009e and Attia 2011g). A combination of shade and natural ventilation also plays a key role in the process of thermal zoning aiming to improve the internal temperatures.
Passive Cooling: The application of passive cooling is most appropriate to release the heat in buildings in hot climates. This includes evaporative, cooling of outdoor air supplied to a building for ventilation, or radiative and convective cooling to cool the buildings structure. Passive cooling includes also ventilation. Ventilation is the provision of a fresh air supply necessary for occupant health and hygiene in buildings. The ventilation process consists of a rate of air exchange that can vary as a function of fresh air requirements, as well as the mechanism of air supply (Givoni 1996).
3.3.2 Active Design Strategies
In hot climates, active design strategies are concerned with rejecting excessive heat from the indoor environment to the outdoor using appropriate mechanical heat exchange mechanisms which typically involve some combinations of fans, refrigerant loops, sensors and controls, pipes and ductworks, and other mechanical equipments (such as fans, pumps, chillers, cooling towers). Since the external heat gain solar radiation residential buildings is significant, and where outdoor summer temperatures are high (due to the climate type, global warming or urban heat island effect) passive and low energy cooling strategies could be incapable sometimes of maintaining indoor comfort conditions (Florides et al. 2002). Consequently, active strategies are often selected for residential buildings in more extreme climate conditions. Chapter 4 presents the active design strategies and technologies for NZEBs in detail.
46

3.4 Passive, Low Energy and Hybrid Cooling Strategies
Both passive and low energy cooling strategies employ natural phenomena to exchange heat with the surrounding environment using architectural elements and natural heat sinks (Voss et al. 2007, Santamouris 2007). The effectiveness of these cooling strategies is therefore mainly dependent on climate and some building fabric components. Since the building is not well defined in the early stages of the design process, the selection of effective cooling strategies depends mainly on climate.
Five main passive cooling strategies are commonly adopted; natural ventilation, nocturnal/night ventilation, direct evaporative cooling, indirect evaporative cooling and ground cooling (Givoni 1994). Night ventilation and direct evaporative cooling are suggested for hot-dry climates, while natural ventilation and indirect evaporative cooling may be strategies suitable for hot-humid climates (Szokolay 2003). Passive designs are very energy efficient and are expected to consume the least energy of the many different cooling strategies. However, the cooling potential of these strategies is sometimes insufficient to satisfy the cooling requirements of all the building zones especially at extreme weather conditions. Moreover, the performance of some passive strategies –evaporative and ground cooling– could hardly be controlled.
Low energy cooling strategies integrate some active cooling components in order to improve the cooling potential, control the cooling performance, and satisfy the majority of cooling needs of the building. Examples of these applications include slab radiant cooling with embedded chilled pipes, evaporative coolers and geothermal borehole heat exchangers (Florides et al. 2002, Liddament 2000, Tassou 1998, Santamouris 2007). Low energy cooling strategies are expected to provide more controllable cooling potential than passive designs but with higher associated energy consumption. This energy consumption is expected to be lower than conventional active systems since these strategies exploit natural energy sources; solar energy, geothermal energy, wetbulb depression and material properties (Santamouris 2007).
High thermal mass is usually used in conjunction with these passive and low energy cooling strategies to act as a heat sink that controls the heat absorption and discharge heat transfer mechanisms. At the same time, thermal mass reduces the fluctuation of the indoor environment and so protects it from the severe dry outdoor climate and the large temperature swings (Abanomi et al. 2005, Zhou et al. 2006, Antinucci et al. 1992). The effectiveness of the thermal mass depends on the exposed surface, material properties and the diurnal dry-bulb temperature variation (Givoni 1998). Since passive strategies should satisfy part of the cooling demands and consume the least energy consumption, the research focuses more on the
47

five different passive strategies (below) together with possible improvements using low energy cooling technologies.
3.4.1 Natural Ventilation
Houses and office buildings were designed to enhance natural cooling, and people spent summer days and evenings on porches or fire escapes. They cooled off by getting wet--opening up fire hydrants, going to the beach, or diving into swimming holes. Before air conditioning, American life followed seasonal cycles determined by weather. Workers' productivity declined in direct proportion to the heat and humidity outside-on the hottest days employees left work early and businesses shut their doors. Stores and theatres also closed down, unable to comfortably accommodate large groups of people in stifling interiors. Cities emptied in summers as people fled the city for mountain and seaside resorts.
3.4.2 Night Ventilation (Nocturnal Ventilation)
Night or nocturnal ventilation makes use of the low night temperature at non-occupied periods to flush the accumulated daytime internal heat such that the structure is cooled down at night while the thermal mass provides a cold discharge mechanism during the following daytime (La Roche 2001). The effect of night ventilation with an exposed thermal mass could reduce the cooling loads, the size of cooling equipments, and the overall energy consumption (Santamouris 2007). Night ventilation has been suggested for dry climates with large diurnal range of 15ºC – 20ºC and night temperature below 20ºC (Santamouris et al.1996). Accordingly, comfort and nocturnal ventilation depend on day and night temperatures, humidity, wind speed and direction.
3.4.3 Direct Evaporative Cooling
As air flows across a wet surface or a mist, direct evaporative cooling occurs through water evaporation. This increases the moisture content of the air and reduces its drybulb temperature (Antinucci et al. 1992); in this process, sensible heat is converted into latent heat at a constant wet-bulb temperature (Szokolay 2003). The dry-bulb temperature can be reduced by about 70% - 80% of the wet bulb depression (Givoni 1991) and this is defined as the difference between dry-bulb temperature (DBT) and the wet-bulb temperature (WBT) (Rosenlund 2000, Santamouris 2007). A larger wet-bulb depression promotes greater reduction in dry-bulb temperature. This strategy has been suggested for dry climates with noon relative humidity below 40% (Smith 2005), maximum WBT 22ºC – 24ºC and maximum DBT 42ºC – 44ºC (Givoni 1994).
Direct evaporative cooling can be enhanced as a passive strategy by implementing indoor fountains, waterfalls and vegetation, by designing a
48

lake at the windward side, or by supplementing moisture pads or sprinklers in integrated wind scoops (Antinucci et al. 1992). The latter strategy is known as Passive Downdraught Evaporative Cooling (PDEC) (Santamouris 2007).
The same cooling mechanism can be enhanced as a low-energy cooling system by integrating fans and fibrous wet pads known as direct evaporative coolers (Florides et al. 2002). In this system, the fan drives airflow across the wet pads and into the space. The moisture content of the air increases associated whilst there is significant dry-bulb temperature reduction. This low-energy cooling system permits more temperature and humidity control of the supplied air than passive applications and its performance could be simulated using EnergyPlus (DOE 2011).
3.4.4 Indirect Evaporative Cooling
Indirect evaporative cooling uses the same evaporative cooling phenomenon to reduce the zone dry-bulb temperature but without increasing its moisture content. This is achieved by the introduction of a heat exchanger with a completely separated air stream, which is cooled by direct-evaporative cooling (La Roche 2001). This can be adopted as a passive strategy by integrating roof sprays, moving water film over the surface and roof ponds together with a high conductivity roof slab (Antinucci et al. 1992, Givoni 1992). In these passive applications, the building structure is cooled by water evaporation from the exterior surface which acts as a heat exchanger to cool the adjacent spaces without raising their moisture content (Antinucci et al. 1992, Givoni 1992). This passive strategy might be applicable with higher maximum WBT of 25ºC and maximum DBT of 46ºC and could suit more humid climates with low wet-bulb temperatures (Santamouris et al. 1996). The passive cooling efficiency is improved with high insolation level and high wind speed which make it appropriate for dry climates (Nahar et al. 2003, Verma et al. 1986).
Indirect evaporative cooling can also be adopted as a low energy cooling strategy in either air systems or radiant systems. For air systems, the outdoor air is cooled by an evaporative cooler in a completely separate circuit and passes through a heat exchanger to cool the supplied air to the space (Florides et al. 2002). Although the supplied air is cooled without any increase in its moisture content, the cooling potential is expected to be lower than with direct evaporative cooling (Liddament 2000). For radiant systems, the building structure with embedded water pipes that is used to reject excessive heat from the indoor space is firstly cooled though water evaporation within cooling towers (Tian et al. 2009b, Strand 2001). This radiant system applies the same concept of passive indirect evaporative cooling (Costelloe et al. 2003) which is considered within bioclimatic analysis methods (Givoni 1992, Brown et al. 2001) but with more system control and wider range of application.
49

3.4.5 Ground Cooling
The ground can act as a heat sink for the building to absorb heat by conduction through the ground and by convection within a circulating fluid (Givoni 1991). The ground temperature changes at a slower rate than the air and is highly affected by the soil materials; conductivity, heat capacity and density (Santamouris 2007). Ground cooling effectiveness depends on the difference between ambient air and ground temperatures (Antinucci et al. 1992) that was suggested to be about 14K – 16K for dry and 10K – 12K for humid climates (Givoni 1994). The highest ground cooling potential is expected to take place during the summer time where maximum temperature difference between the ambient air and the ground exists.
Semi-buried buildings (known as contact cooling) or passing fresh outdoor air through earth tubes could exploit the cooling potential of the ground (Antinucci et al. 1992). These passive applications deal mainly with the surface ground temperature which follows the ambient conditions at a slower rate. For hot climates, the ground may require to be cooled either by shading, planting or irrigation.
Since the temperature of the deep ground is almost stable, the difference between maximum ambient air and ground temperature increases and higher cooling potential could then be achieved using vertical geothermal Borehole Heat Exchangers (BHE). This low-energy cooling strategy can be applied by circulating a fluid within buried closed loop pipe system coupled to heat pumps or directly to radiant cooling devices (Santamouris 2007). Recent research findings show that the long term operation of this system causes a gradual increase in the deep ground temperature which has to be taken into consideration when designing such system (Fisher et al. 2005).
3.4.6 Mixed-Mode/Hybrid Cooling
“Mixed mode is a term used to describe servicing strategies that combine natural ventilation with mechanical ventilation and/or cooling in the most effective manner” (CIBSE 2000).
The mixed-mode cooling concept –sometimes named hybrid ventilation– dates back to late 1980s when research began to address issues such as carbon emissions, building related health problems, productivity and occupant satisfaction. In the 1990s, several research projects studied exploitation of the best of passive and active cooling strategies in mixed-mode/hybrid schemes. Mixed-mode/hybrid strategies seek to maximise the use of passive methods but incorporate supplementary mechanical systems for use in the most extreme conditions (Brager 2006). The main objective is to maintain satisfactory indoor air quality IAQ and thermal comfort during occupied hours while minimizing energy use (Gids 2001). Mixed-mode/hybrid strategies are expected to consume more energy than passive
50

strategies and less than mechanical ones (Lomas et al. 2007, Charvat et al. 2005). Regarding the integration of both natural and mechanical systems, the components needed are therefore some combination of components and features such as low pressure ductworks, variable speed fans and heat recovery systems (Wouters et al. 1999).
Analysis methods, control algorithms and appropriate prediction tools help designers to evaluate and optimize mixed-mode systems (Li 2001). Since mixed-mode strategies are concerned with both IAQ and thermal comfort, coupled thermal multi-zone airflow tools are useful for the detailed analysis of the performance of these strategies (Heiselberg 2002). Due to the high level of uncertainty at the early design stages, and inexperienced users, preliminary analysis tools should be simpler and easy to use (Li and Heiselberg 2003). Various simplified tools have been developed to predict the potential of mixed-mode ventilation at early design stages (Axley et al. 2002, Fracastoro et al. 2001, Luo et al. 2007) but they don’t integrate low energy cooling strategies.
The design challenge of mixed-mode strategies is to overcome existing barriers. Heiselberg et al. (2001) summarized the list of barriers identified in AIOLOS (Allard 1998), NatVent (http://projects.bre.co.uk/natvent/) and Annex 35 projects (IEA 2002) and highlighted on fire, smoke and noise regulations as major barriers. Roth et al. (2006) and Kossik (2001) also suggested unfamiliarity with those strategies, climatic limitations (as most of research and implementation was done in Europe), insufficient guidance within codes and standards as special challenges.
The research conducted to date has mostly been concerned with applications in temperate climates such as that of northern Europe. The application of Mixed-Mode ventilation in severe hot climates and its integration with other passive and low energy cooling strategies is very challenging, has not been systematically studied and so this work presents a distinction with respect to previous work.
3.5 Scale and Urban Density
The potential for net zero energy use in hot climates at a community level is higher than buildings that do stand alone. As NZEBs become technically and economically feasible, extending their boundaries to groups of buildings net-zero energy clusters, neighbourhood, communities, towns, and cities may become more and more realistic. Extending the net-zero energy boundaries beyond a single building addresses the emergence of urban scale that would generate renewable energy for a certain group of buildings. This would be connected to community-based renewable energy systems that would be connected to the grid or to a district cooling system.
51

Residential buildings in Egypt must be based on compact desert developments. The compact and highly dense Nile Valley and Delta cannot anymore host crowded or greater building mass in the available space. Therefore, the future development has to be urban and compact and, above all high quality architecture to compensate the distance from the Nile valley. Compact, integrated dense and community based buildings can provide solutions for the demographic and housing problems as is evidenced by several recent examples, of desert urban typologies.
Another important design decision for NZEB design is the building configuration density. By designing compact NZEBs communities in high densities the energy efficiency can be improved significantly. Designing on community scale is a sustainable approach to the planning of NZEB neighbourhoods. Especially in a country like Egypt where there is a trend of rapidly growing population. This can also halt urban sprawl and provide more affordable housing. A high density planning will save transport fuel and will create a lifestyle with lower dependency on automobiles. More importantly, having a car free urban context will encourage the use of natural ventilation and require less sealed buildings due to the mitigation of noise and acoustic problems (Fig 3.3).
Figure 3.3 Current practices, versus prospective NZEB practice in Egypt
For a large community or neighbourhood, it is often more cost-effective and efficient to generate renewable energy in a central location in the community, rather than on individual buildings. Urban scale systems allow
52

for a single point for all maintenance and offer economies of scale—larger, central systems can be better optimized and cost less per kilowatt of generation capacity. Urban based renewable energy systems, however, have some transmission and distribution losses when providing energy directly to a building. Inefficiencies and costs such as distribution piping and wiring, pumping losses, distribution transformers, and thermal losses are often associated with district distribution systems, whereas this is generally not the case with a building-based renewable energy generation systems.
In Egypt, achieving NZEB on the community scale using central rooftop PV would most likely be the least expensive way to achieve NZEB status. This applies too to solar thermal systems on the scale of community. However, solar assisted cooling systems costs are for this technology. Similarly for wind power is more costly over solar power. Thus, the application of NZEBs on the community scale will result in wider benefit for economies-of-scale. Furthermore, achieving NZEBs on the community scale will decrease the dependence on the grid for electricity. So by expanding the net-zero target to a community scale, designers can take better advantage of economies-of-scale, as well as having other generation options at its disposal.
3.6 High Tech or Low Tech NZEBs
A Net Zero Energy Building should be contextual, resource conserving and efficient. ‘Low Tech’ means simple building design and maximum use of natural resources available in environment. It allows the use of advanced technologies such as PV’s and air-conditioning units; however, it operates within a low energy life style. It does not require sealed buildings, high comfort levels or high construction quality. On the other hand, ‘HighTech’ symbolizes the use of advanced technologies to provide maximum comfort style and is associated with energy standards.
Egypt is full with ‘Low Tech’ examples from history that can teach us several architectural concepts allow minimizing the demand for energy used to cool the buildings in hot climates. Lessons, known as sustainable, vernacular, bioclimatic architecture, involve minimizing heat gain by the building, minimizing solar heating of the envelope and solar penetration through windows and so on (Fathy 1986). However, for the last 50 years, Egyptian practice abandoned the ‘Low Tech’ bioclimatic design and did not consider the existing vernacular buildings as the predecessors for a modern ‘High Tech’ practice (Coch 1996). Instead, the built environment witnessed a continuous rapid ‘High Tech’ urbanization, which does not respond to climate, coupled with rising use of fossil fuels and electricity.
Based on a bioclimatic analysis of the Egyptian climate and the analysis of the existing vernacular Egyptian examples a summary of general ‘Low Tech’ principles and solutions has been developed in a comparative matrix. The aim of this matrix is to support architects with principles and design solutions during the decision making process in early design stages. The matrix in
53

Figure 3.4 shows different design solutions for Low Tech’ design approaches suggested for Egypt and should be combined with Figure 3.2. The matrix links the solutions in the following order: 1) urban morphologies, 2) building architecture and 3) vernacular architectural elements (Fathy 1986, Brown 2001, Al-Wakil 1989).
Figure 3.4 Comparative design matrix listing common principles and solutions in Egypt
54

However, this matrix is not presented as a set recipe for replication but rather as a source of inspiration and guidance for modern and contemporary practice that incorporates those ideas and principles.
Thus achieving NZEBs can employ Low Technologies or High Technologies as long they are justified in architectural solutions. Figure 3.5 illustrates the relation between the Low Tech and High Tech built environments. Buildings in a city like Cairo, with low energy consumption rates and low comfort conditions, will reach high comfort levels and consequentially high energy consumption imitating cities like Los Angles and Dubai. While the energy consumption in the building sector of those two cities aims to reach the low energy consumption levels of Cairo’s buildings. Thus the challenge for new buildings in Cairo is to raise the thermal comfort levels and keep the energy consumption low without repeating the mistakes of other cities.
Figure 3.5 The Low Tech and High Tech challenge of the built environment in Egypt
55

3.7 Design Methodology and Guidance
In order to design a building, architects usually follow standard design methodologies and refer to some design guidance. These design methodologies and guidance are either recommended by architectural associations/schools or self-developed based on design experience. It is extremely hard to ask designers to adopt new guidelines but rather to develop existing ones with amendments. Therefore, the design methodology that will be proposed at the end of this research should be integrated with existing design methodologies where applicable. Common current design guidance should furthermore be updated based on the research findings. Accordingly, the most common and the most applicable design methodology and guidance will be described below.
3.7.1 Design Methodologies
“The design and construction process usually follows a sequence of activities that varies only in detail and extent for various types of project. This process may be seen as a linear function and is commonly referred to as a plan of work” (BSI 1996).
By the early 1960s, several attempts were made to develop a consistent problem-solving design framework (Rowe 1987). In time, these rational frameworks have been improved to follow progress in related fields (project management, construction process and others). Several approaches will be discussed; the architectural approach, the engineering approach (e.g. for building services engineers) as well as recent approaches regarding mixed-mode strategies and bioclimatic design.
3.7.1.1 Architectural Approach
The two main effective design methodologies for architects are those suggested by the Royal Institute of British Architects (RIBA 2008) and the American Institute of Architects (AIA 2007), Table 2.1. These plans of work emphasise a list of objectives for each design phase while suggesting flexibility in achieving them (Lawson 2006). The RIBA plan of work is divided into five main phases–Preparation, Design, Pre- Construction, Construction and use– and 11 subcategories (A-L). The AIA plan of work is presented so that equivalent stages to those of the RIBA coincide. In practice, these different design stages are not sequential but sometimes overlap. The plan of work provides a pattern for collaboration with other effective parties; engineers, contractors and clients (Emmitt, 2007).
The Association of Consulting Engineers (ACE), a well-known UK association, provides sets of agreements that act as contract documents for consultancy appointments. The work stages described in agreement C(2) conform to the RIBA plan of work (ACE 2004).
56

3.7.1.2 Bioclimatic Approach
Victor Olgyay presented a climatic approach that encourages architects to work and make good use of natural forces (Olgyay 1973). This approach consists of four main design stages; climate data, biological evaluation, technological solutions and architectural application, Table 3.1. Climate data is plotted on a bioclimatic chart – based on the psychrometric chart– and strategies are declared. Several design elements are analysed considering site selection, building form, orientation, shading devices, construction and air movement. Finally, Effective design elements are integrated within the final design.
3.7.1.3 Engineering Approach
Bownass had suggested a design methodology for engineers based on the RIBA plan of work (Bownass 2001). The proposed design methodology, Table 2.1, involves a concurrent development process for the project brief and the design in a 3 and 7-stage process respectively. The author highlighted activities and deliverables of the building design services at the main project stages. These main stages are feasibility studies, concept design stage, design brief, scheme design stage, detail design stage, construction design information, construction, and design feedback.
Table 3.1 Comparison of different design approaches
3.7.1.4 CIBSE Approach
More recently, within CIBSE AM13, The Chartered Institution of Building Services Engineers has introduced a design methodology for the application of complementary mixed-mode schemes (CIBSE 2000). The methodology seeks an optimum balance between passive and active strategies. It suggests starting by optimising building components that will encourage passive strategies, design of the complementary active strategy, evaluation of trade-off potentials, specifying the optimum combination and then system specifications and features for application, Table 3.2 and 3.3. Several iterations of the trade-off optimisation procedure are suggested.
57

Table 3.2 AIA and RIBA Plans of Work: Multi-disciplinary Service
3.7.1.5 IEA-Annex 35 Approach
Within IEA-Annex 35 project, another design methodology has been presented in a logical sequential manner (Heiselberg 2002). Its main concept is to minimize energy demand, maximise natural ventilation and the design of a supplementary mechanical system (Heiselberg et al.1999). The design methodology, Table 3.3, consists of seven stages and their subcategories; programme, conceptual design, basic design, detailed design, design evaluation, commissioning and operation (Jagpal 2006). Different decision tools and analytical calculation methods are suggested for each design stage based on the level of detail, time and complexity.
Table 3.3 RIBA Plans of Work: Multi-disciplinary Service
PREPERATION DESIGN PRE-CONSTRUCTION CONSTRUCTION USE A B C D E F G H J K L
Appraisal Design Brief
Concept Design Development
TechnicalDrawings
ProductionInformation
Tender Documentation
TenderAction
Mobilisation Construction to Practical
Completion
Post Practical Completion
3.7.1.5 IEA-Annex 40 Approach
Recently, within IEA-Annex 40 project, a NZEB design approach was presented. The NZEB design approach is based on minimizing the energy demand by achieving maximum building energy efficiency then supplying the energy demand for cooling or heating or electricity through active systems. A NZEB design approach requires designer to spend more effort up front in the design process getting the NZEB objective. Figure 3.6, shows the suggested design process of a NZEB building compared to convectional design. The figure is based on the work of Building Smart (2009) and the Patrick McLeamy Curve. As shown, the opportunities for cost savings decrease as the project goes along, while the cost for making changes increases dramatically. Many of the design decisions that most affect performance should be taken during the pre-design and schematic phases.
58

Figure 3.6 The design process of NZEBs as suggested by the IEA Task 40
3.7.2 Design Guides
Design guides and their data are usually developed as a result of practitioners’ best practice and recent research findings. Various forms of design guides exist and the selection of the most appropriate depends on the main design objective. They may describe different application techniques, ranges of optimal values, and suggested best practice design (Tunstall 2006). In this context, these references could be classified into three main categories; energy codes, design standards and general publications.
3.7.2.1 Energy Codes
International energy codes and standards offer minimum/maximum acceptable values to help designers targeting an energy-efficient design with optimal energy use and carbon emission. An energy-efficient design has to at least comply with available energy codes/standards and probably exceed them. These regulations are mainly classified according to building type (residential and commercial) and climate zone.
These regulations could be complied with using one of three compliance approaches; prescriptive, trade-off or performance approaches (DOE 2000). The prescriptive approach is the easiest to define but the most rigid with lists of minimum/maximum acceptable limits of different building components such as U-values and SHGC (G values). The Trade-off approach is more flexible than the previous one and shows more consideration of the whole
59

building energy efficiency and not just particular components. This approach allows some limits to be exceeded by some components against enhancement of others. The performance approach provides the highest flexibility by evaluating the overall building energy performance using annual energy consumption against that of a reference design.
Local energy codes may replace international ones for some countries with hot locations. Recent surveys show a worldwide concern for developing and applying such building codes/standards for commercial buildings (Janda 2009). As can be seen in Figure 3.7, hot zones show diversity regarding their local commercial building energy codes; mandatory, mixed/voluntary, proposed or with no standards.
Figure 3.7 The Worldwide status of building energy codes/standards for commercial buildings (Janda 2009)
The main energy codes/standards found applied in hot climates are:
• ASHRAE Standard 189.1: Standard for the Design of High-Performance Green Buildings (ASHRAE 2011)
• PERformances ENErgétiques des bâtiments à La Réunion (PERENE 2009)
• ASHRAE Standard 90.2-2007: Energy Standard for Low-Rise Residential Buildings (ASHRAE 2007)
• Building Code of Australia BCA 2006 (ABCB 2006) • International Energy Conservation Code IECC (ICC 2006) • Indian Energy Conservation Building Code (BEE 2006) • Egyptian Energy Efficiency Residential Building Code EERBC (HBRC
2006) • Building Energy Code of Pakistan 1990 (ENERCON 1990)
60

• Commercial Building Energy Standard for Mexico (Huang et al. 1998)
The requirements of these codes/standards vary slightly. The IECC 2006 not only has similar values to but often refers to the ASHRAE standard 90.2-2007. Fenestration and construction requirements of roofs, walls and floors are suggested. The mandatory and prescriptive requirements of the ASHRAE standard 90.2-2007 were seen to represent nearly all other energy codes and standards, in addition to the availability of all the requirements of most building components. Furthermore, standard 90.2-2007 also allows a performance calculation approach on the basis of energy costs.
3.7.2.2 Design Standards
Design standards act as knowledge and technical database that supports the design process at its early stages by providing basic principles and information regarding different building components as a result of latest research findings and good practices. Some of these standards are mandatory but the majority do not usually define regulatory requirements to be followed in the same way as energy codes. Design standards are very effective for new applications, but by experience, designers develop their own designs based on good practice. Therefore, any innovative feature has to be well described originally in the appropriate design standard.
In the case of residential buildings, architects tend to refer to two main design standards; architects’ data (Neufert et al. 2000) and Time-saver standards for architectural design (Watson et al. 2005). The former is mainly organised by building type with massive condensed parametric data, diagrams and spatial requirements at different building scales for each type. Building services have been added lately as a new section. The latter publication is classified by building elements and is more detailed. The data in this case is presented chronologically according to the construction phases; starting from foundations to building services.
In the case of NZEBs, there are no specific standards. Architects can still use other design standards which include the ASHRAE Standard 189 for the Design of High-Performance, Green Buildings Except Low-Rise Residential Buildings or the Passive House Standard (Feist 2011) document or equivalent local authority, and letting agent/client standards. Other technical standards are provided by ASHRAE or CIBSE for the benefit of building services (HVAC) engineers. Thermal comfort limits and models are well described in either ASHRAE standard 55 (ASHRAE 2007) or CIBSE Guide A (CIBSE 2007). With regard to indoor air quality, ASHRAE standard 62 (ASHRAE 2001) provides minimum acceptable ventilation rates for different building types.
61

3.7.2.3 General Publications
This category could include published textbooks, best practice publications, databases, internet materials, media publications, professional journals, statutory documents, design research, refereed papers and journals, manufacturers’ literature and precedents. For example, the ZEBook (Dunster et al 2007), the Green Studio Handbook (Kwok et al. 2006), the Precedents in Zero-Energy Design: Architecture and Passive Design by Zaretsky (2007), the book of Guzowski (2010) Towards Zero-Energy Architecture and the most recent Book published by Voss et al. (2011) about Zero Energy Buildings. CIBSE Application Manual AM13 (CIBSE 2000) presents a comprehensive design guide for mixed-mode ventilation. It covers major aspects regarding mixed-mode ventilation such as different operating schemes, design methodology, basic building design, control strategies, prediction/modelling techniques and energy performance.
62

3.8 Conclusion
This chapter covers selected major and fundamental topics related to the definition and design of NZEBs. These major topics are design concepts, passive and low energy cooling strategies, mixed mode/hybrid cooling, scale and density, high tech or low tech approach and design methodology and guidance for residential NZEBs.
Cooling demands in residential buildings are affected by the severity of the ambient weather conditions. Therefore, cooling of this building type was seen as vital in severe hot climates and was chosen in defining the scope of this work. Passive and low energy cooling strategies depend mainly on climate; nocturnal ventilation and direct evaporative cooling are suggested for hot-dry climate, while comfort ventilation and indirect evaporative cooling suit hot humid climate. The effectiveness of ground-coupled cooling is affected by the difference between comfort and ground temperatures. Therefore, passive and low energy cooling strategies could provide part of the cooling requirements in hot dry climates, reduce the continuous reliance on common active cooling systems and promote for energy and carbon emission savings since they depend on natural energy sources in the surrounding environment. Mixed-mode/hybrid strategies maximise the use of passive methods but incorporate supplementary mechanical systems for use in the most extreme conditions. The main objective is to maintain reliable satisfactory indoor environment –regarding indoor air quality IAQ and thermal comfort.
63

64

Chapter 4 .. Design & Technologies of NZEB
NZEB design in hot climates requires active design strategies and technologies for cooling and energy generation. Active design strategies and technologies refer to mechanical and technological solutions, as is illustrated in Figure 4.1. The active design strategies include electric and thermal energy generation (photovoltaic panels, wind turbines, thermosyphons etc.), movable sun protection, active cooling (solar assisted or conventional Heating Ventilation and Air Conditioning (HVAC)), artificial lighting and mechanical ventilation. One of the most important factors concerning active strategies for NZEBs is the efficiency of the equipment and appliances that achieve those strategies. This includes efficient HVAC equipment, efficient household appliances and high performance ceiling fans. Therefore this chapter aims to review the current technologies, identify the most important design parameters, strategies and technologies through parametric analysis and suggest the most suitable solutions for NZEBs in hot climates.
Figure 4.1 Inventory of active solution sets for NZEBs in hot climates
65

4.1 Introduction
The first strategy to design NZEB is to reduce demand through passive architectural design. The second strategy is to include active design strategies. This includes the use of active cooling and intensive renewable energy concepts. The environmental attributes of renewable systems is to compensate the fossil fuel consumption and CO2 emissions by active acclimatisation systems in the built environment. For architects, utilizing intensive renewable energy concepts is imposing a new responsibility on the shoulders of architects, to integrate a solar system during the early conceptual design phases. Whether we can afford to install renewable systems during building construction or not, we have to prepare our building stock to be receptive to renewable systems at least in the near future. Therefore, in this chapter, we aim to exploring the renewable energy potential and the corresponding active cooling technologies that can acclimatize the buildings efficiently in the Egyptian context.
Designing NZEBs in a country like Egypt, receiving an annual total irradiation above 2409 bankable kWh/m2, implies knowing how to cool buildings and how to integrate renewable systems. Many studies concluded that the incoming solar energy in most Egyptian cities is sufficient to supply the energy needs of the population in the built environment and advocate its use for developing their regions (El-Shazly et al. 1998, Robaa 2006, Attia 2009d). However, the idea of selecting a cooling system or integrating solar energy systems within the building architecture is considered a challenge for many architects in Egypt and elsewhere (IEA 2009, Attia 2009b). There are a number of frustrating uncertainty and unknowns facing architects when designing buildings that incorporate cooling and renewable technologies.
For example, Egypt lies in the Sun Belt area with:
• Direct Normal Irradiation ranges between 2000 kWh/m2/y at the North and 3200 kWh/m2/y at the South.
• The sun shine duration ranges between 9-11 hour/day from North to South, with very few cloudy days.
• Economic Potential 73656 TWh/year
In the same time, a number of studies reviewed the active cooling and renewable energy systems (RES) and technologies that can be applied in the Egyptian context including the work of the IEA:
• Task 14 - Advance Active Solar Energy Systems • Task 16 - Photovoltaics in Buildings • Task 25 - Solar Assisted Air Conditioning of Buildings • Task 38 - Solar Air-Conditioning and Refrigeration
66

The previous mention documentation of the state-of-the-art of active cooling and solar cooling systems is the bases of the review presented in this chapter. It contributes to the background and common understanding of experts in the field and provides basic information required for implementation of the active cooling and renewable technologies for buildings in hot climates.
4.2 Active Ventilation Technologies
Active ventilation technologies using induced draught and exhaust fans, blowers, etc helps in maintaining indoor temperature closer to ambient due to higher rate of air change than what could be achieved through natural ventilation. Active ventilation is significant when it is required to prevent the infiltration of pollutants from building structures or adjacent spaces. This is the case in most hot climate and dense cities. Active ventilation particularly, affects air and moisture flow through the building and poor ventilation may also result in moisture problems that degrade the structure. Active ventilation changes pressure differences across a building and can be achieved with a variety of mechanical methods. Whilst, proper ventilation does indeed generally deliver health improvements, ventilation can also have adverse effects if not properly designed, maintained and managed. It is possible for ventilation to allow the inflow of harmful substances that degrade the indoor air quality.
Ceiling Fans
Ceiling fans are low-tech solutions that help people cope with the heat in residential buildings. Fans evolved from hand-held to electrically powered devices that could produce air movement. Fans are almost a daily use appliance in Egypt and its utility increases, especially in the summer season. Electric fans are one of the oldest mechanical devices that penetrated Egyptian apartments. On a national level, more than 89% of apartments have at least one fan (see Figure 4.2). The most common type is ceiling fans beside pedestal, walls and table fans. As shown in Figure 4.3, elevated air speed is effective at increasing heat loss when the mean radiant temperature is high and the air temperature is low. However, if the mean radiant temperature is low or humidity is high, elevated air speed is less effective. Also the ceiling fans effect cannot control humidity and depends on clothing and activity.
The quality of ceiling fans can be measured through air flow rate (cubic feet per minute CFM), Wind Speed, efficiency rating and noise. The more CFMs the fan can produce, the higher sufficient airflow is provided, which can offset increased higher temperatures (Figure 4.4). For an average size room a ceiling fan should be capable of moving 6000 CFM. Concerning the wind speed the Average wind speed of a ceiling fan is a breeze of about 1.8 meter/second. The Wind Speed is the calculated measure of the expected
67

wind velocity in the column of air directly beneath the fan, so it takes into consideration the Blade Span and the CFMs. Efficiency of ceiling fans is calculated by dividing the amount of air a fan moves by the amount of electricity used (in Watts) at high speed. The average efficiency of a ceiling fan is about 80 Watts/CFM. However, the CFM rating is far more important than the efficiency rating because a fan that produces more airflow is going to offset increased temperature by 2 or 3 times higher than one that blows less air.
Figure 4.2 Typical ceiling fans available in Egyptian market
Figure 4.3 A ceiling fans or indoor motion can make it seem cooler by at least 3 degrees Co thus less air conditioning is needed
Figure 4.4 Air speed required to offset increased temperature (ASHRAE 2005)
68

Finally, fans motors should be precision crafted throughout including the balancing of blades and careful engineering all components so they run perfectly smooth and quiet.
The recent survey conducted by the author shows that the average home in Alexandria, Cairo and Asyut has a 3-4 ceiling fan respectively. The most common fan type is the three blades (48 inch) with a speed of 330 RPM and air flow rate of 3,000 CFM. The average annual operation time in Alexandria, Cairo and Asyut is 1400, 1800 and 2300 hours respectively with a power of 60 watt. The survey results indicate two operational periods for the use of fans. Figure 4.5 shows an example for annual operation profile of electric fans use in Cairo. The survey result indicates the apartment usage modes depend on the thermal comfort. During the warm period only fans are used and during the hot period fans and air-conditioners are used together. The use of fans reduced the total yearly operation hours of air conditioners in particular during early and late summer period.
Figure 4.5 The operation period of ceiling fans and AC in Cairo (average 1800 hours)
69

4.3 Active Cooling Technologies
Typically, residential buildings in hot climates rely on air conditioning units because they are the most cost and energy efficient alternative for cooling. In many hot climate developing countries the cooling demand is rising in residential buildings. The reasons that explain these facts include:
• Improvements in living standards • Trends in architectural design towards more airtight buildings and glass-
made buildings • Increasing average temperatures in summer.
Therefore, cooling is an important energy consumer in residential buildings, and its impact on the carbon dioxide emissions and electricity grid are high. Cooling requires also the close integration of the building dynamics and the HVAC systems. A number of different technologies are considered in this review (see Figure 4.6).
Figure 4.6 Window AC, Split AC, Packaged AC and Central AC chiller
4.3.1 Conventional Air Conditioning Systems
4.3.1.1 Window Units
Window air conditioner is the most commonly used air conditioner for single rooms. In this air conditioner all the components, namely the compressor, condenser, expansion valve or coil, evaporator and cooling coil are enclosed in a single box. This unit is fitted in a slot made in the wall of the room, or often a window sill. Window Units are significantly the cheapest AC technology. A window Unit works best if just one room is cooled with appropriate efficiency and cooling load rating for the space being cooled. Electrical running costs over several years are high and the average life cycle is very short up to 10 years.
70

4.3.1.2 Split Units
The split air conditioner comprises of two parts: the outdoor unit and the indoor unit. The outdoor unit, fitted outside the room, houses components like the compressor, condenser and expansion valve. The indoor unit comprises the evaporator or cooling coil and the cooling fan. For this unit you don’t have to make any slot in the wall of the room. Further, the present day split units have aesthetic looks and add to the beauty of the room. The split air conditioner can be used to cool one or two rooms and is more expensive than Window Units. Also electrical running costs over several years are high and the average life cycle is very short up to 10 years.
4.3.1.3 Packaged Systems and Units
Packaged air conditioner is used if more than two rooms or a larger space in a house are cooled. There are two possible arrangements with the package unit. In the first one, all the components, namely the compressor, condenser (which can be air cooled or water cooled); expansion valve and evaporator are housed in a single box. The cooled air is thrown by the high capacity blower, and it flows through the ducts laid through various rooms. In the second arrangement, the compressor and condenser are housed in one casing. The compressed gas passes through individual units, comprised of the expansion valve and cooling coil, located in various rooms. Unlike split-system units, all components of a complete cooling system are contained in one location, making package units ideal for situations in which indoor space is at a premium. The packaged units are more expensive than Window Units. Also electrical running costs over several years are high and the average life cycle is very short up to 10 years.
4.3.1.4 VRF (VRV) systems
The Variable Refrigerant Flow (VRF) or Variable Refrigerant Volume (VRV copyrighted by Daikin) is different with conventional types of unitary air-conditioning systems. The VRF system can be regarded as a larger version of the split-type air-conditioning unit, in which a compact air-cooled condensing unit located outdoor and be linked to several dozens of indoor fan coil units less than 100 tons. Along with several sets of fixed-speed compressors, one variable-speed compressor pumps the refrigerant flow through a pipe network into the terminal evaporators. The system is able to regulate the refrigerant flow rate to the terminals individually according to the cooling demand of the zone served by each indoor unit. VRF is significantly more expensive than splits and, the system is more complicated, it can cost more to maintain and repair. Electrical running costs should be better with the VRF, which should in theory (and often in practice) make the total cost over several years tip the balance in its favour. Residential VRF systems contain refrigerant gas so will require annual leak checks and records to maintain the systems for good performance and quickly fix any leaks. The
71

refrigerant lines are limited to 40 meter feet to the furthest unit and the average life cycle is 15 years.
4.3.1.5 Central Air Conditioning
The central air conditioning system is used for cooling residential apartments over 100 tons. In hot climates, if the apartment block is to be air conditioned, putting individual units in each of the rooms is very expensive initially as well in the long run. The central air conditioning system is comprised of a huge compressor that has the capacity to produce hundreds of tons of air conditioning. Chilled-water system predominate the residential buildings for cooling. The chilled water system can truly be referred as central air conditioning system because these can be easily networked to have multiple air handling units distributed throughout the large distributed buildings and the main chiller package placed at one central location. Multiple units applied with chilled water system offer greater redundancy and flexibility. In the unitary AC systems one compressor is associated with one air-handling unit cooling coil, hence the flexibility and redundancy of operation is limited. However, the COP of chillers is high and thus consumes high energy. The need to transfer conditioned water imposes space and volume demand on a building. Larger duct sizes, for example may require an increase in floor-to-floor height and consequent, building cost. As system size and sophistication increase, maintenance becomes more difficult. To improve the COP of the AC and avoid condensation, the building has to be very well insulated and sealed for air tightness.
4.3.1.6 Efficiency Ratings of AC Equipment
The efficiency rating of AC equipment is based on several efficiency terms, including EER, COP, Ton. EER or the Energy Efficiency Ratio is a measure of a unit’s efficiency at full load conditions and 35 Co outdoor temperatures. It typically applies to larger units over 20 kWh capacities. Ton or one ton of cooling is the energy required to melt one ton of ice in one hour (One ton = 3.5 kWh). COP or the Coefficient of Performance is the ratio of the heat removed from the cold reservoir to input work. To improve the COP of an AC unit, one needs to reduce the temperature gap Thot minus Tcold at which the system works.
As shown in Table 4.1, the Egyptian standard mandates a minimum efficiency of 10 EER for both split and packaged equipment of less than 20 kW/h capacities. The American Society of Heating, Refrigeration and Air Conditioning Engineers (ASHRAE) recommend 10 EER for equipment between 20 and 40 kW/h. ASHRAE Standard 90.2 recommends other efficiencies for larger equipment. It is often cost effective to pay for more efficient equipment. For example, upgrading from a 10 EER to a 12 will reduce cooling costs by about 15 percent. Upgrading from a 10 to a 15 reduces cooling costs by about 30 percent.
72

As for Central AC, a well designed chiller plant is generally more efficient with higher COP over 100 tons than a VRF system. The VRF is more efficient less than 100 tons cooling range.
4.3.1.7 Supply Ventilation for Air Conditioned Buildings
It has long been recognised that the control of air flow is a crucial and intrinsic part of heat and moisture control in sealed or air-tight buildings. Air flow through the building can carry; exhaust gases, odours, and sounds through buildings as well as mold spores and off gassing generated within the building. Table 4.2 describes the flow rate requirements of the Egypt Energy Standard (HBRC 2005). Supply ventilation systems work by while air leaks out of the building through holes in the shell. A typical supply ventilation system has a fan and duct system that introduces fresh air into usually one, but preferably several rooms of the home that residents occupy most often (e.g., bedrooms, living room), perhaps with adjustable window or wall vents in other rooms. By pressurizing the house, supply ventilation systems discourage the entry of pollutants from outside the living space. Supply ventilation also allows outdoor air introduced into the house to be filtered to remove pollen and dust or dehumidified to provide humidity control. Supply ventilation systems are most applicable in hot climates. If supply ventilation systems do not remove moisture from the make-up air before it enters the house, they may contribute to higher cooling costs compared with heat-recovery systems.
Table 4.1 Egyptian Efficiency Standard for unitary AC equipments (above Window Units, below, Split Units)
Table 4.2 Egyptian Efficiency Standard for air flow control
Function Maximum Air Flow (m3/hour/person)
Living and Bedroom 17
Kitchen and Toilets 85
73

4.3.2 None Conventional Air Conditioning Systems
4.3.2.1 Radiant Cooling
In hot and humid climates such as those of Cairo and Alexandria, radiant cooling systems are not suitable. Due to the high relative humidity, chilled water temperatures of 6-8 oC are required in the warm and hot weather conditions to dehumidify supply air sufficiently to prevent condensation with radiant slab cooling. The key issue is control of indoor relative humidity by dehumidification of supply air and reduction of infiltration. Operable windows with appropriate control are required when combined with radiant slab cooling. Therefore, this technology is not suitable for residential buildings. The three most common reasons found in literature for dismissing radiant cooling are condensation, capacity, and first cost (Mumma 2001, Dickmann et al. 2009).
4.3.2.2 Evaporative Cooling
In hot and humid climates such as those of Cairo and Alexandria, evaporative cooling systems are not suitable. Evaporative cooling systems are based on conversion of sensible heat to latent heat of evaporated water, where water is supplied mechanically. The temperature of air reduced due to evaporation of water in air. Thus, the temperature decreases at the expense of increase in humidity, while the enthalpy of air remains constant in the process. At present evaporative cooling methods include fan pad, fogging system and roof evaporative cooling. In principal evaporative cooling is suitable in hot climates. The technology is not suitable in Delta and Nile Valley due to the high relative humidity.
74

4.3.3 Technology Selection Guide
In order to facilitate the selection of a suitable technology we adapted the technology selection chart developed by IEA Annex 28: Low Energy Cooling (IEA 2001). The table below helps in deciding the suitable strategies for cooling in hot climates (Table 4.3).
Table 4.3 technology selection chart, adapted from IEA Annex 28: Low Energy Cooling
4.3.4 Implications for the Future
In Egypt, air conditioning systems are becoming a cost and energy efficient technology. The technology of "engineered air" has made Egypt's environmental design insignificant. There is a reliance on mechanical acclimatization all over the country without any climatic consideration. This is allowing the repetition of identical residential building and cluster designs. Residential buildings in Egypt are full with AC boxes on the exterior of the building. Noise from air conditioners disturb neighbours, disrupt residents sleep and interfere with their normal daily activities.
75

As most air-conditioning systems are supplied by electricity, this demand increase results in increases in both electricity consumption and the associated greenhouse gas emissions. In addition, electrically powered vapour compression chiller technology uses CFC and HCFC refrigerants that cause pollution. Furthermore, there is a serious drawback in the increase of peak loads.
The demand increase is most notable during the hottest summer days and sometimes results in a peak of demand that is beyond the present capacity of the electricity network. Large cities with a large amount of residential buildings or popular coastal areas with many hotels and seasonal demand peaks are examples of areas where this situation has been happening in recent summer seasons.
Current efforts to reduce energy consumption of unitary equipment are centred upon raising the minimum allowable efficiency using a rating system that has significant limitations, or reducing the number of condensing units by using VRF systems. However, there are other important considerations. Any solution in hot climates must consider the moisture condensation issues. Because of the potential for condensation, it is critical to understand cooling technologies unless a parallel system is in place to decouple the space sensible and latent loads is considered.
4.4 Solar Renewable Technologies
Designing NZEBs in Egypt, implies knowing how to integrate Solar Renewable Technologies (SRT) or Renewable Energy Systems (RES) in the building design. Renewable energy resources in Egypt include solar, wind and biomass. For example, the average annual total irradiation is above 2409 bankable kWh/m2
per annum with approximately 3300 hours of full sunshine and the annual monthly averages of wind speed range from 5.0 to 7.1 m/s (Figure 4.7 and 4.8). However, these resources are generally not yet exploited in the Egyptian building sector on any scale. On the other hand, given the depletion of global fossil fuel resources and the exponential population growth, Egypt declared in 2007 the commencement of its program for nuclear power plants (Georgy et al. 2007). As a response to the previously mentioned contradicting facts it is of the utmost urgency that the existing building stock gets retrofitted to achieve an annual net zero energy performance (Attia 2009c). There is potential for bioclimatic design in all climatic regions of Egypt with the assistance of active solar systems (Attia 2009a). The building stock can easily achieve the zero energy objectives. This is due to match between annual solar irradiation curve and the cooling demand curve (Shaltout 1991). Therefore in this chapter, different RES are presented.
76

Figure 4.7 Average solar irradiation in Egypt (adapted from the Solar Atlas of Egypt)
Figure 4.8 Mean wind speed (Wind Atlas for Egypt)
77

4.4.1 Solar Thermal Systems
Due to this temperature difference, the choice of the most suitable solar collector type varies. In this section, brief technical descriptions of the available solar collector technologies and solar system concepts are given.
4.4.1.1 Solar Thermosyphon
The solar Thermosyphon is one of the first straight forward technologies to reduce traditional energy (electricity, oil, LPG) for domestic hot water DHW. The principle of the Thermosyphon system is that cold water has a higher specific density than warm water, and so being heavier will sink down. Therefore, the collector is always mounted below the water storage tank, so that cold water from the tank reaches the collector via a descending water pipe. If the collector heats up the water, the water rises again and reaches the tank through an ascending water pipe at the upper end of the collector. The cycle of tank -> water pipe -> collector ensures the water is heated up until it achieves an equilibrium temperature. The efficiency of solar Thermosyphon is on average 70% (SPF 2011).
4.4.1.2 Solar Flat Plate Collector
Solar flat collectors are used for solar assisted air conditioning systems. The simplest solar collector consists of a black surface with some fluid circulating in or around it. The fluid serves to extract the heat produced by the radiation absorbed from the sun so that it can be used for some practical application. The heat losses from such an absorber are large if nothing is done to reduce them. The losses can be reduced by placing the collector in a box, with insulation behind it and with a transparent cover. This simple arrangement is known as a single cover flat-plate collector.
The selection of the appropriate collector type depends mainly on the desired working temperature and on climatic conditions. Solar collector efficiency decreases as the fluid temperature increases or the available solar radiation decreases. A graphical representation of the instantaneous efficiency for different collector technologies is given in Figure 4.9. The efficiency of standard flat-plate collectors is in average 70% (SPF 2011).
4.4.1.3 Solar Air Collector
Solar air collectors are used for solar assisted air conditioning systems. Solar air collectors operate just like flat-plate liquid collectors but the heat transfer fluid is air instead of a liquid and a fan provokes the circulation instead of a pump. The main advantages of this technology compared to flat-plate liquid collectors are:
78

Figure 4.9 Instantaneous efficiency for different solar collector types
• There are no overheating problems (summer). • The system components are simpler than in hydraulic systems. • There is no risk of liquid leakage.
The efficiency of standard solar air collectors is in average 62%.The main disadvantages of solar air collectors are:
• No standard heat storage units are available on the market. • The efficiency of the collectors is lower than flat-plate collectors.
4.4.1.4 Solar Evacuated Tube Collector
Solar evacuated tube collectors are used for solar assisted air conditioning systems. Evacuated tube collectors (ETC) are made up of rows of parallel glass tubes connected to a header pipe. Each single tube is evacuated in order to reduce heat losses. The tubular geometry is necessary to support the pressure difference between the atmospheric pressure and the internal vacuum. Evacuated tube collectors can be classified in two main groups:
• Direct flow tubes: the heat transfer fluid flows through the absorber • Heat pipe tubes: tubes with heat transfer between the absorber and heat
transfer fluid of the collector using the heat-pipe principle
79

The first two types mentioned are very efficient at low working temperatures (heating or domestic hot water applications) but can suffer problems relating to loss of vacuum. This is primarily due to the fact that their seal is glass to metal. The heat expansion rates of these two materials are different and so after a few years of daily contraction and expansion the seal can fail resulting in a loss of vacuum. Glass-glass tubes, although generally not quite as efficient as glass-metal tubes, are generally more reliable and much cheaper. However, for some very high temperature solar cooling applications, the efficiency of glass-glass tubes can be even better than efficiency of glass-metal tubes. This depends on the technical parameters of the collector, and the working and ambient temperatures. The efficiency of evacuated tube collectors is in average 50% (SPF 2011).
4.4.2 Solar Electrical Systems
Photovoltaic technology is one of the most suitable technologies for electricity generation. Sufficient sunlight falls on Egypt to provide the nation’s total energy needs. With a few solar modules buildings can capture some of this abundant energy. Solar modules come in two distinct categories – crystalline silicon and amorphous silicon.
4.4.2.1 Crystalline PV Modules
Crystalline solar modules are covered with tempered glass on top and a tough ethylene vinyl acetate material at the back. The glass and backing material protect the solar cells from moisture. The most efficient crystalline silicon cells are made from slices of a large single crystal ingot (hence known as monocrystalline) with efficiency up to 17%. While multicrystalline or polycrystalline cells have a speckled appearance from multiple small crystals which slightly reduces their efficiency to reach up to 14%. Crystalline modules need to be cool. Output efficiency of crystalline PV arrays decreases by 0.5 per cent per degree Celsius over the standard test temperature of 25°C. Good ventilation is required at the back of modules. Exposure to cool breezes when sitting modules is an important consideration.
4.4.2.2 Amorphous PV Modules
Amorphous silicon is one of a number of thin film technologies. This type of solar cell can be applied as a film to low cost substrates such as glass or plastic in a variety of module sizes. Advantages of thin film cells include easier deposition and assembly, low cost of substrates or building materials, ease of production and suitability to large applications. Efficiency of thin film modules is lower (3-7%) than that of crystalline modules but all the types of modules are price competitive. Those currently on the market degrade in output by up to 10 per cent when first exposed to sunlight but quickly
80

stabilize to their rated output. All PV modules need to be cleaned periodically to maintain their efficiency.
4.4.3 Wind Turbines System
Despite several existing wind farms that are spread all over the Red Sea Coast, there is no trace for small-scale wind turbines or building integrated wind turbines in Egypt. A study by the author investigated the ability to use a small-scale wind turbine (D400 Wind Turbine) (Attia 2010c). The total weight of the suggested wind turbine is 15 kg and the diameter is 1.10 m. The turbine head stand 2.20 m above the roof requiring an average wind speed of 5 m/s. In addition, an inverter, which turns the wind-generated electricity from DC to AC, has to be provided. The turbine should produce between 0 and 10 kW hours per day, depending on the prevailing wind speed. A realistic annual yield would equate to 1.8 kW hours per day. The result of the study showed that the wind turbine could generate 660 kWh/year.
4.5 Solar Cooling Technologies
The introduction of other technologies that permit air-conditioning using energy other than electricity is attractive and also necessary. The application of solar energy in air-conditioning systems using solar cooling technologies has several advantages these include:
• The maximum cooling load generally coincides with the maximum available radiation.
• The equipment uses working fluids that are completely harmless, such as water and salt solutions.
• The technology enables solar heating installations to be usefully exploited even when there is no heating demand.
There are two different technological options: photovoltaics or solar thermal energy. Solar radiation can be converted into electricity using photovoltaics panels, and this electricity can be applied to drive a vapour compression chiller. As in the case of thermally driven chillers based systems, the efficiency of thermally driven chiller can be represented by the Coefficient of Performance (COP). The parameter is defined as the relation between the useful cooling and the required driving heat.
A comparison analysis has been conducted based on various simulations by the German institute Fraunhofer ISE (Epp 2011). The study analysed the saved primary energy and total annual costs of solar thermal, photovoltaic and conventional solutions for cooling by using the example of a hotel in Madrid (Henning 2010). Among others, the following conclusions were drawn:
81

• A large solar cooling system with an overall solar fraction of about 65 % leads to an increase of the total annual costs of about 4 % compared to the reference system with a gas condensing boiler and compression chiller.
• A large PV field with a similar area leads to a higher primary energy saving at a lower increase in total annual costs.
• The large solar thermal cooling system is the only system which leads to a reduction in peak electricity consumption of about 8 %.
Similarly the results of IEA Task 25 and 38 showed that solar assisted cooling has low thermal efficiency (COP) and requires higher initial investment costs compared with conventional cooling systems (IEA 2002, IEA 2010, ESTIF 2010, Henning 2011). So it is not cost efficient from a business point of view. Also there is a lack of units with small capacities of package-solutions for residential applications.
4.6 Parametric Analysis and a NZEB Case Study
In the design of NZEB it is very important to identify the most important design parameters, strategies and technologies early in design, in order to develop more efficient alternatives and reach optimized design solutions. Therefore, as part of the research a series of parametric analyses were performed. The parametric analysis aims at setting up basic prescriptive guidelines of NZEB design in Egypt.
4.6.1 Evaluating Passive and Active Design Strategies
To analyse the influence of active features and passive design, a residential apartment module was studied in the city of Cairo, Egypt (30.1N, 31.4E). Since the selected case is an existing building not all design strategies discussed in Part 2 were implemented. Only design strategies that can be classified as add on were selected to optimise the performance of the existing building aiming to reach the zero energy objective.
4.6.1.1 Climate Characteristic
Geographically, Egypt is part of the mid-latitude global desert zone and its climate is considered extremely hot and dry according to Köppen Classification (Group B) (Peel 2007). The only exception is the north region adjacent to Mediterranean Sea, which is considered as hot and humid climate due to the effects of the sea. The apartment block is located in a residential community called New Maadi located in the south east of Cairo, 3.6 km east the Nile. The weather patterns in Cairo are characterized by being extremely hot and dry (Group BSh-Hot subtropical steppe, according to Köppen Classification). Average annual precipitation is 11mm; average daily temperature during July is 35.4 oC; summer temperatures above 40oC
82

are not uncommon and often temperatures rise above 39oC. Average summer relative humidity is 62%. According to ASHRAE classification Cairo falls in zone 4B (Mixed Dry) with 424 HDD and 1859 CDD.
4.6.1.2 Apartment Module Description
The apartment module is part of a typical apartments block in Cairo. The apartment block is a free standing structure 30 m × 20 m with 9 stories and 4 apartments per floor. The block is elongated along an east-west axis. The south and east facades face two main streets (20m wide) and the north and west facades face two internal streets (8 m wide) as shown in Table 4.4. All apartments have a concrete structure and brick walls without thermal insulation. The amount of glazing is 46% for the elongated facades and 40% for the shorter facades of the total wall area. There is no solar protection for the facades.
The building features split HVAC system units in each apartment (DX-cooling) for space cooling and an electric heater for domestic hot water (DHW). The basecase module has dimension 15 m × 10 m × 2.7 m. Table 4.4, lists the general description of the sample building and some properties for the construction sections used, respectively.
Table 4.4 Basecase building characteristics Basecase Module
General Characteristic
Shape Height Volume Wall area Roof area Floor area Windows area Exterior Wall U-Value Roof U-value Floor U-value
Rectangular ( 15 m × 10 m) 2.7 m height per floor 324 m3 120 m2 96 m2 120 m2 12.24 m2, 34% of total wall area 1.78 W/m2 K 1.39 W/m2 K 1.58 W/m2 K
DHW system: 100L Electric water heater,0.86 EF
In the study approach, two variations parametric series were performed, representing the two different strategies. The two strategies were referred to as passive strategies and active strategies to represent a reference point for the energy analysis. The properties of the new variations are listed in Table 4.5. The basecase variations were simulated using the EnergyPlus building simulation program.
Simulation was conducted to determine the building annual energy consumption and the peak load. Several iterations took place to match as possible the field survey for electric consumption. A typical meteorological year (TMY2) of climate data in Cairo was considered for simulations.
83

Table 4.5 Basecase building characteristics (only the values in bold are used for this study)
Pass
ive
Stra
tegi
es
Parameter Parameter Value1- Orientation N, NE, E, SE, S, SW, W, NW (no change) 2-Building Compactness
(no change)
3-Light shelves 0.5 m, 1.0 m 4-Overhang Projection Factor 0.6 (1.5 m wide roof eaves,) 5-Blinds Internal rolling blinds, Shading coefficient >0.5, External rolling
blinds, Shading coefficient: <0.5 6-Insulation
R-10, Floor U-value: 0.35 W/m2 K, R-55, Ceiling U-value: 0.29 W/m2K R-15 cavity + R-30 insulation, Wall U-value: 0.4 W/m2K
7-Thermal Mass Light, medium (160 kJ/m3K), heavy wall 8-Glazing U-value: 0.14, SHGC: 0.48, Fiberglass frames, 15%, 20%, 25%, 30%,
35% window size of wall area 9-Albedo 0.5, 0.7, 0.85 10-Night Ventilation 1, 4, 10, 20, 30 ACH
Act
ive
Stra
tegi
es
11-Ceiling Fans 0.7 m/s High Performance Fans 12-Efficient Lights 0.05 kW 13-Plug Loads 7 W/m2 14-HVAC efficiency 2.58 COP 15-Solar Hot Water 2m2 collector area, 160 L storage (Thermosyphon) 16-Photovoltaic System
PV, monocrystalline, efficiency 14%, nominal power 2.24 kW per apartment (area= 15m2, tilt=0o, azimuth=0o)
4.6.1.3 Comfort criteria and Bioclimatic Analysis
In hot climates thermal comfort in buildings is crucial to determine the periods where passive strategies function appropriate without compromising comfort. In the analysis of passive strategies we have applied the Bioclimatic Model, developed by Givoni and the adaptive model in ASHRAE standard 55-2004 that are based on earlier research by Brager and De Dear (Givoni, 1992, Brager et al. 1998, ASHRAE 2005). The adaptive model allows us to depends more on the adaptability of humans and their environment and maintain upper limits of thermal comfort during extreme warm periods. Both models have been applied to the bioclimatic analysis in order to predict different operational simulation periods (schedules). Figure 4.10a shows the primary climatic assessment for the suggested passive design strategies. On the other side, Figure 4.10b shows three different operational periods defined using dynamic simulations. The result of this analysis defines three major periods when the building is naturally ventilated, fans ceiling ventilated and mechanically ait conditioned.
4.6.2 Parametric Analysis
The first series of variations (numbers 1-10, see Table 4.4) improves the basecase by implementing passive design strategies principles featuring the principals discussed in Chapter 3. The original design characteristics are kept, while the performance of individual changes is observed.
84

Figure 4.10a. Psychrometric chart analysis for Cairo Figure 4.10b. Operational periods defined using simulations
Some parameters including the orientation and building compactness were not changed due the physical building constrains. However, many other passive strategies were implemented to the apartment module including shading, thermal mass and natural ventilation. The second series (11-16, see Table 4.5) improves the basecase through actives design strategies. For the sizing PV solar system the calculations were based on using the maximum available surface area on the roof for one apartment module (15m2). The annual and monthly electrical energy use was obtained from the EgyPV Estimator program (Attia 2010b). The input values for EgyPV Estimator are listed in Table 4.5.
Active feature have changing patterns in space and time making it difficult bridge the natural energy supply and building energy demand. Therefore, the simulations were used on a detailed time basis with 12 time steps per hour, not only to determine the total energy consumption but also determine the energy demand and supply match and critical instances. EnergyPlus was used to perform a parametric analysis for every parameter in relation to the total consumption (DOE 2011a).
4.6.2.1. Analysis and Results
The simulations results are presented in Figure 4.11 and 4.12. Figure 4.11, compares the basecase with the NZEB case after implementing the passive and active strategies. The figure illustrate the yearly energy performance including the electric consumption for cooling, DHW, plug loads and lighting. The implementation of passive and active design strategies (excluding PV and Thermosyphon) achieved high reductions in energy consumption relative to the basecase. The cooling loads were reduced by 46% and the plug loads was reduced by 19% and the lighting by 55%. The space heating demand was eliminated due to the effect of insulation and the DHW loads are met by the solar thermal system. The total energy consumption reduction relative to the basecase is 45%. The basecase consumption was reduced from 24.8 kWh/m2/year to 13.7 kWh/m2/year.
85

Figure 4.11 Basecase vs. NZEB energy consumption
Figure 4.12 ranking of design strategies
86

The implementation of energy generating active strategies (PV and Thermosyphon) met the electric and thermal demand generating almost the double (197 %) of the building electric and thermal (250%) needs on an annual basis. However, by analysing the electric output on a monthly basis the electricity demand in August exceeded the generation (Figure 4.13). Apart from the active generating strategies the most three influential energy conservation measures were the installation of high performance ceiling fans, high efficiency air-conditioners and shaving the plug loads to a 7 W/m2. The insulation in particular succeeded to eliminate the space heating loads (Figure 4.11). Finally, the combination of both strategies met the building demands exceeding the NZEB objective.
Figure 4.13 Monthly PV output vs. electric demand
4.6.2.2 Discussion & Conclusion
The results demonstrate that the apartment module meet the zero energy use objective. Despite that not all passive and active design strategies were tested the case allows us understand the building performance in such a hot climate. Most studied strategies are less architectonic and more active and technical. Results indicate that the most influential indoor strategies were the installation of efficient ceiling fans, efficient AC and controlling plug loads. Controlling the plug loads in theory is feasible but not guaranteed in
87

real building life because it is dependent on occupants’ behaviour. The following most strategic decisions are the installation of efficient glazing, insulation and lighting equipments. Surprisingly, the thermal mass in combination with nocturnal ventilation was not effective due to the small temperature difference between day and night. Concerning the active energy generating systems the installation of a thermosyphon is an effective strategy. The PV system requires more experimental study. Figure 4.13 proofs that there is a relative monthly match, except for August, between solar electric generation patterns and cooling demand patterns. However, a more detailed study should be conducted for more precise PV sizing in relation to the electricity grid. In order to optimize the match in general and in particular the daily match during summer and winter and its effect on the daily peak load. Matching the solar electric energy profile to the urban residential demand is very important. In the case of Cairo, the results of ranking the passive and active strategies are useful for future residential apartment renovation plans. However, the ranking of the strategies will change if coupled with the local electricity prices, life cycle assessment (LCC) and cost parameters. The existing situation of the local context should determine the decision.
The results also highlighted the importance of maintaining comfort in the apartment module in relation to the dynamic severe climatic conditions. The basic idea of a NZEB in a hot climate is to provide comfort in close interaction with the dynamic conditions in the built environment. Achieving that requires a patch work of different design solutions and strategies to provide comfortable and energy independent buildings. The passive strategies are essential to optimise the performance; however the NZEB will only be achieved through mixed mode systems and hybrid mode mechanism.
Due to the building settings the study results were more focused on add-on post-construction active strategies. However, a successful NZEB should implement design strategies during early design phases within a multidisciplinary process. Passive measures are considered to be a first step NZEB design. Many simple passive design concepts already prove to be beneficial. Future work should also address NZEB design for new constructions.
Finally, the impact of different passive and active climate-responsive strategies on the seasonal comfort performance is theoretically studied in this chapter. The methodology and design strategies presented in this study to reach NZEBs in hot climates could be applied for other cities in hot climates. However, the results are necessarily local. To make best of this study, NZEBs in hot climates must be responsive to their local climate.
88

4.7 Conclusion
The net-zero objectives cannot be reached without technologies. The use of technology is necessary to achieve comfort and compensate the energy consumption onsite. In this chapter, different technologies and strategies were reviewed for active cooling including ceiling fans and air conditioning systems. One of the most important functions of a building in hot climate is to provide comfort and indoor air quality. NZEBs should improve occupant health, comfort and productivity while keeping the energy consumption and environmental impact of the active systems to a minimum. It was found that ceiling fans are basic elements in NZEB design in hot climates and active cooling system cannot be avoided. The selection of an AC solution should consider latent and sensible loads and other important issues including the function, aesthetics, acoustics, maintenance, building scale and life cycle of systems. Also different RES were reviewed to allow the selection of the most appropriate technologies. In Egypt, the high solar energy potential can satisfy the energy needs on an annual basis onsite. The PV technology was found to be the most energy and cost efficient technology as (Attia 2010c). The figure compares the efficiency of solar electric and solar thermal systems in meeting the average building heating, DHW and cooling loads. On the other hand, as shown in Figure 4.14, the solar thermal generation even if used for cooling will require large collector area. This dissertation is focusing on grid-connected buildings, however, it is important to look at grid interaction and load matching in the future. Finally, the case study presented was aiming to contextualize the NZEB design in a hot climate. The parametric analysis aims to analyse the influence of active features and passive design for a residential apartment module.
Figure 4.14 Instantaneous efficiency for different solar collector types for typical residential apartment in Egypt
89

90

Chapter 5 .. Design & Modelling of NZEB
The design of net-zero energy buildings (NZEBs) presents a challenge because there is no established design strategy to systematically reach this goal and many of the available building performance simulation (BPS) tools have limited applicability for such buildings. This chapter reviews current design tools for designing NZEBs in hot climates through a literature review and a survey. It also discusses modelling issues and presents the procedure used in design of NZEBs. Despite growing awareness of NZESBs, this chapter identifies many gaps in the design of such buildings, both in terms of process and analysis tools, through a survey and literature review.
5.1 Introduction
“Simulation is a powerful tool in the search for design solutions that ensure occupant well-being, reduce energy consumption, meet sustainability aspirations, mitigate environment impact and contribute to climate change abatement” (Clarke 2001).
Building simulation as a discipline can be traced back to the 1960’s when the US government was involved in projects to evaluate the thermal environment in fallout shelters (Kusuda 1999). Since its inception, building simulation has been constantly evolving as a vibrant discipline that produced a variety of BPS tools that are scientifically and internationally validated. Realizing the increasing importance of the decisions made early in the design process and their impact on energy performance and cost, several BPS tools have been developed during the 80’s to help architects perform early energy analysis, and create more energy efficient more sustainable buildings (Hensen et al. 2004). It was not until the 90’s, that architects and designers got more and more encouraged to join the building simulation field. The architecture discipline started to integrate building simulation, similar to the integration of CAAD and virtual environment (VE) tools into practice. However, despite the proliferation of many building simulation/energy analysis tools in the last ten years, architects and designers are still finding it difficult to use even basic tools (Punjabi et al. 2005). Findings confirm that most these BPS tools are not compatible with architects’ working methods and needs (Van Dijk et al. 2002, Lam et al. 1999, Gratia et al 2002). From the perspective of many architects, most BPS tools are judged as too complex and cumbersome (Tianzhen et al. 1997). In fact, it is repeatedly reported in literature that a growing gap exists between architects as users and BPS tools (Warren 2002). Most BPS tools are of necessity developed by technical researchers, building scientist or HVAC engineers. During development they are mainly concerned with empirical validation, analytical verification and calibration of uncertainty as defined by IEA BESTEST (Hong et al. 2000).In order to bridge this gap we have to recognize that building simulation is also a human, psychological and social discipline because it directly involves man-computer interaction and human
91

knowledge processing, while enriching human experience. Therefore, we have to comprehend architects’ problems in interacting with such tools because architects have a different background; different knowledge processing methods and they are visually oriented.
Building Performance Simulation (BPS) or building energy simulation, is used to simulate the performance of a virtual model of a building with given climate data conditions, captures the dynamic response of that interaction, mimics the thermal response (heat and mass transfer) to conduction, convection and radiation processes, and predicts the associated energy flows. The dynamic response is related not only to the continuous changes in the environmental conditions (solar irradiation, temperatures, relative humidity and wind) and the building operation (occupants’ behaviour) but also to interaction with HVAC systems.
During the recent decades, computing power has increased significantly. BPS is becoming more effective and has been integrated in the design process. It has been utilized for several purposes:
• Calculations of cooling/heating loads and hence sizing system equipments.
• Prediction of energy consumption, carbon emissions and energy costs. • Analysis of HVAC system performance. • Design optimization and sensitivity analysis. • Compliance with energy standards’ target emissions. • Calculation of Energy Performance Certificates (EPC), improving
building performance, determining energy saving potentials, etc. • Identifying hours in mixed-mode buildings where active/passive mode is
operating.
5.2 Building Performance Simulation for NZEBs
BPS techniques can be supportive when integrated early in the design process. However, architects suffer from BPS tools barriers during this decisive phase that addresses more the building geometry and envelope. Despite the proliferation of BPS tools the barriers are still high. The design and decision area during early phases is characterized by barriers regarding architects’ needs and design process. Current simulation tools are inadequate to support and inform the design of NZEBs during early design phases specifically. Most simulation tools are not able to adequately provide feedback regarding the potential of passive and active design and technologies, nor the comfort, used to accommodate these environmental conditions. Several studies show that current tools are inadequate, user hostile and incomplete to be used by architects during the early phases to design NZEBs (Lam 2004, Riether et al. 2008, Attia et al., 2009b, Weytjens et al., 2010). In fact, architects are not on board concerning the use of BPS tools for NZEB design. Out of the 389 BPS tool listed on the DOE website in
92

2010, less than 40 tools are targeting architect during early design phases as shown in Figure 5.1 (DOE 2011b).
Figure 5.1 BPS tools between 1997 and 2010 (Attia 2009b)
On the other hand, the integration of BPS in the design of NZEB is challenging and requires making informed design decisions and strategic analysis of many design solutions and parameter ranges and simulates their performance.
Figure 5.2 Ranking the most important features of a BPS tool (Attia 2010a)
93

A recent study by the author has shown that architects’ most important selection criteria for BPS tools is intelligence, as shown in Figure 5.2, that provides the opportunity to inform the decision making and allows decisions on building performance and cost (Attia et al., 2011e). Architects indicated the lack of intelligence within the compared tools. The study revealed that architects and non-specialist users who want to design NZEBs frequently find it difficult to integrate BPS tools in the design process.
Therefore, to deliver NZEBs we must lower the barrier between building design and performance, ensuring the best guidance is available during critical decision making of NZEB design. Architects’ decisions to design NZEBs should be informed. Many research investigations in literature describe the reasons of those barriers, but little effort has been done to develop the required methods and tools that can predict the building performance in use and support the design decision making of buildings.
In order to cross those barriers and achieve the aims identified it is important to understand the design process of NZEBs prior to identify the drawbacks of existing early design tools.
5.3 Design Process and Tools of NZEB
A building delivery process has traditionally been a discrete and sequential set of activities (Mahdavi et al. 1993). Designers start with rules of thumb to create a design, then model it to verify its compliance with the performance goals. If the proposed design did not meet the goals the designers would go back and start again. This tedious trial and error approach continues until finding the design that meets the performance conditions. However, the “net zero” objective is an energy performance-based design goal that embraces the integration of energy-performance goals early in the design process. Architects are forced to expand their scope of responsibility beyond function and aesthetics. The design process of small scale NZEBs, with no energy specialist on board, shows that the design is not intuitive and energy performance requirements must be determined in the early design stages. Therefore, BPS tools are a fundamental part of the design process [16-18]. During early design phases, 20% of the design decisions taken subsequently influence 80% of all design decisions (Bogenstätter 2000). In order to apply simulation during early design phases it is better to understand the current building design and delivery process of NZEBs, because the effectiveness of tools are affected by the process. This section elaborates on previous attempts at solving integration issues related to the NZEB design delivery process and the use of simulation tools.
94

5.3.1 NZEB as Performance-based Design
The main concern of NZEBs design is the performance-based design (PBD) approach. As formulated by Kalay and Hayter et al., it emphasizes the design decision making in relation to performance (1999 and 2001). Similar to the evidence-based design (EBD) approach that emphasizes the importance of using credible data in order to influence the design process in Healthcare Architecture, the PBD has become a fundamental approach to evaluate the energy performance of buildings in Environmental Architecture. Experience with constructed NZEBs, shows that their design process is based on cyclic iterations and performance-based decision making that effectively integrates, early on, all aspects of building design, energy efficiency, daylight autonomy, comfort levels, renewable energy installations, HVAC solutions, in addition to innovative solutions and technologies (Hayter 2001 and Donn 2009). Architects workflow is iterative aiming to achieve the performance objective while conducting trial-and-error analysis. Designers evaluate different design combinations and parameters based on their performance during early design stages of NZEBs. To put the design process of NZEBs in perspective, designers have to meet with successive layering constraints with a performance based objective and define their work in a set of performance criteria, rather than work out the design traditionally in a prescriptive objective.
5.3.2 Conceptual Early Design Stages of NZEBs
The process of NZEBs design can be described as a successive layering of constraints on a building. Every new added decision, every defined parameters, is just one more constraint on the designer. At the start of the NZEBs design process the designer has many decisions and a relatively open set of goals. By the end, the building is sharply defined and heavily constrained. For high performance buildings high constraints are imposed due to environmental and energetic requirements. The constraints provide useful anchor for ideas. Conceptual early design stages of NZEBs can be divided into five sub-stages: (1) Specifying Performance Criteria, (2) Generating Ideas, (3) Zones-Layout Design, (4) Preliminary Conceptual Design, and (5) Detailed Conceptual Design. Sub-stages 2 to 5 do not always follow a sequential linear order (Attia et al. 2012b). The design process goes into a cyclic progression between those sub-stages in which each sub-stage elaborates upon previous constraints.
5.3.3 Barriers to Integrating BPS during Early Design Phases
Experience with post occupancy evaluation of constructed NZEBs shows that the design of high-performance buildings is not intuitive, and that BPS tools are a fundamental part of the design process (Lenoir et al. 2011). The nature of the aggressive goals of NZEBs requires the early creation of energy models during pre-conceptual and conceptual design phases.
95

Recent studies on current barriers that face the integration of BPS tools into NZEBs design are summarised below (Attia et al. 2012b). Figure 5.3 illustrates the barriers of decision making during the early design stages of NZEBs design.
5.3.3.1 Geometry Representation in Simulation Tools
Architects work in different ways through sketches, physical models, 2D and 3D computer generated imagery, and analytically – and thus have different requirements for representing and communicating their design form.
5.3.3.2 Filling Input
The representation of input parameters in the language of architects is a challenge in many tools. There is a clear separation between architects design language and the building physics language of most tools. This difference is often addressed by using reduced input parameters or using default values. However, filling in the design parameters is an overlooked issue among BPS tools developers.
5.3.3.3 Informative Support during the Decision Making
Design cannot easily predict the impact of decisions on building performance and cost. The building delivery process of NZEB requires instantaneous feedback and support to inform the decision making for passive and active design strategies in their climatic context. The disadvantage of most existing tools is that they operate as post design evaluation tools. Therefore, the informative support should be comprehensive enough to include geometry and envelope and systems.
5.3.3.4 Evaluative Performance Comparisons
During the early design stages the benchmarking and the possibility to compare alternatives is more important than evaluating absolute values. The ideas generation phase is iterative and comparative. Most existing tools do not emulate this process and focus on post-design evaluation.
5.3.3.5 Interpretation of Results
The representation of simulation output and its interpretation is frequently reported as a barrier among architects (Attia 2009b, Attia 2011e). Analytical results presented in tables of numbers or graphs are often too complex and detailed, providing an excessive amount of information. The output representation often lacks variety and visual qualities. Analysis and simulation results should be displayed within the context of the 3D geometric model (Pilgrim 2003, Marsh 2004).
96

5.3.3.6 Informed Iteration
The most important barrier facing architects is cycling informed iterations for concept development and optimisation. In the past, architects iterated back on the design for functional and aesthetical optimisation purposes. For NZEBs they have to iterate for performance optimisation purposes. This requires an understanding of building physics and performance. Architects need fundamental understanding of basic building physics that allows them to interpret the simulation feedback and drive them to iterate back to the concept.
Figure 5.3 Barriers of decision making during early design stages (Attia et al. 2012b)
97

5.4 NZEBs Tools Review
The performance-based approach has implications on BPS tools. The performance-based design approach of NZEBs forces tools to address two issues early on: First maximize energy efficiency and secondly the delivery of needed energy with renewable systems. A critical look at the existing tools in relation to NZEBs design process shows that two main barriers exist in integrating the current analysis tools in this stage:
• First of all, the lack of informative support during the decision-making. • Secondly, the lack of informed iteration based on evaluation.
Therefore, and in order to assess the capabilities of existing BPS tools we established a criteria for NZEB tools. The criteria intend to compare simulation tools and their suitability to cater for NZEBs design.
5.4.1 Criteria for NZEB TOOLS
The selection criteria for NZEB tools are based on two sets of criteria. The first set of criteria addresses the general tools mechanics, necessary to judge the tools usefulness. The second set is based on the specific tools features regarding the NZEB design.
5.4.1.1 NZEB Tools Mechanics
BPS tools selection criteria can be defined as the classification and description of tools’ capabilities, requirements, functionalities, specifications, features, factors, etc. In the past, a number of comparative studies have been published and addressed the selection criteria of BPS tools including the studies of Lam et al. (2004), Crawley et al. (2008), Riether et al. (2008), Attia et al. (2009) and Weytjens et al. (2010). For this thesis we selected Attia’s (2011e) criteria that have been set to justify and classify the major tool capabilities. These five criteria are listed below (see Figure 5.4):
• Usability & Information Management of interface • Intelligence & Integration of Knowledge-Base • Accuracy of tools and Ability to simulate Detailed and Complex building
Components • Interoperability of Building Modelling • Process Adaptability
5.4.1.2 NZEB Tools Matrix
The IEA Task 40/ECBCS Annex 52 is developing comprehensive qualitative and quantitative benchmarks that were established to compare the capabilities of simulation experts’ tools (Bourdoukan P., et al. 2009 2011).
98

Figure 5.4 Selection criteria & NZEB tools mechanics (Attia et al. 2012b)
However, for this thesis we screened the most recurring early design features in the design of NZEBs to compare the capabilities of architects’ simulation tools. Early on during the conceptual stage, designers should address six main building design aspects including:
1. Metric: There are several definitions for NZEBs that are based on energy, environmental or economic balance. Therefore, a NZEB simulation tool must allow the variation of the balance metric.
2. Comfort Level & Climate: The net zero energy definition is very sensitive toward climate. Consequentially, designing NZEBs in hot climates depends on the thermal comfort level. Different comfort models, e.g. static model and the adaptive model, can influence the ‘net zero’ objective.
3. Passive Strategies: Passive strategies are very fundamental in the design of NZEB including daylighting, natural ventilation, thermal mass and shading.
4. Energy Efficiency: A NZEB must be a very efficient building according to the IEA Task 40 Definition (IEA 2011). This implies complying with energy efficiency codes and standards and considering the building envelope performance, low infiltration rates, and reduce artificial lighting and plug loads.
99

5. Renewable Energy Systems (RES): RES are an integral part of NZEB that needs to be addressed early on in relation to building from addressing the panels’ area, mounting position, row spacing and inclination.
6. Innovative Solutions and Technologies: The aggressive nature of ‘net zero’ objective requires always implementing innovative and new solutions and technologies.
5.4.2 Results
Based on those features we created a NZEB tools comparison matrix that provides an overview of the ten compared tool capabilities to support NZEB design. This section presents the comparison results of the ten tools. For this article, main results that reflect the most important tools capabilities are selected. The complete results are presented and can be found in the final study report (Attia 2011f). Table 5.1 shows the NZEB Tools Matrix, indicating what type of NZEBs features each tool can calculate.
5.4.2.1 NZEB Tools Criteria
1. HEED (UCLA 2009): Usability (Medium): The input process follows the wizard approach, which is simple, but lacks flexibility and is primarily based on text. The interface is simple with a restrained set of options, which improves navigation. Component properties are selected from predefined lists, but customised choices are more difficult to define. The output clearly supports benchmarking and alternatives comparison. Particularly, the building‘s performance is compared with a code complying and a more energy-efficient design. This improves the interpretability of the results by architects and facilitates the decision-making process. However, input filling and results interpretations are very challenging.
Intelligence (Medium): Based on few input parameters, the program automatically creates two reference cases, one meeting the California energy code and another more energy efficient. The easy comparison of design alternatives facilitates design decision-making. The tool also has a large and reliable database. Also the tool provides pre-design advices based on the climatic context. The tool does not allows parametric or optimisation analysis.
Interoperability (Low): The building geometry is restricted to shoebox geometry with maximum 10.000 sq. feet. The program does not allow any exchange with CAD, gbXML, BIM or other drawing tools.
Process Adaptability (Low): HEED is easy to use and requires minimal time to perform design evaluations. However, due to the nature of data-input, the low level of detail and limited building area the tool is only suitable
100

for early design phases and does not allow connectivity with evaluation tools used in large buildings, by engineers in advanced design stages.
Accuracy (High): It uses an hourly heat balance technique for calculating the energy consumption. HEED was tested using the ASHRAE/BESTEST evaluation protocol.
2. e-QUEST (LBNL 2009): Usability (Medium): The interface is mainly textual and has limited visual appearances. The wizard approach impedes flexible use and navigation. The process of data-input follows a wizard approach. This facilitates the input process for a well-informed user, but lacks flexibility. The data-input is primarily textual, too detailed and not architect-oriented. Although the output supports easy comparisons of alternatives, it is often difficult to use in relation to design decision-making.
Intelligence (Low): The main intelligence features are related to the alternatives comparison capabilities and the embedded default values. If a non-experienced user changes any default value (in green), the tool highlights the changes in red. The tool does not allow optimisation analysis but allows restricted parametric analysis.
Interoperability (Low): The tool allows importing 2D CAD files, multi-zonal modelling and of modelling of inclined surface for pitched roofs. However, the tool cannot exchange 3D models in any format. The program does not allow any exchange with 3D CAD, BIM, gbXML or other drawing tools.
Process Adaptability (Medium): Most required input parameters are beyond the focus of early architectural design choices. Hence, the tool‘s usage is primarily oriented to schematic and detailed design phases. Engineers can mainly use the tool in large buildings in advanced design stages.
Accuracy (High): The simulation engine within eQUEST is derived from the latest official version of DOE-2. DOE-2 has been widely reviewed and validated using the ASHRAE/BESTEST evaluation protocol.
3. ENERGY-10 (NREL 2009c): Usability (Medium): The interface is not visual, impeding flexible navigation. The input is mainly numerical and it is difficult to customize existing or create new components. Although the output provides an interesting comparison between the two simulated cases, several output graphics are neither intuitively interpretable for architects nor convincing to clients. An exhaustive list of output options is considered.
Intelligence (Medium): Includes default components and extensive US context default values for HVAC systems, material properties and wall sections and library for material components. ENERGY-10 allows
101

alternatives comparison and ranking of design strategies for different parametric and energy efficiency measures.
Interoperability (Low): The building geometry is restricted to shoebox geometry with no 3D representation and maximum 10.000 sq. Feet floor area. The program does not allow any exchange with CAD, gbXML, BIM or other drawing tools.
Process Adaptability (Medium): The required inputs are minimal and solutions are obtained quickly. However, the shoebox abstraction and area limitation of building geometry disconnects the simulation from the architectural design, restricting its usability in the conceptual stage.
Accuracy (High): The accuracy of ENERGY-10 has been demonstrated using the BESTEST procedure.
4. Vasari (AUTODESK 2011): Usability (High): The tool is easy to use and flexible to navigate with many tabs and button including climate analysis, solar radiation and other analysis features imported from Ecotect. The interface has the same Revit modelling logic and is structured to focus on geometrical modelling and energy analysis. The input template is very limited and is in textual format. The out is very visual but still hardly interpretable to feedback or inform the design.
Intelligence (Low): Vasari allows alternatives comparison. The main intelligence of Vasari lies in its ability to do parametric modelling. However, there are many limitation regarding construction, schedules and HVAC databases. The tool uses generic default settings with no possibility for modifications. The tool does not allows parametric or optimisation energy analysis.
Interoperability (High): Vasari and the conceptual modelling features have a background in parametric modelling and programming and allow organic massing. The tool has flexible parametric and geometric modelling features, allowing a variety of 3D forms and templates with a architect friendly 3D massing and modeller tool. The tool exchanges models to full Revit Architecture, Structure or MEP as Vasari uses the same .rvt . gbXML models cannot be imported, but Vasari models can be exported as gbXML from the application menu.
Process Adaptability (Medium): The tool is very suitable for early design phases and especially site, solar analysis, and geometry and massing analysis. However, the main disadvantage of the tool lies in its restricted energy analysis which does not allow it to be used in later phases or by advanced simulation experts.
102

Accuracy (High): Vasari uses Green Building Studio, which is based on DOE2 energy simulations. DOE-2 has been widely reviewed and validated using the ASHRAE/BESTEST evaluation protocol.
5. Solar Shoebox (2010): Usability (High): Very simple one page interface and basic input features allows the designer to explore different passive strategies. The tool is fast and the output is interpretable. The results are reported in a yearly graph that shows the outdoor and indoor temperature. The indoor temperature range is based on adaptive comfort level, which is a unique feature. However, the tools should allow little input and output options.
Intelligence (Medium): The tool is powerful in allowing passive design modifications and design optimisations in relation to thermal comfort, but does not allow alternatives comparisons. The building parameters allow designing a shoebox direct gain passive solar building. The tool does not allow defining HVAC systems, parametric or optimisation energy analysis.
Interoperability (Medium): The tool is restricted to shoebox geometry and does not exchange any form with other tools. The program does not allow any exchange with CAD, BIM or other drawing tools. Process Adaptability (Medium): Very suitable for early design stages while the IDF file can be used by advanced simulation experts in other environments.
Process Adaptability (Medium): Very suitable for early design stages while the IDF file can be used by advanced simulation experts in other environments.
Accuracy (High): The tools’ analysis engine used is EnergyPlus. EnergyPlus has been widely reviewed and validated using the ASHRAE/BESTEST evaluation protocol.
6. OpenStudio (NREL 2008): Usability (Low): OpenStudio is based on the intuitive, easy-to-use SketchUp, a popular drawing tool used by architects. The user spends less effort than to construct the geometrical data numerically in EnergyPlus, however, there is a confusing difference between building the geometry in the regular mode versus the thermal mode. The tools simulation output is basic and user must run the OpenStudio Result Viewer to get feedback for the predicted simulation. The Results viewer is a statistical tool with various output formats. However, results are hardly comparable, interpretable and are often difficult to use in relation to design optimisation.
Intelligence (Low): The tool has a very limited database for HVAC and constructions with no possibility to assign materials, constructions characteristics and Internal loads. OpenStudio does not allow alternatives comparison and ranking of design strategies for different parametric and optimisation analysis of energy efficiency measures.
103

Interoperability (Medium): The tool allows the quick creation of building form and massing. The tool exchange CAD files and embeds the geometry in the IDF file. The program does not allow any exchange BIM or gbXML tools.
Process Adaptability (Medium): The tool can be used by architects and allows the exchange of building models for more detailed input by experts.
Accuracy (High): (see Solar Shoebox)
7. IES VE-Ware (IES-VE 2010): Usability (High): VE-Ware toolbar in Sketch-Up is simple with a restrained set of options, facilitating data-input and navigation. The tool incorporates many quality assurance features. The process of data-input is easy and quick. Building components and systems can easily be defined but only in the UK context, using simple drop-down menus with preset defaults. However, there is no possibility to go beyond the built-in choices, as no customised options are offered. The output results are not very suitable to support the decision-making process. This is mainly due to lack of visual presentation and too much textual and tabular information. In addition, feedback into the design software (Sketch-Up) is not possible.
Intelligence (Medium): VE-Ware allows alternatives comparison. The tool allows the input for HVAC, solar gains, shading, natural ventilation and dimming strategies. Also the tool allows the simulation of thermal comfort, the comparisons of results and checking the compliance with LEED and SBEM. However, many embedded hidden default values cannot be accessed.
Interoperability (Medium): The building geometry is modelled in Sketch-up, a familiar modelling environment to architects. However, the building model has to be imported to IES, interrupting the fluidity of the tool and enforcing the user to switch to another environment. The tool allows direct connectivity to SketchUp, Revit and ArchiCAD. gbXML and DXF models can be imported to VE-Ware.
Process Adaptability (Medium): The tool is adapted to different design phases and design users, allowing the flexibility in developing the model from early design to detailed design stages.
Accuracy (High): The IES APACHE Thermal Analysis system is the core thermal design and energy simulation component. APACHEsim has been tested with ASHRAE Standard 140.
8. ECOTECT (AUTODESK 2009): Usability (High): Ecotect has one of the most user-friendly interfaces that allows powerful visual analysis tool. The interface is structured around five tabbed views, but navigation and intuitive usage are restrained by a multitude of options. Despite ECOTECT‘s strength
104

of visualizing output in the 3D-building model, the results of the thermal analyses (mainly charts), are often difficult to interpret. Also, an overwhelming amount of information is generated.
Intelligence (Medium): ECOTECT can display and animate complex shadows and reflections, generate interactive sun-path diagrams for instant overshadowing analysis, calculate the incident solar radiation on any surface. It can also calculate monthly heat loads and hourly temperature graphs for any zone. Default materials and properties are automatically assigned to building elements, strongly reducing inputs. Component properties can easily be modified and new materials can be created in the material library, but not all required properties are in the architect‘s language. ECOTECT does not allow alternatives comparison, code compliance or ranking of design strategies for different parametric and energy efficiency measures.
Interoperability (Medium): A built-in 3D-modeller facilitates the construction of the building geometry, but the geometry has to be remodelled from scratch. User can import 3D computer models in 3DS or dXF formats from several widely used computer aided design software such as AutoCAD, 3D Studio, Rhinoceros or Sketchup. ECOTECT has added the support for IFC and gbXML schemas.
Process Adaptability (Medium): ECOTECT primarily focuses on EDP. The tool is not adequate for detailed design, as it does not sufficiently support input from general to detail and lacks accuracy. Further, it does not allow straight comparisons between design alternatives.
Accuracy (Low): ECOTECT is lacking an energy analysis option. ECOTECT’s thermal simulation results are not fully representative of reality, although this is perhaps not an issue in case of parametric studies investigating the relative effectiveness of design options. This is the main disadvantage of ECOTECT. This is due to the limitations of its thermal simulation engine, which is based on the CIBSE Admittance Method (CIBSE, 1999). ECOTECT uses this method to calculate internal temperatures and heat loads.
9. DesignBuilder (DESIGNBUILDER, 2011b): Usability (Medium): DesignBuilder‘s interface is well organized around several tabbed views. However, behind this structure, the designer is often confronted with too much information and too many options, impeding ease of use and navigation. DesignBuilder offers several distinctive input options, each requiring different levels of detail. Extensive templates and default values further allow a reduction of data-input, but custom data-input is difficult. Despite the interesting feature to perform parametric analyses, most output graphics are too detailed to architects and are not intuitively interpretable. Also, an overwhelming amount of information is generated. Consequently,
105

the output results do not sufficiently support the architect‘s decision-making process.
Intelligence (Medium): The tool allows a range of input tabs and database including constructions, daylighting controls, and natural ventilation, double facade, advanced solar shading, internal comfort and HVAC components. DesignBuilder allows compliance with energy certificates in UK, alternatives comparison and parametric analysis of different design parameters.
Interoperability (Medium): DesignBuilder provides interoperability with BIM models through its gbXML import capability. This allows importing 3-D architectural models created in Revit, ArchiCAD or Microstation. Also, the building geometry can be constructed using the 3D-modeller.
Process Adaptability (Medium): DesignBuilder supports different levels of data-input, ranging from general to detail. As such, this tool is largely adapted to the different phases and users of the design stages.
Accuracy (High): (See Solar Shoebox)
10. BEopt (NREL 2011): Usability (Medium): BEopt includes an interactive textual main input screen that allows the user to select from many predefined options, those to be used in the optimization. Once an optimization has been completed, each case contains input and output screen. The main output screen includes a results browser that allows navigating among the results associated with each (optimal and non-optimal) building design simulated during optimization. For each building design, the browser will display detailed results regarding energy consumption, costs, and options, which facilities the interpretation of the output. If multiple cases exist in a project file, a combined graphs output screen will be available.
Intelligence (Medium): An options library spreadsheet that allows a user to review and modify detailed information on all available options including geometry and envelope. The main input screen allows a user to select from predefined options in various categories (e.g., wall type, ceiling type, window glass type, HVAC type, etc.) to specify options to be considered in the optimization. The user can create a benchmark for code compliance in a linked options library spreadsheet. Various cases are often used to analyze building performance as a function of climate. Cases can also be used to study how building performance is affected by economic parameters, PV system characteristics, or the options selected for optimization. Up to 20 cases can be defined, with case tabs displayed along the bottom of the screen. The tool is based and supports the USA context communicating in IP format.
Interoperability (Low): Similar to HEED the tool has a built in 3D modeller that allows the construction of residential building geometry. The program does not allow any exchange with CAD, gbXML, BIM or other drawing tools.
106

Process Adaptability (High): BEopt supports different levels of data-input, ranging from general to detail. As such, this tool is largely adapted to the different phases and users of the design stages.
Accuracy (High): BEopt calls the DOE2, TRNSYS, DView and eQUEST simulation engines and uses a sequential search technique to automate the process of identifying optimal building designs.
5.4.2.2 NZEB Tools Mechanics
By compiling the feedback of the ten examined tools and by super imposing the evaluation on a radar graph shown in Figure 5.5 we found:
Figure 5.5 Results of the NZEB Tools Mechanics
107

Usability: According to Figure 5.5, the representation of input parameters is a challenge in many tools. Also the representation of simulation output and its interpretation is a barrier. Analytical results presented in tables of numbers or graphs are often too complex, detailed providing an excessive amount of information. The output should better be displayed within the context of the 3D model. The use of default values is an advantage in many tools, however, input quality control is one of the missing features regarding usability.
Intelligence: As mentioned earlier in the introduction, Intelligence was ranked as the most important features among architects. Most examined tools still lack the intelligence (Figure 4) of supporting the designer with code compliant baselines and citable resources, e.g. database for construction, HVAC, schedules, etc. On the other hand, only few tools integrated code compliance and optimization features. However, we remark that the more intelligent the tool become, the more it becomes exclusive and local serving a certain countries’ context. Moreover, most tools provide only post design evaluations and comparisons. There is a lack of pre-decision and post-design informative support (parametric analysis and optimisation). Even after reviewing the evaluation results, frequently architects ask: What to do next based on the simulation results. More post-processing guidance should be provided in the future. In addition, the optimisation of geometry and envelope in relation to RES systems is still a challenge in all tools.
Interoperability: The seamless geometry exchange is a present problem among all examined tools. Almost no tool allows an easy exchange of geometry.
Process Adaptability: The idea of integrated teamwork and sharing the same simulation model within and simulation package to cater for different design stages and different users (architect/engineers) was successful in a few tools. However, much research is needed to expand the process-coverage of simulation packages to earlier conceptual stages.
Accuracy: Accuracy of most tools was satisfactory and the simulation models were widely reviewed and validated using the ASHRAE/BESTEST evaluation protocol.
5.4.2.3 NZEB Tools Matrix
The following feedback is structured and based on Table 5.1.
Metric: Most tools provide energy metrics to assess the design performance and less provide CO2 emissions and economic matrix. However, almost no tool (except BEopt) operates from a NZEB balance approach allowing the user a variety of balance metrics.
108

Table 5.1 Results of the NZEB Tools Matrix
NZEB Criteria
HEED
eQUEST
Energy 10
Vasari
Solar Shoe
box
Ope
nstudio
IES VE‐Ware
ECOTECT
DesignB
uilder
BeOpt
Metrics Energy Environmental (CO2) Economic Embodied Energy Urban Scale NZEBs Comfort & Climate Climate Analysis Static Adaptive Comfort Visualisation Passive Solar Geometry, Massing Daylighting Natural Ventilation WWR Thermal Mass Shading Devices Energy Efficiency Envelope Insulation Glazing Performance Envelope Air Tightness Artificial lighting Plug Loads Infiltration rate Mechanical Ventilation Cooling System Heating system Renewable ES Photovoltaic (PV) Building Integrated PV Solar Therm. Collectors Innovative Solution & Technologies
Mixed Mode Ventilat. Advanced Fenestration Green Roofs Cool Roofs Double Skin Facade Solar Tubes Phase change materials
109

Comfort & Climate: Only some tools provided climatic analysis features allowing contextual site and solar analysis. More importantly, no tool provided choices for the comfort models hot climates. Most tools do not even mention the comfort and does not allow the user to investigate these very important performance criteria. In addition, most tools are lacking the visualisation of outputs relative to comfort.
Passive Strategies: In fact, passive solar gets insincere and inadequate support from the examined tools, its potential is not being utilized including passive design strategies for geometry and massing. Most tools operate from an energy efficiency realm where buildings by default are mechanically acclimatised and consequently the design aim is to increase their efficiency. While not many tools help to verify the passive design strategies (thermal storage, heating and cooling) of comfortable buildings with no HVAC systems.
Energy Efficiency: Many of the examined tools provide capabilities to evaluate the energy efficiency target values required for designing a NZEB.
Renewable Energy Systems (RES): A very important problem to analyse when the building designer considers integrating PV systems in the NZEBs, is the sizing and physical settings of RES. Most of the examined tools do not allow the simulation of the most important renewable technologies for integration in NZEBs design. No tool allowed the architect planner to compare possible renewable supply solutions at the same site for instance, grid connected photovoltaic systems, BIPV, wind power plants and solar thermal systems.
Innovative Solutions and Technologies: According to Table 1, most tools could not simulate advanced solutions and technologies including mixed mode ventilation, advanced fenestration, green roofs, cool roofs, double skin facades, solar tubes or phase change materials. In NZEBs, many innovative technologies are used and thus the examined tools could not provide feedback for such solutions.
5.4.3 Conclusion
There is a strong feedback from the design community that most those tools are not very accessible and therefore rarely used, during the phases of planning and preliminary design of NZEB.
Also in the current design practice, multiple tools have to be used during the design process of a NZEB. On the other side, the comparison analysis shows that for NZEBs more input is required for early design rather than late design. In fact, more input is shifting to the beginning. Architects are obliged to get access to simulation programs that model building physics rigorously. Therefore, we should invest more in early design application and tools. Early
110

design application and tools that allows combining passive and active design strategies and technologies. The result shows that each one of these tools would be more complete and more functional for NZEB with the addition or improvement of certain features.
Regarding the tools mechanics, intelligence and usability should receive more attention. There is need to improve existing tools to become more effective, efficient and informative tools rather than evaluative tools. To support the design decision, tool developers should provide tools for architects to better manage the NZEB design complexities.
Regarding the NZEB objective, we found that:
• We need tools that focus on carbon besides energy • We need better, citable, queryable and searchable resources databases • We need to allow the simulation of passive design strategies • We need tools that guides achieving minimum efficiency, creating
basecases and doing code compliance calculations • We need to address comfort in tools more explicitly • We need to allow design and optimisation of renewable energy potential
of a site versus whole energy system • We need allow the simulation of innovative system design solution and
technologies
5.5 BPS for Architects’ Decision Support
BPS is ideal to lower such barriers. BPS techniques can be supportive when integrated early on in the architectural design process. Most importantly, they open the door to other mainstream specialism, including architects and smaller practices, during earlier design phases.
5.5.1 Architects and the Problem of BPS Use
However, despite the proliferation of BPS tools, the barriers are still high. As mentioned before, there are no ready-to-use applications that cater specifically for the hot climates and their comfort conditions. Current design and decision support tools are inadequate to support and inform the design of NZEBs, specifically during early design phases. Most simulation tools are not able to adequately provide feedback regarding the potential of passive and active design and technologies, nor the comfort used to accommodate these environmental conditions (Crawley et al. 2008). Several studies show that current tools are inadequate, user hostile and too incomplete to be used by architects during the early phases to design NZEBs (Lam et al. 2004, Riether et al. 2008, Attia et al. 2009b, Weytjens et al. 2010). Architects suffer
111

from BPS tool barriers during this decisive phase that is more focused on addressing the building geometry and envelope. In fact, architects are not on board concerning the use of BPS tools for NZEB design. Out of the 392 BPS tool listed on the DOE website in 2011, less than 40 tools are targeting architects during the early design phases, as shown in Chapter 1 (Figures 1.1 and 1.2) (DOE 2011b).
5.5.2 Decision Making Tools Review
Almost no current tool addresses the design of NZEBs for architects during early design phases (Attia 2011a). NZEBs design strategy addresses a design duo: First maximum energy efficiency and then the delivery of energy required from renewable systems. Almost no tool listed in Table 5.2 helps to answer this. A critical look at the existing tools in relation to the NZEBs design process shows that several barriers exist in integrating the current BPS at this stage. Therefore, future tools should allow both strategies in order to develop NZEBs and supplement the intuitiveness of the design process with analytical techniques and simulation methods.
Over the last few decades, a large number of BPS tools have been developed to help engineers during late design phases. Such tools were developed to produce data concerning buildings’ numerical modelling, simulating the performance of real buildings. Those energy BPS tools require a complicated representation of the building alternatives that require specific and numerical attributes of the building and its context. Those tools can be classified under a main group named “evaluation tools” as shown in Table 5.2. The examples in Table 5.2 are meant to be indicative, not exhaustive.
Table 5.2 Classification of BPS tools allowing design evaluation and design guidance
Evaluative Informative Support
(Technique)
Post-decision
Evaluative
Geometry Plug-in
Pre-decision Evaluative
(Para & Opt.)
Pre-decision Informative
(Parametric)
Pre-decision
Informative
Iterations High High Medium Low Low *Renewable
Systems
Energy Efficiency
Daylighting & Facades
EnergyPlusTRNSYS
Esp-r IES VE
OpenStudio IES VE-Ware
SolarShoeBox Energy 10
DesignBuilder
jEPlus
iDbuild
BeOPT OptiPlus
OptiMaison
Vasari MIT Advisor
BDA
Desgin Inent HEED
Solar House
Sunre
SunTools
COMFENNewFacades
Lightsolve
Diva
Evaluation tools include energy analysis computer tools. Although by being evaluative they produce results that do not actually provide any direct guidance as to how the NZEB design should be improved or the
112

performance objective achieved. The use of evaluation tools in NZEB design is based on a post-decision trial and error approach, where the simulation results are compared to a desired value. If the results are not satisfactory the design is modified and the process is repeated. This approach is cumbersome, tedious, and costly and forces architects to rely on simulation experts during the early design stages. Recently, some plug-ins were developed to facilitate the geometry input and link architectural forms of visualisation and 3D representation with the evaluation tools. However, evaluative tools embed most integration barriers discussed in 5.3.3.
However, during the last decade, a range of design tools has been available to help architects in the design of more energy efficient buildings. Those tools are labelled “guidance tools”, which were developed to facilitate decision making prior to design. They range from quite simple pre-decision evaluation and analysis tools to parametric and optimisation decision tools that aim to inform the design and integrate BPS during the early design process. However, Table 5.2 shows that most developed guidance tools are pre-decision evaluative tools. Despite their remarkable capabilities, most those tools have not been transferred effectively to the architectural community, and in particular architects during the early design stages. The uptake of most those tools among architects is very low, and does not allow continuity with the design process (Weytjens et al. 2010, Ochoa et al. 2009, O'Brien et al. 2009). While they are quite useful to lower the “input filling” barrier, they could not lower the “informative support during the decision making” barrier. Currently, few non-public tools exist that support design pre-decisions, including jEPlus and iDbuild that allow parametric analysis or BEopt that allows optimisation analysis (Petersen et al. 2010, Christensen et al. 2005, Zhang et al. 2010). The potential of parametric tools is very high to bridge the “informative support” barrier because they can provide constructive feedback with very little iterations, and at the same time allow a wide range of solution space. In contrast to optimisation tools that reduces the solution space to a minimum.
In order to address these shortcomings, we identified the requirements of a tool that can be used for the design of NZEBs during early design processes. The author conducted a survey, comparison study and workshops on the use of BPS by architects for NZEB design in Egypt (Attia 2011b). The guidelines of the new tool can be summarised as follows:
• Provide better guidance for design decisions to deliver NZEB in hot climates
• Enable sensitivity analysis to inform decision making and allow a variety of alternatives to be created in short time
• The comfort range criteria and design strategies can be adjusted to respond to local definitions of indoor comfort, local construction systems and local code requirements
• Improve accessibility to decision tools for small practices • Integrate the new tool with sufficiently established, accurate tools
113

• Match the cyclic design iterations and extend the scope of tools to the conceptual phases of the design process
• Allow connectivity with established tools used by different disciplines and in later design stages.
• Very easy to use and to learn, and adaptable for the less experienced with minimum input
In order to support decision making during the early design phases it is important to include an informative tool for the early design phases that can model the complexity of the design. An energy simulation tool, ZEBO, was developed to help architects discover parameters that would achieve a zero energy building and inform them about the sensitivity of each parameter. The interface for ZEBO was built on the above mentioned guidelines. How the proposed tool intends to achieve these goals is explained in the following sections.
5.6 Conclusion
In this chapter we presented an overview of the use of BPS for NZEBs design. A review on the current available simulation tools is presented in relation to the barrier that architects face when using BPS tools. It is important that the simulation tools address those problems and become adaptive to the early design stages. The work presented will be a basis for the development of the decision support aid in Part 2.
114

Conclusion of Part I
The literature review has presented the background of NZEBs definitions, NZEB design and specific strategies and technologies to design NZEBs for residential buildings in hot climates. The literature review provides an overview on the climatic implications on comfort and building performance (chapter 2). The passive design strategies, different cooling techniques and thermal comfort models are essential and will be used as the basis for this study (chapter 3). Chapter 4 presented the background of different active cooling systems and renewable energy systems that fit the residential building sector in hot climates. The comparison of technologies is important to be able to develop the decision support tool. Finally, chapter 5 present a review of BPS software and an analysis of NZEB early design process in order to provide useful information about the integration of simulation tools for NZEB design in hot climates combing passive and active strategies.
115

116

Part II • Development of the Decision Aid
117

118

Chapter 6 .. Towards a NZEB Decision Support Tool
This chapter provides an overview of the use of building performance simulation (BPS) among the building design professionals in Egypt aiming to create a wish list for the proposed decision support tool. To assess the situation and highlight the status and difficulties encounter in the usage and the needs for BPS tools, three workshops were held, in July and August 2010 in Cairo. The chapter first presents a brief overview of the status of the use of BPS in practice then describes the methods used, including, surveys, interviews, tools testing, brainstorming sessions and discussions. Finally, the study presents recommendations for the process of developing and using performance simulation tools for building design support.
6.1 Introduction
In the conference proceedings, of the International Building Performance Simulation Association (IBPSA), there are many studies concerning the use of BPS in practice. The aim of those studies is to describe the uptake and define the challenges of integrating BPS techniques. This includes the study of Lam in Singapore (1993), Goncalves in Portugal (1993), Donn in New Zealand (1997), Plokker in the Netherlands (1997), Crawley et al. in the USA (1997), Dunovska et al in Czech Republic (1999), Mahdavi in Austria (2003) and Hopfe et al in the Netherlands (2005). Most those studies addressed two main topics:
• The status and nature of the relevant design and building community, regarding professionals (skills and education) and buildings (regulation).
• Tools limitations and their ability to be integrated in the design process and practice.
However, no previous discussions or assessments have addressed those two common topics in Egypt. In fact, with the advent of the new Egyptian Energy Standard, Fire Protection Code and the implementation of building rating systems in the Middle East many architectural and engineering consulting firms and schools have been motivated to explore the potential of using building performance simulation (BPS) in practice. Many firms are seeking expertise to develop in-house simulation modelling teams for code compliance or design optimisation. Therefore, this chapter aims to establish a snapshot of the status and potential future use of BPS tools in the Egyptian design community. The results of three workshops, aiming to identify problems and priorities of the design community, are reported. The barriers and difficulties of integrating BPS tools in practice were identified. The final objective is to formulate a list of wishes and needs for an Egyptian BPS tool.
119

6.2 Background
Since Egypt’s independence in 1952 and until now, the building sector has been depending on highly subsidized energy prices without developing any energy code to stimulate energy efficiency. Surprisingly, the oil embargo, led by Egypt in 1973, forced Western governments to encourage research and practice to adapt energy efficiency and use simulation to predict building performance. In contrast, the Egyptian political decision was to subsidize the energy that discouraged the design and research community from adapting energy conservation measures and integrate BPS into design.
Looking back to the last twenty years, we can find that the successive economic, social growth and climatic change have resulted in extrapolating energy consumption rates. Currently, the government subsidizes for its population of almost 84 million, 40% of which live below the poverty line. However, the globalization effect on the Egyptian society and the economic growth has resulted in a higher standard of living among Egyptians. The population and economic growth coupled with long hot summers nourished the demand for building space, comfort and services. Consequently, the built environment became strongly dependant on indoor environmental-control equipments, which raised the demand for energy (Fahmi, 2008). At the same time, the heavily subsidized energy has resulted in a great deal of energy inefficiency (Abdallah, H., 1995, EL Arabi 2002). Over time, the design community neglected environmental design considerations and the knowledge chain of traditional environmental design and constructions has been broken. Passive design strategies such as shading, orientation, massing, thermal mass, natural ventilation and lighting are no longer used and have been replaced by active (mechanical acclimatisation) design strategies.
Accordingly, the Egyptian government faced many energy related problems during the last five years. First, the Egyptian peak of oil production passed in 2007 (the peak of gas production is expected to pass in 2015). Secondly, the increasing oil prices threaten and create a large pressure on the energy subsidy policy. Thirdly, the government is facing peaking energy consumption rates, patterns, and several energy blackouts all-overs the country, especially during summer. Between 2001 and 2011, electricity consumption has been growing over 7-10 percent in the building sector. Led by the Egyptian National Institute of Planning (ENIP) many reports warn that the energy supply will not be able to meet demand by 2015. As a reaction to this trend, and in order to accommodate the prognosis, the Egyptian government imitated the French decision of 1974 and declared the commencement of the Egyptian nuclear power plants program. Driven by the desire to provide cheap electricity to its population, where more than 40% live below the poverty line, the government considered the nuclear solution as the easiest way to solve the energy problem rapidly and centrally.
120

However, postponing the investments into energy efficiency encouraged the private sector, NGOs, international cooperation projects and even governmental bodies. Despite that, the rising energy consumption was not formally curbed by the interest of energy conservation and environmental protection there is interest to act separately. In 2005, the United Nations Development Program (UNDP) granted the Egyptian Housing and Building Research Centre (HBRC) a grant to develop a residential and commercial energy standard (Huang 2003). Both standards are completed, published and could be applied on voluntary basis. In 2009, the Egyptian German Joint Committee (JCEE) on Energy Efficiency and Environmental protection organized a National Consultation Symposium discussing Egypt’s Policies for Energy Efficiency in Buildings in Egypt Energy efficiency codes (Mourtada 2009). In 2009, the UNDP initiated a project to enforce the labelling of appliances. In addition, the Global Environmental Facility (GEF) has financed numerous grants projects promoting the use of efficient lighting equipment and compact fluorescent lamps in Egypt. In 2010, under the Ministry of Housing the Egyptian Green Building Council (EGBC) was established as part of the HBRC aiming to set the Green Pyramid Rating System (EGBC 2011). In April 2011, the EGBC organised an international summit in Cairo on cost-effective sustainable design and construction highlighting key developments, challenges and needs in the sustainable design and construction field of Egypt. EGBC published a public review draft and is currently working on building the first Productive, Low-cost & environmentally friendly Village (PLEV) in Fayoum city (EGBC 2011). Similarly the Egyptian Earth Construction Association with help of the German Aid (GIZ) is aiming to build a prototype for affordable housing in New Cairo using BPS for design assessment. Also there are 10 registered LEED projects in Egypt in hand of local firms according to USGBC Directory.
On the other hand, the recent changes encouraged academia and research to embrace BPS techniques in teaching and research (Sabry 2010). However, a lack of knowledge is limiting the use of BPS techniques and tools in Egypt. For example, the lack of knowledge is forcing Egyptian architectural firms to outsource the simulation work (energy performance, comfort, ventilation and daylighting) to foreign consultants when requested to deliver LEED certified buildings by multinational companies. This makes the use of BPS very limited. Therefore, the author announced three workshops in Cairo in summer 2010.
6.3 Structure of the Workshops
The workshops title was “Introduction to Building Energy Modelling”. The use of BPS tools was promoted as an innovative process in the Egyptian design practice. The overall objective of the three workshops was formulating recommendations that will support a wide use of BPS tools in the Egyptian practice. As a reaction to the announcement, the author combined three groups resulting in three workshops. The first workshop consisted of 5 architecture and 3 mechanical engineering academics aiming to use BPS in
121

their curriculum. The second workshop consisted of 10 architects working on vernacular and traditional environmental design projects and wishes to use BPS to verify and assess their designs. The third workshop was a group of 5 mechanical and 5 architectural engineers working in professional design firms aiming to use BPS for LEED projects. Table B.1 in Appendix B lists the workshop participants.
Figure 6.1 Selection criteria of BPS tools (Attia 2011e)
Participants were asked to identify the obstacles that prevent from using BPS tools in the Egyptian design practice and to generate ideas and wish lists for tools developers for potential future-simulation tools. The workshop focused on applications, integration, capabilities and user interfaces. Each workshop was three days. Participants were introduced to different BPS tools ranging from simple to detailed tools. The included tools were MIT Advisor, ECOTECT, OpenStudio Plug-in, HEED, IES VE Plug-in, HEED, DesignBuilder and EnergyPlus. The aim of introducing those tools was to expose participants to a wide variety of tools and document their feedback based on their experience. Participants had to run a simulation model with some simple input parameter, run simulation and interpret the output results. The first two days were dedicated to introduce participants to the BPS field and describe the BPS selection criteria according to Attia’s criteria, as summarized and displayed in Figure 6.1 (Attia 2011e). According to this classification BPS tools, most important capabilities are Intelligence, Usability, Integration, Interoperability and Adaptability with the design process. In addition, participants were trained to use and explore the previously listed tools. On the third day, participants were asked to:
• Set a priority and rank the selection criteria of BPS according to their needs (Figures 6.2)
122

• Create tools map (Figures 6.3) • Create an input and output wish list • List the tools limitations and their ability to be integrated in the Egyptian
design process and practice. (Figures 6.5-6.9)
Additionally, the facilitator handed a questionnaire to participants daily to collect wider information on participants’ background regarding their practice and design decision-making in relation to Egyptian context. Table B.2 in Appendix B provides an overview of the main questions. The author designed the structure and content of the surveys based on international surveys that have conducted in different countries Lam (1993), Goncalves (1993), Donn (1997), Plokker (1997), Crawley et al.(1997), Dunovska et al (1999), Mahdavi (2003) and Hopfe et al (2005). At the end of the third day, participants were confronted with their combined questionnaires’ answers and engaged in a round table discussion. The three workshops finding are presented in the following section.
6.4 Results of the Workshops
The following sections summarize and groups the concepts and ideas generated in the three workshops.
6.4.1 Participants’ Description
The pre-workshop questionnaire indicated that the usage of BPS was extremely low. The only exceptions were mechanical engineers who use HVAC sizing tools in design firms. The mechanical engineers in Workshop 3 had experience with Hap and Trace 700. Most other participants indicated that they were not aware of the existence of BPS tools and the usage was beyond the scope of their work. However, tools including Revit, CAD, SketchUp and other visualisation tools were used frequently by participants for drawings, design and rendering. Among all participants, natural lighting and ventilation, energy efficiency, acoustics, indoor quality and comfort were not verified in their design.
6.4.2 Ranking of Selection Criteria
Figure 6.2 ranks the selection criteria of BPS tools according to participant’s priorities. The purpose of this graph was to identify the user’s selection criteria for BPS tools. Despite the limited use of BPS tools among Egyptian designers, participants were overwhelmed with the amount of available tools (almost 400 tools) when they were introduced to the U.S. Department of Energy Building Energy Software Tools Directory (BESTD) website (DOE 2010a). Therefore, the workshops explained every criterion prior to the ranking process to make sure that participants understand the different aspects for choosing a BPS tool. The votes of participants were normalized,
123

summed and plotted as percentage in Figure 6.2. Participants of the three workshops agreed to rank Intelligence in the first place followed by Accuracy and Usability. Participants agreed on the importance of Intelligence in any tool in order to inform the design and facilitate the decision making. The Integration and Interoperability ranked last.
Figure 6.2 Ranking the Selection Criteria: Responses ordered by workshops groups
6.4.3 Tool Maps
In Figures 6.3, the tools maps are presented. In order to help participants to compare the tools usability and accuracy, participants were introduced to the study findings by Attia el al (2011e) that ranks 10 analysis tools according to their accuracy. Participants were then asked to position design tools and analysis tools on a scatter plot, Figures 6.3. The x-axis represented the usability of the tool ranging from easy to difficult and the y-axis represented the Accuracy & Detail of the tool ranging from low to high. The aim of this graph was to examine the interoperability of simulation tools and integration with other design tools such as CAD. The discussion also revealed that all participants use CAD tools. Also all participants of workshop 3 use Revit (Architectural or MEP Suite) and are familiar with the BIM applications. The juxtaposition of the design and analysis tools in one graph created a debate on the design process and helped participants to define their expectation from future software packages. The most important argument was the need to find an accurate tool that can serve design and research and in the same time allows interoperability with drawing tools. There was a consensus to select EnergyPlus as a simulation engine. However, there were fewer consensuses on the interface and drawing tool that can be linked to EnergyPlus.
124
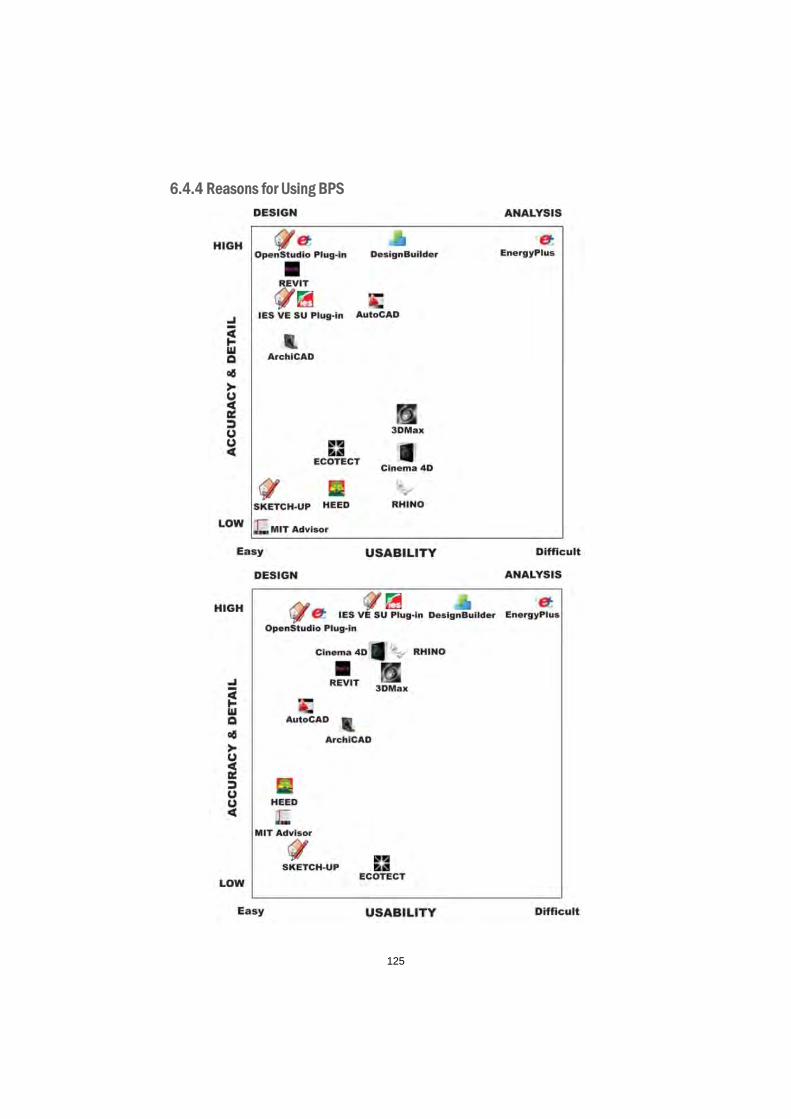
6.4.4 Reasons for Using BPS
125

Figure 6.3a, b, c Tools Map of workshop 1, 2, 3
In Figure 6.4, participants prioritized the most important performance metric they expect from BPS according to three major issues:
• Performance issues (energy, natural ventilation, daylighting etc.) • Occupants issues (comfort, indoor air quality) • Cost return issues
Surprisingly, participants placed comfort on top. The discussion that followed the voting indicates that comfort is the most important commitment to clients in Egypt. The issue of energy is not of great importance because energy is cheap and there is no enforcement of the energy standard. Therefore, the cost return metric followed the comfort metric. However, participants of Workshop 3 pointed that they ranked the energy criteria in second place due to the obligation of LEED projects for minimum energy performance and in particular the ASHRAE 90.1-2 -2007.
126

Figure 6.4 Participants’ responses on the most important feedback expected from BPS
6.4.5 Input and Output Wish List
The following question was an open-ended question which aimed to create an input and output wish list for future BPS tools. Respondents listed the following requirements for simulation inputs. The frequency of votes is listed beside each requirement:
• Informs design decisions (22/28) • more defaults for code compliance (LEED, AHSRAE, Egyptian
Standard) (20/28) • Sufficiently accurate (16/28) • Very easy to use (14/28) • more design guidelines (12/28) • Use minimum amount of input (9/28) • flexible in use (8/28) • Easy to Learn (6/28) • Adaptable to the users expertise (5/28) • Interactive, giving warning if a design strategy/ solution is needed (4/28) • Match the cyclic design iterations (3/28)
Respondents listed the following requirements for simulation outputs:
• Output interpretation (27/28) • Parametric analysis & optimisation (22/28) • Calibration of output results (18/28) • Choose graph type (12/28) • Allows alternative comparison (16/28)
127

6.4.6 Existing Tools Limitations in the Egyptian Practice
6.4.6.1 Are there any barriers to your use of available tools and methods?
Participants from the three workshops found that the highest barrier to use BPS tools is the lack of informative support for decision making and lack of interoperability of geometry exchange with drawing (CAD) tools (Figure 6.5). Some respondent pointed to the BIM technology as a solution to the interoperability problem. However, applying BIM technology is not possible during early design stages. The lack of integration of BPS tools within the design process, the steep learning curve and time consumption were considered by most participants as barriers.
Figure 6.5 Responses given on barriers of using BPS tools
6.4.6.2 What are the barriers to the use of BPS tools for energy savings in your buildings? (Interest)
Almost all participants agreed that the client’s lack of interest in efficiency was the main reason not to use BPS tools (Figure 6.6). Surprisingly, when respondents were confronted with this graph they showed a serious interest in energy efficiency and sustainability but considered that the current practice and policies does not encourage this approach.
128
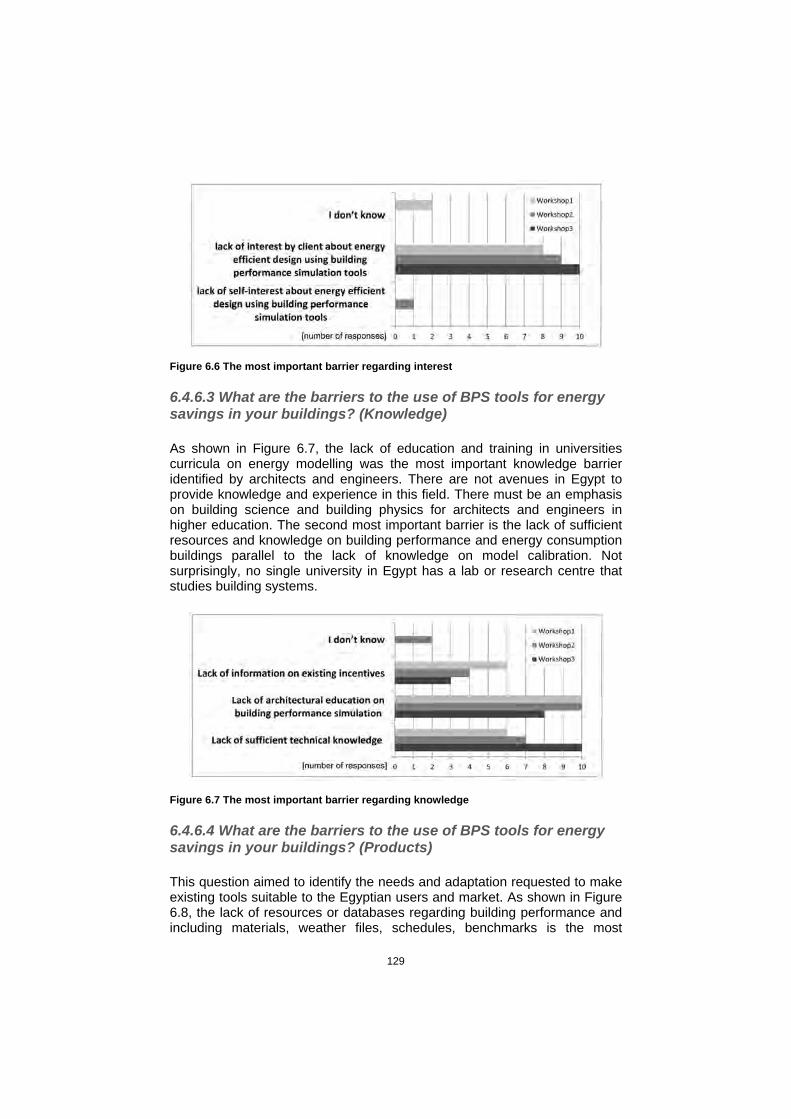
Figure 6.6 The most important barrier regarding interest
6.4.6.3 What are the barriers to the use of BPS tools for energy savings in your buildings? (Knowledge)
As shown in Figure 6.7, the lack of education and training in universities curricula on energy modelling was the most important knowledge barrier identified by architects and engineers. There are not avenues in Egypt to provide knowledge and experience in this field. There must be an emphasis on building science and building physics for architects and engineers in higher education. The second most important barrier is the lack of sufficient resources and knowledge on building performance and energy consumption buildings parallel to the lack of knowledge on model calibration. Not surprisingly, no single university in Egypt has a lab or research centre that studies building systems.
Figure 6.7 The most important barrier regarding knowledge
6.4.6.4 What are the barriers to the use of BPS tools for energy savings in your buildings? (Products)
This question aimed to identify the needs and adaptation requested to make existing tools suitable to the Egyptian users and market. As shown in Figure 6.8, the lack of resources or databases regarding building performance and including materials, weather files, schedules, benchmarks is the most
129

important barrier that existing simulation products and packages do not support. Having a BPS tool in Arabic was considered as an important feature; however, most respondents consider it as an important option.
Figure 6.8 The most important barrier regarding products
6.4.6.5 What are the barriers to the use of BPS tools for energy savings in your buildings? (Process)
Most respondents agreed that the time consumption is the highest barrier to use BPS tools during the design (Figure 6.9). The use of tools in late design phases was identified as the following highest barrier. During the discussion, respondents identified the Egyptian design approach as mono-disciplinary and linear which postpones the use of BPS tools in later stages. Also architects mentioned that most tested tools are not concept oriented.
Figure 6.9 The most important barrier regarding process
130

6.4.6.6 What are the barriers to the use of BPS tools for energy savings in your buildings? (Support)
Most respondents agreed that the design decision support is the highest barrier among users, followed by support for code compliance and design optimisation (Figure 6.10).
Figure 6.10 The most important barrier regarding support
131

6.5 Discussion
It is clear that the participants have a low experience with BPS tool. In same time, two introduction days cannot make the participant familiars with the surveyed tools. However, among all participants, there is recognition of the importance of BPS tools and design decision support tools in the building design community. According to participants, the aspiration of designers to create sustainable buildings by taking well informed decisions concerning, energy efficiency, passive strategies has been considerably growing in Egypt. The three workshops helped to identify gaps and barrier with the BPS sector in Egypt, which can be mainly summarized as follow:
• Lack of interest in energy efficiency and indoor environmental quality among project developers
• Lack of academic and professional education • Lack of information on Egyptian building performance. The thermo-
physical properties of typical Egyptian building materials and constructions are not available in digital databases. This includes properties of typical and special buildings (benchmarks), constructions and occupancy schedules used in Egypt.
• Difficulty of quality control and calibrating the simulation models. • Lack of understanding of the simulation result or output and it
consequences on design. • Investments are needed for capacity building in the field of BPS for
architects, engineers and urban planners. • There is no available comprehensive dynamic BPS tool in Arabic
addressing Egypt hot climate.
In addition to identify the critical needs that are related to BPS, we tried to identify a long-term vision or roadmap for the future of BPS. A post workshop report was produced to summarize the roadmap components targeting long-term needs as well as solutions. Under the three following titles, we summarize the report outcomes:
Practice: The workshop showed that there is a lack of industry knowledge about the power of BPS. In fact, the energy efficiency market in Egypt is estimated to be worth US$ 1 billion (UNDP 2010). Also Egypt is the highest-ranking nation in the Middle East and North Africa (MENA) region for energy efficiency renewable investment potential. Thus the Egyptian professional design community has a large opportunity for leaderships in environmental and energy efficient design. In order to comply with mandatory requirements, rating systems, verify and improve the indoor environmental quality of building the use of BPS is crucial.
Industry organization such as the Egyptian Green Building Council, HBRC, ASHRAE Cairo, the Egyptian Society of Architects, JCEE, MED-ENEC Cairo, GIZ Cairo, Egyptian Universities, Ministry of Electricity, large design
132

and construction firms and manufacturers should start to play a role in influencing the BPS industry, and recognize the importance of collaborating with other activities taking place. By coordinating and building upon these organizations, we can truly capitalize on the opportunities that exist.
Figure 6.11 Workshop 2 participants filling a questionnaire form, August 2010
One of the interesting lessons of designing energy efficient buildings in Europe and North America is the application of Integrated Design Process (IDP), which encourages cross-disciplinary teamwork to deliver high performance buildings during all phases of the development. Despite that the large majority of design firms in Egypt follow the conventional design process that generally limits the achievable performance and has a mainly linear structure; the IDP approach has now been applied to a wide variety of building types that were or will be LEED certified in Egypt. The IDP enforces testing of various design assumptions with energy simulations throughout the process, to provide relatively objective information on this key aspect of performance. This new challenge to the local design and construction techniques and building regulation requires innovative techniques to assist to spearhead this transition. BPS can play this role. Thus, the entry of simulation into a new market like Egypt is evident. The growing interest in verifying the performance regarding: energy, air quality, daylighting, comfort, life cycle analysis, cost, natural ventilation, fire and smoke prevention for complying with Egyptian standard and codes and LEED (ASHRAE 90.1-2007) rating system, can help the integration of BPS in practice, The integration of BPS will improve the efficiency of the built environment and to ensure quality of outdoor and indoor spaces.
Academia: The most solid message that came from the three workshops participants (architects & engineers) was the lack of academic education of BPS. In fact, Egypt has more than 56 architecture departments and 21 mechanical engineering departments in 33 public and private universities (MHE 2011). There are no curriculums for architectural engineering and no
133

single university has degree programs that offer courses specially focused on BPS methods and tools. There is some tool-focused training in some undergraduate courses (Sherif 2008, Ahmed 2010 and Sabry 2010); however, there is no education vision in universities to teach foundational knowledge on building science or building physics for architects and engineers. More importantly, there is a strong resistance and doubts about the use of BPS in design among many professors. Probably this is due to the lack of knowledge and skills. However, investments are needed for capacity building in the field of BPS for architects, engineers, urban planners. There are many resources for sustainable environmental design and BPS including the Environmental Design in University Curricula and Architectural Training in Europe (EDUCATE) and International Building Performance Simulation Association (IBPSA).
On the other hand, with the advent of internet many students are exposed to the international green and environmental design movement. Additionally, most Egyptian architecture students have been bombarded with lessons about integrating traditional environmental design in their future works (Asfour 2008). This is creating pressure on many architectural and engineering design schools. Some departments in Egypt (Mansoura University) are starting to consider building physics as integral in their curriculum in association with the use of building performance simulation as integral for design assessment.
In order to produce graduates that fit in the IDP and use BPS to assess design academia should launch students design competitions, construct little demonstration units for monitoring and verification. BPS should be embraced by architectural and engineering schools as creative and innovative approaches that can assess the design and verify the performance. Involving the students in design competitions, such as the Solar Decathlon or the yearly Hassan Fathy Competition, while using BPS tools, can create a change. Academic institutions should play active roles in providing the training and learning environment for the usage of BPS tools. Such training should start at the undergraduate level and in the form of continuing education for current design professionals.
Research: BPS evolved in research labs. In Europe and North America most universities that do offer BPS coursework are affiliated with labs or research centres. Therefore, it is essential that the local research and academic institutions compile databases that enable, climatic analysis, materials, components data, standards and design details to be incorporated and made accessible to practising professionals rapidly and effectively. This will improve the capabilities of the whole community as a whole to design predictably low impact buildings.
There is a serious need in Egypt to fund research to create quality benchmark data for energy consumption in all building types (Gado 2009). There is a need to provide data on building energy use including, reliable
134

weather data, plug loads and operational schedules. There is a need for test cells and case studies that can allow calibrated feedback to validate and support modelling adequately the latent heat associated with Egypt climates, and the mechanical equipment such as ceiling fans, used to accommodate these environmental conditions for thermal comfort (Khalil 2009 & Sheta 2010). This includes developing local simulation models and tools that cater for the Egyptian context and allow the development of interfaces that inform the decision making and help with output post-processing and interpretation.
135

6.6 Conclusion
According to the workshop participants, the use of BPS tools in Egypt is unexploited. Even the use of BPS tools for code compliance or regulatory conformance is not required. The current energy and fuel prices for consumers in Egypt are very low and do not reflect the real value of energy. However, after the Egyptian revolution the energy prices should increase to world market prices during the coming years. The role of government in this context is to play a leadership role to promote R&D and incentive programs in the building industry and enforce the energy standard and/or provide incentives for code compliance, indoor environmental quality and building energy efficiency.
Figure 6.12 Problems facing the Egyptian design practice
In the same time, Egypt cannot improve its buildings quality and have low impact buildings if there are no tools that enable designers to make better decisions during the design process. The Egyptian professional design community can not improve the environmental impact of buildings and compete regionally and internationally if the loop between building design operation and performance is not closed (Figure 6.12). To ensure that, guidance using BPS tools will be essential. BPS tools are required to help designers predict how buildings will perform in use, and to support the construction and operation of buildings. The authors hope that the information gathered in this workshop will be a starting point for encouraging simulation developers and users to talk more. The complete list of ideas generated during the workshops is available from the authors.
136

It might be interesting to establish IBPSA affiliation in Egypt by a small group of scholars and professionals who are advocates of integrating simulation into the industry of building construction. The objective will be providing knowledge transfer among researchers and practitioners. IBPSA-Egypt can be responsible of organising conferences, symposiums and workshops concerning modelling and simulation. This can allow training for Egyptian BPS professionals and also help in compiling data on climate, building components and materials. Also this can allow presenting practical case studies and research projects.
137

138

Chapter 7 .. Development of Benchmark
The aim of this chapter is to develop representative simulation building energy data sets and benchmark models for the Egyptian residential sector. This study reports the results of a recent field survey for residential apartment buildings in Egypt. Two building performance simulation models are created reflecting the average energy consumption characteristics of air-conditioned residential apartments in Alexandria, Cairo and Asyut. Aiming for future evaluation of the cost and energy affects of the new Egyptian energy standard this study established two detailed models describing the energy use profiles for air-conditioners, lighting, domestic hot water and appliances in respect to buildings layout and construction. Using EnergyPlus simulation tool, the collected surveyed data was used as input for two building simulation models. The simulation models were verified against the apartment characteristic found in the survey. This chapter presents details of the building models including the energy use patterns and profiles created for this study.
7.1 Introduction
In Egypt, the reliance on mechanical equipment in residential buildings has increased sharply over the last ten years. This increase is due to several changes that have occurred. The successive economic, social and climatic change has resulted in higher energy consumption rates. The continuously growing urban population and economic growth, coupled with long hot summers, has resulted in a relatively improvement of living standard among Egyptians (Boko et al. 2007). The economic growth nourishes the demand for building space, comfort and services, which raises the demand for residential energy. Also, the heavily subsidised domestic energy costs, which get rapidly eroded due to inflation, have resulted in a great deal of energy inefficiency in the residential building sector [Abdallah et al. 1995]. Traditional knowledge of appropriate environmental design and construction has been neglected during last 60 years. For example, passive design strategies such as shading, orientation, thermal mass, natural lighting and ventilation are no longer used. In addition, the construction industry in Egypt is still characterised by its poor quality (Abdel-Razek 1998 and El Araby 2002). As a consequence, the existing built environment reflect a repetition of minimalistic, identical, modular and poorly constructed residential blocks that are strongly dependent on environmental control-equipment (Fahmi et al. 2008). All these factors have increasingly accelerated the reliance on mechanical acclimatisation all over the country and resulted in peaking energy consumption rates and patterns. For example, sales figures for fans and air-conditioners are growing rapidly. Between 1996 and 2006 the sale of air-conditioning (AC) units exceeded 54,000 units per year, while between 2006 and 2010 this number has increased to reach an average 766,000 units per year, as shown in Figure 7.1 (CAPMAS 2008, MTI 2004, IDA 2003).
139

Figure 7.1 Increasing air-conditioner and fan sales in Egypt between 1996 and 2009 (Attia et al. 2012a)
In Egypt, residential buildings are the major consumer of energy, in a country where 45% of the population live in urban areas. In 2008, the residential building sector consumed more than 47% of the total nationally generated electricity. Approximately 11 Million tons of oil equivalents (Mtoe) of energy were consumed by approximately 20 million apartments. The rise in average consumption per capita and the desire for better comfort are reflected in a strong upward trend in electricity consumption. In Egypt, electrification has reached 99% of households, where 80% of the residential customers use 50% of the total households’ electricity (Mourtada 2009). If the current consumption trend expands further, which is expected, building electricity consumption and peak loads will continue to rise rapidly as more sectors of the growing population benefit from rising incomes, thus expanding their housing space and upgrading their living standards (Soliman 1996). Demand projections see residential and other building’s demand increase from 8 Mtoe in 2005 to 25 Mtoe in 2030. Between 1998 and 2008, electricity consumption for residential purposes has been growing at over 7-10 percent a year. Most probably this trend is expected to grow in future years by about 35% (Georgy et al. 2007). Lead by the Egyptian National Institute of Planning (ENIP) many different governmental reports warned that the primary energy supply will not be able to meet demand by 2015.
As a reaction to this trend, and in order to accommodate the prognosis for accelerating population growth and rising energy prices, the Egyptian government declared the commencement of its program for nuclear power plants for electricity production in 2007 (Georgy el al. 2007). Driven by the
140

desire to provide cheap electricity to its population, where more than 20 percent live below the poverty line, the government considered nuclear energy as the easiest central solution to concentrate its effort to solve the energy problem centrally (UNHDR 2010). At the same time, no consideration was given to the reform of the building energy sector. The wish for energy conservation in the building sector has been given a lower profile in Egyptian energy policy. The rising energy consumption trend was not curbed by the interest of energy conservation and environmental protection to reform the building energy sector. Overseeing this problem, in 2004 the United Nations Development Programme (UNDP) granted Egypt funding through the Housing and Building Research Centre (HBRC) in Cairo to develop a residential energy standard (Huang et. Al 2003). In 2005, a standard for residential buildings was completed and published (HBRC 2005). The development of the standard required knowledge about the building design details and the end-user energy characteristics of residential buildings in Egypt. The standard was based on several end-user surveys conducted between 1998 and 2005 and described in section 7.2.1.
However, the information available for residential buildings in Egypt is either incomplete or outdated. Almost no current published work addressed the status of energy consumption in the residential building sector or presented current representative models describing the pattern of use of air-conditioners, fans, lighting and other appliances in residential buildings. This information is critical in estimating the space cooling loads and their influence on the electric load profile. There is a need for validated data on the representative load patterns of air-conditioned residential apartments. Applying this information can help future studies in estimating the cost and energy effect of the new Egyptian energy standard in order to reform the building energy sector, since the cost of saving 1kWh of energy through energy-efficiency programs has proven much less expensive than producing 1kWh of energy by building a new power plant (Khalil 2009).
Consequently, the main objective of this chapter is to create two simulation models that represent electricity consumption patterns of residential apartments, for the year 2008, in three central metropolitan areas representing the three climates in Egypt. This is done by conducting field surveys that report on the building characteristics and end-use energy patterns and profiles. Thus a number of original works have been carried out in this study including the creation of an up to date benchmark model for the Egyptian residential buildings sector based on the data collected from surveying almost 1500 apartments in Alexandria, Cairo and Asyut. The study highlights the building physical characteristics and occupancy energy profiles and enables the reflection on the difficulties, barrier and opportunities for development.
This chapter is organised into five sections. The first and second sections identify the research problem, position it in the Egyptian context and explore the research methodology. The third section reports and analyses the survey
141

results and defines the consumption patterns and load profiles for two typical air conditioned apartments. The final two sections discuss the validity of the model and its energy performance characteristics.
7.2 Literature Review 7.2.1 Energy Modelling for Residential Building Sector
In the area of residential energy modelling different methods have been applied to estimate the energy use in many countries. In literature, the most common three methods to estimate energy use in buildings are (1) linear regression models, (2) neural networks and (3) surveys. For example, Aydinalp et al. developed residential energy consumption models for the Canadian residential sector. The study used a neural network method to estimate the consumption of appliances, lighting and space-heating and cooling components (Aydinalp 2002). Other similar studies using neural networks include the work of Sozen et al. in Turkey, Azadeh et al. in Iran, Karatasou et al. in Greece, Gonzalez in Spain and Abdel-Aal in Saudi Arabia (Sozen et al 2005, Azadeh et al 2008, Karatasou et al 2006, Gonzalez et al 2005, Abdel-Aal et al 1997). On the other side, examples using linear regression model is the work of Bianco et al. who tried to forecast electricity consumption in Italy (Bianco et al 2009 and 2010). Similar studies using linear regression include the work of Ranjan in India, Abosedra in Lebanon, Mohamed in New Zealand, Pachauri in India and Murata et al. in China (Ranjan et al 2009, Abossedra et al 2009, Mohamed et al 2005, Pachauri 2004, Murata et al 2008).
However, the neural network method and linear regression method require validation by comparison with real data and fact patterns for existing consumption and a priori statistical analysis. Despite the importance of the neural network and linear regression techniques the two methods are not investigated further in this chapter. The main focus of this chapter is real data and surveys of the buildings energy consumption to build a comprehensive and detailed residential energy model.
Chronologically, many studies aimed to identify the energy consumption use and patterns in residential building by conducting field visit surveys. A major survey conducted by Mansouri et al. in 1996 identified the utilization patterns and energy consumption in UK households. The survey aimed to estimate the variations in energy consumption per household and the annual consumption nationally (Mansouri et al. 1996). In 1996, Lam gathered and analyzed energy-consumption data in the residential sector in Hong Kong. He surveyed 200 households in 5 different classes of residential units. Sub-sector and end-use electricity consumption have been estimated (Lam 1997). Another study in 1997, by Xiaohua et al., applied a stratification sampling method to investigate 384 households in 12 villages of four towns in Yangzhong County. Responses to a questionnaire show that the average annual energy consumption per rural household is 740 kWh/year per family
142

(Xiaohua et al 1997). In 2000, a study was published by Lam on the household electricity use for air conditioning in the residential sector in Hong Kong. DOE-2 building energy modelling program was used to estimate the energy consumption. It was found that air conditioning accounts for about one third of the total electricity use in the residential sector (Lam 2000). Another study in Hong Kong published in 2003 by Tso et al. provides descriptive information on domestic energy usage patterns and investigates the effect of housing type, household characteristics and appliance ownership on electricity energy consumption level. Data were collected via a two-phase self-administered diary survey for households with average monthly electricity consumption of 100 kWh or above (Geoffrey 2003). Also Wan el al. conducted a survey in 2004 aiming to define energy-use characteristics of high-rise residential buildings in Hong Kong. The study obtained various energy data on household energy and electricity uses for domestic appliances and their utilization pattern. The estimated and surveyed average annual electricity-consumption in a typical flat was 144 kWh/m2 where 45% of was for air-conditioning electricity using 66kWh/m2 per household (Wan et al. 2004a). The same authors published in the same year the results of surveys that have been conducted to obtain information about the building design and energy end-use characteristics of high-rise residential buildings in Hong Kong. The energy data obtained include the household energy and electricity uses, and the type and quantity of appliances used in residential units. The saturation rates of various domestic appliances and their utilisation patterns, and the annual energy use for air-conditioning and water heating in residential units in Hong Kong have been estimated based on the collected data. The average annual household electricity-use intensity was about 110 kWh/m2. The average annual air-conditioning electricity-use intensity was estimated to be about 40–45 kWh/m2 (Wan et al. 2004b).
The summarized review of previous studies shows that comprehensive information and detailed data for the residential building stock worldwide is rather limited. There is a shortage of available data in many countries and the overall lack of national residential building energy benchmarks and models (Macmillan et al 2004).
7.2.2 Past and Recent Surveys in Egypt
In Egypt, during the past two decades, Energy surveys and audit exercises were developed and monitored by several institutions including the Organization for Energy Planning (OEP), universities and research centres (Khalil 2005). For example, in 1998, an energy survey on a sample from the residential sector was conducted by the OEP and Cairo University. The sample size consisted of 2634 apartments distributed among 16 zones in Greater Cairo. The average annual end-use energy consumption was 2866 kWh per apartment. Also the survey reported the degree of saturation of air conditioners at 17% (OEP/DRTPC 1999, Abu-Alam Y 2000, GEF, UNDP 2003, Khalil 2006, UNDP Egypt 2003). Later in 2001 and 2002, the OEP
143

conducted three other surveys. One was carried out in Port Said involving 926 apartments and another in Alexandria, studied 2750 apartments (ECEP/DRTPC 2001). A third survey was conducted together with the Faculty of Engineering in Asyut and surveyed the energy consumption of 807 apartments in 13 different districts representing different urban densities and social-economic classes (OEP 2002). However, the information revealed by the surveys was not sufficient to develop representative energy models. In addition there was no energy breakdown for the consumption of the average apartment.
In 2001 and 2003, two surveys were conducted by the Egyptian Housing and Building Research Centre (HBRC) on residential and commercial buildings. A residential survey was done in two phases (Aziz et al 2001). The first phase included a survey of 125 housing apartments, of which 95 were located in Cairo and 30 in Alexandria. Of the 125 sampled housing apartments, 22% were in high-rise buildings of more than 6 storeys, 70% were in mid-rise building buildings from 5 to 6 storeys, and only 8% in low-rise buildings with two floors. The survey defined prototypical housing apartments and developed prototypical occupancy schedules by family type for major residential spaces (bedroom, living room, kitchen and bathroom). Unfortunately, the survey did not present energy consumption data (Huang et al. 2003). The second phase included a survey on commercial buildings, which was completed in September 2003 (Aziz et al 2003). In contrast to the residential survey, the commercial survey consisted of an analysis of sectored data from the 1986 Census, OEP and the Ministry of Electricity and Energy, complemented by energy audits and surveys of a relatively small sample of 19 commercial buildings in Cairo, including 3 banks, 2 shopping malls, 2 residential/commercial mixed-use building, 3 offices, 1 hospital, and 5 government ministries. The report, presented general observations on the typical size, shape, number of floors, envelope conditions and cooling and ventilation equipment of offices, hotels, and retail stores. The energy use characteristics of the audited buildings were also documented. The small sample size made it difficult to generalise the survey findings.
In 2006, Michel and Elsayed conducted field surveys in both the Cairo and Alexandria regions, where construction activities were flourishing. The survey evaluated the design, construction, and energy use of typical new residential buildings with a view to improving current building practices and introducing new energy-efficient features through comprehensive building codes. In order to have a survey sample, representative of new construction, the building selection was carried out according to a predefined sampling scheme for different zones in Cairo (Maadi, Nasr City and New Cairo) and Alexandria (Agami and Borg El-Arab). A total number of 140 buildings were surveyed, analysed and classified into two main building typologies aiming to evaluate the energy performance of different apartments as part of developing the new standard (Michel et al 2006).
144

In 2006 and 2007 Attia et al. (Attia 2009c) conducted a field survey to estimate the average energy consumption for 87 apartment blocks in Cairo. The study presented passive and active renovation strategies for an existing residential community in order to evaluate the impact and potential of a low-energy retrofit. However, the research focused on a small sample of higher income apartments with high energy demand and only considered the saving potential for this particular category.
The summarised review of previous studies cannot provide a general snapshot about the energy end-use in residential buildings in Egypt. Most cases are outdated and do not properly document long performance periods. More importantly, information about the air-conditioners use and power intensities of installed appliances and their usage patterns are missing. This information is essential to predict the energy use of air-conditioners in residential apartments and to construct representative simulation models. However, the previous surveys were used to form a basis for the new survey.
7.3 Methodology
The methodology implemented in this chapter includes aspects which determine the energy consumption characteristics of air-conditioned residential buildings in Egypt. The methodology followed is similar to other recent international energy consumption studies (Khalil 2009, Wan et al 2004, Zhang 2004 and Swang et al 2009). The first step was to carry out a literature review on past and recent surveys. The second step was to identify typical building typology and characteristics through field surveys and literature review. The survey plan included a description of a comprehensive set of building construction, equipments and dimensions. Several specific energy consumption issues were addressed during the on-site surveys. For the third and final step, actions were taken to develop two representative benchmark models of air-conditioned apartments and conducting parametric simulations. The EnergyPlus program was used for modelling the energy performance of the representative apartment models (DOE 2011a). Hourly weather readings for the year 2008 in the three cities were obtained from the Egyptian Meteorological Authority (EMA) in Excel format and formatted into EPW format for use in EnergyPlus (EMA 2010). The following sections describe in detail the steps undertaken.
7.3.1 Selection of Representative Residential Apartments
In Egypt, the hot humid climate predominates. The overheating period lasts for about 7 months and the peak shade temperatures reach about 40oC. According to the 2006 Census (CAPMAS 2008) 88% of air-conditioned apartments are found in the high-rise residential buildings in the three major cities namely, Alexandria, Cairo and Asyut. Therefore, the following three cities were selected Alexandria (31.2oN, 29.95oE), Cairo (30.13oN and
145

31.0oE) and Asyut (31.18oN and 27.18oE) where the outdoor design temperature are 32oC, 38.5oC and 41.2oC, respectively (Attia 2009a). The size of the apartments in those cities varies substantially but they are classified according to the census into classes from A to D:
• A: 7 percent have gross areas greater than 130 m2 • B: 47 percent have gross areas between 110 and 130 m2 • C: 23 percent have areas between 90 and 110 m2 • D: 11 percent have areas between 60 and 90 m2
Based on this classification, the majority of air-conditioned residential apartments are in class B. Therefore, the survey plan was aimed at screening and selecting three middle class neighbourhoods that fall in class B with high penetration values of air-conditioning units. This step was done with help from the local electricity utility companies and from on site observation in the three cities. The selection resulted in three neighbourhoods, namely Sidi Gaber in Alexandria, Mohandessin in Cairo and Firyial in Asyut as shown in Figure 7.2. The site observations showed that those residential neighbourhoods have buildings with minimalist and replicated modular architecture. Apartment blocks and concrete walk-up buildings are dominant.
The major limitation of this data collection method is that it cannot be proven to be statistically representative on any given national population. However, with nearly 1500 survey responses collected, representing the three neighbourhoods, we believe that patterns could be identified and cross-discipline analysis was possible. Already several recent international studies had the same approach (Khalil 2009, Wan et al 2004, Zhang 2004 and Swang et al 2009).
Figure 7.2 The selected neighbourhoods: Alexandria, Cairo and Asyut (source Google).
From the data collected it was observed that the floor layout of residential building blocks would be most probably rectangular. Two typical common block typologies were identified among Class B, referred to as Typology 1 and Typology 2. The resulting two typologies are selected and defined as representative residential building blocks for this study (see Figure 7.3 and 7.4). Typology 1 has six floors with two apartments per floor. Typology 2 has
146

12 floors with four apartments per floor. The position of those typologies within the urban context was also documented. In each of the three cities, more than 250 apartment samples which fall in Typology 1 were surveyed and more than 240 apartment samples were surveyed falling in Typology 2.
Figure 7.3 Typical floor plan of Typology 1 in its urban context (Attia et al. 2012a)
Figure 7.4 Typical floor plan of Typology 2 in its urban context (Attia et al. 2012a)
147

7.3.2 Building Description
The two blocks shown in Figures 7.3 and 7.4, were found to be representative models for residential buildings in the three cities. Typology 1 is a block of base 25m x 11m x 18m with a 2.3:1 aspect ratio. The total area of one apartment is 122 m2 with a net conditioned area of 60 m2, representing three rooms per apartment. The basic building construction is a reinforced-concrete post and beam structure with 0.15m thick brick infill walls without insulation. Windows are single glazed, transparent and have a 0.003m thick glass pane. The total amount of glass in the North and South facades is estimated to be between 45% and 35% of the total wall area. There is no solar protection for the facades and most wooden windows are draughty. Typology 2, shown in Figure 7.4, is a twelve story building block of base 30m x 20m x 34m with a 1.5:1 aspect ratio. The building’s gross floor area is 7200 m2 and the net conditioned area is 60 m2 representing three rooms per apartment. The building has the same construction properties as Typology 1. The amount of glass used is estimated at 46% in the short façades and 20% in the longer facades of the total wall area. There is no solar protection for the facades and most wooden windows are draughty. For both typologies, a multi-thermal-zone configuration per floor was used in conducting energy simulations. To address the different orientation of the surveyed apartments, the benchmark models performance was generated by simulating the building with its actual orientation and again after rotating the entire building 90, 180, and 270 degrees, then averaging the results. Table 7.1, lists the general description of the sample building and some properties for the construction materials used.
Table 7.1 Both typologies’ building description Building Description Typology1 Typology2
Shape No. Floors & Height Aspect Ratio
Rectangular (25 m x 11 m) 6 & 2.8 m height per floor 2.3/1
Rectangular (30 m x 20 m) 12 & 2.7 m height per floor 1.5/1
Apartment Description Volume External Wall area Roof area Floor area Windows area Glazing U-Value Exterior Wall U-Value Roof U-value Floor U-value Single Clear Glazing SHGC
366 m3 110 m2 122 m2 122 m2 60 m2
6.25 W/m2 K 2.5 W/m2 K 1.39 W/m2 K 1.58 W/m2 K Tv = 0.88 0.75
337.5 m3 68 m2 125 m2 125 m2 13 m2
6.25 W/m2 K 2.5 W/m2 K 1.39 W/m2 K 1.58 W/m2 K Tv = 0.88 0.75
7.3.3 Energy Characteristics of Representative Residential Apartments
Two types of energy audit were conducted for the selected apartments during August and September 2008. First analyses of the utility bills, and second a walk-through survey. The utility bill analysis was made prior to the
148

walkthrough survey to become familiar in advance with the consumption patterns of the apartment visited. This step helped in obtaining more accurate information from the apartment’s occupants. A request to the electricity utility companies in the three cities was made to provide the utility bills for the year 2006 and 2007.The bills were analysed and entered in spreadsheets to identify the patterns of use, peak demand, weather and Ramadan effects. Then the walkthroughs were conducted. During the walkthrough visit, major energy use equipment (air-conditioners, ceiling fans, lighting, water heaters, stoves, etc.) were identified and apartment members were asked about the hours of operations during summer, winter and Ramadan. Also the characteristic construction and layout of every visited apartment was noted. Later the utility bills for the year 2008 were collected from the utility companies.
The collected information was combined and analysed to reflect the energy performance of representative realistic situations in air-conditioned residential buildings. The development of the two representative residential apartments was underlined by building design characteristics and audited energy use data collected during the surveys. On the basis of this set of data the building models together with hourly usage profiles and operation patterns of air-conditioners and other equipment were established, representing typical residential apartments in Alexandria, Cairo and Asyut. Details of the representative building benchmark models are described in the results section.
7.4 Survey Results
For each of the following issues, results from the surveys are presented and, where comparable macro information exists, comparisons are made against citywide averages. Where data on citywide averages do not exist, data have been based on the survey. In some cases only survey information is available. Combining the collected data in a representative simulation model took calibration and validation work.
7.4.1 Annual Electricity Use
As the survey addressed the billing history of the sample groups we found average consumption for a typical apartment in Typology 1 to be 22.4kWh/m2/year in Alexandria, 26.6kWh/m2/year in Cairo and 31kWh/m2/year in Asyut. For Typology2 the average consumption for a typical apartment was 11kWh/m2/year in Alexandria, 14kWh/m2/year in Cairo and 18kWh/m2/year in Asyut. Figure 7.5 illustrates the surveyed average monthly electricity consumption for both apartment typologies in the three major cities. The average consumption of apartments of Typology1 was higher than the average consumption values of apartments in Typology2, primarily due to smaller exposed surface area of external walls of apartment in Typology 2 resulting in reduced heat gains.
149

Figure 7.5 Surveyed monthly electricity use for both apartment models (Attia et al. 2012a)
7.4.2 Occupancy Rates
The occupant’s behaviour influences energy consumption in residential buildings. The influence of the occupant’s consumption patterns has a remarkable national character. In each of the three cities, more than 250 apartment samples (Typology 1) and 240 (Typology 2) were surveyed.
In order to define the occupancy rates the average occupancy density and occupancy schedules of typical air-conditioned apartments were
150

investigated. The investigation focused on air-conditioned spaces including living space and bedrooms. However, when the collected data samples were combined and analysed no significant difference, regarding the occupant behaviour in the three neighbourhoods, was found. This is mainly due to the similarity of air-conditioning units’ penetration values, which probably reflects the same economic and consequently lifestyle status. It might be also possible that the short sampling time (August September) did not allow to the recognition of significant difference. The following paragraphs report the findings.
7.4.2.1 Occupancy Density
According to the 2006 Census the national average apartment occupancy is 4.19 people per apartment and the national average occupancy density is 10.75m2 on usable floor areas per person (CAPMAS 2008). The average apartment occupancy in Alexandria, Cairo and Asyut is 3.83, 4.69 and 3.75 people per apartment, respectively. On the other hand, the survey results indicate that the average apartment occupancy is 4 to 5 people per apartment with an average density of 24-28 m2 on usable floor areas per person in the air-conditioned apartments. Based on the above statistics, it would be considered reasonable to assume the same average areas per occupant in air-conditioned residential apartments in Alexandria, Cairo and Asyut, which would be around 26 m2 and could accommodate up to 5 people.
7.4.2.2 Occupancy Schedules
According to the 2006 Population Census the national dominant age groups within apartments are people younger than 45 (50%) and people younger than 15 (21%). Similarly, in the three cities, the dominant age groups are younger than 45 (Alexandria 51%, 51% Cairo and Asyut in 47%) and younger than 15 (Alexandria 18%, 17% Cairo and 25% in Asyut). People between 15 and 45 would most likely be secondary school or university students or working adults while people younger than 15 were most likely school students.
In our survey sample we will assume that over 50% of the apartment occupiers are within the age range of 22 to 60. Most of the apartment occupants would be away from home between 08:00 and 15:00 on weekdays. About 25% of the apartment residents would not return home until after 17:00. Nearly all residents would stay at home after 23:00. Most residents would stay at home on Fridays because the weekend in Egypt is Friday and Saturday.
In the light of the government statistics and the survey results, a representative family type was selected for the establishment of the two models in Alexandria, Cairo and Asyut. The selected family type represented the most dominant type among the surveyed apartments in the three cities.
151

The characteristics of this family type is based on a nuclear family where an adult female would be at home during the daytime, while other family members would be at work or at school. Table 7.2, summarises the surveyed employment status for each family member and the daily hours spent at home. Daily and weekly profiles, defining the number of occupants that would be present in living areas and bedrooms in a residential apartment at different times of the day during the three seasons, are shown in Figure 7.6.
Table 7.2. Occupation status of apartment members in a typical apartment of five family members (Attia et al. 2012a)
2008 Member 1 2 3 4 5 Season1 04/Oct-30/Mai
Employment Occupancy
Full-time 08:00-18:00
Unemployed 14:00-15:00
Student 7:30-15:00
Student 7:30-15:00
Student 7:30-13:00
Season2 01/Jun-30/Aug
Employment Occupancy
Full-time 08:00-18:00
Unemployed -
Student -
Student -
Student -
Ramadan* 31/Aug-29/Sept
Employment Occupancy
Full-time 08:30-16:00
Unemployed -
Student -
Student -
Student -
*Ramadan 2008 was during the summer vacation **During the weekend (Friday and Saturday) all members would stay home
Figure 7.6 Occupancy schedules of the surveyed apartments (average) (Attia et al. 2012a)
152

7.4.2.3 Internal Load Intensities
Estimating the average load is a difficult and complex task, in order to generate accurate results the internal loads were categorised and studied under the three following headings.
7.4.3 Lighting Intensity and Schedules
The data collected in the survey shows that the lighting power density installed in the living spaces and bedrooms vary significantly depending on the types and number of lamps used. The dominant types of lamps used were incandescent lamps and fluorescent tubes. As found from the survey, the average lighting-power intensity for living room and bedrooms are 17 and 13W/m2, respectively. The rest of the space had an intensity of 9 W/m2.Those values were adopted as the typical lighting power intensities for the established models. Figure 7.7 shows the daily profiles of lighting use for a typical living and bedroom for the selected family type.
Figure 7.7 Lighting schedules of the surveyed apartments (average) (Attia et al. 2012a)
153

7.4.4 Plug Load Intensity and Schedules
In order to estimate the plug load intensities and their operation schedules, an inventory of electrical appliances was included in the field survey. The saturation rates and penetration rates of apartment appliances were determined based on the survey findings. Table 7.3 summarises only those types of domestic appliance that had a saturation rate higher than 60% from the surveyed sample. The appliances that are assumed to be commonly used are classified based on the field survey results.
The unit capacity of the continuously plugged appliances and standby power appliances and the average running hours of each appliance were determined with reference to the collected survey data and appliance catalogues. To facilitate and unify the communication of plug loads for the estimated model, all appliance powers were summarised under one unit of power density. The average plug load power intensity is 6 W/m2.
Table 7.3 Appliances in the surveyed apartments and their average daily operating hours Appliance Watt Daily
Operating Hours
Appliance Watt Daily Operating
Hours Exhaust fan 150 24 Television 3 6 Satellite decoder 3 0.2 Washing machine 512 0.2 Mobile charger 5 24 Refrigerator 380 24 Phone charger 3 3 Kettle 1800 0.1 *Collective Water pump
300 0.1 PC or Laptop 300/60 2
Electric Iron 1100 0.1 Mixer 127 0.05 Vacuum cleaner 630 0.1 Stereo 100 0.1 Fans (2-4) 88 (sec. 7.4.6.1) Gas Water Heater - -
* per block
7.4.5 Cooking and Domestic Hot Water
The residential sectors in Egypt mostly consume liquefied petroleum gas (LPG) and natural gas for cooking and electricity for heating water. Until the early 1990s, the use of LPG canisters for cooking and water heating was the most common way in all three cities. It was not until the beginning of the new millennium that Egypt developed a large transmission network for natural gas thanks to the discovery of deposits in the Delta and Mediterranean. In 2008, 460,000 new apartments were connected to the grid, meaning a total of more than 3.3 million apartments were connected to the national natural gas transmission network (NNGTN). In most large Delta cities, Suez Canal cities, Alexandria and Cairo the NNGTN is well developed, however in Upper Egypt cities (South Cairo) only got connected recently.
In the light of the above review, the survey investigated the type of energy and appliances used for cooking and water heating. In the samples of the three cities, most of the investigated apartments had gas stoves for cooking
154

and water heaters for Domestic Hot Water (DHW). However, many water electric heaters were found in the surveyed apartments in the three cities. Based on the gas utility bills, Figure 7.8 illustrates the average monthly natural gas consumption for the year 2008 in the three cities. The difference between the summer and winter gas consumption is mainly due to the DHW.
Figure 7.8 The average surveyed natural gas consumption per apartment (Attia et al. 2012a)
On average, the surveyed apartments consume 16000 to 20000 litres per apartment annually. By analysing the gas utility bills we found that during October to April the consumption increased by 2 to 3 times compared to the rest of the year. Thus the pattern of use of water heaters has two different schedules throughout the year. For the simulation model the average DHW was estimated to be 0.35litres/m2/day for the first period (October-April) and 0.05litres/m2/day for the second period (May-September).
7.4.6 Mechanical Cooling Load Intensities
7.4.6.1 Electric Fans
Fans are an appliance in almost daily use in Egypt and its usage increases especially in the summer season. Electric fans are one of the oldest mechanical devices that entered Egyptian apartments. On a national level, more than 89% of apartments have at least one fan. The most common type is the ceiling fan, besides pedestal, wall and table fans. Figure 7.1 shows the annual market sales since 1996 (Abdelhafiz 2004 and INCOM 2008). Out of the total production, approximately 12 percent of fans are the pedestal type, 25 percent table fans and wall fans and the remaining 63 percent are ceiling fans.
155

Figure 7.9 Annual fan and air conditioning operation profile in Cairo
The data collected in the survey shows that the average home in Alexandria, Cairo and Asyut has an average of 2.8, 3.5 and 4.3 ceiling fan units, respectively. The most common fan type is the three blades (48 inch) with a speed of 330 RPM and air flow rate of 3,000 CF/M. The average annual operation time in Alexandria, Cairo and Asyut is 1400, 1800 and 2300 hours respectively with a power of 60 watt. The survey results indicate two operational periods for the use of fans. Figure 7.9 shows an example for annual operation profile of electric fan use in Cairo. The survey results indicate that the apartment usage modes depend on the thermal comfort level. During the warm periods only fans are used and during the hot periods fans and air conditioners are used simultaneously.
7.4.6.2 Air-Conditioners (ACs)
80% of the apartments in the sample had air conditioners (split or window units) serving mainly bedrooms and/or living rooms. At least, one AC unit was found in all apartments surveyed. The operation patterns of air-conditioners serving living rooms and bedrooms followed the occupancy schedules presented previously in Figure 7.6. Also the daily winter and summer electricity load profiles were verified by comparing the operation schedules to the national average daily load profiles provided by the National Egyptian Electricity Holding Company as shown in Figure 7.10. During the summer season air-conditioners in living rooms operated between 17:00 and 23:00 and those serving bedrooms were operative between 23:00 and 5:00. During Ramadan air-conditioners ran for longer periods in living rooms starting from 15:00.
156

Figure 7.10 National daily average electrical load profiles for residential buildings in 2008 (Attia et al. 2012a)
The final survey findings (Figure 7.11) show that in average the use of air-conditioning raised the annual electricity bill by between 49 and 29 percent (Typology 1 and 2) in Alexandria. In Cairo, the annual electricity bill increase was between 57 and 44 percent, and in Asyut there was an increase of between 65 and 57 percent (Typology 1 and 2).
7.4.7 Two Representative Benchmark Models
Two representative simulation models were constructed based on the previously described representative internal load intensities and patterns. The capacity and power demand of air-conditioning units, ceiling fans, water heaters, plug loads and lighting appliances for the living rooms and bedrooms in the reference flat were calibrated based on the surveyed monthly utility bills using EnergyPlus for prediction. Table 7.4 summarises the major simulation input parameter values. The validity of the estimate has been further checked against the public statistics and verified through a model calibration and utility bill comparison.
As shown in Figure 7.11, the estimated average monthly electricity usage matches the simulated one. The model calibration was done over a year and involved several reviews from peer modellers. All the previous load schedules were included in both models. The most significant calibration strategy was the coupling of the ceiling fans’ yearly schedule with the air-conditioning yearly schedule. Three major operation periods are defined resulting in a match with the surveyed monthly electric utility bills profile.
157

Figure 7.11 Surveyed and simulated monthly electricity usage for both apartment models (Attia et al. 2012a)
There is good agreement in annual energy consumption behaviour and curve shapes between the simulated data and the survey collected data. The estimated energy demand curve shapes are slightly offset towards high limits than the predicted consumption during summer months and the total annual predicted consumption is higher than the actual by about 2%.
158
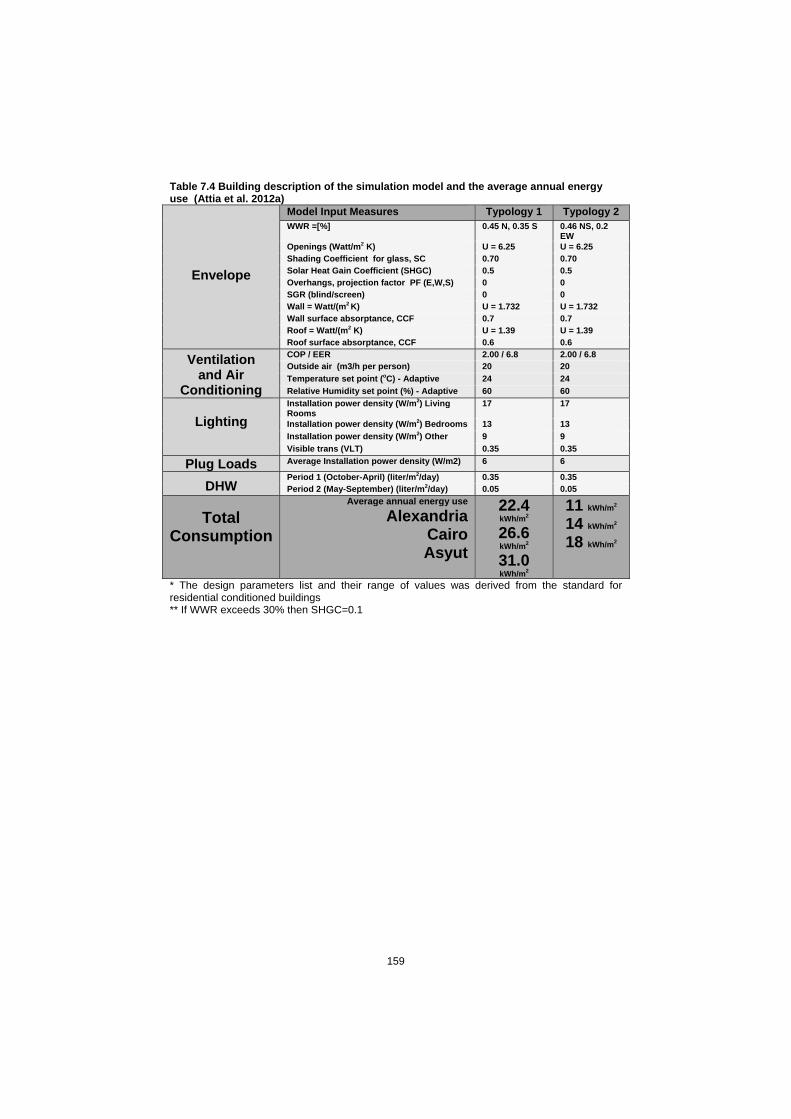
Table 7.4 Building description of the simulation model and the average annual energy use (Attia et al. 2012a)
Envelope
Model Input Measures Typology 1 Typology 2 WWR =[%] 0.45 N, 0.35 S 0.46 NS, 0.2
EW Openings (Watt/m2 K) U = 6.25 U = 6.25 Shading Coefficient for glass, SC 0.70 0.70 Solar Heat Gain Coefficient (SHGC) 0.5 0.5 Overhangs, projection factor PF (E,W,S) 0 0 SGR (blind/screen) 0 0 Wall = Watt/(m2 K) U = 1.732 U = 1.732 Wall surface absorptance, CCF 0.7 0.7 Roof = Watt/(m2 K) U = 1.39 U = 1.39 Roof surface absorptance, CCF 0.6 0.6
Ventilation and Air
Conditioning
COP / EER 2.00 / 6.8 2.00 / 6.8 Outside air (m3/h per person) 20 20 Temperature set point (oC) - Adaptive 24 24 Relative Humidity set point (%) - Adaptive 60 60
Lighting
Installation power density (W/m2) Living Rooms
17 17
Installation power density (W/m2) Bedrooms 13 13 Installation power density (W/m2) Other 9 9 Visible trans (VLT) 0.35 0.35
Plug Loads Average Installation power density (W/m2) 6 6
DHW Period 1 (October-April) (liter/m2/day) 0.35 0.35 Period 2 (May-September) (liter/m2/day) 0.05 0.05
Total
Consumption
Average annual energy use Alexandria
Cairo Asyut
22.4 kWh/m2 26.6 kWh/m2 31.0 kWh/m2
11 kWh/m2 14 kWh/m2 18 kWh/m2
* The design parameters list and their range of values was derived from the standard for residential conditioned buildings ** If WWR exceeds 30% then SHGC=0.1
159

7.5 Discussion
The great need to approach the opportunities for energy efficiency in the Egyptian residential sector requires the development of verified and updated knowledge on energy performance of residential buildings. Therefore, the main objective of this study was to create simulation models that match the electricity consumption patterns of representative residential apartments. Based on the surveyed apartments, the characteristics and electricity consumption patterns were analysed and the average annual apartment electricity use intensity was defined. During the model verification process several important lessons were learned and other questions were raised.
First of all, the model verification shows that the use of air-conditioners dominated the energy usage in residential buildings in the three cities. Therefore, the electricity consumption patterns of residential apartments would be significantly affected during the extended summer period (April-October). Identifying the frequency and pattern of use of air-conditioners in relation to indoor thermal comfort should be a basic step in any future investigation. However, this step is difficult especially during warm periods when mixed mode acclimatisation strategies occur (see Figure 7.9). The survey results revealed that most of the occupants operate their mechanical equipments within an individual adaptive comfort strategy, integrating natural ventilation (diurnal and nocturnal), electric fans and air-conditioners. Occupants in most of the apartments investigated did not maintain comfort in their spaces by relying on fixed, preset temperatures. For example, adapting the Fanger‘s or ASHRAE’s comfort model in the simulation resulted in higher energy consumption values that did not match the real consumption patterns (Fager 1970, EN-ISO-7730 2005, ASHRAE 2005). At the same time, there is almost no study that documents occupant behaviour in relation to thermal comfort in Egyptian apartments. Therefore, it was necessary during the calibration process to compare simulation results with the monthly electricity bills to match real consumption patterns and to create a consistent operating schedule. Also the comparison showed the importance of identifying the usage pattern of electric fans. Future studies should further investigate the indoor thermal comfort in relation to environmental control-equipment.
Secondly, the study revealed that all surveyed buildings had a very poor thermal performance and indoor air quality. The building envelopes of most of the buildings investigated are not airtight, with single glazed openings, with non-insulated walls and without shading treatment. On the other hand, the majority (80%) of apartments have been equipped with at least one air conditioner unit which results in peak electric loads that the existing electricity grid cannot provide. For example Cairo has been witnessing frequently electric blackouts every summer since 2004. Thus the potential in energy savings in the area are necessarily and in the same time high. Also the indoor air quality of most investigated apartments is poor. During the field visit in August and September 2008 it was realised that during the operation times of the air conditioners, the occupants keep the apartment
160

closed, sometimes exceeding 10 hours a day without fresh air intake. Keeping in mind that pollution has reached a dangerous level in the three investigated cities and particularly Cairo, providing fresh air and mechanical acclimatisation of indoor spaces for thermal comfort must be coupled with hygienic indoor air quality conditions. This is also an important problem that requires extra attention in the future.
The third lesson learned from this study is related to occupants’ behaviour. Surprisingly, the study revealed that most occupants were conscious about responsibly operating the air-conditioners, in particular during summer. This is due to the utility bills values that double at least 6 to 8 times more during June, July and August compared to the winter months (December, January and February). However, the study proved that during the month of Ramadan there are behavioural changes. TV watching and air-conditioner usage hours increase sharply. Families across the nation gather in the evening to break their fast simultaneously, which results on a spike in power consumption. Also working hours are shortened during the day, which extends the occupancy hours. Despite the difficulty to quantify the occupant behavioural changes during Ramadan, it is sure that there will be a remarkable increase in energy consumption in the residential apartments throughout the coming years during the summer. The Ramadan month will begin approximately 11 days earlier each year, and people will be required to fast for longer periods, exceeding 14 hours per day which consequentially will increase the demand and use of environmental control-equipment. Further comparable studies should investigate the occupant behaviour in relation to energy consumption during this seasonally shifting month.
The fourth remark is related to the appliances and lightings. The survey results showed that the penetration rates of air conditioners, washing machines, were very high. This is due to the increasing personal income that leads to an unprecedented increase in energy demand. This finding is significant as it matches recent research findings in most of the metropolitan areas located in hot-climate developing countries (Sivak 2009). The survey findings revealed high penetration and saturation of domestic appliances among the survey sample. Most apartments were equipped with air-conditioners, fridges, washing machines and fans. However, almost all appliances have no energy description labels. There must be an effort to phase out poor quality and high energy consumption products. Also the efficiency of electric appliances used for lighting could be increased significantly if incandescent lamps were replaced by energy-efficient light bulbs. There is a potential of energy saving in the existing building stock if high efficiency lighting equipment and appliances are used.
The fifth remark is related to global climate change and the heat island effect. Due to the long hot summers in Egypt, there is already an in increase in temperature profiles during the last 10 years all over Egypt (Boko 2007). The increasing trend of summer discomfort is creating on top of the current energy demand an incremental demand due to cooling (Lam et al 2010).
161

The continuation of this trend will imply a greater demand for cooling specially in metropolitan areas. This increased cooling demand is unwanted given its impacts on energy consumption and associated emissions, grid feeding stability and the vicious heat island effect [Attia, 2009c, Sivak 2009, Lam et al 2010).
A solution to those problems might be switching to solar thermal or solar electric air conditioning systems to break this circle in the future. The use of renewable energy technologies for cooling residential buildings in Egypt should be further investigated. This might result into energy neutral or net zero energy buildings (Bojic et al. 2011). However, this will require theoretical and experimental studies on urban solar access, urban scale development, solar cooling, thermal comfort, grid interaction, loads matching, feed-in tariffs (Attia 2010d).
Finally, this study proves that there is sufficient evidence that energy efficiency can be improved in the building sector. Despite a great part of precious resources being wasted daily, there is an opportunity to reduce the apartment consumption of energy resources through improved end-use utilisation efficiency. Improving the end-use utilisation efficiency may be achieved by improving the building envelopes, operation patterns and by installing more efficient appliances.
This study builds on earlier studies that have documented the energy consumption in residential buildings in Egypt [GEF, UNDP. 2003, OEP, AU 2002, Aziz et al. 2001, Aziz 2003, Michel el al. 2006, Attia 2009c, Khattab 2007 and Hanna 2004). None of these studies, however, provided detailed benchmark energy models describing the energy characteristics of residential apartments. The present study is an essential first step towards establishing models for the real application of a new energy standard in Egypt. A step that will allow the evaluation of the impact of the new standard though detailed parametric studies.
162

7.6 Conclusion
Based on the data collected from surveying almost 1500 apartments and examining relevant public statistics, two apartment models comprising a living room, dining room and a bedroom have been constructed for the representation of typical residential buildings in Alexandria, Cairo and Asyut. The key findings from those surveys have been summarised in this chapter. The survey results include building physical characteristics and occupancy energy profiles. Also based on that set of data, the average operating patterns of appliances were identified. These energy characteristics of residential apartments were intended to be used to model representative benchmark and reference conditions of residential buildings in Egypt.
The survey results show that electricity use is significantly dominated by the seasonal use of air-conditioners. The use of fans reduced the total annual operation hours of air–conditioners, in particular during the early and late summer periods. The average energy use per apartment for Typology 1 was 22.4kWh/m2/year in Alexandria, 26.6kWh/m2/year in Cairo and 31kWh/m2/year in Asyut. For Typology 2 the average consumption for a typical apartment was 11kWh/m2/year in Alexandria, 14kWh/m2/year in Cairo, and 18kWh/m2/year in Asyut. In addition, the frequency and pattern of use of appliances has been identified. Finally, the results presented in this chapter, can provide a good basis for investigating the potential energy savings of applying the new Egyptian energy standard.
163

164

Chapter 8 .. Development of the Decision Support Tool
There is a need for decision support tools that integrate energy simulation into early design of zero energy buildings in the architectural practice. Despite the proliferation of simulation programs in the last decade, there are no ready-to-use applications that cater specifically for the hot climates and their comfort conditions. Furthermore, the majority of existing tools focus on evaluating the design alternatives after the decision making, and largely overlook the issue of informing the design before the decision making. This chapter presents an energy-oriented software tool that both accommodates the Egyptian context and provides informative support that aims to facilitate decision making of zero energy buildings. A residential benchmark was established coupling sensitivity analysis modelling and energy simulation software (EnergyPlus) as a means of developing a decision support tool to allow designers to rapidly and flexibly assess the thermal comfort and energy performance of early design alternatives (Figure 8.1). Validation of the results generated by the tool and ability to support the decision making are presented in the context of a case study and usability testing.
Figure 8.1 The software welcome page, ZEBO
165

8.1 Introduction
The modelling of net zero-energy buildings (NZEBs) is a challenging problem of increasing importance. The NZEBs objective has raised the bar of building performance, and will change the way buildings are designed and constructed. During the coming years, the building design community at large will be galvanised by mandatory codes and standards that aim to reach neutral or zero-energy built environments (IEA 2011, EU 2009 and ASHRAE 2008). At the same time, lessons from practice show that designing a robust NZEB is a complex, costly and tedious task. The uncertainty of decision making for NZEBs is high. Combining passive and active systems early on is a challenge, as is, more importantly, guiding designers towards the objective of energy and indoor comfort of NZEB. The integration of such design aspects during the early design phases is extremely complex, time consuming and requires a high level of expertise, and software packages that are not available. At this stage, the architects are in a constant search for a design direction to make an informed decision. Decisions taken during this stage can determine the success or failure of the design. In order to design and construct such buildings it is important to assure informed decision making during the early design phases for NZEBs. This includes the integration of building performance simulation (BPS) tools early on in the design process (Charron et al 2006, Hayter et al 2001 and Shaviv 1999).
8.2 Tool Description
In response to the barriers, requirements, and expectations identified in section 2, a prototype of the proposed decision support tool was developed. The tool is a conceptual model for software under development called “ZEBO” that aims to address these shortcomings and test the validity of the method proposed in section 2 (Attia 2011d). The tool allows for sensitivity analysis of possible variations of NZEB design parameters and elements during the early design phases in hot climates. Its added value resides in its ability to inform the decision prior to the decision making for NZEBs design. The tool is contextual and is based on an embedded benchmark model and database for Egyptian residential buildings, which includes local materials and construction and allows the generation of code complying design alternatives
Figure 8.2 shows the tool flow chart. The tool is based on templates for a basecase incorporating the benchmark (described in Chapter 7) details. The rule based templates are embedding the Egyptian residential standard requirements and the materials database of typical Egyptian construction materials. Once the user starts to build his first design case the default settings are loaded for a case complying with the Egyptian standard. As shown in Figure 8.2, the user is then allowed to change the performance parameters and conduct the sensitivity analysis for the selected parameter.
166

The initial target audience of ZEBO is architects and architectural students with little experience in building energy efficiency. The tool can be used by architects to lower the barrier to design NZEBs during the early conceptual phases. Typically, architects produce several design alternatives in the conceptual design phases. Thus this is the moment where the tool should be applied to assess the energy performance and energy generation potential for each design solution by studying the effect of the variation of different design parameters ranges. ZEBO also allows for comparative energy evaluations.
Figure 8.2 The flowchart of ZEBO (Attia et al. 2012b)
8.2.1 Simulation Benchmark and Database
One of the challenges to developing the tool was to implement a representative benchmark or reference building for dwellings that can be considered as a basecase when using the simulation tool. The benchmark should represent Egyptian flat apartments in narrow front housing blocks. For this study we selected a benchmark based on the research work reported in Chapter 7, to develop a benchmark models for the Egyptian residential buildings sector. The benchmark represents different settings of apartments that can be constructed in a detached, semidetached, or attached form. It was assumed to represent apartments in high urban densities of Egyptian cities, incorporating surrounding buildings and streets. The benchmark describes the energy use profiles for air-conditioners, lighting, domestic hot water and appliances in respect to buildings layout and construction. The benchmark simulation models were verified against the utility bills and field survey data for 1500 apartments in Alexandria, Cairo and Asyut.
167

For ZEBO a simple multi-dimensional rectangular zone was created to represent mechanically cooled apartment units. Despite the limitation of this reduction or abstraction of the underlying model, the tool coupled the model to the Egyptian climatic and urban context. The selected model is shown in Figure 8.2 and allows maximum design flexibility for a range of architectural early design parameters, including the sites’ urban density and climatic conditions. The input parameters and output options are discussed in section 8.2.5. Moreover, ZEBO is based on a knowledge base system that embeds the recommendations of the Egyptian Residential Energy Standard ECP306-2005 I (HBRC 2005 and Huang et al. 2003). The prescriptive recommendations of the standards are translated into input default values depending on the selected site location and code. Also a self-developed materials library is embedded that allows the combination of the most common material constructions in Egypt, including glazing, insulation, and wall and roof construction.
8.2.2. Thermal Comfort in Hot Climates
Designing NZEBs depend on the expected thermal comfort level. In Egypt comfort is adaptive and mechanical equipment such as ceiling fans are used mainly for occupancy satisfaction. It is known that air movement affects both convective and evaporative heat losses from the human body, and thus influence the thermal comfort and consequently influence the ‘net zero’ objective. For ZEBO we chose Givoni’s comfort method (Givoni 1992) that allows adaptive comfort boundaries in relation to the increase of air movement by turning on fan or opening windows (see Appendix A Figure AC5). As shown in Figure 8.6, a psychrometric chart allows the visualisation of outdoor or indoor dry bulb temperature and relative humidity area temperature. The chart can be used prior to, or after, design to estimate the necessity of installing an acclimatisation system. The chart can also estimate the impact of mechanically assisted ventilation using, e.g., ceiling fans in relation to forced wind speeds ranging from 0.5 to 2 m/s as a desirable strategy for unconditioned buildings in hot climates. This leads the designer to start thinking about the effectiveness of his or her passive design strategies in relation to active cooling system. The chart can visualise impact of any parameter change on thermal comfort opposite to many simulation tools that are unable to adequately simulate human thermal comfort as well as the acclimatization mechanical equipments such as ceiling fans in hot climates.
8.2.3 Renewable Systems
Lessons learned from practice show the importance of informing architects with active system requirements to integrate them in the envelope and become a basic part of the NZEB design concept. Therefore, an extra integral module of ZEBO allows the estimation of the energy generation and required photovoltaic and solar water heater panel area. The solar active tool module is based on earlier research by the author (Attia 2010b) and
168

informs the decision making on the physical integration within the building envelope, addressing the panels’ area, mounting position, row spacing and inclination. The idea of this module is to inform the designer as early as possible on the spatial and physical implication of the NZEB objective. The renewable system module is an implementation of simulation results that estimate the average performance of a PV system in different locations and positions in Egypt. The simulation-generated data was matched with real measurements obtained from literature.
To identify the input parameters, 5 mandatory questions are asked on two successive screens shown in Figure 8.3. On the first screen users are asked to select a city, module type and mounting position. The second screen asks for input regarding panel orientation (azimuth angle) and inclination. There are two additional elective questions on screen two that allow users to input values regarding the panel efficiency and/or nominal peak power. For every question, the user has to choose between different answers, corresponding to the various simulated cases. Instead of communicating those results in the form of textual/numerical data a graphical interactive interface is developed to convey the design guidelines in a visual way. The results are then compiled into performance graphs as shown in Figure 8.3 (see Appendix C: AC6, AC7 and AC8).
Figure 8.3 Annual electric yield of amorphous, polycrystalline and mono-crystalline panels (see Appendix C: AC8, AC9 and AC10)
8.2.4 Decision Support Logic and Sensitivity Analysis
The use of sensitivity analysis prior to the decision making represents an informative approach for the robustness of the design decision in relation to energy consumption and comfort. Based on the feedback obtained from the sensitivity analysis results, the design decision is supported in relation to the possibilities of the parameter range. Therefore, the sensitivity analysis is a method that enables designers to take energy and comfort conscious decisions to reach the final performance goal. For the tool, a global sensitivity analysis was undertaken to investigate the most early design parameters and their ranges (Hansen, 2007 and Hopfe 2009). Figure 8.4 illustrates the method used for the development of the tool. The designers investigates the sensitivity of a single parameter and its consequences on energy saving, energy generation or comfort. The sensitivity analysis result shows the whole parameter range and provides a pre-decision overview of
169

the parameter range and intervals. The designer makes decisions based on this overview, and specifies a perturbation. Based on the compliance with the rules set, the designer can then repeat the process with other parameters before combining all perturbations and running a complete evaluation.
ZEBO allows sensitivity analysis to illustrate how variations in building design parameters can affect the comfort and energy performance. In fact, sensitivity design environments provide an opportunity to inform the decision making. Therefore, the tool depends on the parametric pre-processor, a recent addition to EnergyPlus utilities that allows the accomplishment of sensitivity analysis.
Figure 8.4 Tool workflow scheme (Attia et al. 2012b)
170

The parametric objects of EnergyPlus can be used in a single file as an alternative to maintaining a group of files with small differences. The user effectuates a series of simulations cloning the same IDF file but including all discrete intervals of a predefined parameter range, just by clicking the sensitivity analysis button. The Run Batch will run different simulations using the IDF input file. The user is then provided with a graph that shows the variation in annual energy performance in relation to the parameter intervals’ range, in a way it can become an immediate yet comprehensive support to make informed design decisions.
8.2.5 Implementation, Interface, Input, Output and Design Flow and Design Continuation
ZEBO can accept input data required by the later phase tool EnergyPlus v6 and run a simulation with its engine (DOE 2011a). EnergyPlus is a whole-building energy performance simulation tool developed by the US Department of Energy. EnergyPlus is the next generation of BPS tool that is under constant development and offers advanced simulation capabilities. The software is a free open source tool that allows third-party graphical user interfaces (GUIs). Therefore, EnergyPlus was selected because it can be used in a cyclical process that allows continuity with the design process using the same input files. The tool is based on a one page interface that communicates with EnergyPlus via the input and output format that are in ASCII format. ZEBO creates an IDF input file and the simulation runs the EnergyPlus engine through a “RUN” batch-file. The simulation results are then generated in different formats, mainly HTML and CSV files. The tool uses EnergyPlus‟s IDF format that allows connectivity with established tools used by different disciplines and in later design stages. ZEBO extracts the required output and presents them graphically on the same page. The programming language was written in Visual Basic 2008.
To address the NZEB objective, the interface first addresses the passive design strategies and then the active design strategies. The overall conceptual flowchart is illustrated in Figure 8.4. Upon clicking the execution file, ZEBO opens the main page of the interface as shown in Figure 8.6. Input options are categorised on the upper left of the GUI, and are listed in Figure 8.5. Input categories are divided into eight groups: Weather File, Orientation, Zone Dimensions, North and South Window Width and Type, Shading Devices and Dimensions, Wall Type, Wall Insulation Type and Thickness, and Roof Insulation Type and Thickness. The weather file is selected by a pull down menu. The file is an EPW file type for eleven Egyptian cities downloaded from the DOE EnergyPlus weather file library (DOE 2011a). Once the weather file is selected, the standard requirements of the chosen location are automatically set as default values, allowing the creation of the baseline case. The user is then allowed to change the parameter input without exceeding the minimum standard requirement.
171

The main purpose of the passive design intervention is to reduce the cooling demand. For example, the building can be rotated into eight directions every 45o degrees. Three horizontal scroll bars allow the modification of the height, length and depth of the housing or office unit. Designers can define windows. They can check the window option and modify the window width and type. Eleven different window types can be chosen representing arrangements of typical Egyptian window types in addition to more energy efficient types.
Figure 8.5 Reference model and output plots (Attia et al. 2012b)
It is possible to define the horizontal shading options and determining the shading device locations and dimensions above the windows. Also the wall section can be selected, including the wall type, insulation material and insulation thickness. At the end of this process, and prior to pressing the EnergyPlus button, the tool will update the EnergyPlus input file with the input parameters.
The active design intervention can be done as a last step as it depends on the total energy consumed (see section 8.2.3). The solar active module allows the selection of different parameters including the PV panel type, panel tilt, panel orientation, panel efficiency and mounting to optimise the electrical yield. Once the simulation has been run, the output graphics are displayed upon clicking on any of the 11 output buttons illustrated in Figure 8.3. Graphs are generated by reading the CSV output file using Excel macros. Figure 8.6, illustrates an example of the output graphics. For each case, the ZEBO output screen displays the results in three different graphs: the outdoor temperatures graph located in the upper right corner of the screen, the monthly end use graph in the bottom right side, and the energy consumption breakdown graph on the bottom left side of the screen (see Appendix C Manual C1).
172

Figure 8.6 Interface for ZEBO and reference model and output plots (see Appendix C: AC5 and AC7)
8.3 Case Study
In order to test the validity and usability of the tool we took two measures. First use a case study as an example how a hypothetical design concept would be developed and to discuss how the results generated by the tool are sufficiently accurate for the NZEB design. Second use a usability testing study.
8.3.1 Case Study
To test the validity of the proposed tool of ZEBO, we present a hypothetical design example for an apartment in narrow front housing block in Cairo. The first step is to create a basecase in ZEBO. The user selects a building type, and the weather file for Cairo, a Typical Meteorological Year (TMY2) weather file. Then the user has to select the targeted standard for minimum performance. The choice of standard determines many of the defaults and assumptions that go into the simulation model. The tool is currently limited to the Residential Energy Standard ECP306-2005-I. For this case the Egyptian standard was chosen. The tool then automatically loads a complete EnergyPlus input file for a single zone with complete geometry description that complies with the Egyptian building energy and thermal indoor environment standard. The user can change the building geometry, including the height, floor plan dimensions and number of floors in the building, in addition to the other input parameters mentioned earlier. However, for this
173

case study we chose not to make any changes and run the default file to create a basecase according to Table 8.1.
Table 8.1: Reference model and output plots (Attia et al. 2012b)
Building description Basecase 1 Parametric range Orientation 0◦ 0◦, 45◦, 90◦, 135◦, 180◦,
225◦, 270◦, 315◦
Shape Rectangular 12 × 10, 12 × 11,
(12 m × 10 m) 12 × 12, 10 × 10Floor height 3 m height 3, 4Number of floors 1 1,2,3,4,5,6,7,8Volume 360 m3 NAExternal wall area 72 m2 NAOverhang None 0.0, 0.5, 1, 1.5, 2Fin None 0.0,0.3,0.5,0.8,1.0,1.5
Roof area 120 m2 NAFloor area 120 m2 NAWindows area 28 m2 NAWindow wall ratio WWR 45% 50, 45, 40, 35, 30, 25, 20, 15Exterior wall U-value W/m2 K 2, 1.8, 1.6, 1.4, 1.2, 1, 0.8, 0.6, 0.4Roof U-value 1.4 W/m2 K 1,4, 1.2, 1, 0,8, 0.6Floor U-value W/m2 K 1.4, 1.2, 1Single clear glazing Tv = 0.9 1, 0.9, 0.8, 0.7, 0.6, 0.5, 0.4, 0.3SHGC 0.75 1, 0.75, 0.5, 0.25People density 0.033 people/m2 NALighting power density 6 W/m2 NAPlug loads 7 W/m2 NAOutside air 20 (m3/h per person) NAInfiltration 0.7 ach NAHVAC type On-Split + separate NA ventilation NACooling COP 2.00 NAThermal comfort model Givoni NACooling set point (◦C) 24 NARelative humidity (%) 60 NAFan efficiency (%) 70 NAWater heater (%) 70 NAPV type Amorph, mchrist, pchrist NAPV surface (m2) 0–100 NACell efficiency 6–14% NAInverter efficiency None NA
The second step, after viewing the simulation results for the basecase (Figure 8.6), is performing sensitivity analysis. The designer is encouraged to run sensitivity analysis for any selected parameter. This step introduces designers to the impact of varying the parameter values prior to the decision making. The sensitivity analysis results form the basis for informed decision making. Opposite to the classical design approach, where simulation is used as a post-decision evaluative tool, the designer is informed on the impact of his decision prior to the decision making.
174

In this case study, we chose to examine the wall construction type. Upon selecting the PA checkbox next to the Wall Construction Type, a new window pops up to asking the user to confirm his choice, which will require the running of 8 files for at least 2 minutes. Upon confirmation, the results are generated by EnergyPlus and the output is presented as shown in Figure 8.6. Based on the sensitivity analysis results, the designer is encouraged to select the most energy saving wall construction type. Based on the two sensitivity analysis graphs in Figure 8.7, the user can see the impact of the different construction types, and hence will probably select the wall construction type (7) with the lowest energy consumption (U value = 0.4 W/m2 K for basecase wall). Once the output is displayed, the user can move on to the photovoltaic tool module. This step is done as a last step where five inputs (location, PV type, panel tilt, panel orientation, panel efficiency) are requested to optimise the electrical yield.
Thus ZEBO allows the designers to explore further parameter variations while indicating the optimal value in relation to energy consumption. The designer then makes an informed design decision and enters the decision as an input and reruns the whole simulation. On the same screen the total energy consumption can be compared to the reference case results (Figure 8.8). ZEBO also allows the architect to easily make multiple informed decisions at once and run the simulation button. EnergyPlus actuates the latest changes and the result is presented.
8.3.2 Results Validity
By examining the results of the basecase simulation the consumption was 19.85/kWh/m2/year (U value = 1.78 W/m2 K for wall construction 1). Based on the sensitivity results shown in Figure 8.7 the wall construction with the lowest energy consumption was selected. Accordingly the energy consumption was reduced around 16% to reach 16.61/kWh/m2/year (U value = 0.421 W/m2 K for wall construction 7). Compared to the 8 wall constructions the wall construction 7, comprising a 125 mm double wall with 50mm glass wool insulation, had the best energy performance. This result is consistent with the findings of (Attia 2010d) for low energy design. The case results shows that the tool decision support bring significant savings without any time for design iterations. This helps to extend the application of sensitivity analysis to guide the decision making before the building is designed using appropriate energy principles.
175

Figure 8.7 Reference model and output plots including sensitivity analysis results (Orientation)
Figure 8.8 Reference model and output plots for design alternatives comparison
176

8.4 Usability Testing
The main objective from the usability testing and evaluation was to assess the usability of the interface and the ability of decision making by performing usability tests on the different prototype versions. The usability testing comprised effectiveness, efficiency, and satisfaction metrics for a group of core tasks supported by the tool in order to allow comparison with future design prototypes of ZEBO. To achieve the goals of the usability study, two main iterations of usability testing have been carried out during the development of prototype 1 and 2 of ZEBO. This was done to achieve feedback from designers and potential users. The ISO definition of usability (ISO 9241-11, 1998), comprising the three attributes-effectiveness, efficiency, and satisfaction was used as the basis for the metrics collected. For effectiveness, a rubric was established to judge whether task performances were scored as a pass or fail (see Appendix C Testing Study C2). Each participant was asked to perform a simulation run for a pre-defined building aiming to find the answer to a specific question. To measure the tool success participants were asked to perform a simulation and find the total cooling load (kWh/year) for the hypothetical building in Cairo. Participants provided their answers in structured way, using a paper form. The task had a set of two-choice responses. Either participants complete a task successfully or they didn’t. The success of task depends on users completing a performance simulation. By matching the simulation results for cooling loads users were given a ‘‘success’’ or ‘‘failure’’ score. Typically, these scores were in the form of 1’s (for success) and 0’s (for failure). By having a numeric score, the average binary success rate was calculated. Moreover, a stopwatch was used to measure the attribute of efficiency, the time spent per task in minutes and seconds. The third attribute, satisfaction, was collected using the System Usability Scale (SUS) (ISO 1998). To guarantee the internal validity of the test a set of 10 ordinary (pre-defined) SUS questions were used. A paper based survey was conducted using Likert scale. Users have expressed their agreement with the questionnaire questions on a scale ranging from 1 to 5. (1=’strongly disagree’ - 5=strongly agree’). Scores were added and the total was multiplied by 2.5. A mean score was computed out of the chosen responses with a range between 0 and 100. The highest the score the more usable the tool is. Any value around 60 and above is considered as good usability.
The usability iteration for ZEBO prototype 1 took place in August 2010 with 27 users comprising architects, architectural engineers and architectural students. The second usability testing round was achieved during the organization of four design workshops of Zero Energy Buildings in Cairo conducted in January 2011. Four users’ focus groups tested the tool. Three testing groups comprising architects, architectural engineers and architectural students (62 users) were handed a list of tasks showing the required actions. After installing ZEBO, every user was shown a short tutorial video (Attia 2011c) illustrating the elements of the interface and their meaning. Additionally, every participant was interviewed after conducting the
177

usability testing to follow up and get a valuable understanding of the tools’ limitations. The feedback was incorporated in the ZEBO prototype 2 and followed by a second usability testing.
We evaluated effectiveness by calculating the mean values of task completion for each task, as well as the mean and standard deviation for all tasks combined (Prototype1 M=0.685, SD=0.353, Prototype2 M=0.74, SD=0.565 ). Efficiency (mean time per task) was presented for individual tasks as well as for the full set of tasks (Prototype1 M=456s, SD=103.0s, Prototype2 M=821s, SD=525s). Satisfaction was evaluated by reversing the scale values and computing the mean SUS scores for each group and for all participants (Prototype1 M=0.737, SD=11.2, Prototype2 M=0.812, SD=8.52). The quantitative data representing effectiveness and efficiency were shared with the design team on per-task basis (see Figures 8.9 and 8.10). Given that there was no significant difference discovered between the three conditions applied in the study, users’ satisfaction measures were presented as an average post-task score for all participants.
The quantitative metrics were used to establish a benchmark for each task providing a meaningful reference for improvement of the prototypes. As shown in Figure 8.11, the first prototype scored a good usability for nine questions, however for the last question, participants indicated that they needed to understand how the ZEBO worked in order to get going. Figure 8.12 illustrates the users’ feedback after compiling the 62 responses. In general, the prototype usability was improved when compared to prototype 1. Participants seemed more confident to use the tool, 85 percent compared to 72 percent, after adding the sensitivity analysis feature. This resulted in participants scoring higher for the use of ZEBO more regularly (75 percent compared to 62 percent). Also the tool complexity was reduced by almost 10 percent which resulted in easier of use (78 percent compared to 68 percent). Also the need to understand how the tool worked was improved exceeding the 60 percent threshold of good use.
178

Figure 8.9 Binary success data for performing simulation (Attia et al. 2012b)
Figure 8.10 Mean time per task (Attia et al. 2012b)
179

Figure 8.11 Usability testing of ZEBO prototype 1 using system usability scale
Figure 8.12 Usability testing of ZEBO prototype 2 using system usability scale
180

From the analysis some main strengths and limitations were revealed. Overall, the reactions were particular positive on the tools effectiveness. From the analysis it emerged that there is a great potential for the interface. From the open questions and post testing interviews users appreciated the embedded benchmark and the ability to size and simulate the renewable system. Respondents were also particularly enthusiastic about the sensitivity analysis feature that supports the decision making intuitively and reduce the number of design iterations for each parameter and total design. However, the post usability testing interviews revealed other limitations. For example, many users indicated their unfamiliarity with the tool’s assumptions and were uncertain about communicating the tool results with their clients. Some users found the benchmark very useful but preferred to use other more comprehensive tools beside ZEBO. Other suggested using the tool as an educational tool. Also users suggested a better guidance on the tool use. Many users suggested using the tool with an expert guidance or as an educational tool. Another main reservation many users had, was the difficulty to interpret and explain the output results. This had a direct influence on respondents’ confidence in the results and the reliability of the tool’s results to communicate them with the client. The results of this usability testing will be embedded in next prototype and expanded to a more formal case study design in the near future.
181

8.5 Discussion and Conclusion 8.5.1 Summary of Main Findings
The simulation-based design support tool was found to promote informed decision making for zero energy building design during early design stages. It increased the knowledge about the zero energy building design lessened the uncertainty of decision making. Participants who used ZEBO reported a high level of knowledge and operated their design from an informative decision support approach rather than an evaluative trial and error approach. This congruence between decision making and design objective in the context of higher knowledge accords with our definition of informed decision making of ZEB design. However, based on the interface usability testing the current prototype has not reached a usability level that satisfied the needs of designers. As such, the tool is a starting point for the development of widely usable tool.
8.5.2 Strength and Limitations
This is the first simulation based decision support tool for early stages of zero energy building design in Egypt. The tools’ strength is its capacity to inform design prior to decision making, while managing large sensitivity simulations and presenting complex data in easily comprehensible, fast and comparative formats. Basing the tools on a representative benchmark for Egyptian residential building and local building components and system linked to a detailed simulation engine like EnergyPlus is reinforcing the tools result validity and certainty in decision making. The tool is easy to use, with an interface structure that is based on matching the passive and active design strategies for the net zero objectives. The tool can help achieve the energy performance goal while exploring different ranges of a thermal comfort in hot climates to achieve the performance objective. ZEBO’s strength is in its capacity to reduce decision conflict and the need for tedious design iterations to achieve the performance objective, while creating a variety of alternatives in a short time, which match the early design cyclic explorations and iterations. Better informed decisions, especially at the earliest conceptual design phases, will improve the design of NZEBs. It is hoped that several design trials, currently in progress using the tool, will allow a greater impact on architects’ decision making and actual design outcomes, and enable integration of BPS tools to proceed further than the decision support level reached in this study.
However, the tool in its current state can hardly attract large enough numbers of users. The usability testing results revealed that the tool seems more useful if used with the support of an expert to use ZEBO or in the hands of an educator for design exploration. The decision making support of current prototype can only handle energy issues while many users expect other environmental and economical indices. Also the underlying benchmark
182

model assumes one occupancy schedule for all simulations, which contradicts with the reality of occupant behaviour. One of the main limitations identified during the workshops was the geometry and non-geometric input. Users suggested links to Google SketchUp for geometry input and user interface improvements to insert input visually (not numerical or textual). Similarly the tool is limited to its own library of a generic rectangular single-zone template with few alternatives for building components and systems.
8.5.3 Comparison with Existing Tools
This discussion builds on earlier software review in Chapter 5 that has provided a snapshot on the currently available BPS tools. According to literature, there are few tools that inform design prior to the decision making for early design stages, (Petersen et al. 2010 and Zhang et al. 2010) and in the same time addresses the zero energy objective, combining passive and active design strategies. The suggested tool is a parametric tool that can provide support decision making with very little iterations while addressing the zero-energy objective.
A recent publication by the Attia proves that most existing informative tools are exclusively local serving certain countries’ context (Attia 2011a). In fact, most BPS tools are developed in heating dominated countries. They cater for developed countries with high energy consumption patterns and different expectations for comfort. The main barriers in using those tools are related to the availability and compatibility of input data including weather, comfort models, building benchmarks, renewable systems, and operational characteristics. None of these tools, however, addressed the zero-energy target in a context of hot climate developing country as in our tool.
8.5.4 Future Research
ZEBO is a starting point to provide better guidance for design decisions to deliver NZEBs in hot climates. The tool in its current state has significant limitations and designers will still require more information in order to make informed decision. For better usability, the tool can include a fully visual input interface and allowing users to add new building templates for new building types or case studies. It can have T-shape, H-Shape, U-shape and courtyard shaped templates, or even better integrate an OpenGL modeller. Also the interface can be expanded to include more building systems and components, especially different envelope types and cooling systems at different cities in Egypt using suitable COPs (coefficient of performance). Also the scope of the tool can be extended further to achieve the net zero objective for existing buildings or on a larger scale (cluster or neighbourhood). We listed suggestions to be incorporated in prototype 3:
183

Suggestions for Prototype 3
• Allow the simulation of a full apartment block with an integrated mixed mode cooling system based on a VRV or VRF air conditioning
• Allow other adaptive comfort models (ASHRAE 55 and EN 15251 2007) • Integrate and allow the simulation of different occupancy schedules • Add a shading factor or index to the main parameters • Allow better shading features for the whole facade and roof
Concerning the usability testing, the study will address the tool efficiency and effectiveness as a complementary testing to the satisfaction testing. On the level of decision support, further developments of the tool can incorporate economic indices to achieve net zero energy cost effectively. The tool can be linked to optimisation algorithms too. This can create more viable alternatives and allows the exploration of a wider search space for complex designs. This development can include economy and cost, which may be of interest for designers, researchers, energy legislators and policy makers.
184

Conclusion of Part II
In this part, the development of the simulation based decision aid, ZEBO was described. Chapter 6 contains the results of workshops undertaken to identify the needs for the decision support tool that can aid architects during early design stages. Then Chapter 7 contains a result of a field survey to create a benchmark representing the basecase for a NZEB in Egypt. A specific outcome from this chapter is a benchmark simulation model that will be the basis of decision support tool. In chapter 8, the prototype of the decision support tool under development, ZEBO is presented. There are two main prototypes that are developed. The development embeds the evolving prototypes through usability testing. Participating architects, architectural engineer and architecture student tested the tool using the system usability scale method. The work presented in this part is basic to contextualise the decision support tool that would be used to evaluate the thesis hypothesis.
185

186

Part III • Evaluation of the Decision Aid
187

188
Chapter 9.. Design Case Studies
9.1 Introduction
This section describes three different design case studies for NZEBs in which simulation was used to test and measure the ability to achieve informed decision making for design. Three design workshops were organized early 2011 in Cairo to design and develop three case studies. All participants were provided with rudimentary software training and asked for volunteers for more in-depth study of BPS tools package. The aim was to provide opportunity for all participants to attain basic proficiency in using software package with the help of a checklist developed to have them better understand the complexities of performing simulations. This introduction to BPS is meant to build a common-ground for future investigation of design decision support of BPS during the design development of the case studies in the workshops.
9.2 Case study 1 9.2.1 Introduction
The case study took place during a four day workshop from 17-20 January 2011. The workshop was scheduled to meet 8 hours per day in the German Development Cooperation Building in Cairo. Group 1 entails five architects, one urban planner and four architecture graduate students participated in the workshop. The goals of the workshops were to design a low energy resource efficient building cluster with 6 apartments of 80 m2. This design project is called i-House and is part of the activities of EECA. The EECA aims to adopt and validate a design for an affordable and energy efficient prototype as a demonstration and monitoring building. Initially the group had an original design proposal and wished to simulate its performance and improve its design to become a NZEB.
Most participants participated in a previous introductory workshop on BPS tools in 2010 (Attia 2011e). Prior or parallel to that, all participants were instructed in various analysis techniques, including reading on sun path diagram, thermal comfort and using the Weather Tool and Climate Consultant (2010) tool for climate visualisation.
9.2.2 Design Project
From the first day of the workshop, the analysis and design problem was undertaken. The design problem consisted of proposing a new residential cluster for relocated inhabitants of informal areas in Cairo. The residential cluster should be attractive to and resource efficient integrating socio-economic, environmental aspects. The project is part of the framework of the
189

Egyptian-German Private Sector Development Programme’s (PSDP) innovation component (iThink) that identifies a resource efficient housing as an innovative product with a high potential to be successfully introduced to the Egyptian market. Housing in Egypt and especially the quick allocation and reconstruction of a sufficient number of units for a continuously growing urban population remains a challenge for politicians, planners and private developers. Therefore, the iHouse-network targets the introduction of a resource efficient building, the “iHouse”, to the Egyptian market. The overall aim of the project is to develop an innovative approach for the affordable resource efficient house for Egypt through adopting and validating innovative architectural design, in a comprehensive manual and build one iHouse prototype as a demonstration and testing facility. The EECA, a non-profit organization working to develop, apply, and disseminate alternative building technologies that are appropriate for the Egyptian context. Figure 9.1 illustrates the 3D model of the proposed residential cluster.
Figure 9.1 The proposed design of the EECA Group during Workshop1
The eleven participants were divided into five balanced groups with one volunteer to hold the role of simulation specialist. Although the non-modelling group members worked on various other analysis and design issues, the simulation volunteers had a chance to apply their emerging skills to the preparation of the models of the building. Preliminary analysis addressed envelope and site, envelope and geometry, occupancy schedules, construction, openings, lighting, solar electric and thermal technologies. For cooling the following three options were investigated for the building: purely mechanical air-conditioning, purely natural ventilations and mix-mode ventilation.
To support the simulation specialist in their modelling effort, two extra night sessions were organized to model the building as a base case. In contrast with simplified simulation modelling exercises done by the entire workshop
190

participants, the geometric complexity of the building made very clear the need for a preliminary paper based analysis aimed at properly organizing the computer thermal and airflow network. The preparation of ZEBO and DesignBuilder basecase models was discussed collectively under supervision by the instructor. After each ‘simulation specialist’ completed the basecase models and then linked and cursorily tested them, she or he individually modified the model or internal parameters to reflect the particular option assigned to her or his group. The simulations investigated various upgrades to the building envelope consistent with each option.
During the software instruction portion of the workshop, participants followed procedures as demonstrated by the checklist and instructor to create a model. A checklist was used to remind participants with simulation minimum steps and make them explicit. The checklist offered the possibility of verification and instils a kind of discipline of higher input performance. The use of the checklist was established for a higher standard of baseline performance.
The first BPS-related task required of participants to prepare an analysis of the existing building. The aim of this analysis was to provide an in-depth understanding of the site climate of New Cairo, comfort and energy aspects of the precedent design. The second task was to improve the design by running sensitivity analysis using ZEBO for various building design parameters. The sensitivity analysis was performed in teams, typically composed of two participants. Sensitivity analysis determined the contribution of individual design variables to the total performance of the design solution. Each group had to: i) determine input parameters to be included (provided to participants), ii) generate a simulation and create an output distribution and iii) assess the influence of each input parameter on the output.
9.2.3 Design Outcomes
The final design of the EECA group was based clustering the residential apartment units in a compact configuration as shown in Figure 9.1. The building envelope is using bearing wall system for the building structure. The walls cross section should be combined from a 0.15m brick wall, 0.3m polystrene insulation and then 0.15 brick wall with a total U-value of 0.77 W/m2K. The roof U-value is 0.4 W/m2K. The WWR for all facades is 30%. The glazing is a single grey glazing 6mm. The east and west facades had a projection factor of 0.6. The occupant density was 5 persons per 80m2. The minimum fresh air requirements were 5 litre/second/persons and the target for lighting was 300 lux. The lighting density was 19W/m2. The air conditioning system was a VRF system with a COP of 2.5. For the active systems the participants estimated 16 m2 for all apartments for DHW. For photovoltaics they selected mono-crystalline cells (efficiency 14%) with a surface area of 16 m2 per apartment.
191

9.3 Case study 2
9.3.1 Description
Group 2 comprise 23 architecture students who participated in a five-day workshop to research, analyze and propose a design for a NZEB using BPS tools. The workshop started from 19-23 February 2011. The student participants included undergraduate students from the architecture department at Faculty of Fine Arts in Cairo. The undergraduate students ranged from 2nd year to 5th year students. The students comprised five teams, consisting of four to five students per team. Each team was responsible for an individual design concept for a net zero energy residential cluster. The majority of the work took place in the design studios of the EECA in Cairo. In conjunction with the studio environment, keynote speakers, invited guests, and other interested parties participated in the educational experience.
The workshop focused on developing a conceptual plan for eight residential units utilizing principles of energy efficiency, environmental design, community and art. BPS tools and sensitivity analysis had to be used in the decision-making process and the results may have adverse or unintended effects on the other principles. The workshop title objective was assessing the effectiveness in integration building performance simulation (BPS) tools in the design process of net zero energy buildings. During the workshop process, design duties among team members were necessary to ensure consistency. The first design created without lecturing and without simulation tools was used as control for the first and second interventions. The second design was created after receiving lectures on NZEB design and the third design for both groups was after using ZEBO and DesignBuilder simulation tools.
9.3.2 Design Project
The residential cluster had to be located in the 5th Settlement of New Cairo, a new satellite city of Cairo. The cluster comprised 8 apartment units each 150m2, hosts 5 family members and had to be mechanically air conditioned. Students were asked to arrange the eight units into a cluster. Figure 9.2 shows different possible arrangements of the eight units. Students were not restricted to use anyone shown in the figure. Students had to define the physical performance of the design parameters.
192

Figure 9.2 Different possible arrangements of the eight residential units
9.3.3 Design Outcomes
9.3.3.1 Blue
The final design of the Blue group was based on clustering the residential apartment units horizontally on two floors. The idea was then to create a shed protecting the roof and south facade as shown in Figure 9.3. The building envelope is using bearing wall system for the building structure. The walls cross section should be combined from a 0.15m brick wall, 0.1m poly-urethane insulation layer and then 0.1 mud brick wall with a U-value of 0.7 W/m2 K. The roof U-value is 0.4 W/m2 K. The WWR is 30% and all glazing is a double glazing 6mm/6mm with air filling. The east and west facades had a projection factor of 0.6 equivalent to 1.2 m. The occupant density was 5 persons per 150m2. The minimum fresh air requirements were 5 litre/second/persons and the target for lighting was 300 lux. The lighting density was 19W/m2. The air conditioning system was a VRF system with a COP of 1.7. For the active systems the participants estimated 16 m2 for all apartments for DHW. For photovoltaics they selected mono-crystalline cells (efficiency 14%) resulting into 28 panels mounted on the roof with a total surface area of 14 m2 per apartment.
193

Figure 9.3 Workshop 2 the design of the Blue Group
9.3.3.2 Green
The final design of the Green group was based clustering the residential apartment units on a curved arch as shown in Figure 9.4. The building envelope is using bearing wall system for the building structure. The walls cross section should be combined from a 0.15m brick wall, 0.5m air gap and then 0.15 brick wall with a total U-value of 0.9 W/m2K. The roof U-value is 0.33 W/m2 K. The WWR is 35% for the North facade and 20% for South, East and West facades. The glazing is a double glazing 6mm/6mm with air filling. The east and west facades had a projection factor of 1.8. The occupant density was 5 persons per 150m2. The minimum fresh air requirements were 5 litre/second/persons and the target for lighting was 300 lux. The lighting density was 19W/m2. The air conditioning system was a VRF system with a COP of 1.7. For the active systems the participants estimated 6 evacuated tube water heaters each is 8 by 2.5 m.
Figure 9.4 Workshop 2 the design of the Green Group
194

For photovoltaics they selected mono-crystalline cells (efficiency 14%) resulting into 28 panels mounted on the roof with a total surface area of 16 m2 per apartment.
9.3.3.3 Orange
The final design of the Orange Group was based on clustering the residential apartment units around a courtyard. The courtyard is open from the North side and creates a U-shape cluster as shown in Figure 9.5. An extra shading screen is protecting the south wall and overlaps the roof. The building envelope has a wall cross section combining 0.15m brick wall, 0.5m polyurethane insulation layer and then 0.15 brick wall with a U-value of 1.42 W/m2 K. The roof U-value is 0.43 W/m2 K. The WWR is 30% and all glazing is a double glazing 6mm/6mm with air filling. The east and west facades had a projection factor of 0.6. The occupant density was 5 persons per 150m2. The minimum fresh air requirements were 5 litre/second/persons and the target for lighting was 300 lux. The lighting density was 19W/m2. The air conditioning system was a VRF system with a COP of 1.8. For the active systems the participants estimated 16 m2 for all apartments for DHW. For photovoltaics they selected mono-crystalline cells (efficiency 14%) with a surface area of 16 m2 per apartment.
Figure 9.5 Workshop 2 the design of the Orange Group
9.3.3.4 Purple
The final design of the Purple Group was based on clustering the residential apartment units around a courtyard. The courtyard is open from the North side and creates a U-shape cluster as shown in Figure 9.6. An extra shading screen is protecting the south wall and overlaps the roof. The building envelope has a wall cross section combining 0.1m brick wall, 0.1m poly-urethane insulation layer and then 0.1 concrete block wall with a U-value of 1.43 W/m2 K. The roof U-value is 0.76 W/m2 K. The WWR is 50% for the North facade, 40% for the east facade, 25% for the West facade and 35 for the South facade. The east and west facades had a projection factor of 0.75. The occupant density was 5 persons per 150m2. The minimum fresh air requirements were 5 litre/second/persons and the target for lighting was 300 lux. The lighting density was 19W/m2. The air considering system was a VRF
195

system with a COP of 1.8. For the active systems the participants estimated 16 m2 for all apartments for DHW. For photovoltaics they selected mono-crystalline cells (efficiency 14%) with a surface area of 18 m2 per apartment.
Figure 9.6 Workshop 2 the design of the Purple Group
9.3.3.5 Red
The final design of the Red Group was based on clustering the residential apartment units around a courtyard as shown in Figure 9.7. An extra shading screen is protecting the south wall and overlaps the roof. The building envelope has a wall cross section combining 0.1m sand stone, 0.02m gypsum and a 0.25 AAC block wall with a U-value of 1.3 W/m2 K. The roof U-value is 0.36 W/m2 K. The WWR is 17% for the North facade, 17% for the east facade, 9% for the South facade and no openings for west facade. The east facades had a projection factor of 0.6 and the east facade had a 0.9 projection factor. The occupant density was 5 persons per 150m2. The minimum fresh air requirements were 5 litre/second/persons and the target for lighting was 300 lux. The lighting density was 19W/m2. The air conditioning system was a VRF system with a COP of 1.8. For the active systems the participants estimated 16 m2 for all apartments for DHW. For photovoltaics they selected mono-crystalline cells (efficiency 14%) with a surface area of 18 m2 per apartment.
196

Figure 9.7 Workshop 2 the design of the Red Group
9.4 Case study 3 9.4.1 Description
Group 3 was a mixed group of university professors, professional architects and post graduates with 19 participants. The workshop started from 27-February till 3 Mars 2011. Participants comprised four teams, consisting of four to five students per team. Each team was responsible for an individual design concept for a net zero energy residential cluster. The majority of the work took place in the design studios of EECA in Cairo. Similar to workshop 2, participants were exposed to the same procedure mention in section 9.3.2.
9.4.2 Design Project Participants were assigned the same project described in section 9.3.2.
9.4.3 Design Outcomes
9.4.3.1 Blue
The final design of the Blue group was based on clustering the residential apartment units vertically on four floors. The idea was to create each apartment on two floors and set them in a staggered configuration. The whole cluster was oriented east west as shown in Figure 9.8. The walls cross section should be combined from a 0.125m double masonry walls with a 25 cm expanded polystyrene insulation layer with a U-value of 1.4 W/m2 K. The roof U-value is 0.67 W/m2. The WWR is 22% and all openings have a 0.7 shading device. The southern facade was designed and simulated to
197

guarantee maximum shade casting. Also the roof had a second shading layer to protect the roof from the sun. The occupant density was 5 persons per 150m2. The minimum fresh air requirements were 5 litre/second/persons and the target for lighting was 300 lux. The lighting density was 19W/m2. The air conditioning system was a VRF system with a COP of 2.5. For the active systems the participants estimated 16 m2 for all apartments for DHW. For photovoltaics they selected mono-crystalline cells (efficiency 14%) resulting into 28 panels mounted on the shading roof with a total surface area of 14 m2 per apartment.
Figure 9.8 Workshop 3 the design of the Blue Group
9.4.3.2 Green
The final design of the Green group was based on clustering the residential apartment units on two floors forming a semi circle. The idea was to create a semi open courtyard in the south with several deciduous trees aiming to block the sun from the south as shown in Figure 9.9. The building envelope is using bearing wall system for the building structure. The walls cross section should be combined from a 0.125m double wall sand stone with a 25 cm poly urethane insulation layer with a U-value of 0.75 W/m2 K. The WWR is 30% and all glazing is a double glazing 6mm/13mm with argon filling with a U-vale of 2.04 W/m2 K. All south windows had a shading device with a projection factor of 0.6m equivalent to 1.2 m, additionally; the south walls had second skin forming a portico for shading. The occupant density was 5 persons per 150m2. The minimum fresh air requirements were 5 litre/second/persons and the target for lighting was 300 lux. The lighting density was 19W/m2. The air conditioning system was a VRF system with a COP of 2.5. For the active systems the participants estimated 16 m2 for all apartments for DHW. For photovoltaics they selected mono-crystalline cells (efficiency 14%) resulting into 28 panels mounted on the roof with a total surface area of 14 m2 per apartment.
198

Figure 9.9 Workshop 3 the design of the Green Group
9.4.3.3 Orange
The final design of the Orange group was based on clustering the residential apartment units vertically on four floors while creating a shading screen covering the roof and south facade. The whole cluster was oriented east west as shown in Figure 9.10. The walls cross section should be combined from a 0.125m double masonry walls with a 25 cm expanded polystyrene insulation layer with a U-value of 0.56 W/m2 K. The roof U-value is 0.34 W/m2. The solar absorptance is 0.6 for all envelope surfaces. The WWR is 35% for north, east and west facades. The east facade openings had shading devices with a projection factor of 0.4 equivalent to 0.55m. The west facade openings are protected by a second skin shading wall. The southern facade openings have WWR of 25% and was designed and simulated to guarantee maximum shade casting on the roof and south walls through a second skin. The occupant density was 5 persons per 150m2. The minimum fresh air requirements were 5 litre/second/persons and the target for lighting was 300 lux. The lighting density was 19W/m2. The air conditioning system was a VRF system with a COP of 2.5. For the active systems the participants estimated 16 m2 for all apartments for DHW. For photovoltaics they selected mono-crystalline cells (efficiency 14%) resulting into 28 panels mounted on the skin shading roof with a total surface area of 14 m2 per apartment.
199

Figure 9.10 Workshop 3 the design of the Orange Group
9.4.3.4 Red
The final design of the Red group was based on designing each residential apartment unit as courtyard housing. Each unit was then clustered around a rectangular urban courtyard as shown in Figure 9.11. The walls cross section should be combined from a 0.12m double concrete block walls with a 0.02m air gap with a U-value of 0.66 W/m2 K. The roof U-value is 0.38 W/m2. The openings have WWR of 15% and all glazing is a double glazing 6mm/13mm with air filling. The south, east and west openings have a projection factor of 0.6. The occupant density was 5 persons per 150m2. The minimum fresh air requirements were 5 litre/second/persons and the target for lighting was 300 lux. The lighting density was 19W/m2. The air conditioning system was a VRF system with a COP of 2.5. For the active systems the participants estimated 16 m2 for all apartments for DHW. For photovoltaics they selected mono-crystalline cells (efficiency 14%) resulting into 28 panels mounted on the second skin roof with a total surface area of 14 m2 per apartment.
Figure 9.11 Workshop 3 the design of the Red Group
200

9.5 Conclusion
In this chapter the three main design case studies are presented. Three workshops were conducted with professionals and students groups. One real and two hypothetical design exercised were presented. Each group was asked to achieve the net-zero objective addressing the building geometry, envelope, occupancy patterns, construction types, openings, shading, lighting, natural ventilation, air conditioning and solar thermal and electric technologies. The final design proposals in each workshop are described including the major design transformations of each group during the process.
201

202

Chapter 10 .. Usability Testing & Validation
10.1 Introduction
Informed decision-making is the basis for the design of Net Zero Energy Buildings (NZEBs). This chapter aims to investigate the use of building performance simulation tools as a method of informing the design decision of NZEBs. The aim of this study is to evaluate the effect of a simulation-based decision aid, ZEBO, on informed decision-making using sensitivity analysis. The objective is to assess the effect of ZEBO and other building performance simulation (BPS) tools on three specific outcomes: (i) knowledge and satisfaction when using simulation for NZEB design; (ii) users’ decision-making attitudes and patterns, and (iii) performance robustness based on an energy analysis. The chapter utilizes the three design case studies for NZEB designs comprising a framework to test the use of BPS tools in design. An assessment of the role of the BPS tools used in informing the decision-making was ascertained through several self-reported metrics. The chapter provides results that shed light on the effectiveness of sensitivity analysis as an approach for informing the design decisions of NZEBs.
Past Research
There is an extensive body of literature examining the effects of BPS tools as informative decision aids. For example, the work of Morbitzer in 2003 examined the integration of simulation into the building design process. The work of Donn in 2004 investigated the influence of simulation-based environmental design decision-support tools in architecture. Mourshed’s work in 2006 investigated the optimization of architectural design decision-making. In 2007, Hanne-Tine Hansen investigated the role of sensitivity analysis as a methodical approach to the development of design strategies for environmentally sustainable buildings. Finally, the work of Hopfe in 2009 examined the use of uncertainty and sensitivity analysis in BPS for decision-support and design optimization. By reviewing this work systematically we found that BPS improved the decision-making in a number of ways:
• Increasing designers knowledge of the design problem and options • Reducing decisional uncertainty • Increasing the design robustness
Currently, few non-public tools exist that support design pre-decisions. Existing tools include jEPlus and iDbuild, which allow parametric analysis or sensitivity analysis (Zhang 2010, Petersen 2010). The potential of parametric tools to bridge the “informative support” barrier is very high, because they can provide constructive feedback with very few iterations and at the same time allow a wide range of solution space. Similarly to those tools, it will be shown in this chapter that these quality domains are features
203

of an NZEB decision-support tool that is under development, ZEBO (Attia 2010d). During the case studies, a significant effort was made to measure the influence of sensitivity analysis on decision-making. Furthermore, it will be shown that not only has the NZEB design objective been achieved, but also ZEBO has been used to test the effectiveness of using BPS to achieve informed decision-making.
10.2 Designing and Conducting the Study
Two types of data were collected, mainly preference and performance data. The preference data were used to collect information from participants using self-reported metrics. The performance data were used to collect information on the energy performance of the final design. During the design of the NZEB case study, the following were documented during their evaluation: (i) the knowledge and satisfaction concerning the use of simulation for NZEB design, (ii) the decision-making attitude and behaviour, and (iii) the energy analysis-based performance robustness of three groups (see Section 10.4). The energy evaluations were compared with the results of a quantitative assessment of the overall design performance. Finally the results were compared and presented (see Section 10.5).
10.2.1 Workshop Design
10.2.1.1 Workshop Participants
As described in Chapter 9 three workshops took place in Cairo to examine the effect of using the BPS tools and sensitivity analysis technique in the design of NZEBs. The workshops were announced and three groups of participants were recruited. The first was a group of 10 professional architects specializing in environmental design and representing the Egyptian Earth Construction Association (EECA). The second was a group of undergraduate students studying in the architecture department of the Faculty of Fine Arts in Cairo. The third was a mixed group of university professors, professional architects, and post-graduates.
10.2.1.2 Workshop Preparation
Prior to starting the workshops, participants were asked to achieve proficiency in the use of geometrical modelling in DesignBuilder (2011) using the video tutorials provided online. For ZEBO, participants were asked to view a tutorial video and install the tool to become familiar with the application (Attia 2011c). At the beginning of the workshop, participants were given an introductory crash course in use of the selected energy simulation tools, requiring a time investment of eight hours. Throughout the crash course, participants were required to follow a guidebook checklist on how to carry out successful simulations. The checklist was developed after reviewing the work of Bambardekar (2009) and was used to remind
204

participants to use the minimum number of steps and to make the steps explicit. During the introductory tutorial participants were taught to:
• create a simple building geometry model in ZEBO, • perform a simulation and sensitivity analysis exercise provided to the
participants in ZEBO, • create a simple building geometry model in DesignBuilder, • perform a simulation exercise in DesignBuilder, where the main building
components as well as typical occupancy and equipment schedules were provided to the participants.
10.2.2 Sensitivity Analysis for Decision Support
The simulation-based decision aid ZEBO (beta version 2) was used for this study, including a video clip on how to use the tool. Participants were asked to use the sensitivity analysis features of the tool prior to the decision-making. This step introduces designers to the impact of varying the parameter values prior to the decision-making. The sensitivity analysis results form the basis for informed decision-making. In contrast to the classical design approach, where simulation is used as a post-decision evaluative tool, the designer is informed on the impact of his decision prior to the decision-making.
10.2.3 Simulation Intervention and Controls
Exceptionally, Group 1 already had an initial low energy design and wished to improve it and therefore used only one design improvement iteration. The second and third groups had to create their designs during the workshop with two additional design improvement iterations as shown in Figure 10.1. The first design, created without lecturing or simulation tools, was used as the control for the first and second interventions.
Figure 10.1 the frame work of workshops showing the different interventions and outcomes
205

As mentioned in Chapter 9, the first iteration for Groups 2 and 3 was carried out after participants had received lectures on the design of NZEBs including rules of thumbs and design guidelines. The second iteration for both groups (Group 2 and 3) was carried out after using ZEBO and DesignBuilder simulation tools.
10.2.4 Comparisons and Evaluation Metrics
In order to determine the effect on informed decision-making, the main comparison considered the improved design versus the control. In order to further assess the effect on informed decision-making, correlations between knowledge, satisfaction, and attitude outcomes were examined. Most of the analyses in this study were undertaken on a group basis. However, according to the model of informed decision-making, we should be able to demonstrate good knowledge, attitudes, and uptake of simulation at the level of the individual participant as evidence of informed decision-making by the individual. The data were therefore analysed accordingly, and participants whose knowledge scores were above the median were defined as “high knowledge”. The attitude and intention outcomes were then dichotomized, again on the basis of the median scores, as “high” and “low”. The evaluation data were based on two types of metrics as described below.
10.2.4.1 Preference Data
Self-reported data were collected to obtain the most important information about users’ perceptions of the BPS simulation tools used (sensitivity analysis) and their interaction with them. At attitude and behaviour level, the data may inform about how users feel about the decisions taken. These kinds of reactions are the main thing that the self-reported metrics aimed to document. The self-reported data were captured in a usability test with a Likert rating scale, following the scenario satisfaction questions, open-ended questions, and group discussion (Lewis 1991, ISO 2006, Tullis 2008).
10.2.4.2 Performance Data
Performance data were captured to measure the influence of sensitivity analysis decision-support on the energy performance of the designed buildings. A simulation model was required for the original and improved designs of all participants. The objective of this study was to estimate the effect of applying energy simulation and sensitivity analysis. A thermally improved version of the first design was required as part of the participants’ final submittal. The influence of the tools used was analysed and the total energy consumption was used as an indicator for evaluation.
206

10.3 Case Studies Framework
In the three different design case studies, simulation was used to test and measure the ability to achieve informed decision-making for design. As mentioned in Chapter 9 three design workshops were organized early in 2011 in Cairo to design and develop three case studies. We provided all participants with rudimentary software training and asked for volunteers for more in-depth study of the BPS tools package.
10.4 Results
Section 4.1 identifies the influence of BPS knowledge on the decision-making attitudes and patterns. Then the results of the scenario questionnaire are reported in Section 4.2. Section 4.3 summarizes the results of the energy performance of the three case studies using BPS tools. Finally, Section 4.4 and 4.5 deal with the outcome of the open-ended questions and workshop discussions together with associated material and observations.
10.4.1 Knowledge and Satisfaction
Using self-reported metrics, the background knowledge and understanding of NZEBs design and the satisfaction with the use of BPS decision-support were determined.
10.4.1.1 Knowledge
Evaluating the effectiveness of BPS tools in informing design required an understanding of the participants’ pre- and post-simulation knowledge. Respondents completed pre- and post-simulation surveys to assess the value of the BPS tools to further the participants’ understanding of NZEBs’ design influences and their relation to the use of simulation. The survey questions used a scale of 0 (none) to 10 (expert), a five-point Likert scale with the responses “very advanced”, “advanced”, “fair”, “poor”, and “no skills”.
In order to assess participants’ knowledge about NZEB design issues, participants were asked “How would you assess your ability to design NZEB?” Table 10.1 shows the paired t-test analysis of pre- and post-responses, showing a statistically significant increase. A significant increase in knowledge uptake was recorded for the three groups (35%, 53%, and 87%). Moreover, the repetition of this increase in all three group samples is strong evidence that the use of BPS increased the knowledge uptake. This indicates participant perception of growth in informative knowledge of the basic tenets of decision-making.
207

Table 10.1 Pre- and post-test analysis Item Pre‐test
mean Post‐test mean
Mean difference
t p n
How would you assess your ability to design NZEB? (EECA)
5.40 7.30 ‐1.900 ‐5.01 0.0007 10
How would you assess your ability to design NZEB? (FOFA)
4.00 6.13 ‐2.130 ‐8.66 0.0318 23
How would you assess your ability to design NZEB? (OPEN )
3.57 6.68 ‐3.110 ‐8.88 0.0001 19
10.4.1.2 Satisfaction (After-Scenario Questionnaire)
The After-Scenario Questionnaire (ASQ) developed by Lewis (1995) was used to measure three fundamental areas of usability: effectiveness (question 1), efficiency (question 2), and satisfaction (all three questions). Participants were asked to fill in an online questionnaire by responding to three statements accompanied by a seven-point Likert rating scale of ‘‘strongly disagree’’ to ‘‘strongly agree’’, as shown in Figure 10.2.
Figure 10.2 The After Scenario Questionnaire Results of the EECA, FOFA and OPEN groups respectively.
208

The results indicate a low level of satisfaction regarding the ease of completing the design using ZEBO and other BPS tools for each group respectively (62%, 57%, and 54%). Similarly results indicate a low level of satisfaction with the amount of time taken to complete the design using ZEBO and other BPS tools 42%, 47% and 44% agreed to rate their satisfaction low. The explanation for this low rating for both questions can be found in Sections 4.4 and 4.5. On the other hand, participants’ satisfaction with the information support was reported to be high (88%, 84%, and 83%). Surprisingly, the patterns of answers of the three groups almost match. These findings have unlimited generalisability because the sample size for the factor analysis was relatively large (52 participants). Also the resulting factor structure was very clear.
10.4.2 Decision-Making Attitudes and Patterns
Another self-reported usability metric was a post-workshop questionnaire that was administered to participants regarding how far using ZEBO and other BPS tools informed their decision-making and led to higher reliability and robustness of the NZEB design. Participants were asked to fill in an online questionnaire with six questions.
10.4.2.1 Informed Decision-Making
Figure 10.3 shows that participants’ questionnaire responses vividly indicate agreement with the statements “guides your decision-making” and “informs your decision-making”. With regard to the “guiding” question, 80.0% of Group 1 respondents strongly agreed or agreed while 20.0% were undecided. In Group 2, 65.0% of respondents strongly agreed or agreed while 26.0% were undecided and 9.0% disagreed. In Group 3, 73.7% respondents strongly agreed or agreed while 21.0% were undecided and 5.3% disagreed. In total, 71.2% of participants recognized the importance of BPS tools in guiding the decision-making of NZEBs design even though 6.0% of all three groups disagreed with the statement.
With regard to the “informing” question, 78.8% of participants recognized the importance of BPS tools in informing the decision-making of NZEBs design and none of the questionnaire respondents disagreed with the statement. In Group 1, 90.0% of respondents strongly agreed or agreed while 10.0% were undecided. In Group 2, 74.0% respondents strongly agreed or agreed while 26.0% were undecided. Lastly, in Group 3, 79.0% of respondents strongly agreed or agreed while 21.0% were undecided.
However, participants disagreed with the statement “makes you confident about your decision-making”. In total 34.6% of participants disagreed that the use of ZEBO and other BPS tools made them confident about their
209

decision-making in NZEBs design while 44.2% were undecided and 21.2% agreed with the statement. In Group 1, 30.0% of respondents strongly agreed or agreed while 50.0% were undecided and 20.0% disagreed. In Group 2, 26.0% of Group 2 respondents strongly agreed or agreed while 39.0% were undecided and 35.0% disagreed or strongly disagreed with the statement. In Group 3, 31.5% of respondents strongly agreed or agreed while 47.3% were undecided and 21.2% disagreed or strongly disagreed with the statement.
Figure 10.3a Participants’ responses to a question related to the informed decision making
210

Figure 10.3b Participants’ responses to a question related to the informed decision making
Figure 10.3c Participants’ responses to a question related to the informed decision making
211

10.4.2.2 Reliability and Robustness of Design
Figure 10.4 shows that participants’ questionnaire responses indicate disagreement with the statement “allowed you to achieve the NZEB design target”. In total 51.9% of participants disagreed that the use ZEBO and other BPS tools allowed them to achieve the NZEB design target while 34.6% were undecided and 13.5% agreed with the statement. In Group 1, 70.0% of respondents strongly disagreed or disagreed while 30.0% were undecided. In Group 2, 47.8% of respondents strongly disagreed or disagreed while 34.7% were undecided and 17.5% agreed with statement, and in Group 3, 47.3% of respondents strongly disagreed or disagreed while 36.8% were undecided and 15.9% disagreed or strongly disagreed with the statement.
However, participants’ questionnaire responses vividly indicate agreement with the statements “is essential for NZEB design” and “produced reliable and robust NZEB design”. In total 71.1% of participants agreed that the use ZEBO and other BPS tools is essential for NZEB design while 23.0% of respondents were undecided and 5.9% disagreed with the statement. In Group 1, 90.0% of respondents strongly agreed or agreed while 10.0% were undecided. In Group 2, 52.1% of respondents strongly agreed or agreed while 39.1% were undecided and 8.8% disagreed with the statement, and in Group 3, 84.2% of respondents strongly agreed or agreed while 10.5% were undecided and 5.3% disagreed with the statement.
In total 59.6% of participants agreed that the use ZEBO produced reliable and robust NZEB design while 28.9% of respondents were undecided and 11.5% disagreed with the statement. In Group 1, 40.0% of respondents agreed while 20.0% were undecided and 40.0% disagreed. In Group 2, 60.8% of respondents strongly agreed or agreed while 39.1% were undecided. Lastly, 68.5% of Group 3 respondents strongly agreed or agreed while 31.5% were undecided.
We analysed this qualitative data looking for high-frequency patterns of attitude that might suggest inherent problems with the use of BPS tools. Once this analysis was complete, we prioritized the problems based on frequency and our subjective ratings of severity to help prioritize the order of presentation in our study. While the results indicate the ability of sensitivity analysis to inform and strongly guide the decision and the desire to use BPS tools, the most frequently demonstrated problems involved lack of confidence and difficulty achieving the NZEB design target of this approach. These were all considered to be rather serious problems. In order to analyse the reasons for these problems, participants were asked to provide explanation during the group discussion, which is presented in Section 10.4.5.
212

Figure 10.4a Participants’ responses to a question related to the reliability and robustness of design
Figure 10.4b Participants’ responses to a question related to the reliability and robustness of design
213

Figure 10.4c Participants’ responses to a question related to the reliability and robustness of design
10.4.3 Energy Analysis
This section presents the results of the energy performance of the design projects (in terms of annual consumption in kWh) as simulated by the participant groups. For comparison purposes, the presented results include the simulated energy performance. Similar to the work of Mahdavi (2005) we compared the simulated energy performance of the original with the improved versions of the three design case studies. As mentioned earlier, the participant groups were required to use simulation to come up with a thermally improved version of the initial design (via the use of ZEBO and other simulation tools).
10.4.3.1 Evaluating Case Study 1 (Group1)
Figure 10.5 illustrates the final design of the improved version of the EECA design case study. As shown in Figure 10.6 the energy performance is 40.5% better/more efficient than the energy consumption of the original design. This difference indicates a strong influence of the use of BPS tools in reducing the total energy consumption.
214

Figure 10.5 The final simulation model of EECA in its urban context (Workshop 1)
Figure 10.6 simulated energy performance of the original and improved version EECA (Workshop 1)
215

10.4.3.2 Case Study 2 (Group 2)
Figure 10.7 illustrates the five final improved designs created by the five student groups of Workshop 2. Figure 10.8 compares the energy performance of the three proposed designs of each group (design without any lectures or simulation, design with lectures only, and design with lectures and simulation). The lectures on NZEB design improved the design of the five groups by only 3.7 to 11.7%. Surprisingly, the energy performance of the third design proposal of each group was improved by 48.8 to 64.1% when simulation was used during the design compared to the original design. This difference indicates a strong influence of the use of BPS tools in reducing the total energy consumption and informing decision-making for better performance results.
Figure 10.7 Final designs of the 5 groups of workshop 2.
Figure 10.8 Simulated energy performances of the five design groups (Without - With Lectures – With simulation)
216

10.4.3.3 Case Study 3
Figure 10.9 illustrates the four final improved designs of the four professional groups. Figure 10.10 compares the energy performance of the three proposed designs of each group (design without any lectures or simulation, design with lectures only, and design with lectures and simulation). The lectures on NZEB design improved the designs created by the five groups by only 7.9 to 17.2%. Surprisingly, the energy performance of the third design proposal of each group was improved by 48 to 59.3% when simulation was used during the design compared to the original design. This difference indicates a strong influence of the use of BPS tools in reducing the total energy consumption and informing the decision-making for better performance results.
Figure 10.9 final designs of the 4 groups of workshop 3
Figure 10.10 simulated energy performance of the 5 design groups (Without - With Lectures – With simulation)
217

The energy analysis of the three design case studies is a strong indicator of the influence of sensitivity analysis and BPS tools in informing the decision-making and achieving NZEB design.
10.4.4 Open-Ended Question
An open question followed the workshop in order to allow respondents to share their thoughts and comments. The question concerned what should be done to bridge the barrier between using BPS tools and achieving informed decision-making. A selection of the suggestions for future improvements and their frequencies are classified as follows:
• Combining design tools with simulation tools (20) • Flexible modelling through flexible 3D modellers or other media (18) • Providing further interpretation of results and buildings; physical
behaviour (16) • Provide a local database for materials, occupancy, appliances, and so
on (15) • Providing a pre-educational process (11) • Integration in the design process in a systematic way, for example, using
checklists (10) • More automated quality control (e.g. error-checking, default settings, and
templates) (7) • Allow code compliance and rating system compliance (7) • Allowing cost calculation and life cycle assessment (5) • Provide instantaneous feedback while changing values (4)
According to the results, the freedom of geometrical modelling and the coupling of simulation tools with design tools were the most frequently named topics. One of the participants mentioned that he would like to be able to model projects like Frank Gehry’s. This was repeated again in the group discussion.
10.4.5 Group Discussion
At the end of the three case studies, design group discussions were organized to discuss the participants’ reflections on the workshops’ findings and questionnaire results. Overall, participants perceived BPS as useful and informative for achieving the NZEB design. Most participants considered that BPS tools gave added value in informing and validating the design decision to achieve the design objective. Many respondents highlighted the importance of parametric design and sensitivity analysis features to guide the design. They stated their endorsement of BPS tools for the design of similar performance-based design projects or assignments aiming to address issues like natural ventilation and lighting.
218

At the other end of the spectrum, not all participants found the simulation experience positive. Some participants described the use of BPS as complicated, tedious, and restrictive of creativity, particularly in relation to 3D modelling. During the discussion, participants were asked to explain why they lacked confidence and had difficulty achieving the NZEB design target of this approach using BPS. They acknowledge the added value of BPS in improving the building performance but considered its influence to be small compared to other design aspects that need to be balanced including cost, aesthetics, time, budget, and so on.
In order to address the challenge of effectively integrating BPS in design practice, participants were asked to rank the most important roles of BPS tools in their future works. Participants from the three workshops agreed that the most important roles are “to enrich creativity through flexible 3D modelling using more design mediums or tools” and “to interpret the results to understand the building performances” followed by “informative support for decision-making” and finally the use of BPS for its “ability to compare the performances of design alternatives”.
10.5 Discussion and Conclusion 10.5.1 Summary of Findings
Use of BPS tools and the sensitivity analysis technique in the design of NZEBs demonstrated a strong correlation between increased usage and achieving informed decision-making. In order to evaluate BPS and sensitivity analysis as a tool for informing decision-making, participants completed several questionnaires assessing their informative effectiveness. The questionnaires reveal participants’ perceptions of the simulation’s informative importance in their design decision-making. Specifically, the open-ended questions and group discussion addressed the value of and barriers to the use of simulation as a decision-support method. To validate the study findings a formal energy analysis measure was employed in this respect. A group discussion was also used as an informal triangulation to facilitate the validation of the survey results reported below:
• The use of BPS resulted in an increase in knowledge uptake of between 35 and 87% compared to the pre-workshop knowledge.
• The levels of satisfaction with the ease of use and the time taken to complete the design using ZEBO and DesignBuilder were relatively low at 54–62% and 42–47% respectively.
• The level of satisfaction with the information support given to complete the design using ZEBO and DesignBuilder was relatively high at 83–88%.
• The importance of BPS tools in informing the decision-making was recognized by 78.8% of respondents and the importance of BPS tools in
219

guiding the decision-making of NZEBs design was recognized by 71.2% of respondents.
• It was found that 44.2% of respondents were undecided and 34.6% of participants disagreed that the use ZEBO and other BPS tools made them confident about their decision-making in NZEBs design.
• It was found that 51.9% of respondents disagreed that the use ZEBO and other BPS tools allowed them to achieve the NZEB design.
• It was found that 71.1% of respondents agreed that the use of ZEBO and other BPS tools is essential and 59.6% agreed that the use of ZEBO produced reliable and robust NZEB design.
• The influence of the use of BPS tools improved the energy performance by 40.5% in Workshop 1, 48.8–64.1% in Workshop 2, and 48–59.3% in Workshop 3.
10.5.2 Limitations of the Study
The validity of the study’s findings is potentially open to criticism as only three design groups were used for this study. It would have been desirable to recruit architects from a greater number of design practices to ensure a broader socioeconomic and geographic population distribution. Another limitation was the fact that participants in Workshops 2 and 3 participated in a randomized controlled trial of an NZEB design after which they all completed a written questionnaire. However, we would argue that this study differed significantly in that it focused on the informative aspects of BPS tools, which were not featured in the trial. A quantitative methodology (survey and performance analysis) and a qualitative methodology (discussion) were employed in this study.
10.5.3 Implications for Design Practice and Future Research
Our proposed method of using BPS tools and, in particular, the use of sensitivity analysis for achieving informed decision-making raise a number of challenges for developers of BPS tools, not least of which is the difficulty of accommodating them within the pressures of deadlines and budgets. There is also the challenge of balancing the decision-making of architects as BPS users with those of experts/scientific reference groups, particularly in situations of performance uncertainty/equipoise.
Arguably, the use of BPS tools and sensitivity analysis is too simplistic in that it presupposes a linear progression from intuitive and uncertain decision-making to informed decision-making. In reality, the decision-making for NZEBs design is more complex and might follow a different developmental path wherein the factual design content, for instance, would require both intuitive and informed decision-making in order to develop other design features of the NZEBs. Moreover, the proposed case studies do not take into account other factors, such as the influence of aesthetics and
220

economy, which could have an impact on decision-making about NZEBs in a real/natural design setting.
Nevertheless, the principle of informing the decision-making for NZEB design, whether applied in parts or as a whole, still holds true in our opinion; we suggest further research to test it and other future methods and techniques of BPS. In doing so, it is hoped that designers of NZEBs and international research groups such as IEA: Task 40 will have at their disposal a clearer vision of the use of BPS tools for achieving informed design decisions.
Conclusion of Part III
The core of the evaluation section is three design case studies investigating the effect of BPS tools on achieving informed decision making. The protocol and testing results for those case studies are detailed in chapter 9. The aim of the case studies, the findings of which are presented in chapter 10, was to evaluate the effect of BPS tools on knowledge and decision making attitudes and behaviour, the components of informed decision making, defined as knowledge in the presence of attitudes that are congruent with subsequent decisions. The relationship between the usage of BPS tools including ZEBO and informed decision making is examined in greater detail in this chapter. Using a self reported usability metrics we described patterns of usage from conducting simulation tasks, and analysed correlations with the design outcomes of informed decision making used in the case studies.
221

222

Chapter 11 .. Conclusions
11.1 Introduction
How can an architect, who is considering using BPS, be helped in his or her decision early in design? That difficult question lies at the heart of this thesis, and it is a question that is gaining currency due to an increasingly complexity of NZEB design and performance requirements. Excluding the energy performance aspects from architects’ responsibilities in academia and practice only exacerbate the problem, heightening calls for comprehensive integration of BPS in architectural design and increasing the pressure on architectural accrediting boards. It was in this context that this study was undertaken and why the decision support tool, ZEBO, was developed.
From the outset, the development of ZEBO was underpinned by a research endeavour that not only described the evolving decision support but also explored and challenged existing assumptions. Consequently, a number of research issues emerged, and these crystallised into the four principal research questions of this thesis. Firstly, how to design NZEBs in hot climates? Second, what are the requirements of the BPS decision support tool to be developed? Thirdly, what are the effects of the use of BPS and sensitivity analysis on the decision making of NZEBs? Finally, how to achieve and measure informed decision making for NZEB design?
11.2 Principal Findings
In order to answer the first question, the justification for ZEBO, a literature review (chapter 2, 3 and 4) was undertaken, and an understanding was gained of the considerable complexity of the design of NZEBs in hot climates. We found that the design of NZEB was made more complex by the influence of climate, comfort criteria, cooling strategies, scale and technology. Over and above the complexity related to NZEBs design, uncertainty of decision making would continue to be high. But would a BPS support tool help, and if so, why? This question was addressed in a review encompassing the modelling issues of NZEBs and their ability to support decision making for architects (chapter 5). After identifying the potential role of BPS in helping architects with the most difficult performance choices, we considered in detail what we already know about early design simulation tools. In the systematic review, we identified existing BPS tools and found that, as in other reviews, sensitivity analysis was identified as a successful technique to support the decision making if used prior to design. In this way the foundation for the development process was laid.
The need and requirements for ZEBO was the resultant views, captured in workshops in Cairo (chapter 6). The benchmark model that was embedded in the tool was created during a field study to set a representative residential energy model (chapter 7). The key to the development process of my
223

simulation based decision support tool, ZEBO, was the responses of architects to evolving prototypes of the tool (chapter 8). The resultant views, captured in a usability study, were invaluable in developing the tool, in particular the satisfaction, effectiveness and efficiency. By embedding thus process of usability testing within the tool, I was able to systematically develop, and propose, a model for the future prototype3.
The third question posed in this thesis, the effects of the use of BPS and sensitivity analysis, was evaluated by means of three design case studies (Chapter 9) using a control trial and extended usability testing for preference and performance metrics (Chapter 10). We were especially interested in the effect of the decision support on informed decision making, the benchmark and GUI design that underlay the development of ZEBO, and our hypothesis was that the decision aid would promote informed decision making, knowledge, attitudes and patterns. Furthermore, in line with previous research that has suggested that BPS reduce the uncertainty of decision making. The outcome data from the usability study, combined with detailed information about the design performance of participants improved designs, allowed us to examine the effect of sensitivity analysis on decision making. The key finding from this research was that sensitivity analysis features embedded in ZEBO was found to promote informed decision making. The use of ZEBO and DesignBuilder resulted in an increase in knowledge uptake between 35 and 87 percent compared to the pre-workshop knowledge. Also the use of BPS tools improved the energy performance of the original design by 40 to 64 percent. More importantly, 78.8 percent of participants recognize the importance of BPS tools in informing the decision making and 71.2 percent recognize the importance of BPS tools in guiding the decision making of NZEBs design.
Finally we wanted to explore the tools limitation and the reasons behind the lack of confidence (44.2 percent) and lack of ability (51.9 percent) to achieve NZEBs design using ZEBO and other BPS tools. Based on the feedback provided during the group discussion participants considered the complexity of design and the limitation of the used tool to address all design objectives including, cost, aesthetics, visual comfort, time, and budget, etc. real barriers. Participants expected that the tool can enrich creativity through flexible 3D modelling using more design like medium or tools and allow the interpretation of the results to understand the building performances. Notwithstanding the limitations of using ZEBO and other BPS tools, specifically not accounting for other design objectives, we concluded that the main benefit of ZEBO, is the promotion of informed decision using sensitivity analysis technique. However, according to participants, achieving informed decision does not guarantee the use of BPS.
224

11.3 Interpretation and Critique of the Findings 11.3.1 Part I: Analysis of the problem
Uncertainty regarding NZEB design, and the BPS use in particular was the major theme of this thesis. It was the justification for both the development and evaluation of the simulation-based decision support, ZEBO, and was borne from our literature review (chapter 2-5). The extent to which this study demonstrates such uncertainty therefore requires closer examination. First, the choice of literature review methodology was appropriate, as it allowed various aspects relating to the design of NZEBs to be identified from the large collection of literature, and from aspects the central problem of design uncertainty emerged. The reviews were deliberately different in their scope. The first review (chapter 2) was broad in its focus, considering both the climate and comfort influence on NZEBs design in an Egyptian context. This allowed us to move to the second review of NZEB definition and design and also to explore the different cooling strategies and design methodologies (chapter 3). The third review (chapter 4) considered the cooling technologies and renewable energy generating technologies. This step was necessary to select the most suitable technologies for the NZEBs in the Egyptian context. In general, the variety of those technologies illustrates the sophistication of decision making for NZEBs. The forth review considered the use of BPS by architects and its ability to support the decision making. The evolution of BPS tools in the last decade is remarkable; however, it is still not present in architectural practice. Whether or not BPS tools inevitably improves the decision making and how it improves it, has been an open question. There is arguably a risk that researcher assume such an effect without firm evidence and methodologies to reach such effect.
11.3.12 Part II: Development of the Decision Aid
After establishing the need for a simulation-based decision support tool we commenced the development work. One of the great strengths of the study is that the development process not only was based on field survey to formulate a benchmark, but also conducted usability testing to develop the prototypes. These features are clearly context specific, and one of the strengths of ZEBO is its capacity to inform design prior to decision making, while managing large sensitivity simulations and presenting complex data in easily comprehensible and comparative formats. Basing the tools on a representative benchmark for Egyptian residential building and local building components and system linked to a detailed simulation engine like EnergyPlus is reinforcing the tools result validity and certainty in decision making. The tool is easy to use, with an interface structure that is based on matching the passive and active design strategies for the net zero objectives. The tool can help achieve the energy performance goal while exploring different ranges of a thermal comfort in hot climates to achieve the performance objective. ZEBO’s strength is in its capacity to reduce decision conflict and the need for tedious design iterations to achieve the
225

performance objective, while creating a variety of alternatives in a short time, which match the early design cyclic explorations and iterations. Better informed decisions, especially at the earliest conceptual design phases, will improve the design of NZEBs. It is hoped that several design trials, currently in progress using the tool, will allow a greater impact on architects’ decision making and actual design outcomes, and enable integration of BPS tools to proceed further than the decision support level reached in this study.
However, the tool in its current state can hardly attract large enough numbers of users. The usability testing results revealed that the tool seems more useful if used with the support of an expert to use ZEBO or in the hands of an educator for design exploration. Also, the decision making support of current prototype can only handle energy issues while many users expect other environmental and economical indices. One of the main limitations, identified during the workshops was the geometry and non-geometric input. This was echoed during the three workshops. Users suggested links to Google SketchUp for geometry input and user interface improvements to insert input visually (not numerical or textual). Similarly the tool is limited to its own library of a generic rectangular single-zone template with few alternatives for building components and systems. At the initiation of ZEBO we were aware that there is no comprehensive tool in this respect. No tool is perfect and there is always a balance between time, budget, aesthetics, and accuracy and other objectives. But our aim of developing ZEBO was mainly to use as an instrument focused on applying sensitivity analysis and measuring its impact of decision making.
Reflecting on the impact on the usability metrics on the long term, they could only provide value when there is a frame of reference. Without a clear plan in place for reliable, repeated measures to be collected in the future, an effective frame of reference can be established and valuable comparisons and learning may begin. In the case of ZEBO, the metrics collected in this study represented the first attempt at measuring the usability of the tool. As a result, the reported numbers can become more meaningful if there was a reference point that allows the comparison with different tools.
However, ZEBO remains one of the few decision aids to have been usability tested, with participants responses fed-back to the developer. Indeed, at the outset of the usability testing, there was no model of the process for us to follow. Consequently, at the beginning of the usability test, we relied on the ISO 1998 SUS testing model. In our usability-testing study the researcher sat in the room with the participants, observing their use of the tool. This is unlikely to be done with most developed BPS tools which over look usability testing. Less than 1% of the 400 BPS tools, listed in the DOE BPS tools directory, reported conducting usability testing. As a consequence, the uptake of the architectural community is very low if we don’t conduct usability. But when we compare that with CAAD we find that they have higher uptake because they are visual and allow geometrical freedom.
226

11.3.3 Part III: Evaluation of the Decision Aid
It is one of the major strengths of this thesis that it decision support tool under development ZEBO, was not only based on usability testing but also evaluated through three design case studies. Two of the case studies had a control trial to test the effect and influence of sensitivity analysis on decision making. Nonetheless, the three case studies results were measured through composed preference and performance metrics. As hypothesized, the sensitivity analysis features embedded in ZEBO was found to promote informed decision making. The case studies revealed a significant difference in knowledge levels. However, these results could not be interpreted in the context of wider literature.
One of the most exciting aspects of the case study is that it lends the possibility of using BPS during early design stages. Our finding of achieving informed decision making by using ZEBO raises serious question about the development of BPS tools not only for energy analysis but also for decision aids more generally. It suggests that the current use of BPS during early design stages for post-decision evaluation needs to be less and that, instead, a more pre-decision approach is required to meet the uncertainty of decision making of designers. This important finding is testament to the value of usability testing and other user experience measurements (self-reported metrics) as a research methodology. And, as previously outlined, this value is augmented by the ability to study relationship between BPS usage and performance outcomes. However, the potential is, at present, almost certainly under-appreciated, not least as the usability testing and user experience measurements were, in many respects, a post-hoc consideration in this study. That is, only after developing ZEBO, and on commencing the workshops; we did discover that a wealth of data could be generated from the usability testing and user experience measurement. We would argue that future evaluations of other decision aids should build this valuable methodology into the research plan from the outset.
11.3.4 Implications for Practice /Research
This study is one of the first studies in the architectural domain to develop and test a simulation-based decision aid for NZEB design through usability testing and design case study. An intervention aimed directly at architects, outwith the traditional early design setting, has been found to promote informed decision making with regards to NZEB design. Bypassing the simulation experts was not the aim of ZEBO. Rather, the aim was twofold: firstly to create a representative and contextual simulation model for architects, and secondly to provide a reliable simulation technique, namely sensitivity analysis, to support their decision making.
According the research findings there are four factors that promote or inhibit the uptake of BPS as decision support in architectural practice: 1)
227

interactional usability, 2) decision support (intelligence), 3) users’ skills and 4) contextual integration. All four of these factors apply to the uptake of ZEBO. Interactional usability and decision support could help understand the human computational interaction between the tool and the user for modelling. The third factor, users’ skills, could be used to clarify the educational requirements for the use of ZEBO. Finally, the contextual integration could be explored in terms of the incorporation of a tool such as ZEBO in a climatic and building context. Theoretically, it is possible to develop BPS tools that support the design of NZEBs and address factor 1,2 and 4. However, the success of the design will be always dependent on the users’ skills (factor 3).
In order to fully understand the impact of a simulation-based decision aid such as ZEBO, on the interactional usability and decision support, we need to move outside the crucible of the individual simulation expert consultation. Based on Egyptian population basis, ZEBO has been shown to have satisfactory usability interaction and the potential of promoting informed decision making. The results of usability testing and other user experience measurements showed that architects have the opportunity to interact and gain from an intervention which help them make decisions that are both knowledgeable and in line with their attitudes. Opposite to the trial and error method the use of sensitivity analysis resulted in considerable fewer design iterations undertaken during the design. This is very important, because time is one of the most reported barriers of integrating BPS during early design stages. However, ZEBO require significant development efforts, including testing to reach a level of maturity and to create a user base that provide large enough market.
Moreover, any ambitions towards the utilisation of BPS decision aids to design NZEBs should be tempered by the complexity of design and design process. Successful NZEBs or high performance buildings are a logical outcome of a holistic view of key design decisions requiring a connection between designs and building performance. BPS tools are already a potential medium or vehicle that can bridge this gap. This can be done through skilled design teams that could formerly act independently and are crucial in our ability to deliver NZEB designs. This requires also the use of multiple tools to have informed input for different design objectives and understand the trade-offs and correlations between different design decisions and objectives. So part of the success of architects to be able to design NZEBs is to share decision making and interactions and to use multiple tools.
On the level of contextual integration (factor 4), ZEBO is linked to a detailed analytical engine (EnergyPlus) and has a simple GUI. The tool is contextual representing 1500 surveyed apartments with a very local comfort model. Eventually we still cannot put this tool in the hands of every designer to give them the capacity to deliver NZEBs. However, this could be a step closer to encourage architects to perform simulation during early design stages of
228

NZEBs. The results of the energy analysis comparison showed an improvement of the design performance when BPS tools was used.
Regarding the users skills, the study proofed the increase of participants’ knowledge after the case studies design. But this does not reflect their skills. We should not forget that BPS tools do not create the design. Simulations are just systems of engineering equations that may or may not represent the actual physics of the building even for a simple insulated box with two shaded windows like ZEBO. Too many unknowns that get mashed together into the cloud of data points that are used for the calibrations. So we will need the users’ skills to estimate or synthesize many of the inputs to the simulation. It is skilled designers and teams who create the design. The design team working together within an open, participatory, integrated design process with the requisite skills and knowledge that will create energy and environmentally responsive design solutions. BPS tools of all types and levels of sophistication will be needed to inform and refine the design solution, but the designer (the human tool) is the most important part of the sustainable design process.
Finally, we would like to point to the importance of raising the users’ skills of architects by enforcing the teaching of BPS in the architectural schools. There is a fundamental need that the architectural education has to evolve to get the knowledge and fundamental principles of building performance design. BPS tool cannot substitute for understanding of building performance. Therefore, evolution has to take place in universities introducing new classes and updating existing ones. Not all architecture schools provide a good grounding in building physics and even if provided in practice much of this knowledge is quickly lost (Marsh, 2004). User surveys indicate that architect lack simulation know-how (Mahdavi et al. 2003). For example, an architect, not aware about building thermal characteristics, will find it difficult to specify the thermodynamic properties of a building. However, he or she can easily define the construction material used. In doing so, some of the thermal characteristics are inherently specified (Marsh, 2004). Therefore, it is necessary that architecture student receive a sufficient knowledge in environmental building design to use the tools for quick evaluation of design concepts. BPS tools are a part of this environment and must be brought to the students in the classroom and in the studio.
229

11.4 Future Work
ZEBO is a starting point to provide better guidance for design decisions to deliver NZEBs in hot climates. The tool in its current state has significant limitations and designers will still require more information in order to make informed decision. For better usability, the tool can include a fully visual input interface and allowing users to add new building templates for new building types or case studies. It can have T-shape, H-Shape, U-shape and courtyard shaped templates, or even better integrate an OpenGL modeller. Also the interface can be expanded to include more building systems and components, especially different envelope types and cooling systems at different cities in Egypt using suitable COPs (coefficient of performance). Also the scope of the tool can be extended further to achieve the net zero objective for existing buildings or on a larger scale (cluster or neighbourhood). We listed suggestions to be incorporated in prototype 3:
Suggestions for Prototype 3
• Allow the simulation of a full apartment block with an integrated mixed mode cooling system based on a VRV or VRF air conditioning
• Allow other adaptive comfort models (ASHRAE 55 and EN 15251 2007) • Integrate and allow the simulation of different occupancy schedules • Add a shading factor or index to the main parameters • Allow better shading features for the whole facade and roof
Concerning the usability testing, the study will address the tool efficiency and effectiveness as a complementary testing to the satisfaction testing. On the level of decision support, further developments of the tool can incorporate economic indices to achieve net zero energy cost effectively. The tool can be linked to optimisation algorithms too. This can create more viable alternatives and allows the exploration of a wider search space for complex designs. This development can include economy and cost, which may be of interest for designers, researchers, energy legislators and policy makers.
230

11.5 Conclusion
The need for informed decision making with regards to NZEBs remains undiminished. Moreover, the need for a simulation-based decision support is growing daily. A generation of simulation-savvy architects is now necessary, for whom NZEB design is of increasing relevance. They and following generations will demand easily usable, reliable, simulation based information in order to help them with one of the most difficult and complex processes of NZEBs design.
231

232

References
• ABANOMI, W. AND JONES, P., 2005. PASSIVE COOLING AND ENERGY CONSERVATION DESIGN STRATEGIES OF SCHOOL BUILDINGS IN HOT, ARID REGION: RIYADH, SAUDI ARABIA, PASSIVE AND LOW ENERGY COOLING FOR THE BUILT ENVIRONMENT, SANTORINI, GREECE.
• ABDALLAH, H., 1995, ENERGY EFFICIENCY AND THE EGYPTIAN ECONOMY, OPEC REVIEW, VOL.19, ISS. 3, PP. 263–281.
• ABDEL-AAL, R.E., AL-GARNI A.Z. AND AL-NASSAR Y.N., 1997. MODELLING AND FORECASTING MONTHLY ELECTRIC ENERGY CONSUMPTION IN EASTERN SAUDI ARABIA USING ABDUCTIVE NETWORKS. ENERGY, VOL. 22(9), PP. 911–21.
• ABDELHAFIZ F., 2004. STUDY ON THE APARTMENT APPLIANCE IN THE EGYPTIAN MARKET AND ITS EXPORT POTENTIAL. INDUSTRIAL DEVELOPMENT AUTHORITY, MINISTRY OF TRADE AND INDUSTRY. CAIRO, (IN ARABIC). AVAILABLE ONLINE AT <HTTP://WWW.TPEGYPT.GOV.EG/ARSTUDIES/D_ELAGALHAZA.PDF> [ACCESSED 1 APRIL 2010].
• ABDEL-RAZEK R., 1998. FACTOR AFFECTING CONSTRUCTION QUALITY IN EGYPT: IDENTIFICATION AND RELATIVE IMPORTANCE. ENGINEERING CONSTRUCTION AND ARCHITECTURAL MANAGEMENT; VOL. 5 (3), PP. 220-227.
• ABOSEDRA S, DAH A, GHOSH S., 2009. ELECTRICITY CONSUMPTION AND ECONOMIC GROWTH, THE CASE OF LEBANON. APPLIED ENERGY, VOL. 86, PP. 429–32.
• ABU-ALAM Y., 2000. UNDP/GEF PROJECT IN EGYPT ENERGY EFFICIENCY IMPROVEMENT AND GREENHOUSE GAS REDUCTION. IEEE PROCEEDINGS, VOL. 1, PP. 648-650.
• ACE, ASSOCIATION OF CONSULTING ENGINEERS, 2010, AVAILABLE ONLINE AT : HTTP://WWW.ACENET.CO.UK, [ACCESSED 15 JUN 2010]
• AHMED, A., ET AL, 2010, SIMULATION AS A TOOL TO DEVELOP GUIDELINES FOR THE DESIGN OF PORTABLE LIBRARY IN THE CAMPUS OF MANSOURA UNIVERSITY, ESIM2010, MANITOBA - WINNIPEG, 19-20.
• AIA AMERICAN INSTITUTE OF ARCHITECTS, 2007. DEFINING THE ARCHITECT’S BASIC SERVICES. AIA BEST PRACTICES. AVAILABLE ONLINE AT: HTTP://AIAWEBDEV2.AIA.ORG/BP_TEMPLATE.CFM?PAGENAME=BP_CHAP16 [ACCESSED 20 FEB 2010].
• ALAJLAN, S. AND SAYIGH, A. A. M., 1993. BIOCLIMATIC APPROACH TO BUILDING DESIGN IN AR-RIHADH REGION IN SAUDI ARABIA (HOT ARID). WORKSHOP ON MATERIALS SCIENCE AND PHYSICS OF NON-CONVENTIONAL ENERGY SOURCES, 30 AUGUST – 17 SEPTEMBER 1993, INTERNATIONAL CENTRE FOR THEORETICAL PHYSICS, TRIESTE, ITALY, PP. 33.
• ALLARD, F., 1998. NATURAL VENTILATION IN BUILDINGS: A DESIGN HANDBOOK, JAMES & JAMES, LONDON, PP. 365.
• AL-WAKIL, S. AND SIRAJ, M., 1989. CLIMATE & THE ARCHITECTURE OF HOT REGIONS [IN ARABIC]. THIRD ED., CAIRO: AALAM AL-KUTUB.
• ANSI/ASHRAE STANDARD 140, 2001, STANDARD METHOD OF TEST FOR THE EVALUATION OF BUILDING ENERGY ANALYSIS COMPUTER PROGRAMS, 90 PAGES, ASHRAE, ATLANTA, GA 3032
• ANSI/INCITS 354-2001: COMMON INDUSTRY FORMAT (CIF) FOR USABILITY TEST REPORTS BECAME A STANDARD, DECEMBER 2001
• ANTINUCCI, M., ET AL., 1992. PASSIVE AND HYBRID COOLING OF BUILDINGS - STATE OF THE ART. INTERNATIONAL JOURNAL OF SOLAR ENERGY, VOL. 11(3), PP. 251 - 271.
• ASFOUR, K., 1998. CULTURAL CRISIS - ANALYSIS OF THE ARAB WORLD'S PRACTICE OF BORROWING ARCHITECTURAL DESIGNS FROM OTHER CULTURES, ARCHITECTURAL REVIEW.
• ASHRAE, 2011, STANDARD FOR THE DESIGN OF HIGH-PERFORMANCE, GREEN BUILDINGS EXCEPT LOW-RISE RESIDENTIAL BUILDINGS. I-P EDITION, THE AMERICAN SOCIETY OF HEATING, REFRIGERATING AND AIR-CONDITIONING ENGINEERS, ATLANTA, GA.
• ASHRAE, 2008. AHSRAE VISION 2020, ASHRAE VISION 2020 AD HOC COMMITTEE, AVAILABLE ONLINE AT:
233

HTTP://WWW.ASHRAE.ORG/DOCLIB/20080226_ASHRAEVISION2020.PDF, [ACCESSED 10 JANUARY 2011].
• ASHRAE, 2007A. STANDARD 90.2: ENERGY STANDARD FOR BUILDINGS FOR LOW-RISE RESIDENTIAL BUILDINGS, I-P EDITION, THE AMERICAN SOCIETY OF HEATING, REFRIGERATING AND AIR-CONDITIONING ENGINEERS, ATLANTA, GA.
• ASHRAE, 2007B. ASHRAE HANDBOOK: FUNDAMENTALS, SI ED., THE AMERICAN SOCIETY OF HEATING, REFRIGERATING AND AIR-CONDITIONING ENGINEERS, ATLANTA, GA.
• ASHRAE, 2005. STANDARD 55: THERMAL ENVIRONMENTAL CONDITIONS FOR HUMAN OCCUPANCY, THE AMERICAN SOCIETY OF HEATING, REFRIGERATING AND AIR-CONDITIONING ENGINEERS, ATLANTA, GA.
• ATHIENITIS, A., ATTIA, S. ET AL. 2010. STRATEGIC DESIGN, OPTIMIZATION, AND MODELLING ISSUES OF NET-ZERO ENERGY SOLAR BUILDINGS, EUROSUN 2010, INTERNATIONAL CONFERENCE ON SOLAR HEATING, COOLING AND BUILDINGS, GRAZ.
• ATTIA, S., EVRARD, A., GRATIA, E., 2012A. DEVELOPMENT OF BENCHMARK MODELS FOR THE EGYPTIAN RESIDENTIAL BUILDINGS SECTOR, APPLIED ENERGY, VOLUME 94, JUNE 2012, PAGES 270-284, ISSN 0306-2619, 10.1016/J.APENERGY.2012.01.065.
• ATTIA, S., GRATIA, E., DE HERDE, A., HENSEN, J.L.M., 2012B. SIMULATION-BASED DECISION SUPPORT TOOL FOR EARLY STAGES OF ZERO-ENERGY BUILDING DESIGN, ENERGY AND BUILDINGS, AVAILABLE ONLINE 10 FEBRUARY 2012, ISSN 0378-7788, 10.1016/J.ENBUILD.2012.01.028.
• ATTIA, S., DE HERDE A., 2011A. EARLY DESIGN SIMULATION TOOLS FOR NET ZERO ENERGY BUILDINGS: A COMPARISON OF TEN TOOLS, INTERNATIONAL BUILDING PERFORMANCE SIMULATION ASSOCIATION, NOVEMBER 2011, SYDNEY, AUSTRALIA.
• ATTIA, S., ET AL. 2011B. TOWARDS STRATEGIC USE OF BPS TOOLS IN EGYPT, INTERNATIONAL BUILDING PERFORMANCE SIMULATION ASSOCIATION, NOVEMBER 2011, SYDNEY, AUSTRALIA.
• ATTIA, S., 2011C. ZEBO TUTORIAL VIDEO 1, AVAILABLE ONLINE AT: HTTP://WWW.YOUTUBE.COM/WATCH?V=ZJLYZUL7YJG [ACCESSED SEPTEMBER 2011].
• ATTIA, S., DE HERDE, A., 2011D. DESIGN DECISION TOOL FOR ZERO ENERGY BUILDINGS, PASSIVE AND LOW ENERGY ARCHITECTURE, JULY, LOUVAIN LA NEUVE, BELGIUM.
• ATTIA, S ET AL., 2011E. SELECTION CRITERIA FOR BUILDING PERFORMANCE SIMULATION TOOLS: CONTRASTING ARCHITECTS' AND ENGINEERS' NEEDS', JOURNAL OF BUILDING PERFORMANCE SIMULATION, FIRST PUBLISHED ON: 12 APRIL 2011 (IFIRST)
• ATTIA S., 2011F. EARLY DESIGN SIMULATION TOOLS FOR NET ZERO ENERGY BUILDINGS: A COMPARISON OF TEN TOOLS, TECHNICAL REPORT, ARCHITECTURE ET CLIMAT, LOUVAIN LA NEUVE: UNIVERSITÉ CATHOLIQUE DE LOUVAIN.
• ATTIA, S., DUCHHART, I., 2011G. BIOCLIMATIC LANDSCAPE DESIGN IN EXTREMELY HOT AND ARID CLIMATES, PASSIVE AND LOW ENERGY ARCHITECTURE, JULY, LOUVAIN LA NEUVE, BELGIUM.
• ATTIA S., 2010A. BUILDING PERFORMANCE SIMULATION TOOLS: SELECTION CRITERIA AND USER SURVEY, TECHNICAL REPORT, ARCHITECTURE ET CLIMAT, LOUVAIN LA NEUVE: UNIVERSITÉ CATHOLIQUE DE LOUVAIN.
• ATTIA, S., DE HERDE, A., 2010B. SIZING PHOTOVOLTAIC SYSTEMS DURING EARLY DESIGN A DECISION TOOL FOR ARCHITECTS, AMERICAN SOLAR ENERGY SOCIETY, MAY 2010, ARIZONA, USA
• ATTIA, S., 2010C. ZERO ENERGY RETROFIT CASE STUDY OF A CHALET IN AIN-SUKHNA, EGYPT, AMERICAN SOLAR ENERGY SOCIETY, MAY 2010, ARIZONA, USA
• ATTIA, S., DE HERDE, A., 2010D. STRATEGIC DECISION MAKING FOR ZERO ENERGY BUILDINGS IN HOT CLIMATES, EUROSUN 2010, INTERNATIONAL CONFERENCE ON SOLAR HEATING, COOLING AND BUILDINGS, GRAZ, AUSTRIA
• ATTIA, S., DE HERDE, A., 2009A. BIOCLIMATIC ARCHITECTURE DESIGN STRATEGIES IN EGYPT, 8TH INTERNATIONAL CONFERENCE ON SUSTAINABLE ENERGY TECHNOLOGIES, AUGUST 2009 AACHEN, GERMANY
234

• ATTIA, S., BELTRÁN L., DE HERDE, A, HENSEN, J., 2009B. “ARCHITECT FRIENDLY”: A COMPARISON OF TEN DIFFERENT BUILDING PERFORMANCE SIMULATION TOOLS, INTERNATIONAL BUILDING PERFORMANCE SIMULATION ASSOCIATION, JULY 2009, GLASGOW, UK
• ATTIA, S., DE HERDE, A., 2009C. IMPACT AND POTENTIAL OF COMMUNITY SCALE LOW-ENERGY RETROFIT: CASE STUDY IN CAIRO, SMART AND SUSTAINABLE BUILT ENVIRONMENTS CONFERENCE, JUNE 2009, TU-DELFT, THE NETHERLANDS
• ATTIA, S., 2009D. ACTIVE SOLAR RETROFIT OF A RESIDENTIAL HOUSE, A CASE STUDY IN EGYPT, AMERICAN SOLAR ENERGY SOCIETY, MAY 2009, BUFFALO, USA
• ATTIA, S., 2009E. BIOCLIMATIC LANDSCAPE DESIGN STRATEGY: BIOCLIMATIC-ZONE CONCEPT FOR SITE PLANNING IN ARID CLIMATES, SMART AND SUSTAINABLE BUILT ENVIRONMENTS CONFERENCE, JUNE 2009, TU-DELFT , THE NETHERLANDS
• ATTIA, S., 2006A. THE ROLE OF LANDSCAPE DESIGN IN IMPROVING THE MICROCLIMATE IN TRADITIONAL COURTYARD BUILDINGS IN HOT ARID CLIMATES, PASSIVE AND LOW ENERGY ARCHITECTURE, JULY 2007, GENÈVE, SWITZERLAND.
• ATTIA, S., 2006B. LANDSCAPE ARCHITECTURE FOR MICRO-CLIMATE IMPROVEMENT AND ENERGY CONSERVATION IN EGYPT, MASTER THESIS, WAGENINGEN UNIVERSITY.
• AULICIEMS, A. AND SZOKOLAY, S. V., 1997. THERMAL COMFORT: DESIGN TOOLS AND TECHNIQUES; BRISBANE, QUEENSLAND, PLEA IN ASSOCIATION WITH DEPT. OF ARCHITECTURE, UNIVERSITY OF QUEENSLAND.
• AUTODESK, 2011, VASARI [ONLINE]. AVAILABLE FROM: HTTP://LABS.AUTODESK.COM/UTILITIES/VASARI// [ACCESSED FEBRUARY 2011].
• AUTODESK, 2009A. ECOTECT. AVAILABLE FROM: HTTP://WWW.SQU1.COM/ [ACCESSED NOVEMBER 2009].
• AXLEY, J., EMMERICH, S., DOLS, S. AND WALTON, G., 2002. AN APPROACH TO THE DESIGN OF NATURAL AND HYBRID VENTILATION SYSTEMS FOR COOLING BUILDINGS. PROCEEDINGS: INDOOR AIR 2002. AVAILABLE ONLINE AT: HTTP://WWW.BFRL.NIST.GOV/IAQANALYSIS/DOCS/IA02-6.PDF [ACCESSED 12 JAN 2009].
• AYDINALP, M., UGURSAL, V. AND FUNG, A., 2002. MODELING OF THE APPLIANCE, LIGHTING AND SPACE COOLING ENERGY CONSUMPTIONS IN THE RESIDENTIAL SECTOR USING NEURAL NETWORKS. APPLIED ENERGY; VOL. 71, PP. 87-110.
• AZADEH, A., GHADERI, S.F. AND SOHRABKHANI, S., 2008. A SIMULATED-BASED NEURAL NETWORK ALGORITHM FOR FORECASTING ELECTRICAL ENERGY CONSUMPTION IN IRAN. ENERGY POLICY, VOL. 36 (7), PP. 2637-2644.
• AZIZ, S., GUINDI SE, SHOBOKSHI HE, OSMAN H AND ADHAM R., 2001. RESIDENTIAL BUILDING SURVEY IN CAIRO AND ALEXANDRIA, FINAL REPORT FOR THE BUILDING ENERGY CODE PROJECT: HOUSING AND BUILDING RESEARCH CENTRE; CAIRO.
• AZIZ, S., 2003. GENERAL BUILDING SURVEY - BUILDING ENERGY CODE PROJECT: HOUSING AND BUILDING RESEARCH CENTRE; CAIRO.
• BAMBARDEKAR, S. AND POERSCHKE, U., 2009. THE ARCHITECT AS PERFORMER OF ENERGY SIMULATION IN THE EARLY DESIGN STAGE. IN PROCEEDING OF THE BUILDING SIMULATION CONFERENCE, GLASGOW, PP. 1306-1313.
• BAHADORI, M., 1978. PASSIVE COOLING SYSTEMS IN IRANIAN ARCHITECTURE. SCIENTIFIC AMERICAN, VOL. 238(2), PP. 144-154.
• BECK, C., GRIESER, J., KOTTEK, M., RUBEL, F. AND RUDOLF, B., 2006. CHARACTERIZING GLOBAL CLIMATE CHANGE BY MEANS OF KÖPPEN CLIMATE CLASSIFICATION. DWD, KLIMASTATUSBERICHT 2005, PP. 139-149.
• BIANCO, V., MANCA O. AND NARDINI, S., 2010. LINEAR REGRESSION MODELS TO FORECAST ELECTRICITY CONSUMPTION IN ITALY. ENERGY SOURCES, PART B: ECONOMY PLAN POLICY; IN PRESS.
• BIANCO, V., MANCA, O. AND NARDINI, S., 2009. ELECTRICITY CONSUMPTION FORECASTING IN ITALY USING LINEAR REGRESSION MODELS. ENERGY, VOL. 34(9), PP. 1413–21.
235

• BOGENSTÄTTER, U., 2000. PREDICTION AND OPTIMIZATION OF LIFE-CYCLE COSTS IN EARLY DESIGN, BUILDING RESEARCH & INFORMATION, VOL. 28 (5), PP.376-386.
• BOJIC, M., NILOLIC, N., NIKOLIC, D., SKERLIC, J., MILETIC, I., 2011. TOWARD A POSITIVE-NET-ENERGY RESIDENTIAL BUILDING IN SERBIAN CONDITIONS. APPLIED ENERGY, VOL. 88(7), PP. 2407-2419.
• BOKO, M., NIANG, I., NYONG, A., ET AL. 2007. AFRICA. CLIMATE CHANGE 2007: IMPACTS, ADAPTATION AND VULNERABILITY; CAMBRIDGE UNIVERSITY PRESS.CAMBRIDGE UK: PP. 433-467.
• BOUDEN, C. AND GHRAB, N., 2005. AN ADAPTIVE THERMAL COMFORT MODEL FOR THE TUNISIAN CONTEXT: A FIELD STUDY RESULTS. ENERGY AND BUILDINGS, VOL. 37(9), PP. 952-963.
• BOURDOUKAN P., AND DELISLE, V., 2009, A QUALITATIVE BENCHMARK FOR COMPARISON OF SIMULATION TOOLS USED TO DESIGN NET ZERO ENERGY BUILDINGS, IEA SHC TASK40, ECBCS ANNEX 52
• BOURDOUKAN P., AND DELISLE, V., 2011, A QUANTITATIVE BENCHMARK FOR COMPARISON OF SIMULATION TOOLS USED TO DESIGN NET ZERO ENERGY BUILDINGS, IEA SHC TASK40, ECBCS ANNEX 52
• BRAGER, G. AND DE DEAR R., 1998. THERMAL ADAPTATION IN THE BUILT ENVIRONMENT - A LITERATURE REVIEW. ENERGY AND BUILDINGS, VOL. 27(1), PP. 83-96.
• BRAGER, G. AND BAKER, L., 2008. OCCUPANT SATISFACTION IN MIXED-MODE BUILDINGS, THE AIR CONDITIONING AND THE LOW CARBON COOLING CHALLENGE, WINDSOR, UK, 27-29 JULY 2008.
• BRAGER, G., 2006. MIXED-MODE COOLING. ASHRAE JOURNAL, AUGUST, PP. 30-37., CENTER FOR THE BUILT ENVIRONMENT, CENTER FOR ENVIRONMENTAL DESIGN RESEARCH, UNIVERSITY OF CALIFORNIA, BERKELEY.
• BRIGGS, R., LUCAS, R. AND TAYLOR, Z.T., 2002. CLIMATE CLASSIFICATION FOR BUILDING ENERGY CODES AND STANDARDS. PACIFIC NORTHWEST NATIONAL LABORATORY. AVAILABLE ONLINE AT: HTTP://WWW.ENERGYCODES.GOV/RC/CLIMATE_PAPER_REVIEW_DRAFT_REV.PDF [ACCESSED 15 FEB 2009].
• BROWN, G. Z. AND DEKAY, M., 2001. SUN, WIND & LIGHT: ARCHITECTURAL DESIGN STRATEGIES, (2ND ED.) NEW YORK; CHICHESTER, JOHN WILEY
• BSI BRITISH STANDARDS INSTITUTION, 1996. BS 7000: DESIGN MANAGEMENT SYSTEMS - PART4: GUIDE TO MANAGING DESIGN IN CONSTRUCTION, LONDON, UK, BRITISH STANDARDS INSTITUTION.
• BUILDING SMART, 2009, AVAILABLE ONLINE AT: HTTP://WWW.BUILDINGSMART.ORG/, [ACCESSED 15 JUN 2011]
• CAPMAS, 2008. THE FINAL RESULTS OF POPULATION AND HOUSING CENSUS 2006. CAIRO: CENTRAL AGENCY FOR PUBLIC MOBILIZATION AND STATISTICS.
• CENA, K. AND DE DEAR, R., 2001. THERMAL COMFORT AND BEHAVIOURAL STRATEGIES IN OFFICE BUILDINGS LOCATED IN A HOT-ARID CLIMATE. JOURNAL OF THERMAL BIOLOGY, VOL. 26 (4-5), PP. 409-414.
• CHARRON, R., ATHIENITIS, A. AND BEAUSOLEIL-MORRISON, I., 2006. A TOOL FOR THE DESIGN OF ZERO ENERGY SOLAR HOMES, ASHRAE. ANNUAL MEETING, CHICAGO, VOL. 112 (2), PP. 285-295.
• CHARVAT, P., JICHA, M., NIACHOU, A. AND SANTAMOURIS, M., 2005. SIMULATION OF THE PERFORMANCE OF A HYBRID VENTILATION SYSTEM IN DIFFERENT CLIMATES, BUILDING SIMULATION 2005, MONTRÉAL, CANADA.
• CHRISTENSEN, C., HOROWITZ, S. & BARKER, G. 2005, BEOPT: SOFTWARE FOR IDENTIFYING OPTIMAL BUILDING DESIGNS ON THE PATH TO ZERO NET ENERGY. ISES. ORLANDO, FLORIDA, ISES.
• CIBSE, 2002. CIBSE GUIDE J: WEATHER, SOLAR AND ILLUMINANCE DATA; THE CHARTERED INSTITUTION OF BUILDING SERVICES ENGINEERS, LONDON, UK.
236

• CIBSE, 2007. CIBSE GUIDE A: ENVIRONMENTAL DESIGN; THE CHARTERED INSTITUTION OF BUILDING SERVICES ENGINEERS, LONDON, UK.
• CIBSE, 2000. MIXED MODE VENTILATION, CIBSE APPLICATIONS MANUAL AM13:2000. THE CHARTERED INSTITUTION OF BUILDING SERVICES ENGINEERS, LONDON, UK.
• CIBSE, 1999. ENVIRONMENTAL DESIGN, CIBSE GUIDE A. LONDON: YALE PRESS LTD. • CLARKE, J., 2001. ENERGY SIMULATION IN BUILDING DESIGN, OXFORD, BUTTERWORTH-
HEINEMANN. • CLIMATE CONSULTANT 5, 2010, MILNE MURRAY, UCLA, AVAILABLE ONLINE AT:
HTTP://WWW.ENERGY-DESIGN-TOOLS.AUD.UCLA.EDU/, [ACCESSED 15 JUN 2008] • COCH, H., 1996, BIOCLIMATISM IN VERNACULAR ARCHITECTURE. RENEWABLE AND
SUSTAINABLE ENERGY REVIEWS, VOL. 2(1-2), PP. 67- 87. • COSTELLOE, B. AND FINN, D., 2003. INDIRECT EVAPORATIVE COOLING POTENTIAL IN AIR-
WATER SYSTEMS IN TEMPERATE CLIMATES. ENERGY AND BUILDINGS, VOL. 35(6), PP. 573-591.
• CRAWLEY, D., ET AL., 2008. CONTRASTING THE CAPABILITIES OF BUILDING ENERGY PERFORMANCE SIMULATION PROGRAMS. BUILDING AND ENVIRONMENT, 43(4), 661-673.
• CRAWLEY, D., HAND, J., KUMMERT, M. AND GRIFFITH, B., 2005, CONTRASTING THE CAPABILITIES OF BUILDING ENERGY PERFORMANCE SIMULATION PROGRAMS, US DEPARTMENT OF ENERGY, WASHINGTON.
• CRAWLEY, D ET AL 1997. "WHAT NEXT FOR BUILDING ENERGY SIMULATION — A GLIMPSE OF THE FUTURE," IN PROCEEDINGS OF BUILDING SIMULATION '97, VOL. II, PP. 395-402, PRAGUE, CZECH REPUBLIC, 7-10 SEPTEMBER 1997. IBPSA.
• DARKOH, M.B.K. AND RWOMIRE, A., 2003. HUMAN IMPACT ON ENVIRONMENT AND SUSTAINABLE DEVELOPMENT IN AFRICA, ALDERSHOT, ASHGATE.
• DE DEAR, R.J. AND BRAGER, G.S., 2002. THERMAL COMFORT IN NATURALLY VENTILATED BUILDINGS: REVISIONS TO ASHRAE STANDARD 55. ENERGY AND BUILDINGS, VOL. 34(6), PP. 549-561.
• DE DEAR, R. AND BRAGER, G.S., 2001. THE ADAPTIVE MODEL OF THERMAL COMFORT AND ENERGY CONSERVATION IN THE BUILT ENVIRONMENT. INTERNATIONAL JOURNAL OF BIOMETEOROLOGY, VOL. 45(2), PP. 100-108.
• DE DEAR, R. J., 1999. ADAPTIVE THERMAL COMFORT IN NATURAL AND HYBRID VENTILATION. INTERNATIONAL ENERGY AGENCY, IEA-ANNEX 35 ENERGY CONSERVATION IN BUILDINGS AND COMMUNITY SYSTEMS, SYDNEY, AUSTRALIA.
• DE DEAR, R.J., 1998. A GLOBAL DATABASE OF THERMAL COMFORT FIELD EXPERIMENTS. ASHRAE TRANSACTIONS 104, VOL. 1, PP. 1141–1152.
• DE DEAR R. AND BRAGER G., 1998. DEVELOPING AN ADAPTIVE MODEL OF THERMAL COMFORT AND PREFERENCE, ASHRAE TRANSACTIONS, VOL. 104 (1.A): PP. 145-1DOE/EIA, INTERNATIONAL ENERGY OUTLOOK 2010. 2010, DOE/EIA.
• DESIGNBUILDER, 2011A. DESIGN BUILDER V.2.3.5.036. • DESIGNBUILDER, 2011B. DESIGNBUILDER. AVAILABLE ONLINE AT:
HTTP://WWW.DESIGNBUILDER.CO.UK/ [ACCESSED1 JANUARY 2011]. • DIEKMANN, J., MCKENNEY, K. AND BRODRICK, J., 2009, RADIANT FLOOR COOLING IN
PRACTICE, ASHRAE JOURNAL, NOVEMBER 2009. PP. 70-72. • DOE, 2011A. ENERGYPLUS. AVAILABLE ONLINE AT:
HTTP://APPS1.EERE.ENERGY.GOV/BUILDINGS/ENERGYPLUS/ [ACCESSED 1 JANUARY 2011]. • DOE, U.S., 2011B. BUILDING ENERGY SOFTWARE TOOLS DIRECTORY. AVAILABLE ONLINE
AT: HTTP://APPS1.EERE.ENERGY.GOV/BUILDINGS/TOOLS_DIRECTORY/ [ACCESSED 1 JANUARY 2011].
• DOE, 2011C. EGYPT WEATHER DATA, AVAILABLE ONLINE AT: HTTP://APPS1.EERE.ENERGY.GOV/BUILDINGS/ENERGYPLUS/CFM/WEATHER_DATA3.CFM/REGION=1_AFRICA_WMO_REGION_1/COUNTRY=EGY/CNAME=EGYPT, [ACCESSED 15 JUN 2011]
• DOE, 2010. INTERNATIONAL ENERGY OUTLOOK 2010. DOE/EIA.
237

• DOE, 2009A. ENERGYPLUS [ONLINE]. AVAILABLE FROM: HTTP://APPS1.EERE.ENERGY.GOV/BUILDINGS/ENERGYPLUS/ [ACCESSED NOVEMBER 2009].
• DOE, 2000. 10 CFR PARTS 434 AND 435: ENERGY CODE FOR NEW FEDERAL COMMERCIAL AND MULTI-FAMILY HIGH RISE RESIDENTIAL BUILDINGS. FEDERAL REGISTER, 65(195), 59.
• DONN, M., ET AL. 2009. SIMULATION IN THE SERVICE OF DESIGN – ASKING THE RIGHT QUESTIONS, PROCEEDINGS OF IBPSA 2009, GLASGOW, PP. 1314-1321.
• DONN, M., 2004. SIMULATION OF IMAGINED REALITIES ENVIRONMENTAL DESIGN DECISION SUPPORT TOOLS IN ARCHITECTURE, PHD DISSERTATION, VICTORIA UNIVERSITY, WELLINGTON.
• DONN, M., 1997. A SURVEY OF USERS OF THERMAL SIMULATION PROGRAMS. IBPSA. CZECH REPUBLIC.
• DUNOVSKA, T., DRKAL, F. AND HENSEN, J.L.M., 1999. BARRIERS AND SOLUTIONS TO THE USE OF BUILDING SIMULATION IN THE CZECH REPUBLIC', PROC. BUILDING SIMULATION '99' KYOTO, VI, PP. 257-262.
• DUNSTER ET AL. 2007.THE ZEDBOOK: SOLUTIONS FOR A SHRINKING WORLD, TAYLOR & FRANCIS.LONDON.
• ECEP/DRTPC., 2001. RESIDENTIAL ENERGY SURVEY AND ENVIRONMENTAL INDICATORS IN GREATER CAIRO. REPORT PREPARE BY THE ENERGY CONSERVATION AND ENVIRONMENTAL PROGRAM AT DEVELOPMENT RESEARCH AND TECHNOLOGICAL PLANNING CENTER. UNIVERSITY AND THE ORGANIZATION FOR ENERGY PLANNING. CAIRO.
• EDUCATE, AVAILABLE ONLINE AT: HTTP://WWW.EDUCATE-SUSTAINABILITY.EU/, [ACCESSED 10 APRIL 2011]
• EEHC, 2008. ANNUAL REPORT: EGYPTIAN ELECTRICITY HOLDING COMPANY. CAIRO • EEHC, 2010. ANNUAL REPORT: EGYPTIAN ELECTRICITY HOLDING COMPANY. CAIRO • EL ARABY, M., 2002. URBAN GROWTH & ENVIRONMENTAL DEGRADATION: THE CASE OF
CAIRO, CITIES. VOL. 19(6), PP. 389–400 • EL-SHAZLY, S., ABDELMAGEED, A., AND EL-NOUBI, A., 1998. SOLAR AT QENA/EGYPT.
MAUSAM. RADIATION CHARACTERISTIC VOL. 49(1), PP. 59-70. • EGBC 2011. AVAILABLE ONLINE AT: HTTP://WWW.EGYPT-GBC.GOV.EG/ABOUT/EGYPT-
GBC.HTML. [ACCESSED 10 APRIL 2011] • EGBC 2011, AVAILABLE ONLINE AT HTTP://WWW.HBRC.EDU.EG/FILES/GPRS-
%20FOR%20PUBLIC%20REVIEW_JUNE%202011.PDF • EN ISO 15251, 2007. INDOOR ENVIRONMENTAL INPUT PARAMETERS FOR DESIGN AND
ASSESSMENT OF ENERGY PERFORMANCE OF BUILDINGS ADDRESSING INDOOR AIR QUALITY, THERMAL ENVIRONMENT, LIGHTING AND ACOUSTICS.
• EN ISO 7730, 2005. ERGONOMICS OF THE THERMAL ENVIRONMENT – ANALYTICAL DETERMINATION AND INTERPRETATION OF THERMAL COMFORT USING CALCULATION OF THE PMV AND PPD INDICES AND LOCAL THERMAL COMFORT CRITERIA. INTERNATIONAL ORGANIZATION FOR STANDARDIZATION; GENEVA.
• EMA., 2010. EGYPTIAN METEOROLOGICAL AUTHORITY. CAIRO: EGYPTIAN METEOROLOGICAL AUTHORITY;2010. AVAILABLE ONLINE AT: <HTTP://WWW.EMA.GOV.EG/MAP?MENU=3&LANG=EN> [ACCESSED 1 APRIL 201010]
• EMMITT, S., 2007. DESIGN MANAGEMENT FOR ARCHITECTS, OXFORD; MALDEN, MA, BLACKWELL PUB.
• EPP, B., 2011, SOLAR COOLING: GERMAN FRAUNHOFER ISE COMPARES PV AND SOLAR THERMAL, AVAILABLE ONLINE AT: HTTP://WWW.SOLARTHERMALWORLD.ORG/NODE/1606, [ACCESSED 25 APR 2011].
• ESTIF, 2010. SOLAR ASSISTED COOLING – STATE OF THE ART, AVAILABLE ONLINE AT: HTTP://WWW.ESTIF.ORG/FILEADMIN/ESTIF/CONTENT/POLICIES/DOWNLOADS/D23-SOLAR-ASSISTED-COOLING.PDF, [ACCESSED 13 FEB 2010].
• EVANS, J.M., 2003. EVALUATING COMFORT WITH VARYING TEMPERATURES: A GRAPHIC DESIGN TOOL. ENERGY AND BUILDINGS, VOL. 35(1), PP. 87-93.
238

• EU, 2009. REPORT ON THE PROPOSAL FOR A DIRECTIVE OF THE EUROPEAN PARLIAMENT AND OF THE COUNCIL ON THE ENERGY PERFORMANCE OF BUILDINGS (RECAST), EUROPEAN PARLIAMENT. (COM(2008)0780-C6-0413/2008-2008/0223(COD).
• EU-JRC, 2009. PHOTOVOLTAIC GEOGRAPHICAL INFORMATION SYSTEM (PVGIS), AVAILABLE ONLINE AT: HTTP://RE.JRC.EC.EUROPA.EU/PVGIS/, [ACCESSED MAY 2008].
• FAHMI, W.AND SUTTON, K., 2008. GREATER CAIRO'S HOUSING CRISIS: CONTESTED SPACES FROM INNER CITY AREAS TO NEW COMMUNITIES, CITIES, VOL. 25 (5), PP. 277-297
• FANGER, P.O., 1970. THERMAL COMFORT: ANALYSIS AND APPLICATIONS IN ENVIRONMENTAL ENGINEERING, COPENHAGEN, DANISH TECHNICAL PRESS.
• FARIJA, G.M. AND SAYIGH, A.A.M., 1993. DESIGN FOR COMFORT IN RESIDENTIAL BAHRAINI BUILDINGS. WORKSHOP ON MATERIALS SCIENCE AND PHYSICS OF NON-CONVENTIONAL ENERGY SOURCES, 30 AUGUST – 17 SEPTEMBER 1993, INTERNATIONAL CENTRE FOR THEORETICAL PHYSICS, TRIESTE, ITALY, PP. 22.
• FATHY, H., SHEARER, W. AND SULTAN, 1986. NATURAL ENERGY AND VERNACULAR ARCHITECTURE: PRINCIPLES AND EXAMPLES WITH REFERENCE TO HOT ARID CLIMATES, CHICAGO; LONDON, PUBLISHED FOR THE UNITED NATIONS UNIVERSITY BY THE UNIVERSITY OF CHICAGO PRESS.
• FEIST, W., 2011, PASSIVE HOUSE STANDARD, AVAILABLE ONLINE AT: HTTP://WWW.PASSIVHAUSTAGUNG.DE/PASSIVE_HOUSE_E/PASSIVEHOUSE_DIRECTORY.HTML, [ACCESSED 25 MARCH 2011].
• FISHER, D. E. AND REES, S. J., 2005. MODELLING GROUND SOURCE HEAT PUMP SYSTEMS IN A BUILDING ENERGY SIMULATION PROGRAM (ENERGYPLUS), BUILDING SIMULATION 2005, NINTH INTERNATIONAL IBPSA CONFERENCE, MONTREAL, CANADA, AUGUST 15-18.
• FLORIDES, G. A., TASSOU, S. A., KALOGIROU, S. A. AND WROBEL, L. C., 2002. REVIEW OF SOLAR AND LOW ENERGY COOLING TECHNOLOGIES FOR BUILDINGS. RENEWABLE AND SUSTAINABLE ENERGY REVIEWS, VOL. 6(6), PP. 557-572.
• FOREJT, L., HENSEN, J., DRKAL, F. AND BARANKOVA, P., 2006. WEATHER DATA AROUND THE WORLD FOR DESIGN OF FIELD HOSPITAL HVAC. PRESENTED AT THE 17TH INT. AIRCONDITIONING AND VENTILATION CONFERENCE. PRAGUE, SOCIETY OF ENVIRONMENTAL ENGINEERING.
• FRACASTORO, G.V., MUTANI, G. AND PERINO, M., 2001. A SIMPLE TOOL TO ASSESS THE FEASIBILITY OF HYBRID VENTILATION SYSTEMS, THE IAQVEC 2001: INDOOR AIR QUALITY, VENTILATION AND ENERGY CONSERVATION IN BUILDINGS: FOURTH INTERNATIONAL CONFERENCE, HUNAN, CHINA, 2-5 OCTOBER.
• GADO, T., ET AL., 2009, INVESTIGATING NATURAL VENTILATION INSIDE WALK-UP HOUSING BLOCKS IN THE EGYPTIAN DESERT CLIMATIC DESIGN REGION, INTERNATIONAL JOURNAL OF VENTILATION ISSN 1473-3315 VOL. 8, NO. 2, PAPER 6
• GEF, UNDP. 2003. ENERGY SURVEY AND ENVIRONMENTAL INDICATORS IN THE RESIDENTIAL SECTOR IN GREATER CAIRO, ENERGY EFFICIENCY IMPROVEMENT AND GREENHOUSE GAS REDUCTION PROJECT CAIRO.
• GEOFFREY T AND KELVIN Y., 2003. A STUDY OF DOMESTIC ENERGY USAGE PATTERNS IN HONG KONG. ENERGY; VOL. 28, PP. 1671-1682.
• GEORGY R. AND SOLIMAN A., 2007. ENERGY EFFICIENCY AND RENEWABLE ENERGY EGYPT-NATIONAL STUDY. CAIRO: NREA.
• GIDS, W.D., 2001. HYBRID VENTILATION CONCEPTS CLASSIFICATION AND CHALLENGES, 2ND INTERNATIONAL ONE-DAY FORUM ON HYBRID VENTILATION: AN INTEGRAL SOLUTION FOR VENTILATION, HEALTH AND ENERGY. CAUBERG, H., ED., UNIVERSITY OF TECHNOLOGY, DELFT, THE NETHERLANDS, PP.21-27.
• GILIJAMSE, W. 1995. ZERO ENERGY HOUSES IN THE NETHERLANDS. IBPSA, MADISON, WISCONSIN.
• GIVONI, B., 1969. MAN, CLIMATE AND ARCHITECTURE, AMSTERDAM; LONDON, ELSEVIER. • GIVONI, B., 1991. PERFORMANCE AND APPLICABILITY OF PASSIVE AND LOW-ENERGY
COOLING SYSTEMS. ENERGY AND BUILDINGS, VOL. 17(3), PP. 177-199
239

• GIVONI, B., 1992. COMFORT, CLIMATE ANALYSIS AND BUILDING DESIGN GUIDELINES. ENERGY AND BUILDINGS, VOL. 18(1), PP. 11-23.
• GIVONI, B., 1994. PASSIVE AND LOW ENERGY COOLING OF BUILDINGS, NEW YORK, VAN NOSTRAND REINHOLD.
• GIVONI, B., 1998. CLIMATE CONSIDERATIONS IN BUILDING AND URBAN DESIGN, NEW YORK; LONDON, VAN NOSTRAND REINHOLD.
• GOMAA, A., HAMZA, N. AND UNDERWOOD, C., 2007. THREE-DIMENSIONAL CFD NUMERICAL ANALYSIS OF DOUBLE SKIN FACADES FOR HOT ARID CLIMATES. IN: PROCEEDINGS OF HEAT SET-2007 CONFERENCE. 2007, CHAMBERY, FRANCE.
• GONCALVES, H. 1993. BUILDING SIMULATION IN PRACTICE: THE PORTUGUESE EXPERIENCE. PROCEEDINGS OF THE THIRD IBPSA CONFERENCE. ADELAIDE, AUSTRALIA. PP. 119 –125.
• GONZALEZ P. AND ZAMARRENO, J., 2005. PREDICTION OF HOURLY ENERGY CONSUMPTION IN BUILDINGS BASED ON A FEEDBACK ARTIFICIAL NEURAL NETWORK, ENERGY AND BUILDINGS; VOL. 37(6), PP. 595-601.
• GRATIA, E. AND DE HERDE, A. 2002. A SIMPLE DESIGN TOOL FOR THE THERMAL STUDY OF AN OFFICE BUILDING. ENERGY AND BUILDINGS, VOL. 34, PP. 279-289.
• GRATZFELD, J., 2003. CHAPTER ONE: CHARACTERISTICS OF ARID ENVIRONMENTS, EXTRACTIVE INDUSTRIES IN ARID AND SEMI-ARID ZONES: ENVIRONMENTAL PLANNING AND MANAGEMENT. GLAND, SWITZERLAND; CAMBRIDGE, IUCN.
• GUZOWSKI, M., 2010. TOWARDS ZERO-ENERGY ARCHITECTURE: NEW SOLAR DESIGN, LAURENCE KING PUBLISHERS.
• HANNA, G., 2004. ENERGY ANALYSIS FOR NEW RESIDENTIAL BUILDINGS IN EGYPT. IN: INTERNATIONAL FUTURE VISION AND CHALLENGES FOR URBAN DEVELOPMENT CONFERENCE. CAIRO.
• HANSEN, H., 2007. SENSITIVITY ANALYSIS AS A METHODICAL APPROACH TO THE DEVELOPMENT OF DESIGN STRATEGIES FOR ENVIRONMENTALLY SUSTAINABLE BUILDINGS, PHD DISSERTATION, DEPARTMENT OF ARCHITECTURE AND DESIGN, AALBORG UNIVERSITY. 284.
• HAMZA, N., 2004, THE PERFORMANCE OF DOUBLE SKIN FACADES IN OFFICE BUILDING REFURBISHMENT IN HOT ARID AREAS, PHD, UNI. OF NEWCASTLE UPON TYNE, UK
• HARRIMAN, L., 2008. THE ASHRAE GUIDE FOR BUILDINGS IN HOT AND HUMID CLIMATES. VOL. 1, ATLANTA: ASHRAE.
• HAYTER, S., TORCELLINI, P. ET AL., 2001. THE ENERGY DESIGN PROCESS FOR DESIGNING AND CONSTRUCTING HIGH-PERFORMANCE BUILDINGS, CLIMA 2000/NAPOLI 2001 WORLD CONGRESS.
• HBRC, 2005, EGYPTIAN CODE FOR ENERGY EFFICIENCY IMPROVEMENT IN RESIDENTIAL BUILDINGS, ECP306/, CAIRO
• HBRC, 2010, EGYPTIAN CODE FOR ENERGY EFFICIENCY IMPROVEMENT IN COMMERCIAL BUILDINGS, ECP306/2, CAIRO.
• HEIDARI, S. AND SHARPLES, S., 2002. A COMPARATIVE ANALYSIS OF SHORT-TERM AND LONGTERM THERMAL COMFORT SURVEYS IN IRAN. ENERGY AND BUILDINGS, VOL. 34(6), PP. 607-614.
• HELLWIG, R. T., BRASCHE, S. AND BISCHOF, W., 2006. THERMAL COMFORT IN OFFICES: NATURAL VENTILATION VS. AIR CONDITIONING, CONFERENCE COMFORT AND ENERGY USE IN BUILDINGS, WINDSOR, UK.
• HEISELBERG, P., 2002. PRINCIPLES OF HYBRID VENTILATION. DEPARTMENT OF BUILDING TECHNOLOGY AND STRUCTURAL ENGINEERING, AALBORG UNIVERSITY, PP. 73.
• HEISELBERG, P.K., DELSANTE, A. AND VIK, T.A., 2001. HYBRID VENTILATION: STATE-OF THE-ART REVIEW, PROCEEDINGS OF THE 2ND INTERNATIONAL ONE DAY FORUM ON HYBRID VENTILATION, DELFT, THE NETHERLANDS.
• HEISELBERG, P. AND TJELFLAAT, P.O., 1999. DESIGN PROCEDURE FOR HYBRID VENTILATION, AALBORG, DEPARTMENT OF BUILDING TECHNOLOGY AND STRUCTURAL ENGINEERING, AALBORG UNIVERSITY.
240

• HENNING, H., 2011, SOLAR COOLING POSITION PAPER, TASK 38 SOLAR AIR-CONDITIONING AND REFRIGERATION, AVAILABLE ONLINE AT: HTTP://WWW.IEA-SHC.ORG/PUBLICATIONS/DOWNLOADS/IEA-SHC-SOLAR-COOLING-POSITION-PAPER.PDF, [ACCESSED 25 JUN 2011].
• HENNING, H., 2010, SOLAR AIR-CONDITIONING AND REFRIGERATION ACHIEVEMENTS AND CHALLENGE, EUROSUN 2010, GRAZ, AUSTRIA.
• HENNING, H., 2004, SOLAR ASSISTED AIR-CONDITIONING IN BUILDINGS, SPRINGER, WIEN NEW YORK.
• IEA, 2002, TASK 25: SOLAR ASSISTED AIR CONDITIONING OF BUILDINGS, AVAILABLE ONLINE AT: HTTP://WWW.IEA-SHC-TASK25.ORG/ [ACCESSED 13 FEB 2010].
• HENSEN, J., 2004.TOWARDS MORE EFFECTIVE USE OF BUILDING PERFORMANCE SIMULATION IN DESIGN. 7TH INTERNATIONAL CONFERENCE ON DESIGN & DECISION SUPPORT SYSTEMS IN ARCHITECTURE AND URBAN PLANNING. 2004 EINDHOVEN: TU/E.
• HENSEN, J. LAMBERTS, R. AND NEGRAO, C., 2002. BUILDING PERFORMANCE SIMULATION AT THE START OF THE 3RD MILLENNIUM, BUILDING AND ENVIRONMENT, VOL. 37, PP. 765-767.
• HERNANDEZ, P. AND KENNY, P., 2010. FROM NET ENERGY TO ZERO ENERGY BUILDINGS: DEFINING LIFE CYCLE ZERO ENERGY BUILDINGS (LC-ZEB), ENERGY AND BUILDINGS, VOL. 42, ISS. 6, JUNE 2010, PP. 815-821.
• HILLS, E. S., 1966. ARID LANDS: A GEOGRAPHICAL APPRAISAL. LONDON: METHUEN; PARIS: UNESCO.
• HONG, T., CHOU, S.K. AND BONG, T.Y., 2000. BS: AN OVERVIEW OF DEVELOPMENTS & INFORMATION SOURCES. BUILDING & ENVIRONMENT, 2000. VOL. 35, PP. 347-361.
• HOPFE, C., 2009. UNCERTAINTY AND SENSITIVITY ANALYSIS IN BUILDING PERFORMANCE SIMULATION FOR DECISION SUPPORT AND DESIGN OPTIMIZATION, PHD DISSERTATION, TECHNICAL UNIVERSITY OF EINDHOVEN, THE NETHERLANDS.
• HOPFE, C., ET AL. 2005. EXPLORATION OF USING BUILDING PERFORMANCE SIMULATION TOOLS FOR CONCEPTUAL BUILDING DESIGN. IN IBPSA-NVL CONFERENCE. DELFT, NETHERLANDS.
• HUANG, J., ET AL., 2003, THE DEVELOPMENT OF RESIDENTIAL AND COMMERCIAL BUILDING ENERGY STANDARDS FOR EGYPT. ED. ENERGY CONSERVATION IN BUILDINGS WORKSHOP PROCEEDINGS, KUWAIT.1-16
• IBPSA, AVAILABLE ONLINE AT: HTTP://WWW.IBPSA.ORG/, [ACCESSED 10/04/2011] • ICC INTERNATIONAL CODE COUNCIL, 2006. INTERNATIONAL ENERGY CONSERVATION
CODE (IECC), WASHINGTON DC, INTERNATIONAL CODE COUNCIL. • IDA, 2003. ANNUAL REPORT: INDUSTRIAL DEVELOPMENT AGENCY. CAIRO; (IN ARABIC). • IEA, 2011. TASK 40/ANNEX 52, 2008. TOWARDS NET ZERO ENERGY SOLAR BUILDINGS,
IEA SHC TASK 40 AND ECBCS ANNEX 52, AVAILABLE ONLINE AT: HTTP://WWW.IEA-SHC.ORG/TASK40/INDEX.HTML, [ACCESSED 10 JANUARY 2011].
• IEA, 2010, TASK 38: SOLAR AIR-CONDITIONING AND REFRIGERATION, AVAILABLE ONLINE AT: HTTP://WWW.IEA-SHC-TASK25.ORG/ [ACCESSED 13 FEBRUARY 2010].
• IEA, 2009. TASK 41- SOLAR ENERGY SYSTEMS, SOLAR ARCHITECTURE. AVAILABLE ONLINE AT: HTTP://WWW.IEA-SHC.ORG/TASK41/, [ACCESSED 15 JAN 2011].
• IEA, INTERNATIONAL ENERGY AGENCY, 2002. IEA - ECBCS ANNEX 35 - HYBVENT: HYBRID VENTILATION. AVAILABLE ONLINE AT: HTTP://HYBVENT.CIVIL.AUC.DK/ANNEX35/INDEX_ANNEX35.HTM [ACCESSED 24 MAR 2009].
• IEA, INTERNATIONAL ENERGY AGENCY, 2001. IEA - ECBCS ANNEX 28 - LOW ENERGY COOLING. AVAILABLE ONLINE AT: HTTP://WWW.ECBCS.ORG/DOCS/ANNEX_28_TECHNOLOGY_SELECTION.PDF [ACCESSED 24 MARCH 2009].
• IES VE.2010, AVAILABLE ONLINE AT: HTTP://WWW.IESVE.COM/SOFTWARE/MODEL-BUILDING/SKETCHUP-PLUG-IN [ACCESSED 24 MAY 2010].
241

• INCOM, 2008. A STUDY ON THE PENETRATION OF IRON MACHINES, FANS, AND MIXER IN EGYPTIAN APARTMENTS FOR ADVANCED SYSTEM COMPANY. CAIRO, (IN ARABIC).
• IQBAL, M., 2002. A FEASIBILITY STUDY OF A ZERO ENERGY HOME IN NEWFOUNDLAND. RENEWABLE ENERGY VOL. 29: PP. 277–289.
• ISE, 2009. PVSYST 5.02. AVAILABLE ONLINE AT: HTTP://WWW.PVSYST.COM/5.0/. [ACCESSED AUGUST 2008].
• ISO/IEC 25062, 2006. SOFTWARE ENGINEERING: SOFTWARE PRODUCT QUALITY REQUIREMENTS AND EVALUATION COMMON INDUSTRY FORMAT FOR USABILITY TEST REPORTS, ISO/IEC, GENEVA
• ISO 9241-11, 1998. ERGONOMIC REQUIREMENTS FOR OFFICE WORK WITH VISUAL DISPLAY TERMINALS (VDTS) -- PART 11: GUIDANCE ON USABILITY, INTERNATIONAL ORGANIZATION FOR STANDARDIZATION (1998)
• JAGPAL, R., 2006. CONTROL STRATEGIES FOR HYBRID VENTILATION IN NEW AND RETROFITTED OFFICE AND EDUCATION BUILDINGS (HYBVENT: TECHNICAL SYNTHESIS REPORT), UK, FABER MAUNSELL LTD.
• JANDA, K.B., 2009. WORLDWIDE STATUS OF ENERGY STANDARDS FOR BUILDINGS: A 2009 UPDATE, ECEEE (EUROPEAN COUNCIL FOR AN ENERGY EFFICIENT ECONOMY) PROCEEDINGS, ENVIRONMENTAL CHANGE INSTITUTE, OXFORD UNIVERSITY; BUILDING CODES ASSISTANCE PROJECT (BCAP).
• KALAY, Y., 1999, PERFORMANCE-BASED DESIGN, AUTOMATION IN CONSTRUCTION, VOL. 8 (4), PP. 395–409.
• KARATASOU, S., SANTAMOURIS, M. AND GEROS, V., 2006. MODELING AND PREDICTING BUILDING'S ENERGY USE WITH ARTIFICIAL NEURAL NETWORKS: METHODS AND RESULTS. ENERGY AND BUILDINGS, VOL. 38(8): PP. 949-958.
• KEMPTON, W. AND LUTZENHISER L., 1992. INTRODUCTION TO SPECIAL ISSUE ON SOCIAL AND CULTURAL ASPECTS OF COOLING. ENERGY AND BUILDINGS. VOL. 18(3–4), PP. 171–176.
• KHALI,L E., 2005. ENERGY PERFORMANCE OF BUILDINGS DIRECTIVE IN EGYPT: A NEW DIRECTION. HBRC JOURNAL, VOL. 1(11), PP. 197-213.
• KHALIL, E., 2006. BASELINE STUDY FOR EGYPT, ENERGY EFFICIENCY IN THE CONSTRUCTION SECTOR IN MEDITERRANEAN, ENERGY RESEARCH CENTER FACULTY OF ENGINEERING; CAIRO UNIVERSITY. <HTTP://WWW.MED-ENEC.COM/SITES/DEFAULT/FILES/USER_FILES/DOWNLOADS/EGY%20BASELINE%20STUDY.PDF>.
• KHALIL, E. 2009, CFD APPLICATIONS FOR THE PRESERVATION OF THE TOMBS OF THE VALLEY OF KINGS, LUXOR, BUILDING SIMULATION 2009, GLASGOW, SCOTLAND, 1865-1871
• KHATTAB AS., 2007. THE IMPACT OF REDUCING ENERGY SUBSIDIES ON ENERGY INTENSIVE INDUSTRIES IN EGYPT. ECES WORKING PAPER NO.124.
• KILKIS, S., 2007. “A NEW METRIC FOR NET-ZERO CARBON BUILDINGS,” IN ENERGY SUSTAINABILITY, CALIFORNIA.
• KOCH-NIELSEN, H., 2002. STAY COOL: A DESIGN GUIDE FOR THE BUILT ENVIRONMENT IN HOT CLIMATES. LONDON, UK: JAMES & JAMES. 159 P.
• KOENIGSBERGER, O., 1974. MANUAL OF TROPICAL HOUSING AND BUILDING, HARLOW, LONGMAN.
• KOLOKOTSA, D. ET AL., 2010. A ROADMAP TOWARDS INTELLIGENT NET ZERO- AND POSITIVE-ENERGY BUILDINGS, SOLAR ENERGY, VOL. 85, ISSUE 12, DECEMBER 2011, PAGES 3067-3084, ISSN 0038-092X, 10.1016/J.SOLENER.2010.09.001.
• KOSIK, W.J., 2001. DESIGN STRATEGIES FOR HYBRID VENTILATION. ASHRAE JOURNAL, VOL. 43(10), PP. 18-19, 22-24.
• KOTTEK, M., GRIESER, J., BECK, C., RUDOLF, B. AND RUBEL, F., 2006. WORLD MAP OF THE KÖPPEN-GEIGER CLIMATE CLASSIFICATION UPDATED. METEOROLOGISCHE ZEITSCHRIFT, VOL. 15, PP. 259-263.
242

• KUSUDA, T., 1999. EARLY HISTORY AND FUTURE PROSPECTS OF BUILDINGS SYSTEM SIMULATION. IBPSA. JAPAN.
• KWOK, A., GRONDZIK, W., 2006, THE GREEN STUDIO HANDBOOK: ENVIRONMENTAL STRATEGIES FOR SCHEMATIC DESIGN, ARCHITECTURAL PRESS
• LABS, K. AND WATSON, D., 1981. ANALYSIS OF WEATHER DATA FOR DETERMINING APPROPRIATE CLIMATE CONTROL STRATEGIES IN ARCHITECTURAL DESIGN. UNITED STATES, PP. 83-87.
• LAM JC, WAN KKW, WONG SL, LAM TNT., 2010. LONG-TERM TRENDS OF HEAT STRESS AND ENERGY USE IMPLICATIONS IN SUBTROPICAL CLIMATES. APPLIED ENERGY, VOL. 87(2), PP. 608-612.
• LAM, K.P., ET. AL, 2004. ENERGY MODELLING TOOLS ASSESSMENT FOR EARLY DESIGN PHASE. RESEARCH REPORT, PORTLAND, CARNEGIE MELLON UNIVERSITY, PITTSBURGH.
• LAM J., 2000. RESIDENTIAL SECTOR AIR CONDITIONING LOADS AND ELECTRICITY USE IN HONG KONG. ENERGY CONVERSION & MANAGEMENT, VOL. 41, PP. 1757-1768.
• LAM, K.P., N.H. WONG, AND HENRY, F., 1999. A STUDY OF THE USE OF PERFORMANCE-BASED SIMULATION TOOLS FOR BUILDING DESIGN AND EVALUATION IN SINGAPORE. IN IBPSA. KYOTO, JAPAN.
• LAM J., 1996. AN ANALYSIS OF RESIDENTIAL SECTOR ENERGY USE IN HONG KONG. ENERGY, VOL. 21(1), PP. 1-8.
• LAM, K.P., WONG, N.H. AND HENRY, F., 1993. A STUDY OF THE USE OF PERFORMANCE-BASED SIMULATION TOOLS FOR BUILDING DESIGN & EVALUATION IN SINGAPORE. IBPSA. KYOTO, JAPAN.
• LA ROCHE, P., 2001. PASSIVE COOLING SYSTEMS FOR DEVELOPING COUNTRIES, THE FIRST INTERNATIONAL CONFERENCE ON OPEN SOURCE DESIGN, MASSACHUSETTS INSTITUTE OF TECHNOLOGY, MEDIA LAB CAMBRIDGE, MA.
• LAWSON, B., 2006. HOW DESIGNERS THINK: THE DESIGN PROCESS DEMYSTIFIED, (4TH ED.) AMSTERDAM; LONDON, ARCHITECTURAL.
• LBNL AND HIRSCH, J., 2009A. DOE-2. AVAILABLE ONLINE AT: HTTP://WWW.DOE2.COM/ [ACCESSED NOVEMBER 2009].
• LENOIR, A. AND GARD, F. 2011. ZERO ENERGY BUILDINGS IN FRANCE: OVERVIEW AND FEEDBACK, ASHRAE TRANSACTIONS. VOLUME 117, PART 2.
• LEVERMORE, G.J. AND PARKINSON, J.B., 2006. ANALYSES AND ALGORITHMS FOR NEW TEST REFERENCE YEARS AND DESIGN SUMMER YEARS FOR THE UK. BUILDING SERVICE ENGINEERING RESEARCH AND TECHNOLOGY, VOL. 27(4), PP. 311-325.
• LEWIS, J.R., 1991. ‘PSYCHOMETRIC EVALUATION OF AN AFTER-SCENARIO QUESTIONNAIRE FOR COMPUTER USABILITY STUDIES: THE ASQ’, SIGCHI BULLETIN NO. 23, PP. 78–81.
• LIÉBARD, A. AND DE HERDE, A., 2006. TRAITÉ D'ARCHITECTURE ET D'URBANISME BIOCLIMATIQUES : CONCEVOIR, ÉDIFIER ET AMÉNAGER AVEC LE DÉVELOPPEMENT DURABLE, PARIS: OBSER'VER
• LI, Y. AND HEISELBERG, P., 2003. ANALYSIS METHODS FOR NATURAL AND HYBRID VENTILATION-A CRITICAL LITERATURE REVIEW AND RECENT DEVELOPMENTS. INTERNATIONAL JOURNAL OF VENTILATION, VOL. 1, PP. 3-20.
• LI, Y., 2001. ANALYSIS METHODS AND TOOLS FOR HYBRID VENTILATION SYSTEMS. IN H. CAUBERG (ED.) PROCEEDINGS OF THE 2ND INTERNATIONAL ONE-DAY FORUM ON HYBRID VENTILATION: AN INTEGRAL SOLUTION FOR VENTILATION, HEALTH AND ENERGY. DELFT, PP. 82-113.
• LIDDAMENT, M.W., 2000. IEA ECBCS ANNEX 28: LOW ENERGY COOLING. ESSU (EXCO SUPPORT SERVICES UNIT), COVENTRY, UK. AVAILABLE ONLINE AT: HTTP://WWW.ECBCS.ORG /DOCS/ANNEX_28_CASE_STUDY_BUILDINGS.PDF [ACCESSED 15 APRIL 2009].
• LOHRNANN, U., SAUSEN, R., BENGTSSON, L., CUBASCH, U., PERLWITZ, J. AND ROECKNER, E., 1993. THE KÖPPEN CLIMATE CLASSIFICATION AS A DIAGNOSTIC TOOL FOR GENERAL CIRCULATION MODELS. CLIMATE RESEARCH, VOL. 3, PP. 177-193.
243

• LOMAS, K. J., COOK, M. J. AND FIALA, D., 2007. LOW ENERGY ARCHITECTURE FOR A SEVERE US CLIMATE: DESIGN AND EVALUATION OF A HYBRID VENTILATION STRATEGY. ENERGY AND BUILDINGS, VOL. 39(1), PP. 32-44.
• LOMAS, K. J., FIALA, D., COOK, M. J. AND CROPPER, P. C., 2004. BUILDING BIOCLIMATIC CHARTS FOR NON-DOMESTIC BUILDINGS AND PASSIVE DOWNDRAUGHT EVAPORATIVE COOLING. BUILDING AND ENVIRONMENT, VOL. 39(6), PP. 661-676.
• LUO, Z., ZHAO, J., GAO, J. AND HE, L., 2007. ESTIMATING NATURAL-VENTILATION POTENTIAL CONSIDERING BOTH THERMAL COMFORT AND IAQ ISSUES. BUILDING AND ENVIRONMENT, VOL. 42(6), PP. 2289-2298.
• PETERSEN, S. AND SVENDSEN, S., 2010. METHOD AND SIMULATION PROGRAM INFORMED DECISIONS IN THE EARLY STAGES OF BUILDING DESIGN, ENERGY AND BUILDINGS, VOL. 42 (7), PP. 1113-1119.
• MACMILLAN S, KÖHLER J., 2004. MODELLING ENERGY USE IN THE GLOBAL BUILDING STOCK: A PILOT SURVEY TO IDENTIFY AVAILABLE DATA SOURCES. TECHNICAL REPORT 6, TYNDALL CENTRE FOR CLIMATE CHANGE RESEARCH.
• MAHDAVI, A. ET AL., 2005. EFFORT AND EFFECTIVENESS CONSIDERATIONS IN COMPUTATIONAL DESIGN EVALUATION: A CASE STUDY, BUILDING AND ENVIRONMENT, VOL. 40, PP. 1651-1664.
• MAHDAVI, A., F. SILVANA, ET AL. 2003. AN INQUIRY INTO BUILDING PERFORMANCE SIMULATION TOOLS USAGE BY ARCHITECTS IN AUSTRIA. IBPSA, EINDHOVEN.
• MAHDAVI, A. 1998. COMPUTATIONAL DECISION SUPPORT & THE BUILDING DELIVERY PROCESS: A NECESSARY DIALOGUE. AUTOMATION IN CONSTRUCTION, VOL. 7: PP. 205-211.
• MAHDAVI, A. AND LAM, K., 1993. A DIALECTIC OF PROCESS AND TOOL: KNOWLEDGE TRANSFER AND DECISION-MAKING STRATEGIES IN BUILDING DELIVERY PROCESS. THE MANAGEMENT OF INFORMATION TECHNOLOGY FOR CONSTRUCTION, FIRST INTERNATIONAL CONFERENCE.
• MANSOURI I, NEWBOROUGH M, PROBERT D., 1996. ENERGY CONSUMPTION IN UK HOUSEHOLDS: IMPACT OF DOMESTIC ELECTRICAL APPLIANCES. APPLIED ENERGY, VOL. 54(3): PP. 211-285.
• MARSH, A., 2004, PERFORMANCE ANALYSIS AND CONCEPT DESIGN: THE PARALLEL NEEDS OF CLASSROOM & OFFICE, WELSH SCHOOL OF ARCHITECTURE. BETWEEN RESEARCH AND PRACTICE CONFERENCE, ARCC AND EAAE TRANSACTIONS ON ARCHITECTURAL EDUCATION, DUBLIN. AVAILABLE ONLINE AT: HTTP://COMPANYSHED.COM/1023649200/DOCUMENTS/2004_ARCC.PDF [ACCESSED 1 MARCH 2011].
• MARSZAL, A., ET AL, 2011. ZERO ENERGY BUILDING – A REVIEW OF DEFINITIONS AND CALCULATION METHODOLOGIES. ENERGY AND BUILDINGS, VOL. 43 (4), PP. 971-979.
• MARSZAL, A. J., BOURELLE, J. S., MUSALL, E., GUSTAVSEN, A., HEISELBEBRG, P. AND VOSS, K., 2010. NET ZERO ENERGY BUILDINGS: CALCULATION METHODOLOGIES – AN INTERNATIONAL VIEW, IN THE PROCEEDINGS OF EUROSUN 2010, GRAZ, AT.
• MARSZAL, A. AND HEISELBERG, P., 2009. ZERO ENERGY BUILDING (ZEB) DEFINITIONS - A LITERATURE REVIEW, IN D.O.C. ENGINEERING. AALBORG UNIVERSITY.
• MERMOUD, A., 1994, PVSYST: A USER-FRIENDLY SOFTWARE FOR PV-SYSTEMS SIMULATION. IN TWELFTH EUROPEAN PHOTOVOLTAIC SOLAR ENERGY CONFERENCE: PROCEEDINGS OF THE INTERNATIONAL CONFERENCE. AMSTERDAM, THE NETHERLANDS.
• MERTZ, G., RAFFIO, G. ET AL., 2007. COST OPTIMIZATION OF NET-ZERO ENERGY HOUSE. ENERGY SUSTAINABILITY, CALIFORNIA.
• METEOTEST, REMUND, J. AND KUNZ, S., 2003. THEORY PART II: TEMPERATURE AND ADDITIONAL PARAMETERS, METEONORM HANDBOOK. BERN, SWITZERLAND, METEOTEST. AVAILABLE ONLINE AT: HTTP://WWW.METEOTEST.CH/PDF/AM/THEORY_2.PDF [ACCESSED 23 JAN 2009].
• MHE, 2011. MINISTRY OF HIGHER EDUCATION OF EGYPT, AVAILABLE ONLINE AT: HTTP://WWW.MOHE-
244

CASM.EDU.EG/MAIN_MENU/VERSION/DALEEL_TALEM_AALY/ENGLISH.PDF, [ACCESSED 10 APRIL 2011]
• MICHEL S, ELSAYED H., 2006. EXAMPLES OF LOW ENERGY DESIGN AT URBAN SCALE IN EGYPT. IN: 26TH INTERNATIONAL PLEA CONFERENCE,GENEVA; PP. 885-890.
• MOHAMED Z, BODGER P., 2005. FORECASTING ELECTRICITY CONSUMPTION IN NEW ZEALAND USING ECONOMIC AND DEMOGRAPHIC VARIABLES. ENERGY, VOL. 30(10), PP. 1833–43.
• MORBITZER, C., 2003. TOWARDS THE INTEGRATION OF SIMULATION INTO THE BUILDING DESIGN PROCESS, PHD DISSERTATION, DEPARTMENT OF MECHANICAL ENGINEERING, UNIVERSITY OF STRATHCLYDE, UK.
• MOURSHED, M., 2006. INTEROPERABILITY-BASED OPTIMIZATION OF ARCHITECTURAL DESIGN, PHD DISSERTATION, CIVIL AND ENVIRONMENTAL ENGINEERING AT THE NATIONAL UNIVERSITY OF IRELAND, CORK, IRELAND.
• MOURTADA, A., 2009. NATIONAL CONSULTATION EGYPT POLICIES FOR ENERGY EFFICIENCY IN BUILDINGS IN EGYPT ENERGY EFFICIENCY CODES IN THE POLICY MIX, JCEE, MED-ENEC, CAIRO. AVAILABLE ONLINE AT: HTTP://WWW.JCEE-EG.NET/DOWNLOAD.ASP?PATH=LIBRARY/NC%20BUILDING%20ENERGY%20EGYPT%2009%20REPORT%20090615.DOC, [ACCESSED 10 OCTOBER 2010]
• MTI, 2004. A STUDY ON THE APARTMENT APPLIANCES MARKET IN EGYPT: MINISTRY OF TRADE AND INDUSTRY. CAIRO; (IN ARABIC).
• MUMMA, S., 2001, CEILING PANEL COOLING SYSTEMS, ASHRAE JOURNAL , NOVEMBER 2001, PP. 28-32
• MURATA A., KONDOU Y, HAILIN M, WEISHENG Z., 2008. ELECTRICITY DEMAND IN THE CHINESE URBAN HOUSEHOLD-SECTOR. APPLIED ENERGY, VOL. 85(12), PP. 1113-1125.
• NAHAR, N.M., SHARMA, P. AND PUROHIT, M.M., 2003. PERFORMANCE OF DIFFERENT PASSIVE TECHNIQUES FOR COOLING OF BUILDINGS IN ARID REGIONS. BUILDING AND ENVIRONMENT, VOL. 38(1), PP. 109-116.
• NEUFERT, E., NEUFERT, P., BAICHE, B. AND WALLIMAN, N., 2000. ARCHITECTS' DATA, (3RD ED. / REV. BY BOUSMAHA BAICHE AND NICHOLAS WALLIMAN) MALDEN, MA, BLACKWELL SCIENCE PUBLISHERS.
• NICOL, F., 2004. ADAPTIVE THERMAL COMFORT STANDARDS IN THE HOT-HUMID TROPICS. ENERGY AND BUILDINGS; VOL. 36(7), PP. 628-637.
• NICOL, J.F. AND HUMPHREYS, M.A., 2002. ADAPTIVE THERMAL COMFORT AND SUSTAINABLE THERMAL STANDARDS FOR BUILDINGS. ENERGY AND BUILDINGS, VOL. 34(6), PP. 563-572.
• NICOL, J.F., RAJA, I.A., ALLAUDIN, A. AND JAMY, G.N., 1999. CLIMATIC VARIATIONS IN COMFORTABLE TEMPERATURES: THE PAKISTAN PROJECTS. ENERGY AND BUILDINGS, VOL. 30(3), PP. 261-279.
• NICOL, F. AND RAJA, I., 1996. THERMAL COMFORT, TIME AND POSTURE: EXPLORATORY STUDIES IN THE NATURE OF ADAPTIVE THERMAL COMFORT, OXFORD BROOKES UNIVERSITY, SCHOOL OF ARCHITECTURE.
• NICOL, F., HUMPHREYS, M. A., SYKES, O. AND ROAF, S., 1995. STANDARDS FOR THERMAL COMFORT: INDOOR AIR TEMPERATURE STANDARDS FOR THE 21ST CENTURY, LONDON, E & FN SPON.
• NREL 2011, BEOPT, AVAILABLE ONLINE AT: HTTP://BEOPT.NREL.GOV/ [ACCESSED NOVEMBER 2011].
• NREL, 2009A. PVWATTS V. 1. AVAILABLE ONLINE AT: HTTP://RREDC.NREL.GOV/SOLAR/CALCULATORS/PVWATTS/VERSION1/, [ACCESSED 15 JULY 2009].
• NREL, 2009B SOLAR ADVISOR MODEL. AVAILABLE ONLINE AT: HTTPS://WWW.NREL.GOV/ANALYSIS/SAM/, [ACCESSED 15 JULY 2009].
• NREL, 2009C. ENERGY-10. AVAILABLE ONLINE AT: HTTP://WWW.NREL.GOV/BUILDINGS/ENERGY10.HTML [ACCESSED NOVEMBER 2009].
245

• NREL, 2008. OPENSTUDIO 1.0.2. AVAILABLE ONLINE AT: HTTP://OPENSTUDIO.NREL.GOV/ [ACCESSED NOVEMBER 2011].
• O'BRIEN, W., ATHIENITIS, A., AND KESIK, T., 2009. THE DEVELOPMENT OF SOLAR HOUSE DESIGN TOOL. IN 11TH IBPSA CONFERENCE 2009. GLASGOW, PP. 1397-1404.
• OCHOA, C. AND CAPELUTO, G., 2009. ADVICE TOOL FOR EARLY DESIGN STAGES OF INTELLIGENT FACADES BASED ON ENERGY AND VISUAL COMFORT APPROACH, ENERGY AND BUILDINGS, VOL. 41, PP. 480–488.
• OEP, AU., 2002. ANALYSIS OF ENERGY CONSUMPTION PATTERN AND ENVIRONMENTAL INDICATORS FOR THE RESIDENTIAL SECTOR OF ASYUT CITY. ASYUT UNIVERSITY, FACULTY OF ENGINEERING, ORGANIZATION FOR ENERGY PLANNING, CAIRO, EGYPT.
• OEP/DRTPC, 1999. ENERGY CONSUMPTION SURVEY ON THE RESIDENTIAL SECTOR IN CAIRO. DEVELOPMENT RESEARCH AND TECHNOLOGICAL PLANNING CENTER. CAIRO UNIVERSITY, CAIRO, EGYPT.
• OLGYAY, V., 1973. DESIGN WITH CLIMATE: BIOCLIMATIC APPROACH TO ARCHITECTURAL REGIONALISM, S.L. ED.: PRINCETON/U PRESS.
• OLGYAY, V. AND OLGYAY, A., 1963. DESIGN WITH CLIMATE: BIOCLIMATIC APPROACH TO ARCHITECTURAL REGIONALISM. SOME CHAPTERS BASED ON COOPERATIVE RESEARCH WITH ALADAR OLGYAY, PRINCETON, N.J, PRINCETON UNIVERSITY PRESS.
• OSELAND, N., 1999. ENVIRONMENTAL FACTORS AFFECTING OFFICE WORKER PERFORMANCE: A REVIEW OF EVIDENCE. REPORT FOR TECHNICAL MEMORANDA TM24: CIBSE, LONDON.
• OSELAND N., 1994. A COMPARISON OF THE PREDICTED AND REPORTED THERMAL SENSATION VOTE IN HOMES DURING WINTER AND SUMMER, ENERGY AND BUILDINGS, VOL. 21, PP. 45-9.
• PACHAURI S., 2004. AN ANALYSIS OF CROSS-SECTIONAL VARIATIONS IN TOTAL HOUSEHOLD ENERGY REQUIREMENTS IN INDIA USING MICRO SURVEY DATA. ENERGY POLICY, VOL. 32, PP. 1723–1735.
• PAGLIANO, L. AND ZANGHERI, P. 2010. COMFORT MODELS AND COOLING OF BUILDINGS IN THE MEDITERRANEAN ZONE, ADVANCES IN BUILDING ENERGY RESEARCH, EARTHSCAN, VOLUME 4, NUMBER 1, 2010 , PP. 167-200(34).
• PAPPARELLI, A., KURBAN, A. AND CUNSULO, M., 1996. STRATEGIES FOR BIOCLIMATIC DESIGN IN AN URBAN AREA OF AN ARID ZONE: SAN JUAN (ARGENTINA). LANDSCAPE AND URBAN PLANNING, VOL. 34(1), PP. 19-25.
• PARSONS, K. C., 1995. ISO STANDARDS AND THERMAL COMFORT: RECENT DEVELOPMENTS, IN: F. NICOL, M. A. HUMPHREYS, O. SYKES & S. ROAF (EDS) STANDARDS FOR THERMAL COMFORT: INDOOR AIR TEMPERATURE STANDARDS FOR THE 21ST LONDON, E & FN SPON.
• PEDERSEN, L., 2007. USE OF DIFFERENT METHODOLOGIES FOR THERMAL LOAD AND ENERGY ESTIMATIONS IN BUILDINGS INCLUDING METEOROLOGICAL AND SOCIOLOGICAL INPUT PARAMETERS. RENEWABLE AND SUSTAINABLE ENERGY REVIEWS, VOL. 11(5), PP. 998-1007.
• PEEL, M.C., FINLAYSON, B.L. AND MCMAHON, T.A., 2007. UPDATED WORLD MAP OF THE KÖPPEN-GEIGER CLIMATE CLASSIFICATION. HYDROLOGY AND EARTH SYSTEM SCIENCES, VOL. 4, PP. 439-473.
• PETERSEN, S. AND SVENDSEN, S., 2010. METHOD AND SIMULATION PROGRAM INFORMED DECISIONS IN THE EARLY STAGES OF BUILDING DESIGN, ENERGY AND BUILDINGS, VOL. 42 (7), PP. 1113-1119.
• PILGRIM, M., 2003, THE APPLICATION OF VISUALISATION TECHNIQUES TO THE PROCESS OF BUILDING PERFORMANCE, ANALYSIS, PHD DISSERTATION, DEPARTMENT OF CIVIL & BUILDING ENGINEERING , LOUGHBOROUGH UNIVERSITY
• PFAFFEROTT, J.Ü., HERKEL, S., KALZ, D.E. AND ZEUSCHNER, A., 2007. COMPARISON OF LOW-ENERGY OFFICE BUILDINGS IN SUMMER USING DIFFERENT THERMAL COMFORT CRITERIA. ENERGY AND BUILDINGS, VOL. 39(7), PP. 750-757.
246

• PLOKKER, W., SOETHOUT, L.L., 1997. INTEGRATION OF BUILDING DESIGN TOOLS IN DUTCH PRACTICE. PROC. OF THE FIFTH IBPSA CONFERENCE. PRAGUE, CZECH REPUBLIC. PP. 219 – 224.
• PUNJABI, S. AND MIRANDA. V., 2005. DEVELOPMENT OF AN INTEGRATED BUILDING DESIGN INFORMATION INTERFACE. IN IBPSA. MONTREAL, CANADA.
• RABAH, K. AND TAMAKAN, Z., 2002. APPLICATION OF ARCHIPAK FOR DEVELOPMENT OF PASSIVE SOLAR ENERGY-EFFICIENT BUILDING IN NORTH CYPRUS. ARCHITECTURAL SCIENCE REVIEW, VOL. 45(3), PP. 219-230.
• RANJAN M, JAIN V.K., 1999. MODELLING OF ELECTRICAL ENERGY CONSUMPTION IN DELHI. ENERGY, VOL. 24(4), PP. 351–61.
• RIBA ROYAL INSTITUTE OF BRITISH ARCHITECTS, 2008. RIBA PLAN OF WORK STAGES, AVAILABLE ONLINE AT: HTTP://WWW.PEDR.CO.UK/TEXTPAGE.ASP?MENU=1A&SORTORDER=130&AREA=MAIN, [ACCESSED 16 FEBRUARY 2010].
• RIETHER, G., AND BUTLER,T., 2008. SIMULATION SPACE. A NEW DESIGN ENVIRONMENT FOR ARCHITECTS. IN 26TH ECAADE CONFERENCE PROCEEDINGS. MUYLLE M., ED., ANTWERP, BELGIUM
• RIJAL, H.B., HUMPHREYS, M.A. AND NICOL, J.F., 2008. HOW DO THE OCCUPANTS CONTROL THE TEMPERATURE IN MIXED-MODE BUILDINGS? PREDICTING THE USE OF PASSIVE AND ACTIVE CONTROLS, AIR CONDITIONING AND THE LOW CARBON COOLING CHALLENGE, WINDSOR, UK, 27-29 JULY 2008.
• RIJAL, H. B., HUMPHREYS, M. A. AND NICOL, F., 2009. UNDERSTANDING OCCUPANT BEHAVIOUR: THE USE OF CONTROLS IN MIXED-MODE OFFICE BUILDINGS. BUILDING RESEARCH & INFORMATION, VOL. 37(4), PP. 381-396.
• ROBAA, S., 2006. A STUDY OF SOLAR RADIATION CLIMATE AT CAIRO URBAN AREA, EGYPT AND ITS ENVIRONS. INTERNATIONAL JOURNAL OF CLIMATOLOGY, VOL. 26: PP. 1913-1928.
• ROSENLUND, H., 2000. CLIMATIC DESIGN OF BUILDING USING PASSIVE TECHNIQUES. HOUSING DEVELOPING & MANAGEMENT UNIT, LUND UNIVERSITY, 10(1).
• ROTH, K., DIECKMANN, J. AND BRODRICK, J., 2006. EMERGING TECHNOLOGIES NATURAL AND HYBRID VENTILATION. ASHRAE JOURNAL, VOL. 48(6), PP. H37-H38.
• ROWE, P. G., 1987. DESIGN THINKING, CAMBRIDGE, MASS., MIT PRESS. • SABERI, O., SANEEI, P. AND JAVANBAKHT, A., 2006. THERMAL COMFORT IN ARCHITECTURE,
CONFERENCE COMFORT AND ENERGY USE IN BUILDINGS, WINDSOR, UK. • SABRY, H., ET AL. 2010. INTEGRATION OF DAYLIGHTING SIMULATION SOFTWARE IN
ARCHITECTURAL EDUCATION, 597. IN COMPUTING IN CIVIL AND BUILDING ENGINEERING. NOTTINGHAM.
• SANTAMOURIS, M., 2007. ADVANCES IN PASSIVE COOLING, LONDON, EARTHSCAN. • SARTORI, ET AL., 2010. CRITERIA FOR DEFINITION OF NET ZERO ENERGY BUILDINGS, IN
THE PROCEEDINGS OF EUROSUN 2010, GRATZ, AT. • SARTORI, ET AL., 2012. NET ZERO ENERGY BUILDINGS: A CONSISTENT DEfiNITION
FRAMEWORK, ENERGY BUILDINGS, DOI:10.1016/J.ENBUILD.2012.01.032 • SAYIGH, A. AND MARAFIA, A.H., 1998. CHAPTER 1-THERMAL COMFORT AND THE
DEVELOPMENT OF BIOCLIMATIC CONCEPT IN BUILDING DESIGN. RENEWABLE AND SUSTAINABLE ENERGY REVIEWS, VOL. 2, PP. 3-24.
• SAYIGH, A., 1986. PASSIVE AND ACTIVE BUILDINGS IN THE GULF AREA. SOLAR & WIND TECHNOLOGY, VOL. 3(4), PP. 233-240.
• SHALTOUT, M., 1991. SOLAR ATLAS OF EGYPT, NREA/USAID/IDEA, CAIRO. • SHAVIV, E., 1999. INTEGRATING ENERGY CONSCIOUSNESS IN THE DESIGN PROCESS.
AUTOMATION IN CONSTRUCTION, VOL. 8(4), PP. 463-472. • SHERIF, A., ET AL., 2008. DEVELOPING A NEW ARCHITECTURE CURRICULUM: ACHIEVING
EDUCATIONAL GOALS WITHIN PROGRAM CONSTRAINTS. IN: THE OXFORD CONFERENCE, OXFORD, UK.
247

• SHETA, W. ET AL., 2010, A BUILDING SIMULATION SUSTAINABILITY ANALYSIS TO ASSESS DWELLINGS IN A NEW CAIRO DEVELOPMENT, SIMBUILD CONFERENCE OF IBPSA-USA, NEW YORK
• SIVAK, M., 2009. POTENTIAL ENERGY DEMAND FOR COOLING IN THE 50 LARGEST METROPOLITAN AREAS OF THE WORLD: IMPLICATIONS FOR DEVELOPING COUNTRIES. ENERGY POLICY, VOL. 37, PP. 1382-1384.
• SMITH, P. F., 2005. ARCHITECTURE IN A CLIMATE OF CHANGE: A GUIDE TO SUSTAINABLE DESIGN, (2ND ED.) AMSTERDAM; LONDON, ELSEVIER.
• SOLARSHOEBOX, AVAILABLE ONLINE AT: HTTP://SOLARSHOEBOX.COM/HELP/WELCOME.HTML [ACCESSED 15 JULY 2010].
• SOLIMAN A., 1996. LEGITIMIZING INFORMAL HOUSING: ACCOMMODATING LOW-INCOME GROUPS IN ALEXANDRIA, EGYPT. ENVIRONMENT AND URBANIZATION, VOL. 8(1), PP. 183-194.
• SOZEN A, ARCAKLIOGLU E, OZKAYMAK M., 2005. TURKEY'S NET ENERGY CONSUMPTION. APPLIED ENERGY, VOL. 81(2), PP. 209-221.
• SPF, 2011. SOLARTECHNIK PRUEFUNG FORSCHUNG: COLLECTORS TEST REPORTS AND FACT SHEETS, AVAILABLE ONLINE AT: HTTP://WWW.SOLARENERGY.CH/COLLECTORS.111.0.HTML?&L=6 [ACCESSED 15 MAY 2011].
• STRAND, R.K., 2001. MODELING A RADIANT SLAB COUPLED TO A COOLING TOWER USING THE NEW NATIONAL ENERGY ANALYSIS PROGRAM, COOLING FRONTIERS SYMPOSIUM, ARIZONA STATE UNIVERSITY, OCTOBER 4-7, 2001.
• SWAN L.G., UGURSAL V.I., 2009. MODELING OF END-USE ENERGY CONSUMPTION IN THE RESIDENTIAL SECTOR: A REVIEW OF MODELING TECHNIQUES. RENEWABLE AND SUSTAINABLE ENERGY REVIEWS, VOL. 13(8), PP. 1819-1835.
• SZOKOLAY, S.K., 2003. INTRODUCTION TO ARCHITECTURAL SCIENCE: THE BASIS OF SUSTAINABLE DESIGN, OXFORD, ARCHITECTURAL.
• SZOKOLAY, S.V., 1995. THE CPZ (CONTROL POTENTIAL ZONE) METHOD AND ITS USE TO DEVELOP CLIMATE ZONES. DEPT. OF ARCHITECTURE, THE UNIVERSITY OF QUEENSLAND, QLD. 4072, AUSTRALIA.
• SZOKOLAY, S.V., 1986. CLIMATE ANALYSIS BASED ON THE PSYCHROMETRIC CHART. INTERNATIONAL JOURNAL OF AMBIENT ENERGY, VOL. 7(4), PP. 171-182.
• TASSOU, S., 1998. LOW-ENERGY COOLING TECHNOLOGIES FOR BUILDINGS: CHALLENGES AND OPPORTUNITIES FOR THE ENVIRONMENTAL CONTROL OF BUILDINGS, BURY ST EDMUNDS, PROFESSIONAL ENGINEERING PUBLISHING FOR THE INSTITUTION OF MECHANICAL ENGINEERS.
• TENWOLDE, A. AND COLLIVER, D.G., 2001. WEATHER DATA, IN: H. R. TRECHSEL (ED.) MOISTURE ANALYSIS AND CONDENSATION CONTROL IN BUILDING ENVELOPES. WEST CONSHOHOCKEN, PA, ASTM.
• THORNTHWAITE C.W., 1948. AN APPROACH TOWARD A RATIONAL CLASSIFICATION OF CLIMATE. THE GEOGRAPHICAL REVIEW, VOL. 38(1), PP. 55–94
• TIAN, Z. AND LOVE, J.A., 2009B. APPLICATION OF RADIANT COOLING IN DIFFERENT CLIMATES: ASSESSMENT OF OFFICE BUILDINGS THROUGH SIMULATION, ELEVENTH INTERNATIONAL IBPSA CONFERENCE, GLASGOW, SCOTLAND, JULY 27-30, 2009.
• TIANZHEN, H., INQIAN, Z. AND YI, J., 1997. IISABRE: AN INTEGRATED BUILDING SIMULATION ENVIRONMENT. BUILDING & ENVIRONMENT, VOL. 32(3), PP. 219-224.
• TORCELLINI, P. AND D. CRAWLEY, 2008. UNDERSTANDING ZERO-ENERGY BUILDINGS. ASHRAE, 10.
• TORCELLINI, P., PLESS, S., AND DERU, M., 2006. ZERO ENERGY BUILDINGS: A CRITICAL LOOK AT THE DEFINITION, ACEEE, CALIFORNIA.
• TULLIS, T., ALBERT, B., 2008. MEASURING THE USER EXPERIENCE: COLLECTING, ANALYZING, AND PRESENTING USABILITY METRICS, MORGAN KAUFMANN, 336.
248

• TUNSTALL, G., 2006. MANAGING THE BUILDING DESIGN PROCESS, (2ND ED.) AMSTERDAM; LONDON, BUTTERWORTH-HEINEMANN.
• UCLA, 2009. HEED. AVAILABLE ONLINE AT: HTTP://MACKINTOSH.AUD.UCLA.EDU/HEED/ [ACCESSED NOVEMBER 2009].
• UNDP-GEF, 2010, ENERGY EFFICIENCY IMPROVEMENTS AND GREENHOUSE GAS REDUCTIONS. AVAILABLE ONLINE AT: HTTP://WWW.UNDP.ORG/GEF/PORTFOLIO/WRITEUPS/CC/EGYPT_EE.HTML, [ACCESSED 10 OKTOBER 2010]
• UNHDR, 2010. UNITED NATIONS HUMAN DEVELOPMENT REPORT. EGYPT HUMAN DEVELOPMENT REPORT. 2010. AVAILABLE ONLINE AT: <HTTP://WWW.UNDP.ORG.EG/DEFAULT.ASPX?TABID=227> [ACCESSED 14 NOVEMBER 2010].
• UNDP, 2003. UNDP EGYPT OFFICE. IN FACT: ENERGY EFFICIENCY IMPROVEMENT AND GREENHOUSE GAS (GHG) REDUCTION. SEPTEMBER 17TH; AVAILABLE ONLINE AT: <HTTP://WWW.UNDP.ORG.EG/PROGRAMME/UPDATED%20FACTSHEETS/ENV /EGY_97_G31.PDF> [ACCESSED 9 MAY 2010].
• UPADHYAY, A.K., YOSHIDA, H. AND RIJAL, H.B., 2006. CLIMATE RESPONSIVE BUILDING DESIGN IN THE KATHMANDU VALLEY. JOURNAL OF ASIAN ARCHITECTURE AND BUILDING ENGINEERING, VOL. 5(1), PP. 169-176.
• VAN DER LINDEN, A.C., BOERSTRA, A. C., RAUE, A.K., KURVERS, S.R. AND DE DEAR, R.J., 2006. ADAPTIVE TEMPERATURE LIMITS: A NEW GUIDELINE IN THE NETHERLANDS: A NEW APPROACH FOR THE ASSESSMENT OF BUILDING PERFORMANCE WITH RESPECT TO THERMAL INDOOR CLIMATE. ENERGY AND BUILDINGS, VOL. 38(1), PP. 8-17.
• VAN DIJK, E. AND LUSCUERE, P., 2002. AN ARCHITECT FRIENDLY INTERFACE FOR A DYNAMIC BUILDING SIMULATION PROGRAM. IN SUSTAINABLE BUILDING, NORWAY.
• VERMA, R., BANSAL, N.K. AND GARG, H.P., 1986. THE COMPARATIVE PERFORMANCE OF DIFFERENT APPROACHES TO PASSIVE COOLING. BUILDING AND ENVIRONMENT, VOL. 21, PP. 65-69.
• VISITSAK, S. AND HABERL, J., 2004. AN ANALYSIS OF DESIGN STRATEGIES FOR CLIMATE CONTROLLED- RESIDENCES IN SELECTED CLIMATES. SIMBUILD 2004, UNIVERSITY OF COLORADO, USA.
• VOSS, K., MUSALL, E., 2011, ZERO ENERGY BUILDINGS, DETAIL VERLAG, MUNICH. • VOSS, K., HERKEL, S., PFAFFEROTT, J., LOHNERT, G. AND WAGNER, A. 2007. ENERGY
EFFICIENT OFFICE BUILDINGS WITH PASSIVE COOLING - RESULTS AND EXPERIENCES FROM A RESEARCH AND DEMONSTRATION PROGRAMME. SOLAR ENERGY, VOL. 81(3), PP. 424-434.
• WAN K AND YIK F., 2004A. REPRESENTATIVE BUILDING DESIGN AND INTERNAL LOAD PATTERNS FOR MODELLING ENERGY USE IN RESIDENTIAL BUILDINGS IN HONG KONG. APPLIED ENERGY, VOL. 77, PP. 69-85.
• WAN K. AND YIK F., 2004B. BUILDING DESIGN AND ENERGY END-USE CHARACTERISTICS OF HIGH-RISE RESIDENTIAL BUILDINGS IN HONG KONG. APPLIED ENERGY, VOL. 78, PP. 19-36.
• WARREN, P., 2002. BRINGING SIMULATION TO APPLICATION, IEA ECBCS ANNEX 30.: BRIMINGHAM.
• WATSON, D. AND CROSBIE, M.J., 2005. TIME-SAVER STANDARDS FOR ARCHITECTURAL DESIGN: TECHNICAL DATA FOR PROFESSIONAL PRACTICE, NEW YORK, N.Y.; LONDON, MCGRAW-HILL.
• WESTPHAL, F.S. AND LAMBERTS, R., 2004. THE USE OF SIMPLIFIED WEATHER DATA TO ESTIMATE THERMAL LOADS OF NON-RESIDENTIAL BUILDINGS. ENERGY AND BUILDINGS, VOL. 36(8), PP. 847-854.
• WEYTJENS, L., ET AL., 2010. A COMPARATIVE STUDY OF THE ‘ARCHITECT-FRIENDLINESS’ OF SIX BUILDING PERFORMANCE SIMULATION TOOLS, SUSTAINABLE BUILDINGS CIB 2010, MAASTRICHT, NETHERLANDS.
249

• WILLIAM, M. AND URBAN, K., 1995. USER'S MANUAL FOR TMY2S, COLORADO, USA, GOLDEN. AVAILABLE ONLINE AT: HTTP://RREDC.NREL.GOV/SOLAR/PUBS/TMY2/ [ACCESSED 18 OCT 2009].
• WOUTERS, P., HEIJMANS, N., DELMOTTE, C. AND VANDAELE, L., 1999. CLASSIFICATION OF HYBRID VENTILATION CONCEPTS. IEA-ECBCS ANNEX 35 HYBVENT. AVAILABLE ONLINE AT: HTTP://HYBVENT.CIVIL.AUC.DK/PUPLICATIONS/REPORT/19990826_CLASSIFICATION_HYBVENT_CONCEPTS_PW.PDF [ACCESSED 27 NOV 2009].
• XIAOHUA W. AND ZHENMING F., 1997. RURAL HOUSEHOLD ENERGY CONSUMPTION IN YANGZHONG COUNTY OF JIANGSU PROVINCE IN CHINA. ENERGY; VOL. 22(12), PP. 1159-1162.
• YANG, L., LAM, J.C. AND LIU, J., 2005. BIOCLIMATIC BUILDING DESIGNS FOR DIFFERENT CLIMATES IN CHINA. ARCHITECTURAL SCIENCE REVIEW, VOL. 48(2), PP. 187-194.
• ZAIN-AHMED, A., SAYIGH, A.A.M., SURENDRAN, P.N. AND OTHMAN, M.Y., 1998. THE BIOCLIMATIC DESIGN APPROACH TO LOW-ENERGY BUILDINGS IN THE KLANG VALLEY, MALAYSIA. RENEWABLE ENERGY, VOL. 15(1), PP. 437-440.
• ZHANG, Y. AND KOROLIJA, I., 2010. PERFORMING COMPLEX PARAMETRIC SIMULATIONS WITH JEPLUS, IN 9TH SET CONFERENCE PROCEEDINGS, SHANGHAI, CHINA.
• ZHANG Q., 2004. RESIDENTIAL ENERGY CONSUMPTION IN CHINA AND ITS COMPARISON WITH JAPAN, CANADA, AND USA. ENERGY AND BUILDINGS, VOL. 36(12), PP. 1217-1225
• ZHOU, J., WU, J., ZHANG, G. AND XU, Y., 2006. DEVELOPMENT OF THE PASSIVE COOLING TECHNIQUE IN CHINA. ENERGY SYSTEMS LABORATORY. AVAILABLE ONLINE AT: HTTP://HANDLE.TAMU.EDU/1969.1/5261 [ACCESSED 4 APRIL 2008].
• ZARETSKY, M., 2009. PRECEDENTS IN ZERO-ENERGY DESIGN: ARCHITECTURE AND PASSIVE DESIGN IN THE 2007. SOLAR DECATHLON, ROUTLEDGE.
250

Abbreviations and Acronyms
• AC Air Conditioning • ACH Air changes per hour (unit of the ventilation rate) • AEC Architecture, Engineering and Construction • AHU Air Handling Unit • AIA The American Institute of Architects • ASHRAE The American Society of Heating, Refrigerating and Air-
Conditioning Engineers • ASQ After Scenario Questionnaire • BBCC Building Bioclimatic Chart • BHE Borehole Heat Exchanger • BIM Building Information Modelling • BPS Building Performance Simulation • BWh The hot desert arid zone based on the Köppen climate
classification criteria • CAD Computer Aided Design • CAAD Computer Aided Architectural Design • CAV Constant Air Volume • CDD Cooling Degree Days • CFD Computational Fluid Dynamics • CIBSE The Chartered Institution of Building Services Engineers • CO Carbon Dioxide • COP Coefficient-of-Performance • CSP Calculated cooling setpoints based on the ASHRAE’s adaptive
approach of thermal comfort • DBT Dry-bulb temperature • DEC Direct Evaporative Cooling • DECT Downdraught Evaporative Cool Towers • DHW Domestic Hot Water • DOE The United States’ Department of energy • DRY Design reference year • DSY Design Summer Year • DTM Dynamic Thermal Modelling • EECA Egyptian Earth Construction Association • EGBC Egyptian Green Building Council • EIA The Energy Information Administration • EDUCATE • EMA Egyptian Meteorological Authority • ENIP Egyptian National Institute of Planning • EPW EnergyPlus Weather File • ET Effective Temperature • EUI Energy Use Indices • GUI Graphical User Interface • HBRC Housing and Building Research Center (Egypt) • HDD Heating Degree Days
251

• HSP Calculated heating setpoints based on the ASHRAE’s adaptive approach of thermal comfort
• HVAC Heating, Ventilating, and Air Conditioning • IAQ Indoor Air Quality • IBPSA International Building Performance Simulation Association • IDF EnergyPlus Input Data File • IEA International Energy Agency • IECC International Energy Conservation Code • ISO International Organisation for Standardisation • IWEC International Weather for Energy Calculations • JCEE Egyptian German Joint Committee on Energy Efficiency and
Environmental protection • LCC Life Cycle Cost • LEED Leadership in Energy and Environmental Design • LPG Liquid Pressurized Gas • MAGT Mean Annual Ground Temperature • MAP Mean Annual Precipitation • MARH Mean Annual Relative Humidity • MAT Mean Annual Temperature • NREL National Renewable Energy Laboratory • NV Natural Ventilation • nv Night Ventilation • NZEB Net Zero Energy Building • PDEC Passive Downdraught Evaporative Cooling • PLEV Productive, Low-cost & environmentally friendly Village • PMV Predicted Mean Vote • PPD Predicted Percentage of Dissatisfied • RES Renewable Energy Systems • RH Relative Humidity • S/V Surface Area to Volume • SCAT Smart Controls and Thermal Comfort Project • SHGC The solar heat gain coefficient (G-Value) • SRC Slab Radiant Cooling • SRM Self-Reported Metric • SUS System Usability Scale • TMY Typical Meteorological Year • U-value The overall heat transfer coefficient [W/m².K] • UNDP United Nations Development Program • USGBC United States Green Building Council • VAV Variable Air Volume • VRV Variable Refrigerant Volume • WBT Wet-Bulb Temperature • WWR Window-to-Wall Ratio • WYEC Weather Year for energy Calculations
252

Appendix A Table A1
Description of Köppen climate symbols and defining criteria (Peel et al. 2007)
253

Table A2
Climate Zone Definitions for ASHRAE Classification (Briggs et al. 2002)
Group A : Humid Type Definition (SI): Locations meeting the following criteria: Not Marine AND Pcm ≥ 2.0 × ( TC + 7) where: Pcm = annual precipitation in cm
TC = annual mean temperature in degrees Celsius Group B: Dry Type Definition (SI): Locations meeting the following criteria:
Not Marine AND Pcm < 2.0 × ( TC + 7)
Group C: Marine Type Definition: Locations meeting the following criteria: • mean temperature of coldest month between –3ºC (27ºF) and 18ºC (65ºF) AND • warmest month mean < 22ºC (72ºF) AND • at least four months with mean temperatures over 10ºC (50ºF) AND • dry season in summer. The dry season in summer criterion is met when the month with the heaviest rainfall in the colder season has at least three times as much precipitation as the month in the warmer season with the least precipitation. The colder season is October, November, December, January, February, and March in the Northern Hemisphere and April, May, June, July, August, and September in the Southern Hemisphere. All other months are considered the warmer season, in their respective hemispheres.
254

Table A3 Weather Data for Alexandria (METEONORM)
255

Figure AA1 Weather Data for Alexandria (METEONORM)
256

Table A4 Weather Data for Cairo (METEONORM)
257

Figure AA2 Weather Data for Cairo (METEONORM)
258

Table A5 Weather Data for Aswan (METEONORM)
259

Figure AA3 Weather Data for Aswan (METEONORM)
260

Table A6 Weather Data for Asyut (METEONORM
261

Figure AA4 Weather Data for Asyut (METEONORM)
262

Appendix B Table B.1 LIST OF PARTICIPANTS
Workshop 1 was conducted 01-03/08/2010, workshop 2 was conducted 04-06/08/2010 and workshop3 was conducted 08-10/08/2010. A list of participants is provided in the link below:
http://www.shadyattia.net/academic/WorkshopIntro/StudentGallery.html
263

Table B.2 2010 QUESTIONNAIRES
http://www.shadyattia.net/academic/WorkshopIntro/Files/Surveys.pdf
264

265

266

267

268

269

Appendix C Manual C.1 ZEBO USER MANUAL
Download and Run ZEBO
• Copy and paste the files located in the ZEBO folder on the USB thumb to your C:\ EnergyPlusV6-0-0 folder
• Make sure you are working with excel 2007 or later versions. Enable macros in excel (Developer > Macro Security > Enable All Macros > Ok)
• Make sure the system is set on English system settings (not Arabic) • Double click on the file simulate.exe
Figure AC1 The welcome page
ZEBO Wizard Snapshots
ZEBO has been written in Visual Basic 2008 computer language, for broader distribution using PC systems. It has a graphical interface intended to be as simplified and self-explaining as possible. The tool development is explained in Chapter 8. The following figures illustrate the key snapshot of the software.
270

Figure AC2 Selecting the simulation of passive or active strategies
Figure AC3 The available shoebox typology
271

Figure AC4 The main interface page
Figure AC5 The Psychrometric output window
272

Figure AC6 The parametric analysis wizard viewing sensitivity analysis results
Figure AC7 Sensitivity analysis results for different orientations
273

Figure AC8 Input for the active systems (location module technology and mounting position)
Figure AC9 The input and guidance for orientation, panels tilt, efficiency or nominal peak
274

Figure AC10 The results of parametric simulation for the selected PV panels (static)
275

Testing Study C.2
276

277

Appendix D Table D.1 LIST OF PARTICIPANTS
278

Table D.2 2011 QUESTIONNAIRES
279

List of Figures Figure 1.1 BPS tools developed for architects and engineers between 1997 and 2010 (DOE 2011b) ................................................................................................................................. 8 Figure 1.2 BPS Classification of BPS Tools pre- and post-design decisions (DOE 2011b) 8 Figure 2.1 The world climate zones referred to Köppen-Geiger Classification Method (Kottek et al. 2006) .................................................................................................................... 19 Figure 2.2 The three regional climates of Egypt .................................................................... 20 Figure 2.3 Primary energy consumption by end use in Egypt (EMEE 2010) ...................... 23 Figure 2.4 Examples of residential apartment blocks in density urbanised Nile Valley and Delta ........................................................................................................................................... 24 Figure 2.5 Energy consumption per household in Madinet Al-Mabussin, Cairo (Attia 2009c) ......................................................................................................................................... 25 Figure 2.6 Acceptable operative temperature ranges for naturally ventilated office spaces based on the ASHRAE Adaptive comfort model (De Dear and Brager 2002) ..................... 29 Figure 2.7 Air speed required to offset increased temperature [ASHRAE] ......................... 30 Figure 2.8 Acceptable ranges of operative temperature and air speeds [ASHRAE] .......... 31 Figure 2.9 Psychrometric chart analysis and the corresponding passive design strategies for Alexandria (Climate Consultant 5 see Appendix A) ......................................................... 34 Figure 2.10 Psychrometric chart analysis and the corresponding passive design strategies for Cairo (Climate Consultant 5 see Appendix A) ................................................ 35 Figure 2.11 Psychrometric chart analysis and the corresponding passive design strategies for Aswan (Climate Consultant 5 see Appendix A) ............................................. 36 Figure 2.12 The application of three standards for Cairo (ASHRAE 55, EN 15251 and Givoni) ........................................................................................................................................ 39 Figure 3.1 NZEB definition criteria after the IEA Task 40 (Sartori 2010).............................. 43 Figure 3.2 Inventory of passive and active solution sets for NZEB in hot-humid climates .................................................................................................................................................... 45 Figure 3.3 Current practices, versus prospective NZEB practice in Egypt ........................ 52 Figure 3.4 Comparative design matrix listing common principles and solutions in Egypt .................................................................................................................................................... 54 Figure 3.5 The Low Tech and High Tech challenge of the built environment in Egypt ..... 55 Figure 3.6 The design process of NZEBs as suggested by the IEA Task 40 ...................... 59 Figure 3.7 The Worldwide status of building energy codes/standards for commercial buildings (Janda 2009) ............................................................................................................. 60 Figure 4.1 Inventory of active solution sets for NZEBs in hot climates .............................. 65 Figure 4.2 Typical ceiling fans available in Egyptian market ............................................... 68 Figure 4.3 A ceiling fans or indoor motion can make it seem cooler by at least 3 degrees Co thus less air conditioning is needed .................................................................................. 68 Figure 4.4 Air speed required to offset increased temperature (ASHRAE 2005) ................ 68 Figure 4.5 The operation period of ceiling fans and AC in Cairo (average 1800 hours) .... 69 Figure 4.6 Window AC, Split AC, Packaged AC and Central AC chiller .............................. 70 Figure 4.7 Average solar irradiation in Egypt (adapted from the Solar Atlas of Egypt) .... 77 Figure 4.8 Mean wind speed (Wind Atlas for Egypt) ............................................................. 77 Figure 4.9 Instantaneous efficiency for different solar collector types ............................... 79 Figure 4.10a. Psychrometric chart analysis for Cairo ........................................................... 85 Figure 4.10b. Operational periods defined using simulations ............................................. 85 Figure 4.11 Basecase vs. NZEB energy consumption .......................................................... 86 Figure 4.12 ranking of design strategies ................................................................................ 86 Figure 4.13 Monthly PV output vs. electric demand .............................................................. 87 Figure 4.14 Instantaneous efficiency for different solar collector types for typical residential apartment in Egypt ................................................................................................ 89 Figure 5.1 BPS tools between 1997 and 2010 (Attia 2009b).................................................. 93 Figure 5.2 Ranking the most important features of a BPS tool (Attia 2010a) ..................... 93 Figure 5.3 Barriers of decision making during early design stages (Attia et al. 2012b) .... 97 Figure 5.4 Selection criteria & NZEB tools mechanics (Attia et al. 2012b) ......................... 99 Figure 5.5 Results of the NZEB Tools Mechanics ............................................................... 107 Figure 6.1 Selection criteria of BPS tools (Attia 2011e) ...................................................... 122 Figure 6.2 Ranking the Selection Criteria: Responses ordered by workshops groups . 124 Figure 6.3a, b, c Tools Map of workshop 1, 2, 3................................................................... 126
280

Figure 6.4 Participants’ responses on the most important feedback expected from BPS .................................................................................................................................................. 127 Figure 6.5 Responses given on barriers of using BPS tools ............................................. 128 Figure 6.6 The most important barrier regarding interest .................................................. 129 Figure 6.7 The most important barrier regarding knowledge ............................................. 129 Figure 6.8 The most important barrier regarding products ................................................ 130 Figure 6.9 The most important barrier regarding process.................................................. 130 Figure 6.10 The most important barrier regarding support ................................................ 131 Figure 6.11 Workshop 2 participants filling a questionnaire form, August 2010 ............. 133 Figure 6.12 Problems facing the Egyptian design practice ................................................ 136 Figure 7.1 Increasing air-conditioner and fan sales in Egypt between 1996 and 2009 (Attia et al. 2012a) .............................................................................................................................. 140 Figure 7.2 The selected neighbourhoods: Alexandria, Cairo and Asyut (source Google). .................................................................................................................................................. 146 Figure 7.3 Typical floor plan of Typology 1 in its urban context (Attia et al. 2012a) ........ 147 Figure 7.4 Typical floor plan of Typology 2 in its urban context (Attia et al. 2012a) ........ 147 Figure 7.5 Surveyed monthly electricity use for both apartment models (Attia et al. 2012a) .................................................................................................................................................. 150 Figure 7.6 Occupancy schedules of the surveyed apartments (average) (Attia et al. 2012a) .................................................................................................................................................. 152 Figure 7.7 Lighting schedules of the surveyed apartments (average) (Attia et al. 2012a) .................................................................................................................................................. 153 Figure 7.8 The average surveyed natural gas consumption per apartment (Attia et al. 2012a) ....................................................................................................................................... 155 Figure 7.9 Annual fan and air conditioning operation profile in Cairo .............................. 156 Figure 7.10 National daily average electrical load profiles for residential buildings in 2008 (Attia et al. 2012a) ................................................................................................................... 157 Figure 7.11 Surveyed and simulated monthly electricity usage for both apartment models (Attia et al. 2012a) ................................................................................................................... 158 Figure 8.1 The software welcome page, ZEBO .................................................................... 165 Figure 8.2 The flowchart of ZEBO (Attia et al. 2012b) ......................................................... 167 Figure 8.3 Annual electric yield of amorphous, polycrystalline and mono-crystalline panels (see Appendix C: AC8, AC9 and AC10) .................................................................... 169 Figure 8.4 Tool workflow scheme (Attia et al. 2012b) .......................................................... 170 Figure 8.5 Reference model and output plots (Attia et al. 2012b) ...................................... 172 Figure 8.6 Interface for ZEBO and reference model and output plots (see Appendix C: AC5 and AC7) .......................................................................................................................... 173 Figure 8.7 Reference model and output plots including sensitivity analysis results (Orientation) ............................................................................................................................ 176 Figure 8.8 Reference model and output plots for design alternatives comparison ......... 176 Figure 8.9 Binary success data for performing simulation (Attia et al. 2012b) ............... 179 Figure 8.10 Mean time per task (Attia et al. 2012b) .............................................................. 179 Figure 9.1 The proposed design of the EECA Group during Workshop1 ......................... 190 Figure 9.2 Different possible arrangements of the eight residential units ........................ 193 Figure 9.3 Workshop 2 the design of the Blue Group ......................................................... 194 Figure 9.4 Workshop 2 the design of the Green Group ...................................................... 194 Figure 9.5 Workshop 2 the design of the Orange Group .................................................... 195 Figure 9.6 Workshop 2 the design of the Purple Group...................................................... 196 Figure 9.7 Workshop 2 the design of the Red Group .......................................................... 197 Figure 9.8 Workshop 3 the design of the Blue Group ......................................................... 198 Figure 9.9 Workshop 3 the design of the Green Group ...................................................... 199 Figure 9.10 Workshop 3 the design of the Orange Group .................................................. 200 Figure 9.11 Workshop 3 the design of the Red Group ........................................................ 200 Figure 10.1 the frame work of workshops showing the different interventions and outcomes ................................................................................................................................. 205 Figure 10.2 The After Scenario Questionnaire Results of the EECA, FOFA and OPEN groups respectively. ............................................................................................................... 208 Figure 10.3a Participants’ responses to a question related to the informed decision making ..................................................................................................................................... 210 Figure 10.3b Participants’ responses to a question related to the informed decision making ..................................................................................................................................... 211
281

Figure 10.3c Participants’ responses to a question related to the informed decision making ..................................................................................................................................... 211 Figure 10.4a Participants’ responses to a question related to the reliability and robustness of design .............................................................................................................. 213 Figure 10.4b Participants’ responses to a question related to the reliability and robustness of design .............................................................................................................. 213 Figure 10.4c Participants’ responses to a question related to the reliability and robustness of design .............................................................................................................. 214 Figure 10.5 The final simulation model of EECA in its urban context (Workshop 1) ....... 215 Figure 10.6 simulated energy performance of the original and improved version EECA (Workshop 1) ........................................................................................................................... 215 Figure 10.7 Final designs of the 5 groups of workshop 2................................................... 216 Figure 10.8 Simulated energy performances of the five design groups (Without - With Lectures – With simulation) ................................................................................................... 216 Figure 10.9 final designs of the 4 groups of workshop 3.................................................... 217 Figure 10.10 simulated energy performance of the 5 design groups (Without - With Lectures – With simulation) ................................................................................................... 217 Figure AA1 Weather Data for Alexandria (METEONORM) .................................................. 256 Figure AA2 Weather Data for Cairo (METEONORM) ............................................................ 258 Figure AA3 Weather Data for Aswan (METEONORM) ......................................................... 260 Figure AA4 Weather Data for Asyut (METEONORM) ........................................................... 262 Figure AC1 The welcome page .............................................................................................. 270 Figure AC2 Selecting the simulation of passive or active strategies ................................ 271 Figure AC3 The available shoebox typology ....................................................................... 271 Figure AC4 The main interface page ..................................................................................... 272 Figure AC5 The Psychrometric output window ................................................................... 272 Figure AC6 The parametric analysis wizard viewing sensitivity analysis results ............ 273 Figure AC7 Sensitivity analysis results for different orientations ..................................... 273 Figure AC8 Input for the active systems (location module technology and mounting position) ................................................................................................................................... 274 Figure AC9 The input and guidance for orientation, panels tilt, efficiency or nominal peak .................................................................................................................................................. 274 Figure AC10 The results of parametric simulation for the selected PV panels (static) ... 275
282

283

284

Summary
In this thesis, the development and evaluation of a simulation‐based decision aid for Net Zero Energy Buildings (NZEBs) design, ZEBO, was explored. The thesis investigates the ability to achieve informed decision making for NZEB design, in hot climate. Four main questions were posed. Firstly, how to design NZEBs in hot climates? Second, what are the requirements of the BPS decision support tool to be developed? Thirdly, what are the effects of the use of BPS and sensitivity analysis on the decision making of NZEBs? Finally, how to achieve and measure informed decision making for NZEB design? These questions were explored in three corresponding sections: literature review and analysis of the problem, development of the decision aid and evaluation of the decision aid. Whilst the four questions were addressed under the aegis of fairly narrowly‐focused studies, consideration was given throughout to their broader implications. ________________
The first section, Literature Review and Analysis of the Problem, contains four chapters. The first, chapter 2, presents a review that explored the implications of research problem. The implications of Net Zero Energy Buildings (NZEBs) design in hot climates are discussed. First the chapter reviews the characteristics and classification of hot and humid climates. Then the study context and building typology are defined. Then the anatomy of typical residential buildings performance in Egypt is presented. This is considered as the foundation from which the net-zero target will be reached. The different comfort modes and bioclimatic analysis in hot climates are discussed. Finally, the chapter suggests evaluation criteria of thermal comfort for NZEBs in hot climates.
Chapter 3 contains a review on the concepts and definitions of NZEBs for hot climates. The definition of NZEBs is described with a special attention to the importance of passive design strategies. First passive and low energy cooling strategies are presented. Then we explained the idea of mixed-mode and hybrid cooling to achieve a balance between passive and active cooling to avoid discomfort during extreme conditions. Moreover we discussed the implications of scale and urban density on the net-zero targets. The importance of technology and the suitability of a low tech approach versus high tech approach were also discussed because it has a huge impact on the energy performance. Finally, we composed a design methodology and guidelines for NZEB design in hot climates.
In chapter 4 a third review is presented and this considers the technologies required in a net-zero residential building in Egypt. This chapter discusses firstly, the active cooling techniques and strategies and explain the different technologies that are suitable in hot climates. Secondly, renewable energy technologies are presented and evaluated according to their performance and fitness in the Egyptian context.
285

Chapter 5 reviews the use of BPS by architects and its ability to support the decision making. The chapter reviews the modelling of NZEB and the integration of building performance simulation to support the design decisions. The review considers the most current simulation software and suggests possible future advances in the use of parametric analysis for decision support. ________________
In the second section of this thesis, Development of the Decision Aid, three chapters describe the development of the NZEB decision aid, ZEBO. The first, chapter 6, contains the results of three workshops in Cairo 2010 that aimed to identify the barriers of the use of BPS tools in practice. The workshop activities and discussions highlight the status and difficulties architects encounter in the usage and the needs for BPS tools in the Egyptian context. The chapter first presents a brief overview of the status of the use of BPS in practice then describes the methods used, including, surveys, interviews, tools testing, brainstorming sessions and discussions.
In the second chapter of the development section, chapter 7, a field survey was conducted to set a representative simulation model for residential buildings. The development of the benchmark involved surveying almost 1500 apartment in three urbanely dense cities in Egypt. The different energy consumption patterns of two models describing the energy use profiles for air-conditioners, lighting, domestic hot water and appliances in respect to buildings layout and construction. Using EnergyPlus simulation tool the collected surveyed data was used as input for the benchmark. The simulation models were verified against the apartment characteristic found in the survey. The work in this chapter is a foundation for the tool development described in chapter 8.
In chapter 8, the prototype of the decision support tool under development, ZEBO is presented. There are two main prototypes that are developed. The previously developed residential benchmark was established coupling sensitivity analysis modelling and energy simulation software (EnergyPlus) as a means of developing a decision support tool to allow designers to rapidly and flexibly assess the thermal comfort and energy performance of early design alternatives. The development embeds the evolving prototypes through usability testing. Participating architects, architectural engineer and architecture student tested the tool using the system usability scale method.
The usability testing was mainly implementing the system usability scale. Two prototypes were tested and significant shortcomings were identified during the process. Consequently, significant alterations were made to later prototype of the tool, in particular the inclusion of sensitivity analysis features which allowed designers to see the impact of parametric variations. From the results of this study, decision aid usability testing was found to comprise of two distinct processes: firstly the involvement of users in the development processes, and secondly their responses to prototypes up until the final version. Accordingly we developed suggestions for the third prototype.
286

________________
In the third section of the thesis, Evaluation of the Decision Aid, two chapters describe the evaluation of ZEBO. The first, chapter 9, is reporting the results of three design case studies for NZEBs. The aim of the case studies was to evaluate the effect of ZEBO on knowledge, decision attitudes and patterns, the components of informed decision making, defined as knowledge in the presence of attitudes that are congruent with subsequent decisions. Three design workshops were organized early 2011 in Cairo to design and develop three case studies. This chapter focus on the setting of the case studies and describe the design objectives, design teams, workshop structure and process. The final design outcomes of the different design iterations are reported.
In chapter 10, the relationship between the usage of ZEBO and informed decision making is examined and validated in greater detail. The outcome data from the usability study, combined with detailed information about the design performance of participants improved designs, allowed us to examine the effect of sensitivity analysis on decision making. The key finding from this research was that sensitivity analysis features embedded in ZEBO was found to promote informed decision making. The use of ZEBO and DesignBuilder resulted in an increase in knowledge uptake between 35 and 87 percent compared to the pre-workshop knowledge. Also the use of BPS tools improved the energy performance of the original design by 40 to 64 percent. More importantly, 78.8 percent of participants recognize the importance of BPS tools in informing the decision making and 71.2 percent recognize the importance of BPS tools in guiding the decision making of NZEBs design.
Then we analysed the tools limitations and the reasons behind the lack of confidence (44.2 percent) and lack of ability (51.9 percent) to achieve NZEBs design using ZEBO and other BPS tools. Based on the feedback provided during the group discussion participants considered the complexity of design and the limitation of the used tool to address all design objectives including, cost, aesthetics, visual comfort, time, and budget, etc. real barriers. Participants expected that the tool can enrich creativity through flexible 3D modelling using more design like medium or tools and allow the interpretation of the results to understand the building performances.
In conclusion, in chapter 11 of the thesis, the results and conclusions from the three sections of the thesis are discussed. After outlining the rationale for the thesis, the results of chapters 2 to 10 are described. Then, the findings are interpreted and critiqued from a number of perspectives, including methodology, and with respect to the wider literature. According the research findings there are four factors that promote or inhibit the uptake of BPS as decision support in architectural practice: 1) interactional usability, 2) decision support (intelligence), 3) users’ skills and 4) contextual integration. All four of these factors apply to the uptake of ZEBO. Interactional usability
287

and decision support could help understand the human computational interaction between the tool and the user for modelling. The third factor, users’ skills, could be used to clarify the educational requirements for the use of ZEBO. The fourth factor; the contextual integration could be explored in terms of the incorporation of a tool such as ZEBO in a climatic and building context. Theoretically, it is possible to develop BPS tools that support the design of NZEBs and address factor 1, 2 and 4. However, the success of the design will be always dependent on the users’ skills factor.
I conclude at the end of this thesis that the need for a simulation‐based decision aid remains undiminished. The need for a simulation-based decision support is growing daily. A generation of simulation-savvy architects is now necessary, for whom NZEB design is of increasing relevance. They and following generations will demand easily usable, reliable, simulation based information in order to help them with one of the most difficult and complex processes of NZEBs design. Informed decision making remains the key, and this needs to be developed and evaluated further.
288

Acknowledgements
This research spans some long years, three continents and most importantly many people who have supported and inspired both me and my research in many ways. Having finally reached the end of this long process, I would like to thank those who accompanied me along the way. I will always remember them dearly, and I hope this feeling is mutual.
First and foremost, I owe my deepest gratitude to my promoter Prof. André De Herde for hosting me in Architecture et climat and for leading me professionally towards the better during my research. Working with Prof. De Herde allowed me to have the freedom to develop and do my research while profiting from the resources and accumulated experience of Architecture et climat. Despite being enrolled in the PhD program in Texas A&M I consider myself extremely lucky to have the opportunity to have worked in Architecture et climat. This being said I would like thank Dr. Lilliana Beltran, Charles Culp and Jeff Haberl from the Architecture Department at Texas A&M for their valuable courses they taught me.
In the same time, I would like to express my deepest gratitude to my internal guiding committee members Dr. Elisabeth Gratia and Dr. Magali Bodart. Both of them took the time to review my papers and gave me invaluable feedback during my PhD progress. I would also like to thank my external guiding committee member Prof. Jan Hensen from TU-Eindhoven, who accepted to take part in my committee. He provided me with critique and support especially with publishing my first journal paper. I must admit that without the continuous feedback and discussions with all the above mentioned names I would not have been possible at all to deliver this research. My gratitude also goes to my external jury member, Prof. Koen Steemers, who took the time to review my dissertation and gave invaluable feedback. I would also like to thank David Vanderburgh, who accepted to take part in my committee as Jury President.
Endless thanks go to Architecture et Climat members who generously supported me with their expertise and shared with me a pleasant work environment. Amongst them Tatiana De Meester, Daniella Painemal, Valérie Mahaut, Arnaud Evrard, Olivier Dartevelle, Coralie Cauwerts, Catherine Massart, Sylvie Rouche, Sphie Trachte, Matin Outers and Marie-Hélène Dehut. I would like also to specially thank Cédric Hermand and Stéphanie Salawa who lent their help in the development of ZEBO. Cédric and Stéphanie have helped with the implementation of ZEBO in Visual Basic with much enthusiasm and energy. I would like to thank them both for their inspiring and constructive contributions and their tremendous help in the programming effort of ZEBO. I have learned so much from them.
Many thanks goes to all workshops participants who participated in the evaluation and testing of ZEBO in Cairo. I would like to extend my special thanks to the Egyptian Erath Construction Association and Engineers
289

Consultants Group and the student form the Faculty of Fine Arts, Cairo University and Ain-Shams University. Without their participation in the usability testing surveys and their valuable comments and feedback this work could not be done. One of the most moments that I enjoyed was during the design case studies that allowed me by accident to participate in the Egyptian Revolution.
Also I am extremely grateful to the members of the IEA SHC Task40/ECBCS Annex 52: Towards Net Zero Energy Solar Buildings. I have been joining this Task and worked in Subtask B, which is concerned with design process tools. Being the only architect in this group extended my knowledge enormously through the bi-annual meetings in Wuppertal, Reunion, Graz, Denver, Basel and Naples. Also the PhD school in Montreal was a very enriching opportunity to address Net Zero Energy Buildings Design. There are four colleagues I must thank namely, Aurélie Le Noire from the the Université de la Réunion, William O’Brian from Concordia University, Salvatore Carlucci from Politecnico di Milano and Mohamed Hamdy from Aalto University.
Others that I would like to thank in Belgium are Lieve Weytjens and Mondo Organization. I enjoyed working with Lieve as a PhD colleague from the University of Hasselt, who worked with me on a couple of publications. Mondo, a Non Governmental Organization in Berlaar, invited me to present my PhD work two times and provided me with very valuable feedback on my research. This helped me with the contextualizing of my research problem and the positing of my research in a broader perspective. I would like thank Dirk Knapen, Guido Cuvreur and Clara van den Eeden.
I need also to extend my gratitude to the generous funding I received from the Université catholique de Louvain. Without this funding I could not afford doing this PhD. I would like to thank the University again for the PhD budget scholarship that I won two times via the Ecole Polytechnique de Louvain. This scholarship allowed me to attend the IEA meetings and publish and participate in more than 20 event including conferences, meetings, symposiums and workshops.
Finally, I would like to thank my family for all their love, patience and everything else. You are what make it all worthwhile. My deepest gratitude is due to my family for never giving up on me or letting me give up. Their presence is the most precious gift in my life, and I dedicate this thesis to them.
Shady Attia
May 7th, 2012, Louvain La Neuve
290

Bibliography
Shady Attia was born on 25th May 1979 in Berlin, Germany. He received a Bachelor degree in Architecture from the Faculty of Fine Arts in Cairo, Helwan University in 2002, a Master of Landscape Architecture degree from Wageningen University, The Netherlands in 2006. Between 2002 and 2004, he worked as an architect for El-Ghazali Architects and contributed to several environmental design
projects in Egypt. Then, between 2006 and 2007 he worked as a senior architect at CDC Abdelhalim in Cairo. He attended his PhD courses at the Architecture Department of Texas A&M between 2007 and 2008, USA, where he also worked as a teaching assistant for one year. He started his PhD research in 2008 at the research group Architecture et climat of the Faculty of Architecture at Université Catholique de Louvain in Louvain La Neuve. During his study, he participated in the International Energy Agency Task 40: Towards Net Zero Energy Buildings. As registered architect and LEED accredited professional he has experience in buildings energy efficiency, solar architecture, and sustainability, he worked in government research and university level teaching, as well as building design and energy consulting companies. He is an active member in SBSE, USGBC, ASHRAE, ASES and IBPSA served as a reviewer for several conferences and different international journals. He has published more than 25 papers and articles and made more than 35 presentations on building energy efficiency, and building sustainability topics. His research interests include computer aided design systems, human computational interaction, building rating systems, regenerative design (Cradle to Cradle design) and building performance monitoring.
291

Selected Publications
PEER-REVIEWED JOURNAL PAPERS:
• ATTIA, S., HENSEN, J.L.M., BELTRÁN, L. AND DE HERDE, A., (2011) SELECTION CRITERIA FOR BUILDING PERFORMANCE SIMULATION TOOLS: CONTRASTING ARCHITECTS' AND ENGINEERS' NEEDS', JOURNAL OF BUILDING PERFORMANCE SIMULATION,, FIRST PUBLISHED ON: 12 APRIL 2011 (IFIRST)
• ATTIA, S., (2011) A CASE STUDY FOR A ZERO IMPACT BUILDING IN BELGIUM: MONDO SOLAR-2002, JOURNAL OF SUSTAINABLE BUILDING TECHNOLOGY AND URBAN DEVELOPMENT, VOL.2 NO.2 JUNE, 2011) P.137-142.
• WEYTJENS, L., ATTIA, S. ET AL., (2011) A COMPARATIVE STUDY OF THE ‘ARCHITECT-FRIENDLINESS’ OF SIX BUILDING PERFORMANCE SIMULATION TOOLS, JOURNAL OF SUSTAINABLE BUILDING TECHNOLOGY AND URBAN DEVELOPMENT, VOL.2 NO.3 (SEPT 30, 2011) P.237-244.
• ATTIA, S., GRATIA, E., DE HERDE, A., HENSEN, J.L.M., (2012) SIMULATION-BASED DECISION SUPPORT TOOL FOR EARLY STAGES OF ZERO-ENERGY BUILDING DESIGN, ENERGY AND BUILDINGS, AVAILABLE ONLINE 10 FEBRUARY 2012, ISSN 0378-7788, 10.1016/J.ENBUILD.2012.01.028.
• ATTIA, S., EVRARD, A., GRATIA, E., (2012) DEVELOPMENT OF BENCHMARK MODELS FOR THE EGYPTIAN RESIDENTIAL BUILDINGS SECTOR, APPLIED ENERGY, VOLUME 94, JUNE 2012, PAGES 270-284, ISSN 0306-2619, 10.1016/J.APENERGY.2012.01.065.
PEER-REVIEWED PAPERS IN CONFERENCE PROCEEDINGS:
• ATTIA, S., DE HERDE A., (2011) EARLY DESIGN SIMULATION TOOLS FOR NET ZERO ENERGY BUILDINGS: A COMPARISON OF TEN TOOLS, INTERNATIONAL BUILDING PERFORMANCE SIMULATION ASSOCIATION, NOVEMBER 2011, SYDNEY, AUSTRALIA.
• ATTIA, S., HAMDY, M., SAMAAN, M., DE HERDE, A., HENSEN, J.L.M, (2011) TOWARDS STRATEGIC USE OF BPS TOOLS IN EGYPT, INTERNATIONAL BUILDING PERFORMANCE SIMULATION ASSOCIATION, NOVEMBER 2011, SYDNEY, AUSTRALIA.
• ATTIA, S., DE HERDE, A., (2011) DEFINING ZERO ENERGY BUILDINGS FROM A CRADLE TO CRADLE APPROACH, PASSIVE AND LOW ENERGY ARCHITECTURE, JULY, LOUVAIN LA NEUVE, BELGIUM.
• ATTIA, S., DE HERDE, A., (2011) DESIGN DECISION TOOL FOR ZERO ENERGY BUILDINGS, PASSIVE AND LOW ENERGY ARCHITECTURE, JULY, LOUVAIN LA NEUVE, BELGIUM.
• WEYTJENS, L., ATTIA, S ET AL. (2010) A COMPARATIVE STUDY OF THE ‘ARCHITECT-FRIENDLINESS’ OF SIX BUILDING PERFORMANCE SIMULATION TOOLS, SUSTAINABLE BUILDINGS CIB 2010, MAASTRICHT, NETHERLANDS.
• ATHIENITIS, A., ATTIA, S. ET AL. (2010) STRATEGIC DESIGN, OPTIMIZATION, AND MODELLING ISSUES OF NET-ZERO ENERGY SOLAR BUILDINGS, EUROSUN 2010, GRAZ, AUSTRIA.
292

• ATTIA, S., DE HERDE, A., (2010) STRATEGIC DECISION MAKING FOR ZERO ENERGY BUILDINGS IN HOT CLIMATES, EUROSUN 2010, GRAZ, AUSTRIA.
• ATTIA, S., DE HERDE, A., (2010) SIZING PHOTOVOLTAIC SYSTEMS DURING EARLY DESIGN A DECISION TOOL FOR ARCHITECTS, AMERICAN SOLAR ENERGY SOCIETY, MAY 2010, ARIZONA, USA
• ATTIA, S. (2010) ZERO ENERGY RETROFIT CASE STUDY OF A CHALET IN AIN-SUKHNA, EGYPT, AMERICAN SOLAR ENERGY SOCIETY, MAY 2010, ARIZONA, USA
• ATTIA, S., DE HERDE, A., (2009) BIOCLIMATIC ARCHITECTURE DESIGN STRATEGIES IN EGYPT, 8TH INTERNATIONAL CONFERENCE ON SUSTAINABLE ENERGY TECHNOLOGIES, AUGUST 2009 AACHEN, GERMANY
• ATTIA, S., BELTRÁN L., DE HERDE, A, HENSEN, J.L.M., (2009) “ARCHITECT FRIENDLY”: A COMPARISON OF TEN DIFFERENT BUILDING PERFORMANCE SIMULATION TOOLS, INTERNATIONAL BUILDING PERFORMANCE SIMULATION ASSOCIATION, JULY 2009, GLASGOW, UK
• ATTIA, S., DE HERDE, A., (2009) DESIGNING THE MALQAF FOR SUMMER COOLING IN LOW-RISE HOUSING, AN EXPERIMENTAL STUDY, PASSIVE AND LOW ENERGY ARCHITECTURE, JUNE 2009, QUEBEC, CANADA
• ATTIA, S., DE HERDE, A., (2009) IMPACT AND POTENTIAL OF COMMUNITY SCALE LOW-ENERGY RETROFIT: CASE STUDY IN CAIRO, SMART AND SUSTAINABLE BUILT ENVIRONMENTS CONFERENCE, JUNE 2009, TU-DELFT, THE NETHERLANDS
• ATTIA, S. (2009) ACTIVE SOLAR RETROFIT OF A RESIDENTIAL HOUSE, A CASE STUDY IN EGYPT, AMERICAN SOLAR ENERGY SOCIETY, MAY 2009, BUFFALO, USA
TECHNICAL REPORTS
• ATTIA S. (2010) BUILDING PERFORMANCE SIMULATION TOOLS: SELECTION CRITERIA AND USER SURVEY, TECHNICAL REPORT, ARCHITECTURE ET CLIMAT, LOUVAIN LA NEUVE: UNIVERSITÉ CATHOLIQUE DE LOUVAIN.
• ATTIA S. (2011) STATE OF THE ART OF EXISTING EARLY DESIGN SIMULATION TOOLS FOR NET ZERO ENERGY BUILDINGS: A COMPARISON OF TEN TOOLS, TECHNICAL REPORT, ARCHITECTURE ET CLIMAT, LOUVAIN LA NEUVE: UNIVERSITÉ CATHOLIQUE DE LOUVAIN.
293

294