Pouvoir traditionnel et pouvoir d'Etat en République ... - ORBi
Upload
khangminh22Category
view
0download
0
Brain connectivity and sensorystimulation in patients with disorders of
consciousness
Lizette Heine
Under the direction of Prof. Steven Laureys
Coma Science GroupGIGA research
University of Liège
Thèse présentée en vue de l’obtention du grade de
Docteur en Sciences biomédicales et pharmaceutiques
Liège, 2016

Supervisor
Prof. Dr. Steven Laureys
Assessment committee
Roland Hustinx (president)
Athena Demertzi (secretary)
Serge Bredart
Rainer Goebel
Christophe Phillips
Fabien Perrin
Daniele Marinazzo
c⃝ Lizette Heine, 2016.
The work presented in this thesis was performed at the Coma Science Group, GIGA con-
sciousness and Cyclotron Research Center, University and University Hospital of Liège. Part
of the work was done in collaboration with the Cogntition Auditive et Psychoacoustique team,
Centre de Recherche en Neurosciences de Lyon, Université Claude-Bernard Lyon1 (Inserm
U1028 - CNRS UMR5292).
The studies in this thesis were funded by a grant from the Belgian National Funds for Sci-
entific Research (FRS-FNRS), and the European Space Agency (ESA). Additional funding
was provided through personal travel grants from the LabEx CeLyA (Centre Lyonnais dA-
coustique"), the Federation Wallonie-Bruxelles (FWB), and the Belgian National Funds for
Scientific Research (FRS-FNRS).

List of Publications
This thesis is based on the following publications:
Articles
I. Function-structure uncoupling in patients with severe brain injury as measured
by MRI-DWI and FDG-PET
Annen J*, Heine L*, Ziegler E, Frasso G, Bahri M, Di Perri C, Stender J, Martial C,
Wannez S, D’Ostilio K, Amico E, Antonopoulos G, Bernard C, Tshibanda F, Hustinx
R, Laureys S.
Human Brain Mapping, June 2016
doi:10.1002/hbm.23269
II. Effects of preference and sensory modality on behavioral reactions in patients
with disorders of consciousness
Heine L, Tillmann B, Hauet M, Juliat A, Dubois A, Laureys S, Kandel M, Plailly J,
Luauté J, Perrin F.
under review
III. Exploration of functional connectivity during preferred music stimulation in pa-
tients with disorders of consciousness
Heine L*, Castro M*, Martial C, Tillmann B, Laureys S, Perrin F.
Frontiers in psychology, 2015, 6:1704, doi: 10.3389/fpsyg.2015.01704
IV. Functional connectivity in visual, somatosensory, and language areas in con-
genital blindness
Heine L, Bahri A M, Cavaliere C, Soddu A, Reislev N, Laureys S, Ptito M, Kupers R.
Frontiers in Neuroanatomy, 2015, 138(pt9):2619-31,
doi: 10.3389/fnana.2015.00106
V. Intrinsic functional connectivity differentiates minimally conscious from unre-
sponsive patients
Demertzi A*, Antonopoulos G*, Heine L, Voss H, Crone S,Kronbichler M,
Trinka E, Angeles C, Bahri M, Phillips C, Di-Perri C, Gomez F,

Tshibanda L, Soddu A, Vanhaudenhuyse A, Charland-Verville V, Schiff N, Whitfield-
Gabrieli S*, Laureys S*.
Brain, 2015, 6:1704, doi: 10.3389/fpsyg.2015.01704
VI. Technology-based assessment in patients with disorders of consciousness
Di Perri C, Heine L, Amico E, Soddu A, Laureys S, Demertzi A.
Annali dell’instituto superiore di sanita, 2014, 6:1704, doi:10.4415/ANN_14_03_03
VII. Resting state networks and consciousness: alterations of multiple resting state
network connectivity in physiological, pharmacological, and pathological con-
sciousness States
Heine L, Soddu A, Gomez F, Vanhaudenhuyse A, Tshibanda L, Thonnard M, Charland-
Verville V, Kirsch M, Laureys S, Demertzi A.
Frontiers in Psychology, 2012, 3:295, doi: 10.1093/brain/awv169
Bookchapters:
I. Behavioral Responsiveness in Patients with Disorders of Consciousness
Heine L, Laureys S, Schnakers C.
in: Brain Function and Responsiveness in Disorders of Consciousness, Springer In-
ternational Publishing, 2016
II. Imaging correlations in non-communicating patients.
Heine L, Di Perri C, Soddu A, Gomez F, Laureys S, Demertzi A.
in: Clinical neurophysiology in disorders of consciousness: Brain function monitoring
in the ICU and beyond, Springer International Publishing, 2015
III. Consciousness and disorders of consciousness
Heine L, Demertzi A, Laureys S, Gosseries O.
in: Brain mapping: An encyclopedic reference, Elsevier, 2015
∗ Contributed equally

Other publications:
I. Repeated behavioral assessments with the Coma Recovery Scale-Revised in
patients with disorders of consciousness
Wannez S, Heine L,Thonnard M, Annen J, Charland-Verville V, Martens G, Aubinet
C, Martial C, Bodart O, Vanhaudenhuyse A, Chatelle C, Thibaut A, Schnakers C,
Demertzi A, Gosseries O*, Laureys S*.
under review
II. A method for Independent Component Graph Analysis of resting-state fMRI
Paula D, Ziegler E, Abeyasinghe P, Tushar D, Cavaliere C, Aiello M, Heine L, Di Perri
C, Demertzi A, Noirhomme C, Charland-Verville V, Vanhaudenhuyse A, Stender J,
Gomez F, Tshibanda L, Laureys S, Owen A, Soddu A.
under review
III. Mapping the functional connectome traits of levels of consciousness
Amico E, Marinazzo D, Di Perri C, Heine L, Annen J, Martial C, Dzemidzic M, Laureys
S*, Goni J*.
under review
IV. Structural constraints to information flow within cortical circuits : a TMS / EEG-
dMRI study
Amico E, Bodart, O, Gosseries O, Heine L, Rosanova M, Van Mierlo P, Martial C,
Massimini M, Marinazzo D*, Laureys S*.
under review
V. The neural correlates of consciousness in patients who have emerged from
minimally conscious state: a multimodal imaging study
Di Perri C, Bahri, M A, Amico E, Thibaut A, Heine, L, Antonopoulos, G., Charland-
Verville V, Wannez S, Gomez F, Hustinx R, Tshibanda J, Demertzi A, Soddu A, Lau-
reys S.
Lancet Neurology, 2016, 4422(16)00111-3, doi: 10.1016/S1474-4422(16)00111-3
VI. Clinical response to tDCS depends on residual brain metabolism and grey mat-
ter integrity in patients with minimally conscious state
Thibaut A, Di Perri C, Camille C, Bruno M-A, Bahri M A, Wannez S, Bernard C, Martial
C, Heine L, Hustinx R, Laureys S.
Brain Stimulation, 2015, 8(6):1116-23,doi: 10.1016/j.brs.2015.07.024

VII. Beyond the gaze: communicating in chronic locked-in syndrome
Lugo Z R, Bruno M-A, Gosseries O, Demertzi A, Heine L, Thonnard M, Blandin V,
Pellas F, Laureys S.
Brain Injury, 2015, 29(9):1056-1061,doi:10.3109/02699052.2015.1004750
VIII. Correlation between resting state fMRI total neuronal activity and PET metabolism
in healthy controls and patients with disorders of consciousness
Soddu A, Gomez F, Heine L, Voss HU, Bruno MA, Vanhaudenhuyse A, Phillips C, De-
mertzi A, Chatelle C, Schrouff J, Thonnard M, Thibaut A, Truong J, Charland-Verville
V, Noirhomme Q, Tshibanda JF, Salmon E, Schiff ND, Laureys S
Brain and Behavior, 2015, 6(1),doi:10.1002/brb3.424
IX. Diagnostic precision of multimodal neuroimaging methods in disorders of con-
sciousness - a clinical validation study
Stender J, Gosseries O, Bruno MA, Charland-Verville V, Vanhaudenhuyse A, Demerzti
A, Chatelle C, Thonnard M, Thibaut A, Heine L, Soddu A, Boly M, Schnakers C,
Gjedde A, Laureys S.
The Lancet, 2014, 384(9942):514-522,doi:10.1016/S0140-6736(14)60042-8
X. Assessment of visual fixation in vegetative and minimally conscious states
Di H, Nie Y, Hu X, Tong Y, Heine L, Wannez S, Huang W, Yu D, He M, Thibaut A,
Schnakers C, Laureys S.
BMC Neurology, 2014, 16:14-147,doi:10.1186/1471-2377-14-147
XI. Detection of visual pursuit in minimally conscious patients: a matter of visual
plane?
Thonnard M, Wannez S, Keen S, Brédart S, Bruno MA, Gosseries O., Demertzi A,
Thibaut A, Chatelle C, Charland-Verville V, Heine L, Habbal D, Laureys S, Vanhau-
denhuyse A.
Brain Injury, 2014, 28(9):1164-1170,doi:10.3109/02699052.2014.920521
XII. Measuring consciousness in coma and related states
Di Perri C, Thibaut A, Heine L, Soddu A, Demertzi A, Laureys S.
World journal of radiology, 2014, 6(8):589-597,doi:10.4329/wjr.v6.i8.589
XIII. Looking for the self in pathological unconsciousness
Demertzi A, Vanhaudenhuyse A, Brédart S, Heine L, Di Perri C, Laureys S.
Frontiers in Human Neuroscience, 2013, 7(538),doi:10.3389/fnhum.2013.00538

XIV. Mindsight: Diagnositcs in disorders of consciousness
Guldenmund P, Stender J, Heine L, Laureys S.
Critical care research and practice, 2012, 2012:624724, doi: 10.1155/2012/624724
∗ Contributed equally


Contents
Glossary ix
Abstract xi
Resumé xiii
Samenvatting xv
1 Introduction 1
1.1 Consciousness . . . . . . . . . . . . . . . . . . . . . . . . . . . . . . . . . . . . . . 2
1.2 Disorders of consciousness . . . . . . . . . . . . . . . . . . . . . . . . . . . . . . . 2
1.3 Clinical assessment of consciousness . . . . . . . . . . . . . . . . . . . . . . . . 5
1.4 Ancillary testing of consciousness . . . . . . . . . . . . . . . . . . . . . . . . . . . 8
1.5 Objectives of the thesis . . . . . . . . . . . . . . . . . . . . . . . . . . . . . . . . . 18
I The resting paradigm:Brain function and structure in relation to consciousness 19
Introduction . . . . . . . . . . . . . . . . . . . . . . . . . . . . . . . . . . . . . . . . 21
Default mode network . . . . . . . . . . . . . . . . . . . . . . . . . . . . . . . . . . 21
2 Metabolic function, structural integrity, and function-structure connectivity 25
2.1 Function and structure of the DMN . . . . . . . . . . . . . . . . . . . . . . . . . . 26
2.2 Decreases in function and structure independently . . . . . . . . . . . . . . . . . 28
2.3 The structure-function relationship . . . . . . . . . . . . . . . . . . . . . . . . . . . 29
3 FMRI functional connectivity measures 35
3.1 Resting state functional connectivity networks during unconsciousness . . . . . 36
3.2 Analyzing resting state data from pathological brains: methodological issues . 39
i

ii Contents
4 Classification of resting state functional connectivity 45
4.1 Behavioral relation to functional connectivity networks . . . . . . . . . . . . . . . 46
4.2 Differentiation between MCS and UWS within
connectivity networks . . . . . . . . . . . . . . . . . . . . . . . . . . . . . . . . . . 47
4.3 Single-subject classification of the auditory network . . . . . . . . . . . . . . . . 48
Conclusions and future perspectives part I 51
II The passive paradigm:Sensory stimulation and diagnostic assessment 53
Introduction . . . . . . . . . . . . . . . . . . . . . . . . . . . . . . . . . . . . . . . . 55
5 Sensory stimulation during behavioral examinations of consciousness 57
5.1 Tactile, olfactory and gustatory stimuli during
diagnostic assessment . . . . . . . . . . . . . . . . . . . . . . . . . . . . . . . . . 58
5.2 Self-relevant stimuli might enhance cognitive processes . . . . . . . . . . . . . . 61
6 Resting state functional connectivity during preferred music 63
6.1 Preferred music . . . . . . . . . . . . . . . . . . . . . . . . . . . . . . . . . . . . . . 64
6.2 Effect of music in healthy conscious subjects . . . . . . . . . . . . . . . . . . . . 65
6.3 Effect of music in DOC patients . . . . . . . . . . . . . . . . . . . . . . . . . . . . 66
7 Effect of preference or sound 71
7.1 Effects of sensory stimulation on behavioral
responsiveness . . . . . . . . . . . . . . . . . . . . . . . . . . . . . . . . . . . . . . 74
Conclusions and future perspectives part II 79
III Functional connectivity of the senses 81Introduction . . . . . . . . . . . . . . . . . . . . . . . . . . . . . . . . . . . . . . . . 83
8 Congenitally blind 85
Conclusions and future perspectives part III 97
Concluding remarks 99
Appendix A Paper I 101

Contents iii
Appendix B Paper II 109
Appendix C Paper III 119
Appendix D Paper IV 133
Appendix E Paper V 149
Appendix F Paper VI 163
Appendix G Paper VII 177
Appendix H Paper VIII 191
Appendix I Paper IX 203
Appendix J Paper X 215
References 231
Acknowledgements 251

iv Contents

List of Figures
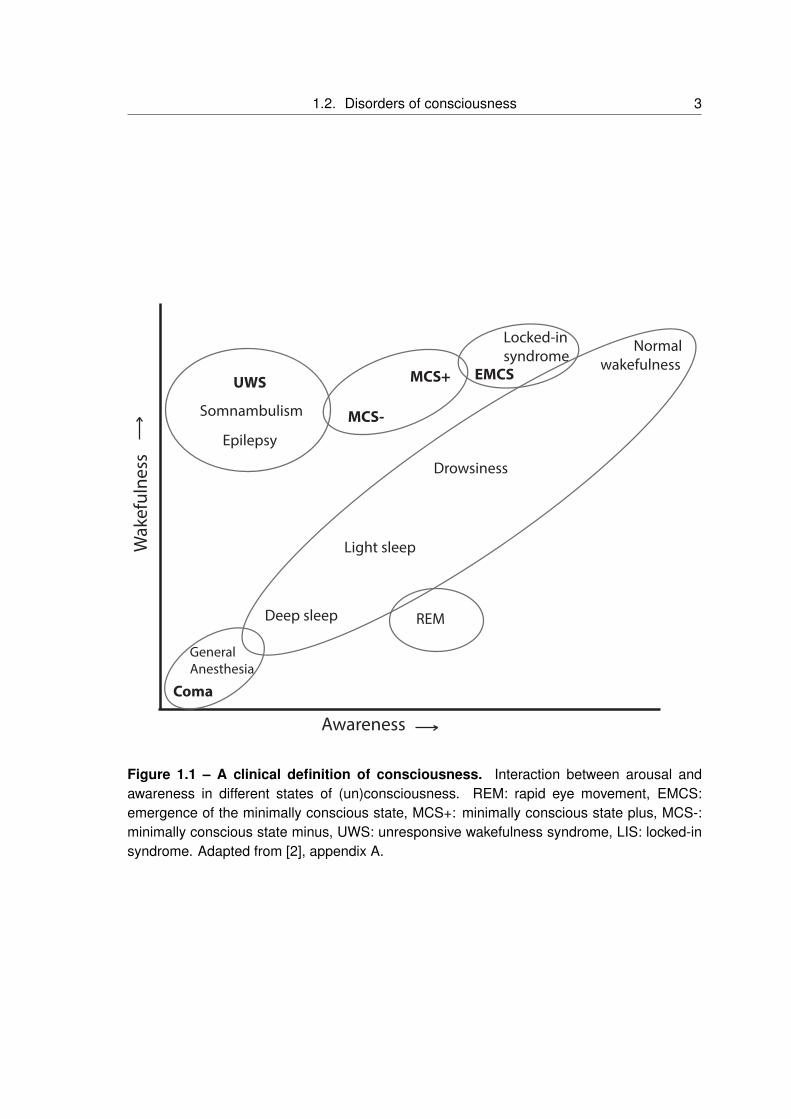
1.1 A clinical definition of consciousness. . . . . . . . . . . . . . . . . . . . . . . . . . 3
1.2 Neuroimaging paradigms for the assessment of residual cognitive processes
in DOC. . . . . . . . . . . . . . . . . . . . . . . . . . . . . . . . . . . . . . . . . . . 12
1.3 PET metabolism in patients with DOC. . . . . . . . . . . . . . . . . . . . . . . . . 13
1.4 Multimodal neuroimaging in three patients. . . . . . . . . . . . . . . . . . . . . . . 17
1.5 Anticorrelated networks. . . . . . . . . . . . . . . . . . . . . . . . . . . . . . . . . . 23
2.1 Default mode network regions and the tracts between the regions in a healthy
volunteer and brain injured patient. . . . . . . . . . . . . . . . . . . . . . . . . . . 27
2.2 Schematic of processing pipeline. . . . . . . . . . . . . . . . . . . . . . . . . . . . 28
2.3 PET functional activity in DMN. . . . . . . . . . . . . . . . . . . . . . . . . . . . . . 29
2.4 MRI structural connectivity in DMN. . . . . . . . . . . . . . . . . . . . . . . . . . . 30
2.5 Linear regression model of the function-structure relationship. . . . . . . . . . . 31
3.1 Resting state networks. . . . . . . . . . . . . . . . . . . . . . . . . . . . . . . . . . 38
3.2 Functional connectivity networks and representative seed regions. . . . . . . . 41
3.3 The challenges of component selection. . . . . . . . . . . . . . . . . . . . . . . . 43
4.1 Intrinsic connectivity networks are involved in consciousness-related processing. 47
4.2 Auditory-visual crossmodal functional connectivity discriminates single patients. 49
5.1 Oriented responses in 23 MCS patients. . . . . . . . . . . . . . . . . . . . . . . . 59
5.2 Oriented responses in 15 UWS patients. . . . . . . . . . . . . . . . . . . . . . . . 60
5.3 Outcome at 1 year. . . . . . . . . . . . . . . . . . . . . . . . . . . . . . . . . . . . . 60
6.1 Functional connectivity in healthy subjects during the music and control condition. 67
6.2 Functional connectivity in patients using primary auditory seeds. . . . . . . . . . 68
6.3 Functional connectivity in patients using mean network connectivity. . . . . . . . 70
7.1 Schematical representation of the behavioral protocol. . . . . . . . . . . . . . . . 73
v

vi List of Figures
7.2 Quantitative and qualitative scores. . . . . . . . . . . . . . . . . . . . . . . . . . . 76
8.1 A priori defined regions of interest. . . . . . . . . . . . . . . . . . . . . . . . . . . 87
8.2 Differences in resting state functional connectivity between blind and sighted
controls (visual ROIs). . . . . . . . . . . . . . . . . . . . . . . . . . . . . . . . . . . 91
8.3 Differences in resting state functional connectivity between blind and sighted
controls (somatosensory and language ROIs). . . . . . . . . . . . . . . . . . . . 93

List of Tables
1.1 Diagnostic criteria for patients with severe brain injuries . . . . . . . . . . . . . . 6
1.2 Coma Recovery Scale - Revised . . . . . . . . . . . . . . . . . . . . . . . . . . . . 9
7.1 Results quantitative and qualitative analysis . . . . . . . . . . . . . . . . . . . . . 77
vii

viii List of Tables

Glossary
Active paradigm Experimental condition which requires the subject to perform a specific
task on request.
CRS-R Coma Recovery Scale-Revised.
DMN Default mode network. Resting state network of distinct, remote, and cooperating brain
areas. DMN activity has been linked to self-related and internal processes.
DOC Disorders of consciousness. This term refers to altered states of consciousness as
a result of severe acquired brain injuries and describes patients in coma, vegetative
state/unresponsive wakefulness syndrome, and minimally conscious states.
DTI Diffusion-tensor imaging. MRI technique that measures water molecule diffusion reveal-
ing the structural integrity of axon tracts in the brain.
EMCS Emergence from minimally conscious state. No clinical disorder of consciousness.
These patients show reliable functional communication and/or functional object use.
FA A measure of directionality of water diffusion assumed to be related to myelination of
white matter.
fMRI Functional magnetic resonance imaging. Non-invasive neuroimaging technique that
measures neuronal activation based on blood-oxygen-level dependent (BOLD) changes.
Functional connectivity The temporal correlation of time courses of spatially distant, func-
tionally related brain regions or voxels of the brain.
Gustatory stimuli Stimuli using the sense of taste.
LIS Locked-in syndrome. A clinical condition wherein patients are awake and aware, but with
severe motor impairments sometimes so severe that they cannot move any part of their
body. The primary means of communication is through eye movements.
ix

x Glossary
MCS Minimally conscious state. A clinical disorder of consciousness wherein patients are
awake but show fluctuating signs of awareness without being able to functionally com-
municate with their surroundings.
NCC Neural correlates of consciousness. These NCC are defined as the neural mechanisms
jointly sufficient for any one specific conscious experience.
Olfactory stimuli Stimuli using the sense of smell.
Passive paradigm Experimental condition during which there is the administration of exter-
nal stimulations such as auditory, tactile or visual stimuli while the subject is not asked
to do anything in particular.
PET Positron emission tomography. Invasive neuroimaging technique that measures brain
metabolism energy turnover.
SUV The ratio of the imaged radioactivity concentration (using PET), and the injected con-
centration in the whole body. Values are generally lower in patients compared to con-
scious control subjects.
Tactile stimuli Stimuli using the sense of touch.
UWS Unresponsive wakefulness syndrome. A clinical disorder of consciousness wherein
patients are awake but not aware of themselves and their surroundings.

Abstract
This thesis assesses brain connectivity and sensory stimulation in patients with disorders
of consciousness (DOC). These are serious conditions where massive brain damage can
lead to a dissociation between arousal and awareness, leaving patients after a comaperiod
in an unresponsive wakefulness syndrome (UWS), or minimally conscious state (MCS). As
an introduction, Chapter 1 focuses on the behavioral profile of the various clinical conditions
of diminished consciousness, as well as available methods and paradigms for diagnostic
assessment. The work described in the rest of this thesis explores these methods to gain a
better understanding of consciousness.
Part I of this thesis is dedicated to the resting paradigm. This paradigm assesses sponta-
neous brain activity and thus does not rely on patient cooperation. It is utilized here with struc-
tural magnetic resonance imaging (MRI), positron emission tomography (PET), and functional
MRI to explore brain structure and function in severely brain damaged patients. In Chapter
2 we demonstrate that function and structure are linked by showing a positive relationship
between glucose metabolism and white matter integrity. This link is present in the default
mode network (i.e., network of cooperating brain areas related to internal thought), but not in
the whole brain. Furthermore, we found a stronger relationship between structural integrity
with the thalamus in patients who have emerged from MCS as compared to DOC patients. In
Chapter 3 we review literature describing a decrease in resting state functional connectivity
(i.e., the correlation between spatially distant, functionally related brain regions) in diminished
levels of consciousness due to pathology, physiology and pharmacology. Chapter 4 extends
this by showing significant differences between functional connectivity in MCS and UWS in
most resting state networks. Using the functional connectivity between auditory and visual
areas, single subject diagnostic classification is shown, pointing towards the importance of
multisensory integration in these patients.
Part II of this thesis explores the passive paradigm to assess behavior and brain-function
in patients. Passive paradigms try to indicate covert cognitive processing through assessment
of brain function after external sensory stimulation. Chapter 5 shows that sensory stimulation
without personal relevance, as used in several assessment scales does not seem to increase
the presence of oriented responses, a sign of consciousness. As instead preferred stim-
uli might improve responsiveness, we then analyzed functional connectivity during preferred

music in Chapter 6. This preliminary study showed that functional connectivity is stronger dur-
ing preferred music compared to the noise condition in brain regions of the auditory network
that might be linked to autobiographical memory. Chapter 7 explored this effect as a testing
context and found that auditory stimuli triggered higher responsiveness compared to olfactory
stimuli. Furthermore, an effect of preference can be seen with better scores for preferred
stimuli compared to neutral ones.
Part III of this thesis concerns the question of wether assessment of brain function in
blind, conscious people could eventually teach us something on the presence or absence
of vision in brain damaged patients. Our data reveal increased functional connectivity within
both the ventral and the dorsal visual streams in congenitally blind participants as compared
to healthy control participants. However, connectivity between the two visual streams was
reduced in blind subjects. Our results underscore the extent of cross-modal reorganization
and the supra-modal function of the occipital cortex in congenitally blind individuals.
Two conclusions can be drawn from this thesis. First, brain connectivity, as explored in
part I, is linked to consciousness. The brain’s function and structure are intimately related
to each other, and the decrease in brain function can be used to distinguish between the
clinically indicated states of consciousness.
Second, sensory stimulations as described in part II have the power to improve respon-
siveness. Preferred stimuli might momentarily enhance brain function and behavioral re-
sponses. The use of preferred stimuli, such as music, as a testing context might optimize the
diagnostic assessments of the fluctuating pattern of minimally conscious patients. The use of
preferred stimuli might thus be advised as a testing context when diagnostic doubts exist.

Résumé
Cette thèse évalue la connectivité cérébrale et la stimulation sensorielle chez les patients
en état de conscience altérée (ECA). Ces troubles de la conscience apparaissent lorsquune
lésion cérébrale sévère mène à une dissociation entre léveil et la conscience après une pé-
riode de coma, caractérisant ainsi un syndrome déveil non répondant (ENR) ou un état de
conscience minimale (ECM). À titre dintroduction, le chapitre 1 traite du profil comportemental
des différentes entités cliniques liées à la diminution de la conscience ainsi que des méthodes
et paradigmes disponibles pour lévaluation diagnostique. Le travail qui est décrit par la suite
explore ces méthodes et vise une meilleure compréhension de la conscience.
La partie I de cette thèse est dédiée au paradigme de repos. Ce paradigme mesure lac-
tivité cérébrale spontanée et ne dépend donc pas de la coopération du patient. Il est utilisé
avec limagerie par résonance magnétique (IRM) structurelle, la tomographie par émission de
positons (TEP) et lIRM fonctionnelle afin dexplorer les fonctions et structures cérébrales chez
ces patients sévèrement cérébrolésés. Dans le chapitre 2, nous démontrons que fonctions
et structures sont liées en montrant une relation positive entre le métabolisme glucidique
et lintégrité de la matière blanche. Ce lien est présent dans le réseau du mode par défaut
(cest-à-dire le réseau des aires cérébrales liées aux réflexions internes), mais ne concerne
pas le cerveau dans son ensemble. En outre, nous avons trouvé une plus forte relation entre
lintégrité structurelle du thalamus et sa fonction chez des patients ayant émergé dun ECM,
en comparaison avec des patients en ECA. Dans le chapitre 3, nous avons passé en revue
la littérature décrivant une diminution de la connectivité fonctionnelle au repos (cest-à-dire
la corrélation entre les régions cérébrales spatialement éloignées mais fonctionnellement re-
liées) chez des patients montrant des niveaux de conscience réduits pour des raisons patho-
logiques, mais aussi physiologiques ou pharmacologiques. Le chapitre 4 élargit ce sujet en
montrant des différences significatives entre la connectivité fonctionnelle chez les patients en
ECM et chez les patients en ENR dans la plupart des réseaux du repos. Nous avons déve-
loppé, via la connectivité fonctionnelle entre les aires auditives et visuelles, une classification
diagnostique individuelle qui souligne limportance de lintégration multi-sensorielle chez ces
patients.
La partie II de cette thèse explore le paradigme passif afin dévaluer le fonctionnement
comportemental et cérébral des patients en ECA. Les paradigmes passifs tentent de dévoi-
ler les processus cognitifs latents en évaluant la fonction cérébrale après une stimulation

sensorielle externe. Le chapitre 5 montre que les stimulations sensorielles dépourvues de
signification personnelle, telles quelles sont utilisées dans plusieurs échelles dévaluation, ne
semblent pas favoriser lapparition de réponses orientées (signes de conscience). Puisque
lutilisation des stimuli préférés des patients pourrait toutefois améliorer leur réactivité, le cha-
pitre 6 se consacre à lanalyse de la connectivité fonctionnelle lors de lécoute dune musique
favorite. Cette étude préliminaire montre que la connectivité fonctionnelle est plus importante
lors dune musique favorite par rapport au bruit ambiant dans des régions cérébrales du ré-
seau auditif qui pourraient être liées à la mémoire autobiographique. Le chapitre 7 explore cet
effet en situation dévaluation et démontre que le stimulus auditif déclenche une réactivité plus
élevée en comparaison au stimulus olfactif. De plus, un effet de préférence peut être observé
par de meilleurs scores pour des stimuli préférés par rapport aux neutres.
La partie III de cette thèse concerne lévaluation du fonctionnement cérébral chez des
personnes aveugles et conscientes, sintéressant à ce quil peut nous enseigner sur la cécité
chez des patients cérébro-lésés. En effet, nous avons mesuré la connectivité fonctionnelle
chez des personnes aveugles pour cause congénitale. Nos données montrent une connecti-
vité fonctionnelle plus élevée au sein des voies visuelles ventrale et dorsale chez ces partici-
pants. Cependant, la connectivité entre ces deux voies visuelles était réduite chez ces sujets
aveugles. Nos résultats soulignent létendue de la réorganisation intermodale et des fonctions
supra-modales du cortex occipital chez des individus aveugles congénitaux.
Deux conclusions ressortent de cette thèse. Premièrement, la connectivité cérébrale, telle
quexplorée dans la partie I, est liée à la conscience. Les fonctions et structures cérébrales
sont intimement connectées les unes aux autres, et la réduction des fonctions cérébrales
peut être employée pour distinguer les différents tableaux cliniques détat de conscience.
Deuxièmement, les stimulations sensorielles telles quelles sont décrites dans la partie II
peuvent améliorer la réactivité des patients. Les stimuli préférés pourraient momentanément
améliorer les fonctions cérébrales ainsi que les réponses comportementales. Lutilisation de
stimuli préférentiels, tels que la musique, dans une situation dévaluation, pourrait également
optimiser les examens diagnostiques des patients en ECM qui présentent généralement une
fluctuation de leur état de conscience. Lutilisation des stimuli préférentiels pourrait donc être
recommandée en situation dévaluation lorsque certains doutes persistent quant au diagnos-
tic.

Samenvatting
In dit proefschrift is hersenconnectiviteit en sensorische stimulatie in patiënten met be-
wustzijnsstoornissen (disorder of consciousness; DOC) onderzocht. Dit zijn ernstige aan-
doeningen waarbij grote schade aan de hersenen kan leiden tot een dissociatie tussen waak-
zaamheid en besef, waardoor patiënten na een periode van coma in een niet responsief
waaksyndroom (unresponsive wakefulness syndrome (UWS)) of een minimaal bewuste staat
(minimally conscious state (MCS)) terecht kunnen komen. Als inleiding richt hoofdstuk 1
zich op het gedragsmatige profiel van de verschillende klinische entiteiten van bewustzijns-
stoornissen, alsmede de beschikbare methoden en paradigmas voor diagnostiek. Het werk
beschreven in in de rest van dit proefschrift verkent deze methodses om een beter begrip te
krijgen van bewustzijn.
Deel I van dit proefschrift is gewijd aan het rust-paradigma. Dit paradigma bestudeerd
spontane hersenactiviteit en is daardor niet afhankelijke van samenwerking vanuit de pati-
ënt. Het wordt hier gebruikt met structurele magnestic resonance imaging (MRI), position
emission tomography (PET), en functionele MRI om de structuur en functie van de herse-
nen te bestuderen in deze patiënten met ernstig hersenletsel. In hoofdstuk 2 demonstreren
we dat functie en structuur gelinkt zijn door het tonen van een positieve relatie tussen de
glucosehuishouding en de integriteit van de witte stof. Deze link is aanwezig in het default
mode network (d.w.z. het netwerk van samenwerkende hersengebieden gerelateerd aan
interne gedachtes), maar niet in het gehele brein. Verder vonden we een sterkere relatie
tussen de structurele integriteit met de thalamus in patiënten die uit een minimaal bewuste
staat zijn gekomen vergeleken met DOC-patiënten. In hoofdstuk 3 geven we een overzicht
van de literatuur die de afname van rust-staat functionele connectiviteit (d.w.z. de correla-
tie tussen van elkaar afgelegen, maar functioneel gerelateerde hersengebieden) beschrijft in
patiënten met een verminderd bewustzijnsniveau door pathologische, physiologische, of par-
macologische oorzaak. Hoofdstuk 4 breidt deze vinding uit door het tonen van significante
verschillen in functionele connectiviteit tussen MCS en UWS in de meeste rust-staat netwer-
ken. Met behulp van de functionele connectiviteit tussen auditieve en visuele gebieden was
het tevens mogelijk om een diagnose te stellen op patiënt basis, wat wijst op het belang van
multi-sensorische integratie in deze patiënten.

Deel II van dit proefschrift gebruikt het passieve paradigma om gedrag- en hersen-functionering
te evalueren in patiënten. Passieve paradigmas proberen om verborgen cognitieve verwer-
king aan te duiden door evaluatie van de verwerking in de hersenen van externe sensorische
stimulaties. Uit hoofdstuk 5 blijkt dat sensorische stimulaties zonder persoonlijke relevantie,
zoals die gebruikt worden in verschillende beoordelingsschalen de aanwezigheid van geori-
ënteerde reacties, een teken van bewustzijn, niet verhogen. Aangezien misschien niet gege-
neraliseerde, maar favoriete stimulaties het reactievermogen verhogen, hebben we daarop-
volgend functionele connectiviteit tijdens favoriete muziek geanalyseerd in hoofdstuk 6. Deze
verkennende studie laat zien dat functionele connectiviteit sterker is tijdens favoriete muziek
vergeleken met een geluid conditie in hersengebieden van het auditieve netwerk die mogelijk
gelinkt kunnen worden aan autobiografisch geheugen. Hoofdstuk 7 verkent dit effect als een
evaluatie-context en we bevonden dat auditieve stimuli een hoger reactievermogen verkrijgen
in vergelijking met olfactieve (reuk) stimuli. Bovendien is er een effect van voorkeur, waarbij
betere scores verkregen worden na favoriete stimuli ten opzichte van neutrale stimuli.
Deel III van dit proefschrift gaat over de vraag of analyse van de functionele connectiviteit
in blinde en bewuste mensen ons uiteindelijk iets kan leren over de aan- of afwezigheid van
zichtvermogen in patiënten. Onze data toont een toegenomen functionele connectiviteit in de
ventrale en dorsale visuele stromen in de hersenen van blinde vergeleken met controle sub-
jecten. Echter, de connectiviteit tussen deze twee visuele stromen was verlaagd in blinden.
Onze data onderstrepen de omvang van de cross-modale reorganisatie en de supra-modale
functie van de occipitale cortex in mensen met aangeboren blindheid.
Twee conclusies kunnen getrokken worden uit dit proefschrift: Ten eerste, de hersencon-
nectiviteit, zoals onderzocht in deel I, is gekoppeld aan bewustzijn. De functie en structuur
van de hersenen zijn nauw gerelateerd, en de afname van hersenfunctie kan worden gebruikt
om onderscheid te maken tussen de klinische bewustzijnstoestanden.
Ten tweede, sensoriële prikkels zoals beschreven in deel II hebben de kracht om het
reactievermogen te verbeteren. Favoriete stimuli kunnen wellicht tijdelijk hersenfunctie en
gedragsreacties vergroten. Het gebruik van favoriete stimuli, zoals muziek, als test-context
zou de diagnostische beoordeling van het fluctuerende patroon van minimaal bewuste pati-
ënten optimaliseren. Het gebruik van favoriete stimuli zou dus geadviseerd kunnen worden
als een test-context wanneer diagnostische twijfels bestaan.

Chapter 1
Introduction
Based on the following articles:
Consciousness and disorders of consciousnessHeine L, Demertzi A, Laureys S, Gosseries O.in: Brain mapping: An encyclopedic reference, Elsevier, 2015
Imaging correlations in non-communicating patientsHeine L, Di Perri C, Soddu A, Gomez F, Laureys S, Demertzi A.in: Clinical neurophysiology in disorders of consciousness: Brain function moni-toring in the ICU and beyond, Springer International Publishing, 2015
Technology-based assessment in patients withdisorders of consciousnessDi Perri C, Heine L, Amico E, Soddu A, Laureys S, Demertzi A.Annali dell’instituto superiore di sanita, 2014, 6:1704,
1

2 Chapter 1. Introduction
1.1 Consciousness
Being conscious means you are aware and responsive to your surroundings. You are having
a subjective, private, what is it like, experience related to, for example, auditory stimuli, visual
stimuli, thoughts, or emotions. The physical origin of this subjective experience and its psy-
chology is still being elucidated. Therefore, there is not yet a universal, all inclusive definition
of consciousness. In a clinical setting, consciousness is reduced into two main components:
wakefulness and awareness [1]. Wakefulness is related to arousal, or the level of vigilance.
Awareness is related to subjective experiences and can be subdivided into awareness of the
external world (e.g., sensory perception of the environment) and of the internal world (e.g.,
stimulus-independent thoughts, such as mental imagery and inner speech).
Sleep is an illustrative example to describe the relationship between wakefulness and
awareness: the drowsier we become as we move towards deep sleep, the less aware we
are of our surroundings and ourselves (figure1.1). A dissociation between wakefulness and
awareness leads to states of diminished consciousness. Anesthesia, epilepsy, somnambu-
lism (i.e., sleep walking) are examples of this.
Disorders of consciousness (DOC) are pathological states with such a dissociation be-
tween arousal and awareness. Arousal can be present, while awareness is absent or fluctu-
ating. What differentiates DOC from other states of unconsciousness, such as those due to
pharmacological anesthesia, sleep and epileptic seizures, is the prolonged impaired aware-
ness followed by severe brain damage.
In this chapter we will first define the different states of consciousness following severe
brain injury. We will describe the necessity of proper clinical evaluation and the most sensitive
clinical scales to do so. We will then shortly present the neuronal characteristics of patients
with DOC as measured by different neuroimaging techniques employing available paradigms
for ancillary testing. Finally, we will briefly present the objectives of this thesis.
1.2 Disorders of consciousness
Coma
The main causes of coma are trauma, stroke, or anoxia (e.g., cardiac arrest). A coma is a
transient state of unarousable unresponsiveness during which the patient lies with the eyes
closed, and has no awareness of self and surrounding [1]. A coma must last at least one
hour to be differentiated from fainting (i.e., syncope). Autonomic functions, such as breathing
and thermoregulation, are reduced, which often requires respiratory assistance. In general,
most patients recover from a coma within the first hours to weeks after injury. However, some
1.2. Disorders of consciousness 3
REM
Somnambulism
Normalwakefulness
Drowsiness
Light sleep
Deep sleep
General Anesthesia
Coma
UWS
Epilepsy
MCS+
MCS-
EMCS
Locked-in syndrome
Wak
eful
ness
Awareness
Figure 1.1 – A clinical definition of consciousness. Interaction between arousal andawareness in different states of (un)consciousness. REM: rapid eye movement, EMCS:emergence of the minimally conscious state, MCS+: minimally conscious state plus, MCS-:minimally conscious state minus, UWS: unresponsive wakefulness syndrome, LIS: locked-insyndrome. Adapted from [2], appendix A.

4 Chapter 1. Introduction
evolve into other disorders of consciousness (DOC) such as the unresponsive wakefulness
syndrome (UWS) and minimally conscious states (MCS). Worth mentioning is brain death,
another result of severe brain injury, defined by a permanent loss of all brain functions. Which
means that the patient is persistently comatose without confounding factors (e.g., hypother-
mia, drugs), all brainstem reflexes are lost, there is no respiration, and neuroimaging shows
an empty skull sign, or the absence of activity in the entirety of the brain [3] (table 1.1)
Unresponsive wakefulness syndrome
The unresponsive wakefulness syndrome (UWS) is the revised name for patients in a vege-
tative state (VS) [4]. These patients recover arousal, meaning that they show spontaneous
or induced eye opening. Awareness however, is absent, and exhibited behaviors are uninten-
tional or reflexive [5]. The patient is able to perform a variety of movements, such as grinding
teeth, blinking and moving eyes, swallowing, yawning, crying, and smiling, but these are al-
ways reflexive/unintentional movements and unrelated to the context [6]. Adapted emotional
responses cannot be elicited. Autonomic functions are generally preserved, and breathing oc-
curs usually without assistance. This state can be persistent but also transient towards both
decreases and increases in health and (conscious) state. They can improve to the minimally
conscious state or further, or remain in the UWS. The UWS has been said to be permanent
12 months after traumatic brain injury, and 3 months after non-traumatic etiologies [6]. These
patients may have in that case less than 5% chance of recovery, after which the difficult ethical
and legal issues around withdrawal of hydration and nutrition may be discussed [6]. However
small but possible [7], the chance of late recoveries highlights the need for a name avoid of
vegetable-like connotations with a more neutral description of the behavioral profile [4]. Thus,
for the remaining of this thesis the term Unresponsive wakefulness syndrome (UWS) will be
used to indicate these patients (table 1.1).
Minimally conscious state
Conscious recovery consists of regaining fluctuating but reproducible non reflexive-oriented
and/or voluntary behaviors. This state is called the minimally conscious state (MCS) [8]. For
example, command following, visual pursuit as a direct response to moving or salient stimuli,
localization of noxious stimulation, as well as contingent responses to emotional stimuli, are
considered signs of consciousness. Furthermore, patients in MCS are more likely to expe-
rience pain and/or suffering [9]. The heterogeneity of this group of patients has led to the
proposal of a stratification into MCS+ (plus) and MCS- (minus) based on the complexity of
behavioral responses [10]. Patients in an MCS- show non reflexive-oriented responses such

1.3. Clinical assessment of consciousness 5
as visual pursuit or localization to noxious stimuli, while MCS+ refers to patients showing non
reflexive voluntary responses such as command following, intelligible verbalization, and/or
nonfunctional communication [11] (table 1.1).
When patients show reliable demonstration of functional communication (i.e., accurate
yes-no responses to situational orientation questions) or functional object use (i.e., demon-
stration of the use of two different objects) on consecutive assessments, the patient is consid-
ered to have emerged from the MCS (EMCS) [12]. After emerging from MCS, these patients
are no longer considered to suffer from a disorder of consciousness. However, they often
remain confused, disoriented, sometimes agitated, and they might continue to need full-time
care (table 1.1).
Locked-in syndrome
Although not a disorder of consciousness, the locked-in syndrome (LIS) is worth mentioning,
as it can easily be misdiagnosed as a DOC. Classically, patients in LIS have fully intact cogni-
tive abilities, while voluntary motor control is lost, with the exception of small eye movements.
Ventral brainstem lesions damaging the corticospinal tract are the most common cause of a
LIS. The primary mode of communication is via eye movements or blinking [13] (table 1.1).
1.3 Clinical assessment of consciousness
Clinically, behavioral assessment is based on the two clinical components of consciousness:
arousal/wakefulness and awareness. Wakefulness is assessed by spontaneous or stimulus
induced eye opening. Awareness can be devided into awareness of the external world and
awareness of the internal world. The former is mainly assessed in consciousness through
contingent behaviors (i.e., action or -emotional- reaction in response) towards specific envi-
ronmental stimuli. Self-awareness is difficult to evaluate when only based on bedside obser-
vations (contrary to self-reports).
Correct diagnosis is highly important in DOC for prognostic, therapeutic and ethical rea-
sons. The prognosis of patients in MCS is better than those in UWS [15]; in one study, twelve
months after brain injury about half of the patients tracked in MCS had improved, compared
to a very small percentage of patients in UWS [16]. In terms of therapeutic choices, the med-
ical team may choose to apply pharmacological (e.g., with amantadine, zolpidem or palliative
medication) and/or non-pharmacological interventions (e.g., deep brain stimulation, transcra-
nial direct current stimulation) [17, 18], or make ethical decisions [19]. However, differentiating
MCS from UWS can be challenging since voluntary and reflexive behaviors can be difficult to
distinguish and subtle signs of consciousness may be missed. The behavioral assessment

6 Chapter 1. Introduction
Table 1.1 – Diagnostic criteria for patients with severe brain injuries
Clinical entities DOC Definition Reference
Brain death No Irreversible coma [14]Evidence for the cause of comaIrreversible loss of all functions of the brain, includingbrainstem reflexesApneaAbsence of confounding factors (e.g., drugs,hypothermia, electrolyte, and endocrinedisturbances)
Coma Yes No wakefulness [1]No awareness of self or environmentAcute state (i.e., resolves in hours to maximum 4weeks)
Unresponsive Yes Wakefulness [4, 6]wakfulness No awareness of self or environmentsyndrome No sustained, reproducible, purposeful,
or voluntary behavioral responses to visual, auditory,tactile, or noxious stimuliNo language comprehension or expressionRelatively preserved hypothalamic and brainstemautonomic functions (e.g., respiration, digestion,thermoregulation)Bowel and bladder incontinenceVariably preserved cranial-nerve and spinal reflexesAcute and/or chronic state
Minimally Yes Wakefulness [10, 12]conscious MINUSstate (MCS) Visual pursuit
Contingent behaviorReaching for objectsOrientation to noxious stimulationPLUSFollowing simple commandsIntentional communicationIntelligible verbalization
Emergence No Functional communication [12]from MCS Functional object use
Locked-in No Wakefulness [13]syndrome Awareness
Aphonia or hypophoniaQuadriplegia or quadriparesisPresence of communication via the eyesPreserved cognitive abilities

1.3. Clinical assessment of consciousness 7
of consciousness should be done through repeated examinations revealing reproducible, ori-
ented or voluntary behavioral responses to various stimuli (the most common being auditory,
verbal and motor stimuli) [20]. Further variance in diagnostic accuracy may result from biases
induced through the environment, the patient and/or the examiner.
Concerning the environment, paralytic and sedative medications, movement restrictions
through restraints and immobilization techniques, poor positioning and excessive ambient
noise / heat / light can decrease or distort voluntary behavioral responses. Concerning the pa-
tient, fluctuations in arousal level, fatigue, subclinical seizure activity, underlying illness, pain,
cortical sensory deficits (e.g., cortical blindness/deafness), motor impairment (e.g., general-
ized hypotonus, spasticity or paralysis) or cognitive deficits (e.g., aphasia, apraxia, agnosia)
constitute a bias to the behavioral assessment and therefore decrease the probability to ob-
serve signs of consciousness. Moreover, while present in the official criteria for MCS [8],
potentially meaningful affective behaviors (e.g., emotional behaviors such as crying during a
specific song) are very difficult to assess objectively and are therefore not usually present in
clinical routine. Lastly, examiner errors may arise when the range of behaviors sampled is
too narrow, response-time windows are over or under-inclusive, criteria for judging purposeful
responses are poorly-defined, or examinations are conducted too infrequently to capture the
full range of behavioral fluctuation (Appendix G, [21, 22]).
The development of diagnostic criteria for MCS [8] (Giacino et al., 2002a) as mentioned
before can help reduce the incidence of misdiagnosis [23, 24]. However, recent studies have
found that around 40% of patients believed to be in UWS remain misdiagnosed [21, 25]. The
use of standardized rating scales offers some protection from these errors, and behavioral
assessment remains at present the gold standard for the assessment of consciousness.
The coma Recovery Scale Revised
The Coma Recovery Scale-Revised (CRS-R) [26] (table 1.2) is currently the most reliable
and sensitive tool for the differential diagnosis of DOC [27]. It was developed to differentiate
UWS from MCS and uses 23 hierarchically organized items in visual, motor, auditory, oro-
motor, communication and arousal subscales. The first five subscales give weighted scores
to reflect presence of cognitively mediated responses (highest scores) towards low scores
when no measurable responses, reflexive/non cooperative activity or brainstem reflexes are
observed. The arousal subscale indicates the level of arousal ranging from attention through
eye-opening to none. The use of self-referential stimuli such as ones own name and ones
own face (using a mirror) should be used during CRS-R assessments to increase the pa-
tients responsiveness [28–30]. The CRS-R has excellent content validity and is the only

8 Chapter 1. Introduction
scale currently available which includes all of the Aspen Workgroup criteria for good stan-
dardized administration and scoring [8]. It showed good inter-rater reliability, test-retest relia-
bility, and internal consistency. Furthermore, confounding factors such as deafness, aphasia
or blindness might be indicated when improbable scoring occurs, and thus could increase the
accuracy of CRS-R scoring [31]. Resent research focused on the lack of evidence-based rec-
ommendations for repetition of assessments. Data of many years of standardized repeated
assessment of patients at the Coma Science Group has shown that when using only one
CRS-R assessment, a 36% chance of false negatives occurs. Rather, diagnostic assessment
should be performed at least 5 times for accurate diagnosis [20].
Although the CRS-R is currently the gold standard for the behavioral examination of pa-
tients with disorders of consciousness, the environmental biases mentioned earlier can still
play a role. To avoid misinterpretation, three out of four repetitions of each task are generally
required for a positive result using the CRS-R, but the risk of false positives cannot be ruled
out. Therefore, absence of adequate response to command does not necessarily prove a
patient is unconscious. Finally, due to lack of a diagnostic ground truth, criterion validity and
diagnostic value (i.e., the scales ability to establish an accurate diagnosis compared with the
true diagnosis as measured by a reference standard) cannot be determined for any available
scoring system [27].
Many other scales for the examination of consciousness exist, some of which will be briefly
mentioned in chapter 5.
1.4 Ancillary testing of consciousness
Neuroimaging is in general viewed as an objective, unbiased tool for the assessment of con-
sciousness in these patients, to be used as an aid next to clinical assessment [32]. The
ultimate aim of neuroimaging in this context is probably to use these patients in the form of a
lesion approach for the exploration of the neural correlates of consciousness (NCC). The NCC
refers to the minimal neuronal mechanisms jointly sufficient for any one specific conscious ex-
perience [33]. This can be content specific, or a full NCC defined as the neural substrates
supporting conscious experiences in their entirety, irrespective of their content [33]. The first
step on the road to an understanding of the full NCC is to understand the level of residual
consciousness on a patient-specific basis.
These neuroimaging studies use three paradigms: active, passive, and resting paradigms
(figure 1.2). Several distinct methods are exploited for these paradigms. Positron emission
tomography (PET), magnetic resonance imaging (MRI), and electroencephalography (EEG)

1.4. Ancillary testing of consciousness 9
Table 1.2 – Coma Recovery Scale - Revised
Auditory function
4 Consistent movement to command#3 Reproducible movement to command#2 Localization to sound1 Auditory startle0 None
Visual function
5 Object recognition*3 Pursuit eye movements*2 Fixation^1 Visual startle0 None
Motor function
6 Functional object use+5 Automatic motor response*4 Object manipulation*3 Localization to noxious stimulation*2 Flexion withdrawal1 Abnormal posturing0 None/flaccid
Oromotor/verbal function
3 Intelligible verbalization#2 Vocalization/oral movement1 Oral reflexive movement0 None
Communication
2 Functional: accurate+1 Nonfunctional: intentional#0 None
Arousal
3 Attention2 Eye-opening w/o stimulation1 Eye-opening with stimulation0 Unarousable
* denotes MCS-; # denotes MCS+; + denotes emergence from MCS; ^denotes an MCSexcept for anoxic etiology.

10 Chapter 1. Introduction
are most often used to explore awareness and covert cognitive processes in healthy subjects
and brain damaged patients [34, 35].
Active, passive, and resting paradigms
Active paradigms use wilfully modulated brain signals, for example by using mental imagery
tasks, to detect command following similar to command response tests done at the bedside.
Command following in patients with DOC is of major clinical importance because, according
to standardized behavioural assessment, this behaviour differentiates patients in MCS from
patients in UWS [10, 26]. The same rationale can be used when applying brain imaging.
However, a criticism of using mental imagery tasks to unfold cognition and/or to communicate
relies on patients limited short-term memory resources and restricted attention span. As a
result, relatively long scanning intervals might be necessary to increase the signal-to-noise
ratio, which in turn contributes to patients fatigue, and ultimately to lack of their vigilance
[36]. Additionally, similar problems as those biasing bedside evaluations exist (e.g., sensory
impairments, small or easily exhausted motor activity, pain, sedative medication, sleep distur-
bances and/or medical complications). In these cases, absence of responsiveness does not
necessarily correspond to absence of awareness [37] (figure 1.2, top).
Passive paradigms measure brain responses to external sensory stimulation (e.g., au-
ditory, somatosensory and visual) while the subject is not performing any mental task (fig-
ure 1.2, middle). The limitations of using this approach stem from patients pathologies and
technical requirements. Indeed, patients have varying clinical presentation, such as visual
problems, motor spasticity, somatosensory hypersensitivity and cortical auditory deafness,
which can inhibit their detection of external stimuli. Furthermore, the technical setup of these
examinations is not as simple as resting paradigms.
Alternatively, increasing attention is being paid to resting state paradigms [38]. This
paradigm does not rely on tasks, or stimulation of some sort, instead spontaneous brain
function is assessed when the subject receives no external stimulation. Usually subjects
are asked to lay still, relax their mind (e.g., not to think of anything in particular), and close
their eyes while not falling asleep or focus vision on a cross. Importantly for clinical studies,
the resting state paradigm is particularly appealing because it does not require sophisticated
experimental setup to administer external stimuli and surpasses the need for patients con-
tribution (e.g., language comprehension and/or production of motor responses [38]). Hence,
resting protocols are a suitable means to study clinical populations in which communica-
tion cannot be established at the bedside, such as patients with DOC. This means that this

1.4. Ancillary testing of consciousness 11
approach might thus bypass the limitations which are raised by the other experimental neu-
roimaging methods, as well as those affecting bedside behavioural assessment (figure 1.2,
bottom).

12 Chapter 1. Introduction
Figure 1.2 – Neuroimagingparadigms for the assess-ment of residual cognitiveprocesses in DOC. Graph-ical representation of apossible neuro-imagingparadigms. Examples indi-cated here used MRI. Activeparadigm where subjectsare asked to perform a task[39]; passive paradigm wheresubjects are exposed tocertain stimuli, for examplemusic ([40], Appendix H);resting paradigms assessspontaneous activity withoutexternal stimulation ([41],Appendix E).

1.4. Ancillary testing of consciousness 13
Positron emission tomography
PET gives an approximation of functional tissue integrity by measuring cerebral glucose con-
sumption. 18-Fludeoxyglucose (FDG) is an analogue of glucose, and the resulting tracer
concentrations imaged indicate the regional glucose uptake and hence indicate neural activ-
ity during resting paradigms. Using this method, clear differences can be seen between DOC
and conscious subjects, and automatic classifiers are well equipped to differentiate between
UWS and LIS [42].
In UWS patients FDG-PET has reliably shown a global massive decrease in metabolism
of up to 40% of normal value [43–45]. However, the loss of consciousness is not related to
a global dysfunction in cerebral metabolism, but rather to regional decreases (figure 1.3). In-
deed, patients suffering from DOC show decreased metabolism in a widespread frontoparietal
network, encompassing lateral prefrontal and posterior parietal areas as well as midline an-
terior cingulate/mesiofrontal and posterior cingulate/precuneal associative cortices [46]. This
frontoparietal network can be functionally subdivided into two different networks: the extrinsic
awareness network, and intrinsic awareness network.
Control MCS UWS
Decrease in PET metabolism
PET resting state
Figure 1.3 – PET metabolism in patients with DOC. Group-level studies utilizing PET inhealthy and DOC (UWS and MCS patients). Higher images show cerebral metabolism asmeasured with PET in the three groups. Images are shown using the same color scale.Lower images show areas with significant metabolic impairments in UWS and MCS comparedto healthy controls. Impairments is clear in the frontoparietal network. Statistical maps arethresholded at a family-wise error correction rate for multiple comparisons (p<0.001). Adaptedfrom Appendix A.

14 Chapter 1. Introduction
The lateral areas of this network are considered to be implicated in external awareness
(extrinsic awareness network, or executive control network), or awareness of the environment
/ sensory awareness. The intrinsic awareness network, more widely known as the default
mode network (DMN; see page 21), is linked to the midline regions. These include mainly
the medial prefrontal cortex, the precuneus and the bilateral posterior parietal cortex, and
it is related to awareness of self and self-related processes, such as mind-wandering and
autobiographical thinking [47]. In accordance with this, patients in MCS show higher glucose
metabolism in the precuneus than patients in UWS [48]. The difference between the two
states is most pronounced in the frontoparietal cortex [49], but thalamocortical metabolism is
also impaired [50]. Interestingly, PET is especially sensitive in making a distinction between
MCS and UWS as well as in prediction of long-term recovery in patients with an UWS [32].
Furthermore, PET studies using passive auditory and noxious stimulations have demon-
strated a disconnection between primary sensory areas and large-scale associative fronto-
parietal cortices in UWS patients. MCS patients do show activation patterns similar to healthy
control subjects after noxious stimuli, possibly suggesting a potential for pain perception [9].
The proposal to subcategorize the MCS into MCS- and MCS+ was confirmed by resting PET
analysis, where differences in language and sensorimotor areas are observed between pa-
tients in MCS- and MCS+ [11] .
Magnetic resonance imaging
Anatomical MRI helps to assess the extent of structural damage. Diffusion tensor imaging
(DTI) is a measure of the directionality of water molecules that and can be used to map
white matter tracts. Using this method it was shown that traumatic brain injury seems to be
specifically affecting the corpus callosum [51]. Other studies on severe brain injury confirm
this, and show decreases in fractional anisotropy (FA; a measure of directionality of water
diffusion assumed to be related to myelination of white matter) in many large fibre tracts
(including the corona radiata, corticospinal tracts, cingulum, external capsule, and corpus
callosum), as well as negative correlations with cognitive and clinical outcomes [52, 53, 53–
55]. Furthermore, white matter integrity dysfunction especially affects the tracts connecting
the regions of the default mode network [56], in cortico-cortical and subcortico-cortical figures
which again are related to cognitive function [57]. This shows the behavioral differences seen
between these two groups of patients are also represented by differences in severity of brain-
damage (figure 1.4, top)
Functional MRI (fMRI) can visualize brain function derived from blood-oxygen-level depen-
dent (BOLD) changes, which is based on changes in the ratio of oxy- to deoxy-hemoglobin of
the blood. fMRI has been largely used in patients with DOC in order to detect brain activity

1.4. Ancillary testing of consciousness 15
related to residual cognition, awareness and command following. Using fMRI, two mental im-
agery tasks have been shown to encompass reproducible cortical activations across healthy
controls, namely thinking about playing tennis (encompassing primarily supplementary motor
area) and imagining visiting the rooms of ones house (encompassing primarily parahippocam-
pal cortex) [39] (figure 1.4 middle, and figure 1.2 top). Some UWS patients can show brain
activity indistinguishable from healthy controls [58]. Since these patients were able to com-
prehend and execute the mental imagery commands in a sustainable manner, the behavioral
diagnosis was challenged and the patient was no longer considered as in UWS [59].
Based on the command-following rationale, other mental tasks for evidencing response
to command in patients with DOC have been employed. For example, with a silent picture
naming task [60], hand moving tasks [61], and selective auditory attention tasks [62]. More
sophisticated designs using mental imagery, and duration of the mental effort can be used in
real-time to answer multiple choice questions [63], or spell words for real-time communication
[64].
As active paradigms are subject to many of the same biases that affect behavioral exami-
nations, efforts have also been put in the assessment of resting-state fMRI. This technique is
used to investigate the spontaneous temporal coherence in BOLD fluctuations related to the
amount of synchronized neural activity (i.e., functional connectivity) existing between distinct
brain locations, even in the absence of input or output tasks [65]. During rest, the brain is or-
ganized in distinct functional networks [66]. In healthy subjects, these resting state networks,
such as the default mode, visual, auditory, salience, sensorimotor and executive control net-
works can reliably be detected [67]. In patients, these functional connectivity patterns are
disturbed [41, 68] (figure 3.1). Chapter 2 will go deeper into functional connectivity, resting
state, and resting state networks. However, in short, functional connectivity has been shown
to decrease as a function of the level of consciousness (Appendix E, [41]). Meta-analysis
showed that this decrease is especially notable in the DMN, and most pronounced in UWS
[69].
Electroencephalography
Resting state measures of electrical brain activity can also aid diagnosis with the advantage
of being performed at the bedside [70]. For instance, recent studies have demonstrated an
absence of electrophysiological characteristics of sleep [71, 72] in UWS. Studies using quan-
titative and connectivity EEG measures have demonstrated the ability of this technique to
differentiate patients in MCS from those in UWS at the group level. EEG alpha activity is
decreased in all DOC patients, whereas delta power is increased only in UWS [73]. Further-
more, different patterns decreases in information integration can be seen in the different DOC

16 Chapter 1. Introduction
[74]. Several studies using passive paradigms have assessed event-related potentials (ERP)
in response to stimulations. The presence of an ERP response to stimuli and to odd stim-
uli within a sequence (mismatch negativity; MMN) serves as predictors of outcome. The P3
ERP response to unexpected stimuli also aids prognosis, and can be used as a response to
a command paradigm by showing higher ERP when used in an active condition as compared
to a passive situation [75]. As in fMRI active paradigms, some patients who are behaviorally
diagnosed as UWS have been shown to be able to perform active mental imagery tasks [76].
EEG in combination with transcranial magnetic stimulation (TMS) is used to stimulate a
brain region and assess cortical excitability (i.e., the amplitude of the initial response to TMS)
and effective connectivity (i.e., causal interaction between the stimulated area and the sub-
sequent activated cortical regions). This technique has been shown to successfully differen-
tiate patients with UWS from MCS. Indeed, MCS patients demonstrate complex long-lasting
widespread activation patterns, whereas patients in UWS show simple and local slow wave
responses that indicate a breakdown of effective connectivity [77] (figure 1.4, bottom).
All these neuroimaging methods can aid diagnostic assessment, however they are not
able to be used instead of bedside evaluation. None of the studies so far are yet able to
accurately diagnose the single subject, and studied groups are not big enough to be applied
on a clinical level.
1.4. Ancillary testing of consciousness 17
MRI active paradigm
MCS
LIS
MRI DTI
UWS
MCS
LIS
UWS
MCS
LIS
UWS
TMS-EEG,
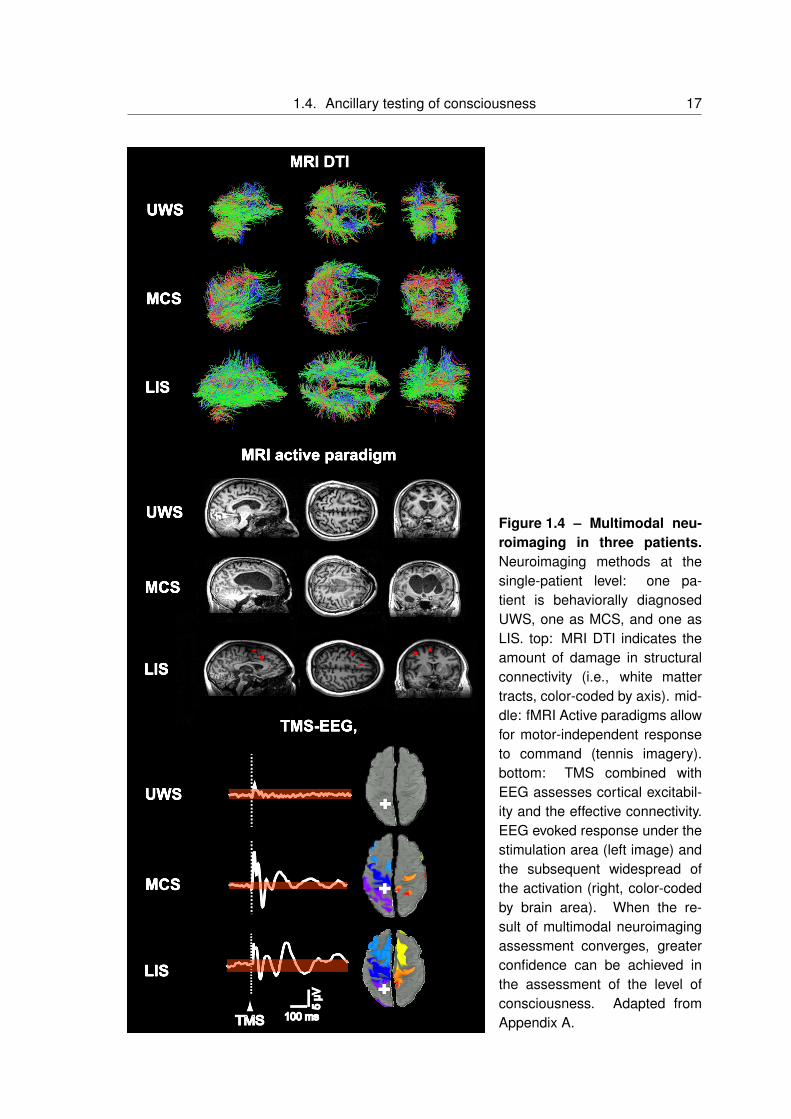
Figure 1.4 – Multimodal neu-roimaging in three patients.Neuroimaging methods at thesingle-patient level: one pa-tient is behaviorally diagnosedUWS, one as MCS, and one asLIS. top: MRI DTI indicates theamount of damage in structuralconnectivity (i.e., white mattertracts, color-coded by axis). mid-dle: fMRI Active paradigms allowfor motor-independent responseto command (tennis imagery).bottom: TMS combined withEEG assesses cortical excitabil-ity and the effective connectivity.EEG evoked response under thestimulation area (left image) andthe subsequent widespread ofthe activation (right, color-codedby brain area). When the re-sult of multimodal neuroimagingassessment converges, greaterconfidence can be achieved inthe assessment of the level ofconsciousness. Adapted fromAppendix A.

18 Chapter 1. Introduction
1.5 Objectives of the thesis
The aims of this thesis are two-fold, concerning both brain connectivity and sen-
sory stimulation.
Part I uses resting paradigms to assess brain connectivity. Using a lesion ap-
proach we hope to gain a better understanding of consciousness and its neces-
sary neural underpinnings. Chapter 2 assesses brain function in the DMN using
PET and structural MRI. Aim of this study is to explore the function-structure re-
lationship, and how this is affected in severely brain injured patients. We then
focus on one single method namely fMRI functional connectivity with the aim to
review differences between brain function in conscious and unconscious states.
Exploring the NCC cannot be done through assessment of brain damaged pa-
tients alone, so chapter 3 will review functional connectivity networks in physio-
logical (sleep, hypnosis), pharmacological (sedation, anesthesia) and patholog-
ical (coma-related states) alteration of consciousness. Clinical care, prognosis,
and ethical decisions are all dependent on diagnosis of DOC, making correct
diagnostic assessments critical. Chapter 4 tries to answer the question if the
observed differences in functional connectivity between UWS and MCS can be
classified.
As mentioned, one of the challenges for clinical evaluation is the fluctuating pat-
tern of responsiveness in the MCS. With the aim to further optimize diagnostic
assessment we use sensory stimulation in the context of passive paradigms in
part II. First aim here was to determine if sensory stimuli without personal rele-
vance, as used in several behavioral scales, could provoke conscious behavioral
responses (chapter 5). We hypothesized that contrary to stimuli without personal
relevance, preferred stimuli might improve behavioral responsiveness. Chapter
6 assessed functional connectivity during patients’ favorite music and classical
resting state scans. To study if the indicated increased functional connectivity
seen in the latter study during preferred music is due to the preferred charac-
teristics or an effect of music, we continued in chapter 7 with a behavioral study
using smell and audition.
Part III, and chapter 8 uses resting state fMRI to assess functional connectivity
in congenitally blind subjects. The understanding of the brains’ adaptation to
sensory loss might someday aid diagnosis of these losses in non-communicating
patients.

Part I
The resting paradigm:Brain function and structure in relation to
consciousness
19


21
Introduction
This part will focus on the resting state, as mentioned this paradigm does not rely on tasks
or external stimulations and thus is suitable in our severely brain injured population. Three
chapters will utilize several different methodologies, namely structural MRI, functional MRI
and PET. Chapter 2 will look at the changes in function and structure using PET and MRI
respectively. We directly investigate, for the first time in severely brain injured patients, the
relationship between functional brain activity and structural connectivity within the DMN in
an objective and combined fashion. We will then return to single method analysis to explore
the use of resting state functional connectivity analysis as measured using functional MRI.
Chapter 3 will review changes in functional connectivity using fMRI under pathological, physi-
ological and pharmaceutical unconsciousness. This is followed in chapter 4 by a study aiming
at differentiating between MCS and UWS using resting state functional connectivity in these
networks.
Default mode network
Using functional resting methods, the default mode network (DMN) has been studied ex-
tensively. This network of distinct, remote, and cooperating brain areas encompass pre-
cuneus/posterior cingulate cortex, mesiofrontal/anterior cingulate, and temporoparietal junc-
tion. It was initially identified in PET studies as regions less active when performance on
cognitive tasks was compared to resting control condition [78–80] (see figure 1.2 bottom left;
figure 1.5; red activations)
After this the DMN was also identified in functional MRI [81], and can now also be repli-
cated in neurophysiological measures of synchronized phase-amplitude coupling of activity,
such as with magnetoencephalography (MEG) [82].
While the DMN is usually defined in terms of functional connectivity, there are indications
of clear structural underpinnings [83, 84]. The structural core of the network is centered in
the posterior elements of the default mode network, and important for functional integration
of the whole brain [85, 86].
FMRI resting state connectivity studies stress that the brain in a resting state is charac-
terized by coherent fluctuations in the blood-oxygen-level-dependent (BOLD) signal. These
BOLD fluctuations can be detected in the low frequency range (<0.1Hz) [87] and are dis-
tinct from respiratory and cardiovascular signal contribution [88]. This indicates that resting
state functional MRI analysis is not only noise and unspecified neural activity, but correlated
fluctuations in absence of tasks organize the brain in large-scale cerebral networks [65, 66].

22
The DMN can be explained in terms of cognitive function, its activity has been linked to self-
related and internal processes, such as stimulus-independent thoughts [89], mind-wandering
[90], social cognition [91], introspection [92], monitoring of the mental self [93], and integration
of cognitive processes [81]. Anatomically, the ventral medial prefrontal cortex can be seen as
a sensory-visceromotor link concerned with social behavior, mood, and motivation, while the
dorsal medial prefrontal cortex is associated to self-referential judgment, and the posterior
elements of the default mode network with the recollection of prior experiences [94].
Concerning patients, the DMN shows functional [47, 95, 96], metabolic [48], and structural
[56, 97, 98] impairments [99]. Furthermore, disconnections with thalamocortical and cortico-
cortical regions in the DMN in DOC correlate with clinical severity [47, 56, 57, 99]. Additionally,
preservation of functional connectivity between frontal and parietal DMN regions is indicated
to be a marker of recovery from coma after 3 months [100].
Anticorrelations
Since the early studies of resting state, it was suggested that the brains baseline activity can
be organized in two brain networks showing anticorrelated activity to each other: an intrinsic
and an extrinsic network [47, 101, 102]. The intrinsic network coincides with the DMN and
is involved in the same cognitive processes as the DMN. The extrinsic system encompasses
lateral frontoparietal areas resembling the brain activations during goal-directed behavior, and
it has been linked to cognitive processes of external sensory input, such as somatosensory
[103], visual [104] and auditory [105] stimuli. Previous studies showed that these two sys-
tems are of a competing character in the sense that they can disturb or even interrupt each
other [106]. Such an anticorrelated pattern is also illustrated in activation studies on motor
performance [107], perceptual discrimination [108], attentional lapses [109], feelings of disso-
ciation during hypnosis [110], and somatosensory perception of stimuli close to somatosen-
sory threshold [103]. These competing networks were furthermore behaviorally implicated in
internal and external awareness, switching around every 20 seconds [47].
However, the fMRI anticorrelations have been subject of debate. It has been argued
that the anticorrelated pattern could arise from the preprocessing procedure when the brains
global signal is regressed out [111]. Nonetheless, anticorrelations have been found in studies
which address the criticisms [112–114], and more importantly, anticorrelations have been
found using EEG [113]. These anticorrelations have also been shown to reduce or disappear
in decreased states of consciousness such as anesthesia [115], sleep [116], and in UWS
patients [117].

23
More recently, it was shown that indeed, patients with an UWS and MCS show decreased
positive correlations within the default mode network, but also the negative correlations be-
tween the external network and DMN disappear. These anticorrelations do appear again in
EMCS patients [118]. Together, these studies show that anticorrelations have a physiological
origin, and a reduction of these anticorrelations can be seen during unconscious states.
0.4
0.3
0.2
0.1
0
0
0.1
0.2
-0.1
-0.2
UWS MCS EMCS HealthyControls
UWS MCS EMCS HealthyControls
Con
trast
Est
imat
es
Default mode network and the anticorrelated external network
Positive connectivity Negative connectivtiy
Figure 1.5 – Anticorrelated networks. Positive default mode network connectivity shownin red (i.e., within-network correlations) was decreased, albeit preserved, in UWS, MCS,and EMCS. Functional connectivity of healthy controls is significantly different from all pa-tient groups, while no differences were identified between the groups of patients. Negativeconnectivity shown in blue (i.e., anticorrelations) are also diminished. Default mode networkanticorrelations are only observed in EMCS and healthy controls. In UWS and MCS patientsthese anticorrelations become positive. Figure adapted from [118].

24

Chapter 2
Metabolic function, structural integrity,and function-structure connectivity
Based on:
Function-structure connectivity in patients with severe brain injury as mea-sured by MRI-DWI and FDG-PETAnnen J*, Heine L*, Ziegler E, Frasso G, Bahri M, Di Perri C, Stender J, Martial C,Wannez S, D’Ostilio K, Amico E, Antonopoulos G, Bernard C, Tshibanda F,Hustinx R, Laureys S.Human Brain Mapping, June 2016
∗ Contributed equally
25

26 Chapter 2. Metabolic function, structural integrity, and function-structure connectivity
2.1 Function and structure of the DMN
As described in the introduction, a substantial body of literature exists on grey matter metabolic
(e.g., fluorodeoxyglucose PET; FDG-PET) and white matter structural (e.g., MRI-DWI; diffusion-
weighted imaging) brain characteristics in DOC. Both these methods independently show se-
vere impairments in DOC and EMCS patients (see introduction, or [35]). In short, at a global
level, functional measures show that metabolism in DOC patients is decreased by up to 40-
50 percent from their normal value [43, 44, 119–121], with specific dysfunction is in the DMN
[46, 48]. More precisely, metabolic activity, functional connectivity, and structural integrity are
reportedly more reduced in these regions than in the rest of the brain [99].
The cerebral metabolic reductions in DOC are proposed to result from widespread neu-
ronal injury [48] or disruption of central excitatory drivers [122]. The latter mesocircuit hy-
pothesis proposes that large-scale dysfunction is due to an important reduction of thalamic
excitatory output to the cortex. The observations of impaired metabolism suggest that ax-
onal deafferentiation may be a key driver. However, no study has directly investigated the
structure (MRI-DWI)-function (PET metabolism) relationship and how it is affected in severely
brain injured patients. We explored this DMN function-structure relationship in severely brain-
damaged patients with varying levels of consciousness using measurements of metabolism
(standardized uptake value; SUV to estimate glucose uptake) and white matter structural in-
tegrity (fractional anisotropy; FA, a measure of directionality of water diffusion assumed to be
related to myelination of white matter) (figure 2.1).
We studied 25 chronic (>1month) severely brain injured patients and 25 healthy subjects
using two neuroimaging modalities: diffusion-weighted MRI and 18F-FDG-PET imaging. The
analysis focused on four regions per hemisphere (thalamus, frontal cortex, precuneus, inferior
parietal cortex) comprising the default mode network.
Each subjects T1-weighted images were manually reoriented, and automatically labelled
using the Desikan-Killiany atlas [123]. Labels were combined to produce the regions of in-
terest. Grey matter (GM), white matter (WM), and cerebrospinal fluid (CSF) masks were
produced by combining Freesurfer and FAST (part of FSL) segmentation methods. DWI
were corrected for vibration artifacts, subject motion and eddy current-induced distortions,
and when necessary volumes were removed when distorted by table-vibrations. Diffusion
tensors were fit at each voxel using non-linear least squares fitting and fractional anisotropy
(FA) was computed. Voxels with unidirectional diffusion were identified and used to estimate
the diffusion-weighted signal response for a single fiber population. Next, non-negativity con-
strained spherical deconvolution was performed, fiber orientation distribution functions within

2.1. Function and structure of the DMN 27
Thalami
Lateral Parietal
Precuneus
Frontal cortices Default mode fibers
Healthy control Brain injured patient
Figure 2.1 – Default mode network regions and the tracts between the regions in ahealthy volunteer and brain injured patient. Left side shows ROI volumes with their re-spective naming. Right side of the figure shows tracts between the ROIs of the default modenetwork (represented on the left) for one control subject and one patient.
each voxel were estimated and probabilistic tractography was performed. A connectivity ma-
trix for the eight-region connectome was computed using the streamline origin and termination
points and the region-of-interest label mask. For each streamline the FA was averaged over
all the voxels it passed through.
FDG-PET underwent partial volume correction using the Muller-Gartner-Rousset method
[124]. Finally, following PVE correction the PET image was transformed into T1 space and the
mean SUV value was extracted within each ROI (see figure 2.2 for the processing pipeline)
Using R (R Core Team (2014)) for statistical analysis we performed three main analyses.
First we tested the difference between controls and brain injured patients in mean SUV and
FA values using two-sample t-tests with Bonferroni correction. Subsequently, multivariate lin-
ear regression analysis with group and FA as regressor to model how group and structural
integrity (FA) of DMN tracts relate to metabolism (SUV) in adjacent regions. Type II ANOVAs
were used to assess significant main and interaction effects. We then focused on patients
alone to better understand the variance within the brain injured group. Multiple linear re-
gression models were used to investigate how demographic factors as diagnosis (DOC vs.
EMCS), etiology (TBI or non-TBI), disease duration (sub chronic vs. chronic), gender, and
age influence the function-structure relationship in the patient population. Type II ANOVAs
were used to assess significant main and interaction effects.
Due to stringent exclusion criteria the final cohort consisted of 25 patients and 25 healthy
controls (mean age of 36.3 years, 11 males for brain injured and 40.9 years and 13 males

28 Chapter 2. Metabolic function, structural integrity, and function-structure connectivity
in the healthy control group). DOC patients had been clinically diagnosed as in an UWS (n
= 7) or MCS (n = 12), and diagnosis was consistent during MRI and PET. Six subjects were
diagnosed as EMCS (n = 6). The patient cohort consisted of sub acute (n = 10, >30 days to
3 months after onset) and chronic patients (n = 15, >3 months after onset) with a mean time
since onset of 1.8 years (SD = 1.9 years). Patients suffered from traumatic brain injury (TBI,
n = 12), anoxia (n = 11), both (n = 1), or infection (n = 1).
Figure 2.2 – Schematic of the processing pipeline. Data was assessed in subject spacewhere the T1 MRI was segmented using Freesurfer. PET glucose metabolism was estimatedby calculation of mean partial volume corrected standardized uptake values within the defaultmode network ROIs. Fractional anisotropy was extracted of the voxels that the DMN tractpassed through.
2.2 Decreases in function and structure independently
We first assessed function (PET metabolism) and structure (DWI-FA) independently, to repli-
cate previous studies focusing on either measure separately. Indeed, marked impairments in
SUV and FA were observed in patients. Standardized uptake value in all DMN regions was
lowered in brain injured patients compared to healthy controls, with a 39-42% reduction of
metabolic rates in brain injured patients in the cortical DMN regions and thalamus (figure 2.3)
This is in accordance with previous findings on a global brain scale [32, 43, 44, 120, 121] and
within the DMN specifically [48, 50, 125]. Fractional anisotropy in all DMN tracts was dimin-
ished by about 13-23% in brain injured patients compared to healthy controls (figure 2.4), in

2.3. The structure-function relationship 29
line with previous reports [56, 97, 98]. Our results support recent findings of diminished struc-
tural integrity of corticocortical and subcortico-cortical DMN connections, which correlated
with clinical severity in a group of 8 patients [57].
***_____
***_____***_____ ***_____
5
10
15
Thalamus Frontal Precuneus Inferior ParietalRegion
FDG−P
ET S
tand
ardi
zed
Upt
ake
Valu
e fo
llow
ing
PVC
HealthyBrain Injured
Average metabolism by region and group
Figure 2.3 – PET functional activity in DMN. Standardized uptake value following partialvolume correction (PVE) in the default mode network regions (average of standardized uptakevalues of left and right hemisphere) for healthy controls and brain injured patients. Braininjured patients show a decreased standardized uptake value compared to controls in alldefault mode network regions. *** = p < 0.001.
2.3 The structure-function relationship
The main aim of this study was to assess the function-structure relationship in the DMN and
thalamus in healthy conscious subjects and coma survivors. First, as expected, we have
replicated previous studies and shown that patients have significantly lower FA in all studied
connections and SUV in all regions. Building on this, we showed that grey matter metabolic
function can be partially explained by white matter anisotropy in several regions of the default
mode network within the patient cohort. More specifically, metabolism of the frontal cortex,
precuneus and inferior parietal cortex can be explained by fronto-inferioparietal, precuneal-
inferiorparietal, and thalamo-inferioparietal as well as thalamo-frontal structural integrity (FA)
(figure 2.5). These results are in line with the limited previous studies indicating there might
be a link between structural integrity and glucose metabolism. For example, one study corre-
lating metabolism with white matter bundles in the default mode network in healthy subjects

30 Chapter 2. Metabolic function, structural integrity, and function-structure connectivity
***_____ ***_____ ***_____ ***_____ ***_____ ***_____
0.1
0.2
0.3
0.4
0.5
0.6
Thalamo− frontal
Thalamo− precuneus
Thalamo− inferioparietal
Fronto− precuneus
Fronto− inferioparietal
Precuneal− inferioparietal
Tract
Aver
age
FA
HealthyBrain Injured
Average structural integrity by region and group
Figure 2.4 – MRI structural connectivity in DMN. Structural connectivity of tracts betweenthe default mode network regions represented with fractional anisotropy (FA) of the voxelsthat the tracts pass through, in healthy controls and brain injured patients (average of left andright hemispheres). Brain injured patients show lower FA values compared to healthy controlssubjects in all tracts. *** = p < 0.001.
found that working memory is related to a structure-function correlation in the cingulum [126].
Further studies have shown that diffusion measures have been correlated to glucose uptake
in patients with Alzheimers disease and dementia [127–129], children with occipital lesions
[130], normal aging [131] and epilepsy [132]. However, all of these studies use simple cor-
relations instead of regressions measures, and thus do not take population-specific changes
into account. This could result in false positive-correlations, driven by main effects of group
on the (in) dependent variables. This could result in false positive-correlations, driven by main
effects of group on the (in) dependent variables. We provide proof that metabolic function is
indeed directly related to structural integrity, surpassing existing correlational results.
Interestingly, we did not find a structure-function relationship at the global brain level,
suggesting that our results do not solely reflect general brain integrity. Instead, the function-
structure relationship of the default mode network might be directly related to consciousness.
This has been shown in single-modality studies, for example functional connectivity [47], white
matter structural integrity [56, 97, 98], and metabolic function [48]. Here we show for the first
time a direct function-structure relationship within this network.
As expected, healthy control subjects showed FA and SUV within normal range and there-
fore we are unable to make inferences about whether one drives the other. Next we investi-
gated the function-structure relationship within our patient population, comparing EMCS with

2.3. The structure-function relationship 31
4
8
12
16
0.3 0.4FA Fronto−inferioparietal
PVC
-SU
V In
ferio
r par
ieta
l
SUV Inferior parietal vs. FA Fronto−inferioparietal
4
8
12
16
0.30 0.35 0.40 0.45FA Thalamo−inferioparietal
PVC
-SU
V In
ferio
r par
ieta
l
SUV Inferior parietal vs. FA Thalamo−inferioparietal
4
8
12
16
0.30 0.35 0.40 0.45FA Thalamo−frontal
PVC
-SU
V Fr
onta
l
SUV Frontal vs. FA Thalamo−frontal
4
8
12
0.2 0.3 0.4FA Precuneal−inferioparietal
PVC
-SU
V Pr
ecun
eus
SUV Precuneus vs. FA Precuneal−inferioparietal
STRUCTURAL CONNECTION (FA)
4
8
12
16
0.2 0.3 0.4FA Precuneal−inferioparietal
PVC
-SU
V In
ferio
r par
ieta
l
SUV Inferior parietal vs. FA Precuneal−inferioparietal
FUNCTION (PVC-SUV)
Brain injuredHealthy
Figure 2.5 – Linear regression model of the function-structure relationship. Left side ofthe image shows a spatial representation of the function-structure relationships. Blue circlesrepresent regions where standardized uptake value (SUV; as corrected for partial volumeeffects) depended on fractional anisotropy (FA), blue arrows for FA of tracts that drive SUVin adjacent regions. Grey versions represent non-significant analysis. Right side of imageshows five scatterplots of the linear regression models for healthy controls (blue dots), andpatients (green dots), and significant main effect of FA (lines). Abbreviations: FA: fractionalanisotropy; SUV: Standardized uptake value.

32 Chapter 2. Metabolic function, structural integrity, and function-structure connectivity
DOC patients (MCS and UWS). EMCS patients are able to use objects and/or functionally
communicate, and thus by definition conscious. Apart from one region-connection pair, all
observed main effects of FA seen in the healthy vs. brain injured analysis were also ob-
served in the analysis between the two patient populations, indicating that there is a positive
linear relation between functional and structural integrity of the default mode network. Fur-
thermore, in contrast to DOC patients, EMCS patients show a significantly stronger function-
structure interaction between the function of the thalamus and the structural integrity of the
thalamo-inferiorparietal tract. On the uni-modal level our results match previous research
in post-comatose patients finding that structural cortico-thalamic connections are diminished
[57] and thalamic metabolism is lowered (Fridman et al., 2014). These findings can be ex-
plained by the mesocircuit theory, which proposes that large-scale dysfunction is due to a
global decrease of excitatory neurotransmission which in turn alters cerebral activity. More
specifically, the globus pallidus is disinhibited and overactive, inhibiting the thalamic excitatory
output to the frontal cortex (Schiff, 2010). By combining both functional metabolism and white
matter structural information we here provide further evidence for the validity of this theory,
supporting the hypothesis that thalamo-cortical connectivity plays an important role in emer-
gence of consciousness [122]. We limited ourselves to the DMN because of the large body of
literature on this brain-network relating to consciousness. Therefore, future research should
extend these findings to more specific sub-cortical regions, such as the globus pallidus or
specific thalamic regions.
We do not find any difference between patients based on etiology, even though several
studies have shown that temporal dynamics of Wallerian degeneration vary given different
etiologies [133, 134] and that traumatic brain injury, unlike anoxia, might selectively affect
DMN white matter integrity [135, 136]. Multi-centric collaborations should provide sufficiently
large data-sets to study these effects in the future.
We here assessed the function-structure relationship within healthy, conscious subjects
and severely brain damaged patients with varying levels of consciousness through direct
combined investigation of function (FDG-PET), and structure (MRI-DWI). Levels of structural
integrity (FA) and metabolic function (SUV) are significantly diminished in patients compared
to controls. Furthermore, a significant positive function-structure relationship can be observed
within most regions of the default mode network. This relationship may be network-specific,
as it does not appear at the whole-brain level. Finally, we show that EMCS compared to DOC
show a significantly stronger thalamo-cortical function-structure relationship, which is in line
with the mesocircuit hypothesis.
Other ways of assessing resting data exist. One of these is functional MRI, which can
detect BOLD (blood-oxygen-level-dependent) changes in the brain. The next chapter will

2.3. The structure-function relationship 33
use this to assess spontaneous brain-activity during the resting paradigm, through functional
connectivity.

34 Chapter 2. Metabolic function, structural integrity, and function-structure connectivity

Chapter 3
FMRI functional connectivity measures
Based on:
Resting state networks and consciousness: alterations of multiple restingstate network connectivity in physiological, pharmacological, and patho-logical consciousness StatesHeine L, Soddu A, Gomez F, Vanhaudenhuyse A, Tshibanda L, Thonnard M, Charland-Verville V, Kirsch M, Laureys S, Demertzi A.Frontiers in Psychology, 2012, 3:295
35

36 Chapter 3. FMRI functional connectivity measures
3.1 Resting state functional connectivity networks duringunconsciousness
Resting state functional MRI can teach us about spontaneous brain-functioning. Resting state
networks, and the DMN are briefly introduced on page 14, and 21. Differences between these
networks during consciousness and unconsciousness can teach us about the NCC, and thus
we will describe resting state networks, and their respective changes during physiological
(e.g., sleep and hypnosis), pharmacological (e.g., sedation and anesthesia), and pathological
(e.g., coma and DOC) states of unconsciousness. Furthermore, the DMN is not the only
resting state network important in consciousness, and the function of any brain region cannot
be understood in isolation but only in terms of functional integration [137]. Therefore we will
further focus this review on the bilateral frontoparietal, salience, sensorimotor, auditory, and
visual networks [66, 67, 88, 107, 138] (figure 3.1).
As indicated before, resting state fMRI studies suggest that activity of the DMN is gen-
erally reduced as a function of the level of consciousness. Not only in patients [118], but
also in other states of diminished consciousness. For example, it has been shown that with
the advancement of sleep, connectivity between the frontal and posterior parts of the DMN
decreases [139]. Decreases in functional connectivity were also observed in the posterior
cingulate cortex (PCC) of the DMN under pharmacological unconsciousness with propofol
[115, 140] and sevoflurane [141]. These studies suggest that DMN functional connectivity
correlates, at least partially, with the level of ongoing conscious cognition. This is in agree-
ment with functional connectivity studies on intermediate states of awareness. For example,
hypnotic state show only small [110] or no connectivity decreases in the DMN [142]. Similarly,
during light sleep [143, 144] there is no change, and during moderate sedation, little [145] or
no changes [146] in DMN connectivity have been observed.
The frontoparietal network (figure 3.1) during normal wakefulness encompasses bilateral
middle, inferior and superior frontal cortices, bilateral inferior parietal lobes, ACC/supplementary
motor area (SMA) and bilateral insular cortices. Resting state independent component analy-
sis identified this network in a lateralized manner. The left frontoparietal network is thought to
be more involved in cognitive and language paradigms while the right frontoparietal network
relates to perceptual, somesthetic and nociceptive processing [67, 147]. Activity in both these
two networks is reduced during deep sleep [116] and anesthesia [115] whereas light sleep did
not seem to mediate functional connectivity in these networks [144]. Taken together, these
results highlight the involvement of the frontoparietal networks in the perception of the exter-
nal world, in line with previous suggestion that activity of these areas is a necessary condition
for conscious (i.e., reportable) visual perception [148].

3.1. Resting state functional connectivity networks during unconsciousness 37
The salience network (figure 3.1) encompasses fronto-insular and anterior cingulate cor-
tices (ACC) with connections to subcortical and limbic structures. In normal conditions, this
network is implicated in the orientation towards salient (e.g., homeostatic, cognitive, and
emotional) stimuli [149], conflict monitoring, information integration, and response selection
[150, 151] and it has been proposed that the salience network enables the switch between
internal attention (the default mode) and task related states [152]. This network also showed
modulations in connectivity under propofol anesthesia [153]. The salience network has also
been linked to pain-related processes both during actual pain (Tracey and Mantyh, 2007),
during resting state while anticipating pain (Ploner et al., 2010;Wiech et al., 2010), and af-
ter hypnotic suggestions for creating pain experiences in the absence of a noxious stimulus
(Derbyshire et al., 2004). In altered states of consciousness, increased connectivity between
the ACC and the insula under light sevoflurane sedation was observed (although connectivity
between the insula and the secondary somatosensory cortex was reduced, [141]). Analysis
of the salience network in comatose states could be beneficial for analysis of pain, as patients
in MCS are more likely to feel noxious stimuli [9].
The (sensori-)motor network (figure 3.1) resembles the activations seen in motor tasks
[65]. In normal wakefulness it encompasses the supplementary motor area (SMA), midcin-
gulate cortex, bilateral primary motor cortex and bilateral middle frontal gyri [65, 154]. During
light sedation the sensorimotor network shows increases in functional connectivity [141, 154].
The auditory network (figure 3.1), important in audition (e.g., tone/pitch discrimination,
music, and speech) [147] in normal wakefulness, encompasses primary and secondary au-
ditory cortices, including Heschls gyrus, bilateral superior temporal gyri, and posterior insular
cortex. During normal wakefulness, resting state independent component analysis also iden-
tifies the visual network in three independent components. One network, the lateral visual
network includes the middle temporal visual association area at the temporo-occipital junction
and is most important in complex (emotional) stimuli [147]. The other networks include medial
and occipital visual networks, important in simple visual (e.g., a flickering checkerboard) and
higher-order visual stimuli (e.g., orthography), respectively [66, 138, 147, 155]. No difference
in connectivity was identified between both these primary auditory and visual sensory net-
works and light sleep [144], or between awake and sedation [115, 141]. One study showed
increased temporal synchrony in auditory and visual areas in light midazolam sedation [156].
The visual cortex (figure 3.1) has been shown to possess a higher amplitude of bold fluctu-
ations when asleep [157]. This indicates that resting state activity continues in these areas
during sleep, and thus is not dependent on consciousness. Finally, reliably indicated as pos-
sessing functional connectivity is the cerebellum. This network is associated with action and
somesthesis [147], but not yet thoroughly studied in altered states of consciousness.

38 Chapter 3. FMRI functional connectivity measures
Figure 3.1 – Resting statenetworks. Functional con-nectivity maps of the sixmost studies resting statefunctional connectivity net-works were produced in agroup of 10 healthy con-scious subjects using theCONN toolbox. For illustra-tive purposes, group-levelspatial maps (z values) arerendered on a structural T1magnetic resonance tem-plate and x, y, and z val-ues indicate the MNI coor-dinates of the representedsections.
DMN
Frontoparietal
Salience
Motor
Auditory
Visualx=3, y=-17, z=-1
x=13, y=-80, z=-1
x=1, y=-21, z=51
x=6, y=20, z=-5
x=-54, y=-48, z=47
x=0, y=-43, z=23

3.2. Analyzing resting state data from pathological brains: methodological issues 39
3.2 Analyzing resting state data from pathological brains:methodological issues
Functional connectivity refers to measures of similarity between the two time-courses, usu-
ally (and in the studies of this thesis) this is done through the Pearson correlations co-
efficient, measuring the linear dependence between the two signals. Depending on the
adopted methodology, several issues need to be taken into account when analyzing rest-
ing state acquisitions from clinical populations. To date, two main approaches are employed;
hypothesis-driven seed-voxel correlation analysis and data-driven independent component
analysis. Each method has its own advantages, yet their methodological difficulties, espe-
cially in non-collaborative patients, must be acknowledged.
Hypothesis-driven method: seed based correlation analysis
The seed-voxel approach uses the extracted BOLD time course from a region of interest (ROI)
and determines the temporal correlation between this signal (the seed) and the time course
from all other brain voxels [101]. This creates a whole-brain voxel-wise functional connectivity
map of covariance with the seed region. See figure 3.2 for an example of the main resting
state networks, and representative seed regions within these networks. This is the most
straightforward method to analyze functional connectivity between brain regions. The method
gives a direct answer to specific hypotheses about functional connectivity of that region. It is
attractive and elegant for many researchers as the data can be interpreted relatively easily
when a well-defined seed area is used. When applying this approach to the study of resting
state activity in patients with DOC, several controversial issues arise. A first general issue
concerns the removal of artifactual influences on the signal. When the review on which this
chapter is based was written in 2012, issues about regressing out the global activity from the
BOLD signal [111, 158] already existed. In the years since, several steps have been taken to
improve quality of the data. For example, other methods regress out signals found in white
matter, ventricles or other noise components [159–161] before bandpass filtering [162]. This
protects against confounding correlations as produced by other methods, like global signal
regression [111, 112, 160, 161].
All resting state studies in this thesis use this method of confound-regression as imple-
mented in open-source, SPM and MATLAB based CONN analysis toolbox [163]. More specif-
ically, aCompCor models the influence of noise as a voxel-specific linear combination of multi-
ple empirically estimated noise sources by deriving principal components from noise regions
of interest (white matter, CSF) and by including them as nuisance parameters within the gen-
eral linear models. Motion is also a severe confounder in resting state analysis, and proper

40 Chapter 3. FMRI functional connectivity measures
methods of filtering are necessary [164]. Our analyses includes regression of the motion
parameters (ART; http://www.nitrc.org/projects/artifact_detect), instead of deletion of motion
contaminated images [114].
Next, patients with severe brain injuries may suffer from structural deformations resulting
from traumatic brain injury and focal hemorrhages. Additionally, patients with severe chronic
brain injuries usually develop atrophy and secondary hydrocephalus (i.e., ex-vacuo dilation of
the ventricles). This implies that even if a statistical structural normalization procedure has
been performed, the selection of a proper seed region can become difficult and will require
visual inspection by an expert. This issue adds to the already intrinsic challenges of a priori
selection of the seed region which can be damaging to network estimation when functionally
inaccurate ROIs are chosen [165, 166]. Finally, as for all group-level analyses, one has to take
into account intersubject variability, such as cortical folding or functional localization between
individuals or groups [165] which can be extremely challenging in severely deformed brains.
Data-driven method: independent component analysis (ICA)
Data-driven methods are used to analyze whole brain connectivity patterns without the need
for a priori seed regions. ICA is a widely used methodology with a high level of consis-
tency in results within subjects [167]. It divides an entire dataset into different maximally
statistical independent spatial components and thus is able to isolate cortical connectivity
maps from non-neural signals [138]. Spontaneous activity is therefore automatically sepa-
rated from noise, such as head motion or physiological confounds (e.g., cardiac pulsation,
respiratory, and slow changes in the depth and rate of breathing) [168]. This method has the
advantage that it can evaluate and compare the coherence of activity in multiple distributed
voxels [165], and can divide multiple resting state networks into different components. How-
ever, ICA does not provide any classification or ordering of the independent components. It is
therefore perceived as more difficult to understand due to the complex representation of the
data. The most straightforward method for labeling the components is by visual inspection,
but this lacks reproducibility and could be hard to perform in cases with a large component
dimensionality. Alternatively, an automatic selection is preferable but the way to choose the
right independent component remains a delicate issue. Merely performing a spatial similarity
test with a predefined template has been shown not to be successful for choosing the right
component [38, 96]. Some automatic approaches for component selection have been pro-
posed, based on template matching using the goodness of fit as an outcome index. However,
these methods have to be interpreted with care especially in cases of deformed brains as in
patients with a traumatic brain injury or comatose state. It was recently proposed that when
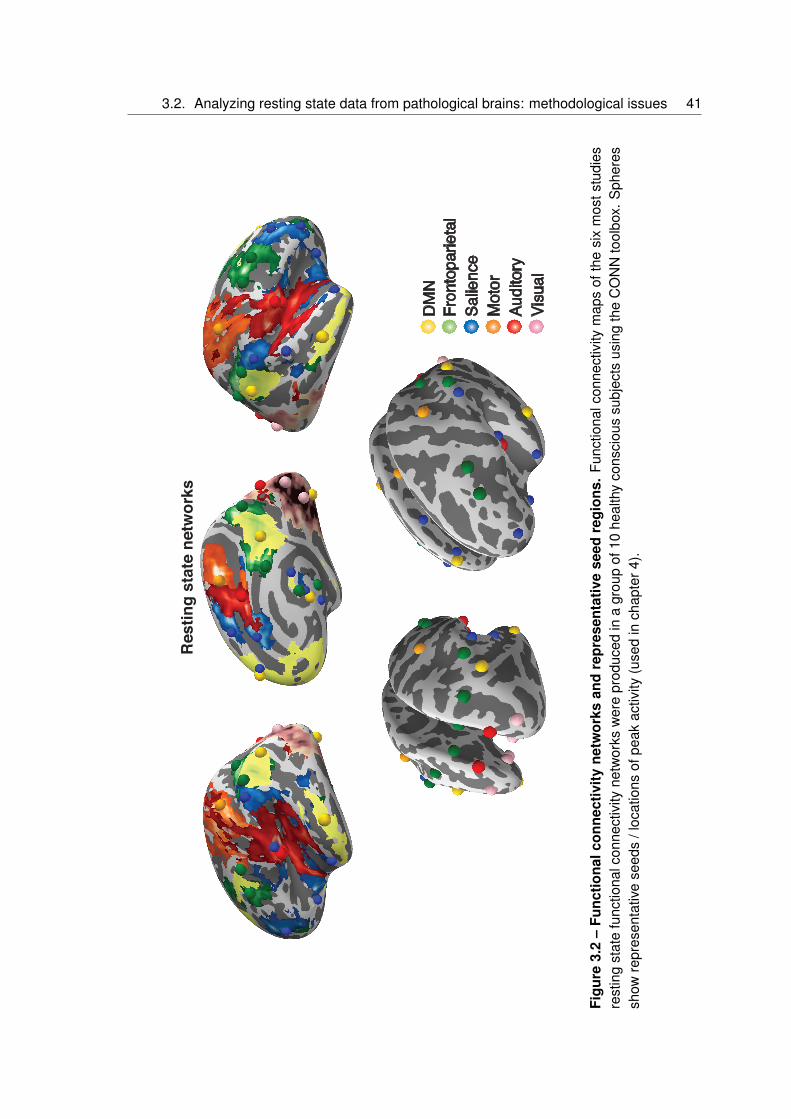
3.2. Analyzing resting state data from pathological brains: methodological issues 41
DMN
Frontoparietal
Salience
Motor
Auditory
Visual
Res
ting
stat
e ne
twor
ks
Figu
re3.
2–
Func
tiona
lcon
nect
ivity
netw
orks
and
repr
esen
tativ
ese
edre
gion
s.Fu
nctio
nalc
onne
ctiv
itym
aps
ofth
esi
xm
osts
tudi
esre
stin
gst
ate
func
tiona
lcon
nect
ivity
netw
orks
wer
epr
oduc
edin
agr
oup
of10
heal
thy
cons
ciou
ssu
bjec
tsus
ing
the
CO
NN
tool
box.
Sph
eres
show
repr
esen
tativ
ese
eds
/loc
atio
nsof
peak
activ
ity(u
sed
inch
apte
r4).

42 Chapter 3. FMRI functional connectivity measures
selecting independent components in a patient population, spatial, temporal and a compro-
mise between spatial and temporal properties of the network of interest need to be met [96].
For example, a component can be erroneously selected as the resting state network of inter-
est if the selection is based on the spatial pattern ignoring the properties in the time-domain
(figure 3.3). Additionally, the determination of the proper dimensionality (i.e., the right number
of estimated components) remains unclear. Extracting many components can result in the
spatial segregation of the network of interest into multiple sub-networks [67]. It was shown,
for example, that the use of 75 components can reduce the DMN into four components and
the sensorimotor network in six [155]. When applying ICA in pathological brains it is probably
best not to select a large quantity of components, because high component dimensionality
can further reduce the chances of identifying a network due to decrease in spatial pattern and
spectral properties [169].
A more resent study indicated that seed based analysis might be more informative com-
pared to ICA, but combination or multiple seed analysis is preferred when trying to correlate
clinical scores of DOC patients to functional connectivity [99]. Other techniques to analyze
resting state data exist such as methods that focus on the (fractional) amplitude of low fre-
quency fluctuations ((f)ALFF; [171]), or on the small world characteristics using correlation
and graph analysis [172, 173] or dynamic functional connectivity [174].

3.2. Analyzing resting state data from pathological brains: methodological issues 43
UWS patientUWS patient
Locked-in syndrome patientHealthy control
Figure 3.3 – The challenges of component selection. The figure illustrates the spatialpattern (brain maps, z values 0.810) and spatial-temporal properties [170] of the default modenetwork in healthy consciousness states. Upper and lower left figures show characteristicproperties in both the spatial and the temporal domain (i.e., the fingerprints pick in the 0.02-0.05 Hz frequency band labeled with the number 9). Lower right figure shows the spatialpattern of the default mode network but the time course of this component is characterizedby high frequency fluctuations, in the 0.1-0.25 Hz frequency band and high spatial entropy(labeled, respectively, with the number 11 and 4 in the fingerprint). Therefore, such activitycannot be considered of neuronal origin. A compromise in the selection of the appropriatenetwork of interest in the space and time domain is needed. Fingerprint labels: (1) degreeof clustering; (2) skewness; (3) kurtosis; (4) spatial entropy; (5) autocorrelation; (6) temporalentropy; power: (7) 0-0.008 Hz; (8) 0.008-0.02 Hz; (9) 0.02-0.05 Hz; (10) 0.05-0.1 Hz; (11)0.1-0.25 Hz.

44 Chapter 3. FMRI functional connectivity measures

Chapter 4
Classification of resting state functionalconnectivity
Based on:
Intrinsic functional connectivity differentiates minimally conscious fromunresponsive patientsDemertzi A*, Antonopoulos G*, Heine L, Voss H U, Crone SJ, Kronbichler M, Trinka E,Angeles C, Bahri M, Phillips C, Di-Perri C, Gomez F, Tshibanda L, Soddu A, Vanhauden-huyse A, Charland-Verville V, Schiff N D, Whitfield-Gabrieli S*, Laureys S*.Brain, 2015, 6:1704,
∗ Contributed equally
45

46 Chapter 4. Classification of resting state functional connectivity
Up to now, research on accurate single-patient categorization in MCS and UWS has been
performed by means of transcranial magnetic stimulation in combination with EEG [77, 175]
and by combining different EEG measures [176]. Patient separation by means of fMRI was
not yet done. In this study we aimed at differentiating the MCS-UWS single-patient population
by using functional connectivity. To this end, we studied systems-level resting state functional
connectivity in severely brain injured patients in a comatose state, UWS, or MCS with the aim
to (i) estimate the contribution of each network to the level of consciousness as determined by
behavioral assessment; (ii) rank the capacity of each network to differentiate between patients
in MCS and UWS; and (iii) automatically classify independently assessed patients.
Three clinical centers collected data from 73 patients in MCS, UWS, and coma. The
main analysis was performed on the data set coming from one center (Liege) including 51
patients (26 MCS, 19 UWS, six coma; 15 females; mean age=49 years, SD=18 years; 16
traumatic, 32 non-traumatic of which 13 anoxic, three mixed; 35 patients assessed > 1-month
post-insult) for whom the clinical diagnosis with the CRS-R was congruent with PET scan-
ning. Group-level functional connectivity was investigated for the default mode, frontoparietal,
salience, auditory, sensorimotor and visual networks using a multiple-seed correlation ap-
proach. Between-group inferential statistics and machine learning were used to identify each
network’s capacity to discriminate between patients in MCS and UWS. Data collected from
22 patients scanned in two other centers (Salzburg: 10 MCS, 5UWS; New York: 5 MCS, 1
UWS, 1 EMCS) were used to validate the classification with the selected features. Coma
Recovery Scale-Revised total scores correlated with key regions of each network reflecting
their involvement in consciousness-related processes.
4.1 Behavioral relation to functional connectivity networks
Resting state functional MRI connectivity of the default mode, frontoparietal, salience, audi-
tory, sensorimotor and visual networks were first shown to correlate with behavioral CRS-R
assessment scores (figure 4.1), highlighting their contribution to the level of consciousness.
As seen in the previous chapter, results are in line with other studies in various forms of uncon-
sciousness. Here, the positive correlation between CRS-R scores and the salience network
anterior cingulate cortex could account for the preserved capacities of some patients to orient
their attentional resources towards environmental salient stimuli, such as noxious stimulation,
corroborating previous PET data [177]. The thalamus and cerebellar networks did not cor-
relate to CRS-R total scores. The cerebellum has minimal implication in conscious-related
processing [178, 179], but the thalamus is generally thought to be implicated in conscious
processing [104, 178]. Taken together, the positive correlation between clinical scores and

4.2. Differentiation between MCS and UWS withinconnectivity networks 47
each network’s functional connectivity highlight that the here studied networks are an appro-
priate means to study, at least to a certain degree, residual cognitive function in this patient
cohort.
Figure 4.1 – Intrinsic connectivity networks are involved in consciousness-related pro-cessing. Functional connectivity of all studied networks (areas in red) correlate with the levelof consciousness as determined by behavioural assessment with the Coma Recovery Scale-Revised (total scores) in patients in MCS, UWS and coma. Statistical maps are thresholdedat FWE P<0.05 (cluster-level) and are rendered on a glass brain template (transverse view).Replicated from [180].
4.2 Differentiation between MCS and UWS withinconnectivity networks
Importantly for clinical practice, we further aimed at determining the capacity of each network
to differentiate between patients in MCS and UWS. Differences in functional connectivity have
been observed only at the group-level for the DMN [47, 96, 117, 181, 182], frontoparietal and
auditory networks [182]. Here, we replicated these findings and further showed group differ-
ences in functional connectivity for the salience, sensori-motor and visual networks. Moving
towards single-patient network-based differentiation, we found that all networks were able to
differentiate patients with an acceptable accuracy (> 86%). Such a high rate of accuracy can
be partly attributed to the fact that the network ranking was based on features extracted from
the same population for which between-group differences were already known.

48 Chapter 4. Classification of resting state functional connectivity
4.3 Single-subject classification of the auditory network
To avoid a double-dipping effect, we aimed at validating the most highly ranked network in
two independently assessed patient data sets (Salzburg and New York) and across healthy
controls. To that end, we opted for single-patient classification based on the connectivity
strength of the auditory network (figure 4.2). Based on this network’s connectivity, 20 of the 22
new patients were classified congruently (i.e., the clinical diagnosis matched the classification
outcome). Of note is that the classifier positioned the independently assessed patients closer
to the decision plane compared to patients included in the training set. This could be explained
by the above mentioned favoring of the Liege training data set during the network ranking
procedure, which might have led to a stricter classification of the validation set. Although
the intrinsic connectivity networks have been shown to be robust independent of different
scanning parameters [183], the different parameters employed in each of the three centers
might also have influenced the classifier’s estimation. Alternatively, the use of a relevance
vector machine classifier [42], which returns probabilities of a patient belonging to a clinical
condition instead of using a binary decision, could be a more sensitive way to classify patients
less strictly. The classification results further highlight the challenges posed by behavioral
examination [184] which in many cases underestimates patients’ level of consciousness [21].
Here, the validation of the auditory network’s classifier worked congruently for the majority of
the included patients (20/22; figure 4.2). Interestingly, the patient who was misclassified as
MCS had a profile of UWS on the day of scan but evolved to MCS 38 days later. The other
patient was misclassified as UWS but had a clinical profile of MCS on the day of scanning
based on the presence of localization to noxious stimulation (note that this behavior could
not be elicited in any other evaluations). The validation of the classifier’s outcome to the
clinical evaluation was used as a starting point in our analysis. Therefore, a well-defined
diagnostic baseline was critical for the subsequent patient classification. To that end, repeated
clinical examinations with the CRS-R (average number of assessments n = 6 per patient) were
performed. The clinical diagnosis was further confirmed with FDG-PET imaging, which has
been shown to have high sensitivity in identifying patients in MCS [32]. Therefore, patients
with an ambiguous profile on clinical assessment and neuroimaging data were not included
in the analysis. Similarly, patients who received sedatives to minimize motion in the scanner
were further excluded.
One explanation of why the auditory network (figure 3.1, 4.1) was identified as the system
with the highest discriminative capacity could concern its underlying functional neuroanatomy.
Apart from temporal cortices, the auditory network further encompasses regions in occipital
cortex, pre- and postcentral areas, insula and anterior cingulate cortex [66, 67, 182, 185, 186].

4.3. Single-subject classification of the auditory network 49
Figure 4.2 – Auditory-visual crossmodal functional connectivity discriminates singlepatients. The 3D space indicating connectivity between left auditory, right auditory and oc-cipital cortex has been compressed into two dimensions to represent the distance of eachpatient (in circles) from the decision plane (arbitrary values). The upper panel plots the dataof patients (in circles) who were used for the classifiers training (Liege data set, n= 45). Thelower panel summarizes the classifiers decision on the validation data set including patients(in asterisks) independently assessed in Salzburg (n= 15) and New York (n= 7). Based on thecrossmodal interaction, 20 of the 22 independently assessed patients were classified congru-ently, namely the behavioural diagnosis matched the classification outcome. Replicated from[180]

50 Chapter 4. Classification of resting state functional connectivity
The direct comparison between patients in MCS and UWS restricted the identified areas to
bilateral auditory and visual cortices. This pattern of auditory-visual functional connectivity
has been previously described in normal conscious subjects during rest as well [187] and is
in line with functional MRI results in consciousness research. For example, preserved func-
tional MRI activity in temporal and occipital areas has been shown for healthy subjects during
mental counting of auditory temporal irregularities; interestingly, this activation was identified
only in those subjects who were attentive and aware of the auditory violations [188]. At a
functional level, the auditory-visual functional connectivity, also referred to as cross modal
interaction, is considered relevant for multisensory integration [189]. Multisensory integra-
tion has been suggested as a facilitator for top-down influences of higher-order regions to
create predictions of forthcoming sensory events [190]. Such top-down connectivity was re-
cently found with an EEG oddball paradigm that differentiated patients in MCS from UWS
[191]. Interestingly, decreased cross modal auditory-visual interaction has been reported in
healthy subjects with preserved structural connections but under pharmacologically-induced
anesthesia [115]. In that study, recovery of consciousness paralleled the restoration of the
cross modal connectivity suggesting a critical role of this connectivity pattern to conscious-
ness level-dependent states. In our results, the cross modal interaction was more preserved
in patients in MCS compared to UWS patients. The reduction in functional connectivity be-
tween the auditory-visual cortices in UWS could be partly attributed to disrupted anatomical
connections, often encountered in post-comatose patients [97, 192–194].

Conclusions and future perspectives part I
In chapter 2 we aimed to directly investigate, in severely brain injured patients, the relationship
between functional brain activity and structural connectivity within the DMN in an objective
and combined fashion using both FDG-PET and MRI FA. We show that the function-structure
relationship is present in both healthy controls and brain-damaged patients between func-
tional metabolism of inferior-parietal, precuneus, and frontal regions and structural integrity
of the frontal-inferior parietal, precuneus-inferioparietal, thalamo-inferioparietal and thalam-
ofrontal tracts. When focusing on patients, we found a stronger relationship between struc-
tural integrity of thalamo-inferioparietal tracts and thalamic metabolism in patients who have
emerged from MCS as compared to DOC patients.
We then reviewed data on resting state functional connectivity in physiological, pharmaco-
logical, and pathological unconsciousness in chapter 3. Resting state connectivity is altered
under altered states of consciousness, such as sleep, sedation/anesthesia, hypnotic state,
and clinical states of unconsciousness. These reductions are most studied in relation to the
DMN, but are also present in other resting networks.
In chapter 4 we replicate the systems-level resting state functional MRI consciousness-
dependent breakdown not only for the default mode network but also for the frontoparietal,
salience, auditory, sensorimotor and visual networks. Furthermore, functional connectivity
between auditory and visual cortices was the most sensitive feature to accurately discriminate
single patients into the categories of MCS and UWS. Our findings point to the significance of
multisensory integration and top-down processes in consciousness seemingly supported by
cross modal connectivity.
The studies mentioned in this chapter have all looked at the brain function in (un)conscious
states. The ultimate goal for this kind of research is to gain better understanding of conscious-
ness and maybe even NCC. Although we are still very far from something like a correlate of
consciousness, or a diagnostic tool easily implicated in clinical practise, several claims can
be made based on these studies.
First of all, based on all three studies, and the many studies in literature, we know that
brain function under unconscious states is reduced. This level of reduction seems different
51

52 Chapter 4. Classification of resting state functional connectivity
for each clinical entity, and differences can still be made between unconsciousness (UWS)
and partial consciousness (MCS). Chapter 2 furthermore tells us that function and structure
are linked, a positive function-structure connectivity exists. Such a structure-function connec-
tivity can also be found between structural white matter and functional connectivity [174], and
functional connectivity with PET metabolism [118]. From this we could conclude that general
structure or function of the brain alone is necessary but not sufficient for conscious experi-
ences to arise. Future research should thus focus its effort on multimodal studies to better
understand brain function. While doing this, the here utilized lesion approach is a start, but
brain function, and integration of information using multimodal studies [195] should be further
explored before real conclusions can be drawn on the NCC.
Methodologically, future research can improve on several points. First of all, one problem
with current resting state fMRI analysis in our patients is the inability to quantify if a subject
fell asleep during our analysis or not [196]. Indeed, the current clinical setup only allows re-
searchers to check patients in between sequences, and visual trackers are not yet available
in the hospital where the patient data of this thesis was acquired. A second point to be men-
tioned here concerns the static nature of functional connectivity. Although informative, studies
on dynamic functional connectivity have the potential to explore information not captured with
classical resting state methods. The nature of the changes in connectivity strengths over time
remains ill-defined in DOC. In addition, the methods for the assessment of deformed brains
remain challenging. Normalisation issues and automatic segmentation can influence results,
and should be taken into account.
Clinically, efforts need to be made to promote the feasibility of these relatively complex
approaches in the clinical setting and promote the clinical utility of the resting paradigm for
single-patient diagnostics. Furthermore, many subjects need to be sedated due to the pres-
ence of pre-scan motion (to reduce noise during data acquisition), and these subjects were
not taken into account for classification of functional connectivity. The reason to exclude
sedated patients in the previous part was because of our limited understanding of the po-
tential effect of anesthetics on network connectivity [41]. Future investigations which will aim
to disentangle between the variances of anesthetics and pathology in functional connectivity
measures are certainly essential.

Part II
The passive paradigm:Sensory stimulation and diagnostic
assessment
53


55
Introduction
As we have seen in the previous chapter, testing the brain at rest can provide information
about the general structure and function of the brain. However, it cannot make inferences
about how the brain reacts to incoming stimuli. Passive paradigms use such external stim-
ulation, and thus try to indicated covert cognitive processing in these patients [197]. Us-
ing passive paradigms, differential activation patterns have been demonstrated in patients in
UWS and MCS. For example, as a respond to sound, patients in UWS show activation limited
to the primary auditory cortex [198], whereas patients in MCS demonstrate brain activation
spreading to secondary auditory cortex, temporal and frontal areas [199]. More importantly
for clinical management, during painful stimulation patients in MCS show similar brain activa-
tion compared to controls, while patients in UWS only show restricted activation in lower-level
subcortical and primary cortical areas.
Furthermore, patients retain some form of cognitive processing, and are able to react
to several kinds of stimuli like the own name [200–202], familiar voices [203], sensorimotor
[204, 205], visual [204, 206, 207], and linguistic processing [192, 208, 209].
Behaviourally, besides the CRS-R scale, there are many more behavioural tests for bed-
side evaluation of patients. Some of these use these passive paradigms, usually sensory
stimulation, to elicit reproducible, voluntary oriented responses and/or evaluate progress dur-
ing sensory stimulation programs. Scales such as the Western Neuro Sensory Stimulation
Profile (WNSSP) [210], the Sensory Modality Assessment Technique (SMART) [211], and
the Disorders of Consciousness Scale (DOCS) [212] include the assessment of more sen-
sory modalities compared to the CRS-R. More precisely they include tactile, olfactory and
gustatory modalities. Few studies have assessed the specificity and sensitivity of these tests.
Even so, it is recommended by the the American Congress of Rehabilitation Medicine to
include such sensory stimulation [27].
Another personally relevant sensory stimulus is music. This stimulus conveys emotion
[213], and might boost cognitive processes. These effects might be seen both in healthy
[214], and pathological cerebral functioning [215, 216]. For example, auditory and verbal
memory, focused attention, and mood improves in patients recovering from stroke when lis-
tening to music on a daily basis [217, 218]. In patients with visual neglect, visual attention
is better when listening to preferred relative to non preferred music (i.e., patients showed en-
hanced visual awareness, also in the neglected side) [219]. Furthermore, music can decrease
levels of anxiety and frequency of sedation during hospitalisation in the intensive care unit,
in comparison with usual care or noise-cancelling conditions [220]. In DOC patients, music
has not yet been extensively studied. Single case studies have indicated potential effects on

56
behavioural responses in UWS patients [221–223], but were unable to draw firm conclusions
due to the lack of quantified measures and/or control conditions.
The study in chapter 5 assesses sensitivity to provoke signs of consciousness using gen-
eral sensory stimuli as used in several assessment scales. Chapter 6 will discuss the neu-
roimaging evidence indicating that personally relevant stimuli (preferred music) might increase
the brains’ functional connectivity. In chapter 7, we will return to the behavioural examinations
assessing music and another sensory domain, namely olfaction. We will assess if this effect
of music is due to preference of the stimuli, or an effect of acoustic properties.

Chapter 5
Sensory stimulation during behavioralexaminations of consciousness
Based on:
Behavioral Responsiveness in Patients with Disorders of ConsciousnessHeine L, Laureys S, Scnakers C.in: Brain Function and Responsiveness in Disorders of Consciousness, SpringerInternational Publishing, 2016
57

58 Chapter 5. Sensory stimulation during behavioral examinations of consciousness
5.1 Tactile, olfactory and gustatory stimuli duringdiagnostic assessment
It has previously been shown that some sensory modalities are more sensitive to detect con-
sciousness than others. In studies investigating misdiagnosis, oriented eye movements (i.e.,
visual pursuit and fixation) have been reported as the responses the most frequently missed
during behavioral assessments [21, 25, 224]. In parallel, the visual modality of the CRS-
R has been shown as the subscale allowing the highest detection of MCS as compared to
the auditory, motor or verbal modalities [28, 225]. Oriented visual responses are particularly
interesting to detect since it is one of the first signs of consciousness appearing during pa-
tients recovery which is also associated with good outcome [226–228]. Until now, the interest
of other sensory modalities (such as tactile, olfactory and gustatory) when assessing con-
sciousness are ill-described, even though several scales recommended by the the American
Congress of Rehabilitation Medicine include such modalities [27].
In a preliminary study, we therefore decided to investigate the interest of tactile, olfac-
tory and gustatory modalities in the assessment of consciousness. We assessed 38 patients
(mean age=46, SD=16 years old, 17 traumatic, 21 chronic) diagnosed as being in a UWS
(n=15) or in a MCS (n=23) by using the CRS-R. Tactile, olfactory and gustatory stimuli used
in the WNSSP, the SMART and the DOCS have been administered in each patient in a ran-
domized order. Tactile stimuli included tap on the shoulder, nasal swab, feather (applied on
arms, fingers and face), air into the neck, hair touching, vibration on the arm, scrub (i.e.,
kitchen scouring pad applied over the arm) and firm hand pressure on the arm. Each of these
stimuli was applied for ten seconds on both sides of the body on three consecutive trials.
Olfactory stimuli included vinegar, syrup and ammonia which were held under the patients
nose for ten seconds (patients mouth closed) on three consecutive trials. In case of tra-
cheotomy, the entrance of the cannula was covered. Gustatory stimuli included vinegar and
syrup. A stick soaked of this flavor was introduced into the patients mouth for ten seconds on
three consecutive trials. Several recommendations had to be followed such as: applying the
treatment while the patients were in a wakeful state with eyes open in a setting with minimal
ambient noise and respecting a 30 minutes rest before each session (i.e., absence of nursing
care). Oriented responses (e.g., eyes/head towards or away from the stimulus, hand towards
or pushes away the stimulus, congruent facial expression, mouth opening or tongue pumping)
was considered as present when it was clear and reproducible, meaning it was observed at
least two out of three times to exclude reflexive behaviors. The oriented responses obtained
using those tactile, olfactory and gustatory stimulations have then been compared to the di-

5.1. Tactile, olfactory and gustatory stimuli duringdiagnostic assessment 59
agnosis obtained using the CRS-R. Patients outcome were also collected at one year after
assessment (n=27), using the Glasgow Outcome Scale (GOS) [229].
82%
65%
30% 30%
0
5
10
15
20
Orientedvisual
response(CRS−R)
Orientedtactile
response
Orientedolfactoryresponse
Orientedgustatoryresponse
num
ber o
f sub
ject
sOriented responses in 23 MCS patients
Figure 5.1 – Oriented responses in 23 MCS patients. Percentage of oriented responses inMCS patients in reaction to olfactory, gustatory and tactile stimuli, as well as the percentageof visual oriented responses as measured with the CRS-R.
In our dataset, 82% of MCS patients showed oriented eye movements, and 0% of UWS
patients did so. Oriented eye movements consisted of visual following or fixation as measured
using the CRS-R. Olfactory, gustatory, and tactile stimuli show different patterns. According
to our results, a minority of patients diagnosed as being in a UWS (by using the CRS-R)
showed oriented olfactory or gustatory responses (7% and 14%, respectively) (figure 5.2).
The patients for whom we had outcome data (1 missing data) did not recover consciousness
a year after assessment.
Additionally, oriented olfactory or gustatory responses were absent in a majority of pa-
tients diagnosed as being in a MCS by using the CRS-R (70%) and in a majority of patients
who showed oriented eyes movements (61%) (figure 5.1). Using tactile stimuli, a higher per-
centage of patients diagnosed as being in a UWS showed oriented responses (40%) (figure
5.2). Oriented tactile responses were present in a majority of patients diagnosed as being in
a MCS by using the CRS-R (65%) and in a majority of patients who showed oriented eyes
movements (83%) (figure 5.1). When considering the stimulus leading to the most frequent
oriented responses, the nasal swab helped to detect 80% of the oriented tactile responses
present. However, only one of the UWS patients showing oriented tactile responses recov-
ered consciousness a year after assessment (17%). The patient (50 years old, 50 days after

60 Chapter 5. Sensory stimulation during behavioral examinations of consciousness
0%
40%
7%14%
0
5
10
15
Orientedvisual
response(CRS−R)
Orientedtactile
response
Orientedolfactoryresponse
Orientedgustatoryresponse
num
ber o
f sub
ject
s
Oriented responses in 15 UWS patients
Figure 5.2 – Oriented responses in 15 UWS patients. Percentage of oriented responses inUWS patients in reaction to olfactory, gustatory and tactile stimuli, as well as the percentageof visual oriented responses as measured with the CRS-R.
non-traumatic injury) was able to localize a tactile stimulus using her hand. Repeated CRS-R
assessments, at that time, showed only reflexive behaviors (i.e., auditory startle, blinking to
threat, flexion to noxious stimulation, oral reflexive movements and arousal with stimulation).
Two years after our assessment, the CRS-R indicated an EMCS. Finally, to test whether the
outcome measured by the GOS differs according to the presence or absence of an oriented
response, U Mann-Whitney tests were performed. There was no statistical difference for ol-
factory (U=51.5; p=0.61), gustatory (U=49; p=0.5) and tactile (U=76.5; p=0.51) modalities
(figure 5.3).
0
1
2
3
4
Presence AbsenceOriented visual response (CRS−R)
Mea
n G
OSE
0
1
2
3
Presence AbsenceOriented tactile responses
Mea
n G
OSE
0
1
2
3
Presence AbsenceOriented olfactory responses
Mea
n G
OSE
0
1
2
3
Presence AbsenceOriented gustatory responses
Mea
n G
OSE
Oriented responses and outcome at 1 year
Figure 5.3 – Outcome at 1 year. Average Glasgow Outcome Scale Extended scores, andits standard error according to the presence or absence of oriented responses.
5.2. Self-relevant stimuli might enhance cognitive processes 61
Considering our data, oriented responses to olfactory and gustatory stimuli without per-
sonal relevance do not seem to be linked to consciousness since they are not observed in the
majority significant proportion of conscious patients and since they are not associated with
consciousness recovery. Oriented tactile responses seem to be observed in most conscious
patients but could be false positives as they are also observed in a large portion of uncon-
scious patients. This preliminary study hence seems to indicate that adding sensory modal-
ities such as olfactory, gustatory or tactile stimuli without personal relevance to the CRS-R
does not constitute a further help when detecting consciousness in patients with severe brain
injury.
5.2 Self-relevant stimuli might enhance cognitive processes
The previous section described the application of general sensory stimuli. These general
stimuli might have induced a number of false negatives due to the lack of personal engage-
ment. Indeed, especially familiar faces increase the likelihood of retrieving episodic informa-
tion [230]. Furthermore, personalized stimuli enhance the probability to observe a cerebral
response in DOC patients. For example, several behavioral studies have shown that a higher
number of responses could be observed following self-referential stimuli, like the use of a
mirror or the patients own name, as compared to neutral stimuli [28–30] or through the use of
autobiographical and emotional stimuli [231].
Neurophysiological studies have shown that salient and emotional stimuli increase the
probability of observing a cerebral response in patients with DOC. For example, the prob-
ability to observe a P300 event-related response (i.e., a brain response reflecting stimulus
processing) is enhanced when the deviant stimulus is not a tone stimulus but the patients
own name [201, 232]. Among these emotional, salient, and self-referential stimuli, music may
be the most assessable and personally relevant. In patients with DOC, there is only a lim-
ited amount of research on the effects of music. Several single-case, or (uncontrolled) group
studies, show that music improves patients interaction [222], emotional responses and cog-
nitive capacity [221, 233, 234]. Very recently, it has also been shown that preferred music
(i.e., an autobiographical and emotional stimulus) has an effect on cognitive processes of pa-
tients with DOC. Indeed, observing a P300 to ones own name was increased in patients with
DOC after having been exposed to their preferred music compared to a control condition (i.e.,
acoustically similar noise) [235].

62 Chapter 5. Sensory stimulation during behavioral examinations of consciousness

Chapter 6
Resting state functional connectivityduring preferred music
Based on:
Exploration of Functional Connectivity During Preferred Music Stimulationin Patients with Disorders of ConsciousnessHeine L*, Castro M*, Martial C, Tillmann B, Laureys S, Perrin F.Frontiers in psychology, 2015, 6:1704
∗ Contributed equally
63

64 Chapter 6. Resting state functional connectivity during preferred music
6.1 Preferred music
To explore whether the effect of music in severely brain-damaged patients with DOC is related
to functional connectivity changes, we acquired functional MRI scans while participants were
exposed to their preferred music as well as a control condition when they were exposed to
the repetitive noise from the scanner (also present in the music condition). Using a functional
connectivity parcellation [236], we assessed functional connectivity using seed regions in both
primary auditory cortices. We also analysed network connectivity of the auditory network,
the external network, and default mode network. The auditory network can be observed in
81% of healthy subjects, 46% in MCS, and is limited to 21% of UWS patients [182]. In fact,
it has strong power to discriminate MCS and UWS patients, making automatic classification
possible [180]. Another network that is also related to auditory processing [105] is the external
network. This network is also related to external orientation, goal-directed behaviours, and
cognitive processing of somatosensory [103], and visual [104] input. The external network
is often named the dorsal attention network, or task positive network [47, 81]. It has been
shown to be anticorrelated with an internal / default mode network [47, 81], implicated in
self-awareness and stimulus-independent thoughts in healthy controls [78, 83]. Interestingly,
auditory, external and internal/default mode networks include cortical regions that have been
shown to be modulated by emotional sounds. Indeed, as compared to noise, meaningful
sounds (infant cries or the patients own name) are associated to a widespread activation of
the auditory cortex and medial cortical structures in DOC patients [237].
To create a sequence of preferred music, five musical excerpts were selected for each
participant from a questionnaire on musical preference completed by family members or loved
ones (for the patients) or the participant him/her self (for the healthy participants). These
musical excerpts had a mean duration of 2 minutes and were all dynamic, musically coherent,
and representative of the whole musical piece. The five excerpts were combined to create a
musical stimulus of a duration of 10 minutes and 10 seconds, which overlaps with the duration
of the functional scan. Fading in and fading out (around 2 sec.) was added to avoid rough
transitions between the excerpts.
The functional scan was acquired twice during one MRI scanning session. Once with the
participants preferred music (i.e., music condition), and once when participants were exposed
to the repetitive noise from the scanner (i.e., control condition). This control condition is the
same as used for the investigation of a classical resting state. Between March 2014 and April
2015, eight healthy participants (four female; mean age = 26 years, SD=3), and 5 patients
(three MCS, two UWS; mean age = 50 years, SD = 10) were acquired and analysed.

6.2. Effect of music in healthy conscious subjects 65
6.2 Effect of music in healthy conscious subjects
We first assessed results in our group of healthy subjects alone. As there is a difference
in age, these results were taken as a reference, but no statistical comparison was made
between healthy subjects and our group of patients. In our healthy participants, the network
of functional connectivity based on both primary auditory regions encompasses large parts
of the auditory cortex, superior temporal gyri, insula, cingulate cortex, central areas (pre and
post), supramarginal gyrus, and occipital areas, in both the music condition and the control
condition. These are, as expected, part of the auditory network [66, 67, 88, 138, 147, 182]. To
assess network integrity, mean network connectivity was assessed in the auditory network,
external network, and default mode network (i.e., networks which are respectively linked to
auditory processing, external orientation, and internal thoughts).
Network-based second level analysis of functional connectivity showed that the auditory
network was clearly replicated in our healthy subjects during both the music and control condi-
tions (figure 6.1, 3.2). This network has consistently been observed in previous resting state
studies investigating not only healthy participants but also DOC patients [182]. In healthy
participants it encompassed bilateral temporal gyri (including Heschls gyrus, opercular, in-
sula, planum polare and superior temporal areas), extending to inferior frontal, precentral and
angular areas, as well as clusters in anterior cingulate, pre- and post-central areas and the
occipital fusiform gyrus [66, 67, 88, 138, 147, 182]. The external network has also been ob-
served in healthy participants. It encompassed, as consistently observed in previous studies
[47, 101], regions of bilateral inferior parietal sulcus and lobule, dorsolateral prefrontal, supra-
marginal gyrus, the frontal eye field, lateral occipital and precentral, as well as cerebellar and
insular areas. The default-mode network showed functional connectivity in regions consis-
tently observed in healthy participants and patient populations [238]. Most importantly, music
did not show any increases in functional connectivity compared to the control condition for
the seed-based and all three network-level analyses (figure 6.1). This result is consistent with
[235], a study which observed that music (in comparison to noise) did not modify the event-
related responses in healthy participants (while this was the case for the DOC patients). This
observation suggests that the effects of music observed in previous research are possibly not
present in healthy subjects (or that the cerebral responses could not be enhanced because
they were already at ceiling). This finding could be due to the nature of our experimental
material. Indeed [239] have shown functional connectivity differences (in the default mode
network and between auditory brain areas and the hippocampus) between two music ma-
terials that strongly differ in terms of emotion, i.e., preferred and disliked music (in healthy
participants). It is thus possible, that our control condition, which can be considered as rather

66 Chapter 6. Resting state functional connectivity during preferred music
neutral, was not disliked enough to warrant significant differences in functional connectivity
with the preferred music condition.
6.3 Effect of music in DOC patients
Next, we analysed the data of our small group of patients. Seed-based analysis indicated that
patients showed strongly limited functional correlations with the primary auditory cortices: ac-
tivation was only observed around the seed areas and no long distance connectivity emerged
within the auditory network (figure 6.2). This finding is in line with previous research showing
a linear decrease in functional connectivity ranging from healthy participants to unresponsive
patients [47, 48, 182]. In fact, many studies have shown that functional connectivity still exists
in DOC patients, and other forms of decreased levels of consciousness [41]. Low-level acti-
vations in primary auditory cortices, without top-down feedback have also been observed in
unresponsive patients [191, 198]. In fact, patients seem to have a general disconnection be-
tween brain regions, notably missing long range connectivity [175]. Our results are congruent
with this observation as we observe mainly functional connectivity in the hemisphere of the
seed. Furthermore, significant differences in the right precentral gyrus are observed during
the preferred music condition compared to the control condition (figure 6.2). This finding is
in agreement with a previous study investigating DOC patients and reporting activation in the
right superior temporal gyrus during three 10-second blocks of musical stimulation based on
a famous song [240].
The three network analyses further revealed significant differences in the auditory net-
work and external network, but not the default mode network, during the music condition
(figure 6.3). Patients showed a severely limited auditory network of functional connectivity
during both conditions. During the control condition, activation was only seen in bilateral
temporal areas. During the music condition, the auditory network was restricted to bilateral
temporal gyri (only left including Heschls gyrus) and small clusters in the right inferior frontal
gyrus and the left supramarginal gyrus, areas included in the temporal cluster for the healthy
subjects. The right inferior frontal gyrus is implicated in auditory memory as well as the pro-
cessing of musical syntactic-like structures [241–247]. When music was compared to the
control condition, patients auditory network showed significantly more functional connectiv-
ity with the left precentral gyrus (Note that the seed-based analysis also revealed significant
increased functional enhancement in the right precentral gyrus during music; see figure 6.3)
and the left frontal pole. The precentral cluster overlaps with regions of the auditory network
in healthy subjects. The lateral prefrontal cortex has also been linked to autobiographical
memory [248, 249], and has also been implicated in rhythm perception [250]. The finding

6.3. Effect of music in DOC patients 67
Figure 6.1 – Functional connectivityin healthy subjects during the mu-sic and control condition. Maps indi-cate healthy subjects (N=8) functionalconnectivity during favorite music ex-posure (Red) and the control condi-tion (Blue), and regions where func-tional connectivity was present in bothconditions (Green). The top two pan-els show seed-based analyses, thelower three panels show mean net-work connectivity. Note that there isno significant difference between mu-sic and control condition. Results wereanalyzed in a network-based mannerand thresholded with a family-wise er-ror corrected extended cluster level ofp<0.05. Standardized MNI T1 2x2x2template was used to render results.(x,y,z) value indicates MNI coordinatesof represented sections.

68 Chapter 6. Resting state functional connectivity during preferred music
Figure 6.2 – Functional connectivity in patients using primary auditory seeds. Red/pinkmaps indicate patients (N=5) functional connectivity during the control condition (left) and fa-vorite music exposure (middle) for both the left and right primary auditory cortex (L p-aud.,and R p-aud.; respectively). Right maps show the regions that show significantly more func-tional connectivity during music condition compared to the control condition. Results wereanalyzed in a network-based manner and thresholded with a family-wise error corrected ex-tended cluster level of p<0.05 (in red). For visualization a lowered threshold is indicated in pink(0.01 uncorrected height with family-wise error corrected extended cluster level of p<0.05).Standardized MNI T1 2x2x2 template was used to render results. (x,y,z) value indicates MNIcoordinates of represented sections.

6.3. Effect of music in DOC patients 69
of increased functional connectivity in music compared to the control condition suggests that
music has an effect on the auditory-related network in DOC patients, in whom short-term func-
tional plasticity might appear following the lesions. In patients, the external network observed
during the control condition was restricted to clusters of functional connectivity in inferior pari-
etal sulcus and lobule, dorsolateral, middle frontal and supramarginal areas (figure 6.3). In
the music condition, the external network showed besides these regions also connectivity with
the region MT and parts of the frontal eye field. When directly compared to the control condi-
tion, the music condition showed more functional connectivity with the supramarginal/angular
gyrus. This cluster overlaps with the supramarginal regions activated during spatial orienting
in healthy subjects [251]. Interestingly, this region overlaps with disconnected areas in UWS
patients [198]. Laureys et al., (2000) proposed that a lack of integration between primary
regions (that activate after simple auditory stimulations in UWS), and higher order regions
like the temporoparietal junction and superior temporal gyri (activated in MCS after simple
auditory stimuli; [199]) makes conscious processing unlikely [198, 199]. Put differently, un-
consciousness might be related to a disruption in feedback processing to the auditory regions
[191].
Concluding, the effect of music on functional cerebral connectivity is reminiscent of pre-
vious findings which have shown effects of music in brain-damaged patients [218, 219, 234,
235]. For example, a recent EEG study investigating DOC patients has shown that the pa-
tients cerebral responses following the presentation of ones own name were increased af-
ter having been exposed to their preferred music [235]. A Mood and Arousal hypothesis,
attributes the beneficial effects of music on cognition to an increase in mood and arousal
[252, 253]. Within this hypothesis, the effects of music in DOC patients might be due to an
overall cortical arousal in the cerebral structures that have been reported to be involved in
emotional and mood states. A second hypothesis attributes the effect of music to autobio-
graphical priming [235]. Interestingly, in the present study, an increased functional connec-
tivity during the music condition (vs. the control condition) was shown in cortical structures
linked to music perception, autobiographical memory and consciousness for DOC patients.

70 Chapter 6. Resting state functional connectivity during preferred music
Figure 6.3 – Functional connectivity in patients using mean network connectivity.Red/pink maps indicate patients (N=5) functional connectivity during the control condition(left) and favorite music exposure (middle) for the auditory network, external network, anddefault mode network (DMN). Right maps show the regions that show significantly more func-tional connectivity during music condition compared to the control condition. Results werethresholded with a family-wise error corrected extended cluster level of p<0.05 (in red). Forvisualization a lowered threshold is indicated in pink (0.01 uncorrected height with family-wiseerror corrected extended cluster level of p<0.05). Standardized MNI T1 2x2x2 template wasused to render results. (x,y,z) value indicates MNI coordinates of represented sections.
Chapter 7
Effect of preference or sound
Based on:
Effects of preference and sensory modality on behavioral reactions in pa-tients with disorders of consciousnessHeine L, Tillmann B, Hauet M, Juliat A, Dubois A, Laureys S, Kandel M, Plailly J, LuautéJ, Perrin F.under review
71

72 Chapter 7. Effect of preference or sound
Not only do the results of chapter 6 need to be confirmed in an extended group of patients,
but the study also cannot disentangle the general effect of music (because of its acoustic and
structural features) from its autobiographical effects (because of its emotional and meaningful
contents in relation to the patients personal memory). Neither is there a clear consensus if
this possible effect of music is translated to behavioural reactions (i.e., if sound is able to elicit
higher scores on the most sensitive tool for diagnosis, the CRS-R).
To try to answer these questions, we aimed to test the potential beneficial context ef-
fects of preference (preferred vs. neutral) and of sensory modality (auditory, olfactory) on
the performance to the CRS-R. Therefore, in 13 patients (7 MCS; 6 UWS), four stimulations
were used as a testing context; preferred music, neutral music, preferred odor, and neutral
odor. Which were followed by one of four items from the CRS-R (visual pursuit using a mir-
ror, auditory localization of the own name, and two movements to command). Six patients
were in an UWS during time of assessment (3 females, mean age=52, SD=11 years), and
seven patients in a MCS (1 female, mean age=37 SD= 10 years) according to internationally
established criteria [6, 8].
For each patient, four testing sessions were performed (separated by 3 to 7 days). Each
session consisted of 4 trials, each including a 5-minute presentation of one of the four stimuli
followed by one of the four CRS-R items. Each of the 16 stimulation-item combinations was
presented once to each patient. Order of stimuli and items were randomized within- and
between patients (figure 7.1).
Stimuli generation
For the selection of preferred sounds, patients legal guardian and/or loved ones were asked
to fill in a questionnaire concerning patients preferred songs/pieces of music, preferred artists
and preferred music styles. Six dynamic, musically coherent, and representative pieces of
music were chosen. For the selection of preferred odors, patients legal guardian and/or loved
ones were asked to indicate patients preferences on a list with 51 pre-defined essential-oils
(herbs/flowers, fruits, foods, candy, drinks), of which 6 were chosen. These essential-oils
were pre-testes by six people on how easily identifiable they are on a 0-3 scale, only odors
with a score above 1,8 were used.
Six neutral sound excerpts were created. They were continuous music-like noise stimuli,
i.e., six music (well-known songs of the genre classical, rap, rock, reggae, French variety, and
pop) for which the overall phase spectrum was randomized the slow temporal envelope was
deleted. Thus, they consisted of a spectral approximation of music, but did not share other
acoustic characteristics (e.g., pitch, rhythm, envelope, or timbre). Six neutral odors consisted
of artificially created smells that do not exist in nature (i.e., Citronellol, Rose oxide, Methyl

73
Figure 7.1 – Schematical representation of the behavioral protocol. For each patient,four testing sessions were performed (separated by 3 to 7 days). Each session consisted of4 trials, each including a 5-minute presentation of one of the four stimuli followed by one ofthe four CRS-R items. Each of the 16 stimulation-item combinations was presented once toeach patient. Order of stimuli and items were randomized within- and between patients.

74 Chapter 7. Effect of preference or sound
octine carbonate, Ethyl acetyl acetate, Linalyl acetate, Cis-3-Hexenyl salicylate). The same
sound and odor neutral stimuli were used for all patients.
Each stimulation had a duration of 5 minutes. For this, 3 musical experts were combined,
and 3 odors were presented 3 times for duration of 30 seconds without direct repetition. The
order within each stimulation was randomized to avoid habituation effects. Every musical
excerpt and each odor was used during only two out of four sessions in the experimental
protocol, and a session never consisted of a group of stimuli that were presented together
before. The time between each stimulation and item was on average 10 seconds, and time
from the end of one item until the start of a new stimulation was 30 seconds. Every session
was preceded by 30 minutes silence (patient rested in his/her room without presence of others
or sound/visual stimuli). The whole CRS-R was administered in the 48 hours before the first
and after the last assessment.
Behavioral scoring
The behavior of the patient was filmed for subsequent quantitative and qualitative scoring,
and scores were assigned during the experiment itself. For each item, the videos were blind-
scored, that is without knowledge of the preceding stimulation, by three experimenters. Quan-
titative responses to the CRS-R item were scored and standardized by translating them into
percentages of maximum score (i.e., 8 for visual pursuit, and 4 for localization to sound and
response to command). Qualitative scoring was performed in order to acknowledge clinical
signs of awareness that occurred during, as well as after the stimulation. A score of 2 was
given when signs of consciousness were present [8] (i.e., voluntary participation, orientation,
emotional reactions, intelligible speech, or automatic movements only observed during stim-
ulation/item), while 1 indicated reactions which were not distinguishable from unintentional
behaviors/reflexes [5] (i.e., short orientation, partial participation, not the requested behavior,
agitation/grimaces. A score of 0 was awarded when no reaction was observed.
7.1 Effects of sensory stimulation on behavioralresponsiveness
Quantitative and qualitative scores were used to assess potential effects of preferred and
neutral contexts presented in the auditory and olfactory modalities on the scores of DOC
patients for items of the CRS-R. Both scores showed that sound stimuli triggered higher
responsiveness compared to olfactory stimuli. Qualitative scores also showed a main effect of
preference (with better scores for preferred stimuli than neutral ones). In addition, qualitative

7.1. Effects of sensory stimulation on behavioralresponsiveness 75
scores revealed that scores were higher after preferred sounds than all other stimuli (figure
7.2, table 7.1).
Thus, this study establishes a hierarchy among the different types of stimuli, placing pre-
ferred music on top. This in in line with several studies reporting improved cognitive func-
tioning after preferred music [40, 222, 233, 235, 254]. Systematical assessment using for
instance the preferred music might thus be advised. Indeed, two UWS patients showed emo-
tional and behavioural reactions to autobiographical/emotional stimulations (one of the criteria
for diagnosis of MCS [8]); behaviours that were not observed during routine CRS-R assess-
ments. One patient showed tears (during the stimulation period in two assessments) and
was purposeful uncooperative (i.e., eyes firmly closed with head-averting), the other patient
showed behavioral responses to the same response to command item only after preferred
stimuli. This suggests that diagnostic assessment might be improved through the elicitation
of meaningful (affective) behaviours due to testing context, which is crucial as misdiagnoses
have consequences on treatment and end-of-life decisions.
No difference could be observed between scores obtained after preferred and neutral
odors. These results suggest that auditory stimuli (and in particular the preferred music) are
better than olfactory stimuli at enhancing cognition or arousal in these patients. However, this
interpretation must be considered with caution; (1) Preferred auditory sound contained more
changes (i.e., tone, rhythm, intensity), while olfactory stimulations had the same intensity and
switched more gradual. (2) The preferred auditory stimuli could be sampled from patients
preference while preferred olfactory stimuli were limited. Thus, the reminiscence power of
autobiographical-memory might be higher for the preferred music. (3) Although the difference
between preferred and neutral olfactory stimuli indicate that patients were not anosmic [255],
we cannot exclude that there might be reduced olfactory abilities.
Although, this was not the main purpose of the study, it should be noted that the different
types of stimulations used in this study did not modify the level of awareness on the long-term.
Indeed, no difference was observed between pre- and post CRS-R.
In conclusion, the results showed that auditory stimuli triggered higher responsiveness
compared to olfactory stimuli, as well as an effect of preference with better scores for preferred
stimuli compared to neutral ones. This result pattern suggests that improving the testing
context helps the expression of residual functions, and thus possibly improves diagnostic
assessment.

76 Chapter 7. Effect of preference or sound
Figure 7.2 – Quantitative and qualitative scores. Left: Bar graphs represent mean stan-dardized quantitative score on the CRS-R items for each stimulation. Right: Bar graphsrepresent mean qualitative score for each stimulation-item combination. Smaller figures inthe top right show significant main effects of modality (auditory>olfactory) in both graphs, anda main effect of preference (preferred>neutral) in the qualitative scores. Lines and startssignificant differences between stimulations. Error bars represent standard error; diamondsindicate median.

7.1. Effects of sensory stimulation on behavioralresponsiveness 77
Table 7.1 – Results quantitative and qualitative analysis
Quantitative QualitativeFriedmans ANOVA X2(3) = 10.48, p=0.015 X2(3) = 13.73, p=0.003
Wilcoxon signed rank testsMain effect of modality: Music: 18,5% Music: 0.83auditory vs. olfactory Olfactory: 10% Olfactory: 0.56
p=0.01; r=-0.35 p=0.006; r=-0.39Main effect of preference: Preference: 17% Preference: 0.8preferred vs. neutral Neutral: 12,5% Neutral: 0.58
p=0.07; r=-0.24 -> NS p=0.005; r=-0.38Preferred music vs. Preferred music: 20% Preferred music: 0.98preferred odor Preferred odor:12% Preferred odor: 0.62
p=0.035; r=-0.41 p=0.014; r=-0.48Preferred music vs. Preferred music:20% Preferred music: 0.98neutral music Preferred odor:17% Preferred odor: 0.67
p=0.36; r=-0.18 -> NS p=0.024; r=-0.44Preferred music vs. Preferred music:20% Preferred music: 0.98neutral odor Preferred odor:8% Preferred odor: 0.5
p=0.011; r=-0.50 p=0.006; r=-0.53

78 Chapter 7. Effect of preference or sound

Conclusions and future perspectives part II
In this part we reported the results of three studies in which we looked at the effect of sensory
stimulation. In chapter 5 we showed that various stimuli without personal relevance olfactory,
gustatory, and tactile modalities do not increase the presence of signs of consciousness when
added to standardized tests, such as the CRS-R. In chapter 6 we demonstrated that preferred
stimuli, in this case tested with passive music listening, may alter functional connectivity. More
precisely, we found that functional connectivity is stronger in music compared to the noise
condition in regions of the auditory network that might be linked to autobiographical memory.
In the final study (chapter 7) we showed that neural effects can be translated to increased
behavioral responsiveness. We showed an effect of auditory stimulation and preference (i.e.,
preferred music) on patients behaviour, which may aid in the evaluation of DOC patients.
Taken together these studies reinforce the notion that incorporating self-referential stimuli into
the behavioural testing context could improve the expression of residual functions in patients,
and increase the sensitivity of diagnostic assessments.
Future research should, in the behavioural domain, explore the potential cumulative ef-
fects of general and preferable stimuli. Although interesting, we were in chapter 7 (the study
on behavioral responsiveness after auditory and olfactory stimuli), unable to compare the
pre- and post CRS-R to the assessments in our experimental protocol. Indeed, CRS-R as-
sessments include arousal protocols, nociceptive stimulations, and tactile as well as verbal
stimulations to awaken the patient, none of which were present in the four experimental tests.
Future studies testing the cumulative effects of general and preferable stimuli should also
test for differences in patients responsiveness induced by nociception compared to preferred
stimuli. If preferred stimuli (e.g., preferred music) were more effective, this would allow the
avoidance of painful stimulations during repeated assessments.
It should be noted that all three studies assessed immediate effects of the sensory stim-
ulation, and no inferences can be made about long term effects. These studies can therefore
not be used as indicators for the effectiveness of sensory stimulation programs. These sen-
sory stimulation programs mainly consist of presenting different types of environmental stimuli
to the patient in order to optimize her/his levels of arousal and awareness. These multimodal
79

80 Chapter 7. Effect of preference or sound
sensory stimulation programs are supposed to constitute enriched environments which are
assumed to improve brain plasticity, and accelerate the recovery from coma [256]. These
programs have been tested before with unproven efficacy. For example, several studies claim
an effect of multisensory stimulation on patients with DOC [208, 256]. Familiar stimuli might
elicit even greater range of behavioral responses [257]. However, other studies could not
support any beneficial effects of multisensory stimulation for severely brain injured patients
(for reviews, see [222, 223, 258, 259]). The main problem is that none of these studies are
able to differentiate spontaneous recovery from recovery due to treatment.
The results in this chapter instead imply that preferred sensory stimulation might have
an immediate and short effect on behavioral responsiveness. It could thus be envisaged
that if these stimuli are used in the context of diagnostic assessment of the highly fluctuating
MCS, the likelihood that the patient is assessed at their best moment and thus able to show
conscious behaviors is increased.

Part III
Functional connectivity of the senses
81


83
Introduction
The methods used in this thesis in relation to DOC patients can also be used to assess many
very different pathologies and healthy brain functioning. For example, functional MRI can be
used to assess the effect of senses. More specifically, vision is an important sense in daily
lives, and learning how the loss of such a sense could be informative on the presence or
absence of vision in brain damaged patients might have implications in patient assessment.
The assessment of healthy conscious subjects without this sense could eventually lead to
indications of (the absence of) vision in DOC patients. We therefore assessed functional
connectivity in healthy but blind subjects.

84

Chapter 8
Congenitally blind
Based on:
Functional connectivity in visual, somatosensory, and language areas incongenital blindnessHeine L, Bahri A M, Cavaliere C, Soddu A, Reislev N, Laureys S, Ptito M, Kupers R.Frontiers in Neuroanatomy, 2015, 138 (pt9):2619-31
85

86 Chapter 8. Congenitally blind
The loss of vision from birth causes a myriad of compensatory plastic changes. At the behav-
ioral level, congenitally blind subjects outperform their sighted counterparts in a wide range
of non-visual sensory discrimination tasks ([260] for a recent review). For example, congeni-
tally blind individuals show improved performance in tactile acuity at the finger tips [261] and
perform better in pitch discrimination [262], syllable recognition [263] and sound localization
[264]. Recent behavioral studies also indicate superior abilities in discrimination, identification
and awareness of odors [265–267]. Compensatory plasticity is dependent on cross-modal re-
organization of the brain in which the occipital cortex becomes recruited by various non-visual
inputs [260]. Brain imaging studies have highlighted the pivotal role of the visual cortex in the
ability of the blind to perform non-visual tasks [268]. Indeed, PET and fMRI studies have re-
ported that congenitally blind individuals recruit their occipital cortex in tasks involving sound
and tactile localization [269, 270], tactile and auditory motion detection [271–273], spatial
navigation [274], odor perception [268], language [275–278] and memory processing [279].
Recent neuro-imaging studies also helped to illuminate the question how congenital blind-
ness affects the structural organization of the brain, and through which pathways non-visual
information reaches the occipital cortex. Structural brain imaging studies seem to concur that
there are significant reductions in grey matter throughout the whole extent of the visual sys-
tem. These include the optic chiasm, the lateral geniculate nucleus, the posterior pulvinar,
and striate and extra-striate visual areas [280–282]. Regions of the ventral visual stream such
as the inferior temporal gyrus and the lateral orbital cortex, as well as regions connected to
the dorsal visual stream like the hippocampus also show volumetric reductions [283, 284].
In addition, cortical thickness is increased in the cuneus [268, 283], which is likely due to a
reduction in cortical pruning during the early maturation process as a result of lack of visual
input, and which may be indicative of alterations in connectivity. White matter changes in the
visual pathways include atrophy of the optic tracts and the optic chiasm, reductions of the
optic radiations, the splenium of the corpus callosum [280, 281, 285, 286] and microstructural
changes within the ventral visual pathways [281].
Recent studies have also tried to elucidate functional changes in the blind brain. Brain
activation studies [260, 273, 287–290] and transcranial magnetic stimulation (TMS) studies
[291, 292] have found evidence for increased functional connectivity of the occipital cortex
with auditory and somatosensory areas. Several of the available resting state studies re-
ported stronger connections of the occipital cortex with somatosensory [293] and language
areas [278, 294–296]. Other studies, however, concluded that the occipital cortex of the blind
has a general reduced connectivity with somatosensory/auditory regions [297, 298], or even
larger parts of the brain [296, 299]. Some of these differences may be due to small or inho-
mogeneous study populations, including both congenital and early blind subjects or subjects

87
with and without residual light perception [294, 295, 300], or to the fact that the resting state
scan was acquired after an active functional scanning paradigm [278].
To circumvent these issues, we analyzed resting state functional magnetic resonance
imaging (rsfMRI) data of a homogeneous group of congenitally blind individuals lacking any
residual light perception, using a priori defined regions of interest (ROIs) in areas with known
roles in visual, somatosensory, auditory and language processing (figure 8.1). included twelve
congenitally blind (CB; 5 females, 7 males; age: mean age=42, SD=14 years) and twenty
healthy sighted controls (SC; 12 females, 8 males; mean age=42, SD=14 years). Using
resting state functional MRI, we mapped out increases as well as decreases in functional
connectivity in the congenitally blind brain, as compared to sighted controls.
Broca
BA41
BA40
S1 BA5 BA7pcBA7a
MTV1V2
hOC4dhOC3d
hOC3vhOC4vFG
BA40
BA7aBA7pc
BA5
MT
hOC4dhOC3d
FG
Figure 8.1 – A priori defined regions of interest. Regions of interest are shown on the lefthemisphere of an inflated brain using PySurfer. Dark areas represent sulci, light gray areasgyri.
Functional connectivity changes in congenitally blind
Although our data revealed a mixture of increases and decreases in functional connectivity in
the blind brain, the increases strongly prevailed. The most striking findings of this study were
the increases in functional connectivity in the congenital blind brain within the ventral and
dorsal visual streams, and between visual cortical regions and Brocas area. In sharp con-
trast, functional connectivity between dorsal and ventral visual areas was reduced. Results
described are represented in figure 8.2, and figure 8.3.

88 Chapter 8. Congenitally blind
Increased functional connectivity within the visual streams
Our data show evidence of increased functional connectivity in the ventral visual stream
in congenitally blind subjects, more specifically between ventral stream areas hOC3v and
fusiform gyrus and the inferior temporal gyrus (BA20). The ventral stream consists of a com-
plex recurrent network between visual areas V1-V4 and the inferior temporal cortex [301].
In sighted subjects, this pathway is implicated in the processing of object quality, object rep-
resentation or object category [301]. These processes are necessary for object and scene
comprehension that form the contents of visual awareness. The fact that this pathway is
preserved in blind subjects adds new evidence to the notion that the ventral visual stream
holds representations of object shape which are supramodal in nature, and not necessarily
visual [302]. For example, non-visual recruitment of the ventral temporal cortex was seen af-
ter haptic [303], non-haptic [304] and auditory [305] exploration of objects in congenital blind
subjects.
Congenitally blind subjects also showed increased functional connectivity in the dorsal
visual stream, more specifically between BA40 and the secondary visual cortex (V2), as well
as between somatosensory areas (BA7pc) and BA40. In normal sighted individuals, the
dorsal visual stream is heavily implicated in the visual guidance of action, and consists of
a set of projections from the visual cortex to the superior parietal lobule. From there, the
dorsal stream splits into the parieto-prefrontal, parieto-medial temporal and parieto-premotor
pathway [306]. The parieto-prefrontal pathway connects the parietal cortex to prefrontal re-
gions (e.g., BA46) and is important in top-down control of eye movements and spatial working
memory. The parieto-medial temporal pathway, connecting to the posterior cingulate cortex
via parahippocampal substructures, is implicated in spatial navigation. Finally, the parieto-
premotor pathway connects to premotor regions and is involved in visually-guided actions
such as reaching and grasping [306]. Our finding of increased functional connectivity be-
tween BA40 and V2, as well as between BA7pc and BA40, are indicative of a fast pathway
for information processing from higher order somatosensory to lower level visual areas. This
conjecture is in line with results of a recent MEG study indicating that somatosensory informa-
tion reaches the occipital cortex in the blind via somatosensory and posterior parietal areas
[287], and with results of functional activation studies showing occipital cortex activation fol-
lowing somatosensory stimulation in blind individuals [288]. Finally, applying TMS over the
occipital cortex can induce tactile sensations in blind subjects trained in the use of a tactile
sensory substitution device or in Braille reading [281, 292].
Our results of increased functional connectivity within both the dorsal and ventral visual
streams in congenitally blind subjects are in line with results of a recent functional connec-
tivity density mapping study [299]. Functional activation studies also support the finding of

89
increased connectivity within the dorsal and ventral streams in the blind brain [302]. For in-
stance, congenitally blind subjects trained in the use of the tongue display unit (TDU) showed
stronger connectivity between the cuneus and areas within the dorsal and ventral streams
[288]. In addition, a dynamic causal modelling study showed that the activation of the occipi-
tal cortex in blind individuals during an auditory discrimination task is mediated via enhanced
corticocortical connections from the auditory to the occipital cortex [289]. These functional
changes are probably due to anatomical reorganization of the pathways that funnel non-visual
information to the visual cortex of the blind [302]. Thus, our rsfMRI data of increased con-
nectivity in the visual streams are supported by results of various functional activation studies
showing that the visual streams of the congenitally blind undergo compensatory plasticity and
are able to process non-visual information in conjunction with the visual cortex [260, 307].
Decreased connectivity between the ventral and dorsal visual stream
In sharp contrast with the increase in functional connectivity within the visual streams, our
data revealed decreases in connectivity between the two streams in blind participants. Con-
nectivity of ventral areas hOC3v, hOC4v and fusiform gyrus with dorsal stream area hMT+
was decreased, as well as that between BA40 and the inferior temporal cortex (BA21). There
is growing evidence that the dorsal and ventral streams are less independent than originally
thought [308]. Although these streams have clear independent functional roles, there is func-
tional and structural evidence that they do not function in an independent manner [308–312].
Our data suggest that in the congenitally blind brain the two streams are less interconnected
than in the sighted brain. We hypothesize that this may be due to increases in functional
connectivity within the two streams. An alternative explanation is that cross-modal non-visual
sensory information processing in extrastriate cortex reduces the need for functional connec-
tivity between the streams.
Connectivity of the primary visual cortex
We did not find evidence for changes in connectivity in primary visual cortex (V1 and V2).
This is in agreement with several other functional connectivity studies [278, 293, 295, 298]. A
recent study reported decreased functional connectivity density only in primary visual areas of
late blind subjects, while congenitally blind showed increased connectivity between lower tier
visual areas and somatosensory areas [299], overlapping with the small cluster of increased
functional connectivity between BA40 and the primary visual areas observed in this study.
However, the literature on changes in functional connectivity of primary visual areas in blind
individuals is incongruent. Thus, several fMRI studies reported a correlation between damage

90 Chapter 8. Congenitally blind
to the optic radiation and an event-related fMRI response in visual areas [313], or decreased
functional connectivity of primary visual areas with the rest of the brain [294, 296, 297, 314].
These results were explained by the general loss hypothesis. However, this proposed mech-
anism cannot explain the ubiquitous role of the primary visual cortex in non-visual perceptual
and cognitive tasks [268, 270, 272–274, 276, 278, 288, 293, 315–320]. Nor can it explain
enhanced effective connectivity with other regions [288, 289, 291]. Furthermore, a recent re-
view on structural changes as measured with diffusion concluded that although the literature
is inconsistent, it suggest that neither strength nor macro-scale topographic organisation is
changed in blind individuals [321]. This is congruent with new research showing that func-
tional connectivity based topographic organization of the visual cortices is indistinguishable
from sighted controls, and increased functional connectivity to frontal and posterior temporal
areas [322].
Visual cortex and language processing
Brocas area (BAs 44 & 45) was the cortical area with the largest amount of alterations in
functional connectivity in congenitally blind participants. A total of five visual seeds, hOC3d,
hOC3v, hOC4v, hMT+ and fusiform gyrus, showed increased functional connectivity with this
area. In addition, Brocas area also showed stronger connectivity with ventral visual areas
hOC3v, hOC4v, and with medial prefrontal cortical area BA 10. The current consensus is that
the occipital cortex of blind individuals is involved in language processing, showing similar
properties as classical language related areas [278]. Braille reading in blind subjects activates
an extensive network of brain areas, including posterior and medial occipital areas, fusiform
gyrus, area hMT+, inferior temporal gyrus, inferior frontal, prefrontal, intraparietal sulcus, and
somatosensory motor areas [323]. More specifically, the increased functional connectivity
between visual areas and Brocas area in congenitally blind individuals might relate to the role
of the occipital cortex in semantic processing. Whereas semantic processing activates the
inferior frontal cortex in both sighted and blind subjects, it activates additionally visual cortical
areas in the latter group [276, 278, 293, 317, 324]. These results expand earlier findings of
increased connectivity of the occipital cortex with Brocas area in congenital blindness [278,
293–296, 298, 325]. The co-activation with Brocas area extends to most of the occipital
cortex [276, 325], and might next to language also functionally correlate to working memory
[325]. These results also relate to findings of increased white matter volume within the tracts
between prefrontal and occipital areas. More specifically in the fronto-occipital fasciculi [281,
321].
The increased functional connectivity between Brocas area and hMT+ might be explained
by the role of tactile flow processing in Braille reading [326]. All our congenitally blind were

91
hOC3d
hOC3v
hOC4v
FG
MT
Left hemisphere Right hemisphere
Sighted controls > Congenitally blind Congenitally blind > Sighted controls
Middle frontalInferior frontal
Inferior frontal
Inferior temporalInferior frontal
Inferior frontal
Inferior frontalInferior temporal Inferior temporal
Thalamus Thalamus
Inferior frontal
Inferior parietal
Middle temporal
Middle temporal
Middle temporal Pre & post central gyri
Figure 8.2 – Differences in resting state functional connectivity between blind andsighted controls (visual ROIs). Increases in functional connectivity in the blind group are in-dicated in red, whereas decreases in functional connectivity compared to controls are shownin blue. Cluster-level FWE-corrected p<0.05. Scale bars indicate Z-values. Abbreviations:CB = congenitally blind; SC = sighted controls.

92 Chapter 8. Congenitally blind
reading Braille from early age (see Table 1 for speed of Braille reading). Burton et al., (2002
[323]) showed that area hMT+ is linked to Braille reading only in early bind subjects. The role
of the occipital cortex in language processing is further supported by studies showing that
rTMS over the mid-occipital cortex not only reduces accuracy of verb-generation [317], but
also impairs Braille reading performance [327]. Finally, it is worth mentioning that a bilateral
occipital stroke in an early blind patient resulted in the loss of Braille reading skills [328].
Future studies should hence more focus on the relationship between Braille reading and
functional connectivity of Brocas area with hMT+ and with other brain areas in congenitally
and late blind subjects. In line with previous results [278], congenitally blind subjects also
showed increased functional connectivity between occipital area hOC4v and the thalamus.
This finding suggests a thalamo-cortical implication in language processing in the congenitally
blind, a conjecture that is supported by the observation that stimulation of left thalamic regions
produces language deficits in blind subjects [329]. Our data also revealed a decrease in
functional connectivity between Brocas area and its homologue in the right hemisphere. In
sighted but not in congenitally blind individuals, the right inferior frontal area is also activated
during language tasks [330]. Blind subjects might use the visually deprived occipital cortex
instead because it is more cost-effective.
Somatosensory areas
Our results indicate increased functional connectivity between the supramarginal gyrus (BA40)
and secondary visual cortex and area hMT+, and between SI and BA40. As stated above, the
supramarginal gyrus, occipital, middle temporal and somatosensory cortices are activated by
Braille reading [330–332]. We explain the co-activation of somatosensory regions by the tac-
tile input of Braille reading. Indeed, tactile stimuli activate inferior and ventral temporal, as well
as somatosensory regions in blind individuals [272, 288, 303, 304, 333]. This co-activation of
parietal and visual areas may be at the basis of the superior tactile acuity in blind individuals
[260], this might also be related to the increases in white matter volume found in somatosen-
sory and motor areas [334]. Other rsfMRI studies have reported a decrease of functional
connectivity between visual and somatosensory regions [278, 296, 297, 300]. However, this
finding is at odds with results of several other activation studies indicating strong connectivity
between these areas. For instance, functional connectivity was shown to be increased be-
tween hMT+ and somatosensory areas [273]. Furthermore, a recent MEG study revealed
activation of the occipital cortex following median nerve stimulation in congenitally blind in-
dividuals [287]. A connectivity analysis further suggested that median nerve stimulation first
activated primary somatosensory cortex, then the posterior parietal cortex and finally visual
areas V3 and V5 [287]. Using somatosensory-evoked potentials, we reported that tactile

93
BA40
BA7pc
S1
broca
Left hemisphere Right hemisphere
Sighted controls > Congenitally blind Congenitally blind > Sighted controls
Middle temporal
BA18
Middle temporalInferior temporal BA18
Inferior parietal Mid. Cingulate / SPL
Mid. Cingulate / SPLSupramarginalPre & post central gyrus
Middle temporal
Mid. Cingulate / SPL
BA17
hOC3v & hOC4v
Prefrontal Inferior frontal
Figure 8.3 – Differences in resting state functional connectivity between blind andsighted controls (somatosensory and language ROIs). Increases in functional connec-tivity in the blind group are indicated in red, whereas decreases in functional connectivitycompared to controls are shown in blue. Cluster-level FWE-corrected p<0.05. Scale barsindicate Z-values. Abbreviations: CB = congenitally blind; SC = sighted controls.

94 Chapter 8. Congenitally blind
stimulation of the tongue in blind individuals trained in the use of the tongue display unit first
activated the somatosensory cortex and then the occipital cortex [292]. Finally, a combined
PET-TMS study showed that TMS of the primary somatosensory cortex leads to increased
blood flow in the occipital cortex in congenitally blind subjects only [291]. Together, these
findings argue in favour of an enhanced parieto-occipital connectivity in congenital blindness
which is supported by the present rsfMRI data.
Auditory and motor areas
Although many studies have indicated superior auditory abilities in congenitally blind individ-
uals [260], we did not find significant group differences in functional connectivity of auditory
areas. Active tasks have indicated stronger cooperation between the auditory and occipital
cortices in congenital blindness [289, 320]. It is possible that in the present study, scanner
noise masked a purported increase in resting state functional connectivity between auditory
and occipital cortices in blind individuals [335]. We found decreased functional connectivity
between the fusiform gyrus and pre- and post-central areas. This is in agreement with several
other studies that found decreases between visual areas and motor-related regions, a finding
that was explained by the loss of eye-hand coordination in blind subjects [294, 296, 297].
Eye-hand coordination in sighted individuals leads to co-activation of visual and motor areas
[336], which is reduced in conditions of congenital blindness.
Methodological considerations
Several rsfMRI studies have explored changes in functional connectivity in the blind brain. The
reported results are not very consistent and sometimes even conflicting. These differences
in results might be due to spurious samples or protocol bias. For instance, some studies
included blind subjects with residual light perception [294, 298, 337], or had a mixture of con-
genitally blind and late-onset blind participants [295]. Our study cohort was a homogeneous
group of congenitally blind participants without any light perception. Furthermore, contrary to
some [296, 297], our study used subjects that are not previously used for any analysis, nor
was there any active paradigm during the scanning session [278]. Another explanation for
the inconsistency between studies relates to differences in used methodologies for assessing
functional connectivity in rsfMRI data. Early studies used a more exploratory method with
atlas-based regions of interest [293, 296, 299, 337, 338], or one or a few hypothesis-driven
ROIs, mostly the primary visual area [297, 300, 337]. In contrast, our investigation focused
on small areas that are not present in current atlases. Information about the time course (and
therefore its functional correlation) of these small areas could also be missed when the time

95
courses of all voxel in an atlas based area are averaged. Our research focused on brain ar-
eas with known functional or structural changes in blind subjects in the visual, somatosensory,
auditory and language domain, and seed placement was done according to architectonical
studies.
We combined the time-series of homologous areas from both hemispheres. For this rea-
son we are unable to draw any conclusions on purported hemispheric differences in functional
connectivity. Further, we excluded increased or decreased correlations in our second level
analysis that were caused by anti-correlating time-series in our first level analysis. As with all
resting state functional connectivity studies, we are only able to show correlations between
different areas, and not any causality.

96 Chapter 8. Congenitally blind

Conclusions and future perspectives part III
Data reveal increased functional connectivity within both the ventral and the dorsal visual
streams in congenitally blind participants. However, connectivity between the two visual
streams was reduced in blind subjects. In addition, our data revealed stronger functional con-
nectivity in blind participants between the occipital cortex and areas implicated in language
and tactile (Braille) processing such as the inferior frontal gyrus (Brocas area), the thalamus,
the supramarginal gyrus and the cerebellum. Our results underscore the extent of cross-
modal reorganisation and the supra-modal function of the occipital cortex in congenitally blind
individuals.
In relation to DOC patients, all the problems that can influence behavioral assessment
are important to quantify objectively. This seems most easy for sensory impairments like
blindness, loss of smell, or deafness. Healthy conscious people who are able to transmay
their conscious perception are good subjects to start to elucidate the changes in the brains
connectivity after such a loss of a sense. There is still a huge work ahead of us before we can
state from passive paradigms if a subject can see or hear, but maybe with this work, a start in
this direction is made.
97

98 Chapter 8. Congenitally blind

Concluding remarks
This thesis explores brain connectivity and sensory stimulation in patients with
disorders of consciousness (DOC). These are serious conditions where massive
brain damage can lead to a dissociation between arousal and awareness (e.g.,
UWS and MCS). The work described here explores several available methods
for the assessment of consciousness. The main method utilized here is fMRI
functional connectivity (Chapter 3, 4, 6, 8), while we also briefly go into PET and
structural MRI (Chapter 2), as well as behavioral assessments (Chapter 5, 7).
Study specific conclusions and future perspectives can be found in all separate
parts of this thesis, Part I on page 51, Part II on page 79, and Part III on page 97.
Two general conclusions can be drawn from this thesis. First, concerning brain
connectivity (as explored in Part I) we can conclude that brain function and struc-
ture are intimately related to each other, and to consciousness. Limited structural
integrity is linked to a decrease in brain function. This decrease in brain function
can be used to distinguish between the clinically indicated states of conscious-
ness.
The second message which can be drawn from this work relates to the passive
sensory stimulation in Part II. Preferred stimuli may have the power to momen-
tarily enhance brain function, and therefore behavioral responses, to its maximal
potential. Using preferred stimuli, such as music, as a testing context might
optimize the diagnostic assessments of the fluctuating pattern of minimally con-
scious patients. The use of preferred stimuli might thus be advised in relation to
diagnostic assessment when diagnostic doubts exist.


Appendix A
Paper I
Consciousness and disorders of consciousness
Heine L, Demertzi A, Laureys S, Gosseries O.
in: Brain mapping: An encyclopedic reference, Elsevier, 2015
101

Consciousness: And Disorders of ConsciousnessL Heine, A Demertzi, S Laureys, and O Gosseries, University of Liege, Liege, Belgium
ã 2015 Elsevier Inc. All rights reserved.
GlossaryActive paradigm Experimental condition that requires thesubject to perform a specific task on request.Coma Recovery Scale – Revised (CRS-R) Behavioral scaledeveloped to assess the level of consciousness in patientsrecovering from coma. This scale has been specificallyintroduced to differentiate patients in VS/UWS from patientsin MCS, and it tests auditory, visual, motor, oromotor,communication, and arousal functions.Diffusion-tensor imaging (DTI) MRI technique thatmeasures water molecule diffusion revealing the structuralintegrity of axon tracts in the brain.Disorders of consciousness (DOCs) Refer to the alteredstates of consciousness as a result of severe acquired braininjuries and describe patients in coma, with vegetative state/unresponsive wakefulness syndrome, and in minimallyconscious state.Functional magnetic resonance imaging(fMRI) Noninvasive neuroimaging technique that measuresneuronal activation based on blood oxygen level-dependent(BOLD) changes.Locked-in syndrome (LIS) A clinical conditionwherein patients are awake and aware, but with severe
motor impairments, sometimes so severe that theycannot move any part of their body. The primarymeans of communication is through eye movements.Minimally conscious state (MCS) A clinical disorderof consciousness wherein patients are awake butshow fluctuating signs of awareness without beingable to functionally communicate with theirsurroundings.Passive paradigm Experimental condition during whichthere is the administration of external stimulations such asauditory, tactile, or visual stimuli while the subject is notasked to do anything in particular.Positron emission tomography (PET) Invasiveneuroimaging technique that measures brain metabolismenergy turnover.Resting paradigm Experimental condition during which nostimulation and/or tasks are administered to the studiedpopulation: subjects are only asked to relax and to let theirthoughts pass without focus.Vegetative state/unresponsive wakefulness syndrome (VS/UWS) A clinical disorder of consciousness wherein patientsare awake but not aware of themselves and theirsurroundings.
Consciousness
At present, there is no definition of consciousness that is uni-versal and covers all essential characteristics. In a clinical set-ting, consciousness is reduced into two main components:wakefulness (i.e., arousal) and awareness (Posner, Saper,Schiff, et al., 2007). Wakefulness refers to the level of vigilanceand relies on the activity of the reticular formation, hypothal-amus, and basal ganglia. Awareness is related to subjectiveexperiences and can be subdivided into awareness of the exter-nal world (i.e., sensory or perception of the environment) andof the internal world (i.e., stimulus-independent thoughts,such as mental imagery and inner speech). Functional integrityof cortical frontoparietal connectivity with the thalamus isthought to be implicated in awareness.
Sleep is an illustrative example to describe the relationshipbetween wakefulness and awareness: the drowsier we becomeas we move toward deep sleep, the less aware we are ofour surroundings and ourselves. A disrupted relationshipbetween these two components is observed in patients withdisorders of consciousness (DOCs) following severe acquiredbrain injury. Anesthesia, epilepsy, and somnambulism (i.e.,sleepwalking) are also states of diminished consciousnessdue to a dissociation between wakefulness and awareness(Figure 1).
Disorders of Consciousness
Coma
Coma may be a result of brainstem lesions and severe diffusecortical or white matter damage. The main causes, however, aretrauma, stroke, and anoxia (e.g., cardiac arrest). A coma is atransient condition: Patients’ eyes remain closed even afterpainful stimulation, and hence, they remain unaware of thesurroundings and of themselves. A coma must last at least onehour to be differentiated from fainting. Autonomous func-tions, such as breathing and thermoregulation, are reduced,which often requires respiratory assistance. Most patientsrecover from a coma within the first hours to weeks after injury.However, some evolve into other DOCs such as in a vegetativestate/unresponsive wakefulness syndrome (VS/UWS) andmin-imally conscious state (MCS). Brain death can also be a resultof severe brain injury and is defined by a permanent loss of allbrain functions. Table 1 summarizes the diagnostic criteria forthe clinical entities that can occur after a severe brain injury.
Vegetative State/Unresponsive Wakefulness Syndrome
Patients in VS/UWS recover arousal, meaning that they showspontaneous or induced eye opening. Autonomic functions aregenerally preserved, and breathing occurs usually without
Brain Mapping: An Encyclopedic Reference http://dx.doi.org/10.1016/B978-0-12-397025-1.00133-0 1067
102 Appendix A. Paper I

Drowsiness
MCS−
MCS+ EMCS
Locked-insyndrome
Normalwakefulness
VS/UWSSomnabulism
Epilepsy
Light sleep
Wakefu
lness
Deep sleep
Coma
Awareness
GeneralAnesthesia
REM
Figure 1 A clinical definition of consciousness. Interaction between arousal and awareness in different states of (un)consciousness. REM, rapid eyemovement; EMCS, emergence from a minimally conscious state; MCSþ, minimally conscious state plus; MCS", minimally conscious state minus;VS/UWS, vegetative state/unresponsive wakefulness syndrome; LIS, locked-in syndrome.
Table 1 Diagnostic criteria for patients with severe brain injuries
Clinical entities DOC Definition Reference
Brain death No Irreversible coma Wijdicks (2001)Evidence for the cause of comaIrreversible loss of all functions of the brain, includingbrainstem reflexes
ApneaAbsence of confounding factors (e.g., drugs, hypothermia,and electrolyte and endocrine disturbances)
Coma Yes No wakefulness Posner, Saper, Schiff, et al. (2007)No awareness of self or environmentAcute state (i.e., resolves in hours to maximum 4 weeks)
Vegetative state/unresponsivewakefulness syndrome
Yes Wakefulness The Multi-Society Task Force on PVS(1994) and Laureys, Celesia, Cohadon,et al. (2010)
No awareness of self or environmentNo sustained, reproducible, purposeful, or voluntarybehavioral responses to visual, auditory, tactile, ornoxious stimuli
No language comprehension or expressionRelatively preserved hypothalamic and brainstemautonomic functions (e.g., respiration, digestion, andthermoregulation)
Bowel and bladder incontinenceVariably preserved cranial nerve and spinal reflexesAcute and/or chronic state
Minimally conscious state Yes Wakefulness Giacino, Ashwal, Childs, et al. (2002)Awareness is inconsistent but definiteMinus Visual pursuit Bruno, Vanhaudenhuyse, Thibaut,
Moonen, and Laureys (2011)Contingent behaviorReaching for objectsOrientation to noxious stimulation
Plus Following simple commandsIntentional communicationIntelligible verbalization
Emergence from minimallyconscious state
No Functional communication Giacino, Ashwal, Childs, et al. (2002)Functional object use
Locked-in syndrome No Wakefulness American Congress of RehabilitationMedicine (1995)Awareness
Aphonia or hypophoniaQuadriplegia or quadriparesisPresence of communication via the eyesPreserved cognitive abilities
103

assistance. They show no voluntary interaction with theirenvironment and no adapted emotional responses. The patientis able to perform a variety of movements, such as grindingteeth, blinking and moving eyes, swallowing, yawning, crying,and smiling, but these are always reflexive movements and notrelated to the context (The Multi-Society Task Force of PVS,1994). ‘Unresponsive wakefulness syndrome’ was recentlyproposed as a replacement term for ‘vegetative state’ to avoidthe negative ‘vegetable-like’ connotation and to provide amore neutral description of the behavior profile (Laureys,Celesia, Cohadon, et al., 2010). VS/UWS can be transient orpermanent.
Minimally Conscious State
Patients in MCS show signs of fluctuating and reproducibleremnants of nonreflexive willful behavior (Giacino, Ashwal,Childs, et al., 2002). For example, command following, visualpursuit as a direct response to moving or salient stimuli, local-ization of noxious stimulation, and contingent responses toemotional stimuli are considered signs of consciousness.Patients in MCS are more likely to experience pain and/orsuffering (Boly, Faymonville, Schnakers, et al., 2008). MCShas been recently stratified into MCSþ (plus) and MCS"(minus) based on the complexity of behavioral responses(Table 1). When patients show reliable demonstration of‘functional communication’ (i.e., accurate yes–no responsesto situational orientation questions) and/or ‘functional objectuse’ (i.e., demonstration of the use of two different objects),the patient emerges from an MCS (EMCS) (Giacino, Ashwal,Childs, et al., 2002).
Locked-In Syndrome
Patients suffering from a locked-in syndrome (LIS) can beeasily misdiagnosed as a DOC due to ventral brainstem lesionsthat damage the corticospinal tract, which severely affectsmotor behavior but leaves cognitive abilities intact. The pri-mary mode of communication is via eye movements or blink-ing (American Congress of Rehabilitation Medicine, 1995).
Clinical Assessment of Consciousness
Correct diagnosis is highly important in DOC for prognostic,therapeutic, and ethical reasons. The prognosis of patients inMCS is relatively better than those in VS/UWS (Luaute,Maucort-Boulch, Tell, et al., 2010); 12 months after braininjury, about half of the patients in MCS had improved, com-pared with a very small percentage of patients in VS/UWS(Giacino & Kalmar, 1997). In terms of therapeutic choices,the medical team may choose to apply pharmacological (e.g.,with amantadine, zolpidem, or palliative medication) and/ornonpharmacological interventions (e.g., deep brain stimu-lation) (Schiff, Giacino, Kalmar, et al., 2007) or choose towithdraw artificial life support. In ethical issues regardingend-of-life decisions, legal precedence in several countries hasestablished the right of the medical team to withdraw artificialnutrition and hydration from patients in VS/UWS but notin MCS.
At present, behavioral assessment remains the gold standardfor the assessment of consciousness. Clinically, wakefulness isassessed by spontaneous or stimulus-induced eye opening,whereas awareness is measured by command following orother nonreflexive purposeful behaviors. The examination ofawareness is challenging and may lead to a high rate of misdiag-nosis (up to 40%) if patients are not assessed carefully by astandardized scale. Indeed, motor reactions can be inconsistent,very small, or easily exhausting. Impaired cognition (aphasia andapraxia), sensory impairment (blindness and deafness), pain,pharmacological sedatives, sleep disturbances, and/or medicalcomplications can all interfere with the assessment of conscious-ness (Schnakers, Vanhaudenhuyse, Giacino, et al., 2009). TheComa Recovery Scale – Revised (CRS-R) (Giacino, Kalmar &Whyte, 2004) is currently the most reliable and sensitive toolfor the differential diagnosis of DOC (Seel, Sherer, Whyte, et al.,2010). It was developed to differentiate VS/UWS fromMCS anduses visual, motor, auditory, oromotor, communication, andarousal subscales. The use of self-referential stimuli such asone’s own name and one’s own face (using a mirror) should beused to increase the patient’s responsiveness. Neuroimagingmethods are starting to assist behavioral assessments with thechallenging task of differential diagnosis.
Ancillary Testing of Consciousness
Neuroimaging methods such as positron emission tomography(PET), functional magnetic resonance imaging (fMRI), and elec-troencephalography (EEG) have offered the possibility to objec-tively study covert cognitive processes. Spontaneous brainfunction can be assessed in resting paradigms where the subjectreceives no external stimulation and is instructed to let their mindwander. Passive paradigmsuse external stimulation to assess brainfunction andmeasure the spreadof informationwithin the cortex.Active paradigms use willfully modulated brain signals, forexample, by using mental imagery tasks, to detect commandfollowing similar to command response tests done at the bedside.
Positron Emission Tomography
PET gives an approximation of functional tissue integrity bymeasuring cerebral glucose consumption. In resting condi-tions, this method has shown a decrease in brain metabolismin VS/UWS of up to 40% of normal value. However, the loss ofconsciousness is not related to a global dysfunction in cerebralmetabolism, but rather to regional decreases. Indeed, patientssuffering from DOC show decreased metabolism in a wide-spread frontoparietal network, encompassing the lateral pre-frontal and posterior parietal areas and midline anteriorcingulate/mesiofrontal and posterior cingulate/precuneal asso-ciative cortices (Nakayama, Okumura, Shinoda, et al., 2006)(Figure 2(c)). The lateral areas of this frontoparietal networkare considered to be implicated in external awareness, whereasthe midline regions have been linked to internal awareness(Vanhaudenhuyse, Demertzi, Schabus, et al., 2010). Accordingto this scheme, patients in MCS show higher metabolism inprecuneus than patients in VS/UWS (Thibaut, Bruno, Chatelle,et al., 2012) and are characterized by the metabolic restorationin the frontoparietal network and the connections between
INTRODUCTION TO CLINICAL BRAIN MAPPING | Consciousness: And Disorders of Consciousness 1069
104 Appendix A. Paper I

prefrontal and central thalamic areas (Laureys, Faymonville &Luxen, 2000). Notably, the decreased metabolism in the thal-amus seems to be related to impaired consciousness (Lull, Noe,Lull, et al., 2010). The recent proposal to subcategorize theMCS into MCS" and MCSþ was confirmed by resting-statePET analysis, where differences in language and sensorimotorareas are observed between patients in MCS" and MCSþ(Bruno, Majerus, Boly, et al., 2011).
Using passive paradigms, differential activation patternshave been demonstrated in patients in VS/UWS and MCS.For example, as a response to sound (Figure 2(b)), patientsin VS/UWS show activation limited to the primary auditorycortex (Laureys, Faymonville, Degueldre, et al., 2000), whereaspatients in MCS demonstrate brain activation spreading to thesecondary auditory cortex as well as temporal and frontal areas(Boly & Faymonville, 2004). More importantly for clinicalmanagement, during painful stimulation, patients in MCSshow similar brain activation compared to controls, whilepatients in VS/UWS only show restricted activation in lower-level subcortical and primary cortical areas.
Magnetic Resonance Imaging
Anatomical MRIs help to assess the extent of structural damage.Diffusion-tensor imaging (DTI) is a measure of the direction-ality of water molecules that indicates white matter tracts(Figure 3(a)). DTI has been shown to correctly classify patients
in VS/UWS versus MCS with a 95% accuracy in a group of 25patients (Fernandez-Espejo, Bekinschtein, Monti, et al., 2011).fMRI visualizes brain function derived from blood oxygenlevel-dependent (BOLD) changes. During rest, the brainshows spontaneous oscillating patterns of BOLD low-frequency neuronal activity, allowing the brain to get orga-nized in distinct functional networks (Damoiseaux, Rombouts,Barkhof, et al., 2006). In healthy subjects, ten resting-statenetworks can be reliably detected, such as the default-mode,visual, auditory, salience, sensorimotor, and executive controlnetworks (Smith, Fox, Miller, et al., 2009). The robustlydetected default-mode network (mainly encompassing themidline anterior cingulate/mesiofrontal and posterior cingu-late/precuneal regions and lateral parietal areas) has beenlinked to conscious processes. Such consciousness-relateddefault-mode functional connectivity has been shown todecrease as a function of the level of consciousness in patientswith DOC (Figure 2(d); Heine, Soddu, Gomez, et al., 2012).Sub cortical, subcortical connectivity may also be informativefor patients in DOC. Indeed, it has been recently suggestedthat, instead of decreased connectivity, patients with DOCpresent hyperconnectivity in the subcortical limbic system (DiPerri, Bastianello, Bartsch, et al., 2013).
Passive fMRI paradigms also indicate that auditory, visual,and somatosensory activation is restricted to lower sensoryregions in patients in VS/UWS, while brain activation is wide-spread in MCS (Di, Yu, Weng, et al., 2007). Unlike PET, fMRI
Control MCS VS/UWS
(a) PET resting state
(b) PET passive paradigm
(c) Decrease in PET metabolism
(d) fMRI Resting state
Figure 2 Group-level studies using PET and fMRI in healthy condition and in disorders of consciousness. Resting and passive paradigms in healthycontrols and in patients in a vegetative state/unresponsive wakefulness syndrome (VS/UWS) and minimally conscious state (MCS). (a) Cerebralmetabolism as measured with PET in the three groups. Images are shown using the same color scale. (b) Cerebral metabolism activation during auditoryparadigm with PET. Healthy controls show activation of the primary and secondary auditory cortices, whereas patients in MCS and VS/UWS show aseverely decreased activity in these areas. (c) Areas with significant metabolic impairment in patients in MCS and VS/UWS compared to healthy controlsare found in the frontoparietal network. (d) Resting-state fMRI BOLD of the default-mode network is preserved in healthy conditions and partiallypreserved in patients with DOC (white spot indicates the seed region with which the other brain areas in red are functionally connected). Both PET andfMRI statistical maps are thresholded at a family-wise error correction rate for multiple comparisons (p<0.001).
1070 INTRODUCTION TO CLINICAL BRAIN MAPPING | Consciousness: And Disorders of Consciousness
105

allows the use of active paradigms to show voluntarily modu-lated responses to command. Patients can be asked to performa mental imagery task such as playing tennis or navigatingthrough their house that activates supplementary motor areasand parahippocampal areas, respectively (Owen, Coleman,Boly, et al., 2006; Figure 3(b)). This study, as well as multipleothers, has shown that some patients behaviorally diagnosedas VS/UWS are able to correctly perform these imagery tasks.Therefore, the absence of responsiveness at the bedside doesnot always correspond to an absence of consciousness. Thismethod has even been used for binary communication in apatient with DOC (Monti, Vanhaudenhuyse, Coleman, et al.,2010). Although active paradigms do not give positive resultsin all (partially) conscious patients, new methods for commu-nication are being created (Naci, Cusack, Jia, et al., 2013).
Electroencephalography
Resting-state measures of electrical brain activity can also aiddiagnosis with the advantage of being performed at the bedside(Gosseries, Schnakers & Ledoux, 2011). For instance, studiesusing quantitative and connectivity EEG measures have dem-onstrated the ability of this technique to differentiate betweenpatients in MCS and those in VS/UWS at the group level. EEGalpha activity is decreased in all patients with DOC, whereasdelta power is increased in VS/UWS only (Lechinger, Bothe,Pichler, et al., 2013). Several studies using passive paradigmshave assessed event-related potentials (ERPs) as a responseto stimulations. The presence of an ERP response to stimuli(e.g., N1) and to odd stimuli within a sequence (mismatchnegativity (MMN)) serves as predictors of outcome. The P3ERP response to unexpected stimuli also aids prognosis andcan be used as a response to a command paradigm by showinghigher ERP when used in an active condition as comparedwith a passive situation (Schnakers, Perrin, Schabus, et al.,2008). As in fMRI active paradigms, some patients who arebehaviorally diagnosed as VS/UWS have been shown to beable to perform active mental imagery tasks (Cruse, Chennu,Chatelle, et al., 2011).
EEG in combination with transcranial magnetic stimula-tion (TMS) is used to stimulate a brain region and assesscortical excitability (i.e., the amplitude of the initial responseto TMS) and effective connectivity response (i.e., causal inter-action between the stimulated area and the subsequent acti-vated cortical regions). This technique has been shown tosuccessfully differentiate patients in VS/UWS from MCS(Figure 3(c)). Indeed, MCS patients demonstrate complexlong-lasting widespread activation patterns, whereas patientsin VS/UWS show stereotyped and local slow-wave responsesthat indicate a breakdown of effective connectivity (Rosanova,Gosseries, Casarotto, et al., 2012).
Multimodal Assessment
The different neuroimaging methods reviewed in the precedingtext provide information on the structural location and extentof brain lesions (e.g., via MRI DTI) and their functional impact(e.g., metabolic FDG-PET, hemodynamic fMRI, and EEG mea-surements). Although there have been many studies indicatingdifferences between patients with DOC and healthy controlsand between patients in VS/UWS and MCS, almost all of themhave reported results at the group level (Figure 2). Neverthe-less, when these methodologies are applied separately inpatients, they can demonstrate challenges in diagnostic andprognostic terms. Multimodal assessment may shed morelight on the individual brain function because it highlightsthe complementarities of these neuroimaging methods in thestudy of DOC (Bruno, Fernandez-Espejo, Lehembre, et al.,2011). When the results of multiple neuroimaging assessmentsconverge, then greater confidence can be achieved in the assess-ment of the level of consciousness (Figure 3).
Conclusion
Patients with DOC offer the possibility of studying conscious-ness using a lesion approach. This has taught us that conscious-ness is not an all-or-none phenomenon and should be
(a) MRI DTI
VS/UWS
MCS
LIS
(b) MRI active paradigm (c) TMS-EEG
TMS 100 ms
5µ
V
Figure 3 Multimodal neuroimaging in three patients with disorders of consciousness. Neuroimaging methods at the single-patient level: One patient isbehaviorally diagnosed with vegetative state/unresponsive wakefulness syndrome (VS/UWS), one diagnosed with minimally conscious state (MCS), andone diagnosed with locked-in syndrome (LIS). (a) MRI diffusion-tensor imaging (DTI) indicates the amount of damage in structural connectivity (i.e.,white matter tracts, color-coded by axis). (b) fMRI active paradigms allow for motor-independent response to command (here, tennis imagery). (c)Transcranial magnetic stimulation (TMS) combined with EEG assesses cortical excitability and effective connectivity. EEG evoked response under thestimulation area (left image) and the subsequent widespread of the activation (right, color-coded by brain area). When the result of multimodalneuroimaging assessment converges, greater confidence can be achieved in the assessment of the level of consciousness.
INTRODUCTION TO CLINICAL BRAIN MAPPING | Consciousness: And Disorders of Consciousness 1071
106 Appendix A. Paper I

considered as a continuum, as shown by the different DOCswith varying levels of awareness. Neuroscientific findingsshould also be viewed together in a theoretical framework ofconsciousness to ultimately lead to a unification of passive andactive paradigms in a coherent diagnostic approach. Severalhypothesis about consciousness and the neural correlates ofconsciousness have been developed (Boly & Seth, 2012). Forexample, the global workspace theory states that consciousnessis an emergent property of the frontoparietal network(Dehaene & Changeux, 2005). The information integrationtheory of consciousness indicates that consciousness is relatedto a system’s capacity for information integration. Each causalmechanism is capable of choosing among alternatives thatgenerate information, and information is integrated to theextent that it is generated by a system above and beyond itsparts (Tononi, 2008). The next step is therefore to combineneuroscientific findings related to conscious and unconsciousstates, as well as theory, in order to study how stimuli accessconscious processing, the phenomenon of consciousness itself,and the neurological basis and measures of dynamical com-plexity. All in all, neuroimaging approaches are showing prom-ise for the assessment of patients with DOC, and the study ofthis patient population might aid the quest for the neuralcorrelates of consciousness.
See also: INTRODUCTION TO ACQUISITION METHODS:Anatomical MRI for Human Brain Morphometry; Basic Principles ofElectroencephalography; Diffusion MRI; Functional MRI Dynamics;Molecular fMRI; Positron Emission Tomography and NeuroreceptorMapping In Vivo; INTRODUCTION TO ANATOMY ANDPHYSIOLOGY: Cytoarchitectonics, Receptorarchitectonics, andNetwork Topology of Language; Functional Connectivity; InsularCortex; Lateral and Dorsomedial Prefrontal Cortex and the Control ofCognition; Posterior Parietal Cortex: Structural and FunctionalDiversity; Somatosensory Cortex; Thalamus: Anatomy; The Brain Stem;The Resting-State Physiology of the Human Cerebral Cortex;INTRODUCTION TO CLINICAL BRAIN MAPPING: Brain MappingTechniques Used to Guide Deep Brain Stimulation Surgery; ImagingAlzheimer’s Disease: The Evolution of Biomarkers; Recovery andRehabilitation Poststroke; INTRODUCTION TO METHODS ANDMODELING: Dynamic Causal Models for Human Electrophysiology:EEG, MEG, and LFPs; Effective Connectivity; Resting-State FunctionalConnectivity; INTRODUCTION TO SOCIAL COGNITIVENEUROSCIENCE: Action Perception and the Decoding of ComplexBehavior; Body Perception; The Default Network and Social Cognition;INTRODUCTION TO SYSTEMS: Large-Scale Functional BrainOrganization; Network Components; Pain: Acute and Chronic.
References
American Congress of Rehabilitation Medicine. (1995). Recommendations for use ofuniform nomenclature pertinent to patients with severe alterations of consciousness.Archives of Physical Medicine and Rehabilitation, 76, 205–209.
Boly, M., & Faymonville, M. (2004). Auditory processing in severely brain injuredpatients: Differences between the minimally conscious state and the persistentvegetative state. Archives of Neurology, 61(2), 233–238.
Boly, M., Faymonville, M. E., Schnakers, C., et al. (2008). Perception of pain in theminimally conscious state with PET activation: An observational study. LancetNeurology, 7(11), 1013–1020.
Boly, M., & Seth, A. K. (2012). Modes and models in disorders of consciousnessscience. Archives Italiennes de Biologie, 150(2–3), 172–184.
Bruno, M. A., Fernandez-Espejo, D., Lehembre, R., et al. (2011). Multimodalneuroimaging in patients with disorders of consciousness showing “functionalhemispherectomy” Progress in Brain Research, 193, 323–333.
Bruno, M. A., Majerus, S., Boly, M., et al. (2011). Functional neuroanatomy underlyingthe clinical subcategorization of minimally conscious state patients. Journal ofNeurology, 259(6), 1087–1098.
Bruno, M. A., Vanhaudenhuyse, A., Thibaut, A., Moonen, G., & Laureys, S. (2011).From unresponsive wakefulness to minimally conscious PLUS and functionallocked-in syndromes: Recent advances in our understanding of disorders ofconsciousness. Journal of Neurology, 258, 1373–1384.
Cruse, D., Chennu, S., Chatelle, C., et al. (2011). Bedside detection of awareness in thevegetative state: A cohort study. Lancet, 378(9809), 2088–2094.
Damoiseaux, J. S., Rombouts, S., Barkhof, F., et al. (2006). Consistent resting-statenetworks across healthy subjects. Proceedings of the National Academy of Sciencesof the United States of America, 103(37), 13848–13853.
Dehaene, S., & Changeux, J. P. (2005). Ongoing spontaneous activity controls accessto consciousness: A neuronal model for inattentional blindness. PLoS Biology,3(5), e141.
Di Perri, C., Bastianello, S., Bartsch, A. J., et al. (2013). Limbic hyperconnectivity in thevegetative state. Neurology, 81, 1417–1424.
Di, H., Yu, S. M., Weng, X. C., et al. (2007). Cerebral response to patient’s ownname in the vegetative and minimally conscious states. Neurology, 68(12),895–899.
Fernandez-Espejo, D., Bekinschtein, T., Monti, M. M., et al. (2011). Diffusion weightedimaging distinguishes the vegetative state from the minimally conscious state.NeuroImage, 54(1), 103–112.
Giacino, J. T., Ashwal, S., Childs, N., et al. (2002). The minimally conscious state:Definition and diagnostic criteria. Neurology, 58(3), 349.
Giacino, J., & Kalmar, K. (1997). The vegetative and minimally conscious states: Acomparison of clinical features and functional outcome. The Journal of HeadTrauma Rehabilitation, 12(4).
Giacino, J. T., Kalmar, K., & Whyte, J. (2004). The JFK coma recovery scale-revised:Measurement characteristics and diagnostic utility. Archives of Physical Medicineand Rehabilitation, 85(12), 2020–2029.
Gosseries, O., Schnakers, C., & Ledoux, D. (2011). Automated EEG entropymeasurements in coma, vegetative state/unresponsive wakefulness syndrome andminimally conscious state. Functional Neurology, 26(1), 1–6.
Heine, L., Soddu, A., Gomez, F., et al. (2012). Resting state networks andconsciousness: Alterations of multiple resting state network connectivity inphysiological, pharmacological and pathological consciousness states. Frontiers inPsychology, 3, 295.
Laureys, S., Celesia, G. G., Cohadon, F., et al. (2010). Unresponsive wakefulnesssyndrome: A new name for the vegetative state or apallic syndrome. BMC Medicine,8(1), 68.
Laureys, S., Faymonville, M. E., Degueldre, C., et al. (2000). Auditory processing in thevegetative state. Brain, 123(8), 1589–1601.
Laureys, S., Faymonville, M., & Luxen, A. (2000). Restoration of thalamocorticalconnectivity after recovery from persistent vegetative state. The Lancet, 355,1790–1791.
Lechinger, J., Bothe, K., Pichler, G., et al. (2013). CRS-R score in disorders ofconsciousness is strongly related to spectral EEG at rest. Journal of Neurology, 260,2348–2356.
Luaute, J., Maucort-Boulch, D., Tell, L., et al. (2010). Long-term outcomes of chronicminimally conscious and vegetative states. Neurology, 75(3), 246–252.
Lull, N., Noe, E., Lull, J. J., et al. (2010). Voxel-based statistical analysis of thalamicglucose metabolism in traumatic brain injury: Relationship with consciousness andcognition. Brain Injury, 24(9), 1098–1107.
Monti, M. M., Vanhaudenhuyse, A., Coleman, M. R., et al. (2010). Willful modulation ofbrain activity in disorders of consciousness. New England Journal of Medicine,362(7), 579–589.
Naci, L., Cusack, R., Jia, V. Z., et al. (2013). The brain’s silent messenger: Usingselective attention to decode human thought for brain-based communication.Journal of Neuroscience, 33(22), 9385–9393.
Nakayama, N., Okumura, A., Shinoda, J., et al. (2006). Relationship between regionalcerebral metabolism and consciousness disturbance in traumatic diffuse brain injurywithout large focal lesions: An FDG-PET study with statistical parametric mappinganalysis. Journal of Neurology, Neurosurgery, and Psychiatry, 77(7), 856–862.
Owen, A. M., Coleman, M. R., Boly, M., et al. (2006). Detecting awareness in thevegetative state. Science, 313(5792), 1402.
Posner, J. B., Saper, C. B., Schiff, N. D., et al. (2007). Plum and Posner’s diagnosis ofstupor and coma. (4th ed.). New York: Oxford University Press.
1072 INTRODUCTION TO CLINICAL BRAIN MAPPING | Consciousness: And Disorders of Consciousness
107

Rosanova, M., Gosseries, O., Casarotto, S., et al. (2012). Recovery of cortical effectiveconnectivity and recovery of consciousness in vegetative patients. Brain, 135(4),1308–1320.
Schiff, N. D., Giacino, J. T., Kalmar, K., et al. (2007). Behavioural improvements withthalamic stimulation after severe traumatic brain injury. Nature, 448(7153), 600–603.
Schnakers, C., Perrin, F., Schabus, M., et al. (2008). Voluntary brain processing indisorders of consciousness. Neurology, 71(20), 1614–1620.
Schnakers, C., Vanhaudenhuyse, A., Giacino, J. T., et al. (2009). Diagnostic accuracy ofthe vegetative and minimally conscious state: Clinical consensus versusstandardized neurobehavioral assessment. Neurology, 9(1), 35.
Seel, R. T., Sherer, M., Whyte, J., et al. (2010). Assessment scales for disorders ofconsciousness: Evidence-based recommendations for clinical practice andresearch. Archives of Physical Medicine and Rehabilitation, 91(12), 1795–1813.
Smith, S. M., Fox, P. T., Miller, K. L., et al. (2009). Correspondence of the brain’sfunctional architecture during activation and rest. Proceedings of the NationalAcademy of Sciences, 106(31), 13040–13045.
The Multi-Society Task Force of PVS. (1994). Medical aspects of the persistentvegetative state. New England Journal of Medicine, 330, 1499–1508.
Thibaut, A., Bruno, M. A., Chatelle, C., et al. (2012). Metabolic activity in external andinternal awareness networks in severely brain-damaged patients. Journal ofRehabilitation Medicine, 44(6), 487–497.
Tononi, G. (2008). Consciousness as integrated information: A provisional manifesto.The Biological Bulletin, 215(3), 216–242.
Vanhaudenhuyse, A., Demertzi, A., Schabus, M., et al. (2010). Two distinct neuronalnetworks mediate the awareness of environment and of self. Journal of CognitiveNeuroscience, 23(3), 570–578.
Wijdicks, E. F. (2001). The diagnosis of brain death. The New England Journal ofMedicine, 344, 1215–1221.
Relevant Websites
http://www.alis-asso.fr – Association for the Locked-in Syndrome.www.comascience.org – Coma Science Group.
INTRODUCTION TO CLINICAL BRAIN MAPPING | Consciousness: And Disorders of Consciousness 1073
108 Appendix A. Paper I

Appendix B
Paper II
Imaging correlations in non-communicating patients.
Heine L, di Perri C, Soddu A, Gomez F, Laureys S, Demertzi A.
in: Clinical neurophysiology in disorders of consciousness:Brain function monitoring in the ICU and beyond
Springer International Publishing, 2015
109

149A.O. Rossetti, S. Laureys (eds.), Clinical Neurophysiology in Disorders of Consciousness: Brain Function Monitoring in the ICU and Beyond, DOI 10.1007/978-3-7091-1634-0_12,© Springer-Verlag Wien 2015
Abstract The diagnosis and medical management of patients with acute or chronic disorders of consciousness (DOC) are challenging. Motor-independent functional neuroimag-ing technologies are increasingly employed to study covert cognitive processes in the absence of behavioural reports. Studies with functional magnetic resonance imaging (fMRI) and positron emission tomography (PET) performed in this patient population have utilized active, passive and resting-state paradigms. Active paradigms refer to mental imagery tasks that measure wilful modulation of brain signal in specifi c brain areas, aiming to detect command- following. Passive paradigms are used to measure brain responses to external sensory stimulation (e.g. auditory, somatosensory and visual). Alternatively, in resting-state paradigms, spontaneous brain function is assessed while subjects receive no external stimula-tion and are instructed to let their mind wan-der. Independently from each other, these methods have shown differences between healthy controls and patients, as well as among patients with DOC. However, these techniques cannot yet be used in clinical set-tings before robust information at the single-subject level will be provided: it is expected that multimodal research will improve the single-patient diagnosis, shed light on the
L. Heine • C. Di Perri • S. Laureys, MD, PhD Coma Science Group, Cyclotron Research Center and Neurology Department , University of Liège , Liège , Belgium
A. Soddu Physics and Astronomy Department , Brain and Mind Institute, Western University , London , ON , Canada
F. Gomez Computer Science Department , Universidad Central de Colombia , Bogotá , Colombia
A. Demertzi , PhD (*) Coma Science Group, Cyclotron Research Center and CHU Neurology Department , University of Liège , Allée du 6 août n° 8, Sart Tilman B30 , Liège 4000 , Belgium e-mail: [email protected]
12 Imaging Correlations inNon- communicating Patients
L. Heine , C. Di Perri , A. Soddu , F. Gomez , Steven Laureys , and Athena Demertzi
Contents12.1 Introduction ................................................ 150
12.2 Neuroimaging Can Aid Diagnosis ............ 15012.2.1 Active Paradigms ......................................... 15012.2.2 Passive Paradigms ........................................ 15212.2.3 Resting-State Paradigms .............................. 153
Conclusions ............................................................. 154
References ............................................................... 155
110 Appendix B. Paper II

150
prognostic biomarkers, and eventually pro-mote the medical management of patients with consciousness alterations.
12.1 Introduction
In the 1950s the intensive care unit welcomed the mechanical ventilator, which allowed patients to sustain heart function and systemic circulation after traumatic and non-traumatic brain injuries. Ever since, some of the surviving patients were found to suffer from altered states of conscious-ness that were never encountered before. Patients could now lie in a coma for hours to weeks with eyes closed and were hence considered unaware of the surroundings and of themselves. In cases where they opened their eyes but remained unre-sponsive to any external stimulation, they were considered to be in a vegetative state (VS; Jennett and Plum 1972 ) or, as most recently coined, unre-sponsive wakefulness syndrome (UWS; Laureys et al. 2010 ). It was only in 2002 that the medical community recognized another entity which char-acterized patients showing signs of fl uctuating yet reproducible remnants of nonrefl exive behaviour; these patients were said to be in a minimal con-scious state (MCS; Giacino et al. 2002 ).
The diagnosis and medical management of patients with acute or chronic disorders of con-sciousness (DOC) are challenging, mainly because these patients are unable to communi-cate. For example, pain 1 in patients with DOC can only be inferred through behavioural obser-vation (Schnakers et al. 2012 ). Interestingly, such observations are not unanimous among clini-cians. As evident by a recent survey, more than half of medical doctors (56 %) thought that patients in a VS/UWS feel pain (Demertzi et al. 2009 ), despite offi cial criteria denouncing such experience from these patients (The Multi- Society Task Force on PVS 1994 ). Similarly, cli-nicians’ opinions differed when more ethically challenging issues were concerned, such as the
1 The unpleasant sensory and emotional experience asso-ciated with actual or potential tissue damage or described in terms of such damage (Loeser and Treede 2008 ).
limitation of life-sustaining therapies. Indeed, clinicians appeared more reluctant to withdraw treatment from patients in MCS (28 % agreed) than from those in UWS (66 % agreed) (Demertzi et al. 2011 ). The agreement with withdrawal of life-sustaining treatment in patients in a UWS is also supported by others (Kuehlmeyer et al. 2012 ). Taken together, these studies show that the medical management of pain as well as discus-sions regarding end-of-life decisions is highly infl uenced by the diagnostic category. As such, the need for valid and sensitive tools to improve accurate diagnosis of patients with DOC is increasing. To date, diagnostic assessment is mainly based on observing motor and oro-motor behaviours at the bedside. As these assessments are prone to false-negative diagnosis (Schnakers et al. 2009 ), motor-independent neuroimaging technologies may aid the search for residual cog-nitive function of non-communicating patients.
12.2 Neuroimaging Can Aid Diagnosis
Functional neuroimaging methods have offered the possibility to objectively study cognitive processing in the absence of behavioural reports. Functional magnetic resonance imaging (fMRI) quantifi es brain function derived from blood-oxygen- level-dependent (BOLD) changes. Position emission tomography (PET) measures different aspects of metabolic function according to the type of the administered radioactive tracer. The structural properties of the brain can also be revealed by means of anatomical MRI, while diffusion tensor imaging (DTI) measures white matter integrity. Below we will refer to experimental paradigms that have been most frequently adopted to infer covert cognitive abilities in non- communicating patients suffering from DOC (Fig. 12.1 ).
12.2.1 Active Paradigms
Active paradigms refer to mental imagery tasks which measure wilful modulation of brain signal in specifi c brain areas, aiming to detect command-
L. Heine et al.
111

151
following. Command-following in patients with DOC is of major clinical importance because, according to standardized behavioural assess-ment, this behaviour differentiates patients in MCS from patients in UWS (Bruno et al. 2011b ; Giacino et al. 2004 ). At the bedside, command- following is tested by asking patients to follow simple object-related and the non-object-related commands. Those patients that can follow the commands “consistently” 2 or “reproducibly” 3 are said to be in MCS. In the fMRI environment, two mental imagery tasks have been shown to encom-pass reproducible cortical activations across healthy controls, namely, thinking about playing tennis (encompassing primarily supplementary motor area) and imagining visiting the rooms of one’s house (encompassing primarily parahippo-campal cortex; Fig. 12.1 , left panel) (Boly et al. 2007 ). When this paradigm was employed in a behaviourally unresponsive patient, her brain activity was indistinguishable from healthy con-trols. Since this patient was able to comprehend and execute the mental imagery commands in a sustainable manner, the behavioural diagnosis was challenged, and the patient was no longer con-sidered as in UWS (Owen et al. 2006 ). In a larger cohort ( n = 54) of patients with DOC, the same
2 When the patient follows both object-related and non-object-related commands in all eight administered trials (i.e. four trials per command). 3 When the patient shows three clearly discernible responses over the four trials on any one of the object- related or non-object-related commands.
paradigm confi rmed that not all behaviourally assessed VS/UWS patients were unresponsive (Monti et al. 2010 ). Indeed, command-follow-ing was observed in fi ve patients, two of whom showed no signs of awareness when evaluated behaviourally. Interestingly, one patient was able to further use this technique to provide yes/no responses to autobiographical questions which could not be elicited at the bedside. Based on the command-following rationale, other mental tasks for evidencing response to command in patients with DOC have been employed. For example, with a silent picture- naming task, complete and partial preservation of the object-naming brain network was observed for all patients in MCS and two in VS/UWS (Rodriguez Moreno et al. 2010 ). By instructing patients in VS/UWS to move their hand, voluntary behaviour was also evidenced for two patients who activated premotor cortex (consistent with movement preparation) in the absence of overt muscle activity (Bekinschtein et al. 2011 ). Similarly, using selective auditory attention, all 3 assessed patients (2 MCS and 1 VS/UWS) were able to convey their ability to follow commands, and 2 of them (1 MCS and VS/UWS) were even able to use attention to cor-rectly communicate answers to several binary questions (Naci and Owen 2013 ). Residual cog-nitive capacities in patients DOC has also been assessed using a hierarchical fMRI approach, starting from command-following tasks similar to those described above, to question tasks using binary choice responses and eventually multiple choice responses (Bardin et al. 2011 ).
Fig. 12.1 Neuroimaging paradigms in assessment of residual cognitive processes in DOC
12 Imaging Correlations in Non-communicating Patients
112 Appendix B. Paper II

152
A criticism of using mental imagery tasks to unfold cognition and/or to communicate relies on patients’ limited short-term memory resources and restricted attention span. As a result, rela-tively long scanning intervals might be neces-sary to increase the signal-to-noise ratio, which in turn contributes in patients’ fatigue and ulti-mately in lack of their vigilance (Naci et al. 2013 ). Additionally, patients may suffer from other cognitive (i.e. aphasia, apraxia) and sen-sory impairments (i.e. blindness, deafness), from small or easily exhausted motor activity, pain, sedative medication, sleep disturbances and/or medical complications (such as infections), which can interfere with the direct assessment of command- following. In these cases, however, absence of responsiveness does not necessarily correspond to absence of awareness (Sanders et al. 2012 ). Alternatively, residual cognitive function in patients with DOC has been further assessed by means of passive and resting-state paradigms which overcome the above-mentioned limitations.
12.2.2 Passive Paradigms
Passive paradigms measure brain responses to external sensory stimulation (e.g. auditory, somatosensory and visual), while the subject is not performing any mental task. Using PET, the administration of simple auditory clicks in patients in VS/UWS was shown to activate pri-mary auditory cortices (Laureys et al. 2000c ), whereas patients in MCS demonstrated more widespread activation in the secondary audi-tory cortex, as well as temporal and frontal areas (Boly and Faymonville 2004 ). More recently a difference between patients in VS/UWS and MCS was observed in the impairment of back-ward connectivity from frontal to temporal corti-ces, as evidenced by an EEG mismatch negativity paradigm using auditory clicks (Boly et al. 2011 ) (see also Chap. 9 ). When more complex audi-tory stimuli were administered, differential brain responses between patients and controls, as well as between patient groups, were also observed. For example, sentences which were manipulated
at different levels of auditory intelligibility 4 and semantic ambiguity 5 were presented to a patient in VS/UWS. The patient presented consistent and similar- to-controls responses in the auditory cortex as a response to intelligible speech stimuli as well as partially intact responses to semanti-cally ambiguous stimuli (Owen and Coleman 2005 ). Also, in an fMRI task of passive listening to narratives played forward and backward, one patient in VS/UWS (out of three) and one patient in MCS (out of four) showed cerebral responses very similar to healthy controls (Fernández-Espejo et al. 2008 ). Another salient auditory stimulus which has been preferred because of its attention- grabbing properties is the patient’s own name. With the own-name paradigm, it was shown that one patient in VS/UWS exhibited activation in medial prefrontal cortex, left tem-poroparietal and superior frontal cortex, which is again similar to activation observed in con-trols (Staffen et al. 2006 ). With a similar own-name paradigm, two out of seven patients in VS/UWS and all four patients in MCS showed activation not only in the primary auditory cor-tex but also in higher-order associative temporal areas, which are thought to be implicated in the conscious processing of the incoming stimuli. Interestingly, these two patients in VS/UWS subsequently recovered to MCS as observed 3 months after their fMRI scan, highlighting the prognostic value of this paradigm (Di et al. 2007 ). This prognostic utility was further sup-ported by data of seven out of eight patients in VS/UWS who progressed to MCS and showed speech-specifi c or semantic responses to sen-tence stimuli 6 months earlier in their fMRI assessment (Coleman et al. 2009 ).
In the somatosensory modality, painful elec-trical stimulation of the median nerve of the wrist encompassed the entire “pain matrix” (including the anterior cingulate cortex and insu-lar areas; Fig. 12.1 , middle panel) in patients in MCS. On the other hand, patients in VS/UWS
4 Speech in noise was used as a form for distortion by add-ing a continuous pink-noise background to sentences. 5 Sentences containing at least two ambiguous words, either homonyms or homophones.
L. Heine et al.
113

153
showed restricted activation to lower-level sub-cortical and primary cortical areas (Boly et al. 2008 ; Laureys et al. 2002 ), indicating that MCS patients are more likely to experience the admin-istered stimuli as painful.
In the visual modality, when pictures of differ-ent emotional valences were presented to patients in MCS by means of fMRI, visual activation sim-ilar to healthy controls was found for patients (Zhu et al. 2009 ). A more recent case study on visual cognition used a battery of tests in a MCS patient. Specifi cally, the battery fi rst assessed passive visual processing whereas, at the fi nal level, it assessed the ability to voluntarily switch visual attention though the focus on competing stimuli. This approach revealed appropriate brain activations, undistinguishable from those seen in healthy and aware volunteers suggesting that the patient retained the ability to access his own visual representations (Monti et al. 2013 ).
Taken together, the rationale behind passive experimental paradigms is that an indistinguish-able response between patients and controls is indicative of covertly preserved cognitive processing in these patients (Owen 2013 ). Generally, these paradigms have shown that audi-tory, visual and somatosensory activation is restricted to lower-level sensory regions in patients in VS/UWS, while brain activation is widespread in MCS reaching higher-level associative areas. The limitations of using this approach stem from patients’ pathologies and technical requirements. Indeed, patients can present variant clinical pic-ture, ranging from visual problems, motor spastic-ity, somatosensory hypersensitivity and cortical auditory deafness, which can prevent the adminis-tration of external stimuli. Also, the technical setup of these examinations are not always straightforward, and therefore cannot be widely used across medical and research institutions.
12.2.3 Resting-State Paradigms
Alternatively, increasing attention is being paid to resting-state paradigms (Soddu et al. 2011 ). In these paradigms, spontaneous brain function is assessed while subjects receive no external stim-
ulation and are instructed to let their mind wan-der. As such, this approach surpasses the limitations which are raised by the other two types of experimental tasks.
Using PET at rest, it was shown that patients in VS/UWS exhibit decreased brain metabo-lism up to 40 % of normal value (Laureys et al. 2000b ; Tommasino et al. 1995 ). Nevertheless, recovery from the VS/UWS does not coincide with the resumption of global metabolic levels. It rather seems that some areas are more criti-cal to consciousness than others. Indeed, patients suffering from DOC show decreased metabolism in a widespread network encompassing fronto-parietal areas, such as lateral prefrontal and pos-terior parietal regions as well as midline anterior cingulate/mesiofrontal and posterior cingulate/precuneal associative cortices (Nakayama et al. 2006 ; Silva et al. 2010 ). Importantly, recovery from the VS/UWS parallels the restoration of connectivity in these areas (cortico-cortical) but also between these regions and the thalamus (thalamo-cortical) (Laureys et al. 2000a , 1999 ). More recently, it was shown that patients in MCS retain metabolism in the lateral frontopa-rietal areas, whereas midline regions are highly dysfunctional (Thibaut et al. 2012 ). Broadly speaking, the midline cortices are assumed to mediate self-related cognition, whereas fronto-parietal cortices are thought to mediate aware-ness of the environment (for a short review, see Demertzi et al. 2013a ). As such, these data sug-gest that patients in MCS are characterized by altered self-awareness besides their abilities to, at least to a certain extent, interact (but not com-municate) with their surroundings.
In fMRI, the resting-state network approach has been used lately to quantify various higher- order and sensory-related systems (Damoiseaux et al. 2006 ; Laird et al. 2011 ; Smith et al. 2009 ). These networks show differential connectivity alterations under different states of unconscious-ness (Heine et al. 2012 ), highlighting their impor-tance when assessing consciousness levels. In a recent investigation of fMRI resting-state con-nectivity in patients with DOC, it was found that, among the long-range systems, the default mode network (DMN, which encompasses precuneus,
12 Imaging Correlations in Non-communicating Patients
114 Appendix B. Paper II

154
medial prefrontal cortex and bilateral temporopa-rietal junctions) and bilateral executive control or frontoparietal networks were severely disturbed in patients with DOC (Fig. 12.1 , right panel) (Demertzi et al. in press). This implies that these systems might be important to sustain conscious-ness-related processes. Interestingly, it has been found that the resting brain is characterized by a switch between the dominance of the DMN (linked to “internal” or self-awareness) and the bilateral frontoparietal network (linked to “exter-nal” or environmental awareness; Fox et al. 2005 ; Fransson 2005 ). More recently, it was found that such alternating pattern not only happens sponta-neously in the brain but also has a behavioural counterpart. In other words, behavioural reports of “internal awareness” were linked to the activ-ity of the DMN, whereas subjective ratings for “external awareness” seem to correlate with the activity of lateral fronto-parieto-temporal regions (Vanhaudenhuyse et al. 2010 ), which are part of the so-called executive control network, exhibit-ing increase of activity during attention- demanding cognitive tasks. These fi ndings imply that the anti-correlated pattern between the inter-nal (DMN) and external (executive control net-work) awareness systems is of functional relevance to the phenomenological complexity of subjectivity (Demertzi et al. 2013b ). This assumption is further supported by evidence from patients who show severely disrupted connectiv-ity in one or both systems. For instance, in a brain dead patient, functional connectivity of the DMN was absent (Boly et al. 2009 ), whereas in patients with DOC, albeit preserved, functional connec-tivity of the DMN showed consciousness level- dependent decreases (Soddu et al. 2012 ; Vanhaudenhuyse et al. 2010 ).
Next to the investigation of reduced connectiv-ity, the presence of pattern of hyper- connectivity might also be informative of patients’ brain func-tion. Indeed, it was recently showed that the sub-cortical limbic system (including the orbitofrontal cortex, insula, hypothalamus, and the ventral teg-mental area) exhibits paradoxically increased fMRI connectivity with the DMN in patients with DOC (Di Perri et al. 2013 ). These results were considered as suggestive of a persistent engage-
ment of residual neural activity in self-reinforcing neural loops, which, in turn, could disrupt normal patterns of connectivity in patients.
12.3 Conclusions
Functional neuroimaging has been employed to test imaging correlations in patients not able to communicate as a result of severe brain dam-age. Nevertheless, parallel to function, informa-tion about the brain’s anatomy also sheds light on the differential neuropathology of patients with DOC. For example, recent studies suggest that the structural connectivity assessment by means of DTI is severely disrupted in patients in coma. Specifi cally, the connections from the brainstem to the thalamus, also known as the ascending arousal system, have been shown to be seriously impaired in patients (Edlow et al. 2012 ). Although one could expect that patients with such severe structural damage show poor recovery rates, this is not necessar-ily the case, especially when the assessment of axonal injury is shortly after the accident. For example, structural imaging of a patient suffering from altered states of consciousness 8 weeks after a traumatic accident showed severe damage in the corpus callosum, brain-stem and bilateral white matter; nevertheless, 1 year after injury, this patient had regained con-sciousness and reintegrated in the community (Edlow et al. 2013 ). In more chronic patients, it has been shown that structural connectivity assessment could correctly classify patients in UWS versus MCS with a 95 % accuracy in a group of 25 patients (Fernández-Espejo et al. 2011 ). These studies imply that the assessment of structural connectivity is of salient clinical importance especially when it is known that structure is linked to function (Sui et al. 2014 ). Ideally, maximal information about patients’ clinical picture can be obtained by combin-ing different technologies (Bruno et al. 2011a ; Gantner et al. 2013 ); the use of functional imaging together with electroencephalography is very promising, as recently done with tran-scranial magnetic stimulation and EEG (TMS/
L. Heine et al.
115

155
EEG; Casali et al. 2013 ; Rosanova et al. 2012 ) (see also Chap. 10 ). Multimodal assessment of patients using the aforementioned neuroimag-ing methods is expected to bring us closer to patient-specifi c underlying neuropathology, which in turn could aid diagnosis and progno-sis (Bruno et al. 2011a ).
Acknowledgment Dr Rossetti is supported by the Swiss National Science Foundation [Grant CR32I3_143780].
References
Bardin JC, Fins JJ, Katz DI, Hersh J, Heier LA, Tabelow K, Dyke JP, Ballon DJ, Schiff ND, Voss HU (2011) Dissociations between behavioural and functional magnetic resonance imaging-based evaluations of cog-nitive function after brain injury. Brain 134:769–782
Bekinschtein TA, Manes FF, Villarreal M, Owen AM, Della-Maggiore V (2011) Functional imaging reveals movement preparatory activity in the vegetative state. Front Hum Neurosci 5:1–6
Boly M, Faymonville M (2004) Auditory processing in severely brain injured patients: differences between the minimally conscious state and the persistent veg-etative state. Arch Neurol 61:233–238
Boly M, Coleman MR, Davis MH, Hampshire A, Bor D, Moonen G, Maquet P, Pickard JD, Laureys S, Owen AM (2007) When thoughts become action: an fMRI paradigm to study volitional brain activity in non- communicative brain injured patients. Neuroimage 36:979–992
Boly M, Faymonville M-EE, Schnakers C, Peigneux P, Lambermont B, Phillips C, Lancellotti P, Luxen A, Lamy M, Moonen G, Maquet P, Laureys S (2008) Perception of pain in the minimally conscious state with PET activation: an observational study. Lancet Neurol 7:1013–1020
Boly M, Tshibanda L, Vanhaudenhuyse A, Noirhomme Q, Schnakers C, Ledoux D, Boveroux P, Garweg C, Lambermont B, Phillips C (2009) Functional connec-tivity in the default network during resting state is pre-served in a vegetative but not in a brain dead patient. Hum Brain Mapp 30:2393–2400
Boly M, Garrido MI, Gosseries O, Bruno M, Laureys S, Friston K (2011) Preserved feedforward but impaired top-down processes in the vegetative state. Science 332
Bruno MA, Fernández-Espejo D, Lehembre R, Tshibanda L, Vanhaudenhuyse A, Gosseries O, Lommers E, Napolitani M, Noirhomme Q, Boly M, Papa M, Owen A, Maquet P, Laureys S, Soddu A (2011a) Multimodal neuroimaging in patients with disorders of conscious-ness showing “functional hemispherectomy”. Prog Brain Res 193:323–333
Bruno MA, Vanhaudenhuyse A, Thibaut A, Moonen G, Laureys S (2011b) From unresponsive wakefulness to minimally conscious PLUS and functional locked-in syndromes: recent advances in our understanding of disorders of consciousness. J Neurol 258:1373–1384
Casali AG, Gosseries O, Rosanova M, Boly M, Sarasso S, Casali KR, Casarotto S, Bruno MA, Laureys S, Tononi G, Massimini M (2013) A theoretically based index of consciousness independent of sensory processing and behavior. Sci Transl Med 5:198ra105
Coleman MR, Davis MH, Rodd JM, Robson T, Ali A, Owen AM, Pickard JD (2009) Towards the routine use of brain imaging to aid the clinical diagnosis of disor-ders of consciousness. Brain 132:2541–2552
Damoiseaux JS, Rombouts SARB, Barkhof F, Scheltens P, Stam CJ, Smith SM, Beckmann CF (2006) Consistent resting-state networks across healthy subjects. Proc Natl Acad Sci U S A 103:13848–13853
Demertzi A, Gómez F, Crone JS, Vanhaudenhuyse A, Tshibanda L, Noirhomme Q, Thonnard M, Charland- Verville V, Kirsch M, Laureys S, Soddu A (2014) Multiple fMRI system-level baseline connectivity is dis-rupted in patients with consciousness alterations. Cortex 52:35–46
Demertzi A, Schnakers C, Ledoux D, Chatelle C, Bruno M-A, Vanhaudenhuyse A, Boly M, Moonen G, Laureys S (2009) Different beliefs about pain percep-tion in the vegetative and minimally conscious states: a European survey of medical and paramedical profes-sionals. Prog Brain Res 177:329–338
Demertzi A, Ledoux D, Bruno M-A, Vanhaudenhuyse A, Gosseries O, Soddu A, Schnakers C, Moonen G, Laureys S (2011) Attitudes towards end-of-life issues in disorders of consciousness: a European survey. J Neurol 258:1058–1065
Demertzi A, Soddu A, Laureys S (2013a) Consciousness supporting networks. Curr Opin Neurobiol 23:239–244
Demertzi A, Vanhaudenhuyse A, Bredart S, Heine L, Di Perri C, Laureys S (2013b) Looking for the self in path-ological unconsciousness. Front Hum Neurosci 7:1–6
Di Perri C, Bastianello S, Bartsch AJ, Pistarini C, Maggioni G, Magrassi L, Imberti R, Pichieccio A, Laureys S, Di Salle F (2013) Limbic hyperconnectiv-ity in the vegetative state. Neurology 81:1417–1424
Di H, Yu SM, Weng XC, Laureys S, Yu D, Li JQ, Qin PM, Zhu YH, Zhang SZ, Chen YZ (2007) Cerebral response to patient’s own name in the vegetative and minimally conscious states. Neurology 68:895–899
Edlow BL, Takahashi E, Wu O, Benner T, Dai G, Bu L, Grant PE, Greer DM, Greenberg SM, Kinney HC, Folkerth RD (2012) Neuroanatomic connectivity of the human ascending arousal system critical to consciousness and its disorders. J Neuropathol Exp Neurol 71:531–546
Edlow BL, Giacino JT, Hirschberg RE, Gerrard J, Wu O, Hochberg LR (2013) Unexpected recovery of function after severe traumatic brain injury: the limits of early neuroimaging-based outcome prediction. Neurocrit Care 19:364–375
12 Imaging Correlations in Non-communicating Patients
116 Appendix B. Paper II

156
Fernández-Espejo D, Junqué C, Vendrell P, Bernabeu M, Roig T, Bargalló N, Mercader JM (2008) Cerebral response to speech in vegetative and minimally con-scious states after traumatic brain injury. Brain Inj 22:882–890
Fernández-Espejo D, Bekinschtein T, Monti MM, Pickard JD, Junque C, Coleman MR, Owen AM (2011) Diffusion weighted imaging distinguishes the vegetative state from the minimally conscious state. Neuroimage 54:103–112
Fox MD, Snyder AZ, Vincent JL, Corbetta M, Van Essen DC, Raichle ME (2005) The human brain is intrinsi-cally organized into dynamic, anticorrelated functional networks. Proc Natl Acad Sci U S A 102:9673–9678
Fransson P (2005) Spontaneous low-frequency BOLD signal fl uctuations: an fMRI investigation of the resting- state default mode of brain function hypoth-esis. Hum Brain Mapp 26:15–29
Gantner IS, Bodart O, Laureys S, Demertzi A (2013) Our rapidly changing understanding of acute and chronic disorders of consciousness: challenges for neurolo-gists. Future Neurology 8:43–54
Giacino JT, Ashwal S, Childs N, Cranford R, Jennett B, Katz DI, Kelly JP, Rosenberg JH, Whyte J, Zafonte RD, Zasler ND (2002) The minimally conscious state: defi nition and diagnostic criteria. Neurology 58:349–353
Giacino JT, Kalmar K, Whyte J (2004) The JFK Coma Recovery Scale-Revised: measurement characteris-tics and diagnostic utility. Arch Phys Med Rehabil 85:2020–2029
Heine L, Soddu A, Gomez F, Vanhaudenhuyse A, Tshibanda L, Thonnard M, Charland-Verville V, Kirsch M, Laureys S, Demertzi A (2012) Resting state networks and consciousness. Alterations of multiple resting state network connectivity in physiological, pharmacological and pathological consciousness states. Front Psychol 3:1–12
Jennett B, Plum F (1972) Persistent vegetative state after brain damage. A syndrome in search of a name. Lancet 1:734–737
Kuehlmeyer K, Racine E, Palmour N, Hoster E, Borasio GD, Jox RJ (2012) Diagnostic and ethical challenges in disorders of consciousness and locked-in syndrome: a survey of German neurologists. J Neurol 259:2076–2089
Laird AR, Fox PTM, Eickhoff SB, Turner JA, Ray KL, McKay DR, Glahn DC, Beckmann CF, Smith SM (2011) Behavioral interpretations of intrinsic connec-tivity networks. J Cogn Neurosci 17:1–16
Laureys S, Goldman S, Phillips C, Van Bogaert P, Aerts J, Luxen A, Franck G, Maquet P (1999) Impaired effec-tive cortical connectivity in vegetative state: prelimi-nary investigation using PET. Neuroimage 9:377–382
Laureys S, Faymonville M, Luxen A (2000a) Restoration of thalamocortical connectivity after recovery from persistent vegetative state. Lancet 355:1790–1791
Laureys S, Faymonville M, Moonen G, Luxen A (2000b) PET scanning and neuronal loss in acute vegetative state. Lancet 355:1825–1826
Laureys S, Faymonville ME, Degueldre C, Fiore GD, Damas P, Lambermont B, Janssens N, Aerts J, Franck G, Luxen A, Moonen G, Lamy M, Maquet P (2000c) Auditory processing in the vegetative state. Brain 123:1589–1601
Laureys S, Faymonville ME, Peigneux P, Damas P, Lambermont B, Del Fiore G, Degueldre C, Aerts J, Luxen A, Franck G, Lamy M, Moonen G, Maquet P (2002) Cortical processing of noxious somatosensory stimuli in the persistent vegetative state. Neuroimage 17:732–741
Laureys S, Celesia G, Cohadon F, Lavrijsen J, Leon- Carrrion J, Sannita WG, Sazbon L, Schmutzhard E, von Wild KR, Zeman A, Dolce G, Disorders Of Consciousness TE (2010) Unresponsive wakefulness syndrome: a new name for the vegetative state or apal-lic syndrome. BMC Med 8:68
Loeser JD, Treede RD (2008) The Kyoto protocol of IASP basic pain terminology. Pain 137:473–477
Monti MM, Vanhaudenhuyse A, Coleman MR, Boly M, Pickard JD, Tshibanda L, Owen AM, Laureys S (2010) Willful modulation of brain activity in disor-ders of consciousness. New Engl J Med 362:579–589
Monti MM, Pickard JD, Owen AM (2013) Visual cognition in disorders of consciousness: from V1 to top- down attention. Hum Brain Mapp 34:1245–1253
Naci L, Owen AM (2013) Making every word count for nonresponsive patients. JAMA Neurol 70:1235–1241
Naci L, Cusack R, Jia VZ, Owen AM (2013) The Brain’s Silent Messenger: using selective attention to decode human thought for brain-based communication. J Neurosci 33:9385–9393
Nakayama N, Okumura A, Shinoda J, Nakashima T, Iwama T (2006) Relationship between regional cere-bral metabolism and consciousness disturbance in traumatic diffuse brain injury without large focal lesions: an FDG-PET study with statistical paramet-ric mapping analysis. J Neurol Neurosurg Psychiatry 77:856–862
Owen AM (2013) Detecting consciousness: a unique role for neuroimaging. Annu Rev Psychol 64:109–133
Owen A, Coleman M (2005) Residual auditory function in persistent vegetative state: a combined PET and fMRI study. Neuropsychol Rehabil 15:290–306
Owen AM, Coleman MR, Boly M, Davis MH, Laureys S, Pickard JD (2006) Detecting awareness in the vegeta-tive state. Science 313:1402
Rodriguez Moreno D, Schiff ND, Giacino J, Kalmar K, Hirsch J (2010) A network approach to assessing cognition in disorders of consciousness. Neurology 75:1871–1878
Rosanova M, Gosseries O, Casarotto S, Boly M, Casali AG, Bruno MA, Mariotti M, Boveroux P, Tononi G, Laureys S, Massimini M (2012) Recovery of cortical effective connectivity and recovery of consciousness in vegetative patients. Brain 135:1308–1320
Sanders RD, Tononi G, Laureys S, Sleigh JW (2012) Unresponsiveness not equal unconsciousness. Anesthesiology 116:946–959
L. Heine et al.
117

157
Schnakers C, Vanhaudenhuyse A, Giacino JT, Ventura M, Boly M, Majerus S, Moonen G, Laureys S (2009) Diagnostic accuracy of the vegetative and minimally conscious state: clinical consensus versus standard-ized neurobehavioral assessment. BMC Neurol 9:35
Schnakers C, Chatelle C, Demertzi A, Majerus S, Laureys S (2012) What about pain in disorders of conscious-ness? AAPS J 14:437–444
Silva S, Alacoque X, Fourcade O, Samii K (2010) Wakefulness and loss of awareness brain and brain-stem interaction in the vegetative state. Neurology 74:313–320
Smith SM, Fox PT, Miller KL, Glahn DC, Fox PM, Mackay CE, Filippini N, Watkins KE, Toro R, Laird AR (2009) Correspondence of the brain’s functional architecture during activation and rest. Proc Natl Acad Sci 106:13040–13045
Soddu A, Vanhaudenhuyse A, Demertzi A, Bruno MA, Tshibanda L, Noirhomme Q, Di H, Mélanie B, Papa M, Laureys S (2011) Resting state activity in patients with disorders of consciousness. Funct Neurol 26:37–43
Soddu A, Vanhaudenhuyse A, Bahri MA, Bruno M-A, Boly M, Demertzi A, Tshibanda J-F, Phillips C, Stanziano M, Ovadia-Caro S, Nir Y, Maquet P, Papa M, Malach R, Laureys S, Noirhomme Q (2012) Identifying the default-mode component in spatial IC analyses of patients with disorders of consciousness. Hum Brain Mapp 33:778–796
Staffen W, Kronbichler M, Aichhorn M, Mair A, Ladurner G (2006) Selective brain activity in response to one’s
own name in the persistent vegetative state. J Neurol Neurosurg Psychiatry 77:1383–1384
Sui J, Huster R, Yu Q, Segall JM, Calhoun VD (2014) Function-structure associations of the brain: Evidence from multimodal connectivity and covariance studies. NeuroImage 102:11–23
The Multi-Society Task Force on PVS (1994) Medical aspects of the persistent vegetative state (2). N Engl J Med 330:1572–1579
Thibaut A, Bruno MA, Chatelle C, Gosseries O, Vanhaudenhuyse A, Demertzi A, Schnakers C, Thonnard M, Charland-Verville V, Bernard C, Bahri M, Phillips C, Boly M, Hustinx R, Laureys S (2012) Metabolic activity in external and internal awareness networks in severely brain-damaged patients J Rehabil Med 44:487–494
Tommasino C, Grana C, Lucignani G, Torri G, Fazio F (1995) Regional cerebral metabolism of glucose in comatose and vegetative state patients. J Neurosurg Anesthesiol 7:109–116
Vanhaudenhuyse A, Demertzi A, Schabus M, Noirhomme Q, Bredart S, Boly M, Phillips C, Soddu A, Luxen A, Moonen G (2010) Two distinct neuronal networks mediate the awareness of environment and of self. J Cogn Neurosci 1–9
Zhu J, Wu X, Gao L, Mao Y, Zhong P, Tang W, Zhou L (2009) Cortical activity after emotional visual stimulation in minimally conscious state patients. J Neurotrauma 26:677–688
12 Imaging Correlations in Non-communicating Patients
118 Appendix B. Paper II

Appendix C
Paper III
Technology-based assessment in patients with disorders ofconsciousness
Di Perri C, Heine L, Amico E, Soddu A, Laureys S, Demertzi A.
Annali dell’instituto superiore di sanita, 2014, 6:1704doi:10.4415/ANN_14_03_03
119

MO
NO
GR
AP
HIC
SE
CT
ION
209
Key words
Address for correspondence:
Carol Di Perri(a), Lizette Heine(b), Enrico Amico(b), Andrea Soddu(c), Steven Laureys(b) and Athena Demertzi(b)
(a) Istituto Neurologico Nazionale C. Mondino, Neuroradiologia, Pavia, Italy(b) Coma Science Group, Cyclotron Research Center & Neurology Department, University of Liège, Belgium
(c) Brain and Mind Institute, Physics and Astronomy Department, Western University, London Ontario, Canada
|
Abstract Introduction.
Background.
Aim.
INTRODUCTION
THE CLINICAL ENTITIES OF CONSCIOUSNESS
i.e.
120 Appendix C. Paper III

Carol Di Perri, Lizette Heine, Enrico Amico et al.
MO
NO
GR
AP
HIC
SE
CT
ION
i.e.
i.e.
Positron emission tomography (PET)
121

TECHNOLOGICAL EVALUATION OF DOC PATIENTS
MO
NO
GR
AP
HIC
SE
CT
ION
(Figure 1)
Figure 1Global brain metabolism detected by FDG-PET in a healthy control (left) and in a patient in an unresponsive wakefulness syn-drome (right). Red colorscale indicates regions with high consumption of glucose; blue colorscale indicates regions with low consumption of glucose.
122 Appendix C. Paper III

Carol Di Perri, Lizette Heine, Enrico Amico et al.
MO
NO
GR
AP
HIC
SE
CT
ION
Functional magnetic resonance imaging (fMRI)
et al.
i.e.
Figure 2
123

TECHNOLOGICAL EVALUATION OF DOC PATIENTS
MO
NO
GR
AP
HIC
SE
CT
ION
i.e.
Electroencephalography and transcranial magnetic stimulation (combined with electroencephalography)
Figure 2fMRI resting state connectivity in long-range (i.e., default mode network, right and left executive control) and sensory cortical networks (i.e., auditory) is disrupted in patients with disorders of consciousness (blue areas) compared to healthy controls (in red). Images are shown on triplanar anatomical slices.
124 Appendix C. Paper III

Carol Di Perri, Lizette Heine, Enrico Amico et al.
MO
NO
GR
AP
HIC
SE
CT
ION
i.e.
STRUCTURAL MRIDiffusion tensor imaging
(Figure 3)
125

TECHNOLOGICAL EVALUATION OF DOC PATIENTS
MO
NO
GR
AP
HIC
SE
CT
ION
in vivo in vivo
Magnetic resonance spectroscopy (MRS
Figure 3Neural tracks obtained with DTI in a healthy control (top) and a patient in MCS (bottom) confirms the structural damage which is evident in the temporo-parietal regions of the right hemisphere (bottom right - T1 MRI structural image). Colors indicate direction-ality of water diffusion: red = left-right; green = anterior-posterior; blue = superior-inferior.
126 Appendix C. Paper III

Carol Di Perri, Lizette Heine, Enrico Amico et al.
MO
NO
GR
AP
HIC
SE
CT
ION
CONCLUSIONS
127

TECHNOLOGICAL EVALUATION OF DOC PATIENTS
MO
NO
GR
AP
HIC
SE
CT
ION
i.e.Conflict of interest statement
Acknowledgments
Conflict of interest statement
Accepted
Nat Rev Neurosci
Future Neu-rol
et al.
BMC Neurol
Lancet Neurol
Proc Natl Acad Sci USA
et al.
BMC Med
Trends Cogn Sci
Clin Med
Brain Inj
N Engl J Med
et alNeurology
Arch Phys Med Rehabil
J Neurol
et al
J Neurol
Nat Clin Pract Neurol
Stroke
REFERENCES
128 Appendix C. Paper III

Carol Di Perri, Lizette Heine, Enrico Amico et al.
MO
NO
GR
AP
HIC
SE
CT
ION
et al.Brain Connect
BMJ
Neurology
et alNeuroradiology
et al
Lancet Neurol
Arch Neurol
et al.
J Neurotrauma
et al. J Neurosci
An-esthesiology
et al
Cortex
et al.
Neuroimage
Curr Opin Neurobiol
et al.
J Cogn Neurosci
et al.
J Rehabil Med
J Neurol Neurosurg Psychiatry
et al.
Neuroimage
et al.Brain
et al. Neurology
et al.
Pain
et al.
Neu-roimage
et al.N Engl J Med
JAMA Neurol
et al.
Brain
BMJ
NMR Biomed
Philos Trans R Soc Lond B Biol Sci
Proc Natl Acad Sci USA
Conscious Cogn
et al.
Brain
et al.
129

TECHNOLOGICAL EVALUATION OF DOC PATIENTS
MO
NO
GR
AP
HIC
SE
CT
ION
Neurology
et al.
Front Psychol
Proc Natl Acad Sci USA
et al. Neu-
roimage
Neuroimage
et al. Nature
et al.
Hum Brain Mapp
et al.Neurology
et al.
Brain Connect
et al.
Anesthesiology
et al. Cereb Cor-
tex
Front Hum Neurosci
et al.
Funct Neurol
et al.
Arch Ital Biol
et al.
Brain Inj
J Clin Neurophysiol
et al. Neurocase
et al.
Clin Neurophysiol
et al.
Lancet
J Neurol Neurosurg Psychiatry
et alSci
Transl Med
Science
et al.
PLoS One
et al.
Brain
et al.
Proc Natl Acad Sci USA
et al.
Eur Radiol
et al.
J Comput Assist Tomogr
Lancet
130 Appendix C. Paper III

Carol Di Perri, Lizette Heine, Enrico Amico et al.
MO
NO
GR
AP
HIC
SE
CT
ION
220
et al.
AJNR Am J Neuroradiol
et al.
Crit Care Med
Hum Brain Mapp
et al.
Anesthesiology
et al.
Anesthesiology
et al.
Neuroimage
et al.
J Neu-rol Neurosurg Psychiatry
et al.
J Neurosurg
in vivo Invest Radiol
et al.
J Neurol Neurosurg Psychiatry
Neuroradiol-
ogy
et al. J Magn Reson Imaging
et al. Neurology
Brain
et al.
AJNR Am J Neuroradiol
J Neurol Neurosurg Psychiatry
et al.
J Neurotrauma
et al.
J Magn Reson Imaging
et al.
Acta Neurochir Suppl
AJNR Am J Neuroradiol
et al.
Schizophr Bull
AJNR Am J Neuroradiol
131

132 Appendix C. Paper III

Appendix D
Paper IV
Function-structure connectivity in patients with severebrain injury as measured by MRI-DWI and FDG-PET
Annen J*, Heine L*, Ziegler E, Frasso G, Bahri M, Di Perri C,Stender J, Martial C, Wannez S, D’Ostilio K, Amico E,
Antonopoulos G, Bernard C, Tshibanda F, Hustinx R, Laureys S.
Human Brain Mapping, June 2016doi:10.1002/hbm.23269
133

Function–Structure Connectivity in Patientswith Severe Brain Injury as Measured by MRI-DWI
and FDG-PET
J. Annen,1,2,3,† L. Heine,1,2,3,† E. Ziegler,1 G. Frasso,4 M. Bahri,1 C. Di Perri,1,2
J. Stender,5 C. Martial,1,2,3 S. Wannez,1,2,3 K. D’ostilio,6 E. Amico,1,2
G. Antonopoulos,1,2 C. Bernard,3 F. Tshibanda,3 R. Hustinx,3 andS. Laureys1,2,3*
1Cyclotron Research Centre, University of Liege, Liege, Belgium2Coma Science Group, GIGA Consciousness, University of Liege, Liege, Belgium
3University Hospital of Liege, Liege, Belgium4Faculty of Social Sciences, Quantitative Methods for Social Sciences, University of Liege,
Liege, Belgium5University of Copenhagen, Copenhagen, Denmark
6Headache Research Unit, University of Liege, Liege, Belgium
r r
Abstract: A vast body of literature exists showing functional and structural dysfunction within thebrains of patients with disorders of consciousness. However, the function (fluorodeoxyglucose FDG-PET metabolism)–structure (MRI-diffusion-weighted images; DWI) relationship and how it is affectedin severely brain injured patients remains ill-defined. FDG-PET and MRI-DWI in 25 severely braininjured patients (19 Disorders of Consciousness of which 7 unresponsive wakefulness syndrome, 12minimally conscious; 6 emergence from minimally conscious state) and 25 healthy control subjectswere acquired here. Default mode network (DMN) function–structure connectivity was assessed byfractional anisotropy (FA) and metabolic standardized uptake value (SUV). As expected, a profounddecline in regional metabolism and white matter integrity was found in patients as compared withhealthy subjects. Furthermore, a function–structure relationship was present in brain-damaged patientsbetween functional metabolism of inferior-parietal, precuneus, and frontal regions and structural integ-rity of the frontal-inferiorparietal, precuneus-inferiorparietal, thalamo-inferioparietal, and thalamofron-tal tracts. When focusing on patients, a stronger relationship between structural integrity of thalamo-inferiorparietal tracts and thalamic metabolism in patients who have emerged from the minimally con-scious state as compared with patients with disorders of consciousness was found. The latter finding
Additional Supporting Information may be found in the onlineversion of this article.
Contract grant sponsor: University and University Hospital ofLiege, the Belgian National Funds for Scientific Research (FRS-FNRS) the French Speaking Community Concerted ResearchAction (ARC - 06/11 - 340); Contract grant sponsor: NSERC dis-covery grant, IAP research network P7/06 of the Belgian Govern-ment (Belgian Science Policy); Contract grant sponsor: theEuropean Commission; Contract grant sponsor: the JamesMcDonnell Foundation, Mind Science Foundation; Contract grantsponsor: the European space agency (ESA); Contract grant spon-
sor: the Public Utility Foundation ‘Universit!e Europ!eenne duTravail’, “Fondazione Europea di Ricerca Biomedica.”
*Correspondence to: Prof. Steven Laureys; Coma Science Group,CHU Sart Tilman, GIGA-Research B34-Quartier Hopital, Avenuede l’Hopital, 11, 4000 Liege, Belgium. E-mail: [email protected]†J. Annen and L. Heine have contributed equally to this work.
Received for publication 10 February 2016; Revised 12 April 2016;Accepted 16 May 2016.
DOI: 10.1002/hbm.23269Published online 00 Month 2016 in Wiley Online Library(wileyonlinelibrary.com).
r Human Brain Mapping 00:00–00 (2016) r
VC 2016 Wiley Periodicals, Inc.
134 Appendix D. Paper IV

was in line with the mesocircuit hypothesis for the emergence of consciousness. The findings showeda positive function–structure relationship within most regions of the DMN. Hum Brain Mapp 00:000–000, 2016. VC 2016 Wiley Periodicals, Inc.
Key words: FDG-PET; DWI; disorders of consciousness; function–structure coupling; default modenetwork
r r
INTRODUCTION
Massive brain trauma can result in a disorder of con-sciousness (DOC), such as the unresponsive wakefulnesssyndrome (UWS) [Laureys et al., 2010], or minimally con-scious state (MCS) [Giacino et al., 2002]. Patients who haveemerged from MCS (EMCS) are able to functionally com-municate and/or functionally use objects, but remainseverely handicapped and dependent on full-time care. Asubstantial body of literature exists on grey matter meta-bolic (e.g., Fluorodeoxyglucose PET [FDG-PET]) and whitematter structural (e.g., MRI-DWI [diffusion-weightedimaging]) brain characteristics in this patient group. Boththese methods independently show severe impairments inDOC and EMCS patients [for review see Laureys andSchiff, 2012]. At a global level, functional measures showthat metabolism in DOC patients is decreased by up to40%–50% from their normal value [De Volder et al., 1997;Laureys et al., 1999b; Laureys et al., 2004; Rudolf et al.,1999; Tommasino et al., 1995]. Regional metabolic dysfunc-tion is seen in a widespread frontoparietal, thalamo-cortical network. The medial part of this frontoparietal net-work, often called the default mode network (DMN),encompasses midline anterior cingulate/mesio-frontal andposterior cingulate/precuneal associative cortices as wellas posterior parietal areas [Nakayama et al., 2006; Thibautand Bruno, 2012]. In patients with disorders of conscious-ness, metabolic activity as well as MRI functional connec-tivity are reportedly more reduced in these regions than inthe rest of the brain [Boly et al., 2009; Demertzi et al.,2014; Soddu et al., 2012; Vanhaudenhuyse et al., 2010a).
While the DMN is defined in terms of functional con-nectivity, there are indications of clear structural underpin-nings [Greicius et al., 2009; Van Den Heuvel et al., 2009].In patients with DOC, these structural connections areknown to be damaged. For example, fractional anisotropy(FA), a measure of directionality of water diffusionassumed to be related to myelination of white matter, isspecifically reduced in the DMN [Fern!andez-Espejo et al.,2011, 2012; Gomez et al., 2012].
The cerebral metabolic reductions in DOC are proposedto result from widespread neuronal injury [Thibaut andBruno, 2012] or disruption of central excitatory drivers[Schiff, 2010]. The latter mesocircuit hypothesis proposesthat large-scale dysfunction is due to an important reduc-tion of thalamic excitatory output to the cortex. The obser-vations of impaired metabolism suggest that axonal
deafferentiation may be a key driver. We here aim toexplore this DMN function–structure relationship inseverely brain-damaged patients with varying levels ofconsciousness as measured by metabolism (standardizeduptake value [SUV]) and white matter structural integrity(fractional anisotropy [FA]).
METHODS
Population
PET and MRI data from patients and 25 healthy controlswere acquired at the University Hospital of Liege, Bel-gium. Patients were excluded from this study when pre-insult neurological illness, non-compatibility with eitherMRI or PET was present, or when less than 18 years.Behavioural diagnosis was determined by multiple comarecovery scale revised [CRS-R’s; Giacino et al.,] assess-ments, including assessments on both MRI and PET scandates. Written informed consent was taken from eachhealthy subject and the legal guardians of each patient inaccordance with the Declaration of Helsinki. The EthicsCommittee of the University Hospital of Liege approvedthe study.
Data Acquisition
MRI data was acquired using a 3 Tesla scanner (SiemensTrio, Siemens Medical Solutions, Erlangen, Germany).Structural MRI T1 data were obtained with T1-weighted3D gradient echo images using 120 slices, repetition time-5 2,300 ms, echo time 5 2.47 ms, voxel size 5 1 3 1 31.2 mm3, flip angle 5 98, field of view 5 256 3 256 mm2.Diffusion-weighted images were acquired at a b-value of1,000 s/mm2 using 64 encoding gradients that were uni-formly distributed in space by an electrostatic repulsionapproach [Jones et al., 1999]. Voxels had dimensions of 1.83 1.8 3 3.3 mm3, field of view 5 230 3 230 mm2, repeti-tion time 5 5,700 ms, echo time 5 87 ms, and volumeswere acquired in 45 transverse slices using a 128 3 128voxel matrix. A single unweighted (b 5 0) image precededthe diffusion-weighted volumes and the 64-volume diffu-sion imaging sequence was repeated twice.
Five days prior to MRI, an 18F-FDG PET scan was per-formed 52 6 13 minutes after intravenous injection of300 6 47 MBq of FDG using a Gemini TF PET-CT scanner(Philips Medical Systems). A low-dose CT was acquired
r Annen & Heine et al. r
r 2 r
135

for attenuation correction, followed by a 12-minuteemission scan. The studies were reconstructed using aLOR-OSEM algorithm and reconstructed images had2 mm3 isotropic voxels in a 256 3 256 3 89 voxel matrix.
Data Processing
The images of each subject were manually reoriented tothe orientation of the MNI 152 1 mm3 template. Next, eachsubject’s T1-weighted image was automatically labelledusing the Desikan–Killiany atlas via the processing pipe-line of Freesurfer v 5.3.0 [Desikan et al., 2006]. Several pre-selected region labels were combined to produce eightregions of interest representing the DMN in both hemi-spheres. Specifically, regions of interest (ROIs) in the leftand right thalamus, inferior parietal cortex, mesio-frontalcortex (encompassing: medial orbital frontal, superior fron-tal, and rostral anterior cingulate cortex), and precuneus/posterior cingulate cortex (encompassing: precuneus, isth-mus, and posterior cingulate cortex) were targeted. Figure1 shows an example of the processing protocol adopted.The Freesurfer processing pipeline was also used to seg-ment the entire cerebrum into distinct grey matter (GM),white matter (WM), and cerebrospinal fluid (CSF) images.
Because the processing of damaged brains is slightlyinconsistent across neuroimaging toolboxes, we addition-
ally segmented each T1-weighted image into whole-brainWM, GM, and CSF masks using FAST, part of FSL (FMRIBSoftware Library v 5.0) [Smith et al., 2004]. A robust cere-bral white matter mask was obtained for each subject bymultiplying the WM masks produced by the FAST andFreesurfer toolbox. Subsequently, a reliable cerebral brainmask for tractography termination was produced by multi-plying the cerebrum mask calculated by Freesurfer(including all cortical brain matter) with the inverse of theFAST cerebrospinal fluid mask. This procedure helped tominimize contamination of masks with non-brain tissuethat had been incorrectly labelled.
Diffusion-weighted images were corrected for subjectmotion by rigid registration of the weighted volumes tothe unweighted volume. Rotations applied to thediffusion-weighted volumes were also applied to the cor-responding gradient directions [Leemans and Jones, 2009].Distortion artefacts induced by eddy currents were thencorrected by affine registration of the diffusion-weightedimages to the unweighted volume. All registrations wereperformed with FLIRT, part of FSL. The data of some sub-jects was contaminated by table vibration artefacts whichhave previously been reported for this model of MR scan-ner [Gallichan et al., 2010]. The artefact manifested asextraordinarily high diffusion in the left-to-right directionthat was clearly visible in calculated RGB-FA images. Inour sample it was found primarily in posterior brain areas,
Figure 1.Schematic representation of the processing pipeline. Data was assessed in subject space wherethe T1 MRI was segmented using Freesurfer. PET glucose metabolism was estimated by calcula-tion of mean partial volume corrected standardized uptake values within the default mode net-work ROIs. FA was extracted of the voxels that the DMN tract passed through. [Color figurecan be viewed in the online issue, which is available at wileyonlinelibrary.com.]
r Function-Structure Connectivity in DOC r
r 3 r
136 Appendix D. Paper IV

though its effects occasionally appeared throughout thebrain. We reduced the effect of the artefact by removingvolumes in which the absolute value of the x-componentof the encoding gradient vector exceeded a manuallyselected threshold. This threshold was chosen by repeat-edly examining the RGB-FA image at distinct thresholdsby at least two assessors.
For both analysis and preprocessing diffusion tensorswere fit at each voxel using non-linear least squares fitting.Tensor eigenvalues were constrained to positivity by tak-ing their absolute value. This method is known to berobust against noise [Koay, 2009]. FA, tensor mode [Ennisand Kindlmann, 2006], and RGB-FA images were com-puted. Tensor mode provides a method for quantifyingthe type of anisotropy (e.g., planar 5 two fibre populations,or linear 5 one fibre population) found in the voxel. Moderanges between 21 (planar anisotropy) and 11 (linear ani-sotropy) with 0 representing orthotropy. All tensor calcula-tions were performed with Dipy [Garyfallidis et al., 2014].
Affine registration was performed between each sub-ject’s white matter mask (in T1 space) and a thresholdedFA image (FA> 0.2) using FLIRT (nearest neighbour inter-polation, mutual information cost function), part of FSL.The translation component of the transformation matrixwas modified by adding half of the difference between thefields of view of the DWI and T1-weighted images. Thisallows the transformation matrix to be used to register T1-derived masks to those in DWI orientation without down-sampling. The transformation matrix was applied to theT1-derived white matter mask, cerebral track terminationmask, and ROI label map.
A set of voxels with unidirectional diffusion (or a“single fibre population”) was identified by eroding andthresholding (0.8< FA< 0.99) the FA image and multiply-ing this by a map of the thresholded tensor mode (mod-e> 0.9). These operations were performed with fslmaths,part of FSL. Binary single fibre population masks weremanually revised to select only voxels that were clearlyinside the corpus callosum and corticospinal tracts. Thesehigh FA and high mode voxels were used to estimate thediffusion-weighted signal response for a single fibre popu-lation. Next, non-negativity constrained spherical deconvo-lution was performed and fibre orientation distributionfunctions within each voxel were estimated. A maximumharmonic order of 4 was used for both response estimationand spherical deconvolution. Probabilistic tractographywas performed using randomly placed seeds within thesubject-specific white matter masks described above. Fibretracking settings were as follows: number oftracks 5 1,000,000, FOD magnitude cutoff for terminatingtracks 5 0.1, minimum track length 5 10 mm, maximumtrack length 5 200 mm, minimum radius ofcurvature 5 1 mm, tracking algorithm step size 5 0.2 mm.Streamlines were terminated when they (i) extended outof the cerebrum track termination mask, or (ii) could notprogress along a direction with FOD magnitude or curva-
ture radius higher than the minimum cutoffs. A connectiv-ity matrix for the eight-region connectome was computedusing the streamline origin and termination points and theROI label mask. For each streamline the FA was averagedover all the voxels it passed through; meaning that weextracted the FA within the 12 tracts connecting each ofour DMN regions of interest. Constrained spherical decon-volution and fibre tracking were performed with MRtrix0.2.12 [Tournier et al., 2012]. Computation of the connec-tivity matrices was performed with MRtrix 0.3.
FDG-PET images for each subject were first manuallyreoriented toward the T1-weighted image using StatisticalParametric Mapping 8 (SPM8; www.fil.ion.ucl.ac.uk/spm)in order to ease later automated registration tasks. FDG-PET images underwent partial volume effect (PVE) correc-tion using the Muller–Gartner–Rousset method [M€uller-G€artner et al., 1992; Rousset et al., 2007] in PVElab v 2.2[Quarantelli et al., 2004; Svarer et al., 2005]. Partial volumecorrection aims to remove the spillover of signal to regionsthat are known to be without activity (e.g., CSF), in orderto prevent underestimation of signal in regions with activ-ity (e.g., GM). Grey matter, white matter, and cerebrospi-nal fluid partial volume estimate images were obtained, asearlier, using FAST. A rigid-body transformation wasobtained between the uncorrected FDG-PET and the sub-ject’s T1-weighted image to bring the T1 image to PETspace (trilinear interpolation, correlation ratio cost func-tion; in six patients, cost function was changed to normal-ized mutual information to improve registration). Theinverse of this transformation matrix was applied to theGM, WM, and CSF partial volume images to bring theminto the space of the PET image. The point spread functionwas modelled by 3D Gaussian function with in-plane full-width at half maximum (FWHM) values of 8 mm. Finally,following PVE correction the PET image was transformedinto T1 space and the mean SUV value was extractedwithin each ROI using in-house software.
For all subjects it was necessary to manually check theperformance of the automated labelling and registrationprocedures. In six patients there were voxels that wereclearly mislabelled and required correction. The ROI labelswere evaluated and adjusted when deemed necessary by atleast two researchers. Processing pipelines were developedin Python using Nipype [Gorgolewski et al., 2011] and arefreely available online (https://github.com/GIGA-Con-sciousness/structurefunction). A figure showing ROIs andtracts can be found in the Supporting Information Fig. 1.
Statistical Analysis
Statistical analysis was done using R [R Core Team,2014]. First, to test for demographic differences (age andgender) between our two groups (healthy controls andbrain-injured patients), we used independent two-samplet-tests or chi-square test, respectively. To test for possibledifferences between left and right brain function/structure
r Annen & Heine et al. r
r 4 r
137

we assessed laterality differences using a two sample t-tests within brain-injured patients and controls with a“logit” transform of FA and log transformation of SUV toaccount for parametric test-assumptions. Subsequently,SUV and FA of the left and right hemisphere regions wereaveraged for each subject. Next, to test the differencesbetween the two groups in mean SUV and FA values two-sample t-tests with Bonferroni correction (a 5 0.012 anda 5 0.008 respectively) were used. Using a v2 test the num-ber of volumes removed during vibration artefact correc-tion was evaluated to identify any potential group bias.Subsequently, multivariate linear regression analysis withgroup and FA as regressors was performed to model howgroup and structural integrity (FA) of DMN tracts relate tometabolism (SUV) in adjacent regions. SUV was log scaledto meet normality assumptions. Furthermore, to take intoaccount the differences in variance we weighted theregression function by the inverse of the FA of the corre-sponding connection. Type II ANOVA’s were used toassess significant main and interaction effects. As eachSUV ROI is tested three times, Bonferroni correction wasused with a 5 0.016.
We then focused on patients alone to better understandthe structure–function relationship in the brain-injuredgroup. Multiple linear regression models were used toinvestigate how demographic factors as diagnosis (DOCvs. EMCS), aetiology (TBI or non-TBI), disease duration(subchronic vs. chronic), gender, and age influence thefunction–structure relationship in the patient population.Type II ANOVA’s were used to assess significant mainand interaction effects. Within the control population wetested for an effect of FA on SUV using a simple linearregression with FA as regressor and SUV as outcomemeasure.
To assess a possible global effect of SUV and FA weused a multivariate linear regression analysis to modelhow group and whole-brain structural integrity of whitematter (FA over all white matter voxels) relate to whole-brain grey matter metabolism (SUV). Furthermore we per-formed an analogous regression analysis for the patientand control group separately.
RESULTS
We obtained MRI data of 163 adult, (sub-) chronic (>30days after injury) patients without pre-existing comorbid-ities and 14 healthy control subjects between November2009 and October 2013. Stringent exclusion criteria wereapplied as visualized in Fig. 2. Patients were excludedbecause of technical difficulties in either MRI or PET(N 5 25), more than 5 days between exams (N 5 5), severedeformations consisting of more than one-third of onehemisphere (e.g., enlarged ventricles, haemorrhage, severeatrophy), metal/drain artefacts (N 5 79). Data of 54patients were preprocessed, although 29 subjects had to beexcluded because Freesurfer was unable to complete seg-
mentation. Thus, the final cohort consisted of 25 patientsand 25 healthy controls. The patients did not differ fromcontrol subjects in age (P 5 0.214; mean age 5 36.3 for braininjured and 40.9 for healthy controls) or gender (P 5 0.756;13 male against 11 male in brain injured and healthygroups, respectively).
DOC patients had been clinically diagnosed as in anunresponsive wakeful state (UWS, n 5 7) or a minimallyconscious state (MCS, n 5 12), and diagnosis was consist-ent with the diagnosis of the day of the PET and MRIscan. Six subjects were diagnosed as emerged from a mini-mally conscious state (EMCS, n 5 6). The patient cohortconsisted of subacute (n 5 10, between 30 days and 3months after onset) and chronic patients (n 5 15, >3 monthafter onset) with a mean time since onset of 1.8 years(SD 5 1.9 years). Patients suffered from traumatic braininjury (TBI, n 5 12), anoxia (n 5 11), both (mix, n 5 1), orinfection (n 5 1). For demographic and clinical details seeTable I.
The vibration artefact affected 14 of 25 patients and 5out of 25 controls. On average, 39 diffusion-weighted vol-umes (30%) had to be removed from patient data and 32(25%) out of 128 volumes from control subjects. We didnot find a difference between the amount of affected vol-umes between patients and controls [v2(1,N 5 50) 5 3.14,P 5 0.076].
Figure 2.Flowchart of exclusion criteria. This study was conducted usingstringent exclusion criteria. Of the 163 MRI examinations per-formed at the Coma Science Group between November 2009and October 2013, 109 were excluded before image analysis.Data preprocessing was done for 54 patients, of which addition-ally 19 subjects had to be excluded due to inaccurate segmenta-tion. Finally, we included 25 patients in the statistical analysis.
r Function-Structure Connectivity in DOC r
r 5 r
138 Appendix D. Paper IV

To assess if there is an effect of laterality, the differencebetween SUV values in our ROIs and FA values for con-nections in the left and right hemisphere were assessed.No differences could be observed within SUV values forcontrols (P 5 0.794) or patients (P 5 0.691), nor in FA val-ues between the left and right tracts (controls; P 5 0.156,patients; P 5 0.053). The values of each hemisphere wereaveraged for subsequent analysis so that each subject wasnot tested twice.
Functional and Structural Integrity
Metabolism (SUV values) was significantly (P< 0.001)lower in brain-injured patients compared with controls(Fig. 3). The average reduction in SUV of patients was42%. The reduction was strongest in the precuneus (44%)and weakest in the frontal cortex (39%).
FA was also significantly (P< 0.001) lower in brain-injured patients compared with controls (Fig. 4). The aver-age reduction of FA was 17%, with the biggest reductionin the fronto-precuneus tract (23%) and the smallest reduc-tion in the thalamo-precuneus radiation (13%). A table
indicating all two-sample t-tests with Bonferroni correctioncan be found in the Supporting Information.
Regression Analysis
Explaining SUV through FA and group
Multiple linear regression (Fig. 5; Supporting Informa-tion Fig. 2; Tables (II–V) for P-values) including the twogroups (patients and controls) showed a main effect of FAand of group (with Bonferoni correction of P< 0.016). Themain effect of group is significant for all the regions andadjacent tracts with a higher SUV for healthy controls thanfor patients, except for SUV in the inferioparietal cortexwith FA from the frontal to inferioparietal tract whereonly a trend can be observed.
The main effect of FA can be found in five tracts(Fig. 5). This is the case for SUV in the inferioparietal cor-tex and FA from all assessed tracts toward this ROI (tha-lamo-interioparietal P< 0.0001, frontal-inferioparietalP 5 0.012, precuneus-inferioparietal P< 0.0001), SUV in theprecuneus and precuneus-inferioparietal FA (P< 0.0001),and SUV of the frontal cortex and thalamo-frontal FA
TABLE I. Patient demographics
Diagnosis Age Gender EtiologyDays
(Onset) GOSE
CRS-RCRS-RtotalA. V. M. O. C. Ar.
EMCS 33 F TBI 388 NA 4 5 6 3 2 3 23EMCS 30 M TBI 881 3 4 5 6 3 2 3 23EMCS 37 M Anoxia 284 3 4 5 6 3 0 2 20EMCS 45 F Anoxia 38 3 4 5 6 3 1 1 20EMCS 31 F TBI 439 3 4 5 5 2 2 2 20EMCS 22 M TBI 2,424 3 3 4 6 3 1 1 18MCS1 28 M TBI 589 3 1 2 2 1 0 1 7MCS1 45 M TBI 533 3 3 3 3 1 0 2 12MCS1 47 F Anoxia 210 NA 3 0 1 1 0 2 7MCS1 19 M MIX 1,236 3 3 4 1 2 0 2 12MCS1 23 M TBI 752 3 3 4 5 1 0 2 15MCS1 48 F Anoxia 292 NA 3 1 2 2 0 1 9MCS1 49 M Anoxia 674 1 3 1 3 1 0 2 10MCS- 29 F TBI 569 3 1 2 1 2 0 1 7MCS- 28 M TBI 634 2 0 1 2 1 1 1 6MCS- 36 F Anoxia 549 3 1 3 2 2 1 1 10MCS- 45 F Anoxia 259 1 0 0 2 1 0 1 4MCS- 48 M Anoxia 1,100 3 1 3 1 2 0 1 8UWS 40 M Anoxia 2,890 3 1 0 1 2 0 1 5UWS 21 M TBI 196 2 1 0 2 2 0 2 7UWS 44 F Anoxia 101 1 0 0 2 1 0 1 4UWS 54 F Infection 51 1 0 0 2 1 0 1 4UWS 20 M TBI 31 7 0 1 2 1 0 1 5UWS 48 F Anoxia 129 1 1 0 0 1 0 2 4UWS 37 F TBI 1,192 3 1 0 1 1 0 2 5
EMCS, Emergence from minimally conscious state; MCS, minimally conscious state; UWS, unresponsive wakefulness syndrome; M,male; F, female; TBI, traumatic brain injury; MIX, anoxia and traumatic brain injury; GOSE, Glasgow outcome scale extended; CRS-R,Coma recovery scale – revised; A., Auditory; V., visual; M., motor; O., oromotor; C., communication; Ar., arousal.
r Annen & Heine et al. r
r 6 r
139

(P 5 0.009) (Tables II–V). The relationship between FA andSUV within each of the two samples has been furtherinvestigated and the results are discussed in the followingparagraph.
Explaining SUV through FA and demographic factors
Within patients, we did not find any significant effect ofaetiology (TBI or non-TBI), duration, gender, or age in themultiple linear regression model. An interaction effect
between group (EMCS vs. DOC) and FA was found (withBonferoni correction a< 0.016) on thalamic SUV andthalamo-inferioparietal FA (P 5 0.006). Trends wereobserved for thalamic SUV and the other two tractstoward this ROI (thalamo-frontal P 5 0.04, thalamo-precuneus P 5 0.017) (Supporting Information Fig. 4).Furthermore, apart from one, all observed main effects ofFA seen in the previous analysis were also observed in thecurrent analysis between the two patient populations. SUVin the inferioparietal cortex is explained by thalamo-
Figure 4.
MRI white matter structural integrity in DMN tracts. Structuralintegrity of tracts between the default mode network regions rep-resented with FA of the voxels that the tracts pass through, inhealthy controls and brain injured patients (average of left and right
hemispheres). Brain injured patients show lower FA values com-pared with healthy controls subjects in all tracts. ***5 P< 0.001.[Color figure can be viewed in the online issue, which is availableat wileyonlinelibrary.com.]
Figure 3.
PET glucose uptake in DMN regions. Standardized uptake valuefollowing partial volume correction (PVC) in the default modenetwork regions (average of standardized uptake values of leftand right hemisphere) for healthy controls and brain injured
patients. Brain injured patients show a decreased standardizeduptake value compared with controls in all default mode net-work regions. *** 5 P< 0.001. [Color figure can be viewed inthe online issue, which is available at wileyonlinelibrary.com.]
r Function-Structure Connectivity in DOC r
r 7 r
140 Appendix D. Paper IV

interioparietal FA (P 5 0.002), and precuneus-inferioparietal FA (P< 0.0001). Similarly, SUV in the precu-neus that depends on the precuneus-inferioparietal FA(P 5 0.002). SUV of the frontal cortex is linearly related tothalamo-frontal FA (P 5 0.012). Within the healthy popula-tion there is no evidence for a main effect of FA on SUVin any of the structure–function pairs (Table VI).
Whole brain regression analysis
To test if these results were limited to the DMN orreflective of general brain integrity, we performed a linearregression analysis to model how group and whole-brainstructural integrity of white matter (FA) relate to wholebrain grey matter metabolism (SUV). This additional anal-ysis showed a main effect of group (P 5 0.0003), but not ofFA (P 5 0.17). Instead, a small evidence for an interactioneffect could be observed (P 5 0.03) (Supporting Informa-tion Fig. 3). However, we did not find evidence for a struc-ture–function relationship within each subgroup.
DISCUSSION
We here aimed to directly investigate, in severely braininjured patients, the relationship between functional brainactivity and structural connectivity within the DMN in anobjective and combined fashion using both FDG-PETand FA MRI. We show that a function–structurerelationship is present in brain-damaged patients betweenfunctional metabolism of inferior-parietal, precuneus, andfrontal regions and structural integrity of the frontal-inferiorparietal, precuneus-inferiorparietal, thalamo-interioparietal and thalamofrontal tracts. When focusing onEMCS versus DOC patients, we found a stronger relation-ship between structural integrity of thalamo-inferiorparietaltracts and thalamic metabolism in patients who haveemerged from MCS as compared with DOC patients.
We first assessed function (PET metabolism) and struc-ture (DWI-FA) independently, to replicate previous studiesfocusing on either measure separately. Indeed, markedimpairments in SUV and FA were observed in patients.
Figure 5.
Linear regression model of the function–structure relationship.Left side of the image shows a spatial representation of thefunction–structure relationships (blue circles for regions wherethe partial volume corrected - standardized uptake value (PVC-SUV) depended on FA, blue arrows for FA of tracts that driveSUV in adjacent regions). Right side of image shows five scatter-
plots of the linear regression models for healthy controls (bluedots), and patients (green dots), and significant main effect of FA(lines). Abbreviations: FA, fractional anisotropy; PVC-SUV, partialvolume corrected-standardized uptake value. [Color figure canbe viewed in the online issue, which is available at wileyonlineli-brary.com.]
r Annen & Heine et al. r
r 8 r
141

SUV in all DMN regions was lowered in brain-injuredpatients compared with healthy controls, with a 39%–42%reduction of metabolic rates in brain-injured patients inthe cortical DMN regions and thalamus (Fig. 3). This is inaccordance with previous findings on a global brain scale[Laureys et al., 1999a,; Rudolf et al., 1999; Stender et al.,2014a,b; Tommasino et al., 1995] and within the DMN spe-cifically [Fridman et al., 2014; Nakashima et al., 2007; Thi-baut and Bruno, 2012]. FA in all DMN tracts wasdiminished by about 13%–23% in brain-injured patientscompared with healthy controls (Fig. 4), in line with previ-ous reports [Fern!andez-Espejo et al., 2011, 2012; G!omez
et al., 2012]. Our results support recent findings of dimin-ished structural integrity of corticocortical and subcortico-cortical DMN connections, which correlated with clinicalseverity in a group of eight patients [Lant et al., 2015].
The main aim of this study was to assess the function–structure relationship in the DMN and thalamus in healthyconscious subjects and coma survivors. First, as expected,we have replicated previous studies and shown thatpatients have significantly lower FA in all studied connec-tions and SUV in all regions. Building on this, we showedthat grey matter metabolic function can be partiallyexplained by white matter anisotropy in several regions of
TABLE II. Regression analysis SUV of the thalamus, FA, and group (healthy vs. brain injured)
SUV FA R2 Beta95% confidence
interval Sum Sq Df F P-value
Thalamus Thalamo-frontal 0.722FA 0.538 21.029 2.105 0.026 1 0.309 0.581Group 0.947 20.819 2.713 4.823 1 56.763 0.000 ***Interaction 20.988 25.216 3.240 0.019 1 0.221 0.640Residuals 3.908 46
Thalamus Thalamo-inferiorparietal 0.721FA 0.523 21.358 2.404 0.036 1 0.425 0.518Group 0.425 21.623 2.474 4.338 1 50.929 0.000 ***Interaction 0.255 24.591 5.101 0.001 1 0.011 0.916Residuals 3.833 45
Thalamus Thalamo-precuneus 0.731FA 1.322 20.882 3.526 0.083 1 1.007 0.321Group 1.100 20.641 2.841 4.200 1 50.900 0.000 ***Interaction 21.411 25.623 2.801 0.038 1 0.456 0.503Residuals 3.713 45
Statistics and confidence interval of the regression models to predict SUV using FA of adjacent tracts and group (brain-injured patientsor healthy control subjects). * 5 P< 0.05, ** 5 P< 0.01, *** 5 P< 0.00.
TABLE III. Regression analysis SUV of the frontal cortex, FA, and group (healthy vs. brain injured)
SUV FA R2 Beta95% confidence
interval Sum Sq Df F P-value
Frontal Thalamo-frontal 0.644FA 2.692 0.860 4.524 0.872 1 7.510 0.009 **Group 1.502 20.563 3.566 2.232 1 19.222 0.000 ***Interaction 22.732 27.674 2.211 0.144 1 1.238 0.272Residuals 5.342 46
Frontal Frontal-inferiorparietal 0.607FA 2.254 0.253 4.255 0.688 1 5.090 0.029 *Group 0.836 21.417 3.088 1.165 1 8.624 0.005 **Interaction 21.254 26.696 4.187 0.029 1 0.216 0.645Residuals 6.081 45
Frontal Frontal-precuneus 0.587FA 1.635 20.754 4.024 0.133 1 0.926 0.341Group 1.574 20.487 3.635 1.685 1 11.736 0.001 **Interaction 22.955 28.174 2.264 0.187 1 1.299 0.260Residuals 6.603 46
Statistics and confidence interval of the regression models to predict SUV using FA of adjacent tracts and group (brain-injured patientsor healthy control subjects). * 5 P< 0.05, ** 5 P< 0.01, *** 5 P< 0.00
r Function-Structure Connectivity in DOC r
r 9 r
142 Appendix D. Paper IV
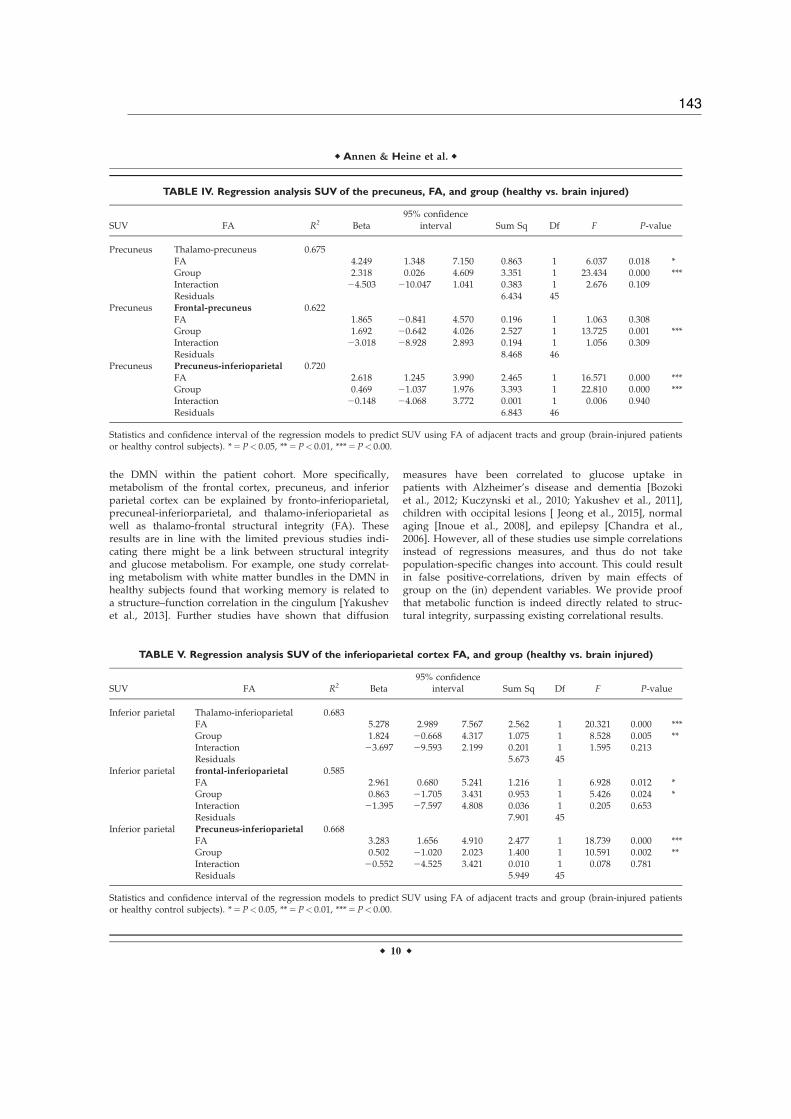
the DMN within the patient cohort. More specifically,metabolism of the frontal cortex, precuneus, and inferiorparietal cortex can be explained by fronto-inferioparietal,precuneal-inferiorparietal, and thalamo-inferioparietal aswell as thalamo-frontal structural integrity (FA). Theseresults are in line with the limited previous studies indi-cating there might be a link between structural integrityand glucose metabolism. For example, one study correlat-ing metabolism with white matter bundles in the DMN inhealthy subjects found that working memory is related toa structure–function correlation in the cingulum [Yakushevet al., 2013]. Further studies have shown that diffusion
measures have been correlated to glucose uptake inpatients with Alzheimer’s disease and dementia [Bozokiet al., 2012; Kuczynski et al., 2010; Yakushev et al., 2011],children with occipital lesions [ Jeong et al., 2015], normalaging [Inoue et al., 2008], and epilepsy [Chandra et al.,2006]. However, all of these studies use simple correlationsinstead of regressions measures, and thus do not takepopulation-specific changes into account. This could resultin false positive-correlations, driven by main effects ofgroup on the (in) dependent variables. We provide proofthat metabolic function is indeed directly related to struc-tural integrity, surpassing existing correlational results.
TABLE IV. Regression analysis SUV of the precuneus, FA, and group (healthy vs. brain injured)
SUV FA R2 Beta95% confidence
interval Sum Sq Df F P-value
Precuneus Thalamo-precuneus 0.675FA 4.249 1.348 7.150 0.863 1 6.037 0.018 *Group 2.318 0.026 4.609 3.351 1 23.434 0.000 ***Interaction 24.503 210.047 1.041 0.383 1 2.676 0.109Residuals 6.434 45
Precuneus Frontal-precuneus 0.622FA 1.865 20.841 4.570 0.196 1 1.063 0.308Group 1.692 20.642 4.026 2.527 1 13.725 0.001 ***Interaction 23.018 28.928 2.893 0.194 1 1.056 0.309Residuals 8.468 46
Precuneus Precuneus-inferioparietal 0.720FA 2.618 1.245 3.990 2.465 1 16.571 0.000 ***Group 0.469 21.037 1.976 3.393 1 22.810 0.000 ***Interaction 20.148 24.068 3.772 0.001 1 0.006 0.940Residuals 6.843 46
Statistics and confidence interval of the regression models to predict SUV using FA of adjacent tracts and group (brain-injured patientsor healthy control subjects). * 5 P< 0.05, ** 5 P< 0.01, *** 5 P< 0.00.
TABLE V. Regression analysis SUV of the inferioparietal cortex FA, and group (healthy vs. brain injured)
SUV FA R2 Beta95% confidence
interval Sum Sq Df F P-value
Inferior parietal Thalamo-inferioparietal 0.683FA 5.278 2.989 7.567 2.562 1 20.321 0.000 ***Group 1.824 20.668 4.317 1.075 1 8.528 0.005 **Interaction 23.697 29.593 2.199 0.201 1 1.595 0.213Residuals 5.673 45
Inferior parietal frontal-inferioparietal 0.585FA 2.961 0.680 5.241 1.216 1 6.928 0.012 *Group 0.863 21.705 3.431 0.953 1 5.426 0.024 *Interaction 21.395 27.597 4.808 0.036 1 0.205 0.653Residuals 7.901 45
Inferior parietal Precuneus-inferioparietal 0.668FA 3.283 1.656 4.910 2.477 1 18.739 0.000 ***Group 0.502 21.020 2.023 1.400 1 10.591 0.002 **Interaction 20.552 24.525 3.421 0.010 1 0.078 0.781Residuals 5.949 45
Statistics and confidence interval of the regression models to predict SUV using FA of adjacent tracts and group (brain-injured patientsor healthy control subjects). * 5 P< 0.05, ** 5 P< 0.01, *** 5 P< 0.00.
r Annen & Heine et al. r
r 10 r
143

Interestingly, we did not find a structure–function rela-tionship at the global brain level, suggesting that ourresults do not solely reflect general brain integrity. Instead,the function–structure relationship of the DMN might bedirectly related to consciousness. This has been shown insingle-modality studies, for example functional connectiv-ity [Vanhaudenhuyse et al., 2010b), white matter structuralintegrity [Fern!andez-Espejo et al., 2011, 2012; Gomez et al.,2012], and metabolic function [Thibaut et al., 2012]. Herewe show for the first time a direct function–structure rela-tionship within this network.
As expected, healthy control subjects showed FA andSUV within normal range and therefore we are unable tomake inferences about whether one drives the other. Nextwe investigated the function–structure relationship withinour patient population, comparing EMCS with DOCpatients (MCS and UWS). EMCS patients are able to useobjects and/or functionally communicate, and thus by def-inition conscious. Apart from one region-connection pair,all observed main effects of FA seen in the healthy vs.brain injured analysis were also observed in the analysisbetween the two patient populations, indicating that thereis a positive linear relation between functional and struc-tural integrity of the DMN. Furthermore, in contrast toDOC patients, EMCS patients show a significantly strongerfunction–structure interaction between the function of thethalamus and the structural integrity of the thalamo-inferiorparietal tract. On the uni-modal level our resultsmatch previous research in post-comatose patients findingthat structural cortico-thalamic connections are diminished[Lant et al., 2015] and thalamic metabolism is lowered[Fridman et al., 2014]. These findings can be explained by
the mesocircuit theory, which proposes that large-scaledysfunction is due to a global decrease of excitatory neu-rotransmission which in turn alters cerebral activity. Morespecifically, the globus pallidus is disinhibited and overac-tive, inhibiting the thalamic excitatory output to the frontalcortex [Schiff, 2010]. By combining both functional metabo-lism and white matter structural information we here pro-vide further evidence for the validity of this theory,supporting the hypothesis that thalamo-cortical connectiv-ity plays an important role in emergence of consciousness[Schiff, 2010]. We limited ourselves to the DMN because ofthe large body of literature on this brain-network relatingto consciousness. Therefore, future research should extendthese findings to more specific sub-cortical regions, suchas the globus pallidus or specific thalamic regions.
We do not find any difference between patients basedon aetiology, even though several studies have shown thattemporal dynamics of Wallerian degeneration vary givendifferent aetiologies [Kumar et al., 2009; Luyt et al., 2012]and that traumatic brain injury, unlike anoxia, might selec-tively affect DMN white matter integrity [Bonnelle et al.,2011; Warner et al., 2010]. Multicentre collaborationsshould provide sufficiently large datasets to study theseeffects in the future.
Methodologically, several comments can be addressedwhen dealing with brain-injured patients, especially con-cerning normalization, SUV, and tractography procedures.We here chose to perform a within-subject ROI labellingrather than applying a common atlas after spatial normal-ization as this latter procedure might results in a lack ofinter-subject anatomical correspondence in severelyinjured brains. As there is no consensus on the most
TABLE VI. Statistics and confidence interval of the regression models to predict SUV of the thalamus using FA ofadjacent tracts and group (DOC patients and patients who recovered from DOC)
SUV FA R2 Beta95% confidence
interval Sum Sq Df F P-value
Thalamus Thalamo-frontal 0.200FA 0.270 21.459 1.999 0.044 1 0.516 0.480Group 23.965 27.742 20.188 0.003 1 0.038 0.848Interaction 10.299 0.456 20.142 0.401 1 4.735 0.041 *Residuals 1.777 21
Thalamus Thalamo-inferiorparietal 0.333FA 20.282 22.243 1.679 0.028 1 0.394 0.537Group 23.891 26.512 21.270 0.002 1 0.023 0.882Interaction 9.986 3.252 16.720 0.685 1 9.567 0.006 **Residuals 1.431 20
Thalamus Thalamo-precuneus 0.296FA 0.852 21.356 3.060 0.118 1 1.607 0.219Group 26.133 211.053 21.212 0.000 1 0.000 0.999Interaction 16.134 3.197 29.071 0.497 1 6.767 0.017 *Residuals 1.468 20
aStatistics and confidence interval of the regression models to predict SUV using FA of adjacent tracts and group (brain-injured patientsor patients who recovered the ability to functionally communicate or use objects in a functionl manner). * 5 P< 0.05, ** 5 P< 0.01,*** 5 P< 0.00.
r Function-Structure Connectivity in DOC r
r 11 r
144 Appendix D. Paper IV

reliable calculation of standard uptake value, weaccounted for the partial-volume effect [Rousset et al.,2007]. Tractography based on constrained spherical decon-volution is optimal with b-values of 2,500–3,000 s/mm2
[Tournier et al., 2013], but crossing fibres can still be morereliably modelled than with simple DTI-based modelsusing our lower b-value of 1,000 s/mm2 [e.g., see for effec-tive application: Roine et al., 2015]. Future studies shouldstrive to acquire diffusion-weighted images using isotropicvoxels, as anisotropic voxel sizes produce datasets in whichthe fibre orientation estimates depend on the position ofthe subject in the scanner. Anisotropic voxel sizes weremitigated in this study by linear interpolation of the fibreorientation distributions during the fibre tracking step.
CONCLUSION
We here assessed the function–structure relationshipwithin healthy, conscious subjects and severely brain dam-aged patients with varying levels of consciousness throughdirect combined investigation of function (FDG-PET), andstructure (MRI-DWI). Levels of structural integrity (FA)and metabolic function (standardized metabolic rates) aresignificantly diminished in patients compared with con-trols. Furthermore, a significant positive function–structurerelationship can be observed within most regions of theDMN. This relationship may be network-specific, as itdoes not appear at the whole-brain level. Finally, we showthat EMCS compared with DOC show a significantlystronger thalamo-cortical function–structure relationship,which is in line with the mesocircuit hypothesis.
REFERENCES
Boly M, Tshibanda L, Vanhaudenhuyse A, Noirhomme Q,Schnakers C, Ledoux D, Boveroux P, Garweg C, LambermontB, Phillips C (2009): Functional connectivity in the default net-work during resting state is preserved in a vegetative but notin a brain dead patient. Hum Brain Mapp 30:2393–2400.
Bonnelle V, Leech R, Kinnunen KM, Ham TE, Beckmann CF, DeBoissezon X, Greenwood RJ, Sharp DJ (2011): Default modenetwork connectivity predicts sustained attention deficits aftertraumatic brain injury. J Neurosci 31:13442–13451.
Bozoki AC, Korolev IO, Davis NC, Hoisington LA, Berger KL(2012): Disruption of limbic white matter pathways in mildcognitive impairment and Alzheimer’s disease: A DTI/FDG-PET Study. Hum Brain Mapp 33:1792–1802.
Chandra PS, Salamon N, Huang J, Wu JY, Koh S, Vinters HV,Mathern GW (2006): FDG-PET/MRI coregistration anddiffusion-tensor imaging distinguish epileptogenic tubers andcortex in patients with tuberous sclerosis complex: A prelimi-nary report. Epilepsia 47:1543–1549.
De Volder AG, Bol A, Blin J, Robert A, Arno P, Grandin C,Michel C, Veraart C (1997): Brain energy metabolism in earlyblind subjects: Neural activity in the visual cortex. Brain Res750:235–244.
Demertzi A, G!omez F, Crone JS, Vanhaudenhuyse A, TshibandaL, Noirhomme Q, Thonnard M, Charland-Verville V, Kirsch
M, Laureys S, et al. (2014): Multiple fMRI system-level baselineconnectivity is disrupted in patients with consciousness altera-tions. Cortex 52:35–46. doi:10.1016/j.cortex.2013.11.005.
Desikan RS, S!egonne F, Fischl B, Quinn BT, Dickerson BC, BlackerD, Buckner RL, Dale AM, Maguire RP, Hyman BT, et al. (2006):An automated labeling system for subdividing the human cere-bral cortex on MRI scans into gyral based regions of interest.Neuroimage 31:968–980. doi:10.1016/j.neuroimage.2006.01.021.
Ennis DB, Kindlmann G (2006): Orthogonal tensor invariants andthe analysis of diffusion tensor magnetic resonance images.Magn Reson Med 55:136–146.
Fern!andez-Espejo D, Bekinschtein T, Monti MM, Pickard JD,Junque C, Coleman MR, Owen AM (2011): Diffusion weightedimaging distinguishes the vegetative state from the minimallyconscious state. Neuroimage 54:103–112.
Fern!andez-Espejo D, Soddu A, Cruse D, Palacios EM, Junque C,Vanhaudenhuyse A, Rivas E, Newcombe V, Menon DK,Pickard JD, et al. (2012): A role for the default mode network inthe bases of disorders of consciousness. Ann Neurol 72:335–343.
Fridman EA, Beattie BJ, Broft A, Laureys S, Schiff ND (2014):Regional cerebral metabolic patterns demonstrate the role ofanterior forebrain mesocircuit dysfunction in the severelyinjured brain. Proc Natl Acad Sci USA 111:6473–6478.
Gallichan D, Scholz J, Bartsch A, Behrens TE, Robson MD, MillerKL (2010): Addressing a systematic vibration artifact indiffusion-weighted MRI. Hum Brain Mapp 31:193–202.
Garyfallidis E, Brett M, Amirbekian B, Rokem A, van der Walt S,Descoteaux M, Nimmo-Smith I (2014): Dipy, a library for theanalysis of diffusion MRI data. Front Neuroinform 8:8.
Giacino JT, Ashwal S, Childs N, Cranford R, Jennett B, Katz DI,Kelly JP, Rosenberg JH, Whyte J, Zafonte RD, et al. (2002): Theminimally conscious state: Definition and diagnostic criteria.Neurology 58:349.
Giacino JT, Kalmar K, Whyte J (2004): The JFK Coma RecoveryScale-Revised: Measurement characteristics and diagnostic util-ity. Arch Phys Med Rehabil 85:2020–2029. doi:10.1016/j.apmr.2004.02.033.
G!omez F, Soddu A, Noirhomme Q, Vanhaudenhuyse A, TshibandaL, Lepor N (2012): DTI based structural damage characterizationfor disorders of consciousness.In: 2012 19th Ieee InternationalConference on Image Processing, 2:1257–1260.
Gorgolewski K, Burns CD, Madison C, Clark D, Halchenko YO,Waskom ML, Ghosh SS (2011): Nipype: A flexible, lightweightand extensible neuroimaging data processing framework inpython. Front Neuroinform 5:1–15.
Greicius MD, Supekar K, Menon V, Dougherty RF (2009): Resting-state functional connectivity reflects structural connectivity inthe default mode network. Cereb Cortex 19:72–78. doi:10.1093/cercor/bhn059.
Inoue K, Ito H, Uchida S, Taki Y, Kinomura S, Tsuji I, Sato S,Horie K, Kawashima R, Ito M, et al. (2008): Decrease in glu-cose metabolism in frontal cortex associated with deteriorationof microstructure of corpus callosum measured by diffusiontensor imaging in healthy elderly. Hum Brain Mapp 29:375–384. doi:10.1002/hbm.20394.
Jones DK, Horsfield MA, Simmons A (1999): Optimal strategiesfor measuring diffusion in anisotropic systems by magneticresonance imaging. Magn Reson Med 42:515–525.
Jeong JW, Tiwari VN, Shin J, Chugani HT, Juh!asz C (2015):Assessment of brain damage and plasticity in the visual sys-tem due to early occipital lesion: Comparison of FDG-PETwith diffusion MRI tractography. J Magn Reson Imaging 41:431–438.
r Annen & Heine et al. r
r 12 r
145

Koay CG (2009): On the six-dimensional orthogonal tensor repre-sentation of the rotation in three dimension: A simplifiedapproach. Mech Mater 41:951–953.
Kuczynski B, Targan E, Madison C, Weiner M, Zhang Y, Reed B,Chui HC, Jagust W (2010): White matter integrity and corticalmetabolic associations in aging and dementia. AlzheimersDement 6:1–17. doi:10.1016/j.jalz.2009.04.1228.White.
Kumar R, Husain M, Gupta RK, Hasan KM, Haris M, AgarwalAK, Pandey CM, Narayana PA (2009): Serial changes in thewhite matter diffusion tensor imaging metrics in moderatetraumatic brain injury and correlation with neuro-cognitivefunction. J Neurotrauma 495:481–495.
Lant ND, Gonzalez-Lara LE, Owen AM, Fern!andez-Espejo D(2015): Relationship between the anterior forebrain mesocircuitand the default mode network in the structural bases of disor-ders of consciousness. NeuroImage Clin 10:27–35.
Laureys S, Schiff ND (2012): Coma and consciousness: Paradigms(re)framed by neuroimaging. Neuroimage 61:478–491.
Laureys S, Goldman S, Phillips C, van Bogaert P, Aerts J, LuxenA, Franck G, Maquet P (1999a): Impaired effective cortical con-nectivity in vegetative state: Preliminary investigation usingPET. Neuroimage 9:377–382.
Laureys S, Lemaire C, Maquet P, Phillips C, Franck G (1999b):Cerebral metabolism during vegetative state and after recoveryto consciousness. J Neurol Neurosurg Psychiatry 67:121.
Laureys S, Owen AM, Schiff ND (2004): Brain function in coma,vegetative state, and related disorders. Lancet 3:537–546.
Laureys S, Celesia GG, Cohadon F, Lavrijsen J, Leon-Carrrion J,Sannita WG, Sazbon L, Schmutzhard E, von Wild KR, ZemanA, et al. (2010): Unresponsive wakefulness syndrome: A newname for the vegetative state or apallic syndrome. BMC Med8:68.
Leemans A, Jones DK (2009): The B-matrix must be rotated whencorrecting for subject motion in DTI data. Magn Reson Med61:1336–1349.
Luyt CE, Galenaud D, Perlbarg V, Vanhaudenhuyse A, StevensRD, Gupta R, Besancenot H, Krainik A, Audibert G, CombesA, et al. (2012): Diffusion tensor imaging to predict long-termoutcome after cardiac arrest. Anesthesiology 117:3–1.
M€uller-G€artner HW, Links JM, Prince JL, Bryan RN, McVeigh E,Leal JP, Davatzikos C, Frost JJ (1992): Measurement of radio-tracer concentration in brain gray matter using positron emis-sion tomography: MR-based correction for partial volumeeffects. J Cereb Blood Flow Metab 12:571–583.
Nakashima T, Nakayama N, Miwa K, Okumura A, Soeda A,Iwama T (2007): Focal brain glucose hypometabolism inpatients with neuropsychologic deficits after diffuse axonalinjury. Am J Neuroradiol 28:236–242. [pii].
Nakayama N, Okumura A, Shinoda J, Nakashima T, Iwama T(2006): Relationship between regional cerebral metabolism andconsciousness disturbance in traumatic diffuse brain injurywithout large focal lesions: An FDG-PET study with statisticalparametric mapping analysis. J Neurol Neurosurg Psychiatry77:856–862.
Quarantelli M, Berkouk K, Prinster A, Landeau B, Svarer C,Balkay L, Alfano B, Brunetti A, Baron JC, Salvatore M (2004):Integrated software for the analysis of brain PET/SPECT stud-ies with partial-volume-effect correction. J Nucl Med 45:192–201.
R core team (2014): R: A Language and Environment for StatisticalComputing. Vienna, Austria: Statistical Computing. URL:https://www.R-project.org
Roine U, Salmi J, Roine T, Wendt TN, Lepp€am€aki S, Rintahaka P(2015): Constrained spherical deconvolution-based tractogra-phy and tract-based spatial statistics show abnormal micro-structural organization in Asperger syndrome. Mol Autism 6:4.
Rousset O, Rahmim A, Alavi A, Zaidi H (2007): Partial volumecorrection strategies in PET. PET Clin 2:235–249.
Rudolf J, Ghaemi M, Haupt WF, Szelies B, Heiss WD (1999): Cere-bral glucose metabolism in acute and persistent vegetativestate. J Neurosurg Anesthesiol 11:17–24.
Schiff NDN (2010): Recovery of consciousness after brain injury:A mesocircuit hypothesis. Trends Neurosci 33:1–9.
Smith SM, Jenkinson M, Woolrich MW, Beckmann CF, BehrensTEJ, Johansen-Berg H, Bannister PR, De Luca M, Drobnjak I,Flitney DE, et al. (2004): Advances in functional and structuralMR image analysis and implementation as FSL. Neuroimage23:208.
Soddu A, Vanhaudenhuyse A, Bahri MA, Bruno MA, Boly M,Demertzi A, Tshibanda JF, Phillips C, Stanziano M,Ovadia-Caro S, et al. (2012): Identifying the default-mode com-ponent in spatial IC analyses of patients with disorders of con-sciousness. Hum Brain Mapp 33:778–796. doi:10.1002/hbm.21249.
Stender J, Gosseries O, Bruno MA, Charland-Verville V,Vanhaudenhuyse A, Demertzi A, Chatelle C, Thonnard M,Thibaut A, Heine L, et al. (2014a): Diagnostic precision of PETimaging and functional MRI in disorders of consciousness: Aclinical validation study. Lancet 384:514–522.
Stender J, Kupers R, Rodell A, Thibaut A, Chatelle C, Bruno MA,Gejl M, Bernard C, Hustinx R, Laureys S, et al. (2014b): Quan-titative rates of brain glucose metabolism distinguish mini-mally conscious from vegetative state patients. J Cereb BloodFlow Metab 35:58.
Svarer C, Madsen K, Hasselbalch SG, Pinborg LH, Haugbøl S,Frøkjær VG, Holm S, Paulson OB, Knudsen GM (2005): MR-basedautomatic delineation of volumes of interest in human brain PETimages using probability maps. Neuroimage 24:969–979.
Thibaut A, Bruno M (2012): Metabolic activity in external andinternal awareness networks in severely brain-damagedpatients. J Rehabil Med 44:487–494.
Thibaut A, Bruno MA, Chatelle C, Gosseries O, VanhaudenhuyseA, Demertzi A, Schnakers C, Thonnard M, Charland-VervilleV, Bernard C, et al. (2012): Metabolic activity in external andinternal awareness networks in severely brain-damagedpatients. J Rehabil Med 44:481–516.
Tommasino C, Grana C, Lucignani G, Torri G, Fazio F (1995):Regional cerebral metabolism of glucose in comatose and vege-tative state patients. J Neurosurg Anesthesiol 7:109–116.
Tournier JD, Calamante F, Connelly A (2012): MRtrix: Diffusiontractography in crossing fiber regions. Int J Imaging Syst Tech-nol 22:53–66.
Tournier JD, Calamante F, Connelly A (2013): Determination ofthe appropriate b value and number of gradient directions forhigh-angular-resolution diffusion-weighted imaging. NMRBiomed 26:1775–1786.
Van Den Heuvel MP, Mandl RCW, Kahn RS, Hulshoff Pol HE(2009): Functionally linked resting-state networks reflect theunderlying structural connectivity architecture of the humanbrain. Hum Brain Mapp 30:3127–3141.
Vanhaudenhuyse A, Demertzi A, Schabus M, Noirhomme Q,Bredart S, Boly M, Phillips C, Soddu A, Luxen A, Moonen G(2010a): Two distinct neuronal networks mediate the aware-ness of environment and of self. J Cogn Neurosci 23:570–578.
r Function-Structure Connectivity in DOC r
r 13 r
146 Appendix D. Paper IV

Vanhaudenhuyse A, Noirhomme Q, Tshibanda LJF, Bruno MA,Boveroux P, Schnakers C, Soddu A, Perlbarg V, Ledoux D,Brichant JF (2010b): Default network connectivity reflects thelevel of consciousness in non-communicative brain-damagedpatients. Brain 133:161–171.
Warner MA, Youn TS, Davis T, Chandra A, Marquez de la PlataC, Moore C, Harper C, Madden CJ, Spence J, McColl R, et al.(2010): Regionally selective atrophy after traumatic axonalinjury. Arch Neurol 67:1336–1344.
Yakushev I, Schreckenberger M, M€uller MJ, Schermuly I,Cumming P, Stoeter P, Gerhard A, Fellgiebel A (2011): Func-tional anatomy of interhemispheric cortical connections in thehuman brain. Eur. J Nucl Med Mol Imaging 38:2219–2227.
Yakushev I, Ch!etelat G, Fischer FU, Landeau B, Bastin C,Scheurich A, Perrotin A, Bahri MA, Drzezga A, Eustache F,et al. (2013): Metabolic and structural connectivity within thedefault mode network relates to working memory performancein young healthy adults. Neuroimage 79:184–190.
r Annen & Heine et al. r
r 14 r
147

148 Appendix D. Paper IV

Appendix E
Paper V
Resting state networks and consciousness: alterations ofmultiple resting state network connectivity in physiological,pharmacological, and pathological consciousness States
Heine L, Soddu A, Gómez F, Vanhaudenhuyse A, Tshibanda L,Thonnard M, Charland-Verville V, Kirsch M, Laureys S,
Demertzi A.
Frontiers in Psychology, 2012, Volume 3:295doi: 10.1093/brain/awv169
149

REVIEW ARTICLEpublished: 27 August 2012
doi: 10.3389/fpsyg.2012.00295
Resting state networks and consciousnessAlterations of multiple resting state network connectivityin physiological, pharmacological, and pathologicalconsciousness states
Lizette Heine1, Andrea Soddu1, Francisco Gómez 1, Audrey Vanhaudenhuyse1, LuabaTshibanda2,MarieThonnard 1,Vanessa Charland-Verville1, Murielle Kirsch3, Steven Laureys1 and Athena Demertzi 1*1 Coma Science Group, Cyclotron Research Center & Neurology Department, University of Liège, Liège, Belgium2 Radiology Department, CHU Sart Tilman Hospital, Liège, Belgium3 Anesthesiology Department, CHU Sart Tilman Hospital, Liège, Belgium
Edited by:
Robert Leech, Imperial College
London, UK
Reviewed by:
Judson Brewer, Yale University School
of Medicine, USA
Melanie Boly, Belgian National Fund
for Scientific Research, Belgium
*Correspondence:
Athena Demertzi , Coma Science
Group, Cyclotron Research Center,
Allée du 6 août no 8, Sart Tilman B30,
University of Liège, 4000 Liège,
Belgium.
e-mail: [email protected]
In order to better understand the functional contribution of resting state activity to con-scious cognition, we aimed to review increases and decreases in functional magneticresonance imaging (fMRI) functional connectivity under physiological (sleep), pharmaco-logical (anesthesia), and pathological altered states of consciousness, such as brain death,coma, vegetative state/unresponsive wakefulness syndrome, and minimally consciousstate.The reviewed resting state networks were the DMN, left and right executive control,salience, sensorimotor, auditory, and visual networks. We highlight some methodologi-cal issues concerning resting state analyses in severely injured brains mainly in termsof hypothesis-driven seed-based correlation analysis and data-driven independent com-ponents analysis approaches. Finally, we attempt to contextualize our discussion withintheoretical frameworks of conscious processes.We think that this “lesion” approach allowsus to better determine the necessary conditions under which normal conscious cognitiontakes place. At the clinical level, we acknowledge the technical merits of the resting stateparadigm. Indeed, fast and easy acquisitions are preferable to activation paradigms in clin-ical populations. Finally, we emphasize the need to validate the diagnostic and prognosticvalue of fMRI resting state measurements in non-communicating brain damaged patients.
Keywords: default mode network, resting state networks, consciousness, sleep, anesthesia, coma, hypnosis
INTRODUCTIONIn the past decades, neuroimaging research has been focusing onstudying brain function in “resting” conditions, when subjectsreceive no external stimulation. Functional magnetic resonanceimaging (fMRI) resting state connectivity studies stress that thebrain at rest is characterized by coherent fluctuations in the blood-oxygen-level-dependent (BOLD) signal. These BOLD fluctuationscan be detected in the low frequency range (<0.1 Hz; Cordes et al.,2001), they are distinct from respiratory and cardiovascular sig-nal contribution (De Luca et al., 2006) and organize the brain inlarge-scale cerebral networks (Damoiseaux et al., 2006). The mostwidely studied resting state network (RSN) is the default mode net-work (DMN), encompassing precuneus/posterior cingulate cortex(PCC), mesiofrontal/anterior cingulate cortex (ACC), and tem-poroparietal junction areas (Figure 1). This network of areas wasinitially identified in positron emission tomography (PET) stud-ies as regions less active when performance on cognitive tasks wascompared to resting control condition, such as eye fixation or eyesclosed (Shulman et al., 1997; Mazoyer et al., 2001). Later, the DMNwas also identified in fMRI and in terms of cognitive function,its activity has been linked to self-related and internal processes,such as stimulus-independent thoughts (McKiernan et al., 2006),
mind-wandering (Mason et al., 2007), social cognition (Schilbachet al., 2008), introspection (Goldberg et al., 2006), monitoring ofthe “mental self” (Lou et al., 2004), and integration of cognitiveprocesses (Greicius et al., 2003). Interestingly, areas of the DMNcan be assigned to specific cognitive functions, for example thePCC seems to be important in autobiographical memory whilethe frontal areas may be important for self-reference (Whitfield-Gabrieli et al., 2011). In that respect, resting state acquisitionscan, at least to a certain degree, be informative of cognitive func-tion. Importantly for clinical studies, the resting state paradigmis particularly appealing because it does not require sophisticatedexperimental setup to administer external stimuli and surpassesthe need for patients’ contribution (e.g., language comprehen-sion and/or production or motor responses; Soddu et al., 2011).Hence, resting state protocols are a suitable means to study clinicalpopulations, in which communication cannot be established atthe bedside, such as patients with disorders of consciousness [e.g.,coma,“vegetative state (VS)”/unresponsive wakefulness syndrome(UWS), minimally conscious state (MCS)]. It has been suggestedthat resting state analyses can be used in a clinical setting to identifygroup differences, to obtain patient-specific diagnostic and prog-nostic information, to perform longitudinal studies and monitor
www.frontiersin.org August 2012 | Volume 3 | Article 295 | 1
150 Appendix E. Paper V

Heine et al. Resting state networks and consciousness
FIGURE 1 | Multiple cerebral networks can be identified with
fMRI in healthy controls (n = 10) during normal wakeful resting
state using independent component analysis. These networks
reflect “higher-order” cognitive (i.e., default mode, left and right
executive control, salience networks), and “lower-order”
sensorimotor, and sensory (auditory, visual) function. For illustrative
purposes, group-level spatial maps (z values) are rendered on a
structural T1 magnetic resonance template and x, y, and z values
indicate the Montreal Neurological Institute coordinates of the
represented sections.
treatment effects, to cluster heterogeneous diseases such as schizo-phrenia or even to guide treatments, such as surgical interventions(Fox and Greicius, 2010).
With an aim to better determine the functional role of rest-ing state activity in healthy conditions and to further comprehendits contribution to clinical states, the present review will adopt a“lesion” approach. Indeed, patients’ neurological data can give usinformation about the functional role of the resting state activity toconsciousness. We will review changes in functional connectivity
in the DMN under physiological (sleep, hypnosis), pharmacolog-ical (sedation, anesthesia), and pathological (coma-related states)alteration of consciousness. The functional contribution of theanticorrelated activity between DMN and the “extrinsic” systemto (un)conscious states will also be discussed. We will furtherfocus on functional connectivity changes in multiple RSNs, suchas the bilateral executive control, salience, sensorimotor, audi-tory, and visual networks (Beckmann et al., 2005; Damoiseauxet al., 2006; De Luca et al., 2006; Fox and Raichle, 2007; Smith
Frontiers in Psychology | Cognition August 2012 | Volume 3 | Article 295 | 2
151

Heine et al. Resting state networks and consciousness
et al., 2009). With regards to resting state assessments of severelybrain-injured patients, we will highlight some methodologicalissues mainly in terms of hypothesis-driven seed-based correla-tion analysis and data-driven independent components analysis.Finally, we will attempt to contextualize our discussion withintheoretical frameworks around conscious processes.
(UN)CONSCIOUS STATES AND RESTING STATE DEFAULTMODE NETWORK ACTIVITYTo date, there is no universal definition for consciousness cover-ing all its essential characteristics (Zeman, 2001). Here, we defineconsciousness in an operational way based on clinical practice,stressing that consciousness can be reduced to two components,arousal and awareness (Posner et al., 2007). Arousal refers to thelevel of alertness and it is clinically evidenced by eyes opening.Awareness refers to the content of consciousness and it is clini-cally evidenced by command following or by observing non-reflexmotor behavior, such as eye tracking and localized responses topain (Posner et al., 2007). Sleep is the best example to describethe relationship between these two components: the drowsier webecome as we move toward deep sleep, the less aware we get ofour surroundings and ourselves (a notorious exception is theoneiric activity during rapid eye movement sleep during whichwe remain behaviorally unconscious; Hobson and Pace-Schott,2002). Based on this definition, subjects in pathological and phar-macological coma (i.e., anesthesia) are not conscious because theyare not awake (American Society of Anesthesiologists Task Forceon Intraoperative Awareness, 2006). Similarly, under sedation (adrug-dose dependent impairment of consciousness) and hypnoticstate (a suggestion-dependent alteration of conscious experience;The Executive Committee of the American Psychological Associ-ation – Division of Psychological Hypnosis, 1994) subjects reportan altered state of awareness as they move toward lower wakeful-ness levels. A unique dissociation between arousal and awareness isobserved in patients in a VS (also called UWS; Laureys et al., 2010)who recover wakefulness but their motor responses are merelyreflexive and, hence, not indicative of conscious awareness (Lau-reys et al., 2005). Patients in VS/UWS should not be mistaken withpatients in a MCS. Patients in MCS, although unable to function-ally communicate with their environment, do show fluctuatingremnants of willful behavior (Giacino et al., 2002). Based on thelevel of their purposeful behavioral repertoire, MCS patients wererecently subcategorized as MCS+ (i.e., showing command fol-lowing,) and MCS− (i.e., showing visual pursuit, localization ofnoxious stimulation, or non-contingent behaviors, such as appro-priate smiling or crying to emotional stimuli; Bruno et al., 2011).This kind of clinical distinction highlights the importance ofmotor output to the evaluation of consciousness. Patients with alocked-in syndrome (LIS), however, have no means of producingspeech, limb, or facial movements but still are awake and con-scious (Posner et al., 2007). Evidently, by solely measuring motorresponses, these patients can be mistaken for unconscious (Laureyset al., 2005). Similarly, consciousness in patients with aphasia canbe underestimated if the clinician does not account for such deficit.As a consequence, valid motor- and language-independent assess-ment of residual brain function in non-communicating patientsis of both clinical and ethical importance.
The resting state paradigm surpasses the requirement for motoroutput or language comprehension. To date, neuroimaging proto-cols investigating connectivity of the DMN during resting state arenot conclusive as to its exact functional role. Nevertheless, restingstate fMRI studies suggest that activity of this network is gener-ally reduced as a function of the level of consciousness (Table 1).For example, it has been shown that with the advancement ofsleep, connectivity between the frontal and posterior parts of theDMN decreases yet persists (Horovitz et al., 2009). Decreases infunctional connectivity were also observed in PCC of the DMNunder pharmacological unconsciousness with propofol (Bover-oux et al., 2010; Schrouff et al., 2011) and sevoflurane (Martuzziet al., 2010). Importantly for clinical populations, connectivity inthe PCC was shown to be indistinguishable between controls andLIS patients, relatively preserved in MCS, significantly reduced inVS/UWS patients (Vanhaudenhuyse et al., 2010) and could not beidentified in brain death (i.e., irreversible coma with absent brain-stem reflexes; Boly et al., 2009). Similarly during a passive auditorytask, DMN deactivations, which are thought to interrupt ongo-ing introspective processes, showed a reduction in MCS whereasVS/UWS patients did not show such task-induced deactivations(Crone et al., 2011). These studies suggest that DMN functionalconnectivity correlates, at least partially, with the level of ongoingconscious cognition. This is in agreement with functional connec-tivity studies on intermediate states of awareness. For example, inhypnotic state there is only relative (Demertzi et al., 2011b) or noconnectivity decreases in the DMN (McGeown et al., 2009). Sim-ilarly, during moderate sedation, little (Greicius et al., 2008) or nochanges (Stamatakis et al., 2010) in DMN connectivity have beenobserved. During light sleep there is no change (Horovitz et al.,2008; Larson-Prior et al., 2009). Nevertheless, in deep sleep brainactivity shows increased modularity, which hinders the brain tointegrate information and therefore might account for decreasedconsciousness during dreamless sleep (Boly et al., 2012).
Taken together, changes in the DMN functional connectivityin altered consciousness states could suggest modified self-relatedconscious mentation. Indeed, it has been suggested that in nor-mal waking conditions, resting state activity in the posteriorcingulate and frontal areas accounts for self-referential thoughts(Whitfield-Gabrieli et al., 2011). Therefore, it could be inferredthat decreased connectivity in the DMN reflects restricted abili-ties for self-referential processing, like in patients with disordersof consciousness. One should keep in mind, though, that our lim-ited understanding of the dynamic neural complexity underlyingconsciousness and its resistance to quantification in the absence ofcommunication make it difficult to establish strong claims aboutself-consciousness in non-communicating subjects.
DMN FUNCTIONAL ANTICORRELATIONS
Since the early studies of resting state, it was suggested that thebrain’s baseline activity can be organized in two brain networksshowing anticorrelated activity to each other: an “intrinsic” andan “extrinsic” network (Fox et al., 2005; Fransson, 2005; Gollandet al., 2007; Tian et al., 2007). The “intrinsic” network coincideswith the DMN and is involved in the same cognitive processes asthe DMN. The “extrinsic” system encompasses lateral frontopari-etal areas resembling the brain activations during goal-directed
www.frontiersin.org August 2012 | Volume 3 | Article 295 | 3
152 Appendix E. Paper V

Heine et al. Resting state networks and consciousness
Table 1 | FMRI studies showing alterations in resting state functional connectivity of multiple networks in physiological (sleep, hypnosis),
pharmacological (sedation), and pathological states of unconsciousness.
N Functional connectivity change Method Study
DMN Light sleep 14 Connectivity persists Seed-based Horovitz et al. (2008)
10 Connectivity persists Seed-based Larson-Prior et al. (2009)
Slow wave sleep 14 ↑: PCC correlation with IPC.
Correlation within nodes persistent
Seed-based Horovitz et al. (2009)
↓: Correlation PCC with MPFC became
absent
25 ↓: PCC, PHG, MPFC ICA Sämann et al. (2011)
Light sedation 16 ↑: PCC and areas outside of the DMN Seed-based Stamatakis et al. (2010)
12 ↓: General deceased connectivity, focal
decreases PCC
ICA Greicius et al. (2008)
Anesthesia 20 ↓: PCC/precuneus, MPFC, superior
frontal sulci, parahippocampal gyrus,
and bilateral TPJ
Seed-based and ICA Boveroux et al. (2010)
14 ↑: PCC and STG Seed-based Martuzzi et al. (2010)
↓: PCC and adjacent areas
18 ↓: Reduction connectivity within the
DMN and between the DMN and other
networks
ICA Schrouff et al. (2011)
Hypnosis 18 ↓ right middle and superior frontal
gyrus
Seed-based McGeown et al. (2009)
12 ↑: Middle frontal and bilateral angular
gyri
ICA Demertzi et al. (2011b)
↓: PCC and bilateral parahippocampal
areas
Comatose states 2 ↓: Connectivity is absent in brain dead,
decreased PCC, and thalamus
connectivity
ICA Boly et al. (2009)
Preserved cortico-cortical connectivity
11 ↓: Connections between PCC and
MPFC
Seed-based and ICA Soddu et al. (2012)
Locked-in patients showed near to
normal connectivity
14 ↓: All areas showed less connectivity in
disorders of consciousness, decrease
of connectivity was negatively
correlated with consciousness. PCC
most significant decrease
ICA Vanhaudenhuyse et al. (2010)
13 Presence of DMN has prognostic value ICA Norton et al. (2012)
Executive control network Light sleep 10 No difference Seed-based Larson-Prior et al. (2009)
Slow wave sleep 25 Correlations within the network persist
but decrease
ICA Sämann et al. (2011)
Light sedation 20 ↓: Right: middle frontal and posterior
parietal cortices.
Seed-based and ICA Boveroux et al. (2010)
Left: residual in middle frontal, PCC,
and temporo-occipital cortices
Salience Slow wave sleep 14 ↑: Connectivity between insula and left
ACC
Seed-based Martuzzi et al. (2010)
↓: Decrease between connectivity in
the insula and supplementary motor
cortex and left middle frontal gyrus
(Continued)
Frontiers in Psychology | Cognition August 2012 | Volume 3 | Article 295 | 4
153

Heine et al. Resting state networks and consciousness
Table 1 | Continued
N Functional connectivity change Method Study
Hypnosis 8 ↑: Increases in mid-insula, primary
sensory, and orbitofrontal cortex
Seed-based Derbyshire et al. (2004)
Sensorymotor network Light sleep 10 No difference Seed-based Larson-Prior et al. (2009)
Slow wave sleep 14 ↑: Connectivity within the network Seed-based Martuzzi et al. (2010)
Light sedation 12 ↑: Within-network increases ICA Greicius et al. (2008)
Auditory Slow wave sleep 14 No difference Seed-based Martuzzi et al. (2010)
Light sedation 20 No difference Seed-based and ICA Boveroux et al. (2010)
Visual Light sleep 10 No difference Seed-based Larson-Prior et al. (2009)
Light sedation 14 ↑: Primary visual area with the cuneus
and lingual gyrus
Seed-based Martuzzi et al. (2010)
Anesthesia 20 No difference Seed-based and ICA Boveroux et al. (2010)
Upper arrow denotes increases in functional connectivity; lower arrow denotes decreases in functional connectivity. (DMN, default mode network; PCC, posterior
cingulate cortex; PHG, parahippocampal gyrus; IPC, inferior parietal cortex; MPFC, medial prefrontal cortex; TPJ, temporoparietal junction; STG, superior temporal
gyrus, ICA, independent component analysis).
behavior and it has been linked to cognitive processes of externalsensory input, such as somatosensory (e.g., Boly et al., 2007), visual(e.g., Dehaene and Changeux, 2005), and auditory (e.g., Brunettiet al., 2008). Previous studies showed that these two systems are ofa competing character in the sense that they can disturb or eveninterrupt each other (e.g., Tian et al., 2007). Such anticorrelatedpattern is also illustrated in activation studies on motor perfor-mance (Fox et al., 2007), perceptual discrimination (Sapir et al.,2005), attentional lapses (Weissman et al., 2006), and somatosen-sory perception of stimuli close to somatosensory threshold (Bolyet al., 2007). We recently determined the cognitive-behavioralcounterpart of such “resting state” activity and showed that activ-ity in the DMN corresponded to behavioral reports of “internal”awareness (i.e., self-related thoughts). Conversely, subjective rat-ings for “external” awareness (i.e., perception of the environmentthrough the senses) correlated with the activity of an “extrinsic”system (encompassing lateral frontoparietal cortices; Vanhauden-huyse et al., 2011). These findings depict that the anticorrelatedpattern between DMN and the extrinsic system is of functionalsignificance to conscious cognition. With an aim to further char-acterize the role of these two systems to subjective awareness, wesought to modulate their relationship by means of hypnosis. Wefound that, as compared to a control condition of autobiograph-ical mental imagery, there was a hypnosis-related reduction inconnectivity in the “extrinsic” system, reflecting a decreased sen-sory or perceptual awareness. Interestingly, this modulated activitywas paralleled to subjective reports of increased sense of dissoci-ation from the environment and reduced intensity of “externalthoughts” (Demertzi et al., 2011b).
Taken together these data indicate that DMN and anticorrelatedextrinsic system activity underlies (at least partially) consciousongoing mentation. It should be mentioned that fMRI anticorre-lations were previously subject to debate in the literature. It hasbeen argued, for instance, that fMRI functional anticorrelationsare nothing more than noise in the signal due to regression ofthe brain’s global activity during data preprocessing (Andersonet al., 2010). Other data, however, suggest that the anticorrelationspersist both with and without global signal regression, suggesting
some underlying biological origins for this anticorrelated pattern(Fox et al., 2009; Chai et al., 2012). We would agree with the latterevidence which is supported by studies in unconscious condi-tions, such as anesthesia (Boveroux et al., 2010; Figure 2), sleep(Sämann et al., 2011), and in unresponsive patients (Boly et al.,2009) where these anticorrelations generally reduce or even dis-appear, accounting for their functional contribution to consciouscognition.
BEYOND THE DMN: RESTING STATE ACTIVITY IN MULTIPLECEREBRAL NETWORKSImportantly, the different functions of a brain region cannot beunderstood in isolation, meaning in terms of functional segre-gation, but only in conjunction with regions it interacts with,that is in terms of functional integration (Seghier et al., 2010).Therefore, we further focus our review on other “large-scalehigher-order” (bilateral executive control and salience networks)and sensorimotor-sensory (auditory, visual) RSNs, which can beconsistently identified in healthy conditions (Figure 2).
The executive control network during normal wakefulnessencompasses bilateral middle, inferior and superior frontal cor-tices, bilateral inferior parietal lobes, ACC/supplementary motorarea (SMA), and bilateral insular cortices (Figure 1). Restingstate independent components analysis identified this networkin a lateralized manner. The left executive control network isthought to be more involved in cognitive and “language” para-digms while the right executive control network relates to per-ceptual, somesthetic, and nociception processing (Smith et al.,2009; Laird et al., 2011). Activity in both these two networks isreduced during deep sleep (Sämann et al., 2011) and anesthe-sia (Boveroux et al., 2010) whereas light sleep does not seemto mediate functional connectivity in these networks (Larson-Prior et al., 2009; Table 1). Taken together, these results high-light the involvement of the executive control networks in theperception of the external world, in line with previous sugges-tion that activity of these areas is a necessary condition forconscious (i.e., reportable) visual perception (Dehaene et al.,2003).
www.frontiersin.org August 2012 | Volume 3 | Article 295 | 5
154 Appendix E. Paper V

Heine et al. Resting state networks and consciousness
FIGURE 2 | Spontaneous fMRI BOLD activity in the default mode
network (in blue; considered to reflect self-related mentation)
anticorrelates with the activity of a lateral frontoparietal system (in
red; considered to mediate conscious perception of the external
world). Here, this anticorrelated activity is shown for normal wakefulness,
hypnotic state, and during deep anesthesia. Of note is the absence of the
activity in the “extrinsic” frontoparietal system in the two conditions of
altered sense of awareness (hypnosis, anesthesia) which is considered as
suggestive of a diminished “external” awareness (i.e., the perception of the
environment through the senses). Statistical maps are thresholded at a
false discovery error rate p < 0.05 and rendered on a structural T1 magnetic
resonance image of a healthy subject (x and z values indicate Talairach
coordinates of the represented sections).
The salience network encompasses fronto-insular and ACCs(Figure 1) with connections to subcortical and limbic structures.In normal conditions, this network is implicated in the orientationtoward salient emotional stimuli (Seeley et al., 2007), conflict mon-itoring, information integration, and response selection (Cole andSchneider, 2007; Roberts and Hall, 2008). It has been proposedthat the salience network enables the switch between internalattention (the default mode) and task-related states (Menon andUddin, 2010). The salience network has also been linked to pain-related processes both during acute stimulus-induced pain (Traceyand Mantyh, 2007), during resting state while anticipating pain
(Ploner et al., 2010; Wiech et al., 2010), and after hypnotic sug-gestions for creating pain experiences in the absence of a noxiousstimulus (Derbyshire et al., 2004). Under light sevoflurane seda-tion, increased connectivity between the ACC and the insula wasobserved, although connectivity between the insula and the sec-ondary somatosensory cortex was reduced (Martuzzi et al., 2010).Analysis of the salience network in comatose states could be bene-ficial for the study of pain and possible suffering in these patients inthe absence of external stimulation. Indeed, such stimulations arenot always feasible due to sophisticated setups or due to patients’clinical picture. Hence, salience network resting state analysiscould shed light on the cerebral substrate that could account forpatients’ orientation to salient stimuli, including painful ones.
The sensorimotor network resembles the activations seen inmotor tasks (Biswal et al., 1995). In normal wakefulness it encom-passes the SMA/midcingulate cortex, bilateral primary motor cor-tex, and bilateral middle frontal gyri (Biswal et al., 1995; Greiciuset al., 2008; Figure 1). During light sedation the sensorimotor net-work shows increases in functional connectivity (Greicius et al.,2008; Martuzzi et al., 2010). To date, the above networks have notbeen further investigated under other unconscious states.
The auditory network, important in audition, such astone/pitch discrimination, music, and speech (Laird et al., 2011)in normal wakefulness, encompasses primary and secondary audi-tory cortices, including Heschl’s gyrus, bilateral superior temporalgyri, and posterior insular cortex (Figure 1). During normal wake-fulness, resting state independent component analysis (ICA) alsoidentifies the visual network in three independent components(Figure 1). One network, the lateral visual network includes themiddle temporal visual association area at the temporo-occipitaljunction and is most important in complex (emotional) stimuli(Laird et al., 2011). The other networks include medial and occip-ital visual networks, important in simple visual (e.g., a flickeringcheckerboard), and higher-order visual stimuli (e.g., orthogra-phy), respectively (Beckmann et al., 2005; Damoiseaux et al., 2006;Allen et al., 2011; Laird et al., 2011). No difference in connectiv-ity was identified between both these primary auditory and visualsensory networks and light sleep (Larson-Prior et al., 2009), orbetween awake and sedation (Boveroux et al., 2010; Martuzzi et al.,2010). One study showed increased temporal synchrony in audi-tory and visual areas in light midazolam sedation (Kiviniemi et al.,2005). The visual cortex has been shown to possess higher ampli-tude of BOLD fluctuations when asleep (Fukunaga et al., 2006).This indicates that resting state activity continues in these areasduring sleep, and thus transcends consciousness. Finally, reliablyindicated as possessing functional connectivity is the cerebellum.This network is associated with action and somesthesis (Lairdet al., 2011), but not yet thoroughly studied in altered states ofconsciousness.
ANALYZING RESTING STATE DATA FROM PATHOLOGICALBRAINS: METHODOLOGICAL ISSUESThe clinical neuro-investigation of severely brain-injured patientswith the resting state paradigm is technically easier compared toactivation (Schiff et al., 2005) or “active” mental imagery protocols(e.g., Monti et al., 2010). This is because patients do not have toperform any task, and such data can have faster translation into
Frontiers in Psychology | Cognition August 2012 | Volume 3 | Article 295 | 6
155

Heine et al. Resting state networks and consciousness
clinical practice (Soddu et al., 2011). Depending on the adoptedmethodology, several issues need to be taken into account whenanalyzing resting state acquisitions from clinical populations. Todate, two main approaches are employed; hypothesis-driven seed-voxel correlation analysis and data-driven ICA (see Table 1 for theadopted approach by each reviewed study). Each method has itsown advantages, yet their methodological difficulties, especially innon-collaborative patients, which merit to be acknowledged.
HYPOTHESIS-DRIVEN METHOD: SEED-BASED CORRELATION ANALYSIS
The seed-voxel approach uses extracted BOLD time course froma region of interest and determines the temporal correlationbetween this signal (the seed) and the time course from all otherbrain voxels (Fox et al., 2005). This creates a whole-brain voxel-wise functional connectivity map of covariance with the seedregion. It is the most straightforward method to analyze functionalconnectivity of a particular brain region. The method gives directanswers to specific hypotheses about functional connectivity ofthat region. It is attractive and elegant for many researchers as thedata can be interpreted relatively easily when a well-defined seedarea is used. When applying this approach to the study of restingstate activity in patients with disorders of consciousness, severalcontroversial issues arise. A first general issue concerns regress-ing out the global activity from the BOLD signal, which mightinduce spurious anticorrelations (Fox et al., 2009; Murphy et al.,2009). However, in the case of brain death (a condition where thebrain totally lacks neuronal activity and arterial blood flow), thistype of regression is an important step to obtain the obvious zeroconnectivity in this condition (Boly et al., 2009). Alternatively,a non-zero BOLD signal measured in brain death can be takento be artifactual, contaminated by head motion or heart beat-ing (Soddu et al., 2011). Next, patients with severe brain injuriesmay suffer from structural deformations resulting from traumaticbrain injury and focal hemorrhages. Additionally, patients withsevere chronic brain injuries usually develop atrophy and sec-ondary hydrocephalus (i.e., ex vacuo dilation of the ventricles).This implies that even if a statistical structural normalization pro-cedure has been performed, the selection of a proper seed regioncan become difficult and will require visual inspection by an experteye. This issue adds to the already intrinsic challenges of an prioriselection of the seed region which, in principle, can lead to as manypossible overlapping networks as the number of possible seeds(Cole et al., 2010). Using seed-based analysis, other noisy con-founds might be influencing the data (e.g., head motion, vascularactivity, scanner artifacts). To reduce such noise, the BOLD signalcan be preprocessed by regressing out head motion curves as well asventricular and white matter signal, and each of their first-orderderivative terms (Fox et al., 2005). Finally, as for all group-levelanalyses, one has to take into account the between-subject vari-ability, such as cortical folding or functional localization betweenindividuals or groups (Cole et al., 2010) which can be extremelychallenging in severely deformed brains.
DATA-DRIVEN METHOD: INDEPENDENT COMPONENT ANALYSIS
Data-driven methods are used to analyze whole-brain connectiv-ity patterns without the need of a priori seed regions. ICA is themost widely used methodology with high level of consistency in
results within subjects (van den Heuvel and Hulshoff Pol, 2010).ICA divides an entire dataset into different maximally statisticalindependent components and thus is able to isolate cortical con-nectivity maps from non-neural signals (Beckmann et al., 2005).Spontaneous activity is therefore automatically separated fromnoise, such as head motion or physiological confounds (e.g., car-diac pulsation, respiratory, and slow changes in the depth and rateof breathing; Beckmann and Smith, 2004). This method has theadvantage that it can evaluate and compare the coherence of activ-ity in multiple distributed voxels (Cole et al., 2010). The advantageis that it divides different RSNs into different components. How-ever, ICA does not provide any classification or ordering of theindependent components. It is therefore perceived as more diffi-cult to understand due to the complex representation of the data.The most straightforward method for labeling the componentsis by visual inspection, but this lacks reproducibility and couldbe hard to perform in cases with a large component dimension-ality. Alternatively, an automatic selection is preferable but theway to choose the right independent component remains a del-icate issue. By merely performing a spatial similarity test witha predefined template has been shown not to be successful forchoosing the right component (Soddu et al., 2012). Some auto-matic approaches for component selection have been proposed,based on template matching using the “goodness of fit” as an out-come index. However, these methods have to be interpreted withcare especially in cases of deformed brains as in patients witha traumatic brain injury or comatose state. It was recently pro-posed that when selecting independent components in patientspopulations, spatial, temporal, and a “compromise” between spa-tial and temporal properties of the network of interest need tobe met (Soddu et al., 2012). For example, a component can beerroneously selected as the RSN of interest if the selection is basedon the spatial pattern ignoring the properties in the time domain(Figure 3, bottom right panel). Additionally, the determination ofthe proper dimensionality (i.e., the “right” number of estimatedcomponents) remains unclear. Extracting many components canresult in the spatial segregation of the network of interest into mul-tiple sub-networks (Smith et al., 2009). It was shown, for example,that the use of 75 components can reduce the DMN into fourcomponents and the sensorimotor network in six (Allen et al.,2011). When applying ICA in pathological brains it is probablymore useful not to select a large quantity of components, becausehigh component dimensionality can further reduce the chancesof identifying a network due to decrease in spatial pattern andspectral properties (Tohka et al., 2008).
Other techniques to analyze resting state data exist such asmethods that focus on the (fractional) amplitude of low frequencyfluctuations [(f)ALFF; Zang et al., 2007; Zuo et al., 2010), or on thesmall world characteristics using correlations and graph analysis(Bullmore and Sporns, 2009; Zalesky et al., 2012].
CONCLUSIONS AND PERSPECTIVESThe default mode network is the most widely studied networkin the resting state literature and has been linked to self-relatedprocesses. To date, fMRI resting state studies show that DMN con-nectivity is reduced under altered states of consciousness, suchas sleep, sedation/anesthesia, hypnotic state, and clinical states
www.frontiersin.org August 2012 | Volume 3 | Article 295 | 7
156 Appendix E. Paper V

Heine et al. Resting state networks and consciousness
FIGURE 3 |The challenge of selecting the “right” independent
component as the resting state network of interest in pathological
conditions. The figure illustrates the spatial pattern (brain maps, z values
0.8–10) and spatial-temporal properties (fingerprints: a representation of
the component in a multidimensional space of parameters; De Martino
et al., 2007) of the default mode network in healthy consciousness states
(healthy subject, patient with locked-in syndrome; upper row) and in two
patients with vegetative state/unresponsive wakefulness syndrome
(VS/UWS; lower row). For the healthy control, the locked-in syndrome and
the VS/UWS patient in the lower left corner, the default mode network
shows the characteristic properties in both the spatial and the temporal
domain (i.e., the fingerprints pick in the 0.02–0.05 Hz frequency band
labeled with the number 9) even if for the VS/UWS patient the spatial
pattern is only partially preserved. Of note is that the second VS/UWS
patient exhibits the spatial pattern of the default mode network but
importantly the time course of this component is characterized by high
frequency fluctuations, in the 0.1–0.25 Hz frequency band and high spatial
entropy (labeled, respectively, with the number 11 and 4 in the fingerprint).
Therefore, such activity cannot be considered of neuronal origin. As a
consequence, if the component selection was merely based on a spatial
similarity test (e.g., with a predefined template), then this component
could be erroneously selected and further statistically analyzed. A
“compromise” in the selection of the appropriate network of interest in
the space and time domain is needed to will eventually exclude
non-neuronal contributions [Fingerprint labels: (1) degree of clustering, (2)
skewness, (3) kurtosis, (4) spatial entropy, (5) autocorrelation, (6) temporal
entropy, power: (7) 0–0.008 Hz, (8) 0.008–0.02 Hz, (9) 0.02–0.05 Hz, (10)
0.05–0.1 Hz, (11) 0.1–0.25 Hz].
of disorders of consciousness (VS/UWS, MCS, coma, and braindeath). Such connectivity alterations can be discussed in two non-mutually exclusive ways. On one hand, one can refer to thesereductions in resting state connectivity during altered consciousstates as reflecting reduced capacities for (conscious) cognitiveprocessing (e.g., Vanhaudenhuyse et al., 2010). On the other hand,we can equally talk about persistent (albeit reduced) functionalconnectivity pattern in unconscious states, which transcends thelevel of consciousness, and which is considered as a physiologicbaseline (e.g., Raichle et al., 2001). In any case, it seems that thepurposes and questions of each study will eventually determine
how such alterations can be further discussed and interpreted.Both the scientific and clinical implications for cognition seem tobe the essence of resting state connectivity measurements.
At the scientific level, resting state analyses shed light on thenecessary conditions needed for conscious awareness to take place.In other words, in the absence of external stimulation, restingstate functional connectivity paradigms could quantify the min-imal prerequisites under which cognitive processes can become“conscious.” This could mean that in the presence of an adequateneural substrate (i.e., the RSN), one could infer preserved capac-ities for conscious cognition. Of course the absence of functional
Frontiers in Psychology | Cognition August 2012 | Volume 3 | Article 295 | 8
157

Heine et al. Resting state networks and consciousness
connectivity cannot be taken as a proof for incapacity for con-scious awareness. Indeed, it has been suggested that functionalconnections are best recruited after external stimulation (Honeyet al., 2009). In any case, the sufficiency of the RSNs integrityto consciousness remains to be further determined with studiesmeasuring effective connectivity (Churchland, 2007).
In summary, we here reviewed studies in resting state fMRI con-nectivity of “higher-order” associative cerebral networks (defaultmode, right and left executive control, and salience) and “lower-level” sensory (auditory and visual) and sensorimotor networksunder various altered states of consciousness. As previously pro-posed, in order for humans to be conscious of something, incom-ing information (via sensory networks) needs to be made globallyavailable to multiple brain systems via long-range neurons associa-tive networks (Dehaene and Changeux, 2011). Here, the reviewedstudies suggest that resting state connectivity is preserved butaltered in most RSNs under physiological and pharmacologi-cal states, impeding information integration. It should be notedhere that it was not among our aims to exhaustively review allspectrum of altered states of consciousness. Much research hasbeen conducted in states of altered sense of awareness, such asin neuropsychiatric disorders (e.g., dementias and schizophre-nia; for a review see Buckner et al., 2008), meditation (Breweret al., 2011; Josipovic et al., 2012), and drug-related states such asalcohol (Esposito et al., 2010), amphetamine (Roberts and Gar-avan, 2010), or psychedelic drugs (Carhart-Harris et al., 2012)which in general show changes in the connection between theposterior cingulate and frontal areas. Resting state investigationshave also been attempted using other modalities, such as elec-troencephalography (e.g., Lehembre et al., 2012). Rather, we herefocused on RSNs obtained using fMRI. We reviewed changes infunctional connectivity as a function of various states of wake-fulness. This aim lies within our ultimate clinical goal to bet-ter document, manage and predict residual brain functioningof patients with disorders of consciousness. As these patientsare incapable of functional communication with their environ-ment, they might be wrongly diagnosed as unconscious whenlocked-in (Laureys et al., 2005) or when suffering from apha-sia (Majerus et al., 2009). The ethical implications of erroneousdiagnostics are apparent, especially when pain (Demertzi et al.,2009, 2012) and end-of-life issues (Demertzi et al., 2011a) arediscussed.
At the clinical level, the study of resting state activity in patho-logical states of consciousness can become demanding due to
both clinical and methodological issues. For example, patientswho show increased prescan motion activity will need to beanesthetized to reduce the noise during data acquisition. Apartfrom the clinical issue of applying anesthetics to these vulnera-ble patients, the effect of anesthesia will need to be accounted forin the acquired data. This is added to the methodological chal-lenge of the spatial normalization of severely deformed brains(Shen et al., 2007). Additionally, identified resting state connec-tivity patterns need to be interpreted according to the studiedpopulation. In brain death, for instance, it was shown that restingstate fMRI activity is absent in line with the clinical neurologicalcriteria for the diagnosis of death (Boly et al., 2009). Therefore,in cases where resting state activity, in the DMN for example, isidentified, such findings can be pertained to motion and otherartifacts, not indicative of neuronal activity (Soddu et al., 2011).The characterization of the fMRI functional connectivity of otherRSNs in comatose states remains to be further elucidated. It canbe expected, though, that in such severely constrained situations,like in disorders of consciousness, the functional integrity of mostRSNs is considerably restricted accounting for patients’ limitedcapacities for conscious cognition.
Despite intrinsic limitations, resting state data are technicallyeasier to obtain in patients’ population, as compared to auditory(Schiff et al., 2005) or visual (Monti et al., 2012) activation pro-tocols or “active” mental imagery protocols (Monti et al., 2010;Bardin et al., 2011). The challenge now is twofold: first, to unravelthe relationship (i.e., correlations, anticorrelations) between andamong the RSNs under various conscious conditions. The secondchallenge is to move from static functional connectivity mea-surements to the assessment of the temporal dynamics of suchassociations, meaning looking at changes in functional connectiv-ity across time. Such imperatives are justified when consideringthe nature of intrinsic brain activity, which is ongoing and whichcharacterizes most areas of the brain, beyond the DMN (Raichleand Snyder, 2007).
ACKNOWLEDGMENTSThis work was supported by the Belgian National Funds for Sci-entific Research (FNRS), the European Commission, the JamesMcDonnell Foundation, the Mind Science Foundation, the FrenchSpeaking Community Concerted Research Action (ARC-06/11-340), the Public Utility Foundation “Université Européenne duTravail,” “Fondazione Europea di Ricerca Biomedica,” and theUniversity Hospital of Liège.
REFERENCESAllen, E. A., Erhardt, E. B., Damaraju,
E., Gruner, W., Segall, J. M., Silva,R. F., Havlicek, M., Rachakonda,S., Fries, J., Kalyanam, R., Michael,A. M., Caprihan, A., Turner, J. A.,Eichele, T., Adelsheim, S., Bryan,A. D., Bustillo, J., Clark, V. P.,Feldstein Ewing, S. W., Filbey, F.,Ford, C. C., Hutchison, K., Jung, R.E., Kiehl, K. A., Kodituwakku, P.,Komesu, Y. M., Mayer, A. R., Pearl-son, G. D., Phillips, J. P., Sadek,J. R., Stevens, M., Teuscher, U.,
Thoma, R. J., and Calhoun, V. D.(2011). A baseline for the multi-variate comparison of resting-statenetworks. Front. Syst. Neurosci. 5:2.doi:10.3389/fnsys.2011.00002
American Society of AnesthesiologistsTask Force on Intraoperative Aware-ness. (2006). Practice advisory forintraoperative awareness and brainfunction monitoring a report bythe American society of anesthesi-ologists task force on intraopera-tive awareness. Anesthesiology 104,847–864.
Anderson, J. S., Druzgal, T. J., Lopez-Larson, M., Jeong, E. K., Desai, K.,and Yurgelun-Todd, D. (2010). Net-work anticorrelations, global regres-sion, and phase-shifted soft tissuecorrection. Hum. Brain Mapp. 32,919–934.
Bardin, J. C., Fins, J. J., Katz, D. I.,Hersh, J., Heier, L. A., Tabelow, K.,Dyke, J. P., Ballon, D. J., Schiff, N. D.,and Voss, H. U. (2011). Dissociationsbetween behavioural and functionalmagnetic resonance imaging-basedevaluations of cognitive function
after brain injury. Brain 134,769–782.
Beckmann, C. F., Deluca, M., Devlin, J.T., and Smith, S. M. (2005). Inves-tigations into resting-state connec-tivity using independent componentanalysis. Philos. Trans. R. Soc. Lond.B Biol. Sci. 360, 1001–1013.
Beckmann, C. F., and Smith, S.M. (2004). Probabilistic indepen-dent component analysis for func-tional magnetic resonance imag-ing. IEEE Trans. Med. Imaging 23,137–152.
www.frontiersin.org August 2012 | Volume 3 | Article 295 | 9
158 Appendix E. Paper V

Heine et al. Resting state networks and consciousness
Beckmann, C. F., and Smith, S. M.(2004). Probabilistic independentcomponent analysis for functionalmagnetic resonance imaging. IEEETrans. Med. Imaging 23, 137–152.
Biswal, B.,Yetkin, F. Z., Haughton,V. M.,and Hyde, J. S. (1995). Functionalconnectivity in the motor cortex ofresting human brain using echo-planar MRI. Magn. Reson. Med. 34,537–541.
Boly, M., Balteau, E., Schnakers, C.,Degueldre, C., Moonen, G., Luxen,A., Phillips, C., Peigneux, P., Maquet,P., and Laureys, S. (2007). Base-line brain activity fluctuations pre-dict somatosensory perception inhumans. Proc. Natl. Acad. Sci. U.S.A.104, 12187–12192.
Boly, M., Perlbarg, V., Marrelec, G.,Schabus, M., Laureys, S., Doyon,J., Pelegrini-Issac, M., Maquet, P.,and Benali, H. (2012). Hierarchi-cal clustering of brain activity dur-ing human nonrapid eye movementsleep. Proc. Natl. Acad. Sci. U.S.A.109, 5856–5861.
Boly, M., Tshibanda, L., Vanhau-denhuyse, A., Noirhomme, Q.,Schnakers, C., Ledoux, D., Bover-oux, P., Garweg, C., Lambermont, B.,Phillips, C., Luxen, A., Moonen, G.,Bassetti, C., Maquet, P., and Laureys,S. (2009). Functional connectivity inthe default network during restingstate is preserved in a vegetative butnot in a brain dead patient. Hum.Brain Mapp. 30, 2393–2400.
Boveroux, P., Vanhaudenhuyse, A.,Bruno, M. A., Noirhomme, Q.,Lauwick, S., Luxen, A., Degueldre,C., Plenevaux, A., Schnakers, C.,Phillips, C., Brichant, J. F., Bon-homme, V., Maquet, P., Greicius,M. D., Laureys, S., and Boly, M.(2010). Breakdown of within- andbetween-network resting state func-tional magnetic resonance imag-ing connectivity during propofol-induced loss of consciousness. Anes-thesiology 113, 1038–1053.
Brewer, J. A., Worhunsky, P. D., Gray, J.R., Tang, Y. Y., Weber, J., and Kober,H. (2011). Meditation experience isassociated with differences in defaultmode network activity and connec-tivity. Proc. Natl. Acad. Sci. U.S.A.108, 20254–20259.
Brunetti, M., Della Penna, S., Ferretti,A., Del Gratta, C., Cianflone, F.,Belardinelli, P., Caulo, M., Pizzella,V., Olivetti Belardinelli, M., andRomani, G. L. (2008). A fron-toparietal network for spatial atten-tion reorienting in the auditorydomain: a human fMRI/MEG studyof functional and temporal dynam-ics. Cereb. Cortex 18, 1139–1147.
Bruno, M.-A., Vanhaudenhuyse, A.,Thibaut, A., Moonen, G., and Lau-reys, S. (2011). From unrespon-sive wakefulness to minimally con-scious PLUS and functional locked-in syndromes: recent advances inour understanding of disordersof consciousness. J. Neurol. 258,1373–1384.
Buckner, R. L., Andrews-Hanna, J. R.,and Schacter, D. L. (2008). Thebrain’s default network: anatomy,function, and relevance to disease.Ann. N. Y. Acad. Sci. 1124, 1–38.
Bullmore, E., and Sporns, O. (2009).Complex brain networks: graph the-oretical analysis of structural andfunctional systems. Nat. Rev. Neu-rosci. 10, 186–198.
Carhart-Harris, R. L., Erritzoe, D.,Williams, T., Stone, J. M., Reed, L. J.,Colasanti, A., Tyacke, R. J., Leech, R.,Malizia, A. L., Murphy, K., Hobden,P., Evans, J., Feilding, A., Wise, R. G.,and Nutt, D. J. (2012). Neural corre-lates of the psychedelic state as deter-mined by fMRI studies with psilocy-bin. Proc. Natl. Acad. Sci. U.S.A. 109,2138–2143.
Chai, X. J., Castanon, A. N., Ongur,D., and Whitfield-Gabrieli, S. (2012).Anticorrelations in resting state net-works without global signal regres-sion. Neuroimage 59, 1420–1428.
Churchland, P. S. (2007). The necessary-and-sufficient boondoggle. Am. J.Bioeth. 7, 54–55; discussion W51–W54.
Cole, D. M., Smith, S. M., and Beck-mann, C. F. (2010). Advances andpitfalls in the analysis and inter-pretation of resting-state FMRIdata. Front. Syst. Neurosci. 4:8.doi:10.3389/fnsys.2010.00008
Cole, M. W., and Schneider, W. (2007).The cognitive control network: inte-grated cortical regions with dis-sociable functions. Neuroimage 37,343–360.
Cordes, D., Haughton, V. M., Arfanakis,K., Carew, J. D., Turski, P. A., Moritz,C. H., Quigley, M. A., and Meyerand,M. E. (2001). Frequencies contribut-ing to functional connectivity inthe cerebral cortex in “resting-state”data. AJNR Am. J. Neuroradiol. 22,1326–1333.
Crone, J. S., Ladurner, G., Höller, Y.,Golaszewski, S., Trinka, E., and Kro-nbichler, M. (2011). Deactivationof the default mode network as amarker of impaired consciousness:an fMRI study. PLoS ONE 6, e26373.doi:10.1371/journal.pone.0026373
Damoiseaux, J. S., Rombouts, S. A.,Barkhof, F., Scheltens, P., Stam, C.J., Smith, S. M., and Beckmann, C.F. (2006). Consistent resting-state
networks across healthy subjects.Proc. Natl. Acad. Sci. U.S.A. 103,13848–13853.
De Luca, M., Beckmann, C. F., De Ste-fano, N., Matthews, P. M., and Smith,S. M. (2006). fMRI resting state net-works define distinct modes of long-distance interactions in the humanbrain. Neuroimage 29, 1359–1367.
De Martino, F., Gentile, F., Esposito, F.,Balsi, M., Di Salle, F., Goebel, R.,and Formisano, E. (2007). Classifi-cation of fMRI independent com-ponents using IC-fingerprints andsupport vector machine classifiers.Neuroimage 34, 177–194.
Dehaene, S., and Changeux, J. P.(2005). Ongoing spontaneous activ-ity controls access to conscious-ness: a neuronal model for inatten-tional blindness. PLoS Biol. 3, e141.doi:10.1371/journal.pbio.0030141
Dehaene, S., and Changeux, J. P.(2011). Experimental and theoreti-cal approaches to conscious process-ing. Neuron 70, 200–227.
Dehaene, S., Sergent, C., and Changeux,J. P. (2003). A neuronal networkmodel linking subjective reports andobjective physiological data duringconscious perception. Proc. Natl.Acad. Sci. U.S.A. 100, 8520–8525.
Demertzi, A., Ledoux, D., Bruno, M.-A.,Vanhaudenhuyse, A., Gosseries, O.,Soddu, A., Schnakers, C., Moonen,G., and Laureys, S. (2011a). Attitudestowards end-of-life issues in disor-ders of consciousness: a Europeansurvey. J. Neurol. 258, 1058–1065.
Demertzi, A., Soddu, A., Faymonville,M. E., Bahri, M. A., Gosseries, O.,Vanhaudenhuyse, A., Phillips, C.,Maquet, P., Noirhomme, Q., Luxen,A., and Laureys, S. (2011b). Hyp-notic modulation of resting statefMRI default mode and extrinsicnetwork connectivity. Prog. BrainRes. 193, 309–322.
Demertzi, A., Racine, E., Bruno, M. A.,Ledoux, D., Gosseries, O., Vanhau-denhuyse, A., Thonnard, M., Soddu,A., Moonen, G., and Laureys, S.(2012). Pain perception in disordersof consciousness: neuroscience, clin-ical care, and ethics in dialogue. Neu-roethics 1–14. doi:10.1007/s12152-011-9149-x
Demertzi, A., Schnakers, C., Ledoux,D., Chatelle, C., Bruno, M.-A., Van-haudenhuyse, A., Boly, M., Moonen,G., and Laureys, S. (2009). Differentbeliefs about pain perception in thevegetative and minimally consciousstates: a European survey of medicaland paramedical professionals. Prog.Brain Res. 177, 329–338.
Derbyshire, S. W., Whalley, M. G.,Stenger, V. A., and Oakley, D. A.
(2004). Cerebral activation duringhypnotically induced and imaginedpain. Neuroimage 23, 392–401.
Esposito, F., Pignataro, G., Di Renzo, G.,Spinali, A., Paccone, A., Tedeschi, G.,and Annunziato, L. (2010). Alcoholincreases spontaneous BOLD signalfluctuations in the visual network.Neuroimage 53, 534–543.
Fox, M. D., and Greicius, M. (2010).Clinical applications of restingstate functional connectiv-ity. Front. Syst. Neurosci. 4:19.doi:10.3389/fnsys.2010.00019
Fox, M. D., and Raichle, M. E. (2007).Spontaneous fluctuations in brainactivity observed with functionalmagnetic resonance imaging. Nat.Rev. Neurosci. 8, 700–711.
Fox, M. D., Snyder, A. Z., Vincent, J. L.,Corbetta, M., Van Essen, D. C., andRaichle, M. E. (2005). The humanbrain is intrinsically organized intodynamic, anticorrelated functionalnetworks. Proc. Natl. Acad. Sci.U.S.A. 102, 9673.
Fox, M. D., Snyder, A. Z., Vincent, J. L.,and Raichle, M. E. (2007). Intrin-sic fluctuations within cortical sys-tems account for intertrial variabil-ity in human behavior. Neuron 56,171–184.
Fox, M. D., Zhang, D., Snyder, A. Z.,and Raichle, M. E. (2009). The globalsignal and observed anticorrelatedresting state brain networks. J. Neu-rophysiol. 101, 3270–3283.
Fransson, P. (2005). Spontaneous low-frequency BOLD signal fluctuations:an fMRI investigation of the resting-state default mode of brain functionhypothesis. Hum. Brain Mapp. 26,15–29.
Fukunaga, M., Horovitz, S. G., vanGelderen, P., de Zwart, J. A., Jansma,J. M., Ikonomidou, V. N., Chu, R.,Deckers, R. H., Leopold, D. A., andDuyn, J. H(2006). Large-amplitude,spatially correlated fluctuations inBOLD fMRI signals during extendedrest and early sleep stages. Magn.Reson. Imaging 24, 979–992.
Giacino, J. T., Ashwal, S., Childs, N.,Cranford, R., Jennett, B., Katz, D. I.,Kelly, J. P., Rosenberg, J. H., Whyte,J., Zafonte, R. D., and Zasler, N.D. (2002). The minimally consciousstate: definition and diagnostic cri-teria. Neurology 58, 349–353.
Goldberg, I. I., Harel, M., and Malach,R. (2006). When the brain loses itsself: prefrontal inactivation duringsensorimotor processing. Neuron 50,329–339.
Golland,Y., Bentin, S., Gelbard, H., Ben-jamini, Y., Heller, R., Nir, Y., Hasson,U., and Malach, R. (2007). Extrinsicand intrinsic systems in the posterior
Frontiers in Psychology | Cognition August 2012 | Volume 3 | Article 295 | 10
159

Heine et al. Resting state networks and consciousness
cortex of the human brain revealedduring natural sensory stimulation.Cereb. Cortex 17, 766–777.
Greicius, M. D., Kiviniemi, V., Tervo-nen, O., Vainionpää, V., Alahuhta,S., Reiss, A. L., and Menon,V. (2008). Persistent default-modenetwork connectivity during lightsedation. Hum. Brain Mapp. 29,839–847.
Greicius, M. D., Krasnow, B., Reiss, A.L., and Menon,V. (2003). Functionalconnectivity in the resting brain:a network analysis of the defaultmode hypothesis. Proc. Natl. Acad.Sci. U.S.A. 100, 253.
Hobson, J. A., and Pace-Schott, E. F.(2002). The cognitive neuroscienceof sleep: neuronal systems, con-sciousness, and learning. Nat. Rev.Neurosci. 3, 679–693.
Honey, C. J., Sporns, O., Cammoun, L.,Gigandet, X., Thiran, J. P., Meuli, R.,and Hagmann, P. (2009). Predictinghuman resting-state functional con-nectivity from structural connectiv-ity. Proc. Natl. Acad. Sci. U.S.A. 106,2035–2040.
Horovitz, S. G., Braun, A. R., Carr, W. S.,Picchioni, D., Balkin, T. J., Fukunaga,M., and Duyn, J. H. (2009). Decou-pling of the brain’s default mode net-work during deep sleep. Proc. Natl.Acad. Sci. U.S.A. 106, 11376–11381.
Horovitz,S. G.,Fukunaga,M.,De Zwart,J. A., Van Gelderen, P., Fulton, S.C., Balkin, T. J., and Duyn, J. H.(2008). Low frequency BOLD fluc-tuations during resting wakefulnessand light sleep: a simultaneous EEG-fMRI study. Hum. Brain Mapp. 29,671–682.
Josipovic, Z., Dinstein, I., Weber,J., and Heeger, D. J. (2012).Influence of meditation on anti-correlated networks in the brain.Front. Hum. Neurosci. 5:183.doi:10.3389/fnhum.2011.00183
Kiviniemi, V. J., Haanpää, H., Kan-tola, J.-H., Jauhiainen, J., Vainion-pää, V., Alahuhta, S., and Tervo-nen, O. (2005). Midazolam sedationincreases fluctuation and synchronyof the resting brain BOLD signal.Magn. Reson. Imaging 23, 531–537.
Laird, A. R., Fox, P. M., Eickhoff, S. B.,Turner, J. A., Ray, K. L., Mckay, D.R., Glahn, D. C., Beckmann, C. F.,Smith, S. M., and Fox, P. T. (2011).Behavioral interpretations of intrin-sic connectivity networks. J. Cogn.Neurosci. 23, 4022–4037.
Larson-Prior, L. J., Zempel, J. M., Nolan,T. S., Prior, F. W., Snyder, A. Z., andRaichle, M. E. (2009). Cortical net-work functional connectivity in thedescent to sleep. Proc. Natl. Acad. Sci.U.S.A. 106, 4489–4494.
Laureys, S., Celesia, G. G., Cohadon, F.,Lavrijsen, J., Leon-Carrrion, J., San-nita,W. G., Sazbon, L., Schmutzhard,E.,Von Wild, K. R., Zeman,A., Dolce,G., and Disorders of Consciousness,T. E. (2010). Unresponsive wakeful-ness syndrome: a new name for thevegetative state or apallic syndrome.BMC Med. 8, 68. doi:10.1186/1741-7015-8-68
Laureys, S., Pellas, F., Van Eeckhout, P.,Ghorbel, S., Schnakers, C., Perrin, F.,Berre, J., Faymonville, M.-E., Pantke,K.-H., Damas, F., Lamy, M., Moo-nen, G., and Goldman, S. (2005).The locked-in syndrome: what is itlike to be conscious but paralyzedand voiceless? Prog. Brain Res. 150,495–511.
Lehembre, R., Bruno, M., Vanhauden-huyse, A., Chatelle, C., Cologan,V., Leclercq, Y., Soddu, A., Macq,B., Laureys, S., and Noirhomme,Q. (2012). Resting state EEG studyof comatose patients: a connectiv-ity and frequency analysis to finddifferences between vegetative andminimally conscious states. Funct.Neurol. 27, 41–47.
Lou, H. C., Luber, B., Crupain, M.,Keenan, J. P., Nowak, M., Kjaer, T.W., Sackeim, H. A., and Lisanby,S. H. (2004). Parietal cortex andrepresentation of the mental self.Proc. Natl. Acad. Sci. U.S.A. 101,6827–6832.
Majerus, S., Bruno, M. A., Schnakers,C., Giacino, J. T., and Laureys, S.(2009). The problem of aphasia inthe assessment of consciousness inbrain-damaged patients. Prog. BrainRes. 177, 49–61.
Martuzzi, R., Ramani, R., Qiu, M.,Rajeevan, N., and Constable, R. T.(2010). Functional connectivity andalterations in baseline brain state inhumans. Neuroimage 49, 823–834.
Mason, M. F., Norton, M. I., Van Horn,J. D., Wegner, D., Grafton, S. T.,and Macrae, C. N. (2007). Wan-dering minds: the default networkand stimulus-independent thought.Science 315, 393–395.
Mazoyer, B., Zago, L., Mellet, E.,Bricogne, S., Etard, O., Houde, O.,Crivello, F., Joliot, M., Petit, L., andTzourio-Mazoyer, N. (2001). Corti-cal networks for working memoryand executive functions sustain theconscious resting state in man. BrainRes. Bull. 54, 287–298.
McGeown, W. J., Mazzoni, G., Venneri,A., and Kirsch, I. (2009). Hypnoticinduction decreases anterior defaultmode activity. Conscious. Cogn. 18,848–855.
McKiernan, K. A., D’angelo, B. R., Kauf-man, J. N., and Binder, J. R. (2006).
Interrupting the “stream of con-sciousness”: an fMRI investigation.Neuroimage 29, 1185–1191.
Menon, V., and Uddin, L. Q. (2010).Saliency, switching, attention andcontrol: a network model of insulafunction. Brain Struct. Funct. 214,655–667.
Monti, M. M., Pickard, J. D., andOwen, A. M. (2012). Visual cog-nition in disorders of conscious-ness: from V1 to top-down atten-tion. Hum. Brain Mapp. doi:10.1002/hbm.21507. [Epub ahead ofprint].
Monti, M. M., Vanhaudenhuyse, A.,Coleman, M. R., Boly, M., Pickard, J.D., Tshibanda, L., Owen, A. M., andLaureys, S. (2010). Willful modula-tion of brain activity in disorders ofconsciousness. N. Engl. J. Med. 362,579–589.
Murphy, K., Birn, R. M., Handwerker,D. A., Jones, T. B., and Bandettini,P. A. (2009). The impact of globalsignal regression on resting statecorrelations: are anti-correlated net-works introduced? Neuroimage 44,893–905.
Norton, L., Hutchison, R. M., Young, G.B., Lee, D. H., Sharpe, M. D., andMirsattari, S. M. (2012). Disruptionsof functional connectivity in thedefault mode network of comatosepatients. Neurology 78, 175–181.
Ploner, M., Lee, M. C., Wiech, K., Bingel,U., and Tracey, I. (2010). Prestim-ulus functional connectivity deter-mines pain perception in humans.Proc. Natl. Acad. Sci. U.S.A. 107,355–360.
Posner, J., Saper, C., Schiff, N. D., andPlum, F. (eds). (2007). Plum and Pos-ner’s Diagnosis of Stupor and Coma.New York: Oxford University Press.
Raichle, M. E., Macleod, A. M., Snyder,A. Z., Powers, W. J., Gusnard, D. A.,and Shulman, G. L. (2001). A defaultmode of brain function. Proc. Natl.Acad. Sci. U.S.A. 98, 676–682.
Raichle, M. E., and Snyder, A. Z. (2007).A default mode of brain function:a brief history of an evolving idea.Neuroimage 37, 1083–1090; discus-sion 1097–1089.
Roberts, G. M., and Garavan, H.(2010). Evidence of increased acti-vation underlying cognitive controlin ecstasy and cannabis users. Neu-roimage 52, 429–435.
Roberts, K. L., and Hall, D. A. (2008).Examining a supramodal networkfor conflict processing: a system-atic review and novel functionalmagnetic resonance imaging datafor related visual and auditorystroop tasks. J. Cogn. Neurosci. 20,1063–1078.
Sämann, P. G., Wehrle, R., Hoehn, D.,Spoormaker, V. I., Peters, H., Tully,C., Holsboer, F., and Czisch, M.(2011). Development of the brain’sdefault mode network from wakeful-ness to slow wave sleep. Cereb. Cortex21, 2082–2093.
Sapir, A., D’Avossa, G., Mcavoy, M.,Shulman, G. L., and Corbetta,M. (2005). Brain signals for spa-tial attention predict performancein a motion discrimination task.Proc. Natl. Acad. Sci. U.S.A. 102,17810–17815.
Schiff, N. D., Rodriguez-Moreno, D.,Kamal, A., Kim, K. H., Giacino, J.T., Plum, F., and Hirsch, J. (2005).fMRI reveals large-scale networkactivation in minimally consciouspatients. Neurology 64, 514–523.
Schilbach, L., Eickhoff, S. B., Rotarska-Jagiela, A., Fink, G. R., and Vogeley,K. (2008). Minds at rest? Social cog-nition as the default mode of cog-nizing and its putative relationshipto the “default system” of the brain.Conscious. Cogn. 17, 457–467.
Schrouff, J., Perlbarg, V., Boly, M.,Marrelec, G., Boveroux, P., Vanhau-denhuyse, A., Bruno, M.-A., Lau-reys, S., Phillips, C., Pélégrini-Issac,M., Maquet, P., and Benali, H.(2011). Brain functional integrationdecreases during propofol-inducedloss of consciousness. Neuroimage57, 198–205.
Seeley, W. W., Menon, V., Schatzberg, A.F., Keller, J., Glover, G. H., Kenna,H., Reiss, A. L., and Greicius, M.D. (2007). Dissociable intrinsic con-nectivity networks for salience pro-cessing and executive control. J. Neu-rosci. 27, 2349–2356.
Seghier, M. L., Zeidman, P., Neufeld,N. H., Leff, A. P., and Price,C. J. (2010). Identifying abnor-mal connectivity in patients usingdynamic causal modeling of FMRIresponses. Front. Syst. Neurosci.4:142. doi:10.3389/fnsys.2010.00142
Shen, S., Szameitat, A. J., and Sterr,A. (2007). VBM lesion detectiondepends on the normalization tem-plate: a study using simulated atro-phy. Magn. Reson. Imaging 25,1385–1396.
Shulman, G. L., Fiez, J. A., Corbetta, M.,Buckner, R. L., Miezin, F. M., Raichle,M. E., and Petersen, S. E. (1997).Common blood flow changes acrossvisual tasks: II. Decreases in cere-bral cortex. J. Cogn. Neurosci. 9,648–663.
Smith, S. M., Fox, P. T., Miller, K. L.,Glahn, D. C., Fox, M. P., Mackay,C. E., Filippini, N., Watkins, K. E.,Toro, R., Laird, A. R., and Beckmann,C. F. (2009). Correspondence of the
www.frontiersin.org August 2012 | Volume 3 | Article 295 | 11
160 Appendix E. Paper V

Heine et al. Resting state networks and consciousness
brain’s functional architecture dur-ing activation and rest. Proc. Natl.Acad. Sci. U.S.A. 106, 13040–13045.
Soddu, A., Vanhaudenhuyse, A., Bahri,M. A., Bruno, M. A., Boly, M.,Demertzi, A., Tshibanda, J. F.,Phillips, C., Stanziano, M., Ovadia-Caro, S., Nir, Y., Maquet, P., Papa,M., Malach, R., Laureys, S., andNoirhomme, Q. (2012). Identifyingthe default-mode component in spa-tial IC analyses of patients with dis-orders of consciousness. Hum. BrainMapp. 33, 778–796.
Soddu, A., Vanhaudenhuyse, A.,Demertzi, A., Marie-Aurelie, B.,Tshibanda, L., Di, H., Melanie,B., Papa, M., Laureys, S., andNoirhomme, Q. (2011). Restingstate activity in patients with disor-ders of consciousness. Funct. Neurol.26, 37–43.
Stamatakis, E. A., Adapa, R. M.,Absalom, A. R., and Menon, D.K. (2010). Changes in restingneural connectivity during propo-fol sedation. PLoS ONE 5, e14224.doi:10.1371/journal.pone.0014224
The Executive Committee of the Amer-ican Psychological Association –Division of Psychological Hypno-sis. (1994). Definition and descrip-tion of hypnosis. Contemp. Hypn. 11,142–162.
Tian, L., Jiang, T., Liu, Y., Yu, C., Wang,K., Zhou, Y., Song, M., and Li, K.(2007). The relationship within and
between the extrinsic and intrinsicsystems indicated by resting statecorrelational patterns of sensorycortices. Neuroimage 36, 684–690.
Tohka, J., Foerde, K., Aron, A., Tom,S., and Toga, A. (2008). Automaticindependent component labeling forartifact removal in fMRI. Neuroim-age 39, 1227–1245.
Tracey, I., and Mantyh, P. W. (2007). Thecerebral signature for pain percep-tion and its modulation. Neuron 55,377–391.
van den Heuvel, M. P., and HulshoffPol, H. E. (2010). Exploring thebrain network: a review on resting-state fMRI functional connectiv-ity. Eur. Neuropsychopharmacol. 20,519–534.
Vanhaudenhuyse, A., Demertzi, A., Sch-abus, M., Noirhomme, Q., Bredart,S., Boly, M., Phillips, C., Soddu,A., Luxen, A., Moonen, G., andLaureys, S. (2011). Two distinctneuronal networks mediate theawareness of environment andof self. J. Cogn. Neurosci. 23,570–578.
Vanhaudenhuyse, A., Noirhomme, Q.,Tshibanda, L. J., Bruno, M. A., Bover-oux, P., Schnakers, C., Soddu, A.,Perlbarg, V., Ledoux, D., Brichant,J. F., Moonen, G., Maquet, P., Gre-icius, M. D., Laureys, S., and Boly,M. (2010). Default network con-nectivity reflects the level of con-sciousness in non-communicative
brain-damaged patients. Brain 133,161–171.
Weissman, D. H., Roberts, K., Viss-cher, K., and Woldorff, M. G. (2006).The neural bases of momentarylapses in attention. Nat. Neurosci. 9,971–978.
Whitfield-Gabrieli, S., Moran, J. M.,Nieto-Castanon, A., Triantafyllou,C., Saxe, R., and Gabrieli, J. D.(2011). Associations and dissoci-ations between default and self-reference networks in the humanbrain. Neuroimage 55, 225–232.
Wiech, K., Lin, C. S., Brodersen, K. H.,Bingel, U., Ploner, M., and Tracey,I. (2010). Anterior insula integratesinformation about salience into per-ceptual decisions about pain. J. Neu-rosci. 30, 16324–16331.
Zalesky,A., Fornito,A., and Bullmore, E.(2012). On the use of correlation asa measure of network connectivity.Neuroimage 60, 2096–2106.
Zang, Y. F., He, Y., Zhu, C. Z.,Cao, Q. J., Sui, M. Q., Liang,M., Tian, L. X., Jiang, T. Z., andWang, Y. F. (2007). Altered base-line brain activity in children withADHD revealed by resting-statefunctional MRI. Brain Dev. 29,83–91.
Zeman, A. (2001). Consciousness. Brain124, 1263–1289.
Zuo, X. N., Di Martino, A., Kelly, C.,Shehzad, Z. E., Gee, D. G., Klein,D. F., Castellanos, F. X., Biswal, B.
B., and Milham, M. P. (2010). Theoscillating brain: complex and reli-able. Neuroimage 49, 1432–1445.
Conflict of Interest Statement: Theauthors declare that the research wasconducted in the absence of any com-mercial or financial relationships thatcould be construed as a potential con-flict of interest.
Received: 01 April 2012; accepted: 28 July2012; published online: 27 August 2012.Citation: Heine L, Soddu A, Gómez F,Vanhaudenhuyse A, Tshibanda L, Thon-nard M, Charland-Verville V, KirschM, Laureys S and Demertzi A (2012)Resting state networks and consciousnessAlterations of multiple resting state net-work connectivity in physiological, phar-macological, and pathological conscious-ness states. Front. Psychology 3:295. doi:10.3389/fpsyg.2012.00295This article was submitted to Frontiersin Cognition, a specialty of Frontiers inPsychology.Copyright © 2012 Heine, Soddu, Gómez,Vanhaudenhuyse, Tshibanda, Thonnard,Charland-Verville, Kirsch, Laureys andDemertzi. This is an open-access arti-cle distributed under the terms of theCreative Commons Attribution License,which permits use, distribution andreproduction in other forums, providedthe original authors and source are cred-ited and subject to any copyright noticesconcerning any third-party graphics etc.
Frontiers in Psychology | Cognition August 2012 | Volume 3 | Article 295 | 12
161

162 Appendix E. Paper V

Appendix F
Paper VI
Intrinsic functional connectivity differentiates minimallyconscious from unresponsive patients
Demertzi A*, Antonopoulos G*, Heine L, Voss H U, Crone S J,Kronbichler M, Trinka E, Angeles C, Bahri M, Phillips C, Di-Perri
C, Gomez F, Tshibanda L, Soddu A, Vanhaudenhuyse A,Charland-Verville V, Schiff N D, Whitfield-Gabrieli S*, Laureys
S*.
Brain, 2015, 6:1704doi: 10.3389/fpsyg.2015.01704
163

Intrinsic functional connectivity differentiatesminimally conscious from unresponsivepatientsAthena Demertzi,1,* Georgios Antonopoulos,1,* Lizette Heine,1 Henning U. Voss,2
Julia Sophia Crone,3,4,5 Carlo de Los Angeles,6 Mohamed Ali Bahri,7 Carol Di Perri,1
Audrey Vanhaudenhuyse,8 Vanessa Charland-Verville,1 Martin Kronbichler,3,4
Eugen Trinka,5 Christophe Phillips,7 Francisco Gomez,9 Luaba Tshibanda,10
Andrea Soddu,11 Nicholas D Schiff,12,13 Susan Whitfield-Gabrieli6,* and Steven Laureys1,*
*These authors contributed equally to this work.
Despite advances in resting state functional magnetic resonance imaging investigations, clinicians remain with the challenge of how
to implement this paradigm on an individualized basis. Here, we assessed the clinical relevance of resting state functional magnetic
resonance imaging acquisitions in patients with disorders of consciousness by means of a systems-level approach. Three clinical
centres collected data from 73 patients in minimally conscious state, vegetative state/unresponsive wakefulness syndrome and
coma. The main analysis was performed on the data set coming from one centre (Liege) including 51 patients (26 minimally
conscious state, 19 vegetative state/unresponsive wakefulness syndrome, six coma; 15 females; mean age 49 ! 18 years, range
11–87; 16 traumatic, 32 non-traumatic of which 13 anoxic, three mixed; 35 patients assessed 41 month post-insult) for whom the
clinical diagnosis with the Coma Recovery Scale-Revised was congruent with positron emission tomography scanning. Group-level
functional connectivity was investigated for the default mode, frontoparietal, salience, auditory, sensorimotor and visual networks
using a multiple-seed correlation approach. Between-group inferential statistics and machine learning were used to identify each
network’s capacity to discriminate between patients in minimally conscious state and vegetative state/unresponsive wakefulness
syndrome. Data collected from 22 patients scanned in two other centres (Salzburg: 10 minimally conscious state, five vegetative
state/unresponsive wakefulness syndrome; New York: five minimally conscious state, one vegetative state/unresponsive wakeful-
ness syndrome, one emerged from minimally conscious state) were used to validate the classification with the selected features.
Coma Recovery Scale-Revised total scores correlated with key regions of each network reflecting their involvement in conscious-
ness-related processes. All networks had a high discriminative capacity (480%) for separating patients in a minimally conscious
state and vegetative state/unresponsive wakefulness syndrome. Among them, the auditory network was ranked the most highly.
The regions of the auditory network which were more functionally connected in patients in minimally conscious state compared to
vegetative state/unresponsive wakefulness syndrome encompassed bilateral auditory and visual cortices. Connectivity values in
these three regions discriminated congruently 20 of 22 independently assessed patients. Our findings point to the significance of
preserved abilities for multisensory integration and top–down processing in minimal consciousness seemingly supported by audi-
tory-visual crossmodal connectivity, and promote the clinical utility of the resting paradigm for single-patient diagnostics.
1 Coma Science Group, GIGA-Research & Cyclotron Research Centre, University and CHU University Hospital of Liege, Liege,Belgium
2 Department of Radiology and Citigroup Biomedical Imaging Centre, Weill Cornell Medical College, New York, USA3 Department of Psychology and Centre for Neurocognitive Research, Salzburg, Austria
doi:10.1093/brain/awv169 BRAIN 2015: Page 1 of 13 | 1
Received January 20, 2015. Revised March 23, 2015. Accepted April 18, 2015.! The Author (2015). Published by Oxford University Press on behalf of the Guarantors of Brain. All rights reserved.For Permissions, please email: [email protected]
Brain Advance Access published June 27, 2015
by guest on July 23, 2015D
ownloaded from
164 Appendix F. Paper VI

4 Neuroscience Institute and Centre for Neurocognitive Research, Christian-Doppler-Klinik, Paracelsus Private Medical University,Salzburg, Austria
5 Department of Neurology, Christian-Doppler-Klinik, Paracelsus Private Medical University, Salzburg, Austria6 Martinos Imaging Centre at McGovern Institute for Brain Research, Massachusetts Institute of Technology, Cambridge MA, USA7 Cyclotron Research Centre, University of Liege, Liege, Belgium8 Department of Algology and Palliative Care, CHU University Hospital of Liege, Liege, Belgium9 Computer Science Department, Universidad Central de Colombia, Bogota, Colombia
10 Department of Radiology, CHU University Hospital of Liege, Liege, Belgium11 Brain and Mind Institute, Department of Physics and Astronomy, Western University, London, Ontario, Canada12 Department of Neuroscience, Weill Cornell Graduate School of Medical Sciences, New York, USA13 Department of Neurology and Neuroscience, Weill Cornell Medical College, New York, USA
Correspondence to: Demertzi Athena,Coma Science Group, Cyclotron Research Centre,Allee du 6 aout n" 8, Sart Tilman B30,Universite de Liege, 4000 Liege, Belgium.E-mail: [email protected]
Keywords: consciousness; traumatic brain injury; resting state connectivity; sensory systems; anoxia
Abbreviations: CRS-R = Coma Recovery Scale-Revised; MCS = minimally conscious state; UWS = unresponsive wakefulnesssyndrome; VS = vegetative state
IntroductionAs patients with acute or chronic disorders of conscious-ness are by definition unable to communicate, their diag-nosis is particularly challenging. Patients in coma, forexample, lay with eyes closed and do not respond to anyexternal stimulation. When they open their eyes but remainunresponsive to external stimuli they are considered to bein a vegetative state (VS; Jennett and Plum, 1972) or, asmost recently coined, unresponsive wakefulness syndrome(UWS; Laureys et al., 2010). When patients exhibit signs offluctuating yet reproducible remnants of non-reflex behav-iour, they are considered to be in a minimally consciousstate (MCS; Giacino et al., 2002). To date, the diagnosticassessment of patients with disorders of consciousness ismainly based on the observation of motor and oro-motorbehaviours at the bedside (Giacino et al., 2014). The evalu-ation of non-reflex behaviour, however, is not straightfor-ward as patients can fluctuate in terms of vigilance, maysuffer from cognitive (e.g. aphasia, apraxia) and/or sensoryimpairments (e.g. blindness, deafness), from small or easilyexhausted motor activity and pain. In these cases, absenceof responsiveness does not necessarily correspond toabsence of awareness (Sanders et al., 2012). Alternatively,motor-independent technologies can aid the clinical differ-entiation between the two patient groups (Bruno et al.,2010).
Up to now, accurate single-patient categorization in MCSand VS/UWS has been performed by means of transcranialmagnetic stimulation in combination with EEG (Rosanovaet al., 2012; Casali et al., 2013) and by combining differentEEG measures (Sitt et al., 2014). In terms of patient separ-ation by means of functional MRI, activation (which utilisesensory stimulation; Schiff et al., 2005; Coleman et al.,2007; Di et al., 2007) and active paradigms (which probe
mental command following; Owen et al., 2006; Montiet al., 2010; Bardin et al., 2012) have been used to detectconvert awareness in these patients. An apparent limitationof the latter approaches is that patients may demonstratemotor and language deficits which incommode these assess-ments and heighten the risk of false-negative findings(Giacino et al., 2014). The application of these paradigmscan also be constrained due to each institution’s technicalfacilities.
Alternatively, functional MRI acquisitions during restingstate do not require sophisticated setup and surpass theneed for subjects’ active participation. Past resting statefunctional MRI-based assessment of patients has focusedon the default mode network, which mainly encompassesanterior and posterior midline regions, and which hasbeen involved in conscious and self-related cognitive pro-cesses (Raichle et al., 2001; Buckner et al., 2008). Suchinvestigations have shown that default mode networkfunctional connectivity decreases alongside the spectrumof consciousness, moving from healthy controls to patientsin MCS, VS/UWS and coma (Boly et al., 2009;Vanhaudenhuyse et al., 2010; Norton et al., 2012;Soddu et al., 2012; Demertzi et al., 2014; Huang et al.,2014). In patients, the precuneus and posterior cingulatecortex of the default mode network have been also char-acterized by decreases in functional MRI resting state lowfrequency fluctuations and regional voxel homogeneity(which refers to the similarity of local brain activityacross a region) (Tsai et al., 2014). Reduced functionalMRI functional connectivity has been further identifiedfor interhemispheric homologous regions belonging tothe extrinsic or task-positive network (implicated in theawareness of the environment; Vanhaudenhuyse et al.,2011) in patients as compared to controls (Ovadia-Caroet al., 2012). Reduced interhemispheric connectivity has
2 | BRAIN 2015: Page 2 of 13 A. Demertzi et al.
by guest on July 23, 2015D
ownloaded from
165

been also indicated by means of partial correlations(Maki-Marttunen et al., 2013). In terms of graph theorymetrics, comatose patients were shown to preserve globalnetwork properties but cortical regions, which worked ashubs in healthy controls, became non-hubs in comatosebrains and vice versa (Achard et al., 2011, 2012).Similarly, chronic patients showed altered network proper-ties in medial parietal and frontal regions as well as in thethalamus, and most of the affected regions in unresponsivepatients belonged to the so-called ‘rich-club’ of highlyinterconnected central nodes (Crone et al., 2014). Morerecently, functional MRI-based single-patient classificationhas been performed by considering as discriminating fea-ture the neuronal properties of various intrinsic connectiv-ity networks (Demertzi et al., 2014). The discriminationbetween ‘neuronal’ and ‘non-neuronal’ was based on thespatial and temporal properties (fingerprints) of the iden-tified networks that were extracted by means of independ-ent component analysis (De Martino et al., 2007).According to specific criteria (Kelly et al., 2010), ‘non-neuronal’ components were those that showed activation/deactivation in peripheral brain areas, in the cerebrospinalfluid (CSF) and white matter, as well as those showinghigh frequency fluctuations (40.1 Hz), spikes, presenceof a sawtooth pattern and presence of thresholdedvoxels in the superior sagittal sinus. Conversely, ‘neuronal’were those networks when at least 10% of the activations/deactivations were found in small to larger grey matterclusters localized to small regions of the brain. Based onthis definition of neuronality, the ‘neuronal’ properties ofthe default mode and auditory network were able to sep-arate single-patients from healthy controls with 85.3% ac-curacy. Nevertheless, the discrimination accuracy betweenpatients in MCS and VS/UWS reached only a chance level(Demertzi et al., 2014).
Taken together, these studies show that the so far rest-
ing state functional MRI-based differentiation of patients
has been performed either at the group-level or concerned
the classification between healthy and pathological groups.
As a consequence, clinicians remain with the challenge of
how to implement the resting state functional MRI para-
digm on an individualized basis for the more challenging
discrimination between the MCS and VS/UWS (Edlow
et al., 2013). Here, we aimed at promoting the MCS-VS/
UWS single-patient differentiation by using resting state
functional MRI measurements in this clinical population.
To this end, we studied systems-level resting state func-
tional MRI functional connectivity in traumatic and non-
traumatic patients with acute and chronic disorders of
consciousness with the aim to (i) estimate the contribution
of each network to the level of consciousness as deter-
mined by behavioural assessment; (ii) rank the capacity
of each network to differentiate between patients in
MCS and VS/UWS; and (iii) automatically classify inde-
pendently assessed patients.
Materials and methods
SubjectsThree data sets were used, including patients scanned in Liege[to address study aims (i) and (ii)], Salzburg and New York[to address study aim (iii)]. Inclusion criteria were patients inMCS, VS/UWS and coma following severe brain damage stu-died at least 2 days after the acute brain insult. Patients wereexcluded when there was contraindication for MRI (e.g. pres-ence of ferromagnetic aneurysm clips, pacemakers), MRIacquisition under sedation or anaesthesia, and uncertain clin-ical diagnosis. Healthy volunteers were free of psychiatric orneurological history. The study was approved by the EthicsCommittee of the Medical School of the University of Liege,the Ethics Committee of Salzburg, and the Institutional ReviewBoard at Weill Cornell Medical College. Informed consent toparticipate in the study was obtained from the healthy subjectsand from the legal surrogates of the patients.
Data acquisitionAll data were acquired on 3 T Siemens TIM Trio MRI scan-ners (Siemens Medical Solutions). For the Liege data set, 300multislice T2*-weighted images were acquired with a gradient-echo echo-planar imaging sequence using axial slice orienta-tion and covering the whole brain (32 slices; voxelsize = 3 # 3 # 3 mm3; matrix size = 64 # 64; repetitiontime = 2000 ms; echo time = 30 ms; flip angle = 78"; field ofview = 192 # 192 mm). For the Salzburg data set, 250T2*-weighted images (36 slices with 3-mm thickness; repeti-tion time = 2250 ms; echo time = 30 ms; flip angle = 70"; fieldof view = 192 # 192 mm). For the New York data set, 180T2*-weighted images were acquired (32 slices; voxelsize = 3.75 # 3.75 # 4 mm3; matrix size = 64 # 64; repetitiontime = 2000 ms; echo time = 30 ms; flip angle = 90"; field ofview = 240 # 240 mm).
Subject-level connectivity analysisData analysis is illustrated in Fig. 1.
Data preprocessing
Preprocessing and connectivity analyses were performed in thesame way for all subjects across the three data sets. The threeinitial volumes were discarded to avoid T1 saturation effects.For anatomical reference, a high-resolution T1-weighted imagewas acquired for each subject (T1-weighted 3D magnetization-prepared rapid gradient echo sequence). Data preprocessingwas performed using Statistical Parametric Mapping8 (SPM8; www.fil.ion.ucl.ac.uk/spm). Preprocessing stepsincluded slice-time correction, realignment, segmentation ofstructural data, normalization into standard stereotacticMontreal Neurological Institute (MNI) space and spatialsmoothing using a Gaussian kernel of 6 mm full-width athalf-maximum. As functional connectivity is influenced byhead motion in the scanner (Van Dijk et al., 2012), weaccounted for motion artifact detection and rejection usingthe artifact detection tool (ART; http://www.nitrc.org/pro-jects/artifact_detect). Specifically, an image was defined as anoutlier (artifact) image if the head displacement in x, y, or
Intrinsic connectivity classification BRAIN 2015: Page 3 of 13 | 3
by guest on July 23, 2015D
ownloaded from
166 Appendix F. Paper VI

z direction was 40.5 mm from the previous frame, or if therotational displacement was 40.02 radians from the previousframe, or if the global mean intensity in the image was 43standard deviations (SD) from the mean image intensity for theentire resting scan. Outliers in the global mean signal intensityand motion were subsequently included as nuisance regressors(i.e. one regressor per outlier within the first-level generallinear model). Therefore, the temporal structure of the datawas not disrupted.
For noise reduction, previous methods subtracted the globalsignal across the brain (a controversial issue in resting stateanalyses; Murphy et al., 2009; Saad et al., 2012; Wong et al.,2012), and the mean signals from noise regions of interest(Greicius et al., 2003; Fox et al., 2005). Here, we used theanatomical component-based noise correction method(aCompCor; Behzadi et al., 2007) as implemented in CONNfunctional connectivity toolbox (http://www.nitrc.org/projects/conn/; Whitfield-Gabrieli and Nieto-Castanon, 2012). TheaCompCor models the influence of noise as a voxel-specificlinear combination of multiple empirically estimated noisesources by deriving principal components from noise regionsof interest and by including them as nuisance parameterswithin the general linear models. Specifically, the anatomicalimage for each participant was segmented into white matter,grey matter, and CSF masks using SPM8. To minimize partialvoluming with grey matter, the white matter and CSF maskswere eroded by one voxel, which resulted in substantiallysmaller masks than the original segmentations (Chai et al.,2012). The eroded white matter and CSF masks were then
used as noise regions of interest. Signals from the whitematter and CSF noise regions of interest were extracted fromthe unsmoothed functional volumes to avoid additional risk ofcontaminating white matter and CSF signals with grey mattersignals. A temporal band-pass filter of 0.008–0.09 Hz wasapplied on the time series to restrict the analysis to low fre-quency fluctuations, which characterize functional MRI bloodoxygenation level-dependent resting state activity as classicallyperformed in seed-correlation analysis (Greicius et al., 2003;Fox et al., 2005). Residual head motion parameters (threerotation and three translation parameters, plus another sixparameters representing their first-order temporal derivatives)were regressed out.
Extraction of intrinsic connectivity networks
Functional connectivity adopted a seed-based correlationapproach. Seed-correlation analysis uses extracted blood oxy-genation level-dependent time series from a region of interest(the seed) and determines the temporal correlation betweenthis signal and the time series from all other brain voxels.Evidently, the selection of the seed region is critical because,in principle, it can lead to as many overlapping networks asthe number of possible selected seeds (Cole et al., 2010).Additionally, a network disruption can be expected due topatients’ underlying neuropathology, as the chosen seed mayno longer be included in the overall network. Using more seedregions, this issue can be overcome and therefore ensureproper network characterization in patients. Here, the seeds
Figure 1 Analysis pipeline. Data analysis at the subject-level encompassed signal preprocessing and extraction of the intrinsic connectivity
networks. Data analysis at the group-level encompassed estimation of functional connectivity in the networks of interest, estimated the con-
tribution of each network to the level of consciousness by means of CRS-R total score regression analysis, and identified connectivity differences
between the group of patients in MCS and VS/UWS for each network. Network ranking methodology was used to rank characteristic features
(i.e., connectivity differences per network)to discriminate individual patients into the groups of MCS and VS/UWS. Two independent data sets of
patients, assessed in Salzburg and New York, were used to further validate patient classification. Different colours indicate the three data sets and
how these where used along the analysis pipeline.
4 | BRAIN 2015: Page 4 of 13 A. Demertzi et al.
by guest on July 23, 2015D
ownloaded from
167

that were selected to replicate the networks were defined as 10-mm (for cortical areas) and 4-mm radius spheres (for subcor-tical structures) around peak coordinates taken from the litera-ture (Supplementary material). For each network, time seriesfrom the voxels contained in each seed region were extractedand then averaged together. In that way, the resulting averagedtime course was estimated by taking into account the timecourses of more than one regions. The averaged time serieswere used to estimate whole-brain correlation r maps thatwere then converted to normally distributed Fisher’s z trans-formed correlation maps to allow for group-level comparisons.
Group-level connectivity analysisFor the Liege data set, one-sample t-tests were ordered toestimate network-level functional connectivity for patients inMCS, VS/UWS and in coma; the data from healthy controlswere used as a reference to ensure proper network character-ization. An exploratory analysis looked for network-level con-nectivity changes as a function of patients’ aetiology andchronicity. Two 2 # 2 factorial designs between aetiology(traumatic, non-traumatic)/ chronicity (acute, chronic) andthe clinical entities (MCS, VS/UWS) were ordered. If an inter-action effect was identified, these variables had to be enteredas regressors in the general linear models.
To address the first aim of the study, i.e. to estimate thecontribution of each network to the level of consciousness,patients’ Coma Recovery Scale-Revised (CRS-R) total scoreswere used as regressors to determine the relationship betweeneach network’s functional connectivity and the level of con-sciousness. As a control, CRS-R total scores were used asregressors of functional connectivity for the cerebellum net-work (three regions of interest, Supplementary material),which is known to be minimally implicated in conscious-related processes (Tononi, 2008; Yu et al., 2015).
To address the second aim of the study, i.e. to determine thecapacity of each network to differentiate between patients inMCS and VS/UWS, initially two-sample t-tests were ordered toidentify the regions of each network showing higher functionalconnectivity in patients in MCS compared to VS/UWS (Liegedata set). The resulting difference maps were saved as masks,which were used subsequently for the network ranking andselection step. All results were considered significantP50.05 corrected for multiple comparisons at false discoveryrate (FWE; cluster-level).
Network ranking and selectionUsing the REX Toolbox (http://www.nitrc.org/projects/rex/),the difference masks which were calculated in the previousstep were used to extract mean connectivity values (averagez-values across the whole mask) from the first-level contrastimages estimated for each network. Therefore, one value persubject per network was created leading to a 6 # 1 vectorper subject (i.e. 45 # 6 matrix). These vector values were con-sidered as features in a feature ranking methodology (Saeyset al., 2007) as implemented in Matlab (http://www.math-works.nl/help/bioinfo/ref/rankfeatures.html). The results of thefeature (i.e. network) ranking were verified by means of single-feature linear support vector machine classifier (Burges, 1998).Supplementary material contains further details on the net-work ranking procedure and results.
To address the third aim of the study, i.e. to automaticallyclassify independently assessed patients coming from two otherclinical centres, we focused on the network which was rankedmost highly during the network ranking procedure. For thatnetwork, a linear kernel support vector machine classifier(Burges, 1998) with regularization parameter C = 1 was used.This parameter was chosen based on its wide use in themachine learning procedure (Phillips et al., 2011). The featuresthat were used for the training were individual mean connect-ivity values extracted from the first-level contrast images usingthe relevant network binary mask as described above. Toavoid single feature classification, hence running the risk ofoverfitting, more features were included for the classifier’straining. The number of features was based on the numberof clusters showing higher connectivity in patients in MCScompared to VS/UWS as indicated by the contrast managerof the CONN toolbox during the connectivity analysis(FWE P50.05, cluster-level correction).
Classification of independentlyassessed patientsThe final validation of the classifier was performed on a newset of connectivity values extracted from independentlyassessed patients in Salzburg (n = 15) and New York (n = 7).The data preprocessing, extraction of intrinsic connectivity net-work, and feature extraction followed an identical procedureas described above for the Liege data set. To test for robust-ness, we also evaluated whether the same classifier generalizedto healthy controls subjects scanned in two centres (Liege,Salzburg; no healthy control data were available for the NewYork centre).
Results
Subjects
In Liege, between April 2008 and December 2012, 177patients with disorders of consciousness underwent MRIscanning. Of these, 80 (45%) were excluded due to sed-ation or anaesthesia during scanning. Of the remaining 97patients scanned in an awake state, five due to change ofdiagnosis within a week after scanning, 14 because theyshowed functional communication, 15 due to technical rea-sons or movement artifacts, and 12 due to incongruencebetween clinical diagnosis and fluorodeoxyglucose (FDG)-PET scanning (Stender et al., 2014). As regards the lattercriterion, we decided to exclude patients showing wide-spread PET activation in midline and frontoparietal regionswhile the bedside diagnosis indicated the VS/UWS, in orderto avoid confounds due to clinical ambiguity.
The included 51 patients were behaviourally diagnosedwith the CRS-R (Giacino et al., 2004) as in MCS = 26, VS/UWS = 19 and coma = 6 (15 females; mean age 49 ! 18years, range 11–87; 16 traumatic, 32 non-traumatic ofwhich 13 were anoxic, three mixed; 35 patients wereassessed in the chronic setting, i.e. 41 month post-insult).Data from an age-matched group of 21 healthy volunteers
Intrinsic connectivity classification BRAIN 2015: Page 5 of 13 | 5
by guest on July 23, 2015D
ownloaded from
168 Appendix F. Paper VI

(eight females; mean age 45 ! 17 years; range 19–72) wereused as a reference to the connectivity analyses and to val-idate the generalizability of the classifier without beingincluded in the training. The data set from Salzburgincluded 10 MCS and five VS/UWS patients; the data setfrom New York included five MCS, one VS/UWS and onepatient emerged from MCS. All patients’ demographic andclinical characteristics are summarized in theSupplementary material.
For the Liege data set, the effects of the denoising pro-cedure are summarized in the Supplementary material.Also, the number of motion outlier images did not differamong healthy controls (mean = 9 ! 8), patients in MCS(mean = 22 ! 17), VS/UWS (mean = 17 ! 12), coma(mean = 2 ! 2) (for all t-tests, P50.05). The exploratoryanalysis indicated a main effect for the clinical entity(i.e. MCS, VS/UWS) on the functional connectivity ofeach network. No interaction was identified betweenthe clinical entity and aetiology (traumatic: MCS = 13,VS/UWS = 1; non-traumatic: MCS = 12 + 1 mixed; VS/UWS = 16 + 2 mixed) or chronicity (acute MCS = 5, VS/UWS = 6; chronic MCS = 21, VS/UWS = 13; averagelength of time since the injury was 902.3 days, min-imum = 2 days, maximum = 9900).
Group-level connectivity analysis
For the default mode, frontoparietal, salience, auditory,sensorimotor and visual network, functional connectivityencompassed regions classically reported for healthy con-trols; all six networks showed reduced connectivity inpatients in MCS, connectivity was hardly identified inpatients in VS/UWS and was absent in comatose patients(Supplementary material).
CRS-R total scores correlated with functional connectiv-ity in key regions of each network (Fig. 2). In contrast,when the CRS-R total scores were used as regressors ofconnectivity in the cerebellum, which is known for its min-imal involvement in consciousness processes (Tononi,2008), no areas showed connectivity with the behaviouralscores. For illustrative purposes, the cerebellar network inhealthy controls is presented in the Supplementarymaterial.
The regions that showed higher functional connectivity inpatients in MCS compared to VS/UWS for each networkare summarized in Fig. 3. To minimize the possibility thatdifferences in functional connectivity reflected differences inbrain anatomy, we performed a two-sample t-test voxel-based morphometry on the normalized grey matter andwhite matter segmented masks (smoothed at 6 mm full-width at half-maximum). No differences in grey mattervolume between patients in MCS and VS/UWS were iden-tified at FWE P50.05 either at the whole-brain or at thecluster-level. Similarly, the analysis of white matter volumesidentified no differences between the two groups, even at aliberal threshold P5 0.001 (whole brain level) uncorrectedfor multiple comparisons. The average grey matter and
white matter volumes in the two patient groups arereported in the Supplementary material.
Network ranking and selection
All networks were found to discriminate between patientsin MCS and VS/UWS with an acceptable accuracy(Supplementary material). Among them, the auditory net-work was the most highly ranked system to separatepatients in MCS from those in VS/UWS.
Validation with independent data set
Functional connectivity of the auditory network was fur-ther used to classify independently assessed patients. Theclassification was performed on the connectivity strength inbilateral auditory and visual cortices (Fig. 3). This three-feature vector was preferred to a single-feature classification(i.e. the average connectivity across all areas of the auditorynetwork mask) to avoid over-fitting of the classifier. Basedon these three clusters’ connectivity strength (z-values),20 of 22 patients independently assessed in Salzburg andNew York were discriminated congruently (Fig. 4 andSupplementary material), namely the CRS-R diagnosismatched the classification outcome. As in Phillips et al.(2011), for each feature we calculated its weighted vector‘w’, which determines the orientation of the decision sur-face, indicative of which feature drives the classification(Bishop, 2006). For the right auditory cortex it wasw = $1.7890, for the left auditory cortex w = $0.4002and for the occipital cortex w = $0.7362. The patientwho was misclassified as being in MCS had a CRS-Rtotal score of 5 on the day of scanning (indicating theVS/UWS; Patient 11 of centre two, Supplementary material)and she evolved to MCS 38 days later (Auditory Function:1, Visual Function: 3, Motor Function: 2, Oromotor/VerbalFunction: 2, Communication: 0, Arousal: 2). The patientwho was misclassified as being in VS/UWS had a CRS-Rtotal score of 9 on the day of scanning (indicating theMCS; Patient 13 of centre two, Supplementary material)based on the presence of localization to noxious stimula-tion but this behaviour could not be elicited in neither pre-vious (AF: 1, VF: 0, MF: 0, O/VF: 1, COM: 0, AR: 2) orsubsequent evaluations (AF: 2, VF: 1, MF: 2, O/VF: 1,COM: 0, AR: 2). To test robustness, we evaluated whetherthe same classifier generalized to healthy control subjectsscanned in Liege and Salzburg (n = 39; no healthy controldata were available for the New York centre). The majorityof healthy controls (37 of 39; 95%) were classified as MCS(Supplementary material).
DiscussionWe here aimed at determining the clinical utility of theresting state functional MRI paradigm in patients with dis-orders of consciousness by employing a systems-level
6 | BRAIN 2015: Page 6 of 13 A. Demertzi et al.
by guest on July 23, 2015D
ownloaded from
169

approach. Resting state functional MRI connectivity of thedefault mode, frontoparietal, salience, auditory, sensori-motor and visual networks were first shown to correlatewith behavioural CRS-R assessment scores, highlighting
their contribution to the level of consciousness. Previousstudies on the default mode network, linked to autobio-graphical memory, mind-wandering, and unconstrainedcognition (Buckner et al., 2008), also showed
Figure 3 Regions showing higher functional connectivity in patients in MCS compared to patients in VS/UWS for each net-
work. Statistical maps are thresholded at FWE P5 0.05 (cluster-level) and are rendered on 3D surface plot template (top = lateral view;
bottom = medial view).
Figure 2 The intrinsic connectivity networks are involved in consciousness-related processing. Functional connectivity of all studied
networks (areas in red) correlate with the level of consciousness as determined by behavioural assessment with the Coma Recovery Scale-
Revised (total scores) in patients in MCS, VS/UWS and coma. Statistical maps are thresholded at FWE P5 0.05 (cluster-level) and are rendere on
a glass brain template (transverse view).
Intrinsic connectivity classification BRAIN 2015: Page 7 of 13 | 7
by guest on July 23, 2015D
ownloaded from
170 Appendix F. Paper VI

consciousness-level dependent reductions in connectivityunder physiological (Horovitz et al., 2009; Samann et al.,2011) and pharmacological unconsciousness (Greiciuset al., 2008; Boveroux et al., 2010; Stamatakis et al.,2010; Amico et al., 2014). Similarly, the frontoparietal net-work, which has been linked to perceptual and somestheticprocessing (Smith et al., 2009; Laird et al., 2011) and isconsidered critical for conscious reportable perception(Dehaene et al., 2003), showed reductions in functionalconnectivity during sleep (Larson-Prior et al., 2009;Samann et al., 2011; Boly et al., 2012) and anaesthesia(Boveroux et al., 2010). The salience network, which hasbeen involved in conflict monitoring, information integra-tion, response selection, interoceptive processes (Seeleyet al., 2007; Smith et al., 2009; Ploner et al., 2010;
Wiech et al., 2010) and the emotional counterpart ofpain (Seeley et al., 2007; Shackman et al., 2011), alsoshowed modulations in connectivity under propofol anaes-thesia (Guldenmund et al., 2013). Here, the positive correl-ation between CRS-R scores and the salience networkanterior cingulate cortex could account for the preservedcapacities of some patients to orient their attentionalresources towards environmental salient stimuli, such asnoxious stimulation, corroborating previous PET data(Boly et al., 2008). With regards to sensory networks,little changes have been reported under physiological andpharmacological unconsciousness (Heine et al., 2012).Nevertheless, propofol-induced disconnections have beenshown between the default mode network and motorcortex, reticular activating system and the thalamus
Figure 4 The auditory-visual crossmodal functional connectivity discriminates single patients in MCS from patients in VS/
UWS. The 3D space indicating connectivity between left auditory, right auditory and occipital cortex (Supplementary material) has been
compressed into two dimensions to represent the distance of each patient (in circles) from the decision plane (arbitrary values). The upper panel
plots the data of patients (in circles) who were used for the classifier’s training (Liege data set, n = 45). The lower panel summarizes the classifier’s
decision on the validation data set including patients (in asterisks) independently assessed in Salzburg (n = 15) and New York (n = 7). Based on the
crossmodal interaction, 20 of the 22 independently assessed patients were classified congruently, namely the behavioural diagnosis matched the
classification outcome.
8 | BRAIN 2015: Page 8 of 13 A. Demertzi et al.
by guest on July 23, 2015D
ownloaded from
171

(Stamatakis et al., 2010). In particular, the thalamus is ofcritical importance to consciousness (Dehaene andChangeux, 2005; Tononi, 2008). In our analysis the signifi-cance of the thalamus was controlled by involving it amongthe regions of interest in the three large-scale networks,namely the default mode network, frontoparietal and sali-ence. The direct comparison between patients in MCS andVS/UWS did not identify any differences in network-levelthalamic connectivity. However, a recent study with pa-tients with disorders of consciousness using a target-detec-tion task showed that respondents had a greaterconnectivity between the anterior thalamus and prefrontalcortex. These findings suggest that thalamo-frontal circuitsare important for cognitive top–down processing (Montiet al., 2015). Interestingly, when the cerebellum was usedas a control network, CRS-R total scores did not correlatewith any regions of this network in patients. Such findingsconfirm previous suggestions that the cerebellum has min-imal implication in conscious-related processing (Tononi,2008; Yu et al., 2015). Taken together, the positive correl-ation between clinical scores and each network’s functionalconnectivity highlight that the here studied networks are anappropriate means to study, at least to a certain degree,residual cognitive function in this patient cohort.
Importantly for clinical practice, we further aimed atdetermining the capacity of each network to differentiatebetween patients in MCS and VS/UWS. In terms of func-tional MRI-based differentiation of patients, to date differ-ences in functional connectivity have been observed only atthe group-level for the default mode (Boly et al., 2009;Vanhaudenhuyse et al., 2010; Norton et al., 2012; Sodduet al., 2012; Demertzi et al., 2014), the frontoparietal andthe auditory networks (Demertzi et al., 2014). Here, wereplicated these findings and further showed group differ-ences in functional connectivity for the salience, sensori-motor and visual networks. Moving towards single-patient network-based differentiation, we found that allnetworks were able to differentiate patients with an accept-able accuracy (486%). Such high rate of accuracy can bepartly attributed to the fact that the network ranking wasbased on features extracted from the same population forwhich between-group differences were already known.To avoid a double-dipping effect, we aimed at validatingthe most highly ranked network in two independently as-sessed patient data sets (Salzburg and New York) andacross healthy controls. To that end, we opted for single-patient classification based on the connectivity strength ofthe auditory network. Based on this network’s connectivity,20 of the 22 new patients were classified congruently, i.e.the clinical diagnosis matched the classification outcome.Of note is that the classifier positioned the independentlyassessed patients closer to the decision plane compared topatients included in the training set. This could beexplained by the abovementioned favouring of the Liegetraining data set during the network ranking procedure,which might have led to a stricter classification of the val-idation set. Although the intrinsic connectivity networks
have been shown to be robust independent of differentscanning parameters (Van Dijk et al., 2010), the differentparameters employed in each of the three centres might alsohave influenced the classifier’s estimation. Alternatively, theuse of a relevance vector machine classifier (Phillips et al.,2011), which returns probabilities of a patient belongingto a clinical condition instead of using a binary decision,could be a more sensitive way to classify patients lessstrictly.
The classification results further highlight the challengesposed by behavioural examination (Majerus et al., 2005)which in many cases underestimates patients’ level of con-sciousness (Schnakers et al., 2009). Here, the validation ofthe auditory network’s classifier worked congruently forthe majority of the included patients (20/22).Interestingly, the patient who was misclassified as MCShad a profile of VS/UWS on the day of scan but evolvedto MCS 38 days later. The other patient was misclassifiedas VS/UWS but had a clinical profile of MCS on the day ofscanning based on the presence of localization to noxiousstimulation (note that this behaviour could not be elicitedin any other evaluations). The validation of the classifier’soutcome to the clinical evaluation was used as a startingpoint in our analysis. Therefore, a well-defined diagnosticbaseline was critical for the subsequent patient classifica-tion. To that end, repeated clinical examinations with theCRS-R (average number of assessments n = 6 per patient)were performed. The clinical diagnosis was further con-firmed with FDG-PET imaging, which has been shown tohave high sensitivity in identifying patients in MCS (Stenderet al., 2014). Therefore, patients with an ambiguous profileon clinical assessment and neuroimaging data were notincluded in the analysis. Similarly, patients who receivedsedatives to minimize motion in the scanner (Soddu et al.,2011) were further excluded. The reason to exclude sedatedpatients was because of our limited understanding of thepotential effect of anaesthetics on network connectivity(Heine et al., 2012). We here recognize the importance ofincreasing the classification power for patients scannedafter receiving anaesthetics, given that many patientsundergo anaesthesia not only to restrict scanner motionbut also for neuroprotective reasons (Schifilliti et al.,2010). Future investigations which will aim to disentanglebetween the variances of anaesthetics and pathology infunctional connectivity measures are certainly essential.Finally, even though patients were scanned in an ‘awake’state, the monitoring of patients’ state of vigilance duringdata acquisition was not feasible because of technical diffi-culties. Hence, one cannot exclude the possibility thatpatients could have fallen asleep during scanning, whichcould subsequently influence the assessment of functionalconnectivity.
One explanation of why the auditory network was iden-tified as the system with the highest discriminative capacitycould concern its underlying functional neuroanatomy.Apart from temporal cortices, the auditory network furtherencompasses regions in occipital cortex, pre- and
Intrinsic connectivity classification BRAIN 2015: Page 9 of 13 | 9
by guest on July 23, 2015D
ownloaded from
172 Appendix F. Paper VI

postcentral areas, insula and anterior cingulate cortex(Damoiseaux et al., 2006; Smith et al., 2009; Laird et al.,2011; Maudoux et al., 2012; Demertzi et al., 2014). Thedirect comparison between patients in MCS and VS/UWSrestricted the identified areas to bilateral auditory andvisual cortices. This pattern of auditory-visual functionalconnectivity has been previously described in normal con-scious subjects during rest as well (Eckert et al., 2008) andis in line with functional MRI results in consciousnessresearch. For example, preserved functional MRI activityin temporal and occipital areas has been shown for healthysubjects during mental counting of auditory temporal irre-gularities; interestingly, this activation was identified onlyin those subjects who were attentive and aware of the audi-tory violations (Bekinschtein et al., 2009). At a functionallevel, the auditory-visual functional connectivity, alsoreferred to as crossmodal interaction, is considered relevantfor multisensory integration (Clavagnier et al., 2004).Multisensory integration has been suggested as a facilitatorfor top–down influences of higher-order regions to createpredictions of forthcoming sensory events (Engel et al.,2001). Such top–down connectivity was recently foundwith an EEG oddball paradigm that differentiated patientsin MCS from VS/UWS (Boly et al., 2011). Interestingly,decreased crossmodal auditory-visual interaction has beenreported in healthy subjects with preserved structural con-nections but under pharmacologically-induced anaesthesia(Boveroux et al., 2010). In that study, recovery of con-sciousness paralleled the restoration of the crossmodal con-nectivity suggesting a critical role of this connectivitypattern to consciousness level-dependent states.
In our results, the crossmodal interaction was more pre-served in patients in MCS compared to unresponsivepatients. The reduction in functional connectivity betweenthe auditory-visual cortices in VS/UWS could be partlyattributed to disrupted anatomical connections, oftenencountered in post-comatose patients (Perlbarg et al.,2009; Fernandez-Espejo et al., 2010, 2011; Stevens et al.,2014; van der Eerden et al., 2014). The tight link betweenfunctional and structural connectivity was recently shownin primates during propofol-induced unconsciousness withregards to resting state functional MRI dynamic fluctu-ations. In this study, functional connectivity was fluctuatingless frequently among distinct consciousness states, it wasmostly linked to the state characterizing unconsciousnessand this pattern was mostly explained by the underlyingstructural connectivity (Barttfeld et al., 2015). Here, thenegative differences between the two patient groups onvoxel-based morphometry of grey and whiter matter seg-ments is suggestive that the changes in functional connect-ivity cannot be fully attributed to the underlyinganatomical abnormalities. We recognize that analyseswith diffusion-weighted imaging and its relation to func-tional data would allow for more confident statementsabout residual functional connectivity in our clinicalsample.
In conclusion, we here identified that systems-level restingstate functional MRI showed consciousness-dependentbreakdown not only for the default mode network butalso for the frontoparietal, salience, auditory, sensorimotorand visual networks. Functional connectivity between audi-tory and visual cortices was the most sensitive feature toaccurately discriminate single patients into the categories ofMCS and VS/UWS. Our findings point to the significanceof multisensory integration and top–down processes in con-sciousness seemingly supported by crossmodal connectivity.In the future, efforts need to be made to promote the feasi-bility of such a complex approach in the clinical setting andpromote the clinical utility of the resting paradigm forsingle-patient diagnostics.
AcknowledgementsWe would like to thank Lionel Naccache and Jacobo Sittfor useful suggestions on the manuscript preparation anddata illustration, and Xiaoqian Jenny Chai for codesharing.
FundingA.D. is postdoctoral Researcher at the Belgian NationalFunds for Scientific Research (FNRS), L.H. and V.C.V.are Research Fellows at the FNRS, S.L. is ResearchDirector at the FNRS. This work was further supportedby the European Commission, the James McDonnellFoundation, the European Space Agency, Mind ScienceFoundation, the French Speaking Community ConcertedResearch Action (ARC - 06/11 - 340), the Public UtilityFoundation ‘Universite Europeenne du Travail’,‘Fondazione Europea di Ricerca Biomedica’ and theUniversity and University Hospital of Liege.
Supplementary materialSupplementary material is available at Brain online.
ReferencesAchard S, Delon-Martin C, Vertes PE, Renard F, Schenck M,
Schneider F, et al. Hubs of brain functional networks are radicallyreorganized in comatose patients. Proc Natl Acad Sci USA 2012;109: 20608–13.
Achard S, Kremer S, Schenck M, Renard F, Ong-Nicolas C, Namer JI,et al. Global functional disconnections in post-anoxic coma patient.Neuroradiol J 2011; 24: 311–5.
Amico E, Gomez F, Di Perri C, Vanhaudenhuyse A, Lesenfants D,Boveroux P, et al. Posterior cingulate cortex-related co-activationpatterns: a resting state FMRI study in propofol-induced loss ofconsciousness. PLoS One 2014; 9: e100012.
Bardin JC, Schiff ND, Voss HU. Pattern classification of volitionalfunctional magnetic resonance imaging responses in patients withsevere brain injury. Arch Neurol 2012; 69: 176–81.
10 | BRAIN 2015: Page 10 of 13 A. Demertzi et al.
by guest on July 23, 2015D
ownloaded from
173

Barttfeld P, Uhrig L, Sitt JD, Sigman M, Jarraya B, Dehaene S.Signature of consciousness in the dynamics of resting-state brainactivity. Proc Natl Acad Sci USA 2015; 112: 887–92.
Behzadi Y, Restom K, Liau J, Liu TT. A component based noise cor-rection method (CompCor) for BOLD and perfusion based fMRI.Neuroimage 2007; 37: 90–101.
Bekinschtein TA, Dehaene S, Rohaut B, Tadel F, Cohen L, NaccacheL. Neural signature of the conscious processing of auditory regula-rities. Proc Natl Acad Sci USA 2009; 106: 1672–7.
Bishop CM. (2006). Pattern Recognition and Machine Learning.Singapore: Springer.
Boly M, Faymonville M-E, Schnakers C, Peigneux P, Lambermont B,Phillips C, et al. Perception of pain in the minimally conscious statewith PET activation: an observational study. Lancet Neurol 2008; 7:1013–20.
Boly M, Garrido MI, Gosseries O, Bruno MA, Boveroux P, SchnakersC, et al. Preserved feedforward but impaired top-down processes inthe vegetative state. Science 2011; 332: 858–62.
Boly M, Perlbarg V, Marrelec G, Schabus M, Laureys S, Doyon J,et al. Hierarchical clustering of brain activity during humannonrapid eye movement sleep. Proc Natl Acad Sci USA 2012;109: 5856–61.
Boly M, Tshibanda L, Vanhaudenhuyse A, Noirhomme Q, SchnakersC, Ledoux D, et al. Functional connectivity in the default networkduring resting state is preserved in a vegetative but not in a braindead patient. Hum Brain Mapp 2009; 30: 2393–400.
Boveroux P, Vanhaudenhuyse A, Bruno MA, Noirhomme Q, LauwickS, Luxen A, et al. Breakdown of within- and between-networkresting state functional magnetic resonance imaging connectivityduring propofol-induced loss of consciousness. Anesthesiology2010; 113: 1038–53.
Bruno MA, Soddu A, Demertzi A, Laureys S, Gosseries O, SchnakersC, et al. Disorders of consciousness: moving from passive to restingstate and active paradigms. Cog Neurosci 2010; 1: 193–203.
Buckner RL, Andrews-Hanna JR, Schacter DL. The brain’s defaultnetwork: anatomy, function, and relevance to disease. Ann N YAcad Sci 2008; 1124: 1–38.
Burges C. A tutorial on support vector machines for pattern recogni-tion. Data Min Knowl Discov 1998; 2: 121–67.
Casali AG, Gosseries O, Rosanova M, Boly M, Sarasso S, Casali KR,et al. A theoretically based index of consciousness independent ofsensory processing and behavior. Sci Transl Med 2013; 5: 198ra05.
Chai XJ, Castanon AN, Ongur D, Whitfield-Gabrieli S.Anticorrelations in resting state networks without global signalregression. Neuroimage 2012; 59: 1420–8.
Clavagnier S, Falchier A, Kennedy H. Long-distance feedback projec-tions to area V1: implications for multisensory integration, spatialawareness, and visual consciousness. Cogn Affect Behav Neurosci2004; 4: 117–26.
Cole DM, Smith SM, Beckmann CF. Advances and pitfalls in theanalysis and interpretation of resting-state FMRI data. Front SystNeurosci 2010; 4: 8.
Coleman MR, Rodd JM, Davis MH, Johnsrude IS, Menon DK,Pickard JD, et al. Do vegetative patients retain aspects of lan-guage comprehension? Evidence from fMRI. Brain 2007; 130:2494–507.
Crone JS, Soddu A, Holler Y, Vanhaudenhuyse A, Schurz M,Bergmann J, et al. Altered network properties of the fronto-parietalnetwork and the thalamus in impaired consciousness. NeuroimageClin 2014; 4: 240–48.
Damoiseaux JS, Rombouts SA, Barkhof F, Scheltens P, Stam CJ, SmithSM, et al. Consistent resting-state networks across healthy subjects.Proc Natl Acad Sci USA 2006; 103: 13848–53.
De Martino F, Gentile F, Esposito F, Balsi M, Di Salle F, Goebel R,et al. Classification of fMRI independent components using IC-fin-gerprints and support vector machine classifiers. Neuroimage 2007;34: 177–94.
Dehaene S, Changeux JP. Ongoing spontaneous activity controlsaccess to consciousness: a neuronal model for inattentional blind-ness. PLoS Biol 2005; 3: e141.
Dehaene S, Sergent C, Changeux JP. A neuronal network model link-ing subjective reports and objective physiological data during con-scious perception. Proc Natl Acad Sci USA 2003; 100: 8520–5.
Demertzi A, Gomez F, Crone JS, Vanhaudenhuyse A, Tshibanda L,Noirhomme Q, et al. Multiple fMRI system-level baseline connect-ivity is disrupted in patients with consciousness alterations. Cortex2014; 52: 35–46.
Di HB, Yu SM, Weng XC, Laureys S, Yu D, Li JQ, et al. Cerebralresponse to patient’s own name in the vegetative and minimallyconscious states. Neurology 2007; 68: 895–9.
Eckert MA, Kamdar NV, Chang CE, Beckmann CF, Greicius MD,Menon V. A cross-modal system linking primary auditory andvisual cortices: evidence from intrinsic fMRI connectivity analysis.Hum Brain Mapp 2008; 29: 848–57.
Edlow BL, Giacino JT, Wu O. Functional MRI and outcome in trau-matic coma. Curr Neurol Neurosci Rep 2013; 13: 1–11.
Engel AK, Fries P, Singer W. Dynamic predictions: oscillations andsynchrony in top-down processing. Nat Rev Neurosci 2001; 2:704–16.
Fernandez-Espejo D, Bekinschtein T, Monti MM, Pickard JD, JunqueC, Coleman MR, et al. Diffusion weighted imaging distinguishes thevegetative state from the minimally conscious state. Neuroimage2011; 54: 103–12.
Fernandez-Espejo D, Junque C, Cruse D, Bernabeu M, Roig-Rovira T,Fabregas N, et al. Combination of diffusion tensor and functionalmagnetic resonance imaging during recovery from the vegetativestate. BMC Neurol 2010; 10: 77.
Fox MD, Snyder AZ, Vincent JL, Corbetta M, Van Essen DC, RaichleME. The human brain is intrinsically organized into dynamic, antic-orrelated functional networks. Proc Natl Acad Sci USA 2005; 102:9673–8.
Giacino JT, Ashwal S, Childs N, Cranford R, Jennett B, Katz DI, et al.The minimally conscious state: Definition and diagnostic criteria.Neurology 2002; 58: 349–53.
Giacino JT, Fins JJ, Laureys S, Schiff ND. Disorders of consciousnessafter acquired brain injury: the state of the science. Nat Rev Neurol2014; 10: 99–114.
Giacino JT, Kalmar K, Whyte J. The JFK Coma Recovery Scale-Revised: measurement characteristics and diagnostic utility. ArchPhys Med Rehabi 2004; 85: 2020–9.
Greicius MD, Kiviniemi V, Tervonen O, Vainionpaa V, Alahuhta S,Reiss AL, et al. Persistent default-mode network connectivity duringlight sedation. Hum Brain Mapp 2008; 29: 839–47.
Greicius MD, Krasnow B, Reiss AL, Menon V. Functional connectivityin the resting brain: a network analysis of the default mode hypoth-esis. Proc Natl Acad Sci USA 2003; 100: 253–8.
Guldenmund P, Demertzi A, Boveroux P, Boly M, Vanhaudenhuyse A,Bruno MA, et al. Thalamus, brainstem and salience network con-nectivity changes during propofol-induced sedation and uncon-sciousness. Brain Connect 2013; 3: 273–85.
Heine L, Soddu A, Gomez F, Vanhaudenhuyse A, Tshibanda L,Thonnard M, et al. Resting state networks and consciousness.Alterations of multiple resting state network connectivity in physio-logical, pharmacological and pathological consciousness states.Front Psychol 2012; 3: 1–12.
Horovitz SG, Braun AR, Carr WS, Picchioni D, Balkin TJ, FukunagaM, et al. Decoupling of the brain’s default mode network duringdeep sleep. Proc Natl Acad Sci USA 2009; 106: 11376–81.
Huang Z, Dai R, Wu X, Yang Z, Liu D, Hu J, et al. The self and itsresting state in consciousness: an investigation of the vegetativestate. Hum Brain Mapp 2014; 35: 1997–2008.
Jennett B, Plum F. Persistent vegetative state after brain damage. Asyndrome in search of a name. Lancet 1972; 1: 734–7.
Kelly RE Jr, Alexopoulos GS, Wang Z, Gunning FM, Murphy CF,Morimoto SS, et al. Visual inspection of independent components:
Intrinsic connectivity classification BRAIN 2015: Page 11 of 13 | 11
by guest on July 23, 2015D
ownloaded from
174 Appendix F. Paper VI

defining a procedure for artifact removal from fMRI data.J Neurosci Methods 2010; 189: 233–45.
Laird AR, Fox PM, Eickhoff SB, Turner JA, Ray KL, McKay DR,et al. Behavioral interpretations of intrinsic connectivity networks.J Cogn Neurosci 2011; 23: 4022–37.
Larson-Prior LJ, Zempel JM, Nolan TS, Prior FW, Snyder AZ, RaichleME. Cortical network functional connectivity in the descent to sleep.Proc Natl Acad Sci USA 2009; 106: 4489–94.
Laureys S, Celesia G, Cohadon F, Lavrijsen J, Leon-Carrrion J,Sannita WG, et al. Unresponsive wakefulness syndrome: a newname for the vegetative state or apallic syndrome. BMC Med2010; 8: 68.
Majerus S, Gill-Thwaites H, Andrews K, Laureys S. Behavioral evalu-ation of consciousness in severe brain damage. Prog Brain Res 2005;150: 397–413.
Maki-Marttunen V, Diez I, Cortes JM, Chialvo DR, Villarreal M.Disruption of transfer entropy and inter-hemispheric brain func-tional connectivity in patients with disorder of consciousness.Front Neuroinform 2013; 7: 24.
Maudoux A, Lefebvre P, Cabay JE, Demertzi A, Vanhaudenhuyse A,Laureys S, et al. Auditory resting-state network connectivity in tin-nitus: a functional MRI study. PLoS One 2012; 7: e36222.
Monti MM, Rosenberg M, Finoia P, Kamau E, Pickard JD, OwenAM. Thalamo-frontal connectivity mediates top-down cogni-tive functions in disorders of consciousness. Neurology 2015; 84:167–73.
Monti MM, Vanhaudenhuyse A, Coleman MR, Boly M, Pickard JD,Tshibanda L, et al. Willful modulation of brain activity in disordersof consciousness. N Engl J Med 2010; 362: 579–89.
Murphy K, Birn RM, Handwerker DA, Jones TB, Bandettini PA. Theimpact of global signal regression on resting state correlations:are anti-correlated networks introduced? Neuroimage 2009; 44:893–905.
Norton L, Hutchison RM, Young GB, Lee DH, Sharpe MD,Mirsattari SM. Disruptions of functional connectivity in the de-fault mode network of comatose patients. Neurology 2012; 78:175–81.
Ovadia-Caro S, Nir Y, Soddu A, Ramot M, Hesselmann G,Vanhaudenhuyse A, et al. Reduction in inter-hemispheric connectiv-ity in disorders of consciousness. PLoS One 2012; 7: e37238.
Owen AM, Coleman MR, Boly M, Davis MH, Laureys S, Pickard JD.Detecting awareness in the vegetative state. Science 2006; 313:1402.
Perlbarg V, Puybasset L, Tollard E, Lehericy S, Benali H, Galanaud D.Relation between brain lesion location and clinical outcome inpatients with severe traumatic brain injury: a diffusion tensor ima-ging study using voxel-based approaches. Hum Brain Mapp 2009;30: 3924–33.
Phillips CL, Bruno MA, Maquet P, Boly M, Noirhomme Q, SchnakersC, et al. “Relevance vector machine” consciousness classifier appliedto cerebral metabolism of vegetative and locked-in patients.Neuroimage 2011; 56: 797–808.
Ploner M, Lee MC, Wiech K, Bingel U, Tracey I. Prestimulus func-tional connectivity determines pain perception in humans. Proc NatlAcad Sci USA 2010; 107: 355–60.
Raichle ME, MacLeod AM, Snyder AZ, Powers WJ, Gusnard DA,Shulman GL. A default mode of brain function. Proc Natl AcadSci USA 2001; 98: 676–82.
Rosanova M, Gosseries O, Casarotto S, Boly M, Casali AG, BrunoMA, et al. Recovery of cortical effective connectivity and recovery ofconsciousness in vegetative patients. Brain 2012; 135: 1308–20.
Saad ZS, Gotts SJ, Murphy K, Chen G, Jo HJ, Martin A, et al.Trouble at rest: how correlation patterns and group differencesbecome distorted after global signal regression. Brain Connect2012; 2: 25–32.
Saeys Y, Inza I, Larranaga P. A review of feature selection techniquesin bioinformatics. Bioinformatics 2007; 23: 2507–17.
Samann PG, Wehrle R, Hoehn D, Spoormaker VI, Peters H, Tully C,et al. Development of the brain’s default mode network from wake-fulness to slow wave sleep. Cereb Cortex 2011; 21: 2082–93.
Sanders RD, Tononi G, Laureys S, Sleigh JW. Unresponsiveness notequal unconsciousness. Anesthesiology 2012; 116: 946–59.
Schiff ND, Rodriguez-Moreno D, Kamal A, Kim KH, Giacino JT,Plum F, et al. fMRI reveals large-scale network activation in min-imally conscious patients. Neurology 2005; 64: 514–23.
Schifilliti D, Grasso G, Conti A, Fodale V. Anaesthetic-related neuro-protection: intravenous or inhalational agents? CNS Drugs 2010;24: 893–907.
Schnakers C, Vanhaudenhuyse A, Giacino JT, Ventura M, Boly M,Majerus S, et al. Diagnostic accuracy of the vegetative and minim-ally conscious state: clinical consensus versus standardized neurobe-havioral assessment. BMC Neurol 2009; 9: 35.
Seeley WW, Menon V, Schatzberg AF, Keller J, Glover GH, Kenna H,et al. Dissociable intrinsic connectivity networks for salience process-ing and executive control. J Neurosci 2007; 27: 2349–56.
Shackman AJ, Salomons TV, Slagter HA, Fox AS, Winter JJ, DavidsonRJ. The integration of negative affect, pain and cognitive control inthe cingulate cortex. Nat Rev Neurosci 2011; 12: 154–67.
Sitt JD, King JR, El Karoui I, Rohaut B, Faugeras F, Gramfort A, et al.Large scale screening of neural signatures of consciousness inpatients in a vegetative or minimally conscious state. Brain 2014;137: 2258–70.
Smith SM, Fox PT, Miller KL, Glahn DC, Fox PM, Mackay CE, et al.Correspondence of the brain’s functional architecture during activa-tion and rest. Proc Natl Acad Sci USA 2009; 106: 13040–5.
Soddu A, Vanhaudenhuyse A, Bahri MA, Bruno MA, Boly M,Demertzi A, et al. Identifying the default-mode component in spatialIC analyses of patients with disorders of consciousness. Hum BrainMapp 2012; 33: 778–96.
Soddu A, Vanhaudenhuyse A, Demertzi A, Bruno MA, Tshibanda L,Di H, et al. Resting state activity in patients with disorders of con-sciousness. Funct Neurol 2011; 26: 37–43.
Stamatakis EA, Adapa RM, Absalom AR, Menon DK. Changes inresting neural connectivity during propofol sedation. PLoS One2010; 5: e14224.
Stender J, Gosseries O, Bruno MA, Charland-Verville V,Vanhaudenhuyse A, Demertzi A, et al. Diagnostic precision ofPET imaging and functional MRI in disorders of consciousness: aclinical validation study. Lancet 2014; 384: 514–22.
Stevens RD, Hannawi Y, Puybasset L. MRI for coma emergence andrecovery. Curr Opin Crit Care 2014; 20: 168–73.
Tononi G. Consciousness as integrated information: a provisionalmanifesto. Biol Bull 2008; 215: 216–42.
Tsai YH, Yuan R, Huang YC, Yeh MY, Lin CP, Biswal BB.Disruption of brain connectivity in acute stroke patients with earlyimpairment in consciousness. Front Psychol 2014; 4: 956.
van der Eerden AW, Khalilzadeh O, Perlbarg V, Dinkel J, Sanchez P,Vos PE, et al. White matter changes in comatose survivors ofanoxic ischemic encephalopathy and traumatic brain injury: com-parative diffusion-tensor imaging study. Radiology 2014; 270:506–16.
Van Dijk KR, Hedden T, Venkataraman A, Evans KC, Lazar SW,Buckner RL. Intrinsic functional connectivity as a tool for humanconnectomics: theory, properties, and optimization. J Neurophysiol2010; 103: 297–321.
Van Dijk KR, Sabuncu MR, Buckner RL. The influence of headmotion on intrinsic functional connectivity MRI. Neuroimage2012; 59: 431–38.
Vanhaudenhuyse A, Demertzi A, Schabus M, Noirhomme Q, BredartS, Boly M, et al. Two distinct neuronal networks mediate the aware-ness of environment and of self. J Cogn Neurosci 2011; 23: 570–8.
Vanhaudenhuyse A, Noirhomme Q, Tshibanda LJ, Bruno MA,Boveroux P, Schnakers C, et al. Default network connectivity reflectsthe level of consciousness in non-communicative brain-damagedpatients. Brain 2010; 133: 161–71.
12 | BRAIN 2015: Page 12 of 13 A. Demertzi et al.
by guest on July 23, 2015D
ownloaded from
175

Whitfield-Gabrieli S, Nieto-Castanon A. Conn: a functional connect-ivity toolbox for correlated and anticorrelated brain networks. BrainConnect 2012; 2: 125–41.
Wiech K, Lin CS, Brodersen KH, Bingel U, Ploner M, Tracey I.Anterior insula integrates information about salience into perceptualdecisions about pain. J Neurosci 2010; 30: 16324–31.
Wong CW, Olafsson V, Tal O, Liu TT. Anti-correlated networks,global signal regression, and the effects of caffeine in resting-statefunctional MRI. Neuroimage 2012; 63: 356–64.
Yu F, Jiang QJ, Sun XY, Zhang RW. A new case of complete primarycerebellar agenesis: clinical and imaging findings in a living patient.Brain 2015; 138: e353.
Intrinsic connectivity classification BRAIN 2015: Page 13 of 13 | 13
by guest on July 23, 2015D
ownloaded from
176 Appendix F. Paper VI

Appendix G
Paper VII
Behavioral Responsiveness in Patientswith Disorders of Consciousness
Heine L, Laureys S, Schnakers C.
in: Brain Function and Responsiveness in Disorders ofConsciousness, Springer International Publishing, 2016
177

25© Springer International Publishing Switzerland 2016 M.M. Monti, W.G. Sannita (eds.), Brain Function and Responsiveness in Disorders of Consciousness, DOI 10.1007/978-3-319-21425-2_3
Chapter 3 Behavioral Responsiveness in Patients with Disorders of Consciousness
Lizette Heine , Steven Laureys , and Caroline Schnakers
Abstract Until now, the main way to assess whether a patient is conscious or not is to observe what he can do spontaneously or in response to stimulation. Although there is a growing body of research on the subject, detecting oriented/voluntary responses is still extremely challenging. Motor, verbal, and cognitive impairments; fl uctuations of vigilance; and medications with impact on the central nervous system are among the factors complicating the diagnosis. Establishing a proper diagnosis is nevertheless of high clinical relevance when considering patients’ prognosis and treatment. In this review, we will characterize the behavioral patterns of the various levels of conscious-ness, we will explain how challenging it is to detect signs of consciousness, and which tools currently exist to help in the assessment of those signs. Secondarily, we will present preliminary data investigating the interest of various sensory modalities in determining the diagnosis of patients with severe brain injury.
Keywords Vegetative state • Minimally conscious state • Consciousness • Assessment • Diagnosis • Sensory stimulation
3.1 Introduction
Some patients surviving extensive brain damage only regain limited levels of con-sciousness. Until now, the main way to assess whether a patient is conscious or not is to observe what he/she can do spontaneously or in response to stimulation. Although there is a growing body of research on the subject, detecting oriented/voluntary
L. Heine , MSc Coma Science Group , Cyclotron Research Centre, University of Liège , Liège , Belgium
S. Laureys , MD, PhD Coma Science Group, Neurology Department , Cyclotron Research Centre, University of Liège , Liège , Belgium
C. Schnakers , PhD (*) Department of Neurosurgery , Geffen School of Medicine at University of California Los Angeles, Brain Injury Research Center , Los Angeles , CA , USA e-mail: [email protected]
178 Appendix G. Paper VII

26
responses is still extremely challenging. Motor, verbal, and cognitive impairments; fl uctuations of vigilance; and medications with impact on the central nervous system are among the factors complicating the diagnosis. Establishing a proper diagnosis is nevertheless of high clinical relevance. Conscious and unconscious patients have dif-ferent outcomes. Patients in a minimally conscious state have a better long-term prog-nosis compared to those in a vegetative state [ 1 ]. Twelve months after brain injury, about half of the patients in minimally conscious state improve and show a good func-tional outcome, whereas only a very small percentage (3 %) of patients in vegetative state do so [ 2 ]. The diagnosis also has an impact on the patients’ daily care and thera-peutic choices when it comes to the administration of pharmacological interventions such as pain medication or new non- pharmacological interventions such as neurostim-ulation (deep brain stimulation or transcranial direct current stimulation) [ 3 , 4 ]. Finally, regarding end-of-life decisions, previous legal cases in several countries have estab-lished the right of the medical team to withdraw artifi cial nutrition and hydration in patients diagnosed as being in a vegetative state [ 5 ]. In such context, a correct diagnosis is therefore crucial. In this review, we will characterize the behavioral pattern of the various levels of consciousness, we will explain how challenging it is to detect signs of consciousness, and which tools currently exist to help in the assessment of those signs. Secondarily, we will also present preliminary data investigating the interest of various sensory modalities in determining the diagnosis of patients with severe brain injury.
3.2 Behavioral Pattern in Disorders of Consciousness
When the patient is in a coma, there is no arousal and no consciousness. During this transient condition, patients’ eyes are continuously closed (even following stimula-tion), autonomic functions are reduced, and respiratory assistance is needed [ 6 ] (Table 3.1 ). Most patients recover from a coma within hours to weeks after injury. However, some patients can recover arousal (i.e., open their eyes spontaneously or in response to stimulation) without being conscious (no oriented/voluntary responses). These patients are in a state called “vegetative state” (VS) [ 7 ] (Table 3.1 ). In this state, breathing occurs without assistance since autonomic functions (e.g., cardiovascular regulation, thermoregulation) are preserved. The patients may also moan, demon-strate smiling, crying, or grimacing even though inappropriate and appearing out of context [ 7 , 8 ]. This state can be either transient or persistent (when above a month post-injury). After a year for traumatic etiologies and 3 months for nontraumatic eti-ologies, the VS can be considered as permanent. These patients have, in that case, less than 5 % of chances to recover. Only then, the ethical and legal issues around with-drawal of hydration and nutrition may be discussed [ 9 ]. Note that, given the negative connotation of the term “vegetative state,” The European Task Force on Disorders of Consciousness has recently proposed to use the more neutral and descriptive term “unresponsive wakefulness syndrome” (VS/UWS) [ 10 ].
L. Heine et al.
179

27
Consciousness recovery consists of regaining fl uctuating but reproducible nonrefl exive- oriented and/or voluntary behaviors. Such state is called the “mini-mally conscious state” (MCS) [ 11 ] (Table 3.1 ). Behaviors that suggest conscious-ness are, for example, command following, visual pursuit, object localization, or contingent responses to emotional stimuli. MCS has recently been divided into two categories, MCS+ (plus) and MCS- (minus), based on the complexity of behavioral responses. Patients in an MCS- show nonrefl exive-oriented responses such as visual pursuit or localization to noxious stimuli, while MCS+ refers to patients showing nonrefl exive voluntary responses such as command following, intelligible verbalization, and/or nonfunctional communication [ 12 , 13 ]. When patients demonstrate reliable “functional communication” (i.e., accurate yes-no responses to situational orientation questions) or “functional object use” (i.e., appropriate use of different common objects) on two consecutive assessments, the patient is considered to have emerged from the MCS (EMCS) [ 11 ] (Table 3.1 ). After emerging from MCS, these patients are not considered as being in a disorder of consciousness anymore. However, they often remain confused, disoriented, and sometimes agitated. The term “acute confusional state” (ACS) has recently been used to describe these patients [ 14 ].
Table 3.1 Summary of the behavioral features for coma, VS/UWS, MCS−, MCS+, and emergence from MCS
Level of consciousness Behavioral features
Coma No arousal/eye opening Impaired spontaneous breathing/brainstem refl exes No oriented or purposeful behaviors No groans, vocalizations, or verbalizations No language comprehension/response to command
Vegetative state/unresponsive wakefulness syndrome
Arousal/spontaneous or stimulus-induced eye opening Preserved spontaneous breathing/brainstem refl exes No oriented or purposeful behaviors Groans and/or vocalizations but no verbalizations No language comprehension/response to command
Minimally conscious state Fluctuation of vigilance (MCS−/+) Preserved spontaneous breathing/brainstem refl exes MCS−: object localization-reaching-manipulation and/or sustained visual fi xation and/or visual pursuit and/or automatic motor behavior and/or localization to pain MCS+: command following and/or object recognition and/or intelligible verbalization and/or intentional communication Emergence: functional communication and/or functional object use on at least two consecutive assessments
3 Behavioral Responsiveness in Patients with Disorders of Consciousness
180 Appendix G. Paper VII

28
3.3 Misdiagnosis
Differentiating MCS from VS/UWS can be challenging since voluntary and refl exive behaviors can be diffi cult to distinguish and subtle signs of consciousness may be missed. The development of diagnostic criteria for MCS [ 11 ] would reasonably be expected to reduce the incidence of misdiagnosis relative to the rates reported before these criteria were established [ 15 , 16 ]. However, recent studies found that around 40 % of patients believed to be in VS/UWS were still misdiagnosed [ 17 , 18 ] (Fig. 3.1 ).
The high rate of misdiagnosis likely refl ects different sources of variance. Variance in diagnostic accuracy may result from biases contributed by the examiner, the environment, and/or the patient. First, examiner errors may arise when the range of behaviors sampled is too narrow, response-time windows are over- or under- inclusive, criteria for judging purposeful responses are poorly defi ned, and exami-nations are conducted too infrequently to capture the full range of behavioral fl uctuation. The use of standardized rating scales offers some protection from these errors, although failure to adhere to specifi c administration and scoring guidelines may jeopardize diagnostic accuracy. Second, the environment in which the patient is evaluated may bias assessment fi ndings. Paralytic and sedative medications, restricted range of movement stemming from restraints and immobilization tech-niques, poor positioning, and excessive ambient noise/heat/light can decrease or
Fig. 3.1 Previous fi ndings on misdiagnosis rate in patients with severe brain injury
L. Heine et al.
181

29
distort voluntary behavioral responses. The last source of variance concerns the patient. Fluctuations in arousal level, fatigue, subclinical seizure activity, occult ill-ness, pain, cortical sensory defi cits (e.g., cortical blindness/deafness), motor impair-ment (e.g., generalized hypotonus, spasticity, or paralysis), or cognitive defi cits (e.g., aphasia, apraxia, agnosia) constitute a bias to the behavioral assessment and therefore decrease the probability to observe signs of consciousness.
Some sources of error can be avoided, but this is not always possible or within the examiner’s control. It is, however, particularly crucial to optimize the way con-sciousness assessments are performed as clinical management, from treatment of pain to end-of-life decision-making, often depends on behavioral observations. For this reason, the use of standardized and sensitive behavioral scales can substantially help clinicians to detect subtle signs of consciousness.
3.4 Clinical Assessment of Disorders of Consciousness
Behavioral assessment is based on two main components: wakefulness and aware-ness. Wakefulness refers to the patient’s level of arousal and is assessed by observing eye opening. Awareness is related to subjective experiences and can be subdivided into awareness of the external world (i.e., perception of the environment or “con-sciousness”) and awareness of the internal world (i.e., stimulus-independent thoughts such as mental imagery and inner speech or “self-awareness”). Raters assessing patients with severe brain injury will mainly assess consciousness of the environment, since self-awareness is diffi cult to evaluate when only based on bedside observations and not on patients’ report. The assessment of consciousness can be done through repeated examinations revealing reproducible, oriented, or voluntary behavioral responses to various stimuli (the most common being auditory, verbal, and motor stimuli). The fi rst scale widely used and known for assessing severely brain-injured patients recovering from coma is the Glasgow coma scale (GCS) [ 19 ]. This scale is short and can easily be incorporated into routine clinical care. Despite its widespread use, the GCS has been criticized for fl uctuant inter-rater reliability and problems of scoring in patients with ocular trauma, tracheostomy, or ventilatory support [ 20 ]. The Full Outline of UnResponsiveness (FOUR) has been developed to replace the GCS for assessing severely brain-injured patients in intensive care [ 21 ]. The scale includes four subscales assessing motor and ocular responses, brainstem refl exes, and breath-ing. The total score ranges from 0 to 16. Unlike the GCS, the FOUR does not assess verbal functions to accommodate the high number of intubated patients in intensive care. It also assesses brainstem refl exes and breathing and, therefore, helps to better monitor comatose and VS/UWS patients. The FOUR also tracks emergence from VS/UWS since it includes the assessment of early signs of consciousness such as visual pursuit. The scale is globally more sensitive than the GCS for diagnosing MCS but like the GCS is not adapted to a rehabilitation setting.
Since the 1970s, a high number of scales have been validated for being used in subacute and chronic patients with severe brain injury (Table 3.2 ). Recently, the
3 Behavioral Responsiveness in Patients with Disorders of Consciousness
182 Appendix G. Paper VII

30 Ta
ble
3.2
Beh
avio
ral r
espo
nses
ass
esse
d by
sca
les
deve
lope
d fo
r pat
ient
s w
ith d
isor
ders
of c
onsc
ious
ness
Nam
e of
the
scal
e (R
efer
ence
) R
espo
nse
to
com
man
d
Con
tinge
nt
emot
iona
l re
spon
se
Obj
ect l
ocal
izat
ion/
man
ipul
atio
n In
telli
gibl
e ve
rbal
izat
ions
Ori
ente
d re
spon
se to
sen
sory
st
imul
atio
n V
N
T
O
G
Com
a R
ecov
ery
Scal
e-R
evis
ed
[ 24 ]
*
* *
* *
Wes
tern
Neu
ro S
enso
ry S
timul
atio
n Pr
ofi le
[ 25 ]
*
* *
* *
* *
Sens
ory
Mod
ality
Ass
essm
ent &
Reh
abili
tatio
n Te
chni
que
[ 34 ]
*
* *
* *
* *
*
Wes
sex
Hea
d In
jury
Mat
rix
[ 23 ]
*
* *
* *
Dis
orde
r of
Con
scio
usne
ss S
cale
[ 2
7 ]
* *
* *
*
Sens
ory
Stim
ulat
ion
Ass
essm
ent M
easu
re [ 3
5 ]
* *
* *
* *
* G
lasg
ow C
oma
Scal
e [ 1
9 ]
* *
*
Rea
ctio
n L
evel
Sca
le
[ 36 ]
*
* *
*
Inns
bruc
k C
oma
Scal
e [ 3
7 ]
*
Gla
sgow
-Liè
ge S
cale
[ 3
8 ]
* *
*
Full
Out
line
of U
nRes
pons
iven
ess
[ 21 ]
*
* *
Com
a/N
ear-
Com
a Sc
ale
[ 39 ]
*
* *
* *
Com
preh
ensi
ve o
f Lev
el o
f Con
scio
usne
ss S
cale
[ 4
0 ]
* *
*
V v
isua
l, N
noc
icep
tive,
T ta
ctile
, O o
lfac
tory
, G g
usta
tory
, bol
d sc
ale
reco
mm
ende
d w
ith m
inor
res
erva
tions
by
the
AC
RM
, ita
lic s
cale
s re
com
men
ded
with
m
oder
ate
rese
rvat
ions
by
the
AC
RM
L. Heine et al.
183

31
American Congress of Rehabilitation Medicine (ACRM) has conducted a systematic evidence-based review of the available scales to provide recommendations for use according to validity, reliability, outcome prediction, and diagnostic sensitivity [ 22 ]. Among the scales evaluated, the Wessex Head Injury Matrix (WHIM) has been rec-ommended with moderate reservations. The WHIM was developed to capture changes in patients in VS/UWS through emergence from post-traumatic amnesia [ 23 ]. This tool is particularly sensitive to detect changes in patients in MCS not captured by other scales such as the GCS. The WHIM has been structured according to the sequence of recovery observed in 88 patients recovering from traumatic brain injury. The scale assesses arousal level and concentration, visual pursuit, communication, cognition (i.e., memory and spatiotemporal orientation), and social behaviors. The WHIM score represents the rank of the most complex behavior observed. Despite a good validity, its reliability is still unproven, and, even though superior to the GCS, its diagnostic sensitivity is lower than other standardized scales such as the Coma Recovery Scale-Revised (CRS-R) [ 24 ]. In fact, according to the ACRM, the CRS-R is the most reli-able tool for differentiating disorders of consciousness and received the strongest recommendation with minor reservations [ 22 ]. This scale was developed in 1991 and revised in 2004. Its primary purpose is to differentiate VS/UWS from MCS and MCS from EMCS. It measures auditory, visual, motor, and verbal functions as well as com-munication and arousal. Each of these subscales is hierarchically structured; the low-est scores refl ect refl exive behaviors, while the highest scores indicate cognitively mediated behaviors. This scale has clear defi nitions for both the administration and the scoring of each item. The CRS-R can be administered reliably by trained examin-ers and produces reasonably stable scores over repeated assessments. Validity analy-ses have shown that the CRS-R is capable of discriminating patients in MCS from those in VS/UWS better than the GCS, the FOUR, and the WHIM [ 24 ].
Other scales such as the Western Neuro Sensory Stimulation Profi le (WNSSP) [ 25 ], the Sensory Modality Assessment Technique (SMART) [ 26 ], and the Disorders of Consciousness Scale (DOCS) [ 27 ] have acceptable standardized administration and scoring procedures and have also been recommended with moderate reserva-tions by the ACRM. On the contrary to the CRS-R whose main purpose is the diag-nosis, the WNSSP, the SMART, and the DOCS are rather used when applying a sensory stimulation treatment to patients with severe brain injury. Sensory stimula-tion programs usually consist in presenting different types of environmental stimuli to the patient in order to optimize her/his consciousness level. These programs are supposed to constitute enriched environments which are supposed to enhance syn-aptic reinnervation, improve brain plasticity, and therefore accelerate the recovery from coma. However, even though numerous studies investigated the interest of these sensory stimulation programs, none of these studies has proven the effi cacy of such treatment since the fi ndings did not allow to differentiate spontaneous recovery from recovery due to treatment. Despite this, scales such as the WNSSP, the SMART, or the DOCS could still be interesting in a diagnostic context since they include the assessment of more sensory modalities than the CRS-R (i.e., tactile, olfactory, and gustatory modalities). The interest of those modalities for detecting signs of con-sciousness has nevertheless never been evaluated.
3 Behavioral Responsiveness in Patients with Disorders of Consciousness
184 Appendix G. Paper VII

32
3.5 Can More Sensory Modalities Increase Diagnostic Sensitivity?
It has previously been shown that some sensory modalities are more sensitive to detect consciousness than others. In studies investigating misdiagnosis, oriented eye movements (i.e., visual pursuit and fi xation) have been reported as the responses the most frequently missed during behavioral assessments [ 28 , 17 , 18 ]. In parallel, the visual modality of the CRS-R has been shown as the subscale allowing the highest detection of MCS as compared to the auditory, motor, or verbal modalities [ 29 , 30 ]. Oriented visual responses are particularly interesting to detect since it is one of the fi rst signs of consciousness appearing during patients’ recovery and as it is associ-ated with good outcome [ 31 , 32 , 2 ]. Until now, no study has investigated the interest of other sensory modalities (such as tactile, olfactory, and gustatory) when assess-ing consciousness, even though several scales recommended by the ACRM include such modalities (Table 3.2 ).
In a preliminary study, we therefore decided to investigate the interest of tactile, olfactory, and gustatory modalities in the assessment of consciousness. We assessed 38 patients (46 ± 16 years old, 17 traumatic, 21 chronic) diagnosed as being in a VS/UWS ( n = 15) or in a MCS ( n = 23) by using the CRS-R. Tactile, olfactory, and gus-tatory stimuli used in the WNSSP, the SMART, and the DOCS have been adminis-tered in each patient in a randomized order. Tactile stimuli included tap on the shoulder, nasal swab, feather (applied on arms, fi ngers, and face), air into the neck, hair touching, vibration on the arm, scrub (i.e., kitchen scouring pad applied over the arm), and fi rm hand pressure on the arm. Each of these stimuli was applied for 10 s on both sides of the body on three consecutive trials. Olfactory stimuli included vinegar, syrup, and ammonia which were held under the patients’ nose for 10 s (patient’s mouth closed) on three consecutive trials. In case of tracheotomy, the entrance of the cannula was covered. Gustatory stimuli included vinegar and syrup. A stick soaked of this fl avor was introduced into the patient’s mouth for 10 s on three consecutive trials. Several recommendations had to be followed such as apply-ing the treatment while the patients were in a wakeful state with eyes open in a set-ting with minimal ambient noise and respecting a 30 min rest before each session (i.e., absence of nursing care). Oriented responses (e.g., eyes/head toward or away from the stimulus, hand toward or pushes away the stimulus, congruent facial expression, mouth opening, or tongue pumping) were considered as present when it was clear and reproducible, meaning it was observed at least two times to exclude refl exive behaviors. The oriented responses obtained using those tactile, olfactory, and gustatory stimulations have then been compared to the diagnosis obtained using the CRS-R. Patients’ outcome has also been collected at 1 year after assessment ( n = 27), using the Glasgow Outcome Scale (GOS) [ 33 ].
According to our results (Fig. 3.2 ), a minority of patients diagnosed as being in a VS/UWS by using the CRS-R showed oriented olfactory or gustatory responses (7 % and 14 %, respectively). The patient for whom we had outcome data (one missing data) did not recover consciousness a year after assessment. Additionally, oriented
L. Heine et al.
185

33
olfactory or gustatory responses were absent in a majority of patients diagnosed as being in a MCS by using the CRS-R (70 %) and in a majority of patients who showed oriented eye movements (61 %). Using tactile stimuli, a higher percentage of patients diagnosed as being in a VS/UWS showed oriented responses (40 %). Oriented tactile responses were present in a majority of patients diagnosed as being in an MCS by using the CRS-R (65 %) and in a majority of patients who showed oriented eye
100 %
30 % 30 %
40 %
65 %
vs/uws
TactileGustatoryOlfactory
TactileGustatory
ns nsns
0 1 0 1 0 1
Olfactory
GO
S
GO
S
GO
S
MCS
14 %
7 %
90 %
80 %
70 %
60 %
50 %
40 %
30 %
20 %
10 %
0 %
Fig. 3.2 Percentage of oriented responses in VS/UWS and MCS patients (panel a ) and outcome at 1 year (averaged Glasgow Outcome Score – GOS, with 95 % confi dence intervals) according to the absence ( 0 ) or presence ( 1 ) of oriented responses (panel b ) (“ns” indicates difference is nonsignifi cant ( p > 0.05))
3 Behavioral Responsiveness in Patients with Disorders of Consciousness
186 Appendix G. Paper VII

34
movements (83 %). When considering the stimulus leading to the most frequent ori-ented responses, the nasal swab helped to detect 80 % of the oriented tactile responses. However, only one of the VS/UWS patients showing oriented tactile responses recov-ered consciousness a year after assessment (17 %). The patient (50 years old, 50 days after nontraumatic injury) was able to localize a tactile stimulus using her hand. Repeated CRS-R assessments, at that time, showed only refl exive behaviors (i.e., auditory startle, blinking to threat, fl exion to noxious stimulation, oral refl exive move-ments, and arousal with stimulation). Two years after our assessment, the CRS-R indicated an EMCS. Finally, to test whether the outcome measured by the GOS differs according to the presence or absence of an oriented response, U Mann-Whitney tests were performed. There was no statistical difference for olfactory ( U = 51.5; p = 0.61), gustatory ( U = 49; p = 0.5), and tactile ( U = 76.5; p = 0.51) modalities.
Considering our data, oriented olfactory and gustatory responses do not seem to be linked to consciousness since they are not observed in the majority of signifi cant proportion of conscious patients and since they are not associated with conscious-ness recovery. Oriented tactile responses seem to be observed in most conscious patients but are not clearly related to consciousness recovery and could be false positives. This preliminary study hence seems to indicate that adding sensory modalities such as olfactory, gustatory, or tactile modalities to the CRS-R does not constitute a further help for decreasing the level of misdiagnosis in patients with disorders of consciousness.
3.6 Conclusion
Establishing a proper diagnosis is very important in the care of patients with severe brain injury. However, clinical assessment is diffi cult and can often lead to a misdi-agnosis of the level of consciousness. The use of sensitive standardized tools is therefore crucial when establishing the diagnosis. The CRS-R is currently the most reliable and valid scale available and constitutes a substantial help in the differentia-tion of conscious vs. unconscious patients. Finally, even though our fi ndings need to be replicated in a bigger sample, using gustatory, olfactory, or tactile stimuli that are included in several behavioral scales for the assessment of disorders of conscious-ness do not seem to be of further help when detecting consciousness in patients with severe brain injury.
References
1. Luaute J, Maucort-Boulch D, Tell L, Quelard F, Sarraf T, Iwaz J et al (2010) Long-term out-comes of chronic minimally conscious and vegetative states. Neurology 75(3):246–252. doi: 10.1212/WNL.0b013e3181e8e8df
2. Giacino JT, Kezmarsky MA, DeLuca J, Cicerone KD (1991) Monitoring rate of recovery to predict outcome in minimally responsive patients. Arch Phys Med Rehabil 72(11):897–901
L. Heine et al.
187

35
3. Schiff ND, Giacino JT, Kalmar K, Victor JD, Baker K, Gerber M et al (2007) Behavioural improvements with thalamic stimulation after severe traumatic brain injury. Nature 448(7153):600–603. doi: 10.1038/nature06041
4. Thibaut A, Bruno MA, Ledoux D, Demertzi A, Laureys S (2014) tDCS in patients with disor-ders of consciousness: sham-controlled randomized double-blind study. Neurology 82(13):1112–1118. doi: 10.1212/WNL.0000000000000260
5. Racine E, Rodrigue C, Bernat JL, Riopelle R, Shemie SD (2010) Observations on the ethical and social aspects of disorders of consciousness. Can J Neurol Sci 37(6):758–768
6. Posner JB, Saper JB, Schiff ND, Plum F (2007) Plum and Posner's diagnosis of stupor and coma, 4th edn, Contemporary neurology series. Oxford University Press, Oxford/New York
7. Jennett B, Plum F (1972) Persistent vegetative state after brain damage. RN 35(10):ICU1–ICU4 8. The Multi-Society Task Force on PVS (1994) Medical aspects of the persistent vegetative state
(1). N Engl J Med 330(21):1499–1508. doi: 10.1056/NEJM199405263302107 9. The Multi-Society Task Force on PVS (1994) Medical aspects of the persistent vegetative state
(2). N Engl J Med 330(22):1572–1579. doi: 10.1056/NEJM199406023302206 10. Laureys S, Celesia GG, Cohadon F, Lavrijsen J, Leon-Carrion J, Sannita WG et al (2010)
Unresponsive wakefulness syndrome: a new name for the vegetative state or apallic syndrome. BMC Med 8:68. doi: 10.1186/1741-7015-8-68
11. Giacino JT, Ashwal S, Childs N, Cranford R, Jennett B, Katz DI et al (2002) The minimally conscious state: defi nition and diagnostic criteria. Neurology 58(3):349–353
12. Bruno MA, Majerus S, Boly M, Vanhaudenhuyse A, Schnakers C, Gosseries O et al (2012) Functional neuroanatomy underlying the clinical subcategorization of minimally conscious state patients. J Neurol 259(6):1087–1098. doi: 10.1007/s00415-011-6303-7
13. Bruno MA, Vanhaudenhuyse A, Thibaut A, Moonen G, Laureys S (2011) From unresponsive wakefulness to minimally conscious PLUS and functional locked-in syndromes: recent advances in our understanding of disorders of consciousness. J Neurol 258(7):1373–1384. doi: 10.1007/s00415-011-6114-x
14. Sherer M, Nakase-Thompson R, Yablon SA, Gontkovsky ST (2005) Multidimensional assess-ment of acute confusion after traumatic brain injury. Arch Phys Med Rehabil 86(5):896–904. doi: 10.1016/j.apmr.2004.09.029
15. Andrews K, Murphy L, Munday R, Littlewood C (1996) Misdiagnosis of the vegetative state: retrospective study in a rehabilitation unit. BMJ 313(7048):13–16
16. Childs NL, Mercer WN, Childs HW (1993) Accuracy of diagnosis of persistent vegetative state. Neurology 43(8):1465–1467
17. Schnakers C, Vanhaudenhuyse A, Giacino J, Ventura M, Boly M, Majerus S et al (2009) Diagnostic accuracy of the vegetative and minimally conscious state: clinical consensus versus standardized neurobehavioral assessment. BMC Neurol 9:35. doi: 10.1186/1471-2377-9-35
18. van Erp WS, Lavrijsen JC, Vos PE, Bor H, Laureys S, Koopmans RT (2015) The vegetative state: prevalence, misdiagnosis, and treatment limitations. J Am Med Dir Assoc 16(1):85 e9–e14. doi: 10.1016/j.jamda.2014.10.014
19. Teasdale G, Jennett B (1974) Assessment of coma and impaired consciousness. A practical scale. Lancet 2(7872):81–84
20. Laureys S, Bodart O, Gosseries O (2014) The Glasgow Coma Scale: time for critical reap-praisal? Lancet Neurol 13(8):755–757. doi: 10.1016/S1474-4422(14)70152-8
21. Wijdicks EF, Bamlet WR, Maramattom BV, Manno EM, McClelland RL (2005) Validation of a new coma scale: The FOUR score. Ann Neurol 58(4):585–593. doi: 10.1002/ana.20611
22. Seel RT, Sherer M, Whyte J, Katz DI, Giacino JT, Rosenbaum AM et al (2010) Assessment scales for disorders of consciousness: evidence-based recommendations for clinical practice and research. Arch Phys Med Rehabil 91(12):1795–1813. doi: 10.1016/j.apmr.2010.07.218
23. Shiel A, Horn SA, Wilson BA, Watson MJ, Campbell MJ, McLellan DL (2000) The Wessex Head Injury Matrix (WHIM) main scale: a preliminary report on a scale to assess and monitor patient recovery after severe head injury. Clin Rehabil 14(4):408–416
24. Giacino JT, Kalmar K, Whyte J (2004) The JFK Coma Recovery Scale-Revised: measurement characteristics and diagnostic utility. Arch Phys Med Rehabil 85(12):2020–2029
3 Behavioral Responsiveness in Patients with Disorders of Consciousness
188 Appendix G. Paper VII

36
25. Ansell BJ, Keenan JE (1989) The Western Neuro Sensory Stimulation Profi le: a tool for assessing slow-to-recover head-injured patients. Arch Phys Med Rehabil 70(2):104–108
26. Gill-Thwaites H, Munday R (2004) The Sensory Modality Assessment and Rehabilitation Technique (SMART): a valid and reliable assessment for vegetative state and minimally con-scious state patients. Brain Inj 18(12):1255–1269
27. Pape TL, Senno RG, Guernon A, Kelly JP (2005) A measure of neurobehavioral functioning after coma. Part II: Clinical and scientifi c implementation. J Rehabil Res Dev 42(1):19–27
28. Childs NL, Mercer WN (1996) Misdiagnosing the persistent vegetative state. Misdiagnosis certainly occurs. BMJ 313(7062):944
29. Vanhaudenhuyse A, Schnakers C, Bredart S, Laureys S (2008) Assessment of visual pursuit in post-comatose states: use a mirror. J Neurol Neurosurg Psychiatry 79(2):223. doi: 10.1136/jnnp.2007.121624
30. Schnakers C, Majerus S, Giacino J, Vanhaudenhuyse A, Bruno MA, Boly M et al (2008) A French validation study of the Coma Recovery Scale-Revised (CRS-R). Brain Inj 22(10):786–792. doi: 10.1080/02699050802403557
31. Candelieri A, Cortese MD, Dolce G, Riganello F, Sannita WG (2011) Visual pursuit: within- day variability in the severe disorder of consciousness. J Neurotrauma 28(10):2013–2017. doi: 10.1089/neu.2011.1885
32. Dolce G, Lucca LF, Candelieri A, Rogano S, Pignolo L, Sannita WG (2011) Visual pursuit in the severe disorder of consciousness. J Neurotrauma 28(7):1149–1154. doi: 10.1089/neu.2010.1405
33. Teasdale GM, Pettigrew LE, Wilson JT, Murray G, Jennett B (1998) Analyzing outcome of treatment of severe head injury: a review and update on advancing the use of the Glasgow Outcome Scale. J Neurotrauma 15(8):587–597
34. Gill-Thwaites H (1997) The Sensory Modality Assessment Rehabilitation Technique–a tool for assessment and treatment of patients with severe brain injury in a vegetative state. Brain Inj 11(10):723–34
35. Rader MA, Ellis DW (1994) The Sensory Stimulation Assessment Measure (SSAM): a tool for early evaluation of severely brain-injured patients. Brain Inj 8(4):309–21
36. Starmark JE, Stålhammar D, Holmgren E (1988) The Reaction Level Scale (RLS85). Manual and guidelines. Acta Neurochir (Wien) 91(1–2):12–20
37. Benzer A, Mitterschiffthaler G, Marosi M et al (1991) Prediction of non-survival after trauma: Innsbruck Coma Scale. Lancet 19;338(8773):977–8
38. Born JD, Albert A, Hans P, Bonnal J (1985) Relative prognostic value of best motor response and brain stem refl exes in patients with severe head injury. Neurosurgery 16(5):595–601
39. Rappaport M, Dougherty AM, Kelting DL (1992) Evaluation of coma and vegetative states. Arch Phys Med Rehabil 73(7):628–34
40. Stanczak DE, White JG, Gouview WD, et al (1984) Assessment of level of consciousness following severe neurological insult. A comparison of the psychometric qualities of the Glasgow Coma Scale and the Comprehensive Level of Consciousness Scale. J Neurosurg 60(5):955–60
L. Heine et al.
189

190 Appendix G. Paper VII

Appendix H
Paper VIII
Exploration of Functional Connectivity During PreferredMusic Stimulation in Patients with Disorders of
Consciousness
Heine L*, Castro M*, Martial C, Tillmann B, Laureys S, Perrin F.
Frontiers in Psychology, 2015, 6:1704doi: 10.3389/fpsyg.2015.01704
191

ORIGINAL RESEARCHpublished: 09 November 2015
doi: 10.3389/fpsyg.2015.01704
Edited by:
Heather Berlin,
Mount Sinai School of Medicine, USA
Reviewed by:
Julien Dubois,
California Institute of Technology, USA
Luis Lemus,
Universidad Nacional Autónoma
de México, Mexico
*Correspondence:
Lizette Heine
†These authors have contributed
equally to this work.
Specialty section:
This article was submitted to
Consciousness Research,
a section of the journal
Frontiers in Psychology
Received: 03 June 2015
Accepted: 22 October 2015
Published: 09 November 2015
Citation:
Heine L, Castro M, Martial C,
Tillmann B, Laureys S and Perrin F
(2015) Exploration of Functional
Connectivity During Preferred Music
Stimulation in Patients with Disorders
of Consciousness.
Front. Psychol. 6:1704.
doi: 10.3389/fpsyg.2015.01704
Exploration of FunctionalConnectivity During Preferred MusicStimulation in Patients withDisorders of ConsciousnessLizette Heine1,2*†, Maïté Castro2†, Charlotte Martial1, Barbara Tillmann2,Steven Laureys1† and Fabien Perrin2†
1 Coma Science Group, GIGA & Cyclotron Research Center and Neurology Department, University and University Hospital of
Liège, Liège, Belgium, 2 Auditory Cognition and Psychoacoustics Team – Lyon Neuroscience Research Center (UCBL,
CNRS, UMR 5292, INSERM U1028), Lyon, France
Preferred music is a highly emotional and salient stimulus, which has previously been
shown to increase the probability of auditory cognitive event-related responses in
patients with disorders of consciousness (DOC). To further investigate whether and
how music modifies the functional connectivity of the brain in DOC, five patients were
assessed with both a classical functional connectivity scan (control condition), and
a scan while they were exposed to their preferred music (music condition). Seed-
based functional connectivity (left or right primary auditory cortex), and mean network
connectivity of three networks linked to conscious sound perception were assessed.
The auditory network showed stronger functional connectivity with the left precentral
gyrus and the left dorsolateral prefrontal cortex during music as compared to the control
condition. Furthermore, functional connectivity of the external network was enhanced
during the music condition in the temporo-parietal junction. Although caution should
be taken due to small sample size, these results suggest that preferred music exposure
might have effects on patients auditory network (implied in rhythm and music perception)
and on cerebral regions linked to autobiographical memory.
Keywords: music, disorders of consciousness, fMRI, functional connectivity, auditory network, external network
INTRODUCTION
Patients with disorders of consciousness (DOC) are a patient population that is very difficult toassess. Following coma, these patients can be in an unresponsive wakefulness syndrome (UWS)where behavior is reflexive, and awareness of the self and surrounding is absent (The Multi-SocietyTask Force of Pvs, 1994; Laureys et al., 2010), or in a minimally conscious state (MCS) wherebehaviors indicating awareness are limited, fluctuating but reproducible (Giacino et al., 2002).Various interferences, both physical and cognitive impairments, or medical complications canaffect the diagnosis based on clinical assessments of consciousness (Schnakers et al., 2009). Thisis one of the issues underlying the current misdiagnosis rate of 40% (Schnakers et al., 2009; van Erpet al., 2015). Consequently, numerous research is investigating the neural and cerebral responsesof these patients, with the aim to provide unbiased and objective measures complementing bedsideevaluation and helping diagnosis (Laureys and Schiff, 2011; Stender et al., 2014).
Frontiers in Psychology | www.frontiersin.org 1 November 2015 | Volume 6 | Article 1704
192 Appendix H. Paper VIII

Heine et al. Functional connectivity during preferred music in DOC
Previous research has also proposed to increase the sensitivityof clinical tests by using personally relevant stimuli (Perrinet al., 2015). For example, several behavioral studies haveshown that a higher number of responses could be observedfollowing self-referential stimuli, like the use of a mirroror the patient’s own name, as compared to neutral stimuli(Vanhaudenhuyse et al., 2008; Cheng et al., 2013; Di et al.,2014). Neurophysiological studies have indicated that salientand emotional stimuli increase the probability of observinga cerebral response in patients with DOC. For example, theprobability to observe a P300 event-related response (i.e., abrain response reflecting stimulus processing) is enhanced whenthe deviant stimulus is not a tone stimulus but the patient’sown name (Perrin et al., 2006; Cavinato et al., 2011). Veryrecently, it has also been shown that preferred music (i.e.,an autobiographical and emotional stimulus) has an effect oncognitive processes of patients with DOC. Indeed, observing aP300 to one’s own name was increased in patients with DOCafter having been exposed to their preferred music compared toa control condition (i.e., acoustically similar noise; Castro et al.,2015). This result is in agreement with a study showing increasedbehavioral responses after preferred music (Verger et al., 2014),and several single-case studies with DOC patients suggestingeffects of music on a behavioral level (Magee, 2005; Magee et al.,2014).
Resting state functional MRI allows investigation ofseveral distinct, reproducible and dynamic brain networks(Beckmann et al., 2005; Damoiseaux et al., 2006; De Lucaet al., 2006; Laird et al., 2011), without the need for patients’cooperation (Soddu et al., 2011). The auditory network is one ofthe reliably observed networks, even though not yet extensivelystudied. This network encompasses primary auditory corticesincluding Heschls gyri, superior temporal gyri, insula, cingulate,post- and pre-central gyri, and supramarginal gyrus (Beckmannet al., 2005; Smith et al., 2009; Laird et al., 2011). The auditorynetwork can be observed in 81% of healthy subjects, 46% inMCS, and is limited to 21% of UWS patients (Demertzi et al.,2014). In fact, it has strong power to discriminate MCS and UWSpatients, making automatic classification possible (Demertziet al., 2015). Another network that is also related to auditoryprocessing (Brunetti et al., 2008) is the external network. Thisnetwork is also related to external orientation, goal-directedbehaviors, and cognitive processing of somatosensory (Boly et al.,2007), and visual (Dehaene and Changeux, 2005) input. Theexternal network is often named the ‘dorsal attention network,’or ‘task positive’ network (Greicius et al., 2003; Vanhaudenhuyseet al., 2010a). It has been shown to be anticorrelated withan internal/default mode network (Greicius et al., 2003;Vanhaudenhuyse et al., 2010a), implicated in self-awarenessand stimulus-independent thoughts in healthy controls (Raichleet al., 2001; Greicius et al., 2009). Interestingly, auditory, externaland internal/default mode networks include cortical regions thathave been shown to be modulated by emotional sounds. Indeed,as compared to noise, meaningful sounds (infant cries or thepatient’s own name) are associated to a widespread activationof the auditory cortex and medial cortical structures in DOCpatients (Laureys et al., 2004). Thus, the effect of music as
reported in Castro et al. (2015) is probably also associated tofunctional connectivity changes of these regions.
We here aim to explore whether the effect of music in severelybrain-damaged patients with DOC is related to functionalconnectivity changes. Functional MRI scans were acquired whileparticipants were exposed to their preferred music as well asa control condition when they were exposed to the repetitivenoise from the scanner (also present in the music condition).Using a functional connectivity parcellation (Gordon et al.,2014), we assessed functional connectivity using seed regionsin both primary auditory cortices. We also analyzed networkconnectivity of the auditory network, the external network, anddefault mode network. We expect to observe changes, and morespecifically increases, in functional connectivity in the auditoryand attentional systems in patients with DOC during the musicstimulation (vs. the control condition).
MATERIALS AND METHODS
ParticipantsEight healthy participants (four female; mean age = 26 years,SD= 3), and seven patients (four MCS; three UWS)were scannedbetween March 2014 and April 2015 for this study. Patientswere excluded for this study when any contraindication for MRIwas present (e.g., presence of ferromagnetic aneurysm clips,pacemakers), or when patients needed sedation. Chronic patientswith DOCwere hospitalized for 1 week of assessment at the comascience group, University hospital of Liege, Belgium. Multiplebehavioral assessments in the form of the CRS-R were completed,including one the morning before the (f)MRI acquisition. Onepatient showed drain artifacts on the T1 and functional MRI scancovering more then 40% of the brain, and in one patient thesegmentation could not be reliably performed due to the lesionextent. Our patient population consisted thus of five patients(three MCS, two UWS; mean age = 50 years, SD = 10; Table 1).The ethics committee of the medical school of the University ofLiège approved the study.
Music Stimulation and ProcedureFive musical excerpts were selected for each participant froma questionnaire on musical preference completed by familymembers or loved ones (for the patients) or the participanthim/her self (for the healthy participants). Thesemusical excerptshad a mean duration of 2 min and were all dynamic, musicallycoherent, and representative of the whole musical piece. The fiveexcerpts were combined to create amusical stimulus of a durationof 10 min and 10 s, which overlaps with the duration of thefunctional scan. Fading in and fading out (around 2 s) was addedto avoid rough transitions between the excerpts.
The functional scan was acquired twice during one MRIscanning session. Once with the participants’ preferred music(i.e., music condition), and once when participants were exposedto the repetitive noise from the scanner (i.e., control condition).This control condition is the same as used for the investigationof a classical resting state. The order of the conditions wasrandomized between participants, and the two functional scans
Frontiers in Psychology | www.frontiersin.org 2 November 2015 | Volume 6 | Article 1704
193

Heine et al. Functional connectivity during preferred music in DOC
TABLE 1 | Diagnostics of the five patients with disorders of consciousness (DOC).
DOC1 DOC2 DOC3 DOC4 DOC5
Sex Male Female Female Male Male
Age (years) 40 50 39 61 58
Time since injury (months) 12 6 26 13 25
Etiology Trauma Anoxic Trauma Anoxic Anoxic
Diagnosis UWS UWS MCS - EMCS MCS +
CRS-R
score
A. 1 1 2 4 3
V. 0 0 3 5 0
M. 2 1 2 6 1
O. 0 1 1 3 1
C. 0 0 0 2 0
Ar. 1 2 2 3 2
Total 4 5 10 23 7
Structural MRI Subcortical diffuse
axonal injury, moderate
enlargement of the
ventricles, and atrophy
of midbrain and sulci
Cortical and subcortical
atrophy with severe
post-anoxic
leukoencephalopathy
Right lenticular lesion,
diffuse axonal injury,
and enlargement of the
third ventricles
Extensive defects in
region of the posterior
cerebral artery,
thalamus, and
enlargement of right
lateral ventricle
Global hemosiderosis
and ischemic damage,
white matter intensities
(frontal + temporal),
and enlargement of the
ventricles
Neuroimaging (PET) Indicated MCS Consistent with an
UWS
Consistent with MCS Consistent with EMCS Consistent with MCS
CRS-R, coma recovery scale revised; A., auditory function; V., visual function; M., motor function; O., oromotor/verbal function; C., communication; Ar., arousal; UWS,
unresponsive wakefulness syndrome; MCS, minimally conscious state; EMCS, emergence from minimally conscious state.
were always separated by a delay of 10min to reduce any potentialorder effects. Instructions and musical stimuli were deliveredthrough MR compatible Siemens headphones. Participants wereinstructed to keep their eyes closed, stay awake, avoid anystructured thoughts, and listen attentively to the music.
MRI Acquisition and AnalysisTwo sets of 300 T2∗-weighted images were acquired using a 3TSiemens TIM Trio MRI scanner (Siemens Medical Solutions,Erlangen, Germany) with a gradient-echo echo-planar imagingsequence using axial slice orientation and covering the wholebrain (32 slices; voxel size = 3 mm × 3 mm × 3 mm; matrix size= 64 × 64 × 32; repetition time = 2000 ms; echo time = 30 ms;flip angle = 78◦; field of view = 192 mm × 192 mm).The 10 initial volumes were discarded to avoid T1 saturationeffects. Data preprocessing was performed using StatisticalParametric Mapping 8 (SPM81). Preprocessing steps includedrealignment and adjustment for movement-related effects, slicetime correction, co-registration of functional onto structuraldata, segmentation of structural data, spatial normalization ofall data to standard stereotactic Montreal Neurological Institute(MNI) space using the normalization parameters which hadresulted from the segmentation step. Normalized functional datawere then smoothed using a Gaussian kernel with an isotropic8 mm of full-width half-maximum.
Motion correction was applied using an automatic artifactdetection tool for global mean and motion outliers2. Outliersin the global mean signal intensity and motion were identifiedand included in the subsequent statistical analysis as nuisance
1www.fil.ion.ucl.ac.uk/spm2http://www.nitrc.org/projects/artifactdetect/
parameters (i.e., one regressor per outlier within the first-levelgeneral linear models). Specifically, an image was defined as anoutlier (artifact) image if the head displacement in x, y, or zdirection was greater than 0.5 mm from the previous frame, orif the rotational displacement was greater than 0.02 radians fromthe previous frame, or if the global mean intensity in the imagewas greater than 3 SD from the mean image intensity for theentire resting session. For our group of patients, the numberof motion outlier images did not differ significantly betweenmusic and noise sessions (two-sided paired t-test; p= 0.16, musiccondition m = 16, SD = 18; control condition m = 3, SD = 4).Healthy participants did not show any movement-affected outlierscans.
Analyses of functional connectivity were performed using theconnectivity toolbox “conn,” version 15D3 (Whitfield-Gabrieliand Nieto-Castanon, 2012). As recently recommended (Behzadiet al., 2007; Murphy et al., 2009; Saad et al., 2012; Wonget al., 2012), we used a regression of nuisance effects beforebandpass filtering (RegBP; Hallquist et al., 2013). The data weredespiked, and white matter (WM) and cerebrospinal fluid (CSF)components were regressed out as nuisance variables accordingto the aCompCor method. We then applied a linear detrendingterm. The residual BOLD time series went through a bandpassfilter between 0.008 and 0.09 Hz to reduce the effect of lowfrequency drifts and high-frequency noise. All described steps arepart of the standard procedure in the “conn” toolbox (Behzadiet al., 2007; Whitfield-Gabrieli and Nieto-Castanon, 2012). Theresidual head motion parameters (three rotation and threetranslation parameters, plus another six parameters representingtheir first-order temporal derivatives) were regressed out.
3http://www.nitrc.org/projects/conn
Frontiers in Psychology | www.frontiersin.org 3 November 2015 | Volume 6 | Article 1704
194 Appendix H. Paper VIII

Heine et al. Functional connectivity during preferred music in DOC
One pitfall of the analysis of resting state functionalconnectivity using seeds is the selection of seeds. The seedplacement bias could lead to different and overlapping networksdepending on the amount and placement of seeds (Coleet al., 2010). This bias can be reduced through the use ofparcellations instead of spheres based on coordinates from theliterature. We used a functional connectivity parcellation atlasbased on a selection of parcels out of 330 parcels containinghighly homogenous signal patterns (Gordon et al., 2014). Thisparcellation allowed us to perform two different analyses.
We first assessed functional connectivity on a seed based level.Two parcels were taken from the atlas of Gordon et al. (2014),localized at the structurally definedHeschl’s gyrus (left and right).These two seeds were chosen for their importance in auditoryprocessing. With these seeds group analysis was performed toassess functional connectivity within both conditions as well asdifferences between the preferred music and control condition.Furthermore, first level beta maps were extracted (i.e., fishertransformed correlation values) for each participant and usedto create individual figures for our a priori regions duringboth conditions (supplementary material). Data of healthysubjects were not directly compared to patients due to agedifferences, thus the difference between the music and controlcondition within one patient could not be compared to therange of differences within controls. Therefore, no within-subjectstatistical analysis was performed.
Although studies in healthy subjects show that single seedscan reveal whole networks, this is not necessarily the case inbrain-damaged patients. Network disruption can be expecteddue to underlying neuropathology excluding regions fromoverall networks. To assess overall network characterizationit is advised to use multiple seeds/regions (Demertzi et al.,2015). All parcels belonging to the auditory network, externalnetwork, and default mode network according to Gordonet al. (2014) were assessed for our group of patients in eachcondition. For all networks, time courses of the parcels wereaveraged and correlated to the whole brain (Halko et al., 2014;Demertzi et al., 2015). Thus, this averaged time series wasused to estimate whole-brain correlation r maps, which werethen converted to normally distributed Fisher’s z transformedcorrelation maps to allow for subsequent group-level analysison the mean network connectivity (comparing music vs. controlconditions). For all analyses on the group level (seed basedand network based functional connectivity analysis) one samplet-tests were used for estimation of functional connectivity ineach condition, and two-sample paired t-tests were used forbetween condition comparisons. The results were reported assignificant when they exceeded a height threshold of uncorrectedp = 0.001 with a family wise error corrected extent threshold ofp = 0.05 at the cluster level. For clusters that showed significantstronger functional connectivity during the music conditioncontrast estimates (beta values) were extracted (SupplementaryFigure S2). We did not compare the healthy group to ourpatient group due to differences in age, and the possible effectsthis might have on network integrity, as well as the possibledifferences in reaction to preferred music in terms of memory oremotion.
FIGURE 1 | Functional connectivity in healthy subjects during the
music condition and the control condition. Maps indicate healthy
subjects’ (N = 8) functional connectivity during favorite music exposure (Red)
and the control condition (Blue), and regions where functional connectivity
was present in both conditions (Green). The top two panels show seed-based
analyses, the lower three panels show mean network connectivity. Note that
there is no significant difference between music and control condition. Results
were analyzed in a network-based manner and thresholded with a family wise
error corrected extended cluster level of p < 0.05. Standardized MNI T1
2x2x2 template was used to render results. (x,y,z) value indicates MNI
coordinates of represented sections.
Frontiers in Psychology | www.frontiersin.org 4 November 2015 | Volume 6 | Article 1704
195

Heine et al. Functional connectivity during preferred music in DOC
FIGURE 2 | Functional connectivity in patients during the music condition and the control condition using primary auditory seeds. Red/pink maps
indicate patients’ (N = 5) functional connectivity during the control condition (left) and favorite music exposure (middle) for both the left and right primary auditory
cortex (L p-aud., and R p-aud.; respectively). Right maps show the regions that show significantly more functional connectivity during music condition compared to
the control condition. Results were analyzed in a network-based manner and thresholded with a family wise error corrected extended cluster level of p < 0.05 (in
red). For visualization a lowered threshold is indicated in pink (0.01 uncorrected height with family wise error corrected extended cluster level of p < 0.05).
Standardized MNI T1 2x2x2 template was used to render results. (x,y,z) value indicates MNI coordinates of represented sections.
RESULTS
In healthy participants, seed-based analyses of both left and rightprimary auditory areas showed functional connectivity in areasconsidered as being part of the auditory network during bothmusic and control conditions. Indeed, functional connectivitywith seeds in both primary auditory cortices was observed inbilateral temporal gyri (encompassing Heschl’s gyrus, operculargyrus, insula, planum polare, and superior temporal areas),anterior cingulate, pre- and post-central areas and the occipitalpole (Figure 1; Supplementary Table S1) in both conditions. Nosignificant difference was observed between the two conditions.Similarly, the auditory network showed activation in bilateraltemporal gyri (encompassing Heschl’s gyrus, opercular, insula,planum polare, and superior temporal areas). This temporalcluster extended from inferior frontal, to precentral and angularareas. The auditory network also included the anterior cingulate,pre- and post-central areas and the occipital fusiform gyrusand cortex (Figure 1; Supplementary Table S2). The externalnetwork encompassed regions of bilateral inferior parietal sulcusand lobule, dorsolateral prefrontal, supramarginal, frontal eyefield, lateral occipital and precentral, as well as cerebellar andinsular areas. The default mode network showed functionalconnectivity with the precuneus, frontal pole and superior frontalgyrus, angular and lateral occipital gyrus, and middle temporalgyrus. For these three networks, the music condition did notsignificantly differ from the control condition.
In patients, seed-based analyses of patients showed thatfunctional connectivity was mainly restricted to the areassurrounding each of the two seeds (i.e., left and right primaryauditory cortex) for both the music and the control conditions;however, several other clusters of functional connectivity werealso observed (Figure 2; Table 2). The left primary auditory seedshowed functional connectivity with the middle temporal gyrusduring the control condition, and the left frontal operculum,
superior temporal gyrus and cerebellum during the musiccondition. The right primary auditory seed showed severalsmaller clusters in the temporal area as well as the supramarginalarea during the control condition, and one large cluster ofactivation in the temporal cortex during the music condition.When the music condition was directly compared to the controlcondition, the left primary auditory seed showed more functionalconnectivity in the right precentral gyrus during music. Nodifference was observed with the right primary auditory seed forthis direct comparison. Single subject first level beta values (i.e.,Fisher’s z transformed correlation values) were used to createindividual patient figures for the two primary auditory seedactivations during both conditions (Supplementary Figure S1).Correlation values during music and control conditions weremainly restricted to the areas surrounding each of the seeds, butin general, more voxels seemed to be strongly correlated in themusic condition than in to the control condition (correlationshigher than 0.8 were assessed and shown in the SupplementaryMaterial).
Patients showed a severely limited auditory network offunctional connectivity during both conditions (Figure 3;Table 3A). During the control condition, activation was onlyseen in bilateral temporal areas. During the music condition,the auditory network consisted of bilateral temporal gyri (onlyincluding left Heschl gyrus), as well as small clusters in theright inferior frontal gyrus and the left supramarginal gyrus;these were areas also included in the temporal cluster for thehealthy subjects. When the music condition was compared tothe control condition, the auditory network showed significantlymore functional connectivity with the left precentral gyrus anda region on the junction of the middle frontal gyrus and frontalpole: the left dorsolateral prefrontal cortex.
The external network in patients was restricted to the inferiorparietal sulcus and lobule, dorsolateral, middle frontal, andsupra marginal areas during both control and music conditions.
Frontiers in Psychology | www.frontiersin.org 5 November 2015 | Volume 6 | Article 1704
196 Appendix H. Paper VIII

Heine et al. Functional connectivity during preferred music in DOC
TABLE 2 | Results of the seed-based analyses in the patients.
MNI coordinates (x,y,z) Cluster size Cluster p-FWE p-unc peak Region
Left primary auditory cortex
Music −40 24 6 223 0 0.000003 Left Frontal operculum
−40 −26 6 200 0 0.000023 Left Heschl/planum temporale
−68 −36 14 52 0.025011 0.000007 Left Superior temporal gyrus
0 −48 −8 50 0.030795 0.000067 Cerebellum
Control −60 −20 6 403 0 0 Left Heschl/planum temporale
−68 −46 4 163 0 0.000003 Left Middle temporal gyrus
Music > Control 46 0 54 113 0.000007 0.000002 Right Precentral gyrus
Right primary auditory cortex
Music 40 26 10 886 0 0.000003 Right Temporal cortex: insula/central
opercular/planum temporale/
Heschl/frontal operculum
Control 44 −16 10 379 0 0.000001 Right Heschl gyrus/central opercular
−68 −10 −2 85 0.00046 0.000047 Left Superior temporal gyrus
−64 −18 6 50 0.017807 0.000005 Left Planum temporale
28 −32 32 47 0.02515 0.000053 Right Supramarginal gyrus
FIGURE 3 | Mean network connectivity in patients during the music condition and the control condition. Red/pink maps indicate patients’ (N = 5)
functional connectivity during the control condition (left) and favorite music exposure (middle) for the auditory network, external network, and default mode network
(DMN). Right maps show the regions that show significantly more functional connectivity during music condition compared to the control condition. Results were
analyzed in a network-based manner and thresholded with a family wise error corrected extended cluster level of p < 0.05 (in red). For visualization a lowered
threshold is indicated in pink (0.01 uncorrected height with family wise error corrected extended cluster level of p < 0.05). Standardized MNI T1 2x2x2 template was
used to render results. (x,y,z) value indicates MNI coordinates of represented sections.
(Figure 3; Table 3B). Compared to the control condition, musicshowed more functional connectivity with the supramarginal/angular gyrus, also referred to as the temporoparietal junction.
The default-mode network in patients seemed disconnected inpatients (Figure 3;Table 3C). The control condition only showed
functional connectivity in the frontal pole/paracingulate gyrus.The music condition showed further functional connectivitywith the precuneus, post-central gyrus, lateral occipital pole, andmiddle temporal gyrus. However, no difference could be foundbetween the two conditions.
Frontiers in Psychology | www.frontiersin.org 6 November 2015 | Volume 6 | Article 1704
197

Heine et al. Functional connectivity during preferred music in DOC
TABLE 3A | Results of network-based analysis in patients: auditory network.
MNI coordinates (x,y,z) Cluster size Cluster p-FWE p-unc peak Region
Auditory network
Music −66 −40 14 161 0.000004 0.000034 Left Supramarginal gyrus
40 20 18 109 0.000174 0.000002 Right Inferior frontal gyrus
60 −4 12 97 0.000466 0.000032 Right Temporal, central opercular
−50 −30 20 48 0.042949 0.000507 Left Parietal operculum/Heschl
Control −50 −40 10 1152 0 0.000004 Left Temporal cortex: planum
temporale/central opercular/
superior temporal
28 6 2 997 0 0 Right Temporal, central
opercular/insula
−36 20 12 208 0 0.000011 Left Frontal operculum
28 −26 26 46 0.046101 0.000094 Right Parietal operculum
Music > Control −66 −8 36 319 0 0.000001 Left Precentral gyrus
−28 42 30 44 0.028322 0.000019 Left DLPFC
TABLE 3B | Results of network-based analysis in patients: external network.
MNI coordinates (x,y,z) Cluster size Cluster p-FWE p-unc peak Region
External network
Music 58 −32 44 4974 0 0 Bilateral Inferior parietal sulcus/inferior
parietal lobule
−36 24 52 424 0 0.000005 Left DLPFC
−52 32 16 122 0.000111 0.000008 Left Middle frontal gyrus (small part
FEF)
−14 −10 64 116 0.000174 0.000013 Left SMA
48 12 56 100 0.000594 0.000021 Right Middle frontal gyrus (small part
FEF)
30 34 −8 69 0.007915 0.000044 Right DLPFC
−38 −54 −12 59 0.019658 0.000013 Left Lateral occipital/MT
−56 −58 4 50 0.046263 0.000163 Left Lateral occipital/MT
Control −24 −62 48 2072 0 0.000001 Left Inferior parietal sulcus/inferior
parietal lobule
12 −74 54 1026 0 0.000004 Right Inferior parietal sulcus/inferior
parietal lobule
−32 14 24 403 0 0.000003 Left SMA extending to small part
FEF
−42 48 24 104 0.000223 0.000012 Left DLPFC
34 8 52 82 0.001473 0.000065 Right Middle frontal gyrus (small part
FEF)
Music > Control −42 −50 30 103 0.000078 0.000003 Left Supramarginal/angular gyrus
DISCUSSION
In the present study, we aimed at assessing the potential effectof music on the brain’s functional connectivity in patients withDOC. We compared patients’ intrinsic brain activation whilebeing exposed to their preferred music and during a controlcondition. For this purpose, seed-based functional connectivityas well as network-level functional connectivity was assessed.Seed-based functional connectivity analyses of primary auditorycortices showed significant differences in functional connectivitybetween music and control conditions for the patients. Network-level analyses showed that patients’ functional connectivity isincreased when being exposed to their preferred music in the
auditory and external network (in comparison to the controlcondition).
In healthy participants, the network of functional connectivitybased on both primary auditory regions encompasses large partsof the auditory cortex, superior temporal gyri, insula, cingulatecortex, central areas (pre and post), supramarginal gyrus, andoccipital areas (Figure 1), in both the music condition and thecontrol condition. These are, as expected, part of the auditorynetwork (Beckmann et al., 2005; Damoiseaux et al., 2006; DeLuca et al., 2006; Smith and Tindell, 2009; Laird et al., 2011;Demertzi et al., 2014). To assess network integrity, mean networkconnectivity was assessed in the auditory network, externalnetwork, and default mode network, i.e., networks that are
Frontiers in Psychology | www.frontiersin.org 7 November 2015 | Volume 6 | Article 1704
198 Appendix H. Paper VIII

Heine et al. Functional connectivity during preferred music in DOC
TABLE 3C | Results of network-based analysis in patients: default mode network.
MNI coordinates (x,y,z) Cluster size Cluster p-FWE p-unc peak Region
Default mode network
Music −26 32 34 1247 0 0.000001 Bilateral Middle frontal gyrus/frontal
pole/paracingulate gyrus
12 −66 62 233 0 0.000004 Right Precuneus/lateral occipital
−38 −76 48 150 0.000014 0.000001 Left Lateral occipital
−30 52 2 110 0.000264 0.000124 Left Frontal pole
−58 −24 −12 81 0.002724 0.000004 Left Middle temporal gyrus
8 60 −4 56 0.025536 0.000149 Right Frontal pole
28 −24 46 53 0.034 0.000094 Right Post-central gyrus
Control −10 48 18 679 0 0.000034 Left Frontal pole/paracingulate
gyrus
respectively linked to auditory processing, external orientation,and internal thoughts.
Network-based second level analysis of functional connecti-vity showed that the auditory network was clearly replicatedin our healthy subjects during both the music and controlconditions. This network has consistently been observed inprevious resting state studies investigating not only healthyparticipants but also DOC patients (Demertzi et al., 2014).In healthy participants it encompassed bilateral temporal gyri(including Heschl’s gyrus, opercular, insula, planum polare, andsuperior temporal areas), extending to inferior frontal, precentraland angular areas, as well as clusters in anterior cingulate,pre- and post-central areas and the occipital fusiform gyrus(Beckmann et al., 2005; Damoiseaux et al., 2006; De Luca et al.,2006; Smith and Tindell, 2009; Laird et al., 2011; Demertziet al., 2014). The external network has also been observed inhealthy participants. It encompassed, as consistently observedin previous studies (Fox et al., 2005; Vanhaudenhuyse et al.,2010a), regions of bilateral inferior parietal sulcus and lobule,dorsolateral prefrontal, supramarginal gyrus, the frontal eye field,lateral occipital and precentral, as well as cerebellar and insularareas. The default-mode network showed functional connectivityin regions consistently observed in healthy participants andpatient populations (Buckner et al., 2008). Most importantly,music did not show any increases in functional connectivitycompared to the control condition for the seed-based and allthree network-level analyses. This result is consistent with Castroet al. (2015) who observed that music (in comparison to noise)did not modify the event-related responses in healthy participants(while this was the case for the DOC patients). This observationsuggests that the effects of music observed in previous researchare possibly not present in healthy subjects (or that the cerebralresponses could not be enhanced because they were alreadyat ceiling). This finding could be due to the nature of ourexperimental material. Indeed Wilkins et al. (2014) have shownfunctional connectivity differences (in the default mode networkand between auditory brain areas and the hippocampus) betweentwo music materials that strongly differ in terms of emotion, i.e.,preferred and disliked music (in healthy participants). It is thuspossible, that our control condition, which can be considered asrather neutral, was not disliked enough to warrant significant
differences in functional connectivity with the preferred musiccondition.
Seed-based analysis indicated that patients showed stronglylimited functional correlations with the primary auditorycortices: activation was only observed around the seed areasand no long distance connectivity emerged within the auditorynetwork. This finding is in line with previous research showing alinear decrease in functional connectivity ranging from healthyparticipants to unresponsive patients (Vanhaudenhuyse et al.,2010b; Thibaut et al., 2012; Demertzi et al., 2014). In fact,many studies have shown that functional connectivity stillexists in DOC patients, and other forms of decreased levelsof consciousness (Heine et al., 2012). Low-level activations inprimary auditory cortices, without top–down feedback have alsobeen observed in unresponsive patients (Laureys et al., 2000;Boly et al., 2011). In fact, patients seem to have a generaldisconnection between brain regions, notably missing long rangeconnectivity (Casali et al., 2013). Our results are congruent withthis observation as we observe mainly functional connectivity inthe hemisphere of the seed. Furthermore, significant differencesin the right precentral gyrus are observed during the preferredmusic condition compared to the control condition (Figure 2).This finding is in agreement with a previous study investigatingDOC patients and reporting activation in the right superiortemporal gyrus during three 10-s blocks of musical stimulationbased on a famous song (Okumura et al., 2014).
First-level connectivity maps of each patient suggest largerareas of correlation near the seed during the music conditionthan during the control condition (Supplementary Figure S1).This difference seems to be present for all subjects, even thesubjects clinically diagnosed as UWS (DOC1 and 2). Thisfinding fits with the neuroimaging results observed in DOC1:diagnostic assessment based on PET metabolism suggested MCS(e.g., Stender et al., 2014). However, the second patient whowas diagnosed as UWS (DOC2) both clinically and usingneuroimaging, also showed more voxels correlated to the seed,indicating that the effect of music as reported here (if replicablein future studies with extended patient samples) might be presentfor all DOC. It is important to note that stronger correlatingvoxels were observed during the music condition (as comparedto the control condition) in all patients for at least one seed. Also,
Frontiers in Psychology | www.frontiersin.org 8 November 2015 | Volume 6 | Article 1704
199

Heine et al. Functional connectivity during preferred music in DOC
no clear correlation with etiology, or time since injury can be seendue to the limited sample.
The three network analyses further revealed significantdifferences in the auditory network and external network, butnot the default mode network, during the music condition.Patients showed a severely limited auditory network of functionalconnectivity during both conditions (Figure 3). During thecontrol condition, activation was only seen in bilateral temporalareas. During the music condition, the auditory network wasrestricted to bilateral temporal gyri (only left including Heschl’sgyrus) and small clusters in the right inferior frontal gyrus andthe left supramarginal gyrus, areas included in the temporalcluster for the healthy subjects. The right inferior frontal gyrusis implicated in auditory memory as well as the processingof musical syntactic-like structures (Maess et al., 2001; Janataet al., 2002; Koelsch et al., 2002, 2005; Tillmann et al., 2003,2006; Koelsch and Siebel, 2005; Albouy et al., 2013). Whenmusic was compared to the control condition, patients’ auditorynetwork showed significantly more functional connectivity withthe left precentral gyrus (Note that the seed-based analysis alsorevealed significant increased functional enhancement in theright precentral gyrus during music; see Figure 2) and the leftfrontal pole. The precentral cluster overlaps with regions of theauditory network in healthy subjects. The lateral prefrontal cortexhas also been linked to autobiographical memory (Svobodaet al., 2006; Cabeza and St Jacques, 2007), and has also beenimplicated in rhythm perception (Zatorre et al., 2007). Thefinding of increased functional connectivity in music comparedto the control condition suggests that music has an effect on theauditory-related network in DOC patients, in whom short-termfunctional plasticity might appear following the lesions.
In patients, the external network observed during the controlcondition was restricted to clusters of functional connectivity ininferior parietal sulcus and lobule, dorsolateral, middle frontal,and supramarginal areas. In the music condition, the externalnetwork showed besides these regions also connectivity with theregion MT and parts of the frontal eye field. When directlycompared to the control condition, the music condition showedmore functional connectivity with the supramarginal/angulargyrus. This cluster overlaps with the supramarginal regionsactivated during spatial orienting in healthy subjects (Corbettaand Shulman, 2002). Interestingly, this region overlaps withdisconnected areas in UWS patients (Laureys et al., 2000).Laureys et al. (2000) proposed that a lack of integration betweenprimary regions (that activate after simple auditory stimulationsin UWS), and higher order regions like the temporoparietaljunction and superior temporal gyri (activated in MCS aftersimple auditory stimuli; Boly and Faymonville, 2004) makesconscious processing unlikely (Laureys et al., 2000; Boly and
Faymonville, 2004). Put differently, unconsciousness might berelated to a disruption in feedback processing to the auditoryregions (Boly et al., 2011).
CONCLUSION
The effect of music on functional cerebral connectivity isreminiscent of previous findings which have shown effectsof music in brain-damaged patients (Soto and Funes, 2009;Särkämö and Soto, 2012; Verger et al., 2014; Castro et al., 2015).For example, a recent EEG study investigating DOC patientshas shown that the patients’ cerebral responses following thepresentation of one’s own name were increased after havingbeen exposed to their preferred music (Castro et al., 2015).A “Mood and Arousal hypothesis,” attributes the beneficial effectsof music on cognition to an increase in mood and arousal(Chabris, 1999; Nantais and Schellenberg, 1999). Within thishypothesis, the effects of music in DOC patients might be dueto an overall cortical arousal in the cerebral structures thathave been reported to be involved in emotional and moodstates. A second hypothesis attributes the effect of music toautobiographical priming (Castro et al., 2015). Interestingly, inthe present study, an increased functional connectivity during themusic condition (vs. the control condition) was shown in corticalstructures linked to music perception, autobiographical memoryand consciousness for DOC patients. These results need to beconfirmed in an extended group of patients, and future studiesshould also disentangle the general effect of music (because of itsacoustic and structural features) from its autobiographical effects(because of its emotional and meaningful contents in relation tothe patients’ personal memory).
ACKNOWLEDGMENTS
Research was funded by the le Fonds de la RechercheScientifique – FNRS; by the federation Wallonie-Bruxelles –FWB; by institutional grants from the LabEx CeLyA (“CentreLyonnais d’Acoustique,” ANR-10-LABX-60); by the grant ANRCogniComa, the “France Traumatisme Crânien” Association andthe “Gueules Cassées” Fondation.
SUPPLEMENTARY MATERIAL
The Supplementary Material for this article can be foundonline at: http://journal.frontiersin.org/article/10.3389/fpsyg.2015.01704
REFERENCES
Albouy, P., Mattout, J., Bouet, R., Maby, E., Sanchez, G., Aguera, P.-E., et al.(2013). Impaired pitch perception and memory in congenital amusia: thedeficit starts in the auditory cortex. Brain 136, 1639–1661. doi: 10.1093/brain/awt082
Beckmann, C. F., Deluca, M., Devlin, J. T., and Smith, S. M. (2005). Investigationsinto resting-state connectivity using independent component analysis. Philos.Trans. R. Soc. Lond. B Biol. Sci. 360, 1001–1013. doi: 10.1098/rstb.2005.1634
Behzadi, Y., Restom, K., Liau, J., and Liu, T. T. (2007). A component basednoise correction method (CompCor) for BOLD and perfusion based fMRI.Neuroimage 37, 90–101. doi: 10.1016/j.neuroimage.2007.04.042
Frontiers in Psychology | www.frontiersin.org 9 November 2015 | Volume 6 | Article 1704
200 Appendix H. Paper VIII

Heine et al. Functional connectivity during preferred music in DOC
Boly, M., Balteau, E., Schnakers, C., Degueldre, C., Moonen, G., Luxen, A.,et al. (2007). Baseline brain activity fluctuations predict somatosensoryperception in humans. Proc. Natl. Acad. Sci. U.S.A. 104, 12187–12192. doi:10.1073/pnas.0611404104
Boly, M., and Faymonville, M. (2004). Auditory processing in severely braininjured patients: differences between the minimally conscious state and thepersistent vegetative state. Arch. Neurol. 61, 233–238. doi: 10.1001/archneur.61.2.233
Boly, M., Garrido, M. I., Gosseries, O., Bruno, M., Laureys, S., and Friston, K.(2011). Preserved feedforward but impaired top-down processes inthe vegetative state. Science 332, 858–862. doi: 10.1126/science.1202043
Brunetti, M., Della Penna, S., Ferretti, A., Del Gratta, C., Cianflone, F.,Belardinelli, P., et al. (2008). A frontoparietal network for spatial attentionreorienting in the auditory domain: a human fMRI/MEG study offunctional and temporal dynamics. Cereb. Cortex 18, 1139–1147. doi:10.1093/cercor/bhm145
Buckner, R. L., Andrews-Hanna, J., and Schacter, D. (2008). The brain’s defaultnetwork: anatomy, function, and relevance to disease. Ann. N. Y. Acad. Sci.1124, 1–38. doi: 10.1196/annals.1440.011
Cabeza, R., and St Jacques, P. (2007). Functional neuroimaging of autobiographicalmemory. Trends Cogn. Sci. 11, 219–227. doi: 10.1016/j.tics.2007.02.005
Casali, A. G., Gosseries, O., Rosanova, M., Boly, M., Sarasso, S., Casali, K. R.,et al. (2013). A theoretically based index of consciousness independentof sensory processing and behavior. Sci. Transl. Med. 5:198ra105. doi:10.1126/scitranslmed.3006294
Castro, M., Tillman, B., Luauté, J., Corneyllie, A., Dailler, F., André-Obadia, N., et al. (2015). Boosting cognition with music in patients withdisorders of consciousness. Neurorehabil. Neural Repair 29, 734–742. doi:10.1177/1545968314565464
Cavinato, M., Volpato, C., Silvoni, S., Sacchetto, M., Merico, A., and Piccione, F.(2011). Event-related brain potential modulation in patients with severebrain damage. Clin. Neurophysiol. 122, 719–724. doi: 10.1016/j.clinph.2010.08.024
Chabris, C. F. (1999). Prelude or requiem for the “Mozart effect?” Nature 400,826–827. doi: 10.1038/23608
Cheng, L., Gosseries, O., Ying, L., Hu, X., Yu, D., Gao, H., et al. (2013). Assessmentof localisation to auditory stimulation in post-comatose states: use the patient’sown name. BMC Neurol 13:27. doi: 10.1186/1471-2377-13-27
Cole, D. M., Smith, S. M., and Beckmann, C. F. (2010). Advances and pitfalls in theanalysis and interpretation of resting-state FMRI data. Front. Syst. Neurosci. 4:8.doi: 10.3389/fnsys.2010.00008
Corbetta, M., and Shulman, G. L. (2002). Control of goal-directed andstimulus-driven attention in the brain. Nat. Rev. Neurosci. 3, 201–215. doi:10.1038/nrn755
Damoiseaux, J. S., Rombouts, S. A. R. B., Barkhof, F., Scheltens, P., Stam,C. J., Smith, S. M., et al. (2006). Consistent resting-state networks acrosshealthy subjects. Proc. Natl. Acad. Sci. U.S.A. 103, 13848–13853. doi:10.1073/pnas.0601417103
Dehaene, S., and Changeux, J.-P. (2005). Ongoing spontaneous activity controlsaccess to consciousness: a neuronal model for inattentional blindness. PLoSBiol. 3:e141. doi: 10.1371/journal.pbio.0030141
De Luca, M., Beckmann, C. F., De Stefano, N., Matthews, P. M., and Smith,S. M. (2006). fMRI resting state networks define distinct modes of long-distance interactions in the human brain. Neuroimage 29, 1359–1367. doi:10.1016/j.neuroimage.2005.08.035
Demertzi, A., Antonopoulos, G., Heine, L., Voss, H. U., Crone, J. S., de LosAngeles, C., et al. (2015). Intrinsic functional connectivity differentiatesminimally conscious from unresponsive patients. Brain 138(Pt 9), 2619–2631.doi: 10.1093/brain/awv169
Demertzi, A., Gómez, F., Crone, J. S., Vanhaudenhuyse, A., Tshibanda, L.,Noirhomme, Q., et al. (2014). Multiple fMRI system-level baseline connectivityis disrupted in patients with consciousness alterations. Cortex 52, 35–46. doi:10.1016/j.cortex.2013.11.005
Di, H., Nie, Y., Hu, X., Tong, Y., Heine, L., Wannez, S., et al. (2014). Assessmentof visual fixation in vegetative and minimally conscious states. BMC Neurol.14:147. doi: 10.1186/1471-2377-14-147
Fox, M. D., Snyder, A. Z., Vincent, J. L., Corbetta, M., Van Essen, D. C., andRaichle, M. E. (2005). The human brain is intrinsically organized into dynamic,anticorrelated functional networks. Proc. Natl. Acad. Sci. U.S.A. 102, 9673–9678.doi: 10.1073/pnas.0504136102
Giacino, J. T., Ashwal, S., and Childs, N. (2002). The minimally consciousstate?: definition and diagnostic criteria. Neurology 58, 349–353. doi:10.1212/WNL.58.3.349
Gordon, E. M., Laumann, T. O., Adeyemo, B., Huckins, J. F., Kelley, W. M., andPetersen, S. E. (2014). Generation and evaluation of a cortical area parcellationfrom resting-state correlations. Cereb. Cortex doi: 10.1093/cercor/bhu239[Epub ahead of print].
Greicius, M. D., Krasnow, B., Reiss, A. L., and Menon, V. (2003). Functionalconnectivity in the resting brain: a network analysis of the defaultmode hypothesis. Proc. Natl. Acad. Sci. U.S.A. 100, 253–258. doi:10.1073/pnas.0135058100
Greicius, M. D., Supekar, K., Menon, V., and Dougherty, R. F. (2009). Resting-state functional connectivity reflects structural connectivity in the default modenetwork. Cereb. Cortex 19, 72–78. doi: 10.1093/cercor/bhn059
Halko, M. A., Farzan, F., Eldaief, M. C., Schmahmann, J. D., and Pascual-Leone, A.(2014). Intermittent theta-burst stimulation of the lateral cerebellum increasesfunctional connectivity of the default network. J. Neurosci. 34, 12049–12056.doi: 10.1523/JNEUROSCI.1776-14.2014
Hallquist, M. N., Hwang, K., and Luna, B. (2013). The nuisance of nuisanceregression: spectral misspecification in a common approach to resting-statefMRI preprocessing reintroduces noise and obscures functional connectivity.Neuroimage 82, 208–225. doi: 10.1016/j.neuroimage.2013.05.116
Heine, L., Soddu, A., Gomez, F., Vanhaudenhuyse, A., Tshibanda, L.,Thonnard, M., et al. (2012). Resting state networks and consciousness.Alterations of multiple resting state network connectivity in physiological,pharmacological and pathological consciousness states. Front. Psychol. 3:295.doi: 10.3389/fpsyg.2012.00295
Janata, P., Birk, J. L., Van Horn, J. D., Leman, M., Tillmann, B., and Bharucha, J. J.(2002). The cortical topography of tonal structures underlying Western music.Science 298, 2167–2170. doi: 10.1126/science.1076262
Koelsch, S., Fritz, T., Schulze, K., Alsop, D., and Schlaug, G. (2005). Adults andchildren processing music: an fMRI study. Neuroimage 25, 1068–1076. doi:10.1016/j.neuroimage.2004.12.050
Koelsch, S., Gunter, T. C., v Cramon, D. Y., Zysset, S., Lohmann, G., and Friederici,A. D. (2002). Bach speaks: a cortical “language-network” serves the processingof music. Neuroimage 17, 956–966. doi: 10.1006/nimg.2002.1154
Koelsch, S., and Siebel, W. A. (2005). Towards a neural basis of music perception.Trends Cogn. Sci. 9, 578–584. doi: 10.1016/j.tics.2005.10.001
Laird, A. R., Fox, P. T. M., Eickhoff, S. B., Turner, J. A., Ray, K. L., McKay,D. R., et al. (2011). Behavioral interpretations of intrinsic connectivity networks.J. Cogn. Neurosci. 17, 1–16. doi: 10.1162/jocn_a_00077
Laureys, S., Celesia, G. G., Cohadon, F., Lavrijsen, J., Leon-Carrrion, J., Sannita,W. G., et al. (2010). Unresponsive wakefulness syndrome: a new name forthe vegetative state or apallic syndrome. BMC Med. 8:68. doi: 10.1186/1741-7015-8-68
Laureys, S., Faymonville, M. E., Degueldre, C., Fiore, G. D., Damas, P.,Lambermont, B., et al. (2000). Auditory processing in the vegetative state. Brain123, 1589–1601. doi: 10.1093/brain/123.8.1589
Laureys, S., Owen, A. M., and Schiff, N. D. (2004). Brain function in coma,vegetative state, and related disorders. Lancet 3, 537–546. doi: 10.1016/S1474-4422(04)00852-X
Laureys, S., and Schiff, N. D. (2011). Coma and consciousness:paradigms (re)framed by neuroimaging. Neuroimage 61, 478–491. doi:10.1016/j.neuroimage.2011.12.041
Maess, B., Koelsch, S., Gunter, T. C., and Friederici, A. D. (2001). Musical syntaxis processed in Broca’s area: an MEG study. Nat. Neurosci. 4, 540–545. doi:10.1038/87502
Magee, W. L. (2005). Music therapy with patients in low awarenessstates: approaches to assessment and treatment in multidisciplinarycare. Neuropsychol. Rehabil. 15, 522–536. doi: 10.1080/09602010443000461
Magee, W. L., Siegert, R. J., Daveson, B. A., Lenton-Smith, G., and Taylor,S. M. (2014). Music therapy assessment tool for awareness in disorders ofconsciousness (MATADOC): standardisation of the principal subscale to assess
Frontiers in Psychology | www.frontiersin.org 10 November 2015 | Volume 6 | Article 1704
201

Heine et al. Functional connectivity during preferred music in DOC
awareness in patients with disorders of consciousness. Neuropsychol. Rehabil.24, 101–124. doi: 10.1080/09602011.2013.844174
Murphy, K., Birn, R. M., Handwerker, D. A., Jones, T. B., and Bandettini, P. A.(2009). The impact of global signal regression on resting state correlations:are anti-correlated networks introduced? Neuroimage 44, 893–905. doi:10.1016/j.neuroimage.2008.09.036
Nantais, K. M., and Schellenberg, E. G. (1999). The mozart effect: an artifact ofpreference. Psychol. Sci. 10, 370–373. doi: 10.1111/1467-9280.00170
Okumura, Y., Asano, Y., Takenaka, S., Fukuyama, S., Yonezawa, S., Kasuya, Y.,et al. (2014). Brain activation by music in patients in a vegetative or minimallyconscious state following diffuse brain injury. Brain Inj. 28, 944–950. doi:10.3109/02699052.2014.888477
Perrin, F., Castro, M., Tillmann, B., and Luauté, J. (2015). Promoting the useof personally relevant stimuli for investigating patients with disorders ofconsciousness. Front. Psychol. 6:1102. doi: 10.3389/fpsyg.2015.01102
Perrin, F., Schnakers, C., Schabus, M., Degueldre, C., Goldman, S., Brédart, S.,et al. (2006). Brain response to one’s own name in vegetative state, minimallyconscious state, and locked-in syndrome. Arch. Neurol. 63, 562–569. doi:10.1001/archneur.63.4.562
Raichle, M. E., MacLeod, A. M., Snyder, A. Z., Powers, W. J., Gusnard, D. A., andShulman, G. L. (2001). A default mode of brain function. Proc. Natl. Acad. Sci.U.S.A 98, 676–686. doi: 10.1073/pnas.98.2.676
Saad, Z. S., Gotts, S. J., Murphy, K., Chen, G., Jo, H. J., Martin, A., et al.(2012). Trouble at rest: how correlation patterns and group differencesbecome distorted after global signal regression. Brain Connect. 2, 25–32. doi:10.1089/brain.2012.0080
Särkämö, T., and Soto, D. (2012). Music listening after stroke: beneficial effectsand potential neural mechanisms. Ann. N. Y. Acad. Sci. 1252, 266–281. doi:10.1111/j.1749-6632.2011.06405.x
Schnakers, C., Vanhaudenhuyse, A., Giacino, J. T., Ventura, M., Boly, M.,Majerus, S., et al. (2009). Diagnostic accuracy of the vegetative and minimallyconscious state: clinical consensus versus standardized neurobehavioralassessment. BMC Neurol. 9:35. doi: 10.1186/1471-2377-9-35
Smith, K., and Tindell, A. (2009). Ventral pallidum roles in reward andmotivation. Behav. Brain Res. 196, 155–167. doi: 10.1016/j.bbr.2008.09.038.Ventral
Smith, S. M., Fox, P. T., Miller, K. L., Glahn, D. C., Fox, P. M., Mackay,C. E., et al. (2009). Correspondence of the brain’s functional architectureduring activation and rest. Proc. Natl. Acad. Sci. U.S.A. 106, 13040–13045. doi:10.1073/pnas.0905267106
Soddu, A., Vanhaudenhuyse, A., Demertzi, A., Bruno, M. A., Tshibanda, L.,Noirhomme, Q., et al. (2011). Resting state activity in patients with disordersof consciousness. Funct. Neurol. 26, 37–43.
Soto, D., and Funes, M. (2009). Pleasant music overcomes the loss of awareness inpatients with visual neglect. Proc. Natl. Acad. Sci. U.S.A. 106, 6011–6016. doi:10.1073/pnas.0811681106
Stender, J., Gosseries, O., Bruno, M.-A., Charland-Verville, V.,Vanhaudenhuyse, A., Demertzi, A., et al. (2014). Diagnostic precision ofPET imaging and functional MRI in disorders of consciousness: a clinicalvalidation study. Lancet 384, 514–522. doi: 10.1016/S0140-6736(14)60042-8
Svoboda, E., McKinnon, M. C., and Levine, B. (2006). The functionalneuroanatomy of autobiographical memory: a meta-analysis. Neuropsychologia44, 2189–2208. doi: 10.1016/j.neuropsychologia.2006.05.023
The Multi-Society Task Force of Pvs. (1994). Medical aspects of the persistentvegetative state. N. Engl. J. Med. 330, 1499–1508. doi: 10.1056/NEJM199405263302107
Thibaut, A., Bruno, M.-A., Chatelle, C., Gosseries, O., Vanhaudenhuyse, A.,Demertzi, A., et al. (2012). Metabolic activity in external and internal awarenessnetworks in severely brain-damaged patients. J. Rehabil. Med. 44, 481–516. doi:10.2340/16501977-0940
Tillmann, B., Janata, P., and Bharucha, J. J. (2003). Activation of the inferiorfrontal cortex in musical priming. Brain Res. Cogn. Brain Res. 16, 145–161. doi:10.1016/S0926-6410(02)00245-8
Tillmann, B., Koelsch, S., Escoffier, N., Bigand, E., Lalitte, P., Friederici,A. D., et al. (2006). Cognitive priming in sung and instrumental music:activation of inferior frontal cortex. Neuroimage 31, 1771–1782. doi:10.1016/j.neuroimage.2006.02.028
van Erp, W. S., Lavrijsen, J. C. M., Vos, P. E., Bor, H., Laureys, S., andKoopmans, R. T. C. M. (2015). The vegetative state: prevalence, misdiagnosis,and treatment limitations. J. Am. Med. Dir. Assoc. 16, 85.e9–85.e14. doi:10.1016/j.jamda.2014.10.014
Vanhaudenhuyse, A., Demertzi, A., Schabus, M., Noirhomme, Q., Bredart, S.,Boly, M., et al. (2010a). Two distinct neuronal networks mediate theawareness of environment and of self. J. Cogn. Neurosci. 23, 570–578. doi:10.1162/jocn.2010.21488
Vanhaudenhuyse, A., Noirhomme, Q., Tshibanda, L. J. F., Bruno,M. A., Boveroux, P., Schnakers, C., et al. (2010b). Default networkconnectivity reflects the level of consciousness in non-communicativebrain-damaged patients. Brain 133, 161–171. doi: 10.1093/brain/awp313
Vanhaudenhuyse, A., Schnakers, C., Brédart, S., and Laureys, S. (2008). Assessmentof visual pursuit in post-comatose states: use a mirror. J. Neurol. Neurosurg.Psychiatry 79, 223. doi: 10.1136/jnnp.2007.121624
Verger, J., Ruiz, S., Tillmann, B., Ben Romdhane, M., De Quelen, M., Castro, M.,et al. (2014). [Beneficial effect of preferred music on cognitive functions inminimally conscious state patients]. Rev. Neurol. (Paris) 170, 693–699. doi:10.1016/j.neurol.2014.06.005
Whitfield-Gabrieli, S., and Nieto-Castanon, A. (2012). Conn: a functionalconnectivity toolbox for correlated and anticorrelated brain networks. BrainConnect. 2, 125–141. doi: 10.1089/brain.2012.0073
Wilkins, R. W., Hodges, D. A., Laurienti, P. J., Steen, M., and Burdette,J. H. (2014). Network science and the effects of music preference onfunctional brain connectivity: from Beethoven to Eminem. Sci. Rep. 4:6130. doi:10.1038/srep06130
Wong, C. W., Olafsson, V., Tal, O., and Liu, T. T. (2012). Anti-correlated networks,global signal regression, and the effects of caffeine in resting-state functionalMRI. Neuroimage 63, 356–364. doi: 10.1016/j.neuroimage.2012.06.035
Zatorre, R. J., Chen, J. L., and Penhune, V. B. (2007). When the brain plays music:auditory-motor interactions in music perception and production. Nat. Rev.Neurosci. 8, 547–558. doi: 10.1038/nrn2152
Conflict of Interest Statement: The authors declare that the research wasconducted in the absence of any commercial or financial relationships that couldbe construed as a potential conflict of interest.
Copyright © 2015 Heine, Castro, Martial, Tillmann, Laureys and Perrin. Thisis an open-access article distributed under the terms of the Creative CommonsAttribution License (CC BY). The use, distribution or reproduction in other forumsis permitted, provided the original author(s) or licensor are credited and that theoriginal publication in this journal is cited, in accordance with accepted academicpractice. No use, distribution or reproduction is permitted which does not complywith these terms.
Frontiers in Psychology | www.frontiersin.org 11 November 2015 | Volume 6 | Article 1704
202 Appendix H. Paper VIII

Appendix I
Paper IX
Effects of preference and sensory modality on behavioralreactions in patients with disorders of consciousness
Heine L, Tillmann B, Hauet M, Juliat A, Dubois A, Laureys S,Kandel M, Plailly J, Luauté J, Perrin F.
Under review
203

Effects of preference and sensory modality on behavioral reaction in patients with disorders of consciousness
Heine L1,2, Tillmann B1, Hauet M1,3, Juliat A1,4, Dubois A4, Laureys S2, Kandel M3, Plailly J5, Luauté J4,6, Perrin F1
1 Auditory Cognition and Psychoacoustics Team – Lyon Neuroscience Research Center (University Lyon 1, CNRS UMR5292), Lyon, France
2 Coma Science Group, GIGA, Neurology Department, University and University Hospital of Liège, Liège, Belgium
3 Centre Germaine Revel, Saint-Maurice-sur-Dargoire, France
4 Hospices Civils de Lyon – Service de Rééducation Neurologique, Mouvement et Handicap, Lyon University Hospital, University Lyon 1, France.
5 Coding and Olfactive Memory Team – Lyon Neuroscience Research Center (University Lyon 1, CNRS UMR5292, InsermU1028), Lyon, France
6 Integrative Multisensory Perception Action and Cognition Team – Lyon Neuroscience Research Center (University Lyon 1,Inserm U1028), Lyon, France
Abstract Reliable evaluation of patients with unresponsive wakefulness syndrome (UWS) or in a minimally conscious state (MCS) remains a major challenge. It has been suggested that the expression of residual cerebral function could be improved by allowing patients to listen to their favourite music. However, music’s potential effect on behavioral responsiveness, as well as the effect of preferred stimuli in other sensory modalities (such as olfaction), remain poorly understood. The aim of the present study was to investigate the effect of sensory modality (auditory versus olfactory) and preference (preferred versus neutral) of the test stimuli on the subsequent performance of patients on the coma recovery scale-revised (CRS-R). We studied four items from the CRS-R (visual pursuit using a mirror, auditory localization of the own name, and two movements to command) in 13 patients (7 MCS; 6 UWS). The results showed that auditory stimuli triggered higher responsiveness compared to olfactory stimuli, and that preferred stimuli were followed by higher scores as compared to neutral ones. This suggests that preferential auditory stimuli at the bedside contributes to the expression of residual function, and could improve diagnostic assessment.
204 Appendix I. Paper IX

Introduction Severe brain injury can lead to disorders of consciousness (DOC) comprising the unresponsive wakefulness syndrome (UWS), and minimally conscious state (MCS)1. Currently, the most reliable diagnosis of these challenging conditions can be achieved through the use of the Coma Recovery Scale-Revised (CRS-R)2. However, signs of consciousness such as meaningful affective behaviors can be hard to distinguish at the bedside 3,4. It has been recently suggested that diagnostic assessment could be improved through the use of autobiographical and emotional context, such as preferred music 5,6. For example, several studies have suggested that music improves patients interaction 7, emotional responses and cognitive capacity 8–10, though many of these are single cases or lack proper control conditions. Neuroimaging in patients with DOC has demonstrated more widespread functional connectivity in the auditory and external networks during preferred music compared to a noise control condition 11. Furthermore, in an event-related potential study the presence of a discriminative response to patients’ own name was also present following a period of preferred music, but not following a noise condition 6. This research, however, did not disentangle the acoustic properties of music from a possible effect of preference. In addition, the effects of preferred stimuli (such as music) as a testing context on behavioural responses in DOC patients are not well established 10. The aim of the present study was to test the potential beneficial effects of sensory modality (auditory, olfactory) and preference (preferred vs. neutral) on performance on items of the CRS-R. We chose to compare preferred music and odors because, in healthy subjects, these stimulation can influence behavior 12,13 and enhance episodic memory 14. In brain injured patients it can improve behavioral vigilance performance 15. Although they have not been extensively studied in DOC, olfactory stimuli are widely used in assessment scales like the WNSSP, SMART, DOCS 16–18. Methods Thirteen patients were assessed (6 UWS: 3 women, 52 ± 11 years, and 7 MCS: 1 woman, 37 ± 10 years; Table 1). Patients were recruited at the revalidation center of hospital of Lyon between November 2014 and August 2015. Patients were required to have had a DOC for longer than one month, be in stable condition, and demonstrate the presence of evoked potentials in response to auditory stimuli. The study was approved by the Lyon Ethics
205

Committee (CPP Sud-Est II, N°2014-A01062-45). Representatives of all patients provided written informed consent. Four stimuli were presented in a 2x2 factorial design: two levels for modality (auditory or olfactory) and two levels for stimulus characteristic (preferred or neutral). Preferred stimuli were chosen and created for each patient on the basis of questionnaires filled out by a close relative (open choice for preferred music and forced-choice from a list of 51 pre-defined food flavorings). Six neutral sound excerpts (i.e. continuous music-like noise stimuli) were created as control stimuli. These were constructed by selecting well-known songs from the genres of classical, rap, rock, reggae, French variety, and pop music, randomizing the overall phase spectrum, and deleting the slowest temporal envelope. Thus, they consisted of a spectral approximation of music, but did not share other acoustic characteristics (e.g., pitch, rhythm, envelope, or timbre). Six neutral olfactory stimuli consisted of mixtures of monomolecular chemicals evaluated to be distinct, unfamiliar, unidentifiable through pretest (i.e., Citronellol, Rose oxide, Methyl octine carbonate, Ethyl acetyl acetate, Linalyl acetate, Cis-3-Hexenyl salicylate) 19. The same neutral sound and odor stimuli were used for all patients. Several items of the CRS-R were selected because they differentiate UWS from MCS: visual pursuit (using a mirror) and two different motor responses to command, chosen based on the patient’s capability. Localization to sound (to the patient’s own name), a non-differentiating item present in both patient populations, was chosen as the fourth item. Each patient was also assessed with the entire CRS-R twice, one prior to and once following the study, both within 48 hours (table 1). For each of our 13 patients, four testing sessions were performed (separated by 3 to 7 days; Figure 1). Each session consisted of four trials, each trial including a 5-minute presentation of one of the four stimuli followed by one of the four CRS-R items. Each of the 16 stimulation-item combinations was presented once to each patient. The order of the stimuli and items was randomized both within and between patients. Each patient was thus seen six times (4 session, plus two complete CRS-R assessments) and total duration of the protocol was 3-4 weeks per subject.
206 Appendix I. Paper IX

Figure 1. Schematic representation of the behavioral protocol. For each patient, four testing sessions were performed (separated by 3 to 7 days). Each session consisted of 4 trials, each including a 5-minute presentation of one of the four stimuli followed by one of the four CRS-R items. Each of the 16 stimulation-item combinations were presented once to each patient. The order of stimuli and items were randomized both within and between patients.
All sessions were filmed for subsequent scoring. For each item, the videos were scored blindly, i.e. without knowledge of the preceding stimulation, by three experimenters. Two measures were assessed from the recorded videos. “Item responses” were scored when correct reactions to the CRS-R item were observed. These were standardized by translating them into percentages of the maximum score (i.e., 8 for visual pursuit, and 4 for localization to sound and response to command, respectively). “Spontaneous signs” were scored in order to acknowledge clinical signs of awareness that occurred either during or after the stimulation. A score of 2 was given when signs of consciousness were present 20 (i.e. voluntary participation, orientation, emotional reactions, intelligible speech, or automatic movements only observed during stimulation and/or assessment). A score of 1 was given when reactions were present that were indistinguishable from unintentional behaviors or reflexes 21 (i.e. short orientation, partial participation, not the requested behavior, agitation/grimaces. A score of 0 was given when no reactions were observed. When blinded scores were not agreed upon between assessors, scores were averaged for subsequent statistical analysis. Notes were taken during each session by the experimenter present. These were however not used for
207

statistical testing of the items responses, but were used for inter-rater reliability testing and aided assessment of spontaneous signs of consciousness. All statistical analyses were performed using non-parametric tests, and reported when significant (p < 0.05). We first tested the effect of preference and sensory modality of the context on item responses and spontaneous signs. Inter-rater reliability, and the long term effect (difference between CRS-R scores before and after the protocol) were also assessed. Analysis was performed at the group level as previous studies have suggested that the beneficial effects of preferred music are independent of diagnosis 11,22. Results Item responses (Figure 2A,B) For the scored item’s responses, Friedman’s ANOVA showed a difference between conditions (χ2(3) = 10.48, p=0.02), and Wilcoxon signed rank tests showed a main effect of modality. Considering preferred and neutral stimuli together, a higher proportion of responses was observed following the auditory stimuli than the olfactory stimuli (18.5% and 10% respectively; p=0.01; r=-0.35). A higher percentage of responses was also observed following the preferred sound than following either the preferred odor (20% and 12%, respectively; p=0.04; r=-0.41), or neutral odor (8%, p=0.01; r=-0.50; all Wilcoxon signed rank tests). Spontaneous signs (Figure 2C,D) Friedman’s ANOVA was significant (χ2(3) = 13.73, p<0.01), and Wilcoxon tests showed a main effect of modality, as well as of preference. Scores were significantly higher after auditory stimuli (average score of 0.83) than after olfactory stimuli (score of 0.56, p p<0.01; r=-0.39), and following preferred stimuli (score of 0.8) compared to neutral stimuli (score of 0.58, p= p<0.01; r=-0.38). Spontaneous signs of consciousness were more frequent following the preferred sound (music, score of 0.98) than after the neutral sound (score of 0.67, p=0.02; r=-0.44), preferred odor (score of 0.62, p=0.01; r=-0.48), and neutral odor (score of 0.5, p p<0.01; r=-0.53). It is worth noting that two patients diagnosed as UWS according to the pre- and post-study CRS-R assessments showed reactions following preferred stimuli. One patient showed tears during one specific song on both occasions it was played, and was purposefully uncooperative (i.e. eyes firmly closed with head-averting) during assessment. The other patient showed behavioral
208 Appendix I. Paper IX

responses to the same response to command item only after preferred music and preferred odor stimuli. Inter-rater reliability and long term effects Inter-rater reliability showed high agreement between assessors (92.8%; mean bivariate Pearson correlation r=0.96). The agreement between the blind ratings (video scoring) and the scores assigned during the experiment (by experimenter present at the time) was lower, yet significant (74.5%, r=0.90). In fact, 15 percent of all items were scored higher during the experiment compared to the blinded scores, and five percent was scored lower then the blinded scores. No significant differences were observed between the complete CRS-R administered before and after the four session protocol.
Figure 2. Scores for item responses and spontaneous signs. A. Mean standardized scores for CRS-R item responses after each stimulation. B. Significant main effects of modality (auditory > olfactory) for item responses. C. Mean scores for spontaneous signs of consciousness for each stimulation-item combinations. D. Significant main effects of modality (auditory > olfactory), and preference (preferred > neutral) for scores of spontaneous signs of consciousness. Lines and stars show significant differences between stimulations. Error bars represent standard error; diamonds indicate median.
209
Discussion Here we assessed the effects of preferred auditory and olfactory stimuli on the behavioral responsiveness of patients with disorders of consciousness. Statistical analysis was performed on scores of four items of the CRS-R and on scores reflecting the frequency of spontaneous signs of consciousness. Both scores showed that auditory stimuli triggered higher responsiveness compared to olfactory stimuli. Scores for spontaneous signs also showed a main effect of preference, with better scores for preferred stimuli. In addition, spontaneous signs were more frequent after preferred music than all other stimuli. These findings establish a hierarchy among the different types of stimuli, placing preferred music at the top. This in in line with several studies reporting improved cognitive function after preferred music in these patients 7,9,11,22,23. Systematic use of, for instance, the patient’s preferred music during assessment might thus be advised. Indeed, two UWS patients showed emotional and behavioral reactions to autobiographical/emotional stimulations (one of the criteria for the diagnosis of MCS 20). These behaviors were not observed during routine CRS-R assessments. This suggests that diagnostic assessment might be improved through the elicitation of meaningful (affective) behaviors due to the testing context. Correct diagnosis is crucial as it determines treatment and end-of-life decisions. These results suggest that auditory stimuli (and in particular, preferred music) are better than olfactory stimuli at enhancing cognition or arousal in these patients. However, this interpretation must be considered with caution for several reasons. First, preferred auditory stimuli contained various changes (i.e. tone, rhythm, intensity), whereas olfactory stimuli had the same intensity and changed more gradually over time. Second, the preferred auditory stimuli were sampled with free choice, while the preferred olfactory stimuli were selected from a limited set. Thus, the personal salience, probably due to the reminiscence power of autobiographical memory might be higher for the musical stimuli. Finally, although olfactory dysfunction (13.5% in TBI after 1 year 24), and dyfunctional olfactory neuronal processing 25 is present in a minority of DOC patients, we cannot exclude that there might be reduced olfactory abilities in our patient population. We detected a slight difference between preferred and neutral olfactory stimuli, however, suggesting that our patients were not anosmic. Although this was not the aim of the study, it should be noted that the different types of stimuli did not modify the level of awareness in the long-term. Indeed,
210 Appendix I. Paper IX

no difference was observed between the complete CRS-R before and after the several week-long protocol. Moreover, although interesting, it is not possible to compare the scores of each item tested during the experimental protocol to the specific item of the complete CRS-R before and after the protocol. Indeed, the full CRS-R assessment includes arousal protocols using deep-pressure stimulations, tactile as well as verbal stimulations to awaken the patient, none of which were present in the four experimental tests. Thus, future research should explore the potential cumulative effect of the arousal protocol and of stimulation with preferred music, as well as the difference between the effects of deep pressure and preferred stimuli on patients’ responsiveness. In conclusion, our data showed an effect of auditory stimulation and preference (i.e., preferred music) on patients’ behavior, which can add relevant information for the evaluation of DOC patients. This indicates that improving the testing context could aid the expression of residual function in patients with disorders of consciousness, thereby improving diagnostic sensitivity. Acknowledgments This work was supported by institutional grants from the LabEx CeLyA (“Centre Lyonnais d’Acoustique,” ANR-10-LABX-60), the Belgian National Funds for Scientific Research (FRS-FNRS), the grant ANR CogniComa (ANR-14-CE-5-0013) and the Federation Wallonie-Bruxelles (FWB). Author Contributions PF conceived the study, and PF, HL, BT, PL, JL designed it. Acquisition and analysis of data was performed by HL, HM, JA, DA, KM. All authors participated in drafting of the manuscript and figures. Conflicts of interest There are no conflicts of interest. References 1. Giacino J, Fins JJ, Laureys S, Schiff N. Disorders of consciousness
after acquired brain injury: the state of the science. Nat. Rev. Neurol. 2014;10:99–114.
2. Seel RT, Sherer M, Whyte J, et al. Assessment scales for disorders of consciousness: Evidence-based recommendations for clinical practice and research. Arch. Phys. Med. Rehabil. 2010;91(12):1795–1813.
3. Schnakers C, Vanhaudenhuyse A, Giacino JT, et al. Diagnostic accuracy of the vegetative and minimally conscious state: Clinical consensus versus standardized neurobehavioral assessment. BMC
211

Neurol. 2009;9(1):35. 4. Giacino JT, Ashwal S, Childs N. The minimally conscious state :
Definition and diagnostic criteria. Neurology 2002;58:349–353. 5. Perrin F, Castro M, Tillmann B, Luauté J. Promoting the use of
personally relevant stimuli for investigating patients with disorders of consciousness. Front. Psychol. 2015;6(July):1–9.
6. Castro M, Tillmann B, Luaute J, et al. Boosting Cognition With Music in Patients With Disorders of Consciousness. Neurorehabil. Neural Repair 2015;29(8):734–742.
7. Formisano R, Vinicola V, Penta F, et al. Active music therapy in the rehabilitation of severe brain injured patients during coma recovery. Ann. Ist. Super. Sanita 2001;37(4):627–30.
8. Magee WL. Music therapy with patients in low awareness states: approaches to assessment and treatment in multidisciplinary care. Neuropsychol. Rehabil. 2005;15(3-4):522–36.
9. Magee WL, Siegert RJ, Daveson B a, et al. Music therapy assessment tool for awareness in disorders of consciousness (MATADOC): standardisation of the principal subscale to assess awareness in patients with disorders of consciousness. Neuropsychol. Rehabil. 2014;24(1):101–24.
10. Verger J, Ruiz S, Tillmann B, et al. [Beneficial effect of preferred music on cognitive functions in minimally conscious state patients]. Rev. Neurol. (Paris). 2014;170(11):693–9.
11. Heine L, Castro M, Martial C, et al. Exploration of functional connectivity during preferred music stimulation in patients with disorders of consciousness. Front. Psychol. 2015;6:1704.
12. Arzi a., Holtzman Y, Samnon P, et al. Olfactory Aversive Conditioning during Sleep Reduces Cigarette-Smoking Behavior. J. Neurosci. 2014;34(46):15382–15393.
13. Chebat J-C, Morrin M, Chebat D-R. Does Age Attenuate the Impact of Pleasant Ambient Scent on Consumer Response? Environ. Behav. 2008;41(2):258–267.
14. Saive A-L, Royet J-P, Plailly J. A review on the neural bases of episodic odor memory: from laboratory-based to autobiographical approaches. Front. Behav. Neurosci. 2014;8(July):240.
15. Sullivan TE, Warm JS, Schefft BK, et al. Effects of olfactory stimulation on the vigilance performance of individuals with brain injury. J. Clin. Exp. Neuropsychol. 1998;20(2):227–236.
16. Ansell BJ, Keenan JE. The Western Neuro Sensory Stimulation Profile: a tool for assessing slow-to-recover head-injured patients. Arch. Phys. Med. Rehabil. 1989;70(2):104–8.
17. Gill-Thwaites H, Munday R. The Sensory Modality Assessment and Rehabilitation Technique (SMART): a valid and reliable assessment for vegetative state and minimally conscious state patients. Brain Inj. 2004;18(12):1255–69.
18. Pape TL-B, Senno RG, Guernon A, Kelly JP. A measure of neurobehavioral functioning after coma. Part II: Clinical and scientific implementation. J. Rehabil. Res. Dev. 2005;42(1):19–27.
212 Appendix I. Paper IX

19. Saive AL, Royet JP, Garcia S, et al. “What-where-which” episodic retrieval requires conscious recollection and is promoted by semantic knowledge. PLoS One 2015;10(12):1–13.
20. Giacino J, Ashwal S, Childs N, et al. The minimally conscious state: definition and diagnostic criteria. Neurology 2002;58(3):349.
21. Fischer DB, Truog RD. What is a reflex ? A guide for understanding disorders of consciousness. Am. Acad. Neurol. 2015;1–6.
22. Castro M, Tillman B, Luauté J, et al. Boosting cognition with music in patients with disorders of consciousness. submitted [date unknown];
23. O’Kelly J, James L, Palaniappan R, et al. Neurophysiological and behavioral responses to music therapy in vegetative and minimally conscious States. Front. Hum. Neurosci. 2013;7(December):884.
24. Sigurdardottir S, Jerstad T, Andelic N, et al. Olfactory dysfunction, gambling task performance and intracranial lesions after traumatic brain injury. Neuropsychology 2010;24(10):504–513.
25. Nigri A, Ferraro S, Bruzzone M, et al. Central olfactory processing in patients with disorders of consciousness. Eur. J. Neurol. 2015;n/a–n/a.
Table 1. Demographics
Abbreviations:M,Male;TBI,Traumaticbraininjury;MCS,minimallyconsciousstate;UWS,unresponsivewakefulnesssyndrome;**,uncooperative:purposefuleyeclosure.
Patient Sex Age Timesinceinjury
(months)
Etiology Diagnosis(CRS-R)
CRS-R A V M O C Ar Total
1 M 54 15 Encephalitis MCS Before 3 3 0 1 0 1 8After 1** ** 1 0 0 1 3
2 M 28 6 TBI MCSBefore 4 5 4 1 0 1 15After 3 4 4 0 0 1 12
3 M 37 7 TBI MCS Before 0 3 3 0 0 2 8After 3 3 2 0 0 2 10
4 F 23 6 TBI MCSBefore 3 3 5 1 0 2 14After 2 4 4 1 0 2 13
5 M 38 6 TBI MCS Before 3 3 3 0 0 2 11After 3 4 2 0 0 2 11
6 M 42 14 TBI MCSBefore 1 1 0 0 0 1 3After 1 1 2 0 0 2 6
7 F 54 23 Anoxic(hemorrhage) UWS Before 0 0 0 2 0 1 3
After 0 0 2 2 0 2 6
8 M 53 90 TBI UWSBefore 1 0 0 0 0 1 2After 1 0 2 1 0 2 6
9 F 53 15 Anoxic(cardiacarrest) UWS Before 0 0 2 1 0 1 4
After 0 0 2 1 0 1 4
10 F 63 45 Anoxic(hemorrhage) UWS Before 0 0 2 1 0 1 4
After 0 0 2 1 0 1 4
11 M 58 36 Anoxic(cardiacarrest) UWS
Before 0 0 2 1 0 2 5After 0 0 2 1 0 1 4
12 M 30 81 TBI UWS Before 0 0 2 1 0 2 5After 0 0 2 0 0 1 3
13 H 34 50 TBI MCS Before 2 3 1 0 0 1 7After 0 3 1 0 0 1 5
213

214 Appendix I. Paper IX

Appendix J
Paper X
Functional connectivity in visual, somatosensory, andlanguage areas in congenital blindness
Heine L, Bahri A M, Cavaliere C, Soddu A, Reislev N, LaureysS, Ptito M, Kupers R.
Frontiers in Neuroanatomy, 2015, Volume 138 (pt9):2619-31doi: 10.3389/fnana.2015.00106
215

ORIGINAL RESEARCHpublished: 01 July 2015
doi: 10.3389/fnana.2015.00086
Frontiers in Neuroanatomy | www.frontiersin.org 1 July 2015 | Volume 9 | Article 86
Edited by:
Kathleen S. Rockland,
Boston University School Medicine,
USA
Reviewed by:
Alino Martinez-Marcos,
Universidad de Castilla, Spain
Beatrice De Gelder,
Maastricht University, Belgium
*Correspondence:
Ron Kupers,
BRAINlab, Department of
Neuroscience and Pharmacology,
Faculty of Health and Medical
Sciences, Panum Institute (33-3),
Blegdamsvej 3B, DK-2200
Copenhagen, Denmark
Received: 15 May 2015
Accepted: 15 June 2015
Published: 01 July 2015
Citation:
Heine L, Bahri MA, Cavaliere C,
Soddu A, Laureys S, PtitoM and
Kupers R (2015) Prevalence of
increases in functional connectivity in
visual, somatosensory and language
areas in congenital blindness.
Front. Neuroanat. 9:86.
doi: 10.3389/fnana.2015.00086
Prevalence of increases in functionalconnectivity in visual, somatosensoryand language areas in congenitalblindnessLizette Heine 1, Mohamed A. Bahri 2, Carlo Cavaliere 1, 3, Andrea Soddu4,Steven Laureys 1, Maurice Ptito 5, 6, 7 and Ron Kupers 5, 6*
1 Coma Science Group, Cyclotron Research Center and Neurology Department, University and University Hospital of Liège,
Liège, Belgium, 2 Cyclotron Research Centre, University of Liège, Liège, Belgium, 3 IRCCS SDN, Istituto di Ricerca
Diagnostica e Nucleare, Naples, Italy, 4 Physics and Astronomy Department, Brain and Mind Institute, Western University,
London, ON, Canada, 5 Harland Sanders Chair, School of Optometry, University of Montreal, Montreal, QC, Canada, 6 Brain
Research and Integrative Neuroscience Laboratory, Department of Neuroscience and Pharmacology, University of
Copenhagen, Copenhagen, Denmark, 7 Laboratory of Neuropsychiatry, Psychiatric Centre Copenhagen and Department of
Neuroscience and Pharmacology, University of Copenhagen, Copenhagen, Denmark
There is ample evidence that congenitally blind individuals rely more strongly on
non-visual information compared to sighted controls when interacting with the outside
world. Although brain imaging studies indicate that congenitally blind individuals recruit
occipital areas when performing various non-visual and cognitive tasks, it remains
unclear through which pathways this is accomplished. To address this question, we
compared resting state functional connectivity in a group of congenital blind and
matched sighted control subjects. We used a seed-based analysis with a priori specified
regions-of-interest (ROIs) within visual, somato-sensory, auditory and language areas.
Between-group comparisons revealed increased functional connectivity within both
the ventral and the dorsal visual streams in blind participants, whereas connectivity
between the two streams was reduced. In addition, our data revealed stronger functional
connectivity in blind participants between the visual ROIs and areas implicated in
language and tactile (Braille) processing such as the inferior frontal gyrus (Broca’s
area), thalamus, supramarginal gyrus and cerebellum. The observed group differences
underscore the extent of the cross-modal reorganization in the brain and the supra-modal
function of the occipital cortex in congenitally blind individuals.
Keywords: congenitally blind, functional connectivity, seed-based analysis, vision
Introduction
The loss of vision from birth causes a myriad of compensatory plastic changes. At the behaviorallevel, congenitally blind subjects outperform their sighted counterparts in a wide range of non-visual sensory discrimination tasks (Kupers and Ptito, 2014 for a recent review). For example,congenitally blind individuals show improved performance in tactile acuity at the finger tips (Wonget al., 2011) and perform better in pitch discrimination (Wan et al., 2010), syllable recognition(Gougoux et al., 2009) and sound localization (Fieger et al., 2006). Recent behavioral studies also
216 Appendix J. Paper X

Heine et al. Functional connectivity in congenitally blind
indicate superior abilities in discrimination, identification andawareness of odors (Rosenbluth et al., 2000; Cuevas et al., 2009;Beaulieu-Lefebvre et al., 2011).
Compensatory plasticity is dependent on cross-modalreorganization of the brain in which the occipital cortex becomesrecruited by various non-visual inputs (Kupers and Ptito, 2014).Brain imaging studies have highlighted the pivotal role of thevisual cortex in the ability of the blind to perform non-visualtasks (Kupers et al., 2011b). Indeed, PET and fMRI studieshave reported that congenitally blind individuals recruit theiroccipital cortex in tasks involving sound and tactile localization(Gougoux et al., 2005; Voss et al., 2008), tactile and auditorymotion detection (Poirier et al., 2006; Ptito et al., 2009; Matteauet al., 2010; Sani et al., 2010), spatial navigation (Kupers et al.,2010), odor perception (Kupers et al., 2011a), language (Burtonet al., 2003; Bedny et al., 2008, 2011; Striem-Amit et al., 2012)and memory processing (Raz et al., 2005).
Recent neuro-imaging studies also helped to illuminatethe question how congenital blindness affects the structuralorganization of the brain, and through which pathways non-visual information reaches the occipital cortex. Structural brainimaging studies seem to concur that there are significantreductions in gray matter throughout the whole extent ofthe visual system. These include the optic chiasm, the lateralgeniculate nucleus, the posterior pulvinar, and striate andextra-striate visual areas (Pan et al., 2007; Ptito et al., 2008b;Cecchetti et al., 2015). Regions of the ventral visual streamsuch as the inferior temporal gyrus and the lateral orbitalcortex, as well as regions connected to the dorsal visualstream like the hippocampus also show volumetric reductions(Fortin et al., 2008; Jiang et al., 2009). In addition, corticalthickness is increased in the cuneus (Jiang et al., 2009;Kupers et al., 2011a), which is likely due to a reduction incortical pruning during the early maturation process as aresult of lack of visual input, and which may be indicativeof alterations in connectivity. White matter changes in thevisual pathways include atrophy of the optic tracts and theoptic chiasm, reductions of the optic radiations, the spleniumof the corpus callosum (Shimony et al., 2006; Pan et al., 2007;Ptito et al., 2008b; Tomaiuolo et al., 2014) and microstructuralchanges within the ventral visual pathways (Ptito et al.,2008a).
Recent studies have also tried to elucidate functional changesin the blind brain. Brain activation studies (Ptito et al.,2005; Klinge et al., 2010; Sani et al., 2010; Collignon et al.,2013; Ioannides et al., 2013; Kupers and Ptito, 2014) andtranscranial magnetic stimulation (TMS) studies (Wittenberget al., 2004; Kupers et al., 2006) have found evidence for increasedfunctional connectivity of the occipital cortex with auditoryand somatosensory areas. Several of the available resting statestudies reported stronger connections of the occipital cortexwith somatosensory (Watkins et al., 2012) and language areas(Liu et al., 2007; Bedny et al., 2011; Butt et al., 2013; Wanget al., 2013). Other studies, however, concluded that the occipitalcortex of the blind has a general reduced connectivity withsomatosensory/auditory regions (Yu et al., 2008; Burton et al.,2014), or even larger parts of the brain (Liu et al., 2007; Qin
et al., 2014). Some of these differences may be due to smallor inhomogeneous study populations, including both congenitaland early blind subjects or subjects with and without residuallight perception (Butt et al., 2013; Qin et al., 2013; Wang et al.,2013), or to the fact that the resting state scan was acquiredafter an active functional scanning paradigm (Bedny et al., 2011).To circumvent these issues, we analyzed resting state functionalmagnetic resonance imaging (rsfMRI) data of a homogeneousgroup of congenitally blind individuals lacking any residual lightperception, using a priori defined regions of interest (ROIs) inareas with known roles in visual, somatosensory, auditory andlanguage processing. No task-related functional brain scans wereacquired before or after the resting state scans. Using state-of-the-art methods for analyzing rsfMRI data, we mapped out increasesas well as decreases in functional connectivity in the congenitallyblind brain.
Materials and Methods
ParticipantsWe included 12 congenitally blind (CB; 5 females, 7 males; age:42 ± 14 year) and 20 healthy sighted controls (SC; 12 females,8 males; 42±14 year). Blind and sighted subjects were matchedfor age, gender, education, and handedness. All our congenitallyblind subjects were born blind and had no history of lightperception;Table 1 lists their demographics. All participants gaveinformed consent and the ethics committee of the Universityof Copenhagen and Frederiksberg had approved the studyprotocol.
fMRI Data Acquisition and AnalysisMRI was conducted on a 3T scanner (Siemens Verio) equippedwith a standard 32-channel head coil. Functional images wereacquired with an EPI sequence (280 volumes, TR = 2.15 s, TE =
26ms, flip angle = 78◦, FOV = 192mm2, 64 × 64 matrix, 43axial slices of 4mm). Scan duration was 15min. Head motionwas restricted by placement of comfortable padding aroundthe participant’s head. The three initial volumes were discarded
TABLE 1 | Demographics congenitally blind participants.
Subject Age Sex Braille (WPM) Cause of blindness
CB1 59 M 148 ROP
CB2 50 M 75 ROP
CB3 37 F 104 ROP
CB4 63 F 124 ROP, glaucoma
CB5 37 M 100 Unknown eye pathology
CB6 44 M 158 Retinoblastoma
CB7 51 M 75 ROP
CB8 29 F 91 ROP
CB9 28 F 115 ROP
CB10 59 M 130 ROP
CB11 25 F 118 ROP
CB12 27 M 94 ROP
ROP, retinopathy of prematurity; WPM, words per minute.
Frontiers in Neuroanatomy | www.frontiersin.org 2 July 2015 | Volume 9 | Article 86
217

Heine et al. Functional connectivity in congenitally blind
to avoid T1 saturation effects. For anatomical reference, ahigh-resolution T1-weighted image was acquired for eachsubject (T1-weighted 3D magnetization-prepared rapid gradientecho sequence “3D MP-RAGE”; TR = 1.54 s, TE = 3.9ms,FOV = 256 × 256mm, 256 × 256 matrix, 92 slices of 1mmthickness). Data preprocessing was performed using StatisticalParametric Mapping toolbox (SPM8, Welcome Departmentof Cognitive Neurology, London, UK) with MATLAB 7.12(Mathworks Inc., Sherboorn, MA). Preprocessing steps includedrealignment and adjustment for movement-related effects, slicetime correction, co-registration of functional onto structuraldata, segmentation of structural data, spatial normalization ofall data to standard stereotactic Montreal Neurological Institute(MNI) space using the normalization parameters resulted fromthe segmentation step. Normalized functional data were thensmoothed using a Gaussian kernel with an isotropic 8mm offull-width half-maximum.
Motion correction was applied using an automatic artifactdetection tool for global mean and motion outliers (http://www.nitrc.org/projects/artifact_detect/). The groups did not differsignificantly in the number of movement artifacted time points(p = 0.08). More specifically, one sighted and one congenitalblind subject showed movement. Outliers in the global meansignal intensity and motion were identified and included in thesubsequent statistical analysis as nuisance parameters (i.e., oneregressor per outlier within the first-level general linear models).
Analysis of functional connectivity was done using theconnectivity toolbox “Conn,” version 13o (http://www.nitrc.org/projects/conn; Whitfield-Gabrieli and Nieto-Castanon, 2012).An explicit graymattermask was used. As recently recommended
(Behzadi et al., 2007; Murphy et al., 2009; Saad et al., 2012;Wong et al., 2012), we used a regression of nuisance effectsbefore bandpass filtering (RegBP; Hallquist et al., 2013). Thedata were despiked, and white matter (WM) and cerebrospinalfluid (CSF) components were regressed out as nuisance variables.Noise was regressed out according to the aCompCor method,where the influence of noise is modeled as a voxel-specific linearcombination of multiple empirically estimated noise sourcesby deriving principal components from noise ROIs and byincluding them as nuisance parameters within the general linearmodels. This method protects against confounding correlationsas produced by other methods, like global signal regression(Murphy et al., 2009; Chai et al., 2012; Saad et al., 2012; Wonget al., 2012). We then applied a linear detrending term. Alldescribed steps are part of the standard procedure in the “Conn”toolbox (Behzadi et al., 2007; Whitfield-Gabrieli and Nieto-Castanon, 2012). The residual BOLD time series went througha bandpass filter between 0.008 and 0.1Hz to reduce the effect oflow frequency drifts and high-frequency noise.
Regions of interest (ROIs) were taken from the literature(Geyer et al., 1999, 2000; Amunts et al., 2000; Binkofski et al.,2000; Rademacher et al., 2001; Rottschy et al., 2007; Scheperjanset al., 2008; Caspers et al., 2010, 2013; Kolster et al., 2010;Kujovic et al., 2013); they were defined as 6-mm radius spheresin both hemispheres. We included 15 seeds to assess functionalconnectivity (Table 2, Figure 1). These seeds were selected withinthe occipital cortex (i.e., V1, V2, hOC3V, hOC3D, hOC4V,hOC4D, MT/V5, and fusiform gyrus), parietal cortex (S1, lateralBA5, anterior BA7, posterior BA7 and BA40), auditory cortex(A1) and Broca’s area.
TABLE 2 | Regions of interest (ROIs).
Left hemisphere Right hemisphere Literature reference
X Y Z X Y Z
VISUAL AREAS
V1 (BA17) −10 −77 3 20 −73 2 Amunts et al., 2000
V2 (BA18) −13 −75 6 23 −71 6 Amunts et al., 2000
hOC3d −15 −97 23 17 −95 24 Kujovic et al., 2013
hOC3v −20 −88 −3 26 −84 −4 Rottschy et al., 2007
hOC4d −17 −95 29 19 −94 29 Kujovic et al., 2013
hOC4v −29 −84 −7 34 −80 −8 Rottschy et al., 2007
hMT (V5) −48 −75 8 46 −78 6 Kolster et al., 2010
Fusiform gyrus −30 −76 −9 33 −73 11 Caspers et al., 2013
SOMATOSENSORY AREAS
S1 (BA3b) −37 −28 55 37 −28 55 Geyer et al., 1999, 2000
BA5 −16 −51 73 13 −55 73 Scheperjans et al., 2008
BA7a −19 −65 64 20 −65 64 Scheperjans et al., 2008
BA7pc −34 −53 61 30 −52 61 Scheperjans et al., 2008
BA40 (PF) −58 −43 39 62 −39 35 Caspers et al., 2008
LANGUAGE AREAS
Broca’s area −42 26 17 Binkofski et al., 2000
AUDITORY AREAS
A1 (BA41) −42 −21 7 56 −13 8 Rademacher et al., 2001
Frontiers in Neuroanatomy | www.frontiersin.org 3 July 2015 | Volume 9 | Article 86
218 Appendix J. Paper X

Heine et al. Functional connectivity in congenitally blind
FIGURE 1 | A priori defined regions of interest. Regions of interest are shown on the left hemisphere of an inflated brain using PySurfer. Dark areas represent
sulci, light gray areas gyri.
The fMRI time series from the left and right ROI seeds wereaveraged and Pearson correlations were calculated between theirmean time course and the time course of all other voxels in thebrain. Fisher-transformed correlation maps were generated usinga general linear model (GLM) to allow for second-level between-group analyses. In all analyses, results were only reported assignificant if they survived a height threshold of uncorrected p <
0.001 with an extent threshold of FWE-corrected p < 0.05 at thecluster level. Significant clusters from the second-level analysiswere further examined using SPM. In order to eliminate resultsderived from a decrease in anti-correlations in blind comparedto sighted controls, we used the anti-correlated voxels of thewithin SC group results as an exclusive mask for the CB > SCcomparison. The opposite comparison (i.e., SC > CB) used theanti-correlated mask from the congenitally blind within groupanalysis. Maps were resliced to the MNI-152 1mm dimensionsusing freesurfer and displayed on the FSaverage inflated brainusing PySurfer (https://github.com/nipy/PySurfer/).
Results
Increased Functional Connectivity in the BlindWithin-group functional connectivity maps can be found in theSupplementary Material (Figures S1, S2). We found significantgroup differences in functional connectivity for five out of theeight visual seeds, including hOC3d, hOC3v, hOC4v, fusiformgyrus and hMT+ (Table 3 and Figure 2). One of the moststriking results was the increased connectivity between theoccipital seeds and Broca’s area in the left inferior frontal cortex.More specifically, CB showed an increase in connectivity betweenhMT+, hOC3d, hOC3v, hOC4v and the fusiform gyrus with theinferior and middle frontal areas, overlapping with BA44 andBA45. The fusiform gyrus and hOC3d also showed increasedfunctional connectivity with the contralateral homolog of Broca’sarea in the right inferior frontal cortex. Next, connectivity ofventral stream areas hOC3v and fusiform gyrus with the inferiortemporal cortex (BA20) was stronger in blind participants. Blindparticipants also had stronger connectivity patterns betweenhOC4v and the thalamus, and between hOC3d and hOC4vand the cerebellum. Finally, CB showed increased connectivity
between the fusiform gyrus and the inferior parietal cortex andsulcus, which is dorsal to, but not overlapping with Wernicke’sarea (Figure 2). No group differences in connectivity wereobserved for V1, V2, and hOC4d.
Blind individuals also showed increases in functionalconnectivity for three somatosensory seeds. First, connectivitywas increased among somatosensory areas. More specifically,SI and BA7pc showed a stronger connectivity with BA40,and the middle cingulate cortex (left and right respectively).In addition, SI had increased functional connectivity withthe primary motor cortex, and middle temporal region(BA22). Our data also revealed increased connectivitybetween BA40 and the visual areas BA18 and hMT+(Figure 3).
Broca’s area showed an increased functional connectivitywith ventral visual stream areas hOC3v and hOC4v, as wellas with area BA10 in the left anterior prefrontal cortex(Figure 4). Finally, no significant group differences in functionalconnectivity were found for the primary or secondary auditorycortex.
Decreased Functional Connectivity in BlindAlthough the largest amount of the observed changes concernedincreases in functional connectivity, blind subjects also showeddecreases in connectivity in a number of brain areas. Morespecifically, blind participants showed reduced functionalconnectivity between ventral visual areas hOC3v, hOC4v andfusiform gyrus and dorsal stream area hMT+ on the onehand, and between fusiform gyrus and MI on the otherhand. For the somatosensory seeds, decreases in functionalconnectivity were observed between BA40 and the inferiortemporal area BA21, and between SI and the cerebellum.Blind participants also had a reduced functional connectivitybetween Broca’s area and its contralateral homolog in the righthemisphere.
Discussion
We investigated alterations in resting state functionalconnectivity in congenital blindness using a seed-based
Frontiers in Neuroanatomy | www.frontiersin.org 4 July 2015 | Volume 9 | Article 86
219

Heine et al. Functional connectivity in congenitally blind
TABLE 3 | Group differences in functional connectivity (congenitally blind vs. sighted controls).
Seed Brodmann area MNI coordinates (mm) Cluster p-FWE
X Y Z Size Cluster
REGION OF INCREASED CONNECTIVITY IN CB
hOC3d Middle cerebellum 0 −60 −38 224 0.0486
Middle and inferior frontal (R) BA44,45 52 32 28 275 0.0238
Inferior frontal and middle frontal (L) BA45 −44 46 −8 233 0.0427
Cerebellum (L) −14 −72 −46 373 0.0067
hOC3v Inferior frontal (L) BA44,45 −48 34 26 272 0.0296
Inferior temporal (L) BA20 −62 −50 −12 323 0.0155
hOC4v Thalamus (bilateral) 10 −4 −8 287 0.0193
Inferior frontal (L) BA44,45 −50 32 24 454 0.0024
Cerebellum 2 −80 −16 339 0.0097
FG Inferior frontal and middle frontal (L) BA44,45 −40 16 26 989 0
Inferior temporal (L) BA20 −56 −46 −10 449 0.003
Middle and inferior frontal (R) BA44,45 44 32 20 435 0.0035
Inferior temporal (R) BA20 62 −42 −10 381 0.0067
Inferior parietal (L) HIP1,2,3, IPC −32 −58 42 316 0.0149
MT Inferior frontal (L) BA44,45 −52 22 22 823 0
BA40 Middle and inferior temporal (R) MT 48 −60 0 426 0.0026
V2 BA18 12 −80 42 393 0.0039
BA7pc Middle cingulate (L) SPL −8 −60 58 847 0
Supramarginal and inferior parietal (L) BA40 −58 −36 32 221 0.0492
S1 Middle cingulate (R) BA4,6,SPL 6 −22 46 1213 0
Supramarginal (L) BA40, IPC −50 −32 24 454 0.0016
Pre and post−central (L) BA1,2,3,4,6 −46 −20 44 290 0.0143
Middle and superior temporal (R) BA22 58 10 −6 233 0.0331
Broca Middle and inferior occipital (L) hOC3v, hOC4v −36 −82 12 1574 0
Prefrontal (L) BA10 2 60 10 248 0.0255
REGION OF DECREASED CONNECTIVITY IN CB
hOC3v Middle temporal (R) MT,OP,IPC 60 −60 14 371 0.0061
hOC4v Superior, middle and inferior temporal (R) MT,OP,IPC 46 −58 12 866 0
FG Middle temporal (R) MT 52 −62 4 568 0.0008
pre and post−central, precuneus BA4,6 6 −34 58 361 0.0085
BA40 Middle and inferior temporal (R) BA21 68 −42 −2 344 0.0074
Middle temporal (L) BA21 −64 −44 6 328 0.0091
S1 Cerebellum and Vl 10 −78 0 209 0.048
Broca Inferior frontal (R) BA44,45 52 8 44 299 0.0121
approach with a priori defined ROIs. Although our data revealeda mixture of increases and decreases in functional connectivityin the blind brain, the increases strongly prevailed. The moststriking findings of this study were the increases in functionalconnectivity in the congenital blind brain within the ventral and
dorsal visual streams, and between visual cortical regions andBroca’s area. In sharp contrast, functional connectivity betweendorsal and ventral visual areas was reduced. Figure 4 summarizesthe observed increases and decreases in functional connectivityof the congenitally blind brain.
Frontiers in Neuroanatomy | www.frontiersin.org 5 July 2015 | Volume 9 | Article 86
220 Appendix J. Paper X

Heine et al. Functional connectivity in congenitally blind
FIGURE 2 | Differences in resting state functional connectivity
between blind and sighted controls (visual ROIs). Increases in functional
connectivity in the blind group are indicated in red, whereas decreases in
functional connectivity compared to controls are shown in blue. Cluster-level
FWE-corrected p < 0.05. Scale bars indicate Z-values. Abbreviations: CB,
congenitally blind; SC, sighted controls.
Increased Functional Connectivity within theVisual StreamsOur data show evidence of increased functional connectivity inthe ventral visual stream in congenitally blind subjects, morespecifically between ventral stream areas hOC3v and fusiformgyrus and the inferior temporal gyrus (BA20). The ventral streamconsists of a complex recurrent network between visual areasV1–V4 and the inferior temporal cortex (Kravitz et al., 2013). Insighted subjects, this pathway is implicated in the processing ofobject quality, object representation or object category (Kravitzet al., 2013). These processes are necessary for object and scenecomprehension that form the contents of visual awareness. The
fact that this pathway is preserved in blind subjects adds newevidence to the notion that the ventral visual stream holdsrepresentations of object shape which are supramodal in nature,and not necessarily visual (Kupers et al., 2011a). For example,non-visual recruitment of the ventral temporal cortex was seenafter haptic (Pietrini et al., 2004), non-haptic (Ptito et al., 2012)and auditory (Amedi et al., 2007) exploration of objects incongenital blind subjects.
Congenitally blind subjects also showed increased functionalconnectivity in the dorsal visual stream, more specificallybetween BA40 and the secondary visual cortex (V2), as wellas between somatosensory areas (BA7pc) and BA40. In normal
Frontiers in Neuroanatomy | www.frontiersin.org 6 July 2015 | Volume 9 | Article 86
221

Heine et al. Functional connectivity in congenitally blind
FIGURE 3 | Differences in resting state functional connectivity
between blind and sighted controls (somatosensory and language
ROIs). Increases in functional connectivity in the blind group are indicated in
red, whereas decreases in functional connectivity compared to controls are
shown in blue. Cluster-level FWE-corrected p < 0.05. Scale bars indicate
Z-values. Abbreviations: CB, congenitally blind; SC, sighted controls.
sighted individuals, the dorsal visual stream is heavily implicatedin the visual guidance of action, and consists of a set ofprojections from the visual cortex to the superior parietal lobule.From there, the dorsal stream splits into the parieto-prefrontal,parieto-medial temporal and parieto-premotor pathway (Kravitzet al., 2011). The parieto-prefrontal pathway connects the parietalcortex to prefrontal regions (e.g., BA46) and is important in top-down control of eye movements and spatial working memory.The parieto-medial temporal pathway, connecting to theposterior cingulate cortex via parahippocampal substructures, isimplicated in spatial navigation. Finally, the parieto-premotorpathway connects to premotor regions and is involved invisually-guided actions such as reaching and grasping (Kravitzet al., 2011). Our finding of increased functional connectivitybetween BA40 and V2, as well as between BA7pc and BA40,are indicative of a fast pathway for information processingfrom higher order somatosensory to lower level visual areas.This conjecture is in line with results of a recent MEG studyindicating that somatosensory information reaches the occipitalcortex in the blind via somatosensory and posterior parietal
areas (Ioannides et al., 2013), and with results of functionalactivation studies showing occipital cortex activation followingsomatosensory stimulation in blind individuals (Ptito et al.,2005). Finally, applying TMS over the occipital cortex can inducetactile sensations in blind subjects trained in the use of a tactilesensory substitution device or in Braille reading (Kupers et al.,2006; Ptito et al., 2008a).
Our results of increased functional connectivity within boththe dorsal and ventral visual streams in congenitally blindsubjects are in line with results of a recent functional connectivitydensity mapping study (Qin et al., 2014). Functional activationstudies also support the finding of increased connectivity withinthe dorsal and ventral streams in the blind brain (Kupers et al.,2011a for a review). For instance, congenitally blind subjectstrained in the use of the tongue display unit (TDU) showedstronger connectivity between the cuneus and areas within thedorsal and ventral streams (Ptito et al., 2005). In addition, adynamic causal modeling study showed that the activation ofthe occipital cortex in blind individuals during an auditorydiscrimination task is mediated via enhanced corticocortical
Frontiers in Neuroanatomy | www.frontiersin.org 7 July 2015 | Volume 9 | Article 86
222 Appendix J. Paper X

Heine et al. Functional connectivity in congenitally blind
FIGURE 4 | Flow chart summarizing group differences in
functional connectivity. The used ROIs are represented by colored
boxes (blue, visual seeds; green, somatosensory seeds; yellow,
language seed; orange, auditory seed). Red arrows indicate an
increased connectivity in blind compared to sighted between our seed
and the boxes’ corresponding brain area. Blue arrows indicate the
opposite, i.e., a decreased connectivity in blind compared to sighted
individuals.
connections from the auditory to the occipital cortex (Klingeet al., 2010). These functional changes are probably due toanatomical reorganization of the pathways that funnel non-visualinformation to the visual cortex of the blind (Kupers et al., 2011a).Thus, our rsfMRI data of increased connectivity in the visualstreams are supported by results of various functional activationstudies showing that the visual streams of the congenitally blindundergo compensatory plasticity and are able to process non-visual information in conjunction with the visual cortex (Dormalet al., 2012; Kupers and Ptito, 2014).
Decreased Connectivity between the Ventral andDorsal Visual StreamIn sharp contrast with the increase in functional connectivitywithin the visual streams, our data revealed decreases inconnectivity between the two streams in blind participants.Connectivity of ventral areas hOC3v, hOC4v and fusiform gyruswith dorsal stream area hMT+ was decreased, as well as thatbetween BA40 and the inferior temporal cortex (BA21). Thereis growing evidence that the dorsal and ventral streams areless independent than originally thought (Schenk and McIntosh,2010). Although these streams have clear independent functional
roles, there is functional and structural evidence that they donot function in an independent manner (Mahon et al., 2007;Borra et al., 2008; Rosa et al., 2009; Schenk and McIntosh, 2010;Zanon et al., 2010). Our data suggest that in the congenitallyblind brain the two streams are less interconnected than in thesighted brain. We hypothesize that this may be due to increasesin functional connectivity within the two streams. An alternativeexplanation is that cross-modal non-visual sensory informationprocessing in extrastriate cortex reduces the need for functionalconnectivity between the streams. Future structural imaging andvoxel based morphometric assessment might shed light on thechanges in white matter structure within the dorsal and ventralstream to assess whether there is a structural or only functionaldifferentiation between the two streams.
Connectivity of the Primary Visual CortexWe did not find evidence for changes in connectivity inprimary visual cortex (V1 and V2). This is in agreementwith several other functional connectivity studies (Bedny et al.,2011; Watkins et al., 2012; Butt et al., 2013; Burton et al.,2014). A recent study reported decreased functional connectivitydensity only in primary visual areas of late blind subjects,
Frontiers in Neuroanatomy | www.frontiersin.org 8 July 2015 | Volume 9 | Article 86
223

Heine et al. Functional connectivity in congenitally blind
while congenitally blind showed increased connectivity betweenlower tier visual areas and somatosensory areas (Qin et al.,2014), overlapping with the small cluster of increased functionalconnectivity between BA40 and the primary visual areas observedin this study. However, the literature on changes in functionalconnectivity of primary visual areas in blind individuals isincongruent. Thus, several fMRI studies reported a correlationbetween damage to the optic radiation and an event-relatedfMRI response in visual areas (Seghier et al., 2004), or decreasedfunctional connectivity of primary visual areas with the restof the brain Liu et al., 2007; Yu et al., 2008; Shu et al., 2009;Wang et al., 2013. These results were explained by the generalloss hypothesis. However, this proposed mechanism cannotexplain the ubiquitous role of the primary visual cortex innon-visual perceptual and cognitive tasks (Sadato et al., 1996;Amedi et al., 2003, 2004; Burton et al., 2003; Ptito et al.,2005, 2007; Karlen et al., 2006; Voss et al., 2008; Kupers et al.,2010, 2011a; Matteau et al., 2010; Sani et al., 2010; Bednyet al., 2011; Collignon et al., 2011; Watkins et al., 2012).Nor can it explain enhanced effective connectivity with otherregions (Wittenberg et al., 2004; Ptito et al., 2005; Klinge et al.,2010). Furthermore, a recent review on structural changes asmeasured with diffusion concluded that although the literatureis inconsistent, it suggest that neither strength nor macro-scaletopographic organization is changed in blind individuals (Bockand Fine, 2014). This is congruent with new research showingthat functional connectivity based topographic organization ofthe visual cortices is indistinguishable from sighted controls,and increased functional connectivity to frontal and posteriortemporal areas (Striem-Amit et al., 2015).
Visual Cortex and Language ProcessingBroca’s area (BAs 44 and 45) was the cortical area with the largestamount of alterations in functional connectivity in congenitallyblind participants. A total of five visual seeds, hOC3d, hOC3v,hOC4v, hMT+ and fusiform gyrus, showed increased functionalconnectivity with this area. In addition, Broca’s area also showedstronger connectivity with ventral visual areas hOC3v, hOC4v,and with medial prefrontal cortical area BA 10. The currentconsensus is that the occipital cortex of blind individuals isinvolved in language processing, showing similar properties as“classical language related areas” (Bedny et al., 2011). Braillereading in blind subjects activates an extensive network of brainareas, including posterior and medial occipital areas, fusiformgyrus, area hMT+, inferior temporal gyrus, inferior frontal,prefrontal, intraparietal sulcus, and somatosensory motor areas(Burton et al., 2002a). More specifically, the increased functionalconnectivity between visual areas and Broca’s area in congenitallyblind individuals might relate to the role of the occipital cortexin semantic processing. Whereas semantic processing activatesthe inferior frontal cortex in both sighted and blind subjects,it activates additionally visual cortical areas in the latter group(Burton et al., 2003; Noppeney et al., 2003; Amedi et al., 2004;Bedny et al., 2011; Watkins et al., 2012). These results expandearlier findings of increased connectivity of the occipital cortexwith Broca’s area in congenital blindness (Liu et al., 2007; Bednyet al., 2011; Watkins et al., 2012; Butt et al., 2013; Wang et al.,
2013; Burton et al., 2014; Deen et al., 2015). The co-activationwith Broca’s area extends to most of the occipital cortex (Burtonet al., 2003; Deen et al., 2015), and might next to language alsofunctionally correlate to working memory (Deen et al., 2015).These results also relate to findings of increased white mattervolume within the tracts between prefrontal and occipital areas.More specifically in the fronto-occipital fasciculi (Ptito et al.,2008b; Bock and Fine, 2014).
The increased functional connectivity between Broca’s areaand hMT+ might be explained by the role of tactile flowprocessing in Braille reading (Ricciardi et al., 2007). All ourcongenitally blind were reading braille from when they werechildren (see Table 1 for speed of braille reading), and Burtonet al. (2002a) showed that this area is linked to braille readingonly in early bind subjects. Furthermore, the role of the occipitalcortex in language processing is further supported by studiesshowing that rTMS over the mid-occipital cortex not onlyreduces accuracy of verb-generation (Amedi et al., 2004), butalso impairs Braille reading performance (Kupers et al., 2007).Finally, it is worth mentioning that a bilateral occipital stroke inan early blind patient resulted in the loss of Braille reading skills(Hamilton et al., 2000). It is thus interesting for further studies toexamine braille performances and related functional connectivitywithin hMT+ as well as other areas in both congenitally and lateblind subjects.
In line with previous results (Bedny et al., 20111), congenitallyblind subjects also showed increased functional connectivitybetween occipital area hOC4v and the thalamus. This findingsuggests a thalamo-cortical implication in language processingin the congenitally blind, a conjecture that is supported by theobservation that stimulation of left thalamic regions produceslanguage deficits in blind subjects (Johnson and Ojemann, 2000).Our data also revealed a decrease in functional connectivitybetween Broca’s area and its homolog in the right hemisphere.In sighted but not in congenitally blind individuals, the rightinferior frontal area is also activated during language tasks(Burton et al., 2002b). Blind subjects might use the visuallydeprived occipital cortex instead because it is more cost-effective.
Somatosensory AreasOur results indicate increased functional connectivity betweenthe supramarginal gyrus (BA40) and secondary visual cortexand area hMT+, and between SI and BA40. As statedabove, the supramarginal gyrus, occipital, middle temporal andsomatosensory cortices are activated by Braille reading (Burtonet al., 2002a; Gizewski et al., 2004; Sadato, 2005). We explainthe co-activation of somatosensory regions by the tactile inputof Braille reading. Indeed, tactile stimuli activate inferior andventral temporal, as well as somatosensory regions in blindindividuals (Pietrini et al., 2004; Ptito et al., 2005, 2012; Matteauet al., 2010; Ricciardi et al., 2013). This co-activation of parietaland visual areas may be at the basis of the superior tactile acuityin blind individuals (Kupers and Ptito, 2014), this might alsobe related to the increases in white matter volume found insomatosensory and motor areas (Noppeney et al., 2005).
Other rsfMRI studies have reported a decrease of functionalconnectivity between visual and somatosensory regions (Liu
Frontiers in Neuroanatomy | www.frontiersin.org 9 July 2015 | Volume 9 | Article 86
224 Appendix J. Paper X

Heine et al. Functional connectivity in congenitally blind
et al., 2007; Yu et al., 2008; Bedny et al., 2011; Qin et al.,2013). However, this finding is at odds with results of severalother activation studies indicating strong connectivity betweenthese areas. For instance, functional connectivity was shown tobe increased between hMT+ and somatosensory areas (Saniet al., 2010). Furthermore, a recent MEG study from our grouprevealed activation of the occipital cortex following median nervestimulation in congenitally blind individuals (Ioannides et al.,2013). A connectivity analysis further suggested that mediannerve stimulation first activated primary somatosensory cortex,then the posterior parietal cortex and finally visual areas V3and V5 (Ioannides et al., 2013). Using somatosensory-evokedpotentials, we reported that tactile stimulation of the tongue inblind individuals trained in the use of the tongue display unit firstactivated the somatosensory cortex and then the occipital cortex(Kupers et al., 2006). Finally, a combined PET-TMS study showedthat TMS of the primary somatosensory cortex leads to increasedblood flow in the occipital cortex in congenitally blind subjectsonly (Wittenberg et al., 2004). Together, these findings argue infavor of an enhanced parieto-occipital connectivity in congenitalblindness which is supported by the present rsfMRI data.
Auditory and Motor AreasAlthough many studies have indicated superior auditory abilitiesin congenitally blind individuals (Kupers and Ptito, 2014),we did not find significant group differences in functionalconnectivity of auditory areas. Active tasks have indicatedstronger cooperation between the auditory and occipital corticesin congenital blindness (Klinge et al., 2010; Collignon et al.,2011). It is possible that in the present study, scannernoise masked a purported increase in resting state functionalconnectivity between auditory and occipital cortices in blindindividuals (De Martino et al., 2014).
We found decreased functional connectivity between thefusiform gyrus and pre- and post-central areas. This is inagreement with several other studies that found decreasesbetween visual areas and motor-related regions, a finding thatwas explained by the loss of eye-hand coordination in blindsubjects (Liu et al., 2007; Yu et al., 2008; Wang et al., 2013). Eye-hand coordination in sighted individuals leads to co-activation ofvisual and motor areas (Winstein et al., 1997), which is reducedin conditions of congenital blindness.
Methodological ConsiderationsSeveral rsfMRI studies have explored changes in functionalconnectivity in the blind brain. The reported results are notvery consistent and sometimes even conflicting. These differencesin results might be due to spurious samples or protocol bias.For instance, some studies included blind subjects with residuallight perception (Li et al., 2013; Wang et al., 2013; Burtonet al., 2014), or had a mixture of congenitally blind and late-onset blind participants (Butt et al., 2013). Our study cohortwas a homogeneous group of congenitally blind participantswithout any light perception. Furthermore, contrary to some(Liu et al., 2007; Yu et al., 2008), our study used subjectsthat are not previously used for any analysis, nor was thereany active paradigm during the scanning session (Bedny et al.,
2011). Another explanation for the inconsistency betweenstudies relates to differences in used methodologies for assessingfunctional connectivity in rsfMRI data. Early studies used a moreexploratorymethodwith atlas-based regions of interest (Liu et al.,2007; Wang et al., 2008; Watkins et al., 2012; Li et al., 2013; Qinet al., 2014), or one or a few hypothesis-driven ROIs, mostly theprimary visual area (Yu et al., 2008; Li et al., 2013; Qin et al.,2013). In contrast, our investigation focussed on small areas thatare not present in current atlases. Information about the timecourse (and therefore its functional correlation) of these smallareas could also bemissed when the time courses of all voxel in anatlas based area are averaged. Our research focused on brain areaswith known functional or structural changes in blind subjects inthe visual, somatosensory, auditory and language domain, andseed placement was done according to architectonical studies.
We combined the time-series of homologous areas fromboth hemispheres. For this reason we are unable to draw anyconclusions on purported hemispheric differences in functionalconnectivity. Further, we excluded “increased” or “decreased”correlations in our second level analysis that were caused byanti-correlating time-series in our first level analysis. As with allresting state functional connectivity studies, we are only able toshow correlations between different areas, and not any causality.Thereto, DCM or granger causality studies are needed.
Conclusion
In summary, our data reveal increased functional connectivitywithin both the ventral and the dorsal visual streams incongenitally blind participants. However, connectivity betweenthe two visual streams was reduced in blind subjects. In addition,our data revealed stronger functional connectivity in blindparticipants between the occipital cortex and areas implicatedin language and tactile (Braille) processing such as the inferiorfrontal gyrus (Broca’s area), the thalamus, the supramarginalgyrus and the cerebellum. Our results underscore the extent ofcross-modal reorganization and the supra-modal function of theoccipital cortex in congenitally blind individuals.
Funding
The Lundbeck Foundation (Denmark), The Danish MedicalResearch Council, the University Hospital of Liège, the BelgianNational Funds for Scientific Research (FRS-FNRS), and thediscovery grant from NSERC funded this research.
Acknowledgments
The authors thank Nina Reislev for acquiring the MRI scans andDr. Marco Aiello for in-depth methodological discussions.
Supplementary Material
The Supplementary Material for this article can be foundonline at: http://journal.frontiersin.org/article/10.3389/fnana.2015.00086
Frontiers in Neuroanatomy | www.frontiersin.org 10 July 2015 | Volume 9 | Article 86
225

Heine et al. Functional connectivity in congenitally blind
Figure S1 | Resting state functional connectivity within blind and sighted
controls (visual ROIs). Within group functional connectivity for sighted controls
(left) and congenitally blind (right). Cluster-level FWE-corrected p < 0.05. Scale
bars indicate Z-values.
Figure S2 | Resting state functional connectivity within blind and sighted
controls (somatosensory and language ROIs). Within group functional
connectivity for sighted controls (left) and congenitally blind (right). Cluster-level
FWE-corrected p < 0.05. Scale bars indicate Z-values.
References
Amedi, A., Floel, A., Knecht, S., Zohary, E., and Cohen, L. G. (2004). Transcranialmagnetic stimulation of the occipital pole interferes with verbal processing inblind subjects. Nat. Neurosci. 7, 1266–1270. doi: 10.1038/nn1328
Amedi, A., Raz, N., Pianka, P., Malach, R., and Zohary, E. (2003). Early “visual”cortex activation correlates with superior verbal memory performance in theblind. Nat. Neurosci. 6, 758–766. doi: 10.1038/nn1072
Amedi, A., Stern, W. M., Camprodon, J. A., Bermpohl, F., Merabet, L., Rotman,S., et al. (2007). Shape conveyed by visual-to-auditory sensory substitutionactivates the lateral occipital complex. Nat. Neurosci. 10, 687–689. doi:10.1038/nn1912
Amunts, K., Malikovic, A., Mohlberg, H., Schormann, T., and Zilles, K. (2000).Brodmann’s areas 17 and 18 brought into stereotaxic space-where and howvariable? Neuroimage 11, 66–84. doi: 10.1006/nimg.1999.0516
Beaulieu-Lefebvre, M., Schneider, F. C., Kupers, R., and Ptito, M. (2011). Odorperception and odor awareness in congenital blindness. Brain Res. Bull. 84,206–209. doi: 10.1016/j.brainresbull.2010.12.014
Bedny, M., Caramazza, A., Grossman, E., Pascual-Leone, A., and Saxe, R. (2008).Concepts are more than percepts: the case of action verbs. J. Neurosci. 28,11347–11353. doi: 10.1523/JNEUROSCI.3039-08.2008
Bedny,M., Pascual-Leone, A., Dodell-Feder, D., Fedorenko, E., and Saxe, R. (2011).Language processing in the occipital cortex of congenitally blind adults. Proc.Natl. Acad. Sci. U.S.A. 108, 4429–4434. doi: 10.1073/pnas.1014818108
Behzadi, Y., Restom, K., Liau, J., and Liu, T. T. (2007). A component basednoise correction method (CompCor) for BOLD and perfusion based fMRI.Neuroimage 37, 90–101. doi: 10.1016/j.neuroimage.2007.04.042
Binkofski, F., Amunts, K., Stephan, K. M., Posse, S., Schormann, T., Freund,H. J., et al. (2000). Broca’s region subserves imagery of motion: a combinedcytoarchitectonic and fMRI study. Hum. Brain Mapp. 11, 273–285. doi:10.1002/1097-0193(200012)11:4<273::AID-HBM40>3.0.CO;2-0
Bock, A. S., and Fine, I. (2014). Anatomical and functional plasticity in earlyblind individuals and themixture of experts architecture. Front. Hum. Neurosci.8:971. doi: 10.3389/fnhum.2014.00971
Borra, E., Belmalih, A., Calzavara, R., Gerbella, M., Murata, A., Rozzi, S., et al.(2008). Cortical connections of the macaque anterior intraparietal (AIP) area.Cereb. Cortex 18, 1094–1111. doi: 10.1093/cercor/bhm146
Burton, H., Diamond, J. B., and McDermott, K. B. (2003). Dissociating corticalregions activated by semantic and phonological tasks: a FMRI study inblind and sighted people. J. Neurophysiol. 90, 1965–1982. doi: 10.1152/jn.00279.2003
Burton, H., Snyder, A. Z., Conturo, T. E., Akbudak, E., Ollinger, J. M.,and Raichle, M. E. (2002a). Adaptive changes in early and late blind: afMRI study of braille reading. J. Neurophysiol. 87, 589–607. doi: 10.1152/jn.00129.2002
Burton, H., Snyder, A. Z., Diamond, J. B., and Raichle, M. E. (2002b). Adaptivechanges in early and late blind: a fMRI study of verb generation to heard nouns.J. Neurophysiol. 88, 3359–3371. doi: 10.1152/jn.00129.2002
Burton, H., Snyder, A. Z., and Raichle, M. E. (2014). Resting state functionalconnectivity in early blind humans. Front. Syst. Neurosci. 8:51. doi:10.3389/fnsys.2014.00051
Butt, O. H., Benson, N. C., Datta, R., and Aguirre, G. K. (2013). The fine-scalefunctional correlation of striate cortex in sighted and blind people. J. Neurosci.33, 16209–16219. doi: 10.1523/JNEUROSCI.0363-13.2013
Caspers, S., Eickhoff, S. B., Geyer, S., Scheperjans, F., Mohlberg, H., Zilles, K., et al.(2008). The human inferior parietal lobule in stereotaxic space. Brain Struct.Funct. 212, 481–495. doi: 10.1007/s00429-008-0195-z
Caspers, J., Zilles, K., Eickhoff, S. B., Schleicher, A., Mohlberg, H., and Amunts,K. (2013). Cytoarchitectonical analysis and probabilistic mapping of twoextrastriate areas of the human posterior fusiform gyrus. Brain Struct. Funct.218, 511–526. doi: 10.1007/s00429-012-0411-8
Caspers, S., Zilles, K., Laird, A. R., and Eickhoff, S. B. (2010). ALE meta-analysisof action observation and imitation in the human brain. Neuroimage 50,1148–1167. doi: 10.1016/j.neuroimage.2009.12.112
Cecchetti, L., Ricciardi, E., Handjaras, G., Kupers, R., Ptito, M., and Pietrini,P. (2015). Congenital blindness affects diencephalic but not mesencephalicstructures in the human brain. Brain Struct. Funct. doi: 10.1007/s00429-014-0984-5. [Epub ahead of print].
Chai, X., Castañón, A., Öngür, D., and Whitfield-Gabrieli, S. (2012).Anticorrelations in resting state networks without global signal regression.Neuroimage 59, 1420–1428. doi: 10.1016/j.neuroimage.2011.08.048
Collignon, O., Dormal, G., Albouy, G., Vandewalle, G., Voss, P., Phillips, C.,et al. (2013). Impact of blindness onset on the functional organizationand the connectivity of the occipital cortex. Brain 136, 2769–2783. doi:10.1093/brain/awt176
Collignon, O., Vandewalle, G., Voss, P., Albouy, G., Charbonneau, G., Lassonde,M., et al. (2011). Functional specialization for auditory-spatial processing inthe occipital cortex of congenitally blind humans. Proc. Natl. Acad. Sci. U.S.A.108, 4435–4440. doi: 10.1073/pnas.1013928108
Cuevas, I., Plaza, P., Rombaux, P., De Volder, A. G., and Renier, L. (2009).Odour discrimination and identification are improved in early blindness.Neuropsychologia 47, 3079–3083. doi: 10.1016/j.neuropsychologia.2009.07.004
Deen, B., Saxe, R., and Bedny, M. (2015). Occipital cortex of blind individuals isfunctionally coupled with executive control areas of frontal cortex. J. Cogn.Neurosci. doi: 10.1162/jocn_a_00807. [Epub ahead of print].
De Martino, F., Moerel, M., Ugurbil, K., Formisano, E., and Yacoub, E. (2014). Lessnoise, more activation: multiband acquisition schemes for auditory functionalMRI.Magn. Reson. Med. doi: 10.1002/mrm.25408. [Epub ahead of print].
Dormal, G., Lepore, F., and Collignon, O. (2012). Plasticity of the dorsal“spatial” stream in visually deprived individuals.Neural Plast. 2012:687659. doi:10.1155/2012/687659
Fieger, A., Röder, B., Teder-Sälejärvi, W., Hillyard, S. A., and Neville, H. J. (2006).Auditory Spatial Tuning in Late-onset Blindness in Humans. J. Cogn. Neurosci.18, 149–157. doi: 10.1162/jocn.2006.18.2.149
Fortin, M., Voss, P., Lord, C., Lassonde, M., Pruessner, J., Saint-Amour, D., et al.(2008). Wayfinding in the blind: larger hippocampal volume and supranormalspatial navigation. Brain 131, 2995–3005. doi: 10.1093/brain/awn250
Geyer, S., Schleicher, A., and Zilles, K. (1999). Areas 3a, 3b, and 1 of humanprimary somatosensory cortex. Neuroimage 10, 63–83. doi: 10.1006/nimg.1999.0440
Geyer, S., Schormann, T., Mohlberg, H., and Zilles, K. (2000). Areas 3a,3b, and 1 of human primary somatosensory cortex. Part 2. Spatialnormalization to standard anatomical space. Neuroimage 11, 684–696. doi:10.1006/nimg.2000.0548
Gizewski, E. R., Timmann, D., and Forsting, M. (2004). Specific cerebellaractivation during Braille reading in blind subjects. Hum. Brain Mapp. 22,229–235. doi: 10.1002/hbm.20031
Gougoux, F., Belin, P., Voss, P., Lepore, F., Lassonde, M., and Zatorre, R.J. (2009). Voice perception in blind persons: a functional magneticresonance imaging study. Neuropsychologia 47, 2967–2974. doi:10.1016/j.neuropsychologia.2009.06.027
Gougoux, F., Zatorre, R. J., Lassonde, M., Voss, P., and Lepore, F. (2005). Afunctional neuroimaging study of sound localization: visual cortex activitypredicts performance in early-blind individuals. PLoS Biol. 3:e27. doi:10.1371/journal.pbio.0030027
Hallquist, M. N., Hwang, K., and Luna, B. (2013). The nuisance of nuisanceregression: spectral misspecification in a common approach to resting-statefMRI preprocessing reintroduces noise and obscures functional connectivity.Neuroimage 82, 208–225. doi: 10.1016/j.neuroimage.2013.05.116
Hamilton, R., Keenan, J. P., Catala, M., and Pascual-Leone, A. (2000). Alexia forBraille following bilateral occipital stroke in an early blind woman.Neuroreport11, 237–240.
Frontiers in Neuroanatomy | www.frontiersin.org 11 July 2015 | Volume 9 | Article 86
226 Appendix J. Paper X

Heine et al. Functional connectivity in congenitally blind
Ioannides, A. A., Liu, L., Poghosyan, V., Saridis, G. A., Gjedde, A., Ptito, M., et al.(2013). MEG reveals a fast pathway from somatosensory cortex to occipitalareas via posterior parietal cortex in a blind subject. Front. Hum. Neurosci.7:429. doi: 10.3389/fnhum.2013.00429
Jiang, J., Zhu, W., Shi, F., Liu, Y., Li, J., Qin, W., et al. (2009). Thick visual cortexin the early blind. J. Neurosci. 29, 2205–2211. doi: 10.1523/JNEUROSCI.5451-08.2009
Johnson, M. D., and Ojemann, G. A. (2000). The role of the human thalamus inlanguage and memory: evidence from electrophysiological studies. Brain Cogn.42, 218–230. doi: 10.1006/brcg.1999.1101
Karlen, S. J., Kahn, D. M., and Krubitzer, L. (2006). Early blindness results inabnormal corticocortical and thalamocortical connections. Neuroscience 142,843–858. doi: 10.1016/j.neuroscience.2006.06.055
Klinge, C., Eippert, F., Röder, B., and Büchel, C. (2010). Corticocorticalconnections mediate primary visual cortex responses to auditory stimulationin the blind. J. Neurosci. 30, 12798–12805. doi: 10.1523/JNEUROSCI.2384-10.2010
Kolster, H., Peeters, R., and Orban, G. A. (2010). The retinotopic organization ofthe human middle temporal area MT/V5 and its cortical neighbors. J. Neurosci.30, 9801–9820. doi: 10.1523/JNEUROSCI.2069-10.2010
Kravitz, D. J., Saleem, K. S., Baker, C. I., and Mishkin, M. (2011). A new neuralframework for visuospatial processing. Nat. Rev. Neurosci. 12, 217–230. doi:10.1038/nrn3008
Kravitz, D. J., Saleem, K. S., Baker, C. I., Ungerleider, L. G., andMishkin, M. (2013).The ventral visual pathway: an expanded neural framework for the processingof object quality. Trends Cogn. Sci. 17, 26–49. doi: 10.1016/j.tics.2012.10.011
Kujovic, M., Zilles, K., Malikovic, A., Schleicher, A., Mohlberg, H., Rottschy, C.,et al. (2013). Cytoarchitectonic mapping of the human dorsal extrastriatecortex. Brain Struct. Funct. 218, 157–172. doi: 10.1007/s00429-012-0390-9
Kupers, R., Beaulieu-lefebvre, M., Schneider, F. C., Kassuba, T., Paulson,O. B., Siebner, H. R., et al. (2011a). Neural correlates of olfactoryprocessing in congenital blindness. Neuropsychologia 49, 2037–2044. doi:10.1016/j.neuropsychologia.2011.03.033
Kupers, R., Chebat, D. R., Madsen, K. H., Paulson, O. B., and Ptito, M. (2010).Neural correlates of virtual route recognition in congenital blindness. Proc.Natl. Acad. Sci. U.S.A. 107, 12716–12721. doi: 10.1073/pnas.1006199107
Kupers, R., Fumal, A., de Noordhout, A. M., Gjedde, A., Schoenen, J., and Ptito,M. (2006). Transcranial magnetic stimulation of the visual cortex inducessomatotopically organized qualia in blind subjects. Proc. Natl. Acad. Sci. U.S.A.103, 13256–13260. doi: 10.1073/pnas.0602925103
Kupers, R., Pappens, M., and Noordhout, A., de. (2007). rTMS of the occipitalcortex abolishes Braille reading and repetition priming in blind subjects.Neurology 68, 691–693. doi: 10.1212/01.wnl.0000255958.60530.11
Kupers, R., Pietrini, P., Ricciardi, E., and Ptito, M. (2011b). The nature ofconsciousness in the visually deprived brain. Front. Psychol. 2:19. doi:10.3389/fpsyg.2011.00019
Kupers, R., and Ptito, M. (2014). Compensatory plasticity and cross-modalreorganization following early visual deprivation. Neurosci. Biobehav. Rev. 41,36–52. doi: 10.1016/j.neubiorev.2013.08.001
Li, J., Liu, Y., Qin, W., Jiang, J., Qiu, Z., Xu, J., et al. (2013). Age ofonset of blindness affects brain anatomical networks constructed usingdiffusion tensor tractography. Cereb. Cortex 23, 542–551. doi: 10.1093/cercor/bhs034
Liu, Y., Yu, C., LIang, M., Li, J., Tian, L., Zhou, Y., et al. (2007). Wholebrain functional connectivity in the early blind. Brain 130, 2085–2096. doi:10.1093/brain/awm121
Mahon, B. Z., Milleville, S. C., Negri, G. A. L., Rumiati, R. I., Caramazza, A., andMartin, A. (2007). Action-related properties shape object representations in theventral stream. Neuron 55, 507–520. doi: 10.1016/j.neuron.2007.07.011
Matteau, I., Kupers, R., Ricciardi, E., Pietrini, P., and Ptito, M. (2010).Beyond visual, aural and haptic movement perception: hMT+ isactivated by electrotactile motion stimulation of the tongue in sightedand in congenitally blind individuals. Brain Res. Bull. 82, 264–270. doi:10.1016/j.brainresbull.2010.05.001
Murphy, K., Birn, R. M., Handwerker, D. A., Jones, T. B., and Bandettini, P. A.(2009). The impact of global signal regression on resting state correlations:
are anti-correlated networks introduced? Neuroimage 44, 893–905. doi:10.1016/j.neuroimage.2008.09.036
Noppeney, U., Friston, K. J., Ashburner, J., Frackowiak, R., and Price, C. J. (2005).Early visual deprivation induces structural plasticity in gray and white matter.Curr. Biol. 15, R488–R490. doi: 10.1016/j.cub.2005.06.053
Noppeney, U., Friston, K. J., and Price, C. J. (2003). Effects of visual deprivationon the organization of the semantic system. Brain 126, 1620–1627. doi:10.1093/brain/awg152
Pan, W.-J., Wu, G., Li, C.-X., Lin, F., Sun, J., and Lei, H. (2007). Progressiveatrophy in the optic pathway and visual cortex of early blind Chinese adults:a voxel-based morphometry magnetic resonance imaging study. Neuroimage37, 212–220. doi: 10.1016/j.neuroimage.2007.05.014
Pietrini, P., Furey, M. L., Ricciardi, E., Gobbini, M. I., Wu, W.-H. C., Cohen,L., et al. V (2004). Beyond sensory images: object-based representation in thehuman ventral pathway. Proc. Natl. Acad. Sci. U.S.A. 101, 5658–5663. doi:10.1073/pnas.0400707101
Poirier, C., Collignon, O., Scheiber, C., Renier, L., Vanlierde, A., Tranduy, D.,et al. (2006). Auditory motion perception activates visual motion areas inearly blind subjects. Neuroimage 31, 279–285. doi: 10.1016/j.neuroimage.2005.11.036
Ptito, M., Fumal, A., de Noordhout, A. M., Schoenen, J., Gjedde, A., and Kupers,R. (2008a). TMS of the occipital cortex induces tactile sensations in the fingersof blind Braille readers. Exp. Brain Res. 184, 193–200. doi: 10.1007/s00221-007-1091-0
Ptito, M., Fumal, A., de Noordhout, A. M., Schoenen, J., Gjedde, A., Kupers,R., et al. (2007). TMS of the occipital cortex induces tactile sensations inthe Vingers of blind Braille readers. Exp. Brain Res. 184, 193–200. doi:10.1007/s00221-007-1091-0
Ptito, M., Matteau, I., Gjedde, A., and Kupers, R. (2009). Recruitment of themiddle temporal area by tactile motion in congenital blindness. Neuroreport20, 543–547. doi: 10.1097/WNR.0b013e3283279909
Ptito, M., Matteau, I., Zhi Wang, A., Paulson, O. B., Siebner, H. R., and Kupers,R. (2012). Crossmodal recruitment of the ventral visual stream in congenitalblindness. Neural Plast. 2012:304045. doi: 10.1155/2012/304045
Ptito, M., Moesgaard, S. M., Gjedde, A., and Kupers, R. (2005). Cross-modalplasticity revealed by electrotactile stimulation of the tongue in the congenitallyblind. Brain 128, 606–614. doi: 10.1093/brain/awh380
Ptito, M., Schneider, F. C. G., Paulson, O., and Kupers, R. (2008b). Alterations ofthe visual pathways in congenital blindness. Exp. Brain Res. 187, 41–49. doi:10.1007/s00221-008-1273-4
Qin, W., Liu, Y., Jiang, T., and Yu, C. (2013). The development of visualareas depends differently on visual experience. PLoS ONE 8:e53784. doi:10.1371/journal.pone.0053784
Qin, W., Xuan, Y., Liu, Y., Jiang, T., and Yu, C. (2014). Functional connectivitydensity in congenitally and late blind subjects. Cereb. Cortex 1, 1–10. doi:10.1093/cercor/bhu051
Rademacher, J., Morosan, P., Schormann, T., Schleicher, A., Werner, C.,Freund, H. J., et al. (2001). Probabilistic mapping and volume measurementof human primary auditory cortex. Neuroimage 13, 669–683. doi:10.1006/nimg.2000.0714
Raz, N., Amedi, A., and Zohary, E. (2005). V1 activation in congenitally blindhumans is associated with episodic retrieval. Cereb. Cortex 15, 1459–1468. doi:10.1093/cercor/bhi026
Ricciardi, E., Bonino, D., Pellegrini, S., and Pietrini, P. (2013). Mind theblind brain to understand the sighted one! Is there a supramodalcortical functional architecture? Neurosci. Biobehav. Rev. 41, 64–77. doi:10.1016/j.neubiorev.2013.10.006
Ricciardi, E., Vanello, N., Sani, L., Gentili, C., Scilingo, E. P., Landini,L., et al. (2007). The effect of visual experience on the developmentof functional architecture in hMT+. Cereb. Cortex 17, 2933–2939. doi:10.1093/cercor/bhm018
Rosa, M. G. P., Palmer, S. M., Gamberini, M., Burman, K. J., Yu, H.-H., Reser, D.H., et al. (2009). Connections of the dorsomedial visual area: pathways for earlyintegration of dorsal and ventral streams in extrastriate cortex. J. Neurosci. 29,4548–4563. doi: 10.1523/JNEUROSCI.0529-09.2009
Rosenbluth, R., Grossman, E. S., and Kaitz, M. (2000). Performance of early-blind and sighted children on olfactory tasks. Perception 29, 101–110. doi:10.1068/p3001
Frontiers in Neuroanatomy | www.frontiersin.org 12 July 2015 | Volume 9 | Article 86
227

Heine et al. Functional connectivity in congenitally blind
Rottschy, C., Eickhoff, S. B., Schleicher, A., Mohlberg, H., Kujovic, M., Zilles, K.,et al. (2007). Ventral visual cortex in humans: cytoarchitectonic mapping of twoextrastriate areas. Hum. Brain Mapp. 28, 1045–1059. doi: 10.1002/hbm.20348
Saad, Z. S., Gotts, S. J., Murphy, K., Chen, G., Jo, H. J., Martin, A., et al.(2012). Trouble at rest: how correlation patterns and group differencesbecome distorted after global signal regression. Brain Connect. 2, 25–32. doi:10.1089/brain.2012.0080
Sadato, N. (2005). How the blind “see” Braille: lessons from functional magneticresonance imaging. Neuroscience 11, 577–582. doi: 10.1177/1073858405277314
Sadato, N., Pascual-Leone, A., Grafman, J., Iban, V., Deiber, M., Dold, G., et al.(1996). Activation of the primary visual cortex by braille reading in blindsubjects. Nature 380, 526–528. doi: 10.1038/380526a0
Sani, L., Ricciardi, E., Gentili, C., Vanello, N., Haxby, J. V., Pietrini, P., et al.(2010). Effects of visual experience on the human MT+ functional connectivitynetworks: an fMRI study ofmotion perception in sighted and congenitally blindindividuals. Front. Syst. Neurosci. 4:159. doi: 10.3389/fnsys.2010.00159
Schenk, T., and McIntosh, R. D. (2010). Do we have independent visualstreams for perception and action? J. Cogn. Neurosci. 1, 52–62. doi:10.1080/17588920903388950
Scheperjans, F., Eickhoff, S. B., Hömke, L., Mohlberg, H., Hermann, K.,Amunts, K., et al. (2008). Probabilistic maps, morphometry, and variability ofcytoarchitectonic areas in the human superior parietal cortex. Cereb. Cortex 18,2141–2157. doi: 10.1093/cercor/bhm241
Seghier, M. L., Lazeyras, F., Zimine, S., Maier, S. E., Hanquinet, S., Delavelle,J., et al. (2004). Combination of event-related fMRI and diffusion tensorimaging in an infant with perinatal stroke. Neuroimage 21, 463–472. doi:10.1016/j.neuroimage.2003.09.015
Shimony, J. S., Burton, H., Epstein, A. A., McLaren, D. G., Sun, S. W., and Snyder,A. Z. (2006). Diffusion tensor imaging reveals white matter reorganizationin early blind humans. Cereb. Cortex 16, 1653–1661. doi: 10.1093/cercor/bhj102
Shu, N., Liu, Y., Li, J., Li, Y., Yu, C., and Jiang, T. (2009). Altered anatomicalnetwork in early blindness revealed by diffusion tensor tractography. PLoS One4:e7228. doi: 10.1371/journal.pone.0007228
Striem-Amit, E., Cohen, L., Dehaene, S., and Amedi, A. (2012). Reading withsounds: sensory substitution selectively activates the visual word form area inthe blind. Neuron 76, 640–652. doi: 10.1016/j.neuron.2012.08.026
Striem-amit, E., Ovadia-caro, S., Caramazza, A., Margulies, S., Villringer, A.,and Amedi, A. (2015). Functional connectivity of visual cortex in theblind follows retinotopic organization principles. Brain 138, 1679–1695. doi:10.1093/brain/awv083
Tomaiuolo, F., Campana, S., Collins, D. L., Fonov, V. S., Ricciardi, E., Sartori,G., et al. (2014). Morphometric changes of the corpus callosum in congenitalblindness. PLoS ONE 9:e107871. doi: 10.1371/journal.pone.0107871
Voss, P., Gougoux, F., Zatorre, R. J., Lassonde, M., and Lepore, F. (2008).Differential occipital responses in early- and late-blind individualsduring a sound-source discrimination task. Neuroimage 40, 746–758. doi:10.1016/j.neuroimage.2007.12.020
Wan, C. Y., Wood, A. G., Reutens, D. C., and Wilson, S. J. (2010). Early butnot late-blindness leads to enhanced auditory perception. Neuropsychologia 48,344–348. doi: 10.1016/j.neuropsychologia.2009.08.016
Wang, D., Qin, W., Liu, Y., Zhang, Y., Jiang, T., and Yu, C. (2013). Alteredresting-state network connectivity in congenital blind.Hum. BrainMapp. 2581,2573–2581. doi: 10.1002/hbm.22350
Wang, K., Jiang, T., Yu, C., Tian, L., Li, J., Liu, Y., et al. (2008). Spontaneous activityassociated with primary visual cortex: a resting-state FMRI study. Cereb. Cortex18, 697–704. doi: 10.1093/cercor/bhm105
Watkins, K. E., Cowey, A., Alexander, I., Filippini, N., Kennedy, J. M., Smith, S.M., et al. (2012). Language networks in anophthalmia: maintained hierarchyof processing in “visual” cortex. Brain 135, 1566–1577. doi: 10.1093/brain/aws067
Whitfield-Gabrieli, S., and Nieto-Castanon, A. (2012). Conn: a functionalconnectivity toolbox for correlated and anticorrelated brain networks. BrainConnect. 2, 125–141. doi: 10.1089/brain.2012.0073
Winstein, C. J., Grafton, S. T., and Pohl, P. S. (1997). Motor task difficulty andbrain activity: investigation of goal- directed reciprocal aiming using positronemission tomography. J. Neurophysiol. 77, 1581–1594.
Wittenberg, G. F.,Werhahn, K. J., Wassermann, E.M., Herscovitch, P., and Cohen,L. G. (2004). Functional connectivity between somatosensory and visual cortexin early blind humans. Eur. J. Neurosci. 20, 1923–1927. doi: 10.1111/j.1460-9568.2004.03630.x
Wong, C. W., Olafsson, V., Tal, O., and Liu, T. T. (2012). Anti-correlatednetworks, global signal regression, and the effects of caffeine in resting-statefunctional MRI. Neuroimage 63, 356–364. doi: 10.1016/j.neuroimage.2012.06.035
Wong, M., Gnanakumaran, V., and Goldreich, D. (2011). Tactile spatial acuityenhancement in blindness: evidence for experience-dependent mechanisms.J. Neurosci. 31, 7028–7037. doi: 10.1523/JNEUROSCI.6461-10.2011
Yu, C., Liu, Y., Li, J., Zhou, Y., Wang, K., Tian, L., et al. (2008). Altered functionalconnectivity of primary visual cortex in early blindness. Hum. Brain Mapp. 29,533–543. doi: 10.1002/hbm.20420
Zanon, M., Busan, P., Monti, F., Pizzolato, G., and Battaglini, P. P. (2010). Corticalconnections between dorsal and ventral visual streams in humans: evidence byTMS/EEG co-registration. Brain Topogr. 22, 307–317. doi: 10.1007/s10548-009-0103-8
Conflict of Interest Statement: The authors declare that the research wasconducted in the absence of any commercial or financial relationships that couldbe construed as a potential conflict of interest.
Copyright © 2015 Heine, Bahri, Cavaliere, Soddu, Laureys, Ptito and Kupers. Thisis an open-access article distributed under the terms of the Creative CommonsAttribution License (CC BY). The use, distribution or reproduction in other forumsis permitted, provided the original author(s) or licensor are credited and that theoriginal publication in this journal is cited, in accordance with accepted academicpractice. No use, distribution or reproduction is permitted which does not complywith these terms.
Frontiers in Neuroanatomy | www.frontiersin.org 13 July 2015 | Volume 9 | Article 86
228 Appendix J. Paper X

GENERAL COMMENTARYpublished: 13 August 2015
doi: 10.3389/fnana.2015.00106
Frontiers in Neuroanatomy | www.frontiersin.org 1 August 2015 | Volume 9 | Article 106
Edited and reviewed by:
James A. Bourne,
Australian Regenerative Medicine
Institute, Australia
*Correspondence:
Ron Kupers,
Received: 21 July 2015
Accepted: 23 July 2015
Published: 13 August 2015
Citation:
Heine L, Bahri MA, Cavaliere C,
Soddu A, Reislev NL, Laureys S,
PtitoM and Kupers R (2015)
Corrigendum: Prevalence of increases
in functional connectivity in visual,
somatosensory and language areas in
congenital blindness.
Front. Neuroanat. 9:106.
doi: 10.3389/fnana.2015.00106
Corrigendum: Prevalence ofincreases in functional connectivity invisual, somatosensory and languageareas in congenital blindness
Lizette Heine 1, Mohammed A. Bahri 2, Carlo Cavaliere 1, 3, Andrea Soddu4,Nina L. Reislev 5, Steven Laureys 1, Maurice Ptito 6, 7, 8 and Ron Kupers 6, 7*
1 Coma Science Group, Cyclotron Research Center and Neurology Department, University and University Hospital of Liège,
Liège, Belgium, 2 Cyclotron Research Center, University of Liège, Liège, Belgium, 3 SDN Istituto di Ricerca Diagnostica e
Nucleare, Naples, Italy, 4 Physics and Astronomy Department, Brain and Mind Institute, Western University, London, ON,
Canada, 5 Danish Research Centre for Magnetic Resonance, Centre for Functional and Diagnostic Imaging and Research,
Copenhagen University Hospital, Hvidovre, Denmark, 6 Harland Sanders Chair, School of Optometry, University of Montreal,
Montreal, QC, Canada, 7 Brain Research and Integrative Neuroscience Laboratory, Department of Neuroscience and
Pharmacology, University of Copenhagen, Copenhagen, Denmark, 8 Laboratory of Neuropsychiatry, Psychiatric Centre
Copenhagen and Department of Neuroscience and Pharmacology, University of Copenhagen, Copenhagen, Denmark
Keywords: congenitally blind, functional connectivity, Seed-based analysis, Vision, Resting-state fMRI
A corrigendum on
Prevalence of increases in functional connectivity in visual, somatosensory and language areasin congenital blindnessby Heine, L., Bahri, M. A., Cavaliere, C., Soddu, A., Reislev, N. L., Laureys, S., et al. (2015) Front.Neuroanat. 9:86. doi: 10.3389/fnana.2015.00086
The list of authors in the original article has beenmodified to include Nina L. Reislev and affiliationshave been modified accordingly. Dr. Reislev was originally listed in the Acknowledgment section,and has now been added to the list of authors. The Acknowledgment section in the original articlehas been updated.
Author contributions: RK and MP designed the study. NR recruited participants, collectedpsychometric and brain imaging data. LH, MB, CC, and AS analyzed the rsfMRI data. LH, RK,and MP wrote the manuscript. SL and AS edited the manuscript and provided scientific expertise.
All the other files remain unchanged. This error does not change the scientific conclusions ofthe article in any way.
The original article has been updated.
Conflict of Interest Statement: The authors declare that the research was conducted in the absence of any commercial orfinancial relationships that could be construed as a potential conflict of interest.
Copyright © 2015 Heine, Bahri, Cavaliere, Soddu, Reislev, Laureys, Ptito and Kupers. This is an open-access article distributedunder the terms of the Creative Commons Attribution License (CC BY). The use, distribution or reproduction in other forumsis permitted, provided the original author(s) or licensor are credited and that the original publication in this journal is cited, inaccordance with accepted academic practice. No use, distribution or reproduction is permitted which does not comply with theseterms.
229

230 Appendix J. Paper X

References
[1] J. B. Posner, et al. (2007). Plum and Posner’s diagnosis of stupor and coma.
[2] L. Heine, et al. (2015). Consciousness: And Disorders of Consciousness, volume 3. Elsevier Inc.
[3] S. Laureys, et al. (2005). Residual cognitive function in comatose, vegetative and minimally consciousstates. Current opinion in neurology, 18 (6): 726–33.
[4] S. Laureys, et al. (2010). Unresponsive wakefulness syndrome: a new name for the vegetative state orapallic syndrome. BMC medicine, 8 (1): 68.
[5] D. B. Fischer, et al. (2015). What is a reflex ? A guide for understanding disorders of consciousness.American Academy of Neurology, pages 1–6.
[6] The Multi-Society Task Force on PVS (1994). Medical aspects of the persistent vegetative state (1). NewEngland Journal of Medicine, 330 (21): 1572–1579.
[7] A. Estraneo, et al. (2010). Late recovery after traumatic, anoxic, or hemorrhagic long-lasting vegetativestate. Neurology, 75 (3): 239–45.
[8] J. Giacino, et al. (2002). The minimally conscious state: definition and diagnostic criteria. Neurology, 58(3): 349.
[9] M. Boly, et al. (2008). Perception of pain in the minimally conscious state with PET activation: an obser-vational study. Lancet Neurology, 7 (11): 1013–20.
[10] M. A. Bruno, et al. (2011). From unresponsive wakefulness to minimally conscious PLUS and functionallocked-in syndromes: Recent advances in our understanding of disorders of consciousness. Journal ofNeurology, 258 (7): 1373–1384.
[11] M. A. Bruno, et al. (2012). Functional neuroanatomy underlying the clinical subcategorization of minimallyconscious state patients. Journal of Neurology, 259 (6): 1087–1098.
[12] J. T. Giacino, et al. (2002). The minimally conscious state : Definition and diagnostic criteria. neurology,58: 349–353.
[13] American Congress of Rehabilitation, et al. (1995). Recommendations for use of uniform nomenclaturepertinent to patients with severe alterations of consciousness. Arch Phys Med Rehabil, 76 (February):205–9.
[14] E. F. Wijdicks (2001). The diagnosis of brain death. The New England journal of medicine, 344 (16):1215–21.
[15] J. Luaute, et al. (2010). Long-term outcomes of chronic minimally conscious and vegetative states. Neu-rology, 75 (3): 246–52.
231

232 References
[16] J. Giacino, et al. (1997). The vegetative and minimally conscious states: a comparison of clinical featuresand functional outcome. The Journal of Head Trauma Rehabilitation.
[17] N. D. Schiff, et al. (2007). Behavioural improvements with thalamic stimulation after severe traumatic braininjury. Nature, 448 (7153): 600–3.
[18] A. Thibaut, et al. (2014). tDCS in patients with disorders of consciousness. Neurology, 82: 1–7.
[19] E. Racine, et al. (2010). Observations on the ethical and social aspects of disorders of consciousness.The Canadian journal of neurological sciences, 37 (6): 758–68.
[20] S. Wannez, et al. Repeated behavioral assessments with the Coma Recovery Scale-Revised in patientswith disorders of consciousness.
[21] C. Schnakers, et al. (2009). Diagnostic accuracy of the vegetative and minimally conscious state: Clinicalconsensus versus standardized neurobehavioral assessment. BMC neurology, 9 (1): 35.
[22] L. Heine, et al. (2016). behavioral responsiveness in patients with disorders of cosnciousness. In M. Monti,et al., editors, Brain Function and Responsiveness in Disorders of Consciousness, chapter Behavioral,pages 25—-36. Springer International Publishing.
[23] N. Childs, et al. (1993). Accuracy of diagnosis of persistent vegetative state. Neurology, 43 (8): 1465–7.
[24] K. Andrews, et al. (1996). Misdiagnosis of the vegetative state: retrospective study in a rehabilitation unit.BMJ (Clinical research ed.), 313 (JuLY): 13–16.
[25] W. S. van Erp, et al. (2015). The Vegetative State: Prevalence, Misdiagnosis, and Treatment Limitations.Journal of the American Medical Directors Association, 16 (1): 85.e9–85.e14.
[26] J. T. Giacino, et al. (2004). The JFK Coma Recovery Scale-Revised: Measurement characteristics anddiagnostic utility. Archives of Physical Medicine and Rehabilitation, 85 (12): 2020–2029.
[27] R. T. Seel, et al. (2010). Assessment scales for disorders of consciousness: Evidence-based recom-mendations for clinical practice and research. Archives of Physical Medicine and Rehabilitation, 91 (12):1795–1813.
[28] A. Vanhaudenhuyse, et al. (2008). Assessment of visual pursuit in post-comatose states: use a mirror.Journal of neurology, neurosurgery, and psychiatry, 79 (2): 223.
[29] H. Di, et al. (2014). Assessment of visual fixation in vegetative and minimally conscious states. BMCneurology, 14 (1): 147.
[30] L. Cheng, et al. (2013). Assessment of localisation to auditory stimulation in post-comatose states: usethe patient’s own name. BMC neurology, 13: 27.
[31] C. Chatelle, et al. (2016). Detection and interpretation of impossible and improbable Coma RecoveryScale-Revised scores. Archives of Physical Medicine and Rehabilitation.
[32] J. Stender, et al. (2014). Diagnostic precision of PET imaging and functional MRI in disorders of con-sciousness: a clinical validation study. Lancet, 384 (14): 514–522.
[33] C. Koch, et al. (2016). The neural correlates of consciousness: progress and problems. Nature ReviewsNeuroscience, in press (5): 307–321.
[34] D. Fernández-Espejo, et al. (2013). Detecting awareness after severe brain injury. Nature reviews. Neu-roscience, 14 (11): 801–9.

References 233
[35] S. Laureys, et al. (2012). Coma and consciousness: Paradigms (re)framed by neuroimaging. NeuroIm-age, 61 (2): 478–491.
[36] L. Naci, et al. (2013). The Brain’s Silent Messenger: Using Selective Attention to Decode Human Thoughtfor Brain-Based Communication. Journal of Neuroscience, 33 (22): 9385–9393.
[37] R. D. Sanders, et al. (2012). Unresponsiveness not equal unconsciousness. Anesthesiology, 116 (4):946–959.
[38] A. Soddu, et al. (2011). Resting state activity in patients with disorders of consciousness. Functionalneurology, 26 (1): 37–43.
[39] M. Boly, et al. (2007). When thoughts become action: an fMRI paradigm to study volitional brain activityin non-communicative brain injured patients. NeuroImage, 36 (3): 979–92.
[40] L. Heine, et al. (2015). Exploration of functional connectivity during preferred music stimulation in patientswith disorders of consciousness. Frontiers in psychology, 6: 1704.
[41] L. Heine, et al. (2012). Resting state networks and consciousness. Alterations of multiple resting statenetwork connectivity in physiological, pharmacological and pathological consciousness states. Frontiersin Psychology, 3: 295.
[42] C. Phillips, et al. (2011). "Relevance vector machine" consciousness classifier applied to cerebralmetabolism of vegetative and locked-in patients. NeuroImage, 56 (2): 797–808.
[43] J. Rudolf, et al. (1999). Cerebral glucose metabolism in acute and persistent vegetative state. Journal ofneurosurgical anesthesiology, 11 (1): 17–24.
[44] C. Tommasino, et al. (1995). Regional cerebral metabolism of glucose in comatose and vegetative statepatients. Journal of neurosurgical anesthesiology, 7 (2): 109–16.
[45] S. Laureys, et al. (2000). PET scanning and neuronal loss in acute vegetative state. Lancet, 355 (9217):1825–1826.
[46] N. Nakayama, et al. (2006). Relationship between regional cerebral metabolism and consciousnessdisturbance in traumatic diffuse brain injury without large focal lesions: an FDG-PET study with statisticalparametric mapping analysis. Journal of neurology, neurosurgery, and psychiatry, 77 (7): 856–62.
[47] A. Vanhaudenhuyse, et al. (2010). Default network connectivity reflects the level of consciousness innon-communicative brain-damaged patients. Brain, 133 (1): 161–171.
[48] A. Thibaut, et al. (2012). Metabolic activity in external and internal awareness networks in severely brain-damaged patients. Journal of Rehabilitation Medicine, 44: 481–516.
[49] J. Stender, et al. (2015). Quantitative rates of brain glucose metabolism distinguish minimally consciousfrom vegetative state patients. Journal of cerebral blood flow and metabolism, 35 (1): 58–65.
[50] E. Fridman, et al. (2014). Regional cerebral metabolic patterns demonstrate the role of anterior forebrainmesocircuit dysfunction in the severely injured brain. Proceedings of the National Academy of Sciencesof the United States of America, 111 (17): 6473–8.
[51] D. R. Rutgers, et al. (2008). Diffusion tensor imaging characteristics of the corpus callosum in mild,moderate, and severe traumatic brain injury. American Journal of Neuroradiology, 29 (9): 1730–1735.
[52] N. Nakayama, et al. (2006). Evidence for white matter disruption in traumatic brain injury without macro-scopic lesions. Journal of neurology, neurosurgery, and psychiatry, 77 (7): 850–855.

234 References
[53] D. Galanaud, et al. (2012). Assessment of White Matter Injury and Outcome in Severe Brain Trauma: AProspective Multicenter Cohort. Anesthesiology, 117 (6): 1300–10.
[54] V. Newcombe, et al. (2011). Mapping traumatic axonal injury using diffusion tensor imaging: Correlationswith functional outcome. PloS one, 6 (5).
[55] M. F. Kraus, et al. (2007). White matter integrity and cognition in chronic traumatic brain injury: a diffusiontensor imaging study. Brain, 130 (Pt 10): 2508–19.
[56] D. Fernández-Espejo, et al. (2012). A role for the default mode network in the bases of disorders ofconsciousness. Annals of Neurology, 72 (3): 335–343.
[57] N. Lant, et al. (2015). Relationship between the anterior forebrain mesocircuit and the default modenetwork in the structural bases of disorders of consciousness. NeuroImage: Clinical.
[58] M. M. Monti, et al. (2010). Willful modulation of brain activity in disorders of consciousness. New EnglandJournal of Medicine, 362 (7): 579–589.
[59] A. Owen, et al. (2006). Detecting awareness in the vegetative state. Science, 313 (5792): 1402.
[60] D. R. Moreno, et al. (2010). A network approach to assessing cognition in disorders of consciousness.Neurology, 75: 1871–1878.
[61] T. A. Bekinschtein, et al. (2011). Functional imaging reveals movement preparatory activity in the vegeta-tive state. Frontiers in human neuroscience, 5 (January): 5.
[62] L. Naci, et al. (2013). Making Every Word Count for Nonresponsive Patients. JAMA neurology, 70 (10):1235–1241.
[63] B. Sorger, et al. (2009). Another kind of [] BOLD Response’: answering multiple-choice questions viaonline decoded single-trial brain signals. Progress in brain research, 177 (0): 275–292.
[64] B. Sorger, et al. (2012). A real-time fMRI-based spelling device immediately enabling robust motor-independent communication. Current biology, 22 (14): 1333–8.
[65] B. Biswal, et al. (1995). Functional connectivity in the motor cortex of resting human brain using echo-planar MRI. Magnetic Resonance in Medicine, 34 (4): 537–41.
[66] J. S. Damoiseaux, et al. (2006). Consistent resting-state networks across healthy subjects. Proceedingsof the National Academy of Sciences of the United States of America, 103 (37): 13848–53.
[67] S. M. Smith, et al. (2009). Correspondence of the brain’s functional architecture during activation and rest.Proceedings of the National Academy of Sciences of the United States of America, 106 (31): 13040–13045.
[68] C. Di Perri, et al. (2013). Limbic hyperconnectivity in the Vegetative State. Neurology, in press (16):1417–1424.
[69] Y. Hannawi, et al. (2015). Resting brain activity in disorders of consciousness: a systematic review andmeta-analysis. Neurology, 84 (12): 1272–1280.
[70] O. Gosseries, et al. (2011). Automated EEG entropy measurements in coma , vegetative state / unre-sponsive wakefulness. Functional, 26 (1): 1–6.
[71] E. Landsness, et al. (2011). Electrophysiological correlates of behavioural changes in vigilance in vege-tative state and minimally conscious state. Brain, 134 (Pt 8): 2222–32.

References 235
[72] V. Cologan, et al. (2013). Sleep in the unresponsive wakefulness syndrome and minimally consciousstate. Journal of neurotrauma, 30 (5): 339–46.
[73] J. Lechinger, et al. (2013). CRS-R score in disorders of consciousness is strongly related to spectral EEGat rest. Journal of Neurology.
[74] D. Marinazzo, et al. (2014). Directed Information Transfer in Scalp Electroencephalographic Recordings:Insights on Disorders of Consciousness. Clinical EEG and Neuroscience, 45 (1): 33–39.
[75] C. Schnakers, et al. (2008). Voluntary brain processing in disorders of consciousness. Neurology, 71(20): 1614–20.
[76] D. Cruse, et al. (2011). Bedside detection of awareness in the vegetative state: a cohort study. Lancet,378 (9809): 2088–94.
[77] M. Rosanova, et al. (2012). Recovery of cortical effective connectivity and recovery of consciousness invegetative patients. Brain.
[78] M. E. Raichle, et al. (2001). A default mode of brain function. Proceedings of the National Academy ofSciences of the United States of America, 98 (2): 676.
[79] G. Shulman, et al. (1997). Common Blood Flow Changes across Visual Tasks: II. Decreases in CerebralCortex. Journal of Cognitive Neuroscience, 9 (5): 648–663.
[80] B. Mazoyer, et al. (2001). Cortical networks for working memory and executive functions sustain theconscious resting state in man. Brain Research Bulletin, 54 (3): 287–298.
[81] M. D. Greicius, et al. (2003). Functional connectivity in the resting brain: a network analysis of the defaultmode hypothesis. Proceedings of the National Academy of Sciences of the United States of America,100 (1): 253.
[82] E. Florin, et al. (2015). The brain’s resting-state activity is shaped by synchronized cross-frequencycoupling of neural oscillations. NeuroImage, 111: 26–35.
[83] M. D. Greicius, et al. (2009). Resting-state functional connectivity reflects structural connectivity in thedefault mode network. Cerebral Cortex, 19 (1): 72–8.
[84] M. P. Van Den Heuvel, et al. (2009). Functionally linked resting-state networks reflect the underlyingstructural connectivity architecture of the human brain. Human Brain Mapping, 30 (10): 3127–3141.
[85] P. Hagmann, et al. (2008). Mapping the structural core of human cerebral cortex. PLoS Biology, 6 (7):1479–1493.
[86] M. P. van den Heuvel, et al. (2011). Rich-Club Organization of the Human Connectome. Journal ofNeuroscience, 31 (44): 15775–15786.
[87] D. Cordes, et al. (2001). Frequencies contributing to functional connectivity in the cerebral cortex in"resting-state" data. American journal of neuroradiology, 22 (7): 1326–33.
[88] M. De Luca, et al. (2006). fMRI resting state networks define distinct modes of long-distance interactionsin the human brain. NeuroImage, 29 (4): 1359–67.
[89] K. a. McKiernan, et al. (2006). Interrupting the "stream of consciousness": an fMRI investigation. Neu-roImage, 29 (4): 1185–91.
[90] M. F. Mason, et al. (2007). Wandering minds: the default network and stimulus-independent thought.Science, 315 (5810): 393–5.

236 References
[91] L. Schilbach, et al. (2008). Minds at rest? Social cognition as the default mode of cognizing and itsputative relationship to the "default system" of the brain. Consciousness and cognition, 17 (2): 457–67.
[92] I. I. Goldberg, et al. (2006). When the brain loses its self: prefrontal inactivation during sensorimotorprocessing. Neuron, 50 (2): 329–39.
[93] H. C. Lou, et al. (2004). Parietal cortex and representation of the mental Self. Proceedings of the NationalAcademy of Sciences of the United States of America, 101 (17): 6827–32.
[94] M. E. Raichle (2015). The Brain’s Default Mode Network. Annual review of neuroscience, (April): 413–427.
[95] F. Cauda, et al. (2009). Disrupted intrinsic functional connectivity in the vegetative state. Journal ofneurology, neurosurgery, and psychiatry, 80 (4): 429–31.
[96] A. Soddu, et al. (2012). Identifying the default-mode component in spatial IC analyses of patients withdisorders of consciousness. Human brain mapping, 33 (4): 778–96.
[97] D. Fernández-Espejo, et al. (2011). Diffusion weighted imaging distinguishes the vegetative state fromthe minimally conscious state. NeuroImage, 54 (1): 103–12.
[98] F. Gómez, et al. (2012). DTI based structural damage characterization for Disorders of Consciousness.In 2012 19th IEEE International Conference on Image Processing, volume 2, pages 1257–1260. IEEE.
[99] C. Rosazza, et al. (2016). Multimodal study of default-mode network integrity in disorders of conscious-ness. Annals of Neurology, pages In press (published online March 11, 2016).
[100] S. Silva, et al. (2015). Disruption of posteromedial large-scale neural communication predicts recoveryfrom coma. Neurology, 85 (23): 2036–2044.
[101] M. D. Fox, et al. (2005). The human brain is intrinsically organized into dynamic, anticorrelated functionalnetworks. Proceedings of the National Academy of Sciences of the United States of America, 102 (27):9673.
[102] P. Fransson (2005). Spontaneous low-frequency BOLD signal fluctuations: an fMRI investigation of theresting-state default mode of brain function hypothesis. Human Brain Mapping, 26 (1): 15–29.
[103] M. Boly, et al. (2007). Baseline brain activity fluctuations predict somatosensory perception in humans.Proceedings of the National Academy of Sciences of the United States of America, 104 (29): 12187–92.
[104] S. Dehaene, et al. (2005). Ongoing spontaneous activity controls access to consciousness: a neuronalmodel for inattentional blindness. PLoS biology, 3 (5): e141.
[105] M. Brunetti, et al. (2008). A frontoparietal network for spatial attention reorienting in the auditory domain:a human fMRI/MEG study of functional and temporal dynamics. Cerebral Cortex, 18 (5): 1139–47.
[106] L. Tian, et al. (2007). The relationship within and between the extrinsic and intrinsic systems indicated byresting state correlational patterns of sensory cortices. NeuroImage, 36 (3): 684–90.
[107] M. D. Fox, et al. (2007). Spontaneous fluctuations in brain activity observed with functional magneticresonance imaging. Nature Reviews Neuroscience, 8 (9): 700–11.
[108] A. Sapir, et al. (2005). Brain signals for spatial attention predict performance in a motion discriminationtask. Proceedings of the National Academy of Sciences of the United States of America, 102 (49):17810–5.
[109] D. H. Weissman, et al. (2006). The neural bases of momentary lapses in attention. Nature neuroscience,9 (7): 971–8.

References 237
[110] A. Demertzi, et al. (2011). Hypnotic modulation of resting state fMRI default mode and extrinsic networkconnectivity. Progress in brain research, 193: 309–322.
[111] K. Murphy, et al. (2009). The impact of global signal regression on resting state correlations: Are anti-correlated networks introduced? NeuroImage, 44 (3): 893–905.
[112] X. Chai, et al. (2012). Anticorrelations in resting state networks without global signal regression. Neu-roimage, 59 (2): 1420–1428.
[113] C. J. Keller, et al. (2013). Neurophysiological investigation of spontaneous correlated and anticorrelatedfluctuations of the BOLD signal. The Journal of neuroscience, 33 (15): 6333–42.
[114] J. D. Power, et al. (2014). Methods to detect, characterize, and remove motion artifact in resting statefMRI. NeuroImage, 29: 997–1003.
[115] P. Boveroux, et al. (2010). Breakdown of within- and between-network Resting State during Propofol-induced Loss of Consciousness. Anesthesiology, (5).
[116] P. G. Sämann, et al. (2011). Development of the Brain’s Default Mode Network from Wakefulness to SlowWave Sleep. Cerebral Cortex, (September).
[117] M. Boly, et al. (2009). Functional connectivity in the default network during resting state is preserved in avegetative but not in a brain dead patient. Human Brain Mapping, 30 (8): 2393–2400.
[118] C. Di Perri, et al. (2016). The neural correlates of consciousness in patients who have emerged fromminimally conscious state: a multimodal imaging study. Lancet Neurology, 4422 (16): in press.
[119] A. De Volder, et al. (1997). Brain energy metabolism in early blind subjects: neural activity in the visualcortex. Brain research, 750 (1-2): 235–44.
[120] S. Laureys, et al. (1999). Impaired effective cortical connectivity in vegetative state: preliminary investi-gation using PET. NeuroImage, 9 (4): 377–82.
[121] S. Laureys, et al. (2004). Brain function in coma, vegetative state, and related disorders. The LancetNeurology, 3 (3): 537–46.
[122] N. D. N. Schiff (2010). Recovery of consciousness after brain injury: a mesocircuit hypothesis. Trends inneurosciences, 33 (1): 1–9.
[123] R. Desikan, et al. (2006). An automated labeling system for subdividing the human cerebral cortex onMRI scans into gyral based regions of interest. NeuroImage, 31 (3): 968–980.
[124] O. Rousset, et al. (2007). Partial Volume Correction Strategies in PET. PET Clinics, 2 (2): 235–249.
[125] T. Nakashima, et al. (2007). Focal brain glucose hypometabolism in patients with neuropsychologicdeficits after diffuse axonal injury. American Journal of Neuroradiology, 28 (2): 236–242.
[126] I. Yakushev, et al. (2013). Metabolic and structural connectivity within the default mode network relates toworking memory performance in young healthy adults. NeuroImage, 79: 184–190.
[127] B. Kuczynski, et al. (2010). White matter integrity and cortical metabolic associations in aging and de-mentia. Alzheimers Dementia, 6 (1): 1–17.
[128] A. C. Bozoki, et al. (2012). Disruption of limbic white matter pathways in mild cognitive impairment andAlzheimer’s disease: A DTI/FDG-PET Study. Human Brain Mapping, 33 (8): 1792–1802.

238 References
[129] I. Yakushev, et al. (2011). Functional implications of hippocampal degeneration in early Alzheimer’s dis-ease: A combined DTI and PET study. European Journal of Nuclear Medicine and Molecular Imaging,38 (12): 2219–2227.
[130] J.-W. Jeong, et al. (2014). Assessment of brain damage and plasticity in the visual system due to earlyoccipital lesion: Comparison of FDG-PET with diffusion MRI tractography. Journal of magnetic resonanceimaging, 00.
[131] K. Inoue, et al. (2008). Decrease in glucose metabolism in frontal cortex associated with deterioration ofmicrostructure of corpus callosum measured by diffusion tensor imaging in healthy elderly. Human BrainMapping, 29 (4): 375–384.
[132] P. S. Chandra, et al. (2006). FDG-PET/MRI coregistration and diffusion-tensor imaging distinguish epilep-togenic tubers and cortex in patients with tuberous sclerosis complex: A preliminary report. Epilepsia, 47(9): 1543–1549.
[133] R. Kumar, et al. (2009). Serial Changes in the White Matter Diffusion Tensor Imaging Metrics in ModerateTraumatic Brain Injury and Correlation with Neuro-Cognitive Function. 495 (April): 481–495.
[134] C. Luyt, et al. (2012). Diffusion Tensor Imaging to Predict Long-term Outcome after Cardiac Arrest.Anesthesiology, 117 (6): 1–3.
[135] M. a. Warner, et al. (2010). Regionally selective atrophy after traumatic axonal injury. Archives of neurol-ogy, 67 (11): 1336–1344.
[136] V. Bonnelle, et al. (2011). Default Mode Network Connectivity Predicts Sustained Attention Deficits afterTraumatic Brain Injury. Journal of Neuroscience, 31 (38): 13442–13451.
[137] M. L. Seghier, et al. (2010). Identifying abnormal connectivity in patients using dynamic causal modelingof FMRI responses. Frontiers in systems neuroscience, 4 (August): 1–14.
[138] C. F. Beckmann, et al. (2005). Investigations into resting-state connectivity using independent componentanalysis. Philosophical transactions of the Royal Society of London. Series B, Biological sciences, 360(1457): 1001–1013.
[139] S. G. Horovitz, et al. (2009). Decoupling of the brain’s default mode network during deep sleep. Proceed-ings of the National Academy of Sciences of the United States of America, 106 (27): 11376–81.
[140] J. Schrouff, et al. (2011). Brain functional integration decreases during propofol-induced loss of con-sciousness. NeuroImage, 57 (1): 198–205.
[141] R. Martuzzi, et al. (2010). Functional connectivity and alterations in baseline brain state in humans.Neuroimage, 49 (1): 823–834.
[142] W. J. McGeown, et al. (2009). Hypnotic induction decreases anterior default mode activity. Consciousnessand cognition, 18 (4): 848–55.
[143] S. G. Horovitz, et al. (2008). Low frequency BOLD fluctuations during resting wakefulness and light sleep:a simultaneous EEG-fMRI study. Human brain mapping, 29 (6): 671–82.
[144] L. J. Larson-Prior, et al. (2009). Cortical network functional connectivity in the descent to sleep. Proceed-ings of the National Academy of Sciences of the United States of America, 106 (11): 4489–94.
[145] M. D. Greicius, et al. (2008). Persistent Default-Mode Network Connectivity During Light Sedation. Humanbrain mapping, 29 (7): 839–847.

References 239
[146] E. Stamatakis, et al. (2010). Changes in resting neural connectivity during propofol sedation. PloS one,5 (12): e14224.
[147] A. Laird, et al. (2011). Behavioral interpretations of intrinsic connectivity networks. Journal of CognitiveNeuroscience, 17 (Early Access): 1–16.
[148] S. Dehaene, et al. (2003). Neural mechanisms for access to consciousness. The cognitive neurosciencesIII.
[149] W. W. Seeley, et al. (2007). Dissociable intrinsic connectivity networks for salience processing and exec-utive control. The Journal of neuroscience, 27 (9): 2349–56.
[150] M. W. Cole, et al. (2007). The cognitive control network: Integrated cortical regions with dissociablefunctions. NeuroImage, 37 (1): 343–60.
[151] K. L. Roberts, et al. (2008). Examining a supramodal network for conflict processing: a systematicreview and novel functional magnetic resonance imaging data for related visual and auditory stroop tasks.Journal of Cognitive Neuroscience, 20 (6): 1063–78.
[152] V. Menon, et al. (2010). Saliency, switching, attention and control: a network model of insula function.Brain structure & function, 214 (5-6): 655–67.
[153] P. Guldenmund, et al. (2013). Thalamus, brainstem and salience network connectivity changes duringmild propofol sedation and unconsciousness. Brain connectivity, 3 (3).
[154] M. D. Greicius (2008). Resting-state functional connectivity in neuropsychiatric disorders. Current opinionin neurology, 21 (4): 424–30.
[155] E. Allen, et al. (2011). A baseline for the multivariate comparison of resting-state networks. Frontiers insystems neuroscience, 5 (February): 2.
[156] V. Kiviniemi, et al. (2005). Midazolam sedation increases fluctuation and synchrony of the resting brainBOLD signal. Magnetic Resonance Imaging, 23 (4): 531–7.
[157] M. Fukunaga, et al. (2006). Large-amplitude, spatially correlated fluctuations in BOLD fMRI signals duringextended rest and early sleep stages. Magnetic Resonance Imaging, 24 (8): 979–92.
[158] M. D. Fox, et al. (2009). The global signal and observed anticorrelated resting state brain networks.Journal of neurophysiology, 101 (6): 3270–83.
[159] Y. Behzadi, et al. (2007). A Component Based Noise Correction Method (CompCor) for BOLD and Perfu-sion Based fMRI. Neuroimage, 37 (1): 90–101.
[160] Z. S. Saad, et al. (2012). Trouble at rest: how correlation patterns and group differences become distortedafter global signal regression. Brain connectivity, 2 (1): 25–32.
[161] C. W. Wong, et al. (2012). Anti-correlated Networks, Global Signal Regression, and the Effects of Caffeinein Resting-State Functional MRI. NeuroImage, 63 (1): 356–364.
[162] M. N. Hallquist, et al. (2013). The nuisance of nuisance regression: Spectral misspecification in a commonapproach to resting-state fMRI preprocessing reintroduces noise and obscures functional connectivity.NeuroImage, 82: 208–25.
[163] S. Whitfield-Gabrieli, et al. (2012). Conn: a functional connectivity toolbox for correlated and anticorrelatedbrain networks. Brain connectivity, 2 (3): 125–41.

240 References
[164] A. Andronache, et al. (2013). Impact of functional MRI data preprocessing pipeline on default-mode net-work detectability in patients with disorders of consciousness. Frontiers in neuroinformatics, 7 (August):16.
[165] D. M. Cole, et al. (2010). Advances and pitfalls in the analysis and interpretation of resting-state FMRIdata. Frontiers in systems neuroscience, 4.
[166] S. M. Smith, et al. (2011). Network modelling methods for FMRI. NeuroImage, 54 (2): 875–891.
[167] M. P. van den Heuvel, et al. (2010). Exploring the brain network: A review on resting-state fMRI functionalconnectivity. European Neuropsychopharmacology, 20: 519–534.
[168] C. Beckmann, et al. (2004). Probabilistic Independent Component Analysis for Functional Magnetic Res-onance Imaging. IEEE Transactions on Medical Imaging, 23 (2): 137–152.
[169] J. Tohka, et al. (2008). Automatic independent component labeling for artifact removal in fMRI. Neuroim-age, 39 (3): 1227–1245.
[170] F. De Martino, et al. (2007). Classification of fMRI independent components using IC-fingerprints andsupport vector machine classifiers. NeuroImage, 34 (1): 177–94.
[171] Q.-H. Zou, et al. (2008). An improved approach to detection of amplitude of low-frequency fluctuation(ALFF) for resting-state fMRI: fractional ALFF. Journal of neuroscience methods, 172 (1): 137–41.
[172] E. Bullmore, et al. (2009). Complex brain networks: graph theoretical analysis of structural and functionalsystems. Nature reviews. Neuroscience, 10 (3): 186–98.
[173] A. Zalesky, et al. (2012). On the use of correlation as a measure of network connectivity. NeuroImage,60 (4): 2096–106.
[174] R. Liégeois, et al. (2014). Cerebral functional connectivity periodically (de)synchronizes with anatomicalconstraints. Arxiv preprint, page 11.
[175] A. Casali, et al. (2013). A Theoretically Based Index of Consciousness Independent of Sensory Process-ing and Behavior. Science translational medicine, 5 (198).
[176] J. Sitt, et al. (2014). Large scale screening of neural signatures of consciousness in patients in a vegeta-tive or minimally conscious state. Brain, 137 (Pt 8): 2258–70.
[177] M. Boly, et al. (2008). Intrinsic brain activity in altered states of consciousness: how conscious is thedefault mode of brain function? Annals of the New York Academy of Sciences, 1129: 119–29.
[178] G. Tononi (2008). Consciousness as Integrated Information : a Provisional Manifesto. Biological bulletin,215: 216–242.
[179] F. Yu, et al. (2015). A new case of complete primary cerebellar agenesis: clinical and imaging findings ina living patient. Brain, 138 (Pt 6): e353.
[180] A. Demertzi, et al. (2015). Intrinsic functional connectivity differentiates minimally conscious from unre-sponsive patients. Brain.
[181] L. Norton, et al. (2012). Disruptions of functional connectivity in the default mode network of comatosepatients. Neurology, 78 (3): 175–81.
[182] A. Demertzi, et al. (2014). Multiple fMRI system-level baseline connectivity is disrupted in patients withconsciousness alterations. Cortex, 52: 35–46.

References 241
[183] K. Van Dijk, et al. (2010). Intrinsic functional connectivity as a tool for human connectomics: theory,properties, and optimization. Journal of neurophysiology, 103 (1): 297–321.
[184] S. Majerus, et al. (2005). Behavioral evaluation of consciousness in severe brain damage. Progress inbrain research, 150: 397–413.
[185] A. Laird, et al. (2009). Investigating the functional heterogeneity of the default mode network usingcoordinate-based meta-analytic modeling. The Journal of neuroscience, 29 (46): 14496–505.
[186] A. Maudoux, et al. (2012). Auditory resting-state network connectivity in tinnitus: A functional MRI study.PloS one, 7 (5): 1–9.
[187] M. A. Eckert, et al. (2008). A cross-modal system linking primary auditory and visual cortices: evidencefrom intrinsic fMRI connectivity analysis. Human brain mapping, 29 (7): 848–57.
[188] T. A. Bekinschtein, et al. (2009). Neural signature of the conscious processing of auditory regularities.Proceedings of the National Academy of Sciences of the United States of America, 106 (5): 1672–7.
[189] S. CLAVAGNIER, et al. (2004). Long-distance feedback projections to area V1: Implications for mul-tisensory integration, spatial awareness, and visual consciousness. Cognitive, Affective, & BehavioralNeuroscience, 4 (2): 117–126.
[190] A. Engel, et al. (2001). Dynamic predictions: oscillations and synchrony in top-down processing. Naturereviews. Neuroscience, 2 (10): 704–16.
[191] M. Boly, et al. (2011). Preserved Feedforward But Impaired Top-Down Processes in the Vegetative State.Science, 332 (May): 858–62.
[192] D. Fernández-Espejo, et al. (2010). Combination of diffusion tensor and functional magnetic resonanceimaging during recovery from the vegetative state. BMC neurology, 10: 77.
[193] V. Perlbarg, et al. (2009). Relation between brain lesion location and clinical outcome in patients withsevere traumatic brain injury: a diffusion tensor imaging study using voxel-based approaches. Humanbrain mapping, 30 (12): 3924–33.
[194] A. van der Eerden, et al. (2014). White matter changes in comatose survivors of anoxic ischemic en-cephalopathy and traumatic brain injury: comparative diffusion-tensor imaging study. Radiology, 270 (2):506–16.
[195] E. Amico, et al. Structural constraints to information flow within cortical circuits : a TMS / EEG-dMRI study. pages 1–27.
[196] E. Tagliazucchi, et al. (2014). Decoding wakefulness levels from typical fMRI resting-state data revealsreliable drifts between wakefulness and sleep. Neuron, 82 (3): 695–708.
[197] A. M. Owen (2013). Detecting consciousness: a unique role for neuroimaging. Annual review of psychol-ogy, 64 (1): 109–33.
[198] S. Laureys, et al. (2000). Auditory processing in the vegetative state. Brain, 123: 1589–601.
[199] M. Boly, et al. (2004). Auditory Processing in Severely Brain Injured Patients. Differences between theminimally conscious state and the presistent vegetative state. Archives of Neurology, 61 (2): 233–238.
[200] H. Di, et al. (2007). Cerebral response to patient’s own name in the vegetative and minimally consciousstates. Neurology, 68 (12): 895–9.
[201] F. Perrin, et al. (2006). Brain response to one’s own name in vegetative state, minimally conscious state,and locked-in syndrome. Archives of neurology, 63 (4): 562–9.

242 References
[202] W. Staffen, et al. (2006). Selective brain activity in response to one’s own name in the persistent vegetativestate. Journal of neurology, neurosurgery, and psychiatry, 77 (12): 1383–4.
[203] T. A. Bekinschtein, et al. (2004). Emotion processing in the minimally conscious state. Journal of neurol-ogy, neurosurgery, and psychiatry, 75: 177–793.
[204] C. H. Moritz, et al. (2001). Functional MR imaging assessment of a non-responsive brain injured patient.Magnetic Resonance Imaging, 19 (8): 1129–32.
[205] N. D. Schiff, et al. (2005). fMRI reveals large-scale network activation in minimally conscious patients.Neurology, 64 (3): 514–23.
[206] M. M. Monti, et al. (2013). Visual cognition in disorders of consciousness: from V1 to top-down attention.Human brain mapping, 34 (6): 1245–53.
[207] P. Janata (2009). The neural architecture of music-evoked autobiographical memories. Cerebral Cortex,19 (11): 2579–94.
[208] T. A. Bekinschtein, et al. (2005). Assessing level of consciousness and cognitive changes from vegetativestate to full recovery. Neuropsychological rehabilitation, 15 (3-4): 307–322.
[209] A. Owen, et al. (2005). Residual auditory function in persistent vegetative state: a combined PET andfMRI study. Neuropsychological rehabilitation, 15 (3-4): 290–306.
[210] B. J. Ansell, et al. (1989). The Western Neuro Sensory Stimulation Profile: a tool for assessing slow-to-recover head-injured patients. Archives of physical medicine and rehabilitation, 70 (2): 104–8.
[211] H. Gill-Thwaites, et al. (2004). The Sensory Modality Assessment and Rehabilitation Technique (SMART):a valid and reliable assessment for vegetative state and minimally conscious state patients. Brain Injury,18 (12): 1255–69.
[212] T. L.-B. Pape, et al. (2005). A measure of neurobehavioral functioning after coma. Part II: Clinical andscientific implementation. Journal of rehabilitation research and development, 42 (1): 19–27.
[213] P. N. Juslin (2013). From everyday emotions to aesthetic emotions: towards a unified theory of musicalemotions. Physics of life reviews, 10 (3): 235–66.
[214] E. G. Schellenberg (2006). Exposure to music: The truth about the consequences. In McPherson G,editor, The Child as Musician: A Handbook of Musical Development., pages 111 – 134. Oxford UniversityPress, New York, NY.
[215] S. Koelsch (2009). A neuroscientific perspective on music therapy. Annals of the New York Academy ofSciences, 1169: 374–84.
[216] M. H. Thaut (2010). Neurologic Music Therapy in Cognitive Rehabilitation. Music Perception, 27 (4):281–285.
[217] T. Särkämö, et al. (2008). Music listening enhances cognitive recovery and mood after middle cerebralartery stroke. Brain, 131 (3): 866–876.
[218] T. Särkämö, et al. (2012). Music listening after stroke: beneficial effects and potential neural mechanisms.Annals of the New York Academy of Sciences, 1252: 266–81.
[219] D. Soto, et al. (2009). Pleasant music overcomes the loss of awareness in patients with visual neglect.Proceedings of the National Academy of Sciences of the United States of America, 106 (14).

References 243
[220] L. L. Chlan, et al. (2013). Effects of patient-directed music intervention on anxiety and sedative exposure incritically ill patients receiving mechanical ventilatory support: a randomized clinical trial. JAMA neurology,12 (22): 2335–2344.
[221] W. L. Magee (2005). Music therapy with patients in low awareness states: approaches to assessmentand treatment in multidisciplinary care. Neuropsychological rehabilitation, 15 (3-4): 522–36.
[222] R. Formisano, et al. (2001). Active music therapy in the rehabilitation of severe brain injured patientsduring coma recovery. Annali dell’Istituto superiore di sanità, 37 (4): 627–30.
[223] G. Lancioni, et al. (2010). An overview of intervention options for promoting adaptive behavior of personswith acquired brain injury and minimally conscious state. Research in developmental disabilities, 31 (6):1121–34.
[224] N. Childs, et al. (1996). Misdiagnosing the persistent vegetative state. Misdiagnosis certainly occurs. BMJ(Clinical research ed.), 313 (October): 944.
[225] C. Schnakers, et al. (2008). A French validation study of the Coma Recovery Scale-Revised (CRS-R).Brain injury, 22 (September): 786–792.
[226] J. T. Giacino, et al. (1991). Monitoring rate of recovery to predict outcome in minimally responsive patients.Archives of Physical Medicine and Rehabilitation, 72 (11): 897–901.
[227] A. Candelieri, et al. (2011). Visual pursuit: within-day variability in the severe disorder of consciousness.Journal of neurotrauma, 28 (10): 2013–7.
[228] G. Dolce, et al. (2011). Visual pursuit in the severe disorder of consciousness. Journal of neurotrauma,28 (7): 1149–54.
[229] G. M. Teasdale, et al. (1998). Analyzing outcome of treatment of severe head injury: a review and updateon advancing the use of the Glasgow Outcome Scale. Journal of neurotrauma, 15 (8): 587–97.
[230] C. Barsics, et al. (2011). Recalling episodic information about personally known faces and voices. Con-sciousness and Cognition, 20 (2): 303–308.
[231] F. Perrin, et al. (2015). Promoting the use of personally relevant stimuli for investigating patients withdisorders of consciousness. Frontiers in Psychology, 6 (July): 1–9.
[232] M. Cavinato, et al. (2011). Event-related brain potential modulation in patients with severe brain damage.Clinical Neurophysiology, 122 (4): 719–724.
[233] W. L. Magee, et al. (2014). Music therapy assessment tool for awareness in disorders of consciousness(MATADOC): standardisation of the principal subscale to assess awareness in patients with disorders ofconsciousness. Neuropsychological rehabilitation, 24 (1): 101–24.
[234] J. Verger, et al. (2014). [Beneficial effect of preferred music on cognitive functions in minimally consciousstate patients]. Revue neurologique, 170 (11): 693–9.
[235] M. Castro, et al. (2015). Boosting Cognition With Music in Patients With Disorders of Consciousness.Neurorehabilitation and Neural Repair, 29 (8): 734–742.
[236] E. M. Gordon, et al. (2014). Generation and Evaluation of a Cortical Area Parcellation from Resting-StateCorrelations. Cerebral Cortex, (July 2015).
[237] S. Laureys, et al. (2004). Cerebral processing in the minimally conscious state. Neurology, 63 (5): 916–918.

244 References
[238] R. Buckner, et al. (2008). The brain’s default network: anatomy, function, and relevance to disease.Annals of the New York Academy of Sciences, 1124: 1–38.
[239] R. W. Wilkins, et al. (2014). Network science and the effects of music preference on functional brainconnectivity: from Beethoven to Eminem. Scientific reports, 4: 6130.
[240] Y. Okumura, et al. (2014). Brain activation by music in patients in a vegetative or minimally consciousstate following diffuse brain injury. Brain injury, 28 (7): 944–50.
[241] S. Koelsch, et al. (2005). Towards a neural basis of music perception. Trends in cognitive sciences, 9(12): 578–84.
[242] S. Koelsch, et al. (2005). Adults and children processing music: an fMRI study. NeuroImage, 25 (4):1068–76.
[243] B. Maess, et al. (2001). Musical syntax is processed in Broca’s area : an MEG study. Nature neuro-science, 4 (5).
[244] S. Koelsch, et al. (2002). Bach Speaks: A Cortical Language-Network Serves the Processing of Music.NeuroImage, 17 (2): 956–966.
[245] P. Albouy, et al. (2013). Impaired pitch perception and memory in congenital amusia: the deficit starts inthe auditory cortex. Brain, 136 (Pt 5): 1639–61.
[246] B. Tillmann, et al. (2003). Activation of the inferior frontal cortex in musical priming. Cognitive BrainResearch, 16 (2): 145–161.
[247] P. Janata, et al. (2002). The cortical topography of tonal structures underlying Western music. Science,298 (5601): 2167–2170.
[248] E. Svoboda, et al. (2006). The functional neuroanatomy of autobiographical memory: A meta-analysis.Neuropsychologia, 44 (12): 2189–2208.
[249] R. Cabeza, et al. (2007). Functional neuroimaging of autobiographical memory. Trends in cognitivesciences, 11 (5): 219–227.
[250] R. J. Zatorre, et al. (2007). When the brain plays music: auditory-motor interactions in music perceptionand production. Nature reviews. Neuroscience, 8 (7): 547–558.
[251] M. Corbetta, et al. (2002). Control of goal-directed and stimulus-driven attention in the brain. NatureReviews Neuroscience, 3 (3): 201–15.
[252] C. F. Chabris (1999). Prelude or requiem for the ’Mozart effect’? Nature, 400 (6747): 826–7; author reply827–8.
[253] K. M. Nantais, et al. (1999). The Mozart Effect: An Artifact of Preference. Psychological Science, 10 (4):370–373.
[254] J. O’Kelly, et al. (2013). Neurophysiological and behavioral responses to music therapy in vegetative andminimally conscious States. Frontiers in human neuroscience, 7 (December): 884.
[255] A. Nigri, et al. (2015). Central olfactory processing in patients with disorders of consciousness. EuropeanJournal of Neurology, pages n/a–n/a.
[256] A. Canedo, et al. (2002). An analysis of assessment instruments for the minimally responsive patient(MRP): clinical observations. Brain Injury, 16 (5): 453–461.

References 245
[257] C. Di Stefano, et al. (2012). Increased behavioural responsiveness with complex stimulation in VS andMCS: Preliminary results. Brain Injury, 26 (10): 1250–1256.
[258] F. Lombardi, et al. (2002). Sensory stimulation of brain-injured individuals in coma or vegetative state:results of a Cochrane systematic review. Clinical Rehabilitation, 16 (5): 464–472.
[259] P. Rigaux, et al. (2003). Indications, efficacité et tolérance des procédures à utiliser en rééducationpour améliorer la reprise de la conscience après un coma traumatique. Annales de Réadaptation et deMédecine Physique, 46 (5): 219–226.
[260] R. Kupers, et al. (2014). Compensatory plasticity and cross-modal reorganization following early visualdeprivation. Neuroscience and biobehavioral reviews, 41 (C): 36–52.
[261] M. Wong, et al. (2011). Tactile spatial acuity enhancement in blindness: evidence for experience-dependent mechanisms. The Journal of neuroscience, 31 (19): 7028–37.
[262] C. Y. Wan, et al. (2010). Early but not late-blindness leads to enhanced auditory perception. Neuropsy-chologia, 48 (1): 344–8.
[263] F. Gougoux, et al. (2009). Voice perception in blind persons: a functional magnetic resonance imagingstudy. Neuropsychologia, 47 (13): 2967–74.
[264] A. Fieger, et al. (2006). Auditory Spatial Tuning in Late-onset Blindness in Humans. Journal of CognitiveNeuroscience, 18 (2): 149–157.
[265] I. Cuevas, et al. (2009). Odour discrimination and identification are improved in early blindness. Neu-ropsychologia, 47 (14): 3079–83.
[266] R. Rosenbluth, et al. (2000). Performance of early-blind and sighted children on olfactory tasks. Percep-tion, 29 (1): 101–10.
[267] M. Beaulieu-Lefebvre, et al. (2011). Odor perception and odor awareness in congenital blindness. Brainresearch bulletin, 84 (3): 206–9.
[268] R. Kupers, et al. (2011). Neural correlates of olfactory processing in congenital blindness. Neuropsy-chologia, 49 (7): 2037–44.
[269] F. Gougoux, et al. (2005). A functional neuroimaging study of sound localization: visual cortex activitypredicts performance in early-blind individuals. PLoS biology, 3 (2): e27.
[270] P. Voss, et al. (2008). Differential occipital responses in early- and late-blind individuals during a sound-source discrimination task. NeuroImage, 40 (2): 746–58.
[271] M. Ptito, et al. (2009). Recruitment of the middle temporal area by tactile motion in congenital blindness.NeuroReport, 20 (6): 543–7.
[272] I. Matteau, et al. (2010). Beyond visual, aural and haptic movement perception: hMT+ is activated by elec-trotactile motion stimulation of the tongue in sighted and in congenitally blind individuals. Brain researchbulletin, 82 (5-6): 264–70.
[273] L. Sani, et al. (2010). Effects of Visual Experience on the Human MT+ Functional Connectivity Networks:An fMRI Study of Motion Perception in Sighted and Congenitally Blind Individuals. Frontiers in systemsneuroscience, 4 (December): 159.
[274] R. Kupers, et al. (2010). Neural correlates of virtual route recognition in congenital blindness. Proceedingsof the National Academy of Sciences of the United States of America, 107 (28): 12716–21.

246 References
[275] E. Striem-Amit, et al. (2012). Reading with sounds: sensory substitution selectively activates the visualword form area in the blind. Neuron, 76 (3): 640–52.
[276] H. Burton, et al. (2003). Dissociating cortical regions activated by semantic and phonological tasks: aFMRI study in blind and sighted people. Journal of neurophysiology, 90 (3): 1965–82.
[277] M. Bedny, et al. (2008). Concepts are more than percepts: the case of action verbs. The Journal ofneuroscience, 28 (44): 11347–53.
[278] M. Bedny, et al. (2011). Language processing in the occipital cortex of congenitally blind adults. Proceed-ings of the National Academy of Sciences of the United States of America, 108 (11): 4429–34.
[279] N. Raz, et al. (2005). V1 activation in congenitally blind humans is associated with episodic retrieval.Cerebral Cortex, 15 (9): 1459–68.
[280] W.-J. Pan, et al. (2007). Progressive atrophy in the optic pathway and visual cortex of early blind Chineseadults: A voxel-based morphometry magnetic resonance imaging study. NeuroImage, 37 (1): 212–20.
[281] M. Ptito, et al. (2008). Alterations of the visual pathways in congenital blindness. Experimental brainresearch, 187 (1): 41–9.
[282] L. Cecchetti, et al. (2015). Congenital blindness affects diencephalic but not mesencephalic structures inthe human brain. Brain structure & function.
[283] J. Jiang, et al. (2009). Thick visual cortex in the early blind. The Journal of neuroscience, 29 (7): 2205–11.
[284] M. Fortin, et al. (2008). Wayfinding in the blind: larger hippocampal volume and supranormal spatialnavigation. Brain, 131 (Pt 11): 2995–3005.
[285] J. S. Shimony, et al. (2006). Diffusion tensor imaging reveals white matter reorganization in early blindhumans. Cerebral Cortex, 16 (11): 1653–1661.
[286] F. Tomaiuolo, et al. (2014). Morphometric changes of the corpus callosum in congenital blindness. PloSone, 9 (9): e107871.
[287] A. a. Ioannides, et al. (2013). MEG reveals a fast pathway from somatosensory cortex to occipital areasvia posterior parietal cortex in a blind subject. Frontiers in human neuroscience, 7 (August): 429.
[288] M. Ptito, et al. (2005). Cross-modal plasticity revealed by electrotactile stimulation of the tongue in thecongenitally blind. Brain, 128 (3): 606–14.
[289] C. Klinge, et al. (2010). Corticocortical connections mediate primary visual cortex responses to auditorystimulation in the blind. The Journal of neuroscience, 30 (38): 12798–805.
[290] O. Collignon, et al. (2013). Impact of blindness onset on the functional organization and the connectivityof the occipital cortex. Brain.
[291] G. Wittenberg, et al. (2004). Functional connectivity between somatosensory and visual cortex in earlyblind humans. The European journal of neuroscience, 20 (7): 1923–7.
[292] R. Kupers, et al. (2006). Transcranial magnetic stimulation of the visual cortex induces somatotopicallyorganized qualia in blind subjects. Proceedings of the National Academy of Sciences of the United Statesof America, 103 (35): 13256–60.
[293] K. Watkins, et al. (2012). Language networks in anophthalmia: maintained hierarchy of processing in’visual’ cortex. Brain, 135 (Pt 5): 1566–77.

References 247
[294] D. Wang, et al. (2013). Altered resting-state network connectivity in congenital blind. Human brain map-ping, 00 (November 2012): 2573–2581.
[295] O. H. Butt, et al. (2013). The fine-scale functional correlation of striate cortex in sighted and blind people.The Journal of neuroscience, 33 (41): 16209–19.
[296] Y. Liu, et al. (2007). Whole brain functional connectivity in the early blind. Brain, 130 (Pt 8): 2085–96.
[297] C. Yu, et al. (2008). Altered functional connectivity of primary visual cortex in early blindness. Humanbrain mapping, 29 (5): 533–43.
[298] H. Burton, et al. (2014). Resting state functional connectivity in early blind humans. Frontiers in systemsneuroscience, 8 (April): 51.
[299] W. Qin, et al. (2014). Functional Connectivity Density in Congenitally and Late Blind Subjects. CerebralCortex, 1: 1–10.
[300] W. Qin, et al. (2013). The development of visual areas depends differently on visual experience. PloSone, 8 (1): e53784.
[301] D. Kravitz, et al. (2013). The ventral visual pathway: an expanded neural framework for the processing ofobject quality. Trends in cognitive sciences, 17 (1): 26–49.
[302] R. Kupers, et al. (2011). The nature of consciousness in the visually deprived brain. Frontiers in psychol-ogy, 2 (February): 19.
[303] P. Pietrini, et al. (2004). Beyond sensory images: Object-based representation in the human ventralpathway. Proceedings of the National Academy of Sciences of the United States of America, 101 (15):5658–63.
[304] M. Ptito, et al. (2012). Crossmodal recruitment of the ventral visual stream in congenital blindness. Neuralplasticity, 2012: 304045.
[305] A. Amedi, et al. (2007). Shape conveyed by visual-to-auditory sensory substitution activates the lateraloccipital complex. Nature neuroscience, 10 (6): 687–9.
[306] D. Kravitz, et al. (2011). A new neural framework for visuospatial processing. Nature Reviews Neuro-science, 12 (4): 217–30.
[307] G. Dormal, et al. (2012). Plasticity of the dorsal "spatial" stream in visually deprived individuals. Neuralplasticity, 2012: 687659.
[308] T. Schenk, et al. (2010). Do we have independent visual streams for perception and action? Journal ofCognitive Neuroscience, 1 (1): 52–62.
[309] B. Mahon, et al. (2007). Action-related properties shape object representations in the ventral stream.Neuron, 55 (3): 507–20.
[310] E. Borra, et al. (2008). Cortical connections of the macaque anterior intraparietal (AIP) area. CerebralCortex, 18 (5): 1094–111.
[311] M. G. P. Rosa, et al. (2009). Connections of the dorsomedial visual area: pathways for early integrationof dorsal and ventral streams in extrastriate cortex. The Journal of neuroscience, 29 (14): 4548–63.
[312] M. Zanon, et al. (2010). Cortical connections between dorsal and ventral visual streams in humans:Evidence by TMS/EEG co-registration. Brain topography, 22 (4): 307–17.

248 References
[313] M. L. Seghier, et al. (2004). Combination of event-related fMRI and diffusion tensor imaging in an infantwith perinatal stroke. NeuroImage, 21 (1): 463–472.
[314] N. Shu, et al. (2009). Altered anatomical network in early blindness revealed by diffusion tensor tractog-raphy. PloS one, 4 (9): e7228.
[315] N. Sadato, et al. (1996). Activation of the primary visual cortex by braille reading in blind subjects. Nature,380 (6574): 526–528.
[316] A. Amedi, et al. (2003). Early ’visual’ cortex activation correlates with superior verbal memory performancein the blind. Nature neuroscience, 6 (7): 758–66.
[317] A. Amedi, et al. (2004). Transcranial magnetic stimulation of the occipital pole interferes with verbalprocessing in blind subjects. Nature neuroscience, 7 (11): 1266–70.
[318] S. J. Karlen, et al. (2006). Early blindness results in abnormal corticocortical and thalamocortical connec-tions. Neuroscience, 142 (3): 843–58.
[319] M. Ptito, et al. (2007). TMS of the occipital cortex induces tactile sensations in the Vingers of blind Braillereaders. Experimental brain research, 184 (2): 193–200.
[320] O. Collignon, et al. (2011). Functional specialization for auditory-spatial processing in the occipital cortexof congenitally blind humans. Proceedings of the National Academy of Sciences of the United States ofAmerica, 108 (11): 4435–40.
[321] A. S. Bock, et al. (2014). Anatomical and functional plasticity in early blind individuals and the mixture ofexperts architecture. Frontiers in human neuroscience, 8 (December): 971.
[322] E. Striem-amit, et al. (2015). Functional connectivity of visual cortex in the blind follows retinotopic orga-nization principles. Brain, 138 (6): 1679–1695.
[323] H. Burton, et al. (2002). Adaptive changes in early and late blind: a fMRI study of Braille reading. TechnicalReport 1.
[324] U. Noppeney, et al. (2003). Effects of visual deprivation on the organization of the semantic system. Brain,126 (Pt 7): 1620–7.
[325] B. Deen, et al. (2015). Occipital cortex of blind individuals is functionally coupled with executive controlareas of frontal cortex. Journal of Cognitive Neuroscience, pages 1–15.
[326] E. Ricciardi, et al. (2007). The effect of visual experience on the development of functional architecture inhMT+. Cerebral Cortex, 17 (12): 2933–9.
[327] R. Kupers, et al. (2007). rTMS of the occipital cortex abolishes Braille reading and repetition priming inblind subjects. Neurology, 68: 691–693.
[328] R. Hamilton, et al. (2000). Alexia for Braille following bilateral occipital stroke in an early blind woman.NeuroReport, 11 (2): 237–40.
[329] M. D. Johnson, et al. (2000). The role of the human thalamus in language and memory: evidence fromelectrophysiological studies. Brain and Cognition, 42 (2): 218–30.
[330] H. Burton, et al. (2002). Adaptive changes in early and late blind: a fMRI study of verb generation toheard nouns. Journal of Neurophysiology, 88 (6): 3359–3371.
[331] E. R. Gizewski, et al. (2004). Specific cerebellar activation during Braille reading in blind subjects. Humanbrain mapping, 22 (3): 229–35.

References 249
[332] N. Sadato (2005). How the blind "see" Braille: lessons from functional magnetic resonance imaging. TheNeuroscientist, 11 (6): 577–82.
[333] E. Ricciardi, et al. (2013). Mind the blind brain to understand the sighted one! Is there a supramodalcortical functional architecture? Neuroscience and biobehavioral reviews, 41: 64–77.
[334] U. Noppeney, et al. (2005). Early visual deprivation induces structural plasticity in gray and white matter.Current biology, 15 (13): R488–90.
[335] F. De Martino, et al. (2014). Less noise, more activation: Multiband acquisition schemes for auditoryfunctional MRI. Magnetic Resonance in Medicine, c: n/a–n/a.
[336] C. J. Winstein, et al. (1997). Motor Task Difficulty and Brain Activity : Investigation of Goal- DirectedReciprocal Aiming Using Positron Emission Tomography. Journal of neurophysiology, 77: 1581–1594.
[337] J. Li, et al. (2013). Age of onset of blindness affects brain anatomical networks constructed using diffusiontensor tractography. Cerebral Cortex, 23 (3): 542–51.
[338] K. Wang, et al. (2008). Spontaneous activity associated with primary visual cortex: a resting-state FMRIstudy. Cerebral Cortex, 18 (3): 697–704.

250 References

Acknowledgements
There are many people without whom this work would not have been where it is now. I
would like to take a moment to thank them.
First of all, I would like to thank my promoter, Prof. Steven Laureys. Thank you for your
invaluable suggestions, guidance, inspiration and encouragement. Your continuous optimism
is very impressive to me. Thank you for the time you spent supervising this thesis throughout
the years and for providing excellent research possibilities and a great working environment.
Without doubt this has been the most unique and effective learning experience of my life.
Next I would like to thank the members of the thesis committee: Professor Roland Hustinx,
Athena Demertzi, Christophe Phillips, and Serge Brédart. Thank you for your guidance and
advice throughout the years. I would also like to thank the members of the jury: Fabien Perrin,
Daniele Marinazzo, and Rainer Goebel, who took the time to evaluate this work.
Furthermore, I would like to mention the great staff of the University Hospital of Liège who
help us care for each and every patient we see. Thank you to everybody in the Neurology
ward, and MRI and PET departments. The families of our patients deserve a very special
thank you as well.
I would like to thank my friends in Liège, you are all amazing. We have had so many
dinners, parties, and inspiring (scientific) discussions that I will never forget. Thanks a ton to
Florian Bretin & Annette Sitzer, Jitka Annen & Gianluca Frasso, Yorgos Antonopoulos & Su-
sanna Frühauf, Enrico Amico, Vincenzo Muto & Sophie Bekacar, Sophie Malatre & Guillaume
Becker & Sarah, Sarah Chellappa, Carol Di Perri, Raphael Liégeois, Olivia Gosseries, Elodie
André, Johan Stender, Yaniv Chocron, Gabriella Agatiello, and family Le Bourdiec: Anahita,
Fabien & Zephir: mon petit professeur de Français.
My colleagues, and friends from the Coma Science Group not yet mentioned need a spe-
cial thank you for supporting me, helping me and boosting my morale in times of stress and
discouragement: Sarah Wannez, Charlotte Martial, Aurore Thibaut, Charlène Aubinet, Geral-
dine Martens, Helena Cassol, Olivier Bodart, Athena Demertzi, Dina Habbal and Vanessa
Charland-Verville. But also Camille Chatelle, Marie-Aurelie Bruno, Audrey Vanhaudenhuyse,
Damien Lesenfants, Audrey Maudoux, Ithabi Gantner, Andrea Piarulli, Andrea Soddu, Nico-
las Depaye, Nicolas Lejeune, Didier Ledoux, Francisco "Patcho" Gómez, Pieter Guldenmund,

Murielle Kirsch, Marie Thonnard, Quentin Noirhomme. And a special thank you to Alexandra
Meys & Caroline Simays, who guide the group and help in too many ways to describe.
There are many people at the Cyclotron I’d like to thank. Specifically, Mohamed Bahri,
who taught me so much, but also Mathieu Jaspar, Julian Li, Marine Manard, Giulia Gaggioni,
Dorothée Coppieters, Sophie Kurth, Annick and Brigitte. Not to forget the ones who have
already left, Jessica Schrouff, and Caroline Kussé.
There are so many people I met during my time in Lyon who have guided me, encouraged
me and showed me how to have a good work-life balance. There is so much still to learn
and I cannot wait for next year! Thank you to Fabien Perrin, Barbara Tillmann, Nico Grimault,
Maïté Castro, Alexandra Corneyllie, Samuel Garcia, Camille Guillemin, Jacques Luauté, Jane
Plailly, Mathieu Kandel, Marjolaine Hauet & Ariane Juliat, Jaqueline Zimmermann, Xuming,
Eric & Brittany, and all the others.
I also want to thank my collaborators and co-authors: Ron Kupers & Maurice Ptito, thank
you for supporting me through the long process of the first paper I wrote, and teaching me
how to do so. Haibo Di and the team in Hangzhou, it is nice to have such good collaborations
on the other side of the world. Angelique van Ombergen, Floris Wuyts for the very interesting
projects on astronauts and visual vertigo. Caroline Schnakers, for her help and scientific dis-
cussions. Willemijn van Erp, Jan Lavrijssen, Berno Overbeek and the others from ’Niemand
tussen wal en schip’ where I have always been welcome during their meetings which helped
me every time to rediscover my passion and the reasons we do this work.
Furthermore I do not want to forget the small team of my Masters’ internship at Maastricht
University. Bettina Sorger, you are my great example. Together with Rainer Goebel, Thom-
mas Emmerling, Sander van Attekum, and Martin Sona you taught me about research and
helped me in my first steps towards becoming a scientist.
My friends from all the other places in the world. You guys are the best! Sjoerd van den
Hoek, mijn beste en oudste vriendje! Ik heb zoveel van de wereld mogen ontdekken tijdens
het opgroeien met jou, je bent heel special voor mij en zult dat ook altijd zijn. Corina Cretu &
Rinderd van den Eeckhout I love our game nights and the distractions you give me. Eveline
Seeney-Lensvelt, het is als vanouds, zelfs wanneer we elkaar maar een keer per jaar echt
zien. Janneke Oostenrijk, reis-buddy, en algeheel geweldig person! Esther Maas, jij kunt mij
stimuleren en motiveren op zoveel manieren, ook nu we niet meer in hetzelfde huis wonen of
dezelfde dingen doen. But also all the other friends from school who I still get to party with
once in a while: Terence Woods, Berber van den Berg, Anne Schuite, and all the others I
am not mentioning but mean so much to me! Thank you all for having listened, helped and
celebrated with me! I furthermore had the chance to meet so many people in Canada I like to
call my friends, thank you all!

I would definitely not have been able to do what I did without the care and love of some
people very close to me. Moreover, I am incredibly lucky to feel part of not one but three
families: Heine, Ziegler & Thorsén. I am very much aware that not everybody gets three
families that care as much as they do, thank you very much for being in my life and always
supporting me! Above all of course my own family, who raised me, made me who I am,
supported me through everything, and never ceased to believe in me. Mama, Papa, Hans,
Hylke ik hou van jullie! Opa, familie Jongejan, familie Heine, te groot om te noemen, maar zo
een grote, hechte familie betekent zoveel voor mij. But also the Ziegler family, Erik, Urban,
Elaine, Phil & Magnus, who make me feel welcomed and loved, each Christmas and every
time we get to see each other. I could never have wished for a better ’family in law’! Family
Thorsén: Kirsten, Karen, Lise, Birgitte & Tomas, thank you for all the trips, weekends, holidays
and laughter that made me relax and appreciate life!
Last, but most important, I want to thank the one person in my life without whom I could
not have done it. Erik, your advice, support, help, and encouragement were what got me
through the hard work. You also taught me to celebrate and enjoy the achievements and to
enjoy science on a daily basis. I love you.

Copyright © 2022 FDOKUMEN