Threshold Value for Chlorophyll Meter as Decision Tool for Nitrogen Management of Potato
11
Threshold Value for Chlorophyll Meter as Decision Tool for Nitrogen Management of Potato Marguerite Olivier, Jean-Pierre Goffart,* and Jean-François Ledent ABSTRACT We developed a practical system to improve crop N efficiency in potato (Solanum tuberosum L.). It is based on a strategy that includes split applications of N fertilizer and the use of the Hydro N Tester (HNT) leaf chlorophyll meter as a plant N status indicator. The method was tested in 12 potato field trials conducted from 1997 to 2000 on loam and sandy loam soils in Belgium. The fields were fertilized at planting with 70% of a field-specific N recommendation. Because of site-specific effects, raw HNT values measured during the growing season were not useful in assessing the crop N status and the need for supplemental N. In each field, there was a 200-m 2 subplot receiving no N fertilizer to obtain a control HNT value. After harvest, the 12 sites were separated into two groups according to the crop response to increasing N fertilizer rates. A parameter called the HNT slope was determined as the dif- ference between HNT values measured in the field and those from the zero-N plot divided by the applied N rate. This parameter shows low values for sites presenting a weak crop response to N and high values for sites with a strong response. A threshold value to determine the need for supplemental N was found to correspond to a HNT slope value of 0.5. This value was successfully validated on a commercial scale at 10 sites in Belgium in 2001 and 2002 for nonirrigated crops of cultivar Bintje. F OR POTATO, as for other main crops, the improvement of agronomic N efficiency has become a crucial fac- tor for economic as well as environmental reasons. In fact, N fertilizers are more and more expensive while the prices for farm products do not increase. Taking into account that only 40 to 50% of mineral N applied at planting is taken up by the potato crop (Bouldin and Selleck, 1977; Tyler et al., 1983), immobilization and losses are substantial, with both volatilization (N 2 O and NH 3 ) and leaching resulting in high NO 3 content in the environment that becomes a risk especially for groundwater and watercourses (Belanger et al., 2003). Improvement of N efficiency in this crop should be possible by matching crop N requirements and mineral N supply (soil and fertilizer as complements) throughout the growing season. According to Vos and MacKerron (2000), MacKerron (2000), and Shepherd (2000), this could be achieved by splitting the N fertilizer applica- tions, combined or not with the monitoring of the crop N needs and soil mineral N supply. That is not the current N fertilization practice, which consists of applying the entire amount of N either before or just around planting time. Low uptake efficiency is essentially due to the shallow root system of the potato, which is less efficient in taking up N than other crops such as cereals, sugarbeet (Beta vulgaris L.), or maize (Zea mays L.). Nitrogen present in soil layers deeper than 50 cm is poorly available to the potato crop. More- over, as the potato crop is considered to have high N needs (4–6 kg N t 21 of fresh plants, i.e., about 250 kg N ha 21 for 50 t), fertilizer N rates currently applied at planting are higher than needed. The N uptake by the potato crop, however, is low before plant emergence and only starts to become intensive about 15 d after emer- gence. Westermann and Kleinkopf (1985) showed that 80 to 90% of the N is taken up during the 2 mo following emergence. Thus, during three or more weeks after N application, the risk of N losses from the plant–soil sys- tem by volatilization or leaching is high. Furthermore, overfertilization can be profitable for the leaf canopy to the detriment of tuber production. Millard and Marshall (1986) showed that potato can take up more N than is needed to satisfy immediate requirements for growth. High rates of N application stimulate excessive canopy dry-matter production (Baker et al., 1980). To minimize such risks of loss and overfertilization, methods were developed at the field scale to assess the total required N rate at the beginning of the season (Hofman and Salomez, 2000). They integrate basic avail- able information on specific field characteristics such as soil type, humus content, and field history to assess, prior to planting, the soil mineral N supply during the season. Even with such a suitable assessment, however, the cli- mate during the growing season and its interaction with the soil determines the real schedule of mineral N pro- duction by the soil and the effective crop N demand. Applying all of the N fertilizer at planting makes it im- possible to make corrections according to the actual crop requirement during the growing period. Bouldin and Selleck (1977) demonstrated that, in Long Island, maximum yields were obtained when fer- tilizer N applications were about 170 kg N ha 21 , split with one-third of the amount applied at planting and the remaining two-thirds applied during the growing season, whereas farmers were currently applying about 225 kg N ha 21 at planting. Hong et al. (2003) showed that split application of N did not increase tuber yield and N uptake. They sug- gested that N application should be matched with the real-time crop requirements by varying the time of split applications of N, or by developing a simulation model to predict N balance for N recommendation. This as- sumption had been previously formulated by Westermann M. Olivier and J.P. Goffart, Agricultural Research Center of Gembloux, Crop Production Dep., 4 rue du Bordia, 5030 Gembloux, Belgium; J.F. Ledent, Catholic Univ. of Louvain, Faculty of Biologic, Agronomic and Environmental Engineering, 2 place Croix du Sud, 1348 Louvain-la-Neuve, Belgium. Received 12 Apr. 2005. *Corre- sponding author ([email protected]). Published in Agron. J. 98:496–506 (2006). Nitrogen Management doi:10.2134/agronj2005.0108 ª American Society of Agronomy 677 S. Segoe Rd., Madison, WI 53711 USA Abbreviations: DAE, days after emergence; HNT, Hydro N Tester leaf chorophyll meter. Reproduced from Agronomy Journal. Published by American Society of Agronomy. All copyrights reserved. 496
-
Upload
independent -
Category
Documents
-
view
0 -
download
0
Transcript of Threshold Value for Chlorophyll Meter as Decision Tool for Nitrogen Management of Potato

Threshold Value for Chlorophyll Meter as Decision Tool for NitrogenManagement of Potato
Marguerite Olivier, Jean-Pierre Goffart,* and Jean-François Ledent
ABSTRACTWe developed a practical system to improve crop N efficiency in
potato (Solanum tuberosum L.). It is based on a strategy that includessplit applications of N fertilizer and the use of the Hydro N Tester(HNT) leaf chlorophyll meter as a plant N status indicator. Themethodwas tested in 12 potato field trials conducted from 1997 to 2000 on loamand sandy loam soils in Belgium. The fields were fertilized at plantingwith 70%of a field-specific N recommendation. Because of site-specificeffects, rawHNT values measured during the growing season were notuseful in assessing the crop N status and the need for supplemental N.In each field, there was a 200-m2 subplot receiving no N fertilizer toobtain a control HNT value. After harvest, the 12 sites were separatedinto two groups according to the crop response to increasingN fertilizerrates. A parameter called the HNT slope was determined as the dif-ference between HNT values measured in the field and those from thezero-N plot divided by the applied N rate. This parameter shows lowvalues for sites presenting a weak crop response toN and high values forsites with a strong response. A threshold value to determine the need forsupplemental N was found to correspond to a HNT slope value of 0.5.This value was successfully validated on a commercial scale at 10 sites inBelgium in 2001 and 2002 for nonirrigated crops of cultivar Bintje.
FOR POTATO, as for other main crops, the improvementof agronomic N efficiency has become a crucial fac-
tor for economic as well as environmental reasons. Infact, N fertilizers are more and more expensive while theprices for farm products do not increase. Taking intoaccount that only 40 to 50% of mineral N applied atplanting is taken up by the potato crop (Bouldin andSelleck, 1977; Tyler et al., 1983), immobilization andlosses are substantial, with both volatilization (N2Oand NH3) and leaching resulting in high NO3 contentin the environment that becomes a risk especially forgroundwater and watercourses (Belanger et al., 2003).Improvement of N efficiency in this crop should be
possible by matching crop N requirements and mineralN supply (soil and fertilizer as complements) throughoutthe growing season. According to Vos and MacKerron(2000), MacKerron (2000), and Shepherd (2000), thiscould be achieved by splitting the N fertilizer applica-tions, combined or not with the monitoring of the crop Nneeds and soil mineral N supply.That is not the current N fertilization practice, which
consists of applying the entire amount of N either before
or just around planting time. Low uptake efficiency isessentially due to the shallow root system of the potato,which is less efficient in taking up N than other cropssuch as cereals, sugarbeet (Beta vulgaris L.), or maize(Zea mays L.). Nitrogen present in soil layers deeperthan 50 cm is poorly available to the potato crop. More-over, as the potato crop is considered to have high Nneeds (4–6 kg N t21 of fresh plants, i.e., about 250 kg Nha21 for 50 t), fertilizer N rates currently applied atplanting are higher than needed. The N uptake by thepotato crop, however, is low before plant emergence andonly starts to become intensive about 15 d after emer-gence. Westermann and Kleinkopf (1985) showed that80 to 90% of the N is taken up during the 2 mo followingemergence. Thus, during three or more weeks after Napplication, the risk of N losses from the plant–soil sys-tem by volatilization or leaching is high.
Furthermore, overfertilization can be profitable for theleaf canopy to the detriment of tuber production. MillardandMarshall (1986) showed that potato can take upmoreN than is needed to satisfy immediate requirements forgrowth. High rates of N application stimulate excessivecanopy dry-matter production (Baker et al., 1980).
To minimize such risks of loss and overfertilization,methods were developed at the field scale to assess thetotal required N rate at the beginning of the season(Hofman and Salomez, 2000). They integrate basic avail-able information on specific field characteristics such assoil type, humus content, and field history to assess, priorto planting, the soil mineral N supply during the season.Even with such a suitable assessment, however, the cli-mate during the growing season and its interaction withthe soil determines the real schedule of mineral N pro-duction by the soil and the effective crop N demand.Applying all of the N fertilizer at planting makes it im-possible to make corrections according to the actual croprequirement during the growing period.
Bouldin and Selleck (1977) demonstrated that, inLong Island, maximum yields were obtained when fer-tilizer N applications were about 170 kgN ha21, split withone-third of the amount applied at planting and theremaining two-thirds applied during the growing season,whereas farmers were currently applying about 225 kg Nha21 at planting.
Hong et al. (2003) showed that split application of Ndid not increase tuber yield and N uptake. They sug-gested that N application should be matched with thereal-time crop requirements by varying the time of splitapplications of N, or by developing a simulation modelto predict N balance for N recommendation. This as-sumption had been previously formulated byWestermann
M. Olivier and J.P. Goffart, Agricultural Research Center ofGembloux, Crop Production Dep., 4 rue du Bordia, 5030 Gembloux,Belgium; J.F. Ledent, Catholic Univ. of Louvain, Faculty of Biologic,Agronomic and Environmental Engineering, 2 place Croix du Sud,1348 Louvain-la-Neuve, Belgium. Received 12 Apr. 2005. *Corre-sponding author ([email protected]).
Published in Agron. J. 98:496–506 (2006).Nitrogen Managementdoi:10.2134/agronj2005.0108ª American Society of Agronomy677 S. Segoe Rd., Madison, WI 53711 USA
Abbreviations: DAE, days after emergence; HNT, Hydro N Testerleaf chorophyll meter.
Repro
duced
from
Agro
nom
yJourn
al.
Publis
hed
by
Am
erican
Socie
tyof
Agro
nom
y.
All
copyrights
reserv
ed.
496

et al. (1988), whose data indicated that a significant im-provement in N fertilizer efficiency in the potato cropwould result from split N fertilizer applications madeaccording to crop growth needs.The recently developed strategy summarized by
MacKerron (2000) involves split fertilizer N applica-tions, applying only part of a global N recommendationbefore emergence, and monitoring the crop after emer-gence to assess whether and when the crop needs sup-plemental N. Using the plant as an indicator appears tobe more appropriate and convenient than the soil ap-proach (sampling and analysis are time consuming). Theplant analysis also offers the advantage of including thecrop N requirement assessment. Such a procedure hasbeen developed and described by Goffart and Olivier(2003). The global N recommendation is given accord-ing to the N balance-sheet method using the softwareAZOBIL, (INRA, Laon, France) developed by Machetet al. (1990). Only 70% of the N-recommendation levelis applied at planting. Monitoring of the crop N statusshould then indicate the usefulness of supplemental N(i.e., the remaining 30% of the N recommendation),which depends on the intensity of the mineralizationduring the growing season and the real crop N demand.To apply this strategy accurately, a tool is required to
investigate the crop N status and to detect the need forsupplemental N. The tool proposed is the HNT chloro-phyll meter (Hydro Agri Europe, Dulmen, Germany).The determination of threshold values for the HNT inorder to accurately make this decision was the mainobjective of this study. A good tool must be quick andeasy to use under field conditions. It has to be sensitiveto variations in plant N concentration, precise, and ableto detect N deficiency early in the growing season.Another requirement for the tool is specificity to N. Inaddition, threshold values must be associated with thetool values to compare and support the decision to addN during the growing season.Initially, invasive methods were proposed for use in
the potato crop, based on the determination of thepetiole NO3 concentration (PSC) either on dry matter(Gardner and Jones, 1975; Roberts et al., 1989) or in thesap (Williams and Maier, 1990; Vitosh et al., 1992).Threshold values of PSC to support the decision on theusefulness of supplemental N during the season weremainly set up by Van Loon and Houwing (1989) in theNetherlands and by Errebhi et al. (1998) in the USA.Such methods are interesting but have also beenstrongly criticized (MacKerron et al., 1995) and remainlaborious. The first attempt to use noninvasive andquicker methods using the SPAD chlorophyll meter(Minolta, Osaka, Japan) on potato was proposed by Vosand Bom (1993). They showed that chlorophyll meterreadings correlate well with analytical measurements ofthe chlorophyll content and with the N concentration inthe leaves (r2 . 0.95).Further investigations have been performed at our
department on the use of the chlorophyll meter, in com-parison with the petiole sap NO3 concentration approach.Conditions of use of both tools have been described inOlivier et al. (1999, 2001). The HNT is a recent version of
the SPAD meter. This user-friendly measuring device isused directly on the foliagewithout invasive leaf sampling.
In studies recommending the use of a chlorophyllmeter as a suitable tool for assessing the N status of acrop, practical interpretations of the values for man-aging N application are rarely proposed, especially inthe case of potato. Factors linked to the site have sig-nificant effects on the HNT values so that raw HNTvalues are not specific to crop N status. Factors otherthan N have been identified as acting on HNT values,either on photosynthesis and chlorophyll concentration,or directly on the chlorophyll meter (Olivier et al., 1999,2001). The effect of the cultivar is one factor, as leafcolor differs among potato cultivars. The site factors caninclude soil type, climate, light, crop water status, andfoliage diseases. Thus, the main drawback of the chlo-rophyll meter is its dependence on soil, climate, and cropaspects, i.e., its lack of specificity to the crop N status.An extensive review of these topics on the chlorophyllmeter was recently given by Gianquinto et al. (2004).This drawback is not a distinctive feature of the HNT.Other tools for quick N status assessment, such as peti-ole sap NO3 concentration or crop reflectance, are alsoinfluenced by site factors. It must be noted that thisdisadvantage appears to be very important for the HNT.A decision support system based on this tool, to beaccurate, has to bypass this disadvantage with a field-specific reference.
Whereas Singh et al. (2002) proposed raw chlorophyllmeter values to determine the right time for N top-dressing in rice (Oryza sativa L.) and wheat (TriticumaestivumL.), other scientists working with foliage opticaltools conclude, like us, that absolute values are not rele-vant. The first idea was to use an overfertilized plot asreference (control). The principle is the following: a sup-plemental N application is considered to be required whenthe difference between theHNT value in the overfertilizedplot and the HNT value in the test N plot is higher than adefined threshold value. Based on the same trials as thosein this study, Denuit et al. (2002) showed that the proposalwas relevant for winter wheat but not for potato.
Varvel et al. (1997) determined an N sufficiency in-dex in corn with the use of the chlorophyll meter and awell-fertilized plot to obtain the greatest N efficiency.Laurent and Lancelot (personal communication, 2000),like Varvel et al. (1997), used a chlorophyll meter and anoverfertilized plot as a field-specific reference to decidewhen a supplemental N application was needed for apotato crop. Raun et al. (2002) and Mullen et al. (2003)tried to improve N efficiency in cereal grain productionusing vegetation optical sensing. With a control treat-ment (zero N) as reference, they determined an in-season a priori estimated grain yield and an in-seasoncrop response index to modulate N application at 1-m2
spatial resolution. In our trial fields, the possibilities ofusing relative HNT values (the relation of HNT valuesat the test N rate to those of the zero-N control) wereexplored. The second idea was the use of a referencewith no N fertilizer.
The trials conducted from 1997 to 2000 intended totest the usefulness of the HNT and to define threshold
Repro
duced
from
Agro
nom
yJourn
al.
Publis
hed
by
Am
erican
Socie
tyof
Agro
nom
y.
All
copyrights
reserv
ed.
497OLIVIER ET AL.: CHLOROPHYLL METER AS DECISION TOOL FOR N SUPPLY

values for potato based on a specific reference systemthat is easy to apply at field scale.When the intention is to characterize the response of a
crop to N fertilization a posteriori, generally only theyield response to N is taken into account. A responseindex using harvest data that indicates the actual cropresponse to applied N within a given year was recentlyproposed (Johnson et al., 2000). This response index,RIharvest, is calculated by dividing the average yield of thehighest yielding treatment receiving N by the averageyield of a control treatment (no N). For wheat, Mullenet al. (2003) determined the relationship betweenRIharvest and the response index measured during theseason and based on sensor readings. To our knowledge,the application of this method to potato has not beenreported. For potato, the response to N fertilizer interms of total yield is not sufficient to comprehensivelydescribe the agronomic efficiency of the N applied. Forthis reason, two further harvest indices were added totake production quality and environmental impact intoaccount. This permitted calibration of a relation be-tween HNT values and the N status of a potato crop interms of the responsiveness to supplemental N. Appli-cation of this relation, once properly calibrated, makespossible a priori determination of the relevance of sup-plemental N from HNT values.
MATERIALS AND METHODS
Potato field trials for the calibration of the threshold valueswere conducted in loam soils in the Walloon area of Belgiumfrom 1997 to 2000 The identified threshold values were vali-dated in commercial potato fields in 2001 and 2002.
Summary of the Strategy
The global strategy, called conditioned N splitting, includesfour stages (Goffart and Olivier, 2003). First, total N fertilizeris recommended using the software AZOBIL (Machet et al.,
1990). Because it is a predictive recommendation, only 70%of the recommended rate is applied at planting. During thegrowing season (25–55 DAE [days after emergence]), the cropN status is monitored by the chlorophyll meter and only whenthe usefulness of supplemental N is indicated by this tool is theremaining 30% of the N recommendation applied. Thus, inpart of fields, the remaining 30% is not applied and the total Nrate is 70% of the initial recommendation.
In both the research trials and the validation fields, the test Ntreatment (70%of the N recommendation) applied on cv. Bintjewas between 80 and 125 kg N ha21. The N fertilizer recom-mendation range suited to this system of reference is 110 to180 kgNha21 (5100%), which corresponds to theN recommen-dation range given for potato (cv. Bintje) in the Walloon areaof Belgium (by AZOBIL and other recommendation systems).
Field Trials Conducted between 1997 and 2000(Calibration Trials)
Twelve field trials with cv. Bintje were conducted from 1997to 2000 on loam or sandy loam soils. The characteristics of theexperimental sites and the trials are described in Table 1. Foreach experimental site, the balance-sheet method developed inAZOBIL (Machet et al., 1990) was used to give a field-specifictotal N rate recommendation at planting time (Table 2). The Ntreatments applied at planting in the trials represented 0, 75,100, and 125% of the N-rate recommendation for the years1997 and 1998, and 0, 70, 100, and 130% for the years 1999 and2000. The N fertilizer was broadcast as NH4NO3 (solidgranules, 27% N). The treatment with 70 or 75% is referredto as the test N treatment (Table 2). The trials were organized ina complete randomized block design with four replicates pertreatment. A single experimental plot was composed of eightrows, 8 to 20 m long, depending on the available space at thedifferent locations. Dates and planting densities of each trialare given in Table 1, which also gives the emergence and har-vest dates, and rainfall during the growing season.
Validation Trials
In 2001 and 2002, a total of 10 field experiments wereperformed in commercial plots managed in collaboration with
Table 1. Description of 12 potato trials (calibration set) with four replications: site characteristics; dates of planting, emergence (75%emerged plants), and harvest; plant density; and rainfall during the potato growing season. Soil mineral nitrogen (SMN) and soil organicmatter content (SOMC) were measured in March.
Dates
Site no. Soil typePreviouscrop SMN† SOMC‡
Manure applic.in previous fall Planting Emergence Harvest Plant density
Rainfall total,April–August
kg N ha21 % plants ha21 mm1997
1 sandy-loam cereal 72 2.3 no 3 Apr. 20 May 18 Sept. 40 400 3442 loam cereal 29 2.23 no 8 Apr. 23 May 17 Sept. 35 550 339
1998
3 sandy-loam cereal 55 1.87 no 23 Apr. 25 May 6 Oct. 36 040 4294 loam cereal 27 2.12 no 4 May 21 May 2 Oct. 36 040 449
1999
5 loam cereal 7 1.78 poultry 4 May 25 May 30 Sept. 39 200 3286 loam cereal 33 1.83 no 6 May 25 May 28 Sept. 51 300 2897 loam cereal 26 2.64 no 4 May 25 May 27 Sept. 32 500 3228 loam cereal 13 1.47 poultry 2 May 25 May 24 Sept. 34 630 3749 loam cereal 35 1.62 no 4 May 25 May 20 Sept. 33 300 381
2000
10 loam sugarbeet 27 2.23 no 14 Apr. 14 May 25 Oct. 40 400 45811 loam cereal 27 2.21 no 13 May 6 June 23 Oct. 31 750 44512 loam sugarbeet 33 1.97 no 20 April 15 May 12 Sept. 35 100 431
† Soil profile 0–60 cm.‡ Soil profile 0–30 cm.
Repro
duced
from
Agro
nom
yJourn
al.
Publis
hed
by
Am
erican
Socie
tyof
Agro
nom
y.
All
copyrights
reserv
ed.
498 AGRONOMY JOURNAL, VOL. 98, MAY–JUNE 2006

potato growers on loam or sandy loam soils in Belgium tovalidate the proposed HNT slope threshold. The N recom-mendation was again obtained following an advisory serviceusing AZOBIL or a similar calculation method based on an Nbalance sheet. Within each of the field experiments, four Ntreatments were used. The first three treatments were appliedat planting time: the zero-N treatment on an area of 200 m2, asubplot within the field; the 70%N treatment corresponding to70% of the N recommendation rate; and the 100% N treat-ment corresponding to 100% of the N recommendation rate.The fourth treatment was the split N application treatmentproposed in this study to be validated, consisting of 70% of therecommended rate applied at planting and the remaining 30%applied or not after emergence according to the proposedHNT slope threshold value. The N treatments were appliedonce in parallel strips at least 50 m long and with the samewidth as the fertilizer sprayer or the fertilizer distributor (15–30-m width depending on the site). In practical terms, the zero-N plot in the field was easily installed by switching off part orall of the fertilizer sprayer or distributor ramp for 10 to 20 m.
The initial fertilizer N and the remaining supplemental Nwere applied by the farmer either as NH4- or NaNO3 solidgranules, or as a liquid foliar application in the form of dilutedurea or N solution. All the strips were located in a homoge-neous field area according to soil texture and crop practices.The zero-N plot was used as reference and was needed tocalculate the HNT slope threshold. The other parts of the fieldtrial were used to compare the yield and other parameters ofthe plot receiving our method of split applications (Treatment4) with those receiving the other N treatments in order toevaluate the performance and validate the method proposed.
The Hydro N Tester Chlorophyll Meter
The HNT is a hand-held instrument measuring the lighttransmittance of a leaf at two specific wavelengths, based onthe spectral absorption features of chlorophyll. The first wave-length is located in the red range (650 nm) specificallyabsorbed by chlorophyll, while the second, located in the in-frared range (940 nm), is absorbed by cell walls and waterbut very slightly by chlorophyll and living vegetation. Aninternal algorithm using the ratio between both transmittance
values determines a chlorophyll index related to the leaf chlo-rophyll content.
The measuring head of the HNT is composed of two parts,between which the leaf is inserted. The upper part emits twobeams of light sequentially, while the receptor on the under partmeasures the transmittance of both wavelengths and recordsthe data as a single value of the chlorophyll index. A meanindex value is displayed on the LCD screen only after 30 singlerecorded readings not deviating by.3% from the mean value.In the trials, the single HNT readings were conducted asdescribed by Olivier et al. (2001). The tip leaflet in the first fullydeveloped leaf at the top was used for the reading. The HNTindex (dimensionless) for plant leaves ranges from 300 to 800.The average value of 30 leaf readings is obtained in a fewminutes, depending on the route in the field (the size of the fieldplot and the distance between successive plants measured).
Hydro N Tester Measurements in the Trials
The plant N status of each plot was assessed by chlorophyllmeter measurements beginning 10 d after emergence at theearliest, and repeated four to six times during the season atintervals of 7 to 15 d. A single HNT measurement (30 readingson 30 individual leaves, one or two leaves being measured perplant) was made per plot on the same plant rows specificallydedicated to assessments during the growing season. Throughtime, the leaves measured were not the same because eachtime the first fully developed one at the top of the stem wasused. The HNT value from plots with treatments of 70 or 75%of the N recommendation (the test N treatment) was called thetest HNT value.
Harvest Evaluations in the Calibration Set of Trials
The potato plots were harvested mechanically after agrowing period of 140 to 190 d after planting (Table 1). Twocentral rows per plot (at least 8 m long) were harvested toassess the effect of the N treatments on tuber yield and qualityparameters in the four replications. The total tuber yield (in tha21) and the weight percentage of large tubers (.50 mm indiameter) were assessed. After harvest, the soil mineral Ncontent was measured in each plot by taking samples on a60-cm depth profile divided into four layers of 15 cm, ac-cording to the method of Guiot et al., 1992.
Harvest Evaluation in the Validation Set of Trials
In each of the four N treatments within the validation fields,four samples of tubers were harvested by hand, each onecorresponding to a row 5 m long in 2001 and 4 m long in 2002.Total tuber yield and the weight percentage of large tuberswere assessed for the entire sample. Dry matter content (as apercentage) was assessed on 3-kg subsamples of tubers bygravimetry in a water bath (weighing machine Robbe 9306,Torhout, Belgium). After harvest, the soil mineral N contentwas measured in each plot at a depth of 60 cm as describedabove. For the validation set, the statistical variable used wasthe deviation between the split N treatment and each othertreatment (in the cases where a supplement was advised by theproposed method) or the deviation between the 70% N treat-ment and the 100% N treatment (in the case where no supple-ment was advised; Table 3).
Crop Response Indices to Nitrogen at Harvest(Calibration Trials)
Three response indices were chosen to assess, at harvest, theefficiency of the N fertilization: the tuber yield response index
Table 2. Nitrogen recommendation rates according to theAZOBIL model for the calibration set (12 sites with cv. Bintjepotato) and amount of N applied at planting (test N treatments,70 or 75% of the recommended rate).
Site no. N recommendation Test N treatmentRatio of the test tothe advised rate
kg N ha21 %1997
1 115 86 752 150 113 75
1998
3 176 132 754 176 132 75
1999
5 150 105 706 160 112 707 170 119 708 125 88 709 160 112 70
2000
10 140 98 7011 145 102 7012 145 102 70
Repro
duced
from
Agro
nom
yJourn
al.
Publis
hed
by
Am
erican
Socie
tyof
Agro
nom
y.
All
copyrights
reserv
ed.
499OLIVIER ET AL.: CHLOROPHYLL METER AS DECISION TOOL FOR N SUPPLY

(YRI), the tuber size response index (SRI), and the residual Nloss index (RNLI). The proportion of large tubers (diameter.50 mm) is a parameter that is positively influenced by the Nuptake of the crop and is a fundamental characteristic in as-sessing production quality for commercial cultivars such asBintje. On the other hand, high residual soil profile N afterharvest is a sign of an excessive N rate, and is often linkedto low efficiency of N fertilization and the risk of loss inthe environment.
The response indices are calculated with the followingrelations:
YRI 5 average of (highest yield obtained with N
treatment)/(yield of zero�N control)
SRI 5 average of (highest percentage in large tuber
obtained with N treatment)/(percentage
in large tubers in control)
RNLI 5 average of (highest soil residual mineral N
obtained with N treatment)/(soil residual
mineral N in control)
The N treatment giving the highest response was deter-mined from a comparison of N treatments (70, 100, or 130%N,with 100% N corresponding to the application rate recom-mended by AZOBIL). Indices were calculated from ratios ofthe highest response to the response in the control (zero-Ntreatment) for each trial and replication separately and theaverage of those ratios was taken. The highest data (yield,percentage in large tubers, and soil residual mineral N afterharvest) give an idea about the potential use of N by the crop.
Validation of the Threshold Value (Validation Trials)
In the validation trials with cv. Bintje, the strategy tomanage N was applying 70% of the N fertilizer recommenda-tion at planting (test N rate) and, from 25 to 55 DAE, to linkthe decision to apply the remaining 30% to indications of cropN status given by the HNT measurements. The values werecompared against a HNT threshold value. In the case of apositive decision, the remaining supplemental N was applied
by the farmer either as NH4- or NaNO3 solid granules, or asa liquid foliar application in the form of diluted urea or Nsolution. Four parameters influenced by N were considered atharvest to assess the effect of supplemental N on the potatocrop: total yield, percentage in large size tubers (.50 mm),residual mineral N in the soil after harvest, and tuber drymatter content. The effects of these parameters are summa-rized in Table 3. The validation of the decision to apply or notapply the remaining supplemental 30% N was based on thecombination of all these effects.
RESULTSDetermination of Crop Nitrogen Response in the
Calibration TrialsTable 4 shows the crop response to N for each site,
expressed according to the three indices described. Themean maximum increase in total tuber yield (YRI),generated by N fertilization against the zero-N treat-ment, was 34.3% and ranged from 10.5% (Site 6) to54.7% (Site 12). The range of the tuber size response(SRI) to N was larger, with the minimum increase ,2%at Site 6 and the maximum increase .75% at Site 8; theaverage for the 12 sites was 39%.
The RNLI is an expression of the waste of N in the soilor the risk of NO3 losses to the environment. The lowestresidual N increase against the control plots was 31.5%at Site 12, where the N application had little impact onthe mineral N found in the soil after harvest. The highestresidual N increase reached 171% at Site 5, where the Nfertilizer efficiency seemed to be very poor. The averagewas 81.8%. Based on results for 4 yr, we considered thatplots used to measure these indices should satisfy thefollowing criteria: they should show at least an increaseof 20% in total tuber yield and large tuber percentageand no more than an 80% increase in residual N througha depth of 60 cm in the soil in response to the applicationof N fertilizer.
This method allows a distinction between sites re-sponding strongly and sites responding weakly to N, thecrops being considered as highly responding only if each
Table 3. Results of validation trials (2001–2002) through a posteriori assessment of the decision concerning supplemental N made using theHydro N Tester (HNT) slope method. For sites where supplemental N was recommended, the split application of 70 and 30% of theAZOBIL N recommendation rate (SA) is compared with the test N treatment (70% rate at planting, TT), the zero-N control (ZC), andthe 100%N treatment at planting (AT). For sites where supplemental N was considered unnecessary, the 100%N treatment is comparedwith the zero-N control and the test N treatment. Effects of split N applications at Sites 13 to 19 and 22 and the effects of an increased Ndose at planting at Sites 20 and 21 are significantly higher (X), not significantly higher (O), or significantly lower (–) using a Newman–Keul test at P 5 0.05; blank signifies no measurement.
Comparison for yield of large tubers (.50 mm)Comparison for drymatter percentage
Comparison forresidual soil N‡
SiteMeanyield†
Decisionwith HNT SA–ZC SA–TT SA–AT AT–ZC AT–TT SA–TT AT–TT SA–TT AT–TT
Assessmentof decision
t ha21
13 46.84 add N X X X O O right14 24.53 add N X O – O right15 33.20 add N X O X O O right16 41.04 add N X X O – O right17 61.12 add N O O O O O wrong18 46.43 add N O X O O right19 50.99 add N X O O O right22 58.81 add N X X O O right20 46.88 no addl. N X O O O right21 49.17 no addl. N O O O O right
†Mean yield of large tubers (.50 mm).‡ Soil profile 0–60 cm.
Repro
duced
from
Agro
nom
yJourn
al.
Publis
hed
by
Am
erican
Socie
tyof
Agro
nom
y.
All
copyrights
reserv
ed.
500 AGRONOMY JOURNAL, VOL. 98, MAY–JUNE 2006

of these three indices matches the chosen norms. Onlyat sites responding strongly to N was the application ofsupplemental N relevant.Combining these results and comparing them with the
fixed norms, seven sites were considered as presenting aglobally relevant response to N fertilization (Table 4).According to this selection, two groups of sites weredetermined: a group of five sites with a weak crop re-sponse to N, including Sites 1, 5, 6, 7, and 11; and a groupof seven sites with a strong crop response to N, includingSites 2, 3, 4, 8, 9, 10, and 12.Table 4 also illustrates the usefulness of the condi-
tioned N splitting approach. For example, for Sites 5 and8, both cropped in 1999 in loam soil after an autumnalapplication of poultry manure, AZOBIL N recommen-dations that take these applications into account wererespectively 150 and 125 kg N ha21 based on specificinformation about the fields. But results at harvestshowed that the Site 5 response to N was very poor andthat, conversely, the Site 8 response was strong espe-cially in terms of tuber size increase. We concluded that,at Site 5, N was not the limiting factor and that theoptimum N rate was lower than the N recommendation.It was not the same at Site 8, where the optimum N rateseemed higher than the N recommendation. The soil Nmineralization, being more uncertain with manure, wasprobably different between the two sites, which wouldexplain a part of these results. To be effective, the deci-sion support system based on chlorophyll meter valueshas to provide a distinction between Sites 5 and 8.
Absolute Values as a Decision Support System(Measurements in the Calibration Set)
For a single site and N treatment, the chlorophyllmeter HNT values vary with the growth of the crop. Forthe test N treatment, the time courses were quite dif-ferent from site to site. As sites were identified by theresponse of the crop to N and specified as sites with aweak crop response (Group 1) or a strong response(Group 2), Table 5 shows that the HNT values for thefirst group are not higher than the second group in thesame year or across years. Consequently, the link be-
tween the time course of the raw HNT values and thecrop N status at a site is not clear. Other factors than Nstatus can affect the HNT values, as indicated above.The chlorophyll meter is not specific to N. These resultsshow that raw HNT values do not really indicate thecrop need for supplemental N.
Relative Values Based on the Overfertilized PlotPrinciple (Calibration Set)
At each site, HNT values of plots fertilized with Nrates ranging from 86 to 221 kg N ha21, which represents70 to 130% of the N recommendation (Table 6), did notdiffer significantly. The 130% plots cannot be a goodreference. On the other hand, plots without N showedHNT values clearly differing in some sites from theN-fertilized plots.
Relative Values Based on the Unfertilized PlotPrinciple (Calibration Set)
In this case, the comparison was made between themean HNT value from the test N rate plots (test HNTvalue) and the mean HNT value from plots without Nfertilization (control HNT value).
Based on the HNTmeasurements taken from 20 to 60DAE within each of the 12 trials of the calibrationset, the comparison leads in several sites to a “signifi-
Table 4. Evaluation of calibration trial sites a posteriori according to the response to N (1997–2000). Assessment based on three responseindices: yield response index (YRI), size response index (SRI), and residual nitrogen loss index (RNLI) and leading to a classificationin sites weakly responding to N and sites with a strong response to N, four replications.
Year Site no. YRI YRI SE† SRI SRI SE† RNLI RNLI SE† Relevant response to N
Sites with a weak response to N fertilizer
1997 1 1.211 0.028 1.346 0.113 1.998 0.200 no1999 5 1.144 0.045 1.146 0.049 2.709 0.287 no1999 6 1.105 0.047 1.016 0.056 2.669 0.595 no1999 7 1.190 0.022 1.043 0.020 1.725 0.353 no2000 11 1.345 0.066 1.500 0.206 2.107 0.105 no
Sites with a strong response to N fertilizer
1997 2 1.466 0.043 1.285 0.069 1.751 0.240 yes1998 3 1.327 0.133 1.558 0.080 1.706 0.164 yes1998 4 1.498 0.142 1.513 0.121 1.375 0.167 yes1999 8 1.380 0.054 1.754 0.083 1.349 0.149 yes1999 9 1.403 0.051 1.361 0.054 1.644 0.199 yes2000 10 1.502 0.175 1.450 0.165 1.762 0.234 yes2000 12 1.547 0.044 1.712 0.060 1.315 0.118 yesFixed norms .1.200 .1.200 ,1.800
† SE, standard error.
Table 5. Chlorophyll meter Hydro N Tester (HNT) mean valuesin the test N treatment (70 or 75% of the AZOBIL recom-mendation) for the sites weakly responding to N (Group 1: Sites1, 5, 6, 7, and 11) and sites strongly responding to N (Group 2:Sites 2, 3, 4, 8, 9, 10, and 12) as determined in the calibrationtrials and comparison of the two groups.
16–30 DAE† 27–37 DAE 40–50 DAE
Parameter Group 1 Group 2 Group 1 Group 2 Group 1 Group 2
HNT avg. 613 585 607 600 573 583SE 11.6 9.6 4.5 5.4 5.5 5.5No. 20 28 20 28 20 28Minimum 557 522 587 561 552 547Maximum 687 633 627 634 614 614Comparison NS‡ NS NS
†DAE, days after emergence.‡NS, difference nonsignificant at the 0.05 probability level.
Repro
duced
from
Agro
nom
yJourn
al.
Publis
hed
by
Am
erican
Socie
tyof
Agro
nom
y.
All
copyrights
reserv
ed.
501OLIVIER ET AL.: CHLOROPHYLL METER AS DECISION TOOL FOR N SUPPLY

cant” difference between control and test HNT values(Table 6). At most sites (2, 3, 4, 6, 7, 8, 9, and 11), onlythe control HNT values were significantly lower than theHNT values obtained within the fertilized plots. At Sites1 and 5, there was no significant difference between Ntreatments. At Sites 10 and 12, mean HNT values in thezero-N treatment, test N treatment, and overfertilizedtreatment were significantly different. An example givenin Fig. 1 illustrates the relation between HNT values andN rates applied at two sites: Site 5 belongs to the groupof sites with a weak nonsignificant crop response to N,and Site 8 belongs to the group of sites with a strong cropresponse. The difference in HNT values between controland test N plots appears to be a good base to discrim-inate between sites where the potato crop respondsstrongly to N and sites where it does not; it should alsoserve as a base to indicate the need for supplemental N.
As illustrated in Fig. 2, the magnitude of the dif-ference between both HNT values can be described bythe slope of the straight line (response line) that passesthrough the mean HNT value of the zero-N plot, and themean HNT value of the test N rate. The relation leadingto this slope, called the HNT slope, is as follows:
HNT slope ¼ (test HNT value 2 control HNT value)/
test N rate
For the 12 sites used for the calibration set and foreach date of HNT measurement, the HNT slope hasbeen calculated according to this relation. Table 7 showsthe average HNT slope of each group of sites and therange of values for each period of measurements. Siteswith weak crop N responses show lower HNT slopevalues, ranging from 20.79 to 0.72, while sites with astrong crop response have higher HNT slope values,ranging from a negative value in the first part of theseason to 1.76. Moreover, for each period of measure-ments, the averages of HNT slopes from both groups aresignificantly different (Table 7). The HNT slope value,
Fig. 1. Influence of N fertilizer rates on Hydro N Tester (HNT) valuesin a cv. Bintje potato crop trial at Sites 5 and 8 (calibration set) in1999. The circled figures represent the N recommended byAZOBIL. One point is one HNT measurement (30 readings) inone plot. Curves are quadratic. DAE 5 days after emergence.
300
350
400
450
500
550
600
650
700
750
0 20 40 60 80 100 120 140 160 180 200
Nitrogen fertilization (kg N ha-1)
HN
T v
alu
e Slope of the straight line is
HNT0 = 518
HNTn = 634
N = nitrogen applied at planting = 88 kg N ha-1
HNT slope = (634 - 518 )/ 88
= 1.32
= (HNTn – HNTo) / N
Fig. 2. Illustration of the Hydro N Tester (HNT) slope, which is theslope of the relationship between HNT values (test HNT value[HNTn] minus the zero-N control HNT value [HNT0]) and Napplied at planting (70% of the AZOBIL recommendation) for Site8 (calibration set), cv. Bintje potato, 1999.
Table 6. Chlorophyll meter Hydro N Tester (HNT) mean valuesin the calibration trials for four mineral fertilizer N rates appliedat planting time: a zero-N control; the test N treatment of 70%(Sites 5–12) or 75% (Sites 1–4) of the recommended rate de-termined with AZOBIL; 100% of the recommended rate; and125% (Sites 1–4) or 130% (Sites 5–12) of the recommendedrate(four replications).
HNT values
Siteno. Control
test Ntreatment 100% Overfertilized
Date ofmeasurements DAE‡
1 563a† 593a 586a 589a 23 June 1997 342 508a 590b 590b 592b 24 June 1997 323 478a 561b 568b 565b 24 June 1998 304 503a 594b 599b 602b 22 June 1998 325 587a 587a 584a 593a 1 July 1999 376 564a 603b 601b 617b 28 June 1999 347 585a 623b 628b 643b 28 June 1999 348 518a 634b 666b 665b 28 June 1999 349 552a 610b 633b 633b 21 June 1999 2710 466a 625b 657bc 667c 21 June 2000 3811 590a 627b 645b 647b 4 July 2000 2812 484a 585b 597bc 610c 15 June 2000 32
†For each site, values followed by the same letter are not significantlydifferent using the Newman-Keuls test at the P 5 0.01 level.
‡DAE 5 days after emergence.
Table 7. Hydro N Tester (HNT) slope values (test HNT value 2zero-N control HNT value)/test N rate) for the sites weaklyresponding to N (Group 1: Sites 1, 5, 6, 7, and 11) and sitesstrongly responding to N (Group 2: Sites 2, 3, 4, 8, 9, 10, and 12)as determined in the calibration trials and comparison of thetwo groups.
16–30 DAE† 27–37 DAE 40–50 DAE
Parameter Group 1 Group 2 Group 1 Group 2 Group 1 Group 2
HNT slopeavg., hakg21 N
0.152 0.447 0.274 0.922 0.343 0.945
SE 0.049 0.080 0.071 0.083 0.038 0.063n 20 28 20 28 20 28Minimum 20.252 20.445 20.790 0.361 0.035 0.295Maximum 0.570 1.439 0.721 1.755 0.706 1.500
** ** **
** For each period of time, HNT slope average values for both groups ofsites are significantly different at the P 5 0.01 level.
†DAE, days after emergence.
Repro
duced
from
Agro
nom
yJourn
al.
Publis
hed
by
Am
erican
Socie
tyof
Agro
nom
y.
All
copyrights
reserv
ed.
502 AGRONOMY JOURNAL, VOL. 98, MAY–JUNE 2006
therefore, appears to be a good indicator of the crop’sneed for supplemental N.
Identification of a Slope Threshold Value in theCalibration Set
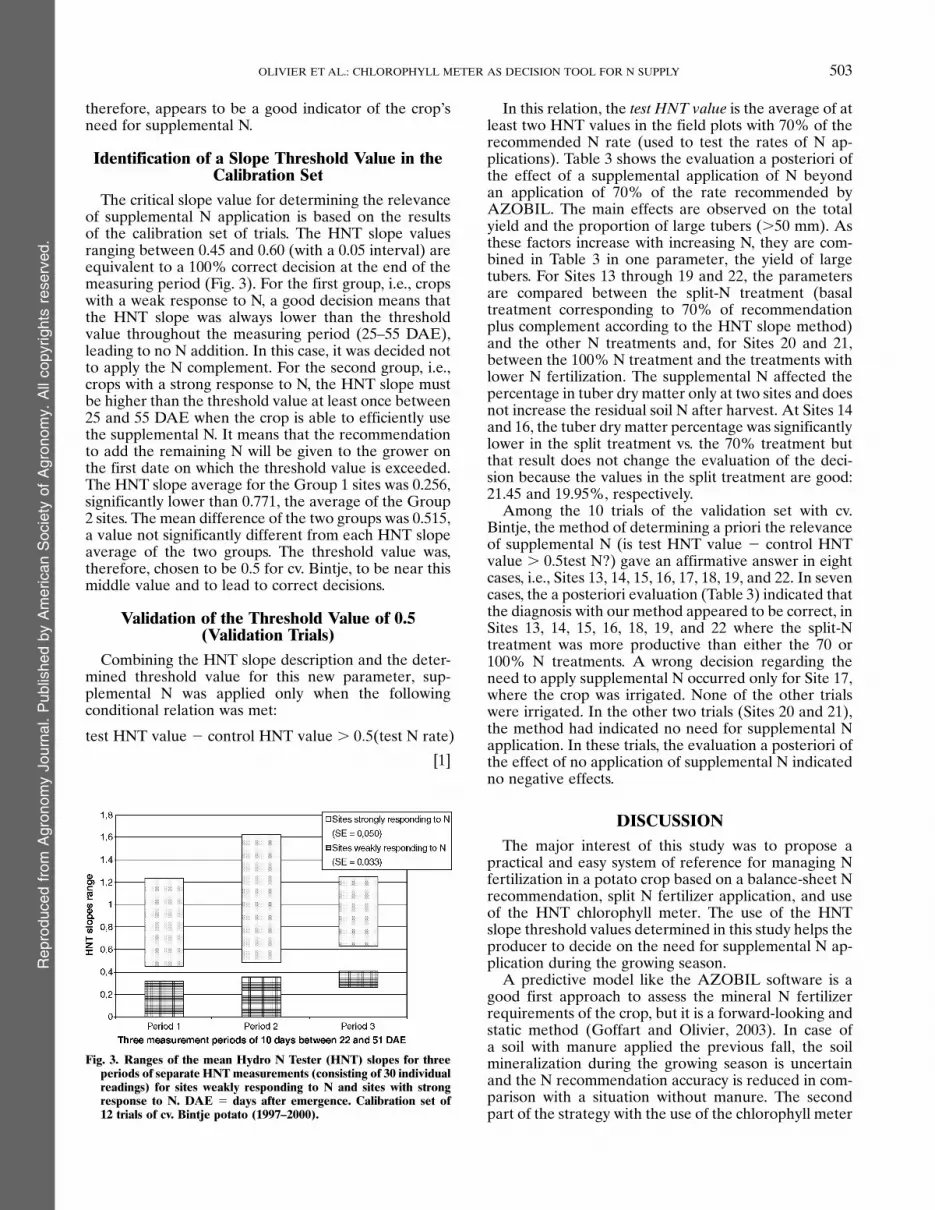
The critical slope value for determining the relevanceof supplemental N application is based on the resultsof the calibration set of trials. The HNT slope valuesranging between 0.45 and 0.60 (with a 0.05 interval) areequivalent to a 100% correct decision at the end of themeasuring period (Fig. 3). For the first group, i.e., cropswith a weak response to N, a good decision means thatthe HNT slope was always lower than the thresholdvalue throughout the measuring period (25–55 DAE),leading to no N addition. In this case, it was decided notto apply the N complement. For the second group, i.e.,crops with a strong response to N, the HNT slope mustbe higher than the threshold value at least once between25 and 55 DAE when the crop is able to efficiently usethe supplemental N. It means that the recommendationto add the remaining N will be given to the grower onthe first date on which the threshold value is exceeded.The HNT slope average for the Group 1 sites was 0.256,significantly lower than 0.771, the average of the Group2 sites. The mean difference of the two groups was 0.515,a value not significantly different from each HNT slopeaverage of the two groups. The threshold value was,therefore, chosen to be 0.5 for cv. Bintje, to be near thismiddle value and to lead to correct decisions.
Validation of the Threshold Value of 0.5(Validation Trials)
Combining the HNT slope description and the deter-mined threshold value for this new parameter, sup-plemental N was applied only when the followingconditional relation was met:
test HNT value 2 control HNT value . 0:5(test N rate)
[1]
In this relation, the test HNT value is the average of atleast two HNT values in the field plots with 70% of therecommended N rate (used to test the rates of N ap-plications). Table 3 shows the evaluation a posteriori ofthe effect of a supplemental application of N beyondan application of 70% of the rate recommended byAZOBIL. The main effects are observed on the totalyield and the proportion of large tubers (.50 mm). Asthese factors increase with increasing N, they are com-bined in Table 3 in one parameter, the yield of largetubers. For Sites 13 through 19 and 22, the parametersare compared between the split-N treatment (basaltreatment corresponding to 70% of recommendationplus complement according to the HNT slope method)and the other N treatments and, for Sites 20 and 21,between the 100% N treatment and the treatments withlower N fertilization. The supplemental N affected thepercentage in tuber dry matter only at two sites and doesnot increase the residual soil N after harvest. At Sites 14and 16, the tuber dry matter percentage was significantlylower in the split treatment vs. the 70% treatment butthat result does not change the evaluation of the deci-sion because the values in the split treatment are good:21.45 and 19.95%, respectively.
Among the 10 trials of the validation set with cv.Bintje, the method of determining a priori the relevanceof supplemental N (is test HNT value 2 control HNTvalue . 0.5test N?) gave an affirmative answer in eightcases, i.e., Sites 13, 14, 15, 16, 17, 18, 19, and 22. In sevencases, the a posteriori evaluation (Table 3) indicated thatthe diagnosis with our method appeared to be correct, inSites 13, 14, 15, 16, 18, 19, and 22 where the split-Ntreatment was more productive than either the 70 or100% N treatments. A wrong decision regarding theneed to apply supplemental N occurred only for Site 17,where the crop was irrigated. None of the other trialswere irrigated. In the other two trials (Sites 20 and 21),the method had indicated no need for supplemental Napplication. In these trials, the evaluation a posteriori ofthe effect of no application of supplemental N indicatedno negative effects.
DISCUSSIONThe major interest of this study was to propose a
practical and easy system of reference for managing Nfertilization in a potato crop based on a balance-sheet Nrecommendation, split N fertilizer application, and useof the HNT chlorophyll meter. The use of the HNTslope threshold values determined in this study helps theproducer to decide on the need for supplemental N ap-plication during the growing season.
A predictive model like the AZOBIL software is agood first approach to assess the mineral N fertilizerrequirements of the crop, but it is a forward-looking andstatic method (Goffart and Olivier, 2003). In case ofa soil with manure applied the previous fall, the soilmineralization during the growing season is uncertainand the N recommendation accuracy is reduced in com-parison with a situation without manure. The secondpart of the strategy with the use of the chlorophyll meter
Fig. 3. Ranges of the mean Hydro N Tester (HNT) slopes for threeperiods of separate HNTmeasurements (consisting of 30 individualreadings) for sites weakly responding to N and sites with strongresponse to N. DAE 5 days after emergence. Calibration set of12 trials of cv. Bintje potato (1997–2000).
Repro
duced
from
Agro
nom
yJourn
al.
Publis
hed
by
Am
erican
Socie
tyof
Agro
nom
y.
All
copyrights
reserv
ed.
503OLIVIER ET AL.: CHLOROPHYLL METER AS DECISION TOOL FOR N SUPPLY

is intended as an improvement that makes the methodmore dynamic and makes it possible to adapt the Nfertilization to the crucial period of intensive N uptakeby the crop (June–July).This method tries to match N fertilizer supply and N
crop demand throughout the growing season. Bijay-Singh et al. (2002) reported that, in rice and wheat, whenN fertilizer application is not synchronized with cropdemand, N losses from the soil–plant system can belarge. Their need-based N management approach usesthe chlorophyll meter to determine the right time for Ntopdressing of both crops. Chlorophyll-meter-based Nmanagement saves 12.5 to 25% of the fertilizer N rec-ommendation, with no loss in yield. Peng and Cassman(1998) demonstrated that apparent recovery of top-dressed N during the panicle initiation stage of ricecould be as high as 78% and suggested that high N fer-tilizer recovery can be achieved with large rates of Napplied when growth conditions are favorable.In regard to potato, the results of this study show that
the improvement of N efficiency should be also achievedby splitting N fertilizer applications and by monitoringthe crop N needs to match crop N requirements andmineral N supply throughout the growing season.The advantages of the HNTare its ease of use and its
sensitivity and accuracy linked with the rapidity of mea-surement without destructive sampling.A decision support system based on this tool, to be
accurate, has to bypass the lack of specificity to the cropN status, as HNT readings are sensitive to other factorsthan N. In this context, the HNT slope was introduced asa new parameter, to characterize the difference betweenthe chlorophyll meter HNT values in the fertilized fieldand in a zero-N subplot used as a reference in the field.According to our results, the zero-N plot reference
seems adequate to assess the N status of the potato crop.It leads to relative HNT threshold values useful forclosely matching crop N demand and split N fertilizerapplications. There are two other advantages to using azero-N subplot as a reference plot within the field: first,it provides indirect information on the contribution ofthe soil mineral N supply to the crop N need during thegrowing season, and second, it gives the producer con-fidence in his soil potential to supply N when no or littledifference appears between parts of the field with andwithout N application.Meier et al. (2001) also proposed using this reference
in vegetable crop fields, but with a simpler methodwithout a diagnostic tool. The amount of topdressing isdetermined by the time it takes for the appearance andthe intensity of N deficiency symptoms to become visiblein the control plot compared with the rest of the field.Mullen et al. (2003) compared two approaches with
control subplots in cereals: using a well-fertilizedtreatment as reference (Varvel et al., 1997), called thesufficiency concept, and the control treatment approach(Raun et al., 2002), which they named the response con-cept using a zero-N subplot. Both methods make refer-ence directly or indirectly to the N status of leaf tissues.Using the sufficiency concept, N fertilizer is applied in
an attempt to match the tissue N concentration of plants
in a well-fertilized control strip (assumed to be 100%sufficient) without recognizing yield potential (Mullenet al., 2003). The response concept, like the HNT slopemethod proposed here, recognizes the yield potentialand then fertilizes based on the likelihood of obtaininga response (Raun et al., 2002). The response conceptindicates the increase in yield that could be obtained viaN fertilization but provides no information about the Nrate to be applied, whereas the sufficiency concept isdirectly linked to an actual fertilizer N rate (Mullenet al., 2003).
In the method proposed here, the determination ofthe potential of N recovery by the crop is preferredagainst achieving a sufficient rate of N to apply. Betterthan the sufficiency concept, the response concept usinga control plot without N fertilizer allows the grower toknow if N is the main limiting factor and therefore toassess the utility of a N supplement.
Relevant threshold values of HNT slopes to detect theneed for supplemental N were determined using a cali-bration set of trials. The method was afterward validatedin commercial fields, which were different from thoseused for calibration. There was only one error of diag-nosis (in an irrigated situation). It must be noted thatan error can be due to a number of factors: a wrongAZOBIL recommendation, an error in HNT measure-ment, an improper threshold, or a faulty N application.The validation is not able to distinguish between thevarious factors but it allows assessment of the finalresults of the N fertilization. Thus, the results validatethe proposed method (the HNT slope method, a thresh-old value of 0.5, and a zero-N control plot) in cropswithout irrigation, using the cv. Bintje, on loam andsandy loam soils under a temperate climate. This repre-sents most situations encountered in Belgium, where,70 to 75% of the total potato crop is planted with cv.Bintje while ,5% the total crop is irrigated. For otherconditions (different cultivars, irrigated fields, othersoils and regions, etc.), the validity of the method mustbe confirmed.
For situations outside the range of the Walloon area,care must be taken in extrapolating N recommendations.Nevertheless, wemay give some hints for cases where therecommended N rate is #100 kg N ha21. In those cases,the potato grower is advised to apply a rate not less than80 kgNha21 and to checkwith the chlorophyll meter thatthis fertilization is not too low, as described above. Forrecommendations .180 kg N ha21, the suitability of thethreshold value of 0.5 needs to be confirmed.
Our method proposes to split the N recommendationgiven by AZOBIL into 70 and 30%, with the secondapplication determined by the HNT values. This split isbased on two observations. First, with a first N appli-cation .70 to 75%, the results in terms of yield andtuber size with or without the second application arerarely different—“the game is not worth the candle.”With a first N application ,65 to 70%, there is a riskof not being able to make up a possible deficiency of Nobserved in the second part of the season.
Further improvement of the method can be expectedwith a refinement of the decisions concerning the pro-
Repro
duced
from
Agro
nom
yJourn
al.
Publis
hed
by
Am
erican
Socie
tyof
Agro
nom
y.
All
copyrights
reserv
ed.
504 AGRONOMY JOURNAL, VOL. 98, MAY–JUNE 2006

portion of the total N recommendation to be given inthe second split application (less or more than 30%of the total N application recommended, according toHNT results). Also, the fertilizer forms for this secondsplit application could be clarified. In fact, the success ofthe second N fertilizer application depends on the use ofN fertilizer types and application modes that allow quickuptake by the crop after application. The spraying ofrepeated doses of foliar urea (maximum 15 kg N ha21
dose) was used successfully in our trials, avoiding sunnyconditions while spraying.The complete strategy, consisting of splitting the N
application with the second application determinedby the use of the chlorophyll meter, has spread, since2002, to potato producers and other partners in the po-tato industry.During the 6 yr of research and validation, from 1997
to 2002, a total of 22 potato fields were managed ac-cording to the proposed strategy and checked after har-vest (calibration and validation trials pooled together).At 14 sites, the best N management was the split appli-cation of the recommended rate, with the supplementalN application (30% remaining) applied when the N ef-ficiency was high. This means that, in 64% of the cases, itwas possible to improve N recovery with the sameN rateas advised a priori but choosing the best applicationschedule. The other eight fields, where N added duringthe season was ineffective, were also instructive becausethey showed that, in 36% of the cases, 70% of the ad-vised dose was sufficient to express the potential of thecrop without causing loss of productivity.
ACKNOWLEDGMENTS
The experiments were carried out with financial supportfrom the Research and Development Administration of theBelgian Ministry of Small Enterprises, Traders and Agricul-ture (1997–2000) and from theWalloonMinistry of Agriculture,Department of Development and Popularisation (2001–2004).Thanks are due to all employees of the Crop Production De-partment who collaborated in the research.
REFERENCESBaker, A.S., R.B. Heyuda, and U. Kafkafi. 1980. Effects of rate, source
and distribution method of N fertilizer on seed potato production.J. Agric. Sci. 94:745–747.
Belanger, G., N. Ziadi, J.R. Walsh, J.E. Richards, and P.H. Milburn.2003. Residual soil nitrate after potato harvest. J. Environ. Qual.32:607–612.
Bouldin, L., and G.W. Selleck. 1977. Management of fertilizer nitro-gen for potatoes consistent with optimum profit and maintenanceof ground water quality. p. 271–278. In M.C. Loehr (ed.) Food,fertilizer and agricultural residues. Proc. Cornell Agric. WasteManage. Conf., 9th, Geneva, NY. 1977. Ann Arbor Science Publ.,Ann Arbor, MI.
Denuit, J.P., M. Olivier, M.J. Goffaux, J.L. Herman, J.P. Goffart, J.P.Destain, and M. Frankinet. 2002. Management of nitrogen fer-tilization of winter wheat and potato crops using the chlorophyllmeter for crop nitrogen status assessment. Agronomie 22:847–853.
Errebhi, M., C.J. Rosen, and D.E. Birong. 1998. Calibration of a peti-ole sap nitrate test for irrigated Russet Burbank potato. Commun.Soil Sci. Plant Anal. 29:23–35.
Gardner, B.R., and J.P. Jones. 1975. Petiole analysis and the nitrogenfertilization of Russet Burbank potatoes. Am. Potato J. 52:195–200.
Gianquinto, G., J.P. Goffart, M. Olivier, G. Guarda, M. Colauzzi, L.
Dalla Costa, G. Delle Vedove, J. Vos, and D.K.L. MacKerron. 2004.The use of hand-held chlorophyll meters as a tool to assess thenitrogen status and to guide nitrogen fertilization of potato crop.Potato Res. 47:35–80.
Goffart, J.P., and M. Olivier. 2003. Management of N-fertilization ofthe potato crop using total N-advice software and in-seasonchlorophyll meter measurements. p. 68–83. In A.J. Haverkort andD.K.L. MacKerron (ed.) Decision support systems in potato pro-duction: Bringing models to practice. Wageningen Acad. Publ.,Wageningen, the Netherlands.
Guiot, J., J.P. Goffart, and J.P. Destain. 1992. Le dosage des nitrates dansle sol. (In French.) Bull. Rech. Agron. (Gembloux) 27:61–74.
Hofman, G., and J. Salomez. 2000. Nitrogen decision support systemsin potato production. p. 219–232. In A.J. Haverkort and D.K.L.MacKerron (ed.) Management of nitrogen and water in potatoproduction. Wageningen Pers, Wageningen, the Netherlands.
Hong, L., L.E. Parent, A. Karam, and C. Tremblay. 2003. Efficiency ofsoil and fertilizer of a sod-potato system in the humid, acid and coolenvironment. Plant Soil 251:23–36.
Johnson, G.V., W.R. Raun, and R.W. Mullen. 2000. Nitrogen useefficiency as influenced by crop response index. p. 291. In 2000Agronomy abstracts. ASA, CSSA, and SSSA, Madison, WI.
Machet, J.M., P. Dubrulle, and P. Louis. 1990. AZOBIL: A computerprogram for fertilizer N recommendations based on a predictivebalance sheet method. S2–P21. InA. Scaife (ed.) Proc. Congr. Eur.Soc. of Agron., 1st, Paris. 5–7 Dec. 1990. Eur. Soc. of Agron.,Colmar, France.
MacKerron, D.K.L. 2000. Perspectives for use in practice– How canassessment of plant and crop nitrogen status be used in practice.p. 103–110. In A.J. Haverkort and D.K.L. MacKerron (ed.) Man-agement of nitrogen and water in potato production. WageningenPers, Wageningen, the Netherlands.
MacKerron, D.K.L. M.W. Young, and H.V. Davies. 1995. A criticalassessment of the value of petiole sap analysis in optimising thenitrogen nutrition of the potato crop. Plant Soil 172:247–260.
Meier, U., U. Van Riesen, and H.C. Scharpf. 2001. Nil-N-plots: A sys-tem to estimate the amount of the nitrogen top-dressing of vege-tables. Acta Hortic. 563:47–52.
Millard, P., and B. Marshall. 1986. Growth, nitrogen uptake and par-titioning within the potato (Solanum tuberosum L.) crop, in relationto nitrogen application. J. Agric. Sci. 107:421–429.
Mullen, R.W., K.W. Freeman, W.R. Raun, G.V. Johnson, M.L. Stone,and J.B. Solie. 2003. Identifying an in-season response index and thepotential to increase wheat yield with nitrogen. Agron. J. 95:347–351.
Olivier, M., and J.P. Goffart. 2002. Chlorophyll meter used as decisiontool to manage nitrogen fertilization in potato crop. p. 68. AbstractsEAPR Triennal Conf., 15th, Hamburg, Germany.14–19 July 2002.Saatgut-Treuhandverwaltungs Gmbh, Bonn, Germany.
Olivier, M., J.P. Goffart, andM. Frankinet. 2001. Twomethods of quickassessment of potato crop nitrogen status: Working frame andthreshold values leading to N-fertilizer supplement during growingperiod. p. 503–504. In Abstracts Nitrogen Workshop, 11th, Reims,France. 9–12 Sept. 2001. Inst. National de Recherches Agronomi-ques, Laon, France.
Olivier, M., J.P. Goffart, G. Sinnaeve, and P. Dardenne. 1999. Evalua-tion of invasive and non-invasive methods to assess the nitrogenstatus of the potato crop in the course of the season. p. 134–135.In Abstracts EAPR Triennal Conf., 14th, Sorento, Italy. 2–7 May1999. Assessorato Agricoltura, Regione Campania, Sorrento, Italy.
Peng, S., and K.G. Cassman. 1998. Upper thresholds of nitrogen up-take rates and associated nitrogen fertilizer efficiencies in irrigatedrice. Agron. J. 90:178–185.
Raun, W.R., J.B. Solie, G.V. Johnson, M.L. Stone, R.W. Mullen, K.W.Freeman, W.E. Thomason, and E.U. Lukina. 2002. Improving ni-trogen use efficiency in cereal grain production with optical sensingand variable rate application. Agron. J. 94:815–820.
Roberts, S., H.H. Cheng, and F.O. Farrow. 1989. Nitrate concentrationin potato petioles from periodic applications of 15N-labelled ammo-nium nitrate fertilizer. Agron. J. 81:271–274.
Singh, B., Y. Singh, J.K. Ladha, K.F. Bronson, V. Balasubramanian,J. Singh, and C.S. Khind. 2002. Chlorophyll meter- and leaf colorchart-based nitrogen management for rice and wheat in northwest-ern India. Agron. J. 94:821–829.
Shepherd, M.A. 2000. Using soil nitrogen status in practice—the need
Repro
duced
from
Agro
nom
yJourn
al.
Publis
hed
by
Am
erican
Socie
tyof
Agro
nom
y.
All
copyrights
reserv
ed.
505OLIVIER ET AL.: CHLOROPHYLL METER AS DECISION TOOL FOR N SUPPLY

for decision support system. p. 165–173. In A.J. Haverkort andD.K.L. MacKerron (ed.) Management of nitrogen and water in po-tato production. Wageningen Pers, Wageningen, the Netherlands.
Tyler, K.B., F.E. Broadbent, and J.C. Bishop. 1983. Efficiency of nitro-gen uptake by potatoes. Am. Potato J. 60:261–269.
Van Loon, C.D., and J.F. Houwing. 1989. Otimalisering van destikstofvoeding van comsuptie-aardappelen. (In Dutch.) Proefsta-tion voor Akkerbouw en de Groenteteelt in de Vollegrond (PAGV)42:1–90.
Varvel, G.E., J.S. Schepers, and D.D. Francis. 1997. Ability for in-season correction of nitrogen deficiency in corn using chlorophyllmeters. Soil Sci. Soc. Am. J. 61:1233–1239.
Vitosh, M.L., G.H. Silva, R.H. Leep, and D.S. Douches. 1992. Sapnitrate testing for improved nitrogen management on potatoes.HortScience 27:614.
Vos, J., and M. Bom. 1993. Hand-held chlorophyll meter: A promisingtool to assess the nitrogen status of potato foliage. Potato Res. 36:301–308.
Vos, J., and D.K.L. MacKerron. 2000. Basic concepts of the manage-ment of supply of nitrogen and water in potato production. p.15–33. In A.J. Haverkort and D.K.L. MacKerron (ed.) Manage-ment of nitrogen and water in potato production. Wageningen Pers,Wageningen, the Netherlands.
Westermann, D.T., and G.E. Kleinkopf. 1985. Nitrogen requirementsof potatoes. Agron. J. 77:616–621.
Westermann, D.T., G.E. Kleinkopf, and L.K. Porter. 1988. Nitrogenfertilizer efficiencies on potatoes. Am. Potato J. 65:377–386.
Williams, C.M.J., and N.A. Maier. 1990. Determination of the nitrogenstatus of irrigated potato crops: II. A simple on farm quick test fornitrate-nitrogen in petiole sap. J. Plant Nutr. 18:985–993.
Repro
duced
from
Agro
nom
yJourn
al.
Publis
hed
by
Am
erican
Socie
tyof
Agro
nom
y.
All
copyrights
reserv
ed.
506 AGRONOMY JOURNAL, VOL. 98, MAY–JUNE 2006