METER OF NETWORK PARAMETERS ND20 TYPE
35
METER OF NETWORK PARAMETERS ND20 TYPE USER’S MANUAL
-
Upload
khangminh22 -
Category
Documents
-
view
0 -
download
0
Transcript of METER OF NETWORK PARAMETERS ND20 TYPE
METER OF NETWORK PARAMETERS ND20 TYPE
USER’S MANUAL
CONTENTS 1. APPLICATION ............................................................................................................... 3 2. METER SET ................................................................................................................... 3 3. BASIC REQUIREMENTS AND OPERATIONAL SAFETY ........................................... 3 4. INSTALLATION ............................................................................................................. 4 5. METER DESCRIPTION ................................................................................................. 5 6. ND20 ProgramMING ..................................................................................................... 8 7. RS-485 INTERFACE ................................................................................................... 21 8. ERROR CODES .......................................................................................................... 29 9. TECHNICAL DATA ..................................................................................................... 30 10. ORDERING CODES ................................................................................................... 33

3
1. APPLICATION The N20D meter is a digital programmable panel meter destined for the measurement of 3-phase 4-wire network parameters in balanced and unbalanced systems with the simultaneous display of measured quantities and digital transmission of their values. The meter enables the control and optimization of power electronics devices, systems and industrial installation operations
The meter ensures the measurement of: rms values of voltage and current, active, reactive and apparent power, active, reactive energy, power factors, frequency, 15, 30, 60 minutes’ mean active power, archive of power profile, THD and harmonic measurements. Additionally, the current value in the neutral wire is calculated. Voltages and currents are multiplied by given voltage and current ratios of measuring transformers. Indications of power and energy take into consideration values of programmed ratios. The value of each measured quantity can be transmitted to the master system through the RS-485 interface. The relay output signals the overflow of the chosen quantity, and the impulse output can be used for the consumption check of 3-phase active and reactive energy. The meter has additionally a continuous current output. The meter has a galvanic separation between respective blocks: - supply, - measuring inputs, - voltage and current inputs, - analog output, - RS-485 output, - impulse output. 2. METER SET
The set of the ND20 meter is composed of: 1. ND20 meter 1 pc. 2. user’s manual 1 pc. 3. guarantee card 1 pc 4. seal 1 pc. 5. holders to fix the meter in the panel 4 pcs
3. BASIC REQUIREMENTS AND OPERATIONAL SAFETY In the safety service scope, the ND20 meter meets to requirements of the EN 61010 -1 standard.
Observations Concerning the Operational Safety
▪ All operations concerning transport, installation, and commissioning as well as maintenance, must be carried out by qualified, skilled personnel, and national

4
regulations for the prevention of accidents must be observed. ▪ Before switching the meter on, one must check the correctness of connection to the network. ▪ Before removing the meter housing, one must switch the supply off and disconnect measuring circuits. ▪ The removal of the meter housing during the guarantee contract period may cause its cancellation. ▪ The ND20 meter is destined to be installed and used in industrial electromagnetic environment conditions. ▪ One must remember that in the building installation, a switch or a circuit-breaker should be installed. This switch should be located near the device, easy accessible by the operator, and suitably marked. 4. INSTALLATION The ND20 meter is adapted to be fixed on a panel by means of holders. The fitting way is presented on the fig.1. Housing overall dimensions: 96 x 96 x 77 mm. At the rear side of the meter, there are screw terminal strips which enable the connection of external wires with a cross-section up to 2.5 mm². One must prepare a 92.5+0.6 x 92.5+0.6 mm cut-out in the panel. The material thickness which the panel is made from should not exceed 15 mm. Insert the meter from the frontal panel side with the disconnected supply voltage. After the insertion into the hole, fix the meter by means of holders.
1
2
Fig. 1. Meter fitting

5
Fig. 2 Meter overall dimensions
5. METER DESCRIPTION
5.1. Current Inputs
All current inputs are galvanically isolated (internal current transformers). The meter is adapted to co-operate with external measuring current transformers. Displayed current values and derivative quantities are automatically recoun in relation to the introduced external current transformer ratio. Current inputs are defined in the order as 1 A or 5 A.
5.2. Voltage Inputs
Quantities on voltage inputs are automatically converted acc. to the introduced ratio of the external voltage transformer. Voltage inputs are defined in the order as 3 x 57.7/100 V, 3 x 230/400 V.
6
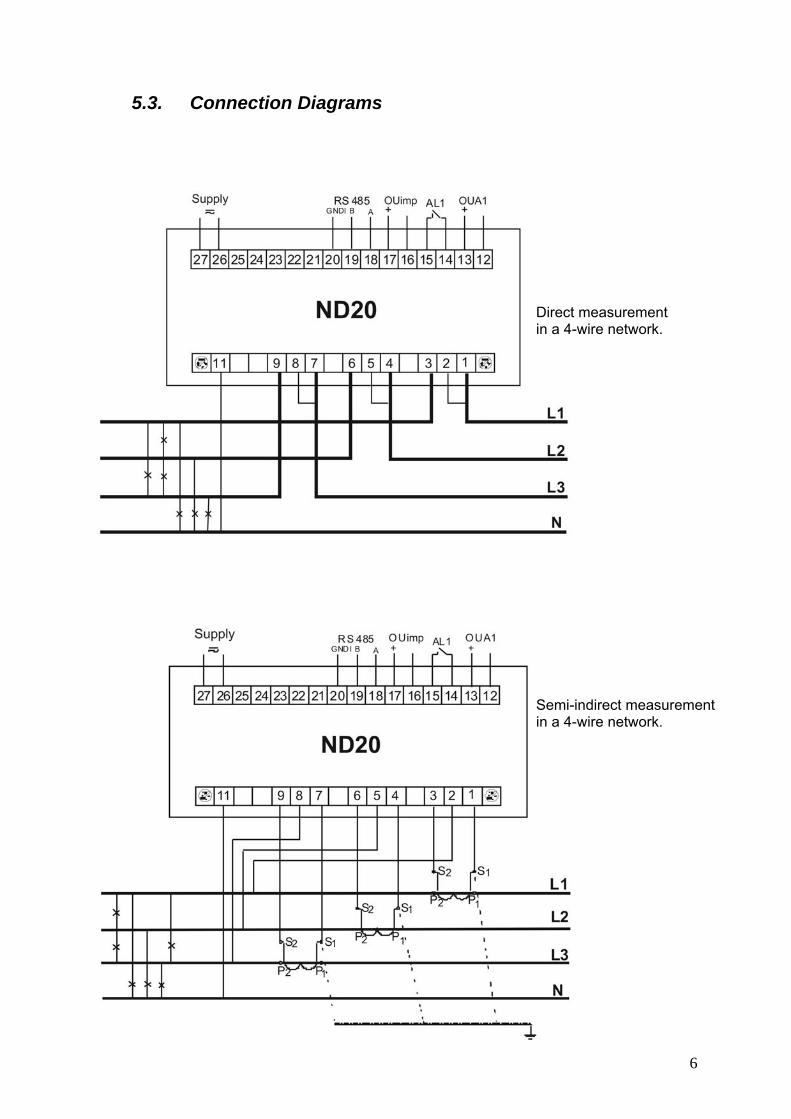
5.3. Connection Diagrams
Semi-indirect measurement in a 4-wire network.
Direct measurement in a 4-wire network.

7
Fig 4. Meter connection diagrams in a 4-wire network.
Indirect measurement with the use of 3 current transformers and 2 or 3 voltage transformers in a 4-wire network.
8
6. ND20 ProgramMING
6.1. Frontal Panel
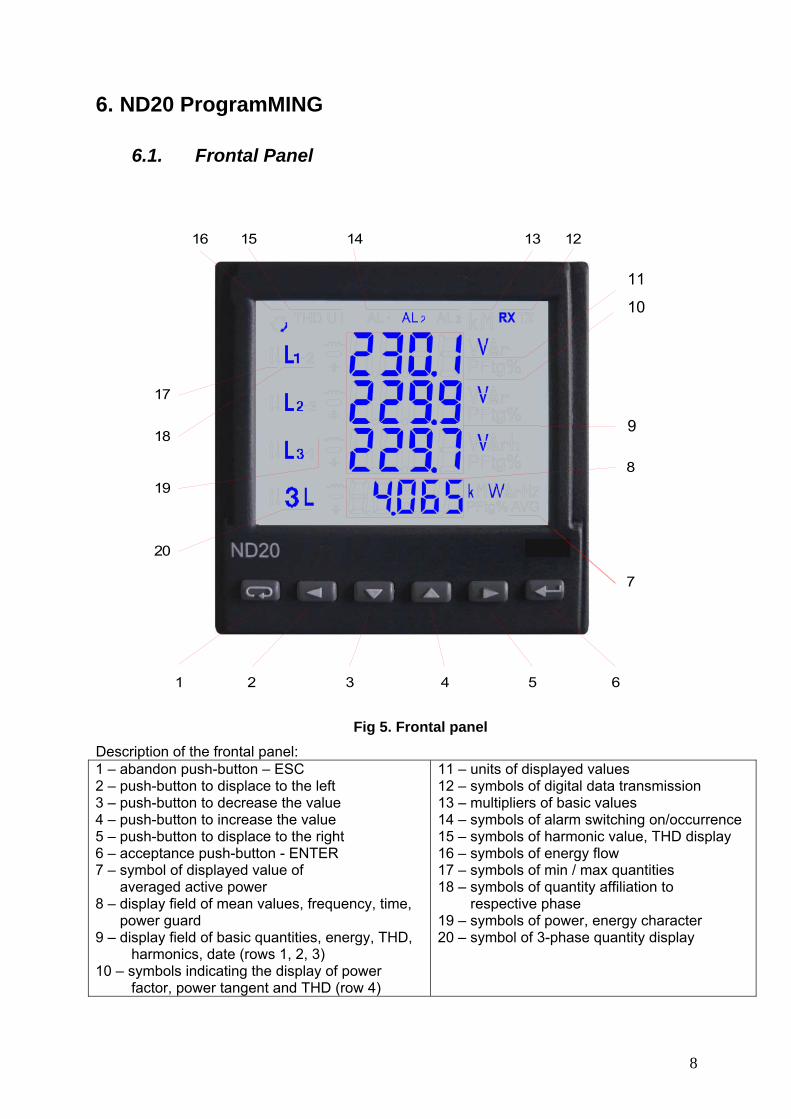
Fig 5. Frontal panel Description of the frontal panel: 1 – abandon push-button – ESC 2 – push-button to displace to the left 3 – push-button to decrease the value 4 – push-button to increase the value 5 – push-button to displace to the right 6 – acceptance push-button - ENTER 7 – symbol of displayed value of averaged active power 8 – display field of mean values, frequency, time, power guard 9 – display field of basic quantities, energy, THD,
harmonics, date (rows 1, 2, 3) 10 – symbols indicating the display of power
factor, power tangent and THD (row 4)
11 – units of displayed values 12 – symbols of digital data transmission 13 – multipliers of basic values 14 – symbols of alarm switching on/occurrence 15 – symbols of harmonic value, THD display 16 – symbols of energy flow 17 – symbols of min / max quantities 18 – symbols of quantity affiliation to respective phase 19 – symbols of power, energy character 20 – symbol of 3-phase quantity display
1 62 43 5
12131416
7
8
15
17
18
19
20
10
9
11
10
9
9
6.2. Messages after Switching the Supply on
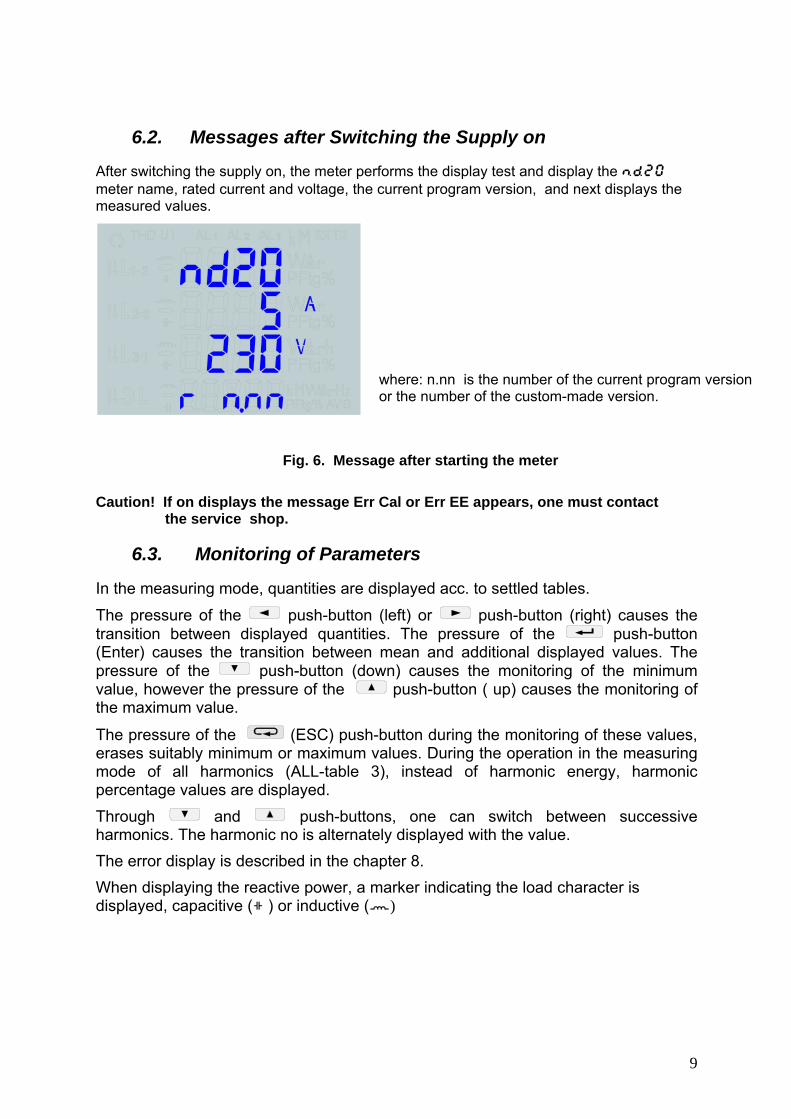
After switching the supply on, the meter performs the display test and display the ND20 meter name, rated current and voltage, the current program version, and next displays the measured values.
where: n.nn is the number of the current program version or the number of the custom-made version.
Fig. 6. Message after starting the meter Caution! If on displays the message Err Cal or Err EE appears, one must contact the service shop.
6.3. Monitoring of Parameters
In the measuring mode, quantities are displayed acc. to settled tables.
The pressure of the push-button (left) or push-button (right) causes the transition between displayed quantities. The pressure of the push-button (Enter) causes the transition between mean and additional displayed values. The pressure of the push-button (down) causes the monitoring of the minimum value, however the pressure of the push-button ( up) causes the monitoring of the maximum value.
The pressure of the (ESC) push-button during the monitoring of these values, erases suitably minimum or maximum values. During the operation in the measuring mode of all harmonics (ALL-table 3), instead of harmonic energy, harmonic percentage values are displayed.
Through and push-buttons, one can switch between successive harmonics. The harmonic no is alternately displayed with the value. The error display is described in the chapter 8. When displaying the reactive power, a marker indicating the load character is displayed, capacitive ( ) or inductive ( )

10
Displayed quantities in the field 9 (fig. 5.)
Table 1
Backlit symbols L1,V L2,V L3,V
L1-2,V L2-3,V L3-1,V
L1,A L2,A L3,A
L1,W L2,W L3,W
L1,Var L2,Var L3,Var
L1,VA L2,VA L3,VA
L1,PF L2,PF L3,PF
L1,tg L2,tg L3,tg
kWh
Displayed values
row 1 U1 U12 I1 P1 Q1 S1 PF1 tg1 Imported active energy
EnP
row 2 U2 U23 I2 P2 Q2 S2 PF2 tg2 row 3 U3 U31 I3 P3 Q3 S3 PF3 tg3
Backlit symbols -, kWh
kVarh
kVarh
L1, THD U L2, THD U L3, THD U
L1, THD I L2, THD I L3, THD I
Displayed values
row 1
exported active energy
reactive inductive energy
/ reactive positive energy
reactive capacitive
energy /
reactive negative energy
Uh1 V / THD1 %
Ih1 A / THD1 %
row 2 Uh2 V / THD2 %
Ih2 A / THD2 %
row 3 Uh3 V / THD3 %
Ih3 A / THD3 %
Displayed symbols
kWh THD
L1, THD I L2, THD I L3, THD I
kWh THD
L1, THD I L3, THD I L2, THD I
c
Displayed values
row 1 imported harmonic
active. energy
Uh1n* % exported harmonic active energy
Ih1n* % cos(ϕ1) year
row 2 Uh2n* % Ih2n* % cos(ϕ2) monthrow 3 Uh3n* % Ih3n* %
cos(ϕ3) day
* Harmonic voltage (current) of L1, L2, L3 phases for n-harmonic Displayed quantities in the field 8 (fig. 5.) Table 2
Displayed symbols 3L A A W Var VA PF tg W
Displayed values in the row 4
Imean
3-phase I(N)
ΣP
3- phase
ΣQ
3-phase
ΣS
3-phase
PF
3-phase
tg
3-phase
ΣP 3-phase (15 min or
30 min or 60 min)
Backlit symbols c Hz % Displayed values
in the row 4 cos(ϕ) 3-phase hour : minutes frequency
Consumption of ordered power (in 15, 30 or 60 minutes’ time)

11
The exceeding of the upper indication range is signaled on the display by upper horizontal lines, however the exceeding of the lower range is signaled by lower horizontal lines. In case of averaged power measurement ΣP3-phase, single measurements are carried out with a 15 seconds’ quantum. Suitably to the 15 min, 30 min, 60 min selection, 60, 120 or 240 measurements are averaged. After starting the meter or the power erasing, the first value will be calculated after 15 seconds since the meter switching on or erasing. Till the time to obtain all active power samples, the value of averaged power is calculated from already measured samples. The current in the neutral wire I(N) is calculated from phase current vectors The value of consumed ordered power can be used for a previous warning against the exceeding of ordered power and to escape of fines related with it. The consumption of ordered power is calculated on the base of time interval set for the synchronization of the mean active power and the value of ordered power (section 6.5.1). the consumption example is presented in the section 6.5.3. The alarm switching on is signaled by the lighting of the AL1 inscription ( in the mode AL1-3: of AL1, AL2, AL3 inscriptions). The end of alarm duration at the alarm signaling support switched on, is indicated by the pulsation of the AL1 inscription ( in the mode AL1-3: of AL1, AL2, AL3 inscriptions).
12
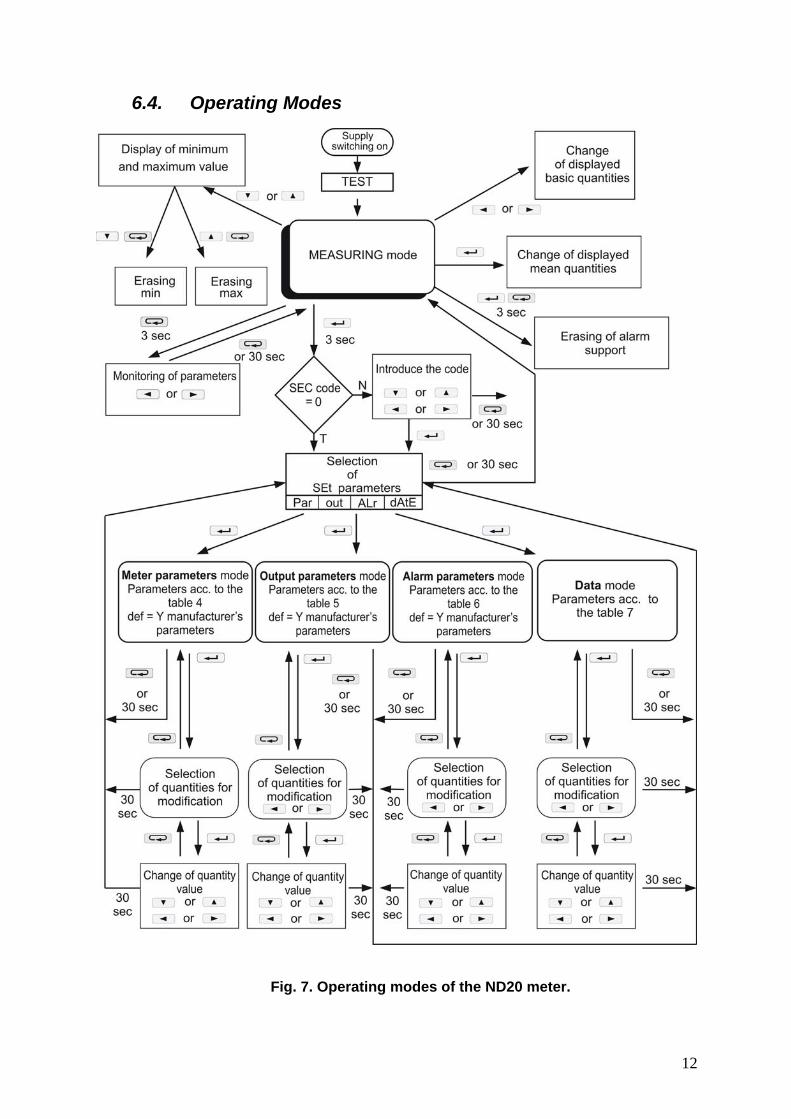
6.4. Operating Modes
Fig. 7. Operating modes of the ND20 meter.
13
6.5. Parameter Settings
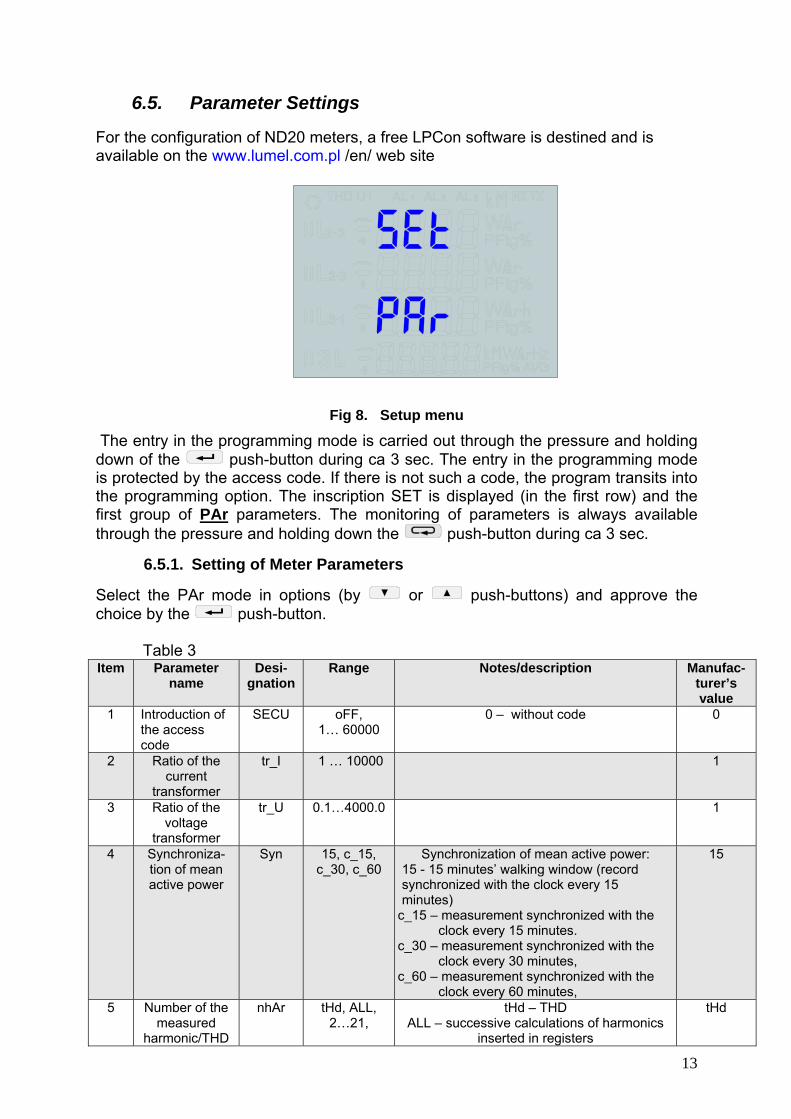
For the configuration of ND20 meters, a free LPCon software is destined and is available on the www.lumel.com.pl /en/ web site
Fig 8. Setup menu
The entry in the programming mode is carried out through the pressure and holding down of the push-button during ca 3 sec. The entry in the programming mode is protected by the access code. If there is not such a code, the program transits into the programming option. The inscription SET is displayed (in the first row) and the first group of PAr parameters. The monitoring of parameters is always available through the pressure and holding down the push-button during ca 3 sec.
6.5.1. Setting of Meter Parameters Select the PAr mode in options (by or push-buttons) and approve the choice by the push-button.
Table 3
Item Parameter name
Desi-gnation
Range Notes/description Manufac- turer’s value
1 Introduction of the access code
SECU oFF, 1… 60000
0 – without code 0
2 Ratio of the current
transformer
tr_I 1 … 10000 1
3 Ratio of the voltage
transformer
tr_U 0.1…4000.0 1
4 Synchroniza-tion of mean active power
Syn 15, c_15, c_30, c_60
Synchronization of mean active power: 15 - 15 minutes’ walking window (record synchronized with the clock every 15 minutes)
c_15 – measurement synchronized with the clock every 15 minutes. c_30 – measurement synchronized with the clock every 30 minutes, c_60 – measurement synchronized with the clock every 60 minutes,
15
5 Number of the measured
harmonic/THD
nhAr tHd, ALL, 2…21,
tHd – THD ALL – successive calculations of harmonics
inserted in registers
tHd

14
2…21 – harmonic number ( in this mode, the active energy is calculated)
6 Storage of
minimum and maximum
values with errors
erLi oFF, on oFF – storage of only correct values (from the measuring range).
on – storage of also error occurrences in measurements (values in registers 1e20 and
1e20)
on
7 Way to calculate
reactive power
q_t trGLE, sInUs TrGle: 22 PSQ −=
sinUs: ( )ii
k
iii IUIUQ ,sin**
1∠= ∑
=
k – harmonic number, k = 21 for 50 Hz, k = 18 for 60 Hz
trGLE
8 Way to calculate
reactive energy
En_q cAP, sIGn cAP – inductive and capacitive energy sIGn – positive and negative energy
cAP
9 Display backlit diSP oFF,1…60, on
off – disabled, on – enabled, 1..60 – time in seconds of backlit support since the push-
button pressure.
on
10 Erasing of watt-hour
meters
En 0 no, EnP, Enq, EnH,
ALL
no – lack of actions, EnP – erasing of active energy, Enq – erasing of reactive energy, EnH – erasing of harmonic energy. ALL –
erasing of all energy.
no
11 Erasing of mean active
power
PA 0 no, yES yES – erasing of power no
12 Erasingof mean active
power archive
PAr0 no, yES yES – erasing of archive no
13 Ordered power PAor 0…144.0 Ordered power for forecasting the power consumption in % of the rated value
100.0
14 Manufacturer’s parameters
dEf no, yES Restoration of manufacturer’s parameters of the group.
no
The automatic erasing of energy is carried out: - for active energy when changing: voltage or current ratio; - for reactive energy when changing: voltage or current ratio, the way of reactive power calculation; - for energy of harmonics when changing: voltage or current ratio, when changing the measured harmonic number. Values are set by means of and push-buttons, however the position of the set digit is selected by means of and push-buttons. The active position is signaled by the cursor. The value is accepted by the push-button and resigned by the pressure of the push-button. During the acceptation, the value insertion possibility in the range is checked. In case when the value is set beyond the range, the meter remains in the parameter edition mode, however the value is set on the maximum value (when the value is too higher) or on the minimum value (when the value is too lower).
15
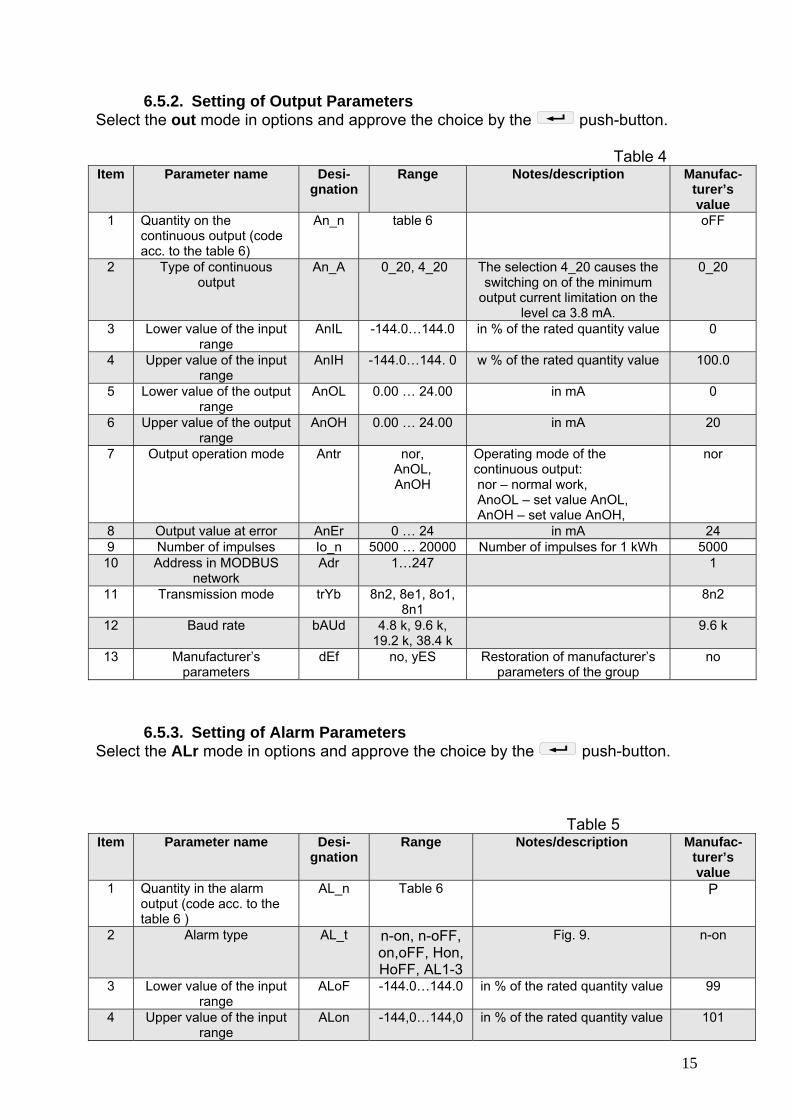
6.5.2. Setting of Output Parameters Select the out mode in options and approve the choice by the push-button.
Table 4
Item Parameter name Desi-gnation
Range Notes/description Manufac- turer’s value
1 Quantity on the continuous output (code acc. to the table 6)
An_n table 6 oFF
2 Type of continuous output
An_A 0_20, 4_20 The selection 4_20 causes the switching on of the minimum
output current limitation on the level ca 3.8 mA.
0_20
3 Lower value of the input range
AnIL -144.0…144.0 in % of the rated quantity value 0
4 Upper value of the input range
AnIH -144.0…144. 0 w % of the rated quantity value 100.0
5 Lower value of the output range
AnOL 0.00 … 24.00 in mA 0
6 Upper value of the output range
AnOH 0.00 … 24.00 in mA 20
7 Output operation mode Antr nor, AnOL, AnOH
Operating mode of the continuous output: nor – normal work, AnoOL – set value AnOL, AnOH – set value AnOH,
nor
8 Output value at error AnEr 0 … 24 in mA 24 9 Number of impulses Io_n 5000 … 20000 Number of impulses for 1 kWh 5000 10 Address in MODBUS
network Adr 1…247 1
11 Transmission mode trYb 8n2, 8e1, 8o1, 8n1
8n2
12 Baud rate bAUd 4.8 k, 9.6 k, 19.2 k, 38.4 k
9.6 k
13 Manufacturer’s parameters
dEf no, yES Restoration of manufacturer’s parameters of the group
no
6.5.3. Setting of Alarm Parameters Select the ALr mode in options and approve the choice by the push-button.
Table 5
Item Parameter name Desi-gnation
Range Notes/description Manufac- turer’s value
1 Quantity in the alarm output (code acc. to the table 6 )
AL_n Table 6 P
2 Alarm type AL_t n-on, n-oFF, on,oFF, Hon, HoFF, AL1-3
Fig. 9. n-on
3 Lower value of the input range
ALoF -144.0…144.0 in % of the rated quantity value 99
4 Upper value of the input range
ALon -144,0…144,0 in % of the rated quantity value 101

16
5 Time delay of the switching reaction
ALdt 0 … 900 in seconds ( for quantities AL._n =P_ord. the delay
occurs only when switching the alarm on.
0
6
Support of the alarm occurrence signaling
AL_S oFF, on In the situation when the support function is enabled, after the retreat of the alarm state the alarm symbol is not blanked but begins to pulsate. In the AL1-3 alarm mode, the signaling support is always enabled, independently of the setting. The signaling exists till the moment of blanking it by means of the and
push-buttons combination (during 3 seconds). The function concerns only and exclusively the alarm signaling, then relay contacts will be active without support, acc. to the selected type of alarm.
oFF
7 Interlocking of a renewed alarm switching on
AL._b 0…900 in seconds 0
8 Manufacturer’s parameters
dEf no, yES Restoration of manufacturer’s parameters of the group.
no
The write of the value ALon lower than ALoF switches the alarm off. Selection of the monitored value:
Table 6
Item/ value in register
4015 Displayed parameter Kind of quantity
Value for the percentage
conversion of alarm values and outputs
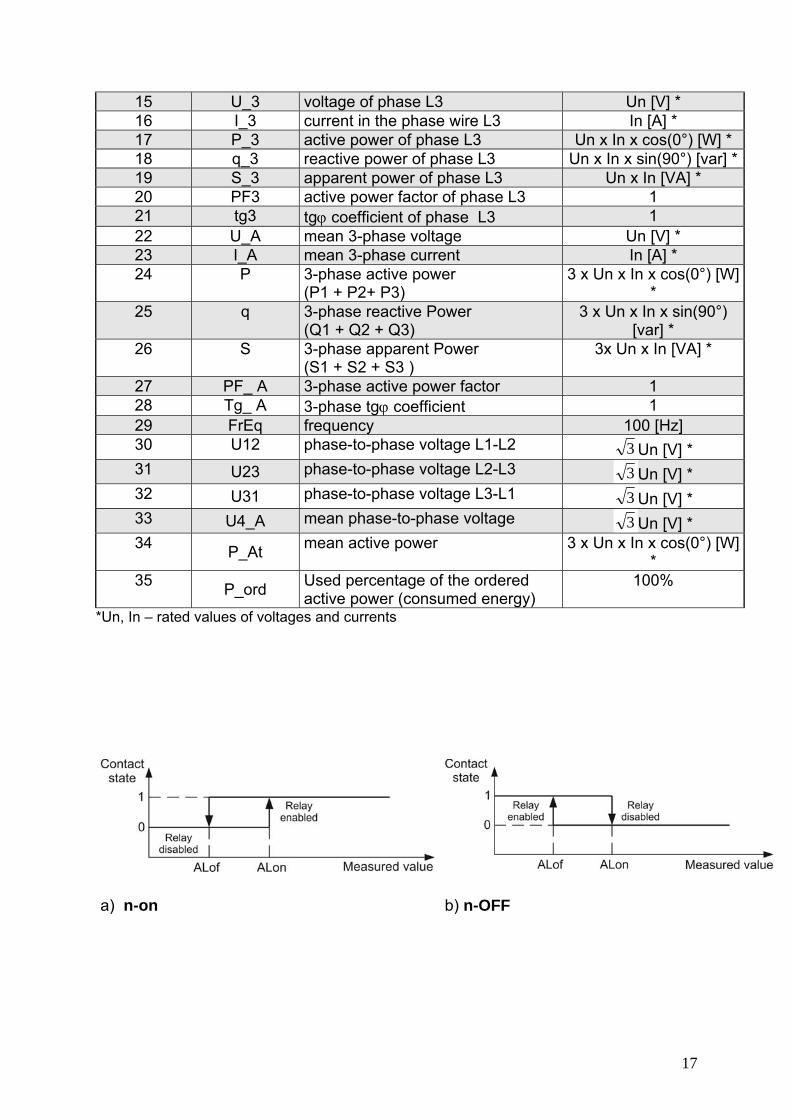
(100%) 00 off lack of quantity /alarm disabled/ none 01 U_1 voltage of phase L1 Un [V] * 02 I_1 current in the phase wire L1 In [A] * 03 P_1 active power of phase L1 Un x In x cos(0°) [W] * 04 q_1 reactive power of phase L1 Un x In x sin(90°) [var] *05 S_1 apparent power of phase L1 Un x In [VA] * 06 PF1 active power factor of phase L1 1 07 tg1 tgϕ coefficient of phase L1 1 08 U_2 voltage of phase L2 Un [V] * 09 I_2 current in the phase wire L2 In [A] * 10 P_2 active power of phase L2 Un x In x cos(0°) [W] * 11 q_2 reactive power of phase L2 Un x In x sin(90°) [var] *12 S_2 apparent power of phase L2 Un x In [VA] * 13 PF2 active power factor of phase L2 1 14 tg2 tgϕ coefficient of phase L2 1
17
15 U_3 voltage of phase L3 Un [V] * 16 I_3 current in the phase wire L3 In [A] * 17 P_3 active power of phase L3 Un x In x cos(0°) [W] * 18 q_3 reactive power of phase L3 Un x In x sin(90°) [var] *19 S_3 apparent power of phase L3 Un x In [VA] * 20 PF3 active power factor of phase L3 1 21 tg3 tgϕ coefficient of phase L3 1 22 U_A mean 3-phase voltage Un [V] * 23 I_A mean 3-phase current In [A] * 24 P 3-phase active power
(P1 + P2+ P3) 3 x Un x In x cos(0°) [W]
* 25 q 3-phase reactive Power
(Q1 + Q2 + Q3) 3 x Un x In x sin(90°)
[var] * 26 S 3-phase apparent Power
(S1 + S2 + S3 ) 3x Un x In [VA] *
27 PF_ A 3-phase active power factor 1 28 Tg_ A 3-phase tgϕ coefficient 1 29 FrEq frequency 100 [Hz] 30 U12 phase-to-phase voltage L1-L2 3 Un [V] * 31 U23 phase-to-phase voltage L2-L3 3 Un [V] * 32 U31 phase-to-phase voltage L3-L1 3 Un [V] * 33 U4_A mean phase-to-phase voltage 3 Un [V] * 34 P_At mean active power 3 x Un x In x cos(0°) [W]
* 35 P_ord Used percentage of the ordered
active power (consumed energy) 100%
*Un, In – rated values of voltages and currents
a) n-on b) n-OFF

18
c) On d) OFF
Fig. 9. Alarm types: a),b) normal c) disabled d) enabled.
Remaining types of the alarm:
− H-on – always enabled; − H-oFF – always disabled, − AL1-3 – in this mode, the alarm quantity must be from the range:0-7. When
the alarm appears on whichever phase, the relay will be enabled and the suitable symbol will be lighted
− ( AL1 – phase 1, AL2 – phase 2, AL3 – phase 3. It will be disabled only when all alarms disappear. Alarms operate in the n-on mode with identical hysteresis thresholds ALof and ALon for each phase.The alarm condition withdraw is signaled by the pulsation of the alarm symbol regardless of the set support value of the alarm signaling. The blanking of the signaling support follows after pressing and push-buttons (during 3 sec).
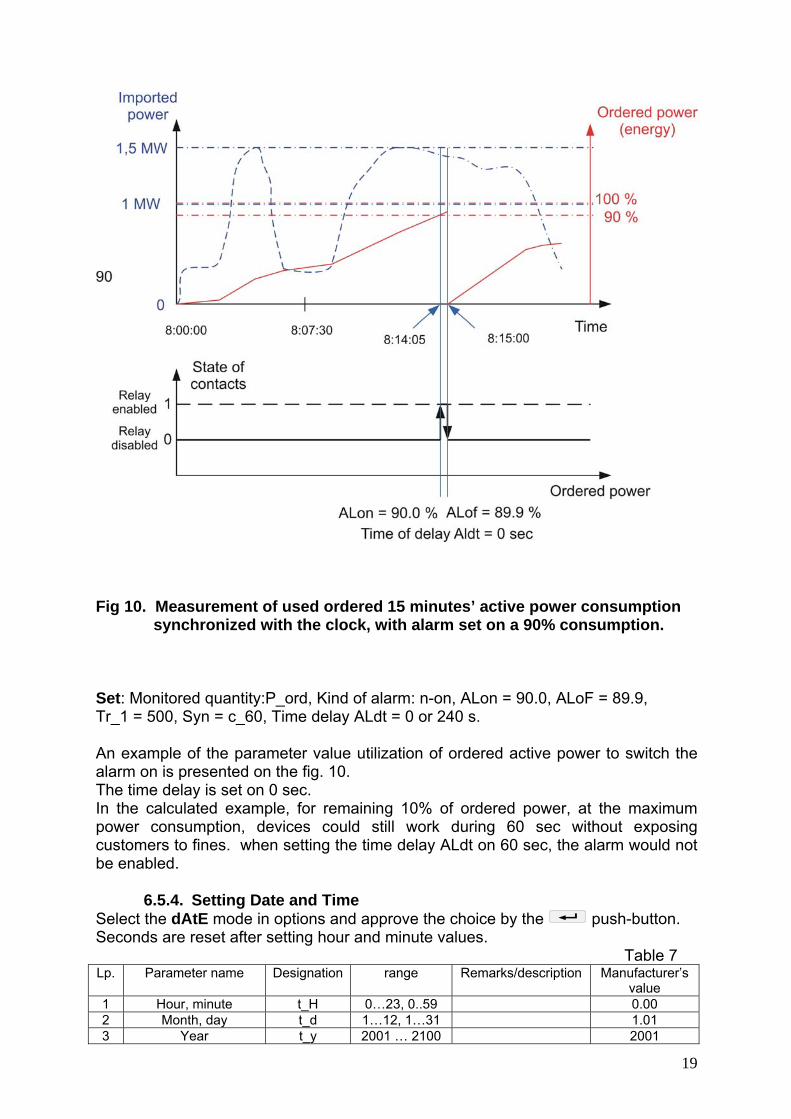
Example no 1 of alarm setting: Set the alarm of n-on type for the monitored quantity P – 3-phase active power, version: 5 A; 3 x 230/400 V. Switching the alarm on, after exceeding 3800 W, switching the alarm off after decreasing 3100 W. Calculate: rated 3-phase active power: P = 3 x 230 V x 5 A = 3450 W 3450 W – 100 % 3450 W – 100 % 3800 W – ALon % 3100 W – ALoF % It appears: ALon = 110 % ALoF = 90 % Set: Monitored quantity: P; Kind of alarm: n-on, ALon 110, ALoF 90.0. Example no 2 of alarm setting: Set the alarm of earliest warning about the possibility to exceed the ordered 1 MW power on the level 90% at the hourly accounting. Measuring current transformer 2500:5 A, voltage : 230 V, Instantaneous maximum import of power: 1.5 MW. Calculate: rated 3-phase active power of the ND20 meter: P = 3 x 230 V x 2500 A (500 * 5 A) = 1.725 MW (500 * 3450 W) – 100%; 90% of ordered power / rated power = 90.0% * 1 MW / 1.725 MW = 52.1 % of the rated meter value (rounding down). The’ ordered hourly power (energy for consumption): 1 MWh / 4 quarters = 900 MWs, 90% - 810 MWs. Remaining 10% at maximum power import would be used in time: 900 MWs / 1.5 MW = 60 s
19
Fig 10. Measurement of used ordered 15 minutes’ active power consumption synchronized with the clock, with alarm set on a 90% consumption. Set: Monitored quantity:P_ord, Kind of alarm: n-on, ALon = 90.0, ALoF = 89.9, Tr_1 = 500, Syn = c_60, Time delay ALdt = 0 or 240 s. An example of the parameter value utilization of ordered active power to switch the alarm on is presented on the fig. 10. The time delay is set on 0 sec. In the calculated example, for remaining 10% of ordered power, at the maximum power consumption, devices could still work during 60 sec without exposing customers to fines. when setting the time delay ALdt on 60 sec, the alarm would not be enabled.
6.5.4. Setting Date and Time Select the dAtE mode in options and approve the choice by the push-button. Seconds are reset after setting hour and minute values. Table 7 Lp. Parameter name Designation range Remarks/description Manufacturer’s
value 1 Hour, minute t_H 0…23, 0..59 0.00 2 Month, day t_d 1…12, 1…31 1.01 3 Year t_y 2001 … 2100 2001

20
6.6. Configuration of THD Measurement, Harmonics and
Energy for the Harmonic
The meter has 3 work modes related to the THD and harmonic calculation. When setting the parameter of the harmonic number: - tHd – the meter measures every 1 second only the THD value for currents and voltages, the result is exposed on the display and expressed in registers in percentages. Energy of harmonics is reset and particular harmonics include the error value (1e20); - All – the meter measures harmonics from 2 up to 21, for 50 Hz frequency (from 2 up to 18 for 60 Hz frequency). Energy of harmonics is reset. - 2 – 21 – measurement of the selected harmonic value, every 1 second, the result is exposed on the display and in basic units (V, A) in registers. Energy for the given harmonic is counted up. The switching of the harmonic number or the change of voltage or current ratio resets energy for harmonics.
6.7. Archive – Active Power Profile
The ND20 meter is equipped with an archive allowing to store up to 9000 measurements of mean active power. Mean active power PAV is archived with a 15, 30, 60 minutes’ interval of time, synchronized with the real time clock. In case of operation in the 15 minutes’ walking window mode, the archiving is performed in the same way as for the 15 minutes’ interval of time (fig. 11). The direct access to the archive is for 15 records including the date, time and value placed in the range of addresses 1000 -1077. The position of the first (oldest) archived sample is placed in the register 1000, however the position of the last archived sample (youngest) is placed in the register 1001. the value of the first record, from 15 available records placed in registers 1003 – 1077, is written in the register 1002. The write of the first read out record value (1 – 9000) causes the data updating of 15 records for readout. In registers, in which samples were not already been written, are 1e20 values. The archive is organized in the shape of a circular buffer. After writing the 9000 th value, the next overwrites the oldest with number 0, and the successive, the next with number 1, etc. If the value of the register 1000 is higher than 1001, that means that the buffer was overflowed one time at least. Eg, the value 15 in the register 1000, and 14 in the register 1001 means, that there were already more than nine thousand samples and oldest samples are from the record 15 up to 9000, next from the record 1 to the youngest record with number 14. The change of the current or voltage ratio, kind of mean power, causes the archive erasing. The reset of averaged power or the change of averaging time does not erase the archive. The automatic erasing of the archive and averaged power is performed when changing the voltage or current ratio.

21
Fig. 10. Measurement of 15 minutes’ mean active power synchronized with the clock. 7. RS-485 INTERFACE Parameter set of the serial ND20 meter link: ▪ identifier: 0xBC ▪ meter address:1..247 ▪ baud rate: 4.8, 9.6, 19.2, 38.4 kbit/s, ▪ working mode: Modbus RTU, ▪ information unit: 8N2, 8E1, 8O1, 8N1, ▪ maximum response time when requesting for archive: 1000 ms. ▪ maximum response time at remaining requests: 750 ms. ▪ maximum quantity of read out registers in one request - 40 registers – 4-byte registerss - 80 registers – 2-byte registers ▪ implemented functions: 03, 16, 17, - 03 - readout of registers, - 16 - write of registers, - 17 - device identification, Manufacturer’s settings: address 1, baud rate: 9600 baud, RTU 8N2 mode, Map of ND20 meter registers
In the ND20 meter, data are placed in 16 and 32-bit registers. Process variables and meter parameters are placed in the address area of registers in a way depended on the variable value type. Bits in 16-bit registers are numbered from the youngest to the oldest (b0-b15). 32-bit registers include numbers of float type in IEEE-754 standard. Sequence of 3210 bytes – the oldest is transmitted as the first.
22
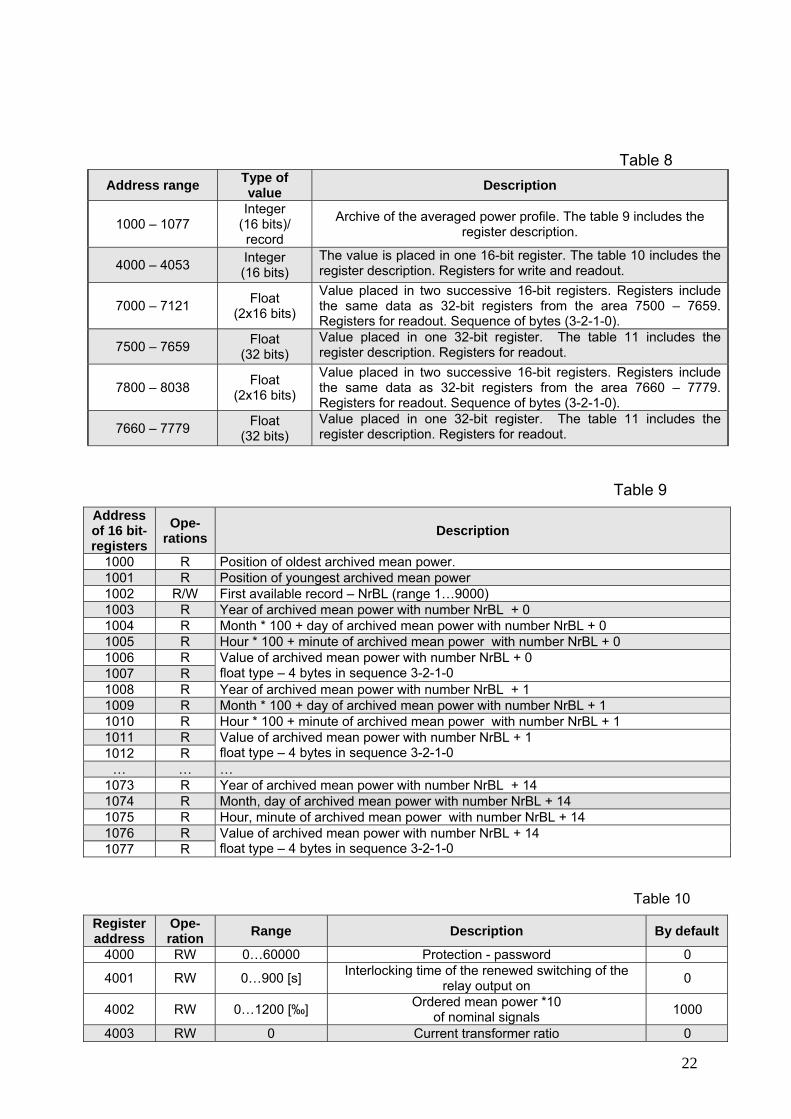
Table 8
Address range Type of value Description
1000 – 1077 Integer
(16 bits)/ record
Archive of the averaged power profile. The table 9 includes the register description.
4000 – 4053 Integer (16 bits)
The value is placed in one 16-bit register. The table 10 includes the register description. Registers for write and readout.
7000 – 7121 Float (2x16 bits)
Value placed in two successive 16-bit registers. Registers include the same data as 32-bit registers from the area 7500 – 7659. Registers for readout. Sequence of bytes (3-2-1-0).
7500 – 7659 Float (32 bits)
Value placed in one 32-bit register. The table 11 includes the register description. Registers for readout.
7800 – 8038 Float (2x16 bits)
Value placed in two successive 16-bit registers. Registers include the same data as 32-bit registers from the area 7660 – 7779. Registers for readout. Sequence of bytes (3-2-1-0).
7660 – 7779 Float (32 bits)
Value placed in one 32-bit register. The table 11 includes the register description. Registers for readout.
Table 9
Address of 16 bit- registers
Ope-rations Description
1000 R Position of oldest archived mean power. 1001 R Position of youngest archived mean power 1002 R/W First available record – NrBL (range 1…9000) 1003 R Year of archived mean power with number NrBL + 0 1004 R Month * 100 + day of archived mean power with number NrBL + 0 1005 R Hour * 100 + minute of archived mean power with number NrBL + 0 1006 R Value of archived mean power with number NrBL + 0
float type – 4 bytes in sequence 3-2-1-0 1007 R 1008 R Year of archived mean power with number NrBL + 1 1009 R Month * 100 + day of archived mean power with number NrBL + 1 1010 R Hour * 100 + minute of archived mean power with number NrBL + 1 1011 R Value of archived mean power with number NrBL + 1
float type – 4 bytes in sequence 3-2-1-0 1012 R … … …
1073 R Year of archived mean power with number NrBL + 14 1074 R Month, day of archived mean power with number NrBL + 14 1075 R Hour, minute of archived mean power with number NrBL + 14 1076 R Value of archived mean power with number NrBL + 14
float type – 4 bytes in sequence 3-2-1-0 1077 R
Table 10
Register address
Ope-ration Range Description By default
4000 RW 0…60000 Protection - password 0
4001 RW 0…900 [s] Interlocking time of the renewed switching of the relay output on 0
4002 RW 0…1200 [‰] Ordered mean power *10 of nominal signals 1000
4003 RW 0 Current transformer ratio 0

23
4002 RW 0 Reserved 0 4003 RW 1...10000 Current transformer ratio 1 4004 RW 1...40000 Voltage transformer ratio *10 10
4005 RW 0..3
Synchronization of mean active power: 0 – 15 minutes’ walking window (record synchronized every 15 minutes with the clock) 1 – measurement synchronized every 15 minutes with the clock 2 – measurement synchronized every 30 minutes with the clock 3 – measurement synchronized every 60 minutes with the clock
0
4006 RW 0…22
Number of the measured harmonic/ 0 – THD, 1 – all harmonics are successively
measured and placed in registers 7660-7780, 2…21 – harmonic number with energy.
0
4007 RW 0,1 Storage way of minimum and maximum values 0 – without errors, 1 – with errors
0
4008 RW 0.1
Way to calculate reactive power:
0 - 22 PSQ −=
1 - ( )ii
k
iii IUIUQ ,sin**
1∠= ∑
=
k – harmonic number, k = 21 for 50 Hz k = 18 dla 60 Hz
0
4009 RW 0.1 Way to calculate reactive energy:
0 – inductive and capacitive energy 1 – positive and negative energy
0
4010 RW 0…61 Display backlit: 0 – disabled, 1-60 – backlit time in
seconds since the push-button pressure, 61 – always enabled
61
4011 RW 0…4
Erasing of watt-hour meters: 0 – without changes, 1- erase active energy,
2 – erase reactive energy, 3 – erase energy of harmonics, 4 – erase all energy.
0
4012 RW 0.1 Erasing of mean active power PAV 0 4013 RW 0.1 Erasing of the averaged power archive 0 4014 RW 0.1 Erase min and max 0
4015 RW 0.1..35 Quantity on the alarm relay output (code acc. to the table 6)
24
4016 RW 0..6 Output type: 0 – n-on, 1– n-oFF, 2 – on, 3 - oFF, 4 – H-on, 5 – H-oFF, 6 - AL1-3 0
4017 RW -1440...0...1440 [o/oo]
Lower alarm switching value of the ratek input range 990
4018 RW -1440...0…440 [o/oo]
Upper alarm switching value of the ratek input range 1010
4019 RW 0..900 s Delay of the alarm switching ( for quantity AL_n = P_ord – rgister 4015 =35, the delay occurs only
when the alarm is switched on. 0
4020 RW 0.1 Alarm signaling support 0
4021 RW 0,1..35 Quantity on the continuous output no 1/ code acc. to the table 6 / 24
4022 RW 0.1 Continuous output type: 0 – 0...20 mA; 1 – 4…20 mA 0
4023 RW -1440..0..1440 [o/oo]
Lower value of the input range in [o/oo] of the rated input range. 0
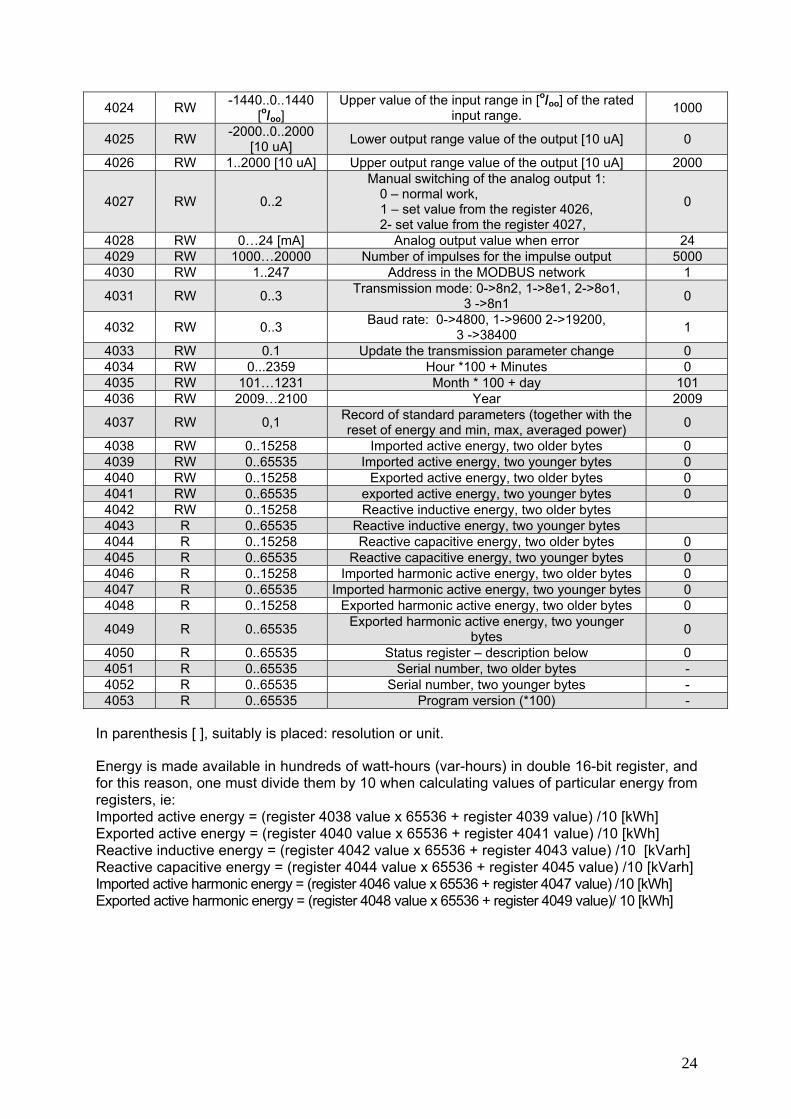
24
4024 RW -1440..0..1440 [o/oo]
Upper value of the input range in [o/oo] of the rated input range. 1000
4025 RW -2000..0..2000 [10 uA] Lower output range value of the output [10 uA] 0
4026 RW 1..2000 [10 uA] Upper output range value of the output [10 uA] 2000
4027 RW 0..2
Manual switching of the analog output 1: 0 – normal work,
1 – set value from the register 4026, 2- set value from the register 4027,
0
4028 RW 0…24 [mA] Analog output value when error 24 4029 RW 1000…20000 Number of impulses for the impulse output 5000 4030 RW 1..247 Address in the MODBUS network 1
4031 RW 0..3 Transmission mode: 0->8n2, 1->8e1, 2->8o1, 3 ->8n1 0
4032 RW 0..3 Baud rate: 0->4800, 1->9600 2->19200, 3 ->38400 1
4033 RW 0.1 Update the transmission parameter change 0 4034 RW 0...2359 Hour *100 + Minutes 0 4035 RW 101…1231 Month * 100 + day 101 4036 RW 2009…2100 Year 2009
4037 RW 0,1 Record of standard parameters (together with the reset of energy and min, max, averaged power) 0
4038 RW 0..15258 Imported active energy, two older bytes 0 4039 RW 0..65535 Imported active energy, two younger bytes 0 4040 RW 0..15258 Exported active energy, two older bytes 0 4041 RW 0..65535 exported active energy, two younger bytes 0 4042 RW 0..15258 Reactive inductive energy, two older bytes 4043 R 0..65535 Reactive inductive energy, two younger bytes 4044 R 0..15258 Reactive capacitive energy, two older bytes 0 4045 R 0..65535 Reactive capacitive energy, two younger bytes 0 4046 R 0..15258 Imported harmonic active energy, two older bytes 0 4047 R 0..65535 Imported harmonic active energy, two younger bytes 0 4048 R 0..15258 Exported harmonic active energy, two older bytes 0
4049 R 0..65535 Exported harmonic active energy, two younger bytes 0
4050 R 0..65535 Status register – description below 0 4051 R 0..65535 Serial number, two older bytes - 4052 R 0..65535 Serial number, two younger bytes - 4053 R 0..65535 Program version (*100) -
In parenthesis [ ], suitably is placed: resolution or unit.
Energy is made available in hundreds of watt-hours (var-hours) in double 16-bit register, and for this reason, one must divide them by 10 when calculating values of particular energy from registers, ie: Imported active energy = (register 4038 value x 65536 + register 4039 value) /10 [kWh] Exported active energy = (register 4040 value x 65536 + register 4041 value) /10 [kWh] Reactive inductive energy = (register 4042 value x 65536 + register 4043 value) /10 [kVarh] Reactive capacitive energy = (register 4044 value x 65536 + register 4045 value) /10 [kVarh] Imported active harmonic energy = (register 4046 value x 65536 + register 4047 value) /10 [kWh] Exported active harmonic energy = (register 4048 value x 65536 + register 4049 value)/ 10 [kWh]

25
Status register: Bit 15 – „1” – damage of the non-volatile memory Bit 7 – „1” – the interval of averaged power is not
elapsed Bit 14 – „1” – lack of calibration or erroneous calibration
Bit 6 – „1” – frequency for THD calculation beyond intervals
− 48 – 52 for frequency 50 Hz, − 58 – 62 for frequency 60 Hz
Bit 13 – „1” – error of parameter values Bit 5 – „1” – voltage too low for frequency
measurements
Bit 12 – „1” – error of energy values Bit 4 – „1” – too low voltage of phase C
Bit 11 – „1” – error of phase sequence Bit 3 – „1” – too low voltage of phase B Bit 10 – current range „0” – 1 A~; 1” – 5 A~ Bit 2 – „1” – too low voltage of phase A
Bit 1 – the RTC time battery is used up
Bit 0 – state of relay output „1” – On, „0” - off
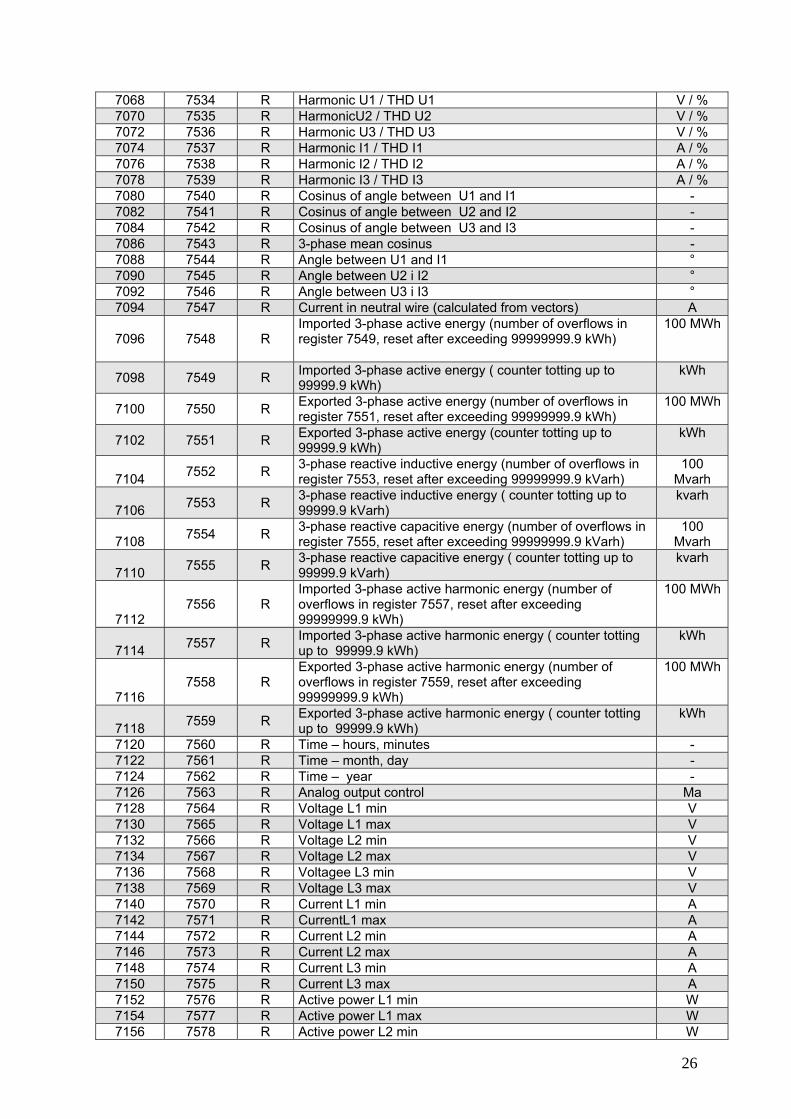
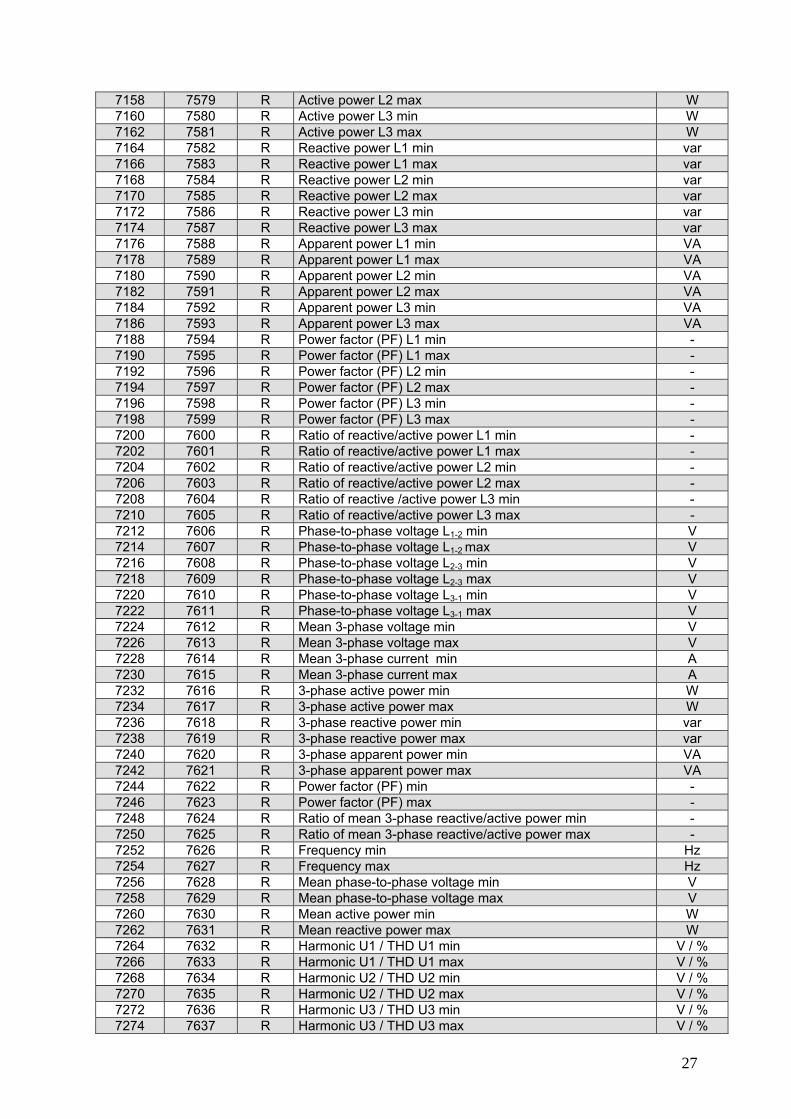
Table 11 Address of 16-bit registers
Address of 32-bit registers
Opera-tion Description
Unit
7000 7500 R Voltage of phase L1 V 7002 7501 R Current in phase L1 A 7004 7502 R Active power of phase L1 W 7006 7503 R Reactive power of phase L1 var 7008 7504 R Apparent power of phase L1 VA 7010 7505 R Power factor (PF) of phase L1 - 7012 7506 R Ratio of reactive power/active power of phase L1 - 7014 7507 R Voltage of phase L2 V 7016 7508 R Current in phase L2 A 7018 7509 R Active power of phase L2 W 7020 7510 R Reactive power of phase L2 var 7022 7511 R Apparent power of phase L2 VA 7024 7512 R Power factor (PF) of phase L2 - 7026 7513 R Ratio of reactive power/active power of phase L2 - 7028 7514 R Voltage of phase L3 V 7030 7515 R Current in phase L3 A 7032 7516 R Active power of phase L3 W 7034 7517 R Reactive power of phase L3 var 7036 7518 R Apparent power of phase L3 VA 7038 7519 R Power factor (PF) of phase L3 - 7040 7520 R Ratio of reactive power/active power of phase L3 - 7042 7521 R Mean 3-phase voltage V 7044 7522 R Mean 3-phase current A 7046 7523 R 3-phase active power W 7048 7524 R 3-phase reactive power var 7050 7525 R 3-phase apparent power VA 7052 7526 R Mean power factor (PF) - 7054 7527 R Mean ratio of reactive power/ active power - 7056 7528 R Frequency Hz 7058 7529 R Phase-to-phase voltage L1-2 V 7060 7530 R Phase-to-phase voltage L2-3 V 7062 7531 R Phase-to-phase voltage L3-1 V 7064 7532 R Mean phase-to-phase voltage V 7066 7533 R 3-phase 15, 30, 60 minutes’ active Power (P1 + P2 + P3) W
Bit 9 Bit 8 Voltage range 0 0 57.7 V~ 0 1 230 V~
26
7068 7534 R Harmonic U1 / THD U1 V / % 7070 7535 R HarmonicU2 / THD U2 V / % 7072 7536 R Harmonic U3 / THD U3 V / % 7074 7537 R Harmonic I1 / THD I1 A / % 7076 7538 R Harmonic I2 / THD I2 A / % 7078 7539 R Harmonic I3 / THD I3 A / % 7080 7540 R Cosinus of angle between U1 and I1 - 7082 7541 R Cosinus of angle between U2 and I2 - 7084 7542 R Cosinus of angle between U3 and I3 - 7086 7543 R 3-phase mean cosinus - 7088 7544 R Angle between U1 and I1 ° 7090 7545 R Angle between U2 i I2 ° 7092 7546 R Angle between U3 i I3 ° 7094 7547 R Current in neutral wire (calculated from vectors) A
7096 7548 R Imported 3-phase active energy (number of overflows in register 7549, reset after exceeding 99999999.9 kWh)
100 MWh
7098 7549 R Imported 3-phase active energy ( counter totting up to 99999.9 kWh)
kWh
7100 7550 R Exported 3-phase active energy (number of overflows in register 7551, reset after exceeding 99999999.9 kWh)
100 MWh
7102 7551 R Exported 3-phase active energy (counter totting up to 99999.9 kWh)
kWh
7104 7552 R 3-phase reactive inductive energy (number of overflows in register 7553, reset after exceeding 99999999.9 kVarh)
100 Mvarh
7106 7553 R 3-phase reactive inductive energy ( counter totting up to 99999.9 kVarh)
kvarh
7108 7554 R 3-phase reactive capacitive energy (number of overflows in register 7555, reset after exceeding 99999999.9 kVarh)
100 Mvarh
7110 7555 R 3-phase reactive capacitive energy ( counter totting up to 99999.9 kVarh)
kvarh
7112 7556 R
Imported 3-phase active harmonic energy (number of overflows in register 7557, reset after exceeding 99999999.9 kWh)
100 MWh
7114 7557 R Imported 3-phase active harmonic energy ( counter totting up to 99999.9 kWh)
kWh
7116 7558 R
Exported 3-phase active harmonic energy (number of overflows in register 7559, reset after exceeding 99999999.9 kWh)
100 MWh
7118 7559 R Exported 3-phase active harmonic energy ( counter totting up to 99999.9 kWh)
kWh
7120 7560 R Time – hours, minutes - 7122 7561 R Time – month, day - 7124 7562 R Time – year - 7126 7563 R Analog output control Ma 7128 7564 R Voltage L1 min V 7130 7565 R Voltage L1 max V 7132 7566 R Voltage L2 min V 7134 7567 R Voltage L2 max V 7136 7568 R Voltagee L3 min V 7138 7569 R Voltage L3 max V 7140 7570 R Current L1 min A 7142 7571 R CurrentL1 max A 7144 7572 R Current L2 min A 7146 7573 R Current L2 max A 7148 7574 R Current L3 min A 7150 7575 R Current L3 max A 7152 7576 R Active power L1 min W 7154 7577 R Active power L1 max W 7156 7578 R Active power L2 min W
27
7158 7579 R Active power L2 max W 7160 7580 R Active power L3 min W 7162 7581 R Active power L3 max W 7164 7582 R Reactive power L1 min var 7166 7583 R Reactive power L1 max var 7168 7584 R Reactive power L2 min var 7170 7585 R Reactive power L2 max var 7172 7586 R Reactive power L3 min var 7174 7587 R Reactive power L3 max var 7176 7588 R Apparent power L1 min VA 7178 7589 R Apparent power L1 max VA 7180 7590 R Apparent power L2 min VA 7182 7591 R Apparent power L2 max VA 7184 7592 R Apparent power L3 min VA 7186 7593 R Apparent power L3 max VA 7188 7594 R Power factor (PF) L1 min - 7190 7595 R Power factor (PF) L1 max - 7192 7596 R Power factor (PF) L2 min - 7194 7597 R Power factor (PF) L2 max - 7196 7598 R Power factor (PF) L3 min - 7198 7599 R Power factor (PF) L3 max - 7200 7600 R Ratio of reactive/active power L1 min - 7202 7601 R Ratio of reactive/active power L1 max - 7204 7602 R Ratio of reactive/active power L2 min - 7206 7603 R Ratio of reactive/active power L2 max - 7208 7604 R Ratio of reactive /active power L3 min - 7210 7605 R Ratio of reactive/active power L3 max - 7212 7606 R Phase-to-phase voltage L1-2 min V 7214 7607 R Phase-to-phase voltage L1-2 max V 7216 7608 R Phase-to-phase voltage L2-3 min V 7218 7609 R Phase-to-phase voltage L2-3 max V 7220 7610 R Phase-to-phase voltage L3-1 min V 7222 7611 R Phase-to-phase voltage L3-1 max V 7224 7612 R Mean 3-phase voltage min V 7226 7613 R Mean 3-phase voltage max V 7228 7614 R Mean 3-phase current min A 7230 7615 R Mean 3-phase current max A 7232 7616 R 3-phase active power min W 7234 7617 R 3-phase active power max W 7236 7618 R 3-phase reactive power min var 7238 7619 R 3-phase reactive power max var 7240 7620 R 3-phase apparent power min VA 7242 7621 R 3-phase apparent power max VA 7244 7622 R Power factor (PF) min - 7246 7623 R Power factor (PF) max - 7248 7624 R Ratio of mean 3-phase reactive/active power min - 7250 7625 R Ratio of mean 3-phase reactive/active power max - 7252 7626 R Frequency min Hz 7254 7627 R Frequency max Hz 7256 7628 R Mean phase-to-phase voltage min V 7258 7629 R Mean phase-to-phase voltage max V 7260 7630 R Mean active power min W 7262 7631 R Mean reactive power max W 7264 7632 R Harmonic U1 / THD U1 min V / % 7266 7633 R Harmonic U1 / THD U1 max V / % 7268 7634 R Harmonic U2 / THD U2 min V / % 7270 7635 R Harmonic U2 / THD U2 max V / % 7272 7636 R Harmonic U3 / THD U3 min V / % 7274 7637 R Harmonic U3 / THD U3 max V / %

28
7276 7638 R Harmonic I1 / THD I1 min A / % 7278 7639 R Harmonic I1 / THD I1 max A / % 7280 7640 R Harmonic I2 / THD I2 min A / % 7282 7641 R Harmonic I2 / THD I2 max A / % 7284 7642 R Harmonic I3 / THD I3 min A / % 7286 7643 R Harmonic I3 / THD I3 max A / % 7288 7644 R Cosinus of angle between U1 i I1 min - 7290 7645 R Cosinus of angle between U1 i I1 max 7292 7646 R Cosinus of angle between U2 i I2 min - 7294 7647 R Cosinus of angle between U2 i I2 max - 7296 7648 R Cosinus of angle between U3 i I3 min - 7298 7649 R Cosinus of angle between U3 i I3 max - 7300 7650 R Mean 3-phase cos min - 7302 7651 R Mean 3-phase cos max - 7304 7652 R Angle between U1 i I1 min ° 7306 7653 R Angle between U1 i I1 max ° 7308 7654 R Angle between U2 i I2 min ° 7310 7655 R Angle between U2 i I2 max ° 7312 7656 R Angle between U3 i I3 min ° 7314 7657 R Anlgle between U3 i I3 max ° 7316 7658 R Current in neutral wire min A 7318 7659 R Current in neutral wire max A 7800 7660 R U1 – harmonic 2 %
… … … … … 7838 7679 R U1 - harmonic 21 % 7840 7680 R U2 - harmonic 2 %
… … … … … 7878 7699 R U2 - harmonic 21 % 7880 7700 R U3 - harmonic 2 %
… … … … … 7918 7719 R U3 - harmonic 21 % 7920 7720 R I1 - harmonic 2 %
… … … … … 7958 7739 R I1 - harmonic 21 % 7960 7740 R I2 – harmonic 2 %
… … … … … 7998 7759 R I2 - harmonic 21 % 8000 7760 R I3 - harmonic 2 %
… … … … … 8038 7779 R I3 - harmonic 21 % 8040 7780 R Consumed ordered power %
In case of a lower exceeding the value -1e20 is written in, however after an upper exceeding or error occurrence, the value 1e20 is written.
29
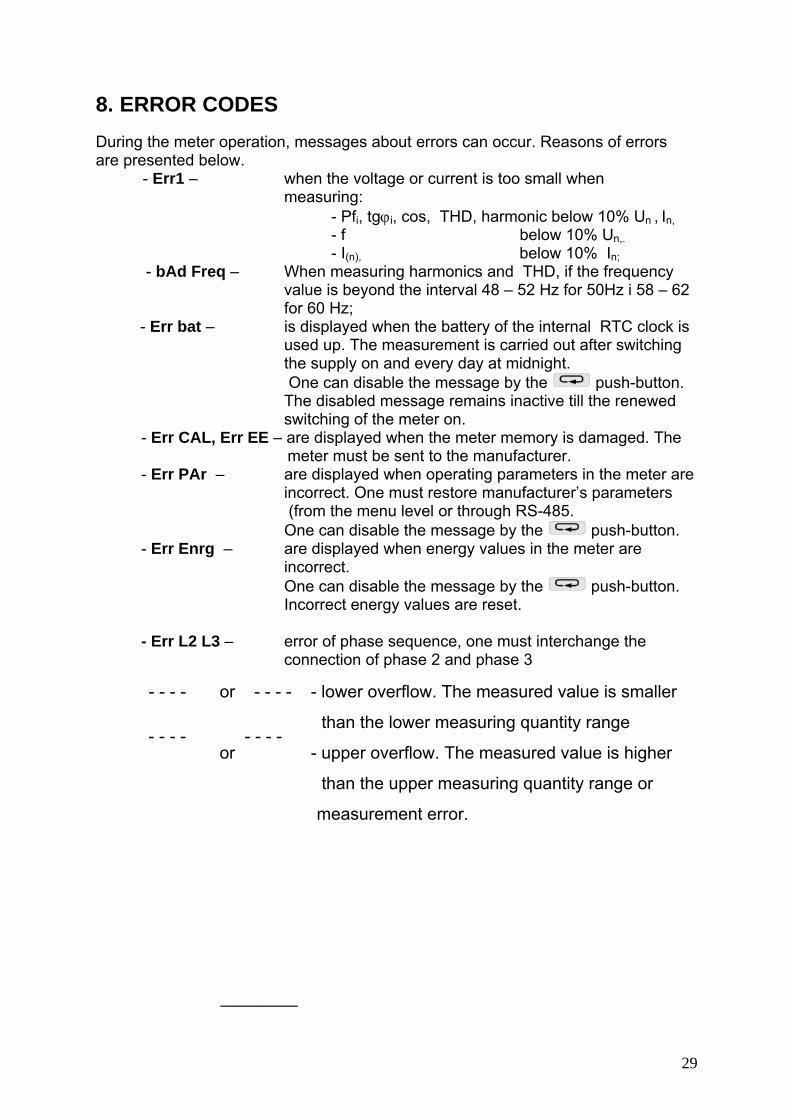
8. ERROR CODES During the meter operation, messages about errors can occur. Reasons of errors are presented below.
- Err1 – when the voltage or current is too small when measuring:
- Pfi, tgϕi, cos, THD, harmonic below 10% Un , In, - f below 10% Un,.
- I(n), below 10% In;
- bAd Freq – When measuring harmonics and THD, if the frequency value is beyond the interval 48 – 52 Hz for 50Hz i 58 – 62 for 60 Hz;
- Err bat – is displayed when the battery of the internal RTC clock is used up. The measurement is carried out after switching the supply on and every day at midnight. One can disable the message by the push-button. The disabled message remains inactive till the renewed switching of the meter on.
- Err CAL, Err EE – are displayed when the meter memory is damaged. The meter must be sent to the manufacturer. - Err PAr – are displayed when operating parameters in the meter are incorrect. One must restore manufacturer’s parameters (from the menu level or through RS-485. One can disable the message by the push-button. - Err Enrg – are displayed when energy values in the meter are
incorrect. One can disable the message by the push-button. Incorrect energy values are reset. - Err L2 L3 – error of phase sequence, one must interchange the connection of phase 2 and phase 3
- - - - or - - - - - lower overflow. The measured value is smaller
than the lower measuring quantity range
- - - -
or - - - -
- upper overflow. The measured value is higher
than the upper measuring quantity range or
measurement error.
________
30
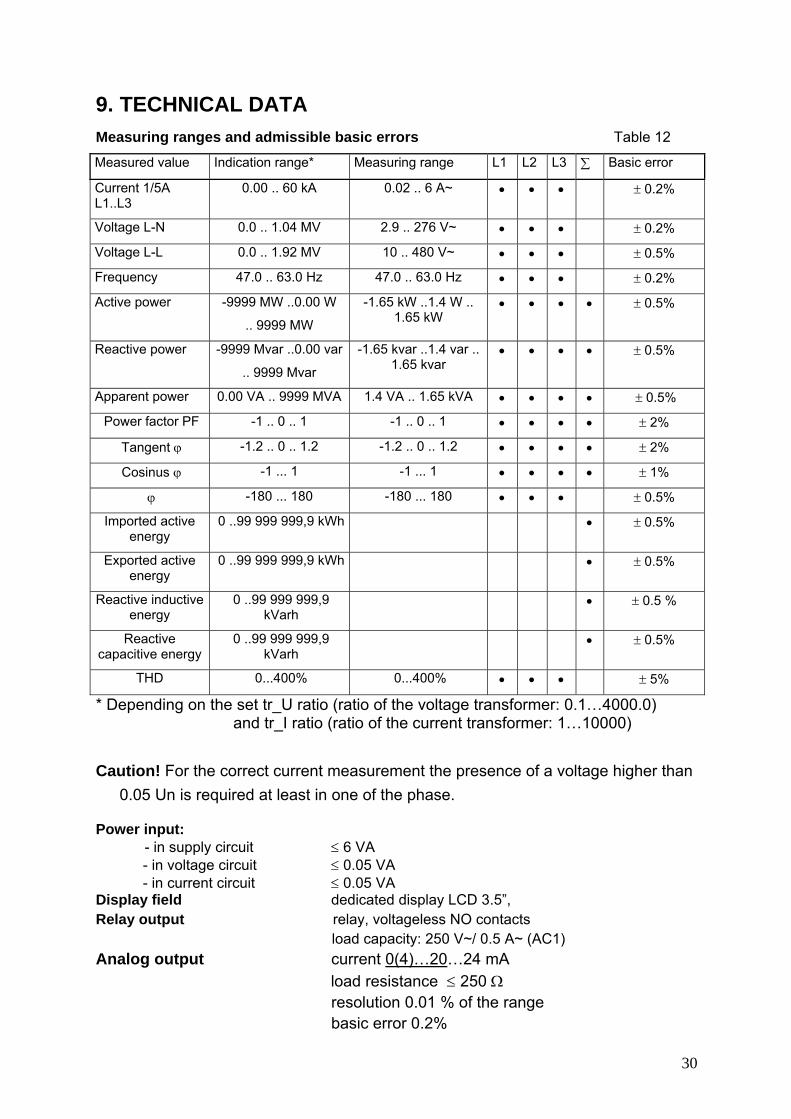
9. TECHNICAL DATA Measuring ranges and admissible basic errors Table 12
Measured value Indication range* Measuring range L1 L2 L3 ∑ Basic error
Current 1/5A L1..L3
0.00 .. 60 kA 0.02 .. 6 A~ • • • ± 0.2%
Voltage L-N 0.0 .. 1.04 MV 2.9 .. 276 V~ • • • ± 0.2%
Voltage L-L 0.0 .. 1.92 MV 10 .. 480 V~ • • • ± 0.5%
Frequency 47.0 .. 63.0 Hz 47.0 .. 63.0 Hz • • • ± 0.2%
Active power -9999 MW ..0.00 W
.. 9999 MW
-1.65 kW ..1.4 W .. 1.65 kW
• • • • ± 0.5%
Reactive power -9999 Mvar ..0.00 var
.. 9999 Mvar
-1.65 kvar ..1.4 var .. 1.65 kvar
• • • • ± 0.5%
Apparent power 0.00 VA .. 9999 MVA 1.4 VA .. 1.65 kVA • • • • ± 0.5%
Power factor PF -1 .. 0 .. 1 -1 .. 0 .. 1 • • • • ± 2%
Tangent ϕ -1.2 .. 0 .. 1.2 -1.2 .. 0 .. 1.2 • • • • ± 2%
Cosinus ϕ -1 ... 1 -1 ... 1 • • • • ± 1%
ϕ -180 ... 180 -180 ... 180 • • • ± 0.5%
Imported active energy
0 ..99 999 999,9 kWh • ± 0.5%
Exported active energy
0 ..99 999 999,9 kWh • ± 0.5%
Reactive inductive energy
0 ..99 999 999,9 kVarh
• ± 0.5 %
Reactive capacitive energy
0 ..99 999 999,9 kVarh
• ± 0.5%
THD 0...400% 0...400% • • • ± 5%
* Depending on the set tr_U ratio (ratio of the voltage transformer: 0.1…4000.0) and tr_I ratio (ratio of the current transformer: 1…10000) Caution! For the correct current measurement the presence of a voltage higher than
0.05 Un is required at least in one of the phase. Power input: - in supply circuit ≤ 6 VA - in voltage circuit ≤ 0.05 VA - in current circuit ≤ 0.05 VA Display field dedicated display LCD 3.5”, Relay output relay, voltageless NO contacts load capacity: 250 V~/ 0.5 A~ (AC1) Analog output current 0(4)…20…24 mA load resistance ≤ 250 Ω resolution 0.01 % of the range basic error 0.2%
31
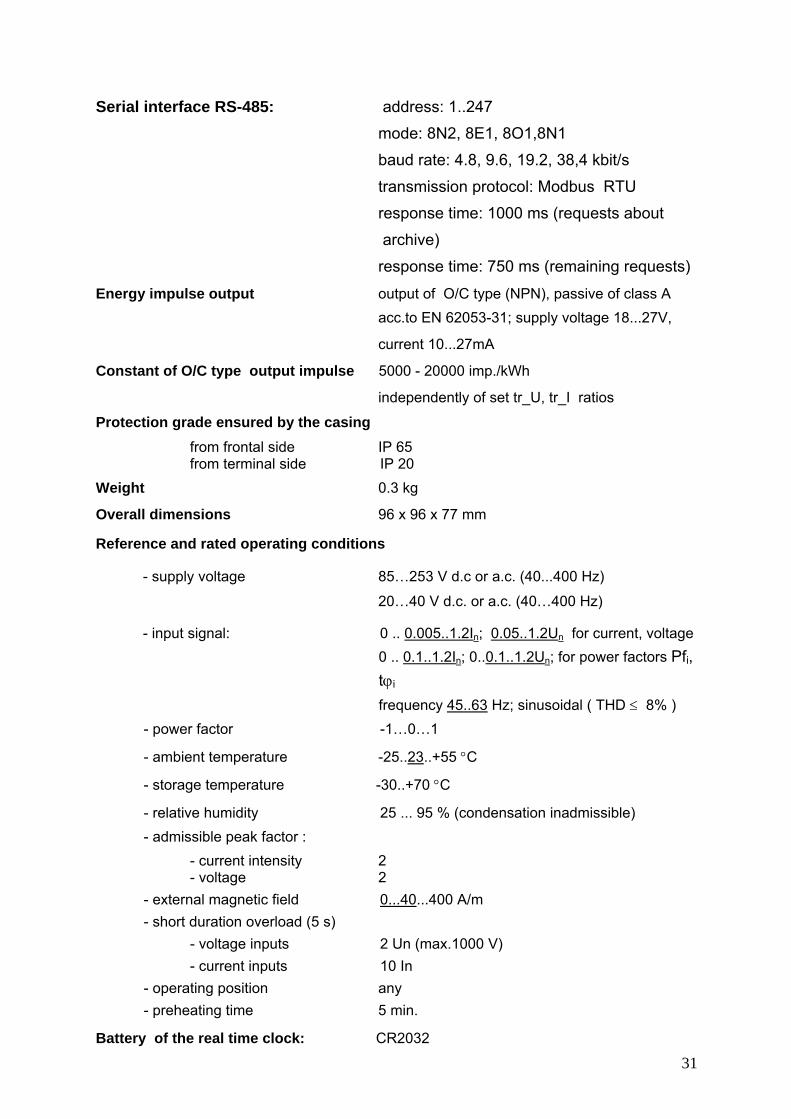
Serial interface RS-485: address: 1..247
mode: 8N2, 8E1, 8O1,8N1
baud rate: 4.8, 9.6, 19.2, 38,4 kbit/s
transmission protocol: Modbus RTU
response time: 1000 ms (requests about
archive)
response time: 750 ms (remaining requests)
Energy impulse output output of O/C type (NPN), passive of class A acc.to EN 62053-31; supply voltage 18...27V,
current 10...27mA
Constant of O/C type output impulse 5000 - 20000 imp./kWh
independently of set tr_U, tr_I ratios
Protection grade ensured by the casing from frontal side IP 65
from terminal side IP 20 Weight 0.3 kg
Overall dimensions 96 x 96 x 77 mm
Reference and rated operating conditions
- supply voltage 85…253 V d.c or a.c. (40...400 Hz)
20…40 V d.c. or a.c. (40…400 Hz)
- input signal: 0 .. 0.005..1.2In; 0.05..1.2Un for current, voltage 0 .. 0.1..1.2In; 0..0.1..1.2Un; for power factors Pfi, tϕi
frequency 45..63 Hz; sinusoidal ( THD ≤ 8% ) - power factor -1…0…1
- ambient temperature -25..23..+55 °C
- storage temperature -30..+70 °C
- relative humidity 25 ... 95 % (condensation inadmissible) - admissible peak factor : - current intensity 2
- voltage 2 - external magnetic field 0...40...400 A/m - short duration overload (5 s)
- voltage inputs 2 Un (max.1000 V) - current inputs 10 In
- operating position any - preheating time 5 min.
Battery of the real time clock: CR2032
32
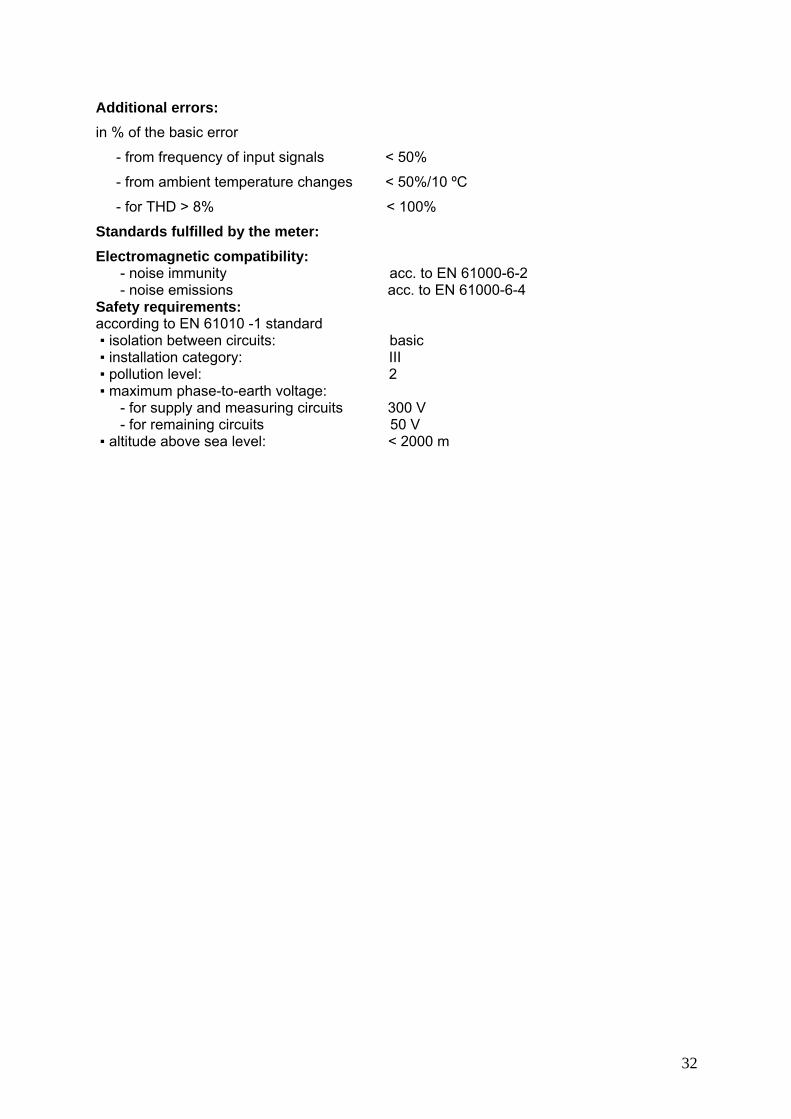
Additional errors: in % of the basic error
- from frequency of input signals < 50%
- from ambient temperature changes < 50%/10 ºC
- for THD > 8% < 100%
Standards fulfilled by the meter: Electromagnetic compatibility: - noise immunity acc. to EN 61000-6-2 - noise emissions acc. to EN 61000-6-4 Safety requirements: according to EN 61010 -1 standard ▪ isolation between circuits: basic ▪ installation category: III ▪ pollution level: 2 ▪ maximum phase-to-earth voltage: - for supply and measuring circuits 300 V - for remaining circuits 50 V ▪ altitude above sea level: < 2000 m

33
10. ORDERING CODES Table 13
Meter of network parameters ND20 X X X X XX X X
Current input In: 1 A (X/1) 1 5 A (X/5) 2 Voltage input (phase/phase-to-phase) Un: 3 x 57.7/100 V 1 3 x 230/400 V 2 Analog current output: without analog output 0 with programmable output: 0(4)…20 mA 1 Supply voltage: 85…253 V d.c. or a.c. (40…400 Hz) 1 20…40 V d.c. or a.c. (40…400 Hz) 2 Kind of version: standard 00 custom-made* XX Language: Polish P English E other X Acceptance tests: without extra quality requirements 0 with an extra quality inspection certificate 1 acc. to customer’s requirements* X *After agreeing with the manufacturer. Example of Order: When ordering please respect successive code numbers. The code: ND20- 2-2-1-1- 00- E-1 means: ND20 – meter of network parameters of ND20 type 2 – current input In : 5 A (x/5), 2 -- input voltage (phase/phase-to-phase) Un = 3 x 230/400 V, 1 – with programmable analog output, 1 – supply voltage: 85…253 V a.c./d.c., 00 – standard version E – all descriptions and user’s manual in English, 1 – with an extra quality inspection certificate.
34
11. MAINTENANCE AND GUARANTEE The ND20 meter does not require any periodical maintenance.
In case of some incorrect operations:
After the dispatch date and in the period stated in the guarantee card:
One should return the instrument to the Manufacturer’s Quality Inspection Dept.
If the instrument has been used in compliance with the instructions, we guarantee
to repair it free of charge.
The disassembling of the housing causes the cancellation of the granted guarantee.
After the guarantee period:
One should turn over the instrument to repair it in a certified service workshop.
Our policy is one of continuous improvement and we reserve
the right to make changes in design and specifications of any
products as engineering advances or necessity requires and to
revise the above specifications without notice.

35
ND20- 09/01 (20.09.2010)