American Journal of Potato Research
26
American Journal of Potato Research Benchmarking Food Crop Diversity in Southern Africa: The Case of Potatoes and Potato Products 1961-2010 --Manuscript Draft-- Manuscript Number: Full Title: Benchmarking Food Crop Diversity in Southern Africa: The Case of Potatoes and Potato Products 1961-2010 Article Type: Original Research Keywords: Markets; trade; production; consumption; technology; private sector Corresponding Author: Gregory Scott, Ph.D. Pontificia Universidad Catolica del Peru Lima, PERU Corresponding Author Secondary Information: Corresponding Author's Institution: Pontificia Universidad Catolica del Peru Corresponding Author's Secondary Institution: First Author: Gregory Scott, Ph.D. First Author Secondary Information: Order of Authors: Gregory Scott, Ph.D. Ricardo Labarta, PhD Victor Suarez, Ms Order of Authors Secondary Information: Abstract: No other region in the world is experiencing the pressures on food production and utilization like Sub-Saharan Africa. With growth rates for population over 2.0%/yr in many countries and urban consumers often eager to diversify their diets, new markets are also opening up. Given these developments, growers, traders and governments are seeking out new ways to capitalize on these developments. This paper examines the evolution of growth rates in potato production, utilization and trade in Southern Africa over nearly the last half century using FAO annual secondary data. After highlighting the different roles that potatoes have played in crop diversification across the sub-region, the paper identifies some key issues for future research as well as some opportunities for industry both large and small. Ninguna región en el mundo enfrenta las presiones sobre la producción e ultilización de alimentos que desafian Africa Sub-Sahariana. Con tasas de crecimiento anual poblacional encima de 2,0% en muchos paises y con consumidores urbanos con ganas de diversificar sus dietas, nuevos mercados están abriendo. Dado esta situación, productores, comerciantes y gobiernos están interesados en aprovechar dichas tendencias. Este articulo examina la evolución de las tasas de crecimiento de la producción, utilización y comercio de la papa en Africa del Sur durante casi el ultimo medio ciclo utilizando los datos de la FAO. Despues de subrayar los diferentes papeles que la papa ha tenido en la diversificación agricola a lo largo de la sub-region durante ese periodo, se identifica algunos temas clave para futuras investigaciónes además de algunas oportunidades para la industria tanta grande como pequeña. Powered by Editorial Manager® and Preprint Manager® from Aries Systems Corporation
-
Upload
khangminh22 -
Category
Documents
-
view
3 -
download
0
Transcript of American Journal of Potato Research
American Journal of Potato Research
Benchmarking Food Crop Diversity in Southern Africa: The Case of Potatoes andPotato Products 1961-2010
--Manuscript Draft--
Manuscript Number:
Full Title: Benchmarking Food Crop Diversity in Southern Africa: The Case of Potatoes andPotato Products 1961-2010
Article Type: Original Research
Keywords: Markets; trade; production; consumption; technology; private sector
Corresponding Author: Gregory Scott, Ph.D.Pontificia Universidad Catolica del PeruLima, PERU
Corresponding Author SecondaryInformation:
Corresponding Author's Institution: Pontificia Universidad Catolica del Peru
Corresponding Author's SecondaryInstitution:
First Author: Gregory Scott, Ph.D.
First Author Secondary Information:
Order of Authors: Gregory Scott, Ph.D.
Ricardo Labarta, PhD
Victor Suarez, Ms
Order of Authors Secondary Information:
Abstract: No other region in the world is experiencing the pressures on food production andutilization like Sub-Saharan Africa. With growth rates for population over 2.0%/yr inmany countries and urban consumers often eager to diversify their diets, new marketsare also opening up. Given these developments, growers, traders and governmentsare seeking out new ways to capitalize on these developments. This paper examinesthe evolution of growth rates in potato production, utilization and trade in SouthernAfrica over nearly the last half century using FAO annual secondary data. Afterhighlighting the different roles that potatoes have played in crop diversification acrossthe sub-region, the paper identifies some key issues for future research as well assome opportunities for industry both large and small.
Ninguna región en el mundo enfrenta las presiones sobre la producción e ultilizaciónde alimentos que desafian Africa Sub-Sahariana. Con tasas de crecimiento anualpoblacional encima de 2,0% en muchos paises y con consumidores urbanos conganas de diversificar sus dietas, nuevos mercados están abriendo. Dado estasituación, productores, comerciantes y gobiernos están interesados en aprovechardichas tendencias. Este articulo examina la evolución de las tasas de crecimiento de laproducción, utilización y comercio de la papa en Africa del Sur durante casi el ultimomedio ciclo utilizando los datos de la FAO. Despues de subrayar los diferentespapeles que la papa ha tenido en la diversificación agricola a lo largo de la sub-regiondurante ese periodo, se identifica algunos temas clave para futuras investigaciónesademás de algunas oportunidades para la industria tanta grande como pequeña.
Powered by Editorial Manager® and Preprint Manager® from Aries Systems Corporation

1 Benchmarking Food Crop Diversity in Southern Africa: 2 The Case of Potatoes and Potato Products 1961-2010 3 4 Gregory J. Scott1 5 CENTRUM Católica, 6 Centro de Negocios de la Pontificia Universidad Católica de Perú 7 Lima, Perú 8 9 Ricardo Labarta 10 International Potato Center (CIP) 11 Nairobi, Kenya 12 13 Víctor Suarez 14 International Potato Center (CIP) 15 Lima, Peru 16 17
18 Abstract No other region in the world is experiencing the pressures on food production and utilization like Sub-19 Saharan Africa. With growth rates for population over 2.0%/yr in many countries and urban consumers often eager 20 to diversify their diets, new markets are also opening up. Given these trends, growers, traders and governments are 21 seeking out new ways to capitalize on these developments. This paper examines the evolution of growth rates in 22 potato production, utilization and trade in Southern Africa over nearly the last half century using FAO annual 23 secondary data. After highlighting the different roles that potatoes have played in crop diversification across the sub-24 region, the paper identifies some key issues for future research as well as some opportunities for industry both large 25 and small. 26 27 Resumen Ninguna región en el mundo enfrenta las presiones sobre la producción e ultilización de alimentos que 28 desafian Africa Sub-Sahariana. Con tasas de crecimiento anual poblacional encima de 2,0% en muchos paises y con 29 consumidores urbanos con ganas de diversificar sus dietas, nuevos mercados están abriendo. Dado esta situación, 30 productores, comerciantes y gobiernos están interesados en aprovechar dichas tendencias. Este articulo examina la 31 evolución de las tasas de crecimiento de la producción, utilización y comercio de la papa en Africa del Sur durante 32 casi el ultimo medio ciclo utilizando los datos de la FAO. Despues de subrayar los diferentes papeles que la papa ha 33 tenido en la diversificación agricola a lo largo de la sub-region durante ese periodo, se identifica algunos temas clave 34 para futuras investigaciónes además de algunas oportunidades para la industria tanta grande como pequeña. 35 36 37 Keywords: Markets; trade; production; consumption; technology; private sector 38 39
40 Introduction 41 42 No other region in the world is experiencing the pressures on food production and utilization like Sub-Saharan Africa 43 (SSA). Population growth rates over 2.0%/yr in many countries represent one challenge. Breakneck urbanization 44 constitutes another. The advent of climate change is but one more. In the wake of these developments over the next 45 roughly twenty-five years, not only will the demand for food skyrocket but the locus of consumption will shift 46 radically from the countryside to the cities putting enormous pressure on all participants engaged in trying to match 47 supply and demand in the process. 48 49 As dramatic as these changes are, they did not emerge overnight. Rather they represent the latest phase of a prolonged 50 process dating back decades but that only now is coming into sharper focus. As food systems evolved over the last 51 half century, shifts in production patterns assaulted by wars, political turmoil, natural disasters and periodic, if not 52
1 Corresponding author, email: [email protected].
ManuscriptClick here to download Manuscript: Submitted Southern Africa paper.docx
recurrent, policy changes have become more common place while at the same time more problematic to fully 53 appreciate on a year-to-year basis. 54 55 In the midst of these developments and demands on local food systems, policymakers’ perceptions of agriculture have 56 begun to change (Binswanger-Mkhize et al. 2011). Recurrent food shortages, the rise of international commodity 57 prices, and crop diversification in other developing country regions have raised the possibility of replicating that 58 experience in SSA. Potatoes have captured particular interest as a possible means to help meet mushrooming urban 59 food requirements, contribute to efforts to enhance food security at both the household and national level, and reduce 60 the incidence of poverty in the countryside (Thiele et al. 2010). 61 62 Growers and entrepreneurs have also shown a renewed interest in potatoes. Farmers have demonstrated an eagerness 63 to diversify food supplies at the farm level and to develop new sources of cash income (Reyes et al. 2012). The 64 private sector sees new opportunities for developing new products and markets based on potatoes (Demo et al. 2009). 65 Furthermore, while the notion of crop diversification involving potatoes in Southern Africa is not entirely new 66 (Autrey et al. 1991; Serage et al. 2002), recent trends in output, area, and yields for potatoes in SSA (Walker et al. 67 2011) have surpassed previous projections (Scott et al. 2000). After a brief review of the latest production data, one 68 analyst concluded that potato production “...in developing countries, especially those situated in sub-Saharan, as the 69 main engines of growth...” for global output of this commodity in the years ahead (Prakash 2010). 70 71 Interest in potatoes for crop diversification is particularly keen amongst the countries in Southern Africa (SA) of late 72 for a variety of reasons. Some countries such as Malawi see crop diversification in potatoes as means of reducing the 73 overwhelming dependence on maize and offsetting the need for massive imports in the case of shortfalls in domestic 74 food production (Demo et al. 2007, 2009). Others like the Republic of South Africa (RSA) have embraced potatoes to 75 help satisfy rapidly changing urban tastes and preferences that include more snack foods and as a way to diversify 76 agricultural exports (Anaya 2009; NAMC and Commark Trust 2007). The end to the 27-year civil war in Angola has 77 focused attention on rebuilding domestic food systems (FAO 2009), diversifying domestic food production to reduce 78 cereal imports (Allen et al. 2003), and offering new, more diverse, income-generating activities to poor farm 79 households in the process (Reyes et al. 2010, 2012). 80 81 A variety of different publications have examined some aspect of potato production and use in SA over the last five 82 decades. Typically, these studies have fallen into one of three types. One group have analysed global trends for 83 potatoes in which the countries of SA are given brief mention (CIP 1999, 2010; Guenthner 2001; Horton 1978). 84 Others have examined these trends as part of a broader look at the evolution of food systems for potatoes in SSA 85 (Ewell 1997; Scott 1992) or in developing countries more generally that includes some brief discussion of SA 86 (Guenthner 2001; Horton et al. 1984; Horton 1987; Low et al. 2007; Scott 2002; Scott and Suarez 1992; Van der Zaag 87 and Horton 1983; Walker et al. 1999, 2011). A few of these have included projections for future production, area and 88 yields with different target years (Anonymous 1995; Scott et al. 2000). A third type has examined some aspect of 89 potato production and use in one or more of the countries in SA at a particular point in time (Autrey et al. 1991; Black 90 2008; Demo et al. 2005; Emongor et al. 2004; Godfrey-Sam-Agrey 1980; Gondwe 1986; Joyce 1986; Rasolo et al. 91 1987; Reyes et al. 2012; Saka 2000; Serage et al. 2002). Very few of these publications have had a specific focus on 92 trends in SA as a whole (Anaya 2009). All these previous publications have been handicapped by their shorter time 93 horizons. Few have considered potatoes in relation to the production or consumption of other food crops grown in SA. 94 95 This paper presents the results of an analysis of FAO annual secondary data and the growing body of literature on 96 potatoes in SA to identify changes in production, utilization and trade over nearly the last half century. In so doing, 97 the paper also tries to analyse the results presented for potatoes in the broader context of related information on other 98 food crops as well as trends for the potato industry in other parts of the developing world where relevant. One key 99 theme is the extent to which the long-term evolution of these trends foreshadows the most likely future scenario for 100 potato production and use in SA in the decades ahead and the associated opportunities for industry. 101 102 Materials and Methods 103
The analysis of growth rates in potato production and use in SA over nearly the last half century presented here 104 utilized a three-step approach as previously presented in Scott (2011) for Latin America and then further developed in 105 Scott and Suarez (2011, 2012a, 2012b) for Asia. As a first step, FAO times-series data served to estimate average 106 annual growth rates on a point-to-point basis beginning with production, area and yields for potatoes and then 107

including other crops. The use of FAO data facilitated international comparisons across countries for key potato 108 parameters and an analysis of the crop’s performance versus that of other food commodities. To that end, annual 109 averages calculated for key production indicators for potatoes for the beginning (1961-63) and end (2008-10) of the 110 period under consideration anchored the analysis and estimates of growth rates over the entire 49-year period. 111 Subsequently, comparable averages for 1984-86, or roughly the mid-point in the overall time-series, were used as 112 reference points to calculate growth rates over the first (vs. 1961-63) and second (vs. 2008-10) halves of the times-113 series in an initial attempt to determine if growth rates were slowing down or speeding up. A review of similar growth 114 rates calculated for the other major food crops in SA helped to better contextualize regional developments in the 115 potato sector over the last five decades. 116 117 A second step in this study involved tracking the rate of change in average compound growth rates (ACGRs) for 118 potato production, area harvested and yields on a more continuous basis during the last five decades. In other words, 119 as referencing a particular set of years (e.g., 1984-86) or a given sub-set of time periods is arbitrary, this study also 120 estimated, then analysed the evolution of the growth rates themselves. Hence, ACGRs for potato production and area 121 were calculated utilizing all the data for every ten-year period beginning with 1961-1971. In other words, growth rates 122 were calculated on a moving ten-year basis, i.e. 1961-1971, 1962-72, then on up to 2000-10. These growth rates were 123 then plotted to observe the changes in their trajectory over the last five decades and then examined to compare over 124 time the shifting relative importance of growth rates for area versus those for yields in relation to those for production. 125 126 As a third step, the estimated growth rates were also compared with earlier studies for clarifying the factors behind 127 these tendencies and analyzing their relative importance. In that regard, it attempts to synthesize the major findings of 128 both published and unpublished material (Scott 1995) as a means of helping to explain the trends that have been 129 quantified or qualify the growth rates presented. The combined set of growth rates, data analysis, and synthesis of the 130 related literature provide an empirical basis on which to evaluate previous projections and alternative future scenarios 131 for potatoes in SA in the decades ahead. In so doing, the paper also draws attention to the more readily apparent 132 inconsistencies and/or gaps in the data—a point of particular relevance in SA—both as a word of caution relating to 133 their interpretation and as one basis for highlighting areas for possible future research and emerging opportunities for 134 industry. 135 136 Results 137
Potato production in SA averaged 3.95 million metric tonnes (mt) in 2008-10 or roughly eight times the 515,000 138 metric tonnes (mt) harvested in 1961-63, nearly half a century earlier (Table 1). This absolute level of production is 139 nearly 50% less than the figures reported by FAOSTAT due entirely to a downward adjustment of the figures for 140 Malawi (see below and Appendix for details). Notwithstanding, as growth in potato production in SA surged 141 upward—particularly since the late 1990s (Fig 1), output in SA now accounts for 42% of the total for SSA. 142 143 The increase in potato output in SA resulted from an annual growth rate for potato production that averaged 4.4%/yr 144 for nearly the last 50 years. However, this overall upward trend masks the quasi-cyclical evolution of growth rates 145 over the 49-year period (Fig 1). In particular, while the overall growth rate for production slowed in the latter half of 146 the 49-year period (Table 1), the most recent trend in these growth rates displays a sharp upward tendency. The 147 moving 10-year average rose from 2.0%/yr during 1985-95 to 5.2 %/yr for 2000-10 (Table 2). 148 149 Area harvested in potatoes in SA averaged 256,000 ha in 2008-10 as increases in area were primarily responsible for 150 the growth in potato production over the last five decades (Table 1 and 2). As a result, SA accounts for 22% of SSA´s 151 area in potatoes. Nevertheless, as area harvested expanded much more rapidly elsewhere in the region over the last 25 152 years (Table 1; Goossens, 2002), SA´s share of regional area harvested actually fell from 38% in 1961-63 (FAOSTAT 153 accessed August 2012). 154 155 ACGRs for area harvested were generally well in excess of those for yields throughout the last half century and like 156 production followed a quasi-cyclical pattern, albeit with a much more extended decline and shaper recovery over the 157 last three decades (Fig 2). They were strong in the 1960s up to the mid-1980s, then slowed considerably in the 1990s 158 when many countries, most notably Angola, continued to be wracked by civil war or political unrest, weak 159 agricultural research and extension, and limited contact with sources of new technology (Allen et al. 2003; FAO 160 2009). By the turn of the century, ACGRs started to accelerate very rapidly reaching their apex during the interval 161 1997-2007 before cooling slightly in recent years (Table 2). 162
163 Average yields for potatoes in SA (15.5 mt/ha) remain above the continental average of 12 mt/ha largely because of 164 the RSA. With RSA as the noteworthy exception, growth rates for average yields over the last 25 years were nearly 165 flat or negative in four of six largest potato-producing countries in SA (Table 1; Fig 3). Several of those countries 166 register among the lowest average yields in all of Africa. Furthermore, growth rates for yields have turned sharply 167 negative since the mid-1990s (Table 2). 168 169 One explanation suggests as potato cultivation spread into new and/or less favourable growing areas (e.g. Angola, 170 Malawi), it simply became harder to sustain earlier growth rates in productivity. Important inputs may be in short 171 supply due to geographic isolation thereby handicapping growers´ efforts to optimize yields (Demo et al. 2005; Reyes 172 et al. 2010). As a corollary, as at least some of these farmers may have taken on potato cultivation to boost household 173 food supplies and/or supplement cash incomes, they may simply have been less familiar with the crop and its 174 agronomic requirements (Demo et al. 2009). 175 176 Concentration of production 177 178 As growth in potato output in SSA took off during the last two decades, it nonetheless remains fairly skewed. Eight of 179 the region´s 48 countries account for nearly 80% of output. Conversely, ten countries in SSA produce less than 180 10,000 mt/yr while a further 15 report producing no potatoes (Table 3). Nonetheless, potato cultivation in SSA is 181 much more diffuse than in Latin America (Scott 2011) or Asia (Scott and Suarez 2012a) where fewer countries 182 harvest most of the output. 183 184 In SA itself, three of the thirteen countries: Angola, Malawi and RSA account for over 86% of the sub-regional 185 output (Table 1). These same three countries harvest 75% of the sub-region´s area in potatoes (Fig 4) as well and 186 were responsible for the overwhelming bulk of the increase in output and area over the last nearly 50 years. Three 187 other countries: Madagascar, Mozambique and Lesotho make up the better part of remaining output and area 188 harvested in the sub-region. 189 190 Potatoes versus other major food crops 191 192 Growth rates for potato production and area harvested have been faster than those for the five major food crops in SA 193 except sweet potatoes (Table 4). Hence, within SA, potatoes rank 5th in terms of total production among the 11 major 194 food crops. However, the level of total output for potatoes remains but a fraction of that for the most important food 195 crops grown in a region where cassava and maize frequently dominate food production. Of the 48 countries in SSA, 196 potatoes are the most important food crop in terms of total production only in Lesotho (CIP 2010). 197 198 Potato production in SA is largely concentrated above 1200m. Under highland growing conditions, the plant´s 199 relatively short vegetative cycle, high yields, and adaptability have long given it a comparative advantage vis-à-vis 200 other food commodities such as maize (Dürr 1986; Saka 2000). It appears that most of the recent expansion in output 201 has taken place in highland production zones (e.g. Angola), but some observers have noted that dry season production 202 at lower altitudes in bottom lands or along receded riverbanks is a fairly longstanding practice in Malawi (Gondwe 203 1986). 204 205 Discussion 206 207 Within SA, trends in potato production and area harvested have been heavily influenced by RSA, Malawi, and Angola 208 as major potato-producing countries. In RSA itself, potatoes are a minor secondary crop cultivated overwhelmingly 209 for sale. As such the growth in output has been atypical. Production doubled over the last quarter century due entirely 210 to improvements in yields rather than an expansion of area (Table 1). Over that same time period, RSA’s potato sector 211 went through a technical restructuring. The number of commercial farms fell by nearly 70% (hence, farm size has 212 clearly risen) as irrigated cultivation went from 50% of area to 75% (Fig.5; NAMC and Commark Trust 2007). 213 Although potatoes are harvested all year long in RSA, four of the 16 potato-producing regions: Limpopo, Eastern 214 Free State, Western Free State and Sandveld, account for some 60% of production and area. 215 216 RSA´s 3.3% growth rate in potato productivity over the last half century has been among the most rapid in the world 217 (Scott 2011, Scott and Suarez 2012a). These improvements in yields have been sustained by a program of technology 218

development and transfer noteworthy for its highly effective linkages between university-based research, government 219 programs, commercial growers and industry (NAMC and Commark Trust 2007). While potato production is currently 220 carried out by some 700 technically advanced, commercial growers with an average area in potatoes of 70 ha (Prof J 221 Kirsten, U of Pretoria, personal communication), much less is known about the small, semi-subsistence growers 222 estimates of which vary from a few dozen (NAMC and Commark Trust 2007), to 1500 (Prof Kirsten), to as many as 223 300,000 as cited by Black (2008). 224 225 The booming fast food sector (http://en.wikipedia.org/wiki/Famous_Brands_Limited accessed August 2012)—one 226 local chain has some 480 restaurants around the country, and the growing consumption of crisps together have 227 become increasingly important sources of demand as over 60% of RSA´s 50 million inhabitants now reside in urban 228 areas (World Bank 2011). Given that, growers´ have shifted their market orientation to increasingly supply 229 processors—these shipments currently absorb 16% -20% of output (350,000-400,000 mt/yr), then ship to 230 supermarkets—another 20%, and are moving away from sales into public wholesale markets (Black 2008; NAMC 231 and Commark Trust 2007; http://www.potatoes.co.za/industry-information/national-annual-information.aspx accessed 232 June 2012). Potato exports represent roughly another 7% of total annual output. These shipments include both seed 233 and ware potatoes to neighbouring countries principally Angola and Mozambique (Demo et al. 2005; Reyes et al. 234 2012), but some exports in particular seed are sent as well to Botswana, Malawi, Namibia, Zambia, Zimbabwe 235 (Anaya 2009; Emongor et al. 2004) and even Mali (http://www.abtassociates.com/Impact/2009/Strengthening-236 Agriculture-and-Trade-in-Mali.aspx accessed August 2012) and Ivory Coast (Black 2008). 237 238 In Malawi, potatoes constitute the fourth major food crop after maize, sweet potato and cassava. In the main potato-239 producing districts, potatoes are the principal cash crop and the second most important food crop after maize (Demo 240 et al. 2009). Although what FAO reports as production and area of potato actually represents potato and sweet 241 potato—where sweet potato accounts for some 75% of the total (see the Appendix for further details), the sharp 242 upward trend in potato output is still noteworthy albeit at far reduced absolute levels of production (Table 1). 243 244 The 11-fold increase in potato production in Malawi —from 66,000 to 742,000 mt/yr—since 1992 has been driven by 245 the tripling in area during the 1990s. While at one point during that period over 80% of production was reportedly 246 harvested in Lilongwe (60%) and Blantyre (20%) districts (Saka 2000), more recent field work suggests that potato 247 cultivation has spread into new areas. A recent survey (n=81) found that farmers in Malawi typically planted less than 248 0.5 ha in potatoes total per year spread over two growing seasons (Demo et al. 2009). Moreover, results from that 249 same study showed that 46% of the potato farmers (n=81) interviewed had not grown the crop before (Ibid.). 250 251 Growing demand for food in general in Malawi (pop. 14 million) and in the cities and towns in particular—252 themselves a function of rapid population growth (3.1%) and urbanization (World Bank 2011)—has driven the 253 expansion in potato area. Moreover, growers report receiving attractive prices and incomes from cultivating this 254 commodity (Demo et al. 2007, 2009). Further evidence of the strong demand for potatoes is manifest in the imports of 255 fresh potatoes from neighbouring RSA (Anaya 2009) and Mozambique (Demo et al. 2005). In light of these trends, 256 government policy has sought to stimulate additional potato production as a means of reducing food imports, 257 improving food security at both the national and household level in the wake of periodic shortages of maize—258 Malawi’s basic staple and the primary focus of public sector initiatives in support of agriculture (FAO 2008a; Minot 259 2010), and as part of strategy to raise rural incomes and lower poverty in the countryside. In recent years these efforts 260 have included public-private partnerships to stimulate and then sustain potato-based agro-industry to produce potato 261 chips. A series of initiatives (e.g., the release of new, improved varieties suitable to growing local conditions aimed to 262 achieve yield potential (Kagona 2008; Labarta 2012), grower contracts with potato processors) have all been intended 263 to improve the efficiency of the value chain for both fresh tubers and processed potato products (Demo et al. 2009). 264 265 Angola saw potato output go from a reported 29,000 mt in 2000 to over 840,000 mt in 2010; area jumped from 8,800 266 to over 104,000 ha over the same period (FAOSTAT accessed June 2012). Potato production and use in Angola did 267 benefit from the end to the 27 years of civil war in 2002 (FAO 2009). As one of the most sparsely populated 268 countries in all of Africa (14 inhabitants/km2), the peace agreement ushered in natural resource-based industries in 269 petroleum and diamonds (World Bank 2007) as well as megaprojects in agriculture focused on biofuels, e.g. 270 producing ethanol from sugarcane, but including food crop production by small farmers (Allen et al. 2003). Rising 271 incomes and increased urbanization combined to generate greater effective demand for food. These trends, in turn, 272 spurred rapid expansion in potato production (FAO 2009) to meet domestic market requirements, reduce ware potato 273 imports—largely from South Africa (Anaya 2009), and bolster food supplies and incomes at the farm household 274

level (Reyes et al. 2010). In that regard, two recent farm surveys found that potato production is dominated by small 275 farmers planting less than half a hectare of the crop, utilizing small amounts of chemical fertilizer and under rain-fed 276 conditions (Reyes et al. 2010, 2012). These growers also fall into one of two groups: those who sell nearly 90% of 277 the 200 kg they harvest or those who produce only a fraction of that amount entirely for on-farm consumption (Ibid.) 278 Cultivation appears to be concentrated in the central highlands in particular 279 (http://en.wikipedia.org/wiki/Geography_of_Angola accessed August 2012). 280 281 Madagascar is only major potato-producing country in Africa that saw production decline over the last quarter 282 century (FAOSTAT accessed August 2012). Area harvested was practically stagnant and the “growth” rate in yields 283 was actually negative (Table 1). The fall in output is all the more remarkable given the tripling in production to 284 380,000 mt/yr from the 1970s to mid-1980s according to national statistics (Rasolo 1986). 285 286 The bulk of potatoes in Madagascar have been traditionally harvested by small farmers (1 +/-) in the Faritany 287 Antananarivo and Vakinankaratra regions of the Central Highlands (Ibid.). Growers cultivate potatoes up three times 288 during the year (Rakoto 1986). The main crop is grown on the hillsides in the primary rainy season Aug-Sept to Dic-289 Feb. In some instances, it is supplemented by a second hillside crop during the (contre saison) produced Jun-July to 290 Oct-Nov. A third crop is planted during the dry season in the harvested rice paddies on the valley floors from 291 roughly Jan-March to May-July. While Madagascar witnessed a steady program of potato research from the 1960s 292 up to the late 1980s (Rakotondramanana 1986), subsequent attempts to revitalize the sector by strengthening the 293 research and extension program appear simply to have proved unsustainable over time. Instead, soil erosion from 294 continued population pressure on the hillsides, the shortage of good quality planting material and the isolation of 295 production zones from major urban markets due to the extremely poor road network have undermined efforts to 296 improve productivity and raise output. This despite evidence gathered in fieldwork (Rasolo et al. 1987) pointed to 297 strong domestic demand for potatoes as an off-season substitute for rice, the traditional staple, and a source of cash 298 income for highland households. In that regard, it appears that in subsequent years supermarkets and the restaurant 299 trade à la French fries (Rasolo 1986) have yet to play a catalytic role in the increased production of basic food 300 commodities in Madagascar--as has proved to be the case for potatoes in RSA, for example--as the low per capita 301 incomes of the vast majority of consumers have restricted demand for food including potatoes and potato products 302 (Minten 2008). 303 304 Unlike the other countries of SA, Mozambique has witnessed a much less erratic evolution in production and area 305 harvested over the last several decades (Table 1). While growth rates for potato output, area and yields have slowed 306 considerably in recent times, they also have avoided the double-digit expansion or negative tendencies exhibited 307 elsewhere in the sub-region. Absolute levels of production (100,000 mt) and area (8,000 ha), however, remain fairly 308 modest relatively speaking. Although baseline fieldwork provides only limited information regarding the factors 309 behind these trends (Demo et al. 2005), preliminary indications suggest that output has been spurred by efforts to 310 diversify food production away from an overwhelming dependence on cassava and maize, help reduce food imports 311 in the form of rice (300,000 mt/yr) and wheat (550,000 mt/yr) as well as capitalize on opportunities for cross-border 312 trade in potatoes with neighbouring countries, e.g. Malawi, Zimbabwe among other considerations. Some 90% of 313 production is harvested in two districts in Tete province in the far northwest part of the country (Ibid.). Despite 314 multiple planting seasons, potato cultivation has been constrained by a shortage of chemical fertilizers that in the past 315 itinerant traders brought into the country from Malawi. Furthermore, Mozambique’s weak organizational base for 316 national potato research and development efforts combined with the limited resources of the average grower have 317 resulted in a shortage of good quality planting material that in turn has hampered efforts to expand area under 318 cultivation, raise productivity and reduce dependence on seed and ware imports from RSA (Ibid.). 319 320 Utilization and Trade 321 322 The overwhelming bulk (73%) of all the potatoes produced in SA goes for human consumption (Table 5). Most of the 323 remainder goes for seed (7%) or so-called “other uses” (13%). Unlike in Europe (Haase and Haverkort 2006), no 324 potatoes serve for industrial use (e.g., starch)—with much more abundant quantities of cassava available for such uses 325 instead (Table 4). Only modest quantities (7%) are fed to livestock, primarily in RSA. 326 327 According to FAO data, the principal changes in potato use patterns over the last five decades involve the declining 328 share of potatoes utilized as seed (Table 5). As area has expanded (e.g., Angola) and as this has been increasingly 329 done by small farmers in more marginal production zones (e.g., Mozambique), then it seems likely that they use less 330

seed per hectare equivalent because the tubers in general are scarce, expensive and hard to come by helping to drive 331 down their use as a percentage of total available supply in the process (Demo et al. 2005, 2009; Reyes et al. 2010, 332 2012). 333 334 Potato basically plays two primary roles in diets across SA. At the farm level in much of the region, potatoes serve as 335 as a complement to maize as average per capita consumption remains minor (≤ 19.6 kg/capita/yr) by comparison 336 (Table 6). In addition, potatoes can serve a food security commodity either during the “hungry season” before the 337 maize crop is ready for harvest (e.g., Malawi) or should shortfalls of basic staples after harvest generate the need for a 338 home-grown food supplement (e.g., rice in Madagascar). While most growers in much of SA will eat at least part of 339 what they harvest, the commercial growers in RSA sell practically all of what they harvest. 340 341 In urban areas, potatoes eaten as a snack (chips) or French fries have become increasingly popular (NAMC and 342 Commark Trust 2007). But other than in South Africa and major cities elsewhere (e.g., Blantyre, Luanda, Maputo), 343 SA has yet to see the emergence of quick service restaurant chains on a scale that has become common in Latin 344 America (Scott 2011) or East Asia (Scott and Suarez 2012c)—nor the industrial potato processing facilities to supply 345 them. Instead, small informal enterprises have captured a hefty niche in this urban market by integrating procurement, 346 processing and retail sales direct to the public, or the processing is done “in-house” by the restaurants and hotels 347 themselves (Rasolo 1986). In RSA, a reported 15% of potato processing is done cottage industry (NAMC and 348 Commark Trust 2007). Given this situation, it is noteworthy that potatoes are one of only a few commodities that 349 experienced an increase in per capita consumption over time and across sub-regions as the evolution has closely 350 mirrored that of production adjusted for population (Table 6, Fig 6). At the same time, potatoes still play a very minor 351 role in the average diet, although their relative importance varies from major production zones (seasonal), to urban 352 areas (moderate), to rural areas where potatoes are not grown (negligible at best). 353 354 Prospects for greater potato exports have long been of interest in SA (Anaya 2009; Black 2008; Rasolo et al. 1987; 355 Scott 1990, 1992, 2002). In the post market-liberalization era in particular, trade in general has been seen as a driver 356 of economic growth and development. In the specific case of potatoes, trade is often considered as a possible source 357 of foreign exchange. In that regard, potatoes were sometimes considered as a less attractive food commodity (e.g., 358 maize in Malawi, rice in Madagascar) with a corollary in some cases that potato exports potentially represented a 359 way of offsetting the cost of cereal imports to meet domestic food requirements (Rasolo et al. 1987). Alternatively, 360 several recent studies have highlighted the interest in reducing imports of potatoes and potato products as a possible 361 means of stimulating greater domestic production and capturing the associated value added (Allen et al. 2003; Demo 362 et al. 2007, 2009; Saka 2000). 363 364 Although average annual total trade (imports plus exports for the combined total of fresh tubers including seed, 365 frozen French fries, and potato flour) represents just 6% percent of annual production in SA, potato imports have 366 expanded rapidly over the last five decades (Table 1 and 7). The overwhelming bulk of registered trade of regional 367 origin consists of exports from RSA to neighbouring countries in the form of table potatoes and seed (Anaya 2009; 368 Emongor et al. 2004; NAMC and Commark Trust 2007; Table 7). RSA also exports small quantities of frozen 369 French fries to countries in East Africa (Tesfaye et al. 2010). 370 371 Various more recent reports have called attention to the informal, cross-border trade in potatoes, e.g. from 372 Mozambique to Malawi (Demo et al. 2005). But the volumes involved are hard to quantify in anything more than an 373 anecdotal way. The sparse empirical evidence suggests this trade is highly localized given the high cost of transport 374 in relation to the low value to weight ratio for potatoes. Nevertheless, the cross border shipments can be highly 375 dynamic in response to shifting supply and demand patterns. At the Mozambique-Malawi border, an important 376 regional market for potatoes at Aldeia Biri Biri (http://www.tripmondo.com/mozambique/provincia-de-tete/aldeia-377 biri-biri/ accessed August 2012) supplies central and northern Mozambique, southern and central Malawi and even 378 Zambia, Zimbabwe, and Tanzania (Ibid.; Demo et al. 2005). Although in some years it served as the focal point for 379 Malawi’s potato exports to adjacent countries, more typically this market has functioned as the shipping point for a 380 large part of Mozambique’s potato exports into Malawi. 381 382 At least in parts of Southern Africa—most notably RSA, the evolution of the domestic market for potatoes has 383 perhaps been more dynamic than that for foreign trade. Supermarkets are capturing greater market share across the 384 continent (Weatherspoon and Reardon 2003), but in RSA in particular their expanding presence at the retail level has 385 led to a restructuring of procurement practices via firm created and run regional assembly centers and away from 386
more traditional public wholesale markets (NAMC and Commark Trust 2007). Nevertheless, it should be pointed 387 out that RSA is much more urbanized than many other countries in the region 388 389 Past Projections and Future Prospects 390 391 Earlier FAO-CIP short-term projections (Anonymous 1995) for average annual growth rates for potatoes for the 392 period 1988 to 2000 were for Africa in total and not by sub-region. Be that as it may, those projections for production 393 (3.73%) and area (2.18%) proved too ambitious for SA during that time span as ACGRs for output (2.9% to 3.5%) 394 and in particular areas (0.2% to 0.5%) were far below the FAO-CIP estimates (Table 2). In the case of yields, the 395 projected growth rate (1.49%) was actually too conservative for SA (2.8%, see Table 2). As it turns out, the time 396 period in question was during the civil war in Angola and political unrest elsewhere in the sub-region. Given that, the 397 data suggest these events acted as a constraint to area expansion and production for several of the major food crops 398 (Table 4). Conversely, once peace broke out, growers other than in RSA made a major push to expand area and 399 contributed to the fall in average yields for potatoes. 400 401 In light of these more recent developments, longer-term projections for production, area, and yields in SA for the 402 period 1993 to 2020 developed using FAO data for all of SSA have proved too modest (Scott et al. 2000). Projected 403 growth rates for production (3.01%) and area (1.25) for SSA when applied to SA have proved to be well below the 404 average annual growth rates of 4.0% for output and 2.9% for area harvested observed during the last quarter century 405 (Table 1). Nonetheless, projected growth rates for yields of 1.25% have been roughly in line with the growth rate for 406 yields so far (1.1%). 407 408 Conclusions 409 410 Potato production expanded more rapidly in SSA than in any other part of the world over the last five decades. Within 411 SSA, the SA sub-region exhibited an array of different tendencies at the country level. In Angola, Malawi and 412 apparently Mozambique, the bulk of that increase in output came from an expansion of area harvested including into 413 more marginal production zones to meet the growing rural and in particular urban demand. RSA experienced just the 414 opposite trend. Rising productivity drove increases in production as area harvested actually declined modestly. 415 Mozambique fell between these two major trends as area grew faster than in RSA and productivity faster than Angola 416 and Mozambique. Both potato production and yields contracted in Madagascar in recent decades. 417 418 Future prospects for potatoes in SA seem equally diverse. RSA, for example, seems unlikely to experience any 419 massive increase in area under cultivation given the farm-level consolidation that has taken place over the last fifteen 420 years and the relatively mature state of the domestic market. Nevertheless, there is growing concern about the 421 possible negative effects of climate change (Hijmans 2003) and in the context of broader discussions regarding the 422 availability of water in the longer term nationwide, the crops’s heavy dependence on irrigation stands out. 423 Notwithstanding, population growth rates for RSA as well as for contiguous countries such as Botswana, Lesotho, 424 Swaziland, and Zimbabwe are running at less than 1.5%/yr. In RSA and Botswana, over 60% of the population 425 already resides in urban areas with some RSA estimates showing the rate of urbanization roughly double that for 426 population as a whole. Given these various trends, growing urban demand and exports could continue to provide a 427 stimulus for further increases in potato output, but the foreign trade component will depend very much on efforts in 428 neighboring countries such as Angola and Malawi to expand both seed and ware production. A corollary to that 429 development would be the extent to which the apparent preference for fresh potatoes in some major restaurant chains 430 in RSA, among other things, will serve to stimulate further efforts to continue to improve the quality and price of 431 locally produced processed potatoes thereby discouraging possible additional imports of frozen French fries. A 432 baseline study of price differentials for the two products as carried in Peru recently (Scott and Zelada 2011) might 433 well provide a benchmark against which to evaluate future developments in this growing segment of the domestic 434 market. Given this scenario, crop diversification in the case of potatoes in RSA means diversifying markets for final 435 use for direct human consumption and exports of seed and ware potatoes. 436 437 For the emerging potato-producing countries such as Angola, Malawi and Mozambique the situation is quite different. 438 Population growth rates of 2.8%/yr, 3.2%/yr and 2.3%, respectively, are still high. With the exception of Angola 439 (59%), urbanization is still low: Malawi (16%), Mozambique (31%). Under these circumstances, potatoes role in crop 440 diversification revolves around improving food security and developing new income-generating activities for the vast 441 majority of small farmers that make up the potato sub-sector and the growing numbers of small-scale entrepreneurs 442

doing business in urban areas. In that regard, aside from basic FAO statistics on production, area and yield, relatively 443 little is known about potatoes in these countries. Hence, besides efforts--already underway in Malawi-- to increase the 444 supply of improved quality planting material, baseline studies of potato production, marketing and consumption 445 aimed at pulling together from national sources the basic statistics, government and research reports could provide 446 common ground for the more detailed debate among the different stakeholders about where and how to develop the 447 sector going forward. A key dimension to such studies would be articulating product flows and marketing practices 448 beyond the farm gate so as to widely disseminate information about commercial opportunities for potatoes and potato 449 products to a broader audience of potential participants in value-added activities. Several earlier studies carried out in 450 other African countries might readily serve as a template for this exercise as well as provide the methods materials 451 about how to go about it. A similar exercise in Madagascar might not only serve to up-date information that is now 452 over 20 years old, but also provide the focal point for initiatives to revitalize the potato sub-sector in that country. 453 454 Appendix. Some reflections on statistics for potatoes in Sub-Saharan Africa. 455 The literature on potatoes in Africa is riddled with examples—some acknowledged, others not—of inconsistencies in 456 the data on production and utilization as has been noted by a number of previous studies: Scott (1988) for 457 Democratic Republic of the Congo (ex- Zaïre), Ferris et al. (2001) for Uganda; Dürr (1983) and Goossens (2002) for 458 Rwanda, Gildemacher et al. (2009) for Ethiopia, to cite but a few examples. The vast majority of instances, but by no 459 means all, involve published statistics for production, area, and yields and the differences between national figures 460 versus those published by FAOSTAT. Another substantial set of differences concern discrepancies between national 461 reporting agencies, for example, the Ministry of Agriculture versus the Census Bureau or the National Agricultural 462 Research Institute. Given this reality, a number of observations are in order. 463 464 Firstly, problems with the accuracy of data on potatoes in SA are by no means peculiar to this region (Scott and 465 Suarez 2012b). For decades, informed observers have pointed to the various features of potatoes in developing 466 countries (e.g. grown by small farmers, in isolated production zones, in multiple-cropping or relay cropping patterns, 467 intercropped with other commodities such as maize, characterized by staggered harvests in the same field and with 468 little foreign trade) that lend it to being susceptible to inaccurate reporting (Horton 1981, 1987, 1988)—even in 469 industrialized countries (Scott 2002). However, many of the same considerations apply to other crops and livestock in 470 developing countries. 471 472 Secondly, it might be argued that the abovementioned factors are more acute for potatoes in SA given the political 473 and therefore institutional instability that has characterized the region´s history over much of the last five decades. In 474 addition, the crop is well down on the list of major food commodities in most the countries even in some where 475 production is relatively high. In effect, where resources are scarce, less attention is given to those commodities that 476 are perceived as less important. Unfortunately for potatoes, the extent to which the crop is underreported, these sorts 477 of circumstances make for something of a self-perpetuating scenario. 478 479 Thirdly, several of the major potato-producing countries simply have not collected and/or disseminated annual 480 statistics on potato production, area and yields in perpetual fashion. For example, Gildemacher et al. (2009) refer to 481 unpublished data on potato production in Ethiopia 1995-2000. Hence, aside from the question of their accuracy, the 482 historical time-series on potato output are incomplete (e.g. for Madagascar, see Rasolo 1986) or sometimes 483 unavailable. 484 485 Finally, given this situation, the discrepancies are there. Hence, the question what if anything can be made of them? 486 For Malawi, the most blatant case of overestimation, various sources have noted the major difference between the 487 figures reported by FAO and those disseminated by other, national sources (Saka 2000; Demo et al. 2009; Minot 488 2010). Conversations with crop specialists have confirmed this phenomenon. But, in this particular case, an 489 alternative exists in the form of times-series data on production and area that we have extended back in time to have a 490 complete set of statistics for the period in question (Table 8). These data also offer a reasonable explanation of why 491 the differences between data sets exist and therefore a justification for their use instead of FAO figures in this paper. 492 FAOSTAT reports that Malawi produces no sweet potatoes when the data and FAO mission reports indicate that it 493 does (FAO 2002). 494 495 Acknowledgements We are grateful to Henry Juarez of CIP´s Research Informatics Unit for sharing the revised map 496 of potato production in Africa. 497 498
References 499 500 Allen, S., J. Brown, S. Gavian, S. Kyle, A. Deprez, and J. Mellor. 2003. A framework for transitioning to rural 501
economic growth in Angola. Agriculture and food security review prepared for USAID-Angola. Mimeo. 502 Bethesda: Abt Associates Inc., 503
504 Anaya Chogo, H. 2009. The impact of deregulation on competitiveness and market integration: the case of South 505 Africa´s potato exports. Msc. thesis. Pretoria: Department of Agricultural Economics, Extension & Rural 506
Development. University of Pretoria. 507 508 Anonymous. 1995. Potatoes in the 1990s: Situation and prospects of the world potato economy. Rome: Food and 509 Agriculture Organization of the United Nations (FAO) in collaboration with the International Potato 510 Center (CIP). ISBN: 92-5-203713-6 511 512 Autrey, L.J.C., P Ferré, A. Dookun, and S. Saumtally. 1991. Seed potato production in the lowland tropics: The 513 Mauritian experience. In N. Govinden, M.H.R Julien, G.L.T. Hunt and L.J.C. Autrey (eds.) Production, post- 514 harvest technology and utilisation of the potato in the warm tropics. Proceedings of a workshop organized by the 515
Mauritius Sugar Industry Research Institute (MSRI), International Potato Center (CIP), and the African Potato 516 Association (APA), 9-38, Reduit, 23-27 July 1990. Reduit: MSRI. 517
518 Binswanger-Mkhize, H., D. Beyerlee, A. McCalla, M. Morris, and J. Staatz. 2011. The growing opportunities for 519
African agricultural development. Conference working paper 16. Prepared for the ASTI(Agricultural Science and 520 Technology Indicators)/IFPRI (International Food Policy Research Institute)-FARA(Forum for Agricultural 521 Research in Africa) conference, 5-7 December 2011, Accra, Ghana. 522
523 Black, V. 2008. Hot potato. GM potatoes in South Africa - a critical analysis. Johannesburg: The African Centre for 524
Biosafety. 525 526
Demo, P., C. Dominguez, S. Cumbi, and T. Walker. 2005. The potato sub sector and sustainable seed production in 527 Mozambique. Maputo: Report submitted to the International Centre for the Semi-Arid Tropics (ICRISAT). 528 529 Demo P, J.W. Low, and J. Mwenye. 2007. Potato production in Malawi: Strengths, weaknesses, opportunities, and 530
threats. In A.A. Khalf-Allah (ed-in-chief) Potato, sweet potato, and root crops improvement for facing poverty 531 and hunger in Africa, Proceedings of the 7th conference of the African Potato Association (APA), 339-345, 532 Alexandria, Egypt, 22-26 October. Alexandria: APA. ISSN 3934 533
534 Demo, P., P. Pankomera, T. Connel, and N. Khumar. 2009. Potential of potato farming in improving the livelihoods 535 of small-scale farmers in Malawi. In J.S.Tenywa, G.D. Joubert, D. Marais, P. R. Rubaihayo, and M.P.Nampala 536 (eds.) African Crop Science Society Conference proceedings 9: 761-765. ISNN: 1023-070X 537 538 Dürr, G. 1983. Potato production and utilization in Rwanda. Social Science Department Working paper 1983- 539 1. Lima: International Potato Centre (CIP). 540 541 Dürr, G. 1986. The role of the potato in Africa and importance of on-farm research. In Regional seed potato workshop 542 and proceedings of the 1
st Triannual meeting of the African Potato Association (APA), Antsirabe, 2-7 November. 543
Antsirabe: FIFAMANOR-CIP-APA. 544 545 Emongor, R.A., A. Louw, J. Kirsten, and H. Madevu. 2004. Regoverning markets: Securing small producer 546 participation in restructured national and regional agri-food systems. Zambia country report. Prepared for 547 International Institute for Environment and Development (IIED). Pretoria: University of Pretoria. 548 549 Ewell, Peter. 1997. International cooperation for the improvement of potato and sweet potato in Sub-Saharan Africa. 550
In N.J.J. Mienie (ed.) Proceedings of the 4th Triennial Congress of the African Potato Association (APA), 157-551 164, Praetoria, 23-28 February. Pretoria: APA. ISBN: 1-86849-086-6 552
553 Ferris, S., G. Okoboi, C. Crissman, P. Ewell, and B. Lemaga. 2001. Uganda’s Irish potato sector. Mimeo. Kampala: 554
IITA-Foodnet, CIP, PRAPACE, ASERECA. 555 556 Food and Agricultural Organization of the United Nations (FAO). 2002. GIEWS Special report FAO/WFPCFSAM to 557
Malawi. FAO, Rome Available at http://www.fao.org/docrep/005/y6811e/y6811e00.htm. Accessed Aug 2012. 558 559 Food and Agricultural Organization of the United Nations (FAO). 2008. State of plant genetic resources for food and 560 agriculture in Malawi. Lilongwe and Rome: FAO. ISBN: 978-92-5-106534-1 561 562 Food and Agricultural Organization of the United Nations (FAO). 2009. International year of the potato 2008: New 563 light on a hidden treasure. An end-of-year review. Rome: FAO. ISBN 978-92-5-106142-8 564 565 Food and Agricultural Organization of the United Nations (FAO). 2010. Strengthening potato value chains. Technical 566
and policy options for developing countries. Rome: FAO and Common Fund for Commodities (CFC). ISBN 567 978-92-5-106627-0 568
569 Gildemacher, P., W. Kaguongo, O. Ortiz, A. Tesfaye, G. Woldegiorgis, W. Wagoire, R. Kakuhenzire, P. Kinyae, 570 M. Nyongesa, P. Struick, and C. Leeuwis C. 2009. Improving potato production in Kenya, Uganda and 571 Ethiopia: A system diagnostics. Potato Research (52):173-205. DOI 10. 1007/s11540-009-9127-4 572
573 Godfrey-Sam-Agrey, W. 1980. Swaziland. In Root crops in Eastern Africa, Proceedings of a workshop, 119-121, 574
Kigali, 23-27 November. Ottawa: International Development Research Centre (IDRC). ISBN 0-88936-305-6 575 576 Gondwe, W. 1986. Potato production in Malawi. In Regional seed potato workshop and proceedings of the 1
st 577
Triannual meeting of the African Potato Association (APA), Antsirabe, 2-7 November. Antsirabe: FIFAMANOR-578 CIP-APA. 579
580 Goossens, F. 2002. Potato marketing in Rwanda. Agricultural policy development project research report No.12. 581 Bethesda : Abt Associates Inc. 582
583 Guenthner, J. 2001. The international potato industry. Cambridge: Woodhead. ISBN 1 85573 465 6 584
585 Haase, N., and A. Haverkort (eds.). 2006. Potato developments in a changing Europe. Wageningen: Wageningen 586
Academic Publishers. ISBN-13: 978-90-8686-011-1 587 588 Hijmans, R. 2003. The effect of climate change on global potato production. American Journal of Potato Research 589
80: 271-280. 590 591 Horton, D. 1978. Potato atlas. International statistics on potato production and utilization. Lima: CIP. 592 593 Horton, D. 1981. A plea for the potato. Ceres 14(1): 28-32. 594 595 Horton, D. 1987. Potatoes: Production, marketing, and programs for developing countries. Boulder: Westview 596
Press. ISBN (U.S.) 0-133-7197-X 597 598 Horton, D. 1988. Underground crops: long-term trends in production of roots and tubers. Morrilton: Winrock 599
International. ISBN 0-933595-19-0 600 601 Horton, D., J. Lynam, and H. Knipscheer. 1984. Root crops in developing countries—an economic appraisal. In 602 F. Schidler and H. Rincón (eds.) Proceedings of the Sixth Symposium of the International Society for Tropical 603
Root Crops, 9-39. Lima, 21-26 February, Lima: CIP. 604 605 International Potato Center (CIP). 1999. Potato facts. Processed. Lima: CIP. 606 607 International Potato Center (CIP). 2010. Potato facts. Processed. Lima, CIP. 608 609
Joyce, M. 1986. Country presentation: Zimbabwe (condensed version). In Regional seed potato workshop and 610 proceedings of the 1
st Triannual meeting of the African Potato Association (APA), Antsirabe, 2-7 November. 611
Antsirabe: FIFAMANOR-CIP-APA. 612 613 Kaela, Y. 1991. Seed potato production in Zambia. In L.J.C. Autrey, G.L.T. Hunt, N. Govinden, and P. Ferré (eds.) 614
Proceedings of the 2nd Triennial meeting and conference of the African Potato Association (APA), 59-63, Reduit, 615 23-27 July 1990. Reduit: Mauritius Sugar Industry Research Institute. 616
617 Kagona, J. 2008. The incidence of bacterial wilt in informal potato planting material used by farmers in Dedza and 618 Ntcheu districts in Malawi. MSc thesis. Department of international environment and development studies. 619 Norwegian University of Life Sciences. 620 621 Karoto, M. 1986. Programme of seed potato production. In Regional seed potato workshop and the 1
st Triannual 622
meeting of the African Potato Association (APA), Antsirabe, 2-7 November. Antsirabe: APA. 623 624 Labarta, R. 2012. The genetic improvement of potato and sweetpotato in Sub-Saharan Africa. Report to the diffusion 625
and impact of improved varieties in Africa (DIIVA) project. Nairobi: CIP. 626 627 Low, J., I. Barker, M. Bonierbale, C. Crissman, G. Forbes, B. Lemaga, and S. Priou. 2007. Emerging trends and 628
advances in potato research relevant to defining the way forward for the potato sector in Sub-Saharan Africa. In 629 A.A. Khalf-Allah (ed-in-chief) Potato, sweet potato, and root crops improvement for facing poverty and hunger in 630 Africa, Proceedings of the 7th Triennial Congress of the African Potato Association (APA), 8-17, Alexandria, 631 Egypt, 22-26 October 2007. Alexandria: APA. ISSN 3934 632
633 Minot, N. 2010. Staple food prices in Malawi. Paper prepared for the Comesa policy seminar on “Variation in 634 staple food prices: Causes, consequences, and policy options”. Maputo, Mozambique, 25-26 January under 635 the African Agricultural Marketing Project (AAMP). 636 637 Minten, B. 2008. The food retail revolution in developing countries: Is it coming or is it over? Economic 638 Development and Cultural Change Vol 56(4): 767-789. 639 640 National Agricultural Marketing Council (NAMC) & Commark Trust. 2007. A diagnostic study of the potato sub 641
sector: unlocking the potential contribution for ASGI-SA. Pretoria: NAMC and Commark Trust. 642 643 Prakash, A. 2010. Introduction. The role of potato in developing country food systems. In Strengthening potato 644 value chains. Technical and policy options for developing countries. Rome: FAO and Common Fund for 645 Commodities (CFC). ISBN 978-92-5-106627-0 646 647 Rakoto, M. 1986. Programme of seed potato production. In Regional seed potato workshop and proceedings of the 1
st 648
Triannual meeting of the African Potato Association (APA), Antsirabe, 2-7 November. Antsirabe: FIFAMANOR-649 CIP-APA. 650
651 Rakotondramanana. 1986. Research and basic seed production at FIFAMANOR. In Regional seed potato workshop 652 and proceedings of the 1
st Triannual meeting of the African Potato Association (APA), Antsirabe, 2-7 November. 653
Antsirabe: FIFAMANOR-CIP-APA. 654 655 Rasolo, F. 1986. La filière pomme de terre á Madagascar: Résultats d’étude sur la production, la commercialisation et 656
la consommation. In Regional seed potato workshop and proceedings of the 1st Triannual meeting of the African 657
Potato Association (APA), Antsirabe, 2-7 November. Antsirabe: FIFAMANOR-CIP-APA. 658 659 Rasolo, F., D. Randrianaivo, H. Abel Ratovo, D. Andrianorosoa, D. Adriambahoaka, R. Razafindraibe, 660
Rakotondramanana, and G. Scott. 1987. La pomme de terre pour l'autosuffisance alimentaire à Madagascar. 661 Antananarivo: FOFIFA, FIFAMANOR, CIP. 662
663

Reyes, B., C. Donavan, and V. Kelly. 2010. Raising the incomes of smallholder farmers in the central highlands of 664 Angola: a model project for improving agricultural value chains in post conflict nations. A baseline report to 665 World Vision. East Lansing: Michigan State University. 666
667 Reyes, B., C. Donovan, R. Bernsten, and M. Maredia. 2012. Market participation and sale of potatoes by smallholder 668 farmers in the central highlands of Angola: a double hurdle approach. Selected poster presentation for the 669 International Association of Agricultural Economists (IAAE) Triennial Conference, Foz do Iguaçu, 18-24 670 August 671 672 Saka, V.W. 2000. Potato production in Malawi. In E. Adipala, P. Nampala, and M. Osiru (eds.) Potatoes for poverty 673
alleviation. Proceedings of the 5th Triennial Congress of the African Potato Association (APA), 39-42, Kampala, 674 29 May-02 June. Kampala: APA and the National Agricultural Research Organization (NARO). ISBN: 1607-9353 675
676 Scott, G. 1988. Potatoes in Central Africa: A study of Burundi, Rwanda and Zaire. Lima: International Potato 677 Center (CIP). 678 679 Scott, G. 1990. Potatoes in the food systems of Sub-Saharan Africa: Present patterns and future prospects. In N. 680
Govinden, M.H.R Julien, G.L.T. Hunt and L.J.C. Autrey (eds.) Production, post-harvest technology and 681 utilisation of the potato in the warm tropics. Proceedings of a workshop organized by the Mauritius Sugar 682 Industry Research Institute (MSRI), International Potato Center (CIP), and the African Potato Association (APA), 683 122-129, Reduit, 23-27 July 1990. Reduit: MSRI. 684
685 Scott, G. 1992. Trends and prospects for the potato South of the Sahara. In G. Scott, P. Ferguson, and J. Herrera 686
(eds.) Product development for root and tuber crops. Vol. III-Africa, Proceedings of the international workshop, 687 121-132, Ibadan, Nigeria, 26, October-2, November 1991. Lima: CIP. ISBN 92-9060-165-9 688
689 Scott, G. 1995. Wall-to-wall fieldwork: Secondary data collection for food systems research. In G. Scott (ed.) Prices, 690
products, and people: analyzing agricultural markets in developing countries. Boulder: Lynne Rienner Pub.; 691 International Potato Center (CIP). ISBN 1-55587-609-9. 692
693 Scott, G. 2002. Maps, models, and muddles: World trends and patterns in potato revisited. Potato Research 45: 45-77. 694 695 Scott, G. 2011. Growth rates for potatoes in Latin America in comparative perspective: 1961-07. American Journal 696 of Potato Research 88: 143-152. DOI 10. 1007/s12230-010-9171-2 697 698 Scott, G., and V. Suarez. 1992. Transforming traditional food crops: product development for roots and tubers. In: G. 699
Scott, P. Ferguson, and J. Herrera (eds.) Product development for root and tuber Crops. Vol. III-Africa, 700 Proceedings of the international workshop, Ibadan, Nigeria, 3-23, 26, October-2, November 1991. Lima: CIP. 701 ISBN 92-9060-165-9 702
703 Scott, G., and V. Suarez. 2011. Growth rates for potato in India 1961-2009 and their implications for industry. 704
Potato Journal 38(2):100-112. 705 706
Scott, G., and V. Suarez. 2012a. The rise of Asia as the center of global potato production and some implications 707 for industry. Potato Journal 39(1): 1-22. 708
709 Scott, G., and V. Suarez. 2012b. Limits to growth or growth to the limits? Trends and prospects for potatoes 710 in China and their implications for industry. Potato Research 55 (2): 135-156. DOI 10. 1007/s11540-012-9215-8 711 712 Scott, G., and V. Suarez. 2012c. From Mao to McDonald´s: Emerging markets for potatoes and potato products in 713
China 1961-2007. American Journal of Potato Research 89(3): 216-231. 714 715
Scott, G. and F. Zelada. 2011. Benchmarking the competitiveness of informal food processors: The case of French 716 fries in Lima, Perú. Potato Research 54(1):29-44. DOI 10.1007/s11540-010-9182-x 717 718

Scott, G., M. Rosegrant, and C. Ringler. 2000. Roots and tubers for the 21st century: Trends, projections, and policy 719
options. Food, Agriculture, and the Environment Discussion paper 31. Washington, D.C.: International Food 720 Policy Research Institute (IFPRI) and International Potato Center (CIP). ISBN: 0-89629-635-0 721
722 Serage, K. L., W.T. Nell, M. Makla, and J.P.C. Tolmay. 2002. Possible predictors determining the adoption of 723 potatoes (solanum tuberosum) into a wheat- (triticum aestivum) based cropping system in Mokhotlong, 724 Lesotho. Paper prepared for presentation at the 13th International Farm Management Congress, Wageningen, 725 July 7-12, 2002. 726 727 Tesfaye A., B. Lemaga, J. Mwakasendo, Z. Nzohabonayoz, J. Mutware, K.Y.Wanda, P.M. Kinyae, O. Ortiz, C. 728
Crissman, an G. Theile 2010. Markets for fresh and frozen potato chips in the ASERECA region and the potential 729 for regional trade: Ethiopia, Tanzania, Rwanda, Kenya, Burundi and Uganda. Social Sciences working paper 730 2010-1. Lima: CIP. ISSN 0256-8748 731
732 Thiele, G., K. Theisen, M. Bonierbale, and T. Walker. 2010. Targeting the poor and hungry with potato science. 733
Potato Journal 37(3-4): 75-86. 734 735 Van der Zaag, D., and D. Horton. 1983. Potato production and utilization in world perspective with special reference 736
to the tropics and sub-tropics. Potato Research 26: 323-362. 737 738 Walker, T., P. Schmiediche, and R. Hijmans. 1999. World patterns and trends in the potato crop: An economic and 739
geographic survey. Potato Research 42: 241-264. 740 741 Walker, T., G. Thiele, V. Suarez, and C. Crissman. 2011. Hindsight and foresight about potato production 742 and consumption. Social Sciences working paper 2011-5. Lima: CIP. ISSN 0256-8748 743 744 Weatherspoon, D.D., and T. Reardon. 2003. The rise of supermarkets in Africa: implications for agrifood systems 745
and the rural poor. Development policy review 21(3): 1-17. 746 747 Woolfe, J. 1987. The potato in the human diet. Cambridge: Cambridge University Press. ISBN 0 521 32669 9 748 749 World Bank. 2007. International development association interim strategy note for the Republic of Angola. 750
Washington D.C.: Southern Africa Country Department 2 (AFCS2). 751 752 World Bank. 2011. World Development Indicators (Edition: April 2011). Manchester: ESDS International, 753 University of Manchester. ISBN 978-0-8213-8709-2 754 755 756 757 758 759 760 761 762 763 764 765 766 767 768 769 770 771 772 773 774

775 776 777 778 779 780 781 782 783 784 785 786 787 788 789 Table 1 Average annual growth rates for potatoes for countries in Southern Africa, 1961-2010 790
2008-2010 Growth ratea __________ 791
Region/country Production Area Yield Production Area Yield 792 (000mt) (000ha) (mt/ha) 1 2 3 1 2 3 1 2 3 793 Africa 17,937 1,518 11.8 4.8 4.5 4.6 3.8 3.7 3.8 0.9 0.8 0.8 794 Sub- Saharan Africa
b,c 9,501 1,185 8.0 4.1 4.7 4.4 3.3 4.6 4.0 0.8 0.1 0.4 795
Southern Africac 3,954 256 15.5 4.9 4.0 4.4 2.5 2.9 2.7 2.3 1.1 1.7 796
Rep of South Africa 1,993 59 33.7 4.7 2.8 3.7 1.1 -0.3 0.4 3.5 3.1 3.3 797 Malawi
c 742 48 15.5 7.1 11.5 9.3 6.5 8.2 7.3 0.6 0.6 1.9 798
Angola 684 85 8.1 3.5 12.6 8.0 1.9 12.1 7.0 1.5 0.4 1.0 799 Madagascar 223 40 5.6 5.2 -0.7 2.1 5.3 0.1 2.6 -0.2 -0.8 -0.5 800 Mozambique 108 8 13.8 7.4 2.2 4.7 3.6 1.1 2.3 3.6 1.0 2.3 801 Lesotho 93 7 14.0 10.1 5.2 7.6 10.0 5.6 7.7 0.1 -0.4 -0.1 802 a 1 = 1984-86 vs 1961-63; 2 = 2008-10 vs 1984-86; 3 = 2008-10 vs 1961-63 where the average annual growth rate is calculated as 803 follows 804 Ending 3 year averageBeginning 3 year average 1 100
b Sub-Saharan Africa consists of Africa less North Africa that in turn is made up of Algeria, Egypt, Libya, Morocco, and the 805 Western Sahara*, and includes West Africa includes Benin, Burkina Faso, Cameroon, Cape Verde, Chad, Côte d´Ivoire*, 806 Gambia*, Ghana*, Guinea, Guinea-Bissau*, Liberia*, Mali, Mauritania, Niger, Nigeria, Senegal, Sierra Leone*, and Togo*; 807 Central Africa is made up of Burundi, Central African Republic, Congo, Equatorial Guinea*, Dem. Rep. of the Congo, Gabon*, 808 Rwanda, and Saõ Tomé and Príncipe*; East Africa consists of Djibouti*, Eritrea, Ethiopia, Kenya, Seychelles*, Somalia*, Sudan 809 ( FAO does not yet report separate data for Sudan and the Rep of South Sudan, Tanzania, and Uganda; Southern Africa consists of 810 Angola, Botswana*, Comoros, Lesotho, Madagascar, Malawi, Mauritius, Mozambique, Rep. of South Africa, Swaziland, Zambia, 811 and Zimbabwe; * according to FAO, these territories reported producing no potatoes during 2008-10 812 c Data for Sub- Saharan and Southern Africa include statistics for Malawi based on Ministry of Agriculture and Food Security 813 data for 1994-2010 (see FAO, 2008; Saka, 2000) plus estimates for this study for years 1961-93 and not FAOSTAT; see 814 Appendix for details 815 816 Source: FAOSTAT (accessed May 2012) and calculations for this study unless otherwise indicated 817
818 819 820 821 822 823 824 825 826 827 828

829 830 831 832 833 834 835 836 837 838 839 840 841 842 843 844 Table 2 Average compound growth rates (ACGRs) for potato in Southern Africa, 1961-2010.
a 845
Years Productionb Areab Yieldb __ 846 R² ACGR (%) Signific. R² ACGR (%) Signific. R² ACGR (%) Signific. 847 1961-71 0.96 6.3 *** 0.31 1.9 * 0.63 4.3 *** 848 1962-72 0.96 6.3 *** 0.26 1.7 n.s 0.66 4.6 *** 849 1963-73 0.91 5.3 *** 0.39 2.2 ** 0.46 3.1 ** 850 1964-74 0.90 5.3 *** 0.57 2.9 *** 0.32 2.3 * 851 1965-75 0.89 5.1 *** 0.63 3.2 *** 0.26 1.9 n.s 852 1966-76 0.88 4.4 *** 0.72 3.5 *** 0.10 0.8 n.s 853 1967-77 0.91 3.9 *** 0.66 3.0 *** 0.11 0.9 n.s 854 1968-78 0.90 3.7 *** 0.65 2.9 *** 0.08 0.8 n.s 855 1969-79 0.88 3.5 *** 0.67 2.1 *** 0.26 1.3 n.s 856 1970-80 0.84 2.8 *** 0.73 2.3 *** 0.05 0.4 n.s 857 1971-81 0.84 3.1 *** 0.74 2.2 *** 0.17 0.8 n.s 858 1972-82 0.81 3.9 *** 0.94 2.8 *** 0.21 1.1 n.s 859 1973-83 0.88 4.4 *** 0.93 2.9 *** 0.42 1.5 ** 860 1974-84 0.88 4.5 *** 0.93 3.2 *** 0.33 1.2 * 861 1975-85 0.89 4.8 *** 0.95 3.8 *** 0.27 1.0 * 862 1976-86 0.91 5.0 *** 0.92 3.5 *** 0.44 1.5 ** 863 1977-87 0.89 4.8 *** 0.86 3.1 *** 0.51 1.7 ** 864 1978-88 0.89 4.8 *** 0.85 2.9 *** 0.62 1.9 *** 865 1979-89 0.89 4.9 *** 0.87 3.1 *** 0.57 1.7 *** 866 1980-90 0.88 4.5 *** 0.78 2.7 *** 0.59 1.9 *** 867 1981-91 0.92 3.9 *** 0.78 2.5 *** 0.44 1.3 ** 868 1982-92 0.87 3.2 *** 0.70 2.2 *** 0.33 1.0 * 869 1983-93 0.72 2.7 *** 0.40 1.3 ** 0.68 1.4 *** 870 1984-94 0.69 2.2 *** 0.07 0.5 n.s 0.67 1.7 *** 871 1985-95 0.66 2.0 *** 0.01 0.2 n.s 0.68 1.8 *** 872 1986-96 0.69 2.5 *** 0.08 0.5 n.s 0.70 2.0 *** 873 1987-97 0.71 2.8 *** 0.15 0.8 n.s 0.69 2.0 *** 874 1988-98 0.72 2.9 *** 0.02 0.3 n.s 0.75 2.6 *** 875 1989-99 0.72 3.0 *** 0.01 0.2 n.s 0.76 2.8 *** 876 1990-00 0.80 3.5 *** 0.07 0.5 n.s 0.79 3.0 *** 877 1991-01 0.86 4.4 *** 0.15 0.8 n.s 0.91 3.6 *** 878 1992-02 0.95 5.1 *** 0.57 2.2 *** 0.73 2.9 *** 879 1993-03 0.95 5.1 *** 0.69 3.8 *** 0.15 1.3 n.s 880 1994-04 0.95 4.8 *** 0.74 5.4 *** 0.02 -0.5 n.s 881 1995-05 0.94 4.4 *** 0.77 6.9 *** 0.24 -2.2 n.s 882 1996-06 0.95 4.0 *** 0.74 6.6 *** 0.27 -2.3 n.s 883 1997-07 0.95 4.5 *** 0.77 6.9 *** 0.25 -2.2 n.s 884 1998-08 0.95 4.6 *** 0.73 6.6 *** 0.16 -1.8 n.s 885 1999-09 0.95 5.0 *** 0.72 6.4 *** 0.09 -1.4 n.s 886 2000-10 0.95 5.2 *** 0.69 5.9 *** 0.03 -0.7 n.s 887 *** = Significant at 1% level; ** = Significant at 5% level; * = Significant at 10% level; n. s. = not significant 888

a Calculated using the following expression: lnY ln , i.e. ln ln ; where, Y = Variables (Production, 889
Area or Yield); ln= natural log; and ACGR 890 b
Data for Southern Africa include statistics for Malawi based on Ministry of Agriculture and Food Security data for 1994-2010 891 (see FAO, 2008; Saka, 2000) plus estimates for this study for years 1961-93 and not FAOSTAT; see Appendix for details 892 893 Source: FAOSTAT (accessed August 2012) and calculations for this study unless otherwise indicated 894 . 895 896 897 898 899 900 901 902 903 Table 3 Distribution of potato producing countries in Sub-Saharan Africa, 2008-10 904
Annual production (000 mt) Sub-Saharan Africa a ____________________________ 905
West Central East Southern b
906
0 or no data 7 3 3 1 c
907 > 0 <10,000 4 3 1 2
d 908
> 10,000 < 50,000 5 -- -- 3 e
909 > 50,000 <250,000 1 1 -- 4
f 910
>250,000 1 1 5 3 g
911 Total 18 8 9 13 912 a See Table 1 footnote b for a list of the countries in each sub-region 913 b
Data for Southern Africa include statistics for Malawi based on Ministry of Agriculture and Food Security data for 1994-2010 914 (see FAO, 2008; Saka (2000) plus estimates for this study for years 1961-93 and not FAOSTAT; see Appendix for details 915 c
Botswana 916 d
Comoros, Swaziland 917 e
Mauritius, Namibia, Zambia 918 f
Lesotho, Madagascar, Mozambique, Zimbabwe 919 gAngola, Malawi, Rep. of South Africa 920
Source: FAOSTAT (accessed August 2012) unless otherwise indicated 921 922 923 924 Table 4 Average annual growth rates for major food crops in Southern Africa, 1961-2010 925
2008-2010 Growth ratea __ 926
Region/country Production Area Yield Production Area Yield 927 (000mt) (000ha) (mt//ha) 1 2 3 1 2 3 1 2 3 928
Sub- Saharan Africa b
929 Cassava 120,823 11,911 10.1 2.6 3.1 2.9 1.3 1.9 1.6 1.2 1.2 1.2 930 Maize 52,156 28,839 1.8 2.3 3.1 2.7 1.3 1.6 1.5 0.9 1.5 1.2 931 Yams 47,723 4,580 10.4 1.6 6.2 3.9 1.9 4.3 3.1 -0.3 1.8 0.8 932 Plantains 26,788 4,303 6.2 2.4 1.9 2.2 2.3 0.9 1.6 0.2 1.0 0.6 933 Sorghum 22,190 25,551 0.9 1.4 2.0 1.7 1.3 1.6 1.4 0.1 0.4 0.2 934 Rice, paddy 17,712 8,537 2.1 3.4 3.8 3.6 2.4 2.6 2.5 0.9 1.1 1.0 935 Sweet potatoes
c 17,008 3,400 5.0 2.5 4.4 3.5 2.8 4.3 3.6 -0.2 0.1 -0.1 936
Potatoes (11) c
9,501 1,185 8.0 4.1 4.7 4.4 3.3 4.6 4.0 0.8 0.1 0.4 937 Southern Africa 938 Cassava 25,418 2,496 10.2 1.8 5.0 3.4 1.2 1.4 1.3 0.5 3.6 2.1 939 Maize 21,880 10,144 2.2 1.5 2.2 1.9 0.9 0.2 0.5 0.6 2.0 1.3 940 Sweet potatoes
c 5,545 599 9.3 2.6 7.2 4.9 2.2 5.2 3.7 0.4 1.9 1.2 941
Rice, paddy 4,759 1,605 3.0 1.5 3.0 2.3 1.5 0.8 1.1 0.0 2.2 1.1 942

Potatoes (5) c
3,954 256 15.5 4.9 4.0 4.4 2.5 2.9 2.7 2.3 1.1 1.7 943 Wheat 2,094 717 2.9 4.2 -0.5 1.8 1.2 -4.3 -1.6 3.0 3.9 3.5 944 Bananas 1,774 189 9.4 2.8 2.8 2.8 2.5 1.7 2.1 0.2 1.1 0.7 945 ( ) indicates the order of importance in terms of the volume of production 946 a 1= 1984-86 vs 1961-63; 2= 2008-10 vs 1984-86; 3= 2008-10 vs 1961-63 947 b
See Table 1 footnote b for a list of the countries in Sub-Saharan Africa and in the Southern Africa sub-region 948 c
Data on potato and sweet potato production include statistics from Malawi’s Ministry of Agriculture and Food Security for 949 1994-2010 (see FAO, 2008; Saka, 2000) and estimates for this study for 1961-63; see Appendix for details 950 951 Source: FAOSTAT (accessed August 2012) and calculations for this study unless otherwise indicated 952 953 954 955 956 957 958 959 960 961 962 963 964 Table 5 Food Balance Sheets for potato in Sub-Saharan Africa, 1961-63 to 2007-09
a 965
Region 1961-63 1976-78 1991-93 2007-09 966
Sub-Saharanb,c
Domestic supply (000 mt) 1,258 2,486 4,341 9,047 967 Food (%) 73 75 78 75 968 Feed (%) 3 3 3 3 969 Seed (%) 14 12 9 11 970 Processing (%) 0 0 0 0 971 Other uses (%)
d 9 10 10 11 972
Southern Africa c Domestic supply (000 mt) 517 1,053 1,857 3,733 973
Food (%) 67 73 75 73 974 Feed (%) 8 8 8 7 975 Seed (%) 16 10 7 7 976 Processing (%) 0 0 0 0 977 Other uses (%)
d 9 9 10 13 978
a Totals may not sum due to rounding 979 b
See Table 1 footnote b for a list of the countries in Sub-Saharan Africa and in South Africa sub-region 980 c
Data for Sub- Saharan and Southern Africa include statistics for Malawi based on Ministry of Agriculture and Food Security 981 data for 1994-2010 (see FAO, 2008; Saka, 2000) plus estimates for this study for years 1961-93 and not FAOSTAT; see 982 Appendix for details 983 d According to FAOSTAT "other uses" refers to "waste" and "other uses"; in previous years it referred only to waste (Anonymous 984
1995; Horton 1988) 985 986 Source: FAOSTAT (accessed August 2012) and calculations for this study unless otherwise indicated 987 988 989 990 991 992 993 994 995 996 997 998 999

1000 1001 1002 1003 1004 1005 1006 1007 1008 1009 1010 1011 1012 1013 1014 1015 1016 1017 1018 1019 1020 1021 1022 Table 6 Average per capita food supply (kg/yr) in Sub-Saharan Africa 1961-2009 1023
Region a 1961-63 1971-73 1981-83 1991-93 2001-03 2007-09 1024
Sub-Saharan Africa 1025
Cassava 103.5 97.7 95.2 109.0 92.3 75.9 1026 Fruits 52.0 54.6 54.6 53.3 53.5 52.8 1027 Maize 36.6 36.5 38.3 42.8 41.0 39.8 1028 Meat 13.6 13.6 14.1 13.4 13.6 14.8 1029 Milk 27.1 29.3 33.2 27.9 30.7 33.2 1030 Potatoes
b 4.0 4.8 5.7 6.4 9.0 8.5 1031
Sorghum 29.1 22.1 20.1 20.7 20.7 20.7 1032 Sweet Potatoes
b 11.7 11.7 12.0 10.7 15.9 16.7 1033
Wheat 10.2 14.4 17.2 17.2 20.9 23.2 1034 Southern Africa 1035 Cassava 91.1 88.2 76.2 74.3 88.9 88.1 1036 Fruits 34.9 41.8 37.4 36.5 38.9 36.7 1037 Maize 100.0 96.2 98.1 94.2 95.2 89.0 1038 Meat 21.9 23.7 23.4 24.6 25.3 31.7 1039 Milk 47.2 55.5 52.1 36.7 34.1 34.0 1040 Potatoes
b 7.5 10.9 12.6 13.7 16.8 19.6 1041
Sorghum 9.5 8.8 4.8 3.1 3.1 3.3 1042 Sweet Potatoes
b 8.9 8.6 8.8 8.2 18.4 25.6 1043
Wheat 25.1 33.5 35.6 33.2 33.4 38.7 1044 a See Table 1 footnote b for a list of the countries in Sub-Saharan Africa and in South Africa sub-region 1045
b Data for Sub- Saharan and Southern Africa include statistics on potato and sweet potato production from Malawi’s Ministry of 1046
Agriculture and Food Security for 1994-2010 (see FAO, 2008; Saka, 2000) and estimates for this study for 1961-63; see 1047 Appendix for details 1048 1049 Source: FAOSTAT (accessed August 2012) and calculations for this study unless otherwise indicated 1050 1051 1052 1053 1054 1055 1056 1057
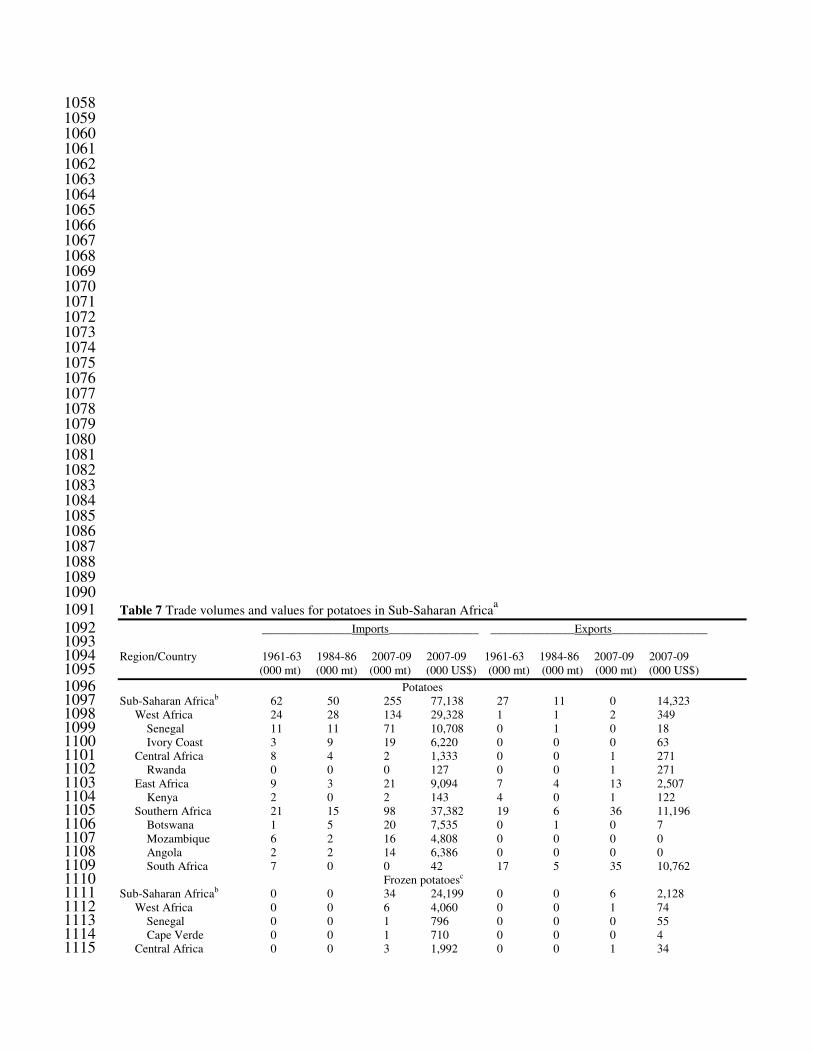
1058 1059 1060 1061 1062 1063 1064 1065 1066 1067 1068 1069 1070 1071 1072 1073 1074 1075 1076 1077 1078 1079 1080 1081 1082 1083 1084 1085 1086 1087 1088 1089 1090 Table 7 Trade volumes and values for potatoes in Sub-Saharan Africa
a 1091 _______________Imports_______________ ______________Exports________________ 1092 1093 Region/Country 1961-63 1984-86 2007-09 2007-09 1961-63 1984-86 2007-09 2007-09 1094
(000 mt) (000 mt) (000 mt) (000 US$) (000 mt) (000 mt) (000 mt) (000 US$) 1095 Potatoes 1096 Sub-Saharan Africab 62 50 255 77,138 27 11 0 14,323 1097 West Africa 24 28 134 29,328 1 1 2 349 1098 Senegal 11 11 71 10,708 0 1 0 18 1099 Ivory Coast 3 9 19 6,220 0 0 0 63 1100 Central Africa 8 4 2 1,333 0 0 1 271 1101 Rwanda 0 0 0 127 0 0 1 271 1102 East Africa 9 3 21 9,094 7 4 13 2,507 1103 Kenya 2 0 2 143 4 0 1 122 1104 Southern Africa 21 15 98 37,382 19 6 36 11,196 1105 Botswana 1 5 20 7,535 0 1 0 7 1106 Mozambique 6 2 16 4,808 0 0 0 0 1107 Angola 2 2 14 6,386 0 0 0 0 1108 South Africa 7 0 0 42 17 5 35 10,762 1109 Frozen potatoesc 1110 Sub-Saharan Africab 0 0 34 24,199 0 0 6 2,128 1111 West Africa 0 0 6 4,060 0 0 1 74 1112 Senegal 0 0 1 796 0 0 0 55 1113 Cape Verde 0 0 1 710 0 0 0 4 1114 Central Africa 0 0 3 1,992 0 0 1 34 1115

East Africa 0 0 1 471 0 0 1 102 1116 Kenya 0 0 0 56 0 0 0 52 1117 Uganda 0 0 0 45 0 0 0 5 1118 Southern Africa 0 0 25 17,677 0 0 4 1,918 1119 South Africa 0 0 19 13,530 0 0 4 1,803 1120 Zambia 0 0 1 217 0 0 0 71 1121 Potato flour c 1122 Sub-Saharan Africab 1 3 67 8,278 1 0 20 5,689 1123 West Africa 0 1 7 1,620 0 0 0 4 1124 Central Africa 0 0 30 759 0 0 0 20 1125 East Africa 1 0 13 1,497 1 0 1 716 1126 Kenya 0 0 0 22 0 0 0 82 1127 Uganda 0 0 0 14 0 0 0 7 1128 Southern Africa 0 1 17 4,403 0 0 19 4,949 1129 South Africa 0 1 4 1,820 0 0 7 3,535 1130 Total 63 53 407 109,616 27 11 79 22,140 1131 a Totals may not sum due to rounding 1132 b
See Table 1 for details about the classification of countries by region and sub-region 1133 c Fresh weight equivalent with a conversion rate of 2:1 for frozen potatoes and 5:1 for potato flour 1134 Source: FAOSTAT (accessed August 2012) 1135 1136 1137 1138 1139 1140 1141 1142 1143 1144 1145 1146 1147 Table 8 Potato production in Malawi according to different sources, 1961-2010 1148
Year FAOSTAT __ Ministry of Agriculture and Food Securitya __________ 1149
Potato Potato + Sweet potato__ Potato _________ Sweet potato__________ 1150 Production Area Production Area Production Area Production Area 1151 (000 mt) (000 ha) (000 mt) (000 ha) (000 mt) (000 ha) (000 mt) (000 ha) 1152 1961 60 10 60 10 11 2 49 8 1153 1962 62 10 62 10 11 2 51 8 1154 1963 64 10 64 10 12 2 52 8 1155 1964 66 11 66 11 12 2 54 9 1156 1965 68 11 68 11 12 2 56 9 1157 1966 70 11 70 11 13 2 57 9 1158 1967 78 12 78 12 14 2 64 10 1159 1968 80 12 80 12 14 2 66 10 1160 1969 84 13 84 13 15 2 69 11 1161 1970 86 13 86 13 16 2 71 11 1162 1971 83 13 83 13 15 2 68 11 1163 1972 85 13 85 13 15 2 70 11 1164 1973 235 35 235 35 42 6 193 29 1165 1974 240 35 240 35 43 6 197 29 1166 1975 245 35 245 35 44 6 201 29 1167 1976 250 35 250 35 45 6 205 29 1168 1977 255 36 255 36 46 6 209 29 1169 1978 260 36 260 36 47 6 213 30 1170 1979 260 36 260 36 47 6 213 30 1171 1980 270 38 270 38 48 6 221 32 1172 1981 280 40 280 40 50 7 230 33 1173 1982 285 40 285 40 51 7 234 33 1174

1983 290 40 290 40 52 7 238 33 1175 1984 295 42 295 42 53 7 242 35 1176 1985 300 42 300 42 54 7 246 35 1177 1986 310 43 310 43 56 7 254 36 1178 1987 320 32 320 32 58 5 262 27 1179 1988 330 32 330 32 59 5 271 26 1180 1989 340 47 340 47 61 8 279 39 1181 1990 350 34 350 34 63 6 287 28 1182 1991 360 54 360 54 65 9 295 45 1183 1992 350 26 350 26 63 4 287 21 1184 1993 370 41 370 41 67 7 303 34 1185 1994 350 41 173 37 42 4 131 33 1186 1995 397 68 366 63 70 7 296 56 1187 1996 703 78 867 94 100 9 767 85 1188 1997 975 102 982 102 115 10 868 92 1189 1998 1, 553 148 1, 455 140 117 12 1, 339 128 1190 1999 1, 840 164 1, 821 165 149 13 1, 672 152 1191 2000 2, 037 178 2, 032 174 173 14 1, 859 161 1192 2001 2, 852 211 2, 713 205 310 22 2, 403 183 1193 2002 1, 404 111 3, 103 239 350 28 2, 753 212 1194 2003 1, 884 144 1, 935 146 399 30 1, 535 116 1195 2004 2, 183 181 2, 006 183 431 33 1, 575 149 1196 2005 1, 486 164 2, 006 183 431 33 1, 575 149 1197 2006 2, 309 173 2, 309 173 528 41 1, 782 132 1198 2007 2, 859 188 2, 901 191 594 40 2, 307 151 1199 2008 2, 994 205 3, 036 208 673 46 2, 362 162 1200 2009 3, 428 212 3, 472 214 776 48 2, 696 166 1201 2010 4, 706 241 3, 674 229 776 49 2, 898 180 1202 1203 Source: FAOSTAT (accessed June 2012); Ministry of Agriculture and Food Security 1994-2010 data are from the same Ministry 1204 (see FAO, 2008; Saka, 2000); data for 1961-1993 represent estimates derived via interpolation calculated for this study based on 1205 the 1994-2010 data 1206 1207 1208 1209 1210 Fig. 1 Potato production and ACGRs for production in Southern Africa, 1961-2010a 1211 1212
1213 a
Data points for the ACGRs are taken from Table 2; see Table 2 for details. Double asterisks R2 1214 indicates the estimated trend line for growth rates is significant at the 1% level 1215 1216 Source: Table 1, 2 and 8 1217 1218 1219 1220

1221 1222 1223 1224 1225 1226 1227 Fig. 2 Area harvested for potato and ACGRs for area in Southern Africa, 1961-2010 a 1228 1229
1230 a
Data points for the ACGRs are taken from Table 2; see Table 2 for details. Double asterisk R2 1231 indicates the estimated trend line is significant at the 1% level 1232 1233 Source: Table 1, 2 and 8 1234 1235 1236 1237 1238 1239 1240 Fig. 3 Yield/ha for potato and ACGRs for yields in Southern Africa, 1961-2010 a 1241 1242
1243 a
Data points for the ACGRs are taken from Table 2; see Table 2 for details. Double asterisk R2 1244

indicates the estimated trend line is significant at the 1% level1245 1246 Source: Table 1, 2 and 8 1247 1248 1249 1250 1251 1252 1253 1254 1255 1256 1257 1258
1259 Fig 4. Potato area in Southern Africa1260 1261 Source: CIP´s Research Informatics Unit1262 1263 1264 1265 1266 1267
1268 Fig. 5 Dry-land versus irrigated potato 1269 1270
significant at the 1% level
Africa
Research Informatics Unit
land versus irrigated potato area in the Rep. of South Africa, 1987-2005

Source: Potatoes SA 1271 1272 1273 1274 1275 1276
1277 1278 Fig. 6 Annual average potato consumption for 1279 1280 Source: FAOSTAT (accessed July 2012)1281 1282 1283 1284 1285 1286
Annual average potato consumption for selected countries in Southern Africa, 1961-
(accessed July 2012)
-2009