A three-dimensional realistic microstructure model of particle-reinforced metal matrix composites
22
This content has been downloaded from IOPscience. Please scroll down to see the full text. Download details: IP Address: 210.72.136.24 This content was downloaded on 16/03/2014 at 00:18 Please note that terms and conditions apply. A three-dimensional realistic microstructure model of particle-reinforced metal matrix composites View the table of contents for this issue, or go to the journal homepage for more 2014 Modelling Simul. Mater. Sci. Eng. 22 035010 (http://iopscience.iop.org/0965-0393/22/3/035010) Home Search Collections Journals About Contact us My IOPscience
-
Upload
independent -
Category
Documents
-
view
2 -
download
0
Transcript of A three-dimensional realistic microstructure model of particle-reinforced metal matrix composites

This content has been downloaded from IOPscience. Please scroll down to see the full text.
Download details:
IP Address: 210.72.136.24
This content was downloaded on 16/03/2014 at 00:18
Please note that terms and conditions apply.
A three-dimensional realistic microstructure model of particle-reinforced metal matrix
composites
View the table of contents for this issue, or go to the journal homepage for more
2014 Modelling Simul. Mater. Sci. Eng. 22 035010
(http://iopscience.iop.org/0965-0393/22/3/035010)
Home Search Collections Journals About Contact us My IOPscience
Modelling and Simulation in Materials Science and Engineering
Modelling Simul. Mater. Sci. Eng. 22 (2014) 035010 (21pp) doi:10.1088/0965-0393/22/3/035010
A three-dimensional realisticmicrostructure model of particle-reinforcedmetal matrix composites
X X Zhang1, Q Zhang1, T Zangmeister2, B L Xiao1, H Andra2
and Z Y Ma1
1 Shenyang National Laboratory for Materials Science, Institute of Metal Research,Chinese Academy of Sciences, 72 Wenhua Road, Shenyang 110016, People’sRepublic of China2 Fraunhofer Institute for Industrial Mathematics, Fraunhofer-Platz 1, Kaiserslautern67663, Germany
E-mail: [email protected]
Received 28 August 2013, revised 5 February 2014Accepted for publication 10 February 2014Published 14 March 2014
AbstractA new and robust methodology is presented for the complete computersimulation of large three-dimensional (3D) microstructures of particle-reinforced metal matrix composites (PRMMCs), by integrating the boundaryrepresentation scheme, the random cutting algorithm and the randomsequential adsorption algorithm. The methodology allows large realistic3D microstructure models to be generated that can be used for multi-scaleinvestigation of PRMMC structure and design. The effect of the simulationparameters on the simulated microstructure is investigated by applying aquantitative metallographic analysis of the distribution functions of aspect ratio,diameter and the area of reinforcements. Simulated large realistic homogenous3D microstructures of PRMMC are in close agreement with the experimentalmicrostructures.
Keywords: metal matrix composites, computer simulation, modeling, realisticmicrostructure
(Some figures may appear in colour only in the online journal)
1. Introduction
Particle-reinforced metal matrix composites (PRMMCs) are widely used in advanced structure,energy and information industries due to their distinctive properties, such as high strength, high
0965-0393/14/035010+21$33.00 © 2014 IOP Publishing Ltd Printed in the UK 1

Modelling Simul. Mater. Sci. Eng. 22 (2014) 035010 X X Zhang et al
stiffness and light weight. These properties result from the multi-scale features and multi-phasestructures of PRMMCs. At the micro-scale (∼µm scale), PRMMCs are viewed as multi-phase (i.e. matrix and particles) materials. The types of matrix alloys and particles, the heattreatment state of the matrix alloy, the content of the particles, etc. control the macroscopicproperties of PRMMCs. At the macro-scale (∼mm scale), PRMMCs are viewed as single-phase (i.e. homogeneous) materials and the macroscopic properties are critical for componentand structure design and analysis.
The multi-scale modeling and simulation of PRMMCs can take into account the multi-phase structure and the heterogeneous distribution of physical fields (such as stress field, strainfield and electromagnetic field) at the micro-scale, and can provide an optimized structureand design of the materials or components before they are fabricated in reality. The twobasic steps involved in multi-scale modeling and simulation of PRMMCs are (i) constructionof multi-phase microstructures of PRMMCs, and (ii) microstructure-based computation ofmacroscopic properties using numerical methods such as finite element (FE) and finite volume(FV) methods. In these steps, the microstructure model plays a primary role.
The microstructure models may be categorized into idealized models, experimental modelsor simulated realistic models. The idealized models assume that the particles have a simplifiedshape or are distributed regularly [1–3]. The complex shape or irregular distribution of realparticles in PRMMCs is not considered in the idealized models. The experimental realisticmodels usually employ experimental images of PRMMCs to reconstruct the microstructure.A two-dimensional (2D) experimentally reconstructed model employs one 2D image, while athree-dimensional (3D) experimentally reconstructed model requires serial 2D images. Theexperimentally reconstructed models can reflect the actual shape, size and distribution ofparticles in PRMMCs [4–8]. However, owing to the laborious work, the length of the thirddimension of a 3D reconstructed microstructure is usually smaller than that of the othertwo dimensions [5, 8–10]. Recently, the x-ray tomography technique has been applied toreconstruct 3D microstructures of PRMMCs [11–13]. Compared to the method using serial2D metallographs, the x-ray tomography technique is more efficient and its resolution reaches1–2 µm [14, 15].
Another method for generating a realistic microstructure is the computer modeling andsimulation method. Up to now, numerous computer simulations of PRMMC microstructureshave been reported. The main categories include the random sequential adsorption (RSA)algorithm [16–21], Monte Carlo procedures [22, 23] and volume mesh techniques [24, 25].However, most of these simulations focused on 2D or 3D idealized microstructures, and didnot compare the simulated results with experimental data.
In this work, a new and robust methodology is proposed for complete computer simulationof large 3D PRMMC microstructures that can be used for multi-scale investigations ofPRMMC structure and design. Since the simulated microstructure is dependent on thesimulation algorithm, assessments of the effect of each simulation parameter on the simulatedmicrostructure are crucial. When building the relationship between the algorithm inputparameters and the microstructural attributes, such as aspect ratio, diameter and the area ofparticles, a large realistic 3D PRMMC microstructure is simulated.
2. Background of the solid modeling method
Usually, the microstructure-material property simulation chain is as follows: microstructuremodel→finite element (FE) or finite volume (FV) mesh→FE/FV modeling/simulation ofmaterial properties. In the chain, the microstructure model needs to capture the main attributes
2

Modelling Simul. Mater. Sci. Eng. 22 (2014) 035010 X X Zhang et al
of the real materials, and then has to be divided into FEs or FVs. A flexible and robusttetrahedral mesh library TetGen developed in [26] has been adopted to generate the FE/FVmeshes. The main advantage of the tetrahedral mesh is that it can be re-meshed efficiently toimprove the mesh quality in the case of large deformations. The general input data structureof TetGen is the piecewise linear complexes (PLC) [27] which can approximately representany 3D domain by using the set of vertices, segments and facets.
Such a mesh-generation technique requires a compatible solid modeling technique, whichprovides the geometrical information, such as vertices, edges and faces, so that the solidmodel can be converted to PLC. Several different techniques can be used for creating orrepresenting solid models. Among them, three prominent solid modeling techniques are thecell decomposition scheme, the constructive solid geometry (CSG) scheme and the boundaryrepresentation (BREP) scheme.
The cell decomposition scheme divides the object space into unit-sized elements (usuallycubes), and represents shapes as sets of these elements. Interfaces and boundaries of thecell decomposition model have step profiles, because the minimal resolution is limited by thesize of these unit elements. To obtain a better approximation of interfaces and boundaries, anadditional technique is required; for example, the extended finite element method (XFEM) [28]or the immersed interface method (IIM) [29]. The geometry model created by the celldecomposition method can be divided into a regular voxel mesh. Unfortunately, it is notsuitable for free unstructured mesh subdividing.
The CSG scheme creates a complex surface or object by using Boolean operations tocombine the primitives, which are the simplest objects, such as cuboids, cylinders and spheres.The two main parts of the CSG technique are the primitives, which are described by sizeparameters and orientation parameters, and Boolean operations, which indicate how to buildthe CSG model from the primitives. The CSG model can be discretized by free unstructuredmeshes. However, the fundamental and topological character of the CSG model is that it doesnot store the geometrical information explicitly. Therefore, if the CSG model is used for meshgeneration, the geometry information can only be evaluated by additional algorithms.
Unlike the cell decomposition and CSG scheme, the BREP scheme represents shapesusing their limits. A BREP model is described by topology (the structure of the object withvertices, edges and faces as the main items) and geometry (the form of the object; i.e. points,curves and surfaces). The BREP technique is particularly suitable for mesh generation usingPLC, because the BREP model explicitly contains the geometry information. Therefore, theBREP technique is applied as the fundamental technique for computer simulation of PRMMCmicrostructure in this study.
The corresponding data structure of the BREP technique that has been well definedin [30] is used in the present work. The framework of 3D Euclidean space is applied forthe microstructure modeling.
3. 3D microstructure model
To reduce the complexity of the modeling algorithm, yet reproduce the main features of a realPRMMC microstructure, we simulate the realistic microstructure. Reinforcements, such asSiC, Al2O3 and B4C particles, are assumed to have convex shapes with planar sides so that theycan be defined as bounded convex polyhedrons rather than real complex shapes. An object-orientated computer program has been written in C++. The algorithms of the microstructuregenerating technique are composed of two parts: (i) the generation of arbitrary polyhedrons;and (ii) the placement of random polyhedrons at random positions in a representative volume
3
Modelling Simul. Mater. Sci. Eng. 22 (2014) 035010 X X Zhang et al
element (RVE). Boolean operations are used to generate random polyhedrons, and the RSAalgorithm is applied to locate the polyhedrons randomly within an RVE. The details of themicrostructure generating technique are described in sections 3.1 and 3.2.
3.1. Generation of random polyhedrons
A novel algorithm has been developed to capture the random shapes and sizes of reinforcementsin PRMMC, for modeling a realistic microstructure of PRMMC. Arbitrary convex polyhedronsare used to represent the random reinforcements in this study. A Boolean-operation-basedtechnique, called a cutting process, is proposed for generating random convex polyhedrons.
Local Euclidean coordinates are used for the cutting process. An arbitrary convexpolyhedron is generated by using several planes to cut a primitive object. The primary substepis to generate a primitive object. This should be simple so that it is easy to implement usingthe BREP technology, and should have one or several fundamental attribute(s) of the realreinforcement. According to these conditions, a cuboid that is defined by a triple (A, B, C)indicating its length A, width B and height C, with its center point located at the origin O
in the local Euclidean coordinates, is applied as the primitive object in this work. It is easyto use the BREP technique for the computer description of such a cuboid. Furthermore,a real reinforcement in PRMMC can be classified into sphere-approximated or ellipsoid-approximated particles, if one considers the minimum convex hull of the reinforcement. Acuboid also has such an attribute. Its minimum convex hull may be a sphere or an ellipsoid,depending on whether A = B = C.
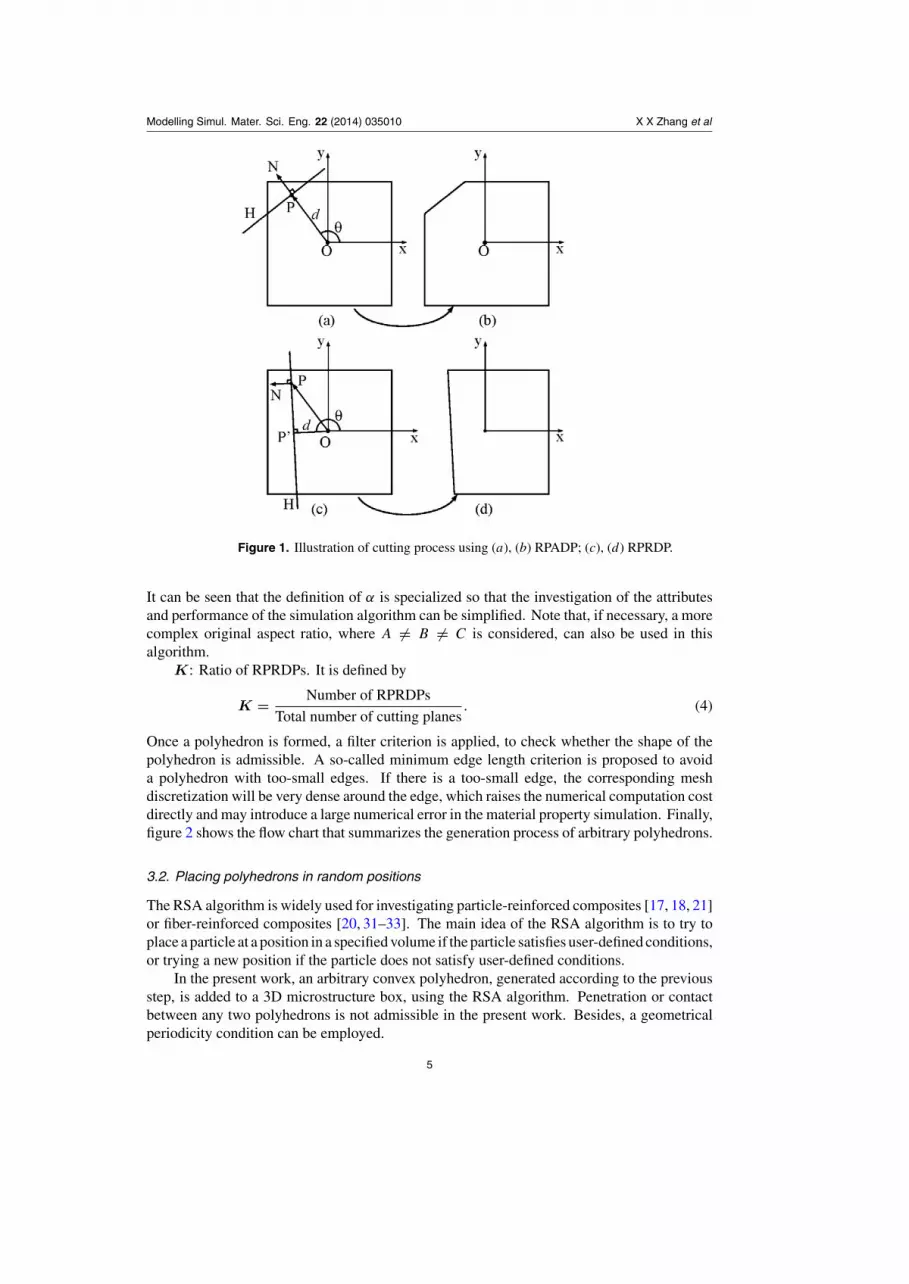
In order to form an arbitrary convex polyhedron, the cuboid basis is then cut by severalplanes. In the present study, a plane in a 3D local Euclidean coordinate system is defined byH(P , N), which states a plane H that passes through point P and has an orthogonal directionequal to N . Point P is simulated at a uniformly distributed random position within the cuboidfor the sake of simplicity. Generally, the direction N and the vector OP are independentof each other. In other words, the direction N can be either parallel to the vector OP ornot. Based on these two relationships between the direction N and the vector OP , two typesof cutting planes are defined and used in the present work. The first type of plane has onlyone governing parameter since the orthogonal direction N is parallel to the vector OP , inother words, the orthogonal direction of the plane is associated with the position of that plane.Hence, the first type of plane is called a random position–associated direction-plane (RPADP).The second type of plane has two governing parameters whereby both the position P and theorthogonal direction N are simulated as uniformly distributed random variables. Hence, thesecond type of plane is called a random position–random direction-plane (RPRDP). Figure 1illustrates the two cutting processes using RPADP and RPRDP.
The effects of the RPADPs and RPRDPs on the geometry attributes of generated arbitraryconvex polyhedrons are investigated in the present work and discussed in section 5.3. Furtherquantitative analysis of the cutting process is necessary to control the size and shape of randomparticles. Therefore, two simulation parameters are introduced, based on the simulationalgorithm for generating arbitrary convex polyhedrons. They are as follows. α: originalaspect ratio of the primitive object. It is defined by the following three equations:
α = B
A, (1)
A = C, (2)
A × B × C = const. (3)
4
Modelling Simul. Mater. Sci. Eng. 22 (2014) 035010 X X Zhang et al
Figure 1. Illustration of cutting process using (a), (b) RPADP; (c), (d) RPRDP.
It can be seen that the definition of α is specialized so that the investigation of the attributesand performance of the simulation algorithm can be simplified. Note that, if necessary, a morecomplex original aspect ratio, where A �= B �= C is considered, can also be used in thisalgorithm.
K: Ratio of RPRDPs. It is defined by
K = Number of RPRDPs
Total number of cutting planes. (4)
Once a polyhedron is formed, a filter criterion is applied, to check whether the shape of thepolyhedron is admissible. A so-called minimum edge length criterion is proposed to avoida polyhedron with too-small edges. If there is a too-small edge, the corresponding meshdiscretization will be very dense around the edge, which raises the numerical computation costdirectly and may introduce a large numerical error in the material property simulation. Finally,figure 2 shows the flow chart that summarizes the generation process of arbitrary polyhedrons.
3.2. Placing polyhedrons in random positions
The RSA algorithm is widely used for investigating particle-reinforced composites [17, 18, 21]or fiber-reinforced composites [20, 31–33]. The main idea of the RSA algorithm is to try toplace a particle at a position in a specified volume if the particle satisfies user-defined conditions,or trying a new position if the particle does not satisfy user-defined conditions.
In the present work, an arbitrary convex polyhedron, generated according to the previousstep, is added to a 3D microstructure box, using the RSA algorithm. Penetration or contactbetween any two polyhedrons is not admissible in the present work. Besides, a geometricalperiodicity condition can be employed.
5

Modelling Simul. Mater. Sci. Eng. 22 (2014) 035010 X X Zhang et al
Figure 2. Flow chart of the generation of random convex polyhedron.
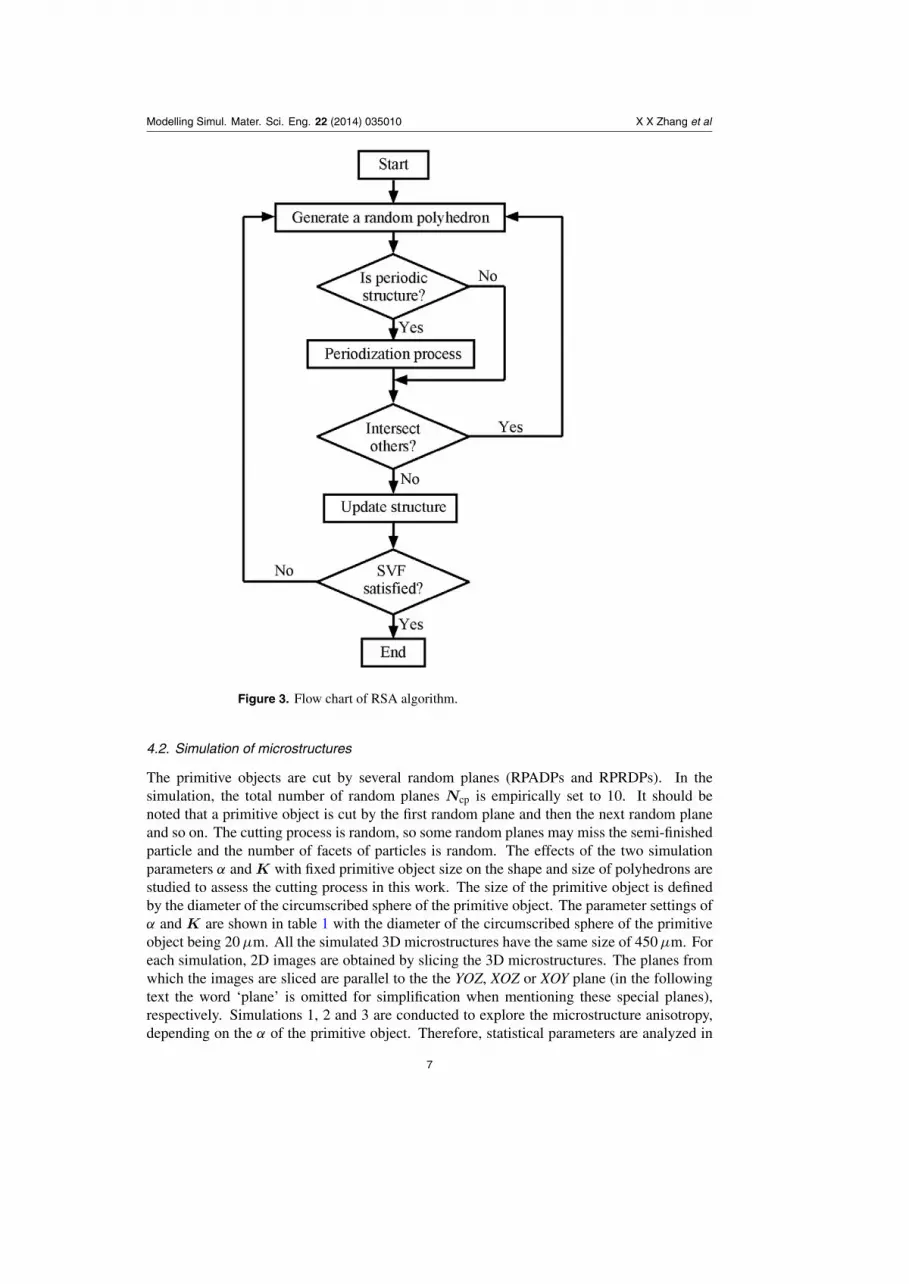
Once a new particle is accepted, the solid volume fraction (SVF) of the added particlesis updated. This sequential adding process repeats until a target SVF (i.e. the volume fractionof particles in the composite) is satisfied. Figure 3 summarizes the flow chart of the RSAalgorithm used in the present work. All simulations run in a ThinkStation-D20 with 2 Xeon5690 CPUs (3.47 GHz) and 32 GB memory.
4. Experiments
4.1. 2D experimental image of PRMMC microstructure
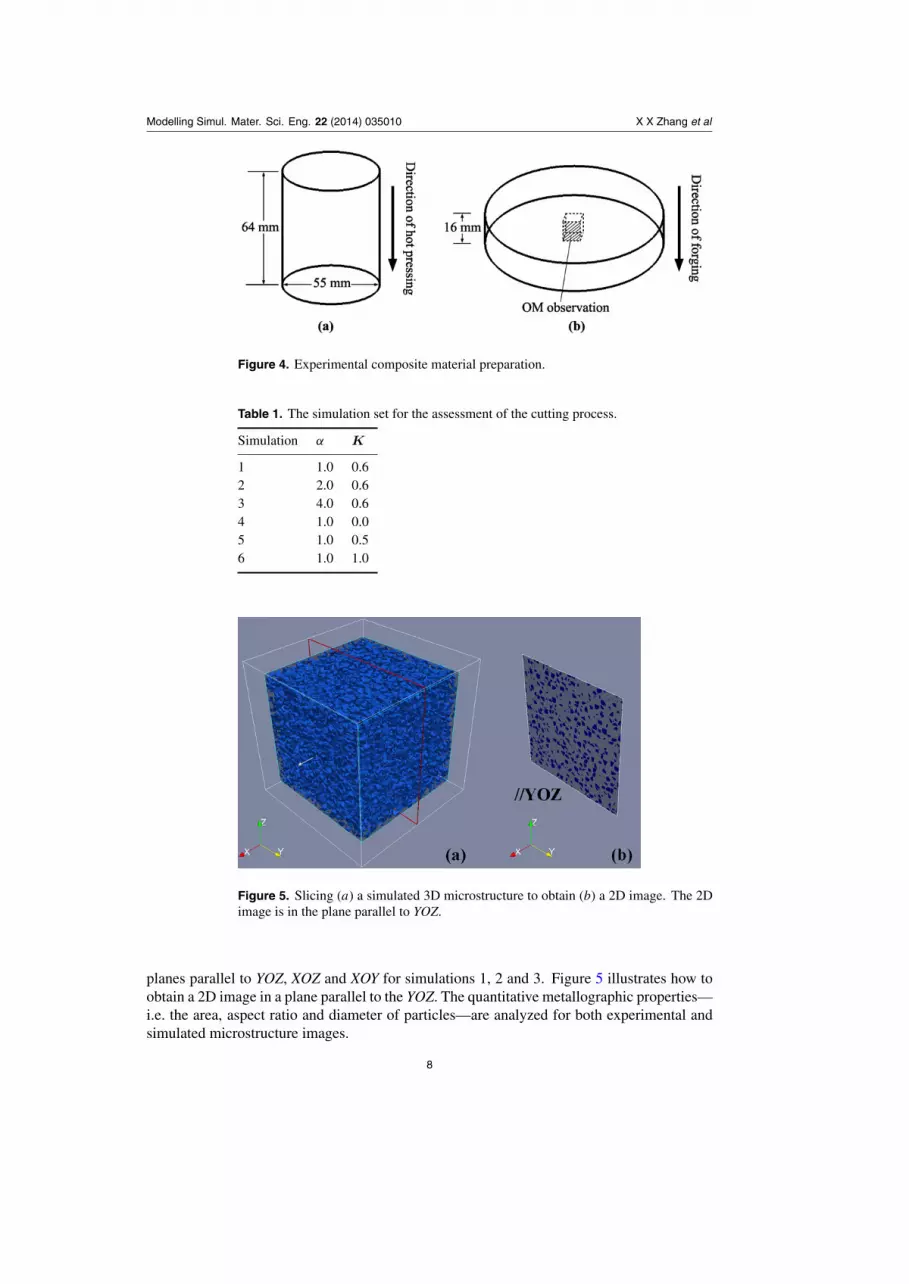
2009Al-based composites, reinforced by 20 vol% SiC particles with a nominal mean particlediameter of 20 µm, were used in this study. The composition of the 2009Al alloy is Cu 3.8–4.2 wt%, Mg 1.2–1.6 wt% and the remainder is Al. All the composites were fabricated bypowder metallurgy (PM) and subsequent hot forging. The Al alloy and SiC powders wereblended for 8 h, and then compacted at a pressure of 40 MPa. The compacts were pressed ata pressure of 50 MPa in a vacuum chamber of 10−2 Pa, after being held at 580 ◦C for 60 min(see figure 4(a)). The hot pressed billets were forged in an open die, using 200 MPa pressure.The total deformation ratio was 4 : 1. The microstructures of the forged billets were examinedby optical microscopy (OM, Axiovert 200 MAT). The sampling location for OM is illustratedin figure 4(b).
6
Modelling Simul. Mater. Sci. Eng. 22 (2014) 035010 X X Zhang et al
Figure 3. Flow chart of RSA algorithm.
4.2. Simulation of microstructures
The primitive objects are cut by several random planes (RPADPs and RPRDPs). In thesimulation, the total number of random planes Ncp is empirically set to 10. It should benoted that a primitive object is cut by the first random plane and then the next random planeand so on. The cutting process is random, so some random planes may miss the semi-finishedparticle and the number of facets of particles is random. The effects of the two simulationparameters α and K with fixed primitive object size on the shape and size of polyhedrons arestudied to assess the cutting process in this work. The size of the primitive object is definedby the diameter of the circumscribed sphere of the primitive object. The parameter settings ofα and K are shown in table 1 with the diameter of the circumscribed sphere of the primitiveobject being 20 µm. All the simulated 3D microstructures have the same size of 450 µm. Foreach simulation, 2D images are obtained by slicing the 3D microstructures. The planes fromwhich the images are sliced are parallel to the the YOZ, XOZ or XOY plane (in the followingtext the word ‘plane’ is omitted for simplification when mentioning these special planes),respectively. Simulations 1, 2 and 3 are conducted to explore the microstructure anisotropy,depending on the α of the primitive object. Therefore, statistical parameters are analyzed in
7
Modelling Simul. Mater. Sci. Eng. 22 (2014) 035010 X X Zhang et al
Figure 4. Experimental composite material preparation.
Table 1. The simulation set for the assessment of the cutting process.
Simulation α K
1 1.0 0.62 2.0 0.63 4.0 0.64 1.0 0.05 1.0 0.56 1.0 1.0
Figure 5. Slicing (a) a simulated 3D microstructure to obtain (b) a 2D image. The 2Dimage is in the plane parallel to YOZ.
planes parallel to YOZ, XOZ and XOY for simulations 1, 2 and 3. Figure 5 illustrates how toobtain a 2D image in a plane parallel to the YOZ. The quantitative metallographic properties—i.e. the area, aspect ratio and diameter of particles—are analyzed for both experimental andsimulated microstructure images.
8
Modelling Simul. Mater. Sci. Eng. 22 (2014) 035010 X X Zhang et al
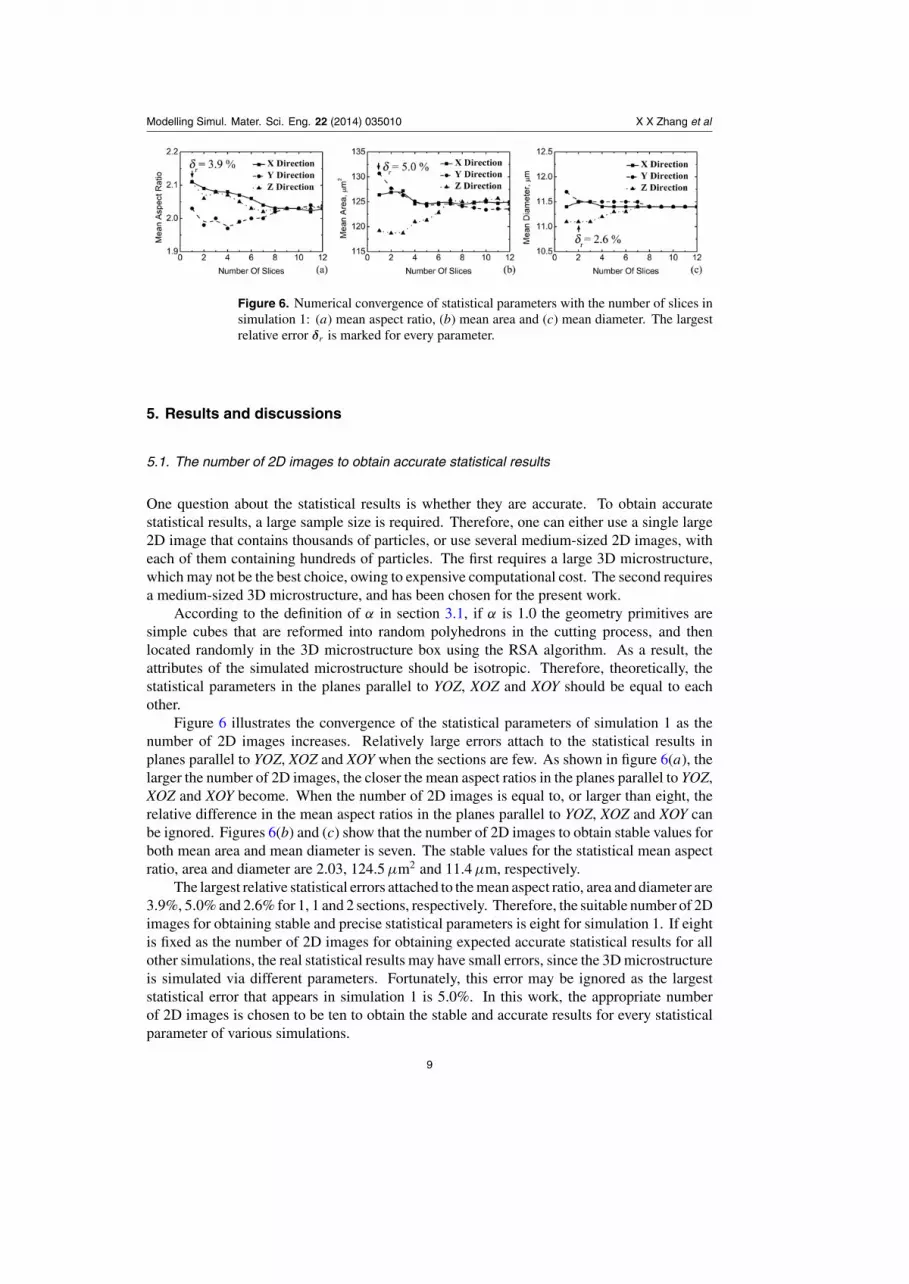
Figure 6. Numerical convergence of statistical parameters with the number of slices insimulation 1: (a) mean aspect ratio, (b) mean area and (c) mean diameter. The largestrelative error δr is marked for every parameter.
5. Results and discussions
5.1. The number of 2D images to obtain accurate statistical results
One question about the statistical results is whether they are accurate. To obtain accuratestatistical results, a large sample size is required. Therefore, one can either use a single large2D image that contains thousands of particles, or use several medium-sized 2D images, witheach of them containing hundreds of particles. The first requires a large 3D microstructure,which may not be the best choice, owing to expensive computational cost. The second requiresa medium-sized 3D microstructure, and has been chosen for the present work.
According to the definition of α in section 3.1, if α is 1.0 the geometry primitives aresimple cubes that are reformed into random polyhedrons in the cutting process, and thenlocated randomly in the 3D microstructure box using the RSA algorithm. As a result, theattributes of the simulated microstructure should be isotropic. Therefore, theoretically, thestatistical parameters in the planes parallel to YOZ, XOZ and XOY should be equal to eachother.
Figure 6 illustrates the convergence of the statistical parameters of simulation 1 as thenumber of 2D images increases. Relatively large errors attach to the statistical results inplanes parallel to YOZ, XOZ and XOY when the sections are few. As shown in figure 6(a), thelarger the number of 2D images, the closer the mean aspect ratios in the planes parallel to YOZ,XOZ and XOY become. When the number of 2D images is equal to, or larger than eight, therelative difference in the mean aspect ratios in the planes parallel to YOZ, XOZ and XOY canbe ignored. Figures 6(b) and (c) show that the number of 2D images to obtain stable values forboth mean area and mean diameter is seven. The stable values for the statistical mean aspectratio, area and diameter are 2.03, 124.5 µm2 and 11.4 µm, respectively.
The largest relative statistical errors attached to the mean aspect ratio, area and diameter are3.9%, 5.0% and 2.6% for 1, 1 and 2 sections, respectively. Therefore, the suitable number of 2Dimages for obtaining stable and precise statistical parameters is eight for simulation 1. If eightis fixed as the number of 2D images for obtaining expected accurate statistical results for allother simulations, the real statistical results may have small errors, since the 3D microstructureis simulated via different parameters. Fortunately, this error may be ignored as the largeststatistical error that appears in simulation 1 is 5.0%. In this work, the appropriate numberof 2D images is chosen to be ten to obtain the stable and accurate results for every statisticalparameter of various simulations.
9
Modelling Simul. Mater. Sci. Eng. 22 (2014) 035010 X X Zhang et al
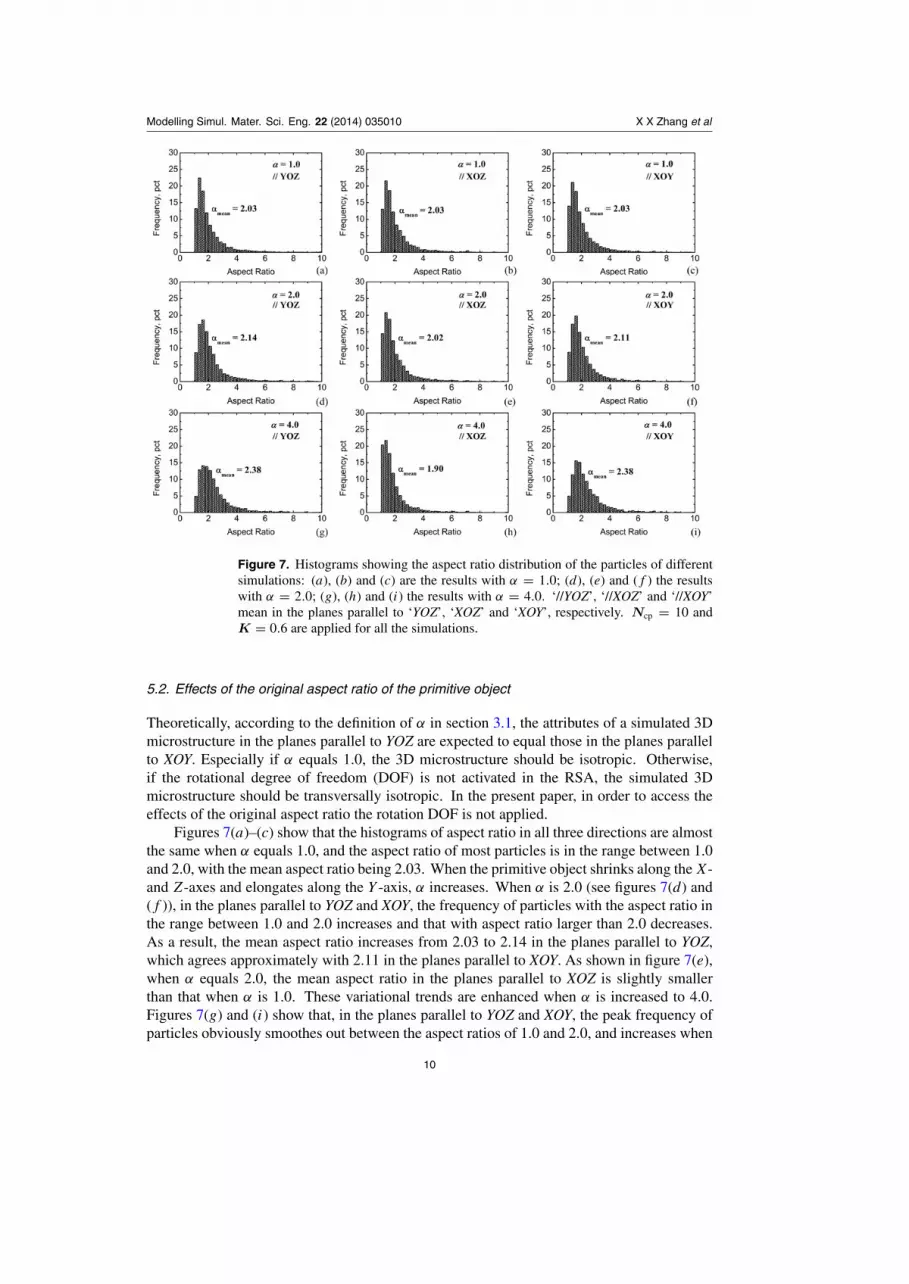
Figure 7. Histograms showing the aspect ratio distribution of the particles of differentsimulations: (a), (b) and (c) are the results with α = 1.0; (d), (e) and (f ) the resultswith α = 2.0; (g), (h) and (i) the results with α = 4.0. ‘//YOZ’, ‘//XOZ’ and ‘//XOY’mean in the planes parallel to ‘YOZ’, ‘XOZ’ and ‘XOY’, respectively. Ncp = 10 andK = 0.6 are applied for all the simulations.
5.2. Effects of the original aspect ratio of the primitive object
Theoretically, according to the definition of α in section 3.1, the attributes of a simulated 3Dmicrostructure in the planes parallel to YOZ are expected to equal those in the planes parallelto XOY. Especially if α equals 1.0, the 3D microstructure should be isotropic. Otherwise,if the rotational degree of freedom (DOF) is not activated in the RSA, the simulated 3Dmicrostructure should be transversally isotropic. In the present paper, in order to access theeffects of the original aspect ratio the rotation DOF is not applied.
Figures 7(a)–(c) show that the histograms of aspect ratio in all three directions are almostthe same when α equals 1.0, and the aspect ratio of most particles is in the range between 1.0and 2.0, with the mean aspect ratio being 2.03. When the primitive object shrinks along the X-and Z-axes and elongates along the Y -axis, α increases. When α is 2.0 (see figures 7(d) and(f )), in the planes parallel to YOZ and XOY, the frequency of particles with the aspect ratio inthe range between 1.0 and 2.0 increases and that with aspect ratio larger than 2.0 decreases.As a result, the mean aspect ratio increases from 2.03 to 2.14 in the planes parallel to YOZ,which agrees approximately with 2.11 in the planes parallel to XOY. As shown in figure 7(e),when α equals 2.0, the mean aspect ratio in the planes parallel to XOZ is slightly smallerthan that when α is 1.0. These variational trends are enhanced when α is increased to 4.0.Figures 7(g) and (i) show that, in the planes parallel to YOZ and XOY, the peak frequency ofparticles obviously smoothes out between the aspect ratios of 1.0 and 2.0, and increases when
10
Modelling Simul. Mater. Sci. Eng. 22 (2014) 035010 X X Zhang et al
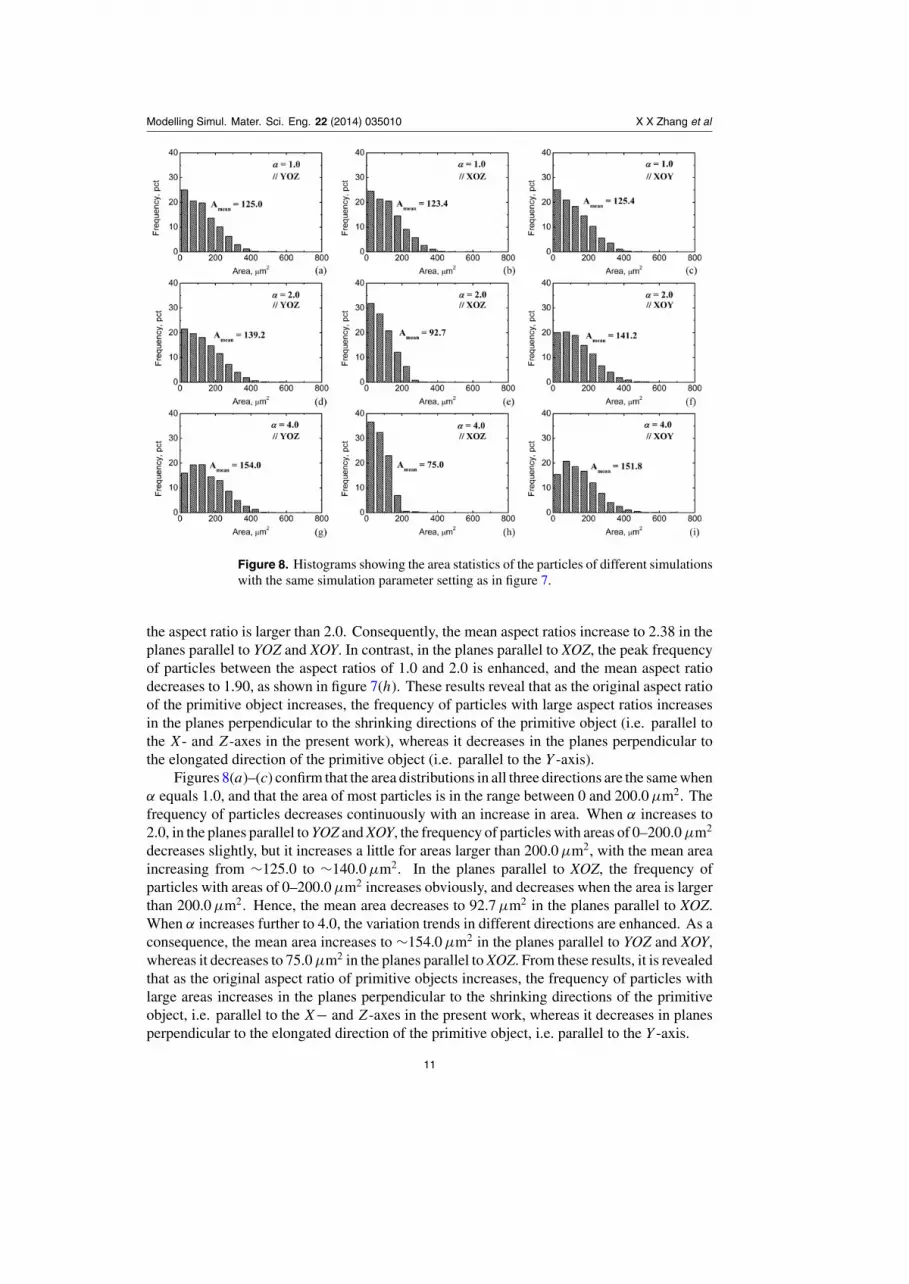
Figure 8. Histograms showing the area statistics of the particles of different simulationswith the same simulation parameter setting as in figure 7.
the aspect ratio is larger than 2.0. Consequently, the mean aspect ratios increase to 2.38 in theplanes parallel to YOZ and XOY. In contrast, in the planes parallel to XOZ, the peak frequencyof particles between the aspect ratios of 1.0 and 2.0 is enhanced, and the mean aspect ratiodecreases to 1.90, as shown in figure 7(h). These results reveal that as the original aspect ratioof the primitive object increases, the frequency of particles with large aspect ratios increasesin the planes perpendicular to the shrinking directions of the primitive object (i.e. parallel tothe X- and Z-axes in the present work), whereas it decreases in the planes perpendicular tothe elongated direction of the primitive object (i.e. parallel to the Y -axis).
Figures 8(a)–(c) confirm that the area distributions in all three directions are the same whenα equals 1.0, and that the area of most particles is in the range between 0 and 200.0 µm2. Thefrequency of particles decreases continuously with an increase in area. When α increases to2.0, in the planes parallel to YOZ and XOY, the frequency of particles with areas of 0–200.0 µm2
decreases slightly, but it increases a little for areas larger than 200.0 µm2, with the mean areaincreasing from ∼125.0 to ∼140.0 µm2. In the planes parallel to XOZ, the frequency ofparticles with areas of 0–200.0 µm2 increases obviously, and decreases when the area is largerthan 200.0 µm2. Hence, the mean area decreases to 92.7 µm2 in the planes parallel to XOZ.When α increases further to 4.0, the variation trends in different directions are enhanced. As aconsequence, the mean area increases to ∼154.0 µm2 in the planes parallel to YOZ and XOY,whereas it decreases to 75.0 µm2 in the planes parallel to XOZ. From these results, it is revealedthat as the original aspect ratio of primitive objects increases, the frequency of particles withlarge areas increases in the planes perpendicular to the shrinking directions of the primitiveobject, i.e. parallel to the X− and Z-axes in the present work, whereas it decreases in planesperpendicular to the elongated direction of the primitive object, i.e. parallel to the Y -axis.
11
Modelling Simul. Mater. Sci. Eng. 22 (2014) 035010 X X Zhang et al
Table 2. Number of particles of each simulation.
Simulation Number of particles
1 85432 88933 97474 43345 74866 16390
These variational trends can be explained with help from the definition of α andequations (1)–(3). The volume of a primitive is assumed to be unitary; i.e.
A × B × C = 1.0. (5)
In order to simplify the explanations, let A and C equal x, then B can be calculated by αx.It is easy to find that
αx3 = 1.0, (6)
then one can easily obtain
S = αx2 = α1/3. (7)
This simple function reflects that the side area of the primitive object increases by increasingthe original aspect ratio. If α increases twice—that is, from 1.0 to 2.0, or from 2.0 to 4.0—ywill increase by 3
√2 (i.e. about 1.3) times. The result plotted in figure 8 shows that the area in
the planes parallel to XOY increases by about 1.1 times (i.e. 139.2/125.0 when α increases from1.0 to 2.0), which reveals that the area increase of the final random polygon, i.e. the section ofpolyhedron, is smaller than that of the original side area. This phenomenon corresponds to thevariation of the total number of particles contained in the whole 3D microstructure. Table 2shows that the number of particles in the simulated 3D microstructure increases with increasingα, which means that the average volume of each particle decreases when α increases. In otherwords, the larger α is, the larger the volume is cut away.
Figure 9 shows that the statistical mean diameter increases in the planes parallel to YOZand XOY, and decreases in the planes parallel to XOZ when α increases. This can be understoodeasily with the help of the relationship between diameter and area. Generally, the relationshipbetween the diameter a in the planes parallel to the YOZ and XOY and the area S can be writtenas
a ∝ S1/2. (8)
According to equation (7), it is easy to get
a ∝ α1/6. (9)
Equation (9) indicates that if the model is self-consistent, the mean diameter in planes parallelto the YOZ and XOY increases with increasing α.
5.3. Effects of the ratio of RPRDPs
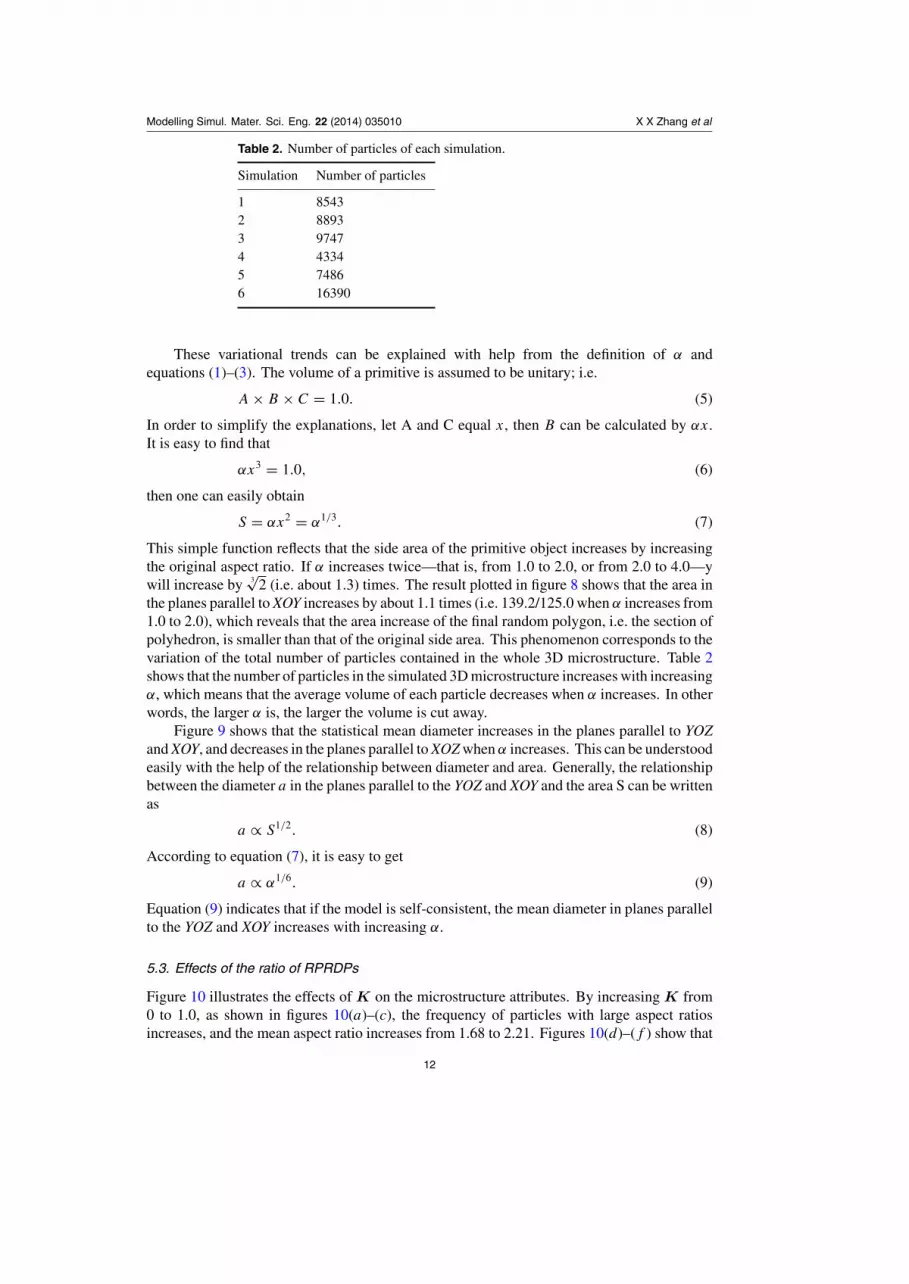
Figure 10 illustrates the effects of K on the microstructure attributes. By increasing K from0 to 1.0, as shown in figures 10(a)–(c), the frequency of particles with large aspect ratiosincreases, and the mean aspect ratio increases from 1.68 to 2.21. Figures 10(d)–(f ) show that
12

Modelling Simul. Mater. Sci. Eng. 22 (2014) 035010 X X Zhang et al
Figure 9. Histograms showing the diameter statistics of the particles of differentsimulations with the same simulation parameter setting as in figure 7.
the frequency of particles with small areas (or small sizes) clearly increases as K increases,with the mean area decreasing from 208.5 to 79.6 µm2. It can be seen that both the valueand the pattern of the area distribution are sensitive to K. Figures 10(g)–(i) confirm that thefrequency of particles with small diameters (or small sizes) clearly increases as K increases,with the mean diameter decreasing from 15.2 to 9.0 µm.
An inspection of these results reveals that the microstructure is strongly dependent on K.According to the definition, the larger K is, the more RPRDPs and fewer RPADPs are usedto cut the primitive object. Therefore, the effects of K are a result of the different effects ofthe RPRDPs and the RPADPs. It should be noted that the first kind of plane is a particularcase of the second kind of plane, because the random direction N of the second kind of planehas an infinitesimal probability of being parallel to the vector OP . In the present work, eachpolyhedron is generated by the cutting process with, at most, ten cutting planes. Even if allthe cutting planes are random planes, the probability that the random direction N is parallelto the vector OP , which is, at most, 10 times infinitesimal, is still an infinitesimal, and canbe ignored. Hence, these two types of planes do differ. Furthermore, if the distance d (asshown in figure 1) between the local origin point O(0, 0, 0) and the cutting plane is considered,the different effects of these two kinds of cutting planes are obvious. It is easy to obtain thefollowing relationship:
dRPADP � dRPRDP, (10)
which suggests that the second kind of plane may cut away more volume of the primitive,because it is closer to the center of the primitive object. As shown in figure 1, if the two cuttingplanes pass through the same position, the RPRDPs are closer to the local origin point than the
13
Modelling Simul. Mater. Sci. Eng. 22 (2014) 035010 X X Zhang et al
Figure 10. Effects of K on the statistical parameters of slices whose parent RVEs aregenerated with Ncp = 10 and α = 1.0: (a), (b), (c) aspect ratio; (d), (e), (f ) diameter;(g), (h), (i) area.
Table 3. Simulation sets for constructing the 3D realistic microstructure.
Fraction of geometry primitives
Microstructure α K 20 µm 10 µm 5 µm
S1 1.0 0.6 0.900 0.090 0.010S2 1.0 0.6 0.900 0.080 0.020S3 1.0 0.6 0.900 0.070 0.030
RPADPs, and the retained shape becomes more elongated. It explains why as K increases,i.e. the number of the RPRDPs increases, the average particle size decreases, while the aspectratio increases.
5.4. Generation of a realistic microstructure
In the present work, two simulation parameters of the cutting process have been investigated.The simulated results show that both α and K affect the sizes and shapes of the arbitrary convexpolyhedrons. In this part, a realistic PRMMC microstructure is simulated by introducing athird parameter; i.e. the diameter distribution function of the primitive object.
Three sets of simulation parameters are studied, as summarized in table 3. The preparationof material for the experiment has been described in section 3.1. In order to obtain the accuratestatistical parameters of the experimental material, the convergence of the statistical parameters
14

Modelling Simul. Mater. Sci. Eng. 22 (2014) 035010 X X Zhang et al
Figure 11. Statistic convergence of (a) the mean aspect, (b) the mean area and (c) themean diameter with the number of slices in the experimental microstructure. The largestrelative error δr is marked for every parameter.
Figure 12. Comparison between simulated microstructure and experimentalmicrostructure using statistical histogram of (a), (b), (c) aspect ratio; (d), (e), (f ) areaand (g), (h), (i) diameter. The statistical error δa is marked for every parameter.
of the SiC PRMMC material is investigated, and shown in figure 11. The plotted resultsreveal that five sections are enough to obtain stable and accurate statistical parameters. Theconvergence of the statistical parameters is required not only for the experimental material, butalso for the simulations. To be consistent, 10 sections that have been used for all the previouslysimulated microstructures are again applied for simulations S1 to S3 and the experiment.
A comparison of the aspect ratio, area and diameter distribution functions between thesimulations and experiment is plotted in figure 12. A statistical error δa is introduced to assessthe accuracy of the simulations. δa is computed by integrating the absolute difference in eachbar of the frequency chart between the simulation and the experiment and then divided by thenumber of bars. It can be observed that simulation S2 is the best approximation (figure 12).In addition, by increasing the content of small primitives, the aspect ratio distribution of
15

Modelling Simul. Mater. Sci. Eng. 22 (2014) 035010 X X Zhang et al
Table 4. Comparison of mean particle number density between different simulationsand the experiment.
Mean particle numberMicrostructure density (mm−2) Relative error
Experiment 2141 —Simulation S1 2014 5.9%Simulation S2 2173 1.5%Simulation S3 2277 6.4%
Figure 13. Microstructures of a 20 µm 20 vol% SiCp/Al composite: (a) simulated large3D microstructure which is 450 µm3 large and has 22075 SiC particles. The simulationtime takes 6699 s in a ThinkStation-D20 with 2 Xeon 5690 CPUs (3.47 GHz) and 32 GBmemory; (b) a 2D image sliced from (a); (c) segmental 2D image of the experimentalmicrostructure.
simulated particles varies slightly, as shown in figures 12(a)–(c), and the content of smallparticles increases, as shown in figures 12(d)–(i).
The aspect ratio, area and diameter distribution functions are relative statistical parameters.The agreement of relative statistical parameters between simulation microstructures and actualmicrostructures can still not indicate completely that the simulation microstructures agree withactual microstructures. An additional absolute statistical parameter is required. In this work,the mean particle number density (the number of particles contained in a unit area) is adopted.Table 4 summarizes the mean particle number density of both simulated and experimentalmicrostructures, and reveals that the particle number density of simulated microstructures canbe controlled by the diameter distribution function. Simulation S2 has the best approximation.
According to both the relative and absolute statistical parameters, simulation S2 is thebest approximation. The simulated S2 microstructure is shown in figure 13. It can be seenthat the 3D realistic microstructure of PRMMC can be generated by controlling the simulationparameters α, K and the diameter distribution function of the primitive object. The simulated3D realistic microstructure mimics the aspect ratio, area and diameter distribution functions ofthe actual microstructure, as well as the mean particle number density. Since the assessments ofthe effect of each simulation parameter on the simulated microstructure are the correspondingattributes of the algorithm, they can be reused for generating other realistic microstructures.
5.5. Discussion of the PRMMC microstructure model
The present algorithm permits simulations of virtual PRMMC microstructures that havedifferent volume fractions. For example, figure 14 shows a simulated large virtual 3D
16

Modelling Simul. Mater. Sci. Eng. 22 (2014) 035010 X X Zhang et al
Figure 14. Simulated large 3D PRMMC microstructure with 15 vol% SiC particleswhich has the same SiC particle population as simulation S2.
microstructure, where all simulation parameters, except SVF, have been kept the same assimulation S2, for the composite reinforced by 15 vol% SiC particles.
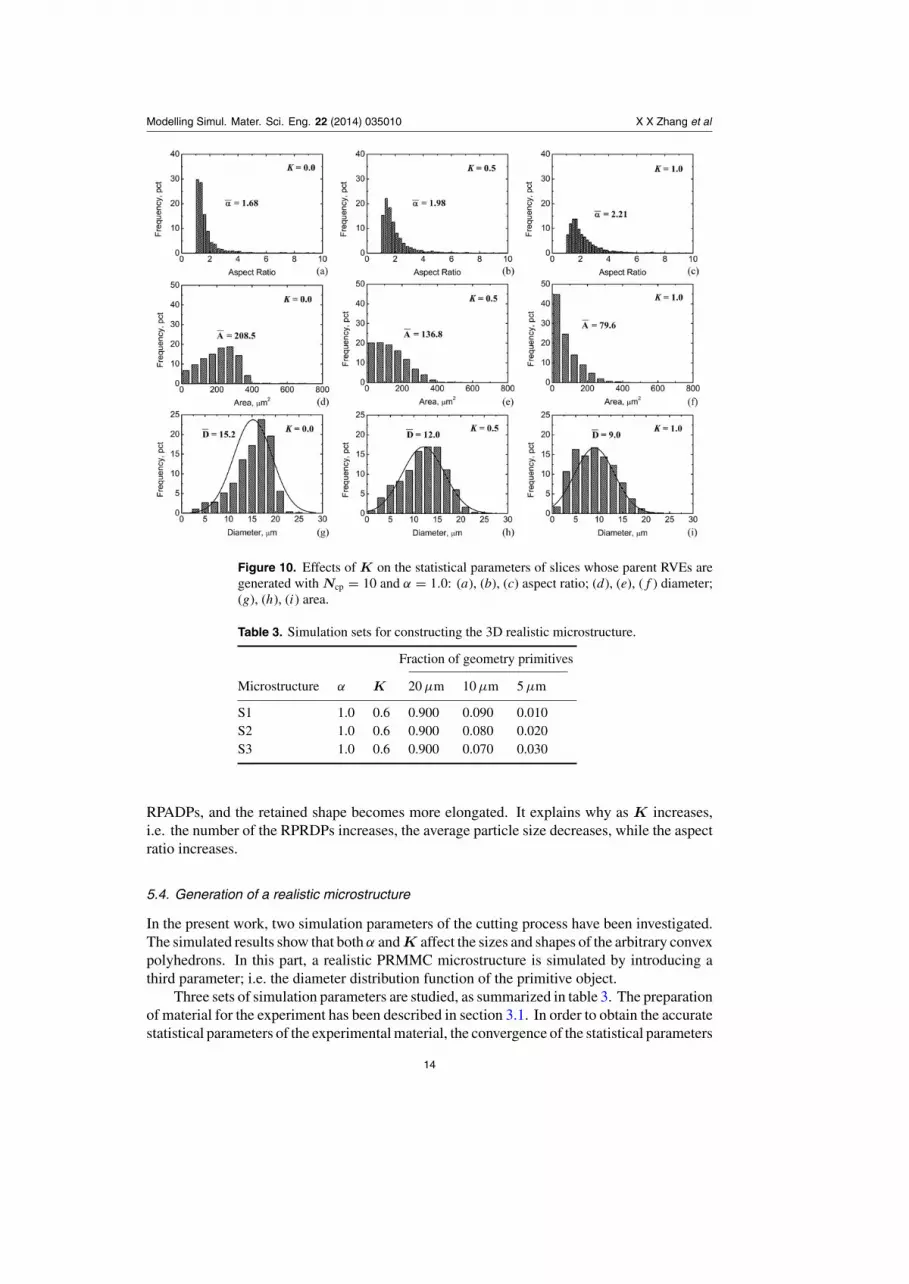
In most actual composite manufacturing, the SiC, Al2O3, B4C particles are polycrystalline.The facets of particles are not strict crystal faces, so there is no strict angle relationship betweenthe facets of particles. In other words, the relationship between any two facets of particles israndom. That is why we use random polyhedron to approximate particles. In real composites,the shapes of particles have camber concaves. However, the concave shape is not too serious, sowith an admissible approximation, the concave-shaped surfaces are simplified to planar facets.An issue is that real composites reinforced by different particles may differ in the particleshape. For example, Al2O3 particles generally have a more spherical shape, while B4C orSiC particles have a random polyhedral shape with sharp corners. The present microstructuresimulation algorithm shows the ability to generate virtual microstructures with different particleshapes. It has been revealed that the simulated particle shape can be controlled by changing thesimulation parameter(s) (α or/and K). For example, figure 15 shows that the shape of most ofthe particles in simulation S4 is equiaxial polygonal, while the shape of most of the particles insimulation S6 is elongated polygonal. These virtual microstructures can be integrated in virtualinvestigations of PRMMC microstructure and design. If the microstructure-based evaluationof material properties is different from the specific target properties, modifications can beconducted in the microstructure simulation, which are then incorporated into the next materialproperty evaluation. Such an inverse investigation is the core part of the virtual material design,which cuts down experimental costs such as time, resources and energy.
In the microstructure-based computations of material properties, the microstructure modelmust satisfy some quantitative criteria to represent the composite. Usually, the minimum sizeof the microstructure model is related closely to the purpose of the simulation in which themicrostructure model is used [34]. Several studies have shown that the minimum sizes of a2D microstructure model are δ = 16 [35], δ = 24 [36], δ = 50 [34], where the dimensionlessvariable δ is called the size ratio, and is defined by the side length of the microstructure model L
17
Modelling Simul. Mater. Sci. Eng. 22 (2014) 035010 X X Zhang et al
Figure 15. 2D microstructures of (a) simulation 4 and (b) simulation 6.
and the radius of reinforcement R using
δ = L
R. (11)
The minimum size of a 3D microstructure is a more complicated problem. Kanit et al [37]investigated the size of the microstructure model for 3D random composites. They showedthat the minimum size of the 3D microstructure model depends on the specific values chosenfor the material parameters of the different phases in the simulation. Furthermore, as Gitmanet al [38] showed, the RVE sizes, which are realized in terms of the predicted macroscopicphysical properties via homogenization, are dependent not only on the values of the materialparameters, but also on the types of material behavior considered. The exception is that noRVE size may exist with the presence of localization deformation [38]. According to these2D and 3D results, the ability to generate large 3D microstructures is important for the studyof the minimum size problem.
Let us compute the size ratio of the 3D microstructures in figures 13(a) and 14. The sidelength of the 3D microstructures is 450 µm. The normal mean diameter of particles is 20 µm.Then the size ratio is computed to be 45 from equation (11).
In order to simulate realistic, high-quality 3D microstructures, reliable experimentallybased data, which results from 3D characterization and quantitative analysis of realmicrostructures, is required, and can serve as model parameters to start direct modeling,or as reference parameters for inverse modeling. However, flexible and robust techniquesfor characterizing and quantitatively analyzing the main properties of the reinforcements in a3D microstructure, such as size (diameter, surface area, volume, etc.), shape (random or not,isotropic or not, symmetric or not, etc.) and spatial arrangements (periodic or not, cluster ornot, gradient or not, etc.), are still under development.
Recently, Tewari et al [39] proposed a practical technique based on two-point correlationfunctions that are governed implicitly by the properties of reinforcements in a 3D material.They developed a quantitative analysis method for estimating the microstructural attributes,especially the clustering behavior of particles in PRMMCs. This technique was then integratedinto large realistic 2D microstructure modeling and the medium realistic 3D microstructuremodeling of PRMMCs, respectively, by Singh et al [6] and Mao [8], using a digital imageprocess-based cell decomposition geometry modeling technique. Chord length distribution(CLD) reflects the sizes, shapes and spatial arrangements of geometrical particles [40],and is, therefore, also an important objective measurement for the quality of the generatedmicrostructure. CLDs can be estimated from small-angle scattering data [41, 42]. This is future
18
Modelling Simul. Mater. Sci. Eng. 22 (2014) 035010 X X Zhang et al
aim of the model. Once two-point correlation functions or the CLD method are implementedfor the quantitative analysis of the 3D BREP model, it is possible to simulate 3D realisticmaterial with more complex microstructures, by matching the same estimated properties withexperimental PRMMC microstructures, like the statistically reconstructed 2D microstructureproposed by Rintoul and Torquato [43].
In this work, traditional 2D quantitative metallographic methods are applied, to estimatethe size and shape of the sections of a 3D material. It is important to recognize that themicrostructure parameters, estimated by 2D sections, may involve errors, especially when themicrostructure has quite complex attributes, such as clustering, directional arrangement andlayer arrangement. Nonetheless, the present work focuses on modeling microstructures usingthe BREP technique, to achieve planar approximations of the reinforcement boundaries, andhas modeled the PRMMC microstructures with uniformly distributed particles successfullyby using a cuboid as the primitive object. This 3D model is flexible enough to permit largesimulations with complex attributes. This may be the first contribution that integrates theBREP technique for the 3D realistic microstructure simulation of PRMMCs. The BREPtechnique allows the direct calculation of the surface area of polyhedrons, because all the sidesof polyhedrons are planar, and all the vertices are known. It is useful for understanding thereinforcement-matrix bonding properties in PRMMCs.
During the present RSA algorithm, the rotational DOF of geometrical particles is not used.If the rotational DOF is activated in the RSA, the anisotropy properties of 3D microstructuresgenerated with α > 1.0 would be removed. Besides, using or not using the rotational DOF willhave significant effects on the possible microstructures achieved, considering microstructureswhere particles are less spherical, or microstructures with maximal possible particle SVFs.This then, in turn, may influence the global material behavior obtained by the microstructure-based material property simulations.
6. Conclusions
(1) A new and robust methodology is developed for computer simulations of large 3D PRMMCmicrostructures, that can be used for virtual investigation of PRMMC structure and design.The size and shape of the reinforcements can be controlled by the simulation parametersα and K, as well as the diameter distribution function.
(2) By increasing the simulation parameters α and K, the mean aspect ratio of simulatedparticles increases, and the mean size of the simulated particles decreases.
(3) The variation of the size of primitive objects has little effect on the aspect ratio of thesimulated particles, but has a significant effect on the size of the simulated particles. Themean size of the simulated particles decreases with decreasing the size of the primitiveobjects.
(4) The methodology can be applied for computer simulations of large 3D realisticmicrostructures that mimic the distribution functions of aspect ratio, diameter and areaof reinforcement of real microstructures. The methodology is general, extensible andapplicable for simulating complex PRMMC microstructures.
Acknowledgment
The authors gratefully acknowledge the support of the National Basic Research Program ofChina under grant No 2012CB619600.
19
Modelling Simul. Mater. Sci. Eng. 22 (2014) 035010 X X Zhang et al
References
[1] Povirk G L, Stout M G, Bourke M, Goldstone J A, Lawson A C, Lovato M, Macewen S R,Nutt S R and Needleman A 1992 Thermally and mechanically induced residual strains in Al–SiCcomposites Acta Metall. Mater. 40 2391–412
[2] Tszeng T C 1998 The effects of particle clustering on the mechanical behavior of particle reinforcedcomposites Composites B 29 299–308
[3] Mishnaevsky L L Jr 2004 Three-dimensional numerical testing of microstructures of particlereinforced composites Acta Mater. 52 4177–88
[4] Li M, Ghosh S, Richmond O, Weiland H and Rouns T N 1999 Three dimensional characterizationand modeling of particle reinforced metal matrix composites: II. Damage characterization Mater.Sci. Eng. A 266 221–40
[5] Singh H, Mao Y, Sreeranganathan A and Gokhale A M 2006 Application of digital image processingfor implementation of complex realistic particle shapes/morphologies in computer simulatedheterogeneous microstructures Modelling Simul. Mater. Sci. Eng. 14 351–63
[6] Singh H, Gokhale A M, Mao Y and Spowart J E 2006 Computer simulations of realisticmicrostructures of discontinuously reinforced aluminum alloy (DRA) composites Acta Mater.54 2131–43
[7] Mao Y, Gokhale A M and Harris J 2006 Computer simulations of realistic microstructures of coarseconstituent particles in a hot-rolled aluminum alloy Comput. Mater. Sci. 37 543–56
[8] Mao Y 2010 Computer simulations of realistic three-dimensional microstructures PhD ThesisGeorgia Institute of Technology
[9] Chawla N, Ganesh V V and Wunsch B 2004 Three-dimensional (3D) microstructure visualizationand finite element modeling of the mechanical behavior of SiC particle reinforced aluminumcomposites Scr. Mater. 51 161–5
[10] Chawla N, Sidhu R S and Ganesh V V 2006 Three-dimensional visualization and micro structure-based modeling of deformation in particle-reinforced composites Acta Mater. 54 1541–8
[11] Landis E N and Keane D T 2010 X-ray microtomography Mater. Charact. 61 1305–16[12] Kenesei P, Borbely A and Biermann H 2004 Microstructure based three-dimensional finite element
modeling of particulate reinforced metal–matrix composites Mater. Sci. Eng. A 387 852–6[13] Borbely A, Csikor F F, Zabler S, Cloetens P and Biermann H 2004 Three-dimensional
characterization of the microstructure of a metal–matrix composite by holotomography Mater.Sci. Eng. A 367 40–50
[14] Padilla E, Jakkali V, Jiang L and Chawla N 2012 Quantifying the effect of porosity on the evolution ofdeformation and damage in Sn-based solder joints by x-ray microtomography and microstructure-based finite element modeling Acta Mater. 60 4017–26
[15] Williams J J, Yazzie K E, Padilla E, Chawla N, Xiao X and De Carlo F 2013 Understanding fatiguecrack growth in aluminum alloys by in situ x-ray synchrotron tomography Int. J. Fatigue 57 79–85
[16] Widom B 1966 Random sequential addition of hard spheres to a volume J. Chem. Phys.44 3888–94
[17] Coelho D, Thovert J F and Adler P M 1997 Geometrical and transport properties of random packingsof spheres and aspherical particles Phys. Rev. E 55 1959–78
[18] Bohm H J, Eckschlager A and Han W 2002 Multi-inclusion unit cell models for metal matrixcomposites with randomly oriented discontinuous reinforcements Comput. Mater. Sci. 25 42–53
[19] Torquato S 2002 Random Heterogeneous Materials: Microstructure and Macroscopic Properties(New York: Springer)
[20] Williams S R and Philipse A P 2003 Random packings of spheres and spherocylinders simulatedby mechanical contraction Phys. Rev. E 67 051301
[21] Tu S T, Cai W Z, Yin Y and Ling X 2005 Numerical simulation of saturation behavior ofphysical properties in composites with randomly distributed second-phase J. Compos. Mater.39 617–31
[22] Gusev A A 1997 Representative volume element size for elastic composites: a numerical studyJ. Mech. Phys. Solids 45 1449–59
20
Modelling Simul. Mater. Sci. Eng. 22 (2014) 035010 X X Zhang et al
[23] Manwart C and Hilfer R 1999 Reconstruction of random media using Monte Carlo methods Phys.Rev. E 59 5596–9
[24] Galli M, Botsis J and Janczak-Rusch J 2008 An elastoplastic three-dimensional homogenizationmodel for particle reinforced composites Comput. Mater. Sci. 41 312–21
[25] Fritzen F and Bohlke T 2011 Periodic three-dimensional mesh generation for particle reinforcedcomposites with application to metal matrix composites Int. J. Solids Struct. 48 706–18
[26] Si H 2008 Three dimensional boundary conforming Delaunay mesh generation PhD ThesisTechnische Universitat Berlin
[27] Miller G L, Talmor D, Teng S H, Walkington N and Wang H 1996 Control volume meshesusing sphere packing: generation refinement, and coarsening Proc. 5th International MeshingRoundtable (Albuquerque, NM: Sandia National Laboratories)
[28] Belytschko T, Parimi C, Moes N, Sukumar N and Usui S 2003 Structured extended finite elementmethods for solids defined by implicit surfaces Int. J. Numer. Methods Eng. 56 609–35
[29] Sethian J A and Wiegmann A 2000 Structural boundary design via level set and immersed interfacemethods J. Comput. Phys. 163 489–528
[30] Ian S 2006 Boundary Representation Modelling Techniques (Heidelberg: Springer)[31] Kari S, Berger H and Gabbert U 2007 Numerical evaluation of effective material properties of
randomly distributed short cylindrical fibre composites Comput. Mater. Sci. 39 198–204[32] Pan Y, Lorga L and Pelegri A A 2008 Numerical generation of a random chopped fiber composite
RVE and its elastic properties Compos. Sci. Technol. 68 2792–8[33] Pan Y, Lorga L and Pelegri A A 2008 Analysis of 3D random chopped fiber reinforced composites
using FEM and random sequential adsorption Comput. Mater. Sci. 43 450–61[34] Trias D, Costa J, Turon A and Hurtado J E 2006 Determination of the critical size of a statistical
representative volume element (SRVE) for carbon reinforced polymers Acta Mater. 54 3471–84[35] Khisaeva Z F and Ostoja-Starzewski M 2006 On the size of RVE in finite elasticity of random
composites J. Elast. 85 153–73[36] Liu C 2005 On the minimum size of representative volume element: An experimental investigation
Exp. Mech. 45 238–43[37] Kanit T, Forest S, Galliet I, Mounoury V and Jeulin D 2003 Determination of the size of the
representative volume element for random composites: statistical and numerical approach Int.J. Solids Struct. 40 3647–79
[38] Gitman I M, Askes H and Sluys L J 2007 Representative volume: existence and size determinationEng. Fract. Mech. 74 2518–34
[39] Tewari A, Gokhale A M, Spowart J E and Miracle D B 2004 Quantitative characterization of spatialclustering in three-dimensional microstructures using two-point correlation functions Acta Mater.52 307–19
[40] Li M Z and Wilkinson D 2005 Determination of non-spherical particle size distribution from chordlength measurements: I. Theoretical analysis Chem. Eng. Sci. 60 3251–65
[41] Gille W 2000 Chord length distributions and small-angle scattering Eur. Phys. J. B 17 371–83[42] Hansen S 2003 Estimation of chord length distributions from small-angle scattering using indirect
Fourier transformation J. Appl. Crystallogr. 36 1190–6[43] Rintoul M D and Torquato S 1997 Reconstruction of the structure of dispersions J. Colloid Interface
Sci. 186 467–76
21