It's Vintage Darling! An exploration of vintage fashion retailing
Upload
independentCategory
view
0download
0
Water for a Healthy Country
Risks to the Shared Water Resources of the Murray-Darling Basin
Part II in a two part series on the shared water resources of the Murray-Darling Basin prepared for the Murray-Darling Basin Commission
MDBC Publication 22/06
February 2006
Albert van Dijk, Ray Evans, Peter Hairsine, Shahbaz Khan, Rory Nathan, Zahra Paydar, Neil Viney, Lu Zhang
Published by Murray-Darling Basin Commission Postal Address GPO Box 409, Canberra ACT 2601 Office location Level 5, 15 Moore Street, Canberra City
Australian Capital Territory Telephone (02) 6279 0100 international + 61 2 6279 0100 Facsimile (02) 6248 8053 international + 61 2 6248 8053 E-Mail [email protected] Internet http://www.mdbc.gov.au For further information contact the Murray-Darling Basin Commission office on (02) 6279 0100
This report may be cited as: Van Dijk, A. et.al 2006 Risks to the Shared Water Resources of the Murray-Darling Basin, Murray-Darling Basin Commission, Canberra
MDBC Publication No. 22/06 ISBN 1 921038 88 8
Copyright Murray-Darling Basin Commission and CSIRO 2006
This work is copyright. Graphical and textual information in the work (with the exception of photographs and the MDBC logo) may be stored, retrieved and reproduced in whole or in part, provided the information is not sold or used for commercial benefit and its source A Systems View on Water in the Murray-Darling Basin - 2. Risks to Our Shared Water Resources is acknowledged. Such reproduction includes fair dealing for the purpose of private study, research, criticism or review as permitted under the Copyright Act 1968. Reproduction for other purposes is prohibited without prior permission of the Murray-Darling Basin Commission or the individual photographers and artists with whom copyright applies.
To the extent permitted by law, the copyright holders (including its employees and consultants) exclude all liability to any person for any consequences, including but not limited to all losses, damages, costs, expenses and any other compensation, arising directly or indirectly from using this report (in part or in whole) and any information or material contained in it.
The contents of this publication do not purport to represent the position of the Murray-Darling Basin Commission. They are presented to inform discussion for improvement of the Basin's natural resources.
Important Disclaimer:
CSIRO advises that the information contained in this publication comprises general statements based on scientific research. The reader is advised and needs to be aware that such information may be incomplete or unable to be used in any specific situation. No reliance or actions must therefore be made on that information without seeking prior expert professional, scientific and technical advice. To the extent permitted by law, CSIRO (including its employees and consultants) excludes all liability to any person for any consequences, including but not limited to all losses, damages, costs, expenses and any other compensation, arising directly or indirectly from using this publication (in part or in whole) and any information or material contained in it.
Acknowledgements:
This review was commissioned and funded by the Murray Darling Basin Commission, and prepared by CSIRO Land and Water as part of the Water for a Healthy Country National Flagship Program. It includes contributions from Rory Nathan of Sinclair Knight Merz, and Ray Evans of Salient Solutions Inc.
Water for a Healthy Country is one of six National Research Flagships established by CSIRO in 2003 as part of the National Research Flagship Initiative. Flagships are partnerships of leading Australian scientists, research institutions, commercial companies and selected international partners. Their scale, long time-frames and clear focus on delivery and adoption of research outputs are designed to maximise their impact in key areas of economic and community need. Flagships address six major national challenges; health, energy, light metals, oceans, food and water. The Water for a Healthy Country Flagship is a research partnership between CSIRO, state and Australian governments, private and public industry and other research providers. The Flagship aims to achieve a tenfold increase in the economic, social and environmental benefits from water by 2025. For more information about Water for a Healthy Country Flagship visit or the National Research Flagship Initiative at www.csiro.au.
Foreword
This report and its companion report, The Shared Water Resources of the Murray-Darling Basin and have been prepared by CSIRO to inform discussion on matters that have the potential to affect the shared water resources of the Basin.
The Murray-Darling Basin Ministerial Council is implementing a number of major strategies to improve the environmental and economic sustainability of the Murray-Darling Basin. These strategies include the Cap on Diversions, which is a limit on the volume of water which can be diverted from the Basin rivers for consumptive uses and the Living Murray, which is, as a first step, undertaking actions to achieve environmental benefits for six significant ecological assets along the River Murray. The success of both these strategies, as well as the Ministerial Council’s other Basin strategies, is dependent upon the quantity and quality of water in the Basin’s rivers.
In 2004, the Ministerial Council directed the Murray-Darling Basin Commission to investigate possible risks to the shared water resources of the Basin. The Commission identified six risks it considered warranted immediate investigation – climate change, increased numbers of farm dams, increased groundwater use, bushfires, afforestation (large scale tree plantings) and reduced return water flow from irrigation. These two reports produced by the CSIRO are a compilation of information on the shared water resources and on the six risks of immediate concern.
Work is continuing through the Commission and its partner governments to better understand how the six risks might impact upon the Basin’s shared water resources, to identify actions the governments and communities of the Basin can take to reduce the level of risk or lessen the potential impact and to identify other potential risks.
This work is an important part of the Murray-Darling Basin Ministerial Council and Commission’s business and it is essential for the sustainable management of the shared water resources of the Murray-Darling Basin.
Wendy Craik Chief Executive Murray-Darling Basin Commission
3

Table of Contents
Foreword …………………………………………………………………………. 3
Table of Contents ………………………………………………………………… 4
Summary …………………………………………………..……………………… 6
Risks to our water resources …………………………………………………… 7
Why are risks on the agenda? ............................................................... 7
Climate change ………………………………………………………………….. 9
Is the Basin climate changing? ………………………………………. 9
Future climate change ……………………………………………….. 11
What will happen to our water resources? ………………………… 11
Changes to flow regime ……………………………………………… 12
Water security ………………………………………………………… 12
River ecology ………………………………………………………….. 13
Afforestation ……………………..……………………………………………… 14
Afforestation on the increase ………………………………………… 14
How do trees affect our water resources? ………………………….. 14
Changes in flow regime with afforestation ………………………… 16
Changes in water quality …………………………………………….. 17
Groundwater extraction ……………………..………………………………… 19
Groundwater: an important resource ………………………………. 19
How is stream flow lost to groundwater pumping? ………………. 20
Impacts differ between regions ……………………………………… 21
What will happen to our water resources? ………………………… 22
River health and water quality ………………………………………. 22
Irrigation water management ……………………..…………………………… 23
How does irrigation water use affect the water cycle? …………….. 23
How will our water resources be affected? …………………………. 24
How is water quality affected? ………………………………………. 25
4
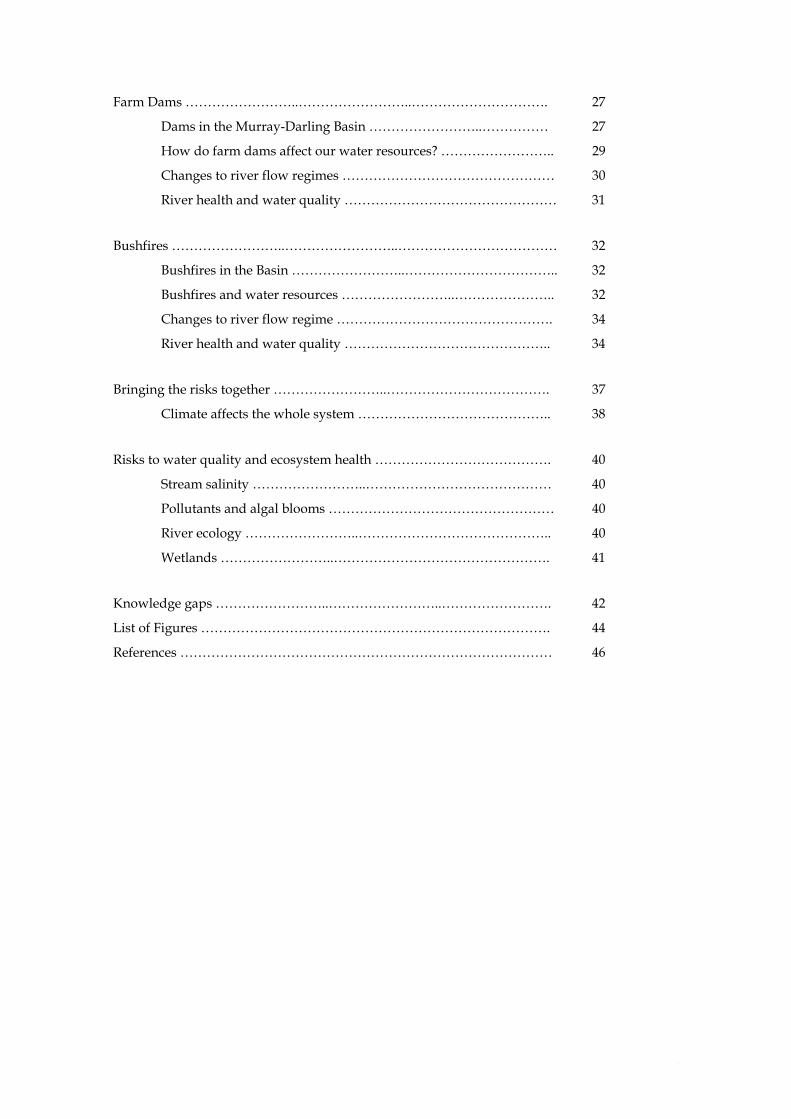
Farm Dams ……………………..……………………..…………………………. 27
Dams in the Murray-Darling Basin ……………………..…………… 27
How do farm dams affect our water resources? …………………….. 29
Changes to river flow regimes ………………………………………… 30
River health and water quality ………………………………………… 31
Bushfires ……………………..……………………..……………………………… 32
Bushfires in the Basin ……………………..…………………………….. 32
Bushfires and water resources ……………………..………………….. 32
Changes to river flow regime …………………………………………. 34
River health and water quality ……………………………………….. 34
Bringing the risks together ……………………..………………………………. 37
Climate affects the whole system …………………………………….. 38
Risks to water quality and ecosystem health …………………………………. 40
Stream salinity ……………………..…………………………………… 40
Pollutants and algal blooms …………………………………………… 40
River ecology ……………………..…………………………………….. 40
Wetlands ……………………..…………………………………………. 41
Knowledge gaps ……………………..……………………..……………………. 42
List of Figures ……………………………………………………………………. 44
References ………………………………………………………………………… 46
5

This is the second in a series of two reports on the shared water resources of the Murray-Darling Basin. The first report entitled The Shared Water Resources of the Murray-Darling Basin provides an overview of the hydrology of the Murray-Darling Basin and the links between hydrology and the key strategies of the Murray-Darling Basin Ministerial Council. This second report is a summary of recent preliminary work undertaken to improve our understanding of potential future changes to the shared water resources of the Basin and the risks those changes might pose.
There are a number of significant changes to the Basin environment that have the potential to alter the quantity and quality of the Basin’s shared water resources, that is, they pose a risk to the shared water resources. It should be remembered that risks are not forgone conclusions and that our understanding of the how the risks might impact upon the Basin is by no means complete.
Initial evidence suggests that climate change, afforestation, groundwater extraction, changes to irrigation water management, farm dams and bushfires are all potential risks in that they may reduce the volume of water in the rivers and streams of the Murray-Darling Basin.
Initial evidence suggests climate change poses the greatest risk to our shared water resources in volume terms. Climate change could potentially reduce stream flow by 1,100 GL in 20 years (5% of annual flow) and by 3,300 GL in 50 years (15% of annual flow).
The impact from farm dams will depend on the effectiveness of farm dam legislation. The potential reduction in stream flow from afforestation and groundwater pumping in 20 years are estimated to be one-third and one-half of the impacts of climate change, respectively. The impact of bushfires and irrigation management changes is expected to be smaller again.
It should be noted, however, that even relatively small risk amounts (in the vicinity of 100 GL per year) are equivalent to one-fifth of the water which the Murray-Darling Basin Ministerial Council is seeking to recover under its Living Murray Initiative.
Whilst there are limitations to the degree to which the risks can be summed, evidence suggests a likely impact on stream flow in 20 years time of between 2,500 and 5,500 GL/year. Given an average annual run off of 24,000 GL, the risks clearly have the potential to significantly affect the quantity of the shared water resource.
The risks might not only affect water volumes but also water security and water quality. The impact of the risks on river salinity is the balance result of changes in salt mobilisation and changes in stream flow. The ongoing trends in climate, afforestation and irrigation water management have a beneficial impact on salt mobilisation in areas that are more important as salt sources than as water sources, but the opposite effect elsewhere. Farm dams intercept fresh overland flows and thus are more likely to increase stream salinity.
It is unclear whether river pollutant concentrations are likely to increase or decrease in future. More efficient irrigation water management and changes towards more vegetation in the landscape are both generally beneficial to water quality, but may not be enough to offset possible reductions in flows. Algal blooms and pollution associated with bushfires may be further increased in a changing climate.
The Murray-Darling Basin Commission (MDBC) and its partner agencies are currently undertaking further work to better define the potential risks to the shared water resources and to better inform management of the Basin’s shared resources.
Summary
6

Risks to our Water Resources
Why are risks on the agenda? Water is a scarce resource in the Murray-Darling Basin and one for which there is considerable demand. As was discussed in the first report of this two part series, the success of the existing MDBC strategies depends upon having flows to manipulate. Should flows diminish this will have implications for the existing strategies.
Reduced flows will also have implications for the existing users of the Basin’s shared water resources.
Factors which could potentially diminish flow therefore represent “risks” to the business of the Murray-Darling Basin Ministerial Council.
In 2003, the MDBC commissioned a study to make a preliminary assessment of factors that might potentially impact upon the shared water resources of the Basin1.
The factors that were assessed were:
• climate change;
• changes in stream flow due to afforestation (large scale tree planting);
• groundwater extraction;
• irrigation water management;
• farm dams; and
• bushfires.
The study highlighted that the combined impact of these six factors has the potential to significantly reduce the volume of water in the streams of the Murray-Darling Basin.
From the preliminary study and work completed by the MDBC and its partner governments a number of aspects of the risks have become evident:
• The six risks by affecting water volumes, also affect water security and quality. They therefore threaten environmental sustainability and economic sustainability.
• The identified risks will not affect stream flow evenly across the Basin.
• The identified risk factors will potentially have different impacts at different scales.
• Most of the six risks do not act in separation, but can affect each other (Figure 1). Thus the total impact on annual river flows cannot be equated to their sum, but may be less or more severe.
Figure 1. The River Murray near Renmark, SA. Future flows may be affected by a range of interacting risks.
In the remainder of this report, we try to answer the following questions, for each of the risks:
• What are the past and future changes that underlie this risk? How is this risk created? Where is it most important?
• How does it threaten our future water resources and water security? How much will our total water resources be affected? Are there differences between seasons, and between high and low flows?
7

• How does it affect water quality, such as stream salinity and river pollutants? Will it impact on river health?
After these separate risk reviews, we consider:
• Which are the greatest risks to total water resources, and can the risks simply be added?
• How will the six risks together affect Basin strategies that aim to improve water quality and river health?
• Where are the largest gaps in our understanding? What new data, knowledge and model tool development do we need to better manage the six risks?
8

Is the Basin climate changing? There has been a sustained and statistically unambiguous increase in mean temperatures across the Basin7. Figure 2 shows rises in the mean Basin temperature between 1961 and 1990 and the level of difference from that mean temperature for each year.
Figure 2. Annual anomalies (based on 1961-1990 averages) of mean temperature in the Basin. The line shows the 11-year moving average. (Source: Bureau of Meteorology7)
It is evident from Figure 2 that mean temperatures across the Basin have risen at a rate of 0.17 ºC per decade since 1950. Similar changes have been found in minimum and maximum daily temperatures, and in seasonal average temperatures. These increases are similar to the changes in average global temperature. The Inter-governmental Panel on Climate Change has ascribed this global warming to the increase in greenhouse gas concentrations7.
There are some regional and seasonal differences in temperature increases. Increases in mean annual temperature tend to be slightly greater (more than 0.2 ºC per decade) in the northern parts of the Basin and lower (less than 0.1 ºC per decade) in the southeast. There is also some evidence that the warming is greater at high elevation than at lower elevation2.
Furthermore, a study in New South Wales found that the frequency of extremely high temperatures has increased since 1957. It is likely that this has been the case across the Basin. In addition the frequency of frosts and the length of frost seasons have both declined3.
Rainfall varies strongly from year to year Rainfall in the Basin has always been characterised by large differences between years, decades and centuries. These fluctuations in rainfall have important effects on water resources, agricultural production and ecosystem health. This high natural variability, combined with the relatively short rainfall record, also makes it much harder to determine trends in rainfall with statistical confidence, when compared to the clearer trends in temperature (Figure 3).
Figure 3. Annual precipitation across the Basin. The line shows the 11-year moving average. (Source: Bureau of Meteorology7)
The only change in rainfall trend that is evident from Figure 3 is the change in rainfall climate around 1950, with an overall increase in average annual rainfall of about 15% (almost 70 mm per year) but with greater variability between years. Figure 3 suggests little, if any, trend in annual rainfall in the Basin since 1950. Strictly speaking, a reduction in annual rainfall of 10 mm per decade can be calculated, but this is not statistically significant.
Climate change
9

There is, however, increasing evidence of a substantial and sustained reduction in rainfall during the past nine years across many parts of southern Australia. This is possibly due to a combination of natural and human causes although is remains unclear which is the dominant cause4.
Regional and seasonal rainfall changes Although there is no clear trend in annual rainfall averaged across the Basin, there are some rather strong regional trends in annual and seasonal rainfall (Figure 4).
Since 1950 rainfall decreases of up to 50 mm per decade have occurred in the eastern and southern parts of the Basin. These are among the largest observed decreases in any part of Australia.
Most of the decline observed in the southern part of the Basin is because of lower summer and winter rainfall. Decreases in autumn rainfall of up to 15 mm per decade were measured in the headwaters of the Murray and Murrumbidgee rivers. In contrast, some of the dry western parts of the Basin have experienced rainfall increases of up to 10 mm per decade.
Averaged over the entire Basin for the period 1950–2004, the most substantial rainfall decreases have occurred in summer (15 mm per decade) and the smallest changes in spring (1 mm per decade), but neither is statistically significant.
By contrast, in the past 15 years or so, there have been statistically significant and substantial decreases in summer rainfall (by 50 mm per decade) and autumn rainfall (by 65 mm per decade). It is too soon to tell how persistent these changes will be. Also, it is not yet clear whether the frequency and intensity of extreme rainfall events has changed4,6.
Figure 4. Observed trends in seasonal and annual rainfall the period 1950–2004. Units are the rate of change in millimetres per decade. (Source: Bureau of Meteorology 7.)
Summer rainfall
Autumn rainfall
Winter rainfall
Spring rainfall
Total annual rainfall
10

Future climate change To predict future climate, researchers now often independently use different models and model assumptions, and combine the predictions to reduce and quantify the uncertainty. Assumptions relate not only to the way the atmosphere and earth surface behave, but also include different scenarios of future greenhouse gas emissions. The result is usually a reasonably wide band of possible outcomes. Because climate prediction models are developed and tested against measured climate patterns, they tend to reinforce trends that have already been observed2.
One modelling exercise for the Basin suggests that in any scenario mean temperature will rise over the coming decades throughout the region3. The rises will be greatest in the northern parts of the Basin, with maximum increases for the most severe scenario of up to 2˚C by 2030 and 5.5˚C by 2070 (relative to 1990). The north-south difference is predicted to occur for all seasons with the greatest increases in the north in spring and summer (up to 2.5 ˚C by 2030 and 7.2 ˚C by 2070). Winter has the smallest predicted temperature increases.
Annual rainfall is generally predicted to decline over the Basin, although there is considerable uncertainty in the predictions as evidenced by the predicted large range4,6. The range of predicted change in average rainfall, between 1990 and 2030 and for the most severe scenario, is –13% to +7% for much of New South Wales, and –13% to 0% for northern Victoria. By 2070, these ranges are –40% to +20% and –40% to 0%, respectively. The largest potential rainfall changes are in winter and spring, with potential reductions in spring rainfall of up to 20% by 2030 and 60% by 2070 over much of the Basin. In contrast, in the dry western part of New South Wales there may be a tendency towards increased rainfall in summer and autumn.
Where rainfall is predicted to increase or only slightly decrease, greater rainfall intensities are predicted. Greater intensity of rainfall is likely to translate into greater surface run off. Where rainfall is predicted
to decrease substantially, reduced rainfall intensity is predicted. Even then, it is possible that the intensity of the very large events will be greater, especially in autumn and winter . 5,6
A double impact: potential evaporation may also increase Most studies predict an increase in potential evapotranspiration (PET, a reference measure of water use when water supply is unlimited). In contrast to the temperature predictions, one study predicted a regional trend in PET increase from east to west, rather than from north to south4. For the most severe scenario, PET is predicted to increase by up to 13% in the eastern half of the Basin by 2030 and by up to 8% further west. By 2070 these maximum PET increases are 40% and 24%, respectively. The percentage changes are larger in winter than in summer, with potential maximum increases in winter PET of 20% by 2030 and 64% by 2070 in the northeast of the Basin.
However, PET is a purely theoretical reference measure of water demand. Whether water use will increase in reality depends on whether there will be enough rainfall to evaporate, or in the case of irrigated agriculture, whether there will be increased use of surface or groundwater. A useful measure of water availability is the difference between mean annual rainfall and potential evaporation. Except in the very high rainfall areas, this balance already represents a deficit. Predictions are that this deficit will increase throughout the Basin, with the greatest change in the north4.
What will happen to our water resources? In a climate of increasing temperatures and potential evaporation, any projected decreases in precipitation will have a significant impact on water resources. The most obvious change is that stream flow is likely to decline. Several researchers have estimated the impacts of climate change on stream flow in the whole or part of the Basin using different techniques, models,
11

and assumptions. One estimate of stream flow decreases over the coming decades indicates a likely reduction of 1,100 GL in 20 years with a worst case reduction of 4,400 GL. In 50 years, the estimated likely reduction is 3,300 GL with a worst case scenario of 11,000 GL1,47.
The effects of any changes in flow will be amplified by the fact that a large proportion of stream flow in the Basin is already used for agriculture or the environment, and therefore reductions in flow will directly affect these uses.
Regional impacts Several studies have predicted changes in stream flow for regions within the Basin10-
14. General predictions are that stream flow reductions will be greatest in the south, and least in the north, where increases in summer and autumn rain may occur7 (Figure 5).
Figure 5. Predicted regional differences in percentage reductions in annual stream flow. Dark red indicates greatest reductions. (Source: Jones and Brooke10).
Some of the regional impacts that have been predicted by different studies include:
• Worst-case stream flow reductions of 20% in eastern and 40% in western Victoria by 2030, and potential reductions in excess of 50% for all of the Victorian part of the Basin by 20708.
• Stream flow reductions of 0–15% by 2030 and 0–35% by 2070 in the Macquarie River, leading to decreases
in the storage of Burrendong Dam by up to 30% and 55%, respectively9.
• A 23% reduction of flows into the main reservoirs in the Murrumbidgee (Burrinjuck and Blowering Dams) and 36% of tributary inflows below the reservoirs. This will cause flow reductions of 52% in the lower Murrumbidgee, below the major irrigation areas10.
Changes to flow regime Any climate change is likely to affect the temporal distribution of stream flow. In unregulated catchments (those without storages), seasonal flow reductions can generally be expected to be greater in winter, when rainfall decreases are predicted to be larger.
In alpine areas, the combination of higher temperatures and a smaller part of precipitation falling as snow will result in earlier peak winter and autumn flows, with a much shorter time lag between precipitation and flow, and possibly larger peak flows. While it is likely that precipitation will be less overall, localised flooding could also occur as a consequence of increased rain intensities.
The downstream impact of flow regime changes depends primarily on whether there is storage. In the earlier mentioned Murrumbidgee predictions, upstream reductions in annual flow of 23-36% caused 52% reductions beyond the main diversion points13. Most of this reduction was in high flows. Low flows (flows not exceeded during 50% of the year) are predicted to be reduced by only 7%. This is because the river operation is designed to maintain low flow in the lower Murrumbidgee River.
Water security The risks to the Basin’s water resources from climate change do not derive from projected rainfall decreases alone. Even if rainfall does not decline, the projected increases in temperature and PET alone can have deleterious effects on water resources.
12
It has been demonstrated that the steadily increasing temperatures over recent decades have already exacerbated the effects of drought11. As a consequence, the Basin drought of 2002–03 was more severe than might have been expected in previous periods with similar rainfall deficits. Increases in temperature and evaporation may also result in increased storage losses.
The impact of climate change on water security for agricultural use is likely to be significant. Reduced on-farm rainfall and increased crop water use will increase the demand for irrigation water, while upstream the same reductions in rainfall and increases in evaporation will reduce the water supply from storages. In a case study for the Macquarie catchment it was found that the risk of irrigation allocations falling below 50% of entitlements for five consecutive years was likely to increase from about 1% at present to 30–40% by 207012. Reduced water security appears unavoidable if present climate trends continue.
River ecology Climate change is also likely to affect water quality and the health of rivers and wetlands, but in many cases opposing beneficial and damaging processes are at work and therefore the outcomes are hard to predict. For example, it has been predicted that reduced fresh overland flows can lead to increased salinity in streamflow from irrigation water supply catchments (by up to 19% in 2050 and 72% in 2100)47.
Conversely, however, reduced rainfall and increased PET can also lead to reduced groundwater recharge and therefore limit salt mobilisation. The trade-off can be favourable or not, depending on local catchment conditions.
The impact of a drier climate on sediment and nutrient delivery to the streams is equally hard to predict, as much depends on the occurrence of high rainfall events and the level of vegetation cover that is maintained in a generally drier climate.
If higher temperatures and lower flows do eventuate, the increased sediment and nutrient concentrations in the streams may
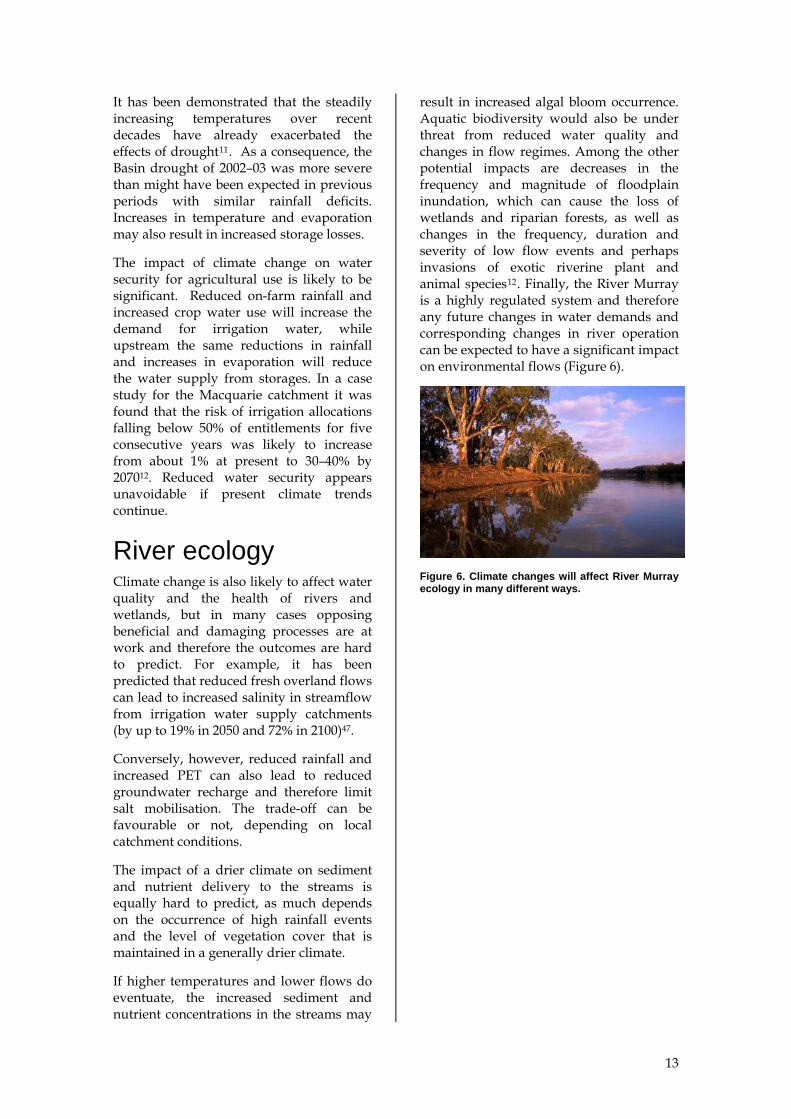
result in increased algal bloom occurrence. Aquatic biodiversity would also be under threat from reduced water quality and changes in flow regimes. Among the other potential impacts are decreases in the frequency and magnitude of floodplain inundation, which can cause the loss of wetlands and riparian forests, as well as changes in the frequency, duration and severity of low flow events and perhaps invasions of exotic riverine plant and animal species12. Finally, the River Murray is a highly regulated system and therefore any future changes in water demands and corresponding changes in river operation can be expected to have a significant impact on environmental flows (Figure 6).
Figure 6. Climate changes will affect River Murray ecology in many different ways.
13

Afforestation on the increase Plantation forestry is an increasingly important land use. Australian industry and State and Federal Governments have together committed to establish new plantations across large areas of land currently used for agriculture. The Plantations 2020 Vision, launched in 1997, aims to enhance regional wealth and international competitiveness by trebling the area of commercial tree crops to 3 million hectares between 1994 and 202013. In 2003 the total plantation area in Australia had already increased to almost 1.7 million ha (Figure 7).
Figure 7. The historic increase of plantation forestry in Australia (dark green) and the trajectory towards the 2020 Vision (light green). (Source: BRS).
An additional 141,000 ha of commercial plantations are expected to be established across the Basin by 2020. Whilst this expansion rate is considerably less than the national trebling, it is none the less significant.
Plantation forests can have a myriad of social, economic and environmental benefits. For example, strategically located plantations can reduce groundwater recharge and address salinity14. However, insufficiently planned afforestation can have potentially large impacts on water availability in the Basin, in a time when our
shared water resources are under great stress.
There are also other land use changes that lead to an increased number of trees or other deeper-rooted vegetation with associated higher water use. These include various forms of farm forestry and tree plantings for environmental reasons, such as biodiversity enhancement, waterways protection and addressing dryland salinity. Where fire and grazing pressure on the land are reduced, natural regrowth of trees and shrubs can occur. Depending on where these other types of tree plantings appear in the landscape, they can have water resource impacts that are similar to those of plantation trees.
How do trees affect our water resources? Trees use more water than unirrigated pastures or crops. This greater water use of forests means less water gets past the forest and out of the catchment. There are a number of reasons for the greater water use of trees, including greater direct evaporation of rainfall from the leaves, access to deeper soil water stores, and greater exposure to drying winds. How this greater water use affects the distribution of high and low river flows depends on catchment characteristics such as relief and groundwater systems. The dominant processes and factors can change from catchment to catchment, but the general trend remains that converting an area from pasture to forest will reduce water yield on an annual basis15.
What is the impact of forest cover on catchment water yield? A recent study analysed run off data from over 250 catchments from 28 countries
Afforestation
14

around the world to determine the impact of forest cover on catchment water yield16. The catchments varied from less than 1 km2 to over 100,000 km2 and spanned tropical, dry, and temperate climates. Vegetation in these catchments ranged from plantations to native woodlands, open forest, rainforest, eucalypts, pines through to native and managed grassland and agricultural cropping. All catchments were classified as either predominantly forested, grassland or a mixture, and the water balance technique was used to calculate water use (see Box). The data revealed that the most important factors controlling annual catchment water yield were rainfall and vegetation cover (Figure 8).
0
400
800
1200
1600
0 500 1000 1500 2000 2500 3000 3500
Rainfall (mm/y)
Wat
er u
se (m
m/y
)
Figure 8. Relationship between annual water use and rainfall for predominantly forest (blue) and pasture (red) catchments. (grey dots represent catchments that have a mix) (source: Zhang19)
Figure 8 shows there is some variation in the relationship between annual water use and rainfall for forested and pasture catchments. These have been related to the seasonal pattern in rainfall and water use, and differences in soil and catchment properties. More subtle differences in forest or grassland type, measurements errors, and various possible other causes are identified although overall, the relationships have been shown to be robust
0
100
200
300
400
500
0 500 1000 1500 2000
Rainfall (mm)
Ann
ual w
ater
yie
ld re
duct
ion
(mm
)
19,48.
Water yield reduction
Figure 9. Annual water yield difference (mm, or ML per km2) between fully forested and non-forested catchments.
The difference between water use in forested and non-forested catchments increases from low rainfall to high rainfall areas. For example, when annual rainfall is less than 500 mm the difference in water use due to different vegetation is relatively small. In an 800 mm rainfall zone conversion from annual pastures to trees results in an average water yield reduction of about 1.5 ML for each hectare planted. In reality most catchments will already have some tree cover, and rarely are entire catchments planted to forest. This can be accounted for in calculating water yield impacts.
Impacts across the Basin Models have been used to predict the impact of plantation expansion on water resources across the Basin. These predictions assume present trends continue for plantations to be established in areas that have moderate to high suitability from a wood production perspective.
Land suitability in the Basin corresponds rather closely with rainfall, with highly suitable areas typically having annual rainfall of 800 mm or more and moderate suitability down to about 700 mm per year. Therefore, as a general rule, the more productive forestry areas will also be those with the greatest water yield impacts.
Long-term catchment water yield can be calculated as the difference between average rainfall and water use. The average reduction of water yield when a tree-less catchment is converted to forest is shown in Figure 9. It is expressed in millimetres per year, which is equivalent to one megalitre per km2 per year.
15

Figure 10. Predicted change in water yield after converting current cover to forest cover. (Source: Dowling and others, 200417)
Changes in flow regime with afforestation Predicted changes in mean annual water yield are useful for regional and Basin-wide planning. Additionally, changes in seasonal stream flow may be equally or more important for water security and environmental flows. Much depends on where new plantations are located.
Reservoirs collect and store the flows from upstream catchments over the year (Figure 11), and therefore annual changes in water yield are an appropriate measure of water resources impact. However, in catchments that drain more or less freely into the lower river system, the seasonal changes in stream flow should be considered.
Figure 10 shows the impact of converting land to forests on water yields in any part of the Basin (the white areas already have forest and therefore show no change). The greatest differences in water yield are found in the high rainfall areas, with values quickly dropping from east to west and the lower rainfall inland areas. The red areas in the southeast part of the Basin are higher rainfall areas where the most suitable forestry land is found, but where the impacts are also greatest.
Two scenarios of future plantation expansion were tested as part of a previous study to predict the total impact of forestry expansion on water resources
Figure 11. The Hume Weir is an important reservoir on the River Murray.
1. The first, ‘worst-case’ scenario was a trebling of the plantation area in the Basin by 2020, from 460,000 ha to almost 1,400,000 ha
Most experimental evidence suggests that plantations can significantly reduce dry season flow or even cause streams to dry up completely. This is because trees can access deeper soil water stores during the dry season and hence maintain high water use rates. A convenient way of summarizing the distribution of flows over the year is provided by Flow Duration Curves (FDCs). These show the range of flows, from high to low, and how they change under different land use scenarios. An example for two small, relatively wet catchments with similar characteristics is shown in Figure 12
17. The estimated reduction in water yield is 1,100-1,400 GL each year, depending on whether new plantations will be in moderate or high suitability areas. The second scenario assumes doubling of the plantation area by 2020. This can lead to a reduction in water yield of 550-700 GL per year, again depending on where new plantations will be located. This more modest latter scenario still represents a forestry expansion rate that is significantly higher than the present best estimate of 141,000 ha. This present best estimate of 141,000 ha would result in a reduction in water yields of less than 550-700 GL per year.
. 18
16

The trade-off between water and salt reductions is typically most favourable in low to medium rainfall areas, where the water use difference between pasture and trees is relatively limited and large amounts of salt may be stopped from moving into the stream.
10
1
0.1
0.01
0.001
0 20 40 60 100
% of time that flow is exceeded
Str
ea
mflo
w(m
m/d
ay)
80
Pines (5-10yrs old)
Pasture
It is also important to note that there will be a time lag before salinity benefits occur. This is because stream flow responds faster to afforestation than does salt mobilisation. The consequence of this is that salinity may increase temporarily, before eventually decreasing below the initial level. The quickest response can be expected in upland areas where hilly relief leads to a rapid groundwater response. An example of such a catchment is shown in Figure 13
Figure 12. Flow duration curves for the Redhill catchments, near Tumut (NSW) (stream flow is divided by catchment area for comparison) (Source: Lane et al.21)
One of the two catchments has been planted with pines, while the other remains under pasture. There is year-round stream flow from the catchment under pasture while the catchment under pines only produces run off during 60% of the year. The two curves are much closer for the high flows than for the low flows. This pattern is typical when comparing forested to non-forested catchments in seasonal rainfall areas: low flows are reduced more than high flows, and the highest flows are not affected much at all
. 19
1988
1991
1994
1997
2000
2003
watersaltsalinity
0%
100%
200%
300%
Cha
nge
21. The small relative reduction in higher flows is still responsible for most of the reduction in total annual water yield.
Changes in water quality
Figure 13. Annual values of stream flow, salt load and stream salinity for Pine Creek (a very small 3 km2 catchment in the southwest Goulburn River catchment, Victoria) after full afforestation was completed in 1988. (Source: Harirsine & Van Dijk22)
Salinity is recognised as one of the most serious environmental issues in the Basin. Predictions suggest increased areas of salt-affected land and increasing stream salt loads (total amounts of salt) and stream salinity (salt concentration). Revegetation is recognised as a tool for managing salinity.
It is clear that the catchment has responded strongly to plantation development in terms of stream flow, salt load and stream salinity (expressed as the ratio of annual total salt load over stream flow). In this case, stream salinity decreased within a few years after planting.
Trade-off between water quantity and water quality
How do trees affect salinity? If water on its way to the stream picks up large amounts of salt, then a reduction of this amount of water will also lead to a reduction in the amount of salt that reaches the stream. However, when the goal is to reduce stream salinity - the concentration of salt in the stream - it is then essential that the percentage reduction in salt load is greater than the reduction in water yield
From the perspective of water quantity and water quality, the preferred locations for plantations may be very different from the planting locations that are preferred for commercial reasons. Strictly commercial plantations are best located in high rainfall areas but this is where most of the fresh, so-called ‘dilution flows’, are generated. Plantations here would result in less
17.
17

dilution and therefore from a stream salinity viewpoint make matters worse: while they will somewhat reduce total salt loads they will in fact increase overall stream salinity17.
Conversely, for salinity management, trees are often preferably planted in parts of the landscape where salt is most present and where they will most reduce groundwater recharge. Such areas often (but not always) have lower rainfall, poorer and thinner soils, and sometimes waterlogged areas and salinity outbreaks22. These factors all compromise the production potential and sustainability of plantation forestry. In a similar way, much stream sediment is often generated in parts of the landscape that are less suitable for commercial forestry.
Figure 14. An example of a commercial plantation forest that also has a clear salinity benefit (the Pine Creek forest from Figure 13).
Designing forestry for both commercial and environmental benefits requires careful targeting of sites where the requirements for productive forests and environmental and water resource outcomes can both be met (Figure 14). The total area of such sites across the Basin is relatively limited and their afforestation may not result in large water resource impacts, nor achieve large salinity decreases in the lower River Murray.
Apart from commercial plantations, revegetation occurs for a variety of other reasons. Examples are farm forestry in woodlots or tree rows, and plantings for enhanced biodiversity (Figure 15), salinity reduction, erosion control, riparian protection or carbon sequestration. Almost all planting types can achieve several environmental objectives to a greater or
lesser degree depending on site characteristics, but all of them will lead to decreased water yield22.
Figure 15. An environmental planting on degraded grazing land in the upper Goulburn River catchment.
Several methods and decision support tools are already available to assist in balancing the water yield impacts of new tree plantings against other economic and environmental outcomes . Use of these tools requires that the different water quantity and quality outcomes can be valued or prioritised.
20
18

Groundwater extraction
Groundwater: an important resource Groundwater is a valuable resource in the Basin. As discussed in the first report in this two part series, groundwater extraction has increased in recent years. In some parts of the Basin, groundwater stores are declining at alarming rates and this may jeopardise its future use locally.
Groundwater pumping can also threaten water security downstream. A number of studies highlight the potential impact on increasing groundwater use on stream flow and on Murray-Darling Basin Ministerial Council strategies such as the Cap on diversions and, indirectly, The Living Murray.
Figure 16. Windmills pumping groundwater in SA.
In connected groundwater-surface water systems, there is normally a time lag of years or decades between the start of groundwater extraction and the moment the full impact of that pumping is felt in the streams. This also means that even if all groundwater pumping were to cease immediately, there will be an ongoing impact in streams due to historical pumping. Management of this legacy of pumping will be a complex task (Figure 16). Furthermore, it is difficult to establish
what exactly constitutes a ‘sustainable groundwater yield’ (see box) 21.
Several studies have attempted to predict future groundwater extraction within the Basin. All studies assume that ultimately, the sustainable yield for the Basin will be the effective upper limit to extraction. The major difference is in how fast this limit will be achieved. One recent study used simple linear models based on long term average rates of increase22, while another highlighted the increased extraction rate and assumed a more rapid increase23. What
Defining sustainable yields The water budget for a region or catchment is the balance between all inputs and outputs of water: water is exchanged with the atmosphere (rainfall and evaporation) and gained from or lost to adjacent areas as surface and groundwater flows. A natural water budget can be assumed to be approximately neutral over the long term, with equal inputs and outputs.
When the groundwater system is pumped, an extra output term is added to the water budget. The only way for the budget to become neutral again, is by increasing inputs (such as greater recharge from rivers) or reducing other outputs (such as discharge to the surface or streams, or groundwater outflows). This change is inevitable but may come about only slowly if the groundwater storage is large.
This means that the natural, pre-development water budget by itself is of limited value in determining the amount of groundwater that can be withdrawn on a sustainable basis . Ignoring this fact will lead to unsustainable groundwater management.
19

all studies have in common is that further groundwater will be extracted from the Basin’s groundwater systems, and that this extraction will continue to erode surface water flows.
How is stream flow lost to groundwater pumping? A geological formation that contains extractable and economic quantities of water is referred to as an aquifer. The aquifer is called unconfined if the watertable is within the aquifer, and water pumping will lower it. If the aquifer is capped by a low permeability layer (an aquitard) and the saturated water is under pressure, the aquifer is said to be confined. A well or bore drilled through the aquitard will allow the water to rise up to the water pressure or hydraulic head in the aquifer. Where a confined aquifer is capped by a leaky aquitard, a semi-confined aquifer will result.
As a groundwater body is pumped, the water level (or hydraulic head) around the pumping bore will be drawn down in the shape of a so-called pumping cone. Over time, this cone will expand and deepen at a rate that depends on the characteristics of the aquifer.
After a longer period of pumping a balance can be achieved in which the cone does not expand, but extractions are compensated by inflows of groundwater further away, or outside the aquifer altogether. The sources of this water can be surface water bodies such as rivers, groundwater that would otherwise discharge into the stream, or other saturated layers. There are several ways groundwater extraction can lead to reduced stream flows. Three common processes are described below.
Induced recharge When the influence of a pumping bore, or area of pumping, is close enough to a river or stream, the hydraulic gradient between the area of pumping and the stream can be increased, or even reversed, such that water
flows from the stream to the aquifer. In both these cases, the volume of water moving to the aquifer from surface water is greater than when there is no pumping. This increase in the water flux is called induced recharge. This type of leakage from streams is effectively a form of groundwater recharge. Sometimes it is apparent as transmission losses: a volume of water that goes missing between two stream gauging stations. In other cases it is not identified at all. It can occur under natural conditions, but groundwater extraction can exacerbate it by increasing the difference in water pressure between the stream and the groundwater system.
In general, the time frame for the onset of induced recharge will be short, but the time to full impact depends on a range of factors including the volumes of water pumped and the volumes of water in the river, how much the hydraulic gradient is changed and the properties of the aquifer material. In some circumstances where the aquifer is pumped at high rates, the water level can be drawn below the river bed. In these cases, the aquifer-stream relationship becomes disconnected. Induced recharge will not occur in a stream-aquifer system that is already disconnected under natural conditions, as in that case leakage to the aquifer will already be at maximum.
Captured discharge When pumping occurs further from the stream and the hydraulic gradients are not changed, the major impact will be that groundwater will be extracted that otherwise would have flowed into the river at a downstream point. Discharge capture can be felt in the river itself as diminished stream flow. It can also be manifested away from the river, for example as reduced water supply to groundwater dependent ecosystems in lakes or billabongs (Figure 17).
20

Figure 17. Groundwater pumping changes the balance of water exchange between the river and the groundwater system, and can also affect groundwater dependent water ecosystems.
Captured groundwater discharge will take longer than induced recharge to be felt. Again, much depends on the distance of the pumping from the stream, the water volumes pumped and water volumes in the river, the change in hydraulic gradient and aquifer properties. In some cases where pumping is close to the stream and the change in the hydraulic gradient is large, the impacts may be felt almost immediately (Figure 18).
Figure 18. A pumping station designed to intercept saline groundwater flowing into the river and provides an example of captured discharge.
Induced leakage A more complex form of water loss can occur in semi-confined aquifers. Pumping the aquifer can cause water to leak out of the semi-confining layer above. This leakage is a one-off component of the water
budget, unless the leakage is matched by water being added at the top of the semi-confining layer, which may be from irrigation or from a river. If there is no addition to the semi-confining layer that compensates for the leakage, then this layer will dewater and this may cause land subsidence. The response of the aquifer to induced leakage from the semi-confining layer is usually indistinguishable from that of induced recharge. This can be a problem when trying to establish the sustainability of a developed water budget.
Impacts differ between regions The major groundwater systems with linkages to surface water in the Basin differ in the way they behave, and in the processes by which they are recharged and discharge. This has important consequences for the impact of groundwater extraction on surface water resources.
Generally, the connected aquifer-stream systems occur in the south-eastern parts of the Basin, and disconnected systems occur in the north. Aquifers in South Australia are connected at the discharge end with the River Murray, but the timing of the onset of impacts is extremely long, and in fact the salinity of the Mallee Limestone system means that a reduction in discharge will provide a salinity benefit.
The regions at highest risk will be those where the current and potential future extraction of groundwater is high and where the aquifer and stream are strongly connected. This situation occurs in the alluvial valleys of New South Wales. A good example is the Mid-Murrumbidgee River valley.
Other areas where extraction rates are high at present, such as the Shepparton-Katunga and Lower Murrumbidgee regions, have a similarly high level of risk. However, the situation here is complicated by the presence of a semi-confining layer. In the Shepparton-Katunga region, high levels of extraction contribute to salinity mitigation.
21

What will happen to our water resources? A number of studies have estimated the impact of groundwater pumping across the Basin on total surface water resources. One study estimated that increased groundwater extraction from aquifers that are connected to streams could range from a reduction of 275 GL to a worst case scenario of reduced annual stream flow of 550 GL in 20 years, with a likely estimate was 330 GL1,26. A later study has estimated that 327 GL of annual stream flow is already lost because of groundwater pumping, and predicts a total reduction of 580 GL by 2012/13, that is, a further reduction of 253 GL22.
Time lag between pumping and changes in stream flow The timing of the impact of pumping on surface water is difficult to predict. A recent modelling study estimated the timing of the response of surface water systems to groundwater extraction24. The results suggest that the onset of the initial impact on stream flow from groundwater extraction is rapid, but it takes several decades for the full impact to be realised. The major factor that determines response time is the volume of groundwater abstracted compared to the size of the groundwater system. The distance of pumping from the river is less important.
The lag between the onset and the ultimate stabilisation of impacts means that at any one time there is a legacy of impacts due to past development. This legacy of previous pumping slows the rate of stream flow change: large changes in short term pumping do not have a correspondingly large change on river impacts. Aquifer management plans need to take this slow response into account.
River health and water quality Groundwater extraction can reduce stream flow quantity in the Basin’s rivers. However, groundwater pumping can also change stream flow quality and river health in direct and indirect ways.
Groundwater is generally more saline than soil water or rainfall. Clearing of native vegetation and irrigation has lead to raised water levels in many parts of the Basin, forcing saline groundwater out into the streams, where it has deleterious effects on river health. Groundwater pumping can in some cases reduce this discharge by reducing the height of the watertable.
Partially or wholly groundwater dependent ecosystems can be severely impacted by local watertable lowering. Others, like the Chowilla floodplains (Figure 19), are threatened by saline groundwater and here pumping again can have a favourable effect.
Figure 19. The Chowilla forests suffer from a long-term lack of flooding and salt accumulation.
22

How does irrigation water use affect the water cycle? Irrigation affects hydrology in the Basin in a number of ways. The transport and diversion of water in the river directly changes river flow regimes (the frequency, seasonality and intensity of flows). Through another set of processes, part of the diverted water never reaches the farms and not all of the water irrigated on-farm is effectively used by crops. These irrigation “losses” flow back into groundwater systems or back into the river system.
Transmission losses Water finds its way to irrigators through a maze of delivery channels (Figure 20). The total length of these channels in the south of the Basin is more than 10,000 km, and most of it leaks to a greater or lesser degree. These transmission losses can account for 20-30% or more of the diverted water. Part of the ‘lost’ water recharges underlying groundwater systems, while another part evaporates.
Figure 20. Irrigation water supply channel in Queensland.
Drainage and return flows The application of water to the field changes the water balance of the land through crop water use, water drainage from the soil into the groundwater system (recharge), and water interception by drains.
About 17% of the irrigated area currently has sub-surface drainage, and more than 80% has some form of surface drainage50. This drainage water can add to the local groundwater system, or can flow back into the river as return flows. Major sources contributing to drainage and return flows include:
• escapes losses: water that is ordered but not used by irrigators, for example, because rainfall has fallen since water was ordered (so-called rainfall rejections);
• local rainfall and irrigation that cannot be taken up by the soil and runs off over the surface;
• recharge to groundwater that later discharges into surface or sub-surface drains, or travels through aquifers and discharges elsewhere at the surface or in rivers;
• subsurface drainage works (such as tile drains and tube wells) that intercept water draining from the soil and transport it into surface drains.
The percentage of drainage water that makes its way back into the river as return flows varies between irrigation areas. For example, it is about 8% of the drainage water in the Murrumbidgee irrigation area, and only 1% in the Riverlands50. Most of the remainder is reused or captured in disposal basins. Irrigation return flows affect both the quantity (flow patterns and volumes) and quality of the river flow. As
Irrigation water management
23

irrigation efficiency is improving, return flows will decrease (Figure 21).
Figure 21. Sprinkler irrigation is more efficient than flood irrigation, but less efficient than drip irrigation.
How will our water resources be affected? As the pressure on water increases, it is reasonable to expect major changes in irrigation water management and in the distribution of irrigation water across the Basin. The emerging trade of water and water entitlements is already causing changes in the distribution of irrigation water use and land use including the types of crops grown.
There is a trend towards increased efficiency in the delivery and use of irrigation water. For example, return flows in the Coleambally Irrigation Area in New South Wales have been reduced by more than 15% (about 20 GL per year) since the introduction of smarter systems for ordering and delivering water to farms, and by reducing escape flows from irrigation channels29. Similarly, transmission losses can be reduced dramatically by channel lining or switching to pipes.
There is also evidence that investments in more efficient water delivery lead to concurrent investments in increased farm water use efficiency. A good example of this occurred in three irrigation areas (Pomona, Coomealla and Curlwaa) in New
South Wales that converted from open channels to pipeline supply systems between 1989 and 2000. This resulted in a 28-58% reduction in annual delivery volume25. It also brought about a major shift in on-farm application systems: furrow irrigation decreased from 35% in 1997 to 13% in 2003, whereas the exact opposite trend occurred for drip irrigation. Following this conversion, drainage to underlying groundwater has also reduced resulting in lowered watertables.
However, increased water delivery and irrigation efficiency does not necessarily create a reduction in water demand, as water saved can be used elsewhere. In several irrigation areas water licenses are based on net diversion (total diversion minus total drainage). In these areas, any water use efficiency improvements that lead to reduced drainage returns must be accompanied by a reduction in total diversion. Therefore, irrigation efficiency improvements made within these areas may not result in a decline in river stream flow. Overall, some decline in the volume of water in the River Murray is anticipated as a result of improved irrigation water management. Improved irrigation water management will also lead to reduced groundwater recharge and irrigation induced salinity. Any future changes in the net volume of water resources used for irrigation (that is, diversion minus return flows) will strongly depend on social and economic developments, and will be influenced by future policies.
The volume of return flows is estimated to vary from 1-20% in the southern part of the Basin, but there is little information in the northern part. As a rough estimate, it is reasonable to suppose that perhaps 10% of the diverted water could return to the river. Thus, return flows could be of the order of 1,000 GL/year.
A study looking at changes to return flows from irrigation management changes in NSW and Victoria since 1993/94, estimated a reduction of 90 GL/year50.
24

How is water quality affected? Impacts on groundwater systems and salinity In many areas, drainage of excess water from irrigated fields recharges groundwater systems that are already receiving greater recharge since broadscale clearing of native vegetation. It has raised the groundwater level and in many irrigation areas formed a local groundwater ‘mound’, that can lead to water logging and salinisation problems. The overall impacts of salinisation in the Basin are widespread. By 1987, already 96,000 ha of irrigated land was affected by soil salinisation and 560,000 ha had watertables within 2 m of the surface26. Overall, 75% or more of the irrigation areas in the Basin has the potential to be affected by shallow watertables in future.
The impacts of increased recharge are not always realised locally. Large groundwater systems in the eastern riverine region can be recharged in one area but ultimately discharge many kilometres away. Some irrigation areas are developed on top of areas where regional aquifers already naturally discharged (often saline) groundwater. This situation is exacerbated by recharge from irrigation higher in the system. The Kerang and Wakool regions of Victoria are examples of such areas (Figure 22).
Figure 22. Saline discharge areas in the lower Basin (in red). (Source: MacKay & Eastburn,27)
In parts of western Victoria and South Australia, irrigation developments are on top of highly saline groundwater systems
that are strongly connected to the River Murray. Here, excess irrigation water pushes much salt into the river, and salt interception schemes are installed to help reduce salt inflows.
Return flows carry pollutants Irrigation return flows can carry large amounts of sediment, organic matter, nutrients, salt and other pollutants. Attributing pollutants to irrigation activities or other sources is not always easy. Surveys have indicated that most nitrate and much phosphate exported from the Goulburn Broken and Lower Murray regions is from return flows from irrigated dairy and horticultural areas.
In most irrigation areas there are initiatives to reduce the export of pollutants. The water quality of return flows depends strongly on the source of these flows, and therefore large return flow volumes do not necessary imply large problems for water quality. Escape losses, for example, do not worsen the water quality from that delivered to the system at all. The magnitude of different drainage components for the Murrumbidgee Irrigation Area is shown in Figure 231.
escape losses
spillage for downstream supply
local rainfall runoff
excess irrigation runoff
subsurface drainage
other
Figure 23. Sources of return flows from the Murrumbidgee Irrigation Area (total volume is 244 GL). (Source: EarthTech1).
Future changes Ongoing improvements in irrigation water management generally leads to more productive water use and reduced groundwater recharge. Future global climate change may influence rainfall patterns, temperatures and evaporation. This can alter crop water requirements, the availability of surface water and the water budget and behaviour of aquifer systems. Higher crop water demand and lower
25

water supplies will lead to greater pressure on water resources, increased salinity of the root zone and further reduced recharge of underlying groundwater systems.
It is not clear yet how increases in both water use efficiency and crop water demand and supply will relate to each other in future. The overall impact on stream flows will be affected to a considerable degree by economic and regulatory changes in irrigated farming.
26

Dams in the Murray-Darling Basin Farm dams play an important role in Australian agriculture. Small dams storing just a few megalitres provide essential supplies for stock and domestic consumption (Figure 24). Larger dams are used for irrigation purposes, and play a vital role in increasing the productivity, and hence viability, of many dryland farming enterprises. Farm dams can intercept overland flow on its way to the stream, or capture flood water from the stream. Over time there has been an increase in the number of dams used for irrigation purposes. There has been a general trend towards constructing larger dams, some impounding many hundreds of megalitres, to provide additional reliability of supply and to irrigate high value crops.
Figure 24. Dams are essential for many farmers. (Photograph courtesy Sinclair Knight Merz)
The range of farm dam sizes and volumes can be investigated by different methods28 (see box on next page). The number and size of farm dams for a typical Victorian catchment is shown below (Figure 25)29. Similar patterns have been found in dryland farming areas elsewhere in the Basin30.
0-1
ML
1-5
ML
5-40
ML
40-1
00 M
L>1
00 M
L
Number (per km2)
Total volume (ML/km2)0.0
0.5
1.0
1.5
2.0
Dam volume
Figure 25. Distribution of farm dams of different sizes in a typical upland area in Victoria. (Source: Lowe et al.34)
There are an average 2.4 dams per km2 in this example; having a combined volume of about 6 ML per km2 (this can be converted to an equal amount of millimetres, to compare it to annual rainfall). The vast majority of farm dams are small dams (<5 ML) for watering stock and domestic purposes. Despite their large number, typically slightly more than two per km2, they account for only 40% of the total volume. Larger dams (>5 ML) are usually for commercial irrigation. They represent only one in ten dams, but make up the remaining 60% of total dam volume. Very large dams (>40 ML) represent less than 1% of the total number, but still account for about 30% of total dam volume.
Regional differences Detailed information on the density of farm dams in different Victorian catchments is shown in Figure 26. The majority of catchments have a total farm dam volume between 1 and 10 ML per km2. About 10%
Farm dams
27

of the catchments have little or no dams at all, but in 20% of the area farm dams account for more than 10 ML storage capacity per km2.
Figure 26. Map and summary of distribution of farm dam development in Victoria. (Source: Lowe et al.34)
Preliminary estimates of farm dam densities in agricultural areas across the Basin show similar densities35. The highest levels of farm dam development occur in the Namoi/Peel, Kiewa, Goulburn-Broken and South-Australian catchments (>10 ML/km2). Little developed areas (<3 ML/km2) include the Warrego, Border Rivers and Avoca catchments. Typical densities of 1-10 ML/km2 occur in the Lachlan, Murrumbidgee, Macquarie/Castlereagh, Upper Murray, and Wimmera catchments.
Measuring farm dams There are so many thousands of farm dams scattered across the landscape that the task of merely counting them over large areas presents a significant practical problem. Aerial photographs, satellite imagery, and topographic maps are most commonly used to estimate the number and location of farm dams. However, it is very costly to do this for large areas. Therefore, estimates of the number of farm dams across the Basin are based on a mix of detailed local analysis and extrapolation. Information on the historical increase in farm dam numbers over time is even more difficult to obtain as the resolution and availability of aerial or remotely-sensed imagery diminishes rapidly with each preceding decade.
The volume of farm dams is most precisely determined from the careful analysis of detailed digital topographic information (Figure 27), but this is very expensive to obtain.
Figure 27. Example of a high resolution digital model of a dam.
It is more common to infer a dam’s volume from its surface area as seen on aerial photographs, satellite imagery, or topographic maps. Once the surface area of a dam is known, its volume is estimated from simple empirical relationships based on field studies33,34.
28

Growth in farm dams There is strong evidence that farm dam numbers have increased in number and size over time, with the largest increases following major droughts (Figure 28). The number of farm dams in the Basin is estimated to have increased by 37% over the last ten years alone35. The associated increase in total farm dam volume is 48%. These estimates are based on extrapolation from a very small part of the Basin, but are consistent with regional estimates36,37,38.
Left unchecked, the number of farm dams is almost certain to increase and so future farm dam numbers will primarily depend on further regulation. In Victoria, irrigation or commercial use of water from new dams must be licensed. Effectively no new licenses are being issued in the Basin part of the State, and anyone proposing to build a new dam must first buy the water entitlement from another irrigator.
In New South Wales landholders have the right to capture and use 10% of the average yearly run off from their property without a licence fee; there are no other catchment limits on levels of development31. Regulation of overland flow other than for stock and domestic purposes currently exists in all of the Queensland part of the Basin. A similar situation exists in South Australia, where a cap on the construction of new farm dams exists in some catchments.
Figure 28. Typical farm dam in the agricultural landscapes of the Murray-Darling Basin. (Photograph courtesy Sinclair Knight Merz)
How do farm dams affect our water resources? The impact of an individual dam on water resources is relatively small, but the cumulative impact of farm dams on stream flows can be very significant. The nature of their impact depends on a number of factors: the timing and volume of water extracted from the dams, their size and their position in the landscape.
The larger the total volume of farm dams in a catchment, the greater their impact. However, the range of dam sizes has an influence, as a small number of large dams will have a larger impact on stream flows than a large number of smaller dams with an equivalent overall volume. This is because small dams harvest run off from a smaller proportion of the catchment than larger dams, and thus there will be less opportunity for run off to be captured prior to reaching a waterway.
The demand for dam water is also important as higher rates of dam water use reduces the storage level, which in turn increases the dam’s potential to intercept and store overland flow. The seasonal pattern of demand has a direct impact on the likelihood of drawdown at different times of the year, which in turn has significant implications for flow regime.
There is much anecdotal evidence that farm dams impact stream flows, but there are relatively few studies that have accurately quantified the nature and magnitude of these impacts32. So far, studies have generally been limited to small catchments and cannot be directly applied to larger catchments. The most important reason for this is that there are few catchments where long and reliable records of both stream flow and farm dam development are available. Even where these are available, climate variability and other land use changes make interpretation difficult36. In practice, so far only two catchments within the Basin have been identified where the rate of farm dam development and its impact on stream flow was measured and
29
was so large that statistically it could not be attributed to any other factor38.
Given these problems, the best way of estimating the impacts of farm dams on stream flows is to use computer models. One such model has been shown to provide accurate results for all but the most highly developed of catchments, and has recently been applied to catchments in South Australia36, New South Wales36,38, and Victoria33,34. Applying the model across Victoria suggested that in 90% of the catchments, mean annual flow is decreased by between 0.3 ML to 1.1 ML for each ML of farm dam volume. The most likely overall impact is somewhere between these extremes and was estimated at 0.84 ML per ML of farm dam volume.
Impact across the Basin The current overall impact of farm dams on stream flow in the Basin can be estimated by combining the above estimates of annual stream flow decrease per unit dam volume (in ML per ML) with Basin-wide hillside farm dam volume, estimated to be around 2,200 GL35. This produces an estimated total stream flow reduction of 1,900 GL per year. Using the lower and higher ends of modelled impacts from the Victorian data gives a rather wide range of 660 to 2,400 GL per year.
Future impacts of farm dams will depend upon the effectiveness of the legislation which has been enacted to restrict their growth. One study has estimated a reduction on stream flow in 20 years time which could range from 250 GL/year to 3,000 GL/year depending upon the effectiveness of the legislation. This same study estimated a reduction of between 400 GL/year and 4,000 GL/year in 50 years1. Clearly there is considerable uncertainty with regard to the impacts of farm dams on the shared water resources of the Basin.
Changes to river flow regimes The basic purpose of a farm dam is to capture overland flow and store it for later use. Thus the impact of dams on seasonal
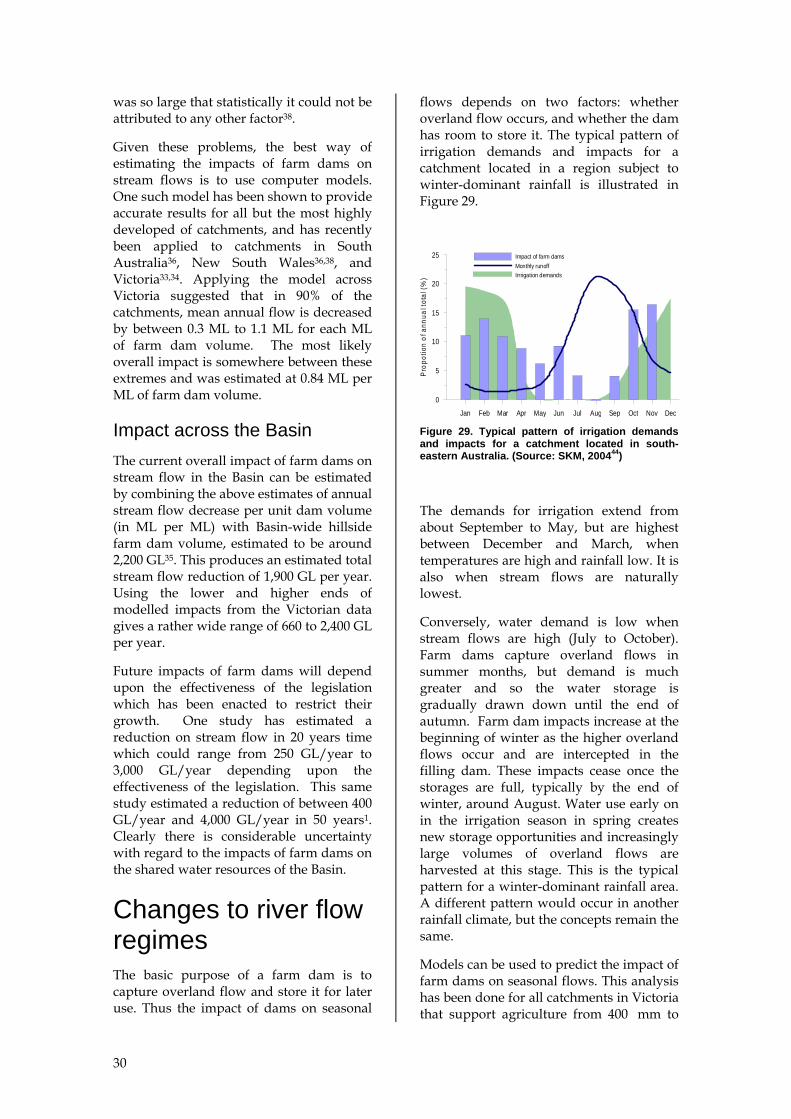
flows depends on two factors: whether overland flow occurs, and whether the dam has room to store it. The typical pattern of irrigation demands and impacts for a catchment located in a region subject to winter-dominant rainfall is illustrated in Figure 29.
Jan Feb Mar Apr May Jun Jul Aug Sep Oct Nov Dec
0
5
10
15
20
25
Pro
potio
n of
ann
ual t
otal
(%)
Impact of farm damsMonthly runoffIrrrigation demands
Figure 29. Typical pattern of irrigation demands and impacts for a catchment located in south-eastern Australia. (Source: SKM, 200444)
The demands for irrigation extend from about September to May, but are highest between December and March, when temperatures are high and rainfall low. It is also when stream flows are naturally lowest.
Conversely, water demand is low when stream flows are high (July to October). Farm dams capture overland flows in summer months, but demand is much greater and so the water storage is gradually drawn down until the end of autumn. Farm dam impacts increase at the beginning of winter as the higher overland flows occur and are intercepted in the filling dam. These impacts cease once the storages are full, typically by the end of winter, around August. Water use early on in the irrigation season in spring creates new storage opportunities and increasingly large volumes of overland flows are harvested at this stage. This is the typical pattern for a winter-dominant rainfall area. A different pattern would occur in another rainfall climate, but the concepts remain the same.
Models can be used to predict the impact of farm dams on seasonal flows. This analysis has been done for all catchments in Victoria that support agriculture from 400 mm to
30

>1000 mm annual rainfall33. The results are consistent with those of other studies across the Basin36,38,49. The range of impacts of farm dams on low, average, and high flows in summer and winter and over the whole year are shown in Figure 30.
Figure 30. Impact of farm dams on low, average, and high stream flows in summer and winter, and over the year (in ML stream flow reduction per ML of farm dam). The bars show the impacts for 90% of all catchments, and the darker colour shows the most frequent and likely impacts. (Source: SKM44).
In this example, low flows are defined as average flows during the 10% of months
with the lowest flows, where high flows are those exceeded in 10% of all months. The typical impacts on low flows are at the lower bound of the range shown. This is because the impacts of farm dams become smaller as stream flows reduce, to the point where surface run off ceases and the additional impact of farm dams is nil (as there are no further opportunities for the dams to intercept flows). Conversely, the impact on summer high flows is very large: each ML of farm dam can reduce summer stream flows by more than two ML. This is because farm dams are drawn down in summer, and so have more room to store the overland flow that often occurs in periods with high flows.
River health and water quality Farm dams have a very important function in providing additional water to land holders during periods of low flow. However, they also have a number of environmental benefits. Dams can be effective sediment and nutrient traps, and they can provide aquatic refuges for birdlife and other organisms. The nature of these benefits depends greatly on where the dams are situated and how they are designed. Whether these benefits compensate the impact on downstream flow reductions and water security is a question that will have different answers for different regions.
31

Bushfires in the Basin During the January and February 2003 fires in south eastern Australia, a total of 1,390,000 hectares largely native forest were burnt (Figure 31). Much of the burnt area was in the south-eastern uplands. These areas have higher rainfall than most other parts of the Basin and provide important water supplies to the Murray system.
Figure 31. Satellite image of the south-eastern uplands just after the 2003 bushfires (affected areas in red). (Source: Sentinel Hotspots34).
Bushfires are a natural phenomenon in forests and many other ecosystems in Australia. When bushfires sweep across the landscape they set in train a natural cycle that affects the landscape for decades to come. As vegetation regrows following a bushfire, the amount of water plants require changes. This in turn changes the quantity of water which flows into streams or seeps into groundwater. Fires also affect water quality in streams, lakes and estuaries. These effects can be small and short-lived or large and protracted and include post-fire pollution of ash and other materials and longer term accumulation of sediments as soils are more prone to wind and soil erosion.
Are bushfires increasing? It is hard to tell whether the frequency, extent and severity of bushfires have increased in recent times and whether they will increase in future. However, there are
clear links between summer droughts and bushfire incidence. Therefore, if climate change leads to more frequent and intense hot and dry periods, fire hazards will almost inevitably increase (Figure 32).
Figure 32. Bushfires are likely to increase if warm and dry periods become more frequent.
Bushfires and water resources All plants extract water from the soil and evaporate it through their leaves. The rate of transpiration depends on the weather, the water available in the soil, and the total area of leaves in trees and understorey. When a fire damages the vegetation this triggers a sequence of change in vegetation water use.
Damage to vegetation can range from mild scorching of the understorey to destruction of the vegetation community. Where damage is mild the vegetation typically recovers within weeks to months. The ground will be rapidly protected by
Bushfires
32

vegetation and water use patterns will be little affected.
At the other extreme, where intense fires kill many trees, the vegetation community will effectively be ‘reset’ and a succession of vegetation will fill the gap in the wake of the fire. In this case, water use by the vegetation will be less than before the fire for a period of typically 2 to 6 years. There can be increased stream flows and recharge of groundwater systems during this period (when compared with a mature forest). After these initial years, however, the vegetation will enter a phase of rapid regrowth, and water use will be higher than that of a mature forest. This phase can persist for periods ranging from 20 to 200 years depending upon the plant species involved. The relationship between forest age and catchment water yield is shown for Mountain Ash forests in Figure 3335.
1400
1200
1000
800
600
400
200
0
0 50 100 150 200
Forest age (yrs)
An
nu
al c
atc
hm
en
tru
no
ff(m
m)
95% confidencelimits
Figure 33. Variation in run off from mountain ash forests in Victoria according to forest age. (after Kuczera, 198543).
The above figure shows large variation in water yield in the forest maturation phase. This is because the magnitude and timing of catchment water yield changes depend on the damage done by the fire, the potential of the vegetation to regenerate, and the rate at which this occurs. These are in turn linked to catchment conditions, including rainfall regime, and the forest type, including the fire tolerance of the trees. Native forests, for example, cope much better with bushfires than pine plantations (Figure 34), which once ravaged by bushfires will often not regenerate at all.
Figure 34. Recovery of native forests one year after fires raged through the Tidbinbilla Ranges (ACT).
How large are the effects? Two studies have estimated the impact of the 2003 fires on water resources in the Basin. The first study used early estimates of the fire extent and severity and its impacts on water use in the Victorian upper Murray catchments1. This study suggested that the inflows to the Murray could be reduced by as much as 430 GL per year by around 2020, but concluded that better estimates of the degree of burning and the age of the burnt trees were needed.
A subsequent study used satellite images and information on the type and age of burnt forests to arrive at more reliable estimates36. It found that the severity of the burn was highly variable with only relatively small areas experiencing tree death. Many burnt areas had experienced major wildfires in the not too distant past. This also lessened the impact on water resources, because water yield was already lower from these forests.
An initial increase in stream flows of 14% to 106% was predicted for different catchments; the effects of which will last until about 2010. After this period there will be a small reduction in the total inflows to the River Murray compared with the no fire scenario. The maximum reduction in the total stream inflow to the Murray varies between -129 GL and +4 GL per year. This range reflects the uncertainty in the relationship between fire severity and tree death.
33

Where are the effects greatest? The 2004 study also investigated the type of catchments where the impacts will be greatest. These were found to be areas where one or more of the following factors are found44:
• high fire severity with a high proportion of tree death;
• tree species that are susceptible to fire, such as Mountain Ash; and/or
• mature forests with a high proportion of old trees.
Within the Basin, the worst affected areas are predicted to be parts of the Dartmouth, Kiewa and Upper Murray catchments.
Changes to river flow regime The impacts of bushfires on flow regime are not well studied, but can be predicted to some extent. The ability of the soil to soak up rainfall is typically reduced after fires. This means that high flows are likely to increase directly after a bushfire as run off is higher than usual. As the forest regenerates and more water is used overall, changes in flow regime will be similar to those associated with afforestation of grazing land, that is, decreases in all flows, but with the greatest relative impact on low flows. Large areas of native forest are found in the supply catchments of our major water reservoirs and so can potentially impact upon post-fire storage levels.
River health and water quality Bushfires can have a serious impact on water quality by changing the water balance and by loss of the forest litter cover and its replacement by ash and charcoal.
The amount of rainfall that can be taken up by the soil usually decreases after a fire, and this run off can carry charcoal, sediment, nutrients and organic matter into
streams and reservoirs. Pollutant contamination depends on catchment characteristics, the severity of the fire, and the sequence of rainfall events shortly after the fire before the soil has some protective vegetation cover again. Sediment run off from burnt forests contains clay particles that can result in increased turbidity, altered water chemistry and changes to local stream ecology.
Most sediment comes from roads and tracks Roads and tracks are the major sources of sediment coming from forests and can generate and concentrate overland flow. This remains the case after a fire (Figure 35), when old roads can become reactivated as sediment sources because the protective litter and vegetation is removed and because the hillslopes can absorb less of the water and pollutants washed from the roads. Erosion rates can increase by one or two orders of magnitude at this stage.
Figure 35. Roads are important sources of sediment, before and after fires.
34

Figure 36. A new gully incision and very coarse material carried by flow from an abandoned road, formed after the 2003 fires hit this native forest in an ACT water supply catchment.
Hillslope scours are frequently triggered by concentrated flow draining from a road surface. In severe cases, new gullies are eroded below the roads where the burnt surface cannot withstand the scouring force of run off draining from the road or tracks (Figure 36).
Management operations during and after the fire can further exacerbate erosion. After the 2003 fires, many hundreds of kilometres of new fire breaks were established using earth-moving machinery. These new tracks form an important additional erosion hazard, especially where the design does not allow sufficient drainage. Frequent maintenance and restoration of road and track drainage should be a priority in the post-fire period.
Water quality deteriorates Water quality generally deteriorates in streams draining fire affected areas, but the effect is highly variable. In some instances the effects are short-lived and small whereas very high levels of pollutants have been transported to streams in other cases. Pollutant loads will generally decrease over time as the catchment stabilises again.
Streams from many Victorian forest catchments still have high pollutant concentrations two years after the fires. Sediment and nutrient loads range between two and as much as a hundred times pre-fire levels. Up to two metres of coarse sediment was deposited in some stream beds. These deposits are very damaging for stream ecology: they degrade the environment for stream life and fill up dry period refuges such as waterholes.
Similar observations were made in the ACT, including in some important water supply catchments. High levels of erosion occurred both in the native forest and plantation areas. Plantations experienced very high erosion rates in the two years since the 2003 fires. This was in part directly due to the fire, but was exacerbated by the relatively high density of roads and soil disturbance during salvage logging and replanting operations.
Where are the greatest impacts? The key factors that influence the degree to which water quality deteriorates after bushfires are:
• the density of roads and tracks in the forest;
• the adequacy of road and track drainage to disperse overland flow;
• the intensity of the fires, which determines how much litter and shallow roots remain; and
• the susceptibility of the forest to severe burning. For example, pine plantations in the ACT were almost totally killed and vegetation is especially slow to recover in these forests. These burnt plantations are being cleared and revegetated with pine and native trees (Figure 37).
In the 2003 bushfires the fire severity in south east Australia was often high on western-facing slopes and these had higher erosion rates. Erosion is most severe in environments where roads and tracks lead to the formation of new gullies. Fire breaks, particularly when poorly designed (for
35

example, when hastily constructed during the fire fighting operations) often have the severest erosion.
Figure 37. A ravaged pine plantation in the ACT, with unprotected soil exposed to erosion.
36

In the preceding sections, we quoted a variety of estimates of the impact of each of the six risks on total annual water resources in the Murray-Darling Basin. It must be noted that the six risks are risks and not forgone conclusions.
How the risks affect the shared water resources of the Murray-Darling Basin will depend upon what actions are taken.
It is also the case that our understanding of how the risks might impact upon the Basin is by no means complete.
A range of potential impacts from the various risks have been discussed in this report and these ranges are compared in Figure 38.
0% 5% 10% 15%
Climate
Farm dams
Afforestation
Groundwater extraction
Bushfires
Irrigation watermanagement
Water resource impacts by 2020
Figure 38. Estimated impact of the six risks on River Murray flows by 2020. The darkest colours showing most likely impact.
In most cases, a rather wide range of estimates has been derived in different studies, for different assumptions, and for different levels of likelihood. For example, the range shown for farm dams probably covers the entire possible range of impacts, whereas that for bushfires shows the likely range.
Nonetheless, Figure 38 suggests that the greatest risks to our shared water resources come from climate change and farm dams, with the risks from afforestation and groundwater pumping estimated to be considerable, but less than that of climate change and farm dams. By contrast, the impacts of bushfires and irrigation
management changes are expected to be smaller.
It should be noted that even relatively small risk amounts (in the vicinity of 100 GL per year) are equivalent to one-fifth of the water which the Murray-Darling Basin Ministerial Council is seeking to recover under its Living Murray Initiative.
The relative sizes of the estimated impact changes if shorter or longer time horizons are considered, but their relative order remains similar.
In a strict sense, the various risks cannot be summed because of the interactions between them. Climate change in particular can potentially affect the impacts of the other risks. However, summing them together does provide an indication of the magnitude of the potential impacts from the risks.
In broad terms, the total reduction in stream flow from all six risks in 20 years time is likely to range between 2,500 GL/year and 5,500 GL/year. With an annual average flow of 24,000 GL/year, this represents a reduction of between 10 and 23% of average annual flow.
In 50 years, the reduction in stream flow could be in the range of 4,500 GL/year to 9,000 GL/year. This represents a reduction of between 19 and 38%.
The future is in our hands Human action can influence the future security of our water resources, but to what degree cannot be predicted (Figure 39). This creates most of the uncertainty in the predictions, and is the main reason for the width of the bars in Figure 38.
For example:
• Future emissions of greenhouse gases determine how severe the impact of climate change will be. Due to the time lag between emissions and climate
Bringing the risks together
37
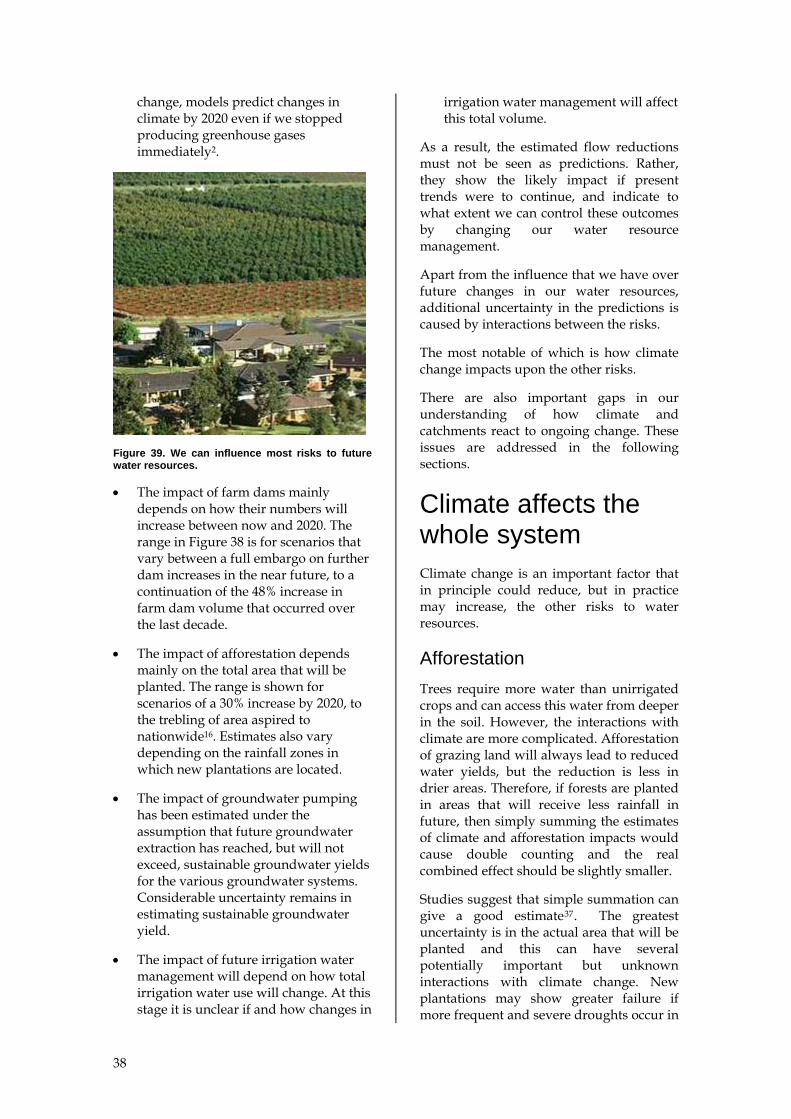
change, models predict changes in climate by 2020 even if we stopped producing greenhouse gases immediately2.
Figure 39. We can influence most risks to future water resources.
• The impact of farm dams mainly depends on how their numbers will increase between now and 2020. The range in Figure 38 is for scenarios that vary between a full embargo on further dam increases in the near future, to a continuation of the 48% increase in farm dam volume that occurred over the last decade.
• The impact of afforestation depends mainly on the total area that will be planted. The range is shown for scenarios of a 30% increase by 2020, to the trebling of area aspired to nationwide16. Estimates also vary depending on the rainfall zones in which new plantations are located.
• The impact of groundwater pumping has been estimated under the assumption that future groundwater extraction has reached, but will not exceed, sustainable groundwater yields for the various groundwater systems. Considerable uncertainty remains in estimating sustainable groundwater yield.
• The impact of future irrigation water management will depend on how total irrigation water use will change. At this stage it is unclear if and how changes in
irrigation water management will affect this total volume.
As a result, the estimated flow reductions must not be seen as predictions. Rather, they show the likely impact if present trends were to continue, and indicate to what extent we can control these outcomes by changing our water resource management.
Apart from the influence that we have over future changes in our water resources, additional uncertainty in the predictions is caused by interactions between the risks.
The most notable of which is how climate change impacts upon the other risks.
There are also important gaps in our understanding of how climate and catchments react to ongoing change. These issues are addressed in the following sections.
Climate affects the whole system Climate change is an important factor that in principle could reduce, but in practice may increase, the other risks to water resources.
Afforestation Trees require more water than unirrigated crops and can access this water from deeper in the soil. However, the interactions with climate are more complicated. Afforestation of grazing land will always lead to reduced water yields, but the reduction is less in drier areas. Therefore, if forests are planted in areas that will receive less rainfall in future, then simply summing the estimates of climate and afforestation impacts would cause double counting and the real combined effect should be slightly smaller.
Studies suggest that simple summation can give a good estimate37. The greatest uncertainty is in the actual area that will be planted and this can have several potentially important but unknown interactions with climate change. New plantations may show greater failure if more frequent and severe droughts occur in
38

future, and this may be exacerbated by increases in bushfires. There are also other forms of land use change that can be significantly influenced by any future climate change.
These can include the rate of land clearing and the fate of existing grazing land in areas where plantation forestry may not be commercial. Some of these grazing lands may be taken out of production in future, and be either actively revegetated or gradually return to more natural conditions. In all these cases, trends are towards decreased water yield.
Irrigation water management Irrigation water requirements will be greater in a drying climate, as crop water use increases and local rainfall decreases. Even without any future changes in the total area and type of crops irrigated, the impact of better irrigation water management on overall water resources will only be beneficial if this greater crop water demand is exceeded by the savings made through greater efficiency in water delivery and irrigation (Figure 40).
Figure 40. The impact of future irrigation water management will depend upon changes in irrigation water use and the interplay with other water risk factors.
Groundwater extraction Groundwater systems will be affected on several fronts in a drying climate. Firstly, groundwater extraction and recharge in irrigation areas are closely related to future irrigation water use and management. Groundwater extractions for irrigation are already increasing due to the greater pressure on water resources. Furthermore, the rate at which groundwater is recharged by rainfall outside irrigation areas will
decline. This further affects sustainable yields and therefore potentially affects future groundwater allocations.
Farm dams The impact of climate change on farm dam development is also two-fold. Reduced rainfall and increased evaporation will act as incentives for landholders to install more dams. The average volume of water held in storage in existing farm dams will also decrease and these dams will therefore intercept more water than at present.
Bushfires The estimated impacts of bushfires reported in this review are only for the 2003 affected catchments. It is generally expected that fire frequency will increase under future climate conditions15. Large-scale fires in the Basin are associated with periods of drought and there are indications the trend of increasingly severe droughts may have contributed to the severity of the 2003 fires14.
There are also feedbacks between vegetation and climate. Large forest areas provide more water and less heat to the atmosphere than grazing land and can also affect air currents. In some cases, broadscale vegetation change can alter rainfall patterns. The limited scale of forestry expansion in the Basin may not be likely to have such impacts, but large-scale forest fires can change the local interaction with the atmosphere considerably for several years, and so may have an impact on climate (Figure 41). These interactions are still poorly understood.
Figure 41. Large-scale bushfires, such as occurred in these ACT forests, can change local and possibly regional climate.
39

Stream salinity To understand the likely impacts of the six risks on future salinity, it is convenient to consider the uplands and lower plains in separation. In the uplands, trends in a drying climate and increasing tree cover will be towards reduced groundwater recharge, and therefore reduced salt mobilisation. Total stream flow will also be reduced and therefore this does not necessary mean a reduction in stream salt concentrations. Studies have shown that the overall outcome varies between areas, depending on the nature and salinity of groundwater bodies and whether the areas affected can presently be classified as sources of salt or of dilution flows. Farm dams intercept fresher overland flow, and therefore an increased number of farm dams will most likely lead to an increase in stream salinity, as well as reduced flows.
Downstream, a drier climate, reduced irrigation water drainage and groundwater extraction may all be expected to have a favourable or insignificant effect on the discharge of salt to the surface and into the streams. The overall change in River Murray salinity will depend on the balance between reduced salt and water volumes.
Pollutants and algal blooms As for salinity, the impacts of the six risks on pollutant concentrations and algal blooms also represents a trade-off between expected reductions in pollutant load and stream flow. Algal blooms are caused by a combination of high water temperatures and high nutrient concentrations, of phosphate in particular. These typically occur during warm summer periods with
low flows. Irrigation areas produce most of the phosphate found in the river system, and a reduction in return flows and associated nutrient exports may well reduce the incidence of algal blooms (Figure 42). This beneficial change could be offset by higher temperatures and lower flows caused by a combination of climate and land use change.
Figure 42. Blue-green algae on Chaffey Reservoir in the Peel River (NSW).
Overall, afforestation and farm dams reduce the delivery of sediment and nutrients from dryland areas. However, bushfires can lead to sudden and very high increases in river pollutants. Climate principally affects pollutant delivery through the intensity and frequency of high rainfall events. Unfortunately, the future trend in rainfall distribution cannot be predicted yet with any confidence. In addition, increased pollutant generation may occur if vegetation cover is deteriorated after increasingly long and intense droughts.
River ecology In-stream ecosystems and native and exotic fish populations are already heavily impacted by changes to river flow quality and regimes in the regulated part of the river system (Figure 43). The identified
Risks to water quality and ecosystem health
40
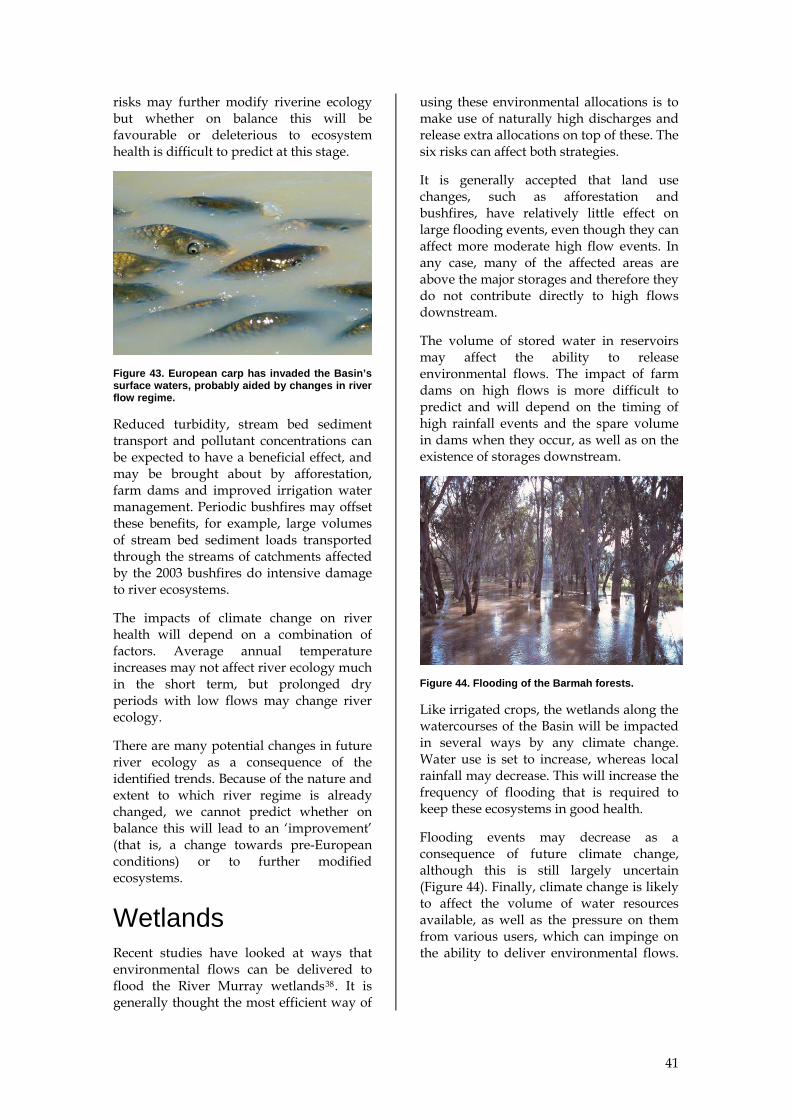
risks may further modify riverine ecology but whether on balance this will be favourable or deleterious to ecosystem health is difficult to predict at this stage.
Figure 43. European carp has invaded the Basin’s surface waters, probably aided by changes in river flow regime.
Reduced turbidity, stream bed sediment transport and pollutant concentrations can be expected to have a beneficial effect, and may be brought about by afforestation, farm dams and improved irrigation water management. Periodic bushfires may offset these benefits, for example, large volumes of stream bed sediment loads transported through the streams of catchments affected by the 2003 bushfires do intensive damage to river ecosystems.
The impacts of climate change on river health will depend on a combination of factors. Average annual temperature increases may not affect river ecology much in the short term, but prolonged dry periods with low flows may change river ecology.
There are many potential changes in future river ecology as a consequence of the identified trends. Because of the nature and extent to which river regime is already changed, we cannot predict whether on balance this will lead to an ‘improvement’ (that is, a change towards pre-European conditions) or to further modified ecosystems.
Wetlands Recent studies have looked at ways that environmental flows can be delivered to flood the River Murray wetlands38. It is generally thought the most efficient way of
using these environmental allocations is to make use of naturally high discharges and release extra allocations on top of these. The six risks can affect both strategies.
It is generally accepted that land use changes, such as afforestation and bushfires, have relatively little effect on large flooding events, even though they can affect more moderate high flow events. In any case, many of the affected areas are above the major storages and therefore they do not contribute directly to high flows downstream.
The volume of stored water in reservoirs may affect the ability to release environmental flows. The impact of farm dams on high flows is more difficult to predict and will depend on the timing of high rainfall events and the spare volume in dams when they occur, as well as on the existence of storages downstream.
Figure 44. Flooding of the Barmah forests.
Like irrigated crops, the wetlands along the watercourses of the Basin will be impacted in several ways by any climate change. Water use is set to increase, whereas local rainfall may decrease. This will increase the frequency of flooding that is required to keep these ecosystems in good health.
Flooding events may decrease as a consequence of future climate change, although this is still largely uncertain (Figure 44). Finally, climate change is likely to affect the volume of water resources available, as well as the pressure on them from various users, which can impinge on the ability to deliver environmental flows.
41

.
In the preceding sections, we have reviewed our understanding of the impact of six identified risks on our future water resources, on water quality, and on the health of river ecosystems. Most of this knowledge is derived from studies that investigated small components of the large and highly complex system that constitutes the Murray-Darling Basin.
In this section, we look specifically at some of the key knowledge gaps that affect our ability to assess the impact of each of the six risks on future water resources. We also discuss the steps being taken to address these knowledge gaps.
Climate change Our understanding and quantification of potential climate changes and their impacts have increased substantially over recent decades, but some priorities for research remain:
• Improving our ability to detect historical climate change and understand its causes.
• Improve our techniques for translating global climate model predictions into smaller space and time scales, and in particular into hydrologic impacts.
• Further development of techniques for seasonal climate forecasting.
The MDBC is helping to address these knowledge gaps through the South Eastern Australia Climate program. This is a joint initiative of the MDBC, Australian Greenhouse Office, Victorian Department of Sustainability and Environment and Land & Water Australia. The climate program has a budget of $7 million over the next three years.
Afforestation Our understanding of the impacts of afforestation on water yield is relatively mature. Nevertheless, there are gaps in our knowledge:
• Local variations in site conditions within catchments can lead to important differences in water yield impact. Similarly, there are differences between forests of different species, structure and age. It is therefore necessary to be able to undertake analysis at a finer scale within those catchments considered most critical.
• The future expansion of planted forest cover across the Basin will depend upon economic viability, which is likely to be affected in the long term by changes in climate. Again, the focus of further research should be on the catchments considered most likely to experience forest expansion.
The MDBC is working with partner agencies and with research organisations involved in forestry to better define these critical catchments and improve water yield change estimates.
Groundwater extraction
Currently there are two major limitations in the technical knowledge base for groundwater. These gaps are in the areas of: • Measurement, monitoring and
reporting on the groundwater resource and use of that resource; and,
• Understanding the connectivity between surface water and groundwater.
Knowledge gaps
42

The MDBC and its agency partners are undertaking research projects in both these areas. The projects will build upon and coordinate related work undertaken within the States of the Murray-Darling Basin to provide a Basin perspective.
Irrigation water management Key knowledge gaps in this area include:
• Data on actual water use, losses and pathways from farm to the irrigation system levels and irrigation return flows to the rivers across the Basin.
• Recharge rates in irrigated areas and how these link with the aquifer and river flows.
The MDBC and its agency partners are undertaking work in these areas in order to refine our estimates of the impact of irrigation water management changes on our shared water resources.
Farm dams The two key gaps in our knowledge about the impact of farm dams on stream flow are:
• The lack of information on the distribution of farm dam numbers and sizes. To date, the most comprehensive effort to estimate farm dam numbers in the Murray Darling Basin only considered 1% of the total area37.
• The annual average demand supplied per unit volume of farm dam. Further
information on the variation in this demand factor is required before impacts can be accurately estimated across the whole Basin34.
Recent improvements in remote sensing are allowing estimates of farm dam numbers to be made with considerably more confidence. The MDBC and its agency partners are currently undertaking work that will access this improved remote sensing technology.
Bushfires Future bushfires will be governed by future climate as will future vegetation growth. Ongoing research is needed to improve our understanding and predictive capacity of the impacts of bushfires:
• Our ability to predict the frequency and severity of bushfires is improving both in a synoptic and operational sense. We now have satellite-based remote sensors that enable a rapid assessment of these key characteristics of bushfire impacts42.
• Simulation models will increasingly be used to assess the hydrological impacts of bushfires.
Work based on the 2003 bushfires in Victoria has enabled more robust estimates of the hydrological impact of bushfires. The MDBC has supported this work through its investment in the Victorian Bushfire Recovery Program.
43

Figure 1. The River Murray near Renmark, SA. Future flows may be affected by a range of interacting risks.
Figure 2. Annual anomalies (based on 1961-1990 averages) of mean temperature in the Basin. The line shows the 11-year moving average. (Source: Bureau of Meteorology7)
Figure 3. Annual precipitation across the Basin. The line shows the 11-year moving average. (Source: Bureau of Meteorology7)
Figure 4. Observed trends in seasonal and annual rainfall the period 1950–2004. Units are the rate of change in millimetres per decade. (Source: Bureau of Meteorology7)
Figure 5. Predicted regional differences in percentage reductions in annual stream flow. Dark red indicates greatest reductions. (Source: Jones and Brooke10.)
Figure 6. Climate changes will affect River Murray ecology in many different ways.
Figure 7. The historic increase of plantation forestry in Australia (dark green) and the trajectory towards the 2020 Vision (light green). (Source: BRS).
Figure 8. Relationship between annual water use and rainfall for predominantly forest (blue) and pasture (red) catchments. (grey dots represent catchments that have a mix) (source: Zhang19)
Figure 9. Annual water yield difference (mm, or ML per km2) between fully forested and non-forested catchments.
Figure 10. Predicted change in water yield after converting current cover to forest cover. (Source: Dowling and others, 20041)
Figure 11. The Hume Weir is an important reservoir on the River Murray.
Figure 12. Flow duration curves for the Redhill catchments, near Tumut (NSW) (stream flow is divided by catchment area for comparison) (Source: Lane et al.23)
List of Figures
Figure 13. Annual values of stream flow, salt load and stream salinity for Pine Creek (a very small 3 km2 catchment in the southwest Goulburn River catchment, Victoria) after full afforestation was completed in 1988. (Source: Harirsine & Van Dikj24)
Figure 14. An example of a commercial plantation forest that also has a clear salinity benefit (the Pine Creek forest from Figure 13).
Figure 15. An environmental planting on degraded grazing land in the upper Goulburn River catchment.
Figure 16. Windmills pumping groundwater in SA.
Figure 17. Groundwater pumping changes the balance of water exchange between the river and the groundwater system, and can also affect groundwater dependent water ecosystems.
Figure 18. A pumping station designed to intercept saline groundwater flowing into the river and provides an example of captured discharge.
Figure 19. The Chowilla forests suffer from a long-term lack of flooding and salt accumulation.
Figure 20. Irrigation water supply channel in Queensland.
Figure 21. Sprinkler irrigation is more efficient than flood irrigation, but less efficient than drip irrigation.
Figure 22. Saline discharge areas in the lower Basin (in red). (Source: MacKay & Eastburn,1)
Figure 23. Sources of return flows from the Murrumbidgee Irrigation Area (total volume is 244 GL). (Source: EarthTech1).
Figure 24. Dams are essential for many farmers. (Photograph courtesy Sinclair Knight Merz)
44

Figure 25. Distribution of farm dams of different sizes in a typical upland area in Victoria. (Source: Lowe et al.36)
Figure 26. Map and summary of distribution of farm dam development in Victoria. (Source: Lowe et al.36)
Figure 27. Example of a high resolution digital model of a dam.
Figure 28. Typical farm dam in the agricultural landscapes of the Murray-Darling Basin. (Photograph courtesy Sinclair Knight Merz)
Figure 29. Typical pattern of irrigation demands and impacts for a catchment located in south-eastern Australia. (Source: SKM, 200444)
Figure 30. Impact of farm dams on low, average, and high stream flows in summer and winter, and over the year (in ML stream flow reduction per ML of farm dam). The bars show the impacts for 90% of all catchments, and the darker colour shows the most frequent and likely impacts. (Source: SKM44).
Figure 31. Satellite image of the south-eastern uplands just after the 2003 bushfires (affected areas in red). (Source: Sentinel Hotspots1).
Figure 32. Bushfires are likely to increase if warm and dry periods become more frequent.
Figure 33. Variation in runoff from mountain ash forests in Victoria according to forest age. (after Kuczera, 198546).
Figure 34. Recovery of native forests one year after fires raged through the Tidbinbilla Ranges (ACT).
Figure 35. Roads are important sources of sediment, before and after fires.
Figure 36. A new gully incision and very coarse material carried by flow from an abandoned road, formed after the 2003 fires hit this native forest in an ACT water supply catchment.
Figure 37. A ravaged pine plantation in the ACT, with unprotected soil exposed to erosion.
Figure 38. Estimated impact of the six risks on River Murray flows by 2020. The darkest colours showing most likely impact.
Figure 39. We can influence most risks to future water resources.
Figure 40. The impact of future irrigation water management will depend upon changes in irrigation water use and the interplay with other water risk factors.
Figure 41. Large-scale bushfires, such as occurred in these ACT forests, can change local and possibly regional climate.
Figure 42. Blue-green algae on Chaffey Reservoir in the Peel River (NSW).
Figure 43. European carp has invaded the Basin’s surface waters, probably aided by changes in river flow regime.
Figure 44. Flooding of the Barmah forests.
45

References and further reading
1 EarthTech (2003). Preliminary review of selected factors that may change future flow patterns in the River Murray System. Final Report for the Murray-Darling Basin Commission.
2 Intergovernmental Panel on Climate Change (2001). Climate Change 2001: The Scientific Basis. Contribution of Working Group I to the Third Assessment Report (Eds Houghton, J.T., Ding, Y., Griggs, D.J., Noguer, M., van der Linden, P.J., Dai, X., Maskell, K. and Johnson, C.A.), Cambridge University Press, United Kingdom and New York.
3 Hennessy, K., P. Whetton, I. Smith, J. Bathols, M. Hutchinson and J. Sharples (2003). The impact of climate change on snow conditions in mainland Australia. CSIRO Consultancy Report, 47pp.
4 Hennessy, K., C. Page, K. McInnes, R. Jones, J. Bathols, D. Collins and D. Jones (2004). Climate change in New South Wales. Part 1: Past climate variability and projected changes in average climate. CSIRO Consultancy Report for NSW Greenhouse Office, 46pp.
5 Wright, W.J., and D.A. Jones (2003). Long-term rainfall declines in southern Australia. Proc. National Drought Forum-Science for Drought, 15–16 April 2003, Brisbane., Queensland Department of primary Industry, p35–40.
6 Suppiah, R. and K.J. Hennessy (1998). Trends in total rainfall, heavy rain events and number of dry days in Australia, 1910–1990. Int. J. Climatol., 18, 1141–1164.
7 Bureau of Meteorology, Australian Climate Change and Variability (http://www.bom.gov.au/silo/products/cli_chg/), last accessed October 2, 2005.
8 Jones, R., P. Whetton, K. Walsh and C. Page (2002). Future impacts of climate variability, climate change and land use on water resources in the Murray Darling Basin. Murray Darling Basin Commission, Canberra, ACT, 43pp.
9 Hennessy, K., K. McInnes, D. Abbs, R. Jones, J. Bathols, R. Suppiah, J. Ricketts, T. Rafter, D. Collins and D. Jones (2004). Climate change in New South Wales, Part 2: Projected changes in climate extremes, CSIRO Consultancy Report for NSW Greenhouse Office, 79pp; Bates, B.C., N.R. Viney and S.P. Charles (2003). Climate change projections for the Australian Capital Territory and its water supply catchments, CSIRO Consultancy Report for ACT Electricity and Water, 55pp.
10 Jones, R., and C. Brooke (2005). Adapting Australia’s water resources to a changing climate. CSIRO Consultancy Report for Australian Greenhouse Office, 43pp.
11 Jones, R.N., and P.J. Durack (2005). Estimating the impacts of climate change on Victoria’s runoff using a hydrological sensitivity model. CSIRO Consultancy Report for Victorian Greenhouse Unit, 46pp.
12 Jones, R.N., and C.M. Page (2001). Assessing the risk of climate change on the water resources of the Macquarie River catchment. Proc. Int. Conf. on Modelling and Simulation, 673–678.
13 Viney, N.R., B.C. Bates, S.P. Charles, I.T. Webster and M. Bormans (2005). Modelling adaptive management strategies for coping with the impacts of climate variability and change on riverine algal blooms. Climatic Change (submitted).
14 Nicholls, N., (2004). The changing nature of Australian droughts. Climatic Change, 63, 323–336.
15 Pittock, B. (Ed.) (2003). Climate change: an Australian guide to the science and potential impacts. Aust. Greenhouse Office, Canberra, 239pp.
16 The 2020 Vision for Plantations (1997). www.plantations2020.com.au, last accessed October 2, 2005.
17 Van Dijk, A. I. J. M., X. Cheng, J. Austin, M. Gilfedder, and P. B. Hairsine 2004. Predicted stream flow and salinity changes after afforestation in the Southwest Goulburn. Public client report for DAFF-NHT/CSIRO Commercial Environmental Forestry project, CSIRO Land and Water.
18 Vertessy, R.A., Zhang, L., Dawes, W.R. (2003) Plantations, river flows and river salinity. Australian Forestry 66: 901—999.
46

19 Zhang, L., W.R. Dawes and G.R. Walker (2001). The response of mean annual evapotranspiration to vegetation changes at catchment scale. Water Resources Research 37: 701-708.; Zhang, L., K. Hickel, W. R. Dawes, F. H. S. Chiew, A. W. Western, and P. R. Briggs (2004) A rational function approach for estimating mean annual evapotranspiration, Water Resources Research 40: W02502.
20 Dowling, T., W.R. Dawes, R. Evans, P. Dyson, G.R. Walker (2004). Prioritising upland catchments in the Murray-Darling Basin with respect to salinity benefits from afforestation. CSIRO Land and Water Consultancy Report for the Murray-Darling Basin Commission.
21 Lane, P. Hickel, K., Best, A. Zhang, L. (2003). The effect of afforestation on annual streamflow regime. CRC for Catchment Hydrology Technical Report. 03/6.; Lane P.N.J., A.E. Best , K. Hickel, and L. Zhang. 2005. The response of flow duration curves to afforestation. , Journal of Hydrology 310: 253-265.
22 Hairsine, P.B. and A.I.J.M. van Dijk (2005). Comparing the in-stream outcomes of commercial and environmental tree plantings. Public client report for DAFF-NHT/CSIRO Commercial Environmental Forestry project, CSIRO Land and Water.
23 e.g. through the Commonwealth Department of Agriculture, Forestry and Fisheries, Commercial and Environmental Forestry Program, http://www.daff.gov.au/cef, last accessed November 2, 2005.
24 Alley, W.M., Reilly, T.E., and Franke, O.L. (1999). Sustainability of Groundwater Resources. US Geol. Surv. Circ. 1186; Bredehoeft, J.D., Papadopulos, S.S., and Cooper Jr, H.H. (1982) Groundwater – the water-budget myth, In: National Research Council Geophysics Study Committee, Scientific basis of water-resource management, National Academy Press.
25 Sinclair Knight Merz (SKM) (2003). Projections of groundwater extraction rates and implications for future demand and competition for surface water. Report to Murray-Darling Basin Commission, Canberra.
26 Resource and Environmental Management Pty Ltd (REM) (2004). Watermark Sustainable Groundwater Use Within Irrigated Regions. Final Report, Stage 1. Prepared for the Murray-Darling Basin Commission.
27 Resource and Environmental Management Pty Ltd (REM) (unpublished) – Summary of Estimated Impact of Groundwater Use on Streamflow in the Murray-Darling Basin. Report to the Murray-Darling Basin Commission
28 Resource and Environmental Management Pty Ltd (REM) (in press) – Watermark Sustainable Groundwater Use Within Irrigated Regions. Final Report, Stage 2. Prepared for the Murray-Darling Basin Commission.
29 Coleambally Irrigation Cooperative Ltd (CICL) (2003) Annual Environment Report.
30 Giddings, J. (2004). Improving Irrigation Efficiency in the Lower Murray Darling. In: Conference Proceedings Irrigation Australia 2004.
31 Murray-Darling Basin Ministerial Council (1987). Salinity and Drainage Strategy Background Paper 87/1. Murray-Darling Basin Commission, Canberra.
32 Mackay, N. and D. Eastburn (Eds.) (1990). The Murray, Murray-Darling Basin Commission, Canberra.
33 Good, M and McMurray, D. (1997) The Management of Farm Dams and their Environmental Impact in the Mount Lofty Ranges, ANCOLD Seminar “Dams and the Environment”, Water Resources Group, South Australian Department of Environmental and Natural Resources; Nathan R, Lowe L, Morden R, Lett R and Griffith H. (2005). Development in Techniques for the Assessment of Farm Dam Impacts on Stream flows. 29th Hydrology and Water Resources Symposium, 21-23 February, Canberra, 2005.
34 Lowe L, Nathan R, Morden R. (in press). Assessing the Impact of Farm Dams on Streamflows, Part II: Regional Characterisation. Australian Journal of Water Resources
35 Agrecon (2005). MDBC Hillside Farm Dams Investigation”, MDBC Project 04/4677DO, Draft Report, June 2005.
36 Neal B., Nathan R.J., Schreider S., Jakeman T. (2002) Identifying the Separate Impact of Farm Dams and Land Use Changes on Catchment Yield. Aust J Water Resour 5: 165-175.
37 Gutteridge, Haskins and Davey (1987). Farm dams in catchments study. Report prepared for the Department of Water Resources, Victoria, Ref No. 5583/01.
38 Schreider S. Yu, Jakeman A.J., Letcher R.A., Nathan R.J., Neal B.P., Beavis S.G. (2002). Detecting changes in streamflow response to changes in non-climatic catchment conditions: farm dam development in the Murray Darling Basin, Australia. Journal of Hydrology 262: 84-98.
47

39 Department of Land and Water Conservation (DLWC) (1999). Farm Dam Assessment Guide. NSW DLWC Publication HO/13/999, NSW Department of Land and Water Conservation, Sydney.
40 Beavis S.G., Howden M. (1996). Effects of farm dams on water resources, Report to the Bureau of Resource Sciences 65, National landcare program (NLP) project.
41 Sinclair Knight Merz (SKM) (2004). Estimating Available Water using Sustainable Diversion Limits: The estimation of farm dam impacts on selected streamflow indices in SDL catchments. Report prepared for the Victorian Department of Sustainability and Environment.
42 Sentinel Hotspots, www.sentinel.csiro.au , last accessed October 2, 2005
43 Kuczera G.A. (1985). Prediction of water yield reduction following a bushfire in Ash-mixed species eucalypt forest. Water Supply Catchment Hydrology Research Report MMBW-W-0014, Melbourne and Metropolitan Board of Works, Melbourne; Kuczera, G. (1987). Prediction of water yield reductions following a bushfire in ash-mixed species Eucalypt forest. Journal of Hydrology 94: 215—236.
44 Sinclair Knight Merz (SKM) (2004). Bushfire Recovery Program. The Impact of the 2003 Alpine Bushfires on Streamflow, Task 1 – Broadscale Assessment. Consulting report to Department of Sustainability and Environment. Victoria.
45 Herron, N., R. Davis and R. Jones (2002). The effects of large-scale afforestation and climate change on water allocation in the Macquarie River catchment, NSW, Australia. Journal of Environmental Management 65: 369–381.
46 Murray-Darling Basin Commission (MDBC) (2005) The Living Murray - Foundation Report on the significant ecological assets targeted in the First Step Decision. MDBC Publication No. 09/05.
47 Beare, S., and A. Heaney (2002). Climate change and water resources in the Murray-Darling Basin. Conference Paper 02.01, Australian Bureau of Agricultural and Resource Economics.
48 Vertessy, R.A. and Bessard, Y. (1999) Anticipating the negative hydrologic effects of plantation expansion: Results from a GIS-based analysis on the Murrumbidgee Basin. In: J. Croke and P. Lane (Eds.), Forest Management for the protection of water quality and quantity. Proceedings of the 2nd Erosion in Forests Meeting, Warburton, 4-6 May 1999, Cooperative Research Centre for Catchment Hydrology, Report 99/6, pp. 69-73.; Zhang, L., T. Dowling, M. Hocking, J. Morris, G. Adams, K. Hickel, A. Best and R. Vertessy (2003). Predicting the effects of large-scale afforestation on annual flow regime and water allocation: an example for the Goulburn-Broken catchments. Technical Report 03/5, CRC for Catchment Hydrology, Canberra.
49 Neal, B., Nathan, R., and Green, J. (2002). The effects of farm dams on streamflows in ungauged catchments in the Hawkesbury Nepean basin. Proceedings, 27th Hydrology and Water Resources Symposium, I.E.Aust, Melbourne, 2002.
50 Meyer, W. (2005) Irrigation in perspective. Technical Report, CRC Irrigation Futures, Murrumbidgee Irrigation Area & Districts Land and Water Management Plan Working Group (1998), MIA and Districts Community Land and Water Management Plan.
48

49
Copyright © 2022 FDOKUMEN