Mapping Economic Returns to Agriculture for Informing Environmental Policy in the Murray–Darling...
16
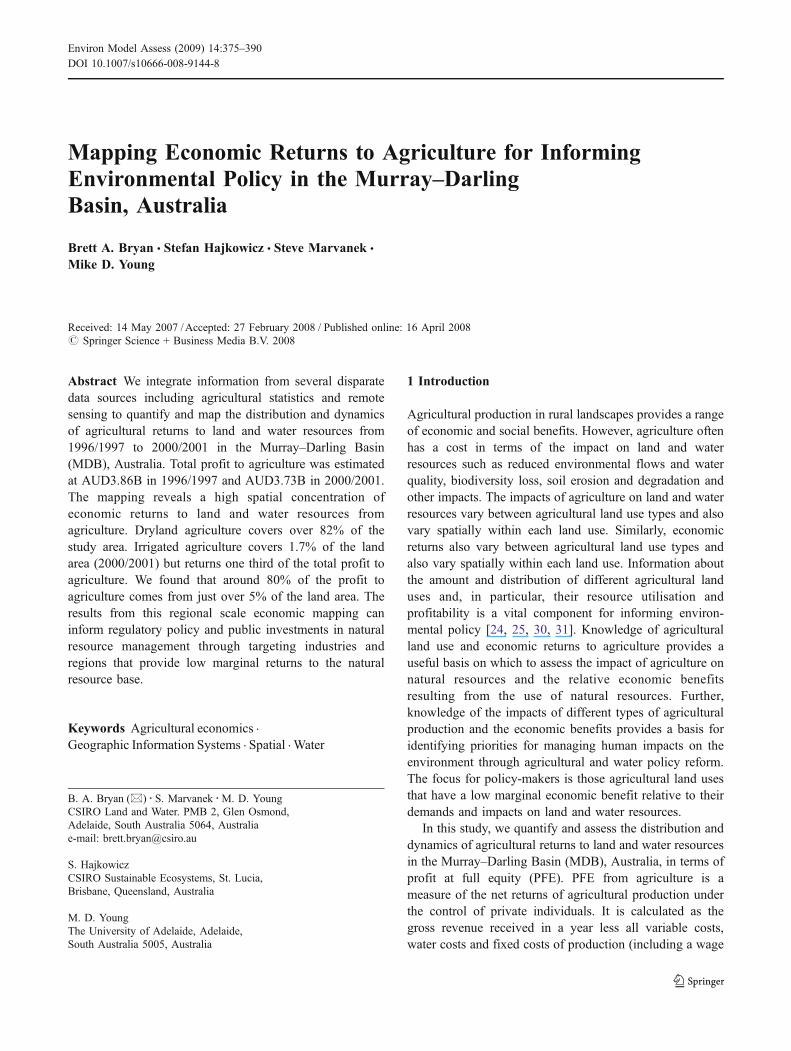
Mapping Economic Returns to Agriculture for Informing Environmental Policy in the Murray–Darling Basin, Australia Brett A. Bryan & Stefan Hajkowicz & Steve Marvanek & Mike D. Young Received: 14 May 2007 / Accepted: 27 February 2008 / Published online: 16 April 2008 # Springer Science + Business Media B.V. 2008 Abstract We integrate information from several disparate data sources including agricultural statistics and remote sensing to quantify and map the distribution and dynamics of agricultural returns to land and water resources from 1996/1997 to 2000/2001 in the Murray–Darling Basin (MDB), Australia. Total profit to agriculture was estimated at AUD3.86B in 1996/1997 and AUD3.73B in 2000/2001. The mapping reveals a high spatial concentration of economic returns to land and water resources from agriculture. Dryland agriculture covers over 82% of the study area. Irrigated agriculture covers 1.7% of the land area (2000/2001) but returns one third of the total profit to agriculture. We found that around 80% of the profit to agriculture comes from just over 5% of the land area. The results from this regional scale economic mapping can inform regulatory policy and public investments in natural resource management through targeting industries and regions that provide low marginal returns to the natural resource base. Keywords Agricultural economics . Geographic Information Systems . Spatial . Water 1 Introduction Agricultural production in rural landscapes provides a range of economic and social benefits. However, agriculture often has a cost in terms of the impact on land and water resources such as reduced environmental flows and water quality, biodiversity loss, soil erosion and degradation and other impacts. The impacts of agriculture on land and water resources vary between agricultural land use types and also vary spatially within each land use. Similarly, economic returns also vary between agricultural land use types and also vary spatially within each land use. Information about the amount and distribution of different agricultural land uses and, in particular, their resource utilisation and profitability is a vital component for informing environ- mental policy [24, 25, 30, 31]. Knowledge of agricultural land use and economic returns to agriculture provides a useful basis on which to assess the impact of agriculture on natural resources and the relative economic benefits resulting from the use of natural resources. Further, knowledge of the impacts of different types of agricultural production and the economic benefits provides a basis for identifying priorities for managing human impacts on the environment through agricultural and water policy reform. The focus for policy-makers is those agricultural land uses that have a low marginal economic benefit relative to their demands and impacts on land and water resources. In this study, we quantify and assess the distribution and dynamics of agricultural returns to land and water resources in the Murray–Darling Basin (MDB), Australia, in terms of profit at full equity (PFE). PFE from agriculture is a measure of the net returns of agricultural production under the control of private individuals. It is calculated as the gross revenue received in a year less all variable costs, water costs and fixed costs of production (including a wage Environ Model Assess (2009) 14:375–390 DOI 10.1007/s10666-008-9144-8 DO09144; No of Pages B. A. Bryan (*) : S. Marvanek : M. D. Young CSIRO Land and Water. PMB 2, Glen Osmond, Adelaide, South Australia 5064, Australia e-mail: [email protected] S. Hajkowicz CSIRO Sustainable Ecosystems, St. Lucia, Brisbane, Queensland, Australia M. D. Young The University of Adelaide, Adelaide, South Australia 5005, Australia
-
Upload
independent -
Category
Documents
-
view
0 -
download
0
Transcript of Mapping Economic Returns to Agriculture for Informing Environmental Policy in the Murray–Darling...
Mapping Economic Returns to Agriculture for InformingEnvironmental Policy in the Murray–DarlingBasin, Australia
Brett A. Bryan & Stefan Hajkowicz & Steve Marvanek &
Mike D. Young
Received: 14 May 2007 /Accepted: 27 February 2008 / Published online: 16 April 2008# Springer Science + Business Media B.V. 2008
Abstract We integrate information from several disparatedata sources including agricultural statistics and remotesensing to quantify and map the distribution and dynamicsof agricultural returns to land and water resources from1996/1997 to 2000/2001 in the Murray–Darling Basin(MDB), Australia. Total profit to agriculture was estimatedat AUD3.86B in 1996/1997 and AUD3.73B in 2000/2001.The mapping reveals a high spatial concentration ofeconomic returns to land and water resources fromagriculture. Dryland agriculture covers over 82% of thestudy area. Irrigated agriculture covers 1.7% of the landarea (2000/2001) but returns one third of the total profit toagriculture. We found that around 80% of the profit toagriculture comes from just over 5% of the land area. Theresults from this regional scale economic mapping caninform regulatory policy and public investments in naturalresource management through targeting industries andregions that provide low marginal returns to the naturalresource base.
Keywords Agricultural economics .
Geographic Information Systems . Spatial .Water
1 Introduction
Agricultural production in rural landscapes provides a rangeof economic and social benefits. However, agriculture oftenhas a cost in terms of the impact on land and waterresources such as reduced environmental flows and waterquality, biodiversity loss, soil erosion and degradation andother impacts. The impacts of agriculture on land and waterresources vary between agricultural land use types and alsovary spatially within each land use. Similarly, economicreturns also vary between agricultural land use types andalso vary spatially within each land use. Information aboutthe amount and distribution of different agricultural landuses and, in particular, their resource utilisation andprofitability is a vital component for informing environ-mental policy [24, 25, 30, 31]. Knowledge of agriculturalland use and economic returns to agriculture provides auseful basis on which to assess the impact of agriculture onnatural resources and the relative economic benefitsresulting from the use of natural resources. Further,knowledge of the impacts of different types of agriculturalproduction and the economic benefits provides a basis foridentifying priorities for managing human impacts on theenvironment through agricultural and water policy reform.The focus for policy-makers is those agricultural land usesthat have a low marginal economic benefit relative to theirdemands and impacts on land and water resources.
In this study, we quantify and assess the distribution anddynamics of agricultural returns to land and water resourcesin the Murray–Darling Basin (MDB), Australia, in terms ofprofit at full equity (PFE). PFE from agriculture is ameasure of the net returns of agricultural production underthe control of private individuals. It is calculated as thegross revenue received in a year less all variable costs,water costs and fixed costs of production (including a wage
Environ Model Assess (2009) 14:375–390DOI 10.1007/s10666-008-9144-8
DO09144; No of Pages
B. A. Bryan (*) : S. Marvanek :M. D. YoungCSIRO Land and Water. PMB 2, Glen Osmond,Adelaide, South Australia 5064, Australiae-mail: [email protected]
S. HajkowiczCSIRO Sustainable Ecosystems, St. Lucia,Brisbane, Queensland, Australia
M. D. YoungThe University of Adelaide, Adelaide,South Australia 5005, Australia

to the farmer). It does not consider interest payments onloans nor off-farm income. PFE is an indicator of the netreturns to land and water resources used for agriculture andthe managerial skill of land managers. Hereafter, we refer tothis concept using the general term economic returns.
The Murray–Darling Basin study area covers around 14%of the land surface of Australia (Fig. 1), and agriculture in theBasin is extremely important in many ways. Nearly half ofthe total economic profit to agriculture in Australia isgenerated in the Murray–Darling Basin, and agriculture is amajor employer of the rural workforce. The region is animportant supplier of agricultural produce to many parts ofsouthern Australia and fresh water to well over 2 millionpeople. However, environmental degradation caused byagricultural and other development, exacerbated by long-term drought, has brought about an urgent need for policyreform to manage land and water resources in the Murray–Darling Basin.
Economic returns to agricultural use of land and waterresources are modelled and mapped for the snapshot years1996/1997 and 2000/2001 in terms of PFE, PFE per hectareand PFE per megalitre of water. These years were chosenbecause of the availability of agricultural census data andagricultural commodity mapping and because the rainfallacross much of the study area was very close to the long-termaverage (Bureau of Meteorology, unpublished data). Eco-nomic returns are summarised by Catchment ManagementRegion (Fig. 1), which is the geographic unit by whichenvironmental policy is implemented and management isprioritised in Australia, including large-scale on-groundworks. The results are interpreted and the implications for
agricultural and natural resource management policy arediscussed. The results of the analysis in this paper providekey data for informing environmental policy in the Murray–Darling Basin.
2 Mapping Economic Returns of Agricultural Land Use
Few studies have attempted to directly model and mapeconomic returns to agriculture over entire river basins at aspatial scale useful for informing environmental policy.Most research into the mapping of agricultural returns hasbeen focused at paddock and farm property scales withinthe field of precision agriculture. Numerous studies haveundertaken paddock scale economic modelling to quantifythe economic benefits of remedial measures such as moretargeted soil treatments [13]. However, there have been fewattempts to apply these models over large regions.
Spatial distribution of the economic value of agriculturehas been estimated typically based on the assumption that itis related to the value of agricultural land. The value ofagricultural land, in turn, may be mapped using cadastralvaluation and sale data where it exists, and modelledagainst other variables such as amenity value [7] andgreenness [27]. Zhao et al. [32] use an ecosystem servicesframework to value agricultural land use change in China.
Consideration of economic impacts has an important partin targeting investment in natural resource managementactions. Bateman et al. [8] use geographical informationsystems (GIS) and farm survey statistics to model and mapthe spatial distribution of profit to dairy and sheep farms in
NorthernTerritory
Western Australia
South Australia
Queensland
New South Wales
Victoria
Tasmania
120°E
120°E
130°E
130°E
140°E
140°E
150°E
150°E
40°S
30°S
20°S
0 500 1,000
Western (NSW)
Warrego-Paroo (QLD)
Lachlan (NSW)
Central West (NSW)
Murrumbidgee (NSW)Mallee (VIC)
Namoi (NSW)
Murray (NSW)
River Murray (SA)
Maranoa-Balonne (QLD)
Lower Murray Darling (NSW)
Gwydir (NSW)
Border Rivers (QLD)
Goulburn (VIC)North Central (VIC)
Condamine (QLD)
North East (VIC)Wimmera (VIC)
Border Rivers (NSW)
ACTKilometres
Murray-Darling Basin
Australia40°S
30°S
20°S
Fig. 1 Location of the Murray–Darling Basin, Australia, including the 20 catchment management regions (including the Australian CapitalTerritory)
376 B.A. Bryan et al.

Wales based on farm level agricultural data and biophysicaldata to identify potential areas for targeting by land useconversion policy. Skop and Schou [29] assessed the spatialdistribution of trade offs between economic returns toagriculture and the environmental impact in terms of nitrateleaching in Vejl Country, Denmark, to test the impact ofnitrate leaching regulations. The authors conclude thattargeting regulatory measures on the basis of nitrogenleaching alone might not be the most economically efficientpolicy option for reducing nitrate leaching.
Similarly, in this study, we integrate land use mapping,agricultural statistics, and a variety of other data to map theeconomic returns to agricultural land use relative to the useof land and water resources. We go further in theassessment of change in agricultural land use and economicreturns to agriculture from land and water resources in theMurray–Darling Basin from 1996/1997 to 2000/2001 anddiscuss the use of this information in a policy context.
3 Methods
3.1 Data Integration and Analysis
Quantifying and valuing the agricultural returns to land andwater resources in the MDB requires the integration of severaldifferent data sources including Australian Bureau of Statistics(ABS) Agricultural Census data and multi-temporal satellite
data within a profit function. Using these disparate datasources, we can create layers for each profit functionparameter, which estimates the spatial distribution of param-eter values (Fig. 2). By integrating these information sourcesin a GIS using the profit function, we can map the spatialdistribution of economic returns to land and water resourcesin the MDB at 1.1-km grid cell resolution including PFE andreturns relative to the use of land and water resources.
These mapped indicators of agricultural economicperformance can then be aggregated by any spatial unitand land use classification and summarised to provideregional summaries. In this paper, we summarise economicreturns by 20 Catchment Management Regions (Fig. 1) toillustrate the use of the data.
3.2 Agricultural Commodity Maps
Maps of agricultural land use in the form of raster GISlayers (1.1-km grid cell resolution) derived by Bryan et al.[9] were used to characterise the spatial distribution ofirrigated and dryland versions of 46 agricultural commod-ities (Table 1) for the years 1996/1997 and 2000/2001(Fig. 3). Profit function parameters are derived for themapped commodity type of each grid cell.
The Agricultural Commodity (hereafter, simply com-modity) classification used in this study is an aggregation ofABS Level 3 Commodities (ABS [1, 2]; Table 1). Thisclassification is further aggregated into agricultural land use
Water Requirements
(WR)
Water Price (WP)
Yield (Q1, Q2)
Price (P1, P2)
Profit at Full Equity
Profit Function
Production Costs
(QC, AC, FOC, FLC, FDC)
ABS Production Stats NDVI Data
Commodity Maps
ABS Value of Production Stats
Commodity Maps
Commodity Maps
ANCID Data
ANCID Data
Commodity Maps
Gross Margin
Handbooks
Commodity Maps
PFE per Hectare
PFE per Megalitre
Fig. 2 Structure of the profit function used in this study includingdata inputs and outputs. The profit function is based on a Commoditylevel agricultural land use map for 1996/1997 and 2000/2001 and
integrates a variety of other data sources to model the spatialdistribution of profit at full equity
Mapping economic returns to agriculture 377

Table 1 Table describing the aggregation between the commodityclassification and agricultural land uses (used for mapping andreporting in this paper)
ABS Level 3Commodity
Agriculturalcommodity
Agriculturalland use
Broadagriculturalland use
Almonds Almonds Tree nuts HorticultureApples Apples Fruit HorticultureApricots Apricots Fruit HorticultureBarley Barley Cereals Broadacre
cropsBeef cattle Beef cattle Beef cattle Beef cattleCanola Canola Oilseeds Broadacre
cropsCereals forhay/silage
Cereals forhay/silage
Hay Broadacrecrops
Cherries Cherries Fruit HorticultureChick peas Chick peas Legumes Broadacre
cropsCotton Cotton Cotton CottonDairy cattle Dairy cattle Dairy cattle Dairy cattleFaba beans Faba beans Legumes Broadacre
cropsField peas Field peas Legumes Broadacre
cropsGrain sorghum Grain
sorghumCoarsegrains
Broadacrecrops
Grapes Grapes Grapes GrapesLentils Lentils Legumes Broadacre
cropsLupins Lupins Legumes Broadacre
cropsMaize Maize Coarse
grainsBroadacrecrops
Millet Millet Coarsegrains
Broadacrecrops
Mung beans Mung beans Legumes Broadacrecrops
Nectarines Nectarines Fruit HorticultureNon-cereal cropsfor silage/greenfeed
Non-cerealcrops cutfor hay
Hay Broadacrecrops
Non-cereal cropscut for hay
Non-cerealcrops cutfor hay
Hay Broadacrecrops
Oats Oats Cereals Broadacrecrops
Oranges Oranges Fruit HorticultureCereal rye Other cereal
cropsCereals Broadacre
cropsBuckwheat Other cereal
cropsCereals Broadacre
cropsLemon/lime Other citrus Fruit HorticultureMandarins Other citrus Fruit HorticultureHops Other non-
cereal cropsOther Broadacre
cropsNurseries/flowers Other non-
cereal cropsOther Broadacre
crops
Table 1 (continued)
ABS Level 3Commodity
Agriculturalcommodity
Agriculturalland use
Broadagriculturalland use
Turf Other non-cereal crops
Other Broadacrecrops
Peppermint Other non-cereal crops
Other Broadacrecrops
Chestnuts Other nuts Tree nuts HorticulturePecans Other nuts Tree nuts HorticulturePistachios Other nuts Tree nuts HorticultureOther nuts Other nuts Tree nuts HorticultureLinseed Other
oilseedsOilseeds Broadacre
cropsSesame Other
oilseedsOilseeds Broadacre
cropsOlives Other stone
fruitFruit Horticulture
Prunes Other stonefruit
Fruit Horticulture
Other orchardfruit
Other stonefruit
Fruit Horticulture
Avocados Other stonefruit
Fruit Horticulture
Kiwi fruit Other stonefruit
Fruit Horticulture
Other vegetables Othervegetables
Vegetables Horticulture
Peaches Peaches Fruit HorticulturePeanuts Peanuts Peanuts Broadacre
cropsPears Pears Fruit HorticultureNashi Pears Fruit HorticulturePlums Plums Fruit HorticulturePopcorn Popcorn Coarse
grainsBroadacrecrops
Potatoes Potatoes Vegetables HorticultureRice Rice Rice RiceSafflower Safflower Oilseeds Broadacre
cropsSheep Sheep Sheep SheepSoybeans Soybeans Legumes Broadacre
cropsSunflower Sunflower Oilseeds Broadacre
cropsTobacco Tobacco Other OtherTriticale Triticale Cereals Broadacre
cropsVetches Vetches Legumes Broadacre
cropsWheat Wheat Cereals Broadacre
crops
Note that both irrigated and dryland versions of each class areidentified although not all occur in the MDB.
378 B.A. Bryan et al.

classes for tabular reporting and broad agricultural land useclasses for mapping (Table 1). Economic mapping andmodelling results are discussed and tabulated at theagricultural land use level and graphed at the commoditylevel.
3.3 The Profit Function
In this study, PFE is measured in dollars per hectare and isdefined as the gross revenue less the variable and fixedcosts of production:
p ¼ q1 bp1 þ p2q2ð Þ � vqq1 þ va þ qwpw� �
� kO þ kL þ kDð Þ
Where:
π PFE ($ ha−1 year−1)q1 yield of the primary product for livestock
(DSE ha−1 year−1) or crops (t ha−1 year−1);q2 yield of the secondary product, being either wool
(kg DSE−1 year−1) for sheep or milk (l DSE−1 year−1)for dairy cattle
β portion of livestock herd or crop sold per year or turn-off rate (dimensionless)
p1 farm gate price of primary product for livestock($/DSE) or crops ($/t)
p2 farm gate price of secondary product for wool ($/kg)for sheep or milk ($/l) for dairy cattle
vq quantity dependent variable costs of production forlivestock ($ DSE−1 year−1) or crops ($ t−1 year−1)
va area dependent variable costs of production($ ha−1 year−1)
qw water use of the crop or pasture (ML ha−1 year−1)pw water use charge imposed by the local water
management authority ($/ML)kO fixed operating costs ($ ha−1 year−1)kL fixed imputed labour costs ($ ha−1 year−1)kD fixed depreciation costs ($ ha−1 year−1)
A description of each of the profit function parametersand their derivation is described in the sections below.
3.4 Price
In the profit function, there are price parameters for theprimary product (p1) and the secondary product (p2). Theseprice parameters represent the farm gate price of theproduce of each agricultural commodity (i.e. exclusive oftransport and marketing costs). Price is measured on a perunit of production basis.
For each ABS Level 3 Commodity class (Table 1) andproduct, price figures are derived from agricultural censusdata [1, 2]. Prices are calculated by dividing the total valueof production ($) by the total production for each statisticallocal area (SLA). A price for each commodity class(Table 1) was calculated as an area-weighted average ofthe prices of the component ABS Level 3 Commodity
0 200
Kilometres
Horticulture
Broadacre Crops
Cotton
Dairy Cattle
Grapes
Rice
Sheep
Beef Cattle
Broad AgriculturalLand Use 1996/97
Broad AgriculturalLand Use 2000/01
Fig. 3 Broad agricultural land use in the Murray–Darling Basin 1996/1997 and 2000/2001
Mapping economic returns to agriculture 379

classes by SLA. GIS-based price surfaces were created forboth p1 and p2 by attaching the price to each grid cellaccording to commodity class, product and SLA.
3.5 Yield
Yield is measured in terms of production per unit area forthe profit function. GIS-based yield surfaces were createdin three stages. Firstly, ABS production and area statistics atthe SLA level were used to derive the yield for eachcommodity in each SLA. Secondly, the yield for eachcommodity within each SLA was reapportioned accordingto satellite imagery. These two stages are described below.Last, ABS data was also used to quantify the proportion ofthe herd sold (or turn-off rate) for livestock.
There are also two yield parameters in the profit function,and they are derived in a similar way to the price parameters.The parameter q1 is the yield of the primary product and q2the yield of the secondary product. Yield parameters arecalculated for each ABS Level 3 Commodity and product ineach SLA by dividing the total production by the total areaof production. Again, area-weighted averaging of the ABSLevel 3 Commodity values is used to aggregate up toagricultural commodity classes (Table 1). Note that beefcattle, dairy cattle and sheep numbers reported by the ABSwere converted to DSE at a rate of 8, 10 and 1.5,respectively, after McLaren [21], to standardise for theenergy requirements of the animals. GIS-based yield surfaceswere created for both q1 and q2 by attaching the yield to eachgrid cell according to commodity class, product and SLA.
The above process results in surfaces with constant yieldvalues for grid cells of each commodity class within eachSLA. In reality, yield varies spatially with variations in soil,climate, managerial skill, and other factors. To better capturethis spatial heterogeneity, we reapportion the primary productyield of grid cells of each commodity type within each SLAaccording to a greenness index called normalised differencevegetation index (NDVI). NDVI has been shown to be a goodindicator of agricultural yield [6, 28] for a variety of cropsincluding maize [5], cotton [14, 15], wheat [17, 19], nuts[18], soybeans [20] and a variety of other crops [26].
Maximum monthly greenness was considered to be a goodproxy indicator for the relative yield of grid cells. A GISoperation was used to create surfaces of maximum NDVIvalues for 1996/1997 and 2000/2001 based onmonthly NDVIimagery from the advanced very high resolution radiometer(AVHRR) sensor. The q1 for each grid cell was spatiallyadjusted across the study area by multiplying by the ratio ofthe maximum NDVI to the average NDVI for eachcommodity and SLA combination (Fig. 4):
q1i ¼ PϕinPn
i¼1ϕi
Where:
qli the adjusted yield of the primary product within gridcell i (t ha−1 year−1 or DSE ha−1 year−1)
P the mean yield of the primary product (t ha−1 year−1 orDSE/ha)
0 200
Kilometres
NDVI
High
Low
Maximum NDVI 1996/97 Maximum NDVI 2000/01
Fig. 4 Maximum NDVI values from the 13 monthly normalised difference vegetation index (NDVI) images from 1996/1997 and 2000/2001 inthe Murray–Darling Basin
380 B.A. Bryan et al.

ϕi the maximum monthly NDVI score for grid cell in the total number of grid cells classified
The turn-off rate (β) is the proportion of livestock sold inthe financial year in each SLA. For non-livestock com-modities, the turn-off rate is set to 1. For livestock, the turn-off rate is calculated from ABS [1, 2] as the number ofanimal sales divided by the total number of animals plusanimal sales.
3.6 Costs
Cost parameters in the profit function include both variableand fixed costs. Variable costs include quantity-dependentcosts, area-dependent costs and water costs. Fixed costsinclude fixed operating costs, fixed depreciation costs andfixed labour costs. Data for cost parameters except watercosts was sourced primarily from Gross Margin Handbooksand other agricultural publications. Note that the use of farmhandbook data may provide a conservative estimate of PFEbecause farm budgets from state departments of agricultureare likely to reflect higher area dependent variable costsrelated to the management practices of higher performingfarmers. Conversely, yield figures used in the analysis reflectaverage production levels as reported by the ABS.
Distinct cost parameter values were assembled for bothirrigated and dryland versions of each commodity class byAustralian Bureau of Agricultural and Resource Economics(ABARE) region for the year 1996/1997 (see Bryan andMarvanek [12] for a full list of cost parameter values). Costparameter values for the year 2000/2001 were created byinflating the 1996/1997 cost values by a factor of 1.1 basedon the national consumer price index (CPI) and producerprice index. Note that this simple indexing of 1996–1997costs by the CPI ignores agricultural productivity improve-ments and is likely to provide a slightly more conservativeestimate of agricultural returns for 2000/2001.
3.6.1 Quantity- and Area-Dependant Variable Costs
Quantity-dependant variable costs are costs that vary withthe quantity of production such as the tonnes of barley orthe number of beef cattle in DSE. Typical quantitydependent costs include harvest costs, storage costs,handling costs, and product treatment costs. Quantity costsare represented in $/tonne for non-livestock and $/DSE forlivestock.
Area-dependant variable costs ($/ha) are costs that varywith the area of production of each commodity class. Area-dependent costs are most common and include the cost ofseeding, fertiliser, pesticide treatment and fuel.
3.6.2 Water Requirements and Water Price
The profit function requires information on typical waterrequirements of the irrigated production of each commodityand on the price of water by ABARE region. Severalsources of information on irrigation exist for the Murray–Darling Basin, but currently, there is no authoritative dataon the typical water requirements of crops. We infer thisdata from available data sources. Estimates on the typicalwater requirements for each irrigated commodity weremade for each major irrigation area within each ABAREregion based on the Australian National Committee onIrrigation and Drainage (ANCID) Australian IrrigationWater Provider Benchmarking Reports for 1998/1999 and2000/2001 [3, 4] and cross-checked against total irrigationdiversions data by state as reported in the water audit andmonitoring reports [22, 23].
Data on water price ($/ML) are derived for the majorirrigation area within each ABARE region also based onANCID [3, 4]. These estimates include volumetric, waterdelivery and environmental charges, which captures full costto purchasers rather than the marginal cost of volumetriccharges. Bryan and Marvanek [9] present the crop waterrequirements and cost data in full detail.
3.6.3 Fixed Costs
Fixed costs are costs of production that are fixed per unitarea for typical farm types and are represented in $/ha foreach commodity class. Fixed operating costs include landrates, accountant fees, costs for energy, waste disposal,maintenance, insurance and administrative overheads.Fixed depreciation costs include depreciation of farmmachinery such as tractors, harvesters, sprayers, etc., andinfrastructure such as irrigation pipes, fences, etc. Fixedlabour costs include the total cost per hectare of labourrequired in the production of each commodity. Thisincludes a wage for the farmer/owner.
4 Results
4.1 Total Economic Returns to Agriculture
Assessment of economic returns to agricultural use of landand water resources for the years 1996/1997 and 2000/2001captures significant variation in total PFE, profit per hectareand profit per megalitre for irrigated commodities. Variation inprofit occurs between individual agricultural commodities andspatially between regions. PFE varies mainly with changes inrevenue (price and production levels) and, to a lesser extent,costs of production. In general, dryland agriculture acrossmost of the land area of the MDB is marginal and small
Mapping economic returns to agriculture 381

changes in revenue or costs can significantly affect PFEmeasures. Irrigated agriculture commands much greaterreturns at the expense of high water resource use.
Total PFE from agriculture in the MDB in 1996/1997was estimated at $3.86B (all figures in Australian dollars)and $3.73B in 2000/2001 (Table 2). Cereals accounted for$1.32B (34%) of the total PFE generated in the MDB in1996/1997, which was reduced to $711M (19%) in 2000/2001 due to higher costs and lower yields.
Dairy accounted for $438M (11%) in PFE in 1996/1997and increased to $592M (16%) in 2000/2001. Cotton returned$623M (16%) in PFE in 1996/1997 and decreased with dropsin both price and yield to $278M (7.4%). Beef cattle alsovaried from $64M (2%) in PFE in 1996/1997 to $805M(21.5%) in 2000/2001 after the recovery of prices for beefcattle. Profit to sheep grazing increased from $364M (9%) in1996/1997 to $429M (11%) in 2000/2001. Significant profits(around $200M) come from fruit, grapes and rice. Profits tograpes more than doubled from 1996/1997–2000/2001. It isworth noting that the price of grapes has recently plummeteddue to oversupply and bounced back due to drought. Totalprofit to individual commodities is presented in Fig. 5.
4.2 Economic Returns to Land Resources
There are a few agricultural land uses such as fruit, treenuts, vegetables, grapes and others that have high rates ofreturn in terms of PFE per hectare (over $2,000/ha). Cotton,rice, peanuts, dairy and oilseeds have rates of return in PFE/ha of between $300 and $1,500/ha. Dryland agriculturalland uses tend to have much lower rates of return of PFE/ha. However, due to their large areas, these low value landuses such as cereals, beef and sheep grazing account for alarge proportion of the total PFE of the MDB. A breakdownby agricultural commodity is presented in Fig. 5.
PFE per hectare is also highly variable over the MDB.PFE/ha is negative or very low in the semi-arid interior ofthe MDB where extensive grazing of beef and sheep are thedominant land uses (Fig. 6). Only relatively small areas ofthe MDB experience very high returns per hectare, andthese are confined largely to the irrigated southern regionsand the northeastern parts.
The distribution of PFE in the MDB is such that veryfew areas have very high PFE per hectare, many grid cellshave low to moderate PFE/ha and a few areas have negativePFE/ha (Fig. 6). Hence, a large proportion of the PFE in theMDB is generated from a relatively small area. Figure 7shows that around 50% of the total PFE occurs in around1% of the agricultural area and 80% of the total PFE occursin just over 5% of the land area. The highest value areas areconcentrated in the irrigated areas located in the crescent-shaped band in the south, east and north–east of the MDB(Fig. 7). In 1996/1997, some 25% of the agricultural area of
the MDB did not make a profit compared to some 15% in2000/2001. That is to say that, in these areas, insufficientmoney was returned from agriculture to pay the manager awage, cover production costs and put aside sufficientmoney to replace depreciating assets.
4.3 Summary by Catchment Management Area
Analysis of the economic returns by catchment manage-ment region reveals significant geographic variations in theMDB between 1996/1997 and 2000/2001 (Table 3). In1996/1997, NSW accounted for 49% of the total PFE in theMDB with the largest contributors being the Murrum-bidgee, Central West, Lachlan and Murray CMRs. This haddeclined to 28% by 2000/2001, led largely by decreases inthe Central West, Namoi and Gwydir CMRs. Conversely, in1996/1997, Victoria accounted for 34% of the total PFE,with the Goulburn, Mallee, North Central and WimmeraCMRs dominating profit generation. This increased to 50%in 2000/2001, owing largely to increases in the Goulburn,Mallee and North Central CMRs. Profit in Queenslandaccounted for just less than 12% of the total PFE in theMDB in 1996/1997 with the largest contribution from theCondamine and the Border Rivers. This share declined onlyslightly in 2000/2001. South Australia more than doubledits share of the total PFE contribution in the MDB from 5%in 1996/1997 to 11.5% in 2000/2001 due to the expansionin high value grape and fruit production (Table 3).
The most profitable agricultural CMRs are located in thesouth of the MDB and include Goulburn (Vic) and theMurrumbidgee (NSW). Many of these southern CMRsderive significant proportions of their agricultural PFE fromcereals but most also derive substantial PFE from irrigatedagriculture. The River Murray (SA) derives PFE fromgrapes, fruit and dairy, Goulburn (Vic) from dairy and fruit,the Murray (NSW) and Murrumbidgee (NSW) from rice,fruit and sheep. The Lachlan (NSW) and the Central West(NSW) derive PFE from cereals and sheep. The northeast-ern CMRs derive profit from beef, cotton and cereals.
4.4 Agricultural Returns to Water Resources
Returns to water resources from irrigated agricultureprovides information about one aspect of the benefits towater use in the Murray–Darling Basin. This informationmay be used to assess large scale trade-offs for the publiccosts such as reduced environmental flows and salinityresulting from irrigation water use. Table 4 shows that in1996/1997, although irrigated agriculture covers only about1.4% of the total land area of the MDB, around 36% of thetotal profits generated from agriculture come from irrigatedland uses. In 2000/2001, irrigated land uses expanded to1.7% of the MDB, but the profit share decreased to 33%.
382 B.A. Bryan et al.

Tab
le2
Sum
maryof
totalareasof
agricultu
ralland
uses,area
ofirrigatedagricultu
reandreturnsto
agricultu
refor19
96/199
7and20
00/200
1includ
ingassessmentof
change
Agriculturalland
use
Total
area
(ha)
TotalPFE
($‘000
)Per
cent
oftotal
PFE
Returns
toland
resources($PFE/ha)
Total
irrigated
area
(ha)
TotalPFE
($‘000
)Per
cent
oftotalirrigatio
nPFE
Per
cent
oftotalMDB
PFE
Returns
toland
resources
($PFE/ha)
Returns
towater
resources
($PFE/M
L)
Allagricultu
reIrrigatedagricultu
reon
ly
1996
/199
7Beef
27,673
,901
63,945
1.7
222
9,10
4−1
5,33
9−1
.1−0
.4−6
7−1
6Cereals
7,45
4,48
21,31
5,87
134
.017
713
9,56
127
,652
2.0
0.7
198
64CoarseGrains
383,61
099
,493
2.6
259
13,045
5,00
50.4
0.1
384
78Cotton
355,76
462
2,58
716
.11,75
029
7,14
854
9,03
839
.214
.21,84
825
8Dairy
1,38
7,53
543
8,93
511.3
316
305,74
023
4,74
316
.76.1
768
95Fruit
39,920
253,47
16.5
6,34
931
,074
226,94
116
.25.9
7,30
393
4Grapes
54,240
121,77
23.1
2,24
546
,818
122,79
08.8
3.2
2,62
340
3Hay
285,86
114
,370
0.4
508,42
1−7
79−0
.10.0
−93
−9Legum
es61
2,79
194
,688
2.4
155
15,427
2,38
90.2
0.1
155
37Oilseeds
322,40
089
,355
2.3
277
22,366
3,08
80.2
0.1
138
43Other
8,55
015
3,86
54.0
17,996
2,61
222
,256
1.6
0.6
8,52
02,36
4Peanu
ts2,50
81,110
0.0
443
212
240
0.0
0.0
1,13
439
1Rice
151,86
8110,27
02.8
726
151,86
8110,27
07.9
2.8
726
67Sheep
48,559
,060
364,47
99
819
0,88
1−5
,454
−0.4
−0.1
−29
−7Treenu
ts4,01
521
,376
15,32
43,68
420
,319
1.5
0.5
5,51
678
8Vegetables
29,748
91,056
23,06
127
,226
83,439
6.0
2.2
3,06
568
3Total
87,326
,253
3,85
6,64
310
044
1,48
5,18
61,38
6,59
810
0.0
36.0
934
148
2000
/200
1Beef
30,915
,091
804,73
421
.526
206,01
6−1
6,04
1−1
.3−0
.4−7
8−1
9Cereals
7,82
6,00
671
0,71
719
.091
229,30
510
,466
0.8
0.3
4615
Coarsegrains
549,62
534
,853
0.9
6316
,315
2,27
30.2
0.1
139
28Cotton
490,28
327
7,56
47.4
566
404,911
247,87
120
.06.6
612
87Dairy
1,65
3,41
059
2,69
215
.835
852
2,97
232
6,80
926
.48.7
625
78Fruit
48,636
155,99
54.2
3,20
740
,371
134,54
610
.93.6
3,33
343
3Grapes
86,552
289,87
27.7
3,34
980
,018
293,85
323
.87.8
3,67
256
1Hay
184,00
443
,070
1.2
234
9,40
3−3
340.0
0.0
−36
−4Legum
es78
5,02
458
,267
1.6
749,68
514
90.0
0.0
154
Oilseeds
776,23
683
,550
2.2
108
8,32
0−4
0.0
0.0
00
Other
3,68
024
,475
0.7
6,65
12,35
56,50
90.5
0.2
2,76
474
6Peanu
ts1,86
974
90.0
401
00
0.0
0.0
−Rice
175,60
871
,895
1.9
409
175,60
871
,895
5.8
1.9
409
38Sheep
45,123
,688
429,09
111
1073
,284
−3,634
−0.3
−0.1
−50
−12
Treenu
ts6,39
812
,169
01,90
25,83
410
,181
0.8
0.3
1,74
524
9Vegetables
36,174
142,70
94
3,94
534
,160
140,99
711.5
3.8
4,12
890
0Total
88,662
,284
3,73
2,40
310
042
1,81
8,55
71,22
5,53
710
0.0
32.8
674
102
Mapping economic returns to agriculture 383

Economic returns to land and water resources from irrigatedagriculture for 1996/1997 and 2000/2001 are presented inTable 2 and a breakdown by commodity in Fig. 8. Cottondelivers the highest total PFE of all irrigated land uses,
although this decreased markedly from 1996/1997 to 2000/2001 owing to decreases in both price and production. Dairyhas the next highest returns of irrigated land uses and hasincreased over the 5-year period due to an increase in the price
0 200
Kilometres
PFE ($/ha) < -5-5- 00 - 1010 - 5050 - 100100 - 500500 - 1,000> 1,000
Profit at Full Equity 1996/97 Profit at Full Equity 2000/01
Fig. 6 Agricultural profit at full equity ($/ha) in the Murray–Darling Basin 1996/1997 and 2000/2001. Note that abrupt linear changes in thespatial distribution of PFE have resulted from differences in yield and price data assembled by SLA
PFE/ha
-1,000
-100
-10
0
10
100
1,000
10,000
100,000
Alm
onds
App
les
Apr
icot
s
Bar
ley
Bee
fCat
tle
Can
ola
Cer
eals
for
Hay
/Sila
ge
Che
rrie
s
Chi
ckP
eas
Cot
ton
Dai
ryC
attle
Fab
aB
eans
Fie
ldP
eas
Gra
inS
orgh
um
Gra
pes
Lent
ils
Lupi
ns
Mai
ze
Mille
t
Mun
gB
eans
Nec
tarin
es
Non
-Cer
ealC
rops
(Hay
)
Oat
s
Ora
nges
Oth
erC
erea
lCro
ps
Oth
erC
itrus
Oth
erno
n-C
erea
lCro
ps
Oth
erN
uts
Oth
erO
ilsee
ds
Oth
erS
tone
Fru
it
Oth
erV
eget
able
s
Pea
ches
Pea
nuts
Pea
rs
Plu
ms
Pop
corn
Pot
atoe
s
Ric
e
Saf
flow
er
She
ep
Soy
bean
s
Sun
flow
er
Tob
acco
Trit
ical
e
Vet
ches
Whe
at
Total PFE
-1,000,000
-10,000
-100
0
100
10,000
1,000,000
100,000,000
10,000,000,000
1996/971996/972000/01
$/h
a$
Fig. 5 Total profit at full equity (PFE) and PFE/ha of agricultural commodities in the Murray–Darling Basin 1996/1997 and 2000/2001
384 B.A. Bryan et al.

of dairy cattle. Fruit, grapes, vegetables and rice also havehigh returns. Returns from grapes have doubled over theperiod from 1996/1997 to 2000/2001 due to a large expansionin area of production and increase in price. Total PFE fromfruit is high but dropped between 1996/1997 and 2000/2001due to lower production levels. Rice also returns a significantproportion of the total PFE of irrigated agriculture (Table 2).
The highest returns per hectare from irrigated agricul-tural land use are gained from the collection of commod-ities grouped under the class other such as cut flowers, turf,peppermint and tobacco. Also yielding high returns perhectare are fruit and tree nuts, vegetables, grapes andcotton. Land uses with the lowest returns per hectareinclude sheep, beef and hay (Table 2). A commoditybreakdown is presented in Fig. 8.
Estimates of PFE in dollars per megalitre of water usedin irrigation for each agricultural land use for 1996/1997and 2000/2001 are presented in Table 2 and a commoditybreakdown in Fig. 8. The other agricultural land use alsohas the highest returns per megalitre. Fruit, tree nuts,vegetables, grapes and peanuts also have fairly high returnsper megalitre of irrigation water used. Cotton has amoderate return per megalitre of irrigation water used. Allother irrigated land uses return less than $100 per megalitreincluding two of the largest water consuming agriculturalland uses in the Murray–Darling Basin – dairy and rice.
5 Discussion
5.1 Profit Function – Advantages and Limitations
Unlike whole farm profit models, which may incorporatenumerous land uses and commodities, this approach links allprofit function variables to a single spatial unit (i.e. a grid cell)in a single year. As such, a 1-year snapshot of agriculturalprofitability is provided. There is no attempt to model theprofit arising from a sequence of production activities overtime, as would occur under crop/livestock rotations.
This form of the profit function provides a consistentmeans of measuring profit under all livestock, crop andhorticultural production for nearly all types of agriculturalactivity in the Murray–Darling Basin. Inclusion of a second-ary product makes it possible to model changes in more thanone type of product at the same location. In this study, we usethis capability for modelling the dual products from dairycattle (head of cattle, milk) and sheep (meat, wool).
However, as applied in this study, the profit functiondoes not capture the multiple production characteristic ofthe farming systems in the Murray–Darling Basin. In futureapplications of the profit function, we envisage theapplication to farming system rotations typically found inAustralia’s agricultural regions. For example, these mayinclude cereal/sheep rotations in dryland agricultural areas
0 200
020406080
100120
0 20 40 60 80 100% Area of Agriculture
% P
FE
0 20 40 60 80 100% Area of Agriculture
% P
FE
0255075
100125
Kilometres
Area Contributing 80% of PFE 1996/97 Area Contributing 80% of PFE 2000/01
Fig. 7 Highest PFE areas accounting for 80% of the total profit at fullequity from agriculture in the Murray–Darling Basin 1996/1997 and2000/2001. Cumulative percentage of agricultural profit at full equitygraphed against cumulative percentage of agricultural area for all
agricultural grid cells ranked in order of highest to lowest PFE forboth 1996/1997 and 2000/2001. Note that the cumulative percentagegoes beyond 100% because of the negative PFE
Mapping economic returns to agriculture 385

Tab
le3
Sum
maryof
totalecon
omic
returnsandtheecon
omic
returnsto
land
andwater
resourcesfrom
agricultu
reby
stateandcatchm
entmanagem
entregion
for1996
/199
7and20
00/200
1
State
Catchmentmanagem
entregion
Total
area
(ha)
Total
area
ofagricultu
re(ha)
Areaof
irrigated
agricultu
re(ha)
PFE
($‘000
)Total
area
ofagricultu
re(ha)
Areaof
irrigated
agricultu
re(ha)
PFE
($‘000
)19
96/199
720
00/200
1
ACTTo
tal
ACT
235,78
543
,663
0−4
3649
,608
083
4NSW
BorderRivers(N
SW)
2,41
7,52
02,18
9,98
542
,173
187,34
81,99
3,67
147
,031
27,532
NSW
Central
West(N
SW)
8,49
4,92
07,05
1,56
856
,348
297,05
17,22
8,83
380
,163
82,574
NSW
Gwyd
ir(N
SW)
2,65
9,64
02,40
5,72
582
,227
280,26
52,30
3,81
610
0,20
160
,573
NSW
Lachlan
(NSW)
8,62
7,05
06,69
5,88
841
,649
290,62
57,42
4,85
747
,051
299,35
9NSW
Low
erMurrayDarlin
g(N
SW)
6,27
9,86
05,46
5,89
36,78
329
,487
5,53
2,17
710
,118
40,015
NSW
Murray(N
SW)
3,53
7,82
02,65
2,45
826
4,57
815
6,83
12,95
2,52
332
2,75
413
9,70
9NSW
Murrumbidg
ee(N
SW)
6,97
1,92
05,63
0,21
330
1,21
435
1,54
45,69
1,84
834
4,18
031
9,50
6NSW
Nam
oi(N
SW)
4,19
9,94
03,24
1,41
782
,457
270,72
63,28
4,80
498
,418
102,37
4NSW
Western
(NSW)
16,621
,400
13,748
,700
26,094
26,365
14,657
,142
21,893
−29,117
NSW
Total
59,810
,070
49,081
,848
903,52
31,89
0,24
151
,069
,671
1,07
1,80
81,04
2,52
5QLD
BorderRivers(Q
LD)
3,74
4,66
03,49
9,76
926
,132
183,42
53,37
2,15
841
,483
140,68
3QLD
Con
damine(Q
LD)
2,44
1,86
02,31
9,09
549
,266
186,53
52,20
7,17
758
,233
125,92
4QLD
Maranoa-Balon
ne(Q
LD)
6,42
2,14
06,24
4,32
823
,455
96,256
5,98
2,49
850
,611
107,24
5QLD
Warrego
-Paroo
(QLD)
13,299
,800
12,466
,605
1,20
1−1
1,49
612
,365
,130
5,87
016
,071
QLD
Total
25,908
,460
24,529
,798
100,05
445
4,72
023
,926
,963
156,19
838
9,92
2SATotal
River
Murray(SA)
6,92
8,01
05,83
8,36
040
,117
190,25
45,37
2,13
259
,493
430,411
VIC
Gou
lburn(V
IC)
2,40
8,21
01,25
6,02
019
2,64
351
8,18
11,37
6,41
723
0,69
668
6,08
5VIC
Mallee(V
IC)
3,92
2,10
02,37
5,83
928
,363
259,36
82,411,68
438
,599
452,37
5VIC
North
Central
(VIC)
2,96
4,53
01,99
5,72
020
7,29
431
3,27
12,24
6,76
924
6,49
045
2,54
1VIC
North
East(V
IC)
1,98
1,94
094
7,01
711,210
36,487
870,70
913
,645
64,109
VIC
Wim
mera(V
IC)
1,69
9,28
01,25
7,98
81,98
119
4,55
71,33
8,33
21,62
821
3,60
0VIC
Total
12,976
,060
7,83
2,58
444
1,49
21,32
1,86
48,24
3,91
053
1,05
81,86
8,71
0Grand
Total
105,85
8,38
587
,326
,253
1,48
5,18
63,85
6,64
388
,662
,284
1,81
8,55
73,73
2,40
3
386 B.A. Bryan et al.

and rice/wheat rotations in some of the irrigated areas of theMurrumbidgee. In this way, we can more accurately mapthe profit to agriculture resulting from typical farmingsystem rotations.
The profit function is also flexible enough to be used tomodel the economic impact under various scenarios. Forexample, using the primary yield term, q1, it is possible toestimate the profit effects arising from changes in production
due to resource degradation. Likewise, the water requirementof the crop or pasture can be changed to gauge the impact ofclimate change on profit, or water price can be altered toassess the impact of water markets on profit. A key benefitfrom this approach is that the profit consequences of land usechange can be modelled explicitly and consistently acrosslarge regions. An additional advantage of the use of PFE isthat it holds relevance to farm business units. As farm gate
PFE/ha
-1,000
-100
-10
0
10
100
1,000
10,000
100,000
Alm
onds
App
les
Apr
icot
s
Barle
y
Bee
fCat
tle
Can
ola
Cer
eals
for
Hay
/Sila
ge
Che
rrie
s
Chi
ckPe
as
Cot
ton
Dai
ryC
attle
Fab
aB
eans
Fie
ldP
eas
Gra
inS
orgh
um
Gra
pes
Lupi
ns
Mai
ze
Mille
t
Mun
gBe
ans
Nec
tarin
es
Non
-Cer
ealC
rops
(Hay
)
Oat
s
Ora
nges
Oth
erC
erea
lCro
ps
Oth
erC
itrus
Oth
erno
n-C
erea
lCro
ps
Oth
erN
uts
Oth
erS
tone
Fru
it
Oth
erVe
geta
bles
Pea
ches
Pean
uts
Pea
rs
Plu
ms
Pop
corn
Pot
atoe
s
Ric
e
Saf
flow
er
Shee
p
Soy
bean
s
Sun
flow
er
Tob
acco
Trit
ical
e
Vet
ches
Whe
at
PFE/ML
-1,000
-100
-10
0
10
100
1,000
10,000
Total PFE
-100,000,000
-1,000,000
-10,000
-100
0
100
10,000
1,000,000
100,000,000
1996/971996/92000/01
$/h
a$/
ML
$
Fig. 8 Total PFE and PFE per megalitre of irrigated agricultural land uses in the Murray–Darling Basin 1996/1997 and 2000/2001
Table 4 Summary of areas and total profit at full equity generated from dryland and irrigated agriculture
Agriculturetype
1996/1997 2000/2001
Area (‘000 ha) Per cent ofMDB area
PFE($‘000)
Per cent ofMDB PFE
Area (‘000 Ha) Per cent ofMDB Area
PFE($‘000)
Per cent ofMDB PFE
Dryland 85,841 81.1 2,470,045 64.4 86,844 82.0 2,506,865 67.2Irrigated 1,485 1.4 1,386,598 35.6 1,818 1.7 1,225,537 32.8Total 87,326 82.5 3,856,643 100.0 88,662 83.7 3,732,403 100.0
Mapping economic returns to agriculture 387

prices are used, PFE approximates earnings before interestand tax, a standard profit measure used by Australianbusinesses for a variety of reporting purposes.
5.2 Uncertainty and Confidence
The introduction of significant uncertainty is inevitablethrough the techniques used in this study, and this has to bemade explicit in the results. There are two main sources ofuncertainty in the analysis – mapping uncertainty andestimation uncertainty, and these are discussed below.
Mapping uncertainty has two components. Firstly, thereare limitations to the accuracy of the agricultural commod-ity mapping, which are described in detail by Bryan andMarvanek [9]. Secondly, there is significant uncertainty inthe spatial estimation of yield and cost parameters acrosssuch a large and heterogeneous region.
Estimation uncertainty refers to uncertainty in the estima-tion of the magnitude of profit function parameters such asfixed costs, variable costs, water requirements and water costs.These are inherently extremely variable over time and space,and vary with different land management practices on a sub-annual timescale. This variation is impossible to capture overa large geographic extent and multiple commodities.
Of particular note is the uncertainty surrounding esti-mates of economic returns per megalitre resulting from theassumption of constant water requirements between 1996/1997 and 2000/2001. Recent qualitative field validationsuggests that the crop water requirement estimates used inthis study were reasonable for 1996/1997. However,substantial improvements in irrigation efficiency acrossmany agriculture types between the years 1996/1997 and2000/2001 were reported in addition to reductions in wateruse on lower value irrigated pastures. This suggests that thewater requirements estimates used for 2000/2001 may havebeen a little high, perhaps by up to 20%. Hence, ourestimates of economic returns per megalitre may beconcomitantly low for these agriculture types.
The impacts of this uncertainty are important for theutility of the results. In general, we believe the results ofthis study provide a reasonable estimate of spatial distribu-tion of economic returns to land and water resources of therange of agricultural commodities under average economicand climatic conditions. The maps are most suitable for re-aggregation by different spatial units rather than for use ona grid cell level. The results are useful for informingcatchment and regional scale environmental policy, but wecaution their use at the farm level.
5.3 Use in Designing Natural Resource Management Policy
The results provide snapshot information about the level ofeconomic returns to land and water resources in the Murray–
Darling Basin for the years 1996/1997 and 2000/2001.Knowledge of the spatial distribution of this income isvaluable for a variety of private and public decision-makingpurposes at the landscape and regional scales. It can, forexample, help inform investment decisions about whereagricultural land is developed, protected or rehabilitated. Itcan also help guide the development of regulatory policiesdesigned to achieve environmental objectives. Mapping of thismeasure, a quasi-economic rent, provides a powerful baselinefor supporting environmental policy decisions in the region.
Spatially explicit policy decisions can be informed bythese information layers in their own right, and the layers canbe useful for assessing the impacts of policy and possiblefuture agro-economic scenarios. To be of most use forinforming environmental and integrated catchment manage-ment policy, agricultural economic data needs to be spatiallydisaggregated to a scale similar to that which biophysicalprocesses operate. It then needs to be integrated with landand water resource use data to provide information on theeconomic benefits and environmental trade-offs of agricul-ture to inform priority-setting for catchment management.
The results of this study illustrate marked variation inagricultural returns to land and water resources bothbetween commodity types and spatial variation withincommodity types across the Murray–Darling Basin. Thishas important implications for government regulation, ruralsupport, and agri-environment programs, as these policyapproaches can be significantly enhanced by consideringthis variation. Policies such as structural adjustment,landscape treatment and amelioration, infrastructure im-provement, land retirement and resource conservation cantarget on the landscape or regional scale, those agriculturalland uses and geographic regions for reform that:
– contribute least economic benefit– utilise the largest amounts of natural resources– return the lowest marginal economic returns for the
natural resources used
However, on the farm scale, farmers take a wide range offactors (land, labour, capital and water) into account whenthey make choices about output mix and input use. Thereare fundamental differences in the resource requirements ofdifferent agricultural land uses and their relative risk.Horticultural crops might offer high returns per hectare,but they also might offer relatively lower rates of return oncapital compared to other activities. Similarly, high return-ing activities often have greater exposure to risk. Policiesthat address the issues above also need to consider decisionprocesses at the farm scale. A simplistic interpretation ofthe results would support a shift from low returningactivities to high returning activities. It should be pointedout that such changes should consider land, labour, capitaland water resources along with the various sources of risk
388 B.A. Bryan et al.

[16]. In this way, policies that consider the economicreturns from agricultural use of land and water resources arelikely to be more economically efficient and result ingreater net benefits to society.
The results reported in this paper provide information onthe average returns to land and water resources at thelandscape or regional scale. The results can provide initialguidance to decision makers as to where an environmentalimprovement could be sought or provide the basis forassessing the impact of market-based approaches to envi-ronmental management such as auctions or water buy-backs.Fine scale design of policy options to intervene in aparticular resource management issue should rely onassessment of the marginal benefits and costs of actionsrather than consideration of average agricultural returns.Investigation of the trade-offs associated with agriculturalland uses for informing policy could be extended beyondresource use by considering other environmental impacts,such as carbon emissions, and social impacts, such as thenumber of jobs and regional population change [10, 11].
Given the importance of considering economic informa-tion in environmental management, the ability to mapagricultural profit at a relatively fine scale is of much valueto those interested in policy analysis. A key challenge,however, is developing a consistent mapping methodologythat can be applied across large regions and cover the greatdiversity of commodity production types. This studycontributes to the development of such a methodology. Afruitful area for further development of the mapping andmodelling of economic returns to agriculture should consideran extended set of production factors affecting farm businessand land use decisions in addition to risk, and the nature ofsupply and demand for agricultural commodities.
6 Conclusion
In this study, we take a novel approach in using a profitfunction to integrate a disparate set of spatial information inthe calculation of spatial layers describing the economicreturns to land and water resources from agriculture in theMurray–Darling Basin, Australia. The results display ahighly diverse and heterogeneous economic landscape. Themost widespread land uses such as beef cattle and sheepgrazing and cereal cropping have low economic returns perhectare. However, in a regional sense, these land uses arevery important, as they are the dominant source of totalprofit to agriculture in the MDB.
Irrigated agriculture comprises only around 1.7% of theland area of the Murray–Darling Basin but returns around onethird of the total profit to agriculture. Several irrigated landuses such as fruit, tree nuts, grapes, vegetables and specialisedindustries such as turf, tobacco and cut flowers yield very high
returns to land and water resources. At the other end of thespectrum, several widespread irrigated land uses includingdairy, beef, sheep, hay, cereals, legumes, oilseeds and ricehave very low returns per megalitre of water. Knowledge ofthe spatial distribution of agricultural returns to land and waterresources, including variations between dryland and irrigatedcrops and between different commodities, can be used toinform policy and support decision making in integratedcatchment management. This kind of baseline knowledge canbe used to focus agri-environmental policies on particularagricultural industries and geographic areas that have loweconomic returns to the natural resource base.
Acknowledgements This work was supported by the Murray–DarlingBasin Commission and CSIRO’s Water for a Healthy Country Flagshipprogram. The authors are grateful to Warwick Macdonald and FionaLynn of theMDBC for their support of the research. Thanks also to BruceHoward (URS) for assembling the cost of production data.
References
1. ABS. Australian Bureau of Statistics (1997). AgStats: Small Areaof Agricultural Commodity Data 1996–97.
2. ABS. Australian Bureau of Statistics (2001). AgStats: Small Areaof Agricultural Commodity Data 2000–01.
3. ANCID. Australian National Committee on Irrigation andDrainage (2000). Australian Irrigation Water Provider Bench-marking Report 1998/99.
4. ANCID. Australian National Committee on Irrigation andDrainage (2002). Australian Irrigation Water Provider Bench-marking Report 2000/01.
5. Baez-Gonzalez, A. D., Chen, P. Y., Tiscareno-Lopez, M., &Srinivasan, R. (2002). Using satellite and field data with cropgrowth modeling to monitor and estimate corn yield in Mexico.Crop Science, 42, 1943–1949.
6. Bastiaanssen, W. G. M., & Ali, S. (2003). A new crop yieldforecasting model based on satellite measurements applied acrossthe Indus Basin Pakistan. Agriculture, Ecosystems and Environ-ment, 94, 321–340.
7. Bastian, C. T., McLeod, D. M., Germino, M. J., Reiners, W. A., &Blasko, B. J. (2002). Environmental amenities and agriculturalland values: a hedonic pricing model using geographic informa-tion systems data. Ecological Economics, 40, 337–349.
8. Bateman, I. J., Ennew, C., Lovett, A. A., & Rayner, A. J. (1999).Modelling and mapping agricultural output values using farmspecific details and environmental databases. Journal of Agricul-tural Economics, 50, 488–511.
9. Bryan, B.A., Barry, S. and Marvanek, S. (2008). Quantifying andmapping commodity-level agricultural land use change in theMurray–Darling Basin, Australia 1996/97–2000/01. Journal ofLand Use Science (in press).
10. Bryan, B. A., Crossman, N. D., King, D., McNeill, J., Wang, E.,Barrett, G., et al. (2007a). Lower murray landscape futures drylandcomponent: Volume 2 – analysis of regional plans and landscapefutures. CSIRO Water for a Healthy Country, 177 p. Retrieved fromhttp://www.landscapefutures.com.au/publications.html.
11. Bryan, B. A., Crossman, N. D., King, D., McNeill, J., Wang, E.,Barrett, G., et al. (2007b). Lower murray landscape futures drylandcomponent: Volume 3 – preliminary analysis and modelling. CSIRO
Mapping economic returns to agriculture 389

water for a healthy country, 378 p. Retrieved from http://www.landscapefutures.com.au/publications.html.
12. Bryan, B. A., & Marvanek, S. (2004). Quantifying and valuingland use change for integrated catchment management evaluationin the Murray–Darling Basin 1996/97–2000/01. Stage 2 Report tothe Murray–Darling Basin Commission, CSIRO Land and Water.
13. Bullock, D. S., Lowenberg-DeBoer, J., & Swinton, S. M. (2002).Adding value to spatially managed inputs by understanding site-specific yield response. Agricultural Economics, 27, 233–245.
14. Dalezios, N. R., Domenikiotis, C., Loukas, A., Tzortzios, S. T., &Kalaitzidis, C. (2001). Cotton Yield Estimation Based on NOAA/AVHRR Produced NDVI. Physics and Chemistry of the EarthPart B-Hydrology Oceans and Atmosphere, 26, 247–251.
15. Domenikiotis, C., Spiliotopoulos, M., Tsiros, E., & Dalezios, N. R.(2004). Early cotton yield assessment by the use of the NOAA/AVHRR derived vegetation condition index (VCI) in Greece.International Journal of Remote Sensing, 25, 2807–2819.
16. Douglas, R., Dwyer, G., & Peterson, D. (2004). Activity grossmargin and water reform. Connections, Autumn.
17. Kalubarme, A. H., Potdar, M. B., Manjunath, K. R., Mahey, R. K.,& Siddhu, S. S. (2003). Growth profile based crop yield models: acase study of large area wheat yield modelling and its extendi-bility using atmospheric corrected NOAA AVHRR data. Interna-tional Journal of Remote Sensing, 24, 2037–2054.
18. Knudby, A. (2004). An AVHRR-based model of groundnut yieldsin the peanut basin of Senegal. International Journal of RemoteSensing, 25, 3161–3175.
19. Labus,M. P., Nielsen, G. A., Lawrence, R. L., Engel, R., & Long, D. S.(2002). Wheat yield estimates using multi-temporal NDVI satelliteimagery. International Journal of Remote Sensing, 23, 4169–4180.
20. Liu, W. T., & Kogan, F. (2002). Monitoring Brazilian soybeanproduction using NOAA/AVHRR based vegetation conditionindices. International Journal of Remote Sensing, 23, 1161–1179.
21. McLaren, C. (1997). Dry sheep equivalents for comparingdifferent classes of livestock. Agriculture Notes, AG0590.
22. MDBC. Murray–Darling Basin Commission, Commonwealth ofAustralia (1998). Water audit monitoring report 1996/97. Report
of the Murray–Darling Basin Commission on the final year of theinterim Cap in the Murray–Darling Basin.
23. MDBC. Murray–Darling Basin Commission, Commonwealth ofAustralia (2002). Water audit monitoring report 2000/01. Reportof the Murray–Darling Basin Commission on the Cap onDiversions.
24. Naidoo, R., & Adamowicz, W. L. (2006). Modeling opportunitycosts of conservation in transitional landscapes. ConservationBiology, 20(2), 490–500.
25. Naidoo, R., Balmford, A., Ferraro, P. J., Polasky, S., Ricketts, T. H.,& Rouget, M. (2006). Integrating economic costs into conservationplanning. Trends in Ecology and Evolution, 21(2), 681–687.
26. Samarasinghe, G. B. (2003). Growth and yields of Sri Lanka’smajor crops interpreted from public domain satellites. AgriculturalWater Management, 58, 145–157.
27. Sengupta, S., & Osgood, D. E. (2003). The value of remoteness: ahedonic estimation of ranchette prices. Ecological Economics, 44,91–103.
28. Shanahan, J. F., Schepers, J. S., Francis, D. D., Varvel, G. E.,Wilhelm, W. W., Tringe, J. M., et al. (2001). Use of remote-sensing imagery to estimate corn grain yield. Agronomy Journal,93, 583–589.
29. Skop, E., & Schou, J. S. (1999). Modeling the effects ofagricultural production. An integrated economic and environmen-tal analysis using farm account statistics and GIS. EcologicalEconomics, 29, 427–442.
30. Walker, P., & Young, M. D. (1997). Using integrated economicand ecological information to improve government policy.International Journal of Geographical Information Science, 7,619–632.
31. Zelek, C. A., & Shively, G. E. (2003). Measuring the opportunitycost of carbon sequestration in tropical agriculture. LandEconomics, 79(3), 342–354.
32. Zhao, B., Kreuter, U., Li, B., Ma, Z. J., Chen, J. K., & Nakagoshi,N. (2004). An ecosystem service value assessment of land-usechange on Chongming island, China. Land Use Policy, 21, 139–148.
390 B.A. Bryan et al.


![[Schaum - Murray R.Spiegel] Mecanica Teorica](https://static.fdokumen.com/doc/165x107/6316b839c5ccb9e1fb03d12d/schaum-murray-rspiegel-mecanica-teorica.jpg)