An Economic and Environmental Evaluation of the Benefits and Risks of Recycled-water Irrigated Crop...
147
An economic and environmental evaluation of the benefits and risks of recycled-water irrigated crop production on the Darling Downs. A study commissioned by the Darling Downs Vision 2000 Technical Sub-Committee. Authors: Dr Lisa Brennan 1 , Dr Shaun Lisson 1 , Dr Shahbaz Khan 2 , Mr Perry Poulton 3 , Dr Peter Carberry 3 , Dr Keith Bristow 4 . 1 CSIRO Sustainable Ecosystems, Brisbane, QLD 2 CSIRO Land and Water, Griffith, NSW 3 CSIRO Sustainable Ecosystems, Toowoomba, QLD 4 CSIRO Land and Water, Townsville, QLD Date: 21 February 2003 Contact: Dr Peter Carberry CSIRO Sustainable Ecosystems 203 Tor St Toowoomba QLD 4350 Ph: 07 4688 1377 Email: [email protected] Dr Lisa Brennan CSIRO Sustainable Ecosystems 120 Meiers Rd Indooroopilly QLD 4068 Ph: 07 3214 2375 Email: [email protected]
-
Upload
independent -
Category
Documents
-
view
0 -
download
0
Transcript of An Economic and Environmental Evaluation of the Benefits and Risks of Recycled-water Irrigated Crop...

An economic and environmental evaluation
of the benefits and risks of recycled-water irrigated crop production
on the Darling Downs.
A study commissioned by the Darling Downs Vision 2000 Technical Sub-Committee.
Authors: Dr Lisa Brennan1, Dr Shaun Lisson1, Dr Shahbaz Khan2, Mr Perry Poulton3, Dr Peter Carberry3, Dr Keith Bristow4. 1 CSIRO Sustainable Ecosystems, Brisbane, QLD 2 CSIRO Land and Water, Griffith, NSW 3 CSIRO Sustainable Ecosystems, Toowoomba, QLD 4 CSIRO Land and Water, Townsville, QLD Date: 21 February 2003 Contact:
Dr Peter Carberry CSIRO Sustainable Ecosystems 203 Tor St Toowoomba QLD 4350 Ph: 07 4688 1377 Email: [email protected]
Dr Lisa Brennan CSIRO Sustainable Ecosystems 120 Meiers Rd Indooroopilly QLD 4068 Ph: 07 3214 2375 Email: [email protected]

2
Acknowledgements The authors acknowledge the valuable cooperation and contribution of the Darling Downs farmers who participated in this study. We are grateful for the assistance provided by Demelza Brand from CSIRO Land and Water, Griffith, for data collection and collation for the system-scale modeling. Merv Probert, CSIRO Sustainable Ecosystems, Brisbane, contributed to the salt modeling aspects of the study. Members of the Darling Downs Vision 2000 Technical Sub-Committee provided valuable guidance. This study was jointly funded by CSIRO and Darling Downs Vision 2000 Inc.

3
Table of Contents Executive Summary 5 Executive Summary (Extended Version) 7 1. Introduction 15 1.1 Background to the study 16 1.2 Objectives of the study 16 1.3 Description of research approach 16
1.3.1 Case studies 16 1.3.2 Biophysical modelling approach 18 1.3.3 Economic analysis approach 23 1.3.4 Overview of low-fidelity sub-catchment modelling framework 25
2. Farm scale assessment of changes in crop productivity and
economic costs / benefits relative to current enterprise practices 27 2.1 Biophysical modelling assumptions 27 2.2 Economic assumptions 28 2.3 Results for case studies 39
2.3.1 Farm 1 39 2.3.2 Farm 2 47 2.3.3 Farm 3 55 2.3.4 Farm 4 62 2.3.5 Farm 5 68 2.3.6 Farm 6 73 2.3.7 Farm 7 80 2.3.8 Farm 8 86 2.3.9 Farm 9 93 2.3.10 Farm 10 98
2.4 Conclusions 105 3. Cropping systems design to meet environmental criteria –
minimization of water/solute movement in run-off and deep drainage from farm paddocks 111
3.1 Modelling assumptions 111 3.2 Case study findings 113 3.3 Conclusions 116 4. Environmental impacts on the surface and groundwater at sub-
catchment and catchment scales as a result of storage of recycled recycled water in on-farm water storages and irrigating with recycled water 117
4.1 Key environmental features of the catchment 117 4.2 Predicted changes in surface runoff under the current and recycled water
irrigated situations 121 4.3 Predicted changes in groundwater dynamics and quality due to
introduction of recycled water irrigation 122 4.3.1 Previous groundwater studies in the area 122 4.3.2 Groundwater recharge under the irrigated fields 123

4
4.3.3 Hydraulic conditions under the storage dams 125 4.3.4 Regional analysis of recharge on watertables 126 4.3.5 Salinity impacts on watertables 129
4.4 Possible improvements in the Darling and Murray Rivers 131 4.5 Conclusions 132 5. Recommendations 135 5.1 Managing recycled water-irrigation for economic and environmental benefit 135 5.2 Recommended research 138 6. References 141 Appendix A – APSIM simulation results for case study farms 144

5
EXECUTIVE SUMMARY The Darling Downs is facing a critical and worsening shortage in irrigation water supply and increased demand for water as evidenced by the 48% increase in the number of ring tanks from 1997-1999. This water shortage is limiting agricultural production and placing increased pressure on the environment through reduction in surface water flows and extraction from groundwater. Groundwater modelling studies suggest no recovery of aquifer levels in the alluvial aquifers if the present trend of pumping continues. However, the pressure on water resources continues as farm businesses strive for economic viability amidst increasing environmental concerns for local and downstream catchments. Access to recycled water from a range of sewerage treatment plants offers an opportunity to supplement irrigation water supply on the Downs. This study addressed economic implications at the farm scale, and environmental implications at the farm and regional scale of introducing recycled water as a source of irrigation on the Downs. Key results of the study suggest: a) Recycled water as an irrigation source has the potential to significantly increase
production levels and profits for farm businesses with cropping enterprises on the Darling Downs. Such benefits are particularly relevant to those farms producing cotton, largely due to increased crop yields and larger areas under irrigation.
b) There is potential for production variability to decline with access to assured recycled water, although year-to-year variability does not disappear. Increased reliability in production can be assumed to generate significant improvements in crop quality and marketing benefits.
c) The use of recycled water for irrigation provides significant opportunities to manage irrigation in a way that achieves environmental benefits, in addition to economic benefits. Any reduction in capturing surface runoff due to increased recycled water use in the upper parts of the catchment will greatly help improve flows to the streams. Reductions in the quantity of water extracted from bores as a result of using recycled water will help reduce pressure on the highly stressed deep groundwater levels.
d) The levels of salt introduced to the soil through recycled water irrigation are, with careful management, unlikely to accumulate in the root zone and be detrimental to crop production.
e) However, there is a need to manage recycled water with the aim of reducing salt loads associated with possible groundwater recharge to protect quality of aquifers. The incorporation of lucerne into cropping systems is one management strategy that can help restrict the movement of recycled water and solutes from below the root zone to the groundwater.
f) The risk of leakage of recycled water under storages suggests there is a need for careful siting and construction of on-farm and large storage facilities according to local hydrogeological conditions to minimise pollution of groundwater and possible lateral flow to the adjoining streams.
With proper management, introducing recycled waters as a source of additional irrigation water provides the opportunity to address some of the existing urgent production and environmental problems arising through severe lack of water resources.

6

7
Executive Summary (Extended Version) 1. Study objectives and methods • The aim of this study was to provide an assessment of the economic and
environmental benefits and risks of recycled-water irrigated crop production incorporating on-farm water storages on the Darling Downs. The research analysed 10 case study farms on the Darling Downs by comparing production and environmental consequences of recycled water irrigation compared to current farming irrigated and dryland practices. For each case study, the analysis linked biophysical modelling of farming systems with farm-scale economic analyses. Results from the analysis of 10 case study farms were also utilised in a broader catchment-scale analysis which addressed issues of catchment hydrology under current and recycled water irrigation schemes.
2. Assessment of the economic and environmental risks and benefits of
recycled-water irrigated crop production on the Darling Downs • The use of recycled water for irrigation has the potential to address the shortage of
irrigation water supplies and increased water demand in the region, as evidenced by a 48% increase in the number of ring tanks in the period from 1997 to 1999. Findings from this study indicate that the use of recycled water for irrigated crop production on the Darling Downs could potentially deliver a range of benefits including a) increased and more reliable incomes to farmers and b) environmental benefits of increased flows to surface water systems and reductions in groundwater use that will help recover stressed aquifer systems.
• It is important to note, however, that there is a risk of excessive recharge and
transport of solutes to the groundwater system. Therefore, for the long-term sustainability of the region, cropping systems must be designed that are effective in minimising water and solute movement off farms, particularly in deep drainage. Both farm and catchment studies show that proper irrigation management can reduce groundwater recharge and reduce risks of waterlogging & secondary salinisation. There is also a need for careful siting of and construction of on-farm and large storage facilities to avoid pollution of groundwater and possible lateral flow to the adjoining streams.
3. Impact of recycled water irrigation on crop productivity • There were gains in average (across 45 years of historical climate data, 1959-
2001) annual whole farm crop production in all simulated recycled water scenarios compared to current benchmark simulations. The simulations indicated substantial year-to-year variability in the response to recycled water, and in some years, a negative impact on whole farm production was possible. Similarly, the extent and nature of this variability changed across the case studies. In two of the case studies, the transition to recycled water led to a reduction in yield variability and more specifically, significant yield improvement in the poor years. The most substantial reduction occurred with a case study in which the only source of irrigation water was overland flow, the least reliable of all possible sources of

8
water. However, in another case study where overland flow was the sole source of water, the impact of recycled water on yield variability was negligible. This was attributed to a relatively small irrigation area being supplied by a comparatively large OFWS and associated catchment area. This meant that in years of the benchmark simulation where the catchment runoff was small, there was often sufficient residual OFWS capacity from the previous year to satisfy (i.e. buffer) the current years demand. In two of the case studies, yield variability actually increased under the recycled water scenarios. This was attributed to increases in both cropping intensity and irrigation application rate. This altered the distribution of the irrigation resource across the various crops and often resulted in certain crops having more irrigation available in some years and less in others. Yield variability was virtually unaffected in the remaining four case studies. These case studies were characterised by an irrigation supply in the benchmark scenario that was able to satisfy (or nearly satisfy) potential crop demand, or benchmark scenarios in which either reliable bore water was the dominant water source or, in which there were multiple water sources that effectively buffered each others unreliability. In most of these case studies, the recycled water displaced a portion of the other water sources. Farmers may reduce the extent to which such displacement occurs by considering greater utilization of existing water through an increase in cropping intensity, expansion of existing irrigated area (if possible) or more intensive irrigation of existing lands. This will impact, however, on ground and surface water at a catchment scale (see Points 7 & 10 below).
4. Impact of recycled water irrigation on annual net cash returns • Based on annual net cash returns averaged over 42 years (corresponding to the
1959-2001 weather record), most of the 10 case studies received a financial benefit from the use of recycled water. That is, the additional revenue attributable to recycled water production offset the additional costs across the range of recycled water prices investigated. At the $150/ML recycled water price, the benefit (loss) from recycled water irrigation ranged from -$23/ha to $1,075/ha (average $292/ha) and -$19/ML to $826/ML (average $203/ML).
• Of the 10 farms, there was no benefit, on average, attributable to the use of
recycled water for one farm when the price was $150/ML. When the price was increased to $250/ML, the number increased to four farms.
• It should be noted that all case studies displayed considerable variability of annual
net cash returns over the 42-year simulation period. For all farms, with the $150/ML recycled water price, recycled water use in some years resulted in annual net cash returns lower than the current situation, even though, on average, recycled water irrigation was the economically attractive option for all but one of these farms. The percentage of years that performed worse than the current (benchmark) situation for these farms ranged from 2% up to approximately 60% of years. Such years of poor performance for the recycled-water irrigated scenarios corresponded to years when a) low crop yields meant that revenue from crop production could not offset additional costs or b) there was little or no increase in yield attributable to recycled water irrigation relative to the current situation on farms (e.g. high rainfall and overland flow years), meaning that the additional fixed costs could not be compensated for.

9
• The average gross return from one megalitre of recycled water (i.e. annual net
cash return for the $0/ML recycled water price) ranged from $131/ML to $1976/ML, with an average of $353/ML. This represents the most the farmer could justify paying, on average, for the recycled water. At prices higher than this, there would be no advantage in using recycled water for irrigation over a substantial period of time.
• Cotton featured in 9 of the 10 case study farms, and was a dominant component of
the cropping systems that were most economically responsive to recycled water-irrigation. Compared to other crops investigated, cotton exhibited the greatest return to irrigation, and substantial increases in the quantity of additional cotton produced by farms under the recycled-water irrigated system resulted in the highest returns to recycled water irrigation. Additional revenue attributable to recycled water irrigation was also assumed to be possible from quality improvements to the cotton crop. Industry experience has shown that fully irrigated cotton results in less discount price penalties compared to dryland or supplementary irrigated crops. Therefore, for a number of case study farms, reductions in discounting penalties for irrigated cotton produced with recycled water irrigation also had the effect of boosting the returns from recycled water irrigation. The increased potential for reliability in production can also be assumed to generate significant improvements in marketing benefits.
• Recycled water irrigation was less economically attractive in situations where
significant displacement of irrigation water sources less expensive than recycled water occurred without any significant increases in yield to offset the extra cost.
5. Overflow from on-farm water storage The receipt of ‘non-returnable’ recycled water occasionally resulted in an increase in storage overflow, which not only represents the inefficient use of purchased water but may also trigger a range of community concerns. In reality, a farmer could manage this in a number of ways, including:
• The irrigation of bare fallows when irrigation demand is typically low (providing there is sufficient residual soil water deficit)
• A reduction in the volume of recycled water purchased • The potential sale of surplus recycled water to other farmers (if allowed) • Modification in the recycled water delivery strategy i.e. more water less often
and/or at a time when demand is high. • Modification of storage capacity or have a designated OFWS for recycled
water. Each of these options could be explored through simulation and a process of optimisation. 6. Impacts on the root zone salt balance • Based on measured salt concentrations and other soil physical and chemical
parameters and data specific to (or representative of) each case study site, six of

10
the ten benchmark scenarios demonstrated a minor (<10%) difference between total salt input from irrigation and total salt loss from the root zone over the course of the simulation, with small resultant changes in root zone salt content. Of the remaining four benchmark scenarios, three showed a net loss of salt from the root zone (i.e. salt in < salt out) ranging from 12 to 56t TSS/ha and one a net gain in salt content of 14t TSS/ha. There was a tendency for more salt to accumulate in the root zone of the recycled water scenarios with eight out of the ten case studies experiencing net gains (i.e. salt in > salt out) in root zone salt content ranging from 1 to 36t TSS/ha. This contrasting result can be attributed to either (or a combination of) higher salt concentrations in the irrigation water, larger irrigation rates or a reduction in the drainage term in association with an increase in cropping intensity. There were net losses in the remaining two recycled scenarios of 5 and 33t TSS/ha. The latter involved a shift from dryland production and a higher initial salt load in the root zone.
• In most of the irrigated benchmark scenarios, the root zone salt content is not in a
steady state condition at the commencement of the simulation. Typically, the time course for drainage and salt loss show that early on, when the salt content in the root zone is high, the salt loss per unit of drainage is also high. With time, the salt content in the root zone declines suggesting that ‘excess’ salt has been leached out and that some kind of steady state is being approached where salt loss through drainage approximates salt input from irrigation. With the higher salt concentration in the irrigation water of the recycled water scenario, the initial ‘flushing’ of surplus salt is often dampened and in some cases the salt loss per unit of drainage actually increases over time.
• Consideration of the average salinity level calculated across all root zone layers to
a depth of 1.8m on January 1 of each year of the simulations, indicates that, in all scenarios, the maximum levels of salinity reached in the root zone were generally well below the levels expected to have a detrimental effect on crop production (i.e. greater than ~2dS/m). It was also found that the maximum level of salinity in any one layer of the root zone did not exceed this level. It should be noted however, that this conclusion is based on root zone salt levels on just one day of each year of the simulation. There may be periods during the rest of the year where higher salinity levels were reached. Furthermore, APSIM does not take into account the impact of high salinity levels on crop production and the associated flow-on effects in terms of deep drainage, and the profile salt balance. Recycled water irrigation salt concentrations of 5000ppm were found to generate average salinity levels in excess of 2dS/m.
• A direct comparison of the change in whole farm average annual salt loss in
moving from the benchmark to the recycled water scenario showed gains in all of the ten case studies.
7. Groundwater implications • The groundwater system is currently under stress given that the present recharge
to the groundwater system is much lower than the allocated and currently exploited groundwater volumes. Previous groundwater modelling studies in the

11
region suggest that river leakage is the main source of groundwater recharge (over 60% of total recharge). Any reductions in groundwater usage especially in the groundwater depression zones east of the North Branch of the Condamine River will help recover stressed aquifer systems and reduce enhanced leakage from the river. Groundwater modelling studies suggest no recovery of aquifer levels in the alluvial aquifers if the present trend of pumping continues. A 50% reduction in pumping combined with recycled water use can help recover deep groundwater levels in the groundwater depression areas.
• The groundwater vulnerability studies by Hansen (1999) suggest that basaltic
landscapes (East of Oakey, Mt Irving, Pittsworth and Clifton), due to shallow depths to watertables and high soil permeabilities, are highly vulnerable to groundwater salinisation and pathogenic and nutrient pollution. Due to deeper depths to watertable and presence of thick clays, the Condamine Alluvial aquifer has a lower vulnerability rating and is therefore more suitable for irrigation with recycled water. Therefore the use of recycled water needs to be carefully considered with the local soil suitability testing since the geology of the area suggests basaltic uplands are comprised of fractured aquifer systems which are highly vulnerable to excessive recharge and transport of solutes.
• Due to the continually ponded conditions in storage dams, the overall soil
conditions below such dams remain unsaturated for less than 3 years post construction for a 15 m soil profile. From the start of the ponding period a wetting front develops under the dam. This wetting front starts moving towards the watertable. After 2.5 years of operation completely saturated conditions develop under the farm dam and leakage from the dam starts recharging the regional groundwater. If the depth of shallow groundwater is small then saturated conditions develop in a shorter period of time e.g. for an 8 m initial depth to watertable the saturated conditions develop after only one year of operation. Once the saturated groundwater conditions develop, pathogens and nutrients in the recycled water can be transported to groundwater. The dam leakage studies suggest there is a need for careful siting and construction of on-farm and large storage facilities to avoid pollution of groundwater and possible lateral flow to the adjoining streams.
• Vertical soil column studies suggest that, for a drainage rate of 110 mm/year
below the root zone, no net recharge to watertable results for the first 7.5 years. Once the profile reaches field capacity this drainage rate results in a dramatic rise of watertables. The time to start of watertable rise, for 10m and 15m initial depths to watertable, were estimated as 2 and 5 years respectively. Therefore management strategies aimed at reducing net recharge below the root zone are essential to the long-term sustainability of the region. Simulation studies show that if the below-root zone deep drainage is reduced to 36 mm/year for a 20 m initial depth to watertable the groundwater levels do not start rising until after 17 years and after that the rate of rise is very slow. If this rate of deep drainage is combined with a net regional groundwater discharge of 0.36 ML/ha the watertables will remain in equilibrium.
• Lower recharge rate (2 mm/year), combined with leachate salinity of 5000 mg/L,
result in only a small rate of increase of salinity of deeper aquifers. However in

12
the shallow aquifers the rise in the salinity of groundwater is much higher due to the dissolution of salts present in the initially unsaturated soil profile.
• Previous and present studies suggest considerable deep drainage (of the order of
30 to 100 mm/yr) associated with higher salt loads below the root zone under different recycled water irrigation scenarios. There is a need to consider conjunctive water use to reduce salt loads associated with possible groundwater recharge.
8. Cropping systems for salt management • In evaluating designs for cropping systems which are effective in minimizing
water and solute movement off farms, the strategy of growing lucerne for hay production in a three-year rotation with irrigated cotton was assessed. When recycled irrigation water is purchased at $150/ML, annual net cash flow was simulated to increase by 5.5% and accumulated salt leached below the root zone decreased by 50% for a recycled-water irrigated lucerne-cotton rotation compared to a benchmark continuous cotton system. In this simple case study, lucerne was simulated to significantly restrict the loss of recycled water and solutes from the root zone.
9. Surface water implications • Any reductions in capturing of surface runoff due to increased recycled water use
in the upper parts of the catchment will greatly help improve flows to the streams. The use of recycled water for irrigation has the potential to reduce the amount of overland flow captured on farms. Where this occurs during periods of low flows, this will help improve rivers flows and the health of ecological system.
• Results of a previous hypothetical study by SKM suggest that a 50% increase in
total ring tank capacity from 143 000 ML (in 1999) to 214 500 ML results in 9% decrease in total volume of flow at Macalister for the 74 year period of study. During this simulation period the maximum decrease in annual volume at Macalister was estimated as – 49 %. Water harvesters located on the tributaries would extract, on average, a 42% increase in total off-allocation volume from the tributaries during the study period. A similar average increase in off-allocation extractions (+ 40 %) would be anticipated from the regulated and unregulated reaches of the river. Therefore any further growth in the number of ring tanks to meet water shortage for capturing overland flow in the region will have major impact on the flows in the area.
• There can be major gains in environmental flows if capturing of overland flow is
reduced as a result of recycled water use displacing some water harvesting. For example results of a previous SKM study suggest a 50% decrease in total ring tank capacity from 143 000 ML (1999) to 71 500 ML, would result in an average increase in total volume of flow at Macalister for the total study period of + 11 %. For this scenario the minimum and maximum increase in total volume at Macalister are 3% and 84 %. Water harvesters located on the tributaries would

13
extract, on average, 47 % less in total off-allocation volume from the tributaries during the study period. If a component of the current water storages were required to store recycled water irrigation, leading to reductions in the harvesting of overland flows, a significant improvement in environmental flows in the rivers is likely to eventuate.
10. Future research recommendations • Optimise on-farm recycled water management for economic and environmental
benefit
The recycled water case studies presented in this report are not necessarily representative of the economically or environmentally optimal designs for either the case study farms, nor for other individual farming operations. Rather, the model configurations were primarily based on individual farmer suggestions/preferences. There is clearly potential to improve the recycled water management for each of the 10 case studies to best meet a range of economic and environmental criteria. In other words, a combination of factors – crop type, irrigation application rate, farm irrigation infrastructure, farm size, irrigation management rules, on-farm storage size, quantity of recycled water purchased, crop prices and costs etc. – need exploration for each farm operation in order to maximise on-farm profits. Likewise, such customised analyses can help establish economic targets within specified environmental (surface water, groundwater, salt loads) objectives. This study has established the feasibility of recycled water usage. Further work, using the system developed in this study, can assist in designing operational systems for individual farms which meet economic and environmental criteria.
• On-farm salt management
More research is required on the management of salt imported to farms through recycled water including.
o identifying crop and irrigation management strategies for storing and holding imported salts between the crop root zone and groundwater
o further exploration of the sensitivity of salt build up / leaching to the salt concentration on the various water sources used for irrigation.
o analysis of conjunctive water use options to reduce salt levels associated with possible groundwater recharge
• Salt export from the catchment
The present cone of depression east of North Branch and Condamine River will initially capture all groundwater recharge and associated salt resulting from possible recycled water irrigation. This will result in net increase in salt loads in the region. For the long term sustainability of the irrigation system it is important to explore salt management and export options by refining the surface-

14
groundwater interaction models developed during this study. There is also a need to research and implement adequate monitoring networks to carefully assess possible changes in the state of groundwater systems and surface and groundwater interactions in the region to avoid undesirable environmental consequences. Further studies are also recommended to understand possible changed surface-groundwater interactions due to possible reduced groundwater pumping and enhanced groundwater recharge on the deeply incised natural channel systems.
• Obtain an analysis of the composition of recycled water used for irrigation and
assess the full range of possible impacts on long-term soil productivity.
Recycled water is a source of water, salt, nutrients, pathogens and other chemical compounds. This study focussed on the salt content of recycled water and did not consider the full composition of recycled water. Further studies should identify what changes must be made to the management of a farm when accounting for the total composition of recycled water.
• Impact of new storage development on the Darling Downs
There is scope for this research to contribute to policy discussion relating to new on farm and communal storage development on the Darling Downs. The research approach used in this study could assess the economic and environmental consequences of storage development options. An example is that if future storage development is restricted to the receipt of recycled water only, this will impact differently on farm-scale economic outcomes, and environmental outcomes (groundwater, surface water etc) than if future storage construction is not limited to receiving recycled water only. There is need to carry out hydrogeologic studies for the siting of major storage facilities with respect to proximity to fresh surface water bodies and well capture zones to minimise environmental impacts. These studies will help devise optimum monitoring networks near the future recycled water storage facilities.
11. Important caveats • One of the difficulties with this task is identifying realistic settings for the
numerous parameters and constants used in the configuration of the model. There are substantial difficulties, for example, in estimating catchment size, runoff potential, salt concentration in the irrigation water etc. ‘Best bet’ settings have been used, backed up by sensitivity studies for parameters where there is particular uncertainty and sensitivity to response.

15
1. Introduction 1.1 Background to the study Darling Downs Vision 2000 Inc. is a community group made up of Darling Downs farming, business and community members who are exploring the potential for treated recycled water from South-East Queensland waste-water treatment plants to become a new sustainable water supply for crop production on the Darling Downs. In total 126,770 mega litres of recycled water have been requested for use in farming systems incorporating on-farm water storages. It is proposed that 201 existing ring tanks would be used to hold treated recycled water with a combined capacity of 124,055 Mega Litres. Approximately 171 proposed new ring tanks or extensions to existing ring tanks to be constructed. Crop production on the Darling Downs is driven by water availability. However, rainfall in the region is highly variable and irrigation supplies are highly dependent on regulated rivers and bores or capture of irregular overland water flow. While the need for the urban community to dispose of large volumes of recycled water and the search by rural industries for additional water supplies has opened opportunities for the region, there are issues that need to be addressed, including: - economic costs/benefits of recycled water irrigation on current or new cropping
systems; - how to efficiently allocate water on farms, particularly in a situation of continuous
supply (which contrasts with the historical experience of uncertain supply); - management of recycled water overflow from storages - on- and off-farm environmental implications from irrigation with water of various
qualities; - economic versus environmental trade-offs. Increasing demands for water from all sectors of the Australian economy, together with increasing scrutiny by the wider community to ensure water is used efficiently and profitably in the Murray-Darling Basin, will demand a focus on efficient and sustainable recycled water-irrigation management practices. While water is essential for crop production, and ultimately profitability of farming enterprises on the Darling Downs, it also affects the way solutes (nutrients, chemicals and salts) are stored and transported across and through soils. Management of solutes, no matter what their source, is therefore inextricably linked with water management, and care is needed to ensure implementation of appropriate strategies to minimise negative environmental impacts associated with inappropriate water and/or solute management practices. Particularly with recycled water, it is important to recognise that both salts and nutrients need to be actively managed to avoid adverse environmental impacts. This can be helped by better matching the supply of water and nutrients to actual needs of the cropping system. To address this set of issues, Darling Downs Vision 2000 commissioned CSIRO to conduct this study - “An economic and environmental evaluation of the benefits and risks of recycled water irrigated crop production on the Darling Downs” – the results of which are presented in this report.

16
1.2 Objectives of the study The aim of this study was to provide an assessment of the economic and environmental benefits and risks of recycled-water irrigated crop production incorporating on-farm water storages on the Darling Downs. Specifically, the 3 key objectives of this project were to: 1. Conduct a farm-scale analysis (including risk assessment) of changes in crop productivity and profitability, attributable to the use of recycled water for irrigation, relative to current cropping practices on the Darling Downs. 2. Evaluate selected cropping system designs for their effectiveness in minimizing water/solute movement off farms in runoff and in deep-drainage. 3. Provide insights into the likely environmental impacts on surface and groundwater at sub-catchment and catchment scales as a result of storage of recycled recycled water in large on-farm water storages and from irrigating with recycled waters. Included within this, are suggestions for implementing a monitoring system to provide early warning of changes that could lead to adverse environmental impacts and summaries of additional work that would provide more complete understanding and economic implications of strategies for minimising negative environmental impacts. 1.3 Description of research approach The research approach is based on the analysis of 10 case study farms in the proposed Darling Downs recycled water irrigation area. For each case study, the analysis links biophysical modelling of farming systems, incorporating on-farm water storages, with farm-scale economic analysis. The farm-scale biophysical modelling utilises APSIM (Agricultural Production Systems Simulator) - a comprehensive, computer-based production systems simulator with capability to address production and sustainability issues for a wide range of cropping systems on the Darling Downs. Results from the analysis of 10 case study farms feed into the broader catchment-scale analysis. The approach of linking APSIM biophysical modelling with farm-scale economic analysis is well established, having been used previously in the Australian sugar industry in the following areas:
• research into improved irrigation management through on-farm water storages (Lisson et al., 2002; Lisson et al., in press)
• analysis of the potential for recycled waters as a resource for sugarcane irrigation (Gardner et al., 2000; Gardner et al., 2002)
• analysis of best sugarcane irrigation practices with limited water supplies (Brennan et al., 1999).
1.3.1 Case studies The farm-scale analysis was based on case studies of farms from the proposed DDV2000 recycled water irrigation area. As discussed in Chapter 4 of this report, some of the results from the analysis of case studies were also incorporated into the

17
sub-catchment modelling framework. The use of case studies for analytical purposes provides valuable insights made possible by the ability to consider the additional complexities that are unique to each farm business. Ten case studies were selected for analysis from a group of DDV2000 members who expressed interest in participating in this research project. The selected group was broadly representative of the mix of cropping enterprises, existing water sources, and locations within the proposed recycled water irrigation area. The 10 participating farmers were asked to describe their current cropping and irrigation activities and nominate how they would incorporate their requested supply of recycled water into their farming system. Both without-recycled water, or ‘benchmark’, and with-recycled water scenarios were modelled in a bio-economic framework, described in the next section, and comparisons were made based on modelled results. Each participating farmer met with the research team to provide feedback on the model results. The timing of interactions with participating farmers was as follows:
1. February/March, 2002: First face-to-face interview with the farmer to discuss current farm management practices and intentions regarding the use of recycled water. Data for use in the APSIM modelling were collected at this meeting.
2. June 2002: APSIM-simulated results applicable to the current ‘benchmark’ situation on the farms were presented for discussion and ‘credibility checking’ by the farm owner/manager. Where necessary, the model set-up was revised. The details of the recycled water irrigated scenario to be modelled were reviewed and finalised. Data for economic analysis were collected.
3. August and October 2002: Revised results for benchmark scenario and results of the analysis of recycled water irrigation were presented and discussed with farm owner/manager.
Table 1.1. Description of case study farms Farmer Area Current Water Sources Current Crops Farm 1 Pittsworth Overland flow dam Cotton, wheat Farm 2 Pittsworth Overland flow dam and bore Cotton, wheat Farm 3 Pittsworth Overland flow dam and bore Maize, wheat,
soybean Farm 4 Pittswoth Nil (rainfed cropping only) Cotton, wheat Farm 5 Dalby River Cotton Farm 6 Dalby Overland flow dam and bore Cotton, wheat, maize Farm 7 Dalby Overland flow dam and bore Cotton, wheat Farm 8 North Branch North Branch, overland flow
dam Cotton, wheat
Farm 9 North Branch River, North Branch and overland flow dam
Cotton, wheat
Farm 10 Jondaryan / Bowenville
Overland flow dam Cotton, wheat, sorghum

18
1.3.2 Biophysical modelling approach The farming systems model, APSIM (Agricultural Production Systems sIMulator; McCown et al. 1996) is the principal biophysical modeling framework used in this study. APSIM simulates agricultural production systems by combining modules describing the specific processes within the system under investigation. In this study, the soil water module SOILWAT (Probert et al. 1997), the soil nitrogen module SOILN (Probert et al. 1997), and the surface residue module RESIDUE (Probert et al., 1997) are linked with a range of crop (specifically cotton, maize, soybean, wheat, sorghum, chickpea and lucerne) modules relevant to the farming systems in the study area. Each of these crop modules simulate growth and development in response to climatic, soil and management inputs. Irrigation infrastructure & sources The Manager module of APSIM is configured to enable simulation of an irrigated production system using water derived from overland flow, river and bore allocations and recycled water (Figure 1.1). For this project it is assumed that all sources of water are initially stored in the OFWS prior to use for irrigation.
Figure 1.1 Model framework. Bore water The bore water allocation is defined by an amount (ML/year) and an ‘allocation period’ over which that amount is potentially available. This period is typically from July 1 to June 30 of the following year. The model also allows for specification of a ‘pumping period’ to reflect the fact that a farmer will typically pump bore water in the period leading up to and during cropping to minimize evaporative losses from the storage and to maximize the potential capture of overland flow. In some locations, farmers are allowed to ‘carry-over’ unused allocation water from one allocation period to the next. In the model, residual bore allocation reported on June 30 (from the current allocation period only) is added to the next allocation volume, which becomes available on the following day (July 1). Transfer from the bore to the OFWS occurs at a defined daily rate (ML/day) and is conditional on there being sufficient residual capacity in the OFWS to accommodate this volume of transferred water. In
OFWS
Sump
E R
Overflow
CroIrrigati
Seepage
Recycled Tailwater
E R
Seepage
Overland flow
Sump - OFWS transfer
Bore allocation
Recycled water
OFWS Catchment
River allocation

19
the event that the remaining bore allocation volume is less than the daily bore pumping rate, a smaller volume is pumped into the OFWS that reduces the bore volume to zero, whereupon it remains until the next allocation is issued. Additional pumping restrictions are imposed when other water sources are available. If river water is available, then bore water is only pumped once the river allocation is exhausted. Similarly, in situations where the farm is receiving regular volumes of recycled water, the model user can set an OFWS volume above which the pumping of bore water stops. This reflects the fact that a farmer will want to allow sufficient capacity in the OFWS to receive the recycled water and hence minimize overflow losses. River water The configuration details for river allocation are similar to those for bore water, but with some key differences. The volume of river allocation pumped each year is determined by a number of factors including; the nominal or maximum amount allowed to be pumped each year, the period over which that amount can be accessed, the threshold river flow rate above which the farmer is allowed to pump and the maximum daily pumping rate. The river flow rate restriction means that in ‘dry’ years when the scheme dam is depleted and river flow volumes are typically low, the farmer will usually pump less than the nominal allocation. In ‘wet’ years or in the year/s following a wet year, the farmer is more likely to pump the full allocation. To approximate these conditions in the model and estimate the annual river allocation, an estimate of the 70% reliable river allocation volume is multiplied by a factor (0-1), which captures annual water availability in the catchment. This factor is derived from simulated overland flow, offset by one year to allow for the time lag between overland flow events and availability in the irrigation scheme. The period of the year over which river water is typically pumped is based on historical pumping records for the study region. As with bore water, when the farm is receiving recycled water, the model user can specify an OFWS volume above which river pumping stops. Recycled water Recycled water is defined by an annual total amount (ML/year), the frequency of recycled water delivery events (days) and, the amount received per event (ML). It is also possible to configure a recycled water delivery period that is less than 365 days. The recycled water must be received and cannot be delayed or postponed. Where the residual volume in the OFWS is less than the incoming recycled water volume, the recycled water will be shunted into the sump. Once the sump is full, surplus is recorded as overflow from the OFWS (see below). Overland flow Daily catchment runoff from the OFWS catchment is estimated using the QDPI model, RUSTIC (Runoff, Storage and Irrigation Calculator) (QDPI 1994). The method adopted in RUSTIC for predicting runoff is that developed by the United States Department of Agriculture (USDA 1972). This method requires selection of a catchment area and a ‘KII factor’ which takes into account the prevailing soil type, land use / vegetation type and the general condition of the catchment. While the model allows for the total catchment to be divided into multiple sub-catchments each

20
defined by an area (ha) and a ‘KII factor’, for the purposes of this study we assume a single catchment area (inclusive of the farm area) with an average KII factor. The USDA method for predicting runoff from daily rainfall totals has been used extensively in farm supply projects throughout Queensland and has reportedly performed well (Horton & Jobling 1992). The storage dam can be located either within or external to the catchment for which runoff is being calculated. If the irrigated cropping area is to be included within the catchment for the on-farm storage, then an adjustment can be made to the catchment area to reflect this additional source of rainfall runoff. On-farm water storage / sump The volume of the OFWS and sump are calculated daily and take into account the various elements of the storage water balance. In the case of the OFWS, inflows include water sourced from the sump (S), direct rainfall capture (Rf), recycled water (Ef), river water (R) and bore water (B). Outflows are from surface evaporation (Ev), irrigation (I), seepage losses (S) and overflow (O). The mass balance can be expressed in equation form as:
Vofs = (S + Rf + E + R + B) – (Ev + I + S + O) In the case of the sump, inflows include recycled tailwater (T), overland flow (Of), direct rainfall capture (Rf). Outflows are from surface evaporation (Ev), sump-to-OFWS transfer (So), seepage losses (S) and overflow (O). The mass balance can be expressed in equation form as: Vsump = (T + Rf + Of) – (Ev + So + S + O) The ‘shape’ and volume (V, ML) and depth (D, m) characteristics of the OFWS and sump are characterised by the following relationship, as defined by Watts (1986): V = a * Db The constant ‘a’ defines the shape of the OFWS. Constant ‘b’ relates the surface area to depth and volume attributes of the OFWS. Direct rainfall capture by the storage (Rf, ML/day) is estimated from the daily rainfall (Rain, m) and the maximum water depth,
Rf = {(a * (D + Rain)b ) - (a * Db )}
Evaporative loss from the storage (Ev, ML/day) is assumed to be 70% of that from a Class A pan (Pratt et al 1974). Pan evaporation (Epan, mm) is taken to be equivalent to that from a bare, saturated soil, calculated using algorithms from the CERES-Maize model (Jones & Kiniry 1986) and based on minimum (Tmin, °C) and maximum (Tmax, °C) temperatures, incident radiation (Rn, MJ/m2) and the soil albedo (α):
Ev = {(a * Db) - (a * (D – (0.7 * Epan / 1000))b)}, where Epan = Rn*23.8846* (0.000204 - (0.000183*α))*(29 + (0.6*Tmax + 0.4*Tmin)),

21
Seepage losses (S, ML/day) depend on the depth of water in the storage (D, metres) and the permeability (k, m/day) of the soil underlying the storage. Two storage lining types have been incorporated in the model: (i) a deep, homogeneous, uniformly permeable underlying soil or, (ii) a thin layer of low permeability material (thickness t, metres) sealing the storage and overlying a deeper material of higher or contrasting permeability. The equations for seepage loss come from Horton & Jobling (1992). In the case of design (i):
S = {(a * Db) - (a * (D – k )b)} In the case of design (ii):
S = {(a * D1b) - (a * (D1 – (k * (D1/t)))b)}
Overflow occurs when the capacity of the storage is exceeded. The model reports the seasonal overflow volume (ML), the number of overflow events of one or more days in duration, and the total number of days that the storage was overflowing. The partitioning of overland flow between bypass, that which is transferred to the OFWS from the sump, and the portion left over in the sump is determined by the sump capacity (ML) and the sump-to-OFWS pumping rate (ML/day). If the pump rate is greater than the sump capacity, more than the sump capacity can potentially be pumped in one day. That is, if the daily overland flow volume exceeds the pump capacity, then an amount equivalent to the pump capacity will be transferred to the OFWS (provided there is sufficient room available in the OFWS) and the residual will be allocated to the sump. If this residual exceeds the sump capacity then the surplus will be recorded as bypass. If the overland flow for a given day is less than the pump capacity then all of the overland flow is transferred to the OFWS (again, assuming there is sufficient room) and bypass is nil. For designs in which the pump capacity is less than the sump capacity, the maximum volume of overland flow that can be pumped in one day is equivalent to the pump capacity. The residual overland flow is distributed to the sump and bypass (once the sump is full). Irrigation rules In order for an irrigation event to take place, a number of conditions must be satisfied:
a) The soil water deficit (drained upper limit – current soil water content) to a specified soil depth (cm) must be greater than a threshold deficit to irrigate (mm).
b) A farmer will normally take several days to irrigate the entire farm over what is referred to as an irrigation ‘cycle’. Given that APSIM is a single paddock model, all irrigation is assumed to be applied on the first day of the cycle with no subsequent irrigation until the defined cycle length has been completed.
c) There must be sufficient water available in the OFWS to meet the minimum volume requirements for irrigation (see below).
d) The maximum number of irrigations specified for a given crop has not been exceeded.

22
Irrigation amount The amount of irrigation water applied is based on the soil water deficit to a specified depth when an irrigation event is triggered. The applied irrigation amount (Iapp, mm) is defined as the volume of water pumped from the OFWS less that returned to the OFWS/sump as recycled tailwater. Some of this water will be lost through evaporation and seepage in the head ditches, furrows and recycling channels or will be lost through pipe leakages etc. These losses are collectively referred to as application inefficiencies (E, fraction of Iapp). What remains, enters the profile and is available for crop uptake and is referred to as ‘effective’ irrigation (Ieffect, mm). Applied irrigation volume can be expressed as:
Iapp = Ieffect / E
In order to monitor the OFWS water balance, this amount is converted to ML (IML) of applied irrigation using the irrigation area (Airr).
IML = (Iapp * Airr) / 100 In order to represent the fact that a farmer will not normally pump all of the water from an OFWS, a minimum OFWS volume (Vmin) is specified in the model at which irrigation ceases. As the stored volume declines, the amount available for irrigation from the OFWS (above Vmin) may fall below Iapp. An amount of irrigation (Ired) less than Iapp will be applied from the storage provided that it exceeds a specified minimum (Imin).
Ired = minimum (Imin, {(Vofs - Vmin) * 100 / Airr})
This justifies the commitment of irrigation equipment and labour resources and prevents numerous small irrigation events from the OFWS. If allocation water remains then the outstanding irrigation requirement (or part thereof) will be met from this source. Salt load The concentration (ppm) of salt in the irrigation water can be specified at the start of a simulation and this is assumed to remain constant with time. In reality however, the salt concentration will vary as a result of the mixing of water from different sources having different salt concentrations and through evaporative losses. Sensitivity analyses are required to explore the impact of this variability on the distribution and movement of salt in the profile and salt losses from the base of the root zone. Other features of biophysical model By establishing this model within the larger framework of APSIM, the simulation capability is extended to encompass the broader crop production system. Within this framework, it is possible to configure detailed management events relating to the cropping cycle (i.e. species, planting dates, harvesting dates), tillage practices (i.e. implement used, depth and timing), crop residue management (i.e. timing, depth and

23
fraction of residues incorporated) and fertiliser management (i.e. amount, type, timing, depth). For each farm system in the study, model runs are conducted over a 45-year period (commencing 1957) using historical climate files so as to capture responses to season-to-season climate variability, and to provide input data to the economic model for risk assessment. These climate files consist of daily temperature, rainfall and radiation data. Each case study reported below, utilizes climate files constructed from the nearest weather station. Similarly, soil physical and chemical properties representative of local conditions are used in each of the case studies. The model is configured to report each year on January 1 and at the time of harvest for each crop. The January 1 report provides cumulative totals for each element of the OFWS/sump water balance, aggregated over the previous 12 month period. It also provides cumulative totals for the key soil water balance components including runoff, drainage and salt leached beyond the root zone, soil evaporation and incident rainfall. The ‘at-harvest’ report provides yield related data as well as irrigation and fertilizer input totals for the crop in question (including pre-irrigations prior to planting). In order to simulate a whole farm comprised of multiple paddocks with offset crop rotations in each, all drawing irrigation water from one or more OFWS’s, some simplification was required in the configuration of the single paddock APSIM model. It is assumed that the farms under consideration in this study are divided into sections, the number of which depends on the complexity and extent of the crop sequence. For example, a farm having a crop rotation comprised of cotton, followed by a winter fallow, cotton, wheat, and then a long fallow back into cotton (C-CW--) is taken to be divided into three sections each offset by one third of the rotation. All irrigation infrastructure is taken to be divided equally amongst the 3 sections. That is, there are three separate OFWS’s (each having a capacity equal to one third of the overall farm OFWS volume), one for each section and each receiving a third of the overland flow, river and bore allocation water. Three separate APSIM model runs are then configured to represent each section of the farm and the output from each aggregated to represent the whole farm situation. 1.3.3 Economic Analysis approach Partial budgeting framework The economic analysis framework used for each case study is the partial budget. A partial budget is used to assess a proposed change within the overall farm plan, and it only considers the extra expenses and extra revenue resulting from the change. In other words, only those parts of the farm business that would be affected by the use of recycled water irrigation are considered. The focus is on identifying the net gains from cropping activities that could occur under the recycled water irrigation scenario, and comparing them to those associated with current (benchmark) cropping activities that would be forgone under a recycled-water irrigated scenario.

24
Additional annual net cash return The additional annual net cash return attributable to the use of recycled water is the key financial criterion used to evaluate the use of recycled water irrigation for each case study. If the additional annual net cash return is positive, then the use of recycled water irrigation is worthwhile. The basic additional annual net cash return (ANCR) calculation for each case study is: annual cash income from crop production (Ieff) less annual cash variable costs for the recycled-water irrigated (VCeff) less the additional annual cash overhead (fixed) costs attributable to recycled water irrigation (FCeff ) less forgone annual cash income from crop production (Ib ) less annual cash variable costs for the benchmark scenarios (VCb): ANCR = Ieff – VCeff - FCeff – Ib –VCb Due to the unique financial circumstances of each farm, annual net cash returns have not been adjusted for tax deductions and payments. Costs considered in the partial budget The costs examined in this analysis fall into the categories of fixed and variable. The variable costs of a cropping activity are those that change as the level of that cropping activity changes. For example total wheat fertilizer costs depend on the area of wheat planted and are not incurred if no wheat is planted. Other variable costs also included are those associated with pumping water from various sources to the crop. Fixed costs are those that are incurred regardless of the level of cropping activity undertaken. These include additional employees (unless paid on a casual basis), insurance and other administration costs. The recycled water supply is regarded in this study as a fixed cost – it is assumed that the annual supply must be paid for regardless of the level of useage. Capital costs are a special type of fixed cost. For cases where additional capital costs are part of a recycled water-irrigation scenario, the capital cost is incorporated into the analysis using an annuity, which can be likened to an annual debt repayment for a given repayment period and interest rate. If, in reality, the farmer does not intend to use borrowed funds, the interest component of the annuity can be interpreted as the opportunity cost of capital (i.e. what the funds could be earning in the best alternative use). Biophysical data used in economic analysis The annual net cash return calculation relies on biophysical data specific to the benchmark and recycled water scenarios. For example, the additional income from incorporating a recycled water irrigation supply is generated from the extra and/or higher value crop yield produced in response to the recycled water supply. The additional costs attributable to incorporating recycled water irrigation include increases in crop fertilizer requirement and irrigation equipment operating costs associated with a change in the amount of water pumped under both scenarios for each case study. The APSIM simulated output described in the previous section is the source of biophysical data used in the economic calculations. APSIM-sourced biophysical data used in the economic analysis include: crop yields (including wheat protein levels),

25
quantity of nitrogen fertilizer, quantity of irrigation applied to the crops, quantity of water pumped to the storage from the sump, bores and river. A benefit of the use of long-term climate data to generate simulated results over a 40+ year time period is that it allows for the assessment of expected variability in annual net cash returns. Economic benefits / costs not taken into account by annual net cash return calculation It is acknowledged that there will be a range of benefits and costs associated with the use of recycled water irrigation for each case study that will not be quantified in monetary values in this study. These fall into three categories: a) benefits/costs that are not traded in markets, particularly those with an
environmental impact, and are difficult to assign monetary values, b) benefits/costs that are incurred beyond the farm scale, c) benefits/costs that are intangible in the context of the farm business – e.g.
enhanced access to credit and markets These will be discussed where applicable throughout the report. 1.3.4 Overview of low-fidelity sub-catchment modelling framework The catchment hydrology studies carried out under the present assignment includes the following aspects:
• Potential hydrological impacts on the surface water resources due to recycled water irrigation derived from previous work
• Assessment of watertable impacts due to deep drainage under recycled water irrigated crops using results from previous studies, APSIM modelling and unsaturated vertical column modelling
• Assessment of groundwater impacts due to on farm storage of recycled waters • Impacts on aquifer pressures and water quality using regional and spatially
zoomed groundwater models

26

27
2. Farm-scale assessment of changes in crop productivity and economic costs / benefits relative to current enterprise practices 2.1 Biophysical modelling assumptions Model settings and assumptions that are common to each case study are:
• The order of transfer to the OFWS is overland flow, then river and finally bore.
• The bore allocation period is from July 1 to June 30. • No carry-over is allowed for river allocation. • River pumping period is assumed to extend from September 1 to February 15.
This is based on historical pumping records which show that 30% of allocation is pumped in September, 30% in December and 40% in January.
• The KII factor for all catchments is set to 75. • The OFWS is taken to be external to the catchment and cropping area. • The delivery efficiency is taken as 80% (this includes losses in tailwater
recycling, evaporative losses in head ditches etc) (Dalton, 2000). • With the exception of Farm 1, the irrigation method is flood with irrigation
based on a 60mm deficit to 90cm trigger and effective irrigation set to 100mm (if available) to approximate saturation in part of the root zone. In Farm 1, the irrigation method is by overhead sprinkler, based on a 60mm deficit trigger and an effective irrigation volume of 60mm.
• The OFWS maximum depth = 15m and the sump maximum depth = 5m. • In the OFWS depth/volume relationship (see theory section), b = 1.1 for
OFWS and the sump and b = 3 for the hillside storage. • Seepage losses are assumed to be nil. A sensitivity study is included for Farm
2 to explore the impact of different OFWS liner permeability values on key model outputs.
• Irrigation salt concentration = 640ppm for the benchmark irrigated scenarios and 1000ppm for the recycled water scenarios.
• Tillage occurs at planting (10% of residue to 50mm) and at harvest (50% to 200mm).
• Irrigation stops when the OFWS volume drops to 1ML. • The initial salt concentrations (kg/ha) in each layer of the root zone to 1.8m
are based on measured concentrations for soils that are representative of each case study farm and which have a history of dryland production. Initial concentrations for all irrigated benchmark and recycled water scenarios are set to values reached after a 15 year run under the benchmark irrigated conditions.
• All deep drainage and salt leachate figures refer to losses below the maximum depth of the root zone, which is 1.8m deep in all case studies.
• The delivery of recycled water is assumed to be spread uniformly throughout the year at 3 day intervals (i.e. 122 delivery events each year).
• The maximum possible irrigation area is assumed to be planted in all years of the simulation. In reality, a farmer will vary the irrigation area depending on a wide range of factors including the availability of irrigation water, soil moisture content, the seasonal climate forecast and so on. This means that in ‘dry’ years, the simulated yield and irrigation water usage (ML/ha) may be less than in reality. In some case studies, this has the effect of decreasing the overall 45 year averages to values that are below farmer expectation. In terms

28
of whole farm production and water usage however, these per unit area declines will be offset to some extent by production over the larger area.
• In all case studies, it was assumed that water from each source was delivered as irrigation via the OFWS. While this reflects reality in most case study farms, some farmers do actually pump some of their river and bore water directly onto the field as well as into the storage. The model output in these cases may partially underestimate irrigation supply for two reasons. Firstly, direct delivery to the field overcomes OFWS capacity and sump-to-OFWS pumping restrictions. Secondly, capacity is freed up in the OFWS to receive water from other sources.
A detailed description of the unique features of each case study that are represented in the biophysical modelling is summarised in Table 2.1. 2.2 Economic assumptions The cost and price assumptions used in the economic analysis that are common to all scenarios are reported in Table 2.2. These include crop product prices, nitrogen fertiliser price, and other crop variable production costs (excluding those associated with irrigation, which are unique to each case study). Crop prices and variable production costs were mainly sourced from DPI (www.dpi.qld.gov.au/fieldcrops) and from participating farmers. Also common to all scenarios are the recycled water price, the annual service fee associated with recycled water use and, where capital expenditure is concerned, the interest rate used in the calculation of the annuity. Other economic analysis assumptions that are unique to each case study are reported in Table 2.1. These costs include irrigation operating costs (electricity, diesel, repairs and maintenance) associated with pumping water from the bores, river, sump and to crops in the field, and fixed costs such as labour, insurance, reticulation equipment, OFWS construction etc.

29
Table 2.1. Biophysical and economic model inputs (C = cotton, W = wheat, M = maize, S = soybean, Cp = chickpea, - = short fallow, - - =long fallow) Farm No.
Area (ha) Rotation Crop management Irrigation infrastructure Economic configuration
1 853ha total 693ha dryland 162 irrigated Benchmark dryland Summer crop 346ha/yr cotton 346ha/yr fallow Winter crop 346ha/yr wheat 346ha/yr fallow Benchmark irrigated Summer crop 162ha/yr cotton Winter crop 162ha/yr fallow Recycled water scenario 1 Summer crop 324ha/yr cotton Winter crop 324ha/yr fallow Recycled water scenario 2 Summer crop 486ha/yr cotton Winter crop 486ha/yr fallow
CW-- C- C- C-
Benchmark dryland Cotton: Sown Oct 1-Nov 30 after 30mm rain in 4 days. 8 plants/m2 (solid). N fertilise to 200kgN/ha. Okra Si14 cultivar. Wheat: Sown May 15-July 15 after 40mm rain in 7 days and ESW > 50mm (opportunity cropping). 100 plants/m2. N fertilise to 80kgN/ha. Janz cultivar. Benchmark irrigated / Recycled water Cotton: Sown Oct 1. 10 plants/m2 (solid). N fertilise to 250kgN/ha. Okra Si14 cultivar. Four irrigations based on a 60mm deficit to 90cm. Soil: Norillee (323 PASW) Climate: Pittsworth
Benchmark OFWS : 1020ML capacity Sump: 180ML Sump-to-OFWS : 115 ML/day Catchment: 11492 ha (KII 75) Bore/river: Nil Recycled water scenario 1 Recycled water delivered at 8.3ML every 3 days (1000ML total per annum). Double irrigation area to 324ha. Dryland area declines by corresponding amount. Overland flow is pumped into the OFWS from the sump only when the OFWS volume drops below 200ML. Recycled water scenario 2 As for Recycled water scenario 1 but with an increased combined storage capacity of 1800ML and a total irrigated area of 486ha (with corresponding decline in dryland area). Threshold for pumping from sump is 400ML.
Variable costs Pumping costs: OFWS to field: $32/ML (includes lateral irrigator running cost) Sump to OFWS: $12/ML Additional annual fixed costs - recycled water scenario 1 Labour: $4200 Insurance: $1000 Lateral flow irrigator: $300 000 Additional annual fixed costs - recycled water scenario 2 Labour: $8400 Insurance: $2000 Lateral flow irrigator (x2): $600 000 OFWS extension and pump: $200 000 Annuity calculated for capital items over 15 years at 9% .

30
2 202ha total 101ha dryland 101ha irrigated Benchmark dryland Summer crop 50.5ha/yr cotton 50.5ha/yr fallow Winter crop 50.5ha/yr wheat 50.5ha/yr fallow Benchmark irrigated Summer crop 101ha/yr cotton Winter crop 101ha/yr fallow Recycled water Summer crop 152ha/yr cotton Winter crop 152ha/yr fallow
CW-- C- C-
Benchmark dryland Cotton: Sown Oct 1-Nov 15 after 20mm rain in 7 days. 8 plants/m2 (solid). N fertilise to 100kgN/ha. Okra Si14 cultivar. Wheat: Sown May 15-July 15 after 20mm rain in 7 days (opportunity cropping). 100 plants/m2. N fertilise to 70kgN/ha. Janz cultivar Benchmark irrigated Cotton: Sown Oct 1. 10 plants/m2 (solid). N fertilise to 200kgN/ha. Okra Si14 cultivar. Three irrigations based on a 60mm deficit to 90cm. Recycled water As for benchmark irrigated. Soil: Norillee (323 PASW) Climate: Dalby
Benchmark irrigated OFWS : 400ML capacity Sump: 50ML Sump-to-OFWS : 144 ML/day Catchment: 1300 ha (KII 75) Bore: 276ML with max. pumping rate of 5ML/day. Pumps from August 18 to March 15. Carry-over for one year only. Recycled water Increase irrigation area by 50% to 152ha (with consequent decline in dryland area). 380ML recycled water arriving at 3.12ML every 3 days. Pump from sump to OFWS and from bore only when capacity of OFWS is less than 200 ML. A further condition for bore transfer is that the date be within August 18 to March 15 (as for benchmark irrigated).
Variable costs Pumping costs: OFWS to field: $20/ML Sump to OFWS: $9/ML Bore to OFWS: $60/ML Additional annual fixed costs- recycled water Repairs to pump: $250

31
3 820ha total 300ha irrigated 520ha dryland Benchmark Irrigated Summer crop: 150ha/yr maize 150ha/yr soybean Winter crop: 150ha/yr fallow 150ha/yr wheat Benchmark Dryland Summer crop: 173ha/yr maize 347ha/yr fallow Winter crop: 173ha/yr wheat 347ha/yr fallow Recycled water Irrigated Summer crop: 250ha/yr maize 250ha/yr soybean Winter crop: 500ha/yr wheat Recycled water Dryland Summer crop: 107ha/yr maize 214ha/yr fallow Winter crop: 107ha/yr wheat 214ha/yr fallow
MWS - M--W-- MWSW M--W--
Benchmark Irrigated Maize: Sown Oct 10. 6.5 plants/m2. N fertilise to 150kgN/ha. usa_18leaf cultivar. Three irrigations based on a 60mm deficit to 90cm. Wheat: Sown June 1 – June 15 after 50mm rain in 7 days. 100 plants/m2. N fertilise to 60kgN/ha. Janz cultivar. Nil irrigation. Soybean: Sown December 15. 25 plants/m2. Nil N fertiliser. Davis cultivar. Three irrigations based on a 60mm deficit to 90cm. Benchmark/Recycled water Dryland Maize: Sown Sep 25 – Oct 30 after 50mm in 5 days. 4 plants/m2 . N fertilise to 150kgN/ha. usa_18leaf cultivar. Nil irrigation. Wheat: Sown May 1- June 25 after 20mm in 3days. 100 plants/m2. N fertilise to 150kgN/ha.. Janz cultivar. Nil irrigation. Recycled water Irrigated Maize: Sown Dec 1. 6.5 plants/m2. N fertilise to 250kgN/ha. usa_18leaf cultivar. Three irrigations based on a 60mm deficit to 90cm. Wheat: Sown May 1. 100 plants/m2. N fertilise to 200kgN/ha. Janz cultivar. Two irrigations based on a 60mm deficit to 90cm.. Soybean: Sown December 15. 25 plants/m2. Nil N fertiliser. Davis cultivar. Three irrigations based on a 60mm deficit to 90cm. Soil: Mywybilla (308 PASW) Climate: Dalby
Benchmark Irrigated OFWS : 972 ML capacity. Sump: 63ML capacity. Sump-to-OFWS : 132 ML/day Catchment: 10000ha (KII 75) Bore: 708ML pumped from August 18 to March 15. Maximum pumping rate of 11ML/day. One year carry-over allowed. **Each of these elements divided in two and allocated to two separate ‘paddocks’. Recycled water Irrigated 1000ML recycled water received as 8.3ML every 3 days and divided equally across the 2 storages. Bore pumped throughout year but only if room in storage after overland flow and recycled water have gone in and only if OFWS volume <250ML. The 250ML threshold also applies to the sump to OFWS transfer. Increase total irrigated area to 500ha.
Variable costs Pumping costs: OFWS to field: $30/ML Sump to OFWS: $15/ML Bore to OFWS: $90/ML Additional annual fixed costs- recycled water Labour: $50 000

32
4 202ha total Benchmark dryland 1 Summer crop: 101ha/yr cotton 101ha/yr fallow Winter crop: 202ha/yr fallow Benchmark dryland 2 Summer crop: 101ha/yr cotton 101ha/yr fallow Winter crop: 101ha/yr wheat 101ha/yr fallow Recycled water Summer crop: 101ha/yr cotton 101ha/yr fallow Winter crop: 101ha/yr chickpea 101ha/yr fallow
C--- CW-- CCp--
Benchmark dryland 1 Cotton: Sown Oct 1-Nov 15 after 30mm rain in 4 days. 8 plants/m2 (solid). N fertilise to 200kgN/ha. Okra Si14 cultivar. Benchmark dryland 2 Cotton: Sown Oct 1-Nov 30 after 30mm rain in 4 days. 8 plants/m2 (solid). N fertilise to 200kgN/ha. Okra Si14 cultivar. Wheat: Sown May 15- July 15 after 40mm rain in 7 days and 40mm ESW. 100 plants/m2. N fertilise to 80kgN/ha. Janz cultivar. ** ‘Must sow’ and opportunity sowing options. Recycled water Cotton: Sown Oct 10. 12 plants/m2 (solid). N fertilise to 250kgN/ha. Okra Si14 cultivar. Pre-irrigation during winter fallow + maximum of 3 in-crop irrigations for cotton based on a 60mm deficit to 90cm. Chickpea: Sown June 15. 20 plants/m2. at 1m row spacing. Amethyst cultivar. Maximum of 3 in-crop irrigations for based on a 60mm deficit to 90cm. Soil: Norillee (323 PASW) Climate: Pittsworth
Recycled water 500ML of recycled water delivered per annum at 1.4ML per day, split across two storages. 2 x 150ML hillside storages (one per ‘paddock’) with no sump.
Variable costs Pumping costs: OFWS to field: $0/ML Tailwater recycling: $15/ML Additional annual fixed costs - recycled water Labour: $36 400 OFWS construction and pipes: $125,000 Annuity calculated for capital items over 15 years at 9%.

33
5 729ha total Benchmark Summer crop: 729ha/yr cotton Winter crop: 729ha/yr fallow Recycled water Summer crop: 729ha/yr cotton Winter crop: 729ha/yr fallow
C- C-
Benchmark / Recycled water Cotton: Sown Oct 1. 10 plants/m2 (solid). N fertilise to 200kgN/ha. Okra Si14 cultivar. Three irrigations based on a 60mm deficit to 90cm. Soil: Anchorfield (285 PASW) Climate: Dalby
Benchmark OFWS: 2200ML capacity. Sump: 180ML capacity. Sump-to-OFWS : 170 ML/day Catchment: 4300ha (KII 75) River: Set river allocation to 1500 ML (70% reliability) available from September 1 to Feb 15. The actual river allocation available each year is 1500ML multiplied by a factor derived from overland flow in the previous year (assuming a delay in the overland flow reaching the scheme. Maximum river pump rate of 96ML/day. **Nil bore Recycled water 1000ML recycled water received as 8.3ML every 3 days. Sump to OFWS and river transfer stops when capacity < 1500ML.
Variable costs Pumping costs: OFWS to field: $6/ML Sump to OFWS: $6/ML River to OFWS: $28/ML

34
6 769ha total Benchmark Summer crop: 256ha/yr cotton 256ha/yr maize 256ha/yr fallow Winter crop: 256ha/yr wheat 512ha/yr fallow Recycled water Summer crop: 512ha/yr cotton 256ha/yr maize Winter crop: 512ha/yr fallow 256ha/yr chickpea
C-MW-- C-CCpM-
Benchmark Cotton: Sown Oct 1. 13 plants/m2 (solid). N fertilise to 200kgN/ha. Okra Si14 cultivar. Three irrigations based on a 70mm deficit to 90cm. Wheat: Sown May 15. 100 plants/m2. N fertilise to 100kgN/ha. Janz cultivar. One irrigation based on a 70mm deficit to 90cm. Maize: Sown Oct 1. 6.5 plants/m2. N fertilise to 200kgN/ha. usa_18leaf cultivar. Four irrigations based on a 60mm deficit to 90cm. Recycled water Cotton: Sown Oct 1. 13 plants/m2 (solid). N fertilise to 200kgN/ha. Okra Si14 cultivar. Pre-irrigate during winter fallow leading up to cotton to minimize recycled water overflow + maximum of 3 in-crop irrigations based on a 70mm deficit to 90cm. Maize: Sown Dec 15. 6.5 plants/m2. N fertilise to 200kgN/ha. usa_18leaf cultivar. Four irrigations based on a 60mm deficit to 90cm. Chickpea: Sown June 15. 20 plants/m2. Nil fertilizer. Amethyst cultivar. Two irrigations based on a 60mm deficit to 90cm. Soil: Cecilvale (278 PASW). Climate: Dalby
Benchmark OFWS: 1180ML capacity. Sump: 120ML capacity. Sump-to-OFWS : 380 ML/day Catchment: 1837ha (KII 75) Bore: 860ML pumped in the lead-up to and during wheat, maize and cotton crops at 19ML/day. Carry-over for one year only. **Each of these elements divided in three and allocated to three separate ‘paddocks’. Recycled water 1000ML recycled water received as 8.3ML every 3 days and split equally across three storages. Increase combined OFWS capacity to 1680ML (+ 120ML sump). Sump-to-OFWS and bore transfer stops at 200ML in each OFWS. Otherwise bore can be pumped at any time throughout the year until the allocation is exhausted.
Variable costs Pumping costs: OFWS to field: $3/ML Sump to OFWS: $4/ML Bore to OFWS: $30/ML Additional annual fixed costs - recycled water Labour: $50 000 OFWS extension: $250 000

35
7 648ha total Benchmark Summer crop: 432ha/yr cotton 216ha/yr fallow Winter crop: 432ha fallow 216ha wheat Recycled water Summer crop: 432ha cotton 216ha maize Winter crop: 432ha fallow 216ha wheat
C-CW-- C-CWM-
Benchmark Cotton: Sown Oct 1. 13 plants/m2 (solid). N fertilise to 200kgN/ha. Okra Si14 cultivar. Tw o irrigations based on a 70mm deficit to 90cm. Wheat: A surrogate for canary grass. Sown June 15. 100 plants/m2. N fertilise to 100kgN/ha. Janz cultivar. One irrigation based on a 60mm deficit to 90cm. Recycled water Cotton: Sown Oct 1. 13 plants/m2 (solid). N fertilise to 200kgN/ha. Okra Si14 cultivar. Two irrigations based on a 60mm deficit to 90cm. Maize: Sown Dec 15. 6.5 plants/m2. N fertilise to 200kgN/ha. usa_18leaf cultivar. Three irrigations based on a 70mm deficit to 90cm. Wheat: A surrogate for canary grass. Sown June 15. 100 plants/m2. N fertilise to 100kgN/ha. Janz cultivar. Two irrigations based on a 60mm deficit to 90cm. Soil: Waco Climate: Dalby
Benchmark Catchment: 1736 (KII 75) OFWS: 950ML capacity. Sump: 150ML capacity. Sump-to-OFWS : 120 ML/day. Bore: 500ML pumped in the lead-up to and during wheat and cotton crops at max. rate of 72ML/day. No carry-over of bore allowed. **Each of these elements divided in three and allocated to three separate ‘paddocks’. Recycled water 500ML recycled water received as 4.1ML every 3 days and divided equally among the three OFWS’s. Sump-to-OFWS and bore transfer stops at 100ML in each OFWS. No date restriction on bore pumping.
Variable costs Pumping costs: OFWS to field: $10/ML Sump to OFWS: $10/ML Bore to OFWS: $45/ML Additional annual fixed costs - recycled water Labour: $23 400 Pipe: $25 000

36
8 1000ha total Benchmark Summer crop: 667ha/yr cotton 333ha/yr fallow Winter crop: 333ha/yr wheat 667ha/yr fallow Recycled water Summer crop: 667ha/yr cotton 333ha/yr fallow Winter crop: 333ha/yr wheat 667ha/yr fallow
C-CW-- C-CW--
Benchmark Cotton: Sown Oct 1. 10 plants/m2 (solid). N fertilise to 180kgN/ha. Okra Si14 cultivar. Pre-irrigation during winter fallow + maximum of 3 in-crop irrigations based on a 60mm deficit to 90cm. Wheat: Sown June 15. 100 plants/m2. N fertilise to 100kgN/ha. Janz cultivar. Two irrigations based on a 60mm deficit to 90cm. Recycled water As for benchmark but with an additional irrigation for the wheat. Increase N fertilizer threshold at planting to 200 kgN/ha for cotton and 150 kgN/ha for wheat. Soil: Mywybilla (308 PASW) Climate: Milmerran
Benchmark OFWS : 3500 ML capacity. Sump: 130ML capacity. Sump-to-OFWS : 708 ML/day. Catchment: 5375ha (KII 75) River: Maximum of 485ML per annum available from Sep 1 to Feb 15. This is based on 985ML (60% reliability) discounted by 500ML for broccoli irrigation. To this total (485ML) add 200ML for purchased Risk A irrigation water. The actual river allocation available each year is this 60% reliability figure (685ML) multiplied by a factor derived from overland flow in the previous year (assuming a delay in the overland flow reaching the scheme. Maximum river to OFWS pumping rate of 69 ML per day (800l/s) from Leslie Dam. **Nil bore **Each of these elements divided in three and allocated to three separate ‘paddocks’. Recycled water 1500ML recycled water received as 12.3ML every 3 days, split equally across three storages. Sump-to-OFWS and river transfer stops at an OFWS volume of 500ML in each storage.
Variable costs Pumping costs: OFWS to field: $7.50/ML Sump to OFWS: $7.50/ML Bore to OFWS: $7.50/ML River water charge: $29/ML Additional annual fixed costs - recycled water Avoided cost of off-farm water purchase: -$80 000

37
9 729ha total Benchmark Summer crop: 486ha/yr cotton 243ha/yr fallow Winter crop: 243ha/yr wheat 486ha/yr fallow Recycled water Summer crop: 648ha/yr cotton 324ha/yr fallow Winter crop: 324ha/yr wheat 648ha/yr fallow
C-CW-- C-CW--
Benchmark Cotton: Sown Oct 1. 10 plants/m2 (solid). N fertilise to 200kgN/ha. Okra Si14 cultivar. Three irrigations based on a 70mm deficit to 90cm. Wheat: Sown June 15. 100 plants/m2. N fertilizer to 150kgN/ha. Janz cultivar. Irrigate twice based on a 60mm deficit to 90cm. Recycled water Increase irrigation area by 600 acres or 243ha (total of 972ha). Pre-irrigate in fallow to reduce overflow. All else the same. Soil: Anchorfield (285 PASW) Climate: Milmerran
Benchmark OFWS : 1850 ML capacity. Sump: 60ML capacity. Sump-to-OFWS : 150 ML/day. Catchment: 1500ha (KII 75) Bore: 695 ML pumped in the lead-up to and during wheat and cotton crops at max. rate of 17ML/day. Has carry-over for one year. River: River Allocation is ~846ML in 70% of years. Use the same factors described above for Farm 5 to capture year to year variability in river water available. Set pumping period from September 1 to Feb 15, based on typical pumping/availability period for scheme, at max rate of 88 ML/day. Does not pump during the summer fallow. **Each of these elements divided in three and allocated to three separate ‘paddocks’. Recycled water 850ML recycled water received as 6.99ML every 3 days and divided equally among the three storages. Sump-to-OFWS, river and bore transfer stops at OFWS volume of 400ML in each storage. Retain date restrictions on pumping of bore and river.
Variable costs Pumping costs: OFWS to field: $3/ML Sump to OFWS: $7.50/ML River to OFWS: $7.50/ML Bore to OFWS: $22.25 Lateral flow irrigator operating cost: $20/ML Additional annual fixed costs - recycled water Labour: $7800 Insurance: $1000 Pump and lateral flow irrigator: $220,000 Land purchase/development: $900,000 Annuity calculated for capital items over 20 years at 9%.

38
10 271ha total 28ha dryland 243ha irrigated Benchmark dryland Summer crop 14ha/yr cotton 14ha/yr fallow Winter crop 14ha/yr wheat 14ha/yr fallow Benchmark irrigated Summer crop 163ha/yr cotton 80ha/yr maize Winter crop 80ha/yr chickpea 163ha/yr fallow Recycled water As for benchmark
CW-- C-CCpM- C-CCpM-
Benchmark dryland Cotton: Sown Oct 1-Nov 15 after 30mm rain in 4 days. 8 plants/m2 (single skip). N fertilise to 120kgN/ha. Okra Si14 cultivar. Wheat: Sown May 15-July 15 after 30mm rain in 7 days deficit to 90cm must be less than 50% of dul-ll to same depth. 100 plants/m2. Nil fertiliser. Janz cultivar. Benchmark irrigated / Recycled water Cotton: Sown Oct 1. 8 plants/m2 (solid). N fertilise to 200kgN/ha. Okra Si14 cultivar. Three irrigations based on a 60mm deficit to 90cm. Chickpea: Sown June15. 30 plants/m2. Nil N fertilizer. Amethyst cultivar. One irrigation based on a 60mm deficit to 90cm. Maize: Sown Dec 15. 6.5 plants/m2. N fertilise to 150kgN/ha. usa_18leaf cultivar. Three irrigations based on a 60mm deficit to 90cm. Soil: Cecilvale (278 PASW). Reduced dul below 90cm to account for reduced rooting depth on this site. Climate: Bowenville
Benchmark irrigated OFWS : 1300ML capacity. Sump: 15ML capacity. Sump-to-OFWS : 288 ML/day (12ML/hour). Catchment: 4300 ha (KII 75) Bore/river: Nil **Each of these elements divided in three and allocated to three separate ‘paddocks’. Recycled water 650ML recycled water received as 5.34ML every 3 days, divided equally among the three storages. Sump-to-OFWS stops at OFWS volume of 233ML in each storage.
Variable costs Pumping costs: OFWS to field: $5/ML Sump to OFWS: $3.75/ML

39
Table 2.2. Assumptions used in economic analysis common to all scenarios
Crop / Input etc Price Variable Cost
Cotton (rain fed) $455/bale $900/ha & $80/bale Cotton (irrigated) $485/bale $1215/ha & $80/bale Cotton seed $206/t Maize (rain fed) $180/t $200/ha Maize (irrigated) $180/t $200/ha Wheat (rain fed) PH $180/t $100/ha Wheat (irrigated) AH $150/t $120/ha APW $135/t PSW/Feed $120/t Soybean (irrigated) $ 330/t $318/ha Chickpea (irrigated) $421/t $218/ha Nitrogen $1/kg Recycled water price $0,100,150,200,250/ML Recycled water service fee $500/yr Interest rate 9% 2.3 Case study findings Results for each case study are discussed in the sections below. Supplementary information is also presented in Appendix A. 2.3.1. Farm 1 OFWS Water Balance / Irrigation Irrigation water in the benchmark design is accessed from overland flow only (Figure 2.1). Over the 45 year simulation period an average of 490ML/year of overland flow is pumped into the OFWS, which represents just 20% of the average annual catchment runoff (45 year average of 2478ML/year). This substantial bypass is not surprising given the large catchment size (11492ha) and a sump capacity of just 180ML. Hence, the majority of bypass occurs in association with large overland flow events which exceed the capacity of the sump. Given the comparatively small irrigation area of 162ha in relation to the size of the storage and catchment area, there is sufficient water available in most years to meet the crop demand. In the first recycled water scenario, the farmer receives 1000ML of recycled water over the course of each year and doubles his irrigation area to 324ha (Figure 2.2). All other management conditions remain unchanged. There is a substantial displacement of overland flow transfer, which now occurs in just 16 of the 45 years (averaging

40
56ML/year). Overflow increases substantially to an average of 123ML/year, reaching as much as 468ML in one year. This reflects the fact that the volume of recycled water received matches the capacity of the OFWS and that the irrigation demand from 324ha of irrigated cotton (under the configured management conditions) is well within the supply limitations. With this in mind it was decided to run a second recycled water scenario in which the irrigation area was trebled to 486ha and the OFWS capacity increased to 1800ML (Figure 2.3). As expected, this resulted in an increased irrigation demand (909ML/year to 1227ML/year), a decline in overflow from the OFWS (123ML/year to 0ML/year) and, an increase in overland flow transfer (56ML/year to 268ML/year) compared with recycled water scenario 1. Clearly there is potential to expand the irrigation area (and hence demand) further beyond that simulated in the second recycled water scenario.
Figure 2.1. OFWS water balance component totals over the 45 year simulation period for the benchmark scenario (ML/year).
Figure 2.2. OFWS water balance component totals over the 45 year simulation period for the recycled water 1 scenario (ML/year).
-1500
-1000
-500
0
500
1000
1500
1959
1961
1963
1965
1967
1969
1971
1973
1975
1977
1979
1981
1983
1985
1987
1989
1991
1993
1995
1997
1999
Vo
lum
e (M
L)
evaporation
rain
sump-ofws
overflow
irrigation
-2000
-1500
-1000
-500
0
500
1000
1500
2000
1959
1961
1963
1965
1967
1969
1971
1973
1975
1977
1979
1981
1983
1985
1987
1989
1991
1993
1995
1997
1999
Vol
ume
(ML) evaporation
rain
sump-ofws
overflow
recycled in
irrigation

41
Figure 2.3. OFWS water balance component totals over the 45 year simulation period for the recycled water 2 scenario (ML/year). Yield Long-term average dryland cotton yields were 5.1 bales/ha and ranged from 0.5 to 8.2 bales/ha. The conditions for planting a double crop of wheat (40mm rain in 7 days and ESW > 50mm) were satisfied in just 18 of the 45 years resulting in a yield range of 0.3 to 4.7 t/ha and an average of 1.7 t/ha. Average annual whole farm wheat production totals 588 tonnes. Irrigated benchmark cotton yields ranged from 5.6 to 13.1 bales/ha with an average of 9.3 bales/ha. There was a small change in cotton yields (bales/ha) with the transition to the two recycled water scenarios, although whole farm cotton production increased by an average of 1162 bales/annum in recycled water scenario 1, and by 2200 bales/annum in recycled water scenario 2 (relative to the total dryland + irrigated benchmark scenario) in response to the increased irrigated production area (Figures 2.4 and 2.5). Average annual whole farm wheat production under recycled water 1 scenario totals 451 tonnes and 313 tonnes under recycled water scenario 2.
Figure 2.4. 45 year distribution of whole farm cotton production (bales) showing production under the benchmark design and subsequent gains and losses under the recycled water 1 scenario.
-2500-2000-1500-1000
-5000
5001000
15002000
1959
1961
1963
1965
1967
1969
1971
1973
1975
1977
1979
1981
1983
1985
1987
1989
1991
1993
1995
1997
1999
Vol
ume
(ML) evaporation
rain
sump-ofws
overflow
recycled in
irrigation
0
1000
2000
3000
4000
5000
6000
7000
8000
1958
1960
1962
1964
1966
1968
1970
1972
1974
1976
1978
1980
1982
1984
1986
1988
1990
1992
1994
1996
1998
2000
Cot
ton
prod
uctio
n (b
ales
)
Recycled 1
Benchmark

42
Figure 2.5. 45 year distribution of whole farm cotton production (bales) showing production under the benchmark design and subsequent gains and losses under the recycled water 2 scenario. Salt / drainage / farm runoff Annual drainage under the benchmark irrigated design ranged from nil to 153mm with an average of 14mm. Annual runoff ranged from 16mm to 358mm with an average of 143mm. There is a negligible change in total runoff in the transition to the irrigated recycled water designs. Average annual drainage for the benchmark irrigated and recycled 1 scenarios are similar but drops to 7mm for recycled water scenario 2. All of the salt in the dryland scenario was leached from the root zone over the course of the simulation period. Note that salt additions from rainfall and runoff are assumed to be small and are ignored in the simulation (Table 2.3). At the commencement of the 45 year simulation period, a total of 51.8t TSS/ha was assumed to exist in the soil profile of the irrigated scenarios to a depth of 1.8m (Table 2.3). Salt addition through irrigation over the same period amounts to 64.9 t TSS/ha for the benchmark design. This increases to 100.8t TSS/ha and 91.9t TSS/ha for the recycled water 1 and recycled water 2 scenarios respectively, largely in response to higher salt concentration in the irrigation water (1000ppm compared with 640ppm for the irrigated benchmark scenario). Salt loss from the base of the root zone increased from 84.1t TSS/ha for the benchmark scenario to 103.7t TSS/ha for recycled water scenario 1 in response to an increase in salt concentration in the irrigation water (irrigation rate in ML/ha was virtually unchanged). Salt loss declined to 71.9t TSS/ha in recycled water 2 scenario in response to a decline in irrigation rate (as the available irrigation resource is spread over an increasingly larger area) and an associated decline in drainage from the base of the profile (Figures 2.6 to 2.8). The end result is that there is a net loss of salt from the root zone amounting to 19.2t TSS/ha for the benchmark scenario, a small net loss of 2.9t TSS/ha for recycled water scenario 1 and a net gain of 20t TSS/ha for recycled water scenario 2. Consideration of the average salinity level calculated across all root zone layers to a depth of 1.8m on January 1 of each year of the recycled water 2 simulation, gave a maximum salinity of 1.2dS/m toward the end of the simulation period. The maximum salinity in any one layer at that time was 3.8dS/m. The maximum whole profile average salinity level would not be expected to have an adverse effect on crop production (Brady and Weil, 1996).
-1000
0
1000
2000
3000
4000
5000
6000
7000
8000
1958
1960
1962
1964
1966
1968
1970
1972
1974
1976
1978
1980
1982
1984
1986
1988
1990
1992
1994
1996
1998
2000
Cot
ton
prod
uctio
n (b
ales
)
Recycled 2
Benchmark
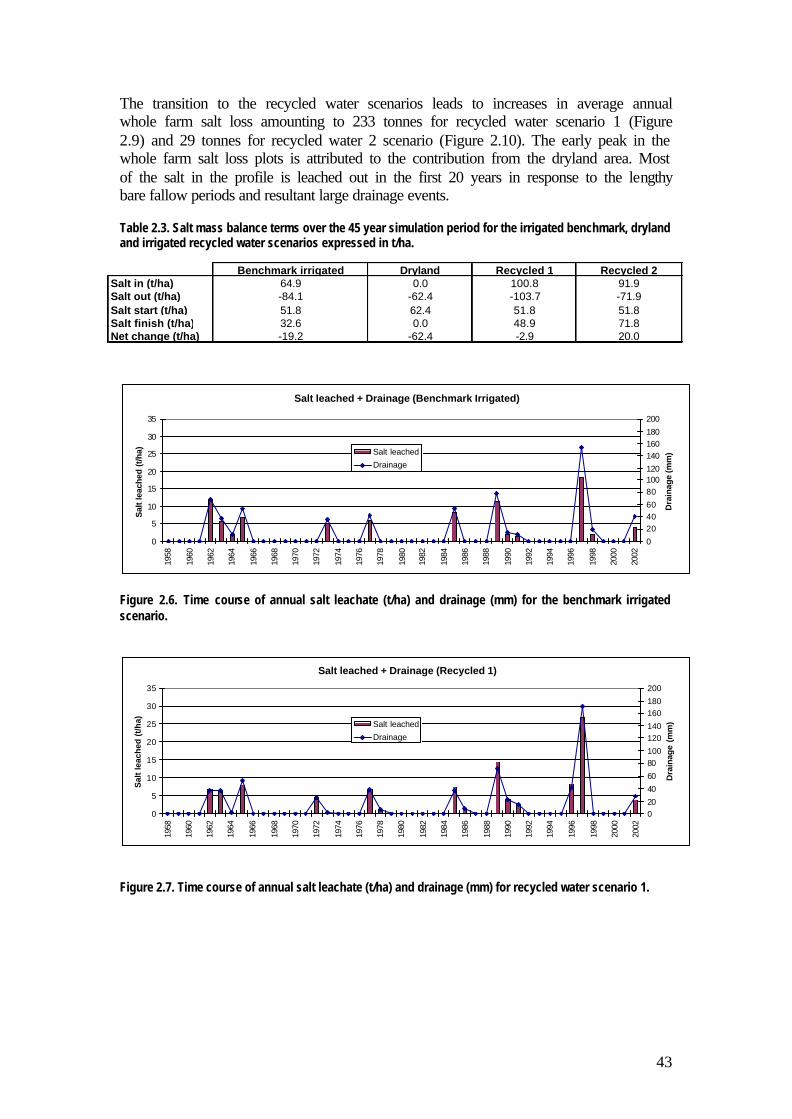
43
The transition to the recycled water scenarios leads to increases in average annual whole farm salt loss amounting to 233 tonnes for recycled water scenario 1 (Figure 2.9) and 29 tonnes for recycled water 2 scenario (Figure 2.10). The early peak in the whole farm salt loss plots is attributed to the contribution from the dryland area. Most of the salt in the profile is leached out in the first 20 years in response to the lengthy bare fallow periods and resultant large drainage events. Table 2.3. Salt mass balance terms over the 45 year simulation period for the irrigated benchmark, dryland and irrigated recycled water scenarios expressed in t/ha.
Figure 2.6. Time course of annual salt leachate (t/ha) and drainage (mm) for the benchmark irrigated scenario.
Figure 2.7. Time course of annual salt leachate (t/ha) and drainage (mm) for recycled water scenario 1.
Benchmark irrigated Dryland Recycled 1 Recycled 2Salt in (t/ha) 64.9 0.0 100.8 91.9Salt out (t/ha) -84.1 -62.4 -103.7 -71.9Salt start (t/ha) 51.8 62.4 51.8 51.8Salt finish (t/ha) 32.6 0.0 48.9 71.8Net change (t/ha) -19.2 -62.4 -2.9 20.0
Salt leached + Drainage (Benchmark Irrigated)
0
5
10
15
20
25
30
35
1958
1960
1962
1964
1966
1968
1970
1972
1974
1976
1978
1980
1982
1984
1986
1988
1990
1992
1994
1996
1998
2000
2002
Sal
t le
ache
d (t
/ha)
0
204060
80100120
140160180
200
Dra
inag
e (m
m)Salt leached
Drainage
Salt leached + Drainage (Recycled 1)
0
5
10
15
20
25
30
35
1958
1960
1962
1964
1966
1968
1970
1972
1974
1976
1978
1980
1982
1984
1986
1988
1990
1992
1994
1996
1998
2000
2002
Sal
t le
ach
ed (
t/h
a)
020
40
60
80100
120140
160180
200
Dra
inag
e (m
m)Salt leached
Drainage

44
Figure 2.8. Time course of annual salt leachate (t/ha) and drainage (mm) for recycled water scenario 2.
Figure 2.9. 45 year distribution of whole farm salt losses from the base of the root profile (tonnes) showing the contribution under the benchmark design and the subsequent increase/decrease under the recycled water 1 scenario.
Figure 2.10. 45 year distribution of whole farm salt losses from the base of the root profile (tonnes) showing the contribution under the benchmark design and the subsequent increase/decrease under the recycled water 2 scenario.
-3000
-1000
1000
3000
5000
7000
9000
11000
13000
15000
17000
1958
1960
1962
1964
1966
1968
1970
1972
1974
1976
1978
1980
1982
1984
1986
1988
1990
1992
1994
1996
1998
2000
2002
Sal
t lea
ched
(to
nn
es)
Recycled 1
Benchmark
-3000
-1000
1000
3000
5000
7000
9000
11000
13000
15000
17000
1958
1960
1962
1964
1966
1968
1970
1972
1974
1976
1978
1980
1982
1984
1986
1988
1990
1992
1994
1996
1998
2000
2002
Sal
t lea
ched
(to
nn
es)
Recycled 2
Benchmark
Salt leached + Drainage (Recycled 2)
0
5
10
15
20
25
30
35
1958
1960
1962
1964
1966
1968
1970
1972
1974
1976
1978
1980
1982
1984
1986
1988
1990
1992
1994
1996
1998
2000
2002
Sal
t le
ache
d (t
/ha)
0
2040
60
80100
120140
160180
200
Dra
inag
e (m
m)Salt leached
Drainage

45
Economic analysis On average, annual net cash returns were higher under the recycled water irrigated scenarios than the benchmark situation across the entire range of recycled water prices (Table 2.4a and b). For example, with a recycled water price of $150/ML, an average additional annual cash return of $214 050 could be expected under the first recycled water irrigation scenario, compared with the benchmark situation. On a $/ha basis, this amounts to $250/ha additional return each year. At this price, one ML of recycled water irrigation generates an average return of $214. The average gross return from one ML of recycled water irrigation was $364 (i.e. corresponding to a recycled water price of $0/ML). This represents the highest price that the farmer could afford to pay for the recycled water before it would become uneconomical change from the current system. Table 2.4a. Average additional annual net cash return ($) (recycled water scenario 1 – benchmark) for 5 recycled water prices. Recycled water Mean additional Mean additional Mean additional
price annual net cash annual net cash annual net cash ($) ($) ($/ha) ($/ML) 0 $ 364,050 $ 426 $ 364
100 $ 264,050 $ 306 $ 264 150 $ 214,050 $ 250 $ 214 200 $ 164,050 $ 192 $ 164 250 $ 114,050 $ 133 $ 114
Table 2.4b. Average additional annual net cash return ($) (recycled water scenario 2 – benchmark) for 5 recycled water prices. Recycled water Mean additional Mean additional Mean additional
price annual net cash annual net cash annual net cash ($) ($) ($/ha) ($/ML) 0 $ 630,338 $ 737 $ 630
100 $ 530,338 $ 620 $ 530 150 $ 480,338 $ 562 $ 480 200 $ 430,338 $ 503 $ 430 250 $ 380,338 $ 445 $ 380
There is however, considerable variability in expected returns, and in 15 of the 45years, net cash return is lower for the first recycled-water irrigated scenario than for the benchmark situation (Fig. 2.11), corresponding to the years of lower cotton yield. For the second recycled-water irrigated scenario, net cash return is lower than for the benchmark scenario in only 3 years. The wide range on the downside (up to -$754 307) is attributable to the poor yield of a recycled-water irrigated cotton crop (2.5bales/ha) in one year. In a realistic situation, the crop may be managed differently to avoid this situation occurring. There is little difference in gross margin ($/ha) between the ‘benchmark’ irrigated cotton and the recycled-water irrigated cotton crops (Table 2.5). The higher annual net cash returns for the recycled-water irrigated scenarios are attributable to the increases in area producing irrigated cotton.

46
Table 2.5. Average gross margins ($/ha) for crops in the benchmark and recycled water irrigated scenario. Crop Benchmark $/ha Recycled 1 $/ha Recycled 2 $/ha D'land wheat $ 45 $ 45 $ 45 D'land cotton $ 1,275 $ 1,275 $ 1,275 Irrig cotton $ 2,947 $ 3,059 $ 2,946
-$1,000,000
-$500,000
$-
$500,000
$1,000,000
$1,500,000
$2,000,000
$2,500,000
B'mark
Recycl
ed 1
Recycl
ed 2
Differen
ce 1
Differen
ce 2
Irrigation scenario
Ann
ual n
et c
ash
retu
rn
MeanUpperLowerMedian
Figure 2.11. Difference in distribution of average additional annual net cash flow for benchmark and recycled-water irrigated scenarios (recycled water price $150/ML). The bar corresponds to the mean, the ‘whisker’ covers the range from minimum to maximum and includes the median. Average returns are higher for the second recycled-water irrigation scenario – which uses the same annual quantity of recycled water, but also captures larger volumes of overland flow as a result of the storage extension. The returns from the increased irrigation area clearly outweigh the additional fixed costs (storage extension and purchase of additional lateral flow irrigators) incurred in order to receive the recycled water supply (Figure 2.12).

47
-$500,000
$-
$500,000
$1,000,000
$1,500,000
$2,000,000
$2,500,000
B'mark Recycled 1 Recycled 2
Irrigation scenario
Ann
ual n
et c
ash
retu
rn
Irrig O'headsIrrig cottonD'land cottonD'land wheat
Figure 2.12. Contribution to average annual net cash return from crops under benchmark and recycled water irrigated scenarios (recycled water price $150/ML). 2.3.2 Farm 2 OFWS Water Balance / Irrigation In the benchmark farm design, irrigation water is accessed from two principal sources, overland flow and bore water (Figure 2.13). A substantial portion (45 year average of 269ML/year or 97% of the allocation) of the annual bore allocation (276ML) is pumped each year. Note that in some years it appears that the total bore transfer is greater than the allocation despite the fact that this farmer does not have the option of carrying unused water over to the following year. This eventuates in the model because the totals presented are over a calendar year from January 1 to December 31 whereas the bore allocation period is from July 1 to June 30. As expected, the year to year variability in overland flow transfer is substantial, ranging from 0ML/year to 318ML/year (average 119ML/year) in response to the actual volume of overland flow generated each year and the residual volume in the OFWS at the time of the overland flow event (and hence the ability of the OFWS to receive overland flow). The volume of overland flow pumped to the OFWS represents just 32% of the total catchment runoff (45 year average of 372ML/year) with the remainder bypassing the sump. The extent of bypass can be attributed to a number of factors. Firstly, the OFWS capacity of 400ML is relatively small (compared to the other farms and in relation to the catchment size). Secondly, the model has been configured such that all bore water is pumped into the OFWS prior to its use for irrigation, whereas in reality the farmer does some direct irrigation from his bores, thus freeing up capacity in the storage to receive additional overland flow. The contribution from direct rainfall capture (21ML/year) by the OFWS is more than offset by the evaporative losses from the storage (31ML/year). Overflow losses are

48
small and attributed to direct rainfall capture when the OFWS is already full to capacity. The pumping of overland flow stops under these conditions and is lost to the farm as bypass. The introduction of 380ML/year of recycled water results in the displacement of bore and overland flow water, previously pumped in the benchmark design (Figure 2.14). Bore transfer drops by an average of ~36% (to 171ML) and overland flow transfer by ~24% (to 90ML). There is a substantial increase in overflow from the storage from an average of 1ML per year in the benchmark scenario to 57ML per year for the recycled water scenario. This reflects the fact that the annual recycled water volume is almost equivalent to the storage capacity and that the farmer must receive the recycled water even if there is insufficient residual OFWS capacity to do so. The potential for overflow is further exacerbated by the winter fallow, during which there is no demand for irrigation water. Future analyses might consider the impact of reducing the OFWS threshold volume for bore and overland flow transfer from 200ML to a smaller amount. This might be expected to reduce overflow and reduce reliance on bore and overland flow sources. Other options might be to increase storage capacity, increase cropping intensity or increase the irrigated cropping area.
Figure 2.13. OFWS water balance component totals over the 45 year simulation period for the benchmark scenario (ML/year).
-800-600
-400-200
0
200400
600800
1959
1961
1963
1965
1967
1969
1971
1973
1975
1977
1979
1981
1983
1985
1987
1989
1991
1993
1995
1997
1999
Vol
ume
(ML) bore
evaporation
rain
sump-ofws
overflow
irrigation

49
Figure 2.14. OFWS water balance component totals over the 45 year simulation period for the recycled water scenario (ML/year). Yield Benchmark dryland cotton yields over the 45 year simulation period range from 3.3 to 11.4 bales/ha with an average of 6.4 bales/ha. This healthy rainfed result can be attributed to the long fallow which precedes the cotton crop. The conditions for planting a double crop of wheat (20mm rain in 7 days) were satisfied in just 20 of the 45 years resulting in a yield range of 0.06 t/ha to 3.0 t/ha and an average of 1.1 t/ha. Average annual whole farm wheat production totals 56 tonnes. Cotton yields in the irrigated benchmark scenario ranged from 4.7 to 10.4 bales/ha with an average of 7.3 bales/ha. The shift from the irrigated benchmark design to the recycled water design involved the receipt of 380ML/year of recycled water, an increase in irrigated area from 101ha to 152ha and subsequent decline in dryland area. There was a negligible yield change associated with the shift to the recycled water scenario. However, whole farm production increased by an average of 158 bales over the 45 year simulation period (Figure 2.15).
Figure 2.15. 45 year distribution of whole farm cotton production (bales) showing production under the benchmark design (dryland + irrigated) and subsequent gains under the recycled water scenario (dryland + irrigated).
-1500
-1000
-500
0
500
1000
1959
1961
1963
1965
1967
1969
1971
1973
1975
1977
1979
1981
1983
1985
1987
1989
1991
1993
1995
1997
1999
Vol
ume
(ML) bore
evaporation
rain
sump-ofws
overflow
recycled in
irrigation
0
200
400
600
800
1000
1200
1400
1600
1800
1959
1961
1963
1965
1967
1969
1971
1973
1975
1977
1979
1981
1983
1985
1987
1989
1991
1993
1995
1997
1999
2001
Cot
ton
prod
uctio
n (b
ales
)
Recycled
Benchmark

50
Average annual whole farm wheat production under the recycled water scenario totals 28 tonnes. Salt / drainage / farm runoff Annual drainage under the benchmark irrigated design ranged from nil to 203mm with an average of 73mm. Annual runoff ranged from 1mm to 195mm with an average of 61mm. In the absence of any significant change in yield or irrigation application rate, the drainage and runoff figures for the recycled water design were similar to those for the benchmark design. At the commencement of the 45 year simulation, a total of 16.6 t TSS/ha was assumed to exist in the soil profile to a depth of 1.8m for the irrigated benchmark and irrigated recycled water scenarios (Table 2.6). Salt addition through irrigation over the same period amounts to 84.8 t TSS/ha for the benchmark scenario and 133.2 t TSS/ha for the recycled water scenario. The larger amount for the recycled water scenario arises from a higher irrigation salt concentration (1000ppm compared with 640ppm for the irrigated benchmark scenario). Salt leached from the base of the root zone is also larger under the irrigated recycled water scenario (122.5t TSS/ha compared with 84.0t TSS/ha for the irrigated benchmark design). Over the 45 year duration of the simulation, all of the salt in the dryland scenario was leached from the root zone. Note that salt additions from rainfall and runoff are assumed to be small and are ignored in the simulation. In each of the irrigated scenarios there is a small net gain of salt in the root zone amounting to 0.8 t TSS/ha for the benchmark scenario and 10.6t TSS/ha for the recycled water scenario. Consideration of the average salinity level calculated across all root zone layers to a depth of 1.8m on January 1 of each year of the recycled water simulation, gave a maximum salinity of 0.40dS/m toward the end of the simulation period. The maximum salinity in any one layer in this same year was 0.75dS/m. These levels of salinity are unlikely to have any adverse effect on crop production (Brady and Weil, 1996). Table 2.6. Salt mass balance terms over the 45 year simulation period for the irrigated benchmark, dryland and irrigated recycled water scenarios expressed in t/ha.
The relatively small long-term change in net root zone salt content and the relatively constant salt loss per unit drainage (Figure 2.16 and 2.17) suggests that the salt balance is close to equilibrium throughout the simulation period of both scenarios. The average annual gain in whole farm salt loss under the recycled water scenario is 159 tonnes (Figure 2.18). The early peak in the whole farm salt loss plot (Figure 2.18) is attributed to the contribution from the dryland area. Most of the salt in the profile is leached out in the first 20 years in response to the lengthy bare fallow periods and resultant large drainage events.
Irrigated benchmark Dryland RecycledSalt in (t/ha) 84.8 0.0 133.2Salt out (t/ha) -84.0 -62.4 -122.5Salt start (t/ha) 16.6 62.4 16.6Salt finish (t/ha) 17.3 0.0 27.2Net change (t/ha) 0.8 -62.4 10.6

51
Figure 2.16. Time course of annual salt leachate (t/ha) and drainage (mm) for the benchmark irrigated scenario.
Figure 2.17. Time course of annual salt leachate (t/ha) and drainage (mm) for the recycled water scenario.
Figure 2.18. 45 year distribution of whole farm salt losses from the base of the root profile (tonnes) showing the contribution under the benchmark design and the subsequent increase/decrease under the recycled water scenario. Sensitivity analysis In order to explore the sensitivity of key output variables to changes in the farm design, selected factors including catchment area, irrigation water salt concentration, the recycled water delivery strategy, OFWS liner permeability and the irrigation
Salt leached + Drainage (Benchmark Irrigated)
0
1
2
3
4
5
6
7
8
9
1958
1960
1962
1964
1966
1968
1970
1972
1974
1976
1978
1980
1982
1984
1986
1988
1990
1992
1994
1996
1998
2000
2002
Sal
t le
ache
d (t
/ha)
0
50
100
150
200
250
Dra
inag
e (m
m)Salt leached
Drainage
Salt leached + Drainage (Recycled)
0
1
2
3
4
5
6
7
8
9
1958
1960
1962
1964
1966
1968
1970
1972
1974
1976
1978
1980
1982
1984
1986
1988
1990
1992
1994
1996
1998
2000
2002
Sal
t lea
ched
(t/h
a)
0
50
100
150
200
250
Dra
inag
e (m
m)Salt leached
Drainage
-1500
-1000
-500
0
500
1000
1500
2000
2500
1958
1960
1962
1964
1966
1968
1970
1972
1974
1976
1978
1980
1982
1984
1986
1988
1990
1992
1994
1996
1998
2000
2002
Sal
t le
ache
d (t
onne
s)
Recycled
Benchmark

52
application efficiency were varied. The impact of these changes is expressed as a percentage change in the 45 year average for the original recycled water scenario (referred to as the ‘baseline’) (Table 2.7). Confining the receipt of recycled water to a 200 day period from day 100 to day 300 (Scenario ‘Delivery 2’) resulted in more bore and overland flow transfer to the OFWS in response to the 165 day period when there is no recycled water inflow and hence more residual OFWS capacity to receive these other sources of water. Not surprisingly, however, when the recycled water does start arriving there is less residual capacity for recycled water and more overflow occurs. Moreover, the recycled water is arriving during a period when there is little or no demand for irrigation water, exacerbating overflow loss. In the ‘Delivery 1’ scenario, recycled water arrived throughout the year but in larger volumes (22ML) less often (21 days) compared to the baseline scenario. The impact of this change on the selected variables is negligible. Increasing the catchment size by 25% (‘Catchment 2’ scenario) resulted in a small increase in bypass (14.3%) and a minor displacement of bore transfer (2.1%). Decreasing the catchment size by 25% (‘Catchment 1’ scenario) had an opposite impact with overland flow transfer decreasing by 3.4%, and bore transfer increasing by 2.5%. As with all scenarios, the impact on long-term cotton yield was negligible (<1%). The reduction of application efficiency to 60% (‘Efficiency 1’ scenario) and 70% (‘Efficiency 2’ scenario) not surprisingly resulted in increases in applied irrigation (30% and 14%), bore transfer (158% and 72%) and overland flow transfer (25% and 10%). Salt loss (7% and 1%) and drainage (12% and 3%) decreased in response to the reduction in the effective irrigation volume. There were small reductions in overflow and bypass. Increasing the salt concentration in the irrigation water to 3000ppm and 5000ppm had significant impacts on the average annual salt leachate term (t/ha/annum), which increased by 147% and 295% respectively. There was a net increase of 39.3 t TSS/ha in the whole profile salt content for the baseline scenario over the course of the 45 year simulation period. Similarly, there were increases in whole profile salt content of 151 and 261 t TSS/ha, respectively. The corresponding whole profile salinity values recorded late in the simulation period were 2.1dS/m and 3.5dS/m, both of which might be expected to have adverse effects on the production of some crops, in particular salt sensitive crops such as maize (Brady and Weil, 1996). Increases in the permeability of the OFWS liner from 0 m/day in the baseline scenario to 0.00004 m/day (‘Seep 1’ scenario) and to 0.0005 m/day (‘Seep 2’ scenario) had a negligible effect on all model outputs. These permeability values cover a range of fine grained (clay) OFWS lining materials (Horton and Jobling 1992).

53
Table 2.7. Change in selected output variables to modifications in the recycled water delivery strategy, catchment size, irrigation application efficiency and irrigation water salt concentration. The changes are expressed as percent increase or decrease of the 45 year average figure for the baseline recycled water scenario.
Economic analysis On average, annual net cash return was higher under the recycled water irrigated scenario than the benchmark situation up to a recycled water prices of $163/ML. For a recycled water price of $150/ML, an average additional annual cash return of $4 950 could be expected under the recycled water irrigation scenario, compared with the benchmark. On a $/ha basis, this amounts to $25/ha additional return each year. At this price one ML of recycled water irrigation generates an average return of $13. The average gross return from one ML of recycled water irrigation was $163 (i.e. corresponding to a recycled water price of $0/ML). This price represents the most the farmer could pay for the water, on average, for the given set of crop price assumptions, for the recycled water scenario to be economically more attractive than the current situation. Table 2.8. Average additional annual net cash return ($) (recycled water –benchmark) for 5 recycled water prices.
Recycled water Mean additional Mean additional Mean additional price annual net cash annual net cash annual net cash
($) ($) ($/ha) ($/ML) 0 $ 61,950 $ 307 $ 163
100 $ 23,950 $ 119 $ 63 150 $ 4,950 $ 25 $ 13 200 -$ 14,050 -$ 70 -$ 37 250 -$ 33,050 -$ 164 -$ 87
Figure 2.19 shows that average annual returns from the recycled-water irrigated scenario in some years are less than those associated with the benchmark situation. This occurred in years of the lower cotton yields and when there was little difference between the benchmark and recycled water yields.
Baseline Delivery 1 Delivery 2 Catchment 1 Catchment 2 Efficiency 1 Efficiency 2 Salt 1 Salt 2 Seep 1 Seep 2Cotton yield 7.5 bales/ha 0.0 0.6 0.0 0.1 0.1 1.0 0.0 0.0 0.0 0.0Sump to OFWS 67.3 ML 0.7 27.6 -3.4 2.7 25.1 10.0 0.0 0.0 0.0 -0.1Bypass 331 ML -0.1 -2.7 -28.1 14.3 -5.4 -1.7 0.0 0.0 0.0 0.0Overflow 59.9 ML 3.9 114.4 -2.1 1.8 -7.2 -5.4 0.0 0.0 -0.1 0.0Bore transfer 70.7 ML 2.0 77.1 2.5 -2.1 158.0 71.7 0.0 0.0 0.0 0.2OFWS irrigation 429 ML 0.0 -1.6 0.0 -0.1 29.9 13.5 0.0 0.0 0.0 0.0Salt leached 1.42 t/ha/year -0.2 -3.4 0.0 -0.1 -6.9 -0.8 147.4 294.8 0.0 0.0Drainage 22.4 mm 0.4 -6.5 -0.5 -2.3 -11.7 -3.3 0.0 0.0 0.0 0.0Catchment runoff 380.6 ML 0.0 0.0 -25.0 13.1 0.0 0.0 0.0 0.0 0.0 0.0
Delivery 1 : 380ML/annum received as 22ML every 21 daysDelivery 2 : 380ML/annum received as 5.7ML every 3 days from day 100 to day 300Catchment 1 : Decrease catchment area by 25% to 975ha (from 1300ha)Catchment 2 : Increase catchment area by 25% to 1625ha (from 1300ha)Efficiency 1 : Reduce application efficiency to 60% (from 80%)Efficiency 2 : Reduce application efficiency to 70% (from 80%)Salt 1 : Increase salt concentration in irrigation water to 3000ppm (from 1000ppm)Salt 2 : Increase salt concentration in irrigation water to 5000ppm (from 1000ppm)Seep 1 : Increase permeability of OFWS lining from 0 m/day to 0.00004m/day Seep 2 : Increase permeability of OFWS lining from 0 m/day to 0.0005m/day

54
-$200,000
-$100,000
$-
$100,000
$200,000
$300,000
$400,000
$500,000
$600,000
B'mark Recycled Difference 1
Irrigation scenario
Ann
ual n
et c
ash
retu
rn
MeanUpperLowerMedian
Figure 2.19. Difference in distribution of average additional annual net cash flow for benchmark and recycled water irrigated scenarios (recycled water price $150/ML). The bar corresponds to the mean, the ‘whisker’ covers the range from minimum to maximum and includes the median. Although average yields were the same under both irrigated scenarios, the average cotton gross margin for the recycled water irrigated crop ($2 022/ha) was slightly higher than the benchmark irrigated cotton gross margin ($1 938/ha), due to the reduction in the pumping costs from bore (Table 2.9). The average wheat gross margins appears low because it was the average of all years of the simulated wheat yields and gross margins, and wheat is not planted in every year. Based only on years when wheat was planted the average gross margin increases to $19/ha. In many years, the low wheat yields result in negative wheat returns. Table 2.9. Average gross margins ($/ha) for crops in the benchmark and recycled water irrigated scenario. Crop Benchmark $/ha Recycled $/ha D'land wheat $ 8 $ 8 D'land cotton $ 1,910 $ 1,910 Irrig cotton $ 1,938 $ 2,022 Overall, on average, the additional returns from expanding the area of irrigated cotton outweighed the additional fixed costs associated with irrigating with recycled water (Fig. 2.20).

55
-$100,000
$-
$100,000
$200,000
$300,000
$400,000
$500,000
$600,000
B'mark Recycled
Irrigation scenario
Ann
ual n
et c
ash
retu
rn
Irrig O'headsIrrig cottonD'land cottonD'land wheat
Figure 2.20. Contribution to average annual net cash return from crops under benchmark and recycled water irrigated scenarios (recycled water price $150/ML). 2.3.3 Farm 3 OFWS Water Balance and Irrigation The principal source of irrigation water is from bores with an average of 707ML pumped each year (the annual bore allocation is 708ML/year) (Figure 2.21) The other main source of water is from overland flow, with an average of 358ML pumped each year. This overland flow transfer volume represents about 17% of the average annual catchment runoff (45 year average of 2142ML/year), with the remainder bypassing the sump. This large bypass figure is the consequence of the large catchment area associated with this property (10000ha), generating substantial overland flow events that often exceed the sump to OFWS pumping capacity. The shift to the recycled water scenario involves the receipt of an additional 1000ML/year of recycled water (Figure 2.22). Coupled with this is an increase in irrigation demand associated with the replacement of the winter fallow with another irrigated wheat crop (thus increasing the cropping intensity to 100%), the potential for two irrigations on each wheat crop and, an overall increase in irrigated area from 300ha to 500ha. In response to this increased demand, the average total irrigation volume pumped from the OFWS increases to 2005ML/year, with a little over half of this sourced from recycled water and the residual from bore and overland flow. The average bore transfer total remains much the same at 708ML/year, which is the maximum that can be pumped in any one year. There is a decrease in the average annual overland flow transfer to 305ML. Average overflow losses are small for both the benchmark and recycled water scenarios, however in the latter case overflow is as much as 74ML in one year. Nevertheless, further gains in water capture might be

56
possible through the removal or lessening of the sump to OFWS pumping restriction (i.e. OFWS volume must be less than 250ML). Better utilization of the overland flow resource might be achievable through increased pumping and storage (both sump and OFWS) capacity.
Figure 2.21. OFWS water balance component totals over the 45 year simulation period for the benchmark scenario (ML/year).
Figure 2.22 OFWS water balance component totals over the 45 year simulation period for the recycled water scenario (ML/year). Yield Dryland maize yields over the 45 year simulation period ranged from 2.7 t/ha to 9.2 t/ha with an average of 6.0 t/ha. In this case study, wheat was double cropped in every year of the simulation. Sowing occurred either upon receiving 20mm rain in 3 days within the planting window from May 1 to June 25 or, if these conditions were not met, at the end of this period irrespective of soil water status (i.e. a ‘must sow’ condition). As expected, wheat yields were highly variable ranging from 0.7 t/ha to 8.2 t/ha with an average of 2.7 t/ha. The inclusion of long fallows preceding both the wheat and maize crops clearly benefited these dryland yields. Irrigated benchmark maize yields ranged from 6.0 to 11.6 t/ha with an average of 10.0 t/ha. Wheat yields ranged from 0.3 to 3.4 t/ha with an average of 1.9 t/ha. The long-term average soybean yield was 2.9 t/ha, ranging from 2.1 to 3.7 t/ha. The shift from the irrigated benchmark design to the recycled water design resulted in a ~9% decrease in the long-term average maize yield (to 9.1 t/ha) and a ~10% reduction in soybean yield (to 2.6 t/ha). These declines are in response to a drop in the volume of applied irrigation water of 1.0ML/ha for maize and 1.2 ML/ha for soybean.
-2000
-1500-1000
-5000
50010001500
2000
1960
1962
1964
1966
1968
1970
1972
1974
1976
1978
1980
1982
1984
1986
1988
1990
1992
1994
1996
1998
2000
Vo
lum
e (M
L)
evaporation
rain
sump-ofws
bore in
overflow
irrigation
-4000
-3000
-2000
-1000
0
1000
2000
3000
1960
1962
1964
1966
1968
1970
1972
1974
1976
1978
1980
1982
1984
1986
1988
1990
1992
1994
1996
1998
2000
Vo
lum
e (M
L) recycled in
evaporation
rain
sump-ofws
bore in
overflow
irrigation

57
Substantial yield gains were made with wheat in response to irrigation under the recycled water scenario with the long-term average increasing from 1.9 t/ha to 4.5 t/ha. Across the whole farm, maize production increased by an average of 405 tonnes/annum (Figure 2.23), soybean by an average of 220 tonnes (Figure 2.24) and, wheat by 625 tonnes (Figure 2.25).
Figure 2.23. 45 year distribution of whole farm maize production (tonnes) showing production under the benchmark design (dryland + irrigated) and subsequent gains under the recycled water scenario.
Figure 2.24. 45 year distribution of whole farm soybean production (tonnes) showing production under the benchmark design (dryland + irrigated) and subsequent gains under the recycled water scenario.
-2000
-1000
0
1000
2000
3000
4000
5000
1958
1960
1962
1964
1966
1968
1970
1972
1974
1976
1978
1980
1982
1984
1986
1988
1990
1992
1994
1996
1998
2000
Mai
ze p
rod
uct
ion
(to
nn
es)
Recycled
Benchmark
-200
0
200
400
600
800
1000
1958
1960
1962
1964
1966
1968
1970
1972
1974
1976
1978
1980
1982
1984
1986
1988
1990
1992
1994
1996
1998
2000
So
ybea
n p
rod
uct
ion
(to
nn
es)
Recycled
Benchmark

58
Figure 2.25. 45 year distribution of whole farm wheat production (tonnes) showing production under the benchmark design (dryland + irrigated) and subsequent gains under the recycled water scenario. Salt / drainage / farm runoff Annual drainage under the benchmark irrigated design ranged from nil to 362mm with an average of 109mm. Annual runoff ranged from 1mm to 183mm with an average of 48mm. The transition to the recycled water design resulted in decreases in both average drainage (to 65mm/year) and average farm runoff (to 39mm/year). The drop in drainage can be attributed to an increase in cropping intensity and hence water extraction from the root zone. The small drop in average runoff is presumably due to the interaction of the summer dominant rainfall pattern and the decline in irrigation applied to the summer crops. At the commencement of the 45 year benchmark irrigated and recycled water simulations, a total of 12.1 t TSS/ha was assumed to exist in the soil profile to a depth of 1.8m. The dryland portion of the farm has 46.1 t TSS/ha (Table 2.10). Salt addition through irrigation over the same period amounts to 78.7t TSS/ha for the benchmark scenario and 141.3t TSS/ha for the recycled water scenario. The larger amount for the recycled water scenario arises from the larger salt concentration in the irrigation water. Salt leached from the base of the root zone is also larger under the recycled water scenario (117.7t TSS/ha compared with 75.2t TSS/ha for the irrigated benchmark design). Over the 45 year duration of the simulation, all of the salt in the dryland scenario was leached from the root zone. Note that salt additions from rainfall and runoff are assumed to be small and are ignored in the simulation. In both the benchmark irrigated and recycled water designs there is a net gain of salt in the root zone amounting to 3.4t TSS/ha for the irrigated benchmark scenario and 23.6t TSS/ha for the recycled water scenario. Consideration of the average salinity level calculated across all root zone layers to a depth of 1.8m on January 1 of each year of the recycled water simulation, gave a maximum salinity of 0.55dS/m in the final year of the simulation. The maximum salinity in any one layer in this same year was 1.37dS/m. These levels of salinity are unlikely to have any adverse effect on crop production (Brady and Weil, 1996).
-1000
-500
0
500
1000
1500
2000
2500
3000
3500
1959
1961
1963
1965
1967
1969
1971
1973
1975
1977
1979
1981
1983
1985
1987
1989
1991
1993
1995
1997
1999
2001
Wh
eat
pro
du
ctio
n (
ton
nes
)
Recycled
Benchmark

59
Table 2.10. Salt mass balance terms over the 45 year simulation period for the irrigated benchmark, dryland and recycled water scenarios expressed in t/ha.
The small long-term change in net root zone salt content and the relatively consistent salt loss per unit drainage in the benchmark irrigated scenario suggests that the salt balance is close to equilibrium throughout the simulation period. In contrast, the substantial long-term gain in net root zone salt content for the recycled water scenario indicates that the salt balance is not always in equilibrium. Salt loss per unit drainage increases over the early years of the simulation in response to the larger amount of salt coming into the profile (Figure 2.27). Eventually it appears that some kind of steady state is being approached where salt loss through drainage approximates salt input from irrigation. The average annual gain in whole farm salt loss under the recycled water scenario is 577 tonnes. The early peak in the whole farm salt loss plot (Figure 2.28) is attributed to the contribution from the dryland area. Most of the salt in the profile is leached out in the first 15 years in response to the lengthy bare fallow periods and resultant large drainage events.
Figure 2.26. Time course of annual salt leachate (t/ha) and drainage (mm) for the benchmark irrigated scenario.
Figure 2.27. Time course of annual salt leachate (t/ha) and drainage (mm) for the recycled water scenario.
Salt leached + Drainage (Benchmark irrigated)
0
2
46
8
10
1214
16
18
1958
1960
1962
1964
1966
1968
1970
1972
1974
1976
1978
1980
1982
1984
1986
1988
1990
1992
1994
1996
1998
2000
2002
Sal
t lea
ched
(t/h
a)
050100150200250300350400450500
Dra
inag
e (m
m)Salt leached
Drainage
Salt leached + Drainage (Recycled)
0
2
4
6
8
10
12
14
16
18
1958
1960
1962
1964
1966
1968
1970
1972
1974
1976
1978
1980
1982
1984
1986
1988
1990
1992
1994
1996
1998
2000
2002
Sal
t le
ache
d (t
/ha)
050100150200250300350400450500
Dra
inag
e (m
m)Salt leached
Drainage
Benchmark irrigated Dryland RecycledSalt in (t/ha) 78.7 0.0 141.3Salt out (t/ha) -75.2 -46.1 -117.7Salt start (t/ha) 12.1 46.1 12.1Salt finish (t/ha) 15.6 0.0 35.8Net change (t/ha) 3.4 -46.1 23.6

60
Figure 2.28. 45 year distribution of whole farm salt losses from the base of the root profile (tonnes) showing the contribution under the benchmark design (dryland + irrigated) and the subsequent increase/decrease under the recycled water scenario. Economic analysis On average, annual net cash returns are higher under the recycled water irrigated scenario than the benchmark situation up to a $131/ML recycled water price (Table 2.11). This corresponds to the average gross return from a ML of recycled water (i.e. a recycled water price of $0/ML). For a recycled water price of $150/ML, an average additional annual cash return of -$18 514 could be expected under the recycled water irrigation scenario, compared with the benchmark situation. On a $/ha basis, this amounts to -$23/ha additional return each year. At this price one ML of recycled water irrigation generates an average return of -$19. Table 2.11. Average additional annual net cash return ($) (recycled water –benchmark) for 5 recycled water prices. Recycled water Mean additional Mean additional Mean additional
price annual net cash annual net cash annual net cash ($) ($) ($/ha) ($/ML) 0 $ 131,486 $ 160 $ 131
100 $ 31,486 $ 38 $ 31 150 -$ 18,514 -$ 23 -$ 19 200 -$ 68,514 -$ 84 -$ 69 250 -$ 118,514 -$ 145 -$ 119
Figure 2.29 shows that annual returns for the recycled water scenario are highly variable compared to the benchmark. In just over 50% of the years, additional annual net returns were below those of the benchmark situation.
-4000
-2000
0
2000
4000
6000
8000
10000
1959
1961
1963
1965
1967
1969
1971
1973
1975
1977
1979
1981
1983
1985
1987
1989
1991
1993
1995
1997
1999
2001
Sal
t lea
ched
(to
nn
es)
Recycled
Benchmark

61
-$600,000
-$400,000
-$200,000
$-
$200,000
$400,000
$600,000
$800,000
$1,000,000
$1,200,000
B'mark Recycled Difference
Irrigation scenario
Ann
ual n
et c
ash
retu
rn
MeanUpperLowerMedian
Figure 2.29. Difference in distribution of average additional annual net cash flow for benchmark and recycled water irrigated scenarios (recycled water price $150/ML). The bar corresponds to the mean, the ‘whisker’ covers the range from minimum to maximum and includes the median. Table 2.12 shows the wheat crop gross margin increased by more than double under irrigation. An average increase in gross margin for soybean was also achieved under the recycled water irrigation scenario. Gross margins from irrigated and maize were similar under both scenarios. Table 2.12. Average gross margins ($/ha) for crops in the benchmark and recycled water irrigated scenario. (wheat (f) =wheat planted after fallow, wheat (s) = wheat planted after soybean, wheat (m) = wheat planted after maize). Crop Benchmark $/ha Recycled $/ha D'land wheat (m) $ 104 Irrigated wheat (m) $ 228 Irrigated wheat (s) $ 226 Irrigated soybean $ 292 $ 391 Irrigated maize $ 1,075 $ 1,038 D'land wheat (f) $ 237 $ 237 Dland maize $ 782 $ 782 Fig. 2.30 shows the substantial additional fixed costs ($200 000 p.a.) associated with a recycled water price of $150/ML, offset the increased returns resulting from increased irrigation area and increased yields. The value of the crops produced for this case study was low in comparison to cotton.

62
-$300,000
-$200,000
-$100,000
$-
$100,000
$200,000
$300,000
$400,000
$500,000
$600,000
$700,000
B'mark Recycled
Irrigation scenario
Ann
ual n
et c
ash
retu
rn
Dland maizeD'land wheat (f)Irrig fixed costsIrrigated maizeIrrigated soyIrrigated wheat (s)Irrigated wheat (m)D'land wheat (m)
Figure 2.30. Contribution to average annual net cash return from crops under benchmark and recycled water irrigated scenarios (recycled water price $150/ML); (wheat (f) =wheat planted after fallow, wheat (s) = wheat planted after soybean, wheat (m) = wheat planted after maize). 2.3.4 Farm 4 OFWS Water Balance and Irrigation This farm does not currently have access to any irrigation water. Two dryland benchmark scenarios were considered, one involving a cotton/wheat rotation in which the wheat crop is sown opportunistically and the other comprised of a cotton/long long fallow. The shift to the recycled water scenario involves the receipt of 500ML/year of recycled water (Figure 2.31) and the construction of a new hillside storage to receive the recycled water. Coupled with this is an increase in irrigation demand associated with the introduction of a thrice irrigated winter chickpea crop. Approximately three fifths of the recycled water supply is used for irrigation purposes (average of 320ML/year pumped from the OFWS). There is a substantial volume of water lost as overflow from the storage (average of 173ML/year). Much of this loss occurs during the fallow periods when water is not being removed from the storage, despite the opportunity for pre-irrigation of the fallow so as to use up some of the stored water. This overflow loss may partly be an artefact of the model design, where the farm and irrigation infrastructure has been divided in two and allocated to the two ‘components’ of the crop system. In reality, the farmer could potentially divert water from the storage that is overflowing to the other, providing there is residual capacity to do so. Otherwise, in the absence of any opportunity to increase total irrigated area, a reduction in overflow loss could be explored through an increase in storage capacity or cropping intensity or a reduction in recycled water volume.

63
Figure 2.31. OFWS water balance component totals over the 45 year simulation period for the recycled water scenario (ML/year). Yield In the cotton/long long fallow benchmark scenario, cotton yields over the 45 year simulation period range from 0.5 to 8.4 bales per hectare with an average of 5.6 bales per hectare. This healthy result can be attributed to the long fallow which precedes the cotton crop. Cotton yields for the cotton/opportunity wheat scenario were similar with a long-term average of 5.5 bales per hectare. The conditions for planting a double crop of wheat (40mm rain in 7 days) were satisfied in just 12 of the 45 years resulting in a yield range of 0.4 to 4.7 t/ha and an average of 2.0 t/ha. This gives an average annual whole farm wheat production of 202 tonnes (Figure 2.32).
Figure 2.32 45 year distribution of whole farm wheat production (tonnes) under the benchmark cotton/opportunity wheat dryland scenario. The transition from the dryland benchmark designs to the recycled water design resulted in a substantial increase in long-term average cotton yields, which ranged from 5.1 to 14.2 bales per hectare with an average of 9.3 bales per hectare. Whole farm cotton production increased by an average of 382 bales per year over and above the benchmark cotton/opportunity wheat scenario (Figure 2.33) and 373 bales per year over and above the benchmark cotton/long long fallow scenario (not shown).
-800
-600
-400
-200
0
200
400
600
800
1960
1962
1964
1966
1968
1970
1972
1974
1976
1978
1980
1982
1984
1986
1988
1990
1992
1994
1996
1998
2000
Vo
lum
e (M
L)
evaporation
rainfall
overflow
recycled in
irrigation
0
50
100
150
200
250
300
350
400
450
500
1958
1960
1962
1964
1966
1968
1970
1972
1974
1976
1978
1980
1982
1984
1986
1988
1990
1992
1994
1996
1998
2000
2002
Wh
eat
pro
du
ctio
n (
ton
nes
)

64
Figure 2.33. 45 year distribution of whole farm cotton production (bales) showing production under the benchmark cotton/opportunity wheat design and subsequent gains and losses under the recycled water scenario. Whole farm chickpea production under the recycled water scenario ranged from 74 to 377 tonnes/year with an average of 293 tonnes/year (Figure 2.34).
Figure 2.34. 45 year distribution of whole farm chickpea production (tonnes/year) showing production under the recycled water scenario. Salt / drainage / farm runoff Annual drainage under the benchmark cotton/opportunity wheat design ranged from nil to 84mm with an average of 12mm. Annual runoff ranged from 5mm to 337mm with an average of 136mm. Runoff and drainage figures were marginally higher under the cotton/long fallow scenario. The transition to the recycled water design resulted in a small increase in average drainage to 21mm/year reflecting the irrigation application inefficiencies. At the commencement of the simulation, a total of 62.4 t TSS/ha was assumed to exist in the soil profile to a depth of 1.8m (Table 2.13). This concentration is higher than most other scenarios given the rainfed history of the farm. Over the next 45 years, a large portion of the salt in the benchmark cotton/opportunity wheat scenario was
-100
100
300
500
700
900
1100
1300
1500
1959
1961
1963
1965
1967
1969
1971
1973
1975
1977
1979
1981
1983
1985
1987
1989
1991
1993
1995
1997
1999
2001
Co
tto
n p
rod
uct
ion
(b
ales
)
Recycled
Dryland
0
50
100
150
200
250
300
350
400
1959
1961
1963
1965
1967
1969
1971
1973
1975
1977
1979
1981
1983
1985
1987
1989
1991
1993
1995
1997
1999
2001
Chi
ckpe
a pr
oduc
tion
(ton
nes)

65
leached from the root zone (Table 2.13). The result for the cotton/long long fallow scenario was similar (results not shown). Note that salt additions from rainfall and runoff are assumed to be small and are ignored in the simulation. Salt addition in the recycled water scenario over the same period amounts to 58.8 t TSS/ha. Salt leached from the base of the root zone totals 92.0t TSS/ha with a net loss of 33.2t TSS/ha. Consideration of the average salinity level calculated across all root zone layers to a depth of 1.8m on January 1 of each year of the three simulations, gave a maximum salinity of 0.78dS/m early in the simulation. The maximum salinity in any one layer in this same year was 2.0dS/m. These levels of salinity are unlikely to have any adverse effect on crop production (Brady and Weil, 1996). Table 2.13. Salt mass balance terms over the 45 year simulation period for the irrigated and recycled water scenarios expressed in t/ha.
The time course for drainage and salt leached in both scenarios show that early on, when the salt content in the root zone is high, the salt loss per unit of drainage is also high (Figure 2.35 and 2.36). Thereafter, the salt content in the root zone declines and will approach zero in the benchmark scenario as there are no further additions from rainfall or runoff, and a higher equilibrium salt concentration in the recycled water scenario. The average annual increase in whole farm salt loss under the recycled water scenario is 108 tonnes (Figure 2.37).
Figure 2.35. Time course of annual salt leachate (t/ha) and drainage (mm) for the benchmark irrigated scenario.
Benchmark (Cotton/opportunity wheat) EffluentSalt in (t/ha) 0.0 58.8Salt out (t/ha) -56.1 -92.0Salt start (t/ha) 62.4 62.4Salt finish (t/ha) 6.3 29.2Net change (t/ha) -56.1 -33.2
Salt leached + Drainage (Benchmark - Opportunity wheat)
0
2
4
6
8
10
12
14
16
18
1959
1961
1963
1965
1967
1969
1971
1973
1975
1977
1979
1981
1983
1985
1987
1989
1991
1993
1995
1997
1999
2001
Sal
t le
ach
ed (
t/ha)
0
50
100
150
200
250
300
350
400D
rain
age
(mm
)
Salt leached
Drainage

66
Figure 2.36. Time course of annual salt leachate (t/ha) and drainage (mm) for the recycled water scenario.
Figure 2.37. 45 year distribution of whole farm salt losses from the base of the root profile (tonnes) for the benchmark and recycled water scenarios. Economic analysis On average, annual net cash return was higher under the recycled water irrigated scenario than those predicted for the benchmark situation (cotton with opportunity wheat) over the range of recycled water prices (Table 2.14). For a recycled water price of $150/ML, an average additional annual cash return of $110 492 could be expected under the recycled water irrigation scenario, compared with the benchmark situation. On a $/ha basis, for 202 ha, this amounts to $547/ha additional return each year. At this price, one ML of recycled water irrigation generates an average return of $221. The average gross return from one ML of recycled water irrigation was $371 (i.e. corresponding to a recycled water price of $0/ML). This price represent the most the farmer could pay for the water, on average, for the given set of crop price assumptions, for the recycled water scenario to be economically more attractive than the current situation.
Salt leached + Drainage (Recycled)
0
2
4
6
8
10
12
14
16
18
1959
1961
1963
1965
1967
1969
1971
1973
1975
1977
1979
1981
1983
1985
1987
1989
1991
1993
1995
1997
1999
2001
Sal
t le
ach
ed (
t/ha)
0
50
100
150
200
250
300
350
400
Dra
inag
e (m
m)
Salt leached
Drainage
-2000
-1500
-1000
-500
0
500
1000
1500
2000
1959
1961
1963
1965
1967
1969
1971
1973
1975
1977
1979
1981
1983
1985
1987
1989
1991
1993
1995
1997
1999
2001
1958
Sal
t le
ach
ed (
ton
nes
)
Recycled
Benchmark Cotton/Wheat

67
Table 2.14. Average additional annual net cash return ($) (recycled water –benchmark situation of cotton incorporating opportunity wheat cropping) for 5 recycled water prices. Recycled water Mean additional Mean additional Mean additional
price annual net cash annual net cash annual net cash ($) ($) ($/ha) ($/ML) 0 $ 185,492 $ 918 $ 371
100 $ 135,492 $ 671 $ 271 150 $ 110,492 $ 547 $ 221 200 $ 85,492 $ 423 $ 171 250 $ 60,492 $ 299 $ 121
Figure 2.38 shows that average annual returns are highly variable for both scenarios, particularly so for the recycled water scenario.
-$200,000-$100,000
$-$100,000$200,000$300,000$400,000$500,000$600,000
Recycled B'mark (C/W) Difference (C/W)
Irrigation Scenario
Ann
ual n
et c
ash
retu
rn
MeanUpperLowerMedian
Figure 2.38. Difference in distribution of average additional annual net cash flow for benchmark and recycled water irrigated scenarios (recycled water price $150/ML). The bar corresponds to the mean, the ‘whisker’ covers the range from the maximum to minimum, and includes the median over the full range of years (C/W = continuous cotton cropping with an opportunity wheat crop). Directly reflecting simulated yields differences, recycled water irrigation had the effect of doubling the average cotton gross margin (Table 2.15). The average irrigated chickpea gross margin was $846/ha. Table 2.15. Average gross margins ($/ha) for crops in the benchmark and recycled water irrigated scenario for a recycled water price of $150/ML. Crop B'mark $/ha Recycled $/ha D'land wheat $ 79 $ - D'land cotton $ 1,487 $ - Irrig. cotton $ 3,076 Chickpea $ 846 Overall, on average, the additional returns from replacing dryland cotton with irrigated cotton, and the incorporation of a chickpea crop to the rotation, outweighed the additional annual fixed costs of $127 407 (labour, storage construction and irrigation infrastructure) associated with irrigating with recycled water (Fig. 2.39).

68
-$200,000
-$100,000
$-
$100,000
$200,000
$300,000
$400,000
$500,000
B'mark (C/W) Recycled
Irrigation scenario
Ann
ual n
et c
ash
retu
rn
Irrig. o'headsIrrig. ChickpeaIrrig. cottonD'land wheatD'land cotton
Figure 2.39. Contribution to average annual net cash return from crops under benchmark and recycled water irrigated scenarios (recycled water price $150/ML). 2.3.5 Farm 5 OFWS Water Balance and Irrigation River allocation is the principal source of irrigation water with an average of 1062ML pumped each year (Figure 2.40). Overland flow is the other main water source with an average of 453ML pumped each year, which is 45% of the average annual catchment runoff (45 year average of 1009 ML/year). Relative to most of the other case study farms, this property has access to a large potential water resource including overland flow from a significant catchment area (4300ha) and a generous river allocation. However, both these sources of water are sensitive to rainfall distribution and amount, as borne out by the substantial year to year variability in the volume transferred from each into the OFWS. The introduction of 1000ML/year of recycled water results in displacement of both the river and overland flow water sources (Figure 2.41). River transfer drops by an average of ~41% (to 630ML/year) and overland flow transfer by ~9% (to 414ML/year) compared to the benchmark design. There is virtually no overflow loss with either scenario.

69
Figure 2.40. OFWS water balance component totals over the 45 year simulation period for the benchmark scenario (ML/year).
Figure 2.41 OFWS water balance component totals over the 45 year simulation period for the recycled water scenario (ML/year). Yield Long-term cotton yields under the benchmark design ranged from 2.0 to 11.1 bales/ha with an average of 7.7 bales/ha. The introduction of recycled water resulted in an increase in long-term average cotton yields to 8.33 bales per hectare. This amounts to an average increase in whole farm cotton production of 480 bales per year (Figure 2.42).
-4000
-3000
-2000
-1000
0
1000
2000
3000
1959
1962
1965
1968
1971
1974
1977
1980
1983
1986
1989
1992
1995
1998
2001
Vo
lum
e (M
L)
river
evaporation
rain
sump-ofws
overflow
irrigation
-5000
-4000
-3000
-2000
-1000
0
1000
2000
3000
4000
1959
1961
1963
1965
1967
1969
1971
1973
1975
1977
1979
1981
1983
1985
1987
1989
1991
1993
1995
1997
1999
2001
Vo
lum
e (M
L)
river
evaporation
rain
sump-ofws
overflow
recycled in
irrigation

70
Figure 2.42. 45 year distribution of whole farm cotton production (bales) showing production under the benchmark design and subsequent gains and losses under the recycled water scenario. Salt / drainage / farm runoff Annual drainage under the benchmark design ranged from nil to 208mm with an average of 24mm. Annual runoff ranged from 1 to 197mm with an average of 60mm. Drainage increased in the recycled water scenario to an average of 43mm/year in response to larger irrigation rates and associated inefficiencies. At the commencement of the 45 year simulation, a total of 11.4 t TSS/ha was assumed to exist in the soil to a depth of 1.8m (Table 2.16). Salt addition through irrigation over the same period amounts to 48.1t TSS/ha for the benchmark scenario and 100.1t TSS/ha for the recycled water scenario. The larger salt influx for the recycled water scenario arises from the greater irrigation salt concentration and higher irrigation rate. Salt leached from the base of the root zone is also larger under the recycled water scenario (80.6t TSS/ha compared with 34.2t TSS/ha for the benchmark design). In both designs there is a net gain of salt in the root zone amounting to 13.9t TSS/ha for the benchmark scenario and 19.6t TSS/ha for the recycled water scenario. Consideration of the average salinity level calculated across all root zone layers to a depth of 1.8m on January 1 of each year of the recycled water simulation, gave a maximum salinity of 0.42dS/m in the final year of the simulation. The maximum salinity in any one layer in this same year was 0.81dS/m. These levels of salinity are unlikely to have any adverse effect on crop production (Brady and Weil, 1996). Table 2.16. Salt mass balance terms over the 45 year simulation period for the irrigated and recycled water scenarios expressed in t/ha.
In both scenarios, salt loss per unit drainage increases over the early years of the simulation suggesting that the salt balance is not in a steady state condition initially (Figure 2.43 and 2.44). Clearly, the salt loss from the recycled water scenario is
-2000
0
2000
4000
6000
8000
10000
1958
1960
1962
1964
1966
1968
1970
1972
1974
1976
1978
1980
1982
1984
1986
1988
1990
1992
1994
1996
1998
2000
Co
tto
n p
rod
uct
ion
(b
ales
)
Recycled
Benchmark
Irrigated RecycledSalt in (t/ha) 48.1 100.1Salt out (t/ha) -34.2 -80.6Salt start (t/ha) 11.4 11.4Salt finish (t/ha) 25.3 31.0Net change (t/ha) 13.9 19.6
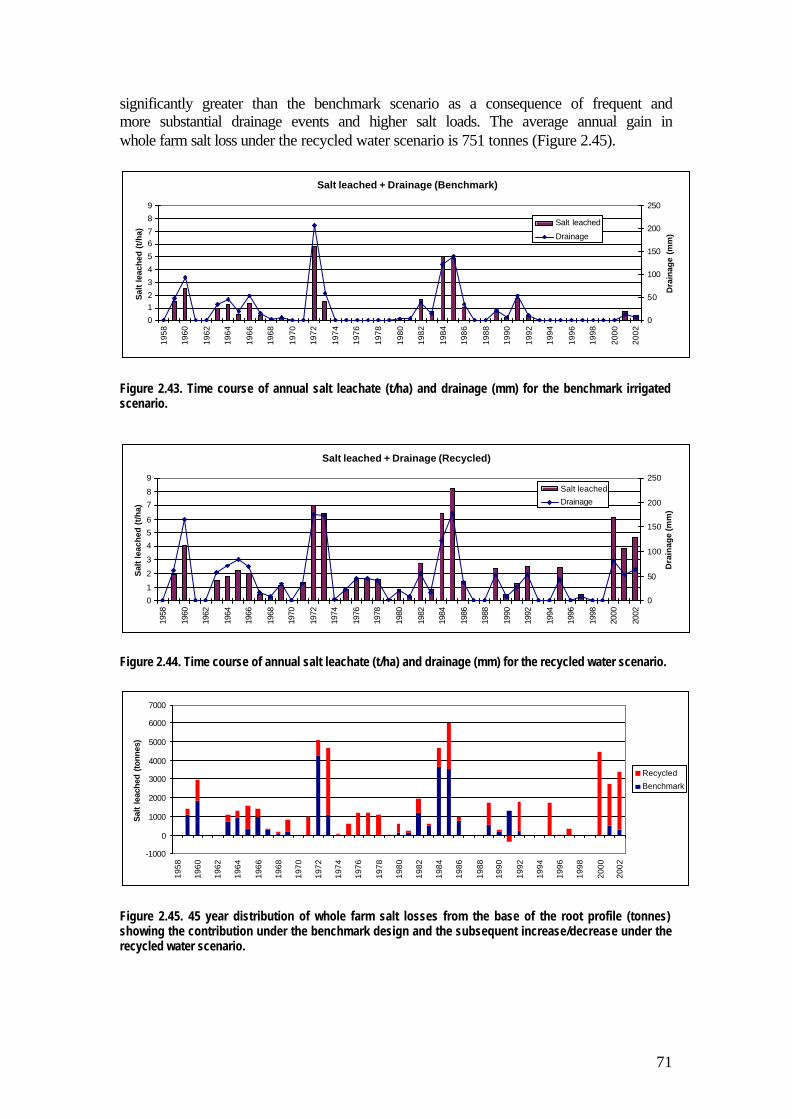
71
significantly greater than the benchmark scenario as a consequence of frequent and more substantial drainage events and higher salt loads. The average annual gain in whole farm salt loss under the recycled water scenario is 751 tonnes (Figure 2.45).
Figure 2.43. Time course of annual salt leachate (t/ha) and drainage (mm) for the benchmark irrigated scenario.
Figure 2.44. Time course of annual salt leachate (t/ha) and drainage (mm) for the recycled water scenario.
Figure 2.45. 45 year distribution of whole farm salt losses from the base of the root profile (tonnes) showing the contribution under the benchmark design and the subsequent increase/decrease under the recycled water scenario.
Salt leached + Drainage (Benchmark)
0
12
3
4
5
67
8
9
1958
1960
1962
1964
1966
1968
1970
1972
1974
1976
1978
1980
1982
1984
1986
1988
1990
1992
1994
1996
1998
2000
2002
Sal
t le
ach
ed (
t/h
a)
0
50
100
150
200
250
Dra
inag
e (m
m)
Salt leached
Drainage
Salt leached + Drainage (Recycled)
0
1
2
3
4
5
6
7
8
9
1958
1960
1962
1964
1966
1968
1970
1972
1974
1976
1978
1980
1982
1984
1986
1988
1990
1992
1994
1996
1998
2000
2002
Sal
t le
ach
ed (
t/h
a)
0
50
100
150
200
250
Dra
inag
e (m
m)
Salt leached
Drainage
-1000
0
1000
2000
3000
4000
5000
6000
7000
1958
1960
1962
1964
1966
1968
1970
1972
1974
1976
1978
1980
1982
1984
1986
1988
1990
1992
1994
1996
1998
2000
2002
Sal
t le
ache
d (t
onne
s)
Recycled
Benchmark

72
Economic analysis On average, annual net cash returns were higher for the recycled water irrigated scenarios than the benchmark situation across the range of recycled water prices examined (Table 2.17). For a recycled water price of $150/ML, the average annual cash return is $115 227 higher than the benchmark situation. On a $/ha basis, this amounts to $158/ha additional return each year. The average gross return from one ML of recycled water irrigation was $265 (i.e. corresponding to a recycled water price of $0/ML). This price represent the most the farmer could pay for the water, on average, for the given set of crop price assumptions, for the recycled water scenario to be economically more attractive than the current situation. Table 2.17. Average additional annual net cash return ($) (recycled water –benchmark) for 5 recycled water prices. Recycled water Mean additional Mean additional Mean additional
price annual net cash annual net cash annual net cash ($) ($) ($/ha) ($/ML) 0 $ 265,227 $ 364 $ 265
100 $ 165,227 $ 227 $ 165 150 $ 115,227 $ 158 $ 115 200 $ 65,227 $ 89 $ 65 250 $ 15,227 $ 21 $ 15
Both the benchmark scenario and recycled water irrigated scenario displayed high year to year variability (Fig. 2.46), with the recycled water scenario showing the greatest variability.
-$2,000,000
-$1,000,000
$-
$1,000,000
$2,000,000
$3,000,000
$4,000,000
$5,000,000
B'mark Recycled Difference
Irrigation scenario
Ann
ualn
et c
ash
retu
rn
MeanUpperLowerMedian
Figure 2.46. Difference in distribution of average additional annual net cash flow for benchmark and recycled water irrigated scenarios (recycled water price $150/ML). The bar corresponds to the mean, the ‘whisker’ covers the range from minimum to maximum and includes the median. Reflecting average yield differences, the average gross margin for the recycled water irrigated crop ($3 238/ha) was slightly higher than the benchmark irrigated cotton gross margin ($2 873/ha). There was also some influence attributable to the reduction

73
in the pumping costs from the sump and river, associated with a reduction in the quantity of water used from these sources. Overall, on average, the additional returns attributable to recycled water irrigation outweighed the additional annual fixed costs of $150 500 (at a recycled water price of $150/ML).
-$500,000
$-
$500,000
$1,000,000
$1,500,000
$2,000,000
$2,500,000
B'mark Recycled
Irrigation scenario
An
nu
al n
et c
ash
ret
urn
Irrig O'headsIrrigated cotton
Figure 2.47. Contribution to average annual net cash return from crops under benchmark and recycled water irrigated scenarios (recycled water price $150/ML). 2.3.6 Farm 6 OFWS Water Balance and Irrigation The principal source of irrigation water is from bores with, on average, the full allocation pumped into the OFWS each year (45 year average of 861ML/year) (Figure 2.48). The other main source of water is overland flow, with an average of 340ML pumped each year, representing about 72% of the average annual catchment runoff (45 year average of 473ML/year). The shift to the recycled water scenario involves the receipt of an additional 1000ML/year of recycled water (Figure 2.49). Coupled with this is an increase in irrigation demand associated with the replacement of the summer fallow with another irrigated cotton crop, and the replacement of the wheat crop with a more intensively irrigated chickpea crop. In response to this increased demand, the total irrigation volume pumped from the OFWS almost doubles to 2137ML/year, with the majority of this sourced from recycled water and the residual from bore and overland flow. There is a small decrease in the average overland flow transfer figure (to 278ML/year). Bore transfer is virtually unchanged. The absence of substantial overflow events in the benchmark and recycled water scenarios coupled with the extent of bypass suggests the potential for further gains through more effective capture of overland flow. This might be achieved through the removal or lessening of the sump to OFWS pumping restriction in the recycled water design (OFWS volume must be less than 200ML) or through increased pumping and storage (both sump and OFWS) capacity.

74
Figure 2.48. OFWS water balance component totals over the 45 year simulation period for the benchmark scenario (ML/year).
Figure 2.49 OFWS water balance component totals over the 45 year simulation period for the recycled water scenario (ML/year). Yield Long-term cotton yields under the benchmark design ranged from 4.9 to 13.9 bales/ha with an average of 9.0 bales/ha. The transition from the irrigated benchmark design to the recycled water design resulted in a ~6% increase in long-term average cotton yields to 9.50 bales/ha and a doubling of the area under cotton. The increase in yield per hectare is a response to increased irrigation (45 year average of 2.2ML/ha of cotton for the benchmark versus 2.7ML/ha of cotton for the recycled water design). This amounts to an increase in average annual total cotton production across the whole farm from 2290 bales to 4872 bales (Figure 2.50).
-2500-2000-1500-1000
-5000
5001000150020002500
1961
1963
1965
1967
1969
1971
1973
1975
1977
1979
1981
1983
1985
1987
1989
1991
1993
1995
1997
1999
2001
Vol
ume
(ML) evaporation
rain
sump-ofws
bore in
overflow
irrigation
-3500
-2500
-1500
-500
500
1500
2500
3500
1961
1963
1965
1967
1969
1971
1973
1975
1977
1979
1981
1983
1985
1987
1989
1991
1993
1995
1997
1999
2001
Vol
ume
(ML) evaporation
rain
sump-ofws
bore in
overflow
recycled in
irrigation

75
Figure 2.50. 45 year distribution of whole farm cotton production (bales) showing production under the benchmark design and subsequent gains under the recycled water scenario. Long-term maize yields under the benchmark design ranged from 0.87 to 11.70 t/ha with an average of 6.69 t/ha. With the transition to the recycled water scenario, average annual maize yield increased to 8.15 t/ha, once again due to increases in applied irrigation (1.5ML/ha to 1.7ML/ha) (Figure 2.51). The impact varied somewhat over the course of the simulation period, with yield reductions in 15 of the 45 years. Average annual total maize production across the whole farm increased from 1772 tonnes to 2086 tonnes (Figure 2.51).
Figure 2.51. 45 year distribution of whole farm maize production (tonnes) showing production under the benchmark design and subsequent gains and losses under the recycled water scenario. Long-term average wheat and chickpea yields for the benchmark and recycled water scenarios were 2.40 t/ha (0.46 to 5.49 t/ha) and 2.22 t/ha (0.59 to 3.52 t/ha) respectively.
0
1000
2000
3000
4000
5000
6000
7000
1959
1961
1963
1965
1967
1969
1971
1973
1975
1977
1979
1981
1983
1985
1987
1989
1991
1993
1995
1997
1999
2001
Co
tto
n p
rod
uct
ion
(b
ales
)
Recycled
Benchmark
-3000
-2000
-1000
0
1000
2000
3000
4000
1960
1962
1964
1966
1968
1970
1972
1974
1976
1978
1980
1982
1984
1986
1988
1990
1992
1994
1996
1998
2000
Mai
ze p
rod
uct
ion
(to
nn
es)
Recycled
Benchmark

76
Salt / drainage / farm runoff Annual drainage under the benchmark design ranged from nil to 299mm with an average of 58mm. Annual runoff ranged from 1mm to 279mm with an average of 57mm. The transition to the recycled water design resulted in a decrease in average drainage to 25mm/year in response to the increased cropping intensity and hence water extraction from the root zone. Farm runoff increased by a small amount to 61mm/year. At the commencement of the 45 year simulation, a total of 4.7 t TSS/ha was assumed to exist in the soil profile to a depth of 1.8m (Table 2.18). Salt addition through irrigation over the same period amounted to 33.9 t TSS/ha for the benchmark scenario and 97.6 t TSS/ha for the recycled water scenario. The larger amount for the recycled water scenario arises from a greater irrigation volume per unit area and higher salt concentration in the irrigation water. Salt leached from the base of the root zone is larger under the recycled water scenario (61.7t TSS/ha compared with 31t TSS/ha for the irrigated benchmark design). In both designs there is a net gain of salt in the root zone amounting to 2.8 t TSS/ha for the benchmark scenario and 35.9t TSS/ha for the recycled water scenario. Consideration of the average salinity level calculated across all root zone layers to a depth of 1.8m on January 1 of each year of the recycled water simulation, gave a maximum salinity of 0.51dS/m in the final year of the simulation. The maximum salinity in any one layer in this same year was 1.01dS/m. These levels of salinity are unlikely to have any adverse effect on crop production (Brady and Weil, 1996). Table 2.18. Salt mass balance terms over the 45 year simulation period for the irrigated and recycled water scenarios expressed in t/ha.
The small long-term change in net root zone salt content and relatively consistent salt loss per unit drainage in the benchmark irrigated scenario suggests that the salt balance is close to equilibrium throughout the simulation period. In contrast, the more substantial long-term gain in net root zone salt content for the recycled water scenario indicates that the salt balance is not always in equilibrium. Salt loss per unit drainage increases over the early years of the simulation in response to the larger amount of salt coming into the profile (Figure 2.53). The average annual gain in whole farm salt loss under the recycled water scenario is 426 tonnes (Figure 2.54).
Benchmark RecycledSalt in (t/ha) 33.9 97.6Salt out (t/ha) -31.0 -61.7Salt start (t/ha) 4.7 4.7Salt finish (t/ha) 7.5 40.6Net change (t/ha) 2.8 35.9

77
Figure 2.52. Time course of annual salt leachate (t/ha) and drainage (mm) for the benchmark irrigated scenario.
Figure 2.53. Time course of annual salt leachate (t/ha) and drainage (mm) for the recycled water scenario.
Figure 2.54. 45 year distribution of whole farm salt losses from the base of the root profile (tonnes) showing the contribution under the benchmark design and the subsequent increase/decrease under the recycled water scenario.
Salt leached + Drainage (Benchmark)
0
2
4
6
8
10
12
1958
1960
1962
1964
1966
1968
1970
1972
1974
1976
1978
1980
1982
1984
1986
1988
1990
1992
1994
1996
1998
2000
2002
Sal
t le
ach
ed (
t/ha)
0
50
100
150
200
250
300
Dra
inag
e (m
m)
Salt leached
Drainage
Salt leached + Drainage (Recycled scenario)
0
2
4
6
8
10
12
1958
1960
1962
1964
1966
1968
1970
1972
1974
1976
1978
1980
1982
1984
1986
1988
1990
1992
1994
1996
1998
2000
2002
Sal
t le
ache
d (t
/ha)
0
50
100
150
200
250
300
Dra
inag
e (m
m)Salt leached
Drainage
-2000
-1000
0
1000
2000
3000
4000
5000
6000
7000
8000
1958
1960
1962
1964
1966
1968
1970
1972
1974
1976
1978
1980
1982
1984
1986
1988
1990
1992
1994
1996
1998
2000
2002
Sal
t le
ach
ed (
ton
nes
)
Recycled
Benchmark

78
Economic analysis On average, annual net cash returns were higher under the recycled-water irrigated scenario than the benchmark situation for all recycled water prices investigated (Table 2.19). For a recycled-water price of $150/ML, an average additional annual net cash return of $825 518 could be expected under the recycled-water irrigation scenario, compared with the benchmark situation. On a $/ha basis, for 768ha, this amounts to $1 075/ha additional return each year. At this price one ML of recycled water irrigation generates an average return of $826. The average gross return from one ML of recycled water irrigation was $976 (i.e. a recycled water price of $0/ML). This price represent the most the farmer could pay for the water, on average, for the given set of crop price assumptions, for the recycled water scenario to be economically more attractive than the current situation. Table 2.19. Average additional annual net cash return ($) (recycled water –benchmark) for 5 recycled water prices.
Recycled water Mean additional Mean additional Mean additional price annual net cash annual net cash annual net cash
($) ($) ($/ha) ($/ML) 0 $ 975,518 $ 1,270 $ 976
100 $ 875,518 $ 1,140 $ 876 150 $ 825,518 $ 1,075 $ 826 200 $ 775,518 $ 1,010 $ 776 250 $ 725,518 $ 945 $ 726
Figure 2.55 shows that annual returns are highly variable. However, with the exception of just one year, the recycled water scenario always generated a higher additional annual net cash return. The difference in additional annual net cash return ranged from -$38 756 to $1 575 056 over the 42 years of simulated data.
-$500,000
$-
$500,000
$1,000,000
$1,500,000
$2,000,000
$2,500,000
$3,000,000
B'mark Recycled Difference
Irrigation scenario
Ann
ual n
et c
ash
retu
rn
MeanUpperLowerMedian
Figure 2.55. Difference in distribution of average additional annual net cash flow for benchmark and recycled water irrigated scenarios (recycled water price $150/ML). The bar corresponds to the mean, the ‘whisker’ covers the range from the minimum to the maximum, and includes the median over the full range of years.

79
Table 2.20 reveals that the large difference in returns is attributable to an increase in average gross margin for cotton, and to a lesser extent for irrigated maize, under the recycled water irrigation scenario. This mainly reflects the increase in average yield gains as avoided pumping costs attributable to the displacement of bore and overland flow were very small. Table 2.20. Average gross margins ($/ha) for crops in the benchmark and recycled water irrigated scenario. Crop B'mark 1 $/ha Recycled $/ha Irrig. wheat $ 150 Irrig. maize $ 829 $ 985 Irrig. cotton 1 $ 2,873 $ 2,643 Irrig. cotton 2 $ 3,685 Irrig. Chickpea $ 669 Fig. 2.56 shows that the addition of the chickpea crop and a second cotton crop to the rotation, combined with higher cotton yields, added a substantial boost to the annual net cash flow and easily offset the substantial additional fixed costs ($300 000 p.a. with a recycled water price of $150/ML) required to implement this recycled water scenario.
-$500,000
$-
$500,000
$1,000,000
$1,500,000
$2,000,000
$2,500,000
Benchmark Recycled
Irrigation scenario
An
nu
al n
et c
ash
ret
urn
Irrig O'heads
Irrig ChickIrrig cotton 2Irrig Cotton 1
Irrig maizeIrrig wheat
Figure 2.56. Contribution to average annual net cash return from crops under benchmark and recycled water irrigated scenarios (recycled water price $150/ML).

80
2.3.7 Farm 7 OFWS Water Balance and Irrigation Irrigation water in the benchmark design is accessed from two principal sources, overland flow and bore water (Figure 2.57). The full bore allocation is pumped in virtually every year of the simulation with the bore transfer average for the 45 year period at 501ML/year. Note that in some years it appears that the total bore transfer is greater than the allocation despite the fact that this farmer does not have the option of carrying unused water over to the following year. This eventuates in the model because the totals presented are over a calendar year from January 1 to December 31 whereas the bore allocation period is from July 1 to June 30. Over the 45 year simulation period an average of 266ML/year of overland flow is pumped into the OFWS, which represents about 60% of the average annual catchment runoff (45 year average of 444ML/year), with the remainder bypassing the sump. The majority of this bypass occurs in association with large overland flow events which exceed the capacity of the sump and, to a lesser extent, as a result of insufficient ‘spare’ OFWS storage capacity at the time of the overland flow event. This latter point is borne out by the absence of any significant overflow event over the 45 year simulation period. The introduction of 500ML/year of recycled water results in a negligible decline in the long-term average bore transfer total and a 26% decline in the overland flow transfer total (to 198ML) compared to the benchmark design (Figure 2). These declines can be attributed to the decline in residual storage capacity due to the regular inflow of recycled water and the restriction on bore and overland flow transfer to periods when each of the 317ML OFWS contains less than 100ML of water. Overflow losses are negligible in both scenarios. The average total volume of water pumped from the OFWS for irrigation increased from 753ML/year under the benchmark design to 1178ML/year for the recycled water scenario in response to the replacement of the summer fallow with an irrigated maize crop and the addition of a second irrigation event for the wheat crop.
Figure 2.57. OFWS water balance component totals over the 45 year simulation period for the benchmark scenario (ML/year).
-2000
-1500-1000
-5000
500
10001500
2000
1961
1963
1965
1967
1969
1971
1973
1975
1977
1979
1981
1983
1985
1987
1989
1991
1993
1995
1997
1999
2001
Vo
lum
e (M
L) evaporation
rain
sump-ofws bore in
overflow
irrigation

81
Figure 2.58 OFWS water balance component totals over the 45 year simulation period for the recycled water scenario (ML/year). Yield Long-term average cotton yields in the benchmark scenario ranged from 0.5 to 13.5 bales/ha, with an average of 7.1 bales/ha. Wheat yields ranged from 0.2 to 4.8 t/ha with an average of 1.8 t/ha. The shift from the benchmark design to the recycled water design involved the receipt of 500ML/year of recycled water, an increase in cropping intensity associated with the displacement of the summer fallow with an irrigated maize crop and, an increase in the irrigation volume applied to the wheat crop. The long-term average cotton yield was virtually unchanged. Average annual whole farm cotton production increased by 23 bales between the benchmark and recycled water scenarios although the year to year variability was substantial (Figure 2.59).
Figure 2.59 45 year distribution of whole farm cotton production (bales) showing production under the benchmark design and subsequent gains and losses under the recycled water scenario. The transition to the recycled water scenario resulted in modest increases in wheat yield with the long-term average rising to 2.1 t/ha (ranging from 0.3 to 5.5 t/ha). This result is in response to gains in applied irrigation with the long-term average rising from 0.9ML/ha to 1.2 ML/ha. Average annual whole farm wheat production increased
-2000-1500
-1000
-5000
5001000
1500
2000
1961
1963
1965
1967
1969
1971
1973
1975
1977
1979
1981
1983
1985
1987
1989
1991
1993
1995
1997
1999
2001
Vo
lum
e (M
L)
evaporation
rain
sump-ofws
bore in
overflow
recycled in
irrigation
-2000
-1000
0
1000
2000
3000
4000
5000
6000
1958
1960
1962
1964
1966
1968
1970
1972
1974
1976
1978
1980
1982
1984
1986
1988
1990
1992
1994
1996
1998
2000
Cot
ton
prod
uctio
n (b
ales
)
Recycled
Benchmark

82
by 52 tonnes between the benchmark and recycled water scenarios, although as with cotton, there was substantial year to year variability (Figure 2.60).
Figure 2.60. 45 year distribution of whole farm wheat production (tonnes) showing production under the benchmark design and subsequent gains and losses under the recycled water scenario. Maize yields in the recycled water scenario were highly variable, ranging from 1.2 t/ha to 12.4 t/ha with an average of 7.8 t/ha. This is in direct response to matching variability in irrigation availability, attributable to competing demand from a range of crops to a limited water resource (Figure 2.61). Average annual whole farm maize production is 1689 tonnes.
Figure 2.61. 45 year distribution of whole farm maize production (tonnes) under the recycled water scenario. Salt / drainage / farm runoff Annual drainage under the benchmark design ranged from nil to 259mm with an average of 38mm. Annual runoff ranged from 2mm to 269mm with an average of 58mm. The transition to the recycled water design resulted in a decrease in average drainage to 12mm/year in response to the increased cropping intensity and hence water extraction from the root zone. Farm runoff remained relatively constant. At the commencement of the 45 year simulation, a total of 8.0t TSS/ha was assumed to exist in the soil profile to a depth of 1.8m (Table 2.21). Salt addition through irrigation over
-400
-200
0
200
400
600
800
1000
1200
140019
58
1960
1962
1964
1966
1968
1970
1972
1974
1976
1978
1980
1982
1984
1986
1988
1990
1992
1994
1996
1998
2000
Whe
at p
rodu
ctio
n (t
onne
s)
Recycled
Benchmark
0
2
4
6
8
10
12
14
1958
1960
1962
1964
1966
1968
1970
1972
1974
1976
1978
1980
1982
1984
1986
1988
1990
1992
1994
1996
1998
2000
Mai
ze p
rod
uct
ion
(to
nn
es)

83
the same period amounts to 26.4t TSS/ha for the benchmark scenario and 64.7t TSS/ha for the recycled water scenario. The larger influx for the recycled water scenario arises from the greater irrigation salt concentration used in the recycled water scenario and the larger irrigation volume applied per hectare. Salt leached from the base of the root zone over the 45 year period is similar for both scenarios (26.9t TSS/ha for the benchmark scenario and 33.6t TSS/ha for the recycled water scenario) despite less drainage in the more intensively cropped recycled water design (Figures 2.43 & 2.44). There was a small net loss of salt from the benchmark scenario totalling 0.5t TSS/ha and a more substantial net gain in the recycled water scenario of 31.0t TSS/ha. Consideration of the average salinity level calculated across all root zone layers to a depth of 1.8m on January 1 of each year of the recycled water simulation, gave a maximum salinity of 0.60dS/m in the final year of the simulation period. The maximum salinity in any one layer in the same year was 1.28dS/m. These levels of salinity are unlikely to have any adverse effect on crop production (Brady and Weil, 1996). Table 2.21. Salt mass balance terms over the 45 year simulation period for the irrigated and recycled water scenarios expressed in t/ha.
The time course of drainage and salt leached for the benchmark design shows that early on, when the salt content in the root zone is higher, the salt loss per unit of drainage is also high. With time, the salt content declines and the salt loss per unit of drainage tends to decrease, suggesting that ‘excess’ salt has been leached out and that some kind of steady state is being approached where salt loss through drainage approximates salt input from irrigation (Figure 2.62). With the recycled water scenario, drainage events are less common than in the benchmark scenario but when they occur, the salt loss per unit drainage is high. Salt loss per unit drainage increases over the early years of the simulation in response to the larger amount of salt coming into the profile (Figure 2.63). The average annual gain in whole farm salt loss under the recycled water scenario is 44.9 tonnes (Figure 2.64).
Figure 2.62. Time course of annual salt leachate (t/ha) and drainage (mm) for the benchmark irrigated scenario.
Benchmark RecycledSalt in (t/ha) 26.4 64.7Salt out (t/ha) -26.9 -33.6Salt start (t/ha) 8.0 8.0Salt finish (t/ha) 7.5 39.0Net change (t/ha) -0.5 31.0
Salt leached + Drainage (Benchmark)
0
1
2
3
45
6
7
8
9
1958
1960
1962
1964
1966
1968
1970
1972
1974
1976
1978
1980
1982
1984
1986
1988
1990
1992
1994
1996
1998
2000
2002
Sal
t le
ach
ed (
t/h
a)
0
50
100
150
200
250
300
Dra
inag
e (m
m)
Salt leached
Drainage

84
Figure 2.63. Time course of annual salt leachate (t/ha) and drainage (mm) for the recycled water scenario.
Figure 2.64. 45 year distribution of whole farm salt losses from the base of the root profile (tonnes) showing the contribution under the benchmark design and the subsequent increase/decrease under the recycled water scenario. Economic analysis On average, annual net cash returns are higher under the recycled water irrigated scenario than the benchmark situation over the entire range of recycled water prices (Table 2.22). For a recycled water price of $150/ML, an average additional annual cash return of $112 899 could be expected under the recycled water irrigation scenario, compared with the benchmark situation. On a $/ha basis, this amounts to $174/ha additional return each year. At this price, each ML of recycled water irrigation generates an average return of $226. The gross average return from one ML of recycled water irrigation was $376 (i.e. corresponding with a recycled water price of $0/ML).
Salt leached + Drainage (Recycled)
01
2
3
4
5
6
7
8
9
1958
1960
1962
1964
1966
1968
1970
1972
1974
1976
1978
1980
1982
1984
1986
1988
1990
1992
1994
1996
1998
2000
2002
Sal
t le
ach
ed (
t/ha)
0
50
100
150
200
250
300
Dra
inag
e (m
m)
Salt leached
Drainage
-1000
-500
0
500
1000
1500
2000
2500
3000
3500
4000
1958
1960
1962
1964
1966
1968
1970
1972
1974
1976
1978
1980
1982
1984
1986
1988
1990
1992
1994
1996
1998
2000
2002
Sal
t le
ach
ed (
ton
nes
)
Recycled
Benchmark

85
Table 2.22. Average additional annual net cash return ($) (recycled water –benchmark) for 5 recycled water prices.
Recycled water Mean additional Mean additional Mean additionalprice annual net cash annual net cash annual net cash
($) ($) ($/ha) ($/ML) 0 $ 187,899 $ 290 $ 376
100 $ 137,899 $ 213 $ 276 150 $ 112,899 $ 174 $ 226 200 $ 87,899 $ 136 $ 176 250 $ 62,899 $ 97 $ 126
Figure 2.65 shows that annual returns, however, are highly variable. In approximately 50% of the years, additional annual net returns were below those of the benchmark situation, corresponding to years when recycled-water irrigated cotton yields were lower than the benchmark yields.
-$1,000,000
-$500,000
$-
$500,000
$1,000,000
$1,500,000
$2,000,000
$2,500,000
B'mark Recycled Difference
Irrigation scenario
Ann
ual n
et c
ash
retu
rn
MeanUpperLowerMedian
Figure 2.65. Difference in distribution of average additional annual net cash flow for benchmark and recycled water irrigated scenarios (recycled water price $150/ML). The bar corresponds to the mean, the ‘whisker’ covers the range from minimum to maximum and includes the median. Table 2.23 shows that that gross margins ($) from wheat and the second cotton crop in the rotation (i.e. following a short fallow) were, on average, higher than the benchmark situation. The lower average yield, compared to the benchmark situation, for the first cotton crop in the rotation (i.e. following a long fallow in the benchark situation and a short fallow in the recycled-water irrigated situation) meant that the average gross margin for this crop was lower. Overall, on average, the additional returns from wheat, the second cotton crop in the rotation and the addition of maize crop outweighed the additional fixed costs associated with irrigating with recycled water (Fig. 2.66).

86
Table 2.23. Average gross margins ($/ha) for crops in the benchmark and recycled water irrigated scenario. Crop Benchmark $/ha Recycled $/ha Irrig wheat $ 68 $ 105 Irrig cotton 1 $ 2,377 $ 1,772 Irrig cotton 2 $ 1,684 $ 2,340 Irrigated maize $ 956
-$200,000
$-
$200,000
$400,000
$600,000
$800,000
$1,000,000
$1,200,000
Benchmark Recycled
Irrigation scenario
An
nu
al n
et c
ash
ret
urn
Effluent o'headsIrrig maizeIrrig cotton 2Irrig cotton 1Irrig wheat
Figure 2.66. Contribution to average annual net cash return from crops under benchmark and recycled water irrigated scenarios (recycled water price $150/ML). 2.3.8 Farm 8 OFWS Water Balance and Irrigation The principal source of irrigation water is from overland flow transfer, with an average of 1054ML pumped into the OFWS each year, representing about 69% of the average annual catchment runoff (45 year average of 1524ML/year). River transfer provides a much smaller portion of the water supply with an average of 284ML pumped each year (Figure 2.67). The shift to the recycled water scenario involves the receipt of an additional 1500ML/year of recycled water (Figure 2.68). Coupled with this is an increase in irrigation demand associated with an additional irrigation for the wheat crop and increases in soil nutrition for both cotton and wheat crops. In response to this increased demand for water, the total average irrigation volume pumped from the OFWS increases from 1296 to 2401ML/year. There are declines in the average river transfer (to 256ML/year), and the overland flow transfer (to 734ML/year) in response to recycled water displacement. The absence of consistent, substantial overflow events in both the benchmark and recycled water scenarios coupled with the extent of bypass and unused river allocation suggests the potential for further gains through

87
more effective capture of existing water sources. This might be achieved through the removal or lessening of the sump to OFWS pumping restriction in the recycled water design (OFWS volume must be less than 500ML) or through increased pumping and storage (both sump and OFWS) capacity.
Figure 2.67. OFWS water balance component totals over the 45 year simulation period for the benchmark scenario (ML/year).
Figure 2.68 OFWS water balance component totals over the 45 year simulation period for the recycled water scenario (ML/year). Yield Long-term cotton yields under the benchmark design ranged from 0 to 10.5 bales/ha with an average of 6.8 bales/ha. The transition to the recycled water design resulted in a ~16% increase in long-term average cotton yields to 7.9 bales/ha. The increase in yield per hectare is a response to increased irrigation (45 year average of 1.8ML/ha of cotton for the benchmark versus 3.1ML/ha of cotton for the recycled water design) and increases in nitrogen supply. This amounts to an increase in average annual total cotton production across the whole farm from 4545 bales to 5288 bales (Figure 2.69).
-4000
-3000
-2000-1000
0
1000
2000
3000
4000
1961
1963
1965
1967
1969
1971
1973
1975
1977
1979
1981
1983
1985
1987
1989
1991
1993
1995
1997
1999
2001
Vo
lum
e (M
L) evaporation
rain
sump-ofws
river in
overflow
irrigation
-5000-4000-3000-2000-1000
01000200030004000
1961
1963
1965
1967
1969
1971
1973
1975
1977
1979
1981
1983
1985
1987
1989
1991
1993
1995
1997
1999
2001
Vo
lum
e (M
L)
evaporation
rain
sump-ofws
river in
overflow
recycled in
irrigation

88
Figure 2.69. 45 year distribution of whole farm cotton production (bales) showing production under the benchmark design and subsequent gains and losses under the recycled water scenario. Long-term wheat yields under the benchmark design ranged from 0 to 4.0 t/ha with an average of 1.5 t/ha. The transition to the recycled water design resulted in an increase in average annual wheat yield to 2.7 t/ha, once again due to increases in applied irrigation (i.e. 0.4ML/ha to 1.2ML/ha) and nitrogen supply. Average annual total wheat production across the whole farm increased from 513 tonnes to 899 tonnes. Salt / drainage / farm runoff Annual drainage under the benchmark design ranged from nil to 282mm with an average of 60mm. Annual runoff ranged from 1mm to 247mm with an average of 60mm. The transition to the recycled water design resulted in an increase in average drainage (to 89mm/year) in response to the increase in applied irrigation (mm/ha). Average farm runoff decreased by a small amount to 56mm/year. At the commencement of the 45 year simulation, a total of 9.3 t TSS/ha was assumed to exist in the soil to a depth of 1.8m (Table 2.24). Salt addition through irrigation over the same period amounts to 28.9 t TSS/ha for the benchmark scenario and 86.1 t TSS/ha for the recycled water scenario. The larger amount for the recycled water scenario arises from a greater irrigation volume per unit area and larger salt concentration in the irrigation water. Salt leached from the base of the root zone is larger under the recycled water scenario (80.5t TSS/ha compared with 31.8t TSS/ha for the benchmark design). There was a small net loss of salt from the benchmark scenario totalling 2.9t TSS/ha and a small net gain to the recycled water scenario of 5.7t TSS/ha. Consideration of the average salinity level calculated across all root zone layers to a depth of 1.8m on January 1 of each year of the recycled water simulation, gave a maximum salinity of 0.25dS/m. The maximum salinity in any one layer was 0.42dS/m. These levels of salinity are unlikely to have any adverse effect on crop production (Brady and Weil, 1996).
-1000
0
1000
2000
3000
4000
5000
6000
7000
8000
1959
1961
1963
1965
1967
1969
1971
1973
1975
1977
1979
1981
1983
1985
1987
1989
1991
1993
1995
1997
1999
2001
Cot
ton
prod
uctio
n (b
ales
)
Recycled
Benchmark

89
Table 2.24. Salt mass balance terms over the 45 year simulation period for the irrigated and recycled water scenarios expressed in t/ha.
The time course of drainage and salt leached for the benchmark design shows that early on, when the salt content in the root zone is higher, the salt loss per unit of drainage is also high. With time, the salt content declines and the salt loss per unit of drainage tends to decrease, suggesting that ‘excess’ salt has been leached out and that some kind of steady state is being approached where salt loss through drainage approximates salt input from irrigation (Figure 2.71). In the recycled water scenario, more salt is entering the profile and there is no apparent decline in salt loss per unit drainage. The average gain in whole farm salt loss under the recycled water scenario is 1094 tonnes (Figure 2.73).
Figure 2.71. Time course of annual salt leachate (kg/ha) and drainage (mm) for the benchmark irrigated scenario.
Figure 2.72. Time course of annual salt leachate (kg/ha) and drainage (mm) for the recycled water scenario.
Salt leached + Drainage (Benchmark)
0
12
3
45
6
7
8
9
1958
1960
1962
1964
1966
1968
1970
1972
1974
1976
1978
1980
1982
1984
1986
1988
1990
1992
1994
1996
1998
2000
2002
Sal
t le
ache
d (t
/ha)
0
50
100
150
200
250
300
350
400
Dra
inag
e (m
m)
Salt leached
Drainage
Benchmark RecycledSalt in (t/ha) 28.9 86.1Salt out (t/ha) -31.8 -80.5Salt start (t/ha) 9.3 9.3Salt finish (t/ha) 6.4 14.9Net change (t/ha) -2.9 5.7
Salt leached + Drainage (Recycled)
0
12
3
45
67
89
1958
1960
1962
1964
1966
1968
1970
1972
1974
1976
1978
1980
1982
1984
1986
1988
1990
1992
1994
1996
1998
2000
2002
Sal
t le
ach
ed (
t/h
a)
0
50
100
150
200
250
300
350
400
Dra
inag
e (m
m)
Salt leached
Drainage

90
Figure 2.73. 45 year distribution of whole farm salt losses from the base of the root profile (tonnes) showing the contribution under the benchmark design and the subsequent increase/decrease under the recycled water scenario. Economic analysis On average, annual net cash returns were higher under the recycled water irrigated scenario than the benchmark situation for all recycled water prices investigated (Table 2.25). For a recycled water price of $150/ML, an average additional annual net cash return of $361 604 could be expected for the recycled water irrigation scenario, compared with the benchmark situation. On a $/ha basis, for 1000ha, this amounts to $241/ha additional return each year. At this price one ML of recycled water irrigation generates an average return of $362. The average gross return from a ML of recycled water irrigation was $391 (i.e. a recycled water price of $0/ML). This price represents the most the farmer could pay for the water, on average, for the given set of crop price assumptions, for the recycled water scenario to be economically more attractive than the current situation. Table 2.25. Average additional annual net cash return ($) (recycled water –benchmark) for 5 recycled water prices.
Recycled water Mean additional Mean additional Mean additional price annual net cash annual net cash annual net cash
($) ($) ($/ha) ($/ML) 0 $ 586,604 $ 587 $ 391
100 $ 436,604 $ 437 $ 291 150 $ 361,604 $ 362 $ 241 200 $ 286,604 $ 287 $ 191 250 $ 211,604 $ 212 $ 141
Figure 2.74 shows that annual net cash returns are highly variable. The effect of recycled water irrigation has been to increase the variability of annual returns. The increased range of returns for the recycled water scenario reflects a situation where, at the upper end, increased yield results in higher returns. At the lower end of the range, returns fall below those at the low end of the range for the benchmark situation not
-1000
0
1000
2000
3000
4000
5000
6000
7000
1958
1960
1962
1964
1966
1968
1970
1972
1974
1976
1978
1980
1982
1984
1986
1988
1990
1992
1994
1996
1998
2000
2002
Sal
t le
ache
d (t
onne
s)
Recycled
Benchmark

91
because yields fall below the benchmark situation, but because there is the added penalty of recycled water fixed costs which is not recouped in years when there is little yield difference between the two scenarios. It should be noted, however, that within the 10th and 90th percentile of the range of returns for the recycled water scenario (i.e. returns falling between the top and bottom 10% of years), the range of returns is lower than the benchmark situation, reflecting the lower yield variability associated with recycled-water irrigated cotton compared with the benchmark situation.
-$1,500,000
-$1,000,000
-$500,000
$-
$500,000
$1,000,000
$1,500,000
$2,000,000
$2,500,000
B'mark Recycled Difference
Irrigation scenario
An
nu
al N
et C
ash
Ret
urn
MeanUpperLowerMedian
Figure 2.74. Difference in distribution of average additional annual net cash flow for benchmark and recycled water irrigated scenarios (recycled water price $150/ML). The bar corresponds to the mean, the ‘whisker’ covers the range from the maximum to minimum, and includes the median over the full range of years. The difference in annual net cash returns between the recycled-water irrigated scenario and the benchmark situation were mainly attributable to the large increase in returns to cotton production. Table 2.26 shows that cotton gross margins increase by $469/ha for the cotton crop following the long fallow, and $976/ha for the cotton crop following the short fallow. Recycled-water irrigated wheat yields were also higher than yields simulated for the benchmark situation, and this is evident in the higher gross margin. It should be noted that the gross margin calculations for the benchmark situation did include the cost of river water used by each crop ($29/ML + pumping cost), and a proportion of the pumping costs to transfer water from the sump to the storage. Quantities of both sources of water were displaced by the use of recycled water, thereby reducing some of the costs accounted for by the gross margin calculation. If the recycled water price was factored into the gross margin calculation, the difference between the benchmark and recycled-water irrigated gross margins would be less. However, for this analysis is it appropriate to allocate the recycled water irrigation as a fixed irrigation overhead cost. Table 2.26. Average gross margins ($/ha) for crops in the benchmark and recycled water irrigated scenario. Crop Benchmark $/ha Recycled $/ha Irrig. wheat $ 22 $ 100 Irrig. cotton (L) $ 1,803 $ 2,272 Irrig. cotton (S) $ 1,402 $ 2,378

92
Fig. 2.75 shows that the increased returns resulting from the increased yields attributable to the use of recycled water substantially offset the additional fixed costs ($145 000 p.a.) required to implement this recycled water scenario, with a recycled water price of $150/ML.
-$400,000-$200,000
$-$200,000$400,000$600,000$800,000
$1,000,000$1,200,000$1,400,000$1,600,000$1,800,000
Benchmark Recycled
Irrigation scenario
An
nu
al N
et C
ash
Ret
urn
s
Irrig. o'headsIrrig. cotton (after short)Irrig.cotton (after long)Irrig. wheat
Figure 2.75. Contribution to average annual net cash return from crops under benchmark and recycled water irrigated scenarios (recycled water price $150/ML). Sensitivity analysis The economic analysis for this case study was based on a cotton price differential between the recycled water and benchmark scenarios (benchmark cotton price of $455/bale and recycled water irrigated price of $485/bale). The differential accounts for quality differences and marketing advantages in securing a higher price for the more reliable recycled-water irrigated cotton. The effect of removing this price differential ($485/bale for both crops) is presented in Table 2.27. At the $150/ML recycled water price the removal of the differential on total returns to the whole farm is $136 357 or $150/ha or $91/ML. The ability to secure higher cotton prices for farmers is clearly an important benefit of recycled water irrigation. Table 2.27. Average additional annual net cash return ($) (recycled water –benchmark) for 5 recycled water prices, and no cotton price differential between benchmark and irrigated cotton.
Recycled water Mean additional Mean additional Mean additional price annual net cash annual net cash annual net cash
($) ($) ($/ha) ($/ML) 0 $ 450,247 $ 451 $ 300
100 $ 300,247 $ 301 $ 200 150 $ 225,247 $ 225 $ 150 200 $ 150,247 $ 150 $ 100 250 $ 75,247 $ 75 $ 50

93
2.3.9 Farm 9 OFWS Water Balance and Irrigation This farm receives irrigation water from three sources. Overland flow transfer amounts to an average of 221ML/year, representing about 56% of the average annual catchment runoff (45 year average of 397ML/year). Bore transfer amounts to an average of 678ML/year and river transfer a further 413ML/year (Figure 2.76). The shift to the recycled water scenario involves the receipt of an additional 850ML/year of recycled water (Figure 2.77). Coupled with this is an increase in irrigation demand associated with an increase in the total irrigation area by 243ha. In response to this increased demand for water, the total irrigation volume pumped from the OFWS increases by 56% from 1268ML/year to 1978ML/year. The receipt of recycled water results in some displacement of other water sources. Average river transfer declines by 16ML/year, bore transfer by 76ML/year and overland flow transfer by 32ML/year. There is a small increase in OFWS overflow from an average of 1ML per year in the benchmark design to 7ML per year for the recycled water scenario. In one year the overflow volume reaches 224ML. Overflow could be reduced to some extent by a reduction in the threshold OFWS volume for river and overland flow transfer from 500ML to a smaller volume.
Figure 2.76. OFWS water balance component totals over the 45 year simulation period for the benchmark scenario (ML/year).
Figure 2.77 OFWS water balance component totals over the 45 year simulation period for the recycled water scenario (ML/year).
-2500-2000-1500-1000-500
0500
1000150020002500
1961
1963
1965
1967
1969
1971
1973
1975
1977
1979
1981
1983
1985
1987
1989
1991
1993
1995
1997
1999
2001
Vo
lum
e (M
L) bore in
evaporation
rainsump-ofws
river in
overflow
irrigation
-3500
-2500
-1500
-500
500
1500
2500
3500
1961
1963
1965
1967
1969
1971
1973
1975
1977
1979
1981
1983
1985
1987
1989
1991
1993
1995
1997
1999
2001
Vo
lum
e (M
L)
bore in
evaporationrain
sump-ofws
river in
overflow
recycled in
irrigation

94
Yield Irrigated benchmark cotton yields ranged from 0 to 12.6 bales/ha with an average of 7.4 bales/ha. Wheat yields ranged from 0 to 5.1 t/ha with an average of 1.5 t/ha. The transition from the irrigated benchmark design to the recycled water design resulted in a small decrease in long-term average cotton yields to 7.3 bales/ha. However, whole farm cotton production increased by an average of 1107 bales per year by virtue of the 243ha increase in production area (Figure 2.78).
Figure 2.78. 45 year distribution of whole farm cotton production (bales) showing production under the benchmark design and subsequent gains and losses under the recycled water scenario. Average annual wheat yield increased to 2.1t/ha but, with the increase in production area, average wheat production across the whole farm increased by 322 tonnes/year. Salt / drainage / farm runoff Annual drainage under the benchmark irrigated design ranged from nil to 244mm with an average of 45mm. Annual runoff ranged from nil to 244mm with an average of 60mm. There was a small increase in drainage on moving to the recycled water scenario. At the commencement of the 45 year simulation, a total of 4.7 t TSS/ha was assumed to exist in the soil profile to a depth of 1.8m (Table 2.28). Salt addition through irrigation over the same period amounts to 39.9t TSS/ha for the benchmark scenario and 75.0t TSS/ha for the recycled water scenario. The larger amount for the recycled water scenario arises from a greater irrigation volume per unit area and larger salt concentration in the irrigation water. Salt leached from the base of the root zone is larger under the recycled water scenario (66.5t TSS/ha compared with 37.1t TSS/ha for the benchmark design). There were small increases in salt content within the root zone amounting to 2.8t TSS/ha for the benchmark scenario and 8.5t TSS/ha for the effluent scenario. Consideration of the average salinity level calculated across all root zone layers to a depth of 1.8m on January 1 of each year of the recycled water simulation, gave a maximum salinity of 0.20dS/m toward the end of the simulation. The maximum salinity in any one layer in this same year was 0.29dS/m. These levels of salinity are unlikely to have any adverse effect on crop production (Brady and Weil, 1996).
-1000
0
1000
2000
3000
4000
5000
6000
7000
1958
1960
1962
1964
1966
1968
1970
1972
1974
1976
1978
1980
1982
1984
1986
1988
1990
1992
1994
1996
1998
2000
Co
tto
n p
rod
uct
ion
(bal
es)
Recycled
Benchmark

95
Table 2.28. Salt mass balance terms over the 45 year simulation period for the irrigated and recycled water scenarios expressed in t/ha.
Drainage events are consistent throughout both scenarios and in the case of the recycled water scenario are often substantial (Figure 2.80 and 2.81), presumably owing to the long fallow periods during which there is no water extraction by the crop and an increased potential for drainage loss. As expected, the salt loss per mm of drainage is larger for the recycled water scenario because of the higher soil salt load. The time course of drainage and salt leached for the benchmark design shows that the salt loss per unit of drainage is higher early on in the simulation (Figure 2.80). With time, the salt loss per unit of drainage tends to decrease as the salt content in the root zone declines, suggesting that ‘excess’ salt has been leached out and that some kind of steady state is being approached where salt loss through drainage approximates salt input from irrigation. By contrast, the salt loss per unit drainage appears to increase over the early years of the recycled water simulation in response to the larger amount of salt coming into the profile. The average annual gain in whole farm salt loss under the recycled water scenario is 759 tonnes (Figure 2.82).
Figure 2.80. Time course of annual salt leachate (t/ha) and drainage (mm) for the benchmark irrigated scenario.
Figure 2.81. Time course of annual salt leachate (t/ha) and drainage (mm) for the recycled water scenario.
Benchmark RecycledSalt in (t/ha) 39.9 75.0Salt out (t/ha) -37.1 -66.5Salt start (t/ha) 4.7 4.7Salt finish (t/ha) 7.5 13.2Net change (t/ha) 2.8 8.5
Salt leached + Drainage (Benchmark)
0
1
2
3
4
5
6
7
8
1958
1960
1962
1964
1966
1968
1970
1972
1974
1976
1978
1980
1982
1984
1986
1988
1990
1992
1994
1996
1998
2000
2002
Sal
t le
ach
ed (
t/h
a)
0
50
100
150
200
250
300
350
400
Dra
inag
e (m
m)
Salt leached
Drainage
Salt leached + Drainage (Recycled)
0
1
2
3
4
5
6
7
8
1958
1960
1962
1964
1966
1968
1970
1972
1974
1976
1978
1980
1982
1984
1986
1988
1990
1992
1994
1996
1998
2000
2002
Sal
t le
ache
d (t
/ha)
0
50
100
150
200
250
300
350
400
Dra
inag
e (m
m)
Salt leached
Drainage

96
Figure 2.82. 45 year distribution of whole farm salt losses from the base of the root profile (tonnes) showing the contribution under the benchmark design and the subsequent increase under the recycled water scenario. Economic analysis On average, annual net cash returns were higher under the recycled water irrigated scenarios than the benchmark situation across the range of recycled water prices (Table 2.29), with the exception of returns associated with the $250/ML price. For example, with a recycled water price of $150/ML, an average additional annual cash return of $84 107 could be expected under the recycled water irrigation scenario, compared with the benchmark situation. On a $/ha basis, over 972ha, this amounts to $87/ha additional return each year. At this price, one ML of recycled water irrigation generates an average return of $99. The average gross return from one ML of recycled water irrigation was $249 (i.e. corresponding to a recycled water price of $0/ML). This represents the highest price that the farmer could afford to pay for the recycled water before it would become uneconomical change from the current system. Table 2.29. Average additional annual net cash return ($) (recycled water scenario – benchmark) for 5 recycled water prices. Recycled water Mean additional Mean additional Mean additional
price annual net cash annual net cash annual net cash ($) ($) ($/ha) ($/ML) 0 $ 211,604 $ 218 $ 249
100 $ 126,607 $ 130 $ 149 150 $ 84,107 $ 87 $ 99 200 $ 41,607 $ 43 $ 49 250 -$ 863 -$ 1 -$ 1
There is however, considerable variability in expected returns, and in almost half of years, net cash return is lower for the recycled-water irrigated scenario than for the benchmark situation, and with greater variability (Fig. 2.83). The greater variability for the recycled water scenario largely reflects that observed for the simulated wheat and cotton yields.
-1000
0
1000
2000
3000
4000
5000
1958
1960
1962
1964
1966
1968
1970
1972
1974
1976
1978
1980
1982
1984
1986
1988
1990
1992
1994
1996
1998
2000
2002
Sal
t le
ache
d (t
onne
s)Recycled
Benchmark

97
-$1,500,000
-$1,000,000
-$500,000
$-
$500,000
$1,000,000
$1,500,000
$2,000,000
$2,500,000
B'mark Recycled Difference
Irrigation scenario
An
nu
al n
et c
ash
ret
urn
MeanUpperLowerMedian
Figure 2.83. Difference in distribution of average additional annual net cash flow for benchmark and recycled water irrigated scenarios (recycled water price $150/ML). The bar corresponds to the mean, the ‘whisker’ covers the range from the maximum to the minimum, and includes the median over the full range of years. The gross margins presented in Table 2.30 reflected underlying yield differences, and to a lesser extent the displacement of irrigation water from the bores, river and overflow flow, resulting in reduced pumping costs of water from these sources under the recycled water scenario. Wheat gross margin increased under the recycled-water irrigated scenario (from -$5/ha to $75/ha), reflecting the lower yield. Table 2.30. Average gross margins ($/ha) for crops in the benchmark and recycled water irrigated scenario. Crop Benchmark $/ha Recycled $/ha Irrig. wheat -$ 5 $ 75 Irrig. cotton (after long fallow) $ 2,546 $ 2,228 Irrig. cotton (after short fallow) $ 1,946 $ 2,123 The returns from the increased irrigation area (from 729ha to 972ha) and higher cotton gross margin clearly outweigh the additional fixed costs (land purchase and development, purchase of additional lateral flow irrigators, labour and insurance) incurred in order to receive the recycled water supply (Figure 2.84).

98
-$400,000
-$200,000
$-
$200,000
$400,000
$600,000
$800,000
$1,000,000
$1,200,000
$1,400,000
$1,600,000
Benchmark Recycled
Irrigation scenario
$
Irrig O'headsIrrigated cotton (S)Irrigated cotton (L)Irrigated wheat
Figure 2.84. Contribution to average annual net cash return from crops under benchmark and recycled water irrigated scenarios (recycled water price $150/ML). 2.3.10 Farm 10 OFWS Water Balance / Irrigation Overland flow is the principle source of irrigation water in the benchmark irrigated design. Over the 45 year simulation period the volume transferred ranges from 0 to 1423ML/year with an average of 562ML/year (Figure 2.85). This average volume represents just 56% of the total average catchment runoff (45 year average of 997ML/year) with the remainder bypassing the sump. The extent of bypass can be attributed to the size of the sump to OFWS pump capacity in relation to the substantial catchment size (4300ha). Overflow losses are negligible as a consequence of the high irrigated cropping intensity and associated irrigation demand. The introduction of 650ML/year of recycled water results in significant displacement of overland flow water, with the average transfer volume dropping to 329ML/year (Figure 2.86). The average irrigation volume pumped from the OFWS increases from 552 to 939ML/year. Overflow is negligible in both scenarios.

99
Figure 2.85. OFWS water balance component totals over the 45 year simulation period for the benchmark scenario (ML/year).
Figure 2.86. OFWS water balance component totals over the 45 year simulation period for the recycled water scenario (ML/year). Yield In the benchmark dryland scenario, cotton yields over the 45 year simulation period range from 2.0 to 7.1 bales/ha with an average of 4.0 bales/ha. Wheat yield ranged from 0 to 2.7 t/ha with an average of 0.9 t/ha. This modest result for wheat can be attributed to the absence of fertilizer application and the ‘must sow’ condition whereby, if the conditions for planting (30mm rain in 7 days) is not satisfied prior to the end of the planting window, the crop is sown anyway (with often poor results). Cotton yields in the benchmark irrigated design ranged from 0.8 to 12.2 bales/ha with an average of 7.4 bales/ha. The application of more irrigation (3.6ML/ha compared with 2.3ML/ha) under the recycled water scenario resulted in further gains, with yield ranging from 5.5 to 14 bales/ha and an average of 8.8 bales/ha. Annual whole farm cotton production under the recycled water scenario (dryland + recycled water irrigated) was an average of 225 bales larger than the benchmark (dryland + irrigated) scenario although the impact was highly variable ranging from –365 bales to +1078 bales (Figure 2.87). However, overall farm cotton production is less variable.
-1500
-1000
-500
0
500
1000
1500
2000
1961
1963
1965
1967
1969
1971
1973
1975
1977
1979
1981
1983
1985
1987
1989
1991
1993
1995
1997
1999
2001
Vo
lum
e (M
L)
evaporation
rain
sump-ofws
overflow
irrigation
-2000
-1500
-1000
-500
0
500
1000
1500
2000
1961
1963
1965
1967
1969
1971
1973
1975
1977
1979
1981
1983
1985
1987
1989
1991
1993
1995
1997
1999
2001
Vo
lum
e (M
L)
evaporation
rain
sump-ofws
overflow
recycled in
irrigation

100
Figure 2.87. 45 year distribution of whole farm cotton production (bales) showing production from the dryland and benchmark areas and subsequent gains and losses under the recycled water design. Maize yields in the benchmark irrigated design ranged from 0 to 10.8 t/ha with an average of 5.8 t/ha. The application of more irrigation under the recycled water scenario (3.4ML/ha compared with 1.6ML/ha) resulted in yield gains, with yield ranging from 4.6 to 11.2 t/ha and an average of 9.0 t/ha. Whole farm maize production under the recycled water scenario was an average of 255 tonnes greater than the benchmark scenario (Figure 2.88). As with cotton, whole farm maize production is more consistent under the recycled scenario.
Figure 2.88. 45 year distribution of whole farm maize production (tonnes) showing production under the benchmark irrigated design and subsequent gains and losses under the recycled water design. Chickpea yields in the benchmark irrigated design ranged from 0 to 3.4 t/ha with an average of 1.5 t/ha. There were small gains in yield under the recycled water scenario with the average increasing to 1.9 t/ha, in response to the small increase in applied irrigation. Whole farm chickpea production under the recycled water scenario was an average of 27 tonnes greater than the benchmark scenario (Figure 2.89).
-500
0
500
1000
1500
2000
2500
1959
1961
1963
1965
1967
1969
1971
1973
1975
1977
1979
1981
1983
1985
1987
1989
1991
1993
1995
1997
1999
2001
Cot
ton
prod
uctio
n (b
ales
)
Recycled
Irrigated benchmark
Rainfed
-400
-200
0
200
400
600
800
1000
1960
1962
1964
1966
1968
1970
1972
1974
1976
1978
1980
1982
1984
1986
1988
1990
1992
1994
1996
1998
2000
Mai
ze p
rod
uct
ion
(to
nn
es)
Recycled
Irrigated benchmark

101
Figure 2.89. 45 year distribution of whole farm chickpea production (tonnes) showing production under the benchmark irrigated design and subsequent gains and losses under the recycled water design. Salt / drainage / farm runoff Annual drainage under the benchmark irrigated design ranged from nil to 224mm with an average of 44mm. Annual runoff ranged from 1 to 138mm with an average of 45mm. The transition to the recycled water design resulted in an increase in the average drainage (to 70mm/year) as a result of an increase in the irrigation application rate. Average farm runoff increased slightly to 50mm/year. At the commencement of the 45 year simulation, a total of 27t TSS/ha was assumed to exist in the soil profile to a depth of 1.8m in the irrigated benchmark and irrigated recycled water designs (Table 2.31). Salt addition through irrigation over the same period amounts to 52t TSS/ha for the benchmark scenario and 138t TSS/ha for the recycled water scenario. The larger amount for the recycled water scenario arises from a greater irrigation volume and salt concentration. Salt leached from the base of the root zone is also larger under the irrigated recycled water scenario (144t TSS/ha compared with 65t TSS/ha for the irrigated benchmark design). Over the 45 year duration of the simulation, all of the salt in the dryland scenario was leached from the root zone. Note that salt additions from rainfall and runoff are assumed to be small and are ignored in the simulation. In both scenarios there is a net loss of salt (‘flushing’) from the root zone over the 45 year simulation period amounting to 12t TSS/ha for the benchmark scenario and 5t TSS/ha for the recycled scenario. Consideration of the average salinity level calculated across all root zone layers to a depth of 1.8m on January 1 of each year of the recycled water simulation, gave a maximum salinity of 0.34dS/m. The maximum salinity in any one layer was 0.51dS/m. These levels of salinity are unlikely to have any adverse effect on crop production (Brady and Weil, 1996).
-100
-50
0
50
100
150
200
250
300
1959
1961
1963
1965
1967
1969
1971
1973
1975
1977
1979
1981
1983
1985
1987
1989
1991
1993
1995
1997
1999
2001
Chi
ckpe
a pr
oduc
tion
(ton
nes)
Recycled
Irrigated benchmark

102
Table 2.31. Salt mass balance terms over the 45 year simulation period for the benchmark and recycled water scenarios expressed in t/ha.
In the irrigated benchmark scenario, the time course for drainage and salt loss show that early on, when the salt content in the root zone is high, the salt loss per unit of drainage is also high. With time, the salt content in the root zone declines suggesting that ‘excess’ salt has been leached out and that some kind of steady state is being approached where salt loss through drainage approximates salt input from irrigation (Figure 2.90). With the higher salt concentration in the irrigation water of the recycled water scenario, the initial ‘flushing’ of surplus salt is dampened and the salt balance in the recycled water scenario appears to be closer to a steady state condition throughout the simulation period. In the dryland scenario, the majority of the salt in the root zone at the commencement of the simulation is leached out within about 20-25 years. These trends are reflected in the general decline in annual whole farm salt loss (Figure 2.92). The average annual gain in whole farm salt loss under the recycled water scenario is 410 tonnes.
Figure 2.90. Time course of annual salt leachate (t/ha) and drainage (mm) for the benchmark irrigated scenario.
Benchmark irrigated Rainfed RecycledSalt in (t/ha) 52.4 0.0 138.4Salt out (t/ha) -64.5 -54.5 -143.7Salt start (t/ha) 26.6 54.5 26.6Salt finish (t/ha) 14.4 0.0 21.2Net change (t/ha) -12.2 -54.5 -5.4
Salt leached + Drainage (Benchmark irrigated)
0123456789
10
1958
1960
1962
1964
1966
1968
1970
1972
1974
1976
1978
1980
1982
1984
1986
1988
1990
1992
1994
1996
1998
2000
2002
Sal
t le
ache
d (t
/ha)
-10
40
90
140
190
240
Dra
inag
e (m
m)Salt leached
Drainage

103
Figure 2.91. Time course of annual salt leachate (t/ha) and drainage (mm) for the recycled water scenario.
Figure 2.92. 45 year distribution of whole farm salt losses from the base of the root profile (tonnes) for the benchmark design and subsequent gains and losses under the recycled water design. Economic analysis On average, annual net cash returns are higher under the recycled water irrigated scenario than the benchmark situation, with the exception of the $250/ML recycled water price (Table 2.32). For a recycled water price of $150/ML, an average additional annual net cash return of $63 721 could be expected under the recycled water irrigation scenario, compared with the benchmark situation. On a $/ha basis, over 243 ha of irrigated area, this amounts to $262/ha additional return each year. At this price one ML of recycled water irrigation generates an average return of $98. The average gross return from a ML of recycled water irrigation was $248 (i.e. a recycled water price of $0/ML). This price represent the most the farmer could pay for the water, on average, for the given set of crop price assumptions, for the recycled water scenario to be economically more attractive than the current situation.
-500
0
500
1000
1500
2000
2500
1958
1960
1962
1964
1966
1968
1970
1972
1974
1976
1978
1980
1982
1984
1986
1988
1990
1992
1994
1996
1998
2000
2002
Sal
t le
ache
d (t
onne
s)
Recycled
Benchmark irrigated
Dryland
Salt leached + Drainage (Recycled)
012345
6789
10
1958
1960
1962
1964
1966
1968
1970
1972
1974
1976
1978
1980
1982
1984
1986
1988
1990
1992
1994
1996
1998
2000
2002
Sal
t le
ache
d (t
/ha)
-10
40
90
140
190
240
Dra
inag
e (m
m)Salt leached
Drainage

104
Table 2.32. Average additional annual net cash return ($) (recycled water –benchmark) for 5 recycled water prices.
Recycled water Mean additional Mean additional Mean additional price annual net cash annual net cash annual net cash
($) ($) ($/ha) ($/ML) 0 $ 161,221 $ 663 $ 248
100 $ 96,221 $ 396 $ 148 150 $ 63,721 $ 262 $ 98 200 $ 31,221 $ 128 $ 48 250 -$ 1,279 -$ 5 -$ 2
Figure 2.93 shows that annual returns are highly variable, particularly for the benchmark scenario. This reflects the high yield variability of all crops in the benchmark situation. The effect of recycled water irrigation has been not only to increase yield, but also reduce the yield the variability, the effects of which are reflected in annual net cash flows.
-$400,000
-$200,000
$-
$200,000
$400,000
$600,000
$800,000
$1,000,000
B'mark Recycled Difference
Irrigation scenario
An
nu
al n
et c
ash
ret
urn
MeanUpperLowerMedian
Figure 2.93 Difference in distribution of average additional annual net cash flow for benchmark and recycled water irrigated scenarios (recycled water price $150/ML). The bar corresponds to the mean, the ‘whisker’ covers the range from the maximum to minimum, and includes the median over the full range of years. Table 2.33 shows an increase in average gross margin for irrigated maize, chickpea and cotton was achieved under the recycled water irrigation scenario. This mainly reflects the increase in average yield, although there was also a reduction in pumping costs attributable to the displacement overland flow. Table 2.33. Average gross margins ($/ha) for crops in the benchmark and recycled water irrigated scenario.
Crop B'mark $/ha Recycled $/ha Irrig. maize $ 641 $ 1,184 Irrig. cotton 1 $ 1,880 $ 2,281 Irrig. cotton 2 $ 2,488 $ 3,400 Irrig. chickpea $ 420 $ 561

105
Fig. 2.94 shows that the increased returns resulting from the increased yields attributable to the recycled water offset the additional fixed costs ($98 000 p.a., with a recycled water price of $150/ML) required to implement this recycled water scenario.
-$200,000
-$100,000
$-
$100,000
$200,000
$300,000
$400,000
$500,000
$600,000
$700,000
Benchmark Recycled
Irrigation scenario
An
nu
al n
et c
ash
ret
urn
Irrig. o'heads
Irrig. chickpeaIrrig. cotton 2Irrig. Cotton 1Irrig. Maize
Figure 2.94. Contribution to average annual net cash return from crops under benchmark and recycled water irrigated scenarios (recycled water price $150/ML). 2.4 Summary and Conclusions There were gains in average (across 45 years) annual whole farm crop production in all recycled water scenarios (Table 2.34). The negative figures in Table 2.34 correspond with a change in crop composition due to a displacement of dryland with irrigated cropland or a change in the crop sequence associated with the transition to the recycled water scenario.
Table 2.34. Gain/loss in average annual whole farm production under recycled water irrigation The simulations indicated substantial year-to-year variability in the response to recycled water, and in some years, a negative impact on whole farm production was possible. Similarly, the extent and nature of this variability changed across the case
Gain/loss in average annual whole farm production Cotton (bales) Wheat (t) Maize (t) Soybean (t) Chickpea (t)
Farm 1 + 2200 - 275 . . .Farm 2 + 158 - 28 . . .Farm 3 . + 625 + 405 + 220 .Farm 4 + 373 - 202 . . + 293Farm 5 + 480 . . . .Farm 6 + 2582 - 614 + 314 . + 568Farm 7 + 23 + 52 + 1689 . .Farm 8 + 743 + 386 . . .Farm 9 + 1107 + 322 . . .Farm 10 + 225 . + 255 . + 27

106
studies. In two of the case studies, the transition to recycled water led to a reduction in yield variability and more specifically, significant yield improvement in the poor years. The most substantial reduction occurred with a case study in which the only source of irrigation water was overland flow, the least reliable of all possible sources of water. However, in another case study where overland flow was the sole source of water, the impact of recycled water on yield variability was negligible. This was attributed to a relatively small irrigation area being supplied by a comparatively large OFWS and associated catchment area. This meant that in years of the benchmark simulation where the catchment runoff was small, there was often sufficient residual OFWS capacity from the previous year to satisfy (i.e. buffer) the current years demand. In two of the case studies, yield variability actually increased under the recycled water scenarios. This was attributed to increases in both cropping intensity and irrigation application rate. This altered the distribution of the irrigation resource across the various crops and often resulted in certain crops having more irrigation available in some years and less in others. Yield variability was virtually unaffected in the remaining four case studies. These case studies were characterised by an irrigation supply in the benchmark scenario that was able to satisfy (or nearly satisfy) potential crop demand, or benchmark scenarios in which either reliable bore water was the dominant water source or, in which there were multiple water sources that effectively buffered each others unreliability. In most of these case studies, the recycled water displaced a portion of the other water sources. Farmers may reduce the extent to which such displacement occurs by considering greater utilization of existing water through an increase in cropping intensity, expansion of existing irrigated area (if possible) or more intensive irrigation of existing lands. This will impact, however, on ground and surface water at a catchment scale. The receipt of recycled water generally results in the displacement of other existing sources of water (Table 2.35). Farmers may reduce the extent to which displacement of current water sources occurs by considering greater utilization of existing water through an increase in cropping intensity, expansion of existing irrigated area (if possible) or more intensive irrigation of existing lands. This will impact, however, on surface and groundwater at a catchment scale. The environmental implications of this displacement of existing water sources are discussed in Chapter 4. Table 2.35. Gain/loss in average annual transfer of water sources to the OFWS under recycled water irrigation.
The receipt of ‘non-returnable’ recycled water occasionally resulted in an increase in storage overflow, which not only represents an inefficient use of purchased water but
Change in average annual transfer to OFWSBore (ML) River (ML) Overland flow (ML)
Farm 1 . . - 222Farm 2 - 98 . - 29Farm 3 + 1 . - 53Farm 4 . . .Farm 5 . - 432 - 39Farm 6 - 1.5 . - 62Farm 7 - 3 . - 68Farm 8 . - 28 - 320Farm 9 - 76 - 17 - 33Farm 10 . . - 233

107
may also trigger a range of community concerns (Table 2.36). In reality, a farmer could manage this in a number of ways, including:
• The irrigation of bare fallows when irrigation demand is typically low (providing there is sufficient residual soil water holding capacity)
• A reduction in the volume of recycled water purchased • The potential sale of surplus recycled water to other farmers (if allowed) • Modification in the recycled water delivery strategy i.e. more water less often
and/or at a time when demand is high. • Modification of storage capacity or have a designated OFWS for recycled
water. Table 2.36. Gain/loss in average annual overflow (ML) from the OFWS under recycled water irrigation.
Based on measured salt concentrations and other soil physical and chemical parameters and data specific to (or representative of) each case study site, six of the ten benchmark scenarios demonstrated a minor (<10%) difference between total salt input from irrigation and total salt loss from the root zone over the course of the simulation, with small resultant changes in root zone salt content. Of the remaining four benchmark scenarios, three showed a net loss of salt from the root zone (i.e. salt in < salt out) ranging from 12 to 56t TSS/ha and one a net gain in salt content of 14t TSS/ha. There was a tendency for more salt to accumulate in the root zone of the recycled water scenarios with eight out of the ten case studies experiencing net gains (i.e. salt in > salt out) in root zone salt content ranging from 1 to 36t TSS/ha. This contrasting result can be attributed to either (or a combination of) higher salt concentrations in the irrigation water, larger irrigation rates or a reduction in the drainage term in association with an increase in cropping intensity. There were net losses in the remaining two recycled scenarios of 5 and 33t TSS/ha. The latter involved a shift from dryland production and a higher initial salt load in the root zone. Consideration of the average salinity level calculated across all root zone layers to a depth of 1.8m on January 1 of each year of the simulations, indicates that, in all scenarios, the maximum levels of salinity reached in the root zone were generally below the levels expected to have a detrimental effect on crop production (i.e. greater than ~2dS/m) (Table 2.38). It was also found that the maximum level of salinity in any one layer of the root zone did not exceed this level. It should be noted however, that this conclusion is based on root zone salt levels on just one day of each year of the simulation. There may be periods during the rest of the year where higher salinity levels were reached. Furthermore, APSIM does not take into account the impact of high salinity levels on crop production and the associated flow-on effects in terms of deep drainage, and the profile salt balance. Recycled water irrigation salt
Change in average annual overflow (ML)Farm 1 -1.4Farm 2 + 56Farm 3 + 1.2Farm 4 + 226Farm 5 0Farm 6 - 0.9Farm 7 0Farm 8 + 3.5Farm 9 + 5.8Farm 10 + 0.9

108
concentrations of 5000ppm were found to generate average salinity levels in excess of 2dS/m. Table 2.38. Average maximum electrical conductivity (dS/m) under recycled water irrigation.
In most of the irrigated benchmark scenarios, the root zone salt content is not in a steady state condition at the commencement of the simulation. Typically, the time course for drainage and salt loss show that early on, when the salt content in the root zone is high, the salt loss per unit of drainage is also high. With time, the salt content in the root zone declines suggesting that ‘excess’ salt has been leached out and that some kind of steady state is being approached where salt loss through drainage approximates salt input from irrigation. With the higher salt concentration in the irrigation water of the recycled water scenario, the initial ‘flushing’ of surplus salt is often dampened and in some cases the salt loss per unit of drainage actually increases over time. A direct comparison of the change in whole farm average annual salt loss in moving from the benchmark to the recycled water scenario showed gains in all ten case studies (Table 2.37). Table 2.37. Gain/loss in average annual whole farm salt loss (tonnes) under recycled water irrigation.
Based on annual net cash returns averaged over 42 years (corresponding to the 1959-2001 weather record), most of the 10 case studies received a financial benefit from the use of recycled water (Table 2.39). That is, the additional revenue attributable to recycled water production offset the additional costs across the range of recycled water prices investigated. At the $150/ML recycled water price, the benefit (loss)
Change in average annual whole farm salt loss (tonnes)
Farm 1 + 29Farm 2 + 159Farm 3 + 577Farm 4 + 108Farm 5 + 751Farm 6 + 426Farm 7 + 45Farm 8 + 1094Farm 9 + 759Farm 10 + 410
Averagemaximum E.C (dS/m)
Farm 1 1.2Farm 2 0.4Farm 3 0.55Farm 4 0.78Farm 5 0.42Farm 6 0.51Farm 7 0.6Farm 8 0.25Farm 9 0.2Farm 10 0.34

109
from recycled water irrigation ranged from -$23/ha to $1,075/ha (average $292/ha) and -$19/ML to $826/ML (average $203/ML). Table 2.39. Average annual net cash return for each farm ($/ha and $/ML) for three recycled water prices $/ha $/ML Case study $0/ML $150/ML $250/ML $0/ML $150/ML $250/ML Farm 1 $ 426 $ 250 $ 133 $364 $ 214 $ 114 Farm 2 $ 307 $ 25 -$ 164 $163 $ 13 -$ 87 Farm 3 $ 160 -$ 23 -$ 145 $131 -$ 19 -$ 119 Farm 4 $ 918 $ 547 $ 299 $371 $ 221 $ 121 Farm 5 $ 364 $ 158 $ 21 $265 $ 115 $ 15 Farm 6 $1,270 $ 1,075 $ 945 $976 $ 826 $ 726 Farm 7 $ 290 $ 174 $ 97 $376 $ 226 $ 126 Farm 8 $ 587 $ 362 $ 212 $391 $ 241 $ 141 Farm 9 $ 218 $ 87 -$ 1 $249 $ 99 -$ 1 Farm 10 $ 663 $ 262 -$ 5 $248 $ 98 -$ 2 Average $ 520 $ 292 $ 139 $353 $ 203 $ 103 Of the 10 farms, there was no benefit, on average, attributable to the use of recycled water for one farm when the price was $150/ML. When the price was increased to $250/ML, the number increased to four farms. It should be noted that all case studies displayed considerable variability of annual net cash returns over the 42-year simulation period. For all farms, with the $150/ML recycled water price, recycled water use in some years resulted in annual net cash returns lower than the current situation, even though, on average, recycled water irrigation was the economically attractive option for all but one of these farms. The percentage of years that performed worse than the current (benchmark) situation for these farms ranged from 2% to approximately 60% of years. Such years of poor performance for the recycled-water irrigated scenarios corresponded to years when a) low crop yields meant that revenue from crop production could not offset additional costs or b) there was little or no increase in yield attributable to recycled water irrigation relative to the current situation on farms (e.g. high rainfall years), meaning that the additional fixed costs could not be compensated for. The average gross return from one megalitre of recycled water (i.e. annual net cash return for the $0/ML recycled water price) ranged from $131/ML to $976/ML, with an average of $353/ML. This represents the most the farmer could justify paying, on average, for the recycled water. At prices higher than this, there would be no advantage in using recycled water for irrigation over a substantial period of time. Cotton featured in 9 of the 10 case study farms, and was a dominant component of the cropping systems of the case study farms that were most economically responsive to recycled water-irrigation. Compared to other crops investigated, cotton exhibited the greatest return to irrigation, and substantial increases in the quantity of additional cotton produced by farms under the recycled-water irrigated system resulted in the highest returns to recycled water irrigation.

110
Recycled water irrigation was less economically attractive in situations where significant displacement of irrigation water sources less expensive than recycled water occurred without any significant increases in yield to offset the extra cost (e.g. although there was sufficient yield increases to economically justify the use of recycled water on Farms 2 and 5, returns were influenced by the displacement of bore and river water, respectively).

111
3. Cropping systems design to meet environmental criteria – minimization of water/solute movement in deep drainage from farm paddocks
The objective of this chapter is to evaluate designs for cropping systems which are effective in minimizing water and solute movement off farms, particularly in deep drainage. The intention is to utilize a farm scenario detailed in Chapter 2 to modify its crop and irrigation management for this specific purpose. The case for modified management was seen in Chapter 2 where significant deep drainage and salt leaching were simulated under both current irrigated practices and the proposed recycled water scenarios. If it is desirable to ensure a low risk of recycled water and solutes escaping from the surface 1-2m of soil, then alternative crop and irrigation management systems need to be implemented. Such alternative systems clearly need to be different from traditional irrigated cropping systems, a wide range of which were simulated within the ten case studies in Chapter 2. Therefore, in this Chapter, the option of incorporating lucerne into the cropping system is assessed as the most likely means of drying the top 2m of soil. 3.1 Modelling assumptions Incorporating lucerne into the cropping system was tested initially using case study 1 described in Chapter 2. Therefore, model settings and assumptions for this case study remain as described in Chapter 2. The new lucerne-based systems are described in Table 3.1. Briefly, the new three-year rotation consists of 12 months of sown lucerne, cut for hay, followed by two years of irrigated cotton. The lucerne was established on 1 June after cotton picking with a pre-irrigation and then grown dryland for the following 12 months. The lucerne was cut and sold for hay if there was sufficient growth. Simulations on this new system were undertaken for both the current farm irrigation capacity and for the proposed recycled water irrigation system. The latter system doubled the area of irrigated crops each year using the additional recycled irrigation water (Table 3.1). The cost and price assumptions used in the economic analysis were as used in previous analyses (Table 3.1). The lucerne price is assumed to be $400/t. Lucerne variable costs are taken as $262/ha and $32/t (www.dpi.qld.gov.au/fieldcrops).

112
Table 3.1. Case specific biophysical and economic model inputs Farm No
Area (ha) Rotation Crop management Irrigation infrastructure Economic configuration
1 853ha total 162ha irrigation Irrigated scenario Summer crop 108ha/yr cotton 54ha/yr lucerne Winter crop 54ha/yr lucerne 108ha/yr fallow Recycled water scenario Summer crop 216ha/yr cotton 108ha/yr lucerne Winter crop 108ha/yr lucerne 216ha/yr fallow
Lucerne→ Lucerne→ Winter Fallow→ Cotton→ Winter fallow→ Cotton…..
Irrigated / recycled water scenarios Cotton: Sown Oct 1. 10 plts/m2 (solid). N fertilise to 250kgN/ha. Okra Si14 cultivar. Up to four irrigations based on a 60mm deficit to 90cm. Lucerne: Sown June 1. 200 stems/m2 (25plants/m2). Trifecta cultivar. One irrigation at sowing based on a 60mm deficit to 90cm. Ploughed/sprayed out June 1. (1 year duration) Soil: Norillee (323 PASW) Climate: Pittsworth
Benchmark irrigated scenario OFWS : 1020ML capacity Sump: 180ML Sump-to-OFWS : 115 ML/day Catchment: 11492 ha (KII 75) Bore/river: Nil Recycled water scenario Same as irrigated scenario but with addition of recycled water delivered at 8.3ML every 3 days (1000ML total per annum). Overland flow is pumped into the OFWS from the sump only when the OFWS volume drops below 200ML.
Variable costs Pumping costs: OFWS to field: $32/ML (includes lateral irrigator running cost) Sump to OFWS: $12/ML Additional annual fixed costs - recycled water scenario 1 Labour: $4200 Insurance: $1000 Lateral flow irrigator: $300 000

113
3.2 Case study findings Yield and production Simulated cotton yields (mean and long-term distribution) for five systems are presented in Figure 3.1. Simulated yields for the benchmark rainfed and irrigated systems and for the recycled water system are as presented previously in Chapter 2 (section 2.3.1) with mean yields for continuous cotton of 5.0, 9.4 and 9.5 bales/ha respectively. Introducing lucerne into the system resulted in slightly lower simulated average cotton yields of 8.9 bales/ha for both the standard irrigated and recycled-water irrigated systems.
Figure 3.1. Distribution of simulated yields for continuous cotton grown in benchmark rainfed and irrigated systems and for a recycled-water irrigated system compared to simulated cotton yields for lucerne-cotton systems using standard irrigation or recycled water irrigation. The bar corresponds to the mean, the ‘whisker’ covers the range from 10th and 90th percentile and includes the median. While cotton yield per hectare remained largely unchanged from introducing lucerne into the system, the area of cotton each year is reduced by one third compared to the benchmark continuous cotton systems (Table 3.1). Simulated production of lucerne hay averaged 6.0 and 6.1 t/ha for the standard irrigated and recycled-water irrigated systems respectively (Figure 3.2). While some years produced greater than 10t/ha, most years produced significantly less than what would be expected from irrigated lucerne production on the Darling Downs. The reason for lower production is that these scenarios essentially represent dryland lucerne production over a single year – only one irrigation is applied at the time of lucerne sowing to ensure adequate emergence. This system ensures that irrigation water is given as priority to the cotton fields each year.
Cotton yield
02468
10121416
BenchmarkRainfed
BenchmarkIrrigated
Recycledwater system
Benchmarklucernesystem
Recycledwater +lucernesystem
Co
tto
n y
ield
(b
ales
/ha)
Mean Upper
Lower Median

114
Figure 3.2. Distribution of simulated yields of lucerne hay (t/ha @18% moisture) grown in standard irrigated systems and recycled-water irrigated systems. The bar corresponds to the mean, the ‘whisker’ covers the range from 10th and 90th percentile and includes the median. Economic analysis As presented in Chapter 2, average annual net cash returns were higher under the recycled water irrigated scenario than the benchmark situation at a recycled water price of $150/ML. The simulations resulted in an average return of $114/ML of purchased recycled water (section 2.3.1). Adding lucerne into a three year cotton rotation reduced returns compared to a continuous cotton production system (Figure 3.3). However, adding lucerne combined with 1000ML of recycled irrigation water increased average net cash returns by $51,000 annually over the current benchmark system. This equates to an average return of $51/ML of recycled water at a water cost of $150/ML. While purchased recycled water at $150/ML is clearly profitable for intensive cotton production, it becomes less so in a lucerne-cotton rotation.
Lucerne biomass
0
2
4
6
8
10
12
Benchmark lucerne system Recycled water + lucernesystem
Hay
bio
mas
s (t
/ha)
Mean UpperLower Median

115
Figure 3.3. Distribution of annual net cash flow for benchmark and recycled water irrigated scenarios (recycled water price $150/ML) with or without lucerne in the system. The bar corresponds to the mean, the ‘whisker’ covers the range from 10th and 90th percentile and includes the median. Salt and Drainage Incorporating lucerne every third year into an irrigated cotton production system dramatically reduced average annual deep drainage and salt leaching below 1.8m compared to the simulated benchmark system (Table 3.2). Lucerne significantly dried the soil profile out and restricted water movement out of the root zone. However, under all systems there were years with significant drainage and salt losses from the system. Because lucerne restricted drainage, in the few years with high drainage, high salt levels were leached. In contrast, the benchmark irrigated system was continuously leaching salt and so the big drainage events leached less salt. Table 3.2: Average and maximum annual values simulated for deep drainage and leached salt (below 1.8m soil depth) for four cropping systems.
System Deep drainage (mm/ha/yr)
Leached salt (t/ha/year)
Average Maximum Average Maximum Benchmark system 14.1 153.1 1.9 18.1 Recycled water system 13.5 172.2 2.4 26.8 Benchmark lucerne system 2.3 111.7 0.7 33.5 Recycled lucerne system 3.2 116.1 1.0 37.8
Annual net cash flow
0
500,000
1,000,000
1,500,000
2,000,000
Benchmarksystem
Recycled watersystem
Benchmarklucerne system
Recycled water +lucerne system
An
nu
al n
et c
ash
flo
w ($
)
Mean UpperLower Median

116
Table 3.3: Salt mass balance terms (t/ha) over the 41 year simulation period for the benchmark irrigated and recycled water scenarios and their equivalent lucerne systems.
Benchmark system
Recycled system
Benchmark lucerne system
Recycled lucerne system
Salt in (t/ha) 65 101 53 83 Salt out (t/ha) -84 -104 -30 -42 Salt start (t/ha) 52 52 52 52 Salt finish (t/ha) 33 49 75 93 Net change (t/ha) -19 -3 23 41 Over the 41 year simulation (1960-2001), the benchmark irrigation system and the recycled water irrigation system resulted in a net losses of 19 t/ha and 3 t/ha salt respectively from the top 1.8m of soil profile (Table 3.3). In the two lucerne systems, benchmark lucerne and recycled water plus lucerne, there was a net gain in salt of 23 and 41 t/ha respectively. By adding lucerne to the crop rotation and using recycled water, salt leached below the root zone decreased by 50% – from 84 t/ha for the benchmark system to 42 t/ha for the recycled water lucerne system over the 45 year simulation period. Clearly, a cropping option such as lucerne can minimise the deep drainage impact of a recycled water irrigation system. However, higher salt accumulation in the soil profile may have significant impacts on long-term crop yields. The impact of this accumulation was not considered in this analysis. 3.3 Conclusions Analyses in Chapter 2 demonstrated that significant deep drainage and salt leaching were simulated under both current irrigated practices and the proposed recycled water scenarios. In this chapter, one simple case study was used to demonstrate one strategy to reduce the drainage and salt movement out of the root zone under a recycled water irrigation system. By rotating irrigated cotton with lucerne hay production over a three year period and purchasing recycled irrigation water ($150/ML), annual net cash flow was simulated to increase by 5.5% and accumulated salt leached below the root zone was simulated to decrease by 50%. This result demonstrates both economic and environmental benefits from a recycled water irrigation system. It should be noted that the analyses undertaken in this chapter are limited and only represent a simple case study of the potential impacts of introducing lucerne into the crop rotation. Other irrigation configurations and management systems will alter these results.

117
4. Environmental impacts on the surface and groundwater at sub-catchment and catchment scales as a result of storage of recycled water in on-farm water storages and irrigating with recycled waters. 4.1 Key environmental features of the catchment Huxley (1982) described the surface and groundwater features of the study area. The main surface water feature is the Condamine River (Figure-1) consisting of the North Branch of the Condamine River and the old course of the river running parallel to the main river south of the Cecil plains. Average annual rainfall is around 650 mm. Average annual pan evaporation varies between 1600 mm to 2000 mm.
Condamine River
North Branch
Condamine River
North Branch
Figure 1. Location Plan of Condamine Catchment System

118
Cotton, grains and horticultural crops are the typical land uses on mainly deep black clays of the Darling Downs. The surface flows in the floodplains consist of short infrequent overland runoff events which are partially captured by farmers using a system of sumps, high capacity pumps, and larger capacity on-farm storage dams called ring tanks. There are over 300 ring tanks in the area with individual capacities as high as over 1500 ML. The satellite imagery data analysed during the SKM study (SKM, 1999, 2001) indicated rapid increase in the number of ring tanks (48% increase from 1997 to 1999) with an estimated storage capacity of 143,000 ML in 1999. Most of the ring tanks are located near the river or its tributary to have access to regulated water supplies in addition to water harvesting. The geology of the area (west of Toowoomba) can be broadly classified into basaltic uplands, sandstone uplands and alluvial plains (Kinhill, 1999). The basaltic uplands are the fractured aquifer systems associated with thin red krasnozem soils on the upper slopes and thick black self-mulching clays on the lower slopes. The main recharge to the aquifer occurs through the thin krasnozem soils which are very permeable. The yield of the basaltic upland aquifers varies between 1 L/s to 50 L/s with low salinity. The sandstone lying to the west of the basaltic uplands consists of consolidated Mesozoic sediments and provide moderate to high salinity groundwater. The shape of the bed rock is shown in Figure-2.
Condamine River
North Branch
Pittsworth
Figure 2. Shape of Bedrock The alluvial aquifer system consists of varying bands of sands and gravels interbedded with the clay aquitards (Figure-3). The width of the alluvial sediments ranges from a few kilometres in the upper tributaries to over 100 m near the river

119
(Huxley, 1982). The groundwater is generally of good quality with salinity levels less than 1,000 mg/L (DNR, 1992).
Figure 3. Geological Log of Bore Number 42230089

120
The alluvial aquifer systems have been overexploited as the groundwater recharge is much less than the historic groundwater recharge. Groundwater depressions (greater than 25 metres depth in the centre) have been developed between Norwin and Brookstead (Figure-4). Figure-5 shows declining groundwater pressures in the area which indicate that the groundwater discharge is much higher than the recharge. The recharge to the aquifer systems is mainly from the Condamine River and its tributaries. The current spatial recharge from rainfall and irrigation to the alluvial aquifer system is very small as vertical hydraulic conductivities of the overlying and inter-bedded clay materials are very low. Groundwater flow directions drawn on top of the bedrock and groundwater pressure levels show (Figure-4) that groundwater system is closed and salts brought with recharge from recycled water irrigation will be contained within the system. The long-term sustainability of the system need to carefully consider salt export options.
Figure 4. Aquifer Pressure Levels Superimposed on Bedrock Level
Condamine River
North Branch
Pittsworth
-50
-40
-30
-20
-10
0

121
Figure 5 Declining Piezometeric Levels in Groundwater Cone of Depression Area The surface water use is around 135,000 ML, which includes around 93,000 ML of water harvesting from streams and 29,000 ML of water harvesting from overland flow (SKM, 2001). The average groundwater use is around 30,000 ML to 50,000 ML with average annual recharge of around 20,000 ML.
4.2 Predicted changes in surface runoff under the current and recycled water irrigated situations For this part of the study findings of the surface water hydrology study by SKM (2001) are referred, as necessary regional scale assessment of surface water resources using IQQM and Ring Tank models is already available. The relevant key findings from SKM study (2001) along with interpretations for the present work are summarised below:
• The passing surface water flow and availability of water to down-slope areas is reduced as the number or volume of ring tanks upslope increases. As the number of ring tanks capturing surface runoff increase the impact on passing flows to receiving streams becomes greater than the impact on capture performance by ring tanks down-slope. This means any reductions in capturing of surface runoff with increased recycled water use in the upper parts of the catchment will greatly help improve flows to the streams.
• Most overland flows during low flow periods are captured by the ring tanks as
compared to captured overland flows during the high runoff periods. The greatest benefits in reduction of capturing of overland flow will be during the low flow periods. Therefore a strategy aimed at recycled water irrigation to
Bore 42230122
-40
-35
-30
-25
-20
-15
-10
-5
0
1966 1970 1974 1978 1982 1986 1990 1994 1998 2002
Gro
undw
ater
Lev
el(m
)
MaxMin

122
offset capturing low flows will help improve rivers flows and health of ecological system.
• Results of a hypothetical study suggest that a 50 percent increase in total ring
tank capacity from 143 000 ML (in 1999) to 214 500 ML results in 9% (25,350 ML/year) decrease in total volume of flow at Macalister for the 74 year study period. During this simulation period the maximum decrease in annual volume at Macalister was estimated as –49 %. Water harvesters located on the tributaries, extract on average a 42 % increase in total off-allocation volume from the tributaries during the study period. A similar average increase in off-allocation extractions (+ 40 %) would be anticipated from the regulated and unregulated reaches of the river. Therefore further growth in the number of ring tanks to meet water shortage by capturing overland flow in the region will have major impact on the flows in the area.
• In another hypothetical scenario a 50% decrease in total ring tank capacity
from 143 000 ML (1999) to 71 500 ML resulted in an average increase in total volume of flow at Macalister for the total study period of + 11 % (30,000 ML/yr). The minimum and maximum increase in total volume at Macalister were 3% and 84 %. Water harvesters located on the tributaries extract on average a 47 % decreased total off-allocation volume from the tributaries during the study period. If part of the recycled water irrigation is aimed at reducing harvesting of overland flows it will greatly improve environmental flows in the rivers.
On the basis of above results it is concluded that if recycled water availability decreases the volume of water harvested in the catchment there will be direct benefits to the surface water flows in the rivers. The maximum benefits will be during reduced overland flow periods as the efficiency of capture is highest at those times. This will help in improved river flows during periods of low runoff in the catchment. The possible reduced capturing of overland flows and lower seepage losses to groundwater will help improve flows in over 200 km reach of Condamine river. 4.3 Predicted changes in groundwater dynamics and quality due to introduction of recycled water irrigation 4.3.1 Previous Groundwater Studies in the Area Geological characteristics of the aquifer system in the study area are given by Huxley (1982). The other major related groundwater studies include:
• Young (1990) Groundwater Model of the Condamine Region • Richards (1992) Recalibration of the Condamine Groundwater Model • Bengston (1997) Recalibration of the Condamine Flow Model • SKM (1999 and 2001) Conjunctive Water Use Options
Huxley developed a database of aquifer characteristics such as structural contours and isopacs of alluvium which indicate that the there are three main aquifer systems which are continuous downstream along the valley but are discontinuous across the valley.

123
Groundwater modelling studies by Young, Richards and Bengston have concluded that river leakage is the main source of groundwater recharge (over 60 percent of total recharge). Aquifer water levels across the Condamine Valley are declining because of over commitment and use of groundwater resources except at locations close to the river. Away from the North Branch and Condamine River, bore hydrograph trends show a 15 to 22 metre decline over a 25 year monitoring period. The metered groundwater use in the Condamine groundwater area during the 1997/98 was 50,299 ML (Heiner et al, 1999). The estimated recharge rates in the area are 22000 to 23000 ML (Bowman, 1999). This situation clearly illustrates the stressed nature of groundwater system which has lead to voluntary reductions in groundwater use by irrigators, with lower announced allocations in sub-area 3 of the Condamine Groundwater Management Area (SKM, 2001). Any reductions in groundwater usage especially in the groundwater depression zones east of North Branch and Condamine River will help recover stressed aquifer systems and help reduce enhanced leakage from the river. The additional recycled water supplies can result in groundwater spatial recharge. Since data available on salinity of recycled water suggests salinity levels of around 1.1 dS/m (Heiner et al, 1999) for the possible supplies to the Darling Downs area there is a threat to the water quality of the system as the salinity of leachate under crops and seepage from dams may be very high. The groundwater vulnerability studies by Hansen (1999) suggest that basaltic landscapes (East of Oakey, Mt Irving, Pittsworth and Clifton) due to shallow depths to watertables and high soil permeabilities are highly vulnerable to groundwater salinisation and pathogenic and nutrient pollution. Due to deeper depths to watertable and presence of thick clays overlying the Condamine Alluvial aquifer has a lower vulnerability rating and therefore more suitable for irrigation with the recycled water. 4.3.2 Groundwater Recharge Under the Irrigated Fields The deep drainage studies below the root zone were carried out by Heiner et al (1999) and by the project team during the present work. Heiner et al (1999) studied three irrigation scenarios for cotton and lucerne in the Darling Downs i.e.
• 100% recycled water irrigation • 50% recycled water : 50 % bore irrigation • 100% bore irrigation
The key findings of Heiner et al (1999) were as below:
• The deep drainage rates calculated using the salinity and leaching Fraction Model (SALF) were from 17 to 137 mm/yr with equilibrium salinity levels of soil profiles from, 0.96 to 2.56 dS/m in the Darling Downs area.
• A minimum of 50% dilution of recycled water is necessary to avoid salinisation problems.
• The MEDLI model studies for 43 years period suggest deep drainage under lucerne from 87 to 133 mm/yr and for cotton from 125 mm/yr to 145 mm/yr.
• The phosphorous leaching below the root zone was less than 1 Kg/ha/yr.

124
• The nitrogen leaching was zero for lucerne and was from 8 to 80 mg/l for cotton with higher numbers for recycled water use.
The deep drainage studies carried out by the project team show average deep drainage values for the case study farms from 30 to 90 mm/yr with maximum deep drainage below 1.8 m zone of over 300 mm/yr. To determine impact of deep drainage on watertable response with different depths of the unsaturated zone a vertical clay column model of unsaturated flow was developed during the current study. The model is based on the VS2D finite difference model of USGS (Healy and Ronan, 1996). The unsaturated hydraulic properties were not readily available from the study area except for some rough lowest Ksat estimates (6 to 50 mm/day) based on modelling studies are available in Heiner et al (1999). The unsaturated van Genuchten parameters (van Genuchten, 1980) were assumed for a typical clay soil with 38 percent porosity, Ksat of 0.048 m/day, alpha of 0.8 and beta value of 1.09. The model results can be easily updated with any alternative set of hydraulic properties data. The initial conditions for these model runs were based on an equilibrium profile. The regional groundwater inflow and outflow is assumed to be equal at the base of the soil column. Simulation results for the 20m initial depth to watertable with irrigation period recharge of 0.5 mm/day (total of 90 mm) and non irrigation period recharge of 0.1 mm/day (18 mm) for thirty years is shown in Figure- 6.
Figure 6. Change in depth of watertable for 110 mm/yr recharge on clay soils The net recharge to watertable is zero for the first 7.5 years and once the profile is close to field capacity it results in the rise of watertables. Once the watertables start
0
1
2
3
4
5
6
0 5 10 15 20 25 30 35
Year
Ch
ang
e in
Dep
th t
o W
ater
tab
le (
m)

125
rising the pressure between the shallow and deep aquifers will increase resulting in enhanced regional groundwater discharge thus reducing the rate of watertable rise. In this model regional groundwater outflow was assumed same as the inflow therefore the rate of rise of watertables after seven years is overestimated under the current rates of depletion of groundwater. Similar runs were made for a number of other initial depths to watertable. Start of rise of watertable for 10 and 15 meters initial depths to watertable were estimated as 2 and 5 years respectively. For the 20 meter depth to watertable the rate of recharge was reduced to 36 mm/year and model was run again. The results show watertables do not start rising until 17 years and rate of rise is also very slow. If this rate of recharge is combined with a net regional groundwater discharge of 0.3 ML/ha the watertables will remain in equilibrium. 4.3.3 Hydraulic Conditions Under the Storage Dams Using a similar column model described in the previous section and imposing a constant recharge of 1 mm/year to account for ponded hydraulic conditions, the model simulations were carried out. Results for 15 metre initial depth to watertable under a farm dam with continuous ponding are given in Figure-7. Results show the overall soil water conditions below the dam remain unsaturated for more than 2 years. From the start of the ponding period a wetting front develops under the dam which starts moving towards the watertable. After 2.5 years of operation completely saturated conditions develop under the farm dam and leakage from dam starts recharging the regional groundwater. If the depth of shallow groundwater is small, the saturated conditions develop in a lesser period of time e.g. for an 8 m initial depth to watertable the saturated conditions develop after only 1 year of operation. Once the saturated groundwater conditions are developed pathogens and nutrients in the recycled water can be transported to directly to the groundwater. The dam leakage studies suggest there is a need for careful siting and construction of on farm and any large recycled water storage facilities to avoid pollution of groundwater and possible lateral flow to adjoining streams. This aspect of work can be covered in future studies using the dam locations and spatial groundwater models described in the next section.

126
0
2
4
6
8
10
12
14
16
0 0.5 1 1.5 2 2.5 3 3.5
Year
Dep
th to
Gro
un
dw
ater
(m)
Figure 7. Change in depth of groundwater for a 15 m deep piezometer located under a farm dam 4.3.4 Regional Analysis of Recharge On Watertables Young (1990), Richards (1992) and Bengston (1997) have described a regional groundwater model covering the Condamine region shown in Figure- 8. The model mesh is very coarse consisting of 195 cells with sizes ranging from 5 km by 5 km to 10 km by 10 km. It is a one-layer model with an option for the groundwater layer to change from the confined to the unconfined conditions if the groundwater potentials fall below the top elevation of the aquifer. The model has been calibrated with very low specific yield values with associated high values of hydraulic conductivities e.g. specific yield of 0.01 with a hydraulic conductivity of 53.9 m/day. These very low values of specific yield are not realistic for the sand strata and make the model very sensitive to any recharge inputs into the model once the pressure levels fall below the top level of aquifers.

127
Figure 8. Regional Groundwater Model of the Condamine Area For the present study calibrated parameters as provided in Bengston (1997) and previous reports have been used with no further improvements to the model. A spatially zoomed version of the model with a refined mesh has been developed from

128
the existing regional model for a preliminary assessment of solute transport in the Condamine Alluvial aquifers as the existing model is too coarse for any reasonable solute transport simulation. Using the calibrated parameters of the Condamine groundwater model described in Bengston (1997) following scenarios of recycled water reuse were studied.
• Current level of groundwater pumping and recycled water reuse
• 50% reduction in groundwater pumping and recycled water reuse Realising deep groundwater potentials and substantial thickness of clay layer a delayed and very low recharge due to recycled water reuse was considered. In both scenarios for the first 11 years the recharge is assumed to be zero and thereafter a spatial average recharge of 2 mm/year is assumed to account for partial cropping of the area. The 2 mm/year was selected after a number of trials with higher recharge estimates which result in the very rapid rise of watertables due to the very low specific yield parameters (e.g. 0.01) for a number of cells. Figure-9 shows groundwater response at cell (7,7) under the current pumping rates and 2 mm/day recharge after year 11. It is located near Horraine and Mangwee in the cone of groundwater depression area under the Cecil Plains south of Dalby. Results show no appreciable recovery of watertables with the introduction of recharge since the pumping rates are too high.
Figure 9. Watertable response for the current level of pumping and 2 mm/year recharge after 15 years Figure-10 shows groundwater response at cell (7,7) under 50 % reduced pumping rates located near Horraine and Mangwee in the cone of groundwater depression area under the Cecil Plains south of Dalby. Simulation studies show appreciable recovery of watertables with reduced groundwater pumping. If groundwater pumping in the cone of depression area is traded/replaced with recycled water irrigation it will greatly benefit the groundwater system.

129
Figure 10. Watertable Response for 50% level of present pumping and 2 mm/year recharge for 11 years Salinity Impacts on Watertables To study the impact of recharge on the salinity of groundwater a spatially zoomed version of the model has been developed using the existing regional model of the area. The existing model mesh was refined by a factor of 9 and the model area was restricted to cells (3,3) and (9,9) to study solute transport due to recharge with lower quality water in the cone of depression region. The refined model mesh is shown in Figure- 11. APSIM crop modelling suggests salinity of water leaving 1.8 m profile may be from 4000 to over 25000 mg/L. Considering a 11 years delay in recharge and thereafter a 2 mm/irrigation season recharge containing 5000 mg/L of salts solute transport studies were carried out for 30 years period. The results of modelling study (Figure-12) show that there will be slight increase of around 100 mg/L in the salinity level for this very low recharge scenario. This lower rate of rise of salinity may be justified by the presence of clay aquitards overlying the main aquifers. Higher recharge values will result in higher groundwater salinity in the area. In the shallow aquifers the salinities of aquifers (several thousands mg/L) will be much higher due to dissolution of salts present in the soil profile. This aspect is not studied during the present assignment due to time and technical constraints of the existing regional groundwater model. Other results not presented here suggest salinity of basaltic uplands will rise more rapidly due to a very shallow vadose zone and higher hydraulic conductivities of soils. Since major pumping activities are in the cone of depression area there is need to carry out wellhead protection studies to limit pathogenic and salinity pollution to groundwater bores in the region.

130
Figure 11. Spatially Zoomed Version of Regional Model

131
Figure 12 Salinity levels (mg/l) at cell number 7_7 with 2 mm/yr recharge
4.4 Possible improvements in the Darling and Murray Rivers
A preliminary effort was made to translate benefits to the Murray river due to lower capture of overland flow as a consequence of availability of recycled water for irrigation. Reference is made to published results of IQQM models of Queensland and NSW and the Monthly Simulation Model of the Murray Darling Basin Commission (MDBC). These model runs were aimed at quantifying economic and environmental impacts of development on the Condamine, Moonie and Border Rivers in Queensland on the Murray and Lower Darling rivers (Prasad and Close 2000). Prasad and Close used Department of Land and Water Conservation NSW results of the Barwon and Darling IQQM models (these model used outputs from Department of Natural Resources Qld modelled scenario results of Moonie, Condamine and Border rivers) to run MDBC Monthly Simulation Model (MSM) describing Murray River. The following scenarios are relevant to present study and are therefore outlined below: Scenario- 1 1993/94 Development Conditions – Bench Mark Scenario Scenario- 4 Condamine Balonne Scenario C – Irrigation levels reduced to the level associated with 1997 level of water resource developments Scenario- 5 Condamine Balonne Scenario B – Irrigation development reduced on the Condamine-Balonne from mid-1999 levels by means of a reduction in the monthly reliability for water projects and a reduction in long terms average diversion opportunities for hectare licenses and water harvesting. Scenario- 6 Condamine Balonne Scenario C – This is the highest diversion scenario described in Water Management and Allocation Planning (WAMP) as it adopts 1999 level of water resources development. The relevant results from Prasad and Close (2000) are listed in Table-1.

132
Table-1 Results of Modelling WAMP Modelling Scenarios (Prasad and Close, 2000)
Scenario Difference from benchmark (1993/1994) at outflow from
Queensland (GL)
Difference from benchmark (1993/1994) at River Murray
at Wentworth (GL) Scenario-1 0 0 Scenario-4 -93 -39 Scenario-5 -109 -45 Scenario-6 -137 -55 Results presented in Table-1 show that increased use of water in the Condamine River results in proportionally decreased flows in the Murray River. Three scenarios studied by MDBC for the Condamine River show 93,000, 109,000 and 137,000 mean annual extra use of surface water in the Condamine/Balonne Catchment (from the benchmark 1993/94 scenario) result in 39,000, 45,000 and 55,000 ML mean annual flow decrease at Wentworth on the Murray River. Since both IQQM and MSM models use loss factors as a fraction of river flows we can use these results to assess approximate increase in flows in the Murray River as a consequence of recycled water irrigation and possible lower capture of overland flow in the Condamine River. Using a loss factor of 0.4 (from above results) 30,000 ML mean annual flow gains (from the SKM study referred to in Section 4.2) at Macalister on the Condamine River due to increased recycled water use and lower capture of overland flow can result in around 12,000 ML extra mean annual flow gains at Wentworth on the Murray River. This will improve environmental conditions both in the Darling and the Murray rivers.
4.5 Conclusions The following conclusions are drawn from this study:
• In general there is a shortage of irrigation water supplies and increased water demand in the region. This is evidenced by a 48% increase in the number of ring tanks from 1997 to 1999 period.
• Any reductions in capturing of surface runoff due to increased recycled water
use in the upper parts of the catchment will greatly help improve flows to the streams. But this needs to be carefully considered with the local soil suitability testing since the geology of the area suggests basaltic uplands comprise of fractured aquifer systems which are highly vulnerable to excessive recharge and transport of solutes.
• Management strategy aimed at recycled water irrigation to offset capturing of
low flows will help improve rivers flows and health of ecological system.
• Results of a previous hypothetical study by SKM suggest a 50 percent increase in total ring tank capacity from 143 000 ML (in 1999) to 214 500 ML results in 9% (25,350 ML/year) decrease in total volume of flow at Macalister for the

133
74 year study period. During this simulation period the maximum decrease in annual volume at Macalister was estimated as – 49 %. Water harvesters located on the tributaries, extract on average a 42 % increase in total off-allocation volume from the tributaries during the study period. A similar average increase in off-allocation extractions (+ 40 %) would be anticipated from the regulated and unregulated reaches of the river. Therefore further growth in the number of ring tanks to meet water shortage by capturing overland flow in the region will have major impact on the flows in the area.
• There can be major gains for the environmental flows if capturing of overland
flow is traded with the recycled water use. For example results of a previous SKM study suggest a 50% decrease in total ring tank capacity from 143 000 ML (1999) to 71 500 ML results in an average increase in total volume of flow at Macalister for the total study period of + 11 % (30,000 ML/year). For this scenario the minimum and maximum increase in total volume at Macalister are 3% and 84 %. Water harvesters located on the tributaries, extract on average a 47 % decrease in total off-allocation volume from the tributaries during the study period. If part of the recycled water irrigation is aimed at reducing harvesting of overland flows it will greatly improve environmental flows in the rivers.
• The groundwater system is under stress since the present recharge to the
groundwater system is much lower than the allocated and currently exploited groundwater volumes. Previous groundwater modelling studies in the region suggest that river leakage is the main source of groundwater recharge (over 60 percent of total recharge). Any reductions in groundwater usage especially in the groundwater depression zones east of North Branch and Condamine River will help recover stressed aquifer systems and reduce enhanced leakage from the river.
• Groundwater flow directions in the area suggest that groundwater system is
closed and salts brought with recharge from recycled water irrigation will be contained within the system. The long-term sustainability of the system need to carefully consider salt export options.
• The groundwater vulnerability studies by Hansen (1999) suggest that basaltic
landscapes (East of Oaky, Mt Irving, Pittsworth and Clifton) due to shallow depths to watertables and high soil permeabilities are highly vulnerable to groundwater salinisation and pathogenic and nutrient pollution. Due to deeper depths to watertable and presence of thick clays Condamine Alluvial aquifer has a lower vulnerability rating and is therefore more suitable for irrigation with the recycled water.
• Previous and present studies suggest considerable deep drainage (of the order
of 30 to 100 mm/yr) associated with higher salt loads below the root zone under different recycled water irrigation scenarios. There is a need to consider conjunctive water use to reduce salt loads associated with possible groundwater recharge.

134
• Vertical soil column studies suggest that for a 110 mm/yr deep drainage below the root zone result in no net recharge to watertable for the first 7.5 years and once the profile is close to field capacity it results in dramatic rise of watertables. Time of start of rise of watertable for 10 and 15 meters initial depths to watertable were estimated as 2 and 5 years respectively. Therefore management strategies aimed at reducing net recharge below the root zone are essential to the long-term sustainability of the region. Simulation studies show that if the below root zone deep drainage is reduced to 36 mm/year for a 20 m initial depth to watertable the groundwater levels do not start rising until 17 years and after that the rate of rise is very slow. If this rate of deep drainage is combined with a net regional groundwater discharge of 0.36 ML/ha the watertables will remain in equilibrium.
• Due to ponded conditions under the dams the overall soil conditions below the
dam remain unsaturated for less than 3 years for a 15 m soil profile. From the start of ponding period a wetting front develops under the dam. This wetting front starts moving towards the watertable. After 2.5 years of operation completely saturated conditions develop under the farm dam and leakage from the dam starts recharging the regional groundwater. If the depth of shallow groundwater is smaller than saturated conditions develop in a shorter period of time e.g. for an 8 m initial depth to watertable the saturated conditions develop after only 1 year of operation. Once the saturated groundwater conditions will develop pathogens and nutrients in the recycled water can be transported to groundwater. The dam leakage studies suggest there is a need for careful siting and construction of on-farm and large storage facilities to avoid pollution of groundwater and possible lateral flow to the adjoining streams.
• Groundwater modelling studies suggest no recovery of aquifer levels in the
alluvial aquifers if the present trend of pumping continues. A 50% reduction in pumping combined with recycled water use can help recover deep groundwater levels in the groundwater depression areas.
• Lower recharge rate (2 mm/year) combined with leachate salinity of 5000
mg/L result in only a small rate of increase of salinity of deeper aquifers. However in the shallow aquifers the rise in the salinity of groundwater is much higher due to the dissolution of salts present in the initially unsaturated soil profile.
• The possible reduced capturing of overland flows and lower seepage losses to
groundwater will help improve flows in over 200 km reach of Condamine River. The improved mean annual flows (around 30,000 ML/yr, based on findings from an SKM study) in the Condamine River will also result in improved mean annual flows of the order of 10,000 ML/yr in the Murray River. This will help improve environmental conditions both in the Darling and the Murray rivers.

135
5. Recommendations Two groups of recommendations are presented. The first group summarises the issues that should be considered when managing recycled water irrigation for economic and environmental benefits. The second group presents recommendations for further research in this area. 5.1 Managing recycled water-irrigation for economic and environmental benefit This study was based on the analysis of 10 case study farms in the proposed Darling Downs recycled water irrigation area. The participating farmers were asked to describe their current cropping and irrigation activities and nominate how they would incorporate their requested supply of recycled water into their farming system. A key insight from the study was that the recycled water management scenarios suggested by the participating farmers in each case study were not necessarily representative of the economically or environmentally optimal design. While there is clearly potential to optimise these designs to target a range of economic and environmental criteria, the current analysis, by virtue of not being representative of the maximum benefits achievable for all farms, provided valuable insight into the conditions that could generate positive and negative benefits attributable to the use of recycled water. Issues to consider when managing recycled water for economic benefit a) Increased crop yields Recycled water irrigation was a financially attractive option in cases where the additional revenue attributable to the use of recycled water for irrigation exceeds the additional costs associated with its use. The additional revenue attributable to the use of recycled water for irrigation was largely driven by increases in crop yields, and the substitution of low-value crops and fallow periods with higher-value irrigated crops. Recycled water irrigation was used to increase crop yields by a) intensification of irrigation on a given area, b) increasing the total area of irrigated production or c) a combination of both. Cotton featured in 9 of the 10 case study farms, and was a dominant component of the cropping systems of the case study farms which were most economically responsive to recycled water-irrigation. Compared to other crops investigated, cotton exhibited the greatest return to irrigation, and substantial increases in the quantity of additional cotton produced by farms under the recycled-water irrigated system resulted in the highest returns to recycled water irrigation. Despite the dominance of cotton in driving the economic performance of the recycled water irrigated system, other recycled-water irrigated crops also made substantial contributions to the additional annual net cash returns attributable to recycled water irrigation. Examples included the replacement of fallow with irrigated maize, and wheat with higher value irrigated chickpea crop.

136
Although the use of recycled water has the potential to reduce yield variability, this does not automatically translate into a reduction in cash flow variability. The range of returns could be expected to increase at both the lower and upper end of the range. In the years when there is little or no difference in yields between benchmark and recycled water situations, it is to be expected that returns could be lower for the recycled water scenario because of the penalty of higher fixed costs. At the upper end of the range, recycled water has the potential to increase yields beyond those achievable for the benchmark situation, thereby pulling up the upper limit of the range. Although the range of returns could be expected to increase over the long-term from recycled water use, the long-term average returns will be higher. b) Reduction in cotton discount penalty Additional revenue attributable to recycled water irrigation was also assumed to be possible from quality improvements to the cotton crop. Industry experience has shown that fully irrigated cotton results in less discount price penalties compared to dryland or supplementary irrigated crops. Therefore, for a number of case study farms, reductions in discounting penalties for irrigated cotton produced with recycled water irrigation also had the effect of boosting the returns from recycled water irrigation. The increased potential for reliability in production can also be assumed to generate significant improvements in marketing benefits. c) Additional costs The additional costs associated with the use of recycled water include some or all of the following: higher variable crop variable production costs, the purchase of recycled water, additional capital infrastructure costs to be able to incorporate this source of water on farms (e.g. storage construction / extension, additional labour costs, administrative overheads such as insurance). Some costs are avoided as a result of using recycled water as a source of irrigation on farms. The main avoided costs are pumping costs and licence fees associated with the use of water from bores, rivers and sumps in cases where recycled water displaces the use of water from these sources. Recycled water irrigation was less economically attractive in situations where significant displacement of irrigation water sources less expensive than recycled water occurred without any significant increases in yield to offset the extra cost. Recycled water irrigation was less economically attractive in situations when yield increases attributable to recycled water-irrigation were not high enough to generate enough revenue to offset additional annual fixed costs, or only just covered the fixed costs. This was most evident in cases where there was no change to the irrigated area or crop rotation, or absence of cotton in the rotation. Issues to consider when managing recycled water for environmental benefit
a) Surface water

137
It is possible that the receipt of recycled water in on-farm water storages will result in the displacement existing sources of irrigation water on farms, particularly in cases where on-farm irrigation infrastructure and irrigation area is operating at or near potential, and when little or no additional storage capacity is provided to receive the recycled water. The positive environmental consequence of this is an improvement in environmental flows to rivers as consequence of possible decrease in the capture of overland flow. The possible environmental benefits can be visualised from previous hydrological studies which suggest a 50% decrease in total over land flow capture from 143 000 ML (during1999) to 71 500 ML can result in an average increase in total volume of flow at Macalister by around 30,000 ML/yr. While optimal design of the recycled water systems, tailored for each farm, will impact on environmental flows, there will be undoubted improvements in environmental flows relative to the current situation. b) Groundwater If bore water becomes replaced in order for the farmer to receive and use the supply of recycled water, the reduction in the groundwater useage can help recover the stressed aquifer levels and reduce leakage from the river which is the dominant source of recharge. The present cone of depression east of North Branch and Condamine River will initially capture all groundwater recharge and associated salt resulting from possible recycled water irrigation therefore minimizing downstream impacts. Groundwater vulnerability studies suggest that some landscapes in the catchment are more vulnerable than others to groundwater salinisation and pathogenic and nutrient pollution. For example, the basaltic landscapes (East of Oaky, Mt Irving, Pittsworth and Clifton) with shallow watertables and high soil permeabilities are highly vulnerable to groundwater. Due to the deeper watertable depths and thick clays, in shallow soil horizons, the Condamine Alluvial aquifer has a lower vulnerability rating and it is therefore more suitable for irrigation with the recycled water. Management strategies aimed at reducing net recharge below the root zone are therefore essential to the long-term sustainability of the region. Simulation studies show that if the below-root zone deep drainage is reduced to 36 mm/year for a 20 m initial depth to watertable the groundwater levels do not start rising until 17 years and after that the rate of rise is very slow. If this rate of deep drainage is combined with a net regional groundwater discharge of 0.36 ML/ha the watertables will remain in equilibrium. Due to the continually ponded conditions in storage dams, the overall soil conditions below such dams remain unsaturated for less than 3 years post construction for a 15 m soil profile. From the start of the ponding period a wetting front develops under the dam. This wetting front starts moving towards the watertable. After 2.5 years of operation completely saturated conditions develop under the farm dam and leakage from the dam directly starts recharging the regional groundwater both laterally and vertically. If the depth of shallow groundwater is small then saturated conditions develop in a shorter period of time e.g. for an 8 m initial depth to watertable the saturated conditions develop after only one year of operation. Once the saturated

138
groundwater conditions develop, pathogens and nutrients in the recycled water can be directly transported to groundwater. The dam leakage studies suggest there is a need for careful siting and construction of on-farm and large storage facilities to suit local hydrogeologic conditions and to avoid pollution of groundwater and possible lateral flow to the adjoining streams
c) Overflow from on-farm water storage The receipt of ‘non-returnable’ recycled water often results in an increase in storage overflow, which not only represents the inefficient use of purchased water but may also trigger a range of community concerns. In reality, a farmer could manage this in a number of ways, including:
• The irrigation of bare fallows when irrigation demand is typically low (providing there is sufficient residual soil water deficit)
• A reduction in the volume of recycled water purchased • The potential sale of surplus recycled water to other farmers (if allowed) • Modification in the recycled water delivery strategyi.e. more water less often
and/or at a time when demand is high. • Modification of storage capacity or have a designated OFWS for recycled
water. Each of these options could be explored through simulation and a process of optimisation.
d) Salt / solute management Previous and present studies suggest there would be considerable deep drainage (of the order of 30 to 100 mm/year) associated with higher salt loads below the root zone under different recycled water irrigation scenarios. There is a need to consider conjunctive water use to reduce salt loads associated with possible groundwater recharge. In evaluating designs for cropping systems which are effective in minimizing water and solute movement off farms, the strategy of growing lucerne for hay production in a three-year rotation with irrigated cotton was assessed. When recycled water irrigation water is purchased at $150/ML, annual net cash flow was simulated to increase by 4.5% and accumulated salt leached below the root zone decreased by 63% for a recycled-water irrigated lucerne-cotton rotation compared to a benchmark continuous cotton system. In this simple case study, lucerne was simulated to significant restrict the loss of recycled water and solutes from the root zone. 5.2 Recommended research Optimise on-farm recycled water management for economic and environmental benefit There is clearly potential to improve the recycled water management for each of the 10 case studies to best meet a range of economic and environmental criteria. In other words, what combinations of factors such as crop type, irrigation application rate, farm irrigation infrastructure, farm size, irrigation management rules, on-farm storage size, quantity of recycled water purchased, crop prices and costs etc. will maximise

139
on-farm profits, and what effect would achieving an economic target have on the environment (surface water, groundwater, salt loads)? How would the optimum combination of factors change if management was aimed at achieving economic benefits only or environmental benefits only? On-farm salt management More research is required on the management of salt imported to farms through recycled water including.
o identifying crop and irrigation management strategies for storing and holding imported salts between the crop root zone and groundwater
o further exploration of the sensitivity of salt build up / leaching to the salt concentration on the various water sources used for irrigation.
o analysis of conjunctive water use options to reduce salt levels associated with possible groundwater recharge
Salt export from the catchment The present cone of depression east of North Branch and Condamine River will initially capture all groundwater recharge and associated salt resulting from possible recycled water irrigation. This will result in net increase in salt loads in the region. For the long-term sustainability of the irrigation system it is important to explore salt management and export options by refining the surface-groundwater interaction models developed during this study. There is also a need to research and implement adequate monitoring networks to carefully assess possible changes in the state of groundwater systems and surface and groundwater interactions in the region to avoid undesirable environmental consequences. Further studies are also recommended to understand possible changed surface-groundwater interactions due to possible reduced groundwater pumping and enhanced groundwater recharge on the deeply incised natural channel systems. Obtain an analysis of the composition of recycled water used for irrigation and assess the full range of possible impacts on long-term soil productivity. Recycled water is a source of water, salt, nutrients, pathogens and other chemical compounds. This study focussed on the salt content of recycled water and did not consider the full composition of recycled water. Further studies should identify what changes must be made to the management of a farm when accounting for the total composition of recycled water. Impact of new storage development on the Darling Downs There is scope for this research to contribute to policy discussion relating to new on-farm and communal storage development on the Darling Downs. The research approach used in this study could assess the economic and environmental consequences of storage development options. An example is that if future storage

140
development is restricted to the receipt of recycled water only, this will impact differently on farm-scale economic outcomes, and environmental outcomes (groundwater, surface water etc) than if future storage construction is not limited to receiving recycled water only. There is need to carry out hydrogeologic studies for the siting of major storage facilities with respect to proximity to fresh surface water bodies and well capture zones to minimise environmental impacts. These studies will help devise optimum monitoring networks near the future recycled water storage facilities.

141
6. References Bengston S. (1996). Recalibration of a Groundwater Flow Model for the Condamine Groundwater Management Areas. Queensland Department of Natural Resources. Brady N.C. and Weil R.R (1996). The nature and properties of soils. 11th Edition. Prentice Hall International Inc. (USA). 740pp. Brennan L.E, Lisson S.N., Inman-Bamber N.G. and Linedale A.I. (1999). Most profitable use of irrigation supplies: a case study of the Bundaberg district. Proc. Aust. Soc. Sugar Cane Technol., 21: 274-279. Dalton P., (2000). WATER TIGHT: Whole farm water use efficiency – determining your own water security. Proceedings of 5th Australian Cotton Conference, pp395- 413. Gardner E, Brennan L, Lisson S, Vieritz A. (2000). Recycled water irrigation of sugarcane – Who Pays?, Who Gains?. Journal of Australian Water Association, May/June. Gardner T.A., Brennan L.E., Lisson S.N. and Vieritz A. (2002). Recycled waters as a source of irrigation. In: Water in the Australian Sugar Industry (Ed: K.L. Bristow and D.J. Popham) Technical Publication CRC Sugar, pp23-31. Healy, R.W., and Ronan, A.D. (1996). Documentation of computer program VS2DH for simulation of energy transport in variably saturated porous media -- modification of the U.S. Geological Survey’s computer program VS2DT: U.S. Geological Survey Water- Resources Investigations Report 96-4230, 36 p. Heiner, I. J., Biggs, A. J. W., Gordon ,I. J. and Vieritz A. M. (1999). Sustainability of Agricultural Systems Using Recycled Water in the Lockyer Valley and Darling Downs Area. Hensen, A. (1999). Groundwater vulnerability and availability mapping of the upper Condamine River Catchment. Queensland Department of Natural Resources. Huxley W. (1982). Condamine River Valley Groundwater Investigation. The Hydrogeology, Hydrology and the Hydrochemistry of the Condamine River Valley Alluvium. Volumes 1 and 2. Queensland Department of Water Resources. Horton, A.J., Jobling, G.A. (Eds), (1992). Farm water supplies design manual: Volume 1. Water Resources Commision, Brisbane, 67 pages. Jones, C.A., Kiniry, J.R., (1986). CERES-Maize: A simulation model of maize growth and development. Texas A & M University Press, College Station, Texas, 194 pages. Kinhill (1999). Use of renewed water for irrigation in the Locyer Valley and Darling Downs. Kinhill Pty Ltd. Milton, Queensland.

142
Land W.B. (1979). Progess report on “Condamine Underground Investigation to December 1978”. Vol 1. QWRD Groundwater Branch Report, June 1979. Lisson S.N., Brennan L.E., Bristow K.L., Keating B.A., Hughes D., Linedale T., Smith M. (2002). Improving water management through on-farm water storages. In: Water in the Australian Sugar Industry (Ed: K.L. Bristow and D.J. Popham), Technical Publication CRC Sugar, pp14-22. McCown, R.L., Hammer, G.L., Hargreaves, J.N.G., Holzworth, D.P., Freebairn, D.M. (1996). APSIM: A novel software system for model development, model testing, and simulation in agricultural systems research. Agricultural Systems, 50: 255-271. Passmore, G., (1999). Water reform update – October 1999. Quarterly Water Review. October 1999, 2 (2), p 19. Prasad, A. and Close, A. (2000). Economic and Environmental Impacts of Development on the Condamine, Moonie and Border Rivers in Queensland on the Murray and Lower Darling Rivers. MDBC Technical Report 2000/6. Pratt, G.L., Wieczorek, A.W., Schettman, R.W., Buchanan, M.L., (1975). Evaporation of water from holding ponds. Proceedings of 3rd International Symposium on Livestock Wastes, University of Illinois, Illinois, pp.391-394. Probert, M.E., Dimes, J.P., Keating, B.A., Dalal, R.C., Strong, W.M., (1997). APSIM’s water and nitrogen modules and simulation of the dynamics of water and nitrogen in fallow systems. Agricultural Systems, 56: 1-28. QDPI, (1994). RUSTIC User Manual Version 1.2. Queensland Department of Primary Industries, Brisbane, 124 pages. Richards, M. (1992). Recalibration of the Condamine Groundwater Management Area Groundwater Model. Queensland Department of Water Resources. SKM (2001). Conjunctive Water Use Options in the Northern Murray Darling Basin. Final Report. United States Department of Agriculture, Soil Conservation Services, (1972). SCS National Engineering Handbook, Section 4, Hydrology, Chapters 4-10. Verburg, K, Keating, B.A., Bristow, K.L., Huth, N.I., Ross, P.J., Catchpoole, V.R., (1996). Evaluation of nitrogen fertilizer management strategies in sugarcane using APSIM-SWIM. In: Proceedings Sugarcane: Research towards efficient and sustainable production (Wilson et al. Eds.) pp. 200-202. van Genuchten, m. Th., (1980). A closed-form equation for predicting the hydraulic conductivity of unsaturated soils: Soil Science Society of America Proceedings, v. 44, no. 5, p. 892-898.

143
Watts P.J., (1986). Irrigation design using whole farm computer simulations. Proceedings of Irrigation ‘86 Conference, 24-26 September 1986, Darling Downs Institute of Advanced Education, Toowoomba, Queensland, pp. 283-305. Young S. L. (1990). A groundwater flow model of Condamine Groundwater Management Area. Queensland Department of Water Resources.

144
APPENDIX A – APSIM simulation results for each case study Farm 1:
Farm 2:
Benchmark irrigated Recycled 1 Recycled 2Mean Upper Lower Median Mean Upper Lower Median Mean Upper Lower Median
Recycled-OFWS transfer - - - - 1000.7 1002.7 994.5 1002.7 1000.7 1002.7 994.5 1002.7OFWS evaporation 71.3 78.9 41.6 72.9 72.1 76.7 66.8 72.2 118.0 128.7 105.4 118.6OFWS rainfall 54.0 80.2 32.2 52.7 54.0 80.2 32.2 52.7 95.2 141.6 56.9 92.9OFWS overflow 1.4 14.0 0.0 0.0 123.0 468.2 0.0 69.5 0.0 0.0 0.0 0.0OFWS irrigation 455.4 700.7 159.1 444.6 909.2 1438.7 255.8 986.7 1226.9 2089.9 362.7 1151.6Overland flow-OFWS transfer 489.6 1124.5 0.0 464.5 56.3 403.1 0.0 0.0 267.6 630.3 0.0 281.7Catchment runoff (ML) 2477.9 13413.6 0.0 1696.5 2477.9 13413.6 0.0 1696.5 2477.9 13413.6 0.0 1696.5Bypass (ML) 1991.7 12532.4 0.0 956.0 2412.4 13235.1 0.9 1613.6 2201.1 12785.8 0.0 1276.5Cotton yield (bales/ha) 9.30 13.13 5.63 9.71 9.49 13.34 5.44 9.61 9.24 13.42 2.56 9.62Cotton irrigation (ML/ha) 2.8 4.1 1.7 2.9 2.8 4.2 1.5 3.1 2.6 3.9 0.8 2.7Farm runoff (mm) 142.7 357.8 15.7 124.3 144.3 359.1 16.0 122.6 142.6 354.1 15.8 123.0Drainage (mm) 13.8 153.1 0.0 0.0 13.2 172.2 0.0 0.0 6.6 96.7 0.0 0.0
Benchmark drylandMean Upper Lower Median
Wheat yield (t/ha) 1.7 4.7 0.0 1.6Cotton yield (bales/ha) 5.10 8.21 0.46 5.49Farm runoff (mm) 113.6 297.1 2.2 87.8Drainage (mm) 47.4 227.6 0.0 16.9
Benchmark irrigated RecycledMean Upper Lower Median Mean Upper Lower Median
Bore-OFWS transfer 268.6 540.0 10.0 276.0 170.7 330.0 0.0 167.5Recycled-OFWS transfer - - - - 379.9 380.6 377.5 380.6OFWS evaporation 30.5 33.0 25.8 30.7 29.8 31.7 27.7 29.8OFWS rainfall 20.7 30.6 12.0 20.6 20.7 30.6 12.0 20.6OFWS overflow 1.0 8.5 0.0 0.0 56.8 164.0 0.0 40.4OFWS irrigation 366.7 757.5 0.0 378.8 553.3 1137.3 0.0 570.0Overland flow-OFWS transfer 119.4 318.2 0.0 123.0 89.9 311.2 0.0 69.7Catchment runoff (ML) 372.1 1844.4 0.0 204.9 372.1 1844.4 0.0 204.9Bypass (ML) 255.4 1716.9 0.0 52.3 292.5 1655.8 0.0 87.5Cotton yield (bales per ha) 7.32 10.36 4.70 7.27 7.29 9.92 4.70 7.27Cotton irrigation (ML/ha) 3.7 3.8 1.9 3.8 3.7 3.8 2.5 3.8Farm runoff (mm) 61.3 194.7 1.0 45.9 61.4 193.3 1.0 45.9Drainage (mm) 72.7 202.7 0.0 65.4 72.0 202.7 0.0 65.0
DrylandMean Upper Lower Median
Cotton yield (bales per ha) 6.37 11.36 3.25 5.87Wheat yield (t/ha) 1.08 2.95 0.06 1.18Farm runoff (mm) 53.8 233.4 0.0 41.1Drainage (mm) 63.9 334.9 0.0 24.0

145
Farm 3:
Farm 4:
RecycledMean Upper Lower Median
Recycled-OFWS transfer 500.4 501.4 499.4 500.4OFWS evaporation 98.0 116.4 78.6 95.7OFWS rainfall 92.2 138.7 54.3 90.0OFWS overflow 172.5 379.2 17.2 122.5OFWS irrigation 319.7 525.2 126.3 313.4Cotton yield (bales/ha) 9.26 14.23 5.05 9.37Cotton irrigation (ML/ha) 1.9 3.1 1.3 1.9Chickpea yield (t/ha) 2.55 3.73 0.73 2.67Chickpea irrigation (ML/ha) 0.5 1.6 0.0 0.7Farm runoff (mm) 150.6 384.4 10.4 123.8Drainage (mm) 20.5 84.1 0.0 15.6
Benchmark (cotton/long long fallow) Benchmark (cotton/opportunity wheat)Mean Upper Lower Median Mean Upper Lower Median
Cotton yield (bales/ha) 5.56 8.43 0.46 5.55 5.48 8.45 0.46 5.55Wheat yield (t/ha) - - - - 2.00 4.71 0.40 2.11Farm runoff (mm) 147.8 353.5 4.7 114.8 135.9 337.2 4.7 113.2Drainage (mm) 15.8 118.4 0.0 0.8 12.1 84.1 0.0 0.0
Benchmark irrigated RecycledMean Upper Lower Median Mean Upper Lower Median
Bore-OFWS transfer 707.1 1065.5 288.0 728.3 708.1 994.0 444.0 708.0Recycled-OFWS transfer - - - - 1010.5 1012.6 1008.4 1010.5OFWS evaporation 70.8 78.3 58.9 71.0 67.9 71.8 64.0 67.9OFWS rainfall 49.6 74.3 29.1 49.8 49.6 74.3 29.1 49.8OFWS overflow 1.4 12.3 0.0 0.0 2.6 74.3 0.0 0.0OFWS irrigation 1041.9 1662.2 562.5 1125.0 2004.7 2928.3 1144.0 2062.5Overland flow-OFWS transfer 358.3 823.4 30.8 392.7 305.3 649.2 0.0 282.8Catchment runoff (ML) 2142.1 11669.7 0.0 1476.1 2142.1 11669.7 0.0 1476.1Bypass (ML) 1785.1 11252.2 0.0 1047.6 1835.8 11418.8 0.0 1108.1Maize yield (t/ha) 9.99 11.62 6.01 10.15 9.11 13.85 3.43 10.20Maize irrigation (ML/ha) 3.4 3.8 1.3 3.8 2.4 3.4 1.2 2.4Wheat yield (t/ha) 1.93 3.43 0.28 1.96 4.52 9.56 0.78 3.78Wheat irrigation (ML/ha) 0.0 0.0 0.0 0.0 1.7 3.0 0.6 1.6Soybean yield (t/ha) 2.90 3.67 2.06 2.96 2.62 3.67 1.06 2.81Soybean irrigation (ML/ha) 3.5 3.8 1.3 3.8 2.3 3.5 1.3 2.2Farm runoff (mm) 47.6 182.6 1.3 32.2 38.8 164.8 0.6 25.0Drainage (mm) 108.7 362.1 0.0 101.7 64.6 320.4 0.0 43.5
DrylandMean Upper Lower Median
Maize yield (t/ha) 5.99 9.15 2.65 5.98Wheat yield (t/ha) 2.69 8.17 0.72 2.48Farm runoff (mm) 40.6 367.9 0.0 15.8Drainage (mm) 54.0 324.9 0.0 0.4
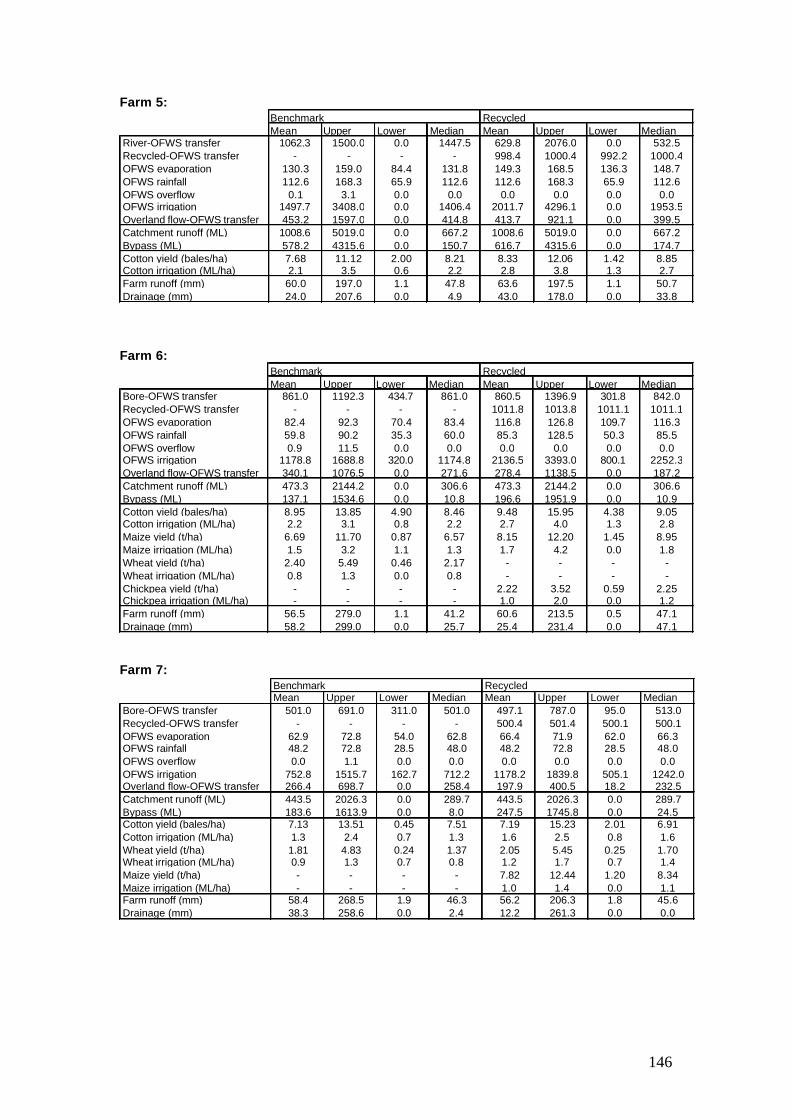
146
Farm 5:
Farm 6:
Farm 7:
Benchmark RecycledMean Upper Lower Median Mean Upper Lower Median
Bore-OFWS transfer 861.0 1192.3 434.7 861.0 860.5 1396.9 301.8 842.0Recycled-OFWS transfer - - - - 1011.8 1013.8 1011.1 1011.1OFWS evaporation 82.4 92.3 70.4 83.4 116.8 126.8 109.7 116.3OFWS rainfall 59.8 90.2 35.3 60.0 85.3 128.5 50.3 85.5OFWS overflow 0.9 11.5 0.0 0.0 0.0 0.0 0.0 0.0OFWS irrigation 1178.8 1688.8 320.0 1174.8 2136.5 3393.0 800.1 2252.3Overland flow-OFWS transfer 340.1 1076.5 0.0 271.6 278.4 1138.5 0.0 187.2Catchment runoff (ML) 473.3 2144.2 0.0 306.6 473.3 2144.2 0.0 306.6Bypass (ML) 137.1 1534.6 0.0 10.8 196.6 1951.9 0.0 10.9Cotton yield (bales/ha) 8.95 13.85 4.90 8.46 9.48 15.95 4.38 9.05Cotton irrigation (ML/ha) 2.2 3.1 0.8 2.2 2.7 4.0 1.3 2.8Maize yield (t/ha) 6.69 11.70 0.87 6.57 8.15 12.20 1.45 8.95Maize irrigation (ML/ha) 1.5 3.2 1.1 1.3 1.7 4.2 0.0 1.8Wheat yield (t/ha) 2.40 5.49 0.46 2.17 - - - -Wheat irrigation (ML/ha) 0.8 1.3 0.0 0.8 - - - -Chickpea yield (t/ha) - - - - 2.22 3.52 0.59 2.25Chickpea irrigation (ML/ha) - - - - 1.0 2.0 0.0 1.2Farm runoff (mm) 56.5 279.0 1.1 41.2 60.6 213.5 0.5 47.1Drainage (mm) 58.2 299.0 0.0 25.7 25.4 231.4 0.0 47.1
Benchmark RecycledMean Upper Lower Median Mean Upper Lower Median
River-OFWS transfer 1062.3 1500.0 0.0 1447.5 629.8 2076.0 0.0 532.5Recycled-OFWS transfer - - - - 998.4 1000.4 992.2 1000.4OFWS evaporation 130.3 159.0 84.4 131.8 149.3 168.5 136.3 148.7OFWS rainfall 112.6 168.3 65.9 112.6 112.6 168.3 65.9 112.6OFWS overflow 0.1 3.1 0.0 0.0 0.0 0.0 0.0 0.0OFWS irrigation 1497.7 3408.0 0.0 1406.4 2011.7 4296.1 0.0 1953.5Overland flow-OFWS transfer 453.2 1597.0 0.0 414.8 413.7 921.1 0.0 399.5Catchment runoff (ML) 1008.6 5019.0 0.0 667.2 1008.6 5019.0 0.0 667.2Bypass (ML) 578.2 4315.6 0.0 150.7 616.7 4315.6 0.0 174.7Cotton yield (bales/ha) 7.68 11.12 2.00 8.21 8.33 12.06 1.42 8.85Cotton irrigation (ML/ha) 2.1 3.5 0.6 2.2 2.8 3.8 1.3 2.7Farm runoff (mm) 60.0 197.0 1.1 47.8 63.6 197.5 1.1 50.7Drainage (mm) 24.0 207.6 0.0 4.9 43.0 178.0 0.0 33.8
Benchmark RecycledMean Upper Lower Median Mean Upper Lower Median
Bore-OFWS transfer 501.0 691.0 311.0 501.0 497.1 787.0 95.0 513.0Recycled-OFWS transfer - - - - 500.4 501.4 500.1 500.1OFWS evaporation 62.9 72.8 54.0 62.8 66.4 71.9 62.0 66.3OFWS rainfall 48.2 72.8 28.5 48.0 48.2 72.8 28.5 48.0OFWS overflow 0.0 1.1 0.0 0.0 0.0 0.0 0.0 0.0OFWS irrigation 752.8 1515.7 162.7 712.2 1178.2 1839.8 505.1 1242.0Overland flow-OFWS transfer 266.4 698.7 0.0 258.4 197.9 400.5 18.2 232.5Catchment runoff (ML) 443.5 2026.3 0.0 289.7 443.5 2026.3 0.0 289.7Bypass (ML) 183.6 1613.9 0.0 8.0 247.5 1745.8 0.0 24.5Cotton yield (bales/ha) 7.13 13.51 0.45 7.51 7.19 15.23 2.01 6.91Cotton irrigation (ML/ha) 1.3 2.4 0.7 1.3 1.6 2.5 0.8 1.6Wheat yield (t/ha) 1.81 4.83 0.24 1.37 2.05 5.45 0.25 1.70Wheat irrigation (ML/ha) 0.9 1.3 0.7 0.8 1.2 1.7 0.7 1.4Maize yield (t/ha) - - - - 7.82 12.44 1.20 8.34Maize irrigation (ML/ha) - - - - 1.0 1.4 0.0 1.1Farm runoff (mm) 58.4 268.5 1.9 46.3 56.2 206.3 1.8 45.6Drainage (mm) 38.3 258.6 0.0 2.4 12.2 261.3 0.0 0.0

147
Farm 8:
Farm 9:
Farm 10:
Benchmark irrigated RecycledMean Upper Lower Median Mean Upper Lower Median
Recycled-OFWS transfer - - - - 645.0 651.5 432.5 649.7OFWS evaporation 74.6 97.1 42.1 73.9 93.1 101.8 65.6 94.4OFWS rainfall 57.4 80.6 33.3 59.6 56.8 80.6 33.3 58.3OFWS overflow 0.3 11.4 0.0 0.0 1.2 14.7 0.0 0.0OFWS irrigation 551.5 1113.8 5.4 517.8 939.4 1417.5 252.8 1012.5Overland flow-OFWS transfer 561.6 1423.2 0.0 551.6 328.7 807.8 0.0 336.7Catchment runoff (ML) 997.0 5019.0 0.0 602.4 997.0 5019.0 0.0 602.4Bypass (ML) 458.3 4088.6 0.0 10.8 677.6 4412.4 0.0 182.2Cotton yield (bales/ha) 7.42 12.15 0.84 7.91 8.84 14.01 5.48 8.55Cotton irrigation (ML/ha) 2.3 3.8 0.0 2.5 3.6 3.8 2.5 3.8Maize yield (t/ha) 5.84 10.83 0.00 6.40 9.02 11.24 4.64 9.36Maize irrigation (ML/ha) 1.6 3.8 0.0 1.3 3.4 3.8 0.0 3.8Chickpea yield (t/ha) 1.53 3.42 0.00 1.53 1.87 3.42 0.26 1.94Chickpea irrigation (ML/ha) 0.8 1.3 0.0 0.8 1.1 1.3 0.0 1.3Farm runoff (mm) 44.9 137.9 0.6 39.4 50.0 142.2 1.8 42.4Drainage (mm) 43.5 223.5 0.0 24.0 70.1 217.7 0.0 59.6
DrylandMean Upper Lower Median
Cotton yield (bales/ha) 3.97 7.12 1.95 3.94Wheat yield (t/ha) 0.85 2.67 0.00 0.60Farm runoff (mm) 41.7 172.7 0.0 26.3Drainage (mm) 63.8 221.6 0.0 39.7
Benchmark RecycledMean Upper Lower Median Mean Upper Lower Median
Bore-OFWS transfer 677.7 1099.0 144.8 673.2 601.5 1209.6 0.0 630.5River-OFWS transfer 413.3 566.0 0.0 566.0 396.8 1052.0 0.0 378.2Recycled-OFWS transfer - - - - 851.1 852.8 850.5 850.5OFWS evaporation 118.8 136.7 86.1 120.7 129.4 140.1 86.8 130.0OFWS rainfall 93.8 137.3 54.5 94.3 93.0 137.3 54.5 93.0OFWS overflow 1.1 8.5 0.0 0.0 6.9 224.2 0.0 0.0OFWS irrigation 1268.0 2419.4 483.7 1215.0 1977.6 3349.6 951.4 1986.9Overland flow-OFWS transfer 221.0 580.7 0.0 202.1 189.0 516.6 0.0 166.0Catchment runoff (ML) 397.0 1750.8 0.0 250.3 397.0 1750.8 0.0 250.3Bypass (ML) 178.5 1414.5 0.0 45.3 206.7 1530.7 0.0 51.7Cotton yield (bales/ha) 7.41 12.57 0.00 7.29 7.34 12.09 0.00 7.32Cotton irrigation (ML/ha) 2.5 3.8 0.0 2.5 2.6 3.8 0.0 2.5Wheat yield (t/ha) 1.45 5.11 0.00 0.84 2.11 5.57 0.01 1.65Wheat irrigation (ML/ha) 0.4 5.0 0.0 0.0 1.0 2.0 0.2 0.9Farm runoff (mm) 60.0 243.7 0.2 49.4 58.8 230.2 0.5 42.1Drainage (mm) 44.7 244.4 0.0 4.3 50.4 258.4 0.0 0.0
Benchmark RecycledMean Upper Lower Median Mean Upper Lower Median
River-OFWS transfer 283.9 456.6 0.0 315.1 255.8 618.7 0.0 269.4Recycled-OFWS transfer - - - - 1485.3 1500.6 996.3 1496.5OFWS evaporation 212.5 255.8 160.1 212.6 236.9 258.2 157.8 238.7OFWS rainfall 178.3 259.6 103.0 179.9 176.8 259.6 103.0 176.6OFWS overflow 0.2 0.0 9.9 0.0 5.7 0.0 234.4 0.0OFWS irrigation 1296.4 2738.6 0.0 1248.8 2400.6 3582.3 841.9 2413.7Overland flow-OFWS transfer 1053.5 3169.3 16.3 852.4 734.1 1564.7 58.0 744.9Catchment runoff (ML) 1524.0 7625.8 0.0 847.0 1524.0 7625.8 0.0 847.0Bypass (ML) 575.5 4849.0 0.0 0.0 870.2 6402.4 0.0 132.8Cotton yield (bales/ha) 6.83 10.54 0.00 7.33 7.90 11.45 0.00 8.08Cotton irrigation (ML/ha) 1.8 4.5 0.0 1.4 3.1 5.0 0.0 3.2Wheat yield (t/ha) 1.54 3.95 0.01 1.48 2.70 5.72 0.28 2.37Wheat irrigation (ML/ha) 0.4 2.5 0.0 0.0 1.2 3.1 0.6 0.9Farm runoff (mm) 60.0 246.8 1.0 45.0 55.6 231.4 1.0 43.7Drainage (mm) 59.8 281.7 0.0 32.4 88.9 300.8 0.0 61.3