
Understanding the sources of uncertainty to reduce the risks of undesirable outcomes in large-scale...
12
Understanding the sources of uncertainty to reduce the risks of undesirable outcomes in large-scale freshwater ecosystem restoration projects: An example from the Murray–Darling Basin, Australia R.H. Bark a, *, L.J.M. Peeters b , R.E. Lester c , C.A. Pollino d , N.D. Crossman e , J.M. Kandulu e a CSIRO Ecosystem Sciences, 41 Boggo Road, Dutton Park, QLD 4102, Australia b CSIRO Land & Water, PMB 2, Glen Osmond, SA 5064, Australia c School of Life and Environmental Sciences, Deakin University, P.O. Box 423, Warrnambool, VIC 3280, Australia d CSIRO Land & Water, GPO Box 1666, Canberra, ACT 2601, Australia e CSIRO Ecosystem Sciences, PMB 2, Glen Osmond, SA 5064, Australia 1. Introduction There is an imperative that large-scale ecosystem restoration projects be based on the best available science because they are costly and involve potential trade-offs between the environ- ment and the economy (Doyle and Drew, 2008; Lee, 1993). However there are many challenges in using best science in large complex restoration projects. These challenges include not only the integration of peer-reviewed science into decision- making and making decisions in the face of scientific uncertainty (Doody et al., 2012) and limited and/or emerging scientific understanding (Doyle and Drew, 2008; Harris and Heathwaite, 2012), but also how to provide information to ‘‘decision-makers in ways that foster good decisions that increase the likelihood of attaining desired outcomes’’ (Pielke, 2007, p. 30). There are multiple sources of uncertainty (see Ascough et al., 2008 for a review) in achieving outcomes in e n v i r o n m e n t a l s c i e n c e & p o l i c y 3 3 ( 2 0 1 3 ) 9 7 – 1 0 8 a r t i c l e i n f o Article history: Received 2 January 2013 Received in revised form 29 April 2013 Accepted 29 April 2013 Published on line Keywords: Ecosystem restoration Uncertainty Risk analysis Murray–Darling a b s t r a c t There are a growing number of large-scale freshwater ecological restoration projects world- wide. Assessments of the benefits and costs of restoration often exclude an analysis of uncertainty in the modelled outcomes. To address this shortcoming we explicitly model the uncertainties associated with measures of ecosystem health in the estuary of the Murray– Darling Basin, Australia and how those measures may change with the implementation of a Basin-wide Plan to recover water to improve ecosystem health. Specifically, we compare two metrics – one simple and one more complex – to manage end-of-system flow requirements for one ecosystem asset in the Basin, the internationally important Coorong saline wet- lands. Our risk assessment confirms that the ecological conditions in the Coorong are likely to improve with implementation of the Basin Plan; however, there are risks of a Type III error (where the correct answer is found for the wrong question) associated with using the simple metric for adaptive management. Crown Copyright # 2013 Published by Elsevier Ltd. All rights reserved. * Corresponding author. Tel.: +61 7 3833 5678. E-mail addresses: [email protected], [email protected] (R.H. Bark). Available online at www.sciencedirect.com journal homepage: www.elsevier.com/locate/envsci 1462-9011/$ – see front matter . Crown Copyright # 2013 Published by Elsevier Ltd. All rights reserved. http://dx.doi.org/10.1016/j.envsci.2013.04.010
-
Upload
independent -
Category
Documents
-
view
0 -
download
0
Transcript of Understanding the sources of uncertainty to reduce the risks of undesirable outcomes in large-scale...
Understanding the sources of uncertainty to reducethe risks of undesirable outcomes in large-scalefreshwater ecosystem restoration projects:An example from the Murray–Darling Basin,Australia
R.H. Bark a,*, L.J.M. Peeters b, R.E. Lester c, C.A. Pollino d, N.D. Crossman e,J.M. Kandulu e
aCSIRO Ecosystem Sciences, 41 Boggo Road, Dutton Park, QLD 4102, AustraliabCSIRO Land & Water, PMB 2, Glen Osmond, SA 5064, AustraliacSchool of Life and Environmental Sciences, Deakin University, P.O. Box 423, Warrnambool, VIC 3280, AustraliadCSIRO Land & Water, GPO Box 1666, Canberra, ACT 2601, AustraliaeCSIRO Ecosystem Sciences, PMB 2, Glen Osmond, SA 5064, Australia
e n v i r o n m e n t a l s c i e n c e & p o l i c y 3 3 ( 2 0 1 3 ) 9 7 – 1 0 8
a r t i c l e i n f o
Article history:
Received 2 January 2013
Received in revised form
29 April 2013
Accepted 29 April 2013
Published on line
Keywords:
Ecosystem restoration
Uncertainty
Risk analysis
Murray–Darling
a b s t r a c t
There are a growing number of large-scale freshwater ecological restoration projects world-
wide. Assessments of the benefits and costs of restoration often exclude an analysis of
uncertainty in the modelled outcomes. To address this shortcoming we explicitly model the
uncertainties associated with measures of ecosystem health in the estuary of the Murray–
Darling Basin, Australia and how those measures may change with the implementation of a
Basin-wide Plan to recover water to improve ecosystem health. Specifically, we compare two
metrics – one simple and one more complex – to manage end-of-system flow requirements
for one ecosystem asset in the Basin, the internationally important Coorong saline wet-
lands. Our risk assessment confirms that the ecological conditions in the Coorong are likely
to improve with implementation of the Basin Plan; however, there are risks of a Type III error
(where the correct answer is found for the wrong question) associated with using the simple
metric for adaptive management.
Crown Copyright # 2013 Published by Elsevier Ltd. All rights
reserved.
Available online at www.sciencedirect.com
journal homepage: www.elsevier.com/locate/envsci
1. Introduction
There is an imperative that large-scale ecosystem restoration
projects be based on the best available science because they are
costly and involve potential trade-offs between the environ-
ment and the economy (Doyle and Drew, 2008; Lee, 1993).
However there are many challenges in using best science in
large complex restoration projects. These challenges include
* Corresponding author. Tel.: +61 7 3833 5678.E-mail addresses: [email protected], [email protected] (R.H
1462-9011/$ – see front matter. Crown Copyright # 2013 Published bhttp://dx.doi.org/10.1016/j.envsci.2013.04.010
not only the integration of peer-reviewed science into decision-
making and making decisions in the face of scientific
uncertainty (Doody et al., 2012) and limited and/or emerging
scientific understanding (Doyle and Drew, 2008; Harris and
Heathwaite, 2012), but also how to provide information to
‘‘decision-makers in ways that foster good decisions that
increase the likelihood of attaining desired outcomes’’ (Pielke,
2007, p. 30). There are multiple sources of uncertainty (see
Ascough et al., 2008 for a review) in achieving outcomes in
. Bark).
y Elsevier Ltd. All rights reserved.
e n v i r o n m e n t a l s c i e n c e & p o l i c y 3 3 ( 2 0 1 3 ) 9 7 – 1 0 898
complex coupled natural and human systems (Liu et al., 2007)
but long-term restoration projects provide opportunities for
adaptive management approaches that involve experimenting,
learning and reducing uncertainties (Lee, 1993; Doyle and Drew,
2008).
The goal of this paper is to provide a clearer understanding
of the types of uncertainty and the sources of risk related to
achieving the outcomes (i.e. benefits) of a large ecological
restoration project. Arguably the biggest restoration project in
Australia is the AU $10.7 billion investment by the Australian
Government to restore the health of freshwater ecosystems in
Australia’s largest river basin, the Murray–Darling.1 A Murray–
Darling Basin Plan, outlining how that investment should be
made, including multiple strategies such as water buy-backs
from irrigators and investment in irrigation efficiency, was
adopted by the Federal Water Minister in late 2012. We focus
on the risks inherent in the Murray–Darling Basin Plan,
drawing on material from a recently-completed study that
quantified the ecosystem service benefits of returning water to
the environment under the proposed Basin Plan (CSIRO, 2012).
‘‘Newig et al. (2005) discuss two types of uncertainty that
affect decision making: normative uncertainty – or decision
uncertainty (doubt as to what to do and how to do it) – and
informational uncertainty (limited knowledge or factual
uncertainty)’’ (Harris and Heathwaite, 2012, p. 93). What they
term informational uncertainty can be further classified as
either statistical or systematic (Daneshkhah, 2004). Statistical
uncertainty results from natural variation in a system which,
based on observations, can be quantified through probability
distributions. In turn these can be used to derive confidence
intervals and risk profiles (Hayes, 2011; Kandulu et al., 2012). A
relevant example of statistical uncertainty, in the context of
restoration of ecosystems, is the variability in the hydro-
climatology of the basin (Peel et al., 2004; Kirby et al., 2006).
Hydrological and ecological response models used to project
outcomes from changes in water resource management are
also subject to this type of uncertainty.
In hydrological models used to assess effects of changes in
water resources management, the uncertainty associated with
input data, such as precipitation, and observed output data, such
as streamflow observations, is often classified as statistical
uncertainty while the model structure and parameters are
considered a source of systematic uncertainty. The input and
observed data should however also be considered as systematic
uncertainty as there are seldom sufficient independent data to
characterise the probability distribution of these quantities
(Kavetskietal.,2006;Shaoetal.,2012).Thesystematicuncertainty
from model structure and parameters arises because it is often
not possible, based on the available data, to infer and conceptu-
alise all processes relevant to the model prediction at the given
spatial and temporal scale (Gupta et al., 2012).
More fully, systematic uncertainty results from: (i) a lack
of data or knowledge about a system; (ii) the inherent
1 Comprising AU $3.1 bn under the Restoring the Balance Pro-gramme for water buybacks, AU $5.8 billion under the SustainableRural Water Use and Infrastructure Programme for irrigation effi-ciency projects most of which will be in the Basin, and an addi-tional AU $1.77 bn announced in October 2012 for additionalinfrastructure investments.
complexities of the system and; (iii) interactions with other
systems such as between human and natural systems. The
inherent complexities stem from, among others: stochastic
parameters that are difficult to estimate, non-linearities, non-
stationarities, and unknown conditioning information (Lo and
Mueller, 2010). Lo and Mueller (2010) describe a spectrum of
systematic uncertainty from fully reducible or partially reduc-
ible to irreducible uncertainty. Systematic uncertainty cannot
be quantified, but new knowledge or data can, in some
instances, reduce this type of uncertainty to statistical
uncertainty. In ecohydrological models sources of systemic
uncertainty include non-stationarity of the catchment, tempo-
ral variability of system characteristics, representation of
processes in models and lack of commensurability in observed
and predicted variables because of scale issues or difference in
meaning (Beven and Alcock, 2012; Harris and Heathwaite, 2012).
Systematic uncertainty is prevalent in modelling ecological
response to policy-contingent water resources management
change. This uncertainty derives from incomplete knowledge
of water requirements for ecological systems, the complexi-
ties, feedbacks and nested nature of diverse ecosystems in the
basin, the potential for non-linearities of ecological response
to changed hydrologic conditions, the non-hydrologic system
influences, the time-scale of ecological recovery (Lee, 1993)
and associated difficulty in measuring changes in ecological
condition due to time lags and measurement effort. In
addition there may be instances where the absence of
spatially-explicit, workable ecological response models is a
constraint on any predictive modelling of policy-contingent
change (CSIRO, 2012) or where available models provide little
information on how to simultaneously achieve multiple
ecological objectives. To estimate the value of water resources
management change there is an added level of uncertainty
stemming from the mismatch between the complexity of
ecological systems and the ecosystem service framework to
monetarily value benefits (Norgaard, 2010) as well as from the
monetary valuation methods.
The link between uncertainty and outcomes is risk.
There are many definitions of risk, for instance the ISO
31000 risk management standard (IEC, 2009) describes risk
as the effect of uncertainty on objectives. The complexity of
the nested hierarchy of uncertainties means that, although
decision-makers might benefit from the provision of
information on the uncertainties intrinsic in modelled
assessment of policy-contingent changes (Bateman et al.,
2011) such risk assessments are rarely undertaken. This
means that the decision-maker has little information on
what objectives are likely to be met with a high probability
of confidence and which ones are less certain outcomes. We
argue that it is important for decision-makers to understand
uncertainty typologies and how to approach each in a risk
management framework.
In this paper we consider both sides of the river restoration
problem identified by Harris and Heathwaite (2012) uncertain-
ty on the biophysical side and decision-making uncertainty on
the policy side. We begin with background to the Murray–
Darling Basin Plan (Section 2). Section 3 provides detail on the
method and results for a worked example using a simplistic
metric and a more complex ecological model. The risk analysis
highlights that, for some outcomes, uncertainties are likely
e n v i r o n m e n t a l s c i e n c e & p o l i c y 3 3 ( 2 0 1 3 ) 9 7 – 1 0 8 99
reducible (Lo and Mueller, 2010) whereas for others the
complexity of the system and the interconnections with other
systems (Liu et al., 2007) means that outcomes are less certain.
In the discussion section we address whether such ex ante
programme valuations are sufficient to guide decision-making
and how they might be improved. We find that the risk
framework provides a systematic means of prioritising efforts
for reducing uncertainty to increase the likelihood of meeting
key objectives. The final conclusions section puts lessons
learned into a more generalised context.
2. Background: policy-contingent change, theMurray–Darling Basin Plan
In response to widespread long-term decline in riverine,
floodplain, wetland and estuarine ecosystems and worsening
ecological degradation in the Murray–Darling Basin (see Fig. 1)
during the severe millennium drought (1997–2009) the
Australian Government passed the Water Act 2007 (Common-
wealth). An objective of the Water Act was to ‘‘protect, restore
and provide for the ecological values and ecosystem services
of the Murray–Darling Basin’’ (Water Act 2007, 3 Objects (d)(ii)).
The Act mandates that the Murray–Darling Basin Authority
(MDBA), a federal agency, prepare a Basin Plan to recover
ecosystem functions and to balance the multiple needs in the
Basin. Underpinning the Basin Plan (MDBA, 2011a), the MDBA
determined the environmentally sustainable level of take
(ESLT) for key ecosystem assets and functions to guide basin-
scale water resource management (MDBA, 2011b). Comple-
menting the ESLT was the establishment of a Sustainable
Diversion Limit (SDL) that capped the amount of water that
could be diverted for consumptive use. The current SDL from
the Basin Plan is 2750 GL below current diversion levels
meaning that this volume can be returned to the environment.
An additional 450 GL/year will be made available as part of the
Water Recovery Act, which is separate from the SDL and the
Basin Plan.
The recovery of this water for the environment will be
through two mechanisms. The Australian Government has set
aside AU $3.1 billion to permanently purchase water access
licenses from willing sellers for the environment and a further
AU $5.0 billion to upgrade inefficient irrigation infrastructure
in the basin, with conserved water shared among irrigators
and the environment. An additional $1.77 billion was
announced in November 2012 that can be used to purchase
entitlements, invest in conservation or to reduce system
constraints on environmental watering events, e.g. raising
levees to protect towns from flooding. Once the Australian
Government has taken ownership of the water for the
environment, an Environmental Watering Plan (EWP) will
inform how and where that water is delivered to the
environment to meet the objectives of the Basin Plan.
The proposed Basin Plan released in December 2011 lays
out the management objectives and outcomes to be achieved
(MDBA, 2011a, Chapter 5). They include: protecting and
restoring water-dependent ecosystems in the Basin; ensuring
that these ecosystems are resilient to risks and threats; using
water resources to give effect to international agreements
(listed under Water Act 2007, §4 relevant international
agreement); and to optimise economic and social outcomes
and improve the water security of all uses in the Basin. The
proposed Basin Plan also recognises that there are risks to
achieving these objectives including insufficient water quan-
tity for the environment and/or unsuitable water quality
which may result in poor health of the Basin’s water-
dependent ecosystems. To address these risks the MDBA
has five policy levers above and beyond the SDL: the EWP; a
water quality and salinity management plan; water trading
rules; approval authority over water resource planning by
states (Garrick et al., 2012); and the opportunity to invest in
improved measuring, monitoring and research to improve
knowledge of environmental water requirements, impacts of
land use change including to conservation uses (Smith et al.,
2012), and climate change. This knowledge component is a
clear signal that the MDBA will invest resources to reduce
systematic uncertainty.
A big risk in implementation of the Basin Plan is it may not
meet the objectives desired by the various stakeholders
because of statistical and systematic uncertainty. Assessing
the risk of not meeting the objectives in the Basin Plan requires
an understanding of nested statistical and systematic uncer-
tainty in the hydro-climatology of the basin and the
hydrological, ecological response and socioeconomic valua-
tion modelling underpinning the Basin Plan as well as how the
development of water sharing plans and the EWP can address
these uncertainties. The presence of uncertainty at each stage
does not invalidate assessment of policy-contingent change
under the Basin Plan (CSIRO, 2012): rather by unpacking the
type of uncertainty and whether the magnitude is large
enough to change a decision, it is possible to see where for
instance, further investment in data collection or model
development might reduce uncertainty and where sufficient
information, in spite of uncertainty, already exists to enable a
decision to be taken. While, the final EWP that will guide
management and use of recovered environmental water had
not, at the time of writing, been developed by the Australian
Government, a series of discussion papers point to methodo-
logical frameworks to prioritise watering events, measure and
monitor the ecological responses and other outcomes, and
provide greater flexibility to the Australian Government
(DEWHA, 2009; DSEWPaC, 2011; CEW, 2011).
3. Method and results
This section draws on results from the coupled natural and
human system assessment (CSIRO, 2012). CSIRO (2012)
assessed the ecosystem service benefits of setting an SDL
and delivering recovered water to the environment under a
scenario very similar to the proposed Basin Plan (an SDL of
2800 GL/year). The incremental ecological and ecosystem
service benefits of two scenarios – a baseline scenario (a
simulated 114-year run that preserves hydro-climatologically
variability and current water-resource infrastructure) and a
2800 GL scenario (a simulated 114-year run with the policy-
contingent change, i.e. a further 2800 GL/year additional
environmental water) – were modelled and where possible
valued in monetary terms. The study concluded that returning
2800 GL/year to the environment would halt the decline (and
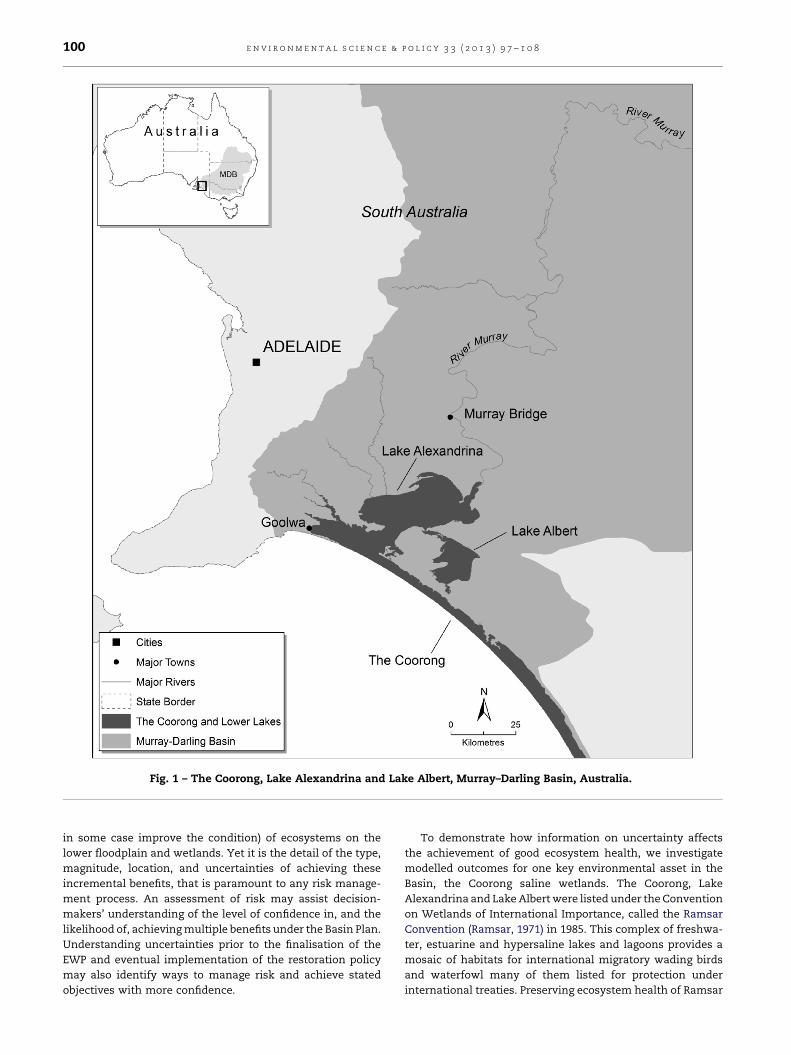
Fig. 1 – The Coorong, Lake Alexandrina and Lake Albert, Murray–Darling Basin, Australia.
e n v i r o n m e n t a l s c i e n c e & p o l i c y 3 3 ( 2 0 1 3 ) 9 7 – 1 0 8100
in some case improve the condition) of ecosystems on the
lower floodplain and wetlands. Yet it is the detail of the type,
magnitude, location, and uncertainties of achieving these
incremental benefits, that is paramount to any risk manage-
ment process. An assessment of risk may assist decision-
makers’ understanding of the level of confidence in, and the
likelihood of, achieving multiple benefits under the Basin Plan.
Understanding uncertainties prior to the finalisation of the
EWP and eventual implementation of the restoration policy
may also identify ways to manage risk and achieve stated
objectives with more confidence.
To demonstrate how information on uncertainty affects
the achievement of good ecosystem health, we investigate
modelled outcomes for one key environmental asset in the
Basin, the Coorong saline wetlands. The Coorong, Lake
Alexandrina and Lake Albert were listed under the Convention
on Wetlands of International Importance, called the Ramsar
Convention (Ramsar, 1971) in 1985. This complex of freshwa-
ter, estuarine and hypersaline lakes and lagoons provides a
mosaic of habitats for international migratory wading birds
and waterfowl many of them listed for protection under
international treaties. Preserving ecosystem health of Ramsar
e n v i r o n m e n t a l s c i e n c e & p o l i c y 3 3 ( 2 0 1 3 ) 9 7 – 1 0 8 101
sites is a stated rationale behind the Water Act 2007 and the
Basin Plan.
The Coorong Ramsar site is vulnerable: during the millenni-
um drought, insufficient freshwater reached the sea and the
Mouth of the Murray silted up, thus closing the natural
connection between freshwater, estuarine and marine ecosys-
tems in the Coorong lagoon system (Webster, 2010). Freshwater
flows ceased completely for a period of more than three years
(March 2007–October 2010) which was unprecedented in
recorded history for the River Murray (Webster, 2010). A
consequence of the lack of freshwater flows was the develop-
ment of extreme hypersaline conditions (i.e. water went from
twice the salinity of seawater to seven times the salinity of
seawater) in the South Lagoon of the Coorong and a loss of
estuarine conditions in the North Lagoon, closer to the Murray
Mouth (Kingsford et al., 2011). The South Australian State
Government initiated an emergency dredging programme in
2002 to re-establish connectivity between the Coorong and the
Southern Ocean to mitigate the extreme hypersaline conditions
(Kingsford et al., 2011). Estuarine conditions could not be
restored without a return of freshwater flows from the River
Murray which later occurred in 2010.
Hashimoto et al. (1982) described three aspects to system
performance that ideally could be used to assess the outcomes
against stated objectives. The three aspects are: (i) how often
the system fails (reliability); (ii) how quickly the system
returns to a satisfactory state once a failure has occurred
(resiliency, Folke et al., 2004), and; (iii) how significant the
likely consequences of failure may be (vulnerability). Our risk
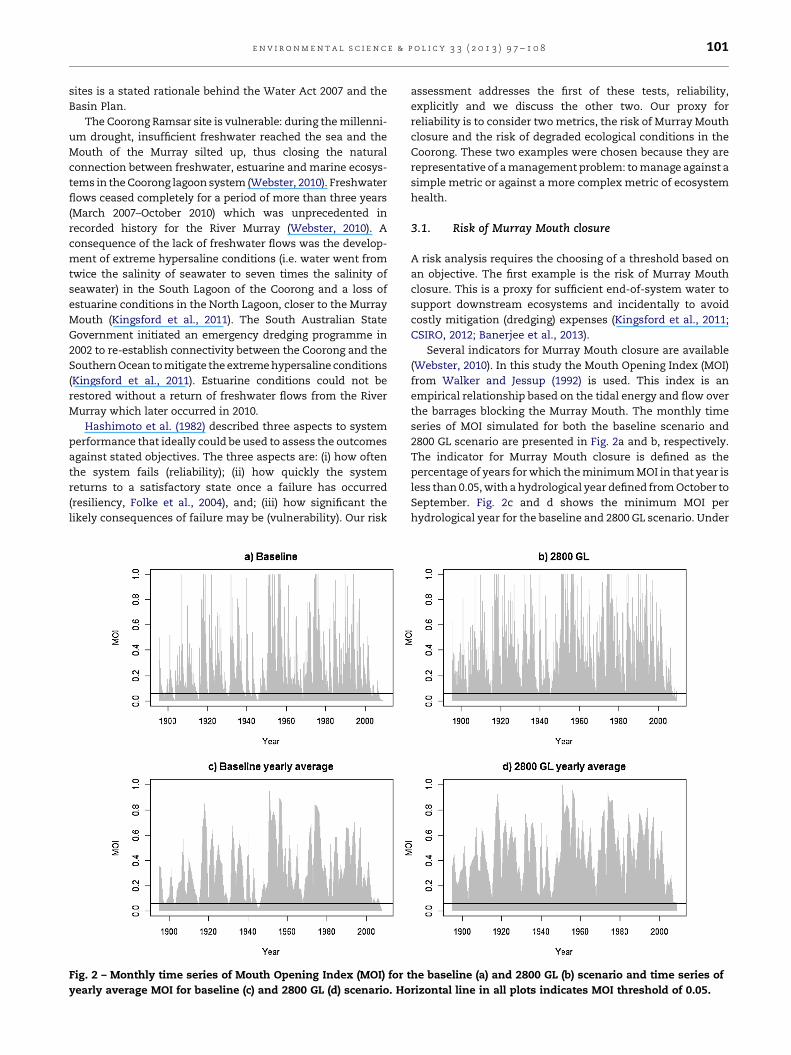
Fig. 2 – Monthly time series of Mouth Opening Index (MOI) for t
yearly average MOI for baseline (c) and 2800 GL (d) scenario. Ho
assessment addresses the first of these tests, reliability,
explicitly and we discuss the other two. Our proxy for
reliability is to consider two metrics, the risk of Murray Mouth
closure and the risk of degraded ecological conditions in the
Coorong. These two examples were chosen because they are
representative of a management problem: to manage against a
simple metric or against a more complex metric of ecosystem
health.
3.1. Risk of Murray Mouth closure
A risk analysis requires the choosing of a threshold based on
an objective. The first example is the risk of Murray Mouth
closure. This is a proxy for sufficient end-of-system water to
support downstream ecosystems and incidentally to avoid
costly mitigation (dredging) expenses (Kingsford et al., 2011;
CSIRO, 2012; Banerjee et al., 2013).
Several indicators for Murray Mouth closure are available
(Webster, 2010). In this study the Mouth Opening Index (MOI)
from Walker and Jessup (1992) is used. This index is an
empirical relationship based on the tidal energy and flow over
the barrages blocking the Murray Mouth. The monthly time
series of MOI simulated for both the baseline scenario and
2800 GL scenario are presented in Fig. 2a and b, respectively.
The indicator for Murray Mouth closure is defined as the
percentage of years for which the minimum MOI in that year is
less than 0.05, with a hydrological year defined from October to
September. Fig. 2c and d shows the minimum MOI per
hydrological year for the baseline and 2800 GL scenario. Under
he baseline (a) and 2800 GL (b) scenario and time series of
rizontal line in all plots indicates MOI threshold of 0.05.
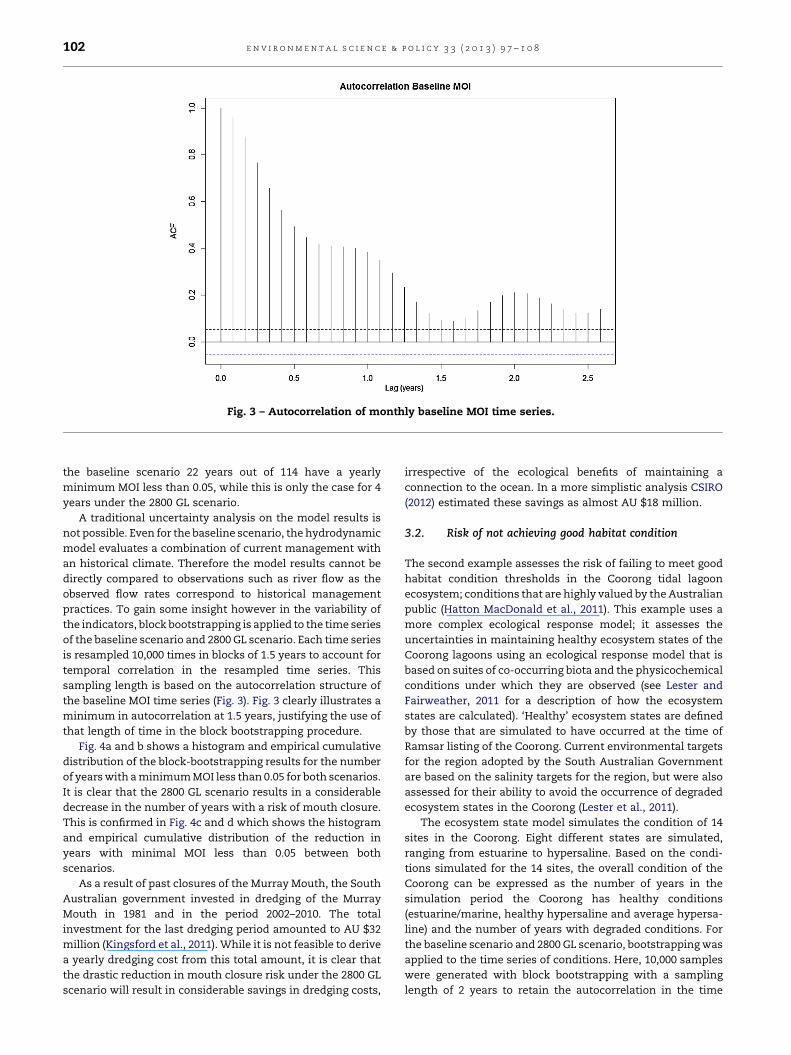
Fig. 3 – Autocorrelation of monthly baseline MOI time series.
e n v i r o n m e n t a l s c i e n c e & p o l i c y 3 3 ( 2 0 1 3 ) 9 7 – 1 0 8102
the baseline scenario 22 years out of 114 have a yearly
minimum MOI less than 0.05, while this is only the case for 4
years under the 2800 GL scenario.
A traditional uncertainty analysis on the model results is
not possible. Even for the baseline scenario, the hydrodynamic
model evaluates a combination of current management with
an historical climate. Therefore the model results cannot be
directly compared to observations such as river flow as the
observed flow rates correspond to historical management
practices. To gain some insight however in the variability of
the indicators, block bootstrapping is applied to the time series
of the baseline scenario and 2800 GL scenario. Each time series
is resampled 10,000 times in blocks of 1.5 years to account for
temporal correlation in the resampled time series. This
sampling length is based on the autocorrelation structure of
the baseline MOI time series (Fig. 3). Fig. 3 clearly illustrates a
minimum in autocorrelation at 1.5 years, justifying the use of
that length of time in the block bootstrapping procedure.
Fig. 4a and b shows a histogram and empirical cumulative
distribution of the block-bootstrapping results for the number
of years with a minimum MOI less than 0.05 for both scenarios.
It is clear that the 2800 GL scenario results in a considerable
decrease in the number of years with a risk of mouth closure.
This is confirmed in Fig. 4c and d which shows the histogram
and empirical cumulative distribution of the reduction in
years with minimal MOI less than 0.05 between both
scenarios.
As a result of past closures of the Murray Mouth, the South
Australian government invested in dredging of the Murray
Mouth in 1981 and in the period 2002–2010. The total
investment for the last dredging period amounted to AU $32
million (Kingsford et al., 2011). While it is not feasible to derive
a yearly dredging cost from this total amount, it is clear that
the drastic reduction in mouth closure risk under the 2800 GL
scenario will result in considerable savings in dredging costs,
irrespective of the ecological benefits of maintaining a
connection to the ocean. In a more simplistic analysis CSIRO
(2012) estimated these savings as almost AU $18 million.
3.2. Risk of not achieving good habitat condition
The second example assesses the risk of failing to meet good
habitat condition thresholds in the Coorong tidal lagoon
ecosystem; conditions that are highly valued by the Australian
public (Hatton MacDonald et al., 2011). This example uses a
more complex ecological response model; it assesses the
uncertainties in maintaining healthy ecosystem states of the
Coorong lagoons using an ecological response model that is
based on suites of co-occurring biota and the physicochemical
conditions under which they are observed (see Lester and
Fairweather, 2011 for a description of how the ecosystem
states are calculated). ‘Healthy’ ecosystem states are defined
by those that are simulated to have occurred at the time of
Ramsar listing of the Coorong. Current environmental targets
for the region adopted by the South Australian Government
are based on the salinity targets for the region, but were also
assessed for their ability to avoid the occurrence of degraded
ecosystem states in the Coorong (Lester et al., 2011).
The ecosystem state model simulates the condition of 14
sites in the Coorong. Eight different states are simulated,
ranging from estuarine to hypersaline. Based on the condi-
tions simulated for the 14 sites, the overall condition of the
Coorong can be expressed as the number of years in the
simulation period the Coorong has healthy conditions
(estuarine/marine, healthy hypersaline and average hypersa-
line) and the number of years with degraded conditions. For
the baseline scenario and 2800 GL scenario, bootstrapping was
applied to the time series of conditions. Here, 10,000 samples
were generated with block bootstrapping with a sampling
length of 2 years to retain the autocorrelation in the time
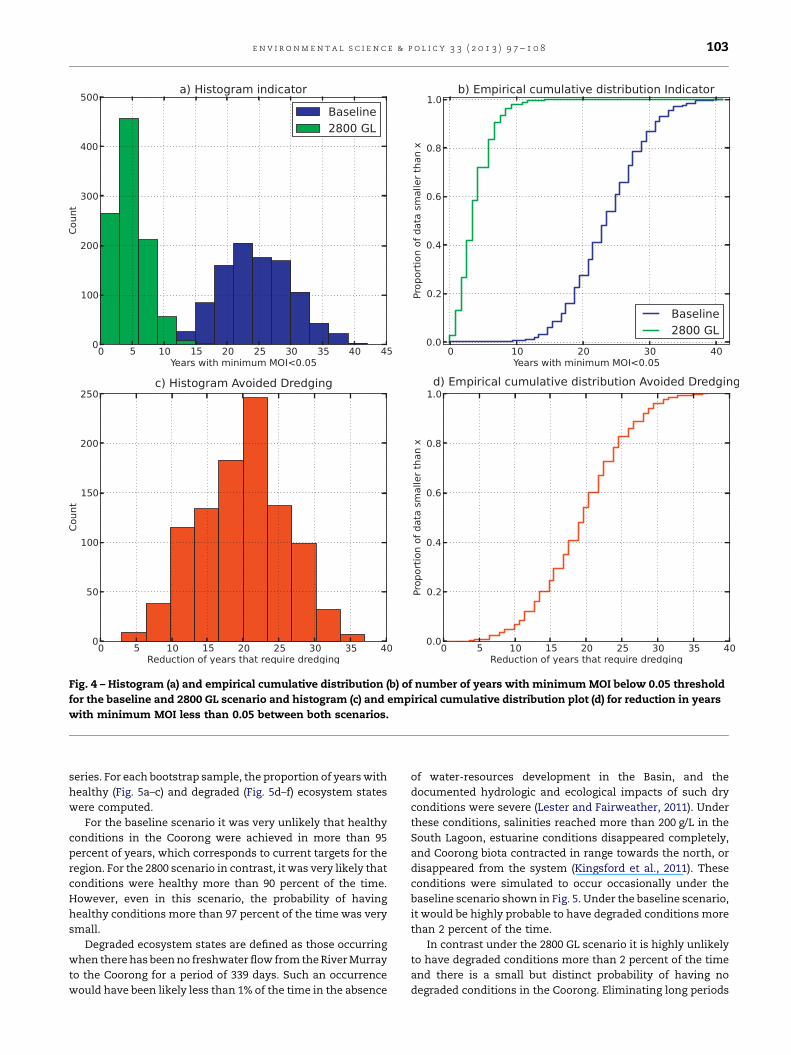
Fig. 4 – Histogram (a) and empirical cumulative distribution (b) of number of years with minimum MOI below 0.05 threshold
for the baseline and 2800 GL scenario and histogram (c) and empirical cumulative distribution plot (d) for reduction in years
with minimum MOI less than 0.05 between both scenarios.
e n v i r o n m e n t a l s c i e n c e & p o l i c y 3 3 ( 2 0 1 3 ) 9 7 – 1 0 8 103
series. For each bootstrap sample, the proportion of years with
healthy (Fig. 5a–c) and degraded (Fig. 5d–f) ecosystem states
were computed.
For the baseline scenario it was very unlikely that healthy
conditions in the Coorong were achieved in more than 95
percent of years, which corresponds to current targets for the
region. For the 2800 scenario in contrast, it was very likely that
conditions were healthy more than 90 percent of the time.
However, even in this scenario, the probability of having
healthy conditions more than 97 percent of the time was very
small.
Degraded ecosystem states are defined as those occurring
when there has been no freshwater flow from the River Murray
to the Coorong for a period of 339 days. Such an occurrence
would have been likely less than 1% of the time in the absence
of water-resources development in the Basin, and the
documented hydrologic and ecological impacts of such dry
conditions were severe (Lester and Fairweather, 2011). Under
these conditions, salinities reached more than 200 g/L in the
South Lagoon, estuarine conditions disappeared completely,
and Coorong biota contracted in range towards the north, or
disappeared from the system (Kingsford et al., 2011). These
conditions were simulated to occur occasionally under the
baseline scenario shown in Fig. 5. Under the baseline scenario,
it would be highly probable to have degraded conditions more
than 2 percent of the time.
In contrast under the 2800 GL scenario it is highly unlikely
to have degraded conditions more than 2 percent of the time
and there is a small but distinct probability of having no
degraded conditions in the Coorong. Eliminating long periods
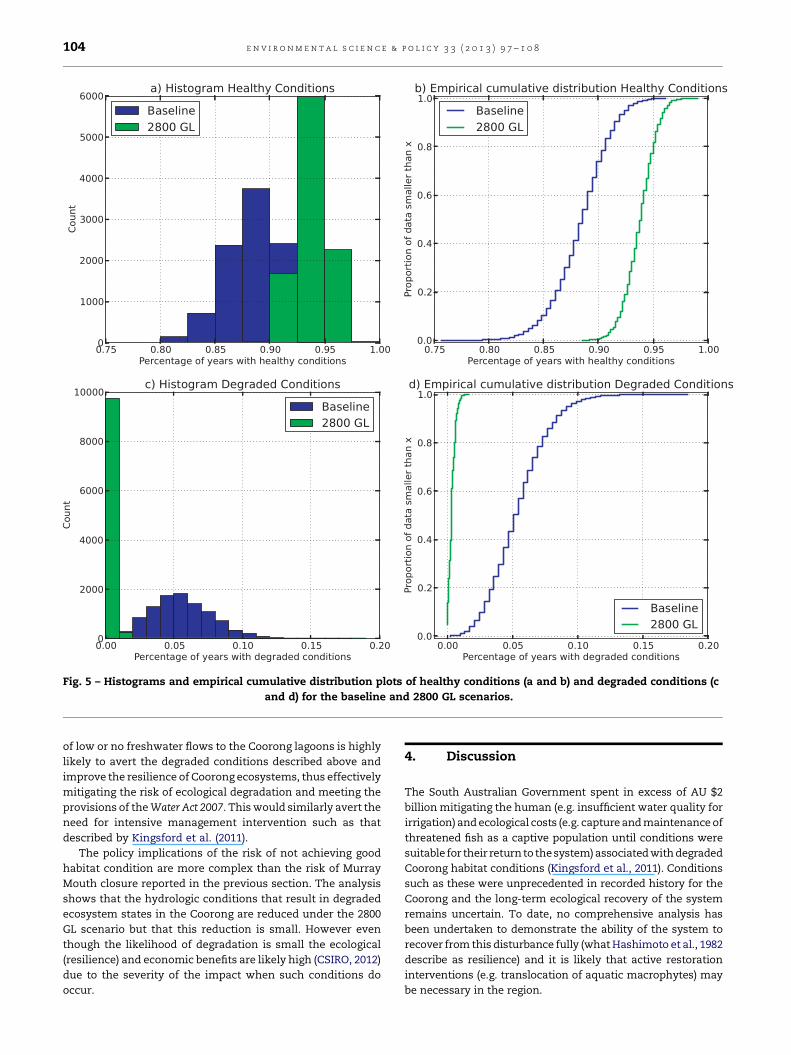
Fig. 5 – Histograms and empirical cumulative distribution plots of healthy conditions (a and b) and degraded conditions (c
and d) for the baseline and 2800 GL scenarios.
e n v i r o n m e n t a l s c i e n c e & p o l i c y 3 3 ( 2 0 1 3 ) 9 7 – 1 0 8104
of low or no freshwater flows to the Coorong lagoons is highly
likely to avert the degraded conditions described above and
improve the resilience of Coorong ecosystems, thus effectively
mitigating the risk of ecological degradation and meeting the
provisions of the Water Act 2007. This would similarly avert the
need for intensive management intervention such as that
described by Kingsford et al. (2011).
The policy implications of the risk of not achieving good
habitat condition are more complex than the risk of Murray
Mouth closure reported in the previous section. The analysis
shows that the hydrologic conditions that result in degraded
ecosystem states in the Coorong are reduced under the 2800
GL scenario but that this reduction is small. However even
though the likelihood of degradation is small the ecological
(resilience) and economic benefits are likely high (CSIRO, 2012)
due to the severity of the impact when such conditions do
occur.
4. Discussion
The South Australian Government spent in excess of AU $2
billion mitigating the human (e.g. insufficient water quality for
irrigation) and ecological costs (e.g. capture and maintenance of
threatened fish as a captive population until conditions were
suitable for their return to the system) associated with degraded
Coorong habitat conditions (Kingsford et al., 2011). Conditions
such as these were unprecedented in recorded history for the
Coorong and the long-term ecological recovery of the system
remains uncertain. To date, no comprehensive analysis has
been undertaken to demonstrate the ability of the system to
recover from this disturbance fully (what Hashimoto et al., 1982
describe as resilience) and it is likely that active restoration
interventions (e.g. translocation of aquatic macrophytes) may
be necessary in the region.
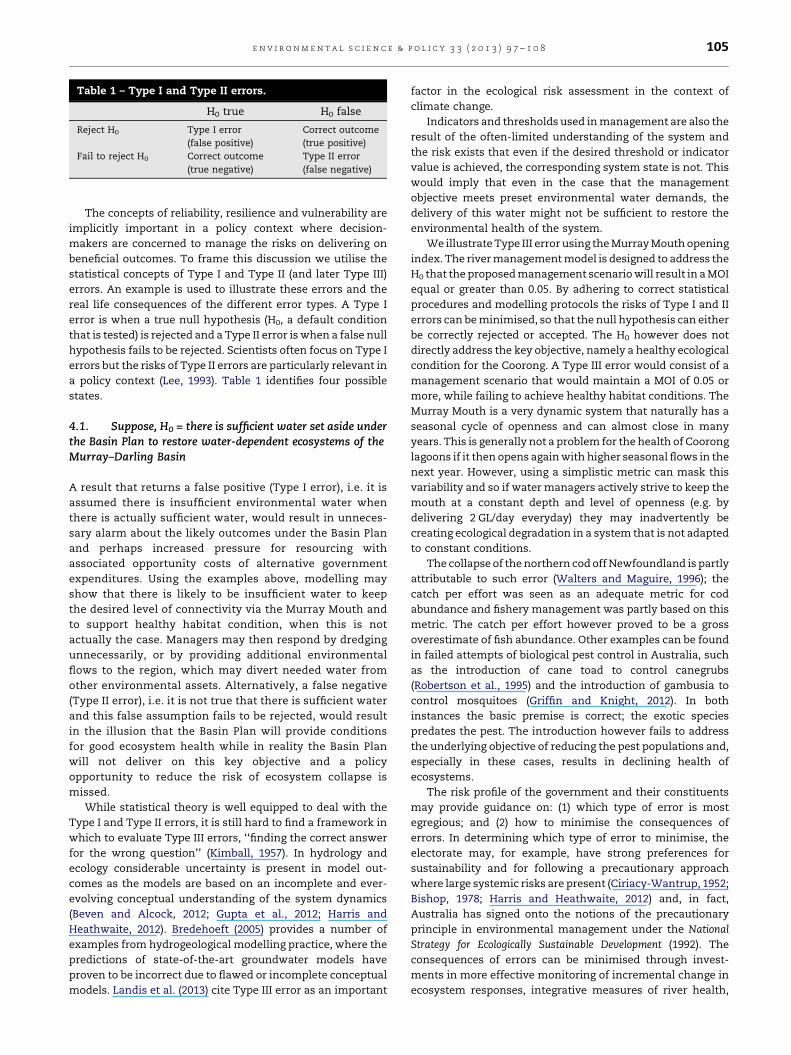
Table 1 – Type I and Type II errors.
H0 true H0 false
Reject H0 Type I error
(false positive)
Correct outcome
(true positive)
Fail to reject H0 Correct outcome
(true negative)
Type II error
(false negative)
e n v i r o n m e n t a l s c i e n c e & p o l i c y 3 3 ( 2 0 1 3 ) 9 7 – 1 0 8 105
The concepts of reliability, resilience and vulnerability are
implicitly important in a policy context where decision-
makers are concerned to manage the risks on delivering on
beneficial outcomes. To frame this discussion we utilise the
statistical concepts of Type I and Type II (and later Type III)
errors. An example is used to illustrate these errors and the
real life consequences of the different error types. A Type I
error is when a true null hypothesis (H0, a default condition
that is tested) is rejected and a Type II error is when a false null
hypothesis fails to be rejected. Scientists often focus on Type I
errors but the risks of Type II errors are particularly relevant in
a policy context (Lee, 1993). Table 1 identifies four possible
states.
4.1. Suppose, H0 = there is sufficient water set aside underthe Basin Plan to restore water-dependent ecosystems of theMurray–Darling Basin
A result that returns a false positive (Type I error), i.e. it is
assumed there is insufficient environmental water when
there is actually sufficient water, would result in unneces-
sary alarm about the likely outcomes under the Basin Plan
and perhaps increased pressure for resourcing with
associated opportunity costs of alternative government
expenditures. Using the examples above, modelling may
show that there is likely to be insufficient water to keep
the desired level of connectivity via the Murray Mouth and
to support healthy habitat condition, when this is not
actually the case. Managers may then respond by dredging
unnecessarily, or by providing additional environmental
flows to the region, which may divert needed water from
other environmental assets. Alternatively, a false negative
(Type II error), i.e. it is not true that there is sufficient water
and this false assumption fails to be rejected, would result
in the illusion that the Basin Plan will provide conditions
for good ecosystem health while in reality the Basin Plan
will not deliver on this key objective and a policy
opportunity to reduce the risk of ecosystem collapse is
missed.
While statistical theory is well equipped to deal with the
Type I and Type II errors, it is still hard to find a framework in
which to evaluate Type III errors, ‘‘finding the correct answer
for the wrong question’’ (Kimball, 1957). In hydrology and
ecology considerable uncertainty is present in model out-
comes as the models are based on an incomplete and ever-
evolving conceptual understanding of the system dynamics
(Beven and Alcock, 2012; Gupta et al., 2012; Harris and
Heathwaite, 2012). Bredehoeft (2005) provides a number of
examples from hydrogeological modelling practice, where the
predictions of state-of-the-art groundwater models have
proven to be incorrect due to flawed or incomplete conceptual
models. Landis et al. (2013) cite Type III error as an important
factor in the ecological risk assessment in the context of
climate change.
Indicators and thresholds used in management are also the
result of the often-limited understanding of the system and
the risk exists that even if the desired threshold or indicator
value is achieved, the corresponding system state is not. This
would imply that even in the case that the management
objective meets preset environmental water demands, the
delivery of this water might not be sufficient to restore the
environmental health of the system.
We illustrate Type III error using the Murray Mouth opening
index. The river management model is designed to address the
H0 that the proposed management scenario will result in a MOI
equal or greater than 0.05. By adhering to correct statistical
procedures and modelling protocols the risks of Type I and II
errors can be minimised, so that the null hypothesis can either
be correctly rejected or accepted. The H0 however does not
directly address the key objective, namely a healthy ecological
condition for the Coorong. A Type III error would consist of a
management scenario that would maintain a MOI of 0.05 or
more, while failing to achieve healthy habitat conditions. The
Murray Mouth is a very dynamic system that naturally has a
seasonal cycle of openness and can almost close in many
years. This is generally not a problem for the health of Coorong
lagoons if it then opens again with higher seasonal flows in the
next year. However, using a simplistic metric can mask this
variability and so if water managers actively strive to keep the
mouth at a constant depth and level of openness (e.g. by
delivering 2 GL/day everyday) they may inadvertently be
creating ecological degradation in a system that is not adapted
to constant conditions.
The collapse of the northern cod off Newfoundland is partly
attributable to such error (Walters and Maguire, 1996); the
catch per effort was seen as an adequate metric for cod
abundance and fishery management was partly based on this
metric. The catch per effort however proved to be a gross
overestimate of fish abundance. Other examples can be found
in failed attempts of biological pest control in Australia, such
as the introduction of cane toad to control canegrubs
(Robertson et al., 1995) and the introduction of gambusia to
control mosquitoes (Griffin and Knight, 2012). In both
instances the basic premise is correct; the exotic species
predates the pest. The introduction however fails to address
the underlying objective of reducing the pest populations and,
especially in these cases, results in declining health of
ecosystems.
The risk profile of the government and their constituents
may provide guidance on: (1) which type of error is most
egregious; and (2) how to minimise the consequences of
errors. In determining which type of error to minimise, the
electorate may, for example, have strong preferences for
sustainability and for following a precautionary approach
where large systemic risks are present (Ciriacy-Wantrup, 1952;
Bishop, 1978; Harris and Heathwaite, 2012) and, in fact,
Australia has signed onto the notions of the precautionary
principle in environmental management under the National
Strategy for Ecologically Sustainable Development (1992). The
consequences of errors can be minimised through invest-
ments in more effective monitoring of incremental change in
ecosystem responses, integrative measures of river health,
e n v i r o n m e n t a l s c i e n c e & p o l i c y 3 3 ( 2 0 1 3 ) 9 7 – 1 0 8106
complexity indicators and indicators of ecological progress for
adaptive management (Harris and Heathwaite, 2012). Other
strategies include setting safe minimum standards (Bateman
et al., 2011), and the use of probabilistic forecasting coupled
with simple economic models (Verkade and Werner, 2011).
Furthermore, the EWP will be implemented separately each
year and, although Pielke reminds us that ‘‘a continuous
decision process is more complicated than a one-time,
discrete choice’’ (2007: 25), this strategy provides opportunities
for adaptive learning (Lee, 1993; Harris and Heathwaite, 2012).
In a multi-dimensional space it can be easy to lose sight of
the fact some things are more important than others to the
application of a restoration strategy, i.e. all risks are not equal
and many are not critical in policy trade-offs. This might
involve prioritising management focus (Harris and
Heathwaite, 2012) for instance on those natural systems that
are historically abundant but are now quite rare, or the degree
and effort (and cost) of restoring highly-disturbed sites
compared to maintaining or improving minimally-disturbed
sites (Palik, 2000). Newig et al. (2005) recommend participatory
approaches as a way to mediate interests and goals to: manage
normative uncertainty, improve acceptance, and improve
implementation outcomes. Participatory approaches that
incorporate local knowledge may also help to make better
informed decisions. Meanwhile, Harris and Heathwaite (2012)
discuss opportunity to integrate land and water management
for ecological outcomes and Doody et al. (2012) recommend
appraisal of the structures and procedures of the implemen-
tation agent to identify likely failings and address these early
in the implementation phase.
5. Conclusions
Is uncertainty analysis useful for decision-makers or does
acknowledging uncertainties undermine the Basin Plan? It is
true that the science community does not know everything,
nor does it need to (post-normal science; Funtowicz and
Ravetz, 1993); and there is nested uncertainty from hydro-
climatology through hydrological models through ecological
response models and the monetary valuation of benefits. As a
policy process is necessarily one of negotiation and dialogues,
science encompasses the legitimacy of multiple perspectives,
commitments and is a process of discourse and demonstra-
tion through evidence (Funtowicz and Ravetz, 1993). Manage-
ment rules can be designed, monitored and amended as more
information on the water requirements and regimes of water-
dependent ecosystems and on the success of delivery options
becomes available. It is through learning and adaptive
processes that we allow a fresh and progressive approach to
risk-based water resource management.
The benefits of a risk-based approach include the possibili-
ty for more robust planning and therefore better-defined
planning objectives that are more likely to be achieved.
Providing decision-makers and the public with easily inter-
pretable information on uncertainty provides an opportunity
for more fruitful discussion of policy objectives and ways to
achieve good outcomes and to manage expectations. Assess-
ment that includes risk can provide information on the risk
profile you are currently operating under and perhaps identify
management options to get you to the risk profile you wish to
have. The risk assessment provides guidance for those things
that can be managed adaptively and those that are likely
dependent on the actual sequencing of wet and dry years (e.g.
the need to piggy-back on flood events to achieve watering of
the high floodplain) or those objectives that are beyond the
scope of water resource managers without collaboration and
integration with other policy instruments, e.g. native fish
recovery and the need for complementary land management
and investment in fish ladders.
In some cases more water, water managed more efficiently,
or more sensitively managed to achieve co-benefits, i.e.
cultural benefits for indigenous communities in the Basin,
will enable better outcomes or outcomes to be achieved with
greater certainty. In this instance, if sufficient water cannot be
delivered because of flood risk to private property then a
creative solution could comprise the purchase of flood
easements or building up levees around regional towns or
irrigation districts. The additional funding announced in
November 2012 provides opportunity for this type of invest-
ment. In yet other cases, outcomes might be better reached
with a paradigm shift in thinking, for instance a focus on
achieving the desired outcomes opens the solution set,
illuminates the nature of the risks to water-dependent
activities, highlights the long-term nature of the recovery
project and the benefits of a more resilient whole-of-system.
This paradigm shift is straightforward to implement in an
uncertainty analysis/risk management framework. Rather
than focusing on the probability of an event happening, the
same simulations can be used to express the most likely
system state given a scenario of boundary conditions, such as
climate and management strategy.
Acknowledgements
The authors would like to thank The Water for a Healthy
Country Flagship, CSIRO. Darran King provided early insight
into uncertainties in the Basin Planning process. Thanks also
to Martin Nolan for creating Fig. 1.
r e f e r e n c e s
Ascough I.I., J.C., Maier, H.R., Ravalico, J.K., Strudley, M.W., 2008.Future research challenges for incorporation of uncertaintyin environmental and ecological decision-making. EcologicalModelling 219 (3–4) 383–399.
Banerjee, O., Bark, R., Connor, J., Crossman, N., 2013. Anecosystem services approach to estimating economic lossesassociated with drought. Ecological Economics 91, 19–27.
Bateman, I.J., Mace, G.M., Fezzi, C., Atkinson, G., Turner, K.,2011. Economic analysis for ecosystem service assessments.Environmental and Resource Economics 48, 177–218.
Beven, K.J., Alcock, R.E., 2012. Modelling everything everywhere:a new approach to decision-making for water managementunder uncertainty. Freshwater Biology 57, 124–132 (BlackwellPublishing Ltd.).
Bishop, R., 1978. Endangered species and uncertainty: theeconomics of a safe minimum standard. American Journal ofAgricultural Economics 60, 10–18.
e n v i r o n m e n t a l s c i e n c e & p o l i c y 3 3 ( 2 0 1 3 ) 9 7 – 1 0 8 107
Bredehoeft, J., 2005. The conceptualization model problem—surprise. Hydrogeology Journal 13 (1) 37–46.
CEW, 2011. Commonwealth Environmental Water-tradingArrangements. Discussion Paper. CommonwealthEnvironmental Water, 22 (November).
Ciriacy-Wantrup, S.V., 1952. Resource Conservation: Economicsand Policies. University of California Press, Berkeley.
CSIRO, 2012. Assessment of the ecological and economicbenefits of environmental water in the Murray–DarlingBasin. CISRO Water for a Healthy Country National ResearchFlagship, Australia.
Daneshkhah, A.R., 2004. Uncertainty in probabilistic riskassessment: a review. In: BEEP Working Paper: BayesianElicitation Of Experts’ Probabilities. University of Sheffield,Sheffield, UK. , 9 August (accessed 21.05.12)http://www.sheffield.ac.uk/content/1/c6/03/09/33/risk.pdf.
DEWHA, 2009. A Framework for Determining CommonwealthEnvironmental Watering Actions. Department of theEnvironment, Water, Heritage and the Arts, Canberra(December).
Doody, D.G., Foy, R.H., Barry, C.D., 2012. Accounting for the roleof uncertainty in declining water quality in an extensivelyfarmed grassland catchment. Environmental Science andPolicy 24, 15–23.
Doyle, M., Drew, C.A., 2008. In: Doyle, M., Drew, C.A. (Eds.),Large-scale Ecosystem Restoration: Five Case Studies from theUnited States. Island Press, Washington, DC, p. 325.
DSEWPaC, 2011. A Proposed Monitoring, Evaluation andReporting Framework for use of CommonwealthEnvironmental Water in the Murray–Darling Basin:Discussion Paper. Department of Sustainability,Environment, Water, Population and Communities, 22(June).
Folke, C., Carpenter, S., et al., 2004. Regime shifts, resilience,and biodiversity in ecosystem management. Annual Reviewof Ecology, Evolution, and Systematics S35, 557–581.
Funtowicz, S., Ravetz, J.R., 1993. Science for the post-normalage. Futures 25, 735–755.
Garrick, D., Bark, R., Connor, J., Banerjee, O., 2012.Environmental water governance in federal rivers:opportunities and limits of subsidiarity in the River Murrayof Australia. Water Policy 14, 915–936.
Griffin, L.F., Knight, J.M., 2012. A review of the role of fish asbiological control agents of disease vector mosquitoes inmangrove forests: reducing human health risks whilereducing environmental risk. Wetlands Ecology andManagement 20 (3) 243–252.
Gupta, H.V., Clark, M.P., Vrugt, J.A., Abramowitz, G., Ye, M., 2012.Towards a comprehensive assessment of model structuraladequacy. Water Resources Research (AGU) 48, W08301–W08308, http://dx.doi.org/10.1029/2011WR011044.
Harris, G.P., Heathwaite, A.L., 2012. Why is achieving goodecological outcomes in rivers so difficult? FreshwaterBiology 57 (Suppl. 1) 91–107.
Hashimoto, T., Stedinger, J.R., Loucks, D.P., 1982. Reliabilityresiliency and vulnerability criteria for water resourcesystem performance evaluation. Water Resources Research18 (February (1)) 14–20.
Hatton MacDonald, D., Morrison, M.D., Rose, J.M., Boyle, K.J.,2011. Valuing a multistate river: the case of the River Murray.Australian Journal of Agricultural and Resources Economics55 (3) 373–391.
Hayes, K.R., 2011. Uncertainty and uncertainty analysismethods Issues in quantitative and qualitative risk modelingwith application to import risk assessment. ACERA Project(0705) Report Number: EP102467. .
IEC, 2009. IEC/ISO 31010:2009-11, Risk Management—RiskAssessment Techniques. International ElectrotechnicalCommission, International Standards Organisation.
Kandulu, J.M., Bryan, B.A., King, D., Connor, J.D., 2012. Mitigatingeconomic risk from climate variability in rain-fed agriculturethrough enterprise mix diversification. Ecological Economics79, 105–112.
Kavetski, D., Kuczera, G., Franks, S.W., 2006. Bayesian analysisof input uncertainty in hydrological modeling: 1. Theory.Water Resources Research (AGU) 42, W03407.3, http://dx.doi.org/10.1029/2005WR004368.
Kimball, A.W., 1957. Errors of the third kind in statisticalconsulting. Journal of the American Statistical Association,American Statistical Association 52 (278) 133–142.
Kingsford, R.T., Walker, K.F., Lester, R.E., Young, W.J.,Fairweather, P.G., Sammut, J., et al., 2011. A Ramsar wetlandin crisis—the Coorong, Lower Lakes and Murray Mouth,Australia. Marine and Freshwater Research 62 (3)255–265.
Kirby, M., Evans, R., Walker, G., Cresswell, R., Coram, J., Khan, S.,et al., 2006. The Shared Water Resources of the Murray–Darling Basin. , http://www.csiro.au/files/files/p7g9.pdf.
Landis, W.G., Durda, J.L., Brooks, M.L., Chapman, P.M., Menzie,C.A., Stahl Ralph, G.J., Stauber, J.L., 2013. Ecological riskassessment in the context of global climate change.Environmental Toxicology and Chemistry 32, 79–92.
Lee, K.N., 1993. Compass and Gyroscope: Integrating Scienceand Politics for the Environment, vol. xii. Island Press,Washington, DC, ISBN: 1559631988pp. 243.
Lester, R.E., Fairweather, P.G., 2011. Ecosystem states: creating adata-derived, ecosystem-scale ecological response modelthat is explicit in space and time. Ecological Modelling 222,2690–2703.
Lester, R.E., Webster, I.T., Fairweather, P.G., Young, W.J., 2011.Linking water-resource models to ecosystem-responsemodels to guide water-resource planning: an example fromthe Murray–Darling Basin, Australia. Marine and FreshwaterResearch 62, 279–289.
Liu, J., Dietz, T., Carpenter, S.R., Alberti, M., Folke, C., Moran, E.,et al., 2007. Complexity of coupled human and naturalsystems. Science 317 (5844) 1513–1516.
Lo, A.W., Mueller, M.T., 2010. WARNING: physics envy may behazardous to your wealth. , 20MarcharXiv:1003.2688v3[q*fin.RM].
MDBA, 2011a. Proposed Basin Plan. MDBA publication no: 192/11. , http://download.mdba.gov.au/proposed/proposed_basin_plan.pdf.
MDBA, 2011b. The Proposed ‘Environmentally Sustainable Levelof Take’ for Surface Water of the Murray–Darling Basin:Methods and Outcomes. Murray–Darling Basin Authority,Canberra. , http:\\www.download.mdba.gov.au/proposed/ESLT_MDBA_report.pdf.
Newig, J., Pahl-Wostl, C., Sigel, K., 2005. The role of publicparticipation in managing uncertainty in theimplementation of the Water Framework Directive.European Environment 15, 333–343.
Norgaard, R.B., 2010. Ecosystem services: from eye-openingmetaphor to complexity blinder. Ecological Economics 69 (6), http://dx.doi.org/10.1016/j.ecolecon.2009.11.009.
Palik, B.J., 2000. Using landscape hierarchies to guide restorationof disturbed ecosystems. Ecological Applications 10, 189–202.
Peel, M.C., McMahon, T.A., Finlayson, B.L., 2004. Continentaldifferences in the variability of annual runoff—update andreassessment. Journal of Hydrology 295, 185–197.
Pielke Jr., R.A., 2007. The Honest Broker: Making Sense ofScience in Policy and Politics. Cambridge University Press,New York.
Ramsar Convention, 1971. The Convention on Wetlands ofInternational Importance, Especially as Waterfowl Habitat,in 3 December 1982 as Amended by the Paris Protocol, andRegina Amendments, 28 May 1987. , Ramsar: UN TreatySeries No. 14583.

e n v i r o n m e n t a l s c i e n c e & p o l i c y 3 3 ( 2 0 1 3 ) 9 7 – 1 0 8108
Robertson, L.N., Allsopp, P.G., Chandler, K.J., Mullins, R.T., 1995.Integrated management of Canegrubs in Australia—currentsituation and future-research directions. Australian Journalof Agricultural Research 46 (1) 1–16.
Shao, Q., Lerat, J., Brink, H., Tomkins, K., Yang, A., Peeters, L.,Li, M., Zhang, L., Podger, G., Renzullo, L.J., 2012. Gaugebased precipitation estimation and associated model andproduct uncertainties. Journal of Hydrology, http://dx.doi.org/10.1016/j.jhydrol.2012.04.009 pp. 444–445,100–1120.
Smith, L., Inman, A., Cherrington, R., 2012. The potential of landconservation agreements for protection of water resources.Environmental Science and Policy 24, 92–100.
Verkade, J.S., Werner, M.G.F., 2011. Estimating the benefits ofsingle value and portability forecasting for flood warning.Hydrological and Earth System Science 15, 3751–3765.
Walker, D.J., Jessup, A., 1992. Analysis of the dynamic aspects ofthe River Murray Mouth, South Australia. Journal of CoastalResearch 8 (1) 71–76.
Walters, C., Maguire, J.-J., 1996. Lessons for stock assessmentfrom the northern cod collapse. Reviews in Fish Biology andFisheries 6 (2) 125–137.
Webster, I.T., 2010. The hydrodynamics and salinity regime of acoastal lagoon—the Coorong, Australia—seasonal to multi-decadal timescales. Estuarine, Coastal and Shelf Science 90,264–274.


![[Schaum - Murray R.Spiegel] Mecanica Teorica](https://static.fdokumen.com/doc/165x107/6316b839c5ccb9e1fb03d12d/schaum-murray-rspiegel-mecanica-teorica.jpg)